
2012 A n n u A l R e p o R t
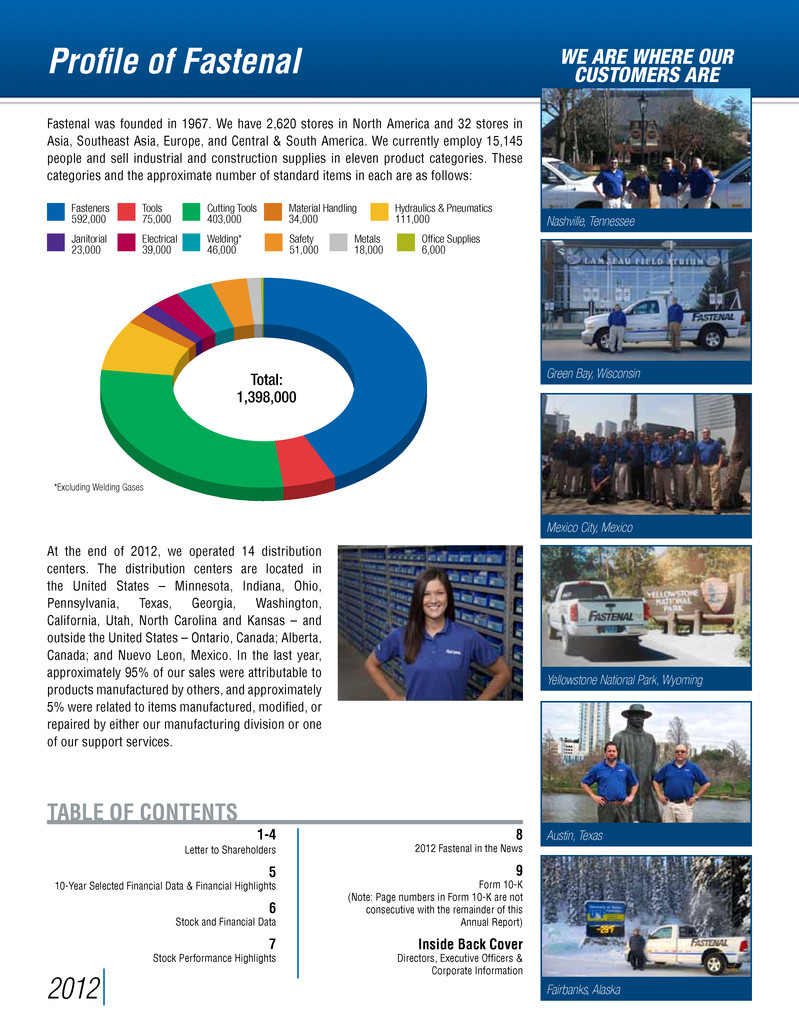
Fasteners 592,000 Tools 75,000 Cutting Tools 403,000 Hydraulics & Pneumatics 111,000 Material Handling 34,000 Janitorial 23,000 Electrical 39,000 Welding* 46,000 Safety 51,000 Metals 18,000 Office Supplies 6,000 Total: 1,398,000 *Excluding Welding Gases Profile of Fastenal 2012 TABLE OF CONTENTS 1-4 Letter to Shareholders 5 10-Year Selected Financial Data & Financial Highlights 6 Stock and Financial Data 7 Stock Performance Highlights 8 2012 Fastenal in the News 9 Form 10-K (Note: Page numbers in Form 10-K are not consecutive with the remainder of this Annual Report) Inside Back Cover Directors, Executive Officers & Corporate Information Nashville, Tennessee Green Bay, Wisconsin Mexico City, Mexico Yellowstone National Park, Wyoming Austin, Texas WE ARE WHERE OUR CUSTOMERS ARE Fairbanks, Alaska Fastenal was founded in 1967. We have 2,620 stores in North America and 32 stores in Asia, Southeast Asia, Europe, and Central & South America. We currently employ 15,145 people and sell industrial and construction supplies in eleven product categories. These categories and the approximate number of standard items in each are as follows: At the end of 2012, we operated 14 distribution centers. The distribution centers are located in the United States – Minnesota, Indiana, Ohio, Pennsylvania, Texas, Georgia, Washington, California, Utah, North Carolina and Kansas – and outside the United States – Ontario, Canada; Alberta, Canada; and Nuevo Leon, Mexico. In the last year, approximately 95% of our sales were attributable to products manufactured by others, and approximately 5% were related to items manufactured, modified, or repaired by either our manufacturing division or one of our support services.
LETTER TO SHAREHOLDERS 2012 1 As a shareholder, it’s important to move beyond the numbers and gain at least a basic understanding of the company you’re investing in. So, before we delve into our results for 2012, we’d like to present Fastenal’s core principles and business strategy. Our organization is guided by a motto of Growth Through Customer Service, and we embrace a decentralized structure that encourages everyone in Fastenal to make decisions in pursuit of that goal. We start by hiring people who share our values of Ambition, Innovation, Integrity, and Teamwork. Then, after providing them with intensive training, we place these individuals in a role alongside veteran team members and give them an opportunity to make smart decisions for their customers and the company. By empowering every employee to make timely, local decisions, we’ve created an environment in which we respond with urgency and allow good ideas to emerge. Our business has been built with local stores as the focal point. Some may feel this isn’t the most efficient model in today’s world, but we strongly believe the closer we are to our customer, the better we can understand their needs and help them improve their business. We also believe in vertical integration throughout our organization. Our teams work hard to develop solutions and systems ‘in-house’ whenever possible – from designing our own computer systems, to operating our own trucking fleet, to utilizing our own engineers to design our warehouse systems. We believe this approach not only makes us more profitable but also more responsive and flexible. Now that you have a better sense of how we operate, let’s focus on our results for 2012. The year started strong with 20% sales growth in the first quarter, but in the late-April/May timeframe we saw a slowdown in our growth. This slower environment occurred over a broad geographic area and in most customer segments, and continued throughout the remainder of the year. For the year, our sales were $3.13 billion, an increase of 13.3% over our sales of $2.77 billion in 2011. Our net earnings in 2012 were $421 million, an increase of 17.5% compared to our earnings of $358 million in 2011. This increase allowed us to achieve pre-tax earnings as a percentage of sales of 21.5%, an increase of 70 basis points over the 20.8% we reported in 2011 and the highest reported pre-tax earnings in company history. This improvement was made possible entirely by good expense control – in fact, our gross margin decreased slightly, coming in at 51.5% for 2012 versus 51.8% in 2011. We worked hard on improving our gross margin throughout the year but found it difficult due to a lower percentage of sales coming from fasteners (our highest-margin product category) and due to better than average growth from larger customers (which typically receive volume-leveraged pricing terms). Expense control has always been a part of our culture, and it’s an area where we continually focus. This year was no exception as our operating and administrative expenses grew only 9.5% compared to the 13.3% sales growth number cited above. Employee and related expenses, our largest operating expense category, grew at 10.1%. This expense was pushed higher by: (1) a 44.0% increase in our employee profit sharing program (this is calculated based on our pre-tax earnings); (2) the introduction of our vending incentive (more on this below); and (3) our decision to implement a pay guarantee for store managers. The non-payroll category, which includes all general expenses, the largest being occupancy, grew at just 8.3% versus 13.3% sales growth. We continue to make progress on our ‘pathway to profit’ strategic growth initiative. Introduced in 2007, this plan simply calls for us to slow down our store openings while adding sales people. Through this balanced approach, we originally projected we could increase our average monthly store sales from $72,000 to $125,000 over a five-year period from 2007 to 2012, in turn increasing our pre-tax earnings one percentage point a year, from 18 to 23% of sales. Because of the impact of the 2008-2009 recession on our revenue, we anticipated the timeline would be extended by 18 to 24 months. However, during the recession we became more efficient – lean, if you will – and we now believe our 23% pre-tax earnings goal can be achieved with average monthly store “By empowering every employee to make timely, local decisions, we’ve created an environment in which we respond with urgency and allow good ideas to emerge. ” Investing in the Future Our third automated picking system, located in Winona, MN, came online during the third quarter. This technology decreases our picking errors, picking time, and our cost per pick, providing better service to our customers at a lower cost. Rolling Out CNG Vehicles In November we introduced six compressed natural gas (CNG) fueled vehicles to our semi fleet. These vehicles produce fewer carbon emissions and run at roughly half the cost of diesel-fueled trucks based on current prices.

LETTER TO SHAREHOLDERS 2012 2 sales of just $100,000 to $110,000. Based on this recalculation, and assuming normal economic conditions, we remain confident we can achieve our 23% pre-tax earnings goal in 2013. One of the true highlights of the year was the strong growth of our FAST SolutionsSM℠ (industrial vending) program. Why are we working so hard to grow this business? It’s simply a better way to both buy and sell product. The benefits to our customers are numerous: reduced consumption, reduced inventory investment, reduced purchase orders, reduced product handling, and 24-hour product availability. The benefit to Fastenal is a much stronger relationship, which translates into more opportunities. We also save money on the service side of the business because, with our Internet-enabled machines, the orders automatically flow into our system. This saves labor, eliminates errors, and streamlines the supply chain. Late in 2011 we introduced an employee incentive program designed to increase the number of vending agreements signed with new and existing customers. By all accounts, this incentive has been a tremendous success. We far exceeded our internal goal of signing 15,000 vending machines and ended the year with 20,162 signings – an increase of 157% compared to our signings in 2011. We will continue to work hard in all areas of industrial vending, with the goal of providing better and more cost-effective solutions for our customers. To that end, our team will work with our equipment supplier to continually improve the machines we have today, and to develop the systems we will need in the future. This year proved to be a challenging one for our international business. The global economic slowdown affected nearly all of our international markets, but we were hit particularly hard in Asia and Europe. The majority of the decline can be attributed to our existing customers simply purchasing less in 2012 versus 2011. Our Canadian business was also impacted by factors out of our control, yet we were able to grow sales by 10.1% (in local currency, this growth was 11.6%). Our sales growth of 32.9% in Mexico represented a bright spot for our international operations – this was the one international market that remained strong throughout the year. As reported in last year’s letter, we opened our first location in Brazil in 2011, and although it’s still a relatively small operation, we’re happy to report that it’s growing and adding customers. In 2012, we opened in three additional countries – Colombia, Romania, and Thailand. Overall, our international business grew 14.9% in 2012 compared to 44.4% in 2011. We continued to make investments in our sales specialists in 2012. These individuals cover larger geographical areas, and their job is to provide a high level of expertise when making end-user calls with our store personnel. Each person is trained in a specific area. The largest group is dedicated to national account business, but we also have teams focused on metalworking/manufacturing, government, safety products, industrial vending, and large fastener opportunities. In addition, there are smaller teams specializing in various other product and market opportunities. Overall, the results have been very positive, and we believe our specialists represent a good investment to help drive continued growth in our existing stores and markets. More than 30 years ago, our founder Bob Kierlin recognized that in order to provide the best possible service to our customers, we needed to be able to manufacture hard-to-find parts. Back then it was one machinist, a couple of used pieces of equipment, and a lot of enthusiasm. This business has steadily grown over the years, and today it is a large producer of fasteners and specialty machined parts with approximately 569 employees and locations on four continents. As we’ve grown and expanded our manufacturing business, we’ve also increased our capabilities. Today we can produce anything from a standard screw or bolt to a highly machined replacement part. These capabilities have been implemented with one purpose in mind, and that is customer service. Many of our customers run their facilities 24 hours a day, seven days per week, so when something breaks they need their local store to respond immediately. With our large inventory of raw materials, our broad capabilities, and our locations around the globe, we can deliver. “We far exceeded our internal goal of signing 15,000 vending machines and ended the year with 20,162 signings – an increase of 157% compared to our signings in 2011.” FAST SolutionsSM – Revolutionizing Industrial Supply We have more than 20,000 FAST Solutions (industrial vending) machines installed at customer sites – almost three times the number we had a year ago. Exclusive Brands Our exclusive brand product lines now represent approximately 10% of total company sales. In the year ahead, we’ll work hard to integrate more of these high-quality products into our business, creating new solutions for our customers and sales people.
LETTER TO SHAREHOLDERS 2012 3 Our distribution team worked very hard in 2012 on developing new systems and ideas to make our systems not only more cost-effective, but also more accurate and efficient. The largest project was the construction of our automated warehouse in Winona, MN, which came online in the third quarter. In addition to giving us the storage capacity we need to support future growth, this system is allowing us to reduce labor costs, decrease shipping errors, and accelerate picking time so our trucks can get on the road earlier in the evening. Based on the success we’re seeing with this system and similar systems previously implemented in our Dallas, TX and Indianapolis, IN facilities, we’ve made a decision to accelerate our investment in warehouse automation and have started projects in both our Atlanta, GA and Akron, OH facilities. In last year’s letter, we reported that our distribution team was focused on providing better service at a lower price, and that’s exactly what they accomplished – yet again – in 2012. Not only did our distribution costs grow far slower than sales, our accuracy also improved. This is a direct result of the talented distribution team we have at Fastenal. In other distribution-related news, our transportation team purchased six compressed natural gas (‘CNG’) semi trucks. These vehicles arrived in the fourth quarter, and to date we’ve seen a nice cost savings compared to our diesel-powered fleet. Our team will continue to monitor the results of this program to determine how we expand it in the future. The introduction of CNG technology is part of the team’s larger goal of increasing our transportation efficiency, and they made great progress during 2012. Although fuel costs were at record highs for the year, we moved our product at the lowest relative cost in company history. Our information technology group not only keeps the computer systems running, they also continue to develop new and better ways to save time and improve our customer service. During the year they developed a new software system that allows us to automate the ordering and billing process for our vending machines. We’ve spoken with many store managers about this software, and everyone says it is saving them a tremendous amount of time while improving their accuracy. The IT group also developed a new inventory management application for our larger volume stores. This system is very similar to what we use in our distribution centers, and it allows the store to pick orders faster and more accurately. These are just two examples of the solutions this group is working on to improve our business. Most people probably don’t realize how much time employees spend on the computer. Every time we develop ideas like these, we can potentially free up thousands of hours per month that can be better spent serving our customers and growing our business. During the past year, our product development team focused much of their time on two areas. The first was our metalworking product expansion. In 2011 we made a strategic decision to increase our investment in this product line in order to create more customer opportunity. We chose this area for several reasons, but the major reason is that we have well-established relationships with customers in nearly every market that are large users of this product. Another reason is that we’ve been selling these products for years, albeit with a much less comprehensive offering than we have today. The product development team has done a very good job of first determining which parts were needed to fill in our offering, and then finding the best suppliers with which to partner. Our goal for 2012 was for metalworking product sales to exceed overall company growth by a minimum of ten percentage points, and we’re pleased to announce that we’ve exceeded that goal. The team’s second area of focus has been the continual development of Fastenal’s lineup of private label brands. This is an important initiative because it allows us to provide our customers with high-quality products at a competitive price. Although we still have a tremendous amount of work ahead of us, we’re making very good progress with this project. To keep pace with the nonstop demand for new skills and knowledge in the field, the Fastenal School of Business, our corporate university, provided more training, to more employees, in more creative ways, than ever before. Overall, Fastenal employees completed more than 8,600 face-to-face courses. Online training isn’t new at Fastenal, but 2012 saw a major increase in participation. During the year, employees completed more than 247,000 online courses, nearly doubling the number of online courses completed in 2011. “During the year, employees completed more than 247,000 online courses, nearly doubling the number of online courses completed in 2011.” OEM & MRO Fasteners – Getting Back to Basics With our industry-leading sourcing, manufacturing, engineering, quality-control, logistics, and local service capabilities, Fastenal offers a unique value proposition for both OEM & MRO fastener customers. One of our top initiatives for 2013 is to better leverage our competitive advantages to accelerate our share gain in this core area of our business.
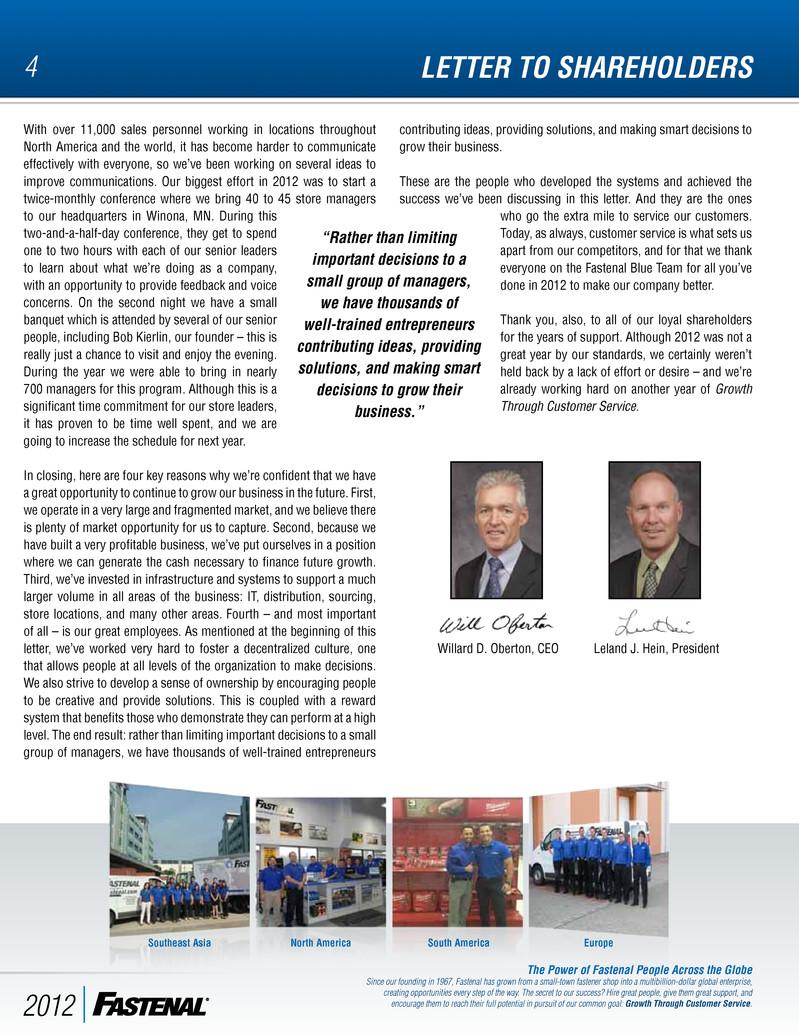
LETTER TO SHAREHOLDERS 2012 4 With over 11,000 sales personnel working in locations throughout North America and the world, it has become harder to communicate effectively with everyone, so we’ve been working on several ideas to improve communications. Our biggest effort in 2012 was to start a twice-monthly conference where we bring 40 to 45 store managers to our headquarters in Winona, MN. During this two-and-a-half-day conference, they get to spend one to two hours with each of our senior leaders to learn about what we’re doing as a company, with an opportunity to provide feedback and voice concerns. On the second night we have a small banquet which is attended by several of our senior people, including Bob Kierlin, our founder – this is really just a chance to visit and enjoy the evening. During the year we were able to bring in nearly 700 managers for this program. Although this is a significant time commitment for our store leaders, it has proven to be time well spent, and we are going to increase the schedule for next year. In closing, here are four key reasons why we’re confident that we have a great opportunity to continue to grow our business in the future. First, we operate in a very large and fragmented market, and we believe there is plenty of market opportunity for us to capture. Second, because we have built a very profitable business, we’ve put ourselves in a position where we can generate the cash necessary to finance future growth. Third, we’ve invested in infrastructure and systems to support a much larger volume in all areas of the business: IT, distribution, sourcing, store locations, and many other areas. Fourth – and most important of all – is our great employees. As mentioned at the beginning of this letter, we’ve worked very hard to foster a decentralized culture, one that allows people at all levels of the organization to make decisions. We also strive to develop a sense of ownership by encouraging people to be creative and provide solutions. This is coupled with a reward system that benefits those who demonstrate they can perform at a high level. The end result: rather than limiting important decisions to a small group of managers, we have thousands of well-trained entrepreneurs contributing ideas, providing solutions, and making smart decisions to grow their business. These are the people who developed the systems and achieved the success we’ve been discussing in this letter. And they are the ones who go the extra mile to service our customers. Today, as always, customer service is what sets us apart from our competitors, and for that we thank everyone on the Fastenal Blue Team for all you’ve done in 2012 to make our company better. Thank you, also, to all of our loyal shareholders for the years of support. Although 2012 was not a great year by our standards, we certainly weren’t held back by a lack of effort or desire – and we’re already working hard on another year of Growth Through Customer Service. Willard D. Oberton, CEO Leland J. Hein, President “Rather than limiting important decisions to a small group of managers, we have thousands of well-trained entrepreneurs contributing ideas, providing solutions, and making smart decisions to grow their business.” The Power of Fastenal People Across the Globe Since our founding in 1967, Fastenal has grown from a small-town fastener shop into a multibillion-dollar global enterprise, creating opportunities every step of the way. The secret to our success? Hire great people, give them great support, and encourage them to reach their full potential in pursuit of our common goal: Growth Through Customer Service. Southeast Asia North America South America Europe
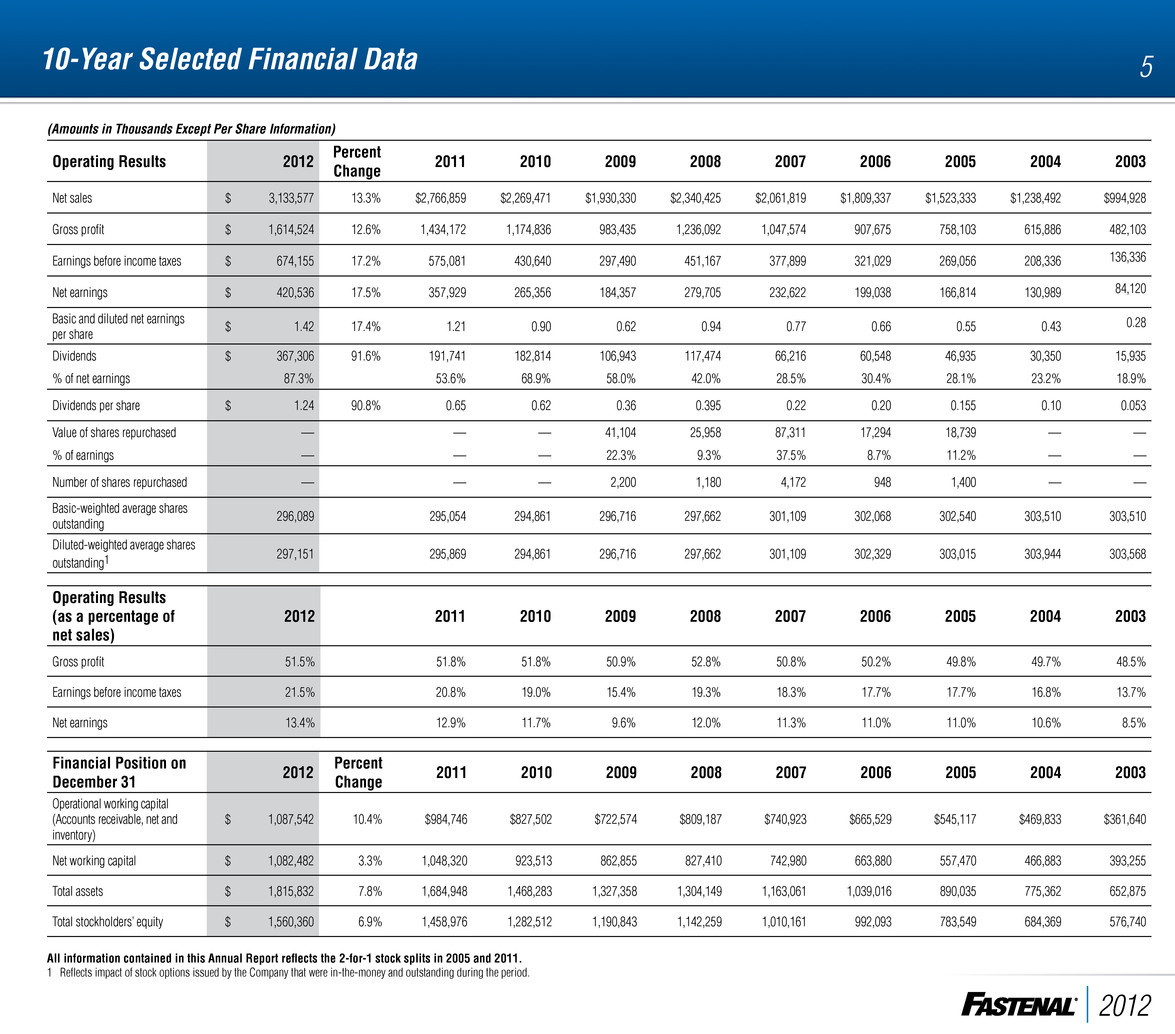
Operating Results 2012 Percent Change 2011 2010 2009 2008 2007 2006 2005 2004 2003 Net sales $ 3,133,577 13.3% $2,766,859 $2,269,471 $1,930,330 $2,340,425 $2,061,819 $1,809,337 $1,523,333 $1,238,492 $994,928 Gross profit $ 1,614,524 12.6% 1,434,172 1,174,836 983,435 1,236,092 1,047,574 907,675 758,103 615,886 482,103 Earnings before income taxes $ 674,155 17.2% 575,081 430,640 297,490 451,167 377,899 321,029 269,056 208,336 136,336 Net earnings $ 420,536 17.5% 357,929 265,356 184,357 279,705 232,622 199,038 166,814 130,989 84,120 Basic and diluted net earnings per share $ 1.42 17.4% 1.21 0.90 0.62 0.94 0.77 0.66 0.55 0.43 0.28 Dividends $ 367,306 91.6% 191,741 182,814 106,943 117,474 66,216 60,548 46,935 30,350 15,935 % of net earnings 87.3% 53.6% 68.9% 58.0% 42.0% 28.5% 30.4% 28.1% 23.2% 18.9% Dividends per share $ 1.24 90.8% 0.65 0.62 0.36 0.395 0.22 0.20 0.155 0.10 0.053 Value of shares repurchased — — — 41,104 25,958 87,311 17,294 18,739 — — % of earnings — — — 22.3% 9.3% 37.5% 8.7% 11.2% — — Number of shares repurchased — — — 2,200 1,180 4,172 948 1,400 — — Basic-weighted average shares outstanding 296,089 295,054 294,861 296,716 297,662 301,109 302,068 302,540 303,510 303,510 Diluted-weighted average shares outstanding1 297,151 295,869 294,861 296,716 297,662 301,109 302,329 303,015 303,944 303,568 Operating Results (as a percentage of net sales) 2012 2011 2010 2009 2008 2007 2006 2005 2004 2003 Gross profit 51.5% 51.8% 51.8% 50.9% 52.8% 50.8% 50.2% 49.8% 49.7% 48.5% Earnings before income taxes 21.5% 20.8% 19.0% 15.4% 19.3% 18.3% 17.7% 17.7% 16.8% 13.7% Net earnings 13.4% 12.9% 11.7% 9.6% 12.0% 11.3% 11.0% 11.0% 10.6% 8.5% Financial Position on December 31 2012 Percent Change 2011 2010 2009 2008 2007 2006 2005 2004 2003 Operational working capital (Accounts receivable, net and inventory) $ 1,087,542 10.4% $984,746 $827,502 $722,574 $809,187 $740,923 $665,529 $545,117 $469,833 $361,640 Net working capital $ 1,082,482 3.3% 1,048,320 923,513 862,855 827,410 742,980 663,880 557,470 466,883 393,255 Total assets $ 1,815,832 7.8% 1,684,948 1,468,283 1,327,358 1,304,149 1,163,061 1,039,016 890,035 775,362 652,875 Total stockholders’ equity $ 1,560,360 6.9% 1,458,976 1,282,512 1,190,843 1,142,259 1,010,161 992,093 783,549 684,369 576,740 All information contained in this Annual Report reflects the 2-for-1 stock splits in 2005 and 2011. 1 Reflects impact of stock options issued by the Company that were in-the-money and outstanding during the period. (Amounts in Thousands Except Per Share Information) 10-Year Selected Financial Data 5 2012
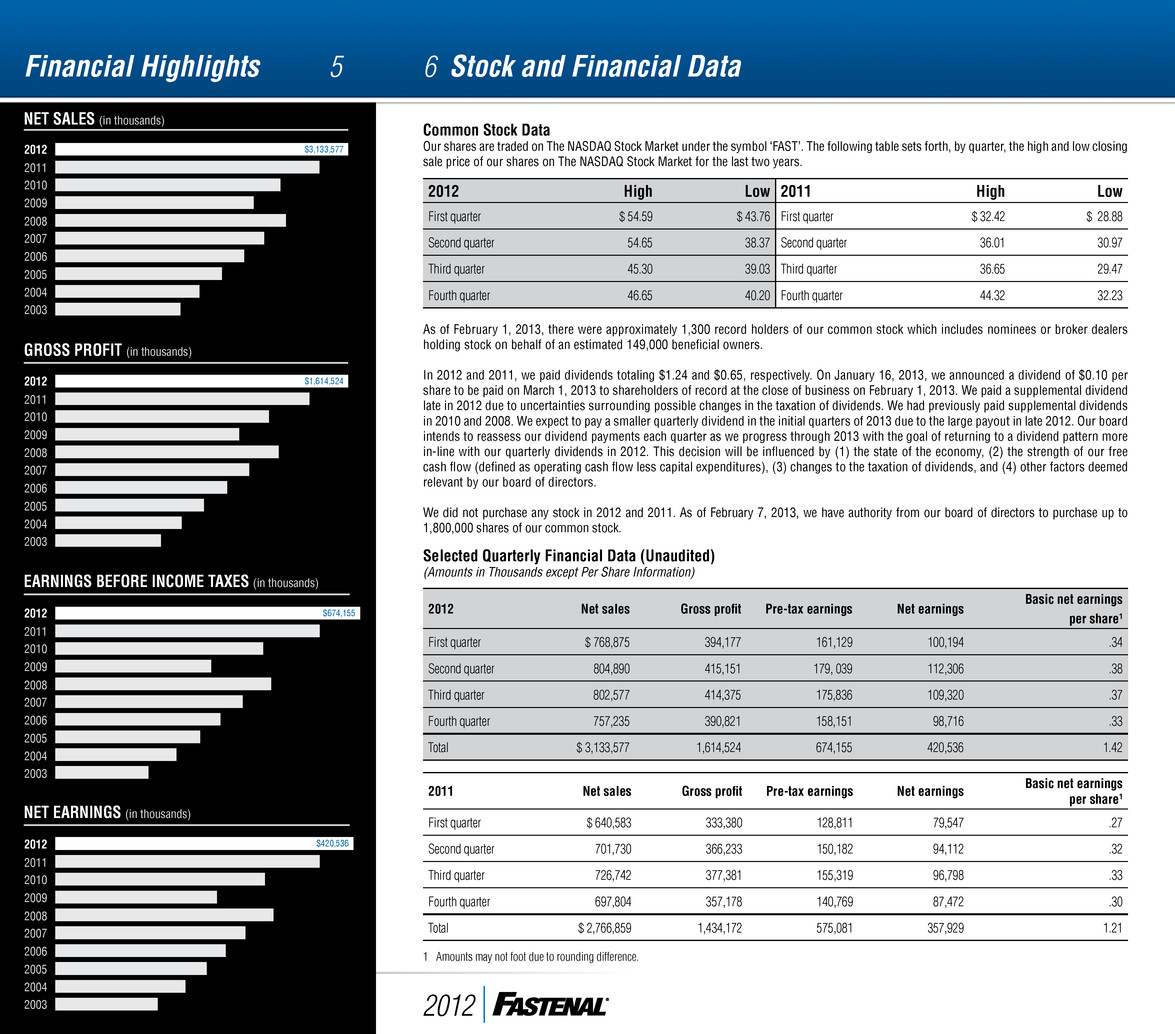
GROSS PROFIT (in thousands) 2011 2010 2009 2008 2007 2006 2005 2004 2003 EARNINGS BEFORE INCOME TAXES (in thousands) 2011 2010 2009 2008 2007 2006 2005 2004 2003 NET EARNINGS (in thousands) 2011 2010 2009 2008 2007 2006 2005 2004 2003 Stock and Financial Data 2012 High Low 2011 High Low First quarter $ 54.59 $ 43.76 First quarter $ 32.42 $ 28.88 Second quarter 54.65 38.37 Second quarter 36.01 30.97 Third quarter 45.30 39.03 Third quarter 36.65 29.47 Fourth quarter 46.65 40.20 Fourth quarter 44.32 32.23 As of February 1, 2013, there were approximately 1,300 record holders of our common stock which includes nominees or broker dealers holding stock on behalf of an estimated 149,000 beneficial owners. In 2012 and 2011, we paid dividends totaling $1.24 and $0.65, respectively. On January 16, 2013, we announced a dividend of $0.10 per share to be paid on March 1, 2013 to shareholders of record at the close of business on February 1, 2013. We paid a supplemental dividend late in 2012 due to uncertainties surrounding possible changes in the taxation of dividends. We had previously paid supplemental dividends in 2010 and 2008. We expect to pay a smaller quarterly dividend in the initial quarters of 2013 due to the large payout in late 2012. Our board intends to reassess our dividend payments each quarter as we progress through 2013 with the goal of returning to a dividend pattern more in-line with our quarterly dividends in 2012. This decision will be influenced by (1) the state of the economy, (2) the strength of our free cash flow (defined as operating cash flow less capital expenditures), (3) changes to the taxation of dividends, and (4) other factors deemed relevant by our board of directors. We did not purchase any stock in 2012 and 2011. As of February 7, 2013, we have authority from our board of directors to purchase up to 1,800,000 shares of our common stock. Common Stock Data Our shares are traded on The NASDAQ Stock Market under the symbol ‘FAST’. The following table sets forth, by quarter, the high and low closing sale price of our shares on The NASDAQ Stock Market for the last two years. Selected Quarterly Financial Data (Unaudited) (Amounts in Thousands except Per Share Information) 2012 Net sales Gross profit Pre-tax earnings Net earnings Basic net earnings per share1 First quarter $ 768,875 394,177 161,129 100,194 .34 Second quarter 804,890 415,151 179, 039 112,306 .38 Third quarter 802,577 414,375 175,836 109,320 .37 Fourth quarter 757,235 390,821 158,151 98,716 .33 Total $ 3,133,577 1,614,524 674,155 420,536 1.42 2011 Net sales Gross profit Pre-tax earnings Net earnings Basic net earnings per share1 First quarter $ 640,583 333,380 128,811 79,547 .27 Second quarter 701,730 366,233 150,182 94,112 .32 Third quarter 726,742 377,381 155,319 96,798 .33 Fourth quarter 697,804 357,178 140,769 87,472 .30 Total $ 2,766,859 1,434,172 575,081 357,929 1.21 6Financial Highlights 2012 5 2012 2012 2012 1 Amounts may not foot due to rounding difference. NET SALES (in thousands) 2011 2010 2009 2008 2007 2006 2005 2004 2003 2012 $3,133,577 $1,614,524 $674,155 $420,536
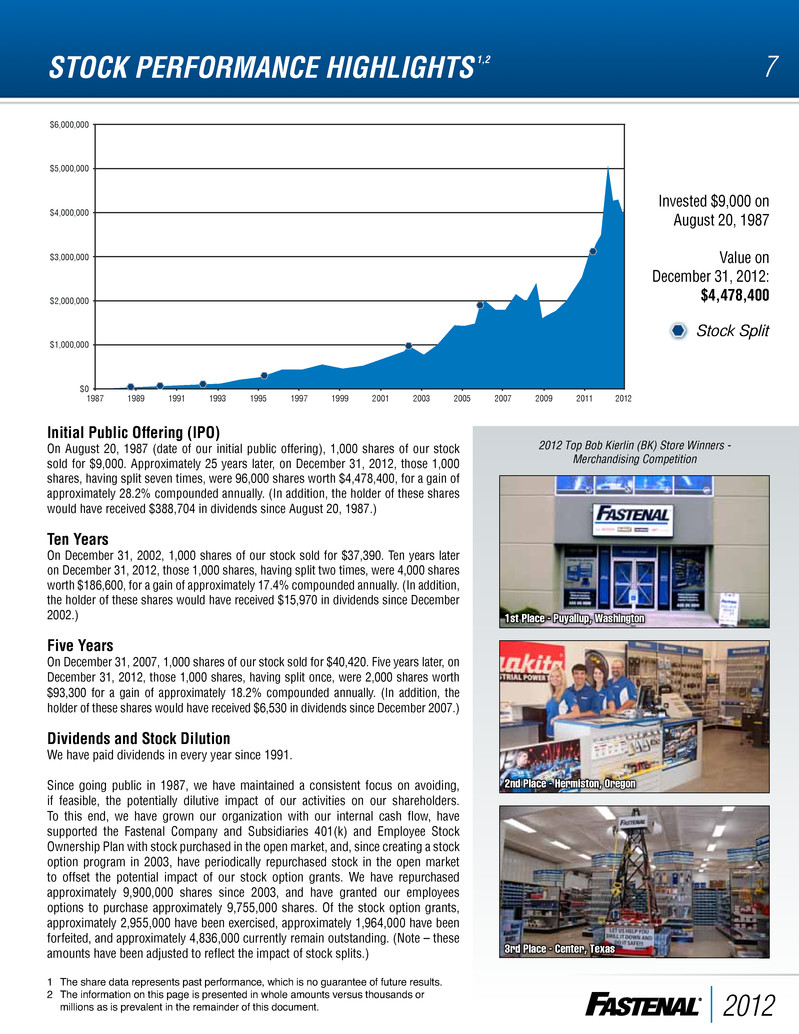
2012 STOCK PERFORMANCE HIGHLIGHTS 1,2 7 3rd Place - Center, Texas 2nd Place - Hermiston, Oregon 1st Place - Puyallup, Washington 2012 Top Bob Kierlin (BK) Store Winners - Merchandising Competition Invested $9,000 on August 20, 1987 Value on December 31, 2012: $4,478,400 Stock Split Initial Public Offering (IPO) On August 20, 1987 (date of our initial public offering), 1,000 shares of our stock sold for $9,000. Approximately 25 years later, on December 31, 2012, those 1,000 shares, having split seven times, were 96,000 shares worth $4,478,400, for a gain of approximately 28.2% compounded annually. (In addition, the holder of these shares would have received $388,704 in dividends since August 20, 1987.) Ten Years On December 31, 2002, 1,000 shares of our stock sold for $37,390. Ten years later on December 31, 2012, those 1,000 shares, having split two times, were 4,000 shares worth $186,600, for a gain of approximately 17.4% compounded annually. (In addition, the holder of these shares would have received $15,970 in dividends since December 2002.) Five Years On December 31, 2007, 1,000 shares of our stock sold for $40,420. Five years later, on December 31, 2012, those 1,000 shares, having split once, were 2,000 shares worth $93,300 for a gain of approximately 18.2% compounded annually. (In addition, the holder of these shares would have received $6,530 in dividends since December 2007.) Dividends and Stock Dilution We have paid dividends in every year since 1991. Since going public in 1987, we have maintained a consistent focus on avoiding, if feasible, the potentially dilutive impact of our activities on our shareholders. To this end, we have grown our organization with our internal cash flow, have supported the Fastenal Company and Subsidiaries 401(k) and Employee Stock Ownership Plan with stock purchased in the open market, and, since creating a stock option program in 2003, have periodically repurchased stock in the open market to offset the potential impact of our stock option grants. We have repurchased approximately 9,900,000 shares since 2003, and have granted our employees options to purchase approximately 9,755,000 shares. Of the stock option grants, approximately 2,955,000 have been exercised, approximately 1,964,000 have been forfeited, and approximately 4,836,000 currently remain outstanding. (Note – these amounts have been adjusted to reflect the impact of stock splits.) 1 The share data represents past performance, which is no guarantee of future results. 2 The information on this page is presented in whole amounts versus thousands or millions as is prevalent in the remainder of this document. $6,000,000 $5,000,000 $4,000,000 $3,000,000 $2,000,000 $1,000,000 $0 1987 1989 1991 1993 1995 1997 1999 2001 2003 2005 2007 2009 2011 2012
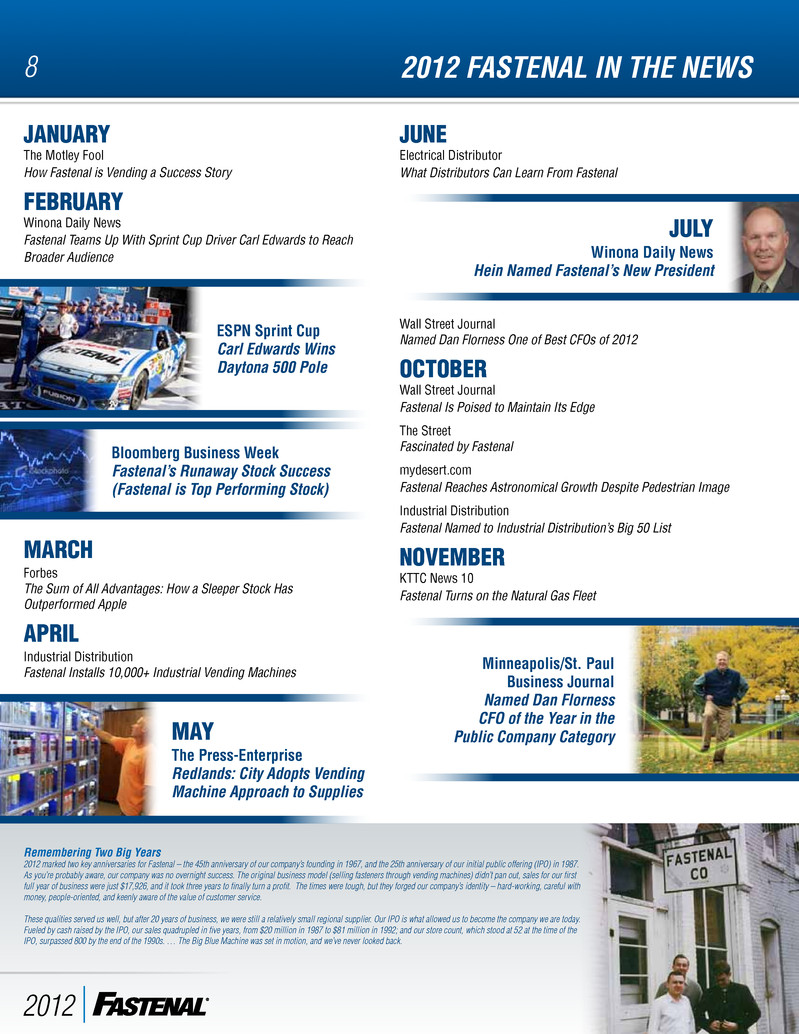
2012 FASTENAL IN THE NEWS8 2012 JANUARY The Motley Fool How Fastenal is Vending a Success Story FEBRUARY Winona Daily News Fastenal Teams Up With Sprint Cup Driver Carl Edwards to Reach Broader Audience MARCH Forbes The Sum of All Advantages: How a Sleeper Stock Has Outperformed Apple APRIL Industrial Distribution Fastenal Installs 10,000+ Industrial Vending Machines JULY Winona Daily News Hein Named Fastenal’s New President ESPN Sprint Cup Carl Edwards Wins Daytona 500 Pole Bloomberg Business Week Fastenal’s Runaway Stock Success (Fastenal is Top Performing Stock) JUNE Electrical Distributor What Distributors Can Learn From Fastenal Wall Street Journal Named Dan Florness One of Best CFOs of 2012 OCTOBER Wall Street Journal Fastenal Is Poised to Maintain Its Edge The Street Fascinated by Fastenal mydesert.com Fastenal Reaches Astronomical Growth Despite Pedestrian Image Industrial Distribution Fastenal Named to Industrial Distribution’s Big 50 List NOVEMBER KTTC News 10 Fastenal Turns on the Natural Gas Fleet MAY The Press-Enterprise Redlands: City Adopts Vending Machine Approach to Supplies Remembering Two Big Years 2012 marked two key anniversaries for Fastenal – the 45th anniversary of our company’s founding in 1967, and the 25th anniversary of our initial public offering (IPO) in 1987. As you’re probably aware, our company was no overnight success. The original business model (selling fasteners through vending machines) didn’t pan out, sales for our first full year of business were just $17,926, and it took three years to finally turn a profit. The times were tough, but they forged our company’s identity – hard-working, careful with money, people-oriented, and keenly aware of the value of customer service. These qualities served us well, but after 20 years of business, we were still a relatively small regional supplier. Our IPO is what allowed us to become the company we are today. Fueled by cash raised by the IPO, our sales quadrupled in five years, from $20 million in 1987 to $81 million in 1992; and our store count, which stood at 52 at the time of the IPO, surpassed 800 by the end of the 1990s. … The Big Blue Machine was set in motion, and we’ve never looked back. Minneapolis/St. Paul Business Journal Named Dan Florness CFO of the Year in the Public Company Category
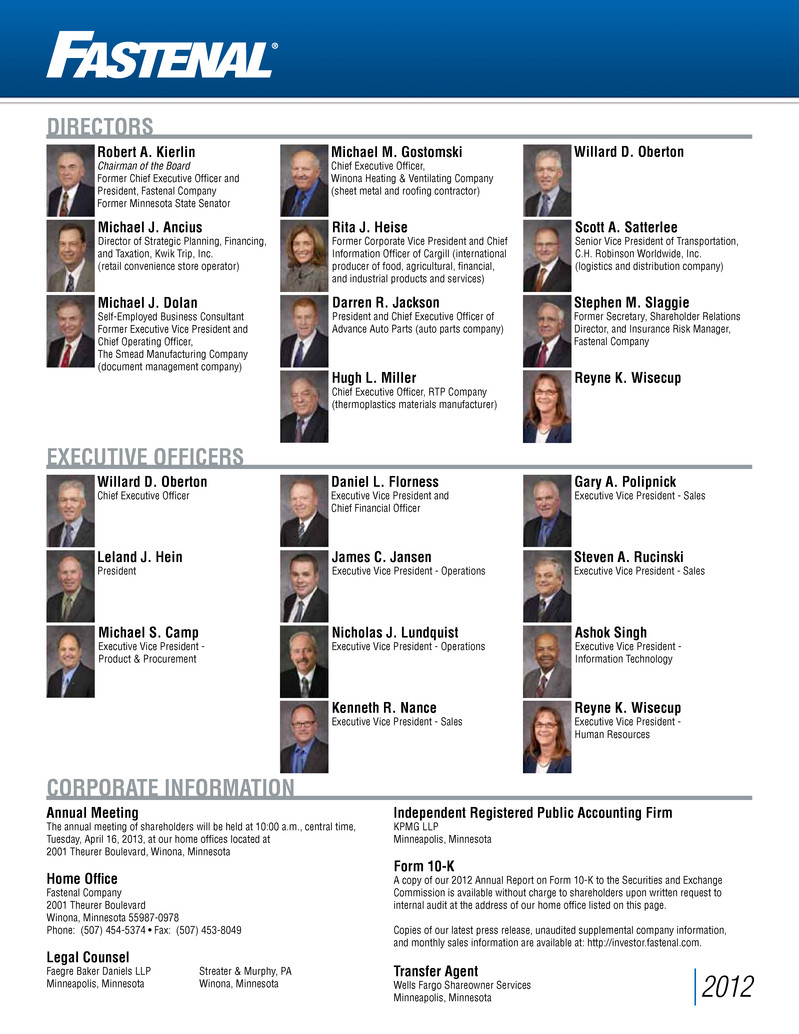
2012 DIRECTORS EXECUTIVE OFFICERS CORPORATE INFORMATION Annual Meeting The annual meeting of shareholders will be held at 10:00 a.m., central time, Tuesday, April 16, 2013, at our home offices located at 2001 Theurer Boulevard, Winona, Minnesota Home Office Fastenal Company 2001 Theurer Boulevard Winona, Minnesota 55987-0978 Phone: (507) 454-5374 • Fax: (507) 453-8049 Legal Counsel Faegre Baker Daniels LLP Streater & Murphy, PA Minneapolis, Minnesota Winona, Minnesota Robert A. Kierlin Chairman of the Board Former Chief Executive Officer and President, Fastenal Company Former Minnesota State Senator Willard D. Oberton Chief Executive Officer Michael J. Dolan Self-Employed Business Consultant Former Executive Vice President and Chief Operating Officer, The Smead Manufacturing Company (document management company) Gary A. Polipnick Executive Vice President - Sales Scott A. Satterlee Senior Vice President of Transportation, C.H. Robinson Worldwide, Inc. (logistics and distribution company) James C. Jansen Executive Vice President - Operations Stephen M. Slaggie Former Secretary, Shareholder Relations Director, and Insurance Risk Manager, Fastenal Company Leland J. Hein President Nicholas J. Lundquist Executive Vice President - Operations Kenneth R. Nance Executive Vice President - Sales Rita J. Heise Former Corporate Vice President and Chief Information Officer of Cargill (international producer of food, agricultural, financial, and industrial products and services) Michael S. Camp Executive Vice President - Product & Procurement Michael M. Gostomski Chief Executive Officer, Winona Heating & Ventilating Company (sheet metal and roofing contractor) Daniel L. Florness Executive Vice President and Chief Financial Officer Hugh L. Miller Chief Executive Officer, RTP Company (thermoplastics materials manufacturer) Reyne K. Wisecup Reyne K. Wisecup Executive Vice President - Human Resources Darren R. Jackson President and Chief Executive Officer of Advance Auto Parts (auto parts company) Ashok Singh Executive Vice President - Information Technology Willard D. Oberton Steven A. Rucinski Executive Vice President - Sales Michael J. Ancius Director of Strategic Planning, Financing, and Taxation, Kwik Trip, Inc. (retail convenience store operator) Independent Registered Public Accounting Firm KPMG LLP Minneapolis, Minnesota Form 10-K A copy of our 2012 Annual Report on Form 10-K to the Securities and Exchange Commission is available without charge to shareholders upon written request to internal audit at the address of our home office listed on this page. Copies of our latest press release, unaudited supplemental company information, and monthly sales information are available at: http://investor.fastenal.com. Transfer Agent Wells Fargo Shareowner Services Minneapolis, Minnesota

9702901 • 02.13/JP • 2012 Annual Report • Printed in the USA 2012 A n n u A l R e p o R t Wherever our customers operate, there’s a nearby Blue Team to provide the products and services needed to stay productive. Each of our stores tailors its inventory to anticipate local demand, keeps product flowing when and where it’s needed, and, in many cases, functions more like a true partner than just a supplier. Want to experience the heart and soul of our company? Just drive a few minutes and visit with your local Fastenal store team.