Profile of Fastenal Company
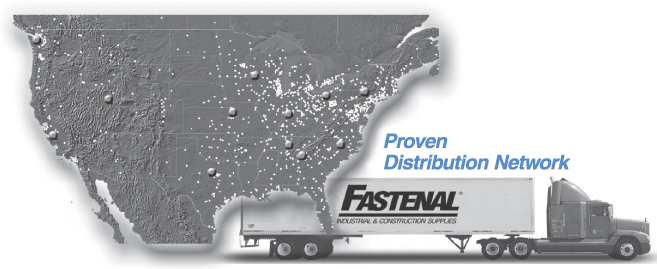
Fastenal Company was founded in 1967. As of December 31, 2002, the Company operated 1,169 store sites located in 50 states, PuertoRico, Canada, Mexico and Singapore and employed 4,743 people at these sites. In addition, there were 2,365 people employed in various support positions. The Company sells approximately 356,000 different types of industrial and construction supplies in ten product categories. These include approximately 169,000 different types of threaded fasteners and miscellaneous supplies; approximately 67,000 different types of tools; approximately 29,000 different types of metal cutting tool blades; approximately 34,000 different types of fluid transfer components and accessories for hydraulic and pneumatic power; approximately 10,000 different types of material handling and storage products; approximately 5,000 different types of janitorial and paper products; approximately 10,000 different types of electrical supplies; approximately 17,000 different types of welding supplies (excluding gas & welding machines); approximately 9,000 different types of safety supplies; and approximately 6,000 different types of raw materials (metals). As of December 31, 2002, the Company operated eleven distribution centers located in Minnesota, Indiana, Ohio, Pennsylvania, Texas, Georgia,Washington, California, Utah, North Carolina, and Kansas and also a facility located in Tennessee which is used to distribute “Customer Service Project” inventory and supplies to new stores and to existing stores for their conversion. (See additional discussion below.) Approximately 95.7% of the Company’s 2002 sales were attributable to products manufactured by others, and approximately 4.3% related to items manufactured, modified or repaired by either the Company’s Manufacturing Division or its Support Services. Since December 31, 2002, the Company has opened additional store sites.
This Annual Report, including the sections captioned “President’s Letter to Shareholders,” “Management’s Discussion and Analysis of Financial Condition and Results of Operations” and “Stock and Financial Data,” contains statements that are not historical in nature and that are intended to be, and are hereby identified as, “forward-looking statements” as defined in the Private Securities Litigation Reform Act of 1995 (the “Reform Act”), including statements regarding the expected non-recurrence of a large increase late last year in expenses for general self-insured claims, the implementation of the Company’s Customer Service Project (CSP), the expansion of the course offerings at the Fastenal School of Business, opening of new distribution centers, the leveling off of sales growth and the variability of sales at older stores, expansion of foreign operations, capital expenditures, funding of expansion plans, expected increased leasing of vehicles, and dividends. A discussion of certain risks and uncertainties that could cause actual results to differ materially from those predicted in such forward-looking statements is included in the section of this Annual Report captioned “Management’s Discussion and Analysis of Financial Condition and Results of Operations.” The Company assumes no obligation to update either such forward-looking statements or the discussion of such risks and uncertainties.
Table of Contents
| | pages2-3 |
| | PRESIDENT’S LETTERTO SHAREHOLDERS |
| | page4 |
| | SIX-YEAR SELECTED FINANCIAL DATA |
| | pages5-8 |
| | MANAGEMENT’S DISCUSSION & ANALYSISOF FINANCIAL CONDITION & RESULTSOF OPERATIONS |
| | page9 |
| | STOCKAND FINANCIAL DATA |
| | page10 |
| | CONSOLIDATED BALANCE SHEETS |
| | page11 |
| | CONSOLIDATED STATEMENTSOF EARNINGS |
|
page12 | | 
|
CONSOLIDATED STATEMENTSOF STOCKHOLDERS’ EQUITY & COMPREHENSIVE INCOME | |
page13 | |
CONSOLIDATED STATEMENTSOF CASH FLOWS | |
pages14-19 | |
NOTESTO CONSOLIDATED FINANCIAL STATEMENTS | |
page20 | |
REPORTOF MANAGEMENT & INDEPENDENT AUDITORS’ REPORT | |
Inside Back Cover | |
OFFICERS & DIRECTORS CORPORATE INFORMATION | |
2002 Annual Report 1
President’s Letter to Shareholders
For Fastenal, 2002 was a better year than 2001 but not a great one. We were able to grow both our sales and our earnings in 2002. Sales in 2002 were $905.4 million, a 10.7% increase over sales of $818.3 million in 2001. We continued to see improvement in our sales growth throughout much of the year. The industrial economy was difficult to read in 2002. We saw a slow but continual improvement in our business for the first six months of the year, then saw a weakening in July. After July, sales slowly gained momentum through November, again slowing down around the holidays. Despite the uncertain economy, we opened 144 stores increasing our total to 1,169 at year-end.
Our net earnings in 2002 were $75.5 million, an increase of 7.7% over $70.1 million in 2001. This was made possible by the increase in sales and the gain we had on the sale of our DIY Business (see description on page 5). Our people did a good job of expense control in 2002, but we had some large unexpected increases in our expenses for general self-insured claims late in the year. These expenses were to cover changes in claim estimates from 2002 and earlier years and should not be reoccurring.
In October, we completed the sale of our DIY Business to The Hillman Group. We learned a lot about retail sales and customer service in the 13 months we owned this business. Based on this, we felt Fastenal could best service its industrial and construction customers by applying what we learned to our Fastenal stores. We wanted to focus all of our energy and resources on improving our stores.
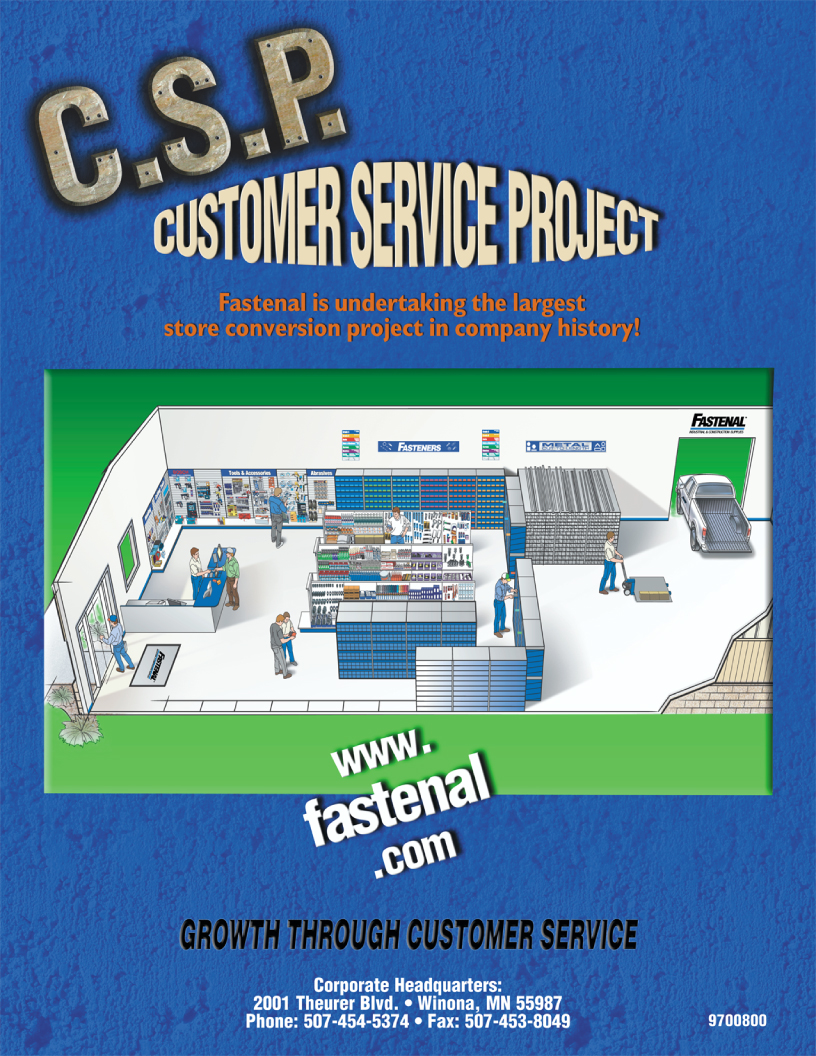
After purchasing the DIY Business, we put a team of experienced Fastenal employees in place to lead the business. These individuals spent a great deal of time in hardware and lumber stores, setting displays and merchandising product. They soon came to us with many ideas that they believed could improve our stores. These ideas centered on stocking a broader inventory in our stores and displaying it so our customers can service themselves. The team believed this would improve the efficiency for both our people and our customers. Our sales force, marketing department, and finance people researched this further and concluded it was worth the investment to assemble a team and develop this concept. Internally, the concept is known as the Customer Service Project, or CSP. Our product development and marketing people, along with the help of our suppliers, spent months determining which products should be represented and how they should be merchandised. In the next 12 months you should see significant changes taking place at our Fastenal stores. We are re-merchandising them with an open floor design, a broader product selection, improved signage and improved store fixtures, and we are making system changes that will speed up the invoicing process.
Since June 2002, we converted approximately 75 of our existing stores to and opened approximately 80 stores with this new format; each time getting a little better at the process and achieving better results. The early returns on our investments look favorable. Based on these results, and our continued commitment to improve our customer service, we intend to continue to move forward on this project. Our plan is to convert approximately 80 stores per month and to open all new stores with the CSP format in 2003. Our goal is simple: to position our stores to be the best industrial products distributor in each of the markets we are in.
The Fastenal School of Business experienced continued success and growth in 2002, both in the number of people served and also in the programs offered. The number of employees attending Fastenal School of Business courses in 2002 increased approximately 50% from 900 in 2001. An accelerated training program for high potential employees seeking store manager positions started mid year and continued to expand. The school will continue to expand its course offerings in alignment with our business and employee needs.
For our National Accounts group, 2002 was a good year. We added 65 new accounts, bringing our total number of national account customers to 211. We continued to see improvement in our sales growth throughout much of the year. In the first quarter, our national account sales grew 20.4% over the previous year, and in the fourth quarter such sales grew 30.9%. In 2002, national account sales represented 20.7% of our overall sales. Our efforts to sell to government accounts were also very successful. Sales to the government grew 53.1% over 2001. In 2002, government sales represented 1.7% of our overall sales.
2 2002 Annual Report
President’s Letter to Shareholders
In the third quarter, we started a new specialty sales group focused on the largest construction companies in North America. This is a small group of experienced employees who focus their efforts on developing national sales agreements with large construction companies.
Our marketing department continued to work on product development in 2002; adding more than 63,000 new parts to existing product lines. Late in 2001, we added raw materials (or metals) to our product offering, and in the second half of 2002 we added a selection of metals to 25 stores. This selection consists of over 300 items in different materials, shapes, and sizes. This product offering is focused on selling smaller quantities to the maintenance market.
Although the Internet is not changing our business like some thought it would, we continue to use it to improve our business. In 2002 we introduced our new electronic billing software. This project was developed internally and allows our customers to access their account information 24 hours a day. This program has received great reviews from our customers. In December we introduced a new website designed for recruiting and screening prospective employees. The initial results have been very promising. Take a look at www.fastenal.com.
During 2002 we purchased two new distribution centers. The first is a 198,000 square foot facility in Atlanta, Georgia that will open in the first quarter of 2003. This facility will replace our existing distribution center in Atlanta, which is 54,000 square feet. The second is a 62,000 square foot facility in Kitchener, Ontario. This facility will be our first distribution center in Canada and is expected to open in the second quarter of 2003.
Although the results we reported for 2002 were less than great, I believe the efforts put forth by the Fastenal team were, indeed, great. I want to thank every one of them. We are better positioned than we have ever been to grow our business, to grow the opportunities for our employees, and to create better returns for our shareholders.
Thank you for your support and your belief in the Fastenal Team.

2002 Annual Report 3
Six -Year Selected Financial Data
(AMOUNTS IN THOUSANDS EXCEPT EARNINGS AND DIVIDENDS PER SHARE INFORMATION.)
Operating Results Years Ended Dec. 31 | | 2002 | | | Percent Change | | 2001 | | 2000 | | 1999 | | 1998 | | 1997 |
|
Net sales | | $ | 905,438 | | | 10.7% | | $ | 818,283 | | 755,618 | | 618,191 | | 511,233 | | 404,248 |
|
Gross profit | | | 448,476 | | | 8.7% | | | 412,427 | | 388,118 | | 319,460 | | 265,179 | | 209,143 |
|
Earnings before income taxes | | | 121,207 | 1 | | 6.7% | | | 113,634 | | 131,430 | | 106,479 | | 86,123 | | 67,336 |
|
Net earnings | | | 75,542 | 2 | | 7.7% | | | 70,112 | | 80,730 | | 65,455 | | 52,953 | | 40,834 |
|
Basic and diluted earnings per share | | | 1.00 | 2 | | 8.7% | | | .92 | | 1.06 | | .86 | | .70 | | .54 |
|
Dividends per share | | $ | .05 | | | 11.1% | | $ | .045 | | .04 | | .02 | | .01 | | .01 |
|
Weighted average shares outstanding | | | 75,877 | | | — | | | 75,877 | | 75,877 | | 75,877 | | 75,877 | | 75,877 |
|
Financial Position December 31
|
Net working capital | | $ | 349,422 | | | 16.2% | | $ | 300,680 | | 247,876 | | 193,744 | | 142,459 | | 106,555 |
|
Total assets | | | 559,008 | | | 17.6% | | | 475,244 | | 402,464 | | 318,621 | | 251,234 | | 205,137 |
|
Total stockholders’ equity | | $ | 499,871 | | | 17.6% | | $ | 424,888 | | 359,258 | | 281,960 | | 217,646 | | 165,872 |
All information contained in this Annual Report reflects the 2-for-1 stock split
effected in the form of a stock dividend in 2002.
| 1 | | Amount includes a gain on the sale of the DIY Business of $5,934. |
| 2 | | Amount includes an extraordinary gain, net of tax, of $716, or $.01 per basic and diluted share. |
4 2002 Annual Report
Management’s Discussion & Analysis of
Financial Condition & Results of Operations
(AMOUNTS IN THOUSANDS EXCEPT PERSONNEL COUNTS AND DIVIDENDS PER SHARE.)
Results of Operations
During August 2001, the Company acquired a business which sold packaged fasteners to the retail market (Do-It-Yourself or DIY Business). During October 2002 this business was sold. The DIY Business had sales of $16,974 and $8,526 (or approximately 1.9% and 1.0% of the consolidated sales of the Company) during 2002 and 2001, respectively.
Net sales for 2002 exceeded net sales for 2001 by 10.7%. This compares with an 8.3% net sales growth rate experienced from 2000 to 2001. The increase in net sales in 2002 came primarily from new site openings, unit sales growth in existing sites less than 5 years old, growth in the newer product lines, and the acquisition. The growth in 2002 was tempered by a slight deflationary impact to pricing. The increase in net sales in 2001 came primarily from new site openings, unit sales growth in existing sites less than 5 years old, growth in the newer product lines, and the acquisition. This 2001 growth was tempered by a contraction of 3.0% in the sales of sites open more than 5 years and by a deflationary impact to pricing during the year. The following table indicates: (1) percentage of net sales from the Fastenal®product line and from the newer product lines and (2) product lines added to the original fastener product line and the year of introduction.
| | | Introduced | | 2002 | | 2001 |
|
Fastenal Product Line | | 1967 | | 55.6% | | 58.8% |
|
Tools | | 1993 | | 11.1% | | 11.6% |
|
Cutting Tools | | 1996 | | 5.4% | | 5.5% |
|
Hydraulics & Pneumatics | | 1996 | | 6.0% | | 5.2% |
|
Material Handling | | 1996 | | 6.7% | | 6.7% |
|
Janitorial Supplies | | 1996 | | 3.2% | | 2.5% |
|
Electrical Supplies | | 1997 | | 2.6% | | 2.4% |
|
Welding Supplies | | 1997 | | 2.8% | | 2.3% |
|
Safety Supplies | | 1999 | | 4.1% | | 3.3% |
|
Raw Materials | | 2001 | | 0.1% | | 0.2% |
|
Retail Packaged Products* | | 2001 | | 1.9% | | 1.0% |
|
Other | | – | | 0.5% | | 0.5% |
*The Retail Packaged Product line was added as a result of the DIY Business acquisition. This business was sold in October 2002. This product line has been merged into the Company’s other product lines.
Threaded fasteners accounted for approximately 46%, 49%, and 51% of the Company’s consolidated sales in 2002, 2001, and 2000, respectively. Sites opened in 2002 contributed approximately $18,600 (or 2.1%) to 2002 net sales. Sites opened in 2001 contributed approximately $56,370 (or 6.2%) to 2002 net sales and approximately $21,620 (or 2.6%) to 2001 net sales. The rate of growth in sales of sites generally levels off after sites have been open for five years, and the sales of older sites typically vary more with the economy than do the sales of younger sites.
The twelve months of 2002 and 2001 had daily sales growth rates of (compared to the comparable month in the preceding year, and excluding the impact of the DIY Business):
Month | | 2002 | | 2001 |
|
January | | 2.7% | | 20.0% |
|
February | | 4.8% | | 16.2% |
|
March | | 6.0% | | 11.4% |
|
April | | 9.3% | | 9.0% |
|
May | | 9.4% | | 9.4% |
|
June | | 11.0% | | 7.6% |
|
July | | 8.7% | | 7.4% |
|
August | | 10.4% | | 5.9% |
|
September | | 12.5% | | 4.8% |
|
October | | 13.3% | | 1.0% |
|
November | | 17.9% | | -0.5% |
|
December | | 11.6% | | 1.4% |
|
Note: Daily sales are defined as the sales for a period divided by the number of business days in a period.
The daily sales growth rates above represent several trends. The first being a downward trend in the first eleven months of 2001, which reflected the overall weakening of the industrial economy we service in North America. This trend reversed itself from December 2001 to June 2002; this was partly due to changing comparisons in the prior year and partly due to stronger month-to-month (i.e. April to May and May to June) growth rates compared to 2001. During July 2002, the daily sales growth rate decreased and began to improve again in August 2002 and September 2002. During the fourth quarter, the daily sales growth rate continued to grow through November, and slipped in December, the final month of the year.
Gross profit as a percent of net sales was 49.5% in 2002, 50.4% in 2001, and 51.4% in 2000. The fluctuations resulted primarily from changes in the mix of products being sold. Absent the DIY Business acquisition, the gross profit percent would have been 0.4% and 0.2% higher in 2002 and 2001, respectively. The DIY Business operated at 30% to 32% gross margin.
2002 Annual Report 5
Management’s Discussion & Analysis of
Financial Condition & Results of Operations
(AMOUNTS IN THOUSANDS EXCEPT PERSONNEL COUNTS AND DIVIDENDS PER SHARE.)
Operating and administrative expenses were 37.0% of net sales in 2002, compared to 36.7% of net sales in 2001, and 34.2% of net sales in 2000. These increases were primarily due to changes in payroll and related costs, changes in occupancy costs, flat or lower net sales in stores greater than five years old, and, with respect to 2002, changes in the estimate of general self-insured clams, plus the impact of the August 2001 acquisition.
In 2002 and 2001, payroll and related costs, increased at a rate which was greater than the rate of increase in net sales. The increases in payroll and related costs were due to the following increases in the average number of employees:
| | | 2002 | | 2001 |
|
Sales Personnel | | 6.1% | | 7.4% |
|
Support Personnel | | 11.4% | | 8.3% |
|
During the fourth quarter of 2002, we completed the preparation for our January 2003 change in our general insurance provider. During this process, our first change in over 20 years, we experienced some difficulties. As is common in the industry, we have a self-insurance program that is administered by our insurance provider. On a periodic basis, we are updated as to the status of our claims. This update includes an estimate by our insurance provider regarding the reserves needed for open claims. During the transition process, we were advised by our old insurance provider of reserve levels which were inconsistent with earlier information and with estimates previously provided. The estimation process conducted by our outside insurance provider indicated a reserve adjustment of approximately $4 million was necessary. This change was recorded during the fourth quarter and increased our operating and administrative expenses in 2002.
In 2002 and 2001, the rate of increase in occupancy costs was greater than the rate of increase in net sales. Occupancy costs increased due to a 14.0% and a 14.3% increase in the number of sites in 2002 and 2001, respectively.
Interest income, net of interest expense, in 2002 decreased $266 from 2001. Interest income, net of interest expense, in 2001 increased $207 over 2000. Changes were due to the fluctuations in the weighted average amount of outstanding Company investments combined with the impact of lower interest rates in 2002 and 2001.
The loss on sale of property and equipment in all years came primarily from the sale of used vehicles. The gain on sale of the DIY Business in 2002 was from the sale of the business acquired in 2001. The extraordinary gain of $716, net of tax, in 2002 resulted from the negative goodwill recognized on the DIY Business acquisition.
Net earnings grew 7.7% from 2001 to 2002 and contracted 13.2% from 2000 to 2001. During 2002 and 2001, the net earnings growth rate was lower than that of net sales because of the earlier mentioned impact of operating and administrative costs. The growth in net earnings in 2002 resulted primarily from increased net sales and from the gain on the sale of the DIY Business. The contraction in net earnings in 2001 resulted primarily from (1) lower net sales growth, (2) the decrease in gross margin percentage, caused primarily by changes in product mix, (3) the decrease in the gross margin dollars generated in older stores due to decreases in net sales, (4) the additional expenses of store site openings (see comments earlier), (5) the added impact of increases in utility and health care costs when compared to the same period in 2000, and (6) the increase in depreciation expense associated with additions of property and equipment, most notably software and hardware for the Company’s management information system.
Effects of Inflation
Price deflation related to certain products negatively impacted net sales in 2002, 2001, and 2000.
Critical Accounting Policies
The Company’s estimates related to certain assets and liabilities are an integral part of the consolidated financial statements. These estimates are considered critical to the consolidated financial statements because they require subjective and complex judgments.
Allowance for doubtful accounts – This reserve is for accounts receivable balances that are potentially uncollectible. The reserve is based on (1) an analysis of customer accounts and (2) the Company’s historical experience with accounts receivable write-offs. The analysis includes the aging of accounts receivable, the financial condition of a customer or industry, and general economic conditions. Management believes the results could be materially different if historical trends do not reflect actual results or if economic conditions worsened for the Company’s customers.
Inventory reserves – This reserve is for shrinkage, slow moving, and obsolete inventory. The reserve is based on an analysis of inventory trends. The analysis includes inventory levels, physical inventory counts, cycle count adjustments, the nature of the products and their inherent risk of obsolescence, the gross margin of the product, and the on-hand quantities relative to the sales history for the product. Management believes the results could be materially different if historical
6 2002 Annual Report
Management’s Discussion & Analysis of
Financial Condition & Results of Operations
(AMOUNTS IN THOUSANDS EXCEPT PERSONNEL COUNTS AND DIVIDENDS PER SHARE.)
trends do not reflect actual results or if demand for the Company’s products decreases because of economic or competitive conditions.
Health insurance reserves – This reserve is for incurred but not reported health claims. The reserve is based on an external analysis of the Company’s historical claim reporting trends. Management believes the results could be materially different if historical trends do not reflect actual results.
General insurance reserves – This reserve is for general claims related to worker’s compensation, property and casualty losses, and other self-insured losses. The reserve is based on an external analysis of the Company’s historical general claim trends. Management believes the results could be materially different if historical trends do not reflect actual results. (See comments earlier.)
Liquidity and Capital Resources
Net cash provided by operating activities was:
2002 | | $17,819 |
|
2001 | | $91,727 |
|
2000 | | $38,253 |
|
The 2002 decrease in net cash provided by operating activities was primarily due to the increases in inventory for the continued implementation of the Company’s “CSP” Project (discussed below). The 2001 increase in net cash provided by operating activities was primarily due to the decrease in cash needed to fund trade accounts receivable and inventory due to lower sales growth in 2001.
During 2002, the Company’s inventory level increased by $64,556 (or 42.3%) from December 31, 2001. The increase in 2002 was the result of: (1) growth in sales and in the number of store locations over the last two years, (2) the Company’s “CSP” implementation, and (3) higher stocking levels in the Company’s distribution centers. During 2001, the Company’s inventory level increased $9,638 (or 6.7%) from December 31, 2000.
During 2002, the Company began its Customer Service Project (CSP). This project centers on stocking a broader inventory in each of our stores and displaying it so our customers can service themselves. The impact of this project on our inventory will vary from store to store. The inventory stocked under a CSP format consists of a core stocking level of approximately $55,000 per location. Existing stores stock some, but not all, of the inventory stocked under the CSP format. The existing stores converted have experienced increases in their inventory levels as they fill out the product selection. New stores, prior to the CSP, opened with approximately $25,000 of inventory per location, and would grow this amount to approximately $50,000 after operating for twelve months. On December 31, 2002, the Company had 155 stores operating under the CSP format. This number consisted of 75 existing stores and 80 new stores. The Company currently intends to convert approximately 80 stores per month and to open all new stores with the CSP format beginning in 2003.
Net cash used in investing activities was:
2002 | | $47,007 |
|
2001 | | $60,648 |
|
2000 | | $43,300 |
|
The 2002 decrease in net cash used in investing activities resulted primarily from the sale of the DIY Business. The 2001 increase in net cash used in investing activities resulted primarily from the purchase of the DIY Business and from the increase in marketable securities.
The Company had future commitments for leased facilities and for leased vehicles at December 31, 2002. The Company had $6,533 of long-term debt related to an Industrial Revenue Bond (IRB) at December 31, 2002 and 2001, and had no long-term debt at December 31, 2000. The future contractual cash obligations related to the commitments are as follows:
| | | Total | | 2003 | | 2004 | | 2005 and 2006 | | After 2006 |
|
Facilities | | $ | 33,951 | | 18,269 | | 9,534 | | 5,702 | | 446 |
Vehicles | | | 12,597 | | 8,182 | | 4,199 | | 216 | | –– |
IRB | | | 6,533 | | –– | | –– | | –– | | 6,533 |
Total | | $ | 53,081 | | 26,451 | | 13,733 | | 5,918 | | 6,979 |
| | |
|
The Company has a letter of credit issued on its behalf to its insurance carrier. The future commercial commitment related to the letter of credit is $3,969. See notes 8 and 9 of the Notes to Consolidated Financial Statements for additional information related to these obligations and to our current line of credit.
The Company paid an annual dividend of $.05 per share in 2002, $.045 per share in 2001, and $.04 per share in 2000.
As of December 31, 2002, the Company had no material outstanding commitments for capital expenditures.
The Company expects to incur approximately $38,000 in total capital expenditures in 2003, consisting of approximately $7,000 for manufacturing, warehouse and
2002 Annual Report 7
Management’s Discussion & Analysis of
Financial Condition & Results of Operations
(AMOUNTS IN THOUSANDS EXCEPT PERSONNEL COUNTS AND DIVIDENDS PER SHARE.)
packaging equipment and facilities, approximately $7,000 for shelving and related supplies for the Company’s “CSP” implementation, approximately $6,000 for data processing equipment, approximately $10,000 for store buildings, and approximately $8,000 for vehicles. The capital expenditures for vehicles, which represented a substantial portion of the total amount in prior years, represented a smaller portion in both 2002 and 2001. This decrease from earlier years is a direct result of increases in the number of vehicles leased as opposed to owned. We expect this to recur in 2003.
Management anticipates funding its current expansion plans with cash generated from operations, from available cash and cash equivalents, and, to a lesser degree, from its borrowing capacity. In addition to opening new sites in the United States, the Company plans to continue opening additional sites in Canada, Puerto Rico, Mexico, and Singapore.
Market Risk Management
The Company is exposed to certain market risks from changes in interest rates and foreign currency exchange rates. Changes in these factors cause fluctuations in the Company’s earnings and cash flows. The Company evaluates and manages exposure to these market risks as follows:
Interest Rates – The Company has a $15,000 line of credit of which $0 was outstanding at December 31, 2002. The line bears interest at .9% over the LIBOR rate.
Foreign Currency Exchange Rates –
Foreign currency fluctuations can affect the Company’s net investments and earnings denominated in foreign currencies. The Company’s primary exchange rate exposure is with the Canadian dollar against the U.S. dollar. The Company’s estimated net earnings exposure for foreign currency exchange rates was not material at December 31, 2002.
Certain Risks and Uncertainties
Certain statements in this Annual Report, in the Company’s Annual Report on Form 10-K for the fiscal year ended December 31, 2002, in future filings by the Company with the Securities and Exchange Commission, in the Company’s press releases and in oral statements made by or with approval of the Company’s executive officers constitute or will constitute “forward-looking statements” under the Reform Act. The following factors are among those that could cause the Company’s actual results to differ materially from those predicted in such forward-looking statements: (i) an upturn or downturn in the economy could impact sales at existing stores and the rates of new store openings and additions of new employees, (ii) an upturn or downturn in the economy, or a change in product mix, could impact gross margins, (iii) a change, from that projected, in the number of markets able to support future store sites could impact the rates of new store openings and additions of new employees, (iv) the ability of the Company to develop product expertise at the store level, to identify future product lines that complement existing product lines, to transport and store certain hazardous products and to otherwise integrate new product lines into the Company’s existing stores and distribution network could impact sales and margins, (v) increases or decreases in fuel and utility costs could impact distribution and occupancy expenses of the Company, (vi) the ability of the Company to successfully attract and retain qualified personnel to staff the Company’s stores could impact sales at existing stores and the rate of new store openings, (vii) changes in governmental regulations related to product quality or product source traceability could impact the cost to the Company of regulatory compliance, (viii) inclement weather could impact the Company’s distribution network, (ix) foreign currency fluctuations, changes in trade relations, or fluctuations in the relative strength of foreign economies could impact the ability of the Company to procure products overseas at competitive prices and the Company’s sales, (x) disruptions caused by the implementation of the Company’s new management information systems infrastructure could impact sales, (xi) changes in the rate of new store openings could impact expenditures for computers and other capital equipment, (xii) disruption related to the “CSP” implementation could cause expenses and inventory investments to increase, which in turn could cause the Company to reevaluate implementation of the project, and (xiii) changes in the availability of suitable land and buildings could impact expenditures for additional owned locations which house our stores.
New Accounting Pronouncements
During 2002, the Financial Accounting Standards Board (FASB) issued Statement of Financial Account Standards (SFAS) No. 146,Accounting for Costs Associated with Exit and Disposal Activities, and Interpretation (FIN) No. 45,Guarantor’s Accounting and Disclosure Requirements for Guarantees, Including Indirect Guarantees of Indebtedness of Others. SFAS No. 146 requires that a liability for a cost associated with an exit or disposal activity be recognized when the liability is incurred. This statement also establishes that fair value is the objective for initial measurement of the liability. FIN No. 45 requires companies to recognize, at the inception of a guarantee, a liability for the fair value of the obligation undertaken in issuing the guarantee. Guarantees in existence at December 15, 2002 are grandfathered for the purposes of recognition and would only need to be disclosed. The adoption of both SFAS No.146 and FIN No. 45 in 2003 is not expected to have a significant impact on the Company’s financial condition or results of operations.
8 2002 Annual Report
Stock & Financial Data
Common Stock Data
The Company’s shares are traded on The Nasdaq Stock Market under the symbol “FAST”. The following table sets forth, by quarter, the high and low closing sale price of the Company’s shares on The Nasdaq Stock Market for 2002 and 2001.
| | |
|
|
2002: | | High | | Low | | | | 2001: | | High | | Low |
|
First quarter | | $38.84 | | 31.63 | | | | First quarter | | $32.03 | | 24.19 |
| | |
|
Second quarter | | 43.35 | | 36.15 | | | | Second quarter | | 36.50 | | 24.50 |
| | |
|
Third quarter | | 41.80 | | 29.49 | | | | Third quarter | | 33.95 | | 25.24 |
| | |
|
Fourth quarter | | 39.39 | | 26.61 | | | | Fourth quarter | | 33.73 | | 27.32 |
| | |
|
As of February 3, 2003, there were approximately 1,800 recordholders of the Company’s Common Stock. A $.05 annual dividend per share was paid in 2002 and a $.045 annual dividend per share was paid in 2001. On January 21, 2003, the Company announced a $.06 annual dividend per share to be paid on March 7, 2003 to shareholders of record at the close of business on February 21, 2003. The Company expects that it will continue to pay comparable cash dividends in the foreseeable future, provided that any future determination as to payment of dividends will depend upon the financial condition and results of operations of the Company and such other factors as are deemed relevant by the board of directors.
Selected Quarterly Financial Data (Unaudited)
(AMOUNTS IN THOUSANDS EXCEPT PER SHARE DATA)
|
2002: | | Net sales | | Gross profit | | Net earnings | | Earnings per share2 |
|
First quarter | | $214,582 | | 106,577 | | 17,705 | | .23 |
|
Second quarter | | 233,484 | | 115,485 | | 21,8311 | | .29 |
|
Third quarter | | 238,086 | | 117,069 | | 19,117 | | .25 |
|
Fourth quarter | | 219,286 | | 109,345 | | 16,889 | | .22 |
|
Total | | $905,438 | | 448,476 | | 75,542 | | 1.00 |
|
|
2001: | | Net sales | | Gross profit | | Net earnings | | Earnings per share |
|
First quarter | | $203,374 | | 104,555 | | 20,739 | | .27 |
|
Second quarter | | 207,442 | | 104,631 | | 19,018 | | .25 |
|
Third quarter | | 209,397 | | 104,774 | | 17,001 | | .22 |
|
Fourth quarter | | 198,070 | | 98,467 | | 13,354 | | .18 |
|
Total | | $818,283 | | 412,427 | | 70,112 | | .92 |
|
| 1 | | Includes an extraordinary gain, net of tax, of $716. |
| 2 | | Earnings per share amounts do not equal the total annual earnings per share due to rounding differences. |
2002 Annual Report 9
Consolidated Balance Sheets
DECEMBER 31, 2002 & 2001
(AMOUNTS IN THOUSANDS EXCEPT SHARE INFORMATION.)
Assets | | 2002 | | | 2001 | |
|
Current assets: | | | | | | | |
Cash and cash equivalents | | $ | 14,296 | | | 47,264 | |
Marketable securities | | | 37,062 | | | 21,258 | |
Trade accounts receivable, net of allowance for doubtful
accounts of $3,543 and $3,474, respectively | | | 105,553 | | | 101,356 | |
Inventories | | | 217,262 | | | 152,706 | |
Deferred income tax asset | | | 5,868 | | | 4,696 | |
Other current assets | | | 14,607 | | | 13,961 | |
Refundable income taxes | | | 1,838 | | | — | |
| | |
|
|
Total current assets | | | 396,486 | | | 341,241 | |
|
Marketable securities | | | 15,340 | | | 9,374 | |
Property and equipment, less accumulated depreciation | | | 144,252 | | | 121,607 | |
Other assets, net | | | 2,930 | | | 3,022 | |
| | | | | | | | |
| | |
|
|
Total assets | | $ | 559,008 | | | 475,244 | |
| | |
|
|
|
Liabilities and Stockholders’ Equity | | | | | | | |
Current liabilities: | | | | | | | |
Accounts payable | | $ | 25,783 | | | 20,100 | |
Accrued expenses | | | 21,281 | | | 17,973 | |
Income tax payable | | | — | | | 2,488 | |
| | |
|
|
Total current liabilities | | | 47,064 | | | 40,561 | |
| | |
|
|
|
Deferred income tax liability | | | 12,073 | | | 9,795 | |
| | |
|
|
|
Stockholders’ equity: | | | | | | | |
Preferred stock | | | — | | | — | |
Common stock, 100,000,000 shares authorized
75,877,376 shares issued | | | 759 | | | 759 | |
Additional paid-in capital | | | 7,472 | | | 4,044 | |
Retained earnings | | | 493,693 | | | 421,945 | |
Accumulated other comprehensive loss | | | (2,053 | ) | | (1,860 | ) |
| | |
|
|
Total stockholders’ equity | | | 499,871 | | | 424,888 | |
Commitments (notes 4, 8, and 9) | | | | | | | |
| | | | | | | | |
| | |
|
|
Total liabilities and stockholders’ equity | | $ | 559,008 | | | 475,244 | |
| | |
|
|
THE ACCOMPANYING NOTESAREAN INTEGRAL PARTOFTHE FINANCIAL STATEMENTS.
10 2002 Annual Report
Consolidated Statements of Earnings
(AMOUNTS IN THOUSANDS EXCEPT EARNINGS PER SHARE.)
YEARS ENDED DECEMBER 31,
2002, 2001, & 2000
| | | 2002 | | | 2001 | | 2000 |
Net sales | | $ | 905,438 | | | 818,283 | | 755,618 |
|
Cost of sales | | | 456,962 | | | 405,856 | | 367,500 |
| | |
|
Gross profit | | | 448,476 | | | 412,427 | | 388,118 |
|
Operating and administrative expenses | | | 334,875 | | | 300,696 | | 258,561 |
Loss on sale of property and equipment | | | 304 | | | 339 | | 162 |
Gain on sale of DIY Business | | | (5,934 | ) | | –– | | –– |
| | |
|
Operating income | | | 119,231 | | | 111,392 | | 129,395 |
|
Interest income | | | 1,976 | | | 2,242 | | 2,035 |
| | |
|
|
Earnings before income taxes
and extraordinary gain | | | 121,207 | | | 113,634 | | 131,430 |
|
Income tax expense | | | 46,381 | | | 43,522 | | 50,700 |
| | |
|
|
Net earnings before extraordinary gain | | $ | 74,826 | | | 70,112 | | 80,730 |
|
Extraordinary gain on DIY Business acquisition, net of tax | | | 716 | | | –– | | –– |
| | | | | | | | | |
| | |
|
Net earnings | | $ | 75,542 | | | 70,112 | | 80,730 |
| | |
|
|
Basic and diluted earnings per share before
extraordinary gain | | $ | .99 | | | .92 | | 1.06 |
|
Basic and diluted extraordinary gain
per share, net of tax | | | .01 | | | –– | | –– |
| | | | | | | | | |
| | |
|
Basic and diluted earnings per share | | $ | 1.00 | | | .92 | | 1.06 |
| | |
|
|
Weighted average shares outstanding | | | 75,877 | | | 75,877 | | 75,877 |
| | |
|
THE ACCOMPANYING NOTESAREAN INTEGRAL PARTOFTHE FINANCIAL STATEMENTS.
2002 Annual Report 11
Consolidated Statements of Stockholders’
Equity & Comprehensive Income
(AMOUNTS IN THOUSANDS.)
YEARS ENDED DECEMBER 31,
2002, 2001, & 2000
| | | Common Stock | | Additional Paid-in Capital | | Retained Earnings | | | Accumulated Other Comprehensive Income (Loss) | | | Total Stockholders’ Equity | |
| |
| | | | |
| | | Shares | | Amount | | | | |
|
|
Balances as of
December 31, 1999 | | 75,877 | | $ | 759 | | 4,044 | | 277,553 | | | (396 | ) | | 281,960 | |
|
Dividends paid in cash | | — | | | — | | — | | (3,035 | ) | | — | | | (3,035 | ) |
|
Net earnings for the year | | — | | | — | | — | | 80,730 | | | — | | | 80,730 | |
|
Translation adjustment | | — | | | — | | — | | — | | | (397 | ) | | (397 | ) |
| | | | | | | | | | | | | | | |
|
|
|
Total comprehensive income | | | | | | | | | | | | | | | 80,333 | |
|
|
Balances as of
December 31, 2000 | | 75,877 | | | 759 | | 4,044 | | 355,248 | | | (793 | ) | | 359,258 | |
|
Dividends paid in cash | | — | | | — | | — | | (3,415 | ) | | — | | | (3,415 | ) |
|
Net earnings for the year | | — | | | — | | — | | 70,112 | | | — | | | 70,112 | |
|
Translation adjustment | | — | | | — | | — | | — | | | (1,067 | ) | | (1,067 | ) |
| | | | | | | | | | | | | | | |
|
|
|
Total comprehensive income | | | | | | | | | | | | | | | 69,045 | |
|
|
Balances as of
December 31, 2001 | | 75,877 | | | 759 | | 4,044 | | 421,945 | | | (1,860 | ) | | 424,888 | |
|
Dividends paid in cash | | — | | | — | | — | | (3,794 | ) | | — | | | (3,794 | ) |
|
Tax benefit from
exercise of stock options | | | | | | | 3,428 | | | | | | | | 3,428 | |
|
Net earnings for the year | | — | | | — | | –– | | 75,542 | | | | | | 75,542 | |
|
Translation adjustment | | — | | | — | | — | | — | | | (193 | ) | | (193 | ) |
| | | | | | | | | | | | | | | |
|
|
|
Total comprehensive income | | | | | | | | | | | | | | | 75,349 | |
|
|
Balances as of
December 31, 2002 | | 75,877 | | $ | 759 | | 7,472 | | 493,693 | | | (2,053 | ) | | 499,871 | |
|
THE ACCOMPANYING NOTESAREAN INTEGRAL PARTOFTHE FINANCIAL STATEMENTS.
12 2002 Annual Report
Consolidated Statements of Cash Flows
(AMOUNTS IN THOUSANDS)
YEARS ENDED DECEMBER 31,
2002, 2001, & 2000
| | | 2002 | | | 2001 | | | 2000 | |
|
Cash flows from operating activities: | | | | | | | | | | |
Net earnings | | $ | 75,542 | | | 70,112 | | | 80,730 | |
Adjustments to reconcile net earnings to
net cash provided by operating activities: | | | | | | | | | | |
Depreciation of property and equipment | | | 16,945 | | | 14,747 | | | 11,757 | |
Loss on sale of property and equipment | | | 304 | | | 339 | | | 162 | |
Gain on sale of DIY Business | | | (5,934 | ) | | – | | | – | |
Bad debt expense | | | 5,189 | | | 5,453 | | | 4,496 | |
Deferred income taxes | | | 1,106 | | | 2,532 | | | 2,453 | |
Tax benefit from exercise of stock options | | | 3,428 | | | – | | | – | |
Amortization of goodwill and non-compete agreement | | | 67 | | | 220 | | | 220 | |
Changes in operating assets and liabilities, net of acquisition
and sale of the DIY Business: | | | | | | | | | | |
Trade accounts receivable | | | (13,025 | ) | | 6,232 | | | (26,053 | ) |
Inventories | | | (71,738 | ) | | (2,605 | ) | | (36,471 | ) |
Other current assets | | | (1,893 | ) | | (4,407 | ) | | (1,959 | ) |
Accounts payable | | | 6,949 | | | (1,835 | ) | | 573 | |
Accrued expenses | | | 5,205 | | | 1,630 | | | 1,717 | |
Income taxes, net | | | (4,326 | ) | | (691 | ) | | 628 | |
| | |
|
|
Net cash provided by operating activities | | | 17,819 | | | 91,727 | | | 38,253 | |
| | |
|
|
|
Cash flows from investing activities: | | | | | | | | | | |
Purchases of business and property and equipment | | | (42,683 | ) | | (45,342 | ) | | (36,729 | ) |
Proceeds from sale of property and equipment | | | 2,693 | | | 3,295 | | | 6,633 | |
Proceeds from sale of DIY business | | | 14,935 | | | – | | | – | |
Translation adjustment | | | (207 | ) | | (957 | ) | | (340 | ) |
Net increase in marketable securities | | | (21,770 | ) | | (17,635 | ) | | (12,782 | ) |
Decrease (increase) in other assets | | | 25 | | | (9 | ) | | (82 | ) |
| | |
|
|
Net cash used in investing activities | | | (47,007 | ) | | (60,648 | ) | | (43,300 | ) |
| | |
|
|
|
Cash flows from financing activities: | | | | | | | | | | |
Payment of dividends | | | (3,794 | ) | | (3,415 | ) | | (3,035 | ) |
| | |
|
|
Net cash used in financing activities | | | (3,794 | ) | | (3,415 | ) | | (3,035 | ) |
| | |
|
|
Effect of exchange rate changes on cash | | | 14 | | | (110 | ) | | (57 | ) |
| | |
|
|
Net increase (decrease) in cash and cash equivalents | | | (32,968 | ) | | 27,554 | | | (8,139 | ) |
|
Cash and cash equivalents at beginning of year | | | 47,264 | | | 19,710 | | | 27,849 | |
| | |
|
|
|
Cash and cash equivalents at end of year | | $ | 14,296 | | | 47,264 | | | 19,710 | |
| | |
|
|
|
Supplemental disclosure of cash flow information: | | | | | | | | | | |
Cash paid during each year for: | | | | | | | | | | |
Income taxes | | $ | 46,573 | | | 41,682 | | | 50,072 | |
THE ACCOMPANYING NOTESAREAN INTEGRAL PARTOFTHE FINANCIAL STATEMENTS.
2002 Annual Report 13
Notes to Consolidated Financial Statements
(AMOUNTS IN THOUSANDS EXCEPT SHARE AND PER SHARE DATA.)
YEARS ENDED DECEMBER 31,
2002, 2001, & 2000
Summary of Significant Accounting Policies
Principles of Consolidation
The consolidated financial statements include the accounts of Fastenal Company and its wholly-owned subsidiaries, Fastenal Company Services, Fastenal Company Purchasing, Fastenal Company Leasing, Fastenal Canada Company, Fastenal Mexico, S. de R.L. de C.V., Fastenal Mexico Services, S. de R.L. de NE C.V., and Fastenal Singapore P.T.E., Ltd. (collectively referred to as the Company). All material intercompany balances and transactions have been eliminated in consolidation.
Revenue Recognition and Accounts Receivable
The Company recognizes sales and the related cost of sales on the accrual basis of accounting at the time products are shipped to or picked up by customers. Accounts receivable are stated at their estimated net realizable value.
Financial Instruments
All financial instruments are carried at amounts that approximate estimated fair value.
Cash Equivalents
For purposes of the Consolidated Statements of Cash Flows, the Company considers all highly-liquid debt instruments purchased with original maturities of three months or less to be cash equivalents.
Inventories
Inventories, consisting of merchandise held for resale, are stated at the lower of cost (first in, first out method) or market.
Marketable Securities
Marketable securities as of December 31, 2002 and 2001 consist of debt securities. The Company classifies its debt securities as available-for-sale. Available-for-sale securities are recorded at fair value based on current market value. Unrealized holding gains and losses on available-for-sale securities are excluded from earnings, but are included in comprehensive income, and are reported as a separate component of stockholders’ equity until realized, provided that a decline in the market value of any available-for-sale security below cost that is deemed other than temporary is charged to earnings resulting in the establishment of a new cost basis for the security.
The amortized cost approximated the fair value of available-for-sale debt securities as of December 31, 2002 and 2001.
Property and Equipment
Property and equipment are stated at cost. Depreciation on buildings and equipment is provided for using the straight line method over the anticipated economic useful lives of the related property.
14 2002 Annual Report
Notes to Consolidated Financial Statements
(AMOUNTS IN THOUSANDS EXCEPT SHARE AND PER SHARE DATA.)
YEARS ENDED DECEMBER 31,
2002, 2001, & 2000
Summary of Significant Accounting Policies continued
Other Assets and Long-Lived Assets
Other assets consists of prepaid security deposits, goodwill and a non-compete agreement.
Goodwill represents the excess of the purchase price over the fair value of net assets acquired. Beginning in 2002, goodwill amortization was discontinued in accordance with SFAS No. 142,Goodwill, and Other Intangible Assets. Total goodwill amortization costs were $153 per year in 2001 and 2000. The non-compete is amortized on a straight-line basis over 15 years. Total non-compete amortization costs were $67 per year in 2002, 2001, and 2000.
Goodwill and other tangible and identifiable intangible long-lived assets are reviewed whenever events or changes in circumstances indicate that the carrying amount of an asset may not be recoverable, or on an annual basis if no event or change occurs, to determine that the unamortized balances are recoverable. Recoverability is measured by a comparison of the carrying amount of an asset to future net cash flows expected to be generated by the asset, or, in the case of goodwill, by also looking at an adverse change in legal factors or the business climate, a transition to a new product or services strategy, a significant change in the customer base, and/or a realization of failed marketing efforts. If the asset is deemed to be impaired, the amount of impairment is charged to earnings as a part of operating and administrative expenses in the current period. Assets to be disposed of are reported at the lower of the carrying amount or fair value less cost to sell.
Accounting Estimates
The preparation of financial statements in conformity with accounting principles generally accepted in the United States of America requires management to make estimates and assumptions that affect the reported amounts of assets and liabilities and disclosure of contingent assets and liabilities at the date of the financial statements and the reported amounts of revenues and expenses during the reported period. Actual results could differ from those estimates.
Insurance Reserves
The Company is self-insured for certain losses relating to medical, worker’s compensation, and other casualty losses. Specific stop loss coverage is provided for catastrophic claims in order to limit exposure to significant claims. Losses and claims are charged to operations when it is probable a loss has been incurred and the amount can be reasonably estimated. Accrued insurance liabilities are based on claims filed and estimates of claims incurred but not reported.
Stock-Based Compensation
The Company has not granted any stock options. However, certain employees participate in a stock option plan sponsored by the Company’s founder, Robert A. Kierlin. This is a shareholder sponsored plan, and does not directly involve the Company. The Company continues to apply the provisions of Accounting Principles Board Opinion (APB) No. 25,Accounting for Stock Issued to Employees, however, a proforma fair value disclosure is contained in Note 4.
During 2000, the Company established a stock appreciation rights (SAR) plan. During 2002, 2001, and 2000, the Company granted 8,000, 8,000, and 20,000 SAR units, respectively, under this plan. The SAR units granted in 2000 vested in July 2002 with a six month exercise period before expiration. The SAR units granted in 2001 and 2002 also vest approximately 2.5 years after grant and also have a six month exercise period. The Company recognized $80, $154, and $0 compensation expense during 2002, 2001, and 2000, respectively, related to the SAR plan.
2002 Annual Report 15
Notes to Consolidated Financial Statements
(AMOUNTS IN THOUSANDS EXCEPT SHARE AND PER SHARE DATA.)
YEARS ENDED DECEMBER 31,
2002, 2001, & 2000
Summary of Significant Accounting Policies continued
Income Taxes
The Company accounts for income taxes under the asset and liability method. Under this method, deferred tax assets and liabilities are recognized for the future tax consequences attributable to differences between the financial statement carrying amounts of existing assets and liabilities and their respective tax bases. Deferred tax assets and liabilities are measured using enacted tax rates expected to apply to taxable income in the years in which those temporary differences are expected to be recovered or settled. The effect on deferred tax assets and liabilities of a change in tax rates is recognized in income in the period that includes the enactment date.
Earnings Per Share
Basic and diluted earnings per share are computed by dividing net earnings by the weighted average number of common shares outstanding. All common shares and per share amounts have been adjusted to reflect the 2-for-1 stock split effected in the form of a stock dividend in May 2002. As of December 31, 2002 and 2001, the Company did not have any contingently issuable shares.
Segment Reporting
The Company has reviewed SFAS No. 131,Disclosures about Segments of an Enterprise and Related Information, and determined the Company meets the aggregation criteria outlined as the various operations of the Company have similar (1) economic characteristics, (2) products and services, (3) customers, (4) distribution channels, and (5) regulatory environments. Therefore the Company reports as a single business segment.
2Property and Equipment
Property and equipment as of December 31 consists of the following:
| | | Depreciable life in years | | 2002 | | | 2001 | |
|
Land | | — | | $ | 9,246 | | | 7,029 | |
Buildings and improvements | | 31 to 39 | | | 56,093 | | | 37,572 | |
Equipment and shelving | | 3 to 10 | | | 129,306 | | | 111,079 | |
Transportation equipment | | 3 to 5 | | | 17,162 | | | 17,413 | |
Construction in progress | | — | | | 12,145 | | | 13,349 | |
| | | |
|
| | | | | | 223,952 | | | 186,442 | |
Less accumulated depreciation | | | | | (79,700 | ) | | (64,835 | ) |
| | | |
|
Net property and equipment | | | | $ | 144,252 | | | 121,607 | |
| | | |
|
3Accrued Expenses
Accrued expenses as of December 31 consist of the following:
| | | 2002 | | 2001 |
|
Payroll and related taxes | | $ | 7,545 | | 7,273 |
Bonuses and commissions | | | 3,724 | | 3,449 |
Insurance | | | 5,963 | | 2,371 |
Sales and real estate taxes | | | 1,566 | | 1,062 |
Other | | | 2,483 | | 3,818 |
| |
|
| | | $ | 21,281 | | 17,973 |
| |
|
16 2002 Annual Report
Notes to Consolidated Financial Statements
(AMOUNTS IN THOUSANDS EXCEPT SHARE AND PER SHARE DATA.)
YEARS ENDED DECEMBER 31,
2002, 2001, & 2000
4Stockholders’ Equity
Preferred stock has a par value of $.01 per share. There were 5,000,000 shares authorized and no shares issued as of December 31, 2002 and 2001. Common Stock has a par value of $.01 per share. There were 100,000,000 shares authorized and 75,877,376 shares issued and outstanding as of December 31, 2002 and 2001.
Dividends
On January 21, 2003, the Company’s board of directors declared a dividend of $.06 per share of Common Stock to be paid in cash on March 7, 2003 to shareholders of record at the close of business on February 21, 2003.
Stock Options
In 2002, 2001, and 2000, options were granted, under the Robert A. Kierlin Stock Option Plan, to purchase shares of common stock owned by the Company’s founder Robert A. Kierlin. The individuals eligible to receive options included those employees with three or more years of service, or employed as a district manager or a store manager, on the last business day of December in the previous year. The options were granted with an exercise price equal to or greater than fair market value on the date of grant. The stock options vest approximately 2.5 years after grant and expire approximately 3 years after grant. The stock option plan was sponsored by the Company’s founder and does not involve a commitment by the Company. The Company’s net earnings and net earnings per share would have been as follows if the Company had elected to recognize compensation expense consistent with the methodology prescribed in SFAS No.123,Accounting for Stock-Based Compensation:
| | | 2002 | | 2001 | | 2000 |
|
Net earnings, as reported | | $ | 75,542 | | 70,112 | | 80,730 |
Pro forma net earnings | | $ | 72,868 | | 67,603 | | 79,215 |
|
Basic and diluted earnings per share | | $ | 1.00 | | .92 | | 1.06 |
Pro forma basic and diluted earnings per share | | $ | 0.96 | | .89 | | 1.04 |
The fair value of stock options is estimated as of the grant date using the Black-Scholes option-pricing model with the following assumptions:
| | | 2002 | | 2001 | | 2000 |
|
Risk-free interest rate | | 4.5% | | 5.0% | | 6.0% |
Expected life of option in years | | 2.66 | | 2.75 | | 2.75 |
Expected dividend yield | | 0.2% | | 0.2% | | 0.2% |
Expected stock volatility | | 27.03% | | 37.66% | | 42.29% |
The fair market value of options granted in 2002, 2001, and 2000 was estimated to be $6.65, $8.07, and $5.77 per share, respectively. A summary of stock option activity under the plan described above, by grant year, is:
| | | 2002 | | 2001 | | 2000 |
|
Exercise price of options issued during the year | | $ | 35.00 | | 27.50 | | 27.50 |
Options granted during the year | | | 820 | | 700 | | 1,451 |
Options canceled since grant | | | 192 | | 199 | | 388 |
Options exercised in 2002 | | | –– | | –– | | 1,063 |
5Retirement Plan
In 1998 the Company established the Fastenal Company and Subsidiaries 401(k) Plan. This plan covers all employees of the Company in the United States. The Company made no contributions to the plan in 2002, 2001, or 2000.
2002 Annual Report 17
Notes to Consolidated Financial Statements
(AMOUNTS IN THOUSANDS EXCEPT SHARE AND PER SHARE DATA.)
YEARS ENDED DECEMBER 31,
2002, 2001, & 2000
6Income Taxes
Components of income tax expense are as follows:
2002: | | Current | | Deferred | | Total |
|
Federal | | $39,346 | | 960 | | 40,306 |
State | | 5,929 | | 146 | | 6,075 |
| | |
|
| | | $45,275 | | 1,106 | | 46,381 |
| | |
|
|
2001: | | Current | | Deferred | | Total |
|
Federal | | $35,623 | | 2,199 | | 37,822 |
State | | 5,367 | | 333 | | 5,700 |
| | |
|
| | | $40,990 | | 2,532 | | 43,522 |
| | |
|
|
2000: | | Current | | Deferred | | Total |
|
Federal | | $41,472 | | 2,110 | | 43,582 |
State | | 6,775 | | 343 | | 7,118 |
| | |
|
| | | $48,247 | | 2,453 | | 50,700 |
| | |
|
Income tax expense in the accompanying consolidated financial statements differs from the “expected” tax expense as follows:
| | | 2002 | | 2001 | | 2000 |
|
Federal income tax expense at the “expected” rate of 35% | | $ | 42,422 | | 39,772 | | 46,000 |
|
Increase attributed to: | | | | | | | |
State income taxes, net of federal benefit | | | 3,949 | | 3,705 | | 4,627 |
Other, net | | | 10 | | 45 | | 73 |
| | |
|
Total income tax expense | | $ | 46,381 | | 43,522 | | 50,700 |
| | |
|
The tax effects of temporary differences that give rise to deferred tax assets and liabilities as of December 31 are as follows:
| | | 2002 | | | 2001 | |
|
Deferred tax asset (liability): | | | | | | | |
Inventory costing and valuation methods | | $ | 2,425 | | | 2,020 | |
Allowance for doubtful accounts receivable | | | 1,357 | | | 1,188 | |
Insurance claims payable | | | 2,112 | | | 965 | |
Fixed assets | | | (12,016 | ) | | (9,795 | ) |
Other, net | | | (83 | ) | | 523 | |
| | |
|
|
Net deferred tax liability | | $ | (6,205 | ) | | (5,099 | ) |
| | |
|
|
No valuation allowance for deferred tax assets was necessary as of December 31, 2002 and 2001. The character of the deferred tax assets is such that they can be realized through carryback to prior tax periods or offset against future taxable income.
During 2002, $3,428 was added to additional paid-in capital reflecting the permanent book to tax difference in accounting for tax benefits related to employee stock option transactions.
18 2002 Annual Report
Notes to Consolidated Financial Statements
(AMOUNTS IN THOUSANDS EXCEPT SHARE AND PER SHARE DATA.)
YEARS ENDED DECEMBER 31,
2002, 2001, & 2000
7Acquisition of Business
On August 31, 2001, the Company acquired certain assets of two subsidiaries of Textron, Inc. These assets were used in their business of selling packaged fasteners to the retail market (Do-It-Yourself or DIY Business). The purchase price consisted of a cash payment and the assumption of certain liabilities at closing.The acquisition was not material to the financial statements of the Company. The DIY Business was sold to The Hillman Group, Inc. on October 3, 2002.
On July 1, 2001, the Company adopted SFAS No. 141,Business Combinations. SFAS No. 141 requires the use of the purchase method of accounting and, accordingly, the operating results of the DIY Business were included in the Company’s consolidated financial statements from the date of acquisition through the date of sale. The total purchase price was allocated to tangible assets and liabilities based upon the estimate of their fair value on the acquisition date. The purchase price was finalized during the second quarter of 2002. The final purchase price resulted in tangible assets in excess of the cash paid and liabilities assumed, or negative goodwill. The negative goodwill, net of tax, of $716 was recognized in earnings during the second quarter of 2002 as an extraordinary gain.
The DIY Business was purchased after a prolonged period of contraction; therefore, the historical sales and earnings were not reflective of the DIY Business’s operations at the time it was acquired. If the business combination had occurred at the beginning of the respective years, net income would not have been materially different from the amounts reported.
The net sales from the DIY Business totaled $8,526 from August 31, 2001 through December 31, 2001. The net sales from the DIY Business totaled $16,974 from January 1, 2002 through October 3, 2002. The Company recognized a gain, before tax, of $5,934 from the sale of the DIY Business during the fourth quarter of 2002.
8Operating Leases
The Company leases space under non-cancelable operating leases for its California, North Carolina, Utah, and Washington distribution centers, its Tennessee conversion center, and certain store sites with initial terms of one to 48 months. The Company leases certain semi-tractors and pick-ups under operating leases. The semi-tractor leases typically have a 36 month term. The pick-up leases typically have a 72 month term and include an early buy out clause the Company generally exercises, thereby giving the leases an effective term of 12-15 months.
Future minimum annual rentals for the leased facilities and the leased vehicles are as follows:
| | | Leased Facilities | | Leased Vehicles | | Total |
|
2003 | | $18,269 | | 8,182 | | 26,451 |
2004 | | 9,534 | | 4,199 | | 13,733 |
2005 | | 4,387 | | 216 | | 4,603 |
2006 | | 1,315 | | –– | | 1,315 |
2007 and thereafter | | 446 | | –– | | 446 |
|
Rent expense under all operating leases is as follows:
| | | Leased Facilities | | Leased Vehicles | | Total |
|
2002 | | $22,127 | | 10,770 | | 32,879 |
2001 | | 19,826 | | 10,660 | | 30,486 |
2000 | | 16,899 | | 8,328 | | 25,227 |
9Lines of Credit and Commitments
The Company has a line of credit arrangement with a bank which expires June 30, 2003. The line allows for borrowings of up to $15,000 at .9% over the LIBOR rate. On December 31, 2002 there was $0 outstanding on the line. The Company currently has a letter of credit issued on its behalf to its insurance carrier. As of December 31, 2002, the total undrawn balance of this letter of credit was $3,969.
During 2001, the Company completed the construction of a new building for its Kansas City warehouse. The Company was required to obtain financing for this facility under an Industrial Revenue Bond (IRB). The Company subsequently purchased 100% of the outstanding bonds under the IRB at par. In addition to purchasing the outstanding obligations, the Company has a right of offset included in the IRB debt agreement. Accordingly, the Company has netted the impact of the IRB in the accompanying consolidated financial statements. The outstanding balance of the IRB at December 31, 2002 and 2001 was $6,533.
2002 Annual Report 19
Report of Management &
Independent Auditors’ Report
The Board of Directors and Stockholders
Fastenal Company:
Management is responsible for the integrity and accuracy of the consolidated financial information included in this report. Management believes these consolidated financial statements have been prepared in accordance with accounting principles generally accepted in the United Sates of America. The preparation of the consolidated financial statements requires management to make estimates and assumptions that affect the reported amounts of assets and liabilities and disclosure of contingent assets and liabilities at the date of the consolidated financial statements and the reported amounts of revenues and expenses during the periods reported.
In meeting its responsibility for the reliability of the financial statements, management relies on a system of internal accounting control. This system is designed to provide reasonable assurance assets are safeguarded and transactions are appropriately authorized and included in the financial records in all material aspects. The design of this system recognizes errors or irregularities may occur and estimates and judgments are required to assess the relative cost and expected benefits of the controls. Management believes the Company’s accounting controls provide reasonable assurance errors or irregularities material to the consolidated financial statements are prevented or would be detected in a reasonable time period.
The Audit Committee, comprised of members of the Board of Directors who are not employees of the Company, meets periodically with the independent auditors and management of the Company to discuss internal accounting control, auditing and financial reporting matters. In 2002, the Audit Committee recommended the selection of the independent auditors, who were then appointed by the Board of Directors, subject to ratification by the shareholders. The independent auditors, KPMG LLP, conduct an independent audit of the consolidated financial statements.
|
| | 
|
Willard D. Oberton Chief Executive Officer and President | | Daniel L. Florness Executive Vice-President, Chief Financial Officer, and Treasurer |
The Board of Directors and Stockholders
Fastenal Company:
We have audited the accompanying consolidated balance sheets of Fastenal Company and subsidiaries as of December 31, 2002 and 2001, and the related consolidated statements of earnings, stockholders’ equity and comprehensive income, and cash flows for each of the years in the three-year period ended December 31, 2002. These consolidated financial statements are the responsibility of the Company’s management. Our responsibility is to express an opinion on these consolidated financial statements based on our audits.
We conducted our audits in accordance with auditing standards generally accepted in the United States of America. Those standards require that we plan and perform the audit to obtain reasonable assurance about whether the financial statements are free of material misstatement. An audit includes examining, on a test basis, evidence supporting the amounts and disclosures in the financial statements. An audit also includes assessing the accounting principles used and significant estimates made by management, as well as evaluating the overall financial statement presentation. We believe that our audits provide a reasonable basis for our opinion.
In our opinion, the consolidated financial statements referred to above present fairly, in all material respects, the financial position of Fastenal Company and subsidiaries as of December 31, 2002 and 2001, and the results of their operations and their cash flows for each of the years in the three-year period ended December 31, 2002, in conformity with accounting principles generally accepted in the United States of America.
|
| | | |

| | |
|
Minneapolis, Minnesota | | |
January 17, 2003 | | |
| | | |
20 2002 Annual Report
0fficers
Robert A. Kierlin
Chairman of the Board
Willard D. Oberton
Chief Executive Officer and President
Nicholas J. Lundquist
Executive Vice-President and Chief
Operating Officer
Daniel L. Florness
Executive Vice-President, Chief Financial
Officer, and Treasurer
Steven L. Appelwick
Vice-President–Product Procurement,
Marketing, and Logistics
Stephen M. Slaggie
Secretary
Directors
Robert A. Kierlin
Michael M. Gostomski
President
Winona Heating & Ventilating Company
(sheet metal and roofing contractor)
Michael J. Dolan
Self Employed Business Consultant
Robert A. Hansen
Associate Professor of Marketing and Logistics
Management, Carlson School of Management,
University of Minnesota
Henry K. McConnon
President
Wise Eyes, Inc.
(eyeglass retailer and wholesaler)
Willard D. Oberton
John D. Remick
President and Chief Executive Officer
Rochester Athletic Club, Inc.
(health club)
Stephen M. Slaggie
Reyne K. Wisecup
Human Resource Manager
Fastenal Company Services
Corporate Information
Annual Meeting
The annual meeting of shareholders
will be held at 10:00 a.m.,
Tuesday, April 15, 2003,
at Corporate Headquarters,
2001 Theurer Boulevard,
Winona, Minnesota
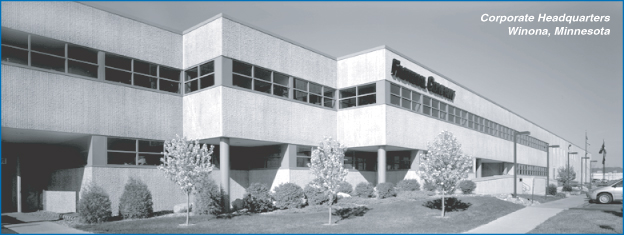
Corporate Headquarters
Fastenal Company
2001 Theurer Boulevard
Winona, Minnesota 55987-0978
Phone: (507) 454-5374
Fax: (507) 453-8049
Legal Counsel
Faegre & Benson LLP
Minneapolis, Minnesota
Streater & Murphy, PA
Winona, Minnesota
Form 10-K
A copy of the Company’s 2002 Annual Report
on Form 10-K to the Securities and Exchange
Commission is available without charge to
shareholders upon written request to the
Secretary of the Company at the address listed
on this page for the Company’s corporate
headquarters.
Copies of our latest press release, unaudited
supplemental Company information and monthly
sales information (beginning with October 2000
sales) are available at the Fastenal Company
World Wide Web site at:www.fastenal.com
Auditors
KPMG LLP
Minneapolis, Minnesota
Transfer Agent
Wells Fargo Bank Minnesota, National Association
Minneapolis, Minnesota