Exhibit 99.1 Growth Through Customer Service
|
WELCOME TO THE
2003 ANNUAL
SHAREHOLDER’S MEETING
| www.fastenal.com
[LOGO OF BOLTS]
|

CSP CONVERSION COMPLETE |
|
CSP Conversion with
NO
Business Interruptions
STATISTICS ON THREE GROUPS OF STORES |
|
| • | COMPANY – All stores operating on December 31, 2001, |
| except Canada and Singapore (961 stores) |
| • | 3rd QTR’02 – Stores converted to CSP in the 3rd Quarter |
| of 2002 (24 stores) |
| • | RANDOM SAMPLE – A random sample of non-CSP stores |
| to serve as a benchmark (24 stores) |
OPERATING STATISTICS |
|
| • | Sales per day (daily average sales) |
| • | New accounts added |
| • | Activity levels (active accounts) |
| • | Productivity (sales per employee) |
| • | Collections (days out) |
| • | Gross margin |
DAILY AVERAGE SALES PER STORE |
|
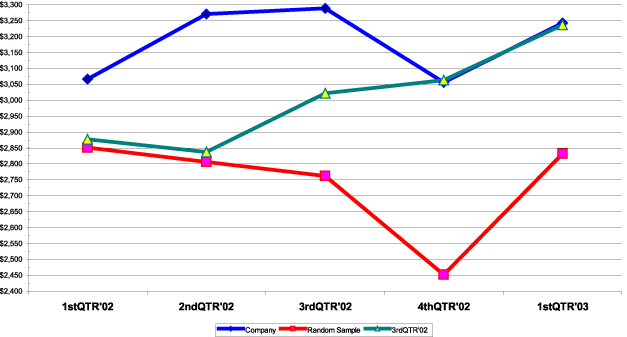
DEFINITION: Daily average sales is the sales per store divided by the number of business days in the period.
MONTHLY NEW ACCOUNTS PER STORE |
|

MONTHLY ACTIVE ACCOUNTS PER STORE |
|
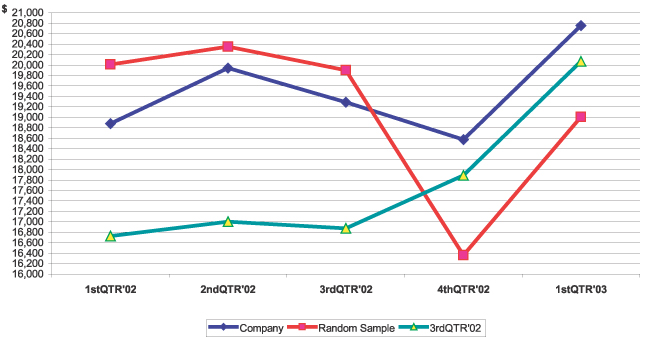
PRODUCTIVITY—MONTHLY SALES PER EMPLOYEE (FTE) |
|
FTE | ||||
Full-time employee = 1 Part-time employee = .5 |
DEFINITION: Sales per month divided by full-time equivalent (FTE).
COLLECTIONS – DAYS OUT |
|
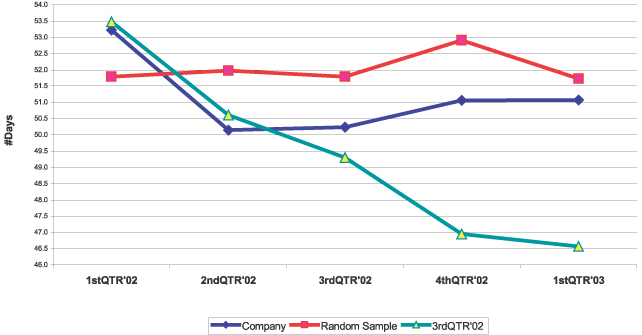
DEFINITION: Days Out represent the number of calendar days, on average, between when a sale occurs and when the cash is collected. The Company usually operates around 51.
SUMMARYOF FINDINGS |
|
| • | Statistics with noticeable impact in the 3rdQtr’02 CSP group |
| • | Daily sales average increased. |
| • | # of invoices increased. |
| • | # of new accounts increased, trend slipped in Q1-2003. |
| • | # of active accounts increased, trend slipped in Q1-2003. |
| • | Days out decreased 4 days from Q2-2002. |
SUMMARY OF FINDINGS |
|
| • | Statistics with inconclusive impact |
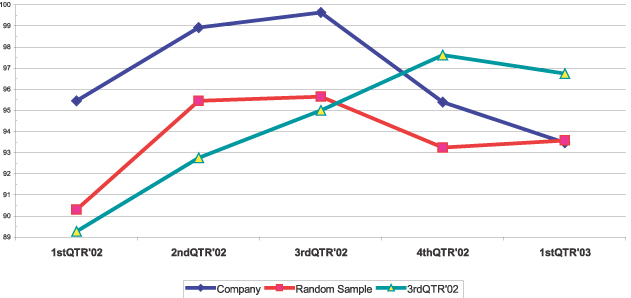
| • | Gross margin percentage. |
| • | October 2002 CSP stores (15 stores) |
| • | No conclusive impact on statistics. |
| • | Average sales of the October group was approximately 2X the average sales of the 3rdQtr’02 CSP group ($140,000 per month vs. $70,000 per month). |
INITIAL CSP ASSUMPTIONS – SCENARIO A |
|
| • | Inventory shifts from the ‘Historical model’ to the ‘CSP model’. Inventory turns stays the same. |
| • | ‘Historical model’ – approximately 60% of inventory in the store and approximately 40% in the distribution center. |
| • | ‘CSP model’– approximately 70 to 75% in the store and 25 to 30% in the distribution center. |
| • | Shelving and signage investment is $6,000 per store. |
| • | Occupancy costs increase $500 per store. |
| • | Gross margin = 50%. |
CSP needs to produce $1,500 in sales per month of incremental revenue to offset incremental expenses and to produce a 32.5% pre-tax return on shelving and signage invest. (32.5% pre-tax = approximately 20% after-tax return given Fastenal’s 38.3% tax rate.)
INITIAL CSP ASSUMPTIONS—SCENARIO B |
|
| • | Inventory assumption is too optimistic, inventory per store increases $30,000 without corresponding decrease at the distribution center. |
| • | Shelving and signage investment is $6,000 per store. |
| • | Occupancy costs increase $500 per store. |
| • | Gross margin = 50%. |
CSP needs to produce $3,000 in sales per month of incremental revenue to offset incremental expenses and to produce a 32.5% pre-tax return on inventory, shelving, and signage invest. (32.5% pre-tax = approximately 20% after-tax return given Fastenal’s 38.3% tax rate.)
CONCLUSION |
|
We believe the tangible results to date support the continued investment in the CSP initiative.