Exhibit 99.1
Fastenal Company Web Release dated October 17th, 2003 (amended October 30, 2003)
Customer Service Project (CSP) converted store information.
September 30, 2003
Included below is an update to the CSP store conversion information released on July 18th, 2003. The information is contained in five charts. The analysis centered on the operating statistics of four distinct groups of stores:
| (1) | | Company – All stores operating on December 31, 2001, excluding Canada and Singapore stores, |
| (2) | | Random sample – A random sample of 24 non-CSP stores to serve as a benchmark. This group of non-CSP stores was first selected in the first quarter of 2003; seven and nine of these stores had converted to the CSP format as of June 30, 2003 and September 30, 2003, respectively, |
| (3) | | 3rd Qtr’02 – Existing stores converted to the CSP format in the 3rd Qtr of 2002 (24 stores), |
| (4) | | 4th Qtr’02 – Existing stores converted to the CSP format in the 4th Qtr of 2002 (51 stores) |
************************************
The operating statistics include:
| (1) | | Daily Average Sales per Store. This is defined as sales per store for the period (three month period) divided by the number of business days in that period. |
| (2) | | Monthly New Accounts per Store. This is defined as the number of new accounts added each month per store. |
| (3) | | Monthly Active Accounts per Store. This is defined as the number of accounts that purchased product during a month. |
| (4) | | Productivity – Monthly Sales per Employee (FTE). This is defined as the sales per month divided by the number of full-time equivalent employees (FTE). The term full-time equivalent employee (FTE) is measured as full-time employee equals 1 and a part-time employee equals .5 (i.e. two full-time employees plus one part-time employee would equal 2.5 FTE. |
| (5) | | Collections – Days Out.This is defined as the ending accounts receivable balance divided by the average sales per day over the previous 60 calendar days. The Days Out represents the number of calendar days, on average, between when a sale occurs and when the cash is collected. |
Page 1 of 5
Fastenal Company Web Release dated October 17th, 2003 (amended October 30, 2003)
Customer Service Project (CSP) converted store information.
September 30, 2003
Daily Average Sales Per Store
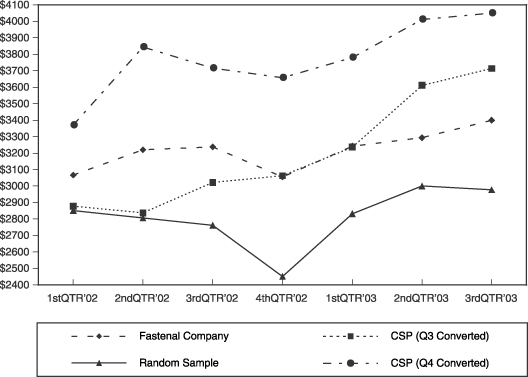
| | | 1stQTR’02
| | 2ndQTR’02
| | 3rdQTR’02
| | 4thQTR’02
| | 1stQTR’03
| | 2ndQTR’03
| | 3rdQTR’03
|
Company | | $ | 3,067 | | $ | 3,220 | | $ | 3,238 | | $ | 3,056 | | $ | 3,243 | | $ | 3,294 | | $ | 3,400 |
Random Sample | | $ | 2,852 | | $ | 2,807 | | $ | 2,763 | | $ | 2,452 | | $ | 2,833 | | $ | 3,000 | | $ | 2,978 |
CSP (Q3 Converted) | | $ | 2,878 | | $ | 2,837 | | $ | 3,022 | | $ | 3,063 | | $ | 3,237 | | $ | 3,612 | | $ | 3,714 |
CSP (Q4 Converted) | | $ | 3,370 | | $ | 3,844 | | $ | 3,716 | | $ | 3,658 | | $ | 3,781 | | $ | 4,012 | | $ | 4,050 |
Monthly New Accounts per Store
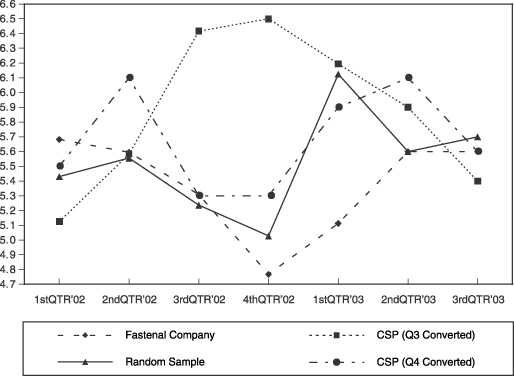
| | | 1stQTR’02
| | 2ndQTR’02
| | 3rdQTR’02
| | 4thQTR’02
| | 1stQTR’03
| | 2ndQTR’03
| | 3rdQTR’03
|
Company | | 5.7 | | 5.6 | | 5.3 | | 4.8 | | 5.1 | | 5.6 | | 5.6 |
Random Sample | | 5.4 | | 5.6 | | 5.2 | | 5.0 | | 6.1 | | 5.6 | | 5.7 |
CSP (Q3 Converted) | | 5.1 | | 5.6 | | 6.4 | | 6.5 | | 6.2 | | 5.9 | | 5.4 |
CSP (Q4 Converted) | | 5.5 | | 6.1 | | 5.3 | | 5.3 | | 5.9 | | 6.1 | | 5.6 |
Page 2 of 5
Fastenal Company Web Release dated October 17th, 2003 (amended October 30, 2003)
Customer Service Project (CSP) converted store information.
September 30, 2003
Monthly Active Accounts per Store
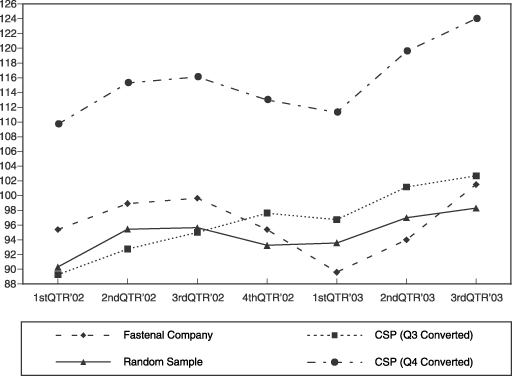
| | | 1stQTR’02
| | 2ndQTR’02
| | 3rdQTR’02
| | 4thQTR’02
| | 1stQTR’03
| | 2ndQTR’03
| | 3rdQTR’03
|
Company | | 95.4 | | 98.9 | | 99.6 | | 95.4 | | 89.6 | | 94.0 | | 101.5 |
Random Sample | | 90.3 | | 95.5 | | 95.7 | | 93.3 | | 93.6 | | 97.0 | | 98.3 |
CSP (Q3 Converted) | | 89.3 | | 92.8 | | 95.0 | | 97.6 | | 96.7 | | 101.2 | | 102.7 |
CSP (Q4 Converted) | | 109.7 | | 115.3 | | 116.1 | | 113.0 | | 111.3 | | 119.6 | | 124.0 |
Productivity - Monthly Sales per Employee (FTE)
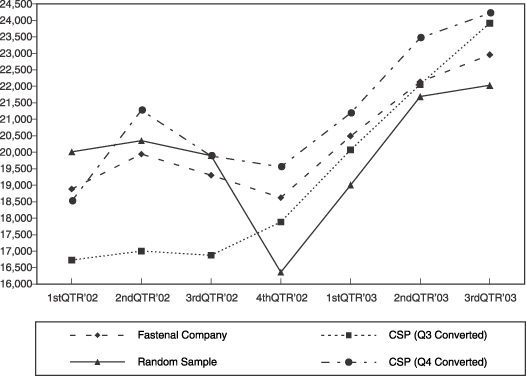
| | | 1stQTR’02
| | 2ndQTR’02
| | 3rdQTR’02
| | 4thQTR’02
| | 1stQTR’03
| | 2ndQTR’03
| | 3rdQTR’03
|
Company | | 18,885 | | 19,943 | | 19,303 | | 18,621 | | 20,492 | | 22,141 | | 22,960 |
Random Sample | | 20,012 | | 20,351 | | 19,898 | | 16,361 | | 19,006 | | 21,691 | | 22,029 |
CSP (Q3 Converted) | | 16,729 | | 17,000 | | 16,877 | | 17,887 | | 20,072 | | 22,059 | | 23,915 |
CSP (Q4 Converted) | | 18,517 | | 21,272 | | 19,889 | | 19,554 | | 21,184 | | 23,471 | | 24,222 |
Page 3 of 5
Fastenal Company Web Release dated October 17th, 2003 (amended October 30, 2003)
Customer Service Project (CSP) converted store information.
September 30, 2003
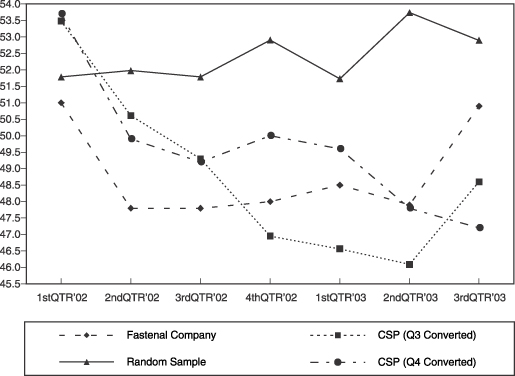
# Days-Out Comparison
| | | 1stQTR’02
| | 2ndQTR’02
| | 3rdQTR’02
| | 4thQTR’02
| | 1stQTR’03
| | 2ndQTR’03
| | 3rdQTR’03
|
Company | | 51.0 | | 47.8 | | 47.8 | | 48.0 | | 48.5 | | 47.9 | | 50.9 |
Random Sample | | 51.8 | | 52.0 | | 51.8 | | 52.9 | | 51.7 | | 53.7 | | 52.9 |
CSP (Q3 Converted) | | 53.5 | | 50.6 | | 49.3 | | 47.0 | | 46.6 | | 46.1 | | 48.6 |
CSP (Q4 Converted) | | 53.7 | | 49.9 | | 49.2 | | 50.0 | | 49.6 | | 47.8 | | 47.2 |
Page 4 of 5
Fastenal Company Web Release dated October 17th, 2003 (amended October 30, 2003)
Customer Service Project (CSP) converted store information.
September 30, 2003
Summary of Findings for Converted Stores
The impact on the two groups was as follows:
3rd Qtr’02
| • | | Daily Average Sales per Store increased in every quarter since conversion. Total increase from Q2-2002 (quarter before conversion) until Q3-2003 (most recent quarter) is $877 per day, or 30.9%. |
| • | | Monthly New Accounts per Store increased in Q3-2002 and Q4-2002. The increase softened in Q1-2003 and Q2-2003; the new accounts in Q3-2003 were similar to Q2-2002. |
| • | | Monthly Active Accounts per Store increased in Q4-2002, slipped in Q1-2003, and increased in Q2-2003 and Q3-2003. Total increase from Q2-2002 (quarter before conversion) until Q3-2003 (most recent quarter) is 9.9 customers, or 10.7%. |
| • | | Productivity–Monthly Sales per Employee (FTE) increased in every quarter since conversion. (This productivity increase is common in the first, second, and third quarter; however, it is very uncharacteristic of the fourth quarter.) |
| • | | Collections–Days Out decreased in the first four quarters after conversion, and increased in Q3-2003. Total decrease from Q2-2002 (quarter before conversion) until Q3-2003 (most recent quarter) is 2.0 days, or 4.0%. |
4th Qtr’02
| • | | Daily Average Sales per Store increased in every quarter since conversion. Total increase from Q3-2002 (quarter before conversion) until Q3-2003 (most recent quarter) is $334 per day, or 9.0%. |
| • | | Monthly New Accounts per Store increased in Q1-2003, Q2-2003, and then softened in Q3-2003 to a level consistent with the comparable quarter in 2002. |
| • | | Monthly Active Accounts per Store softened in Q1-2003 and increased in both Q2-2003 and Q3-2003. Total increase from Q3-2002 (quarter before conversion) until Q3-2003 (most recent quarter) is 7.9 customers, or 6.8%. |
| • | | Productivity–Monthly Sales per Employee (FTE) increased in every quarter since conversion. (This productivity increase is common in the first, second, and third quarter; however, it is very uncharacteristic of the fourth quarter.) |
| • | | Collections–Days Out increased in Q4-2002 and Q1-2003; and then decreased in both Q2-2003 and Q3-2003. Total decrease from Q3-2002 (quarter before conversion) until Q3-2003 (most recent quarter) is 2.0 days, or 4.1%. |
We believe the tangible results continue to support the investment in the CSP initiative.
Page 5 of 5