| | |
| 2006 | | Profile of Fastenal Company |
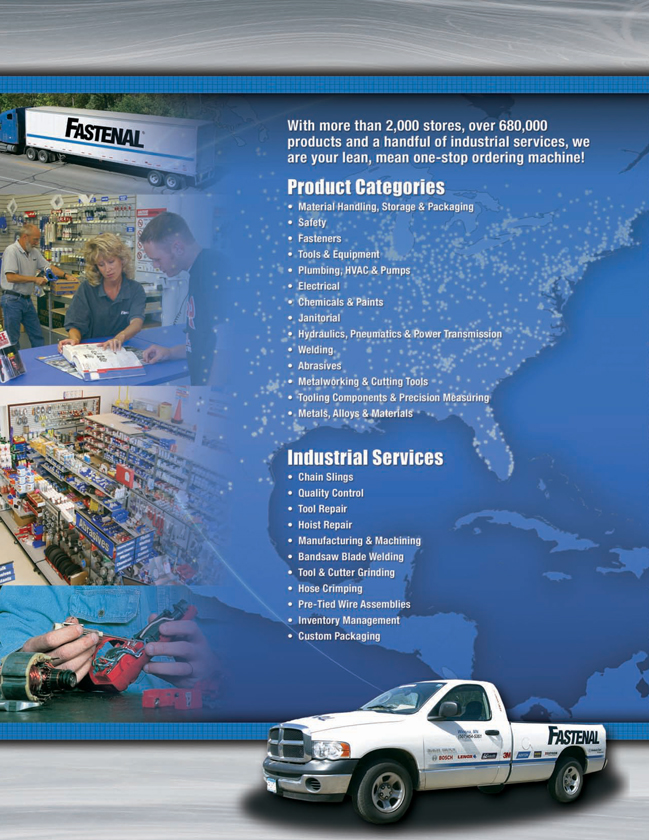
Fastenal Company was founded in 1967. As of December 31, 2006, we operated 2,000 store sites located in 50 states, Puerto Rico, Canada, Mexico, Singapore, China, and the Netherlands and employed 7,174 people at these sites. In addition, there were 3,241 people employed in various support positions. We sell approximately 689,000 different types of industrial and construction supplies in ten product categories. These include (approximately): 306,000 different types of threaded fasteners and miscellaneous supplies (fasteners); 110,000 different types of tools and equipment (tools); 127,000 different types of cutting tool blades and abrasives (cutting tools); 47,000 different types of fluid transfer components and accessories for hydraulic power, pneumatic power, plumbing, and HVAC (hydraulics & pneumatics); 9,000 different types of material handling, storage, and packaging products (material handling); 12,000 different types of janitorial supplies, chemicals, and paint (janitorial supplies); 24,000 different types of electrical supplies; 26,000 different types of welding supplies (excluding welding gases); 19,000 different types of safety supplies; and 9,000 different types of metals, alloys, and materials (metals).
As of December 31, 2006, we operated twelve distribution centers located in Minnesota, Indiana, Ohio, Pennsylvania, Texas, Georgia, Washington, California, Utah, North Carolina, Kansas, and Ontario, Canada. Approximately 94.8% of our 2006 sales were attributable to products manufactured by others, and approximately 5.2% related to items manufactured, modified, or repaired by either our Manufacturing Division or one of our Support Services. Since December 31, 2006, we have opened additional store sites.
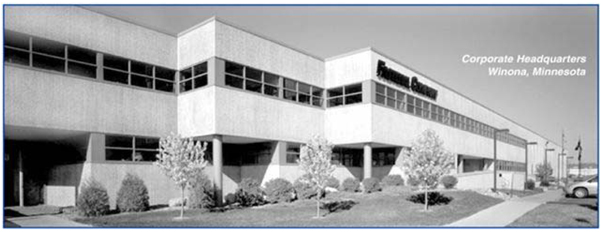
Customer Service Project 3 (CSP3) store format – Winona, MN
This annual report, including the sections captioned “President’s Letter to Shareholders,” “Management’s Discussion & Analysis of Financial Condition & Results of Operations” and “Stock and Financial Data,” contains statements that are not historical in nature and that are intended to be, and are hereby identified as, “forward-looking statements” as defined in the Private Securities Litigation Reform Act of 1995 (the “Reform Act”), including statements regarding the opening of stores on schedule, our plans regarding the CSP3 project, improvement of inventory turns, the expansion of air shipments of products from our distribution centers, our go-direct strategy, the payment of dividends, the leveling off of sales growth and the variability of sales at older stores, management of headcount and retention of labor efficiency, capital expenditures, our CSP store format operating model, management of inventory growth, using airlines for shipping, funding of expansion plans and the expansion of foreign operations. A discussion of certain risks and uncertainties that could cause actual results to differ materially from those predicted in such forward-looking statements is included in the section of this Annual Report captioned “Management’s Discussion & Analysis of Financial Condition & Results of Operations.” We assume no obligation to update either such forward-looking statements or the discussion of such risks and uncertainties.
pages2-4
PRESIDENT’S LETTER TO SHAREHOLDERS
page5
SIX-YEAR SELECTED FINANCIAL DATA
page6
STOCKAND FINANCIAL DATA
page7-8
STOCK PERFORMANCE HIGHLIGHTS
pages9-19
MANAGEMENT’S DISCUSSION & ANALYSISOF
FINANCIAL CONDITION & RESULTSOF OPERATIONS
page20
CONSOLIDATED BALANCE SHEETS
page21
CONSOLIDATED STATEMENTSOF EARNINGS
page22
CONSOLIDATED STATEMENTSOF STOCKHOLDERS’
EQUITYAND COMPREHENSIVE INCOME

NASCAR TRUCK SERIES SPONSORSHIP

page23
CONSOLIDATED STATEMENTSOF CASH FLOWS
pages24-33
NOTES TO CONSOLIDATED FINANCIAL STATEMENTS
page34
MANAGEMENT REPORTON INTERNAL CONTROL
OVER FINANCIAL REPORTING
page35
REPORTOF INDEPENDENT REGISTERED PUBLIC ACCOUNTING FIRMON CONSOLIDATED FINANCIAL STATEMENTSAND SUPPLEMENTAL SCHEDULE
page36
REPORTOF INDEPENDENT REGISTERED PUBLIC ACCOUNTING FIRMON INTERNAL CONTROL OVER FINANCIAL REPORTING
Inside Back Cover
EXECUTIVE OFFICERS & DIRECTORS
CORPORATE INFORMATION
| | |
| 2006 | | President’s Letter to Shareholders |
In most respects, 2006 was a good year for Fastenal. The year started out strong but as the overall economy in North America slowed in the second half of the year, so did Fastenal. This caused us to have lower sales and earnings growth than predicted. Even though this was not a stellar year for Fastenal, there are several initiatives in which we made great progress. These initiatives are like pieces of a puzzle we are putting together. Individually they do not do much, but when linked together correctly they help execute our overall strategy; to become the best distributor of industrial and construction products in each of the markets we serve. I would like to share some of these initiatives with you as I believe they are key contributors to our continued growth.
Our 2006 sales growth was 18.8%. This gave us total revenue of $1.8 billion which is an increase of more than $286 million over 2005. Our reported net earnings for 2006 was $199 million, an increase of 19.3% over 2005. We thought we would be able to produce more earnings leverage than we did, but with the slowing of sales growth in the second quarter, combined with the CSP2 expansion, this was not possible.
We opened 245 stores in 2006. We opened 222 stores in 2005. We started the year opening stores on schedule but fell behind in the second quarter and had to work hard to catch up in the fourth quarter. This is a very inefficient way to open our stores, and we lose sales contribution from these stores when they are opened late. I believe the plan we put in place to prevent this from happening in the future is a good plan. A milestone for Fastenal in 2006 was the opening of our 2,000th store in Seattle, Washington. This is a significant accomplishment for Fastenal and it was a very proud moment for our team. I traveled to Seattle for the grand opening and enjoyed visiting with some of our local customers. This opening is also special for me because I was born in Seattle and have spent a lot of time in the Northwest.
The people working on the CSP2 store conversions are doing a very good job of staying on schedule and the project is going well. However, I believe the number of conversions completed in 2006 may have contributed to the delay in new store openings. We converted 163 stores to this format in 2006. This team
continues to improve the store conversion process. These improvements have served to lower some costs and reduce the existing store inventory before we convert them to CSP2.
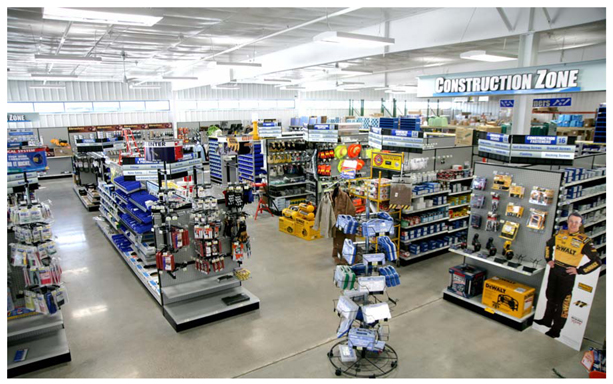
Another new store project called CSP3 was started in 2006. At this time, this project will be limited to 8 to 10 stores. It is much like CSP2, only larger. The store size will average 12,000 square feet and stock more than 14,000 different items. Because of the low number of stores in this project, we will develop a labor model as we learn more. Our plan is to continue working on this project, but not to increase the number of conversions in 2007.
Our sales people did a great job of increasing the account activity in 2006. During the fourth quarter we increased our active accounts by 18.5% over the same period in 2005. This is one of the largest increases in our history.
We saw mixed results in the area of asset management. We continued to lower our days outstanding for accounts receivable as the people in our call center continue to speed up the collection process. We reduced our days outstanding by four days since December 2004, when we first implemented the central collection process.
Our overall inventory grew faster than we had planned. Most of this growth was due to our aggressive plans of opening stores, converting CSP2 stores, and expanding the stocking levels in distribution. In 2006 we added $94 million in inventory, an increase of 26.1%. We have put plans in place to slow this growth and I believe we will improve our inventory turns in 2007.
In 2006 our Chief Operating Officer, Nick Lundquist, reorganized the National Accounts group, our National Construction Group and any other people that were assigned to large account business. The key accounts program began in 1995 and became fragmented from an organizational standpoint as it grew. This reorganized group is now referred to as our Strategic Accounts Group and is lead by Steve Rucinski. Steve is a 26 year employee with a proven track record in key account sales.
2
| | |
| 2006 | | President’s Letter to Shareholders |
This group is charged with signing up large accounts for the entire company. The early results show a large increase in the number of quotes to potential customers, but the real measure will come in the first half of 2007 when we review how this piece of our business is growing.
Over the last several years we have taken many steps to strengthen our name recognition in the marketplace. Four of the larger steps are: 1) lease better store locations, 2) add better signage to increase customer awareness, 3) place decals on our large fleet of vehicles creating moving billboards, and 4) develop better packaging.
In addition, in 2006 we took a much bigger step and became the primary sponsor of a NASCAR Craftsman Truck Series race truck. After doing research on the demographics of racing, we determined the truck series provided the best demographic match to our customers and was a good entry point into motor sports marketing. We signed a two year sponsorship deal with Bobby Hamilton Racing and became the sponsor of the #18 Dodge driven by Bobby Hamilton, Sr., the 2004 Truck Series Champion. We invited some of our larger product suppliers to help co-sponsor the team. Our marketing goal is to familiarize people with Fastenal and our quality brands like Bosch Power tools, Lenox saw blades, Craftsman hand tools, etc. The season started off well and we received great television coverage as a new sponsor. Then, less than a month into the season, our driver Bobby Hamilton, Sr. was diagnosed with cancer. After a courageous battle, Bobby passed away, and on that day we lost a great friend.
As part of our motor sports marketing initiative our marketing team worked hard to produce and direct our first television commercial. Although I am no marketing expert, I believe they did a great job creating a very high quality commercial with a clear message about who Fastenal is. The main focus on all of our marketing efforts is two fold. First, is to tell our story with the goal of driving traffic to our stores and second, is to create brand awareness for our sales people when they are making calls on potential customers. We have found it much easier to get an appointment with a potential customer if they have heard of Fastenal in the past.
The biggest project we started in 2006 and the one that will produce the most to improve our customer service is the inventory expansion project we undertook in our Indianapolis warehouse. We chose Indianapolis for this project because of its central location to our customer base and the good interstate highway system out of Indianapolis. In mid 2005 we started studying the feasibility of expanding our stocking model in Indianapolis to include all of the items in our catalog. Up until this time, we had only stocked the best selling items and the stores bought the other items as they needed them. We estimated we would save 9% on the product and another 13% on freight if we purchased it centrally and hauled it with our own fleet. Based on this information, and our strong commitment to continually improve our customer service, we made the decision to expand the number of items we stock in that facility from 28,000 to more than 120,000. We estimated it would require about $25 million of additional inventory in Indianapolis to accomplish this. The project started late in 2005 and has made steady progress throughout the year. This has been a very difficult project and has caused many service problems in 2006.
For us to gain the maximum benefit from the inventory expansion project we need to continue to improve our transportation system. We worked hard on this goal in 2006 by improving our delivery times, providing five-day a week delivery service to more stores and developing scanning hardware to better track the shipments. We also started our first consolidated air shipments from Indianapolis to our facility in Seattle. By contracting with commercial airlines, we are able to provide second day shipments at very reasonable prices. We plan to expand this service in 2007 to all of our distribution centers in western North America. Although I am pleased with the progress in our transportation system, there are still many areas we are working to improve that will provide better service and make us more efficient.
We completed many projects in distribution in 2006, but the largest project was the opening of our new distribution center in California. In November 2005, we purchased a 320,000 square foot warehouse in Modesto, California. We currently occupy 140,000 square feet of the building and have leased out the remaining space.
3
| | |
| 2006 | | President’s Letter to Shareholders |
Our distribution team spent most of the year designing and installing the most efficient warehouse system in our network. The project was completed in November 2006 and we started operation in December. This new facility replaced our existing warehouse in Fresno, California.
The Information Systems people worked on many projects, but I believe the most exciting area of development is hand-held sales devices. They are currently testing hand-held computers that will give our sales people much better information. Armed with this new device, a sales person in the field can price product, check order status, check product availability and do almost anything else they can do from their desk. This is another big step in both customer service and labor productivity.
The people in our accounting department have been busy developing and implementing new systems to increase efficiency in both accounts receivable and payable. Using a new automated scanning system we are able to collect data from incoming checks and invoices and shorten the time it takes to process the transaction. This new system has not only helped us improve our labor efficiency, but has also allowed us to improve our ability to take advantage of early pay discounts offered by our suppliers.
Product development continues to be a big part of our growth strategy. Our product managers had a very busy 2006 splitting their time between CSP2, CSP3 and the Indianapolis expansion project. I believe they have done a very good job of determining not only which brands to support, but also which products we should stock in each area and in what quantity. In 2007 they will focus on streamlining the process.
Many of the products we buy in North America were originally produced in Southeast Asia and then imported by one of our suppliers. Since the early 1990’s, we have worked to go-direct to the manufacturer when volume justified. The go direct strategy took a huge leap forward in 2003 when we established a trading company in Shanghai, China called FASTCO Trading Company. FASTCO Trading Company continues its rapid growth. In 2006 they imported 4,500 containers, an increase of 32% over 2005. At this point, I believe the only thing
that will limit the growth of this business will be our ability to find the quality suppliers we need to produce our product.
We now have a second office in Kang Shan, Taiwan where we installed a product testing laboratory. This investment was made to improve our turnaround time in quality control; which will speed up shipping time from our Asian suppliers.
Our manufacturing division had another good year. They produced sales growth in 2006 of 26%. They also moved our manufacturing facilities in both Indianapolis and Fresno. Indianapolis moved within our current facility to a much larger space to accommodate the growth. The Fresno facility moved to our new building in Modesto. Both of these moves provide us with larger and improved manufacturing space.
I have talked about many areas of Fastenal, and even more projects, but none of this would be possible without great people. In 2006 we hit another milestone by surpassing 10,000 employees for the first time. Our dedicated staff in the Fastenal School of Business had another record training year. They developed new training programs for the CSP2 managers, additional product trainings, and more than doubled the training that is done in the training centers outside of Winona. Our commitment to training our people continues to be one of the main reasons we perform at a high level.
We have made great progress in 2006 in our effort to build the best distribution organization in our industry. But no matter how good our systems are, they cannot perform without our great people. I am very proud of everything our dedicated employees accomplished. I strongly believe if we continue to hire people that share our values, give them strong support and put them in a position to make good decisions, we will always be successful.
Thank you for your belief in us and we promise to work hard for the continued success of Fastenal.
|
|
| /s/ Willard D. Oberton |
Willard D. Oberton CEO and President |
4
| | |
| 2006 | | Six – Year Selected Financial Data |
(Amounts in Thousands Except Per Share Information)
| | | | | | | | | | | | | | | | | | | | | | |
Operating Results | | 2006 | | | Percent
Change | | | 2005 | | | 2004 | | | 2003 | | | 2002 | | | 2001 |
Net sales | | $ | 1,809,337 | | | 18.8 | % | | $ | 1,523,333 | | | 1,238,492 | | | 994,928 | | | 905,438 | | | 818,283 |
Gross profit1 | | | 907,675 | | | 19.7 | % | | | 758,103 | | | 615,886 | | | 482,103 | | | 442,138 | | | 406,699 |
Earnings before income taxes | | | 321,029 | | | 19.3 | % | | | 269,056 | | | 208,336 | | | 136,336 | | | 121,207 | 2 | | 113,634 |
Net earnings | | | 199,038 | | | 19.3 | % | | | 166,814 | | | 130,989 | | | 84,120 | | | 75,542 | 3 | | 70,112 |
Basic and diluted earnings per share | | | 1.32 | | | 20.0 | % | | | 1.10 | | | .86 | | | .56 | | | .50 | | | .46 |
Dividends | | | 60,548 | | | 29.0 | % | | | 46,935 | | | 30,350 | | | 15,935 | | | 3,794 | | | 3,415 |
Dividends per share | | $ | .40 | | | 29.0 | % | | $ | .31 | | | .20 | | | .105 | | | .025 | | | .0225 |
Number of shares repurchased | | | 474 | | | | | | | 700 | | | — | | | — | | | — | | | — |
Value of shares repurchased | | $ | 17,294 | | | | | | $ | 18,739 | | | — | | | — | | | — | | | — |
Basic-weighted average shares outstanding | | | 151,034 | | | | | | | 151,270 | | | 151,755 | | | 151,755 | | | 151,755 | | | 151,755 |
Diluted-weighted average shares outstanding | | | 151,165 | 4 | | | | | | 151,508 | 4 | | 151,972 | 4 | | 151,784 | 4 | | 151,755 | | | 151,755 |
| | | | | | | | | | | | | | | | | | |
Operating Results (as a percentage of net sales) | | 2006 | | | 2005 | | | 2004 | | | 2003 | | | 2002 | | | 2001 | |
Gross profit1 | | 50.2 | % | | 49.8 | % | | 49.7 | % | | 48.5 | % | | 48.8 | % | | 49.7 | % |
Earnings before income taxes | | 17.7 | % | | 17.7 | % | | 16.8 | % | | 13.7 | % | | 13.4 | % | | 13.9 | % |
Net earnings | | 11.0 | % | | 11.0 | % | | 10.6 | % | | 8.5 | % | | 8.3 | % | | 8.6 | % |
| | | | | | | | | | | | | | | | | |
Financial Position on December 31 | | 2006 | | Percent
Change | | | 2005 | | 2004 | | 2003 | | 2002 | | 2001 |
Accounts receivable plus inventory | | $ | 665,529 | | 22.1 | % | | $ | 545,117 | | 469,833 | | 361,640 | | 322,815 | | 254,062 |
Net working capital | | | 663,880 | | 19.1 | % | | | 557,470 | | 466,883 | | 393,255 | | 349,422 | | 300,680 |
Total assets5 | | | 1,039,016 | | 16.7 | % | | | 890,035 | | 775,362 | | 652,875 | | 563,384 | | 476,694 |
Total stockholders’ equity | | $ | 992,093 | | 26.6 | % | | $ | 783,549 | | 684,369 | | 576,740 | | 499,871 | | 424,888 |
All information contained in this Annual Report reflects the 2-for-1 stock splits effected in the form of a
stock dividend in each of 2002 and 2005.
1 | Reflects impact of reclassification of certain internal trucking cost between operating expenses and cost of goods sold related to the freight initiative, which decreased gross profit by $12,477, $8,447, $6,964, $6,338, and $5,728 in 2005, 2004, 2003, 2002, and 2001, respectively. |
2 | Amount includes a gain on the sale of the Do-It-Yourself (DIY) Business of $5,934. |
3 | Amount includes an extraordinary gain, net of tax, of $716. |
4 | Reflects impact of stock options issued by the Company in May 2003 that were in-the-money during the period outstanding. |
5 | Reflects impact of reclassification of prior years’ presentation to conform to current year presentation. |
5
| | |
| 2006 | | Stock and Financial Data |
Common Stock Data
Our shares are traded on The NASDAQ Global Select Market under the symbol “FAST”. The following table sets forth, by quarter, the high and low closing sale price of our shares on The NASDAQ Global Select Market for 2006 and 2005.
| | | | | |
2006: | | High | | Low |
First quarter | | $ | 47.39 | | 37.92 |
Second quarter | | $ | 48.84 | | 36.54 |
Third quarter | | $ | 41.09 | | 33.23 |
Fourth quarter | | $ | 42.81 | | 34.99 |
| | | | | |
2005: | | High | | Low |
First quarter | | $ | 31.87 | | 27.55 |
Second quarter | | $ | 31.79 | | 25.54 |
Third quarter | | $ | 33.29 | | 28.85 |
Fourth quarter | | $ | 41.96 | | 30.43 |
As of February 1, 2007, there were approximately 1,636 recordholders of our common stock, which includes nominees or broker dealers holding stock on behalf of an estimated 32,401 beneficial owners.
In 2006, we paid two dividends, each of $.20 per share, and in 2005 we paid two dividends, each of $.155 per share. On January 18, 2007, we announced a semi-annual dividend of $.21 per share to be paid on March 2, 2007 to shareholders of record at the close of business on February 26, 2007. We expect that we will continue to pay comparable semi-annual cash dividends in the foreseeable future, provided that any future determination as to payment of dividends will depend upon our financial condition and results of our operations and such other factors as are deemed relevant by our board of directors.
Selected Quarterly Financial Data (Unaudited)
(Amounts in thousands except per share information)
| | | | | | | | | |
2006: | | Net sales | | Gross
profit | | Net
earnings | | Basic
earnings
per
share |
First quarter | | $ | 431,703 | | 217,487 | | 47,854 | | .32 |
Second quarter | | | 458,817 | | 229,005 | | 51,513 | | .34 |
Third quarter | | | 470,088 | | 237,235 | | 54,101 | | .36 |
Fourth quarter | | | 448,729 | | 223,948 | | 45,570 | | .30 |
| | | | | | | | | |
Total | | $ | 1,809,337 | | 907,675 | | 199,038 | | 1.32 |
| | | | | | | | | |
| | | | | | | | | |
2005: | | Net sales | | Gross
profit1 | | Net
earnings | | Basic
earnings
per
share |
First quarter | | $ | 353,809 | | 174,762 | | 37,032 | | .24 |
Second quarter | | | 383,263 | | 190,793 | | 44,647 | | .30 |
Third quarter | | | 402,218 | | 199,123 | | 45,971 | | .30 |
Fourth quarter | | | 384,043 | | 193,425 | | 39,164 | | .26 |
| | | | | | | | | |
Total | | $ | 1,523,333 | | 758,103 | | 166,814 | | 1.10 |
| | | | | | | | | |
1 | Reflects impact of reclassification of certain internal trucking cost between operating expenses and cost of goods sold related to the freight initiative, which decreased gross profit by $2,611, $3,015, $3,223, and $3,628 in first, second, third, and fourth quarters of 2005, respectively. |
6
| | |
| 2006 | | Stock Performance Highlights |
Fastenal Stock Performance1, 2
Initial Public Offering (IPO)
On August 27, 1987 (date of our initial public offering), 1,000 shares of our stock sold for $9,000. Approximately 19 years later, on December 31, 2006, those 1,000 shares, having split 6 times, were 48,000 shares worth $1,722,240, for a gain of approximately 31.9% compounded annually.
Ten Years
On December 31, 1996, 1,000 shares of our stock sold for $45,750. Ten years later, on December 31, 2006, those 1,000 shares, having split twice, were 4,000 shares worth $143,520, for a gain of approximately 12.1% compounded annually.
Five Years
On December 31, 2001, 1,000 shares of our stock sold for $66,430. Five years later, on December 31, 2006, those 1,000 shares, having split twice, were 4,000 shares worth $143,520, for a gain of approximately 16.6% compounded annually.
Dividends and Stock Repurchases
We have paid dividends in every year since 1991.
In June 2006, we issued a press release announcing our board of directors had authorized purchases by us of up to an additional 500,000 shares of its common stock (over and above previously authorized amounts). We purchased 474,000 shares of our outstanding stock at an average price of approximately $36.49 per share since the beginning of this repurchase plan. On January 18, 2007, we issued a press release announcing our board of directors had authorized us to purchase up to an additional 1,000,000 shares of our common stock (over and above previously authorized amounts). With this new authorization, we have remaining authority to purchase up to 1,086,000 shares of our common stock.
1 | The share data featured represents past performance, which is no guarantee of future results. |
2 | The share data is presented in whole amount versus thousands or millions as is prevalent in the remainder of this document. |
7
| | |
| 2006 | | Stock Performance Highlights |
Performance Graph
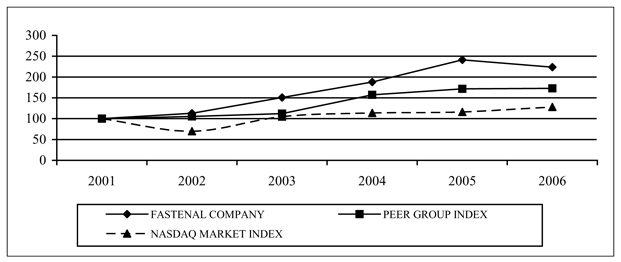
Set forth below is a graph comparing, for the five years ended December 31, 2006, the yearly cumulative total shareholder return on our common stock with the yearly cumulative total shareholder return of the NASDAQ Market Index and an index (the “Peer Group Index”) of a group of peer companies selected by us (the “Peer Group”). The companies in the Peer Group are Industrial Distribution Group, Inc., Lawson Products, Inc., MSC Industrial Direct Co., Inc. and W.W. Grainger, Inc. Fastenal is not included in the Peer Group.
In calculating the yearly cumulative total shareholder return of the Peer Group Index, the shareholder returns of the companies included in the Peer Group are weighted according to the stock market capitalization of such companies at the beginning of each period for which a return is indicated.
The comparison of total shareholder returns in the performance graph assumes that $100 was invested on December 31, 2001 in Fastenal Company, the NASDAQ Market Index and the Peer Group Index, and that dividends were reinvested when and as paid.
Comparison of Five Year Cumulative Total Return Among Fastenal Company,
Peer Group Index, and NASDAQ Market Index
| | | | | | | | | | | | |
| | | 2001 | | 2002 | | 2003 | | 2004 | | 2005 | | 2006 |
Fastenal Company | | 100.00 | | 112.73 | | 150.82 | | 187.97 | | 241.41 | | 223.62 |
Peer Group Index | | 100.00 | | 105.39 | | 112.07 | | 157.36 | | 171.67 | | 172.66 |
NASDAQ Market Index | | 100.00 | | 69.75 | | 104.88 | | 113.70 | | 116.19 | | 128.12 |

8
| | |
| 2006 | | Management’s Discussion & Analysis of Financial Condition & Results of Operations |
(Dollar Amounts in Millions except Per Share Information and as Otherwise Noted)
Results of Operations
Business Overview— Fastenal is a North American leader in the wholesale distribution of industrial and construction supplies. We operate store sites primarily located in North America. On December 31, 2006, we operated 2,000 company-owned or leased store sites.
Most of our customers are in the construction and manufacturing markets. The construction market includes general, electrical, plumbing, sheet metal, and road contractors. The manufacturing market includes both original equipment manufacturers (OEM) and maintenance and repair operations (MRO). Other users of our products include farmers, truckers, railroads, mining companies, federal, state, and local governmental entities, schools, and certain retail trades. Geographically, our customers are primarily located in North America.
Financial Overview— During 2006, 2005, and 2004, the strength of the global industrial environment positively impacted our performance. During the first half of 2003, the recession in the global industrial environment, which had begun several years earlier, negatively impacted our performance, and that of the industry as a whole. The impact of the economy is best reflected in the growth performance of our stores greater than five years old (2006 group reflects stores sites opened in 2001 and earlier). These stores are more cyclical due to the increased market share they enjoy in their local markets. Our stores that are two to five years old (2006 group reflects store sites opened in 2004, 2003, or 2002) are also impacted by the economy, but to a lesser degree. Combined, these two groups represent a consistent same-store view of our business. The net sales growth rate for each of the classifications was as follows:
| | | | | | | | | |
Store Site Age | | 2006 | | | 2005 | | | 2004 | |
Greater than 5 Years Old | | 9.7 | % | | 12.0 | % | | 15.3 | % |
Two to Five Years Old | | 22.5 | % | | 22.5 | % | | 24.9 | % |
Greater than 2 Years Old | | 12.2 | % | | 15.6 | % | | 17.1 | % |
Net sales— Net sales and growth rates in net sales were as follows:
| | | | | | | | | | | | |
| | | 2006 | | | 2005 | | | 2004 | |
Net sales | | $ | 1,809.3 | | | $ | 1,523.3 | | | $ | 1,238.5 | |
Percent change | | | 18.8 | % | | | 23.0 | % | | | 24.5 | % |
The 2006, 2005, and 2004 net sales growth rate percentages reflect the strengthening of the North American market in the period since July 2003. The increase in net sales in 2006, 2005, and 2004 came primarily from unit sales growth in existing stores more than two years old, growth in the newer product lines, and new site openings. The 2004 growth was increased by 3.0% to 4.0% due to an inflationary increase in pricing during the year.
9
| | |
| 2006 | | Management’s Discussion & Analysis of Financial Condition & Results of Operations |
(Dollar Amounts in Millions except Per Share Information and as Otherwise Noted)
Stores sites opened in 2006 contributed approximately $32.9 (or 1.8%) to 2006 net sales. Store sites opened in 2005 contributed approximately $109.1 (or 6.0%) to 2006 net sales and approximately $35.5 (or 2.3%) to 2005 net sales. The rate of growth in sales of store sites generally levels off after they have been open for five years, and, as stated earlier, the sales of older store sites typically vary more with the economy than do the sales of younger store sites.
Monthly Daily Sales Growth—Our business had daily sales growth rates of (compared to the comparable month in the preceding year):
| | | | | | | | | |
Month | | 2006 | | | 2005 | | | 2004 | |
January | | 23.9 | % | | 26.2 | % | | 16.1 | % |
February | | 21.3 | % | | 25.1 | % | | 20.1 | % |
March | | 21.1 | % | | 22.5 | % | | 19.1 | % |
April | | 19.1 | % | | 26.6 | % | | 22.1 | % |
May | | 19.2 | % | | 22.9 | % | | 25.6 | % |
June | | 20.6 | % | | 21.2 | % | | 25.7 | % |
July | | 19.7 | % | | 21.8 | % | | 27.0 | % |
August | | 20.7 | % | | 21.7 | % | | 24.9 | % |
September | | 16.1 | % | | 26.8 | % | | 26.2 | % |
October | | 15.9 | % | | 22.7 | % | | 27.6 | % |
November | | 16.3 | % | | 21.7 | % | | 25.0 | % |
December | | 17.7 | % | | 17.0 | % | | 27.4 | % |
Note: Daily sales are defined as the sales for a period divided by the number of business days in a period.
The January 2004 to November 2005 time frame generally represents improvement followed by stabilization in our daily sales trends. The January 2004 to November 2005 general improvement and stabilization reflects continued strengthening in the economy as it relates to the customers we sell to in North America and the impact of our standard inventory stocking model (see reference below regarding the Customer Service Project, or CSP). The 2004 period was positively impacted by inflation in the steel based products we sell. The December 2005 daily sales growth rate was weaker than we expected; however, we believe this was an abnormality due to the following reasons (1) historically we have seen fluctuations in December’s daily sales growth rates due to the presence of the various holidays and their impact on our customers’ buying patterns and (2) December 2004 experienced strong growth, which creates a more difficult comparison in the next year. In 2005, item (2) is also noticeable in months such as May, June, July, and, to a lesser degree, October. The noticeable exception to item (2) is the month of September, which experienced stronger growth due to the demand generated by Hurricane Katrina. The continued strong growth in the January 2006 to March 2006 time frame generally represents a continuation of the strong environments experienced in 2004 and 2005. The first two months of the second quarter of 2006 experienced weaker sales growth than we expected. The April 2006 growth was negatively impacted by Easter (which occurred in March last year), but was still weaker than we expected. The June to August 2006 time frame represents stronger sales activity than the preceding two to three month period. The daily sales growth amount in September 2006 appears weaker due to the difficult comparison with Hurricane Katrina’s added sales in September 2005 (approximately $4.0 impact); however, the increase in our daily sales number from August 2006 to September 2006, the current year month to month increase in our daily sales volume of 4.1%, is consistent with historical norms. The final three months of 2006 continued in the same variable fashion as the previous six months. The October growth number was negatively impacted by the difficult comparison with Hurricane Katrina’s added sales in October 2005 (approximately $1.5 impact). The months of November and December, like the months of April and May, were weaker than expected.
10
| | |
| 2006 | | Management’s Discussion & Analysis of Financial Condition & Results of Operations |
(Dollar Amounts in Millions except Per Share Information and as Otherwise Noted)
Sales by Product Line—The following table indicates, by product line: the year of introduction and the percentage of net sales.
| | | | | | | | | | | |
Type | | Introduced | | 2006 | | | 2005 | | | 2004 | |
Fasteners1 | | 1967 | | 51.5 | % | | 53.7 | % | | 55.6 | % |
Tools | | 1993 | | 10.9 | % | | 10.5 | % | | 10.9 | % |
Cutting Tools | | 1996 | | 4.8 | % | | 4.6 | % | | 5.0 | % |
Hydraulics & Pneumatics | | 1996 | | 6.2 | % | | 6.1 | % | | 6.1 | % |
Material Handling | | 1996 | | 6.3 | % | | 6.4 | % | | 6.8 | % |
Janitorial Supplies | | 1996 | | 5.3 | % | | 4.7 | % | | 3.5 | % |
Electrical Supplies | | 1997 | | 3.7 | % | | 3.3 | % | | 3.2 | % |
Welding Supplies | | 1997 | | 3.5 | % | | 3.4 | % | | 3.3 | % |
Safety Supplies | | 1999 | | 5.4 | % | | 5.0 | % | | 4.8 | % |
Metals | | 2001 | | 0.6 | % | | 0.6 | % | | 0.5 | % |
Direct Ship2 | | 2004 | | 1.6 | % | | 1.5 | % | | 0.1 | % |
Other | | | | 0.2 | % | | 0.2 | % | | 0.2 | % |
| | | | | | | | | | | |
| | | | 100.0 | % | | 100.0 | % | | 100.0 | % |
| | | | | | | | | | | |
1 | Fastener product line represents fasteners and miscellaneous supplies. |
2 | Direct Ship represents a cross section of products from the ten product lines. The items included here represent certain items with historically low margins which are shipped direct from our suppliers to our customers. |
Threaded fasteners accounted for approximately 90% of the fastener product line sales in 2006, 2005, and 2004 and approximately 46%, 48%, and 50% of consolidated net sales in 2006, 2005, and 2004, respectively.
Impact of Current Initiatives— During 2006 and 2005, we have been actively pursuing several initiatives to improve our operational performance. These include: (1) a new freight model, (2) tactical changes to our working capital model, and (3) an expanded store model called CSP2.
The freight model represents a focused effort to haul a higher percentage of our products utilizing our trucking network (which operates at a substantial savings to external service providers because of our ability to leverage our existing routes) and to charge freight more consistently in our various operating units. This initiative positively impacted the latter two-thirds of 2005 and all of 2006 despite the fact we experienced year-over-year increases of approximately 31.7% and 5.3%, respectively, in per gallon diesel fuel costs during those periods. The diesel fuel cost per gallon did soften in the last four months of 2006 as our average price per gallon dropped below $2.90. Given the nature of our distribution business, if the lower fuel prices continue, it will translate into cost savings in our business during 2007.
The tactical changes to our working capital model include the establishment of a central call center for accounts receivable collection and the establishment of financial business rules for the purchasing of products outside the standard stocking model (formerly referred to as CSP) at the store. The balance sheet impacts of these changes are described below in the working capital discussion.
The CSP2 store model represents an expansion of the core stocking items and sales personnel in an existing store with the goal of driving additional product sales to existing customers, target customers, and specific geographic areas within established markets. During 2006, 163 stores were converted to the CSP2 format (an additional, five new stores opened with the CSP2 format). This resulted in 193 stores converted to the CSP2 format since the third quarter of 2005, plus the six new stores opened with the CSP2 format. The balance sheet impacts of the CSP2 locations are described below in the working capital discussion.
11
| | |
| 2006 | | Management’s Discussion & Analysis of Financial Condition & Results of Operations |
(Dollar Amounts in Millions except Per Share Information and as Otherwise Noted)
Impact of Fuel Prices during the year— Rising fuel prices did take a toll on the year ended December 31, 2006, but there was some relief in the final four months. During 2005, our total vehicle fuel costs averaged approximately $1.2, $1.5, $1.7, and $1.8 per month in the first, second, third, and fourth quarters, respectively. During 2006, total vehicle fuel costs averaged approximately $1.9, $2.1, $2.2, and $1.9 per month in the first, second, third, and fourth quarters, respectively. These changes result from variations in fuel costs, the freight initiative discussed earlier, and the increase in sales and store locations. These fuel costs include the fuel utilized in our distribution vehicles (semi-tractors, straight trucks, and sprinter trucks) which is recorded in cost of goods and the fuel utilized in our store delivery vehicles which is included in operating and administrative expenses.
Gross Profit Margins—Gross profit as a percent of net sales was as follows:
| | | |
2006 | | 50.2 | % |
2005 | | 49.8 | % |
2004 | | 49.7 | % |
Reclassification note: Historically, we have included certain of our internal trucking costs in operating and administrative expenses. These costs include items such as driver pay, truck depreciation, and the cost of our transfer stations and transfer trucks. Historically, we felt this classification was appropriate for a distribution business; however, we now believe our distribution operation has many characteristics of an outside trucking firm. Our costs associated with outside trucking, such as small parcel and less-than-truckload (or LTL) shipping, have historically been included in cost of sales. We have reclassified the distribution expenses discussed above from operating and administrative expenses to costs of sales as we believe it provides a more accurate presentation for the readers of our financial statements; and have also reclassified the 2005 and 2004 presentation to consistently reflect the new classification. This reclassification lowered the gross profit margins and the operating and administrative expense percentages above by 0.8% points and 0.7% points in the years ended 2005 and 2004, respectively.
Gross profit margins for 2006 increased over 2005. The improvement was driven by our freight initiative (discussed earlier) and by improvements in our direct sourcing operations.
Gross profit margins for 2005 and 2004 were similar. The gross margin in 2005 was reduced by the greater inflation cost in steel-based products flowing through cost of sales. This impact was expected, and reflects product costs in the last three to six month ‘turn period’ of inventory in a ‘first-in, first-out’ inventory costing model. This impact was more than offset by an improvement in the gross profit associated with net freight revenue since May 2005 and a reduction in outside freight costs in the fourth quarter of 2005 due to the freight initiatives discussed earlier.
12
| | |
| 2006 | | Management’s Discussion & Analysis of Financial Condition & Results of Operations |
(Dollar Amounts in Millions except Per Share Information and as Otherwise Noted)
Operating and Administrative Expenses—Operating and administrative expenses as a percent of net sales were as follows:
| | | |
2006 | | 32.5 | % |
2005 | | 32.2 | % |
2004 | | 32.9 | % |
Operating and administrative expenses grew faster than the net sales growth rate in 2006. This was primarily due to (1) the previously mentioned initiatives (most notably the CSP2 conversions) and their impact on employee numbers throughout the organization during 2006, (2) the impact of rising fuel costs for the first eight months of the year, and (3) increases in occupancy costs. In addition, the loss of a business day for the year, which occurred in the third quarter, negatively impacted our ability to leverage operating and administrative expenses. During the fourth quarter, we were better able to leverage our operating and administrative expenses. This was primarily due to the tight management of headcount growth since early June when we first experienced weakness in our sales growth.
Operating and administrative expenses grew at a slower rate than net sales growth during 2005 and 2004. This was primarily due to the tight management of employee numbers throughout the organization. See reclassification note under gross profit margins discussed earlier.
Payroll and related costs represent approximately 69%, 68%, and 69% of operating and administrative expenses in 2006, 2005, and 2004, respectively. In 2006, 2005, and 2004, payroll and related costs increased at a rate which was less than the rate of increase in net sales. Effective management of this expense allows us to leverage the sales growth more effectively. This tight management was significant, given the store expansion (discussed elsewhere). We will continue to manage headcount in a similar fashion and expect to maintain most of the labor efficiency. We were pleased with our organization’s ability to manage operating and administrative expenses in 2006 and 2005, while also contributing approximately $3.1 and $2.5, respectively, to our annual profit sharing contribution for our employees’ 401(k) plan (RRSP in Canada). This contribution was a new program introduced in 2005.
The changes in payroll and related costs were due to the following increases in the average number of employees:
| | | | | | | | | |
| | | 2006 | | | 2005 | | | 2004 | |
Sales personnel | | 12.2 | % | | 16.2 | % | | 13.8 | % |
Support personnel | | 11.2 | % | | 19.2 | % | | 21.2 | % |
The increase in support personnel in 2006 was slower than sales growth due to the tight management of headcount growth since early June 2006 when we first experienced weakness in our sales growth. The 2005 and 2004 increases in the average number of support people were due to an increase in the overall store count and increasing sales growth.
In 2006, 2005, and 2004, the rate of increase in occupancy costs was greater than the rate of increase in net sales. Occupancy costs increased due to (1) a 14.0%, 14.5% and 16.7% increase in the number of store locations in 2006, 2005, and 2004, respectively, and (2) the upgrade of store locations in connection with the store upgrade initiative (formerly referred to as CSP).
13
| | |
| 2006 | | Management’s Discussion & Analysis of Financial Condition & Results of Operations |
(Dollar Amounts in Millions except Per Share Information and as Otherwise Noted)
The 2006 operating and administrative expenses include $279 thousand of expenses related to the adoption of new stock option accounting rules. This expense occurred in the first five months of 2006, but ceased on June 1, 2006 as all outstanding options became vested.
The loss on sale of property and equipment in all years came primarily from the sale of used vehicles.
Net earnings— Net earnings, growth rates in net earnings, and net earnings per share (EPS), were as follows:
| | | | | | | | | | | | |
| | | 2006 | | | 2005 | | | 2004 | |
Net earnings | | $ | 199.0 | | | $ | 166.8 | | | $ | 131.0 | |
Percentage change | | | 19.3 | % | | | 27.3 | % | | | 55.7 | % |
Basic EPS | | $ | 1.32 | | | $ | 1.10 | | | $ | 0.86 | |
Diluted EPS | | $ | 1.32 | | | $ | 1.10 | | | $ | 0.86 | |
During 2006, 2005, and 2004, the net earnings growth rate was greater than that of net sales primarily because of the earlier mentioned impact of payroll and related costs and the improvements in gross profit margins.
Working Capital—Two components of working capital, accounts receivable and inventories, are highlighted below. The annual rate of growth and dollar increase were as follows at December 31, 2006 and 2005:
| | | | | | | | |
Annual growth rate | | 2006 | | | 2005 | |
Accounts receivable | | | 14.2 | % | | | 13.0 | % |
Inventories | | | 26.1 | % | | | 17.6 | % |
| | |
Dollar growth rate | | 2006 | | | 2005 | |
Accounts receivable | | $ | 26.0 | | | $ | 21.1 | |
Inventories | | $ | 94.4 | | | $ | 54.2 | |
These two assets were impacted by our initiatives to improve working capital. These initiatives include (1) the establishment of a centralized call center to facilitate accounts receivable management (this facility became operational early in 2005) and (2) the tight management of all inventory amounts not identified as either expected store inventory (see reference below regarding CSP), new expanded inventory, or inventory necessary for upcoming store openings.
The accounts receivable increase of 13.0% in 2005 represents a meaningful lag behind the 17.0% daily sales increase in December 2005. The accounts receivable increase of 14.2% in 2006 also represents a meaningful lag behind the daily sales increase of 17.7% in December 2006. We continue to be pleased with the improvements in accounts receivable during 2005 and 2006, and with the related reduction in bad debt expense when compared to historical amounts.
The inventory increase of 26.1% in 2006 is meaningfully ahead of the 17.7% daily sales increase in December 2006 and the 18.8% sales increase in all of 2006. The increase of approximately $94.0 since December 2005 is comprised of approximately $15.0 for new stores, $11.0 for CSP2 conversions, and $68.0 for current stocking initiatives and sales growth at our hub and store locations.
14
| | |
| 2006 | | Management’s Discussion & Analysis of Financial Condition & Results of Operations |
(Dollar Amounts in Millions except Per Share Information and as Otherwise Noted)
We were disappointed by our execution related to inventory growth in the fourth quarter of 2006. Approximately $8.0 of this growth occurred because of opportunistic spending with our vendors late in the year and approximately $6.0 occurred because the lower sales growth pattern late in the year could not be matched with a similar short-term slowdown in our sourcing patterns due to the lead times of our supply channel. The majority of the remaining inventory growth should not have occurred. We are working to remedy this in the first three to six months of 2007.
As we indicated in earlier communications, our goals center on our ability to move the ratio of annual sales to accounts receivable and inventory (Annual Sales: AR&I) back to better than a 3.0:1 ratio (on December 31, 2006 and 2005, we had a ratio of 2.7:1 and 2.8:1, respectively). Historically, we have been able to achieve a 20% after tax return on total assets (our internal goal) when our Annual Sales: AR&I ratio is at or above 3.0:1. While the incremental investments in 2006 did not allow us to improve our ratio (these investments include CSP2 conversions and our master hub stocking model); we believe our initiatives are having a positive impact on accounts receivable and inventory. In 2007 we need to execute better on the inventory portion of these working capital initiatives. This need has been communicated throughout our organization.
Stock Repurchase— In June 2006, we issued a press release announcing our board of directors had authorized us to purchase up to an additional 500,000 shares of our common stock (over and above previously authorized amounts). During 2006, we purchased 474,000 shares of our outstanding stock at an average price of approximately $36.49 per share. On January 18, 2007, we issued a press release announcing our board of directors had authorized us to purchase of up to an additional 1,000,000 shares of our common stock (over and above previously authorized amounts). With this new authorization, we have remaining authority to purchase up to 1,086,000 shares of our common stock (please note, these share amounts are not in millions).
Effects of Inflation—Price inflation related to certain products positively impacted net sales in 2004 and, to a lesser degree, in 2005 and 2006.
Critical Accounting Policies—Our estimates related to certain assets and liabilities are an integral part of our consolidated financial statements. These estimates are considered critical because they require subjective and complex judgments.
Allowance for doubtful accounts – This reserve is for accounts receivable balances that are potentially uncollectible. The reserve is based on an analysis of customer accounts and our historical experience with accounts receivable write-offs. The analysis includes the aging of accounts receivable, the financial condition of a customer or industry, and general economic conditions. Historically, results have reflected the reserves previously recorded. We believe the results could be materially different if historical trends do not reflect actual results or if economic conditions worsen for our customers.
Inventory reserve – This reserve is for potentially obsolete inventory and shrinkage. The reserve is based on an analysis of inventory trends. The analysis includes inventory levels, sales information, physical inventory counts, cycle count adjustments, and the on-hand quantities relative to the sales history for the product. Historically, results have reflected the reserves previously recorded. We believe the results could be materially different if historical trends do not reflect actual results.
Health insurance reserve – This reserve is for incurred but not reported and reported and unpaid health claims. The reserve is based on an analysis of external data related to our historical claim reporting trends. Historically, results have reflected the reserves previously recorded. We believe the results could be materially different if historical trends do not reflect actual results.
15
| | |
| 2006 | | Management’s Discussion & Analysis of Financial Condition & Results of Operations |
(Dollar Amounts in Millions except Per Share Information and as Otherwise Noted)
General insurance reserve – This reserve is for general claims related to worker’s compensation, property and casualty losses, and other self-insured losses. The reserve is based on an analysis of external data related to our historical general claim trends. We believe the results could be materially different if historical trends do not reflect actual results.
Liquidity and Capital Resources
Net cash provided by operating activities was:
| | | |
2006 | | $ | 97.9 |
2005 | | $ | 121.9 |
2004 | | $ | 57.4 |
The 2006 decrease in net cash provided by operating activities was primarily due to the additional investment in inventory noted in the working capital discussion above. The 2005 increase in net cash provided by operating activities was primarily due to the impact of improvements in working capital management in both accounts receivable and inventory (discussed previously). The 2004 decrease in net cash provided by operating activities was primarily due to the increase in inventories.
The percentage mix of inventory stocked at our stores versus our distribution center (DC) locations was as follows on December 31:
| | | | | | | | | |
| | | 2006 | | | 2005 | | | 2004 | |
Store | | 62 | % | | 65 | % | | 64 | % |
DC | | 38 | % | | 35 | % | | 36 | % |
| | | | | | | | | |
Total | | 100 | % | | 100 | % | | 100 | % |
| | | | | | | | | |
New stores open with the standard store model which consists of a core stocking level of approximately $62 thousand per location. This inventory level will grow as the level of business in a store grows. We operated 193 stores under our Customer Service Project 2 (CSP2) format on December 31, 2006. This model consists of a core stocking model of $120 thousand per location, plus inventory necessary to support specific customer needs. During 2006 the store to DC relationship was altered by our expansion of products in our master DC. This expansion relates to our desire to stock a more expansive assortment of products within our network.
Net cash used in investing activities was:
| | | |
2006 | | $ | 74.2 |
2005 | | $ | 33.6 |
2004 | | $ | 43.5 |
The 2006 increase is primarily due to an increase in property and equipment expenditures of approximately $11.6 and the impact of approximately $27.1 due to sales of marketable securities in 2005. The 2005 decrease is primarily due to a decrease in marketable securities of $22.2 offset by an increase in property and equipment expenditures of approximately $13.2.
16
| | |
| 2006 | | Management’s Discussion & Analysis of Financial Condition & Results of Operations |
(Dollar Amounts in Millions except Per Share Information and as Otherwise Noted)
We have future commitments for leased facilities and for leased vehicles at December 31, 2006. The future contractual cash obligations related to the commitments are as follows:
| | | | | | | | | | | | | | | |
| | | Total | | 2007 | | 2008 &
2009 | | 2010 &
2011 | | After
2011 |
Facilities | | $ | 190.1 | | $ | 64.5 | | $ | 92.4 | | $ | 32.4 | | $ | 0.8 |
Vehicles | | | 24.1 | | | 15.3 | | | 8.8 | | | — | | | — |
| | | | | | | | | | | | | | | |
Total | | $ | 214.2 | | $ | 79.8 | | $ | 101.2 | | $ | 32.4 | | $ | 0.8 |
| | | | | | | | | | | | | | | |
Property and equipment expenditures in 2006 consisted of: (1) the purchase of software and hardware for our information processing systems, (2) the addition of certain pickup trucks, (3) the purchase of signage, shelving, and other fixed assets related to store openings and conversion of existing stores to the expected inventory stocking model (formerly referred to as CSP) or to the CSP2 stocking model, (4) the addition of manufacturing and warehouse equipment, (5) the expansion or improvement of certain owned or leased store properties, (6) the expansion of our distribution/trucking fleet, and (7) cost related to the relocation of our Fresno, California distribution center (approximately 52,500 square feet) to our new Modesto, California distribution center (approximately 320,000 square feet). Disposals of property and equipment consisted of the planned disposition of certain pickup trucks, semi-tractors, and trailers in the normal course of business and the disposition of real estate relating to several store locations.
We declared a semi-annual dividend of $.21 per share on January 18, 2007. We paid aggregate annual dividends per share of $.40, $.31, and $.20 in 2006, 2005, and 2004, respectively.
We expect to incur approximately $75 in total capital expenditures in 2007, consisting of approximately $29 for manufacturing, warehouse and packaging equipment and facilities, $8 for shelving and related supplies for our store openings and CSP2 implementation, $12 for data processing equipment, $11 for store buildings and improvement to store buildings, and $15 for vehicles. We have expanded the number of owned store locations over the last several years, and expect to purchase additional locations in the future. As of December 31, 2006, we had no material outstanding commitments for capital expenditures.
We anticipate funding our current expansion plans with cash generated from operations, from available cash and cash equivalents, and, to a lesser degree, from our borrowing capacity. In addition to opening new sites in the United States, we plan to continue opening additional store locations in our foreign markets.
We have a $10 line of credit under which $0 was outstanding at December 31, 2006. The line bears interest at 0.9% over the LIBOR rate.
Market Risk Management
We are exposed to certain market risks from changes in foreign currency exchange rates and commodity pricing. Changes in these factors cause fluctuations in our earnings and cash flows. We evaluate and manage exposure to these market risks as follows:
| (1) | Foreign Currency Exchange Rates – Foreign currency fluctuations can affect our net investments and earnings denominated in foreign currencies. Our primary exchange rate exposure is with the Canadian dollar against the United States dollar. Our estimated net earnings exposure for foreign currency exchange rates was not material at December 31, 2006. |
17
| | |
| 2006 | | Management’s Discussion & Analysis of Financial Condition & Results of Operations |
(Dollar Amounts in Millions except Per Share Information and as Otherwise Noted)
| (2) | Commodities – We buy and sell various types of steel products which consist primarily of different types of threaded fasteners. During the last decade, there has been nominal movement in overall product pricing, with some deflation occurring in the wake of the economic crisis of the Far East markets that occurred in the late 1990’s. This trend reversed to inflation in late 2003 and early 2004. Fluctuations in pricing of certain commodities like steel can affect our cost structure and pricing. We are exposed to the impact of commodity steel pricing and our related ability to pass through the impacts to our end customers. |
Geographic Information
Information regarding our revenues and long-lived assets by geographic area is set forth in note 8 to the Notes to Consolidated Financial Statements. Risks related to our foreign operations are described under “Certain Risks and Uncertainties” below.
Certain Risks and Uncertainties
Certain statements in this annual report, in our annual report on form 10-K for the fiscal year ended December 31, 2006, in our future filings with the Securities and Exchange Commission, in our press releases and in oral statements made by or with approval of our executive officers constitute or will constitute “forward-looking statements” under the Reform Act. The following factors are among those that could cause our actual results to differ materially from those predicted in such forward-looking statements: (i) an upturn or downturn in the economy could impact sales at existing stores, the rates of new store openings, additions of new employees, the time it typically takes a new store to achieve profitability or operating results comparable to existing stores, and the conversion of stores to the CSP2 format, (ii) an upturn or downturn in the economy, a change in product mix, a change in inbound inventory costs, a change in the ability to increase selling prices in response to increased inventory costs, and a change in inventory buying patterns could impact gross margins, (iii) a change, from that projected, in the number of markets able to support future store sites could impact the rates of new store openings and additions of new employees, (iv) our ability to develop product expertise at the store level, to identify future products and product lines that complement existing products and product lines, to transport and store certain hazardous products and to otherwise integrate new products and product lines into our existing stores and distribution network could impact sales and margins, (v) increases or decreases in fuel and utility costs could impact our distribution and occupancy expenses, (vi) our ability to successfully attract and retain qualified personnel to staff our stores could impact sales at existing stores and the rate of new store openings, (vii) changes in governmental regulations related to product quality or product source traceability could impact our cost of regulatory compliance, (viii) inclement weather could impact our distribution network, (ix) foreign currency fluctuations, changes in trade relations, or fluctuations in the relative strength of foreign economies could impact our ability to procure products overseas at competitive prices and our foreign sales, (x) changes in the rate of new store openings could impact expenditures for computers and other capital equipment, (xi) changes in the stocking and buying patterns related to product, both domestic and imported, could impact our ability to slow our inventory growth and could have a negative impact on cash flows from investing activities, (xii) actions of competitors, suppliers, and customers could impact our ability to raise prices, (xiii) disruption related to the CSP2 implementation could cause expenses and investments to increase, which in turn could cause us to reevaluate implementation of the project, (xiv) a change in the economy from that currently being experienced, a change in buying patterns, a change in forecast or a change in vendor production lead times could cause working capital (including inventory) to change from expected amounts, (xv) changes in the rate of stores converted from our standard stocking model to the CSP2 format, which would limit available resources, or difficulties in procuring potential lease sites, may delay the opening of new stores, (xvi) our ability to develop an operational model to evaluate our CSP3 project may impact the number of CSP3 stores we open, (xvii) our ability to expand the use of airlines for shipping effectively may negatively impact our sales and gross margin which in turn could cause us to reevaluate our use of airlines for shipping, and (xviii) a change in the number of markets
18
| | |
| 2006 | | Management’s Discussion & Analysis of Financial Condition & Results of Operations |
(Dollar Amounts in Millions except Per Share Information and as Otherwise Noted)
served by sales specialists and a change in the number of markets able to support future store sites could change the management of headcount, which in turn, together with changes in sales growth and store openings, could impact labor efficiency. A discussion of other risks and uncertainties which could cause our operating results to vary from anticipated results or which could materially adversely effect our business, financial condition, or operating results is included in our annual report on form 10-K for the fiscal year ended December 31, 2006.
New Accounting Pronouncements
In August 2006, the FASB issued Staff Position No. AUG AIR-1,Accounting for Planned Major Maintenance Activities. This Staff Position prohibits the use of the accrue-in-advance method of accounting for planned major maintenance activities in annual and interim financial reporting periods. We will adopt the provisions of this Staff Position in the first quarter of 2007, as required. We do not expect the adoption of this Staff Position will have a material impact on our consolidated results of operations or financial condition.
In July 2006, the FASB issued Interpretation No. 48,Accounting for Uncertainty in Income Taxes (FIN No. 48). This interpretation clarifies the accounting for uncertainty in income taxes recognized in an entity’s financial statements in accordance with SFAS No. 109,Accounting for Income Taxes. It prescribes a recognition threshold and measurement attributes for financial statement disclosure of tax positions taken or expected to be taken on a tax return. We will adopt the provisions of this interpretation in the first quarter of 2007, as required. We do not expect this new pronouncement will have a material impact on our consolidated financial condition or results of operations.
19
| | |
| 2006 | | Consolidated Balance Sheets |
(Dollar and Share Amounts in Thousands except Per Share Information and as Otherwise Noted)
| | | | | |
| | | 2006 | | 2005 |
Assets | | | | | |
Current assets: | | | | | |
Cash and cash equivalents | | $ | 19,346 | | 56,204 |
Marketable securities | | | 10,835 | | 669 |
Trade accounts receivable net of allowance for doubtful accounts of $2,119 and $3,875, respectively | | | 209,532 | | 183,556 |
Inventories | | | 455,997 | | 361,561 |
Deferred income tax asset | | | 11,709 | | 9,925 |
Other current assets | | | 60,357 | | 37,093 |
| | | | | |
Total current assets | | | 767,776 | | 649,008 |
Marketable securities | | | 3,695 | | 13,228 |
Property and equipment, less accumulated depreciation | | | 264,030 | | 224,448 |
Other assets, net | | | 3,515 | | 3,351 |
| | | | | |
Total assets | | $ | 1,039,016 | | 890,035 |
| | | | | |
Liabilities and Stockholders’ Equity | | | | | |
Current liabilities: | | | | | |
Accounts payable | | $ | 41,371 | | 38,572 |
Accrued expenses | | | 61,544 | | 50,258 |
Income taxes payable | | | 981 | | 2,708 |
| | | | | |
Total current liabilities | | | 103,896 | | 91,538 |
| | | | | |
Deferred income tax liability | | | 13,027 | | 14,948 |
| | | | | |
Stockholders’ equity: | | | | | |
Preferred stock, 5,000 shares authorized, | | | — | | — |
Common stock, 200,000 shares authorized, 151,207 and 151,055 shares issued and outstanding, respectively | | | 1,512 | | 1,511 |
Additional paid-in capital | | | 12,697 | | — |
Retained earnings | | | 902,550 | | 776,598 |
Accumulated other comprehensive income | | | 5,334 | | 5,440 |
| | | | | |
Total stockholders’ equity | | | 922,093 | | 783,549 |
Commitments (notes 5, 9, and 10 ) | | | | | |
| | | | | |
Total liabilities and stockholders’ equity | | $ | 1,039,016 | | 890,035 |
| | | | | |
SEE ACCOMPANYING NOTESTO CONSOLIDATED FINANCIAL STATEMENTS.
20
| | |
| 2006 | | Consolidated Statement of Earnings |
(Dollar and Share Amounts in Thousands except Per Share Information and as Otherwise Noted)
| | | | | | | |
| | | 2006 | | 2005 | | 2004 |
Net sales | | $ | 1,809,337 | | 1,523,333 | | 1,238,492 |
Cost of sales | | | 901,662 | | 765,230 | | 622,606 |
| | | | | | | |
Gross profit | | | 907,675 | | 758,103 | | 615,886 |
Operating and administrative expenses | | | 587,610 | | 489,792 | | 408,077 |
Loss on sale of property and equipment | | | 223 | | 447 | | 652 |
| | | | | | | |
Operating income | | | 319,842 | | 267,864 | | 207,157 |
Interest income | | | 1,187 | | 1,192 | | 1,179 |
| | | | | | | |
Earnings before income taxes | | | 321,029 | | 269,056 | | 208,336 |
Income tax expense | | | 121,991 | | 102,242 | | 77,347 |
| | | | | | | |
Net earnings | | $ | 199,038 | | 166,814 | | 130,989 |
| | | | | | | |
Basic and diluted earnings per share | | $ | 1.32 | | 1.10 | | .86 |
| | | | | | | |
Basic-weighted average shares outstanding | | | 151,034 | | 151,270 | | 151,755 |
Diluted-weighted average shares outstanding | | | 151,165 | | 151,508 | | 151,972 |
SEE ACCOMPANYING NOTESTO CONSOLIDATED FINANCIAL STATEMENTS.
21
| | |
| 2006 | | Consolidated Statements of Stockholders’ Equity and Comprehensive Income |
(Dollar and Share Amounts in Thousands except Per Share Information and as Otherwise Noted)
| | | | | | | | | | | | | | | | | | | |
| | | Common Stock | | | Additional
Paid-in
Capital | | | Retained
Earnings | | | Accumulated
Other
Comprehensive
Income (Loss) | | | Total
Stockholders’
Equity | |
| | | Shares | | | Amount | | | | | |
Balances as of December 31, 2003 | | 151,755 | | | $ | 1,518 | | | 8,686 | | | 561,878 | | | 4,658 | | | 576,740 | |
| | | | | | | | | | | | | | | | | | | |
Dividends paid in cash | | — | | | | — | | | — | | | (30,350 | ) | | — | | | (30,350 | ) |
Tax benefit from exercise of stock options | | — | | | | — | | | 4,248 | | | — | | | — | | | 4,248 | |
| | | | | | | | | | | | | | | | | | | |
Net earnings for the year | | — | | | | — | | | — | | | 130,989 | | | — | | | 130,989 | |
Change in marketable securities | | — | | | | — | | | — | | | — | | | 63 | | | 63 | |
Translation adjustment | | — | | | | — | | | — | | | — | | | 2,679 | | | 2,679 | |
| | | | | | | | | | | | | | | | | | | |
Total comprehensive income | | | | | | | | | | | | | | | | | | 133,731 | |
| | | | | | | | | | | | | | | | | | | |
Balances as of December 31, 2004 | | 151,755 | | | | 1,518 | | | 12,934 | | | 662,517 | | | 7,400 | | | 684,369 | |
| | | | | | | | | | | | | | | | | | | |
Dividends paid in cash | | — | | | | — | | | — | | | (46,935 | ) | | — | | | (46,935 | ) |
Purchase of common stock | | (700 | ) | | | (7 | ) | | (12,934 | ) | | (5,798 | ) | | — | | | (18,739 | ) |
| | | | | | | | | | | | | | | | | | | |
Net earnings for the year | | — | | | | — | | | — | | | 166,814 | | | — | | | 166,814 | |
Change in marketable securities | | — | | | | — | | | — | | | — | | | (279 | ) | | (279 | ) |
Translation adjustment (net of tax effect of $3,572) | | — | | | | — | | | — | | | — | | | (1,681 | ) | | (1,681 | ) |
| | | | | | | | | | | | | | | | | | | |
Total comprehensive income | | | | | | | | | | | | | | | | | | 164,854 | |
| | | | | | | | | | | | | | | | | | | |
Balances as of December 31, 2005 | | 151,055 | | | | 1,511 | | | — | | | 776,598 | | | 5,440 | | | 783,549 | |
| | | | | | | | | | | | | | | | | | | |
Dividends paid in cash | | — | | | | — | | | — | | | (60,548 | ) | | — | | | (60,548 | ) |
Purchase of common stock | | (474 | ) | | | (5 | ) | | (4,751 | ) | | (12,538 | ) | | — | | | (17,294 | ) |
Stock options exercised | | 626 | | | | 6 | | | 12,516 | | | — | | | — | | | 12,522 | |
Stock option expense | | — | | | | — | | | 279 | | | — | | | — | | | 279 | |
Tax benefit from exercise of stock options | | — | | | | — | | | 4,653 | | | — | | | — | | | 4,653 | |
| | | | | | | | | | | | | | | | | | | |
Net earnings for the year | | — | | | | — | | | — | | | 199,038 | | | — | | | 199,038 | |
Change in marketable securities | | — | | | | — | | | — | | | — | | | 147 | | | 147 | |
Translation adjustment (net of tax effect of $61) | | — | | | | — | | | — | | | — | | | (253 | ) | | (253 | ) |
| | | | | | | | | | | | | | | | | | | |
Total comprehensive income | | | | | | | | | | | | | | | | | | 198,932 | |
| | | | | | | | | | | | | | | | | | | |
Balances as of December 31, 2006 | | 151,207 | | | $ | 1,512 | | | 12,697 | | | 902,550 | | | 5,334 | | | 922,093 | |
| | | | | | | | | | | | | | | | | | | |
SEE ACCOMPANYING NOTESTO CONSOLIDATED FINANCIAL STATEMENTS.
22
| | |
| 2006 | | Consolidated Statements of Cash Flows |
(Dollar and Share Amounts in Thousands except Per Share Information and as Otherwise Noted)
| | | | | | | | | | |
| | | 2006 | | | 2005 | | | 2004 | |
Cash flows from operating activities: | | | | | | | | | | |
Net earnings | | $ | 199,038 | | | 166,814 | | | 130,989 | |
Adjustments to reconcile net earnings to net cash provided by operating activities: | | | | | | | | | | |
Depreciation of property and equipment | | | 33,530 | | | 29,006 | | | 23,643 | |
Loss on sale of property and equipment | | | 223 | | | 447 | | | 652 | |
Bad debt expense | | | 3,722 | | | 5,933 | | | 6,931 | |
Deferred income taxes | | | (3,705 | ) | | (3,165 | ) | | (1,520 | ) |
Tax benefit from exercise of stock options | | | — | | | — | | | 4,248 | |
Stock based compensation | | | 279 | | | — | | | — | |
Amortization of non-compete agreement | | | 67 | | | 67 | | | 67 | |
Changes in operating assets and liabilities: | | | | | | | | | | |
Trade accounts receivable | | | (29,698 | ) | | (26,989 | ) | | (40,675 | ) |
Inventories | | | (94,436 | ) | | (54,228 | ) | | (74,449 | ) |
Other current assets | | | (23,264 | ) | | (9,225 | ) | | (9,090 | ) |
Accounts payable | | | 2,799 | | | (704 | ) | | (848 | ) |
Accrued expenses | | | 11,286 | | | 13,497 | | | 14,612 | |
Income taxes | | | (1,727 | ) | | 2,434 | | | 338 | |
Other | | | (239 | ) | | (1,975 | ) | | 2,539 | |
Net cash provided by operating activities | | | 97,875 | | | 121,912 | | | 57,437 | |
| | | | | | | | | | |
Cash flows from investing activities: | | | | | | | | | | |
Purchase of property and equipment | | | (77,581 | ) | | (65,910 | ) | | (52,687 | ) |
Proceeds from sale of property and equipment | | | 4,246 | | | 5,455 | | | 4,499 | |
Proceeds of Industrial Revenue Bond | | | — | | | — | | | 3,200 | |
Purchase of Industrial Revenue Bond | | | — | | | — | | | (3,200 | ) |
Net (increase) decrease in marketable securities | | | (633 | ) | | 27,067 | | | 4,903 | |
Increase in other assets | | | (231 | ) | | (164 | ) | | (252 | ) |
| | | | | | | | | | |
Net cash used in investing activities | | | (74,199 | ) | | (33,552 | ) | | (43,537 | ) |
| | | | | | | | | | |
Cash flows from financing activities: | | | | | | | | | | |
Proceeds from exercise of stock options | | | 12,522 | | | — | | | — | |
Tax benefit from exercise of stock options | | | 4,653 | | | — | | | — | |
Purchase of common stock | | | (17,294 | ) | | (18,739 | ) | | — | |
Payment of dividends | | | (60,548 | ) | | (46,935 | ) | | (30,350 | ) |
Net cash used in financing activities | | | (60,667 | ) | | (65,674 | ) | | (30,350 | ) |
Effect of exchange rate changes on cash | | | 133 | | | 15 | | | 203 | |
| | | | | | | | | | |
Net (decrease) increase in cash and cash equivalents | | | (36,858 | ) | | 22,701 | | | (16,247 | ) |
Cash and cash equivalents at beginning of year | | | 56,204 | | | 33,503 | | | 49,750 | |
| | | | | | | | | | |
Cash and cash equivalents at end of year | | $ | 19,346 | | | 56,204 | | | 33,503 | |
| | | | | | | | | | |
Supplemental disclosure of cash flow information: | | | | | | | | | | |
Cash paid during each year for income taxes | | $ | 122,831 | | | 106,545 | | | 74,281 | |
SEE ACCOMPANYING NOTESTO CONSOLIDATED FINANCIAL STATEMENTS.
23
| | |
| 2006 | | Notes to Consolidated Financial Statements |
(Dollar and Share Amounts in Thousands except Per Share Information and as Otherwise Noted)
| 1 | Business Overview and Summary of Significant Accounting Policies |
Business Overview
Fastenal is a North American leader in the wholesale distribution of industrial and construction supplies. We operate store sites primarily located in North America. On December 31, 2006, we operated 2,000 company-owned or leased store sites.
Principles of Consolidation
The consolidated financial statements include the accounts of Fastenal Company and its wholly-owned subsidiaries (collectively referred to as Fastenal or by such terms as we, our, or us). All material intercompany balances and transactions have been eliminated in consolidation.
Revenue Recognition and Accounts Receivable
Net sales include products, services, and freight and handling costs billed; net of any related sales incentives paid to customers and net of an estimate for product returns. We recognize revenue when persuasive evidence of an arrangement exists, title and risk of ownership have passed, the sales price is fixed or determinable, and collectibility is probable. These criteria are met at the time the product is shipped to, or picked up by, the customer. We recognize billings for freight and handling charges at the time the products are shipped to, or picked up by, the customer. We recognize services at the time the service is provided to the customer. We estimate product returns based on historical return rates. Accounts receivable are stated at their estimated net realizable value. The allowance for doubtful accounts is based on an analysis of customer accounts and our historical experience with accounts receivable write-offs.
Foreign Currency Translation and Transactions
The functional currency of our foreign operations is the applicable local currency. The functional currency is translated into U.S. dollars for balance sheet accounts (with the exception of retained earnings) using current exchange rates as of the balance sheet date, for retained earnings at historical exchange rates, and for revenue and expense accounts using a weighted-average exchange rate during the year. The translation adjustments are deferred as a separate component of stockholders’ equity, captioned accumulated other comprehensive income. Gains or losses resulting from transactions denominated in foreign currencies are included in operating and administrative expenses in the consolidated statements of earnings.
Financial Instruments
All financial instruments are carried at amounts that approximate estimated fair value.
Cash Equivalents
For purposes of the consolidated statements of cash flows, we consider all highly-liquid debt instruments purchased with original maturities of three months or less to be cash equivalents.
Inventories
Inventories, consisting of merchandise held for resale, are stated at the lower of cost (first in, first out method) or market.
Marketable Securities
Marketable securities as of December 31, 2006 and 2005 consist of debt securities. We classify our debt securities as available-for-sale. Available-for-sale securities are recorded at fair value based on current market value. Unrealized holding gains and losses on available-for-sale securities are excluded from earnings, but are included in comprehensive income, and are reported as a separate component of stockholders’ equity until realized, provided that a decline in the market value of any available-for-sale security below cost that is deemed other than temporary is charged to earnings resulting in the establishment of a new cost basis for the security.
24
| | |
| 2006 | | Notes to Consolidated Financial Statements |
(Dollar and Share Amounts in Thousands except Per Share Information and as Otherwise Noted)
Business Overview and Summary of Significant Accounting Policies, continued
Property and Equipment
Property and equipment are stated at cost. Depreciation on buildings and equipment is provided for using the straight-line method over the anticipated economic useful lives of the related property.
Leases
We lease space under non-cancelable operating leases for our Utah and Washington distribution centers, and certain store sites with initial terms of one to 60 months. Most store sites have initial lease terms of 36 to 48 months. These leases do not have significant rent escalation holidays, concessions, leasehold improvement incentives, or other build-out clauses. Any such terms are recognized as rent expense over the term of the lease. Further, the leases do not contain contingent rent provisions. Leasehold improvements on operating leases are amortized over a 36-month period. We lease certain semi-tractors and pick-ups under operating leases. The semi-tractor leases typically have a 36-month term. The pick-up leases typically have a 72-month term and include an early buy out clause, which we generally exercise, thereby giving the leases an effective term of 12-15 months.
Other Assets and Long-Lived Assets
Other assets consist of prepaid security deposits, goodwill, and a non-compete agreement.
Goodwill represents the excess of the purchase price over the fair value of net assets acquired. Net goodwill was $1,400 in all three years. The non-compete is amortized on a straight-line basis over 15 years. Net non-compete was $424, $491, and $558 at December 31, 2006, 2005, and 2004, respectively. Total non-compete amortization costs were $67 per year in 2006, 2005, and 2004.
Goodwill and other tangible and identifiable intangible long-lived assets are reviewed whenever events or changes in circumstances indicate that the carrying amount of an asset may not be recoverable, or on an annual basis if no event or change occurs, to determine that the unamortized balances are recoverable. Recoverability is measured by a comparison of the carrying amount of an asset to future net cash flows expected to be generated by the asset, and, in the case of goodwill, by also looking at an adverse change in legal factors or the business climate, a transition to a new product or services strategy, a significant change in the customer base, and/or a realization of failed marketing efforts. If the asset is deemed to be impaired, the amount of impairment is charged to earnings as a part of operating and administrative expenses in the current period. Assets to be disposed of are reported at the lower of the carrying amount or fair value less cost to sell.
Accounting Estimates
The preparation of financial statements in conformity with the U.S. generally accepted accounting principles requires us to make estimates and assumptions that affect the reported amounts of assets and liabilities and disclosure of contingent assets and liabilities at the date of the financial statements and the reported amounts of revenues and expenses during the reported period. Actual results could differ from those estimates.
Insurance Reserves
We are self-insured for certain losses relating to medical, worker’s compensation, and other casualty losses. Specific stop loss coverage is provided for catastrophic claims in order to limit exposure to significant claims. Losses and claims are charged to operations when it is probable a loss has been incurred and the amount can be reasonably estimated. Accrued insurance liabilities are based on claims filed and estimates of claims incurred but not reported.
25
| | |
| 2006 | | Notes to Consolidated Financial Statements |
(Dollar and Share Amounts in Thousands except Per Share Information and as Otherwise Noted)
Business Overview and Summary of Significant Accounting Policies, continued
Product Warranties
We offer a basic limited warranty for certain of our products. The specific terms and conditions of those warranties vary depending upon the product sold. We typically recoup these costs through product warranties we hold with the original equipment manufacturers. Our warranty expense has historically been minimal.
Stockholders’ Equity and Stock-Based Compensation
During the three-year period ended December 31, 2006, we had one stock option employee compensation plan (Fastenal Option Plan). The Fastenal Option Plan was approved by our shareholders in April 2003. We granted options to purchase our common stock to certain of our employees under the Fastenal Option Plan in May 2003. These options became vested and exercisable in June 2006 and lapsed, to the extent not exercised, in November 2006.
Prior to January 1, 2006, we accounted for the Fastenal Option Plan under the recognition and measurement principles of Accounting Principles Board (APB) Opinion No. 25,Accounting for Stock Issued to Employees(APB No. 25), and related interpretations. Accordingly, no stock-based employee compensation cost was reflected in net earnings prior to January 1, 2006 as all options to purchase our common stock had an exercise price equal to, or greater than, the market value of the underlying common stock on the date of grant.
Effective January 1, 2006, we began recording compensation expense associated with stock-based awards in accordance with Statement of Financial Accounting Standards (SFAS) No. 123 (revised 2004),Share-Based Payment (SFAS No.123R), as interpreted by SEC Staff Accounting Bulletin No. 107. SFAS No. 123R supercedes APB No. 25, and amends SFAS No. 95,Statement of Cash Flows. Generally, the approach in SFAS No.123R is similar to the approach described in SFAS No. 123,Accounting for Stock-Based Compensation (SFAS No. 123). However, SFAS No. 123R requires all stock-based payments to employees, including grants of employee stock options, to be recognized in the income statement based on their fair values at the date of grant. The stock-based compensation expense amount recorded was $279 (pre-tax amount) in 2006. The following table illustrates the effect on net income and earnings per share if we had applied the fair value recognition provisions of SFAS No. 123R for all awards in 2005 and 2004:
| | | | | |
| | | 2005 | | 2004 |
Net earnings, as reported | | $ | 166,814 | | 130,989 |
Total stock-based employee compensation expense determined under fair value-based method for all awards, net of related tax effects | | | 560 | | 891 |
| | | | | |
Pro forma net earnings | | $ | 166,254 | | 130,098 |
| | | | | |
Basic and diluted earnings per share | | $ | 1.10 | | .86 |
Pro forma basic and diluted earnings per share | | $ | 1.10 | | .86 |
26
| | |
| 2006 | | Notes to Consolidated Financial Statements |
(Dollar and Share Amounts in Thousands except Per Share Information and as Otherwise Noted)
Business Overview and Summary of Significant Accounting Policies, continued
The fair value of each stock option is estimated as of the grant date using the Black-Scholes option-pricing model. The assumptions used and the estimated fair values are as follows:
| | | | | | | | | | | | | | |
Year of grant | | Risk-free interest rate | | | Expected life of option in years | | Expected dividend yield | | | Expected stock volatility | | | Estimated fair value of stock option |
2003 | | 4.5 | % | | 3.42 | | 0.2 | % | | 30.33 | % | | $ | 3.55 |
2002 | | 4.5 | % | | 2.66 | | 0.2 | % | | 27.03 | % | | $ | 3.33 |
2001 | | 5.0 | % | | 2.75 | | 0.2 | % | | 37.66 | % | | $ | 4.04 |
2000 | | 6.0 | % | | 2.75 | | 0.2 | % | | 42.29 | % | | $ | 2.89 |
Income Taxes
We account for income taxes under the asset and liability method. Under this method, deferred tax assets and liabilities are recognized for the future tax consequences attributable to differences between the financial statement carrying amounts of existing assets and liabilities and their respective tax bases. Deferred tax assets and liabilities are measured using enacted tax rates expected to apply to taxable income in the years in which those temporary differences are expected to be recovered or settled. The effect on deferred tax assets and liabilities of a change in tax rates is recognized in income in the period that includes the enactment date.
Comprehensive Income
We comply with the provisions of SFAS No. 130,Reporting Comprehensive Income, which establishes standards for the reporting of comprehensive income and its components. The components of comprehensive income are as follows:
| | | | | | | | | |
| | | 2006 | | | 2005 | | | 2004 |
Net earnings, as reported | | $ | 199,038 | | | 166,814 | | | 130,989 |
Change in marketable securities | | | 147 | | | (279 | ) | | 63 |
Translation adjustment | | | (253 | ) | | (1,681 | ) | | 2,679 |
| | | | | | | | | |
Comprehensive income | | $ | 198,932 | | | 164,854 | | | 133,731 |
| | | | | | | | | |
Earnings Per Share
Basic net earnings per share is calculated using net earnings available to common stockholders divided by the weighted average number of shares of common stock outstanding during the year. Diluted net earnings per share is similar to basic net earnings per share except that the weighted average number of shares of common stock outstanding plus the assumed issuance of contingent shares is increased to include the number of additional shares of common stock that would have been outstanding assuming the issuance of all potentially dilutive shares, such as common stock to be issued upon exercise of options. The following table presents a reconciliation of the denominators used in the computation of basic and diluted earnings per share related to the Fastenal Option Plan:
| | | | | | |
| | | 2006 | | 2005 | | 2004 |
Basic—weighted shares outstanding | | 151,034 | | 151,270 | | 151,755 |
Weighted shares assumed upon exercise of stock options | | 131 | | 238 | | 217 |
| | | | | | |
Diluted—weighted shares outstanding | | 151,165 | | 151,508 | | 151,972 |
| | | | | | |
27
| | |
| 2006 | | Notes to Consolidated Financial Statements |
(Dollar and Share Amounts in Thousands except Per Share Information and as Otherwise Noted)
Business Overview and Summary of Significant Accounting Policies, continued
Segment Reporting
We have reviewed SFAS No. 131,Disclosures about Segments of an Enterprise and Related Information, and determined we meet the aggregation criteria outlined as our various operations have similar (1) economic characteristics, (2) products and services, (3) customers, (4) distribution channels, and (5) regulatory environments. Therefore we report as a single business segment.
Available-for-sale securities at December 31 consist of the following:
| | | | | | | | | | |
2006: | | Amortized
cost | | Gross
unrealized
gains | | Gross
unrealized
losses | | | Fair value |
Federal mortgage backed security | | $ | 10,000 | | — | | (132 | ) | | 9,868 |
State and municipal bonds | | | 3,695 | | — | | — | | | 3,695 |
Certificates of deposit or money market | | | 967 | | — | | — | | | 967 |
| | | | | | | | | | |
Total available-for-sale securities | | $ | 14,662 | | — | | (132 | ) | | 14,530 |
| | | | | | | | | | |
| | | | | | | | | | |
2005: | | Amortized
cost | | Gross
unrealized
gains | | Gross
unrealized
losses | | | Fair value |
Federal mortgage backed security | | $ | 10,000 | | — | | (279 | ) | | 9,721 |
State and municipal bonds | | | 3,644 | | — | | — | | | 3,644 |
Certificates of deposit or money market | | | 532 | | — | | — | | | 532 |
| | | | | | | | | | |
Total available-for-sale securities | | $ | 14,176 | | — | | (279 | ) | | 13,897 |
| | | | | | | | | | |
We recorded gains related to our available-for-sale securities which were immaterial in 2006, 2005, and 2004. Gains and losses from the sale of investments are calculated based on the specific identification method.
Maturities of our available-for-sale securities at December 31, 2006 consist of the following:
| | | | | | | | | |
| | | Less than 12 months | | Greater than 12 months |
| | | Amortized
cost | | Fair value | | Amortized
cost | | Fair value |
Federal mortgage backed security | | $ | 10,000 | | 9,868 | | — | | — |
State and municipal bonds | | | — | | — | | 3,695 | | 3,695 |
Certificates of deposit or money market | | | 967 | | 967 | | — | | — |
| | | | | | | | | |
Total available-for-sale securities | | $ | 10,967 | | 10,835 | | 3,695 | | 3,695 |
| | | | | | | | | |
28
| | |
| 2006 | | Notes to Consolidated Financial Statements |
(Dollar and Share Amounts in Thousands except Per Share Information and as Otherwise Noted)
Property and equipment as of December 31 consists of the following:
| | | | | | | | | |
| | | Depreciable
life in years | | 2006 | | | 2005 | |
Land | | — | | $ | 21,854 | | | 19,649 | |
Buildings and improvements | | 31 to 39 | | | 123,905 | | | 106,393 | |
Equipment and shelving | | 3 to 10 | | | 231,269 | | | 191,013 | |
Transportation equipment | | 3 to 5 | | | 36,601 | | | 26,355 | |
Construction in progress | | — | | | 9,495 | | | 13,916 | |
| | | | | | | | | |
| | | | | 423,124 | | | 357,326 | |
Less accumulated depreciation | | | | | (159,094 | ) | | (132,878 | ) |
| | | | | | | | | |
Net property and equipment | | | | $ | 264,030 | | | 224,448 | |
| | | | | | | | | |
Accrued expenses as of December 31 consist of the following:
| | | | | |
| | | 2006 | | 2005 |
Payroll and related taxes | | $ | 13,072 | | 10,876 |
Bonuses and commissions | | | 8,828 | | 8,485 |
Profit sharing contribution | | | 3,153 | | 2,532 |
Insurance | | | 17,662 | | 12,533 |
Sales, real estate, and personal property taxes | | | 5,871 | | 5,350 |
Vehicle loss reserve and deferred rebates | | | 4,937 | | 5,113 |
Other | | | 8,021 | | 5,369 |
| | | | | |
| | $ | 61,544 | | 50,258 |
| | | | | |
Preferred stock has a par value of $.01 per share. There were 5,000,000 shares authorized and no shares issued as of December 31, 2006 and 2005. Common stock has a par value of $.01 per share. There were 200,000,000 shares authorized and 151,206,712 shares issued and outstanding as of December 31, 2006 and 200,000,000 shares authorized and 151,054,752 shares issued and outstanding as of December 31, 2005 (please note, these share amounts are not reflected in thousands).
Dividends
On January 18, 2007, our board of directors declared a semi-annual dividend of $.21 per share of common stock to be paid in cash on March 2, 2007 to shareholders of record at the close of business on February 26, 2007.
Stock Options
In 2003, options were granted, under the Fastenal Option Plan, to purchase shares of common stock. In 2002, 2001, and 2000, options were granted, under an employee stock option plan established by one of our founders, Robert A. Kierlin (RAK Option Plan), to purchase shares of common stock owned by Mr. Kierlin. The individuals eligible to receive options in all years included those employees with three or more years of service, or employed as a district manager or a store manager, on the last business day of December of the previous year. The options were granted with an exercise price equal to or greater than fair market value on the date of grant. The RAK Option Plan was sponsored by Mr. Kierlin and did not involve a commitment by Fastenal. The RAK Option Plan is no longer in effect.
29
| | |
| 2006 | | Notes to Consolidated Financial Statements |
(Dollar and Share Amounts in Thousands except Per Share Information and as Otherwise Noted)
Stockholders’ Equity, continued
Stock option activity under all plans is as follows:
| | | | | | | | | | | | | | | |
Year of grant | | Exercise
price per
share | | Number of
options
granted | | Options
cancelled
since grant | | | Options
exercised | | | Options
remaining at
December 31,
2006 | | Year options
vest3 |
20031 | | $ | 20.00 | | 930 | | (304 | ) | | (626 | ) | | 0 | | 2006 |
20022 | | $ | 17.50 | | 1,640 | | (616 | ) | | (1,024 | ) | | 0 | | 2004 |
20012 | | $ | 13.75 | | 1,400 | | (478 | ) | | (922 | ) | | 0 | | 2003 |
20002 | | $ | 13.75 | | 2,902 | | (776 | ) | | (2,126 | ) | | 0 | | 2002 |
1 | Granted by Fastenal under the Fastenal Option Plan. |
2 | Granted by Robert A. Kierlin under the RAK Option Plan. |
3 | The options vest during the year indicated. The participants have six months to exercise, or forfeit, the vested options. All unused vested options expire no later than December 31 of the vesting year. |
The Fastenal Company and Subsidiaries 401(k) Plan covers all of our employees in the United States. The general purpose of this plan is to provide additional financial security during retirement by providing employees with an incentive to make regular savings. We contributed $3,153 and $2,532 to our employees’ retirement accounts for 2006 and 2005, respectively. We made no contributions in 2004.
Earnings (losses) before income taxes were derived from the following sources:
| | | | | | | | |
| | | 2006 | | 2005 | | | 2004 |
Domestic | | $ | 319,494 | | 273,145 | | | 204,045 |
Foreign | | | 1,535 | | (4,089 | ) | | 4,291 |
| | | | | | | | |
| | $ | 321,029 | | 269,056 | | | 208,336 |
| | | | | | | | |
Components of income tax expense (benefit) are as follows:
| | | | | | | | |
2006: | | Current | | Deferred | | | Total |
Federal | | $ | 109,595 | | (1,864 | ) | | 107,731 |
State | | | 14,539 | | (284 | ) | | 14,255 |
Foreign | | | 278 | | (273 | ) | | 5 |
| | | | | | | | |
| | $ | 124,412 | | (2,421 | ) | | 121,991 |
| | | | | | | | |
| | | | | | | | |
2005: | | Current | | Deferred | | | Total |
Federal | | $ | 94,323 | | (4,495 | ) | | 89,828 |
State | | | 12,992 | | (614 | ) | | 12,378 |
Foreign | | | — | | 36 | | | 36 |
| | | | | | | | |
| | $ | 107,315 | | (5,073 | ) | | 102,242 |
| | | | | | | | |
| | | | | | | | |
2004: | | Current | | Deferred | | | Total |
Federal | | $ | 66,732 | | (463 | ) | | 66,269 |
State | | | 9,709 | | (118 | ) | | 9,591 |
Foreign | | | 1,959 | | (472 | ) | | 1,487 |
| | | | | | | | |
| | $ | 78,400 | | (1,053 | ) | | 77,347 |
| | | | | | | | |
30
| | |
| 2006 | | Notes to Consolidated Financial Statements |
(Dollar and Share Amounts in Thousands except Per Share Information and as Otherwise Noted)
Income Taxes, continued
Income tax expense in the accompanying consolidated financial statements differs from the expected expense as follows:
| | | | | | | | |
| | | 2006 | | 2005 | | 2004 | |
Federal income tax expense at the “expected” rate of 35% | | $ | 112,360 | | 94,170 | | 72,918 | |
Increase (decrease) attributed to: | | | | | | | | |
State income taxes, net of federal benefit | | | 9,266 | | 8,046 | | 6,234 | |
Resolution of state tax matters | | | — | | — | | (1,821 | ) |
Other, net | | | 365 | | 26 | | 16 | |
| | | | | | | | |
Total income tax expense | | $ | 121,991 | | 102,242 | | 77,347 | |
| | | | | | | | |
The tax effects of temporary differences that give rise to deferred tax assets and liabilities as of December 31 are as follows:
| | | | | | | |
| | | 2006 | | | 2005 | |
Deferred tax asset (liability): | | | | | | | |
Inventory costing and valuation methods | | $ | 4,444 | | | 3,540 | |
Allowance for doubtful accounts receivable | | | 821 | | | 1,473 | |
Insurance claims payable | | | 5,632 | | | 4,077 | |
Fixed assets | | | (13,854 | ) | | (13,263 | ) |
Promotions payable | | | 795 | | | 861 | |
Other, net | | | 844 | | | (1,711 | ) |
| | | | | | | |
Net deferred tax liability | | $ | (1,318 | ) | | (5,023 | ) |
| | | | | | | |
No valuation allowance for deferred tax assets was necessary as of December 31, 2006 and 2005. The character of the deferred tax assets is such that they can be realized through carryback to prior tax periods or offset against future taxable income.
During 2006, 2005, and 2004, $4,653, $0, and $4,248, respectively, were added to additional paid-in capital reflecting the permanent book to tax difference in accounting for tax benefits related to employee stock option transactions.
Our revenues and long-lived assets relate to the following geographic areas:
| | | | | | | |
Revenues | | 2006 | | 2005 | | 2004 |
United States | | $ | 1,683,271 | | 1,427,605 | | 1,173,422 |
Canada | | | 98,491 | | 76,783 | | 52,546 |
Other foreign countries | | | 27,575 | | 18,945 | | 12,524 |
| | | | | | | |
| | $ | 1,809,337 | | 1,523,333 | | 1,238,492 |
| | | | | | | |
| | | | | | | |
Long-Lived Assets | | 2006 | | 2005 | | 2004 |
United States | | $ | 257,075 | | 218,468 | | 188,637 |
Canada | | | 8,546 | | 8,261 | | 7,547 |
Other foreign countries | | | 1,924 | | 1,070 | | 516 |
| | | | | | | |
| | $ | 267,545 | | 227,799 | | 196,700 |
| | | | | | | |
Accounting policies of the operations in the various geographic areas are the same as those described in the summary of significant accounting policies. Long-lived assets consist of property and equipment, location security deposits, goodwill, and other intangibles. Revenues are attributed to countries based on the location of the store from which the sale occurred. No single customer represents more than 10% of our consolidated net sales.
31
| | |
| 2006 | | Notes to Consolidated Financial Statements |
(Dollar and Share Amounts in Thousands except Per Share Information and as Otherwise Noted)
We lease space under non-cancelable operating leases for our Utah and Washington distribution centers, and certain store sites with initial terms of one to 60 months. Most store sites have initial lease terms of 36 months. These leases do not have significant rent escalation holidays, concessions, leasehold improvement incentives, or other build-out clauses. Any such terms are recognized as rent expense over the term of the lease. Further, the leases do not contain contingent rent provisions. Leasehold improvements, with a net book value of $3,435 at December 31, 2006, on operating leases are amortized over a 36-month period. We lease certain semi-tractors and pick-ups under operating leases. The semi-tractor leases typically have a 36-month term. The pick-up leases typically have a 72-month term and include an early buy out clause we generally exercise, thereby giving the leases an effective term of 12-15 months. Future minimum annual rentals for the leased facilities and the leased vehicles are as follows:
| | | | | | | |
| | | Leased
facilities | | Leased
vehicles | | Total |
2007 | | $ | 64,525 | | 15,353 | | 79,878 |
2008 | | | 53,845 | | 8,047 | | 61,892 |
2009 | | | 38,638 | | 740 | | 39,378 |
2010 | | | 23,217 | | — | | 23,217 |
2011 | | | 9,153 | | — | | 9,153 |
2012 and thereafter | | | 758 | | — | | 758 |
| | | | | | | |
| | $ | 190,136 | | 24,140 | | 214,276 |
| | | | | | | |
Rent expense under all operating leases was as follows:
| | | | | | | |
| | | Leased
facilities | | Leased
vehicles | | Total |
2006 | | $ | 60,915 | | 21,577 | | 82,492 |
2005 | | $ | 45,613 | | 17,414 | | 63,027 |
2004 | | $ | 33,557 | | 13,674 | | 47,231 |
Certain operating leases for vehicles contain residual value guarantee provisions which would become due at the expiration of the operating lease agreement if the fair value of the leased vehicles is less than the guaranteed residual value. The aggregate residual value at lease expiration, of the leases that contain residual value guarantees, is approximately $10,864. We believe the likelihood of funding the guarantee obligation under any provision of the operating lease agreements is remote, except for a $2,320 loss on disposal reserve provided at December 31, 2006.
| 10 | Line of Credit and Commitments |
We have a line of credit arrangement with a bank which expires June 1, 2007. The line allows for borrowings of up to $10,000 at 0.9% over the LIBOR rate. On December 31, 2006 there was $0 outstanding on the line. We have a letter of credit issued on our behalf to our insurance carrier. As of December 31, 2006, the total undrawn balance of this letter of credit was $13,000.
During 2001, we completed the construction of a new building for our Kansas City warehouse, and completed an expansion of this warehouse in 2004. We were required to obtain financing for the construction and expansion of this facility under an Industrial Revenue Bond (IRB). We subsequently purchased 100% of the outstanding bonds under the IRB at par. In addition to purchasing the outstanding obligations, we have a right of offset included in the IRB debt agreement. Accordingly, we have netted the impact of the IRB in the accompanying consolidated financial statements. The outstanding balance of the IRB was $9,733 at December 31, 2006 and 2005.
32
| | |
| 2006 | | Notes to Consolidated Financial Statements |
(Dollar and Share Amounts in Thousands except Per Share Information and as Otherwise Noted)
The percentages of our net sales by product line are as follows:
| | | | | | | | | | | |
Type | | Introduced | | 2006 | | | 2005 | | | 2004 | |
Fasteners1 | | 1967 | | 51.5 | % | | 53.7 | % | | 55.6 | % |
Tools | | 1993 | | 10.9 | % | | 10.5 | % | | 10.9 | % |
Cutting Tools | | 1996 | | 4.8 | % | | 4.6 | % | | 5.0 | % |
Hydraulics & Pneumatics | | 1996 | | 6.2 | % | | 6.1 | % | | 6.1 | % |
Material Handling | | 1996 | | 6.3 | % | | 6.4 | % | | 6.8 | % |
Janitorial Supplies | | 1996 | | 5.3 | % | | 4.7 | % | | 3.5 | % |
Electrical Supplies | | 1997 | | 3.7 | % | | 3.3 | % | | 3.2 | % |
Welding Supplies | | 1997 | | 3.5 | % | | 3.4 | % | | 3.3 | % |
Safety Supplies | | 1999 | | 5.4 | % | | 5.0 | % | | 4.8 | % |
Metals | | 2001 | | 0.6 | % | | 0.6 | % | | 0.5 | % |
Direct Ship2 | | 2004 | | 1.6 | % | | 1.5 | % | | 0.1 | % |
Other | | | | 0.2 | % | | 0.2 | % | | 0.2 | % |
| | | | | | | | | | | |
| | | | 100.0 | % | | 100.0 | % | | 100.0 | % |
| | | | | | | | | | | |
1 | Fastener product line represents fasteners and miscellaneous supplies. |
2 | Direct Ship represents a cross section of products from the ten product lines. The items included here represent certain items with historically low margins which are shipped direct from our suppliers to our customers. |
| 12 | New Accounting Pronouncements |
In August 2006, the FASB issued Staff Position No. AUG AIR-1,Accounting for Planned Major Maintenance Activities. This Staff Position prohibits the use of the accrue-in-advance method of accounting for planned major maintenance activities in annual and interim financial reporting periods. We will adopt the provisions of this Staff Position in the first quarter of 2007, as required. We do not expect the adoption of this Staff Position will have a material impact on our consolidated results of operations or financial condition.
In July 2006, the FASB issued Interpretation No. 48,Accounting for Uncertainty in Income Taxes (FIN No. 48). This interpretation clarifies the accounting for uncertainty in income taxes recognized in an entity’s financial statements in accordance with SFAS No. 109,Accounting for Income Taxes. It prescribes a recognition threshold and measurement attributes for financial statement disclosure of tax positions taken or expected to be taken on a tax return. We will adopt the provisions of this interpretation in the first quarter of 2007, as required. We do not expect this new pronouncement will have a material impact on our consolidated financial condition or results of operations.
33
| | |
| 2006 | | Management Report on Internal Control Over Financial Reporting |
The Board of Directors and Stockholders Fastenal Company:
Management is responsible for establishing and maintaining adequate internal control over financial reporting as defined in Rules 13a15-(f) and 15d-15(f) under the Securities Exchange Act of 1934. The Company’s internal control over financial reporting is designed to provide reasonable assurance regarding the reliability of financial reporting and the preparation of financial statements for external purposes in accordance with U.S. generally accepted accounting principles. The Company’s internal control over financial reporting includes those policies and procedures that:
| | (i) | pertain to the maintenance of records that, in reasonable detail, accurately and fairly reflect the transactions and dispositions of the assets of the Company; |
| | (ii) | provide reasonable assurance that the transactions are recorded as necessary to permit preparation of financial statements in accordance with U.S. generally accepted accounting principles, and that receipts and expenditures of the Company are being made only in accordance with authorizations of management and directors of the Company; and |
| | (iii) | provide reasonable assurance regarding prevention or timely detection of unauthorized acquisition, use or disposition of the Company’s assets that could have a material effect on the financial statements. |
Because of its inherent limitations, internal control over financial reporting may not prevent or detect misstatements. Also, projections of any evaluation of effectiveness to future periods are subject to the risk that controls may become inadequate because of changes in conditions, or that the degree of compliance with the policies or procedures may deteriorate.
Under the supervision of our principal executive officer and our principal financial officer, we conducted an evaluation of the effectiveness of our internal control over financial reporting based on the framework inInternal Control – Integrated Frameworkissued by the Committee of Sponsoring Organization of the Treadway Commission. Based on our assessment and those criteria, management believes that the Company maintained effective internal control over financial reporting as of December 31, 2006. There was no change in the Company’s internal control over financial reporting during the Company’s most recently completed fiscal quarter that has materially affected, or is reasonably likely to materially affect, the Company’s internal control over financial reporting.
KPMG LLP, the independent registered public accounting firm that audited the financial statements in this Annual Report, has issued an attestation report on management’s assessment of the effectiveness of our internal control over financial reporting, which report is included in this Annual Report.
| | | | |
| | |
| /s/ Willard D. Oberton | | | | /s/ Daniel L. Florness |
| Chief Executive Officer & President | | | | Executive Vice-President & Chief Financial Officer |
Winona, Minnesota
February 23, 2007
34
| | |
| 2006 | | Report of Independent Registered Public Accounting Firm on Consolidated Financial Statements and Supplemental Schedule |
The Board of Directors and Stockholders Fastenal Company:
We have audited the accompanying consolidated balance sheets of Fastenal Company and subsidiaries as of December 31, 2006 and 2005, and the related consolidated statements of earnings, stockholders’ equity and comprehensive income, and cash flows for each of the years in the three-year period ended December 31, 2006. In connection with our audits of the consolidated financial statements, we also have audited financial statement schedule II—Valuation and Qualifying Accounts. These consolidated financial statements and financial statement schedule are the responsibility of the Company’s management. Our responsibility is to express an opinion on these consolidated financial statements and financial statement schedule based on our audits.
We conducted our audits in accordance with the standards of the Public Company Accounting Oversight Board (United States). Those standards require that we plan and perform the audit to obtain reasonable assurance about whether the financial statements are free of material misstatement. An audit includes examining, on a test basis, evidence supporting the amounts and disclosures in the financial statements. An audit also includes assessing the accounting principles used and significant estimates made by management, as well as evaluating the overall financial statement presentation. We believe that our audits provide a reasonable basis for our opinion.
In our opinion, the consolidated financial statements referred to above present fairly, in all material respects, the financial position of Fastenal Company and subsidiaries as of December 31, 2006 and 2005, and the results of their operations and their cash flows for each of the years in the three-year period ended December 31, 2006, in conformity with U.S. generally accepted accounting principles. Also in our opinion, the related financial statement schedule, when considered in relation to the basic consolidated financial statements taken as a whole, presents fairly, in all material respects, the information set forth therein.
We also have audited, in accordance with the standards of the Public Company Accounting Oversight Board (United States), the effectiveness of Fastenal Company’s internal control over financial reporting as of December 31, 2006, based on criteria established inInternal Control—Integrated Framework issued by the Committee of Sponsoring Organizations of the Treadway Commission (COSO), and our report dated February 23, 2007 expressed an unqualified opinion on management’s assessment of, and the effective operation of, internal control over financial reporting.
|
|
| /s/ KPMG, LLP |
|
Minneapolis, Minnesota February 23, 2007 |
35
| | |
| 2006 | | Report of Independent Registered Public Accounting Firm on Internal Control Over Financial Reporting |
The Board of Directors and Stockholders Fastenal Company:
We have audited management’s assessment, included in the accompanying Management Report on Internal Control over Financial Reporting,that Fastenal Company maintained effective internal control over financial reporting as of December 31, 2006, based on criteria established inInternal Control—Integrated Framework issued by the Committee of Sponsoring Organizations of the Treadway Commission (COSO).Fastenal Company’s management is responsible for maintaining effective internal control over financial reporting and for its assessment of the effectiveness of internal control over financial reporting. Our responsibility is to express an opinion on management’s assessment and an opinion on the effectiveness of the Company’s internal control over financial reporting based on our audit.
We conducted our audit in accordance with the standards of the Public Company Accounting Oversight Board (United States). Those standards require that we plan and perform the audit to obtain reasonable assurance about whether effective internal control over financial reporting was maintained in all material respects. Our audit included obtaining an understanding of internal control over financial reporting, evaluating management’s assessment, testing and evaluating the design and operating effectiveness of internal control, and performing such other procedures as we considered necessary in the circumstances. We believe that our audit provides a reasonable basis for our opinion.
A company’s internal control over financial reporting is a process designed to provide reasonable assurance regarding the reliability of financial reporting and the preparation of financial statements for external purposes in accordance with generally accepted accounting principles. A company’s internal control over financial reporting includes those policies and procedures that (1) pertain to the maintenance of records that, in reasonable detail, accurately and fairly reflect the transactions and dispositions of the assets of the company; (2) provide reasonable assurance that transactions are recorded as necessary to permit preparation of financial statements in accordance with generally accepted accounting principles, and that receipts and expenditures of the company are being made only in accordance with authorizations of management and directors of the company; and (3) provide reasonable assurance regarding prevention or timely detection of unauthorized acquisition, use, or disposition of the company’s assets that could have a material effect on the financial statements.
Because of its inherent limitations, internal control over financial reporting may not prevent or detect misstatements. Also, projections of any evaluation of effectiveness to future periods are subject to the risk that controls may become inadequate because of changes in conditions, or that the degree of compliance with the policies or procedures may deteriorate.
In our opinion, management’s assessment that Fastenal Company maintained effective internal control over financial reporting as of December 31, 2006, is fairly stated, in all material respects, based on criteria established inInternal Control—Integrated Framework issued by the Committee of Sponsoring Organizations of the Treadway Commission (COSO).Also, in our opinion, Fastenal Company maintained, in all material respects, effective internal control over financial reporting as of December 31, 2006, based on criteria established inInternal Control—Integrated Framework issued by the Committee of Sponsoring Organizations of the Treadway Commission (COSO).
We also have audited, in accordance with the standards of the Public Company Accounting Oversight Board (United States), the consolidated balance sheets of Fastenal Company and subsidiaries as of December 31, 2006 and 2005, and the related consolidated statements of earnings, stockholders’ equity and comprehensive income, and cash flows for each of the years in the three-year period ended December 31, 2006, and our report dated February 23, 2007 expressed an unqualified opinion on those consolidated financial statements.
|
|
| /s/ KPMG, LLP |
|
Minneapolis, Minnesota February 23, 2007 |
36
EXECUTIVE OFFICERS
Willard D. Oberton
Chief Executive Officer and President
Nicholas J. Lundquist
Executive Vice-President and Chief Operating Officer
Daniel L. Florness
Executive Vice-President and Chief Financial Officer
Steven L. Appelwick
Vice-President–Product Development, Supply Chain, Global Procurement & Trading
DIRECTORS
Robert A. Kierlin
Chairman of the Board
Former Minnesota State Senator
Former Chief Executive Officer and President
Fastenal Company
Michael J. Dolan
Self Employed Business Consultant,
Former Executive Vice-President and Chief
Operating Officer
The Smead Manufacturing Company
(document management company)
Michael M. Gostomski
President
Winona Heating & Ventilating Company (sheet metal and roofing contractor)
Robert A. Hansen
Associate Professor of Marketing and Logistics Management, Carlson School of Management, University of Minnesota
Henry K. McConnon
President
Wise Eyes, Inc.
(eyeglass retailer and wholesaler)
Willard D. Oberton
John D. Remick
President and Chief Executive Officer
Rochester Athletic Club, Inc.
(health club)
Retired effective April 17, 2007
Stephen M. Slaggie
Retired
Former Secretary, Shareholder Relations
Director, and Insurance Risk Manager
Fastenal Company
Reyne K. Wisecup
Director of Employee Development
Fastenal Company
CORPORATE INFORMATION
Annual Meeting
The annual meeting of shareholders
will be held at 10:00 a.m.,
Tuesday, April 17, 2007,
at Corporate Headquarters,
2001 Theurer Boulevard,
Winona, Minnesota
Corporate Headquarters
Fastenal Company
2001 Theurer Boulevard
Winona, Minnesota 55987-0978
Phone: (507) 454-5374
Fax: (507) 453-8049
Legal Counsel
Faegre & Benson LLP
Minneapolis, Minnesota
Streater & Murphy, PA
Winona, Minnesota
Form 10-K
A copy of our 2006 Annual Report on Form 10-K to the Securities and Exchange Commission is available without charge to shareholders upon written request to our Assistant Controller at the address listed on this page for our corporate headquarters.
Copies of our latest press release, unaudited supplemental company information and monthly sales information (beginning with October 2000 sales) are available at our World Wide Web site at:www.fastenal.com
Auditors
KPMG LLP
Minneapolis, Minnesota
Transfer Agent
Wells Fargo Bank, National Association
Minneapolis, Minnesota