Exhibit 13


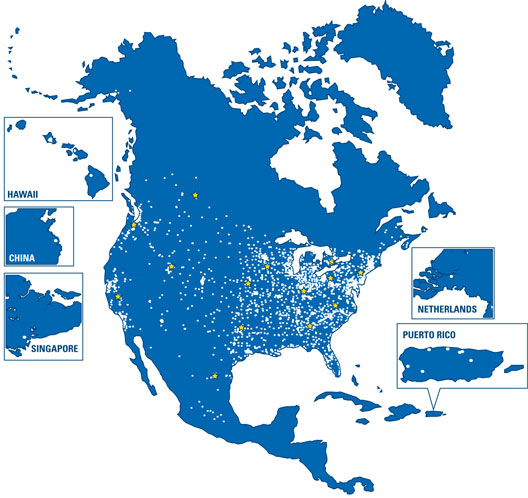
Fastenal Company was founded in 1967. As of December 31, 2008, we operated 2,311 stores located in 50 states, Puerto Rico, Canada, Mexico, Singapore, China, and The Netherlands and employed 9,428 people at these locations. In addition, there were 4,206 people employed in various support positions, 2,709 of whom were employed in one of our distribution centers, manufacturing operations, or service operations; and the remaining 1,497 of whom were employed at one of our administrative support facilities or home office. We sell approximately 910,000 different types of industrial and construction supplies in 10 product categories. These include: 382,000 different types of threaded fasteners and miscellaneous supplies (fasteners); 128,000 different types of tools and equipment (tools); 226,000 different types of cutting tool blades and abrasives (cutting tools); 58,000 different types of fluid transfer components and accessories for hydraulic power, pneumatic power, plumbing, and HVAC (hydraulics & pneumatics); 15,000 different types of material handling, storage, and packaging products (material handling); 14,000 different types of janitorial supplies, chemicals, and paint (janitorial supplies); 23,000 different types of electrical supplies; 30,000 different types of welding supplies (excluding welding gases); 25,000 different types of safety supplies; and 9,000 different types of metals, alloys, and materials (metals).
As of December 31, 2008, we operated 14 distribution centers located in Minnesota, Indiana, Ohio, Pennsylvania, Texas, Georgia, Washington, California, Utah, North Carolina, Kansas, Ontario, Canada; Alberta, Canada; and Nuevo Leon, Mexico. During 2008, approximately 95.1% of our sales were attributable to products manufactured by others, and approximately 4.9% where related to items manufactured, modified, or repaired by either our manufacturing division or one of our support services. Since December 31, 2008, we have opened additional store locations.

| | |
PAGE | | SECTION |
| |
2-4 | | President’s Letter to Shareholders |
| |
5 | | 10-Year Selected Financial Data & Financial Highlights |
| |
6 | | Stock and Financial Data |
| |
7 | | Stock Performance Highlights |
| |
8 | | 2008 Media & Market Highlights |
| |
| | Form 10-K |
| |
| | (Note: Page numbers in Form 10-K are not consecutive with the remainder of this annual report) |
| |
Inside Back Cover | | Directors, Executive Officers & Corporate Information |
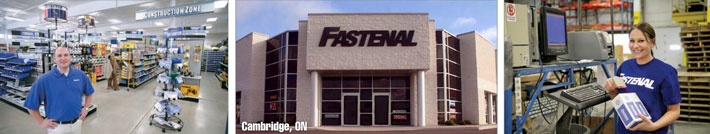
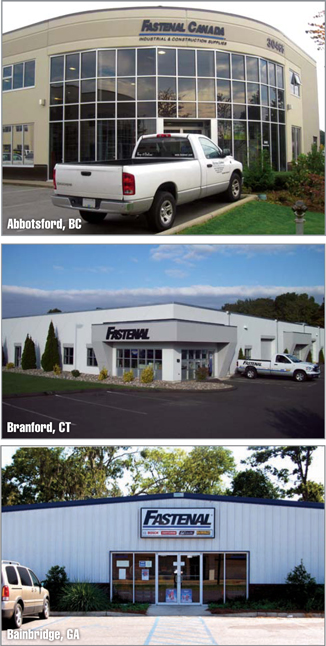
LOCAL PRODUCTS AND SERVICE AT MORE THAN 2,300 FASTENAL STORES
What does local Fastenal store service mean for our customers? It means immediate access to a broad product mix that’s tailored to anticipate their demand, enabling them to carry less inventory and free up cash. It also means regular, on-site service from a dedicated Fastenal representative who lives in their community, understands their business, and can take a flexible approach to help them solve problems and succeed. The result is a level of effort, collaboration, and accountability that pays off in countless ways – every day, and when they need it most.
So remember, when we talk about our 2,300 stores, we’re not talking about how big we are; we’re talking about howlocal we are. And that’s what Fastenal is all about – using our global sourcing and distribution strength to be the bestlocal industrial supplier in every market we serve.


“We promote a culture that encourages innovation and continuous improvement at all levels of the organization, with a strong belief that everything we do at Fastenal can somehow be done better.”
I am proud to report that, thanks to the hard work and dedication of our Fastenal team, 2008 was a very good year for Fastenal. We had solid growth in terms of sales and earnings, but I believe those numbers are only a short-term measure of what we really accomplished during the year. The more substantial achievements, in my opinion, were the improvements we made throughout the business that will widen our competitive moat and provide greater returns for years to come.
From the outside it may be hard to perceive the changes we’re continually making at Fastenal. We sell industrial and construction products through a store-based network – a basic model that hasn’t changed in over 40 years. But behind the scenes, our entire team is working to improve this basic model every day. We promote a culture that encourages innovation and continuous improvement at all levels of the organization, with a strong belief that everything we do at Fastenal can somehow be done better. In this letter I will try to explain some of the important changes we made in 2008 and how they fit together like pieces of a puzzle to improve the overall business, now and for years to come.
First, let’s take a look at some key performance numbers. Our 2008 sales growth was 13.5% and our total revenue for the year was $2.34 billion. Our sales growth started out strong in 2008 and remained strong through the first three quarters of the year, with sales growing 16.4% through September. In October, we started seeing the effects of the economic downturn. Our growth numbers fell during each of the last three months through December, which saw the lowest sales growth rate in our company’s history – essentially no growth on a daily basis.
On a more positive note, our reported net earnings for 2008 were $279.7 million – a 20.2% increase over 2007. This improvement was really driven by our “Pathway to Profit” initiative, which has a stated goal of increasing our pre-tax profit, as a percentage of sales, by one percentage point per year for the five year period from 2007 to 2012. I am happy to report that we achieved this goal in 2008 by increasing our pretax profits by 1.0 percentage point versus 2007.
Launched in 2007, the Pathway to Profit strategy is very straightforward – to grow our average store sales to $125,000 per month (which we had determined was the “sweet spot” for store profitability) and, in turn, drive our pretax operating margin to 23.0% of sales. Our stated goal is to achieve these targets by 2012.
To get to that point, we transitioned from a growth strategy primarily based on store openings to a strategy that blends store openings with increased investment in additional outside sales personnel at existing stores. We also sought to make our outside sales force more accountable and entrepreneurial by giving each outside sales person ownership of a geographic sales zone. (Traditionally, we had simply assigned sales zones to our stores and left it up to them to divide up current and potential accounts.)
Our stated goal at the onset of Pathway to Profit was to slow the rate of additional store openings from 13-18% to approximately 7-10% and to use the money saved to add outside sales people at our strongest performing stores. Accordingly, in 2008 we invested less in brick and mortar and more in people – specifically, people who contribute directly to sales. I make that distinction because, with fewer store openings, we were able to reduce the rate of support (non-store) personnel growth to 3.1% in 2008, well within our stated goal, which was half the rate of sales growth.
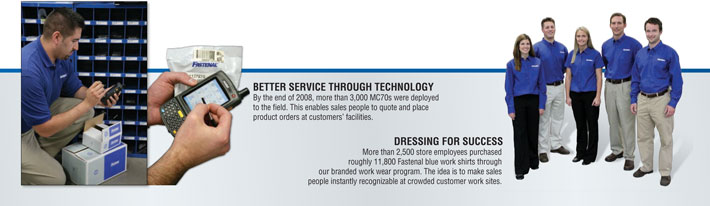
Of course, the Pathway to Profit isn’t just about throwing sales people onto the street; it’s about providing them with the tools, training, and knowledge they need to be successful. In 2007 and early 2008, we equipped each of our outside sales people with a Symbol MC70 wireless device, enabling them to place product orders, access selling information, and communicate via email (customers’ preferred mode of communication) out in the field. During the year, we worked hard to streamline the technology, making it faster and easier to use. Moving forward, our focus will be on enhancing the MC70s with detailed selling information based on market research, sales history, and NAICS (North American Industry Classification System) data. The goal is to make it easy for our sales people to access and populate an evolving database that tells them what each of their customers should spend, which products they’d be most likely to buy, and which marketing materials would be most relevant. It also allows them to schedule which customers they will see on a given day.
It all adds up to a more productive and efficient sales force. Not only did sales through our outside sales personnel outperform other areas of the company, we were

also able to grow our average monthly number of active customer accounts at a good rate. This is a direct result of more outside sales people getting out and building relationships with more customers. This ability to aggressively expand our customer base is helping us weather an economy in which many existing customers are spending less. At the same time, it’s also positioning us for strong growth when customers return to normal spending levels. Our market share is growing, and we believe this can be capitalized on when the entire market begins to grow again, pointing to good future results.
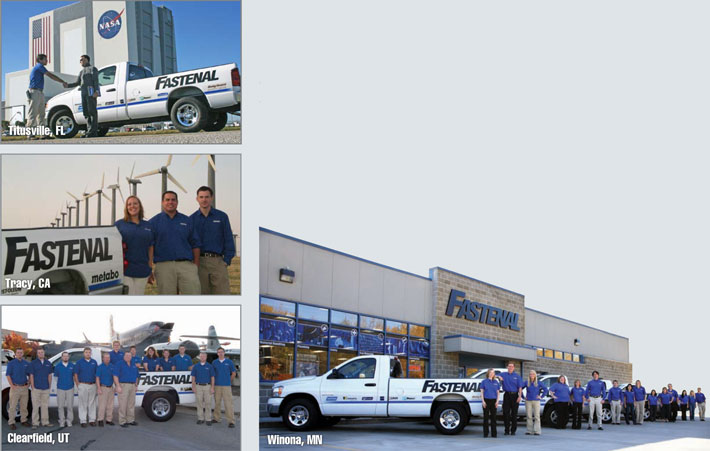
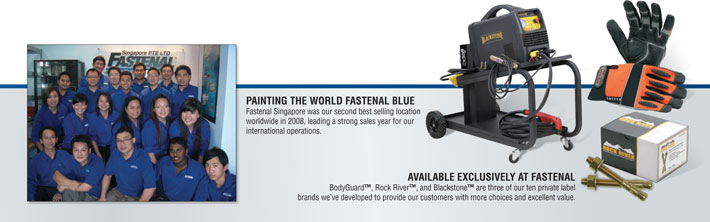
One area of the business that I am very excited about is our international expansion opportunities. We began to operate in Canada in 1994 and Mexico in 2001, and the model in these countries is very similar to the one we use in the United States, with local stores serving local customers. We have been very successful in both countries with this model and look forward to continued growth. We’ve also opened locations in Asia and Europe, with larger facilities serving a broader geographic area and selling to a more multi-national customer base. We opened our first facility outside of North America in Singapore in 2001 and opened in Shanghai, China in 2005. We struggled for a few years, but in 2007, and even more so in 2008, things really started to improve, with both locations enjoying strong sales growth and even better profit growth. In fact, Singapore had the second-highest sales volume of any store in our system in 2008, and Shanghai ranked sixteenth. While our gross margins are lower in these businesses, our operating margin is well above the company average due to a lower cost structure. We are still working on this model in our European operation (located in The Netherlands) and have seen nice improvements in the last six to nine months. In short, I believe we have developed a model that will allow us to expand to many areas of the world and show positive returns.
Another area that saw improvement in 2008 was product development. Our team of product managers spent a great deal of time in 2007 and 2008 developing Fastenal private brand names for different product groups. We now have private label brands in most product areas, and the response from both store personnel and our customers has been positive. The challenge for our product development team was to develop product lines with high quality while staying at a price point that provides a competitive price to the customer and maintains our profit margins. They did a great job achieving this goal and creating a win-win situation for our customers and our stores.
One of our top priorities is to be in a position to provide a wide range of products to our customers every day. Over 62% of our transactions come off the shelves of a local store, thus providing same-day service for our customers. We are working hard to increase the percent of product in-stock by analyzing the buying habits of our customers at each store and customizing their inventory to meet local needs. We call this our “a la carte” program, and although we have a lot of work yet to do, we believe the customer service benefits will be tremendous. In short, it will get us closer to our goal of having more products closer to more customers than any distributor of industrial products.
If we don’t have the product in the local store, we will try to stock it in the regional distribution center and truck it overnight so that the customer can receive it early the next morning. Currently, over 80% of our store deliveries from the distribution centers arrive before 7:00 a.m. local time – several hours earlier than they’d arrive via small parcel shipping companies. This early delivery represents an important benefit for our customers and a major competitive advantage for our business. If a customer needs a non-standard product, then we would typically stock it in one of our master distribution centers (Indianapolis, Indiana or Modesto, California), which carry a much broader inventory than our regional distribution centers. Products from one of these two locations can be delivered to a store within 24 to 48 hours. At the current time, 28% of our customers receive next-day service from Indianapolis; and with the benefit of the new automated systems we are installing in that facility (more on that below), we should be able to deliver to over 65% of our customers overnight on our own trucks. This will further improve our customer service and put our sales people in a better position to say what they always want to say: “Yes, I have it.”
We made some great strides in our distribution centers in 2008. In the fourth quarter we moved into our new distribution center in Denton, Texas, which replaces our facility in Carrollton, Texas. This is the most automated facility we have ever built and will allow us to greatly reduce our distribution labor costs as a percentage of sales. We installed two automated storage and retrieval systems (ASRS) – one for pallet-sized loads and the other for smaller packaged items. These systems are designed to bring the product directly to the person filling the order, reducing thousands of steps every day and improving shipping accuracy. The result is that orders can be processed faster and our drivers can leave earlier, improving our service for our customers.
“Over 62% of our transactions come off the shelves of a local store, thus providing same-day service for our customers.”

In 2008 we began implementing similar but much larger systems at our Indianapolis distribution center. The first phase of the ASRS implementation will be finished in early 2009, and the second phase will be completed in the latter half of the year. Indianapolis is our largest distribution center, and because of its central location, it stocks a large inventory of semi-standard items that have lower demand but are important to our customers when they need them. Overall, we stock more than 150,000 different items in this facility. The expansion will increase our storage by more than 50,000 pallets, which represents roughly 2,000 truck-loads of product. This investment will create many long-term benefits: shipping accuracy will improve, labor costs will decrease, and we will be able to continue our inventory expansion project. However, I believe the biggest benefit is the time it will save in processing orders, allowing us to provide overnight delivery from this vast inventory to a much larger geographic area.
In 1967, when Bob Kierlin first started Fastenal, his vision was that the company would dispense fasteners through vending machines. Well, it’s taken us 41 years but we finally realized that dream in 2008 with the introduction of our SmartStore vending program. Many of our competitors also offer some type of vending solution, but most of their systems are intended for high-usage customers and are cost prohibitive for smaller businesses. Because the SmartStore program is far more competitively priced, it can be implemented profitably for small and medium-sized customers, dramatically expanding the market opportunity for industrial vending solutions. We were able to improve the program’s pricing by partnering directly with a leading manufacturer of vending machines and integrating their software into the program. This software allows an employee at a customer’s site to quickly access the product they need by using their I.D. badge or a personalized key code, in turn allowing the company to monitor and control who uses what. The result is lower costs and 24-hour point-of-use access to needed supplies, such as safety products, with complete accountability.
In 2008 our manufacturing facilities continued to grow in terms of sales and profitability. Our Rockford, Illinois location moved into a newly renovated 100,000 square foot facility. We are currently occupying 50,000 feet and plan to rent the other half of the building. The facility houses our cold heading plant, which produces fasteners by cold forming wire, a process that’s used when we receive customer orders requiring larger quantities of a single size. This expansion, along with some added machinery, will allow us to increase the range of parts we are able to produce in house, once again improving the service we’re able to provide our customers.
The Fastenal School of Business (FSB) continued its growth in 2008 by adding more classes and increasing the number of employees trained by 26%. They made this happen by expanding the amount of training done outside of our headquarters in Winona. By training more employees in the field, FSB was able to lower training costs while also reducing employees’ travel time. In 2009, FSB plans to conduct more than 50% of all training in the field. To support that goal, they introduced a new learning management system which will allow them to greatly increase our online training – further reducing training costs while increasing training time.
Because of all the improvements we are making at Fastenal, it’s always hard to give a complete report on our progress. However, I hope I was able to give you an idea of how we are steadily improving the business one piece at a time. As I said earlier, the basic business has not changed in 41 years; it’s how we strive to continuously improve each area of the business that defines us as an organization. I want to make sure you understand that all of these ideas and improvements were developed by the dedicated people that make up our company. I am very proud of this team.
I also want to thank you, as shareholders, for sticking with us in a difficult time in the market. Although there is much uncertainty in the economy, I believe that if we continue to provide our people with good leadership and a great work environment, they will make the right decisions about how to serve our customers and grow our business in the coming year.
“In 1967, when Bob Kierlin first started Fastenal, his vision was that the company would dispense fasteners through vending machines. Well, it’s taken us 41 years but we finally realized that dream in 2008 with the introduction of our SmartStore vending program.”
|

|
| Willard D. Oberton |
| Chief Executive Officer and President |


| | | | | | | | | | | | | | | | | | | | | | | | | | | | | | | | | | | | | | | | | | | |
| (Amounts in Thousands except Per Share Information) | |
| | | | | | | | | | | |
Operating
Results | | 2008 | | | Percent
Change | | | 2007 | | | 2006 | | | 2005 | | | 2004 | | | 2003 | | | 2002 | | | 2001 | | | 2000 | | | 1999 | |
Net Sales | | $ | 2,340,425 | | | 13.5 | % | | $ | 2,061,819 | | | $ | 1,809,337 | | | $ | 1,523,333 | | | $ | 1,238,492 | | | $ | 994,928 | | | $ | 905,438 | | | $ | 818,283 | | | $ | 755,618 | | | $ | 618,191 | |
Gross Profit1 | | | 1,236,092 | | | 18.0 | % | | | 1,047,574 | | | | 907,675 | | | | 758,103 | | | | 615,886 | | | | 482,103 | | | | 442,138 | | | | 406,699 | | | | 382,829 | | | | 315,133 | |
Earnings before income taxes | | | 451,167 | | | 19.4 | % | | | 377,899 | | | | 321,029 | | | | 269,056 | | | | 208,336 | | | | 136,336 | | | | 121,207 | 2 | | | 113,634 | | | | 131,430 | | | | 106,479 | |
Net earnings | | | 279,705 | | | 20.2 | % | | | 232,622 | | | | 199,038 | | | | 166,814 | | | | 130,989 | | | | 84,120 | | | | 75,542 | 3 | | | 70,112 | | | | 80,730 | | | | 65,455 | |
Basic and diluted net earnings per share | | | 1.88 | | | 21.3 | % | | | 1.55 | | | | 1.32 | | | | 1.10 | | | | 0.86 | | | | 0.56 | | | | 0.50 | 3 | | | 0.46 | | | | 0.53 | | | | 0.43 | |
Dividends | | | 117,474 | | | 77.4 | % | | | 66,216 | | | | 60,548 | | | | 46,935 | | | | 30,350 | | | | 15,935 | | | | 3,794 | | | | 3,414 | | | | 3,035 | | | | 1,518 | |
% of Net Earnings | | | 42.0 | % | | | | | | 28.5 | % | | | 30.4 | % | | | 28.1 | % | | | 23.2 | % | | | 18.9 | % | | | 5.0 | % | | | 4.9 | % | | | 3.8 | % | | | 2.3 | % |
Dividends per share | | | 0.79 | | | 79.5 | % | | | 0.44 | | | | 0.40 | | | | 0.31 | | | | 0.20 | | | | 0.105 | | | | 0.025 | | | | 0.0225 | | | | 0.02 | | | | 0.01 | |
Value of shares repurchased | | | 25,955 | | | | | | | 87,311 | | | | 17,294 | | | | 18,739 | | | | — | | | | — | | | | — | | | | — | | | | — | | | | — | |
% of Earnings | | | 9.3 | % | | | | | | 37.5 | % | | | 8.7 | % | | | 11.2 | % | | | — | | | | — | | | | — | | | | — | | | | — | | | | — | |
Number of shares repurchased | | | 590 | | | | | | | 2,086 | | | | 474 | | | | 700 | | | | — | | | | — | | | | — | | | | — | | | | — | | | | — | |
Basic-weighted average shares outstanding | | | 148,831 | | | | | | | 150,555 | | | | 151,034 | | | | 151,270 | | | | 151,755 | | | | 151,755 | | | | 151,755 | | | | 151,755 | | | | 151,755 | | | | 151,755 | |
Diluted-weighted average shares outstanding4 | | | 148,831 | | | | | | | 150,555 | | | | 151,165 | | | | 151,508 | | | | 151,972 | | | | 151,784 | | | | 151,755 | | | | 151,755 | | | | 151,755 | | | | 151,755 | |
| | | | | | | | | | | |
Operating
Results (as a
percentage of
net sales) | | 2008 | | | | | | 2007 | | | 2006 | | | 2005 | | | 2004 | | | 2003 | | | 2002 | | | 2001 | | | 2000 | | | 1999 | |
Gross Profit1 | | | 52.8 | % | | | | | | 50.8 | % | | | 50.2 | % | | | 49.8 | % | | | 49.7 | % | | | 48.5 | % | | | 48.8 | % | | | 49.7 | % | | | 50.7 | % | | | 51.0 | % |
Earnings before income taxes | | | 19.3 | % | | | | | | 18.3 | % | | | 17.7 | % | | | 17.7 | % | | | 16.8 | % | | | 13.7 | % | | | 13.4 | % | | | 13.9 | % | | | 17.4 | % | | | 17.2 | % |
Net Earnings | | | 12.0 | % | | | | | | 11.3 | % | | | 11.0 | % | | | 11.0 | % | | | 10.6 | % | | | 8.5 | % | | | 8.3 | % | | | 8.6 | % | | | 10.7 | % | | | 10.6 | % |
| | | | | | | | | | | |
Financial
Position on
December 31 | | 2008 | | | Percent
Change | | | 2007 | | | 2006 | | | 2005 | | | 2004 | | | 2003 | | | 2002 | | | 2001 | | | 2000 | | | 1999 | |
Accounts receivable plus inventory | | $ | 809,187 | | | 9.2 | % | | $ | 740,923 | | | $ | 665,529 | | | $ | 545,117 | | | $ | 469,833 | | | $ | 361,640 | | | $ | 322,815 | | | $ | 254,062 | | | $ | 249,188 | | | $ | 191,160 | |
Net working capital | | | 827,410 | | | 11.4 | % | | | 742,980 | | | | 663,880 | | | | 557,470 | | | | 466,883 | | | | 393,255 | | | | 349,422 | | | | 300,680 | | | | 247,876 | | | | 193,744 | |
Total assets5 | | | 1,304,149 | | | 12.1 | % | | | 1,163,061 | | | | 1,039,016 | | | | 890,035 | | | | 775,362 | | | | 652,875 | | | | 563,384 | | | | 476,694 | | | | 402,464 | | | | 318,621 | |
Total stockholders’ equity | | | 1,142,259 | | | 13.1 | % | | | 1,010,161 | | | | 992,093 | | | | 783,549 | | | | 684,369 | | | | 576,740 | | | | 499,871 | | | | 424,888 | | | | 359,258 | | | | 281,960 | |
All information contained in this Annual Report reflects the 2-for-1 stock splits effected in the form of a stock dividend in each of 2002 and 2005.
| 1 | Reflects impact of reclassification of certain internal trucking cost between operating expenses and cost of goods sold related to the freight initiative. The reclassification decreased gross profit by $12,477, $8,447, $6,964, $6,338, $5,728, $5,289 and $4,327 in 2005, 2004, 2003, 2002, 2001, 2000 and 1999, respectively. |
| 2 | Amount includes a gain on the sale of the Do-It-Yourself (DIY) Business of $5,934. |
| 3 | Amount includes an extraordinary gain, net of tax, of $716. |
| 4 | Reflects impact of stock options issued by the Company in April 2008, April 2007, or May 2003 that were in-the-money and outstanding during the period. |
| 5 | Reflects impact of reclassification of prior years’ presentation to conform to current year presentation. |

Common Stock Data
Our shares are traded on The NASDAQ Global Select Market under the symbol “FAST.” The following table sets forth, by quarter, the high and low closing sale price of our shares on The NASDAQ Global Select Market for 2008 and 2007.
| | | | | | | | | | | | | | |
2008 | | High | | Low | | 2007 | | High | | Low |
First quarter | | $ | 46.94 | | $ | 33.13 | | First quarter | | $ | 38.18 | | $ | 34.03 |
Second quarter | | | 51.76 | | | 43.16 | | Second quarter | | | 43.60 | | | 34.78 |
Third quarter | | | 55.45 | | | 42.23 | | Third quarter | | | 51.07 | | | 41.87 |
Fourth quarter | | | 45.25 | | | 31.87 | | Fourth quarter | | | 49.29 | | | 37.76 |
As of February 16, 2009, there were approximately 1,500 recordholders of our common stock, which includes nominees or broker dealers holding stock on behalf of an estimated 104,000 beneficial owners.
In 2008, we paid semi-annual dividends of $.25 and $.27 per share. In December 2008, we paid a special one-time dividend of $.27 per share. In 2007, we paid semi-annual dividends of $.21 and $.23 per share. On January 19, 2009, we announced a semi-annual dividend of $.35 per share to be paid on February 27, 2009 to shareholders of record at the close of business on February 16, 2009. We expect that we will continue to pay comparable semi-annual cash dividends in the foreseeable future, provided that any future determination as to payment of dividends will depend upon our financial condition and results of our operations and such other factors as are deemed relevant by our board of directors.
Selected Quarterly Financial Data (Unaudited)
(Amounts in Thousands Except Per Share Information)
| | | | | | | | | |
2008 | | Net Sales | | Gross
profit | | Net
earnings | | Basic net
earnings
per share |
First quarter | | $ | 566,210 | | 296,630 | | 68,094 | | .46 |
Second quarter | | | 604,219 | | 317,389 | | 76,166 | | .51 |
Third quarter | | | 625,037 | | 330,883 | | 72,909 | | .49 |
Fourth quarter | | | 544,959 | | 291,190 | | 62,536 | | .42 |
| | | | | | | | | |
Total | | $ | 2,340,425 | | 1,236,092 | | 279,705 | | 1.88 |
| | | | | | | | | |
| | | | |
2007 | | Net Sales | | Gross
profit | | Net
earnings | | Basic net
earnings
per share |
First quarter | | $ | 489,157 | | 249,515 | | 54,033 | | .36 |
Second quarter | | | 519,706 | | 261,469 | | 60,256 | | .40 |
Third quarter | | | 533,750 | | 272,024 | | 62,142 | | .41 |
Fourth quarter | | | 519,206 | | 264,566 | | 56,191 | | .38 |
| | | | | | | | | |
Total | | $ | 2,061,819 | | 1,047,574 | | 232,622 | | 1.55 |
| | | | | | | | | |

Fastenal Stock Performance1,2
Initial Public Offering (IPO)
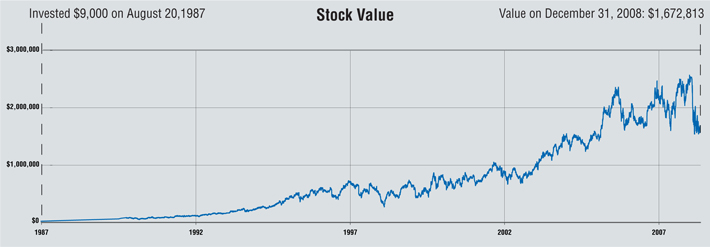
On August 20, 1987 (date of our initial public offering), 1,000 shares of our stock sold for $9,000. Approximately 21 years later, on December 31, 2008, those 1,000 shares, having split 6 times, were 48,000 shares worth $1,672,800, for a gain of approximately 28.3% compounded annually.
Ten Years
On December 31, 1998, 1,000 shares of our stock sold for $44,000. Ten years later, on December 31, 2008, those 1,000 shares, having split twice, were 4,000 shares worth $139,400, for a gain of approximately 12.2% compounded annually.
Five Years
On December 31, 2003, 1,000 shares of our stock sold for $49,750. Five years later, on December 31, 2008, those 1,000 shares, having split once, were 2,000 shares worth $69,700, for a gain of approximately 7.0% compounded annually.
Dividends and Stock Repurchases
We have paid dividends in every year since 1991.
On July 10, 2008, we issued a press release announcing our board of directors had authorized purchases by us of up to an additional 1,000,000 shares of our common stock (over and above previously authorized amounts). During 2008, we purchased 590,000 shares of our outstanding stock at an average price of $43.99 per share. With the new authorization in 2008, we have remaining authority to purchase up to approximately 1,410,000 additional shares of our common stock .
| 1 | The share data featured represents past performance, which is no guarantee of future results. |
2 | Data on this page is in whole amounts. |

| | |
| FORTUNE | | Fastenal comes in at #878 on Fortune’s listing of America’s largest corporations, up from #918 in 2007. |
| | |
| |
| The 2008 Industrial Distribution “Big 50” report ranks Fastenal as the 9th largest industrial supplier. | | INDUSTRIAL DISTRIBUTION |
| | |
| |
| KIPLINGER.COM | | Kiplinger.com cites Fastenal as one of five “Stocks [Warren] Buffett Would Love.” |
| | |
| |
| Morningstar ranks Fastenal as one of the “20 Best Companies in the World” based on the company’s long-term stock outlook. | | MORNINGSTAR |
| | |
| |
| S&P 500 | | Fastenal is added to the S&P 500, the most widely followed index of large-cap American stocks. |
| | |
| |
| Fastenal ranks 26th in the “Star Tribune 100,” a listing of the largest publicly held companies with headquarters in Minnesota. | | STAR TRIBUNE |

DIRECTORS
Robert A. Kierlin
Chairman of the Board
Former Minnesota State Senator
Former Chief Executive Officer and President, Fastenal Company
Henry K. McConnon(Retired effective 2/5/09)
President, Wise Eyes, Inc. (eyeglass retailer and wholesaler)
Stephen M. Slaggie
Former Secretary, Shareholder Relations Director, and Insurance Risk Manager, Fastenal Company
Michael M. Gostomski
Chief Executive Officer, Winona Heating & Ventilating Company (sheet metal and roofing contractor)
Robert A. Hansen(Retired effective 1/19/09)
Associate Professor of Marketing and Logistics Management, Carlson School of Management, University of Minnesota
Willard D. Oberton
Michael J. Dolan
Self-Employed Business Consultant Former Executive Vice President and Chief Operating Officer, The Smead Manufacturing Company (document management company)
Reyne K. Wisecup
Hugh L. Miller
Chief Executive Officer, RTP Company (thermoplastics materials manufacturer)
Michael J. Ancius
Director of Finance, Strategic Planning, and Taxation, Kwik Trip, Inc. (retail convenience store operator)
Scott A. Satterlee
Senior Vice-President of Transportation, C.H. Robinson Worldwide, Inc. (logistics and distribution company)
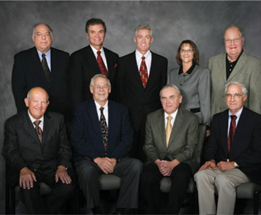
From left to right: (top) Hugh Miller, Michael Dolan, Will Oberton, Reyne Wisecup, Robert Hansen, (bottom) Michael Gostomski, Henry McConnon, Bob Kierlin, and Stephen Slaggie Not pictured: Michael Ancius and Scott Satterlee
EXECUTIVE OFFICERS
Willard D. Oberton
Chief Executive Officer and President
Daniel L. Florness
Executive Vice President and Chief Financial Officer
Nicholas J. Lundquist
Executive Vice President - Sales
Leland J. Hein
Executive Vice President - Sales
Steven A. Rucinski
Executive Vice President - Sales
Reyne K. Wisecup
Executive Vice President - Human Resources
James C. Jansen
Executive Vice President - Internal Operations
CORPORATE INFORMATION
Annual Meeting
The annual meeting of shareholders will be held at
10:00 a.m., central time, Tuesday, April 21, 2009,
at our home offices located at 2001 Theurer Boulevard,
Winona, Minnesota
Home Office
Fastenal Company
2001 Theurer Boulevard
Winona, Minnesota 55987-0978
Phone: (507) 454-5374
Fax: (507) 453-8049
Legal Counsel
Faegre & Benson LLP
Minneapolis, Minnesota
Streater & Murphy, PA
Winona, Minnesota
Transfer Agent
Wells Fargo Bank, National Association
Minneapolis, Minnesota
Form 10-K
A copy of our 2008 Annual Report on Form 10-K to the Securities and Exchange Commission is available without charge to shareholders upon written request to our Controller at the address listed on this page for our home office.
Copies of our latest press release, unaudited supplemental company information, and monthly sales information are available at our World Wide Web site at: www.investor.fastenal.com
Auditors
KPMG LLP
Minneapolis, Minnesota