Exhibit 99.1
Second Quarter Earnings Call July 26, 2006 |
During the course of this presentation, we may make projections or other forward-looking statements regarding future events or the future financial performance of the company. Such statements are just estimates and actual events or results may differ materially from these forward-looking statements. Please refer to the documents that the company files with the SEC from time to time and the company’s second quarter earnings press release for a detailed discussion of the factors, risks and uncertainties that could cause actual results to differ materially from those contained in our projections or forward-looking statements. During this presentation, we will refer to certain non-GAAP measures as defined by the SEC. As required, we have provided a reconciliation of those measures to the most comparable GAAP measures.Copies of our SEC filings are available upon request or by accessing our company website at www.metrologic.com. Forward-Looking Statements Private Securities Litigation Reform Act of 1995 Safe Harbor Provision Page 2 |
C. Harry Knowles Chairman of the Board Interim CEO |
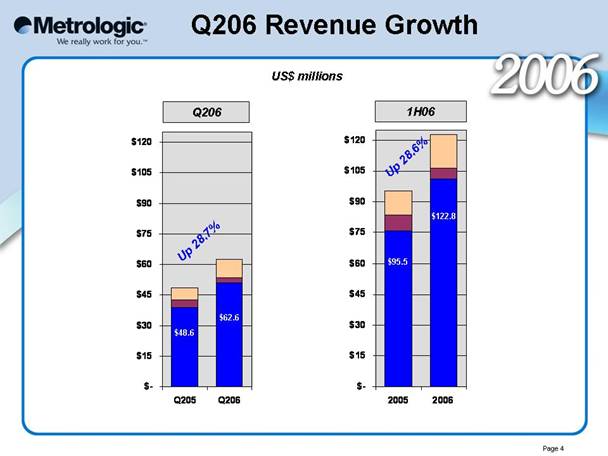
Q206 Revenue Growth Q206 1H06 Page 4 $48.6 $62.6 $95.5 $122.8 US$ millions Up 28.7% Up 28.6% $-$15$30$45$60$75$90$105$120Q205Q206$-$15$30$45$60$75$90$105$12020052006 |

Q206 Highlights Page 5 Sales growth: 28+% Strong operating cash flow: $2.7M /mo Strong balance sheet: $66M in cash & mkt securities So why tinker with success? |
Strategy INCREASE MARKET SHARE 21+% CAGR is our Goal HOW? WW Sales New Products Cost Reductions Patent offense and defense NEED ENGINEERS Page 6 |
To Sustain Growth?ENGINEERS! Numbers and quality Tightly coupled to STRATEGIC PRODUCTS Well motivated; recognition & pay Generate NEW PRODUCTS Generate COST REDUCTIONS Generate PATENTS Generate CAN DO SPIRIT Need a PRODUCTION MACHINE TO FEED Page 7 |
So What? We’ve GOT: Resources WW Sales Marketing Engineering Production Page 8 |
Mark C. Schmidt Executive Vice President, Strategic Initiatives |
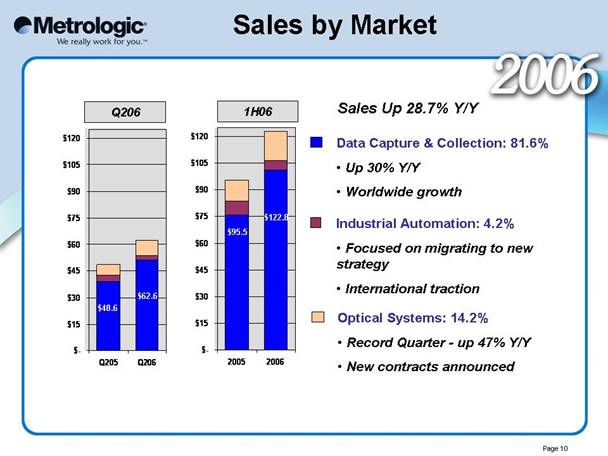
Sales by Market Q206 1H06 Data Capture & Collection: 81.6% Up 30% Y/Y Worldwide growthIndustrial Automation: 4.2% Focused on migrating to new strategy International traction Optical Systems: 14.2% Record Quarter - up 47% Y/Y New contracts announced Page 10 $48.6 $62.6 $95.5 $122.8 Sales Up 28.7% Y/Y $-$15$30$45$60$75$90$105$12020052006$-$15$30$45$60$75$90$105$120Q205Q206 |
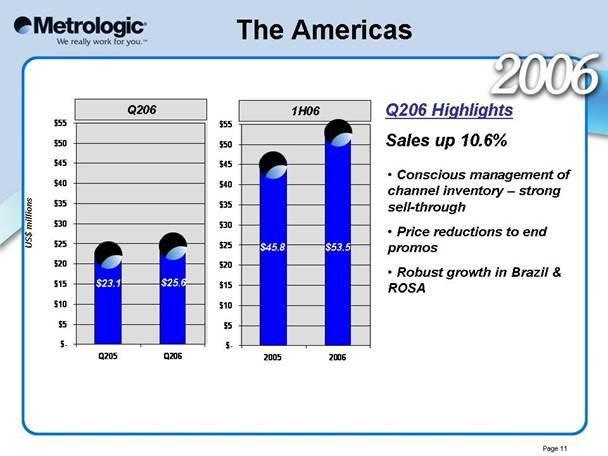
The Americas Q206 Highlights Sales up 10.6% Q206 $45.8 $53.5 1H06 $23.1 $25.6 Conscious management of channel inventory – strong sell-through Price reductions to end promos Robust growth in Brazil & ROSA US$ millions Page 11 $-$5$10$15$20$25$30$35$40$45$50$55Q205Q206$-$5$10$15$20$25$30$35$40$45$50$5520052006 |
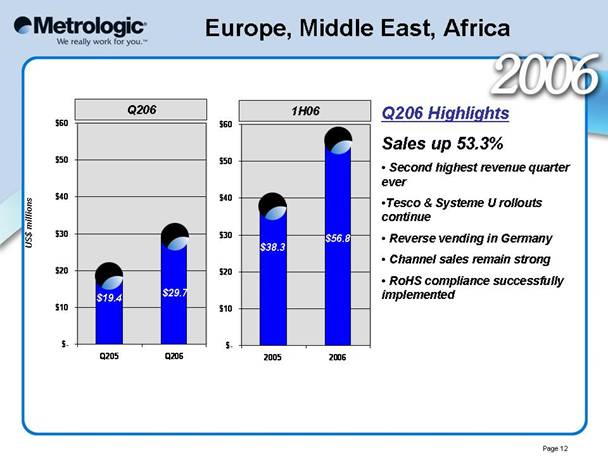
Europe, Middle East, Africa Q206 Highlights Sales up 53.3% Second highest revenue quarter ever Tesco & Systeme U rollouts continue Reverse vending in Germany Channel sales remain strong RoHS compliance successfully implemented Q206 $38.3 $56.8 1H06 $19.4 $29.7 US$ millions Page 12 $-$10$20$30$40$50$60Q205Q206$-$10$20$30$40$50$6020052006 |
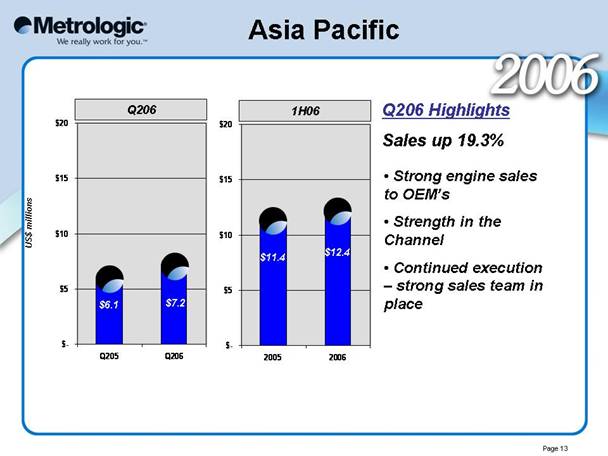
Asia Pacific Q206 Highlights Sales up 19.3% Q206 1H06 $6.1 $7.2 US$ millions $11.4 $12.4 Strong engine sales to OEM’s Strength in the Channel Continued execution – strong sales team in place Page 13 $-$5$10$15$20Q205Q206$-$5$10$15$2020052006 |
Kevin Bratton Chief Financial Officer |
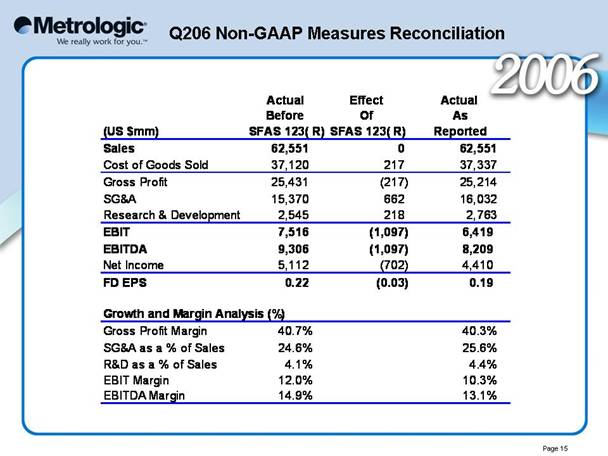
Q206 Non-GAAP Measures Reconciliation Page 15 Actual Effect Actual Before Of As(US $mm)SFAS 123( R)SFAS 123( R)ReportedSales62,551062,551Cost of Goods Sold37,12021737,337Gross Profit25,431(217)25,214SG&A15,37066216,032Research & Development2,5452182,763EBIT7,516(1,097)6,419EBITDA9,306(1,097)8,209Net Income5,112(702)4,410FD EPS0.22(0.03)0.19Growth and Margin Analysis (%)Gross Profit Margin40.7%40.3%SG&A as a % of Sales24.6%25.6%R&D as a % of Sales4.1%4.4%EBIT Margin12.0%10.3%EBITDA Margin14.9%13.1% |
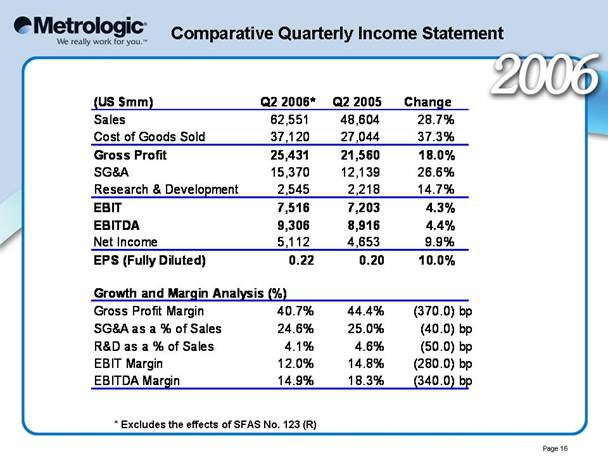
Comparative Quarterly Income Statement * Excludes the effects of SFAS No. 123 (R) Page 16 (US $mm)Q2 2006*Q2 2005ChangeSales62,55148,60428.7%Cost of Goods Sold37,12027,04437.3%Gross Profit25,43121,56018.0%SG&A15,37012,13926.6%Research & Development2,5452,21814.7%EBIT7,5167,2034.3%EBITDA9,3068,9164.4%Net Income5,1124,6539.9%EPS (Fully Diluted)0.220.2010.0%Growth and Margin Analysis (%)Gross Profit Margin40.7%44.4%(370.0)bpSG&A as a % of Sales24.6%25.0%(40.0)bpR&D as a % of Sales4.1%4.6%(50.0)bpEBIT Margin12.0%14.8%(280.0)bpEBITDA Margin14.9%18.3%(340.0)bp |
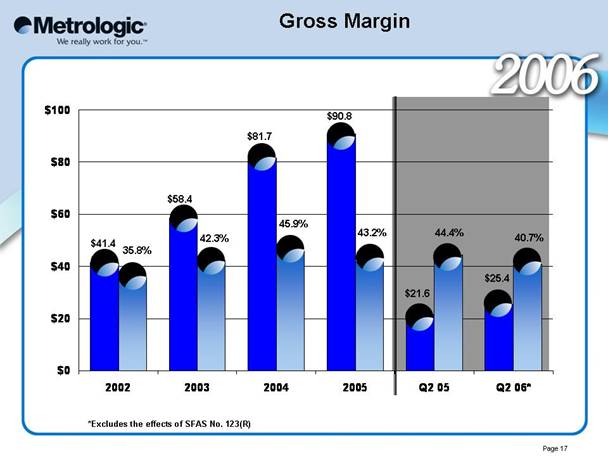
Gross Margin $41.4 $25.4 $21.6 $90.8 $81.7 $58.4 35.8% 42.3% 45.9% 43.2% 44.4% 40.7% *Excludes the effects of SFAS No. 123(R) Page 17 $0$20$40$60$80$1002002200320042005Q2 05Q2 06* |
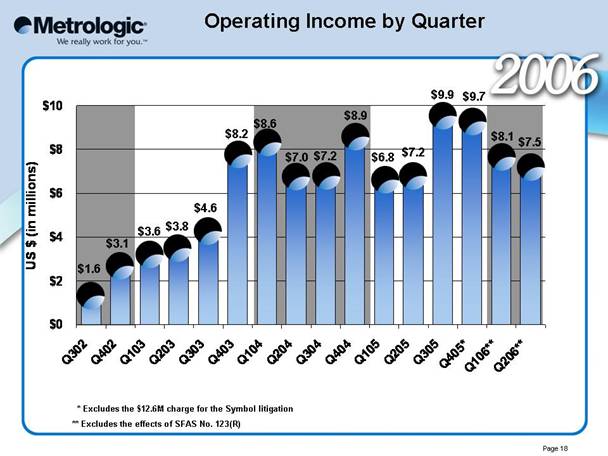
Operating Income by Quarter $1.6 $3.1 $3.6 $3.8 $4.6 $8.2 $8.6 $7.0 $7.2 $8.9 $6.8 $7.2 $9.9 $9.7 $8.1 * Excludes the $12.6M charge for the Symbol litigation ** Excludes the effects of SFAS No. 123(R) $7.5 Page 18 $0$2$4$6$8$10Q302Q402Q103Q203Q303 Q403Q104Q204Q304Q404Q105Q205Q305Q405*Q106**Q206**US $ (in millions) |
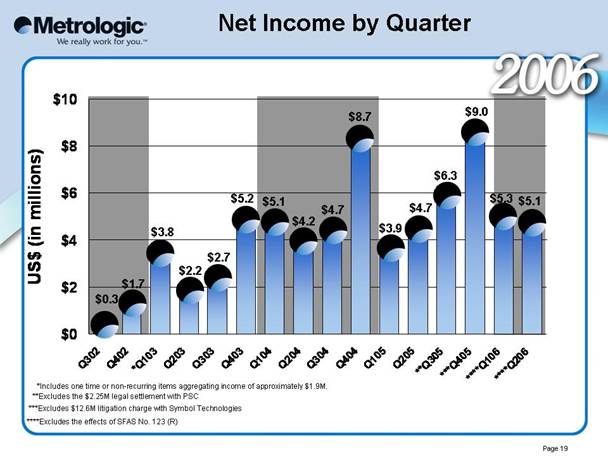
Net Income by Quarter *Includes one time or non-recurring items aggregating income of approximately $1.9M. **Excludes the $2.25M legal settlement with PSC ***Excludes $12.6M litigation charge with Symbol Technologies ****Excludes the effects of SFAS No. 123 (R) $1.7 $3.8 $2.2 $2.7 $5.2 $5.1 $4.2 $4.7 $8.7 $3.9 $0.3 $4.7 $6.3 $9.0 $5.3 $5.1 Page 19 $0$2$4$6$8$10Q302Q402*Q103Q203Q303Q403Q104Q204Q304Q404Q105Q205**Q305***Q405****Q106****Q206US$ (in millions) |
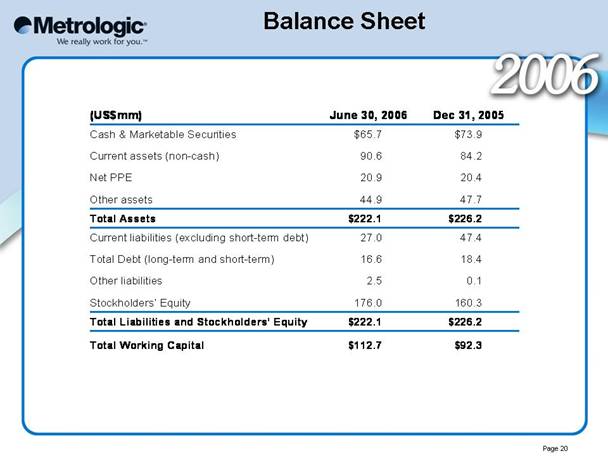
Balance Sheet Page 20 (US$mm)June 30, 2006Dec 31, 2005Cash& Marketable Securities$65.7$73.9Current assets (non-cash)90.684.2 Net PPE20.920.4Other assets44.947.7Total Assets$222.1$226.2Current liabilities(exc luding short-term debt)27.047.4Total Debt (long-term and short-term)16.618.4Other liabilities2.50.1Stockholders’ Equity176.0160.3Total Liabilities and Stockholders’ Equity$222.1$226.2TotalWorking Capital$112.7$92.3 |
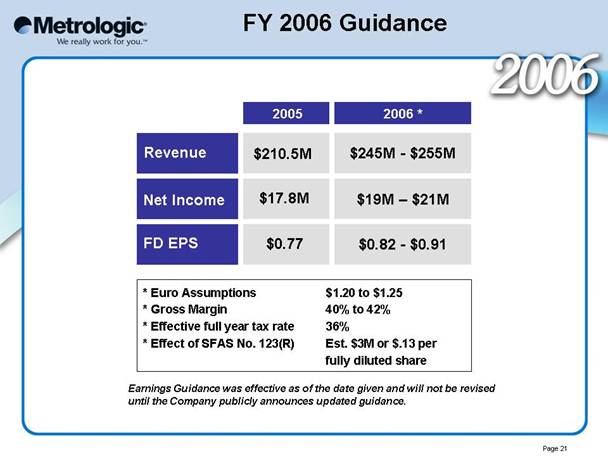
FY 2006 Guidance2005 * Euro Assumptions $1.20 to $1.25 * Gross Margin 40% to 42% * Effective full year tax rate 36% * Effect of SFAS No. 123(R) Est. $3M or $.13 per fully diluted share $210.5M $245M - $255M $19M – $21M $0.82 - $0.91 $17.8M $0.77 FD EPS Net Income Revenue 2006 * Earnings Guidance was effective as of the date given and will not be revised until the Company publicly announces updated guidance. Page 21 |

C. Harry Knowles Chairman of the Board Interim CEO |
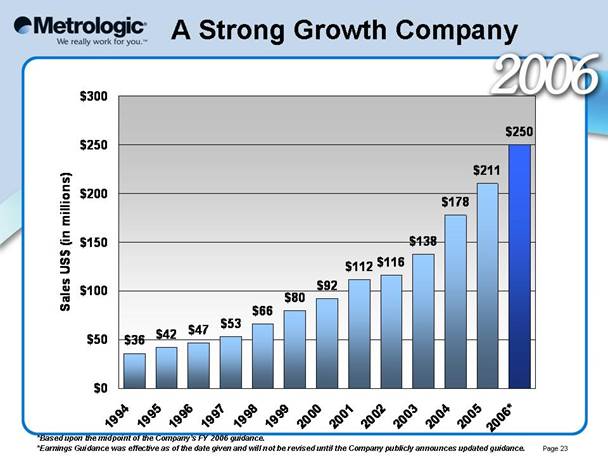
A Strong Growth Company *Based upon the midpoint of the Company’s FY 2006 guidance. *Earnings Guidance was effective as of the date given and will not be revised until the Company publicly announces updated guidance. Page 23 $36$42$47$53$66$80$92$112$116$138$178$211$250$0$50$100$150$200$250$3001994199519961997199819992000200120022003200420052006*Sales US$ (in millions) |