UNITED STATES
SECURITIES AND EXCHANGE COMMISSION
Washington, D.C. 20549
FORM N-CSR
CERTIFIED SHAREHOLDER REPORT OF REGISTERED
MANAGEMENT INVESTMENT COMPANIES
Investment Company Act file number | 811-05201 |
Thornburg Investment Trust
| (Exact name of registrant as specified in charter) |
C/O Thornburg Investment Management, Inc. 2300 N. Ridgetop Rd., Santa Fe, New Mexico | 87506 | |
| (Address of principal executive offices) | (Zip code) |
Garrett Thornburg, 2300 N. Ridgetop Rd., Santa Fe, New Mexico 87506
| (Name and address of agent for service) |
Registrant’s telephone number, including area code: 505-984-0200
Date of fiscal year end: September 30, 2009
Date of reporting period: March 31, 2009
| Item 1. | Reports to Stockholders |
The following annual reports are attached hereto, in order:
Thornburg Limited Term Municipal Fund
Thornburg California Limited Term Municipal Fund
Thornburg Intermediate Municipal Fund
Thornburg New Mexico Intermediate Municipal Fund
Thornburg New York Intermediate Municipal Fund
Thornburg Limited Term Income Funds
Thornburg Value Fund
Thornburg International Value Fund
Thornburg Core Growth Fund
Thornburg Investment Income Builder Fund
Thornburg Global Opportunities Fund
Thornburg International Growth Fund
Thornburg Strategic Income Fund

Important Information
The information presented in this report is current as of March 31, 2009. The managers’ views, portfolio holdings, and sector diversification are provided for the general information of the Fund’s shareholders; they are historical and subject to change. This material should not be deemed a recommendation to buy or sell any of the securities mentioned.
Investments in the Fund carry risks, including possible loss of principal. As with direct bond ownership, funds that invest in bonds are subject to certain risks including interest-rate risk, credit risk, and inflation risk. The principal value of bonds will fluctuate relative to changes in interest rates, decreasing when interest rates rise. Unlike bonds, bond funds have ongoing fees and expenses. Please see the Fund’s Prospectus for a discussion of the risks associated with an investment in the Fund. Investments in the Fund are not deposits or obligations of, or guaranteed or endorsed by, any bank, the Federal Deposit Insurance Corporation, the Federal Reserve Board or any government agency. There is no guarantee that the Fund will meet its investment objectives. The laddering strategy does not assure or guarantee better performance and cannot eliminate the risk of investment losses.
Performance data given at net asset value (NAV) does not take into account applicable sales charges. If the sales charges had been included, the performance would have been lower.
Minimum investments for Class I shares are higher than those for other classes. Class I shares may not be available to all investors.
Share Class | NASDAQ Symbol | Cusip | ||
| Class A | LTMFX | 885-215-459 | ||
| Class C | LTMCX | 885-215-442 | ||
| Class I | LTMIX | 885-215-434 |
Awards
Thornburg Limited Term Municipal Fund, Ranked #1 by Morningstar
Class I shares ranked #1 out of 65 funds in Morningstar’s Muni National Short category for the 10-year period ended 3/31/09. Class I shares ranked #23 out of 123 funds for five years and #53 out of 134 for one year. Class A shares ranked #11 out of 65 for the ten-year period ended 3/31/09; #46 out of 123 for five years; and #64 out of 134 for one year. Ranks are based on total returns without sales charge. Past performance does not guarantee future results.
© 2008 Morningstar, Inc. All Rights Reserved. The information contained herein: (1) is proprietary to Morningstar and/or its content providers; (2) may not be copied or distributed; and (3) is not warranted to be accurate, complete or timely. Neither Morningstar nor its content providers are responsible for any damages or losses arising from any use of this information.
Awarded the Lipper Performance Achievement Certificate for the ten-year period ended 12/31/08
Class I shares ranked #1 out of 25 funds in the Short-Intermediate Municipal Debt Funds category based on total returns. The Fund did not win the award for other time periods.
LIPPER and the LIPPER Corporate Marks are proprietary trademarks of Lipper, a Thomson Reuters Company. © 2009 THOMSON REUTERS. All rights reserved. Any copying, republication or redistribution of Lipper Content is expressly prohibited without the prior written consent of Lipper.
Lipper’s 2008
Best Fixed-Income Fund Family
Thornburg Investment Management ranked #1 out of 41 eligible firms in Lipper, Inc.’s fixed income large firm universe for the three-year period ended 12/31/07, based on risk-adjusted returns. Past performance does not guarantee future results.
Lipper’s large firm universe is comprised of fund families with more than $28 billion in total net assets. Only fund families with at least five bond funds were eligible. Risk-adjusted returns were calculated with dividends reinvested and without sales charges. We did not win this award in 2009.
Glossary
Barclays Capital Five-Year Municipal Bond Index – A rules-based, market-value-weighted index of the tax-exempt bond market. To be included in the index, bonds must have a minimum credit rating of Baa. The approximate maturity of the municipal bonds in the index is five years.
Unless otherwise noted, index returns reflect the reinvestment of income dividends and capital gains, if any, but do not reflect fees, brokerage commissions or other expenses of investing. Investors may not make direct investments into any index.
Alternative Minimum Tax (AMT) – A federal tax aimed at ensuring that high-income individuals, estates, trusts, and corporations pay a minimal level income tax. For individuals, the AMT is calculated by adding tax preference items to regular taxable income.
Distribution Rate – The distribution rate is calculated by taking the sum of the month’s total distribution factors and dividing this sum by a 30-day period and annualizing to a 360-day year. The value is then divided by the ending Net Asset Value (NAV) to arrive at the annualized distribution yield. The yield is calculated on a periodic basis and is subject to change depending on the Fund’s NAV and current distributions.
This page is not part of the Semi-Annual Report. 3
Important Information
Continued
Duration – The weighted maturity of a bond’s cash flows. Duration measures the price sensitivity of a bond for a given change in interest rates. Bonds with longer durations experience greater price volatility than bond with shorter durations.
General Obligation (GO) Bonds – A municipal bond secured by the pledge of the issuer’s full faith, credit, and taxing power rather than the revenue from a given project.
Leverage – The amount of debt used to finance a firm’s assets. A firm with significantly more debt than equity is considered to be highly leveraged.
Pre-Refunded Bond – A type of municipal bond that has been escrowed or collateralized either by direct obligations guaranteed by the U.S. government, or by other types of securities. The escrow account is structured so that these refunded bonds are to be called at the first possible call date. Such bonds, if escrowed with securities guaranteed by the U.S. government, have little if any credit risk.
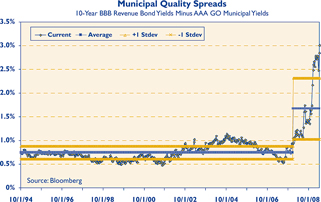
Quality Spread – The difference between the yields of securities with different quality ratings.
Revenue Bond – A bond on which the debt service is payable solely from the revenue generated from the operation of the project being financed or a category of facilities, or from other non-tax sources.
SEC Yield – SEC Yield is computed in accordance with SEC standards measuring the net investment income per share over a specified 30-day period expressed as a percentage of the maximum offering price of the Fund’s shares at the end of the period.
Tax-Backed Bonds – A broad category of bonds that are secured by taxes levied by the obligor.
U.S. Treasury Securities – U.S. Treasury securities, such as bills, notes and bonds, are negotiable debt obligations of the U.S. government. These debt obligations are backed by the “full faith and credit” of the government and issued at various schedules and maturities. Income from Treasury securities is exempt from state and local, but not federal income taxes.
Yield Spread – The difference in yield, at a given time, between two bonds or between different segments of the bond market.
4 This page is not part of the Semi-Annual Report.
Thornburg Limited Term Municipal Fund
At Thornburg, our approach to fixed-income management is based on the premise that investors in our bond funds seek preservation of capital along with an attractive, relatively stable yield. While aggressive bond strategies may generate stronger returns when the market is turning a blind eye towards risk, they usually fail to stack up over longer periods of time. Our patience and diligence was recognized by Lipper, in 2008 with the Best Fixed-Income Fund Family Award.
We apply time-tested techniques to manage risk and provide attractive returns. These include:
| • | Building a laddered portfolio. Laddering has been shown over time to mitigate price and interest rate risk. |
| • | Investing on a cash-only basis without using leverage. While leveraged strategies may enhance returns when market conditions are favorable, they can quickly compound losses when sentiment shifts. |
| • | Conducting in-depth fundamental research on each issue and actively monitoring positions for subsequent credit events. |
| • | Diversifying among a large number of generally high-quality bonds. |
IMPORTANT
PERFORMANCE INFORMATION
Performance data shown represents past performance and is no guarantee of future results. Investment return and principal value will fluctuate so shares, when redeemed, may be worth more or less than their original cost. Current performance may be lower or higher than quoted. For performance current to the most recent month end, visit thornburg.com.
The maximum sales charge for the Fund’s Class A shares is 1.50%. The total annual fund operating expense of Class A shares is 0.89%, as disclosed in the most recent Prospectus.
AVERAGE ANNUAL TOTAL RETURNS
For periods ended March 31, 2009
| 1 Yr | 3 Yrs | 5 Yrs | 10 Yrs | Since Inception | |||||||||||
A Shares (Incep: 9/28/84) | |||||||||||||||
Without Sales Charge | 2.50 | % | 3.47 | % | 2.47 | % | 3.52 | % | 5.51 | % | |||||
With Sales Charge | 0.94 | % | 2.96 | % | 2.16 | % | 3.36 | % | 5.44 | % |
30-DAY YIELDS, A SHARES
As of March 31, 2009
Annualized | SEC Yield | SEC Taxable Equivalent Yield | ||
| 3.42% | 2.27% | 3.49% |
SEC Taxable Equivalent Yields assume a 35.0% marginal federal tax rate. Portions of the income of the Fund may be subject to the alternative minimum tax.
KEY PORTFOLIO ATTRIBUTES
As of March 31, 2009
Average Credit Quality | AA | |
Number of Bonds | 521 | |
Duration | 3.7 Yrs | |
Average Maturity | 4.6 Yrs | |
See the entire portfolio in the Schedule of Investments on page 21.
This page is not part of the Semi-Annual Report. 5
THORNBURG LIMITED TERM MUNICIPAL FUND VERSUS
LIPPER TAX-EXEMPT MONEY MARKET FUNDS AVERAGE
Class A shares as of March 31, 2009
We are often asked to compare Thornburg Limited Term Municipal Fund to money market fund returns. Municipal bond funds are not an exact substitute for money market funds. These investments have certain differences, which are summarized below. Investors in the Thornburg Limited Term Municipal Fund took more risk than tax-exempt money market fund investors to earn their higher returns.
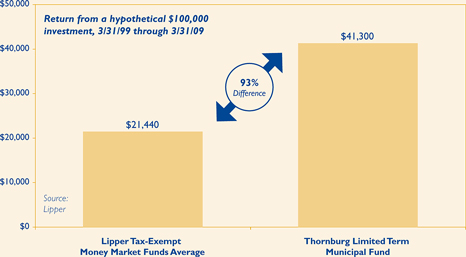
Past performance does not guarantee future results. Performance data above does not include the 1.50% sales charge for Class A shares. If the sales charge had been included, returns would have been lower. Returns shown are minus the initial investment.
Investors in municipal bond funds may experience more volatility than those in comparable money market funds. There are also differences in fees and expenses.
Investors in the Thornburg Limited Term Municipal Fund took more risk than money market investors to earn their higher returns including reinvestment risk, credit risk, and inflation risk. Unlike money market funds, the prices of bonds fluctuate relative to changes in interest rates, with principal values decreasing when interest rates rise and increasing when interest rates fall. Generally, money market funds seek to maintain an investment portfolio with an average maturity of 90 days or less. Thornburg Limited Term Municipal Fund has an average maturity of normally less than five years. Interest dividends paid by the Fund or by tax- exempt money market funds are generally exempt from federal income tax (interest dividends may be subject to AMT). Income sourced from state of residency is generally exempt from state income tax.
Money market funds seek to preserve the value per share at $1.00, whereas, the Thornburg Limited Term Municipal Fund’s net asset value changes daily. It is possible to lose money when investing in either the Thornburg Limited Term Municipal Fund or a tax-exempt money market fund. Neither are insured by the FDIC or any other government agency.
Lipper Tax-Exempt Money Market Funds Average is an arithmetic average of the total return of all tax-exempt money market mutual funds. You cannot invest in a category average.
6 This page is not part of the Semi-Annual Report.

Thornburg Limited Term Municipal Fund
March 31, 2009
Table of Contents | ||
| 8 | ||
| 11 | ||
| 12 | ||
| 13 | ||
| 14 | ||
| 18 | ||
| 21 | ||
| 36 | ||
| 37 | ||
This report is certified under the Sarbanes-Oxley Act of 2002, which requires that public companies, including mutual funds, affirm that the information provided in their annual and semiannual shareholder reports fully and fairly represents their financial position.
Certified Semi-Annual Report 7
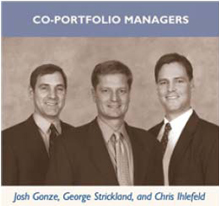
George Strickland Co-Portfolio Manager | April 21, 2009
| |
Dear Fellow Shareholder:
| ||
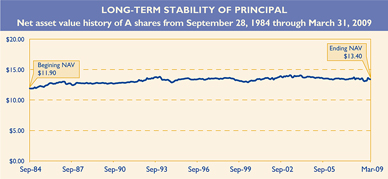
| We are pleased to present the Semi-Annual Report for the Thornburg Limited Term Municipal Fund. The net asset value of the Class A shares increased by 18 cents to $13.40 during the six months ended March 31, 2009. If you were with us for the entire period, you received dividends of 24.1 cents per share. If you reinvested your dividends, you received 24.2 cents per share. Dividends per share were lower for Class C shares and higher for Class I shares to account for varying class-specific expenses. | ||
Josh Gonze Co-Portfolio Manager | The last six months have been an extremely volatile period for municipal bond prices. It started in September and October of 2008 with the Lehman Brothers bankruptcy which led many investors to shun taxable and tax-free money market funds. The money market funds were forced to dump their investments in order to meet redemptions, which caused the yield on tax-free money market securities to spike. Since hedge funds and other leveraged investors finance their purchases of long-term bonds with money market securities, their borrowing costs shot up so they had to sell long-term bonds in order to deleverage. This placed significant selling pressure on the municipal marketplace and sent yields up (and prices lower) in a precipitous fashion.
| |
| From mid-September to mid-October of 2008, the yield on AAA-rated municipal bonds rose from 2.93% to 3.68%. Over that time period, yields went higher almost every day. From mid-October on, the market for the highest quality bonds settled down quite a bit, but prices for all other bonds have been quite variable. For instance, the yield spread between a ten-year AAA- rated general obligation bond and a BBB-rated revenue bond averaged 0.75% from May 1991 to December 2007. That average yield spread surged to 1.67% from January 2008 to April 2009. As of April 15, 2009, the AAA to BBB yield spread stood at 3.01%. | ||
Christopher Ihlefeld Co-Portfolio Manager | Investors have been shunning risk of all types and that is certainly true in the municipal bond market. However, there are other reasons that municipal quality spreads are at unprecedented levels. Large monoline bond insurers such as MBIA, AMBAC and FGIC were in the business of arbitraging bond spreads. If a bond’s spread to the AAA yield curve got too wide, they would typically step in and charge the issuer a premium for an insurance policy that got them a AAA rating. Bonds that received a AAA rating through insurance didn’t quite get an issuer the same interest rate as a “natural” AAA bond such as a bond issued by the State of Maryland, but it got them very close. In this way, the bond insurers were the policemen of the municipal | |
| ||


8 Certified Semi-Annual Report
spread markets. Instead of writing speeding tickets, they wrote insurance policies that got issuers back in line with AAA rates. Now that investors’ confidence in the bond insurers has been justifiably shattered, insured bonds typically trade at very wide spreads based upon market views of the underlying obligor. In effect, there are no policemen anymore.
The market, which was becoming more generic and homogenous in nature, is now fractured and harder to analyze. Many traders used to glance at a bond, see the MBIA insurance, and work up a quick bid. Many of those traders are now out of business. Traders and portfolio managers today have to look into covenants, security provisions, margins and balance sheets before they can decide what a bond is worth. These are skills that we, at Thornburg Investment Management, have never gotten out of the habit of using.
The consequences of faulty or incomplete analysis are more severe today. The market is adapting to the new reality, but while it does, fear and opportunity are at exaggerated levels. Liquidity is harder to find, and any bond that is not straightforward and easy to analyze is trading at a large yield premium to widely recognized bonds. The market is greatly favoring bonds pre-refunded in Treasury securities and large general obligation issuers over high and medium quality issuers of tax-backed and revenue bonds. In other words, it is a bond picker’s paradise. For the price of a little research and market knowledge, great value can be extracted. We have not changed our management style, but we are spending more time looking into “story” bonds and have slightly decreased the average credit rating of the portfolio as we have found good values in bonds rated below AAA.
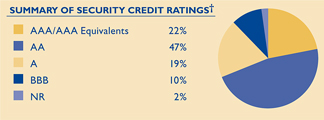
Investors do have some legitimate reasons to be shunning risk these days. The average high yield municipal bond fund lost over 25% last year. The economy is basically in shambles in much of the country and collectively, the 50 states are currently grappling with $100 billion of projected deficits in their 2010 fiscal years. However, we see some reasons for optimism. Investment grade municipal bonds have an impressive long-term track record. Standard & Poor’s recently updated their study showing ten-year cumulative default rates that averaged 0.13%. We expect defaults to be somewhat more frequent going forward, but there are counterbalancing factors that could limit any rise in the default rate. Many state and local governments set aside large reserve balances when times were good so that they can draw upon those resources today. Others are rebalancing their budgets frequently and are cutting spending aggressively. Some governments are doing both while raising taxes and fees, and all are making use of the federal largess in the $787 billion American Recovery and Reinvestment Act. As we scrutinize municipal finances, we see many issuers that are standing up to these challenging times. There are a few that may not, and we will strive to continue avoiding their bonds in order to protect the portfolio. It is a very important time for careful diligence and diversification of investment portfolios. Your Fund is broadly diversified and 87% invested in bonds rated A or above by at least one of the major rating agencies.
Your Thornburg Limited Term Municipal Fund is a laddered portfolio of over 520 municipal obligations from 48 states. We ladder the maturity dates of the bonds in your portfolio so that some of the bonds are scheduled to mature during each of the coming years. Laddering intermediate bonds accomplishes two goals. First, the staggered bond maturities contained in a ladder defuse interest-rate risk and dampen the Fund’s price volatility. Second, laddering gives the Fund a steady cash flow stream from maturing bonds to reinvest toward the top of the
% of Portfolio Maturing | Cumulative % Maturing | |
| 1 year = 14.8% | Year 1 = 14.8% | |
| 1 to 2 years = 8.7% | Year 2 = 23.5% | |
| 2 to 3 years = 9.5% | Year 3 = 33.0% | |
| 3 to 4 years = 9.5% | Year 4 = 42.5% | |
| 4 to 5 years = 9.7% | Year 5 = 52.2% | |
| 5 to 6 years = 9.2% | Year 6 = 61.4% | |
| 6 to 7 years = 9.5% | Year 7 = 70.9% | |
| 7 to 8 years = 11.1% | Year 8 = 82.0% | |
| 8 to 9 years = 9.4% | Year 9 = 91.4% | |
| Over 9 years = 8.6% | Over 9 Years = 100.0% |
Percentages can and do vary. Data as of 3/31/09.
Certified Semi-Annual Report 9
Letter to Shareholders
Continued
ladder where yields are typically higher. The chart on the previous page describes the percentages of your Fund’s bond portfolio maturing in each of the coming years.
The Class A shares of your Fund produced a total return of 3.21% over the six-month period ended March 31, 2009, compared to a 6.20% return for the Barclays Capital Five-Year Municipal Bond Index. Over the last six months, pre-refunded and general obligation bonds from large issuers generally performed better than a diversified portfolio of revenue and tax-backed bonds from smaller issuers. Since the Fund predominantly holds bonds from smaller and mid-sized issuers, the Fund underperformed the index over the last six months.
Historically, our practice of laddering a diversified portfolio of short and intermediate maturity municipal bonds has allowed your Fund to perform consistently well in varying interest rate environments. Thank you for investing in Thornburg Limited Term Municipal Fund.
Sincerely,
 |  |  | ||
| George Strickland | Josh Gonze | Christopher Ihlefeld | ||
| Co-Portfolio Manager | Co-Portfolio Manager | Co-Portfolio Manager | ||
| Managing Director | Managing Director | Managing Director |
The matters discussed in this report may constitute forward-looking statements made pursuant to the safe harbor provisions of the Securities Litigation Reform Act of 1995. These include any advisor or portfolio manager prediction, assessment, analysis or outlook for individual securities, industries, investment styles, market sectors and/or markets. These statements involve risks and uncertainties. In addition to the general risks described for each fund in its current prospectus, other factors bearing on these reports include the accuracy of the advisor’s or portfolio manager’s forecasts and predictions, the appropriateness of the investment strategies designed by the advisor or portfolio manager and the ability of the advisor or portfolio manager to implement their strategies efficiently and successfully. Any one or more of these factors, as well as other risks affecting the securities markets generally, could cause the actual results of any fund to differ materially as compared to its benchmarks.
10 Certified Semi-Annual Report
| STATEMENT OF ASSETS AND LIABILITIES | ||
| Thornburg Limited Term Municipal Fund | March 31, 2009 (Unaudited) | |
ASSETS | ||||
Investments at value (cost $1,452,237,324) (Note 2) | $ | 1,459,243,913 | ||
Cash | 192,517 | |||
Receivable for investments sold | 515,000 | |||
Receivable for fund shares sold | 13,418,110 | |||
Interest receivable | 17,304,602 | |||
Prepaid expenses and other assets | 53,383 | |||
Total Assets | 1,490,727,525 | |||
LIABILITIES | ||||
Payable for securities purchased | 27,105,550 | |||
Payable for fund shares redeemed | 1,748,673 | |||
Payable to investment advisor and other affiliates (Note 3) | 816,587 | |||
Accounts payable and accrued expenses | 87,013 | |||
Dividends payable | 989,608 | |||
Total Liabilities | 30,747,431 | |||
NET ASSETS | $ | 1,459,980,094 | ||
NET ASSETS CONSIST OF: | ||||
Distribution in excess of net investment income | $ | (3,894 | ) | |
Net unrealized appreciation on investments | 7,006,589 | |||
Accumulated net realized gain (loss) | (5,181,291 | ) | ||
Net capital paid in on shares of beneficial interest | 1,458,158,690 | |||
| $ | 1,459,980,094 | |||
NET ASSET VALUE: | ||||
Class A Shares: | ||||
Net asset value and redemption price per share ($779,736,192 applicable to 58,192,229 shares of beneficial interest outstanding - Note 4) | $ | 13.40 | ||
Maximum sales charge, 1.50% of offering price | 0.20 | |||
Maximum offering price per share | $ | 13.60 | ||
Class C Shares: | ||||
Net asset value and offering price per share * ($130,471,863 applicable to 9,719,337 shares of beneficial interest outstanding - Note 4) | $ | 13.42 | ||
Class I Shares: | ||||
Net asset value, offering and redemption price per share ($549,772,039 applicable to 41,024,539 shares of beneficial interest outstanding - Note 4) | $ | 13.40 | ||
| * | Redemption price per share is equal to net asset value less any applicable contingent deferred sales charge. |
See notes to financial statements.
Certified Semi-Annual Report 11
| STATEMENT OF OPERATIONS | ||
| Thornburg Limited Term Municipal Fund | Six Months Ended March 31, 2009 (Unaudited) | |
INVESTMENT INCOME: | ||||
Interest income (net of premium amortized of $3,101,431) | $ | 29,104,638 | ||
EXPENSES: | ||||
Investment advisory fees (Note 3) | 2,693,893 | |||
Administration fees (Note 3) | ||||
Class A Shares | 447,901 | |||
Class C Shares | 68,500 | |||
Class I Shares | 117,764 | |||
Distribution and service fees (Note 3) | ||||
Class A Shares | 895,802 | |||
Class C Shares | 550,388 | |||
Transfer agent fees | ||||
Class A Shares | 147,741 | |||
Class C Shares | 27,517 | |||
Class I Shares | 71,370 | |||
Registration and filing fees | ||||
Class A Shares | 14,476 | |||
Class C Shares | 10,285 | |||
Class I Shares | 22,524 | |||
Custodian fees (Note 3) | 74,965 | |||
Professional fees | 37,779 | |||
Accounting fees | 17,873 | |||
Trustee fees | 18,005 | |||
Other expenses | 40,041 | |||
Total Expenses | 5,256,824 | |||
Less: | ||||
Distribution fees waived (Note 3) | (275,194 | ) | ||
Fees paid indirectly (Note 3) | (3,694 | ) | ||
Net Expenses | 4,977,936 | |||
Net Investment Income | 24,126,702 | |||
REALIZED AND UNREALIZED GAIN (LOSS) | ||||
Net realized gain (loss) on investments sold | 128,923 | |||
Net change in unrealized appreciation (depreciation) of investments | 16,235,355 | |||
Net Realized and Unrealized Gain | 16,364,278 | |||
Net Increase in Net Assets Resulting From Operations | $ | 40,490,980 | ||
See notes to financial statements.
12 Certified Semi-Annual Report
| STATEMENTS OF CHANGES IN NET ASSETS | ||
| Thornburg Limited Term Municipal Fund | March 31, 2009 | |
| Six Months Ended March 31, 2009* | Year Ended September 30, 2008 | |||||||
INCREASE (DECREASE) IN NET ASSETS FROM: | ||||||||
OPERATIONS: | ||||||||
Net investment income | $ | 24,126,702 | $ | 41,145,120 | ||||
Net realized gain on investments | 128,923 | 762,038 | ||||||
Increase (Decrease) in unrealized appreciation (depreciation) of investments | 16,235,355 | (26,391,583 | ) | |||||
Net Increase (Decrease) in Net Assets Resulting from Operations | 40,490,980 | 15,515,575 | ||||||
DIVIDENDS TO SHAREHOLDERS: | ||||||||
From net investment income | ||||||||
Class A Shares | (12,987,921 | ) | (24,624,429 | ) | ||||
Class C Shares | (1,832,534 | ) | (2,909,085 | ) | ||||
Class I Shares | (9,306,247 | ) | (13,611,606 | ) | ||||
FUND SHARE TRANSACTIONS (NOTE 4): | ||||||||
Class A Shares | 65,312,185 | 22,835,685 | ||||||
Class C Shares | 29,131,250 | 15,492,880 | ||||||
Class I Shares | 106,568,977 | 142,907,714 | ||||||
Net Increase in Net Assets | 217,376,690 | 155,606,734 | ||||||
NET ASSETS: | ||||||||
Beginning of period | 1,242,603,404 | 1,086,996,670 | ||||||
End of period | $ | 1,459,980,094 | $ | 1,242,603,404 | ||||
| * | Unaudited. |
See notes to financial statements.
Certified Semi-Annual Report 13
| NOTES TO FINANCIAL STATEMENTS | ||
| Thornburg Limited Term Municipal Fund | March 31, 2009 (Unaudited) | |
NOTE 1 – ORGANIZATION
Thornburg Limited Term Municipal Fund (the “Fund”) (formerly Thornburg Limited Term Municipal Fund – National Portfolio) is a diversified series of Thornburg Investment Trust (the “Trust”). The Trust is organized as a Massachusetts business trust under a Declaration of Trust dated June 3, 1987 and is registered as a diversified, open-end management investment company under the Investment Company Act of 1940, as amended. The Trust is currently issuing thirteen series of shares of beneficial interest in addition to those of the Fund: Thornburg California Limited Term Municipal Fund, Thornburg New York Intermediate Municipal Fund, Thornburg New Mexico Intermediate Municipal Fund, Thornburg Intermediate Municipal Fund, Thornburg Limited Term U.S. Government Fund, Thornburg Limited Term Income Fund, Thornburg Value Fund, Thornburg International Value Fund, Thornburg Core Growth Fund, Thornburg Investment Income Builder Fund, Thornburg Global Opportunities Fund, Thornburg International Growth Fund, and Thornburg Strategic Income Fund. Each series is considered to be a separate entity for financial reporting and tax purposes and bears expenses directly attributable to it. The Fund’s primary investment objective is to obtain as high a level of current income exempt from federal individual income taxes as is consistent, in the view of the Fund’s investment advisor, with the preservation of capital. The Fund’s secondary objective is to reduce expected changes in its share price compared to longer intermediate and long-term bond portfolios.
The Fund currently offers three classes of shares of beneficial interest: Class A, Class C, and Institutional Class (Class I) shares. Each class of shares of the Fund represents an interest in the same portfolio of investments, except that (i) Class A shares are sold subject to a front-end sales charge collected at the time the shares are purchased and bear a service fee, (ii) Class C shares are sold at net asset value without a sales charge at the time of purchase, but are subject to a contingent deferred sales charge upon redemption within one year of purchase, and bear both a service fee and a distribution fee, (iii) Class I shares are sold at net asset value without a sales charge at the time of purchase, and (iv) the respective classes may have different reinvestment privileges and conversion rights. Additionally, the Fund may allocate among its classes certain expenses, to the extent allowable to specific classes, including transfer agent fees, government registration fees, certain printing and postage costs, and administrative and legal expenses. Currently, class specific expenses of the Fund are limited to service and distribution fees, administration fees, and certain registration and transfer agent expenses.
NOTE 2 – SIGNIFICANT ACCOUNTING POLICIES
Significant accounting policies of the Trust are as follows:
Valuation of Investments: Debt obligations have a primary market over the counter and are valued by an independent pricing service approved by the Trustees of the Trust. The pricing service ordinarily values debt obligations at quoted bid prices. When quotations are not available, debt obligations are valued at evaluated prices determined by the pricing service using methods which include consideration of yields or prices of debt obligations of comparable quality, type of issue, coupon, maturity, and rating, and indications as to value from dealers and general market conditions. Short-term obligations having remaining maturities of 60 days or less are valued at amortized cost, which approximates market value.
In any case where a pricing service fails to provide a price for a debt obligation held by the Fund, the valuation and pricing committee determines a fair value for the obligation using procedures approved by the Trustees. Additionally, in any case where management believes that a price provided by a pricing service for a debt obligation may be unreliable, the valuation and pricing committee decides whether or not to use the pricing service’s valuation or to determine a fair value for the obligation.
In determining fair value for any portfolio security or other investment, the valuation and pricing committee seeks to determine the amount that an owner of the investment might reasonably expect to receive upon a sale of the investment. However, because fair value prices are estimated prices, the valuation and pricing committee’s determination of fair value for an investment may differ from the value that would be realized by the Fund upon a sale of the investment, and that difference could be material to the Fund’s financial statements. The valuation and pricing committee’s determination of fair value for an investment may also differ from the prices obtained by other persons (including other mutual funds) for the investment.
Valuation Measurements: Various inputs are used in determining the value of the Fund’s investments. These inputs are summarized in the three levels listed below.
Level 1: Quoted prices in active markets for identical investments.
Level 2: Other significant observable inputs (including quoted prices for similar investments, interest rates, prepayment rates, credit risk, etc.).
Level 3: Significant unobservable inputs (including the Fund’s own assumptions in determining the fair value of investments).
The following table displays a summary of the inputs used to value the Fund’s net assets as of March 31, 2009. In any instance when valuation inputs from more than one level are used to determine the fair value of a specific investment, the investment is placed in the level of the table based upon the lowest level input that is significant in determining the fair value of the investment:
Valuation Inputs | Investments in Securities | Investments in Other Financial Instruments* | ||||
Level 1 - Quoted Prices in Active Markets for Identical Assets | $ | — | $ | — | ||
Level 2 - Other Significant Observable Inputs | 1,459,243,913 | — | ||||
Level 3 - Significant Unobservable Inputs | — | — | ||||
Total | $ | 1,459,243,913 | $ | — | ||
| * | Other financial instruments include investments not reflected in the Schedule of Investments, such as futures, forwards and swap contracts, which are valued at the unrealized appreciation (depreciation) on the instrument. |
14 Certified Semi-Annual Report
| NOTES TO FINANCIAL STATEMENTS, CONTINUED | ||
| Thornburg Limited Term Municipal Fund | March 31, 2009 (Unaudited) | |
Federal Income Taxes: It is the policy of the Trust to comply with the provisions of the Internal Revenue Code applicable to “regulated investment companies” and to distribute to shareholders substantially all taxable (if any) and tax exempt income of the Fund. Therefore, no provision for federal income tax is required.
When-Issued and Delayed Delivery Transactions: The Trust may engage in when-issued or delayed delivery transactions. To the extent the Trust engages in such transactions, it will do so for the purpose of acquiring portfolio securities consistent with the Fund’s investment objectives and not for the purpose of investment leverage or to speculate on interest rate and/or market changes. At the time the Trust makes a commitment to purchase a security on a when-issued or delayed delivery basis, the Fund will record the transaction and reflect the value in determining its net asset value. When effecting such transactions, assets of an amount sufficient to make payment for the portfolio securities to be purchased will be segregated on the Fund’s records on the trade date. Securities purchased on a when-issued or delayed delivery basis do not earn interest until the settlement date.
Dividends: Net investment income of the Fund is declared daily as a dividend on shares for which the Fund has received payment. Dividends are paid monthly and are reinvested in additional shares of the Fund at net asset value per share at the close of business on the dividend payment date, or at the shareholder’s option, paid in cash. Net realized capital gains, to the extent available, will be distributed at least annually.
General: Securities transactions are accounted for on a trade date basis. Interest income is accrued as earned. Premiums and discounts on securities purchased are amortized to call dates or maturity dates of the respective securities. Realized gains and losses from the sale of securities are recorded on an identified cost basis. Net investment income (other than class specific expenses) and realized and unrealized gains and losses are allocated daily to each class of shares based upon the relative net asset value of outstanding shares (or the value of the dividend-eligible shares, as appropriate) of each class of shares at the beginning of the day (after adjusting for the current capital shares activity of the respective class). Expenses common to all funds are allocated among the funds comprising the Trust based upon their relative net asset values or other appropriate allocation methods.
Guarantees and Indemnifications: Under the Trust’s organizational documents, its officers and Trustees are indemnified against certain liabilities arising out of the performance of their duties to the Fund. Additionally, in the normal course of business the Trust enters into contracts with service providers that contain general indemnification clauses. The Trust’s maximum exposure under these arrangements is unknown. However, based on experience, the Trust expects the risk of loss to be remote.
Use of Estimates: The preparation of financial statements, in conformity with generally accepted accounting principles, requires management to make estimates and assumptions that affect the reported amounts of assets and liabilities and the disclosure of contingent assets and liabilities at the date of the financial statements and the reported amounts of increases and decreases in net assets from operations during the reporting period. Actual results could differ from those estimates.
NOTE 3 – INVESTMENT ADVISORY FEE AND OTHER TRANSACTIONS WITH AFFILIATES
Pursuant to an investment advisory agreement, Thornburg Investment Management, Inc. (the “Advisor”) serves as the investment advisor and performs services to the Fund for which the fees are payable at the end of each month. For the six months ended March 31, 2009, these fees were payable at annual rates ranging from .50 of 1% to .225 of 1% per annum of the average daily net assets of the Fund depending on the Fund’s asset size. The Trust also has entered into administrative services agreements with the Advisor, whereby the Advisor will perform certain administrative services for the shareholders of each class of the Fund’s shares, and for which fees will be payable at an annual rate of up to .125 of 1% per annum of the average daily net assets attributable to each class of shares.
The Trust has an underwriting agreement with Thornburg Securities Corporation (the “Distributor,” an affiliate of the Advisor), which acts as the distributor of the Fund’s shares. For the six months ended March 31, 2009, the Distributor has advised the Fund that it earned commissions aggregating $5,422 from the sale of Class A shares, and collected contingent deferred sales charges aggregating $8,650 from redemptions of Class C shares of the Fund.
Certified Semi-Annual Report 15
| NOTES TO FINANCIAL STATEMENTS, CONTINUED | ||
| Thornburg Limited Term Municipal Fund | March 31, 2009 (Unaudited) | |
Pursuant to a service plan under Rule 12b-1 of the Investment Company Act of 1940, the Fund may reimburse to the Advisor an amount not to exceed .25 of 1% per annum of the average daily net assets attributable to each class of shares of the Fund for payments made by the Advisor to securities dealers and other financial institutions to obtain various shareholder and distribution related services. The Advisor may pay out of its own resources additional expenses for distribution of the Fund’s shares.
The Trust has also adopted distribution plans pursuant to Rule 12b-1, applicable only to the Fund’s Class C shares under which the Fund compensates the Distributor for services in promoting the sale of Class C shares of the Fund at an annual rate of up to .75 of 1% per annum of the average daily net assets attributable to Class C shares. Total fees incurred by the Distributor for each class of shares of the Fund under their respective Service and Distribution Plans and Class C distribution fees waived by the Distributor for the six months ended March 31, 2009, are set forth in the Statement of Operations. Distribution fees in the amount of $275,194 were waived for Class C shares.
The Trust has an agreement with the custodian bank to indirectly pay a portion of the custodian’s fees through credits earned by the Fund’s cash on deposit with the bank. This deposit agreement is an alternative to overnight investments. Custodial fees have been adjusted to reflect amounts that would have been paid without this agreement, with a corresponding adjustment reflected as fees paid indirectly in the Statement of Operations. For the six months ended March 31, 2009, fees paid indirectly were $3,694.
Certain officers and Trustees of the Trust are also officers and/ or directors of the Advisor and Distributor. The compensation of independent Trustees is borne by the Trust.
NOTE 4 – SHARES OF BENEFICIAL INTEREST
At March 31, 2009, there were an unlimited number of shares of beneficial interest authorized. Transactions in shares of beneficial interest were as follows:
| �� | Six Months Ended March 31, 2009 (Unaudited) | Year Ended September 30, 2008 (Audited) | ||||||||||||
| Shares | Amount | Shares | Amount | |||||||||||
Class A Shares | ||||||||||||||
Shares sold | 10,636,787 | $ | 141,869,309 | 10,565,297 | $ | 142,941,921 | ||||||||
Shares issued to shareholders in reinvestment of dividends | 688,232 | 9,163,194 | 1,285,615 | 17,344,279 | ||||||||||
Shares repurchased | (6,482,464 | ) | (85,720,318 | ) | (10,153,413 | ) | (137,450,515 | ) | ||||||
Net Increase (Decrease) | 4,842,555 | $ | 65,312,185 | 1,697,499 | $ | 22,835,685 | ||||||||
Class C Shares | ||||||||||||||
Shares sold | 3,090,078 | $ | 41,324,563 | 2,274,026 | $ | 30,831,860 | ||||||||
Shares issued to shareholders in reinvestment of dividends | 89,019 | 1,187,468 | 143,526 | 1,939,419 | ||||||||||
Shares repurchased | (1,008,666 | ) | (13,380,781 | ) | (1,274,574 | ) | (17,278,399 | ) | ||||||
Net Increase (Decrease) | 2,170,431 | $ | 29,131,250 | 1,142,978 | $ | 15,492,880 | ||||||||
Class I Shares | ||||||||||||||
Shares sold | 15,776,370 | $ | 210,207,637 | 16,181,603 | $ | 218,944,840 | ||||||||
Shares issued to shareholders in reinvestment of dividends | 581,862 | 7,750,453 | 797,599 | 10,754,694 | ||||||||||
Shares repurchased | (8,417,547 | ) | (111,389,113 | ) | (6,409,073 | ) | (86,791,820 | ) | ||||||
Net Increase (Decrease) | 7,940,685 | $ | 106,568,977 | 10,570,129 | $ | 142,907,714 | ||||||||
NOTE 5 – SECURITIES TRANSACTIONS
For the six months ended March 31, 2009, the Fund had purchase and sale transactions of investment securities (excluding short-term investments) of $250,135,944 and $94,047,233, respectively.
16 Certified Semi-Annual Report
| NOTES TO FINANCIAL STATEMENTS, CONTINUED | ||
| Thornburg Limited Term Municipal Fund | March 31, 2009 (Unaudited) | |
NOTE 6 – INCOME TAXES
At March 31, 2009, information on the tax components of capital is as follows:
Cost of investments for tax purposes | $ | 1,452,237,324 | ||
Gross unrealized appreciation on a tax basis | $ | 28,245,426 | ||
Gross unrealized depreciation on a tax basis | (21,238,837 | ) | ||
Net unrealized appreciation (depreciation) on investments (tax basis) | $ | 7,006,589 | ||
At March 31, 2009, the Fund had tax basis capital losses, which may be carried forward to offset future capital gains. To the extent such carryforwards are used, capital gain distributions may be reduced to the extent provided by regulations.
Such capital loss carryforwards expire as follows:
2013 | $ | 30,614 | |
2014 | 2,276,013 | ||
2015 | 2,811,143 | ||
2016 | 192,444 | ||
| $ | 5,310,214 | ||
OTHER NOTES:
Statement of Accounting Standards No. 161:
On March 19, 2008, the Financial Accounting Standards Board issued Statement of Financial Accounting Standards No. 161, “Disclosures about Derivative Instruments and Hedging Activities” (“FAS 161”). FAS 161 is effective for fiscal years and interim periods beginning after November 15, 2008. FAS 161 requires enhanced disclosures about any derivative and hedging activities by the Fund, including how such activities are accounted for and any effect on the Fund’s financial position, performance and cash flows.
Certified Semi-Annual Report 17
Thornburg Limited Term Municipal Fund
Class A Shares: | Six Months Ended March 31, | 2008 | Year Ended September 30, | Three Months Ended Sept. 30, | ||||||||||||||||||||
| 2009* | 2007 | 2006 | 2005 | 2004(a) | ||||||||||||||||||||
PER SHARE PERFORMANCE | ||||||||||||||||||||||||
(for a share outstanding throughout the period) | ||||||||||||||||||||||||
Net asset value, beginning of period | $ | 13.22 | $ | 13.49 | $ | 13.53 | $ | 13.59 | $ | 13.83 | $ | 13.68 | ||||||||||||
Income from investment operations: | ||||||||||||||||||||||||
Net investment income (loss) | 0.24 | 0.48 | 0.46 | 0.44 | 0.40 | 0.09 | ||||||||||||||||||
Net realized and unrealized gain (loss) on investments | 0.18 | (0.27 | ) | (0.04 | ) | (0.06 | ) | (0.24 | ) | 0.15 | ||||||||||||||
Total from investment operations | 0.42 | 0.21 | 0.42 | 0.38 | 0.16 | 0.24 | ||||||||||||||||||
Less dividends from: | ||||||||||||||||||||||||
Net investment income | (0.24 | ) | (0.48 | ) | (0.46 | ) | (0.44 | ) | (0.40 | ) | (0.09 | ) | ||||||||||||
Change in net asset value | 0.18 | (0.27 | ) | (0.04 | ) | (0.06 | ) | (0.24 | ) | 0.15 | ||||||||||||||
NET ASSET VALUE, end of period | $ | 13.40 | $ | 13.22 | $ | 13.49 | $ | 13.53 | $ | 13.59 | $ | 13.83 | ||||||||||||
RATIOS/SUPPLEMENTAL DATA | ||||||||||||||||||||||||
Total return (%)(b) | 3.21 | 1.54 | 3.18 | 2.87 | 1.16 | 1.78 | ||||||||||||||||||
Ratios to average net assets: | ||||||||||||||||||||||||
Net investment income (loss) (%) | 3.62 | (c) | 3.54 | 3.43 | 3.28 | 2.91 | 2.69 | (c) | ||||||||||||||||
Expenses, after expense reductions (%) | 0.86 | (c) | 0.89 | 0.90 | 0.91 | 0.90 | 0.89 | (c) | ||||||||||||||||
Expenses, after expense reductions and net of custody credits (%) | 0.86 | (c) | 0.88 | 0.90 | 0.90 | 0.90 | 0.89 | (c) | ||||||||||||||||
Expenses, before expense reductions (%) | 0.86 | (c) | 0.89 | 0.90 | 0.91 | 0.90 | 0.89 | (c) | ||||||||||||||||
Portfolio turnover rate (%) | 7.60 | 17.78 | 21.35 | 23.02 | 27.80 | 4.57 | ||||||||||||||||||
Net assets at end of period (thousands) | $ | 779,736 | $ | 705,238 | $ | 696,717 | $ | 833,189 | $ | 967,650 | $ | 1,039,050 | ||||||||||||
| (a) | The Fund’s fiscal year-end changed to September 30. |
| (b) | Sales loads are not reflected in computing total return, which is not annualized for periods less than one year. |
| (c) | Annualized. |
| * | Unaudited. |
See notes to financial statements.
18 Certified Semi-Annual Report
| FINANCIAL HIGHLIGHTS, CONTINUED | ||
| Thornburg Limited Term Municipal Fund | ||
Class C Shares: | Six Months Ended March 31, | Year Ended September 30, | Three Months Sept. 30, | |||||||||||||||||||||
| 2009* | 2008 | 2007 | 2006 | 2005 | 2004(a) | |||||||||||||||||||
PER SHARE PERFORMANCE | ||||||||||||||||||||||||
(for a share outstanding throughout the period) | ||||||||||||||||||||||||
Net asset value, beginning of period | $ | 13.24 | $ | 13.51 | $ | 13.55 | $ | 13.62 | $ | 13.86 | $ | 13.70 | ||||||||||||
Income from investment operations: | ||||||||||||||||||||||||
Net investment income (loss) | 0.22 | 0.44 | 0.43 | 0.41 | 0.36 | 0.08 | ||||||||||||||||||
Net realized and unrealized gain (loss) on investments | 0.18 | (0.27 | ) | (0.04 | ) | (0.07 | ) | (0.24 | ) | 0.16 | ||||||||||||||
Total from investment operations | 0.40 | 0.17 | 0.39 | 0.34 | 0.12 | 0.24 | ||||||||||||||||||
Less dividends from: | ||||||||||||||||||||||||
Net investment income | (0.22 | ) | (0.44 | ) | (0.43 | ) | (0.41 | ) | (0.36 | ) | (0.08 | ) | ||||||||||||
Change in net asset value | 0.18 | (0.27 | ) | (0.04 | ) | (0.07 | ) | (0.24 | ) | 0.16 | ||||||||||||||
NET ASSET VALUE, end of period | $ | 13.42 | $ | 13.24 | $ | 13.51 | $ | 13.55 | $ | 13.62 | $ | 13.86 | ||||||||||||
RATIOS/SUPPLEMENTAL DATA | ||||||||||||||||||||||||
Total return (%)(b) | 3.06 | 1.26 | 2.90 | 2.52 | 0.89 | 1.79 | ||||||||||||||||||
Ratios to average net assets: | ||||||||||||||||||||||||
Net investment income (loss) (%) | 3.34 | (c) | 3.26 | 3.15 | 3.00 | 2.63 | 2.43 | (c) | ||||||||||||||||
Expenses, after expense reductions (%) | 1.14 | (c) | 1.17 | 1.19 | 1.18 | 1.18 | 1.15 | (c) | ||||||||||||||||
Expenses, after expense reductions and net of custody credits (%) | 1.14 | (c) | 1.16 | 1.18 | 1.18 | 1.18 | 1.15 | (c) | ||||||||||||||||
Expenses, before expense reductions (%) | 1.64 | (c) | 1.67 | 1.68 | 1.68 | 1.68 | 1.65 | (c) | ||||||||||||||||
Portfolio turnover rate (%) | 7.60 | 17.78 | 21.35 | 23.02 | 27.80 | 4.57 | ||||||||||||||||||
Net assets at end of period (thousands) | $ | 130,472 | $ | 99,972 | $ | 86,564 | $ | 105,436 | $ | 140,606 | $ | 156,870 | ||||||||||||
| (a) | The Fund’s fiscal year-end changed to September 30. |
| (b) | Not annualized for periods less than one year. |
| (c) | Annualized. |
| * | Unaudited. |
See notes to financial statements.
Certified Semi-Annual Report 19
| FINANCIAL HIGHLIGHTS, CONTINUED | ||
| Thornburg Limited Term Municipal Fund | ||
Class I Shares: | Six Months Ended March 31, 2009* |
Year Ended September 30, | Three Months Ended Sept. 30, 2004(a) | |||||||||||||||||||||
| 2008 | 2007 | 2006 | 2005 | |||||||||||||||||||||
PER SHARE PERFORMANCE | ||||||||||||||||||||||||
(for a share outstanding throughout the period) | ||||||||||||||||||||||||
Net asset value, beginning of period | $ | 13.22 | $ | 13.49 | $ | 13.53 | $ | 13.59 | $ | 13.83 | $ | 13.68 | ||||||||||||
Income from investment operations: | ||||||||||||||||||||||||
Net investment income (loss) | 0.26 | 0.52 | 0.51 | 0.49 | 0.44 | 0.11 | ||||||||||||||||||
Net realized and unrealized gain (loss) on investments | 0.18 | (0.27 | ) | (0.04 | ) | (0.06 | ) | (0.24 | ) | 0.15 | ||||||||||||||
Total from investment operations | 0.44 | 0.25 | 0.47 | 0.43 | 0.20 | 0.26 | ||||||||||||||||||
Less dividends from: | ||||||||||||||||||||||||
Net investment income | (0.26 | ) | (0.52 | ) | (0.51 | ) | (0.49 | ) | (0.44 | ) | (0.11 | ) | ||||||||||||
Change in net asset value | 0.18 | (0.27 | ) | (0.04 | ) | (0.06 | ) | (0.24 | ) | 0.15 | ||||||||||||||
NET ASSET VALUE, end of period | $ | 13.40 | $ | 13.22 | $ | 13.49 | $ | 13.53 | $ | 13.59 | $ | 13.83 | ||||||||||||
RATIOS/SUPPLEMENTAL DATA | ||||||||||||||||||||||||
Total return (%)(b) | 3.38 | 1.88 | 3.53 | 3.22 | 1.50 | 1.87 | ||||||||||||||||||
Ratios to average net assets: | ||||||||||||||||||||||||
Net investment income (loss) (%) | 3.95 | (c) | 3.88 | 3.78 | 3.62 | 3.25 | 3.02 | (c) | ||||||||||||||||
Expenses, after expense reductions (%) | 0.53 | (c) | 0.55 | 0.57 | 0.57 | 0.57 | 0.55 | (c) | ||||||||||||||||
Expenses, after expense reductions and net of custody credits (%) | 0.53 | (c) | 0.55 | 0.57 | 0.57 | 0.57 | 0.55 | (c) | ||||||||||||||||
Expenses, before expense reductions (%) | 0.53 | (c) | 0.55 | 0.57 | 0.57 | 0.57 | 0.55 | (c) | ||||||||||||||||
Portfolio turnover rate (%) | 7.60 | 17.78 | 21.35 | 23.02 | 27.80 | 4.57 | ||||||||||||||||||
Net assets at end of period (thousands) | $ | 549,772 | $ | 437,393 | $ | 303,716 | $ | 285,878 | $ | 290,369 | $ | 238,589 | ||||||||||||
| (a) | The Fund’s fiscal year-end changed to September 30. |
| (b) | Not annualized for periods less than one year. |
| (c) | Annualized. |
| * | Unaudited. |
See notes to financial statements.
20 Certified Semi-Annual Report
| SCHEDULE OF INVESTMENTS | ||
| Thornburg Limited Term Municipal Fund | March 31, 2009 (Unaudited) | |
 | We have used ratings from Standard & Poor’s, (S&P). Where S&P ratings are not available, we have used Moody’s Investors Service. Where neither rating is available, we have used ratings from Fitch Ratings. The category of investments identified as “AAA” in this graph includes investments which are pre-refunded or escrowed to maturity. Such investments are backed by an escrow or trust containing sufficient U.S. Government or U.S. Government agency securities to satisfy the timely payment of principal and interest and, therefore, are normally deemed to be equivalent to AAA-rated securities. |
Issuer-Description | Credit Rating† | Principal Amount | Value | |||||
ALABAMA — 0.87% | ||||||||
Mobile GO Warrants, 4.50% due 8/15/2016 | NR/NR | $ | 2,475,000 | $ | 2,569,124 | |||
Mobile Industrial Development PCR, 5.00% due 6/1/2034 put 3/19/2015 (Alabama Power Co.) | A2/A | 6,000,000 | 6,186,060 | |||||
University of Alabama at Birmingham Hospital Revenue, 5.25% due 9/1/2017 | A1/A+ | 2,500,000 | 2,523,575 | |||||
University of Alabama at Birmingham Hospital Revenue, 5.00% due 9/1/2018 | A1/A+ | 1,500,000 | 1,469,085 | |||||
ALASKA — 0.62% | ||||||||
Alaska Energy Power Authority, 6.00% due 7/1/2011 (Bradley Lake Hydroelectric; Insured: FSA) | Aa3/AAA | 955,000 | 1,020,943 | |||||
Alaska Municipal Bond Bank, 5.00% due 6/1/2014 (Insured: MBIA) | A1/AA- | 1,175,000 | 1,272,842 | |||||
Alaska Student Loan Corp., 5.25% due 1/1/2012 (Insured: FSA) | NR/AAA | 3,000,000 | 3,190,650 | |||||
North Slope Boro GO, 5.00% due 6/30/2015 (Insured: MBIA) | A2/AA- | 3,250,000 | 3,632,720 | |||||
ARIZONA — 1.89% | ||||||||
Glendale IDA, 5.00% due 5/15/2015 (Midwestern University) | NR/A- | 1,000,000 | 1,039,740 | |||||
Glendale IDA, 5.00% due 5/15/2016 (Midwestern University) | NR/A- | 1,325,000 | 1,366,552 | |||||
Glendale IDA, 5.00% due 5/15/2017 (Midwestern University) | NR/A- | 1,440,000 | 1,472,717 | |||||
Glendale Western Loop 101 Public Facilities Corp., 6.00% due 7/1/2019 | A2/AA | 2,200,000 | 2,306,480 | |||||
Mohave County IDA, 5.00% due 4/1/2009 (Mohave Prison LLC; Insured: XLCA) | NR/AAA | 2,780,000 | 2,780,000 | |||||
Mohave County IDA, 5.00% due 4/1/2014 (Mohave Prison LLC; Insured: XLCA) | NR/AAA | 3,135,000 | 3,561,987 | |||||
Mohave County IDA, 7.25% due 5/1/2015 (Mohave Prison LLC) | NR/BBB+ | 12,000,000 | 11,912,040 | |||||
Pima County IDA, 6.40% due 7/1/2013 (Arizona Charter Schools) | Baa3/NR | 915,000 | 872,114 | |||||
Pima County IDA Lease Obligation, 7.25% due 7/15/2010 (Insured: FSA) | Aa3/AAA | 135,000 | 135,682 | |||||
Salt River Agricultural Improvement & Power District, 5.00% due 1/1/2020 | Aa1/AA | 1,205,000 | 1,214,206 | |||||
Show Low IDA Hospital, 5.25% due 12/1/2010 (Navapache Regional Medical Center; Insured: ACA) | NR/BBB | 1,000,000 | 1,001,650 | |||||
ARKANSAS — 0.21% | ||||||||
Jefferson County Hospital Improvement, 5.50% due 6/1/2010 (Jefferson Hospital Association) | NR/A | 1,000,000 | 1,028,340 | |||||
Jefferson County Hospital Improvement, 5.50% due 6/1/2011 (Jefferson Hospital Association) | NR/A | 1,075,000 | 1,116,602 | |||||
Little Rock Hotel & Restaurant GRT, 7.125% due 8/1/2009 | A3/NR | 940,000 | 946,176 | |||||
CALIFORNIA — 4.27% | ||||||||
Calexico USD, 5.75% due 9/1/2013 | NR/NR | 2,390,000 | 2,413,661 | |||||
California HFA, 5.25% due 10/1/2013 (Kaiser Permanente) (ETM) | NR/AAA | 2,620,000 | 2,654,532 | |||||
California State Department of Transportation COP, 5.25% due 3/1/2016 (Insured: MBIA) | A3/AA- | 1,000,000 | 1,002,760 | |||||
California State Department of Water Resources Power Supply, 5.50% due 5/1/2012 | Aa3/A+ | 2,600,000 | 2,845,180 | |||||
California State Department of Water Resources Power Supply, 6.00% due 5/1/2013 | Aa3/A+ | 2,550,000 | 2,808,238 | |||||
California State Economic Recovery, 0.40% due 7/1/2023 put 4/1/2009 (SPA: Bank of America) (daily demand notes) | A2/A | 14,850,000 | 14,850,000 | |||||
Certified Semi-Annual Report 21
| SCHEDULE OF INVESTMENTS, CONTINUED | ||
| Thornburg Limited Term Municipal Fund | March 31, 2009 (Unaudited) | |
Issuer-Description | Credit Rating† Moody’s/S&P | Principal Amount | Value | |||||
California State Public Works Board, 5.00% due 9/1/2016 (Regents of University of California; Insured: FGIC) | Aa2/AA- | $ | 3,000,000 | $ | 3,306,660 | |||
California State Public Works Board, 5.00% due 9/1/2017 (Regents of University of California; Insured: FGIC) | Aa2/AA- | 3,000,000 | 3,291,810 | |||||
Corona Norco USD GO, 3.50% due 2/1/2010 | NR/NR | 5,470,000 | 5,496,365 | |||||
Desert Sands USD, 5.25% due 3/1/2016 | A2/A+ | 1,500,000 | 1,562,910 | |||||
Eastern Municipal Water District California Water & Sewer Revenue COP, 0.27% due 7/1/2020 put 4/7/2009 (SPA: JPMorgan Chase) (weekly demand notes) | Aa3/AA | 2,300,000 | 2,300,000 | |||||
Escondido USD GO, 5.60% due 11/1/2009 (Insured: MBIA) (ETM) | NR/AA | 1,250,000 | 1,254,825 | |||||
Golden State Tobacco Securitization Corp., 5.50% due 6/1/2043 pre-refunded 6/1/2013 | Aaa/AAA | 2,000,000 | 2,244,120 | |||||
Los Angeles Convention & Exhibition Center Authority Lease Revenue, 5.00% due 8/15/2018 | A1/AA- | 2,000,000 | 2,147,500 | |||||
Los Angeles USD GO, 5.00% due 7/1/2018 (Insured: FSA) | Aa3/AAA | 4,000,000 | 4,351,760 | |||||
Modesto Health Facilities, 6.00% due 6/1/2018 (Memorial Hospitals Association; Insured: MBIA) | Aa3/AA- | 1,300,000 | 1,301,235 | |||||
San Joaquin Delta Community College District GO, 0% due 8/1/2019 (Insured: FSA) | Aa3/AAA | 7,600,000 | 4,535,756 | |||||
San Luis & Delta-Mendota Water Authority, 4.50% due 3/1/2014 (Water Utility Improvements) (1) | NR/NR | 3,900,000 | 3,903,120 | |||||
COLORADO — 2.40% | ||||||||
Adams County Platte Valley Medical Center, 5.00% due 2/1/2015 (Brighton Community Hospital Association; Insured: FHA, MBIA) | NR/AA- | 1,530,000 | 1,579,312 | |||||
Adams County Platte Valley Medical Center, 5.00% due 8/1/2015 (Brighton Community Hospital Association; Insured: FHA, MBIA) | NR/AA- | 1,565,000 | 1,615,268 | |||||
Central Platte Valley Metropolitan District GO, 5.00% due 12/1/2031 put 12/1/2009 (LOC: BNP Paribas) | NR/AA | 12,400,000 | 12,635,600 | |||||
Colorado Educational & Cultural Facilities, 6.00% due 6/1/2011 | A3/A | 1,035,000 | 1,052,616 | |||||
Denver City and County Airport System, 5.00% due 11/15/2016 (Insured: MBIA) | A1/AA- | 1,515,000 | 1,609,839 | |||||
Denver City and County Airport System, 5.00% due 11/15/2017 (Insured: MBIA) | A1/AA- | 1,000,000 | 1,053,110 | |||||
Denver Convention Center Hotel, 5.25% due 12/1/2014 (Insured: XLCA) | Baa3/BBB- | 3,450,000 | 3,183,315 | |||||
E-470 Public Highway Authority Capital Appreciation, 0% due 9/1/2014 (Insured: MBIA) | Baa1/AA | 1,910,000 | 1,360,378 | |||||
Plaza Metropolitan District, 7.125% due 12/1/2010 (Public Improvement Fee/Tax Increment) | NR/NR | 4,210,000 | 4,166,384 | |||||
Plaza Metropolitan District, 7.60% due 12/1/2016 (Public Improvement Fee/Tax Increment) | NR/NR | 6,000,000 | 5,584,620 | |||||
Southlands Metropolitan District GO, 6.75% due 12/1/2016 pre-refunded 12/1/2014 | NR/AAA | 1,000,000 | 1,172,740 | |||||
CONNECTICUT — 0.14% | ||||||||
Connecticut Development Authority PCR, 5.75% due 6/1/2026 put 2/1/2012 | Baa2/NR | 1,000,000 | 1,000,170 | |||||
Connecticut Health & Educational Facilities, 3.50% due 11/15/2029 put 2/1/2012 (Ascension Health) (2) | NR/AA | 1,000,000 | 1,002,940 | |||||
DELAWARE — 0.32% | ||||||||
Delaware EDA, 5.50% due 7/1/2025 put 7/1/2010 (Delmarva Power & Light) | Baa2/BBB | 2,045,000 | 2,135,716 | |||||
Delaware HFA, 5.25% due 6/1/2011 (Beebe Medical Center) | Baa1/BBB+ | 1,275,000 | 1,267,630 | |||||
Delaware HFA, 5.25% due 5/1/2012 (Nanticoke Memorial Hospital; Insured: Radian) | NR/BBB+ | 1,270,000 | 1,223,239 | |||||
DISTRICT OF COLUMBIA — 2.23% | ||||||||
District of Columbia, 6.00% due 6/1/2018 (Insured: MBIA) | A1/AA- | 5,000,000 | 5,611,000 | |||||
District of Columbia Convention Center Authority, 5.00% due 10/1/2013 (Insured: AMBAC) | A2/A | 3,000,000 | 3,123,300 | |||||
District of Columbia COP, 5.25% due 1/1/2013 (Insured: AMBAC) | Baa1/A | 5,950,000 | 6,295,159 | |||||
District of Columbia COP, 5.25% due 1/1/2015 (Insured: FGIC) | A2/AA- | 2,875,000 | 3,023,091 | |||||
District of Columbia COP, 5.25% due 1/1/2016 (Insured: FGIC) | A2/AA- | 4,125,000 | 4,312,853 | |||||
District of Columbia COP, 5.00% due 1/1/2019 (Insured: MBIA) | A2/AA- | 5,000,000 | 4,976,750 | |||||
District of Columbia Tax Increment, 0% due 7/1/2009 (Mandarin Oriental; Insured: FSA) | Aa3/AAA | 2,000,000 | 1,991,680 | |||||
District of Columbia Tax Increment, 0% due 7/1/2011 (Mandarin Oriental; Insured: FSA) | Aa3/AAA | 1,990,000 | 1,876,789 | |||||
District of Columbia Tax Increment, 0% due 7/1/2012 (Mandarin Oriental; Insured: FSA) | Aa3/AAA | 1,480,000 | 1,347,792 | |||||
22 Certified Semi-Annual Report
| SCHEDULE OF INVESTMENTS, CONTINUED | ||
| Thornburg Limited Term Municipal Fund | March 31, 2009 (Unaudited) | |
Issuer-Description | Credit Rating† Moody’s/S&P | Principal Amount | Value | |||||
FLORIDA — 9.23% | ||||||||
Broward County Airport Systems, 5.00% due 10/1/2014 (Insured: AMBAC) | Aa3/A+ | $ | 4,000,000 | $ | 4,282,720 | |||
Broward County Resource Recovery, 5.375% due 12/1/2009 (Wheelabrator South) | A3/AA | 5,000,000 | 5,066,550 | |||||
Broward County School Board COP, 5.25% due 7/1/2016 (Insured: FSA) | Aa3/AAA | 7,630,000 | 8,317,310 | |||||
Broward County School Board COP, 5.00% due 7/1/2017 (Insured: FGIC) | A1/AA- | 1,000,000 | 1,018,880 | |||||
Capital Projects Finance Authority, 5.50% due 10/1/2012 (Insured: MBIA) | Baa1/AA- | 1,820,000 | 1,837,272 | |||||
Capital Projects Finance Authority, 5.50% due 10/1/2015 (Insured: MBIA) | Baa1/AA- | 3,260,000 | 3,163,113 | |||||
Capital Trust Agency Multi Family Housing, 5.15% due 11/1/2030 put 11/1/2010 (Shadow Run; Collateralized: FNMA) | Aaa/NR | 3,190,000 | 3,332,338 | |||||
Crossings at Fleming Island Community Development, 5.45% due 5/1/2010 (Insured: MBIA) | Baa1/AA- | 1,600,000 | 1,607,952 | |||||
Escambia County HFA, 5.125% due 10/1/2014 (Baptist Hospital/Baptist Manor) | Baa1/BBB- | 2,755,000 | 2,642,844 | |||||
Escambia County HFA, 5.00% due 11/1/2028 pre-refunded 11/1/2010 (Charity Obligated Group) | NR/NR | 2,540,000 | 2,574,137 | |||||
Flagler County School Board COP, 5.00% due 8/1/2014 (Insured: FSA) | Aa3/AAA | 1,605,000 | 1,741,040 | |||||
Flagler County School Board COP, 5.00% due 8/1/2015 (Insured: FSA) | Aa3/AAA | 1,500,000 | 1,622,145 | |||||
Florida Hurricane Catastrophe Series A, 5.00% due 7/1/2014 | Aa3/AA- | 11,000,000 | 11,199,870 | |||||
Florida State Correctional Privatization Commission COP, 5.00% due 8/1/2015 (Insured: AMBAC) | Aa2/AA+ | 2,000,000 | 2,087,860 | |||||
Florida State Department of Children & Families COP, 5.00% due 10/1/2012 | NR/AA+ | 770,000 | 828,504 | |||||
Florida State Department of Children & Families COP, 5.00% due 10/1/2014 | NR/AA+ | 905,000 | 971,916 | |||||
Florida State Department of Children & Families COP, 5.00% due 10/1/2015 | NR/AA+ | 925,000 | 988,122 | |||||
Florida State Department of Transportation, 5.00% due 7/1/2018 | Aa1/AAA | 3,000,000 | 3,301,620 | |||||
Hillsborough County Assessment, 5.00% due 3/1/2015 (Insured: FGIC) | A3/AA- | 5,000,000 | 5,009,150 | |||||
Hillsborough County IDA PCR, 5.10% due 10/1/2013 (Tampa Electric Co.) | Baa2/BBB- | 6,410,000 | 6,219,751 | |||||
Hillsborough County IDA PCR, 5.00% due 12/1/2034 put 3/15/2012 (Tampa Electric Co.; Insured: AMBAC) | Baa1/A | 3,250,000 | 3,266,315 | |||||
Hollywood Community Redevelopment Agency, 5.00% due 3/1/2016 (Insured: XLCA) | Baa1/NR | 2,000,000 | 1,893,120 | |||||
Hollywood Community Redevelopment Agency, 5.00% due 3/1/2017 (Insured: XLCA) | Baa1/NR | 2,000,000 | 1,859,440 | |||||
Jacksonville Electric Authority, 5.25% due 10/1/2012 (St. John’s River Park Systems) (2) | Aa2/AA- | 5,000,000 | 5,368,350 | |||||
Jacksonville Electric Authority, 5.00% due 10/1/2014 | Aa3/A+ | 7,165,000 | 7,653,080 | |||||
Jea Water & Sewer Systems Revenue, 5.00% due 10/1/2018 | Aa3/AA- | 1,500,000 | 1,600,470 | |||||
Marion County Hospital District, 5.00% due 10/1/2015 (Munroe Regional Health Systems) | A3/NR | 1,000,000 | 951,730 | |||||
Miami Dade County, 5.25% due 7/1/2018 (Building Better Communities) | Aa3/AA- | 4,540,000 | 5,037,902 | |||||
Miami Dade County Educational Facilities Authority, 5.00% due 4/1/2016 (University of Miami; Insured: AMBAC) | A2/A | 3,000,000 | 3,132,240 | |||||
Miami Dade County School Board COP, 5.00% due 5/1/2014 (Insured: MBIA-IBC FGIC) | A3/AA- | 1,000,000 | 1,052,460 | |||||
Miami Dade County School Board COP, 5.00% due 10/1/2015 (Insured: AMBAC) | A3/A | 1,000,000 | 1,050,320 | |||||
Miami Dade County School Board COP, 5.00% due 10/1/2016 (Insured: AMBAC) | A3/A | 1,000,000 | 1,042,650 | |||||
Miami Dade County School Board COP, 5.50% due 5/1/2030 put 5/1/2011 (Insured: MBIA) | A3/AA- | 1,010,000 | 1,076,226 | |||||
Miami Dade County Special Housing, 5.80% due 10/1/2012 (HUD Section 8) | Baa3/NR | 2,480,000 | 2,643,085 | |||||
Miami Street Sidewalk Improvement, 5.00% due 1/1/2018 (Insured: MBIA) | A3/AA- | 1,970,000 | 2,057,862 | |||||
Orange County HFA, 5.80% due 11/15/2009 (Adventist Health) (ETM) | A1/NR | 1,395,000 | 1,441,495 | |||||
Palm Beach County Public Improvement, 5.00% due 11/1/2030 put 11/1/2011 (Convention Center; Insured: FGIC) | Aa1/AA+ | 3,000,000 | 3,225,930 | |||||
Palm Beach County School Board COP, 5.00% due 8/1/2025 (Insured: FGIC) | A1/AA- | 1,500,000 | 1,519,170 | |||||
Pelican Marsh Community Development District, 5.00% due 5/1/2011 (Insured: Radian) | NR/AA | 1,110,000 | 1,072,138 | |||||
Port Everglades Authority, 5.00% due 9/1/2016 (Insured: FSA) | Aa3/AAA | 4,355,000 | 4,375,033 | |||||
Putnam County Development Authority PCR, 5.35% due 3/15/2042 put 5/1/2018 (Seminole; Insured: AMBAC) | Baa1/A | 10,000,000 | 9,873,000 | |||||
South Miami HFA, 5.00% due 8/15/2016 (Baptist Health) | Aa3/AA- | 1,560,000 | 1,578,798 | |||||
St. John’s County IDA, 5.50% due 8/1/2014 (Presbyterian Retirement) | NR/NR | 2,755,000 | 2,524,021 | |||||
University of Central Florida Athletics Association Inc. COP, 5.00% due 10/1/2016 (Insured: FGIC) | NR/AA- | 1,640,000 | 1,614,055 | |||||
GEORGIA — 2.89% | ||||||||
Atlanta Tax Allocation, 5.25% due 12/1/2016 (Atlantic Station; Insured: Assured Guaranty) | Aa2/AAA | 3,850,000 | 4,098,672 | |||||
Certified Semi-Annual Report 23
| SCHEDULE OF INVESTMENTS, CONTINUED | ||
| Thornburg Limited Term Municipal Fund | March 31, 2009 (Unaudited) | |
Issuer-Description | Credit Rating† Moody’s/S&P | Principal Amount | Value | |||||
Burke County PCR, 4.375% due 10/1/2032 put 4/1/2010 (Georgia Power Co.) | A2/A | $ | 5,000,000 | $ | 5,056,400 | |||
Burke County PCR, 4.75% due 1/1/2039 put 4/1/2011 (Oglethorpe Power; Insured: MBIA) | A3/AA | 10,000,000 | 10,278,400 | |||||
Fulton County Development Authority, 0.55% due 4/1/2034 put 4/1/2009 (LOC: Bank of America) (daily demand notes) | NR/NR | 5,000,000 | 5,000,000 | |||||
Lagrange Troup County Hospital Authority Series A, 5.00% due 7/1/2018 | A1/A+ | 2,500,000 | 2,623,525 | |||||
Main Street Natural Gas Inc., 5.00% due 3/15/2013 | A2/A | 1,500,000 | 1,277,985 | |||||
Main Street Natural Gas Inc., 5.00% due 3/15/2014 | Aa3/A | 3,000,000 | 2,773,290 | |||||
Main Street Natural Gas Inc., 5.00% due 3/15/2014 | A2/A | 3,590,000 | 2,920,788 | |||||
Monroe County Development Authority PCR, 6.75% due 1/1/2010 (Oglethorpe Power; Insured: MBIA) | A3/AA- | 2,000,000 | 2,070,520 | |||||
Monroe County Development Authority PCR, 6.80% due 1/1/2012 (Oglethorpe Power; Insured: MBIA) | A3/AA- | 1,000,000 | 1,107,180 | |||||
Monroe County Development Authority PCR, 4.50% due 7/1/2025 put 4/1/2011 (Georgia Power Co.) | A2/A | 5,000,000 | 5,017,550 | |||||
GUAM — 0.07% | ||||||||
Guam Educational Financing Foundation COP, 5.00% due 10/1/2010 (Guam Public Schools) | NR/A- | 1,000,000 | 1,012,270 | |||||
HAWAII — 0.48% | ||||||||
Hawaii State Department of Budget & Finance, 4.95% due 4/1/2012 (Hawaiian Electric Company; Insured: MBIA) | Baa1/AA- | 6,750,000 | 7,017,300 | |||||
IDAHO — 0.19% | ||||||||
Twin Falls Urban Renewal Agency, 4.95% due 8/1/2014 | NR/NR | 1,640,000 | 1,489,464 | |||||
Twin Falls Urban Renewal Agency, 5.15% due 8/1/2017 | NR/NR | 1,455,000 | 1,224,630 | |||||
ILLINOIS — 11.61% | ||||||||
Bolingbrook, 0% due 1/1/2016 (Insured: MBIA) | A2/NR | 1,500,000 | 1,152,000 | |||||
Bolingbrook, 0% due 1/1/2017 (Insured: MBIA) | A2/NR | 2,000,000 | 1,441,720 | |||||
Broadview Tax Increment Revenue, 5.375% due 7/1/2015 | NR/NR | 3,400,000 | 3,074,178 | |||||
Chicago Board of Education, 5.00% due 12/1/2018 (Insured: MBIA) | A1/AA- | 1,000,000 | 1,071,010 | |||||
Chicago Board of Education GO, 6.00% due 12/1/2009 (Insured: FGIC) | A1/AA- | 2,000,000 | 2,064,060 | |||||
Chicago Capital Appreciation, 0% due 1/1/2016 (City Colleges; Insured: FGIC) | Aa3/AA | 2,670,000 | 2,108,312 | |||||
Chicago Gas Supply, 4.75% due 3/1/2030 put 6/30/2014 (Peoples Gas Light & Coke) | A1/A- | 1,500,000 | 1,527,645 | |||||
Chicago GO, 6.125% due 1/1/2012 (Insured: AMBAC) | Aa3/AA- | 1,000,000 | 1,109,800 | |||||
Chicago GO, 5.375% due 1/1/2013 (Insured: MBIA) | Aa3/AA- | 2,725,000 | 2,909,619 | |||||
Chicago GO, 5.40% due 1/1/2018 (Insured: FSA) | Aa3/AAA | 3,000,000 | 3,033,180 | |||||
Chicago GO, 1.50% due 1/1/2040 put 4/7/2009 (Insured: FSA/SPA-Dexia Credit Local) (weekly demand notes) | Aa3/AAA | 34,800,000 | 34,800,000 | |||||
Chicago Housing Authority Capital Program, 5.25% due 7/1/2010 (ETM) | NR/NR | 2,300,000 | 2,431,468 | |||||
Chicago Housing Authority Capital Program, 5.00% due 7/1/2015 (Insured: FSA) | Aa3/AAA | 8,460,000 | 9,068,189 | |||||
Chicago Housing Authority Capital Program, 5.00% due 7/1/2016 (Insured: FSA) | Aa3/AAA | 2,000,000 | 2,129,860 | |||||
Chicago Metropolitan Water Reclamation District, 7.00% due 1/1/2011 (ETM) | NR/NR | 735,000 | 785,671 | |||||
Chicago Midway Airport, 5.50% due 1/1/2013 (Insured: MBIA) | A2/AA- | 1,180,000 | 1,277,728 | |||||
Chicago Park District Parking Facility, 5.75% due 1/1/2010 (ETM) | Baa1/NR | 1,000,000 | 1,039,320 | |||||
Cook County, 6.25% due 11/15/2013 (Insured: MBIA) | Aa2/AA | 3,995,000 | 4,622,295 | |||||
Cook County Community Consolidated School District GO, 0% due 12/1/2010 (Insured: FSA) | Aa3/NR | 2,000,000 | 1,946,840 | |||||
Cook County Community Consolidated School District GO, 9.00% due 12/1/2016 (Tinley Park; Insured: FGIC) | A1/NR | 2,500,000 | 3,346,575 | |||||
Cook County Community School District GO, 9.00% due 12/1/2013 (Oak Park; Insured: FGIC) | Aa3/NR | 2,250,000 | 2,834,663 | |||||
Du Page County Forest Preservation District, 0% due 11/1/2009 (Partial ETM) | Aaa/AAA | 5,000,000 | 4,971,550 | |||||
Illinois DFA, 6.00% due 11/15/2009 (Adventist Health; Insured: MBIA) | Baa1/AA | 3,635,000 | 3,682,800 | |||||
Illinois DFA, 6.00% due 11/15/2010 (Adventist Health; Insured: MBIA) | Baa1/AA | 3,860,000 | 3,972,403 | |||||
24 Certified Semi-Annual Report
| SCHEDULE OF INVESTMENTS, CONTINUED | ||
| Thornburg Limited Term Municipal Fund | March 31, 2009 (Unaudited) | |
Issuer-Description | Credit Rating† Moody’s/S&P | Principal Amount | Value | |||||
Illinois DFA Community Rehab Providers, 6.00% due 7/1/2015 | NR/BBB | $ | 1,160,000 | $ | 1,129,875 | |||
Illinois Educational Facilities, 0.50% due 3/1/2027 put 4/7/2009 (Art Institute of Chicago; SPA: Bank of America) (weekly demand notes) | A1/A+ | 6,100,000 | 6,100,000 | |||||
Illinois Educational Facilities, 4.75% due 3/1/2030 put 3/1/2017 (Art Institute of Chicago) | A1/A+ | 2,625,000 | 2,784,259 | |||||
Illinois Educational Facilities, 5.00% due 3/1/2030 put 3/1/2017 (Art Institute of Chicago) | NR/NR | 3,000,000 | 3,032,520 | |||||
Illinois Educational Facilities, 5.25% due 3/1/2034 put 3/1/2018 (Art Institute of Chicago) | NR/NR | 3,500,000 | 3,553,130 | |||||
Illinois Educational Facilities, 4.15% due 11/1/2036 put 11/1/2012 (Field Museum) | A2/A | 5,250,000 | 5,131,297 | |||||
Illinois Educational Facilities, 4.30% due 11/1/2036 put 11/1/2013 (Field Museum) | A2/A | 3,000,000 | 2,927,040 | |||||
Illinois Finance Authority, 5.00% due 11/1/2017 (Rush University Medical Center; Insured: MBIA) | A3/AA | 1,000,000 | 951,190 | |||||
Illinois Finance Authority, 5.50% due 11/1/2018 | Aa3/AA | 1,000,000 | 1,035,350 | |||||
Illinois Finance Authority, 3.875% due 11/1/2030 put 5/1/2012 (Health Care) | Aa3/AA | 2,000,000 | 1,998,920 | |||||
Illinois Finance Authority Student Housing, 5.00% due 5/1/2014 | Baa3/NR | 3,895,000 | 3,693,629 | |||||
Illinois HFA, 6.50% due 2/15/2010 (Iowa Health System) (ETM) | Aa3/NR | 1,465,000 | 1,511,704 | |||||
Illinois HFA, 6.00% due 2/15/2011 (Iowa Health System; Insured: AMBAC) (ETM) | Aa3/A | 1,560,000 | 1,644,146 | |||||
Illinois HFA, 5.50% due 11/15/2011 (Methodist Medical Center; Insured: MBIA) (2) | A2/AA- | 3,000,000 | 3,017,310 | |||||
Illinois HFA, 5.375% due 7/1/2017 (Loyola University; Insured: MBIA) | Baa1/AA | 7,085,000 | 6,893,634 | |||||
Illinois HFA, 6.00% due 7/1/2017 (Lake Forest Hospital) | A3/A- | 1,500,000 | 1,521,885 | |||||
Illinois Hospital District GO, 5.50% due 1/1/2010 (Insured: FGIC) | NR/AA- | 1,040,000 | 1,051,034 | |||||
Kane County Forest Preservation District GO, 5.00% due 12/15/2015 (Insured: FGIC) | NR/AA | 2,780,000 | 3,121,801 | |||||
Kane County Waubonsee Community College District GO, 0% due 12/15/2013 (Insured: FGIC) | Aa3/AA- | 3,000,000 | 2,475,270 | |||||
Lake County Community High School District GO, 0% due 12/1/2011 (Insured: FGIC) | NR/NR | 3,235,000 | 2,956,078 | |||||
McHenry & Kane Counties Community Consolidated School District GO, 0% due 1/1/2010 (Insured: FGIC) | NR/AA- | 1,000,000 | 979,070 | |||||
McHenry & Kane Counties Community Consolidated School District GO, 0% due 1/1/2012 (Insured: FGIC) | NR/AA- | 2,200,000 | 1,994,388 | |||||
Metropolitan Pier & Exposition Authority Dedicated State Tax, 0% due 6/15/2013 (McCormick Place; Insured: MBIA) | A1/AAA | 1,045,000 | 930,991 | |||||
Metropolitan Pier & Exposition Authority Dedicated State Tax, 0% due 6/15/2016 (McCormick Place; Insured: FGIC) | A1/AA- | 11,295,000 | 8,721,999 | |||||
Quincy Illinois, 5.00% due 11/15/2014 (Blessing Hospital) | A3/A- | 1,000,000 | 985,180 | |||||
Quincy Illinois, 5.00% due 11/15/2016 (Blessing Hospital) | A3/A- | 1,000,000 | 960,430 | |||||
Southwestern Illinois Development Authority, 5.125% due 8/15/2016 (Anderson Hospital) | Baa2/BBB | 2,160,000 | 2,002,968 | |||||
INDIANA — 4.82% | ||||||||
Allen County Economic Development, 5.60% due 12/30/2009 (Indiana Institute of Technology) | NR/NR | 390,000 | 392,633 | |||||
Allen County Economic Development, 5.00% due 12/30/2012 (Indiana Institute of Technology) | NR/NR | 1,370,000 | 1,329,832 | |||||
Allen County Jail Building Corp. First Mortgage, 5.75% due 10/1/2010 (ETM) | Aa3/NR | 1,115,000 | 1,196,440 | |||||
Allen County Jail Building Corp. First Mortgage, 5.00% due 10/1/2014 (Insured: XLCA) | Aa3/NR | 1,000,000 | 1,084,710 | |||||
Allen County Jail Building Corp. First Mortgage, 5.00% due 10/1/2015 (Insured: XLCA) | Aa3/NR | 1,480,000 | 1,606,007 | |||||
Allen County Jail Building Corp. First Mortgage, 5.00% due 10/1/2016 (Insured: XLCA) | Aa3/NR | 1,520,000 | 1,635,550 | |||||
Allen County Redevelopment District, 5.00% due 11/15/2016 | A3/NR | 1,000,000 | 1,044,710 | |||||
Ball State University Student Fee, 5.75% due 7/1/2012 (Insured: FGIC) | A1/AA- | 1,000,000 | 1,086,920 | |||||
Boonville Junior High School Building Corp., 0% due 7/1/2010 (State Aid Withholding) | NR/A | 850,000 | 813,221 | |||||
Boonville Junior High School Building Corp., 0% due 1/1/2011 (State Aid Withholding) | NR/A | 850,000 | 794,580 | |||||
Boonville Junior High School Building Corp., 0% due 7/1/2011 (State Aid Withholding) | NR/A | 950,000 | 869,203 | |||||
Brownsburg 1999 School Building Corp., 5.00% due 8/1/2018 (Insured: FSA/State Aid Withholding) | Aa3/AAA | 1,250,000 | 1,326,587 | |||||
Carmel Redevelopment Authority, 0% due 2/1/2015 (Performing Arts Center) | Aa2/AA | 1,575,000 | 1,279,057 | |||||
Center Grove Building Corp., 5.00% due 7/15/2010 (Insured: AMBAC) (ETM) | Baa1/AA+ | 1,135,000 | 1,197,368 | |||||
Eagle Union Middle School Building Corp., 5.50% due 7/15/2009 (ETM) | Baa1/AA- | 910,000 | 923,404 | |||||
Evansville Vanderburgh, 5.00% due 7/15/2014 (Insured: AMBAC) | Baa1/A+ | 1,000,000 | 1,084,410 | |||||
Evansville Vanderburgh, 5.00% due 7/15/2015 (Insured: AMBAC) | Baa1/A+ | 1,000,000 | 1,085,790 | |||||
Huntington Economic Development, 6.20% due 11/1/2010 (United Methodist Memorial) | NR/NR | 790,000 | 786,224 | |||||
Indiana Bond Bank, 5.25% due 10/15/2016 (Special Gas Program) | Aa3/NR | 1,500,000 | 1,334,445 | |||||
Indiana Health Facilities, 3.625% due 11/15/2036 put 8/1/2011 (Ascension Health) | NR/NR | 3,955,000 | 3,980,431 | |||||
Certified Semi-Annual Report 25
| SCHEDULE OF INVESTMENTS, CONTINUED | ||
| Thornburg Limited Term Municipal Fund | March 31, 2009 (Unaudited) | |
Issuer-Description | Credit Rating† Moody’s/S&P | Principal Amount | Value | |||||
Indiana Multi School Building Corp. First Mortgage, 5.00% due 7/15/2016 (Insured: MBIA) | Baa1/AA | $ | 5,000,000 | $ | 5,433,650 | |||
Indiana State Educational Facilities Authority, 5.75% due 10/1/2009 (University of Indianapolis) | NR/A- | 670,000 | 680,251 | |||||
Indiana State Finance Authority, 5.00% due 7/1/2016 (Forensic & Health Science; Insured: MBIA) | Aa2/AA+ | 1,030,000 | 1,104,922 | |||||
Indiana State Finance Authority Revenue, 5.00% due 7/1/2011 (Wabash Correctional Facilities) | NR/NR | 1,390,000 | 1,482,838 | |||||
Indiana State Finance Authority Revenue, 5.25% due 7/1/2018 (Wabash Correctional Facilities) | Aa2/AA+ | 1,000,000 | 1,081,320 | |||||
Indiana State Finance Authority Revenue, 5.25% due 7/1/2018 (Rockville Correctional Facilities) | Aa2/AA+ | 2,150,000 | 2,324,838 | |||||
Indiana State Finance Authority Revenue, 5.00% due 11/1/2018 | Aa3/AA+ | 2,000,000 | 2,148,780 | |||||
Indianapolis Local Public Improvement Bond, 5.00% due 1/1/2015 (Waterworks; Insured: MBIA) | A1/AA- | 1,000,000 | 1,096,560 | |||||
Indianapolis Local Public Improvement Bond, 5.00% due 7/1/2015 (Waterworks; Insured: MBIA) | A1/AA- | 1,000,000 | 1,101,180 | |||||
Indianapolis Local Public Improvement Bond, 5.00% due 7/1/2016 (Insured: FGIC) | Aa2/AA | 1,030,000 | 1,117,807 | |||||
Knox Middle School Building Corp. First Mortgage, 0% due 1/15/2020 (Insured: FGIC) | NR/AA | 1,295,000 | 672,753 | |||||
Madison Schools Lydia Middleton Building Corp., 5.00% due 7/15/2014 (Insured: FGIC) | NR/AA+ | 1,200,000 | 1,340,532 | |||||
Madison Schools Lydia Middleton Building Corp., 5.00% due 7/15/2015 (Insured: FGIC) | NR/AA+ | 1,250,000 | 1,399,475 | |||||
Mount Vernon of Hancock County First Mortgage, 5.00% due 7/15/2013 (Insured: MBIA) | Baa1/AA- | 1,055,000 | 1,146,405 | |||||
Mount Vernon of Hancock County First Mortgage, 5.00% due 7/15/2014 (Insured: MBIA) | Baa1/AA- | 1,135,000 | 1,230,805 | |||||
Mount Vernon of Hancock County First Mortgage, 5.00% due 7/15/2015 (Insured: MBIA) | Baa1/AA- | 1,140,000 | 1,237,801 | |||||
Noblesville Redevelopment Authority, 5.00% due 8/1/2016 (146th Street Extension A) | NR/AA- | 1,660,000 | 1,764,729 | |||||
Perry Township Multi School Building, 5.00% due 7/10/2014 (Insured: FSA) | Aa3/NR | 2,130,000 | 2,348,112 | |||||
Peru Community School Corp. First Mortgage, 0% due 7/1/2010 (State Aid Withholding) | NR/A | 835,000 | 798,870 | |||||
Plainfield Community High School Building Corp. First Mortgage, 5.00% due 1/15/2015 (Insured: FGIC) | NR/AA- | 1,445,000 | 1,564,386 | |||||
Rockport PCR, 6.25% due 6/1/2025 put 6/2/2014 (Indiana Michigan Power Co.) | NR/BBB | 4,100,000 | 4,113,899 | |||||
South Bend Community School Building Corp., 5.00% due 7/15/2016 (Insured: FGIC State Aid Withholding) | NR/AA+ | 1,785,000 | 1,978,369 | |||||
Warren Township Vision 2005, 5.00% due 7/10/2015 (Insured: FGIC) | NR/AA+ | 2,095,000 | 2,326,937 | |||||
Wawasee Community School Corp. First Mortgage, 5.50% due 7/15/2010 (State Aid Withholding) (ETM) | NR/AA+ | 995,000 | 1,056,441 | |||||
Wawasee Community School Corp. First Mortgage, 5.50% due 7/15/2011 (State Aid Withholding) (ETM) | NR/AA+ | 1,095,000 | 1,205,343 | |||||
West Clark School Building Corp., 5.25% due 1/15/2014 (Insured: MBIA) | Baa1/AA+ | 1,335,000 | 1,495,000 | |||||
West Clark School Building Corp. First Mortgage, 5.75% due 7/15/2011 (State Aid Withholding) | NR/AA+ | 2,080,000 | 2,278,162 | |||||
IOWA — 1.20% | ||||||||
Ankeny Community School District Sales & Services Tax, 5.00% due 7/1/2010 | NR/AA- | 2,900,000 | 3,026,643 | |||||
Des Moines Limited Obligation, 4.40% due 12/1/2015 put 12/1/2011 (Des Moines Parking Associates; LOC: Wells Fargo Bank) | NR/NR | 2,535,000 | 2,536,293 | |||||
Dubuque Community School District, 5.00% due 1/1/2013 | A3/NR | 1,600,000 | 1,611,632 | |||||
Dubuque Community School District, 5.00% due 7/1/2013 | A3/NR | 1,640,000 | 1,650,545 | |||||
Iowa Finance Authority, 6.50% due 2/15/2010 (Iowa Health Services) | Aa3/NR | 2,955,000 | 3,049,471 | |||||
Iowa Finance Authority, 5.75% due 12/1/2010 (Trinity Health) | Aa2/AA | 2,260,000 | 2,331,710 | |||||
Iowa Finance Authority, 6.00% due 2/15/2011 pre-refunded 2/15/2010 (Iowa Health Services; Insured: AMBAC) | Baa1/A | 3,145,000 | 3,318,919 | |||||
KANSAS — 0.96% | ||||||||
Burlington Environmental Improvement, 5.00% due 12/1/2023 put 4/1/2011 (Kansas City Power & Light; Insured: XLCA) | A3/BBB+ | 1,500,000 | 1,515,195 | |||||
Burlington Environmental Improvement, 5.374% due 9/1/2035 put 4/1/2013 (Kansas City Power & Light; Insured: FGIC) | Baa1/A | 12,400,000 | 12,499,696 | |||||
KENTUCKY — 1.07% | ||||||||
Kentucky Economic DFA, 5.35% due 10/1/2009 (Norton Healthcare; Insured: MBIA) (ETM) | NR/AA | 2,835,000 | 2,899,808 | |||||
Kentucky Economic DFA, 5.35% due 10/1/2009 (Norton Healthcare; Insured: MBIA) | Baa1/AA- | 4,565,000 | 4,579,928 | |||||
26 Certified Semi-Annual Report
| SCHEDULE OF INVESTMENTS, CONTINUED | ||
| Thornburg Limited Term Municipal Fund | March 31, 2009 (Unaudited) | |
Issuer-Description | Credit Rating† Moody’s/S&P | Principal Amount | Value | |||||
Kentucky Economic DFA, 5.40% due 10/1/2010 (Norton Healthcare; Insured: MBIA) (ETM) | NR/AA | $ | 3,775,000 | $ | 4,008,257 | |||
Kentucky Economic DFA, 5.40% due 10/1/2010 (Norton Healthcare; Insured MBIA) | Baa1/AA- | 4,055,000 | 4,095,672 | |||||
LOUISIANA — 2.83% | ||||||||
East Baton Rouge Sewer, 5.00% due 2/1/2018 (Insured: FSA) | Aa3/AAA | 3,000,000 | 3,248,700 | |||||
Louisiana Environmental Facilities & Community Development Authority, 5.00% due 9/1/2012 (Bellemont Apartments) | Ba1/NR | 725,000 | 654,421 | |||||
Louisiana Environmental Facilities & Community Development Authority, 5.00% due 3/1/2015 (Independence Stadium) | NR/A | 1,000,000 | 1,043,460 | |||||
Louisiana Environmental Facilities & Community Development Authority, 5.00% due 3/1/2016 (Independence Stadium) | NR/A | 1,000,000 | 1,036,620 | |||||
Louisiana Environmental Facilities & Community Development Authority, 5.00% due 3/1/2017 (Independence Stadium) | NR/A | 1,265,000 | 1,304,139 | |||||
Louisiana Environmental Facilities & Community Development Authority, 5.00% due 3/1/2018 (Independence Stadium) | NR/A | 1,000,000 | 1,020,150 | |||||
Louisiana Public Facilities Authority Revenue, 5.00% due 5/15/2014 (Ochsner Clinic Foundation) | A3/NR | 1,000,000 | 959,920 | |||||
Louisiana Public Facilities Authority Revenue, 5.00% due 5/15/2015 (Ochsner Clinic Foundation) | A3/NR | 1,825,000 | 1,722,946 | |||||
Louisiana Public Facilities Authority Revenue, 5.00% due 5/15/2016 (Ochsner Clinic Foundation) | A3/NR | 1,000,000 | 926,240 | |||||
Louisiana Public Facilities Authority Revenue, 5.00% due 5/15/2017 (Ochsner Clinic Foundation) | A3/NR | 1,035,000 | 944,251 | |||||
Louisiana Public Facilities Authority Revenue, 5.00% due 5/15/2018 (Ochsner Clinic Foundation) | A3/NR | 1,000,000 | 894,730 | |||||
Louisiana Public Facilities Authority Revenue, 7.00% due 12/1/2038 (Cleco Power LLC) | Baa1/BBB | 9,000,000 | 9,016,740 | |||||
Louisiana State Citizens Property Insurance Corp., 5.00% due 6/1/2015 (Insured: AMBAC) | Baa1/A | 5,000,000 | 4,953,950 | |||||
Louisiana State GO, 5.00% due 8/1/2017 (Insured: MBIA) | A1/AA- | 4,000,000 | 4,235,840 | |||||
Louisiana State Offshore Terminal Authority, 4.25% due 10/1/2037 put 10/1/2010 (Deepwater Port Loop LLC) | A3/A | 4,200,000 | 4,246,200 | |||||
Monroe Sales Tax Increment Garrett Road Economic Development Area, 5.00% due 3/1/2017 (Insured: Radian) | NR/BBB+ | 1,505,000 | 1,685,826 | |||||
Morehouse Parish PCR, 5.25% due 11/15/2013 (International Paper Co.) | Baa3/BBB | 2,400,000 | 2,131,032 | |||||
Regional Transportation Authority, 8.00% due 12/1/2011 (Insured: FGIC) | NR/AA- | 1,250,000 | 1,354,225 | |||||
MARYLAND — 0.19% | ||||||||
Maryland Health & Higher Educational Facilities, 5.00% due 1/1/2017 (Washington County Hospital) | NR/BBB- | 1,000,000 | 917,120 | |||||
Maryland Health & Higher Educational Facilities, 5.00% due 1/1/2018 (Washington County Hospital) | NR/BBB- | 1,000,000 | 901,610 | |||||
Maryland Health & Higher Educational Facilities, 0.50% due 7/1/2034 put 4/7/2009 (Univ. of Maryland Medical; LOC: Bank of America) (weekly demand notes) | Aa3/AA+ | 900,000 | 900,000 | |||||
MASSACHUSETTS — 2.51% | ||||||||
Massachusetts DFA Resource Recovery, 5.50% due 1/1/2011 (Seamass Partnership; Insured: MBIA) | Baa1/AA- | 3,720,000 | 3,753,591 | |||||
Massachusetts Health & Educational Facilities, 0.26% due 11/1/2035 put 4/1/2009 (Berkshire Health Systems; Insured: Assured Guaranty) (daily demand notes) | Aaa/AAA | 4,050,000 | 4,050,000 | |||||
Massachusetts Health & Educational Facilities Authority, 5.00% due 10/1/2011 (Berkshire Health Systems; Insured: Assured Guaranty) | NR/AAA | 2,345,000 | 2,466,401 | |||||
Massachusetts Health & Educational Facilities Authority, 5.375% due 5/15/2012 (New England Medical Center Hospital; Insured: FGIC) (ETM) | NR/NR | 3,415,000 | 3,814,350 | |||||
Massachusetts Health & Educational Facilities Authority, 5.00% due 10/1/2012 (Berkshire Health Systems; Insured: Assured Guaranty) | NR/AAA | 2,330,000 | 2,459,129 | |||||
Massachusetts Health & Educational Facilities Authority, 5.00% due 10/1/2013 (Berkshire Health Systems; Insured: Assured Guaranty) | NR/AAA | 3,215,000 | 3,375,235 | |||||
Massachusetts Health & Educational Facilities Authority, 5.00% due 10/1/2019 (Berkshire Health Systems; Insured: Assured Guaranty) | NR/AAA | 1,750,000 | 1,725,150 | |||||
Massachusetts Western Turnpike Revenue, 5.55% due 1/1/2017 (Insured: MBIA) (2) | Aa3/AA- | 15,000,000 | 15,054,450 | |||||
Certified Semi-Annual Report 27
| SCHEDULE OF INVESTMENTS, CONTINUED | ||
| Thornburg Limited Term Municipal Fund | March 31, 2009 (Unaudited) | |
Issuer-Description | Credit Rating† Moody’s/S&P | Principal Amount | Value | |||||
MICHIGAN — 4.41% | ||||||||
Detroit Sewage Disposal Revenue, 5.00% due 7/1/2014 (Insured: MBIA) | A3/AA- | $ | 2,000,000 | $ | 2,033,060 | |||
Detroit Sewage Disposal Revenue, 5.50% due 7/1/2032 (Insured: MBIA) | A3/AA- | 3,500,000 | 3,582,950 | |||||
Detroit Water Supply System, 6.00% due 7/1/2015 (Insured: MBIA) | A2/AA- | 3,080,000 | 3,253,466 | |||||
Dickinson County Economic Development Corp. Environmental Impact, 5.75% due 6/1/2016 (International Paper Co.) | Baa3/BBB | 3,715,000 | 3,140,810 | |||||
Dickinson County Healthcare Systems, 5.50% due 11/1/2013 (Insured: ACA) | NR/NR | 3,095,000 | 3,011,094 | |||||
Gull Lake Community School District GO, 0% due 5/1/2013 (Insured: FGIC) | NR/AA- | 2,485,000 | 2,044,136 | |||||
Kalamazoo Hospital Finance Authority Facilities Revenue, 5.00% due 5/15/2018 (Bronson Hospital; Insured: FSA) | Aa3/AAA | 1,520,000 | 1,535,109 | |||||
Kalamazoo Hospital Finance Authority Facilities Revenue, 5.00% due 5/15/2018 (Bronson Hospital; Insured: FSA) | Aa3/AAA | 2,500,000 | 2,524,850 | |||||
Kent Hospital Finance Authority, 5.25% due 1/15/2047 put 1/15/2014 (Spectrum Health) | Aa3/AA | 2,000,000 | 2,022,600 | |||||
Michigan HFA, 5.375% due 7/1/2012 (Port Huron Hospital; Insured: FSA) | NR/AAA | 1,405,000 | 1,407,894 | |||||
Michigan Housing Development Authority Rental Housing Revenue, 5.00% due 4/1/2016 | NR/AA | 6,000,000 | 6,082,800 | |||||
Michigan State Building Authority, 5.00% due 10/15/2015 (Insured: AMBAC) | A1/A+ | 6,000,000 | 6,414,420 | |||||
Michigan State Building Authority, 5.50% due 10/15/2017 | A1/A+ | 4,000,000 | 4,343,200 | |||||
Michigan State COP, 5.00% due 9/1/2031 put 9/1/2011 (Insured: MBIA) | Baa1/AA- | 6,000,000 | 6,028,080 | |||||
Michigan State HFA, 5.00% due 11/15/2017 (Sparrow Memorial Hospital) | A1/A+ | 1,000,000 | 932,100 | |||||
Michigan State HFA, 5.75% due 12/1/2034 | Aa2/AA | 10,000,000 | 10,637,200 | |||||
Michigan State Strategic Fund, 5.00% due 10/15/2017 (Insured: Assured Guaranty) | Aa2/AAA | 2,000,000 | 2,189,000 | |||||
Michigan State Strategic Fund, 4.85% due 9/1/2030 put 9/1/2011 (Detroit Edison Co.; Insured: AMBAC) | Baa1/NR | 2,175,000 | 2,133,697 | |||||
Royal Oak Hospital Finance Authority Hospital Revenue, 6.25% due 9/1/2014 (William Beaumont Hospital) | A1/NR | 1,000,000 | 1,037,170 | |||||
MINNESOTA — 0.82% | ||||||||
Dakota County Community Development Agency Multi Family Housing, 5.00% due 11/1/2017 (Commons on Marice) | NR/NR | 1,150,000 | 921,403 | |||||
Minneapolis St. Paul Health Care Systems, 5.25% due 12/1/2012 (Healthpartners Obligated Group) | Baa1/BBB | 1,000,000 | 997,880 | |||||
Minneapolis St. Paul Health Care Systems, 5.25% due 12/1/2013 (Healthpartners Obligated Group) | Baa1/BBB | 1,500,000 | 1,486,755 | |||||
Minneapolis St. Paul Metropolitan Airports, 5.00% due 1/1/2017 (Insured: AMBAC) | Baa1/AA- | 8,005,000 | 8,605,215 | |||||
MISSISSIPPI — 0.16% | ||||||||
Gautier Utility District Systems, 5.50% due 3/1/2012 (Insured: FGIC) | NR/NR | 1,020,000 | 1,053,935 | |||||
Mississippi Development Bank Public Improvement GO, 4.75% due 7/1/2017 | NR/NR | 1,565,000 | 1,331,158 | |||||
MISSOURI — 0.30% | ||||||||
Missouri Development Finance Board Healthcare Facilities, 4.80% due 11/1/2012 (Lutheran Home Aged; LOC: Commerce Bank) | Aa2/NR | 1,045,000 | 1,055,492 | |||||
Missouri State Health & Educational Facilities Authority, 5.00% due 6/1/2011 (SSM Healthcare Corp.) | NR/AA- | 1,000,000 | 1,039,480 | |||||
Springfield Public Utilities COP, 5.00% due 12/1/2013 (Insured: MBIA) | A1/AA- | 2,000,000 | 2,236,940 | |||||
MONTANA — 0.30% | ||||||||
Forsyth PCR, 5.20% due 5/1/2033 put 5/1/2009 (Portland General) | Baa1/A | 4,385,000 | 4,384,912 | |||||
NEBRASKA — 0.60% | ||||||||
Madison County Hospital Authority, 5.25% due 7/1/2010 (Faith Regional Health Services; Insured: Radian) | NR/BBB+ | 1,455,000 | 1,491,201 | |||||
Madison County Hospital Authority, 5.50% due 7/1/2012 (Faith Regional Health Services; Insured: Radian) | NR/BBB+ | 1,625,000 | 1,795,251 | |||||
28 Certified Semi-Annual Report
| SCHEDULE OF INVESTMENTS, CONTINUED | ||
| Thornburg Limited Term Municipal Fund | March 31, 2009 (Unaudited) | |
Issuer-Description | Credit Rating† Moody’s/S&P | Principal Amount | Value | |||||
Omaha Public Power District Electric Systems, 5.00% due 2/1/2013 | Aa1/AA | $ | 5,000,000 | $ | 5,476,700 | |||
NEVADA — 1.75% | ||||||||
Clark County GO, 5.00% due 11/1/2017 (insured: AMBAC) | Aa1/AA+ | 1,185,000 | 1,254,346 | |||||
Clark County Improvement District, 5.00% due 12/1/2015 (Insured: AMBAC) | Baa1/A | 1,885,000 | 1,695,049 | |||||
Clark County School District GO, 5.00% due 6/15/2015 (Insured: MBIA) | Aa2/AA | 1,000,000 | 1,056,950 | |||||
Clark County School District GO, 0.60% due 6/15/2021 put 4/1/2009 (Insured: FSA, SPA: Bayerische Landesbank) (daily demand notes) | Aa3/AAA | 365,000 | 365,000 | |||||
Las Vegas Clark County GO, 5.00% due 1/1/2018 | NR/NR | 6,535,000 | 6,730,593 | |||||
Las Vegas Clark County GO, 5.00% due 1/1/2019 | NR/NR | 3,000,000 | 3,055,410 | |||||
Las Vegas Convention & Visitors Authority, 5.25% due 7/1/2013 (Insured: AMBAC) | Aa3/A+ | 1,530,000 | 1,603,669 | |||||
Las Vegas Convention & Visitors Authority, 5.25% due 7/1/2014 (Insured: AMBAC) | Aa3/A+ | 2,555,000 | 2,653,827 | |||||
Las Vegas Special Local Improvement District, 5.125% due 6/1/2011 (Insured: FSA) | Aa3/AAA | 1,600,000 | 1,612,576 | |||||
Reno Hospital Revenue, 5.25% due 6/1/2014 (Washoe Medical Center; Insured: FSA) | Aa3/AAA | 1,000,000 | 1,054,190 | |||||
Reno Hospital Revenue, 5.25% due 6/1/2016 (Washoe Medical Center; Insured: FSA) | Aa3/AAA | 1,100,000 | 1,142,955 | |||||
Reno Hospital Revenue, 5.25% due 6/1/2018 (Washoe Medical Center; Insured: FSA) | Aa3/AAA | 1,000,000 | 1,023,520 | |||||
Sparks Redevelopment Agency Tax Allocation, 5.75% due 1/15/2010 (Insured: Radian) | NR/BBB+ | 1,000,000 | 1,015,170 | |||||
Sparks Redevelopment Agency Tax Allocation, 5.75% due 1/15/2011 (Insured: Radian) | NR/BBB+ | 1,285,000 | 1,310,841 | |||||
NEW HAMPSHIRE — 0.72% | ||||||||
Manchester Housing & Redevelopment Authority, 6.05% due 1/1/2012 (Insured: ACA) | Baa3/NR | 1,500,000 | 1,483,815 | |||||
New Hampshire Health & Educational Facilities, 5.00% due 10/1/2016 (Southern NH Health Systems) | NR/A- | 1,260,000 | 1,230,768 | |||||
New Hampshire Health & Educational Facilities, 5.00% due 10/1/2017 (Southern NH Health Systems) | NR/A- | 1,000,000 | 969,050 | |||||
New Hampshire Municipal Bond Bank, 5.00% due 8/15/2016 (Insured: MBIA) | Aa3/AA | 2,985,000 | 3,359,886 | |||||
New Hampshire Municipal Bond Bank, 5.00% due 8/15/2017 (Insured: MBIA) | Aa3/AA | 3,130,000 | 3,518,308 | |||||
NEW JERSEY — 1.81% | ||||||||
Hudson County COP, 7.00% due 12/1/2012 (Insured: MBIA) | Baa1/AA- | 1,000,000 | 1,114,510 | |||||
Hudson County COP, 6.25% due 12/1/2014 (Insured: MBIA) | Baa1/AA- | 1,500,000 | 1,630,365 | |||||
New Jersey EDA, 5.00% due 11/15/2011 (Seabrook Village) | NR/NR | 1,000,000 | 971,760 | |||||
New Jersey EDA, 5.00% due 11/15/2014 (Seabrook Village) | NR/NR | 1,000,000 | 905,670 | |||||
New Jersey EDA Cigarette Tax Revenue, 5.00% due 6/15/2012 (Insured: FGIC) | Baa2/BBB | 7,375,000 | 7,237,751 | |||||
New Jersey State Transit Corp. COP, 5.25% due 9/15/2013 (Insured: AMBAC) | A1/A | 6,000,000 | 6,389,340 | |||||
New Jersey State Transit Corp. COP, 5.50% due 9/15/2013 (Insured: AMBAC) | A1/A | 7,650,000 | 8,211,357 | |||||
NEW MEXICO — 0.98% | ||||||||
Albuquerque Airport, 5.50% due 7/1/2013 | A1/A | 1,820,000 | 1,936,207 | |||||
Gallup PCR, 5.00% due 8/15/2016 (Insured: AMBAC) | Baa1/A | 2,300,000 | 2,095,231 | |||||
Los Alamos County Gross Receipts Tax, 5.50% due 6/1/2017 | A1/AA+ | 2,365,000 | 2,570,282 | |||||
Los Alamos County Gross Receipts Tax, 5.50% due 6/1/2018 | A1/AA+ | 2,205,000 | 2,379,813 | |||||
New Mexico Highway Commission Tax, 5.00% due 6/15/2011 (Insured: AMBAC) (ETM) | Aa2/AAA | 4,865,000 | 5,277,795 | |||||
NEW YORK — 6.83% | ||||||||
Monroe County IDA, 5.375% due 6/1/2017 (St. John Fisher College; Insured: Radian) | NR/BBB+ | 3,910,000 | 3,653,074 | |||||
New York City GO, 0.50% due 11/1/2026 put 4/1/2009 (Insured: FSA/SPA-Dexia Credit Local) (daily demand notes) | Aa3/AAA | 7,680,000 | 7,680,000 | |||||
New York City IDA, 5.00% due 6/1/2010 (Lycee Francais de New York; Insured: ACA) | Baa1/NR | 1,175,000 | 1,177,421 | |||||
New York City IDA, 5.25% due 6/1/2011 (Lycee Francais de New York; Insured: ACA) | Baa1/NR | 2,215,000 | 2,206,162 | |||||
New York City IDA, 5.25% due 6/1/2012 (Lycee Francais de New York; Insured: ACA) | Baa1/NR | 2,330,000 | 2,282,701 | |||||
New York City Municipal Water Finance Authority, 1.00% due 6/15/2032 put 4/1/2009 (SPA: Dexia Credit Local) (daily demand notes) | Aa3/AA+ | 5,805,000 | 5,805,000 | |||||
Certified Semi-Annual Report 29
| SCHEDULE OF INVESTMENTS, CONTINUED | ||
| Thornburg Limited Term Municipal Fund | March 31, 2009 (Unaudited) | |
Issuer-Description | Credit Rating† Moody’s/S&P | Principal Amount | Value | |||||
New York City Municipal Water Finance Authority, 0.85% due 6/15/2033 put 4/1/2009 (SPA: Dexia Credit Local) (daily demand notes) | Aa2/AAA | $ | 25,300,000 | $ | 25,300,000 | |||
New York City Transitional Finance Authority, 5.00% due 11/1/2012 | Aa1/AAA | 5,000,000 | 5,545,950 | |||||
New York City Transitional Finance Authority, 5.00% due 11/1/2014 | Aa1/AAA | 2,000,000 | 2,247,480 | |||||
New York State Dormitory Authority, 5.50% due 7/1/2012 (South Nassau Community Hospital) | Baa1/NR | 1,820,000 | 1,823,585 | |||||
New York State Dormitory Authority, 5.50% due 7/1/2013 (South Nassau Community Hospital) | Baa1/NR | 1,500,000 | 1,499,865 | |||||
New York State Dormitory Authority, 5.25% due 8/15/2013 (Presbyterian Hospital; Insured: FHA & FSA) | Aa3/AAA | 3,650,000 | 3,988,428 | |||||
New York State Dormitory Authority, 5.50% due 2/15/2017 (Mental Health Services) | NR/AA- | 5,000,000 | 5,286,650 | |||||
New York State Dormitory Authority, 5.50% due 2/15/2018 (Mental Health Services) | NR/AA- | 5,000,000 | 5,238,750 | |||||
New York State Dormitory Authority, 5.25% due 11/15/2026 put 5/15/2012 (Insured: AMBAC) | A1/AA- | 4,000,000 | 4,219,480 | |||||
New York State Dormitory Authority Aids Long Term Health Facilities, 5.00% due 11/1/2012 (Insured: SONYMA) | Aa1/NR | 2,000,000 | 2,084,660 | |||||
New York State Dormitory Authority Aids Long Term Health Facilities, 5.00% due 11/1/2013 (Insured: SONYMA) | Aa1/NR | 4,600,000 | 4,794,718 | |||||
New York State Dormitory Authority Aids Long Term Health Facilities, 5.00% due 11/1/2014 (Insured: SONYMA) | Aa1/NR | 1,500,000 | 1,563,495 | |||||
New York State Dormitory Authority Mental Health Services Facilities Improvement, 5.00% due 8/15/2010 (Insured: MBIA) | A1/AA- | 1,600,000 | 1,670,704 | |||||
New York State Thruway Authority Service Contract, 5.50% due 4/1/2013 (Local Highway & Bridge; Insured: XLCA) | A1/AA- | 1,000,000 | 1,089,310 | |||||
Port Authority 148th, 5.00% due 8/15/2017 (Insured: FSA) | Aa3/AAA | 4,725,000 | 5,321,862 | |||||
Tobacco Settlement Financing Corp. Asset Backed, 5.25% due 6/1/2013 | A1/AA- | 3,160,000 | 3,164,203 | |||||
Tobacco Settlement Financing Corp. Asset Backed, 5.25% due 6/1/2013 (Insured: XLCA) | A1/AA- | 2,000,000 | 2,002,620 | |||||
NORTH CAROLINA — 3.85% | ||||||||
Charlotte Mecklenberg Hospital Authority Health Care Systems, 5.00% due 1/15/2016 (Carolinas Health Network) | Aa3/AA- | 3,420,000 | 3,571,506 | |||||
Charlotte Mecklenberg Hospital Authority Health Care Systems, 5.00% due 1/15/2017 (Carolinas Health Network) | Aa3/AA- | 2,000,000 | 2,086,320 | |||||
Mecklenburg County GO, 5.00% due 2/1/2011 | Aa1/AA+ | 1,000,000 | 1,066,270 | |||||
North Carolina Eastern Municipal Power Agency, 5.375% due 1/1/2011 | Baa1/BBB+ | 3,000,000 | 3,102,270 | |||||
North Carolina Eastern Municipal Power Agency, 5.25% due 1/1/2012 | Baa1/BBB+ | 650,000 | 676,423 | |||||
North Carolina Eastern Municipal Power Agency, 5.50% due 1/1/2012 | Baa1/BBB+ | 1,100,000 | 1,151,843 | |||||
North Carolina Eastern Municipal Power Agency, 5.25% due 1/1/2013 | Baa1/BBB+ | 1,055,000 | 1,101,557 | |||||
North Carolina Eastern Municipal Power Agency, 5.00% due 1/1/2016 (Insured: AMBAC) | Baa1/A | 1,700,000 | 1,713,430 | |||||
North Carolina Eastern Municipal Power Agency, 6.00% due 1/1/2018 (Insured: AMBAC) | Baa1/A | 7,500,000 | 7,889,850 | |||||
North Carolina Eastern Municipal Power Agency, 6.00% due 1/1/2018 | Aaa/AAA | 5,700,000 | 6,493,611 | |||||
North Carolina Eastern Municipal Power Agency, 5.25% due 1/1/2019 (Insured: Assured Guaranty) | Aa2/AAA | 3,000,000 | 3,119,220 | |||||
North Carolina Infrastructure Finance Corp. COP, 5.00% due 2/1/2017 (Correctional Facilities) | Aa1/AA+ | 2,400,000 | 2,526,072 | |||||
North Carolina Medical Care Commission, 5.00% due 9/1/2013 (Rowan Regional Medical Center; Insured: FSA & FHA 242) | Aa3/AAA | 1,000,000 | 1,048,750 | |||||
North Carolina Municipal Power Agency, 6.00% due 1/1/2010 (Catawba Electric; Insured: MBIA) | A2/AA- | 2,400,000 | 2,467,560 | |||||
North Carolina Municipal Power Agency, 5.50% due 1/1/2013 (Catawba Electric) | A2/A- | 2,505,000 | 2,685,861 | |||||
North Carolina Municipal Power Agency, 6.375% due 1/1/2013 (Catawba Electric) | A2/A- | 1,500,000 | 1,546,305 | |||||
North Carolina Municipal Power Agency, 5.25% due 1/1/2017 (Catawba Electric) | A2/A- | 3,000,000 | 3,147,630 | |||||
North Carolina State Infrastructure Finance Corp. COP, 5.00% due 2/1/2016 (Correctional Facilities) | Aa1/AA+ | 5,000,000 | 5,312,300 | |||||
University of North Carolina Systems Pool Revenue, 5.00% due 4/1/2012 (Insured: AMBAC) | Baa1/A | 1,030,000 | 1,141,291 | |||||
Wake County GO, 5.00% due 3/1/2011 | Aaa/AAA | 4,000,000 | 4,306,920 | |||||
NORTH DAKOTA — 0.17% | ||||||||
Ward County Health Care Facilities, 5.00% due 7/1/2011 (Trinity Obligated Group) | NR/BBB+ | 1,000,000 | 968,970 | |||||
Ward County Health Care Facilities, 5.00% due 7/1/2013 (Trinity Obligated Group) | NR/BBB+ | 1,560,000 | 1,465,885 | |||||
30 Certified Semi-Annual Report
| SCHEDULE OF INVESTMENTS, CONTINUED | ||
| Thornburg Limited Term Municipal Fund | March 31, 2009 (Unaudited) | |
Issuer-Description | Credit Rating† Moody’s/S&P | Principal Amount | Value | |||||
OHIO — 1.42% | ||||||||
Akron COP, 5.00% due 12/1/2013 (Insured: Assured Guaranty) | NR/AAA | $ | 3,000,000 | $ | 3,321,750 | |||
Akron COP, 5.00% due 12/1/2014 (Insured: Assured Guaranty) | NR/AAA | 2,000,000 | 2,213,320 | |||||
Greater Cleveland Regional Transportation Authority GO, 5.00% due 12/1/2015 (Insured: MBIA) | Aa3/NR | 1,000,000 | 1,094,120 | |||||
Hudson City GO, 6.35% due 12/1/2011 (Library Improvement) | Aa1/NR | 1,400,000 | 1,552,572 | |||||
Mahoning Valley Sanitary District, 5.90% due 11/15/2009 (Insured: FSA) | Aa3/AAA | 770,000 | 795,418 | |||||
Montgomery County, 6.00% due 12/1/2009 (Catholic Health Initiatives) | Aa2/AA | 2,385,000 | 2,436,802 | |||||
Montgomery County, 6.00% due 12/1/2010 (Catholic Health Initiatives) | Aa2/AA | 1,530,000 | 1,595,560 | |||||
Montgomery County, 4.10% due 10/1/2041 put 11/10/2011 (Catholic Health Initiatives) | Aa2/AA | 2,500,000 | 2,624,000 | |||||
Ohio State Unlimited Tax GO, 5.75% due 6/15/2010 pre-refunded 6/15/2009 | Aa1/AA+ | 5,000,000 | 5,055,200 | |||||
OKLAHOMA — 0.91% | ||||||||
Comanche County Hospital Authority, 5.00% due 7/1/2011 (Insured: Radian) | NR/BBB+ | 1,000,000 | 996,140 | |||||
Comanche County Hospital Authority, 5.25% due 7/1/2015 (Insured: Radian) | NR/BBB+ | 1,340,000 | 1,290,152 | |||||
Oklahoma DFA, 5.75% due 6/1/2011 (Oklahoma Hospital Association; Insured: AMBAC) | Aa3/NR | 740,000 | 806,297 | |||||
Oklahoma DFA Health, 5.00% due 8/15/2017 (Integris Baptist Medical Center) | Aa3/AA- | 2,900,000 | 3,056,339 | |||||
Oklahoma DFA Hospital, 5.25% due 12/1/2011 (Duncan Regional Hospital) | NR/A | 1,215,000 | 1,262,033 | |||||
Oklahoma DFA Hospital, 5.25% due 12/1/2012 (Duncan Regional Hospital) | NR/A | 1,330,000 | 1,386,472 | |||||
Oklahoma State Industrial Authority, 6.00% due 8/15/2010 pre-refunded 8/15/2009 (Integris Health Systems; Insured: MBIA) | Aa3/AA- | 2,150,000 | 2,216,026 | |||||
Oklahoma State Industrial Authority, 5.00% due 7/1/2016 (Medical Research Foundation) | A1/NR | 1,165,000 | 1,176,906 | |||||
Oklahoma State Industrial Authority, 5.25% due 7/1/2017 (Medical Research Foundation) | A1/NR | 1,075,000 | 1,098,736 | |||||
OREGON — 0.07% | ||||||||
Oregon State Department Administrative Services COP, 5.00% due 11/1/2014 (Insured: FGIC) | Aa3/AA- | 1,000,000 | 1,086,970 | |||||
PENNSYLVANIA — 2.01% | ||||||||
Allegheny County Hospital Development Authority, 5.00% due 6/15/2018 (University of Pittsburgh Medical Center) | Aa3/AA- | 3,000,000 | 3,064,170 | |||||
Chester County School Authority, 5.00% due 4/1/2016 (Intermediate School; Insured: AMBAC) | NR/A | 1,915,000 | 2,060,521 | |||||
Geisinger Authority Health Systems, 5.50% due 8/15/2009 (Penn State Geisinger Health) | Aa2/AA | 1,000,000 | 1,011,580 | |||||
Northampton County IDA, 5.35% due 7/1/2010 (Moravian Hall Square; Insured: Radian) | NR/BBB+ | 1,200,000 | 1,200,960 | |||||
Pennsylvania Higher Educational Facilities Authority, 5.00% due 6/1/2015 | Baa2/BBB | 1,200,000 | 1,091,424 | |||||
Philadelphia Gas Works, 5.00% due 9/1/2014 (Insured: FSA) | Aa2/AAA | 3,000,000 | 3,269,160 | |||||
Philadelphia Gas Works, 5.00% due 9/1/2015 (Insured: FSA) | Aa2/AAA | 3,315,000 | 3,573,073 | |||||
Philadelphia Parking Authority Revenue, 5.00% due 9/1/2016 | A2/A- | 1,500,000 | 1,565,340 | |||||
Philadelphia Parking Authority Revenue, 5.00% due 9/1/2017 | A2/A- | 1,020,000 | 1,052,701 | |||||
Pittsburgh GO, 5.00% due 9/1/2012 (Insured: MBIA) | Baa1/AA- | 3,415,000 | 3,455,126 | |||||
Pittsburgh GO, 5.50% due 9/1/2014 (Insured: AMBAC) | Baa1/A | 2,000,000 | 2,132,920 | |||||
Pittsburgh GO, 5.25% due 9/1/2016 (Insured: FSA) | Aa3/AAA | 3,000,000 | 3,203,370 | |||||
Sayre HFA, 5.25% due 7/1/2011 (Latrobe Area Hospital; Insured: AMBAC) (ETM) | Baa1/A | 1,400,000 | 1,514,394 | |||||
Sayre HFA, 5.25% due 7/1/2012 (Latrobe Area Hospital; Insured: AMBAC) (ETM) | Baa1/A | 1,000,000 | 1,108,070 | |||||
RHODE ISLAND — 0.54% | ||||||||
Providence GO, 5.50% due 1/15/2012 (Insured: FGIC) | A3/AA- | 1,880,000 | 2,037,036 | |||||
Rhode Island COP, 5.00% due 10/1/2014 (Providence Plantations; Insured MBIA) | A1/AA- | 1,000,000 | 1,045,820 | |||||
Rhode Island State Economic Development Corp., 5.75% due 7/1/2010 (Providence Place Mall; Insured: Radian) | NR/BBB+ | 1,115,000 | 1,124,176 | |||||
Rhode Island State Health & Education Building Corp., 4.50% due 9/1/2009 (Butler Hospital; LOC: Bank of America) (ETM) | NR/NR | 1,960,000 | 1,993,242 | |||||
Rhode Island State Health & Education Building Corp., 5.25% due 7/1/2014 (Memorial Hospital; LOC: Fleet Bank) | NR/AA+ | 1,565,000 | 1,634,439 | |||||
Certified Semi-Annual Report 31
| SCHEDULE OF INVESTMENTS, CONTINUED | ||
| Thornburg Limited Term Municipal Fund | March 31, 2009 (Unaudited) | |
Issuer-Description | Credit Rating† Moody’s/S&P | Principal Amount | Value | |||||
SOUTH CAROLINA — 1.36% | ||||||||
Georgetown County Environmental Improvement, 5.70% due 4/1/2014 (International Paper Co.) | Baa3/BBB | $ | 7,975,000 | $ | 7,067,525 | |||
Greenville County School District, 5.25% due 12/1/2015 (Building Equity Sooner Tomorrow) | Aa3/AA | 1,000,000 | 1,054,370 | |||||
Greenwood County Hospital Facilities, 5.00% due 10/1/2013 (Self Regional Healthcare; Insured: FSA) | Aa3/AAA | 2,000,000 | 2,140,680 | |||||
Greenwood Fifty Facilities School District, 5.00% due 12/1/2015 (Insured: Assured Guaranty) | Aa2/AAA | 1,000,000 | 1,104,160 | |||||
Greenwood Fifty Facilities School District, 5.00% due 12/1/2016 (Insured: Assured Guaranty) | Aa2/AAA | 1,000,000 | 1,100,620 | |||||
South Carolina Jobs Economic Carealliance, 5.00% due 8/15/2014 | Aa3/AAA | 4,000,000 | 4,271,160 | |||||
South Carolina Jobs Economic Carealliance, 5.00% due 8/15/2015 | Aa3/AAA | 3,000,000 | 3,184,980 | |||||
SOUTH DAKOTA — 0.08% | ||||||||
South Dakota State Health & Educational Facilities Authority, 5.50% due 9/1/2011 (Rapid City Regional Hospital; Insured: MBIA) | A1/AA- | 1,100,000 | 1,142,240 | |||||
TENNESSEE — 1.03% | ||||||||
Knox County Health, Educational, & Housing Facilities, 5.00% due 4/1/2017 (University Health Systems) | NR/BBB+ | 3,130,000 | 2,868,144 | |||||
Tennessee Energy Acquisition Corp., 5.00% due 9/1/2014 | Ba1/BBB+ | 975,000 | 821,701 | |||||
Tennessee Energy Acquisition Corp., 5.00% due 9/1/2015 | Ba1/BBB+ | 3,000,000 | 2,462,640 | |||||
Tennessee Energy Acquisition Corp., 5.00% due 2/1/2017 | Baa1/A | 5,000,000 | 4,000,900 | |||||
Tennessee Energy Acquisition Corp., 5.25% due 9/1/2018 | Ba1/BBB+ | 5,000,000 | 3,933,300 | |||||
Tennessee Energy Acquisition Corp., 5.25% due 9/1/2020 | Ba1/BBB+ | 1,190,000 | 903,615 | |||||
TEXAS — 11.57% | ||||||||
Amarillo Health Facilities Corp., 5.50% due 1/1/2011 (St. Anthony’s Hospital Corp.; Insured: FSA) | Aa3/NR | 1,350,000 | 1,415,070 | |||||
Austin Community College Public Facilities Corp., 5.25% due 8/1/2017 (Round Rock Campus) | Aa3/AA+ | 1,500,000 | 1,646,400 | |||||
Austin Water & Wastewater, 5.00% due 5/15/2014 (Insured: AMBAC) | Aa3/AA | 2,890,000 | 3,129,610 | |||||
Austin Water & Wastewater, 5.00% due 5/15/2015 (Insured: AMBAC) | Aa3/AA | 1,520,000 | 1,648,972 | |||||
Bexar County Housing Finance Corp. Multi Family Housing, 5.00% due 1/1/2011 (American Opportunity Housing; Insured: MBIA) | Baa1/NR | 1,230,000 | 1,191,563 | |||||
Brazos River Authority, 4.90% due 10/1/2015 (Center Point Energy; Insured: MBIA) | Baa1/AA- | 2,415,000 | 2,112,642 | |||||
Clint ISD GO, 5.50% due 2/15/2011 (Guaranty: PSF) | Aaa/AAA | 1,700,000 | 1,837,717 | |||||
Clint ISD GO, 5.50% due 2/15/2012 (Guaranty: PSF) | NR/AAA | 1,155,000 | 1,234,037 | |||||
Collin County Limited Tax Improvement GO, 5.00% due 2/15/2016 | Aaa/AAA | 1,465,000 | 1,676,795 | |||||
Corpus Christi Business & Job Development Corp., 5.00% due 9/1/2012 (Arena Project; Insured: AMBAC) | A3/A | 1,025,000 | 1,111,203 | |||||
Corpus Christi Utility Systems, 5.50% due 7/15/2009 (Insured: FSA) | Aa3/AAA | 4,780,000 | 4,845,773 | |||||
Dallas County Texas Utility & Reclamation District, 5.00% due 2/15/2017 (Insured: AMBAC) | Baa1/A | 1,160,000 | 1,143,621 | |||||
Dallas County Texas Utility & Reclamation District, 5.00% due 2/15/2017 (Insured: AMBAC) | Baa1/A | 1,260,000 | 1,242,209 | |||||
Dallas County Texas Utility & Reclamation District, 5.00% due 2/15/2018 (Insured: AMBAC) | Baa1/A | 1,935,000 | 1,877,298 | |||||
Dallas County Texas Utility & Reclamation District, 5.00% due 2/15/2018 (Insured: AMBAC) | Baa1/A | 2,035,000 | 1,974,316 | |||||
Dallas County Texas Utility & Reclamation District, 5.00% due 2/15/2019 (Insured: AMBAC) | Baa1/A | 2,175,000 | 2,078,974 | |||||
Duncanville ISD GO, 0% due 2/15/2011 (Guaranty: PSF) | Aaa/AAA | 4,945,000 | 4,789,381 | |||||
Duncanville ISD GO, 0% due 2/15/2012 (Guaranty: PSF) | Aaa/AAA | 1,245,000 | 1,176,338 | |||||
Fort Worth Water & Sewer, 5.25% due 2/15/2011 (Tarrant & Denton County) | Aa2/AA | 1,390,000 | 1,491,748 | |||||
Grapevine Colleyville ISD GO, 0% due 8/15/2011 (Guaranty: PSF) | Aaa/AAA | 7,350,000 | 7,043,431 | |||||
Grapevine GO, 5.25% due 2/15/2012 (Insured: FGIC) | NR/AA | 2,005,000 | 2,011,215 | |||||
Harris County Health Facilities Development Corp. Thermal Utility, 5.45% due 2/15/2011 (Teco; Insured: AMBAC) | Aa3/A | 2,595,000 | 2,653,906 | |||||
Harris County Health Facilities Development Corp. Thermal Utility, 5.00% due 11/15/2015 (Teco; Insured: MBIA) | Aa3/AA- | 1,500,000 | 1,568,325 | |||||
Harris County Hospital District, 5.75% due 2/15/2011 pre-refunded 8/15/2010 (Insured: MBIA) | NR/AA | 10,000,000 | 10,616,800 | |||||
Harris County Hospital District Senior Lien, 5.00% due 2/15/2014 (Insured: MBIA) | A1/AA- | 1,275,000 | 1,340,152 | |||||
Harris County Hospital District Senior Lien, 5.00% due 2/15/2017 (Insured: MBIA) | A1/AA- | 1,500,000 | 1,550,175 | |||||
32 Certified Semi-Annual Report
| SCHEDULE OF INVESTMENTS, CONTINUED | ||
| Thornburg Limited Term Municipal Fund | March 31, 2009 (Unaudited) | |
Issuer-Description | Credit Rating† Moody’s/S&P | Principal Amount | Value | |||||
Harris County Sports Authority Senior Lien, 0% due 11/15/2010 (Insured: MBIA) | Baa1/AA | $ | 3,260,000 | $ | 3,058,825 | |||
Houston ISD Public West Side, 0% due 9/15/2014 (Insured: AMBAC) | Aa3/AA | 6,190,000 | 5,226,093 | |||||
Hutto ISD GO, 0% due 8/1/2017 (Guaranty: PSF) | NR/AAA | 2,170,000 | 1,570,451 | |||||
Irving ISD GO, 0% due 2/15/2017 (Guaranty: PSF) | Aaa/AAA | 1,000,000 | 739,920 | |||||
Keller ISD GO, 0% due 8/15/2012 (Guaranty: PSF) | Aaa/AAA | 1,250,000 | 1,165,588 | |||||
Laredo GO, 5.00% due 2/15/2018 (Insured: MBIA) | A1/AA- | 2,000,000 | 2,121,220 | |||||
Laredo Sports Venue Sales Refunding & Improvement, 5.00% due 3/15/2012 (Insured: AMBAC) | A3/A+ | 1,660,000 | 1,762,688 | |||||
Laredo Sports Venue Sales Refunding & Improvement, 5.00% due 3/15/2013 (Insured: AMBAC) | A3/A+ | 1,745,000 | 1,858,669 | |||||
Laredo Sports Venue Sales Refunding & Improvement, 5.00% due 3/15/2014 (Insured: AMBAC) | A3/A+ | 1,835,000 | 1,944,293 | |||||
Laredo Sports Venue Sales Refunding & Improvement, 5.00% due 3/15/2015 (Insured: AMBAC) | A3/A+ | 1,930,000 | 2,036,999 | |||||
Mesquite ISD GO, 0% due 8/15/2011 pre-refunded 8/15/2010 (Guaranty: PSF) | NR/AAA | 1,865,000 | 1,736,856 | |||||
Mesquite ISD GO, 0% due 8/15/2011 (Guaranty: PSF) | NR/AAA | 1,200,000 | 1,110,924 | |||||
Midtown Redevelopment Authority, 6.00% due 1/1/2010 (Insured: Radian) | Baa1/A- | 700,000 | 710,143 | |||||
Midtown Redevelopment Authority, 6.00% due 1/1/2011 (Insured: Radian) | Baa1/A- | 740,000 | 758,167 | |||||
North Central Health Facility Development, 5.00% due 5/15/2017 (Baylor Health Care System) | Aa2/AA- | 5,000,000 | 5,014,100 | |||||
North East ISD GO, 5.00% due 8/1/2016 | Aaa/AAA | 2,000,000 | 2,288,800 | |||||
North Texas Tollway Authority, 5.50% due 1/1/2038 | A2/A- | 10,000,000 | 10,294,800 | |||||
North Texas Tollway Authority, 5.00% due 1/1/2043 put 1/1/2011 | A2/A- | 2,140,000 | 2,185,154 | |||||
Red River Authority PCR, 5.20% due 7/1/2011 (Southwestern Public Service; Insured: AMBAC) | Baa1/A | 1,050,000 | 1,042,010 | |||||
Richardson Refunding & Improvement GO, 5.00% due 2/15/2014 (Insured: MBIA) | Aa1/AAA | 3,000,000 | 3,334,680 | |||||
Sam Rayburn Municipal Power Agency, 5.50% due 10/1/2012 | Baa2/BBB- | 6,000,000 | 5,979,300 | |||||
Sam Rayburn Municipal Power Agency, 6.00% due 10/1/2021 | Baa2/BBB- | 2,000,000 | 1,807,400 | |||||
Spring Texas ISD GO, 5.00% due 8/15/2028 (Insured: FSA) | A1/AAA | 10,000,000 | 10,084,700 | |||||
Tarrant County Cultural Educational Facilities, 5.00% due 8/15/2014 | Aa3/AA- | 1,180,000 | 1,208,379 | |||||
Tarrant County Cultural Educational Facilities, 5.00% due 8/15/2016 | Aa3/AA- | 2,280,000 | 2,290,602 | |||||
Tarrant County Cultural Educational Facilities, 5.00% due 8/15/2017 | Aa3/AA- | 2,000,000 | 1,996,360 | |||||
Tarrant County Health Facilities Development Corp., 6.00% due 11/15/2009 (Adventist/Sunbelt Health System) (ETM) | A1/NR | 650,000 | 672,347 | |||||
Tarrant County Health Facilities Development Corp., 6.10% due 11/15/2011 pre-refunded 11/15/2010 (Adventist/Sunbelt Health System) | A1/NR | 730,000 | 793,882 | |||||
Texas Municipal Power Agency, 0% due 9/1/2013 (Insured: MBIA) | Baa1/AA | 1,000,000 | 844,630 | |||||
Texas Municipal Power Agency, 5.00% due 9/1/2017 (Insured: Assured Guaranty) | Aa2/AAA | 10,000,000 | 10,950,000 | |||||
Texas State Affordable Housing Corp., 4.85% due 9/1/2012 (Insured: MBIA) | Baa1/AA- | 1,415,000 | 1,320,223 | |||||
Texas State Public Finance Authority, 6.00% due 8/1/2011 pre-refunded 8/1/2009 (State Preservation; Insured: FSA) | Aa2/AAA | 1,000,000 | 1,018,560 | |||||
Texas State Public Finance Authority, 5.00% due 10/15/2014 (Stephen F. Austin University Financing; Insured: MBIA) | A2/NR | 1,305,000 | 1,418,026 | |||||
Texas State Public Finance Authority, 5.00% due 10/15/2015 (Stephen F. Austin University Financing; Insured: MBIA) | A2/NR | 1,450,000 | 1,576,382 | |||||
Tomball Hospital Authority, 5.00% due 7/1/2013 | Baa3/NR | 1,460,000 | 1,351,551 | |||||
Travis County Health Facilities Development Corp., 5.75% due 11/15/2010 (Ascension Health; Insured: MBIA) | Aa1/AA | 2,000,000 | 2,066,040 | |||||
Washington County Health Facilities Development Corp., 5.35% due 6/1/2009 (Trinity Medical Center; Insured: ACA) (2) | NR/NR | 445,000 | 444,537 | |||||
Washington County Health Facilities Development Corp., 5.75% due 6/1/2019 (Trinity Medical Center; Insured: ACA) | NR/NR | 3,840,000 | 3,140,314 | |||||
Weslaco GO Waterworks & Sewer System, 5.25% due 2/15/2019 (Insured: MBIA) | Baa1/AA- | 2,835,000 | 3,014,285 | |||||
West Harris County Regional Water, 5.25% due 12/15/2012 (Insured: FSA) | Aa3/AAA | 2,435,000 | 2,627,901 | |||||
UTAH — 1.91% | ||||||||
Intermountain Power Agency Supply, 5.00% due 7/1/2012 (1) | NR/NR | 15,000,000 | 16,075,650 | |||||
Intermountain Power Agency Supply, 5.00% due 7/1/2012 (ETM) | NR/AAA | 4,355,000 | 4,365,713 | |||||
Certified Semi-Annual Report 33
| SCHEDULE OF INVESTMENTS, CONTINUED | ||
| Thornburg Limited Term Municipal Fund | March 31, 2009 (Unaudited) | |
Issuer-Description | Credit Rating† Moody’s/S&P | Principal Amount | Value | |||||
Intermountain Power Agency Supply, 5.00% due 7/1/2013 (1) | NR/NR | $ | 5,000,000 | $ | 5,376,350 | |||
Salt Lake County Municipal Building Authority, 5.50% due 10/1/2009 | Aa1/AA+ | 1,500,000 | 1,536,330 | |||||
Utah State Board of Regents Auxiliary Systems & Student Fee, 5.00% due 5/1/2010 (2) | NR/AA | 510,000 | 533,511 | |||||
VIRGINIA — 0.79% | ||||||||
Alexandria IDA, 5.75% due 10/1/2009 (Institute for Defense; Insured: AMBAC) (ETM) | Baa1/A | 1,130,000 | 1,160,341 | |||||
Alexandria IDA, 5.75% due 10/1/2010 (Institute for Defense; Insured: AMBAC) (ETM) | Baa1/A | 1,195,000 | 1,282,653 | |||||
Chesterfield County IDA PCR, 5.50% due 10/1/2009 (VEPCO) | Baa1/NR | 1,500,000 | 1,502,820 | |||||
Louisa Industrial Development Authority PCR, 5.00% due 11/1/2035 put 12/1/2011 (Virginia Electric & Power Company) | NR/A- | 3,000,000 | 3,052,590 | |||||
Norton IDA Hospital Improvement, 5.75% due 12/1/2012 (Norton Community Hospital; Insured: ACA) | NR/NR | 1,460,000 | 1,434,625 | |||||
Suffolk Redevelopment Housing Authority, 4.85% due 7/1/2031 put 7/1/2011 (Windsor at Potomac; Collateralized: FNMA) | Aaa/NR | 3,000,000 | 3,151,710 | |||||
WASHINGTON — 2.86% | ||||||||
Chelan County Public Utilities, 0% due 6/1/2014 (Insured: MBIA) | Aa2/AA | 2,000,000 | 1,659,920 | |||||
Energy Northwest Washington Electric, 5.00% due 7/1/2017 (Number 3) | Aaa/AA | 5,470,000 | 5,963,175 | |||||
Port Seattle Washington Revenue, 5.50% due 9/1/2018 (Insured: MBIA) | A1/AA- | 5,000,000 | 5,332,700 | |||||
Snohomish County Public Utilities District, 5.00% due 12/1/2015 (Insured: FSA) | Aa3/AAA | 5,015,000 | 5,509,429 | |||||
Washington State GO, 0% due 1/1/2018 (Insured: FGIC) | Aa1/AA+ | 4,000,000 | 2,843,120 | |||||
Washington State GO, 0% due 1/1/2019 (Insured: FGIC) | Aa1/AA+ | 3,000,000 | 2,000,400 | |||||
Washington State Health Care Facilities Authority, 6.75% due 12/1/2011 (Group Health CO-OP Puget Sound) | Baa1/NR | 2,060,000 | 2,060,638 | |||||
Washington State HFA, 5.50% due 12/1/2009 (Providence Services; Insured: MBIA) (ETM) | NR/AA | 1,500,000 | 1,550,670 | |||||
Washington State HFA, 5.00% due 7/1/2013 (Overlake Hospital; Credit Support: Assured Guaranty) | Aa2/AAA | 1,000,000 | 1,045,430 | |||||
Washington State HFA, 5.25% due 8/1/2018 (Insured: FSA 242) | NR/A+ | 8,095,000 | 8,372,092 | |||||
Washington State Public Power Supply Systems, 5.40% due 7/1/2012 (Nuclear Number 2; Insured: FSA) | Aaa/AAA | 1,300,000 | 1,448,629 | |||||
Washington State Public Power Supply Systems, 0% due 7/1/2013 (Nuclear Number 3; Insured: MBIA-IBC) | Aaa/AA | 1,760,000 | 1,576,344 | |||||
Washington State Public Power Supply Systems, 0% due 7/1/2015 (Nuclear Number 3; Insured: MBIA-IBC) | Aaa/AA | 3,000,000 | 2,448,000 | |||||
WEST VIRGINIA — 0.55% | ||||||||
Kanawha, Mercer, Nicholas Counties Single Family Mortgage, 0% due 2/1/2015 pre-refunded 2/1/2014 | NR/NR | 2,260,000 | 1,751,636 | |||||
Monongalia County Community Hospital, 5.25% due 7/1/2020 (Monongalia General Hospital) | NR/BBB+ | 5,000,000 | 4,429,300 | |||||
West Virginia EDA PCR, 4.85% due 5/1/2019 (Appalachian Power Company) | Baa2/BBB | 1,000,000 | 961,080 | |||||
West Virginia EDA PCR, 4.85% due 5/1/2019 (Pollution Control) | Baa2/BBB | 1,000,000 | 961,080 | |||||
WISCONSIN — 0.91% | ||||||||
Bradley PCR, 6.75% due 7/1/2009 (Owens Illinois Solid Waste) (ETM) | NR/B | 1,500,000 | 1,523,535 | |||||
Wisconsin State Health & Educational Facilities Authority, 5.40% due 8/15/2013 (Sorrowful Mother Corp.; Insured: MBIA) | Baa1/AA | 1,135,000 | 1,135,443 | |||||
Wisconsin State Health & Educational Facilities Authority, 5.50% due 8/15/2019 (Sorrowful Mother Corp.; Insured: MBIA) | Baa1/AA- | 11,000,000 | 10,581,450 | |||||
34 Certified Semi-Annual Report
| SCHEDULE OF INVESTMENTS, CONTINUED | ||
| Thornburg Limited Term Municipal Fund | March 31, 2009 (Unaudited) | |
Issuer-Description | Credit Rating† | Principal Amount | Value | |||||
WYOMING — 0.24% | ||||||||
West Park Hospital District, 5.90% due 7/1/2010 (Insured: ACA) | NR/NR | $ | 975,000 | $ | 974,951 | |||
Wyoming Farm Loan Board, 0% due 4/1/2009 | NR/AA+ | 2,500,000 | 2,500,000 | |||||
TOTAL INVESTMENTS — 99.95% (Cost $1,452,237,324) | $ | 1,459,243,913 | ||||||
OTHER ASSETS LESS LIABILITIES — 0.05% | 736,181 | |||||||
NET ASSETS — 100.00% | $ | 1,459,980,094 | ||||||
Footnote Legend
| † | Credit ratings are unaudited. Rating changes may have occurred prior to or subsequent to the reporting period end. |
| (1) | When-issued security. |
| (2) | Segregated as collateral for a when-issued security. |
Portfolio Abbreviations
To simplify the listings of securities, abbreviations are used per the table below:
| ACA | Insured by American Capital Access | |
| AMBAC | Insured by American Municipal Bond Assurance Corp. | |
| COP | Certificates of Participation | |
| DFA | Development Finance Authority | |
| EDA | Economic Development Authority | |
| ETM | Escrowed to Maturity | |
| FGIC | Insured by Financial Guaranty Insurance Co. | |
| FHA | Insured by Federal Housing Administration | |
| FNMA | Collateralized by Federal National Mortgage Association | |
| FSA | Insured by Financial Security Assurance Co. | |
| GO | General Obligation | |
| GRT | Gross Receipts Tax | |
| HFA | Health Facilities Authority | |
| HUD | Department of Housing & Urban Development | |
| IDA | Industrial Development Authority | |
| ISD | Independent School District | |
| LOC | Letter of Credit | |
| MBIA | Insured by Municipal Bond Investors Assurance | |
| MBIA-IBC | Insured by Municipal Bond Investors Assurance - Insured Bond Certificates | |
| PCR | Pollution Control Revenue Bond | |
| PSF | Guaranteed by Permanent School Fund | |
| RADIAN | Insured by Radian Asset Assurance | |
| SONYMA | State of New York Mortgage Authority | |
| USD | Unified School District | |
| XLCA | Insured by XL Capital Assurance |
See notes to financial statements.
Certified Semi-Annual Report 35
| Thornburg Limited Term Municipal Fund | March 31, 2009 (Unaudited) |
As a shareholder of the Fund, you incur two types of costs:
| (1) | transaction costs, including |
(a) sales charges (loads) on purchase payments, for Class A shares;
(b) a deferred sales charge on redemptions of any part or all of a purchase of $1 million of Class A shares within 12 months of purchase;
(c) a deferred sales charge on redemptions of Class C shares within 12 months of purchase;
| (2) | ongoing costs, including management fees; distribution and/or service (12b-1) fees; and other Fund expenses. |
This example is intended to help you understand your ongoing costs (in dollars) of investing in the Fund and to compare these costs with the ongoing costs of investing in other mutual funds.
The example is based on an investment of $1,000 invested on September 30, 2008 and held until March 31, 2009.
Actual Expenses
For each class of shares, the first line of the table at right provides information about actual account values and actual expenses. You may use the information in this line, together with the amount you invested, to estimate the expenses that you paid over the period. Simply divide your account value by $1,000 (for example, an $8,600 account value divided by $1,000 = 8.6), then multiply the result by the number in the first line for your class of shares under the heading entitled “Expenses Paid During Period” to estimate the expenses you paid on your account during this period.
Hypothetical Example for Comparison Purposes
For each class of shares, the second line of the table at right provides information about hypothetical account values and hypothetical expenses based on the Fund’s actual expense ratio and an assumed rate of return of 5% per year before expenses, which is not the Fund’s actual return. The hypothetical account values and expenses may not be used to estimate the actual ending account balance or expenses you paid for the period. You may use this information to compare the ongoing costs of investing in the Fund and other funds. To do so, compare this 5% hypothetical example with the 5% hypothetical examples that appear in the shareholder reports of the other funds.
| Beginning Account Value 9/30/08 | Ending Account Value 3/31/09 | Expenses Paid During Period† 9/30/08–3/31/09 | |||||||
Class A Shares | |||||||||
Actual | $ | 1,000.00 | $ | 1,032.10 | $ | 4.38 | |||
Hypothetical* | $ | 1,000.00 | $ | 1,020.62 | $ | 4.35 | |||
Class C Shares | |||||||||
Actual | $ | 1,000.00 | $ | 1,030.60 | $ | 5.77 | |||
Hypothetical* | $ | 1,000.00 | $ | 1,019.25 | $ | 5.74 | |||
Class I Shares | |||||||||
Actual | $ | 1,000.00 | $ | 1,033.80 | $ | 2.71 | |||
Hypothetical* | $ | 1,000.00 | $ | 1,022.27 | $ | 2.69 | |||
| † | Expenses are equal to the annualized expense ratio for each class (A: 0.86%; C: 1.14%; and I: 0.53%) multiplied by the average account value over the period, multiplied by 182/365 to reflect the one-half year period. |
| * | Hypothetical assumes a rate of return of 5% per year before expenses. |
Please note that the expenses shown in the table are meant to highlight your ongoing costs only and do not reflect any transactional costs, such as sales charges (loads), redemption fees, or exchange fees. Therefore, the second line of the table for each class of shares is useful in comparing ongoing costs only, and will not help you determine the relative total costs of owning different funds. In addition, if these transactional costs were included, your costs would have been higher.
36 Certified Semi-Annual Report
Thornburg Limited Term Municipal Fund | March 31, 2009 (Unaudited) |
PORTFOLIO PROXY VOTING
Policies and Procedures:
The Trust has delegated to Thornburg Investment Management, Inc. (the “Advisor”) voting decisions respecting proxies for the Fund’s voting securities. The Advisor makes voting decisions in accordance with its Proxy Voting Policy and Procedures. A description of the Policy and Procedures is available (i) without charge, upon request, by calling the Advisor toll-free at 1-800-847-0200, (ii) on the Thornburg website at www.thornburg.com, and (iii) on the Securities and Exchange Commission’s website at www.sec.gov.
Information regarding how proxies were voted is available on or before August 31 of each year for the twelve months ending the preceding June 30. This information is available (i) without charge, upon request by calling the Advisor toll-free at 1-800-847-0200, (ii) on the Thornburg website at www. thornburg.com, and (iii) on the Securities and Exchange Commission’s website at www.sec.gov.
AVAILABILITY OF QUARTERLY PORTFOLIO SCHEDULE
The Fund files with the Securities and Exchange Commission schedules of its portfolio holdings on Form N-Q for the first and third quarters of each fiscal year. The Fund’s Forms N-Q are available on the Commission’s website at www.sec.gov, or may be reviewed and copied at the Commission’s Public Reference Room in Washington, D.C. Information on the operation of the Public Reference Room may be obtained by calling 1-800-SEC-0330. The Fund also makes this information available on its website at www.thornburg.com/download or upon request by calling 1-800-847-0200.
Certified Semi-Annual Report 37
Trustees’ Statement to Shareholders
Not part of the Certified Semi-Annual Report
February 8, 2005, as readopted September 15, 2008
The Trustees are concerned that ongoing commentaries and opinions reported in the media may confuse investors in general as to the supervisory duties of trustees of mutual funds and, in particular, leave Thornburg Investment Trust shareholders uncertain regarding how we discharge our responsibilities in supervising the Funds’ investment advisor and in reviewing the advisor’s contract for renewal. We decided to spell out clearly three principal guidelines that we follow in supervising the Trust’s investment advisor on your behalf.
We begin with the premise that each shareholder selected his or her Fund because its investments are managed by the investment advisor identified in the prospectus and in accordance with the objective and policies described in the prospectus. We realize, as each of you do, that if you believe that your Fund’s stated objective and policies no longer serve your personal investment goals, you can sell your shares and leave the Fund.
Therefore, we believe that our primary supervisory task – our principal obligation to you – is to assess the nature and quality of the advisor’s services, and to confirm that the advisor actively and competently pursues the Fund’s objective, in accordance with the policies set out in the prospectus. To do this, we meet regularly with management to review your Fund’s portfolio and to discuss the advisor’s specific actions and judgments in pursuing the Fund’s objective. We do not substitute our own judgment for the advisor’s decisions in selecting investments; the advisor is paid to exercise its informed judgment on investment decisions, and we seek to confirm, in reviewing the advisor’s performance, that the advisor is doing just that.
Second, while we are conscious of costs and the effect that costs have on shareholders’ returns, we do not seek the lowest fees or expense ratio as our sole or primary objective. We try to make sure that your Fund’s fees and costs are reasonable in relationship to the services rendered and that they are generally in line with those charged by other expert investment advisors, consistent with our belief that the Fund’s investors searched for and expect that expertise and attention and have decided to pay a reasonable price for it. We do not put the management contract “out to bid” as a matter of course, and we would not do so unless we had concluded that the advisor materially had failed to pursue the Fund’s objectives in accordance with its policies, or for other equally important reasons. We believe that any other approach would be inconsistent with your interests and contrary to your expectations when you bought shares of the Fund in the first place.
Finally, because we believe that most Thornburg Fund shareholders have invested with a long-term perspective, we try not to focus too much on the fashions of the moment and on short-term performance. The market will not favor any specific investment objective or set of policies at all times and under all economic circumstances. A fund will experience periods of both high and low returns relative to other funds and other investments. Even if one of our Funds is not favored by the market at a particular time, we believe that the advisor is nonetheless obliged to remain true to the Fund’s objective and policies, and we watch to see that it does so.
38 This page is not part of the Semi-Annual Report.
Planning Options
Retirement and Education Accounts
Thornburg Investment Management offers retirement and education savings accounts that can help you meet a variety of planning challenges. For account applications or further information on any of the accounts below, please call 1-800-847-0200 or go to www.thornburg.com/ira. Your financial advisor can help you determine which plan is right for you.
Individual Retirement Accounts
Individual Retirement Accounts (IRAs) provide a tax-advantaged means to save money for the future. For a detailed outline of the difference between retirement accounts, see www.thornburg.com/ira. Rollovers are available. Call 1-800-847-0200 for more information.
Traditional IRAs – Contributions to Traditional IRAs are tax deductible for eligible individuals, and withdrawals are taxed as additional ordinary income. You may contribute to an IRA if you receive compensation and are under 70 1/2, even if you are covered by an employer retirement plan. Deductible contributions are subject to certain qualifications. Please consult your tax advisor.
Roth IRAs – Under a Roth IRA, there is no tax deduction for contributions, but there is no income tax on qualified withdrawals. For a more detailed comparison of Traditional and Roth IRAs, please see our web site at www.thornburg.com/ira.
SEP IRAs – Simplified Employee Pension (SEP) IRAs are established by employers. The employer is allowed a tax deduction for contributions made to the SEP Plan and makes contributions to each eligible employee’s SEP IRA on a discretionary basis.
SIMPLE IRAs – Savings Incentive Match Plan for Employees of Small Employers (SIMPLE) is designed to give small business owners a simplified method to establish and contribute to a retirement plan for employees. The employer is allowed a tax deduction for contributions and makes either matching or non-elective contributions to each eligible employee’s SIMPLE IRA. Employees may make salary deferral contributions.
Coverdell Education Savings Account
These savings accounts are designed to provide a way to save money for higher education expenses. In an Education Savings Account, earnings and interest grow tax-free, and qualified withdrawals used to pay for eligible higher-education expenses are tax- and penalty-free.
Funds Available
The following funds are available in the accounts listed above:
Thornburg International Value Fund
Thornburg Value Fund
Thornburg Core Growth Fund
Thornburg Investment Income Builder Fund
Thornburg Global Opportunities Fund
Thornburg International Growth Fund
Thornburg Limited Term U.S. Government Fund
Thornburg Limited Term Income Fund
Thornburg Strategic Income Fund
This page is not part of the Semi-Annual Report. 39

Thornburg Equity Funds
Thornburg’s equity research uses a fundamental and comprehensive analytical approach. Thornburg equity funds focus on a limited number of securities so that each holding can impact performance. The equity team searches for firms believed to have a promising future and seeks to buy shares of those companies at a discount to their intrinsic value.
| • | Thornburg Value Fund |
| • | Thornburg International Value Fund |
| • | Thornburg Core Growth Fund |
| • | Thornburg Investment Income Builder Fund |
| • | Thornburg Global Opportunities Fund |
| • | Thornburg International Growth Fund |
Thornburg Bond Funds
Thornburg Investment Management applies a disciplined philosophy to fixed-income management. Since the launch of our first fixed-income fund 25 years ago, we have been conducting fundamental, bottom-up research in an effort to identify bonds which we believe provide the best return for a given level of risk. We are very organic in our approach, avoiding leverage or complex strategies which could backfire in periods of market uncertainty.
| • | Thornburg Limited Term Municipal Fund |
| • | Thornburg Intermediate Municipal Fund |
| • | Thornburg California Limited Term Municipal Fund |
| • | Thornburg New Mexico Intermediate Municipal Fund |
| • | Thornburg New York Intermediate Municipal Fund |
| • | Thornburg Strategic Municipal Income Fund |
| • | Thornburg Limited Term U.S. Government Fund |
| • | Thornburg Limited Term Income Fund |
| • | Thornburg Strategic Income Fund |
Before investing, carefully consider the Fund’s investment goals, risks, charges, and expenses. For a prospectus containing this and other information, contact your financial advisor or visit thornburg. com. Read it carefully before investing.
For additional information, please visit www.thornburg.com
Thornburg Investment Management, Inc. 2300 North Ridgetop Road, Santa Fe, NM 87506
This page is not part of the Semi-Annual Report. 41
This page intentionally left blank.
42 This page is not part of the Semi-Annual Report.
This page intentionally left blank.
This page is not part of the Semi-Annual Report. 43
 | Waste not, |  | ||||
| Wait not | ||||||
| Get instant access to your shareholder reports. | ||||||
| This Semi-Annual Report is submitted for the general information of shareholders of the Fund. It is not authorized for distribution to prospective investors in the Fund unless preceded or accompanied by an effective prospectus. | By switching from your postal mailbox to your email inbox, you reduce paper clutter, improve record keeping access, and help conserve our natural resources. | |||||
 | Investment Advisor: | Go to www.thornburg.com/edelivery and sign up to receive your shareholder reports, prospectuses, and proxy statements electronically. | ||||
| Thornburg Investment Management® | ||||||
| 800.847.0200 | ||||||
Distributor: | ||||||
| Thornburg Securities Corporation® | You invest in the future, without spending a dime. | |||||
| 800.847.0200 | ||||||
| TH1072 | ||||||

Important Information
The information presented on the following pages was current as of March 31, 2009. The managers’ views, portfolio holdings, and sector diversification are provided for the general information of the Fund’s shareholders, they are historical and subject to change. This material should not be deemed a recommendation to buy or sell any of the securities mentioned.
Investments in the Fund carry risks, including possible loss of principal. As with direct bond ownership, funds that invest in bonds are subject to certain risks including interest-rate risk, credit risk, and inflation risk. The principal value of bonds will fluctuate relative to changes in interest rates, decreasing when interest rates rise. Unlike bonds, bond funds have ongoing fees and expenses. Please see the Fund’s Prospectus for a discussion of the risks associated with an investment in the Fund. Investments in the Fund are not deposits or obligations of, or guaranteed or endorsed by, any bank, the Federal Deposit Insurance Corporation, the Federal Reserve Board or any government agency. There is no guarantee that the Fund will meet its investment objectives. The laddering strategy does not assure or guarantee better performance and cannot eliminate the risk of investment losses.
Performance data given at net asset value (NAV) does not take into account applicable sales charges. If the sales charges had been included, the performance would have been lower.
Minimum investments for Class I shares are higher than those for other classes. Class I shares may not be available to all investors.
Share Class | NASDAQ Symbol | Cusip | ||
Class A | LTCAX | 885-215-426 | ||
Class C | LTCCX | 885-215-418 | ||
Class I | LTCIX | 885-215-392 |
Lipper’s 2008
Best Fixed-Income Fund Family
Thornburg Investment Management ranked #1 out of 41 eligible firms in Lipper, Inc.’s fixed income large firm universe for the three-year period ended 12/31/07, based on risk-adjusted returns. Past performance does not guarantee future results.
Lipper’s large firm universe is comprised of fund families with more than $28 billion in total net assets. Only fund families with at least five bond funds were eligible. Risk-adjusted returns were calculated with dividends reinvested and without sales charges. We did not win this award in 2009.
Glossary
Barclays Capital Five-Year Municipal Bond Index – A rules-based, market-value-weighted index of the tax-exempt bond market. To be included in the index, bonds must have a minimum credit rating of Baa. The approximate maturity of the municipal bonds in the index is five years.
Unless otherwise noted, index returns reflect the reinvestment of income dividends and capital gains, if any, but do not reflect fees, brokerage commissions or other expenses of investing. Investors may not make direct investments into any index.
Alternative Minimum Tax (AMT) – A federal tax aimed at ensuring that high-income individuals, estates, trusts, and corporations pay a minimal level income tax. For individuals, the AMT is calculated by adding tax preference items to regular taxable income.
Distribution Rate – The distribution rate is calculated by taking the sum of the month’s total distribution factors and dividing this sum by a 30-day period and annualizing to a 360-day year. The value is then divided by the ending Net Asset Value (NAV) to arrive at the annualized distribution yield. The yield is calculated on a periodic basis and is subject to change depending on the Fund’s NAV and current distributions.
Duration – The weighted maturity of a bond’s cash flows. Duration measures the price sensitivity of a bond for a given change in interest rates. Bonds with longer durations experience greater price volatility than bond with shorter durations.
General Obligation (GO) Bonds – A municipal bond secured by the pledge of the issuer’s full faith, credit, and taxing power rather than the revenue from a given project.
Leverage – The amount of debt used to finance a firm’s assets. A firm with significantly more debt than equity is considered to be highly leveraged.
Pre-Refunded Bond – A type of municipal bond that has been escrowed or collateralized either by direct obligations guaranteed by the U.S. government, or by other types of securities. The escrow account is structured so that these refunded bonds are to be called at the first possible call date. Such bonds, if escrowed with securities guaranteed by the U.S. government, have little if any credit risk.
Quality Spread – The difference between the yields of securities with different quality ratings.
This page is not part of the Semi-Annual Report. 3
Important Information
Continued
Revenue Bond – A bond on which the debt service is payable solely from the revenue generated from the operation of the project being financed or a category of facilities, or from other non-tax sources.
SEC Yield – SEC Yield is computed in accordance with SEC standards measuring the net investment income per share over a specified 30-day period expressed as a percentage of the maximum offering price of the Fund’s shares at the end of the period.
Tax-Backed Bonds – A broad category of bonds that are secured by taxes levied by the obligor.
U.S. Treasury Securities – U.S. Treasury securities, such as bills, notes and bonds, are negotiable debt obligations of the U.S. government. These debt obligations are backed by the “full faith and credit” of the government and issued at various schedules and maturities. Income from Treasury securities is exempt from state and local, but not federal income taxes.
Yield Spread – The difference in yield, at a given time, between two bonds or between different segments of the bond market.
4 This page is not part of the Semi-Annual Report.
Thornburg California Limited Term Municipal Fund
At Thornburg, our approach to fixed-income management is based on the premise that investors in our bond funds seek preservation of capital along with an attractive, relatively stable yield. While aggressive bond strategies may generate stronger returns when the market is turning a blind eye towards risk, they usually fail to stack up over longer periods of time. Our patience and diligence was recognized by Lipper, in 2008 with the Best Fixed-Income Fund Family Award.
We apply time-tested techniques to manage risk and provide attractive returns. These include:
| • | Building a laddered portfolio. Laddering has been shown over time to mitigate price and interest rate risk. |
| • | Investing on a cash-only basis without using leverage. While leveraged strategies may enhance returns when market conditions are favorable, they can quickly compound losses when sentiment shifts. |
| • | Conducting in-depth fundamental research on each issue and actively monitoring positions for subsequent credit events. |
| • | Diversifying among a large number of generally high-quality bonds. |
Josh Gonze, George Strickland, and Chris Ihlefeld |
|

IMPORTANT
PERFORMANCE INFORMATION
Performance data shown represents past performance and is no guarantee of future results. Investment return and principal value will fluctuate so shares, when redeemed, may be worth more or less than their original cost. Current performance may be lower or higher than quoted. For performance current to the most recent month end, visit thornburg.com.
The maximum sales charge for the Fund’s Class A shares is 1.50%. The total annual fund operating expense of Class A shares is 1.00%, as disclosed in the most recent Prospectus. Thornburg Investment Management intends to waive fees and reimburse expenses so that actual expenses for Class A shares do not exceed 0.99%. The fee waivers and expense reimbursements are voluntary and may be terminated at any time.
AVERAGE ANNUAL TOTAL RETURNS
For periods ended March 31, 2009
| 1 Yr | 3 Yrs | 5 Yrs | 10 Yrs | Since Inception | |||||||||||
A Shares (Incep: 2/19/87) | |||||||||||||||
Without Sales Charge | 2.20 | % | 3.20 | % | 2.29 | % | 3.13 | % | 4.68 | % | |||||
With Sales Charge | 0.70 | % | 2.69 | % | 1.99 | % | 2.97 | % | 4.61 | % |
30-DAY YIELDS, A SHARES
As of March 31, 2009
Annualized Distribution Rate (@NAV) | SEC Yield | SEC Taxable Equivalent Yield | ||
3.26% | 2.07% | 3.51% |
SEC taxable equivalent yields assume a 35% marginal federal tax rate and a 9.3% state of California marginal tax rate. Portions of the income of the Fund may be subject to alternative minimum tax.
KEY PORTFOLIO ATTRIBUTES
As of March 31, 2009
Average Credit Quality | AA | |
Number of Bonds | 105 | |
Duration | 3.8 Yrs | |
Average Maturity | 4.7 Yrs |
See the entire portfolio in the Schedule of Investments on page 21.
Without waivers and reimbursements, yields and total returns would be lower.
This page is not part of the Semi-Annual Report. 5
THORNBURG CALIFORNIA LIMITED TERM MUNICIPAL FUND VERSUS
LIPPER CALIFORNIA TAX-EXEMPT MONEY MARKET FUNDS AVERAGE
Class A Shares as of March 31, 2009
We are often asked to compare Thornburg California Limited Term Municipal Fund to money market fund returns. Municipal bond funds are not an exact substitute for money market funds. These investments have certain differences, which are summarized below. Investors in the Thornburg California Limited Term Municipal Fund took more risk than tax-exempt money market fund investors to earn their higher returns.
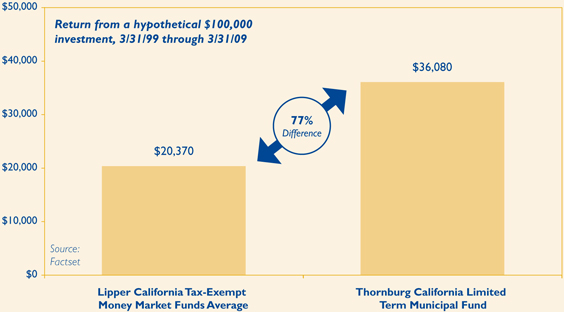
Past performance does not guarantee future results. Performance data above does not include the 1.50% sales charge for Class A shares. If the sales charge had been included, returns would have been lower. Returns shown are minus the initial investment.
Investors in municipal bond funds may experience more volatility than those in comparable money market funds. There are also differences in fees and expenses.
Investors in the Thornburg California Limited Term Municipal Fund took more risk than money market investors to earn their higher returns including reinvestment risk, credit risk, and inflation risk. Unlike money market funds, the prices of bonds fluctuate relative to changes in interest rates, with principal values decreasing when interest rates rise and increasing when interest rates fall. Generally, money market funds seek to maintain an investment portfolio with an average maturity of 90 days or less. Thornburg California Limited Term Municipal Fund has an average maturity of normally less than five years. Interest dividends paid by the Fund or by California tax-exempt money market funds are generally exempt from federal income tax and (for residents of California) state income tax (may be subject to AMT).
Money market funds seek to preserve the value per share at $1.00, whereas, the Thornburg California Limited Term Municipal Fund’s net asset value changes daily. It is possible to lose money when investing in either the Thornburg California Limited Term Municipal Fund or a tax-exempt money market fund. Neither are insured by the FDIC or any other government agency.
Lipper California Tax-Exempt Money Market Funds Average is an arithmetic average of the total return of all tax-exempt California money market mutual funds. You cannot invest in a category average.
6 This page is not part of the Semi-Annual Report.

Thornburg California Limited Term Municipal Fund
March 31, 2009
Table of Contents | ||
| 8 | ||
| 11 | ||
| 12 | ||
| 13 | ||
| 14 | ||
| 18 | ||
| 21 | ||
| 25 | ||
| 26 | ||
This report is certified under the Sarbanes-Oxley Act of 2002, which requires that public companies, including mutual funds, affirm that the information provided in their annual and semiannual shareholder reports fully and fairly represents their financial position.
Certified Semi-Annual Report 7
George Strickland Co-Portfolio Manager
Josh Gonze Co-Portfolio Manager
Christopher Ihlefeld Co-Portfolio Manager | April 21, 2009 | |
Dear Shareholder: | ||
We are pleased to present the Semi-Annual Report for the Thornburg California Limited Term Municipal Fund. The net asset value of the Class A shares increased by 12 cents to $12.61 during the six months ended March 31, 2009. If you were with us for the entire period, you received dividends of 21.3 cents per share. If you reinvested your dividends, you received 21.5 cents per share. Dividends per share were lower for Class C shares and higher for Class I shares, to account for varying class-specific expenses. | ||
The last six months have been an extremely volatile period for municipal bond prices. It started in September and October of 2008, with the Lehman Brothers bankruptcy which led many investors to shun taxable and tax-free money market funds. The money market funds were forced to dump their investments in order to meet redemptions, which caused the yield on tax-free money market securities to spike. Since hedge funds and other leveraged investors finance their purchases of long-term bonds with money market securities, their borrowing costs shot up so they had to sell long-term bonds in order to deleverage. This placed significant selling pressure on the municipal marketplace and sent yields up (and prices lower) in a precipitous fashion. | ||
From mid-September to mid-October, the yield on AAA-rated municipal bonds rose from 2.93% to 3.68%. Over that time period, yields went higher almost every day. From mid-October on, the market for the highest quality bonds settled down quite a bit, but prices for all other bonds have been quite variable. For instance, the yield spread between a 10-year AAA-rated general obligation bond and a BBB-rated revenue bond averaged 0.75% from May 1991 to December 2007. That average yield spread surged to 1.67% from January 2008 to April 2009. As of April 15, 2009, the AAA to BBB yield spread stood at 3.01%. | ||
| ||
Investors have been shunning risk of all types and that is certainly true in the municipal bond market. However, there are other reasons that municipal quality spreads are at unprecedented levels. Large monoline bond insurers such as MBIA, AMBAC and FGIC were in the business of arbitraging bond spreads. If a bond’s spread to the AAA yield curve got too wide, they would typically step in and charge the issuer a premium for an insurance policy that got them a AAA rating. Bonds that received a AAA rating through insurance didn’t quite get an issuer the same interest rate as a “natural” AAA bond such as a bond issued by the State of Maryland, but it got them very close. In this way, the bond insurers were the policemen of the municipal |


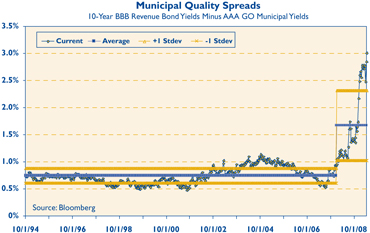
8 Certified Semi-Annual Report
spread markets. Instead of writing speeding tickets, they wrote insurance policies that got issuers back in line with AAA rates. Now that investors’ confidence in the bond insurers has been justifiably shattered, insured bonds typically trade at very wide spreads based upon market views of the underlying obligor. In effect, there are no policemen anymore.
The market, which was becoming more generic and homogenous in nature, is now fractured and harder to analyze. Many traders used to glance at a bond, see the MBIA insurance, and work up a quick bid. Many of those traders are now out of business. Traders and portfolio managers today have to look into covenants, security provisions, margins and balance sheets before they can decide what a bond is worth. These are skills that we, at Thornburg Investment Management, have never gotten out of the habit of using.
The consequences of faulty or incomplete analysis are more severe today. The market is adapting to the new reality, but while it does, fear and opportunity are at exaggerated levels. Liquidity is harder to find, and any bond that is not straightforward and easy to analyze is trading at a large yield premium to widely recognized bonds. The market is greatly favoring bonds pre-refunded in Treasury securities and large general obligation issuers, over high and medium quality issuers of tax-backed and revenue bonds. In other words, it is a bond picker’s paradise. For the price of a little research and market knowledge, great value can be extracted. We have not changed our management style, but we are spending more time looking into “story” bonds and have slightly decreased the average credit rating of the portfolio as we have found good values in bonds rated below AAA.
Investors do have some legitimate reasons to be shunning risk these days. The average high-yield municipal bond fund lost over 25% last year. The economy is basically in shambles in much of the country and collectively, the 50 states are currently grappling with $100 billion of projected deficits in their 2010 fiscal years. However, we see some reasons for optimism. Investment grade municipal bonds have an impressive long-term track record. Standard & Poor’s recently updated their study showing ten-year cumulative default rates that averaged 0.13%. We expect defaults to be somewhat more frequent going forward, but there are counterbalancing factors that could limit any rise in the default rate. Many state and local governments set aside large reserve balances when times were good so that they can draw upon those resources today. Others are rebalancing their budgets frequently and are cutting spending aggressively. Some governments are doing both while raising taxes and fees, and all are making use of the federal largess in the $787 billion American Recovery and Reinvestment Act. As we scrutinize municipal finances, we see many issuers that are standing up to these challenging times. There are a few that may not, and we will strive to continue avoiding their bonds in order to protect the portfolio. It is a very important time for careful diligence and diversification of investment portfolios. Your Fund is broadly diversified and 90% invested in bonds rated A or above by at least one of the major rating agencies.
California state budget negotiations went a full 15 rounds this year, before an agreement was reached that allowed the state to avoid issuing IOUs. The budget gap was closed using $15.7 billion of projected spending cuts, $12.5 billion in tax and revenue increases, $8 billion in federal stimulus funding, and $5.4 billion in borrowing. While there are some signs the housing market may be reaching a bottom, the economy continues to deteriorate. We expect budget negotiations to be drawn out again this year as the governor’s office projects future deficits in the $10-$13 billion range through 2013. The state deficit is affecting local finances as many school districts and other entities rely upon state aid for part of their funding. In some cases, local sources such as property and sales taxes are also declining, so we are paying close attention to revenue trends and balance sheets.
Your Thornburg California Limited Term Municipal Fund is a laddered portfolio of over 100 municipal obligations from all over California. We ladder the maturity dates of the bonds in your portfolio so that some of the bonds are scheduled to mature during each of the coming years. Laddering intermediate bonds accomplishes
Certified Semi-Annual Report 9
Letter to Shareholders
Continued |
two goals. First, the staggered bond maturities contained in a ladder defuse interest-rate risk and dampen the Fund’s price volatility. Second, laddering gives the Fund a steady cash flow stream from maturing bonds to reinvest toward the top of the ladder where yields are typically higher. The chart on the right describes the percentages of your Fund’s bond portfolio maturing in each of the coming years.
The Class A shares of your Fund produced a total return of 2.69% over the six-month period ended March 31, 2009, compared to a 6.20% return for the Barclays Capital Five-Year Municipal Bond Index. Over the last six months, pre-refunded and general obligation bonds from large issuers generally performed better than a diversified portfolio of revenue and tax-backed bonds from smaller issuers. Since the Fund predominantly holds bonds from smaller and mid-sized California municipal bond issuers, the Fund underper-formed the index over the last six months.
% of Portfolio Maturing | Cumulative % Maturing | |||||
| 1 year = 10.5% | Year 1 = 10.5% | |||||
| 1 to 2 years = 10.5% | Year 2 = 21.0% | |||||
| 2 to 3 years = 11.5% | Year 3 = 32.5% | |||||
| 3 to 4 years = 6.4% | Year 4 = 38.9% | |||||
| 4 to 5 years = 12.5% | Year 5 = 51.4% | |||||
| 5 to 6 years = 12.8% | Year 6 = 64.2% | |||||
| 6 to 7 years = 6.3% | Year 7 = 70.5% | |||||
| 7 to 8 years = 9.5% | Year 8 = 80.0% | |||||
| 8 to 9 years = 9.7% | Year 9 = 89.7% | |||||
| Over 9 years = 10.3% | Over 9 Years = 100.0% |
Percentages can and do vary. Data as of 3/31/09.
Historically, our practice of laddering a diversified portfolio of short and intermediate maturity municipal bonds has allowed your Fund to perform consistently well in varying interest rate environments. Thank you for investing in Thornburg California Limited Term Municipal Fund.
Sincerely,
 |  |  | ||
| George Strickland | Josh Gonze | Christopher Ihlefeld | ||
| Co-Portfolio Manager | Co-Portfolio Manager | Co-Portfolio Manager | ||
| Managing Director | Managing Director | Managing Director |
The matters discussed in this report may constitute forward-looking statements made pursuant to the safe harbor provisions of the Securities Litigation Reform Act of 1995. These include any advisor or portfolio manager prediction, assessment, analysis or outlook for individual securities, industries, investment styles, market sectors and/or markets. These statements involve risks and uncertainties. In addition to the general risks described for each fund in its current prospectus, other factors bearing on these reports include the accuracy of the advisor’s or portfolio manager’s forecasts and predictions, the appropriateness of the investment strategies designed by the advisor or portfolio manager and the ability of the advisor or portfolio manager to implement their strategies efficiently and successfully. Any one or more of these factors, as well as other risks affecting the securities markets generally, could cause the actual results of any fund to differ materially as compared to its benchmarks.
10 Certified Semi-Annual Report
STATEMENT OF ASSETS AND LIABILITIES
| Thornburg California Limited Term Municipal Fund | March 31, 2009 (Unaudited) |
ASSETS | ||||
Investments at value (cost $136,646,411) (Note 2) | $ | 136,760,841 | ||
Cash | 266,905 | |||
Receivable for fund shares sold | 664,248 | |||
Interest receivable | 1,610,482 | |||
Prepaid expenses and other assets | 365 | |||
Total Assets | 139,302,841 | |||
LIABILITIES | ||||
Payable for securities purchased | 2,000,000 | |||
Payable for fund shares redeemed | 245,875 | |||
Payable to investment advisor and other affiliates (Note 3) | 91,227 | |||
Accounts payable and accrued expenses | 32,303 | |||
Dividends payable | 102,121 | |||
Total Liabilities | 2,471,526 | |||
NET ASSETS | $ | 136,831,315 | ||
NET ASSETS CONSIST OF: | ||||
Net unrealized appreciation on investments | $ | 114,430 | ||
Accumulated net realized gain (loss) | (704,469 | ) | ||
Net capital paid in on shares of beneficial interest | 137,421,354 | |||
| $ | 136,831,315 | |||
NET ASSET VALUE: | ||||
Class A Shares: | ||||
Net asset value and redemption price per share | $ | 12.61 | ||
Maximum sales charge, 1.50% of offering price | 0.19 | |||
Maximum offering price per share | $ | 12.80 | ||
Class C Shares: | ||||
Net asset value and offering price per share * | $ | 12.62 | ||
Class I Shares: | ||||
Net asset value, offering and redemption price per share | $ | 12.62 | ||
| * | Redemption price per share is equal to net asset value less any applicable contingent deferred sales charge. |
See notes to financial statements.
Certified Semi-Annual Report 11
| Thornburg California Limited Term Municipal Fund | Six Months Ended March 31, 2009 (Unaudited) |
INVESTMENT INCOME: | ||||
Interest income (net of premium amortized of $351,013) | $ | 2,690,012 | ||
EXPENSES: | ||||
Investment advisory fees (Note 3) | 306,300 | |||
Administration fees (Note 3) | ||||
Class A Shares | 41,212 | |||
Class C Shares | 10,305 | |||
Class I Shares | 10,023 | |||
Distribution and service fees (Note 3) | ||||
Class A Shares | 82,426 | |||
Class C Shares | 82,674 | |||
Transfer agent fees | ||||
Class A Shares | 12,506 | |||
Class C Shares | 4,675 | |||
Class I Shares | 4,546 | |||
Registration and filing fees | ||||
Class A Shares | 22 | |||
Class C Shares | 22 | |||
Class I Shares | 22 | |||
Custodian fees (Note 3) | 16,707 | |||
Professional fees | 12,664 | |||
Accounting fees | 1,748 | |||
Trustee fees | 2,177 | |||
Other expenses | 6,219 | |||
Total Expenses | 594,248 | |||
Less: | ||||
Expenses reimbursed by investment advisor (Note 3) | (612 | ) | ||
Distribution fees waived (Note 3) | (41,338 | ) | ||
Fees paid indirectly (Note 3) | (1,263 | ) | ||
Net Expenses | 551,035 | |||
Net Investment Income | 2,138,977 | |||
REALIZED AND UNREALIZED GAIN (LOSS) | ||||
Net realized gain (loss) on investments | (50,953 | ) | ||
Net change in unrealized appreciation (depreciation) of investments | 1,035,479 | |||
Net Realized and Unrealized Gain | 984,526 | |||
Net Increase in Net Assets Resulting From Operations | $ | 3,123,503 | ||
See notes to financial statements.
12 Certified Semi-Annual Report
STATEMENTS OF CHANGES IN NET ASSETS
| Thornburg California Limited Term Municipal Fund | March 31, 2009 (Unaudited) |
| Six Months Ended March 31, 2009* | Year Ended September 30, 2008 | |||||||
INCREASE (DECREASE) IN NET ASSETS FROM: | ||||||||
OPERATIONS: | ||||||||
Net investment income | $ | 2,138,977 | $ | 3,888,722 | ||||
Net realized gain (loss) on investments | (50,953 | ) | 186,069 | |||||
Increase (Decrease) in unrealized appreciation (depreciation) of investments | 1,035,479 | (2,621,401 | ) | |||||
Net Increase (Decrease) in Net Assets Resulting from Operations | 3,123,503 | 1,453,390 | ||||||
DIVIDENDS TO SHAREHOLDERS: | ||||||||
From net investment income | ||||||||
Class A Shares | (1,126,242 | ) | (2,220,961 | ) | ||||
Class C Shares | (259,767 | ) | (437,867 | ) | ||||
Class I Shares | (752,968 | ) | (1,229,894 | ) | ||||
FUND SHARE TRANSACTIONS (NOTE 4): | ||||||||
Class A Shares | 6,064,810 | 137,530 | ||||||
Class C Shares | 3,758,661 | 1,822,538 | ||||||
Class I Shares | 2,224,246 | 10,723,886 | ||||||
Net Increase in Net Assets | 13,032,243 | 10,248,622 | ||||||
NET ASSETS: | ||||||||
Beginning of period | 123,799,072 | 113,550,450 | ||||||
End of period | $ | 136,831,315 | $ | 123,799,072 | ||||
| * | Unaudited. |
See notes to financial statements.
Certified Semi-Annual Report 13
| Thornburg California Limited Term Municipal Fund | March 31, 2009 (Unaudited) |
NOTE 1 – ORGANIZATION
Thornburg California Limited Term Municipal Fund (the “Fund”) (formerly Thornburg Limited Term Municipal Fund – California Portfolio) is a diversified series of Thornburg Investment Trust (the “Trust”). The Trust is organized as a Massachusetts business trust under a Declaration of Trust dated June 3, 1987 and is registered as a diversified, open-end management investment company under the Investment Company Act of 1940, as amended. The Trust is currently issuing thirteen series of shares of beneficial interest in addition to those of the Fund: Thornburg Limited Term Municipal Fund, Thornburg New York Intermediate Municipal Fund, Thornburg New Mexico Intermediate Municipal Fund, Thornburg Intermediate Municipal Fund, Thornburg Limited Term U.S. Government Fund, Thornburg Limited Term Income Fund, Thornburg Value Fund, Thornburg International Value Fund, Thornburg Core Growth Fund, Thornburg Investment Income Builder Fund, Thornburg Global Opportunities Fund, Thornburg International Growth Fund, and Thornburg Strategic Income Fund. Each series is considered to be a separate entity for financial reporting and tax purposes and bears expenses directly attributable to it. The Fund’s primary investment objective is to obtain as high a level of current income exempt from federal and California state individual income tax as is consistent, in the view of the Fund’s investment advisor, with the preservation of capital. The Fund’s secondary objective is to reduce expected changes in its share price compared to longer intermediate and long-term bond portfolios.
The Fund currently offers three classes of shares of beneficial interest: Class A, Class C, and Institutional Class (Class I) shares. Each class of shares of the Fund represents an interest in the same portfolio of investments, except that (i) Class A shares are sold subject to a front-end sales charge collected at the time the shares are purchased and bear a service fee, (ii) Class C shares are sold at net asset value without a sales charge at the time of purchase, but are subject to a contingent deferred sales charge upon redemption within one year of purchase, and bear both a service fee and a distribution fee, (iii) Class I shares are sold at net asset value without a sales charge at the time of purchase, and (iv) the respective classes may have different reinvestment privileges and conversion rights. Additionally, the Fund may allocate among its classes certain expenses, to the extent allowable to specific classes, including transfer agent fees, government registration fees, certain printing and postage costs, and administrative and legal expenses. Currently, class specific expenses of the Fund are limited to service and distribution fees, administration fees, and certain registration and transfer agent expenses.
NOTE 2 – SIGNIFICANT ACCOUNTING POLICIES
Significant accounting policies of the Trust are as follows:
Valuation of Investments: Debt obligations have a primary market over the counter and are valued by an independent pricing service approved by the Trustees of the Trust. The pricing service ordinarily values debt obligations at quoted bid prices. When quotations are not available, debt obligations are valued at evaluated prices determined by the pricing service using methods which include consideration of yields or prices of debt obligations of comparable quality, type of issue, coupon, maturity, and rating, and indications as to value from dealers and general market conditions. Short-term obligations having remaining maturities of 60 days or less are valued at amortized cost, which approximates market value.
In any case where a pricing service fails to provide a price for a debt obligation held by the Fund, the valuation and pricing committee determines a fair value for the obligation using procedures approved by the Trustees. Additionally, in any case where management believes that a price provided by a pricing service for a debt obligation may be unreliable, the valuation and pricing committee decides whether or not to use the pricing service’s valuation or to determine a fair value for the obligation.
In determining fair value for any portfolio security or other investment, the valuation and pricing committee seeks to determine the amount that an owner of the investment might reasonably expect to receive upon a sale of the investment. However, because fair value prices are estimated prices, the valuation and pricing committee’s determination of fair value for an investment may differ from the value that would be realized by the Fund upon a sale of the investment, and that difference could be material to the Fund’s financial statements. The valuation and pricing committee’s determination of fair value for an investment may also differ from the prices obtained by other persons (including other mutual funds) for the investment.
Valuation Measurements: Various inputs are used in determining the value of the Fund’s investments. These inputs are summarized in the three levels listed below.
Level 1: Quoted prices in active markets for identical investments.
Level 2: Other significant observable inputs (including quoted prices for similar investments, interest rates, prepayment rates, credit risk, etc.).
Level 3: Significant unobservable inputs (including the Fund’s own assumptions in determining the fair value of investments).
14 Certified Semi-Annual Report
NOTES TO FINANCIAL STATEMENTS, CONTINUED
| Thornburg California Limited Term Municipal Fund | March 31, 2009 (Unaudited) |
The following table displays a summary of the inputs used to value the Fund’s net assets as of March 31, 2009. In any instance when valuation inputs from more than one level are used to determine the fair value of a specific investment, the investment is placed in the level of the table based upon the lowest level input that is significant in determining the fair value of the investment:
| Valuation inputs | Investments in Securities | Investments in Other Financial Instruments* | ||||
Level 1 - Quoted Prices in Active | ||||||
Markets for Identical Assets | $ | — | $ | — | ||
Level 2 - Other Significant | ||||||
Observable Inputs | 136,760,841 | — | ||||
Level 3 - Significant | ||||||
Unobservable Inputs | — | — | ||||
Other | — | — | ||||
Total | $ | 136,760,841 | $ | — | ||
| * | Other financial instruments include investments not reflected in the Schedule of Investments, such as futures, forwards and swap contracts, which are valued at the unrealized appreciation (depreciation) on the instrument. |
Federal Income Taxes: It is the policy of the Trust to comply with the provisions of the Internal Revenue Code applicable to “regulated investment companies” and to distribute to shareholders substantially all taxable (if any) and tax exempt income of the Fund. Therefore, no provision for federal income tax is required.
When-Issued and Delayed Delivery Transactions: The Trust may engage in when-issued or delayed delivery transactions. To the extent the Trust engages in such transactions, it will do so for the purpose of acquiring portfolio securities consistent with the Fund’s investment objectives and not for the purpose of investment leverage or to speculate on interest rate and/or market changes. At the time the Trust makes a commitment to purchase a security on a when-issued or delayed delivery basis, the Fund will record the transaction and reflect the value in determining its net asset value. When effecting such transactions, assets of an amount sufficient to make payment for the portfolio securities to be purchased will be segregated on the Fund’s records on the trade date. Securities purchased on a when-issued or delayed delivery basis do not earn interest until the settlement date.
Dividends: Net investment income of the Fund is declared daily as a dividend on shares for which the Fund has received payment. Dividends are paid monthly and are reinvested in additional shares of the Fund at net asset value per share at the close of business on the dividend payment date, or at the shareholder’s option, paid in cash. Net realized capital gains, to the extent available, will be distributed at least annually.
General: Securities transactions are accounted for on a trade date basis. Interest income is accrued as earned. Premiums and discounts on securities purchased are amortized to call dates or maturity dates of the respective securities. Realized gains and losses from the sale of securities are recorded on an identified cost basis. Net investment income (other than class specific expenses) and realized and unrealized gains and losses are allocated daily to each class of shares based upon the relative net asset value of outstanding shares (or the value of the dividend-eligible shares, as appropriate) of each class of shares at the beginning of the day (after adjusting for the current capital shares activity of the respective class). Expenses common to all funds are allocated among the funds comprising the Trust based upon their relative net asset values or other appropriate allocation methods.
Guarantees and Indemnifications: Under the Trust’s organizational documents, its officers and Trustees are indemnified against certain liabilities arising out of the performance of their duties to the Fund. Additionally, in the normal course of business the Trust enters into contracts with service providers that contain general indemnification clauses. The Trust’s maximum exposure under these arrangements is unknown. However, based on experience, the Trust expects the risk of loss to be remote.
Use of Estimates: The preparation of financial statements, in conformity with generally accepted accounting principles, requires management to make estimates and assumptions that affect the reported amounts of assets and liabilities and the disclosure of contingent assets and liabilities at the date of the financial statements and the reported amounts of increases and decreases in net assets from operations during the reporting period. Actual results could differ from those estimates.
NOTE 3 – INVESTMENT ADVISORY FEE AND OTHER TRANSACTIONS WITH AFFILIATES
Pursuant to an investment advisory agreement, Thornburg Investment Management, Inc. (the “Advisor”) serves as the investment advisor and performs services to the Fund for which the fees are payable at the end of each month. For the six months ended March 31, 2009, these fees were payable at annual rates ranging from .50 of 1% to .225 of 1% per annum of the average daily net assets of the Fund depending on the Fund’s asset size. The Trust also has entered into administrative services agreements with the Advisor, whereby the Advisor will perform certain administrative services for the shareholders of each class of the Fund’s shares, and for which fees will be payable at an annual rate of up to .125 of 1% per annum of the average daily net assets attributable to each class of shares. For the six months ended March 31, 2009, the Advisor voluntarily reimbursed certain class specific expenses and administrative fees of $612 for Class C shares.
The Trust has an underwriting agreement with Thornburg Securities Corporation (the “Distributor,” an affiliate of the
Certified Semi-Annual Report 15
NOTES TO FINANCIAL STATEMENTS, CONTINUED
| Thornburg California Limited Term Municipal Fund | March 31, 2009 (Unaudited) |
Advisor), which acts as the distributor of the Fund’s shares. For the six months ended March 31, 2009, the Distributor has advised the Fund that it earned commissions aggregating $787 from the sale of Class A shares, and collected contingent deferred sales charges aggregating $1,893 from redemptions of Class C shares of the Fund.
Pursuant to a service plan under Rule 12b-1 of the Investment Company Act of 1940, the Fund may reimburse to the Advisor an amount not to exceed .25 of 1% per annum of the average daily net assets attributable to each class of shares of the Fund for payments made by the Advisor to securities dealers and other financial institutions to obtain various shareholder and distribution related services. The Advisor may pay out of its own resources additional expenses for distribution of the Fund’s shares.
The Trust has also adopted distribution plans pursuant to Rule 12b-1, applicable only to the Fund’s Class C shares, under which the Fund compensates the Distributor for services in promoting the sale of Class C shares of the Fund at an annual rate of up to .75 of 1% per annum of the average daily net assets attributable to Class C shares. Total fees incurred by the Distributor for each class of shares of the Fund under their respective Service and Distribution Plans and Class C distribution fees waived by the Distributor for the six months ended March 31, 2009, are set forth in the Statement of Operations. Distribution fees in the amount of $41,338 were waived for Class C shares.
The Trust has an agreement with the custodian bank to indirectly pay a portion of the custodian’s fees through credits earned by the Fund’s cash on deposit with the bank. This deposit agreement is an alternative to overnight investments. Custodial fees have been adjusted to reflect amounts that would have been paid without this agreement, with a corresponding adjustment reflected as fees paid indirectly in the Statement of Operations. For the six months ended March 31, 2009, fees paid indirectly were $1,263.
Certain officers and Trustees of the Trust are also officers and/or directors of the Advisor and Distributor. The compensation of independent Trustees is borne by the Trust.
NOTE 4 – SHARES OF BENEFICIAL INTEREST
At March 31, 2009, there were an unlimited number of shares of beneficial interest authorized. Transactions in shares of beneficial interest were as follows:
| Six Months Ended March 31, 2009 (Unaudited) | Year Ended September 30, 2008 (Unaudited) | |||||||||||||
| Shares | Amount | Shares | Amount | |||||||||||
Class A Shares | ||||||||||||||
Shares sold | 1,162,266 | $ | 14,617,743 | 1,256,600 | $ | 16,038,976 | ||||||||
Shares issued to shareholders in reinvestment of dividends | 62,282 | 780,311 | 114,676 | 1,458,516 | ||||||||||
Shares repurchased | (751,727 | ) | (9,333,244 | ) | (1,362,378 | ) | (17,359,962 | ) | ||||||
Net Increase (Decrease) | 472,821 | $ | 6,064,810 | 8,898 | $ | 137,530 | ||||||||
Class C Shares | ||||||||||||||
Shares sold | 441,809 | $ | 5,577,655 | 349,863 | $ | 4,463,176 | ||||||||
Shares issued to shareholders in reinvestment of dividends | 14,859 | 186,198 | 26,389 | 335,881 | ||||||||||
Shares repurchased | (161,432 | ) | (2,005,192 | ) | (233,249 | ) | (2,976,519 | ) | ||||||
Net Increase (Decrease) | 295,236 | $ | 3,758,661 | 143,003 | $ | 1,822,538 | ||||||||
Class I Shares | ||||||||||||||
Shares sold | 1,096,816 | $ | 13,794,146 | 1,606,761 | $ | 20,521,258 | ||||||||
Shares issued to shareholders in reinvestment of dividends | 45,323 | 567,799 | 73,325 | 933,060 | ||||||||||
Shares repurchased | (972,926 | ) | (12,137,699 | ) | (840,081 | ) | (10,730,432 | ) | ||||||
Net Increase (Decrease) | 169,213 | $ | 2,224,246 | 840,005 | $ | 10,723,886 | ||||||||
16 Certified Semi-Annual Report
NOTES TO FINANCIAL STATEMENTS, CONTINUED
| Thornburg California Limited Term Municipal Fund | March 31, 2009 (Unaudited) |
NOTE 5 – SECURITIES TRANSACTIONS
For the six months ended March 31, 2009, the Fund had purchase and sale transactions of investment securities (excluding short-term investments) of $34,315,107 and $22,839,509, respectively.
NOTE 6 – INCOME TAXES
At March 31, 2009, information on the tax components of capital is as follows:
Cost of investments for tax purposes | $ | 136,646,411 | ||
Gross unrealized appreciation on a tax basis | $ | 2,488,562 | ||
Gross unrealized depreciation on a tax basis | (2,374,132 | ) | ||
Net unrealized appreciation (depreciation) on investments (tax basis) | $ | 114,430 | ||
At March 31, 2009, the Fund had tax basis capital losses, which may be carried forward to offset future capital gains. To the extent such carryforwards are used, capital gain distributions may be reduced to the extent provided by regulations.
Such capital loss carryforwards expire as follows:
2012 | $ | 33,844 | |
2014 | 148,124 | ||
2015 | 471,548 | ||
| $ | 653,516 | ||
OTHER NOTES:
Statement of Accounting Standards No. 161:
On March 19, 2008, the Financial Accounting Standards Board issued Statement of Financial Accounting Standards No. 161, “Disclosures about Derivative Instruments and Hedging Activities” (“FAS 161”). FAS 161 is effective for fiscal years and interim periods beginning after November 15, 2008. FAS 161 requires enhanced disclosures about any derivative and hedging activities by the Fund, including how such activities are accounted for and any effect on the Fund’s financial position, performance and cash flows.
Certified Semi-Annual Report 17
Thornburg California Limited Term Municipal Fund
| Class A Shares: | Six Months Ended March 31, 2009* |
Year Ended September 30, | Three Months Ended Sept. 30, 2004(a) | |||||||||||||||||||||
| 2008 | 2007 | 2006 | 2005 | |||||||||||||||||||||
PER SHARE PERFORMANCE | ||||||||||||||||||||||||
(for a share outstanding throughout the period) | ||||||||||||||||||||||||
Net asset value, beginning of period | $ | 12.49 | $ | 12.73 | $ | 12.77 | $ | 12.79 | $ | 13.02 | $ | 12.87 | ||||||||||||
Income from investment operations: | ||||||||||||||||||||||||
Net investment income (loss) | 0.21 | 0.42 | 0.43 | 0.40 | 0.36 | 0.08 | ||||||||||||||||||
Net realized and unrealized gain (loss) on investments | 0.12 | (0.24 | ) | (0.04 | ) | (0.02 | ) | (0.23 | ) | 0.15 | ||||||||||||||
Total from investment operations | 0.33 | 0.18 | 0.39 | 0.38 | 0.13 | 0.23 | ||||||||||||||||||
Less dividends from: | ||||||||||||||||||||||||
Net investment income | (0.21 | ) | (0.42 | ) | (0.43 | ) | (0.40 | ) | (0.36 | ) | (0.08 | ) | ||||||||||||
Change in net asset value | 0.12 | (0.24 | ) | (0.04 | ) | (0.02 | ) | (0.23 | ) | 0.15 | ||||||||||||||
NET ASSET VALUE, end of period | $ | 12.61 | $ | 12.49 | $ | 12.73 | $ | 12.77 | $ | 12.79 | $ | 13.02 | ||||||||||||
RATIOS/SUPPLEMENTAL DATA | ||||||||||||||||||||||||
Total return (%)(b) | 2.69 | 1.42 | 3.10 | 3.06 | 0.98 | 1.81 | ||||||||||||||||||
Ratios to average net assets: | ||||||||||||||||||||||||
Net investment income (loss) (%) | 3.42 | (c) | 3.32 | 3.37 | 3.17 | 2.75 | 2.53 | (c) | ||||||||||||||||
Expenses, after expense reductions (%) | 0.98 | (c) | 1.00 | 0.99 | 0.92 | 1.00 | 0.99 | (c) | ||||||||||||||||
Expenses, after expense reductions and net of custody credits (%) | 0.98 | (c) | 0.98 | 0.99 | 0.87 | 0.99 | 0.99 | (c) | ||||||||||||||||
Expenses, before expense reductions (%) | 0.98 | (c) | 1.00 | 1.01 | 1.01 | 1.02 | 1.05 | (c) | ||||||||||||||||
Portfolio turnover rate (%) | 19.62 | 34.88 | 22.71 | 25.77 | 26.33 | 4.18 | ||||||||||||||||||
Net assets at end of period (thousands) | $ | 72,629 | $ | 66,023 | $ | 67,183 | $ | 80,589 | $ | 111,102 | $ | 134,588 | ||||||||||||
| (a) | The Fund’s fiscal year-end changed to September 30. |
| (b) | Sales loads are not reflected in computing total return, which is not annualized for periods less than one year. |
| (c) | Annualized. |
| * | Unaudited. |
See notes to financial statements.
18 Certified Semi-Annual Report
FINANCIAL HIGHLIGHTS, CONTINUED
| Thornburg California Limited Term Municipal Fund |
| Class C Shares: | Six Months Ended March 31, 2009* |
Year Ended September 30, | Three Months Ended Sept. 30, 2004(a) | |||||||||||||||||||||
| 2008 | 2007 | 2006 | 2005 | |||||||||||||||||||||
PER SHARE PERFORMANCE | ||||||||||||||||||||||||
(for a share outstanding throughout the period) | ||||||||||||||||||||||||
Net asset value, beginning of period | $ | 12.50 | $ | 12.74 | $ | 12.78 | $ | 12.80 | $ | 13.03 | $ | 12.88 | ||||||||||||
Income from investment operations: | ||||||||||||||||||||||||
Net investment income (loss) | 0.20 | 0.39 | 0.40 | 0.37 | 0.32 | 0.07 | ||||||||||||||||||
Net realized and unrealized gain (loss) on investments | 0.12 | (0.24 | ) | (0.04 | ) | (0.02 | ) | (0.23 | ) | 0.15 | ||||||||||||||
Total from investment operations | 0.32 | 0.15 | 0.36 | 0.35 | 0.09 | 0.22 | ||||||||||||||||||
Less dividends from: | ||||||||||||||||||||||||
Net investment income | (0.20 | ) | (0.39 | ) | (0.40 | ) | (0.37 | ) | (0.32 | ) | (0.07 | ) | ||||||||||||
Change in net asset value | 0.12 | (0.24 | ) | (0.04 | ) | (0.02 | ) | (0.23 | ) | 0.15 | ||||||||||||||
NET ASSET VALUE, end of period | $ | 12.62 | $ | 12.50 | $ | 12.74 | $ | 12.78 | $ | 12.80 | $ | 13.03 | ||||||||||||
RATIOS/SUPPLEMENTAL DATA | ||||||||||||||||||||||||
Total return (%)(b) | 2.56 | 1.16 | 2.85 | 2.80 | 0.73 | 1.75 | ||||||||||||||||||
Ratios to average net assets: | ||||||||||||||||||||||||
Net investment income (loss) (%) | 3.15 | (c) | 3.06 | 3.13 | 2.92 | 2.50 | 2.28 | (c) | ||||||||||||||||
Expenses, after expense reductions (%) | 1.24 | (c) | 1.26 | 1.24 | 1.18 | 1.25 | 1.24 | (c) | ||||||||||||||||
Expenses, after expense reductions and net of custody credits (%) | 1.24 | (c) | 1.24 | 1.23 | 1.13 | 1.24 | 1.24 | (c) | ||||||||||||||||
Expenses, before expense reductions (%) | 1.75 | (c) | 1.78 | 1.79 | 1.83 | 1.82 | 1.87 | (c) | ||||||||||||||||
Portfolio turnover rate (%) | 19.62 | 34.88 | 22.71 | 25.77 | 26.33 | 4.18 | ||||||||||||||||||
Net assets at end of period (thousands) | $ | 19,845 | $ | 15,963 | $ | 14,449 | $ | 16,801 | $ | 20,021 | $ | 21,941 | ||||||||||||
| (a) | The Fund’s fiscal year-end changed to September 30. |
| (b) | Not annualized for periods less than one year. |
| (c) | Annualized. |
| * | Unaudited. |
See notes to financial statements.
Certified Semi-Annual Report 19
FINANCIAL HIGHLIGHTS, CONTINUED
| Thornburg California Limited Term Municipal Fund |
| Class I Shares: | Six Months Ended March 31, 2009* |
Year Ended September 30, | Three Months Ended Sept. 30, 2004(a) | |||||||||||||||||||||
| 2008 | 2007 | 2006 | 2005 | |||||||||||||||||||||
PER SHARE PERFORMANCE | ||||||||||||||||||||||||
(for a share outstanding throughout the period) | ||||||||||||||||||||||||
Net asset value, beginning of period | $ | 12.50 | $ | 12.74 | $ | 12.78 | $ | 12.80 | $ | 13.03 | $ | 12.89 | ||||||||||||
Income from investment operations: | ||||||||||||||||||||||||
Net investment income (loss) | 0.23 | 0.47 | 0.47 | 0.44 | 0.40 | 0.09 | ||||||||||||||||||
Net realized and unrealized gain (loss) on investments | 0.12 | (0.24 | ) | (0.04 | ) | (0.02 | ) | (0.23 | ) | 0.14 | ||||||||||||||
Total from investment operations | 0.35 | 0.23 | 0.43 | 0.42 | 0.17 | 0.23 | ||||||||||||||||||
Less dividends from: | ||||||||||||||||||||||||
Net investment income | (0.23 | ) | (0.47 | ) | (0.47 | ) | (0.44 | ) | (0.40 | ) | (0.09 | ) | ||||||||||||
Change in net asset value | 0.12 | (0.24 | ) | (0.04 | ) | (0.02 | ) | (0.23 | ) | 0.14 | ||||||||||||||
NET ASSET VALUE, end of period | $ | 12.62 | $ | 12.50 | $ | 12.74 | $ | 12.78 | $ | 12.80 | $ | 13.03 | ||||||||||||
RATIOS/SUPPLEMENTAL DATA | ||||||||||||||||||||||||
Total return (%)(b) | 2.87 | 1.77 | 3.44 | 3.39 | 1.31 | 1.81 | ||||||||||||||||||
Ratios to average net assets: | ||||||||||||||||||||||||
Net investment income (loss) (%) | 3.76 | (c) | 3.66 | 3.71 | 3.50 | 3.09 | 2.85 | (c) | ||||||||||||||||
Expenses, after expense reductions (%) | 0.64 | (c) | 0.65 | 0.66 | 0.66 | 0.68 | 0.67 | (c) | ||||||||||||||||
Expenses, after expense reductions and net of custody credits (%) | 0.64 | (c) | 0.63 | 0.65 | 0.55 | 0.67 | 0.67 | (c) | ||||||||||||||||
Expenses, before expense reductions (%) | 0.64 | (c) | 0.65 | 0.68 | 0.71 | 0.73 | 0.77 | (c) | ||||||||||||||||
Portfolio turnover rate (%) | 19.62 | 34.88 | 22.71 | 25.77 | 26.33 | 4.18 | ||||||||||||||||||
Net assets at end of period (thousands) | $ | 44,358 | $ | 41,814 | $ | 31,918 | $ | 28,334 | $ | 30,843 | $ | 25,728 | ||||||||||||
| (a) | The Fund’s fiscal year-end changed to September 30. |
| (b) | Not annualized for periods less than one year. |
| (c) | Annualized. |
| * | Unaudited. |
See notes to financial statements.
20 Certified Semi-Annual Report
| SCHEDULE OF INVESTMENTS | ||
| Thornburg California Limited Term Municipal Fund | March 31, 2009 (Unaudited) | |
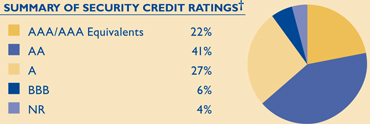 | We have used ratings from Standard & Poor’s, (S&P). Where S&P ratings are not available, we have used Moody’s Investors Service. Where neither rating is available, we have used ratings from Fitch Ratings. The category of investments identified as “AAA” in this graph includes investments which are pre-refunded or escrowed to maturity. Such investments are backed by an escrow or trust containing sufficient U.S. Government or U.S. Government agency securities to satisfy the timely payment of principal and interest and, therefore, are normally deemed to be equivalent to AAA-rated securities. |
Issuer-Description | Credit Rating† Moody’s/S&P | Principal Amount | Value | |||||
ABAG Finance Authority, 4.75% due 10/1/2011 (California School of Mechanical Arts) | A3/NR | $ | 435,000 | $ | 454,488 | |||
ABAG Finance Authority, 4.75% due 10/1/2012 (California School of Mechanical Arts) | A3/NR | 455,000 | 477,554 | |||||
Alameda County COP, 5.375% due 12/1/2010 (Insured: MBIA) | A2/NR | 2,000,000 | 2,073,460 | |||||
Alameda County COP, 5.625% due 12/1/2016 (Santa Rita Jail; Insured: AMBAC) | Baa1/AA- | 1,830,000 | 2,087,829 | |||||
Alvord USD GO, 5.25% due 2/1/2014 (Insured: MBIA) | Baa1/AA- | 1,150,000 | 1,246,749 | |||||
Bay Area Toll Bridge Revenue, 5.00% due 4/1/2016 | Aa3/AA | 2,075,000 | 2,304,142 | |||||
Calexico School District, 6.75% due 9/1/2017 | NR/BBB+ | 3,060,000 | 3,108,776 | |||||
California Eastern Municipal Water District, 0.27% due 7/1/2020 put 4/7/2009 (SPA: JPMorgan Chase Bank) (weekly demand notes) | VMIG1/A-1+ | 700,000 | 700,000 | |||||
California HFA, 5.00% due 11/15/2011 (Cedars Sinai Medical Center) | A2/NR | 1,500,000 | 1,550,715 | |||||
California HFA, 5.25% due 10/1/2013 (Providence Health) | Aa2/AA | 650,000 | 691,138 | |||||
California HFA, 6.00% due 10/1/2018 (Providence Health) | Aa2/AA | 500,000 | 547,745 | |||||
California HFA, 5.125% due 7/1/2022 (Catholic Healthcare West) | A2/A | 2,500,000 | 2,421,400 | |||||
California Housing Finance Agency, 4.85% due 8/1/2016 (Insured: FSA) (AMT) | Aa2/AAA | 1,000,000 | 1,014,170 | |||||
California Housing Finance Agency, 9.875% due 2/1/2017 | Aa2/AA- | 1,345,000 | 1,367,878 | |||||
California Housing Finance Agency, 5.00% due 8/1/2017 (Insured: FSA) (AMT) | Aa2/AAA | 980,000 | 999,335 | |||||
California Housing Finance Agency, 5.125% due 8/1/2018 (Insured: FSA) (AMT) | Aa2/AAA | 1,000,000 | 964,070 | |||||
California Mobile Home Park Financing Authority, 4.75% due 11/15/2010 (Rancho Vallecitos; Insured: ACA) | NR/NR | 500,000 | 496,055 | |||||
California Mobile Home Park Financing Authority, 5.00% due 11/15/2013 (Rancho Vallecitos; Insured: ACA) | NR/NR | 570,000 | 539,112 | |||||
California PCR Authority, 5.90% due 6/1/2014 (San Diego Gas & Electric Project) | A2/A | 2,500,000 | 2,576,825 | |||||
California PCR Authority Solid Waste Disposal, 6.75% due 7/1/2011 (ETM) | Aaa/NR | 1,470,000 | 1,566,741 | |||||
California PCR Authority Solid Waste Disposal, 5.25% due 6/1/2023 (AMT) | Baa3/BBB | 2,000,000 | 1,761,560 | |||||
California State, 0.30% due 5/1/2040 put 4/7/2009 (LOC: Bank of America) (weekly demand notes) | VMIG1/A-1+ | 2,000,000 | 2,000,000 | |||||
California State Department of Transportation COP, 5.25% due 3/1/2016 (Insured: MBIA) | A3/AA- | 2,000,000 | 2,005,520 | |||||
California State Department of Water Resources, 2.00% due 5/1/2022 put 4/1/2009 (Insured: FSA) (daily demand notes) | VMIG1/A-1+ | 3,600,000 | 3,600,000 | |||||
California State Economic Recovery, 0.40% due 7/1/2023 put 4/1/2009 (SPA: Bank of America) (daily demand notes) | VMIG1/A-1+ | 1,600,000 | 1,600,000 | |||||
California State GO, 5.75% due 10/1/2010 (Insured: FSA) | Aa3/AAA | 1,000,000 | 1,051,480 | |||||
California State GO, 5.50% due 3/1/2012 (School Improvements; Insured: FGIC-TCRS) | A2/A | 230,000 | 232,935 | |||||
California State Public Works Board Lease, 5.50% due 6/1/2010 (Various Universities) | Aa2/AA- | 780,000 | 794,750 | |||||
California State Public Works Board Lease, 5.25% due 10/1/2013 (California State University) | A1/A | 500,000 | 506,375 | |||||
California State Public Works Board Lease, 5.25% due 12/1/2014 | A3/A- | 1,525,000 | 1,544,444 | |||||
California State Public Works Board Lease, 5.00% due 1/1/2015 (Department of Corrections; Insured: AMBAC) | A2/A | 2,000,000 | 2,062,300 | |||||
California State Public Works Board Lease, 5.00% due 11/1/2015 (Various Universities) | Aa2/AA- | 1,000,000 | 1,095,410 | |||||
California Statewide Community Development Authority, 5.25% due 8/1/2014 (EAH-East Campus Apartments; Insured: ACA) | Baa1/NR | 1,215,000 | 1,168,478 | |||||
California Statewide Community Development Authority, 5.50% due 8/15/2014 (Enloe Medical Center; Insured: CA Mtg Insurance) | NR/A+ | 750,000 | 786,780 | |||||
Certified Semi-Annual Report 21
SCHEDULE OF INVESTMENTS, CONTINUED
| Thornburg California Limited Term Municipal Fund | March 31, 2009 (Unaudited) |
Issuer-Description | Credit Rating† Moody’s/S&P | Principal Amount | Value | |||||
California Statewide Community Development Authority, 4.10% due 4/1/2028 (Pollution Control Revenue; Insured: XLCA) | A2/A | $ | 2,000,000 | $ | 1,985,440 | |||
California Statewide Community Development Authority, 4.70% due 11/1/2036 put 6/1/2009 (Kaiser Permanente) (1) | NR/A+ | 2,000,000 | 2,004,980 | |||||
California Statewide Community Development Authority COP, 6.50% due 8/1/2012 (Cedars Sinai Center Hospital; Insured: MBIA) | A2/AA | 550,000 | 586,784 | |||||
California Statewide Community Development Authority COP, 5.30% due 12/1/2015 (Kaiser Permanente) (ETM) | Aa3/AAA | 2,785,000 | 2,879,217 | |||||
Central Union High School District Imperial County, 5.00% due 8/1/2012 (Insured: FGIC) | NR/AA- | 830,000 | 891,204 | |||||
Central Valley Financing Authority, 5.25% due 7/1/2011 (Carson Ice; Insured: MBIA) | Baa1/AA- | 1,300,000 | 1,315,067 | |||||
Cerritos Public Financing Authority, 5.00% due 11/1/2014 (Tax Allocation Redevelopment; Insured: AMBAC) | Baa1/A | 1,260,000 | 1,284,028 | |||||
Corona Norco USD GO, 3.50% due 2/1/2010 | NR/NR | 2,000,000 | 2,009,640 | |||||
Corona Norco USD GO, 0% due 9/1/2017 (Insured: FSA) | Aa3/AAA | 1,595,000 | 1,087,455 | |||||
Daly City Housing Development Financing Agency, 5.00% due 12/15/2019 (Franciscan Mobile Home Park) | NR/A- | 1,815,000 | 1,577,961 | |||||
Desert Sands USD COP, 5.25% due 3/1/2014 (School Improvements) | A2/A+ | 1,745,000 | 1,837,607 | |||||
Desert Sands USD COP, 5.00% due 3/1/2017 (School Improvements) | A2/A+ | 1,500,000 | 1,525,830 | |||||
Escondido USD GO, 6.10% due 11/1/2011 (Insured: MBIA) | Baa1/AA- | 500,000 | 501,975 | |||||
Fillmore Public Financing Authority, 5.00% due 5/1/2016 (Water Recycling; Insured: CIFG) | Baa2/A | 735,000 | 743,269 | |||||
Golden State Tobacco Securitization Corp., 5.375% due 6/1/2028 pre-refunded 6/1/2010 (Insured: FGIC-TCRS) | Aaa/AAA | 2,000,000 | 2,101,440 | |||||
Golden State Tobacco Securitization Corp., 5.50% due 6/1/2043 pre-refunded 6/1/2013 | Aaa/AAA | 2,000,000 | 2,244,120 | |||||
High Desert California Memorial Health Care, 5.40% due 10/1/2011 | NR/NR | 1,920,000 | 1,881,984 | |||||
Kern High School District GO, 7.00% due 8/1/2010 (ETM) | Baa1/NR | 165,000 | 178,992 | |||||
Lindsay USD COP, 5.75% due 10/1/2017 (Insured: Assured Guaranty) | NR/AAA | 1,160,000 | 1,157,692 | |||||
Lindsay USD COP, 6.00% due 10/1/2018 (Insured: Assured Guaranty) | NR/AAA | 680,000 | 682,196 | |||||
Los Angeles Community Redevelopment Agency, 5.00% due 7/1/2009 (Cinerama Dome Public Parking; Insured: ACA) | NR/NR | 835,000 | 827,276 | |||||
Los Angeles Community Redevelopment Agency, 5.75% due 7/1/2010 (Cinerama Dome Public Parking; Insured: ACA) | NR/NR | 435,000 | 419,745 | |||||
Los Angeles Convention & Exhibition Center Authority, 5.00% due 8/15/2016 | A1/AA- | 2,000,000 | 2,178,180 | |||||
Los Angeles COP, 5.00% due 2/1/2012 (Insured: MBIA) | A1/AA- | 1,400,000 | 1,503,068 | |||||
Los Angeles County Schools, 5.00% due 6/1/2016 (Pooled Financing; Insured: MBIA) | Baa1/AA- | 1,000,000 | 1,006,700 | |||||
Los Angeles County Schools, 5.00% due 6/1/2017 (Pooled Financing; Insured: MBIA) | Baa1/AA- | 1,010,000 | 1,003,718 | |||||
Los Angeles Department of Airports, 5.50% due 5/15/2018 (Los Angeles Intl.) | Aa3/AA | 2,000,000 | 1,981,220 | |||||
Los Angeles Department of Water & Power, 5.25% due 7/1/2011 (Insured: MBIA) | Aa3/AA- | 3,000,000 | 3,255,570 | |||||
Los Angeles USD GO, 5.50% due 7/1/2012 (Insured: MBIA) | Aa3/AA- | 2,500,000 | 2,776,425 | |||||
Milpitas Redevelopment Agency Tax Allocation, 5.00% due 9/1/2015 (Insured: MBIA) | Baa1/AA- | 2,000,000 | 2,008,320 | |||||
Mojave USD COP, 0% due 9/1/2017 (Insured: FSA) | NR/AAA | 1,045,000 | 706,639 | |||||
Mojave USD COP, 0% due 9/1/2018 (Insured: FSA) | NR/AAA | 1,095,000 | 676,688 | |||||
Moorpark Mobile Home Park, 5.80% due 5/15/2010 (Villa Del Arroyo; Insured: ACA) | NR/NR | 525,000 | 526,538 | |||||
Norwalk Redevelopment Agency Tax Allocation, 5.00% due 10/1/2014 (Insured: MBIA) | Baa1/AA- | 625,000 | 640,900 | |||||
Oxnard Financing Authority Solid Waste, 5.00% due 5/1/2013 (Insured: AMBAC) (AMT) | Baa1/A | 2,115,000 | 2,136,679 | |||||
Oxnard Financing Authority Solid Waste, 5.25% due 6/1/2014 (Insured: FGIC) | NR/AA- | 1,000,000 | 1,079,090 | |||||
Palomar Pomerado Health GO, 0% due 8/1/2019 (Insured: Assured Guaranty) | Aa2/AAA | 2,000,000 | 1,099,120 | |||||
Pomona USD GO, 6.10% due 2/1/2010 (Insured: MBIA) | Baa1/AA- | 320,000 | 330,112 | |||||
Port Oakland, 5.75% due 11/1/2012 (Airport & Marina Improvements; Insured: FGIC) | A1/AA- | 2,175,000 | 2,210,017 | |||||
Richmond Joint Powers Financing Authority Lease & Gas Tax, 5.25% due 5/15/2013 | NR/A | 475,000 | 475,689 | |||||
Riverside County Palm Desert Financing Authority, 5.00% due 5/1/2013 | A2/AA- | 1,000,000 | 1,050,910 | |||||
Roseville Natural Gas Financing Authority, 5.00% due 2/15/2017 | A2/A | 1,000,000 | 769,890 | |||||
Sacramento City Financing Authority, 0% due 11/1/2014 (Insured: MBIA) | Baa1/AA- | 3,310,000 | 2,443,972 | |||||
Sacramento County Sanitation District Financing Authority, 5.75% due 12/1/2009 | Aa3/AA | 560,000 | 578,452 | |||||
22 Certified Semi-Annual Report
SCHEDULE OF INVESTMENTS, CONTINUED
| Thornburg California Limited Term Municipal Fund | March 31, 2009 (Unaudited) |
Issuer-Description | Credit Rating† Moody’s/S&P | Principal Amount | Value | |||||
San Bernardino County Community Facilities District, 5.10% due 9/1/2011 | NR/NR | $ | 190,000 | $ | 188,201 | |||
San Bernardino County Community Facilities District, 5.20% due 9/1/2012 | NR/NR | 205,000 | 201,911 | |||||
San Bernardino County Community Facilities District, 5.30% due 9/1/2013 | NR/NR | 300,000 | 293,280 | |||||
San Bernardino County Multi Family Housing, 4.75% due 12/15/2031 put 12/15/2011 (Rolling Ridge LLC; Collateralized: FNMA) | Aaa/NR | 3,100,000 | 3,299,795 | |||||
San Bernardino County Transportation Authority Sales Tax, 6.00% due 3/1/2010 (Insured: FGIC) (ETM) | NR/NR | 195,000 | 203,547 | |||||
San Diego County COP, 5.625% due 9/1/2012 (Insured: AMBAC) | Baa1/A | 550,000 | 561,781 | |||||
San Diego County COP Developmental Services Foundation, 5.50% due 9/1/2017 | Baa1/NR | 2,000,000 | 1,657,980 | |||||
San Francisco City GO, 5.00% due 6/15/2014 (Laguna Honda Hospital; Insured: FSA) | Aa2/AAA | 2,320,000 | 2,537,639 | |||||
San Francisco City & County Airports, 6.50% due 5/1/2019 (International Airport) | A1/A | 1,480,000 | 1,554,178 | |||||
San Francisco City & County Redevelopment Agency, 0% due 7/1/2010 (George R. Moscone Convention Center) | A1/AA- | 1,380,000 | 1,336,806 | |||||
San Joaquin Delta Community College District GO, 0% due 8/1/2019 (Insured: FSA) | Aa3/AAA | 5,000,000 | 2,984,050 | |||||
San Jose Evergreen Community College District GO, 0% due 9/1/2011 crossover refunded 9/1/2010 (Insured: AMBAC) | Aa2/AA- | 2,200,000 | 2,029,346 | |||||
San Jose Redevelopment Agency Tax Allocation, 6.00% due 8/1/2010 (Merged Area Redevelopment; Insured: MBIA) | A3/AA- | 670,000 | 695,112 | |||||
San Jose Redevelopment Agency Tax Allocation, 5.25% due 8/1/2012 (Merged Area Redevelopment; Insured: MBIA) | A3/AA- | 1,000,000 | 1,050,670 | |||||
San Luis & Delta-Mendota Water Authority, 4.50% due 3/1/2014 (Water Utility Improvements) (2) | A/A+ | 2,000,000 | 2,001,600 | |||||
San Mateo Flood Control District COP, 5.25% due 8/1/2017 (Colma Creek; Insured: MBIA) | Baa1/AA- | 1,000,000 | 1,009,370 | |||||
San Mateo USD GO, 0% due 9/1/2019 (Insured: FGIC) | Aa3/AA- | 2,000,000 | 1,187,580 | |||||
Seal Beach Redevelopment Agency Mobile Home Park, 5.20% due 12/15/2013 (Insured: ACA) | NR/NR | 575,000 | 543,674 | |||||
Southeast Resource Recovery Facilities Authority, 5.375% due 12/1/2013 (Insured: AMBAC) (AMT) | A2/A+ | 1,060,000 | 1,086,256 | |||||
Southern California Public Power Authority, 5.15% due 7/1/2015 (Insured: AMBAC) | Aa3/A | 350,000 | 390,971 | |||||
Southern California Public Power Authority, 5.15% due 7/1/2015 (Insured: AMBAC) | Aa3/A | 250,000 | 279,265 | |||||
Val Verde USD COP, 5.00% due 1/1/2014 (Insured: FGIC) (ETM) | NR/NR | 445,000 | 506,708 | |||||
Victorville Redevelopment Agency, 5.00% due 12/1/2014 (Bear Valley Road Project; Insured: FSA) | Aa3/AAA | 300,000 | 319,581 | |||||
Walnut Valley USD GO, 8.75% due 8/1/2010 (Insured: MBIA) (ETM) | NR/AA | 1,000,000 | 1,107,530 | |||||
Washington Township Health Care District, 5.00% due 7/1/2009 | A3/NR | 450,000 | 451,750 | |||||
Washington USD COP, 5.00% due 8/1/2017 (New High School; Insured: AMBAC) | Baa1/A | 725,000 | 719,736 | |||||
Whittier Solid Waste, 5.375% due 8/1/2014 (Insured: AMBAC) | Baa1/A | 1,000,000 | 1,002,510 | |||||
TOTAL INVESTMENTS — 99.95% (Cost $136,646,411) | $ | 136,760,841 | ||||||
OTHER ASSETS LESS LIABILITIES — 0.05% | 70,474 | |||||||
NET ASSETS — 100.00% | $ | 136,831,315 | ||||||
Certified Semi-Annual Report 23
SCHEDULE OF INVESTMENTS, CONTINUED
| Thornburg California Limited Term Municipal Fund | March 31, 2009 (Unaudited) |
Footnote Legend
| † | Credit ratings are unaudited. Rating changes may have occurred prior to or subsequent to the reporting period end. |
| (1) | Segregated as collateral for a when-issued security. |
| (2) | When-issued security. |
Portfolio Abbreviations
To simplify the listings of securities, abbreviations are used per the table below:
| ACA | Insured by American Capital Access | |
| AMBAC | Insured by American Municipal Bond Assurance Corp. | |
| AMT | Alternative Minimum Tax | |
| CIFG | CIFG Assurance North America Inc. | |
| COP | Certificates of Participation | |
| ETM | Escrowed to Maturity | |
| FGIC | Insured by Financial Guaranty Insurance Co. | |
| FNMA | Collateralized by Federal National Mortgage Association | |
| FSA | Insured by Financial Security Assurance Co. | |
| GO | General Obligation | |
| HFA | Health Facilities Authority | |
| LOC | Letter of Credit | |
| MBIA | Insured by Municipal Bond Investors Assurance | |
| Mtg | Mortgage | |
| PCR | Pollution Control Revenue Bond | |
| USD | Unified School District | |
| XLCA | Insured by XL Capital Assurance |
See notes to financial statements.
24 Certified Semi-Annual Report
| Thornburg California Limited Term Municipal Fund | March 31, 2009 (Unaudited) |
As a shareholder of the Fund, you incur two types of costs:
(1) transaction costs, including
(a) sales charges (loads) on purchase payments, for Class A shares;
(b) a deferred sales charge on redemptions of any part or all of a purchase of $1 million of Class A shares within 12 months of purchase;
(c) a deferred sales charge on redemptions of Class C shares within 12 months of purchase;
(2) ongoing costs, including management fees; distribution and/or service (12b-1) fees; and other Fund expenses.
This example is intended to help you understand your ongoing costs (in dollars) of investing in the Fund and to compare these costs with the ongoing costs of investing in other mutual funds.
The example is based on an investment of $1,000 invested on September 30, 2008 and held until March 31, 2009.
Actual Expenses
For each class of shares, the first line of the table at right provides information about actual account values and actual expenses. You may use the information in this line, together with the amount you invested, to estimate the expenses that you paid over the period. Simply divide your account value by $1,000 (for example, an $8,600 account value divided by $1,000 = 8.6), then multiply the result by the number in the first line for your class of shares under the heading entitled “Expenses Paid During Period” to estimate the expenses you paid on your account during this period.
Hypothetical Example for Comparison Purposes
For each class of shares, the second line of the table at right provides information about hypothetical account values and hypothetical expenses based on the Fund’s actual expense ratio and an assumed rate of return of 5% per year before expenses, which is not the Fund’s actual return. The hypothetical account values and expenses may not be used to estimate the actual ending account balance or expenses you paid for the period. You may use this information to compare the ongoing costs of investing in the Fund and other funds. To do so, compare this 5% hypothetical example with the 5% hypothetical examples that appear in the shareholder reports of the other funds.
| Beginning Account Value 9/30/08 | Ending Account Value 3/31/09 | Expenses Paid During Period† 9/30/08–3/31/09 | |||||||
Class A Shares | |||||||||
Actual | $ | 1,000.00 | $ | 1,026.90 | $ | 4.93 | |||
Hypothetical* | $ | 1,000.00 | $ | 1,020.07 | $ | 4.91 | |||
Class C Shares | |||||||||
Actual | $ | 1,000.00 | $ | 1,025.60 | $ | 6.26 | |||
Hypothetical* | $ | 1,000.00 | $ | 1,018.76 | $ | 6.23 | |||
Class I Shares | |||||||||
Actual | $ | 1,000.00 | $ | 1,028.70 | $ | 3.21 | |||
Hypothetical* | $ | 1,000.00 | $ | 1,021.77 | $ | 3.20 | |||
| † | Expenses are equal to the annualized expense ratio for each class (A: 0.98%; C: 1.24%; and I: 0.64%) multiplied by the average account value over the period, multiplied by 182/365 to reflect the one-half year period. |
| * | Hypothetical assumes a rate of return of 5% per year before expenses. |
Please note that the expenses shown in the table are meant to highlight your ongoing costs only and do not reflect any transactional costs, such as sales charges (loads), redemption fees, or exchange fees. Therefore, the second line of the table for each class of shares is useful in comparing ongoing costs only, and will not help you determine the relative total costs of owning different funds. In addition, if these transactional costs were included, your costs would have been higher.
Certified Semi-Annual Report 25
| Thornburg California Limited Term Municipal Fund | March 31, 2009 (Unaudited) |
PORTFOLIO PROXY VOTING
Policies and Procedures:
The Trust has delegated to Thornburg Investment Management, Inc. (the “Advisor”) voting decisions respecting proxies for the Fund’s voting securities. The Advisor makes voting decisions in accordance with its Proxy Voting Policy and Procedures. A description of the Policy and Procedures is available (i) without charge, upon request, by calling the Advisor toll-free at 1-800-847-0200, (ii) on the Thornburg website at www.thornburg.com, and (iii) on the Securities and Exchange Commission’s website at www.sec.gov.
Information regarding how proxies were voted is available on or before August 31 of each year for the twelve months ending the preceding June 30. This information is available (i) without charge, upon request by calling the Advisor toll-free at 1-800-847-0200, (ii) on the Thornburg website at www.thornburg.com, and (iii) on the Securities and Exchange Commission’s website at www.sec.gov.
AVAILABILITY OF QUARTERLY PORTFOLIO SCHEDULE
The Fund files with the Securities and Exchange Commission schedules of its portfolio holdings on Form N-Q for the first and third quarters of each fiscal year. The Fund’s Forms N-Q are available on the Commission’s website at www.sec.gov, or may be reviewed and copied at the Commission’s Public Reference Room in Washington, D.C. Information on the operation of the Public Reference Room may be obtained by calling 1-800-SEC-0330. The Fund also makes this information available on its website at www.thornburg.com/download or upon request by calling 1-800-847-0200.
26 Certified Semi-Annual Report
Trustees’ Statement to Shareholders
Not part of the Certified Semi-Annual Report
February 8, 2005, as readopted September 15, 2008
The Trustees are concerned that ongoing commentaries and opinions reported in the media may confuse investors in general as to the supervisory duties of trustees of mutual funds and, in particular, leave Thornburg Investment Trust shareholders uncertain regarding how we discharge our responsibilities in supervising the Funds’ investment advisor and in reviewing the advisor’s contract for renewal. We decided to spell out clearly three principal guidelines that we follow in supervising the Trust’s investment advisor on your behalf.
We begin with the premise that each shareholder selected his or her Fund because its investments are managed by the investment advisor identified in the prospectus and in accordance with the objective and policies described in the prospectus. We realize, as each of you do, that if you believe that your Fund’s stated objective and policies no longer serve your personal investment goals, you can sell your shares and leave the Fund.
Therefore, we believe that our primary supervisory task – our principal obligation to you – is to assess the nature and quality of the advisor’s services, and to confirm that the advisor actively and competently pursues the Fund’s objective, in accordance with the policies set out in the prospectus. To do this, we meet regularly with management to review your Fund’s portfolio and to discuss the advisor’s specific actions and judgments in pursuing the Fund’s objective. We do not substitute our own judgment for the advisor’s decisions in selecting investments; the advisor is paid to exercise its informed judgment on investment decisions, and we seek to confirm, in reviewing the advisor’s performance, that the advisor is doing just that.
Second, while we are conscious of costs and the effect that costs have on shareholders’ returns, we do not seek the lowest fees or expense ratio as our sole or primary objective. We try to make sure that your Fund’s fees and costs are reasonable in relationship to the services rendered and that they are generally in line with those charged by other expert investment advisors, consistent with our belief that the Fund’s investors searched for and expect that expertise and attention and have decided to pay a reasonable price for it. We do not put the management contract “out to bid” as a matter of course, and we would not do so unless we had concluded that the advisor materially had failed to pursue the Fund’s objectives in accordance with its policies, or for other equally important reasons. We believe that any other approach would be inconsistent with your interests and contrary to your expectations when you bought shares of the Fund in the first place.
Finally, because we believe that most Thornburg Fund shareholders have invested with a long-term perspective, we try not to focus too much on the fashions of the moment and on short-term performance. The market will not favor any specific investment objective or set of policies at all times and under all economic circumstances. A fund will experience periods of both high and low returns relative to other funds and other investments. Even if one of our Funds is not favored by the market at a particular time, we believe that the advisor is nonetheless obliged to remain true to the Fund’s objective and policies, and we watch to see that it does so.
This page is not part of the Semi-Annual Report. 27
OTHER INFORMATION, CONTINUED
This page intentionally left blank.
28 This page is not part of the Semi-Annual Report.
Planning Options
Retirement and Education Accounts
Thornburg Investment Management offers retirement and education savings accounts that can help you meet a variety of planning challenges. For account applications or further information on any of the accounts below, please call 1-800-847-0200 or go to www.thornburg.com/ira. Your financial advisor can help you determine which plan is right for you.
Individual Retirement Accounts
Individual Retirement Accounts (IRAs) provide a tax-advantaged means to save money for the future. For a detailed outline of the difference between retirement accounts, see www.thornburg.com/ira. Rollovers are available. Call 1-800-847-0200 for more information.
Traditional IRAs – Contributions to Traditional IRAs are tax deductible for eligible individuals, and withdrawals are taxed as additional ordinary income. You may contribute to an IRA if you receive compensation and are under 70 1/2, even if you are covered by an employer retirement plan. Deductible contributions are subject to certain qualifications. Please consult your tax advisor.
Roth IRAs – Under a Roth IRA, there is no tax deduction for contributions, but there is no income tax on qualified withdrawals. For a more detailed comparison of Traditional and Roth IRAs, please see our web site at www.thornburg.com/ira.
SEP IRAs – Simplified Employee Pension (SEP) IRAs are established by employers. The employer is allowed a tax deduction for contributions made to the SEP Plan and makes contributions to each eligible employee’s SEP IRA on a discretionary basis.
SIMPLE IRAs – Savings Incentive Match Plan for Employees of Small Employers (SIMPLE) is designed to give small business owners a simplified method to establish and contribute to a retirement plan for employees. The employer is allowed a tax deduction for contributions and makes either matching or non-elective contributions to each eligible employee’s SIMPLE IRA. Employees may make salary deferral contributions.
Coverdell Education Savings Account
These savings accounts are designed to provide a way to save money for higher education expenses. In an Education Savings Account, earnings and interest grow tax-free, and qualified withdrawals used to pay for eligible higher-education expenses are tax- and penalty-free.
Funds Available
The following funds are available in the accounts listed above:
| • | Thornburg International Value Fund |
| • | Thornburg Value Fund |
| • | Thornburg Core Growth Fund |
| • | Thornburg Investment Income Builder Fund |
| • | Thornburg Global Opportunities Fund |
| • | Thornburg International Growth Fund |
| • | Thornburg Limited Term U.S. Government Fund |
| • | Thornburg Limited Term Income Fund |
| • | Thornburg Strategic Income Fund |
This page is not part of the Semi-Annual Report. 29

Thornburg Equity Funds
Thornburg’s equity research uses a fundamental and comprehensive analytical approach. Thornburg equity funds focus on a limited number of securities so that each holding can impact performance. The equity team searches for firms believed to have a promising future and seeks to buy shares of those companies at a discount to their intrinsic value.
| • | Thornburg Value Fund |
| • | Thornburg International Value Fund |
| • | Thornburg Core Growth Fund |
| • | Thornburg Investment Income Builder Fund |
| • | Thornburg Global Opportunities Fund |
| • | Thornburg International Growth Fund |
Thornburg Bond Funds
Thornburg Investment Management applies a disciplined philosophy to fixed-income management. Since the launch of our first fixed-income fund 25 years ago, we have been conducting fundamental, bottom-up research in an effort to identify bonds which we believe provide the best return for a given level of risk. We are very organic in our approach, avoiding leverage or complex strategies which could backfire in periods of market uncertainty.
| • | Thornburg Limited Term Municipal Fund |
| • | Thornburg Intermediate Municipal Fund |
| • | Thornburg California Limited Term Municipal Fund |
| • | Thornburg New Mexico Intermediate Municipal Fund |
| • | Thornburg New York Intermediate Municipal Fund |
| • | Thornburg Strategic Municipal Income Fund |
| • | Thornburg Limited Term U.S. Government Fund |
| • | Thornburg Limited Term Income Fund |
| • | Thornburg Strategic Income Fund |
Before investing, carefully consider the Fund’s investment goals, risks, charges, and expenses. For a prospectus containing this and other information, contact your financial advisor or visit thornburg.com. Read it carefully before investing.
For additional information, please visit www.thornburg.com
Thornburg Investment Management, Inc. 2300 North Ridgetop Road, Santa Fe, NM 87506
This page is not part of the Semi-Annual Report. 31

| This Semi-Annual Report is submitted for the general information of shareholders of the Fund. It is not authorized for distribution to prospective investors in the Fund unless preceded or accompanied by an effective prospectus. | ||
 | Investment Advisor: Thornburg Investment Management® 800.847.0200
Distributor: Thornburg Securities Corporation® 800.847.0200
TH1070 | |
| Waste not, |  | |
| Wait not |
Get instant access to your shareholder reports.
By switching from your postal mailbox to your email inbox, you reduce paper clutter, improve record keeping access, and help conserve our natural resources.
Go to www.thornburg.com/edelivery and sign up to receive your shareholder reports, prospectuses, and proxy statements electronically.
You invest in the future, without spending a dime.
2 This page is not part of the Semi-Annual Report.
Important Information
The information presented on the following pages was current as of March 31, 2009. The managers’ views, portfolio holdings, and sector diversification are provided for the general information of the Fund’s shareholders; they are historical and subject to change. This material should not be deemed a recommendation to buy or sell any of the securities mentioned.
Investments in the Fund carry risks, including possible loss of principal. As with direct bond ownership, funds that invest in bonds are subject to certain risks including interest-rate risk, credit risk, and inflation risk. The principal value of bonds will fluctuate relative to changes in interest rates, decreasing when interest rates rise. Unlike bonds, bond funds have ongoing fees and expenses. Please see the Fund’s Prospectus for a discussion of the risks associated with an investment in the Fund. Investments in the Fund are not deposits or obligations of, or guaranteed or endorsed by, any bank, the Federal Deposit Insurance Corporation, the Federal Reserve Board or any government agency. There is no guarantee that the Fund will meet its investment objectives. The laddering strategy does not assure or guarantee better performance and cannot eliminate the risk of investment losses.
Performance data given at net asset value (NAV) does not take into account applicable sales charges. If the sales charges had been included, the performance would have been lower.
Minimum investments for Class I shares are higher than those for other classes. Class I shares may not be available to all investors.
Share Class | NASDAQ Symbol | Cusip | ||
Class A | THIMX | 885-215-202 | ||
Class C | THMCX | 885-215-780 | ||
Class I | THMIX | 885-215-673 |
Lipper’s 2008
Best Fixed-Income Fund Family
Thornburg Investment Management ranked #1 out of 41 eligible firms in Lipper, Inc.’s fixed income large firm universe for the three-year period ended 12/31/07, based on risk-adjusted returns. Past performance does not guarantee future results.
Lipper’s large firm universe is comprised of fund families with more than $28 billion in total net assets. Only fund families with at least five bond funds were eligible. Risk-adjusted returns were calculated with dividends reinvested and without sales charges. We did not win this award in 2009.
Glossary
Merrill Lynch 7-12 Year Municipal Bond Index – The Merrill Lynch 7-12 Year Municipal Bond Index represents a broad measure of market performance. It is a model portfolio of municipal obligations throughout the U.S., with an average maturity which ranges from seven to twelve years.
Unless otherwise noted, index returns reflect the reinvestment of income dividends and capital gains, if any, but do not reflect fees, brokerage commissions or other expenses of investing. Investors may not make direct investments into any index.
Alternative Minimum Tax (AMT) – A federal tax aimed at ensuring that high-income individuals, estates, trusts, and corporations pay a minimal level income tax. For individuals, the AMT is calculated by adding tax preference items to regular taxable income.
Distribution Rate – The distribution rate is calculated by taking the sum of the month’s total distribution factors and dividing this sum by a 30-day period and annualizing to a 360-day year. The value is then divided by the ending Net Asset Value (NAV) to arrive at the annualized distribution yield. The yield is calculated on a periodic basis and is subject to change depending on the Fund’s NAV and current distributions.
Duration – The weighted maturity of a bond’s cash flows. Duration measures the price sensitivity of a bond for a given change in interest rates. Bonds with longer durations experience greater price volatility than bond with shorter durations.
General Obligation (GO) Bonds – A municipal bond secured by the pledge of the issuer’s full faith, credit, and taxing power rather than the revenue from a given project.
Leverage – The amount of debt used to finance a firm’s assets. A firm with significantly more debt than equity is considered to be highly leveraged.
Pre-Refunded Bond – A type of municipal bond that has been escrowed or collateralized either by direct obligations guaranteed by the U.S. government, or by other types of securities. The escrow account is structured so that these refunded bonds are to be called at the first possible call date. Such bonds, if escrowed with securities guaranteed by the U.S. government, have little if any credit risk.
Quality Spread – The difference between the yields of securities with different quality ratings.
Revenue Bond – A bond on which the debt service is payable solely from the revenue generated from the operation of the project being financed or a category of facilities, or from other non-tax sources.
This page is not part of the Semi-Annual Report. 3
Important Information
Continued
SEC Yield – SEC Yield is computed in accordance with SEC standards measuring the net investment income per share over a specified 30-day period expressed as a percentage of the maximum offering price of the Fund’s shares at the end of the period.
Tax-Backed Bonds – A broad category of bonds that are secured by taxes levied by the obligor.
U.S. Treasury Securities – U.S. Treasury securities, such as bills, notes and bonds, are negotiable debt obligations of the U.S. government. These debt obligations are backed by the “full faith and credit” of the government and issued at various schedules and maturities. Income from Treasury securities is exempt from state and local, but not federal income taxes.
Yield Spread – The difference in yield, at a given time, between two bonds or between different segments of the bond market.
4 This page is not part of the Semi-Annual Report.
Thornburg Intermediate Municipal Fund
At Thornburg, our approach to fixed-income management is based on the premise that investors in our bond funds seek preservation of capital along with an attractive, relatively stable yield. While aggressive bond strategies may generate stronger returns when the market is turning a blind eye towards risk, they usually fail to stack up over longer periods of time. Our patience and diligence was recognized by Lipper, in 2008 with the Best Fixed-Income Fund Family Award.
We apply time-tested techniques to manage risk and provide attractive returns. These include:
| • | Building a laddered portfolio. Laddering has been shown over time to mitigate price and interest rate risk. |
| • | Investing on a cash-only basis without using leverage. While leveraged strategies may enhance returns when market conditions are favorable, they can quickly compound losses when sentiment shifts. |
| • | Conducting in-depth fundamental research on each issue and actively monitoring positions for subsequent credit events. |
| • | Diversifying among a large number of generally high-quality bonds. |
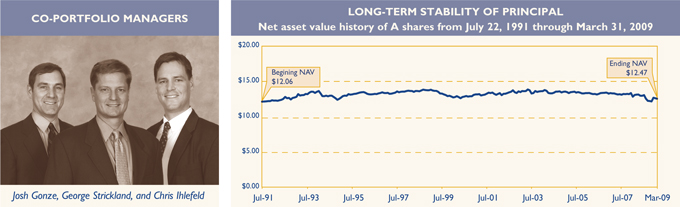
IMPORTANT
PERFORMANCE INFORMATION
Performance data shown represents past performance and is no guarantee of future results. Investment return and principal value will fluctuate so shares, when redeemed, may be worth more or less than their original cost. Current performance may be lower or higher than quoted. For performance current to the most recent month end, visit thornburg.com.
The maximum sales charge for the Fund’s Class A shares is 2.00%. The total annual fund operating expense of Class A shares is 0.96%, as disclosed in the most recent Prospectus.
AVERAGE ANNUAL TOTAL RETURNS
For periods ended March 31, 2009
| 1 Yr | 3 Yrs | 5 Yrs | 10 Yrs | Since Inception | |||||||||||
A Shares (Incep: 7/22/91) | |||||||||||||||
Without Sales Charge | -0.06 | % | 2.11 | % | 2.15 | % | 3.32 | % | 4.94 | % | |||||
With Sales Charge | -2.09 | % | 1.42 | % | 1.73 | % | 3.11 | % | 4.81 | % |
30-DAY YIELDS, A SHARES
As of March 31, 2009
Annualized Distribution Rate (@NAV) | SEC Yield | SEC Taxable Equivalent Yield | ||
4.28% | 3.02% | 4.64% |
SEC Taxable Equivalent Yields assume a 35% marginal federal tax rate. Portions of the income of the Fund may be subject to the alternative minimum tax.
KEY PORTFOLIO ATTRIBUTES
As of March 31, 2009
Average Credit Quality | AA | |
Number of Bonds | 315 | |
Duration | 5.2 Yrs | |
Average Maturity | 8.1 Yrs |
See the entire portfolio in the Schedule of Investments on page 21.
This page is not part of the Semi-Annual Report. 5
THORNBURG INTERMEDIATE MUNICIPAL FUND VERSUS
LIPPER TAX-EXEMPT MONEY MARKET FUNDS AVERAGE
Class A shares as of March 31, 2009
We are often asked to compare Thornburg Intermediate Municipal Fund to money market fund returns. Municipal bond funds are not an exact substitute for money market funds. These investments have certain differences, which are summarized below. Investors in the Thornburg Intermediate Municipal Fund took more risk than tax-exempt money market fund investors to earn their higher returns.
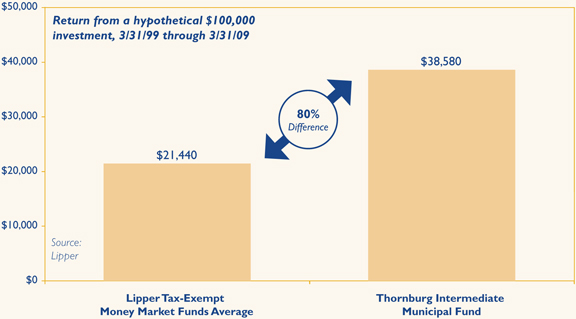
Past performance does not guarantee future results. Performance data above does not include the 2.00% sales charge for Class A shares. If the sales charge had been included, returns would have been lower. Returns shown are minus the initial investment.
Investors in municipal bond funds may experience more volatility than those in comparable money market funds. There are also differences in fees and expenses.
Investors in the Thornburg Intermediate Municipal Fund took more risk than money market investors to earn their higher returns including reinvestment risk, credit risk, and inflation risk. Unlike money market funds, the prices of bonds fluctuate relative to changes in interest rates, with principal values decreasing when interest rates rise and increasing when interest rates fall. Generally, money market funds seek to maintain an investment portfolio with an average maturity of 90 days or less. Thornburg Intermediate Municipal Fund has an average maturity of normally between three and ten years. Interest dividends paid by the Fund or by tax-exempt money market funds are generally exempt from federal income tax and state income tax (may be subject to AMT).
Money market funds seek to preserve the value per share at $1.00, whereas, the Thornburg Intermediate Municipal Fund’s net asset value changes daily. It is possible to lose money when investing in either the Thornburg Intermediate Municipal Fund or a tax-exempt money market fund. Neither are insured by the FDIC or any other government agency.
Lipper Tax-Exempt Money Market Funds Average is an arithmetic average of the total return of all tax-exempt money market mutual funds. You cannot invest in a category average.
6 This page is not part of the Semi-Annual Report.

Thornburg Intermediate Municipal Fund
March 31, 2009
Table of Contents | ||
| 8 | ||
| 11 | ||
| 12 | ||
| 13 | ||
| 14 | ||
| 18 | ||
| 21 | ||
| 31 | ||
| 32 | ||
This report is certified under the Sarbanes-Oxley Act of 2002, which requires that public companies, including mutual funds, affirm that the information provided in their annual and semiannual shareholder reports fully and fairly represents their financial position.
Certified Semi-Annual Report 7
George Strickland Co-Portfolio Manager
Josh Gonze Co-Portfolio Manager
Christopher Ihlefeld Co-Portfolio Manager | April 21, 2009
Dear Fellow Shareholder:
We are pleased to present the Semi-Annual Report for the Thornburg Intermediate Municipal Fund. The net asset value of the Class A shares was unchanged during the six months ended March 31, 2009 and finished the period at $12.47. If you were with us for the entire period, you received dividends of 26.8 cents per share. If you reinvested your dividends, you received 27.1 cents per share. Dividends per share were lower for Class C shares and higher for Class I shares to account for varying class-specific expenses.
The last six months have been an extremely volatile period for municipal bond prices. It started in September and October of 2008, with the Lehman Brothers bankruptcy which led many investors to shun taxable and tax-free money market funds. The money market funds were forced to dump their investments in order to meet redemptions, which caused the yield on tax-free money market securities to spike. Since hedge funds and other leveraged investors finance their purchases of long-term bonds with money market securities, their borrowing costs shot up so they had to sell long-term bonds in order to deleverage. This placed significant selling pressure on the municipal marketplace and sent yields up (and prices lower) in a precipitous fashion.
From mid-September to mid-October, the yield on AAA-rated municipal bonds rose from 2.93% to 3.68%. Over that time period, yields went higher almost every day. From mid-October on, the market for the highest quality bonds has settled down quite a bit, but prices for all other bonds have been quite variable. For instance, the yield spread between a ten-year AAA-rated general obligation bond and a BBB-rated revenue bond averaged 0.75% from May 1991 to December 2007. That average yield spread surged to 1.67% from January 2008 to April 2009. As of April 15, 2009, the AAA to BBB yield spread stood at 3.01%. | |
| ||
| Investors have been shunning risk of all types and that is certainly true in the municipal bond market. However, there are other reasons that municipal quality spreads are at unprecedented levels. Large monoline bond insurers such as MBIA, AMBAC and FGIC were in the business of arbitraging bond spreads. If a bond’s spread to the AAA yield curve got too wide, they would typically step in and charge the issuer a premium for an insurance policy that got them a AAA rating. Bonds that received a AAA rating through insurance didn’t quite get an issuer the same interest rate as a “natural” AAA bond such as a bond issued by the State of Maryland, but it got them very close. In this |


8 Certified Semi-Annual Report
way, the bond insurers were the policemen of the municipal spread markets. Instead of writing speeding tickets, they wrote insurance policies that got issuers back in line with AAA rates. Now that investors’ confidence in the bond insurers has been justifiably shattered, insured bonds typically trade at very wide spreads based upon market views of the underlying obligor. In effect, there are no policemen anymore.
The market, which was becoming more generic and homogenous in nature, is now fractured and harder to analyze. Many traders used to glance at a bond, see the MBIA insurance, and work up a quick bid. Many of those traders are now out of business. Traders and portfolio managers today have to look into covenants, security provisions, margins and balance sheets before they can decide what a bond is worth. These are skills that we, at Thornburg Investment Management, have never gotten out of the habit of using.
The consequences of faulty or incomplete analysis are more severe today. The market is adapting to the new reality, but while it does, fear and opportunity are at exaggerated levels. Liquidity is harder to find, and any bond that is not straightforward and easy to analyze is trading at a large yield premium to widely recognized bonds. The market is greatly favoring bonds pre-refunded in Treasury securities and large general obligation issuers, over high and medium quality issuers of tax-backed and revenue bonds. In other words, it is a bond picker’s paradise. For the price of a little research and market knowledge, great value can be extracted. We have not changed our management style, but we are spending more time looking into “story” bonds and have slightly decreased the average credit rating of the portfolio as we have found good values in bonds rated below AAA.
Investors do have some legitimate reasons to be shunning risk these days. The average high-yield municipal bond fund lost over 25% last year. The economy is basically in shambles in much of the country and collectively, the 50 states are currently grappling with $100 billion of projected deficits in their 2010 fiscal years. However, we see some reasons for optimism. Investment grade municipal bonds have an impressive long-term track record. Standard & Poor’s recently updated their study showing ten-year cumulative default rates that averaged 0.13%. We expect defaults to be somewhat more frequent going forward, but there are counterbalancing factors that could limit any rise in the default rate. Many state and local governments set aside large reserve balances when times were good so that they can draw upon those resources today. Others are rebalancing their budgets frequently and are cutting spending aggressively. Some governments are doing both while raising taxes and fees, and all are making use of the federal largess in the $787 billion American Recovery and Reinvestment Act. As we scrutinize municipal finances, we see many issuers that are standing up to these challenging times. There are a few that may not, and we will strive to continue avoiding their bonds in order to protect the portfolio. It is a very important time for careful diligence and diversification of investment portfolios. Your Fund is broadly diversified and 80% invested in bonds rated A or above by at least one of the major rating agencies.
Your Thornburg Intermediate Municipal Fund is a laddered portfolio of over 300 municipal obligations from 41 states. We ladder the maturity dates of the bonds in your portfolio so that some of the bonds are scheduled to mature during each of the coming years. Laddering intermediate bonds accomplishes two goals. First, the staggered bond maturities contained in a ladder defuse interest-rate risk and dampen the Fund’s price volatility. Second, laddering gives the Fund a steady cash flow stream from maturing bonds to reinvest toward the top of the
% of Portfolio Maturing | Cumulative % Maturing | ||||||
| 2 years = | 12.8% | Year 2 = | 12.8 | % | |||
| 2 to 4 years = | 10.0% | Year 4 = | 22.8 | % | |||
| 4 to 6 years = | 11.1% | Year 6 = | 33.9 | % | |||
| 6 to 8 years = | 12.7% | Year 8 = | 46.6 | % | |||
| 8 to 10 years = | 9.8% | Year 10 = | 56.4 | % | |||
| 10 to 12 years = | 14.2% | Year 12 = | 70.6 | % | |||
| 12 to 14 years = | 12.6% | Year 14 = | 83.2 | % | |||
| 14 to 16 years = | 8.9% | Year 16 = | 92.1 | % | |||
| 16 to 18 years = | 2.4% | Year 18 = | 94.5 | % | |||
Over 18 years = | 5.5% | Over 18 years = | 100.0 | % | |||
Percentages can and do vary. Data as of 3/31/09.
Certified Semi-Annual Report 9
Letter to Shareholders
Continued
ladder where yields are typically higher. The chart on the previous page describes the percentages of your Fund’s bond portfolio maturing in each of the coming years.
The Class A shares of your Fund produced a total return of 2.19% over the six-month period ended March 31, 2009, compared to a 6.58% return for the Merrill Lynch 7-12 Year Municipal Bond Index. Over the last six months, pre-refunded and general obligation bonds from large issuers generally performed better than a diversified portfolio of revenue and tax-backed bonds from smaller issuers. Since the Fund predominantly holds bonds from smaller and mid-sized issuers and kept average credit quality somewhat lower than the index, the Fund underperformed the index over the last six months.
Historically, our practice of laddering a diversified portfolio of short and intermediate maturity municipal bonds has allowed your Fund to perform consistently well in varying interest rate environments. Thank you for investing in Thornburg Intermediate Municipal Fund.
| Sincerely, | ||||
 |  |  | ||
| George Strickland | Josh Gonze | Christopher Ihlefeld | ||
| Co-Portfolio Manager | Co-Portfolio Manager | Co-Portfolio Manager | ||
| Managing Director | Managing Director | Managing Director | ||
The matters discussed in this report may constitute forward-looking statements made pursuant to the safe harbor provisions of the Securities Litigation Reform Act of 1995. These include any advisor or portfolio manager prediction, assessment, analysis or outlook for individual securities, industries, investment styles, market sectors and/or markets. These statements involve risks and uncertainties. In addition to the general risks described for each fund in its current prospectus, other factors bearing on these reports include the accuracy of the advisor’s or portfolio manager’s forecasts and predictions, the appropriateness of the investment strategies designed by the advisor or portfolio manager and the ability of the advisor or portfolio manager to implement their strategies efficiently and successfully. Any one or more of these factors, as well as other risks affecting the securities markets generally, could cause the actual results of any fund to differ materially as compared to its benchmarks.
10 Certified Semi-Annual Report
STATEMENT OF ASSETS AND LIABILITIES
| Thornburg Intermediate Municipal Fund | March 31, 2009 (Unaudited) |
ASSETS | ||||
Investments at value (cost $514,246,518) (Note 2) | $ | 497,297,933 | ||
Cash | 250,399 | |||
Receivable for investments sold | 4,439,301 | |||
Receivable for fund shares sold | 1,054,391 | |||
Interest receivable | 7,485,887 | |||
Prepaid expenses and other assets | 27,236 | |||
Total Assets | 510,555,147 | |||
| LIABILITIES | ||||
Payable for fund shares redeemed | 1,072,014 | |||
Payable to investment advisor and other affiliates (Note 3) | 347,519 | |||
Accounts payable and accrued expenses | 78,113 | |||
Dividends payable | 538,774 | |||
Total Liabilities | 2,036,420 | |||
| NET ASSETS | $ | 508,518,727 | ||
| NET ASSETS CONSIST OF: | ||||
Distribution in excess of net investment income | $ | (4,864 | ) | |
Net unrealized depreciation on investments | (16,948,585 | ) | ||
Accumulated net realized gain (loss) | (8,135,125 | ) | ||
Net capital paid in on shares of beneficial interest | 533,607,301 | |||
| $ | 508,518,727 | |||
| NET ASSET VALUE: | ||||
| Class A Shares: | ||||
Net asset value and redemption price per share | $ | 12.47 | ||
Maximum sales charge, 2.00% of offering price | 0.25 | |||
Maximum offering price per share | $ | 12.72 | ||
Class C Shares: | ||||
Net asset value and offering price per share * | $ | 12.48 | ||
Class I Shares: | ||||
Net asset value, offering and redemption price per share | $ | 12.45 | ||
| * | Redemption price per share is equal to net asset value less any applicable contingent deferred sales charge. |
See notes to financial statements.
Certified Semi-Annual Report 11
| Thornburg Intermediate Municipal Fund | Six Months Ended March 31, 2009 (Unaudited) |
INVESTMENT INCOME: | ||||
Interest income (net of premium amortized of $742,925) | $ | 13,349,081 | ||
| EXPENSES: | ||||
Investment advisory fees (Note 3) | 1,249,857 | |||
Administration fees (Note 3) | ||||
Class A Shares | 185,428 | |||
Class C Shares | 36,950 | |||
Class I Shares | 36,169 | |||
Distribution and service fees (Note 3) | ||||
Class A Shares | 370,856 | |||
Class C Shares | 295,770 | |||
Transfer agent fees | ||||
Class A Shares | 60,167 | |||
Class C Shares | 13,944 | |||
Class I Shares | 33,679 | |||
Registration and filing fees | ||||
Class A Shares | 13,207 | |||
Class C Shares | 9,554 | |||
Class I Shares | 13,634 | |||
Custodian fees (Note 3) | 51,560 | |||
Professional fees | 22,623 | |||
Accounting fees | 7,959 | |||
Trustee fees | 8,625 | |||
Other expenses | 27,699 | |||
Total Expenses | 2,437,681 | |||
Less: | ||||
Expenses reimbursed by investment advisor (Note 3) | (35,519 | ) | ||
Distribution fees waived (Note 3) | (118,309 | ) | ||
Fees paid indirectly (Note 3) | (1,270 | ) | ||
Net Expenses | 2,282,583 | |||
Net Investment Income | 11,066,498 | |||
| REALIZED AND UNREALIZED GAIN (LOSS) | ||||
Net realized gain (loss) on investments | (1,411,462 | ) | ||
Net change in unrealized appreciation (depreciation) of investments | 756,070 | |||
Net Realized and Unrealized Loss | (655,392 | ) | ||
Net Increase in Net Assets Resulting From Operations | $ | 10,411,106 | ||
See notes to financial statements.
12 Certified Semi-Annual Report
STATEMENTS OF CHANGES IN NET ASSETS
| Thornburg Intermediate Municipal Fund |
| Six Months Ended March 31, 2009* | Year Ended September 30, 2008 | |||||||
INCREASE (DECREASE) IN NET ASSETS FROM: | ||||||||
OPERATIONS: | ||||||||
Net investment income | $ | 11,066,498 | $ | 21,863,322 | ||||
Net realized gain (loss) on investments | (1,411,462 | ) | 1,598,830 | |||||
Increase (Decrease) in unrealized appreciation (depreciation) of investments | 756,070 | (31,001,380 | ) | |||||
Net Increase (Decrease) in Net Assets Resulting from Operations | 10,411,106 | (7,539,228 | ) | |||||
| DIVIDENDS TO SHAREHOLDERS: | ||||||||
From net investment income | ||||||||
Class A Shares | (6,473,862 | ) | (13,036,059 | ) | ||||
Class C Shares | (1,210,548 | ) | (2,065,179 | ) | ||||
Class I Shares | (3,382,088 | ) | (6,762,084 | ) | ||||
FUND SHARE TRANSACTIONS (NOTE 4): | ||||||||
Class A Shares | (11,687,897 | ) | (5,176,838 | ) | ||||
Class C Shares | 5,089,003 | 8,496,598 | ||||||
Class I Shares | (26,752,883 | ) | 55,028,894 | |||||
Net Increase (Decrease) in Net Assets | (34,007,169 | ) | 28,946,104 | |||||
| NET ASSETS: | ||||||||
Beginning of period | 542,525,896 | 513,579,792 | ||||||
End of period | $ | 508,518,727 | $ | 542,525,896 | ||||
| * | Unaudited. |
See notes to financial statements.
Certified Semi-Annual Report 13
| Thornburg Intermediate Municipal Fund | March 31, 2009 (Unaudited) |
NOTE 1 – ORGANIZATION
Thornburg Intermediate Municipal Fund (the “Fund”) is a diversified series of Thornburg Investment Trust (the “Trust”). The Trust is organized as a Massachusetts business trust under a Declaration of Trust dated June 3, 1987 and is registered as a diversified, open-end management investment company under the Investment Company Act of 1940, as amended. The Trust is currently issuing thirteen series of shares of beneficial interest in addition to those of the Fund: Thornburg Limited Term Municipal Fund, Thornburg California Limited Term Municipal Fund, Thornburg New York Intermediate Municipal Fund, Thornburg New Mexico Intermediate Municipal Fund, Thornburg Limited Term U.S. Government Fund, Thornburg Limited Term Income Fund, Thornburg Value Fund, Thornburg International Value Fund, Thornburg Core Growth Fund, Thornburg Investment Income Builder Fund, Thornburg Global Opportunities Fund, Thornburg International Growth Fund, and Thornburg Strategic Income Fund. Each series is considered to be a separate entity for financial reporting and tax purposes and bears expenses directly attributable to it. The Fund’s primary investment objective is to obtain as high a level of current income exempt from federal individual income taxes as is consistent, in the view of the Fund’s investment advisor, with the preservation of capital. The Fund’s secondary objective is to reduce expected changes in its share price compared to long-term bond portfolios.
The Fund currently offers three classes of shares of beneficial interest: Class A, Class C, and Institutional Class (Class I) shares. Each class of shares of the Fund represents an interest in the same portfolio of investments, except that (i) Class A shares are sold subject to a front-end sales charge collected at the time the shares are purchased and bear a service fee, (ii) Class C shares are sold at net asset value without a sales charge at the time of purchase, but are subject to a contingent deferred sales charge upon redemption within one year of purchase, and bear both a service fee and a distribution fee, (iii) Class I shares are sold at net asset value without a sales charge at the time of purchase, and (iv) the respective classes may have different reinvestment privileges and conversion rights. Additionally, the Fund may allocate among its classes certain expenses, to the extent allowable to specific classes, including transfer agent fees, government registration fees, certain printing and postage costs, and administrative and legal expenses. Currently, class specific expenses of the Fund are limited to service and distribution fees, administration fees, and certain registration and transfer agent expenses.
NOTE 2 – SIGNIFICANT ACCOUNTING POLICIES
Significant accounting policies of the Trust are as follows:
Valuation of Investments: Debt obligations have a primary market over the counter and are valued by an independent pricing service approved by the Trustees of the Trust. The pricing service ordinarily values debt obligations at quoted bid prices. When quotations are not available, debt obligations are valued at evaluated prices determined by the pricing service using methods which include consideration of yields or prices of debt obligations of comparable quality, type of issue, coupon, maturity, and rating, and indications as to value from dealers and general market conditions. Short-term obligations having remaining maturities of 60 days or less are valued at amortized cost, which approximates market value.
In any case where a pricing service fails to provide a price for a debt obligation held by the Fund, the valuation and pricing committee determines a fair value for the obligation using procedures approved by the Trustees. Additionally, in any case where management believes that a price provided by a pricing service for a debt obligation may be unreliable, the valuation and pricing committee decides whether or not to use the pricing service’s valuation or to determine a fair value for the obligation.
In determining fair value for any portfolio security or other investment, the valuation and pricing committee seeks to determine the amount that an owner of the investment might reasonably expect to receive upon a sale of the investment. However, because fair value prices are estimated prices, the valuation and pricing committee’s determination of fair value for an investment may differ from the value that would be realized by the Fund upon a sale of the investment, and that difference could be material to the Fund’s financial statements. The valuation and pricing committee’s determination of fair value for an investment may also differ from the prices obtained by other persons (including other mutual funds) for the investment.
Valuation Measurements: Various inputs are used in determining the value of the Fund’s investments. These inputs are summarized in the three levels listed below.
Level 1: Quoted prices in active markets for identical investments.
Level 2: Other significant observable inputs (including quoted prices for similar investments, interest rates, prepayment rates, credit risk, etc.).
Level 3: Significant unobservable inputs (including the Fund’s own assumptions in determining the fair value of investments).
The following table displays a summary of the inputs used to value the Fund’s net assets as of March 31, 2009. In any instance when valuation inputs from more than one level are used to determine the fair value of a specific investment, the investment is placed in the level of the table based upon the lowest level input that is significant in determining the fair value of the investment:
14 Certified Semi-Annual Report
NOTES TO FINANCIAL STATEMENTS, CONTINUED
| Thornburg Intermediate Municipal Fund | March 31, 2009 (Unaudited) |
Valuation Inputs | Investments in Securities | Investments in Other Financial Instruments* | ||||
Level 1 - Quoted Prices in Active Markets for Identical Assets | $ | — | $ | — | ||
Level 2 - Other Significant Observable Inputs | 497,297,933 | — | ||||
Level 3 - Significant Unobservable Inputs | — | — | ||||
Total | $ | 497,297,933 | $ | — | ||
| * | Other financial instruments include investments not reflected in the Schedule of Investments, such as futures, forwards and swap contracts, which are valued at the unrealized appreciation (depreciation) on the instrument. |
Federal Income Taxes: It is the policy of the Trust to comply with the provisions of the Internal Revenue Code applicable to “regulated investment companies” and to distribute to shareholders substantially all taxable (if any) and tax exempt income of the Fund. Therefore, no provision for federal income tax is required.
When-Issued and Delayed Delivery Transactions: The Trust may engage in when-issued or delayed delivery transactions. To the extent the Trust engages in such transactions, it will do so for the purpose of acquiring portfolio securities consistent with the Fund’s investment objectives and not for the purpose of investment leverage or to speculate on interest rate and/or market changes. At the time the Trust makes a commitment to purchase a security on a when-issued or delayed delivery basis, the Fund will record the transaction and reflect the value in determining its net asset value. When effecting such transactions, assets of an amount sufficient to make payment for the portfolio securities to be purchased will be segregated on the Fund’s records on the trade date. Securities purchased on a when-issued or delayed delivery basis do not earn interest until the settlement date.
Dividends: Net investment income of the Fund is declared daily as a dividend on shares for which the Fund has received payment. Dividends are paid monthly and are reinvested in additional shares of the Fund at net asset value per share at the close of business on the dividend payment date, or at the shareholder’s option, paid in cash. Net realized capital gains, to the extent available, will be distributed at least annually.
General: Securities transactions are accounted for on a trade date basis. Interest income is accrued as earned. Premiums and discounts on securities purchased are amortized to call dates or maturity dates of the respective securities. Realized gains and losses from the sale of securities are recorded on an identified cost basis. Net investment income (other than class specific expenses) and realized and unrealized gains and losses are allocated daily to each class of shares based upon the relative net asset value of outstanding shares (or the value of the dividend-eligible shares, as appropriate) of each class of shares at the beginning of the day (after adjusting for the current capital shares activity of the respective class). Expenses common to all funds are allocated among the funds comprising the Trust based upon their relative net asset values or other appropriate allocation methods.
Guarantees and Indemnifications: Under the Trust’s organizational documents, its officers and Trustees are indemnified against certain liabilities arising out of the performance of their duties to the Fund. Additionally, in the normal course of business the Trust enters into contracts with service providers that contain general indemnification clauses. The Trust’s maximum exposure under these arrangements is unknown. However, based on experience, the Trust expects the risk of loss to be remote.
Use of Estimates: The preparation of financial statements, in conformity with generally accepted accounting principles, requires management to make estimates and assumptions that affect the reported amounts of assets and liabilities and the disclosure of contingent assets and liabilities at the date of the financial statements and the reported amounts of increases and decreases in net assets from operations during the reporting period. Actual results could differ from those estimates.
NOTE 3 – INVESTMENT ADVISORY FEE AND OTHER TRANSACTIONS WITH AFFILIATES
Pursuant to an investment advisory agreement, Thornburg Investment Management, Inc. (the “Advisor”) serves as the investment advisor and performs services to the Fund for which the fees are payable at the end of each month. For the six months ended March 31, 2009, these fees were payable at annual rates ranging from .50 of 1% to .275 of 1% per annum of the average daily net assets of the Fund depending on the Fund’s asset size. The Trust also has entered into administrative services agreements with the Advisor, whereby the Advisor will perform certain administrative services for the shareholders of each class of the Fund’s shares, and for which fees will be payable at an annual rate of up to .125 of 1% per annum of the average daily net assets attributable to each class of shares. For the six months ended March 31, 2009, the Advisor voluntarily reimbursed certain class specific expenses and administrative fees of $32,941 for Class C shares and $2,578 for Class I shares.
The Trust has an underwriting agreement with Thornburg Securities Corporation (the “Distributor,” an affiliate of the Advisor), which acts as the distributor of the Fund’s shares. For the six months ended March 31, 2009, the Distributor has advised the Fund that it earned net commissions aggregating $559 from the sale of Class A shares, and collected contingent deferred sales charges aggregating $4,036 from redemptions of Class C shares of the Fund.
Certified Semi-Annual Report 15
NOTES TO FINANCIAL STATEMENTS, CONTINUED
| Thornburg Intermediate Municipal Fund | March 31, 2009 (Unaudited) |
Pursuant to a service plan under Rule 12b-1 of the Investment Company Act of 1940, the Fund may reimburse to the Advisor an amount not to exceed .25 of 1% per annum of the average daily net assets attributable to each class of shares of the Fund for payments made by the Advisor to securities dealers and other financial institutions to obtain various shareholder and distribution related services. The Advisor may pay out of its own resources additional expenses for distribution of the Fund’s shares.
The Trust has also adopted distribution plans pursuant to Rule 12b-1, applicable only to the Fund’s Class C shares, under which the Fund compensates the Distributor for services in promoting the sale of Class C shares of the Fund at an annual rate of up to .75 of 1% per annum of the average daily net assets attributable to Class C shares. Total fees incurred by the Distributor for each class of shares of the Fund under their respective Service and Distribution Plans for the six months ended March 31, 2009, are set forth in the Statement of Operations. Distribution fees in the amount of $118,309 were waived for Class C shares.
The Trust has an agreement with the custodian bank to indirectly pay a portion of the custodian’s fees through credits earned by the Fund’s cash on deposit with the bank. This deposit agreement is an alternative to overnight investments. Custodial fees have been adjusted to reflect amounts that would have been paid without this agreement, with a corresponding adjustment reflected as fees paid indirectly in the Statement of Operations. For the six months ended March 31, 2009, fees paid indirectly were $1,270.
Certain officers and Trustees of the Trust are also officers and/ or directors of the Advisor and Distributor. The compensation of independent Trustees is borne by the Trust.
NOTE 4 – SHARES OF BENEFICIAL INTEREST
At March 31, 2009, there were an unlimited number of shares of beneficial interest authorized. Transactions in shares of beneficial interest were as follows:
| Six Months Ended March 31, 2009 (Unaudited) | Year Ended September 30, 2008 (Audited) | |||||||||||||
| Shares | Amount | Shares | Amount | |||||||||||
Class A Shares | ||||||||||||||
Shares sold | 2,393,866 | $ | 29,387,022 | 4,450,931 | $ | 58,138,441 | ||||||||
Shares issued to shareholders in reinvestment of dividends | 329,098 | 4,060,254 | 626,634 | 8,132,456 | ||||||||||
Shares repurchased | (3,692,948 | ) | (45,135,173 | ) | (5,480,272 | ) | (71,447,735 | ) | ||||||
Net Increase (Decrease) | (969,984 | ) | $ | (11,687,897 | ) | (402,707 | ) | $ | (5,176,838 | ) | ||||
Class C Shares | ||||||||||||||
Shares sold | 1,194,026 | $ | 14,730,293 | 1,148,857 | $ | 14,986,114 | ||||||||
Shares issued to shareholders in reinvestment of dividends | 63,477 | 784,259 | 104,215 | 1,353,476 | ||||||||||
Shares repurchased | (851,365 | ) | (10,425,549 | ) | (599,797 | ) | (7,842,992 | ) | ||||||
Net Increase (Decrease) | 406,138 | $ | 5,089,003 | 653,275 | $ | 8,496,598 | ||||||||
Class I Shares | ||||||||||||||
Shares sold | 2,339,632 | $ | 28,662,901 | 8,563,318 | $ | 111,626,302 | ||||||||
Shares issued to shareholders in reinvestment of dividends | 199,308 | 2,456,452 | 339,488 | 4,395,192 | ||||||||||
Shares repurchased | (4,718,354 | ) | (57,872,236 | ) | (4,686,010 | ) | (60,992,600 | ) | ||||||
Net Increase (Decrease) | (2,179,414 | ) | $ | (26,752,883 | ) | 4,216,796 | $ | 55,028,894 | ||||||
16 Certified Semi-Annual Report
NOTES TO FINANCIAL STATEMENTS, CONTINUED
Thornburg Intermediate Municipal Fund | March 31, 2009 (Unaudited) |
NOTE 5 – SECURITIES TRANSACTIONS
For the six months ended March 31, 2009, the Fund had purchase and sale transactions of investment securities (excluding short-term investments) of $31,014,623 and $66,946,246, respectively.
NOTE 6 – INCOME TAXES
At March 31, 2009, information on the tax components of capital is as follows:
Cost of investments for tax purposes | $ | 514,246,518 | ||
Gross unrealized appreciation on a tax basis | $ | 9,122,391 | ||
Gross unrealized depreciation on a tax basis | (26,070,976) | |||
Net unrealized appreciation (depreciation)on investments (tax basis) | $ | (16,948,585 | ) | |
At March 31, 2009, the Fund had tax basis capital losses, which may be carried forward to offset future capital gains. Such losses include losses from the merger of the Thornburg Florida Intermediate Municipal Fund that took place on September 15, 2006. Utilization of these losses may be subject to limitations from the IRS regulations. To the extent such carryforwards are used, capital gain distributions may be reduced to the extent provided by regulations.
Such capital loss carryforwards expire as follows:
2009 | $ | 2,374,508 | |
2011 | 11,597 | ||
2012 | 4,297,982 | ||
2013 | 39,577 | ||
| $ | 6,723,664 | ||
OTHER NOTES:
Statement of Accounting Standards No. 161:
On March 19, 2008, the Financial Accounting Standards Board issued Statement of Financial Accounting Standards No. 161, “Disclosures about Derivative Instruments and Hedging Activities” (“FAS 161”). FAS 161 is effective for fiscal years and interim periods beginning after November 15, 2008. FAS 161 requires enhanced disclosures about any derivative and hedging activities by the Fund, including how such activities are accounted for and any effect on the Fund’s financial position, performance and cash flows.
Certified Semi-Annual Report 17
| Thornburg Intermediate Municipal Fund |
| Six Months Ended March 31, 2009* | Year Ended September 30, | |||||||||||||||||||||||
| 2008 | 2007 | 2006 | 2005 | 2004 | ||||||||||||||||||||
Class A Shares: | ||||||||||||||||||||||||
PER SHARE PERFORMANCE (for a share outstanding throughout the period) | ||||||||||||||||||||||||
Net asset value, beginning of period | $ | 12.47 | $ | 13.15 | $ | 13.30 | $ | 13.33 | $ | 13.48 | $ | 13.56 | ||||||||||||
Income from investment operations: | ||||||||||||||||||||||||
Net investment income (loss) | 0.27 | 0.52 | 0.51 | 0.49 | 0.49 | 0.52 | ||||||||||||||||||
Net realized and unrealized gain (loss) on investments | (0.00 | )(a) | (0.68 | ) | (0.15 | ) | (0.03 | ) | (0.15 | ) | (0.08 | ) | ||||||||||||
Total from investment operations | 0.27 | (0.16 | ) | 0.36 | 0.46 | 0.34 | 0.44 | |||||||||||||||||
Less dividends from: | ||||||||||||||||||||||||
Net investment income | (0.27 | ) | (0.52 | ) | (0.51 | ) | (0.49 | ) | (0.49 | ) | (0.52 | ) | ||||||||||||
Change in net asset value | — | (0.68 | ) | (0.15 | ) | (0.03 | ) | (0.15 | ) | (0.08 | ) | |||||||||||||
NET ASSET VALUE, end of period | $ | 12.47 | $ | 12.47 | $ | 13.15 | $ | 13.30 | $ | 13.33 | $ | 13.48 | ||||||||||||
RATIOS/SUPPLEMENTAL DATA | ||||||||||||||||||||||||
Total return (%)(b) | 2.19 | (1.33 | ) | 2.74 | 3.57 | 2.57 | 3.29 | |||||||||||||||||
Ratios to average net assets: | ||||||||||||||||||||||||
Net investment income (loss) (%) | 4.36 | (c) | 3.95 | 3.84 | 3.74 | 3.66 | 3.83 | |||||||||||||||||
Expenses, after expense reductions (%) | 0.97 | (c) | 0.96 | 0.99 | 0.99 | 0.99 | 0.98 | |||||||||||||||||
Expenses, after expense reductions and net of custody credits (%) | 0.97 | (c) | 0.95 | 0.98 | 0.99 | 0.99 | 0.98 | |||||||||||||||||
Expenses, before expense reductions (%) | 0.97 | (c) | 0.96 | 0.99 | 1.00 | 1.01 | 0.98 | |||||||||||||||||
Portfolio turnover rate (%) | 6.34 | 22.00 | 22.55 | 18.95 | 20.06 | 11.81 | ||||||||||||||||||
Net assets at end of period (thousands) | $ | 299,428 | $ | 311,435 | $ | 333,800 | $ | 366,702 | $ | 362,783 | $ | 370,227 | ||||||||||||
| (a) | Net realized and unrealized loss on investments was less than (0.01). |
| (b) | Sales loads are not reflected in computing total return, which is not annualized for periods less than one year. |
| (c) | Annualized. |
| * | Unaudited. |
See notes to financial statements.
18 Certified Semi-Annual Report
FINANCIAL HIGHLIGHTS, CONTINUED
| Thornburg Intermediate Municipal Fund |
| Six Months Ended March 31, 2009* | Year Ended September 30, | |||||||||||||||||||||||
| 2008 | 2007 | 2006 | 2005 | 2004 | ||||||||||||||||||||
Class C Shares: | ||||||||||||||||||||||||
PER SHARE PERFORMANCE (for a share outstanding throughout the period) | ||||||||||||||||||||||||
Net asset value, beginning of period | $ | 12.48 | $ | 13.16 | $ | 13.31 | $ | 13.34 | $ | 13.50 | $ | 13.58 | ||||||||||||
Income from investment operations: | ||||||||||||||||||||||||
Net investment income (loss) | 0.25 | 0.48 | 0.47 | 0.46 | 0.46 | 0.48 | ||||||||||||||||||
Net realized and unrealized gain (loss) on investments | (0.00 | )(a) | (0.68 | ) | (0.15 | ) | (0.03 | ) | (0.16 | ) | (0.08 | ) | ||||||||||||
Total from investment operations | 0.25 | (0.20 | ) | 0.32 | 0.43 | 0.30 | 0.40 | |||||||||||||||||
Less dividends from: | ||||||||||||||||||||||||
Net investment income | (0.25 | ) | (0.48 | ) | (0.47 | ) | (0.46 | ) | (0.46 | ) | (0.48 | ) | ||||||||||||
Change in net asset value | — | (0.68 | ) | (0.15 | ) | (0.03 | ) | (0.16 | ) | (0.08 | ) | |||||||||||||
NET ASSET VALUE, end of period | $ | 12.48 | $ | 12.48 | $ | 13.16 | $ | 13.31 | $ | 13.34 | $ | 13.50 | ||||||||||||
RATIOS/SUPPLEMENTAL DATA | ||||||||||||||||||||||||
Total return (%)(b) | 2.06 | (1.61 | ) | 2.48 | 3.31 | 2.24 | 3.02 | |||||||||||||||||
Ratios to average net assets: | ||||||||||||||||||||||||
Net investment income (loss) (%) | 4.10 | (c) | 3.67 | 3.59 | 3.49 | 3.41 | 3.57 | |||||||||||||||||
Expenses, after expense reductions (%) | 1.24 | (c) | 1.25 | 1.24 | 1.24 | 1.25 | 1.24 | |||||||||||||||||
Expenses, after expense reductions and net of custody credits (%) | 1.24 | (c) | 1.24 | 1.24 | 1.24 | 1.24 | 1.24 | |||||||||||||||||
Expenses, before expense reductions (%) | 1.75 | (c) | 1.75 | 1.78 | 1.78 | 1.80 | 1.78 | |||||||||||||||||
Portfolio turnover rate (%) | 6.34 | 22.00 | 22.55 | 18.95 | 20.06 | 11.81 | ||||||||||||||||||
Net assets at end of period (thousands) | $ | 64,332 | $ | 59,243 | $ | 53,890 | $ | 55,497 | $ | 55,382 | $ | 57,979 | ||||||||||||
| (a) | Net realized and unrealized loss on investments was less than (0.01). |
| (b) | Not annualized for periods less than one year. |
| (c) | Annualized. |
| * | Unaudited. |
See notes to financial statements.
Certified Semi-Annual Report 19
FINANCIAL HIGHLIGHTS, CONTINUED
| Thornburg Intermediate Municipal Fund |
| Six Months Ended March 31, 2009* | Year Ended September 30, | |||||||||||||||||||||||
| 2008 | 2007 | 2006 | 2005 | 2004 | ||||||||||||||||||||
Class I Shares: | ||||||||||||||||||||||||
PER SHARE PERFORMANCE (for a share outstanding throughout the period) | ||||||||||||||||||||||||
Net asset value, beginning of period | $ | 12.45 | $ | 13.13 | $ | 13.28 | $ | 13.31 | $ | 13.46 | $ | 13.54 | ||||||||||||
Income from investment operations: | ||||||||||||||||||||||||
Net investment income (loss) | 0.29 | 0.56 | 0.55 | 0.54 | 0.53 | 0.56 | ||||||||||||||||||
Net realized and unrealized gain (loss) on investments | (0.00 | )(a) | (0.68 | ) | (0.15 | ) | (0.03 | ) | (0.15 | ) | (0.08 | ) | ||||||||||||
Total from investment operations | 0.29 | (0.12 | ) | 0.40 | 0.51 | 0.38 | 0.48 | |||||||||||||||||
Less dividends from: | ||||||||||||||||||||||||
Net investment income | (0.29 | ) | (0.56 | ) | (0.55 | ) | (0.54 | ) | (0.53 | ) | (0.56 | ) | ||||||||||||
Change in net asset value | — | (0.68 | ) | (0.15 | ) | (0.03 | ) | (0.15 | ) | (0.08 | ) | |||||||||||||
NET ASSET VALUE, end of period | $ | 12.45 | $ | 12.45 | $ | 13.13 | $ | 13.28 | $ | 13.31 | $ | 13.46 | ||||||||||||
RATIOS/SUPPLEMENTAL DATA | ||||||||||||||||||||||||
Total return (%)(b) | 2.35 | (1.02 | ) | 3.06 | 3.90 | 2.90 | 3.61 | |||||||||||||||||
Ratios to average net assets: | ||||||||||||||||||||||||
Net investment income (loss) (%) | 4.68 | (c) | 4.28 | 4.16 | 4.07 | 3.98 | 4.12 | |||||||||||||||||
Expenses, after expense reductions (%) | 0.66 | (c) | 0.64 | 0.67 | 0.67 | 0.67 | 0.67 | |||||||||||||||||
Expenses, after expense reductions and net of custody credits (%) | 0.66 | (c) | 0.63 | 0.67 | 0.67 | 0.67 | 0.67 | |||||||||||||||||
Expenses, before expense reductions (%) | 0.66 | (c) | 0.64 | 0.73 | 0.75 | 0.77 | 0.75 | |||||||||||||||||
Portfolio turnover rate (%) | 6.34 | 22.00 | 22.55 | 18.95 | 20.06 | 11.81 | ||||||||||||||||||
Net assets at end of period (thousands) | $ | 144,759 | $ | 171,848 | $ | 125,890 | $ | 89,589 | $ | 52,037 | $ | 33,079 | ||||||||||||
| (a) | Net realized and unrealized loss on investments was less than (0.01). |
| (b) | Not annualized for periods less than one year. |
| (c) | Annualized. |
| * | Unaudited. |
See notes to financial statements.
20 Certified Semi-Annual Report
| Thornburg Intermediate Municipal Fund | March 31, 2009 (Unaudited) |
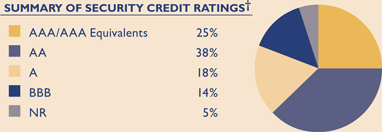 | We have used ratings from Standard & Poor’s, (S&P). Where S&P ratings are not available, we have used Moody’s Investors Service. Where neither rating is available, we have used ratings from Fitch Ratings. The category of investments identified as “AAA” in this graph includes investments which are pre-refunded or escrowed to maturity. Such investments are backed by an escrow or trust containing sufficient U.S. Government or U.S. Government agency securities to satisfy the timely payment of principal and interest and, therefore, are normally deemed to be equivalent to AAA-rated securities. |
Issuer-Description | Credit Rating† Moody’s/S&P | Principal Amount | Value | |||||
ALABAMA — 0.67% | ||||||||
Lauderdale County & Florence City Health Care Authority, 5.75% due 7/1/2013 (Coffee Health; Insured: MBIA) | Baa1/AA- | $ | 1,600,000 | $ | 1,611,392 | |||
University of Alabama at Birmingham Hospital Revenue, 5.25% due 9/1/2025 | A1/A+ | 2,000,000 | 1,807,820 | |||||
ALASKA — 0.62% | ||||||||
Alaska Municipal Bond Bank, 5.00% due 10/1/2017 (Insured: FGIC) | A1/AA- | 2,470,000 | 2,608,024 | |||||
Anchorage GO, 6.00% due 10/1/2012 (Insured: MBIA/FGIC) | NR/AA | 500,000 | 535,945 | |||||
ARIZONA — 2.34% | ||||||||
Chandler IDA, 4.375% due 12/1/2035 (Intel Corp.) | A1/NR | 1,000,000 | 980,170 | |||||
Mohave County IDA, 7.25% due 5/1/2015 (Mohave Prison LLC) | NR/BBB+ | 4,740,000 | 4,705,256 | |||||
Phoenix Civic Improvement Corp., 5.00% due 7/1/2017 (Insured: MBIA) | Aa3/AA | 1,000,000 | 1,113,450 | |||||
Pima County IDA, 6.70% due 7/1/2021 (Arizona Charter Schools) | Baa3/NR | 2,635,000 | 2,162,070 | |||||
Salt Verde Financial Corp. Gas Revenue, 5.25% due 12/1/2022 | A3/A | 2,000,000 | 1,452,400 | |||||
Salt Verde Financial Corp. Gas Revenue, 5.25% due 12/1/2028 | A3/A | 500,000 | 326,745 | |||||
Tucson GO, 9.75% due 7/1/2012 (ETM) | NR/AA | 400,000 | 506,104 | |||||
Tucson GO, 9.75% due 7/1/2013 (ETM) | NR/AA | 500,000 | 662,515 | |||||
CALIFORNIA — 4.03% | ||||||||
California HFA, 5.125% due 7/1/2022 (Catholic Healthcare West) | A2/A | 1,000,000 | 979,350 | |||||
California State Economic Recovery, 0.40% due 7/1/2023 put 4/1/2009 (SPA: Bank of America) (daily demand notes) | VMIG1/A-1 | 3,300,000 | 3,300,000 | |||||
California State GO, 0.30% due 5/1/2040 put 4/7/2009 (LOC: Bank of America) (weekly demand notes) | VMIG1/A-1 | 1,300,000 | 1,300,000 | |||||
California State Public Works Board Lease, 5.00% due 6/1/2017 (Regents of University of California; Insured: FGIC) | Aa2/AA- | 2,000,000 | 2,194,420 | |||||
California Statewide Community Development Authority, 6.25% due 8/15/2028 (Enloe Medical Center; Insured: CA Mtg Insurance) | NR/A+ | 1,050,000 | 1,048,740 | |||||
El Camino Hospital District, 6.25% due 8/15/2017 (ETM) | Baa1/A | 1,000,000 | 1,174,730 | |||||
Golden West Schools Financing Authority, 0% due 8/1/2018 (Insured: MBIA) | Baa1/AA- | 2,140,000 | 1,277,451 | |||||
Los Angeles Regional Airport Improvement Corp., 5.00% due 1/1/2017 (LAX Fuel Corp.; Insured: FSA) (AMT) | Aa3/AAA | 1,120,000 | 1,088,394 | |||||
Mojave USD COP, 0% due 9/1/2021 (Insured: FSA) | NR/AAA | 1,095,000 | 526,826 | |||||
Mojave USD COP, 0% due 9/1/2023 (Insured: FSA) | NR/AAA | 1,100,000 | 450,439 | |||||
Redwood City Redevelopment Project, 0% due 7/15/2023 (Insured: AMBAC) | Baa1/A | 2,060,000 | 850,718 | |||||
San Francisco City & County Airports, 6.50% due 5/1/2019 (International Airport) | A1/A | 2,000,000 | 2,100,240 | |||||
San Mateo USD GO, 0% due 9/1/2019 (Insured: FGIC) | Aa3/AA- | 3,000,000 | 1,781,370 | |||||
Victor Elementary School District GO, 0% due 8/1/2025 (Insured: FGIC) | A2/AA- | 1,535,000 | 578,020 | |||||
Certified Semi-Annual Report 21
SCHEDULE OF INVESTMENTS, CONTINUED
| Thornburg Intermediate Municipal Fund | March 31, 2009 (Unaudited) |
Issuer-Description | Credit Rating† Moody’s/S&P | Principal Amount | Value | |||||
Washington USD, 5.00% due 8/1/2022 (New High School; Insured: AMBAC) | Baa1/A | $ | 2,010,000 | $ | 1,862,486 | |||
COLORADO — 5.33% | ||||||||
Adams County, 5.00% due 8/1/2014 (Brighton Community Hospital Association; Insured: FHA 242; MBIA) | NR/AA- | 1,000,000 | 1,041,350 | |||||
Adams County Communication Center COP, 5.75% due 12/1/2016 | Baa1/NR | 1,265,000 | 1,275,727 | |||||
Arvada IDRB, 5.60% due 12/1/2012 (Wanco Inc.; LOC: US Bank N.A.) (AMT) | NR/NR | 370,000 | 357,131 | |||||
Central Platte Valley Metropolitan District GO, 5.15% due 12/1/2013 pre-refunded 12/1/2009 | NR/AAA | 1,000,000 | 1,041,630 | |||||
Central Platte Valley Metropolitan District GO, 5.00% due 12/1/2031 put 12/1/2009 (LOC: BNP Paribas) | NR/AA | 3,995,000 | 4,070,905 | |||||
Colorado Educational & Cultural Facilities, 5.25% due 8/15/2019 (Peak to Peak Charter School; Insured: XLCA) | NR/A | 1,475,000 | 1,380,969 | |||||
Denver City & County Airport, 5.50% due 11/15/2015 (Insured: FGIC) | A1/AA- | 5,000,000 | 5,043,200 | |||||
Denver City & County Housing Authority, 5.20% due 11/1/2027 (Three Towers Rehabilitation; Insured: FSA) (AMT) | Aa3/NR | 2,555,000 | 2,341,121 | |||||
El Paso County School District GO, 7.10% due 12/1/2013 (State Aid Withholding) | Aa3/AA- | 500,000 | 604,200 | |||||
Madre Metropolitan District GO, 5.375% due 12/1/2026 | NR/NR | 2,220,000 | 1,159,595 | |||||
Murphy Creek Metropolitan District GO, 6.00% due 12/1/2026 | NR/NR | 2,000,000 | 1,359,700 | |||||
North Range Metropolitan District GO, 5.00% due 12/15/2021 (Insured: ACA) | NR/NR | 1,500,000 | 908,820 | |||||
Northwest Parkway Public Highway Authority Senior Convertible C, 0% due 6/15/2014 (Insured: FSA) (ETM) | Aa3/AAA | 1,005,000 | 1,025,743 | |||||
Plaza Metropolitan District Public Improvement Fee/Tax Increment, 7.70% due 12/1/2017 | NR/NR | 2,500,000 | 2,292,775 | |||||
Public Authority For Colorado Energy Gas Revenue, 6.125% due 11/15/2023 (Guaranty: Merrill Lynch) | A2/A | 2,000,000 | 1,517,260 | |||||
Southlands Metropolitan District GO, 7.00% due 12/1/2024 pre-refunded 12/1/2014 | NR/AAA | 1,370,000 | 1,708,966 | |||||
DELAWARE — 0.14% | ||||||||
Delaware State HFA, 5.25% due 5/1/2016 (Nanticoke Memorial Hospital; Insured: Radian) | NR/BBB+ | 785,000 | 704,263 | |||||
DISTRICT OF COLUMBIA — 2.23% | ||||||||
District of Columbia Association of American Medical Colleges, 5.00% due 2/15/2017 (Insured: AMBAC) | Aa2/AA | 1,000,000 | 1,075,170 | |||||
District of Columbia COP, 5.25% due 1/1/2014 (Insured: FGIC) | A2/AA- | 2,000,000 | 2,107,060 | |||||
District of Columbia COP, 5.00% due 1/1/2020 (Insured: FGIC) | A2/AA- | 3,900,000 | 3,832,920 | |||||
District of Columbia COP, 5.00% due 1/1/2023 (Insured: FGIC) | A2/AA- | 1,000,000 | 967,100 | |||||
District of Columbia GO, 6.00% due 6/1/2015 (Insured: MBIA) | A1/AA- | 3,000,000 | 3,377,880 | |||||
FLORIDA — 11.54% | ||||||||
Broward County Housing Finance Authority Multi Family, 5.40% due 10/1/2011 (Pembroke Park Apartments; Guaranty: Florida Housing Finance Corp.) (AMT) | NR/NR | 270,000 | 274,795 | |||||
Broward County School Board COP, 5.00% due 7/1/2020 (Insured: FSA) | Aa3/AAA | 1,000,000 | 1,020,030 | |||||
Collier County Housing Finance Authority Multi Family, 4.90% due 2/15/2032 put 2/15/2012 (Goodlette Arms; Collateralized: FNMA) | Aaa/NR | 1,000,000 | 1,063,890 | |||||
Crossings at Fleming Island Community Development, 5.60% due 5/1/2012 (Insured: MBIA) | Baa1/AA- | 1,405,000 | 1,412,672 | |||||
Enterprise Community Development District Assessment Bonds, 6.00% due 5/1/2010 (Insured: MBIA) | Baa1/AA- | 595,000 | 597,023 | |||||
Escambia County HFA, 5.125% due 10/1/2014 (Baptist Hospital/Baptist Manor) | Baa1/BBB- | 1,000,000 | 959,290 | |||||
Escambia County HFA, 5.95% due 7/1/2020 (Florida Health Care Facility Loan; Insured: AMBAC) | Baa1/NR | 2,420,000 | 2,462,834 | |||||
Flagler County School Board COP, 5.00% due 8/1/2020 (Insured: FSA) | Aa3/AAA | 2,560,000 | 2,604,723 | |||||
Florida Board of Education GO Capital Outlay, 9.125% due 6/1/2014 | Aa1/AAA | 905,000 | 1,030,632 | |||||
Florida Board of Education GO Capital Outlay, 5.75% due 6/1/2018 | Aa1/AAA | 1,460,000 | 1,537,555 | |||||
Florida Housing Finance Corp., 5.40% due 4/1/2014 pre-refunded 10/1/2010 (Augustine Club Apartments; Insured: MBIA) | Aaa/NR | 415,000 | 451,346 | |||||
Florida Housing Finance Corp. Homeowner Mtg, 4.80% due 1/1/2016 | Aa1/AA+ | 270,000 | 278,251 | |||||
22 Certified Semi-Annual Report
SCHEDULE OF INVESTMENTS, CONTINUED
| Thornburg Intermediate Municipal Fund | March 31, 2009 (Unaudited) |
Issuer-Description | Credit Rating† Moody’s/S&P | Principal Amount | Value | |||||
Florida Municipal Loan Council, 5.00% due 10/1/2024 (Insured: MBIA) | Baa1/AA- | $ | 2,235,000 | $ | 2,201,855 | |||
Florida State Department of Children & Families COP, 5.00% due 10/1/2018 (South Florida Evaluation Treatment) | NR/AA+ | 2,090,000 | 2,162,858 | |||||
Florida State Department of Children & Families COP, 5.00% due 10/1/2019 (South Florida Evaluation Treatment) | NR/AA+ | 2,255,000 | 2,308,105 | |||||
Florida State Department of Environmental Protection, 5.00% due 7/1/2017 (Florida Forever; Insured: FGIC) | A1/AA- | 1,000,000 | 1,066,370 | |||||
Highlands County HFA, 5.00% due 11/15/2019 (Adventist Health Hospital) | A1/A+ | 875,000 | 855,916 | |||||
Highlands County HFA, 5.00% due 11/15/2019 (Adventist Health Hospital) | A1/A+ | 1,100,000 | 1,076,009 | |||||
Hillsborough County Assessment Capacity, 5.00% due 3/1/2017 (Insured: FGIC) | A3/AA- | 1,000,000 | 978,680 | |||||
Hillsborough County IDA PCR, 5.10% due 10/1/2013 (Tampa Electric Co.) | Baa2/BBB- | 1,000,000 | 970,320 | |||||
Hollywood Community Redevelopment Agency, 5.00% due 3/1/2021 (Insured: XLCA) | Baa1/NR | 3,000,000 | 2,585,040 | |||||
Jacksonville HFA Hospital, 5.75% due 8/15/2014 pre-refunded 8/15/2011 | NR/NR | 1,000,000 | 1,026,030 | |||||
Manatee County, 5.00% due 10/1/2016 (Insured: AMBAC) | Aa3/AA- | 1,000,000 | 1,054,740 | |||||
Marion County Hospital District, 5.00% due 10/1/2022 (Munroe Regional Health) | A3/NR | 1,000,000 | 840,280 | |||||
Miami Dade County GO, 6.25% due 7/1/2026 (Building Better Communities) | Aa3/AA- | 2,130,000 | 2,343,277 | |||||
Miami Dade County School Board COP, 5.00% due 10/1/2021 (Insured: AMBAC) | A3/A | 3,035,000 | 2,985,196 | |||||
Miami Dade County School Board COP, 5.25% due 5/1/2022 (Insured: Assured Guaranty) | Aa2/AAA | 2,600,000 | 2,616,666 | |||||
Miami GO, 5.375% due 9/1/2015 (Insured: MBIA) | A2/AA- | 1,000,000 | 1,091,370 | |||||
Orange County HFA, 6.25% due 10/1/2013 (Orlando Regional Hospital; Insured: MBIA) | A2/AA- | 440,000 | 464,363 | |||||
Orange County HFA, 5.125% due 6/1/2014 (Mayflower Retirement; Insured: Radian) | NR/BBB+ | 1,000,000 | 913,290 | |||||
Orange County HFA, 6.25% due 10/1/2016 (Orlando Regional Hospital; Insured: MBIA) | A2/AA | 280,000 | 292,065 | |||||
Orange County HFA, 6.375% due 11/15/2020 pre-refunded 11/15/2010 (Adventist Health Systems) | A1/NR | 1,000,000 | 1,095,330 | |||||
Port Everglades Authority, 5.00% due 9/1/2016 (Insured: FSA) | Aa3/AAA | 5,635,000 | 5,660,921 | |||||
South Miami HFA, 5.00% due 8/15/2022 (Baptist Health Group) | Aa3/AA- | 1,500,000 | 1,420,035 | |||||
St. Johns County IDA, 5.85% due 8/1/2024 | NR/NR | 4,885,000 | 3,860,371 | |||||
Tampa Bay Water Utilities System Revenue, 5.50% due 10/1/2022 (Insured: FGIC) | Aa3/AA+ | 2,750,000 | 2,988,755 | |||||
Tampa Health Systems, 5.50% due 11/15/2013 (Baycare Health Group; Insured: MBIA) | Aa3/AA- | 1,050,000 | 1,088,577 | |||||
University of Central Florida COP Convocation Corp., 5.00% due 10/1/2019 (Insured: FGIC) | NR/AA- | 1,135,000 | 1,036,357 | |||||
GEORGIA — 1.24% | ||||||||
Atlanta Airport Revenue, 6.00% due 1/1/2018 (Insured: FGIC) (AMT) | A1/AA- | 1,000,000 | 1,003,400 | |||||
Atlanta Tax Allocation, 5.00% due 12/1/2015 (Atlantic Station; Insured: Assured Guaranty) | Aa2/AAA | 4,120,000 | 4,358,053 | |||||
Georgia Municipal Electric Power Authority, 10.00% due 1/1/2010 | A1/A+ | 230,000 | 243,669 | |||||
Main Street Natural Gas Inc., 5.50% due 9/15/2022 | A2/A | 1,000,000 | 678,750 | |||||
HAWAII — 0.41% | ||||||||
Hawaii Department of Budget & Finance, 6.40% due 7/1/2013 (Hawaii Pacific Health; Insured: MBIA) | Baa1/AA- | 2,000,000 | 2,092,820 | |||||
IDAHO — 0.38% | ||||||||
Boise City IDRB Corp., 5.00% due 5/15/2020 (Western Trailer Co.; LOC: Wells Fargo) (AMT) | Aa2/NR | 2,000,000 | 1,957,660 | |||||
ILLINOIS — 9.33% | ||||||||
Chicago GO, 1.50% due 1/1/2040 put 4/7/2009 (Insured: FSA; SPA: Dexia Credit Local) (weekly demand notes) | VMIG1/A-1 | 4,700,000 | 4,700,000 | |||||
Chicago Midway Airport Second Lien, 5.00% due 1/1/2019 (Insured: AMBAC) (AMT) | A3/A | 1,210,000 | 1,140,292 | |||||
Chicago O’Hare International Airport Revenue Second Lien, 5.75% due 1/1/2018 (Insured: AMBAC) | A1/A | 3,000,000 | 2,979,360 | |||||
Chicago Tax Increment, 6.25% due 11/15/2013 (Near South Redevelopment; Insured: ACA) | NR/NR | 1,500,000 | 1,414,905 | |||||
Chicago Tax Increment, 0% due 11/15/2014 (Near South Redevelopment; Insured: ACA) | NR/NR | 1,340,000 | 880,996 | |||||
Chicago Tax Increment Allocation, 5.30% due 1/1/2014 (Lincoln Belmont; Insured: ACA) | NR/NR | 2,285,000 | 2,126,558 | |||||
Cook County School District GO, 0% due 12/1/2022 (ETM) | NR/NR | 2,000,000 | 1,117,000 | |||||
Illinois DFA, 6.00% due 11/15/2012 (Adventist Health Group; Insured: MBIA) | Baa1/AA | 2,860,000 | 2,952,950 | |||||
Certified Semi-Annual Report 23
SCHEDULE OF INVESTMENTS, CONTINUED
| Thornburg Intermediate Municipal Fund | March 31, 2009 (Unaudited) |
Issuer-Description | Credit Rating† Moody’s/S&P | Principal Amount | Value | |||||
Illinois DFA Community Rehab Providers, 5.90% due 7/1/2009 | NR/BBB | $ | 290,000 | $ | 289,997 | |||
Illinois Educational Facilities Authority, 5.00% due 11/1/2016 (Rush University Medical Center) | A3/AA | 1,000,000 | 960,600 | |||||
Illinois Educational Facilities Authority, 5.625% due 10/1/2022 (Augustana College) | Baa1/NR | 1,625,000 | 1,419,031 | |||||
Illinois Educational Facilities Authority, 5.75% due 11/1/2028 (Rush University Medical Center) | A3/AA | 1,000,000 | 915,460 | |||||
Illinois Finance Authority, 5.00% due 8/1/2022 (Bradley University; Insured: XLCA) | NR/A | 1,000,000 | 1,000,940 | |||||
Illinois Finance Authority, 6.125% due 11/1/2023 (Advocate Health) | Aa3/AA | 5,000,000 | 5,184,850 | |||||
Illinois Finance Authority, 5.00% due 2/1/2027 (Newman Foundation; Insured: Radian) | NR/BBB+ | 1,220,000 | 968,241 | |||||
Illinois HFA, 6.00% due 7/1/2011 (Loyola University Health Systems; Insured: MBIA) | Baa1/AA | 1,370,000 | 1,414,142 | |||||
Illinois HFA, 6.00% due 7/1/2012 (Loyola University Health Systems; Insured: MBIA) (ETM) | NR/AA | 230,000 | 264,049 | |||||
Illinois HFA, 6.00% due 7/1/2012 (Loyola University Health Systems; Insured: MBIA) | Baa1/AA- | 1,080,000 | 1,123,092 | |||||
Illinois HFA, 6.25% due 11/15/2019 pre-refunded 11/15/2009 (OSF Healthcare) | A2/A | 1,250,000 | 1,304,950 | |||||
Illinois HFA, 5.70% due 2/20/2021 (Midwest Care Center; Collateralized: GNMA) | Aaa/NR | 855,000 | 876,247 | |||||
Melrose Park Tax Increment, 6.50% due 12/15/2015 (Insured: FSA) | Aa3/AAA | 1,015,000 | 1,094,332 | |||||
Sangamon County School District COP, 5.875% due 8/15/2018 (Hay Edwards; Insured: ACA) | NR/NR | 2,400,000 | 2,111,112 | |||||
Sherman Mtg, 6.10% due 10/1/2014 (Villa Vianney Health Care; Collateralized: FHA/GNMA) | NR/AAA | 1,170,000 | 1,206,410 | |||||
Sherman Mtg, 6.20% due 10/1/2019 (Villa Vianney Health Care; Collateralized: FHA/GNMA) | NR/AAA | 1,600,000 | 1,641,968 | |||||
Southern Illinois University, 0% due 4/1/2014 (Insured: MBIA) | A1/AA- | 1,425,000 | 1,203,356 | |||||
Southwestern Illinois Development Authority, 0% due 12/1/2024 (Insured: FSA) | NR/AAA | 2,975,000 | 1,221,000 | |||||
Tazewell County School District GO, 9.00% due 12/1/2024 (Insured: FGIC) | A3/NR | 1,205,000 | 1,737,490 | |||||
University of Illinois, 0% due 4/1/2014 (Insured: MBIA) | Aa3/AA- | 1,590,000 | 1,373,426 | |||||
Will County Community School District GO, 0% due 11/1/2011 (Insured: FSA) | Aa3/AAA | 2,965,000 | 2,811,383 | |||||
| INDIANA — 6.26% | ||||||||
Allen County Economic Development, 5.80% due 12/30/2012 (Indiana Institute of Technology) | NR/NR | 895,000 | 891,930 | |||||
Allen County Economic Development, 5.75% due 12/30/2015 (Indiana Institute of Technology) | NR/NR | 1,355,000 | 1,287,968 | |||||
Allen County Jail Building Corp., 5.00% due 4/1/2018 (Insured: XLCA) | Aa3/NR | 2,495,000 | 2,627,036 | |||||
Allen County Redevelopment District, 5.00% due 11/15/2018 | A3/NR | 1,560,000 | 1,593,618 | |||||
Boone County Hospital Association, 5.625% due 1/15/2015 pre-refunded 7/15/2011 (Insured: FGIC) | NR/A+ | 1,000,000 | 1,102,870 | |||||
Carmel Redevelopment Authority Lease, 0% due 2/1/2016 (Performing Arts Center) | Aa2/AA | 1,730,000 | 1,335,923 | |||||
Carmel Redevelopment Authority Lease, 0% due 2/1/2021 (Performing Arts Center) | Aa2/AA | 2,000,000 | 1,092,600 | |||||
Dyer Redevelopment Authority, 6.40% due 7/15/2015 pre-refunded 7/15/2009 | NR/A- | 1,515,000 | 1,556,254 | |||||
Dyer Redevelopment Authority, 6.50% due 7/15/2016 pre-refunded 7/15/2009 | NR/A- | 1,910,000 | 1,962,544 | |||||
Fishers Redevelopment Authority, 5.25% due 2/1/2020 (Insured: XLCA) | NR/AA | 1,025,000 | 1,101,711 | |||||
Fort Wayne Redevelopment Authority, 5.00% due 8/1/2023 (Harrison Square; Insured: Assured Guaranty) | Aa2/NR | 2,290,000 | 2,375,921 | |||||
Goshen Chandler School Building, 0% due 1/15/2011 (Insured: MBIA) | Baa1/AA- | 1,020,000 | 970,183 | |||||
Huntington Economic Development, 6.40% due 5/1/2015 (United Methodist Memorial) | NR/NR | 1,000,000 | 946,870 | |||||
Indiana Bond Bank, 5.25% due 4/1/2023 (Hendricks Regional; Insured: AMBAC) | Baa1/AA | 2,000,000 | 2,005,900 | |||||
Indiana Bond Bank Gas Revenue, 5.25% due 10/15/2020 | Aa3/NR | 5,000,000 | 4,131,400 | |||||
Indiana HFA, 5.75% due 9/1/2015 (Methodist Hospital) (ETM) | A3/AAA | 575,000 | 588,127 | |||||
Lawrence Multifamily Redevelopment Authority, 5.40% due 6/1/2024 put 1/1/2018 (Pinnacle Apartments; Collateralized: FNMA) | NR/AAA | 1,500,000 | 1,500,945 | |||||
Noblesville Redevelopment Authority, 5.00% due 8/1/2017 (146th Street Extension) | NR/AA- | 1,000,000 | 1,052,950 | |||||
Noblesville Redevelopment Authority, 5.00% due 8/1/2020 (146th Street Extension) | NR/AA- | 1,000,000 | 1,020,540 | |||||
Vanderburgh County Redevelopment District Tax Increment, 5.00% due 2/1/2020 | NR/A | 1,000,000 | 851,820 | |||||
West Clark School Building Corp. First Mtg, 5.75% due 7/15/2017 (Insured: FGIC) | NR/AA+ | 1,685,000 | 1,830,382 | |||||
| IOWA — 1.79% | ||||||||
Coralville COP, 5.25% due 6/1/2022 | A3/NR | 2,980,000 | 2,838,182 | |||||
Iowa Finance Authority, 6.00% due 7/1/2012 (Trinity Regional Hospital; Insured: FSA) | Aa3/AAA | 820,000 | 873,357 | |||||
Iowa Finance Authority, 6.00% due 7/1/2013 (Genesis Medical Center) | A1/NR | 1,000,000 | 1,015,640 | |||||
Iowa Finance Authority, 5.75% due 12/1/2015 (Trinity Health) | Aa2/AA | 1,250,000 | 1,290,450 | |||||
Iowa Finance Authority, 6.75% due 2/15/2016 pre-refunded 2/15/2010 (Iowa Health Services) | Aa3/NR | 1,000,000 | 1,058,430 | |||||
24 Certified Semi-Annual Report
SCHEDULE OF INVESTMENTS, CONTINUED
| Thornburg Intermediate Municipal Fund | March 31, 2009 (Unaudited) |
Issuer-Description | Credit Rating† Moody’s/S&P | Principal Amount | Value | |||||
Iowa Finance Authority, 6.00% due 12/1/2018 (Catholic Health Initiatives) | Aa2/AA | $ | 2,000,000 | $ | 2,047,060 | |||
KANSAS — 1.23% | ||||||||
Olathe Tax Increment Special Obligation, 5.45% due 9/1/2022 (West Village Center) | NR/NR | 1,155,000 | 860,336 | |||||
Wichita Hospital Revenue, 6.75% due 11/15/2019 (Via Christi Health System) | NR/A+ | 4,200,000 | 4,275,306 | |||||
Wyandotte County School District GO, 5.00% due 9/1/2014 (Insured: FGIC) | A3/NR | 1,030,000 | 1,118,148 | |||||
KENTUCKY — 1.03% | ||||||||
Kentucky EDA, 5.85% due 10/1/2015 (Norton Healthcare; Insured: MBIA) | Baa1/AA- | 2,665,000 | 2,657,192 | |||||
Kentucky EDA, 0% due 10/1/2024 (Norton Healthcare; Insured: MBIA) | Baa1/AA- | 3,000,000 | 1,070,820 | |||||
Kentucky EDA, 5.75% due 12/1/2028 (Louisville Arena; Insured: Assured Guaranty) | Aa2/AAA | 1,500,000 | 1,515,825 | |||||
LOUISIANA — 2.05% | ||||||||
Louisiana Local Government Environment Facilities Authority, 5.00% due 3/1/2014 (Independence Stadium) | NR/A | 1,000,000 | 1,045,560 | |||||
Louisiana Public Facilities Authority, 5.00% due 7/1/2022 (Black & Gold Facilities; Insured: CIFG) | Baa3/BBB- | 1,500,000 | 1,300,200 | |||||
Morehouse Parish PCR, 5.25% due 11/15/2013 (International Paper Co.) | Baa3/BBB | 3,000,000 | 2,663,790 | |||||
New Orleans Aviation Board, 5.25% due 1/1/2018 (Insured: FSA) | Aa3/AAA | 1,000,000 | 975,280 | |||||
New Orleans Aviation Board, 5.25% due 1/1/2020 (Insured: FSA) | Aa3/AAA | 2,000,000 | 2,104,400 | |||||
St. Tammany Parish Sales Tax Revenue, 5.00% due 6/1/2019 (Insured: CIFG) | NR/A+ | 1,300,000 | 1,314,781 | |||||
St. Tammany Parish Sales Tax Revenue, 5.00% due 6/1/2020 (Insured: CIFG) | NR/A+ | 1,000,000 | 1,000,440 | |||||
MARYLAND — 0.16% | ||||||||
Maryland State Health & Higher Educational Facilities, 0.50% due 7/1/2034 put 4/7/2009 (University of Maryland Medical Systems; LOC: Bank of America) (weekly demand notes) | VMIG1/A-1+ | 800,000 | 800,000 | |||||
MASSACHUSETTS — 0.38% | ||||||||
Massachusetts Health & Educational Facilities, 0.26% due 11/1/2035 put 4/1/2009 (Berkshire Health Systems; Insured: Assured Guaranty) (daily demand notes) | VMIG1/A-1+ | 700,000 | 700,000 | |||||
Massachusetts Housing Finance Agency, 5.05% due 6/1/2010 (Insured: MBIA) (AMT) | Baa1/AA- | 290,000 | 293,239 | |||||
Massachusetts Housing Finance Agency, 6.125% due 12/1/2011 (Insured: MBIA) (AMT) | Baa1/AA- | 950,000 | 951,710 | |||||
MICHIGAN — 3.53% | ||||||||
Kalamazoo Hospital Finance Authority, 6.25% due 6/1/2014 (Borgess Medical Center) (ETM) | Aaa/AAA | 650,000 | 780,410 | |||||
Kalamazoo Hospital Finance Authority, 5.00% due 5/15/2019 (Bronson Hospital; Insured: FSA) | Aa3/AAA | 1,500,000 | 1,492,500 | |||||
Kent Hospital Finance Authority, 7.25% due 1/15/2013 (Butterworth Hospital; Insured: MBIA) | A2/AA | 670,000 | 736,377 | |||||
Michigan Higher Education Student Loan Authority, 3.95% due 3/1/2011 | Aa3/AA | 750,000 | 687,248 | |||||
Michigan Public Educational Facilities Authority, 5.50% due 9/1/2022 (Black River School) | NR/NR | 1,110,000 | 811,432 | |||||
Michigan State Building Authority, 5.25% due 10/15/2017 (Insured: FSA) | Aa3/AAA | 2,450,000 | 2,505,566 | |||||
Michigan State Building Authority, 0% due 10/15/2025 (Insured: FGIC) | A1/AA | 6,000,000 | 2,071,380 | |||||
Michigan State Hospital Finance Authority, 5.00% due 11/15/2024 (Sparrow Obligated Group) | A1/A+ | 2,140,000 | 1,716,237 | |||||
Michigan State Hospital Finance Authority, 5.00% due 7/15/2025 (Oakwood Obligated Group) | A2/A | 3,650,000 | 2,952,886 | |||||
Michigan Strategic Fund, 5.25% due 10/15/2023 (Michigan House of Representatives Facilities; Insured: Assured Guaranty) | Aa2/AAA | 1,000,000 | 1,044,690 | |||||
Royal Oak Hospital Finance Authority, 8.00% due 9/1/2029 (William Beaumont Hospital) | A1/A | 2,500,000 | 2,659,425 | |||||
Southfield Economic Development Corp., 7.25% due 12/1/2010 (N.W. 12 LP Transcon Builders) | NR/NR | 520,000 | 493,095 | |||||
MINNESOTA — 0.70% | ||||||||
Minneapolis St. Paul Health, 6.00% due 12/1/2018 (Healthpartners Obligated Group) | Baa1/BBB | 1,000,000 | 983,380 | |||||
Southern Minnesota Municipal Power Agency, 5.75% due 1/1/2018 pre-refunded to various dates (Insured: MBIA) | NR/AA | 700,000 | 748,636 | |||||
St. Paul Housing & Redevelopment Authority, 5.25% due 5/15/2020 (Healthpartners Obligated Group) | Baa1/BBB | 1,965,000 | 1,806,071 | |||||
Certified Semi-Annual Report 25
SCHEDULE OF INVESTMENTS, CONTINUED
| Thornburg Intermediate Municipal Fund | March 31, 2009 (Unaudited) |
Issuer-Description | Credit Rating† Moody’s/S&P | Principal Amount | Value | |||||
MISSISSIPPI — 1.77% | ||||||||
Mississippi Development Bank Special Obligation, 5.00% due 7/1/2022 (Canton Public Improvement) | NR/NR | $ | 1,935,000 | $ | 1,476,270 | |||
Mississippi Development Bank Special Obligation, 5.00% due 7/1/2027 (Lowndes County Industrial Development; Insured: FSA) | Aa3/AAA | 2,500,000 | 2,496,850 | |||||
Mississippi Development Bank Special Obligation Municipal Energy Agency Power Supply, 5.00% due 3/1/2018 (Insured: XLCA) | Baa2/NR | 920,000 | 883,494 | |||||
Mississippi Development Bank Special Obligation Municipal Energy Agency Power Supply, 5.00% due 3/1/2020 (Insured: XLCA) | Baa2/NR | 1,000,000 | 930,320 | |||||
Mississippi Higher Educational Authority, 7.50% due 9/1/2009 (Guaranty: Student Loans) (AMT) | A2/NR | 1,500,000 | 1,454,640 | |||||
Mississippi Hospital Equipment & Facilities, 5.25% due 8/1/2026 (Delta Regional Medical Center; Insured: MBIA/FHA) | Baa1/AA- | 2,000,000 | 1,755,320 | |||||
MISSOURI — 1.08% | ||||||||
Kansas City Tax Increment Financing Commission, 5.00% due 3/1/2012 (Maincor) | NR/NR | 905,000 | 867,560 | |||||
Missouri Development Finance Board, 5.00% due 4/1/2019 (Eastland Center) | NR/A+ | 1,000,000 | 1,007,870 | |||||
Missouri Development Finance Board, 5.00% due 4/1/2021 (Eastland Center) | NR/A+ | 2,000,000 | 1,968,120 | |||||
Missouri Development Finance Board, 5.125% due 4/1/2022 (Eastland Center) | NR/A+ | 2,000,000 | 1,668,280 | |||||
NEBRASKA — 0.35% | ||||||||
Adams County Hospital Authority, 5.00% due 12/15/2023 (Mary Lanning Memorial Hospital; Insured: Radian) | NR/A- | 2,000,000 | 1,788,220 | |||||
NEVADA — 0.89% | ||||||||
Las Vegas Special Improvement District, 5.375% due 6/1/2013 (Insured: FSA) | Aa3/AAA | 1,100,000 | 1,104,763 | |||||
Reno Sparks Indian Colony, 5.00% due 6/1/2021 (LOC: U.S. Bank NA) | NR/NR | 1,000,000 | 939,930 | |||||
Washoe County GO, 0% due 7/1/2011 (Reno Sparks Convention Center; Insured: FSA) | Aa2/AAA | 2,600,000 | 2,492,256 | |||||
NEW HAMPSHIRE — 1.89% | ||||||||
Manchester Housing & Redevelopment Authority, 0% due 1/1/2016 (Insured: Radian ACA) | Baa3/BBB+ | 4,990,000 | 3,350,286 | |||||
New Hampshire Business Finance Authority, 7.125% due 7/1/2027 (United Illuminating Co.) | Baa2/NR | 1,000,000 | 1,001,630 | |||||
New Hampshire Health & Education Facilities, 5.25% due 10/1/2023 (Southern New Hampshire Medical Center) | NR/A- | 1,000,000 | 900,260 | |||||
New Hampshire IDA PCR, 5.90% due 8/1/2018 (CT Light & Power) (AMT) | Baa1/BBB | 1,000,000 | 934,510 | |||||
New Hampshire PCR, 5.375% due 5/1/2014 (Central Maine Power Co.) | A3/BBB+ | 3,500,000 | 3,423,105 | |||||
NEW JERSEY — 0.03% | ||||||||
New Jersey EDA, 7.50% due 12/1/2019 (Spectrum for Living Development) | NR/NR | 160,000 | 160,752 | |||||
NEW MEXICO — 0.74% | ||||||||
Farmington PCR, 0.35% due 5/1/2024 put 4/1/2009 (LOC: Barclays Bank) (daily demand notes) | VMIG1/A-1+ | 2,500,000 | 2,500,000 | |||||
Santa Fe County Charter School Foundation, 6.50% due 1/15/2026 (ATC Foundation) | NR/NR | 1,515,000 | 1,249,905 | |||||
NEW YORK — 1.36% | ||||||||
New York City GO, 0.90% due 8/1/2028 put 4/1/2009 (SPA: Dexia Credit Local) (daily demand notes) | VMIG1/A-1+ | 3,700,000 | 3,700,000 | |||||
New York City Municipal Water Finance Authority, 0.85% due 6/15/2033 put 4/1/2009 (SPA: Dexia Credit Local) (daily demand notes) | VMIG1/A-1 | 1,500,000 | 1,500,000 | |||||
New York City Trust Cultural Resources, 5.75% due 7/1/2015 (Museum of American Folk Art; Insured: ACA) | NR/NR | 875,000 | 804,904 | |||||
New York State Dormitory Authority, 5.00% due 7/1/2017 (Bishop Henry B. Hucles Nursing; Insured: SONYMA) | Aa1/NR | 850,000 | 892,066 | |||||
26 Certified Semi-Annual Report
SCHEDULE OF INVESTMENTS, CONTINUED
| Thornburg Intermediate Municipal Fund | March 31, 2009 (Unaudited) |
Issuer-Description | Credit Rating† Moody’s/S&P | Principal Amount | Value | |||||
NORTH CAROLINA — 0.15% | ||||||||
North Carolina Housing Finance Agency SFMR, 6.50% due 9/1/2026 | Aa2/AA | $ | 740,000 | $ | 755,081 | |||
NORTH DAKOTA — 0.16% | ||||||||
Ward County Health Care Facilities, 5.125% due 7/1/2021 (Trinity Obligated Group) | NR/BBB+ | 1,000,000 | 800,720 | |||||
OHIO — 2.23% | ||||||||
Cleveland Cuyahoga County Port Authority, 6.25% due 5/15/2016 (LOC: Fifth Third Bank) | NR/NR | 1,140,000 | 1,076,719 | |||||
Deerfield Township Tax Increment, 5.00% due 12/1/2025 | A3/NR | 1,000,000 | 788,340 | |||||
Franklin County Health Care, 6.00% due 11/1/2010 (Heinzerling Foundation; LOC: Banc One) | Aa1/NR | 415,000 | 416,050 | |||||
Hamilton Wastewater Systems, 5.25% due 10/1/2017 (Insured: FSA) | Aa3/NR | 1,500,000 | 1,640,490 | |||||
Lorain County Hospital Revenue, 5.625% due 10/1/2016 (Catholic Healthcare) | A1/AA- | 1,435,000 | 1,476,184 | |||||
North Ridgeville Economic Development, 0% due 2/1/2015 (Lake Ridge Nursing Home; Collateralized: FHA) | NR/AAA | 195,000 | 125,874 | |||||
Ohio State Air Quality Development Authority, 4.85% due 8/1/2040 (Columbus Southern Power; Insured: MBIA) | A3/AA | 1,500,000 | 1,508,760 | |||||
Ohio State Air Quality Development Authority, 5.10% due 11/1/2042 (Columbus Southern Power; Insured: MBIA) | A3/AA | 3,000,000 | 3,055,920 | |||||
Ohio State Higher Educational Facilities, 5.05% due 7/1/2037 put 7/1/2016 (Kenyon College) | A1/A+ | 1,200,000 | 1,279,320 | |||||
OKLAHOMA — 1.86% | ||||||||
Comanche County Hospital Authority, 5.25% due 7/1/2019 (Insured: Radian) | NR/BBB+ | 1,725,000 | 1,571,320 | |||||
Oklahoma City Municipal Water & Sewer, 0% due 7/1/2011 (Insured: AMBAC) | Baa1/A | 1,125,000 | 1,054,429 | |||||
Oklahoma City Municipal Water & Sewer, 0% due 7/1/2013 (Insured: AMBAC) | Baa1/A | 1,485,000 | 1,275,526 | |||||
Oklahoma State DFA, 5.40% due 6/1/2013 pre-refunded 12/1/2010 (Integris Health; Insured: AMBAC) | Aa3/NR | 825,000 | 894,151 | |||||
Oklahoma State Industries Authority, 5.50% due 7/1/2023 (OK Medical Research Foundation) | A1/NR | 3,730,000 | 3,625,634 | |||||
Tulsa IDA, 5.00% due 12/15/2024 (St. Francis Health Systems) | Aa2/AA | 1,130,000 | 1,014,921 | |||||
OREGON — 0.43% | ||||||||
Forest Grove Campus Improvement, 6.00% due 5/1/2015 pre-refunded 5/1/2010 (Pacific University; Insured: Radian) | NR/BBB+ | 800,000 | 846,840 | |||||
Oregon State Housing & Community Services Department Single Family Mtg Program, 5.35% due 7/1/2018 (AMT) | Aa2/NR | 375,000 | 380,659 | |||||
Portland Housing Authority, 4.75% due 5/1/2022 (Yards Union Station) (AMT) | Aa2/NR | 1,000,000 | 943,120 | |||||
PENNSYLVANIA — 1.44% | ||||||||
Allegheny County Hospital Development, 6.50% due 5/1/2012 pre-refunded 5/1/2010 (South Hills Health Systems) | Baa2/NR | 1,400,000 | 1,473,822 | |||||
Carbon County IDA, 6.65% due 5/1/2010 (Panther Creek Partners) | NR/BBB- | 3,050,000 | 3,050,702 | |||||
Chartiers Valley Industrial & Community Development Authority, 5.75% due 12/1/2022 (Asbury Health Center) | NR/NR | 900,000 | 658,008 | |||||
Lancaster County, 0% due 5/1/2014 (Insured: FGIC) | Aa3/NR | 795,000 | 645,643 | |||||
Lancaster County, 0% due 5/1/2015 (Insured: FGIC) | Aa3/NR | 800,000 | 611,568 | |||||
Pennsylvania Higher Education Facilities Authority, 0% due 7/1/2020 (Insured: AMBAC) | Baa1/A | 2,032,839 | 889,245 | |||||
RHODE ISLAND — 0.70% | ||||||||
Rhode Island Health & Education Building Corp., 5.00% due 3/15/2014 (Salve Regina University; Insured: Radian) | NR/BBB+ | 1,065,000 | 1,133,054 | |||||
Rhode Island Health & Education Building Corp., 6.00% due 8/1/2014 (Roger Williams Realty; Credit Support: FHA) | NR/A- | 995,000 | 1,026,412 | |||||
Rhode Island Health & Education Building Corp. Hospital Financing, 5.25% due 7/1/2015 (Memorial Hospital; LOC: Fleet Bank) | NR/AA+ | 1,325,000 | 1,377,496 | |||||
Certified Semi-Annual Report 27
SCHEDULE OF INVESTMENTS, CONTINUED
| Thornburg Intermediate Municipal Fund | March 31, 2009 (Unaudited) |
Issuer-Description | Credit Rating† Moody’s/S&P | Principal Amount | Value | |||||
SOUTH CAROLINA — 4.01% | ||||||||
Berkeley County School District Installment Lease, 5.00% due 12/1/2019 | A3/A- | $ | 2,000,000 | $ | 2,082,400 | |||
Charleston Educational Excellence Financing Corp., 5.25% due 12/1/2020 (Charleston County School District) | A1/AA- | 1,855,000 | 1,912,153 | |||||
Greenwood School Facilities, Inc., 5.00% due 12/1/2025 (Greenwood School District 50; Insured: Assured Guaranty) | Aa2/AAA | 2,400,000 | 2,425,248 | |||||
Lexington One School Facilities Corp. School District 1, 5.00% due 12/1/2019 | A1/NR | 1,000,000 | 1,016,940 | |||||
Lexington One School Facilities Corp. School District 1, 5.25% due 12/1/2021 | A1/NR | 1,700,000 | 1,726,996 | |||||
Scago Educational Facilities Corp., 5.00% due 12/1/2017 (Colleton School District; Insured: Assured Guaranty) | Aa2/AAA | 1,000,000 | 1,034,550 | |||||
Scago Educational Facilities Corp. Spartanburg County, 5.00% due 4/1/2019 (Insured: FSA) | Aa3/AAA | 2,740,000 | 2,887,138 | |||||
Scago Educational Facilities Corp. Spartanburg County, 5.00% due 4/1/2021 (Insured: FSA) | Aa3/AAA | 1,000,000 | 1,035,490 | |||||
South Carolina Housing Finance & Development Authority, 5.875% due 7/1/2022 | Aa1/NR | 2,265,000 | 2,310,526 | |||||
South Carolina Housing Finance & Development Authority, 5.30% due 7/1/2023 | Aa1/NR | 1,000,000 | 996,940 | |||||
Sumter School Facilities Inc. School District 2, 5.00% due 12/1/2021 (Insured: Assured Guaranty) | Aa2/AAA | 2,855,000 | 2,974,225 | |||||
TENNESSEE — 1.76% | ||||||||
Knox County Health, 4.90% due 6/1/2031 put 6/1/2011 (Eastowne Partners II Ltd.; Collateralized: FNMA) | NR/AAA | 1,935,000 | 2,042,199 | |||||
Tennessee Energy Acquisition Corp., 5.00% due 2/1/2023 | Baa1/A | 2,500,000 | 1,787,700 | |||||
Tennessee Energy Acquisition Corp., 5.25% due 9/1/2023 | Ba1/BBB+ | 7,000,000 | 5,115,110 | |||||
TEXAS — 14.07% | ||||||||
Austin Community College District, 5.50% due 8/1/2023 (Round Rock Campus) | Aa3/AA+ | 2,180,000 | 2,294,058 | |||||
Bexar County Health Facilities Development Corp., 6.125% due 7/1/2022 pre-refunded 7/1/2012 (Army Retirement Residence) | NR/NR | 1,250,000 | 1,432,100 | |||||
Bexar County Health Facilities Development Corp., 5.00% due 7/1/2027 (Army Retirement Residence) | NR/BBB | 2,000,000 | 1,304,840 | |||||
Bexar County Housing Finance Corp., 5.40% due 8/1/2012 (Dymaxion & Marrach Park Apartments; Insured: MBIA) | Baa1/NR | 620,000 | 580,593 | |||||
Bexar County Housing Finance Corp., 5.875% due 4/1/2014 (Honey Creek Apartments; Insured: MBIA) | Baa1/NR | 975,000 | 854,451 | |||||
Bexar County Housing Finance Corp., 5.50% due 1/1/2016 (American Opportunity Housing & Colinas; Insured: MBIA) | Baa1/NR | 600,000 | 517,764 | |||||
Bexar County Housing Finance Corp., 6.125% due 4/1/2020 (Honey Creek Apartments; Insured: MBIA) | Baa1/NR | 1,000,000 | 767,060 | |||||
Bexar County Housing Finance Corp., 5.95% due 8/1/2020 (Dymaxion & Marrach Park Apartments; Insured: MBIA) | Baa1/NR | 1,270,000 | 1,015,047 | |||||
Bexar County Housing Finance Corp., 5.70% due 1/1/2021 (American Opportunity Housing & Colinas; Insured: MBIA) | Baa1/NR | 1,035,000 | 807,238 | |||||
Bexar County Housing Finance Corp., 6.50% due 12/1/2021 (American Opportunity Housing- Waterford) | Baa3/NR | 2,000,000 | 1,529,020 | |||||
Bexar Metropolitan Water District Waterworks, 5.00% due 5/1/2021 (Insured: XLCA) | A3/A | 1,300,000 | 1,341,275 | |||||
Bexar Metropolitan Water District Waterworks, 5.00% due 5/1/2022 (Insured: XLCA) | A3/A | 2,300,000 | 2,350,531 | |||||
Birdville ISD GO, 0% due 2/15/2012 (Guaranty: PSF) | Aaa/AAA | 2,800,000 | 2,645,580 | |||||
Carroll ISD GO, 0% due 2/15/2011 (Guaranty: PSF) | Aaa/AAA | 345,000 | 316,596 | |||||
Cedar Park Improvement District GO, 5.00% due 2/15/2016 (Insured: MBIA) | A1/AA- | 1,000,000 | 1,083,770 | |||||
Coppell ISD GO, 0% due 8/15/2013 (Guaranty: PSF) | NR/AAA | 1,495,000 | 1,189,123 | |||||
Dallas County Utilities & Reclamation District, 5.15% due 2/15/2022 (Insured: AMBAC) | Baa1/A | 3,000,000 | 2,789,640 | |||||
Duncanville ISD GO, 0% due 2/15/2016 pre-refunded 2/15/2012 (Guaranty: PSF) | Aaa/AAA | 2,985,000 | 2,246,123 | |||||
Duncanville ISD GO, 0% due 2/15/2016 (Guaranty: PSF) | Aaa/AAA | 15,000 | 11,055 | |||||
Ennis ISD GO, 0% due 8/15/2012 pre-refunded 8/15/2010 (Guaranty: PSF) | Aaa/NR | 1,625,000 | 1,443,016 | |||||
Ennis ISD GO, 0% due 8/15/2012 (Guaranty: PSF) | Aaa/NR | 835,000 | 737,873 | |||||
28 Certified Semi-Annual Report
SCHEDULE OF INVESTMENTS, CONTINUED
| Thornburg Intermediate Municipal Fund | March 31, 2009 (Unaudited) |
Issuer-Description | Credit Rating† Moody’s/S&P | Principal Amount | Value | |||||
Ennis ISD GO, 0% due 8/15/2013 (Guaranty: PSF) | Aaa/NR | $ | 845,000 | $ | 700,784 | |||
Ennis ISD GO, 0% due 8/15/2014 (Guaranty: PSF) | Aaa/NR | 855,000 | 664,814 | |||||
Gulf Coast Center, 6.75% due 9/1/2020 (Mental Health Retardation Center) | NR/BBB | 1,320,000 | 1,292,214 | |||||
Hays Consolidated ISD GO, 0% due 8/15/2013 pre-refunded 8/15/2011 (Guaranty: PSF) | Aaa/AAA | 6,245,000 | 5,378,069 | |||||
Laredo Sports Venue Sales Tax, 5.00% due 3/15/2018 (Insured: AMBAC) | A3/A+ | 2,040,000 | 2,081,820 | |||||
Lewisville Combination Contract Special Assessment District, 4.75% due 9/1/2012 (Insured: ACA) | NR/NR | 2,055,000 | 2,013,736 | |||||
Midtown Redevelopment Authority Tax, 6.00% due 1/1/2012 (Insured: Radian) | Baa1/A- | 735,000 | 745,011 | |||||
Midtown Redevelopment Authority Tax, 6.00% due 1/1/2013 (Insured: Radian) | Baa1/A- | 500,000 | 504,230 | |||||
Mission EDA, 6.00% due 8/1/2020 (Waste Management, Inc.) | NR/BBB | 3,000,000 | 2,860,170 | |||||
Sam Rayburn Municipal Power Agency, 6.00% due 10/1/2016 | Baa2/BBB- | 3,000,000 | 2,877,780 | |||||
Sam Rayburn Municipal Power Agency, 6.00% due 10/1/2021 | Baa2/BBB- | 2,675,000 | 2,417,397 | |||||
Spring ISD GO, 5.00% due 8/15/2029 (Insured: FSA) | A1/AAA | 4,000,000 | 4,033,880 | |||||
Stafford Economic Development, 6.00% due 9/1/2017 (Insured: FGIC) | A2/AA- | 1,775,000 | 2,030,511 | |||||
Tarrant County Health Facilities, 6.625% due 11/15/2020 pre-refunded 11/15/2010 (Adventist/Sunbelt) | A1/NR | 3,500,000 | 3,835,720 | |||||
Texarkana Health Facilities, 5.75% due 10/1/2011 (Wadely Regional Medical Center; Insured: MBIA) | Baa1/AA- | 2,500,000 | 2,552,500 | |||||
Texas City Industrial Development Corp., 7.375% due 10/1/2020 (Arco Pipe Line Company) | Aa1/AA | 2,450,000 | 3,001,372 | |||||
Texas State Public Finance Authority, 5.00% due 8/15/2023 (Idea Charter School; Insured: ACA) | NR/BBB- | 3,100,000 | 2,122,167 | |||||
Travis County GO, 5.25% due 3/1/2021 | Aaa/AAA | 1,000,000 | 1,106,870 | |||||
Travis County Health Facilities Development Corp., 5.75% due 11/15/2010 (Ascension Health; Insured: MBIA) | Aa1/AA | 2,000,000 | 2,066,040 | |||||
Waco Health Facilities Development Corp., 6.00% due 11/15/2015 pre-refunded 11/15/2009 (Ascension Health) | Aa1/AAA | 870,000 | 908,976 | |||||
Waco Health Facilities Development Corp., 6.00% due 11/15/2016 pre-refunded 11/15/2009 (Ascension Health) | Aa1/AAA | 1,050,000 | 1,097,040 | |||||
UTAH — 0.48% | ||||||||
Salt Lake Valley Fire Services, 5.25% due 4/1/2020 | Aa3/NR | 1,250,000 | 1,329,700 | |||||
Utah County Municipal Building Authority, 5.50% due 11/1/2016 pre-refunded 11/1/2011 (Insured: AMBAC) | Aa3/NR | 1,000,000 | 1,111,540 | |||||
Utah Housing Finance Authority SFMR, 5.85% due 7/1/2015 (Credit Support: FHA) | Aaa/AA | 20,000 | 20,020 | |||||
VIRGINIA — 1.05% | ||||||||
Amelia County IDA, 4.80% due 4/1/2027 put 4/1/2010 (Waste Management) (AMT) | NR/BBB | 2,000,000 | 1,962,880 | |||||
Fauquier County IDRB, 5.50% due 10/1/2016 (Insured: Radian) | NR/BBB+ | 1,000,000 | 990,330 | |||||
Hanover County IDRB Medical Facilities, 6.00% due 10/1/2021 (ETM) | NR/AA | 795,000 | 798,140 | |||||
Norton IDA, 6.00% due 12/1/2014 (Norton Community Hospital; Insured: ACA) | NR/NR | 1,635,000 | 1,590,561 | |||||
WASHINGTON — 4.56% | ||||||||
King County Housing Authority, 5.20% due 5/1/2028 (Birch Creek Apts.) | NR/AAA | 2,400,000 | 2,329,248 | |||||
Skagit County Public Hospital District GO, 5.125% due 12/1/2015 (Insured: MBIA) | A3/NR | 1,900,000 | 2,011,245 | |||||
Washington Health Care Facilities, 5.50% due 12/1/2010 pre-refunded 12/1/2009 (Providence Services; Insured: MBIA) | NR/AA | 2,690,000 | 2,806,934 | |||||
Washington Health Care Facilities, 6.00% due 12/1/2014 (Catholic Health Services; Insured: MBIA) | Aa2/AA | 1,735,000 | 1,788,212 | |||||
Washington Health Care Facilities, 6.00% due 12/1/2015 (Catholic Health Services; Insured: MBIA) | Aa2/AA | 1,945,000 | 2,001,775 | |||||
Washington Health Care Facilities, 6.25% due 12/1/2021 (Group Health Co-op Puget Sound; Insured: MBIA) | Baa1/AA | 3,775,000 | 3,720,149 | |||||
Washington Health Care Facilities, 5.25% due 8/15/2024 (Multi Health Services; Insured: FSA) | Aa3/AAA | 1,000,000 | 998,260 | |||||
Washington Health Care Facilities, 6.25% due 8/1/2028 (Insured: FHA 242) | NR/A+ | 4,000,000 | 4,142,520 | |||||
Washington Housing Finance Commission, 5.60% due 7/1/2011 (Kline Galland Center; Insured: Radian) | NR/BBB+ | 500,000 | 505,745 | |||||
Washington Housing Finance Commission, 6.10% due 1/1/2016 (Seattle Academy; Insured: ACA) | NR/NR | 1,040,000 | 974,376 | |||||
Washington Housing Finance Commission, 5.875% due 7/1/2019 (Kline Galland Center; Insured: Radian) | NR/BBB+ | 1,000,000 | 972,550 | |||||
Certified Semi-Annual Report 29
SCHEDULE OF INVESTMENTS, CONTINUED
| Thornburg Intermediate Municipal Fund | March 31, 2009 (Unaudited) |
Issuer-Description | Credit Rating† Moody’s/S&P | Principal Amount | Value | |||||
Washington Public Power Supply, 0% due 7/1/2011 | Aaa/AA | $ | 1,000,000 | $ | 955,790 | |||
WEST VIRGINIA — 0.28% | ||||||||
West Virginia Hospital Finance Authority, 5.00% due 6/1/2020 (United Hospital Center; Insured: AMBAC) | A2/A+ | 1,530,000 | 1,400,470 | |||||
WISCONSIN — 1.11% | ||||||||
Wisconsin Health & Educational Facilities, 5.40% due 8/15/2013 (Sorrowful Mother; Insured: MBIA) | Baa1/AA- | 3,065,000 | 3,066,195 | |||||
Wisconsin Health & Educational Facilities, 5.75% due 8/15/2020 (Eagle River Memorial Hospital Inc.; Insured: Radian) | NR/BBB+ | 1,000,000 | 901,540 | |||||
Wisconsin Housing & Economic Development, 5.875% due 11/1/2016 (Insured: AMBAC) | Aa3/AA | 1,635,000 | 1,667,128 | |||||
TOTAL INVESTMENTS — 97.79% (Cost $514,246,518) | $ | 497,297,933 | ||||||
OTHER ASSETS LESS LIABILITIES — 2.21% | 11,220,794 | |||||||
NET ASSETS — 100.00% | $ | 508,518,727 | ||||||
Footnote Legend
| † | Credit ratings are unaudited. Rating changes may have occurred prior to or subsequent to the reporting period end. |
Portfolio Abbreviations
To simplify the listings of securities, abbreviations are used per the table below:
| ACA | Insured by American Capital Access | |
| AMBAC | Insured by American Municipal Bond Assurance Corp. | |
| AMT | Alternative Minimum Tax | |
| CIFG | CIFG Assurance North America Inc. | |
| COP | Certificates of Participation | |
| DFA | Development Finance Authority | |
| EDA | Economic Development Authority | |
| ETM | Escrowed to Maturity | |
| FGIC | Insured by Financial Guaranty Insurance Co. | |
| FHA | Insured by Federal Housing Administration | |
| FNMA | Collateralized by Federal National Mortgage Association | |
| FSA | Insured by Financial Security Assurance Co. | |
| GNMA | Insured by Government National Mortgage Co. | |
| GO | General Obligation | |
| HFA | Health Facilities Authority | |
| IDA | Industrial Development Authority | |
| IDRB | Industrial Development Revenue Bond | |
| ISD | Independent School District | |
| LOC | Letter of Credit | |
| MBIA | Insured by Municipal Bond Investors Assurance | |
| Mtg | Mortgage | |
| PCR | Pollution Control Revenue Bond | |
| PSF | Guaranteed by Permanent School Fund | |
| RADIAN | Insured by Radian Asset Assurance | |
| SFMR | Single Family Mortgage Revenue Bond | |
| SONYMA | State of New York Mortgage Authority | |
| USD | Unified School District | |
| XLCA | Insured by XL Capital Assurance |
See notes to financial statements.
30 Certified Semi-Annual Report
| Thornburg Intermediate Municipal Fund | March 31, 2009 (Unaudited) |
As a shareholder of the Fund, you incur two types of costs:
(1) transaction costs, including
(a) sales charges (loads) on purchase payments, for Class A shares;
(b) a deferred sales charge on redemptions of any part or all of a purchase of $1 million of Class A shares within 12 months of purchase;
(c) a deferred sales charge on redemptions of Class C shares within 12 months of purchase;
(2) ongoing costs, including management fees; distribution and/or service (12b-1) fees; and other Fund expenses.
This example is intended to help you understand your ongoing costs (in dollars) of investing in the Fund and to compare these costs with the ongoing costs of investing in other mutual funds.
The example is based on an investment of $1,000 invested on September 30, 2008 and held until March 31, 2009.
Actual Expenses
For each class of shares, the first line of the table at right provides information about actual account values and actual expenses. You may use the information in this line, together with the amount you invested, to estimate the expenses that you paid over the period. Simply divide your account value by $1,000 (for example, an $8,600 account value divided by $1,000 = 8.6), then multiply the result by the number in the first line for your class of shares under the heading entitled “Expenses Paid During Period” to estimate the expenses you paid on your account during this period.
Hypothetical Example for Comparison Purposes
For each class of shares, the second line of the table at right provides information about hypothetical account values and hypothetical expenses based on the Fund’s actual expense ratio and an assumed rate of return of 5% per year before expenses, which is not the Fund’s actual return. The hypothetical account values and expenses may not be used to estimate the actual ending account balance or expenses you paid for the period. You may use this information to compare the ongoing costs of investing in the Fund and other funds. To do so, compare this 5% hypothetical example with the 5% hypothetical examples that appear in the shareholder reports of the other funds.
| Beginning Account value 9/30/08 | Ending Account value 3/31/09 | Expenses Paid During Period† 9/30/08–3/31/09 | |||||||
Class A Shares | |||||||||
Actual | $ | 1,000.00 | $ | 1,021.90 | $ | 4.89 | |||
Hypothetical* | $ | 1,000.00 | $ | 1,020.09 | $ | 4.89 | |||
Class C Shares | |||||||||
Actual | $ | 1,000.00 | $ | 1,020.60 | $ | 6.25 | |||
Hypothetical* | $ | 1,000.00 | $ | 1,018.75 | $ | 6.24 | |||
Class I Shares | |||||||||
Actual | $ | 1,000.00 | $ | 1,023.50 | $ | 3.32 | |||
Hypothetical* | $ | 1,000.00 | $ | 1,021.65 | $ | 3.32 | |||
| † | Expenses are equal to the annualized expense ratio for each class (A: 0.97%; C: 1.24%; and I: 0.66%) multiplied by the average account value over the period, multiplied by 182/365 to reflect the one-half year period. |
| * | Hypothetical assumes a rate of return of 5% per year before expenses. |
Please note that the expenses shown in the table are meant to highlight your ongoing costs only and do not reflect any transactional costs, such as sales charges (loads), redemption fees, or exchange fees. Therefore, the second line of the table for each class of shares is useful in comparing ongoing costs only, and will not help you determine the relative total costs of owning different funds. In addition, if these transactional costs were included, your costs would have been higher.
Certified Semi-Annual Report 31
| Thornburg Intermediate Municipal Fund | March 31, 2009 (Unaudited) |
PORTFOLIO PROXY VOTING
Policies and Procedures:
The Trust has delegated to Thornburg Investment Management, Inc. (the “Advisor”) voting decisions respecting proxies for the Fund’s voting securities. The Advisor makes voting decisions in accordance with its Proxy Voting Policy and Procedures. A description of the Policy and Procedures is available (i) without charge, upon request, by calling the Advisor toll-free at 1-800-847-0200, (ii) on the Thornburg website at www.thornburg.com, and (iii) on the Securities and Exchange Commission’s website at www.sec.gov.
Information regarding how proxies were voted is available on or before August 31 of each year for the twelve months ending the preceding June 30. This information is available (i) without charge, upon request by calling the Advisor toll-free at 1-800-847-0200, (ii) on the Thornburg website at www. thornburg.com, and (iii) on the Securities and Exchange Commission’s website at www.sec.gov.
AVAILABILITY OF QUARTERLY
PORTFOLIO SCHEDULE
The Fund files with the Securities and Exchange Commission schedules of its portfolio holdings on Form N-Q for the first and third quarters of each fiscal year. The Fund’s Forms N-Q are available on the Commission’s website at www.sec.gov, or may be reviewed and copied at the Commission’s Public Reference Room in Washington, D.C. Information on the operation of the Public Reference Room may be obtained by calling 1-800-SEC-0330. The Fund also makes this information available on its website at www.thornburg.com/download or upon request by calling 1-800-847-0200.
32 Certified Semi-Annual Report
Trustees’ Statement to Shareholders
Not part of the Certified Semi-Annual Report
February 8, 2005, as readopted September 15, 2008
The Trustees are concerned that ongoing commentaries and opinions reported in the media may confuse investors in general as to the supervisory duties of trustees of mutual funds and, in particular, leave Thornburg Investment Trust shareholders uncertain regarding how we discharge our responsibilities in supervising the Funds’ investment advisor and in reviewing the advisor’s contract for renewal. We decided to spell out clearly three principal guidelines that we follow in supervising the Trust’s investment advisor on your behalf.
We begin with the premise that each shareholder selected his or her Fund because its investments are managed by the investment advisor identified in the prospectus and in accordance with the objective and policies described in the prospectus. We realize, as each of you do, that if you believe that your Fund’s stated objective and policies no longer serve your personal investment goals, you can sell your shares and leave the Fund.
Therefore, we believe that our primary supervisory task – our principal obligation to you – is to assess the nature and quality of the advisor’s services, and to confirm that the advisor actively and competently pursues the Fund’s objective, in accordance with the policies set out in the prospectus. To do this, we meet regularly with management to review your Fund’s portfolio and to discuss the advisor’s specific actions and judgments in pursuing the Fund’s objective. We do not substitute our own judgment for the advisor’s decisions in selecting investments; the advisor is paid to exercise its informed judgment on investment decisions, and we seek to confirm, in reviewing the advisor’s performance, that the advisor is doing just that.
Second, while we are conscious of costs and the effect that costs have on shareholders’ returns, we do not seek the lowest fees or expense ratio as our sole or primary objective. We try to make sure that your Fund’s fees and costs are reasonable in relationship to the services rendered and that they are generally in line with those charged by other expert investment advisors, consistent with our belief that the Fund’s investors searched for and expect that expertise and attention and have decided to pay a reasonable price for it. We do not put the management contract “out to bid” as a matter of course, and we would not do so unless we had concluded that the advisor materially had failed to pursue the Fund’s objectives in accordance with its policies, or for other equally important reasons. We believe that any other approach would be inconsistent with your interests and contrary to your expectations when you bought shares of the Fund in the first place.
Finally, because we believe that most Thornburg Fund shareholders have invested with a long-term perspective, we try not to focus too much on the fashions of the moment and on short-term performance. The market will not favor any specific investment objective or set of policies at all times and under all economic circumstances. A fund will experience periods of both high and low returns relative to other funds and other investments. Even if one of our Funds is not favored by the market at a particular time, we believe that the advisor is nonetheless obliged to remain true to the Fund’s objective and policies, and we watch to see that it does so.
This page is not part of the Semi-Annual Report. 33
This page intentionally left blank.
34 This page is not part of the Semi-Annual Report.
Planning Options
Retirement and Education Accounts
Thornburg Investment Management offers retirement and education savings accounts that can help you meet a variety of planning challenges. For account applications or further information on any of the accounts below, please call 1-800-847-0200 or go to www.thornburg.com/ira. Your financial advisor can help you determine which plan is right for you.
Individual Retirement Accounts
Individual Retirement Accounts (IRAs) provide a tax-advantaged means to save money for the future. For a detailed outline of the difference between retirement accounts, see www.thornburg.com/ira. Rollovers are available. Call 1-800-847-0200 for more information.
Traditional IRAs – Contributions to Traditional IRAs are tax deductible for eligible individuals, and withdrawals are taxed as additional ordinary income. You may contribute to an IRA if you receive compensation and are under 70 1/2, even if you are covered by an employer retirement plan. Deductible contributions are subject to certain qualifications. Please consult your tax advisor.
Roth IRAs – Under a Roth IRA, there is no tax deduction for contributions, but there is no income tax on qualified withdrawals. For a more detailed comparison of Traditional and Roth IRAs, please see our web site at www.thornburg.com/ira.
SEP IRAs – Simplified Employee Pension (SEP) IRAs are established by employers. The employer is allowed a tax deduction for contributions made to the SEP Plan and makes contributions to each eligible employee’s SEP IRA on a discretionary basis.
SIMPLE IRAs – Savings Incentive Match Plan for Employees of Small Employers (SIMPLE) is designed to give small business owners a simplified method to establish and contribute to a retirement plan for employees. The employer is allowed a tax deduction for contributions and makes either matching or non-elective contributions to each eligible employee’s SIMPLE IRA. Employees may make salary deferral contributions.
Coverdell Education Savings Account
These savings accounts are designed to provide a way to save money for higher education expenses. In an Education Savings Account, earnings and interest grow tax-free, and qualified withdrawals used to pay for eligible higher-education expenses are tax- and penalty-free.
Funds Available
The following funds are available in the accounts listed above:
| • | Thornburg International Value Fund |
| • | Thornburg Value Fund |
| • | Thornburg Core Growth Fund |
| • | Thornburg Investment Income Builder Fund |
| • | Thornburg Global Opportunities Fund |
| • | Thornburg International Growth Fund |
| • | Thornburg Limited Term U.S. Government Fund |
| • | Thornburg Limited Term Income Fund |
| • | Thornburg Strategic Income Fund |
This page is not part of the Semi-Annual Report. 35

36 This page is not part of the Semi-Annual Report.
Thornburg Equity Funds
Thornburg’s equity research uses a fundamental and comprehensive analytical approach. Thornburg equity funds focus on a limited number of securities so that each holding can impact performance. The equity team searches for firms believed to have a promising future and seeks to buy shares of those companies at a discount to their intrinsic value.
| • | Thornburg Value Fund |
| • | Thornburg International Value Fund |
| • | Thornburg Core Growth Fund |
| • | Thornburg Investment Income Builder Fund |
| • | Thornburg Global Opportunities Fund |
| • | Thornburg International Growth Fund |
Thornburg Bond Funds
Thornburg Investment Management applies a disciplined philosophy to fixed-income management. Since the launch of our first fixed-income fund 25 years ago, we have been conducting fundamental, bottom-up research in an effort to identify bonds which we believe provide the best return for a given level of risk. We are very organic in our approach, avoiding leverage or complex strategies which could backfire in periods of market uncertainty.
| • | Thornburg Limited Term Municipal Fund |
| • | Thornburg Intermediate Municipal Fund |
| • | Thornburg California Limited Term Municipal Fund |
| • | Thornburg New Mexico Intermediate Municipal Fund |
| • | Thornburg New York Intermediate Municipal Fund |
| • | Thornburg Strategic Municipal Income Fund |
| • | Thornburg Limited Term U.S. Government Fund |
| • | Thornburg Limited Term Income Fund |
| • | Thornburg Strategic Income Fund |
Before investing, carefully consider the Fund’s investment goals, risks, charges, and expenses. For a prospectus containing this and other information, contact your financial advisor or visit thornburg.com. Read it carefully before investing.
For additional information, please visit www.thornburg.com
Thornburg Investment Management, Inc. 2300 North Ridgetop Road, Santa Fe, NM 87506
This page is not part of the Semi-Annual Report. 37
This page intentionally left blank.
38 This page is not part of the Semi-Annual Report.
This page intentionally left blank.
This page is not part of the Semi-Annual Report. 39

| This Semi-Annual Report is submitted for the general information of shareholders of the Fund. It is not authorized for distribution to prospective investors in the Fund unless preceded or accompanied by an effective prospectus. | ||
 | Investment Advisor: Thornburg Investment Management® 800.847.0200
Distributor: Thornburg Securities Corporation® 800.847.0200
TH172 | |
Waste not, Wait not |  | |
Get instant access to your shareholder reports.
By switching from your postal mailbox to your email inbox, you reduce paper clutter, improve record keeping access, and help conserve our natural resources.
Go to www.thornburg.com/edelivery and sign up to receive your shareholder reports, prospectuses, and proxy statements electronically.
You invest in the future, without spending a dime. | ||

| 2 | This page is not part of the Semi-Annual Report. |
Important Information
The information presented on the following pages was current as of March 31, 2009. The managers’ views, portfolio holdings, and sector diversification are provided for the general information of the Fund’s shareholders; they are historical and subject to change. This material should not be deemed a recommendation to buy or sell any of the securities mentioned.
Investments in the Fund carry risks, including possible loss of principal. As with direct bond ownership, funds that invest in bonds are subject to certain risks including interest-rate risk, credit risk, and inflation risk. The principal value of bonds will fluctuate relative to changes in interest rates, decreasing when interest rates rise. Unlike bonds, bond funds have ongoing fees and expenses. Please see the Fund’s Prospectus for a discussion of the risks associated with an investment in the Fund. Investments in the Fund are not deposits or obligations of, or guaranteed or endorsed by, any bank, the Federal Deposit Insurance Corporation, the Federal Reserve Board or any government agency. There is no guarantee that the Fund will meet its investment objectives. The laddering strategy does not assure or guarantee better performance and cannot eliminate the risk of investment losses.
Performance data given at net asset value (NAV) does not take into account the applicable sales charges. If the sales charges had been included, the performance would have been lower.
Minimum investments for Class I shares are higher than those for other classes. Class I shares may not be available to all investors.
Share Class | NASDAQ Symbol | Cusip | ||
| Class A | THNMX | 885-215-301 | ||
| Class D | THNDX | 885-215-624 | ||
| Class I | THNIX | 885-215-285 |
Lipper’s 2008
Best Fixed-Income Fund Family
Thornburg Investment Management ranked #1 out of 41 eligible firms in Lipper, Inc.’s fixed income large firm universe for the three-year period ended 12/31/07, based on risk-adjusted returns. Past performance does not guarantee future results.
Lipper’s large firm universe is comprised of fund families with more than $28 billion in total net assets. Only fund families with at least five bond funds were eligible. Risk-adjusted returns were calculated with dividends reinvested and without sales charges. We did not win this award in 2009.
Glossary
Merrill Lynch 7-12 Year Municipal Bond Index – The Merrill Lynch 7-12 Year Municipal Bond Index represents a broad measure of market performance. It is a model portfolio of municipal obligations throughout the U.S., with an average maturity which ranges from seven to twelve years.
Unless otherwise noted, index returns reflect the reinvestment of income dividends and capital gains, if any, but do not reflect fees, brokerage commissions or other expenses of investing. Investors may not make direct investments into any index.
Alternative Minimum Tax (AMT) – A federal tax aimed at ensuring that high-income individuals, estates, trusts, and corporations pay a minimal level income tax. For individuals, the AMT is calculated by adding tax preference items to regular taxable income.
Distribution Rate – The distribution rate is calculated by taking the sum of the month’s total distribution factors and dividing this sum by a 30-day period and annualizing to a 360-day year. The value is then divided by the ending Net Asset Value (NAV) to arrive at the annualized distribution yield. The yield is calculated on a periodic basis and is subject to change depending on the Fund’s NAV and current distributions.
Duration – The weighted maturity of a bond’s cash flows. Duration measures the price sensitivity of a bond for a given change in interest rates. Bonds with longer durations experience greater price volatility than bond with shorter durations.
General Obligation (GO) Bonds – A municipal bond secured by the pledge of the issuer’s full faith, credit, and taxing power rather than the revenue from a given project.
Leverage – The amount of debt used to finance a firm’s assets. A firm with significantly more debt than equity is considered to be highly leveraged.
Pre-Refunded Bond – A type of municipal bond that has been escrowed or collateralized either by direct obligations guaranteed by the U.S. government, or by other types of securities. The escrow account is structured so that these refunded bonds are to be called at the first possible call date. Such bonds, if escrowed with securities guaranteed by the U.S. government, have little if any credit risk.
Quality Spread – The difference between the yields of securities with different quality ratings.
| This page is not part of the Semi-Annual Report. | 3 |
Important Information
Continued
Revenue Bond – A bond on which the debt service is payable solely from the revenue generated from the operation of the project being financed or a category of facilities, or from other non-tax sources.
SEC Yield – SEC Yield is computed in accordance with SEC standards measuring the net investment income per share over a specified 30-day period expressed as a percentage of the maximum offering price of the Fund’s shares at the end of the period.
Tax-Backed Bonds – A broad category of bonds that are secured by taxes levied by the obligor.
U.S. Treasury Securities – U.S. Treasury securities, such as bills, notes and bonds, are negotiable debt obligations of the U.S. government. These debt obligations are backed by the “full faith and credit” of the government and issued at various schedules and maturities. Income from Treasury securities is exempt from state and local, but not federal income taxes.
Yield Spread – The difference in yield, at a given time, between two bonds or between different segments of the bond market.
| 4 | This page is not part of the Semi-Annual Report. |
Thornburg New Mexico Intermediate Municipal Fund
At Thornburg, our approach to fixed-income management is based on the premise that investors in our bond funds seek preservation of capital along with an attractive, relatively stable yield. While aggressive bond strategies may generate stronger returns when the market is turning a blind eye towards risk, they usually fail to stack up over longer periods of time. Our patience and diligence was recognized by Lipper, in 2008 with the Best Fixed-Income Fund Family Award.
We apply time-tested techniques to manage risk and provide attractive returns. These include:
| • | Building a laddered portfolio. Laddering has been shown over time to mitigate price and interest rate risk. |
| • | Investing on a cash-only basis without using leverage. While leveraged strategies may enhance returns when market conditions are favorable, they can quickly compound losses when sentiment shifts. |
| • | Conducting in-depth fundamental research on each issue and actively monitoring positions for subsequent credit events. |
| • | Diversifying among a large number of generally high-quality bonds. |
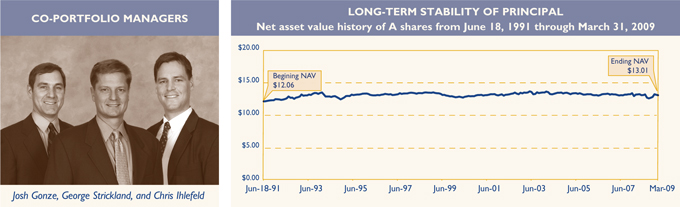
IMPORTANT
PERFORMANCE INFORMATION
Performance data shown represents past performance and is no guarantee of future results. Investment return and principal value will fluctuate so shares, when redeemed, may be worth more or less than their original cost. Current performance may be lower or higher than quoted. For performance current to the most recent month end, visit thornburg.com.
The maximum sales charge for the Fund’s Class A shares is 2.00%. The total annual fund operating expense of Class A shares is 0.97%, as disclosed in the most recent Prospectus.
AVERAGE ANNUAL TOTAL RETURNS
For periods ended March 31, 2009
| 1 Yr | 3 Yrs | 5 Yrs | 10 Yrs | Since Inception | |||||||||||
A Shares (Incep: 6/18/91) | |||||||||||||||
Without Sales Charge | 2.84 | % | 3.53 | % | 2.79 | % | 3.65 | % | 4.86 | % | |||||
With Sales Charge | 0.77 | % | 2.82 | % | 2.37 | % | 3.44 | % | 4.74 | % |
30-DAY YIELDS, A SHARES
As of March 31, 2009
Annualized Distribution Rate (@NAV) | SEC Yield | SEC Taxable | ||
3.59% | 2.24% | 3.62% |
SEC Taxable Equivalent Yields assume a 35% marginal federal tax rate and a 4.9% state of New Mexico marginal tax rate. Portions of the income of the Fund may be subject AMT.
KEY PORTFOLIO ATTRIBUTES
As of March 31, 2009
Average Credit Quality | AA | |
Number of Bonds | 132 | |
Duration | 4.9 Yrs | |
Average Maturity | 8.1 Yrs |
See the entire portfolio in the Schedule of Investments on page 21.
| This page is not part of the Semi-Annual Report. | 5 |
THORNBURG NEW MEXICO INTERMEDIATE MUNICIPAL FUND VERSUS LIPPER OTHER STATES
TAX-EXEMPT MONEY MARKET FUNDS AVERAGE
Class A shares as of March 31, 2009
We are often asked to compare Thornburg New Mexico Intermediate Municipal Fund to money market fund returns. These investments have certain differences, which are summarized below. Investors in the Thornburg New Mexico Intermediate Municipal Fund took more risk than tax-exempt money market fund investors to earn their higher returns.
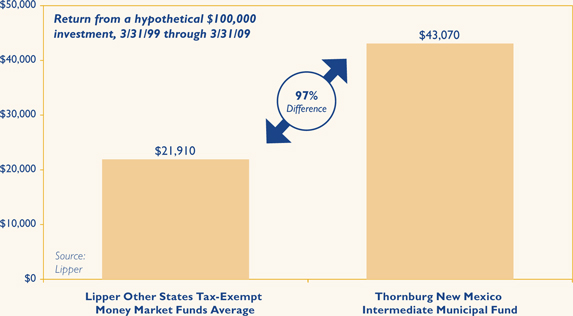
Past performance does not guarantee future results. Performance data above does not include the 2.00% sales charge for Class A shares. If the sales charge had been included, returns would have been lower. Returns shown are minus the initial investment.
Municipal bond funds are not an exact substitute for money market funds. Investors in municipal bond funds may experience more volatility than those in comparable money market funds. There are also differences in fees and expenses.
Investors in the Thornburg New Mexico Intermediate Municipal Fund took more risk than money market investors to earn their higher returns including reinvestment risk, credit risk, and inflation risk. Unlike money market funds, the prices of bonds fluctuate relative to changes in interest rates, with principal values decreasing when interest rates rise and increasing when interest rates fall. Generally, money market funds seek to maintain an investment portfolio with an average maturity of 90 days or less. Thornburg New Mexico Intermediate Municipal Fund has an average maturity of normally between three and ten years. Interest dividends paid by the Fund or by tax-exempt money market funds are generally exempt from federal income tax and (for residents of New Mexico) state income tax (may be subject to AMT).
Money market funds seek to preserve the value per share at $1.00, whereas, the Thornburg New Mexico Intermediate Municipal Fund’s net asset value changes daily. It is possible to lose money when investing in either the Thornburg New Mexico Intermediate Municipal Fund or a tax-exempt money market fund. Neither are insured by the FDIC or any other government agency.
Lipper Other States Tax-Exempt Money Market Funds Average is an arithmetic average of the total return of all other states tax-exempt money market mutual funds. You cannot invest in a category average.
| 6 | This page is not part of the Semi-Annual Report. |

Thornburg New Mexico Intermediate Municipal Fund
March 31, 2009
Table of Contents
| 8 | ||
| 11 | ||
| 12 | ||
| 13 | ||
| 14 | ||
| 18 | ||
| 21 | ||
| 25 | ||
| 26 | ||
This report is certified under the Sarbanes-Oxley Act of 2002, which requires that public companies, including mutual funds, affirm that the information provided in their annual and semiannual shareholder reports fully and fairly represents their financial position.
| Certified Semi-Annual Report | 7 |
 George Strickland Co-Portfolio Manager
Josh Gonze Co-Portfolio Manager
Christopher Ihlefeld Co-Portfolio Manager | April 21, 2009
Dear Fellow Shareholder:
We are pleased to present the Semi-Annual Report for the Thornburg New Mexico Intermediate Municipal Fund. The net asset value of the Class A shares increased by 37 cents to $13.01 during the six months ended March 31, 2009. If you were with us for the entire period, you received dividends of 23.9 cents per share. If you reinvested your dividends, you received 24.1 cents per share. Dividends per share were lower for Class D shares and higher for Class I shares, to account for varying class-specific expenses.
The last six months have been an extremely volatile period for municipal bond prices. It started in September and October of 2008, with the Lehman Brothers bankruptcy which led many investors to shun taxable and tax-free money market funds. The money market funds were forced to dump their investments in order to meet redemptions, which caused the yield on tax-free money market securities to spike. Since hedge funds and other leveraged investors finance their purchases of long-term bonds with money market securities, their borrowing costs shot up so they had to sell long-term bonds in order to deleverage. This placed significant selling pressure on the municipal marketplace and sent yields up (and prices lower) in a precipitous fashion.
From mid-September to mid-October, the yield on AAA-rated municipal bonds rose from 2.93% to 3.68%. Over that time period, yields went higher almost every day. From mid-October on, the market for the highest quality bonds settled down quite a bit, but prices for all other bonds have been quite variable. For instance, the yield spread between a ten-year AAA-rated general obligation bond and a BBB-rated revenue bond averaged 0.75% from May 1991 to December 2007. That average yield spread surged to 1.67% from January 2008 to April 2009. As of April 15, 2009, the AAA to BBB yield spread stood at 3.01%.
Investors have been shunning risk of all types and that is certainly true in the municipal bond market. However, there are other reasons that municipal quality spreads are at unprecedented levels. Large monoline bond insurers such as MBIA, AMBAC and FGIC were in the business of arbitraging bond spreads. If a bond’s spread to the AAA yield curve got too wide, they would typically step in and charge the issuer a premium for an insurance policy that got them a AAA rating. Bonds that received a AAA rating through insurance didn’t quite get an issuer the same interest rate as a “natural” AAA bond such as a bond issued by the State of Maryland, but it got them very close. In this way, the bond insurers were the policemen of the municipal spread markets. Instead of writing |


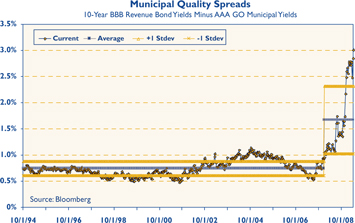
| 8 | Certified Semi-Annual Report |
speeding tickets, they wrote insurance policies that got issuers back in line with AAA rates. Now that investors’ confidence in the bond insurers has been justifiably shattered, insured bonds typically trade at very wide spreads based upon market views of the underlying obligor. In effect, there are no policemen anymore.
The market, which was becoming more generic and homogenous in nature, is now fractured and harder to analyze. Many traders used to glance at a bond, see the MBIA insurance, and work up a quick bid. Many of those traders are now out of business. Traders and portfolio managers today have to look into covenants, security provisions, margins and balance sheets before they can decide what a bond is worth. These are skills that we, at Thornburg Investment Management, have never gotten out of the habit of using.
The consequences of faulty or incomplete analysis are more severe today. The market is adapting to the new reality, but while it does, fear and opportunity are at exaggerated levels. Liquidity is harder to find, and any bond that is not straightforward and easy to analyze is trading at a large yield premium to widely recognized bonds. The market is greatly favoring bonds pre-refunded in Treasury securities and large general obligation issuers over high and medium quality issuers of tax-backed and revenue bonds. In other words, it is a bond picker’s paradise. For the price of a little research and market knowledge, great value can be extracted. We have not changed our management style, but we are spending more time looking into “story” bonds and have slightly decreased the average credit rating of the portfolio as we have found good values in bonds rated below AAA.
Investors do have some legitimate reasons to be shunning risk these days. The average high yield municipal bond fund lost over 25% last year. The economy is basically in shambles in much of the country and collectively, the 50 states are currently grappling with $100 billion of projected deficits in their 2010 fiscal years. However, we see some reasons for optimism. Investment grade municipal bonds have an impressive long-term track record. Standard & Poor’s recently updated their study showing ten-year cumulative default rates that averaged 0.13%. We expect defaults to be somewhat more frequent going forward, but there are counterbalancing factors that could limit any rise in the default rate. Many state and local governments set aside large reserve balances when times were good so that they can draw upon those resources today. Others are rebalancing their budgets frequently and are cutting spending aggressively. Some governments are doing both while raising taxes and fees, and all are making use of the federal largess in the $787 billion American Recovery and Reinvestment Act. As we scrutinize municipal finances, we see many issuers that are standing up to these challenging times. There are a few that may not, and we will strive to continue avoiding their bonds in order to protect the portfolio. It is a very important time for careful diligence and diversification of investment portfolios. Your Fund is broadly diversified and 93% invested in bonds rated A or above by at least one of the major rating agencies.
New Mexico finances have been impacted recently by lower oil and natural gas prices and a weakening economy. The state cut spending by over $160 million and transferred $130 million of state agency funds to bring the current fiscal year into balance and end the year with the targeted 10% reserve fund balance. The 2010 fiscal year looks challenging with a projected revenue shortfall of $576 million (10.5% of revenues). However, there are further cuts that can be made, and the $2 billion of fiscal stimulus funds that appears to be allocated to the state should be flowing into revenues over the next couple of years.
Your Thornburg New Mexico Intermediate Municipal Fund is a laddered portfolio of over 130 municipal obligations from all over New Mexico. We ladder the maturity dates of the bonds in your portfolio so that some of the bonds are scheduled to mature during each of the coming years. Laddering intermediate bonds accomplishes two goals. First, the staggered bond maturities contained in a ladder defuse interest-rate risk and dampen the Fund’s price volatility. Second, laddering gives the Fund a steady cash flow stream from maturing bonds to reinvest toward the top of the
| Certified Semi-Annual Report | 9 |
Letter to Shareholders
Continued
ladder where yields are typically higher. The chart on the right describes the percentages of your Fund’s bond portfolio maturing in each of the coming years.
The Class A shares of your Fund produced a total return of 4.85% over the six-month period ended March 31, 2009, compared to a 6.58% return for the Merrill Lynch 7-12 Year Municipal Bond Index. Over the last six months, pre-refunded and general obligation bonds from large issuers generally performed better than a diversified portfolio of revenue and tax-backed bonds from smaller issuers. Since the Fund predominantly holds bonds from smaller and mid-sized issuers, the Fund underperformed the Index over the last six months.
Historically, our practice of laddering a diversified portfolio of short and intermediate maturity municipal bonds has allowed your Fund to perform consistently well in varying interest rate environments. Thank you for investing in Thornburg New Mexico Intermediate Municipal Fund.
% of Portfolio Maturing | Cumulative % Maturing | |||||||
| 2 years = | 11.0% | Year 2 = | 11.0% | |||||
| 2 to 4 years = | 11.5% | Year 4 = | 22.5% | |||||
| 4 to 6 years = | 10.9% | Year 6 = | 33.4% | |||||
| 6 to 8 years = | 10.5% | Year 8 = | 43.9% | |||||
| 8 to 10 years = | 12.7% | Year 10 = | 56.6% | |||||
| 10 to 12 years = | 8.7% | Year 12 = | 65.3% | |||||
| 12 to 14 years = | 10.9% | Year 14 = | 76.2% | |||||
| 14 to 16 years = | 11.7% | Year 16 = | 87.9% | |||||
| 16 to 18 years = | 4.8% | Year 18 = | 92.7% | |||||
| Over 18 years = | 7.3% | Over 18 years = | 100.0% | |||||
| ||||||||
| Percentages can and do vary. Data as of 3/31/09. | ||||||||
Sincerely,
 |  |  | ||
| George Strickland | Josh Gonze | Christopher Ihlefeld | ||
| Co-Portfolio Manager | Co-Portfolio Manager | Co-Portfolio Manager | ||
| Managing Director | Managing Director | Managing Director |
The matters discussed in this report may constitute forward-looking statements made pursuant to the safe harbor provisions of the Securities Litigation Reform Act of 1995. These include any advisor or portfolio manager prediction, assessment, analysis or outlook for individual securities, industries, investment styles, market sectors and/or markets. These statements involve risks and uncertainties. In addition to the general risks described for each fund in its current prospectus, other factors bearing on these reports include the accuracy of the advisor’s or portfolio manager’s forecasts and predictions, the appropriateness of the investment strategies designed by the advisor or portfolio manager and the ability of the advisor or portfolio manager to implement their strategies efficiently and successfully. Any one or more of these factors, as well as other risks affecting the securities markets generally, could cause the actual results of any fund to differ materially as compared to its benchmarks.
| 10 | Certified Semi-Annual Report |
STATEMENT OF ASSETS AND LIABILITIES
| Thornburg New Mexico Intermediate Municipal Fund | March 31, 2009 (Unaudited) |
ASSETS | ||||
Investments at value (cost $205,677,827) (Note 2) | $ | 207,669,973 | ||
Cash | 131,817 | |||
Receivable for fund shares sold | 1,632,781 | |||
Interest receivable | 2,989,699 | |||
Prepaid expenses and other assets | 1,064 | |||
Total Assets | 212,425,334 | |||
| LIABILITIES | ||||
Payable for securities purchased | 2,688,216 | |||
Payable for fund shares redeemed | 139,864 | |||
Payable to investment advisor and other affiliates (Note 3) | 150,444 | |||
Accounts payable and accrued expenses | 33,032 | |||
Dividends payable | 215,929 | |||
Total Liabilities | 3,227,485 | |||
| NET ASSETS | $ | 209,197,849 | ||
| NET ASSETS CONSIST OF: | ||||
Distribution in excess of net investment income | $ | (24,691 | ) | |
Net unrealized appreciation on investments | 1,992,146 | |||
Accumulated net realized gain (loss) | (544,056 | ) | ||
Net capital paid in on shares of beneficial interest | 207,774,450 | |||
| $ | 209,197,849 | |||
| NET ASSET VALUE: | ||||
| Class A Shares: | ||||
Net asset value and redemption price per share | $ | 13.01 | ||
Maximum sales charge, 2.00% of offering price | 0.27 | |||
Maximum offering price per share | $ | 13.28 | ||
Class D Shares: | ||||
Net asset value, offering and redemption price per share | $ | 13.01 | ||
| Class I Shares: | ||||
Net asset value, offering and redemption price per share | $ | 13.00 | ||
See notes to financial statements.
| Certified Semi-Annual Report | 11 |
| Thornburg New Mexico Intermediate Municipal Fund | Six Months Ended March 31, 2009 (Unaudited) |
| INVESTMENT INCOME: | ||||
Interest income (net of premium amortized of $394,417) | $ | 4,765,030 | ||
| EXPENSES: | ||||
Investment advisory fees (Note 3) | 507,835 | |||
Administration fees (Note 3) | ||||
Class A Shares | 101,213 | |||
Class D Shares | 9,887 | |||
Class I Shares | 6,343 | |||
Distribution and service fees (Note 3) | ||||
Class A Shares | 202,425 | |||
Class D Shares | 79,174 | |||
Transfer agent fees | ||||
Class A Shares | 26,205 | |||
Class D Shares | 3,804 | |||
Class I Shares | 1,673 | |||
Registration and filing fees | ||||
Class A Shares | 269 | |||
Class D Shares | 293 | |||
Class I Shares | 242 | |||
Custodian fees (Note 3) | 18,542 | |||
Professional fees | 13,027 | |||
Accounting fees | 3,281 | |||
Trustee fees | 2,769 | |||
Other expenses | 9,852 | |||
Total Expenses | 986,834 | |||
Less: | ||||
Distribution fees waived (Note 3) | (39,587 | ) | ||
Fees paid indirectly (Note 3) | (1,096 | ) | ||
Net Expenses | 946,151 | |||
Net Investment Income | 3,818,879 | |||
REALIZED AND UNREALIZED GAIN (LOSS) | ||||
Net realized gain (loss) on investments sold | 83,774 | |||
Net change in unrealized appreciation (depreciation) of investments | 5,663,269 | |||
Net Realized and Unrealized Gain | 5,747,043 | |||
Net Increase in Net Assets Resulting From Operations | $ | 9,565,922 | ||
See notes to financial statements.
| 12 | Certified Semi-Annual Report |
STATEMENTS OF CHANGES IN NET ASSETS
|
| Thornburg New Mexico Intermediate Municipal Fund |
| Six Months Ended March 31, 2009* | Year Ended September 30, 2008 | |||||||
INCREASE (DECREASE) IN NET ASSETS FROM: | ||||||||
OPERATIONS: | ||||||||
Net investment income | $ | 3,818,879 | $ | 7,304,597 | ||||
Net realized gain on investments | 83,774 | 306,833 | ||||||
Increase (Decrease) in unrealized appreciation (depreciation) of investments | 5,663,269 | (7,873,236 | ) | |||||
Net Increase (Decrease) in Net Assets Resulting from Operations | 9,565,922 | (261,806 | ) | |||||
DIVIDENDS TO SHAREHOLDERS: | ||||||||
From net investment income | ||||||||
Class A Shares | (3,026,833 | ) | (5,987,083 | ) | ||||
Class D Shares | (274,308 | ) | (495,075 | ) | ||||
Class I Shares | (517,738 | ) | (822,439 | ) | ||||
FUND SHARE TRANSACTIONS (NOTE 4): | ||||||||
Class A Shares | (1,799,618 | ) | 863,745 | |||||
Class D Shares | 519,181 | 2,599,577 | ||||||
Class I Shares | 1,549,923 | 5,203,704 | ||||||
Net Increase in Net Assets | 6,016,529 | 1,100,623 | ||||||
NET ASSETS: | ||||||||
Beginning of period | 203,181,320 | 202,080,697 | ||||||
End of period | $ | 209,197,849 | $ | 203,181,320 | ||||
| * | Unaudited. |
See notes to financial statements.
| Certified Semi-Annual Report | 13 |
Thornburg New Mexico Intermediate Municipal Fund | March 31, 2009 (Unaudited) | |
NOTE 1 – ORGANIZATION
Thornburg New Mexico Intermediate Municipal Fund (the “Fund”) is a non-diversified series of Thornburg Investment Trust (the “Trust”). The Trust is organized as a Massachusetts business trust under a Declaration of Trust dated June 3, 1987 and is registered as a diversified, open-end management investment company under the Investment Company Act of 1940, as amended. The Trust is currently issuing thirteen series of shares of beneficial interest in addition to those of the Fund: Thornburg Limited Term Municipal Fund, Thornburg California Limited Term Municipal Fund, Thornburg New York Intermediate Municipal Fund, Thornburg Intermediate Municipal Fund, Thornburg Limited Term U.S. Government Fund, Thornburg Limited Term Income Fund, Thornburg Value Fund, Thornburg International Value Fund, Thornburg Core Growth Fund, Thornburg Investment Income Builder Fund, Thornburg Global Opportunities Fund, Thornburg International Growth Fund, and Thornburg Strategic Income Fund. Each series is considered to be a separate entity for financial reporting and tax purposes and bears expenses directly attributable to it. The Fund’s primary investment objective is to obtain as high a level of current income exempt from federal and New Mexico state individual income tax as is consistent, in the view of the Fund’s investment advisor, with the preservation of capital. The Fund’s secondary objective is to reduce expected changes in its share price compared to long-term bond portfolios.
The Fund currently offers three classes of shares of beneficial interest: Class A, Class D, and Institutional Class (Class I) shares. Each class of shares of the Fund represents an interest in the same portfolio of investments, except that (i) Class A shares are sold subject to a front-end sales charge collected at the time the shares are purchased and bear a service fee, (ii) Class D shares are sold at net asset value without a sales charge at the time of purchase or redemption, and bear both a service fee and a distribution fee, (iii) Class I shares are sold at net asset value without a sales charge at the time of purchase, and (iv) the respective classes may have different reinvestment privileges and conversion rights. Additionally, the Fund may allocate among its classes certain expenses, to the extent allowable to specific classes, including transfer agent fees, government registration fees, certain printing and postage costs, and administrative and legal expenses. Currently, class specific expenses of the Fund are limited to service and distribution fees, administration fees, and certain registration and transfer agent expenses.
NOTE 2 – SIGNIFICANT ACCOUNTING POLICIES
Significant accounting policies of the Trust are as follows:
Valuation of Investments: Debt obligations have a primary market over the counter and are valued by an independent pricing service approved by the Trustees of the Trust. The pricing service ordinarily values debt obligations at quoted bid prices. When quotations are not available, debt obligations are valued at evaluated prices determined by the pricing service using methods which include consideration of yields or prices of debt obligations of comparable quality, type of issue, coupon, maturity, and rating, and indications as to value from dealers and general market conditions. Short-term obligations having remaining maturities of 60 days or less are valued at amortized cost, which approximates market value.
In any case where a pricing service fails to provide a price for a debt obligation held by the Fund, the valuation and pricing committee determines a fair value for the obligation using procedures approved by the Trustees. Additionally, in any case where management believes that a price provided by a pricing service for a debt obligation may be unreliable, the valuation and pricing committee decides whether or not to use the pricing service’s valuation or to determine a fair value for the obligation.
In determining fair value for any portfolio security or other investment, the valuation and pricing committee seeks to determine the amount that an owner of the investment might reasonably expect to receive upon a sale of the investment. However, because fair value prices are estimated prices, the valuation and pricing committee’s determination of fair value for an investment may differ from the value that would be realized by the Fund upon a sale of the investment, and that difference could be material to the Fund’s financial statements. The valuation and pricing committee’s determination of fair value for an investment may also differ from the prices obtained by other persons (including other mutual funds) for the investment.
Valuation Measurements: Various inputs are used in determining the value of the Fund’s investments. These inputs are summarized in the three levels listed below.
Level 1: Quoted prices in active markets for identical investments.
Level 2: Other significant observable inputs (including quoted prices for similar investments, interest rates, prepayment rates, credit risk, etc.).
Level 3: Significant unobservable inputs (including the Fund’s own assumptions in determining the fair value of investments).
| 14 | Certified Semi-Annual Report |
| NOTES TO FINANCIAL STATEMENTS, CONTINUED | ||
Thornburg New Mexico Intermediate Municipal Fund | March 31, 2009 (Unaudited) | |
The following table displays a summary of the inputs used to value the Fund’s net assets as of March 31, 2009. In any instance when valuation inputs from more than one level are used to determine the fair value of a specific investment, the investment is placed in the level of the table based upon the lowest level input that is significant in determining the fair value of the investment:
Valuation Inputs | Investments in Securities | Investments in Other Financial Instruments* | ||||
Level 1 - Quoted Prices in Active Markets for Identical Assets | $ | — | $ | — | ||
Level 2 - Other Significant Observable Inputs | 207,669,973 | — | ||||
Level 3 - Significant Unobservable Inputs | — | — | ||||
Other | — | — | ||||
Total | $ | 207,669,973 | $ | — | ||
* Other financial instruments include investments not reflected in the Schedule of Investments, such as futures, forwards and swap contracts, which are valued at the unrealized appreciation (depreciation) on the instrument. | ||||||
Federal Income Taxes: It is the policy of the Trust to comply with the provisions of the Internal Revenue Code applicable to “regulated investment companies” and to distribute to shareholders substantially all taxable (if any) and tax exempt income of the Fund. Therefore, no provision for federal income tax is required.
When-Issued and Delayed Delivery Transactions: The Trust may engage in when-issued or delayed delivery transactions. To the extent the Trust engages in such transactions, it will do so for the purpose of acquiring portfolio securities consistent with the Fund’s investment objectives and not for the purpose of investment leverage or to speculate on interest rate and/or market changes. At the time the Trust makes a commitment to purchase a security on a when-issued or delayed delivery basis, the Fund will record the transaction and reflect the value in determining its net asset value. When effecting such transactions, assets of an amount sufficient to make payment for the portfolio securities to be purchased will be segregated on the Fund’s records on the trade date. Securities purchased on a when-issued or delayed delivery basis do not earn interest until the settlement date.
Dividends: Net investment income of the Fund is declared daily as a dividend on shares for which the Fund has received payment. Dividends are paid monthly and are reinvested in additional shares of the Fund at net asset value per share at the close of business on the dividend payment date, or at the shareholder’s option, paid in cash. Net realized capital gains, to the extent available, will be distributed at least annually.
General: Securities transactions are accounted for on a trade date basis. Interest income is accrued as earned. Premiums and discounts on securities purchased are amortized to call dates or maturity dates of the respective securities. Realized gains and losses from the sale of securities are recorded on an identified cost basis. Net investment income (other than class specific expenses) and realized and unrealized gains and losses are allocated daily to each class of shares based upon the relative net asset value of outstanding shares (or the value of the dividend-eligible shares, as appropriate) of each class of shares at the beginning of the day (after adjusting for the current capital shares activity of the respective class). Expenses common to all funds are allocated among the funds comprising the Trust based upon their relative net asset values or other appropriate allocation methods.
Guarantees and Indemnifications: Under the Trust’s organizational documents, its officers and Trustees are indemnified against certain liabilities arising out of the performance of their duties to the Fund. Additionally, in the normal course of business the Trust enters into contracts with service providers that contain general indemnification clauses. The Trust’s maximum exposure under these arrangements is unknown. However, based on experience, the Trust expects the risk of loss to be remote.
Use of Estimates: The preparation of financial statements, in conformity with generally accepted accounting principles, requires management to make estimates and assumptions that affect the reported amounts of assets and liabilities and the disclosure of contingent assets and liabilities at the date of the financial statements and the reported amounts of increases and decreases in net assets from operations during the reporting period. Actual results could differ from those estimates.
NOTE 3 – INVESTMENT ADVISORY FEE AND OTHER TRANSACTIONS WITH AFFILIATES
Pursuant to an investment advisory agreement, Thornburg Investment Management, Inc. (the “Advisor”) serves as the investment advisor and performs services to the Fund for which the fees are payable at the end of each month. For the six months ended March 31, 2009, these fees were payable at annual rates ranging from .50 of 1% to .275 of 1% per annum of the average daily net assets of the Fund depending on the Fund’s asset size. The Trust also has entered into administrative services agreements with the Advisor, whereby the Advisor will perform certain administrative services for the shareholders of each class of the Fund’s shares, and for which fees will be payable at an annual rate of up to .125 of 1% per annum of the average daily net assets attributable to each class of shares.
The Trust has an underwriting agreement with Thornburg Securities Corporation (the “Distributor,” an affiliate of the Advisor), which acts as the distributor of the Fund’s shares. For the six months ended March 31, 2009, the Distributor has advised the Fund that it earned net commissions aggregating $1,231 from the sale of Class A shares.
| Certified Semi-Annual Report | 15 |
| NOTES TO FINANCIAL STATEMENTS, CONTINUED | ||
Thornburg New Mexico Intermediate Municipal Fund | March 31, 2009 (Unaudited) | |
Pursuant to a service plan under Rule 12b-1 of the Investment Company Act of 1940, the Fund may reimburse to the Advisor an amount not to exceed .25 of 1% per annum of the average daily net assets attributable to each class of shares of the Fund for payments made by the Advisor to securities dealers and other financial institutions to obtain various shareholder and distribution related services. The Advisor may pay out of its own resources additional expenses for distribution of the Fund’s shares.
The Trust has also adopted distribution plans pursuant to Rule 12b-1, applicable only to the Fund’s Class D shares, under which the Fund compensates the Distributor for services in promoting the sale of Class D shares of the Fund at an annual rate of up to .75 of 1% per annum of the average daily net assets attributable to Class D shares. Total fees incurred by the Distributor for each class of shares of the Fund under their respective Service and Distribution Plans for the six months ended March 31, 2009, are set forth in the Statement of Operations. Distribution fees in the amount of $39,587 were waived for Class D shares.
The Trust has an agreement with the custodian bank to indirectly pay a portion of the custodian’s fees through credits earned by the Fund’s cash on deposit with the bank. This deposit agreement is an alternative to overnight investments. Custodial fees have been adjusted to reflect amounts that would have been paid without this agreement, with a corresponding adjustment reflected as fees paid indirectly in the Statement of Operations. For the six months ended March 31, 2009, fees paid indirectly were $1,096.
Certain officers and Trustees of the Trust are also officers and/or directors of the Advisor and Distributor. The compensation of independent Trustees is borne by the Trust.
NOTE 4 – SHARES OF BENEFICIAL INTEREST
At March 31, 2009, there were an unlimited number of shares of beneficial interest authorized. Transactions in shares of beneficial interest were as follows:
| Six Months Ended March 31, 2009 (Unaudited) | Year Ended September 30, 2008 (Audited) | |||||||||||||
| Shares | Amount | Shares | Amount | |||||||||||
Class A Shares | ||||||||||||||
Shares sold | 927,144 | $ | 11,899,530 | 1,962,932 | $ | 25,829,862 | ||||||||
Shares issued to shareholders in reinvestment of dividends | 145,391 | 1,868,480 | 281,958 | 3,685,132 | ||||||||||
Shares repurchased | (1,231,072 | ) | (15,567,628 | ) | (2,179,867 | ) | (28,651,249 | ) | ||||||
Net Increase (Decrease) | (158,537 | ) | $ | (1,799,618 | ) | 65,023 | $ | 863,745 | ||||||
Class D Shares | ||||||||||||||
Shares sold | 111,085 | $ | 1,442,026 | 334,108 | $ | 4,407,249 | ||||||||
Shares issued to shareholders in reinvestment of dividends | 17,272 | 222,217 | 29,797 | 389,455 | ||||||||||
Shares repurchased | (89,058 | ) | (1,145,062 | ) | (167,471 | ) | (2,197,127 | ) | ||||||
Net Increase (Decrease) | 39,299 | $ | 519,181 | 196,434 | $ | 2,599,577 | ||||||||
Class I Shares | ||||||||||||||
Shares sold | 147,995 | $ | 1,824,148 | 730,390 | $ | 9,604,681 | ||||||||
Shares issued to shareholders in reinvestment of dividends | 30,924 | 397,230 | 49,543 | 647,263 | ||||||||||
Shares repurchased | (53,200 | ) | (671,455 | ) | (384,441 | ) | (5,048,240 | ) | ||||||
Net Increase (Decrease) | 125,719 | $ | 1,549,923 | 395,492 | $ | 5,203,704 | ||||||||
| 16 | Certified Semi-Annual Report |
| NOTES TO FINANCIAL STATEMENTS, CONTINUED | ||
Thornburg New Mexico Intermediate Municipal Fund | March 31, 2009 (Unaudited) | |
NOTE 5 – SECURITIES TRANSACTIONS
For the six months ended March 31, 2009, the Fund had purchase and sale transactions of investment securities (excluding short-term investments) of $19,213,666 and $17,549,833, respectively.
NOTE 6 – INCOME TAXES
At March 31, 2009, information on the tax components of capital is as follows:
Cost of investments for tax purposes | $ | 205,677,827 | ||
Gross unrealized appreciation on a tax basis | $ | 5,898,747 | ||
Gross unrealized depreciation on a tax basis | (3,906,601 | ) | ||
Net unrealized appreciation (depreciation) on investments (tax basis) | $ | 1,992,146 | ||
At March 31, 2009, the Fund had tax basis capital losses, which may be carried forward to offset future capital gains. To the extent such carryforwards are used, capital gains distributions may be reduced to the extent provided by regulations.
Such capital loss carryforwards expire as follows:
2009 | $ | 320,666 | |
2011 | 145,437 | ||
2013 | 255 | ||
2014 | 49,136 | ||
2015 | 112,336 | ||
| $ | 627,830 | ||
OTHER NOTES:
Statement of Accounting Standards No. 161:
On March 19, 2008, the Financial Accounting Standards Board issued Statement of Financial Accounting Standards No. 161, “Disclosures about Derivative Instruments and Hedging Activities” (“FAS 161”). FAS 161 is effective for fiscal years and interim periods beginning after November 15, 2008. FAS 161 requires enhanced disclosures about any derivative and hedging activities by the Fund, including how such activities are accounted for and any effect on the Fund’s financial position, performance and cash flows.
| Certified Semi-Annual Report | 17 |
Thornburg New Mexico Intermediate Municipal Fund
| Six Months Ended March 31, | Year Ended September 30, | |||||||||||||||||||||||
| 2009* | 2008 | 2007 | 2006 | 2005 | 2004 | |||||||||||||||||||
| Class A Shares: | ||||||||||||||||||||||||
PER SHARE PERFORMANCE | ||||||||||||||||||||||||
Net asset value, beginning of period | $ | 12.64 | $ | 13.10 | $ | 13.20 | $ | 13.22 | $ | 13.40 | $ | 13.46 | ||||||||||||
Income from investment operations: | ||||||||||||||||||||||||
Net investment income (loss) | 0.24 | 0.47 | 0.47 | 0.45 | 0.43 | 0.45 | ||||||||||||||||||
Net realized and unrealized gain (loss) on investments | 0.37 | (0.46 | ) | (0.10 | ) | (0.02 | ) | (0.18 | ) | (0.06 | ) | |||||||||||||
Total from investment operations | 0.61 | 0.01 | 0.37 | 0.43 | 0.25 | 0.39 | ||||||||||||||||||
Less dividends from: | ||||||||||||||||||||||||
Net investment income | (0.24 | ) | (0.47 | ) | (0.47 | ) | (0.45 | ) | (0.43 | ) | (0.45 | ) | ||||||||||||
Change in net asset value | 0.37 | (0.46 | ) | (0.10 | ) | (0.02 | ) | (0.18 | ) | (0.06 | ) | |||||||||||||
NET ASSET VALUE, end of period | $ | 13.01 | $ | 12.64 | $ | 13.10 | $ | 13.20 | $ | 13.22 | $ | 13.40 | ||||||||||||
| RATIOS/SUPPLEMENTAL DATA | ||||||||||||||||||||||||
Total return (%)(a) | 4.85 | 0.00 | (b) | 2.82 | 3.31 | 1.88 | 3.00 | |||||||||||||||||
Ratios to average net assets: | ||||||||||||||||||||||||
Net investment income (loss) (%) | 3.74 | (c) | 3.56 | 3.55 | 3.41 | 3.22 | 3.40 | |||||||||||||||||
Expenses, after expense reductions (%) | 0.95 | (c) | 0.97 | 0.98 | 0.99 | 0.99 | 0.96 | |||||||||||||||||
Expenses, after expense reductions and net of custody credits (%) | 0.95 | (c) | 0.95 | 0.97 | 0.98 | 0.98 | 0.96 | |||||||||||||||||
Expenses, before expense reductions (%) | 0.95 | (c) | 0.97 | 0.98 | 0.99 | 0.99 | 0.96 | |||||||||||||||||
Portfolio turnover rate (%) | 8.84 | 13.48 | 17.38 | 11.59 | 16.63 | 14.66 | ||||||||||||||||||
Net assets at end of period (thousands) | $ | 166,653 | $ | 163,928 | $ | 169,130 | $ | 196,163 | $ | 212,335 | $ | 208,435 | ||||||||||||
| (a) | Sales loads are not reflected in computing total return, which is not annualized for periods less than one year. |
| (b) | Total return figure was less than 0.01%. |
| (c) | Annualized. |
| * | Unaudited. |
See notes to financial statements.
| 18 | Certified Semi-Annual Report |
FINANCIAL HIGHLIGHTS, CONTINUED
Thornburg New Mexico Intermediate Municipal Fund
| Six Months Ended March 31, | Year Ended September 30, | |||||||||||||||||||||||
| 2009* | 2008 | 2007 | 2006 | 2005 | 2004 | |||||||||||||||||||
| Class D Shares: | ||||||||||||||||||||||||
PER SHARE PERFORMANCE | ||||||||||||||||||||||||
Net asset value, beginning of period | $ | 12.64 | $ | 13.11 | $ | 13.21 | $ | 13.23 | $ | 13.41 | $ | 13.47 | ||||||||||||
Income from investment operations: | ||||||||||||||||||||||||
Net investment income (loss) | 0.22 | 0.43 | 0.43 | 0.41 | 0.39 | 0.42 | ||||||||||||||||||
Net realized and unrealized gain (loss) on investments | 0.37 | (0.47 | ) | (0.10 | ) | (0.02 | ) | (0.18 | ) | (0.06 | ) | |||||||||||||
Total from investment operations | 0.59 | (0.04 | ) | 0.33 | 0.39 | 0.21 | 0.36 | |||||||||||||||||
Less dividends from: | ||||||||||||||||||||||||
Net investment income | (0.22 | ) | (0.43 | ) | (0.43 | ) | (0.41 | ) | (0.39 | ) | (0.42 | ) | ||||||||||||
Change in net asset value | 0.37 | (0.47 | ) | (0.10 | ) | (0.02 | ) | (0.18 | ) | (0.06 | ) | |||||||||||||
NET ASSET VALUE, end of period | $ | 13.01 | $ | 12.64 | $ | 13.11 | $ | 13.21 | $ | 13.23 | $ | 13.41 | ||||||||||||
RATIOS/SUPPLEMENTAL DATA | ||||||||||||||||||||||||
Total return (%)(a) | 4.71 | (0.35 | ) | 2.57 | 3.04 | 1.62 | 2.70 | |||||||||||||||||
Ratios to average net assets: | ||||||||||||||||||||||||
Net investment income (loss) (%) | 3.47 | (b) | 3.29 | 3.30 | 3.15 | 2.96 | 3.11 | |||||||||||||||||
Expenses, after expense reductions (%) | 1.22 | (b) | 1.24 | 1.23 | 1.24 | 1.25 | 1.25 | |||||||||||||||||
Expenses, after expense reductions and net of custody credits (%) | 1.22 | (b) | 1.22 | 1.23 | 1.24 | 1.24 | 1.24 | |||||||||||||||||
Expenses, before expense reductions (%) | 1.72 | (b) | 1.74 | 1.77 | 1.82 | 1.83 | 1.83 | |||||||||||||||||
Portfolio turnover rate (%) | 8.84 | 13.48 | 17.38 | 11.59 | 16.63 | 14.66 | ||||||||||||||||||
Net assets at end of period (thousands) | $ | 16,490 | $ | 15,525 | $ | 13,524 | $ | 14,113 | $ | 18,577 | $ | 14,051 | ||||||||||||
| (a) | Not annualized for periods less than one year. |
| (b) | Annualized. |
| * | Unaudited. |
See notes to financial statements.
| Certified Semi-Annual Report | 19 |
FINANCIAL HIGHLIGHTS, CONTINUED
Thornburg New Mexico Intermediate Municipal Fund
| Six Months Ended March 31, 2009* | Year Ended Sept. 30, 2008 | Period Ended Sept. 30, 2007(a) | ||||||||||
| Class I Shares: | ||||||||||||
PER SHARE PERFORMANCE | ||||||||||||
Net asset value, beginning of period | $ | 12.63 | $ | 13.10 | $ | 13.10 | ||||||
Income from investment operations: | ||||||||||||
Net investment income (loss) | 0.26 | 0.51 | 0.34 | |||||||||
Net realized and unrealized gain (loss) on investments | 0.37 | (0.47 | ) | — | ||||||||
Total from investment operations | 0.63 | 0.04 | 0.34 | |||||||||
Less dividends from: | ||||||||||||
Net investment income | (0.26 | ) | (0.51 | ) | (0.34 | ) | ||||||
Change in net asset value | 0.37 | (0.47 | ) | — | ||||||||
NET ASSET VALUE, end of period | $ | 13.00 | $ | 12.63 | $ | 13.10 | ||||||
RATIOS/SUPPLEMENTAL DATA | ||||||||||||
Total return (%)(b) | 5.03 | 0.26 | 2.64 | |||||||||
Ratios to average net assets: | ||||||||||||
Net investment income (loss) (%) | 4.08 | (c) | 3.90 | 3.95 | (c) | |||||||
Expenses, after expense reductions (%) | 0.61 | (c) | 0.63 | 0.63 | (c) | |||||||
Expenses, after expense reductions and net of custody credits (%) | 0.61 | (c) | 0.61 | 0.62 | (c) | |||||||
Expenses, before expense reductions (%) | 0.61 | (c) | 0.63 | 0.63 | (c) | |||||||
Portfolio turnover rate (%) | 8.84 | 13.48 | 17.38 | |||||||||
Net assets at end of period (thousands) | $ | 26,055 | $ | 23,728 | $ | 19,427 | ||||||
| (a) | Effective date of this class of shares was February 1, 2007. |
| (b) | Not annualized for periods less than one year. |
| (c) | Annualized. |
| * | Unaudited. |
See notes to financial statements.
| 20 | Certified Semi-Annual Report |
| SCHEDULE OF INVESTMENTS | ||
Thornburg New Mexico Intermediate Municipal Fund | March 31, 2009 (Unaudited) | |
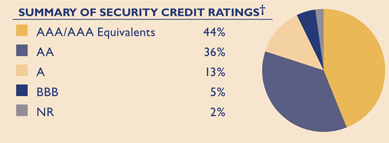
We have used ratings from Standard & Poor’s, (S&P). Where S&P ratings are not available, we have used Moody’s Investors Service. Where neither rating is available, we have used ratings from Fitch Ratings. The category of investments identified as “AAA” in this graph includes investments which are pre-refunded or escrowed to maturity. Such investments are backed by an escrow or trust containing sufficient U.S. Government or U.S. Government agency securities to satisfy the timely payment of principal and interest and, therefore, are normally deemed to be equivalent to AAA-rated securities.
Issuer-Description | Credit Rating† Moody’s/S&P | Principal Amount | Value | |||||
Albuquerque Airport, 5.50% due 7/1/2013 | A1/A | $ | 4,000,000 | $ | 4,255,400 | |||
Albuquerque GRT, 0% due 7/1/2012 pre-refunded 7/1/2011 | Aa3/AAA | 1,775,000 | 1,641,076 | |||||
Albuquerque GRT, 0% due 7/1/2012 (Insured: FSA) | Aa3/AAA | 225,000 | 206,084 | |||||
Albuquerque IDRB, 5.15% due 4/1/2016 (MCT Industries Inc.; LOC: Bank of the West) (AMT) | Aa3/NR | 1,170,000 | 1,197,472 | |||||
Albuquerque IDRB, 5.25% due 4/1/2017 (MCT Industries Inc.; LOC: Bank of the West) (AMT) | Aa3/NR | 2,140,000 | 2,185,197 | |||||
Albuquerque Municipal School District GO, 5.00% due 8/1/2015 | Aa2/AA | 1,175,000 | 1,224,620 | |||||
Albuquerque Refuse Removal & Disposal, 5.00% due 7/1/2010 (Insured: FSA) | Aa3/AAA | 415,000 | 436,202 | |||||
Belen Gasoline Tax Improvement, 5.40% due 1/1/2011 | NR/NR | 345,000 | 343,437 | |||||
Bernalillo County GRT, 5.50% due 10/1/2011 pre-refunded 10/01/2009 | Aa3/AAA | 495,000 | 507,622 | |||||
Bernalillo County GRT, 5.25% due 10/1/2012 | Aa3/AAA | 1,000,000 | 1,117,600 | |||||
Bernalillo County GRT, 5.75% due 10/1/2015 pre-refunded 10/01/2009 | Aa3/AAA | 2,000,000 | 2,053,500 | |||||
Bernalillo County GRT, 5.00% due 4/1/2021 (Insured: MBIA) | Aa3/AA | 3,000,000 | 3,286,260 | |||||
Bernalillo County GRT, 5.25% due 10/1/2022 (Insured: AMBAC) | Aa3/AAA | 3,170,000 | 3,532,172 | |||||
Bernalillo County GRT, 5.25% due 10/1/2023 (Insured: AMBAC) | Aa3/AAA | 1,275,000 | 1,412,980 | |||||
Bernalillo County GRT, 5.25% due 10/1/2025 (Insured: AMBAC) | Aa3/AAA | 3,850,000 | 4,207,318 | |||||
Bernalillo County Water Utility Authority, 5.00% due 7/1/2021 (1) | Aa2/AAA | 1,520,000 | 1,634,106 | |||||
Bernalillo County Water Utility Authority, 5.50% due 7/1/2025 (1) | Aa2/AAA | 1,000,000 | 1,075,790 | |||||
Bernalillo County Water Utility Authority, 5.00% due 7/1/2026 | Aa2/AAA | 1,420,000 | 1,449,422 | |||||
Chaves County GRT, 5.00% due 7/1/2017 pre-refunded 7/1/2010 (Insured: FGIC) | A3/NR | 1,000,000 | 1,054,060 | |||||
Chaves County GRT, 5.05% due 7/1/2019 pre-refunded 7/1/2010 (Insured: FGIC) | A3/NR | 735,000 | 775,190 | |||||
Cibola County GRT, 6.00% due 11/1/2010 (Insured: AMBAC) (ETM) | Baa1/A | 555,000 | 599,722 | |||||
Farmington Hospital, 5.00% due 6/1/2017 (San Juan Regional Medical Center) | A3/NR | 1,035,000 | 991,395 | |||||
Farmington Hospital, 5.125% due 6/1/2018 (San Juan Regional Medical Center) | A3/NR | 570,000 | 545,233 | |||||
Farmington Hospital, 5.125% due 6/1/2019 (San Juan Regional Medical Center) | A3/NR | 645,000 | 604,320 | |||||
Farmington Hospital, 5.00% due 6/1/2022 (San Juan Regional Medical Center) | A3/NR | 2,325,000 | 2,028,702 | |||||
Farmington PCR, 0.35% due 5/1/2024 put 4/1/2009 (LOC: Barclays Bank) (daily demand notes) | VMIG1/A-1+ | 4,700,000 | 4,700,000 | |||||
Farmington Utility Systems, 5.00% due 5/15/2012 (Insured: FSA) | Aa3/AAA | 6,095,000 | 6,476,974 | |||||
Gallup PCR Tri-State Generation, 5.00% due 8/15/2012 (Insured: AMBAC) | Baa1/A | 3,345,000 | 3,302,017 | |||||
Gallup PCR Tri-State Generation, 5.00% due 8/15/2013 (Insured: AMBAC) | Baa1/A | 2,110,000 | 2,047,059 | |||||
Gallup PCR Tri-State Generation, 5.00% due 8/15/2017 (Insured: AMBAC) | Baa1/A | 3,540,000 | 3,160,937 | |||||
Grant County Department of Health, 5.50% due 7/1/2020 (Ft. Bayard) | Aa2/AA | 1,565,000 | 1,607,083 | |||||
Grant County Department of Health, 5.50% due 7/1/2021 (Ft. Bayard) (2) | Aa2/AA | 1,655,000 | 1,697,666 | |||||
Grant County Department of Health, 5.50% due 7/1/2022 (Ft. Bayard) | Aa2/AA | 1,745,000 | 1,779,045 | |||||
Grant County Hospital Facility, 5.50% due 8/1/2009 (Gila Regional Medical Center; Insured: Radian) | NR/BBB+ | 665,000 | 668,006 | |||||
Grant County Hospital Facility, 5.50% due 8/1/2010 (Gila Regional Medical Center; Insured: Radian) | NR/BBB+ | 1,385,000 | 1,421,841 | |||||
Las Cruces School District GO, 5.50% due 8/1/2010 | Aa3/NR | 1,000,000 | 1,016,760 | |||||
Los Alamos County GRT Improvement, 5.75% due 6/1/2016 | A1/AA+ | 1,000,000 | 1,105,950 | |||||
Los Alamos County GRT Improvement, 5.625% due 6/1/2023 | A1/AA+ | 1,000,000 | 1,038,730 | |||||
Los Alamos County GRT Improvement, 5.75% due 6/1/2024 | A1/AA+ | 3,000,000 | 3,123,300 | |||||
Los Alamos County GRT Improvement, 5.75% due 6/1/2025 | A1/AA+ | 1,000,000 | 1,032,990 | |||||
| Certified Semi-Annual Report | 21 |
| SCHEDULE OF INVESTMENTS, CONTINUED | ||
Thornburg New Mexico Intermediate Municipal Fund | March 31, 2009 (Unaudited) | |
Issuer-Description | Credit Rating† Moody’s/S&P | Principal Amount | Value | |||||
Los Alamos County Utility Systems, 5.00% due 7/1/2013 (Insured: FSA) | Aa3/AAA | $ | 1,265,000 | $ | 1,393,322 | |||
New Mexico Finance Authority, 5.15% due 6/1/2012 pre-refunded 6/1/2009 (Insured: MBIA) | Aa2/AA+ | 255,000 | 257,007 | |||||
New Mexico Finance Authority, 5.25% due 6/1/2013 pre-refunded 6/1/2009 (Insured: MBIA) | Aa2/AA+ | 130,000 | 131,044 | |||||
New Mexico Finance Authority, 5.00% due 6/15/2013 (Insured: AMBAC) | Aa3/NR | 2,280,000 | 2,453,212 | |||||
New Mexico Finance Authority, 5.00% due 6/1/2014 (Insured: MBIA) | Aa2/AA+ | 2,660,000 | 2,912,328 | |||||
New Mexico Finance Authority, 5.35% due 6/1/2014 pre-refunded 6/1/2009 (Insured: MBIA) | Aa2/AA+ | 130,000 | 131,066 | |||||
New Mexico Finance Authority, 5.25% due 6/1/2015 (Insured: AMBAC) | Aa2/AA+ | 1,000,000 | 1,109,840 | |||||
New Mexico Finance Authority, 5.45% due 6/1/2015 pre-refunded 6/1/2009 (Insured: MBIA) | Aa2/AA+ | 145,000 | 146,212 | |||||
New Mexico Finance Authority, 5.00% due 6/15/2015 (Insured: AMBAC) | Aa3/NR | 2,360,000 | 2,528,598 | |||||
New Mexico Finance Authority, 5.00% due 6/15/2018 (Insured: AMBAC) | Aa3/NR | 2,915,000 | 3,139,980 | |||||
New Mexico Finance Authority, 5.00% due 6/15/2019 (Insured: MBIA) | Aa3/NR | 1,215,000 | 1,296,247 | |||||
New Mexico Finance Authority, 5.00% due 6/1/2020 (Insured: AMBAC) | Aa2/AA+ | 365,000 | 387,926 | |||||
New Mexico Finance Authority, 5.00% due 6/15/2022 (Insured: MBIA) | Aa3/AA- | 1,300,000 | 1,306,240 | |||||
New Mexico Finance Authority, 5.00% due 6/15/2024 (Insured: MBIA) | Aa3/AA- | 7,000,000 | 7,189,560 | |||||
New Mexico Finance Authority State Transportation, 5.00% due 6/15/2014 (Insured: MBIA) | Aa2/AA+ | 2,100,000 | 2,333,436 | |||||
New Mexico Highway Commission Senior Tax, 5.50% due 6/15/2014 | Aa2/AAA | 2,000,000 | 2,140,720 | |||||
New Mexico Highway Commission Tax, 6.00% due 6/15/2011 pre-refunded 6/15/2009 | Aa2/AAA | 5,000,000 | 5,057,200 | |||||
New Mexico Hospital Equipment Loan Council, 4.80% due 8/1/2010 (Presbyterian Healthcare) | Aa3/AA- | 500,000 | 513,695 | |||||
New Mexico Hospital Equipment Loan Council, 5.75% due 8/1/2016 pre-refunded 8/1/2011 (Presbyterian Healthcare) | Aa3/AA- | 3,205,000 | 3,539,474 | |||||
New Mexico Hospital Equipment Loan Council, 5.00% due 7/1/2017 pre-refunded 7/1/2015 (St. Vincent Hospital; Insured: Radian) | Baa1/NR | 1,730,000 | 1,943,603 | |||||
New Mexico Hospital Equipment Loan Council, 5.00% due 7/1/2019 pre-refunded 7/1/2015 (St. Vincent Hospital; Insured: Radian) | Baa1/NR | 1,000,000 | 1,123,470 | |||||
New Mexico Hospital Equipment Loan Council, 5.00% due 7/1/2021 pre-refunded 7/1/2015 (St. Vincent Hospital; Insured: Radian) | Baa1/NR | 1,185,000 | 1,331,312 | |||||
New Mexico Hospital Equipment Loan Council, 5.25% due 7/1/2025 pre-refunded 7/1/2015 (St. Vincent Hospital; Insured: Radian) | Baa1/NR | 1,000,000 | 1,137,690 | |||||
New Mexico Housing Authority Multi Family Housing, 5.30% due 12/1/2022 (El Paseo Apartments; Insured: AMBAC) (AMT) | NR/A | 1,010,000 | 1,013,252 | |||||
New Mexico MFA Forward Mortgage, 6.50% due 7/1/2025 (Collateralized: FNMA/GNMA) | NR/AAA | 135,000 | 140,655 | |||||
New Mexico MFA General, 5.80% due 9/1/2019 pre-refunded 9/1/2009 | NR/AAA | 775,000 | 792,337 | |||||
New Mexico MFA Multi Family, 5.05% due 9/1/2027 (St. Anthony; Insured: FHA) (AMT) | NR/AAA | 890,000 | 819,272 | |||||
New Mexico MFA Multi Family, 6.05% due 7/1/2028 (Sandpiper Apartments; Insured: FHA) (AMT) | NR/AA | 2,335,000 | 2,345,274 | |||||
New Mexico MFA Multi Family, 5.00% due 7/1/2031 put 7/1/2011 (Sombra Del Oso Apartments; Collateralized: FNMA) | Aaa/NR | 1,000,000 | 1,046,160 | |||||
New Mexico MFA Multi Family, 5.00% due 7/1/2031 put 7/1/2011 (Riverwalk Apartments; Collateralized: FNMA) | Aaa/NR | 1,910,000 | 1,998,166 | |||||
New Mexico MFA Multi Family, 5.00% due 7/1/2031 put 7/1/2011 (Tierra Pointe I Apartments; Collateralized: FNMA) | Aaa/NR | 2,785,000 | 2,913,556 | |||||
New Mexico MFA SFMR, 5.70% due 9/1/2014 (Collateralized: FNMA/GNMA) (AMT) | NR/AAA | 65,000 | 66,657 | |||||
New Mexico MFA SFMR, 5.80% due 9/1/2016 (Collateralized: FNMA/GNMA) | NR/AAA | 115,000 | 116,212 | |||||
New Mexico MFA SFMR, 5.75% due 3/1/2017 (Collateralized: FNMA/GNMA) | NR/AAA | 175,000 | 176,579 | |||||
New Mexico MFA SFMR, 6.15% due 9/1/2017 (Collateralized: FNMA/GNMA) | NR/AAA | 60,000 | 60,608 | |||||
New Mexico MFA SFMR, 0% due 9/1/2019 (GIC: Bayerisch Landesbank) (AMT) | NR/AAA | 195,000 | 189,394 | |||||
New Mexico MFA SFMR, 5.875% due 9/1/2020 (AMT) | NR/AAA | 175,000 | 179,102 | |||||
New Mexico MFA SFMR, 5.875% due 9/1/2021 (Collateralized: FNMA/GNMA) (AMT) | NR/AAA | 305,000 | 304,567 | |||||
New Mexico MFA SFMR, 6.05% due 9/1/2021 (Collateralized: FNMA/GNMA) (AMT) | NR/AAA | 200,000 | 201,502 | |||||
New Mexico MFA SFMR, 5.25% due 7/1/2023 (Collateralized: GNMA/FNMA/FHLMC) (AMT) | NR/AAA | 1,500,000 | 1,480,635 | |||||
New Mexico MFA SFMR, 5.375% due 7/1/2023 (Collateralized: GNMA/FNMA/FHLMC) (AMT) | NR/AAA | 2,225,000 | 2,247,228 | |||||
New Mexico MFA SFMR, 5.50% due 7/1/2028 (Collateralized: GNMA/FNMA/FHLMC) (AMT) | NR/AAA | 3,265,000 | 3,174,102 | |||||
New Mexico MFA SFMR, 5.60% due 7/1/2028 (Collateralized: GNMA/FNMA/FHLMC) (AMT) | NR/AAA | 2,000,000 | 1,990,480 | |||||
| 22 | Certified Semi-Annual Report |
| SCHEDULE OF INVESTMENTS, CONTINUED | ||
Thornburg New Mexico Intermediate Municipal Fund | March 31, 2009 (Unaudited) | |
Issuer-Description | Credit Rating† Moody’s/S&P | Principal Amount | Value | |||||
New Mexico Highway Commission Tax, 5.00% due 6/15/2010 (ETM) | Aa2/AAA | $ | 255,000 | $ | 268,347 | |||
New Mexico Highway Commission Tax, 5.00% due 6/15/2010 | Aa2/AAA | 245,000 | 257,894 | |||||
New Mexico Hospital Equipment Loan, 6.00% due 8/1/2023 (Presbyterian Healthcare Services) | Aa3/AA- | 6,000,000 | 6,382,800 | |||||
New Mexico State University Improvement, 5.00% due 4/1/2013 (Insured: FSA) | Aa3/AAA | 1,000,000 | 1,107,870 | |||||
Rio Rancho GRT, 5.00% due 6/1/2014 (Insured: FGIC) | A1/AA- | 955,000 | 1,034,523 | |||||
Rio Rancho GRT, 5.00% due 6/1/2016 (Insured: FGIC) | A1/AA- | 555,000 | 594,682 | |||||
Rio Rancho GRT, 5.00% due 6/1/2022 (Insured: FGIC) | A1/AA- | 1,000,000 | 1,018,250 | |||||
San Juan County Gasoline Tax/Motor Vehicle Improvement, 5.25% due 5/15/2014 | A1/NR | 400,000 | 424,572 | |||||
San Juan County Gasoline Tax/Motor Vehicle Improvement, 5.25% due 5/15/2022 | A1/NR | 1,725,000 | 1,748,598 | |||||
San Juan County GRT, 5.30% due 9/15/2009 | A1/NR | 110,000 | 111,676 | |||||
San Juan County GRT, 5.00% due 6/15/2014 (Insured: MBIA) | A1/AA- | 1,225,000 | 1,327,459 | |||||
Sandoval County Incentive Payment, 5.00% due 6/1/2020 (Intel Corp.) | NR/A+ | 6,390,000 | 6,516,905 | |||||
Sandoval County Landfill Improvement, 5.50% due 8/15/2015 | Baa2/NR | 1,420,000 | 1,325,684 | |||||
Sandoval County Landfill Improvement, 5.75% due 8/15/2018 | Baa2/NR | 1,335,000 | 1,197,842 | |||||
Santa Fe County, 5.50% due 5/15/2015 (El Castillo Retirement) | NR/BBB- | 1,250,000 | 1,188,062 | |||||
Santa Fe County, 5.80% due 5/15/2018 (El Castillo Retirement) | NR/BBB- | 1,835,000 | 1,706,899 | |||||
Santa Fe County, 7.25% due 7/1/2029 (Rancho Viejo Improvement District) | NR/NR | 1,745,000 | 1,424,409 | |||||
Santa Fe County Charter School Foundation, 6.50% due 1/15/2026 (ATC Foundation) | NR/NR | 1,000,000 | 825,020 | |||||
Santa Fe County Charter School Foundation, 6.625% due 1/15/2036 (ATC Foundation) | NR/NR | 1,030,000 | 797,344 | |||||
Santa Fe County Correctional Systems, 5.00% due 2/1/2018 (Insured: FSA) (2) | Aa3/AAA | 1,000,000 | 1,085,450 | |||||
Santa Fe County Correctional Systems, 6.00% due 2/1/2027 (Insured: FSA) | Aa3/AAA | 1,520,000 | 1,645,795 | |||||
Santa Fe County GRT, 5.00% due 6/1/2025 | Aa2/AA+ | 1,400,000 | 1,439,942 | |||||
Santa Fe County GRT, 5.00% due 6/1/2026 | Aa2/AA+ | 1,535,000 | 1,566,590 | |||||
Santa Fe Educational Facilities, 5.40% due 3/1/2017 (St. John’s College) | NR/BBB+ | 1,105,000 | 1,018,412 | |||||
Santa Fe SFMR, 6.00% due 11/1/2010 (Collateralized: FNMA/GNMA) (AMT) | Aaa/NR | 55,000 | 55,120 | |||||
Santa Fe SFMR, 6.10% due 11/1/2011 (Collateralized: FNMA/GNMA) (AMT) | Aaa/NR | 75,000 | 75,144 | |||||
Santa Fe SFMR, 6.20% due 11/1/2016 (Collateralized: FNMA/GNMA) (AMT) | Aaa/NR | 90,000 | 90,093 | |||||
Taos County GRT, 4.25% due 10/1/2009 | Baa1/NR | 500,000 | 500,120 | |||||
Taos County GRT, 4.25% due 10/1/2010 (Insured: Radian) | Baa1/NR | 1,000,000 | 993,560 | |||||
Taos County GRT, 4.75% due 10/1/2012 (ETM) | Baa1/NR | 1,500,000 | 1,670,505 | |||||
University of New Mexico, 5.25% due 6/1/2013 | Aa3/AA | 665,000 | 722,250 | |||||
University of New Mexico, 5.25% due 6/1/2014 | Aa3/AA | 335,000 | 361,190 | |||||
University of New Mexico, 5.00% due 6/1/2015 (Insured: AMBAC) | Aa3/AA | 1,590,000 | 1,790,435 | |||||
University of New Mexico, 5.25% due 6/1/2015 | Aa3/AA | 1,195,000 | 1,304,570 | |||||
University of New Mexico, 5.25% due 6/1/2016 | Aa3/AA | 645,000 | 695,426 | |||||
University of New Mexico, 5.25% due 6/1/2017 | Aa3/AA | 1,730,000 | 1,865,251 | |||||
University of New Mexico, 5.25% due 6/1/2018 | Aa3/AA | 1,825,000 | 1,957,915 | |||||
University of New Mexico, 5.25% due 6/1/2018 | Aa3/AA | 1,200,000 | 1,294,272 | |||||
University of New Mexico, 5.25% due 6/1/2021 | Aa3/AA | 1,000,000 | 1,059,980 | |||||
University of New Mexico, 6.00% due 6/1/2021 | Aa3/AA | 610,000 | 701,085 | |||||
University of New Mexico Hospital Mortgage Bonds, 5.00% due 1/1/2016 (Insured: FSA/FHA) | Aa3/AAA | 2,920,000 | 3,206,043 | |||||
University of New Mexico Hospital Mortgage Bonds, 5.00% due 1/1/2017 (Insured: FSA/FHA) | Aa3/AAA | 2,000,000 | 2,173,620 | |||||
University of New Mexico Hospital Mortgage Bonds, 5.00% due 1/1/2018 (Insured: FSA/FHA) | Aa3/AAA | 2,000,000 | 2,109,240 | |||||
University of New Mexico Hospital Mortgage Bonds, 5.00% due 1/1/2019 (Insured: FSA/FHA) | Aa3/AAA | 3,000,000 | 3,134,820 | |||||
University of New Mexico Hospital Mortgage Bonds, 5.00% due 7/1/2019 (Insured: FSA/FHA) | Aa3/AAA | 3,000,000 | 3,128,340 | |||||
University of New Mexico Hospital Mortgage Bonds, 5.00% due 1/1/2020 (Insured: FSA/FHA) | Aa3/AAA | 2,310,000 | 2,397,202 | |||||
University of New Mexico Hospital Mortgage Bonds, 5.00% due 7/1/2020 (Insured FSA/FHA) | Aa3/AAA | 500,000 | 517,925 | |||||
Ventana West Public Improvement District Special Tax, 6.625% due 8/1/2023 | NR/NR | 2,000,000 | 1,530,260 | |||||
| Certified Semi-Annual Report | 23 |
| SCHEDULE OF INVESTMENTS, CONTINUED | ||
Thornburg New Mexico Intermediate Municipal Fund | March 31, 2009 (Unaudited) | |
Issuer-Description | Credit Rating† Moody’s/S&P | Principal Amount | Value | |||||
Villa Hermosa Multi Family Housing, 5.85% due 11/20/2016 (Villa Hermosa Apartments; Collateralized: GNMA) (AMT) | NR/CC | $ | 1,105,000 | $ | 1,018,423 | |||
TOTAL INVESTMENTS — 99.27% (Cost $205,677,827) | $ | 207,669,973 | ||||||
OTHER ASSETS LESS LIABILITIES — 0.73% | 1,527,876 | |||||||
NET ASSETS — 100.00% | $ | 209,197,849 | ||||||
Footnote Legend
| † | Credit ratings are unaudited. Rating changes may have occurred prior to or subsequent to the reporting period end. |
| (1) | When-issued security. |
| (2) | Segregated as collateral for a when-issued security. |
Portfolio Abbreviations
To simplify the listings of securities, abbreviations are used per the table below:
| AMBAC | Insured by American Municipal Bond Assurance Corp. | |
| AMT | Alternative Minimum Tax | |
| ETM | Escrowed to Maturity | |
| FGIC | Insured by Financial Guaranty Insurance Co. | |
| FHA | Insured by Federal Housing Administration | |
| FHLMC | Insured by Federal Home Loan Mortgage Corp. | |
| FNMA | Collateralized by Federal National Mortgage Association | |
| FSA | Insured by Financial Security Assurance Co. | |
| GNMA | Insured by Government National Mortgage Co. | |
| GO | General Obligation | |
| GRT | Gross Receipts Tax | |
| IDRB | Industrial Development Revenue Bond | |
| LOC | Letter of Credit | |
| MBIA | Insured by Municipal Bond Investors Assurance | |
| MFA | Mortgage Finance Authority | |
| PCR | Pollution Control Revenue Bond | |
| RADIAN | Insured by Radian Asset Assurance | |
| SFMR | Single Family Mortgage Revenue Bond |
See notes to financial statements.
| 24 | Certified Semi-Annual Report |
| EXPENSE EXAMPLE | ||
Thornburg New Mexico Intermediate Municipal Fund | March 31, 2009 (Unaudited) | |
As a shareholder of the Fund, you incur two types of costs:
(1) transaction costs, including
(a) sales charges (loads) on purchase payments, for Class A shares;
(b) a deferred sales charge on redemptions of any part or all of a purchase of $1 million of Class A shares within 12 months of purchase;
(2) ongoing costs, including management fees; distribution and/or service (12b-1) fees; and other Fund expenses.
This example is intended to help you understand your ongoing costs (in dollars) of investing in the Fund and to compare these costs with the ongoing costs of investing in other mutual funds.
The example is based on an investment of $1,000 invested on September 30, 2008 and held until March 31, 2009.
Actual Expenses
For each class of shares, the first line of the table at right provides information about actual account values and actual expenses. You may use the information in this line, together with the amount you invested, to estimate the expenses that you paid over the period. Simply divide your account value by $1,000 (for example, an $8,600 account value divided by $1,000 = 8.6), then multiply the result by the number in the first line for your class of shares under the heading entitled “Expenses Paid During Period” to estimate the expenses you paid on your account during this period.
Hypothetical Example for Comparison Purposes
For each class of shares, the second line of the table at right provides information about hypothetical account values and hypothetical expenses based on the Fund’s actual expense ratio and an assumed rate of return of 5% per year before expenses, which is not the Fund’s actual return. The hypothetical account values and expenses may not be used to estimate the actual ending account balance or expenses you paid for the period. You may use this information to compare the ongoing costs of investing in the Fund and other funds. To do so, compare this 5% hypothetical example with the 5% hypothetical examples that appear in the shareholder reports of the other funds.
| Beginning Account Value 9/30/08 | Ending Account Value 3/31/09 | Expenses Paid During Period† 9/30/08–3/31/09 | |||||||
Class A Shares | |||||||||
Actual | $ | 1,000.00 | $ | 1,048.50 | $ | 4.87 | |||
Hypothetical* | $ | 1,000.00 | $ | 1,020.18 | $ | 4.80 | |||
Class D Shares | |||||||||
Actual | $ | 1,000.00 | $ | 1,047.10 | $ | 6.24 | |||
Hypothetical* | $ | 1,000.00 | $ | 1,018.83 | $ | 6.16 | |||
Class I Shares | |||||||||
Actual | $ | 1,000.00 | $ | 1,050.30 | $ | 3.12 | |||
Hypothetical* | $ | 1,000.00 | $ | 1,021.89 | $ | 3.08 | |||
| † | Expenses are equal to the annualized expense ratio for each class (A: 0.95%; D: 1.22%; and I: 0.61%) multiplied by the average account value over the period, multiplied by 182/365 to reflect the one-half year period. |
| * | Hypothetical assumes a rate of return of 5% per year before expenses. |
Please note that the expenses shown in the table are meant to highlight your ongoing costs only and do not reflect any transactional costs, such as sales charges (loads), redemption fees, or exchange fees. Therefore, the second line of the table for each class of shares is useful in comparing ongoing costs only, and will not help you determine the relative total costs of owning different funds. In addition, if these transactional costs were included, your costs would have been higher.
| Certified Semi-Annual Report | 25 |
| Thornburg New Mexico Intermediate Municipal Fund | March 31, 2009 (Unaudited) | |
PORTFOLIO PROXY VOTING
Policies and Procedures:
The Trust has delegated to Thornburg Investment Management, Inc. (the “Advisor”) voting decisions respecting proxies for the Fund’s voting securities. The Advisor makes voting decisions in accordance with its Proxy Voting Policy and Procedures. A description of the Policy and Procedures is available (i) without charge, upon request, by calling the Advisor toll-free at 1-800-847-0200, (ii) on the Thornburg website at www.thornburg.com, and (iii) on the Securities and Exchange Commission’s website at www.sec.gov.
Information regarding how proxies were voted is available on or before August 31 of each year for the twelve months ending the preceding June 30. This information is available (i) without charge, upon request by calling the Advisor toll-free at 1-800-847-0200, (ii) on the Thornburg website at www.thornburg.com, and (iii) on the Securities and Exchange Commission’s website at www.sec.gov.
AVAILABILITY OF QUARTERLY PORTFOLIO SCHEDULE
The Fund files with the Securities and Exchange Commission schedules of its portfolio holdings on Form N-Q for the first and third quarters of each fiscal year. The Fund’s Forms N-Q are available on the Commission’s website at www.sec.gov, or may be reviewed and copied at the Commission’s Public Reference Room in Washington, D.C. Information on the operation of the Public Reference Room may be obtained by calling 1-800-SEC-0330. The Fund also makes this information available on its website at www.thornburg.com/download or upon request by calling 1-800-847-0200.
| 26 | Certified Semi-Annual Report |
Trustees’ Statement to Shareholders
Not part of the Certified Semi-Annual Report
February 8, 2005, as readopted September 15, 2008
The Trustees are concerned that ongoing commentaries and opinions reported in the media may confuse investors in general as to the supervisory duties of trustees of mutual funds and, in particular, leave Thornburg Investment Trust shareholders uncertain regarding how we discharge our responsibilities in supervising the Funds’ investment advisor and in reviewing the advisor’s contract for renewal. We decided to spell out clearly three principal guidelines that we follow in supervising the Trust’s investment advisor on your behalf.
We begin with the premise that each shareholder selected his or her Fund because its investments are managed by the investment advisor identified in the prospectus and in accordance with the objective and policies described in the prospectus. We realize, as each of you do, that if you believe that your Fund’s stated objective and policies no longer serve your personal investment goals, you can sell your shares and leave the Fund.
Therefore, we believe that our primary supervisory task – our principal obligation to you – is to assess the nature and quality of the advisor’s services, and to confirm that the advisor actively and competently pursues the Fund’s objective, in accordance with the policies set out in the prospectus. To do this, we meet regularly with management to review your Fund’s portfolio and to discuss the advisor’s specific actions and judgments in pursuing the Fund’s objective. We do not substitute our own judgment for the advisor’s decisions in selecting investments; the advisor is paid to exercise its informed judgment on investment decisions, and we seek to confirm, in reviewing the advisor’s performance, that the advisor is doing just that.
Second, while we are conscious of costs and the effect that costs have on shareholders’ returns, we do not seek the lowest fees or expense ratio as our sole or primary objective. We try to make sure that your Fund’s fees and costs are reasonable in relationship to the services rendered and that they are generally in line with those charged by other expert investment advisors, consistent with our belief that the Fund’s investors searched for and expect that expertise and attention and have decided to pay a reasonable price for it. We do not put the management contract “out to bid” as a matter of course, and we would not do so unless we had concluded that the advisor materially had failed to pursue the Fund’s objectives in accordance with its policies, or for other equally important reasons. We believe that any other approach would be inconsistent with your interests and contrary to your expectations when you bought shares of the Fund in the first place.
Finally, because we believe that most Thornburg Fund shareholders have invested with a long-term perspective, we try not to focus too much on the fashions of the moment and on short-term performance. The market will not favor any specific investment objective or set of policies at all times and under all economic circumstances. A fund will experience periods of both high and low returns relative to other funds and other investments. Even if one of our Funds is not favored by the market at a particular time, we believe that the advisor is nonetheless obliged to remain true to the Fund’s objective and policies, and we watch to see that it does so.
| This page is not part of the Semi-Annual Report. | 27 |
This page intentionally left blank.
| 28 | This page is not part of the Semi-Annual Report. |
Planning Options
Retirement and Education Accounts
Thornburg Investment Management offers retirement and education savings accounts that can help you meet a variety of planning challenges. For account applications or further information on any of the accounts below, please call 1-800-847-0200 or go to www.thornburg.com/ira. Your financial advisor can help you determine which plan is right for you.
Individual Retirement Accounts
Individual Retirement Accounts (IRAs) provide a tax-advantaged means to save money for the future. For a detailed outline of the difference between retirement accounts, see www.thornburg.com/ira. Rollovers are available. Call 1-800-847-0200 for more information.
Traditional IRAs – Contributions to Traditional IRAs are tax deductible for eligible individuals, and withdrawals are taxed as additional ordinary income. You may contribute to an IRA if you receive compensation and are under 70 1/2, even if you are covered by an employer retirement plan. Deductible contributions are subject to certain qualifications. Please consult your tax advisor.
Roth IRAs – Under a Roth IRA, there is no tax deduction for contributions, but there is no income tax on qualified withdrawals. For a more detailed comparison of Traditional and Roth IRAs, please see our web site at www.thornburg.com/ira.
SEP IRAs – Simplified Employee Pension (SEP) IRAs are established by employers. The employer is allowed a tax deduction for contributions made to the SEP Plan and makes contributions to each eligible employee’s SEP IRA on a discretionary basis.
SIMPLE IRAs – Savings Incentive Match Plan for Employees of Small Employers (SIMPLE) is designed to give small business owners a simplified method to establish and contribute to a retirement plan for employees. The employer is allowed a tax deduction for contributions and makes either matching or non-elective contributions to each eligible employee’s SIMPLE IRA. Employees may make salary deferral contributions.
Coverdell Education Savings Account
These savings accounts are designed to provide a way to save money for higher education expenses. In an Education Savings Account, earnings and interest grow tax-free, and qualified withdrawals used to pay for eligible higher-education expenses are tax- and penalty-free.
Funds Available
The following funds are available in the accounts listed above:
| • | Thornburg International Value Fund |
| • | Thornburg Value Fund |
| • | Thornburg Core Growth Fund |
| • | Thornburg Investment Income Builder Fund |
| • | Thornburg Global Opportunities Fund |
| • | Thornburg International Growth Fund |
| • | Thornburg Limited Term U.S. Government Fund |
| • | Thornburg Limited Term Income Fund |
| • | Thornburg Strategic Income Fund |
| This page is not part of the Semi-Annual Report. | 29 |

| 30 | This page is not part of the Semi-Annual Report. |
Thornburg Equity Funds
Thornburg’s equity research uses a fundamental and comprehensive analytical approach. Thornburg equity funds focus on a limited number of securities so that each holding can impact performance. The equity team searches for firms believed to have a promising future and seeks to buy shares of those companies at a discount to their intrinsic value.
| • | Thornburg Value Fund |
| • | Thornburg International Value Fund |
| • | Thornburg Core Growth Fund |
| • | Thornburg Investment Income Builder Fund |
| • | Thornburg Global Opportunities Fund |
| • | Thornburg International Growth Fund |
Thornburg Bond Funds
Thornburg Investment Management applies a disciplined philosophy to fixed-income management. Since the launch of our first fixed-income fund 25 years ago, we have been conducting fundamental, bottom-up research in an effort to identify bonds which we believe provide the best return for a given level of risk. We are very organic in our approach, avoiding leverage or complex strategies which could backfire in periods of market uncertainty.
| • | Thornburg Limited Term Municipal Fund |
| • | Thornburg Intermediate Municipal Fund |
| • | Thornburg California Limited Term Municipal Fund |
| • | Thornburg New Mexico Intermediate Municipal Fund |
| • | Thornburg New York Intermediate Municipal Fund |
| • | Thornburg Strategic Municipal Income Fund |
| • | Thornburg Limited Term U.S. Government Fund |
| • | Thornburg Limited Term Income Fund |
| • | Thornburg Strategic Income Fund |
Before investing, carefully consider the Fund’s investment goals, risks, charges, and expenses. For a prospectus containing this and other information, contact your financial advisor or visit thornburg. com. Read it carefully before investing.
For additional information, please visit www.thornburg.com
Thornburg Investment Management, Inc. 2300 North Ridgetop Road, Santa Fe, NM 87506
| This page is not part of the Semi-Annual Report. | 31 |

 | This Semi-Annual Report is submitted for the general information of shareholders of the Fund. It is not authorized for distribution to prospective investors in the Fund unless preceded or accompanied by an effective prospectus.
Investment Advisor:
Thornburg Investment Management® 800.847.0200
Distributor:
Thornburg Securities Corporation® 800.847.0200 | |
| TH178 | ||
Waste not, Wait not |
| |
Get instant access to your shareholder reports.
By switching from your postal mailbox to your email inbox, you reduce paper clutter, improve record keeping access, and help conserve our natural resources.
Go to www.thornburg.com/edelivery and sign up to receive your shareholder reports, prospectuses, and proxy statements electronically.
You invest in the future, without spending a dime.
| ||

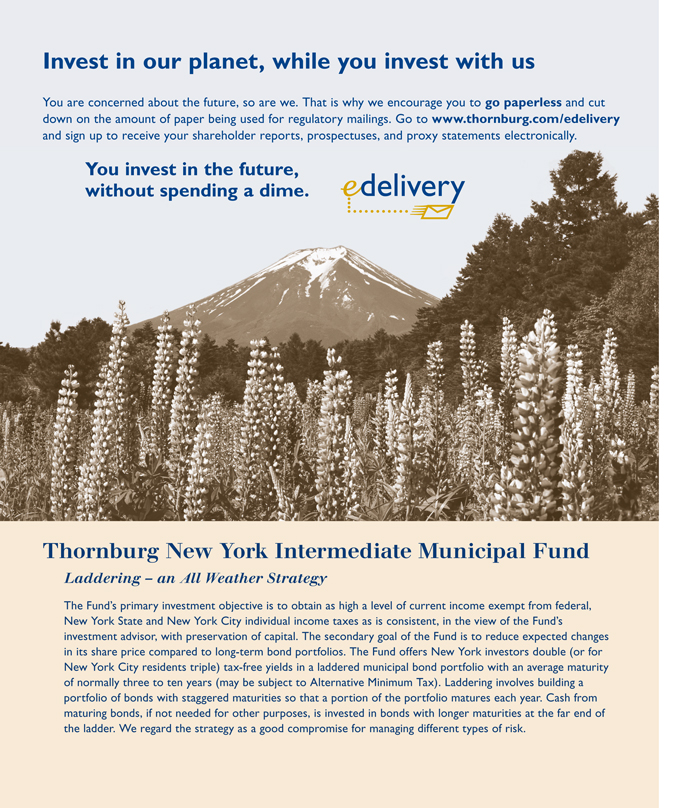
| 2 This page is not part of the Semi-Annual Report. |
Important Information
The information presented on the following pages was current as of March 31, 2009. The managers’ views, portfolio holdings, and sector diversification are provided for the general information of the Fund’s shareholders; they are historical and subject to change. This material should not be deemed a recommendation to buy or sell any of the securities mentioned.
Investments in the Fund carry risks, including possible loss of principal. As with direct bond ownership, funds that invest in bonds are subject to certain risks including interest-rate risk, credit risk, and inflation risk. The principal value of bonds will fluctuate relative to changes in interest rates, decreasing when interest rates rise. Unlike bonds, bond funds have ongoing fees and expenses. Please see the Fund’s Prospectus for a discussion of the risks associated with an investment in the Fund. Investments in the Fund are not deposits or obligations of, or guaranteed or endorsed by, any bank, the Federal Deposit Insurance Corporation, the Federal Reserve Board or any government agency. There is no guarantee that the Fund will meet its investment objectives. The laddering strategy does not assure or guarantee better performance and cannot eliminate the risk of investment losses.
Performance data given at net asset value (NAV) does not take into account the applicable sales charges. If the sales charges had been included, the performance would have been lower.
Share Class | NASDAQ Symbol | Cusip | ||
Class A | 885-215-665 | THNYX |
Lipper’s 2008
Best Fixed-Income Fund Family
Thornburg Investment Management ranked #1 out of 41 eligible firms in Lipper, Inc.’s fixed income large firm universe for the three-year period ended 12/31/07, based on risk-adjusted returns. Past performance does not guarantee future results.
Lipper’s large firm universe is comprised of fund families with more than $28 billion in total net assets. Only fund families with at least five bond funds were eligible. Risk-adjusted returns were calculated with dividends reinvested and without sales charges. We did not win this award in 2009.
Glossary
Merrill Lynch 7-12 Year Municipal Bond
Index – The Merrill Lynch 7-12 Year Municipal Bond Index represents a broad measure of market performance. It is a model portfolio of municipal obligations throughout the U.S., with an average maturity which ranges from seven to twelve years.
Unless otherwise noted, index returns reflect the reinvestment of income dividends and capital gains, if any, but do not reflect fees, brokerage commissions or other expenses of investing. Investors may not make direct investments into any index.
Alternative Minimum Tax (AMT) – A federal tax aimed at ensuring that high-income individuals, estates, trusts, and corporations pay a minimal level income tax. For individuals, the AMT is calculated by adding tax preference items to regular taxable income.
Distribution Rate – The distribution rate is calculated by taking the sum of the month’s total distribution factors and dividing this sum by a 30-day period and annualizing to a 360-day year. The value is then divided by the ending Net Asset Value (NAV) to arrive at the annualized distribution yield. The yield is calculated on a periodic basis and is subject to change depending on the Fund’s NAV and current distributions.
Duration – The weighted maturity of a bond’s cash flows. Duration measures the price sensitivity of a bond for a given change in interest rates. Bonds with longer durations experience greater price volatility than bond with shorter durations.
General Obligation (GO) Bonds – A municipal bond secured by the pledge of the issuer’s full faith, credit, and taxing power rather than the revenue from a given project.
Leverage – The amount of debt used to finance a firm’s assets. A firm with significantly more debt than equity is considered to be highly leveraged.
Pre-Refunded Bond – A type of municipal bond that has been escrowed or collateralized either by direct obligations guaranteed by the U.S. government, or by other types of securities. The escrow account is structured so that these refunded bonds are to be called at the first possible call date. Such bonds, if escrowed with securities guaranteed by the U.S. government, have little if any credit risk.
Quality Spread – The difference between the yields of securities with different quality ratings.
Revenue Bond – A bond on which the debt service is payable solely from the revenue generated from the operation of the project being financed or a category of facilities, or from other non-tax sources.
| This page is not part of the Semi-Annual Report. 3 |
Important Information
Continued
SEC Yield – SEC Yield is computed in accordance with SEC standards measuring the net investment income per share over a specified 30-day period expressed as a percentage of the maximum offering price of the Fund’s shares at the end of the period.
Tax-Backed Bonds – A broad category of bonds that are secured by taxes levied by the obligor.
U.S. Treasury Securities – U.S. Treasury securities, such as bills, notes and bonds, are negotiable debt obligations of the U.S. government. These debt obligations are backed by the “full faith and credit” of the government and issued at various schedules and maturities. Income from Treasury securities is exempt from state and local, but not federal income taxes.
Yield Spread – The difference in yield, at a given time, between two bonds or between different segments of the bond market.
| 4 This page is not part of the Semi-Annual Report. |
Thornburg New York Intermediate Municipal Fund
At Thornburg, our approach to fixed-income management is based on the premise that investors in our bond funds seek preservation of capital along with an attractive, relatively stable yield. While aggressive bond strategies may generate stronger returns when the market is turning a blind eye towards risk, they usually fail to stack up over longer periods of time. Our patience and diligence was recognized by Lipper, in 2008 with the Best Fixed-Income Fund Family Award.
We apply time-tested techniques to manage risk and provide attractive returns. These include:
| • | Building a laddered portfolio. Laddering has been shown over time to mitigate price and interest rate risk. |
| • | Investing on a cash-only basis without using leverage. While leveraged strategies may enhance returns when market conditions are favorable, they can quickly compound losses when sentiment shifts. |
| • | Conducting in-depth fundamental research on each issue and actively monitoring positions for subsequent credit events. |
| • | Diversifying among a large number of generally high-quality bonds. |
Josh Gonze, George Strickland, and Chris Ihlefeld
| 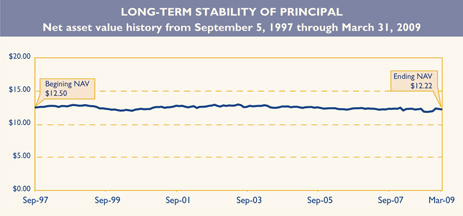 | |||||

IMPORTANT
PERFORMANCE INFORMATION
Performance data shown represents past performance and is no guarantee of future results. Investment return and principal value will fluctuate so shares, when redeemed, may be worth more or less than their original cost. Current performance may be lower or higher than quoted. For performance current to the most recent month end, visit thornburg.com.
The maximum sales charge for the Fund’s Class A shares is 2.00%. The total annual fund operating expense of Class A shares is 1.08%, as disclosed in the most recent Prospectus. Thornburg Investment Management intends to waive fees and reimburse expenses so that actual expenses for Class A shares do not exceed 0.99%. The fee waivers and expense reimbursements are voluntary and may be terminated at any time.
AVERAGE ANNUAL TOTAL RETURNS
For periods ended March 31, 2009
| 1 Yr | 3 Yrs | 5 Yrs | 10 Yrs | Since Inception | |||||||||||
A Shares (Incep: 9/5/97) | |||||||||||||||
Without Sales Charge | 3.33 | % | 3.60 | % | 2.74 | % | 3.71 | % | 4.07 | % | |||||
With Sales Charge | 1.27 | % | 2.90 | % | 2.33 | % | 3.50 | % | 3.88 | % |
30-DAY YIELDS, A SHARES
As of March 31, 2009
Annualized Distribution Rate (@NAV) | SEC Yield | SEC Taxable Equivalent Yield | |||||
| 3.54 | % | 2.38 | % | 4.08 | % |
SEC Taxable Equivalent Yields assume a 35% marginal federal tax rate and a combined 10.5% City and State of New York marginal tax rate. Portions of the income of the Fund may be subject to AMT.
KEY PORTFOLIO ATTRIBUTES
As of March 31, 2009
Average Credit Quality | AA | |
Number of Bonds | 43 | |
Duration | 4.4 Yrs | |
Average Maturity | 8.0 Yrs |
See the entire portfolio in the Schedule of Investments on page 18.
Without waivers and reimbursements, yields and total returns would be lower.
| This page is not part of the Semi-Annual Report. 5 |
THORNBURG NEW YORK INTERMEDIATE MUNICIPAL FUND VERSUS
LIPPER NEW YORK TAX-EXEMPT MONEY MARKET FUNDS AVERAGE
Class A shares as of March 31, 2009
We are often asked to compare Thornburg New York Intermediate Municipal Fund to money market fund returns. Municipal bond funds are not an exact substitute for money market funds. These investments have certain differences, which are summarized below. Investors in the Thornburg New York Intermediate Municipal Fund took more risk than money market fund investors to earn their higher returns.
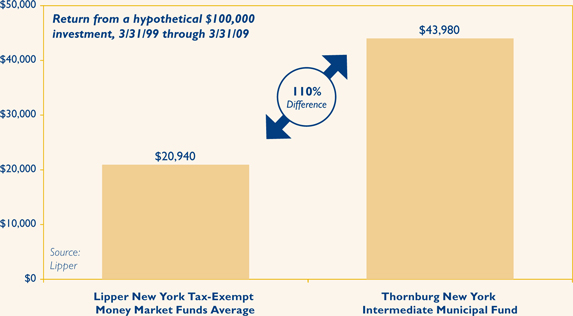
Past performance does not guarantee future results. Performance data above does not include the 2.00% maximum sales charge for Class A shares. If the sales charge had been included, returns would have been lower. Returns shown are minus the initial investment.
Investors in municipal bond funds may experience more volatility than those in comparable money market funds. There are also differences in fees and expenses.
Investors in the Thornburg New York Intermediate Municipal Fund took more risk than money market investors to earn their higher returns including reinvestment risk, credit risk, and inflation risk. Unlike money market funds, the prices of bonds fluctuate relative to changes in interest rates, with principal values decreasing when interest rates rise and increasing when interest rates fall. Generally, money market funds seek to maintain an investment portfolio with an average maturity of 90 days or less. Thornburg New York Intermediate Municipal Fund has an average maturity of normally between three and ten years. Interest dividends paid by the Fund or by New York tax-exempt money market funds are generally exempt from federal income tax and for residents of New York State and New York CIty, state, and local income tax (may be subject to AMT).
Money market funds seek to preserve the value per share at $1.00, whereas, the Thornburg New York Intermediate Municipal Fund’s net asset value changes daily. It is possible to lose money when investing in either the Thornburg New York Intermediate Municipal Fund or a money market fund. Neither are insured by the FDIC or any other government agency.
Lipper New York Tax-Exempt Money Market Funds Average is an arithmetic average of the total return of all tax-exempt New York money market mutual funds. You cannot invest in a category average.
| 6 This page is not part of the Semi-Annual Report. |

Thornburg New York Intermediate Municipal Fund
March 31, 2009
Table of Contents
| 8 | ||
| 11 | ||
| 12 | ||
| 13 | ||
| 14 | ||
| 17 | ||
| 18 | ||
| 20 | ||
| 21 | ||
This report is certified under the Sarbanes-Oxley Act of 2002, which requires that public companies, including mutual funds, affirm that the information provided in their annual and semiannual shareholder reports fully and fairly represents their financial position.
| Certified Semi-Annual Report 7 |
 | April 21, 2009 | |
George Strickland Co-Portfolio Manager | Dear Shareholder: | |
| We are pleased to present the Semi-Annual Report for the Thornburg New York Intermediate Municipal Fund. The net asset value of the Class A shares increased 35 cents to $12.22 during the six-months ended March 31, 2009. If you were with us for the entire period, you received dividends of 22.6 cents per share. If you reinvested your dividends, you received 22.7 cents per share. | ||
Josh Gonze Co-Portfolio Manager | The last six months have been an extremely volatile period for municipal bond prices. It started in September and October of 2008, with the Lehman Brothers bankruptcy which led many investors to shun taxable and tax-free money market funds. The money market funds were forced to dump their investments in order to meet redemptions, which caused the yield on tax-free money market securities to spike. Since hedge funds and other leveraged investors finance their purchases of long-term bonds with money market securities, their borrowing costs shot up so they had to sell long-term bonds in order to deleverage. This placed significant selling pressure on the municipal marketplace and sent yields up (and prices lower) in a precipitous fashion. | |
| From mid-September to mid-October, the yield on AAA-rated municipal bonds rose from 2.93% to 3.68%. Over that time period, yields went higher almost every day. From mid-October on, the market for the highest quality bonds settled down quite a bit, but prices for all other bonds have been quite variable. For instance, the yield spread between a ten-year AAA-rated general obligation bond and a BBB-rated revenue bond averaged 0.75% from May 1991 to December 2007. That average yield spread surged to 1.67% from January 2008 to April 2009. As of April 15, 2009, the AAA to BBB yield spread stood at 3.01%. | ||
Christopher Ihlefeld Co-Portfolio Manager | Investors have been shunning risk of all types and that is certainly true in the municipal bond market. However, there are other reasons that municipal quality spreads are at unprecedented levels. Large monoline bond insurers such as MBIA, AMBAC and FGIC were in the business of arbitraging bond spreads. If a bond’s spread to the AAA yield curve got too wide, they would typically step in and charge the issuer a premium for an insurance policy that got them a AAA rating. Bonds that received a AAA rating through insurance didn’t quite get an issuer the same interest rate as a “natural” AAA bond such as a bond issued by the State of Maryland, but it got them very close. In this | |


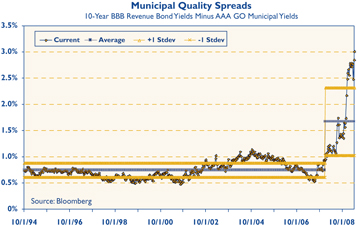
| 8 Certified Semi-Annual Report |
way, the bond insurers were the policemen of the municipal spread markets. Instead of writing speeding tickets, they wrote insurance policies that got issuers back in line with AAA rates. Now that investors’ confidence in the bond insurers has been justifiably shattered, insured bonds typically trade at very wide spreads based upon market views of the underlying obligor. In effect, there are no policemen anymore.
The market, which was becoming more generic and homogenous in nature, is now fractured and harder to analyze. Many traders used to glance at a bond, see the MBIA insurance, and work up a quick bid. Many of those traders are now out of business. Traders and portfolio managers today have to look into covenants, security provisions, margins and balance sheets before they can decide what a bond is worth. These are skills that we, at Thornburg Investment Management, have never gotten out of the habit of using.
The consequences of faulty or incomplete analysis are more severe today. The market is adapting to the new reality, but while it does, fear and opportunity are at exaggerated levels. Liquidity is harder to find, and any bond that is not straightforward and easy to analyze is trading at a large yield premium to widely recognized bonds. The market is greatly favoring bonds pre-refunded in Treasury securities and large general obligation issuers over high and medium quality issuers of tax-backed and revenue bonds. In other words, it is a bond picker’s paradise. For the price of a little research and market knowledge, great value can be extracted. We have not changed our management style, but we are spending more time looking into “story” bonds and have slightly decreased the average credit rating of the portfolio as we have found good values in bonds rated below AAA.
Investors do have some legitimate reasons to be shunning risk these days. The average high yield municipal bond fund lost over 25% last year. The economy is basically in shambles in much of the country and collectively, the 50 states are currently grappling with $100 billion of projected deficits in their 2010 fiscal years. However, we see some reasons for optimism. Investment grade municipal bonds have an impressive long-term track record. Standard & Poor’s recently updated their study showing ten-year cumulative default rates that averaged 0.13%. We expect defaults to be somewhat more frequent going forward, but there are counterbalancing factors that could limit any rise in the default rate. Many state and local governments set aside large reserve balances when times were good so that they can draw upon those resources today. Others are rebalancing their budgets frequently and are cutting spending aggressively. Some governments are doing both while raising taxes and fees, and all are making use of the federal largess in the $787 billion American Recovery and Reinvestment Act. As we scrutinize municipal finances, we see many issuers that are standing up to these challenging times. There are a few that may not, and we will strive to continue avoiding their bonds in order to protect the portfolio. It is a very important time for careful diligence and diversification of investment portfolios. Your Fund is broadly diversified and 89% invested in bonds rated A or above by at least one of the major rating agencies.
New York State recently enacted a 2010 fiscal year budget that closes a record projected $17.7 billion deficit with a combination of $6.5 billion of spending cuts, $5.2 billion of new taxes, and several billion of federal fiscal stimulus funds. Property, sales and income taxes have all been impacted by rising unemployment and reduced earnings on Wall Street. The city, state and other authorities, such as the Metropolitan Transportation Authority have been proactive in dealing with budget shortfalls, but have been facing very large challenges lately. We will be watching closely to see if gaps can be closed without creating roadblocks to future growth.
Your Thornburg New York Intermediate Municipal Fund is a laddered portfolio of 43 municipal obligations from all over New York. We ladder the maturity dates of the bonds in your portfolio so that some of the bonds are scheduled to mature during each of the coming years. Laddering intermediate bonds accomplishes two goals. First, the staggered bond maturities contained in a ladder defuse interest-rate risk and dampen the Fund’s price volatility. Second, laddering gives the Fund a steady cash flow stream from maturing bonds to reinvest toward the
| Certified Semi-Annual Report 9 |
Letter to Shareholders
Continued
top of the ladder where yields are typically higher. The chart on the right describes the percentages of your Fund’s bond portfolio maturing in each of the coming years.
The Class A shares of your Fund produced a total return of 4.89% over the six-month period ended March 31, 2009, compared to a 6.58% return for the Merrill Lynch 7-12 Year Municipal Bond Index. Over the last six months, pre-refunded and general obligation bonds from large issuers generally performed better than a diversified portfolio of revenue and tax-backed bonds from smaller issuers. Since the Fund predominantly holds bonds from smaller and mid-sized issuers, the Fund underperformed the index over the last six months.
Historically, our practice of laddering a diversified portfolio of short and intermediate maturity municipal bonds has allowed your Fund to perform consistently well in varying interest rate environments. Thank you for investing in Thornburg New York Intermediate Municipal Fund.
% of Portfolio Maturing | Cumulative % Maturing | ||
2 years = 12.7% | Year 2 = 12.7 | % | |
2 to 4 years = 8.4% | Year 4 = 21.1 | % | |
4 to 6 years = 14.5% | Year 6 = 35.6 | % | |
6 to 8 years = 6.2% | Year 8 = 41.8 | % | |
8 to 10 years = 13.5% | Year 10 = 55.3 | % | |
10 to 12 years = 13.3% | Year 12 = 68.6 | % | |
12 to 14 years = 15.0% | Year 14 = 83.6 | % | |
14 to 16 years = 5.9% | Year 16 = 89.5 | % | |
16 to 18 years = 5.3% | Year 18 = 94.8 | % | |
Over 18 years = 5.2% | Over 18 years = 100.0 | % |
Percentages can and do vary. Data as of 3/31/09.
Sincerely,
 |  |  | ||
| George Strickland | Josh Gonze | Christopher Ihlefeld | ||
| Co-Portfolio Manager | Co-Portfolio Manager | Co-Portfolio Manager | ||
| Managing Director | Managing Director | Managing Director |
The matters discussed in this report may constitute forward-looking statements made pursuant to the safe harbor provisions of the Securities Litigation Reform Act of 1995. These include any advisor or portfolio manager prediction, assessment, analysis or outlook for individual securities, industries, investment styles, market sectors and/or markets. These statements involve risks and uncertainties. In addition to the general risks described for each fund in its current prospectus, other factors bearing on these reports include the accuracy of the advisor’s or portfolio manager’s forecasts and predictions, the appropriateness of the investment strategies designed by the advisor or portfolio manager and the ability of the advisor or portfolio manager to implement their strategies efficiently and successfully. Any one or more of these factors, as well as other risks affecting the securities markets generally, could cause the actual results of any fund to differ materially as compared to its benchmarks.
| 10 Certified Semi-Annual Report |
| STATEMENT OF ASSETS AND LIABILITIES | ||
| Thornburg New York Intermediate Municipal Fund | March 31, 2009 (Unaudited) | |
ASSETS | ||||
Investments at value (cost $34,184,865) (Note 2) | $ | 34,745,752 | ||
Cash | 185,300 | |||
Receivable for fund shares sold | 51,720 | |||
Interest receivable | 424,360 | |||
Prepaid expenses and other assets | 209 | |||
Total Assets | 35,407,341 | |||
LIABILITIES | ||||
Payable for fund shares redeemed | 20,970 | |||
Payable to investment advisor and other affiliates (Note 3) | 23,953 | |||
Accounts payable and accrued expenses | 18,033 | |||
Dividends payable | 29,000 | |||
Total Liabilities | 91,956 | |||
NET ASSETS | $ | 35,315,385 | ||
NET ASSETS CONSIST OF: | ||||
Distribution in excess of net investment income | $ | (16,535 | ) | |
Net unrealized appreciation on investments | 560,887 | |||
Accumulated net realized gain (loss) | (72,427 | ) | ||
Net capital paid in on shares of beneficial interest | 34,843,460 | |||
| $ | 35,315,385 | |||
NET ASSET VALUE: | ||||
Class A Shares: | ||||
Net asset value and redemption price per share | $ | 12.22 | ||
Maximum sales charge, 2.00% of offering price | 0.25 | |||
Maximum offering price per share | $ | 12.47 | ||
See notes to financial statements.
| Certified Semi-Annual Report 11 |
| STATEMENT OF OPERATIONS | ||
| Thornburg New York Intermediate Municipal Fund | Six Months Ended March 31, 2009 (Unaudited) | |
INVESTMENT INCOME: | ||||
Interest income (net of premium amortized of $47,860) | $ | 767,288 | ||
EXPENSES: | ||||
Investment advisory fees (Note 3) | 80,829 | |||
Administration fees (Note 3) | 20,207 | |||
Distribution and service fees (Note 3) | 40,415 | |||
Transfer agent fees | 8,620 | |||
Registration and filing fees | 146 | |||
Custodian fees (Note 3) | 7,275 | |||
Professional fees | 10,716 | |||
Accounting fees | 505 | |||
Trustee fees | 437 | |||
Other expenses | 2,382 | |||
Total Expenses | 171,532 | |||
Less: | ||||
Investment advisory fees waived by investment advisor (Note 3) | (11,029 | ) | ||
Fees paid indirectly (Note 3) | (462 | ) | ||
Net Expenses | 160,041 | |||
Net Investment Income | 607,247 | |||
REALIZED AND UNREALIZED GAIN (LOSS) | ||||
Net realized gain (loss) on investments sold | 7,361 | |||
Net change in unrealized appreciation (depreciation) of investments | 943,222 | |||
Net Realized and Unrealized Gain | 950,583 | |||
Net Increase in Net Assets Resulting From Operations | $ | 1,557,830 | ||
See notes to financial statements.
| 12 Certified Semi-Annual Report |
| STATEMENTS OF CHANGES IN NET ASSETS | ||
| Thornburg New York Intermediate Municipal Fund | ||
| Six Months Ended March 31, 2009* | Year Ended September 30, 2008 | |||||||
INCREASE (DECREASE) IN NET ASSETS FROM: | ||||||||
OPERATIONS: | ||||||||
Net investment income | $ | 607,247 | $ | 1,149,262 | ||||
Net realized gain (loss) on investments | 7,361 | (30,533 | ) | |||||
Increase (Decrease) in unrealized appreciation (depreciation) of investments | 943,222 | (1,056,739 | ) | |||||
Net Increase (Decrease) in Net Assets Resulting from Operations | 1,557,830 | 61,990 | ||||||
DIVIDENDS TO SHAREHOLDERS: | ||||||||
From net investment income | ||||||||
Class A Shares | (607,247 | ) | (1,149,262 | ) | ||||
FUND SHARE TRANSACTIONS (NOTE 4): | ||||||||
Class A Shares | 3,679,648 | (1,243,777 | ) | |||||
Net Increase (Decrease) in Net Assets | 4,630,231 | (2,331,049 | ) | |||||
NET ASSETS: | ||||||||
Beginning of period | 30,685,154 | 33,016,203 | ||||||
End of period | $ | 35,315,385 | $ | 30,685,154 | ||||
| * | Unaudited. |
See notes to financial statements.
| Certified Semi-Annual Report 13 |
| NOTES TO FINANCIAL STATEMENTS | ||
| Thornburg New York Intermediate Municipal Fund | March 31, 2009 (Unaudited) | |
NOTE 1 – ORGANIZATION
Thornburg New York Intermediate Municipal Fund (the “Fund”) is a non-diversified series of Thornburg Investment Trust (the “Trust”). The Trust is organized as a Massachusetts business trust under a Declaration of Trust dated June 3, 1987 and is registered as a diversified, open-end management investment company under the Investment Company Act of 1940, as amended. The Trust is currently issuing thirteen series of shares of beneficial interest in addition to those of the Fund: Thornburg California Limited Term Municipal Fund, Thornburg Limited Term Municipal Fund, Thornburg New Mexico Intermediate Municipal Fund, Thornburg Intermediate Municipal Fund, Thornburg Limited Term U.S. Government Fund, Thornburg Limited Term Income Fund, Thornburg Value Fund, Thornburg International Value Fund, Thornburg Core Growth Fund, Thornburg Investment Income Builder Fund, Thornburg Global Opportunities Fund, Thornburg International Growth Fund, and Thornburg Strategic Income Fund. Each series is considered to be a separate entity for financial reporting and tax purposes and bears expenses directly attributable to it. The Fund’s primary investment objective is to obtain as high a level of current income exempt from federal, New York State, and New York City individual income tax as is consistent, in the view of the Fund’s investment advisor, with the preservation of capital. The Fund’s secondary objective is to reduce expected changes in its share price compared to long-term bond portfolios. The Fund will invest primarily in municipal obligations within the state of New York. The Fund currently offers only one class of shares of beneficial interest, Class A shares.
NOTE 2 – SIGNIFICANT ACCOUNTING POLICIES
Significant accounting policies of the Trust are as follows:
Valuation of Investments: Debt obligations have a primary market over the counter and are valued by an independent pricing service approved by the Trustees of the Trust. The pricing service ordinarily values debt obligations at quoted bid prices. When quotations are not available, debt obligations are valued at evaluated prices determined by the pricing service using methods which include consideration of yields or prices of debt obligations of comparable quality, type of issue, coupon, maturity, and rating, and indications as to value from dealers and general market conditions. Short-term obligations having remaining maturities of 60 days or less are valued at amortized cost, which approximates market value.
In any case where a pricing service fails to provide a price for a debt obligation held by the Fund, the valuation and pricing committee determines a fair value for the obligation using procedures approved by the Trustees. Additionally, in any case where management believes that a price provided by a pricing service for a debt obligation may be unreliable, the valuation and pricing committee decides whether or not to use the pricing service’s valuation or to determine a fair value for the obligation.
In determining fair value for any portfolio security or other investment, the valuation and pricing committee seeks to determine the amount that an owner of the investment might reasonably expect to receive upon a sale of the investment. However, because fair value prices are estimated prices, the valuation and pricing committee’s determination of fair value for an investment may differ from the value that would be realized by the Fund upon a sale of the investment, and that difference could be material to the Fund’s financial statements. The valuation and pricing committee’s determination of fair value for an investment may also differ from the prices obtained by other persons (including other mutual funds) for the investment.
Valuation Measurements: Various inputs are used in determining the value of the Fund’s investments. These inputs are summarized in the three levels listed below.
Level 1: Quoted prices in active markets for identical investments.
Level 2: Other significant observable inputs (including quoted prices for similar investments, interest rates, prepayment rates, credit risk, etc.).
Level 3: Significant unobservable inputs (including the Fund’s own assumptions in determining the fair value of investments).
The following table displays a summary of the inputs used to value the Fund’s net assets as of March 31, 2009. In any instance when valuation inputs from more than one level are used to determine the fair value of a specific investment, the investment is placed in the level of the table based upon the lowest level input that is significant in determining the fair value of the investment:
Valuation Inputs | Investments in Securities | Investments in Other Financial Instruments* | ||||
Level 1 - Quoted Prices in Active Markets for Identical Assets | $ | — | $ | — | ||
Level 2 - Other Significant Observable Inputs | 34,745,752 | — | ||||
Level 3 - Significant Unobservable Inputs | — | — | ||||
Total | $ | 34,745,752 | $ | — | ||
| * | Other financial instruments include investments not reflected in the Schedule of Investments, such as futures, forwards and swap contracts, which are valued at the unrealized appreciation (depreciation) on the instrument. |
| 14 Certified Semi-Annual Report |
| NOTES TO FINANCIAL STATEMENTS, CONTINUED | ||
| Thornburg New York Intermediate Municipal Fund | March 31, 2009 (Unaudited) | |
Federal Income Taxes: It is the policy of the Trust to comply with the provisions of the Internal Revenue Code applicable to “regulated investment companies” and to distribute to shareholders substantially all taxable (if any) and tax exempt income of the Fund. Therefore, no provision for federal income tax is required.
When-Issued and Delayed Delivery Transactions: The Trust may engage in when-issued or delayed delivery transactions. To the extent the Trust engages in such transactions, it will do so for the purpose of acquiring portfolio securities consistent with the Fund’s investment objectives and not for the purpose of investment leverage or to speculate on interest rate and/or market changes. At the time the Trust makes a commitment to purchase a security on a when-issued or delayed delivery basis, the Fund will record the transaction and reflect the value in determining its net asset value. When effecting such transactions, assets of an amount sufficient to make payment for the portfolio securities to be purchased will be segregated on the Fund’s records on the trade date. Securities purchased on a when-issued or delayed delivery basis do not earn interest until the settlement date.
Dividends: Net investment income of the Fund is declared daily as a dividend on shares for which the Fund has received payment. Dividends are paid monthly and are reinvested in additional shares of the Fund at net asset value per share at the close of business on the dividend payment date, or at the shareholder’s option, paid in cash. Net realized capital gains, to the extent available, will be distributed at least annually.
General: Securities transactions are accounted for on a trade date basis. Interest income is accrued as earned. Premiums and discounts on securities purchased are amortized to call dates or maturity dates of the respective securities. Realized gains and losses from the sale of securities are recorded on an identified cost basis. Expenses common to all funds are allocated among the funds comprising the Trust based upon their relative net asset values or other appropriate allocation methods.
Guarantees and Indemnifications: Under the Trust’s organizational documents, its officers and Trustees are indemnified against certain liabilities arising out of the performance of their duties to the Fund. Additionally, in the normal course of business the Trust enters into contracts with service providers that contain general indemnification clauses. The Trust’s maximum exposure under these arrangements is unknown. However, based on experience, the Trust expects the risk of loss to be remote.
Use of Estimates: The preparation of financial statements, in conformity with generally accepted accounting principles, requires management to make estimates and assumptions that affect the reported amounts of assets and liabilities and the disclosure of contingent assets and liabilities at the date of the financial statements and the reported amounts of increases and decreases in net assets from operations during the reporting period. Actual results could differ from those estimates.
NOTE 3 – INVESTMENT ADVISORY FEE AND OTHER TRANSACTIONS WITH AFFILIATES
Pursuant to an investment advisory agreement, Thornburg Investment Management, Inc. (the “Advisor”) serves as the investment advisor and performs services to the Fund for which the fees are payable at the end of each month. For the six months ended March 31, 2009, these fees were payable at annual rates ranging from .50 of 1% to .275 of 1% per annum of the average daily net assets of the Fund depending on the Fund’s asset size. For the six months ended March 31, 2009, the Advisor voluntarily waived investment advisory fees of $11,029. The Trust also has entered into administrative services agreements with the Advisor, whereby the Advisor will perform certain administrative services and for which fees will be payable at an annual rate of up to .125 of 1% per annum of the average daily net assets.
The Trust has an underwriting agreement with Thornburg Securities Corporation (the “Distributor,” an affiliate of the Advisor), which acts as the distributor of the Fund’s shares. For the six months ended March 31, 2009, the Distributor has advised the Fund that it earned net commissions aggregating $14 from the sale of Class A shares.
Pursuant to a service plan under Rule 12b-1 of the Investment Company Act of 1940, the Fund may reimburse to the Advisor an amount not to exceed .25 of 1% per annum of the average daily net assets for payments made by the Advisor to securities dealers and other financial institutions to obtain various shareholder and distribution related services. The Advisor may pay out of its own resources additional expenses for distribution of the Fund’s shares.
The Trust has an agreement with the custodian bank to indirectly pay a portion of the custodian’s fees through credits earned by the Fund’s cash on deposit with the bank. This deposit agreement is an alternative to overnight investments. Custodial fees have been adjusted to reflect amounts that would have been paid without this agreement, with a corresponding adjustment reflected as fees paid indirectly in the Statement of Operations. For the six months ended March 31, 2009, fees paid indirectly were $462.
Certain officers and Trustees of the Trust are also officers and/ or directors of the Advisor and Distributor. The compensation of independent Trustees is borne by the Trust.
| Certified Semi-Annual Report 15 |
| NOTES TO FINANCIAL STATEMENTS, CONTINUED | ||
| Thornburg New York Intermediate Municipal Fund | March 31, 2009 (Unaudited) | |
NOTE 4 – SHARES OF BENEFICIAL INTEREST
At March 31, 2009, there were an unlimited number of shares of beneficial interest authorized. Transactions in shares of beneficial interest were as follows:
| Six Months Ended March 31, 2009 (Unaudited) | Year Ended September 30, 2008 (Audited) | |||||||||||||
| Shares | Amount | Shares | Amount | |||||||||||
Class A Shares | ||||||||||||||
Shares sold | 472,037 | $ | 5,676,350 | 411,254 | $ | 5,063,258 | ||||||||
Shares issued to shareholders in reinvestment of dividends | 35,641 | 430,547 | 65,938 | 806,929 | ||||||||||
Shares repurchased | (202,334 | ) | (2,427,249 | ) | (577,748 | ) | (7,113,964 | ) | ||||||
Net Increase (Decrease) | 305,344 | $ | 3,679,648 | (100,556 | ) | $ | (1,243,777 | ) | ||||||
NOTE 5 – SECURITIES TRANSACTIONS
For the six months ended March 31, 2009, the Fund had purchase and sale transactions of investment securities (excluding short-term investments) of $3,949,930 and $2,625,956, respectively.
NOTE 6 – INCOME TAXES
At March 31, 2009, information on the tax components of capital is as follows:
Cost of investments for tax purposes | $ | 34,184,865 | ||
Gross unrealized appreciation on a tax basis | $ | 853,871 | ||
Gross unrealized depreciation on a tax basis | (292,984 | ) | ||
Net unrealized appreciation (depreciation) on investments (tax basis) | $ | 560,887 | ||
At March 31, 2009, the Fund had tax basis capital losses of $49,255, which may be carried forward to offset future capital gains. To the extent such carryforwards are used, capital gain distributions may be reduced to the extent provided by regulations. Such capital loss carryforwards will expire September 30, 2014.
As of March 31, 2009, the Fund had deferred tax basis capital losses occurring subsequent to October 31, 2007 of $30,533. For tax purposes, such losses will be reflected in the year ending September 30, 2009. Unutilized tax basis capital losses may be carried forward to offset realized gains in future years. To the extent such carryforwards are used, capital gains distributions may be reduced to the extent provided by regulations.
OTHER NOTES:
Statement of Accounting Standards No. 161:
On March 19, 2008, the Financial Accounting Standards Board issued Statement of Financial Accounting Standards No. 161, “Disclosures about Derivative Instruments and Hedging Activities” (“FAS 161”). FAS 161 is effective for fiscal years and interim periods beginning after November 15, 2008. FAS 161 requires enhanced disclosures about any derivative and hedging activities by the Fund, including how such activities are accounted for and any effect on the Fund’s financial position, performance and cash flows.
| 16 Certified Semi-Annual Report |
Thornburg New York Intermediate Municipal Fund
Class A Shares: | Six Months Ended March 31, 2009* | Year Ended September 30, | Three Months Ended Sept. 30, 2004(a) | |||||||||||||||||||||
| 2008 | 2007 | 2006 | 2005 | |||||||||||||||||||||
PER SHARE PERFORMANCE (for a share outstanding throughout the period) | ||||||||||||||||||||||||
Net asset value, beginning of period | $ | 11.87 | $ | 12.30 | $ | 12.38 | $ | 12.44 | $ | 12.64 | $ | 12.46 | ||||||||||||
Income from investment operations: | ||||||||||||||||||||||||
Net investment income (loss) | 0.23 | 0.44 | 0.46 | 0.45 | 0.42 | 0.10 | ||||||||||||||||||
Net realized and unrealized gain (loss) on investments | 0.35 | (0.43 | ) | (0.08 | ) | (0.06 | ) | (0.20 | ) | 0.18 | ||||||||||||||
Total from investment operations | 0.58 | 0.01 | 0.38 | 0.39 | 0.22 | 0.28 | ||||||||||||||||||
Less dividends from: | ||||||||||||||||||||||||
Net investment income | (0.23 | ) | (0.44 | ) | (0.46 | ) | (0.45 | ) | (0.42 | ) | (0.10 | ) | ||||||||||||
Change in net asset value | 0.35 | (0.43 | ) | (0.08 | ) | (0.06 | ) | (0.20 | ) | 0.18 | ||||||||||||||
NET ASSET VALUE, end of period | $ | 12.22 | $ | 11.87 | $ | 12.30 | $ | 12.38 | $ | 12.44 | $ | 12.64 | ||||||||||||
RATIOS/SUPPLEMENTAL DATA | ||||||||||||||||||||||||
Total return (%)(b) | 4.89 | 0.07 | 3.13 | 3.23 | 1.73 | 2.26 | ||||||||||||||||||
Ratios to average net assets: | ||||||||||||||||||||||||
Net investment income (loss) (%) | 3.76 | (c) | 3.61 | 3.74 | 3.66 | 3.31 | 3.19 | (c) | ||||||||||||||||
Expenses, after expense reductions (%) | 0.99 | (c) | 1.01 | 1.01 | 1.01 | 1.00 | 0.99 | (c) | ||||||||||||||||
Expenses, after expense reductions and net of custody credits (%) | 0.99 | (c) | 0.99 | 0.99 | 0.99 | 0.99 | 0.99 | (c) | ||||||||||||||||
Expenses, before expense reductions (%) | 1.06 | (c) | 1.08 | 1.11 | 1.11 | 1.12 | 1.18 | (c) | ||||||||||||||||
Portfolio turnover rate (%) | 8.50 | 13.42 | 14.91 | 15.38 | 28.70 | 4.27 | ||||||||||||||||||
Net assets at end of period (thousands) | $ | 35,315 | $ | 30,685 | $ | 33,016 | $ | 34,849 | $ | 41,375 | $ | 45,543 | ||||||||||||
| (a) | The Fund’s fiscal year-end changed to September 30. |
| (b) | Sales loads are not reflected in computing total return, which is not annualized for periods less than one year. |
| (c) | Annualized. |
| * | Unaudited. |
See notes to financial statements.
| Certified Semi-Annual Report 17 |
| SCHEDULE OF INVESTMENTS | ||
| Thornburg New York Intermediate Municipal Fund | March 31, 2009 (Unaudited) | |
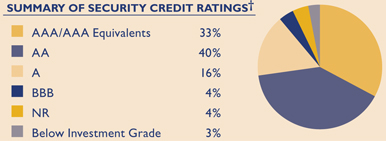
We have used ratings from Standard & Poor’s, (S&P). Where S&P ratings are not available, we have used Moody’s Investors Service. Where neither rating is available, we have used ratings from Fitch Ratings. The category of investments identified as “AAA” in this graph includes investments which are pre-refunded or escrowed to maturity. Such investments are backed by an escrow or trust containing sufficient U.S. Government or U.S. Government agency securities to satisfy the timely payment of principal and interest and, therefore, are normally deemed to be equivalent to AAA-rated securities.
Issuer-Description | Credit Rating† Moody’s/S&P | Principal Amount | Value | |||||
Amherst IDA Civic Facility, 5.75% due 4/1/2015 (Insured: ACA) | NR/NR | $ | 465,000 | $ | 437,565 | |||
Dutchess County IDA, 5.00% due 8/1/2021 (Bard College) | Baa1/NR | 1,100,000 | 1,084,006 | |||||
Hempstead IDA Resource Recovery, 5.00% due 12/1/2010 put 6/1/2010 (American Ref-Fuel) | Baa3/BB+ | 1,000,000 | 972,780 | |||||
Monroe County IDA, 6.45% due 2/1/2014 (DePaul Community Facility; Insured: SONYMA) | Aa1/NR | 545,000 | 553,660 | |||||
Monroe County IDA, 5.375% due 6/1/2017 (St. John Fisher College; Insured: Radian) | NR/BBB+ | 495,000 | 462,474 | |||||
Nassau Health Care Corp., 6.00% due 8/1/2011 pre-refunded 8/1/2009 | Aa3/AAA | 400,000 | 415,232 | |||||
New York City GO, 0.30% due 8/15/2019 put 4/1/2009 (LOC: Morgan Guaranty Trust) (daily demand notes) | VMIG1/A-1+ | 300,000 | 300,000 | |||||
New York City GO, 5.00% due 8/1/2025 | Aa3/AA | 400,000 | 397,676 | |||||
New York City GO, 0.50% due 11/1/2026 put 4/1/2009 (Insured: FSA) (daily demand notes) | Aa3/A-1 | 1,000,000 | 1,000,000 | |||||
New York City Metropolitan Transportation Authority, 6.25% due 11/15/2023 | A2/A | 1,000,000 | 1,078,400 | |||||
New York City Municipal Water Finance Authority, 5.75% due 6/15/2013 (ETM) | A2/AAA | 1,000,000 | 1,073,080 | |||||
New York City Municipal Water Finance Authority, 1.00% due 6/15/2032 put 4/1/2009 (SPA: Dexia Credit Local) (daily demand notes) | VMIG1/A-1 | 500,000 | 500,000 | |||||
New York City Municipal Water Finance Authority, 0.85% due 6/15/2033 put 4/1/2009 (SPA: Dexia Credit Local) (daily demand notes) | VMIG1/A-1 | 500,000 | 500,000 | |||||
New York City Transitional Finance Authority, 5.25% due 8/1/2016 (Insured: AMBAC) | Aa1/AAA | 1,000,000 | 1,089,000 | |||||
New York City Transitional Finance Authority, 5.00% due 1/15/2020 | A1/AA- | 1,000,000 | 1,031,730 | |||||
New York City Transitional Finance Authority, 5.00% due 11/1/2020 | Aa1/AAA | 1,000,000 | 1,058,830 | |||||
New York City Trust Cultural Resources, 5.75% due 7/1/2014 (Museum of American Folk Art; Insured: ACA) | NR/NR | 920,000 | 866,235 | |||||
New York Convention Center Development Corp. Hotel Unit Fee, 5.00% due 11/15/2017 (Insured: AMBAC) | A2/A | 1,000,000 | 1,019,300 | |||||
New York Dormitory Authority, 5.25% due 7/1/2010 (D’Youville College; Insured: Radian) | NR/BBB+ | 350,000 | 355,005 | |||||
New York Dormitory Authority, 5.25% due 7/1/2011 (D’Youville College; Insured: Radian) | NR/BBB+ | 370,000 | 374,743 | |||||
New York Dormitory Authority, 5.00% due 2/15/2015 (Mental Health Services; Insured: AMBAC) | Baa1/AA- | 1,000,000 | 1,058,160 | |||||
New York Dormitory Authority, 5.00% due 7/1/2016 (Bishop Henry B Hucles Nursing Home; Insured: SONYMA) | Aa1/NR | 400,000 | 424,936 | |||||
New York Dormitory Authority, 5.00% due 10/1/2018 (Insured: Assured Guaranty) | Aa2/AAA | 1,000,000 | 1,066,420 | |||||
New York Dormitory Authority, 5.50% due 2/15/2019 pre-refunded 8/15/2011 (Mental Health Services; Insured: MBIA) | NR/AA | 585,000 | 647,431 | |||||
New York Dormitory Authority, 6.10% due 7/1/2019 (Ryan Clinton Community Health Center; Insured: SONYMA) | Aa1/NR | 1,000,000 | 1,018,690 | |||||
New York Dormitory Authority, 5.00% due 7/1/2024 (Bishop Henry B Hucles Nursing Home; Insured: SONYMA) | Aa1/NR | 1,000,000 | 988,890 | |||||
New York Dormitory Authority, 5.25% due 7/1/2027 (Health Quest Systems; Insured: Assured Guaranty) | Aa2/AAA | 500,000 | 509,680 | |||||
New York Dormitory Authority Lease, 5.25% due 8/15/2013 (Master Boces; Insured: FSA) | Aa3/AAA | 1,000,000 | 1,066,190 | |||||
New York Dormitory Authority Lease, 5.00% due 1/15/2023 | A1/AA- | 1,000,000 | 1,017,000 | |||||
New York Dormitory Authority Personal Income Tax, 5.50% due 3/15/2012 | Aa3/AAA | 1,000,000 | 1,107,430 | |||||
| 18 Certified Semi-Annual Report |
| SCHEDULE OF INVESTMENTS, CONTINUED | ||
| Thornburg New York Intermediate Municipal Fund | March 31, 2009 (Unaudited) | |
Issuer-Description | Credit Rating† Moody’s/S&P | Principal Amount | Value | |||||
New York Dormitory Authority Personal Income Tax, 5.00% due 3/15/2019 (Insured: FSA) | Aa3/AAA | $ | 1,000,000 | $ | 1,080,590 | |||
New York Environmental Facilities Corp. PCR Water, 6.875% due 6/15/2014 (State Revolving Fund) | Aaa/AAA | 400,000 | 401,848 | |||||
New York State Thruway Authority General, 5.00% due 1/1/2018 (Insured: AMBAC) | A1/A+ | 1,000,000 | 1,058,750 | |||||
New York State Thruway Authority Highway & Bridge Trust Fund, 5.00% due 4/1/2022 | NR/AA | 1,000,000 | 1,034,140 | |||||
New York State Urban Development Corp., 5.25% due 1/1/2021 | NR/AA- | 1,000,000 | 1,054,560 | |||||
Newark Wayne Community Hospital, 5.875% due 1/15/2033 (Insured: AMBAC) | Baa1/A | 1,280,000 | 1,279,975 | |||||
Oneida County IDA, 6.00% due 1/1/2010 (Insured: Radian) | NR/BBB+ | 375,000 | 379,211 | |||||
Oneida County IDA, 6.10% due 6/1/2020 (Presbyterian Home for Central NY; LOC: HSBC Bank USA) | Aa3/NR | 450,000 | 460,818 | |||||
Port Authority New York & New Jersey, 5.00% due 8/15/2022 (Insured: FSA) | Aa3/AAA | 1,000,000 | 1,055,420 | |||||
Port Chester IDA, 4.75% due 7/1/2031 put 7/1/2011 (American Foundation; Collateralized: FNMA) | NR/AAA | 750,000 | 790,433 | |||||
Tobacco Settlement Funding Corp., 5.50% due 6/1/2021 | A1/AA- | 1,000,000 | 1,008,690 | |||||
Triborough Bridge & Tunnel Authority, 5.00% due 11/15/2025 | Aa2/AA- | 1,410,000 | 1,443,741 | |||||
Utica IDA Civic Facility, 5.25% due 7/15/2016 (Munson Williams Proctor Institute) | A1/NR | 210,000 | 223,033 | |||||
TOTAL INVESTMENTS — 98.39% (Cost $34,184,865) | $ | 34,745,752 | ||||||
OTHER ASSETS LESS LIABILITIES — 1.61% | 569,633 | |||||||
NET ASSETS — 100.00% | $ | 35,315,385 | ||||||
Footnote Legend
| † | Credit ratings are unaudited. Rating changes may have occurred prior to or subsequent to the reporting period end. |
Portfolio Abbreviations
To simplify the listings of securities, abbreviations are used per the table below:
| ACA | Insured by American Capital Access | |
| AMBAC | Insured by American Municipal Bond Assurance Corp. | |
| ETM | Escrowed to Maturity | |
| FNMA | Collateralized by Federal National Mortgage Association | |
| FSA | Insured by Financial Security Assurance Co. | |
| GO | General Obligation | |
| IDA | Industrial Development Authority | |
| LOC | Letter of Credit | |
| MBIA | Insured by Municipal Bond Investors Assurance | |
| PCR | Pollution Control Revenue Bond | |
| RADIAN | Insured by Radian Asset Assurance | |
| SONYMA | State of New York Mortgage Authority |
See notes to financial statements.
| Certified Semi-Annual Report 19 |
| EXPENSE EXAMPLE | ||
| Thornburg New York Intermediate Municipal Fund | March 31, 2009 (Unaudited) | |
As a shareholder of the Fund, you incur two types of costs:
(1) transaction costs, including
(a) sales charges (loads) on purchase payments, for Class A shares;
(b) a deferred sales charge on redemptions of any part or all of a purchase of $1 million of Class A shares within 12 months of purchase;
(2) ongoing costs, including management fees; distribution and/or service (12b-1) fees; and other Fund expenses.
This example is intended to help you understand your ongoing costs (in dollars) of investing in the Fund and to compare these costs with the ongoing costs of investing in other mutual funds.
The example is based on an investment of $1,000 invested on September 30, 2008 and held until March 31, 2009.
Actual Expenses
The first line of the table at right provides information about actual account values and actual expenses. You may use the information in this line, together with the amount you invested, to estimate the expenses that you paid over the period. Simply divide your account value by $1,000 (for example, an $8,600 account value divided by $1,000 = 8.6), then multiply the result by the number in the first line under the heading entitled “Expenses Paid During Period” to estimate the expenses you paid on your account during this period.
Hypothetical Example for Comparison Purposes
The second line of the table at right provides information about hypothetical account values and hypothetical expenses based on the Fund’s actual expense ratio and an assumed rate of return of 5% per year before expenses, which is not the Fund’s actual return. The hypothetical account values and expenses may not be used to estimate the actual ending account balance or expenses you paid for the period. You may use this information to compare the ongoing costs of investing in the Fund and other funds. To do so, compare this 5% hypothetical example with the 5% hypothetical examples that appear in the shareholder reports of the other funds.
| Beginning Account Value 9/30/08 | Ending Account Value 3/31/09 | Expenses Paid During Period† 9/30/08–3/31/09 | |||||||
Class A Shares | |||||||||
Actual | $ | 1,000.00 | $ | 1,048.90 | $ | 5.06 | |||
Hypothetical* | $ | 1,000.00 | $ | 1,020.00 | $ | 4.99 | |||
| † | Expenses are equal to the annualized expense ratio for Class A shares (0.99%) multiplied by the average account value over the period, multiplied by 182/365 to reflect the one-half year period. |
| * | Hypothetical assumes a rate of return of 5% per year before expenses. |
Please note that the expenses shown in the table are meant to highlight your ongoing costs only and do not reflect any transactional costs, such as sales charges (loads), redemption fees, or exchange fees. Therefore, the second line of the table is useful in comparing ongoing costs only, and will not help you determine the relative total costs of owning different funds. In addition, if these transactional costs were included, your costs would have been higher.
| 20 Certified Semi-Annual Report |
| OTHER INFORMATION | ||
| Thornburg New York Intermediate Municipal Fund | March 31, 2009 (Unaudited) | |
PORTFOLIO PROXY VOTING
Policies and Procedures:
The Trust has delegated to Thornburg Investment Management, Inc. (the “Advisor”) voting decisions respecting proxies for the Fund’s voting securities. The Advisor makes voting decisions in accordance with its Proxy Voting Policy and Procedures. A description of the Policy and Procedures is available (i) without charge, upon request, by calling the Advisor toll-free at 1-800-847-0200, (ii) on the Thornburg website at www.thornburg.com, and (iii) on the Securities and Exchange Commission’s website at www.sec.gov.
Information regarding how proxies were voted is available on or before August 31 of each year for the twelve months ending the preceding June 30. This information is available (i) without charge, upon request by calling the Advisor toll-free at
1-800-847-0200, (ii) on the Thornburg website at www. thornburg.com, and (iii) on the Securities and Exchange Commission’s website at www.sec.gov.
AVAILABILITY OF QUARTERLY PORTFOLIO SCHEDULE
The Fund files with the Securities and Exchange Commission schedules of its portfolio holdings on Form N-Q for the first and third quarters of each fiscal year. The Fund’s Forms N-Q are available on the Commission’s website at www.sec.gov, or may be reviewed and copied at the Commission’s Public Reference Room in Washington, D.C. Information on the operation of the Public Reference Room may be obtained by calling 1-800-SEC-0330. The Fund also makes this information available on its website at www.thornburg.com/download or upon request by calling 1-800-847-0200.
| Certified Semi-Annual Report 21 |
Trustees’ Statement to Shareholders
Not part of the Certified Semi-Annual Report
February 8, 2005, as readopted September 15, 2008
The Trustees are concerned that ongoing commentaries and opinions reported in the media may confuse investors in general as to the supervisory duties of trustees of mutual funds and, in particular, leave Thornburg Investment Trust shareholders uncertain regarding how we discharge our responsibilities in supervising the Funds’ investment advisor and in reviewing the advisor’s contract for renewal. We decided to spell out clearly three principal guidelines that we follow in supervising the Trust’s investment advisor on your behalf.
We begin with the premise that each shareholder selected his or her Fund because its investments are managed by the investment advisor identified in the prospectus and in accordance with the objective and policies described in the prospectus. We realize, as each of you do, that if you believe that your Fund’s stated objective and policies no longer serve your personal investment goals, you can sell your shares and leave the Fund.
Therefore, we believe that our primary supervisory task – our principal obligation to you – is to assess the nature and quality of the advisor’s services, and to confirm that the advisor actively and competently pursues the Fund’s objective, in accordance with the policies set out in the prospectus. To do this, we meet regularly with management to review your Fund’s portfolio and to discuss the advisor’s specific actions and judgments in pursuing the Fund’s objective. We do not substitute our own judgment for the advisor’s decisions in selecting investments; the advisor is paid to exercise its informed judgment on investment decisions, and we seek to confirm, in reviewing the advisor’s performance, that the advisor is doing just that.
Second, while we are conscious of costs and the effect that costs have on shareholders’ returns, we do not seek the lowest fees or expense ratio as our sole or primary objective. We try to make sure that your Fund’s fees and costs are reasonable in relationship to the services rendered and that they are generally in line with those charged by other expert investment advisors, consistent with our belief that the Fund’s investors searched for and expect that expertise and attention and have decided to pay a reasonable price for it. We do not put the management contract “out to bid” as a matter of course, and we would not do so unless we had concluded that the advisor materially had failed to pursue the Fund’s objectives in accordance with its policies, or for other equally important reasons. We believe that any other approach would be inconsistent with your interests and contrary to your expectations when you bought shares of the Fund in the first place.
Finally, because we believe that most Thornburg Fund shareholders have invested with a long-term perspective, we try not to focus too much on the fashions of the moment and on short-term performance. The market will not favor any specific investment objective or set of policies at all times and under all economic circumstances. A fund will experience periods of both high and low returns relative to other funds and other investments. Even if one of our Funds is not favored by the market at a particular time, we believe that the advisor is nonetheless obliged to remain true to the Fund’s objective and policies, and we watch to see that it does so.
| 22 This page is not part of the Semi-Annual Report. |
Planning Options
Retirement and Education Accounts
Thornburg Investment Management offers retirement and education savings accounts that can help you meet a variety of planning challenges. For account applications or further information on any of the accounts below, please call 1-800-847-0200 or go to www.thornburg.com/ira. Your financial advisor can help you determine which plan is right for you.
Individual Retirement Accounts
Individual Retirement Accounts (IRAs) provide a tax-advantaged means to save money for the future. For a detailed outline of the difference between retirement accounts, see www.thornburg.com/ira. Rollovers are available. Call 1-800-847-0200 for more information.
Traditional IRAs – Contributions to Traditional IRAs are tax deductible for eligible individuals, and withdrawals are taxed as additional ordinary income. You may contribute to an IRA if you receive compensation and are under 70 1/2, even if you are covered by an employer retirement plan. Deductible contributions are subject to certain qualifications. Please consult your tax advisor.
Roth IRAs – Under a Roth IRA, there is no tax deduction for contributions, but there is no income tax on qualified withdrawals. For a more detailed comparison of Traditional and Roth IRAs, please see our web site at www.thornburg.com/ira.
SEP IRAs – Simplified Employee Pension (SEP) IRAs are established by employers. The employer is allowed a tax deduction for contributions made to the SEP Plan and makes contributions to each eligible employee’s SEP IRA on a discretionary basis.
SIMPLE IRAs – Savings Incentive Match Plan for Employees of Small Employers (SIMPLE) is designed to give small business owners a simplified method to establish and contribute to a retirement plan for employees. The employer is allowed a tax deduction for contributions and makes either matching or non-elective contributions to each eligible employee’s SIMPLE IRA. Employees may make salary deferral contributions.
Coverdell Education Savings Account
These savings accounts are designed to provide a way to save money for higher education expenses. In an Education Savings Account, earnings and interest grow tax-free, and qualified withdrawals used to pay for eligible higher-education expenses are tax- and penalty-free.
Funds Available
The following funds are available in the accounts listed above:
| • | Thornburg International Value Fund |
| • | Thornburg Value Fund |
| • | Thornburg Core Growth Fund |
| • | Thornburg Investment Income Builder Fund |
| • | Thornburg Global Opportunities Fund |
| • | Thornburg International Growth Fund |
| • | Thornburg Limited Term U.S. Government Fund |
| • | Thornburg Limited Term Income Fund |
| • | Thornburg Strategic Income Fund |
| This page is not part of the Semi-Annual Report. 23 |

| 24 This page is not part of the Semi-Annual Report. |
Thornburg Equity Funds
Thornburg’s equity research uses a fundamental and comprehensive analytical approach. Thornburg equity funds focus on a limited number of securities so that each holding can impact performance. The equity team searches for firms believed to have a promising future and seeks to buy shares of those companies at a discount to their intrinsic value.
| • | Thornburg Value Fund |
| • | Thornburg International Value Fund |
| • | Thornburg Core Growth Fund |
| • | Thornburg Investment Income Builder Fund |
| • | Thornburg Global Opportunities Fund |
| • | Thornburg International Growth Fund |
Thornburg Bond Funds
Thornburg Investment Management applies a disciplined philosophy to fixed-income management. Since the launch of our first fixed-income fund 25 years ago, we have been conducting fundamental, bottom-up research in an effort to identify bonds which we believe provide the best return for a given level of risk. We are very organic in our approach, avoiding leverage or complex strategies which could backfire in periods of market uncertainty.
| • | Thornburg Limited Term Municipal Fund |
| • | Thornburg Intermediate Municipal Fund |
| • | Thornburg California Limited Term Municipal Fund |
| • | Thornburg New Mexico Intermediate Municipal Fund |
| • | Thornburg New York Intermediate Municipal Fund |
| • | Thornburg Strategic Municipal Income Fund |
| • | Thornburg Limited Term U.S. Government Fund |
| • | Thornburg Limited Term Income Fund |
| • | Thornburg Strategic Income Fund |
Before investing, carefully consider the Fund’s investment goals, risks, charges, and expenses. For a prospectus containing this and other information, contact your financial advisor or visit thornburg. com. Read it carefully before investing.
For additional information, please visit www.thornburg.com
Thornburg Investment Management, Inc. 2300 North Ridgetop Road, Santa Fe, NM 87506
| This page is not part of the Semi-Annual Report. 25 |
This page intentionally left blank.
| 26 This page is not part of the Semi-Annual Report. |
This page intentionally left blank.
| This page is not part of the Semi-Annual Report. 27 |

| This Semi-Annual Report is submitted for the general information of shareholders of the Fund. It is not authorized for distribution to prospective investors in the Fund unless preceded or accompanied by an effective prospectus. | ||
 | Investment Advisor: | |
Thornburg Investment Management® 800.847.0200
| ||
| Distributor: | ||
Thornburg Securities Corporation® 800.847.0200 | ||
TH1069 | ||
Waste not, Wait not |  |
Get instant access to your shareholder reports.
By switching from your postal mailbox to your email inbox, you reduce paper clutter, improve record keeping access, and help conserve our natural resources.
Go to www.thornburg.com/edelivery and sign up to receive your shareholder reports, prospectuses, and proxy statements electronically.
You invest in the future, without spending a dime.


| 2 This page is not part of the Semi-Annual Report. | ||
Important Information
The information presented on the following pages was current as of March 31, 2009. The managers’ views, portfolio holdings, and sector and country diversification are provided for the general information of the Funds’ shareholders; they are historical and subject to change. This material should not be deemed a recommendation to buy or sell any of the securities mentioned.
Investments in the Funds carry risks, including possible loss of principal. As with direct bond ownership, funds that invest in bonds are subject to certain risks including interest-rate risk, credit risk, and inflation risk. The principal value of bonds will fluctuate relative to changes in interest rates, decreasing when interest rates rise. Unlike bonds, bond funds have ongoing fees and expenses. Please see the Funds’ Prospectus for a discussion of the risks associated with an investment in the Funds. Investments in the Funds are not deposits or obligations of, or guaranteed or endorsed by, any bank, the Federal Deposit Insurance Corporation, the Federal Reserve Board or any government agency. There is no guarantee that the Funds will meet their investment objectives. The laddering strategy does not assure or guarantee better performance and cannot eliminate the risk of investment losses.
Performance data given at net asset value (NAV) does not take into account applicable sales charges. If the sales charges had been included, the performance would have been lower.
Minimum investments for Class I shares are higher than those for other classes. Class I and R3 shares may not be available to all investors.
Limited Term U.S. Government Fund | NASDAQ Symbols | Cusips | ||
Class A | LTUSX | 885-215-103 | ||
Class B | LTUBX | 885-215-848 | ||
Class C | LTUCX | 885-215-830 | ||
Class I | LTUIX | 885-215-699 | ||
Class R3 | LTURX | 885-215-491 | ||
Limited Term Income Fund | NASDAQ Symbols | Cusips | ||
Class A | THIFX | 885-215-509 | ||
Class C | THICX | 885-215-764 | ||
Class I | THIIX | 885-215-681 | ||
Class R3 | THIRX | 885-215-483 | ||
Lipper’s 2008
Best Fixed-Income Fund Family
Thornburg Investment Management ranked #1 out of 41 eligible firms in Lipper, Inc.’s fixed income large firm universe for the three-year period ended 12/31/07, based on risk-adjusted returns. Past performance does not guarantee future results.
Lipper’s large firm universe is comprised of fund families with more than $28 billion in total net assets. Only fund families with at least five bond funds were eligible. Risk-adjusted returns were calculated with dividends reinvested and without sales charges. We did not win this award in 2009.
Glossary
Barclays Capital Intermediate Government/Credit Bond Index – An unmanaged, market-weighted index generally representative of intermediate government and investment-grade corporate debt securities having maturities of up to ten years.
Barclays Capital Intermediate Government Bond Index – An unmanaged, market-weighted index generally representative of all public obligations of the U.S. Government, its agencies and instrumentalities having maturities of up to ten years.
Lipper Short-Intermediate U.S. Government Funds – Funds that invest primarily in securities issued or guaranteed by the U.S. government, its agencies, or its instrumentalities, with dollar-weighted average maturities of one to five years.
Lipper Short-Intermediate Investment Grade Debt Funds – Funds that invest primarily in investment-grade debt issues (rated in the top four grades) with dollar-weighted average maturities of one to five years.
Unless otherwise noted, index returns reflect the reinvestment of income dividends and capital gains, if any, but do not reflect fees, brokerage commissions or other expenses of investing. Investors may not make direct investments into any index.
Distribution Rate – The distribution rate is calculated by taking the sum of the month’s total distribution factors and dividing this sum by a 30-day period and annualizing to a 360-day year. The value is then divided by the ending Net Asset Value (NAV) to arrive at the annualized distribution yield. The yield is calculated on a periodic basis and is subject to change depending on the Fund’s NAV and current distributions.
Duration – The weighted maturity of a bond’s cash flows. Duration measures the price sensitivity of a bond for a given change in interest rates. Bonds with longer durations experience greater price volatility than bond with shorter durations.
SEC Yield – SEC Yield is computed in accordance with SEC standards measuring the net investment income per share over a specified 30-day period expressed as a percentage of the maximum offering price of the Fund’s shares at the end of the period.
U.S. Treasury Securities – U.S. Treasury Securities, such as bills, notes and bonds, are negotiable debt obligations of the U.S. government. These debt obligations are backed by the “full faith and credit” of the government and issued at various schedules and maturities. Income from Treasury securities is exempt from state and local, but not federal income taxes.
| This page is not part of the Semi-Annual Report. 3 | ||
Thornburg Limited Term U.S. Government Fund
At Thornburg, our approach to fixed-income management is based on the premise that investors in our bond funds seek preservation of capital along with an attractive, relatively stable yield. While aggressive bond strategies may generate stronger returns when the market is turning a blind eye towards risk, they usually fail to stack up over longer periods of time. Our patience and diligence was recognized by Lipper, in 2008 with the Best Fixed-Income Fund Family Award.
We apply time-tested techniques to manage risk and provide attractive returns. These include:
| • | Building a laddered portfolio. Laddering has been shown over time to mitigate price and interest rate risk. |
| • | Investing on a cash-only basis without using leverage. While leveraged strategies may enhance returns when market conditions are favorable, they can quickly compound losses when sentiment shifts. |
| • | Conducting careful research to invest where we see the best relative value among government and agency sectors. |
IMPORTANT
PERFORMANCE INFORMATION
Performance data shown represents past performance and is no guarantee of future results. Investment return and principal value will fluctuate so shares, when redeemed, may be worth more or less than their original cost. Current performance may be lower or higher than quoted. For performance current to the most recent month end, visit thornburg. com.
The maximum sales charge for the Limited Term U.S. Government Fund’s Class A shares is 1.50%. The total annual fund operating expense of Class A shares is 0.95%, as disclosed in the most recent Prospectus.
LONG-TERM STABILITY OF PRINCIPAL
Net asset value history of A shares from November 16, 1987 through March 31, 2009
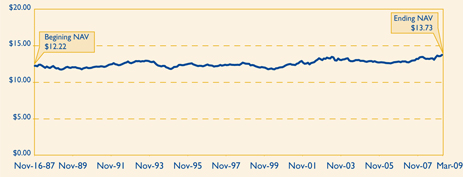
AVERAGE ANNUAL TOTAL RETURNS
For periods ended March 31, 2009
| 1 Yr | 3 Yrs | 5 Yrs | 10 Yrs | Since Inception | |||||||||||
A Shares (Incep: 11/16/87) | |||||||||||||||
Without Sales Charge | 5.18 | % | 6.12 | % | 3.68 | % | 4.98 | % | 6.08 | % | |||||
With Sales Charge | 3.64 | % | 5.59 | % | 3.37 | % | 4.82 | % | 6.00 | % | |||||
PORTFOLIO LADDER
As of March 31, 2009
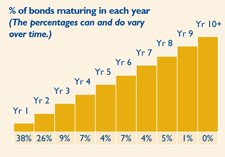
30-DAY YIELDS
As of March 31, 2009
| Annualized Distribution Rate | SEC Yield | |||||
A Shares | 3.55 | % | 2.52 | % |
KEY PORTFOLIO ATTRIBUTES
As of March 31, 2009
Average Credit Quality | AAA | |
Number of Bonds | 133 | |
Duration | 2.6 Yrs | |
Average Maturity | 2.9 Yrs | |
See the entire portfolio in the Schedule of Investments on page 33.
| 4 This page is not part of the Semi-Annual Report. | ||
THORNBURG LIMITED TERM U.S. GOVERNMENT FUND VERSUS
LIPPER U.S. GOVERNMENT MONEY MARKET FUNDS AVERAGE
Class A shares as of March 31, 2009
We often are asked to compare Thornburg Limited Term U.S. Government Fund to money market fund returns. U.S. Government bond funds are not an exact substitute for money market funds. These investments have certain differences, which are discussed below. Investors in Thornburg Limited Term U.S. Government Fund took more risk than money market fund investors to earn their higher returns.
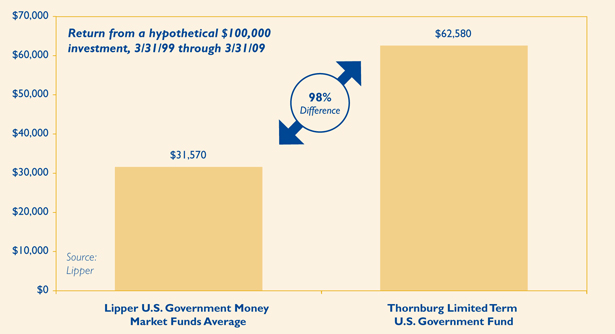
Past performance does not guarantee future results. Performance data above does not include the 1.50% sales charge for Class A shares. If the sales charge had been included, returns would have been lower. Returns shown are minus the initial investment.
Investors in U.S. Government bond funds may experience more volatility than those in comparable money market funds. There are also differences in fees and expenses.
Investors in the Thornburg Limited Term U.S. Government Fund took more risk than money market investors to earn their higher returns including reinvestment risk, credit risk, and inflation risk. Unlike money market funds, the prices of bonds fluctuate relative to changes in interest rates, with principal values decreasing when interest rates rise and increasing when interest rates fall. Generally, money market funds seek to maintain an investment portfolio with an average maturity of 90 days or less. Thornburg Limited Term U.S. Government Fund has an average maturity of normally less than five years. Interest dividends paid by the Fund or by U.S. Government money market funds are generally exempt from federal income tax and may be exempt from some state income tax.
Money market funds seek to preserve the value per share at $1.00, whereas, the Thornburg Limited Term U.S. Government Fund’s net asset value changes daily. It is possible to lose money when investing in either the Thornburg Limited Term U.S. Government Fund or a U.S. Government money market fund. Neither are insured by the FDIC or any other government agency.
Lipper U.S. Government Money Market Funds Average is an arithmetic average of the total return of all U.S. Government money market mutual funds. You cannot invest in a category average.
| This page is not part of the Semi-Annual Report. 5 | ||
Thornburg Limited Term Income Fund
The Thornburg Limited Term Income Fund takes the laddering strategy to the broader fixed-income market. Expanding beyond government and agency securities brings additional risks – as well as potentially higher returns. The team addresses these uncertainties by employing a comprehensive approach to risk management. While utilizing the ladder to balance interest rate and reinvestment risk, the team also:
| • | Invests on a cash-only basis. While leveraged strategies may enhance returns when market conditions are favorable, they can quickly compound losses when sentiment shifts. |
| • | Conducts in-depth fundamental research on each credit issue under consideration. The goal of this research is identification of bonds which provide a reasonable return for their given level of risk. |
| • | Maintains a portfolio of high-quality bonds and diversifies among a large number of bonds to minimize the potential impact of default by any single issuer. |
IMPORTANT
PERFORMANCE INFORMATION
Performance data shown represents past performance and is no guarantee of future results. Investment return and principal value will fluctuate so shares, when redeemed, may be worth more or less than their original cost. Current performance may be lower or higher than quoted. For performance current to the most recent month end, visit thornburg. com.
The maximum sales charge for the Limited Term Income Fund’s Class A shares is 1.50%. The total annual fund operating expense of Class A shares is 1.03%, as disclosed in the most recent Prospectus. Thornburg Investment Management intends to waive fees and reimburse expenses so that actual expenses for Class A shares do not exceed 0.99%. The fee waivers and expense reimbursements are voluntary and may be terminated at any time.
LONG-TERM STABILITY OF PRINCIPAL
Net asset value history of A shares from October 1, 1992 through March 31, 2009
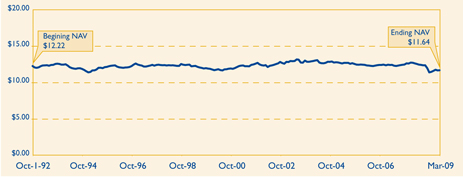
AVERAGE ANNUAL TOTAL RETURNS
For periods ended March 31, 2009
| 1 Yr | 3 Yrs | 5 Yrs | 10 Yrs | Since Inception | |||||||||||
A Shares (Incep: 10/1/92) | |||||||||||||||
Without Sales Charge | -2.99 | % | 2.56 | % | 1.86 | % | 4.21 | % | 5.02 | % | |||||
With Sales Charge | -4.43 | % | 2.04 | % | 1.55 | % | 4.04 | % | 4.92 | % | |||||
PORTFOLIO LADDER
As of March 31, 2009

30-DAY YIELDS
As of March 31, 2009
| Annualized Distribution Rate | SEC Yield | |||||
A Shares | 5.14 | % | 3.98 | % |
Without waivers and reimbursements, yields and total returns would be lower.
KEY PORTFOLIO ATTRIBUTES
As of March 31, 2009
Average Credit Quality | A | |
Number of Bonds | 280 | |
Duration | 3.7 Yrs | |
Average Maturity | 4.5 Yrs | |
See the entire portfolio in the Schedule of Investments on page 37.
| 6 | This page is not part of the Semi-Annual Report. |
THORNBURG LIMITED TERM INCOME FUND VERSUS
LIPPER MONEY MARKET FUNDS (TAXABLE) AVERAGE
Class A shares as of March 31, 2009
We often are asked to compare Thornburg Limited Term Income Fund to money market fund returns. Taxable bond funds are not an exact substitute for money market funds. These investments have certain differences, which are discussed below. Investors in Thornburg Limited Term Income Fund took more risk than money market fund investors to earn their higher returns.
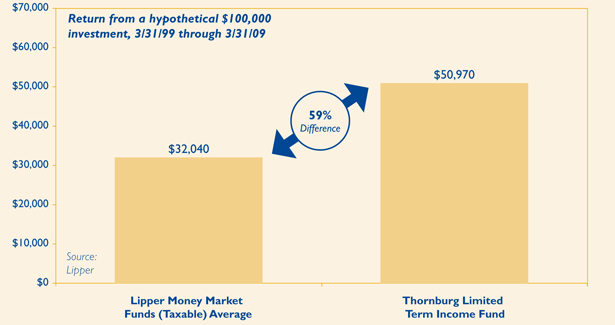
Past performance does not guarantee future results. Performance data above does not include the 1.50% sales charge for Class A shares. If the sales charge had been included, returns would have been lower. Returns shown are minus the initial investment.
Investors in taxable bond funds may experience more volatility than those in comparable money market funds. There are also differences in fees and expenses.
Investors in the Thornburg Limited Term Income Fund took more risk than money market investors to earn their higher returns including reinvestment risk, credit risk, and inflation risk. Unlike money market funds, the prices of bonds fluctuate relative to changes in interest rates, with principal values decreasing when interest rates rise and increasing when interest rates fall. Generally, money market funds seek to maintain an investment portfolio with an average maturity of 90 days or less. Thornburg Limited Term Income Fund has an average maturity of normally less than five years.
Interest dividends paid by the Fund or by taxable money market funds are generally subject to federal income tax and state income tax (except for income from U.S. Government Treasuries, if applicable). Both Thornburg Limited Term Income Fund and taxable money market funds may be subject to AMT.
Money market funds seek to preserve the value per share at $1.00, whereas, the Thornburg Limited Term Income Fund’s net asset value changes daily. It is possible to lose money when investing in either the Thornburg Limited Term Income Fund or a taxable money market fund. Neither are insured by the FDIC or any other government agency.
Lipper Money Market Funds (Taxable) Average is an arithmetic average of the total return of all taxable money market mutual funds. You cannot invest in a category average.
| This page is not part of the Semi-Annual Report. 7 | ||

Thornburg Limited Term Income Funds
March 31, 2009
Table of Contents | ||||||
| 9 | ||||||
| 12 | ||||||
| 14 | ||||||
| 16 | ||||||
| 17 | ||||||
| 18 | ||||||
| 24 | ||||||
| 29 | ||||||
| 33 | ||||||
| 37 | ||||||
| 48 | ||||||
| 49 | ||||||
This report is certified under the Sarbanes-Oxley Act of 2002, which requires that public companies, including mutual funds, affirm that the information provided in their annual and semiannual shareholder reports fully and fairly represents their financial position.
| 8 Certified Semi-Annual Report | ||
Jason Brady, CFA Portfolio Manager | April 19, 2009
Dear Fellow Shareholder:
I am pleased to present the Semi-Annual Report for the Thornburg Limited Term U.S. Government Fund and the Thornburg Limited Term Income Fund for the period ended March 31, 2009. The net asset value of a Class A share of the Thornburg Limited Term U.S. Government Fund increased 47 cents in the period to $13.73. If you were invested for the entire period, you received dividends of 17.2 cents per share. If you reinvested your dividends, you received 17.3 cents per share. The net asset value of a Class A share of the Thornburg Limited Term Income Fund decreased 28 cents in the period to $11.64. If you were invested for the entire period, you received dividends of 30.3 cents per share. If you reinvested your dividends, you received 30.6 cents per share. For both Funds, dividends per share were lower for some classes and higher for other classes of shares to account for varying class-specific expenses. Please examine the accompanying exhibits for more detailed information. |

The yields on U.S. Treasuries were volatile over the course of the past year, with general price appreciation in U.S. Treasuries driving returns in that sector. A much larger factor in the fixed income market generally, however, was a continued widening in spreads (the additional yield the market requires for investing in less credit worthy securities versus credit risk-less U.S. Treasuries) on all non-Treasury bond asset classes, which only abated in the 1st quarter of 2009. The two-year U.S. Treasury moved from a 1.96% yield to a 0.80% yield over the course of the past year, while the ten-year U.S. Treasury moved from a 3.82% yield to a 2.67% yield. Credit spreads continued to widen dramatically through December, 2008 though that damage has been mitigated somewhat through the end of the 1st quarter (and more significantly at the beginning of the second quarter). As an example, the Barclays Capital Corporate Credit Index Option Adjusted Spread (or the difference between Treasuries and the average investment grade corporate bond) moved from 4.41% on September 30, 2008, to 5.43% on March 31, 2009. On December 3, 2008 it touched its all-time high of 6.18%. The 30 year average of this index is 1.25%, to give some perspective. By almost any measure, non-Treasury fixed income had its worst year ever in 2008. Despite some recovery, the market continues to be challenging from a price and liquidity standpoint, though frankly yields in non-Treasury securities are extremely attractive for any long-term investor given fundamental risks.
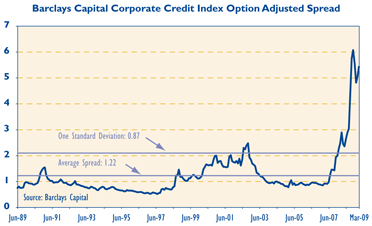
Putting income and change in price together, the Class A shares of the Thornburg Limited Term U.S. Government Fund produced a total return of 4.87% at NAV over the six-month period ended March 31, 2009, assuming a beginning-of-period investment at the net asset value. The Barclays Intermediate
| Certified Semi-Annual Report 9 | ||
Letter to Shareholders
Continued
Government Bond Index produced a 6.08% total return over the same time period. The average return for the Lipper Short-Intermediate U.S. Government Bond category was 4.47%. The Class A shares of the Thornburg Limited Term Income Fund produced a total return of 0.24% at NAV over the six-month period, assuming a beginning-of-period investment at the net asset value. The Barclays Intermediate Government/Credit Index produced a 4.79% total return over the same time period. The average return for the Lipper Short-Intermediate Investment Grade category was 0.93%. Both Barclays indices reflect no deduction for fees, expenses, or taxes.
The Funds kept their durations somewhat shorter than the Indices during much of the past year and as a result did not participate in some appreciation in longer-term Treasury securities. At the same time, Thornburg’s laddered portfolio strategy and prudent credit selection (within the Income Fund) clearly benefited the Fund. However, the Thornburg Limited Term Income Fund, while maintaining a high (low AA to high A) average credit rating, holds a much smaller proportion of U.S. Treasury securities than the index. In a time of widening credit spreads, U.S. Treasuries outperformed any other security, limiting returns for the Fund relative to its index. That said, the Fund continued to pick up high quality corporate bonds during the end of 2008 into the beginning of 2009 as I believe they represent tremendous long-term value. This stance has reaped some gains for the Fund and you, the shareholders, over the course of 2009 thus far and I expect these holdings to be ones that we’ll be proud to own for some time. The Thornburg Limited Term U.S. Government Fund continues to hold only instruments guaranteed by the U.S. Government or Government Sponsored Enterprises. The Fund’s holdings in non-Treasury securities including Agency Debentures and Mortgages increased significantly in January 2009, which was a positive contributor to Fund performance. I remain quite comfortable with our holdings and believe that over time each investment will yield satisfactory results, and in aggregate position the Funds well. Furthermore, the medium and long term yields available in the market today make for significant investment opportunities for an investor with a reasonable time horizon.
The recent volatility in the marketplace continues to underline the importance of high quality bonds in your bond portfolio allocation. Both Funds continue to perform even in an environment with nearly unprecedented movements in all asset classes. These periods of volatility have been relatively short in the past, and credit spreads had remained fairly well behaved. However, the past year has shown that volatility is alive and well. Furthermore, the challenges to continued smooth economic and asset growth are significant. Problems within financial institutions caused by weakness in housing markets have spilled over into the broader economy. Though we have seen some better economic news of late, it is likely that the road to recovery will be longer than any of us desire.
Thornburg Investment Management will continue to strive to give you, the bond investor, a consistent income stream and a set of funds which are not highly correlated to equity markets’ returns. The broad distribution of fund returns in the past six months shows that those that reached for yield by taking incremental risk for which they were not compensated have suffered. In many cases investors have been surprised by their fixed income allocation’s performance, and unfortunately these surprises have not been particularly pleasant ones. We believe that the store of value in your bond portfolio should benefit you through economic cycles and we strive to invest with that in mind. In this environment, though low quality fixed income can move in tandem with equities, the risk of holding
| 10 Certified Semi-Annual Report | ||
extremely high quality cash instruments or U.S. Treasuries alone is also present, especially when one considers potential erosion of purchasing power due to potential long-run inflation. As a result, I continue to try to place capital preservation (in all senses of the term) at the top of the list of priorities for these core funds.
No matter the direction of interest rates or credit spreads in the near term, I believe your Funds are well positioned to achieve their longer term goals of principal stability and reasonable income. The Thornburg Limited Term U.S. Government Fund and the Thornburg Limited Term Income Fund are laddered portfolios of short-to-intermediate bonds. This balances duration and yield in a way which is designed to provide the best risk-adjusted bond returns over time. Intermediate bonds can provide stability to the underlying principal, they can provide income for your portfolio, and over time they have provided an attractive return versus money market instruments.
Thank you very much for investing in our Funds. I feel that the Thornburg Limited Term U.S. Government Fund and the Thornburg Limited Term Income Fund are appropriate investments for those looking for core bond investments. While future performance cannot be guaranteed, Thornburg Investment Management will continue to strive to chart a steady course in what continues to be a volatile marketplace.
Sincerely, |
 |
Jason H. Brady, CFA |
Portfolio Manager |
The matters discussed in this report may constitute forward-looking statements made pursuant to the safe harbor provisions of the Securities Litigation Reform Act of 1995. These include any advisor or portfolio manager prediction, assessment, analysis or outlook for individual securities, industries, investment styles, market sectors and/or markets. These statements involve risks and uncertainties. In addition to the general risks described for each fund in its current prospectus, other factors bearing on these reports include the accuracy of the advisor’s or portfolio manager’s forecasts and predictions, the appropriateness of the investment strategies designed by the advisor or portfolio manager and the ability of the advisor or portfolio manager to implement their strategies efficiently and successfully. Any one or more of these factors, as well as other risks affecting the securities markets generally, could cause the actual results of any fund to differ materially as compared to its benchmarks.
| Certified Semi-Annual Report 11 | ||
STATEMENTS OF ASSETS AND LIABILITIES
| Thornburg Limited Term Income Funds | March 31, 2009 (Unaudited) | |
| Limited Term U.S. Government Fund | Limited Term Income Fund | ||||||
ASSETS | |||||||
Investments at value (cost $281,478,238 and $380,574,052, respectively)(Note 2) | $ | 290,270,900 | $ | 359,038,291 | |||
Cash | 4,025,996 | 686,980 | |||||
Receivable for investments sold | — | 165,000 | |||||
Principal receivable | 726 | — | |||||
Receivable for fund shares sold | 1,267,814 | 2,558,118 | |||||
Interest receivable | 1,781,241 | 4,236,204 | |||||
Prepaid expenses and other assets | 139,992 | 34,113 | |||||
Total Assets | 297,486,669 | 366,718,706 | |||||
LIABILITIES | |||||||
Payable for securities purchased | — | 499,960 | |||||
Payable for fund shares redeemed | 911,984 | 487,975 | |||||
Payable to investment advisor and other affiliates (Note 3) | 206,612 | 230,783 | |||||
Accounts payable and accrued expenses | 21,916 | 113,597 | |||||
Dividends payable | 194,541 | 333,771 | |||||
Total Liabilities | 1,335,053 | 1,666,086 | |||||
NET ASSETS | $ | 296,151,616 | $ | 365,052,620 | |||
NET ASSETS CONSIST OF: | |||||||
Undistributed (distribution in excess of) net investment income | $ | 61,459 | $ | (98,854 | ) | ||
Net unrealized appreciation (depreciation) on investments | 8,792,662 | (21,535,761 | ) | ||||
Accumulated net realized gain (loss) | 1,089,165 | (5,819,393 | ) | ||||
Net capital paid in on shares of beneficial interest | 286,208,330 | 392,506,628 | |||||
| $ | 296,151,616 | $ | 365,052,620 | ||||
| 12 Certified Semi-Annual Report | ||
| STATEMENTS OF ASSETS AND LIABILITIES, CONTINUED | ||
| Thornburg Limited Term Income Funds | March 31, 2009 (Unaudited) | |
| Limited Term U.S. Government Fund | Limited Term Income Fund | |||||
NET ASSET VALUE: | ||||||
Class A Shares: | ||||||
Net asset value and redemption price per share | $ | 13.73 | $ | 11.64 | ||
Maximum sales charge, 1.50% of offering price | 0.21 | 0.18 | ||||
Maximum offering price per share | $ | 13.94 | $ | 11.82 | ||
Class B Shares: | ||||||
Net asset value and offering price per share * | $ | 13.70 | $ | — | ||
Class C Shares: | ||||||
Net asset value and offering price per share * | $ | 13.82 | $ | 11.62 | ||
Class I Shares: | ||||||
Net asset value, offering and redemption price per share | $ | 13.73 | $ | 11.64 | ||
Class R3 Shares: | ||||||
Net asset value, offering and redemption price per share | $ | 13.74 | $ | 11.65 | ||
| * | Redemption price per share is equal to net asset value less any applicable contingent deferred sales charge. |
See notes to financial statements.
| Certified Semi-Annual Report 13 | ||
Thornburg Limited Term Income Funds | Six Months Ended March 31, 2009 (Unaudited) | |
| Limited Term U.S. Government Fund | Limited Term Income Fund | |||||||
INVESTMENT INCOME: | ||||||||
Interest income (net of premium amortized of $369,235 and $159,372, respectively) | $ | 4,718,089 | $ | 9,691,692 | ||||
EXPENSES: | ||||||||
Investment advisory fees (Note 3) | 513,388 | 778,710 | ||||||
Administration fees (Note 3) | ||||||||
Class A Shares | 92,312 | 84,198 | ||||||
Class B Shares | 4,107 | — | ||||||
Class C Shares | 56,263 | 38,692 | ||||||
Class I Shares | 5,615 | 26,486 | ||||||
Class R3 Shares | 4,410 | 5,573 | ||||||
Distribution and service fees (Note 3) | ||||||||
Class A Shares | 184,624 | 168,396 | ||||||
Class B Shares | 32,885 | — | ||||||
Class C Shares | 451,836 | 310,212 | ||||||
Class R3 Shares | 17,656 | 22,281 | ||||||
Transfer agent fees | ||||||||
Class A Shares | 66,366 | 61,545 | ||||||
Class B Shares | 6,222 | — | ||||||
Class C Shares | 45,668 | 33,568 | ||||||
Class I Shares | 11,147 | 30,700 | ||||||
Class R3 Shares | 2,943 | 5,900 | ||||||
Registration and filing fees | ||||||||
Class A Shares | 13,154 | 9,773 | ||||||
Class B Shares | 8,357 | — | ||||||
Class C Shares | 10,517 | 7,180 | ||||||
Class I Shares | 8,554 | 9,877 | ||||||
Class R3 Shares | 8,812 | 9,004 | ||||||
Custodian fees (Note 3) | 33,052 | 41,753 | ||||||
Professional fees | 18,442 | 21,149 | ||||||
Accounting fees | 2,704 | 4,363 | ||||||
Trustee fees | 3,853 | 4,350 | ||||||
Other expenses | 18,391 | 14,170 | ||||||
Total Expenses | 1,621,278 | 1,687,880 | ||||||
Less: | ||||||||
Expenses reimbursed by investment advisor (Note 3) | (15,617 | ) | (87,936 | ) | ||||
Distribution fees waived (Note 3) | (225,918 | ) | (155,106 | ) | ||||
Fees paid indirectly (Note 3) | (19,700 | ) | (1,602 | ) | ||||
Net Expenses | 1,360,043 | 1,443,236 | ||||||
Net Investment Income | $ | 3,358,046 | $ | 8,248,456 | ||||
| 14 Certified Semi-Annual Report | ||
| STATEMENTS OF OPERATIONS, CONTINUED | ||
| Thornburg Limited Term Income Funds | Six Months Ended March 31, 2009 (Unaudited) | |
| Limited Term U.S. Government Fund | Limited Term Income Fund | ||||||
REALIZED AND UNREALIZED GAIN (LOSS) | |||||||
Net realized gain (loss) on investments sold | $ | 2,498,222 | $ | 1,173,320 | |||
Net change in unrealized appreciation (depreciation) on investments | 7,092,513 | (8,820,517 | ) | ||||
Net Realized and Unrealized Gain (Loss) | 9,590,735 | (7,647,197 | ) | ||||
Net Increase in Net Assets Resulting From Operations | $ | 12,948,781 | $ | 601,259 | |||
See notes to financial statements.
| Certified Semi-Annual Report 15 | ||
STATEMENTS OF CHANGES IN NET ASSETS
Thornburg Limited Term U.S. Government Fund
| Six Months Ended March 31, 2009* | Year Ended September 30, 2008 | |||||||
INCREASE (DECREASE) IN NET ASSETS FROM: | ||||||||
OPERATIONS: | ||||||||
Net investment income | $ | 3,358,046 | $ | 5,523,034 | ||||
Net realized gain on investments | 2,498,222 | 591,631 | ||||||
Increase (Decrease) in unrealized appreciation (depreciation) of investments | 7,092,513 | 2,079,673 | ||||||
Net Increase (Decrease) in Net Assets Resulting from Operations | 12,948,781 | 8,194,338 | ||||||
DIVIDENDS TO SHAREHOLDERS: | ||||||||
From net investment income | ||||||||
Class A Shares | (1,893,259 | ) | (3,449,329 | ) | ||||
Class B Shares | (50,295 | ) | (62,097 | ) | ||||
Class C Shares | (1,031,284 | ) | (1,141,337 | ) | ||||
Class I Shares | (316,628 | ) | (687,676 | ) | ||||
Class R3 Shares | (88,165 | ) | (182,595 | ) | ||||
FUND SHARE TRANSACTIONS (NOTE 4): | ||||||||
Class A Shares | 32,983,920 | 30,152,088 | ||||||
Class B Shares | 1,824,169 | 2,522,111 | ||||||
Class C Shares | 31,084,879 | 38,094,236 | ||||||
Class I Shares | (1,205,458 | ) | 5,016,787 | |||||
Class R3 Shares | 1,482,607 | 1,881,814 | ||||||
Net Increase in Net Assets | 75,739,267 | 80,338,340 | ||||||
NET ASSETS: | ||||||||
Beginning of period | 220,412,349 | 140,074,009 | ||||||
End of period | $ | 296,151,616 | $ | 220,412,349 | ||||
Undistributed net investment income | $ | 61,459 | $ | 83,044 | ||||
| * | Unaudited. |
See notes to financial statements.
| 16 Certified Semi-Annual Report | ||
STATEMENTS OF CHANGES IN NET ASSETS
Thornburg Limited Term Income Fund
| Six Months Ended March 31, 2009* | Year Ended September 30, 2008 | |||||||
INCREASE (DECREASE) IN NET ASSETS FROM: | ||||||||
OPERATIONS: | ||||||||
Net investment income | $ | 8,248,456 | $ | 13,741,379 | ||||
Net realized gain (loss) on investments | 1,173,320 | (1,268,288 | ) | |||||
Increase (Decrease) in unrealized appreciation (depreciation) of investments | (8,820,517 | ) | (11,780,991 | ) | ||||
Net Increase (Decrease) in Net Assets Resulting from Operations | 601,259 | 692,100 | ||||||
DIVIDENDS TO SHAREHOLDERS: | ||||||||
From net investment income | ||||||||
Class A Shares | (3,525,638 | ) | (6,044,314 | ) | ||||
Class C Shares | (1,541,377 | ) | (1,908,409 | ) | ||||
Class I Shares | (2,947,935 | ) | (5,435,409 | ) | ||||
Class R3 Shares | (233,506 | ) | (353,247 | ) | ||||
FUND SHARE TRANSACTIONS (NOTE 4): | ||||||||
Class A Shares | 35,502,043 | (15,302,054 | ) | |||||
Class C Shares | 22,720,161 | 18,676,711 | ||||||
Class I Shares | (4,495,068 | ) | 19,634,479 | |||||
Class R3 Shares | (447,190 | ) | 3,948,966 | |||||
Net Increase in Net Assets | 45,632,749 | 13,908,823 | ||||||
NET ASSETS: | ||||||||
Beginning of period | 319,419,871 | 305,511,048 | ||||||
End of period | $ | 365,052,620 | $ | 319,419,871 | ||||
| * | Unaudited. |
See notes to financial statements.
| Certified Semi-Annual Report 17 | ||
| Thornburg Limited Term Income Funds | March 31, 2009 (Unaudited) | |
NOTE 1 – ORGANIZATION
Thornburg Limited Term U.S. Government Fund (the “Government Fund”) and Thornburg Limited Term Income Fund (the “Income Fund”), hereafter referred to collectively as the “Funds,” are diversified series of Thornburg Investment Trust (the “Trust”). The Trust is organized as a Massachusetts business trust under a Declaration of Trust dated June 3, 1987 and is registered as a diversified, open-end management investment company under the Investment Company Act of 1940, as amended. The Trust is currently issuing twelve series of shares of beneficial interest in addition to those of the Funds: Thornburg Limited Term Municipal Fund, Thornburg California Limited Term Municipal Fund, Thornburg Intermediate Municipal Fund, Thornburg New Mexico Intermediate Municipal Fund, Thornburg New York Intermediate Municipal Fund, Thornburg Value Fund, Thornburg International Value Fund, Thornburg Core Growth Fund, Thornburg Investment Income Builder Fund, Thornburg Global Opportunities Fund, Thornburg International Growth Fund, and Thornburg Strategic Income Fund. Each series is considered to be a separate entity for financial reporting and tax purposes and bears expenses directly attributable to it. The Funds’ primary objectives are to obtain as high a level of current income as is consistent, in the view of the Funds’ investment advisor, with safety of capital. As a secondary objective, the Funds seek to reduce changes in their share prices compared to longer term portfolios.
The Government Fund currently offers five classes of shares of beneficial interest: Class A, Class B, Class C, Institutional Class (Class I), and Retirement Class (Class R3) shares. The Income Fund currently offers four classes of shares of beneficial interest, Class A, Class C, Institutional Class (Class I), and Retirement Class (Class R3) shares. Each class of shares of the Funds represents an interest in the same portfolio of investments, except that (i) Class A shares are sold subject to a front-end sales charge collected at the time the shares are purchased and bear a service fee, (ii) Class B shares are sold at net asset value without a sales charge at the time of purchase, but are subject to a contingent deferred sales charge upon redemption and bear both a service fee and distribution fee, (iii) Class C shares are sold at net asset value without a sales charge at the time of purchase, but are subject to a contingent deferred sales charge upon redemption within one year of purchase, and bear both a service fee and a distribution fee, (iv) Class I shares are sold at net asset value without a sales charge at the time of purchase, (v) Class R3 shares are sold at net asset value without a sales charge, but bear both a service fee and a distribution fee, and (vi) the respective classes may have different reinvestment privileges and conversion rights. Additionally, each Fund may allocate among its classes certain expenses, to the extent allowable to specific classes, including transfer agent fees, government registration fees, certain printing and postage costs, and administrative and legal expenses. Currently, class specific expenses of the Funds are limited to distribution and service fees, administration fees, and certain registration and transfer agent expenses. Class B shares of the Government Fund outstanding for eight years will convert to Class A shares of the Government Fund.
NOTE 2 – SIGNIFICANT ACCOUNTING POLICIES
Significant accounting policies of the Trust are as follows:
Valuation of Investments: Debt obligations have a primary market over the counter and are valued by an independent pricing service approved by the Trustees of the Trust. The pricing service ordinarily values debt obligations at quoted bid prices. Quotations for any foreign debt obligations in foreign currencies are converted to U.S. dollar equivalents using the foreign exchange quotation in effect at the time of valuation. When quotations are not available, debt obligations are valued at evaluated prices determined by the pricing service using methods which include consideration of yields or prices of debt obligations of comparable quality, type of issue, coupon, maturity, and rating, and indications as to value from dealers and general market conditions. Short-term obligations having remaining maturities of 60 days or less are valued at amortized cost, which approximates market value.
In any case where a pricing service fails to provide a price for a debt obligation held by the Funds, the valuation and pricing committee determines a fair value for the obligation using procedures approved by the Trustees. Additionally, in any case where management believes that a price provided by a pricing service for a debt obligation may be unreliable, the valuation and pricing committee decides whether or not to use the pricing service’s valuation or to determine a fair value for the obligation.
In determining fair value for any portfolio security or other investment, the valuation and pricing committee seeks to determine the amount that an owner of the investment might reasonably expect to receive upon a sale of the investment. However, because fair value prices are estimated prices, the valuation and pricing committee’s determination of fair value for an investment may differ from the value that would be realized by the Funds upon a sale of the investment, and that difference could be material to the Funds’ financial statements. The valuation and pricing committee’s determination of fair value for an investment may also differ from the prices obtained by other persons (including other mutual funds) for the investment.
Valuation Measurements: Various inputs are used in determining the value of the Funds’ investments. These inputs are summarized in the three levels listed below.
Level 1: Quoted prices in active markets for identical investments.
Level 2: Other significant observable inputs (including quoted prices for similar investments, interest rates, prepayment rates, credit risk, etc.).
| 18 Certified Semi-Annual Report | ||
| NOTES TO FINANCIAL STATEMENTS, CONTINUED | ||
| Thornburg Limited Term Income Funds | March 31, 2009 (Unaudited) | |
Level 3: Significant unobservable inputs (including the Funds’ own assumptions in determining the fair value of investments).
GOVERNMENT FUND
The following table displays a summary of the inputs used to value the Fund’s net assets as of March 31, 2009. In any instance when valuation inputs from more than one level are used to determine the fair value of a specific investment, the investment is placed in the level of the table based upon the lowest level input that is significant in determining the fair value of the investment:
Valuation Inputs | Investments in Securities | Investments in Other Financial Instruments* | ||||
Level 1 - Quoted Prices in Active Markets for Identical Assets | $ | 61,044,448 | $ | — | ||
Level 2 - Other Significant Observable Inputs | 229,226,452 | — | ||||
Level 3 - Significant Unobservable Inputs | — | — | ||||
Total | $ | 290,270,900 | $ | — | ||
| * | Other financial instruments include investments not reflected in the Schedule of Investments, such as futures, forwards and swap contracts, which are valued at the unrealized appreciation (depreciation) on the instrument. |
INCOME FUND
The following table displays a summary of the inputs used to value the Fund’s net assets as of March 31, 2009. In any instance when valuation inputs from more than one level are used to determine the fair value of a specific investment, the investment is placed in the level of the table based upon the lowest level input that is significant in determining the fair value of the investment:
Valuation Inputs | Investments in Securities | Investments in Other Financial Instruments* | ||||
Level 1 - Quoted Prices in Active Markets for Identical Assets | $ | 3,546,953 | $ | — | ||
Level 2 - Other Significant Observable Inputs | 355,491,338 | — | ||||
Level 3 - Significant Unobservable Inputs | — | — | ||||
Total | $ | 359,038,291 | $ | — | ||
| * | Other financial instruments include investments not reflected in the Schedule of Investments, such as futures, forwards and swap contracts, which are valued at the unrealized appreciation (depreciation) on the instrument. |
Federal Income Taxes: It is the policy of the Trust to comply with the provisions of the Internal Revenue Code applicable to “regulated investment companies” and to distribute to shareholders substantially all taxable income, including any net realized gain on investments of the Funds. Therefore, no provision for federal income taxes is required.
When-Issued and Delayed Delivery Transactions: The Trust may engage in when-issued or delayed delivery transactions. To the extent the Trust engages in such transactions, it will do so for the purpose of acquiring portfolio securities consistent with the Funds’ investment objectives and not for the purpose of investment leverage or to speculate on interest rate and/or market changes. At the time the Trust makes a commitment to purchase a security on a when-issued or delayed delivery basis, the Funds will record the transaction and reflect the value in determining each Fund’s net asset value. When effecting such transactions, assets of an amount sufficient to make payment for the portfolio securities to be purchased will be segregated on each Fund’s records at the trade date. Securities purchased on a when-issued or delayed delivery basis do not earn interest until the settlement date.
Dividends: Net investment income of the Funds are declared daily as a dividend on shares for which the Funds have received payment. Dividends are paid monthly and are reinvested in additional shares of the Funds at net asset value per share at the close of business on the dividend payment date, or at the shareholder’s option, paid in cash. Net realized capital gains, to the extent available, will be distributed at least annually.
General: Securities transactions are accounted for on a trade date basis. Interest income is accrued as earned. Premiums and discounts on securities purchased are amortized over the life of the respective securities. Realized gains and losses from the sale of securities are recorded on an identified cost basis. The Funds invest in various mortgage-backed securities. Such securities pay interest and a portion of principal each month, which is then available for investment in securities at prevailing prices. Paydown gains and losses on these securities are included in interest income. Net investment income (other than class specific expenses) and realized and unrealized gains and losses are allocated daily to each class of shares based upon the relative net asset value of outstanding shares (or the value of the dividend-eligible shares, as appropriate) of each class of shares at the beginning of the day (after adjusting for the current share activity of the respective class). Expenses common to all funds are allocated among the funds comprising the Trust based upon their relative net asset values or other appropriate allocation methods.
Foreign Currency Translation: With respect to the Income Fund, portfolio securities and other assets and liabilities denominated in foreign currencies are translated into U.S. dollars based on the rate of exchange of such currencies against
| Certified Semi-Annual Report 19 | ||
| NOTES TO FINANCIAL STATEMENTS, CONTINUED | ||
| Thornburg Limited Term Income Funds | March 31, 2009 (Unaudited) | |
U.S. dollars on the date of valuation. Purchases and sales of portfolio securities and interest denominated in foreign currencies are translated into U.S. dollar amounts on the respective dates of such transactions.
The Income Fund does not isolate that portion of the results of operations resulting from changes in foreign exchange rates on investments from the fluctuations arising from changes in market prices of securities held. Such fluctuations are included with the net realized and unrealized gain or loss from investments.
Reported net realized foreign exchange gains or losses arise from sales of foreign currencies, currency gains or losses realized between the trade and settlement dates on securities transactions, and the difference between the amount of interest recorded on the Income Fund’s books and the U.S. dollar equivalent of the amounts actually received or paid.
Guarantees and Indemnifications: Under the Trust’s organizational documents, its officers and Trustees are indemnified against certain liabilities arising out of the performance of their duties to the Funds. Additionally, in the normal course of business the Trust enters into contracts with service providers that contain general indemnification clauses. The Trust’s maximum exposure under these arrangements is unknown. However, based on experience, the Trust expects the risk of loss to be remote.
Use of Estimates: The preparation of financial statements, in conformity with generally accepted accounting principles, requires management to make estimates and assumptions that affect the reported amounts of assets and liabilities and the disclosure of contingent assets and liabilities at the date of the financial statements and the reported amounts of increases and decreases in net assets from operations during the reporting period. Actual results could differ from those estimates.
NOTE 3 – INVESTMENT ADVISORY FEE AND OTHER TRANSACTIONS WITH AFFILIATES
Pursuant to an investment advisory agreement, Thornburg Investment Management, Inc. (the “Advisor”) serves as the investment advisor and performs services to the Funds for which the fees are payable at the end of each month. For the six months ended March 31, 2009, these fees were payable at annual rates ranging from .375 of 1% to .275 of 1% per annum of the average daily net assets of the Government Fund and .50 of 1% to .275 of 1% per annum of the average daily net assets of the Income Fund depending on each Fund’s asset size. The Trust also has entered into administrative services agreements with the Advisor, whereby the Advisor will perform certain administrative services for the shareholders of each class of each Fund’s shares, and for which fees will be payable at an annual rate of up to .125 of 1% per annum of the average daily net assets attributable to Class A, Class B, Class C, and Class R3 shares, and up to .05 of 1% per annum of the average daily net assets attributable to Class I shares. For the six months ended March 31, 2009, the Advisor voluntarily reimbursed certain class specific expenses and administrative fees of $1,540, $485, and $13,592 for the Class B, C, and R3 shares, respectively, of the Government Fund and $31,610, $22,278, $10,718, and $23,330 for the Class A, C, I, and R3 shares, respectively, of the Income Fund.
The Trust has an underwriting agreement with Thornburg Securities Corporation (the “Distributor,” an affiliate of the Advisor), which acts as the distributor of each Fund’s shares. For the six months ended March 31, 2009, the Distributor has advised the Funds that they earned net commissions aggregating $893 from the sale of Class A shares of the Government Fund, $1,358 from the sale of Class A shares of the Income Fund, and collected contingent deferred sales charges aggregating $18,801 and $10,239 from redemptions of Class C shares of the Government Fund and Income Fund, respectively.
Pursuant to a service plan under Rule 12b-1 of the Investment Company Act of 1940, the Funds may reimburse to the Advisor an amount not to exceed .25 of 1% per annum of the average daily net assets attributable to the Class A, Class B, Class C, and Class R3 shares of the Funds for payments made by the Advisor to securities dealers and other financial institutions to obtain various shareholder and distribution related services. The Advisor may pay out of its own resources additional expenses for distribution of each Fund’s shares.
The Trust has also adopted distribution plans pursuant to Rule 12b-1, applicable to each Fund’s Class B, Class C, and Class R3 shares under which the Funds compensate the Distributor for services in promoting the sale of Class B, C, and R3 shares of the Funds at an annual rate of up to .75 of 1% per annum of the average daily net assets attributable to these classes. Total fees incurred by the Distributor for each class of shares of the Funds under their respective Service and Distribution Plans for the six months ended March 31, 2009, are set forth in the Statements of Operations. Distribution fees of $225,918 and $155,106, respectively, for Class C shares of the Government Fund and Income Fund were waived.
The Trust has an agreement with the custodian bank to indirectly pay a portion of the custodian’s fees through credits earned by each Fund’s cash on deposit with the bank. This deposit agreement is an alternative to overnight investments. Custodial fees have been adjusted to reflect amounts that would have been paid without this agreement, with a corresponding adjustment reflected as fees paid indirectly in the Statements of Operations. For the six months ended March 31, 2009, fees paid indirectly were $19,700 for the Government Fund and $1,602 for the Income Fund.
Certain officers and Trustees of the Trust are also officers and/ or directors of the Advisor and Distributor. The compensation of independent Trustees is borne by the Trust.
| 20 Certified Semi-Annual Report | ||
| NOTES TO FINANCIAL STATEMENTS, CONTINUED | ||
| Thornburg Limited Term Income Funds | March 31, 2009 (Unaudited) | |
NOTE 4 – SHARES OF BENEFICIAL INTEREST
At March 31, 2009, there were an unlimited number of shares of beneficial interest authorized. Transactions in shares of beneficial interest were as follows:
GOVERNMENT FUND
| Six Months Ended March 31, 2009 (Unaudited) | Year Ended September 30, 2008 (Audited) | |||||||||||||
| Shares | Amount | Shares | Amount | |||||||||||
Class A Shares | ||||||||||||||
Shares sold | 5,334,587 | $ | 71,814,944 | 4,369,558 | $ | 58,069,047 | ||||||||
Shares issued to shareholders in reinvestment of dividends | 113,481 | 1,532,131 | 211,200 | 2,798,238 | ||||||||||
Shares repurchased | (2,994,473 | ) | (40,363,155 | ) | (2,318,228 | ) | (30,715,197 | ) | ||||||
Net Increase (Decrease) | 2,453,595 | $ | 32,983,920 | 2,262,530 | $ | 30,152,088 | ||||||||
Class B Shares | ||||||||||||||
Shares sold | 246,635 | $ | 3,306,071 | 287,259 | $ | 3,815,622 | ||||||||
Shares issued to shareholders in reinvestment of dividends | 3,108 | 41,876 | 3,540 | 46,773 | ||||||||||
Shares repurchased | (113,488 | ) | (1,523,778 | ) | (101,549 | ) | (1,340,284 | ) | ||||||
Net Increase (Decrease) | 136,255 | $ | 1,824,169 | 189,250 | $ | 2,522,111 | ||||||||
Class C Shares | ||||||||||||||
Shares sold | 4,491,475 | $ | 60,626,435 | 4,329,138 | $ | 57,987,683 | ||||||||
Shares issued to shareholders in reinvestment of dividends | 54,474 | 740,129 | 65,290 | 870,692 | ||||||||||
Shares repurchased | (2,234,104 | ) | (30,281,685 | ) | (1,556,409 | ) | (20,764,139 | ) | ||||||
Net Increase (Decrease) | 2,311,845 | $ | 31,084,879 | 2,838,019 | $ | 38,094,236 | ||||||||
Class I Shares | ||||||||||||||
Shares sold | 696,817 | $ | 9,406,650 | 922,038 | $ | 12,250,106 | ||||||||
Shares issued to shareholders in reinvestment of dividends | 15,363 | 207,050 | 39,092 | 517,921 | ||||||||||
Shares repurchased | (797,851 | ) | (10,819,158 | ) | (587,596 | ) | (7,751,240 | ) | ||||||
Net Increase (Decrease) | (85,671 | ) | $ | (1,205,458 | ) | 373,534 | $ | 5,016,787 | ||||||
Class R3 Shares | ||||||||||||||
Shares sold | 238,207 | $ | 3,214,172 | 265,853 | $ | 3,540,253 | ||||||||
Shares issued to shareholders in reinvestment of dividends | 6,385 | 86,293 | 13,376 | 177,342 | ||||||||||
Shares repurchased | (135,452 | ) | (1,817,858 | ) | (138,318 | ) | (1,835,781 | ) | ||||||
Net Increase (Decrease) | 109,140 | $ | 1,482,607 | 140,911 | $ | 1,881,814 | ||||||||
| Certified Semi-Annual Report 21 | ||
| NOTES TO FINANCIAL STATEMENTS, CONTINUED | ||
| Thornburg Limited Term Income Funds | March 31, 2009 (Unaudited) | |
INCOME FUND
| Six Months Ended March 31, 2009 (Unaudited) | Year Ended September 30, 2008 (Audited) | |||||||||||||
| Shares | Amount | Shares | Amount | |||||||||||
Class A Shares | ||||||||||||||
Shares sold | 4,799,967 | $ | 55,814,958 | 4,077,504 | $ | 50,782,602 | ||||||||
Shares issued to shareholders in reinvestment of dividends | 247,805 | 2,862,902 | 382,187 | 4,756,794 | ||||||||||
Shares repurchased | (2,000,374 | ) | (23,175,817 | ) | (5,687,221 | ) | (70,841,450 | ) | ||||||
Net Increase (Decrease) | 3,047,398 | $ | 35,502,043 | (1,227,530 | ) | $ | (15,302,054 | ) | ||||||
Class C Shares | ||||||||||||||
Shares sold | 3,147,037 | $ | 36,542,865 | 2,478,217 | $ | 30,760,300 | ||||||||
Shares issued to shareholders in reinvestment of dividends | 94,875 | 1,095,314 | 109,746 | 1,362,431 | ||||||||||
Shares repurchased | (1,290,770 | ) | (14,918,018 | ) | (1,080,947 | ) | (13,446,020 | ) | ||||||
Net Increase (Decrease) | 1,951,142 | $ | 22,720,161 | 1,507,016 | $ | 18,676,711 | ||||||||
Class I Shares | ||||||||||||||
Shares sold | 2,057,012 | $ | 23,866,089 | 4,178,477 | $ | 52,176,888 | ||||||||
Shares issued to shareholders in reinvestment of dividends | 202,396 | 2,337,373 | 358,454 | 4,462,198 | ||||||||||
Shares repurchased | (2,655,534 | ) | (30,698,530 | ) | (2,966,749 | ) | (37,004,607 | ) | ||||||
Net Increase (Decrease) | (396,126 | ) | $ | (4,495,068 | ) | 1,570,182 | $ | 19,634,479 | ||||||
Class R3 Shares | ||||||||||||||
Shares sold | 221,959 | $ | 2,573,690 | 538,236 | $ | 6,722,392 | ||||||||
Shares issued to shareholders in reinvestment of dividends | 18,288 | 211,354 | 24,032 | 298,513 | ||||||||||
Shares repurchased | (278,956 | ) | (3,232,234 | ) | (246,888 | ) | (3,071,939 | ) | ||||||
Net Increase (Decrease) | (38,709 | ) | $ | (447,190 | ) | 315,380 | $ | 3,948,966 | ||||||
NOTE 5 – SECURITIES TRANSACTIONS
For the six months ended March 31, 2009, the Government Fund had purchase and sale transactions of investment securities (excluding short-term investments) of $147,100,913 and $68,237,783, respectively, while the Income Fund had purchase and sale transactions of investment securities (excluding short-term investments and U.S. Government obligations) of $121,428,255 and $60,784,918, respectively.
| 22 Certified Semi-Annual Report | ||
| NOTES TO FINANCIAL STATEMENTS, CONTINUED | ||
| Thornburg Limited Term Income Funds | March 31, 2009 (Unaudited) | |
NOTE 6 – INCOME TAXES
At March 31, 2009, information on the tax components of capital is as follows:
| Government Fund | Income Fund | |||||||
Cost of investments for tax purposes | $ | 281,478,238 | $ | 380,604,746 | ||||
Gross unrealized appreciation on a tax basis | $ | 9,010,732 | $ | 6,514,276 | ||||
Gross unrealized depreciation on a tax basis | (218,070 | ) | (28,080,731 | ) | ||||
Net unrealized appreciation (depreciation) on investments (tax basis) | $ | 8,792,662 | $ | (21,566,455 | ) | |||
As of March 31, 2009, the Income Fund had deferred tax basis capital losses occurring subsequent to October 31, 2007 of $1,238,185. For tax purposes, such losses will be reflected in the year ending September 30, 2009. Unutilized tax basis capital losses may be carried forward to offset realized gains in future years. To the extent such carryforwards are used, capital gain distributions may be reduced to the extent provided by regulations.
At March 31, 2009, the Government Fund had tax basis capital losses, which may be carried forward to offset future capital gains. Such capital loss carryforwards expire as follows:
2009 | $ | 674,873 | |
2010 | 13,611 | ||
2014 | 3,770 | ||
2015 | 108,190 | ||
2016 | 608,613 | ||
| $ | 1,409,057 | ||
At March 31, 2009, the Income Fund had tax basis capital losses, which may be carried forward to offset future capital gains. Such capital loss carryforwards expire as follows:
2009 | $ | 650,941 | |
2010 | 308,333 | ||
2013 | 1,625,980 | ||
2014 | 601,391 | ||
2015 | 178,155 | ||
2016 | 2,359,034 | ||
| $ | 5,723,834 | ||
OTHER NOTES:
Statement of Accounting Standards No. 161:
On March 19, 2008, the Financial Accounting Standards Board issued Statement of Financial Accounting Standards No. 161, “Disclosures about Derivative Instruments and Hedging Activities” (“FAS 161”). FAS 161 is effective for fiscal years and interim periods beginning after November 15, 2008. FAS 161 requires enhanced disclosures about any derivative and hedging activities by the Funds, including how such activities are accounted for and any effect on the Funds’ financial position, performance and cash flows.
| Certified Semi-Annual Report 23 | ||
Thornburg Limited Term U.S. Government Fund
| Six Months Ended March 31, | Year Ended September 30, | |||||||||||||||||||||||
| Class A Shares: | 2009* | 2008 | 2007 | 2006 | 2005 | 2004 | ||||||||||||||||||
PER SHARE PERFORMANCE | ||||||||||||||||||||||||
(for a share outstanding throughout the period) | ||||||||||||||||||||||||
Net asset value, beginning of period | $ | 13.26 | $ | 12.97 | $ | 12.75 | $ | 12.76 | $ | 13.01 | $ | 13.23 | ||||||||||||
Income from investment operations: | ||||||||||||||||||||||||
Net investment income (loss) | 0.17 | 0.45 | 0.40 | 0.37 | 0.32 | 0.35 | ||||||||||||||||||
Net realized and unrealized gain (loss) on investments | 0.47 | 0.29 | 0.23 | (0.01 | ) | (0.24 | ) | (0.22 | ) | |||||||||||||||
Total from investment operations | 0.64 | 0.74 | 0.63 | 0.36 | 0.08 | 0.13 | ||||||||||||||||||
Less dividends from: | ||||||||||||||||||||||||
Net investment income | (0.17 | ) | (0.45 | ) | (0.41 | ) | (0.37 | ) | (0.33 | ) | (0.35 | ) | ||||||||||||
Change in net asset value | 0.47 | 0.29 | 0.22 | (0.01 | ) | (0.25 | ) | (0.22 | ) | |||||||||||||||
NET ASSET VALUE, end of period | $ | 13.73 | $ | 13.26 | $ | 12.97 | $ | 12.75 | $ | 12.76 | $ | 13.01 | ||||||||||||
RATIOS/SUPPLEMENTAL DATA | ||||||||||||||||||||||||
Total return (%)(a) | 4.87 | 5.75 | 5.03 | 2.87 | 0.66 | 1.04 | ||||||||||||||||||
Ratios to average net assets: | ||||||||||||||||||||||||
Net investment income (loss) (%) | 2.55 | (b) | 3.39 | 3.13 | 2.90 | 2.50 | 2.72 | |||||||||||||||||
Expenses, after expense reductions (%) | 0.91 | (b) | 0.95 | 0.98 | 0.99 | 0.99 | 0.92 | |||||||||||||||||
Expenses, after expense reductions and net of custody credits (%) | 0.90 | (b) | 0.93 | 0.97 | 0.96 | 0.98 | 0.91 | |||||||||||||||||
Expenses, before expense reductions (%) | 0.91 | (b) | 0.95 | 0.99 | 0.99 | 0.99 | 0.92 | |||||||||||||||||
Portfolio turnover rate (%) | 26.88 | 19.61 | 43.35 | 7.47 | 18.00 | 12.39 | ||||||||||||||||||
Net assets at end of period (thousands) | $ | 161,762 | $ | 123,625 | $ | 91,561 | $ | 106,913 | $ | 138,422 | $ | 163,530 | ||||||||||||
| (a) | Sales loads are not reflected in computing total return, which is not annualized for periods less than one year. |
| (b) | Annualized. |
| * | Unaudited. |
See notes to financial statements.
| 24 Certified Semi-Annual Report | ||
| FINANCIAL HIGHLIGHTS, CONTINUED | ||
| Thornburg Limited Term U.S. Government Fund | ||
| Six Months Ended March 31, | Year Ended September 30, | |||||||||||||||||||||||
| Class B Shares: | 2009* | 2008 | 2007 | 2006 | 2005 | 2004 | ||||||||||||||||||
PER SHARE PERFORMANCE | ||||||||||||||||||||||||
(for a share outstanding throughout the period) | ||||||||||||||||||||||||
Net asset value, beginning of period | $ | 13.23 | $ | 12.94 | $ | 12.72 | $ | 12.73 | $ | 12.98 | $ | 13.22 | ||||||||||||
Income from investment operations: | ||||||||||||||||||||||||
Net investment income (loss) | 0.10 | 0.28 | 0.22 | 0.18 | 0.13 | 0.21 | ||||||||||||||||||
Net realized and unrealized gain (loss) on investments | 0.47 | 0.28 | 0.23 | (0.01 | ) | (0.24 | ) | (0.24 | ) | |||||||||||||||
Total from investment operations | 0.57 | 0.56 | 0.45 | 0.17 | (0.11 | ) | (0.03 | ) | ||||||||||||||||
Less dividends from: | ||||||||||||||||||||||||
Net investment income | (0.10 | ) | (0.27 | ) | (0.23 | ) | (0.18 | ) | (0.14 | ) | (0.21 | ) | ||||||||||||
Change in net asset value | 0.47 | 0.29 | 0.22 | (0.01 | ) | (0.25 | ) | (0.24 | ) | |||||||||||||||
NET ASSET VALUE, end of period | $ | 13.70 | $ | 13.23 | $ | 12.94 | $ | 12.72 | $ | 12.73 | $ | 12.98 | ||||||||||||
RATIOS/SUPPLEMENTAL DATA | ||||||||||||||||||||||||
Total return (%)(a) | 4.34 | 4.37 | 3.55 | 1.32 | (0.82 | ) | (0.24 | ) | ||||||||||||||||
Ratios to average net assets: | ||||||||||||||||||||||||
Net investment income (loss) (%) | 1.51 | (b) | 2.08 | 1.73 | 1.41 | 1.03 | 1.65 | |||||||||||||||||
Expenses, after expense reductions (%) | 1.95 | (b) | 2.26 | 2.40 | 2.51 | 2.46 | 1.99 | |||||||||||||||||
Expenses, after expense reductions and net of custody credits (%) | 1.94 | (b) | 2.25 | 2.39 | 2.48 | 2.45 | 1.99 | |||||||||||||||||
Expenses, before expense reductions (%) | 2.00 | (b) | 2.26 | 2.63 | 3.21 | 2.86 | 2.74 | |||||||||||||||||
Portfolio turnover rate (%) | 26.88 | 19.61 | 43.35 | 7.47 | 18.00 | 12.39 | ||||||||||||||||||
Net assets at end of period (thousands) | $ | 7,199 | $ | 5,147 | $ | 2,586 | $ | 2,476 | $ | 1,875 | $ | 2,396 | ||||||||||||
| (a) | Not annualized for periods less than one year. |
| (b) | Annualized. |
| * | Unaudited. |
See notes to financial statements.
| Certified Semi-Annual Report 25 | ||
| FINANCIAL HIGHLIGHTS, CONTINUED | ||
| Thornburg Limited Term U.S. Government Fund | ||
| Six Months Ended March 31, | Year Ended September 30, | |||||||||||||||||||||||
| Class C Shares: | 2009* | 2008 | 2007 | 2006 | 2005 | 2004 | ||||||||||||||||||
PER SHARE PERFORMANCE | ||||||||||||||||||||||||
(for a share outstanding throughout the period) | ||||||||||||||||||||||||
Net asset value, beginning of period | $ | 13.34 | $ | 13.04 | $ | 12.83 | $ | 12.84 | $ | 13.09 | $ | 13.31 | ||||||||||||
Income from investment operations: | ||||||||||||||||||||||||
Net investment income (loss) | 0.15 | 0.41 | 0.37 | 0.34 | 0.29 | 0.31 | ||||||||||||||||||
Net realized and unrealized gain (loss) on investments | 0.49 | 0.30 | 0.22 | (0.01 | ) | (0.24 | ) | (0.22 | ) | |||||||||||||||
Total from investment operations | 0.64 | 0.71 | 0.59 | 0.33 | 0.05 | 0.09 | ||||||||||||||||||
Less dividends from: | ||||||||||||||||||||||||
Net investment income | (0.16 | ) | (0.41 | ) | (0.38 | ) | (0.34 | ) | (0.30 | ) | (0.31 | ) | ||||||||||||
Change in net asset value | 0.48 | 0.30 | 0.21 | (0.01 | ) | (0.25 | ) | (0.22 | ) | |||||||||||||||
NET ASSET VALUE, end of period | $ | 13.82 | $ | 13.34 | $ | 13.04 | $ | 12.83 | $ | 12.84 | $ | 13.09 | ||||||||||||
RATIOS/SUPPLEMENTAL DATA | ||||||||||||||||||||||||
Total return (%)(a) | 4.79 | 5.51 | 4.66 | 2.60 | 0.41 | 0.73 | ||||||||||||||||||
Ratios to average net assets: | ||||||||||||||||||||||||
Net investment income (loss) (%) | 2.28 | (b) | 3.10 | 2.88 | 2.63 | 2.24 | 2.40 | |||||||||||||||||
Expenses, after expense reductions (%) | 1.18 | (b) | 1.24 | 1.25 | 1.26 | 1.25 | 1.24 | |||||||||||||||||
Expenses, after expense reductions and net of custody credits (%) | 1.17 | (b) | 1.22 | 1.24 | 1.23 | 1.24 | 1.24 | |||||||||||||||||
Expenses, before expense reductions (%) | 1.68 | (b) | 1.75 | 1.80 | 1.79 | 1.79 | 1.76 | |||||||||||||||||
Portfolio turnover rate (%) | 26.88 | 19.61 | 43.35 | 7.47 | 18.00 | 12.39 | ||||||||||||||||||
Net assets at end of period (thousands) | $ | 98,235 | $ | 63,998 | $ | 25,566 | $ | 25,132 | $ | 32,821 | $ | 43,404 | ||||||||||||
| (a) | Not annualized for periods less than one year. |
| (b) | Annualized. |
| * | Unaudited. |
See notes to financial statements.
| 26 Certified Semi-Annual Report | ||
| FINANCIAL HIGHLIGHTS, CONTINUED | ||
| Thornburg Limited Term U.S. Government Fund | ||
| Six Months Ended March 31, | Year Ended September 30, | |||||||||||||||||||||||
| Class I Shares: | 2009* | 2008 | 2007 | 2006 | 2005 | 2004 | ||||||||||||||||||
PER SHARE PERFORMANCE | ||||||||||||||||||||||||
(for a share outstanding throughout the period) | ||||||||||||||||||||||||
Net asset value, beginning of period | $ | 13.26 | $ | 12.97 | $ | 12.75 | $ | 12.76 | $ | 13.01 | $ | 13.22 | ||||||||||||
Income from investment operations: | ||||||||||||||||||||||||
Net investment income (loss) | 0.19 | 0.49 | 0.44 | 0.41 | 0.36 | 0.39 | ||||||||||||||||||
Net realized and unrealized gain (loss) on investments | 0.47 | 0.29 | 0.23 | (0.01 | ) | (0.24 | ) | (0.21 | ) | |||||||||||||||
Total from investment operations | 0.66 | 0.78 | 0.67 | 0.40 | 0.12 | 0.18 | ||||||||||||||||||
Less dividends from: | ||||||||||||||||||||||||
Net investment income | (0.19 | ) | (0.49 | ) | (0.45 | ) | (0.41 | ) | (0.37 | ) | (0.39 | ) | ||||||||||||
Change in net asset value | 0.47 | 0.29 | 0.22 | (0.01 | ) | (0.25 | ) | (0.21 | ) | |||||||||||||||
NET ASSET VALUE, end of period | $ | 13.73 | $ | 13.26 | $ | 12.97 | $ | 12.75 | $ | 12.76 | $ | 13.01 | ||||||||||||
RATIOS/SUPPLEMENTAL DATA | ||||||||||||||||||||||||
Total return (%)(a) | 5.01 | 6.06 | 5.35 | 3.19 | 0.95 | 1.37 | ||||||||||||||||||
Ratios to average net assets: | ||||||||||||||||||||||||
Net investment income (loss) (%) | 2.81 | (b) | 3.68 | 3.45 | 3.22 | 2.82 | 2.95 | |||||||||||||||||
Expenses, after expense reductions (%) | 0.66 | (b) | 0.66 | 0.68 | 0.68 | 0.68 | 0.67 | |||||||||||||||||
Expenses, after expense reductions and net of custody credits (%) | 0.64 | (b) | 0.64 | 0.67 | 0.65 | 0.67 | 0.67 | |||||||||||||||||
Expenses, before expense reductions (%) | 0.66 | (b) | 0.67 | 0.74 | 0.78 | 0.80 | 0.77 | |||||||||||||||||
Portfolio turnover rate (%) | 26.88 | 19.61 | 43.35 | 7.47 | 18.00 | 12.39 | ||||||||||||||||||
Net assets at end of period (thousands) | $ | 20,861 | $ | 21,275 | $ | 15,963 | $ | 14,900 | $ | 16,075 | $ | 12,905 | ||||||||||||
| (a) | Not annualized for periods less than one year. |
| (b) | Annualized. |
| * | Unaudited. |
See notes to financial statements.
| Certified Semi-Annual Report 27 | ||
| FINANCIAL HIGHLIGHTS, CONTINUED | ||
| Thornburg Limited Term U.S. Government Fund | ||
| Six Months Ended March 31, | Year Ended September 30, | |||||||||||||||||||||||
| Class R3 Shares: | 2009* | 2008 | 2007 | 2006 | 2005 | 2004 | ||||||||||||||||||
PER SHARE PERFORMANCE | ||||||||||||||||||||||||
(for a share outstanding throughout the period) | ||||||||||||||||||||||||
Net asset value, beginning of period | $ | 13.27 | $ | 12.97 | $ | 12.76 | $ | 12.77 | $ | 13.02 | $ | 13.23 | ||||||||||||
Income from investment operations: | ||||||||||||||||||||||||
Net investment income (loss) | 0.17 | 0.44 | 0.40 | 0.37 | 0.34 | 0.37 | ||||||||||||||||||
Net realized and unrealized gain (loss) on investments | 0.47 | 0.30 | 0.22 | (0.01 | ) | (0.25 | ) | (0.21 | ) | |||||||||||||||
Total from investment operations | 0.64 | 0.74 | 0.62 | 0.36 | 0.09 | 0.16 | ||||||||||||||||||
Less dividends from: | ||||||||||||||||||||||||
Net investment income | (0.17 | ) | (0.44 | ) | (0.41 | ) | (0.37 | ) | (0.34 | ) | (0.37 | ) | ||||||||||||
Change in net asset value | 0.47 | 0.30 | 0.21 | (0.01 | ) | (0.25 | ) | (0.21 | ) | |||||||||||||||
NET ASSET VALUE, end of period | $ | 13.74 | $ | 13.27 | $ | 12.97 | $ | 12.76 | $ | 12.77 | $ | 13.02 | ||||||||||||
RATIOS/SUPPLEMENTAL DATA | ||||||||||||||||||||||||
Total return (%)(a) | 4.82 | 5.77 | 4.93 | 2.86 | 0.72 | 1.26 | ||||||||||||||||||
Ratios to average net assets: | ||||||||||||||||||||||||
Net investment income (loss) (%) | 2.48 | (b) | 3.33 | 3.15 | 2.90 | 2.66 | 2.62 | |||||||||||||||||
Expenses, after expense reductions (%) | 1.00 | (b) | 1.01 | 1.00 | 1.00 | 0.93 | 0.91 | |||||||||||||||||
Expenses, after expense reductions and net of custody credits (%) | 0.99 | (b) | 0.99 | 0.99 | 0.97 | 0.91 | 0.91 | |||||||||||||||||
Expenses, before expense reductions (%) | 1.39 | (b) | 1.47 | 1.64 | 1.55 | 3.55 | 13.56 | |||||||||||||||||
Portfolio turnover rate (%) | 26.88 | 19.61 | 43.35 | 7.47 | 18.00 | 12.39 | ||||||||||||||||||
Net assets at end of period (thousands) | $ | 8,094 | $ | 6,367 | $ | 4,398 | $ | 3,591 | $ | 3,008 | $ | 422 | ||||||||||||
| (a) | Not annualized for periods less than one year. |
| (b) | Annualized. |
| * | Unaudited. |
See notes to financial statements.
| 28 Certified Semi-Annual Report | ||
FINANCIAL HIGHLIGHTS
Thornburg Limited Term Income Fund
| Six Months Ended March 31, | Year Ended September 30, | |||||||||||||||||||||||
| Class A Shares: | 2009* | 2008 | 2007 | 2006 | 2005 | 2004 | ||||||||||||||||||
PER SHARE PERFORMANCE | ||||||||||||||||||||||||
(for a share outstanding throughout the period) | ||||||||||||||||||||||||
Net asset value, beginning of period | $ | 11.92 | $ | 12.40 | $ | 12.37 | $ | 12.51 | $ | 12.80 | $ | 12.99 | ||||||||||||
Income from investment operations: | ||||||||||||||||||||||||
Net investment income (loss) | 0.30 | 0.55 | 0.50 | 0.50 | 0.46 | 0.43 | ||||||||||||||||||
Net realized and unrealized gain (loss) on investments | (0.28 | ) | (0.48 | ) | 0.04 | (0.14 | ) | (0.28 | ) | (0.19 | ) | |||||||||||||
Total from investment operations | 0.02 | 0.07 | 0.54 | 0.36 | 0.18 | 0.24 | ||||||||||||||||||
Less dividends from: | ||||||||||||||||||||||||
Net investment income | (0.30 | ) | (0.55 | ) | (0.51 | ) | (0.50 | ) | (0.47 | ) | (0.43 | ) | ||||||||||||
Change in net asset value | (0.28 | ) | (0.48 | ) | 0.03 | (0.14 | ) | (0.29 | ) | (0.19 | ) | |||||||||||||
NET ASSET VALUE, end of period | $ | 11.64 | $ | 11.92 | $ | 12.40 | $ | 12.37 | $ | 12.51 | $ | 12.80 | ||||||||||||
RATIOS/SUPPLEMENTAL DATA | ||||||||||||||||||||||||
Total return (%)(a) | 0.24 | 0.44 | 4.43 | 2.96 | 1.44 | 1.96 | ||||||||||||||||||
Ratios to average net assets: | ||||||||||||||||||||||||
Net investment income (loss) (%) | 5.23 | (b) | 4.38 | 4.07 | 4.05 | 3.52 | 3.33 | |||||||||||||||||
Expenses, after expense reductions (%) | 0.99 | (b) | 0.99 | 1.00 | 1.00 | 1.00 | 0.99 | |||||||||||||||||
Expenses, after expense reductions and net of custody credits (%) | 0.99 | (b) | 0.99 | 0.99 | 0.99 | 0.99 | 0.99 | |||||||||||||||||
Expenses, before expense reductions (%) | 1.04 | (b) | 1.03 | 1.08 | 1.09 | 1.09 | 1.07 | |||||||||||||||||
Portfolio turnover rate (%) | 22.70 | 42.84 | 41.55 | 6.77 | 23.16 | 22.73 | ||||||||||||||||||
Net assets at end of period (thousands) | $ | 166,702 | $ | 134,372 | $ | 155,021 | $ | 190,670 | $ | 212,881 | $ | 230,256 | ||||||||||||
| (a) | Sales loads are not reflected in computing total return, which is not annualized for periods less than one year. |
| (b) | Annualized. |
| * | Unaudited. |
See notes to financials statements.
| Certified Semi-Annual Report 29 | ||
| FINANCIAL HIGHLIGHTS, CONTINUED | ||
| Thornburg Limited Term Income Fund | ||
| Six Months Ended March 31, | Year Ended September 30, | |||||||||||||||||||||||
| Class C Shares: | 2009* | 2008 | 2007 | 2006 | 2005 | 2004 | ||||||||||||||||||
PER SHARE PERFORMANCE | ||||||||||||||||||||||||
(for a share outstanding throughout the period) | ||||||||||||||||||||||||
Net asset value, beginning of period | $ | 11.90 | $ | 12.38 | $ | 12.35 | $ | 12.49 | $ | 12.78 | $ | 12.97 | ||||||||||||
Income from investment operations: | ||||||||||||||||||||||||
Net investment income (loss) | 0.29 | 0.52 | 0.47 | 0.47 | 0.43 | 0.40 | ||||||||||||||||||
Net realized and unrealized gain (loss) on investments | (0.28 | ) | (0.49 | ) | 0.03 | (0.14 | ) | (0.28 | ) | (0.19 | ) | |||||||||||||
Total from investment operations | 0.01 | 0.03 | 0.50 | 0.33 | 0.15 | 0.21 | ||||||||||||||||||
Less dividends from: | ||||||||||||||||||||||||
Net investment income | (0.29 | ) | (0.51 | ) | (0.47 | ) | (0.47 | ) | (0.44 | ) | (0.40 | ) | ||||||||||||
Change in net asset value | (0.28 | ) | (0.48 | ) | 0.03 | (0.14 | ) | (0.29 | ) | (0.19 | ) | |||||||||||||
NET ASSET VALUE, end of period | $ | 11.62 | $ | 11.90 | $ | 12.38 | $ | 12.35 | $ | 12.49 | $ | 12.78 | ||||||||||||
RATIOS/SUPPLEMENTAL DATA | ||||||||||||||||||||||||
Total return (%)(a) | 0.11 | 0.18 | 4.17 | 2.71 | 1.19 | 1.70 | ||||||||||||||||||
Ratios to average net assets: | ||||||||||||||||||||||||
Net investment income (loss) (%) | 4.98 | (b) | 4.15 | 3.82 | 3.79 | 3.27 | 3.07 | |||||||||||||||||
Expenses, after expense reductions (%) | 1.24 | (b) | 1.24 | 1.24 | 1.25 | 1.25 | 1.25 | |||||||||||||||||
Expenses, after expense reductions and net of custody credits (%) | 1.24 | (b) | 1.24 | 1.24 | 1.24 | 1.24 | 1.24 | |||||||||||||||||
Expenses, before expense reductions (%) | 1.81 | (b) | 1.83 | 1.89 | 1.87 | 1.88 | 1.87 | |||||||||||||||||
Portfolio turnover rate (%) | 22.70 | 42.84 | 41.55 | 6.77 | 23.16 | 22.73 | ||||||||||||||||||
Net assets at end of period (thousands) | $ | 78,455 | $ | 57,114 | $ | 40,769 | $ | 44,361 | $ | 59,355 | $ | 65,398 | ||||||||||||
| (a) | Not annualized for periods less than one year. |
| (b) | Annualized. |
| * | Unaudited. |
See notes to financial statements.
| 30 Certified Semi-Annual Report | ||
| FINANCIAL HIGHLIGHTS, CONTINUED | ||
| Thornburg Limited Term Income Fund | ||
| Six Months Ended March 31, | Year Ended September 30, | |||||||||||||||||||||||
| Class I Shares: | 2009* | 2008 | 2007 | 2006 | 2005 | 2004 | ||||||||||||||||||
PER SHARE PERFORMANCE | ||||||||||||||||||||||||
(for a share outstanding throughout the period) | ||||||||||||||||||||||||
Net asset value, beginning of period | $ | 11.92 | $ | 12.40 | $ | 12.37 | $ | 12.51 | $ | 12.80 | $ | 12.99 | ||||||||||||
Income from investment operations: | ||||||||||||||||||||||||
Net investment income (loss) | 0.32 | 0.59 | 0.54 | 0.54 | 0.51 | 0.47 | ||||||||||||||||||
Net realized and unrealized gain (loss) on investments | (0.28 | ) | (0.48 | ) | 0.04 | (0.14 | ) | (0.29 | ) | (0.19 | ) | |||||||||||||
Total from investment operations | 0.04 | 0.11 | 0.58 | 0.40 | 0.22 | 0.28 | ||||||||||||||||||
Less dividends from: | ||||||||||||||||||||||||
Net investment income | (0.32 | ) | (0.59 | ) | (0.55 | ) | (0.54 | ) | (0.51 | ) | (0.47 | ) | ||||||||||||
Change in net asset value | (0.28 | ) | (0.48 | ) | 0.03 | (0.14 | ) | (0.29 | ) | (0.19 | ) | |||||||||||||
NET ASSET VALUE, end of period | $ | 11.64 | $ | 11.92 | $ | 12.40 | $ | 12.37 | $ | 12.51 | $ | 12.80 | ||||||||||||
RATIOS/SUPPLEMENTAL DATA | ||||||||||||||||||||||||
Total return (%)(a) | 0.40 | 0.77 | 4.76 | 3.30 | 1.77 | 2.29 | ||||||||||||||||||
Ratios to average net assets: | ||||||||||||||||||||||||
Net investment income (loss) (%) | 5.57 | (b) | 4.72 | 4.39 | 4.38 | 3.85 | 3.64 | |||||||||||||||||
Expenses, after expense reductions (%) | 0.66 | (b) | 0.66 | 0.67 | 0.68 | 0.67 | 0.67 | |||||||||||||||||
Expenses, after expense reductions and net of custody credits (%) | 0.66 | (b) | 0.66 | 0.67 | 0.67 | 0.67 | 0.67 | |||||||||||||||||
Expenses, before expense reductions (%) | 0.68 | (b) | 0.67 | 0.72 | 0.72 | 0.72 | 0.72 | |||||||||||||||||
Portfolio turnover rate (%) | 22.70 | 42.84 | 41.55 | 6.77 | 23.16 | 22.73 | ||||||||||||||||||
Net assets at end of period (thousands) | $ | 110,860 | $ | 118,222 | $ | 103,530 | $ | 111,535 | $ | 99,396 | $ | 90,025 | ||||||||||||
| (a) | Not annualized for periods less than one year. |
| (b) | Annualized. |
| * | Unaudited. |
See notes to financial statements.
| Certified Semi-Annual Report 31 | ||
| FINANCIAL HIGHLIGHTS, CONTINUED | ||
| Thornburg Limited Term Income Fund | ||
| Six Months Ended March 31, | Year Ended September 30, | |||||||||||||||||||||||
| Class R3 Shares: | 2009* | 2008 | 2007 | 2006 | 2005 | 2004 | ||||||||||||||||||
PER SHARE PERFORMANCE | ||||||||||||||||||||||||
(for a share outstanding throughout the period) | ||||||||||||||||||||||||
Net asset value, beginning of period | $ | 11.92 | $ | 12.40 | $ | 12.38 | $ | 12.52 | $ | 12.81 | $ | 12.99 | ||||||||||||
Income from investment operations: | ||||||||||||||||||||||||
Net investment income (loss) | 0.30 | 0.55 | 0.50 | 0.50 | 0.48 | 0.45 | ||||||||||||||||||
Net realized and unrealized gain (loss) on investments | (0.27 | ) | (0.48 | ) | 0.03 | (0.14 | ) | (0.30 | ) | (0.18 | ) | |||||||||||||
Total from investment operations | 0.03 | 0.07 | 0.53 | 0.36 | 0.18 | 0.27 | ||||||||||||||||||
Less dividends from: | ||||||||||||||||||||||||
Net investment income | (0.30 | ) | (0.55 | ) | (0.51 | ) | (0.50 | ) | (0.47 | ) | (0.45 | ) | ||||||||||||
Change in net asset value | (0.27 | ) | (0.48 | ) | 0.02 | (0.14 | ) | (0.29 | ) | (0.18 | ) | |||||||||||||
NET ASSET VALUE, end of period | $ | 11.65 | $ | 11.92 | $ | 12.40 | $ | 12.38 | $ | 12.52 | $ | 12.81 | ||||||||||||
RATIOS/SUPPLEMENTAL DATA | ||||||||||||||||||||||||
Total return (%)(a) | 0.32 | 0.44 | 4.34 | 2.97 | 1.43 | 2.14 | ||||||||||||||||||
Ratios to average net assets: | ||||||||||||||||||||||||
Net investment income (loss) (%) | 5.24 | (b) | 4.42 | 4.09 | 4.07 | 3.57 | 3.41 | |||||||||||||||||
Expenses, after expense reductions (%) | 0.99 | (b) | 0.99 | 0.99 | 1.00 | 1.00 | 0.98 | |||||||||||||||||
Expenses, after expense reductions and net of custody credits (%) | 0.99 | (b) | 0.99 | 0.99 | 0.99 | 0.99 | 0.98 | |||||||||||||||||
Expenses, before expense reductions (%) | 1.51 | (b) | 1.52 | 1.71 | 1.79 | 3.15 | 7.63 | |||||||||||||||||
Portfolio turnover rate (%) | 22.70 | 42.84 | 41.55 | 6.77 | 23.16 | 22.73 | ||||||||||||||||||
Net assets at end of period (thousands) | $ | 9,035 | $ | 9,712 | $ | 6,191 | $ | 3,331 | $ | 2,162 | $ | 911 | ||||||||||||
| (a) | Not annualized for periods less than one year. |
| (b) | Annualized. |
| * | Unaudited. |
See notes to financial statements.
| 32 Certified Semi-Annual Report | ||
| SCHEDULE OF INVESTMENTS | ||
| Thornburg Limited Term U.S. Government Fund | March 31, 2009 (Unaudited) | |
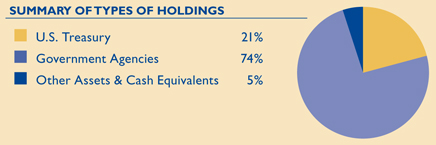
Issuer-Description | Principal Amount | Value | ||||
U.S. TREASURY SECURITIES — 20.61% | ||||||
United States Treasury Notes, 5.50% due 5/15/2009 | $ | 8,000,000 | $ | 8,051,406 | ||
United States Treasury Notes, 3.625% due 1/15/2010 | 16,000,000 | 16,387,501 | ||||
United States Treasury Notes, 2.125% due 4/30/2010 | 5,000,000 | 5,083,886 | ||||
United States Treasury Notes, 4.625% due 10/31/2011 | 2,000,000 | 2,186,875 | ||||
United States Treasury Notes, 4.875% due 6/30/2012 | 4,000,000 | 4,463,125 | ||||
United States Treasury Notes, 2.625% due 2/29/2016 | 2,000,000 | 2,051,484 | ||||
United States Treasury Notes, 4.875% due 8/15/2016 | 5,000,000 | 5,884,375 | ||||
United States Treasury Notes, 4.625% due 2/15/2017 | 4,000,000 | 4,648,750 | ||||
United States Treasury Notes Inflationary Index, 2.00% due 7/15/2014 | 2,239,960 | 2,316,959 | ||||
United States Treasury Notes Inflationary Index, 1.875% due 7/15/2015 | 4,341,440 | 4,468,970 | ||||
United States Treasury Notes Inflationary Index, 2.00% due 1/15/2016 | 5,318,300 | 5,501,117 | ||||
TOTAL U.S. TREASURY SECURITIES (Cost $58,309,483) | 61,044,448 | |||||
U.S. GOVERNMENT AGENCIES — 74.02% | ||||||
Federal Agricultural Mtg Corp., 6.71% due 7/28/2014 | 200,000 | 238,471 | ||||
Federal Farm Credit Bank, 6.75% due 7/7/2009 | 350,000 | 355,471 | ||||
Federal Farm Credit Bank, 6.06% due 5/28/2013 | 240,000 | 273,547 | ||||
Federal Farm Credit Bank, 3.98% due 1/22/2015 | 1,000,000 | 1,037,388 | ||||
Federal Home Loan Bank, 5.985% due 4/9/2009 | 1,000,000 | 1,001,179 | ||||
Federal Home Loan Bank, 5.79% due 4/27/2009 | 200,000 | 200,741 | ||||
Federal Home Loan Bank, 5.125% due 4/29/2009 | 1,750,000 | 1,756,082 | ||||
Federal Home Loan Bank, 4.125% due 8/13/2010 | 3,000,000 | 3,118,559 | ||||
Federal Home Loan Bank, 5.375% due 6/13/2014 | 2,000,000 | 2,239,639 | ||||
Federal Home Loan Bank, 5.00% due 12/8/2017 | 3,000,000 | 3,239,960 | ||||
Federal Home Loan Mtg Corp., 2.375% due 2/24/2012 | 2,000,000 | 2,011,253 | ||||
Federal Home Loan Mtg Corp., 4.50% due 6/12/2013 | 2,000,000 | 2,018,729 | ||||
Federal Home Loan Mtg Corp., 4.50% due 1/15/2015 | 5,000,000 | 5,478,486 | ||||
Federal Home Loan Mtg Corp., 5.50% due 3/28/2016 | 1,190,000 | 1,275,448 | ||||
Federal Home Loan Mtg Corp., 4.875% due 6/13/2018 | 3,000,000 | 3,325,500 | ||||
Federal Home Loan Mtg Corp., 5.50% due 7/15/2019 | 4,801,215 | 5,054,063 | ||||
Federal Home Loan Mtg Corp., CMO Series 00246, 5.50% due 5/15/2034 | 1,967,553 | 2,049,135 | ||||
Federal Home Loan Mtg Corp., CMO Series 1321 Class TE, 7.00% due 8/15/2022 | 763,964 | 763,964 | ||||
Federal Home Loan Mtg Corp., CMO Series 2420 Class MC, 6.00% due 2/15/2017 | 1,480,607 | 1,560,343 | ||||
Federal Home Loan Mtg Corp., CMO Series 2509 Class TV, 5.50% due 4/15/2022 | 2,500,000 | 2,617,375 | ||||
Federal Home Loan Mtg Corp., CMO Series 2553 Class GB, 5.00% due 1/15/2018 | 1,000,000 | 1,069,531 | ||||
Federal Home Loan Mtg Corp., CMO Series 2592 Class PD, 5.00% due 7/15/2014 | 85,681 | 85,582 | ||||
Federal Home Loan Mtg Corp., CMO Series 2628 Class DQ, 3.00% due 11/15/2017 | 723,711 | 730,718 | ||||
Federal Home Loan Mtg Corp., CMO Series 2649 Class QH, 4.50% due 7/15/2018 | 1,000,000 | 1,038,685 | ||||
| Certified Semi-Annual Report 33 | ||
| SCHEDULE OF INVESTMENTS, CONTINUED | ||
| Thornburg Limited Term U.S. Government Fund | March 31, 2009 (Unaudited) | |
Issuer-Description | Principal Amount | Value | ||||
Federal Home Loan Mtg Corp., CMO Series 26925 Class QD, 5.00% due 12/15/2022 | $ | 2,575,000 | $ | 2,697,730 | ||
Federal Home Loan Mtg Corp., CMO Series 2731 Class Vl, 5.50% due 12/15/2014 | 2,641,396 | 2,769,391 | ||||
Federal Home Loan Mtg Corp., CMO Series 2738 Class QE, 5.00% due 7/15/2032 | 3,000,000 | 3,159,374 | ||||
Federal Home Loan Mtg Corp., CMO Series 2744 Class JG, 5.00% due 8/15/2032 | 1,500,000 | 1,568,215 | ||||
Federal Home Loan Mtg Corp., CMO Series 2764 Class UE, 5.00% due 10/15/2032 | 2,000,000 | 2,100,530 | ||||
Federal Home Loan Mtg Corp., CMO Series 2770 Class UD, 4.50% due 5/15/2017 | 2,400,000 | 2,492,939 | ||||
Federal Home Loan Mtg Corp., CMO Series 2802 Class NE, 5.00% due 2/15/2033 | 1,470,000 | 1,543,828 | ||||
Federal Home Loan Mtg Corp., CMO Series 2814 Class GB, 5.00% due 6/15/2019 | 1,120,683 | 1,146,729 | ||||
Federal Home Loan Mtg Corp., CMO Series 2825 Class VP, 5.50% due 6/15/2015 | 5,064,437 | 5,316,640 | ||||
Federal Home Loan Mtg Corp., CMO Series 2834 Class VE, 5.50% due 7/15/2015 | 2,277,491 | 2,330,962 | ||||
Federal Home Loan Mtg Corp., CMO Series 2901 Class UB, 5.00% due 3/15/2033 | 2,400,000 | 2,516,785 | ||||
Federal Home Loan Mtg Corp., CMO Series 2943 Class HE, 5.00% due 3/15/2033 | 1,965,000 | 2,067,593 | ||||
Federal Home Loan Mtg Corp., CMO Series 3020 Class VA, 5.50% due 11/15/2014 | 1,339,502 | 1,397,419 | ||||
Federal Home Loan Mtg Corp., CMO Series 3067 Class PJ, 5.50% due 7/15/2031 | 3,000,000 | 3,122,181 | ||||
Federal Home Loan Mtg Corp., CMO Series 3068 Class VA, 5.50% due 10/15/2016 | 1,509,670 | 1,563,061 | ||||
Federal Home Loan Mtg Corp., CMO Series 3078 Class PC, 5.50% due 11/15/2030 | 2,250,000 | 2,341,797 | ||||
Federal Home Loan Mtg Corp., CMO Series 3138 Class PC, 5.50% due 6/15/2032 | 5,000,000 | 5,208,518 | ||||
Federal Home Loan Mtg Corp., CMO Series 3178 Class MC, 6.00% due 4/15/2032 | 5,275,000 | 5,499,635 | ||||
Federal Home Loan Mtg Corp., CMO Series 3184 Class PC, 5.50% due 8/15/2032 | 5,535,000 | 5,754,983 | ||||
Federal Home Loan Mtg Corp., CMO Series 3187 Class LA, 5.50% due 4/15/2031 | 2,609,184 | 2,678,727 | ||||
Federal Home Loan Mtg Corp., CMO Series 3192 Class GB, 6.00% due 1/15/2031 | 1,000,000 | 1,034,894 | ||||
Federal Home Loan Mtg Corp., CMO Series 3195 Class PD, 6.50% due 7/15/2036 | 4,300,000 | 4,620,366 | ||||
Federal Home Loan Mtg Corp., CMO Series 3216 Class NA, 6.00% due 5/15/2028 | 1,425,765 | 1,448,852 | ||||
Federal Home Loan Mtg Corp., CMO Series 3219 Class PD, 6.00% due 11/15/2035 | 3,000,000 | 3,176,462 | ||||
Federal Home Loan Mtg Corp., CMO Series 3228 Class PC, 5.50% due 7/15/2030 | 5,000,000 | 5,129,953 | ||||
Federal Home Loan Mtg Corp., CMO Series 3271 Class LU, 5.50% due 1/15/2018 | 2,783,246 | 2,914,460 | ||||
Federal Home Loan Mtg Corp., CMO Series 3319 Class PA, 5.50% due 8/15/2030 | 769,521 | 792,406 | ||||
Federal Home Loan Mtg Corp., CMO Series 3320 Class TC, 5.50% due 10/15/2032 | 2,000,000 | 2,081,175 | ||||
Federal Home Loan Mtg Corp., CMO Series 3331 Class PB, 6.00% due 1/15/2031 | 2,000,000 | 2,073,952 | ||||
Federal Home Loan Mtg Corp., CMO Series 3351 Class PK, 5.50% due 1/15/2032 | 3,000,000 | 3,130,671 | ||||
Federal Home Loan Mtg Corp., CMO Series 3456 Class KV, 5.50% due 9/15/2017 | 2,809,213 | 2,944,362 | ||||
Federal Home Loan Mtg Corp., CMO Series 3480 Class VA, 6.00% due 6/15/2019 | 2,882,923 | 3,063,655 | ||||
Federal Home Loan Mtg Corp., CMO Series R003 Class VA, 5.50% due 8/15/2016 | 1,320,105 | 1,379,521 | ||||
Federal Home Loan Mtg Corp., CMO Series R012 Class AB, 5.50% due 12/15/2020 | 2,926,404 | 2,993,397 | ||||
Federal Home Loan Mtg Corp., Pool # 1N1736, 5.24% due 4/1/2037 | 1,275,905 | 1,316,024 | ||||
Federal Home Loan Mtg Corp., Pool # 252986, 10.75% due 4/1/2010 | 4,790 | 4,866 | ||||
Federal Home Loan Mtg Corp., Pool # 298107, 10.25% due 8/1/2017 | 22,398 | 25,260 | ||||
Federal Home Loan Mtg Corp., Pool # C90041, 6.50% due 11/1/2013 | 18,141 | 18,854 | ||||
Federal Home Loan Mtg Corp., Pool # D37120, 7.00% due 7/1/2023 | 27,713 | 29,577 | ||||
Federal National Mtg Assoc, 2.00% due 3/2/2011 | 2,000,000 | 2,007,561 | ||||
Federal National Mtg Assoc, 4.40% due 2/19/2015 | 1,585,000 | 1,695,777 | ||||
Federal National Mtg Assoc CMO Series 1993-122 Class D, 6.50% due 6/25/2023 | 16,638 | 16,749 | ||||
Federal National Mtg Assoc CMO Series 1993-32 Class H, 6.00% due 3/25/2023 | 83,889 | 87,731 | ||||
Federal National Mtg Assoc CMO Series 2002-18 Class PC, 5.50% due 4/25/2017 | 1,983,183 | 2,077,194 | ||||
Federal National Mtg Assoc CMO Series 2003-15 Class CY, 5.00% due 3/25/2018 | 1,017,000 | 1,072,282 | ||||
Federal National Mtg Assoc CMO Series 2003-44 Class CB, 4.25% due 3/25/2033 | 2,843,720 | 2,883,045 | ||||
Federal National Mtg Assoc CMO Series 2003-9 Class DB, 5.00% due 2/25/2018 | 1,000,000 | 1,059,068 | ||||
Federal National Mtg Assoc CMO Series 2003-92 Class KH, 5.00% due 3/25/2032 | 2,000,000 | 2,089,822 | ||||
Federal National Mtg Assoc CMO Series 2004-2 Class QL, 4.00% due 2/25/2019 | 2,000,000 | 1,998,988 | ||||
Federal National Mtg Assoc CMO Series 2004-33 Class MW, 4.50% due 1/25/2030 | 2,897,000 | 3,002,796 | ||||
Federal National Mtg Assoc CMO Series 2004-35 Class CA, 4.00% due 12/25/2017 | 1,526,873 | 1,568,016 | ||||
Federal National Mtg Assoc CMO Series 2005-68 Class PD, 6.00% due 9/25/2030 | 2,713,163 | 2,711,828 | ||||
Federal National Mtg Assoc CMO Series 2006-51 Class PB, 5.50% due 8/25/2033 | 3,000,000 | 3,121,190 | ||||
| 34 Certified Semi-Annual Report | ||
| SCHEDULE OF INVESTMENTS, CONTINUED | ||
| Thornburg Limited Term U.S. Government Fund | March 31, 2009 (Unaudited) | |
Issuer-Description | Principal Amount | Value | ||||
Federal National Mtg Assoc CMO Series 2006-78 Class MB, 5.50% due 7/25/2034 | $ | 3,000,000 | $ | 3,152,725 | ||
Federal National Mtg Assoc CMO Series 2007-42 Class YA, 5.50% due 1/25/2036 | 2,267,052 | 2,331,121 | ||||
Federal National Mtg Assoc CMO Series 2007-60 Class VA, 6.00% due 12/25/2017 | 4,355,850 | 4,577,290 | ||||
Federal National Mtg Assoc CMO Series 2007-65 Class PB, 6.00% due 10/25/2032 | 2,916,000 | 3,032,446 | ||||
Federal National Mtg Assoc CMO Series 2007-79 Class MB, 5.50% due 12/25/2030 | 1,000,000 | 1,038,492 | ||||
Federal National Mtg Assoc CMO Series 2007-83 Class PA, 6.00% due 3/25/2029 | 1,656,663 | 1,702,719 | ||||
Federal National Mtg Assoc CMO Series 2008-77 Class VA, 6.00% due 7/25/2019 | 3,890,184 | 4,130,693 | ||||
Federal National Mtg Assoc REMIC Series 2002-59 Class B, 5.50% due 9/25/2017 | 2,006,777 | 2,128,515 | ||||
Federal National Mtg Assoc REMIC Series 2006-B1 Class AB, 6.00% due 6/25/2016 | 2,482,872 | 2,538,322 | ||||
Federal National Mtg Assoc REMIC Series 2008-86 Class PC, 5.00% due 3/25/2034 | 5,000,000 | 5,184,233 | ||||
Federal National Mtg Assoc, Pool # 044003, 8.00% due 6/1/2017 | 22,395 | 23,777 | ||||
Federal National Mtg Assoc, Pool # 050811, 7.50% due 12/1/2012 | 17,302 | 17,990 | ||||
Federal National Mtg Assoc, Pool # 050832, 7.50% due 6/1/2013 | 20,518 | 21,308 | ||||
Federal National Mtg Assoc, Pool # 076388, 9.25% due 9/1/2018 | 59,991 | 65,367 | ||||
Federal National Mtg Assoc, Pool # 100286, 7.50% due 8/1/2009 | 1,439 | 1,442 | ||||
Federal National Mtg Assoc, Pool # 112067, 9.50% due 10/1/2016 | 19,719 | 21,763 | ||||
Federal National Mtg Assoc, Pool # 190555, 7.00% due 1/1/2014 | 16,568 | 17,407 | ||||
Federal National Mtg Assoc, Pool # 190836, 7.00% due 6/1/2009 | 728 | 762 | ||||
Federal National Mtg Assoc, Pool # 250387, 7.00% due 11/1/2010 | 12,015 | 12,177 | ||||
Federal National Mtg Assoc, Pool # 251759, 6.00% due 5/1/2013 | 33,693 | 35,341 | ||||
Federal National Mtg Assoc, Pool # 252648, 6.50% due 5/1/2022 | 123,962 | 132,141 | ||||
Federal National Mtg Assoc, Pool # 303383, 7.00% due 12/1/2009 | 846 | 852 | ||||
Federal National Mtg Assoc, Pool # 312663, 7.50% due 6/1/2010 | 6,655 | 6,722 | ||||
Federal National Mtg Assoc, Pool # 334996, 7.00% due 2/1/2011 | 9,845 | 9,999 | ||||
Federal National Mtg Assoc, Pool # 342947, 7.25% due 4/1/2024 | 215,304 | 231,849 | ||||
Federal National Mtg Assoc, Pool # 384243, 6.10% due 10/1/2011 | 587,907 | 603,461 | ||||
Federal National Mtg Assoc, Pool # 406384, 8.25% due 12/1/2024 | 113,563 | 120,595 | ||||
Federal National Mtg Assoc, Pool # 443909, 6.50% due 9/1/2018 | 87,900 | 93,255 | ||||
Federal National Mtg Assoc, Pool # 516363, 5.00% due 3/1/2014 | 117,053 | 122,252 | ||||
Federal National Mtg Assoc, Pool # 555207, 7.00% due 11/1/2017 | 38,378 | 40,328 | ||||
Federal National Mtg Assoc, Pool # 895572, 5.654% due 6/1/2036 | 2,656,485 | 2,747,301 | ||||
Government National Mtg Assoc CMO Series 2008-56 Class CH, 5.00% due 5/20/2035 | 5,000,000 | 5,151,811 | ||||
Government National Mtg Assoc, Pool # 000623, 8.00% due 9/20/2016 | 33,088 | 34,996 | ||||
Government National Mtg Assoc, Pool # 409921, 7.50% due 8/15/2010 | 6,685 | 6,771 | ||||
Government National Mtg Assoc, Pool # 410240, 7.00% due 12/15/2010 | 10,868 | 11,042 | ||||
Government National Mtg Assoc, Pool # 410271, 7.50% due 8/15/2010 | 12,462 | 12,654 | ||||
Government National Mtg Assoc, Pool # 410846, 7.00% due 12/15/2010 | 18,193 | 18,471 | ||||
Government National Mtg Assoc, Pool # 430150, 7.25% due 12/15/2026 | 29,387 | 31,424 | ||||
Government National Mtg Assoc, Pool # 453928, 7.00% due 7/15/2017 | 50,314 | 53,866 | ||||
Government National Mtg Assoc, Pool # 780448, 6.50% due 8/15/2011 | 28,936 | 30,688 | ||||
Overseas Private Investment Corp., 4.10% due 11/15/2014 (2) | 1,502,400 | 1,544,186 | ||||
Private Export Funding Corp., 5.685% due 5/15/2012 | 5,000,000 | 5,539,610 | ||||
Private Export Funding Corp., 4.974% due 8/15/2013 | 2,700,000 | 2,973,632 | ||||
Tennessee Valley Authority, 4.75% due 8/1/2013 | 3,000,000 | 3,281,891 | ||||
U.S. Department of Transportation Headquarters Series 2004 Class A-2, 5.594% due 12/7/2021 (1)(2) | 2,835,066 | 3,005,170 | ||||
TOTAL U.S. GOVERNMENT AGENCIES (Cost $213,168,799) | 219,226,497 | |||||
| Certified Semi-Annual Report 35 | ||
| SCHEDULE OF INVESTMENTS, CONTINUED | ||
| Thornburg Limited Term U.S. Government Fund | March 31, 2009 (Unaudited) | |
Issuer-Description | Principal Amount | Value | ||||
SHORT TERM INVESTMENTS — 3.38% | ||||||
Federal Home Loan Bank, 0.01% due 4/2/2009 | $ | 10,000,000 | $ | 9,999,955 | ||
TOTAL SHORT TERM INVESTMENTS (Cost $9,999,956) | 9,999,955 | |||||
TOTAL INVESTMENTS — 98.01% (Cost $281,478,238) | $ | 290,270,900 | ||||
OTHER ASSETS LESS LIABILITIES — 1.99% | 5,880,716 | |||||
NET ASSETS — 100.00% | $ | 296,151,616 | ||||
Footnote Legend
| (1) | Securities exempt from registration under Rule 144A of the Securities Act of 1933, as amended. These securities may only be resold in the ordinary course of business in transactions exempt from registration, normally to qualified institutional buyers. As of March 31, 2009, the aggregate value of these securities in the Fund’s portfolio was $3,005,170, representing 1.01% of the Fund’s net assets. |
| (2) | Security currently fair valued by the valuation and pricing committee using procedures approved by the Trustees. |
Portfolio Abbreviations
To simplify the listings of securities, abbreviations are used per the table below:
| CMO | Collateralized Mortgage Obligation | |
| Mtg | Mortgage | |
| REMIC | Real Estate Mortgage Investment Conduit |
See notes to financial statements.
| 36 Certified Semi-Annual Report | ||
| SCHEDULE OF INVESTMENTS | ||
| Thornburg Limited Term Income Fund | March 31, 2009 (Unaudited) | |
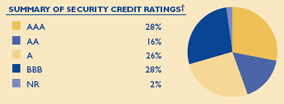 | We have used ratings from Standard & Poor’s, (S&P). Where S&P ratings are not available, we have used Moody’s Investors Service. Where neither rating is available, we have used ratings from Fitch Ratings. |
Issuer-Description | Credit Rating† Moody’s/S&P | Principal Amount | Value | |||||
U.S. TREASURY SECURITIES — 0.97% | ||||||||
United States Treasury Notes, 5.125% due 5/15/2016 | Aaa/AAA | $ | 1,000,000 | $ | 1,193,203 | |||
United States Treasury Notes, 4.875% due 8/15/2016 | Aaa/AAA | 2,000,000 | 2,353,750 | |||||
TOTAL U.S. TREASURY SECURITIES (Cost $3,091,343) | 3,546,953 | |||||||
U.S. GOVERNMENT AGENCIES — 4.11% | ||||||||
Federal Home Loan Bank, 5.985% due 4/9/2009 | Aaa/AAA | 85,000 | 85,100 | |||||
Federal Home Loan Mtg Corp., CMO Series 2814 Class GB, 5.00% due 6/15/2019 | Aaa/AAA | 1,120,683 | 1,146,729 | |||||
Federal Home Loan Mtg Corp., CMO Series 3192 Class GB, 6.00% due 1/15/2031 | Aaa/AAA | 2,000,000 | 2,069,789 | |||||
Federal Home Loan Mtg Corp., CMO Series 3195 Class PD, 6.50% due 7/15/2036 | NR/NR | 1,000,000 | 1,074,504 | |||||
Federal National Mtg Assoc, 7.00% due 3/1/2011 | Aaa/AAA | 7,118 | 7,214 | |||||
Federal National Mtg Assoc, 6.42% due 4/1/2011 | Aaa/AAA | 2,257,008 | 2,372,623 | |||||
Federal National Mtg Assoc, 5.095% due 12/1/2011 | Aaa/AAA | 119,444 | 124,689 | |||||
Federal National Mtg Assoc, 7.491% due 8/1/2014 | Aaa/AAA | 25,672 | 25,672 | |||||
Federal National Mtg Assoc CMO Series 2003-64 Class EC, 5.50% due 5/25/2030 | Aaa/AAA | 325,419 | 328,822 | |||||
Federal National Mtg Assoc CMO Series 2007-65 Class PB, 6.00% due 10/25/2032 | Aaa/AAA | 3,000,000 | 3,119,801 | |||||
Government National Mtg Assoc, Pool # 003007, 8.50% due 11/20/2015 | Aaa/AAA | 20,867 | 22,439 | |||||
Government National Mtg Assoc, Pool # 827148, 5.375% due 2/20/2024 | Aaa/AAA | 35,705 | 36,106 | |||||
Small Business Administration, 4.638% due 2/10/2015 | NR/NR | 1,781,911 | 1,815,382 | |||||
U.S. Department of Transportation Headquarters Series 2004 Class A-2, 5.594% due 12/7/2021(1) NR/A- | 2,598,811 | 2,754,739 | ||||||
TOTAL U.S. GOVERNMENT AGENCIES (Cost $14,433,473) | 14,983,609 | |||||||
ASSET BACKED SECURITIES — 7.39% | ||||||||
BANKS — 1.36% | ||||||||
COMMERCIAL BANKS — 1.16% | ||||||||
Wachovia Bank Commercial Mtg Trust Series 2005-C21 Class A-4, 5.209% due 10/15/2044 | Aaa/AAA | 5,000,000 | 3,517,111 | |||||
Wells Fargo Asset Securities Corp. Series 2005-AR2 Class B1, 4.549% due 2/25/2035 | Aa2/AA | 998,998 | 193,512 | |||||
Wells Fargo Asset Securities Corp. Series 2005-AR2 Class B1, 4.688% due 3/25/2035 | NR/NR | 1,068,580 | 200,404 | |||||
Wells Fargo Mtg Backed Securities Series 2005-3 Class-A10, 5.50% due 5/25/2035 | Aaa/NR | 328,439 | 328,533 | |||||
THRIFTS & MORTGAGE FINANCE — 0.20% | ||||||||
Washington Mutual Series 05-AR4, Class-A4B, 4.67% due 4/25/2035 | Aaa/AAA | 830,000 | 733,519 | |||||
| 4,973,079 | ||||||||
CONSUMER SERVICES — 1.21% | ||||||||
HOTELS, RESTAURANTS & LEISURE— 1.21% | ||||||||
Dunkin 2006-1 Class A2, 5.779% due 6/20/2031 | NR/NR | 4,000,000 | 2,911,080 | |||||
| Certified Semi-Annual Report 37 | ||
| SCHEDULE OF INVESTMENTS, CONTINUED | ||
| Thornburg Limited Term Income Fund | March 31, 2009 (Unaudited) | |
Issuer-Description | Credit Rating† Moody’s/S&P | Principal Amount | Value | |||||
IHOP Franchising LLC Series 2007-1A Class A1, 5.144% due 3/20/2037 (2) | Baa2/BBB- | $ | 3,000,000 | $ | 1,500,000 | |||
| 4,411,080 | ||||||||
DIVERSIFIED FINANCIALS — 4.27% | ||||||||
CAPITAL MARKETS — 2.56% | ||||||||
Bear Stearns Mtg Series 2004-3 Class 1-A2, 4.611% due 7/25/2034 | Aaa/AAA | 470,019 | 336,322 | |||||
GS Mtg Securities Corp. 2001-Rock Class C, 6.878% due 5/3/2018 | Aaa/AAA | 545,000 | 583,863 | |||||
GSR Mtg Loan Trust Series 2004-3F Class 2-A10, 16.44% due 2/25/2034 | NR/AAA | 613,685 | 558,445 | |||||
Legg Mason Mtg Capital Corp., 2.773% due 6/1/2009 | NR/NR | 1,714,286 | 1,713,703 | |||||
Merrill Lynch Mtg Investors, 4.226% due 8/25/2034 | NR/AA | 991,922 | 304,805 | |||||
Merrill Lynch Mtg Investors, Series 2003 E Class B3, 2.022% due 10/25/2028 | A2/A+ | 1,441,184 | 392,328 | |||||
Morgan Stanley Dean Witter Capital Trust Series 2000 Xl-1345 Class C, 7.577% due 9/3/2015 | Aaa/NR | 545,000 | 581,162 | |||||
Morgan Stanley Dean Witter Capital Trust Series 2001 Xl-280 Class C, 6.756% due 2/3/2016 | Aaa/NR | 825,000 | 879,971 | |||||
Salomon Brothers Mtg Securities Series 1999-C1 Class D, 6.988% due 5/18/2032 | Aaa/NR | 4,000,000 | 3,988,988 | |||||
DIVERSIFIED FINANCIAL SERVICES — 1.71% | ||||||||
Banc America Mtg Securities, Inc. Series 2005 A Class B1 Floating Rate Note, 4.722% due 2/25/2035 | NR/NR | 2,909,541 | 905,188 | |||||
Citigroup Commercial Mtg Trust Series 2004-HYB2 Class B1, 4.908% due 3/25/2034 | Aa2/AA | 629,831 | 202,575 | |||||
Countrywide Home Loan Series 2004 Class 1-A, 5.597% due 7/20/2034 | Aaa/AAA | 797,845 | 478,520 | |||||
FNBC Trust Series 1993 A, 8.08% due 1/5/2018 | Aa3/AA- | 1,040,163 | 1,122,003 | |||||
JPMorgan Chase Commercial Mtg Series 2004-C3 Class A-5, 4.878% due 1/15/2042 | Aaa/NR | 5,000,000 | 3,558,864 | |||||
| 15,606,737 | ||||||||
TELECOMMUNICATION SERVICES — 0.55% | ||||||||
WIRELESS TELECOMMUNICATION SERVICES — 0.55% | ||||||||
Global Signal Trust Series 2006-1 Class A-1 Floating Rate Note, 0.776% due 2/15/2036 (2) | Aaa/AAA | 2,250,000 | 2,002,500 | |||||
| 2,002,500 | ||||||||
TOTAL ASSET BACKED SECURITIES (Cost $37,914,830) | 26,993,396 | |||||||
CORPORATE BONDS — 67.72% | ||||||||
AUTOMOBILES & COMPONENTS — 1.07% | ||||||||
AUTOMOBILES — 1.07% | ||||||||
American Honda Finance Corp., 5.125% due 12/15/2010 (1) | A1/A+ | 1,500,000 | 1,477,328 | |||||
Harley Davidson Funding Corp. Series C, 6.80% due 6/15/2018 (1) | A2/BBB+ | 2,500,000 | 1,622,075 | |||||
Toyota Motor Credit Corp., 4.35% due 12/15/2010 | Aa1/AA+ | 800,000 | 819,411 | |||||
| 3,918,814 | ||||||||
BANKS — 4.16% | ||||||||
COMMERCIAL BANKS — 3.66% | ||||||||
ANZ National International, 6.20% due 7/19/2013 (1) | Aa2/AA | 1,000,000 | 964,267 | |||||
Charter One Bank NA, 5.50% due 4/26/2011 | Aa3/A- | 1,750,000 | 1,686,234 | |||||
Household Finance Corp., 6.40% due 9/15/2009 | A3/A | 400,000 | 387,774 | |||||
Household Finance Corp. CPI Floating Rate Note, 1.40% due 8/10/2009 | A3/A | 5,000,000 | 4,764,700 | |||||
National City Bank, 7.25% due 7/15/2010 | NR/A | 2,000,000 | 2,037,078 | |||||
National Westminster Bank, 7.375% due 10/1/2009 | A1/A | 715,000 | 696,063 | |||||
Nations Bank Corp., 7.23% due 8/15/2012 | A2/A | 250,000 | 219,726 | |||||
Sovereign Bank, 5.125% due 3/15/2013 | Baa1/A- | 400,000 | 338,903 | |||||
Suntrust Bank, 5.20% due 1/17/2017 | A1/A | 400,000 | 340,380 | |||||
| 38 Certified Semi-Annual Report | ||
| SCHEDULE OF INVESTMENTS, CONTINUED | ||
| Thornburg Limited Term Income Fund | March 31, 2009 (Unaudited) | |
Issuer-Description | Credit Rating† Moody’s/S&P | Principal Amount | Value | |||||
Whitney National Bank, 5.875% due 4/1/2017 | A3/BBB | $ | 2,000,000 | $ | 1,906,732 | |||
THRIFTS & MORTGAGE FINANCE — 0.50% | ||||||||
Sovereign Bancorp, Inc., 1.457% due 3/23/2010 | Baa1/A | 2,000,000 | 1,827,046 | |||||
| 15,168,903 | ||||||||
CAPITAL GOODS — 5.27% | ||||||||
AEROSPACE & DEFENSE — 0.42% | ||||||||
Boeing Co., 5.00% due 3/15/2014 | A2/A+ | 1,500,000 | 1,537,587 | |||||
ELECTRICAL EQUIPMENT — 0.53% | ||||||||
Emerson Electric Co., 5.75% due 11/1/2011 | A2/A | 800,000 | 855,534 | |||||
Hubbell, Inc., 6.375% due 5/15/2012 | A3/A+ | 1,000,000 | 1,058,829 | |||||
INDUSTRIAL CONGLOMERATES — 1.74% | ||||||||
General Electric Capital Corp., 7.75% due 6/9/2009 | Aa2/AA+ | 200,000 | 199,997 | |||||
General Electric Capital Corp., 7.375% due 1/19/2010 | Aa2/AA+ | 400,000 | 402,418 | |||||
General Electric Capital Corp., 4.875% due 10/21/2010 | Aa2/AA+ | 2,500,000 | 2,485,088 | |||||
General Electric Capital Corp. Floating Rate Note, 1.44% due 12/15/2009 | Aa2/AA+ | 1,000,000 | 974,715 | |||||
Tyco International Finance, 6.375% due 10/15/2011 | Baa1/BBB+ | 1,500,000 | 1,519,728 | |||||
Tyco International Finance, 8.50% due 1/15/2019 | Baa1/BBB+ | 750,000 | 774,141 | |||||
MACHINERY — 2.58% | ||||||||
Caterpillar Financial Services Corp., 5.85% due 9/1/2017 | A2/A | 1,750,000 | 1,520,472 | |||||
General American Railcar Corp., 6.69% due 9/20/2016 (1)(2) | A3/AA- | 164,646 | 163,097 | |||||
Illinois Tool Works Cupids Financing Trust, 6.55% due 12/31/2011 (1) | A1/NR | 5,000,000 | 5,089,675 | |||||
Ingersoll Rand Global Holding Co., 6.875% due 8/15/2018 | Baa1/BBB+ | 570,000 | 532,119 | |||||
Ingersoll-Rand Global Holding Co., 9.50% due 4/15/2014 | Baa1/BBB+ | 500,000 | 499,960 | |||||
John Deere Capital Corp., 5.25% due 10/1/2012 | A2/A | 1,600,000 | 1,615,576 | |||||
| 19,228,936 | ||||||||
COMMERCIAL & PROFESSIONAL SERVICES— 0.62% | ||||||||
COMMERCIAL SERVICES & SUPPLIES — 0.62% | ||||||||
Science Applications International Corp., 6.25% due 7/1/2012 | A3/A- | 1,000,000 | 1,016,242 | |||||
Waste Management, Inc., 6.875% due 5/15/2009 | Baa3/BBB | 725,000 | 726,716 | |||||
Waste Management, Inc., 7.375% due 8/1/2010 | Baa3/BBB | 500,000 | 511,539 | |||||
| 2,254,497 | ||||||||
CONSUMER DURABLES & APPAREL — 0.62% | ||||||||
TEXTILES, APPAREL & LUXURY GOODS — 0.62% | ||||||||
Nike, Inc., 5.15% due 10/15/2015 | A1/A+ | 2,315,000 | 2,259,021 | |||||
| 2,259,021 | ||||||||
DIVERSIFIED FINANCIALS — 7.54% | ||||||||
CAPITAL MARKETS — 1.94% | ||||||||
Bear Stearns Co., Inc., 4.50% due 10/28/2010 | Aa3/A+ | 3,000,000 | 2,969,862 | |||||
Lehman Brothers Holdings, Inc., 5.625% due 1/24/2013 (3)(4) | NR/NR | 1,300,000 | 156,000 | |||||
Merrill Lynch & Co., 4.125% due 9/10/2009 | A2/A | 2,000,000 | 1,972,554 | |||||
Merrill Lynch & Co. Floating Rate Note, 0.646% due 8/14/2009 | A2/A | 2,000,000 | 1,969,366 | |||||
CONSUMER FINANCE — 0.93% | ||||||||
American Express Credit Corp., 5.875% due 5/2/2013 | A1/A | 2,500,000 | 2,194,945 | |||||
American General Finance Corp., 4.625% due 9/1/2010 | Baa2/BB+ | 200,000 | 92,177 | |||||
Capital One Bank, 6.50% due 6/13/2013 | A3/BBB+ | 300,000 | 265,984 | |||||
Capital One Financial Corp., 5.70% due 9/15/2011 | A3/BBB+ | 950,000 | 855,366 | |||||
| Certified Semi-Annual Report 39 | ||
| SCHEDULE OF INVESTMENTS, CONTINUED | ||
| Thornburg Limited Term Income Fund | March 31, 2009 (Unaudited) | |
Issuer-Description | Credit Rating† Moody’s/S&P | Principal Amount | Value | |||||
DIVERSIFIED FINANCIAL SERVICES — 4.67% | ||||||||
Bank of America Corp., 7.40% due 1/15/2011 | A3/A- | $ | 1,500,000 | $ | 1,398,390 | |||
Bank of America Corp., 7.80% due 2/15/2010 | A3/A- | 1,060,000 | 1,018,297 | |||||
Bank of America Institutional Series B, 7.70% due 12/31/2026 (1) | Baa3/BB- | 2,000,000 | 784,236 | |||||
Citigroup, Inc., 6.50% due 8/19/2013 | A3/A | 1,000,000 | 918,915 | |||||
Citigroup, Inc., 6.125% due 5/15/2018 | A3/A | 500,000 | 431,568 | |||||
Citigroup, Inc., 5.00% due 9/15/2014 | Baa1/A- | 3,000,000 | 1,988,703 | |||||
CME Group, Inc., 5.75% due 2/15/2014 | Aa3/AA | 750,000 | 772,981 | |||||
JPMorgan Chase Co. CPI Floating Rate Note, 1.76% due 6/28/2009 | Aa3/A+ | 5,000,000 | 4,762,500 | |||||
MBNA Corp., 6.125% due 3/1/2013 | A2/A | 1,000,000 | 865,487 | |||||
Merrill Lynch & Co., Inc., 6.875% due 4/25/2018 | A2/A | 2,000,000 | 1,564,186 | |||||
National Rural Utilities CFC, 10.375% due 11/1/2018 | A1/A+ | 1,500,000 | 1,736,562 | |||||
Textron Financial Corp. Floating Rate Note, 1.379% due 2/25/2011 | Baa2/BB+ | 1,250,000 | 809,864 | |||||
| 27,527,943 | ||||||||
ENERGY — 5.64% | ||||||||
ENERGY EQUIPMENT & SERVICES — 1.52% | ||||||||
Detroit Edison Corporate Senior Note Series D, 5.40% due 8/1/2014 | A3/A- | 2,000,000 | 2,043,616 | |||||
Nabors Industries, Inc., 9.25% due 1/15/2019 (1) | Baa1/BBB+ | 1,000,000 | 948,228 | |||||
Smith International, Inc., 8.625% due 3/15/2014 | Baa1/BBB+ | 1,500,000 | 1,526,664 | |||||
Weatherford International Ltd., 9.625% due 3/1/2019 | Baa1/BBB+ | 1,000,000 | 1,034,313 | |||||
OIL, GAS & CONSUMABLE FUELS — 4.12% | ||||||||
Chevron Phillips Chemical, 7.00% due 3/15/2011 | Baa1/BBB+ | 500,000 | 514,193 | |||||
Conocophillips, 5.75% due 2/1/2019 | A1/A | 1,000,000 | 1,006,629 | |||||
Conocophillips, 4.75% due 2/1/2014 | A1/A | 1,000,000 | 1,040,154 | |||||
DCP Midstream LLC, 9.75% due 3/15/2019 (1) | Baa2/BBB | 1,500,000 | 1,487,107 | |||||
Enbridge Energy Partners LP, 9.875% due 3/1/2019 | Baa2/BBB | 2,000,000 | 2,061,888 | |||||
Energy Transfer Partners LP, 6.00% due 7/1/2013 | Baa3/BBB- | 1,000,000 | 945,491 | |||||
Enterprise Products Participating LP, 7.50% due 2/1/2011 | Baa3/BBB- | 250,000 | 254,114 | |||||
Hess Corp., 8.125% due 2/15/2019 | Baa2/BBB- | 1,500,000 | 1,546,305 | |||||
Marathon Oil Corp., 7.50% due 2/15/2019 | Baa1/BBB+ | 1,000,000 | 1,007,489 | |||||
Murphy Oil Corp., 6.375% due 5/1/2012 | Baa3/BBB | 750,000 | 756,062 | |||||
Occidental Petroleum Corp., 7.00% due 11/1/2013 | A2/A | 1,000,000 | 1,116,496 | |||||
Oneok Partners LP, 8.625% due 3/1/2019 | Baa2/BBB | 1,500,000 | 1,513,593 | |||||
Phillips Petroleum Co., 9.375% due 2/15/2011 | A1/A | 900,000 | 998,716 | |||||
Phillips Petroleum Co., 8.75% due 5/25/2010 | A1/A | 250,000 | 267,365 | |||||
Sunoco Logistics Partner, 8.75% due 2/15/2014 | Baa2/BBB | 500,000 | 511,139 | |||||
| 20,579,562 | ||||||||
FOOD & STAPLES RETAILING — 0.25% | ||||||||
FOOD & STAPLES RETAILING — 0.25% | ||||||||
Wal-Mart Stores, Inc., 6.875% due 8/10/2009 | Aa2/AA | 900,000 | 916,807 | |||||
| 916,807 | ||||||||
FOOD, BEVERAGE & TOBACCO— 4.99% | ||||||||
BEVERAGES — 3.56% | ||||||||
Anheuser Busch Cos., Inc., 4.70% due 4/15/2012 | Baa2/BBB+ | 1,000,000 | 981,864 | |||||
Anheuser Busch Cos., Inc., 4.375% due 1/15/2013 | Baa2/BBB+ | 2,000,000 | 1,926,470 | |||||
Anheuser Busch InBev, 7.75% due 1/15/2019 (1) | Baa2/BBB+ | 1,000,000 | 997,101 | |||||
Bacardi Ltd., 7.45% due 4/1/2014 (1) | Baa1/BBB | 2,500,000 | 2,507,390 | |||||
Bacardi Ltd., 8.20% due 4/1/2019 (1) | Baa1/BBB | 1,500,000 | 1,501,401 | |||||
Bottling Group LLC, 6.95% due 3/15/2014 | Aa2/A+ | 1,000,000 | 1,137,031 | |||||
| 40 Certified Semi-Annual Report | ||
| SCHEDULE OF INVESTMENTS, CONTINUED | ||
| Thornburg Limited Term Income Fund | March 31, 2009 (Unaudited) | |
Issuer-Description | Credit Rating† Moody’s/S&P | Principal Amount | Value | |||||
Coca-Cola Co., 5.75% due 3/15/2011 | Aa3/A+ | $ | 200,000 | $ | 213,700 | |||
Sabmiller PLC, 6.50% due 7/15/2018 (1) | Baa1/BBB+ | 4,000,000 | 3,725,224 | |||||
FOOD PRODUCTS — 0.60% | ||||||||
Conagra, Inc., 7.875% due 9/15/2010 | Baa2/BBB+ | 100,000 | 105,564 | |||||
General Mills, 5.20% due 3/17/2015 | Baa1/BBB+ | 1,000,000 | 1,019,298 | |||||
Kraft Foods, Inc., 6.00% due 2/11/2013 | Baa2/BBB+ | 1,000,000 | 1,053,490 | |||||
TOBACCO — 0.83% | ||||||||
Altria Group, Inc., 8.50% due 11/10/2013 | Baa1/BBB | 1,000,000 | 1,084,550 | |||||
Altria Group, Inc., 9.70% due 11/10/2018 | Baa1/BBB | 1,000,000 | 1,088,500 | |||||
UST, Inc., 5.75% due 3/1/2018 | Baa1/BBB | 1,000,000 | 876,425 | |||||
| 18,218,008 | ||||||||
HEALTH CARE EQUIPMENT & SERVICES — 1.73% | ||||||||
HEALTH CARE EQUIPMENT & SUPPLIES — 0.56% | ||||||||
Covidien International Finance Senior Note, 6.00% due 10/15/2017 | Baa1/A- | 2,000,000 | 2,028,452 | |||||
HEALTH CARE PROVIDERS & SERVICES — 1.17% | ||||||||
McKesson Corp., 6.50% due 2/15/2014 | Baa3/BBB+ | 1,000,000 | 1,034,344 | |||||
McKesson Corp., 7.50% due 2/15/2019 | Baa3/BBB+ | 500,000 | 530,699 | |||||
Unitedhealth Group, Inc., 6.00% due 2/15/2018 | Baa1/A- | 1,000,000 | 960,760 | |||||
Wellpoint, Inc., 6.00% due 2/15/2014 | Baa1/A- | 1,000,000 | 1,000,712 | |||||
Wellpoint, Inc., 7.00% due 2/15/2019 | Baa1/A- | 750,000 | 750,404 | |||||
| 6,305,371 | ||||||||
INSURANCE — 6.16% | ||||||||
INSURANCE — 6.16% | ||||||||
American International Group, Inc., 5.85% due 1/16/2018 | A3/A- | 4,000,000 | 1,566,016 | |||||
Berkshire Hathaway Finance Corp., 4.625% due 10/15/2013 | Aaa/AAA | 1,000,000 | 1,014,199 | |||||
Genworth Life Institutional Fund, 5.875% due 5/3/2013 (1) | A1/A | 1,000,000 | 672,404 | |||||
Hartford Financial Services Group, Inc., 4.625% due 7/15/2013 | Baa1/BBB | 1,000,000 | 661,008 | |||||
International Lease Finance Corp., 5.00% due 9/15/2012 | Baa2/BBB+ | 2,000,000 | 1,087,476 | |||||
International Lease Finance Corp. Floating Rate Note, 1.494% due 1/15/2010 | Baa2/BBB+ | 2,925,000 | 2,309,393 | |||||
Liberty Mutual Group, Inc., 5.75% due 3/15/2014 (1) | Baa2/BBB- | 1,000,000 | 770,688 | |||||
Lincoln National Corp., 4.75% due 2/15/2014 | Baa1/A- | 1,000,000 | 431,209 | |||||
Metlife, Inc. Series A, 6.817% due 8/15/2018 | A2/A- | 2,000,000 | 1,717,090 | |||||
Pacific Life Global Funding CPI Floating Rate Note, 1.49% due 2/6/2016 | Aa3/AA- | 8,000,000 | 6,978,640 | |||||
Principal Financial Group Australia, 8.20% due 8/15/2009 (1) | A3/A- | 700,000 | 702,519 | |||||
Principal Life Global Funding, 4.40% due 10/1/2010 (1) | Aa3/AA- | 4,000,000 | 3,900,312 | |||||
UnumProvident Corp., 7.625% due 3/1/2011 | Ba1/BBB- | 691,000 | 687,639 | |||||
| 22,498,593 | ||||||||
MATERIALS — 1.98% | ||||||||
CHEMICALS — 0.37% | ||||||||
E.I. du Pont de Nemours & Co., 4.75% due 11/15/2012 | A2/A | 1,000,000 | 1,032,646 | |||||
E.I. du Pont de Nemours & Co., 4.125% due 3/6/2013 | A2/A | 325,000 | 325,588 | |||||
CONSTRUCTION MATERIALS — 0.81% | ||||||||
CRH America, Inc., 8.125% due 7/15/2018 | Baa1/BBB+ | 2,000,000 | 1,559,440 | |||||
Martin Marietta Materials, Inc., 1.324% due 4/30/2010 | Baa3/BBB+ | 1,500,000 | 1,405,524 | |||||
| Certified Semi-Annual Report 41 | ||
| SCHEDULE OF INVESTMENTS, CONTINUED | ||
| Thornburg Limited Term Income Fund | March 31, 2009 (Unaudited) | |
Issuer-Description | Credit Rating† Moody’s/S&P | Principal Amount | Value | |||||
METALS & MINING — 0.80% | ||||||||
Barrick Gold Corp., 6.95% due 4/1/2019 | Baa1/A- | $ | 1,000,000 | $ | 1,004,563 | |||
BHP Billiton Finance, 5.40% due 3/29/2017 | A1/A+ | 2,000,000 | 1,914,082 | |||||
| 7,241,843 | ||||||||
MEDIA — 3.59% | ||||||||
MEDIA — 3.59% | ||||||||
AOL Time Warner, Inc., 6.75% due 4/15/2011 | Baa2/BBB+ | 750,000 | 761,195 | |||||
Comcast Corp., 6.30% due 11/15/2017 | Baa2/BBB+ | 1,000,000 | 973,023 | |||||
Comcast Corp. Floating Rate Note, 1.46% due 7/14/2009 | Baa2/BBB+ | 300,000 | 298,426 | |||||
Thomson Corp., 4.25% due 8/15/2009 | Baa1/A- | 2,900,000 | 2,901,772 | |||||
Thomson Reuters Corp., 5.95% due 7/15/2013 | Baa1/A- | 2,000,000 | 1,953,534 | |||||
Time Warner Cable, Inc., 7.50% due 4/1/2014 | Baa2/BBB | 1,500,000 | 1,529,382 | |||||
Time Warner Cable, Inc., 5.40% due 7/2/2012 | Baa2/BBB | 3,000,000 | 2,897,838 | |||||
Time Warner Cable, Inc., 8.75% due 2/14/2019 | Baa2/BBB | 750,000 | 796,370 | |||||
Time Warner Cable, Inc., 8.25% due 2/14/2014 | Baa2/BBB | 750,000 | 783,976 | |||||
Time Warner Co., Inc., 8.05% due 1/15/2016 | Baa2/BBB | 200,000 | 202,390 | |||||
| 13,097,906 | ||||||||
PHARMACEUTICALS, BIOTECHNOLOGY & LIFE SCIENCES — 2.34% | ||||||||
PHARMACEUTICALS — 2.34% | ||||||||
Abbott Labs, 3.75% due 3/15/2011 | A1/AA | 500,000 | 515,738 | |||||
Lilly Eli & Co., 4.20% due 3/6/2014 | A1/AA | 1,165,000 | 1,200,013 | |||||
Pfizer, Inc., 5.35% due 3/15/2015 | Aa2/AAA | 3,000,000 | 3,165,138 | |||||
Roche Holdings, Inc., 6.00% due 3/1/2019 (1) | A2/AA- | 2,000,000 | 2,058,522 | |||||
Tiers Inflation Linked Trust Series Wyeth 2004-21 Trust Certificate CPI Floating Rate Note, 1.941% due 2/1/2014 | Baa1/A+ | 2,000,000 | 1,611,360 | |||||
| 8,550,771 | ||||||||
RETAILING — 1.57% | ||||||||
SPECIALTY RETAIL — 1.57% | ||||||||
Best Buy Co., Inc., 6.75% due 7/15/2013 | Baa2/BBB- | 2,500,000 | 2,378,597 | |||||
Staples, Inc., 7.75% due 4/1/2011 | Baa2/BBB | 1,500,000 | 1,533,371 | |||||
Staples, Inc., 9.75% due 1/15/2014 | Baa2/BBB | 1,750,000 | 1,832,005 | |||||
| 5,743,973 | ||||||||
SEMICONDUCTORS & SEMICONDUCTOR EQUIPMENT — 1.61% | ||||||||
SEMICONDUCTORS & SEMICONDUCTOR EQUIPMENT — 1.61% | ||||||||
KLA Tencor Corp. Senior Note, 6.90% due 5/1/2018 | Baa1/BBB | 3,000,000 | 2,371,380 | |||||
National Semiconductor Corp. Senior Note, 1.57% due 6/15/2010 | Baa1/BB+ | 4,000,000 | 3,505,164 | |||||
| 5,876,544 | ||||||||
SOFTWARE & SERVICES — 0.84% | ||||||||
INFORMATION TECHNOLOGY SERVICES — 0.84% | ||||||||
Computer Sciences Corp., 5.50% due 3/15/2013 (1) | Baa1/A- | 1,000,000 | 970,874 | |||||
Electronic Data Systems Corp., 6.00% due 8/1/2013 | A2/A | 1,000,000 | 1,059,124 | |||||
Western Union Co., 6.50% due 2/26/2014 | A3/A- | 1,000,000 | 1,019,597 | |||||
| 3,049,595 | ||||||||
| 42 Certified Semi-Annual Report | ||
| SCHEDULE OF INVESTMENTS, CONTINUED | ||
| Thornburg Limited Term Income Fund | March 31, 2009 (Unaudited) | |
Issuer-Description | Credit Rating† Moody’s/S&P | Principal Amount | Value | |||||
TECHNOLOGY HARDWARE & EQUIPMENT — 0.13% | ||||||||
ELECTRONIC EQUIPMENT, INSTRUMENTS & COMPONENTS — 0.13% | ||||||||
Jabil Circuit, Inc., 5.875% due 7/15/2010 | Ba1/BB+ | $ | 500,000 | $ | 477,500 | |||
| 477,500 | ||||||||
TELECOMMUNICATION SERVICES — 1.16% | ||||||||
DIVERSIFIED TELECOMMUNICATION SERVICES — 1.16% | ||||||||
AT&T, Inc., 4.85% due 2/15/2014 | A2/A | 1,000,000 | 1,009,521 | |||||
AT&T, Inc., 5.80% due 2/15/2019 | A2/A | 750,000 | 734,199 | |||||
Deutsche Telekom International Finance, 6.75% due 8/20/2018 | Baa1/BBB+ | 2,000,000 | 2,008,612 | |||||
Verizon Communications, Inc., 6.10% due 4/15/2018 | A3/A | 500,000 | 495,342 | |||||
| 4,247,674 | ||||||||
TRANSPORTATION — 0.97% | ||||||||
AIR FREIGHT & LOGISTICS — 0.57% | ||||||||
FedEx Corp., 8.76% due 5/22/2015 | Baa1/BBB+ | 500,000 | 495,849 | |||||
FedEx Corp., 7.375% due 1/15/2014 | Baa2/BBB | 750,000 | 795,110 | |||||
FedEx Corp., 8.00% due 1/15/2019 | Baa2/BBB | 750,000 | 789,341 | |||||
AIRLINES — 0.03% | ||||||||
Continental Airlines Series 1997-4 Class 4-A, 6.90% due 1/2/2018 | Baa2/BBB+ | 150,662 | 120,529 | |||||
ROAD & RAIL — 0.37% | ||||||||
Ryder System, Inc., 7.20% due 9/1/2015 | Baa1/BBB+ | 1,500,000 | 1,351,061 | |||||
| 3,551,890 | ||||||||
UTILITIES — 15.58% | ||||||||
ELECTRIC UTILITIES — 11.58% | ||||||||
AEP Texas Central Transition Bond A1, 4.98% due 1/1/2010 | Aaa/AAA | 769,044 | 802,554 | |||||
Appalachian Power Co., 7.95% due 1/15/2020 | Baa2/BBB | 2,500,000 | 2,565,760 | |||||
Appalachian Power Co., 6.60% due 5/1/2009 (Insured: MBIA) | Baa1/AA- | 175,000 | 175,295 | |||||
Aquila, Inc., 7.95% due 2/1/2011 | Baa3/BBB | 1,500,000 | 1,473,253 | |||||
Arizona Public Service Co., 8.75% due 3/1/2019 | Baa2/BBB- | 1,000,000 | 1,004,061 | |||||
Centerpoint Energy, 7.00% due 3/1/2014 | Baa2/BBB+ | 2,000,000 | 2,085,740 | |||||
Commonwealth Edison Co., 4.74% due 8/15/2010 | Baa2/BBB+ | 975,000 | 965,209 | |||||
Commonwealth Edison Co., 6.15% due 3/15/2012 | Baa2/BBB+ | 910,000 | 928,897 | |||||
Commonwealth Edison Co. Series 108, 5.80% due 3/15/2018 | Baa2/BBB+ | 1,000,000 | 947,438 | |||||
Consumers Energy Co., 6.70% due 9/15/2019 | Baa1/BBB | 2,000,000 | 2,070,386 | |||||
Duke Energy Ohio, Inc., 5.45% due 4/1/2019 | A3/A | 1,000,000 | 1,008,739 | |||||
E. ON AG, 5.80% due 4/30/2018 (1) | A2/A | 2,000,000 | 1,967,276 | |||||
Entergy Gulf States, Inc., 5.12% due 8/1/2010 | Baa3/BBB+ | 1,800,000 | 1,769,456 | |||||
Entergy Gulf States, Inc., 5.70% due 6/1/2015 | Baa3/BBB+ | 2,300,000 | 2,130,465 | |||||
Entergy Texas, Inc., 7.125% due 2/1/2019 | Baa3/BBB+ | 1,500,000 | 1,466,423 | |||||
Florida Power & Light Co., 5.55% due 11/1/2017 | Aa3/A | 1,000,000 | 1,053,192 | |||||
Great River Energy Series 2007-A, 5.829% due 7/1/2017 (Insured: MBIA) (1) | A2/AAA | 4,365,306 | 4,505,039 | |||||
Gulf Power Co., 4.35% due 7/15/2013 | A2/A | 925,000 | 931,130 | |||||
Idaho Power Corp., 6.025% due 7/15/2018 | A3/A- | 1,000,000 | 1,002,356 | |||||
Illinois Power Co., 9.75% due 11/15/2018 | Baa3/BBB | 2,000,000 | 2,177,308 | |||||
Korea Southern Power Co., 5.375% due 4/18/2013 (1) | A1/A | 1,000,000 | 881,587 | |||||
Metropolitan Edison Co., 7.70% due 1/15/2019 | Baa2/BBB | 2,250,000 | 2,282,591 | |||||
MP Environmental, 4.982% due 7/1/2014 | Aaa/AAA | 3,833,610 | 3,903,016 | |||||
Oglethorpe Power Corp., 6.10% due 3/15/2019 (1) | A3/A | 2,500,000 | 2,521,035 | |||||
| Certified Semi-Annual Report 43 | ||
| SCHEDULE OF INVESTMENTS, CONTINUED | ||
| Thornburg Limited Term Income Fund | March 31, 2009 (Unaudited) | |
Issuer-Description | Credit Rating† Moody’s/S&P | Principal Amount | Value | |||||
PPL Energy Supply LLC, 6.50% due 5/1/2018 | Baa2/BBB | $ | 1,000,000 | $ | 878,814 | |||
Progress Energy, Inc., 6.05% due 3/15/2014 | Baa2/BBB | 750,000 | 755,442 | |||||
GAS UTILITIES — 0.69% | ||||||||
Atmos Energy Corp., 8.50% due 3/15/2019 | Baa3/BBB+ | 2,250,000 | 2,297,288 | |||||
Southern California Gas Co., 4.375% due 1/15/2011 | A1/NR | 225,000 | 229,703 | |||||
MULTI-UTILITIES — 3.21% | ||||||||
Atlantic City Electric Co., 7.75% due 11/15/2018 | A3/A- | 500,000 | 559,848 | |||||
Dominion Resources, Inc., 8.875% due 1/15/2019 | Baa2/A- | 1,000,000 | 1,132,095 | |||||
Northern States Power Co., 4.75% due 8/1/2010 | A2/A | 2,825,000 | 2,846,233 | |||||
South Carolina Electric & Gas Co., 6.50% due 11/1/2018 | A2/A- | 1,000,000 | 1,098,154 | |||||
Southern California Edison Co., 5.75% due 3/15/2014 | A2/A | 500,000 | 540,608 | |||||
Taqa Abu Dhabi National Energy Co., 7.25% due 8/1/2018 (1) | Aa2/AA- | 1,000,000 | 952,073 | |||||
Taqa Abu Dhabi National Energy Co., 6.60% due 8/1/2013 (1) | Aa2/AA- | 1,000,000 | 1,010,042 | |||||
Union Electric Co., 4.65% due 10/1/2013 | Baa1/BBB | 2,000,000 | 1,889,128 | |||||
Union Electric Co., 6.70% due 2/1/2019 | Baa1/BBB | 500,000 | 476,260 | |||||
Wisconsin Public Service Corp., 6.125% due 8/1/2011 | Aa3/A | 1,150,000 | 1,221,943 | |||||
| 56,505,837 | ||||||||
TOTAL CORPORATE BONDS (Cost $257,866,916) | 247,219,988 | |||||||
MUNICIPAL BONDS — 11.33% | ||||||||
Amelia County IDA, 4.80% due 4/1/2027 put 4/1/2010 (Waste Management) (AMT) | NR/BBB | 1,000,000 | 981,440 | |||||
American Campus Properties Student Housing, 7.38% due 9/1/2012 (Insured: MBIA) | Baa1/AA- | 2,460,000 | 2,465,043 | |||||
American Fork City Utah Sales, 4.89% due 3/1/2012 (Insured: FSA) | Aa3/AAA | 300,000 | 306,417 | |||||
American Fork City Utah Sales, 5.07% due 3/1/2013 (Insured: FSA) | Aa3/AAA | 120,000 | 123,686 | |||||
Brockton Massachusetts Taxable Economic Development, 6.45% due 5/1/2017 (Insured: FGIC) | A2/AA- | 150,000 | 148,082 | |||||
California State, 5.168% due 10/1/2037 | A2/A | 2,000,000 | 1,971,340 | |||||
Cleveland Cuyahoga County Ohio, 6.10% due 5/15/2013 | NR/NR | 1,215,000 | 1,192,024 | |||||
Cook County Illinois School District 083, 4.625% due 12/1/2010 (Insured: FSA) | Aa3/NR | 250,000 | 258,588 | |||||
Cook County Illinois School District 083, 4.875% due 12/1/2011 (Insured: FSA) | Aa3/NR | 150,000 | 157,829 | |||||
Granite City Madison County, 4.875% due 5/1/2027 (Waste Management, Inc.) | NR/BBB | 1,000,000 | 980,570 | |||||
Green Bay Wisconsin, 4.875% due 4/1/2011 (Insured: MBIA) | Aa2/NR | 365,000 | 372,088 | |||||
Hancock County Mississippi, 4.80% due 8/1/2010 (Insured: MBIA) | A3/NR | 245,000 | 245,414 | |||||
Hancock County Mississippi, 4.90% due 8/1/2011 (Insured: MBIA) | A3/NR | 315,000 | 315,129 | |||||
Hanover Pennsylvania Area School District Notes, 4.47% due 3/15/2013 (Insured: FSA) | Aa3/AAA | 1,385,000 | 1,419,777 | |||||
Jefferson County Texas Navigation Refunding, 5.50% due 5/1/2010 (Insured: FSA) | Aa3/NR | 500,000 | 501,125 | |||||
Jersey City New Jersey Municipal Utilities Authority, 3.72% due 5/15/2009 (Insured: MBIA) | Baa1/AA- | 575,000 | 573,436 | |||||
Louisiana Public Facilities Authority, 5.72% due 7/1/2015 (Insured: CIFG) | Baa3/BBB- | 2,370,000 | 2,114,988 | |||||
Mississippi Development Bank Special Obligation Refinance Harrison County B, 5.21% due 7/1/2013 (Insured: FSA) | NR/AAA | 1,200,000 | 1,264,308 | |||||
Missouri State Development Finance Board, 5.45% due 3/1/2011 (Crackerneck Creek) | NR/A+ | 1,090,000 | 1,116,945 | |||||
Montgomery County Maryland Revenue Authority, 5.00% due 2/15/2012 | Aa2/AA+ | 100,000 | 103,353 | |||||
New Jersey Health Care Facilities Financing, 10.75% due 7/1/2010 (ETM) | NR/NR | 205,000 | 215,814 | |||||
New Jersey Health Care Facilities Financing, 7.70% due 7/1/2011 (Insured: Connie Lee) | NR/A | 70,000 | 73,091 | |||||
New Mexico Mtg Finance Authority SFMR, 5.77% due 1/1/2016 (GNMA/FNMA/FHLMC) | NR/AAA | 910,000 | 932,887 | |||||
New Mexico Mtg Finance Authority Taxable, 5.00% due 7/1/2025 | NR/AAA | 1,000,000 | 963,240 | |||||
New Rochelle New York Industrial Development Agency, 7.15% due 10/1/2014 (LOC: Bank of New York) | Aaa/A+ | 320,000 | 327,645 | |||||
New York State Housing Finance, 4.46% due 8/15/2009 | Aa1/NR | 65,000 | 65,194 | |||||
New York State Urban Development Corp., 4.75% due 12/15/2011 | NR/AAA | 1,400,000 | 1,447,180 | |||||
Newark New Jersey, 4.70% due 4/1/2011 (Insured: MBIA) | A1/NR | 845,000 | 824,627 | |||||
Newark New Jersey, 4.90% due 4/1/2012 (Insured: MBIA) | A1/NR | 1,225,000 | 1,174,114 | |||||
| 44 Certified Semi-Annual Report | ||
| SCHEDULE OF INVESTMENTS, CONTINUED | ||
| Thornburg Limited Term Income Fund | March 31, 2009 (Unaudited) | |
Issuer-Description | Credit Rating† Moody’s/S&P | Principal Amount | Value | |||||
Niagara Falls New York Public Water, 4.30% due 7/15/2010 (Insured: MBIA) | Baa1/AA- | $ | 360,000 | $ | 358,063 | |||
Ohio Housing Financing Agency Mtg, 5.20% due 9/1/2014 (GNMA/FNMA) | Aaa/NR | 2,395,000 | 2,466,587 | |||||
Ohio State Solid Waste, 4.25% due 4/1/2033 (Republic Services) | NR/BBB | 1,000,000 | 863,530 | |||||
Ohio State Taxable Development Assistance, 4.88% due 10/1/2011 (Insured: MBIA) | Aa3/AA | 550,000 | 562,287 | |||||
Pasadena California Pension Funding, 7.33% due 5/15/2022 | Baa1/AA+ | 2,000,000 | 2,125,400 | |||||
Pennsylvania Economic Development, 4.70% due 11/1/2021 (Waste Management) | NR/BBB | 2,250,000 | 1,951,852 | |||||
Port Walla Walla Washington Revenue, 5.30% due 12/1/2009 | NR/NR | 235,000 | 233,935 | |||||
Redlands California Redevelopment Agency, 5.818% due 8/1/2022 (Insured: AMBAC) | Baa1/A | 2,850,000 | 2,441,395 | |||||
Santa Fe County New Mexico Charter School Taxable, 7.55% due 1/15/2010 (ATC Foundation) | NR/NR | 85,000 | 82,012 | |||||
Springfield Ohio City School District Tax Anticipation Notes, 6.35% due 12/1/2010 (Insured: AMBAC) | Baa1/NR | 1,400,000 | 1,429,246 | |||||
Springfield Ohio City School District Tax Anticipation Notes, 6.40% due 12/1/2011 (Insured: AMBAC) | Baa1/NR | 1,500,000 | 1,532,400 | |||||
Tazewell County Illinois Community High School, 5.20% due 12/1/2011 (Insured: FSA) | Aa3/NR | 355,000 | 372,271 | |||||
Tennessee State Taxable, 6.00% due 2/1/2013 | Aa1/AA+ | 500,000 | 529,530 | |||||
Texas Tech University, 6.00% due 8/15/2011 (Insured: MBIA) | Aa3/AA | 245,000 | 255,052 | |||||
Victor New York, 9.20% due 5/1/2014 | NR/NR | 1,085,000 | 1,094,461 | |||||
Wisconsin State General Revenue, 4.80% due 5/1/2013 (Insured: FSA) | Aa3/AAA | 200,000 | 208,030 | |||||
Wisconsin State Health & Educational Facilities, 7.08% due 6/1/2016 (Insured: ACA) | NR/NR | 2,610,000 | 2,218,630 | |||||
TOTAL MUNICIPAL BONDS (Cost $42,581,844) | 41,360,055 | |||||||
YANKEE BONDS — 4.09% | ||||||||
BANKS — 0.01% | ||||||||
COMMERCIAL BANKS — 0.01% | ||||||||
Glitnir Banki HF, 4.421% due 1/18/2012 (1)(3)(4) | C/D | 400,000 | 43,000 | |||||
| 43,000 | ||||||||
DIVERSIFIED FINANCIALS — 0.70% | ||||||||
DIVERSIFIED FINANCIAL SERVICES — 0.70% | ||||||||
Export Import Bank of Korea, 8.125% due 1/21/2014 | A2/A | 1,000,000 | 1,033,629 | |||||
Korea Development Bank, 1.565% due 4/3/2010 | A2/A | 500,000 | 486,068 | |||||
Korea Development Bank, 8.00% due 1/23/2014 | A2/A | 1,000,000 | 1,028,673 | |||||
| 2,548,370 | ||||||||
ENERGY — 1.91% | ||||||||
OIL, GAS & CONSUMABLE FUELS — 1.91% | ||||||||
BP Capital Markets Plc, 3.875% due 3/10/2015 | Aa1/AA | 2,000,000 | 2,006,002 | |||||
Enbridge, Inc., 5.80% due 6/15/2014 | Baa1/A- | 2,000,000 | 1,914,394 | |||||
Petrobras International Finance Co., 7.875% due 3/15/2019 | Baa1/BBB | 1,500,000 | 1,554,300 | |||||
Woodside Finance Ltd., 8.125% due 3/1/2014 (1) | Baa1/A- | 1,500,000 | 1,496,659 | |||||
| 6,971,355 | ||||||||
MATERIALS — 0.74% | ||||||||
METALS & MINING — 0.74% | ||||||||
BHP Billiton Finance USA Ltd., 6.50% due 4/1/2019 | A1/A+ | 250,000 | 253,285 | |||||
BHP Billiton Finance USA Ltd., 5.50% due 4/1/2014 | A1/A+ | 750,000 | 755,170 | |||||
Codelco, Inc., 7.50% due 1/15/2019 (1) | A1/A | 1,500,000 | 1,701,846 | |||||
| 2,710,301 | ||||||||
| Certified Semi-Annual Report 45 | ||
| SCHEDULE OF INVESTMENTS, CONTINUED | ||
| Thornburg Limited Term Income Fund | March 31, 2009 (Unaudited) | |
Issuer-Description | Credit Rating† Moody’s/S&P | Principal Amount | Value | |||||
MISCELLANEOUS — 0.15% | ||||||||
MISCELLANEOUS — 0.15% | ||||||||
Nova Scotia Province Canada, 5.75% due 2/27/2012 | Aa2/A+ | $ | 500,000 | $ | 538,219 | |||
| 538,219 | ||||||||
UTILITIES — 0.58% | ||||||||
ELECTRIC UTILITIES — 0.58% | ||||||||
Electricite de France SA, 5.50% due 1/26/2014 (1) | Aa3/A+ | 2,000,000 | 2,123,044 | |||||
| 2,123,044 | ||||||||
TOTAL YANKEE BONDS (Cost $14,685,646) | 14,934,289 | |||||||
SHORT TERM INVESTMENTS — 2.74% | ||||||||
Chicago GO, 1.50% due 1/1/2040 put 4/7/2009 (Insured: FSA/SPA-Dexia Credit Local) (weekly demand notes) | Aa3/AAA | 4,000,000 | 4,000,000 | |||||
Kansas City Power & Light, 1.75% due 4/1/2009 | P2/A-3 | 6,000,000 | 6,000,000 | |||||
TOTAL SHORT TERM INVESTMENTS (Cost $10,000,000) | 10,000,000 | |||||||
TOTAL INVESTMENTS — 98.35% (Cost $380,574,052) | $ | 359,038,291 | ||||||
OTHER ASSETS LESS LIABILITIES — 1.65% | 6,014,329 | |||||||
NET ASSETS — 100.00% | $ | 365,052,620 | ||||||
Footnote Legend
| † | Credit ratings are unaudited. Rating changes may have occurred prior to or subsequent to the reporting period end. |
| (1) | Securities exempt from registration under Rule 144A of the Securities Act of 1933, as amended. These securities may only be resold in the ordinary course of business in transactions exempt from registration, normally to qualified institutional buyers. As of March 31, 2009, the aggregate value of these securities in the Fund’s portfolio was $50,298,788, representing 13.78% of the Fund’s net assets. |
| (2) | Security currently fair valued by the valuation and pricing committee using procedures approved by the Trustees. |
| (3) | Bond in default. |
| (4) | Non-income producing. |
| 46 Certified Semi-Annual Report | ||
| SCHEDULE OF INVESTMENTS, CONTINUED | ||
| Thornburg Limited Term Income Fund | March 31, 2009 (Unaudited) | |
Portfolio Abbreviations
To simplify the listings of securities, abbreviations are used per the table below:
| ACA | Insured by American Capital Access | |
| AMBAC | Insured by American Municipal Bond Assurance Corp. | |
| AMT | Alternative Minimum Tax | |
| CIFG | CIFG Assurance North America Inc. | |
| CMO | Collateralized Mortgage Obligation | |
| CPI | Consumer Price Index | |
| Cupids | Cumulative Undivided Preferred Interests In Debt Securities | |
| ETM | Escrowed to Maturity | |
| FGIC | Insured by Financial Guaranty Insurance Co. | |
| FHLMC | Insured by Federal Home Loan Mortgage Corp. | |
| FNMA | Collateralized by Federal National Mortgage Association | |
| FSA | Insured by Financial Security Assurance Co. | |
| GNMA | Insured by Government National Mortgage Co. | |
| GO | General Obligation | |
| IDA | Industrial Development Authority | |
| LOC | Letter of Credit | |
| MBIA | Insured by Municipal Bond Investors Assurance | |
| Mtg | Mortgage | |
| SFMR | Single Family Mortgage Revenue Bond |
See notes to financial statements.
| Certified Semi-Annual Report 47 | ||
| EXPENSE EXAMPLE | ||
| Thornburg Limited Term Income Funds | March 31, 2009 (Unaudited) | |
As a shareholder of the Funds, you incur two types of costs:
(1) transaction costs, including
(a) sales charges (loads) on purchase payments, for Class A shares;
(b) a deferred sales charge on redemptions of any part or all of a purchase of $1 million of Class A shares within 12 months of purchase;
(c) a deferred sales charge on redemptions of Class B shares within eight years of purchase;
(d) a deferred sales charge on redemptions of Class C shares within 12 months of purchase;
(2) ongoing costs, including management fees; distribution and/or service (12b-1) fees; and other Fund expenses.
This example is intended to help you understand your ongoing costs (in dollars) of investing in the Funds and to compare these costs with the ongoing costs of investing in other mutual funds.
The example is based on an investment of $1,000 invested on September 30, 2008 and held until March 31, 2009.
Actual Expenses
For each class of shares, the first line of the table at right provides information about actual account values and actual expenses. You may use the information in this line, together with the amount you invested, to estimate the expenses that you paid over the period. Simply divide your account value by $1,000 (for example, an $8,600 account value divided by $1,000 = 8.6), then multiply the result by the number in the first line for your class of shares under the heading entitled “Expenses Paid During Period” to estimate the expenses you paid on your account during this period.
Hypothetical Example for Comparison Purposes
For each class of shares, the second line of the table at right provides information about hypothetical account values and hypothetical expenses based on the Funds’ actual expense ratio and an assumed rate of return of 5% per year before expenses, which is not the Funds’ actual return. The hypothetical account values and expenses may not be used to estimate the actual ending account balance or expenses you paid for the period. You may use this information to compare the ongoing costs of investing in the Funds and other funds. To do so, compare this 5% hypothetical example with the 5% hypothetical examples that appear in the shareholder reports of the other funds.
Please note that the expenses shown in the table are meant to highlight your ongoing costs only and do not reflect any
| Beginning Account Value 9/30/08 | Ending Account Value 3/31/09 | Expenses Paid During Period† 9/30/08–3/31/09 | |||||||
| U.S. Government Fund | |||||||||
Class A Shares | |||||||||
Actual | $ | 1,000.00 | $ | 1,048.70 | $ | 4.59 | |||
Hypothetical* | $ | 1,000.00 | $ | 1,020.45 | $ | 4.53 | |||
Class B Shares | |||||||||
Actual | $ | 1,000.00 | $ | 1,043.40 | $ | 9.88 | |||
Hypothetical* | $ | 1,000.00 | $ | 1,015.26 | $ | 9.74 | |||
Class C Shares | |||||||||
Actual | $ | 1,000.00 | $ | 1,047.90 | $ | 5.96 | |||
Hypothetical* | $ | 1,000.00 | $ | 1,019.11 | $ | 5.88 | |||
Class I Shares | |||||||||
Actual | $ | 1,000.00 | $ | 1,050.10 | $ | 3.28 | |||
Hypothetical* | $ | 1,000.00 | $ | 1,021.73 | $ | 3.23 | |||
Class R3 Shares | |||||||||
Actual | $ | 1,000.00 | $ | 1,048.20 | $ | 5.06 | |||
Hypothetical* | $ | 1,000.00 | $ | 1,020.00 | $ | 4.99 | |||
| Income Fund | |||||||||
Class A Shares | |||||||||
Actual | $ | 1,000.00 | $ | 1,002.40 | $ | 4.93 | |||
Hypothetical* | $ | 1,000.00 | $ | 1,020.00 | $ | 4.98 | |||
Class C Shares | |||||||||
Actual | $ | 1,000.00 | $ | 1,001.10 | $ | 6.19 | |||
Hypothetical* | $ | 1,000.00 | $ | 1,018.75 | $ | 6.24 | |||
Class I Shares | |||||||||
Actual | $ | 1,000.00 | $ | 1,004.00 | $ | 3.30 | |||
Hypothetical* | $ | 1,000.00 | $ | 1,021.64 | $ | 3.33 | |||
Class R3 Shares | |||||||||
Actual | $ | 1,000.00 | $ | 1,003.20 | $ | 4.94 | |||
Hypothetical* | $ | 1,000.00 | $ | 1,020.00 | $ | 4.99 | |||
| † | Thornburg Limited Term U.S. Government Fund expenses are equal to the annualized expense ratio for each class (A: 0.90%; B: 1.94%; C: 1.17%; I: 0.64%; and R3: 0.99%) multiplied by the average account value over the period, multiplied by 182/365 to reflect the one-half year period. |
| † | Thornburg Limited Term Income Fund expenses are equal to the annualized expense ratio for each class (A: 0.99%; C: 1.24%; I: 0.66%; and R3: 0.99%) multiplied by the average account value over the period, multiplied by 182/365 to reflect the one-half year period. |
| * | Hypothetical assumes a rate of return of 5% per year before expenses. |
transactional costs, such as sales charges (loads), redemption fees, or exchange fees. Therefore, the second line of the table for each class of shares is useful in comparing ongoing costs only, and will not help you determine the relative total costs of owning different funds. In addition, if these transactional costs were included, your costs would have been higher.
| 48 Certified Semi-Annual Report | ||
| OTHER INFORMATION | ||
| Thornburg Limited Term Income Funds | March 31, 2009 (Unaudited) | |
PORTFOLIO PROXY VOTING
Policies and Procedures:
The Trust has delegated to Thornburg Investment Management, Inc. (the “Advisor”) voting decisions respecting proxies for the Fund’s voting securities. The Advisor makes voting decisions in accordance with its Proxy Voting Policy and Procedures. A description of the Policy and Procedures is available (i) without charge, upon request, by calling the Advisor toll-free at 1-800-847-0200, (ii) on the Thornburg website at www.thornburg.com, and (iii) on the Securities and Exchange Commission’s website at www.sec.gov.
Information regarding how proxies were voted is available on or before August 31 of each year for the twelve months ending the preceding June 30. This information is available (i) without charge, upon request by calling the Advisor toll-free at 1-800-847-0200, (ii) on the Thornburg website at www. thornburg.com, and (iii) on the Securities and Exchange Commission’s website at www.sec.gov.
AVAILABILITY OF QUARTERLY PORTFOLIO SCHEDULE
The Funds file with the Securities and Exchange Commission schedules of their portfolio holdings on Form N-Q for the first and third quarters of each fiscal year. The Funds’ Forms N-Q are available on the Commission’s website at www.sec.gov, or may be reviewed and copied at the Commission’s Public Reference Room in Washington, D.C. Information on the operation of the Public Reference Room may be obtained by calling 1-800-SEC-0330. The Funds also make this information available on their website at www.thornburg.com/download or upon request by calling 1-800-847-0200.
| Certified Semi-Annual Report 49 | ||
Trustees’ Statement to Shareholders
Not part of the Certified Semi-Annual Report
February 8, 2005, as readopted September 15, 2008
The Trustees are concerned that ongoing commentaries and opinions reported in the media may confuse investors in general as to the supervisory duties of trustees of mutual funds and, in particular, leave Thornburg Investment Trust shareholders uncertain regarding how we discharge our responsibilities in supervising the Funds’ investment advisor and in reviewing the advisor’s contract for renewal. We decided to spell out clearly three principal guidelines that we follow in supervising the Trust’s investment advisor on your behalf.
We begin with the premise that each shareholder selected his or her Fund because its investments are managed by the investment advisor identified in the prospectus and in accordance with the objective and policies described in the prospectus. We realize, as each of you do, that if you believe that your Fund’s stated objective and policies no longer serve your personal investment goals, you can sell your shares and leave the Fund.
Therefore, we believe that our primary supervisory task – our principal obligation to you – is to assess the nature and quality of the advisor’s services, and to confirm that the advisor actively and competently pursues the Fund’s objective, in accordance with the policies set out in the prospectus. To do this, we meet regularly with management to review your Fund’s portfolio and to discuss the advisor’s specific actions and judgments in pursuing the Fund’s objective. We do not substitute our own judgment for the advisor’s decisions in selecting investments; the advisor is paid to exercise its informed judgment on investment decisions, and we seek to confirm, in reviewing the advisor’s performance, that the advisor is doing just that.
Second, while we are conscious of costs and the effect that costs have on shareholders’ returns, we do not seek the lowest fees or expense ratio as our sole or primary objective. We try to make sure that your Fund’s fees and costs are reasonable in relationship to the services rendered and that they are generally in line with those charged by other expert investment advisors, consistent with our belief that the Fund’s investors searched for and expect that expertise and attention and have decided to pay a reasonable price for it. We do not put the management contract “out to bid” as a matter of course, and we would not do so unless we had concluded that the advisor materially had failed to pursue the Fund’s objectives in accordance with its policies, or for other equally important reasons. We believe that any other approach would be inconsistent with your interests and contrary to your expectations when you bought shares of the Fund in the first place.
Finally, because we believe that most Thornburg Fund shareholders have invested with a long-term perspective, we try not to focus too much on the fashions of the moment and on short-term performance. The market will not favor any specific investment objective or set of policies at all times and under all economic circumstances. A fund will experience periods of both high and low returns relative to other funds and other investments. Even if one of our Funds is not favored by the market at a particular time, we believe that the advisor is nonetheless obliged to remain true to the Fund’s objective and policies, and we watch to see that it does so.
| 50 This page is not part of the Semi-Annual Report. | ||
Planning Options
Retirement and Education Accounts
Thornburg Investment Management offers retirement and education savings accounts that can help you meet a variety of planning challenges. For account applications or further information on any of the accounts below, please call 1-800-847-0200 or go to www.thornburg.com/ira. Your financial advisor can help you determine which plan is right for you.
Individual Retirement Accounts
Individual Retirement Accounts (IRAs) provide a tax-advantaged means to save money for the future. For a detailed outline of the difference between retirement accounts, see www.thornburg.com/ira. Rollovers are available. Call 1-800-847-0200 for more information.
Traditional IRAs – Contributions to Traditional IRAs are tax deductible for eligible individuals, and withdrawals are taxed as additional ordinary income. You may contribute to an IRA if you receive compensation and are under 70 1/2, even if you are covered by an employer retirement plan. Deductible contributions are subject to certain qualifications. Please consult your tax advisor.
Roth IRAs – Under a Roth IRA, there is no tax deduction for contributions, but there is no income tax on qualified withdrawals. For a more detailed comparison of Traditional and Roth IRAs, please see our web site at www.thornburg.com/ira.
SEP IRAs – Simplified Employee Pension (SEP) IRAs are established by employers. The employer is allowed a tax deduction for contributions made to the SEP Plan and makes contributions to each eligible employee’s SEP IRA on a discretionary basis.
SIMPLE IRAs – Savings Incentive Match Plan for Employees of Small Employers (SIMPLE) is designed to give small business owners a simplified method to establish and contribute to a retirement plan for employees. The employer is allowed a tax deduction for contributions and makes either matching or non-elective contributions to each eligible employee’s SIMPLE IRA. Employees may make salary deferral contributions.
Coverdell Education Savings Account
These savings accounts are designed to provide a way to save money for higher education expenses. In an Education Savings Account, earnings and interest grow tax-free, and qualified withdrawals used to pay for eligible higher-education expenses are tax- and penalty-free.
Funds Available
The following funds are available in the accounts listed above:
| • | Thornburg International Value Fund |
| • | Thornburg Value Fund |
| • | Thornburg Core Growth Fund |
| • | Thornburg Investment Income Builder Fund |
| • | Thornburg Global Opportunities Fund |
| • | Thornburg International Growth Fund |
| • | Thornburg Limited Term U.S. Government Fund |
| • | Thornburg Limited Term Income Fund |
| • | Thornburg Strategic Income Fund |
| This page is not part of the Semi-Annual Report. 51 | ||

Thornburg Equity Funds
Thornburg’s equity research uses a fundamental and comprehensive analytical approach. Thornburg equity funds focus on a limited number of securities so that each holding can impact performance. The equity team searches for firms believed to have a promising future and seeks to buy shares of those companies at a discount to their intrinsic value.
| • | Thornburg Value Fund |
| • | Thornburg International Value Fund |
| • | Thornburg Core Growth Fund |
| • | Thornburg Investment Income Builder Fund |
| • | Thornburg Global Opportunities Fund |
| • | Thornburg International Growth Fund |
Thornburg Bond Funds
Thornburg Investment Management applies a disciplined philosophy to fixed-income management. Since the launch of our first fixed-income fund 25 years ago, we have been conducting fundamental, bottom-up research in an effort to identify bonds which we believe provide the best return for a given level of risk. We are very organic in our approach, avoiding leverage or complex strategies which could backfire in periods of market uncertainty.
| • | Thornburg Limited Term Municipal Fund |
| • | Thornburg Intermediate Municipal Fund |
| • | Thornburg California Limited Term Municipal Fund |
| • | Thornburg New Mexico Intermediate Municipal Fund |
| • | Thornburg New York Intermediate Municipal Fund |
| • | Thornburg Strategic Municipal Income Fund |
| • | Thornburg Limited Term U.S. Government Fund |
| • | Thornburg Limited Term Income Fund |
| • | Thornburg Strategic Income Fund |
Before investing, carefully consider the Fund’s investment goals, risks, charges, and expenses. For a prospectus containing this and other information, contact your financial advisor or visit thornburg. com. Read it carefully before investing.
For additional information, please visit www.thornburg.com
Thornburg Investment Management, Inc. 2300 North Ridgetop Road, Santa Fe, NM 87506
| This page is not part of the Semi-Annual Report. 53 | ||
This page intentionally left blank.
| 54 This page is not part of the Semi-Annual Report. | ||
This page intentionally left blank.
| This page is not part of the Semi-Annual Report. 55 | ||
 | Waste not, Wait not |  | ||||||
This Semi-Annual Report is submitted for the general information of shareholders of the Fund. It is not authorized for distribution to prospective investors in the Fund unless preceded or accompanied by an effective prospectus. | Get instant access to your shareholder reports.
By switching from your postal mailbox to your email inbox, you reduce paper clutter, improve record keeping access, and help conserve our natural resources. | |||||||
|
Investment Advisor: Thornburg Investment Management® 800.847.0200
Distributor: Thornburg Securities Corporation® 800.847.0200
TH174 |
Go to www.thornburg.com/edelivery and sign up to receive your shareholder reports, prospectuses, and proxy statements electronically.
You invest in the future, without spending a dime. | ||||||


| 2 This page is not part of the Semi-Annual Report. |
Important Information
The information presented on the following pages was current as of March 31, 2009. The managers’ views, portfolio holdings, and sector diversification are provided for the general information of the Fund’s shareholders; they are historical and subject to change. This material should not be deemed a recommendation to buy or sell any of the securities mentioned.
Investments in the Fund carry risks including possible loss of principal. Investing outside the United States involves additional risks, such as currency fluctuations. Additionally, the Fund may invest a portion of the assets in small capitalization companies, which may increase the risk of greater price fluctuations. Funds invested in a limited number of holdings may expose an investor to greater volatility. Please see the Fund’s Prospectus for a discussion of the risks associated with an investment in the Fund. Investments in the Fund are not deposits or obligations of, or guaranteed or endorsed by, any bank, the Federal Deposit Insurance Corporation, the Federal Reserve Board or any government agency. There is no guarantee that the Fund will meet its investment objectives.
Performance data given at net asset value (NAV) does not take into account the applicable sales charges. If the sales charges had been included, the performance would have been lower.
Class I, R3, R4, and R5 shares may not be available to all investors. Minimum investments for Class I shares may be higher than those for other classes.
Share Class | NASDAQ Symbol | Cusip | ||
Class A | TVAFX | 885-215-731 | ||
Class B | TVBFX | 885-215-590 | ||
Class C | TVCFX | 885-215-715 | ||
Class I | TVIFX | 885-215-632 | ||
Class R3 | TVRFX | 885-215-533 | ||
Class R4 | TVIRX | 885-215-277 | ||
Class R5 | TVRRX | 885-215-376 |
Glossary
Standard & Poor’s 500 Stock Index (S&P 500) – The S&P 500 Index is a broad measure of the U.S. stock market.
Unless otherwise noted, index returns reflect the reinvestment of income dividends and capital gains, if any, but do not reflect fees, brokerage commissions or other expenses of investing. Investors may not make direct investments into any index. The performance of any index is not indicative of the performance of any particular investment.
Beta – A measure of market-related risk. Less than one means the portfolio is less volatile than the index, while greater than one indicates more volatility than the index.
Fed Funds Rate – The interest rate at which a depository institution lends immediately available funds (balances at the Federal Reserve) to another depository institution overnight.
Median Market Capitalization – Market capitalization (market cap) is the total value of a company’s stock, calculated by multiplying the number of outstanding common shares by the current share price. The company whose market cap is in the middle of the portfolio is the median market cap. Half the companies in the portfolio have values greater than the median and half have values that are less.
Price to Book Value (P/B) – A ratio used to compare a stock’s market value to its book value. It is calculated by dividing the current closing price of the stock by the latest quarter’s book value (book value is simply assets minus liabilities).
Price to Cash Flow Ratio – A measure of the market’s expectations of a firm’s future financial health. It is calculated by dividing the price per share by cash flow per share.
Price to Earnings Ratio (P/E) – A valuation ratio equaling a company’s market value per share divided by earnings per share.
| This page is not part of the Semi-Annual Report. 3 |
Thornburg Value Fund
CO-PORTFOLIO MANAGERS

Left to right: Connor Browne,CFA, Bill Fries,CFA,
Edward Maran,CFA.
KEY PORTFOLIO ATTRIBUTES
As of 3/31/09
Portfolio P/E Trailing 12-months* | 9.1x | ||
Portfolio Price to Cash Flow* | 4.0 | ||
Portfolio Price to Book Value* | 1.3 | ||
Median Market Cap* | $ | 13.5 B | |
7-Year Beta (A Shares vs. S&P 500)* | 1.01 | ||
Number of Companies | 53 |
| * | Source: FactSet |
IMPORTANT PERFORMANCE
INFORMATION
Performance data shown represents past performance and is no guarantee of future results. Investment return and principal value will fluctuate so shares, when redeemed, may be worth more or less than their original cost. Current performance may be lower or higher than quoted. For performance current to the most recent month end, visit thornburg.com.
The maximum sales charge for Class A shares is 4.50%. Class A shares are subject to a 1% 30-day redemption fee. The total annual fund operating expense of Class A shares is 1.37%, as disclosed in the most recent Prospectus.
Finding Promising Companies at a Discount
The Thornburg Value Fund seeks to find promising companies at a discounted valuation. It differs from many other equity funds in two key ways. First, it focuses on a limited number of stocks, and second, it takes a more comprehensive approach to value investing.
Our team is dedicated to providing value to shareholders. We accomplish this through the application of seasoned investment principles with hands-on, company-oriented research. We use a collaborative research approach in identifying and analyzing investment ideas. Our focus is on finding promising companies available at a discount to our estimate of their intrinsic value.
In managing the Thornburg Value Fund, we take a bottom-up approach to stock selection. The Fund is not predisposed to an industry or sector. We use a combination of financial analysis, collaborative research, and business evaluation in an effort to gauge the intrinsic value of a company based on its past record and future potential. The continuum of process moves from screens and idea generation, through conventional “Wall Street” research and documentation, to company contact, the latter often including on-site visits.
AVERAGE ANNUAL TOTAL RETURNS
FOR PERIODS ENDED MARCH 31, 2009
| 1 Yr | 3 Yrs | 5 Yrs | 10 Yrs | |||||||||
A Shares (Incep: 10/2/95) | ||||||||||||
Without Sales Charge | -39.38 | % | -13.39 | % | -4.44 | % | -0.02 | % | ||||
With Sales Charge | -42.10 | % | -14.71 | % | -5.32 | % | -0.48 | % | ||||
S&P 500 Index | ||||||||||||
(Since: 10/2/95) | -38.09 | % | -13.06 | % | -4.76 | % | -3.00 | % |
| 4 This page is not part of the Semi-Annual Report. |
The focus of the analysis is on what’s behind the numbers, its revenue and cash-generating model. We make an effort to get to know the company’s reputation in the industry, its people and its corporate culture.
The current posture is to maintain a portfolio of 40–55 companies diversified by sector, industry, market capitalization, and our three categories of stocks: Basic Value, Consistent Earners and Emerging Franchises. Because of the limited number of stocks in the portfolio, every holding counts. At the time of purchase, we set a 12–18 month price target for each stock. The target is reviewed as the fundamentals of the stock change during the course of ownership.
The bottom line? Engendering a wide-open, collegial environment fosters information flow and critical thinking intended to benefit portfolio decision making. We do not view our location in Santa Fe, NM, as a disadvantage. While we have access to the best of Wall Street’s analysis, we are not ruled by it. Distance from the crowd serves to fortify independent and objective thinking.
COMPANIES CONTRIBUTING AND DETRACTING
FOR SIX-MONTHS ENDED 3/31/09
Top Contributors | Top Detractors | |
| Priceline.com, Inc. | Fifth Third Bancorp | |
| Charles Schwab Corp. | ConocoPhilips | |
| U.S. Bancorp | Hartford Financial Services Group, Inc. | |
| Apple, Inc. | Allstate Corp. | |
| Genentech | Level 3 Communications, Inc. | |
| Source: FactSet | ||
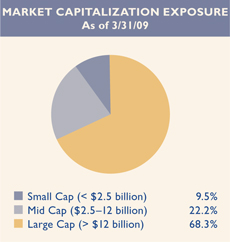
TOP TEN HOLDINGS
As of 3/31/09
Microsoft Corp. | 4.1 | % | |
Eli Lilly & Co. | 4.1 | % | |
Entergy Corp. | 3.8 | % | |
Ace Ltd. | 3.6 | % | |
Comcast Corp. | 3.5 | % | |
Gilead Sciences, Inc. | 3.4 | % | |
Marathon Oil Corp. | 3.3 | % | |
Apple, Inc. | 2.9 | % | |
Dell, Inc. | 2.7 | % | |
DIRECTV Group, Inc. | 2.7 | % |
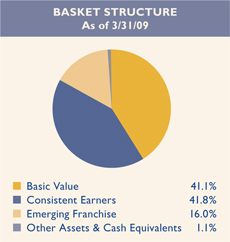
| This page is not part of the Semi-Annual Report. 5 |

Thornburg Value Fund
March 31, 2009
Table of Contents
| 7 | ||
| 10 | ||
| 12 | ||
| 14 | ||
| 15 | ||
| 21 | ||
| 28 | ||
| 34 | ||
| 35 | ||
| 36 | ||
This report is certified under the Sarbanes-Oxley Act of 2002, which requires that public companies, including mutual funds, affirm that the information provided in their annual and semiannual shareholder reports fully and fairly represents their financial position.
| 6 Certified Semi-Annual Report |
 | April 21, 2009 | |
William V. Fries,CFA Co-Portfolio Manager |
Dear Fellow Shareholder:
The six months ended March 31, 2009, were exceptionally challenging for equity investors. The unfortunate combination of financial panic and a broad global slowdown have made this recession deeper and longer than most of us have seen in our lifetimes. Governments of the leading economies of the world have worked feverishly to restore confidence. Despite these actions, global equities experienced severe declines. Between September 31, 2008, and March 31, 2009, the S&P 500 Index returned a negative 30.54%. The Thornburg Value Fund (Class A at NAV) returned a negative 28.53% over the same time period. While we are disappointed with these results, we have some reason to be optimistic. As we critically examine our decisions through the downturn thus far, we are pleased overall with the actions that we have taken, and the positioning of our current portfolio. Through the last five months of this semi-annual period, the portfolio has generally met or exceeded the benchmark in both up and down markets. While the semi-annual period ended March 31st was very challenging, we remain confident in our comprehensive approach to value investing.
Throughout most of the six-month period, the performance of financial stocks continued to deteriorate. As a sector, the stocks of financial companies were down in excess of 50%. Our financial stocks generally performed better than the benchmark exposure during the period. However, many of our financial holdings posted material declines on an absolute basis, with the stocks of insur- ance companies, in particular, detracting from performance. Shares of Hartford Financial Services Group came under pressures as capital markets impacted their balance sheet and concerns arose over their exposure to variable annuity guarantees. Capital adequacy concerns impacted insurance stocks broadly, including our investments in Allstate and Swiss Re. While not in the insurance industry, Fifth Third Bancorp was actually our largest detractor to performance, as many questioned this institution’s capital levels. We continue to monitor the company closely, and we’re encouraged by positive fundamental news late in the period (the sale of a portion of their Fifth Third Processing Solutions subsidiary which improves their capital position). | |
Connor Browne,CFA Co-Portfolio Manager | ||
Edward E. Maran,CFA Co-Portfolio Manager |


| Certified Semi-Annual Report 7 |
Letter to Shareholders
Continued
Two of our energy holdings, ConocoPhillips and Marathon Oil, traded down with energy prices and weaker refining margins. Shares of Dell struggled after the company reduced its fourth quarter earnings guidance and indicated weak growth in 2009. Level 3 Communications saw its shares decline over concerns about its financial leverage, and Comcast fell amidst continuing competition among cable, satellite and telecom companies in a weak economy.
While we believe the credit crisis is far from over, volatility during the period did present opportunities to invest in financial companies with strong franchises which we believe stand to gain from the current turmoil. In two specific cases, we used the widespread sell-off in the sector to take positions in stocks which we had owned in the past. Early in the fourth quarter of 2008, we exited U.S. Bancorp at our price target. We were able to re-purchase U.S. Bancorp in late February 2009 at a much lower stock price. Charles Schwab is attracting healthy flows from new customers, and we believe that their retail banking franchise is underappreciated. The stock was also added back to the portfolio late in the period. Both stocks contributed positively to performance almost immediately.
Health care positions in aggregate were a source of strength for the Fund, as Gilead Sciences, Genentech, Thermo Fisher Scientific and Teva Pharmaceuticals resisted the market decline. Unfortunately, HIV/AIDS continues to be a growing problem worldwide, but Gilead’s products positively impact both the longevity and the quality of life of those infected. Genentech rose as Roche acquired those roughly 46% of shares in the company which it did not already own. Thermo Fisher was added during the quarter, and has contributed positively to performance during the time it’s been owned. Teva Pharmaceuticals continues to dominate the generic drug industry, and stands to benefit from ongoing efforts to reduce health care costs.
Other positions that contributed positively to performance included Priceline.com, Apple, Exxon, and Visa. Priceline (primarily an airline and hotel reservation service company) continues to benefit from growing share in the U.S. and abroad, and recent operating results have positively surprised investors. We initially purchased Visa on its initial public offering then sold when it quickly hit our price target. We continued to follow the stock, hoping for a pullback to re-enter the name. The most recent period presented us with such an opportunity, and the stock subsequently contributed positively to performance.
During the period, we purchased a number of select fixed-income securities. In many cases, we were already familiar with the issuers of the debt from our fundamental research on the equity. Given the extreme dislocation in the equity and fixed-income markets, we were presented with what we believe to be opportunities to generate positive returns with preservation of capital in mind. Some of these bonds have already been sold after hitting our internal price targets. The Thornburg Value Fund will continue to invest primarily in domestic stocks.
| 8 Certified Semi-Annual Report |
Again, as we review the period, there are reasons for encouragement. The Thornburg Value Fund underperformed the S&P 500 Index in October 2008, before generating performance that met or exceeded the benchmark during each of the following five months. We remain committed to our unique form of diversification, where stocks are categorized as Consistent Earners, Basic Value Companies or Emerging Franchises. While we do not subscribe to a particular macro view of the economy, our Consistent Earner basket contains stocks which we believe will prove more resilient in a tough environment. Our Basic Value and Emerging Franchise baskets are populated with stocks which we expect to lead when there are clear signs of a recovery.
Today more than ever, our research efforts are centered on understanding the business models of the companies we own. In 2008, it was well demonstrated that unprecedented events do happen, and our evaluation process attempts to uncover downside risks before we initiate an investment. We cannot foresee all events, and when events do not develop as hoped, we employ a flexible yet disciplined sell process in an effort to contain losses.
The past six months were challenging. We continue to look for promising companies trading at a discount and remain confident that our portfolio contains sound investments whose value we believe will be recognized by other market participants over time.
Thank you for your trust and confidence, especially during this period of unusual market dislocation.
We invite you to visit our web site at www.thornburg.com, where you will find additional information about the Thornburg Value Fund, as well as other Thornburg investment products.
Sincerely,
 |  |  | ||
| William V. Fries,CFA | Connor Browne,CFA | Edward E. Maran,CFA | ||
| Co-Portfolio Manager | Co-Portfolio Manager | Co-Portfolio Manager | ||
| Managing Director | Managing Director | Managing Director |
The matters discussed in this report may constitute forward-looking statements made pursuant to the safe harbor provisions of the Securities Litigation Reform Act of 1995. These include any advisor or portfolio manager prediction, assessment, analysis or outlook for individual securities, industries, investment styles, market sectors and/or markets. These statements involve risks and uncertainties. In addition to the general risks described for each fund in its current prospectus, other factors bearing on these reports include the accuracy of the advisor’s or portfolio manager’s forecasts and predictions, the appropriateness of the investment strategies designed by the advisor or portfolio manager, and the ability of the advisor or portfolio manager to implement their strategies efficiently and successfully. Any one or more of these factors, as well as other risks affecting the securities markets generally, could cause the actual results of any fund to differ materially as compared to its benchmarks.
| Certified Semi-Annual Report 9 |
| STATEMENT OF ASSETS AND LIABILITIES | ||
| Thornburg Value Fund | March 31, 2009 (Unaudited) | |
ASSETS | ||||
Investments at value (cost $3,219,897,310) (Note 2) | $ | 2,215,866,893 | ||
Cash | 3,502,086 | |||
Receivable for investments sold | 2,606,806 | |||
Receivable for fund shares sold | 4,338,663 | |||
Unrealized gain on forward exchange contracts (Note 7) | 766,780 | |||
Dividends receivable | 1,765,220 | |||
Interest receivable | �� | 9,579,992 | ||
Prepaid expenses and other assets | 109,980 | |||
Total Assets | 2,238,536,420 | |||
LIABILITIES | ||||
Payable for securities purchased | 10,291,274 | |||
Payable for fund shares redeemed | 6,330,079 | |||
Unrealized loss on forward exchange contracts (Note 7) | 614,420 | |||
Payable to investment advisor and other affiliates (Note 3) | 1,830,690 | |||
Accounts payable and accrued expenses | 1,690,130 | |||
Dividends payable | 17,882 | |||
Total Liabilities | 20,774,475 | |||
NET ASSETS | $ | 2,217,761,945 | ||
NET ASSETS CONSIST OF: | ||||
Undistributed net investment income | $ | 5,270,192 | ||
Net unrealized depreciation on investments | (1,003,891,588 | ) | ||
Accumulated net realized gain (loss) | (1,089,228,684 | ) | ||
Net capital paid in on shares of beneficial interest | 4,305,612,025 | |||
| $ | 2,217,761,945 | |||
| 10 Certified Semi-Annual Report |
| STATEMENT OF ASSETS AND LIABILITIES, CONTINUED | ||
| Thornburg Value Fund | March 31, 2009 (Unaudited) | |
NET ASSET VALUE: | |||
Class A Shares: | |||
Net asset value and redemption price per share | $ | 19.84 | |
Maximum sales charge, 4.50% of offering price | 0.93 | ||
Maximum offering price per share | $ | 20.77 | |
Class B Shares: | |||
Net asset value and offering price per share * | |||
($33,620,131 applicable to 1,780,862 shares of beneficial interest outstanding - Note 4) | $ | 18.88 | |
Class C Shares: | |||
Net asset value and offering price per share * | |||
($246,291,929 applicable to 12,889,339 shares of beneficial interest outstanding - Note 4) | $ | 19.11 | |
Class I Shares: | |||
Net asset value, offering and redemption price per share | |||
($957,992,274 applicable to 47,501,967 shares of beneficial interest outstanding - Note 4) | $ | 20.17 | |
Class R3 Shares: | |||
Net asset value, offering and redemption price per share | |||
($105,513,734 applicable to 5,349,489 shares of beneficial interest outstanding - Note 4) | $ | 19.72 | |
Class R4 Shares: | |||
Net asset value, offering and redemption price per share | |||
($22,972,956 applicable to 1,159,348 shares of beneficial interest outstanding - Note 4) | $ | 19.82 | |
Class R5 Shares: | |||
Net asset value, offering and redemption price per share | |||
($97,275,197 applicable to 4,827,600 shares of beneficial interest outstanding - Note 4) | $ | 20.15 | |
| * | Redemption price per share is equal to net asset value less any applicable contingent deferred sales charge. |
See notes to financial statements.
| Certified Semi-Annual Report 11 |
| Thornburg Value Fund | Six Months Ended March 31, 2009 (Unaudited) | |
INVESTMENT INCOME: | ||||
Dividend income (net of foreign taxes withheld of $393,211) | $ | 25,970,165 | ||
Interest income | 14,242,105 | |||
Total Income | 40,212,270 | |||
EXPENSES: | ||||
Investment advisory fees (Note 3) | 9,860,088 | |||
Administration fees (Note 3) | ||||
Class A Shares | 522,659 | |||
Class B Shares | 25,943 | |||
Class C Shares | 173,390 | |||
Class I Shares | 289,471 | |||
Class R3 Shares | 71,238 | |||
Class R4 Shares | 14,477 | |||
Class R5 Shares | 25,519 | |||
Distribution and service fees (Note 3) | ||||
Class A Shares | 1,042,194 | |||
Class B Shares | 206,385 | |||
Class C Shares | 1,381,568 | |||
Class R3 Shares | 283,992 | |||
Class R4 Shares | 28,905 | |||
Transfer agent fees | ||||
Class A Shares | 796,750 | |||
Class B Shares | 56,645 | |||
Class C Shares | 299,090 | |||
Class I Shares | 937,780 | |||
Class R3 Shares | 278,667 | |||
Class R4 Shares | 54,482 | |||
Class R5 Shares | 183,283 | |||
Registration and filing fees | ||||
Class A Shares | 26,881 | |||
Class B Shares | 8,304 | |||
Class C Shares | 10,348 | |||
Class I Shares | 18,716 | |||
Class R3 Shares | 10,226 | |||
Class R4 Shares | 6,810 | |||
Class R5 Shares | 9,239 | |||
Custodian fees (Note 3) | 166,162 | |||
Professional fees | 69,330 | |||
Accounting fees | 70,857 | |||
Trustee fees | 50,100 | |||
Other expenses | 280,948 | |||
Total Expenses | 17,260,447 | |||
Less: | ||||
Expenses reimbursed by investment advisor (Note 3) | (837,778 | ) | ||
Fees paid indirectly (Note 3) | (32,142 | ) | ||
Net Expenses | 16,390,527 | |||
Net Investment Income | $ | 23,821,743 | ||
| 12 Certified Semi-Annual Report |
STATEMENT OF OPERATIONS, CONTINUED | ||
| Thornburg Value Fund | Six Months Ended March 31, 2009 (Unaudited) | |
REALIZED AND UNREALIZED GAIN (LOSS) | ||||
Net realized gain (loss) on: | ||||
Investments sold | $ | (818,112,725 | ) | |
Foreign currency transactions | 14,361,704 | |||
| (803,751,021 | ) | |||
Net change in unrealized appreciation (depreciation) on: | ||||
Investments | (288,420,390 | ) | ||
Foreign currency translations | (7,493,749 | ) | ||
| (295,914,139 | ) | |||
Net Realized and Unrealized Loss | (1,099,665,160 | ) | ||
Net Decrease in Net Assets Resulting From Operations | $ | (1,075,843,417 | ) | |
See notes to financial statements.
| Certified Semi-Annual Report 13 |
STATEMENTS OF CHANGES IN NET ASSETS
Thornburg Value Fund
| Six Months Ended March 31, 2009* | Year Ended September 30, 2008 | |||||||
INCREASE (DECREASE) IN NET ASSETS FROM: | ||||||||
OPERATIONS: | ||||||||
Net investment income | $ | 23,821,743 | $ | 29,752,935 | ||||
Net realized loss on investments and foreign currency transactions | (803,751,021 | ) | (269,404,026 | ) | ||||
Increase (Decrease) in unrealized appreciation (depreciation) on investments and foreign currency translation | (295,914,139 | ) | (1,362,764,344 | ) | ||||
Net Increase (Decrease) in Net Assets Resulting from Operations | (1,075,843,417 | ) | (1,602,415,435 | ) | ||||
DIVIDENDS TO SHAREHOLDERS: | ||||||||
From net investment income | ||||||||
Class A Shares | (7,754,254 | ) | (5,630,222 | ) | ||||
Class B Shares | (193,190 | ) | (7,933 | ) | ||||
Class C Shares | (1,503,155 | ) | (85,943 | ) | ||||
Class I Shares | (11,571,586 | ) | (18,551,738 | ) | ||||
Class R3 Shares | (1,079,518 | ) | (726,604 | ) | ||||
Class R4 Shares | (238,602 | ) | (170,180 | ) | ||||
Class R5 Shares | (1,124,185 | ) | (1,086,258 | ) | ||||
From realized gains | ||||||||
Class A Shares | — | (145,917,343 | ) | |||||
Class B Shares | — | (10,428,887 | ) | |||||
Class C Shares | — | (57,732,547 | ) | |||||
Class I Shares | — | (223,563,517 | ) | |||||
Class R3 Shares | — | (14,403,384 | ) | |||||
Class R4 Shares | — | (1,166,969 | ) | |||||
Class R5 Shares | — | (9,376,741 | ) | |||||
FUND SHARE TRANSACTIONS (NOTE 4): | ||||||||
Class A Shares | (9,875,175 | ) | 120,614,733 | |||||
Class B Shares | (12,313,553 | ) | (7,316,619 | ) | ||||
Class C Shares | (38,475,705 | ) | 20,666,716 | |||||
Class I Shares | (459,969,746 | ) | 597,263,995 | |||||
Class R3 Shares | (9,669,615 | ) | 84,257,580 | |||||
Class R4 Shares | 2,328,747 | 33,018,022 | ||||||
Class R5 Shares | 2,464,242 | 83,701,115 | ||||||
Net Decrease in Net Assets | (1,624,818,712 | ) | (1,159,058,159 | ) | ||||
NET ASSETS: | ||||||||
Beginning of period | 3,842,580,657 | 5,001,638,816 | ||||||
End of period | $ | 2,217,761,945 | $ | 3,842,580,657 | ||||
Undistributed net investment income | $ | 5,270,192 | $ | 4,912,939 | ||||
| * | Unaudited. |
See notes to financial statements.
| 14 Certified Semi-Annual Report |
| NOTES TO FINANCIAL STATEMENTS | ||
| Thornburg Value Fund | March 31, 2009 (Unaudited) | |
NOTE 1 – ORGANIZATION
Thornburg Value Fund, hereinafter referred to as the “Fund,” is a diversified series of Thornburg Investment Trust (the “Trust”). The Trust is organized as a Massachusetts business trust under a Declaration of Trust dated June 3, 1987 and is registered as a diversified, open-end management investment company under the Investment Company Act of 1940, as amended. The Trust is currently issuing thirteen series of shares of beneficial interest in addition to those of the Fund: Thornburg Limited Term Municipal Fund, Thornburg California Limited Term Municipal Fund, Thornburg Limited Term U.S. Government Fund, Thornburg New Mexico Intermediate Municipal Fund, Thornburg Intermediate Municipal Fund, Thornburg Limited Term Income Fund, Thornburg International Value Fund, Thornburg Core Growth Fund, Thornburg New York Intermediate Municipal Fund, Thornburg Investment Income Builder Fund, Thornburg Global Opportunities Fund, Thornburg International Growth Fund, and Thornburg Strategic Income Fund. Each series is considered to be a separate entity for financial reporting and tax purposes and bears expenses directly attributable to it. The Fund seeks long-term capital appreciation by investing in equity and debt securities of all types. As a secondary objective, the Fund also seeks some current income.
The Fund currently offers seven classes of shares of beneficial interest: Class A, Class B, Class C, Institutional Class (Class I), and Retirement Classes (Class R3, Class R4, and Class R5) shares. Each class of shares of the Fund represents an interest in the same portfolio of investments, except that (i) Class A shares are sold subject to a front-end sales charge collected at the time the shares are purchased and bear a service fee, (ii) Class B shares are sold at net asset value without a sales charge at the time of purchase, but are subject to a contingent deferred sales charge upon redemption and bear both a service fee and distribution fee, (iii) Class C shares are sold at net asset value without a sales charge at the time of purchase, but are subject to a contingent deferred sales charge upon redemption within one year of purchase, and bear both a service fee and a distribution fee, (iv) Class I shares are sold at net asset value without a sales charge at the time of purchase, (v) Class R3 shares are sold at net asset value without a sales charge at the time of purchase, but bear both a service fee and distribution fee, (vi) Class R4 shares are sold at net asset value without a sales charge at the time of purchase, but bear a service fee, (vii) Class R5 shares are sold at net asset value without a sales charge at the time of purchase, and (viii) the respective classes may have different reinvestment privileges and conversion rights. Additionally, the Fund may allocate among its classes certain expenses, to the extent allowable to specific classes, including transfer agent fees, government registration fees, certain printing and postage costs, and administrative and legal expenses. Currently, class specific expenses of the Fund are limited to service and distribution fees, administration fees, and certain registration and transfer agent expenses. Class B shares of the Fund outstanding for eight years will convert to Class A shares of the Fund.
NOTE 2 – SIGNIFICANT ACCOUNTING POLICIES
Significant accounting policies of the Trust are as follows:
Valuation of Investments: Portfolio securities listed or traded on a national securities exchange are valued on the valuation date at the last reported sale price on the exchange that is the primary market for the security. Portfolio securities traded on an exchange for which there has been no sale that day and other equity securities traded in the over-the-counter market are valued at the mean between the last reported bid and asked prices. Portfolio securities reported by NASDAQ are valued at the NASDAQ official closing price. Any foreign security traded on exchanges outside the United States is valued at the price of the security on the exchange that is normally the security’s primary market, as of the close of that exchange preceding the time of the Fund’s valuation.
Debt obligations held by the Fund have a primary market over the counter and are valued by an independent pricing service approved by the Trustees of the Trust. The pricing service ordinarily values debt obligations at quoted bid prices. When quotations are not available, debt obligations held by the Fund are valued at evaluated prices determined by the pricing service using methods which include consideration of yields or prices of debt obligations of comparable quality, type of issue, coupon, maturity, and rating, and indications as to value from dealers and general market conditions. Short-term obligations having remaining maturities of 60 days or less are valued at amortized cost, which approximates market value.
Quotations in foreign currencies for foreign portfolio investments are converted to U.S. dollar equivalents using the foreign exchange quotation in effect at the time of valuation.
In any case where the market value of an equity security held by the Fund is not readily available, the Trust’s valuation and pricing committee determines a fair value for the security using procedures approved by the Trustees, which may include the use of prices obtained from an independent pricing service. The pricing service ordinarily values equity securities in these instances using multi-factor models to adjust market prices based upon various inputs, including exchange data, depository receipt prices, futures and index data and other data. A security’s market value is deemed not readily available whenever the exchange or market on which the security is primarily traded is closed for the entire scheduled day of trading. Additionally, a security’s market value may be deemed not readily available under other circumstances identified by the Trustees, including when developments occurring after the most recent close of the security’s primary exchange or market, but before the most recent close of trading in Fund shares, create a serious question about the reliability of the security’s market value.
In any case where a pricing service fails to provide a price for a debt obligation held by the Fund, the valuation and pricing committee determines a fair value for the debt obligation using procedures approved by the Trustees. Additionally, in any case where management believes that a price provided by a pricing service for a debt obligation held by the Fund may be unreliable, the valuation and pricing committee decides whether or not to use the pricing service’s valuation or to determine a fair value for the debt obligation.
| Certified Semi-Annual Report 15 |
| NOTES TO FINANCIAL STATEMENTS, CONTINUED | ||
| Thornburg Value Fund | March 31, 2009 (Unaudited) | |
In determining fair value for any portfolio security or other investment, the valuation and pricing committee seeks to determine the amount that an owner of the investment might reasonably expect to receive upon a sale of the investment. However, because fair value prices are estimated prices, the valuation and pricing committee’s determination of fair value for an investment may differ from the value that would be realized by the Fund upon a sale of the investment, and that difference could be material to the Fund’s financial statements. The valuation and pricing committee’s determination of fair value for an investment may also differ from the prices obtained by other persons (including other mutual funds) for the investment.
Valuation Measurements: Various inputs are used in determining the value of the Fund’s investments. These inputs are summarized in the three levels listed below.
Level 1: Quoted prices in active markets for identical investments.
Level 2: Other significant observable inputs (including quoted prices for similar investments, interest rates, prepayment rates, credit risk, etc.).
Level 3: Significant unobservable inputs (including the Fund’s own assumptions in determining the fair value of investments).
The following table displays a summary of the inputs used to value the Fund’s net assets as of March 31, 2009. In any instance when valuation inputs from more than one level are used to determine the fair value of a specific investment, the investment is placed in the level of the table based upon the lowest level input that is significant in determining the fair value of the investment:
Valuation Inputs | Investments in Securities | Investments in Other Financial Instruments* | ||||
Level 1 - Quoted Prices in Active Markets for Identical Assets | $ | 1,877,431,716 | $ | — | ||
Level 2 - Other Significant Observable Inputs | 338,435,177 | 152,360 | ||||
Level 3 - Significant Unobservable Inputs | — | — | ||||
Total | $ | 2,215,866,893 | $ | 152,360 | ||
| * | Other financial instruments include investments not reflected in the Schedule of Investments, such as futures, forwards and swap contracts, which are valued at the unrealized appreciation (depreciation) on the instrument. |
Foreign Currency Translation: Portfolio securities and other assets and liabilities denominated in foreign currencies are translated into U.S. dollars based on the exchange rate of such currencies against the U.S. dollar on the date of valuation. Purchases and sales of securities and income items denominated in foreign currencies are translated into U.S. dollars at the exchange rate in effect on the translation date. When the Fund purchases or sells foreign securities it will customarily enter into a foreign exchange contract to minimize foreign exchange risk from the trade date to the settlement date of such transactions.
The Fund does not separately report the effect of changes in foreign exchange rates from changes in market prices on securities held. Such changes are included in net realized and unrealized gain or loss from investments.
Reported net realized foreign exchange gains or losses arise from sales of foreign currencies, currency gains or losses realized between the trade and settlement dates on securities transactions and the difference between the amounts of dividends, interest, and foreign withholding taxes recorded on the Fund’s books, and the U.S. dollar equivalent of the amounts actually received or paid.
Net unrealized foreign exchange gains and losses arise from changes in the fair value of assets and liabilities, other than investments in securities at fiscal period end, resulting from changes in exchange rates.
Federal Income Taxes: It is the policy of the Trust to comply with the provisions of the Internal Revenue Code applicable to “regulated investment companies” and to distribute to shareholders substantially all taxable income, including any net realized gain on investments of the Funds. Therefore, no provision for federal income taxes is required.
When-Issued and Delayed Delivery Transactions: The Trust may engage in when-issued or delayed delivery transactions. To the extent the Trust engages in such transactions, it will do so for the purpose of acquiring portfolio securities consistent with the Fund’s investment objectives and not for the purpose of investment leverage or to speculate on interest rate and/or market changes. At the time the Trust makes a commitment to purchase a security on a when-issued or delayed delivery basis, the Fund will record the transaction and reflect the value in determining its net asset value. When effecting such transactions, assets of an amount sufficient to make payment for the portfolio securities to be purchased will be segregated on the Fund’s records on the trade date. Securities purchased on a when-issued or delayed delivery basis do not earn interest until the settlement date.
Dividends: Dividends to shareholders are generally paid quarterly and are reinvested in additional shares of the Fund at net asset value per share at the close of business on the dividend payment date or, at the shareholder’s option, paid in cash. Net realized capital gains, to the extent available, will be distributed at least annually. Distributions to shareholders are based on income tax regulations and therefore, their characteristics may differ for financial statement and tax purposes.
| 16 Certified Semi-Annual Report |
NOTES TO FINANCIAL STATEMENTS, CONTINUED | ||
| Thornburg Value Fund | March 31, 2009 (Unaudited) | |
General: Securities transactions are accounted for on a trade date basis. Interest income is accrued as earned and dividend income is recorded on the ex-dividend date. Certain income from foreign securities is recognized as soon as information is available to the Fund. Realized gains and losses from the sale of securities are recorded on an identified cost basis. Net investment income (other than class specific expenses) and realized and unrealized gains and losses are allocated daily to each class of shares based upon the relative net asset value of outstanding shares of each class of shares at the beginning of the day (after adjusting for the current share activity of the respective class). Expenses common to all funds are allocated among the funds comprising the Trust based upon their relative net asset values or other appropriate allocation methods.
Guarantees and Indemnifications: Under the Trust’s organizational documents, its officers and Trustees are indemnified against certain liabilities arising out of the performance of their duties to the Fund. Additionally, in the normal course of business the Trust enters into contracts with service providers that contain general indemnification clauses. The Trust’s maximum exposure under these arrangements is unknown. However, based on experience, the Trust expects the risk of loss to be remote.
Use of Estimates: The preparation of financial statements, in conformity with generally accepted accounting principles, requires management to make estimates and assumptions that affect the reported amounts of assets and liabilities and the disclosure of contingent assets and liabilities at the date of the financial statements and the reported amounts of increases and decreases in net assets from operations during the reporting period. Actual results could differ from those estimates.
NOTE 3 – INVESTMENT ADVISORY FEE AND OTHER TRANSACTIONS WITH AFFILIATES
Pursuant to an investment advisory agreement, Thornburg Investment Management, Inc. (the “Advisor”) serves as the investment advisor and performs services to the Fund for which the fees are payable at the end of each month. For the six months ended March 31, 2009, these fees were payable at annual rates ranging from .875 of 1% to .675 of 1% per annum of the average daily net assets of the Fund depending on the Fund’s asset size. The Trust also has entered into administrative services agreements with the Advisor, whereby the Advisor will perform certain administrative services for the shareholders of each class of the Fund’s shares, and for which fees will be payable at an annual rate of up to .125 of 1% per annum of the average daily net assets attributable to each class of shares. For the six months ended March 31, 2009, the Advisor voluntarily reimbursed certain class specific expenses, administrative fees, and distribution fees of $303,866 for Class I shares, $342,380 for Class R3 shares, $55,039 for Class R4 Shares, and $136,493 for Class R5 shares.
The Trust has an underwriting agreement with Thornburg Securities Corporation (the “Distributor,” an affiliate of the Advisor), which acts as the distributor of the Fund’s shares. For the six months ended March 31, 2009, the Distributor has advised the Fund that it earned net commissions aggregating $15,159 from the sale of Class A shares, and collected contingent deferred sales charges aggregating $15,673 from redemptions of Class C shares of the Fund.
Pursuant to a service plan under Rule 12b-1 of the Investment Company Act of 1940, the Fund may reimburse to the Advisor an amount not to exceed .25 of 1% per annum of the average daily net assets attributable to each class of shares of the Fund for payments made by the Advisor to securities dealers and other financial institutions to obtain various shareholder and distribution related services. The Advisor may pay out of its own resources additional expenses for distribution of the Fund’s shares.
The Trust has also adopted distribution plans pursuant to Rule 12b-1, applicable only to the Fund’s Class B, Class C, and Class R3 shares, under which the Fund compensates the Distributor for services in promoting the sale of Class B, Class C, and Class R3 shares of the Fund at an annual rate of up to .75 of 1% per annum of the average daily net assets attributable to Class B, Class C, and Class R3 shares. Total fees incurred by the Distributor for each class of shares of the Fund under their respective Service and Distribution Plans for the six months ended March 31, 2009, are set forth in the Statement of Operations.
The Trust has an agreement with the custodian bank to indirectly pay a portion of the custodian’s fees through credits earned by the Fund’s cash on deposit with the bank. This deposit agreement is an alternative to overnight investments. Custodial fees have been adjusted to reflect amounts that would have been paid without this agreement, with a corresponding adjustment reflected as fees paid indirectly in the Statement of Operations. For the six months ended March 31, 2009, fees paid indirectly were $32,142.
Certain officers and Trustees of the Trust are also officers and/or directors of the Advisor and Distributor. The compensation of independent Trustees is borne by the Trust.
| Certified Semi-Annual Report 17 |
NOTES TO FINANCIAL STATEMENTS, CONTINUED | ||
| Thornburg Value Fund | March 31, 2009 (Unaudited) | |
NOTE 4 – SHARES OF BENEFICIAL INTEREST
At March 31, 2009, there were an unlimited number of shares of beneficial interest authorized. Transactions in shares of beneficial interest were as follows:
| Six Months Ended March 31, 2009 (Unaudited) | Year Ended September 30, 2008 (Audited) | |||||||||||||
| Shares | Amount | Shares | Amount | |||||||||||
Class A Shares | ||||||||||||||
Shares sold | 15,122,123 | $ | 312,091,959 | 11,174,321 | $ | 399,226,305 | ||||||||
Shares issued to shareholders in reinvestment of dividends | 284,660 | 5,892,214 | 3,754,600 | 138,338,268 | ||||||||||
Shares repurchased | (16,257,498 | ) | (327,886,458 | ) | (12,304,141 | ) | (416,973,786 | ) | ||||||
Redemption fees received** | — | 27,110 | — | 23,946 | ||||||||||
Net Increase (Decrease) | (850,715 | ) | $ | (9,875,175 | ) | 2,624,780 | $ | 120,614,733 | ||||||
Class B Shares | ||||||||||||||
Shares sold | 88,668 | $ | 1,799,996 | 129,348 | $ | 4,492,381 | ||||||||
Shares issued to shareholders in reinvestment of dividends | 8,182 | 161,313 | 256,872 | 9,083,791 | ||||||||||
Shares repurchased | (727,184 | ) | (14,276,188 | ) | (649,891 | ) | (20,894,338 | ) | ||||||
Redemption fees received** | — | 1,326 | — | 1,547 | ||||||||||
Net Increase (Decrease) | (630,334 | ) | $ | (12,313,553 | ) | (263,671 | ) | $ | (7,316,619 | ) | ||||
Class C Shares | ||||||||||||||
Shares sold | 1,150,910 | $ | 23,331,106 | 1,768,463 | $ | 62,269,164 | ||||||||
Shares issued to shareholders in reinvestment of dividends | 64,795 | 1,291,386 | 1,418,890 | 50,776,902 | ||||||||||
Shares repurchased | (3,215,760 | ) | (63,107,041 | ) | (2,816,339 | ) | (92,388,285 | ) | ||||||
Redemption fees received** | — | 8,844 | — | 8,935 | ||||||||||
Net Increase (Decrease) | (2,000,055 | ) | $ | (38,475,705 | ) | 371,014 | $ | 20,666,716 | ||||||
Class I Shares | ||||||||||||||
Shares sold | 8,878,422 | $ | 187,972,732 | 33,733,127 | $ | 1,210,083,621 | ||||||||
Shares issued to shareholders in reinvestment of dividends | 429,579 | 9,033,413 | 5,086,814 | 189,825,719 | ||||||||||
Shares repurchased | (30,695,882 | ) | (657,012,034 | ) | (23,528,996 | ) | (802,685,508 | ) | ||||||
Redemption fees received** | — | 36,143 | — | 40,163 | ||||||||||
Net Increase (Decrease) | (21,387,881 | ) | $ | (459,969,746 | ) | 15,290,945 | $ | 597,263,995 | ||||||
Class R3 Shares | ||||||||||||||
Shares sold | 827,725 | $ | 17,297,805 | 3,326,232 | $ | 116,410,112 | ||||||||
Shares issued to shareholders in reinvestment of dividends | 50,839 | 1,045,834 | 401,141 | 14,656,658 | ||||||||||
Shares repurchased | (1,327,278 | ) | (28,016,903 | ) | (1,371,429 | ) | (46,812,136 | ) | ||||||
Redemption fees received** | — | 3,649 | — | 2,946 | ||||||||||
Net Increase (Decrease) | (448,714 | ) | $ | (9,669,615 | ) | 2,355,944 | $ | 84,257,580 | ||||||
| 18 Certified Semi-Annual Report |
NOTES TO FINANCIAL STATEMENTS, CONTINUED | ||
| Thornburg Value Fund | March 31, 2009 (Unaudited) | |
| Six Months Ended March 31, 2009 (Unaudited) | Year Ended September 30, 2008 (Audited) | |||||||||||||
| Shares | Amount | Shares | Amount | |||||||||||
Class R4 Shares | ||||||||||||||
Shares sold | 334,477 | $ | 7,099,384 | 1,140,551 | $ | 41,174,367 | ||||||||
Shares issued to shareholders in reinvestment of dividends | 9,406 | 194,286 | 34,386 | 1,249,751 | ||||||||||
Shares repurchased | (237,276 | ) | (4,965,665 | ) | (281,635 | ) | (9,406,561 | ) | ||||||
Redemption fees received** | — | 742 | — | 465 | ||||||||||
Net Increase (Decrease) | 106,607 | $ | 2,328,747 | 893,302 | $ | 33,018,022 | ||||||||
Class R5 Shares | ||||||||||||||
Shares sold | 1,132,995 | $ | 24,908,539 | 3,316,951 | $ | 117,084,163 | ||||||||
Shares issued to shareholders in reinvestment of dividends | 52,950 | 1,112,030 | 282,183 | 10,452,223 | ||||||||||
Shares repurchased | (1,109,771 | ) | (23,559,577 | ) | (1,235,288 | ) | (43,837,491 | ) | ||||||
Redemption fees received** | — | 3,250 | — | 2,220 | ||||||||||
Net Increase (Decrease) | 76,174 | $ | 2,464,242 | 2,363,846 | $ | 83,701,115 | ||||||||
| ** | The Fund charges a redemption fee of 1% of the Class A and Class I shares redeemed or exchanged within 30 days of purchase. Redemption fees charged to any class are allocated to all classes upon receipt of payment based on relative net asset values of each class or other appropriate allocation methods. |
NOTE 5 – SECURITIES TRANSACTIONS
For the six months ended March 31, 2009, the Fund had purchase and sale transactions of investment securities (excluding short-term investments) of $1,123,939,884 and $1,533,390,940, respectively.
NOTE 6 – INCOME TAXES
At March 31, 2009, information on the tax components of capital is as follows:
Cost of investments for tax purposes | $ | 3,215,286,275 | ||
Gross unrealized appreciation on a tax basis | $ | 69,876,983 | ||
Gross unrealized depreciation on a tax basis | (1,069,296,365 | ) | ||
Net unrealized appreciation (depreciation) on investments (tax basis) | $ | (999,419,382 | ) | |
At March 31, 2009, the Fund had deferred tax basis currency and capital losses occurring subsequent to October 31, 2007 of $338,072, and $275,314,874, respectively. For tax purposes, such losses will be reflected in the year ending September 30, 2009.
| Certified Semi-Annual Report 19 |
NOTES TO FINANCIAL STATEMENTS, CONTINUED | ||
| Thornburg Value Fund | March 31, 2009 (Unaudited) | |
NOTE 7 – FINANCIAL INSTRUMENTS WITH OFF-BALANCE SHEET RISK AND FOREIGN INVESTMENT RISK
During the six months ended March 31, 2009, the Fund was a party to financial instruments with off-balance sheet risks, primarily currency forward exchange contracts. A forward exchange contract is an agreement between two parties to exchange different currencies at a specified rate at an agreed upon future date. These contracts are purchased in order to minimize the risk to the Fund with respect to its foreign stock transactions from adverse changes in the relationship between the U.S. dollar and foreign currencies. In each case these contracts have been initiated in conjunction with foreign stock transactions. These instruments may involve market risks in excess of the amount recognized on the Statement of Assets and Liabilities. Such risks would arise from the possible inability of counterparties to meet the terms of their contracts, future movement in currency value and interest rates and contract positions that are not exact offsets. These contracts are reported in the financial statements at the Fund’s net equity, as measured by the difference between the forward exchange rates at the reporting date and the forward exchange rates at the dates of entry into the contract. There are special risks associated with international investing, including currency fluctuations, economic and political instability, confiscation, inability or delays in selling foreign investments, and reduced legal protection for investments.
CONTRACTS TO BUY OR SELL:
Contract Description | Buy/Sell | Contract Amount | Contract Value Date | Value (USD) | Unrealized Appreciation | Unrealized (Depreciation) | ||||||||||
Euro Dollar | Sell | 23,440,000 | 4/30/2009 | $ | 30,525,912 | $ | — | $ | (614,420 | ) | ||||||
Euro Dollar | Buy | 23,440,000 | 4/30/2009 | 30,373,552 | 766,780 | — | ||||||||||
Total unrealized appreciation (depreciation) from forward exchange contracts | $ | 766,780 | $ | (614,420 | ) | |||||||||||
OTHER NOTES:
Statement of Accounting Standards No. 161:
On March 19, 2008, the Financial Accounting Standards Board issued Statement of Financial Accounting Standards No. 161, “Disclosures about Derivative Instruments and Hedging Activities” (“FAS 161”). FAS 161 is effective for fiscal years and interim periods beginning after November 15, 2008. FAS 161 requires enhanced disclosures about any derivative and hedging activities by the Fund, including how such activities are accounted for and any effect on the Fund’s financial position, performance and cash flows.
| 20 Certified Semi-Annual Report |
Thornburg Value Fund
| Six Months Ended March 31, | Year Ended September 30, | |||||||||||||||||||||||
| 2009* | 2008 | 2007 | 2006 | 2005 | 2004 | |||||||||||||||||||
Class A Shares: | ||||||||||||||||||||||||
PER SHARE PERFORMANCE (for a share outstanding throughout the period)+ | ||||||||||||||||||||||||
Net asset value, beginning of period | $ | 28.02 | $ | 44.17 | $ | 37.59 | $ | 32.79 | $ | 28.11 | $ | 26.29 | ||||||||||||
Income from investment operations: | ||||||||||||||||||||||||
Net investment income (loss) | 0.18 | 0.18 | 0.29 | 0.35 | 0.32 | 0.20 | ||||||||||||||||||
Net realized and unrealized gain (loss) on investments | (8.17 | ) | (12.26 | ) | 7.86 | 4.76 | 4.64 | 1.81 | ||||||||||||||||
Total from investment operations | (7.99 | ) | (12.08 | ) | 8.15 | 5.11 | 4.96 | 2.01 | ||||||||||||||||
Less dividends from: | ||||||||||||||||||||||||
Net investment income | (0.19 | ) | (0.14 | ) | (0.27 | ) | (0.31 | ) | (0.28 | ) | (0.19 | ) | ||||||||||||
Net realized gains | — | (3.93 | ) | (1.30 | ) | — | — | — | ||||||||||||||||
Total dividends | (0.19 | ) | (4.07 | ) | (1.57 | ) | (0.31 | ) | (0.28 | ) | (0.19 | ) | ||||||||||||
Change in net asset value | (8.18 | ) | (16.15 | ) | 6.58 | 4.80 | 4.68 | 1.82 | ||||||||||||||||
NET ASSET VALUE, end of period | $ | 19.84 | $ | 28.02 | $ | 44.17 | $ | 37.59 | $ | 32.79 | $ | 28.11 | ||||||||||||
RATIOS/SUPPLEMENTAL DATA | ||||||||||||||||||||||||
Total return (%)(a) | (28.53 | ) | (29.52 | ) | 22.23 | 15.63 | 17.70 | 7.61 | ||||||||||||||||
Ratios to average net assets: | ||||||||||||||||||||||||
Net investment income (loss) (%) | 1.78 | (b) | 0.52 | 0.70 | 1.02 | 1.05 | 0.69 | |||||||||||||||||
Expenses, after expense reductions (%) | 1.39 | (b) | 1.27 | 1.27 | 1.35 | 1.40 | 1.37 | |||||||||||||||||
Expenses, after expense reductions and net of custody credits (%) | 1.39 | (b) | 1.27 | 1.27 | 1.34 | 1.40 | 1.37 | |||||||||||||||||
Expenses, before expense reductions (%) | 1.39 | (b) | 1.27 | 1.27 | 1.35 | 1.40 | 1.37 | |||||||||||||||||
Portfolio turnover rate (%) | 43.09 | 70.65 | 79.29 | 51.36 | 58.90 | 68.74 | ||||||||||||||||||
Net assets at end of period (thousands) | $ | 754,096 | $ | 1,088,766 | $ | 1,599,976 | $ | 1,121,720 | $ | 972,478 | $ | 1,086,448 | ||||||||||||
| (a) | Sales loads are not reflected in computing total return, which is not annualized for periods less than one year. |
| (b) | Annualized. |
| + | Based on weighted average shares outstanding. |
| * | Unaudited. |
See notes to financial statements.
| Certified Semi-Annual Report 21 |
FINANCIAL HIGHLIGHTS, CONTINUED
Thornburg Value Fund
| Six Months Ended March 31, | Year Ended September 30, | |||||||||||||||||||||||
| 2009* | 2008 | 2007 | 2006 | 2005 | 2004 | |||||||||||||||||||
Class B Shares: | ||||||||||||||||||||||||
PER SHARE PERFORMANCE (for a share outstanding throughout the period)+ | ||||||||||||||||||||||||
Net asset value, beginning of period | $ | 26.66 | $ | 42.36 | $ | 36.17 | $ | 31.60 | $ | 27.13 | $ | 25.47 | ||||||||||||
Income from investment operations: | ||||||||||||||||||||||||
Net investment income (loss) | 0.09 | (0.09 | ) | (0.04 | ) | 0.07 | 0.08 | (0.03 | ) | |||||||||||||||
Net realized and unrealized gain (loss) on investments | (7.77 | ) | (11.68 | ) | 7.55 | 4.58 | 4.47 | 1.74 | ||||||||||||||||
Total from investment operations | (7.68 | ) | (11.77 | ) | 7.51 | 4.65 | 4.55 | 1.71 | ||||||||||||||||
Less dividends from: | ||||||||||||||||||||||||
Net investment income | (0.10 | ) | (0.00 | )(a) | (0.02 | ) | (0.08 | ) | (0.08 | ) | (0.05 | ) | ||||||||||||
Net realized gains | — | (3.93 | ) | (1.30 | ) | — | — | — | ||||||||||||||||
Total dividends | (0.10 | ) | (3.93 | ) | (1.32 | ) | (0.08 | ) | (0.08 | ) | (0.05 | ) | ||||||||||||
Change in net asset value | (7.78 | ) | (15.70 | ) | 6.19 | 4.57 | 4.47 | 1.66 | ||||||||||||||||
NET ASSET VALUE, end of period | $ | 18.88 | $ | 26.66 | $ | 42.36 | $ | 36.17 | $ | 31.60 | $ | 27.13 | ||||||||||||
RATIOS/SUPPLEMENTAL DATA | ||||||||||||||||||||||||
Total return (%)(b) | (28.83 | ) | (30.05 | ) | 21.26 | 14.71 | 16.78 | 6.71 | ||||||||||||||||
Ratios to average net assets: | ||||||||||||||||||||||||
Net investment income (loss) (%) | 0.89 | (c) | (0.28 | ) | (0.09 | ) | 0.21 | 0.27 | (0.12 | ) | ||||||||||||||
Expenses, after expense reductions (%) | 2.25 | (c) | 2.05 | 2.07 | 2.15 | 2.17 | 2.18 | |||||||||||||||||
Expenses, after expense reductions and net of custody credits (%) | 2.25 | (c) | 2.05 | 2.07 | 2.14 | 2.17 | 2.18 | |||||||||||||||||
Expenses, before expense reductions (%) | 2.25 | (c) | 2.05 | 2.07 | 2.15 | 2.17 | 2.20 | |||||||||||||||||
Portfolio turnover rate (%) | 43.09 | 70.65 | 79.29 | 51.36 | 58.90 | 68.74 | ||||||||||||||||||
Net assets at end of period (thousands) | $ | 33,620 | $ | 64,287 | $ | 113,299 | $ | 96,587 | $ | 92,410 | $ | 93,508 | ||||||||||||
| (a) | Dividends from net investment income per share were less than $(0.01). |
| (b) | Not annualized for periods less than one year. |
| (c) | Annualized. |
| + | Based on weighted average shares outstanding. |
| * | Unaudited. |
See notes to financial statements.
| 22 Certified Semi-Annual Report |
FINANCIAL HIGHLIGHTS, CONTINUED
Thornburg Value Fund
Six Months Ended March 31, | Year Ended September 30, | |||||||||||||||||||||||
| 2009* | 2008 | 2007 | 2006 | 2005 | 2004 | |||||||||||||||||||
Class C Shares: | ||||||||||||||||||||||||
PER SHARE PERFORMANCE (for a share outstanding throughout the period)+ | ||||||||||||||||||||||||
Net asset value, beginning of period | $ | 26.99 | $ | 42.82 | $ | 36.55 | $ | 31.92 | $ | 27.40 | $ | 25.70 | ||||||||||||
Income from investment operations: | ||||||||||||||||||||||||
Net investment income (loss) | 0.10 | (0.08 | ) | (0.02 | ) | 0.09 | 0.09 | (0.02 | ) | |||||||||||||||
Net realized and unrealized gain (loss) on investments | (7.87 | ) | (11.81 | ) | 7.62 | 4.62 | 4.51 | 1.77 | ||||||||||||||||
Total from investment operations | (7.77 | ) | (11.89 | ) | 7.60 | 4.71 | 4.60 | 1.75 | ||||||||||||||||
Less dividends from: | ||||||||||||||||||||||||
Net investment income | (0.11 | ) | (0.01 | ) | (0.03 | ) | (0.08 | ) | (0.08 | ) | (0.05 | ) | ||||||||||||
Net realized gains | — | (3.93 | ) | (1.30 | ) | — | — | — | ||||||||||||||||
Total dividends | (0.11 | ) | (3.94 | ) | (1.33 | ) | (0.08 | ) | (0.08 | ) | (0.05 | ) | ||||||||||||
Change in net asset value | (7.88 | ) | (15.83 | ) | 6.27 | 4.63 | 4.52 | 1.70 | ||||||||||||||||
NET ASSET VALUE, end of period | $ | 19.11 | $ | 26.99 | $ | 42.82 | $ | 36.55 | $ | 31.92 | $ | 27.40 | ||||||||||||
RATIOS/SUPPLEMENTAL DATA | ||||||||||||||||||||||||
Total return (%)(a) | (28.80 | ) | (30.03 | ) | 21.29 | 14.77 | 16.80 | 6.81 | ||||||||||||||||
Ratios to average net assets: | ||||||||||||||||||||||||
Net investment income (loss) (%) | 0.99 | (b) | (0.23 | ) | (0.05 | ) | 0.27 | 0.31 | (0.07 | ) | ||||||||||||||
Expenses, after expense reductions (%) | 2.17 | (b) | 2.02 | 2.03 | 2.09 | 2.14 | 2.14 | |||||||||||||||||
Expenses, after expense reductions and net of custody credits (%) | 2.16 | (b) | 2.01 | 2.03 | 2.09 | 2.14 | 2.14 | |||||||||||||||||
Expenses, before expense reductions (%) | 2.17 | (b) | 2.02 | 2.03 | 2.09 | 2.14 | 2.15 | |||||||||||||||||
Portfolio turnover rate (%) | 43.09 | 70.65 | 79.29 | 51.36 | 58.90 | 68.74 | ||||||||||||||||||
Net assets at end of period (thousands) | $ | 246,292 | $ | 401,880 | $ | 621,687 | $ | 490,399 | $ | 446,567 | $ | 475,296 | ||||||||||||
| (a) | Not annualized for periods less than one year. |
| (b) | Annualized. |
| + | Based on weighted average shares outstanding. |
| * | Unaudited. |
See notes to financial statements.
| Certified Semi-Annual Report 23 |
FINANCIAL HIGHLIGHTS, CONTINUED
Thornburg Value Fund
| Six Months Ended March 31, | Year Ended September 30, | |||||||||||||||||||||||
| 2009* | 2008 | 2007 | 2006 | 2005 | 2004 | |||||||||||||||||||
Class I Shares: | ||||||||||||||||||||||||
PER SHARE PERFORMANCE (for a share outstanding throughout the period)+ | ||||||||||||||||||||||||
Net asset value, beginning of period | $ | 28.47 | $ | 44.80 | $ | 38.11 | $ | 33.23 | $ | 28.49 | $ | 26.64 | ||||||||||||
Income from investment operations: | ||||||||||||||||||||||||
Net investment income (loss) | 0.23 | 0.32 | 0.44 | 0.50 | 0.45 | 0.31 | ||||||||||||||||||
Net realized and unrealized gain (loss) on investments | (8.30 | ) | (12.45 | ) | 7.96 | 4.82 | 4.70 | 1.84 | ||||||||||||||||
Total from investment operations | (8.07 | ) | (12.13 | ) | 8.40 | 5.32 | 5.15 | 2.15 | ||||||||||||||||
Less dividends from: | ||||||||||||||||||||||||
Net investment income | (0.23 | ) | (0.27 | ) | (0.41 | ) | (0.44 | ) | (0.41 | ) | (0.30 | ) | ||||||||||||
Net realized gains | — | (3.93 | ) | (1.30 | ) | — | — | — | ||||||||||||||||
Total dividends | (0.23 | ) | (4.20 | ) | (1.71 | ) | (0.44 | ) | (0.41 | ) | (0.30 | ) | ||||||||||||
Change in net asset value | (8.30 | ) | (16.33 | ) | 6.69 | 4.88 | 4.74 | 1.85 | ||||||||||||||||
NET ASSET VALUE, end of period | $ | 20.17 | $ | 28.47 | $ | 44.80 | $ | 38.11 | $ | 33.23 | $ | 28.49 | ||||||||||||
RATIOS/SUPPLEMENTAL DATA | ||||||||||||||||||||||||
Total return (%)(a) | (28.37 | ) | (29.24 | ) | 22.62 | 16.10 | 18.16 | 8.04 | ||||||||||||||||
Ratios to average net assets: | ||||||||||||||||||||||||
Net investment income (loss) (%) | 2.15 | (b) | 0.92 | 1.05 | 1.41 | 1.44 | 1.07 | |||||||||||||||||
Expenses, after expense reductions (%) | 0.98 | (b) | 0.91 | 0.93 | 0.98 | 0.99 | 0.99 | |||||||||||||||||
Expenses, after expense reductions and net of custody credits (%) | 0.98 | (b) | 0.90 | 0.92 | 0.97 | 0.98 | 0.99 | |||||||||||||||||
Expenses, before expense reductions (%) | 1.04 | (b) | 0.91 | 0.93 | 0.98 | 1.00 | 0.99 | |||||||||||||||||
Portfolio turnover rate (%) | 43.09 | 70.65 | 79.29 | 51.36 | 58.90 | 68.74 | ||||||||||||||||||
Net assets at end of period (thousands) | $ | 957,992 | $ | 1,961,495 | $ | 2,401,473 | $ | 1,074,492 | $ | 457,788 | $ | 378,334 | ||||||||||||
| (a) | Not annualized for periods less than one year. |
| (b) | Annualized. |
| + | Based on weighted average shares outstanding. |
| * | Unaudited. |
See notes to financial statements.
| 24 Certified Semi-Annual Report |
FINANCIAL HIGHLIGHTS, CONTINUED
Thornburg Value Fund
| Six Months Ended March 31, | Year Ended September 30, | |||||||||||||||||||||||
| 2009* | 2008 | 2007 | 2006 | 2005 | 2004 | |||||||||||||||||||
Class R3 Shares: | ||||||||||||||||||||||||
PER SHARE PERFORMANCE (for a share outstanding throughout the period)+ | ||||||||||||||||||||||||
Net asset value, beginning of period | $ | 27.86 | $ | 43.94 | $ | 37.43 | $ | 32.68 | $ | 28.06 | $ | 26.27 | ||||||||||||
Income from investment operations: | ||||||||||||||||||||||||
Net investment income (loss) | 0.19 | 0.17 | 0.26 | 0.37 | 0.33 | 0.17 | ||||||||||||||||||
Net realized and unrealized gain (loss) on investments | (8.13 | ) | (12.19 | ) | 7.81 | 4.71 | 4.60 | 1.85 | ||||||||||||||||
Total from investment operations | (7.94 | ) | (12.02 | ) | 8.07 | 5.08 | 4.93 | 2.02 | ||||||||||||||||
Less dividends from: | ||||||||||||||||||||||||
Net investment income | (0.20 | ) | (0.13 | ) | (0.26 | ) | (0.33 | ) | (0.31 | ) | (0.23 | ) | ||||||||||||
Net realized gains | — | (3.93 | ) | (1.30 | ) | — | — | — | ||||||||||||||||
Total dividends | (0.20 | ) | (4.06 | ) | (1.56 | ) | (0.33 | ) | (0.31 | ) | (0.23 | ) | ||||||||||||
Change in net asset value | (8.14 | ) | (16.08 | ) | 6.51 | 4.75 | 4.62 | 1.79 | ||||||||||||||||
NET ASSET VALUE, end of period | $ | 19.72 | $ | 27.86 | $ | 43.94 | $ | 37.43 | $ | 32.68 | $ | 28.06 | ||||||||||||
RATIOS/SUPPLEMENTAL DATA | ||||||||||||||||||||||||
Total return (%)(a) | (28.54 | ) | (29.54 | ) | 22.11 | 15.60 | 17.64 | 7.68 | ||||||||||||||||
Ratios to average net assets: | ||||||||||||||||||||||||
Net investment income (loss) (%) | 1.80 | (b) | 0.50 | 0.63 | 1.05 | 1.07 | 0.61 | |||||||||||||||||
Expenses, after expense reductions (%) | 1.35 | (b) | 1.35 | 1.35 | 1.36 | 1.35 | 1.34 | |||||||||||||||||
Expenses, after expense reductions and net of custody credits (%) | 1.35 | (b) | 1.35 | 1.35 | 1.35 | 1.35 | 1.34 | |||||||||||||||||
Expenses, before expense reductions (%) | 1.95 | (b) | 1.66 | 1.63 | 1.69 | 1.94 | 2.22 | |||||||||||||||||
Portfolio turnover rate (%) | 43.09 | 70.65 | 79.29 | 51.36 | 58.90 | 68.74 | ||||||||||||||||||
Net assets at end of period (thousands) | $ | 105,514 | $ | 161,517 | $ | 151,260 | $ | 48,627 | $ | 11,661 | $ | 5,754 | ||||||||||||
| (a) | Not annualized for periods less than one year. |
| (b) | Annualized. |
| + | Based on weighted average shares outstanding. |
| * | Unaudited. |
See notes to financial statements.
| Certified Semi-Annual Report 25 |
FINANCIAL HIGHLIGHTS, CONTINUED
Thornburg Value Fund
| Six Months Ended March 31, 2009* | Year Ended Sept. 30, 2008 | Period Ended Sept. 30, 2007(a) | ||||||||||
Class R4 Shares: | ||||||||||||
PER SHARE PERFORMANCE (for a share outstanding throughout the period)+ | ||||||||||||
Net asset value, beginning of period | $ | 27.99 | $ | 44.14 | $ | 41.00 | ||||||
Income from investment operations: | ||||||||||||
Net investment income (loss) | 0.20 | 0.19 | 0.20 | |||||||||
Net realized and unrealized gain (loss) on investments | (8.16 | ) | (12.23 | ) | 3.12 | |||||||
Total from investment operations | (7.96 | ) | (12.04 | ) | 3.32 | |||||||
Less dividends from: | ||||||||||||
Net investment income | (0.21 | ) | (0.18 | ) | (0.18 | ) | ||||||
Net realized gains | — | (3.93 | ) | — | ||||||||
Total dividends | (0.21 | ) | (4.11 | ) | (0.18 | ) | ||||||
Change in net asset value | (8.17 | ) | (16.15 | ) | 3.14 | |||||||
NET ASSET VALUE, end of period | $ | 19.82 | $ | 27.99 | $ | 44.14 | ||||||
RATIOS/SUPPLEMENTAL DATA | ||||||||||||
Total return (%)(b) | (28.47 | ) | (29.47 | ) | 8.09 | |||||||
Ratios to average net assets: | ||||||||||||
Net investment income (loss) (%) | 1.94 | (c) | 0.58 | 0.70 | (c) | |||||||
Expenses, after expense reductions (%) | 1.25 | (c) | 1.24 | 1.25 | (c) | |||||||
Expenses, after expense reductions and net of custody credits (%) | 1.25 | (c) | 1.24 | 1.25 | (c) | |||||||
Expenses, before expense reductions (%) | 1.73 | (c) | 1.48 | 2.34 | (c) | |||||||
Portfolio turnover rate (%) | 43.09 | 70.65 | 79.29 | |||||||||
Net assets at end of period (thousands) | $ | 22,973 | $ | 29,462 | $ | 7,038 | ||||||
| (a) | Effective date of this class of shares was February 1, 2007. |
| (b) | Not annualized for periods less than one year. |
| (c) | Annualized. |
| + | Based on weighted average shares outstanding. |
| * | Unaudited. |
See notes to financial statements.
| 26 Certified Semi-Annual Report |
FINANCIAL HIGHLIGHTS, CONTINUED
Thornburg Value Fund
| Six Months Ended March 31, | Year Ended September 30, | Period Ended Sept. 30, 2005(a) | ||||||||||||||||||
| 2009* | 2008 | 2007 | 2006 | |||||||||||||||||
Class R5 Shares: | ||||||||||||||||||||
PER SHARE PERFORMANCE (for a share outstanding throughout the period)+ | ||||||||||||||||||||
Net asset value, beginning of period | $ | 28.45 | $ | 44.78 | $ | 38.09 | $ | 33.22 | $ | 30.75 | ||||||||||
Income from investment operations: | ||||||||||||||||||||
Net investment income (loss) | 0.23 | 0.32 | 0.49 | 0.24 | 0.28 | |||||||||||||||
Net realized and unrealized gain (loss) on investments | (8.30 | ) | (12.47 | ) | 7.91 | 5.07 | 2.45 | |||||||||||||
Total from investment operations | (8.07 | ) | (12.15 | ) | 8.40 | 5.31 | 2.73 | |||||||||||||
Less dividends from: | ||||||||||||||||||||
Net investment income | (0.23 | ) | (0.25 | ) | (0.41 | ) | (0.44 | ) | (0.26 | ) | ||||||||||
Net realized gains | — | (3.93 | ) | (1.30 | ) | — | — | |||||||||||||
Total dividends | (0.23 | (4.18 | ) | (1.71 | ) | (0.44 | ) | (0.26 | ) | |||||||||||
Change in net asset value | (8.30 | ) | (16.33 | ) | 6.69 | 4.87 | 2.47 | |||||||||||||
NET ASSET VALUE, end of period | $ | 20.15 | $ | 28.45 | $ | 44.78 | $ | 38.09 | $ | 33.22 | ||||||||||
RATIOS/SUPPLEMENTAL DATA | ||||||||||||||||||||
Total return (%)(b) | (28.38 | ) | (29.30 | ) | 22.63 | 16.07 | 8.93 | |||||||||||||
Ratios to average net assets: | ||||||||||||||||||||
Net investment income (loss) (%) | 2.20 | (c) | 0.92 | 1.14 | 0.64 | 1.31 | (c) | |||||||||||||
Expenses, after expense reductions (%) | 0.98 | (c) | 0.98 | 0.91 | 1.00 | 1.00 | (c) | |||||||||||||
Expenses, after expense reductions and net of custody credits (%) | 0.98 | (c) | 0.98 | 0.91 | 0.98 | 0.99 | (c) | |||||||||||||
Expenses, before expense reductions (%) | 1.25 | (c) | 1.03 | 0.93 | 3.24 | 127.30 | (c)(d) | |||||||||||||
Portfolio turnover rate (%) | 43.09 | 70.65 | 79.29 | 51.36 | 58.90 | |||||||||||||||
Net assets at end of period (thousands) | $ | 97,275 | $ | 135,173 | $ | 106,906 | $ | 10,483 | $ | 31 | ||||||||||
| (a) | Effective date of this class of shares was February 1, 2005. |
| (b) | Not annualized for periods less than one year. |
| (c) | Annualized. |
| (d) | Due to the size of net assets and fixed expenses, ratios may appear disproportionate. |
| + | Based on weighted average shares outstanding. |
| * | Unaudited. |
See notes to financial statements.
| Certified Semi-Annual Report 27 |
| SCHEDULE OF INVESTMENTS | ||
| Thornburg Value Fund | March 31, 2009 (Unaudited) | |
SUMMARY OF INDUSTRY EXPOSURE
As of 3/31/09
Pharmaceuticals, Biotechnology & Life Sciences | 12.8 | % | |
Energy | 11.0 | % | |
Diversified Financials | 10.0 | % | |
Telecommunication Services | 9.4 | % | |
Technology Hardware & Equipment | 9.1 | % | |
Software & Services | 9.0 | % | |
Media | 8.4 | % | |
Insurance | 7.6 | % | |
Banks | 5.3 | % | |
Utilities | 3.8 | % | |
Health Care Equipment & Services | 3.3 | % | |
Food, Beverage & Tobacco | 2.1 | % | |
Retailing | 1.9 | % | |
Semiconductors & Semiconductor Equipment | 1.8 | % | |
Capital Goods | 1.4 | % | |
Consumer Services | 0.8 | % | |
Food & Staples Retailing | 0.8 | % | |
Transportation | 0.3 | % | |
Other Assets & Cash Equivalents | 1.2 | % |
| Shares/ Principal Amount | Value | ||||
COMMON STOCK — 84.39% | |||||
BANKS — 4.35% | |||||
COMMERCIAL BANKS — 4.35% | |||||
Fifth Third Bancorp | 14,664,443 | $ | 42,820,174 | ||
U.S. Bancorp | 3,674,900 | 53,690,289 | |||
| 96,510,463 | |||||
CAPITAL GOODS — 0.48% | |||||
AEROSPACE & DEFENSE — 0.48% | |||||
Boeing Co. | 301,400 | 10,723,812 | |||
| 10,723,812 | |||||
CONSUMER SERVICES — 0.84% | |||||
HOTELS, RESTAURANTS & LEISURE — 0.84% | |||||
Life Time Fitness, Inc.+ | 1,482,736 | 18,623,164 | |||
| 18,623,164 | |||||
DIVERSIFIED FINANCIALS — 5.35% | |||||
CAPITAL MARKETS — 3.71% | |||||
AllianceBernstein Holdings LP | 517,030 | 7,610,682 | |||
Charles Schwab Corp. | 2,984,012 | 46,252,186 | |||
Goldman Sachs Group, Inc. | 267,863 | 28,398,835 | |||
DIVERSIFIED FINANCIAL SERVICES — 1.64% | |||||
JPMorgan Chase & Co. | 1,365,800 | 36,302,964 | |||
| 118,564,667 | |||||
| 28 Certified Semi-Annual Report |
| SCHEDULE OF INVESTMENTS, CONTINUED | ||
| Thornburg Value Fund | March 31, 2009 (Unaudited) | |
| Shares/ Principal Amount | Value | ||||
ENERGY — 9.85% | |||||
ENERGY EQUIPMENT & SERVICES — 3.10% | |||||
Nabors Industries Ltd.+ | 1,973,800 | $ | 19,718,262 | ||
Transocean Ltd.+ | 834,100 | 49,078,444 | |||
OIL, GAS & CONSUMABLE FUELS — 6.75% | |||||
Addax Petroleum Corp. | 757,400 | 16,399,921 | |||
ConocoPhillips | 1,151,600 | 45,096,656 | |||
Marathon Oil Corp. | 2,822,700 | 74,208,783 | |||
OAO Gazprom ADR | 933,100 | 13,856,535 | |||
| 218,358,601 | |||||
FOOD & STAPLES RETAILING — 0.46% | |||||
FOOD & STAPLES RETAILING — 0.46% | |||||
Rite Aid Corp.+ | 28,214,107 | 10,157,078 | |||
| 10,157,078 | |||||
FOOD, BEVERAGE & TOBACCO — 2.12% | |||||
BEVERAGES — 2.12% | |||||
Dr. Pepper Snapple Group, Inc.+ | 2,779,941 | 47,008,802 | |||
| 47,008,802 | |||||
HEALTH CARE EQUIPMENT & SERVICES — 3.33% | |||||
HEALTH CARE EQUIPMENT & SUPPLIES — 1.03% | |||||
Varian Medical Services, Inc.+ | 752,490 | 22,905,796 | |||
HEALTH CARE PROVIDERS & SERVICES — 1.13% | |||||
Community Health Systems, Inc.+ | 1,635,740 | 25,092,252 | |||
HEALTH CARE TECHNOLOGY — 1.17% | |||||
Eclipsys Corp.+ | 2,543,140 | 25,787,439 | |||
| 73,785,487 | |||||
INSURANCE — 7.00% | |||||
INSURANCE — 7.00% | |||||
Ace Ltd. | 1,956,220 | 79,031,288 | |||
Allstate Corp. | 1,774,600 | 33,983,590 | |||
Hartford Financial Services Group, Inc. | 2,989,959 | 23,471,178 | |||
Swiss Re | 1,149,600 | 18,825,041 | |||
| 155,311,097 | |||||
MEDIA — 8.33% | |||||
MEDIA — 8.33% | |||||
Comcast Corp. | 5,957,150 | 76,668,520 | |||
DIRECTV Group, Inc.+ | 2,633,592 | 60,019,562 | |||
Dish Network Corp.+ | 4,328,938 | 48,094,501 | |||
| 184,782,583 | |||||
PHARMACEUTICALS, BIOTECHNOLOGY & LIFE SCIENCES — 12.79% | |||||
BIOTECHNOLOGY — 3.37% | |||||
Gilead Sciences, Inc.+ | 1,613,900 | 74,755,848 | |||
LIFE SCIENCES TOOLS & SERVICES — 2.02% | |||||
Thermo Fisher Scientific, Inc.+ | 1,252,400 | 44,673,108 | |||
| Certified Semi-Annual Report 29 |
| SCHEDULE OF INVESTMENTS, CONTINUED | ||
| Thornburg Value Fund | March 31, 2009 (Unaudited) | |
| Shares/ Principal Amount | Value | ||||
PHARMACEUTICALS — 7.40% | |||||
Eli Lilly & Co. | 2,700,343 | $ | 90,218,460 | ||
Roche Holdings AG | 253,700 | 34,813,265 | |||
Teva Pharmaceutical Industries Ltd. ADR | 868,736 | 39,136,557 | |||
| 283,597,238 | |||||
RETAILING — 1.94% | |||||
INTERNET & CATALOG RETAIL — 1.94% | |||||
Priceline.com, Inc.+ | 547,500 | 43,132,050 | |||
| 43,132,050 | |||||
SEMICONDUCTORS & SEMICONDUCTOR EQUIPMENT — 1.02% | |||||
SEMICONDUCTORS & SEMICONDUCTOR EQUIPMENT — 1.02% | |||||
ON Semiconductor Corp.+ | 5,819,627 | 22,696,545 | |||
| 22,696,545 | |||||
SOFTWARE & SERVICES — 7.96% | |||||
INFORMATION TECHNOLOGY SERVICES — 1.29% | |||||
Visa, Inc. | 515,700 | 28,672,920 | |||
SOFTWARE — 6.67% | |||||
Amdocs Ltd.+ | 3,023,348 | 55,992,405 | |||
Microsoft Corp. | 5,001,200 | 91,872,044 | |||
| 176,537,369 | |||||
TECHNOLOGY HARDWARE & EQUIPMENT — 9.08% | |||||
COMMUNICATIONS EQUIPMENT — 3.44% | |||||
Corning, Inc. | 3,332,800 | 44,226,256 | |||
Research In Motion Ltd.+ | 745,700 | 32,117,299 | |||
COMPUTERS & PERIPHERALS — 5.64% | |||||
Apple, Inc.+ | 618,750 | 65,043,000 | |||
Dell, Inc.+ | 6,331,300 | 60,020,724 | |||
| 201,407,279 | |||||
TELECOMMUNICATION SERVICES — 5.71% | |||||
DIVERSIFIED TELECOMMUNICATION SERVICES — 2.45% | |||||
AT&T, Inc. | 2,089,548 | 52,656,610 | |||
Level 3 Communications, Inc.+ | 1,871,800 | 1,722,056 | |||
WIRELESS TELECOMMUNICATION SERVICES — 3.26% | |||||
China Mobile Ltd. | 4,566,800 | 39,860,659 | |||
Crown Castle International Corp.+ | 1,581,650 | 32,281,477 | |||
| 126,520,802 | |||||
UTILITIES — 3.78% | |||||
ELECTRIC UTILITIES — 3.78% | |||||
Entergy Corp. | 1,232,136 | 83,896,140 | |||
| 83,896,140 | |||||
TOTAL COMMON STOCK (Cost $2,863,045,882) | 1,871,613,177 | ||||
| 30 Certified Semi-Annual Report |
| SCHEDULE OF INVESTMENTS, CONTINUED | ||
| Thornburg Value Fund | March 31, 2009 (Unaudited) | |
| Shares/ Principal Amount | Value | |||||
PREFERRED STOCK — 0.26% | ||||||
DIVERSIFIED FINANCIAL SERVICES — 0.26% | ||||||
DIVERSIFIED FINANCIAL SERVICES — 0.26% | ||||||
CIT Group, Inc. | 319,700 | $ | 5,818,540 | |||
TOTAL PREFERRED STOCK (Cost $15,985,000) | 5,818,540 | |||||
CORPORATE BONDS — 7.57% | ||||||
BANKS — 0.97% | ||||||
COMMERCIAL BANKS — 0.97% | ||||||
Fifth Third Capital Trust IV, 6.50%, 4/15/2067 | $ | 28,864,000 | 9,386,053 | |||
USB Capital IX, 6.189%, 4/15/2049 | 30,816,000 | 12,172,320 | ||||
| 21,558,373 | ||||||
CAPITAL GOODS — 0.91% | ||||||
INDUSTRIAL CONGLOMERATES — 0.91% | ||||||
General Electric Capital Corp., 6.375%, 11/15/2067 | 41,534,000 | 20,168,163 | ||||
| 20,168,163 | ||||||
DIVERSIFIED FINANCIALS — 3.16% | ||||||
CAPITAL MARKETS — 1.17% | ||||||
Goldman Sachs Capital II, 5.793%, 12/29/2049 | 50,995,000 | 21,231,309 | ||||
Goldman Sachs Capital III, 2.031%, 9/29/2049 | 15,277,000 | 4,812,255 | ||||
DIVERSIFIED FINANCIAL SERVICES — 1.99% | ||||||
CIT Group, Inc., 5.00%, 2/13/2014 | 4,011,900 | 2,299,922 | ||||
CIT Group, Inc., 5.125%, 9/30/2014 | 3,695,000 | 2,233,579 | ||||
CIT Group, Inc., 5.00%, 2/1/2015 | 5,879,000 | 3,579,429 | ||||
CIT Group, Inc., 5.40%, 1/30/2016 | 17,808,300 | 10,673,654 | ||||
CIT Group, Inc., 5.85%, 9/15/2016 | 3,028,700 | 1,713,008 | ||||
JPMorgan Chase Capital XXI, 2.12%, 2/2/2037 | 15,502,000 | 5,976,161 | ||||
JPMorgan Chase Capital XXIII, 2.238%, 5/15/2047 | 43,056,000 | 17,617,267 | ||||
| 70,136,584 | ||||||
FOOD & STAPLES RETAILING — 0.34% | ||||||
FOOD & STAPLES RETAILING — 0.34% | ||||||
Rite Aid Corp., 7.50%, 3/1/2017 | 1,273,000 | 655,595 | ||||
Rite Aid Corp., 10.375%, 7/15/2016 | 11,277,000 | 6,766,200 | ||||
| 7,421,795 | ||||||
INSURANCE — 0.59% | ||||||
INSURANCE — 0.59% | ||||||
Glen Meadow Pass Through, 6.505%, 2/12/2067(1) | 36,315,000 | 8,180,789 | ||||
Hartford Financial Services Group, 8.125%, 6/15/2038 | 15,457,000 | 4,951,805 | ||||
| 13,132,594 | ||||||
TELECOMMUNICATION SERVICES — 1.60% | ||||||
DIVERSIFIED TELECOMMUNICATION SERVICES — 1.60% | ||||||
Level 3 Financing, Inc., 9.25%, 11/1/2014 | 51,489,000 | 35,527,410 | ||||
| 35,527,410 | ||||||
TOTAL CORPORATE BONDS (Cost $179,924,905) | 167,944,919 | |||||
| Certified Semi-Annual Report 31 |
| SCHEDULE OF INVESTMENTS, CONTINUED | ||
| Thornburg Value Fund | March 31, 2009 (Unaudited) | |
| Shares/ Principal Amount | Value | |||||
CONVERTIBLE BONDS — 6.63% | ||||||
DIVERSIFIED FINANCIALS — 1.23% | ||||||
DIVERSIFIED FINANCIAL SERVICES — 1.23% | ||||||
NASDAQ OMX Group, 2.50%, 8/15/2013 | $ | 32,434,000 | $ | 27,204,017 | ||
| 27,204,017 | ||||||
ENERGY — 1.12% | ||||||
OIL, GAS & CONSUMABLE FUELS — 1.12% | ||||||
Chesapeake Energy Corp., 2.75%, 11/15/2035 | 9,406,000 | 7,101,530 | ||||
Chesapeake Energy Corp., 2.25%, 12/15/2038 | 34,366,000 | 17,698,490 | ||||
| 24,800,020 | ||||||
SEMICONDUCTORS & SEMICONDUCTOR EQUIPMENT — 0.82% | ||||||
SEMICONDUCTORS & SEMICONDUCTOR EQUIPMENT — 0.82% | ||||||
ON Semiconductor Corp., 2.625%, 12/15/2026 | 25,812,000 | 18,229,725 | ||||
| 18,229,725 | ||||||
SOFTWARE & SERVICES — 1.05% | ||||||
INFORMATION TECHNOLOGY SERVICES — 1.05% | ||||||
Alliance Data Systems Corp., 1.75%, 8/1/2013(1) | 32,925,000 | 23,253,281 | ||||
| 23,253,281 | ||||||
TELECOMMUNICATION SERVICES — 2.13% | ||||||
DIVERSIFIED TELECOMMUNICATION SERVICES — 1.74% | ||||||
Level 3 Communications, Inc., 10.00%, 5/1/2011 | 22,525,000 | 14,613,094 | ||||
Level 3 Communications, Inc., 5.25%, 12/15/2011 | 47,130,000 | 24,036,300 | ||||
WIRELESS TELECOMMUNICATION SERVICES — 0.39% | ||||||
SBA Communications Corp., 1.875%, 5/1/2013(1) | 10,856,900 | 8,685,520 | ||||
| 47,334,914 | ||||||
TRANSPORTATION — 0.28% | ||||||
AIRLINES — 0.28% | ||||||
JetBlue Airways Corp., 3.75%, 3/15/2035 | 7,090,000 | 6,168,300 | ||||
| 6,168,300 | ||||||
TOTAL CONVERTIBLE BONDS (Cost $139,431,092) | 146,990,257 | |||||
SHORT TERM INVESTMENTS — 1.06% | ||||||
Intesa Funding, LLC, 0.25%, 4/1/2009 | 23,500,000 | 23,500,000 | ||||
TOTAL SHORT TERM INVESTMENTS (Cost $23,500,000) | 23,500,000 | |||||
TOTAL INVESTMENTS — 99.91% (Cost $3,219,897,310) | $ | 2,215,866,893 | ||||
OTHER ASSETS LESS LIABILITIES — 0.09% | 1,895,052 | |||||
NET ASSETS — 100.00% | $ | 2,217,761,945 | ||||
| 32 Certified Semi-Annual Report |
| SCHEDULE OF INVESTMENTS, CONTINUED | ||
| Thornburg Value Fund | March 31, 2009 (Unaudited) | |
Footnote Legend
| + | Non-income producing |
| (1) | Securities exempt from registration under Rule 144A of the Securities Act of 1933, as amended. These securities may only be resold in the ordinary course of business in transactions exempt from registration, normally to qualified institutional buyers. As of March 31, 2009, the aggregate value of these securities in the Fund’s portfolio was $40,119,590, representing 1.81% of the Fund’s net assets. |
Portfolio Abbreviations
To simplify the listings of securities, abbreviations are used per the table below:
ADR American Depository Receipt
See notes to financial statements.
| Certified Semi-Annual Report 33 |
| EXPENSE EXAMPLE | ||
| Thornburg Value Fund | March 31, 2009 (Unaudited) | |
As a shareholder of the Fund, you incur two types of costs:
(1) transaction costs, including
(a) sales charges (loads) on purchase payments for Class A shares;
(b) a deferred sales charge on redemptions of any part or all of a purchase of $1 million of Class A shares within 12 months of purchase;
(c) a deferred sales charge on redemptions of Class B shares within eight years of purchase;
(d) a deferred sales charge on redemptions of Class C shares within 12 months of purchase;
(e) a 30-day redemption fee on Class A and Class I shares;
(2) ongoing costs, including management fees; distribution and/or service (12b-1) fees; and other Fund expenses.
This example is intended to help you understand your ongoing costs (in dollars) of investing in the Fund and to compare these costs with the ongoing costs of investing in other mutual funds.
The example is based on an investment of $1,000 invested on September 30, 2008 and held until March 31, 2009.
| Beginning Account Value 9/30/08 | Ending Account Value 3/31/09 | Expenses Paid During Period† 9/30/08–3/31/09 | |||||||
Class A Shares | |||||||||
Actual | $ | 1,000.00 | $ | 714.70 | $ | 5.95 | |||
Hypothetical* | $ | 1,000.00 | $ | 1,017.99 | $ | 7.01 | |||
Class B Shares | |||||||||
Actual | $ | 1,000.00 | $ | 711.70 | $ | 9.61 | |||
Hypothetical* | $ | 1,000.00 | $ | 1,013.70 | $ | 11.31 | |||
Class C Shares | |||||||||
Actual | $ | 1,000.00 | $ | 712.00 | $ | 9.24 | |||
Hypothetical* | $ | 1,000.00 | $ | 1,014.14 | $ | 10.87 | |||
Class I Shares | |||||||||
Actual | $ | 1,000.00 | $ | 716.30 | $ | 4.20 | |||
Hypothetical* | $ | 1,000.00 | $ | 1,020.04 | $ | 4.94 | |||
Class R3 Shares | |||||||||
Actual | $ | 1,000.00 | $ | 714.60 | $ | 5.77 | |||
Hypothetical* | $ | 1,000.00 | $ | 1,018.20 | $ | 6.79 | |||
Class R4 Shares | |||||||||
Actual | $ | 1,000.00 | $ | 715.30 | $ | 5.35 | |||
Hypothetical* | $ | 1,000.00 | $ | 1,018.70 | $ | 6.29 | |||
Class R5 Shares | |||||||||
Actual | $ | 1,000.00 | $ | 716.20 | $ | 4.20 | |||
Hypothetical* | $ | 1,000.00 | $ | 1,020.04 | $ | 4.94 | |||
| † | Expenses are equal to the annualized expense ratio for each class (A: 1.39%; B: 2.25%; C: 2.16%; I: 0.98%; R3: 1.35%; R4: 1.25%; and R5: 0.98%) multiplied by the average account value over the period, multiplied by 182/365 to reflect the one-half year period. |
| * | Hypothetical assumes a rate of return of 5% per year before expenses. |
Actual Expenses
For each class of shares, the first line of the table at right provides information about actual account values and actual expenses. You may use the information in this line, together with the amount you invested, to estimate the expenses that you paid over the period. Simply divide your account value by $1,000 (for example, an $8,600 account value divided by $1,000 = 8.6), then multiply the result by the number in the first line for your class of shares under the heading entitled “Expenses Paid During Period” to estimate the expenses you paid on your account during this period.
Hypothetical Example for Comparison Purposes
For each class of shares, the second line of the table at right provides information about hypothetical account values and hypothetical expenses based on the Fund’s actual expense ratio and an assumed rate of return of 5% per year before expenses, which is not the Fund’s actual return. The hypotheti-cal account values and expenses may not be used to estimate the actual ending account balance or expenses you paid for the period. You may use this information to compare the ongoing costs of investing in the Fund and other funds. To do so, compare this 5% hypothetical example with the 5% hypothetical examples that appear in the shareholder reports of the other funds.
Please note that the expenses shown in the table are meant to highlight your ongoing costs only and do not reflect any transactional costs, such as sales charges (loads), redemption fees, or exchange fees. Therefore, the second line of the table for each class of shares is useful in comparing ongoing costs only, and will not help you determine the relative total costs of owning different funds. In addition, if these transactional costs were included, your costs would have been higher.
| 34 Certified Semi-Annual Report |
| INDEX COMPARISON | ||
| Thornburg Value Fund | March 31, 2009 (Unaudited) | |
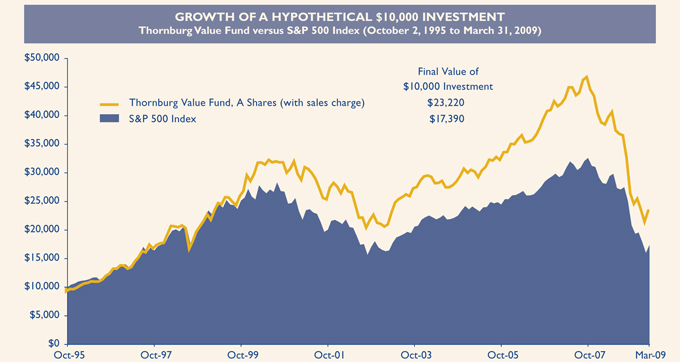
AVERAGE ANNUAL TOTAL RETURNS
For periods ended March 31, 2009 (with sales charge)
| 1 Yr | 5 Yrs | 10 Yrs | Since Inception | |||||||||
A Shares (Incep: 10/2/95) | -42.10 | % | -5.32 | % | -0.48 | % | 6.44 | % | ||||
B Shares (Incep: 4/3/00) | -42.84 | % | -5.52 | % | — | -3.95 | % | |||||
C Shares (Incep: 10/2/95) | -40.42 | % | -5.16 | % | -0.78 | % | 5.98 | % | ||||
I Shares (Incep: 11/2/98) | -39.12 | % | -4.07 | % | 0.38 | % | 1.88 | % | ||||
R3 Shares (Incep: 7/1/03) | -39.39 | % | -4.47 | % | — | -1.52 | % | |||||
R4 Shares (Incep: 2/1/07) | -39.30 | % | — | — | -24.49 | % | ||||||
R5 Shares (Incep: 2/1/05) | -39.15 | % | — | — | -5.65 | % | ||||||
S&P 500 Index (Since: 10/2/95) | -38.09 | % | -4.76 | % | -3.00 | % | 4.18 | % |
The S&P 500 Index, an unmanaged broad measure of the U.S. stock market, does not reflect sales charges or expenses. Investors cannot invest directly in an index.
Performance data reflects past performance, which is no guarantee of future results. The performance data and graph do not reflect the deduction of taxes that a shareholder would pay on distributions or the redemption of Fund shares.
Returns reflect the reinvestment of dividends and capital gains as well as applicable sales charges. Class A shares are sold with a maximum sales charge of 4.50%. Class B shares are sold with a contingent deferred sales charge (CDSC) that declines from 5.00% to 0% depending upon the period of time the shares are held. Class B shares will automatically convert to Class A shares on a quarterly basis approximately eight years after purchase. Class C shares are subject to a 1% CDSC for the first year only. There is no up-front sales charge for Class I, R3, R4 and R5 shares. Class A and I shares are subject to a 1% 30-day redemption fee.
| Certified Semi-Annual Report 35 |
| OTHER INFORMATION | ||
| Thornburg Value Fund | March 31, 2009 (Unaudited) | |
PORTFOLIO PROXY VOTING
Policies and Procedures:
The Trust has delegated to Thornburg Investment Management, Inc. (the “Advisor”) voting decisions respecting proxies for the Fund’s voting securities. The Advisor makes voting decisions in accordance with its Proxy Voting Policy and Procedures. A description of the Policy and Procedures is available (i) without charge, upon request, by calling the Advisor toll-free at 1-800-847-0200, (ii) on the Thornburg web site at www.thornburg.com, and (iii) on the Securities and Exchange Commission’s web site at www.sec.gov.
Information regarding how proxies were voted is available on or before August 31 of each year for the twelve months ending the preceding June 30. This information is available (i) without charge, upon request by calling the Advisor toll-free at 1-800-847-0200, (ii) on the Thornburg web site at www. thornburg.com, and (iii) on the Securities and Exchange Commission’s web site at www.sec.gov.
AVAILABILITY OF QUARTERLY PORTFOLIO SCHEDULE
The Fund files with the Securities and Exchange Commission schedules of its portfolio holdings on Form N-Q for the first and third quarters of each fiscal year. The Fund’s Forms N-Q are available on the Commission’s web site at www.sec.gov, or may be reviewed and copied at the Commission’s Public Reference Room in Washington, D.C. Information on the operation of the Public Reference Room may be obtained by calling 1-800-SEC-0330. The Fund also makes this information available on its web site at www. thornburg.com/download or upon request by calling 1-800-847-0200.
| 36 Certified Semi-Annual Report |
Trustees’ Statement to Shareholders
Not part of the Certified Semi-Annual Report
February 8, 2005, as readopted September 15, 2008
The Trustees are concerned that ongoing commentaries and opinions reported in the media may confuse investors in general as to the supervisory duties of trustees of mutual funds and, in particular, leave Thornburg Investment Trust shareholders uncertain regarding how we discharge our responsibilities in supervising the Funds’ investment advisor and in reviewing the advisor’s contract for renewal. We decided to spell out clearly three principal guidelines that we follow in supervising the Trust’s investment advisor on your behalf.
We begin with the premise that each shareholder selected his or her Fund because its investments are managed by the investment advisor identified in the prospectus and in accordance with the objective and policies described in the prospectus. We realize, as each of you do, that if you believe that your Fund’s stated objective and policies no longer serve your personal investment goals, you can sell your shares and leave the Fund.
Therefore, we believe that our primary supervisory task – our principal obligation to you – is to assess the nature and quality of the advisor’s services, and to confirm that the advisor actively and competently pursues the Fund’s objective, in accordance with the policies set out in the prospectus. To do this, we meet regularly with management to review your Fund’s portfolio and to discuss the advisor’s specific actions and judgments in pursuing the Fund’s objective. We do not substitute our own judgment for the advisor’s decisions in selecting investments; the advisor is paid to exercise its informed judgment on investment decisions, and we seek to confirm, in reviewing the advisor’s performance, that the advisor is doing just that.
Second, while we are conscious of costs and the effect that costs have on shareholders’ returns, we do not seek the lowest fees or expense ratio as our sole or primary objective. We try to make sure that your Fund’s fees and costs are reasonable in relationship to the services rendered and that they are generally in line with those charged by other expert investment advisors, consistent with our belief that the Fund’s investors searched for and expect that expertise and attention and have decided to pay a reasonable price for it. We do not put the management contract “out to bid” as a matter of course, and we would not do so unless we had concluded that the advisor materially had failed to pursue the Fund’s objectives in accordance with its policies, or for other equally important reasons. We believe that any other approach would be inconsistent with your interests and contrary to your expectations when you bought shares of the Fund in the first place.
Finally, because we believe that most Thornburg Fund shareholders have invested with a long-term perspective, we try not to focus too much on the fashions of the moment and on short-term performance. The market will not favor any specific investment objective or set of policies at all times and under all economic circumstances. A fund will experience periods of both high and low returns relative to other funds and other investments. Even if one of our Funds is not favored by the market at a particular time, we believe that the advisor is nonetheless obliged to remain true to the Fund’s objective and policies, and we watch to see that it does so.
| This page is not part of the Semi-Annual Report. 37 |
This page intentionally left blank.
| 38 This page is not part of the Semi-Annual Report. |
Planning Options
Retirement and Education Accounts
Thornburg Investment Management offers retirement and education savings accounts that can help you meet a variety of planning challenges. For account applications or further information on any of the accounts below, please call 1-800-847-0200 or go to www.thornburg.com/ira. Your financial advisor can help you determine which plan is right for you.
Individual Retirement Accounts
Individual Retirement Accounts (IRAs) provide a tax-advantaged means to save money for the future. For a detailed outline of the difference between retirement accounts, see www.thornburg.com/ira. Rollovers are available. Call 1-800-847-0200 for more information.
Traditional IRAs – Contributions to Traditional IRAs are tax deductible for eligible individuals, and withdrawals are taxed as additional ordinary income. You may contribute to an IRA if you receive compensation and are under 70 1/2, even if you are covered by an employer retirement plan. Deductible contributions are subject to certain qualifications. Please consult your tax advisor.
Roth IRAs – Under a Roth IRA, there is no tax deduction for contributions, but there is no income tax on qualified withdrawals. For a more detailed comparison of Traditional and Roth IRAs, please see our web site at www.thornburg.com/ira.
SEP IRAs – Simplified Employee Pension (SEP) IRAs are established by employers. The employer is allowed a tax deduction for contributions made to the SEP Plan and makes contributions to each eligible employee’s SEP IRA on a discretionary basis.
SIMPLE IRAs – Savings Incentive Match Plan for Employees of Small Employers (SIMPLE) is designed to give small business owners a simplified method to establish and contribute to a retirement plan for employees. The employer is allowed a tax deduction for contributions and makes either matching or non-elective contributions to each eligible employee’s SIMPLE IRA. Employees may make salary deferral contributions.
Coverdell Education Savings Account
These savings accounts are designed to provide a way to save money for higher education expenses. In an Education Savings Account, earnings and interest grow tax-free, and qualified withdrawals used to pay for eligible higher-education expenses are tax- and penalty-free.
Funds Available
The following funds are available in the accounts listed above:
| • | Thornburg International Value Fund |
| • | Thornburg Value Fund |
| • | Thornburg Core Growth Fund |
| • | Thornburg Investment Income Builder Fund |
| • | Thornburg Global Opportunities Fund |
| • | Thornburg International Growth Fund |
| • | Thornburg Limited Term U.S. Government Fund |
| • | Thornburg Limited Term Income Fund |
| • | Thornburg Strategic Income Fund |
| This page is not part of the Semi-Annual Report. 39 |

| 40 This page is not part of the Semi-Annual Report. |
Thornburg Equity Funds
Thornburg’s equity research uses a fundamental and comprehensive analytical approach. Thornburg equity funds focus on a limited number of securities so that each holding can impact performance. The equity team searches for firms believed to have a promising future and seeks to buy shares of those companies at a discount to their intrinsic value.
| • | Thornburg Value Fund |
| • | Thornburg International Value Fund |
| • | Thornburg Core Growth Fund |
| • | Thornburg Investment Income Builder Fund |
| • | Thornburg Global Opportunities Fund |
| • | Thornburg International Growth Fund |
Thornburg Bond Funds
Thornburg Investment Management applies a disciplined philosophy to fixed-income management. Since the launch of our first fixed-income fund 25 years ago, we have been conducting fundamental, bottom-up research in an effort to identify bonds which we believe provide the best return for a given level of risk. We are very organic in our approach, avoiding leverage or complex strategies which could backfire in periods of market uncertainty.
| • | Thornburg Limited Term Municipal Fund |
| • | Thornburg Intermediate Municipal Fund |
| • | Thornburg California Limited Term Municipal Fund |
| • | Thornburg New Mexico Intermediate Municipal Fund |
| • | Thornburg New York Intermediate Municipal Fund |
| • | Thornburg Strategic Municipal Income Fund |
| • | Thornburg Limited Term U.S. Government Fund |
| • | Thornburg Limited Term Income Fund |
| • | Thornburg Strategic Income Fund |
Before investing, carefully consider the Fund’s investment goals, risks, charges, and expenses. For a prospectus containing this and other information, contact your financial advisor or visit thornburg.com. Read it carefully before investing.
For additional information, please visit www.thornburg.com
Thornburg Investment Management, Inc. 2300 North Ridgetop Road, Santa Fe, NM 87506
| This page is not part of the Semi-Annual Report. 41 |
This page intentionally left blank.
| 42 This page is not part of the Semi-Annual Report. |
This page intentionally left blank.
| This page is not part of the Semi-Annual Report. 43 |

This Semi-Annual Report is submitted for the general information of shareholders of the Fund. It is not authorized for distribution to prospective investors in the Fund unless preceded or accompanied by an effective prospectus.
| ||
 | Investment Advisor:
| |
Thornburg Investment Management® 800.847.0200
| ||
Distributor:
| ||
Thornburg Securities Corporation® 800.847.0200 | ||
TH170 |
Waste not, Wait not |  |
Get instant access to your shareholder reports.
By switching from your postal mailbox to your email inbox, you reduce paper clutter, improve record keeping access, and help conserve our natural resources.
Go to www.thornburg.com/edelivery and sign up to receive your shareholder reports, prospectuses, and proxy statements electronically.
You invest in the future, without spending a dime.

| 2 This page is not part of the Semi-Annual Report. |
Important Information
The information presented on the following pages was current as of March 31, 2009. The managers’ views, portfolio holdings, and sector and country diversification are provided for the general information of the Fund’s shareholders; they are historical and subject to change. This material should not be deemed a recommendation to buy or sell any of the securities mentioned.
Investments in the Fund carry risks including possible loss of principal. Investing outside the United States involves additional risks, such as currency fluctuations. Risks may be associated with investments in emerging markets including illiquidity and volatility. Additionally, the Fund may invest a portion of the assets in small capitalization companies, which may increase the risk of greater price fluctuations. Funds invested in a limited number of holdings may expose an investor to greater volatility. Please see the Fund’s Prospectus for a discussion of the risks associated with an investment in the Fund. Investments in the Fund are not deposits or obligations of, or guaranteed or endorsed by, any bank, the Federal Deposit Insurance Corporation, the Federal Reserve Board or any government agency. There is no guarantee that the Fund will meet its investment objectives.
Performance data given at net asset value (NAV) does not take into account the applicable sales charges. If the sales charges had been included, the performance would have been lower.
Class I, R3, R4, and R5 shares may not be available to all investors. Minimum investments for Class I shares may be higher than those for other classes.
Share Class | NASDAQ Symbol | Cusip | ||
Class A | TGVAX | 885-215-657 | ||
Class B | THGBX | 885-215-616 | ||
Class C | THGCX | 885-215-640 | ||
Class I | TGVIX | 885-215-566 | ||
Class R3 | TGVRX | 885-215-525 | ||
Class R4 | THVRX | 815-215-269 | ||
Class R5 | TIVRX | 885-215-368 |
Glossary
MSCI EAFE (Europe, Australasia, Far East) Index – An unmanaged, market capitalization weighted index that is the common benchmark for international portfolio performance. The index is calculated with net dividends reinvested in U.S. dollars.
Unless otherwise noted, index returns reflect the reinvestment of income dividends and capital gains, if any, but do not reflect fees, brokerage commissions or other expenses of investing. Investors may not make direct investments into any index. The performance of any index is not indicative of the performance of any particular investment.
Basis Point – A unit that is equal to 1/100th of 1%. A 1% change = 100 basis points (bps).
Beta – A measure of market-related risk. Less than one means the portfolio is less volatile than the index, while greater than one indicates more volatility than the index.
Median Market Capitalization – Market capitalization (market cap) is the total value of a company’s stock, calculated by multiplying the number of outstanding common shares by the current share price. The company whose market cap is in the middle of the portfolio is the median market cap. Half the companies in the portfolio have values greater than the median, and half have values that are less.
Price to Book Value (P/B) – A ratio used to compare a stock’s market value to its book value. It is calculated by dividing the current closing price of the stock by the latest quarter’s book value (book value is simply assets minus liabilities).
Price to Cash Flow Ratio – A measure of the market’s expectations of a firm’s future financial health. It is calculated by dividing the price per share by cash flow per share.
Price to Earnings Ratio (P/E) – A valuation ratio equaling a company’s market value per share divided by earnings per share.
| This page is not part of the Semi-Annual Report. 3 |
Thornburg International Value Fund

Left to right: Lei Wang,CFA, Bill Fries,CFA,
Wendy Trevisani
KEY PORTFOLIO ATTRIBUTES
As of 3/31/09
Portfolio P/E Trailing 12-months* | 11.2x | ||
Portfolio Price to Cash Flow* | 6.4 | ||
Portfolio Price to Book Value* | 1.9 | ||
Median Market Cap* | $ | 17.7 B | |
7-Year Beta (A Shares vs. MSCI EAFE)* | 0.92 | ||
Holdings | 54 |
| * | Source: FactSet |
IMPORTANT PERFORMANCE
INFORMATION
Performance data shown represents past performance and is no guarantee of future results. Investment return and principal value will fluctuate so shares, when redeemed, may be worth more or less than their original cost. Current performance may be lower or higher than quoted. For performance current to the most recent month end, visit thornburg.com.
The maximum sales charge for Class A shares is 4.50%. Class A shares are subject to a 1% 30-day redemption fee. The total annual fund operating expenses of Class A shares is 1.36%, as disclosed in the most recent Prospectus.
Finding Promising Companies at a Discount
The Thornburg International Value Fund seeks to find value in overseas markets. It differs from many other international equity funds in two key ways. First, it focuses on a limited number of stocks, and second, it takes a more comprehensive approach to value investing.
Our team is dedicated to providing value to shareholders. We accomplish this through the application of seasoned investment principles with hands-on, company-oriented research. We use a collaborative approach in implementing our investment research process. Our focus is on finding promising companies available at a discount to our estimate of their intrinsic value, no matter where they are located outside the United States. Geographic location is secondary to individual stock merit.
In managing the Thornburg International Value Fund, we take a bottom-up approach to stock selection. The Fund is not predisposed to a particular geographic region or industry. We use a variety of valuation methods and business evaluations in an effort to gauge the intrinsic value of a company based on its past record and future potential. The continuum of process moves from screens and idea
AVERAGE ANNUAL TOTAL RETURNS
FOR PERIODS ENDED MARCH 31, 2009
| 1 Yr | 3 Yrs | 5 Yrs | 10 Yrs | |||||||||
A Shares (Incep: 5/28/98) | ||||||||||||
Without Sales Charge | -41.82 | % | -8.81 | % | 1.93 | % | 7.17 | % | ||||
With Sales Charge | -44.44 | % | -10.19 | % | 0.99 | % | 6.67 | % | ||||
MSCI EAFE Index (Since: 5/28/98) | -46.51 | % | -14.47 | % | -2.18 | % | -0.84 | % |
| 4 This page is not part of the Semi-Annual Report. |
generation, through conventional “Wall Street” research and documentation, to company contact, the latter often including on-site visits. The focus of the analysis is on what’s behind the numbers: its revenue and cash-generating model. We make an effort to get to know the company’s reputation in the industry, its people and its corporate culture.
The current posture is to maintain a portfolio of 50–65 companies diversified by country, sector, industry, market capitalization, and our three categories of stocks: Basic Value, Consistent Earners and Emerging Franchises. Because of the limited number of stocks in the portfolio, every holding counts. At the time of purchase, we set a 12–18 month price target for each stock. The target is reviewed as the fundamentals of the stock change during the course of ownership.
The bottom line? Engendering a wide-open, collegial environment fosters information flows and critical thinking intended to benefit portfolio decision making. We do not view our location in Santa Fe, NM, as a disadvantage. While we have access to the best of Wall Street’s analysis, we are not ruled by it. Distance from the crowd serves to fortify independent and objective thinking.
STOCKS CONTRIBUTING AND DETRACTING
FOR SIX MONTHS ENDED 3/31/09
Top Contributors | Top Detractors | |
| Baidu, Inc. ADR | AXA SA | |
| Teva Pharmaceutical Industries Ltd. | BNP Paribas SA | |
| Redecard SA | National Bank of Greece SA | |
| Covidien Ltd. | Swiss Re | |
| Next plc | Carlsberg AS | |
| Source: FactSet | ||
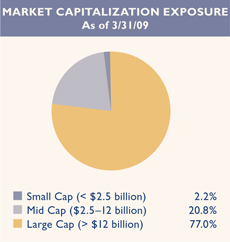
TOP TEN HOLDINGS
As of 3/31/09
Teva Pharmaceutical Industries Ltd. | 4.7 | % | |
Novo Nordisk A/S | 3.8 | % | |
Nestlé SA | 3.5 | % | |
China Life Insurance Co. | 3.2 | % | |
Roche Holding AG | 2.8 | % | |
Reckitt Beckiser plc | 2.7 | % | |
SAP AG | 2.5 | % | |
LVMH Moët Hennessy Louis Vuitton | 2.5 | % | |
Standard Chartered plc | 2.5 | % | |
Hennes & Mauritz AB | 2.5 | % |
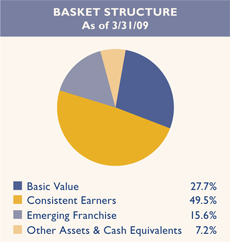
| This page is not part of the Semi-Annual Report. 5 |

Thornburg International Value Fund
March 31, 2009
Table of Contents
| 7 | ||
| 10 | ||
| 12 | ||
| 14 | ||
| 15 | ||
| 21 | ||
| 28 | ||
| 34 | ||
| 35 | ||
| 36 | ||
This report is certified under the Sarbanes-Oxley Act of 2002, which requires that public companies, including mutual funds, affirm that the information provided in their annual and semiannual shareholder reports fully and fairly represents their financial position.
| 6 Certified Semi-Annual Report |
William V. Fries,CFA Co-Portfolio Manager | April 21, 2009
| |
Dear Fellow Shareholder:
For the six-month period ended March 31, 2009, the Thornburg International Value Fund (Class A shares at NAV) recorded a return of negative 27.98%, versus a return of negative 31.11% for the Morgan Stanley Capital International Europe, Australia, Far East Index (MSCI EAFE Index). Our relative outperformance vs. the benchmark provided little consolation.
| ||
Wendy Trevisani Co-Portfolio Manager | The sell-off in equities was broad, with every sector of the benchmark posting double digit losses. The decline in financial services stocks was well publicized, as the ongoing credit crisis raised questions about the solvency of many large financial institutions. Other cyclical areas such as industrials and materials created pain for equity investors as well. Health care and telecommunication stocks, traditionally defensive areas of the market, were also impacted, albeit to a lesser degree. | |
| Our financial sector positions in Swiss Re, AXA, BNP Paribas and National Bank of Greece led our list of stocks detracting from performance. Fortunately, an early 2008 exit from a number of other financial holdings, which had approached target valuations, reduced our exposure in the sector to a level somewhat less than that of the benchmark. Swiss Re is no longer held in the portfolio, yet we have added opportunistically to our BNP Paribas and National Bank of Greece positions during the period. | ||
Lei Wang,CFA Co-Portfolio Manager | Global economic slowdown has resulted in demand deterioration for crude oil. While this may be welcomed by consumers for its impact on the price of gasoline, it has also worked to reduce the wholesale prices for electric power, especially in Europe. This price weakness along with the market price of “carbon credits” has weakened the competitive posture of power generators with relatively “green” assets. These pricing dynamics have adversely impacted our investments in European utilities E.ON and Fortum. Oil service holding Schlumberger was also pressured by lower oil prices. Broadly, lower oil prices also pressured our holdings in Russia. | |


| Certified Semi-Annual Report 7 |
Letter to Shareholders
Continued
Gazprom, a leading Russian natural gas company, and Carlsberg, the Danish brewer with a strong position in Russia, have subsequently been adversely impacted. Both have been sold from the portfolio.
In such a tough environment, few stocks contributed positively to performance. Recent additions Baidu and Covidien posted positive performance, as did long-time holding Teva Pharmaceuticals. Additional contributions came from Redecard (Brazilian credit card acquirer) and Next plc (U.K. apparel retailer).
Markets did respond favorably late in the period to initiatives implemented by governments and monetary authorities in the United States, Europe, and Asia. Efforts to stimulate economies and to take legacy toxic assets off the balance sheets of large financial institutions were met with renewed confidence. We remain hopeful that these efforts will prove effective. For example, the economic growth in China is encouraging, but in a globally interdependent world, it is not sufficient alone to spark a recovery in developed markets. It is realistic to assume that further equity market recovery will largely depend on the pace of broad business and earnings development.
Our investment approach remains rooted in fundamental research. We have written before that in periods of extreme economic uncertainty, individual share prices can stray from their underlying values. We found that to be the case in late 2008 and early 2009, as equity investors indiscriminately sold their shares. As equities were sold across the board, share prices of our holdings retreated further from our internally established price targets. The bright side of this disheartening market volatility is that it has provided an opportunity to add to a number of positions at larger discounts to their intrinsic value than originally postured.
We continue to search for fresh investment opportunities as well. Our investment goal remains capital appreciation, but we continue to keep downside risk in mind as we evaluate new investments. Our comprehensive approach to value – melding consistent earners, basic values, and emerging franchises in a diversified portfolio – is intended to support this objective. Our consistent earner basket contains stocks with relatively robust business models which are expected to be more resilient in periods of economic uncertainty. Throughout the six-month period, this was the largest weight in the portfolio, as these names held up better than most others. We continue to look for opportunities among basic value and emerging franchise stocks, which we believe should lead when the markets perceive that global economic conditions are improving. With a broad universe of stocks that are out of favor, our prospects of finding attractive investments in companies with solid business models seem favorable.
| 8 Certified Semi-Annual Report |
We acknowledge that until recently, returns have been disappointing on an absolute basis. However, we do retain confidence in our investment philosophy, research process and people. It will take some time to recapture previous stock price levels, but we would like to think we are on our way. Results since the end of the period have been encouraging. Thank you for your trust and confidence.
We invite you to visit our web site at www.thornburg.com, where you will find additional information about the Thornburg International Value Fund, as well as other Thornburg investment products.
Sincerely,
 |  |  | ||
| William V. Fries,CFA | Wendy Q. Trevisani | Lei Wang,CFA | ||
| Co-Portfolio Manager | Co-Portfolio Manager | Co-Portfolio Manager | ||
| Managing Director | Managing Director | Managing Director |
The matters discussed in this report may constitute forward-looking statements made pursuant to the safe harbor provisions of the Securities Litigation Reform Act of 1995. These include any advisor or portfolio manager prediction, assessment, analysis or outlook for individual securities, industries, investment styles, market sectors and/or markets. These statements involve risks and uncertainties. In addition to the general risks described for each fund in its current prospectus, other factors bearing on these reports include the accuracy of the advisor’s or portfolio manager’s forecasts and predictions, the appropriateness of the investment strategies designed by the advisor or portfolio manager, and the ability of the advisor or portfolio manager to implement their strategies efficiently and successfully. Any one or more of these factors, as well as other risks affecting the securities markets generally, could cause the actual results of any fund to differ materially as compared to its benchmarks.
| Certified Semi-Annual Report 9 |
STATEMENT OF ASSETS AND LIABILITIES
| Thornburg International Value Fund | March 31, 2009 (Unaudited) |
ASSETS | ||||
Investments at value (cost $13,762,381,553) (Note 2) | $ | 10,088,115,676 | ||
Cash | 9,527,405 | |||
Receivable for investments sold | 4,200,944 | |||
Receivable for fund shares sold | 54,297,639 | |||
Unrealized gain on forward exchange contracts (Note 7) | 21,864,608 | |||
Dividends receivable | 49,418,402 | |||
Interest receivable | 326,580 | |||
Prepaid expenses and other assets | 201,260 | |||
Total Assets | 10,227,952,514 | |||
LIABILITIES | ||||
Payable for securities purchased | 30,546,963 | |||
Payable for fund shares redeemed | 23,626,429 | |||
Unrealized loss on forward exchange contracts (Note 7) | 13,813,454 | |||
Payable to investment advisor and other affiliates (Note 3) | 8,030,649 | |||
Accounts payable and accrued expenses | 6,503,299 | |||
Dividends payable | 8,414 | |||
Total Liabilities | 82,529,208 | |||
NET ASSETS | $ | 10,145,423,306 | ||
NET ASSETS CONSIST OF: | ||||
Undistributed net investment income | $ | 13,404,099 | ||
Net unrealized depreciation on investments | (3,667,027,571 | ) | ||
Accumulated net realized gain (loss) | (2,299,823,123 | ) | ||
Net capital paid in on shares of beneficial interest | 16,098,869,901 | |||
| $ | 10,145,423,306 | |||
| 10 Certified Semi-Annual Report |
| STATEMENT OF ASSETS AND LIABILITIES, CONTINUED | ||
| Thornburg International Value Fund | March 31, 2009 (Unaudited) | |
NET ASSET VALUE: | |||
Class A Shares: | |||
Net asset value and redemption price per share | $ | 17.02 | |
Maximum sales charge, 4.50% of offering price | 0.80 | ||
Maximum offering price per share | $ | 17.82 | |
Class B Shares: | |||
Net asset value and offering price per share * | $ | 16.04 | |
Class C Shares: | |||
Net asset value and offering price per share * | $ | 16.11 | |
Class I Shares: | |||
Net asset value, offering and redemption price per share | $ | 17.39 | |
Class R3 Shares: | |||
Net asset value, offering and redemption price per share | $ | 17.05 | |
Class R4 Shares: | |||
Net asset value, offering and redemption price per share | $ | 16.96 | |
Class R5 Shares: | |||
Net asset value, offering and redemption price per share | $ | 17.37 | |
| * | Redemption price per share is equal to net asset value less any applicable contingent deferred sales charge. |
See notes to financial statements.
| Certified Semi-Annual Report 11 |
| STATEMENT OF OPERATIONS | ||
| Thornburg International Value Fund | Six Months Ended March 31, 2009 (Unaudited) | |
INVESTMENT INCOME: | ||||
Dividend income (net of foreign taxes withheld of $8,447,547) | $ | 86,109,120 | ||
Interest income | 3,923,258 | |||
Total Income | 90,032,378 | |||
EXPENSES: | ||||
Investment advisory fees (Note 3) | 37,588,195 | |||
Administration fees (Note 3) | ||||
Class A Shares | 2,433,279 | |||
Class B Shares | 42,988 | |||
Class C Shares | 800,559 | |||
Class I Shares | 957,545 | |||
Class R3 Shares | 439,782 | |||
Class R4 Shares | 133,041 | |||
Class R5 Shares | 194,567 | |||
Distribution and service fees (Note 3) | ||||
Class A Shares | 4,840,931 | |||
Class B Shares | 341,938 | |||
Class C Shares | 6,372,722 | |||
Class R3 Shares | 1,756,207 | |||
Class R4 Shares | 266,376 | |||
Transfer agent fees | ||||
Class A Shares | 5,200,750 | |||
Class B Shares | 88,990 | |||
Class C Shares | 1,417,960 | |||
Class I Shares | 2,505,050 | |||
Class R3 Shares | 1,310,130 | |||
Class R4 Shares | 519,001 | |||
Class R5 Shares | 958,320 | |||
Registration and filing fees | ||||
Class A Shares | 22,735 | |||
Class B Shares | 9,068 | |||
Class C Shares | 18,640 | |||
Class I Shares | 92,320 | |||
Class R3 Shares | 13,164 | |||
Class R4 Shares | 11,051 | |||
Class R5 Shares | 13,555 | |||
Custodian fees (Note 3) | 1,698,701 | |||
Professional fees | 171,326 | |||
Accounting fees | 270,560 | |||
Trustee fees | 191,000 | |||
Other expenses | 675,136 | |||
Total Expenses | 71,355,587 | |||
Less: | ||||
Expenses reimbursed by investment advisor (Note 3) | (1,958,128 | ) | ||
Fees paid indirectly (Note 3) | (267,401 | ) | ||
Net Expenses | 69,130,058 | |||
Net Investment Income | $ | 20,902,320 | ||
| 12 Certified Semi-Annual Report |
| STATEMENT OF OPERATIONS, CONTINUED | ||
| Thornburg International Value Fund | Six Months Ended March 31, 2009 (Unaudited) | |
REALIZED AND UNREALIZED GAIN (LOSS) | ||||
Net realized gain (loss) on: | ||||
Investments | $ | (1,822,290,704 | ) | |
Foreign currency transactions | 347,275,177 | |||
| (1,475,015,527 | ) | |||
Net change in unrealized appreciation (depreciation) on: | ||||
Investments | (2,515,677,554 | ) | ||
Foreign currency translations | (107,411,166 | ) | ||
| (2,623,088,720 | ) | |||
Net Realized and Unrealized Loss | (4,098,104,247 | ) | ||
Net Decrease in Net Assets Resulting From Operations | $ | (4,077,201,927 | ) | |
See notes to financial statements.
| Certified Semi-Annual Report 13 |
| STATEMENTS OF CHANGES IN NET ASSETS | ||
| Thornburg International Value Fund | ||
| Six Months Ended March 31, 2009* | Year Ended September 30, 2008 | |||||||
INCREASE (DECREASE) IN NET ASSETS FROM: | ||||||||
OPERATIONS: | ||||||||
Net investment income | $ | 20,902,320 | $ | 220,879,180 | ||||
Net realized loss on investments and foreign currency transactions | (1,475,015,527 | ) | (808,936,421 | ) | ||||
Increase (Decrease) in unrealized appreciation (depreciation) on investments and foreign currency translation | (2,623,088,720 | ) | (4,947,975,765 | ) | ||||
Net Increase (Decrease) in Net Assets Resulting from Operations | (4,077,201,927 | ) | (5,536,033,006 | ) | ||||
DIVIDENDS TO SHAREHOLDERS: | ||||||||
From net investment income | ||||||||
Class A Shares | (8,001,653 | ) | (75,245,625 | ) | ||||
Class B Shares | (12,512 | ) | (664,681 | ) | ||||
Class C Shares | (348,549 | ) | (13,733,669 | ) | ||||
Class I Shares | (12,166,912 | ) | (86,528,884 | ) | ||||
Class R3 Shares | (1,344,710 | ) | (10,260,007 | ) | ||||
Class R4 Shares | (503,409 | ) | (2,772,322 | ) | ||||
Class R5 Shares | (2,562,470 | ) | (13,817,161 | ) | ||||
From realized gains | ||||||||
Class A Shares | — | (600,769,404 | ) | |||||
Class B Shares | — | (11,739,966 | ) | |||||
Class C Shares | — | (203,158,109 | ) | |||||
Class I Shares | — | (426,254,876 | ) | |||||
Class R3 Shares | — | (85,519,217 | ) | |||||
Class R4 Shares | — | (4,805,028 | ) | |||||
Class R5 Shares | — | (39,612,380 | ) | |||||
FUND SHARE TRANSACTIONS (NOTE 4): | ||||||||
Class A Shares | (447,374,559 | ) | 1,289,526,844 | |||||
Class B Shares | (11,089,123 | ) | 15,813,625 | |||||
Class C Shares | (236,303,805 | ) | 509,105,066 | |||||
Class I Shares | (4,430,494 | ) | 2,388,464,998 | |||||
Class R3 Shares | 32,620,032 | 349,026,118 | ||||||
Class R4 Shares | 85,304,576 | 262,833,310 | ||||||
Class R5 Shares | 136,844,740 | 844,102,498 | ||||||
Net Decrease in Net Assets | (4,546,570,775 | ) | (1,452,041,876 | ) | ||||
NET ASSETS: | ||||||||
Beginning of period | 14,691,994,081 | 16,144,035,957 | ||||||
End of period | $ | 10,145,423,306 | $ | 14,691,994,081 | ||||
Undistributed net investment income | $ | 13,404,099 | $ | 17,441,994 | ||||
| * | Unaudited. |
See notes to financial statements.
| 14 Certified Semi-Annual Report |
| NOTES TO FINANCIAL STATEMENTS | ||
| Thornburg International Value Fund | March 31, 2009 (Unaudited) | |
NOTE 1 – ORGANIZATION
Thornburg International Value Fund, hereinafter referred to as the “Fund,” is a diversified series of Thornburg Investment Trust (the “Trust”). The Trust was organized as a Massachusetts business trust under a Declaration of Trust dated June 3, 1987 and is registered as a diversified, open-end management investment company under the Investment Company Act of 1940, as amended. The Trust is currently issuing thirteen series of shares of beneficial interest in addition to those of the Fund: Thornburg Limited Term Municipal Fund, Thornburg California Limited Term Municipal Fund, Thornburg Limited Term U.S. Government Fund, Thornburg New Mexico Intermediate Municipal Fund, Thornburg Intermediate Municipal Fund, Thornburg Limited Term Income Fund, Thornburg Value Fund, Thornburg Core Growth Fund, Thornburg New York Intermediate Municipal Fund, Thornburg Investment Income Builder Fund, Thornburg Global Opportunities Fund, Thornburg International Growth Fund, and Thornburg Strategic Income Fund. Each series is considered to be a separate entity for financial reporting and tax purposes and bears expenses directly attributable to it. The Fund seeks long-term capital appreciation by investing in equity and debt securities of all types. As a secondary objective, the Fund also seeks some current income.
The Fund currently offers seven classes of shares of beneficial interest: Class A, Class B, Class C, Institutional Class (Class I), and Retirement Classes (Class R3, Class R4, and Class R5) shares. Each class of shares of the Fund represents an interest in the same portfolio of investments, except that (i) Class A shares are sold subject to a front-end sales charge collected at the time the shares are purchased and bear a service fee, (ii) Class B shares are sold at net asset value without a sales charge at the time of purchase, but are subject to a contingent deferred sales charge upon redemption and bear both a service fee and distribution fee, (iii) Class C shares are sold at net asset value without a sales charge at the time of purchase, but are subject to a contingent deferred sales charge upon redemption within one year of purchase, and bear both a service fee and a distribution fee, (iv) Class I shares are sold at net asset value without a sales charge at the time of purchase, (v) Class R3 shares are sold at net asset value without a sales charge at the time of purchase, but bear both a service fee and distribution fee, (vi) Class R4 shares are sold at net asset value without a sales charge at the time of purchase, but bear a service fee, (vii) Class R5 shares are sold at net asset value without a sales charge at the time of purchase, and (viii) the respective classes may have different reinvestment privileges and conversion rights. Additionally, the Fund may allocate among its classes certain expenses, to the extent allowable to specific classes, including transfer agent fees, government registration fees, certain printing and postage costs, and administrative and legal expenses. Currently, class specific expenses of the Fund are limited to service and distribution fees, administration fees, and certain registration and transfer agent expenses. Class B shares of the Fund outstanding for eight years will convert to Class A shares of the Fund.
NOTE 2 – SIGNIFICANT ACCOUNTING POLICIES
Significant accounting policies of the Trust are as follows:
Valuation of Investments: Portfolio securities listed or traded on a national securities exchange are valued on the valuation date at the last reported sale price on the exchange that is the primary market for the security. Portfolio securities traded on an exchange for which there has been no sale that day and other equity securities traded in the over-the-counter market are valued at the mean between the last reported bid and asked prices. Portfolio securities reported by NASDAQ are valued at the NASDAQ official closing price. Any foreign security traded on exchanges outside the United States is valued at the price of the security on the exchange that is normally the security’s primary market, as of the close of that exchange preceding the time of the Fund’s valuation.
Debt obligations held by the Fund have a primary market over the counter and are valued by an independent pricing service approved by the Trustees of the Trust. The pricing service ordinarily values debt obligations at quoted bid prices. When quotations are not available, debt obligations held by the Fund are valued at evaluated prices determined by the pricing service using methods which include consideration of yields or prices of debt obligations of comparable quality, type of issue, coupon, maturity, and rating, and indications as to value from dealers and general market conditions. Short-term obligations having remaining maturities of 60 days or less are valued at amortized cost, which approximates market value.
Quotations in foreign currencies for foreign portfolio investments are converted to U.S. dollar equivalents using the foreign exchange quotation in effect at the time of valuation.
In any case where the market value of an equity security held by the Fund is not readily available, the Trust’s valuation and pricing committee determines a fair value for the security using procedures approved by the Trustees, which may include the use of prices obtained from an independent pricing service. The pricing service ordinarily values equity securities in these instances using multi-factor models to adjust market prices based upon various inputs, including exchange data, depository receipt prices, futures and index data and other data. A security’s market value is deemed not readily available whenever the exchange or market on which the security is primarily traded is closed for the entire scheduled day of trading. Additionally, a security’s market value may be deemed not readily available under other circumstances identified by the Trustees, including when developments occurring after the most recent close of the security’s primary exchange or market, but before the most recent close of trading in Fund shares, create a serious question about the reliability of the security’s market value.
In any case where a pricing service fails to provide a price for a debt obligation held by the Fund, the valuation and pricing committee determines a fair value for the debt obligation using procedures approved by the Trustees. Additionally, in any case where management believes that a price provided by a pricing service for a debt obligation held by the Fund may be unreliable, the valuation and pricing committee decides whether or not to use the pricing service’s valuation or to determine a fair value for the debt obligation.
| Certified Semi-Annual Report 15 |
| NOTES TO FINANCIAL STATEMENTS, CONTINUED | ||
| Thornburg International Value Fund | March 31, 2009 (Unaudited) | |
In determining fair value for any portfolio security or other investment, the valuation and pricing committee seeks to determine the amount that an owner of the investment might reasonably expect to receive upon a sale of the investment. However, because fair value prices are estimated prices, the valuation and pricing committee’s determination of fair value for an investment may differ from the value that would be realized by the Fund upon a sale of the investment, and that difference could be material to the Fund’s financial statements. The valuation and pricing committee’s determination of fair value for an investment may also differ from the prices obtained by other persons (including other mutual funds) for the investment.
Valuation Measurements: Various inputs are used in determining the value of the Fund’s investments. These inputs are summarized in the three levels listed below.
Level 1: Quoted prices in active markets for identical investments.
Level 2: Other significant observable inputs (including quoted prices for similar investments, interest rates, prepayment rates, credit risk, etc.).
Level 3: Significant unobservable inputs (including the Fund’s own assumptions in determining the fair value of investments).
The following table displays a summary of the inputs used to value the Fund’s net assets as of March 31, 2009. In any instance when valuation inputs from more than one level are used to determine the fair value of a specific investment, the investment is placed in the level of the table based upon the lowest level input that is significant in determining the fair value of the investment:
Valuation Inputs | Investments in Securities | Investments in Other Financial Instruments* | ||||
Level 1 - Quoted Prices in Active Markets for Identical Assets | $ | 9,467,915,954 | $ | 167,547 | ||
Level 2 - Other Significant Observable Inputs | 620,199,722 | 8,051,154 | ||||
Level 3 - Significant Unobservable Inputs | — | — | ||||
Total | $ | 10,088,115,676 | $ | 8,218,701 | ||
| * | Other financial instruments include investments not reflected in the Schedule of Investments, such as futures, forwards and swap contracts, which are valued at the unrealized appreciation (depreciation) on the instrument. |
Foreign Currency Translation: Portfolio securities and other assets and liabilities denominated in foreign currencies are translated into U.S. dollars based on the exchange rate of such currencies against the U.S. dollar on the date of valuation. Purchases and sales of securities and income items denominated in foreign currencies are translated into U.S. dollars at the exchange rate in effect on the translation date. When the Fund purchases or sells foreign securities it will customarily enter into a foreign exchange contract to minimize foreign exchange risk from the trade date to the settlement date of such transactions.
The Fund does not separately report the effect of changes in foreign exchange rates from changes in market prices on securities held. Such changes are included in net realized and unrealized gain or loss from investments.
Reported net realized foreign exchange gains or losses arise from sales of foreign currencies, currency gains or losses realized between the trade and settlement dates on securities transactions and the difference between the amounts of dividends, interest, and foreign withholding taxes recorded on the Fund’s books, and the U.S. dollar equivalent of the amounts actually received or paid.
Net unrealized foreign exchange gains and losses arise from changes in the fair value of assets and liabilities, other than investments in securities at fiscal period end, resulting from changes in exchange rates.
Deferred Taxes: The Fund is subject to a tax imposed on net realized gains of securities of certain foreign countries. The Fund records an estimated deferred tax liability for net unrealized gains on these securities as reflected in the accompanying financial statements.
Federal Income Taxes: It is the policy of the Trust to comply with the provisions of the Internal Revenue Code applicable to “regulated investment companies” and to distribute to shareholders substantially all taxable income, including any net realized gain on investments of the Funds. Therefore, no provision for federal income taxes is required.
When-Issued and Delayed Delivery Transactions: The Trust may engage in when-issued or delayed delivery transactions. To the extent the Trust engages in such transactions, it will do so for the purpose of acquiring portfolio securities consistent with the Fund’s investment objectives and not for the purpose of investment leverage or to speculate on interest rate and/or market changes. At the time the Trust makes a commitment to purchase a security on a when-issued or delayed delivery basis, the Fund will record the transaction and reflect the value in determining its net asset value. When effecting such transactions, assets of an amount sufficient to make payment for the portfolio securities to be purchased will be segregated on the Fund’s records on the trade date. Securities purchased on a when-issued or delayed delivery basis do not earn interest until the settlement date.
| 16 Certified Semi-Annual Report |
| NOTES TO FINANCIAL STATEMENTS, CONTINUED | ||
| Thornburg International Value Fund | March 31, 2009 (Unaudited) | |
Dividends: Dividends to shareholders are generally paid quarterly and are reinvested in additional shares of the Fund at net asset value per share at the close of business on the dividend payment date or, at the shareholder’s option, paid in cash. Net realized capital gains, to the extent available, will be distributed at least annually. Distributions to shareholders are based on income tax regulations and therefore, their characteristics may differ for financial statement and tax purposes.
General: Securities transactions are accounted for on a trade date basis. Interest income is accrued as earned and dividend income is recorded on the ex-dividend date. Certain income from foreign securities is recognized as soon as information is available to the Fund. Realized gains and losses from the sale of securities are recorded on an identified cost basis. Net investment income (other than class specific expenses) and realized and unrealized gains and losses are allocated daily to each class of shares based upon the relative net asset value of outstanding shares of each class of shares at the beginning of the day (after adjusting for the current share activity of the respective class). Expenses common to all funds are allocated among the funds comprising the Trust based upon their relative net asset values or other appropriate allocation methods.
Guarantees and Indemnifications: Under the Trust’s organizational documents, its officers and Trustees are indemnified against certain liabilities arising out of the performance of their duties to the Fund. Additionally, in the normal course of business the Trust enters into contracts with service providers that contain general indemnification clauses. The Trust’s maximum exposure under these arrangements is unknown. However, based on experience, the Trust expects the risk of loss to be remote.
Use of Estimates: The preparation of financial statements, in conformity with generally accepted accounting principles, requires management to make estimates and assumptions that affect the reported amounts of assets and liabilities and the disclosure of contingent assets and liabilities at the date of the financial statements and the reported amounts of increases and decreases in net assets from operations during the reporting period. Actual results could differ from those estimates.
NOTE 3 – INVESTMENT ADVISORY FEE AND OTHER TRANSACTIONS WITH AFFILIATES
Pursuant to an investment advisory agreement, Thornburg Investment Management, Inc. (the “Advisor”) serves as the investment advisor and performs services to the Fund for which the fees are payable at the end of each month. For the six months ended March 31, 2009, these fees were payable at annual rates ranging from .875 of 1% to .675 of 1% per annum of the average daily net assets of the Fund depending on the Fund’s asset size. The Trust also has entered into administrative services agreements with the Advisor, whereby the Advisor will perform certain administrative services for the shareholders of each class of the Fund’s shares, and for which fees will be payable at an annual rate of up to .125 of 1% per annum of the average daily net assets attributable to each class of shares. For the six months ended March 31, 2009, the Advisor voluntarily reimbursed certain class specific expenses, administrative fees, and distribution fees of $3,446 for Class I shares, $1,055,125 for Class R3 shares, $396,570 for Class R4 shares, and $502,987 for Class R5 shares.
The Trust has an underwriting agreement with Thornburg Securities Corporation (the “Distributor,” an affiliate of the Advisor), which acts as the distributor of the Fund’s shares. For the six months ended March 31, 2009, the Distributor has advised the Fund that it earned net commissions aggregating $81,282 from the sale of Class A shares, and collected contingent deferred sales charges aggregating $289,389 from redemptions of Class C shares of the Fund.
Pursuant to a service plan under Rule 12b-1 of the Investment Company Act of 1940, the Fund may reimburse to the Advisor an amount not to exceed .25 of 1% per annum of the average daily net assets attributable to each class of shares of the Fund for payments made by the Advisor to securities dealers and other financial institutions to obtain various shareholder and distribution related services. The Advisor may pay out of its own resources additional expenses for distribution of the Fund’s shares.
The Trust has also adopted distribution plans pursuant to Rule 12b-1, applicable only to the Fund’s Class B, Class C, and Class R3 shares, under which the Fund compensates the Distributor for services in promoting the sale of Class B, Class C, and Class R3 shares of the Fund at an annual rate of up to .75 of 1% per annum of the average daily net assets attributable to Class B, Class C, and Class R3 shares. Total fees incurred by the Distributor for each class of shares of the Fund under their respective Service and Distribution Plans for the six months ended March 31, 2009, are set forth in the Statement of Operations.
The Trust has an agreement with the custodian bank to indirectly pay a portion of the custodian’s fees through credits earned by the Fund’s cash on deposit with the bank. This deposit agreement is an alternative to overnight investments. Custodial fees have been adjusted to reflect amounts that would have been paid without this agreement, with a corresponding adjustment reflected as fees paid indirectly in the Statement of Operations. For the six months ended March 31, 2009, fees paid indirectly were $267,401.
Certain officers and Trustees of the Trust are also officers and/or directors of the Advisor and Distributor. The compensation of independent Trustees is borne by the Trust.
| Certified Semi-Annual Report 17 |
| NOTES TO FINANCIAL STATEMENTS, CONTINUED | ||
| Thornburg International Value Fund | March 31, 2009 (Unaudited) | |
NOTE 4 – SHARES OF BENEFICIAL INTEREST
At March 31, 2009, there were an unlimited number of shares of beneficial interest authorized. Transactions in shares of beneficial interest were as follows:
| Six Months Ended March 31, 2009 (Unaudited) | Year Ended September 30, 2008 (Audited) | |||||||||||||
| Shares | Amount | Shares | Amount | |||||||||||
Class A Shares | ||||||||||||||
Shares sold | 48,335,327 | $ | 873,613,508 | 108,956,029 | $ | 3,391,672,055 | ||||||||
Shares issued to shareholders in reinvestment of dividends | 362,930 | 6,690,806 | 18,277,901 | 582,600,796 | ||||||||||
Shares repurchased | (73,052,171 | ) | (1,327,746,556 | ) | (91,613,103 | ) | (2,684,825,344 | ) | ||||||
Redemption fees received** | — | 67,683 | — | 79,337 | ||||||||||
Net Increase (Decrease) | (24,353,914 | ) | $ | (447,374,559 | ) | 35,620,827 | $ | 1,289,526,844 | ||||||
Class B Shares | ||||||||||||||
Shares sold | 161,568 | $ | 2,763,305 | 839,348 | $ | 25,311,160 | ||||||||
Shares issued to shareholders in reinvestment of dividends | 482 | 8,389 | 287,761 | 8,760,191 | ||||||||||
Shares repurchased | (816,607 | ) | (13,862,012 | ) | (669,684 | ) | (18,259,141 | ) | ||||||
Redemption fees received** | — | 1,195 | — | 1,415 | ||||||||||
Net Increase (Decrease) | (654,557 | ) | $ | (11,089,123 | ) | 457,425 | $ | 15,813,625 | ||||||
Class C Shares | ||||||||||||||
Shares sold | 6,778,850 | $ | 116,978,616 | 27,283,818 | $ | 819,809,729 | ||||||||
Shares issued to shareholders in reinvestment of dividends | 12,601 | 220,662 | 4,272,790 | 130,242,728 | ||||||||||
Shares repurchased | (20,702,414 | ) | (353,525,331 | ) | (16,133,810 | ) | (440,973,314 | ) | ||||||
Redemption fees received** | — | 22,248 | — | 25,923 | ||||||||||
Net Increase (Decrease) | (13,910,963 | ) | $ | (236,303,805 | ) | 15,422,798 | $ | 509,105,066 | ||||||
Class I Shares | ||||||||||||||
Shares sold | 62,185,501 | $ | 1,143,705,854 | 114,796,742 | $ | 3,562,363,852 | ||||||||
Shares issued to shareholders in reinvestment of dividends | 434,590 | 8,174,949 | 10,634,700 | 342,652,908 | ||||||||||
Shares repurchased | (62,568,689 | ) | (1,156,378,076 | ) | (51,339,452 | ) | 1,516,614,397 | |||||||
Redemption fees received** | — | 66,779 | — | 62,635 | ||||||||||
Net Increase (Decrease) | 51,402 | $ | (4,430,494 | ) | 74,091,990 | $ | 2,388,464,998 | |||||||
Class R3 Shares | ||||||||||||||
Shares sold | 10,601,426 | $ | 193,776,402 | 22,845,687 | $ | 711,229,882 | ||||||||
Shares issued to shareholders in reinvestment of dividends | 63,240 | 1,168,042 | 2,601,406 | 82,998,888 | ||||||||||
Shares repurchased | (9,023,113 | ) | (162,336,705 | ) | (14,653,445 | ) | (445,214,207 | ) | ||||||
Redemption fees received** | — | 12,293 | — | 11,555 | ||||||||||
Net Increase (Decrease) | 1,641,553 | $ | 32,620,032 | 10,793,648 | $ | 349,026,118 | ||||||||
| 18 Certified Semi-Annual Report |
| NOTES TO FINANCIAL STATEMENTS, CONTINUED | ||
| Thornburg International Value Fund | March 31, 2009 (Unaudited) | |
| Six Months Ended March 31, 2009 (Unaudited) | Year Ended September 30, 2008 (Audited) | |||||||||||||
| Shares | Amount | Shares | Amount | |||||||||||
Class R4 Shares | ||||||||||||||
Shares sold | 7,471,734 | $ | 134,989,623 | 10,423,276 | $ | 310,505,054 | ||||||||
Shares issued to shareholders in reinvestment of dividends | 19,283 | 354,221 | 199,073 | 6,047,020 | ||||||||||
Shares repurchased | (2,842,974 | ) | (50,042,983 | ) | (1,883,686 | ) | (53,720,408 | ) | ||||||
Redemption fees received** | — | 3,715 | — | 1,644 | ||||||||||
Net Increase (Decrease) | 4,648,043 | $ | 85,304,576 | 8,738,663 | $ | 262,833,310 | ||||||||
Class R5 Shares | ||||||||||||||
Shares sold | 15,545,028 | $ | 290,414,620 | 33,390,724 | $ | 1,036,104,971 | ||||||||
Shares issued to shareholders in reinvestment of dividends | 124,129 | 2,332,379 | 1,568,885 | 49,576,729 | ||||||||||
Shares repurchased | (8,319,104 | ) | (155,915,821 | ) | (8,111,555 | ) | (241,587,993 | ) | ||||||
Redemption fees received** | — | 13,562 | — | 8,791 | ||||||||||
Net Increase (Decrease) | 7,350,053 | $ | 136,844,740 | 26,848,054 | $ | 844,102,498 | ||||||||
| ** | The Fund charges a redemption fee of 1% of the Class A and Class I shares redeemed or exchanged within 30 days of purchase. Redemption fees charged to any class are allocated to all classes upon receipt of payment based on relative net asset values of each class or other appropriate allocation methods. |
NOTE 5 – SECURITIES TRANSACTIONS
For the six months ended March 31, 2009, the Fund had purchase and sale transactions of investment securities (excluding short-term investments) of $1,441,336,344 and $1,336,878,844, respectively.
NOTE 6 – INCOME TAXES
At March 31, 2009, information on the tax components of capital is as follows:
Cost of investments for tax purposes | $ | 13,762,381,553 | ||
Gross unrealized appreciation on a tax basis | $ | 374,348,269 | ||
Gross unrealized depreciation on a tax basis | (4,048,614,146 | ) | ||
Net unrealized appreciation (depreciation) on investments (tax basis) | $ | 3,674,265,877 | ||
At March 31, the Fund had deferred tax basis currency and capital losses occurring subsequent to October 31, 2007 of $5,830,128 and $709,222,026, respectively. For tax purposes, such losses will be reflected in the year ending September 30, 2009.
| Certified Semi-Annual Report 19 |
| NOTES TO FINANCIAL STATEMENTS, CONTINUED | ||
| Thornburg International Value Fund | March 31, 2009 (Unaudited) | |
NOTE 7 – FINANCIAL INSTRUMENTS WITH OFF-BALANCE SHEET RISK AND FOREIGN INVESTMENT RISK
During the six months ended March 31, 2009, the Fund was a party to financial instruments with off-balance sheet risks, primarily currency forward exchange contracts. A forward exchange contract is an agreement between two parties to exchange different currencies at a specified rate at an agreed upon future date. These contracts are purchased in order to minimize the risk to the Fund with respect to its foreign stock transactions from adverse changes in the relationship between the U.S. dollar and foreign currencies. In each case these contracts have been initiated in conjunction with foreign stock transactions. These instruments may involve market risks in excess of the amount recognized on the Statement of Assets and Liabilities. Such risks would arise from the possible inability of counterparties to meet the terms of their contracts, future movement in currency value and interest rates and contract positions that are not exact offsets. These contracts are reported in the financial statements at the Fund’s net equity, as measured by the difference between the forward exchange rates at the reporting date and the forward exchange rates at the dates of entry into the contract. There are special risks associated with international investing, including currency fluctuations, economic and political instability, confiscation, inability or delays in selling foreign investments, and reduced legal protection for investments.
CONTRACTS TO BUY OR SELL:
Contract Description | Buy/Sell | Contract Amount | Contract Value Date | Value (USD) | Unrealized Appreciation | Unrealized (Depreciation) | ||||||||||
Euro Dollar | Sell | 625,491,000 | 6/16/2009 | $ | 833,699,440 | $ | 2,596,640 | $ | — | |||||||
Euro Dollar | Buy | 350,779,000 | 6/16/2009 | 479,900,750 | — | (13,813,454 | ) | |||||||||
Euro Dollar | Buy | 137,224,000 | 6/16/2009 | 176,452,225 | 5,880,136 | — | ||||||||||
Great Britain Pound | Sell | 123,625,000 | 6/19/2009 | 189,461,494 | 12,030,783 | — | ||||||||||
Mexican Peso | Sell | 3,415,900,000 | 5/29/2009 | 240,007,026 | 1,357,049 | — | ||||||||||
Total unrealized appreciation (depreciation) from forward exchange contracts | $ | 21,864,608 | $ | (13,813,454 | ) | |||||||||||
OTHER NOTES:
Statement of Accounting Standards No. 161:
On March 19, 2008, the Financial Accounting Standards Board issued Statement of Financial Accounting Standards No. 161, “Disclosures about Derivative Instruments and Hedging Activities” (“FAS 161”). FAS 161 is effective for fiscal years and interim periods beginning after November 15, 2008. FAS 161 requires enhanced disclosures about any derivative and hedging activities by the Fund, including how such activities are accounted for and any effect on the Fund’s financial position, performance and cash flows.
| 20 Certified Semi-Annual Report |
| FINANCIAL HIGHLIGHTS | ||
| Thornburg International Value Fund | ||
| Six Months Ended March 31, 2009* | Year Ended September 30, | ||||||||||||||||||||||
| 2008 | 2007 | 2006 | 2005 | 2004 | |||||||||||||||||||
Class A Shares: | |||||||||||||||||||||||
PER SHARE PERFORMANCE (for a share outstanding throughout the period)+ | |||||||||||||||||||||||
Net asset value, beginning of period | $ | 23.68 | $ | 36.09 | $ | 26.51 | $ | 22.80 | $ | 18.18 | $ | 14.95 | |||||||||||
Income from investment operations: | |||||||||||||||||||||||
Net investment income (loss) | 0.02 | 0.37 | 0.27 | 0.32 | 0.18 | 0.15 | |||||||||||||||||
Net realized and unrealized gain (loss) on investments | (6.64 | ) | (9.59 | ) | 10.25 | 4.00 | 4.63 | 3.08 | |||||||||||||||
Total from investment operations | (6.62 | ) | (9.22 | ) | 10.52 | 4.32 | 4.81 | 3.23 | |||||||||||||||
Less dividends from: | |||||||||||||||||||||||
Net investment income | (0.04 | ) | (0.31 | ) | (0.29 | ) | (0.21 | ) | (0.19 | ) | — | ||||||||||||
Net realized gains | — | (2.88 | ) | (0.65 | ) | (0.40 | ) | — | — | ||||||||||||||
Total dividends | (0.04 | ) | (3.19 | ) | (0.94 | ) | (0.61 | ) | (0.19 | ) | — | ||||||||||||
Change in net asset value | (6.66 | ) | (12.41 | ) | 9.58 | 3.71 | 4.62 | 3.23 | |||||||||||||||
NET ASSET VALUE, end of period | $ | 17.02 | $ | 23.68 | $ | 36.09 | $ | 26.51 | $ | 22.80 | $ | 18.18 | |||||||||||
RATIOS/SUPPLEMENTAL DATA | |||||||||||||||||||||||
Total return (%)(a) | (27.98 | ) | (27.77 | ) | 40.64 | 19.30 | 26.51 | 21.61 | |||||||||||||||
Ratios to average net assets: | |||||||||||||||||||||||
Net investment income (loss) (%) | 0.26 | (b) | 1.23 | 0.88 | 1.25 | 0.87 | 0.88 | ||||||||||||||||
Expenses, after expense reductions (%) | 1.40 | (b) | 1.28 | 1.29 | 1.33 | 1.44 | 1.49 | ||||||||||||||||
Expenses, after expense reductions and net of custody credits (%) | 1.39 | (b) | 1.28 | 1.29 | 1.33 | 1.44 | 1.49 | ||||||||||||||||
Expenses, before expense reductions (%) | 1.40 | (b) | 1.28 | 1.29 | 1.33 | 1.44 | 1.51 | ||||||||||||||||
Portfolio turnover rate (%) | 13.11 | 27.31 | 64.77 | 36.58 | 34.17 | 35.84 | |||||||||||||||||
Net assets at end of period (thousands) | $ | 3,544,635 | $ | 5,510,070 | $ | 7,111,205 | $ | 4,261,892 | $ | 2,205,924 | $ | 948,631 | |||||||||||
| (a) | Sales loads are not reflected in computing total return, which is not annualized for periods less than one year. |
| (b) | Annualized. |
| + | Based on weighted average shares outstanding. |
| * | Unaudited. |
See notes to financial statements.
| Certified Semi-Annual Report 21 |
| FINANCIAL HIGHLIGHTS, CONTINUED | ||
| Thornburg International Value Fund | ||
| Six Months Ended March 31, 2009* | Year Ended September 30, | |||||||||||||||||||||||
| 2008 | 2007 | 2006 | 2005 | 2004 | ||||||||||||||||||||
Class B Shares: | ||||||||||||||||||||||||
PER SHARE PERFORMANCE (for a share outstanding throughout the period)+ | ||||||||||||||||||||||||
Net asset value, beginning of period | $ | 22.37 | $ | 34.33 | $ | 25.28 | $ | 21.82 | $ | 17.39 | $ | 14.43 | ||||||||||||
Income from investment operations: | ||||||||||||||||||||||||
Net investment income (loss) | (0.04 | ) | 0.13 | 0.03 | 0.11 | 0.01 | (0.02 | ) | ||||||||||||||||
Net realized and unrealized gain (loss) on investments | (6.29 | ) | (9.06 | ) | 9.75 | 3.81 | 4.44 | 2.98 | ||||||||||||||||
Total from investment operations | (6.33 | ) | (8.93 | ) | 9.78 | 3.92 | 4.45 | 2.96 | ||||||||||||||||
Less dividends from: | ||||||||||||||||||||||||
Net investment income | (0.00 | )(a) | (0.15 | ) | (0.08 | ) | (0.06 | ) | (0.02 | ) | — | |||||||||||||
Net realized gains | — | (2.88 | ) | (0.65 | ) | (0.40 | ) | — | — | |||||||||||||||
Total dividends | (0.00 | ) | (3.03 | ) | (0.73 | ) | (0.46 | ) | (0.02 | ) | — | |||||||||||||
Change in net asset value | (6.33 | ) | (11.96 | ) | 9.05 | 3.46 | 4.43 | 2.96 | ||||||||||||||||
NET ASSET VALUE, end of period | $ | 16.04 | $ | 22.37 | $ | 34.33 | $ | 25.28 | $ | 21.82 | $ | 17.39 | ||||||||||||
RATIOS/SUPPLEMENTAL DATA | ||||||||||||||||||||||||
Total return (%)(b) | (28.28 | ) | (28.33 | ) | 39.55 | 18.32 | 25.59 | 20.51 | ||||||||||||||||
Ratios to average net assets: | ||||||||||||||||||||||||
Net investment income (loss) (%) | (0.52 | )(c) | 0.44 | 0.11 | 0.44 | 0.04 | (0.12 | ) | ||||||||||||||||
Expenses, after expense reductions (%) | 2.16 | (c) | 2.04 | 2.06 | 2.13 | 2.26 | 2.36 | |||||||||||||||||
Expenses, after expense reductions and net of custody credits (%) | 2.15 | (c) | 2.04 | 2.06 | 2.13 | 2.25 | 2.36 | |||||||||||||||||
Expenses, before expense reductions (%) | 2.16 | (c) | 2.04 | 2.06 | 2.13 | 2.27 | 2.42 | |||||||||||||||||
Portfolio turnover rate (%) | 13.11 | 27.31 | 64.77 | 36.58 | 34.17 | 35.84 | ||||||||||||||||||
Net assets at end of period (thousands) | $ | 60,160 | $ | 98,541 | $ | 135,486 | $ | 82,799 | $ | 47,306 | $ | 22,181 | ||||||||||||
| (a) | Dividends from net investment income per share were less than $(0.01). |
| (b) | Not annualized for periods less than one year. |
| (c) | Annualized. |
| + | Based on weighted average shares outstanding. |
| * | Unaudited. |
See notes to financial statements.
| 22 Certified Semi-Annual Report |
| FINANCIAL HIGHLIGHTS, CONTINUED | ||
| Thornburg International Value Fund | ||
| Six Months Ended March 31, 2009* | Year Ended September 30, | ||||||||||||||||||||||
| 2008 | 2007 | 2006 | 2005 | 2004 | |||||||||||||||||||
Class C Shares: | |||||||||||||||||||||||
PER SHARE PERFORMANCE (for a share outstanding throughout the period)+ | |||||||||||||||||||||||
Net asset value, beginning of period | $ | 22.46 | $ | 34.45 | $ | 25.37 | $ | 21.89 | $ | 17.46 | $ | 14.47 | |||||||||||
Income from investment operations: | |||||||||||||||||||||||
Net investment income (loss) | (0.04 | ) | 0.15 | 0.05 | 0.13 | 0.03 | 0.01 | ||||||||||||||||
Net realized and unrealized gain (loss) on investments | (6.31 | ) | (9.10 | ) | 9.78 | 3.82 | 4.45 | 2.98 | |||||||||||||||
Total from investment operations | (6.35 | ) | (8.95 | ) | 9.83 | 3.95 | 4.48 | 2.99 | |||||||||||||||
Less dividends from: | |||||||||||||||||||||||
Net investment income | (0.00 | )(a) | (0.16 | ) | (0.10 | ) | (0.07 | ) | (0.05 | ) | — | ||||||||||||
Net realized gains | — | (2.88 | ) | (0.65 | ) | (0.40 | ) | — | — | ||||||||||||||
Total dividends | (0.00 | ) | (3.04 | ) | (0.75 | ) | (0.47 | ) | (0.05 | ) | — | ||||||||||||
Change in net asset value | (6.35 | ) | (11.99 | ) | 9.08 | 3.48 | 4.43 | 2.99 | |||||||||||||||
NET ASSET VALUE, end of period | $ | 16.11 | $ | 22.46 | $ | 34.45 | $ | 25.37 | $ | 21.89 | $ | 17.46 | |||||||||||
RATIOS/SUPPLEMENTAL DATA | |||||||||||||||||||||||
Total return (%)(b) | (28.25 | ) | (28.28 | ) | 39.63 | 18.41 | 25.65 | 20.66 | |||||||||||||||
Ratios to average net assets: | |||||||||||||||||||||||
Net investment income (loss) (%) | (0.47 | )(c) | 0.50 | 0.17 | 0.55 | 0.16 | 0.04 | ||||||||||||||||
Expenses, after expense reductions (%) | 2.10 | (c) | 2.00 | 2.01 | 2.06 | 2.16 | 2.26 | ||||||||||||||||
Expenses, after expense reductions and net of custody credits (%) | 2.09 | (c) | 2.00 | 2.01 | 2.05 | 2.15 | 2.26 | ||||||||||||||||
Expenses, before expense reductions (%) | 2.10 | (c) | 2.00 | 2.01 | 2.06 | 2.16 | 2.26 | ||||||||||||||||
Portfolio turnover rate (%) | 13.11 | 27.31 | 64.77 | 36.58 | 34.17 | 35.84 | |||||||||||||||||
Net assets at end of period (thousands) | $ | 1,104,358 | $ | 1,852,185 | $ | 2,309,487 | $ | 1,290,250 | $ | 635,833 | $ | 243,955 | |||||||||||
| (a) | Dividends from net investment income per share were less than $(0.01). |
| (b) | Not annualized for periods less than one year. |
| (c) | Annualized. |
| + | Based on weighted average shares outstanding. |
| * | Unaudited. |
See notes to financial statements.
| Certified Semi-Annual Report 23 |
| FINANCIAL HIGHLIGHTS, CONTINUED | ||
| Thornburg International Value Fund | ||
| Six Months Ended March 31, 2009* | Year Ended September 30, | ||||||||||||||||||||||
| 2008 | 2007 | 2006 | 2005 | 2004 | |||||||||||||||||||
Class I Shares: | |||||||||||||||||||||||
PER SHARE PERFORMANCE (for a share outstanding throughout the period)+ | |||||||||||||||||||||||
Net asset value, beginning of period | $ | 24.18 | $ | 36.77 | $ | 26.99 | $ | 23.19 | $ | 18.48 | $ | 15.13 | |||||||||||
Income from investment operations: | |||||||||||||||||||||||
Net investment income (loss) | 0.07 | 0.51 | 0.41 | 0.43 | 0.28 | 0.24 | |||||||||||||||||
Net realized and unrealized gain (loss) on investments | (6.80 | ) | (9.79 | ) | 10.42 | 4.06 | 4.72 | 3.11 | |||||||||||||||
Total from investment operations | (6.73 | ) | (9.28 | ) | 10.83 | 4.49 | 5.00 | 3.35 | |||||||||||||||
Less dividends from: | |||||||||||||||||||||||
Net investment income | (0.06 | ) | (0.43 | ) | (0.40 | ) | (0.29 | ) | (0.29 | ) | — | ||||||||||||
Net realized gains | — | (2.88 | ) | (0.65 | ) | (0.40 | ) | — | — | ||||||||||||||
Total dividends | (0.06 | ) | (3.31 | ) | (1.05 | ) | (0.69 | ) | (0.29 | ) | — | ||||||||||||
Change in net asset value | (6.79 | ) | (12.59 | ) | 9.78 | 3.80 | 4.71 | 3.35 | |||||||||||||||
NET ASSET VALUE, end of period | $ | 17.39 | $ | 24.18 | $ | 36.77 | $ | 26.99 | $ | 23.19 | $ | 18.48 | |||||||||||
RATIOS/SUPPLEMENTAL DATA | |||||||||||||||||||||||
Total return (%)(a) | (27.86 | ) | (27.45 | ) | 41.17 | 19.76 | 27.15 | 22.14 | |||||||||||||||
Ratios to average net assets: | |||||||||||||||||||||||
Net investment income (loss) (%) | 0.75 | (b) | 1.64 | 1.32 | 1.67 | 1.32 | 1.35 | ||||||||||||||||
Expenses, after expense reductions (%) | 0.94 | (b) | 0.89 | 0.90 | 0.94 | 0.99 | 0.99 | ||||||||||||||||
Expenses, after expense reductions and net of custody credits (%) | 0.93 | (b) | 0.89 | 0.90 | 0.94 | 0.99 | 0.99 | ||||||||||||||||
Expenses, before expense reductions (%) | 0.94 | (b) | 0.89 | 0.90 | 0.94 | 1.02 | 1.11 | ||||||||||||||||
Portfolio turnover rate (%) | 13.11 | 27.31 | 64.77 | 36.58 | 34.17 | 35.84 | |||||||||||||||||
Net assets at end of period (thousands) | $ | 3,707,519 | $ | 5,152,506 | $ | 5,113,109 | $ | 2,034,453 | $ | 892,216 | $ | 293,583 | |||||||||||
| (a) | Not annualized for periods less than one year. |
| (b) | Annualized. |
| + | Based on weighted average shares outstanding. |
| * | Unaudited. |
See notes to financial statements.
| 24 Certified Semi-Annual Report |
| FINANCIAL HIGHLIGHTS, CONTINUED | ||
| Thornburg International Value Fund | ||
| Six Months Ended March 31, 2009* | Year Ended September 30, | ||||||||||||||||||||||
| 2008 | 2007 | 2006 | 2005 | 2004 | |||||||||||||||||||
Class R3 Shares: | |||||||||||||||||||||||
PER SHARE PERFORMANCE (for a share outstanding throughout the period)+ | |||||||||||||||||||||||
Net asset value, beginning of period | $ | 23.73 | $ | 36.18 | $ | 26.58 | $ | 22.88 | $ | 18.28 | $ | 15.01 | |||||||||||
Income from investment operations: | |||||||||||||||||||||||
Net investment income (loss) | 0.02 | 0.33 | 0.23 | 0.33 | 0.21 | 0.19 | |||||||||||||||||
Net realized and unrealized gain (loss) on investments | (6.67 | ) | (9.63 | ) | 10.26 | 3.97 | 4.63 | 3.08 | |||||||||||||||
Total from investment operations | (6.65 | ) | (9.30 | ) | 10.49 | 4.30 | 4.84 | 3.27 | |||||||||||||||
Less dividends from: | |||||||||||||||||||||||
Net investment income | (0.03 | ) | (0.27 | ) | (0.24 | ) | (0.20 | ) | (0.24 | ) | — | ||||||||||||
Net realized gains | — | (2.88 | ) | (0.65 | ) | (0.40 | ) | — | — | ||||||||||||||
Total dividends | (0.03 | ) | (3.15 | ) | (0.89 | ) | (0.60 | ) | (0.24 | ) | — | ||||||||||||
Change in net asset value | (6.68 | ) | (12.45 | ) | 9.60 | 3.70 | 4.60 | 3.27 | |||||||||||||||
NET ASSET VALUE, end of period | $ | 17.05 | $ | 23.73 | $ | 36.18 | $ | 26.58 | $ | 22.88 | $ | 18.28 | |||||||||||
RATIOS/SUPPLEMENTAL DATA | |||||||||||||||||||||||
Total return (%)(a) | (28.02 | ) | (27.90 | ) | 40.43 | 19.15 | 26.54 | 21.79 | |||||||||||||||
Ratios to average net assets: | |||||||||||||||||||||||
Net investment income (loss) (%) | 0.25 | (b) | 1.07 | 0.75 | 1.29 | 0.99 | 1.08 | ||||||||||||||||
Expenses, after expense reductions (%) | 1.45 | (b) | 1.45 | 1.45 | 1.45 | 1.45 | 1.45 | ||||||||||||||||
Expenses, after expense reductions and net of custody credits (%) | 1.45 | (b) | 1.45 | 1.45 | 1.45 | 1.45 | 1.45 | ||||||||||||||||
Expenses, before expense reductions (%) | 1.75 | (b) | 1.62 | 1.61 | 1.61 | 1.72 | 2.42 | ||||||||||||||||
Portfolio turnover rate (%) | 13.11 | 27.31 | 64.77 | 36.58 | 34.17 | 35.84 | |||||||||||||||||
Net assets at end of period (thousands) | $ | 676,102 | $ | 902,150 | $ | 984,587 | $ | 445,081 | $ | 118,436 | $ | 11,207 | |||||||||||
| (a) | Not annualized for periods less than one year. |
| (b) | Annualized. |
| + | Based on weighted average shares outstanding. |
| * | Unaudited. |
See notes to financial statements.
| Certified Semi-Annual Report 25 |
| FINANCIAL HIGHLIGHTS, CONTINUED | ||
| Thornburg International Value Fund | ||
| Six Months Ended March 31, 2009* | Year Ended Sept. 30, 2008 | Period Ended Sept. 30, 2007(a) | ||||||||||
Class R4 Shares: | ||||||||||||
PER SHARE PERFORMANCE (for a share outstanding throughout the period)+ | ||||||||||||
Net asset value, beginning of period | $ | 23.60 | $ | 36.02 | $ | 28.86 | ||||||
Income from investment operations: | ||||||||||||
Net investment income (loss) | 0.05 | 0.44 | 0.09 | |||||||||
Net realized and unrealized gain (loss) on investments | (6.65 | ) | (9.62 | ) | 7.36 | |||||||
Total from investment operations | (6.60 | ) | (9.18 | ) | 7.45 | |||||||
Less dividends from: | ||||||||||||
Net investment income | (0.04 | ) | (0.36 | ) | (0.29 | ) | ||||||
Net realized gains | — | (2.88 | ) | — | ||||||||
Total dividends | (0.04 | ) | (3.24 | ) | (0.29 | ) | ||||||
Change in net asset value | (6.64 | ) | (12.42 | ) | 7.16 | |||||||
NET ASSET VALUE, end of period | $ | 16.96 | $ | 23.60 | $ | 36.02 | ||||||
RATIOS/SUPPLEMENTAL DATA | ||||||||||||
Total return (%)(b) | (27.96 | ) | (27.73 | ) | 25.90 | |||||||
Ratios to average net assets: | ||||||||||||
Net investment income (loss) (%) | 0.56 | (c) | 1.51 | 0.42 | (c) | |||||||
Expenses, after expense reductions (%) | 1.25 | (c) | 1.25 | 1.25 | (c) | |||||||
Expenses, after expense reductions and net of custody credits (%) | 1.25 | (c) | 1.25 | 1.25 | (c) | |||||||
Expenses, before expense reductions (%) | 1.63 | (c) | 1.40 | 1.70 | (c) | |||||||
Portfolio turnover rate (%) | 13.11 | 27.31 | 64.77 | |||||||||
Net assets at end of period (thousands) | $ | 245,571 | $ | 231,960 | $ | 39,217 | ||||||
| (a) | Effective date of this class of shares was February 1, 2007. |
| (b) | Not annualized for periods less than one year. |
| (c) | Annualized. |
| + | Based on weighted average shares outstanding. |
| * | Unaudited. |
See notes to financial statements.
| 26 Certified Semi-Annual Report |
| FINANCIAL HIGHLIGHTS, CONTINUED | ||
| Thornburg International Value Fund | ||
| Six Months Ended March 31, 2009* | Year Ended September 30, | Period Ended Sept. 30, 2005(a) | ||||||||||||||||||
| 2008 | 2007 | 2006 | ||||||||||||||||||
Class R5 Shares: | ||||||||||||||||||||
PER SHARE PERFORMANCE (for a share outstanding throughout the period)+ | ||||||||||||||||||||
Net asset value, beginning of period | $ | 24.14 | $ | 36.74 | $ | 26.97 | $ | 23.18 | $ | 20.37 | ||||||||||
Income from investment operations: | ||||||||||||||||||||
Net investment income (loss) | 0.07 | 0.50 | 0.43 | 0.45 | 0.16 | |||||||||||||||
Net realized and unrealized gain (loss) on investments | (6.78 | ) | (9.81 | ) | 10.39 | 4.03 | 2.84 | |||||||||||||
Total from investment operations | (6.71 | ) | (9.31 | ) | 10.82 | 4.48 | 3.00 | |||||||||||||
Less dividends from: | ||||||||||||||||||||
Net investment income | (0.06 | ) | (0.41 | ) | (0.40 | ) | (0.29 | ) | (0.19 | ) | ||||||||||
Net realized gains | — | (2.88 | ) | (0.65 | ) | (0.40 | ) | — | ||||||||||||
Total dividends | (0.06 | ) | (3.29 | ) | (1.05 | ) | (0.69 | ) | (0.19 | ) | ||||||||||
Change in net asset value | (6.77 | ) | (12.60 | ) | 9.77 | 3.79 | 2.81 | |||||||||||||
NET ASSET VALUE, end of period | $ | 17.37 | $ | 24.14 | $ | 36.74 | $ | 26.97 | $ | 23.18 | ||||||||||
RATIOS/SUPPLEMENTAL DATA | ||||||||||||||||||||
Total return (%)(b) | (27.81 | ) | (27.54 | ) | 41.13 | 19.72 | 14.72 | |||||||||||||
Ratios to average net assets: | ||||||||||||||||||||
Net investment income (loss) (%) | 0.81 | (c) | 1.65 | 1.33 | 1.76 | 1.10 | (c) | |||||||||||||
Expenses, after expense reductions (%) | 0.92 | (c) | 0.99 | 0.94 | 0.95 | 1.00 | (c) | |||||||||||||
Expenses, after expense reductions and net of custody credits (%) | 0.92 | (c) | 0.99 | 0.94 | 0.95 | 0.99 | (c) | |||||||||||||
Expenses, before expense reductions (%) | 1.05 | (c) | 1.01 | 0.95 | 0.96 | 2.13 | (c) | |||||||||||||
Portfolio turnover rate (%) | 13.11 | 27.31 | 64.77 | 36.58 | 34.17 | |||||||||||||||
Net assets at end of period (thousands) | $ | 807,078 | $ | 944,582 | $ | 450,944 | $ | 48,699 | $ | 14,458 | ||||||||||
| (a) | Effective date of this class of shares was February 1, 2005. |
| (b) | Not annualized for periods less than one year. |
| (c) | Annualized. |
| + | Based on weighted average shares outstanding. |
| * | Unaudited. |
See notes to financial statements.
| Certified Semi-Annual Report 27 |
| SCHEDULE OF INVESTMENTS | ||
| Thornburg International Value Fund | March 31, 2009 (Unaudited) | |
SUMMARY OF INDUSTRY EXPOSURE
As of 3/31/09
Telecommunication Services | 13.3 | % | |
Pharmaceuticals, Biotechnology & Life Sciences | 13.0 | % | |
Food, Beverage & Tobacco | 8.5 | % | |
Software & Services | 8.2 | % | |
Banks | 7.1 | % | |
Insurance | 4.4 | % | |
Capital Goods | 4.1 | % | |
Materials | 3.0 | % | |
Health Care Equipment & Services | 2.8 | % | |
Diversified Financials | 2.8 | % | |
Household & Personal Products | 2.7 | % | |
Consumer Services | 2.7 | % | |
Technology Hardware & Equipment | 2.5 | % | |
Consumer Durables & Apparel | 2.5 | % | |
Energy | 2.5 | % | |
Retailing | 2.5 | % | |
Utilities | 2.4 | % | |
Transportation | 2.1 | % | |
Automobiles & Components | 2.0 | % | |
Food & Staples Retailing | 1.8 | % | |
Media | 1.1 | % | |
Semiconductors & Semiconductor Equipment | 0.8 | % | |
Other Assets & Cash Equivalents | 7.2 | % |
SUMMARY OF COUNTRY EXPOSURE
As of 3/31/09 (percent of equity holdings)
United Kingdom | 17.7 | % | |
Switzerland | 11.6 | % | |
France | 11.1 | % | |
China | 8.7 | % | |
Canada | 7.5 | % | |
Japan | 7.0 | % | |
Denmark | 5.3 | % | |
Germany | 5.3 | % | |
Israel | 5.1 | % | |
Mexico | 3.4 | % | |
Finland | 3.2 | % | |
Sweden | 2.7 | % | |
Spain | 2.6 | % | |
Greece | 2.2 | % | |
Brazil | 1.9 | % | |
Hong Kong | 1.8 | % | |
Turkey | 1.3 | % | |
Netherlands | 1.1 | % | |
Bermuda | 0.5 | % |
| 28 Certified Semi-Annual Report |
| SCHEDULE OF INVESTMENTS, CONTINUED | ||
| Thornburg International Value Fund | March 31, 2009 (Unaudited) | |
| Shares/ Principal Amount | Value | ||||
COMMON STOCK — 92.83% | |||||
AUTOMOBILES & COMPONENTS — 1.99% | |||||
AUTOMOBILES — 1.99% | |||||
Toyota Motor Corp. | 6,411,100 | $ | 202,077,406 | ||
| 202,077,406 | |||||
BANKS — 7.11% | |||||
COMMERCIAL BANKS — 7.11% | |||||
BNP Paribas SA | 4,095,100 | 169,316,133 | |||
China Merchants Bank Co., Ltd. | 87,630,503 | 152,408,740 | |||
National Bank of Greece SA | 9,538,937 | 144,603,853 | |||
Standard Chartered plc | 20,529,927 | 255,248,060 | |||
| 721,576,786 | |||||
CAPITAL GOODS — 4.09% | |||||
AEROSPACE & DEFENSE — 0.69% | |||||
Empresa Brasileira de Aeronáutica SA ADR | 5,302,345 | 70,362,118 | |||
ELECTRICAL EQUIPMENT — 1.15% | |||||
Vestas Wind Systems A/S+ | 2,656,671 | 116,571,578 | |||
MACHINERY — 2.25% | |||||
Fanuc Ltd. | 2,369,307 | 158,695,817 | |||
Komatsu Ltd. | 6,405,655 | 69,243,328 | |||
| 414,872,841 | |||||
CONSUMER DURABLES & APPAREL — 2.52% | |||||
TEXTILES, APPAREL & LUXURY GOODS — 2.52% | |||||
LVMH Moët Hennessy Louis Vuitton SA | 4,070,011 | 255,716,727 | |||
| 255,716,727 | |||||
CONSUMER SERVICES — 2.66% | |||||
HOTELS, RESTAURANTS & LEISURE— 2.66% | |||||
Carnival plc | 8,974,400 | 204,099,137 | |||
OPAP SA | 2,508,030 | 66,043,581 | |||
| 270,142,718 | |||||
DIVERSIFIED FINANCIALS — 2.82% | |||||
CAPITAL MARKETS — 1.12% | |||||
Julius Baer Holding AG | 4,631,169 | 113,917,888 | |||
DIVERSIFIED FINANCIAL SERVICES — 1.70% | |||||
Hong Kong Exchanges & Clearing Ltd. | 18,227,900 | 171,799,357 | |||
| 285,717,245 | |||||
ENERGY — 2.51% | |||||
ENERGY EQUIPMENT & SERVICES — 1.02% | |||||
Schlumberger Ltd. | 2,550,772 | 103,612,359 | |||
OIL, GAS & CONSUMABLE FUELS — 1.49% | |||||
Canadian Natural Resources Ltd. | 3,884,200 | 150,679,110 | |||
| 254,291,469 | |||||
| Certified Semi-Annual Report 29 |
| SCHEDULE OF INVESTMENTS, CONTINUED | ||
| Thornburg International Value Fund | March 31, 2009 (Unaudited) | |
| Shares/ Principal Amount | Value | ||||
FOOD & STAPLES RETAILING — 1.80% | |||||
FOOD & STAPLES RETAILING — 1.80% | |||||
Wal-Mart de Mexico SAB de C.V. | 78,180,000 | $ | 182,521,186 | ||
| 182,521,186 | |||||
FOOD, BEVERAGE & TOBACCO — 8.46% | |||||
BEVERAGES — 1.27% | |||||
Sabmiller plc | 8,615,750 | 128,197,136 | |||
FOOD PRODUCTS — 5.64% | |||||
Groupe Danone | 4,361,800 | 212,447,903 | |||
Nestlé SA | 10,646,000 | 359,885,865 | |||
TOBACCO — 1.55% | |||||
British American Tobacco plc | 6,809,690 | 157,604,345 | |||
| 858,135,249 | |||||
HEALTH CARE EQUIPMENT & SERVICES — 2.84% | |||||
HEALTH CARE EQUIPMENT & SUPPLIES — 1.74% | |||||
Covidien Ltd. | 1,338,208 | 44,482,034 | |||
Smith & Nephew plc | 21,348,825 | 132,331,795 | |||
HEALTH CARE PROVIDERS & SERVICES — 1.10% | |||||
Fresenius Medical Care AG & Co. | 2,854,900 | 110,983,767 | |||
| 287,797,596 | |||||
HOUSEHOLD & PERSONAL PRODUCTS — 2.69% | |||||
HOUSEHOLD PRODUCTS — 2.69% | |||||
Reckitt Benckiser plc | 7,250,378 | 272,459,921 | |||
| 272,459,921 | |||||
INSURANCE — 4.45% | |||||
INSURANCE — 4.45% | |||||
AXA | 10,210,100 | 122,764,504 | |||
China Life Insurance Co. | 98,986,200 | 328,225,601 | |||
| 450,990,105 | |||||
MATERIALS — 3.05% | |||||
CHEMICALS — 3.05% | |||||
Air Liquide SA | 1,294,376 | 105,323,511 | |||
Givaudan SA | 177,329 | 91,912,598 | |||
Potash Corp. of Saskatchewan, Inc. | 1,386,800 | 112,067,308 | |||
| 309,303,417 | |||||
MEDIA — 1.14% | |||||
MEDIA — 1.14% | |||||
British Sky Broadcasting Group plc | 18,616,720 | 115,797,384 | |||
| 115,797,384 | |||||
PHARMACEUTICALS, BIOTECHNOLOGY & LIFE SCIENCES — 13.02% | |||||
PHARMACEUTICALS — 13.02% | |||||
Novartis AG | 4,761,996 | 180,222,075 | |||
Novo Nordisk A/S | 7,970,350 | 381,716,977 | |||
Roche Holding AG | 2,048,700 | 281,127,066 | |||
Teva Pharmaceutical Industries Ltd. ADR | 10,619,100 | 478,390,455 | |||
| 1,321,456,573 | |||||
| 30 Certified Semi-Annual Report |
SCHEDULE OF INVESTMENTS, CONTINUED
| Thornburg International Value Fund | March 31, 2009 (Unaudited) |
| Shares/ Principal Amount | Value | ||||
RETAILING — 2.47% | |||||
SPECIALTY RETAIL — 2.47% | |||||
Hennes & Mauritz AB | 6,663,487 | $ | 250,507,030 | ||
| 250,507,030 | |||||
SEMICONDUCTORS & SEMICONDUCTOR EQUIPMENT — 0.74% | |||||
SEMICONDUCTORS & SEMICONDUCTOR EQUIPMENT — 0.74% | |||||
Arm Holdings plc | 50,986,100 | 74,986,336 | |||
| 74,986,336 | |||||
SOFTWARE & SERVICES — 8.24% | |||||
INFORMATION TECHNOLOGY SERVICES — 1.08% | |||||
Redecard SA | 9,067,300 | 109,640,162 | |||
INTERNET SOFTWARE & SERVICES — 1.14% | |||||
Baidu, Inc. ADR+ | 657,800 | 116,167,480 | |||
SOFTWARE — 6.02% | |||||
Amdocs Ltd.+ | 6,593,900 | 122,119,028 | |||
Nintendo Co., Ltd. | 799,231 | 229,712,804 | |||
SAP AG | 7,290,861 | 258,439,495 | |||
| 836,078,969 | |||||
TECHNOLOGY HARDWARE & EQUIPMENT — 2.53% | |||||
COMMUNICATIONS EQUIPMENT — 1.91% | |||||
Nokia Oyj | 16,481,900 | 194,452,925 | |||
COMPUTERS & PERIPHERALS — 0.62% | |||||
Logitech International SA+ | 6,057,621 | 62,742,117 | |||
| 257,195,042 | |||||
TELECOMMUNICATION SERVICES — 13.27% | |||||
DIVERSIFIED TELECOMMUNICATION SERVICES — 4.18% | |||||
France Telecom SA | 7,895,275 | 179,897,706 | |||
Telefónica SA | 12,229,900 | 244,054,646 | |||
WIRELESS TELECOMMUNICATION SERVICES — 9.09% | |||||
América Móvil SAB de C.V. ADR | 5,173,344 | 140,094,156 | |||
China Mobile Ltd. | 25,144,172 | 219,467,297 | |||
Rogers Communications, Inc. | 10,259,100 | 236,379,168 | |||
Turkcell | 25,027,800 | 122,674,226 | |||
Vodafone Group plc ADR | 11,719,483 | 204,153,394 | |||
| 1,346,720,593 | |||||
TRANSPORTATION — 2.08% | |||||
ROAD & RAIL — 2.08% | |||||
Canadian National Railway Co. | 5,889,800 | 211,150,825 | |||
| 211,150,825 | |||||
UTILITIES — 2.35% | |||||
ELECTRIC UTILITIES — 2.35% | |||||
E. ON AG | 4,614,901 | 128,206,682 | |||
Fortum Oyj | 5,780,828 | 110,213,854 | |||
| 238,420,536 | |||||
TOTAL COMMON STOCK (Cost $13,092,181,831) | 9,417,915,954 | ||||
| Certified Semi-Annual Report 31 |
SCHEDULE OF INVESTMENTS, CONTINUED
| Thornburg International Value Fund | March 31, 2009 (Unaudited) |
| Shares/ Principal Amount | Value | |||||
SHORT TERM INVESTMENTS — 6.61% | ||||||
AGL Capital Corp., 0.75%, 4/1/2009 | $ | 50,000,000 | $ | 50,000,000 | ||
California State Department of Water Resources, put 4/7/2009 (Insured: FSA/SPA: Dexia Credit Local) (weekly demand notes), 2.00%, 5/1/2022 | 32,500,000 | 32,500,000 | ||||
California State, put 4/7/2009 (LOC: Bank of America) (weekly demand notes), 0.30%, 5/1/2040 | 12,975,000 | 12,975,000 | ||||
Chevron Phillips Chemical Co., LLC, 0.80%, 4/1/2009 | 30,000,000 | 30,000,000 | ||||
Chicago GO, put 4/7/2009 (Insured: FSA/SPA: Dexia Credit Local) (weekly demand notes), 1.50%, 1/1/2040 | 66,840,000 | 66,840,000 | ||||
Clark County School District GO, put 4/1/2009 (Insured: FSA/SPA: Bayerische Landesbank) (daily demand notes), 0.60%, 6/15/2021 | 1,700,000 | 1,700,000 | ||||
Devon Energy Corp., 0.60%, 4/1/2009 | 36,000,000 | 36,000,000 | ||||
Farmington PCR, put 4/1/2009 (LOC: Barclays Bank) (daily demand notes), 0.35%, 5/1/2024 | 8,600,000 | 8,600,000 | ||||
JEA Florida Electric Systems, put 4/7/2009 (SPA: Dexia Credit Local) (weekly demand notes), 1.50%, 10/1/2040 | 6,570,000 | 6,570,000 | ||||
JEA Florida Electrical Services, put 4/7/2009 (SPA: Dexia Credit Local) (weekly demand notes), 1.50%, 10/1/2036 | 14,050,000 | 14,050,000 | ||||
Kansas City Power & Light, 2.30%, 4/1/2009 | 25,000,000 | 25,000,000 | ||||
Lehigh County Pennsylvania, put 4/1/2009 (Muhlenberg College; LOC: Bank of America) (daily demand notes), 0.35%, 11/1/2037 | 16,430,000 | 16,430,000 | ||||
Maryland State Health & Higher Educational Facilities Authority, put 4/7/2009 (Univ. of Maryland Medical; LOC: Bank of America) (weekly demand notes), 0.50%, 7/1/2034 | 20,795,000 | 20,795,000 | ||||
Mississippi State, put 4/7/2009 (Nissan; Insured: Bank of America) (weekly demand notes), 1.15%, 11/1/2028 | 30,700,000 | 30,700,000 | ||||
Nevada Department of Business & Industry, put 4/7/2009 (NV Cancer Institute; LOC: Bank of America) (weekly demand notes), 0.55%, 12/1/2033 | 12,000,000 | 12,000,000 | ||||
New York City GO, put 4/1/2009 (Insured: FSA/SPA: Dexia Credit Local) (daily demand notes), 0.50%, 11/1/2026 | 8,000,000 | 8,000,000 | ||||
New York City Municipal Water Finance Authority, put 4/1/2009 (SPA: Dexia Credit Local) (daily demand notes), 1.00%, 6/15/2032 | 9,000,000 | 9,000,000 | ||||
New York State Local Government Assistance Corp., put 4/7/2009 (Insured: FSA GO of Corp./SPA: Westlb AG) (weekly demand notes), 1.30%, 4/1/2022 | 25,600,000 | 25,600,000 | ||||
New York, NY, 4/1/2009 (SPA: Dexia Credit Local) (daily demand notes), 0.90%, 8/1/2028 | 39,300,000 | 39,300,000 | ||||
Pepco Holdings, Inc., 2.75%, 4/9/2009 | 25,000,000 | 24,984,722 | ||||
San Diego County CA Pension Obligation, put 4/7/2009 (SPA: Landesbank Baden) (weekly demand notes), 2.25%, 8/15/2027 | 9,400,000 | 9,400,000 | ||||
South Fulton Georgia Municipal Water & Sewer Authority, put 4/7/2009 (LOC: Bank of America) (weekly demand notes), 0.55%, 1/1/2033 | 14,755,000 | 14,755,000 | ||||
Toyota Motor Credit Corp. Master Note, put 4/7/2009 (weekly demand notes), 1.178%, 1/1/2050 | 50,000,000 | 50,000,000 | ||||
Vodafone Group plc, 0.55%, 4/1/2009 | 125,000,000 | 125,000,000 | ||||
TOTAL SHORT TERM INVESTMENTS (Cost $670,199,722) | 670,199,722 | |||||
TOTAL INVESTMENTS — 99.44% (Cost $13,762,381,553) | $ | 10,088,115,676 | ||||
OTHER ASSETS LESS LIABILITIES — 0.56% | 57,307,630 | |||||
NET ASSETS — 100.00% | $ | 10,145,423,306 | ||||
| 32 Certified Semi-Annual Report |
SCHEDULE OF INVESTMENTS, CONTINUED
| Thornburg International Value Fund | March 31, 2009 (Unaudited) |
Footnote Legend
| + | Non-income producing |
Portfolio Abbreviations
To simplify the listings of securities, abbreviations are used per the table below:
| ADR | American Depository Receipt | |
| ARM | Adjustable Rate Mortgage | |
| FSA | Insured by Financial Security Assurance Co. | |
| GO | General Obligation | |
| LOC | Letter of Credit | |
| PCR | Pollution Control Revenue Bond |
See notes to financial statements.
| Certified Semi-Annual Report 33 |
| Thornburg International Value Fund | March 31, 2009 (Unaudited) |
As a shareholder of the Fund, you incur two types of costs:
(1) transaction costs, including
(a) sales charges (loads) on purchase payments for Class A shares;
(b) a deferred sales charge on redemptions of any part or all of a purchase of $1 million of Class A shares within 12 months of purchase;
(c) a deferred sales charge on redemptions of Class B shares within eight years of purchase;
(d) a deferred sales charge on redemptions of Class C shares within 12 months of purchase;
(e) a 30-day redemption fee on Class A and Class I shares;
(2) ongoing costs, including management fees; distribution and/or service (12b-1) fees; and other Fund expenses.
This example is intended to help you understand your ongoing costs (in dollars) of investing in the Fund and to compare these costs with the ongoing costs of investing in other mutual funds.
The example is based on an investment of $1,000 invested on September 30, 2008 and held until March 31, 2009.
| Beginning Account Value 9/30/08 | Ending Account Value 3/31/09 | Expenses Paid During Period† 9/30/08–3/31/09 | |||||||
Class A Shares | |||||||||
Actual | $ | 1,000.00 | $ | 720.20 | $ | 5.97 | |||
Hypothetical* | $ | 1,000.00 | $ | 1,018.00 | $ | 7.00 | |||
Class B Shares | |||||||||
Actual | $ | 1,000.00 | $ | 717.20 | $ | 9.22 | |||
Hypothetical* | $ | 1,000.00 | $ | 1,014.19 | $ | 10.81 | |||
Class C Shares | |||||||||
Actual | $ | 1,000.00 | $ | 717.50 | $ | 8.96 | |||
Hypothetical* | $ | 1,000.00 | $ | 1,014.49 | $ | 10.51 | |||
Class I Shares | |||||||||
Actual | $ | 1,000.00 | $ | 721.40 | $ | 4.01 | |||
Hypothetical* | $ | 1,000.00 | $ | 1,020.27 | $ | 4.71 | |||
Class R3 Shares | |||||||||
Actual | $ | 1,000.00 | $ | 719.80 | $ | 6.21 | |||
Hypothetical* | $ | 1,000.00 | $ | 1,017.70 | $ | 7.29 | |||
Class R4 Shares | |||||||||
Actual | $ | 1,000.00 | $ | 720.40 | $ | 5.36 | |||
Hypothetical* | $ | 1,000.00 | $ | 1,018.70 | $ | 6.29 | |||
Class R5 Shares | |||||||||
Actual | $ | 1,000.00 | $ | 721.90 | $ | 3.95 | |||
Hypothetical* | $ | 1,000.00 | $ | 1,020.35 | $ | 4.63 | |||
| † | Expenses are equal to the annualized expense ratio for each class (A: 1.39%; B: 2.15%; C: 2.09%; I: 0.93%; R3: 1.45%; R4: 1.25%; and R5: 0.92%) multiplied by the average account value over the period, multiplied by 182/365 to reflect the one-half year period. |
| * | Hypothetical assumes a rate of return of 5% per year before expenses. |
Actual Expenses
For each class of shares, the first line of the table at right provides information about actual account values and actual expenses. You may use the information in this line, together with the amount you invested, to estimate the expenses that you paid over the period. Simply divide your account value by $1,000 (for example, an $8,600 account value divided by $1,000 = 8.6), then multiply the result by the number in the first line for your class of shares under the heading entitled “Expenses Paid During Period” to estimate the expenses you paid on your account during this period.
Hypothetical Example for Comparison Purposes
For each class of shares, the second line of the table at right provides information about hypothetical account values and hypothetical expenses based on the Fund’s actual expense ratio and an assumed rate of return of 5% per year before expenses, which is not the Fund’s actual return. The hypothetical account values and expenses may not be used to estimate the actual ending account balance or expenses you paid for the period. You may use this information to compare the ongoing costs of investing in the Fund and other funds. To do so, compare this 5% hypothetical example with the 5% hypothetical examples that appear in the shareholder reports of the other funds.
Please note that the expenses shown in the table are meant to highlight your ongoing costs only and do not reflect any transactional costs, such as sales charges (loads), redemption fees, or exchange fees. Therefore, the second line of the table for each class of shares is useful in comparing ongoing costs only, and will not help you determine the relative total costs of owning different funds. In addition, if these transactional costs were included, your costs would have been higher.
| 34 Certified Semi-Annual Report |
| Thornburg International Value Fund | March 31, 2009 (Unaudited) |
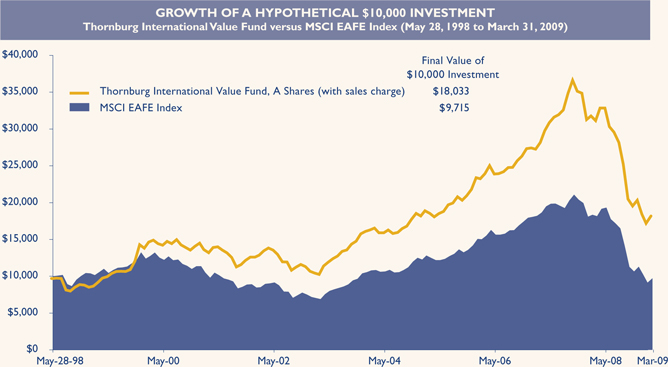
AVERAGE ANNUAL TOTAL RETURNS
For periods ended March 31, 2009 (with sales charge)
| 1 Yr | 5 Yrs | 10 Yrs | Since Inception | |||||||||
A Shares (Incep: 5/28/98) | -44.44 | % | 0.99 | % | 6.67 | % | 5.59 | % | ||||
B Shares (Incep: 4/3/00) | -45.15 | % | 0.76 | % | — | 1.71 | % | |||||
C Shares (Incep: 5/28/98) | -42.82 | % | 1.18 | % | 6.30 | % | 5.17 | % | ||||
I Shares (Incep: 3/30/01) | -41.58 | % | 2.35 | % | — | 4.60 | % | |||||
R3 Shares (Incep: 7/1/03) | -41.88 | % | 1.83 | % | — | 7.03 | % | |||||
R4 Shares (Incep: 2/1/07) | -41.78 | % | — | — | -17.77 | % | ||||||
R5 Shares (Incep: 2/1/05) | -41.61 | % | — | — | 0.33 | % | ||||||
MSCI EAFE Index (Since: 5/28/98) | -46.51 | % | -2.18 | % | -0.84 | % | -0.26 | % |
The MSCI EAFE (Europe, Australasia, Far East) Index is an unmanaged, market capitalization weighted index and is the common benchmark for international portfolio performance. The index is calculated with net dividends reinvested in U.S. dollars. Unless otherwise noted, index returns do not reflect fees, broker- age commissions or other expenses of investing. Investors may not make direct investments into any index.
Performance data reflects past performance, which is no guarantee of future results. The performance data and graph do not reflect the deduction of taxes that a shareholder would pay on distributions or the redemption of Fund shares.
Returns reflect the reinvestment of dividends and capital gains as well as applicable sales charges. Class A shares are sold with a maximum sales charge of 4.50%. Class B shares are sold with a contingent deferred sales charge (CDSC) that declines from 5.00% to 0% depending upon the period of time the shares are held. Class B shares will automatically convert to Class A shares on a quarterly basis approximately eight years after purchase. Class C shares are subject to a 1% CDSC for the first year only. There is no up-front sales charge for Class I, R3, R4 and R5 shares. Class A and I shares are subject to a 1% 30-day redemption fee.
| Certified Semi-Annual Report 35 |
| Thornburg International Value Fund | March 31, 2009 (Unaudited) |
PORTFOLIO PROXY VOTING
Policies and Procedures:
The Trust has delegated to Thornburg Investment Management, Inc. (the “Advisor”) voting decisions respecting proxies for the Fund’s voting securities. The Advisor makes voting decisions in accordance with its Proxy Voting Policy and Procedures. A description of the Policy and Procedures is available (i) without charge, upon request, by calling the Advisor toll-free at 1-800-847-0200, (ii) on the Thornburg web site at www.thornburg.com, and (iii) on the Securities and Exchange Commission’s web site at www.sec.gov.
Information regarding how proxies were voted is available on or before August 31 of each year for the twelve months ending the preceding June 30. This information is available (i) without charge, upon request by calling the Advisor toll-free at 1-800-847-0200, (ii) on the Thornburg web site at www. thornburg.com, and (iii) on the Securities and Exchange Commission’s web site at www.sec.gov.
AVAILABILITY OF QUARTERLY PORTFOLIO SCHEDULE
The Fund files with the Securities and Exchange Commission schedules of its portfolio holdings on Form N-Q for the first and third quarters of each fiscal year. The Fund’s Forms N-Q are available on the Commission’s web site at www.sec.gov, or may be reviewed and copied at the Commission’s Public Reference Room in Washington, D.C. Information on the operation of the Public Reference Room may be obtained by calling 1-800-SEC-0330. The Fund also makes this information available on its web site at www.thornburg.com/download or upon request by calling 1-800-847-0200.
| 36 Certified Semi-Annual Report |
Trustees’ Statement to Shareholders
Not part of the Certified Semi-Annual Report
February 8, 2005, as readopted September 15, 2008
The Trustees are concerned that ongoing commentaries and opinions reported in the media may confuse investors in general as to the supervisory duties of trustees of mutual funds and, in particular, leave Thornburg Investment Trust shareholders uncertain regarding how we discharge our responsibilities in supervising the Funds’ investment advisor and in reviewing the advisor’s contract for renewal. We decided to spell out clearly three principal guidelines that we follow in supervising the Trust’s investment advisor on your behalf.
We begin with the premise that each shareholder selected his or her Fund because its investments are managed by the investment advisor identified in the prospectus and in accordance with the objective and policies described in the prospectus. We realize, as each of you do, that if you believe that your Fund’s stated objective and policies no longer serve your personal investment goals, you can sell your shares and leave the Fund.
Therefore, we believe that our primary supervisory task – our principal obligation to you – is to assess the nature and quality of the advisor’s services, and to confirm that the advisor actively and competently pursues the Fund’s objective, in accordance with the policies set out in the prospectus. To do this, we meet regularly with management to review your Fund’s portfolio and to discuss the advisor’s specific actions and judgments in pursuing the Fund’s objective. We do not substitute our own judgment for the advisor’s decisions in selecting investments; the advisor is paid to exercise its informed judgment on investment decisions, and we seek to confirm, in reviewing the advisor’s performance, that the advisor is doing just that.
Second, while we are conscious of costs and the effect that costs have on shareholders’ returns, we do not seek the lowest fees or expense ratio as our sole or primary objective. We try to make sure that your Fund’s fees and costs are reasonable in relationship to the services rendered and that they are generally in line with those charged by other expert investment advisors, consistent with our belief that the Fund’s investors searched for and expect that expertise and attention and have decided to pay a reasonable price for it. We do not put the management contract “out to bid” as a matter of course, and we would not do so unless we had concluded that the advisor materially had failed to pursue the Fund’s objectives in accordance with its policies, or for other equally important reasons. We believe that any other approach would be inconsistent with your interests and contrary to your expectations when you bought shares of the Fund in the first place.
Finally, because we believe that most Thornburg Fund shareholders have invested with a long-term perspective, we try not to focus too much on the fashions of the moment and on short-term performance. The market will not favor any specific investment objective or set of policies at all times and under all economic circumstances. A fund will experience periods of both high and low returns relative to other funds and other investments. Even if one of our Funds is not favored by the market at a particular time, we believe that the advisor is nonetheless obliged to remain true to the Fund’s objective and policies, and we watch to see that it does so.
This page is not part of the Semi-Annual Report. 37
This page intentionally left blank.
| 38 This page is not part of the Semi-Annual Report. |
This page intentionally left blank.
| This page is not part of the Semi-Annual Report. 39 |
This page intentionally left blank.
| 40 This page is not part of the Semi-Annual Report. |
Planning Options
Retirement and Education Accounts
Thornburg Investment Management offers retirement and education savings accounts that can help you meet a variety of planning challenges. For account applications or further information on any of the accounts below, please call 1-800-847-0200 or go to www.thornburg.com/ira. Your financial advisor can help you determine which plan is right for you.
Individual Retirement Accounts
Individual Retirement Accounts (IRAs) provide a tax-advantaged means to save money for the future. For a detailed outline of the difference between retirement accounts, see www.thornburg.com/ira. Rollovers are available. Call 1-800-847-0200 for more information.
Traditional IRAs – Contributions to Traditional IRAs are tax deductible for eligible individuals, and withdrawals are taxed as additional ordinary income. You may contribute to an IRA if you receive compensation and are under 70 1/2, even if you are covered by an employer retirement plan. Deductible contributions are subject to certain qualifications. Please consult your tax advisor.
Roth IRAs – Under a Roth IRA, there is no tax deduction for contributions, but there is no income tax on qualified withdrawals. For a more detailed comparison of Traditional and Roth IRAs, please see our web site at www.thornburg.com/ira.
SEP IRAs – Simplified Employee Pension (SEP) IRAs are established by employers. The employer is allowed a tax deduction for contributions made to the SEP Plan and makes contributions to each eligible employee’s SEP IRA on a discretionary basis.
SIMPLE IRAs – Savings Incentive Match Plan for Employees of Small Employers (SIMPLE) is designed to give small business owners a simplified method to establish and contribute to a retirement plan for employees. The employer is allowed a tax deduction for contributions and makes either matching or non-elective contributions to each eligible employee’s SIMPLE IRA. Employees may make salary deferral contributions.
Coverdell Education Savings Account
These savings accounts are designed to provide a way to save money for higher education expenses. In an Education Savings Account, earnings and interest grow tax-free, and qualified withdrawals used to pay for eligible higher-education expenses are tax- and penalty-free.
Funds Available
The following funds are available in the accounts listed above:
| • | Thornburg International Value Fund |
| • | Thornburg Value Fund |
| • | Thornburg Core Growth Fund |
| • | Thornburg Investment Income Builder Fund |
| • | Thornburg Global Opportunities Fund |
| • | Thornburg International Growth Fund |
| • | Thornburg Limited Term U.S. Government Fund |
| • | Thornburg Limited Term Income Fund |
| • | Thornburg Strategic Income Fund |
| This page is not part of the Semi-Annual Report. 41 |

| 42 This page is not part of the Annual Report. |
Thornburg Equity Funds
Thornburg’s equity research uses a fundamental and comprehensive analytical approach. Thornburg equity funds focus on a limited number of securities so that each holding can impact performance. The equity team searches for firms believed to have a promising future and seeks to buy shares of those companies at a discount to their intrinsic value.
| • | Thornburg Value Fund |
| • | Thornburg International Value Fund |
| • | Thornburg Core Growth Fund |
| • | Thornburg Investment Income Builder Fund |
| • | Thornburg Global Opportunities Fund |
| • | Thornburg International Growth Fund |
Thornburg Bond Funds
Thornburg Investment Management applies a disciplined philosophy to fixed-income management. Since the launch of our first fixed-income fund 25 years ago, we have been conducting fundamental, bottom-up research in an effort to identify bonds which we believe provide the best return for a given level of risk. We are very organic in our approach, avoiding leverage or complex strategies which could backfire in periods of market uncertainty.
| • | Thornburg Limited Term Municipal Fund |
| • | Thornburg Intermediate Municipal Fund |
| • | Thornburg California Limited Term Municipal Fund |
| • | Thornburg New Mexico Intermediate Municipal Fund |
| • | Thornburg New York Intermediate Municipal Fund |
| • | Thornburg Strategic Municipal Income Fund |
| • | Thornburg Limited Term U.S. Government Fund |
| • | Thornburg Limited Term Income Fund |
| • | Thornburg Strategic Income Fund |
Before investing, carefully consider the Fund’s investment goals, risks, charges, and expenses. For a prospectus containing this and other information, contact your financial advisor or visit thornburg.com. Read it carefully before investing.
For additional information, please visit www.thornburg.com
Thornburg Investment Management, Inc. 2300 North Ridgetop Road, Santa Fe, NM 87506
| This page is not part of the Semi-Annual Report. 43 |
 | ||
| This Semi-Annual Report is submitted for the general information of shareholders of the Fund. It is not authorized for distribution to prospective investors in the Fund unless preceded or accompanied by an effective prospectus. | ||
 | Investment Advisor: Thornburg Investment Management® 800.847.0200
| |
Distributor: Thornburg Securities Corporation® 800.847.0200
| ||
| TH176 | ||
Waste not, Wait not |  | |
| Get instant access to your shareholder reports. | ||
| By switching from your postal mailbox to your email inbox, you reduce paper clutter, improve record keeping access, and help conserve our natural resources. | ||
| Go to www.thornburg.com/edelivery and sign up to receive your shareholder reports, prospectuses, and proxy statements electronically. | ||
| You invest in the future, without spending a dime. | ||
| 2 This page is not part of the Semi-Annual Report. |
Important Information
The information presented on the following pages was current as of March 31, 2009. The managers’ views, portfolio holdings, and sector and country diversification are provided for the general information of the Fund’s shareholders; they are historical and subject to change. This material should not be deemed a recommendation to buy or sell any of the securities mentioned.
Investments in the Fund carry risks including possible loss of principal. Investing outside the United States involves additional risks, such as currency fluctuations. Additionally, the Fund invests a portion of the assets in small capitalization companies, which may increase the risk of greater price fluctuations. Funds invested in a limited number of holdings may expose an investor to greater volatility. Please see the Fund’s Prospectus for a discussion of the risks associated with an investment in the Fund. Investments in the Fund are not deposits or obligations of, or guaranteed or endorsed by, any bank, the Federal Deposit Insurance Corporation, the Federal Reserve Board or any government agency. There is no guarantee that the Fund will meet its investment objectives.
Performance data given at net asset value (NAV) does not take into account the applicable sales charges. If the sales charges had been included, the performance would have been lower.
Class I, R3, R4, and R5 shares may not be available to all investors. Minimum investments for Class I shares may be higher than those for other classes.
Share Class | NASDAQ Symbol | Cusip | ||
Class A | THCGX | 885-215-582 | ||
Class C | TCGCX | 885-215-574 | ||
Class I | THIGX | 885-215-475 | ||
Class R3 | THCRX | 885-215-517 | ||
Class R4 | TCGRX | 885-215-251 | ||
Class R5 | THGRX | 885-215-350 |
Glossary
Russell 3000 Growth Index – The Russell 3000 Growth Index (Russell 3K G) is an unmanaged index comprised of those Russell 3000 companies with higher price-to-book ratios and higher forecasted growth values.
Standard & Poor’s 500 Stock Index (S&P 500) – The S&P 500 Index is a broad measure of the U.S. stock market.
Unless otherwise noted, index returns reflect the reinvestment of income dividends and capital gains, if any, but do not reflect fees, brokerage commissions or other expenses of investing. Investors may not make direct investments into any index. The performance of any index is not indicative of the performance of any particular investment.
Basis Point (BPS) – Unit equal to 1/100th of 1%. A 1% change = 100 basis points (bps).
Beta – Beta is a measure of market-related risk. Less than one means the portfolio is less volatile than the index, while greater than one indicates more volatility than the index.
Estimated EPS Growth – The estimated growth in earnings per share (EPS) over a given time period. For example, estimated EPS growth for a single year would be calculated as: [(estimated earnings for the upcoming year - current earnings) x 100] divided by current earnings.
Median Market Capitalization – Market capitalization (market cap) is the total value of a company’s stock, calculated by multiplying the number of outstanding common shares by the current share price. The company whose market cap is in the middle of the portfolio is the median market cap. Half the companies in the portfolio have values greater than the median, and half have values that are less. If there is an even number of companies, then the median is the average of the two companies in the middle.
Price to Book Value (P/B) – A ratio used to compare a stock’s market value to its book value. It is calculated by dividing the current closing price of the stock by the latest quarter’s book value (book value is simply assets minus liabilities).
Price to Cash Flow Ratio – A measure of the market’s expectations of a firm’s future financial health. It is calculated by dividing the price per share by cash flow per share.
Price to Earnings Ratio (P/E) – A valuation ratio equaling a company’s market value per share divided by earnings per share.
Selection Effect – The portion of portfolio excess return attributable to choosing different securities within groups from the benchmark. A group’s selection effect equals the weight of the benchmark’s group multiplied by the total return of the portfolio’s group minus the total return of the benchmark’s group.
| This page is not part of the Semi-Annual Report. 3 |
Thornburg Core Growth Fund
PORTFOLIO MANAGER
 | Alexander M.V. Motola, CFA |
KEY PORTFOLIO ATTRIBUTES
As of 3/31/09
Portfolio P/E Trailing 12-months* | 16.1x | ||
Portfolio Price to Cash Flow* | 9.1 | ||
Portfolio Price to Book Value* | 2.4 | ||
Median Market Cap* | $ | 5.5 B | |
7-Year Beta (A shares vs. Russell 3K G)* | 1.14 | ||
Holdings | 36 |
| * | Source: FactSet |
IMPORTANT PERFORMANCE
INFORMATION
Performance data shown represents past performance and is no guarantee of future results. Investment return and principal value will fluctuate so shares, when redeemed, may be worth more or less than their original cost. Current performance may be lower or higher than quoted. For performance current to the most recent month end, visit thornburg.com.
The maximum sales charge for Class A shares is 4.50%. Class A shares are subject to a 1% 30-day redemption fee. The total annual fund operating expense of Class A shares is 1.65%, as disclosed in the most recent Prospectus. Thornburg Investment Management intends to waive fees and reimburse expenses so that actual Class A expenses do not exceed 1.63%. The fee waivers and expense reimbursements are voluntary and may be terminated at any time. Without these waivers, returns would be lower.
Continually Evaluating the Risk Equation
Growth stocks are often referred to as “glamour” stocks . . . and it is easy to understand why. Growth stocks generate excitement. These are stocks where rapid earnings growth is expected to be followed by rapid price appreciation. Growth stocks capture the imagination, and investing in them may potentially offer considerable opportunities for reward.
But growth stocks can also be volatile. Identifying which companies will succeed takes work. It takes digging down to the nuts and bolts of companies. The management team of Thornburg Core Growth Fund understands this. They know that it is grit, not glamour, that creates a successful growth fund.
Portfolio manager Alex Motola and his team apply a rigorous stock selection process to investments for the Thornburg Core Growth Fund. This is a portfolio run on common sense, not on abstract theory. Motola’s overarching philosophy is to create a fund that generates good performance over the long term, while reducing volatility in the interim. Intensive, hands-on, independent research is the central theme. While many other growth funds rely on broad portfolio diversification to temper volatility, the Thornburg Core Growth Fund focuses on a limited number of stocks and diversifies those investments among three segments of the growth fund universe: Consistent Growth Companies, Growth Industry Leaders, and Emerging Growth Companies. By limiting the number of securities, the Fund’s managers can cover each stock in greater depth. We believe that diversifying among three growth baskets further mitigates risk because each of these segments typically reacts differently than the equity markets as a whole.
AVERAGE ANNUAL TOTAL RETURNS
FOR PERIODS ENDED MARCH 31, 2009
| 1 Yr | 3 Yrs | 5 Yrs | Since Inception | |||||||||
A Shares (Incep: 12/27/00) | ||||||||||||
Without Sales Charge | -40.91 | % | -16.41 | % | -2.29 | % | -2.38 | % | ||||
With Sales Charge | -43.58 | % | -17.69 | % | -3.19 | % | -2.92 | % | ||||
Russell 3000 Growth | ||||||||||||
Index (since: 12/27/00) | -34.42 | % | -11.70 | % | -4.44 | % | -5.98 | % |
| 4 This page is not part of the Semi-Annual Report. |
How does the stock selection process work? Before adding a stock to the Fund’s portfolio, Motola and his team drill down into the company and its business. The team believes that an intimate understanding of the companies in the portfolio is one of the most effective forms of risk management.
Companies are initially screened using a variety of quantitative measures and parameters. Most are rejected and logged as a screening rejection. Only those with the most appealing opportunities to expand margins and grow earnings move on to the next step – the construction of a company-specific model. The goal is to cut to the quick and get at the underlying business. The team uses SEC filings to construct proprietary income statement, balance sheet and cash flow statement models for each remaining company. From these they analyze historical data, monitor current conditions, identify red flags, and estimate future growth potential.
Motola, a former historian who has been at the Fund’s helm since its inception, is not one to go along with the crowd. He and his team are not tied to “mainstream thinking.” While they have access to the best of Wall Street’s analysis, they are not ruled by it.
They test the strength of a company’s underlying business model against a variety of what-if screens. They conduct site visits and interview company management. And they complete the picture by checking in with a company’s major customers, suppliers, and distributors. Revenue and cost of goods sold are given particular attention, with each broken down in as many ways as the data will allow.
STOCKS CONTRIBUTING AND DETRACTING
FOR SIX MONTHS ENDED 3/31/09
Top Contributors | Top Detractors | |
| SBA Communications Corp. | Western Union Co. | |
| Starent Networks Corp. | Las Vegas Sands Corp. | |
| Hansen Natural Corp. | Amdocs Ltd. | |
| Goldman Sachs Group, Inc. | Guess? Inc. | |
| Genentech | VistaPrint Ltd. | |
| Source: FactSet | ||
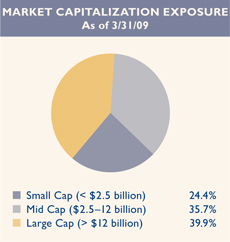
TOP TEN HOLDINGS
As of 3/31/09
Equinix, Inc. | 4.4 | % | |
Gilead Sciences, Inc. | 4.2 | % | |
Qualcomm, Inc. | 3.9 | % | |
Amdocs Ltd. | 3.6 | % | |
McAfee, Inc. | 3.5 | % | |
Alexion Pharmaceuticals, Inc. | 3.3 | % | |
Western Union Co. | 3.3 | % | |
DIRECTV Group, Inc. | 3.2 | % | |
Celgene Corp. | 3.2 | % | |
Research In Motion Ltd. | 3.2 | % |
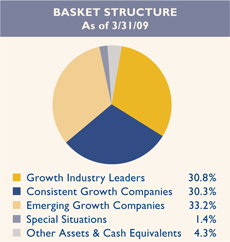
| This page is not part of the Semi-Annual Report. 5 |
This page intentionally left blank.
| 6 This page is not part of the Semi-Annual Report. |

Thornburg Core Growth Fund
March 31, 2009
Table of Contents
| 8 | ||
| 12 | ||
| 14 | ||
| 16 | ||
| 17 | ||
| 23 | ||
| 29 | ||
| 33 | ||
| 34 | ||
| 35 | ||
This report is certified under the Sarbanes-Oxley Act of 2002, which requires that public companies, including mutual funds, affirm that the information provided in their annual and semiannual shareholder reports fully and fairly represents their financial position.
| Certified Semi-Annual Report 7 |
Alexander M.V. Motola,CFA Portfolio Manager | April 22, 2009 | |
Dear Fellow Shareholder: | ||
For the six months ended March 31, 2009, the Thornburg Core Growth Fund performed poorly in both relative and absolute terms. On March 31, 2009, the net asset value (NAV) for the Class A shares was $9.62. At the end of the last fiscal year (September 30, 2008), the Fund’s NAV was $13.36. The Fund’s Class A shares underperformed its benchmark with a total return of negative 27.99% (at NAV) compared to negative 26.64% for the Russell 3000 Growth Index. | ||
It was definitely the tale of two quarters. In the quarter ended December 31, 2008, the Fund underperformed the Russell 3000 Growth’s negative 23.15% return by 3.80%. This was a frustrating conclusion to an already frustrating year. The Thornburg Core Growth Fund has historically demonstrated more resilience in bad markets, and there was not much evidence of that in 2008. Since we started the Fund back in December of 2000, this was the first calendar year of underperformance. | ||
The first calendar quarter of 2009 (ended 3/31/09) was a little different. While the market continued to decline, the pace moderated with the S&P 500 Index falling 11.01% and the Russell 3000 Growth (this Fund’s benchmark index) returning negative 4.54%. After the strong market in March, the Core Growth Fund finished the three-month period with a return of negative 1.43%. While no one likes negative absolute performance, it was good to have some strong relative performance. Most importantly, during the start of 2009, performance on a relative basis was good both during the decline at the start of the year as well as during the rally which began March 10, 2009. | ||
What caused the difference? Many things in the stock market are unknowable. In the past, we have performed better during periods where there has been a lot of variance among individual stock returns, which makes sense. As we emphasize our stock selection ability, we would expect to have better performance when the spread of performance among stocks is high. Likewise, during periods when stocks all move similarly, we would expect to do less well on a relative basis. |

| 8 Certified Semi-Annual Report |
My favorite quote with regard to the stock market is from Benjamin Graham. While it may seem strange for a “dyed in the wool” growth investor to quote the patriarch of value investing, our approach to investing at Thornburg is deeply rooted in fundamental and valuation analysis, whether the style is growth or value, domestic or international. I think this bias towards valuation is a competitive advantage in our fund peer group.
Graham famously said, “In the short run the market is a voting machine, but in the long run it’s a weighing machine.” Much of 2008 felt like a voting machine market with sentiment driving stock prices far more than intrinsic value. Debt-laden companies were tossed out the window regardless of their ability to service their debt, even in a “nuclear winter” scenario. Consumer businesses and financials were tough stocks to own in 2008. Some stocks traded where they “deserved” but many traded at opportunistic prices – driven there by the “madness of crowds.”
Patience is a valuable trait for an investor to possess. 2008 tried the patience of all investors. While value and opportunity were certainly created, the realization of that value has so far been a long time in coming. In the meantime, we continue to maintain our disciplined, long-term approach to stock selection – growth with a value bias backed by rigorous fundamental analysis.
Over the past six months, several stocks have contributed strongly to the value of the Fund. The five largest contributors were SBA Communications, Starent Networks, Hansen’s Natural, Goldman Sachs Group, and Genentech. That is an interesting list of companies, especially in light of how they came to be top contributors over the period in question. SBA Communications is a company that generates cash flow by borrowing money and buying cell phone towers. In some ways, this may seem crazy – like the stories you hear of speculative real estate investors buying six houses in Phoenix, Las Vegas, or Miami. But the customers of SBA Communications are the wireless carriers and, in spite of a tough environment, those customers need to expand their networks and expand their offerings. To do this, carriers need to install antennas on cell phone towers. Once investors realized the stability of the underlying business, the stock came to life. We entered a period where the market as a whole was willing to look at the business model and not just the amount of debt on the balance sheet.
Starent Networks (STAR) sells specialized equipment to the same carrier customers. STAR has enjoyed very rapid growth in its business, but smaller high-growth companies were not in favor in the fourth calendar quarter of 2008. Our approach to managing the portfolio helped us here – our portfolio was underweight a type of stock we refer to as an “Emerging Growth Company.” STAR fit the bill perfectly and we bought the company in spite of the extremely negative market sentiment at the time. The combination of the discipline of our approach combined with our valuation-driven analysis led us into a strong contributor to the portfolio (the stock was up over 40% during a period when the Russell 3000 Growth returned negative 27%).
| Certified Semi-Annual Report 9 |
Letter to Shareholders
Continued
Hansen Natural Corp. (HANS) has been a long-time holding of the Fund. The stock was hurt by a variety of issues, including high gas prices (less discretionary income to spend at convenience stores during refueling stops), the near demise of the auction rate preferred market (it had some short-term cash invested there), and a difference between its reported sales (lower) and the sell through retail data from Nielsen (higher). The key to these issues was time, and we are seeing relief on all of them. HANS also signed up Coke as a major global distributor to help drive sales of their Monster Energy brand, which should help growth going forward.
Goldman Sachs is obviously a financial stock and we bought the stock when it was clearly out of favor. In fact, we’ve wanted to buy Goldman for a long time, but we were waiting for the right price. Patience is its own reward. Of the major financials, we felt that while Goldman had material headline (sentiment) risk, it also had one of the strongest franchises and the least exposure to consumer lending, a major risk area.
Genentech has received a fair amount of ink from the Core Growth Fund since we have owned it twice now. We felt the franchise was materially undervalued; apparently, Roche did as well, because they bid $89 per share near the end of the summer of 2008. Investors felt the bid was too low and bid the stock higher, to $95 – which is where we sold. We were again rewarded for exhibiting patience. In early October, in the aftermath of the market reaction to the September bailout proposal, Genentech’s stock price dropped as investors questioned Roche’s ability to raise funds to complete the acquisition. We took advantage of the opportunity to repurchase our Genentech position at a cost below $75. Roche ultimately did raise their offer, in March of 2009, to $95 (ironically). They were also able to raise the funds to complete the deal. We sold our shares at just over $94 and reinvested the cash into other interesting investment opportunities.
The point was not to discuss the “winners” stock by stock, but to demonstrate the flexibility of our approach, the attention to valuation we use, and our interest in investing opportunistically. We certainly had our share of “losers” as well. Most notably, these included Western Union, Las Vegas Sands, Amdocs, Guess? Inc., and VistaPrint. Guess? and VistaPrint were sold during the period covered by this letter, but we remain shareholders of the other names. We believe these stocks represent companies with great franchises, depressed valuations, and strong market shares.
Above, I referenced one aspect of the purchase of Starent Networks was a lower-than-preferred exposure to Emerging Growth Companies. We use a variety of tools to manage the risks of our concentrated portfolio. We seek to manage risk through consciously diversifying our portfolio by capitalization range, by sector and within sectors, as well as by basket (Growth Industry Leaders, Consistent Growth Companies, and Emerging Growth Companies). We focus our research efforts on identifying stock-specific risks by knowing the business model, understanding the accounting issues, assessing the competitive, regulatory and legal risks, and weighing the quality of earnings being generated. We feel we are managing our risks at the most basic and important level: the individual security level.
| 10 Certified Semi-Annual Report |
We intend to continue implementing our investment process in a disciplined, consistent manner. We continue to find what we believe to be attractive growth companies. Part of our past success can be attributed to the fact that our broad mandate allows us to search in parts of the market not open to other managers more tightly constrained to specific style boxes. This flexible approach allows us to do what we love; researching companies and identifying opportunities is our passion. We encourage you to learn more about your portfolio. Descriptions of each holding and links to company web sites can be found by pointing your Internet browser to www.thornburg.com/ funds. Thank you for investing in the Thornburg Core Growth Fund.
| Sincerely, |
 |
| Alexander M.V. Motola,CFA |
| Managing Director |
| Portfolio Manager |
The matters discussed in this report may constitute forward-looking statements made pursuant to the safe harbor provisions of the Securities Litigation Reform Act of 1995. These include any advisor or portfolio manager prediction, assessment, analysis or outlook for individual securities, industries, investment styles, market sectors and/or markets. These statements involve risks and uncertainties. In addition to the general risks described for each fund in its current prospectus, other factors bearing on these reports include the accuracy of the advisor’s or portfolio manager’s forecasts and predictions, the appropriateness of the investment strategies designed by the advisor or portfolio manager, and the ability of the advisor or portfolio manager to implement their strategies efficiently and successfully. Any one or more of these factors, as well as other risks affecting the securities markets generally, could cause the actual results of any fund to differ materially as compared to its benchmarks.
| Certified Semi-Annual Report 11 |
| STATEMENT OF ASSETS AND LIABILITIES | ||
| Thornburg Core Growth Fund | March 31, 2009 (Unaudited) | |
ASSETS | ||||
Investments at value (Note 2) | ||||
Non-controlled affiliated issuers (cost $67,721,129) | $ | 14,261,197 | ||
Non-affiliated issuers (cost $1,300,104,434) | 1,141,059,689 | |||
Cash | 3,495,667 | |||
Receivable for investments sold | 28,658,176 | |||
Receivable for fund shares sold | 1,615,681 | |||
Dividends receivable | 247,036 | |||
Interest receivable | 7,756 | |||
Prepaid expenses and other assets | 80,816 | |||
Total Assets | 1,189,426,018 | |||
LIABILITIES | ||||
Payable for securities purchased | 23,645,119 | |||
Payable for fund shares redeemed | 4,424,546 | |||
Unrealized loss on forward exchange contracts (Note 7) | 130,483 | |||
Payable to investment advisor and other affiliates (Note 3) | 1,068,115 | |||
Accounts payable and accrued expenses | 1,811,215 | |||
Total Liabilities | 31,079,478 | |||
NET ASSETS | $ | 1,158,346,540 | ||
NET ASSETS CONSIST OF: | ||||
Net investment loss | $ | (5,166,149 | ) | |
Net unrealized depreciation on investments | (212,641,808 | ) | ||
Accumulated net realized gain (loss) | (1,042,917,229 | ) | ||
Net capital paid in on shares of beneficial interest | 2,419,071,726 | |||
| $ | 1,158,346,540 | |||
| 12 Certified Semi-Annual Report |
| STATEMENT OF ASSETS AND LIABILITIES, CONTINUED | ||
| Thornburg Core Growth Fund | March 31, 2009 (Unaudited) | |
NET ASSET VALUE: | |||
Class A Shares: | |||
Net asset value and redemption price per share | $ | 9.62 | |
Maximum sales charge, 4.50% of offering price | 0.45 | ||
Maximum offering price per share | $ | 10.07 | |
Class C Shares: | |||
Net asset value and offering price per share * | $ | 8.98 | |
Class I Shares: | |||
Net asset value, offering and redemption price per share | $ | 9.89 | |
Class R3 Shares: | |||
Net asset value, offering and redemption price per share | $ | 9.63 | |
Class R4 Shares: | |||
Net asset value, offering and redemption price per share | $ | 9.63 | |
Class R5 Shares: | |||
Net asset value, offering and redemption price per share | $ | 9.89 | |
| * | Redemption price per share is equal to net asset value less any applicable contingent deferred sales charge. |
See notes to financial statements.
| Certified Semi-Annual Report 13 |
| STATEMENT OF OPERATIONS | ||
| Thornburg Core Growth Fund | Six Months Ended March 31, 2009 (Unaudited) | |
INVESTMENT INCOME: | ||||
Dividend income | $ | 5,226,554 | ||
Interest income | 194,047 | |||
Total Income | 5,420,601 | |||
EXPENSES: | ||||
Investment advisory fees (Note 3) | 5,393,384 | |||
Administration fees (Note 3) | ||||
Class A Shares | 280,559 | |||
Class C Shares | 153,734 | |||
Class I Shares | 50,204 | |||
Class R3 Shares | 125,045 | |||
Class R4 Shares | 9,266 | |||
Class R5 Shares | 46,525 | |||
Distribution and service fees (Note 3) | ||||
Class A Shares | 557,400 | |||
Class C Shares | 1,223,712 | |||
Class R3 Shares | 498,762 | |||
Class R4 Shares | 18,489 | |||
Transfer agent fees | ||||
Class A Shares | 771,300 | |||
Class C Shares | 446,105 | |||
Class I Shares | 203,690 | |||
Class R3 Shares | 406,606 | |||
Class R4 Shares | 46,515 | |||
Class R5 Shares | 393,743 | |||
Registration and filing fees | ||||
Class A Shares | 17,282 | |||
Class C Shares | 13,126 | |||
Class I Shares | 13,226 | |||
Class R3 Shares | 9,628 | |||
Class R4 Shares | 9,723 | |||
Class R5 Shares | 12,654 | |||
Custodian fees (Note 3) | 129,657 | |||
Professional fees | 44,895 | |||
Accounting fees | 52,800 | |||
Trustee fees | 23,640 | |||
Other expenses | 266,777 | |||
Total Expenses | 11,218,447 | |||
Less: | ||||
Expenses reimbursed by investment advisor (Note 3) | (1,196,241 | ) | ||
Fees paid indirectly (Note 3) | (5,392 | ) | ||
Net Expenses | 10,016,814 | |||
Net Investment Loss | $ | (4,596,213 | ) | |
| 14 Certified Semi-Annual Report |
| STATEMENT OF OPERATIONS, CONTINUED | ||
| Thornburg Core Growth Fund | Six Months Ended March 31, 2009 (Unaudited) | |
REALIZED AND UNREALIZED GAIN (LOSS) | ||||
Net realized gain (loss) on: | ||||
Investments | $ | (733,020,891 | ) | |
Foreign currency transactions | 815,950 | |||
| (732,204,941 | ) | |||
Net change in unrealized appreciation (depreciation) on: | ||||
Investments | 170,280,981 | |||
Foreign currency translations | (1,026,042 | ) | ||
| 169,254,939 | ||||
Net Realized and Unrealized Loss | (562,950,002 | ) | ||
Net Decrease in Net Assets Resulting From Operations | $ | (567,546,215 | ) | |
See notes to financial statements.
| Certified Semi-Annual Report 15 |
| STATEMENTS OF CHANGES IN NET ASSETS | ||
| Thornburg Core Growth Fund | March 31, 2009 (Unaudited) | |
| Six Months Ended March 31, 2009* | Year Ended September 30, 2008 | |||||||
INCREASE (DECREASE) IN NET ASSETS FROM: | ||||||||
OPERATIONS: | ||||||||
Net investment income (loss) | $ | (4,596,213 | ) | $ | (19,529,732 | ) | ||
Net realized loss on investments and foreign currency transactions | (732,204,941 | ) | (311,125,361 | ) | ||||
Increase (Decrease) in unrealized appreciation (depreciation) on investments and foreign currency translation | 169,254,939 | (955,488,623 | ) | |||||
Net Increase (Decrease) in Net Assets Resulting from Operations | (567,546,215 | ) | (1,286,143,716 | ) | ||||
DIVIDENDS TO SHAREHOLDERS: | ||||||||
From realized gains | ||||||||
Class A Shares | — | (868,507 | ) | |||||
Class C Shares | — | (412,872 | ) | |||||
Class I Shares | — | (352,383 | ) | |||||
Class R3 Shares | — | (247,109 | ) | |||||
Class R4 Shares | — | (4,219 | ) | |||||
Class R5 Shares | — | (106,648 | ) | |||||
FUND SHARE TRANSACTIONS (NOTE 4): | ||||||||
Class A Shares | (146,154,986 | ) | (210,044,230 | ) | ||||
Class C Shares | (58,495,597 | ) | (29,193,088 | ) | ||||
Class I Shares | (91,790,613 | ) | (68,000,355 | ) | ||||
Class R3 Shares | (15,305,889 | ) | 35,651,603 | |||||
Class R4 Shares | (436,908 | ) | 25,878,562 | |||||
Class R5 Shares | 6,166,114 | 213,479,491 | ||||||
Net Decrease in Net Assets | (873,564,094 | ) | (1,320,363,471 | ) | ||||
NET ASSETS: | ||||||||
Beginning of period | 2,031,910,634 | 3,352,274,105 | ||||||
End of period | $ | 1,158,346,540 | $ | 2,031,910,634 | ||||
| * | Unaudited. |
See notes to financial statements.
| 16 Certified Semi-Annual Report |
| NOTES TO FINANCIAL STATEMENTS | ||
| Thornburg Core Growth Fund | March 31, 2009 (Unaudited) | |
NOTE 1 – ORGANIZATION
Thornburg Core Growth Fund, hereinafter referred to as the “Fund,” is a diversified series of Thornburg Investment Trust (the “Trust”). The Trust was organized as a Massachusetts business trust under a Declaration of Trust dated June 3, 1987 and is registered as a diversified, open-end management investment company under the Investment Company Act of 1940, as amended. The Trust is currently issuing thirteen series of shares of beneficial interest in addition to those of the Fund: Thornburg Limited Term Municipal Fund, Thornburg California Limited Term Municipal Fund, Thornburg Intermediate Municipal Fund, Thornburg New Mexico Intermediate Municipal Fund, Thornburg New York Intermediate Municipal Fund, Thornburg Limited Term U.S. Government Fund, Thornburg Limited Term Income Fund, Thornburg Value Fund, Thornburg International Value Fund, Thornburg Investment Income Builder Fund, Thornburg Global Opportunities Fund, Thornburg International Growth Fund, and Thornburg Strategic Income Fund. Each series is considered to be a separate entity for financial reporting and tax purposes and bears expenses directly attributable to it. The Fund seeks long-term capital appreciation by investing in equity securities selected for their growth potential.
The Fund currently offers six classes of shares of beneficial interest: Class A, Class C, Institutional Class (Class I), and Retirement Classes (Class R3, Class R4, and Class R5) shares. Each class of shares of the Fund represents an interest in the same portfolio of investments, except that (i) Class A shares are sold subject to a front-end sales charge collected at the time the shares are purchased and bear a service fee, (ii) Class C shares are sold at net asset value without a sales charge at the time of purchase, but are subject to a contingent deferred sales charge upon redemption within one year of purchase, and bear both a service fee and a distribution fee, (iii) Class I shares are sold at net asset value without a sales charge at the time of purchase, (iv) Class R3 shares are sold at net asset value without a sales charge at the time of purchase, but bear both a service fee and distribution fee, (v) Class R4 shares are sold at net asset value without sales charge at the time of purchase, but bear a service fee, (vi) Class R5 shares are sold at net asset value without a sales charge at the time of purchase, and (vii) the respective classes may have different reinvestment privileges and conversion rights. Additionally, the Fund may allocate among its classes certain expenses, to the extent allowable to specific classes, including transfer agent fees, government registration fees, certain printing and postage costs, and administrative and legal expenses. Currently, class specific expenses of the Fund are limited to service and distribution fees, administration fees, and certain registration and transfer agent expenses.
NOTE 2 – SIGNIFICANT ACCOUNTING POLICIES
Significant accounting policies of the Trust are as follows:
Valuation of Investments: Portfolio securities listed or traded on a national securities exchange are valued on the valuation date at the last reported sale price on the exchange that is the primary market for the security. Portfolio securities traded on an exchange for which there has been no sale that day and other equity securities traded in the over-the-counter market are valued at the mean between the last reported bid and asked prices. Portfolio securities reported by NASDAQ are valued at the NASDAQ official closing price. Any foreign security traded on exchanges outside the United States is valued at the price of the security on the exchange that is normally the security’s primary market, as of the close of that exchange preceding the time of the Fund’s valuation.
Debt obligations held by the Fund have a primary market over the counter and are valued by an independent pricing service approved by the Trustees of the Trust. The pricing service ordinarily values debt obligations at quoted bid prices. When quotations are not available, debt obligations held by the Fund are valued at evaluated prices determined by the pricing service using methods which include consideration of yields or prices of debt obligations of comparable quality, type of issue, coupon, maturity, and rating, and indications as to value from dealers and general market conditions. Short-term obligations having remaining maturities of 60 days or less are valued at amortized cost, which approximates market value.
Quotations in foreign currencies for foreign portfolio investments are converted to U.S. dollar equivalents using the foreign exchange quotation in effect at the time of valuation.
In any case where the market value of an equity security held by the Fund is not readily available, the Trust’s valuation and pricing committee determines a fair value for the security using procedures approved by the Trustees, which may include the use of prices obtained from an independent pricing service. The pricing service ordinarily values equity securities in these instances using multi-factor models to adjust market prices based upon various inputs, including exchange data, depository receipt prices, futures and index data and other data. A security’s market value is deemed not readily available whenever the exchange or market on which the security is primarily traded is closed for the entire scheduled day of trading. Additionally, a security’s market value may be deemed not readily available under other circumstances identified by the Trustees, including when developments occurring after the most recent close of the security’s primary exchange or market, but before the most recent close of trading in Fund shares, create a serious question about the reliability of the security’s market value.
In any case where a pricing service fails to provide a price for a debt obligation held by the Fund, the valuation and pricing committee determines a fair value for the debt obligation using procedures approved by the Trustees. Additionally, in any case where management believes that a price provided by a pricing service for a debt obligation held by the Fund may be unreliable, the valuation and pricing committee decides whether or not to use the pricing service’s valuation or to determine a fair value for the debt obligation.
| Certified Semi-Annual Report 17 |
| NOTES TO FINANCIAL STATEMENTS, CONTINUED | ||
| Thornburg Core Growth Fund | March 31, 2009 (Unaudited) | |
In determining fair value for any portfolio security or other investment, the valuation and pricing committee seeks to determine the amount that an owner of the investment might reasonably expect to receive upon a sale of the investment. However, because fair value prices are estimated prices, the valuation and pricing committee’s determination of fair value for an investment may differ from the value that would be realized by the Fund upon a sale of the investment, and that difference could be material to the Fund’s financial statements. The valuation and pricing committee’s determination of fair value for an investment may also differ from the prices obtained by other persons (including other mutual funds) for the investment.
Valuation Measurements: Various inputs are used in determining the value of the Fund’s investments. These inputs are summarized in the three levels listed below.
Level 1: Quoted prices in active markets for identical investments.
Level 2: Other significant observable inputs (including quoted prices for similar investments, interest rates, prepayment rates, credit risk, etc.).
Level 3: Significant unobservable inputs (including the Fund’s own assumptions in determining the fair value of investments).
The following table displays a summary of the inputs used to value the Fund’s net assets as of March 31, 2009. In any instance when valuation inputs from more than one level are used to determine the fair value of a specific investment, the investment is placed in the level of the table based upon the lowest level input that is significant in determining the fair value of the investment:
Valuation Inputs | Investments in Securities | Investments in Other Financial Instruments* | |||||
Level 1 - Quoted Prices in Active Markets for Identical Assets | $ | 1,108,120,886 | $ | (13,988 | ) | ||
Level 2 - Other Significant Observable Inputs | 47,200,000 | (130,483 | ) | ||||
Level 3 - Significant Unobservable Inputs | — | — | |||||
Total | $ | 1,155,320,886 | $ | (144,471 | ) | ||
| * | Other financial instruments include investments not reflected in the Schedule of Investments, such as futures, forwards and swap contracts, which are valued at the unrealized appreciation (depreciation) on the instrument. |
Foreign Currency Translation: Portfolio securities and other assets and liabilities denominated in foreign currencies are translated into U.S. dollars based on the exchange rate of such currencies against the U.S. dollar on the date of valuation. Purchases and sales of securities and income items denominated in foreign currencies are translated into U.S. dollars at the exchange rate in effect on the translation date. When the Fund purchases or sells foreign securities it will customarily enter into a foreign exchange contract to minimize foreign exchange risk from the trade date to the settlement date of such transactions.
The Fund does not separately report the effect of changes in foreign exchange rates from changes in market prices on securities held. Such changes are included in net realized and unrealized gain or loss from investments.
Reported net realized foreign exchange gains or losses arise from sales of foreign currencies, currency gains or losses realized between the trade and settlement dates on securities transactions and the difference between the amounts of dividends, interest, and foreign withholding taxes recorded on the Fund’s books, and the U.S. dollar equivalent of the amounts actually received or paid.
Net unrealized foreign exchange gains and losses arise from changes in the fair value of assets and liabilities, other than investments in securities at fiscal period end, resulting from changes in exchange rates.
Deferred Taxes: The Fund is subject to a tax imposed on net realized gains of securities of certain foreign countries. The Fund records an estimated deferred tax liability for net unrealized gains on these securities as reflected in the accompanying financial statements.
Federal Income Taxes: It is the policy of the Trust to comply with the provisions of the Internal Revenue Code applicable to “regulated investment companies” and to distribute to shareholders substantially all taxable income, including any net realized gain on investments of the Funds. Therefore, no provision for federal income taxes is required.
When-Issued and Delayed Delivery Transactions: The Trust may engage in when-issued or delayed delivery transactions. To the extent the Trust engages in such transactions, it will do so for the purpose of acquiring portfolio securities consistent with the Fund’s investment objectives and not for the purpose of investment leverage or to speculate on interest rate and/or market changes. At the time the Trust makes a commitment to purchase a security on a when-issued or delayed delivery basis, the Fund will record the transaction and reflect the value in determining its net asset value. When effecting such transactions, assets of an amount sufficient to make payment for the portfolio securities to be purchased will be segregated on the Fund’s records on the trade date. Securities purchased on a when-issued or delayed delivery basis do not earn interest until the settlement date.
Dividends: Dividends to shareholders are generally paid quarterly and are reinvested in additional shares of the Fund at net asset value per share at the close of business on the dividend payment date or, at the shareholder’s option, paid in cash. Net realized capital gains, to the extent available, will be distributed at least annually. Distributions to shareholders are based on income tax regulations and therefore, their characteristics may differ for financial statement and tax purposes.
| 18 Certified Semi-Annual Report |
| NOTES TO FINANCIAL STATEMENTS, CONTINUED | ||
| Thornburg Core Growth Fund | March 31, 2009 (Unaudited) | |
General: Securities transactions are accounted for on a trade date basis. Interest income is accrued as earned and dividend income is recorded on the ex-dividend date. Certain income from foreign securities is recognized as soon as information is available to the Fund. Realized gains and losses from the sale of securities are recorded on an identified cost basis. Net investment income (other than class specific expenses) and realized and unrealized gains and losses are allocated daily to each class of shares based upon the relative net asset value of outstanding shares of each class of shares at the beginning of the day (after adjusting for the current share activity of the respective class). Expenses common to all funds are allocated among the funds comprising the Trust based upon their relative net asset values or other appropriate allocation methods.
Guarantees and Indemnifications: Under the Trust’s organizational documents, its officers and Trustees are indemnified against certain liabilities arising out of the performance of their duties to the Fund. Additionally, in the normal course of business the Trust enters into contracts with service providers that contain general indemnification clauses. The Trust’s maximum exposure under these arrangements is unknown. However, based on experience, the Trust expects the risk of loss to be remote.
Use of Estimates: The preparation of financial statements, in conformity with generally accepted accounting principles, requires management to make estimates and assumptions that affect the reported amounts of assets and liabilities and the disclosure of contingent assets and liabilities at the date of the financial statements and the reported amounts of increases and decreases in net assets from operations during the reporting period. Actual results could differ from those estimates.
NOTE 3 – INVESTMENT ADVISORY FEE AND OTHER TRANSACTIONS WITH AFFILIATES
Pursuant to an investment advisory agreement, Thornburg Investment Management, Inc. (the “Advisor”) serves as the investment advisor and performs services to the Fund for which the fees are payable at the end of each month. For the six months ended March 31, 2009, these fees were payable at annual rates ranging from .875 of 1% to .675 of 1% per annum of the average daily net assets of the Fund depending on the Fund’s asset size. The Trust also has entered into administrative services agreements with the Advisor, whereby the Advisor will perform certain administrative services for the shareholders of each class of the Fund’s shares, and for which fees will be payable at an annual rate of up to .125 of 1% per annum of the average daily net assets attributable to each class of shares. For the six months ended March 31, 2009, the Advisor voluntarily reimbursed certain class specific expenses, administrative fees, and distribution fees of $67,530 for Class A shares, $62,798 for Class C shares, $187,336 for Class I shares, $451,098 for Class R3 shares, $47,757 for Class R4 shares, and $379,722 for Class R5 shares.
The Trust has an underwriting agreement with Thornburg Securities Corporation (the “Distributor,” an affiliate of the Advisor), which acts as the distributor of the Fund’s shares. For the six months ended March 31, 2009, the Distributor has advised the Fund that it earned commissions aggregating $14,927 from the sale of Class A shares, and collected contingent deferred sales charges aggregating $50,749 from redemptions of Class C shares of the Fund.
Pursuant to a service plan under Rule 12b-1 of the Investment Company Act of 1940, the Fund may reimburse to the Advisor an amount not to exceed .25 of 1% per annum of the average daily net assets attributable to each class of shares of the Fund for payments made by the Advisor to securities dealers and other financial institutions to obtain various shareholder and distribution related services. The Advisor may pay out of its own resources additional expenses for distribution of the Fund’s shares.
The Trust has also adopted distribution plans pursuant to Rule 12b-1, applicable only to the Fund’s Class C and Class R3 shares, under which the Fund compensates the Distributor for services in promoting the sale of Class C and Class R3 shares of the Fund at an annual rate of up to .75 of 1% per annum of the average daily net assets attributable to Class C and Class R3 shares. Total fees incurred by the Distributor for each class of shares of the Fund under their respective Service and Distribution Plans for the six months ended March 31, 2009, are set forth in the Statement of Operations.
The Trust has an agreement with the custodian bank to indirectly pay a portion of the custodian’s fees through credits earned by the Fund’s cash on deposit with the bank. This deposit agreement is an alternative to overnight investments. Custodial fees have been adjusted to reflect amounts that would have been paid without this agreement, with a corresponding adjustment reflected as fees paid indirectly in the Statement of Operations. For the six months ended March 31, 2009, fees paid indirectly were $5,392.
Certain officers and Trustees of the Trust are also officers and/or directors of the Advisor and Distributor. The compensation of independent Trustees is borne by the Trust.
| Certified Semi-Annual Report 19 |
| NOTES TO FINANCIAL STATEMENTS, CONTINUED | ||
| Thornburg Core Growth Fund | March 31, 2009 (Unaudited) | |
NOTE 4 – SHARES OF BENEFICIAL INTEREST
At March 31, 2009, there were an unlimited number of shares of beneficial interest authorized. Transactions in shares of beneficial interest were as follows:
| Six Months Ended March 31, 2009 (Unaudited) | Year Ended September 30, 2008 (Audited) | |||||||||||||
| Shares | Amount | Shares | Amount | |||||||||||
Class A Shares | ||||||||||||||
Shares sold | 5,201,757 | $ | 49,937,671 | 26,809,564 | $ | 495,189,261 | ||||||||
Shares issued to shareholders in reinvestment of dividends | — | — | 40,087 | 785,693 | ||||||||||
Shares repurchased | (20,051,706 | ) | (196,099,539 | ) | (42,528,073 | ) | (706,046,372 | ) | ||||||
Redemption fees received** | — | 6,882 | — | 27,188 | ||||||||||
Net Increase (Decrease) | (14,849,949 | ) | $ | (146,154,986 | ) | (15,678,422 | ) | $ | (210,044,230 | ) | ||||
Class C Shares | ||||||||||||||
Shares sold | 1,535,627 | $ | 14,015,755 | 8,646,972 | $ | 152,462,922 | ||||||||
Shares issued to shareholders in reinvestment of dividends | — | — | 16,338 | 302,087 | ||||||||||
Shares repurchased | (8,087,346 | ) | (72,515,154 | ) | (11,861,766 | ) | (181,970,668 | ) | ||||||
Redemption fees received** | — | 3,802 | — | 12,571 | ||||||||||
Net Increase (Decrease) | (6,551,719 | ) | $ | (58,495,597 | ) | (3,198,456 | ) | $ | (29,193,088 | ) | ||||
Class I Shares | ||||||||||||||
Shares sold | 1,929,018 | $ | 19,048,703 | 15,461,535 | $ | 279,059,846 | ||||||||
Shares issued to shareholders in reinvestment of dividends | — | — | 14,035 | 281,124 | ||||||||||
Shares repurchased | (11,204,614 | ) | (110,842,550 | ) | (20,541,257 | ) | (347,352,869 | ) | ||||||
Redemption fees received** | — | 3,234 | — | 11,544 | ||||||||||
Net Increase (Decrease) | (9,275,596 | ) | $ | (91,790,613 | ) | (5,065,687 | ) | $ | (68,000,355 | ) | ||||
Class R3 Shares | ||||||||||||||
Shares sold | 3,374,074 | $ | 32,682,074 | 12,855,510 | $ | 228,947,293 | ||||||||
Shares issued to shareholders in reinvestment of dividends | — | — | 12,192 | 239,334 | ||||||||||
Shares repurchased | (4,948,143 | ) | (47,990,939 | ) | (11,177,709 | ) | (193,542,866 | ) | ||||||
Redemption fees received** | — | 2,976 | — | 7,842 | ||||||||||
Net Increase (Decrease) | (1,574,069 | ) | $ | (15,305,889 | ) | 1,689,993 | $ | 35,651,603 | ||||||
Class R4 Shares | ||||||||||||||
Shares sold | 420,576 | $ | 3,964,280 | 1,828,792 | $ | 32,886,157 | ||||||||
Shares issued to shareholders in reinvestment of dividends | — | — | 176 | 3,449 | ||||||||||
Shares repurchased | (460,686 | ) | (4,401,407 | ) | (423,841 | ) | (7,011,429 | ) | ||||||
Redemption fees received** | — | 219 | — | 385 | ||||||||||
Net Increase (Decrease) | (40,110 | ) | $ | (436,908 | ) | 1,405,127 | $ | 25,878,562 | ||||||
| 20 Certified Semi-Annual Report |
| NOTES TO FINANCIAL STATEMENTS, CONTINUED | ||
| Thornburg Core Growth Fund | March 31, 2009 (Unaudited) | |
| Six Months Ended March 31, 2009 (Unaudited) | Year Ended September 30, 2008 (Audited) | |||||||||||||
| Shares | Amount | Shares | Amount | |||||||||||
Class R5 Shares | ||||||||||||||
Shares sold | 4,033,065 | $ | 41,354,312 | 16,258,681 | $ | 304,900,695 | ||||||||
Shares issued to shareholders in reinvestment of dividends | — | — | 4,768 | 95,440 | ||||||||||
Shares repurchased | (3,545,644 | ) | (35,190,902 | ) | (5,390,743 | ) | (91,522,347 | ) | ||||||
Redemption fees received** | — | 2,704 | — | 5,703 | ||||||||||
Net Increase (Decrease) | 487,421 | $ | 6,166,114 | 10,872,706 | $ | 213,479,491 | ||||||||
| ** | The Fund charges a redemption fee of 1% of the Class A and Class I shares redeemed or exchanged within 30 days of purchase. Redemption fees charged to any class are allocated to all classes upon receipt of payment based on relative net asset values of each class or other appropriate allocation methods. |
NOTE 5 – SECURITIES TRANSACTIONS
For the six months ended March 31, 2009, the Fund had purchase and sale transactions of investment securities (excluding short-term investments) of $640,751,109 and $943,227,606, respectively.
NOTE 6 – INCOME TAXES
At March 31, 2009, information on the tax components of capital is as follows:
Cost of investments for tax purposes | $ | 1,372,684,374 | ||
Gross unrealized appreciation on a tax basis | $ | 70,554,015 | ||
Gross unrealized depreciation on a tax basis | (287,917,503 | ) | ||
Net unrealized appreciation (depreciation) on investments (tax basis) | $ | (217,363,488 | ) | |
At March 31, 2009, the Fund had deferred tax basis currency and capital losses occurring subsequent to October 31, 2007 of $569,936 and $295,770,118, respectively. For tax purposes, such losses will be reflected in the year ending September 30, 2009.
At March 31, 2009, the Fund had tax basis capital losses of $10,083,359, which may be carried forward to offset future capital gains. To the extent such carryforwards are used, capital gain distributions may be reduced to the extent provided by regulations. Such capital loss carryforwards will expire September 30, 2016.
| Certified Semi-Annual Report 21 |
| NOTES TO FINANCIAL STATEMENTS, CONTINUED | ||
| Thornburg Core Growth Fund | March 31, 2009 (Unaudited) | |
NOTE 7 – FINANCIAL INSTRUMENTS WITH OFF-BALANCE SHEET RISK AND FOREIGN INVESTMENT RISK
During the six months ended March 31, 2009, the Fund was a party to financial instruments with off-balance sheet risks, primarily currency forward exchange contracts. A forward exchange contract is an agreement between two parties to exchange different currencies at a specified rate at an agreed upon future date. These contracts are purchased in order to minimize the risk to the Fund with respect to its foreign stock transactions from adverse changes in the relationship between the U.S. dollar and foreign currencies. In each case these contracts have been initiated in conjunction with foreign stock transactions. These instruments may involve market risks in excess of the amount recognized on the Statement of Assets and Liabilities. Such risks would arise from the possible inability of counterparties to meet the terms of their contracts, future movement in currency value and interest rates and contract positions that are not exact offsets. These contracts are reported in the financial statements at the Fund’s net equity, as measured by the difference between the forward exchange rates at the reporting date and the forward exchange rates at the dates of entry into the contract. There are special risks associated with international investing, including currency fluctuations, economic and political instability, confiscation, inability or delays in selling foreign investments, and reduced legal protection for investments.
CONTRACTS TO BUY OR SELL:
Contract Description | Buy/Sell | Contract Amount | Contract Value Date | Value (USD) | Unrealized Appreciation | Unrealized (Depreciation) | ||||||||||
Philippine Peso | Sell | 1,200,700,000 | 6/15/2009 | $ | 24,604,508 | $ | — | $ | (78,280 | ) | ||||||
Philippine Peso | Buy | 204,995,000 | 6/15/2009 | 4,266,285 | — | (52,203 | ) | |||||||||
Total unrealized appreciation (depreciation) from forward exchange contracts | $ | — | $ | (130,483 | ) | |||||||||||
OTHER NOTES:
Statement of Accounting Standards No. 161:
On March 19, 2008, the Financial Accounting Standards Board issued Statement of Financial Accounting Standards No. 161, “Disclosures about Derivative Instruments and Hedging Activities” (“FAS 161”). FAS 161 is effective for fiscal years and interim periods beginning after November 15, 2008. FAS 161 requires enhanced disclosures about any derivative and hedging activities by the Fund, including how such activities are accounted for and any effect on the Fund’s financial position, performance and cash flows.
| 22 Certified Semi-Annual Report |
Thornburg Core Growth Fund
| Six Months Ended March 31, 2009* | Year Ended September 30, | |||||||||||||||||||||||
| 2008 | 2007 | 2006 | 2005 | 2004 | ||||||||||||||||||||
Class A Shares: | ||||||||||||||||||||||||
PER SHARE PERFORMANCE | ||||||||||||||||||||||||
(for a share outstanding throughout the period)+ | ||||||||||||||||||||||||
Net asset value, beginning of period | $ | 13.36 | $ | 20.72 | $ | 16.38 | $ | 14.21 | $ | 10.87 | $ | 10.11 | ||||||||||||
Income from investment operations: | ||||||||||||||||||||||||
Net investment income (loss) | (0.04 | ) | (0.10 | ) | (0.15 | ) | (0.14 | ) | (0.14 | ) | (0.15 | ) | ||||||||||||
Net realized and unrealized gain (loss) on investments | (3.70 | ) | (7.25 | ) | 4.49 | 2.54 | 3.48 | 0.90 | ||||||||||||||||
Total from investment operations | (3.74 | ) | (7.35 | ) | 4.34 | 2.40 | 3.34 | 0.75 | ||||||||||||||||
Redemption fees added to paid in capital | — | — | — | 0.01 | — | 0.01 | ||||||||||||||||||
Less dividends from: | ||||||||||||||||||||||||
Net realized gains | — | (0.01 | ) | — | (0.24 | ) | — | — | ||||||||||||||||
Change in net asset value | (3.74 | ) | (7.36 | ) | 4.34 | 2.17 | 3.34 | 0.76 | ||||||||||||||||
NET ASSET VALUE, end of period | $ | 9.62 | $ | 13.36 | $ | 20.72 | $ | 16.38 | $ | 14.21 | $ | 10.87 | ||||||||||||
RATIOS/SUPPLEMENTAL DATA | ||||||||||||||||||||||||
Total return (%)(a) | (27.99 | ) | (35.48 | ) | 26.50 | 17.20 | 30.73 | 7.52 | ||||||||||||||||
Ratios to average net assets: | ||||||||||||||||||||||||
Net investment income (loss) (%) | (0.77 | )(b) | (0.58 | ) | (0.78 | ) | (0.86 | ) | (1.14 | ) | (1.37 | ) | ||||||||||||
Expenses, after expense reductions (%) | 1.61 | (b) | 1.38 | 1.37 | 1.48 | 1.60 | 1.62 | |||||||||||||||||
Expenses, after expense reductions and net of custody credits (%) | 1.61 | (b) | 1.38 | 1.36 | 1.46 | 1.57 | 1.61 | |||||||||||||||||
Expenses, before expense reductions (%) | 1.64 | (b) | 1.38 | 1.37 | 1.48 | 1.60 | 1.70 | |||||||||||||||||
Portfolio turnover rate (%) | 48.60 | 79.73 | 82.37 | 98.00 | 115.37 | 108.50 | ||||||||||||||||||
Net assets at end of period (thousands) | $ | 388,563 | $ | 738,457 | $ | 1,470,020 | $ | 502,345 | $ | 110,836 | $ | 40,899 | ||||||||||||
| (a) | Sales loads are not reflected in computing total return, which is not annualized for periods less than one year. |
| (b) | Annualized. |
| + | Based on weighted average shares outstanding. |
| * | Unaudited. |
See notes to financial statements.
| Certified Semi-Annual Report 23 |
FINANCIAL HIGHLIGHTS, CONTINUED
Thornburg Core Growth Fund
| Six Months Ended March 31, 2009* | Year Ended September 30, | |||||||||||||||||||||||
| 2008 | 2007 | 2006 | 2005 | 2004 | ||||||||||||||||||||
Class C Shares: | ||||||||||||||||||||||||
PER SHARE PERFORMANCE | ||||||||||||||||||||||||
(for a share outstanding throughout the period)+ | ||||||||||||||||||||||||
Net asset value, beginning of period | $ | 12.53 | $ | 19.57 | $ | 15.59 | $ | 13.63 | $ | 10.51 | $ | 9.85 | ||||||||||||
Income from investment operations: | ||||||||||||||||||||||||
Net investment income (loss) | (0.07 | ) | (0.22 | ) | (0.28 | ) | (0.24 | ) | (0.23 | ) | (0.22 | ) | ||||||||||||
Net realized and unrealized gain (loss) on investments | (3.48 | ) | (6.81 | ) | 4.26 | 2.43 | 3.35 | 0.88 | ||||||||||||||||
Total from investment operations | (3.55 | ) | (7.03 | ) | 3.98 | 2.19 | 3.12 | 0.66 | ||||||||||||||||
Redemption fees added to paid in capital | — | — | — | 0.01 | — | — | ||||||||||||||||||
Less dividends from: | ||||||||||||||||||||||||
Net realized gains | — | (0.01 | ) | — | (0.24 | ) | — | — | ||||||||||||||||
Change in net asset value | (3.55 | ) | (7.04 | ) | 3.98 | 1.96 | 3.12 | 0.66 | ||||||||||||||||
NET ASSET VALUE, end of period | $ | 8.98 | $ | 12.53 | $ | 19.57 | $ | 15.59 | $ | 13.63 | $ | 10.51 | ||||||||||||
RATIOS/SUPPLEMENTAL DATA | ||||||||||||||||||||||||
Total return (%)(a) | (28.33 | ) | (35.93 | ) | 25.53 | 16.38 | 29.69 | 6.70 | ||||||||||||||||
Ratios to average net assets: | ||||||||||||||||||||||||
Net investment income (loss) (%) | (1.52 | )(b) | (1.34 | ) | (1.53 | ) | (1.63 | ) | (1.91 | ) | (2.13 | ) | ||||||||||||
Expenses, after expense reductions (%) | 2.35 | (b) | 2.13 | 2.12 | 2.25 | 2.37 | 2.38 | |||||||||||||||||
Expenses, after expense reductions and net of custody credits (%) | 2.35 | (b) | 2.13 | 2.11 | 2.23 | 2.34 | 2.37 | |||||||||||||||||
Expenses, before expense reductions (%) | 2.41 | (b) | 2.13 | 2.12 | 2.25 | 2.37 | 2.52 | |||||||||||||||||
Portfolio turnover rate (%) | 48.60 | 79.73 | 82.37 | 98.00 | 115.37 | 108.50 | ||||||||||||||||||
Net assets at end of period (thousands) | $ | 217,238 | $ | 385,110 | $ | 664,252 | $ | 187,180 | $ | 41,737 | $ | 14,693 | ||||||||||||
| (a) | Not annualized for periods less than one year. |
| (b) | Annualized. |
| + | Based on weighted average shares outstanding. |
| * | Unaudited. |
See notes to financial statements.
| 24 Certified Semi-Annual Report |
FINANCIAL HIGHLIGHTS, CONTINUED
Thornburg Core Growth Fund
| Six Months Ended March 31, 2009* | Year Ended September 30, | Period Ended Sept 30, 2004 (a) | ||||||||||||||||||||||
| 2008 | 2007 | 2006 | 2005 | |||||||||||||||||||||
Class I Shares: | ||||||||||||||||||||||||
PER SHARE PERFORMANCE | ||||||||||||||||||||||||
(for a share outstanding throughout the period)+ | ||||||||||||||||||||||||
Net asset value, beginning of period | $ | 13.71 | $ | 21.16 | $ | 16.66 | $ | 14.37 | $ | 10.93 | $ | 10.87 | ||||||||||||
Income from investment operations: | ||||||||||||||||||||||||
Net investment income (loss) | (0.01 | ) | (0.03 | ) | (0.08 | ) | (0.06 | ) | (0.07 | ) | (0.08 | ) | ||||||||||||
Net realized and unrealized gain (loss) on investments | (3.81 | ) | (7.41 | ) | 4.58 | 2.58 | 3.51 | 0.14 | ||||||||||||||||
Total from investment operations | (3.82 | ) | (7.44 | ) | 4.50 | 2.52 | 3.44 | 0.06 | ||||||||||||||||
Redemption fees added to paid in capital | — | — | — | 0.01 | — | — | ||||||||||||||||||
Less dividends from: | ||||||||||||||||||||||||
Net realized gains | — | (0.01 | ) | — | (0.24 | ) | — | — | ||||||||||||||||
Change in net asset value | (3.82 | ) | (7.45 | ) | 4.50 | 2.29 | 3.44 | 0.06 | ||||||||||||||||
NET ASSET VALUE, end of period | $ | 9.89 | $ | 13.71 | $ | 21.16 | $ | 16.66 | $ | 14.37 | $ | 10.93 | ||||||||||||
RATIOS/SUPPLEMENTAL DATA | ||||||||||||||||||||||||
Total return (%)(b) | (27.86 | ) | (35.17 | ) | 27.01 | 17.85 | 31.47 | 0.55 | ||||||||||||||||
Ratios to average net assets: | ||||||||||||||||||||||||
Net investment income (loss) (%) | (0.15 | )(c) | (0.17 | ) | (0.39 | ) | (0.40 | ) | (0.55 | ) | (0.74 | )(c) | ||||||||||||
Expenses, after expense reductions (%) | 0.99 | (c) | 0.96 | 0.98 | 1.01 | 1.02 | 1.00 | (c) | ||||||||||||||||
Expenses, after expense reductions and net of custody credits (%) | 0.99 | (c) | 0.96 | 0.97 | 0.99 | 0.99 | 0.99 | (c) | ||||||||||||||||
Expenses, before expense reductions (%) | 1.18 | (c) | 0.96 | 0.98 | 1.10 | 1.15 | 1.31 | (c) | ||||||||||||||||
Portfolio turnover rate (%) | 48.60 | 79.73 | 82.37 | 98.00 | 115.37 | 108.50 | ||||||||||||||||||
Net assets at end of period (thousands) | $ | 158,313 | $ | 346,497 | $ | 642,143 | $ | 188,422 | $ | 49,975 | $ | 21,578 | ||||||||||||
| (a) | Effective date of this class of shares was November 1, 2003. |
| (b) | Not annualized for periods less than one year. |
| (c) | Annualized. |
| + | Based on weighted average shares outstanding. |
| * | Unaudited. |
See notes to financial statements.
| Certified Semi-Annual Report 25 |
FINANCIAL HIGHLIGHTS, CONTINUED
Thornburg Core Growth Fund
| Six Months Ended March 31, 2009* | Year Ended September 30, | |||||||||||||||||||||||
| 2008 | 2007 | 2006 | 2005 | 2004 | ||||||||||||||||||||
Class R3 Shares: | ||||||||||||||||||||||||
PER SHARE PERFORMANCE | ||||||||||||||||||||||||
(for a share outstanding throughout the period)+ | ||||||||||||||||||||||||
Net asset value, beginning of period | $ | 13.37 | $ | 20.75 | $ | 16.43 | $ | 14.26 | $ | 10.90 | $ | 10.11 | ||||||||||||
Income from investment operations: | ||||||||||||||||||||||||
Net investment income (loss) | (0.03 | ) | (0.13 | ) | (0.18 | ) | (0.14 | ) | (0.14 | ) | (0.12 | ) | ||||||||||||
Net realized and unrealized gain (loss) on investments | (3.71 | ) | (7.24 | ) | 4.50 | 2.54 | 3.50 | 0.91 | ||||||||||||||||
Total from investment operations | (3.74 | ) | (7.37 | ) | 4.32 | 2.40 | 3.36 | 0.79 | ||||||||||||||||
Redemption fees added to paid in capital | — | — | — | 0.01 | — | — | ||||||||||||||||||
Less dividends from: | ||||||||||||||||||||||||
Net realized gains | — | (0.01 | ) | — | (0.24 | ) | — | — | ||||||||||||||||
Change in net asset value | (3.74 | ) | (7.38 | ) | 4.32 | 2.17 | 3.36 | 0.79 | ||||||||||||||||
NET ASSET VALUE, end of period | $ | 9.63 | $ | 13.37 | $ | 20.75 | $ | 16.43 | $ | 14.26 | $ | 10.90 | ||||||||||||
RATIOS/SUPPLEMENTAL DATA | ||||||||||||||||||||||||
Total return (%)(a) | (27.97 | ) | (35.53 | ) | 26.29 | 17.14 | 30.83 | 7.81 | ||||||||||||||||
Ratios to average net assets: | ||||||||||||||||||||||||
Net investment income (loss) (%) | (0.67 | )(b) | (0.74 | ) | (0.91 | ) | (0.90 | ) | (1.08 | ) | (1.17 | ) | ||||||||||||
Expenses, after expense reductions (%) | 1.50 | (b) | 1.50 | 1.51 | 1.53 | 1.52 | 1.50 | |||||||||||||||||
Expenses, after expense reductions and net of custody credits (%) | 1.50 | (b) | 1.50 | 1.50 | 1.50 | 1.49 | 1.49 | |||||||||||||||||
Expenses, before expense reductions (%) | 1.95 | (b) | 1.72 | 1.64 | 1.73 | 3.56 | 722.79 | (c) | ||||||||||||||||
Portfolio turnover rate (%) | 48.60 | 79.73 | 82.37 | 98.00 | 115.37 | 108.50 | ||||||||||||||||||
Net assets at end of period (thousands) | $ | 193,270 | $ | 289,500 | $ | 414,267 | $ | 90,167 | $ | 6,345 | $ | 16 | ||||||||||||
| (a) | Not annualized for periods less than one year. |
| (b) | Annualized. |
| (c) | Due to the size of net assets and fixed expenses, ratios may appear disproportionate. |
| + | Based on weighted average shares outstanding. |
| * | Unaudited. |
See notes to financial statements.
| 26 Certified Semi-Annual Report |
FINANCIAL HIGHLIGHTS, CONTINUED
Thornburg Core Growth Fund
| Six Months Ended March 31, 2009* | Year Ended Sept. 30, 2008 | Period Ended Sept. 30, 2007(a) | ||||||||||
Class R4 Shares: | ||||||||||||
PER SHARE PERFORMANCE | ||||||||||||
(for a share outstanding throughout the period)+ | ||||||||||||
Net asset value, beginning of period | $ | 13.37 | $ | 20.73 | $ | 18.90 | ||||||
Income from investment operations: | ||||||||||||
Net investment income (loss) | (0.03 | ) | (0.13 | ) | (0.12 | ) | ||||||
Net realized and unrealized gain (loss) on investments | (3.71 | ) | (7.22 | ) | 1.95 | |||||||
Total from investment operations | (3.74 | ) | (7.35 | ) | 1.83 | |||||||
Less dividends from: | ||||||||||||
Net realized gains | — | (0.01 | ) | — | ||||||||
Change in net asset value | (3.74 | ) | (7.36 | ) | 1.83 | |||||||
NET ASSET VALUE, end of period | $ | 9.63 | $ | 13.37 | $ | 20.73 | ||||||
RATIOS/SUPPLEMENTAL DATA | ||||||||||||
Total return (%)(b) | (27.97 | ) | (35.47 | ) | 9.68 | |||||||
Ratios to average net assets: | ||||||||||||
Net investment income (loss) (%) | (0.58 | )(c) | (0.78 | ) | (0.93 | )(c) | ||||||
Expenses, after expense reductions (%) | 1.40 | (c) | 1.40 | 1.41 | (c) | |||||||
Expenses, after expense reductions and net of custody credits (%) | 1.40 | (c) | 1.40 | 1.40 | (c) | |||||||
Expenses, before expense reductions (%) | 2.05 | (c) | 1.73 | 8.74 | (c)(d) | |||||||
Portfolio turnover rate (%) | 48.60 | 79.73 | 82.37 | |||||||||
Net assets at end of period (thousands) | $ | 14,773 | $ | 21,047 | $ | 3,508 | ||||||
| (a) | Effective date of this class of shares was February 1, 2007. |
| (b) | Not annualized for periods less than one year. |
| (c) | Annualized. |
| (d) | Due to the size of net assets and fixed expenses, ratios may appear disproportionate. |
| + | Based on weighted average shares outstanding. |
| * | Unaudited. |
See notes to financial statements.
| Certified Semi-Annual Report 27 |
FINANCIAL HIGHLIGHTS, CONTINUED
Thornburg Core Growth Fund
| Six Months Ended March 31, 2009* | Year Ended September 30, | Period Ended Sept. 30, 2006 (a) | ||||||||||||||
| 2008 | 2007 | |||||||||||||||
Class R5 Shares: | ||||||||||||||||
PER SHARE PERFORMANCE | ||||||||||||||||
(for a share outstanding throughout the period)+ | ||||||||||||||||
Net asset value, beginning of period | $ | 13.70 | $ | 21.15 | $ | 16.65 | $ | 14.43 | ||||||||
Income from investment operations: | ||||||||||||||||
Net investment income (loss) | (0.01 | ) | (0.05 | ) | (0.07 | ) | (0.06 | ) | ||||||||
Net realized and unrealized gain (loss) on investments | (3.80 | ) | (7.39 | ) | 4.57 | 2.51 | ||||||||||
Total from investment operations | (3.81 | ) | (7.44 | ) | 4.50 | 2.45 | ||||||||||
Redemption fees added to paid in capital | — | — | — | 0.01 | ||||||||||||
Less dividends from: | ||||||||||||||||
Net realized gains | — | (0.01 | ) | — | (0.24 | ) | ||||||||||
Change in net asset value | (3.81 | ) | (7.45 | ) | 4.50 | 2.22 | ||||||||||
NET ASSET VALUE, end of period | $ | 9.89 | $ | 13.70 | $ | 21.15 | $ | 16.65 | ||||||||
RATIOS/SUPPLEMENTAL DATA | ||||||||||||||||
Total return (%)(b) | (27.81 | ) | (35.19 | ) | 27.03 | 17.29 | ||||||||||
Ratios to average net assets: | ||||||||||||||||
Net investment income (loss) (%) | (0.17 | )(c) | (0.30 | ) | (0.37 | ) | (0.38 | )(c) | ||||||||
Expenses, after expense reductions (%) | 0.99 | (c) | 0.99 | 0.95 | 1.01 | (c) | ||||||||||
Expenses, after expense reductions and net of custody credits (%) | 0.99 | (c) | 0.99 | 0.95 | 0.99 | (c) | ||||||||||
Expenses, before expense reductions (%) | 1.40 | (c) | 1.18 | 0.97 | 176.54 | (c)(d) | ||||||||||
Portfolio turnover rate (%) | 48.60 | 79.73 | 82.37 | 98.00 | ||||||||||||
Net assets at end of period (thousands) | $ | 186,190 | $ | 251,299 | $ | 158,084 | $ | 45 | ||||||||
| (a) | Effective date of this class of shares was October 3, 2005. |
| (b) | Not annualized for periods less than one year. |
| (c) | Annualized. |
| (d) | Due to the size of net assets and fixed expenses, ratios may appear disproportionate. |
| + | Based on weighted average shares outstanding. |
| * | Unaudited. |
See notes to financial statements.
| 28 Certified Semi-Annual Report |
| SCHEDULE OF INVESTMENTS | ||
| Thornburg Core Growth Fund | March 31, 2009 (Unaudited) | |
SUMMARY OF INDUSTRY EXPOSURE
As of 3/31/09
Software & Services | 25.6 | % | |
Technology Hardware & Equipment | 13.0 | % | |
Pharmaceuticals, Biotechnology & Life Sciences | 10.7 | % | |
Diversified Financials | 7.0 | % | |
Media | 6.5 | % | |
Health Care Equipment & Services | 5.6 | % | |
Telecommunication Services | 5.6 | % | |
Utilities | 5.3 | % | |
Materials | 2.9 | % | |
Food, Beverage & Tobacco | 2.8 | % | |
Semiconductors & Semiconductor Equipment | 2.6 | % | |
Retailing | 2.5 | % | |
Energy | 2.4 | % | |
Banks | 2.0 | % | |
Consumer Services | 1.2 | % | |
Other Assets & Cash Equivalents | 4.3 | % |
SUMMARY OF COUNTRY EXPOSURE
As of 3/31/09 (percent of equity holdings)
United States | 85.9 | % | |
United Kingdom | 3.8 | % | |
Canada | 3.3 | % | |
Philippines | 3.0 | % | |
Mexico | 2.7 | % | |
China | 1.3 | % |
| Shares/ Principal Amount | Value | ||||
COMMON STOCK — 95.66% | |||||
BANKS — 2.00% | |||||
COMMERCIAL BANKS — 2.00% | |||||
SVB Financial Group+ | 1,156,800 | $ | 23,147,568 | ||
| 23,147,568 | |||||
CONSUMER SERVICES — 1.22% | |||||
HOTELS, RESTAURANTS & LEISURE — 1.22% | |||||
Las Vegas Sands Corp.+ | 4,683,305 | 14,096,748 | |||
| 14,096,748 | |||||
DIVERSIFIED FINANCIALS — 6.95% | |||||
CAPITAL MARKETS — 6.95% | |||||
Affiliated Managers Group, Inc.+ | 543,589 | 22,673,097 | |||
Charles Schwab Corp. | 1,944,100 | 30,133,550 | |||
Goldman Sachs Group, Inc. | 261,600 | 27,734,832 | |||
| 80,541,479 | |||||
ENERGY — 2.40% | |||||
OIL, GAS & CONSUMABLE FUELS — 2.40% | |||||
XTO Energy, Inc. | 907,600 | 27,790,712 | |||
| 27,790,712 | |||||
| Certified Semi-Annual Report 29 |
| SCHEDULE OF INVESTMENTS CONTINUED | ||
| Thornburg Core Growth Fund | March 31, 2009 (Unaudited) | |
| Shares/ Principal Amount | Value | ||||
FOOD, BEVERAGE & TOBACCO — 2.82% | |||||
BEVERAGES — 2.82% | |||||
Hansen Natural Corp.+ | 908,342 | $ | 32,700,312 | ||
| 32,700,312 | |||||
HEALTH CARE EQUIPMENT & SERVICES — 5.61% | |||||
HEALTH CARE PROVIDERS & SERVICES — 5.61% | |||||
Community Health Systems, Inc.+ | 1,033,554 | 15,854,718 | |||
Express Scripts, Inc.+ | 513,000 | 23,685,210 | |||
VCA Antech, Inc.+ | 1,126,900 | 25,411,595 | |||
| 64,951,523 | |||||
MATERIALS — 2.86% | |||||
CHEMICALS — 2.86% | |||||
Ecolab, Inc. | 954,189 | 33,138,984 | |||
| 33,138,984 | |||||
MEDIA — 6.50% | |||||
MEDIA — 6.50% | |||||
Airmedia Group, Inc. ADR+ (1) | 3,403,627 | 14,261,197 | |||
Comcast Corp. Special Class A | 1,845,800 | 23,755,446 | |||
DIRECTV Group, Inc.+ | 1,637,921 | 37,328,220 | |||
| 75,344,863 | |||||
PHARMACEUTICALS, BIOTECHNOLOGY & LIFE SCIENCES — 10.69% | |||||
BIOTECHNOLOGY — 10.69% | |||||
Alexion Pharmaceuticals, Inc.+ | 1,006,966 | 37,922,339 | |||
Celgene Corp.+ | 831,334 | 36,911,230 | |||
Gilead Sciences, Inc.+ | 1,058,900 | 49,048,248 | |||
| 123,881,817 | |||||
RETAILING — 2.53% | |||||
INTERNET & CATALOG RETAIL — 2.53% | |||||
Priceline.com, Inc.+ | 371,804 | 29,290,719 | |||
| 29,290,719 | |||||
SEMICONDUCTORS & SEMICONDUCTOR EQUIPMENT — 2.62% | |||||
SEMICONDUCTORS & SEMICONDUCTOR EQUIPMENT — 2.62% | |||||
ON Semiconductor Corp.+ | 7,778,098 | 30,334,582 | |||
| 30,334,582 | |||||
SOFTWARE & SERVICES — 25.63% | |||||
INFORMATION TECHNOLOGY SERVICES — 8.01% | |||||
Fiserv, Inc.+ | 862,300 | 31,439,458 | |||
Visa, Inc. | 424,500 | 23,602,200 | |||
Western Union Co. | 3,005,937 | 37,784,628 | |||
INTERNET SOFTWARE & SERVICES — 7.46% | |||||
Equinix, Inc.+ | 901,243 | 50,604,795 | |||
Google, Inc.+ | 102,705 | 35,747,502 | |||
| 30 Certified Semi-Annual Report |
SCHEDULE OF INVESTMENTS, CONTINUED
| Thornburg Core Growth Fund | March 31, 2009 (Unaudited) |
| Shares/ Principal Amount | Value | |||||
SOFTWARE — 10.16% | ||||||
Amdocs Ltd.+ | 2,276,486 | $ | 42,160,521 | |||
McAfee, Inc.+ | 1,225,827 | 41,065,204 | ||||
Microsoft Corp. | 1,876,600 | 34,473,142 | ||||
| 296,877,450 | ||||||
TECHNOLOGY HARDWARE & EQUIPMENT — 12.96% | ||||||
COMMUNICATIONS EQUIPMENT — 8.89% | ||||||
Qualcomm, Inc. | 1,152,900 | 44,859,339 | ||||
Research In Motion Ltd.+ | 852,700 | 36,725,789 | ||||
Starent Networks Corp.+ | 1,355,992 | 21,438,233 | ||||
COMPUTERS & PERIPHERALS — 1.72% | ||||||
Data Domain, Inc.+ | 1,579,886 | 19,859,167 | ||||
ELECTRONIC EQUIPMENT, INSTRUMENTS & COMPONENTS — 2.35% | ||||||
FLIR Systems, Inc.+ | 1,330,000 | 27,238,400 | ||||
| 150,120,928 | ||||||
TELECOMMUNICATION SERVICES — 5.61% | ||||||
WIRELESS TELECOMMUNICATION SERVICES — 5.61% | ||||||
América Móvil SAB de C.V. | 21,775,300 | 29,653,762 | ||||
SBA Communications Corp.+ | 1,514,346 | 35,284,262 | ||||
| 64,938,024 | ||||||
UTILITIES — 5.26% | ||||||
ELECTRIC UTILITIES — 2.43% | ||||||
Entergy Corp. | 414,400 | 28,216,496 | ||||
INDEPENDENT POWER PRODUCERS & ENERGY TRADERS — 2.83% | ||||||
PNOC Energy Development Corp. | 405,789,730 | 32,748,680 | ||||
| 60,965,176 | ||||||
TOTAL COMMON STOCK (Cost $1,320,625,563) | 1,108,120,886 | |||||
SHORT TERM INVESTMENTS — 4.08% | ||||||
California State, put 4/7/2009 (LOC: Bank of America) (weekly demand notes), 0.30%, 5/1/2040 | $ | 800,000 | 800,000 | |||
Clark County School District GO, put 4/1/2009 (Insured: FSA, SPA: Bayerische Landesbank) (daily demand notes), 0.60%, 6/15/2021 | 7,500,000 | 7,500,000 | ||||
Maryland State Health & Higher Educational Facilities, 0.50%, 7/1/2034, put 4/7/2009 (Univ. of Maryland Medical; LOC: Bank of America) (weekly demand notes) | 2,000,000 | 2,000,000 | ||||
San Diego County CA Pension Obligation, put 4/7/09 (SPA: Landesbank Baden) (weekly demand notes), 2.25%, 8/15/2027 | 1,900,000 | 1,900,000 | ||||
Wellpoint, Inc., 0.45%, 4/1/2009 | 35,000,000 | 35,000,000 | ||||
TOTAL SHORT TERM INVESTMENTS (Cost $47,200,000) | 47,200,000 | |||||
TOTAL INVESTMENTS — 99.74% (Cost $1,367,825,563) | $ | 1,155,320,886 | ||||
OTHER ASSETS LESS LIABILITIES — 0.26% | 3,025,654 | |||||
NET ASSETS — 100.00% | $ | 1,158,346,540 | ||||
| Certified Semi-Annual Report 31 |
SCHEDULE OF INVESTMENTS, CONTINUED
| Thornburg Core Growth Fund | March 31, 2009 (Unaudited) |
Footnote Legend
| + | Non-income producing |
| (1) | Investment in Affiliates |
Holdings of voting securities of each portfolio company which is considered “affiliated” to the Fund under the Investment Company Act of 1940 because the Fund’s holding represented 5% or more of the company’s voting securities during the period, are shown below:
Issuer | Shares at Sept. 30, 2008 | Gross Additions | Gross Reductions | Shares at March 31, 2009 | Market Value March 31, 2009 | Dividend Income | ||||||||
ATP Oil & Gas Corp. | 2,213,652 | — | 2,213,652 | — | $ | * | $ | * | ||||||
Air Media Group, Inc. ADR | 2,938,927 | 464,700 | — | 3,403,627 | $ | 14,261,197 | $ | — | ||||||
| * | No longer a non-controlled affiliated issuer at March 31, 2009. |
| Total non-controlled affiliated issuers – 1.23% of net assets. |
Portfolio Abbreviations
To simplify the listings of securities, abbreviations are used per the table below:
| ADR | American Depository Receipt | |
| FSA | Insured by Financial Security Assurance Co. | |
| GO | General Obligation | |
| LOC | Letter of Credit | |
| SPA | Standby Bond Purchase Agreement |
See notes to financial statements.
| 32 Certified Semi-Annual Report |
| Thornburg Core Growth Fund | March 31, 2009 (Unaudited) |
As a shareholder of the Fund, you incur two types of costs:
(1) transaction costs, including
(a) sales charges (loads) on purchase payments for Class A shares;
(b) a deferred sales charge on redemptions of any part or all of a purchase of $1 million of Class A shares within 12 months of purchase;
(c) a deferred sales charge on redemptions of Class C shares within 12 months of purchase;
(d) a 30-day redemption fee on Class A and Class I shares;
(2) ongoing costs, including management fees; distribution and/or service (12b-1) fees; and other Fund expenses.
This example is intended to help you understand your ongoing costs (in dollars) of investing in the Fund and to compare these costs with the ongoing costs of investing in other mutual funds.
The example is based on an investment of $1,000 invested on September 30, 2008 and held until March 31, 2009.
| Beginning Account Value 9/30/08 | Ending Account Value 3/31/09 | Expenses Paid During Period† 9/30/08–3/31/09 | |||||||
Class A Shares | |||||||||
Actual | $ | 1,000.00 | $ | 720.10 | $ | 6.88 | |||
Hypothetical* | $ | 1,000.00 | $ | 1,016.93 | $ | 8.07 | |||
Class C Shares | |||||||||
Actual | $ | 1,000.00 | $ | 716.70 | $ | 10.07 | |||
Hypothetical* | $ | 1,000.00 | $ | 1,013.20 | $ | 11.81 | |||
Class I Shares | |||||||||
Actual | $ | 1,000.00 | $ | 721.40 | $ | 4.25 | |||
Hypothetical* | $ | 1,000.00 | $ | 1,020.00 | $ | 4.99 | |||
Class R3 Shares | |||||||||
Actual | $ | 1,000.00 | $ | 720.30 | $ | 6.43 | |||
Hypothetical* | $ | 1,000.00 | $ | 1,017.45 | $ | 7.54 | |||
Class R4 Shares | |||||||||
Actual | $ | 1,000.00 | $ | 720.30 | $ | 6.00 | |||
Hypothetical* | $ | 1,000.00 | $ | 1,017.95 | $ | 7.04 | |||
Class R5 Shares | |||||||||
Actual | $ | 1,000.00 | $ | 721.90 | $ | 4.25 | |||
Hypothetical* | $ | 1,000.00 | $ | 1,020.00 | $ | 4.99 | |||
| † | Expenses are equal to the annualized expense ratio for each class (A: 1.61%; C: 2.35%; I: 0.99%; R3: 1.50%; R4: 1.40% and R5: 0.99%) multiplied by the average account value over the period, multiplied by 182/365 to reflect the one-half year period. |
| * | Hypothetical assumes a rate of return of 5% per year before expenses. |
Actual Expenses
For each class of shares, the first line of the table at right provides information about actual account values and actual expenses. You may use the information in this line, together with the amount you invested, to estimate the expenses that you paid over the period. Simply divide your account value by $1,000 (for example, an $8,600 account value divided by $1,000 = 8.6), then multiply the result by the number in the first line for your class of shares under the heading entitled “Expenses Paid During Period” to estimate the expenses you paid on your account during this period.
Hypothetical Example for Comparison Purposes
For each class of shares, the second line of the table at right provides information about hypothetical account values and hypothetical expenses based on the Fund’s actual expense ratio and an assumed rate of return of 5% per year before expenses, which is not the Fund’s actual return. The hypothetical account values and expenses may not be used to estimate the actual ending account balance or expenses you paid for the period. You may use this information to compare the ongoing costs of investing in the Fund and other funds. To do so, compare this 5% hypothetical example with the 5% hypothetical examples that appear in the shareholder reports of the other funds.
Please note that the expenses shown in the table are meant to highlight your ongoing costs only and do not reflect any transactional costs, such as sales charges (loads), redemption fees, or exchange fees. Therefore, the second line of the table for each class of shares is useful in comparing ongoing costs only, and will not help you determine the relative total costs of owning different funds. In addition, if these transactional costs were included, your costs would have been higher.
| Certified Semi-Annual Report 33 |
| Thornburg Core Growth Fund | March 31, 2009 (Unaudited) |
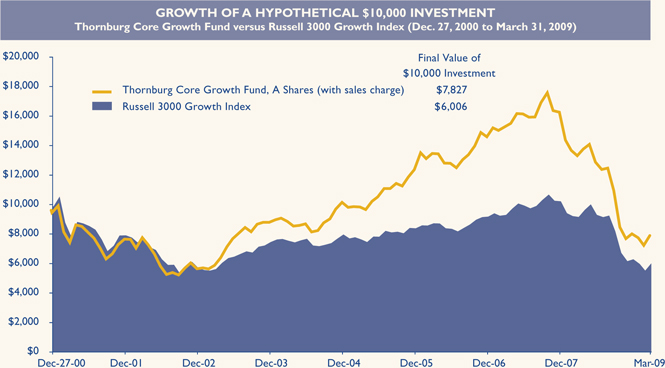
AVERAGE ANNUAL TOTAL RETURNS
For periods ended March 31, 2009 (with sales charge)
| 1 Yr | 5 Yrs | Since Inception | |||||||
A Shares (Incep: 12/27/00) | -43.58 | % | -3.19 | % | -2.92 | % | |||
C Shares (Incep: 12/27/00) | -41.97 | % | -3.04 | % | -3.18 | % | |||
I Shares (Incep: 11/3/03) | -40.64 | % | -1.81 | % | -1.42 | % | |||
R3 Shares (Incep: 7/1/03) | -40.88 | % | -2.49 | % | 0.37 | % | |||
R4 Shares (Incep: 2/1/07) | -40.85 | % | — | -26.81 | % | ||||
R5 Shares (Incep: 10/3/05) | -40.60 | % | — | -9.82 | % | ||||
Russell 3000 Growth Index | |||||||||
(Since: 12/27/00) | -34.42 | % | -4.44 | % | -5.98 | % |
Performance data reflects past performance, which is no guarantee of future results. The performance data and graph do not reflect the deduction of taxes that a shareholder would pay on distributions or the redemption of Fund shares.
Returns reflect the reinvestment of dividends and capital gains as well as applicable sales charges. Class A shares are sold with a maximum sales charge of 4.50%. Class C shares are subject to a 1% contingent deferred sales charge (CDSC) for the first year only. There is no up-front sales charge for Class I, R3, R4, and R5 shares. Class A and I shares are subject to a 1% 30-day redemption fee.
The Russell 3000 Growth Index is an unmanaged index comprised of those Russell 3000 companies with higher price-to-book ratios and higher forecasted growth values. Unless otherwise noted, index returns reflect the reinvestment of income dividends and capital gains, if any, but do not reflect fees, brokerage commissions or other expenses of investing. Investors may not make direct investments into any index. The performance of any index is not indicative of the performance of any particular investment.
| 34 Certified Semi-Annual Report |
| Thornburg Core Growth Fund | March 31, 2009 (Unaudited) |
PORTFOLIO PROXY VOTING
Policies and Procedures:
The Trust has delegated to Thornburg Investment Management, Inc. (the “Advisor”) voting decisions respecting proxies for the Fund’s voting securities. The Advisor makes voting decisions in accordance with its Proxy Voting Policy and Procedures. A description of the Policy and Procedures is available (i) without charge, upon request, by calling the Advisor toll-free at 1-800-847-0200, (ii) on the Thornburg web site at www.thornburg.com, and (iii) on the Securities and Exchange Commission’s web site at www.sec.gov.
Information regarding how proxies were voted is available on or before August 31 of each year for the twelve months ending the preceding June 30. This information is available (i) without charge, upon request by calling the Advisor toll-free at 1-800-847-0200, (ii) on the Thornburg web site at www. thornburg.com, and (iii) on the Securities and Exchange Commission’s web site at www.sec.gov.
AVAILABILITY OF QUARTERLY PORTFOLIO SCHEDULE
The Fund files with the Securities and Exchange Commission schedules of its portfolio holdings on Form N-Q for the first and third quarters of each fiscal year. The Fund’s Forms N-Q are available on the Commission’s web site at www.sec.gov, or may be reviewed and copied at the Commission’s Public Reference Room in Washington, D.C. Information on the operation of the Public Reference Room may be obtained by calling 1-800-SEC-0330. The Fund also makes this information available on its web site at www. thornburg.com/download or upon request by calling 1-800-847-0200.
| Certified Semi-Annual Report 35 |
Trustees’ Statement to Shareholders
Not part of the Certified Semi-Annual Report
February 8, 2005, as readopted September 15, 2008
The Trustees are concerned that ongoing commentaries and opinions reported in the media may confuse investors in general as to the supervisory duties of trustees of mutual funds and, in particular, leave Thornburg Investment Trust shareholders uncertain regarding how we discharge our responsibilities in supervising the Funds’ investment advisor and in reviewing the advisor’s contract for renewal. We decided to spell out clearly three principal guidelines that we follow in supervising the Trust’s investment advisor on your behalf.
We begin with the premise that each shareholder selected his or her Fund because its investments are managed by the investment advisor identified in the prospectus and in accordance with the objective and policies described in the prospectus. We realize, as each of you do, that if you believe that your Fund’s stated objective and policies no longer serve your personal investment goals, you can sell your shares and leave the Fund.
Therefore, we believe that our primary supervisory task – our principal obligation to you – is to assess the nature and quality of the advisor’s services, and to confirm that the advisor actively and competently pursues the Fund’s objective, in accordance with the policies set out in the prospectus. To do this, we meet regularly with management to review your Fund’s portfolio and to discuss the advisor’s specific actions and judgments in pursuing the Fund’s objective. We do not substitute our own judgment for the advisor’s decisions in selecting investments; the advisor is paid to exercise its informed judgment on investment decisions, and we seek to confirm, in reviewing the advisor’s performance, that the advisor is doing just that.
Second, while we are conscious of costs and the effect that costs have on shareholders’ returns, we do not seek the lowest fees or expense ratio as our sole or primary objective. We try to make sure that your Fund’s fees and costs are reasonable in relationship to the services rendered and that they are generally in line with those charged by other expert investment advisors, consistent with our belief that the Fund’s investors searched for and expect that expertise and attention and have decided to pay a reasonable price for it. We do not put the management contract “out to bid” as a matter of course, and we would not do so unless we had concluded that the advisor materially had failed to pursue the Fund’s objectives in accordance with its policies, or for other equally important reasons. We believe that any other approach would be inconsistent with your interests and contrary to your expectations when you bought shares of the Fund in the first place.
Finally, because we believe that most Thornburg Fund shareholders have invested with a long-term perspective, we try not to focus too much on the fashions of the moment and on short-term performance. The market will not favor any specific investment objective or set of policies at all times and under all economic circumstances. A fund will experience periods of both high and low returns relative to other funds and other investments. Even if one of our Funds is not favored by the market at a particular time, we believe that the advisor is nonetheless obliged to remain true to the Fund’s objective and policies, and we watch to see that it does so.
| 36 This page is not part of the Semi-Annual Report. |
Planning Options
Retirement and Education Accounts
Thornburg Investment Management offers retirement and education savings accounts that can help you meet a variety of planning challenges. For account applications or further information on any of the accounts below, please call 1-800-847-0200 or go to www.thornburg.com/ira. Your financial advisor can help you determine which plan is right for you.
Individual Retirement Accounts
Individual Retirement Accounts (IRAs) provide a tax-advantaged means to save money for the future. For a detailed outline of the difference between retirement accounts, see www.thornburg.com/ira. Rollovers are available. Call 1-800-847-0200 for more information.
Traditional IRAs – Contributions to Traditional IRAs are tax deductible for eligible individuals, and withdrawals are taxed as additional ordinary income. You may contribute to an IRA if you receive compensation and are under 70 1/2, even if you are covered by an employer retirement plan. Deductible contributions are subject to certain qualifications. Please consult your tax advisor.
Roth IRAs – Under a Roth IRA, there is no tax deduction for contributions, but there is no income tax on qualified withdrawals. For a more detailed comparison of Traditional and Roth IRAs, please see our web site at www.thornburg.com/ira.
SEP IRAs – Simplified Employee Pension (SEP) IRAs are established by employers. The employer is allowed a tax deduction for contributions made to the SEP Plan and makes contributions to each eligible employee’s SEP IRA on a discretionary basis.
SIMPLE IRAs – Savings Incentive Match Plan for Employees of Small Employers (SIMPLE) is designed to give small business owners a simplified method to establish and contribute to a retirement plan for employees. The employer is allowed a tax deduction for contributions and makes either matching or non-elective contributions to each eligible employee’s SIMPLE IRA. Employees may make salary deferral contributions.
Coverdell Education Savings Account
These savings accounts are designed to provide a way to save money for higher education expenses. In an Education Savings Account, earnings and interest grow tax-free, and qualified withdrawals used to pay for eligible higher-education expenses are tax- and penalty-free.
Funds Available
The following funds are available in the accounts listed above:
| • | Thornburg International Value Fund |
| • | Thornburg Value Fund |
| • | Thornburg Core Growth Fund |
| • | Thornburg Investment Income Builder Fund |
| • | Thornburg Global Opportunities Fund |
| • | Thornburg International Growth Fund |
| • | Thornburg Limited Term U.S. Government Fund |
| • | Thornburg Limited Term Income Fund |
| • | Thornburg Strategic Income Fund |
| This page is not part of the Semi-Annual Report. 37 |

| 38 This page is not part of the Semi-Annual Report. |
Thornburg Equity Funds
Thornburg’s equity research uses a fundamental and comprehensive analytical approach. Thornburg equity funds focus on a limited number of securities so that each holding can impact performance. The equity team searches for firms believed to have a promising future and seeks to buy shares of those companies at a discount to their intrinsic value.
| • | Thornburg Value Fund |
| • | Thornburg International Value Fund |
| • | Thornburg Core Growth Fund |
| • | Thornburg Investment Income Builder Fund |
| • | Thornburg Global Opportunities Fund |
| • | Thornburg International Growth Fund |
Thornburg Bond Funds
Thornburg Investment Management applies a disciplined philosophy to fixed-income management. Since the launch of our first fixed-income fund 25 years ago, we have been conducting fundamental, bottom-up research in an effort to identify bonds which we believe provide the best return for a given level of risk. We are very organic in our approach, avoiding leverage or complex strategies which could backfire in periods of market uncertainty.
| • | Thornburg Limited Term Municipal Fund |
| • | Thornburg Intermediate Municipal Fund |
| • | Thornburg California Limited Term Municipal Fund |
| • | Thornburg New Mexico Intermediate Municipal Fund |
| • | Thornburg New York Intermediate Municipal Fund |
| • | Thornburg Strategic Municipal Income Fund |
| • | Thornburg Limited Term U.S. Government Fund |
| • | Thornburg Limited Term Income Fund |
| • | Thornburg Strategic Income Fund |
Before investing, carefully consider the Fund’s investment goals, risks, charges, and expenses. For a prospectus containing this and other information, contact your financial advisor or visit thornburg. com. Read it carefully before investing.
For additional information, please visit www.thornburg.com
Thornburg Investment Management, Inc. 2300 North Ridgetop Road, Santa Fe, NM 87506
| This page is not part of the Semi-Annual Report. 39 |
 | ||
| This Semi-Annual Report is submitted for the general information of shareholders of the Fund. It is not authorized for distribution to prospective investors in the Fund unless preceded or accompanied by an effective prospectus. | ||
 | Investment Advisor: Thornburg Investment Management® 800.847.0200 | |
Distributor: Thornburg Securities Corporation® 800.847.0200 | ||
TH180 | ||
Waste not, Wait not |  |
Get instant access to your shareholder reports.
By switching from your postal mailbox to your email inbox, you reduce paper clutter, improve record keeping access, and help conserve our natural resources.
Go to www.thornburg.com/edelivery and sign up to receive your shareholder reports, prospectuses, and proxy statements electronically.
You invest in the future, without spending a dime.

2 This page is not part of the Semi-Annual Report.
Important Information
The information presented on the following pages was current as of March 31, 2009. The managers’ views, portfolio holdings, and sector and country diversification are provided for the general information of the Fund’s shareholders; they are historical and subject to change. This material should not be deemed a recommendation to buy or sell any of the securities mentioned.
Investments in the Fund carry risks including possible loss of principal. Investing outside the United States involves additional risks, such as currency fluctuations. Additionally, the Fund may invest a portion of the assets in small capitalization companies, which may increase the risk of greater price fluctuations. As with direct bond ownership, funds that invest in bonds are subject to certain risks including interest-rate risk, credit risk, and inflation risk. The principal value of bonds will fluctuate relative to changes in interest rates, decreasing when interest rates rise. Please see the Fund’s Prospectus for a discussion of the risks associated with an investment in the Fund. Investments in the Fund are not deposits or obligations of, or guaranteed or endorsed by, any bank, the Federal Deposit Insurance Corporation, the Federal Reserve Board or any government agency. There is no guarantee that the Fund will meet its investment objectives.
Performance data given at net asset value (NAV) does not take into account the applicable sales charges. If the sales charges had been included, the performance would have been lower.
Class I, R3, R4, and R5 shares may not be available to all investors. Minimum investments for Class I shares may be higher than those for other classes.
Share Class | NASDAQ Symbol | Cusip | ||
Class A | TIBAX | 885-215-558 | ||
Class C | TIBCX | 885-215-541 | ||
Class I | TIBIX | 885-215-467 | ||
Class R3 | TIBRX | 885-215-384 | ||
Class R4 | TIBGX | 885-215-186 | ||
Class R5 | TIBMX | 885-215-236 |
Glossary
Blended Index – The blended index is comprised of 25% Barclays Capital Aggregate Bond Index and 75% MSCI World Index. The Barclays Capital Aggregate Bond Index is composed of approximately 6,000 publicly traded bonds including U.S. government, mortgage-backed, corporate and Yankee bonds with an average maturity of approximately 10 years. The index is weighted by the market value of the bonds included in the index. The Morgan Stanley Capital International (MSCI) World Index is an unmanaged market-weighted index that consists of equity securities traded in 23 of the world’s most developed countries. The index is calculated with net dividends reinvested, in U.S. dollars.
MSCI All Country Asia ex-Japan Index – A free float-adjusted market capitalization index that is designed to measure equity market performance in Asia. As of January 2009, the MSCI All Country Asia ex-Japan Index consisted of the following 10 developed and emerging market country indices: China, Hong Kong, India, Indonesia, Korea, Malaysia, Philippines, Singapore, Taiwan, and Thailand.
MSCI Country Indices (Australia, U.K. and Japan) – Free float-adjusted market capitalization indices that are designed to measure equity market performance in that specific country.
MSCI Europe ex-U.K. Index – A free float-adjusted market capitalization index that is designed to measure developed market equity performance in Europe. As of June 2007, the MSCI Europe Index consisted of the following 15 developed market country indices: Austria, Belgium, Denmark, Finland, France, Germany, Greece, Ireland, Italy, the Netherlands, Norway, Portugal, Spain, Sweden, and Switzerland.
MSCI EM (Emerging Markets) Latin America Index – A free float-adjusted market capitalization index that is designed to measure equity market performance in Latin America. As of June 2007, the MSCI EM Latin America Index consisted of the following emerging market country indices: Argentina, Brazil, Chile, Colombia, Mexico, and Peru.
Russell 1000 Index – Consists of the 1,000 largest securities in the Russell 3000 Index, which represents approximately 90% of the total market capitalization of the Russell 3000 Index. It is a large-cap, market-oriented index and is highly correlated with the S&P 500 Index.
Russell 2000 Index – An unmanaged index generally representative of the 2,000 smallest companies in the Russell 3000 Index, representing approximately 10% of the total market capitalization of the Russell 3000 Index.
Standard & Poor’s 500 Stock Index (S&P 500) – An unmanaged index generally representative of the U.S. stock market.
Unless otherwise noted, index returns reflect the reinvestment of income dividends and capital gains, if any, but do not reflect fees, brokerage commissions or other expenses of investing. Investors may not make direct investments into any index. The performance of any index is not indicative of the performance of any particular investment.
Duration – The weighted maturity of a bond’s cash flows. Duration measures the price sensitivity of a bond for a given change in interest rates. Bonds with longer durations experience greater price volatility than bond with shorter durations.
Median Market Capitalization – Market capitalization (market cap) is the total value of a company’s stock, calculated by multiplying the number of outstanding common shares by the current share price. The company whose market cap is in the middle of the portfolio is the median market cap. Half the companies in the portfolio have values greater than the median, and half have values that are less.
Price to Earnings Ratio (P/E) – A valuation ratio equaling a company’s market value per share divided by earnings per share.
U.S. Treasury Securities – U.S. Treasury securities, such as bills, notes and bonds, are negotiable debt obligations of the U.S. government. These debt obligations are backed by the “full faith and credit” of the government and issued at various schedules and maturities. Income from Treasury securities is exempt from state and local, but not federal income taxes.
This page is not part of the Semi-Annual Report. 3
The Dividend Landscape
To appreciate the investment environment that Thornburg Investment Income Builder Fund operates in, you may wish to review these highlights of the “dividend landscape.”
The S&P 500 Index Payout Ratio – A Historical Perspective
The dividend payout ratio is a fraction that expresses dividend payments as a percentage of per-share earnings. As the economy slowed in the recent downturn, earnings-per-share on average have declined, causing the payout ratio to climb. However, the trend over time suggests that a rebound in earnings will result in a coincident rebound in dividend payments.
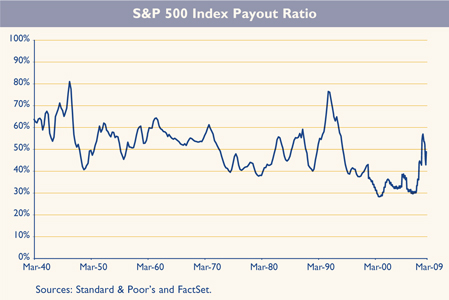
Corporate Willingness to Pay Dividends Key to the Fund’s Investment Process
The Russell 1000 Index includes 1000 public companies that are supposed to be generally representative of corporate America. Between 1980 and 1993, at least 75% of these firms paid some dividend. Between 1994 and 2001, the percentage of Russell 1000 companies paying dividends sank to just over 50%, indicating a preference towards reinvesting retained earnings in growth initiatives. Today, the recent downturn notwithstanding, corporate executives appear more willing to recognize that cash which cannot be invested at high rates of return should be returned to shareholders in the form of dividends. Even in the current environment, more than 60% of Russell 1000 companies continue to pay dividends.
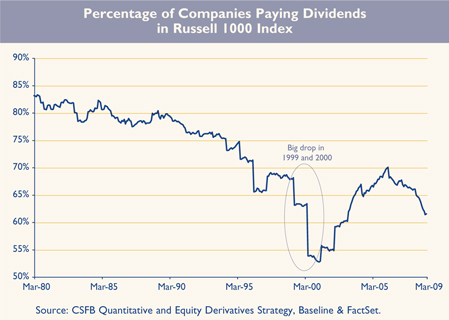
4 This page is not part of the Semi-Annual Report.
Rising Dividend Payments Despite Decreasing Dividend Yields
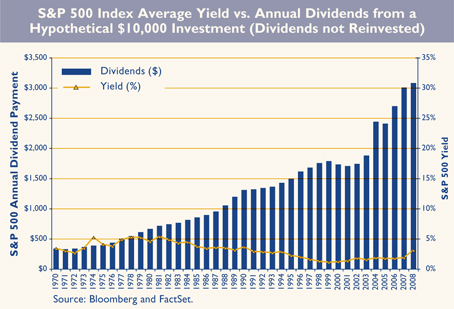
Over time, the dollar dividend per unit of the S&P 500 Index has increased. Because the price of the index itself has increased even more, the yield on the S&P 500 Index, as a percentage of the current index price, has generally decreased in recent decades. You should note, however, that the yield on the original investment made at a fixed point in time (say, 1970 or 1989) has increased, even without reinvestment of dividends.
Hypothetical chart is for illustration purposes only and is not indicative of an investment in any particular security. Investors may not invest directly in an index.
A Truly Diversified Dividend-Paying Portfolio Must Look Beyond the Obvious High Yield Stocks!
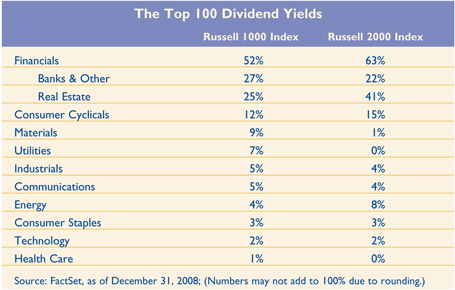
In the (large cap) Russell 1000 Index, 52% of the top 100 dividend payers are in the Financials sector. In the (small cap) Russell 2000 Index, 63% of the top 100 dividend-yielding stocks are financial companies. In order to construct a diversified portfolio of attractive yielding stocks, one must look beyond this sector. We do!
Dividend yield is a ratio that shows how much a company pays out in dividends each year relative to its share price.
This page is not part of the Semi-Annual Report. 5
The Dividend Landscape
Continued
Global Diversification Can Improve the Portfolio Yield
Since firms outside the U.S. tend to pay higher dividends than U.S. firms, particularly outside the real estate and utility sectors, we diversify the Thornburg Investment Income Builder Fund into foreign dividend-paying stocks to try to take advantage of these opportunities.
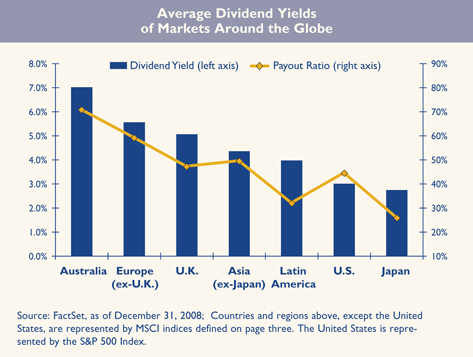
6 This page is not part of the Semi-Annual Report.
Portfolio Overview
Thornburg Investment Income Builder Fund
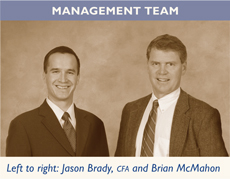
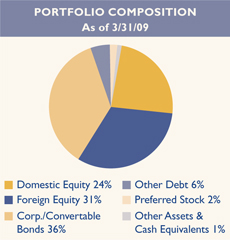
IMPORTANT PERFORMANCE INFORMATION
Performance data shown represents past performance and is no guarantee of future results. Investment return and principal value will fluctuate so shares, when redeemed, may be worth more or less than their original cost. Current performance may be lower or higher than quoted. For performance current to the most recent month end, visit thornburg.com.
The maximum sales charge for Class A shares is 4.50%. Class A shares are subject to a 1% 30-day redemption fee. The total annual fund operating expense of Class A shares is 1.31%, as disclosed in the most recent Prospectus.
We do not expect each sequential quarter’s dividend to increase over that of the prior quarter, since dividend payments outside the United States tend to be seasonal. Rather, the Fund aspires to increase the dividend paid on an annual basis.
QUARTERLY DIVIDEND HISTORY
| Q1 | Q2 | Q3 | Q4 | TOTAL | |||||||||||
| Class A Shares | |||||||||||||||
2009 | 18.0 | ¢ | N/A | N/A | N/A | N/A | |||||||||
2008 | 17.9 | ¢ | 21.7 | ¢ | 26.0 | ¢ | 36.8 | ¢ | 102.4 | ¢ | |||||
2007 | 14.2 | ¢ | 18.5 | ¢ | 21.5 | ¢ | 36.8 | ¢ | 91.0 | ¢ | |||||
2006 | 12.5 | ¢ | 16.0 | ¢ | 19.2 | ¢ | 33.0 | ¢ | 80.7 | ¢ | |||||
2005 | 11.0 | ¢ | 13.6 | ¢ | 17.4 | ¢ | 29.0 | ¢ | 71.0 | ¢ |
30-day SEC Yield as of March 31, 2009 (A Shares): 8.09%
KEY PORTFOLIO ATTRIBUTES
| Equity Statistics | ||||
Portfolio P/E (12-mo. trailing) | 8.7x | |||
Median Market Cap | $ | 5.5B | ||
Common Equity Holdings | 49 | |||
Fixed Income Statistics | ||||
Weighted Average Coupon | 7.0 | % | ||
Average Credit Quality | BBB | |||
Average Maturity | 10.8 yrs | |||
Duration | 4.3 yrs | |||
Bond & Pref. Equity Holdings | 185 | |||
TOP TEN EQUITY HOLDINGS
Eli Lilly & Co. | 3.4 | % | |
Telefónica SA | 3.3 | % | |
Telstra Corp. Ltd. | 3.0 | % | |
OPAP SA | 2.5 | % | |
Philip Morris | 2.3 | % | |
Eni SpA | 2.2 | % | |
China Mobile Ltd. | 2.2 | % | |
Coca Cola Co. | 2.1 | % | |
Entergy Corp. | 1.9 | % | |
McDonald’s Corp. | 1.8 | % |
AVERAGE ANNUAL TOTAL RETURNS
For periods ended March 31, 2009
| 1 Yr | 3 Yrs | 5 Yrs | Since Inception | |||||||||
A Shares (Incep: 12/24/02) | ||||||||||||
Without Sales Charge | -34.40 | % | -6.93 | % | 1.57 | % | 6.42 | % | ||||
With Sales Charge | -37.36 | % | -8.35 | % | 0.64 | % | 5.64 | % | ||||
Blended Index* (Since: 12/24/02) | -32.96 | % | -8.92 | % | -1.40 | % | 2.89 | % | ||||
S&P 500 Index (Since:12/24/02) | -38.09 | % | -13.06 | % | -4.76 | % | 0.18 | % |
| * | Blended Index: 25% Barclays Capital Aggregate Bond Index/75% MSCI World Equity Index |
This page is not part of the Semi-Annual Report. 7
Portfolio Overview
Continued
The primary investment objective of Thornburg Investment Income Builder Fund is to provide a level of current income which exceeds the average yield on U.S. stocks, and which will generally grow, subject to periodic fluctuations, over the years on a per share basis. This objective remains constant over time. However, the specific investments we have used to try to reach our objective have changed over time. There is no guarantee the Fund will meet its investment objectives.
Business conditions for various industries and operating effectiveness at individual firms change over time. Investor preferences, expressed as both absolute and relative prices, also change over time. In the view of your portfolio management team, “some doors close and others open.” As shown in the tables below, the percentage industry allocations of your Fund evolve to reflect these changing conditions.
TOP TEN INDUSTRIES
As of 3/31/09
Telecommunication Services | 15.0 | % | |
Utilities | 12.4 | % | |
Energy | 11.3 | % | |
Food, Beverage & Tobacco | 8.4 | % | |
Banks | 7.7 | % | |
Diversified Financials | 7.6 | % | |
Consumer Services | 5.2 | % | |
Real Estate | 4.8 | % | |
Materials | 4.7 | % | |
Insurance | 4.2 | % |
TOP TEN INDUSTRIES
As of 12/31/08
Telecommunication Services | 15.4 | % | |
Energy | 11.5 | % | |
Utilities | 11.3 | % | |
Food, Beverage & Tobacco | 8.0 | % | |
Diversified Financials | 7.9 | % | |
Banks | 7.7 | % | |
Consumer Services | 7.0 | % | |
Insurance | 5.6 | % | |
Materials | 3.9 | % | |
Pharma, Biotech & Life Sciences | 3.7 | % |
TOP TEN INDUSTRIES
As of 9/30/08
Telecommunication Services | 14.3 | % | |
Banks | 12.4 | % | |
Energy | 10.4 | % | |
Diversified Financials | 8.3 | % | |
Utilities | 7.7 | % | |
Consumer Services | 7.5 | % | |
Food, Beverage & Tobacco | 6.1 | % | |
Materials | 4.5 | % | |
Semiconductors & Semi Equipment | 3.9 | % | |
Insurance | 3.7 | % |
TOP TEN INDUSTRIES
As of 6/30/08
Telecommunication Services | 16.7 | % | |
Energy | 10.2 | % | |
Food, Beverage & Tobacco | 9.2 | % | |
Utilities | 8.9 | % | |
Banks | 8.8 | % | |
Diversified Financials | 7.4 | % | |
Consumer Services | 6.6 | % | |
Materials | 4.4 | % | |
Semiconductors & Semi Equipment | 4.1 | % | |
Insurance | 3.5 | % |
8 This page is not part of the Semi-Annual Report.

Thornburg Investment Income Builder Fund
March 31, 2009
| Table of Contents | ||
| 10 | ||
| 14 | ||
| 16 | ||
| 18 | ||
| 19 | ||
| 25 | ||
| 31 | ||
| 43 | ||
| 44 | ||
| 45 | ||
This report is certified under the Sarbanes-Oxley Act of 2002, which requires that public companies, including mutual funds, affirm that the information provided in their annual and semiannual shareholder reports fully and fairly represents their financial position.
Certified Semi-Annual Report 9
April 24, 2009
Dear Fellow Shareholder:
This letter will be somewhat longer than others we have written for the semi-annual reports of Thornburg Investment Income Builder Fund. In addition to covering the basic results of your Fund’s investment activities for the period under review, we believe it is appropriate to comment more extensively on the overall investment landscape, which continues to evolve in important ways.
Thornburg Investment Income Builder paid ordinary quarterly dividends of 54.8¢ per Class A share in the six-month period ended March 31, 2009, up marginally from 54.7¢ in the comparable six-month period of the prior fiscal year. The dividend per share was higher for Class I shares and lower for Class C shares, to account for varying class-specific expenses.
Your Fund’s net asset value decreased by $4.27 per Class A share during the six-month period under review. As of March 31, the net asset values per share of the Class A and Class C shares were both $12.59. Your Fund outperformed its blended benchmark (75% MSCI World Equity Index; 25% Barclays Capital Aggregate U.S. Bond Index) and the S&P 500 Index by 0.86% and 8.38%, respectively, over the six-month period. We consider these to be hollow victories in light of the net asset value decline we experienced.
As has often been the case with Thornburg Investment Income Builder, the best and worst performers in your portfolio during the period were diverse collections of businesses. The negative contributors overwhelmed the positive in number and magnitude: 8 of your portfolio stocks delivered positive returns for the period under review, while 60 showed negative returns.
Consider the largest average sector weightings in Thornburg Investment Income Builder, along with the average price performance of the investments we owned in these sectors during the six-month period under review: Financials (20.9% weighting; negative 38.5% performance), Telecommunications Services (13.5% weighting; negative 14% performance), Energy (10.5% weighting; negative 28.6% performance), Utilities (10.2% weighting; negative 23.5% performance), Consumer Staples (8.6% weighting; negative 17.8% performance), and Consumer Discretionary (7.9% weighting; negative 16.3% performance). We expected our stocks in several of these sectors, especially telecom, utilities, and staples, to give better price resilience in this tough market. Instead, all ten sectors of the MSCI World Index portfolio and all ten sectors of your Income Builder portfolio delivered negative returns over the six-month period.
Your portfolio’s top performers included: Chimera Investment Corp, a mortgage REIT that we purchased near its 52-week low in November; Cincinnati Financial, an insurance holding company;
10 Certified Semi-Annual Report
Banque Cantonale Vaudoise, a Swiss bank; Associated Banc-Corp, a Wisconsin bank; and six different bonds issued by the following companies: Deutsche Telekom, Sovereign Bancorp, Vornado Realty Trust, Dominion Resources, Entergy Gulf States, and Enel Finance International.
Your Fund’s worst performers were all equities: Swiss Re, KKR Financial Holdings, Enel S.p.A., Canadian Oil Sands Trust, Apollo Investment Corporation, Huntington Bank Preferred Stock, Diamond Offshore Drilling, Aristocrat Leisure Ltd., AXA, and Seek Ltd. Each of these has its own story. We sold shares of Canadian Oil Sands Trust, Aristocrat, and AXA. The European insurers, Swiss Re and AXA, have been subject to investor concerns about the values of financial assets on their balance sheets and the potential for dilution of common equity holders if they must issue additional shares at the current low valuations in order to satisfy ratings agencies or regulators. Huntington Bank, KKR Financial, and Apollo are now trading below their stated book values due to investor concerns about possible future loan losses, and possible equity dilution if they are forced to issue new shares to offset realized losses. Enel S.p.A., a large Italian electric utility, joins Canadian Oil Sands Trust and Diamond Offshore Drilling as perceived losers if lower oil prices persist through 2010. Aristocrat develops and sells gaming equipment to casinos, a business that turned down significantly over recent quarters. Seek is an Australian-based internet employment clearinghouse and internet education developer. Its business softened along with the resource-heavy Australian economy in late 2008 and early 2009.
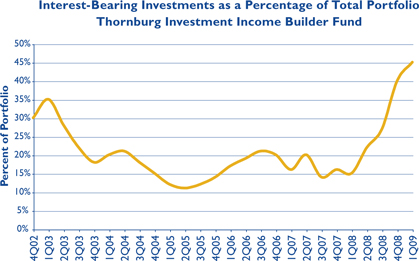
Prices of bonds and preferred stocks were already soft in the first three quarters of 2008 due to credit concerns and forced liquidations from leveraged investors. As the forced liquidation of assets of leveraged players, including Lehman Brothers, began last autumn, prices of bonds and hybrid securities experienced additional sharp declines. When bond prices decline, the yields available to buyers of the lower-priced bonds increase. Since we like higher yields, we viewed the market dislocation caused by the bond portfolio liquidations of others as a buying opportunity for Thornburg Investment Income Builder. The chart here shows that interest-bearing investments as a percentage of your Fund’s portfolio increased sharply over the last year, from 16% at March 31, 2008, to 45% at March 31, 2009. A large portion of this increase happened during the six-month period ended March 31, 2009.
Certified Semi-Annual Report 11
Letter to Shareholders
Continued
As of March 31, 2009, your portfolio included more than 150 bonds and hybrid securities, with an average cost just below 75% of the maturity value of these bonds. In general, secondary market prices of these bonds declined over the six-month period, so the average market price of these bonds on March 31 was slightly below 63% of maturity value. We believe most of these bonds will recover a substantial portion of their value over time, while paying us interesting income yields in the interim. Why? (1) Corporate borrowers are finding it attractive to buy back their own debt at discounted prices in the secondary market, even if they have to issue new equity to do so; (2) Individual and institutional investors are in the early stages of allocating additional investment dollars to bonds. For those bonds with the highest credit ratings, prices have already appreciated.
At March 31, 2009, domestic stocks, including preferred stocks, comprise around 26% of your portfolio; foreign stocks around 31%; and interest-bearing investments 43%. We cannot predict how this will evolve over the coming months, but we expect the interest-bearing proportion of your portfolio to remain high as long as bond yields remain competitive with expected equity returns.
In recent years, the dividend increases paid by Income Builder have been powered almost entirely by dividend increases from our equity holdings. There were 58 stocks in the Income Builder portfolio on September 30, 2008. In the period under review, 38 companies in your portfolio increased their per-share stock dividends, 17 decreased their dividends, and 3 held dividends constant. We sold 12 of the 17 stocks that cut dividends, and we are hopeful that the smaller remaining portfolio of equities will continue to pay attractive, growing dividends. You may be interested to know that the average per-share earnings of companies whose stocks we own increased by around 1% in 2008. Recognizing that conditions can change, we expect another single-digit percentage increase in average earnings this year. We also expect a higher percentage of the companies we own to hold their dividends constant during 2009 in comparison to prior years. We believe that the attractively yielding bonds we have acquired in recent months should keep our quarterly dividends at interesting levels.
For almost two years, an overwhelming majority of new investor dollars invested in mutual funds have flowed into money market funds . . . more than $1 trillion. Yields on taxable and tax-exempt money funds have dropped below 3/10 of one percent, and it is only a matter of time before a very large pool of investor dollars will be looking for better returns elsewhere, but in sensible investment programs. We are optimistic that the types of income-producing investments owned by Thornburg Investment Income Builder will experience renewed popularity among investors as their intrinsic values are recognized.
12 Certified Semi-Annual Report
Thank you for being a shareholder of Thornburg Investment Income Builder Fund. Short-term stock price fluctuations notwithstanding, we are generally encouraged by the progress, and the dividend-paying capacities, of the businesses owned in your portfolio. We expect price appreciation to accompany income production from the bond portion of the portfolio. Remember that you can review descriptions of many of the stocks in your portfolio at your leisure by going to our internet site, www. thornburg.com/funds. Best wishes for a wonderful summer.
Sincerely,
|
| |||
| Brian McMahon | Jason Brady,CFA | |||
| Co-Portfolio Manager | Co-Portfolio Manager | |||
| CEO & Chief Investment Officer | Managing Director |


The matters discussed in this report may constitute forward-looking statements made pursuant to the safe harbor provisions of the Securities Litigation Reform Act of 1995. These include any advisor or portfolio manager prediction, assessment, analysis or outlook for individual securities, industries, investment styles, market sectors and/or markets. These statements involve risks and uncertainties. In addition to the general risks described for each fund in its current prospectus, other factors bearing on these reports include the accuracy of the advisor’s or portfolio manager’s forecasts and predictions, the appropriateness of the investment strategies designed by the advisor or portfolio manager, and the ability of the advisor or portfolio manager to implement their strategies efficiently and successfully. Any one or more of these factors, as well as other risks affecting the securities markets generally, could cause the actual results of any fund to differ materially as compared to its benchmarks.
Certified Semi-Annual Report 13
STATEMENT OF ASSETS AND LIABILITIES
| Thornburg Investment Income Builder Fund | March 31, 2009 (Unaudited) |
| ASSETS | ||||
Investments at value (Note 2) | ||||
Non-controlled affiliated issuers (cost $125,324,957) | $ | 38,893,368 | ||
Non affiliated issuers (cost $3,171,348,371) | 2,364,813,013 | |||
Cash | 550,963 | |||
Receivable for investments sold | 2,093,496 | |||
Receivable for fund shares sold | 7,437,130 | |||
Unrealized gain on forward exchange contracts (Note 7) | 8,452,043 | |||
Dividends receivable | 10,146,250 | |||
Interest receivable | 24,601,665 | |||
Prepaid expenses and other assets | 93,548 | |||
Total Assets | 2,457,081,476 | |||
LIABILITIES | ||||
Payable for securities purchased | 1,029,341 | |||
Payable for fund shares redeemed | 7,173,718 | |||
Unrealized loss on forward exchange contracts (Note 7) | 17,118,556 | |||
Payable to investment advisor and other affiliates (Note 3) | 2,487,725 | |||
Accounts payable and accrued expenses | 1,071,523 | |||
Dividends payable | 2,342,366 | |||
Total Liabilities | 31,223,229 | |||
NET ASSETS | $ | 2,425,858,247 | ||
NET ASSETS CONSIST OF: | ||||
Distribution in excess of net investment income | $ | (7,567,665 | ) | |
Net unrealized depreciation on investments | (901,670,123 | ) | ||
Accumulated net realized gain (loss) | (603,591,008 | ) | ||
Net capital paid in on shares of beneficial interest | 3,938,687,043 | |||
| $ | 2,425,858,247 | |||
14 Certified Semi-Annual Report
STATEMENT OF ASSETS AND LIABILITIES, CONTINUED
| Thornburg Investment Income Builder Fund | March 31, 2009 (Unaudited) |
NET ASSET VALUE: | |||
Class A Shares: | |||
Net asset value and redemption price per share | $ | 12.59 | |
Maximum sales charge, 4.50% of offering price | 0.59 | ||
Maximum offering price per share | $ | 13.18 | |
Class C Shares: | |||
Net asset value and offering price per share * | $ | 12.59 | |
Class I Shares: | |||
Net asset value, offering and redemption price per share | $ | 12.68 | |
Class R3 Shares: | |||
Net asset value, offering and redemption price per share | $ | 12.59 | |
Class R4 Shares: | |||
Net asset value, offering and redemption price per share | $ | 12.65 | |
Class R5 Shares: | |||
Net asset value, offering and redemption price per share | $ | 12.67 | |
| * | Redemption price per share is equal to net asset value less any applicable contingent deferred sales charge. |
See notes to financial statements.
Certified Semi-Annual Report 15
| Thornburg Investment Income Builder Fund | Six Months Ended March 31, 2009 (Unaudited) |
| INVESTMENT INCOME: | ||||
Dividend income | ||||
Non-controlled affiliated issuers | $ | 383,552 | ||
Non-affiliated issuers (net of foreign taxes withheld of $2,302,009) | 47,739,095 | |||
Interest income (net of premium amortized of $266,152) | 49,041,414 | |||
Total Income | 97,164,061 | |||
EXPENSES: | ||||
Investment advisory fees (Note 3) | 10,194,735 | |||
Administration fees (Note 3) | ||||
Class A Shares | 632,537 | |||
Class C Shares | 656,627 | |||
Class I Shares | 144,780 | |||
Class R3 Shares | 5,669 | |||
Class R4 Shares | 131 | |||
Class R5 Shares | 61 | |||
Distribution and service fees (Note 3) | ||||
Class A Shares | 1,256,599 | |||
Class C Shares | 5,227,366 | |||
Class R3 Shares | 22,577 | |||
Class R4 Shares | 272 | |||
Transfer agent fees | ||||
Class A Shares | 657,435 | |||
Class C Shares | 816,365 | |||
Class I Shares | 299,820 | |||
Class R3 Shares | 14,505 | |||
Class R4 Shares | 1,030 | |||
Class R5 Shares | 1,275 | |||
Registration and filing fees | ||||
Class A Shares | 17,895 | |||
Class C Shares | 16,193 | |||
Class I Shares | 15,267 | |||
Class R3 Shares | 8,302 | |||
Class R4 Shares | 8,312 | |||
Class R5 Shares | 10,383 | |||
Custodian fees (Note 3) | 306,430 | |||
Professional fees | 77,390 | |||
Accounting fees | 66,035 | |||
Trustee fees | 51,860 | |||
Other expenses | 294,326 | |||
Total Expenses | 20,804,177 | |||
Less: | ||||
Expenses reimbursed by investment advisor (Note 3) | (1,171,519 | ) | ||
Fees paid indirectly (Note 3) | (86,850 | ) | ||
Net Expenses | 19,545,808 | |||
Net Investment Income | $ | 77,618,253 | ||
16 Certified Semi-Annual Report
STATEMENT OF OPERATIONS, CONTINUED
| Thornburg Investment Income Builder Fund | Six Months Ended March 31, 2009 (Unaudited) |
REALIZED AND UNREALIZED GAIN (LOSS) | ||||
Net realized gain (loss) on: | ||||
Investments | $ | (526,010,220 | ) | |
Foreign currency transactions | 83,912,742 | |||
| (442,097,478 | ) | |||
Net change in unrealized appreciation (depreciation) on: | ||||
Investments | (363,857,969 | ) | ||
Foreign currency translations | (51,693,230 | ) | ||
| (415,551,199 | ) | |||
Net Realized and Unrealized Loss | (857,648,677 | ) | ||
Net Decrease in Net Assets Resulting From operations | $ | (780,030,424 | ) | |
See notes to financial statements.
Certified Semi-Annual Report 17
STATEMENTS OF CHANGES IN NET ASSETS
| Thornburg Investment Income Builder Fund |
| Six Months Ended March 31, 2009* | Year Ended September 30, 2008 | |||||||
INCREASE (DECREASE) IN NET ASSETS FROM: | ||||||||
OPERATIONS: | ||||||||
Net investment income | $ | 77,618,253 | $ | 201,925,832 | ||||
Net realized loss on investments and foreign currency transactions | (442,097,478 | ) | (186,719,560 | ) | ||||
Increase (Decrease) in unrealized appreciation (depreciation) on investments and foreign currency translation | (415,551,199 | ) | (1,088,917,409 | ) | ||||
Net Increase (Decrease) in Net Assets Resulting from operations | (780,030,424 | ) | (1,073,711,137 | ) | ||||
DIVIDENDS TO SHAREHOLDERS: | ||||||||
From net investment income | ||||||||
Class A Shares | (42,140,793 | ) | (87,293,427 | ) | ||||
Class C Shares | (40,890,573 | ) | (69,974,272 | ) | ||||
Class I Shares | (25,071,958 | ) | (38,332,930 | ) | ||||
Class R3 Shares | (368,346 | ) | (528,541 | ) | ||||
Class R4 Shares | (8,531 | ) | (5,226 | ) | ||||
Class R5 Shares | (10,780 | ) | (10,324 | ) | ||||
From realized gains | ||||||||
Class A Shares | — | (36,128,892 | ) | |||||
Class C Shares | — | (32,902,777 | ) | |||||
Class I Shares | — | (13,856,430 | ) | |||||
Class R3 Shares | — | (182,203 | ) | |||||
Class R5 Shares | — | (1,810 | ) | |||||
FUND SHARE TRANSACTIONS (NOTE 4): | ||||||||
Class A Shares | (126,939,796 | ) | 262,958,781 | |||||
Class C Shares | (92,242,561 | ) | 396,649,527 | |||||
Class I Shares | (38,884,563 | ) | 372,408,738 | |||||
Class R3 Shares | (10,195 | ) | 8,197,717 | |||||
Class R4 Shares | 25,915 | 294,327 | ||||||
Class R5 Shares | 123,605 | 223,121 | ||||||
Net Decrease in Net Assets | (1,146,449,000 | ) | (312,195,758 | ) | ||||
NET ASSETS: | ||||||||
Beginning of period | 3,572,307,247 | 3,884,503,005 | ||||||
End of period | $ | 2,425,858,247 | $ | 3,572,307,247 | ||||
Undistributed net investment income | $ | — | $ | 23,305,063 | ||||
| * | Unaudited. |
See notes to financial statements.
18 Certified Semi-Annual Report
| Thornburg Investment Income Builder Fund | March 31, 2009 (Unaudited) |
NOTE 1 – ORGANIZATION
Thornburg Investment Income Builder Fund, hereinafter referred to as the “Fund,” is a diversified series of Thornburg Investment Trust (the “Trust”). The Trust was organized as a Massachusetts business trust under a Declaration of Trust dated June 3, 1987 and is registered as a diversified, open-end management investment company under the Investment Company Act of 1940, as amended. The Trust is currently issuing thirteen series of shares of beneficial interest in addition to those of the Fund: Thornburg Limited Term Municipal Fund, Thornburg California Limited Term Municipal Fund, Thornburg Limited Term U.S. Government Fund, Thornburg New Mexico Intermediate Municipal Fund, Thornburg Intermediate Municipal Fund, Thornburg Limited Term Income Fund, Thornburg Value Fund, Thornburg International Value Fund, Thornburg New York Intermediate Municipal Fund, Thornburg Core Growth Fund, Thornburg Global Opportunities Fund, Thornburg International Growth Fund, and Thornburg Strategic Income Fund. Each series is considered to be a separate entity for financial reporting and tax purposes and bears expenses directly attributable to it. The Fund’s primary investment goal is to provide a level of current income which exceeds the average yield on U.S. stocks generally, and which will generally grow, subject to periodic fluctuations, over the years on a per share basis. The Fund’s secondary investment goal is long-term capital appreciation.
The Fund currently offers six classes of shares of beneficial interest: Class A, Class C, Institutional Class (Class I), and Retirement Classes (Class R3, Class R4, and Class R5) shares. Each class of shares of the Fund represents an interest in the same portfolio of investments, except that (i) Class A shares are sold subject to a front-end sales charge collected at the time the shares are purchased and bear a service fee, (ii) Class C shares are sold at net asset value without a sales charge at the time of purchase, but are subject to a contingent deferred sales charge upon redemption within one year of purchase, and bear both a service fee and a distribution fee, (iii) Class I shares are sold at net asset value without a sales charge at the time of purchase, (iv) Class R3 shares are sold at net asset value without a sales charge at the time of purchase, but bear both a service fee and distribution fee, (v) Class R4 shares are sold at net asset value without sales charge at the time of purchase, but bear a service fee, (vi) Class R5 shares are sold at net asset value without a sales charge at the time of purchase, and (vii) the respective classes may have different reinvestment privileges and conversion rights. Additionally, the Fund may allocate among its classes certain expenses, to the extent allowable to specific classes, including transfer agent fees, government registration fees, certain printing and postage costs, and administrative and legal expenses. Currently, class specific expenses of the Fund are limited to service and distribution fees, administration fees, and certain registration and transfer agent expenses.
NOTE 2 – SIGNIFICANT ACCOUNTING POLICIES
Significant accounting policies of the Trust are as follows:
Valuation of Investments: Portfolio securities listed or traded on a national securities exchange are valued on the valuation date at the last reported sale price on the exchange that is the primary market for the security. Portfolio securities traded on an exchange for which there has been no sale that day and other equity securities traded in the over-the-counter market are valued at the mean between the last reported bid and asked prices. Portfolio securities reported by NASDAQ are valued at the NASDAQ official closing price. Any foreign security traded on exchanges outside the United States is valued at the price of the security on the exchange that is normally the security’s primary market, as of the close of that exchange preceding the time of the Fund’s valuation.
Debt obligations held by the Fund have a primary market over the counter and are valued by an independent pricing service approved by the Trustees of the Trust. The pricing service ordinarily values debt obligations at quoted bid prices. When quotations are not available, debt obligations held by the Fund are valued at evaluated prices determined by the pricing service using methods which include consideration of yields or prices of debt obligations of comparable quality, type of issue, coupon, maturity, and rating, and indications as to value from dealers and general market conditions. Short-term obligations having remaining maturities of 60 days or less are valued at amortized cost, which approximates market value.
Quotations in foreign currencies for foreign portfolio investments are converted to U.S. dollar equivalents using the foreign exchange quotation in effect at the time of valuation.
In any case where the market value of an equity security held by the Fund is not readily available, the Trust’s valuation and pricing committee determines a fair value for the security using procedures approved by the Trustees, which may include the use of prices obtained from an independent pricing service. The pricing service ordinarily values equity securities in these instances using multi-factor models to adjust market prices based upon various inputs, including exchange data, depository receipt prices, futures and index data and other data. A security’s market value is deemed not readily available whenever the exchange or market on which the security is primarily traded is closed for the entire scheduled day of trading. Additionally, a security’s market value may be deemed not readily available under other circumstances identified by the Trustees, including when developments occurring after the most recent close of the security’s primary exchange or market, but before the most recent close of trading in Fund shares, create a serious question about the reliability of the security’s market value.
In any case where a pricing service fails to provide a price for a debt obligation held by the Fund, the valuation and pricing committee determines a fair value for the debt obligation using procedures approved by the Trustees. Additionally, in any case where management believes that a price provided by a pricing service for a debt obligation held by the Fund may
Certified Semi-Annual Report 19
NOTES TO FINANCIAL STATEMENTS, CONTINUED
| Thornburg Investment Income Builder Fund | March 31, 2009 (Unaudited) |
be unreliable, the valuation and pricing committee decides whether or not to use the pricing service’s valuation or to determine a fair value for the debt obligation.
In determining fair value for any portfolio security or other investment, the valuation and pricing committee seeks to determine the amount that an owner of the investment might reasonably expect to receive upon a sale of the investment. However, because fair value prices are estimated prices, the valuation and pricing committee’s determination of fair value for an investment may differ from the value that would be realized by the Fund upon a sale of the investment, and that difference could be material to the Fund’s financial statements. The valuation and pricing committee’s determination of fair value for an investment may also differ from the prices obtained by other persons (including other mutual funds) for the investment.
Valuation Measurements: Various inputs are used in determining the value of the Fund’s investments. These inputs are summarized in the three levels listed below.
Level 1: Quoted prices in active markets for identical investments.
Level 2: Other significant observable inputs (including quoted prices for similar investments, interest rates, prepayment rates, credit risk, etc.)
Level 3: Significant unobservable inputs (including the Fund’s own assumptions in determining the fair value of investments)
The following table displays a summary of the inputs used to value the Fund’s net assets as of March 31, 2009. In any instance when valuation inputs from more than one level are used to determine the fair value of a specific investment, the investment is placed in the level of the table based upon the lowest level input that is significant in determining the fair value of the investment:
Valuation Inputs | Investments in Securities | Investments in Other Financial Instruments* | |||||
Level 1 - Quoted Prices in Active | $ | 1,422,036,456 | $ | (1,330 | ) | ||
Level 2 - Other Significant | 981,669,925 | (8,666,513 | ) | ||||
Level 3 - Significant | — | — | |||||
Total | $ | 2,403,706,381 | $ | (8,667,843 | ) | ||
| * | Other financial instruments include investments not reflected in the Schedule of Investments, such as futures, forwards and swap contracts, which are valued at the unrealized appreciation (depreciation) on the instrument. |
Foreign Currency Translation: Portfolio securities and other assets and liabilities denominated in foreign currencies are translated into U.S. dollars based on the exchange rate of such currencies against the U.S. dollar on the date of valuation. Purchases and sales of securities and income items denominated in foreign currencies are translated into U.S. dollars at the exchange rate in effect on the translation date. When the Fund purchases or sells foreign securities it will customarily enter into a foreign exchange contract to minimize foreign exchange risk from the trade date to the settlement date of such transactions.
The Fund does not separately report the effect of changes in foreign exchange rates from changes in market prices on securities held. Such changes are included in net realized and unrealized gain or loss from investments.
Reported net realized foreign exchange gains or losses arise from sales of foreign currencies, currency gains or losses realized between the trade and settlement dates on securities transactions and the difference between the amounts of dividends, interest, and foreign withholding taxes recorded on the Fund’s books, and the U.S. dollar equivalent of the amounts actually received or paid.
Net unrealized foreign exchange gains and losses arise from changes in the fair value of assets and liabilities, other than investments in securities at fiscal period end, resulting from changes in exchange rates.
Deferred Taxes: The Fund is subject to a tax imposed on net realized gains of securities of certain foreign countries. The Fund records an estimated deferred tax liability for net unrealized gains on these securities as reflected in the accompanying financial statements.
Federal Income Taxes: It is the policy of the Trust to comply with the provisions of the Internal Revenue Code applicable to “regulated investment companies” and to distribute to shareholders substantially all taxable income, including any net realized gain on investments of the Funds. Therefore, no provision for federal income taxes is required.
When-Issued and Delayed Delivery Transactions: The Trust may engage in when-issued or delayed delivery transactions. To the extent the Trust engages in such transactions, it will do so for the purpose of acquiring portfolio securities consistent with the Fund’s investment objectives and not for the purpose of investment leverage or to speculate on interest rate and/or market changes. At the time the Trust makes a commitment to purchase a security on a when-issued or delayed delivery basis, the Fund will record the transaction and reflect the value in determining its net asset value. When effecting such transactions, assets of an amount sufficient to make payment for the portfolio securities to be purchased will be segregated on the Fund’s records on the trade date. Securities purchased on a when-issued or delayed delivery basis do not earn interest until the settlement date.
20 Certified Semi-Annual Report
NOTES TO FINANCIAL STATEMENTS, CONTINUED
| Thornburg Investment Income Builder Fund | March 31, 2009 (Unaudited) |
Dividends: Net investment income of the Fund is declared daily as a dividend on shares for which the Fund has received payment. Dividends are paid quarterly and are reinvested in additional shares of the Fund at net asset value per share at the close of business on the dividend payment date, or at the shareholder’s option, paid in cash. Net realized capital gains, to the extent available, will be distributed at least annually. Distributions to shareholders are based on income tax regulations and therefore, their characteristics may differ for financial statement and tax purposes.
General: Securities transactions are accounted for on a trade date basis. Interest income is accrued as earned and dividend income is recorded on the ex-dividend date. Certain income from foreign securities is recognized as soon as information is available to the Fund. Realized gains and losses from the sale of securities are recorded on an identified cost basis. Net investment income (other than class specific expenses) and realized and unrealized gains and losses are allocated daily to each class of shares based upon the relative net asset value of outstanding shares of each class of shares at the beginning of the day (after adjusting for the current share activity of the respective class). Expenses common to all funds are allocated among the funds comprising the Trust based upon their relative net asset values or other appropriate allocation methods.
Guarantees and Indemnifications: Under the Trust’s organizational documents, its officers and Trustees are indemnified against certain liabilities arising out of the performance of their duties to the Fund. Additionally, in the normal course of business the Trust enters into contracts with service providers that contain general indemnification clauses. The Trust’s maximum exposure under these arrangements is unknown. However, based on experience, the Trust expects the risk of loss to be remote.
Use of Estimates: The preparation of financial statements, in conformity with generally accepted accounting principles, requires management to make estimates and assumptions that affect the reported amounts of assets and liabilities and the disclosure of contingent assets and liabilities at the date of the financial statements and the reported amounts of increases and decreases in net assets from operations during the reporting period. Actual results could differ from those estimates.
NOTE 3 – INVESTMENT ADVISORY FEE AND OTHER TRANSACTIONS WITH AFFILIATES
Pursuant to an investment advisory agreement, Thornburg Investment Management, Inc. (the “Advisor”) serves as the investment advisor and performs services to the Fund for which the fees are payable at the end of each month. For the six months ended March 31, 2009, these fees were payable at annual rates ranging from .875 of 1% to .675 of 1% per annum of the average daily net assets of the Fund depending on the Fund’s asset size. The Trust also has entered into administrative services agreements with the Advisor, whereby the Advisor will perform certain administrative services for the shareholders of each class of the Fund’s shares, and for which fees will be payable at an annual rate of up to ..125 of 1% per annum of the average daily net assets attributable to each class of shares. For the six months ended March 31, 2009, the Advisor voluntarily reimbursed certain class specific expenses, administrative fees, and distribution fees of $1,074,328 for Class C shares, $56,198 for Class I shares, $20,339 for Class R3 shares, $9,141 for Class R4 shares, and $11,513 for Class R5 shares.
The Trust has an underwriting agreement with Thornburg Securities Corporation (the “Distributor,” an affiliate of the Advisor), which acts as the distributor of the Fund’s shares. For the six months ended March 31, 2009, the Distributor has advised the Fund that it earned commissions aggregating $114,131 from the sale of Class A shares, and collected contingent deferred sales charges aggregating $219,563 from redemptions of Class C shares of the Fund.
Pursuant to a service plan under Rule 12b-1 of the Investment Company Act of 1940, the Fund may reimburse to the Advisor an amount not to exceed .25 of 1% per annum of the average daily net assets attributable to each class of shares of the Fund for payments made by the Advisor to securities dealers and other financial institutions to obtain various shareholder and distribution related services. The Advisor may pay out of its own resources additional expenses for distribution of the Fund’s shares.
The Trust has also adopted distribution plans pursuant to Rule 12b-1, applicable only to the Fund’s Class C and Class R3 shares, under which the Fund compensates the Distributor for services in promoting the sale of Class C and Class R3 shares of the Fund at an annual rate of up to .75 of 1% per annum of the average daily net assets attributable to Class C and Class R3 shares. Total fees incurred by the Distributor for each class of shares of the Fund under their respective Service and Distribution Plans for the six months ended March 31, 2009, are set forth in the Statement of Operations.
The Trust has an agreement with the custodian bank to indirectly pay a portion of the custodian’s fees through credits earned by the Fund’s cash on deposit with the bank. This deposit agreement is an alternative to overnight investments. Custodial fees have been adjusted to reflect amounts that would have been paid without this agreement, with a corresponding adjustment reflected as fees paid indirectly in the Statement of Operations. For the six months ended March 31, 2009, fees paid indirectly were $86,850.
Certain officers and Trustees of the Trust are also officers and/or directors of the Advisor and Distributor. The compensation of independent Trustees is borne by the Trust.
Certified Semi-Annual Report 21
NOTES TO FINANCIAL STATEMENTS, CONTINUED
| Thornburg Investment Income Builder Fund | March 31, 2009 (Unaudited) |
NOTE 4 – SHARES OF BENEFICIAL INTEREST
At March 31, 2009, there were an unlimited number of shares of beneficial interest authorized. Transactions in shares of beneficial interest were as follows:
| Six Months Ended March 31, 2009 (Unaudited) | Year Ended September 30, 2008 (Audited) | |||||||||||||
| Shares | Amount | Shares | Amount | |||||||||||
Class A Shares | ||||||||||||||
Shares sold | 11,018,169 | $ | 147,284,663 | 32,312,509 | $ | 694,658,919 | ||||||||
Shares issued to shareholders in reinvestment of dividends | 2,449,683 | 32,407,438 | 4,928,456 | 101,966,780 | ||||||||||
Shares repurchased | (22,764,265 | ) | (306,647,890 | ) | (27,276,934 | ) | (533,691,076 | ) | ||||||
Redemption fees received** | — | 15,993 | — | 24,158 | ||||||||||
Net Increase (Decrease) | (9,296,413 | ) | $ | (126,939,796 | ) | 9,964,031 | $ | 262,958,781 | ||||||
Class C Shares | ||||||||||||||
Shares sold | 9,194,149 | $ | 123,033,237 | 28,098,198 | $ | 605,445,590 | ||||||||
Shares issued to shareholders in reinvestment of dividends | 2,262,798 | 29,961,177 | 3,780,967 | 78,327,028 | ||||||||||
Shares repurchased | (18,427,702 | ) | (245,253,629 | ) | (14,602,336 | ) | (287,145,318 | ) | ||||||
Redemption fees received** | — | 16,654 | — | 22,227 | ||||||||||
Net Increase (Decrease) | (6,970,755 | ) | $ | (92,242,561 | ) | 17,276,829 | $ | 396,649,527 | ||||||
Class I Shares | ||||||||||||||
Shares sold | 11,423,694 | $ | 153,096,685 | 28,502,232 | $ | 584,478,619 | ||||||||
Shares issued to shareholders in reinvestment of dividends | 1,467,613 | 19,540,251 | 1,872,549 | 38,475,342 | ||||||||||
Shares repurchased | (15,816,162 | ) | (211,530,638 | ) | (12,599,865 | ) | (250,554,875 | ) | ||||||
Redemption fees received** | — | 9,139 | — | 9,652 | ||||||||||
Net Increase (Decrease) | (2,924,855 | ) | $ | (38,884,563 | ) | 17,774,916 | $ | 372,408,738 | ||||||
Class R3 Shares | ||||||||||||||
Shares sold | 132,753 | $ | 1,752,130 | 530,412 | $ | 11,253,161 | ||||||||
Shares issued to shareholders in reinvestment of dividends | 24,304 | 321,432 | 32,259 | 656,744 | ||||||||||
Shares repurchased | (152,302 | ) | (2,083,900 | ) | (182,609 | ) | (3,712,337 | ) | ||||||
Redemption fees received** | — | 143 | — | 149 | ||||||||||
Net Increase (Decrease) | 4,755 | $ | (10,195 | ) | 380,062 | $ | 8,197,717 | |||||||
Class R4 Shares* | ||||||||||||||
Shares sold | 1,290 | $ | 17,525 | 14,552 | $ | 289,196 | ||||||||
Shares issued to shareholders in reinvestment of dividends | 634 | 8,414 | 281 | 5,130 | ||||||||||
Shares repurchased | (2 | ) | (27 | ) | — | — | ||||||||
Redemption fees received** | — | 3 | — | 1 | ||||||||||
Net Increase (Decrease) | 1,922 | $ | 25,915 | 14,833 | $ | 294,327 | ||||||||
22 Certified Semi-Annual Report
NOTES TO FINANCIAL STATEMENTS, CONTINUED
| Thornburg Investment Income Builder Fund | March 31, 2009 (Unaudited) |
| Six Months Ended March 31, 2009 (Unaudited) | Year Ended September 30, 2008 (Audited) | |||||||||||||
| Shares | Amount | Shares | Amount | |||||||||||
Class R5 Shares | ||||||||||||||
Shares sold | 32,512 | $ | 483,071 | 22,563 | $ | 462,911 | ||||||||
Shares issued to shareholders in reinvestment of dividends | 669 | 8,908 | 342 | 6,456 | ||||||||||
Shares repurchased | (26,522 | ) | (368,377 | ) | (12,922 | ) | (246,249 | ) | ||||||
Redemption fees received** | — | 3 | — | 3 | ||||||||||
Net Increase (Decrease) | 6,659 | $ | 123,605 | 9,983 | $ | 223,121 | ||||||||
| * | Effective date for Class R4 shares was February 1, 2008. |
| ** | The Fund charges a redemption fee of 1% of the Class A and Class I shares redeemed or exchanged within 30 days of purchase. Redemption fees charged to any class are allocated to all classes upon receipt of payment based on relative net asset values of each class or other appropriate allocation methods. |
NOTE 5 – SECURITIES TRANSACTIONS
For the six months ended March 31, 2009, the Fund had purchase and sale transactions of investment securities (excluding short-term investments and U. S. Government obligations) of $1,189,961,846 and $1,142,390,137, respectively.
NOTE 6 – INCOME TAXES
At March 31, 2009, information on the tax components of capital is as follows:
Cost of investments for tax purposes | $ | 3,296,988,711 | ||
Gross unrealized appreciation on a tax basis | $ | 82,577,851 | ||
Gross unrealized depreciation on a tax basis | (975,860,527 | ) | ||
Net unrealized appreciation (depreciation) on investments (tax basis) | $ | (893,282,676 | ) | |
At March 31, 2009, the Fund had deferred tax basis currency and capital losses occurring subsequent to October 31, 2007 of $616,236 and $110,250,670, respectively. For tax purposes, such losses will be reflected in the year ending September 30, 2009.
At March 31, 2009, the Fund had tax basis capital losses of $4,262,779 which may be carried forward to offset future capital gains. To the extent such carryforwards are used, capital gain distributions may be reduced to the extent provided by regulations. Such capital loss carryforwards expire at September 30, 2016.
Certified Semi-Annual Report 23
NOTES TO FINANCIAL STATEMENTS, CONTINUED
| Thornburg Investment Income Builder Fund | March 31, 2009 (Unaudited) |
NOTE 7 – FINANCIAL INSTRUMENTS WITH OFF-BALANCE SHEET RISK AND FOREIGN INVESTMENT RISK
During the six months ended March 31, 2009, the Fund was a party to financial instruments with off-balance sheet risks, primarily currency forward exchange contracts. A forward exchange contract is an agreement between two parties to exchange different currencies at a specified rate at an agreed upon future date. These contracts are purchased in order to minimize the risk to the Fund with respect to its foreign investment transactions from adverse changes in the relationship between the U.S. dollar and foreign currencies. In each case these contracts have been initiated in conjunction with foreign investment transactions. These instruments may involve market risks in excess of the amount recognized on the Statement of Assets and Liabilities. Such risks would arise from the possible inability of counterparties to meet the terms of their contracts, future movement in currency value and interest rates and contract positions that are not exact offsets. These contracts are reported in the financial statements at the Fund’s net equity, as measured by the difference between the forward exchange rates at the reporting date and the forward exchange rates at the dates of entry into the contract. There are special risks associated with international investing, including currency fluctuations, economic and political instability, confiscation, inability or delays in selling foreign investments, and reduced legal protection for investments.
CONTRACTS TO BUY OR SELL:
Contract Description | Buy/Sell | Contract Amount | Contract Value Date | Value (USD) | Unrealized Appreciation | Unrealized (Depreciation) | ||||||||||
Euro Dollar | Sell | 257,260,000 | 5/4/2009 | $ | 325,832,653 | $ | — | $ | (15,937,250 | ) | ||||||
Euro Dollar | Buy | 60,000,000 | 5/4/2009 | 75,295,800 | 4,414,198 | — | ||||||||||
Great Britain Pound | Sell | 23,520,000 | 5/5/2009 | 37,674,336 | 3,924,079 | — | ||||||||||
Great Britain Pound | Buy | 4,880,600 | 5/5/2009 | 6,889,699 | 113,766 | — | ||||||||||
Swiss Franc | Sell | 50,700,000 | 5/4/2009 | 44,148,380 | — | (419,914 | ) | |||||||||
Turkish Lira | Sell | 14,300,000 | 5/21/2009 | 7,729,730 | — | (761,392 | ) | |||||||||
Total unrealized appreciation (depreciation) from forward exchange contracts | $ | 8,452,043 | $ | (17,118,556 | ) | |||||||||||
OTHER NOTES:
Statement of Accounting Standards No. 161:
On March 19, 2008, the Financial Accounting Standards Board issued Statement of Financial Accounting Standards No. 161, “Disclosures about Derivative Instruments and Hedging Activities” (“FAS 161”). FAS 161 is effective for fiscal years and interim periods beginning after November 15, 2008. FAS 161 requires enhanced disclosures about any derivative and hedging activities by the Fund, including how such activities are accounted for and any effect on the Fund’s financial position, performance and cash flows.
24 Certified Semi-Annual Report
| Thornburg Investment Income Builder Fund |
| Six Months Ended March 31, 2009* | ||||||||||||||||||||||||
| Year Ended September 30, | ||||||||||||||||||||||||
| 2008 | 2007 | 2006 | 2005 | 2004 | ||||||||||||||||||||
Class A Shares: | ||||||||||||||||||||||||
PER SHARE PERFORMANCE | ||||||||||||||||||||||||
(for a share outstanding throughout the period)+ | ||||||||||||||||||||||||
Net asset value, beginning of period | $ | 16.86 | $ | 23.35 | $ | 19.58 | $ | 17.93 | $ | 15.60 | $ | 13.77 | ||||||||||||
Income from investment operations: | ||||||||||||||||||||||||
Net investment income (loss) | 0.40 | 1.04 | 0.93 | 0.78 | 0.73 | 0.72 | ||||||||||||||||||
Net realized and unrealized gain (loss) on investments | (4.12 | ) | (6.04 | ) | 4.23 | 1.98 | 2.24 | 1.66 | ||||||||||||||||
Total from investment operations | (3.72 | ) | (5.00 | ) | 5.16 | 2.76 | 2.97 | 2.38 | ||||||||||||||||
Less dividends from: | ||||||||||||||||||||||||
Net investment income | (0.55 | ) | (1.02 | ) | (0.88 | ) | (0.77 | ) | (0.64 | ) | (0.55 | ) | ||||||||||||
Net realized gains | — | (0.47 | ) | (0.51 | ) | (0.34 | ) | — | — | |||||||||||||||
Total dividends | (0.55 | ) | (1.49 | ) | (1.39 | ) | (1.11 | ) | (0.64 | ) | (0.55 | ) | ||||||||||||
Change in net asset value | (4.27 | ) | (6.49 | ) | 3.77 | 1.65 | 2.33 | 1.83 | ||||||||||||||||
NET ASSET VALUE, end of period | $ | 12.59 | $ | 16.86 | $ | 23.35 | $ | 19.58 | $ | 17.93 | $ | 15.60 | ||||||||||||
RATIOS/SUPPLEMENTAL DATA | ||||||||||||||||||||||||
Total return (%)(a) | (22.16 | ) | (22.48 | ) | 27.40 | 16.05 | 19.21 | 17.40 | ||||||||||||||||
Ratios to average net assets: | ||||||||||||||||||||||||
Net investment income (loss) (%) | 5.99 | (b) | 5.01 | 4.39 | 4.22 | 4.26 | 4.72 | |||||||||||||||||
Expenses, after expense reductions (%) | 1.34 | (b) | 1.25 | 1.30 | 1.38 | 1.47 | 1.50 | |||||||||||||||||
Expenses, after expense reductions and net of custody credits (%) | 1.33 | (b) | 1.25 | 1.30 | 1.38 | 1.47 | 1.49 | |||||||||||||||||
Expenses, before expense reductions (%) | 1.34 | (b) | 1.25 | 1.30 | 1.38 | 1.47 | 1.50 | |||||||||||||||||
Portfolio turnover rate (%) | 43.11 | 46.07 | 62.60 | 55.29 | 76.76 | 109.21 | ||||||||||||||||||
Net assets at end of period (thousands) | $ | 923,304 | $ | 1,393,268 | $ | 1,697,061 | $ | 903,347 | $ | 515,915 | $ | 224,522 | ||||||||||||
| (a) | Sales loads are not reflected in computing total return, which is not annualized for periods less than one year. |
| (b) | Annualized. |
| + | Based on weighted average shares outstanding. |
| * | Unaudited. |
See notes to financial statements.
Certified Semi-Annual Report 25
FINANCIAL HIGHLIGHTS, CONTINUED
| Thornburg Investment Income Builder Fund |
| Six Months Ended March 31, 2009* | ||||||||||||||||||||||||
| Year Ended September 30, | ||||||||||||||||||||||||
| 2008 | 2007 | 2006 | 2005 | 2004 | ||||||||||||||||||||
Class C Shares: | ||||||||||||||||||||||||
PER SHARE PERFORMANCE | ||||||||||||||||||||||||
(for a share outstanding throughout the period)+ | ||||||||||||||||||||||||
Net asset value, beginning of period | $ | 16.87 | $ | 23.37 | $ | 19.60 | $ | 17.95 | $ | 15.62 | $ | 13.79 | ||||||||||||
Income from investment operations: | ||||||||||||||||||||||||
Net investment income (loss) | 0.36 | 0.90 | 0.81 | 0.70 | 0.66 | 0.66 | ||||||||||||||||||
Net realized and unrealized gain (loss) on investments | (4.12 | ) | (6.04 | ) | 4.22 | 1.97 | 2.24 | 1.66 | ||||||||||||||||
Total from investment operations | (3.76 | ) | (5.14 | ) | 5.03 | 2.67 | 2.90 | 2.32 | ||||||||||||||||
Less dividends from: | ||||||||||||||||||||||||
Net investment income | (0.52 | ) | (0.89 | ) | (0.75 | ) | (0.68 | ) | (0.57 | ) | (0.49 | ) | ||||||||||||
Net realized gains | — | (0.47 | ) | (0.51 | ) | (0.34 | ) | — | — | |||||||||||||||
Total dividends | (0.52 | ) | (1.36 | ) | (1.26 | ) | (1.02 | ) | (0.57 | ) | (0.49 | ) | ||||||||||||
Change in net asset value | (4.28 | ) | (6.50 | ) | 3.77 | 1.65 | 2.33 | 1.83 | ||||||||||||||||
NET ASSET VALUE, end of period | $ | 12.59 | $ | 16.87 | $ | 23.37 | $ | 19.60 | $ | 17.95 | $ | 15.62 | ||||||||||||
RATIOS/SUPPLEMENTAL DATA | ||||||||||||||||||||||||
Total return (%)(a) | (22.42 | ) | (23.02 | ) | 26.64 | 15.45 | 18.70 | 16.89 | ||||||||||||||||
Ratios to average net assets: | ||||||||||||||||||||||||
Net investment income (loss) (%) | 5.44 | (b) | 4.36 | 3.79 | 3.73 | 3.84 | 4.33 | |||||||||||||||||
Expenses, after expense reductions (%) | 1.90 | (b) | 1.90 | 1.90 | 1.90 | 1.90 | 1.89 | |||||||||||||||||
Expenses, after expense reductions and net of custody credits (%) | 1.90 | (b) | 1.90 | 1.89 | 1.90 | 1.89 | 1.89 | |||||||||||||||||
Expenses, before expense reductions (%) | 2.11 | (b) | 2.03 | 2.06 | 2.15 | 2.23 | 2.25 | |||||||||||||||||
Portfolio turnover rate (%) | 43.11 | 46.07 | 62.60 | 55.29 | 76.76 | 109.21 | ||||||||||||||||||
Net assets at end of period (thousands) | $ | 957,453 | $ | 1,399,947 | $ | 1,535,532 | $ | 636,947 | $ | 337,489 | $ | 143,122 | ||||||||||||
| (a) | Not annualized for periods less than one year. |
| (b) | Annualized. |
| + | Based on weighted average shares outstanding. |
| * | Unaudited. |
See notes to financial statements.
26 Certified Semi-Annual Report
FINANCIAL HIGHLIGHTS, CONTINUED
| Thornburg Investment Income Builder Fund |
| Six Months Ended March 31, 2009* | Period Ended Sept. 30, 2004(a) | |||||||||||||||||||||||
| Year Ended September 30, | ||||||||||||||||||||||||
| 2008 | 2007 | 2006 | 2005 | |||||||||||||||||||||
Class I Shares: | ||||||||||||||||||||||||
PER SHARE PERFORMANCE | ||||||||||||||||||||||||
(for a share outstanding throughout the period)+ | ||||||||||||||||||||||||
Net asset value, beginning of period | $ | 16.97 | $ | 23.50 | $ | 19.71 | $ | 18.03 | $ | 15.64 | $ | 14.45 | ||||||||||||
Income from investment operations: | ||||||||||||||||||||||||
Net investment income (loss) | 0.43 | 1.10 | 1.02 | 0.88 | 0.84 | 0.74 | ||||||||||||||||||
Net realized and unrealized gain (loss) on investments | (4.14 | ) | (6.06 | ) | 4.24 | 1.98 | 2.22 | 1.01 | ||||||||||||||||
Total from investment operations | (3.71 | ) | (4.96 | ) | 5.26 | 2.86 | 3.06 | 1.75 | ||||||||||||||||
Less dividends from: | �� | |||||||||||||||||||||||
Net investment income | (0.58 | ) | (1.10 | ) | (0.96 | ) | (0.84 | ) | (0.67 | ) | (0.56 | ) | ||||||||||||
Net realized gains | — | (0.47 | ) | (0.51 | ) | (0.34 | ) | — | — | |||||||||||||||
Total dividends | (0.58 | ) | (1.57 | ) | (1.47 | ) | (1.18 | ) | (0.67 | ) | (0.56 | ) | ||||||||||||
Change in net asset value | (4.29 | ) | (6.53 | ) | 3.79 | 1.68 | 2.39 | 1.19 | ||||||||||||||||
NET ASSET VALUE, end of period | $ | 12.68 | $ | 16.97 | $ | 23.50 | $ | 19.71 | $ | 18.03 | $ | 15.64 | ||||||||||||
RATIOS/SUPPLEMENTAL DATA | ||||||||||||||||||||||||
Total return (%)(b) | (21.98 | ) | (22.20 | ) | 27.80 | 16.53 | 19.73 | 12.19 | ||||||||||||||||
Ratios to average net assets: | ||||||||||||||||||||||||
Net investment income (loss) (%) | 6.38 | (c) | 5.34 | 4.74 | 4.68 | 4.86 | 5.33 | (c) | ||||||||||||||||
Expenses, after expense reductions (%) | 0.97 | (c) | 0.89 | 0.95 | 0.99 | 1.00 | 0.99 | (c) | ||||||||||||||||
Expenses, after expense reductions and net of custody credits (%) | 0.96 | (c) | 0.89 | 0.94 | 0.98 | 0.99 | 0.99 | (c) | ||||||||||||||||
Expenses, before expense reductions (%) | 0.99 | (c) | 0.89 | 0.95 | 1.02 | 1.09 | 1.21 | (c) | ||||||||||||||||
Portfolio turnover rate (%) | 43.11 | 46.07 | 62.60 | 55.29 | 76.76 | 109.21 | ||||||||||||||||||
Net assets at end of period (thousands) | $ | 535,729 | $ | 766,772 | $ | 644,294 | $ | 308,859 | $ | 129,110 | $ | 33,247 | ||||||||||||
| (a) | Effective date of this class of shares was November 3, 2003. |
| (b) | Not annualized for periods less than one year. |
| (c) | Annualized. |
| + | Based on weighted average shares outstanding. |
| * | Unaudited. |
See notes to financial statements.
Certified Semi-Annual Report 27
FINANCIAL HIGHLIGHTS, CONTINUED
| Thornburg Investment Income Builder Fund |
| Six Months Ended March 31, 2009* | Period Ended Sept. 30, 2005(a) | |||||||||||||||||||
| Year Ended September 30, | ||||||||||||||||||||
| 2008 | 2007 | 2006 | ||||||||||||||||||
Class R3 Shares: | ||||||||||||||||||||
PER SHARE PERFORMANCE | ||||||||||||||||||||
(for a share outstanding throughout the period)+ | ||||||||||||||||||||
Net asset value, beginning of period | $ | 16.85 | $ | 23.34 | $ | 19.58 | $ | 17.93 | $ | 16.98 | ||||||||||
Income from investment operations: | ||||||||||||||||||||
Net investment income (loss) | 0.39 | 1.00 | 0.86 | 0.82 | 0.50 | |||||||||||||||
Net realized and unrealized gain (loss) on investments | (4.11 | ) | (6.05 | ) | 4.24 | 1.92 | 0.79 | |||||||||||||
Total from investment operations | (3.72 | ) | (5.05 | ) | 5.10 | 2.74 | 1.29 | |||||||||||||
Less dividends from: | ||||||||||||||||||||
Net investment income | (0.54 | ) | (0.97 | ) | (0.83 | ) | (0.75 | ) | (0.34 | ) | ||||||||||
Net realized gains | — | (0.47 | ) | (0.51 | ) | (0.34 | ) | — | ||||||||||||
Total dividends | (0.54 | ) | (1.44 | ) | (1.34 | ) | (1.09 | ) | (0.34 | ) | ||||||||||
Change in net asset value | (4.26 | ) | (6.49 | ) | 3.76 | 1.65 | 0.95 | |||||||||||||
NET ASSET VALUE, end of period | $ | 12.59 | $ | 16.85 | $ | 23.34 | $ | 19.58 | $ | 17.93 | ||||||||||
RATIOS/SUPPLEMENTAL DATA | ||||||||||||||||||||
Total return (%)(b) | (22.18 | ) | (22.69 | ) | 27.10 | 15.91 | 7.67 | |||||||||||||
Ratios to average net assets: | ||||||||||||||||||||
Net investment income (loss) (%) | 5.87 | (c) | 4.89 | 4.00 | 4.36 | 4.27 | (c) | |||||||||||||
Expenses, after expense reductions (%) | 1.51 | (c) | 1.49 | 1.50 | 1.50 | 1.50 | (c) | |||||||||||||
Expenses, after expense reductions and net of custody credits (%) | 1.50 | (c) | 1.49 | 1.50 | 1.50 | 1.49 | (c) | |||||||||||||
Expenses, before expense reductions (%) | 1.96 | (c) | 1.77 | 2.16 | 6.05 | 28.93 | (c)(d) | |||||||||||||
Portfolio turnover rate (%) | 43.11 | 46.07 | 62.60 | 55.29 | 76.76 | |||||||||||||||
Net assets at end of period (thousands) | $ | 8,911 | $ | 11,848 | $ | 7,544 | $ | 1,301 | $ | 280 | ||||||||||
| (a) | Effective date of this class of shares was February 1, 2005. |
| (b) | Not annualized for periods less than one year. |
| (c) | Annualized. |
| (d) | Due to the size of net assets and fixed expenses, ratios may appear disproportionate. |
| + | Based on weighted average shares outstanding. |
| * | Unaudited. |
See notes to financial statements.
28 Certified Semi-Annual Report
FINANCIAL HIGHLIGHTS, CONTINUED
| Thornburg Investment Income Builder Fund |
| Six Months Ended March 31, 2009* | Period Ended Sept. 30, 2008 (a) | |||||||
Class R4 Shares: | ||||||||
PER SHARE PERFORMANCE | ||||||||
(for a share outstanding throughout the period)+ | ||||||||
Net asset value, beginning of period | $ | 16.94 | $ | 21.22 | ||||
Income from investment operations: | ||||||||
Net investment income (loss) | 0.40 | 0.66 | ||||||
Net realized and unrealized gain (loss) on investments | (4.14 | ) | (4.39 | ) | ||||
Total from investment operations | (3.74 | ) | (3.73 | ) | ||||
Less dividends from: | ||||||||
Net investment income | (0.55 | ) | (0.55 | ) | ||||
Change in net asset value | (4.29 | ) | (4.28 | ) | ||||
NET ASSET VALUE, end of period | $ | 12.65 | $ | 16.94 | ||||
RATIOS/SUPPLEMENTAL DATA | ||||||||
Total return (%)(b) | (22.19 | ) | (17.79 | ) | ||||
Ratios to average net assets: | ||||||||
Net investment income (loss) (%) | 5.98 | (c) | 5.28 | (c) | ||||
Expenses, after expense reductions (%) | 1.41 | (c) | 1.40 | (c) | ||||
Expenses, after expense reductions and net of custody credits (%) | 1.40 | (c) | 1.40 | (c) | ||||
Expenses, before expense reductions (%) | 10.15 | (c)(d) | 16.97 | (c)(d) | ||||
Portfolio turnover rate (%) | 43.11 | 46.07 | ||||||
Net assets at end of period (thousands) | $ | 212 | $ | 251 | ||||
| (a) | Effective date of this class of shares was February 1, 2008. |
| (b) | Not annualized for periods less than one year. |
| (c) | Annualized. |
| (d) | Due to the size of net assets and fixed expenses, ratios may appear disproportionate. |
| + | Based on weighted average shares outstanding. |
| * | Unaudited. |
| See notes to financial statements. |
Certified Semi-Annual Report 29
FINANCIAL HIGHLIGHTS, CONTINUED
| Thornburg Investment Income Builder Fund |
| Six Months Ended March 31, 2009* | Year Ended Sept. 30, 2008 | Period Ended Sept. 30, 2007(a) | ||||||||||
Class R5 Shares: | ||||||||||||
PER SHARE PERFORMANCE | ||||||||||||
(for a share outstanding throughout the period)+ | ||||||||||||
Net asset value, beginning of period | $ | 16.98 | $ | 23.51 | $ | 20.74 | ||||||
Income from investment operations: | ||||||||||||
Net investment income (loss) | 0.40 | 1.11 | 0.46 | |||||||||
Net realized and unrealized gain (loss) on investments | (4.13 | ) | (6.09 | ) | 2.87 | |||||||
Total from investment operations | (3.73 | ) | (4.98 | ) | 3.33 | |||||||
Less dividends from: | ||||||||||||
Net investment income | (0.58 | ) | (1.08 | ) | (0.56 | ) | ||||||
Net realized gains | — | (0.47 | ) | — | ||||||||
Total dividends | (0.58 | ) | (1.55 | ) | (0.56 | ) | ||||||
Change in net asset value | (4.31 | ) | (6.53 | ) | 2.77 | |||||||
NET ASSET VALUE, end of period | $ | 12.67 | $ | 16.98 | $ | 23.51 | ||||||
RATIOS/SUPPLEMENTAL DATA | ||||||||||||
Total return (%)(b) | (22.10 | ) | (22.27 | ) | 16.19 | |||||||
Ratios to average net assets: | ||||||||||||
Net investment income (loss) (%) | 5.85 | (c) | 5.48 | 3.17 | (c) | |||||||
Expenses, after expense reductions (%) | 0.99 | (c) | 0.99 | 0.99 | (c) | |||||||
Expenses, after expense reductions and net of custody credits (%) | 0.99 | (c) | 0.99 | 0.98 | (c) | |||||||
Expenses, before expense reductions (%) | 10.37 | (c)(d) | 11.77 | (d) | 278.77 | (c)(d) | ||||||
Portfolio turnover rate (%) | 43.11 | 46.07 | 62.60 | |||||||||
Net assets at end of period (thousands) | $ | 250 | $ | 221 | $ | 72 | ||||||
| (a) | Effective date of this class of shares was February 1, 2007. |
| (b) | Not annualized for periods less than one year. |
| (c) | Annualized. |
| (d) | Due to the size of net assets and fixed expenses, ratios may appear disproportionate. |
| + | Based on weighted average shares outstanding. |
| * | Unaudited. |
| See notes to financial statements. |
30 Certified Semi-Annual Report
| Thornburg Investment Income Builder Fund | March 31, 2009 (Unaudited) |
SUMMARY OF INDUSTRY EXPOSURE
As of 3/31/09
Telecommunication Services | 15.0 | % | |
Utilities | 12.4 | % | |
Energy | 11.3 | % | |
Food, Beverage & Tobacco | 8.4 | % | |
Banks | 7.7 | % | |
Diversified Financials | 7.6 | % | |
Consumer Services | 5.2 | % | |
Real Estate | 4.8 | % | |
Materials | 4.7 | % | |
Insurance | 4.2 | % | |
Pharmaceuticals, Biotechnology & Life Sciences | 3.7 | % | |
Semiconductors & Semiconductor Equipment | 2.4 | % | |
Transportation | 2.1 | % | |
Media | 1.5 | % | |
Technology Hardware & Equipment | 0.8 | % | |
Commercial & Professional Services | 0.8 | % | |
Food & Staples Retailing | 0.7 | % | |
Retailing | 0.3 | % | |
Automobiles & Components | 0.3 | % | |
Software & Services | 0.2 | % | |
Other Non-Classified Securities: | |||
Exchange Traded Funds | 1.7 | % | |
Other Securities | 1.6 | % | |
U.S. Government Agencies | 0.5 | % | |
Asset Backed Securities | 0.4 | % | |
Foreign Bonds | 0.4 | % | |
Taxable Municipal Bonds | 0.1 | % | |
Other Assets & Cash Equivalents | 1.2 | % | |
SUMMARY OF COUNTRY EXPOSURE
As of 3/31/09
United States | 60.4 | % | |
Australia | 5.7 | % | |
Spain | 4.2 | % | |
Italy | 3.6 | % | |
Switzerland | 3.1 | % | |
France | 2.8 | % | |
Greece | 2.5 | % | |
China | 2.2 | % | |
Canada | 2.1 | % | |
United Kingdom | 2.1 | % | |
Luxembourg | 1.6 | % | |
Finland | 1.2 | % | |
Netherlands | 1.2 | % | |
Hong Kong | 1.1 | % | |
Israel | 0.8 | % | |
South Africa | 0.7 | % | |
Russia | 0.6 | % | |
Turkey | 0.5 | % | |
Norway | 0.5 | % | |
Germany | 0.5 | % | |
South Korea | 0.5 | % | |
Bermuda | 0.4 | % | |
Brazil | 0.3 | % | |
United Arab Emirates | 0.1 | % | |
Malaysia | 0.1 | % | |
Mexico* | 0.0 | % | |
Ireland* | 0.0 | % | |
Other Assets & Cash Equivalents | 1.2 | % | |
| * | Country percentages were less than 0.1%. |
Certified Semi-Annual Report 31
SCHEDULE OF INVESTMENTS, CONTINUED
| Thornburg Investment Income Builder Fund | March 31, 2009 (Unaudited) |
| Shares/ Principal Amount | Value | ||||
COMMON STOCK — 55.16% | |||||
BANKS — 3.98% | |||||
COMMERCIAL BANKS — 3.98% | |||||
Associated Banc-Corp. | 523,400 | $ | 8,081,296 | ||
Bank of Montreal | 1,000,000 | 26,165,926 | |||
Banque Cantonale Vaudoise | 34,200 | 11,349,425 | |||
Huntington Bancshares, Inc. | 1,825,494 | 3,030,320 | |||
Liechtensteinische Landesbank AG | 910,000 | 41,171,045 | |||
St. Galler Kantonalbank | 20,800 | 6,715,277 | |||
| 96,513,289 | |||||
COMMERCIAL & PROFESSIONAL SERVICES — 0.72% | |||||
COMMERCIAL SERVICES & SUPPLIES — 0.72% | |||||
Seek Ltd. | 9,000,000 | 17,522,816 | |||
| 17,522,816 | |||||
CONSUMER SERVICES — 4.43% | |||||
HOTELS, RESTAURANTS & LEISURE — 4.43% | |||||
Berjaya Sports Toto Berhad | 2,500,000 | 3,140,859 | |||
McDonald’s Corp. | 800,000 | 43,656,000 | |||
OPAP SA | 2,300,000 | 60,565,558 | |||
| 107,362,417 | |||||
DIVERSIFIED FINANCIALS — 3.58% | |||||
CAPITAL MARKETS — 1.71% | |||||
AllianceBernstein Holdings LP | 750,000 | 11,040,000 | |||
Apollo Investment Corp. | 5,316,600 | 18,501,768 | |||
Henderson Group plc | 10,100,000 | 11,810,967 | |||
DIVERSIFIED FINANCIAL SERVICES — 1.87% | |||||
Bolsas y Mercados Espanoles | 900,000 | 20,817,833 | |||
Hong Kong Exchanges & Clearing Ltd. | 1,900,000 | 17,907,646 | |||
KKR Financial Holdings, LLC (1) | 7,500,000 | 6,675,000 | |||
| 86,753,214 | |||||
ENERGY — 5.52% | |||||
ENERGY EQUIPMENT & SERVICES — 1.01% | |||||
Diamond Offshore Drilling, Inc. | 192,700 | 12,113,122 | |||
Fred Olsen Energy ASA | 450,000 | 12,388,024 | |||
OIL, GAS & CONSUMABLE FUELS — 4.51% | |||||
Eni SpA | 2,795,000 | 54,290,448 | |||
Total SA | 857,900 | 42,657,237 | |||
Tupras-Turkiye Petrol Rafinerileri A.S. | 1,250,000 | 12,554,503 | |||
| 134,003,334 | |||||
FOOD & STAPLES RETAILING — 0.56% | |||||
FOOD & STAPLES RETAILING — 0.56% | |||||
Sysco Corp. | 600,000 | 13,680,000 | |||
| 13,680,000 | |||||
FOOD, BEVERAGE & TOBACCO — 7.31% | |||||
BEVERAGES — 2.06% | |||||
Coca Cola Co. | 1,134,200 | 49,848,090 | |||
32 Certified Semi-Annual Report
SCHEDULE OF INVESTMENTS, CONTINUED
| Thornburg Investment Income Builder Fund | March 31, 2009 (Unaudited) |
| Shares/ Principal Amount | Value | ||||
FOOD PRODUCTS — 1.33% | |||||
Kraft Foods, Inc. A | 1,450,000 | $ | 32,320,500 | ||
TOBACCO — 3.92% | |||||
Altria Group, Inc. | 2,377,900 | 38,093,958 | |||
Philip Morris | 1,600,000 | 56,928,000 | |||
| 177,190,548 | |||||
INSURANCE — 1.69% | |||||
INSURANCE — 1.69% | |||||
Cincinnati Financial Corp. | 1,077,340 | 24,638,766 | |||
Swiss Re | 1,000,000 | 16,375,296 | |||
| 41,014,062 | |||||
MATERIALS — 2.06% | |||||
CHEMICALS — 0.84% | |||||
Israel Chemicals Ltd. | 2,500,000 | 20,274,914 | |||
METALS & MINING — 1.22% | |||||
Impala Platinum Holdings Ltd. | 1,000,000 | 16,706,255 | |||
Southern Copper Corp. | 740,000 | 12,890,800 | |||
| 49,871,969 | |||||
PHARMACEUTICALS, BIOTECHNOLOGY & LIFE SCIENCES — 3.44% | |||||
PHARMACEUTICALS — 3.44% | |||||
Eli Lilly & Co. | 2,500,000 | 83,525,000 | |||
| 83,525,000 | |||||
REAL ESTATE — 2.63% | |||||
REAL ESTATE INVESTMENT TRUSTS — 2.63% | |||||
Annaly Capital Management, Inc. | 2,280,000 | 31,623,600 | |||
Chimera Investment Corp. (1) | 9,588,800 | 32,218,368 | |||
| 63,841,968 | |||||
SEMICONDUCTORS & SEMICONDUCTOR EQUIPMENT — 1.61% | |||||
SEMICONDUCTORS & SEMICONDUCTOR EQUIPMENT — 1.61% | |||||
Intel Corp. | 2,600,000 | 39,130,000 | |||
| 39,130,000 | |||||
SOFTWARE & SERVICES — 0.09% | |||||
INFORMATION TECHNOLOGY SERVICES — 0.09% | |||||
Redecard SA | 178,800 | 2,162,018 | |||
| 2,162,018 | |||||
TELECOMMUNICATION SERVICES — 11.02% | |||||
DIVERSIFIED TELECOMMUNICATION SERVICES — 7.90% | |||||
AT&T, Inc. | 500,000 | 12,600,000 | |||
France Telecom SA | 1,102,200 | 25,114,167 | |||
Telefónica SA | 4,027,200 | 80,365,078 | |||
Telstra Corp. Ltd. | 32,902,081 | 73,439,847 | |||
WIRELESS TELECOMMUNICATION SERVICES — 3.12% | |||||
China Mobile Ltd. | 6,000,000 | 52,370,139 | |||
Vodafone Group plc | 13,261,900 | 23,357,896 | |||
| 267,247,127 | |||||
Certified Semi-Annual Report 33
SCHEDULE OF INVESTMENTS, CONTINUED
| Thornburg Investment Income Builder Fund | March 31, 2009 (Unaudited) |
| Shares/ Principal Amount | Value | |||||
TRANSPORTATION — 1.31% | ||||||
TRANSPORTATION INFRASTRUCTURE — 1.31% | ||||||
Hopewell Highway | 15,643,500 | $ | 8,739,498 | |||
Macquarie Airports | 18,334,671 | 23,139,455 | ||||
| 31,878,953 | ||||||
UTILITIES — 5.21% | ||||||
ELECTRIC UTILITIES — 4.92% | ||||||
E. ON AG | 427,100 | 11,865,276 | ||||
Enel S.p.A. | 6,800,000 | 32,637,058 | ||||
Entergy Corp. | 680,000 | 46,301,200 | ||||
Fortum Oyj | 1,492,120 | 28,447,879 | ||||
INDEPENDENT POWER PRODUCERS & ENERGY TRADERS — 0.29% | ||||||
Algonquin Power Income Fund Trust (1) | 3,710,900 | 7,093,329 | ||||
| 126,344,742 | ||||||
TOTAL COMMON STOCK (Cost $1,970,501,396) | 1,338,041,457 | |||||
PREFERRED STOCK — 1.88% | ||||||
BANKS — 1.74% | ||||||
COMMERCIAL BANKS — 1.74% | ||||||
Barclays Bank plc | 200,000 | 2,340,000 | ||||
Fifth Third Bancorp | 400,000 | 16,480,000 | ||||
First Tennessee Bank | 12,000 | 3,232,500 | ||||
Huntington Bancshares | 60,200 | 20,167,000 | ||||
| 42,219,500 | ||||||
DIVERSIFIED FINANCIALS — 0.14% | ||||||
CAPITAL MARKETS — 0.05% | ||||||
Morgan Stanley | 120,000 | 1,170,000 | ||||
DIVERSIFIED FINANCIAL SERVICES — 0.09% | ||||||
Bank of America Corp. | 420,000 | 2,129,400 | ||||
| 3,299,400 | ||||||
TOTAL PREFERRED STOCK (Cost $110,182,796) | 45,518,900 | |||||
EXCHANGE TRADED FUNDS — 1.72% | ||||||
iShares High Yield Corporate Bond ETF | 400,000 | 27,120,000 | ||||
iShares Investment Grade Corporate Bond ETF | 155,000 | 14,588,600 | ||||
TOTAL EXCHANGE TRADED FUNDS (Cost $41,630,118) | 41,708,600 | |||||
ASSET BACKED SECURITIES — 0.44% | ||||||
BANKS — 0.16% | ||||||
COMMERCIAL BANKS — 0.16% | ||||||
Wells Fargo Asset Securities Corp. Series 2005-AR2 Class B1, 4.549%, 2/25/2035 | $ | 10,599,367 | 2,053,162 | |||
Wells Fargo Asset Securities Corp. Series 2005-AR2 Class B1, 4.688%, 3/25/2035 | 9,894,262 | 1,855,589 | ||||
| 3,908,751 | ||||||
34 Certified Semi-Annual Report
SCHEDULE OF INVESTMENTS, CONTINUED
| Thornburg Investment Income Builder Fund | March 31, 2009 (Unaudited) |
| Shares/ Principal Amount | Value | |||||
DIVERSIFIED FINANCIALS — 0.28% | ||||||
CAPITAL MARKETS — 0.11% | ||||||
Bear Stearns ARM Mtg Series 2003-6 Class 2B-1, 4.825%, 8/25/2033 | $ | 1,179,357 | $ | 393,376 | ||
Merrill Lynch Mtg Investors Trust, 4.226%, 8/25/2034 | 7,300,545 | 2,243,362 | ||||
DIVERSIFIED FINANCIAL SERVICES — 0.17% | ||||||
Banc of America Funding Corp. Series 2006-I Class SB1, 4.735%, 12/20/2036 | 3,330,299 | 482,679 | ||||
Banc of America Mtg Securities Series 2005-A Class B1, 4.722%, 2/25/2035 | 5,414,655 | 1,684,555 | ||||
Citigroup Mtg Loan Trust, Inc., 4.908%, 3/25/2034 | 2,269,661 | 729,999 | ||||
Structured Asset Security Corp. Series 2002-27A Class B1, 5.264%, 1/25/2033 | 3,615,154 | 1,147,652 | ||||
| 6,681,623 | ||||||
TOTAL ASSET BACKED SECURITIES (Cost $38,750,380) | 10,590,374 | |||||
CORPORATE BONDS — 30.68% | ||||||
AUTOMOBILES & COMPONENTS — 0.27% | ||||||
AUTOMOBILES — 0.27% | ||||||
American Honda Finance, 7.625%, 10/1/2018 (2) | 7,000,000 | 6,591,032 | ||||
| 6,591,032 | ||||||
BANKS — 1.95% | ||||||
COMMERCIAL BANKS — 1.29% | ||||||
Alfa Diversified, 3.32%, 3/15/2012 (2) | 5,250,000 | 3,979,920 | ||||
Fifth Third Bancorp, 6.25%, 5/1/2013 | 2,750,000 | 2,625,648 | ||||
Huntington Capital III, 6.65%, 5/15/2037 | 11,700,000 | 2,967,167 | ||||
National City Bank, 7.25%, 7/15/2010 | 5,000,000 | 5,092,695 | ||||
National City Preferred Capital Trust I, 12.00%, 12/29/2049 | 3,250,000 | 2,231,060 | ||||
PNC Financial Services Group, Inc., 8.25%, 5/29/2049 | 10,000,000 | 4,895,320 | ||||
PNC Preferred Funding Trust, 8.70%, 12/31/2049 (2) | 4,500,000 | 2,025,045 | ||||
Provident Bank MD, 9.50%, 5/1/2018 | 4,250,000 | 3,965,590 | ||||
Silicon Valley Bank, 6.05%, 6/1/2017 | 1,200,000 | 930,022 | ||||
Webster Capital Trust IV, 7.65%, 6/15/2037 | 3,400,000 | 1,410,891 | ||||
Wells Fargo Capital XIII Preferred Note, 7.70%, 12/29/2049 | 2,500,000 | 1,190,787 | ||||
THRIFTS & MORTGAGE FINANCE — 0.66% | ||||||
Sovereign Bancorp, Inc., 1.457%, 3/23/2010 | 17,500,000 | 15,986,652 | ||||
| 47,300,797 | ||||||
COMMERCIAL & PROFESSIONAL SERVICES — 0.03% | ||||||
COMMERCIAL SERVICES & SUPPLIES — 0.03% | ||||||
Allied Waste North America, Inc., 6.375%, 4/15/2011 | 500,000 | 495,000 | ||||
Waste Management, Inc., 7.375%, 8/1/2010 | 175,000 | 179,038 | ||||
| 674,038 | ||||||
CONSUMER SERVICES — 0.74% | ||||||
HOTELS, RESTAURANTS & LEISURE — 0.74% | ||||||
NPC International, Inc., 9.50%, 5/1/2014 | 16,835,000 | 13,131,300 | ||||
Seneca Nation of Indians Capital Improvements Authority, 6.75%, 12/1/2013 | 5,095,000 | 4,775,289 | ||||
| 17,906,589 | ||||||
DIVERSIFIED FINANCIALS — 2.97% | ||||||
CAPITAL MARKETS — 0.26% | ||||||
Goldman Sachs Group, Inc., 5.625%, 1/15/2017 | 8,000,000 | 6,231,736 | ||||
Certified Semi-Annual Report 35
SCHEDULE OF INVESTMENTS, CONTINUED
| Thornburg Investment Income Builder Fund | March 31, 2009 (Unaudited) |
| Shares/ Principal Amount | Value | |||||
CONSUMER FINANCE — 1.34% | ||||||
American Express Credit Co., 5.875%, 5/2/2013 | $ | 5,000,000 | $ | 4,389,890 | ||
Capital One Financial Corp., 6.15%, 9/1/2016 | 25,500,000 | 16,141,576 | ||||
SLM Corp., 4.50%, 7/26/2010 | 12,800,000 | 9,600,000 | ||||
SLM Corp. LIBOR Floating Rate Note, 1.459%, 1/27/2014 | 5,000,000 | 2,292,270 | ||||
DIVERSIFIED FINANCIAL SERVICES — 1.37% | ||||||
CIT Group, Inc., 5.00%, 2/13/2014 | 9,500,000 | 5,446,113 | ||||
Citigroup, Inc., 5.00%, 9/15/2014 | 16,250,000 | 10,772,141 | ||||
JPMorgan Chase & Co., 7.90%, 4/29/2049 | 15,000,000 | 9,639,600 | ||||
MBNA Corp., 6.125%, 3/1/2013 | 2,000,000 | 1,730,974 | ||||
National Rural Utilities CFC, 10.375%, 11/1/2018 | 5,000,000 | 5,788,540 | ||||
| 72,032,840 | ||||||
ENERGY — 5.14% | ||||||
ENERGY EQUIPMENT & SERVICES — 0.67% | ||||||
Calfrac Holdings, 7.75%, 2/15/2015 (2) | 7,900,000 | 3,752,500 | ||||
Nabors Industries, Inc., 9.25%, 1/15/2019 (2) | 11,000,000 | 10,430,508 | ||||
Seitel, Inc., 9.75%, 2/15/2014 | 1,000,000 | 442,500 | ||||
Weatherford International Ltd., 9.625%, 3/1/2019 | 1,500,000 | 1,551,470 | ||||
OIL, GAS & CONSUMABLE FUELS — 4.47% | ||||||
Chesapeake Energy Corp., 7.00%, 8/15/2014 | 1,000,000 | 880,000 | ||||
DCP Midstream LLC, 9.75%, 3/15/2019 (2) | 5,000,000 | 4,957,025 | ||||
Enbridge Energy Partners LP, 9.875%, 3/1/2019 | 9,750,000 | 10,051,704 | ||||
Enterprise Products Operating LP, 9.75%, 1/31/2014 | 4,750,000 | 5,219,314 | ||||
Enterprise Products Operating LP, 7.034%, 1/15/2068 | 5,900,000 | 3,687,500 | ||||
Gaz Capital SA, 7.343%, 4/11/2013 (2) | 1,000,000 | 876,250 | ||||
Gaz Capital SA, 8.146%, 4/11/2018 (2) | 2,000,000 | 1,640,000 | ||||
GS Caltex Corp., 7.25%, 7/2/2013 (2)(3) | 7,000,000 | 5,936,980 | ||||
Kinder Morgan Energy Partners, 9.00%, 2/1/2019 | 9,750,000 | 10,422,214 | ||||
Murphy Oil Corp., 6.375%, 5/1/2012 | 5,000,000 | 5,040,415 | ||||
NuStar Logistics, 7.65%, 4/15/2018 | 19,000,000 | 15,656,988 | ||||
Oneok Partners, LP, 5.90%, 4/1/2012 | 3,000,000 | 2,937,576 | ||||
Oneok Partners LP, 8.625%, 3/1/2019 | 8,000,000 | 8,072,496 | ||||
Petroleum Development Corp., 12.00%, 2/15/2018 | 15,500,000 | 10,230,000 | ||||
Petroplus Finance Ltd., 6.75%, 5/1/2014 (2) | 4,000,000 | 2,960,000 | ||||
Plains Exploration & Production Co., 7.625%, 6/1/2018 | 1,000,000 | 810,000 | ||||
Southern Union Co., 7.20%, 11/1/2066 | 19,900,000 | 9,950,000 | ||||
Teppco Partners LP, 7.00%, 6/1/2067 | 2,000,000 | 1,144,190 | ||||
Woodside Financial Ltd., 8.125%, 3/1/2014 (2) | 8,000,000 | 7,982,184 | ||||
| 124,631,814 | ||||||
FOOD & STAPLES RETAILING — 0.12% | ||||||
FOOD & STAPLES RETAILING — 0.12% | ||||||
Rite Aid Corp., 9.375%, 12/15/2015 | 9,500,000 | 2,196,875 | ||||
Rite Aid Corp., 8.625%, 3/1/2015 | 3,000,000 | 675,000 | ||||
| 2,871,875 | ||||||
FOOD, BEVERAGE & TOBACCO — 1.05% | ||||||
BEVERAGES — 0.15% | ||||||
Anheuser Busch Cos., Inc., 4.70%, 4/15/2012 | 3,750,000 | 3,681,990 | ||||
36 Certified Semi-Annual Report
SCHEDULE OF INVESTMENTS, CONTINUED
| Thornburg Investment Income Builder Fund | March 31, 2009 (Unaudited) |
| Shares/ Principal Amount | Value | |||||
TOBACCO — 0.90% | ||||||
Altria Group, Inc., 8.50%, 11/10/2013 | $ | 4,000,000 | $ | 4,338,200 | ||
Altria Group, Inc., 9.70%, 11/10/2018 | 10,750,000 | 11,701,375 | ||||
B.A.T. International Finance, plc, 9.50%, 11/15/2018 (2) | 5,000,000 | 5,680,900 | ||||
| 25,402,465 | ||||||
INSURANCE — 2.47% | ||||||
INSURANCE — 2.47% | ||||||
American General Finance Corp., 4.875%, 7/15/2012 | 1,000,000 | 398,818 | ||||
International Lease Finance Corp., 5.125%, 11/1/2010 | 5,000,000 | 3,744,345 | ||||
Liberty Mutual Group, Inc., 5.75%, 3/15/2014 (2) | 1,000,000 | 770,688 | ||||
Metlife Capital Trust, 9.25%, 4/8/2068 (2) | 24,000,000 | 13,440,000 | ||||
Metlife, Inc. Series A, 6.817%, 8/15/2018 | 4,250,000 | 3,648,816 | ||||
Pacific Life Global Funding CPI Floating Rate Note, 1.49%, 2/6/2016 | 2,000,000 | 1,744,660 | ||||
Prudential Holdings, LLC, 8.695%, 12/18/2023 (2) | 4,300,000 | 3,700,279 | ||||
Swiss Re Capital I, LP, 6.854%, 5/29/2049 (2) | 99,600,000 | 30,378,000 | ||||
ZFS Finance USA Trust V, 6.50%, 5/9/2037 (2) | 5,000,000 | 2,050,000 | ||||
| 59,875,606 | ||||||
MATERIALS — 2.43% | ||||||
CONSTRUCTION MATERIALS — 0.63% | ||||||
Ace Hardware Corp., 9.125%, 6/1/2016 (2) | 6,250,000 | 5,125,000 | ||||
C8 Capital Ltd., 6.64%, 12/31/2049 (2) | 2,000,000 | 700,080 | ||||
CRH America, Inc., 8.125%, 7/15/2018 | 12,250,000 | 9,551,570 | ||||
METALS & MINING — 1.48% | ||||||
Bemax Resources, 9.375%, 7/15/2014 (2) | 5,000,000 | 1,350,000 | ||||
FMG Finance Property Ltd., 10.00%, 9/1/2013 (2) | 2,000,000 | 1,700,000 | ||||
Freeport-McMoRan Copper & Gold, 8.375%, 4/1/2017 | 6,965,000 | 6,512,275 | ||||
Freeport-McMoran Corp., 6.125%, 3/15/2034 | 4,500,000 | 2,925,000 | ||||
Freeport-McMoRan Copper & Gold, 8.25%, 4/1/2015 | 8,000,000 | 7,660,000 | ||||
GTL Trade Finance, Inc., 7.25%, 10/20/2017 (2) | 7,000,000 | 5,985,000 | ||||
Mercator Minerals Ltd., 11.50%, 2/16/2012 (3) | 16,700,000 | 9,687,670 | ||||
PAPER & FOREST PRODUCTS — 0.32% | ||||||
International Paper Co., 7.40%, 6/15/2014 | 9,500,000 | 7,836,978 | ||||
| 59,033,573 | ||||||
MEDIA — 1.34% | ||||||
MEDIA — 1.34% | ||||||
AOL Time Warner, Inc., 6.875%, 5/1/2012 | 425,000 | 432,565 | ||||
Comcast Cable Communications, 8.875%, 5/1/2017 | 5,000,000 | 5,421,105 | ||||
DIRECTV Holdings, 6.375%, 6/15/2015 | 5,100,000 | 4,806,750 | ||||
DIRECTV Holdings, 7.625%, 5/15/2016 | 3,000,000 | 2,940,000 | ||||
Time Warner Cable, Inc., 8.75%, 2/14/2019 | 14,000,000 | 14,865,564 | ||||
Time Warner Cable, Inc., 8.25%, 2/14/2014 | 4,000,000 | 4,181,204 | ||||
| 32,647,188 | ||||||
PHARMACEUTICALS, BIOTECHNOLOGY & LIFE SCIENCES — 0.27% | ||||||
BIOTECHNOLOGY — 0.27% | ||||||
Biogen Idec, Inc., 6.00%, 3/1/2013 | 4,000,000 | 4,053,496 | ||||
Tiers Inflation Linked Trust Series Wyeth 2004 21 Trust Certificate CPI Floating Rate Note, 1.941%, 2/1/2014 | 3,000,000 | 2,417,040 | ||||
| 6,470,536 | ||||||
Certified Semi-Annual Report 37
SCHEDULE OF INVESTMENTS, CONTINUED
| Thornburg Investment Income Builder Fund | March 31, 2009 (Unaudited) |
| Shares/ Principal Amount | Value | |||||
REAL ESTATE — 0.30% | ||||||
REAL ESTATE — 0.30% | ||||||
Agile Property Holdings Ltd, 9.00%, 9/22/2013 (2) | $ | 10,000,000 | $ | 7,200,000 | ||
| 7,200,000 | ||||||
RETAILING — 0.27% | ||||||
INTERNET & CATALOG RETAIL — 0.04% | ||||||
Ticketmaster, 10.75%, 8/1/2016 (2) | 1,500,000 | 1,020,000 | ||||
MULTILINE RETAIL — 0.07% | ||||||
Parkson Retail Group, 7.125%, 5/30/2012 | 2,110,000 | 1,767,125 | ||||
SPECIALTY RETAIL — 0.16% | ||||||
Best Buy, Inc., 6.75%, 7/15/2013 | 4,000,000 | 3,805,756 | ||||
| 6,592,881 | ||||||
SEMICONDUCTORS & SEMICONDUCTOR EQUIPMENT — 0.79% | ||||||
SEMICONDUCTORS & SEMICONDUCTOR EQUIPMENT — 0.79% | ||||||
KLA Instruments Corp., 6.90%, 5/1/2018 | 10,000,000 | 7,904,600 | ||||
National Semiconductor Corp., 1.57%, 6/15/2010 | 11,200,000 | 9,814,459 | ||||
National Semiconductor Corp., 6.15%, 6/15/2012 | 2,000,000 | 1,556,156 | ||||
| 19,275,215 | ||||||
SOFTWARE & SERVICES — 0.15% | ||||||
SOFTWARE — 0.15% | ||||||
BMC Software, Inc., 7.25%, 6/1/2018 | 4,000,000 | 3,617,188 | ||||
| 3,617,188 | ||||||
TECHNOLOGY HARDWARE & EQUIPMENT — 0.78% | ||||||
COMMUNICATIONS EQUIPMENT — 0.63% | ||||||
Corning, Inc., 6.05%, 6/15/2015 | 8,000,000 | 7,642,248 | ||||
Motorola, Inc., 6.00%, 11/15/2017 | 10,000,000 | 7,755,100 | ||||
COMPUTERS & PERIPHERALS — 0.15% | ||||||
Jabil Circuit, Inc., 5.875%, 7/15/2010 | 3,695,000 | 3,528,725 | ||||
| 18,926,073 | ||||||
TELECOMMUNICATION SERVICES — 3.18% | ||||||
DIVERSIFIED TELECOMMUNICATION SERVICES — 3.18% | ||||||
Deutsche Telekom International Finance B.V., 8.75%, 6/15/2030 | 26,150,000 | 27,936,228 | ||||
Global Crossing Ltd., 7.484%, 5/9/2012 | 4,500,000 | 2,250,000 | ||||
Level 3 Financing, Inc., 9.25%, 11/1/2014 | 33,600,000 | 23,184,000 | ||||
Level 3 Financing, Inc., 12.25%, 3/15/2013 | 6,000,000 | 4,500,000 | ||||
TCI Communications, Inc., 7.875%, 8/1/2013 | 2,285,000 | 2,313,816 | ||||
Telecom Italia Capital SA, 5.25%, 10/1/2015 | 4,190,000 | 3,532,815 | ||||
Vimpelcom, 8.25%, 5/23/2016 (2) | 4,500,000 | 2,745,000 | ||||
Windstream Corp., 8.125%, 8/1/2013 | 10,800,000 | 10,638,000 | ||||
| 77,099,859 | ||||||
TRANSPORTATION — 0.76% | ||||||
AIR FREIGHT & LOGISTICS — 0.21% | ||||||
FedEx Corp., 5.50%, 8/15/2009 | 5,000,000 | 5,040,235 | ||||
ROAD & RAIL — 0.33% | ||||||
Hertz Corp., 8.875%, 1/1/2014 | 13,205,000 | 8,005,531 | ||||
TRANSPORTATION INFRASTRUCTURE — 0.22% | ||||||
Southern Cross Air Corp., 5.262%, 12/20/2016 | 12,792,600 | 5,337,200 | ||||
| 18,382,966 | ||||||
38 Certified Semi-Annual Report
SCHEDULE OF INVESTMENTS, CONTINUED
| Thornburg Investment Income Builder Fund | March 31, 2009 (Unaudited) |
| Shares/ Principal Amount | Value | |||||
UTILITIES — 5.67% | ||||||
ELECTRIC UTILITIES — 2.39% | ||||||
Alabama Power Capital Trust V, 5.50%, 10/1/2042 | $ | 4,000,000 | $ | 3,117,684 | ||
Aquila, Inc., 7.95%, 2/1/2011 | 3,000,000 | 2,946,507 | ||||
Arizona Public Services Co., 5.50%, 9/1/2035 | 5,000,000 | 3,053,150 | ||||
Arizona Public Services Co., 8.75%, 3/1/2019 | 6,500,000 | 6,526,396 | ||||
Entergy Gulf States Louisiana, LLC, 6.00%, 5/1/2018 | 14,000,000 | 12,724,334 | ||||
Great River Energy, 5.829%, 7/1/2017 (2) | 2,518,781 | 2,599,408 | ||||
Monongahela Power, 7.95%, 12/15/2013 (2) | 2,000,000 | 2,163,514 | ||||
Monongahela Power, 5.70%, 3/15/2017 (2) | 7,000,000 | 6,203,057 | ||||
Texas-New Mexico Power, 9.50%, 4/1/2019 (2) | 19,000,000 | 18,704,208 | ||||
GAS UTILITIES — 0.39% | ||||||
Southwest Gas Corp., 7.625%, 5/15/2012 | 9,465,000 | 9,382,267 | ||||
MULTI-UTILITIES — 2.89% | ||||||
Dominion Resources, Inc., 8.875%, 1/15/2019 | 14,750,000 | 16,698,401 | ||||
Illinois Power Co., 9.75%, 11/15/2018 | 5,000,000 | 5,443,270 | ||||
NiSource Finance Corp., 6.15%, 3/1/2013 | 12,237,000 | 10,687,918 | ||||
NiSource Finance Corp., 6.40%, 3/15/2018 | 20,000,000 | 16,183,140 | ||||
Sempra Energy, 9.80%, 12/1/2019 | 7,750,000 | 8,584,164 | ||||
Sempra Energy, 8.90%, 11/15/2013 | 2,000,000 | 2,173,822 | ||||
Union Electric Co., 6.70%, 2/1/2019 | 2,500,000 | 2,381,300 | ||||
Ville De Montreal, 5.45%, 12/1/2019 | 10,000,000 | 8,037,357 | ||||
| 137,609,897 | ||||||
TOTAL CORPORATE BONDS (Cost $847,012,902) | 744,142,433 | |||||
CONVERTIBLE BONDS — 3.86% | ||||||
DIVERSIFIED FINANCIALS — 0.73% | ||||||
DIVERSIFIED FINANCIAL SERVICES — 0.73% | ||||||
KKR Financial Holdings, LLC, 7.00%, 7/15/2012 | 64,100,000 | 17,707,625 | ||||
| 17,707,625 | ||||||
ENERGY — 0.34% | ||||||
OIL, GAS & CONSUMABLE FUELS — 0.34% | ||||||
Chesapeake Energy Corp., 2.25%, 12/15/2038 | 16,000,000 | 8,240,000 | ||||
| 8,240,000 | ||||||
FOOD & STAPLES RETAILING — 0.05% | ||||||
FOOD & STAPLES RETAILING — 0.05% | ||||||
Rite Aid Corp., 8.50%, 5/15/2015 | 4,250,000 | 1,174,063 | ||||
| 1,174,063 | ||||||
MEDIA — 0.04% | ||||||
MEDIA — 0.04% | ||||||
Central European Media, 3.50%, 3/15/2013 (2) | 2,000,000 | 1,007,500 | ||||
| 1,007,500 | ||||||
REAL ESTATE — 1.82% | ||||||
REAL ESTATE INVESTMENT TRUSTS — 1.82% | ||||||
Extra Space Storage, LP, 3.625%, 4/1/2027 (2) | 24,750,000 | 16,149,375 | ||||
Vornado Realty Trust, 2.85%, 4/1/2027 | 35,800,000 | 26,850,000 | ||||
Washington REIT, 3.875%, 9/15/2026 | 1,470,000 | 1,236,637 | ||||
| 44,236,012 | ||||||
Certified Semi-Annual Report 39
SCHEDULE OF INVESTMENTS, CONTINUED
| Thornburg Investment Income Builder Fund | March 31, 2009 (Unaudited) |
| Shares/ Principal Amount | Value | |||||
TELECOMMUNICATION SERVICES — 0.88% | ||||||
WIRELESS TELECOMMUNICATION SERVICES — 0.88% | ||||||
NII Holdings, 3.125%, 6/15/2012 | $ | 23,300,000 | $ | 16,193,500 | ||
SBA Communications Corp., 1.875%, 5/1/2013 (2) | 6,500,000 | 5,200,000 | ||||
| 21,393,500 | ||||||
TOTAL CONVERTIBLE BONDS (Cost $130,692,763) | 93,758,700 | |||||
MUNICIPAL BONDS— 0.07% | ||||||
Victor New York, 9.20%, 5/1/2014 | 1,735,000 | 1,750,129 | ||||
TOTAL MUNICIPAL BONDS (Cost $1,825,799) | 1,750,129 | |||||
U.S. GOVERNMENT AGENCIES — 0.52% | ||||||
Federal National Mtg. Association Remic Series 2006-B1 Class AB, 6.00%, 6/25/2016 | 12,414,360 | 12,691,609 | ||||
TOTAL U.S. GOVERNMENT AGENCIES (Cost $12,373,152) | 12,691,609 | |||||
FOREIGN BONDS — 0.42% | ||||||
ENERGY — 0.21% | ||||||
OIL, GAS & CONSUMABLE FUELS — 0.21% | ||||||
OAO Gazprom, 7.25%, 2/22/2010 (RUB) | 195,000,000 | 4,999,366 | ||||
| 4,999,366 | ||||||
MEDIA — 0.01% | ||||||
MEDIA — 0.01% | ||||||
Independent News & Media plc, 5.75%, 5/17/2009 (EUR) | 600,000 | 318,864 | ||||
| 318,864 | ||||||
MISCELLANEOUS — 0.20% | ||||||
MISCELLANEOUS — 0.20% | ||||||
Republic of Brazil, 12.50%, 1/5/2016 (BRL) | 10,750,000 | 4,865,826 | ||||
| 4,865,826 | ||||||
TOTAL FOREIGN BONDS (Cost $14,863,608) | 10,184,056 | |||||
YANKEE BONDS — 2.41% | ||||||
BANKS — 0.03% | ||||||
COMMERCIAL BANKS — 0.03% | ||||||
Banco Industrial e Commercial S.A., 7.00%, 4/23/2010 | 500,000 | 450,000 | ||||
Landsbanki Islands HF, 7.431%, 12/31/2049 (2)(4)+ | 5,000,000 | 500 | ||||
Shinhan Bank, 6.819%, 9/20/2036 | 900,000 | 439,527 | ||||
| 890,027 | ||||||
DIVERSIFIED FINANCIALS — 0.19% | ||||||
DIVERSIFIED FINANCIAL SERVICES — 0.19% | ||||||
Export-Import Bank of Korea, 8.125%, 1/21/2014 | 2,750,000 | 2,842,480 | ||||
Korea Development Bank, 5.30%, 1/17/2013 | 800,000 | 742,083 | ||||
Korea Development Bank, 1.565%, 4/3/2010 | 1,000,000 | 972,136 | ||||
| 4,556,699 | ||||||
40 Certified Semi-Annual Report
SCHEDULE OF INVESTMENTS, CONTINUED
| Thornburg Investment Income Builder Fund | March 31, 2009 (Unaudited) |
| Shares/ Principal Amount | Value | |||||
ENERGY — 0.32% | ||||||
OIL, GAS & CONSUMABLE FUELS — 0.32% | ||||||
Griffin Coal Mining Ltd., 9.50%, 12/1/2016 (2) | $ | 22,000,000 | $ | 7,755,000 | ||
| 7,755,000 | ||||||
MATERIALS — 0.18% | ||||||
METALS & MINING — 0.18% | ||||||
Vedanta Resources, plc, 6.625%, 2/22/2010 | 4,500,000 | 4,342,500 | ||||
| 4,342,500 | ||||||
TELECOMMUNICATION SERVICES — 0.13% | ||||||
DIVERSIFIED TELECOMMUNICATION SERVICES — 0.13% | ||||||
GC Impsat Holdings I plc, 9.875%, 2/15/2017 (2) | 4,750,000 | 3,182,500 | ||||
| 3,182,500 | ||||||
UTILITIES — 1.56% | ||||||
ELECTRIC UTILITIES — 1.56% | ||||||
Enel Finance International S.A., 6.25%, 9/15/2017 (2) | 38,000,000 | 34,432,864 | ||||
Taqa Abu Dhabi National Energy Co., 7.25%, 8/1/2018 (2) | 3,500,000 | 3,332,255 | ||||
| 37,765,119 | ||||||
TOTAL YANKEE BONDS (Cost $75,975,901) | 58,491,845 | |||||
OTHER SECURITIES — 1.62% | ||||||
LOAN PARTICIPATIONS — 1.62% | ||||||
Charter Communications, Inc., 3.18%, 3/6/2014 | 5,332,300 | 4,317,670 | ||||
Charter Communications, Inc., 3.36%, 3/6/2014 | 891,300 | 721,704 | ||||
Charter Communications, Inc., 3.23%, 3/6/2014 | 1,736,098 | 1,405,753 | ||||
Charter Communications, Inc., 3.36%, 1/28/2014 | 20,151 | 16,317 | ||||
Crown Castle Operating Co., 5.376%, 3/6/2014 | 2,992,386 | 2,652,002 | ||||
Fairpoint Communications, Inc. Term Loan B, 5.75%, 3/8/2015 | 4,243,902 | 1,892,059 | ||||
Fairpoint Communications, Inc. Term Loan B, 5.75%, 3/9/2015 | 36,585 | 16,311 | ||||
Fairpoint Communications, Inc. Term Loan B, 5.75%, 3/31/2015 | 336,585 | 150,060 | ||||
Fairpoint Communications, Inc. Term Loan B, 5.75%, 3/31/2015 | 58,537 | 26,097 | ||||
Fairpoint Communications, Inc. Term Loan B, 5.75%, 3/8/2015 | 4,024,390 | 1,794,194 | ||||
Fairpoint Communications, Inc. Term Loan B, 5.75%, 3/8/2015 | 300,000 | 133,749 | ||||
Global Crossing Ltd., 5.00%, 5/15/2011 | 5,500,000 | 2,750,000 | ||||
Mylan Laboratories, Inc., 4.50%, 10/2/2014 | 7,824,726 | 7,243,740 | ||||
Mylan Laboratories, Inc., 3.75%, 10/2/2014 | 633,803 | 586,743 | ||||
Mylan Laboratories, Inc., 3.75%, 10/2/2014 | 1,341,471 | 1,241,867 | ||||
Texas Comp Elec. Holdings, LLC, 4.033%, 10/10/2014 | 7,878,788 | 5,180,303 | ||||
Texas Comp Elec. Holdings, LLC, 4.033%, 10/10/2014 | 13,787,879 | 9,017,686 | ||||
Texas Comp Elec. Holdings, LLC, 3.979%, 10/31/2014 | 70,707 | 46,244 | ||||
Texas Comp Elec. Holdings, LLC, 3.979%, 10/10/2014 | 101,010 | 66,414 | ||||
Texas Comp Elec. holdings, LLC, 4.451%, 10/31/2014 | 106,061 | 69,367 | ||||
| 39,328,280 | ||||||
TOTAL OTHER SECURITIES (Cost $45,364,513) | 39,328,280 | |||||
Certified Semi-Annual Report 41
SCHEDULE OF INVESTMENTS, CONTINUED
| Thornburg Investment Income Builder Fund | March 31, 2009 (Unaudited) |
| Shares/ Principal Amount | Value | |||||
SHORT TERM INVESTMENTS — 0.31% | ||||||
California State, put 4/7/2009 (LOC: Bank of America) (weekly demand notes), 0.30%, 5/1/2040 | $ | 2,000,000 | $ | 2,000,000 | ||
Intesa Funding, LLC, 0.25%, 4/1/2009 | 5,500,000 | 5,500,000 | ||||
TOTAL SHORT TERM INVESTMENTS (Cost $7,500,000) | 7,500,000 | |||||
TOTAL INVESTMENTS — 99.09% (Cost $3,296,673,328) | $ | 2,403,706,381 | ||||
OTHER ASSETS LESS LIABILITIES — 0.91% | 22,151,866 | |||||
NET ASSETS — 100.00% | $ | 2,425,858,247 | ||||
Footnote Legend
| + | Non-income producing |
| (1) | Investment in Affiliates |
Holdings of voting securities of each portfolio company which is considered “affiliated” to the Fund under the Investment Company Act of 1940 because the Fund’s holding represented 5% or more of the company’s voting securities during the period, are shown below:
Issuer | Shares at Sept 30, 2008 | Gross Additions | Gross Reductions | Shares at March 31, 2009 | Market Value March 31, 2009 | Dividend Income | ||||||||
Algonquin Power Income Fund Trust | 3,710,900 | — | — | 3,710,900 | * | * | ||||||||
Chimera Investment Corp. | — | 9,588,800 | — | 9,588,800 | $ | 32,218,368 | $ | 383,552 | ||||||
KKR Financial Holdings, LLC | 7,400,000 | 100,000 | — | 7,500,000 | 6,675,000 | — | ||||||||
| $ | 38,893,368 | $ | 383,552 | |||||||||||
| * | No longer a non-controlled affiliated issuer at March 31, 2009. |
Total non-controlled affiliated issuers – 1.60% of net assets.
| (2) | Securities exempt from registration under Rule 144A of the Securities Act of 1933, as amended. These securities may only be resold in the ordinary course of business in transactions exempt from registration, normally to qualified institutional buyers. As of March 31, 2009, the aggregate value of these securities in the Fund’s portfolio was $233,706,572, representing 9.63% of the Fund’s net assets. |
| (3) | Security currently fair valued by the valuation and pricing committee using procedures approved by the Trustees. |
| (4) | Bond in default. |
Portfolio Abbreviations
To simplify the listings of securities, abbreviations are used per the table below:
ARM | Adjustable Rate Mortgage | |
BRL | Denominated in Brazilian Dollars | |
CPI | Consumer Price Index | |
EUR | Denominated in Euro Dollars | |
LOC | Letter of Credit | |
Mtg | Mortgage | |
REIT | Real Estate Investment Trust | |
REMIC | Real Estate Mortgage Investment Conduit | |
RUB | Denominated in Russian Rubles | |
SBA | Small Business Administration | |
SPA | Stand-by Purchase Agreement |
See notes to financial statements.
42 Certified Semi-Annual Report
| Thornburg Investment Income Builder Fund | March 31, 2009 (Unaudited) |
As a shareholder of the Fund, you incur two types of costs:
(1) transaction costs, including
(a) sales charges (loads) on purchase payments for Class A shares;
(b) a deferred sales charge on redemptions of any part or all of a purchase of $1 million of Class A shares within 12 months of purchase;
(c) a deferred sales charge on redemptions of Class C shares within 12 months of purchase;
(d) a 30-day redemption fee on Class A and Class I shares;
(2) ongoing costs, including management fees; distribution and/or service (12b-1) fees; and other Fund expenses.
This example is intended to help you understand your ongoing costs (in dollars) of investing in the Fund and to compare these costs with the ongoing costs of investing in other mutual funds.
The example is based on an investment of $1,000 invested on September 30, 2008 and held until March 31, 2009.
| Beginning Account Value 9/30/08 | Ending Account Value 3/31/09 | Expenses Paid During Period† 9/30/08–3/31/09 | |||||||
Class A Shares | |||||||||
Actual | $ | 1,000.00 | $ | 778.40 | $ | 5.89 | |||
Hypothetical* | $ | 1,000.00 | $ | 1,018.30 | $ | 6.69 | |||
Class C Shares | |||||||||
Actual | $ | 1,000.00 | $ | 775.80 | $ | 8.40 | |||
Hypothetical* | $ | 1,000.00 | $ | 1,015.47 | $ | 9.53 | |||
Class I Shares | |||||||||
Actual | $ | 1,000.00 | $ | 780.20 | $ | 4.27 | |||
Hypothetical* | $ | 1,000.00 | $ | 1,020.13 | $ | 4.85 | |||
Class R3 Shares | |||||||||
Actual | $ | 1,000.00 | $ | 778.20 | $ | 6.65 | |||
Hypothetical* | $ | 1,000.00 | $ | 1,017.45 | $ | 7.54 | |||
Class R4 Shares | |||||||||
Actual | $ | 1,000.00 | $ | 778.10 | $ | 6.21 | |||
Hypothetical* | $ | 1,000.00 | $ | 1,017.95 | $ | 7.05 | |||
Class R5 Shares | |||||||||
Actual | $ | 1,000.00 | $ | 779.00 | $ | 4.39 | |||
Hypothetical* | $ | 1,000.00 | $ | 1,020.00 | $ | 4.98 | |||
| † | Expenses are equal to the annualized expense ratio for each class (A: 1.33%; C: 1.90%; I: 0.96%; R3: 1.50%; R4: 1.40%; and R5: 0.99%) multiplied by the average account value over the period, multiplied by 182/365 to reflect the one-half year period. |
| * | Hypothetical assumes a rate of return of 5% per year before expenses. |
Actual Expenses
For each class of shares, the first line of the table at right provides information about actual account values and actual expenses. You may use the information in this line, together with the amount you invested, to estimate the expenses that you paid over the period. Simply divide your account value by $1,000 (for example, an $8,600 account value divided by $1,000 = 8.6), then multiply the result by the number in the first line for your class of shares under the heading entitled “Expenses Paid During Period” to estimate the expenses you paid on your account during this period.
Hypothetical Example for Comparison Purposes
For each class of shares, the second line of the table at right provides information about hypothetical account values and hypothetical expenses based on the Fund’s actual expense ratio and an assumed rate of return of 5% per year before expenses, which is not the Fund’s actual return. The hypothetical account values and expenses may not be used to estimate the actual ending account balance or expenses you paid for the period. You may use this information to compare the ongoing costs of investing in the Fund and other funds. To do so, compare this 5% hypothetical example with the 5% hypothetical examples that appear in the shareholder reports of the other funds.
Please note that the expenses shown in the table are meant to highlight your ongoing costs only and do not reflect any transactional costs, such as sales charges (loads), redemption fees, or exchange fees. Therefore, the second line of the table for each class of shares is useful in comparing ongoing costs only, and will not help you determine the relative total costs of owning different funds. In addition, if these transactional costs were included, your costs would have been higher.
Certified Semi-Annual Report 43
| Thornburg Investment Income Builder Fund | March 31, 2009 (Unaudited) |
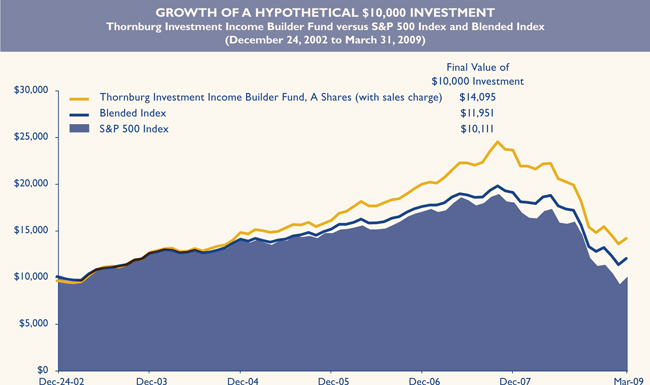
AVERAGE ANNUAL TOTAL RETURNS
For periods ended March 31, 2009 (with sales charge)
| 1 Yr | 5 Yr | Since Inception | |||||||
A Shares (Incep: 12/24/02) | -37.36 | % | 0.64 | % | 5.64 | % | |||
C Shares (Incep: 12/24/02) | -35.44 | % | 1.03 | % | 5.88 | % | |||
I Shares (Incep: 11/3/03) | -34.10 | % | 2.00 | % | 3.66 | % | |||
R3 Shares (Incep: 2/1/05) | -34.44 | % | — | -1.12 | % | ||||
R4 Shares (Incep: 2/1/08) | -34.40 | % | — | -31.92 | % | ||||
R5 Shares (Incep: 2/1/07) | -34.22 | % | — | -15.02 | % | ||||
Blended Index (Since: 12/24/02) | -32.96 | % | -1.40 | % | 2.89 | % | |||
S&P 500 Index (Since: 12/24/02) | -38.09 | % | -4.76 | % | 0.18 | % |
Performance data reflects past performance, which is no guarantee of future results. The performance data and graph do not reflect the deduction of taxes that a shareholder would pay on distributions or the redemption of Fund shares.
Returns reflect the reinvestment of dividends and capital gains as well as applicable sales charges. Class A shares are sold with a maximum sales charge of 4.50%. Class C shares are subject to a 1% contingent deferred sales charge (CDSC) for the first year only. There is no up-front sales charge for Class I, R3, R4, or R5 shares. Class A and I shares are subject to a 1% 30-day redemption fee.
The Blended Index is comprised of 25% Barclays Capital Aggregate Bond Index and 75% MSCI World Index. The Barclays Capital Aggregate Bond Index is composed of approximately 6,000 publicly traded bonds including U.S. government, mortgage-backed, corporate and Yankee bonds with an average maturity of approximately 10 years. The index is weighted by the market value of the bonds included in the index. The Morgan Stanley Capital International (MSCI) World Index is an unmanaged market-weighted index that consists of equity securities traded in 23 of the world’s most developed countries. The index is calculated with net dividends reinvested, in U.S. dollars. The S&P 500 Index, an unmanaged broad measure of the U.S. stock market, does not reflect sales charges or expenses. Investors cannot invest directly in an index.
44 Certified Semi-Annual Report
| Thornburg Investment Income Builder Fund | March 31, 2009 (Unaudited) |
PORTFOLIO PROXY VOTING
Policies and Procedures:
The Trust has delegated to Thornburg Investment Management, Inc. (the “Advisor”) voting decisions respecting proxies for the Fund’s voting securities. The Advisor makes voting decisions in accordance with its Proxy Voting Policy and Procedures. A description of the Policy and Procedures is available (i) without charge, upon request, by calling the Advisor toll-free at 1-800-847-0200, (ii) on the Thornburg web site at www.thornburg.com, and (iii) on the Securities and Exchange Commission’s web site at www.sec.gov.
Information regarding how proxies were voted is available on or before August 31 of each year for the twelve months ending the preceding June 30. This information is available (i) without charge, upon request by calling the Advisor toll-free at 1-800-847-0200, (ii) on the Thornburg web site at www.thornburg.com, and (iii) on the Securities and Exchange Commission’s web site at www.sec.gov.
AVAILABILITY OF QUARTERLY
PORTFOLIO SCHEDULE
The Fund files with the Securities and Exchange Commission schedules of its portfolio holdings on Form N-Q for the first and third quarters of each fiscal year. The Fund’s Forms N-Q are available on the Commission’s web site at www.sec.gov, or may be reviewed and copied at the Commission’s Public Reference Room in Washington, D.C. Information on the operation of the Public Reference Room may be obtained by calling 1-800-SEC-0330. The Fund also makes this information available on its web site at www.thornburg.com/download or upon request by calling 1-800-847-0200.
Certified Semi-Annual Report 45
Trustees’ Statement to Shareholders
Not part of the Certified Semi-Annual Report
February 8, 2005, as readopted September 15, 2008
The Trustees are concerned that ongoing commentaries and opinions reported in the media may confuse investors in general as to the supervisory duties of trustees of mutual funds and, in particular, leave Thornburg Investment Trust shareholders uncertain regarding how we discharge our responsibilities in supervising the Funds’ investment advisor and in reviewing the advisor’s contract for renewal. We decided to spell out clearly three principal guidelines that we follow in supervising the Trust’s investment advisor on your behalf.
We begin with the premise that each shareholder selected his or her Fund because its investments are managed by the investment advisor identified in the prospectus and in accordance with the objective and policies described in the prospectus. We realize, as each of you do, that if you believe that your Fund’s stated objective and policies no longer serve your personal investment goals, you can sell your shares and leave the Fund.
Therefore, we believe that our primary supervisory task – our principal obligation to you – is to assess the nature and quality of the advisor’s services, and to confirm that the advisor actively and competently pursues the Fund’s objective, in accordance with the policies set out in the prospectus. To do this, we meet regularly with management to review your Fund’s portfolio and to discuss the advisor’s specific actions and judgments in pursuing the Fund’s objective. We do not substitute our own judgment for the advisor’s decisions in selecting investments; the advisor is paid to exercise its informed judgment on investment decisions, and we seek to confirm, in reviewing the advisor’s performance, that the advisor is doing just that.
Second, while we are conscious of costs and the effect that costs have on shareholders’ returns, we do not seek the lowest fees or expense ratio as our sole or primary objective. We try to make sure that your Fund’s fees and costs are reasonable in relationship to the services rendered and that they are generally in line with those charged by other expert investment advisors, consistent with our belief that the Fund’s investors searched for and expect that expertise and attention and have decided to pay a reasonable price for it. We do not put the management contract “out to bid” as a matter of course, and we would not do so unless we had concluded that the advisor materially had failed to pursue the Fund’s objectives in accordance with its policies, or for other equally important reasons. We believe that any other approach would be inconsistent with your interests and contrary to your expectations when you bought shares of the Fund in the first place.
Finally, because we believe that most Thornburg Fund shareholders have invested with a long-term perspective, we try not to focus too much on the fashions of the moment and on short-term performance. The market will not favor any specific investment objective or set of policies at all times and under all economic circumstances. A fund will experience periods of both high and low returns relative to other funds and other investments. Even if one of our Funds is not favored by the market at a particular time, we believe that the advisor is nonetheless obliged to remain true to the Fund’s objective and policies, and we watch to see that it does so.
46 This page is not part of the Semi-Annual Report.
This page intentionally left blank.
This page is not part of the Semi-Annual Report. 47
This page intentionally left blank.
48 This page is not part of the Semi-Annual Report.
Planning Options
Retirement and Education Accounts
Thornburg Investment Management offers retirement and education savings accounts that can help you meet a variety of planning challenges. For account applications or further information on any of the accounts below, please call 1-800-847-0200 or go to www.thornburg.com/ira. Your financial advisor can help you determine which plan is right for you.
Individual Retirement Accounts
Individual Retirement Accounts (IRAs) provide a tax-advantaged means to save money for the future. For a detailed outline of the difference between retirement accounts, see www.thornburg.com/ira. Rollovers are available. Call 1-800-847-0200 for more information.
Traditional IRAs – Contributions to Traditional IRAs are tax deductible for eligible individuals, and withdrawals are taxed as additional ordinary income. You may contribute to an IRA if you receive compensation and are under 70 1/2, even if you are covered by an employer retirement plan. Deductible contributions are subject to certain qualifications. Please consult your tax advisor.
Roth IRAs – Under a Roth IRA, there is no tax deduction for contributions, but there is no income tax on qualified withdrawals. For a more detailed comparison of Traditional and Roth IRAs, please see our web site at www.thornburg.com/ira.
SEP IRAs – Simplified Employee Pension (SEP) IRAs are established by employers. The employer is allowed a tax deduction for contributions made to the SEP Plan and makes contributions to each eligible employee’s SEP IRA on a discretionary basis.
SIMPLE IRAs – Savings Incentive Match Plan for Employees of Small Employers (SIMPLE) is designed to give small business owners a simplified method to establish and contribute to a retirement plan for employees. The employer is allowed a tax deduction for contributions and makes either matching or non-elective contributions to each eligible employee’s SIMPLE IRA. Employees may make salary deferral contributions.
Coverdell Education Savings Account
These savings accounts are designed to provide a way to save money for higher education expenses. In an Education Savings Account, earnings and interest grow tax-free, and qualified withdrawals used to pay for eligible higher-education expenses are tax- and penalty-free.
Funds Available
The following funds are available in the accounts listed above:
| • | Thornburg International Value Fund |
| • | Thornburg Value Fund |
| • | Thornburg Core Growth Fund |
| • | Thornburg Investment Income Builder Fund |
| • | Thornburg Global Opportunities Fund |
| • | Thornburg International Growth Fund |
| • | Thornburg Limited Term U.S. Government Fund |
| • | Thornburg Limited Term Income Fund |
| • | Thornburg Strategic Income Fund |
This page is not part of the Semi-Annual Report. 49

50 This page is not part of the Semi-Annual Report.
Thornburg Equity Funds
Thornburg’s equity research uses a fundamental and comprehensive analytical approach. Thornburg equity funds focus on a limited number of securities so that each holding can impact performance. The equity team searches for firms believed to have a promising future and seeks to buy shares of those companies at a discount to their intrinsic value.
| • | Thornburg Value Fund |
| • | Thornburg International Value Fund |
| • | Thornburg Core Growth Fund |
| • | Thornburg Investment Income Builder Fund |
| • | Thornburg Global Opportunities Fund |
| • | Thornburg International Growth Fund |
Thornburg Bond Funds
Thornburg Investment Management applies a disciplined philosophy to fixed-income management. Since the launch of our first fixed-income fund 25 years ago, we have been conducting fundamental, bottom-up research in an effort to identify bonds which we believe provide the best return for a given level of risk. We are very organic in our approach, avoiding leverage or complex strategies which could backfire in periods of market uncertainty.
| • | Thornburg Limited Term Municipal Fund |
| • | Thornburg Intermediate Municipal Fund |
| • | Thornburg California Limited Term Municipal Fund |
| • | Thornburg New Mexico Intermediate Municipal Fund |
| • | Thornburg New York Intermediate Municipal Fund |
| • | Thornburg Strategic Municipal Income Fund |
| • | Thornburg Limited Term U.S. Government Fund |
| • | Thornburg Limited Term Income Fund |
| • | Thornburg Strategic Income Fund |
Before investing, carefully consider the Fund’s investment goals, risks, charges, and expenses. For a prospectus containing this and other information, contact your financial advisor or visit thornburg.com. Read it carefully before investing.
For additional information, please visit www.thornburg.com
Thornburg Investment Management, Inc. 2300 North Ridgetop Road, Santa Fe, NM 87506
This page is not part of the Semi-Annual Report. 51

| This Semi-Annual Report is submitted for the general information of shareholders of the Fund. It is not authorized for distribution to prospective investors in the Fund unless preceded or accompanied by an effective prospectus. | ||
 | Investment Advisor: Thornburg Investment Management® 800.847.0200
Distributor: Thornburg Securities Corporation® 800.847.0200
TH1075 | |
Waste not,
Wait not |
| |
Get instant access to your shareholder reports.
By switching from your postal mailbox to your email inbox, you reduce paper clutter, improve record keeping access, and help conserve our natural resources.
Go to www.thornburg.com/edelivery and sign up to receive your shareholder reports, prospectuses, and proxy statements electronically.
You invest in the future, without spending a dime.
| ||


| 2 This page is not part of the Semi-Annual Report. |
Important Information
The information presented on the following pages was current as of March 31, 2009. The managers’ views, portfolio holdings, and sector and country diversification are provided for the general information of the Fund’s shareholders; they are historical and subject to change. This material should not be deemed a recommendation to buy or sell any of the securities mentioned.
Investments in the Fund carry risks including possible loss of principal. Funds invested in a limited number of holdings may expose an investor to greater volatility. Investing outside the United States involves additional risks, such as currency fluctuations. Risks may be associated with investments in emerging markets including illiquidity and volatility. Additionally, the Fund invests a portion of the assets in small capitalization companies, which may increase the risk of greater price fluctuations. Please see the Fund’s Prospectus for a discussion of the risks associated with an investment in the Fund. Investments in the Fund are not deposits or obligations of, or guaranteed or endorsed by, any bank, the Federal Deposit Insurance Corporation, the Federal Reserve Board or any government agency. There is no guarantee that the Fund will meet its investment objectives.
Performance data given at net asset value (NAV) does not take into account the applicable sales charges. If the sales charges had been included, the performance would have been lower.
Class I, R3, R4, and R5 shares may not be available to all investors. Minimum investments for Class I shares may be higher than those for other classes.
From time to time, the Fund may invest in shares of companies through initial public offerings (IPOs). IPOs have the potential to produce substantial gains the Fund. There is no assurance that the Fund will have continued access to profitable IPOs and as the Fund’s assets grow, the impact of IPO investment may decline. Therefore, investors should not rely on these past gains as an indication of future performance.
Share Class | NASDAQ Symbol | Cusip | ||
Class A | THOAX | 885-215-343 | ||
Class C | THOCX | 885-215-335 | ||
Class I | THOIX | 885-215-327 | ||
Class R3 | THORX | 885-215-145 | ||
Class R4 | THOVX | 885-215-137 | ||
Class R5 | THOFX | 885-215-129 |
Glossary
Morgan Stanley Capital International (MSCI) All Country (AC) World Index – The Morgan Stanley Capital International All Country World Index (MSCI AC World Index) is a market capitalization weighted index composed of over 2,000 companies, and is representative of the market structure of 48 developed and emerging market countries in North and South America, Europe, Africa, and the Pacific Rim. The index is calculated with net dividends reinvested in U.S. dollars.
Unless otherwise noted, index returns reflect the reinvestment of income dividends and capital gains, if any, but do not reflect fees, brokerage commissions or other expenses of investing. Investors may not make direct investments into any index. The performance of any index is not indicative of the performance of any particular investment.
Earnings Per Share (EPS) – The total earnings divided by the number of shares outstanding.
EBITDA – Earnings Before Interest, Taxes, Depreciation and Amortization (EBITDA), an indicator of a company’s financial performance.
Median Market Capitalization – Market capitalization (market cap) is the total value of a company’s stock, calculated by multiplying the number of outstanding common shares by the current share price. The company whose market cap is in the middle of the portfolio is the median market cap. Half the companies in the portfolio have values greater than the median, and half have values that are less.
Price to Book Value (P/B) – A ratio used to compare a stock’s market value to its book value. It is calculated by dividing the current closing price of the stock by the latest quarter’s book value (book value is simply assets minus liabilities).
Price to Cash Flow Ratio – A measure of the market’s expectations of a firm’s future financial health. It is calculated by dividing the price per share by cash flow per share.
Price to Earnings Ratio (P/E) – A valuation ratio equaling a company’s market value per share divided by earnings per share.
U.S. Treasury Securities – U.S. Treasury securities, such as bills, notes and bonds, are negotiable debt obligations of the U.S. government. These debt obligations are backed by the “full faith and credit” of the government and issued at various schedules and maturities. Income from Treasury securities is exempt from state and local, but not federal income taxes.
Gross Domestic Product (GDP) – The market value of goods and services produced by labor and property in the United States, regardless of nationality.
| This page is not part of the Semi-Annual Report. 3 |
Thornburg Global Opportunities Fund
CO-PORTFOLIO MANAGERS

W. Vinson Walden,CFA, and Brian McMahon
KEY PORTFOLIO ATTRIBUTES
As of 3/31/09
Portfolio P/E Trailing 12-months* | 8.7x | ||
Portfolio Price to Cash Flow* | 5.5 | ||
Portfolio Price to Book Value* | 1.6 | ||
Median Market Cap* | $ | 4.4 B | |
Number of Companies | 33 |
| * | Source: FactSet |
IMPORTANT PERFORMANCE
INFORMATION
Performance data shown represents past performance and is no guarantee of future results. Investment return and principal value will fluctuate so shares, when redeemed, may be worth more or less than their original cost. Current performance may be lower or higher than quoted. For performance current to the most recent month end, visit thornburg.com.
The maximum sales charge for Class A shares is 4.50%. Class A shares are subject to a 1% 30-day redemption fee. The total annual fund operating expense of Class A shares is 1.67%, as disclosed in the most recent Prospectus. Thornburg Investment Management intends to waive fees and reimburse expenses so that actual Class A expenses do not exceed 1.63%. The fee waivers and expense reimbursements are voluntary and may be terminated at any time. Without these waivers, returns would be lower.
Investment fads come and go, and the landscape is littered with funds which generated an avalanche of interest for a brief period of time, then fell by the wayside when the market turned its attention to the next hot trend. At Thornburg Investment Management, we believe that the soundest investments over the long-term are conceptually simple and grounded in common sense. It is with this mindset that we created the Thornburg Global Opportunities Fund.
The Fund was launched in 2006 to capitalize on what Thornburg Investment Management is known for – solid, bottom-up research based on a team-oriented, flexible approach to uncovering value. The goal in creating the Fund was to leverage the research of the entire Thornburg equity investment team, while employing a broad mandate to pursue companies across the globe. Once identified, a focused number of stocks are combined into a compact, yet diversified portfolio.
The philosophy of Thornburg Global Opportunities Fund is straightforward – to purchase promising companies that the team feels are trading at a discount to their intrinsic value. As the balance sheets of global companies become more complex, it is getting increasingly difficult to see how some companies actually make money. These companies are not the ones pursued in the Global Opportunities Fund.
AVERAGE ANNUAL TOTAL RETURNS
FOR PERIODS ENDED 3/31/09
| 1 Yr | Since Inception | |||||
A Shares (Incep: 7/28/06) | ||||||
Without Sales Charge | -50.37 | % | -10.79 | % | ||
With Sales Charge | -52.60 | % | -12.31 | % | ||
MSCI AC World Index (Since: 7/28/06) | -43.10 | % | -14.78 | % |
| 4 This page is not part of the Semi-Annual Report. |
Rather, we believe that straightforward business models executed by capable management teams make the best investments.
The Thornburg Global Opportunities Fund is unique in the marketplace. Currently, assets in the global stock fund universe are concentrated in a few very large funds. Based on size alone, these funds must focus on the largest capitalization stocks, or alternatively, spread their assets across many names. In fact, about 84% of category assets are concentrated in 10 funds, and the average world stock fund holds approximately 180 stocks (as of 3/31/09).
Thornburg Global Opportunities Fund is different, in that it will typically be focused in 30–50 stocks which the management team feels have the best combination of promise and discount. Each stock is analyzed on its own merits, and the team then combines them into a portfolio of stocks, with attractive long-term prospects. The result is a Fund which looks quite unlike either the MSCI AC World Index or its peers.
Thornburg Global Opportunities Fund is grounded in common sense principles, which we think resonate well with investors and make sense over the long-term.
COMPANIES CONTRIBUTING AND DETRACTING
FOR SIX MONTHS ENDED 3/31/09
Top Contributors | Top Detractors | |
| Crown Castle International Corp. | KKR Financial Holdings LLC | |
| Fifth Third Bancorp | Swiss Re | |
| Vornado Realty Trust | Eclipsys Corp. | |
| Huntington Bancshares, Inc. Pfd. | Precision Drilling Trust | |
| Redecard SA | Level 3 Communications, Inc. | |
| Source: FactSet |
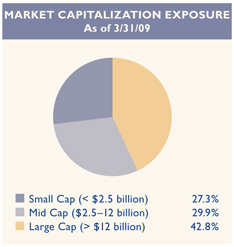
TOP TEN EQUITY HOLDINGS
As of 3/31/09
Liechtensteinische Landesbank AG | 5.7 | % | |
Crown Castle International Corp. | 4.7 | % | |
Dell Inc. | 4.5 | % | |
Teva Pharmaceutical Industries Ltd. | 4.4 | % | |
Global Crossing Ltd. | 4.3 | % | |
Willis Group Holdings Ltd. | 3.7 | % | |
Google, Inc. | 3.6 | % | |
China Mobile Ltd. | 3.5 | % | |
OPAP SA | 3.5 | % | |
Bachem Holding AG | 3.5 | % |
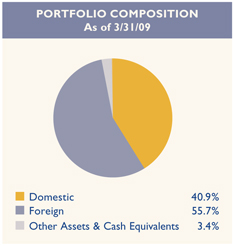
| This page is not part of the Semi-Annual Report. 5 |

Thornburg Global Opportunities Fund
March 31, 2009
Table of Contents
| 7 | ||
| 12 | ||
| 14 | ||
| 16 | ||
| 17 | ||
| 23 | ||
| 29 | ||
| 33 | ||
| 34 | ||
| 35 | ||
This report is certified under the Sarbanes-Oxley Act of 2002, which requires that public companies, including mutual funds, affirm that the information provided in their annual and semiannual shareholder reports fully and fairly represents their financial position.
| 6 Certified Semi-Annual Report |
April 27, 2009
Dear Fellow Shareholder:
For the six-month period ended March 31, 2009, the Thornburg Global Opportunities Fund produced a total return of negative 37.28% (Class A shares at NAV), compared to a total return of negative 30.67% for the MSCI AC World Index. It is impossible to be satisfied with this outcome, and we are not satisfied. Thornburg Global Opportunities Fund commenced operations on July 28, 2006 with a net asset value per share of $11.94. From its inception date through March 31, 2009, your Fund produced an average annual total return of negative 10.79% (Class A shares at NAV), compared to negative 14.78% for the MSCI AC World Index.
We advise caution in placing too much weight on results from six- or twelve-month periods. Prices can change quickly in any environment, particularly the current one. Indeed, both the MSCI Index and Thornburg Global Opportunities Fund have had significant price recoveries in recent weeks.
The six-month period under review includes the first months following the failure of Lehman Brothers and near failure of AIG, two long established financial giants that faltered in the early autumn of 2008. Soon thereafter, significant portions of the investment portfolios of each of these, and many other financial entities, began to be liquidated by lenders or their managements into nervous markets with few buyers. Many other investors who were NOT forced to sell became caught up in the drama, and elected to join the selling frenzy, further pressuring prices. The semi-frozen condition of the global financial markets rippled through the real economy, and virtually every sector in every geography suffered slower business conditions and lower share prices. All ten major sectors of the MSCI AC World Index delivered average share price declines, ranging from negative 17.9% (Telecom Services) to negative 46.6% (Financials):
| MSCI AC World Index | ||||||
Sector | Sector Total Return 9/30/08 – 3/31/09 | Average Sector Weight | ||||
Financials | -46.6 | % | 18 | % | ||
Energy | -28.2 | % | 12 | % | ||
Health Care | -19.6 | % | 11 | % | ||
Information Technology | -23.0 | % | 11 | % | ||
Consumer Staples | -22.9 | % | 11 | % | ||
Industrials | -34.7 | % | 10 | % | ||
Consumer Discretionary | -28.3 | % | 9 | % | ||
Materials | -29.5 | % | 7 | % | ||
Telecom Services | -17.9 | % | 6 | % | ||
Utilities | -24.7 | % | 5 | % | ||
In the hardest-hit sector, Financials, your Fund improved slightly on the poor index result with an average weighting that was almost 3% higher than the weighting of financials in the index. Within this sector, the Fund’s best performers were preferred stocks of Fifth Third Bancorp and Huntington Bancshares and bonds of Vornado Realty Trust, while the worst performers were the stock and bonds
| Certified Semi-Annual Report 7 |
Letter to Shareholders
Continued
of Swiss Re and the stocks of Hong Kong Exchanges & Clearing, Liechtenstein Landesbank, and Willis Group Holdings. Our energy stocks underperformed the index, with an average weighting similar to the benchmark. Both Gazprom and Precision Drilling Trust were down by more than 50%, and Canadian Natural Resources was down by more than 43%.
Thornburg Global Opportunities Fund’s most costly relative underperformers were in the Telecom Services sector, where your portfolio’s average weighting of almost 22% substantially exceeded the 6% weighting of this sector in the MSCI AC World Index. Our average return from these holdings, negative 32.3%, was well below the negative 17.9% delivered by the index stocks in this sector. Stock prices of Fund holdings Level 3 Communications, Global Crossing, and Millicom International Cellular each declined in price by more than 45% during the six-month period. (A larger investment in Level 3 bonds delivered a modest positive total return for your portfolio during the period.) At the time of this writing, each of these has made a substantial recovery from its March 2009 low price, and financial results for each of these holdings have been generally in line with expectations. The leveraged balance sheets of Level 3 and Global Crossing, each of which has a substantial and valuable base of fiber optic network assets, took investor attention off the operating business results. The emerging markets orientation of Millicom International Cellular pressured its price in the six-month period. We have favored the bonds of Level 3 over the common shares.
Between October 1, 2008, and March 31, 2009, twelve of your portfolio investments delivered positive returns, while 41 showed negative returns. In general, the magnitude of the negative returns exceeded those of the positive returns.
Below are listed the top twelve equity holdings of the Global Opportunities Fund, based upon average portfolio weighting during the period under review. Combined, these twelve investments accounted for an average of 45.7% of the Fund’s portfolio. We summarize key attributes, noting that the earnings changes for 2009 were tabulated based upon analyst forecasts, which are subject to change:
Company (2008 P/E*) | 2008 Revenue Change | 2008 Earnings Change | 2009 Est. Earnings Change | 6-Month Period Share Price Change | ||||||||
Liechtenstein Landesbank AG (10.1x) | -14.1 | % | -39.7 | % | +13.6 | % | -30.0 | % | ||||
Teva Pharmaceuticals (62.7x) | +17.8 | % | -67.2 | % | +315 | % | -1.6 | % | ||||
Dell Inc. (8.9x) | -0.1 | % | -4.9 | % | -23.8 | % | -42.5 | % | ||||
China Mobile Ltd (10.9x) | +15.5 | % | +29.4 | % | +4.7 | % | -12.3 | % | ||||
Comcast Corp. (15.9x) | +10.9 | % | +4.4 | % | +7.7 | % | -30.5 | % | ||||
Roche Holding (14.9x) | -1.1 | % | -8.0 | % | +12.0 | % | -10.5 | % | ||||
ENI S.p.A. (7.7x) | +23.9 | % | -11.1 | % | -40.7 | % | -21.4 | % | ||||
Willis Group (10.7x) | +9.9 | % | -26.4 | % | -5.0 | % | -31.8 | % | ||||
Eclipsys Corp. (6.6x) | +8.0 | % | +138 | % | -39.1 | % | -51.6 | % | ||||
OPAP SA (8.7x) | +9.0 | % | +27.5 | % | -2.0 | % | -8.4 | % | ||||
Bachem Holding (15.9x) | -1.7 | % | -9.0 | % | -1.4 | % | -30.0 | % | ||||
Telefónica (9.2x) | +2.7 | % | -12.7 | % | +2.1 | % | -10.5 | % |
| * | P/E ratios from FACTSET tabulations of analyst estimates for 2009 expected earnings, as of April 24, 2009. |
| 8 Certified Semi-Annual Report |
With the possible exceptions of pharmaceutical firms Teva, Roche, and Bachem, it is fair to say that the current serious recession has negatively impacted all of these businesses. All twelve stocks declined in price during the six-month period under review, ranging from negative 1.6% to negative 51.6%. Looking forward, we will evaluate these businesses in terms of their financial strength and staying power, whether they are maintaining their industry position through this downturn, and their values relative to other opportunities. Given their importance to your Fund’s portfolio and the discouraging performance of their stock prices between September 30, 2008, and March 31, 2009, we believe it is appropriate to write a few words about each of these twelve businesses:
Liechtenstein Landesbank (LLB): LLB is a 147 year old bank specializing in asset management and custody, with more than 46 billion Swiss Francs of client assets at December 31, 2008. Declines in stock and bond markets, and the generally weaker currencies of client assets relative to the Swiss Franc that LLB uses for its own accounts, caused management fees tied to these assets to decline in 2008. Also, values of the bank’s own investments were marked down through the income statement. LLB is well capitalized, has a dividend yield above 6%, and was priced below its book value/share at March 31, 2009.
Teva Pharmaceuticals: The world’s largest generic drug company, Teva had revenues of more than $11 billion in 2008. Reported EPS for 2008 were down due to write-offs of $1.76 billion relating primarily to acquisitions (Barr Laboratories, Sicor, Co-Genesys). Adjusted for these non-recurring write-offs, adjusted 2008 earnings of $2.86/share would have been 20% above 2007 levels, and would bring the price/earnings ratio down to around 15x.
Dell Inc.: The large manufacturer of personal computers, servers, printers, and peripherals had revenues exceeding $60 billion each of the last two years. Dell’s business clearly slowed over the course of 2008, and a challenging environment will persist in 2009. The market capitalization of Dell was approximately $19 billion at March 31, 2009, and net cash in excess of debt on the balance sheet was around $7 billion, leaving a firm value of around $12 billion. During fiscal 2008, Dell generated approximately $4 billion of operating cash flow; therefore, the firm value as a multiple of operating cash flow was an interesting 3x.
China Mobile: The world’s largest mobile telephony company had 2008 revenues of around $60 billion and EBITDA of $33 billion from more than 500 million subscribers. China Mobile had a March 31, 2009, market capitalization of approximately $175 billion, $25 billion of net balance sheet cash, and a dividend yield of just over 4%. Virtually all revenues are in Chinese Renminbi.
Comcast: The cable, broadband, and telephone service provider had 2008 revenues of more than $34 billion and EBITDA of $12.9 billion. Comcast has a market capitalization of $40 billion, and net debt of $30 billion.
| Certified Semi-Annual Report 9 |
Letter to Shareholders
Continued
Roche Holding: The Swiss pharmaceuticals and medical diagnostics giant had 2008 revenues of more than 45 billion Swiss Francs, a number that was constrained by the significant appreciation of that currency relative to most global currencies last year. The vast majority of Roche’s revenues are earned outside Switzerland. Long a majority shareholder of U.S.-based Genentech, 113-year-old Roche has a portfolio of important biologic drugs, including cancer fighters Avastin and Herceptin, and anti-arthritic drug Rituxan. Roche has a dividend yield of more than 3%.
ENI S.p.A.: Italy-based ENI is one of the world’s largest integrated oil companies, and also owns a large network of natural gas transport pipelines throughout Western Europe. Negative sentiment toward ENI relates primarily to the fact that the average oil price declined from more than $100/barrel in 2008 to around $44/barrel during Q1 2009. ENI currently pays a 1.30 EUR dividend, giving an 8.8% yield on its March 31, 2009 closing price. The company recently stated its intention to maintain this dividend, a credible assertion if the oil price doesn’t sink materially from current levels.
Willis Group: One of the world’s largest commercial insurance brokerages, Willis Group had 2008 revenues of more than $2.7 billion and operating income of approximately $600 million. Commercial insurance commissions are a function of both unit prices and volumes, which are in turn a byproduct of business conditions. At this time, unit prices are firm (due to capital constraints in the insurance industry), while we expect business volumes to be soft in 2009. Willis Group has a dividend yield of more than 4%.
Eclipsys: A provider of clinical software and related services to the health care industry, Eclipsys may benefit from Obama administration efforts to invest in automation of the IT infrastructure of the U.S. health care industry. In recent quarters, revenue growth has been below expectations, due to financial pressures on hospitals and medical clinics (Eclipsys’ customers). Eclipsys had no net debt and a market capitalization of around $600 million at March 31, 2009. In 2008, revenues were $515 million.
OPAP SA: Formally known as the Greek Organization of Football Prognostics, OPAP develops and operates six numerical lottery games and three sports betting games. The public can play these games or place bets through more than 5,000 agencies located throughout Greece and Cyprus. This is a cash-generative business with no net debt, minimal capital expenditure requirements, and a dividend yield that exceeds 10%.
Bachem Holding: With revenues of around 200 million Swiss Francs, this Swiss-based company is the world’s largest independent producer of peptide active ingredients for drugs and vaccines. A number of peptide drugs with interesting potential are being developed, and loss of patent protection on several older peptide drugs offers business opportunities for Bachem. Most generic drug firms are not capable of manufacturing peptides and must purchase them from independent suppliers. Bachem has no net debt, and a dividend yield of approximately 5% at March 31, 2009.
| 10 Certified Semi-Annual Report |
Telefónica: Spain-based Telefónica is one of the world’s largest telecommunications service companies, providing service to more than 250 million customers in Spain, Western Europe, and Central and South America. In 2008, Telefónica had 58 billion EUR of revenues and more than 23 billion of EBITDA. In general, the Central and South American businesses of Telefónica are growing more quickly than the European operations, though depreciation of Latin American currencies relative to the Euro masked the growth of these businesses in 2008. Telefónica’s market capitalization is 68 billion EUR, debt is manageable at 40 billion EUR, and the dividend yield is 5.5%, based upon 2008 distributions.
At March 31, 2009, domestic stocks and bonds comprised approximately 41% of your portfolio; foreign stocks around 56%; and cash the remainder. The average price/earnings multiple of the stocks in your portfolio was 8.7x on March 31, 2009. We believe the portfolio includes a diverse and valuable collection of businesses, priced below intrinsic value. We try to remain alert to the possibility that changing circumstances could cause us to make changes to your Fund’s portfolio, whether due to an investment thesis for a particular stock proving faulty or to finding another asset that appears to be a better investment than one that is in the portfolio.
There can be a shortage of immediate reinforcement to contrarian investors who channel funds away from the crowd, but it usually pays to own attractively valued businesses with positive future prospects, even if the businesses face headwinds in the immediate future. We recommend that shareholders of Thornburg Global Opportunities Fund maintain a long-term perspective regarding their investment in this Fund.
Thank you for being a shareholder of Thornburg Global Opportunities Fund. Remember that you can review descriptions of many of the stocks in your portfolio by going to our internet site, www.thornburg. com/funds. Best wishes for a wonderful summer.
Sincerely,
 |  | |||
| Brian McMahon | W. Vinson Walden,CFA | |||
| Co-Portfolio Manager | Co-Portfolio Manager | |||
| CEO & Chief Investment Officer | Managing Director |
The matters discussed in this report may constitute forward-looking statements made pursuant to the safe harbor provisions of the Securities Litigation Reform Act of 1995. These include any advisor or portfolio manager prediction, assessment, analysis or outlook for individual securities, industries, investment styles, market sectors and/or markets. These statements involve risks and uncertainties. In addition to the general risks described for each fund in its current prospectus, other factors bearing on these reports include the accuracy of the advisor’s or portfolio manager’s forecasts and predictions, the appropriateness of the investment strategies designed by the advisor or portfolio manager, and the ability of the advisor or portfolio manager to implement their strategies efficiently and successfully. Any one or more of these factors, as well as other risks affecting the securities markets generally, could cause the actual results of any fund to differ materially as compared to its benchmarks.
| Certified Semi-Annual Report 11 |
| STATEMENT OF ASSETS AND LIABILITIES | ||
| Thornburg Global Opportunities Fund | March 31, 2009 (Unaudited) | |
ASSETS | ||||
Investments at value (cost $247,930,686) (Note 2) | $ | 178,424,336 | ||
Cash | 312,747 | |||
Receivable for investments sold | 3,052,260 | |||
Receivable for fund shares sold | 302,994 | |||
Unrealized gain on forward exchange contracts (Note 7) | 309,461 | |||
Dividends receivable | 616,335 | |||
Interest receivable | 1,407,888 | |||
Prepaid expenses and other assets | 48,766 | |||
Total Assets | 184,474,787 | |||
LIABILITIES | ||||
Payable for securities purchased | 1,429,903 | |||
Payable for fund shares redeemed | 693,072 | |||
Unrealized loss on forward exchange contracts (Note 7) | 876,843 | |||
Payable to investment advisor and other affiliates (Note 3) | 153,620 | |||
Accounts payable and accrued expenses | 263,150 | |||
Dividends payable | 3,211 | |||
Total Liabilities | 3,419,799 | |||
NET ASSETS | $ | 181,054,988 | ||
NET ASSETS CONSIST OF: | ||||
Undistributed net investment income | $ | 471,632 | ||
Net unrealized depreciation on investments | (70,113,404 | ) | ||
Accumulated net realized gain (loss) | (246,680,832 | ) | ||
Net capital paid in on shares of beneficial interest | 497,377,592 | |||
| $ | 181,054,988 | |||
| 12 Certified Semi-Annual Report |
| STATEMENT OF ASSETS AND LIABILITIES, CONTINUED | ||
| Thornburg Global Opportunities Fund | March 31, 2009 (Unaudited) | |
NET ASSET VALUE: | |||
Class A Shares: | |||
Net asset value and redemption price per share | $ | 8.14 | |
Maximum sales charge, 4.50% of offering price | 0.38 | ||
Maximum offering price per share | $ | 8.52 | |
Class C Shares: | |||
Net asset value and offering price per share * | $ | 8.05 | |
Class I Shares: | |||
Net asset value, offering and redemption price per share | $ | 8.17 | |
Class R3 Shares: | |||
Net asset value, offering and redemption price per share | $ | 8.13 | |
Class R4 Shares: | |||
Net asset value, offering and redemption price per share | $ | 8.13 | |
Class R5 Shares: | |||
Net asset value, offering and redemption price per share | $ | 8.18 | |
| * | Redemption price per share is equal to net asset value less any applicable contingent deferred sales charge. |
See notes to financial statements.
| Certified Semi-Annual Report 13 |
| STATEMENT OF OPERATIONS | ||
| Thornburg Global Opportunities Fund | Six Months Ended March 31, 2009 (Unaudited) | |
INVESTMENT INCOME: | ||||
Dividend income (net of foreign taxes withheld of $215,723) | $ | 2,828,392 | ||
Interest income | 1,680,127 | |||
Total Income | 4,508,519 | |||
EXPENSES: | ||||
Investment advisory fees (Note 3) | 1,069,342 | |||
Administration fees (Note 3) | ||||
Class A Shares | 53,642 | |||
Class C Shares | 41,124 | |||
Class I Shares | 23,193 | |||
Class R3 Shares | 13 | |||
Class R4 Shares | 1 | |||
Distribution and service fees (Note 3) | ||||
Class A Shares | 106,090 | |||
Class C Shares | 327,099 | |||
Class R3 Shares | 53 | |||
Class R4 Shares | 2 | |||
Transfer agent fees | ||||
Class A Shares | 97,850 | |||
Class C Shares | 84,676 | |||
Class I Shares | 144,079 | |||
Class R3 Shares | 896 | |||
Class R4 Shares | 628 | |||
Class R5 Shares | 635 | |||
Registration and filing fees | ||||
Class A Shares | 13,764 | |||
Class C Shares | 11,333 | |||
Class I Shares | 14,009 | |||
Class R3 Shares | 8,403 | |||
Class R4 Shares | 8,437 | |||
Class R5 Shares | 8,420 | |||
Custodian fees (Note 3) | 69,362 | |||
Professional fees | 27,631 | |||
Accounting fees | 9,322 | |||
Trustee fees | 5,660 | |||
Other expenses | 73,718 | |||
Total Expenses | 2,199,382 | |||
Less: | ||||
Expenses reimbursed by investment advisor (Note 3) | (224,596 | ) | ||
Investment advisory fees waived by investment advisor (Note 3) | (35,190 | ) | ||
Fees paid indirectly (Note 3) | (10,322 | ) | ||
Net Expenses | 1,929,274 | |||
Net Investment Income | $ | 2,579,245 | ||
| 14 Certified Semi-Annual Report |
| STATEMENT OF OPERATIONS, CONTINUED | ||
| Thornburg Global Opportunities Fund | Six Months Ended March 31, 2009 (Unaudited) | |
REALIZED AND UNREALIZED GAIN (LOSS) | ||||
Net realized gain (loss) on: | ||||
Investments | $ | (214,907,461 | ) | |
Foreign currency transactions | 7,306,753 | |||
| (207,600,708 | ) | |||
Net change in unrealized appreciation (depreciation) on: | ||||
Investments | 60,417,545 | |||
Foreign currency translations | (3,732,485 | ) | ||
| 56,685,060 | ||||
Net Realized and Unrealized Loss | (150,915,648 | ) | ||
Net Decrease in Net Assets Resulting From Operations | $ | (148,336,403 | ) | |
See notes to financial statements.
| Certified Semi-Annual Report 15 |
STATEMENTS OF CHANGES IN NET ASSETS
Thornburg Global Opportunities Fund
| Six Months Ended March 31, 2009* | Year Ended September 30, 2008 | |||||||
INCREASE (DECREASE) IN NET ASSETS FROM: | ||||||||
OPERATIONS: | ||||||||
Net investment income | $ | 2,579,245 | $ | 10,150,566 | ||||
Net realized loss on investments and foreign currency transactions | (207,600,708 | ) | (36,760,899 | ) | ||||
Increase (Decrease) in unrealized appreciation (depreciation) on investments and foreign currency translation | 56,685,060 | (183,908,572 | ) | |||||
Net Increase (Decrease) in Net Assets Resulting from Operations | (148,336,403 | ) | (210,518,905 | ) | ||||
DIVIDENDS TO SHAREHOLDERS: | ||||||||
From net investment income | ||||||||
Class A Shares | (2,840,127 | ) | (2,015,112 | ) | ||||
Class C Shares | (1,808,947 | ) | (334,642 | ) | ||||
Class I Shares | (3,299,561 | ) | (2,715,611 | ) | ||||
Class R3 Shares | (821 | ) | (441 | ) | ||||
Class R4 Shares | (63 | ) | (22 | ) | ||||
Class R5 Shares | (59 | ) | (27 | ) | ||||
From realized gains | ||||||||
Class A Shares | — | (8,262,772 | ) | |||||
Class C Shares | — | (3,642,010 | ) | |||||
Class I Shares | — | (5,983,950 | ) | |||||
FUND SHARE TRANSACTIONS (NOTE 4): | ||||||||
Class A Shares | (46,399,509 | ) | (5,314,571 | ) | ||||
Class C Shares | (9,662,235 | ) | 47,611,421 | |||||
Class I Shares | (22,629,072 | ) | 128,935,073 | |||||
Class R3 Shares | (14,665 | ) | 46,867 | |||||
Class R4 Shares | 481 | 3,327 | ||||||
Class R5 Shares | 60 | 3,227 | ||||||
Net Decrease in Net Assets | (234,990,921 | ) | (62,188,148 | ) | ||||
NET ASSETS: | ||||||||
Beginning of period | 416,045,909 | 478,234,057 | ||||||
End of period | $ | 181,054,988 | $ | 416,045,909 | ||||
Undistributed net investment income | $ | 471,632 | $ | 5,841,965 | ||||
| * | Unaudited. |
See notes to financial statements.
| 16 Certified Semi-Annual Report |
| NOTES TO FINANCIAL STATEMENTS | ||
| Thornburg Global Opportunities Fund | March 31, 2009 (Unaudited) | |
NOTE 1 – ORGANIZATION
Thornburg Global Opportunities Fund, hereinafter referred to as the “Fund,” is a diversified series of Thornburg Investment Trust (the “Trust”). The Trust was organized as a Massachusetts business trust under a Declaration of Trust dated June 3, 1987 and is registered as a diversified, open-end management investment company under the Investment Company Act of 1940, as amended. The Trust is currently issuing thirteen series of shares of beneficial interest in addition to those of the Fund: Thornburg Limited Term Municipal Fund, Thornburg California Limited Term Municipal Fund, Thornburg Limited Term U.S. Government Fund, Thornburg New Mexico Intermediate Municipal Fund, Thornburg Intermediate Municipal Fund, Thornburg Limited Term Income Fund, Thornburg Value Fund, Thornburg International Value Fund, Thornburg New York Intermediate Municipal Fund, Thornburg Core Growth Fund, Thornburg Investment Income Builder Fund, Thornburg International Growth Fund, and Thornburg Strategic Income Fund. Each series is considered to be a separate entity for financial reporting and tax purposes and bears expenses directly attributable to it. The Fund seeks long-term capital appreciation by investing in equity and debt securities of all types from issuers around the world.
The Fund currently offers six classes of shares of beneficial interest: Class A, Class C, Institutional Class (Class I), and Retirement Classes (Class R3, Class R4, and Class R5) shares. Each class of shares of the Fund represents an interest in the same portfolio of investments, except that (i) Class A shares are sold subject to a front-end sales charge collected at the time the shares are purchased and bear a service fee, (ii) Class C shares are sold at net asset value without a sales charge at the time of purchase, but are subject to a contingent deferred sales charge upon redemption within one year of purchase, and bear both a service fee and a distribution fee, (iii) Class I shares are sold at net asset value without a sales charge at the time of purchase, (iv) Class R3 shares are sold at net asset value without a sales charge at the time of purchase, but bear both a service fee and distribution fee, (v) Class R4 shares are sold at net asset value without a sales charge at the time of purchase, but bear a service fee, (vi) Class R5 shares are sold at net asset value without a sales charge at the time of purchase, and (vii) the respective classes may have different reinvestment privileges and conversion rights. Additionally, the Fund may allocate among its classes certain expenses, to the extent allowable to specific classes, including transfer agent fees, government registration fees, certain printing and postage costs, and administrative and legal expenses. Currently, class specific expenses of the Fund are limited to service and distribution fees, administration fees, and certain registration and transfer agent expenses.
NOTE 2 – SIGNIFICANT ACCOUNTING POLICIES
Significant accounting policies of the Trust are as follows:
Valuation of Investments: Portfolio securities listed or traded on a national securities exchange are valued on the valuation date at the last reported sale price on the exchange that is the primary market for the security. Portfolio securities traded on an exchange for which there has been no sale that day and other equity securities traded in the over-the-counter market are valued at the mean between the last reported bid and asked prices. Portfolio securities reported by NASDAQ are valued at the NASDAQ official closing price. Any foreign security traded on exchanges outside the United States is valued at the price of the security on the exchange that is normally the security’s primary market, as of the close of that exchange preceding the time of the Fund’s valuation.
Debt obligations held by the Fund have a primary market over the counter and are valued by an independent pricing service approved by the Trustees of the Trust. The pricing service ordinarily values debt obligations at quoted bid prices. When quotations are not available, debt obligations held by the Fund are valued at evaluated prices determined by the pricing service using methods which include consideration of yields or prices of debt obligations of comparable quality, type of issue, coupon, maturity, and rating, and indications as to value from dealers and general market conditions. Short-term obligations having remaining maturities of 60 days or less are valued at amortized cost, which approximates market value.
Quotations in foreign currencies for foreign portfolio investments are converted to U.S. dollar equivalents using the foreign exchange quotation in effect at the time of valuation.
In any case where the market value of an equity security held by the Fund is not readily available, the Trust’s valuation and pricing committee determines a fair value for the security using procedures approved by the Trustees, which may include the use of prices obtained from an independent pricing service. The pricing service ordinarily values equity securities in these instances using multi-factor models to adjust market prices based upon various inputs, including exchange data, depository receipt prices, futures and index data and other data. A security’s market value is deemed not readily available whenever the exchange or market on which the security is primarily traded is closed for the entire scheduled day of trading. Additionally, a security’s market value may be deemed not readily available under other circumstances identified by the Trustees, including when developments occurring after the most recent close of the security’s primary exchange or market, but before the most recent close of trading in Fund shares, create a serious question about the reliability of the security’s market value.
In any case where a pricing service fails to provide a price for a debt obligation held by the Fund, the valuation and pricing committee determines a fair value for the debt obligation using procedures approved by the Trustees. Additionally, in any case where management believes that a price provided by a pricing service for a debt obligation held by the Fund may be unreliable, the valuation and pricing committee decides whether or not to use the pricing service’s valuation or to determine a fair value for the debt obligation.
| Certified Semi-Annual Report 17 |
| NOTES TO FINANCIAL STATEMENTS CONTINUED | ||
| Thornburg Global Opportunities Fund | March 31, 2009 (Unaudited) | |
In determining fair value for any portfolio security or other investment, the valuation and pricing committee seeks to determine the amount that an owner of the investment might reasonably expect to receive upon a sale of the investment. However, because fair value prices are estimated prices, the valuation and pricing committee’s determination of fair value for an investment may differ from the value that would be realized by the Fund upon a sale of the investment, and that difference could be material to the Fund’s financial statements. The valuation and pricing committee’s determination of fair value for an investment may also differ from the prices obtained by other persons (including other mutual funds) for the investment.
Valuation Measurements: Various inputs are used in determining the value of the Fund’s investments. These inputs are summarized in the three levels listed below.
Level 1: Quoted prices in active markets for identical investments.
Level 2: Other significant observable inputs (including quoted prices for similar investments, interest rates, prepayment rates, credit risk, etc.)
Level 3: Significant unobservable inputs (including the Fund’s own assumptions in determining the fair value of investments)
The following table displays a summary of the inputs used to value the Fund’s net assets as of March 31, 2009. In any instance when valuation inputs from more than one level are used to determine the fair value of a specific investment, the investment is placed in the level of the table based upon the lowest level input that is significant in determining the fair value of the investment:
Valuation Inputs | Investments in Securities | Investments in Other Financial Instruments* | |||||
Level 1 - Quoted Prices in Active Markets for Identical Assets | $ | 148,282,730 | $ | 476 | |||
Level 2 - Other Significant Observable Inputs | 30,141,606 | (567,382 | ) | ||||
Level 3 - Significant Unobservable Inputs | — | — | |||||
Other | — | — | |||||
Total | $ | 178,424,336 | $ | (566,906 | ) | ||
| * | Other financial instruments include investments not reflected in the Schedule of Investments, such as futures, forwards and swap contracts, which are valued at the unrealized appreciation (depreciation) on the instrument. |
Foreign Currency Translation: Portfolio securities and other assets and liabilities denominated in foreign currencies are translated into U.S. dollars based on the exchange rate of such currencies against the U.S. dollar on the date of valuation. Purchases and sales of securities and income items denominated in foreign currencies are translated into U.S. dollars at the exchange rate in effect on the translation date. When the Fund purchases or sells foreign securities it will customarily enter into a foreign exchange contract to minimize foreign exchange risk from the trade date to the settlement date of such transactions.
The Fund does not separately report the effect of changes in foreign exchange rates from changes in market prices on securities held. Such changes are included in net realized and unrealized gain or loss from investments.
Reported net realized foreign exchange gains or losses arise from sales of foreign currencies, currency gains or losses realized between the trade and settlement dates on securities transactions and the difference between the amounts of dividends, interest, and foreign withholding taxes recorded on the Fund’s books, and the U.S. dollar equivalent of the amounts actually received or paid.
Net unrealized foreign exchange gains and losses arise from changes in the fair value of assets and liabilities, other than investments in securities at fiscal period end, resulting from changes in exchange rates.
Deferred Taxes: The Fund is subject to a tax imposed on net realized gains of securities of certain foreign countries. The Fund records an estimated deferred tax liability for net unrealized gains on these securities as reflected in the accompanying financial statements.
Federal Income Taxes: It is the policy of the Trust to comply with the provisions of the Internal Revenue Code applicable to “regulated investment companies” and to distribute to shareholders substantially all taxable income, including any net realized gain on investments of the Funds. Therefore, no provision for federal income taxes is required.
When-Issued and Delayed Delivery Transactions: The Trust may engage in when-issued or delayed delivery transactions. To the extent the Trust engages in such transactions, it will do so for the purpose of acquiring portfolio securities consistent with the Fund’s investment objectives and not for the purpose of investment leverage or to speculate on interest rate and/or market changes. At the time the Trust makes a commitment to purchase a security on a when-issued or delayed delivery basis, the Fund will record the transaction and reflect the value in determining its net asset value. When effecting such transactions, assets of an amount sufficient to make payment for the portfolio securities to be purchased will be segregated on the Fund’s records on the trade date. Securities purchased on a when-issued or delayed delivery basis do not earn interest until the settlement date.
| 18 Certified Semi-Annual Report |
| NOTES TO FINANCIAL STATEMENTS, CONTINUED | ||
| Thornburg Global Opportunities Fund | March 31, 2009 (Unaudited) | |
Dividends: Dividends to shareholders are generally paid quarterly and are reinvested in additional shares of the Fund at net asset value per share at the close of business on the dividend payment date or, at the shareholder’s option, paid in cash. Net realized capital gains, to the extent available, will be distributed at least annually. Distributions to shareholders are based on income tax regulations and therefore, their characteristics may differ for financial statement and tax purposes.
General: Securities transactions are accounted for on a trade date basis. Interest income is accrued as earned and dividend income is recorded on the ex-dividend date. Certain income from foreign securities is recognized as soon as information is available to the Fund. Realized gains and losses from the sale of securities are recorded on an identified cost basis. Net investment income (other than class specific expenses) and realized and unrealized gains and losses are allocated daily to each class of shares based upon the relative net asset value of outstanding shares of each class of shares at the beginning of the day (after adjusting for the current share activity of the respective class). Expenses common to all funds are allocated among the funds comprising the Trust based upon their relative net asset values or other appropriate allocation methods.
Guarantees and Indemnifications: Under the Trust’s organizational documents, its officers and Trustees are indemnified against certain liabilities arising out of the performance of their duties to the Fund. Additionally, in the normal course of business the Trust enters into contracts with service providers that contain general indemnification clauses. The Trust’s maximum exposure under these arrangements is unknown. However, based on experience, the Trust expects the risk of loss to be remote.
Use of Estimates: The preparation of financial statements, in conformity with generally accepted accounting principles, requires management to make estimates and assumptions that affect the reported amounts of assets and liabilities and the disclosure of contingent assets and liabilities at the date of the financial statements and the reported amounts of increases and decreases in net assets from operations during the reporting period. Actual results could differ from those estimates.
NOTE 3 – INVESTMENT ADVISORY FEE AND OTHER TRANSACTIONS WITH AFFILIATES
Pursuant to an investment advisory agreement, Thornburg Investment Management, Inc. (the “Advisor”) serves as the investment advisor and performs services to the Fund for which the fees are payable at the end of each month. For the six months ended March 31, 2009, these fees were payable at annual rates ranging from .875 of 1% to .675 of 1% per annum of the average daily net assets of the Fund depending on the Fund’s asset size. For the period ended March 31, 2009, the Advisor voluntarily waived investment advisory fees of $35,190. The Trust also has entered into administrative services agreements with the Advisor, whereby the Advisor will perform certain administrative services for the shareholders of each class of the Fund’s shares, and for which fees will be payable at an annual rate of up to .125 of 1% per annum of the average daily net assets attributable to each class of shares. For the six months ended March 31, 2009, the Advisor voluntarily reimbursed certain class specific expenses, administrative fees, and distribution fees of $4,552 for Class A shares, $11,332 for Class C shares, $181,280 for Class I shares, $9,310 for Class R3 shares, $9,067 for Class R4 shares, and $9,055 for Class R5 shares.
The Trust has an underwriting agreement with Thornburg Securities Corporation (the “Distributor,” an affiliate of the Advisor), which acts as the distributor of the Fund’s shares. For the six months ended March 31, 2009, the Distributor has advised the Fund that it earned commissions aggregating $2,857 from the sale of Class A shares, and collected contingent deferred sales charges aggregating $20,774 from redemptions of Class C shares of the Fund.
Pursuant to a service plan under Rule 12b-1 of the Investment Company Act of 1940, the Fund may reimburse to the Advisor an amount not to exceed .25 of 1% per annum of the average daily net assets attributable to each class of shares of the Fund for payments made by the Advisor to securities dealers and other financial institutions to obtain various shareholder and distribution related services. The Advisor may pay out of its own resources additional expenses for distribution of the Fund’s shares.
The Trust has also adopted distribution plans pursuant to Rule 12b-1, applicable only to the Fund’s Class C and Class R3 shares, under which the Fund compensates the Distributor for services in promoting the sale of Class C and Class R3 shares of the Fund at an annual rate of up to .75 of 1% per annum of the average daily net assets attributable to Class C and Class R3 shares. Total fees incurred by the Distributor for each class of shares of the Fund under their respective Service and Distribution Plans for the six months ended March 31, 2009, are set forth in the Statement of Operations.
The Trust has an agreement with the custodian bank to indirectly pay a portion of the custodian’s fees through credits earned by the Fund’s cash on deposit with the bank. This deposit agreement is an alternative to overnight investments. Custodial fees have been adjusted to reflect amounts that would have been paid without this agreement, with a corresponding adjustment reflected as fees paid indirectly in the Statement of Operations. For the six months ended March 31, 2009, fees paid indirectly were $10,322.
Certain officers and Trustees of the Trust are also officers and/or directors of the Advisor and Distributor. The compensation of independent Trustees is borne by the Trust.
| Certified Semi-Annual Report 19 |
| NOTES TO FINANCIAL STATEMENTS, CONTINUED | ||
| Thornburg Global Opportunities Fund | March 31, 2009 (Unaudited) | |
NOTE 4 – SHARES OF BENEFICIAL INTEREST
At March 31, 2009, there were an unlimited number of shares of beneficial interest authorized. Transactions in shares of beneficial interest were as follows:
| Six Months Ended March 31, 2009 (Unaudited) | Year Ended September 30, 2008 (Audited) | |||||||||||||
| Shares | Amount | Shares | Amount | |||||||||||
Class A Shares | ||||||||||||||
Shares sold | 2,864,484 | $ | 26,476,982 | 7,801,931 | $ | 146,068,191 | ||||||||
Shares issued to shareholders in reinvestment of dividends | 286,925 | 2,622,494 | 487,847 | 9,037,357 | ||||||||||
Shares repurchased | (8,369,470 | ) | (75,501,044 | ) | (9,414,853 | ) | (160,449,772 | ) | ||||||
Redemption fees received** | — | 2,059 | — | 29,653 | ||||||||||
Net Increase (Decrease) | (5,218,061 | ) | $ | (46,399,509 | ) | (1,125,075 | ) | $ | (5,314,571 | ) | ||||
Class C Shares | ||||||||||||||
Shares sold | 1,307,821 | $ | 12,314,839 | 4,215,177 | $ | 78,470,996 | ||||||||
Shares issued to shareholders in reinvestment of dividends | 161,778 | 1,465,709 | 170,775 | 3,149,277 | ||||||||||
Shares repurchased | (2,633,827 | ) | (23,444,413 | ) | (2,077,837 | ) | (34,024,836 | ) | ||||||
Redemption fees received** | — | 1,630 | — | 15,984 | ||||||||||
Net Increase (Decrease) | (1,164,228 | ) | $ | (9,662,235 | ) | 2,308,115 | $ | 47,611,421 | ||||||
Class I Shares | ||||||||||||||
Shares sold | 1,348,985 | $ | 12,529,202 | 11,051,219 | $ | 214,187,269 | ||||||||
Shares issued to shareholders in reinvestment of dividends | 320,286 | 2,933,820 | 389,918 | 7,203,956 | ||||||||||
Shares repurchased | (4,138,035 | ) | (38,094,441 | ) | (5,362,705 | ) | (92,479,984 | ) | ||||||
Redemption fees received** | — | 2,347 | — | 23,832 | ||||||||||
Net Increase (Decrease) | (2,468,764 | ) | $ | (22,629,072 | ) | 6,078,432 | $ | 128,935,073 | ||||||
Class R3 Shares* | ||||||||||||||
Shares sold | 407 | $ | 3,400 | 3,492 | $ | 60,788 | ||||||||
Shares issued to shareholders in reinvestment of dividends | 90 | 821 | 27 | 441 | ||||||||||
Shares repurchased | (2,364 | ) | (18,887 | ) | (894 | ) | (14,366 | ) | ||||||
Redemption fees received** | — | 1 | — | 4 | ||||||||||
Net Increase (Decrease) | (1,867 | ) | $ | (14,665 | ) | 2,625 | $ | 46,867 | ||||||
Class R4 Shares* | ||||||||||||||
Shares sold | 47 | $ | 418 | 187 | $ | 3,304 | ||||||||
Shares issued to shareholders in reinvestment of dividends | 7 | 63 | 1 | 23 | ||||||||||
Shares repurchased | — | — | — | — | ||||||||||
Redemption fees received** | — | — | — | — | ||||||||||
Net Increase (Decrease) | 54 | $ | 481 | 188 | $ | 3,327 | ||||||||
| 20 Certified Semi-Annual Report |
| NOTES TO FINANCIAL STATEMENTS, CONTINUED | ||
| Thornburg Global Opportunities Fund | March 31, 2009 (Unaudited) | |
| Six Months Ended March 31, 2009 (Unaudited) | Year Ended September 30, 2008 (Audited) | |||||||||
| Shares | Amount | Shares | Amount | |||||||
Class R5 Shares* | ||||||||||
Shares sold | — | $ | — | 179 | $ | 3,200 | ||||
Shares issued to shareholders in reinvestment of dividends | 6 | 60 | 1 | 27 | ||||||
Shares repurchased | — | — | — | — | ||||||
Redemption fees received** | — | — | — | — | ||||||
Net Increase (Decrease) | 6 | $ | 60 | 180 | $ | 3,227 | ||||
| * | Effective date of these classes of shares was February 1, 2008. |
| ** | The Fund charges a redemption fee of 1% of the Class A and Class I shares redeemed or exchanged within 30 days of purchase. Redemption fees charged to any class are allocated to all classes upon receipt of payment based on relative net asset values of each class or other appropriate allocation methods. |
NOTE 5 – SECURITIES TRANSACTIONS
For the six months ended March 31, 2009, the Fund had purchase and sale transactions of investment securities (excluding short-term investments) of $149,329,403 and $215,198,588, respectively.
NOTE 6 – INCOME TAXES
At March 31, 2009, information on the tax components of capital is as follows:
Cost of investments for tax purposes | $ | 253,742,979 | ||
Gross unrealized appreciation on a tax basis | $ | 5,774,725 | ||
Gross unrealized depreciation on a tax basis | (81,093,367 | ) | ||
Net unrealized appreciation (depreciation) on investments (tax basis) | $ | (75,318,642 | ) | |
At March 31, 2009, the Fund had deferred tax basis currency and capital losses occurring subsequent to October 31, 2007 of $56,198 and $28,793,156, respectively. For tax purposes, such losses will be reflected in the year ending September 30, 2009.
At March 31, 2009, the Fund had tax basis capital losses of $88,134, which may be carried forward to offset future capital gains. To the extent such carryforwards are used, capital gain distributions may be reduced to the extent provided by regulations. Such loss carryforwards expire September 30, 2016.
| Certified Semi-Annual Report 21 |
| NOTES TO FINANCIAL STATEMENTS, CONTINUED | ||
| Thornburg Global Opportunities Fund | March 31, 2009 (Unaudited) | |
NOTE 7 – FINANCIAL INSTRUMENTS WITH OFF-BALANCE SHEET RISK AND FOREIGN INVESTMENT RISK
During the six months ended March 31, 2009, the Fund was a party to financial instruments with off-balance sheet risks, primarily currency forward exchange contracts. A forward exchange contract is an agreement between two parties to exchange different currencies at a specified rate at an agreed upon future date. These contracts are purchased in order to minimize the risk to the Fund with respect to its foreign stock transactions from adverse changes in the relationship between the U.S. dollar and foreign currencies. In each case these contracts have been initiated in conjunction with foreign stock transactions. These instruments may involve market risks in excess of the amount recognized on the Statement of Assets and Liabilities. Such risks would arise from the possible inability of counterparties to meet the terms of their contracts, future movement in currency value and interest rates and contract positions that are not exact offsets. These contracts are reported in the financial statements at the Fund’s net equity, as measured by the difference between the forward exchange rates at the reporting date and the forward exchange rates at the dates of entry into the contract. There are special risks associated with international investing, including currency fluctuations, economic and political instability, confiscation, inability or delays in selling foreign investments, and reduced legal protection for investments.
CONTRACTS TO BUY OR SELL:
Contract Description | Buy/Sell | Contract Amount | Contract Value Date | Value (USD) | Unrealized Appreciation | Unrealized (Depreciation) | ||||||||||
Euro Dollar | Sell | 8,750,000 | 8/20/2009 | $ | 10,969,438 | $ | — | $ | (660,364 | ) | ||||||
Swiss Franc | Sell | 26,137,500 | 5/4/2009 | 22,759,927 | — | (216,479 | ) | |||||||||
Swiss Franc | Buy | 9,375,000 | 5/4/2009 | 7,959,080 | 282,099 | — | ||||||||||
Swiss Franc | Buy | 1,097,000 | 5/4/2009 | 936,966 | 27,362 | — | ||||||||||
Total unrealized appreciation (depreciation) from forward exchange contracts | $ | 309,461 | $ | (876,843 | ) | |||||||||||
OTHER NOTES:
Statement of Accounting Standards No. 161:
On March 19, 2008, the Financial Accounting Standards Board issued Statement of Financial Accounting Standards No. 161, “Disclosures about Derivative Instruments and Hedging Activities” (“FAS 161”). FAS 161 is effective for fiscal years and interim periods beginning after November 15, 2008. FAS 161 requires enhanced disclosures about any derivative and hedging activities by the Fund, including how such activities are accounted for and any effect on the Fund’s financial position, performance and cash flows.
| 22 Certified Semi-Annual Report |
Thornburg Global Opportunities Fund
Six Months Ended March 31, | Year Ended September 30, | Period Ended Sept. 30, 2006(a) | ||||||||||||||
| 2009* | 2008 | 2007 | ||||||||||||||
Class A Shares: | ||||||||||||||||
PER SHARE PERFORMANCE (for a share outstanding throughout the period)+ | ||||||||||||||||
Net asset value, beginning of period | $ | 13.38 | $ | 20.06 | $ | 12.86 | $ | 11.94 | ||||||||
Income from investment operations: | ||||||||||||||||
Net investment income (loss) | 0.09 | 0.30 | 0.07 | 0.01 | ||||||||||||
Net realized and unrealized gain (loss) on investments | (5.05 | ) | (6.30 | ) | 7.29 | 0.91 | ||||||||||
Total from investment operations | (4.96 | ) | (6.00 | ) | 7.36 | 0.92 | ||||||||||
Less dividends from: | ||||||||||||||||
Net investment income | (0.28 | ) | (0.14 | ) | (0.00 | )(b) | — | |||||||||
Net realized gains | — | (0.54 | ) | (0.16 | ) | — | ||||||||||
Total dividends | (0.28 | ) | (0.68 | ) | (0.16 | ) | — | |||||||||
Change in net asset value | (5.24 | ) | (6.68 | ) | 7.20 | 0.92 | ||||||||||
NET ASSET VALUE, end of period | $ | 8.14 | $ | 13.38 | $ | 20.06 | $ | 12.86 | ||||||||
RATIOS/SUPPLEMENTAL DATA | ||||||||||||||||
Total return (%)(c) | (37.28 | ) | (30.85 | ) | 57.75 | 7.71 | ||||||||||
Ratios to average net assets: | ||||||||||||||||
Net investment income (loss) (%) | 2.01 | (d) | 1.68 | 0.41 | 0.34 | (d) | ||||||||||
Expenses, after expense reductions (%) | 1.62 | (d) | 1.50 | 1.51 | 1.70 | (d) | ||||||||||
Expenses, after expense reductions and net of custody credits (%) | 1.61 | (d) | 1.49 | 1.50 | 1.63 | (d) | ||||||||||
Expenses, before expense reductions (%) | 1.66 | (d) | 1.50 | 1.55 | 6.12 | (d)(e) | ||||||||||
Portfolio turnover rate (%) | 61.37 | 83.70 | 91.02 | 6.08 | ||||||||||||
Net assets at end of period (thousands) | $ | 54,877 | $ | 159,996 | $ | 262,475 | $ | 8,477 | ||||||||
| (a) | Fund commenced operations on July 28, 2006. |
| (b) | Dividends from net investment income per share were less than $(0.01). |
| (c) | Sales loads are not reflected in computing total return, which is not annualized for periods less than one year. |
| (d) | Annualized. |
| (e) | Due to the size of net assets and fixed expenses, ratios may appear disproportionate. |
| + | Based on weighted average shares outstanding. |
| * | Unaudited. |
See notes to financial statements.
| Certified Semi-Annual Report 23 |
FINANCIAL HIGHLIGHTS, CONTINUED
Thornburg Global Opportunities Fund
| Six Months Ended March 31, | Year Ended September 30, | Period Ended Sept. 30, 2006(a) | ||||||||||||||
| 2009* | 2008 | 2007 | ||||||||||||||
Class C Shares: | ||||||||||||||||
PER SHARE PERFORMANCE (for a share outstanding throughout the period)+ | ||||||||||||||||
Net asset value, beginning of period | $ | 13.22 | $ | 19.87 | $ | 12.84 | $ | 11.94 | ||||||||
Income from investment operations: | ||||||||||||||||
Net investment income (loss) | 0.06 | 0.17 | (0.06 | ) | (0.01 | ) | ||||||||||
Net realized and unrealized gain (loss) on investments | (4.99 | ) | (6.24 | ) | 7.25 | 0.91 | ||||||||||
Total from investment operations | (4.93 | ) | (6.07 | ) | 7.19 | 0.90 | ||||||||||
Less dividends from: | ||||||||||||||||
Net investment income | (0.24 | ) | (0.04 | ) | — | — | ||||||||||
Net realized gains | — | (0.54 | ) | (0.16 | ) | — | ||||||||||
Total dividends | (0.24 | ) | (0.58 | ) | (0.16 | ) | — | |||||||||
Change in net asset value | (5.17 | ) | (6.65 | ) | 7.03 | 0.90 | ||||||||||
NET ASSET VALUE, end of period | $ | 8.05 | $ | 13.22 | $ | 19.87 | $ | 12.84 | ||||||||
RATIOS/SUPPLEMENTAL DATA | ||||||||||||||||
Total return (%)(b) | (37.49 | ) | (31.38 | ) | 56.48 | 7.54 | ||||||||||
Ratios to average net assets: | ||||||||||||||||
Net investment income (loss) (%) | 1.37 | (c) | 0.97 | (0.34 | ) | (0.40 | )(c) | |||||||||
Expenses, after expense reductions (%) | 2.37 | (c) | 2.25 | 2.28 | 2.41 | (c) | ||||||||||
Expenses, after expense reductions and net of custody credits (%) | 2.37 | (c) | 2.24 | 2.28 | 2.35 | (c) | ||||||||||
Expenses, before expense reductions (%) | 2.44 | (c) | 2.25 | 2.33 | 9.01 | (c)(d) | ||||||||||
Portfolio turnover rate (%) | 61.37 | 83.70 | 91.02 | 6.08 | ||||||||||||
Net assets at end of period (thousands) | $ | 52,695 | $ | 101,908 | $ | 107,298 | $ | 3,505 | ||||||||
| (a) | Fund commenced operations on July 28, 2006. |
| (b) | Not annualized for periods less than one year. |
| (c) | Annualized. |
| (d) | Due to the size of net assets and fixed expenses, ratios may appear disproportionate. |
| + | Based on weighted average shares outstanding. |
| * | Unaudited. |
See notes to financial statements.
| 24 Certified Semi-Annual Report |
FINANCIAL HIGHLIGHTS, CONTINUED
Thornburg Global Opportunities Fund
| Six Months Ended March 31, | Year Ended September 30, | Period Ended Sept. 30, 2006(a) | ||||||||||||||
| 2009* | 2008 | 2007 | ||||||||||||||
Class I Shares: | ||||||||||||||||
PER SHARE PERFORMANCE (for a share outstanding throughout the period)+ | ||||||||||||||||
Net asset value, beginning of period | $ | 13.45 | $ | 20.16 | $ | 12.87 | $ | 11.94 | ||||||||
Income from investment operations: | ||||||||||||||||
Net investment income (loss) | 0.13 | 0.40 | 0.17 | 0.02 | ||||||||||||
Net realized and unrealized gain (loss) on investments | (5.08 | ) | (6.34 | ) | 7.29 | 0.91 | ||||||||||
Total from investment operations | (4.95 | ) | (5.94 | ) | 7.46 | 0.93 | ||||||||||
Less dividends from: | ||||||||||||||||
Net investment income | (0.33 | ) | (0.23 | ) | (0.01 | ) | — | |||||||||
Net realized gains | — | (0.54 | ) | (0.16 | ) | — | ||||||||||
Total dividends | (0.33 | ) | (0.77 | ) | (0.17 | ) | — | |||||||||
Change in net asset value | (5.28 | ) | (6.71 | ) | 7.29 | 0.93 | ||||||||||
NET ASSET VALUE, end of period | $ | 8.17 | $ | 13.45 | $ | 20.16 | $ | 12.87 | ||||||||
RATIOS/SUPPLEMENTAL DATA | ||||||||||||||||
Total return (%)(b) | (37.07 | ) | (30.49 | ) | 58.51 | 7.79 | ||||||||||
Ratios to average net assets: | ||||||||||||||||
Net investment income (loss) (%) | 2.72 | (c) | 2.25 | 0.97 | 0.90 | (c) | ||||||||||
Expenses, after expense reductions (%) | 1.00 | (c) | 0.99 | 1.00 | 1.04 | (c) | ||||||||||
Expenses, after expense reductions and net of custody credits (%) | 0.99 | (c) | 0.99 | 0.99 | 0.99 | (c) | ||||||||||
Expenses, before expense reductions (%) | 1.42 | (c) | 1.10 | 1.20 | 2.98 | (c) | ||||||||||
Portfolio turnover rate (%) | 61.37 | 83.70 | 91.02 | 6.08 | ||||||||||||
Net assets at end of period (thousands) | $ | 73,473 | $ | 154,102 | $ | 108,461 | $ | 12,968 | ||||||||
| (a) | Fund commenced operations on July 28, 2006. |
| (b) | Not annualized for periods less than one year. |
| (c) | Annualized. |
| + | Based on weighted average shares outstanding. |
| * | Unaudited. |
See notes to financial statements.
| Certified Semi-Annual Report 25 |
FINANCIAL HIGHLIGHTS, CONTINUED
Thornburg Global Opportunities Fund
| Six Months Ended March 31, 2009* | Period Ended Sept. 30, 2008(a) | |||||||
Class R3 Shares: | ||||||||
PER SHARE PERFORMANCE (for a share outstanding throughout the period)+ | ||||||||
Net asset value, beginning of period | $ | 13.37 | $ | 17.91 | ||||
Income from investment operations: | ||||||||
Net investment income (loss) | 0.10 | 0.29 | ||||||
Net realized and unrealized gain (loss) on investments | (5.04 | ) | (4.70 | ) | ||||
Total from investment operations | (4.94 | ) | (4.41 | ) | ||||
Less dividends from: | ||||||||
Net investment income | (0.30 | ) | (0.13 | ) | ||||
Change in net asset value | (5.24 | ) | (4.54 | ) | ||||
NET ASSET VALUE, end of period | $ | 8.13 | $ | 13.37 | ||||
RATIOS/SUPPLEMENTAL DATA | ||||||||
Total return (%)(b) | (37.21 | ) | (24.78 | ) | ||||
Ratios to average net assets: | ||||||||
Net investment income (loss) (%) | 2.06 | (c) | 2.61 | (c) | ||||
Expenses, after expense reductions (%) | 1.51 | (c) | 1.49 | (c) | ||||
Expenses, after expense reductions and net of custody credits (%) | 1.49 | (c) | 1.49 | (c) | ||||
Expenses, before expense reductions (%) | 88.19 | (c)(d) | 67.47 | (c)(d) | ||||
Portfolio turnover rate (%) | 61.37 | 83.70 | ||||||
Net assets at end of period (thousands) | $ | 6 | $ | 35 | ||||
| (a) | Effective date of this class of shares was February 1, 2008. |
| (b) | Not annualized for periods less than one year. |
| (c) | Annualized. |
| (d) | Due to the size of net assets and fixed expenses, ratios may appear disproportionate. |
| + | Based on weighted average shares outstanding. |
| * | Unaudited. |
See notes to financial statements.
| 26 Certified Semi-Annual Report |
FINANCIAL HIGHLIGHTS, CONTINUED
Thornburg Global Opportunities Fund
| Six Months Ended March 31, 2009* | Period Ended Sept. 30, 2008(a) | |||||||
Class R4 Shares: | ||||||||
PER SHARE PERFORMANCE (for a share outstanding throughout the period)+ | ||||||||
Net asset value, beginning of period | $ | 13.38 | $ | 17.91 | ||||
Income from investment operations: | ||||||||
Net investment income (loss) | 0.11 | 0.28 | ||||||
Net realized and unrealized gain (loss) on investments | (5.05 | ) | (4.69 | ) | ||||
Total from investment operations | (4.94 | ) | (4.41 | ) | ||||
Less dividends from: | ||||||||
Net investment income | (0.31 | ) | (0.12 | ) | ||||
Change in net asset value | (5.25 | ) | (4.53 | ) | ||||
NET ASSET VALUE, end of period | $ | 8.13 | $ | 13.38 | ||||
RATIOS/SUPPLEMENTAL DATA | ||||||||
Total return (%)(b) | (37.15 | ) | (24.74 | ) | ||||
Ratios to average net assets: | ||||||||
Net investment income (loss) (%) | 2.53 | (c) | 2.48 | (c) | ||||
Expenses, after expense reductions (%) | 1.40 | (c) | 1.41 | (c) | ||||
Expenses, after expense reductions and net of custody credits (%) | 1.40 | (c) | 1.40 | (c) | ||||
Expenses, before expense reductions (%) | 943.36 | (c)(d) | 864.00 | (c)(d) | ||||
Portfolio turnover rate (%) | 61.37 | 83.70 | ||||||
Net assets at end of period (thousands) | $ | 2 | $ | 3 | ||||
| (a) | Effective date of this class of shares was February 1, 2008. |
| (b) | Not annualized for periods less than one year. |
| (c) | Annualized. |
| (d) | Due to the size of net assets and fixed expenses, ratios may appear disproportionate. |
| + | Based on weighted average shares outstanding. |
| * | Unaudited. |
See notes to financial statements.
| Certified Semi-Annual Report 27 |
FINANCIAL HIGHLIGHTS, CONTINUED
Thornburg Global Opportunities Fund
| Six Months Ended March 31, 2009* | Period Ended Sept. 30, 2008(a) | |||||||
Class R5 Shares: | ||||||||
PER SHARE PERFORMANCE (for a share outstanding throughout the period)+ | ||||||||
Net asset value, beginning of period | $ | 13.46 | $ | 17.98 | ||||
Income from investment operations: | ||||||||
Net investment income (loss) | 0.13 | 0.33 | ||||||
Net realized and unrealized gain (loss) on investments | (5.08 | ) | (4.70 | ) | ||||
Total from investment operations | (4.95 | ) | (4.37 | ) | ||||
Less dividends from: | ||||||||
Net investment income | (0.33 | ) | (0.15 | ) | ||||
Change in net asset value | (5.28 | ) | (4.52 | ) | ||||
NET ASSET VALUE, end of period | $ | 8.18 | $ | 13.46 | ||||
RATIOS/SUPPLEMENTAL DATA | ||||||||
Total return (%)(b) | (37.04 | ) | (24.47 | ) | ||||
Ratios to average net assets: | ||||||||
Net investment income (loss) (%) | 2.91 | (c) | 2.97 | (c) | ||||
Expenses, after expense reductions (%) | 0.88 | (c) | 0.92 | (c) | ||||
Expenses, after expense reductions and net of custody credits (%) | 0.88 | (c) | 0.92 | (c) | ||||
Expenses, before expense reductions (%) | 1,082.79 | (c)(d) | 850.59 | (c)(d) | ||||
Portfolio turnover rate (%) | 61.37 | 83.70 | ||||||
Net assets at end of period (thousands) | $ | 2 | $ | 2 | ||||
| (a) | Effective date of this class of shares was February 1, 2008. |
| (b) | Not annualized for periods less than one year. |
| (c) | Annualized. |
| (d) | Due to the size of net assets and fixed expenses, ratios may appear disproportionate. |
| + | Based on weighted average shares outstanding. |
| * | Unaudited. |
See notes to financial statements.
| 28 Certified Semi-Annual Report |
| SCHEDULE OF INVESTMENTS | ||
| Thornburg Global Opportunities Fund | March 31, 2009 (Unaudited) | |
SUMMARY OF INDUSTRY EXPOSURE
As of 3/31/09
Telecommunication Services | 24.4 | % | |
Banks | 12.5 | % | |
Pharmaceuticals, Biotechnology & Life Sciences | 11.2 | % | |
Energy | 9.8 | % | |
Insurance | 7.8 | % | |
Software & Services | 7.8 | % | |
Technology Hardware & Equipment | 4.5 | % | |
Real Estate | 3.9 | % | |
Consumer Services | 3.6 | % | |
Media | 3.4 | % | |
Food & Staples Retailing | 3.0 | % | |
Health Care Equipment & Services | 2.1 | % | |
Capital Goods | 1.9 | % | |
Materials | 0.7 | % | |
Other Assets & Cash Equivalents | 3.4 | % |
SUMMARY OF COUNTRY EXPOSURE
As of 3/31/09 (percent of equity holdings)
United States | 33.4 | % | |
Switzerland | 16.1 | % | |
China | 7.7 | % | |
Greece | 7.5 | % | |
Israel | 5.7 | % | |
Bermuda | 5.5 | % | |
United Kingdom | 5.5 | % | |
Luxembourg | 4.2 | % | |
Italy | 4.1 | % | |
Spain | 3.6 | % | |
Russia | 3.1 | % | |
Brazil | 2.0 | % | |
Canada | 1.6 | % |
| Shares/ Principal Amount | Value | ||||
COMMON STOCK — 77.43% | |||||
BANKS — 8.06% | |||||
COMMERCIAL BANKS — 8.06% | |||||
China Merchants Bank Co., Ltd. | 2,503,500 | $ | 4,354,138 | ||
Liechtensteinische Landesbank AG | 226,368 | 10,241,546 | |||
| 14,595,684 | |||||
CAPITAL GOODS — 1.86% | |||||
AEROSPACE & DEFENSE — 1.86% | |||||
Spirit Aerosystems Holdings, Inc.+ | 337,800 | 3,367,866 | |||
| 3,367,866 | |||||
CONSUMER SERVICES — 3.54% | |||||
HOTELS, RESTAURANTS & LEISURE — 3.54% | |||||
OPAP SA | 243,515 | 6,412,444 | |||
| 6,412,444 | |||||
| Certified Semi-Annual Report 29 |
| SCHEDULE OF INVESTMENTS, CONTINUED | ||
| Thornburg Global Opportunities Fund | March 31, 2009 (Unaudited) | |
| Shares/ Principal Amount | Value | ||||
ENERGY — 8.40% | |||||
ENERGY EQUIPMENT & SERVICES — 0.22% | |||||
Precision Drilling Trust | 150,200 | $ | 402,536 | ||
OIL, GAS & CONSUMABLE FUELS — 8.18% | |||||
Canadian Natural Resources Ltd. | 15,200 | 589,651 | |||
Capital Product Partners LP | 587,274 | 4,052,191 | |||
Eni S.p.A. | 298,200 | 5,792,276 | |||
OAO Gazprom ADR | 294,181 | 4,368,588 | |||
| 15,205,242 | |||||
FOOD & STAPLES RETAILING — 3.02% | |||||
FOOD & STAPLES RETAILING — 3.02% | |||||
Walgreen Co. | 210,700 | 5,469,772 | |||
| 5,469,772 | |||||
HEALTH CARE EQUIPMENT & SERVICES — 2.14% | |||||
HEALTH CARE TECHNOLOGY — 2.14% | |||||
Eclipsys Corp.+ | 381,431 | 3,867,710 | |||
| 3,867,710 | |||||
INSURANCE — 3.70% | |||||
INSURANCE — 3.70% | |||||
Willis Group Holdings Ltd. | 304,800 | 6,705,600 | |||
| 6,705,600 | |||||
MATERIALS — 0.72% | |||||
METALS & MINING — 0.72% | |||||
Eastern Platinum Ltd.+ | 4,073,200 | 1,308,412 | |||
| 1,308,412 | |||||
MEDIA — 3.38% | |||||
MEDIA — 3.38% | |||||
Comcast Corp. | 475,426 | 6,118,733 | |||
| 6,118,733 | |||||
PHARMACEUTICALS, BIOTECHNOLOGY & LIFE SCIENCES — 11.20% | |||||
LIFE SCIENCES TOOLS & SERVICES — 3.53% | |||||
Bachem Holding AG | 117,348 | 6,391,615 | |||
PHARMACEUTICALS — 7.67% | |||||
Roche Holding AG | 43,200 | 5,927,998 | |||
Teva Pharmaceutical Industries Ltd. ADR | 176,600 | 7,955,830 | |||
| 20,275,443 | |||||
SOFTWARE & SERVICES — 7.79% | |||||
INFORMATION TECHNOLOGY SERVICES — 1.56% | |||||
Redecard SA | 233,900 | 2,828,277 | |||
INTERNET SOFTWARE & SERVICES — 3.63% | |||||
Google, Inc.+ | 18,900 | 6,578,334 | |||
SOFTWARE — 2.60% | |||||
Amdocs Ltd.+ | 53,900 | 998,228 | |||
Microsoft Corp. | 201,500 | 3,701,555 | |||
| 14,106,394 | |||||
| 30 Certified Semi-Annual Report |
| SCHEDULE OF INVESTMENTS, CONTINUED | ||
| Thornburg Global Opportunities Fund | March 31, 2009 (Unaudited) | |
| Shares/ Principal Amount | Value | |||||
TECHNOLOGY HARDWARE & EQUIPMENT — 4.51% | ||||||
COMPUTERS & PERIPHERALS — 4.51% | ||||||
Dell Inc.+ | 861,500 | $ | 8,167,020 | |||
| 8,167,020 | ||||||
TELECOMMUNICATION SERVICES — 19.11% | ||||||
DIVERSIFIED TELECOMMUNICATION SERVICES — 7.58% | ||||||
Global Crossing Ltd.+ | 1,106,852 | 7,747,964 | ||||
Level 3 Communications, Inc.+ | 1,031,725 | 949,187 | ||||
Telefónica SA | 252,100 | 5,030,800 | ||||
WIRELESS TELECOMMUNICATION SERVICES — 11.53% | ||||||
China Mobile Ltd. | 735,500 | 6,419,706 | ||||
Crown Castle International Corp.+ | 416,100 | 8,492,601 | ||||
Millicom International Cellular S.A. | 160,800 | 5,956,032 | ||||
| 34,596,290 | ||||||
TOTAL COMMON STOCK (Cost $211,223,145) | 140,196,610 | |||||
PREFERRED STOCK — 4.47% | ||||||
BANKS — 4.47% | ||||||
COMMERCIAL BANKS — 4.47% | ||||||
Fifth Third Bancorp | 142,600 | 5,875,120 | ||||
Huntington Bancshares | 6,600 | 2,211,000 | ||||
TOTAL PREFERRED STOCK (Cost $7,249,598) | 8,086,120 | |||||
CONVERTIBLE BONDS — 10.56% | ||||||
ENERGY — 1.44% | ||||||
OIL, GAS & CONSUMABLE FUELS — 1.44% | ||||||
Chesapeake Energy Corp., 2.75% , 11/15/2035 | $ | 3,450,000 | 2,604,750 | |||
| 2,604,750 | ||||||
REAL ESTATE — 3.90% | ||||||
REAL ESTATE INVESTMENT TRUSTS — 3.90% | ||||||
Vornado Realty Trust, 2.85% , 4/1/2027 | 9,400,000 | 7,050,000 | ||||
| 7,050,000 | ||||||
TELECOMMUNICATION SERVICES — 5.22% | ||||||
DIVERSIFIED TELECOMMUNICATION SERVICES — 5.22% | ||||||
Level 3 Communications, Inc., 10.00% , 5/1/2011 | 14,575,000 | 9,455,532 | ||||
| 9,455,532 | ||||||
TOTAL CONVERTIBLE BONDS (Cost $17,745,229) | 19,110,282 | |||||
| Certified Semi-Annual Report 31 |
| SCHEDULE OF INVESTMENTS, CONTINUED | ||
| Thornburg Global Opportunities Fund | March 31, 2009 (Unaudited) | |
| Shares/ Principal Amount | Value | |||||
YANKEE BONDS — 4.10% | ||||||
INSURANCE — 4.10% | ||||||
INSURANCE — 4.10% | ||||||
Swiss Re Capital I, LP, 6.854% , 5/29/2049 (1) | $ | 24,365,000 | $ | 7,431,324 | ||
TOTAL YANKEE BONDS (Cost $8,479,924) | 7,431,325 | |||||
SHORT TERM INVESTMENTS — 1.99% | ||||||
Intesa Funding, LLC, 0.25% , 4/1/2009 | 3,600,000 | 3,600,000 | ||||
TOTAL SHORT TERM INVESTMENTS (Cost $3,600,000) | 3,600,000 | |||||
TOTAL INVESTMENTS — 98.55% (Cost $247,930,686) | $ | 178,424,336 | ||||
OTHER ASSETS LESS LIABILITIES — 1.45% | 2,630,652 | |||||
NET ASSETS — 100.00% | $ | 181,054,988 | ||||
Footnote Legend
| + | Non-income producing |
| (1) | Securities exempt from registration under Rule 144A of the Securities Act of 1933, as amended. These securities may only be resold in the ordinary course of business in transactions exempt from registration, normally to qualified institutional buyers. As of March 31, 2009, the aggregate value of these securities in the Fund’s portfolio was $7,431,324, representing 4.10% of the Fund’s net assets. |
Portfolio Abbreviations
To simplify the listings of securities, abbreviations are used per the table below:
| ADR | American Depository Receipt |
See notes to financial statements.
| 32 Certified Semi-Annual Report |
| EXPENSE EXAMPLE | ||
| Thornburg Global Opportunities Fund | March 31, 2009 (Unaudited) | |
As a shareholder of the Fund, you incur two types of costs:
(1) transaction costs, including
(a) sales charges (loads) on purchase payments for Class A shares;
(b) a deferred sales charge on redemptions of any part or all of a purchase of $1 million of Class A shares within 12 months of purchase;
(c) a deferred sales charge on redemptions of Class C shares within 12 months of purchase;
(d) a 30-day redemption fee on Class A and Class I shares;
(2) ongoing costs, including management fees; distribution and/or service (12b-1) fees; and other Fund expenses.
This example is intended to help you understand your ongoing costs (in dollars) of investing in the Fund and to compare these costs with the ongoing costs of investing in other mutual funds.
The example is based on an investment of $1,000 invested on September 30, 2008 and held until March 31, 2009.
| Beginning Account Value 9/30/08 | Ending Account Value 3/31/09 | Expenses Paid During Period† 9/30/08–3/31/09 | |||||||
Class A Shares | |||||||||
Actual | $ | 1,000.00 | $ | 627.20 | $ | 6.53 | |||
Hypothetical* | $ | 1,000.00 | $ | 1,016.90 | $ | 8.10 | |||
Class C Shares | |||||||||
Actual | $ | 1,000.00 | $ | 625.10 | $ | 9.59 | |||
Hypothetical* | $ | 1,000.00 | $ | 1,013.13 | $ | 11.88 | |||
Class I Shares | |||||||||
Actual | $ | 1,000.00 | $ | 629.30 | $ | 4.02 | |||
Hypothetical* | $ | 1,000.00 | $ | 1,020.00 | $ | 4.99 | |||
Class R3 Shares | |||||||||
Actual | $ | 1,000.00 | $ | 627.90 | $ | 6.06 | |||
Hypothetical* | $ | 1,000.00 | $ | 1,017.49 | $ | 7.51 | |||
Class R4 Shares | |||||||||
Actual | $ | 1,000.00 | $ | 628.50 | $ | 5.74 | |||
Hypothetical* | $ | 1,000.00 | $ | 1,017.88 | $ | 7.12 | |||
Class R5 Shares | |||||||||
Actual | $ | 1,000.00 | $ | 629.60 | $ | 3.56 | |||
Hypothetical* | $ | 1,000.00 | $ | 1,020.56 | $ | 4.41 | |||
| † | Expenses are equal to the annualized expense ratio for each class (A: 1.61%; C: 2.37%; I: 0.99%; R3: 1.49%; R4: 1.41%; R5: 0.88%) multiplied by the average account value over the period, multiplied by 182/365 to reflect the one-half year period. |
| * | Hypothetical assumes a rate of return of 5% per year before expenses. |
Actual Expenses
For each class of shares, the first line of the table at right provides information about actual account values and actual expenses. You may use the information in this line, together with the amount you invested, to estimate the expenses that you paid over the period. Simply divide your account value by $1,000 (for example, an $8,600 account value divided by $1,000 = 8.6), then multiply the result by the number in the first line for your class of shares under the heading entitled “Expenses Paid During Period” to estimate the expenses you paid on your account during this period.
Hypothetical Example for Comparison Purposes
For each class of shares, the second line of the table at right provides information about hypothetical account values and hypothetical expenses based on the Fund’s actual expense ratio and an assumed rate of return of 5% per year before expenses, which is not the Fund’s actual return. The hypothetical account values and expenses may not be used to estimate the actual ending account balance or expenses you paid for the period.
You may use this information to compare the ongoing costs of investing in the Fund and other funds. To do so, compare this 5% hypothetical example with the 5% hypothetical examples that appear in the shareholder reports of the other funds.
Please note that the expenses shown in the table are meant to highlight your ongoing costs only and do not reflect any transactional costs, such as sales charges (loads), redemption fees, or exchange fees. Therefore, the second line of the table for each class of shares is useful in comparing ongoing costs only, and will not help you determine the relative total costs of owning different funds. In addition, if these transactional costs were included, your costs would have been higher.
| Certified Semi-Annual Report 33 |
| INDEX COMPARISON | ||
| Thornburg Global Opportunities Fund | March 31, 2009 (Unaudited) | |
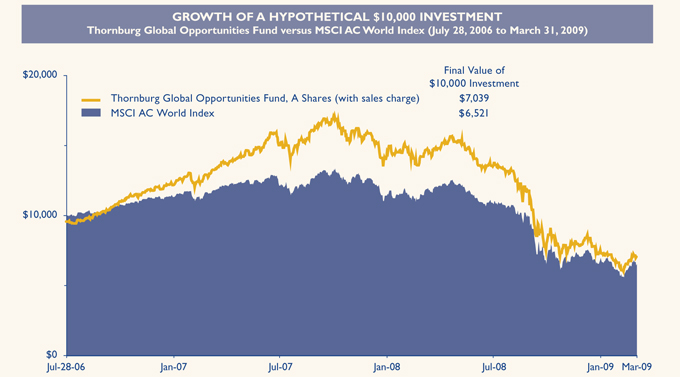
AVERAGE ANNUAL TOTAL RETURNS
For periods ended March 31, 2009 (with sales charge)
| 1 Yr | Since Inception | |||||
A Shares (Incep: 07/28/06) | -52.60 | % | -12.31 | % | ||
C Shares (Incep: 07/28/06) | -51.20 | % | -11.47 | % | ||
I Shares (Incep: 07/28/06) | -50.04 | % | -10.32 | % | ||
R3 Shares (Incep: 02/01/08) | -50.29 | % | -47.57 | % | ||
R4 Shares (Incep: 02/01/08) | -50.22 | % | -47.50 | % | ||
R5 Shares (Incep: 02/01/08) | -50.00 | % | -47.27 | % | ||
MSCI AC World Index (Since: 07/28/06) | -43.10 | % | -14.78 | % |
Performance data reflects past performance, which is no guarantee of future results. The performance data and graph do not reflect the deduction of taxes that a shareholder would pay on distributions or the redemption of Fund shares.
Returns reflect the reinvestment of dividends and capital gains as well as applicable sales charges. Class A shares are sold with a maximum sales charge of 4.50%. Class C shares are subject to a 1% contingent deferred sales charge (CDSC) for the first year only. There is no up-front sales charge for Class I, R3, R4 and R5 shares. Class A and Class I shares are subject to a 1% 30-day redemption fee.
The Morgan Stanley Capital International All Country World Index (MSCI AC World Index) is a market capitalization weighted index composed of over 2,000 companies, and is representative of the market structure of 48 developed and emerging market countries in North and South America, Europe, Africa, and the Pacific Rim. The index is calculated with net dividends reinvested in U.S. dollars. Investors may not make direct investments into any index.
| 34 Certified Semi-Annual Report |
| OTHER INFORMATION | ||
| Thornburg Global Opportunities Fund | March 31, 2009 (Unaudited) | |
PORTFOLIO PROXY VOTING
Policies and Procedures:
The Trust has delegated to Thornburg Investment Management, Inc. (the “Advisor”) voting decisions respecting proxies for the Fund’s voting securities. The Advisor makes voting decisions in accordance with its Proxy Voting Policy and Procedures. A description of the Policy and Procedures is available (i) without charge, upon request, by calling the Advisor toll-free at 1-800-847-0200, (ii) on the Thornburg web site at www.thornburg.com, and (iii) on the Securities and Exchange Commission’s web site at www.sec.gov.
Information regarding how proxies were voted is available on or before August 31 of each year for the twelve months ending the preceding June 30. This information is available (i) without charge, upon request by calling the Advisor toll-free at 1-800-847-0200, (ii) on the Thornburg web site at www.thornburg.com, and (iii) on the Securities and Exchange Commission’s web site at www.sec.gov.
AVAILABILITY OF QUARTERLY PORTFOLIO SCHEDULE
The Fund files with the Securities and Exchange Commission schedules of its portfolio holdings on Form N-Q for the first and third quarters of each fiscal year. The Fund’s Forms N-Q are available on the Commission’s web site at www.sec.gov, or may be reviewed and copied at the Commission’s Public Reference Room in Washington, D.C. Information on the operation of the Public Reference Room may be obtained by calling 1-800-SEC-0330. The Fund also makes this information available on its web site at www. thornburg.com/download or upon request by calling 1-800-847-0200.
| Certified Semi-Annual Report 35 |
Trustees’ Statement to Shareholders
Not part of the Certified Semi-Annual Report
February 8, 2005, as readopted September 15, 2008
The Trustees are concerned that ongoing commentaries and opinions reported in the media may confuse investors in general as to the supervisory duties of trustees of mutual funds and, in particular, leave Thornburg Investment Trust shareholders uncertain regarding how we discharge our responsibilities in supervising the Funds’ investment advisor and in reviewing the advisor’s contract for renewal. We decided to spell out clearly three principal guidelines that we follow in supervising the Trust’s investment advisor on your behalf.
We begin with the premise that each shareholder selected his or her Fund because its investments are managed by the investment advisor identified in the prospectus and in accordance with the objective and policies described in the prospectus. We realize, as each of you do, that if you believe that your Fund’s stated objective and policies no longer serve your personal investment goals, you can sell your shares and leave the Fund.
Therefore, we believe that our primary supervisory task – our principal obligation to you – is to assess the nature and quality of the advisor’s services, and to confirm that the advisor actively and competently pursues the Fund’s objective, in accordance with the policies set out in the prospectus. To do this, we meet regularly with management to review your Fund’s portfolio and to discuss the advisor’s specific actions and judgments in pursuing the Fund’s objective. We do not substitute our own judgment for the advisor’s decisions in selecting investments; the advisor is paid to exercise its informed judgment on investment decisions, and we seek to confirm, in reviewing the advisor’s performance, that the advisor is doing just that.
Second, while we are conscious of costs and the effect that costs have on shareholders’ returns, we do not seek the lowest fees or expense ratio as our sole or primary objective. We try to make sure that your Fund’s fees and costs are reasonable in relationship to the services rendered and that they are generally in line with those charged by other expert investment advisors, consistent with our belief that the Fund’s investors searched for and expect that expertise and attention and have decided to pay a reasonable price for it. We do not put the management contract “out to bid” as a matter of course, and we would not do so unless we had concluded that the advisor materially had failed to pursue the Fund’s objectives in accordance with its policies, or for other equally important reasons. We believe that any other approach would be inconsistent with your interests and contrary to your expectations when you bought shares of the Fund in the first place.
Finally, because we believe that most Thornburg Fund shareholders have invested with a long-term perspective, we try not to focus too much on the fashions of the moment and on short-term performance. The market will not favor any specific investment objective or set of policies at all times and under all economic circumstances. A fund will experience periods of both high and low returns relative to other funds and other investments. Even if one of our Funds is not favored by the market at a particular time, we believe that the advisor is nonetheless obliged to remain true to the Fund’s objective and policies, and we watch to see that it does so.
| 36 This page is not part of the Semi-Annual Report. |
Planning Options
Retirement and Education Accounts
Thornburg Investment Management offers retirement and education savings accounts that can help you meet a variety of planning challenges. For account applications or further information on any of the accounts below, please call 1-800-847-0200 or go to www.thornburg.com/ira. Your financial advisor can help you determine which plan is right for you.
Individual Retirement Accounts
Individual Retirement Accounts (IRAs) provide a tax-advantaged means to save money for the future. For a detailed outline of the difference between retirement accounts, see www.thornburg.com/ira. Rollovers are available. Call 1-800-847-0200 for more information.
Traditional IRAs – Contributions to Traditional IRAs are tax deductible for eligible individuals, and withdrawals are taxed as additional ordinary income. You may contribute to an IRA if you receive compensation and are under 70 1/2, even if you are covered by an employer retirement plan. Deductible contributions are subject to certain qualifications. Please consult your tax advisor.
Roth IRAs – Under a Roth IRA, there is no tax deduction for contributions, but there is no income tax on qualified withdrawals. For a more detailed comparison of Traditional and Roth IRAs, please see our web site at www.thornburg.com/ira.
SEP IRAs – Simplified Employee Pension (SEP) IRAs are established by employers. The employer is allowed a tax deduction for contributions made to the SEP Plan and makes contributions to each eligible employee’s SEP IRA on a discretionary basis.
SIMPLE IRAs – Savings Incentive Match Plan for Employees of Small Employers (SIMPLE) is designed to give small business owners a simplified method to establish and contribute to a retirement plan for employees. The employer is allowed a tax deduction for contributions and makes either matching or non-elective contributions to each eligible employee’s SIMPLE IRA. Employees may make salary deferral contributions.
Coverdell Education Savings Account
These savings accounts are designed to provide a way to save money for higher education expenses. In an Education Savings Account, earnings and interest grow tax-free, and qualified withdrawals used to pay for eligible higher-education expenses are tax- and penalty-free.
Funds Available
The following funds are available in the accounts listed above:
| • | Thornburg International Value Fund |
| • | Thornburg Value Fund |
| • | Thornburg Core Growth Fund |
| • | Thornburg Investment Income Builder Fund |
| • | Thornburg Global Opportunities Fund |
| • | Thornburg International Growth Fund |
| • | Thornburg Limited Term U.S. Government Fund |
| • | Thornburg Limited Term Income Fund |
| • | Thornburg Strategic Income Fund |
| This page is not part of the Semi-Annual Report. 37 |

| 38 This page is not part of the Semi-Annual Report. |
Thornburg Equity Funds
Thornburg’s equity research uses a fundamental and comprehensive analytical approach. Thornburg equity funds focus on a limited number of securities so that each holding can impact performance. The equity team searches for firms believed to have a promising future and seeks to buy shares of those companies at a discount to their intrinsic value.
| • | Thornburg Value Fund |
| • | Thornburg International Value Fund |
| • | Thornburg Core Growth Fund |
| • | Thornburg Investment Income Builder Fund |
| • | Thornburg Global Opportunities Fund |
| • | Thornburg International Growth Fund |
Thornburg Bond Funds
Thornburg Investment Management applies a disciplined philosophy to fixed-income management. Since the launch of our first fixed-income fund 25 years ago, we have been conducting fundamental, bottom-up research in an effort to identify bonds which we believe provide the best return for a given level of risk. We are very organic in our approach, avoiding leverage or complex strategies which could backfire in periods of market uncertainty.
| • | Thornburg Limited Term Municipal Fund |
| • | Thornburg Intermediate Municipal Fund |
| • | Thornburg California Limited Term Municipal Fund |
| • | Thornburg New Mexico Intermediate Municipal Fund |
| • | Thornburg New York Intermediate Municipal Fund |
| • | Thornburg Strategic Municipal Income Fund |
| • | Thornburg Limited Term U.S. Government Fund |
| • | Thornburg Limited Term Income Fund |
| • | Thornburg Strategic Income Fund |
Before investing, carefully consider the Fund’s investment goals, risks, charges, and expenses. For a prospectus containing this and other information, contact your financial advisor or visit thornburg.com. Read it carefully before investing.
For additional information, please visit www.thornburg.com
Thornburg Investment Management, Inc. 2300 North Ridgetop Road, Santa Fe, NM 87506
| This page is not part of the Semi-Annual Report. 39 |

| This Semi-Annual Report is submitted for the general information of shareholders of the Fund. It is not authorized for distribution to prospective investors in the Fund unless preceded or accompanied by an effective prospectus. | ||
 | Investment Advisor: Thornburg Investment Management® 800.847.0200 | |
Distributor: Thornburg Securities Corporation® 800.847.0200 | ||
TH1411 | ||
Waste not, Wait not |  |
Get instant access to your shareholder reports.
By switching from your postal mailbox to your email inbox, you reduce paper clutter, improve record keeping access, and help conserve our natural resources.
Go to www.thornburg.com/edelivery and sign up to receive your shareholder reports, prospectuses, and proxy statements electronically.
You invest in the future, without spending a dime.

2 This page is not part of the Semi-Annual Report. |
Important Information
The information presented on the following pages was current as of March 31, 2009. The managers’ views, portfolio holdings, and sector and country diversification are provided for the general information of the Fund’s shareholders; they are historical and subject to change. This material should not be deemed a recommendation to buy or sell any of the securities mentioned.
Investments in the Fund carry risks including possible loss of principal. Funds invested in a limited number of holdings may expose an investor to greater volatility. Investing outside the United States involves additional risks, such as currency fluctuations. Risks may be associated with investments in emerging markets including illiquidity and volatility. Additionally, the Fund invests a portion of the assets in small capitalization companies, which may increase the risk of greater price fluctuations. Please see the Fund’s Prospectus for a discussion of the risks associated with an investment in the Fund. Investments in the Fund are not deposits or obligations of, or guaranteed or endorsed by, any bank, the Federal Deposit Insurance Corporation, the Federal Reserve Board or any government agency. There is no guarantee that the Fund will meet its investment objectives.
Performance data given at net asset value (NAV) does not take into account the applicable sales charges. If the sales charges had been included, the performance would have been lower.
Class I, R3, R4, and R5 shares may not be available to all investors. Minimum investments for Class I shares may be higher than those for other classes.
From time to time, the Fund may invest in shares of companies through initial public offerings (IPOs). IPOs have the potential to produce substantial gains for the Fund. There is no assurance that the Fund will have continued access to profitable IPOs and as the Fund’s assets grow, the impact of IPO investments may decline. Therefore, investors should not rely on these past gains as an indication of future performance.
Share Class | NASDAQ Symbol | Cusip | ||
Class A | TIGAX | 885-215-319 | ||
Class C | TIGCX | 885-215-293 | ||
Class I | TINGX | 885-215-244 | ||
Class R3 | TIGVX | 885-215-178 | ||
Class R4 | TINVX | 885-215-160 | ||
Class R5 | TINFX | 885-215-152 |
Glossary
MSCI All Country (AC) World ex-U.S. Growth Index – The Morgan Stanley Capital International (MSCI) All Country World ex-U.S. Growth Index includes growth companies in developed and emerging markets throughout the world, excluding the United States.
Unless otherwise noted, index returns reflect the reinvestment of income dividends and capital gains, if any, but do not reflect fees, brokerage commissions or other expenses of investing. Investors may not make direct investments into any index. The performance of any index is not indicative of the performance of any particular investment.
Basis Point (BPS) – A unit equal to 1/100th of 1%. A 1% change = 100 basis points (bps).
Median Market Capitalization – Market capitalization (market cap) is the total value of a company’s stock, calculated by multiplying the number of outstanding common shares by the current share price. The company whose market cap is in the middle of the portfolio is the median market cap. Half the companies in the portfolio have values greater than the median, and half have values that are less.
Price to Book Value (P/B) – A ratio used to compare a stock’s market value to its book value. It is calculated by dividing the current closing price of the stock by the latest quarter’s book value (book value is simply assets minus liabilities).
Price to Cash Flow Ratio – A measure of the market’s expectations of a firm’s future financial health. It is calculated by dividing the price per share by cash flow per share.
Price to Earnings Ratio (P/E) – A valuation ratio equaling a company’s market value per share divided by earnings per share.
| This page is not part of the Semi-Annual Report. 3 |
Thornburg International Growth Fund
PORTFOLIO MANAGER
 | Alexander M.V. Motola, CFA |
KEY PORTFOLIO ATTRIBUTES
As of 3/31/09
Portfolio P/E Trailing 12-months* | 9.6x | ||
Portfolio Price to Cash Flow* | 7.0 | ||
Portfolio Price to Book Value* | 2.0 | ||
Median Market Cap* | $ | 3.8 B | |
Equity Holdings | 38 |
| * | Source: FactSet |
IMPORTANT PERFORMANCE
INFORMATION
Performance data shown represents past performance and is no guarantee of future results. Investment return and principal value will fluctuate so shares, when redeemed, may be worth more or less than their original cost. Current performance may be lower or higher than quoted. For performance current to the most recent month end, visit thornburg.com.
The maximum sales charge for Class A shares is 4.50%. Class A shares are subject to a 1% 30-day redemption fee. The total annual fund operating expense of Class A shares is 2.00%, as disclosed in the most recent Prospectus. Thornburg Investment Management intends to waive fees and reimburse expenses so that actual Class A expenses do not exceed 1.63%. The fee waivers and expense reimbursements are voluntary and may be terminated at any time. Without these waivers, returns would be lower.
Comprehensive International Growth Investing
A major benefit of an interconnected global economy is the ability to tap into a country or region’s comparative advantages. Some countries have abundant natural resources, while others excel at manufacturing or engineering. The ability to allocate capital across borders allows the entire globe to benefit from these advantages. In an effort to capture these opportunities, Thornburg Investment Management launched the Thornburg International Growth Fund in 2007.
The Fund’s process is centered on identifying attractively valued international growth companies from the bottom-up. The management team will leave it to others to make broad-based calls on the direction of the market. Instead, portfolio manager Alex Motola and his team will employ a comprehensive, “go-everywhere” approach to growth investing. The team classifies stocks into various growth baskets: Growth Industry Leaders, Consistent Growers, or Emerging Growth Companies. From those baskets, the team will build a portfolio of 35–50 stocks which they believe provides the best long-term prospects for investors. While stocks are analyzed on their individual merits, their role as part of a diversified portfolio is also taken into account.
Equity investing, especially disciplines focused on growing companies, can bring volatility. The Thornburg International Growth Fund team recognizes this and strives to balance the aims of generating a strong long-term record while managing downside volatility. Portfolio construction and geographic diversification provide part of the answer, but fundamental analysis can often play a more important role. While other growth funds limit volatility by diversifying across a large number of names, the team managing the Thornburg International Growth Fund believes that a more robust understanding of a smaller number of portfolio holdings is one of the most effective forms of risk management.
AVERAGE ANNUAL TOTAL RETURNS
FOR PERIODS ENDED 3/31/09
| 1 Yr | Since Inception | |||||
A Shares (Incep: 2/1/07) | ||||||
Without Sales Charge | -47.40 | % | -20.72 | % | ||
With Sales Charge | -49.75 | % | -22.39 | % | ||
MSCI AC World ex-U.S. | -45.98 | % | -21.94 | % |
| 4 This page is not part of the Semi-Annual Report. |
Much of the research process is focused on identifying how the overall market came to price a security. Many of the ideas are sourced through a quantitative screening process of the universe of international companies. Only those with the most appealing growth and valuation characteristics pass on to the step of having a complex financial model built. Thornburg’s growth investment team scours regulatory filings, visits company management, and interviews suppliers and customers. By doing this work, they develop their own view of the intrinsic value of the company. Only if their view is materially higher than the market do they make an investment.
Others may question how the team manages a growth portfolio, especially an international one, from Santa Fe, New Mexico. At Thornburg Investment Management, we embrace our location, away from the ancillary noise of the major money centers. We have access to Wall Street research, but prefer to come to our own conclusions about the value of an investment. The investment process allows the team to take a very broad view of what an attractively valued, international growth company looks like, and invest in those few companies that they believe provide the most attractive risk-reward trade-off. The result is a portfolio which at any given time will look quite unlike the MSCI AC World ex-U.S. Growth Index or the competition. All of this is done with a goal of providing attractive, consistent returns over the long term.
STOCKS CONTRIBUTING AND DETRACTING
SIX-MONTHS ENDED 3/31/09
Top Contributors | Top Detractors | |
| Baidu, Inc. | HHLA | |
| Telecity Group plc | EFG Eurobank Ergasias SA | |
| New Oriental Education & Technology Group, Inc. ADR | Carlsberg A/S | |
| Banco ABC Brasil SA | EFG International AG | |
| Open Text Corp. | Amdocs Ltd. | |
| Source: FactSet | ||
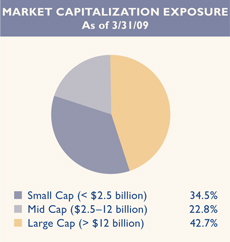
TOP TEN HOLDINGS
As of 3/31/09
Nestlé S.A. | 4.1 | % | |
Nintendo Co. Ltd. | 4.1 | % | |
Telefónica SA | 4.1 | % | |
Novo Nordisk A/S | 4.0 | % | |
Amdocs Ltd. | 3.8 | % | |
Research In Motion Ltd. | 3.6 | % | |
Deutsche Börse AG | 3.4 | % | |
Roche Holding AG | 3.4 | % | |
Telecity Group plc | 3.3 | % | |
Open Text Corp. | 3.2 | % |
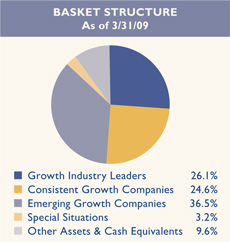
| This page is not part of the Semi-Annual Report. 5 |
This page intentionally left blank.
| 6 This page is not part of the Semi-Annual Report. |

Thornburg International Growth Fund
March 31, 2009
Table of Contents
| 8 | ||
| 10 | ||
| 12 | ||
| 14 | ||
| 15 | ||
| 21 | ||
| 27 | ||
| 31 | ||
| 32 | ||
| 33 | ||
This report is certified under the Sarbanes-Oxley Act of 2002, which requires that public companies, including mutual funds, affirm that the information provided in their annual and semiannual shareholder reports fully and fairly represents their financial position.
| Certified Semi-Annual Report 7 |
| April 22, 2009 | |
| Dear Fellow Shareholder: | ||
Alexander M.V. Motola,CFA Portfolio Manager | For the six months ended March 31, 2009, the Thornburg International Growth Fund generated slightly worse performance than its benchmark. On September 30, 2008, the net asset value (NAV) for the Class A shares was $10.35. By March 31, 2009, the NAV of the Class A shares was $6.94. The Fund’s Class A shares underperformed its benchmark with a total negative return of 31.74% compared to negative 29.73% for the MSCI AC World ex-US Growth Index. | |
| Every part of the financial system has exhibited volatility over the past six months. Rapidly moving prices characterized the securities comprising all parts of companies’ capital structure. Volatility impacts currencies as well. Movement in local currencies affects both the direct value of foreign holdings, as well as reported earnings (after translation) for many companies. | ||
| By March 31, the posture of the portfolio had changed a fair amount. A year ago, our biggest sectors were Utilities, Financials, and Consumer Staples. Now, Information Technology is by far the largest sector, followed by Consumer Discretionary, and Health Care. In developed markets, these are usually the fastest growing sectors. Continental Europe represents nearly a third of the portfolio, with the U.K. having an additional 11% exposure. Asia-Pacific is 28% of the equity in the portfolio. Our exposure to emerging markets has crept up a little to 40%. | ||
| While it is often easiest to explain the portfolio in terms of sectors or geographies, that approach implies a focus on those characteristics. However, we use a bottom-up approach that focuses primarily on the fundamentals of individual stocks with secondary consideration given to sectors and geographies. That is not to say we are unconcerned about our country and sector exposures – we are. We know them well and monitor them closely. But the focus of our monitoring is to ensure that, while not compromising the “opportunity” component of the portfolio, we are not taking undue risks caused by the relationship between securities, markets, and how businesses relate to one another. We do this by investing in different types of companies: Growth Industry Leaders, Consistent Growers, and Emerging Growth companies. We have found that over time each group performs differently and provides an added layer of diversity. Ideally, we would have a third of the portfolio in each basket. Due to our concentrated nature, we don’t always have the prescribed exposure. We use 33% for each basket as a horizon target. The baskets are effective in managing market exposure and their viability has been tested across several different funds at Thornburg, going back to the inception of the Thornburg Value Fund in 1995. | ||

| 8 Certified Semi-Annual Report |
Due to our unique approach, there are countries we have never invested in because we have never found a great stock there. Yet we rarely feel that we are underexposed, at a macro level, to a type of business or a location on the globe. And while there is volatility to the construction of the portfolio, we try to have consistency with regard to the baskets.
Our bottom-up approach is also evident in the diverse group of companies that had an outsized impact on performance over the past six months. Our top five positive contributors to performance, on a weighted basis, were Baidu, Telecity Group, New Oriental Education and Technology Group, Banco ABC Brasil, and Open Text. Three of those stocks (the first three listed) were purchased in 2009, and benefited from timing as well as selection. Open Text has been held over a year, and Banco ABC Brasil was purchased in late 2008 as we began tentatively investing in undervalued smaller banks globally. Other banks purchased at approximately the same time as Banco ABC Brasil are Banca Populare di Milano and Marfin Popular Bank. Stocks that detracted the most from performance were largely in Europe: CEZ, Porsche Automobil Holding, EFG International, and HHLA.
We intend to continue implementing our investment process in a disciplined, consistent manner. We continue to find what we believe to be attractive growth companies. Part of our historical success can be attributed to the fact that our broad mandate allows us to search in parts of the market not open to managers more tightly constrained to specific style boxes. This flexible approach allows us to do what we love; researching companies and identifying opportunities is our passion. We encourage you to learn more about your portfolio. Descriptions of each holding and links to company web sites can be found by pointing your Internet browser to www.thornburg.com/funds. Thank you for investing in the Thornburg International Growth Fund.
| Sincerely, |
 |
| Alexander M.V. Motola,CFA |
| Managing Director |
| Portfolio Manager |
The matters discussed in this report may constitute forward-looking statements made pursuant to the safe harbor provisions of the Securities Litigation Reform Act of 1995. These include any advisor or portfolio manager prediction, assessment, analysis or outlook for individual securities, industries, investment styles, market sectors and/or markets. These statements involve risks and uncertainties. In addition to the general risks described for each fund in its current prospectus, other factors bearing on these reports include the accuracy of the advisor’s or portfolio manager’s forecasts and predictions, the appropriateness of the investment strategies designed by the advisor or portfolio manager, and the ability of the advisor or portfolio manager to implement their strategies efficiently and successfully. Any one or more of these factors, as well as other risks affecting the securities markets generally, could cause the actual results of any fund to differ materially as compared to its benchmarks.
| Certified Semi-Annual Report 9 |
STATEMENT OF ASSETS AND LIABILITIES
| Thornburg International Growth Fund | March 31, 2009 (Unaudited) |
ASSETS | ||||
Investments at value (cost $60,958,986) (Note 2) | $ | 40,907,389 | ||
Cash | 2,117,621 | |||
Receivable for investments sold | 2,120,168 | |||
Receivable for fund shares sold | 9,568 | |||
Unrealized gain on forward exchange contracts (Note 7) | 228,531 | |||
Dividends receivable | 205,081 | |||
Prepaid expenses and other assets | 68,536 | |||
Total Assets | 45,656,894 | |||
LIABILITIES | ||||
Payable for securities purchased | 9,095 | |||
Payable for fund shares redeemed | 69,537 | |||
Unrealized loss on forward exchange contracts (Note 7) | 223,846 | |||
Payable to investment advisor and other affiliates (Note 3) | 26,090 | |||
Accounts payable and accrued expenses | 87,836 | |||
Total Liabilities | 416,404 | |||
NET ASSETS | $ | 45,240,490 | ||
NET ASSETS CONSIST OF: | ||||
Undistributed net investment income | $ | 45,719 | ||
Net unrealized depreciation on investments | (20,057,103 | ) | ||
Accumulated net realized gain (loss) | (38,844,327 | ) | ||
Net capital paid in on shares of beneficial interest | 104,096,201 | |||
| $ | 45,240,490 | |||
| 10 Certified Semi-Annual Report |
| STATEMENT OF ASSETS AND LIABILITIES, CONTINUED | ||
| Thornburg International Growth Fund | March 31, 2009 (Unaudited) | |
NET ASSET VALUE: | |||
Class A Shares: | |||
Net asset value and redemption price per share | $ | 6.94 | |
Maximum sales charge, 4.50% of offering price | 0.33 | ||
Maximum offering price per share | $ | 7.27 | |
Class C Shares: | |||
Net asset value and offering price per share * | $ | 6.91 | |
Class I Shares: | |||
Net asset value, offering and redemption price per share | $ | 6.97 | |
Class R3 Shares: | |||
Net asset value, offering and redemption price per share | $ | 6.92 | |
Class R4 Shares: | |||
Net asset value, offering and redemption price per share | $ | 6.89 | |
Class R5 Shares: | |||
Net asset value, offering and redemption price per share | $ | 6.99 | |
| * | Redemption price per share is equal to net asset value less any applicable contingent deferred sales charge. |
See notes to financial statements.
| Certified Semi-Annual Report 11 |
| STATEMENT OF OPERATIONS | ||
| Thornburg International Growth Fund | Six Months Ended March 31, 2009 (Unaudited) | |
INVESTMENT INCOME: | ||||
Dividend income (net of foreign taxes withheld of $49,309) | $ | 456,252 | ||
Interest income | 16,261 | |||
Total Income | 472,513 | |||
EXPENSES: | ||||
Investment advisory fees (Note 3) | 229,199 | |||
Administration fees (Note 3) | ||||
Class A Shares | 11,172 | |||
Class C Shares | 9,811 | |||
Class I Shares | 4,637 | |||
Class R3 Shares | 164 | |||
Class R4 Shares | 1 | |||
Distribution and service fees (Note 3) | ||||
Class A Shares | 22,141 | |||
Class C Shares | 77,916 | |||
Class R3 Shares | 676 | |||
Class R4 Shares | 2 | |||
Transfer agent fees | ||||
Class A Shares | 21,699 | |||
Class C Shares | 26,114 | |||
Class I Shares | 7,708 | |||
Class R3 Shares | 666 | |||
Class R4 Shares | 635 | |||
Class R5 Shares | 635 | |||
Registration and filing fees | ||||
Class A Shares | 16,935 | |||
Class C Shares | 10,944 | |||
Class I Shares | 10,596 | |||
Class R3 Shares | 7,966 | |||
Class R4 Shares | 7,967 | |||
Class R5 Shares | 7,967 | |||
Custodian fees (Note 3) | 42,543 | |||
Professional fees | 23,032 | |||
Accounting fees | 1,483 | |||
Trustee fees | 1,308 | |||
Other expenses | 28,487 | |||
Total Expenses | 572,404 | |||
Less: | ||||
Expenses reimbursed by investment advisor (Note 3) | (81,864 | ) | ||
Investment advisory fees waived by investment advisor (Note 3) | (64,674 | ) | ||
Fees paid indirectly (Note 3) | (2,083 | ) | ||
Net Expenses | 423,783 | |||
Net Investment Income | $ | 48,730 | ||
| 12 Certified Semi-Annual Report |
| STATEMENT OF OPERATIONS, CONTINUED | ||
| Thornburg International Growth Fund | Six Months Ended March 31, 2009 (Unaudited) | |
REALIZED AND UNREALIZED GAIN (LOSS) | ||||
Net realized gain (loss) on: | ||||
Investments | $ | (34,657,766 | ) | |
Foreign currency transactions | 1,459,555 | |||
| (33,198,211 | ) | |||
Net change in unrealized appreciation (depreciation) on: | ||||
Investments | 8,530,258 | |||
Foreign currency translations | (709,496 | ) | ||
| 7,820,762 | ||||
Net Realized and Unrealized Loss | (25,377,449 | ) | ||
Net Decrease in Net Assets Resulting From Operations | $ | (25,328,719 | ) | |
See notes to financial statements.
| Certified Semi-Annual Report 13 |
| STATEMENTS OF CHANGES IN NET ASSETS | ||
| Thornburg International Growth Fund | March 31, 2009 (Unaudited) | |
| Six Months Ended March 31, 2009* | Year Ended September 30, 2008 | |||||||
INCREASE (DECREASE) IN NET ASSETS FROM: | ||||||||
OPERATIONS: | ||||||||
Net investment income | $ | 48,730 | $ | 512,202 | ||||
Net realized loss on investments and foreign currency transactions | (33,198,211 | ) | (4,538,662 | ) | ||||
Increase (Decrease) in unrealized appreciation (depreciation) on investments and foreign currency translation | 7,820,762 | (33,963,511 | ) | |||||
Net Increase (Decrease) in Net Assets Resulting from Operations | (25,328,719 | ) | (37,989,971 | ) | ||||
DIVIDENDS TO SHAREHOLDERS: | ||||||||
From net investment income | ||||||||
Class A Shares | (345,267 | ) | — | |||||
Class C Shares | (109,592 | ) | — | |||||
Class I Shares | (518,715 | ) | — | |||||
Class R3 Shares | (1,928 | ) | — | |||||
Class R4 Shares | (47 | ) | — | |||||
Class R5 Shares | (43 | ) | — | |||||
From realized gains | ||||||||
Class A Shares | — | (1,043,825 | ) | |||||
Class C Shares | — | (692,219 | ) | |||||
Class I Shares | — | (841,205 | ) | |||||
FUND SHARE TRANSACTIONS (NOTE 4): | ||||||||
Class A Shares | (4,338,032 | ) | 19,403,825 | |||||
Class C Shares | (2,231,549 | ) | 23,121,017 | |||||
Class I Shares | (2,650,005 | ) | 13,038,441 | |||||
Class R3 Shares | 431,014 | 149,898 | ||||||
Class R4 Shares | 47 | 3,200 | ||||||
Class R5 Shares | 43 | 3,254 | ||||||
Net Increase (Decrease) in Net Assets | (35,092,793 | ) | 15,152,415 | |||||
NET ASSETS: | ||||||||
Beginning of period | 80,333,283 | 65,180,868 | ||||||
End of period | $ | 45,240,490 | $ | 80,333,283 | ||||
Undistributed net investment income | $ | 45,719 | $ | 972,581 | ||||
| * | Unaudited. |
See notes to financial statements.
| 14 Certified Semi-Annual Report |
| NOTES TO FINANCIAL STATEMENTS | ||
| Thornburg International Growth Fund | March 31, 2009 (Unaudited) | |
NOTE 1 – ORGANIZATION
Thornburg International Growth Fund, hereinafter referred to as the “Fund,” is a diversified series of Thornburg Investment Trust (the “Trust”). The Fund commenced operations on February 1, 2007. The Trust was organized as a Massachusetts business trust under a Declaration of Trust dated June 3, 1987 and is registered as a diversified, open-end management investment company under the Investment Company Act of 1940, as amended. The Trust is currently issuing thirteen series of shares of beneficial interest in addition to those of the Fund: Thornburg Limited Term Municipal Fund, Thornburg California Limited Term Municipal Fund, Thornburg Limited Term U.S. Government Fund, Thornburg New Mexico Intermediate Municipal Fund, Thornburg Intermediate Municipal Fund, Thornburg Limited Term Income Fund, Thornburg Value Fund, Thornburg International Value Fund, Thornburg New York Intermediate Municipal Fund, Thornburg Core Growth Fund, Thornburg Investment Income Builder Fund, Thornburg Global Opportunities Fund, and Thornburg Strategic Income Fund. Each series is considered to be a separate entity for financial reporting and tax purposes and bears expenses directly attributable to it. The Fund seeks long-term capital appreciation by investing in equity securities selected for their growth potential.
The Fund currently offers six classes of shares of beneficial interest: Class A, Class C, Institutional Class (Class I), and Retirement Classes (Class R3, Class R4, and Class R5) shares. Each class of shares of the Fund represents an interest in the same portfolio of investments, except that (i) Class A shares are sold subject to a front-end sales charge collected at the time the shares are purchased and bear a service fee, (ii) Class C shares are sold at net asset value without a sales charge at the time of purchase, but are subject to a contingent deferred sales charge upon redemption within one year of purchase, and bear both a service fee and a distribution fee, (iii) Class I shares are sold at net asset value without a sales charge at the time of purchase, (iv) Class R3 shares are sold at net asset value without a sales charge at the time of purchase, but bear both a service fee and distribution fee, (v) Class R4 shares are sold at net asset value without a sales charge at the time of purchase, but bear a service fee, (vi) Class R5 shares are sold at net asset value without a sales charge at the time of purchase, and (vii) the respective classes may have different reinvestment privileges and conversion rights. Additionally, the Fund may allocate among its classes certain expenses, to the extent allowable to specific classes, including transfer agent fees, government registration fees, certain printing and postage costs, and administrative and legal expenses. Currently, class specific expenses of the Fund are limited to service and distribution fees, administration fees, and certain registration and transfer agent expenses.
NOTE 2 – SIGNIFICANT ACCOUNTING POLICIES
Significant accounting policies of the Trust are as follows:
Valuation of Investments: Portfolio securities listed or traded on a national securities exchange are valued on the valuation date at the last reported sale price on the exchange that is the primary market for the security. Portfolio securities traded on an exchange for which there has been no sale that day and other equity securities traded in the over-the-counter market are valued at the mean between the last reported bid and asked prices. Portfolio securities reported by NASDAQ are valued at the NASDAQ official closing price. Any foreign security traded on exchanges outside the United States is valued at the price of the security on the exchange that is normally the security’s primary market, as of the close of that exchange preceding the time of the Fund’s valuation.
Debt obligations held by the Fund have a primary market over the counter and are valued by an independent pricing service approved by the Trustees of the Trust. The pricing service ordinarily values debt obligations at quoted bid prices. When quotations are not available, debt obligations held by the Fund are valued at evaluated prices determined by the pricing service using methods which include consideration of yields or prices of debt obligations of comparable quality, type of issue, coupon, maturity, and rating, and indications as to value from dealers and general market conditions. Short-term obligations having remaining maturities of 60 days or less are valued at amortized cost, which approximates market value.
Quotations in foreign currencies for foreign portfolio investments are converted to U.S. dollar equivalents using the foreign exchange quotation in effect at the time of valuation.
In any case where the market value of an equity security held by the Fund is not readily available, the Trust’s valuation and pricing committee determines a fair value for the security using procedures approved by the Trustees, which may include the use of prices obtained from an independent pricing service. The pricing service ordinarily values equity securities in these instances using multi-factor models to adjust market prices based upon various inputs, including exchange data, depository receipt prices, futures and index data and other data. A security’s market value is deemed not readily available whenever the exchange or market on which the security is primarily traded is closed for the entire scheduled day of trading. Additionally, a security’s market value may be deemed not readily available under other circumstances identified by the Trustees, including when developments occurring after the most recent close of the security’s primary exchange or market, but before the most recent close of trading in Fund shares, create a serious question about the reliability of the security’s market value.
In any case where a pricing service fails to provide a price for a debt obligation held by the Fund, the valuation and pricing committee determines a fair value for the debt obligation using procedures approved by the Trustees. Additionally, in any case where management believes that a price provided by a pricing service for a debt obligation held by the Fund may be unreliable, the valuation and pricing committee decides whether or not to use the pricing service’s valuation or to determine a fair value for the debt obligation.
| Certified Semi-Annual Report 15 |
| NOTES TO FINANCIAL STATEMENTS, CONTINUED | ||
| Thornburg International Growth Fund | March 31, 2009 (Unaudited) | |
In determining fair value for any portfolio security or other investment, the valuation and pricing committee seeks to determine the amount that an owner of the investment might reasonably expect to receive upon a sale of the investment. However, because fair value prices are estimated prices, the valuation and pricing committee’s determination of fair value for an investment may differ from the value that would be realized by the Fund upon a sale of the investment, and that difference could be material to the Fund’s financial statements. The valuation and pricing committee’s determination of fair value for an investment may also differ from the prices obtained by other persons (including other mutual funds) for the investment.
Valuation Measurements: Various inputs are used in determining the value of the Fund’s investments. These inputs are summarized in the three levels listed below.
Level 1: Quoted prices in active markets for identical investments.
Level 2: Other significant observable inputs (including quoted prices for similar investments, interest rates, prepayment rates, credit risk, etc.).
Level 3: Significant unobservable inputs (including the Fund’s own assumptions in determining the fair value of investments).
The following table displays a summary of the inputs used to value the Fund’s net assets as of March 31, 2009. In any instance when valuation inputs from more than one level are used to determine the fair value of a specific investment, the investment is placed in the level of the table based upon the lowest level input that is significant in determining the fair value of the investment:
Valuation Inputs | Investments in Securities | Investments in Other Financial Instruments* | |||||
Level 1 - Quoted Prices in Active Markets for Identical Assets | $ | 40,319,282 | $ | (9,095 | ) | ||
Level 2 - Other Significant Observable Inputs | 588,107 | 4,685 | |||||
Level 3 - Significant Unobservable Inputs | — | — | |||||
Total | $ | 40,907,389 | $ | (4,410 | ) | ||
| * | Other financial instruments include investments not reflected in the Schedule of Investments, such as futures, forwards and swap contracts, which are valued at the unrealized appreciation (depreciation) on the instrument. |
Foreign Currency Translation: Portfolio securities and other assets and liabilities denominated in foreign currencies are translated into U.S. dollars based on the exchange rate of such currencies against the U.S. dollar on the date of valuation. Purchases and sales of securities and income items denominated in foreign currencies are translated into U.S. dollars at the exchange rate in effect on the translation date. When the Fund purchases or sells foreign securities it will customarily enter into a foreign exchange contract to minimize foreign exchange risk from the trade date to the settlement date of such transactions.
The Fund does not separately report the effect of changes in foreign exchange rates from changes in market prices on securities held. Such changes are included in net realized and unrealized gain or loss from investments.
Reported net realized foreign exchange gains or losses arise from sales of foreign currencies, currency gains or losses realized between the trade and settlement dates on securities transactions and the difference between the amounts of dividends, interest, and foreign withholding taxes recorded on the Fund’s books, and the U.S. dollar equivalent of the amounts actually received or paid.
Net unrealized foreign exchange gains and losses arise from changes in the fair value of assets and liabilities, other than investments in securities at fiscal period end, resulting from changes in exchange rates.
Deferred Taxes: The Fund is subject to a tax imposed on net realized gains of securities of certain foreign countries. The Fund records an estimated deferred tax liability for net unrealized gains on these securities as reflected in the accompanying financial statements.
Federal Income Taxes: It is the policy of the Trust to comply with the provisions of the Internal Revenue Code applicable to “regulated investment companies” and to distribute to shareholders substantially all taxable income, including any net realized gain on investments of the Funds. Therefore, no provision for federal income taxes is required.
When-Issued and Delayed Delivery Transactions: The Trust may engage in when-issued or delayed delivery transactions. To the extent the Trust engages in such transactions, it will do so for the purpose of acquiring portfolio securities consistent with the Fund’s investment objectives and not for the purpose of investment leverage or to speculate on interest rate and/or market changes. At the time the Trust makes a commitment to purchase a security on a when-issued or delayed delivery basis, the Fund will record the transaction and reflect the value in determining its net asset value. When effecting such transactions, assets of an amount sufficient to make payment for the portfolio securities to be purchased will be segregated on the Fund’s records on the trade date. Securities purchased on a when-issued or delayed delivery basis do not earn interest until the settlement date.
Dividends: Dividends to shareholders are generally paid quarterly and are reinvested in additional shares of the Fund at net asset value per share at the close of business on the dividend payment date or, at the shareholder’s option, paid in cash. Net realized capital gains, to the extent available, will be distributed at least annually. Distributions to shareholders are based on income tax regulations and therefore, their characteristics may differ for financial statement and tax purposes.
| 16 Certified Semi-Annual Report |
| NOTES TO FINANCIAL STATEMENTS, CONTINUED | ||
| Thornburg International Growth Fund | March 31, 2009 (Unaudited) | |
General: Securities transactions are accounted for on a trade date basis. Interest income is accrued as earned and dividend income is recorded on the ex-dividend date. Certain income from foreign securities is recognized as soon as information is available to the Fund. Realized gains and losses from the sale of securities are recorded on an identified cost basis. Net investment income (other than class specific expenses) and realized and unrealized gains and losses are allocated daily to each class of shares based upon the relative net asset value of outstanding shares of each class of shares at the beginning of the day (after adjusting for the current share activity of the respective class). Expenses common to all funds are allocated among the funds comprising the Trust based upon their relative net asset values or other appropriate allocation methods.
Guarantees and Indemnifications: Under the Trust’s organizational documents, its officers and Trustees are indemnified against certain liabilities arising out of the performance of their duties to the Fund. Additionally, in the normal course of business the Trust enters into contracts with service providers that contain general indemnification clauses. The Trust’s maximum exposure under these arrangements is unknown. However, based on experience, the Trust expects the risk of loss to be remote.
Use of Estimates: The preparation of financial statements, in conformity with generally accepted accounting principles, requires management to make estimates and assumptions that affect the reported amounts of assets and liabilities and the disclosure of contingent assets and liabilities at the date of the financial statements and the reported amounts of increases and decreases in net assets from operations during the reporting period. Actual results could differ from those estimates.
NOTE 3 – INVESTMENT ADVISORY FEE AND OTHER TRANSACTIONS WITH AFFILIATES
Pursuant to an investment advisory agreement, Thornburg Investment Management, Inc. (the “Advisor”) serves as the investment advisor and performs services to the Fund for which the fees are payable at the end of each month. For the six months ended March 31, 2009, these fees were payable at annual rates ranging from .875 of 1% to .675 of 1% per annum of the average daily net assets of the Fund depending on the Fund’s asset size. For the period ended March 31, 2009, the Advisor voluntarily waived investment advisory fees of $64,674. The Trust also has entered into administrative services agreements with the Advisor, whereby the Advisor will perform certain administrative services for the shareholders of each class of the Fund’s shares, and for which fees will be payable at an annual rate of up to .125 of 1% per annum of the average daily net assets attributable to each class of shares. For the six months ended March 31, 2009, the Advisor voluntarily reimbursed certain class specific expenses, administrative fees, and distribution fees of $17,053 for Class A shares, $15,896 for Class C shares, $22,942 for Class I shares, $8,769 for Class R3 shares, $8,602 for Class R4 shares, and $8,602 for Class R5 shares.
The Trust has an underwriting agreement with Thornburg Securities Corporation (the “Distributor,” an affiliate of the Advisor), which acts as the distributor of the Fund’s shares. For the six months ended March 31, 2009, the Distributor has advised the Fund that it earned commissions aggregating $1,201 from the sale of Class A shares, and collected contingent deferred sales charges aggregating $8,094 from redemptions of Class C shares of the Fund.
Pursuant to a service plan under Rule 12b-1 of the Investment Company Act of 1940, the Fund may reimburse to the Advisor an amount not to exceed .25 of 1% per annum of the average daily net assets attributable to each class of shares of the Fund for payments made by the Advisor to securities dealers and other financial institutions to obtain various shareholder and distribution related services. The Advisor may pay out of its own resources additional expenses for distribution of the Fund’s shares.
The Trust has also adopted distribution plans pursuant to Rule 12b-1, applicable only to the Fund’s Class C and Class R3 shares, under which the Fund compensates the Distributor for services in promoting the sale of Class C and Class R3 shares of the Fund at an annual rate of up to .75 of 1% per annum of the average daily net assets attributable to Class C and Class R3 shares. Total fees incurred by the Distributor for each class of shares of the Fund under their respective Service and Distribution Plans for the six months ended March 31, 2009, are set forth in the Statement of Operations.
The Trust has an agreement with the custodian bank to indirectly pay a portion of the custodian’s fees through credits earned by the Fund’s cash on deposit with the bank. This deposit agreement is an alternative to overnight investments. Custodial fees have been adjusted to reflect amounts that would have been paid without this agreement, with a corresponding adjustment reflected as fees paid indirectly in the Statement of Operations. For the six months ended March 31, 2009, fees paid indirectly were $2,083.
Certain officers and Trustees of the Trust are also officers and/or directors of the Advisor and Distributor. The compensation of independent Trustees is borne by the Trust.
| Certified Semi-Annual Report 17 |
| NOTES TO FINANCIAL STATEMENTS, CONTINUED | ||
| Thornburg International Growth Fund | March 31, 2009 (Unaudited) | |
NOTE 4 – SHARES OF BENEFICIAL INTEREST
At March 31, 2009, there were an unlimited number of shares of beneficial interest authorized. Transactions in shares of beneficial interest were as follows:
| Six Months Ended March 31, 2009 (Unaudited) | Year Ended September 30, 2008 (Audited) | |||||||||||||
| Shares | Amount | Shares | Amount | |||||||||||
Class A Shares | ||||||||||||||
Shares sold | 1,018,879 | $ | 7,531,709 | 2,783,429 | $ | 40,878,185 | ||||||||
Shares issued to shareholders in reinvestment of dividends | 42,746 | 313,329 | 63,051 | 972,881 | ||||||||||
Shares repurchased | (1,678,889 | ) | (12,183,604 | ) | (1,786,855 | ) | (22,448,682 | ) | ||||||
Redemption fees received** | — | 534 | — | 1,441 | ||||||||||
Net Increase (Decrease) | (617,264 | ) | $ | (4,338,032 | ) | 1,059,625 | $ | 19,403,825 | ||||||
Class C Shares | ||||||||||||||
Shares sold | 645,574 | $ | 4,590,876 | 1,946,922 | $ | 28,877,850 | ||||||||
Shares issued to shareholders in reinvestment of dividends | 9,948 | 72,724 | 28,999 | 444,555 | ||||||||||
Shares repurchased | (963,266 | ) | (6,895,622 | ) | (497,198 | ) | (6,202,344 | ) | ||||||
Redemption fees received** | — | 473 | — | 956 | ||||||||||
Net Increase (Decrease) | (307,744 | ) | $ | (2,231,549 | ) | 1,478,723 | $ | 23,121,017 | ||||||
Class I Shares | ||||||||||||||
Shares sold | 350,150 | $ | 2,650,130 | 1,311,234 | $ | 18,680,586 | ||||||||
Shares issued to shareholders in reinvestment of dividends | 65,869 | 484,138 | 48,137 | 747,089 | ||||||||||
Shares repurchased | (790,822 | ) | (5,784,831 | ) | (511,958 | ) | (6,390,352 | ) | ||||||
Redemption fees received** | — | 558 | — | 1,118 | ||||||||||
Net Increase (Decrease) | (374,803 | ) | $ | (2,650,005 | ) | 847,413 | $ | 13,038,441 | ||||||
Class R3 Shares* | ||||||||||||||
Shares sold | 63,501 | $ | 479,900 | 11,033 | $ | 151,712 | ||||||||
Shares issued to shareholders in reinvestment of dividends | 264 | 1,928 | — | — | ||||||||||
Shares repurchased | (8,044 | ) | (50,823 | ) | (144 | ) | (1,815 | ) | ||||||
Redemption fees received** | — | 9 | — | 1 | ||||||||||
Net Increase (Decrease) | 55,721 | $ | 431,014 | 10,889 | $ | 149,898 | ||||||||
Class R4 Shares* | ||||||||||||||
Shares sold | — | $ | — | 230 | $ | 3,200 | ||||||||
Shares issued to shareholders in reinvestment of dividends | 7 | 47 | — | — | ||||||||||
Shares repurchased | — | — | — | — | ||||||||||
Redemption fees received** | — | — | — | — | ||||||||||
Net Increase (Decrease) | 7 | $ | 47 | 230 | $ | 3,200 | ||||||||
| 18 Certified Semi-Annual Report |
| NOTES TO FINANCIAL STATEMENTS, CONTINUED | ||
| Thornburg International Growth Fund | March 31, 2009 (Unaudited) | |
| Six Months Ended March 31, 2009 (Unaudited) | Year Ended September 30, 2008 (Audited) | |||||||||
| Shares | Amount | Shares | Amount | |||||||
Class R5 Shares* | ||||||||||
Shares sold | — | $ | — | 229 | $ | 3,254 | ||||
Shares issued to shareholders in reinvestment of dividends | 6 | 43 | — | — | ||||||
Shares repurchased | — | — | — | — | ||||||
Redemption fees received** | — | — | — | — | ||||||
Net Increase (Decrease) | 6 | $ | 43 | 229 | $ | 3,254 | ||||
| * | Effective date of these classes of shares was February 1, 2008. |
| ** | The Fund charges a redemption fee of 1% of the Class A and Class I shares redeemed or exchanged within 30 days of purchase. Redemption fees charged to any class are allocated to all classes upon receipt of payment based on relative net asset values of each class or other appropriate allocation methods. |
NOTE 5 – SECURITIES TRANSACTIONS
For the six months ended March 31, 2009, the Fund had purchase and sale transactions of investment securities (excluding short-term investments) of $23,418,527 and $35,600,720, respectively.
NOTE 6 – INCOME TAXES
At March 31, 2009, information on the tax components of capital is as follows:
Cost of investments for tax purposes | $ | 60,958,986 | ||
Gross unrealized appreciation on a tax basis | $ | 1,328,204 | ||
Gross unrealized depreciation on a tax basis | (21,379,801 | ) | ||
Net unrealized appreciation (depreciation) on investments (tax basis) | $ | (20,051,597 | ) | |
At March 31, 2009, the Fund had deferred tax basis currency losses of $4,974,731, which may be carried forward to offset future capital gains. To the extent such carryforwards are used, capital gain distributions may be reduced to the extent provided by regulations. Such loss carryforwards expire at September 30, 2016.
| Certified Semi-Annual Report 19 |
| NOTES TO FINANCIAL STATEMENTS, CONTINUED | ||
| Thornburg International Growth Fund | March 31, 2009 (Unaudited) | |
NOTE 7 – FINANCIAL INSTRUMENTS WITH OFF-BALANCE SHEET RISK AND FOREIGN INVESTMENT RISK
During the six months ended March 31, 2009, the Fund was a party to financial instruments with off-balance sheet risks, primarily currency forward exchange contracts. A forward exchange contract is an agreement between two parties to exchange different currencies at a specified rate at an agreed upon future date. These contracts are purchased in order to minimize the risk to the Fund with respect to its foreign stock transactions from adverse changes in the relationship between the U.S. dollar and foreign currencies. In each case these contracts have been initiated in conjunction with foreign stock transactions. These instruments may involve market risks in excess of the amount recognized on the Statement of Assets and Liabilities. Such risks would arise from the possible inability of counterparties to meet the terms of their contracts, future movement in currency value and interest rates and contract positions that are not exact offsets. These contracts are reported in the financial statements at the Fund’s net equity, as measured by the difference between the forward exchange rates at the reporting date and the forward exchange rates at the dates of entry into the contract. There are special risks associated with international investing, including currency fluctuations, economic and political instability, confiscation, inability or delays in selling foreign investments, and reduced legal protection for investments.
CONTRACTS TO BUY OR SELL:
Contract Description | Buy/Sell | Contract Amount | Contract Value Date | Value (USD) | Unrealized Appreciation | Unrealized (Depreciation) | ||||||||||
Euro Dollar | Sell | 3,390,000 | 4/30/2009 | $ | 4,402,254 | $ | — | $ | (101,403 | ) | ||||||
Euro Dollar | Buy | 3,390,000 | 4/30/2009 | 4,417,780 | 85,877 | — | ||||||||||
Japanese Yen | Sell | 88,200,000 | 5/7/2009 | 964,040 | 72,615 | — | ||||||||||
Japanese Yen | Sell | 133,050,000 | 5/7/2009 | 1,334,035 | — | (10,681 | ) | |||||||||
Japanese Yen | Buy | 60,120,000 | 5/7/2009 | 638,556 | — | (30,932 | ) | |||||||||
Philippine Peso | Sell | 5,610,000 | 6/15/2009 | 117,119 | 1,794 | — | ||||||||||
Philippine Peso | Sell | 61,815,000 | 6/15/2009 | 1,266,701 | — | (4,030 | ) | |||||||||
Philippine Peso | Buy | 10,550,000 | 6/15/2009 | 219,563 | — | (2,687 | ) | |||||||||
Swiss Franc | Sell | 4,500,000 | 5/4/2009 | 3,881,653 | — | (74,113 | ) | |||||||||
Swiss Franc | Buy | 4,500,000 | 5/4/2009 | 3,887,521 | 68,245 | — | ||||||||||
Total unrealized appreciation (depreciation) from forward exchange contracts | $ | 228,531 | $ | (223,846 | ) | |||||||||||
OTHER NOTES:
Statement of Accounting Standards No. 161:
On March 19, 2008, the Financial Accounting Standards Board issued Statement of Financial Accounting Standards No. 161, “Disclosures about Derivative Instruments and Hedging Activities” (“FAS 161”). FAS 161 is effective for fiscal years and interim periods beginning after November 15, 2008. FAS 161 requires enhanced disclosures about any derivative and hedging activities by the Fund, including how such activities are accounted for and any effect on the Fund’s financial position, performance and cash flows.
| 20 Certified Semi-Annual Report |
Thornburg International Growth Fund
| Six Months Ended March 31, 2009* | Year Ended Sept. 30, 2008 | Period Ended Sept. 30, 2007(a) | ||||||||||
Class A Shares: | ||||||||||||
PER SHARE PERFORMANCE (for a share outstanding throughout the period)+ | ||||||||||||
Net asset value, beginning of period | $ | 10.35 | $ | 14.92 | $ | 11.94 | ||||||
Income from investment operations: | ||||||||||||
Net investment income (loss) | 0.01 | 0.07 | (0.03 | ) | ||||||||
Net realized and unrealized gain (loss) on investments | (3.29 | ) | (4.27 | ) | 3.01 | |||||||
Total from investment operations | (3.28 | ) | (4.20 | ) | 2.98 | |||||||
Less dividends from: | ||||||||||||
Net investment income | (0.13 | ) | — | — | ||||||||
Net realized gains | — | (0.37 | ) | — | ||||||||
Total Dividends | (0.13 | ) | (0.37 | ) | — | |||||||
Change in net asset value | (3.41 | ) | (4.57 | ) | 2.98 | |||||||
NET ASSET VALUE, end of period | $ | 6.94 | $ | 10.35 | $ | 14.92 | ||||||
RATIOS/SUPPLEMENTAL DATA | ||||||||||||
Total return (%)(b) | (31.74 | ) | (28.98 | ) | 24.96 | |||||||
Ratios to average net assets: | ||||||||||||
Net investment income (loss) (%) | 0.17 | (c) | 0.53 | (0.29 | )(c) | |||||||
Expenses, after expense reductions (%) | 1.61 | (c) | 1.56 | 1.64 | (c) | |||||||
Expenses, after expense reductions and net of custody credits (%) | 1.60 | (c) | 1.55 | 1.62 | (c) | |||||||
Expenses, before expense reductions (%) | 2.05 | (c) | 1.63 | 2.10 | (c) | |||||||
Portfolio turnover rate (%) | 47.71 | 54.31 | 113.34 | |||||||||
Net assets at end of period (thousands) | $ | 14,769 | $ | 28,414 | $ | 25,145 | ||||||
| (a) | Fund commenced operations on February 1, 2007. |
| (b) | Sales loads are not reflected in computing total return, which is not annualized for periods less than one year. |
| (c) | Annualized. |
| + | Based on weighted average shares outstanding. |
| * | Unaudited |
See notes to financial statements.
| Certified Semi-Annual Report 21 |
FINANCIAL HIGHLIGHTS, CONTINUED
Thornburg International Growth Fund
| Six Months Ended March 31, 2009* | Year Ended Sept. 30, 2008 | Period Ended Sept. 30, 2007(a) | ||||||||||
Class C Shares: | ||||||||||||
PER SHARE PERFORMANCE (for a share outstanding throughout the period)+ | ||||||||||||
Net asset value, beginning of period | $ | 10.22 | $ | 14.85 | $ | 11.94 | ||||||
Income from investment operations: | ||||||||||||
Net investment income (loss) | (0.02 | ) | (0.03 | ) | (0.10 | ) | ||||||
Net realized and unrealized gain (loss) on investments | (3.24 | ) | (4.23 | ) | 3.01 | |||||||
Total from investment operations | (3.26 | ) | (4.26 | ) | 2.91 | |||||||
Less dividends from: | ||||||||||||
Net investment income | (0.05 | ) | — | — | ||||||||
Net realized gains | — | (0.37 | ) | — | ||||||||
Total Dividends | (0.05 | ) | (0.37 | ) | — | |||||||
Change in net asset value | (3.31 | ) | (4.63 | ) | 2.91 | |||||||
NET ASSET VALUE, end of period | $ | 6.91 | $ | 10.22 | $ | 14.85 | ||||||
RATIOS/SUPPLEMENTAL DATA | ||||||||||||
Total return (%)(b) | (31.93 | ) | (29.53 | ) | 24.37 | |||||||
Ratios to average net assets: | ||||||||||||
Net investment income (loss) (%) | (0.56 | )(c) | (0.23 | ) | (1.13 | )(c) | ||||||
Expenses, after expense reductions (%) | 2.39 | (c) | 2.32 | 2.39 | (c) | |||||||
Expenses, after expense reductions and net of custody credits (%) | 2.38 | (c) | 2.32 | 2.38 | (c) | |||||||
Expenses, before expense reductions (%) | 2.84 | (c) | 2.45 | 3.23 | (c) | |||||||
Portfolio turnover rate (%) | 47.71 | 54.31 | 113.34 | |||||||||
Net assets at end of period (thousands) | $ | 13,846 | $ | 23,638 | $ | 12,376 | ||||||
| (a) | Fund commenced operations on February 1, 2007. |
| (b) | Not annualized for periods less than one year. |
| (c) | Annualized. |
| + | Based on weighted average shares outstanding. |
| * | Unaudited. |
See notes to financial statements.
| 22 Certified Semi-Annual Report |
FINANCIAL HIGHLIGHTS, CONTINUED
Thornburg International Growth Fund
| Six Months Ended March 31, 2009* | Year Ended Sept. 30, 2008 | Period Ended Sept. 30, 2007(a) | ||||||||||
Class I Shares: | ||||||||||||
PER SHARE PERFORMANCE (for a share outstanding throughout the period)+ | ||||||||||||
Net asset value, beginning of period | $ | 10.46 | $ | 14.99 | $ | 11.94 | ||||||
Income from investment operations: | ||||||||||||
Net investment income (loss) | 0.03 | 0.14 | 0.05 | |||||||||
Net realized and unrealized gain (loss) on investments | (3.32 | ) | (4.30 | ) | 3.00 | |||||||
Total from investment operations | (3.29 | ) | (4.16 | ) | 3.05 | |||||||
Less dividends from: | ||||||||||||
Net investment income | (0.20 | ) | — | — | ||||||||
Net realized gains | — | (0.37 | ) | — | ||||||||
Total Dividends | (0.20 | ) | (0.37 | ) | — | |||||||
Change in net asset value | (3.49 | ) | (4.53 | ) | 3.05 | |||||||
NET ASSET VALUE, end of period | $ | 6.97 | $ | 10.46 | $ | 14.99 | ||||||
RATIOS/SUPPLEMENTAL DATA | ||||||||||||
Total return (%)(b) | (31.53 | ) | (28.57 | ) | 25.54 | |||||||
Ratios to average net assets: | ||||||||||||
Net investment income (loss) (%) | 0.82 | (c) | 1.03 | 0.52 | (c) | |||||||
Expenses, after expense reductions (%) | 1.00 | (c) | 1.00 | 1.01 | (c) | |||||||
Expenses, after expense reductions and net of custody credits (%) | 0.99 | (c) | 0.99 | 0.99 | (c) | |||||||
Expenses, before expense reductions (%) | 1.49 | (c) | 1.25 | 1.64 | (c) | |||||||
Portfolio turnover rate (%) | 47.71 | 54.31 | 113.34 | |||||||||
Net assets at end of period (thousands) | $ | 16,161 | $ | 28,164 | $ | 27,659 | ||||||
| (a) | Fund commenced operations on February 1, 2007. |
| (b) | Not annualized for periods less than one year. |
| (c) | Annualized. |
| + | Based on weighted average shares outstanding. |
| * | Unaudited. |
See notes to financial statements.
| Certified Semi-Annual Report 23 |
FINANCIAL HIGHLIGHTS, CONTINUED
Thornburg International Growth Fund
| Six Months Ended March 31, 2009* | Period Ended Sept. 30, 2008 (a) | |||||||
Class R3 Shares: | ||||||||
PER SHARE PERFORMANCE (for a share outstanding throughout the period)+ | ||||||||
Net asset value, beginning of period | $ | 10.36 | $ | 13.94 | ||||
Income from investment operations: | ||||||||
Net investment income (loss) | 0.03 | 0.09 | ||||||
Net realized and unrealized gain (loss) on investments | (3.30 | ) | (3.67 | ) | ||||
Total from investment operations | (3.27 | ) | (3.58 | ) | ||||
Less dividends from: | ||||||||
Net investment income | (0.17 | ) | — | |||||
Change in net asset value | (3.44 | ) | (3.58 | ) | ||||
NET ASSET VALUE, end of period | $ | 6.92 | $ | 10.36 | ||||
RATIOS/SUPPLEMENTAL DATA | ||||||||
Total return (%)(b) | (31.61 | ) | (25.68 | ) | ||||
Ratios to average net assets: | ||||||||
Net investment income (loss) (%) | 0.77 | (c) | 1.08 | (c) | ||||
Expenses, after expense reductions (%) | 1.50 | (c) | 1.50 | (c) | ||||
Expenses, after expense reductions and net of custody credits (%) | 1.50 | (c) | 1.49 | (c) | ||||
Expenses, before expense reductions (%) | 8.43 | (c)(d) | 26.47 | (c)(d) | ||||
Portfolio turnover rate (%) | 47.71 | 54.31 | ||||||
Net assets at end of period (thousands) | $ | 461 | $ | 113 | ||||
| (a) | Effective date of this class of shares was February 1, 2008. (b) Not annualized for periods less than one year. |
| (c) | Annualized. |
| (d) | Due to the size of net assets and fixed expenses, ratios may appear disproportionate. |
| + | Based on weighted average shares outstanding. |
| * | Unaudited. |
See notes to financial statements.
| 24 Certified Semi-Annual Report |
FINANCIAL HIGHLIGHTS, CONTINUED
Thornburg International Growth Fund
| Six Months Ended March 31, 2009* | Period Ended Sept. 30, 2008(a) | |||||||
Class R4 Shares: | ||||||||
PER SHARE PERFORMANCE (for a share outstanding throughout the period)+ | ||||||||
Net asset value, beginning of period | $ | 10.36 | $ | 13.94 | ||||
Income from investment operations: | ||||||||
Net investment income (loss) | 0.02 | 0.10 | ||||||
Net realized and unrealized gain (loss) on investments | (3.29 | ) | (3.68 | ) | ||||
Total from investment operations | (3.27 | ) | (3.58 | ) | ||||
Less dividends from: | ||||||||
Net investment income | (0.20 | ) | — | |||||
Change in net asset value | (3.47 | ) | (3.58 | ) | ||||
NET ASSET VALUE, end of period | $ | 6.89 | $ | 10.36 | ||||
RATIOS/SUPPLEMENTAL DATA | ||||||||
Total return (%)(b) | (31.64 | ) | (25.68 | ) | ||||
Ratios to average net assets: | ||||||||
Net investment income (loss) (%) | 0.51 | (c) | 1.16 | (c) | ||||
Expenses, after expense reductions (%) | 1.37 | (c) | 1.40 | (c) | ||||
Expenses, after expense reductions and net of custody credits (%) | 1.36 | (c) | 1.40 | (c) | ||||
Expenses, before expense reductions (%) | 1,016.59 | (c)(d) | 861.94 | (c)(d) | ||||
Portfolio turnover rate (%) | 47.71 | 54.31 | ||||||
Net assets at end of period (thousands) | $ | 2 | $ | 2 | ||||
| (a) | Effective date of this class of shares was February 1, 2008. |
| (b) | Not annualized for periods less than one year. |
| (c) | Annualized. |
| (d) | Due to the size of net assets and fixed expenses, ratios may appear disproportionate. |
| + | Based on weighted average shares outstanding. |
| * | Unaudited. |
See notes to financial statements.
| Certified Semi-Annual Report 25 |
FINANCIAL HIGHLIGHTS, CONTINUED
Thornburg International Growth Fund
| Six Months Ended March 31, 2009* | Period Ended Sept. 30, 2008 (a) | |||||||
Class R5 Shares: | ||||||||
PER SHARE PERFORMANCE (for a share outstanding throughout the period)+ | ||||||||
Net asset value, beginning of period | $ | 10.46 | $ | 14.03 | ||||
Income from investment operations: | ||||||||
Net investment income (loss) | 0.03 | 0.14 | ||||||
Net realized and unrealized gain (loss) on investments | (3.31 | ) | (3.71 | ) | ||||
Total from investment operations | (3.28 | ) | (3.57 | ) | ||||
Less dividends from: | ||||||||
Net investment income | (0.19 | ) | — | |||||
Change in net asset value | (3.47 | ) | (3.57 | ) | ||||
NET ASSET VALUE, end of period | $ | 6.99 | $ | 10.46 | ||||
RATIOS/SUPPLEMENTAL DATA | ||||||||
Total return (%)(b) | (31.48 | ) | (25.45 | ) | ||||
Ratios to average net assets: | ||||||||
Net investment income (loss) (%) | 0.94 | (c) | 1.57 | (c) | ||||
Expenses, after expense reductions (%) | 0.92 | (c) | 0.96 | (c) | ||||
Expenses, after expense reductions and net of custody credits (%) | 0.91 | (c) | 0.95 | (c) | ||||
Expenses, before expense reductions (%) | 1,011.89 | (c)(d) | 851.43 | (c)(d) | ||||
Portfolio turnover rate (%) | 47.71 | 54.31 | ||||||
Net assets at end of period (thousands) | $ | 2 | $ | 2 | ||||
| (a) | Effective date of this class of shares was February 1, 2008. |
| (b) | Not annualized for periods less than one year. |
| (c) | Annualized. |
| (d) | Due to the size of net assets and fixed expenses, ratios may appear disproportionate. |
| + | Based on weighted average shares outstanding. |
| * | Unaudited. |
See notes to financial statements.
| 26 Certified Semi-Annual Report |
| SCHEDULE OF INVESTMENTS | ||
| Thornburg International Growth Fund | March 31, 2009 (Unaudited) | |
SUMMARY OF INDUSTRY EXPOSURE
As of 3/31/09
Software & Services | 19.4 | % | |
Pharmaceuticals, Biotechnology & Life Sciences | 12.1 | % | |
Telecommunication Services | 10.2 | % | |
Media | 8.0 | % | |
Diversified Financials | 7.5 | % | |
Technology Hardware & Equipment | 5.0 | % | |
Energy | 4.2 | % | |
Food, Beverage & Tobacco | 4.1 | % | |
Utilities | 3.1 | % | |
Banks | 2.9 | % | |
Consumer Services | 2.8 | % | |
Semiconductors & Semiconductor Equipment | 2.6 | % | |
Automobiles & Components | 2.2 | % | |
Commercial & Professional Services | 2.0 | % | |
Capital Goods | 1.1 | % | |
Other | 3.2 | % | |
Other Assets & Cash Equivalents | 9.6 | % |
SUMMARY OF COUNTRY EXPOSURE
As of 3/31/09 (percent of equity holdings)
United Kingdom | 10.9 | % | |
China | 9.2 | % | |
Switzerland | 8.3 | % | |
Canada | 7.5 | % | |
Brazil | 6.6 | % | |
Germany | 6.3 | % | |
Israel | 5.1 | % | |
Japan | 4.5 | % | |
Spain | 4.5 | % | |
Denmark | 4.4 | % | |
Mexico | 3.5 | % | |
Philippines | 3.5 | % | |
Indonesia | 3.3 | % | |
Taiwan | 2.8 | % | |
Norway | 2.6 | % | |
United States | 2.3 | % | |
Turkey | 2.2 | % | |
Australia | 2.2 | % | |
Russia | 1.7 | % | |
Hong Kong | 1.6 | % | |
Korea | 1.2 | % | |
Italy | 0.9 | % | |
Cyprus | 0.8 | % | |
Qatar | 0.6 | % | |
Other | 3.5 | % |
| Certified Semi-Annual Report 27 |
| SCHEDULE OF INVESTMENTS, CONTINUED | ||
| Thornburg International Growth Fund | March 31, 2009 (Unaudited) | |
| Shares/ Principal Amount | Value | ||||
COMMON STOCK — 87.19% | |||||
AUTOMOBILES & COMPONENTS — 2.21% | |||||
AUTOMOBILES — 2.21% | |||||
Porsche Automobil Holding SE+ | 21,300 | $ | 1,001,225 | ||
| 1,001,225 | |||||
BANKS — 2.88% | |||||
COMMERCIAL BANKS — 2.88% | |||||
Asya Katilim Bankasi AS+ | 543,200 | 362,623 | |||
BPM Group | 70,200 | 349,754 | |||
Commercial Bank of Qatar | 19,100 | 242,838 | |||
Marfin Popular Bank ADR+ | 83,350 | 345,269 | |||
| 1,300,484 | |||||
CAPITAL GOODS — 1.12% | |||||
MACHINERY — 1.12% | |||||
Taewoong Co., Ltd. | 8,300 | 508,231 | |||
| 508,231 | |||||
COMMERCIAL & PROFESSIONAL SERVICES — 1.99% | |||||
COMMERCIAL SERVICES & SUPPLIES — 1.99% | |||||
Seek Ltd. | 461,665 | 898,852 | |||
| 898,852 | |||||
CONSUMER SERVICES — 2.79% | |||||
DIVERSIFIED CONSUMER SERVICES | |||||
New Oriental Education & Technology Group, Inc. ADR+ | 25,100 | 1,261,275 | |||
| 1,261,275 | |||||
DIVERSIFIED FINANCIALS — 7.47% | |||||
DIVERSIFIED FINANCIAL SERVICES — 7.47% | |||||
Banco ABC Brasil S.A. | 204,500 | 498,963 | |||
BM&F Bovespa SA | 436,935 | 1,324,131 | |||
Deutsche Börse AG | 25,800 | 1,555,530 | |||
| 3,378,624 | |||||
ENERGY — 4.18% | |||||
OIL, GAS & CONSUMABLE FUELS — 4.18% | |||||
OAO Gazprom ADR | 46,000 | 683,100 | |||
Petroleo Brasileiro SA ADR | 22,100 | 673,387 | |||
Tupras-Turkiye Petrol Rafinerileri A.S. | 53,400 | 536,328 | |||
| 1,892,815 | |||||
FOOD, BEVERAGE & TOBACCO — 4.12% | |||||
FOOD PRODUCTS — 4.12% | |||||
Nestlé S.A. | 55,110 | 1,862,982 | |||
| 1,862,982 | |||||
| 28 Certified Semi-Annual Report |
| SCHEDULE OF INVESTMENTS, CONTINUED | ||
| Thornburg International Growth Fund | March 31, 2009 (Unaudited) | |
| Shares/ Principal Amount | Value | ||||
MEDIA — 8.00% | |||||
MEDIA — 8.00% | |||||
Airmedia Group, Inc. ADR+ | 310,891 | $ | 1,302,633 | ||
British Sky Broadcasting Group plc | 200,100 | 1,244,637 | |||
RRsat Global Communications Network | 89,211 | 1,070,532 | |||
| 3,617,802 | |||||
PHARMACEUTICALS, BIOTECHNOLOGY & LIFE SCIENCES — 12.07% | |||||
PHARMACEUTICALS — 12.07% | |||||
Novo Nordisk A/S | 38,000 | 1,819,901 | |||
Pronova BioPharma AS+ | 405,500 | 1,080,094 | |||
Roche Holding AG | 11,100 | 1,523,166 | |||
Teva Pharmaceutical Industries Ltd. ADR | 23,000 | 1,036,150 | |||
| 5,459,311 | |||||
SEMICONDUCTORS & SEMICONDUCTOR EQUIPMENT — 2.57% | |||||
SEMICONDUCTORS & SEMICONDUCTOR EQUIPMENT — 2.57% | |||||
Taiwan Semiconductor Manufacturing Co., Ltd. ADR | 130,000 | 1,163,500 | |||
| 1,163,500 | |||||
SOFTWARE & SERVICES — 19.43% | |||||
INFORMATION TECHNOLOGY SERVICES — 0.43% | |||||
Redecard SA | 16,300 | 197,096 | |||
INTERNET SOFTWARE & SERVICES — 9.07% | |||||
Baidu, Inc. ADR+ | 6,700 | 1,183,220 | |||
Open Text Corp.+ | 41,800 | 1,439,592 | |||
Telecity Group plc+ | 486,200 | 1,478,963 | |||
SOFTWARE — 9.93% | |||||
Amdocs Ltd.+ | 92,829 | 1,719,193 | |||
Nintendo Co. Ltd. | 6,400 | 1,839,471 | |||
Solera Holdings, Inc.+ | 37,700 | 934,206 | |||
| 8,791,741 | |||||
TECHNOLOGY HARDWARE & EQUIPMENT — 5.04% | |||||
COMMUNICATIONS EQUIPMENT — 3.63% | |||||
Research In Motion Ltd.+ | 38,100 | 1,640,967 | |||
ELECTRONIC EQUIPMENT, INSTRUMENTS & COMPONENTS — 1.41% | |||||
China Security & Surveillance Technology, Inc.+ | 166,300 | 638,592 | |||
| 2,279,559 | |||||
TELECOMMUNICATION SERVICES — 10.20% | |||||
DIVERSIFIED TELECOMMUNICATION SERVICES — 7.07% | |||||
PT Telekomunikasi Indonesia | 2,084,000 | 1,361,679 | |||
Telefónica SA | 92,000 | 1,835,913 | |||
WIRELESS TELECOMMUNICATION SERVICES — 3.13% | |||||
America Móvil SAB de C.V. | 1,040,800 | 1,417,369 | |||
| 4,614,961 | |||||
| Certified Semi-Annual Report 29 |
| SCHEDULE OF INVESTMENTS, CONTINUED | ||
| Thornburg International Growth Fund | March 31, 2009 (Unaudited) | |
| Shares/ Principal Amount | Value | ||||
UTILITIES — 3.12% | |||||
INDEPENDENT POWER PRODUCERS & ENERGY TRADERS — 3.12% | |||||
PNOC Energy Development Corp. | 17,498,131 | $ | 1,412,162 | ||
| 1,412,162 | |||||
TOTAL COMMON STOCK (Cost $59,592,649) | 39,443,524 | ||||
EXCHANGE TRADED FUNDS — 3.23% | |||||
iShares MSCI EAFE Small Cap Index | 31,400 | 709,640 | |||
iShares MSCI Emerging Markets Index | 30,400 | 754,225 | |||
TOTAL EXCHANGE TRADED FUNDS (Cost $1,366,337) | 1,463,865 | ||||
TOTAL INVESTMENTS — 90.42% (Cost $60,958,986) | $ | 40,907,389 | |||
OTHER ASSETS LESS LIABILITIES — 9.58% | 4,333,101 | ||||
NET ASSETS — 100.00% | $ | 45,240,490 | |||
Footnote Legend
| + | Non-income producing |
Portfolio Abbreviations
To simplify the listings of securities, abbreviations are used per the table below:
| ADR | American Depository Receipt |
See notes to financial statements.
| 30 Certified Semi-Annual Report |
| EXPENSE EXAMPLE | ||
| Thornburg International Growth Fund | March 31, 2009 (Unaudited) | |
As a shareholder of the Fund, you incur two types of costs:
(1) transaction costs, including
(a) sales charges (loads) on purchase payments for Class A shares;
(b) a deferred sales charge on redemptions of any part or all of a purchase of $1 million of Class A shares within 12 months of purchase;
(c) a deferred sales charge on redemptions of Class C shares within 12 months of purchase;
(d) a 30-day redemption fee on Class A and Class I shares;
(2) ongoing costs, including management fees; distribution and/or service (12b-1) fees; and other Fund expenses.
This example is intended to help you understand your ongoing costs (in dollars) of investing in the Fund and to compare these costs with the ongoing costs of investing in other mutual funds.
The example is based on an investment of $1,000 invested on September 30, 2008 and held until March 31, 2009.
| Beginning Account Value 9/30/08 | Ending Account Value 3/31/09 | Expenses Paid During Period† 9/30/08–3/31/09 | |||||||
Class A Shares | |||||||||
Actual | $ | 1,000.00 | $ | 682.60 | $ | 6.73 | |||
Hypothetical* | $ | 1,000.00 | $ | 1,016.93 | $ | 8.07 | |||
Class C Shares | |||||||||
Actual | $ | 1,000.00 | $ | 680.70 | $ | 9.96 | |||
Hypothetical* | $ | 1,000.00 | $ | 1,013.08 | $ | 11.93 | |||
Class I Shares | |||||||||
Actual | $ | 1,000.00 | $ | 684.70 | $ | 4.16 | |||
Hypothetical* | $ | 1,000.00 | $ | 1,020.00 | $ | 4.99 | |||
Class R3 Shares | |||||||||
Actual | $ | 1,000.00 | $ | 683.90 | $ | 6.30 | |||
Hypothetical* | $ | 1,000.00 | $ | 1,017.45 | $ | 7.54 | |||
Class R4 Shares | |||||||||
Actual | $ | 1,000.00 | $ | 683.60 | $ | 5.71 | |||
Hypothetical* | $ | 1,000.00 | $ | 1,018.15 | $ | 6.84 | |||
Class R5 Shares | |||||||||
Actual | $ | 1,000.00 | $ | 685.20 | $ | 3.83 | |||
Hypothetical* | $ | 1,000.00 | $ | 1,020.39 | $ | 4.59 | |||
| † | Expenses are equal to the annualized expense ratio for each class (A: 1.60%; C: 2.38%; I: 0.99%; R3: 1.50%; R4: 1.36%; R5: 0.91%) multiplied by the average account value over the period, multiplied by 182/365 to reflect the one-half year period. |
| * | Hypothetical assumes a rate of return of 5% per year before expenses. |
Actual Expenses
For each class of shares, the first line of the table at right provides information about actual account values and actual expenses. You may use the information in this line, together with the amount you invested, to estimate the expenses that you paid over the period. Simply divide your account value by $1,000 (for example, an $8,600 account value divided by $1,000 = 8.6), then multiply the result by the number in the first line for your class of shares under the heading entitled “Expenses Paid During Period” to estimate the expenses you paid on your account during this period.
Hypothetical Example for Comparison Purposes
For each class of shares, the second line of the table at right provides information about hypothetical account values and hypothetical expenses based on the Fund’s actual expense ratio and an assumed rate of return of 5% per year before expenses, which is not the Fund’s actual return. The hypothetical account values and expenses may not be used to estimate the actual ending account balance or expenses you paid for the period.
You may use this information to compare the ongoing costs of investing in the Fund and other funds. To do so, compare this 5% hypothetical example with the 5% hypothetical examples that appear in the shareholder reports of the other funds.
Please note that the expenses shown in the table are meant to highlight your ongoing costs only and do not reflect any transactional costs, such as sales charges (loads), redemption fees, or exchange fees. Therefore, the second line of the table for each class of shares is useful in comparing ongoing costs only, and will not help you determine the relative total costs of owning different funds. In addition, if these transactional costs were included, your costs would have been higher.
| Certified Semi-Annual Report 31 |
| INDEX COMPARISON | ||
| Thornburg International Growth Fund | March 31, 2009 (Unaudited) | |
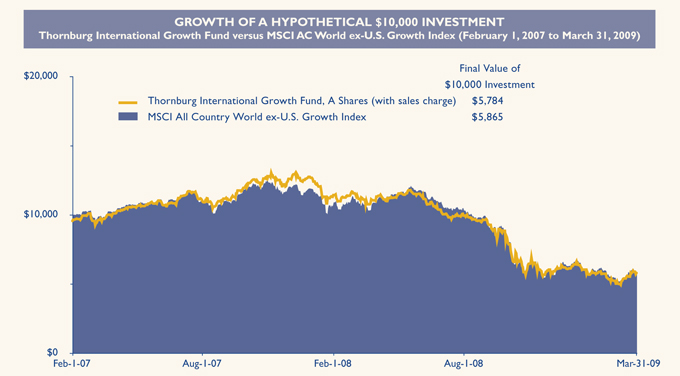
AVERAGE ANNUAL TOTAL RETURNS
For periods ended March 31, 2009 (with sales charge)
| 1 Yr | Since Inception | |||||
A Shares (Incep: 2/1/07) | -49.75 | % | -22.39 | % | ||
C Shares (Incep: 2/1/07) | -48.29 | % | -21.28 | % | ||
I Shares (Incep: 2/1/07) | -47.06 | % | -20.22 | % | ||
R3 Shares (Incep: 2/1/08) | -47.28 | % | -44.15 | % | ||
R4 Shares (Incep: 2/1/08) | -47.30 | % | -44.17 | % | ||
R5 Shares (Incep: 2/1/08) | -47.03 | % | -43.91 | % | ||
MSCI All Country World ex-U.S. Growth Index (Since: 2/1/07) | -45.98 | % | -21.94 | % |
Performance data reflects past performance, which is no guarantee of future results. The performance data and graph do not reflect the deduction of taxes that a shareholder would pay on distributions or the redemption of Fund shares.
Returns reflect the reinvestment of dividends and capital gains as well as applicable sales charges. Class A shares are sold with a maximum sales charge of 4.50%. Class C shares are subject to a 1% contingent deferred sales charge (CDSC) for the first year only. There is no up-front sales charge for Class I, R3, R4 and R5 shares. Class A and Class I shares are subject to a 1% 30-day redemption fee.
The MSCI All Country (AC) World ex-U.S. Growth Index includes growth companies in developed and emerging markets throughout the world, excluding the United States. Indices do not take into account fees and expenses. Investors cannot make direct investments in an index.
| 32 Certified Semi-Annual Report |
| OTHER INFORMATION | ||
| Thornburg International Growth Fund | March 31, 2009 (Unaudited) | |
PORTFOLIO PROXY VOTING
Policies and Procedures:
The Trust has delegated to Thornburg Investment Management, Inc. (the “Advisor”) voting decisions respecting proxies for the Fund’s voting securities. The Advisor makes voting decisions in accordance with its Proxy Voting Policy and Procedures. A description of the Policy and Procedures is available (i) without charge, upon request, by calling the Advisor toll-free at 1-800-847-0200, (ii) on the Thornburg website at www.thornburg.com, and (iii) on the Securities and Exchange Commission’s website at www.sec.gov.
Information regarding how proxies were voted is available on or before August 31 of each year for the twelve months ending the preceding June 30. This information is available (i) without charge, upon request by calling the Advisor toll-free at
1-800-847-0200, (ii) on the Thornburg web site at www. thornburg.com, and (iii) on the Securities and Exchange Commission’s web site at www.sec.gov.
AVAILABILITY OF QUARTERLY PORTFOLIO SCHEDULE
The Fund files with the Securities and Exchange Commission schedules of its portfolio holdings on Form N-Q for the first and third quarters of each fiscal year. The Fund’s Forms N-Q are available on the Commission’s web site at www.sec.gov, or may be reviewed and copied at the Commission’s Public Reference Room in Washington, D.C. Information on the operation of the Public Reference Room may be obtained by calling 1-800-SEC-0330. The Fund also makes this information available on its web site at www. thornburg.com/download or upon request by calling 1-800-847-0200.
| Certified Semi-Annual Report 33 |
Trustees’ Statement to Shareholders
Not part of the Certified Semi-Annual Report
February 8, 2005, as readopted September 15, 2008
The Trustees are concerned that ongoing commentaries and opinions reported in the media may confuse investors in general as to the supervisory duties of trustees of mutual funds and, in particular, leave Thornburg Investment Trust shareholders uncertain regarding how we discharge our responsibilities in supervising the Funds’ investment advisor and in reviewing the advisor’s contract for renewal. We decided to spell out clearly three principal guidelines that we follow in supervising the Trust’s investment advisor on your behalf.
We begin with the premise that each shareholder selected his or her Fund because its investments are managed by the investment advisor identified in the prospectus and in accordance with the objective and policies described in the prospectus. We realize, as each of you do, that if you believe that your Fund’s stated objective and policies no longer serve your personal investment goals, you can sell your shares and leave the Fund.
Therefore, we believe that our primary supervisory task – our principal obligation to you – is to assess the nature and quality of the advisor’s services, and to confirm that the advisor actively and competently pursues the Fund’s objective, in accordance with the policies set out in the prospectus. To do this, we meet regularly with management to review your Fund’s portfolio and to discuss the advisor’s specific actions and judgments in pursuing the Fund’s objective. We do not substitute our own judgment for the advisor’s decisions in selecting investments; the advisor is paid to exercise its informed judgment on investment decisions, and we seek to confirm, in reviewing the advisor’s performance, that the advisor is doing just that.
Second, while we are conscious of costs and the effect that costs have on shareholders’ returns, we do not seek the lowest fees or expense ratio as our sole or primary objective. We try to make sure that your Fund’s fees and costs are reasonable in relationship to the services rendered and that they are generally in line with those charged by other expert investment advisors, consistent with our belief that the Fund’s investors searched for and expect that expertise and attention and have decided to pay a reasonable price for it. We do not put the management contract “out to bid” as a matter of course, and we would not do so unless we had concluded that the advisor materially had failed to pursue the Fund’s objectives in accordance with its policies, or for other equally important reasons. We believe that any other approach would be inconsistent with your interests and contrary to your expectations when you bought shares of the Fund in the first place.
Finally, because we believe that most Thornburg Fund shareholders have invested with a long-term perspective, we try not to focus too much on the fashions of the moment and on short-term performance. The market will not favor any specific investment objective or set of policies at all times and under all economic circumstances. A fund will experience periods of both high and low returns relative to other funds and other investments. Even if one of our Funds is not favored by the market at a particular time, we believe that the advisor is nonetheless obliged to remain true to the Fund’s objective and policies, and we watch to see that it does so.
| 34 This page is not part of the Semi-Annual Report. |
Planning Options
Retirement and Education Accounts
Thornburg Investment Management offers retirement and education savings accounts that can help you meet a variety of planning challenges. For account applications or further information on any of the accounts below, please call 1-800-847-0200 or go to www.thornburg.com/ira. Your financial advisor can help you determine which plan is right for you.
Individual Retirement Accounts
Individual Retirement Accounts (IRAs) provide a tax-advantaged means to save money for the future. For a detailed outline of the difference between retirement accounts, see www.thornburg.com/ira. Rollovers are available. Call 1-800-847-0200 for more information.
Traditional IRAs – Contributions to Traditional IRAs are tax deductible for eligible individuals, and withdrawals are taxed as additional ordinary income. You may contribute to an IRA if you receive compensation and are under 70 1/2, even if you are covered by an employer retirement plan. Deductible contributions are subject to certain qualifications. Please consult your tax advisor.
Roth IRAs – Under a Roth IRA, there is no tax deduction for contributions, but there is no income tax on qualified withdrawals. For a more detailed comparison of Traditional and Roth IRAs, please see our web site at www.thornburg.com/ira.
SEP IRAs – Simplified Employee Pension (SEP) IRAs are established by employers. The employer is allowed a tax deduction for contributions made to the SEP Plan and makes contributions to each eligible employee’s SEP IRA on a discretionary basis.
SIMPLE IRAs – Savings Incentive Match Plan for Employees of Small Employers (SIMPLE) is designed to give small business owners a simplified method to establish and contribute to a retirement plan for employees. The employer is allowed a tax deduction for contributions and makes either matching or non-elective contributions to each eligible employee’s SIMPLE IRA. Employees may make salary deferral contributions.
Coverdell Education Savings Account
These savings accounts are designed to provide a way to save money for higher education expenses. In an Education Savings Account, earnings and interest grow tax-free, and qualified withdrawals used to pay for eligible higher-education expenses are tax- and penalty-free.
Funds Available
The following funds are available in the accounts listed above:
| • | Thornburg International Value Fund |
| • | Thornburg Value Fund |
| • | Thornburg Core Growth Fund |
| • | Thornburg Investment Income Builder Fund |
| • | Thornburg Global Opportunities Fund |
| • | Thornburg International Growth Fund |
| • | Thornburg Limited Term U.S. Government Fund |
| • | Thornburg Limited Term Income Fund |
| • | Thornburg Strategic Income Fund |
| This page is not part of the Semi-Annual Report. 35 |

| 36 This page is not part of the Semi-Annual Report. |
Thornburg Equity Funds
Thornburg’s equity research uses a fundamental and comprehensive analytical approach. Thornburg equity funds focus on a limited number of securities so that each holding can impact performance. The equity team searches for firms believed to have a promising future and seeks to buy shares of those companies at a discount to their intrinsic value.
| • | Thornburg Value Fund |
| • | Thornburg International Value Fund |
| • | Thornburg Core Growth Fund |
| • | Thornburg Investment Income Builder Fund |
| • | Thornburg Global Opportunities Fund |
| • | Thornburg International Growth Fund |
Thornburg Bond Funds
Thornburg Investment Management applies a disciplined philosophy to fixed-income management. Since the launch of our first fixed-income fund 25 years ago, we have been conducting fundamental, bottom-up research in an effort to identify bonds which we believe provide the best return for a given level of risk. We are very organic in our approach, avoiding leverage or complex strategies which could backfire in periods of market uncertainty.
| • | Thornburg Limited Term Municipal Fund |
| • | Thornburg Intermediate Municipal Fund |
| • | Thornburg California Limited Term Municipal Fund |
| • | Thornburg New Mexico Intermediate Municipal Fund |
| • | Thornburg New York Intermediate Municipal Fund |
| • | Thornburg Strategic Municipal Income Fund |
| • | Thornburg Limited Term U.S. Government Fund |
| • | Thornburg Limited Term Income Fund |
| • | Thornburg Strategic Income Fund |
Before investing, carefully consider the Fund’s investment goals, risks, charges, and expenses. For a prospectus containing this and other information, contact your financial advisor or visit thornburg.com. Read it carefully before investing.
For additional information, please visit www.thornburg.com
Thornburg Investment Management, Inc. 2300 North Ridgetop Road, Santa Fe, NM 87506
| This page is not part of the Semi-Annual Report. 37 |
This page intentionally left blank.
| 38 This page is not part of the Semi-Annual Report. |
This page intentionally left blank.
| This page is not part of the Semi-Annual Report. 39 |

| This Semi-Annual Report is submitted for the general information of shareholders of the Fund. It is not authorized for distribution to prospective investors in the Fund unless preceded or accompanied by an effective prospectus. | ||
 | Investment Advisor:
Thornburg Investment Management® 800.847.0200 | |
Distributor:
Thornburg Securities Corporation® 800.847.0200 | ||
| TH1409 | ||
| Waste not, |  | |
| Wait not |
Get instant access to your shareholder reports.
By switching from your postal mailbox to your email inbox, you reduce paper clutter, improve record keeping access, and help conserve our natural resources.
Go to www.thornburg.com/edelivery and sign up to receive your shareholder reports, prospectuses, and proxy statements electronically.
You invest in the future, without spending a dime.

| 2 | This page is not part of the Semi-Annual Report. |

Thornburg Strategic Income Fund
March 31, 2009
Table of Contents
| 6 | ||
| 8 | ||
| 9 | ||
| 11 | ||
| 12 | ||
| 17 | ||
| 20 | ||
| 31 | ||
| 32 | ||
This report is certified under the Sarbanes-Oxley Act of 2002, which requires that public companies, including mutual funds, affirm that the information provided in their annual and semiannual shareholder reports fully and fairly represents their financial position.
| Certified Semi-Annual Report | 3 |
This page intentionally left blank.
| 4 | Certified Semi-Annual Report |
Important Information
The information presented on the following pages was current as of March 31, 2009. The managers’ views, portfolio holdings, and sector and country diversification are provided for the general information of the Fund’s shareholders; they are historical and subject to change. This material should not be deemed a recommendation to buy or sell any of the securities mentioned.
Investments in the Fund carry risks including possible loss of principal. As with direct bond ownership, funds that invest in bonds are subject to certain risks including interest rate risk, credit risk, and inflation risk. The principal value of bonds will fluctuate relative to changes in interest rates, decreasing when interest rates rise. Unlike bonds, bond funds have ongoing fees and expenses. Investments in structured finance arrangements and other types of derivatives are subject to the risks associated with the securities or other assets underlying the pool of securities including illiquidity and difficulty in valuation, and also may involve risks different or greater than the risks affecting the underlying assets. Investing outside the United States involves additional risks, such as currency fluctuations. Additionally, the Fund may invest a portion of the assets in small capitalization companies and in emerging markets which may increase the risk of greater price fluctuations. Investments in the Fund are not FDIC insured, nor are they deposits of or guaranteed by a bank or any other entity. There is no guarantee that the Fund will meet its investment objectives.
Performance data shown represents past performance and is no guarantee of future results. Investment return and principal value will fluctuate so shares, when redeemed, may be worth more or less than their original cost. Current performance may be lower or higher than quoted. For performance current to the most recent month end, visit thornburg.com.
Performance data given at net asset value (NAV) does not take into account the applicable sales charges. If the sales charges had been included, the performance would have been lower.
Class I shares may not be available to all investors. Minimum investments for Class I shares may be higher than those for other classes.
Share Class | NASDAQ Symbol | Cusip | ||
Class A | TSIAX | 885-215-228 | ||
Class C | TSICX | 885-215-210 | ||
Class I | TSIIX | 885-215-194 |
Glossary
Blended Benchmark – The Blended Benchmark is comprised of 80% Barclays Capital Aggregate Bond Index and 20% MSCI World Index. The Barclays Capital Aggregate Bond Index is composed of approximately 6,000 publicly traded bonds including U.S. government, mortgage-backed, corporate and Yankee bonds with an average maturity of approximately 10 years. The index is weighted by the market value of the bonds included in the index. The Morgan Stanley Capital International (MSCI) World Index is an unmanaged market-weighted index that consists of over 1,200 equity securities traded in 23 of the world’s most developed countries. The index is calculated with net dividends reinvested, in U.S. dollars.
Barclays Capital U.S. Corporate High Yield Index – Index covering the USD-denominated, non-investment grade, fixed-rate, taxable corporate bond market. Securities are classified as high-yield if the middle rating of Moody’s, Fitch, and S&P is Ba1/BB+/BB+ or below. The index excludes Emerging Markets debt.
Barclays Capital U.S. Universal Index – Represents the union of the U.S. Aggregate Index, U.S. Corporate High-Yield Index, Investment-Grade 144A Index, Eurodollar Index, U.S. Emerging Markets Index, and the non-ERISA eligible portion of the CMBS Index. The index covers USD-denominated, taxable bonds that are rated either investment-grade or below investment-grade.
Barclays Capital U.S. Corporate Investment Grade Index – Index covering USD-denominated, investment-grade, fixed-rate, taxable securities sold by industrial, utility and financial issuers. It includes publicly issued U.S. corporate and foreign debentures and secured notes that meet specified maturity, liquidity, and quality requirements.
Unless otherwise noted, index returns reflect the reinvestment of income dividends and capital gains, if any, but do not reflect fees, brokerage commissions or other expenses of investing. Investors may not make direct investments into any index. The performance of any index is not indicative of the performance of any particular investment.
Duration – The weighted maturity of a bond’s cash flows. Duration measures the price sensitivity of a bond for a given change in interest rates. Bonds with longer durations experience greater price volatility than bond with shorter durations.
Leverage – The amount of debt used to finance a firm’s assets. A firm with significantly more debt than equity is considered to be highly leveraged.
U.S. Treasury Securities – U.S. Treasury securities, such as bills, notes and bonds, are negotiable debt obligations of the U.S. government. These debt obligations are backed by the “full faith and credit” of the government and issued at various schedules and maturities. Income from Treasury securities is exempt from state and local, but not federal income taxes.
| Certified Semi-Annual Report | 5 |
Jason Brady,CFA Co-Portfolio Manager | April 19, 2009 | |
Dear Fellow Shareholder:
We are happy to present the Semi-Annual Report for the Thornburg Strategic Income Fund for the period ended March 31, 2009. The net asset value of a Class A share of the Fund decreased $1.23 to $9.34 since September 30, 2008. If you were invested for the entire period, you received dividends of 38.0 cents per share. If you reinvested your dividends, you received 38.7 cents per share. The dividend per share was higher for Class I shares and lower for Class C shares, to account for varying class-specific expenses. | ||
George Strickland Co-Portfolio Manager |
Since the Fund’s inception, we have been navigating an environment of very high volatility in both the global fixed income and equity markets. We believe we are well positioned to continue to pursue the Fund’s primary goal, which is a relatively high level of current income. | |
Putting income and price change together, the Class A shares of the Thornburg Strategic Income Fund produced a total return of negative 7.98% (at NAV) since September 30, 2008. A blended index of 80% of the Barclays Aggregate Bond Index and 20% of the MSCI World index produced a negative 3.21% total return over the same time period. The Barclays U.S. Universal Index and the Barclays U.S. High Yield Index produced total returns of 3.12% and negative 12.97%, respectively. These indices reflect no deduction for fees, expenses, or taxes. | ||
Given the above figures, it has obviously been a challenging period. Owning less credit worthy assets in 2008 was a losing proposition relative to credit-risk free assets such as U.S. Treasuries (a major component of both the Barclays Aggregate and Barclays Universal Indices). However, some of the ugliness of 2008 has appeared to turn around in 2009 as spreads have tightened and credit has performed better, even in the face of negative equity returns. While recent returns have been unpleasant, opportunities for long-term yield have multiplied. Furthermore, by not limiting the Fund to one source of income, the Fund has been able to mitigate large downdrafts in equities and speculative-grade corporate bonds. | ||
| The U.S. economy is now officially in recession, though as investors we need to be more interested in what is to come. With spread product, particularly corporate bonds, at levels only seen previously in the Great Depression, it is important to remember that lower prices and correspondingly higher yields can go a long way towards mitigating risk, especially relative to other asset classes like Treasuries or equities. We fully expect a 15% annual default level in high-yield bonds going forward, which would exceed both the 1991 Drexel-dominated meltdown as well as the 2001 telecom bust. High-grade bonds, particularly financials (which dominate the high-grade index: they comprise 34% of it) continue to be vulnerable and it is possible that defaults there will exceed any period in recent history. That said, spreads are still pricing significant multiples of any previous default experience, and that makes the corporate asset class attractive. | ||


| 6 | Certified Semi-Annual Report |
Economically, as we said in our last letter, we expect consumer spending to slow as leverage comes down and savings rates climb. This is healthy in the long term but potentially painful in the short term. As a result, we are cautious on sectors such as retail, given that the environment may be much different going forward than the one many companies expected only a few quarters ago. Leverage generally, for the investment community, corporations, and individuals, is likely to decline. Again, this is healthy in the sense that it makes the “system” more robust, but it also hampers returns relative to the past decade. We believe generally this is to the advantage of shareholders of the Strategic Income Fund. With the leveraged investor broadly on the sidelines, the “real money” investor can take advantage of attractive unlevered returns which had been unavailable until the leveraged houses of cards collapsed.
For these reasons, we believe that remaining invested in income-producing assets is crucial. As many market participants have run to the safety of U.S. Treasuries, some front-end maturities continue to sell at negative yields. This reflects extreme risk aversion which is unlikely to be rewarded over a long period of time. On the other side of the investment spectrum, the Fund could certainly print a higher “yield,” but our objective remains a high level of current income and the default environment which we envision is inconsistent with a heavier weighting in speculative-grade corporates or a wholesale downgrading of the portfolio. Instead, selectively investing in high quality companies and assets while keeping an eye on income production is this Fund’s goal and a mindset which we believe will serve our shareholders over time and across many different environments.
Thank you very much for investing in our Funds. We believe that the Thornburg Strategic Income Fund continues to be an appropriate investment for those looking for an attractive, sustainable yield from a variety of instruments. While future performance cannot be guaranteed, Thornburg Investment Management will continue to strive to chart a steady course in what continues to be a volatile marketplace.
| Regards, | ||||
 |  | |||
| Jason Brady,CFA | George Strickland | |||
| Co-Portfolio Manager | Co-Portfolio Manager | |||
| Managing Director | Managing Director | |||
The matters discussed in this report may constitute forward-looking statements made pursuant to the safe harbor provisions of the Securities Litigation Reform Act of 1995. These include any advisor or portfolio manager prediction, assessment, analysis or outlook for individual securities, industries, investment styles, market sectors and/or markets. These statements involve risks and uncertainties. In addition to the general risks described for each fund in its current prospectus, other factors bearing on these reports include the accuracy of the advisor’s or portfolio manager’s forecasts and predictions, the appropriateness of the investment strategies designed by the advisor or portfolio manager, and the ability of the advisor or portfolio manager to implement their strategies efficiently and successfully. Any one or more of these factors, as well as other risks affecting the securities markets generally, could cause the actual results of any fund to differ materially as compared to its benchmarks.
| Certified Semi-Annual Report | 7 |
| STATEMENT OF ASSETS AND LIABILITIES | ||
Thornburg Strategic Income Fund | March 31, 2009 (Unaudited) | |
ASSETS | ||||
Investments at value (cost $86,457,940) (Note 2) | $ | 74,929,168 | ||
Cash | 1,197,118 | |||
Receivable for fund shares sold | 704,350 | |||
Dividends receivable | 36,922 | |||
Interest receivable | 1,210,627 | |||
Prepaid expenses and other assets | 36,333 | |||
Total Assets | 78,114,518 | |||
LIABILITIES | ||||
Payable for securities purchased | 2,264,016 | |||
Payable for fund shares redeemed | 268,035 | |||
Unrealized loss on forward exchange contracts (Note 7) | 31,626 | |||
Payable to investment advisor and other affiliates (Note 3) | 58,643 | |||
Accounts payable and accrued expenses | 33,789 | |||
Dividends payable | 73,518 | |||
Total Liabilities | 2,729,627 | |||
NET ASSETS | $ | 75,384,891 | ||
NET ASSETS CONSIST OF: | ||||
Undistributed net investment income | $ | 23,810 | ||
Net unrealized depreciation on investments | (11,559,331 | ) | ||
Accumulated net realized gain (loss) | (564,569 | ) | ||
Net capital paid in on shares of beneficial interest | 87,484,981 | |||
| $ | 75,384,891 | |||
NET ASSET VALUE: | ||||
Class A Shares: | ||||
Net asset value and redemption price per share | $ | 9.34 | ||
Maximum sales charge, 4.50% of offering price | 0.44 | |||
Maximum offering price per share | $ | 9.78 | ||
Class C Shares: | ||||
Net asset value and offering price per share * | $ | 9.33 | ||
Class I Shares: | ||||
Net asset value, offering and redemption price per share | $ | 9.35 | ||
| * | Redemption price per share is equal to net asset value less any applicable contingent deferred sales charge. |
See notes to financial statements.
| 8 | Certified Semi-Annual Report |
| STATEMENT OF OPERATIONS | ||
Thornburg Strategic Income Fund | Six Months Ended March 31, 2009 (Unaudited) | |
INVESTMENT INCOME: | ||||
Dividend income (net of foreign taxes withheld of $3,208) | $ | 180,034 | ||
Interest income (net of premium amortized of $9,415) | 2,187,769 | |||
Total Income | 2,367,803 | |||
EXPENSES: | ||||
Investment advisory fees (Note 3) | 196,400 | |||
Administration fees (Note 3) | ||||
Class A Shares | 12,160 | |||
Class C Shares | 9,869 | |||
Class I Shares | 4,282 | |||
Distribution and service fees (Note 3) | ||||
Class A Shares | 24,983 | |||
Class C Shares | 80,002 | |||
Transfer agent fees | ||||
Class A Shares | 8,599 | |||
Class C Shares | 12,282 | |||
Class I Shares | 4,034 | |||
Registration and filing fees | ||||
Class A Shares | 10,172 | |||
Class C Shares | 9,919 | |||
Class I Shares | 10,199 | |||
Custodian fees (Note 3) | 21,848 | |||
Professional fees | 34,205 | |||
Accounting fees | 383 | |||
Trustee fees | 751 | |||
Other expenses | 8,898 | |||
Total Expenses | 448,986 | |||
Less: | ||||
Expenses reimbursed by investment advisor (Note 3) | (98,240 | ) | ||
Investment advisory fees waived by investment advisor (Note 3) | (1,219 | ) | ||
Fees paid indirectly (Note 3) | (1,034 | ) | ||
Net Expenses | 348,493 | |||
Net Investment Income | $ | 2,019,310 | ||
| Certified Semi-Annual Report | 9 |
| STATEMENT OF OPERATIONS, CONTINUED | ||
Thornburg Strategic Income Fund | Six Months Ended March 31, 2009 (Unaudited) | |
REALIZED AND UNREALIZED GAIN (LOSS) | ||||
Net realized gain (loss) on: | ||||
Investments | $ | (293,804 | ) | |
Foreign currency transactions | 128,578 | |||
| (165,226 | ) | |||
Net change in unrealized appreciation (depreciation) on: | ||||
Investments | (5,093,268 | ) | ||
Foreign currency translations | (74,425 | ) | ||
| (5,167,693 | ) | |||
Net Realized and Unrealized Loss | (5,332,919 | ) | ||
Net Decrease in Net Assets Resulting From Operations | $ | (3,313,609 | ) | |
See notes to financial statements.
| 10 | Certified Semi-Annual Report |
STATEMENT OF CHANGES IN NET ASSETS
Thornburg Strategic Income Fund
| Six Months Ended March 31, 2009* | For the Period from Commencement of Operations on December 19, 2007 through September 30, 2008 | |||||||
INCREASE (DECREASE) IN NET ASSETS FROM: | ||||||||
OPERATIONS: | ||||||||
Net investment income | $ | 2,019,310 | $ | 1,888,967 | ||||
Net realized loss on investments and foreign currency transactions | (165,226 | ) | (397,587 | ) | ||||
Increase (Decrease) in unrealized appreciation (depreciation) on investments and foreign currency translation | (5,167,693 | ) | (6,391,638 | ) | ||||
Net Increase (Decrease) in Net Assets Resulting from Operations | (3,313,609 | ) | (4,900,258 | ) | ||||
DIVIDENDS TO SHAREHOLDERS: | ||||||||
From net investment income | ||||||||
Class A Shares | (790,372 | ) | (697,021 | ) | ||||
Class C Shares | (593,051 | ) | (426,979 | ) | ||||
Class I Shares | (713,854 | ) | (664,946 | ) | ||||
FUND SHARE TRANSACTIONS (NOTE 4): | ||||||||
Class A Shares | 7,946,172 | 21,118,332 | ||||||
Class C Shares | 11,989,010 | 15,777,216 | ||||||
Class I Shares | 13,347,695 | 17,306,556 | ||||||
Net Increase in Net Assets | 27,871,991 | 47,512,900 | ||||||
NET ASSETS: | ||||||||
Beginning of period | 47,512,900 | — | ||||||
End of period | $ | 75,384,891 | $ | 47,512,900 | ||||
Undistributed net investment income | $ | 23,810 | $ | 101,777 | ||||
| * | Unaudited. |
See notes to financial statements.
| Certified Semi-Annual Report | 11 |
| NOTES TO FINANCIAL STATEMENTS | ||
Thornburg Strategic Income Fund | March 31, 2009 (Unaudited) | |
NOTE 1 – ORGANIZATION
Thornburg Strategic Income Fund, hereinafter referred to as the “Fund,” is a diversified series of Thornburg Investment Trust (the “Trust”). The Fund commenced operations on December 19, 2007. The Trust was organized as a Massachusetts business trust under a Declaration of Trust dated June 3, 1987 and is registered as a diversified, open-end management investment company under the Investment Company Act of 1940, as amended. The Trust is currently issuing thirteen series of shares of beneficial interest in addition to those of the Fund: Thornburg Limited Term Municipal Fund, Thornburg California Limited Term Municipal Fund, Thornburg Limited Term U.S. Government Fund, Thornburg New Mexico Intermediate Municipal Fund, Thornburg Intermediate Municipal Fund, Thornburg Limited Term Income Fund, Thornburg Value Fund, Thornburg International Value Fund, Thornburg New York Intermediate Municipal Fund, Thornburg Core Growth Fund, Thornburg Investment Income Builder Fund, Thornburg Global Opportunities Fund, and Thornburg International Growth Fund. Each series is considered to be a separate entity for financial reporting and tax purposes and bears expenses directly attributable to it. The Fund seeks long-term capital appreciation by investing primarily in both foreign and domestic equity securities selected for their growth potential.
The Fund currently offers three classes of shares of beneficial interest: Class A, Class C, and Institutional Class (Class I) shares. Each class of shares of the Fund represents an interest in the same portfolio of investments, except that (i) Class A shares are sold subject to a front-end sales charge collected at the time the shares are purchased and bear a service fee, (ii) Class C shares are sold at net asset value without a sales charge at the time of purchase, but are subject to a contingent deferred sales charge upon redemption within one year of purchase, and bear both a service fee and a distribution fee, (iii) Class I shares are sold at net asset value without a sales charge at the time of purchase, and (iv) the respective classes may have different reinvestment privileges and conversion rights. Additionally, the Fund may allocate among its classes certain expenses, to the extent allowable to specific classes, including transfer agent fees, government registration fees, certain printing and postage costs, and administrative and legal expenses. Currently, class specific expenses of the Fund are limited to service and distribution fees, administration fees, and certain registration and transfer agent expenses.
NOTE 2 – SIGNIFICANT ACCOUNTING POLICIES
Significant accounting policies of the Trust are as follows:
Valuation of Investments: Portfolio securities listed or traded on a national securities exchange are valued on the valuation date at the last reported sale price on the exchange that is the primary market for the security. Portfolio securities traded on an exchange for which there has been no sale that day and other equity securities traded in the over-the-counter market are valued at the mean between the last reported bid and asked prices. Portfolio securities reported by NASDAQ are valued at the NASDAQ official closing price. Any foreign security traded on exchanges outside the United States is valued at the price of the security on the exchange that is normally the security’s primary market, as of the close of that exchange preceding the time of the Fund’s valuation.
Debt obligations held by the Fund have a primary market over the counter and are valued by an independent pricing service approved by the Trustees of the Trust. The pricing service ordinarily values debt obligations at quoted bid prices. When quotations are not available, debt obligations held by the Fund are valued at evaluated prices determined by the pricing service using methods which include consideration of yields or prices of debt obligations of comparable quality, type of issue, coupon, maturity, and rating, and indications as to value from dealers and general market conditions. Short-term obligations having remaining maturities of 60 days or less are valued at amortized cost, which approximates market value.
Quotations in foreign currencies for foreign portfolio investments are converted to U.S. dollar equivalents using the foreign exchange quotation in effect at the time of valuation.
In any case where the market value of an equity security held by the Fund is not readily available, the Trust’s valuation and pricing committee determines a fair value for the security using procedures approved by the Trustees, which may include the use of prices obtained from an independent pricing service. The pricing service ordinarily values equity securities in these instances using multi-factor models to adjust market prices based upon various inputs, including exchange data, depository receipt prices, futures and index data and other data. A security’s market value is deemed not readily available whenever the exchange or market on which the security is primarily traded is closed for the entire scheduled day of trading. Additionally, a security’s market value may be deemed not readily available under other circumstances identified by the Trustees, including when developments occurring after the most recent close of the security’s primary exchange or market, but before the most recent close of trading in Fund shares, create a serious question about the reliability of the security’s market value.
In any case where a pricing service fails to provide a price for a debt obligation held by the Fund, the valuation and pricing committee determines a fair value for the debt obligation using procedures approved by the Trustees. Additionally, in any case where management believes that a price provided by a pricing service for a debt obligation held by the Fund may be unreliable, the valuation and pricing committee decides whether or not to use the pricing service’s valuation or to determine a fair value for the debt obligation.
| 12 | Certified Semi-Annual Report |
| NOTES TO FINANCIAL STATEMENTS, CONTINUED | ||
Thornburg Strategic Income Fund | March 31, 2009 (Unaudited) | |
In determining fair value for any portfolio security or other investment, the valuation and pricing committee seeks to determine the amount that an owner of the investment might reason-ably expect to receive upon a sale of the investment. However, because fair value prices are estimated prices, the valuation and pricing committee’s determination of fair value for an investment may differ from the value that would be realized by the Fund upon a sale of the investment, and that difference could be material to the Fund’s financial statements. The valuation and pricing committee’s determination of fair value for an investment may also differ from the prices obtained by other persons (including other mutual funds) for the investment.
Valuation Measurements: Various inputs are used in determining the value of the Fund’s investments. These inputs are summarized in the three levels listed below.
Level 1: Quoted prices in active markets for identical investments.
Level 2: Other significant observable inputs (including quoted prices for similar investments, interest rates, prepayment rates, credit risk, etc.).
Level 3: Significant unobservable inputs (including the Fund’s own assumptions in determining the fair value of investments).
The following table displays a summary of the inputs used to value the Fund’s net assets as of March 31, 2009. In any instance when valuation inputs from more than one level are used to determine the fair value of a specific investment, the investment is placed in the level of the table based upon the lowest level input that is significant in determining the fair value of the investment:
Valuation Inputs | Investments in Securities | Investments in Other Financial Instruments* | |||||
Level 1 - Quoted Prices in Active Markets for Identical Assets | $ | 4,111,726 | $ | — | |||
Level 2 - Other Significant Observable Inputs | 70,817,442 | (31,626 | ) | ||||
Level 3 - Significant Unobservable Inputs | — | — | |||||
Total | $ | 74,929,168 | $ | (31,626 | ) | ||
| * | Other financial instruments include investments not reflected in the Schedule of Investments, such as futures, forwards and swap contracts, which are valued at the unrealized appreciation (depreciation) on the instrument. |
Foreign Currency Translation: Portfolio securities and other assets and liabilities denominated in foreign currencies are translated into U.S. dollars based on the exchange rate of such currencies against the U.S. dollar on the date of valuation. Purchases and sales of securities and income items denominated in foreign currencies are translated into U.S. dollars at the exchange rate in effect on the translation date. When the Fund purchases or sells foreign securities it will customarily enter into a foreign exchange contract to minimize foreign exchange risk from the trade date to the settlement date of such transactions.
The Fund does not separately report the effect of changes in foreign exchange rates from changes in market prices on securities held. Such changes are included in net realized and unrealized gain or loss from investments.
Reported net realized foreign exchange gains or losses arise from sales of foreign currencies, currency gains or losses realized between the trade and settlement dates on securities transactions and the difference between the amounts of dividends, interest, and foreign withholding taxes recorded on the Fund’s books, and the U.S. dollar equivalent of the amounts actually received or paid.
Net unrealized foreign exchange gains and losses arise from changes in the fair value of assets and liabilities, other than investments in securities at fiscal period end, resulting from changes in exchange rates.
Deferred Taxes: The Fund is subject to a tax imposed on net realized gains of securities of certain foreign countries. The Fund records an estimated deferred tax liability for net unrealized gains on these securities as reflected in the accompanying financial statements.
Federal Income Taxes: It is the policy of the Trust to comply with the provisions of the Internal Revenue Code applicable to “regulated investment companies” and to distribute to shareholders substantially all taxable income, including any net realized gain on investments of the Funds. Therefore, no provision for federal income taxes is required.
When-Issued and Delayed Delivery Transactions: The Trust may engage in when-issued or delayed delivery transactions. To the extent the Trust engages in such transactions, it will do so for the purpose of acquiring portfolio securities consistent with the Fund’s investment objectives and not for the purpose of investment leverage or to speculate on interest rate and/or market changes. At the time the Trust makes a commitment to purchase a security on a when-issued or delayed delivery basis, the Fund will record the transaction and reflect the value in determining its net asset value. When effecting such transactions, assets of an amount sufficient to make payment for the portfolio securities to be purchased will be segregated on the Fund’s records on the trade date. Securities purchased on a when-issued or delayed delivery basis do not earn interest until the settlement date.
| Certified Semi-Annual Report | 13 |
| NOTES TO FINANCIAL STATEMENTS, CONTINUED | ||
| Thornburg Strategic Income Fund | March 31, 2009 (Unaudited) | |
Dividends: Dividends to shareholders are generally paid quarterly and are reinvested in additional shares of the Fund at net asset value per share at the close of business on the dividend payment date or, at the shareholder’s option, paid in cash. Net realized capital gains, to the extent available, will be distributed at least annually. Distributions to shareholders are based on income tax regulations and therefore, their characteristics may differ for financial statement and tax purposes.
General: Securities transactions are accounted for on a trade date basis. Interest income is accrued as earned and dividend income is recorded on the ex-dividend date. Certain income from foreign securities is recognized as soon as information is available to the Fund. Realized gains and losses from the sale of securities are recorded on an identified cost basis. Net investment income (other than class specific expenses) and realized and unrealized gains and losses are allocated daily to each class of shares based upon the relative net asset value of outstanding shares of each class of shares at the beginning of the day (after adjusting for the current share activity of the respective class). Expenses common to all funds are allocated among the funds comprising the Trust based upon their relative net asset values or other appropriate allocation methods.
Guarantees and Indemnifications: Under the Trust’s organizational documents, its officers and Trustees are indemnified against certain liabilities arising out of the performance of their duties to the Fund. Additionally, in the normal course of business the Trust enters into contracts with service providers that contain general indemnification clauses. The Trust’s maximum exposure under these arrangements is unknown. However, based on experience, the Trust expects the risk of loss to be remote.
Use of Estimates: The preparation of financial statements, in conformity with generally accepted accounting principles, requires management to make estimates and assumptions that affect the reported amounts of assets and liabilities and the disclosure of contingent assets and liabilities at the date of the financial statements and the reported amounts of increases and decreases in net assets from operations during the reporting period. Actual results could differ from those estimates.
NOTE 3 – INVESTMENT ADVISORY FEE AND OTHER TRANSACTIONS WITH AFFILIATES
Pursuant to an investment advisory agreement, Thornburg Investment Management, Inc. (the “Advisor”) serves as the investment advisor and performs services to the Fund for which the fees are payable at the end of each month. For the six months ended March 31, 2009, these fees were payable at annual rates ranging from .75 of 1% to .50 of 1% per annum of the average daily net assets of the Fund depending on the Fund’s asset size. For the period ended March 31, 2009, the Advisor voluntarily waived investment advisory fees of $1,219. The Trust also has entered into administrative services agreements with the Advisor, whereby the Advisor will perform certain administrative services for the shareholders of each class of the Fund’s shares, and for which fees will be payable at an annual rate of up to .125 of 1% per annum of the average daily net assets attributable to each class of shares. For the six months ended March 31, 2009, the Advisor voluntarily reimbursed certain class specific expenses, administrative fees, and distribution fees of $31,582 for Class A shares, $48,143 for Class C shares, and $18,515 for Class I shares.
The Trust has an underwriting agreement with Thornburg Securities Corporation (the “Distributor,” an affiliate of the Advisor), which acts as the distributor of the Fund’s shares. For the six months ended March 31, 2009, the Distributor has advised the Fund that it earned commissions aggregating $8,427 from the sale of Class A shares, and collected contingent deferred sales charges aggregating $9,999 from redemptions of Class C shares of the Fund.
Pursuant to a service plan under Rule 12b-1 of the Investment Company Act of 1940, the Fund may reimburse to the Advisor an amount not to exceed .25 of 1% per annum of the average daily net assets attributable to each class of shares of the Fund for payments made by the Advisor to securities dealers and other financial institutions to obtain various shareholder and distribution related services. The Advisor may pay out of its own resources additional expenses for distribution of the Fund’s shares.
The Trust has also adopted distribution plans pursuant to Rule 12b-1, applicable only to the Fund’s Class C shares, under which the Fund compensates the Distributor for services in promoting the sale of Class C shares of the Fund at an annual rate of up to .75 of 1% per annum of the average daily net assets attributable to Class C shares. Total fees incurred by the Distributor for each class of shares of the Fund under their respective Service and Distribution Plans for the six months ended March 31, 2009, are set forth in the Statement of Operations.
The Trust has an agreement with the custodian bank to indirectly pay a portion of the custodian’s fees through credits earned by the Fund’s cash on deposit with the bank. This deposit agreement is an alternative to overnight investments. Custodial fees have been adjusted to reflect amounts that would have been paid without this agreement, with a corresponding adjustment reflected as fees paid indirectly in the Statement of Operations. For the six months ended March 31, 2009, fees paid indirectly were $1,034.
Certain officers and Trustees of the Trust are also officers and/ or directors of the Advisor and Distributor. The compensation of independent Trustees is borne by the Trust.
| 14 | Certified Semi-Annual Report |
| NOTES TO FINANCIAL STATEMENTS, CONTINUED | ||
| Thornburg Strategic Income Fund | March 31, 2009 (Unaudited) | |
NOTE 4 – SHARES OF BENEFICIAL INTEREST
At March 31, 2009, there were an unlimited number of shares of beneficial interest authorized. Transactions in shares of beneficial interest were as follows:
| Six Months Ended March 31, 2009 (Unaudited) | Period Ended* September 30, 2008 (Audited) | |||||||||||||
| Shares | Amount | Shares | Amount | |||||||||||
Class A Shares | ||||||||||||||
Shares sold | 1,392,434 | $ | 12,989,516 | 2,036,571 | $ | 24,361,553 | ||||||||
Shares issued to shareholders in reinvestment of dividends | 63,650 | 590,481 | 48,664 | 551,142 | ||||||||||
Shares repurchased | (602,704 | ) | (5,633,825 | ) | (331,297 | ) | (3,794,363 | ) | ||||||
Net Increase (Decrease) | 853,380 | $ | 7,946,172 | 1,753,938 | $ | 21,118,332 | ||||||||
Class C Shares | ||||||||||||||
Shares sold | 1,924,960 | $ | 17,866,450 | 1,944,005 | $ | 23,044,909 | ||||||||
Shares issued to shareholders in reinvestment of dividends | 39,060 | 362,552 | 23,034 | 258,781 | ||||||||||
Shares repurchased | (664,617 | ) | (6,239,992 | ) | (658,789 | ) | (7,526,474 | ) | ||||||
Net Increase (Decrease) | 1,299,403 | $ | 11,989,010 | 1,308,250 | $ | 15,777,216 | ||||||||
Class I Shares | ||||||||||||||
Shares sold | 1,587,048 | $ | 14,874,234 | 1,608,221 | $ | 19,363,753 | ||||||||
Shares issued to shareholders in reinvestment of dividends | 54,967 | 511,148 | 40,595 | 461,471 | ||||||||||
Shares repurchased | (217,431 | ) | (2,037,687 | ) | (217,390 | ) | (2,518,668 | ) | ||||||
Net Increase (Decrease) | 1,424,584 | $ | 13,347,695 | 1,431,426 | $ | 17,306,556 | ||||||||
| * | The Fund commenced operations on December 19, 2007. |
The Advisor, its owners, employees, and affiliated entities of the Advisor have invested amounts in the Fund valued at $14,464,415, representing 19.19% of the net asset value as of March 31, 2009.
NOTE 5 – SECURITIES TRANSACTIONS
For the six months ended March 31, 2009, the Fund had purchase and sale transactions of investment securities (excluding short-term investments and U. S. Government obligations) of $45,181,931 and $13,982,409, respectively.
NOTE 6 – INCOME TAXES
At March 31, 2009, information on the tax components of capital is as follows:
Cost of investments for tax purposes | $ | 86,363,940 | ||
Gross unrealized appreciation on a tax basis | $ | 1,729,911 | ||
Gross unrealized depreciation on a tax basis | (13,164,683 | ) | ||
Net unrealized appreciation (depreciation) on investments (tax basis) | $ | (11,434,772 | ) | |
At March 31, 2009, the fund had deferred tax basis capital losses occurring subsequent to inception date of December 19, 2007, of $350,904. For tax purposes, such losses will be reflected in the year ending September 30, 2009.
| Certified Semi-Annual Report | 15 |
| NOTES TO FINANCIAL STATEMENTS, CONTINUED | ||
| Thornburg Strategic Income Fund | March 31, 2009 (Unaudited) | |
NOTE 7 – FINANCIAL INSTRUMENTS WITH OFF-BALANCE SHEET RISK AND FOREIGN INVESTMENT RISK
During the six months ended March 31, 2009, the Fund was a party to financial instruments with off-balance sheet risks, primarily currency forward exchange contracts. A forward exchange contract is an agreement between two parties to exchange different currencies at a specified rate at an agreed upon future date. These contracts are purchased in order to minimize the risk to the Fund with respect to its foreign investment transactions from adverse changes in the relationship between the U.S. dollar and foreign currencies. In each case these contracts have been initiated in conjunction with foreign investment transactions. These instruments may involve market risks in excess of the amount recognized on the Statement of Assets and Liabilities. Such risks would arise from the possible inability of counterparties to meet the terms of their contracts, future movement in currency value and interest rates and contract positions that are not exact offsets. These contracts are reported in the financial statements at the Fund’s net equity, as measured by the difference between the forward exchange rates at the reporting date and the forward exchange rates at the dates of entry into the contract. There are special risks associated with international investing, including currency fluctuations, economic and political instability, confiscation, inability or delays in selling foreign investments, and reduced legal protection for investments.
CONTRACTS TO BUY OR SELL:
Contract Description | Buy/Sell | Contract Amount | Contract Value Date | Value (USD) | Unrealized Appreciation | Unrealized (Depreciation) | ||||||||||
Euro Dollar | Sell | 358,200 | 5/19/2009 | $ | 451,726 | $ | — | $ | (24,172 | ) | ||||||
Turkish Lira | Sell | 140,000 | 5/21/2009 | 75,676 | — | (7,454 | ) | |||||||||
Total unrealized appreciation (depreciation) from forward exchange contracts | $ | — | $ | (31,626 | ) | |||||||||||
OTHER NOTES:
Statement of Accounting Standards No. 161:
On March 19, 2008, the Financial Accounting Standards Board issued Statement of Financial Accounting Standards No. 161, “Disclosures about Derivative Instruments and Hedging Activities” (“FAS 161”). FAS 161 is effective for fiscal years and interim periods beginning after November 15, 2008. FAS 161 requires enhanced disclosures about any derivative and hedging activities by the Fund, including how such activities are accounted for and any effect on the Fund’s financial position, performance and cash flows.
| 16 | Certified Semi-Annual Report |
Thornburg Strategic Income Fund
| Six Months Ended March 31, 2009* | Period Ended Sept. 30, 2008(a) | |||||||
Class A Shares: | ||||||||
PER SHARE PERFORMANCE | ||||||||
Net asset value, beginning of period | $ | 10.57 | $ | 11.94 | ||||
Income from investment operations: | ||||||||
Net investment income (loss) | 0.36 | 0.59 | ||||||
Net realized and unrealized gain (loss) on investments | (1.21 | ) | (1.41 | ) | ||||
Total from investment operations | (0.85 | ) | (0.82 | ) | ||||
Less dividends from: | ||||||||
Net investment income | (0.38 | ) | (0.55 | ) | ||||
Change in net asset value | (1.23 | ) | (1.37 | ) | ||||
NET ASSET VALUE, end of period | $ | 9.34 | $ | 10.57 | ||||
RATIOS/SUPPLEMENTAL DATA | ||||||||
Total return (%)(b) | (7.98 | ) | (7.18 | ) | ||||
Ratios to average net assets: | ||||||||
Net investment income (loss) (%) | 7.80 | (c) | 6.51 | (c) | ||||
Expenses, after expense reductions (%) | 1.25 | (c) | 1.27 | (c) | ||||
Expenses, after expense reductions and net of custody credits (%) | 1.25 | (c) | 1.25 | (c) | ||||
Expenses, before expense reductions (%) | 1.58 | (c) | 1.79 | (c) | ||||
Portfolio turnover rate (%) | 27.03 | 36.22 | ||||||
Net assets at end of period (thousands) | $ | 24,357 | $ | 18,538 | ||||
| (a) | Fund commenced operations on December 19, 2007. |
| (b) | Sales loads are not reflected in computing total return, which is not annualized for periods less than one year. |
| (c) | Annualized. |
| + | Based on weighted average shares outstanding. |
| * | Unaudited. |
See notes to financial statements.
| Certified Semi-Annual Report | 17 |
FINANCIAL HIGHLIGHTS, CONTINUED
Thornburg Strategic Income Fund
| Six Months Ended March 31, 2009* | Period Ended Sept. 30, 2008(a) | |||||||
Class C Shares: | ||||||||
PER SHARE PERFORMANCE | ||||||||
Net asset value, beginning of period | $ | 10.57 | $ | 11.94 | ||||
Income from investment operations: | ||||||||
Net investment income (loss) | 0.34 | 0.55 | ||||||
Net realized and unrealized gain (loss) on investments | (1.23 | ) | (1.42 | ) | ||||
Total from investment operations | (0.89 | ) | (0.87 | ) | ||||
Less dividends from: | ||||||||
Net investment income | (0.35 | ) | (0.50 | ) | ||||
Change in net asset value | (1.24 | ) | (1.37 | ) | ||||
NET ASSET VALUE, end of period | $ | 9.33 | $ | 10.57 | ||||
RATIOS/SUPPLEMENTAL DATA | ||||||||
Total return (%)(b) | (8.32 | ) | (7.57 | ) | ||||
Ratios to average net assets: | ||||||||
Net investment income (loss) (%) | 7.23 | (c) | 5.96 | (c) | ||||
Expenses, after expense reductions (%) | 1.80 | (c) | 1.82 | (c) | ||||
Expenses, after expense reductions and net of custody credits (%) | 1.80 | (c) | 1.80 | (c) | ||||
Expenses, before expense reductions (%) | 2.42 | (c) | 2.65 | (c) | ||||
Portfolio turnover rate (%) | 27.03 | 36.22 | ||||||
Net assets at end of period (thousands) | $ | 24,337 | $ | 13,829 | ||||
| (a) | Fund commenced operations on December 19, 2007. |
| (b) | Not annualized for periods less than one year. |
| (c) | Annualized. |
| + | Based on weighted average shares outstanding. |
| * | Unaudited. |
See notes to financial statements.
| 18 | Certified Semi-Annual Report |
FINANCIAL HIGHLIGHTS, CONTINUED
Thornburg Strategic Income Fund
| Six Months Ended March 31, 2009* | Period Ended Sept. 30, 2008(a) | |||||||
Class I Shares: | ||||||||
PER SHARE PERFORMANCE | ||||||||
Net asset value, beginning of period | $ | 10.58 | $ | 11.94 | ||||
Income from investment operations: | ||||||||
Net investment income (loss) | 0.37 | 0.63 | ||||||
Net realized and unrealized gain (loss) on investments | (1.21 | ) | (1.42 | ) | ||||
Total from investment operations | (0.84 | ) | (0.79 | ) | ||||
Less dividends from: | ||||||||
Net investment income | (0.39 | ) | (0.57 | ) | ||||
Change in net asset value | (1.23 | ) | (1.36 | ) | ||||
NET ASSET VALUE, end of period | $ | 9.35 | $ | 10.58 | ||||
RATIOS/SUPPLEMENTAL DATA | ||||||||
Total return (%)(b) | (7.85 | ) | (6.90 | ) | ||||
Ratios to average net assets: | ||||||||
Net investment income (loss) (%) | 8.05 | (c) | 6.81 | (c) | ||||
Expenses, after expense reductions (%) | 0.99 | (c) | 1.01 | (c) | ||||
Expenses, after expense reductions and net of custody credits (%) | 0.99 | (c) | 0.99 | (c) | ||||
Expenses, before expense reductions (%) | 1.21 | (c) | 1.44 | (c) | ||||
Portfolio turnover rate (%) | 27.03 | 36.22 | ||||||
Net assets at end of period (thousands) | $ | 26,691 | $ | 15,145 | ||||
| (a) | Fund commenced operations on December 19, 2007. |
| (b) | Not annualized for periods less than one year. |
| (c) | Annualized. |
| + | Based on weighted average shares outstanding. |
| * | Unaudited. |
See notes to financial statements.
| Certified Semi-Annual Report | 19 |
| SCHEDULE OF INVESTMENTS | ||
| Thornburg Strategic Income Fund | March 31, 2009 (Unaudited) | |
SUMMARY OF INDUSTRY EXPOSURE
As of 3/31/09
Energy | 15.9 | % | |
Utilities | 12.8 | % | |
Diversified Financials | 6.5 | % | |
Telecommunication Services | 6.4 | % | |
Capital Goods | 5.9 | % | |
Banks | 5.4 | % | |
Materials | 4.7 | % | |
Food, Beverage & Tobacco | 4.6 | % | |
Insurance | 4.1 | % | |
Media | 3.8 | % | |
Retailing | 3.3 | % | |
Transportation | 2.5 | % | |
Pharmaceuticals, Biotechnology & Life Sciences | 2.4 | % | |
Semiconductors & Semiconductor Equipment | 2.2 | % | |
Consumer Services | 2.0 | % | |
Health Care Equipment & Services | 1.6 | % | |
Real Estate | 1.4 | % | |
Technology Hardware & Equipment | 0.6 | % | |
Automobiles & Components | 0.4 | % | |
Food & Staples Retailing | 0.3 | % | |
Other Non-Classified Securities: | |||
Asset Backed Securities | 4.4 | % | |
Municipal Bonds | 2.4 | % | |
United States Treasury Securities | 1.8 | % | |
Other Securities | 0.9 | % | |
Foreign Bonds | 0.8 | % | |
U.S. Gov’t Agencies* | 0.0 | % | |
Other Assets & Cash Equivalents | 2.9 | % | |
| * | Industry percentage was less than 0.1%. |
SUMMARY OF COUNTRY EXPOSURE
As of 3/31/09
United States of America | 74.1 | % | |
Bermuda | 5.6 | % | |
Luxembourg | 2.3 | % | |
Australia | 1.9 | % | |
Russia | 1.7 | % | |
South Korea | 1.7 | % | |
United Kingdom | 1.6 | % | |
United Arab Emirates | 1.3 | % | |
China | 1.2 | % | |
Brazil | 1.2 | % | |
Cayman Islands | 0.7 | % | |
Germany | 0.5 | % | |
Netherlands | 0.4 | % | |
Chile | 0.4 | % | |
Italy | 0.4 | % | |
France | 0.4 | % | |
Malaysia | 0.3 | % | |
Greece | 0.3 | % | |
Hong Kong | 0.3 | % | |
Singapore | 0.2 | % | |
Canada | 0.2 | % | |
Turkey | 0.2 | % | |
Switzerland | 0.1 | % | |
Iceland | 0.1 | % | |
Other Assets & Cash Equivalents | 2.9 | % | |
| 20 | Certified Semi-Annual Report |
| SCHEDULE OF INVESTMENTS, CONTINUED | ||
| Thornburg Strategic Income Fund | March 31, 2009 (Unaudited) | |
| Shares/ Principal Amount | Value | ||||
COMMON STOCK — 3.34% | |||||
CONSUMER SERVICES — 0.58% | |||||
HOTELS, RESTAURANTS & LEISURE — 0.58% | |||||
Berjaya Sports Toto Berhad | 176,700 | $ | 221,996 | ||
OPAP SA | 8,300 | 218,563 | |||
| 440,559 | |||||
DIVERSIFIED FINANCIALS — 0.09% | |||||
DIVERSIFIED FINANCIAL SERVICES — 0.09% | |||||
KKR Financial Holdings LLC | 73,000 | 64,970 | |||
| 64,970 | |||||
ENERGY — 0.16% | |||||
OIL, GAS & CONSUMABLE FUELS — 0.16% | |||||
Tupras-Turkiye Petrol Rafinerileri A.S. | 12,100 | 121,528 | |||
| 121,528 | |||||
INSURANCE — 0.10% | |||||
INSURANCE — 0.10% | |||||
Swiss Re | 4,400 | 72,051 | |||
| 72,051 | |||||
MATERIALS — 0.41% | |||||
METALS & MINING — 0.41% | |||||
Southern Copper Corp. | 17,800 | 310,076 | |||
| 310,076 | |||||
REAL ESTATE — 0.34% | |||||
REAL ESTATE INVESTMENT TRUSTS — 0.34% | |||||
Chimera Investment Corp. | 76,700 | 257,712 | |||
| 257,712 | |||||
TELECOMMUNICATION SERVICES — 0.54% | |||||
DIVERSIFIED TELECOMMUNICATION SERVICES — 0.54% | |||||
Telstra Corp. Ltd. | 183,000 | 408,469 | |||
| 408,469 | |||||
TRANSPORTATION — 0.27% | |||||
TRANSPORTATION INFRASTRUCTURE — 0.27% | |||||
Hopewell Highway Infrastructure Ltd. | 359,000 | 200,561 | |||
| 200,561 | |||||
UTILITIES — 0.85% | |||||
ELECTRIC UTILITIES — 0.85% | |||||
E. ON AG | 13,100 | 363,931 | |||
Enel SpA | 57,800 | 277,415 | |||
| 641,346 | |||||
TOTAL COMMON STOCK (Cost $5,021,181) | 2,517,272 | ||||
| Certified Semi-Annual Report | 21 |
| SCHEDULE OF INVESTMENTS, CONTINUED | ||
| Thornburg Strategic Income Fund | March 31, 2009 (Unaudited) | |
| Shares/ Principal Amount | Value | |||||
PREFERRED STOCK — 0.33% | ||||||
BANKS — 0.33% | ||||||
COMMERCIAL BANKS — 0.33% | ||||||
Huntington Bancshares | 750 | $ | 251,250 | |||
TOTAL PREFERRED STOCK (Cost $750,000) | 251,250 | |||||
ASSET BACKED SECURITIES— 4.36% | ||||||
BANKS — 0.33% | ||||||
COMMERCIAL BANKS — 0.33% | ||||||
CW Capital Colbalt Series 2007-C2 Class A1, 5.064%, 9/15/2011 | $ | 26,754 | 26,161 | |||
Greenwich Capital Commercial Funding Corp. Series 2007-GG9 Class A1, 5.233%, 3/10/2039 | 28,243 | 27,840 | ||||
Wachovia Bank Commercial Mtg Trust Series 2007-C30 Class A1, 5.031%, 12/15/2043 | 25,535 | 25,105 | ||||
Wachovia Bank Commercial Mtg Trust Series 2007-C31 Class A1, 5.14%, 4/15/2047 | 17,667 | 17,378 | ||||
Wells Fargo Asset Securities Corp. Series 2005-AR1 Class B1, 4.549%, 2/25/2035 | 399,600 | 77,405 | ||||
Wells Fargo Asset Securities Corp. Series 2005-AR2 Class B1, 4.688%, 3/25/2035 | 395,771 | 74,224 | ||||
| 248,113 | ||||||
DIVERSIFIED FINANCIALS — 3.14% | ||||||
CAPITAL MARKETS — 1.89% | ||||||
Bear Stearns ARM Mtg Series 2003-6 Class 2B-1, 4.825%, 8/25/2033 | 1,179,357 | 393,376 | ||||
Bear Stearns Commercial Mtg Securities Series 2007-PW15 Class A1, 5.016%, 2/11/2044 | 3,924 | 3,824 | ||||
Bear Stearns Commercial Mtg Securities Series 2007-T26 Class A1, 5.145%, 1/12/2045 | 58,908 | 57,575 | ||||
Bear Stearns Commercial Mtg Securities Series 2007-T28 Class A1, 5.422%, 9/11/2042 | 26,588 | 26,007 | ||||
Commercial Mtg Series 2006-C8 Class A1, 5.108%, 12/10/2046 | 26,760 | 26,622 | ||||
Credit Suisse Mtg Capital Certificates Series 2007-C1 Class A1, 5.227%, 2/15/2040 | 20,187 | 19,931 | ||||
Credit Suisse Mtg Capital Certificates Series 2007-C2 Class A1, 5.269%, 1/15/2049 | 14,257 | 14,064 | ||||
Credit Suisse Mtg Capital Certificates Series 2007-C3 Class A1, 5.664%, 6/15/2039 | 19,025 | 18,851 | ||||
GS Mtg Securities Corp. II Series 2007-GG10 Class A1, 5.69%, 8/10/2045 | 33,363 | 32,698 | ||||
LB-UBS Commercial Mtg Trust Series 2007-C1 Class A1, 5.391%, 2/15/2040 | 16,580 | 16,393 | ||||
LB-UBS Commercial Mtg Trust Series 2007-C2 Class A1, 5.226%, 2/17/2040 | 15,781 | 15,573 | ||||
Merrill Lynch Mtg Investors Trust, 4.226%, 8/25/2034 | 396,769 | 121,922 | ||||
Merrill Lynch Mtg Trust, 5.222%, 11/12/2037 | 550,000 | 499,459 | ||||
Merrill Lynch/Countrywide Commercial Mtg Trust Series 2007-5 Class A1, 4.275%, 8/12/2048 | 13,023 | 12,665 | ||||
Merrill Lynch/Countrywide Commercial Mtg Trust Series 2007-6 Class A1, 5.175%, 3/12/2051 | 16,886 | 16,636 | ||||
Morgan Stanley Capital I Series 2007-HQ11 Class A1, 5.246%, 2/20/2044 | 28,622 | 28,149 | ||||
Morgan Stanley Capital I Series 2007-IQ13 Class A1, 5.05%, 3/15/2044 | 27,877 | 27,179 | ||||
Morgan Stanley Capital I Series 2007-IQ14 Class A1, 5.38%, 4/15/2049 | 56,409 | 55,261 | ||||
Morgan Stanley Capital I Series 2007-T25 Class A1, 5.391%, 11/12/2049 | 41,031 | 40,261 | ||||
DIVERSIFIED FINANCIAL SERVICES — 1.25% | ||||||
Banc of America Commerical Mtg, Inc. Series 2007-2 Class A1, 5.421%, 1/10/2012 | 31,267 | 30,701 | ||||
Banc of America Funding Corp. Series 2006-I Class SB1, 4.735%, 12/20/2036 | 991,308 | 143,676 | ||||
Banc of America Mtg Services Series 2005-A Class B1, 4.722%, 2/25/2035 | 969,847 | 301,729 | ||||
Citigroup Commercial Mtg Trust Series 2004-HYB2 Class B1, 4.908%, 3/25/2034 | 283,708 | 91,250 | ||||
Citigroup Commercial Mtg Trust Series 2007-C6 Class A1, 5.622%, 12/10/2049 | 83,202 | 81,797 | ||||
Citigroup/Deutsche Bank Commercial Mtg Series 2007-CD4 Class A1, 4.977%, 12/11/2049 | 46,834 | 45,857 | ||||
JPMorgan Chase Commercial Mtg Securities Corp. Series 2006-LDP9 Class A1, 5.17%, 5/15/2047 | 36,756 | 36,414 | ||||
JPMorgan Chase Commercial Mtg Securities Corp. Series 2007-LDPX Class A1, 5.122%, 1/15/2049 | 16,968 | 16,664 | ||||
JPMorgan Chase Series 2000-C9 Class A2, 7.77%, 10/15/2032 | 192,605 | 193,707 | ||||
| 2,368,241 | ||||||
| 22 | Certified Semi-Annual Report |
| SCHEDULE OF INVESTMENTS, CONTINUED | ||
| Thornburg Strategic Income Fund | March 31, 2009 (Unaudited) | |
| Shares/ Principal Amount | Value | |||||
TELECOMMUNICATION SERVICES — 0.89% | ||||||
WIRELESS TELECOMMUNICATION SERVICES — 0.89% | ||||||
Global Signal Trust Series 2006-1 Class A-1 Floating Rate Note, 0.776%, 2/15/2036 (2) | $ | 750,000 | $ | 667,500 | ||
| 667,500 | ||||||
TOTAL ASSET BACKED SECURITIES (Cost $6,013,747) | 3,283,854 | |||||
CORPORATE BONDS — 65.45% | ||||||
AUTOMOBILES & COMPONENTS — 0.43% | ||||||
AUTOMOBILES — 0.43% | ||||||
Harley Davidson Funding Corp. Series C, 6.80%, 6/15/2018 (1) | 500,000 | 324,415 | ||||
BANKS — 4.03% | ||||||
COMMERCIAL BANKS — 3.31% | ||||||
Charter One Bank NA, 5.50%, 4/26/2011 | 250,000 | 240,890 | ||||
Huntington Capital III, 6.65%, 5/15/2037 | 500,000 | 126,802 | ||||
PNC Preferred Funding Floating Rate Note, 8.70%, 12/31/2049 (1) | 500,000 | 225,005 | ||||
Provident Bank MD, 9.50%, 5/1/2018 | 750,000 | 699,810 | ||||
Suntrust Bank, 7.25%, 3/15/2018 | 1,000,000 | 962,740 | ||||
Wells Fargo Capital XIII Preferred Note, 7.70%, 12/29/2049 | 500,000 | 238,158 | ||||
THRIFTS & MORTGAGE FINANCE — 0.72% | ||||||
Sovereign Bancorp, Inc., 1.457%, 3/23/2010 | 500,000 | 456,761 | ||||
Sovereign Bank, 5.125%, 3/15/2013 | 100,000 | 84,726 | ||||
| 3,034,892 | ||||||
CAPITAL GOODS — 4.27% | ||||||
INDUSTRIAL CONGLOMERATES — 1.01% | ||||||
Tyco International Finance SA, 6.375%, 10/15/2011 | 500,000 | 506,576 | ||||
Tyco International Finance SA, 8.50%, 1/15/2019 | 250,000 | 258,047 | ||||
MACHINERY — 2.22% | ||||||
Caterpillar Financial Services, 5.85%, 9/1/2017 | 750,000 | 651,631 | ||||
Ingersoll Rand Co., 9.50%, 4/15/2014 | 500,000 | 499,960 | ||||
Paccar, Inc., 6.875%, 2/15/2014 | 500,000 | 520,740 | ||||
TRADING COMPANIES & DISTRIBUTORS — 1.04% | ||||||
Noble Group Ltd. Mtg, 8.50%, 5/30/2013 (1) | 1,000,000 | 785,000 | ||||
| 3,221,954 | ||||||
CONSUMER SERVICES — 1.40% | ||||||
HOTELS, RESTAURANTS & LEISURE— 1.40% | ||||||
FU JI Food, 0%, 10/10/2018 (2) | 7,000,000 | 665,827 | ||||
NPC International, Inc., 9.50%, 5/1/2014 | 500,000 | 390,000 | ||||
| 1,055,827 | ||||||
DIVERSIFIED FINANCIALS — 5.27% | ||||||
CAPITAL MARKETS — 0.65% | ||||||
Goldman Sachs Group, Inc., 5.625%, 1/15/2017 | 600,000 | 467,380 | ||||
Lehman Brothers Holdings, Inc., 5.625%, 1/24/2013 (3)+ | 200,000 | 24,000 | ||||
CONSUMER FINANCE — 1.36% | ||||||
American Express Credit Corp., 5.875%, 5/2/2013 | 500,000 | 438,989 | ||||
SLM Corp., 4.50%, 7/26/2010 | 780,000 | 585,000 | ||||
DIVERSIFIED FINANCIAL SERVICES — 3.26% | ||||||
Bank of America Corp., 7.40%, 1/15/2011 | 500,000 | 466,130 | ||||
Citicorp Series 1999-1 Class 2, 8.04%, 12/15/2019 (1) | 250,000 | 234,717 | ||||
| Certified Semi-Annual Report | 23 |
| SCHEDULE OF INVESTMENTS, CONTINUED | ||
| Thornburg Strategic Income Fund | March 31, 2009 (Unaudited) | |
| Shares/ Principal Amount | Value | |||||
Citigroup, Inc., 5.00%, 9/15/2014 | $ | 750,000 | $ | 497,176 | ||
CME Group, Inc., 5.75%, 2/15/2014 | 250,000 | 257,660 | ||||
MBNA Corp., 6.125%, 3/1/2013 | 305,000 | 263,973 | ||||
National Rural Utilities CFC, 10.375%, 11/1/2018 | 500,000 | 578,854 | ||||
Textron Financial Corp., 1.379%, 2/25/2011 | 250,000 | 161,973 | ||||
| 3,975,852 | ||||||
ENERGY — 11.15% | ||||||
ENERGY EQUIPMENT & SERVICES — 2.37% | ||||||
Calfrac Holdings LP, 7.75%, 2/15/2015 (1) | 600,000 | 285,000 | ||||
Nabors Industries, Inc., 9.25%, 1/15/2019 (1) | 500,000 | 474,114 | ||||
Smith International, Inc., 8.625%, 3/15/2014 | 500,000 | 508,888 | ||||
Weatherford International, Ltd., 9.625%, 3/1/2019 | 500,000 | 517,157 | ||||
OIL, GAS & CONSUMABLE FUELS — 8.78% | ||||||
DCP Midstream LLC, 9.75%, 3/15/2019 (1) | 500,000 | 495,703 | ||||
El Paso Corp., 7.75%, 6/15/2010 | 55,000 | 54,187 | ||||
Enbridge Energy Partners LP, 9.875%, 3/1/2019 | 250,000 | 257,736 | ||||
Entergy Gulf States, 6.00%, 5/1/2018 | 240,000 | 218,131 | ||||
Enterprise Products Operating LP, 7.034%, 1/15/2068 | 100,000 | 62,500 | ||||
Enterprise Products Operating LP, 9.75%, 1/31/2014 | 250,000 | 274,701 | ||||
Forest Oil Corp., 8.50%, 2/15/2014 (1) | 500,000 | 463,750 | ||||
Gaz Capital SA, 7.51%, 7/31/2013 (1) | 1,000,000 | 874,238 | ||||
Hess Corp., 8.125%, 2/15/2019 | 500,000 | 515,435 | ||||
Inergy LP/Inergy Finance Corp., 8.75%, 3/1/2015 (1) | 500,000 | 482,500 | ||||
Kinder Morgan Energy Partners, 9.00%, 2/1/2019 | 250,000 | 267,236 | ||||
NuStar Logistics, 7.65%, 4/15/2018 | 1,000,000 | 824,052 | ||||
Oneok Partners LP, 8.625%, 3/1/2019 | 500,000 | 504,531 | ||||
Petroleum Development Corp., 12.00%, 2/15/2018 | 500,000 | 330,000 | ||||
Southwestern Energy Co., 7.50%, 2/1/2018 (1) | 500,000 | 482,500 | ||||
Sunoco Logistics Partner, 8.75%, 2/15/2014 | 500,000 | 511,139 | ||||
| 8,403,498 | ||||||
FOOD, BEVERAGE & TOBACCO— 4.61% | ||||||
BEVERAGES — 3.91% | ||||||
Anheuser Busch Cos., Inc., 4.70%, 4/15/2012 | 250,000 | 245,466 | ||||
Anheuser-Busch InBev, 7.75%, 1/15/2019 (1) | 250,000 | 249,275 | ||||
Bacardi Ltd., 7.45%, 4/1/2014 (1) | 500,000 | 501,478 | ||||
Bacardi Ltd., 8.20%, 4/1/2019 (1) | 500,000 | 500,467 | ||||
Constellation Brands, Inc., 8.375%, 12/15/2014 | 500,000 | 502,500 | ||||
Dr Pepper Snapple Group, Inc., 6.82%, 5/1/2018 | 1,000,000 | 943,811 | ||||
FOOD PRODUCTS — 0.34% | ||||||
Bunge Ltd. Financial Corp., 5.10%, 7/15/2015 | 321,000 | 256,414 | ||||
TOBACCO — 0.36% | ||||||
Altria Group, Inc., 9.70%, 11/10/2018 | 250,000 | 272,125 | ||||
| 3,471,536 | ||||||
HEALTH CARE EQUIPMENT & SERVICES — 1.58% | ||||||
HEALTH CARE PROVIDERS & SERVICES — 1.58% | ||||||
Alliance Imaging, Inc., 7.25%, 12/15/2012 | 175,000 | 168,000 | ||||
Alliance Imaging, Inc., 7.25%, 12/15/2012 | 250,000 | 240,000 | ||||
McKesson Corp., 7.50%, 2/15/2019 | 500,000 | 530,698 | ||||
Wellpoint, Inc., 7.00%, 2/15/2019 | 250,000 | 250,135 | ||||
| 1,188,833 | ||||||
| 24 | Certified Semi-Annual Report |
| SCHEDULE OF INVESTMENTS, CONTINUED | ||
| Thornburg Strategic Income Fund | March 31, 2009 (Unaudited) | |
| Shares/ Principal Amount | Value | |||||
INSURANCE — 2.38% | ||||||
INSURANCE — 2.38% | ||||||
International Lease Finance Corp., 4.875%, 9/1/2010 | $ | 1,000,000 | $ | 730,507 | ||
Metlife, Inc. Series A, 6.817%, 8/15/2018 | 750,000 | 643,909 | ||||
Prudential Holdings LLC, 8.695%, 12/18/2023 (1) | 485,000 | 417,357 | ||||
| 1,791,773 | ||||||
MATERIALS — 2.58% | ||||||
CONSTRUCTION MATERIALS — 1.40% | ||||||
CRH America, Inc., 8.125%, 7/15/2018 | 750,000 | 584,790 | ||||
Martin Marietta Materials, Inc. LIBOR Floating Rate Note, 1.324%, 4/30/2010 | 500,000 | 468,508 | ||||
METALS & MINING — 0.63% | ||||||
Freeport-McMoRan Copper & Gold, Inc., 8.25%, 4/1/2015 | 500,000 | 478,750 | ||||
PAPER & FOREST PRODUCTS — 0.55% | ||||||
International Paper Co., 7.40%, 6/15/2014 | 500,000 | 412,473 | ||||
| 1,944,521 | ||||||
MEDIA — 3.17% | ||||||
MEDIA — 3.17% | ||||||
DIRECTV Holdings, 6.375%, 6/15/2015 | 900,000 | 848,250 | ||||
Time Warner Cable, Inc., 7.50%, 4/1/2014 | 500,000 | 509,794 | ||||
Time Warner Cable, Inc., 8.75%, 2/14/2019 | 250,000 | 265,457 | ||||
Time Warner Cable, Inc., 8.25%, 2/14/2014 | 250,000 | 261,325 | ||||
Washington Post Co., 7.25%, 2/1/2019 | 500,000 | 505,520 | ||||
| 2,390,346 | ||||||
PHARMACEUTICALS, BIOTECHNOLOGY & LIFE SCIENCES— 2.35% | ||||||
BIOTECHNOLOGY — 1.34% | ||||||
Biogen Idec, Inc., 6.00%, 3/1/2013 | 1,000,000 | 1,013,374 | ||||
PHARMACEUTICALS — 1.01% | ||||||
Axcan Intermediate Holdings, Inc., 12.75%, 3/1/2016 | 250,000 | 233,125 | ||||
Pfizer, Inc., 5.35%, 3/15/2015 | 500,000 | 527,523 | ||||
| 1,774,022 | ||||||
REAL ESTATE — 0.28% | ||||||
REAL ESTATE INVESTMENT TRUSTS — 0.28% | ||||||
HRPT Properties Trust, 1.92%, 3/16/2011 | 275,000 | 211,240 | ||||
| 211,240 | ||||||
RETAILING — 2.92% | ||||||
INTERNET & CATALOG RETAIL — 0.45% | ||||||
Ticketmaster, 10.75%, 8/1/2016 (1) | 500,000 | 340,000 | ||||
SPECIALTY RETAIL — 2.47% | ||||||
Ace Hardware Corp., 9.125%, 6/1/2016 (1) | 750,000 | 615,000 | ||||
Best Buy, Inc., 6.75%, 7/15/2013 | 500,000 | 475,720 | ||||
Staples, Inc., 7.75%, 4/1/2011 | 500,000 | 511,123 | ||||
Staples, Inc., 9.75%, 1/15/2014 | 250,000 | 261,715 | ||||
| 2,203,558 | ||||||
SEMICONDUCTORS & SEMICONDUCTOR EQUIPMENT — 2.21% | ||||||
SEMICONDUCTORS & SEMICONDUCTOR EQUIPMENT — 2.21% | ||||||
KLA Instruments Corp., 6.90%, 5/1/2018 | 1,000,000 | 790,460 | ||||
| Certified Semi-Annual Report | 25 |
| SCHEDULE OF INVESTMENTS, CONTINUED | ||
| Thornburg Strategic Income Fund | March 31, 2009 (Unaudited) | |
| Shares/ Principal Amount | Value | |||||
National Semiconductor, 1.57%, 6/15/2010 | $ | 1,000,000 | $ | 876,291 | ||
| 1,666,751 | ||||||
TECHNOLOGY HARDWARE & EQUIPMENT — 0.63% | ||||||
COMMUNICATIONS EQUIPMENT — 0.63% | ||||||
Motorola, Inc., 7.625%, 11/15/2010 | 500,000 | 475,117 | ||||
| 475,117 | ||||||
TELECOMMUNICATION SERVICES — 3.64% | ||||||
DIVERSIFIED TELECOMMUNICATION SERVICES — 2.98% | ||||||
Level 3 Financing, Inc., 9.25%, 11/1/2014 | 700,000 | 483,000 | ||||
Telecom Italia Capital, 6.999%, 6/4/2018 | 520,000 | 471,321 | ||||
Vimpelcom, 8.25%, 5/23/2016 (1) | 500,000 | 305,000 | ||||
Windstream Corp., 8.125%, 8/1/2013 | 1,000,000 | 985,000 | ||||
WIRELESS TELECOMMUNICATION SERVICES — 0.66% | ||||||
Crown Castle International Corp., 9.00%, 1/15/2015 | 500,000 | 501,250 | ||||
| 2,745,571 | ||||||
TRANSPORTATION — 2.20% | ||||||
AIR FREIGHT & LOGISTICS — 1.36% | ||||||
FedEx Corp., 8.76%, 5/22/2015 | 500,000 | 495,849 | ||||
FedEx Corp., 7.375%, 1/15/2014 | 250,000 | 265,036 | ||||
FedEx Corp., 8.00%, 1/15/2019 | 250,000 | 263,114 | ||||
ROAD & RAIL — 0.84% | ||||||
Hertz Corp., 8.875%, 1/1/2014 | 300,000 | 181,875 | ||||
Ryder System, Inc., 7.20%, 9/1/2015 | 500,000 | 450,354 | ||||
| 1,656,228 | ||||||
UTILITIES — 10.35% | ||||||
ELECTRIC UTILITIES — 6.38% | ||||||
Alabama Power Capital Trust V, 5.50%, 10/1/2042 | 700,000 | 545,595 | ||||
Appalachian Power Co., 7.95%, 1/15/2020 | 500,000 | 513,152 | ||||
Aquila, Inc., 7.95%, 2/1/2011 | 500,000 | 491,084 | ||||
Arizona Public Service Co., 5.50%, 9/1/2035 | 370,000 | 225,933 | ||||
Arizona Public Service Co., 8.75%, 3/1/2019 | 500,000 | 502,030 | ||||
Atlantic City Electric, 7.75%, 11/15/2018 | 250,000 | 279,924 | ||||
Commonwealth Edison, 6.15%, 3/15/2012 | 300,000 | 306,230 | ||||
Entergy Texas, Inc., 7.125%, 2/1/2019 | 500,000 | 488,808 | ||||
Illinois Power Co., 9.75%, 11/15/2018 | 500,000 | 544,327 | ||||
Metropolitan Edison, 7.70%, 1/15/2019 | 250,000 | 253,621 | ||||
Progress Energy, Inc., 6.05%, 3/15/2014 | 250,000 | 251,814 | ||||
Reliant Energy, Inc., 7.625%, 6/15/2014 | 500,000 | 405,000 | ||||
GAS UTILITIES — 1.08% | ||||||
Atmos Energy Corp., 8.50%, 3/15/2019 | 750,000 | 765,763 | ||||
Southern Union Co., 7.20%, 11/1/2066 | 100,000 | 50,000 | ||||
MULTI-UTILITIES — 2.89% | ||||||
NiSource Finance Corp., 6.40%, 3/15/2018 | 1,130,000 | 914,347 | ||||
Sempra Energy, 9.80%, 12/1/2019 | 250,000 | 276,909 | ||||
Texas-New Mexico Power, 9.50%, 4/1/2019 (1) | 1,000,000 | 984,432 | ||||
| 7,798,969 | ||||||
TOTAL CORPORATE BONDS (Cost $52,708,192) | 49,334,903 | |||||
| 26 | Certified Semi-Annual Report |
| SCHEDULE OF INVESTMENTS, CONTINUED | ||
Thornburg Strategic Income Fund | March 31, 2009 (Unaudited) | |
| Shares/ Principal Amount | Value | |||||
CONVERTIBLE BONDS — 5.22% | ||||||
CAPITAL GOODS — 1.66% | ||||||
MACHINERY — 1.66% | ||||||
Ingersoll Rand Co., 4.50%, 4/15/2012 | $ | 1,250,000 | $ | 1,250,000 | ||
| 1,250,000 | ||||||
DIVERSIFIED FINANCIALS — 0.18% | ||||||
DIVERSIFIED FINANCIAL SERVICES — 0.18% | ||||||
KKR Financial Holdings LLC, 7.00%, 7/15/2012 | 500,000 | 138,125 | ||||
| 138,125 | ||||||
ENERGY — 0.68% | ||||||
OIL, GAS & CONSUMABLE FUELS — 0.68% | ||||||
Chesapeake Energy Corp., 2.25%, 12/15/2038 | 1,000,000 | 515,000 | ||||
| 515,000 | ||||||
FOOD & STAPLES RETAILING — 0.28% | ||||||
FOOD & STAPLES RETAILING — 0.28% | ||||||
Rite Aid Corp., 8.50%, 5/15/2015 | 750,000 | 207,187 | ||||
| 207,187 | ||||||
MEDIA — 0.67% | ||||||
MEDIA — 0.67% | ||||||
Central European Media, 3.50%, 3/15/2013 (1) | 1,000,000 | 503,750 | ||||
| 503,750 | ||||||
REAL ESTATE — 0.77% | ||||||
REAL ESTATE INVESTMENT TRUSTS — 0.77% | ||||||
Extra Space Storage, LP, 3.625%, 4/1/2027 (1) | 250,000 | 163,125 | ||||
Washington REIT, 3.875%, 9/15/2026 | 500,000 | 420,625 | ||||
| 583,750 | ||||||
TELECOMMUNICATION SERVICES — 0.98% | ||||||
DIVERSIFIED TELECOMMUNICATION SERVICES — 0.33% | ||||||
Global Crossing Ltd., 5.00%, 5/15/2011 | 500,000 | 250,000 | ||||
WIRELESS TELECOMMUNICATION SERVICES — 0.65% | ||||||
NII Holdings, Inc., 3.125%, 6/15/2012 | 700,000 | 486,500 | ||||
| 736,500 | ||||||
TOTAL CONVERTIBLE BONDS (Cost $4,879,153) | 3,934,312 | |||||
MUNICIPAL BONDS — 2.44% | ||||||
Louisiana Public Facilities Authority Revenue (Black & Gold Facilities Project C), 5.15%, 4/1/2012 | 330,000 | 313,777 | ||||
Michigan Higher Education Student Loan Authority, 3.95%, 3/1/2011 | 250,000 | 229,083 | ||||
Ohio State Solid Waste (Republic Services Project), 4.25%, 4/1/2033 | 900,000 | 777,177 | ||||
Pennsylvania Economic Development Series A (Waste Management, Inc. Project), 4.70%, 11/1/2021 | 600,000 | 520,494 | ||||
TOTAL MUNICIPAL BONDS (Cost $1,945,876) | 1,840,531 | |||||
U.S. GOVERNMENT AGENCIES — 0.02% | ||||||
Federal National Mtg Association, 6.50%, 3/25/2024 | 16,506 | 17,391 | ||||
TOTAL U.S. GOVERNMENT AGENCIES (Cost $16,582) | 17,391 | |||||
| Certified Semi-Annual Report | 27 |
| SCHEDULE OF INVESTMENTS, CONTINUED | ||
| Thornburg Strategic Income Fund | March 31, 2009 (Unaudited) | |
| Shares/ Principal Amount | Value | |||||
U.S. TREASURY SECURITIES — 1.78% | ||||||
United States Treasury Notes, 3.375%, 11/30/2012 | $ | 300,000 | $ | 321,984 | ||
United States Treasury Notes, 4.25%, 11/15/2017 | 900,000 | 1,021,219 | ||||
TOTAL U.S. TREASURY SECURITIES (Cost $1,204,489) | 1,343,203 | |||||
FOREIGN BONDS — 0.79% | ||||||
ENERGY — 0.17% | ||||||
OIL, GAS & CONSUMABLE FUELS — 0.17% | ||||||
OAO Gazprom, 7.25%, 2/22/2010 (RUB) | 5,000,000 | 128,189 | ||||
| 128,189 | ||||||
MISCELLANEOUS — 0.62% | ||||||
MISCELLANEOUS — 0.62% | ||||||
Republic of Brazil, 12.50%, 1/5/2016 (BRL) | 1,025,000 | 463,951 | ||||
| 463,951 | ||||||
TOTAL FOREIGN BONDS (Cost $846,024) | 592,140 | |||||
YANKEE BONDS — 12.49% | ||||||
BANKS — 1.02% | ||||||
COMMERCIAL BANKS — 1.02% | ||||||
Banco Industrial e Comercial S.A., 7.00%, 4/23/2010 | 500,000 | 450,000 | ||||
Bank of Scotland plc, 5.625%, 7/20/2009 (1) | 37,000 | 37,139 | ||||
DBS Bank Ltd. /Singapore, 5.125%, 5/16/2017 (1) | 200,000 | 176,713 | ||||
Glitnir Banki HF, 4.421%, 1/18/2012 (1), (3)+ | 500,000 | 53,750 | ||||
Glitnir Banki HF, 5.73%, 8/25/2009 (1), (3)+ | 175,000 | 438 | ||||
Islandsbanki, 4.41%, 10/15/2008 (1), (3)+ | 60,000 | 300 | ||||
Shinhan Bank, 6.819%, 9/20/2036 | 100,000 | 48,836 | ||||
| 767,176 | ||||||
DIVERSIFIED FINANCIALS — 0.98% | ||||||
DIVERSIFIED FINANCIAL SERVICES — 0.98% | ||||||
Export-Import Bank of Korea, 8.125%, 1/21/2014 | 250,000 | 258,407 | ||||
Korea Development Bank, 5.30%, 1/17/2013 | 200,000 | 185,521 | ||||
Korea Development Bank, 1.565%, 4/3/2010 | 300,000 | 291,641 | ||||
| 735,569 | ||||||
ENERGY — 3.89% | ||||||
OIL, GAS & CONSUMABLE FUELS — 3.89% | ||||||
BP Capital Markets plc., 3.875%, 3/10/2015 | 500,000 | 501,500 | ||||
Petrobras International Finance Co., 7.875%, 3/15/2019 | 500,000 | 518,100 | ||||
Petroplus Finance Ltd., 6.75%, 5/1/2014 (1) | 1,000,000 | 740,000 | ||||
Posco, 8.75%, 3/26/2014 (1) | 500,000 | 519,740 | ||||
Trans-Canada Pipelines Ltd., 6.35%, 5/15/2067 | 275,000 | 156,750 | ||||
Woodside Finance Ltd., 8.125%, 3/1/2014 (1) | 500,000 | 498,887 | ||||
| 2,934,977 | ||||||
INSURANCE — 1.62% | ||||||
INSURANCE — 1.62% | ||||||
Swiss Re Capital I, LP, 6.854%, 5/29/2049 (1) | 4,000,000 | 1,220,000 | ||||
| 1,220,000 | ||||||
| 28 | Certified Semi-Annual Report |
| SCHEDULE OF INVESTMENTS, CONTINUED | ||
| Thornburg Strategic Income Fund | March 31, 2009 (Unaudited) | |
| Shares/ Principal Amount | Value | |||||
MATERIALS — 1.74% | ||||||
METALS & MINING — 1.74% | ||||||
BHP Billiton Finance USA Ltd., 5.50%, 4/1/2014 | $ | 250,000 | $ | 251,723 | ||
BHP Billiton Finance USA Ltd., 6.50%, 4/1/2019 | 250,000 | 253,285 | ||||
Codelco, Inc., 7.50%, 1/15/2019 (1) | 250,000 | 283,641 | ||||
Rio Tinto Alcan, Inc., 5.00%, 6/1/2015 | 50,000 | 39,721 | ||||
Vedanta Resources, plc, 6.625%, 2/22/2010 | 500,000 | 482,500 | ||||
| 1,310,870 | ||||||
RETAILING — 0.33% | ||||||
MULTILINE RETAIL — 0.33% | ||||||
Parkson Retail Group, 7.125%, 5/30/2012 | 300,000 | 251,250 | ||||
| 251,250 | ||||||
TELECOMMUNICATION SERVICES — 1.26% | ||||||
DIVERSIFIED TELECOMMUNICATION SERVICES — 1.26% | ||||||
Deutsche Telekom International Finance, 5.75%, 3/23/2016 | 315,000 | 309,052 | ||||
GC Impsat Holdings I plc, 9.875%, 2/15/2017 (1) | 250,000 | 167,500 | ||||
Telecom Italia Capital, 1.753%, 7/18/2011 | 550,000 | 475,649 | ||||
| 952,201 | ||||||
UTILITIES — 1.65% | ||||||
ELECTRIC UTILITIES — 1.65% | ||||||
Electricite de France SA, 5.50%, 1/26/2014 (1) | 250,000 | 265,381 | ||||
Taqa Abu Dhabi National Energy Co., 7.25%, 8/1/2018 (1) | 500,000 | 476,036 | ||||
Taqa Abu Dhabi National Energy Co., 6.60%, 8/1/2013 (1) | 500,000 | 505,021 | ||||
| 1,246,438 | ||||||
TOTAL YANKEE BONDS (Cost $10,203,090) | 9,418,481 | |||||
OTHER SECURITIES — 0.92% | ||||||
LOAN PARTICIPATIONS — 0.92% | ||||||
Fairpoint Communications, Inc. Term Loan B, 5.75%, 3/8/2015 | 471,545 | 210,229 | ||||
Fairpoint Communications, Inc. Term Loan B, 6.563%, 3/9/2015 | 4,065 | 1,812 | ||||
Fairpoint Communications, Inc. Term Loan B, 6.563%, 3/31/2015 | 37,398 | 16,673 | ||||
Fairpoint Communications, Inc. Term Loan B, 6.563%, 3/31/2015 | 6,504 | 2,900 | ||||
Fairpoint Communications, Inc. Term Loan B, 6.563%, 3/8/2015 | 447,154 | 199,355 | ||||
Fairpoint Communications, Inc. Term Loan B, 5.75%, 3/8/2015 | 33,333 | 14,861 | ||||
Global Crossing Ltd., 7.484%, 5/9/2012 | 500,000 | 250,000 | ||||
| 695,830 | ||||||
TOTAL OTHER SECURITIES (Cost $1,169,605) | 695,830 | |||||
SHORT TERM INVESTMENTS — 2.26% | ||||||
San Diego County CA Pension Obligation, put 4/7/2009 (SPA: Landesbank Baden) (weekly demand notes), 2.25%, 8/15/2027 | 1,700,000 | 1,700,000 | ||||
TOTAL SHORT TERM INVESTMENTS (Cost $1,700,000) | 1,700,000 | |||||
TOTAL INVESTMENTS — 99.40% (Cost $86,457,940) | $ | 74,929,168 | ||||
OTHER ASSETS LESS LIABILITIES — 0.60% | 455,723 | |||||
NET ASSETS — 100.00% | $ | 75,384,891 | ||||
| Certified Semi-Annual Report | 29 |
| SCHEDULE OF INVESTMENTS, CONTINUED | ||
Thornburg Strategic Income Fund | March 31, 2009 (Unaudited) | |
Footnote Legend
| + | Non-income producing. |
| (1) | Securities exempt from registration under Rule 144A of the Securities Act of 1933, as amended. These securities may only be resold in the ordinary course of business in transactions exempt from registration, normally to qualified institutional buyers. As of March 31, 2009, the aggregate value of these securities in the Fund’s portfolio was $14,651,372, representing 19.44% of the Fund’s net assets. |
| (2) | Security currently fair valued by the valuation and pricing committee using procedures approved by the Trustees. |
| (3) | Bond in default. |
Portfolio Abbreviations
To simplify the listings of securities, abbreviations are used per the table below:
| ARM | Adjustable Rate Mortgage | |
| BRL | Denominated in Brazilian Dollars | |
| LIBOR | London Interbank Offered Rates | |
| Mtg | Mortgage | |
| REIT | Real Estate Investment Trust | |
| RUB | Denominated in Russian Rubles | |
| SPA | Stock Purchase Agreement |
See notes to financial statements.
| 30 | Certified Semi-Annual Report |
| EXPENSE EXAMPLE | ||
| Thornburg Strategic Income Fund | March 31, 2009 (Unaudited) | |
As a shareholder of the Fund, you incur two types of costs:
(1) transaction costs, including
(a) sales charges (loads) on purchase payments for Class A shares;
(b) a deferred sales charge on redemptions of any part or all of a purchase of $1 million of Class A shares within 12 months of purchase;
(c) a deferred sales charge on redemptions of Class C shares within 12 months of purchase;
(2) ongoing costs, including management fees; distribution and/or service (12b-1) fees; and other Fund expenses.
This example is intended to help you understand your ongoing costs (in dollars) of investing in the Fund and to compare these costs with the ongoing costs of investing in other mutual funds.
The example is based on an investment of $1,000 invested on September 30, 2008 and held until March 31, 2009.
Actual Expenses
For each class of shares, the first line of the table at right provides information about actual account values and actual expenses. You may use the information in this line, together with the amount you invested, to estimate the expenses that you paid over the period. Simply divide your account value by $1,000 (for example, an $8,600 account value divided by $1,000 = 8.6), then multiply the result by the number in the first line for your class of shares under the heading entitled “Expenses Paid During Period” to estimate the expenses you paid on your account during this period.
Hypothetical Example for Comparison Purposes
For each class of shares, the second line of the table at right provides information about hypothetical account values and hypothetical expenses based on the Fund’s actual expense ratio and an assumed rate of return of 5% per year before expenses, which is not the Fund’s actual return. The hypothetical account values and expenses may not be used to estimate the actual ending account balance or expenses you paid for the period. You may use this information to compare the ongoing costs of investing in the Fund and other funds. To do so, compare this 5% hypothetical example with the 5% hypothetical examples that appear in the shareholder reports of the other funds.
| Beginning Account Value 9/30/08 | Ending Account Value 3/31/09 | Expenses Paid During Period† 9/30/08–3/31/09 | |||||||
Class A Shares | |||||||||
Actual | $ | 1,000.00 | $ | 920.20 | $ | 5.98 | |||
Hypothetical* | $ | 1,000.00 | $ | 1,018.70 | $ | 6.29 | |||
Class C Shares | |||||||||
Actual | $ | 1,000.00 | $ | 916.80 | $ | 8.60 | |||
Hypothetical* | $ | 1,000.00 | $ | 1,015.96 | $ | 9.05 | |||
Class I Shares | |||||||||
Actual | $ | 1,000.00 | $ | 921.50 | $ | 4.74 | |||
Hypothetical* | $ | 1,000.00 | $ | 1,020.00 | $ | 4.99 | |||
| † | Expenses are equal to the annualized expense ratio for each class (A: 1.25%; C: 1.80%; I: 0.99%) multiplied by the average account value over the period, multiplied by 182/365 to reflect the one-half year period. |
| * | Hypothetical assumes a rate of return of 5% per year before expenses. |
Please note that the expenses shown in the table are meant to highlight your ongoing costs only and do not reflect any transactional costs, such as sales charges (loads), redemption fees, or exchange fees. Therefore, the second line of the table for each class of shares is useful in comparing ongoing costs only, and will not help you determine the relative total costs of owning different funds. In addition, if these transactional costs were included, your costs would have been higher.
| Certified Semi-Annual Report | 31 |
| OTHER INFORMATION | ||
| Thornburg Strategic Income Fund | March 31, 2009 (Unaudited) | |
PORTFOLIO PROXY VOTING
Policies and Procedures:
The Trust has delegated to Thornburg Investment Management, Inc. (the “Advisor”) voting decisions respecting proxies for the Fund’s voting securities. The Advisor makes voting decisions in accordance with its Proxy Voting Policy and Procedures. A description of the Policy and Procedures is available (i) without charge, upon request, by calling the Advisor toll-free at 1-800-847-0200, (ii) on the Thornburg website at www.thornburg.com, and (iii) on the Securities and Exchange Commission’s website at www.sec.gov.
Information regarding how proxies were voted is currently available for the period from the Fund’s commencement of investment operations on December 19, 2007 through June 30, 2008, and will hereafter be available on or before August 31 of each year for the twelve months ending the preceding June 30. This information is available (i) without charge, upon request by calling the Advisor toll-free at 1-800-847-0200, (ii) on the Thornburg web site at www.thornburg.com, and (iii) on the Securities and Exchange Commission’s web site at www.sec.gov.
AVAILABILITY OF QUARTERLY PORTFOLIO SCHEDULE
The Fund files with the Securities and Exchange Commission schedules of its portfolio holdings on Form N-Q for the first and third quarters of each fiscal year. The Fund’s Forms N-Q are available on the Commission’s web site at www.sec.gov, or may be reviewed and copied at the Commission’s Public Reference Room in Washington, D.C. Information on the operation of the Public Reference Room may be obtained by calling 1-800-SEC-0330. The Fund also makes this information available on its web site at www. thornburg.com/download or upon request by calling 1-800-847-0200.
| 32 | Certified Semi-Annual Report |
Trustees’ Statement to Shareholders
Not part of the Certified Semi-Annual Report
February 8, 2005, as readopted September 15, 2008
The Trustees are concerned that ongoing commentaries and opinions reported in the media may confuse investors in general as to the supervisory duties of trustees of mutual funds and, in particular, leave Thornburg Investment Trust shareholders uncertain regarding how we discharge our responsibilities in supervising the Funds’ investment advisor and in reviewing the advisor’s contract for renewal. We decided to spell out clearly three principal guidelines that we follow in supervising the Trust’s investment advisor on your behalf.
We begin with the premise that each shareholder selected his or her Fund because its investments are managed by the investment advisor identified in the prospectus and in accordance with the objective and policies described in the prospectus. We realize, as each of you do, that if you believe that your Fund’s stated objective and policies no longer serve your personal investment goals, you can sell your shares and leave the Fund.
Therefore, we believe that our primary supervisory task – our principal obligation to you – is to assess the nature and quality of the advisor’s services, and to confirm that the advisor actively and competently pursues the Fund’s objective, in accordance with the policies set out in the prospectus. To do this, we meet regularly with management to review your Fund’s portfolio and to discuss the advisor’s specific actions and judgments in pursuing the Fund’s objective. We do not substitute our own judgment for the advisor’s decisions in selecting investments; the advisor is paid to exercise its informed judgment on investment decisions, and we seek to confirm, in reviewing the advisor’s performance, that the advisor is doing just that.
Second, while we are conscious of costs and the effect that costs have on shareholders’ returns, we do not seek the lowest fees or expense ratio as our sole or primary objective. We try to make sure that your Fund’s fees and costs are reasonable in relationship to the services rendered and that they are generally in line with those charged by other expert investment advisors, consistent with our belief that the Fund’s investors searched for and expect that expertise and attention and have decided to pay a reasonable price for it. We do not put the management contract “out to bid” as a matter of course, and we would not do so unless we had concluded that the advisor materially had failed to pursue the Fund’s objectives in accordance with its policies, or for other equally important reasons. We believe that any other approach would be inconsistent with your interests and contrary to your expectations when you bought shares of the Fund in the first place.
Finally, because we believe that most Thornburg Fund shareholders have invested with a long-term perspective, we try not to focus too much on the fashions of the moment and on short-term performance. The market will not favor any specific investment objective or set of policies at all times and under all economic circumstances. A fund will experience periods of both high and low returns relative to other funds and other investments. Even if one of our Funds is not favored by the market at a particular time, we believe that the advisor is nonetheless obliged to remain true to the Fund’s objective and policies, and we watch to see that it does so.
| This page is not part of the Semi-Annual Report. | 33 |
This page intentionally left blank.
| 34 | This page is not part of the Semi-Annual Report. |
Planning Options
Retirement and Education Accounts
Thornburg Investment Management offers retirement and education savings accounts that can help you meet a variety of planning challenges. For account applications or further information on any of the accounts below, please call 1-800-847-0200 or go to www.thornburg.com/ira. Your financial advisor can help you determine which plan is right for you.
Individual Retirement Accounts
Individual Retirement Accounts (IRAs) provide a tax-advantaged means to save money for the future. For a detailed outline of the difference between retirement accounts, see www.thornburg.com/ira. Rollovers are available. Call 1-800-847-0200 for more information.
Traditional IRAs – Contributions to Traditional IRAs are tax deductible for eligible individuals, and withdrawals are taxed as additional ordinary income. You may contribute to an IRA if you receive compensation and are under 70 1/2, even if you are covered by an employer retirement plan. Deductible contributions are subject to certain qualifications. Please consult your tax advisor.
Roth IRAs – Under a Roth IRA, there is no tax deduction for contributions, but there is no income tax on qualified withdrawals. For a more detailed comparison of Traditional and Roth IRAs, please see our web site at www.thornburg.com/ira.
SEP IRAs – Simplified Employee Pension (SEP) IRAs are established by employers. The employer is allowed a tax deduction for contributions made to the SEP Plan and makes contributions to each eligible employee’s SEP IRA on a discretionary basis.
SIMPLE IRAs – Savings Incentive Match Plan for Employees of Small Employers (SIMPLE) is designed to give small business owners a simplified method to establish and contribute to a retirement plan for employees. The employer is allowed a tax deduction for contributions and makes either matching or non-elective contributions to each eligible employee’s SIMPLE IRA. Employees may make salary deferral contributions.
Coverdell Education Savings Account
These savings accounts are designed to provide a way to save money for higher education expenses. In an Education Savings Account, earnings and interest grow tax-free, and qualified withdrawals used to pay for eligible higher-education expenses are tax- and penalty-free.
Funds Available
The following funds are available in the accounts listed above:
| • | Thornburg International Value Fund |
| • | Thornburg Value Fund |
| • | Thornburg Core Growth Fund |
| • | Thornburg Investment Income Builder Fund |
| • | Thornburg Global Opportunities Fund |
| • | Thornburg International Growth Fund |
| • | Thornburg Limited Term U.S. Government Fund |
| • | Thornburg Limited Term Income Fund |
| • | Thornburg Strategic Income Fund |
| This page is not part of the Semi-Annual Report. | 35 |

| 36 | This page is not part of the Semi-Annual Report. |
Thornburg Equity Funds
Thornburg’s equity research uses a fundamental and comprehensive analytical approach. Thornburg equity funds focus on a limited number of securities so that each holding can impact performance. The equity team searches for firms believed to have a promising future and seeks to buy shares of those companies at a discount to their intrinsic value.
| • | Thornburg Value Fund |
| • | Thornburg International Value Fund |
| • | Thornburg Core Growth Fund |
| • | Thornburg Investment Income Builder Fund |
| • | Thornburg Global Opportunities Fund |
| • | Thornburg International Growth Fund |
Thornburg Bond Funds
Thornburg Investment Management applies a disciplined philosophy to fixed-income management. Since the launch of our first fixed-income fund 25 years ago, we have been conducting fundamental, bottom-up research in an effort to identify bonds which we believe provide the best return for a given level of risk. We are very organic in our approach, avoiding leverage or complex strategies which could backfire in periods of market uncertainty.
| • | Thornburg Limited Term Municipal Fund |
| • | Thornburg Intermediate Municipal Fund |
| • | Thornburg California Limited Term Municipal Fund |
| • | Thornburg New Mexico Intermediate Municipal Fund |
| • | Thornburg New York Intermediate Municipal Fund |
| • | Thornburg Strategic Municipal Income Fund |
| • | Thornburg Limited Term U.S. Government Fund |
| • | Thornburg Limited Term Income Fund |
| • | Thornburg Strategic Income Fund |
Before investing, carefully consider the Fund’s investment goals, risks, charges, and expenses. For a prospectus containing this and other information, contact your financial advisor or visit thornburg.com. Read it carefully before investing.
For additional information, please visit www.thornburg.com
Thornburg Investment Management, Inc. 2300 North Ridgetop Road, Santa Fe, NM 87506
| This page is not part of the Semi-Annual Report. | 37 |
This page intentionally left blank.
| 38 | This page is not part of the Semi-Annual Report. |
This page intentionally left blank.
| This page is not part of the Semi-Annual Report. | 39 |

 | This Semi-Annual Report is submitted for the general information of shareholders of the Fund. It is not authorized for distribution to prospective investors in the Fund unless preceded or accompanied by an effective prospectus.
Investment Advisor:
Thornburg Investment Management® 800.847.0200
Distributor:
Thornburg Securities Corporation® 800.847.0200
| |
| TH1663 | ||
| Waste not, Wait not |  | |
Get instant access to your shareholder reports.
By switching from your postal mailbox to your email inbox, you reduce paper clutter, improve record keeping access, and help conserve our natural resources.
Go to www.thornburg.com/edelivery and sign up to receive your shareholder reports, prospectuses, and proxy statements electronically.
You invest in the future, without spending a dime.
| ||
| Item 2. | Code of Ethics |
Not applicable.
| Item 3. | Audit Committee Financial Expert |
Not applicable.
| Item 4. | Principal Accountant Fees and Services |
Not applicable.
| Item 5. | Audit Committee of Listed Registrants |
Not applicable.
| Item 6. | Schedule of Investments |
Filed as part of the reports to shareholders filed under item 1 of this Form.
| Item 7. | Disclosure of Proxy Voting Policies and Procedures for Closed-End Management Investment Companies |
Not applicable.
| Item 8. | Portfolio Managers of Closed-End Management Investment Companies |
Not applicable.
| Item 9. | Purchases of Equity Securities by Closed-End Management Investment Companies and Affiliated Purchasers. |
Not applicable.
| Item 10. | Submission of Matters to a Vote of Security Holders |
The authority to consider candidates recommended by the shareholders in accordance with the Trust’s Procedures for Shareholder Communications is committed to the Governance and Nominating Committee.
| Item 11. | Controls and Procedures |
(a) The principal executive officer and the principal financial officer have concluded that Thornburg Investment Trust’s disclosure controls and procedures provide reasonable assurance that material information relating to Thornburg Investment Trust is made known to them by the appropriate persons, based on their evaluation of these controls and procedures as of a date within 90 days prior to the filing date of this report.
(b) There was no change in Thornburg Investment Trust’s internal control over financial reporting that occurred during the registrant’s second fiscal quarter of the period covered by this report (that is, the registrant’s second fiscal quarter) that has materially affected, or is reasonably likely to materially affect, the registrant’s internal control over financial reporting.
| Item 12. | Exhibits |
| (a) | (1) Not Applicable. |
| (a) | (2) Certifications pursuant to Rule 30a-2(a) under the Investment Company Act of 1940 |
(17 CFR 70.30a-2(a)) attached hereto as Exhibit 99.CERT.
| (a) | (3) Not Applicable |
| (b) | Certification pursuant to Section 906 of the Sarbanes-Oxley Act of 2002 and Rule 30a-2(b) under the Investment Company Act of 1940 (17 CFR 70.30a-2(b)) attached hereto as Exhibit 99.906CERT. |
SIGNATURES
Pursuant to the requirements of the Securities Exchange Act of 1934 and the Investment Company Act of 1940, the registrant has duly caused this report to be signed on its behalf by the undersigned, thereunto duly authorized.
Thornburg Investment Trust, in respect of the following Thornburg Funds: Limited Term Municipal Fund, California Limited Term Municipal Fund, Intermediate Municipal Fund, New Mexico Intermediate Municipal Fund, New York Intermediate Municipal Fund, Limited Term U.S. Government Fund, Limited Term Income Fund, Value Fund, International Value Fund, Core Growth Fund, Investment Income Builder Fund, Global Opportunities Fund, International Growth Fund and Strategic Income Fund.
| By: | /s/ Brian J. McMahon | |
Brian J. McMahon President and principal executive officer | ||
Date: May 21, 2009
Pursuant to the requirements of the Securities Exchange Act of 1934 and the Investment Company Act of 1940, this report has been signed below by the following persons on behalf of the registrant and in the capacities and on the dates indicated.
| By: | /s/ Brian J. McMahon | |
Brian J. McMahon President and principal executive officer | ||
Date: May 21, 2009
| By: | /s/ George T. Strickland | |
George T. Strickland Treasurer and principal financial officer | ||
Date: May 21, 2009