0000816153 tbit:MSCIEAFENetTotalReturnUSDIndex95Member 2015-11-30 0000816153 tbit:C000042672Member 2024-01-31 0000816153 tbit:MSCIAllCountryWorldexUSANetTotalReturnUSDIndex160Member 2021-11-30 0000816153 tbit:MSCIAllCountryWorldexUSANetTotalReturnUSDIndex209Member 2021-07-31 0000816153 tbit:MSCIAllCountryWorldexUSANetTotalReturnUSDIndex250Member 2018-08-31 0000816153 tbit:MSCIAllCountryWorldexUSANetTotalReturnUSDIndex289Member 2015-09-30 0000816153 tbit:C000081861Member 2023-04-30 0000816153 tbit:Russell3000Index373Member 2019-03-31 0000816153 tbit:Russell3000Index413Member 2018-10-31 0000816153 tbit:Russell2500GrowthIndex452Member 2018-04-30 0000816153 tbit:Russell2500GrowthIndex492Member 2017-08-31 0000816153 tbit:ThornburgInvestmentIncomeBuilderFundsBlendedIndex604Member 2024-05-31 0000816153 tbit:ThornburgSummitFundsBlendedIndex667Member 2024-05-31 0000816153 tbit:BloombergUSAggregateTotalReturnValueIndex733Member 2024-05-31 0000816153 tbit:BloombergUSGovernmentIntermediateTotalReturnIndex809Member 2017-03-31 0000816153 tbit:BloombergUSGovernmentIntermediateTotalReturnIndex843Member 2024-08-31 0000816153 tbit:BloombergUSAggregateTotalReturnValueIndex902Member 2021-07-31 0000816153 tbit:BloombergUSAggregateTotalReturnValueIndex973Member 2024-03-31 0000816153 tbit:BloombergIntermediateUSGovernmentCreditTotalReturnIndex1041Member 2023-05-31 0000816153 tbit:BloombergUSUniversalTotalReturnIndex1244Member 2018-11-30 0000816153 tbit:BloombergUSUniversalTotalReturnIndex1305Member 2019-02-28 0000816153 tbit:BloombergUSUniversalTotalReturnIndex1365Member 2019-05-31 0000816153 tbit:C000001438Member 2022-05-31 0000816153 tbit:C000032355Member 2015-07-31 0000816153 tbit:ICEBofAUSMunicipalSecuritiesIndex1724Member 2016-11-30 0000816153 tbit:ICEBofAUSMunicipalSecuritiesIndex1789Member 2020-05-31 0000816153 tbit:C000032368Member 2017-12-31
UNITED STATES
SECURITIES AND EXCHANGE COMMISSION
Washington, D.C. 20549
FORM N-CSR
CERTIFIED SHAREHOLDER REPORT OF REGISTERED
MANAGEMENT INVESTMENT COMPANIES
Investment Company Act file number 811-05201
Thornburg Investment Trust
(Exact name of registrant as specified in charter)
c/o Thornburg Investment Management, Inc.
2300 North Ridgetop Road, Santa Fe, New Mexico 87506
(Address of principal executive offices) (Zip code)
Garrett Thornburg
2300 North Ridgetop Road, Santa Fe, New Mexico 87506
(Name and address of agent for service)
Registrant’s telephone number, including area code: 505-984-0200
Date of fiscal year end: September 30, 2024
Date of reporting period: September 30, 2024
Item 1. Reports to Stockholders
| (a) | The following are the reports transmitted to stockholders pursuant to Rule 30e-1 under the Act (17 CFR 270.30e-1): |
Thornburg Global Opportunities Fund Tailored Shareholder Report
Thornburg Global Opportunities Fund CLASS: A TICKER: THOAX Annual Shareholder Report | |
This annual shareholder report contains important information about the Thornburg Global Opportunities Fund Class A Shares for the period from October 1, 2023 to September 30, 2024. You can find additional information about the Fund at https://www.thornburg.com/download. You can also request this information by contacting us at 1-800-847-0200. This report also describes changes to the Fund that occurred during the reporting period.
How did the Fund perform last year and what affected its performance?
The Fund’s Class A shares underperformed the MSCI All Country World Net Total Return USD Index (the 'Index”) during the 12-month period ended September 30, 2024. During the period, major world events included the ongoing Russian/Ukraine conflict, moderating inflation figures in the U.S., Mideast tensions, and upcoming political contests in the U.S. Despite the conflicting economic and geo-political signals, the S&P 500, the Bloomberg U.S. Aggregate Bond, and the MSCI ACWI indexes reported varying positive returns for the period, +36.3%, +11.6%, and +31.8%, respectively. In brief, most equities repriced higher due to a surprising level of economic strength and resilient corporate profits, while interest rates declined along with inflation rates, creating a more favorable backdrop for the economy. Stock selection was a positive contributor to relative performance, consistent with the Fund’s bottom-up investment approach. Sector and geographic allocations detracted from relative results. The Fund’s cash and currency forwards allocations were also a drag on performance. During the period, stock selection in communication services, energy, and the U.S. helped to drive relative performance. The Fund’s underweight allocation and weaker security selection in information technology hampered relative returns. In South Korea, both an overweight positioning and negative security selection detracted from returns.
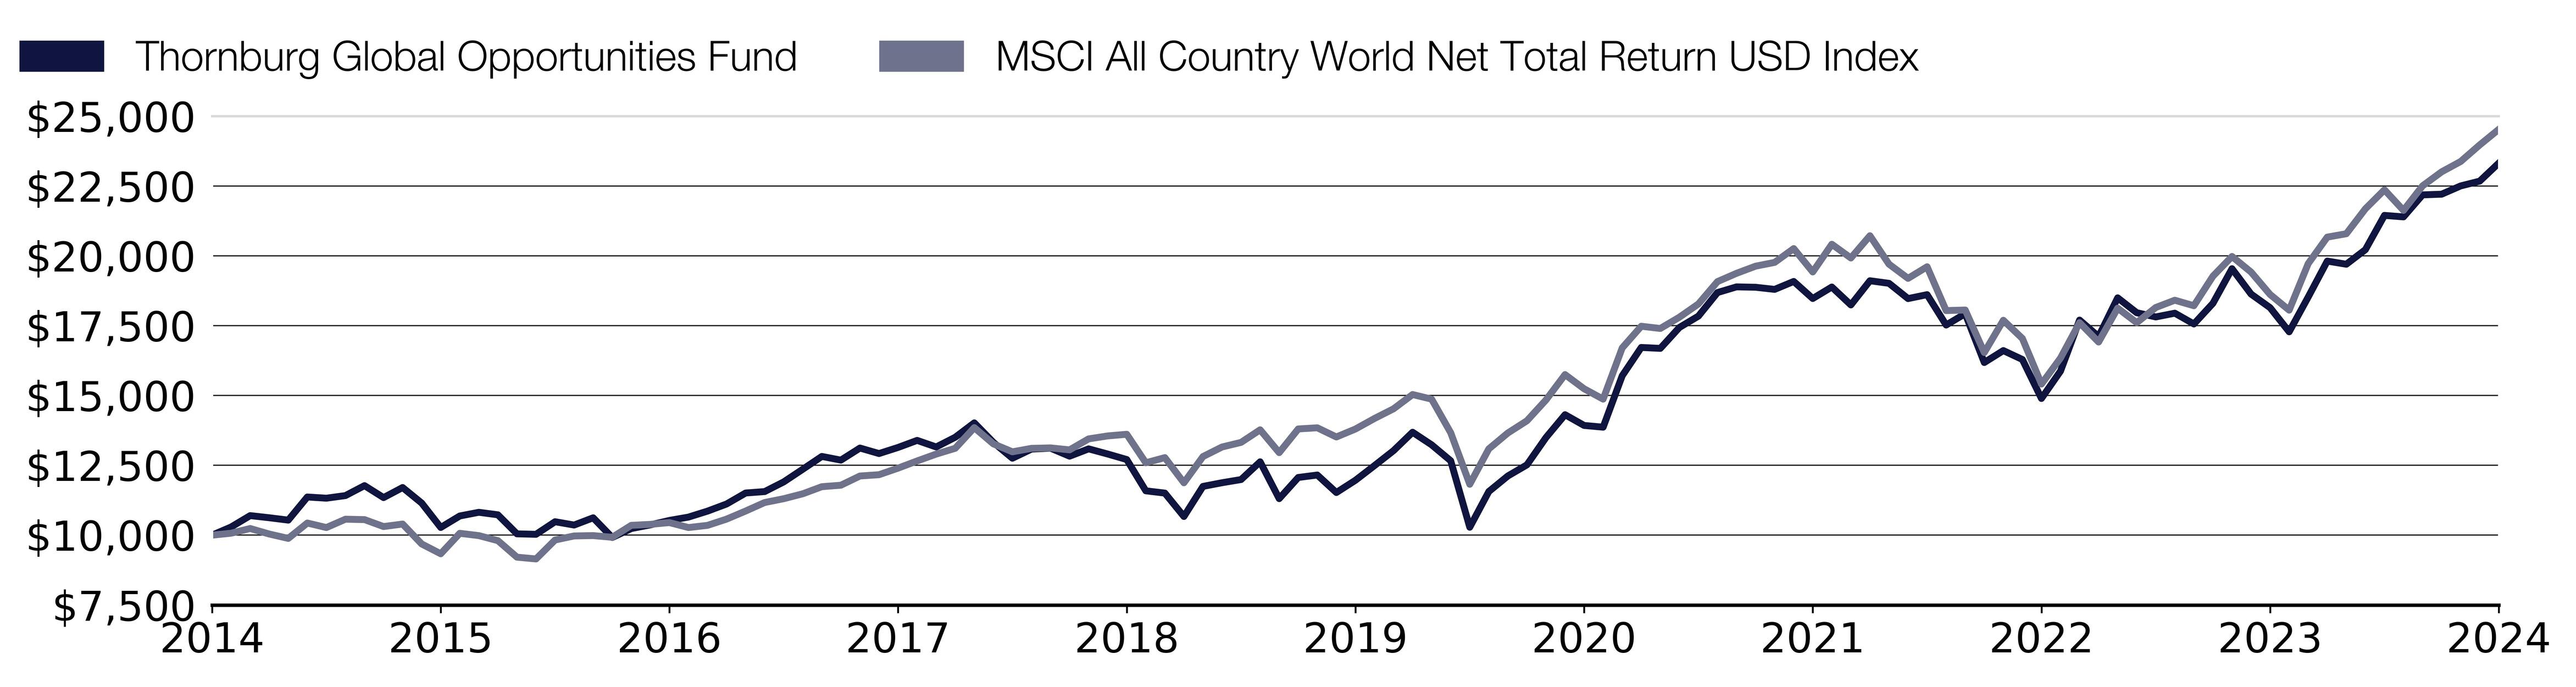
How did the Fund perform over the past 10 years?
The line graph below reflects a hypothetical $10,000 investment and assumes the deduction of the maximum sales charge associated with that investment. The returns shown in the line graph and table assume the reinvestment of dividends and capital gains, but do not reflect the deduction of taxes that a shareholder would pay on distributions or the redemption of Fund shares. The performance information shown below represents past performance and is no guarantee of future results. For Fund performance current to the most recent month end, visit https://www.thornburg.com/product/mutual-funds/fgo/THOAX or call 1-800-847-0200. Performance for other share classes of the Fund will vary.
Cumulative Performance
Growth Table
Date | Thornburg Global Opportunities Fund | MSCI All Country World Net Total Return USD Index |
09/30/2014 | 9549.4862 | 10000 |
10/31/2014 | 9827.0408 | 10070.4015 |
11/30/2014 | 10221.2487 | 10238.8433 |
12/31/2014 | 10144.8207 | 10041.2717 |
01/31/2015 | 10068.3926 | 9884.2795 |
02/28/2015 | 10856.8085 | 10434.5511 |
03/31/2015 | 10820.6057 | 10272.8725 |
04/30/2015 | 10909.1014 | 10570.9341 |
05/31/2015 | 11251.0164 | 10557.1413 |
06/30/2015 | 10840.7183 | 10308.6058 |
07/31/2015 | 11186.6559 | 10398.1255 |
08/31/2015 | 10655.682 | 9685.3233 |
09/30/2015 | 9818.9957 | 9334.4339 |
10/31/2015 | 10217.2262 | 10067.0465 |
11/30/2015 | 10341.9246 | 9983.9174 |
12/31/2015 | 10257.9614 | 9803.8662 |
01/31/2016 | 9612.299 | 9212.5892 |
02/29/2016 | 9592.122 | 9149.2172 |
03/31/2016 | 10023.9088 | 9827.2446 |
04/30/2016 | 9910.9178 | 9972.308 |
05/31/2016 | 10161.112 | 9984.8759 |
06/30/2016 | 9486.3191 | 9924.4328 |
07/31/2016 | 9789.2028 | 10352.1142 |
08/31/2016 | 9918.4332 | 10386.9422 |
09/30/2016 | 10070.9793 | 10450.5805 |
10/31/2016 | 10184.2273 | 10273.192 |
11/30/2016 | 10386.4558 | 10351.2621 |
12/31/2016 | 10631.4649 | 10574.8749 |
01/31/2017 | 11008.4097 | 10864.043 |
02/28/2017 | 11057.0478 | 11168.8146 |
03/31/2017 | 11390.4474 | 11305.4106 |
04/30/2017 | 11824.1762 | 11481.6274 |
05/31/2017 | 12261.9585 | 11735.1688 |
06/30/2017 | 12139.3623 | 11788.5291 |
07/31/2017 | 12553.3426 | 12117.9572 |
08/31/2017 | 12366.6456 | 12164.3945 |
09/30/2017 | 12573.6357 | 12399.4036 |
10/31/2017 | 12817.1535 | 12656.8857 |
11/30/2017 | 12593.9289 | 12901.9065 |
12/31/2017 | 12932.5853 | 13109.9159 |
01/31/2018 | 13420.7609 | 13849.5047 |
02/28/2018 | 12757.6557 | 13267.8667 |
03/31/2018 | 12216.5944 | 12983.8641 |
04/30/2018 | 12529.8404 | 13107.839 |
05/31/2018 | 12562.3854 | 13124.1879 |
06/30/2018 | 12285.7526 | 13053.1473 |
07/31/2018 | 12537.9767 | 13446.7994 |
08/31/2018 | 12363.0471 | 13552.4017 |
09/30/2018 | 12175.9131 | 13611.407 |
10/31/2018 | 11101.9268 | 12591.3835 |
11/30/2018 | 11024.6323 | 12775.5352 |
12/31/2018 | 10227.3608 | 11875.5991 |
01/31/2019 | 11259.6707 | 12813.3987 |
02/28/2019 | 11384.5469 | 13156.1402 |
03/31/2019 | 11492.7729 | 13321.5465 |
04/30/2019 | 12100.5038 | 13771.3814 |
05/31/2019 | 10839.2542 | 12954.468 |
06/30/2019 | 11567.6987 | 13802.7479 |
07/31/2019 | 11655.112 | 13843.1675 |
08/31/2019 | 11051.5437 | 13514.8046 |
09/30/2019 | 11471.9602 | 13799.1266 |
10/31/2019 | 11979.7901 | 14176.8026 |
11/30/2019 | 12492.9325 | 14522.8991 |
12/31/2019 | 13130.0688 | 15034.2955 |
01/31/2020 | 12699.5748 | 14868.2501 |
02/29/2020 | 12155.1264 | 13667.3235 |
03/31/2020 | 9871.8197 | 11822.1855 |
04/30/2020 | 11095.7734 | 13088.6676 |
05/31/2020 | 11631.7807 | 13657.8975 |
06/30/2020 | 12015.8489 | 14094.3125 |
07/31/2020 | 12952.8066 | 14839.706 |
08/31/2020 | 13746.2662 | 15748.003 |
09/30/2020 | 13374.8596 | 15240.2279 |
10/31/2020 | 13315.7722 | 14869.7412 |
11/30/2020 | 15084.9676 | 16702.6307 |
12/31/2020 | 16060.8146 | 17478.1127 |
01/31/2021 | 16029.1899 | 17398.658 |
02/28/2021 | 16747.5217 | 17801.6296 |
03/31/2021 | 17145.089 | 18277.1328 |
04/30/2021 | 17958.2948 | 19076.2595 |
05/31/2021 | 18152.5606 | 19373.0962 |
06/30/2021 | 18143.525 | 19628.3949 |
07/31/2021 | 18066.7222 | 19763.6596 |
08/31/2021 | 18346.8264 | 20258.3342 |
09/30/2021 | 17764.0289 | 19421.4506 |
10/31/2021 | 18161.5962 | 20412.8235 |
11/30/2021 | 17545.4124 | 19921.2376 |
12/31/2021 | 18376.0423 | 20718.1276 |
01/31/2022 | 18288.2669 | 19700.6071 |
02/28/2022 | 17761.6144 | 19191.767 |
03/31/2022 | 17901.0224 | 19607.4662 |
04/30/2022 | 16852.8806 | 18038.0232 |
05/31/2022 | 17245.2884 | 18059.165 |
06/30/2022 | 15567.2289 | 16536.8516 |
07/31/2022 | 15980.2897 | 17691.6605 |
08/31/2022 | 15675.6574 | 17040.3131 |
09/30/2022 | 14333.2098 | 15409.0425 |
10/31/2022 | 15278.0863 | 16338.9605 |
11/30/2022 | 17037.6688 | 17606.2413 |
12/31/2022 | 16474.6254 | 16913.4626 |
01/31/2023 | 17808.2345 | 18125.7322 |
02/28/2023 | 17299.4278 | 17606.2413 |
03/31/2023 | 17154.8196 | 18149.1107 |
04/30/2023 | 17283.3602 | 18409.9478 |
05/31/2023 | 16913.8059 | 18212.749 |
06/30/2023 | 17626.1353 | 19270.2098 |
07/31/2023 | 18820.492 | 19975.663 |
08/31/2023 | 17947.4869 | 19417.4566 |
09/30/2023 | 17476.1712 | 18614.5489 |
10/31/2023 | 16646.0129 | 18054.8514 |
11/30/2023 | 17853.4202 | 19721.2696 |
12/31/2023 | 19095.0603 | 20668.5483 |
01/31/2024 | 18987.4027 | 20789.7007 |
02/29/2024 | 19486.0274 | 21681.8618 |
03/31/2024 | 20670.2611 | 22362.6052 |
04/30/2024 | 20619.2654 | 21624.7737 |
05/31/2024 | 21384.2011 | 22503.0355 |
06/30/2024 | 21406.8658 | 23004.2603 |
07/31/2024 | 21695.8415 | 23375.2263 |
08/31/2024 | 21865.8272 | 23968.8998 |
09/30/2024 | 22489.1081 | 24525.7216 |

What were the Fund costs for the past year?
(based on a hypothetical $10,000 investment)
Class Name | Costs of a $10,000 investment | Costs paid as a percentage of a $10,000 investment |
|---|
Class A | $149.00 | 1.30% |
End Block
Thornburg Global Opportunities Fund Tailored Shareholder Report
Thornburg Global Opportunities Fund Tailored Shareholder Report | |
Annual Performance | 1 Year | 5 Year | 10 Year |
|---|
Global Opportunities Fund Class A (with sales charge) | 22.88% | 13.36% | 8.44% |
Global Opportunities Fund Class A (without sales charge) | 28.68% | 14.41% | 8.94% |
MSCI All Country World Net Total Return USD Index | 31.76% | 12.19% | 9.39% |
Key Fund Statistics
(as of September 30, 2024)
| |
|---|
Fund Size (Millions) | $1,306.0M |
Number of Holdings | 37 |
Annual Portfolio Turnover | 14.91% |
Total Advisory Fee | $9.3M |
What did the Fund invest in?
(as of September 30, 2024)
Market Capitalization Exposure | (%) |
|---|
| Small Cap (<$2.5 B) | 2.6 |
| Mid Cap ($2.5-12 B) | 17.7 |
| Large Cap (>$12 B) | 79.8 |
Market Capitalization Exposure | (%) |
Small Cap (<$2.5 B) | 2.6% |
Mid Cap ($2.5-12 B) | 17.7% |
Large Cap (>$12 B) | 79.8% |
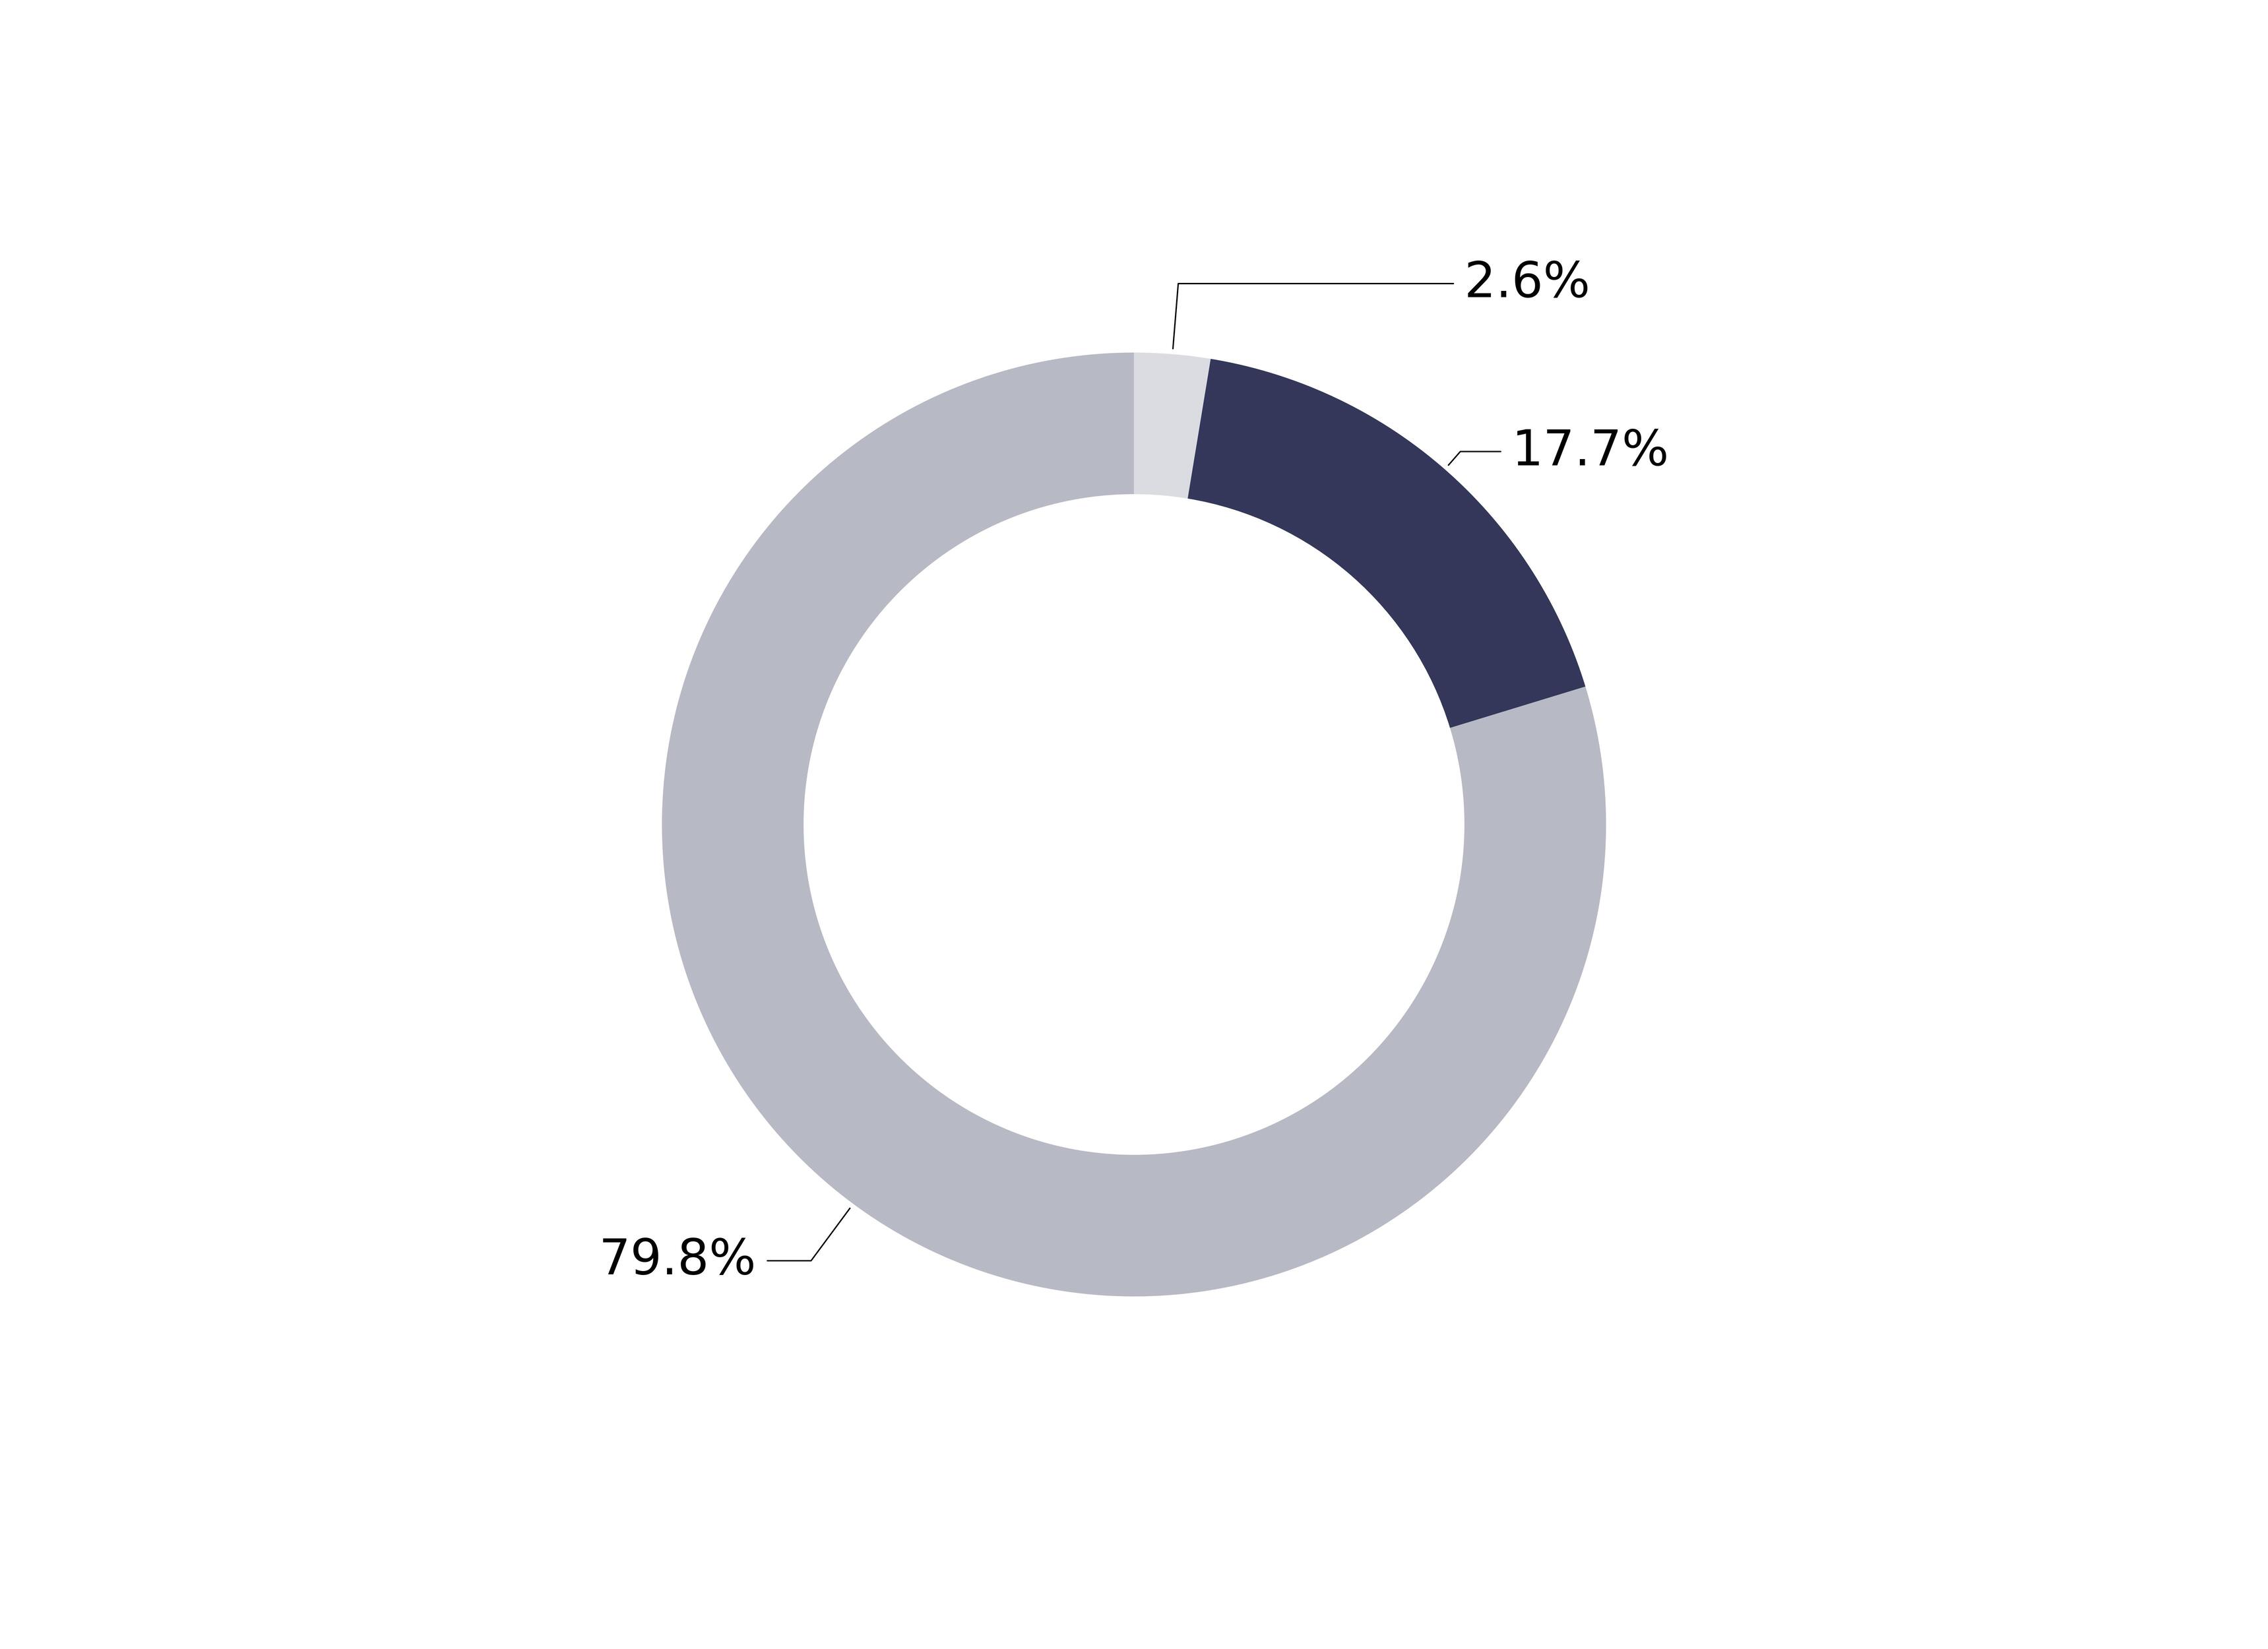
Expressed as a percentage of the Fund’s net assets.
How has the Fund changed?
This is a summary of certain changes to the Fund since October 1, 2023. For more complete information, you may review the Fund’s next prospectus, which we expect to be available by February 1, 2025 at https://www.thornburg.com/download or upon request by calling 1-800-847-0200.
Changes In and Disagreements with Accountants
No changes and/or disagreements occurred in the current reporting period.
End Block
For additional information about the Fund, including its prospectus, financial information, holdings and proxy information, visit www.thornburg.com/download.

Thornburg Global Opportunities Fund Tailored Shareholder Report | |
Thornburg Global Opportunities Fund Tailored Shareholder Report
Thornburg Global Opportunities Fund CLASS: C TICKER: THOCX Annual Shareholder Report | |
This annual shareholder report contains important information about the Thornburg Global Opportunities Fund Class C Shares for the period from October 1, 2023 to September 30, 2024. You can find additional information about the Fund at https://www.thornburg.com/download. You can also request this information by contacting us at 1-800-847-0200. This report also describes changes to the Fund that occurred during the reporting period.
How did the Fund perform last year and what affected its performance?
The Fund’s Class C shares underperformed the MSCI All Country World Net Total Return USD Index (the 'Index”) during the 12-month period ended September 30, 2024. During the period, major world events included the ongoing Russian/Ukraine conflict, moderating inflation figures in the U.S., Mideast tensions, and upcoming political contests in the U.S. Despite the conflicting economic and geo-political signals, the S&P 500, the Bloomberg U.S. Aggregate Bond, and the MSCI ACWI indexes reported varying positive returns for the period, +36.3%, +11.6%, and +31.8%, respectively. In brief, most equities repriced higher due to a surprising level of economic strength and resilient corporate profits, while interest rates declined along with inflation rates, creating a more favorable backdrop for the economy. Stock selection was a positive contributor to relative performance, consistent with the Fund’s bottom-up investment approach. Sector and geographic allocations detracted from relative results. The Fund’s cash and currency forwards allocations were also a drag on performance.During the period, stock selection in communication services, energy, and the U.S. helped to drive relative performance. The Fund’s underweight allocation and weaker security selection in information technology hampered relative returns. In South Korea, both an overweight positioning and negative security selection detracted from returns.
How did the Fund perform over the past 10 years?
The line graph below reflects a hypothetical $10,000 investment. The returns shown in the line graph and table assume the reinvestment of dividends and capital gains, but do not reflect the deduction of taxes that a shareholder would pay on distributions or the redemption of Fund shares. The performance information shown below represents past performance and is no guarantee of future results. For Fund performance current to the most recent month end, visit https://www.thornburg.com/product/mutual-funds/fgo/THOCX or call 1-800-847-0200. Performance for other share classes of the Fund will vary.
Cumulative Performance
Growth Table
Date | Thornburg Global Opportunities Fund | MSCI All Country World Net Total Return USD Index |
09/30/2014 | 10000.0039 | 10000 |
10/31/2014 | 10284.1194 | 10070.4015 |
11/30/2014 | 10684.464 | 10238.8433 |
12/31/2014 | 10602.6731 | 10041.2717 |
01/31/2015 | 10512.2728 | 9884.2795 |
02/28/2015 | 11330.181 | 10434.5511 |
03/31/2015 | 11282.8284 | 10272.8725 |
04/30/2015 | 11368.924 | 10570.9341 |
05/31/2015 | 11717.6112 | 10557.1413 |
06/30/2015 | 11287.1332 | 10308.6058 |
07/31/2015 | 11635.8203 | 10398.1255 |
08/31/2015 | 11076.1989 | 9685.3233 |
09/30/2015 | 10202.3286 | 9334.4339 |
10/31/2015 | 10606.9779 | 10067.0465 |
11/30/2015 | 10731.8165 | 9983.9174 |
12/31/2015 | 10637.1114 | 9803.8662 |
01/31/2016 | 9956.9561 | 9212.5892 |
02/29/2016 | 9935.4322 | 9149.2172 |
03/31/2016 | 10374.5198 | 9827.2446 |
04/30/2016 | 10253.986 | 9972.308 |
05/31/2016 | 10503.6632 | 9984.8759 |
06/30/2016 | 9801.9841 | 9924.4328 |
07/31/2016 | 10107.6234 | 10352.1142 |
08/31/2016 | 10232.4621 | 10386.9422 |
09/30/2016 | 10387.4341 | 10450.5805 |
10/31/2016 | 10495.0536 | 10273.192 |
11/30/2016 | 10701.6831 | 10351.2621 |
12/31/2016 | 10943.2993 | 10574.8749 |
01/31/2017 | 11322.288 | 10864.043 |
02/28/2017 | 11369.6616 | 11168.8146 |
03/31/2017 | 11705.5834 | 11305.4106 |
04/30/2017 | 12140.5591 | 11481.6274 |
05/31/2017 | 12584.1482 | 11735.1688 |
06/30/2017 | 12450.6408 | 11788.5291 |
07/31/2017 | 12864.083 | 12117.9572 |
08/31/2017 | 12665.9753 | 12164.3945 |
09/30/2017 | 12868.3897 | 12399.4036 |
10/31/2017 | 13109.5644 | 12656.8857 |
11/30/2017 | 12877.0031 | 12901.9065 |
12/31/2017 | 13207.4222 | 13109.9159 |
01/31/2018 | 13702.9698 | 13849.5047 |
02/28/2018 | 13013.5122 | 13267.8667 |
03/31/2018 | 12457.637 | 12983.8641 |
04/30/2018 | 12767.8929 | 13107.839 |
05/31/2018 | 12793.7476 | 13124.1879 |
06/30/2018 | 12505.0372 | 13053.1473 |
07/31/2018 | 12754.9656 | 13446.7994 |
08/31/2018 | 12569.6739 | 13552.4017 |
09/30/2018 | 12367.1457 | 13611.407 |
10/31/2018 | 11268.3226 | 12591.3835 |
11/30/2018 | 11182.1404 | 12775.5352 |
12/31/2018 | 10366.2804 | 11875.5991 |
01/31/2019 | 11407.264 | 12813.3987 |
02/28/2019 | 11529.2203 | 13156.1402 |
03/31/2019 | 11629.3986 | 13321.5465 |
04/30/2019 | 12239.1798 | 13771.3814 |
05/31/2019 | 10954.2837 | 12954.468 |
06/30/2019 | 11681.6656 | 13802.7479 |
07/31/2019 | 11760.066 | 13843.1675 |
08/31/2019 | 11145.9292 | 13514.8046 |
09/30/2019 | 11564.0649 | 13799.1266 |
10/31/2019 | 12069.3122 | 14176.8026 |
11/30/2019 | 12580.1104 | 14522.8991 |
12/31/2019 | 13209.1159 | 15034.2955 |
01/31/2020 | 12773.6506 | 14868.2501 |
02/29/2020 | 12219.4219 | 13667.3235 |
03/31/2020 | 9914.5346 | 11822.1855 |
04/30/2020 | 11141.7551 | 13088.6676 |
05/31/2020 | 11673.9906 | 13657.8975 |
06/30/2020 | 12052.2736 | 14094.3125 |
07/31/2020 | 12980.3866 | 14839.706 |
08/31/2020 | 13767.7432 | 15748.003 |
09/30/2020 | 13389.4602 | 15240.2279 |
10/31/2020 | 13319.0819 | 14869.7412 |
11/30/2020 | 15083.7608 | 16702.6307 |
12/31/2020 | 16042.4344 | 17478.1127 |
01/31/2021 | 15999.9316 | 17398.658 |
02/28/2021 | 16713.0337 | 17801.6296 |
03/31/2021 | 17095.5586 | 18277.1328 |
04/30/2021 | 17893.6662 | 19076.2595 |
05/31/2021 | 18077.8448 | 19373.0962 |
06/30/2021 | 18054.2322 | 19628.3949 |
07/31/2021 | 17969.2267 | 19763.6596 |
08/31/2021 | 18233.6883 | 20258.3342 |
09/30/2021 | 17643.3721 | 19421.4506 |
10/31/2021 | 18025.897 | 20412.8235 |
11/30/2021 | 17404.343 | 19921.2376 |
12/31/2021 | 18216.341 | 20718.1276 |
01/31/2022 | 18119.3309 | 19700.6071 |
02/28/2022 | 17591.1648 | 19191.767 |
03/31/2022 | 17715.1222 | 19607.4662 |
04/30/2022 | 16669.5689 | 18038.0232 |
05/31/2022 | 17041.4409 | 18059.165 |
06/30/2022 | 15376.1008 | 16536.8516 |
07/31/2022 | 15769.5307 | 17691.6605 |
08/31/2022 | 15462.3321 | 17040.3131 |
09/30/2022 | 14125.7484 | 15409.0425 |
10/31/2022 | 15047.3444 | 16338.9605 |
11/30/2022 | 16776.1303 | 17606.2413 |
12/31/2022 | 16209.3211 | 16913.4626 |
01/31/2023 | 17512.4995 | 18125.7322 |
02/28/2023 | 16996.7736 | 17606.2413 |
03/31/2023 | 16841.5013 | 18149.1107 |
04/30/2023 | 16963.501 | 18409.9478 |
05/31/2023 | 16586.411 | 18212.749 |
06/30/2023 | 17274.0456 | 19270.2098 |
07/31/2023 | 18427.4971 | 19975.663 |
08/31/2023 | 17562.4085 | 19417.4566 |
09/30/2023 | 17091.0461 | 18614.5489 |
10/31/2023 | 16270.321 | 18054.8514 |
11/30/2023 | 17437.2686 | 19721.2696 |
12/31/2023 | 18629.6259 | 20668.5483 |
01/31/2024 | 18513.4811 | 20789.7007 |
02/29/2024 | 18989.6748 | 21681.8618 |
03/31/2024 | 20127.8938 | 22362.6052 |
04/30/2024 | 20064.0142 | 21624.7737 |
05/31/2024 | 20795.7264 | 22503.0355 |
06/30/2024 | 20801.5337 | 23004.2603 |
07/31/2024 | 21068.6667 | 23375.2263 |
08/31/2024 | 21219.655 | 23968.8998 |
09/30/2024 | 21806.1862 | 24525.7216 |

What were the Fund costs for the past year?
(based on a hypothetical $10,000 investment)
Class Name | Costs of a $10,000 investment | Costs paid as a percentage of a $10,000 investment |
|---|
Class C | $243.00 | 2.14% |
End Block
Thornburg Global Opportunities Fund Tailored Shareholder Report
Thornburg Global Opportunities Fund Tailored Shareholder Report | |
Annual Performance | 1 Year | 5 Year | 10 Year |
|---|
Global Opportunities Fund Class C (with sales charge) | 26.59% | 13.53% | 8.11% |
Global Opportunities Fund Class C (without sales charge) | 27.59% | 13.53% | 8.11% |
MSCI All Country World Net Total Return USD Index | 31.76% | 12.19% | 9.39% |
Key Fund Statistics
(as of September 30, 2024)
| |
|---|
Fund Size (Millions) | $1,306.0M |
Number of Holdings | 37 |
Annual Portfolio Turnover | 14.91% |
Total Advisory Fee | $9.3M |
What did the Fund invest in?
(as of September 30, 2024)
Market Capitalization Exposure | (%) |
|---|
| Small Cap (<$2.5 B) | 2.6 |
| Mid Cap ($2.5-12 B) | 17.7 |
| Large Cap (>$12 B) | 79.8 |
Market Capitalization Exposure | (%) |
Small Cap (<$2.5 B) | 2.6% |
Mid Cap ($2.5-12 B) | 17.7% |
Large Cap (>$12 B) | 79.8% |
Expressed as a percentage of the Fund’s net assets.
How has the Fund changed?
This is a summary of certain changes to the Fund since October 1, 2023. For more complete information, you may review the Fund’s next prospectus, which we expect to be available by February 1, 2025 at https://www.thornburg.com/download or upon request by calling 1-800-847-0200.
Changes In and Disagreements with Accountants
No changes and/or disagreements occurred in the current reporting period.
End Block
For additional information about the Fund, including its prospectus, financial information, holdings and proxy information, visit www.thornburg.com/download.

Thornburg Global Opportunities Fund Tailored Shareholder Report | |
Thornburg Global Opportunities Fund Tailored Shareholder Report
Thornburg Global Opportunities Fund CLASS: I TICKER: THOIX Annual Shareholder Report | |
This annual shareholder report contains important information about the Thornburg Global Opportunities Fund Class I Shares for the period from October 1, 2023 to September 30, 2024. You can find additional information about the Fund at https://www.thornburg.com/download. You can also request this information by contacting us at 1-800-847-0200. This report also describes changes to the Fund that occurred during the reporting period.
How did the Fund perform last year and what affected its performance?
The Fund’s Class I shares underperformed the MSCI All Country World Net Total Return USD Index (the 'Index”) during the 12-month period ended September 30, 2024. During the period, major world events included the ongoing Russian/Ukraine conflict, moderating inflation figures in the U.S., Mideast tensions, and upcoming political contests in the U.S. Despite the conflicting economic and geo-political signals, the S&P 500, the Bloomberg U.S. Aggregate Bond, and the MSCI ACWI indexes reported varying positive returns for the period, +36.3%, +11.6%, and +31.8%, respectively. In brief, most equities repriced higher due to a surprising level of economic strength and resilient corporate profits, while interest rates declined along with inflation rates, creating a more favorable backdrop for the economy. Stock selection was a positive contributor to relative performance, consistent with the Fund’s bottom-up investment approach. Sector and geographic allocations detracted from relative results. The Fund’s cash and currency forwards allocations were also a drag on performance. During the period, stock selection in communication services, energy, and the U.S. helped to drive relative performance. The Fund’s underweight allocation and weaker security selection in information technology hampered relative returns. In South Korea, both an overweight positioning and negative security selection detracted from returns.
How did the Fund perform over the past 10 years?
The line graph below reflects a hypothetical $10,000 investment. The returns shown in the line graph and table assume the reinvestment of dividends and capital gains, but do not reflect the deduction of taxes that a shareholder would pay on distributions or the redemption of Fund shares. The performance information shown below represents past performance and is no guarantee of future results. For Fund performance current to the most recent month end, visit https://www.thornburg.com/product/mutual-funds/fgo/THOIX or call 1-800-847-0200. Performance for other share classes of the Fund will vary.
Cumulative Performance
Growth Table
Date | Thornburg Global Opportunities Fund | MSCI All Country World Net Total Return USD Index |
09/30/2014 | 10000.0076 | 10000 |
10/31/2014 | 10294.2491 | 10070.4015 |
11/30/2014 | 10706.1872 | 10238.8433 |
12/31/2014 | 10632.4899 | 10041.2717 |
01/31/2015 | 10552.578 | 9884.2795 |
02/28/2015 | 11381.1383 | 10434.5511 |
03/31/2015 | 11347.4912 | 10272.8725 |
04/30/2015 | 11444.2267 | 10570.9341 |
05/31/2015 | 11805.9332 | 10557.1413 |
06/30/2015 | 11381.1383 | 10308.6058 |
07/31/2015 | 11747.0508 | 10398.1255 |
08/31/2015 | 11191.8733 | 9685.3233 |
09/30/2015 | 10317.0482 | 9334.4339 |
10/31/2015 | 10737.6372 | 10067.0465 |
11/30/2015 | 10872.2256 | 9983.9174 |
12/31/2015 | 10787.469 | 9803.8662 |
01/31/2016 | 10110.6082 | 9212.5892 |
02/29/2016 | 10093.6867 | 9149.2172 |
03/31/2016 | 10550.5677 | 9827.2446 |
04/30/2016 | 10436.3475 | 9972.308 |
05/31/2016 | 10698.631 | 9984.8759 |
06/30/2016 | 9994.5996 | 9924.4328 |
07/31/2016 | 10317.0061 | 10352.1142 |
08/31/2016 | 10456.9983 | 10386.9422 |
09/30/2016 | 10616.9856 | 10450.5805 |
10/31/2016 | 10740.34 | 10273.192 |
11/30/2016 | 10961.5272 | 10351.2621 |
12/31/2016 | 11222.5256 | 10574.8749 |
01/31/2017 | 11619.3678 | 10864.043 |
02/28/2017 | 11679.1074 | 11168.8146 |
03/31/2017 | 12033.2099 | 11305.4106 |
04/30/2017 | 12490.2754 | 11481.6274 |
05/31/2017 | 12960.1558 | 11735.1688 |
06/30/2017 | 12832.7291 | 11788.5291 |
07/31/2017 | 13273.6134 | 12117.9572 |
08/31/2017 | 13080.9941 | 12164.3945 |
09/30/2017 | 13303.8056 | 12399.4036 |
10/31/2017 | 13569.3677 | 12656.8857 |
11/30/2017 | 13333.7884 | 12901.9065 |
12/31/2017 | 13694.5709 | 13109.9159 |
01/31/2018 | 14218.8061 | 13849.5047 |
02/28/2018 | 13518.3935 | 13267.8667 |
03/31/2018 | 12946.8911 | 12983.8641 |
04/30/2018 | 13282.0579 | 13107.839 |
05/31/2018 | 13320.731 | 13124.1879 |
06/30/2018 | 13032.8313 | 13053.1473 |
07/31/2018 | 13303.543 | 13446.7994 |
08/31/2018 | 13118.7715 | 13552.4017 |
09/30/2018 | 12921.1091 | 13611.407 |
10/31/2018 | 11786.6984 | 12591.3835 |
11/30/2018 | 11709.3523 | 12775.5352 |
12/31/2018 | 10864.2322 | 11875.5991 |
01/31/2019 | 11963.4576 | 12813.3987 |
02/28/2019 | 12100.309 | 13156.1402 |
03/31/2019 | 12219.5021 | 13321.5465 |
04/30/2019 | 12868.4424 | 13771.3814 |
05/31/2019 | 11530.8307 | 12954.468 |
06/30/2019 | 12307.7933 | 13802.7479 |
07/31/2019 | 12400.499 | 13843.1675 |
08/31/2019 | 11764.8024 | 13514.8046 |
09/30/2019 | 12215.0875 | 13799.1266 |
10/31/2019 | 12758.0784 | 14176.8026 |
11/30/2019 | 13311.1772 | 14522.8991 |
12/31/2019 | 13989.2197 | 15034.2955 |
01/31/2020 | 13531.2927 | 14868.2501 |
02/29/2020 | 12956.6393 | 13667.3235 |
03/31/2020 | 10523.3411 | 11822.1855 |
04/30/2020 | 11834.2693 | 13088.6676 |
05/31/2020 | 12408.9227 | 13657.8975 |
06/30/2020 | 12821.9549 | 14094.3125 |
07/31/2020 | 13827.5984 | 14839.706 |
08/31/2020 | 14671.6206 | 15748.003 |
09/30/2020 | 14281.0359 | 15240.2279 |
10/31/2020 | 14222.6726 | 14869.7412 |
11/30/2020 | 16118.2923 | 16702.6307 |
12/31/2020 | 17159.4793 | 17478.1127 |
01/31/2021 | 17130.5831 | 17398.658 |
02/28/2021 | 17905.9624 | 17801.6296 |
03/31/2021 | 18329.7721 | 18277.1328 |
04/30/2021 | 19206.2878 | 19076.2595 |
05/31/2021 | 19418.1926 | 19373.0962 |
06/30/2021 | 19413.3766 | 19628.3949 |
07/31/2021 | 19336.3203 | 19763.6596 |
08/31/2021 | 19639.7296 | 20258.3342 |
09/30/2021 | 19018.463 | 19421.4506 |
10/31/2021 | 19451.9048 | 20412.8235 |
11/30/2021 | 18794.8876 | 19921.2376 |
12/31/2021 | 19690.6206 | 20718.1276 |
01/31/2022 | 19602.3713 | 19700.6071 |
02/28/2022 | 19045.2977 | 19191.767 |
03/31/2022 | 19199.734 | 19607.4662 |
04/30/2022 | 18080.0712 | 18038.0232 |
05/31/2022 | 18504.7709 | 18059.165 |
06/30/2022 | 16706.6918 | 16536.8516 |
07/31/2022 | 17153.4538 | 17691.6605 |
08/31/2022 | 16833.5502 | 17040.3131 |
09/30/2022 | 15393.9838 | 15409.0425 |
10/31/2022 | 16408.8505 | 16338.9605 |
11/30/2022 | 18310.5662 | 17606.2413 |
12/31/2022 | 17705.7707 | 16913.4626 |
01/31/2023 | 19145.8706 | 18125.7322 |
02/28/2023 | 18600.8129 | 17606.2413 |
03/31/2023 | 18451.6392 | 18149.1107 |
04/30/2023 | 18595.0754 | 18409.9478 |
05/31/2023 | 18204.9289 | 18212.749 |
06/30/2023 | 18973.7472 | 19270.2098 |
07/31/2023 | 20264.6734 | 19975.663 |
08/31/2023 | 19329.4691 | 19417.4566 |
09/30/2023 | 18830.3109 | 18614.5489 |
10/31/2023 | 17941.0061 | 18054.8514 |
11/30/2023 | 19246.049 | 19721.2696 |
12/31/2023 | 20582.4462 | 20668.5483 |
01/31/2024 | 20478.9862 | 20789.7007 |
02/29/2024 | 21020.6295 | 21681.8618 |
03/31/2024 | 22304.7502 | 22362.6052 |
04/30/2024 | 22256.0632 | 21624.7737 |
05/31/2024 | 23083.7428 | 22503.0355 |
06/30/2024 | 23114.1722 | 23004.2603 |
07/31/2024 | 23436.7239 | 23375.2263 |
08/31/2024 | 23619.3003 | 23968.8998 |
09/30/2024 | 24300.9188 | 24525.7216 |

What were the Fund costs for the past year?
(based on a hypothetical $10,000 investment)
Class Name | Costs of a $10,000 investment | Costs paid as a percentage of a $10,000 investment |
|---|
Class I | $113.00 | 0.99% |
End Block
Thornburg Global Opportunities Fund Tailored Shareholder Report
Thornburg Global Opportunities Fund Tailored Shareholder Report | |
Annual Performance | 1 Year | 5 Year | 10 Year |
|---|
Global Opportunities Fund Class I | 29.05% | 14.75% | 9.29% |
MSCI All Country World Net Total Return USD Index | 31.76% | 12.19% | 9.39% |
Key Fund Statistics
(as of September 30, 2024)
| |
|---|
Fund Size (Millions) | $1,306.0M |
Number of Holdings | 37 |
Annual Portfolio Turnover | 14.91% |
Total Advisory Fee | $9.3M |
What did the Fund invest in?
(as of September 30, 2024)
Market Capitalization Exposure | (%) |
|---|
| Small Cap (<$2.5 B) | 2.6 |
| Mid Cap ($2.5-12 B) | 17.7 |
| Large Cap (>$12 B) | 79.8 |
Market Capitalization Exposure | (%) |
Small Cap (<$2.5 B) | 2.6% |
Mid Cap ($2.5-12 B) | 17.7% |
Large Cap (>$12 B) | 79.8% |
Expressed as a percentage of the Fund’s net assets.
How has the Fund changed?
This is a summary of certain changes to the Fund since October 1, 2023. For more complete information, you may review the Fund’s next prospectus, which we expect to be available by February 1, 2025 at https://www.thornburg.com/download or upon request by calling 1-800-847-0200.
End Block
Changes In and Disagreements with Accountants
No changes and/or disagreements occurred in the current reporting period.
End Block
For additional information about the Fund, including its prospectus, financial information, holdings and proxy information, visit www.thornburg.com/download.

Thornburg Global Opportunities Fund Tailored Shareholder Report | |
Thornburg Global Opportunities Fund Tailored Shareholder Report
Thornburg Global Opportunities Fund CLASS: R3 TICKER: THORX Annual Shareholder Report | |
This annual shareholder report contains important information about the Thornburg Global Opportunities Fund Class R3 Shares for the period from October 1, 2023 to September 30, 2024. You can find additional information about the Fund at https://www.thornburg.com/download. You can also request this information by contacting us at 1-800-847-0200. This report also describes changes to the Fund that occurred during the reporting period.
How did the Fund perform last year and what affected its performance?
The Fund’s Class R3 shares underperformed the MSCI All Country World Net Total Return USD Index (the 'Index”) during the 12-month period ended September 30, 2024. During the period, major world events included the ongoing Russian/Ukraine conflict, moderating inflation figures in the U.S., Mideast tensions, and upcoming political contests in the U.S. Despite the conflicting economic and geo-political signals, the S&P 500, the Bloomberg U.S. Aggregate Bond, and the MSCI ACWI indexes reported varying positive returns for the period, +36.3%, +11.6%, and +31.8%, respectively. In brief, most equities repriced higher due to a surprising level of economic strength and resilient corporate profits, while interest rates declined along with inflation rates, creating a more favorable backdrop for the economy. Stock selection was a positive contributor to relative performance, consistent with the Fund’s bottom-up investment approach. Sector and geographic allocations detracted from relative results. The Fund’s cash and currency forwards allocations were also a drag on performance. During the period, stock selection in communication services, energy, and the U.S. helped to drive relative performance. The Fund’s underweight allocation and weaker security selection in information technology hampered relative returns. In South Korea, both an overweight positioning and negative security selection detracted from returns.
How did the Fund perform over the past 10 years?
The line graph below reflects a hypothetical $10,000 investment. The returns shown in the line graph and table assume the reinvestment of dividends and capital gains, but do not reflect the deduction of taxes that a shareholder would pay on distributions or the redemption of Fund shares. The performance information shown below represents past performance and is no guarantee of future results. For Fund performance current to the most recent month end, visit https://www.thornburg.com/product/mutual-funds/fgo/THORX or call 1-800-847-0200. Performance for other share classes of the Fund will vary.
Cumulative Performance
Growth Table
Date | Thornburg Global Opportunities Fund | MSCI All Country World Net Total Return USD Index |
09/30/2014 | 9999.9894 | 10000 |
10/31/2014 | 10292.9827 | 10070.4015 |
11/30/2014 | 10700.6256 | 10238.8433 |
12/31/2014 | 10619.9463 | 10041.2717 |
01/31/2015 | 10535.0207 | 9884.2795 |
02/28/2015 | 11363.0453 | 10434.5511 |
03/31/2015 | 11320.5825 | 10272.8725 |
04/30/2015 | 11414.0006 | 10570.9341 |
05/31/2015 | 11766.4419 | 10557.1413 |
06/30/2015 | 11337.5676 | 10308.6058 |
07/31/2015 | 11698.5014 | 10398.1255 |
08/31/2015 | 11137.9924 | 9685.3233 |
09/30/2015 | 10267.505 | 9334.4339 |
10/31/2015 | 10679.3942 | 10067.0465 |
11/30/2015 | 10806.7826 | 9983.9174 |
12/31/2015 | 10721.0628 | 9803.8662 |
01/31/2016 | 10040.3604 | 9212.5892 |
02/29/2016 | 10019.0884 | 9149.2172 |
03/31/2016 | 10470.0538 | 9827.2446 |
04/30/2016 | 10350.9309 | 9972.308 |
05/31/2016 | 10610.4487 | 9984.8759 |
06/30/2016 | 9904.7592 | 9924.4328 |
07/31/2016 | 10219.7365 | 10352.1142 |
08/31/2016 | 10351.6864 | 10386.9422 |
09/30/2016 | 10511.9168 | 10450.5805 |
10/31/2016 | 10627.0108 | 10273.192 |
11/30/2016 | 10840.1478 | 10351.2621 |
12/31/2016 | 11095.6683 | 10574.8749 |
01/31/2017 | 11484.3156 | 10864.043 |
02/28/2017 | 11535.5658 | 11168.8146 |
03/31/2017 | 11881.5047 | 11305.4106 |
04/30/2017 | 12329.944 | 11481.6274 |
05/31/2017 | 12786.9249 | 11735.1688 |
06/30/2017 | 12655.6101 | 11788.5291 |
07/31/2017 | 13087.2942 | 12117.9572 |
08/31/2017 | 12886.4115 | 12164.3945 |
09/30/2017 | 13104.3906 | 12399.4036 |
10/31/2017 | 13356.5625 | 12656.8857 |
11/30/2017 | 13121.487 | 12901.9065 |
12/31/2017 | 13466.3868 | 13109.9159 |
01/31/2018 | 13975.9258 | 13849.5047 |
02/28/2018 | 13282.2677 | 13267.8667 |
03/31/2018 | 12717.0648 | 12983.8641 |
04/30/2018 | 13038.2028 | 13107.839 |
05/31/2018 | 13072.4575 | 13124.1879 |
06/30/2018 | 12781.2924 | 13053.1473 |
07/31/2018 | 13042.4846 | 13446.7994 |
08/31/2018 | 12858.3655 | 13552.4017 |
09/30/2018 | 12661.4009 | 13611.407 |
10/31/2018 | 11543.8406 | 12591.3835 |
11/30/2018 | 11458.2038 | 12775.5352 |
12/31/2018 | 10628.775 | 11875.5991 |
01/31/2019 | 11698.2 | 12813.3987 |
02/28/2019 | 11829.15 | 13156.1402 |
03/31/2019 | 11942.64 | 13321.5465 |
04/30/2019 | 12571.2 | 13771.3814 |
05/31/2019 | 11257.335 | 12954.468 |
06/30/2019 | 12012.48 | 13802.7479 |
07/31/2019 | 12099.78 | 13843.1675 |
08/31/2019 | 11471.22 | 13514.8046 |
09/30/2019 | 11907.72 | 13799.1266 |
10/31/2019 | 12431.52 | 14176.8026 |
11/30/2019 | 12960.8988 | 14522.8991 |
12/31/2019 | 13617.0049 | 15034.2955 |
01/31/2020 | 13166.783 | 14868.2501 |
02/29/2020 | 12601.7987 | 13667.3235 |
03/31/2020 | 10231.5129 | 11822.1855 |
04/30/2020 | 11502.7276 | 13088.6676 |
05/31/2020 | 12054.4701 | 13657.8975 |
06/30/2020 | 12451.7247 | 14094.3125 |
07/31/2020 | 13418.3776 | 14839.706 |
08/31/2020 | 14234.9565 | 15748.003 |
09/30/2020 | 13850.9437 | 15240.2279 |
10/31/2020 | 13789.1486 | 14869.7412 |
11/30/2020 | 15617.2776 | 16702.6307 |
12/31/2020 | 16619.6581 | 17478.1127 |
01/31/2021 | 16586.5607 | 17398.658 |
02/28/2021 | 17328.8897 | 17801.6296 |
03/31/2021 | 17735.5157 | 18277.1328 |
04/30/2021 | 18572.4089 | 19076.2595 |
05/31/2021 | 18770.9937 | 19373.0962 |
06/30/2021 | 18756.8091 | 19628.3949 |
07/31/2021 | 18676.4295 | 19763.6596 |
08/31/2021 | 18960.1221 | 20258.3342 |
09/30/2021 | 18350.183 | 19421.4506 |
10/31/2021 | 18761.5373 | 20412.8235 |
11/30/2021 | 18120.8125 | 19921.2376 |
12/31/2021 | 18976.9929 | 20718.1276 |
01/31/2022 | 18879.8134 | 19700.6071 |
02/28/2022 | 18339.9274 | 19191.767 |
03/31/2022 | 18480.2978 | 19607.4662 |
04/30/2022 | 17395.1269 | 18038.0232 |
05/31/2022 | 17800.0414 | 18059.165 |
06/30/2022 | 16061.6085 | 16536.8516 |
07/31/2022 | 16482.7196 | 17691.6605 |
08/31/2022 | 16169.5857 | 17040.3131 |
09/30/2022 | 14776.6798 | 15409.0425 |
10/31/2022 | 15748.4746 | 16338.9605 |
11/30/2022 | 17566.7263 | 17606.2413 |
12/31/2022 | 16980.4429 | 16913.4626 |
01/31/2023 | 18354.9703 | 18125.7322 |
02/28/2023 | 17824.1569 | 17606.2413 |
03/31/2023 | 17673.2941 | 18149.1107 |
04/30/2023 | 17807.3944 | 18409.9478 |
05/31/2023 | 17421.8562 | 18212.749 |
06/30/2023 | 18153.82 | 19270.2098 |
07/31/2023 | 19377.4847 | 19975.663 |
08/31/2023 | 18477.8956 | 19417.4566 |
09/30/2023 | 17991.7822 | 18614.5489 |
10/31/2023 | 17136.8932 | 18054.8514 |
11/30/2023 | 18374.1106 | 19721.2696 |
12/31/2023 | 19644.6953 | 20668.5483 |
01/31/2024 | 19532.5748 | 20789.7007 |
02/29/2024 | 20051.8698 | 21681.8618 |
03/31/2024 | 21267.4923 | 22362.6052 |
04/30/2024 | 21208.4815 | 21624.7737 |
05/31/2024 | 21993.3252 | 22503.0355 |
06/30/2024 | 22011.0284 | 23004.2603 |
07/31/2024 | 22306.0824 | 23375.2263 |
08/31/2024 | 22477.2137 | 23968.8998 |
09/30/2024 | 23114.5304 | 24525.7216 |

What were the Fund costs for the past year?
(based on a hypothetical $10,000 investment)
Class Name | Costs of a $10,000 investment | Costs paid as a percentage of a $10,000 investment |
|---|
Class R3 | $171.00 | 1.50% |
End Block
Thornburg Global Opportunities Fund Tailored Shareholder Report
Thornburg Global Opportunities Fund Tailored Shareholder Report | |
Annual Performance | 1 Year | 5 Year | 10 Year |
|---|
Global Opportunities Fund Class R3 | 28.47% | 14.19% | 8.74% |
MSCI All Country World Net Total Return USD Index | 31.76% | 12.19% | 9.39% |
Key Fund Statistics
(as of September 30, 2024)
| |
|---|
Fund Size (Millions) | $1,306.0M |
Number of Holdings | 37 |
Annual Portfolio Turnover | 14.91% |
Total Advisory Fee | $9.3M |
What did the Fund invest in?
(as of September 30, 2024)
Market Capitalization Exposure | (%) |
|---|
| Small Cap (<$2.5 B) | 2.6 |
| Mid Cap ($2.5-12 B) | 17.7 |
| Large Cap (>$12 B) | 79.8 |
Market Capitalization Exposure | (%) |
Small Cap (<$2.5 B) | 2.6% |
Mid Cap ($2.5-12 B) | 17.7% |
Large Cap (>$12 B) | 79.8% |
Expressed as a percentage of the Fund’s net assets.
How has the Fund changed?
This is a summary of certain changes to the Fund since October 1, 2023. For more complete information, you may review the Fund’s next prospectus, which we expect to be available by February 1, 2025 at https://www.thornburg.com/download or upon request by calling 1-800-847-0200.
End Block
Changes In and Disagreements with Accountants
No changes and/or disagreements occurred in the current reporting period.
End Block
For additional information about the Fund, including its prospectus, financial information, holdings and proxy information, visit www.thornburg.com/download.

Thornburg Global Opportunities Fund Tailored Shareholder Report | |
Thornburg Global Opportunities Fund Tailored Shareholder Report
Thornburg Global Opportunities Fund CLASS: R4 TICKER: THOVX Annual Shareholder Report | |
This annual shareholder report contains important information about the Thornburg Global Opportunities Fund Class R4 Shares for the period from October 1, 2023 to September 30, 2024. You can find additional information about the Fund at https://www.thornburg.com/download. You can also request this information by contacting us at 1-800-847-0200. This report also describes changes to the Fund that occurred during the reporting period.
How did the Fund perform last year and what affected its performance?
The Fund’s Class R4 shares underperformed the MSCI All Country World Net Total Return USD Index (the 'Index”) during the 12-month period ended September 30, 2024. During the period, major world events included the ongoing Russian/Ukraine conflict, moderating inflation figures in the U.S., Mideast tensions, and upcoming political contests in the U.S. Despite the conflicting economic and geo-political signals, the S&P 500, the Bloomberg U.S. Aggregate Bond, and the MSCI ACWI indexes reported varying positive returns for the period, +36.3%, +11.6%, and +31.8%, respectively. In brief, most equities repriced higher due to a surprising level of economic strength and resilient corporate profits, while interest rates declined along with inflation rates, creating a more favorable backdrop for the economy. Stock selection was a positive contributor to relative performance, consistent with the Fund’s bottom-up investment approach. Sector and geographic allocations detracted from relative results. The Fund’s cash and currency forwards allocations were also a drag on performance. During the period, stock selection in communication services, energy, and the U.S. helped to drive relative performance. The Fund’s underweight allocation and weaker security selection in information technology hampered relative returns. In South Korea, both an overweight positioning and negative security selection detracted from returns.
How did the Fund perform over the past 10 years?
The line graph below reflects a hypothetical $10,000 investment. The returns shown in the line graph and table assume the reinvestment of dividends and capital gains, but do not reflect the deduction of taxes that a shareholder would pay on distributions or the redemption of Fund shares. The performance information shown below represents past performance and is no guarantee of future results. For Fund performance current to the most recent month end, visit https://www.thornburg.com/product/mutual-funds/fgo/THOVX or call 1-800-847-0200. Performance for other share classes of the Fund will vary.
Cumulative Performance
Growth Table
Date | Thornburg Global Opportunities Fund | MSCI All Country World Net Total Return USD Index |
09/30/2014 | 9999.9968 | 10000 |
10/31/2014 | 10292.7417 | 10070.4015 |
11/30/2014 | 10700.039 | 10238.8433 |
12/31/2014 | 10623.6707 | 10041.2717 |
01/31/2015 | 10538.8171 | 9884.2795 |
02/28/2015 | 11366.1397 | 10434.5511 |
03/31/2015 | 11323.7129 | 10272.8725 |
04/30/2015 | 11417.0519 | 10570.9341 |
05/31/2015 | 11773.437 | 10557.1413 |
06/30/2015 | 11344.9263 | 10308.6058 |
07/31/2015 | 11705.5541 | 10398.1255 |
08/31/2015 | 11149.763 | 9685.3233 |
09/30/2015 | 10275.771 | 9334.4339 |
10/31/2015 | 10687.3109 | 10067.0465 |
11/30/2015 | 10818.834 | 9983.9174 |
12/31/2015 | 10728.5189 | 9803.8662 |
01/31/2016 | 10047.6133 | 9212.5892 |
02/29/2016 | 10030.5906 | 9149.2172 |
03/31/2016 | 10481.6906 | 9827.2446 |
04/30/2016 | 10362.5321 | 9972.308 |
05/31/2016 | 10622.1274 | 9984.8759 |
06/30/2016 | 9917.4895 | 9924.4328 |
07/31/2016 | 10236.9963 | 10352.1142 |
08/31/2016 | 10369.0591 | 10386.9422 |
09/30/2016 | 10527.7992 | 10450.5805 |
10/31/2016 | 10647.2877 | 10273.192 |
11/30/2016 | 10860.6602 | 10351.2621 |
12/31/2016 | 11115.7151 | 10574.8749 |
01/31/2017 | 11509.1917 | 10864.043 |
02/28/2017 | 11560.5148 | 11168.8146 |
03/31/2017 | 11907.335 | 11305.4106 |
04/30/2017 | 12360.7034 | 11481.6274 |
05/31/2017 | 12818.3488 | 11735.1688 |
06/30/2017 | 12686.2919 | 11788.5291 |
07/31/2017 | 13118.7305 | 12117.9572 |
08/31/2017 | 12921.7783 | 12164.3945 |
09/30/2017 | 13140.1383 | 12399.4036 |
10/31/2017 | 13392.751 | 12656.8857 |
11/30/2017 | 13157.2646 | 12901.9065 |
12/31/2017 | 13505.2978 | 13109.9159 |
01/31/2018 | 14020.1122 | 13849.5047 |
02/28/2018 | 13320.8226 | 13267.8667 |
03/31/2018 | 12754.5268 | 12983.8641 |
04/30/2018 | 13080.5759 | 13107.839 |
05/31/2018 | 13114.8968 | 13124.1879 |
06/30/2018 | 12827.4588 | 13053.1473 |
07/31/2018 | 13089.1561 | 13446.7994 |
08/31/2018 | 12904.681 | 13552.4017 |
09/30/2018 | 12707.3354 | 13611.407 |
10/31/2018 | 11587.6141 | 12591.3835 |
11/30/2018 | 11506.1018 | 12775.5352 |
12/31/2018 | 10668.3158 | 11875.5991 |
01/31/2019 | 11745.6581 | 12813.3987 |
02/28/2019 | 11877.0413 | 13156.1402 |
03/31/2019 | 11990.9067 | 13321.5465 |
04/30/2019 | 12625.9255 | 13771.3814 |
05/31/2019 | 11307.7141 | 12954.468 |
06/30/2019 | 12065.3572 | 13802.7479 |
07/31/2019 | 12152.946 | 13843.1675 |
08/31/2019 | 11526.6861 | 13514.8046 |
09/30/2019 | 11964.6301 | 13799.1266 |
10/31/2019 | 12490.1629 | 14176.8026 |
11/30/2019 | 13025.6801 | 14522.8991 |
12/31/2019 | 13684.4806 | 15034.2955 |
01/31/2020 | 13233.4896 | 14868.2501 |
02/29/2020 | 12663.1187 | 13667.3235 |
03/31/2020 | 10284.3625 | 11822.1855 |
04/30/2020 | 11562.1702 | 13088.6676 |
05/31/2020 | 12119.2767 | 13657.8975 |
06/30/2020 | 12517.2099 | 14094.3125 |
07/31/2020 | 13494.357 | 14839.706 |
08/31/2020 | 14312.3308 | 15748.003 |
09/30/2020 | 13927.662 | 15240.2279 |
10/31/2020 | 13865.7613 | 14869.7412 |
11/30/2020 | 15705.7628 | 16702.6307 |
12/31/2020 | 16719.0378 | 17478.1127 |
01/31/2021 | 16685.8933 | 17398.658 |
02/28/2021 | 17434.0123 | 17801.6296 |
03/31/2021 | 17841.2162 | 18277.1328 |
04/30/2021 | 18684.0338 | 19076.2595 |
05/31/2021 | 18887.6358 | 19373.0962 |
06/30/2021 | 18873.431 | 19628.3949 |
07/31/2021 | 18797.6721 | 19763.6596 |
08/31/2021 | 19081.7679 | 20258.3342 |
09/30/2021 | 18470.9619 | 19421.4506 |
10/31/2021 | 18882.9008 | 20412.8235 |
11/30/2021 | 18241.12 | 19921.2376 |
12/31/2021 | 19106.5306 | 20718.1276 |
01/31/2022 | 19014.5682 | 19700.6071 |
02/28/2022 | 18468.2037 | 19191.767 |
03/31/2022 | 18608.852 | 19607.4662 |
04/30/2022 | 17521.5325 | 18038.0232 |
05/31/2022 | 17927.2487 | 18059.165 |
06/30/2022 | 16179.9641 | 16536.8516 |
07/31/2022 | 16607.3185 | 17691.6605 |
08/31/2022 | 16288.155 | 17040.3131 |
09/30/2022 | 14892.4911 | 15409.0425 |
10/31/2022 | 15871.6197 | 16338.9605 |
11/30/2022 | 17698.9175 | 17606.2413 |
12/31/2022 | 17110.5497 | 16913.4626 |
01/31/2023 | 18495.3157 | 18125.7322 |
02/28/2023 | 17962.7134 | 17606.2413 |
03/31/2023 | 17811.3422 | 18149.1107 |
04/30/2023 | 17945.8943 | 18409.9478 |
05/31/2023 | 17559.0569 | 18212.749 |
06/30/2023 | 18299.0938 | 19270.2098 |
07/31/2023 | 19538.0949 | 19975.663 |
08/31/2023 | 18629.8678 | 19417.4566 |
09/30/2023 | 18142.1162 | 18614.5489 |
10/31/2023 | 17278.7399 | 18054.8514 |
11/30/2023 | 18525.6648 | 19721.2696 |
12/31/2023 | 19810.4508 | 20668.5483 |
01/31/2024 | 19697.8578 | 20789.7007 |
02/29/2024 | 20219.3414 | 21681.8618 |
03/31/2024 | 21446.0131 | 22362.6052 |
04/30/2024 | 21392.6795 | 21624.7737 |
05/31/2024 | 22180.8308 | 22503.0355 |
06/30/2024 | 22204.5346 | 23004.2603 |
07/31/2024 | 22500.8321 | 23375.2263 |
08/31/2024 | 22672.6847 | 23968.8998 |
09/30/2024 | 23318.6133 | 24525.7216 |
What were the Fund costs for the past year?
(based on a hypothetical $10,000 investment)
Class Name | Costs of a $10,000 investment | Costs paid as a percentage of a $10,000 investment |
|---|
Class R4 | $160.00 | 1.40% |
End Block
Thornburg Global Opportunities Fund Tailored Shareholder Report
Thornburg Global Opportunities Fund Tailored Shareholder Report | |
Annual Performance | 1 Year | 5 Year | 10 Year |
|---|
Global Opportunities Fund Class R4 | 28.53% | 14.28% | 8.84% |
MSCI All Country World Net Total Return USD Index | 31.76% | 12.19% | 9.39% |
Key Fund Statistics
(as of September 30, 2024)
| |
|---|
Fund Size (Millions) | $1,306.0M |
Number of Holdings | 37 |
Annual Portfolio Turnover | 14.91% |
Total Advisory Fee | $9.3M |
What did the Fund invest in?
(as of September 30, 2024)
Market Capitalization Exposure | (%) |
|---|
| Small Cap (<$2.5 B) | 2.6 |
| Mid Cap ($2.5-12 B) | 17.7 |
| Large Cap (>$12 B) | 79.8 |
Market Capitalization Exposure | (%) |
Small Cap (<$2.5 B) | 2.6% |
Mid Cap ($2.5-12 B) | 17.7% |
Large Cap (>$12 B) | 79.8% |
Expressed as a percentage of the Fund’s net assets.
How has the Fund changed?
This is a summary of certain changes to the Fund since October 1, 2023. For more complete information, you may review the Fund’s next prospectus, which we expect to be available by February 1, 2025 at https://www.thornburg.com/download or upon request by calling 1-800-847-0200.
End Block
Changes In and Disagreements with Accountants
No changes and/or disagreements occurred in the current reporting period.
End Block
For additional information about the Fund, including its prospectus, financial information, holdings and proxy information, visit www.thornburg.com/download.

Thornburg Global Opportunities Fund Tailored Shareholder Report | |
Thornburg Global Opportunities Fund Tailored Shareholder Report
Thornburg Global Opportunities Fund CLASS: R5 TICKER: THOFX Annual Shareholder Report | |
This annual shareholder report contains important information about the Thornburg Global Opportunities Fund Class R5 Shares for the period from October 1, 2023 to September 30, 2024. You can find additional information about the Fund at https://www.thornburg.com/download. You can also request this information by contacting us at 1-800-847-0200. This report also describes changes to the Fund that occurred during the reporting period.
How did the Fund perform last year and what affected its performance?
The Fund’s Class R5 shares underperformed the MSCI All Country World Net Total Return USD Index (the 'Index”) during the 12-month period ended September 30, 2024. During the period, major world events included the ongoing Russian/Ukraine conflict, moderating inflation figures in the U.S., Mideast tensions, and upcoming political contests in the U.S. Despite the conflicting economic and geo-political signals, the S&P 500, the Bloomberg U.S. Aggregate Bond, and the MSCI ACWI indexes reported varying positive returns for the period, +36.3%, +11.6%, and +31.8%, respectively. In brief, most equities repriced higher due to a surprising level of economic strength and resilient corporate profits, while interest rates declined along with inflation rates, creating a more favorable backdrop for the economy. Stock selection was a positive contributor to relative performance, consistent with the Fund’s bottom-up investment approach. Sector and geographic allocations detracted from relative results. The Fund’s cash and currency forwards allocations were also a drag on performance. During the period, stock selection in communication services, energy, and the U.S. helped to drive relative performance. The Fund’s underweight allocation and weaker security selection in information technology hampered relative returns. In South Korea, both an overweight positioning and negative security selection detracted from returns.
How did the Fund perform over the past 10 years?
The line graph below reflects a hypothetical $10,000 investment. The returns shown in the line graph and table assume the reinvestment of dividends and capital gains, but do not reflect the deduction of taxes that a shareholder would pay on distributions or the redemption of Fund shares. The performance information shown below represents past performance and is no guarantee of future results. For Fund performance current to the most recent month end, visit https://www.thornburg.com/product/mutual-funds/fgo/THOFX or call 1-800-847-0200. Performance for other share classes of the Fund will vary.
Cumulative Performance
Growth Table
Date | Thornburg Global Opportunities Fund | MSCI All Country World Net Total Return USD Index |
09/30/2014 | 10000.0095 | 10000 |
10/31/2014 | 10294.0039 | 10070.4015 |
11/30/2014 | 10705.5961 | 10238.8433 |
12/31/2014 | 10631.7684 | 10041.2717 |
01/31/2015 | 10551.9251 | 9884.2795 |
02/28/2015 | 11383.9765 | 10434.5511 |
03/31/2015 | 11346.156 | 10272.8725 |
04/30/2015 | 11447.0107 | 10570.9341 |
05/31/2015 | 11804.2045 | 10557.1413 |
06/30/2015 | 11379.7742 | 10308.6058 |
07/31/2015 | 11745.3726 | 10398.1255 |
08/31/2015 | 11190.6716 | 9685.3233 |
09/30/2015 | 10316.5974 | 9334.4339 |
10/31/2015 | 10732.6231 | 10067.0465 |
11/30/2015 | 10867.0961 | 9983.9174 |
12/31/2015 | 10784.6499 | 9803.8662 |
01/31/2016 | 10104.2704 | 9212.5892 |
02/29/2016 | 10091.5925 | 9149.2172 |
03/31/2016 | 10547.9962 | 9827.2446 |
04/30/2016 | 10429.6693 | 9972.308 |
05/31/2016 | 10695.9048 | 9984.8759 |
06/30/2016 | 9992.8975 | 9924.4328 |
07/31/2016 | 10314.9756 | 10352.1142 |
08/31/2016 | 10450.5874 | 10386.9422 |
09/30/2016 | 10617.2014 | 10450.5805 |
10/31/2016 | 10740.4102 | 10273.192 |
11/30/2016 | 10957.0878 | 10351.2621 |
12/31/2016 | 11222.004 | 10574.8749 |
01/31/2017 | 11618.3756 | 10864.043 |
02/28/2017 | 11673.7823 | 11168.8146 |
03/31/2017 | 12031.4736 | 11305.4106 |
04/30/2017 | 12487.987 | 11481.6274 |
05/31/2017 | 12957.2998 | 11735.1688 |
06/30/2017 | 12833.3098 | 11788.5291 |
07/31/2017 | 13269.3517 | 12117.9572 |
08/31/2017 | 13076.9803 | 12164.3945 |
09/30/2017 | 13302.6207 | 12399.4036 |
10/31/2017 | 13563.5403 | 12656.8857 |
11/30/2017 | 13328.2849 | 12901.9065 |
12/31/2017 | 13686.4717 | 13109.9159 |
01/31/2018 | 14209.9042 | 13849.5047 |
02/28/2018 | 13510.5641 | 13267.8667 |
03/31/2018 | 12939.9369 | 12983.8641 |
04/30/2018 | 13274.5904 | 13107.839 |
05/31/2018 | 13313.2043 | 13124.1879 |
06/30/2018 | 13021.455 | 13053.1473 |
07/31/2018 | 13296.0426 | 13446.7994 |
08/31/2018 | 13111.5541 | 13552.4017 |
09/30/2018 | 12914.1943 | 13611.407 |
10/31/2018 | 11781.5208 | 12591.3835 |
11/30/2018 | 11700.0026 | 12775.5352 |
12/31/2018 | 10857.4705 | 11875.5991 |
01/31/2019 | 11955.1198 | 12813.3987 |
02/28/2019 | 12096.1831 | 13156.1402 |
03/31/2019 | 12215.2053 | 13321.5465 |
04/30/2019 | 12863.2151 | 13771.3814 |
05/31/2019 | 11523.1132 | 12954.468 |
06/30/2019 | 12303.3699 | 13802.7479 |
07/31/2019 | 12395.9428 | 13843.1675 |
08/31/2019 | 11756.7494 | 13514.8046 |
09/30/2019 | 12210.7971 | 13799.1266 |
10/31/2019 | 12753.0094 | 14176.8026 |
11/30/2019 | 13300.9005 | 14522.8991 |
12/31/2019 | 13981.822 | 15034.2955 |
01/31/2020 | 13524.5774 | 14868.2501 |
02/29/2020 | 12946.2975 | 13667.3235 |
03/31/2020 | 10516.6253 | 11822.1855 |
04/30/2020 | 11825.6 | 13088.6676 |
05/31/2020 | 12403.8799 | 13657.8975 |
06/30/2020 | 12816.2966 | 14094.3125 |
07/31/2020 | 13815.9588 | 14839.706 |
08/31/2020 | 14663.2061 | 15748.003 |
09/30/2020 | 14273.2034 | 15240.2279 |
10/31/2020 | 14214.9271 | 14869.7412 |
11/30/2020 | 16107.7216 | 16702.6307 |
12/31/2020 | 17152.3832 | 17478.1127 |
01/31/2021 | 17123.5314 | 17398.658 |
02/28/2021 | 17897.7209 | 17801.6296 |
03/31/2021 | 18320.8803 | 18277.1328 |
04/30/2021 | 19196.051 | 19076.2595 |
05/31/2021 | 19407.6307 | 19373.0962 |
06/30/2021 | 19402.8221 | 19628.3949 |
07/31/2021 | 19330.6926 | 19763.6596 |
08/31/2021 | 19628.8277 | 20258.3342 |
09/30/2021 | 19008.5144 | 19421.4506 |
10/31/2021 | 19441.2911 | 20412.8235 |
11/30/2021 | 18785.3635 | 19921.2376 |
12/31/2021 | 19679.2668 | 20718.1276 |
01/31/2022 | 19591.1917 | 19700.6071 |
02/28/2022 | 19035.218 | 19191.767 |
03/31/2022 | 19189.3493 | 19607.4662 |
04/30/2022 | 18071.8973 | 18038.0232 |
05/31/2022 | 18495.7584 | 18059.165 |
06/30/2022 | 16701.2295 | 16536.8516 |
07/31/2022 | 17147.1094 | 17691.6605 |
08/31/2022 | 16822.3326 | 17040.3131 |
09/30/2022 | 15385.6085 | 15409.0425 |
10/31/2022 | 16403.9762 | 16338.9605 |
11/30/2022 | 18302.0651 | 17606.2413 |
12/31/2022 | 17697.335 | 16913.4626 |
01/31/2023 | 19134.4205 | 18125.7322 |
02/28/2023 | 18590.5037 | 17606.2413 |
03/31/2023 | 18441.6422 | 18149.1107 |
04/30/2023 | 18590.5037 | 18409.9478 |
05/31/2023 | 18195.4483 | 18212.749 |
06/30/2023 | 18968.3827 | 19270.2098 |
07/31/2023 | 20250.8813 | 19975.663 |
08/31/2023 | 19317.6346 | 19417.4566 |
09/30/2023 | 18819.5213 | 18614.5489 |
10/31/2023 | 17932.0781 | 18054.8514 |
11/30/2023 | 19234.4 | 19721.2696 |
12/31/2023 | 20572.512 | 20668.5483 |
01/31/2024 | 20463.2129 | 20789.7007 |
02/29/2024 | 21009.7082 | 21681.8618 |
03/31/2024 | 22290.9361 | 22362.6052 |
04/30/2024 | 22242.3587 | 21624.7737 |
05/31/2024 | 23074.246 | 22503.0355 |
06/30/2024 | 23104.6069 | 23004.2603 |
07/31/2024 | 23420.3597 | 23375.2263 |
08/31/2024 | 23608.597 | 23968.8998 |
09/30/2024 | 24288.68 | 24525.7216 |

What were the Fund costs for the past year?
(based on a hypothetical $10,000 investment)
Class Name | Costs of a $10,000 investment | Costs paid as a percentage of a $10,000 investment |
|---|
Class R5 | $113.00 | 0.99% |
End Block
Thornburg Global Opportunities Fund Tailored Shareholder Report
Thornburg Global Opportunities Fund Tailored Shareholder Report | |
Annual Performance | 1 Year | 5 Year | 10 Year |
|---|
Global Opportunities Fund Class R5 | 29.06% | 14.74% | 9.28% |
MSCI All Country World Net Total Return USD Index | 31.76% | 12.19% | 9.39% |
Key Fund Statistics
(as of September 30, 2024)
| |
|---|
Fund Size (Millions) | $1,306.0M |
Number of Holdings | 37 |
Annual Portfolio Turnover | 14.91% |
Total Advisory Fee | $9.3M |
What did the Fund invest in?
(as of September 30, 2024)
Market Capitalization Exposure | (%) |
|---|
| Small Cap (<$2.5 B) | 2.6 |
| Mid Cap ($2.5-12 B) | 17.7 |
| Large Cap (>$12 B) | 79.8 |
Market Capitalization Exposure | (%) |
Small Cap (<$2.5 B) | 2.6% |
Mid Cap ($2.5-12 B) | 17.7% |
Large Cap (>$12 B) | 79.8% |
Expressed as a percentage of the Fund’s net assets.
How has the Fund changed?
This is a summary of certain changes to the Fund since October 1, 2023. For more complete information, you may review the Fund’s next prospectus, which we expect to be available by February 1, 2025 at https://www.thornburg.com/download or upon request by calling 1-800-847-0200.
End Block
Changes In and Disagreements with Accountants
No changes and/or disagreements occurred in the current reporting period.
End Block
For additional information about the Fund, including its prospectus, financial information, holdings and proxy information, visit www.thornburg.com/download.

Thornburg Global Opportunities Fund Tailored Shareholder Report | |
Thornburg Global Opportunities Fund Tailored Shareholder Report
Thornburg Global Opportunities Fund CLASS: R6 TICKER: THOGX Annual Shareholder Report | |
This annual shareholder report contains important information about the Thornburg Global Opportunities Fund Class R6 Shares for the period from October 1, 2023 to September 30, 2024. You can find additional information about the Fund at https://www.thornburg.com/download. You can also request this information by contacting us at 1-800-847-0200. This report also describes changes to the Fund that occurred during the reporting period.
How did the Fund perform last year and what affected its performance?
The Fund’s Class R6 shares underperformed the MSCI All Country World Net Total Return USD Index (the 'Index”) during the 12-month period ended September 30, 2024. During the period, major world events included the ongoing Russian/Ukraine conflict, moderating inflation figures in the U.S., Mideast tensions, and upcoming political contests in the U.S. Despite the conflicting economic and geo-political signals, the S&P 500, the Bloomberg U.S. Aggregate Bond, and the MSCI ACWI indexes reported varying positive returns for the period, +36.3%, +11.6%, and +31.8%, respectively. In brief, most equities repriced higher due to a surprising level of economic strength and resilient corporate profits, while interest rates declined along with inflation rates, creating a more favorable backdrop for the economy. Stock selection was a positive contributor to relative performance, consistent with the Fund’s bottom-up investment approach. Sector and geographic allocations detracted from relative results. The Fund’s cash and currency forwards allocations were also a drag on performance. During the period, stock selection in communication services, energy, and the U.S. helped to drive relative performance. The Fund’s underweight allocation and weaker security selection in information technology hampered relative returns. In South Korea, both an overweight positioning and negative security selection detracted from returns.
How did the Fund perform over the past 10 years?
The line graph below reflects a hypothetical $10,000 investment. The returns shown in the line graph and table assume the reinvestment of dividends and capital gains, but do not reflect the deduction of taxes that a shareholder would pay on distributions or the redemption of Fund shares. The performance information shown below represents past performance and is no guarantee of future results. For Fund performance current to the most recent month end, visit https://www.thornburg.com/product/mutual-funds/fgo/THOGX or call 1-800-847-0200. Performance for other share classes of the Fund will vary.
Cumulative Performance
Growth Table
Date | Thornburg Global Opportunities Fund | MSCI All Country World Net Total Return USD Index |
04/10/2017 | 10000.0089 | 10000 |
04/30/2017 | 10328.0515 | 10183.8364 |
05/31/2017 | 10712.5316 | 10408.7195 |
06/30/2017 | 10606.7114 | 10456.0484 |
07/31/2017 | 10973.5547 | 10748.2405 |
08/31/2017 | 10814.8244 | 10789.4289 |
09/30/2017 | 11001.6612 | 10997.8745 |
10/31/2017 | 11220.5646 | 11226.2529 |
11/30/2017 | 11029.9068 | 11443.5785 |
12/31/2017 | 11326.5874 | 11628.0761 |
01/31/2018 | 11762.3616 | 12284.0678 |
02/28/2018 | 11181.3293 | 11768.1734 |
03/31/2018 | 10710.1262 | 11516.2723 |
04/30/2018 | 10990.0138 | 11626.234 |
05/31/2018 | 11021.8997 | 11640.735 |
06/30/2018 | 10784.5267 | 11577.7242 |
07/31/2018 | 11011.271 | 11926.8811 |
08/31/2018 | 10858.9272 | 12020.547 |
09/30/2018 | 10699.4976 | 12072.8827 |
10/31/2018 | 9760.6344 | 11168.1546 |
11/30/2018 | 9696.8626 | 11331.4912 |
12/31/2018 | 8997.149 | 10533.2767 |
01/31/2019 | 9908.899 | 11365.0749 |
02/28/2019 | 10025.603 | 11669.0756 |
03/31/2019 | 10124.072 | 11815.7857 |
04/30/2019 | 10663.828 | 12214.7749 |
05/31/2019 | 9555.14 | 11490.1989 |
06/30/2019 | 10200.659 | 12242.596 |
07/31/2019 | 10280.893 | 12278.4469 |
08/31/2019 | 9752.078 | 11987.1995 |
09/30/2019 | 10127.719 | 12239.3841 |
10/31/2019 | 10579.947 | 12574.3706 |
11/30/2019 | 11036.8672 | 12881.3471 |
12/31/2019 | 11601.1927 | 13334.9393 |
01/31/2020 | 11218.695 | 13187.6624 |
02/29/2020 | 10747.0716 | 12122.4789 |
03/31/2020 | 8730.6031 | 10485.9005 |
04/30/2020 | 9818.6791 | 11609.2296 |
05/31/2020 | 10297.7296 | 12114.1184 |
06/30/2020 | 10639.378 | 12501.2045 |
07/31/2020 | 11474.9313 | 13162.3447 |
08/31/2020 | 12176.796 | 13967.9751 |
09/30/2020 | 11857.429 | 13517.5948 |
10/31/2020 | 11805.439 | 13188.9849 |
11/30/2020 | 13380.7946 | 14814.6994 |
12/31/2020 | 14249.3741 | 15502.527 |
01/31/2021 | 14229.4338 | 15432.0533 |
02/28/2021 | 14871.513 | 15789.4762 |
03/31/2021 | 15226.4513 | 16211.2323 |
04/30/2021 | 15956.2681 | 16920.0321 |
05/31/2021 | 16135.7312 | 17183.3168 |
06/30/2021 | 16131.7431 | 17409.7586 |
07/31/2021 | 16071.9221 | 17529.7341 |
08/31/2021 | 16323.1705 | 17968.4946 |
09/30/2021 | 15808.7095 | 17226.2057 |
10/31/2021 | 16171.6239 | 18105.5217 |
11/30/2021 | 15627.8451 | 17669.5007 |
12/31/2021 | 16374.3608 | 18376.3167 |
01/31/2022 | 16301.2201 | 17473.8085 |
02/28/2022 | 15839.5199 | 17022.4836 |
03/31/2022 | 15967.516 | 17391.1955 |
04/30/2022 | 15039.5441 | 15999.1498 |
05/31/2022 | 15396.1047 | 16017.9018 |
06/30/2022 | 13905.8642 | 14667.6586 |
07/31/2022 | 14276.1387 | 15691.9371 |
08/31/2022 | 14011.0039 | 15114.2128 |
09/30/2022 | 12813.3259 | 13667.3279 |
10/31/2022 | 13663.5858 | 14492.1355 |
11/30/2022 | 15244.3387 | 15616.1731 |
12/31/2022 | 14744.5383 | 15001.7004 |
01/31/2023 | 15944.2876 | 16076.9449 |
02/28/2023 | 15492.0011 | 15616.1731 |
03/31/2023 | 15368.2175 | 16097.6808 |
04/30/2023 | 15492.0011 | 16329.035 |
05/31/2023 | 15168.2593 | 16154.1259 |
06/30/2023 | 15810.9821 | 17092.0599 |
07/31/2023 | 16886.9478 | 17717.7743 |
08/31/2023 | 16110.9194 | 17222.6631 |
09/30/2023 | 15696.7203 | 16510.5097 |
10/31/2023 | 14954.0183 | 16014.0759 |
11/30/2023 | 16046.6161 | 17492.1355 |
12/31/2023 | 17163.1849 | 18332.3414 |
01/31/2024 | 17077.2425 | 18439.7997 |
02/29/2024 | 17532.2312 | 19231.118 |
03/31/2024 | 18609.0378 | 19834.9157 |
04/30/2024 | 18568.5944 | 19180.4827 |
05/31/2024 | 19261.1883 | 19959.4729 |
06/30/2024 | 19291.5209 | 20404.0433 |
07/31/2024 | 19559.4587 | 20733.0783 |
08/31/2024 | 19716.177 | 21259.6476 |
09/30/2024 | 20287.4406 | 21753.5308 |

What were the Fund costs for the past year?
(based on a hypothetical $10,000 investment)
Class Name | Costs of a $10,000 investment | Costs paid as a percentage of a $10,000 investment |
|---|
Class R6 | $97.00 | 0.85% |
End Block
Thornburg Global Opportunities Fund Tailored Shareholder Report
Thornburg Global Opportunities Fund Tailored Shareholder Report | |
Annual Performance | 1 Year | 5 Year |
|---|
Global Opportunities Fund Class R6 | 29.25% | 14.91% |
MSCI All Country World Net Total Return USD Index | 31.76% | 12.19% |
Key Fund Statistics
(as of September 30, 2024)
| |
|---|
Fund Size (Millions) | $1,306.0M |
Number of Holdings | 37 |
Annual Portfolio Turnover | 14.91% |
Total Advisory Fee | $9.3M |
What did the Fund invest in?
(as of September 30, 2024)
Market Capitalization Exposure | (%) |
|---|
| Small Cap (<$2.5 B) | 2.6 |
| Mid Cap ($2.5-12 B) | 17.7 |
| Large Cap (>$12 B) | 79.8 |
Market Capitalization Exposure | (%) |
Small Cap (<$2.5 B) | 2.6% |
Mid Cap ($2.5-12 B) | 17.7% |
Large Cap (>$12 B) | 79.8% |
Expressed as a percentage of the Fund’s net assets.
How has the Fund changed?
This is a summary of certain changes to the Fund since October 1, 2023. For more complete information, you may review the Fund’s next prospectus, which we expect to be available by February 1, 2025 at https://www.thornburg.com/download or upon request by calling 1-800-847-0200.
End Block
Changes In and Disagreements with Accountants
No changes and/or disagreements occurred in the current reporting period.
End Block
For additional information about the Fund, including its prospectus, financial information, holdings and proxy information, visit www.thornburg.com/download.

Thornburg Global Opportunities Fund Tailored Shareholder Report | |
Thornburg International Equity Fund Tailored Shareholder Report
Thornburg International Equity Fund CLASS: A TICKER: TGVAX Annual Shareholder Report | |
This annual shareholder report contains important information about the Thornburg International Equity Fund Class A Shares for the period from October 1, 2023 to September 30, 2024. You can find additional information about the Fund at https://www.thornburg.com/download. You can also request this information by contacting us at 1-800-847-0200. This report also describes changes to the Fund that occurred during the reporting period.
How did the Fund perform last year and what affected its performance?
The Fund’s Class A shares outperformed the MSCI All Country World ex USA Net Total Return USD Index (the “Index”) during the 12-month period ended September 30, 2024. During the period, non-U.S. equities have posted strong returns but lagged their U.S. counterparts, as U.S. mega-cap and artificial intelligence beneficiaries have continued to lead the market. Stock selection was a major contributor of the Fund’s outperformance relative to its benchmark, consistent with the Fund’s bottom-up investment approach. Sector allocation was modestly additive to performance while geographic allocation detracted from relative results. The Fund’s cash allocation was a drag on performance. Within industrials and information technology, stock selection bolstered relative returns. Additionally, stock selection in Japan and the U.S. also drove positive relative performance. An underweight positioning and weaker stock selection within financials and India hampered relative returns.
How did the Fund perform over the past 10 years?
The line graph below reflects a hypothetical $10,000 investment and assumes the deduction of the maximum sales charge associated with that investment. The returns shown in the line graph and table assume the reinvestment of dividends and capital gains, but do not reflect the deduction of taxes that a shareholder would pay on distributions or the redemption of Fund shares. The performance information shown below represents past performance and is no guarantee of future results. For Fund performance current to the most recent month end, visit https://www.thornburg.com/product/mutual-funds/fiv/TGVAX or call 1-800-847-0200. Performance for other share classes of the Fund will vary.
Cumulative Performance
Growth Table
Date | Thornburg International Equity Fund | MSCI All Country World ex USA Net Total Return USD Index | MSCI EAFE Net Total Return USD Index |
09/30/2014 | 9548.8 | 10000 | 10000 |
10/31/2014 | 9564.8 | 9900.9916 | 9854.8027 |
11/30/2014 | 9804.3005 | 9972.6147 | 9988.8459 |
12/31/2014 | 9377.735 | 9613.0446 | 9642.8195 |
01/31/2015 | 9573.3956 | 9598.8003 | 9689.957 |
02/28/2015 | 10100.9805 | 10111.9989 | 10269.2311 |
03/31/2015 | 10076.523 | 9948.5397 | 10113.2303 |
04/30/2015 | 10764.8291 | 10451.1052 | 10526.1436 |
05/31/2015 | 10873.1413 | 10287.947 | 10472.2625 |
06/30/2015 | 10570.8248 | 10000.9028 | 10175.5462 |
07/31/2015 | 10774.3799 | 9973.1163 | 10386.8244 |
08/31/2015 | 10061.9372 | 9210.8418 | 9622.7394 |
09/30/2015 | 9668.1645 | 8783.7614 | 9134.1379 |
10/31/2015 | 10207.0458 | 9437.6483 | 9848.1483 |
11/30/2015 | 10080.6553 | 9242.8415 | 9694.9419 |
12/31/2015 | 9964.9282 | 9068.7492 | 9564.3111 |
01/31/2016 | 9258.1664 | 8451.8776 | 8872.6782 |
02/29/2016 | 9001.9136 | 8355.2767 | 8710.1239 |
03/31/2016 | 9535.0848 | 9034.6429 | 9276.8694 |
04/30/2016 | 9758.2727 | 9272.3835 | 9545.445 |
05/31/2016 | 9696.2761 | 9115.896 | 9458.7334 |
06/30/2016 | 9248.343 | 8976.4115 | 9141.226 |
07/31/2016 | 9619.7792 | 9420.3444 | 9604.511 |
08/31/2016 | 9736.6355 | 9479.93 | 9611.3298 |
09/30/2016 | 9851.5887 | 9596.794 | 9729.3984 |
10/31/2016 | 9683.4011 | 9458.8142 | 9530.3854 |
11/30/2016 | 9506.8041 | 9240.0327 | 9340.5777 |
12/31/2016 | 9691.8105 | 9476.419 | 9659.9725 |
01/31/2017 | 9876.8168 | 9812.1147 | 9940.1874 |
02/28/2017 | 9872.6121 | 9968.552 | 10082.3268 |
03/31/2017 | 10356.1515 | 10221.2893 | 10359.8799 |
04/30/2017 | 10684.1173 | 10440.0708 | 10623.4864 |
05/31/2017 | 11087.7675 | 10778.8762 | 11013.4103 |
06/30/2017 | 11272.6617 | 10812.3304 | 10993.9322 |
07/31/2017 | 11614.5133 | 11210.8719 | 11311.0613 |
08/31/2017 | 11386.6122 | 11269.5045 | 11306.7993 |
09/30/2017 | 11701.3603 | 11478.7062 | 11588.1173 |
10/31/2017 | 11832.6459 | 11694.6789 | 11764.0795 |
11/30/2017 | 11940.1705 | 11789.6748 | 11887.4756 |
12/31/2017 | 12113.2165 | 12053.1957 | 12078.2834 |
01/31/2018 | 12874.6187 | 12724.4868 | 12684.1237 |
02/28/2018 | 12103.3282 | 12124.5179 | 12111.613 |
03/31/2018 | 11821.5105 | 11910.6517 | 11893.318 |
04/30/2018 | 11915.4497 | 12100.8441 | 12164.8742 |
05/31/2018 | 11668.2412 | 11821.4237 | 11891.4326 |
06/30/2018 | 11267.7634 | 11599.2316 | 11746.1521 |
07/31/2018 | 11594.0786 | 11876.6458 | 12035.2871 |
08/31/2018 | 11233.1542 | 11628.0714 | 11802.8554 |
09/30/2018 | 11218.3217 | 11681.0364 | 11905.29 |
10/31/2018 | 10224.5436 | 10730.9268 | 10957.723 |
11/30/2018 | 10392.6453 | 10832.4932 | 10943.915 |
12/31/2018 | 9684.0259 | 10342.216 | 10412.6559 |
01/31/2019 | 10547.0583 | 11123.6502 | 11096.9768 |
02/28/2019 | 10943.451 | 11340.9771 | 11379.8535 |
03/31/2019 | 11189.3149 | 11408.5376 | 11451.6124 |
04/30/2019 | 11826.5539 | 11709.9264 | 11773.5779 |
05/31/2019 | 11068.8918 | 11081.4186 | 11208.1415 |
06/30/2019 | 11676.025 | 11748.6972 | 11873.0695 |
07/31/2019 | 11575.6724 | 11606.5043 | 11722.319 |
08/31/2019 | 11374.9672 | 11248.0376 | 11418.6413 |
09/30/2019 | 11495.3903 | 11537.4893 | 11745.855 |
10/31/2019 | 11861.6773 | 11940.0432 | 12167.8726 |
11/30/2019 | 12038.5937 | 12045.3212 | 12305.043 |
12/31/2019 | 12460.7323 | 12566.946 | 12704.9525 |
01/31/2020 | 12300.2248 | 12229.3444 | 12439.5754 |
02/29/2020 | 11620.743 | 11262.6833 | 11315.0659 |
03/31/2020 | 10026.3685 | 9631.9034 | 9804.8628 |
04/30/2020 | 10684.4493 | 10361.8271 | 10438.2833 |
05/31/2020 | 11379.9818 | 10700.9334 | 10892.8165 |
06/30/2020 | 11877.555 | 11184.5398 | 11263.7119 |
07/31/2020 | 12685.4427 | 11683.1931 | 11526.2569 |
08/31/2020 | 13552.1832 | 12183.301 | 12118.8319 |
09/30/2020 | 13257.9195 | 11883.8181 | 11803.9447 |
10/31/2020 | 13076.011 | 11628.3222 | 11332.6268 |
11/30/2020 | 14635.7188 | 13192.4946 | 13089.3349 |
12/31/2020 | 15246.3722 | 13905.5658 | 13697.936 |
01/31/2021 | 15356.7331 | 13935.81 | 13552 |
02/28/2021 | 15781.623 | 14211.6693 | 13855.9629 |
03/31/2021 | 15880.9479 | 14391.329 | 14174.5556 |
04/30/2021 | 16294.8017 | 14814.9987 | 14601.061 |
05/31/2021 | 17050.7745 | 15278.3922 | 15077.2152 |
06/30/2021 | 16543.1139 | 15179.3838 | 14907.5391 |
07/31/2021 | 16129.2601 | 14929.2546 | 15019.785 |
08/31/2021 | 16344.4641 | 15213.0386 | 15284.7244 |
09/30/2021 | 15864.3938 | 14725.9212 | 14841.1473 |
10/31/2021 | 16416.1988 | 15077.4162 | 15206.1705 |
11/30/2021 | 15811.9318 | 14398.5013 | 14498.4184 |
12/31/2021 | 16353.298 | 14993.5549 | 15240.7933 |
01/31/2022 | 15806.0915 | 14441.0338 | 14504.2965 |
02/28/2022 | 14850.0525 | 14155.1934 | 14247.8395 |
03/31/2022 | 14573.3044 | 14177.7637 | 14339.4171 |
04/30/2022 | 13623.5552 | 13287.4905 | 13411.7322 |
05/31/2022 | 13831.1163 | 13382.8375 | 13512.2774 |
06/30/2022 | 12818.4697 | 12231.5513 | 12258.5056 |
07/31/2022 | 13252.4611 | 12650.3057 | 12869.3466 |
08/31/2022 | 12636.0676 | 12243.4383 | 12258.1214 |
09/30/2022 | 11441.0189 | 11019.9271 | 11111.4106 |
10/31/2022 | 11730.3465 | 11349.2529 | 11708.923 |
11/30/2022 | 13585.8168 | 12688.9762 | 13027.7676 |
12/31/2022 | 13571.6542 | 12594.0806 | 13038.2364 |
01/31/2023 | 14786.8353 | 13615.6126 | 14094.035 |
02/28/2023 | 14115.2878 | 13137.6739 | 13799.9409 |
03/31/2023 | 14652.5258 | 13458.8242 | 14141.9588 |
04/30/2023 | 14933.9361 | 13692.6526 | 14541.2266 |
05/31/2023 | 14435.0723 | 13194.8018 | 13925.87 |
06/30/2023 | 15049.0586 | 13786.846 | 14559.6312 |
07/31/2023 | 15592.6922 | 14347.342 | 15030.7292 |
08/31/2023 | 15055.4543 | 13699.3735 | 14454.8655 |
09/30/2023 | 14396.6982 | 13266.6757 | 13961.1207 |
10/31/2023 | 14083.3094 | 12719.3207 | 13395.1119 |
11/30/2023 | 15170.2993 | 13864.2371 | 14638.4169 |
12/31/2023 | 15711.7222 | 14560.8069 | 15416.1415 |
01/31/2024 | 15737.8866 | 14416.1563 | 15504.8593 |
02/29/2024 | 16228.4691 | 14781.1433 | 15788.6688 |
03/31/2024 | 16908.7435 | 15243.1825 | 16307.952 |
04/30/2024 | 16712.5105 | 14969.4799 | 15890.3251 |
05/31/2024 | 17615.1823 | 15404.0336 | 16505.8361 |
06/30/2024 | 17438.5726 | 15389.3378 | 16239.3678 |
07/31/2024 | 18020.7305 | 15745.6978 | 16715.7754 |
08/31/2024 | 18452.4431 | 16194.1448 | 17259.3077 |
09/30/2024 | 18995.3544 | 16630.2031 | 17418.6872 |
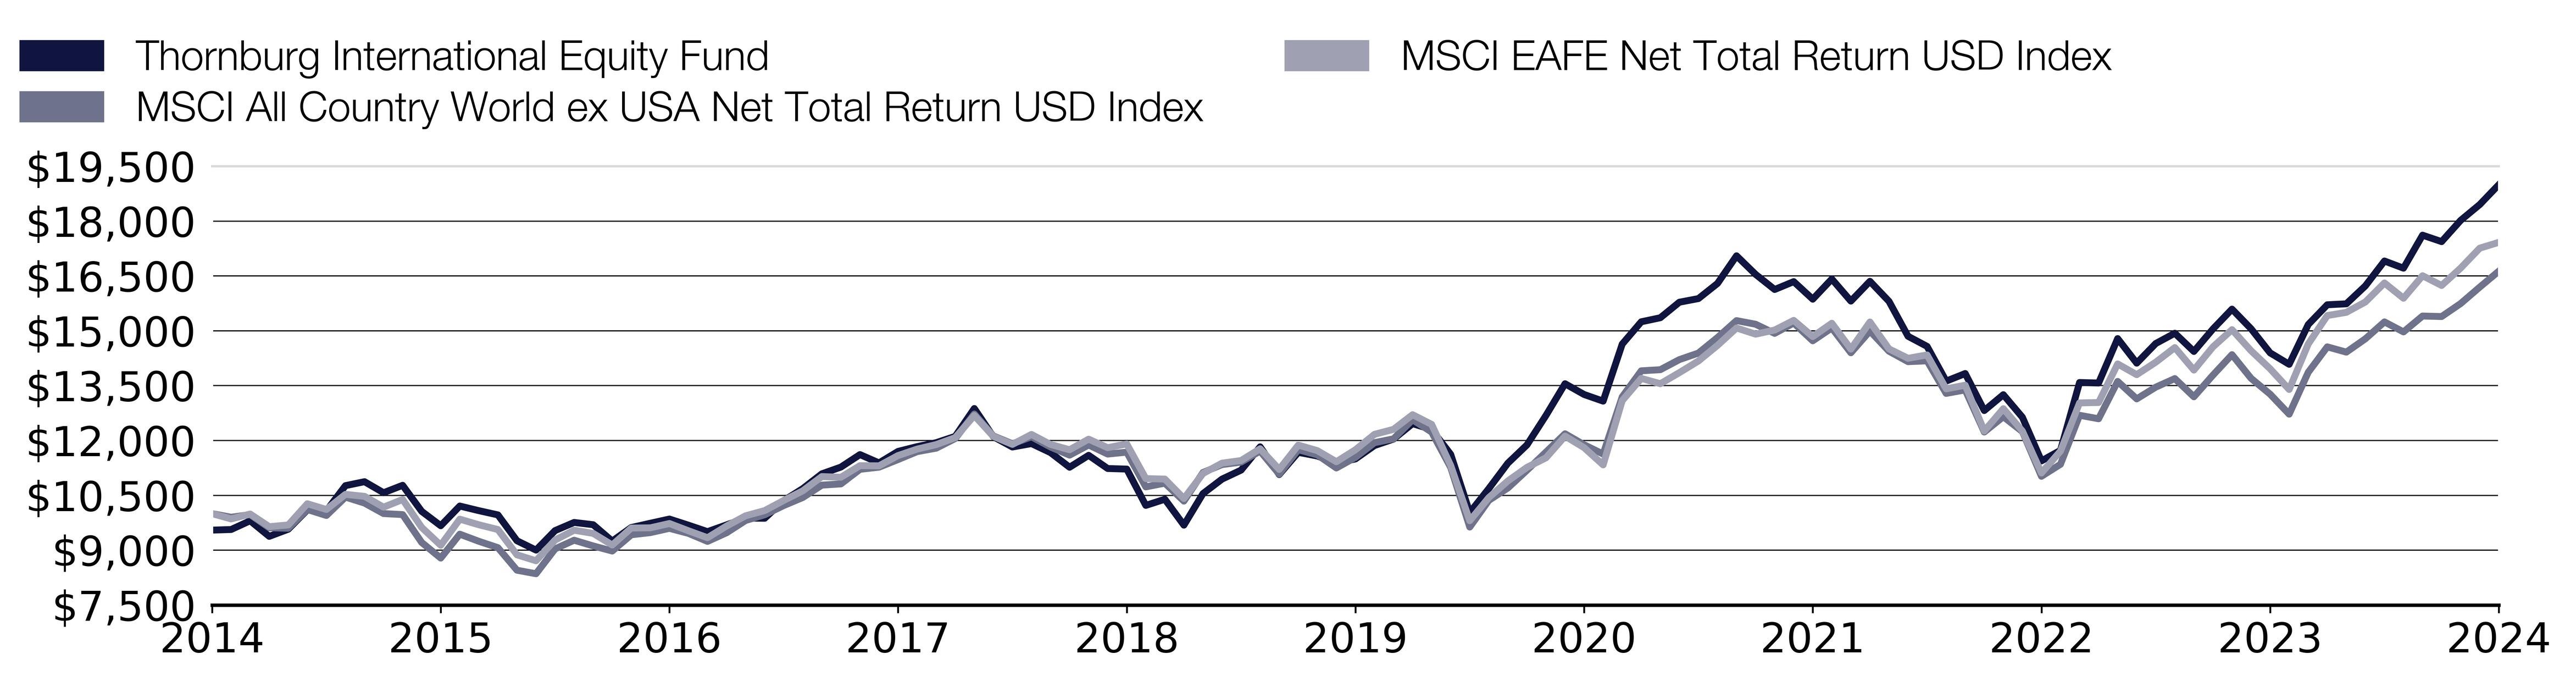
What were the Fund costs for the past year?
(based on a hypothetical $10,000 investment)
Class Name | Costs of a $10,000 investment | Costs paid as a percentage of a $10,000 investment |
|---|
Class A | $142.00 | 1.22% |
End Block
Thornburg International Equity Fund Tailored Shareholder Report
Thornburg International Equity Fund Tailored Shareholder Report | |
Annual Performance | 1 Year | 5 Year | 10 Year |
|---|
International Equity Fund Class A (with sales charge) | 26.01% | 9.55% | 6.63% |
International Equity Fund Class A (without sales charge) | 31.94% | 10.57% | 7.12% |
MSCI All Country World ex USA Net Total Return USD Index | 25.35% | 7.59% | 5.22% |
MSCI EAFE Net Total Return USD Index | 24.77% | 8.20% | 5.71% |
Key Fund Statistics
(as of September 30, 2024)
| |
|---|
Fund Size (Millions) | $2,969.1M |
Number of Holdings | 56 |
Annual Portfolio Turnover | 45.47% |
Total Advisory Fee | $17.2M |
What did the Fund invest in?
(as of September 30, 2024)
Market Capitalization Exposure | (%) |
|---|
| Small Cap (<$2.5 B) | 0.0 |
| Mid Cap ($2.5-12 B) | 3.5 |
| Large Cap (>$12 B) | 96.5 |
Market Capitalization Exposure | (%) |
Small Cap (<$2.5 B) | 0.0% |
Mid Cap ($2.5-12 B) | 3.5% |
Large Cap (>$12 B) | 96.5% |

Expressed as a percentage of the Fund’s net assets.
How has the Fund changed?
This is a summary of certain changes to the Fund since October 1, 2023. For more complete information, you may review the Fund’s next prospectus, which we expect to be available by February 1, 2025 at https://www.thornburg.com/download or upon request by calling 1-800-847-0200.
End Block
Changes In and Disagreements with Accountants
No changes and/or disagreements occurred in the current reporting period.
End Block
For additional information about the Fund, including its prospectus, financial information, holdings and proxy information, visit www.thornburg.com/download.

Thornburg International Equity Fund Tailored Shareholder Report | |
Thornburg International Equity Fund Tailored Shareholder Report
Thornburg International Equity Fund CLASS: C TICKER: THGCX Annual Shareholder Report | |
This annual shareholder report contains important information about the Thornburg International Equity Fund Class C Shares for the period from October 1, 2023 to September 30, 2024. You can find additional information about the Fund at https://www.thornburg.com/download. You can also request this information by contacting us at 1-800-847-0200. This report also describes changes to the Fund that occurred during the reporting period.
How did the Fund perform last year and what affected its performance?
The Fund’s Class C shares outperformed the MSCI All Country World ex USA Net Total Return USD Index (the “Index”) during the 12-month period ended September 30, 2024. During the period, non-U.S. equities have posted strong returns but lagged their U.S. counterparts, as U.S. mega-cap and artificial intelligence beneficiaries have continued to lead the market. Stock selection was a major contributor of the Fund’s outperformance relative to its benchmark, consistent with the Fund’s bottom-up investment approach. Sector allocation was modestly additive to performance while geographic allocation detracted from relative results. The Fund’s cash allocation was a drag on performance. Within industrials and information technology, stock selection bolstered relative returns. Additionally, stock selection in Japan and the U.S. also drove positive relative performance. An underweight positioning and weaker stock selection within financials and India hampered relative returns.
How did the Fund perform over the past 10 years?
The line graph below reflects a hypothetical $10,000 investment. The returns shown in the line graph and table assume the reinvestment of dividends and capital gains, but do not reflect the deduction of taxes that a shareholder would pay on distributions or the redemption of Fund shares. The performance information shown below represents past performance and is no guarantee of future results. For Fund performance current to the most recent month end, visit https://www.thornburg.com/product/mutual-funds/fiv/THGCX or call 1-800-847-0200. Performance for other share classes of the Fund will vary.
Cumulative Performance
Growth Table
Date | Thornburg International Equity Fund | MSCI All Country World ex USA Net Total Return USD Index | MSCI EAFE Net Total Return USD Index |
09/30/2014 | 10000.0127 | 10000 | 10000 |
10/31/2014 | 10007.1914 | 9900.9916 | 9854.8027 |
11/30/2014 | 10254.3385 | 9972.6147 | 9988.8459 |
12/31/2014 | 9800.9556 | 9613.0446 | 9642.8195 |
01/31/2015 | 10002.021 | 9598.8003 | 9689.957 |
02/28/2015 | 10546.0805 | 10111.9989 | 10269.2311 |
03/31/2015 | 10510.5984 | 9948.5397 | 10113.2303 |
04/30/2015 | 11224.1836 | 10451.1052 | 10526.1436 |
05/31/2015 | 11330.63 | 10287.947 | 10472.2625 |
06/30/2015 | 11010.9272 | 10000.9028 | 10175.5462 |
07/31/2015 | 11212.3466 | 9973.1163 | 10386.8244 |
08/31/2015 | 10465.91 | 9210.8418 | 9622.7394 |
09/30/2015 | 10052.0754 | 8783.7614 | 9134.1379 |
10/31/2015 | 10602.1693 | 9437.6483 | 9848.1483 |
11/30/2015 | 10468.6864 | 9242.8415 | 9694.9419 |
12/31/2015 | 10341.4791 | 9068.7492 | 9564.3111 |
01/31/2016 | 9597.0811 | 8451.8776 | 8872.6782 |
02/29/2016 | 9328.5324 | 8355.2767 | 8710.1239 |
03/31/2016 | 9875.0525 | 9034.6429 | 9276.8694 |
04/30/2016 | 10101.1987 | 9272.3835 | 9545.445 |
05/31/2016 | 10030.528 | 9115.896 | 9458.7334 |
06/30/2016 | 9559.0391 | 8976.4115 | 9141.226 |
07/31/2016 | 9938.5543 | 9420.3444 | 9604.511 |
08/31/2016 | 10047.6649 | 9479.93 | 9611.3298 |
09/30/2016 | 10164.3357 | 9596.794 | 9729.3984 |
10/31/2016 | 9982.9149 | 9458.8142 | 9530.3854 |
11/30/2016 | 9796.72 | 9240.0327 | 9340.5777 |
12/31/2016 | 9982.9149 | 9476.419 | 9659.9725 |
01/31/2017 | 10164.3357 | 9812.1147 | 9940.1874 |
02/28/2017 | 10154.7872 | 9968.552 | 10082.3268 |
03/31/2017 | 10646.5329 | 10221.2893 | 10359.8799 |
04/30/2017 | 10975.9548 | 10440.0708 | 10623.4864 |
05/31/2017 | 11381.7643 | 10778.8762 | 11013.4103 |
06/30/2017 | 11565.3692 | 10812.3304 | 10993.9322 |
07/31/2017 | 11909.8899 | 11210.8719 | 11311.0613 |
08/31/2017 | 11670.6394 | 11269.5045 | 11306.7993 |
09/30/2017 | 11987.525 | 11478.7062 | 11588.1173 |
10/31/2017 | 12112.1953 | 11694.6789 | 11764.0795 |
11/30/2017 | 12213.8571 | 11789.6748 | 11887.4756 |
12/31/2017 | 12384.8397 | 12053.1957 | 12078.2834 |
01/31/2018 | 13154.2614 | 12724.4868 | 12684.1237 |
02/28/2018 | 12362.042 | 12124.5179 | 12111.613 |
03/31/2018 | 12065.6721 | 11910.6517 | 11893.318 |
04/30/2018 | 12151.1634 | 12100.8441 | 12164.8742 |
05/31/2018 | 11888.9901 | 11821.4237 | 11891.4326 |
06/30/2018 | 11478.6319 | 11599.2316 | 11746.1521 |
07/31/2018 | 11797.7994 | 11876.6458 | 12035.2871 |
08/31/2018 | 11427.3371 | 11628.0714 | 11802.8554 |
09/30/2018 | 11404.5394 | 11681.0364 | 11905.29 |
10/31/2018 | 10390.0427 | 10730.9268 | 10957.723 |
11/30/2018 | 10549.6264 | 10832.4932 | 10943.915 |
12/31/2018 | 9820.1007 | 10342.216 | 10412.6559 |
01/31/2019 | 10686.4125 | 11123.6502 | 11096.9768 |
02/28/2019 | 11085.3719 | 11340.9771 | 11379.8535 |
03/31/2019 | 11330.447 | 11408.5376 | 11451.6124 |
04/30/2019 | 11963.0826 | 11709.9264 | 11773.5779 |
05/31/2019 | 11187.9615 | 11081.4186 | 11208.1415 |
06/30/2019 | 11792.1 | 11748.6972 | 11873.0695 |
07/31/2019 | 11683.811 | 11606.5043 | 11722.319 |
08/31/2019 | 11472.9325 | 11248.0376 | 11418.6413 |
09/30/2019 | 11586.9209 | 11537.4893 | 11745.855 |
10/31/2019 | 11951.6837 | 11940.0432 | 12167.8726 |
11/30/2019 | 12124.0549 | 12045.3212 | 12305.043 |
12/31/2019 | 12536.479 | 12566.946 | 12704.9525 |
01/31/2020 | 12384.8525 | 12229.3444 | 12439.5754 |
02/29/2020 | 11687.3706 | 11262.6833 | 11315.0659 |
03/31/2020 | 10080.1297 | 9631.9034 | 9804.8628 |
04/30/2020 | 10735.1562 | 10361.8271 | 10438.2833 |
05/31/2020 | 11432.6381 | 10700.9334 | 10892.8165 |
06/30/2020 | 11923.908 | 11184.5398 | 11263.7119 |
07/31/2020 | 12730.5609 | 11683.1931 | 11526.2569 |
08/31/2020 | 13585.7344 | 12183.301 | 12118.8319 |
09/30/2020 | 13288.5465 | 11883.8181 | 11803.9447 |
10/31/2020 | 13094.4645 | 11628.3222 | 11332.6268 |
11/30/2020 | 14643.9458 | 13192.4946 | 13089.3349 |
12/31/2020 | 15251.7604 | 13905.5658 | 13697.936 |
01/31/2021 | 15352.0185 | 13935.81 | 13552 |
02/28/2021 | 15765.5831 | 14211.6693 | 13855.9629 |
03/31/2021 | 15853.3089 | 14391.329 | 14174.5556 |
04/30/2021 | 16260.6074 | 14814.9987 | 14601.061 |
05/31/2021 | 17000.0107 | 15278.3922 | 15077.2152 |
06/30/2021 | 16486.188 | 15179.3838 | 14907.5391 |
07/31/2021 | 16066.3573 | 14929.2546 | 15019.785 |
08/31/2021 | 16273.1396 | 15213.0386 | 15284.7244 |
09/30/2021 | 15790.6476 | 14725.9212 | 14841.1473 |
10/31/2021 | 16329.5348 | 15077.4162 | 15206.1705 |
11/30/2021 | 15718.8225 | 14398.5013 | 14498.4184 |
12/31/2021 | 16243.021 | 14993.5549 | 15240.7933 |
01/31/2022 | 15692.4101 | 14441.0338 | 14504.2965 |
02/28/2022 | 14736.0859 | 14155.1934 | 14247.8395 |
03/31/2022 | 14453.5356 | 14177.7637 | 14339.4171 |
04/30/2022 | 13504.4563 | 13287.4905 | 13411.7322 |
05/31/2022 | 13707.313 | 13382.8375 | 13512.2774 |
06/30/2022 | 12693.0298 | 12231.5513 | 12258.5056 |
07/31/2022 | 13113.2328 | 12650.3057 | 12869.3466 |
08/31/2022 | 12497.418 | 12243.4383 | 12258.1214 |
09/30/2022 | 11309.2577 | 11019.9271 | 11111.4106 |
10/31/2022 | 11591.808 | 11349.2529 | 11708.923 |
11/30/2022 | 13403.028 | 12688.9762 | 13027.7676 |
12/31/2022 | 13384.2696 | 12594.0806 | 13038.2364 |
01/31/2023 | 14571.702 | 13615.6126 | 14094.035 |
02/28/2023 | 13904.6875 | 13137.6739 | 13799.9409 |
03/31/2023 | 14425.1054 | 13458.8242 | 14141.9588 |
04/30/2023 | 14688.9793 | 13692.6526 | 14541.2266 |
05/31/2023 | 14190.5509 | 13194.8018 | 13925.87 |
06/30/2023 | 14776.9373 | 13786.846 | 14559.6312 |
07/31/2023 | 15304.685 | 14347.342 | 15030.7292 |
08/31/2023 | 14762.2776 | 13699.3735 | 14454.8655 |
09/30/2023 | 14102.5929 | 13266.6757 | 13961.1207 |
10/31/2023 | 13780.0804 | 12719.3207 | 13395.1119 |
11/30/2023 | 14835.2046 | 13864.2371 | 14638.4169 |
12/31/2023 | 15352.4953 | 14560.8069 | 15416.1415 |
01/31/2024 | 15374.8208 | 14416.1563 | 15504.8593 |
02/29/2024 | 15836.2142 | 14781.1433 | 15788.6688 |
03/31/2024 | 16491.0953 | 15243.1825 | 16307.952 |
04/30/2024 | 16290.1659 | 14969.4799 | 15890.3251 |
05/31/2024 | 17153.4181 | 15404.0336 | 16505.8361 |
06/30/2024 | 16967.3724 | 15389.3378 | 16239.3678 |
07/31/2024 | 17525.5097 | 15745.6978 | 16715.7754 |
08/31/2024 | 17934.8103 | 16194.1448 | 17259.3077 |
09/30/2024 | 18440.8547 | 16630.2031 | 17418.6872 |
What were the Fund costs for the past year?
(based on a hypothetical $10,000 investment)
Class Name | Costs of a $10,000 investment | Costs paid as a percentage of a $10,000 investment |
|---|
Class C | $244.00 | 2.11% |
End Block
Thornburg International Equity Fund Tailored Shareholder Report
Thornburg International Equity Fund Tailored Shareholder Report | |
Annual Performance | 1 Year | 5 Year | 10 Year |
|---|
International Equity Fund Class C (with sales charge) | 29.76% | 9.74% | 6.31% |
International Equity Fund Class C (without sales charge) | 30.76% | 9.74% | 6.31% |
MSCI All Country World ex USA Net Total Return USD Index | 25.35% | 7.59% | 5.22% |
MSCI EAFE Net Total Return USD Index | 24.77% | 8.20% | 5.71% |
Key Fund Statistics
(as of September 30, 2024)
| |
|---|
Fund Size (Millions) | $2,969.1M |
Number of Holdings | 56 |
Annual Portfolio Turnover | 45.47% |
Total Advisory Fee | $17.2M |
What did the Fund invest in?
(as of September 30, 2024)
Market Capitalization Exposure | (%) |
|---|
| Small Cap (<$2.5 B) | 0.0 |
| Mid Cap ($2.5-12 B) | 3.5 |
| Large Cap (>$12 B) | 96.5 |
Market Capitalization Exposure | (%) |
Small Cap (<$2.5 B) | 0.0% |
Mid Cap ($2.5-12 B) | 3.5% |
Large Cap (>$12 B) | 96.5% |
Expressed as a percentage of the Fund’s net assets.
How has the Fund changed?
This is a summary of certain changes to the Fund since October 1, 2023. For more complete information, you may review the Fund’s next prospectus, which we expect to be available by February 1, 2025 at https://www.thornburg.com/download or upon request by calling 1-800-847-0200.
End Block
Changes In and Disagreements with Accountants
No changes and/or disagreements occurred in the current reporting period.
End Block
For additional information about the Fund, including its prospectus, financial information, holdings and proxy information, visit www.thornburg.com/download.

Thornburg International Equity Fund Tailored Shareholder Report | |
Thornburg International Equity Fund Tailored Shareholder Report
Thornburg International Equity Fund CLASS: I TICKER: TGVIX Annual Shareholder Report | |
This annual shareholder report contains important information about the Thornburg International Equity Fund Class I Shares for the period from October 1, 2023 to September 30, 2024. You can find additional information about the Fund at https://www.thornburg.com/download. You can also request this information by contacting us at 1-800-847-0200. This report also describes changes to the Fund that occurred during the reporting period.
How did the Fund perform last year and what affected its performance?
The Fund’s Class I shares outperformed the MSCI All Country World ex USA Net Total Return USD Index (the “Index”) during the 12-month period ended September 30, 2024. During the period, non-U.S. equities have posted strong returns but lagged their U.S. counterparts, as U.S. mega-cap and artificial intelligence beneficiaries have continued to lead the market. Stock selection was a major contributor of the Fund’s outperformance relative to its benchmark, consistent with the Fund’s bottom-up investment approach. Sector allocation was modestly additive to performance while geographic allocation detracted from relative results. The Fund’s cash allocation was a drag on performance. Within industrials and information technology, stock selection bolstered relative returns. Additionally, stock selection in Japan and the U.S. also drove positive relative performance. An underweight positioning and weaker stock selection within financials and India hampered relative returns.
How did the Fund perform over the past 10 years?
The line graph below reflects a hypothetical $10,000 investment. The returns shown in the line graph and table assume the reinvestment of dividends and capital gains, but do not reflect the deduction of taxes that a shareholder would pay on distributions or the redemption of Fund shares. The performance information shown below represents past performance and is no guarantee of future results. For Fund performance current to the most recent month end, visit https://www.thornburg.com/product/mutual-funds/fiv/TGVIX or call 1-800-847-0200. Performance for other share classes of the Fund will vary.
Cumulative Performance
Growth Table
Date | Thornburg International Equity Fund | MSCI All Country World ex USA Net Total Return USD Index | MSCI EAFE Net Total Return USD Index |
09/30/2014 | 9999.9979 | 10000 | 10000 |
10/31/2014 | 10019.7153 | 9900.9916 | 9854.8027 |
11/30/2014 | 10275.8545 | 9972.6147 | 9988.8459 |
12/31/2014 | 9829.3356 | 9613.0446 | 9642.8195 |
01/31/2015 | 10040.912 | 9598.8003 | 9689.957 |
02/28/2015 | 10593.1622 | 10111.9989 | 10269.2311 |
03/31/2015 | 10571.6459 | 9948.5397 | 10113.2303 |
04/30/2015 | 11299.612 | 10451.1052 | 10526.1436 |
05/31/2015 | 11417.9514 | 10287.947 | 10472.2625 |
06/30/2015 | 11103.816 | 10000.9028 | 10175.5462 |
07/31/2015 | 11316.7264 | 9973.1163 | 10386.8244 |
08/31/2015 | 10573.3445 | 9210.8418 | 9622.7394 |
09/30/2015 | 10165.2571 | 8783.7614 | 9134.1379 |
10/31/2015 | 10730.7992 | 9437.6483 | 9848.1483 |
11/30/2015 | 10605.1273 | 9242.8415 | 9694.9419 |
12/31/2015 | 10485.7049 | 9068.7492 | 9564.3111 |
01/31/2016 | 9743.3916 | 8451.8776 | 8872.6782 |
02/29/2016 | 9476.1589 | 8355.2767 | 8710.1239 |
03/31/2016 | 10040.3169 | 9034.6429 | 9276.8694 |
04/30/2016 | 10277.8572 | 9272.3835 | 9545.445 |
05/31/2016 | 10218.4721 | 9115.896 | 9458.7334 |
06/30/2016 | 9747.9024 | 8976.4115 | 9141.226 |
07/31/2016 | 10142.6238 | 9420.3444 | 9604.511 |
08/31/2016 | 10267.0469 | 9479.93 | 9611.3298 |
09/30/2016 | 10390.4275 | 9596.794 | 9729.3984 |
10/31/2016 | 10217.3979 | 9458.8142 | 9530.3854 |
11/30/2016 | 10035.7168 | 9240.0327 | 9340.5777 |
12/31/2016 | 10234.7008 | 9476.419 | 9659.9725 |
01/31/2017 | 10429.3591 | 9812.1147 | 9940.1874 |
02/28/2017 | 10429.3591 | 9968.552 | 10082.3268 |
03/31/2017 | 10946.6445 | 10221.2893 | 10359.8799 |
04/30/2017 | 11293.0573 | 10440.0708 | 10623.4864 |
05/31/2017 | 11726.0733 | 10778.8762 | 11013.4103 |
06/30/2017 | 11927.2613 | 10812.3304 | 10993.9322 |
07/31/2017 | 12292.6478 | 11210.8719 | 11311.0613 |
08/31/2017 | 12057.7565 | 11269.5045 | 11306.7993 |
09/30/2017 | 12394.5409 | 11478.7062 | 11588.1173 |
10/31/2017 | 12538.7143 | 11694.6789 | 11764.0795 |
11/30/2017 | 12648.7251 | 11789.6748 | 11887.4756 |
12/31/2017 | 12841.5574 | 12053.1957 | 12078.2834 |
01/31/2018 | 13649.2345 | 12724.4868 | 12684.1237 |
02/28/2018 | 12841.5574 | 12124.5179 | 12111.613 |
03/31/2018 | 12546.9331 | 11910.6517 | 11893.318 |
04/30/2018 | 12648.5277 | 12100.8441 | 12164.8742 |
05/31/2018 | 12384.3817 | 11821.4237 | 11891.4326 |
06/30/2018 | 11967.8439 | 11599.2316 | 11746.1521 |
07/31/2018 | 12313.2655 | 11876.6458 | 12035.2871 |
08/31/2018 | 11937.3655 | 11628.0714 | 11802.8554 |
09/30/2018 | 11922.1263 | 11681.0364 | 11905.29 |
10/31/2018 | 10870.6222 | 10730.9268 | 10957.723 |
11/30/2018 | 11048.4127 | 10832.4932 | 10943.915 |
12/31/2018 | 10296.1977 | 10342.216 | 10412.6559 |
01/31/2019 | 11216.7015 | 11123.6502 | 11096.9768 |
02/28/2019 | 11645.9252 | 11340.9771 | 11379.8535 |
03/31/2019 | 11909.6651 | 11408.5376 | 11451.6124 |
04/30/2019 | 12592.2859 | 11709.9264 | 11773.5779 |
05/31/2019 | 11785.5522 | 11081.4186 | 11208.1415 |
06/30/2019 | 12437.1449 | 11748.6972 | 11873.0695 |
07/31/2019 | 12333.7175 | 11606.5043 | 11722.319 |
08/31/2019 | 12121.6913 | 11248.0376 | 11418.6413 |
09/30/2019 | 12250.9755 | 11537.4893 | 11745.855 |
10/31/2019 | 12643.9997 | 11940.0432 | 12167.8726 |
11/30/2019 | 12836.6916 | 12045.3212 | 12305.043 |
12/31/2019 | 13291.1757 | 12566.946 | 12704.9525 |
01/31/2020 | 13125.6567 | 12229.3444 | 12439.5754 |
02/29/2020 | 12402.8904 | 11262.6833 | 11315.0659 |
03/31/2020 | 10703.562 | 9631.9034 | 9804.8628 |
04/30/2020 | 11409.7764 | 10361.8271 | 10438.2833 |
05/31/2020 | 12154.6119 | 10700.9334 | 10892.8165 |
06/30/2020 | 12689.79 | 11184.5398 | 11263.7119 |
07/31/2020 | 13561.5234 | 11683.1931 | 11526.2569 |
08/31/2020 | 14482.9125 | 12183.301 | 12118.8319 |
09/30/2020 | 14179.461 | 11883.8181 | 11803.9447 |
10/31/2020 | 13980.8382 | 11628.3222 | 11332.6268 |
11/30/2020 | 15655.41 | 13192.4946 | 13089.3349 |
12/31/2020 | 16316.6376 | 13905.5658 | 13697.936 |
01/31/2021 | 16441.9749 | 13935.81 | 13552 |
02/28/2021 | 16892.0498 | 14211.6693 | 13855.9629 |
03/31/2021 | 17005.9927 | 14391.329 | 14174.5556 |
04/30/2021 | 17456.0676 | 14814.9987 | 14601.061 |
05/31/2021 | 18265.0629 | 15278.3922 | 15077.2152 |
06/30/2021 | 17729.5308 | 15179.3838 | 14907.5391 |
07/31/2021 | 17290.8502 | 14929.2546 | 15019.785 |
08/31/2021 | 17524.4334 | 15213.0386 | 15284.7244 |
09/30/2021 | 17023.0842 | 14725.9212 | 14841.1473 |
10/31/2021 | 17621.285 | 15077.4162 | 15206.1705 |
11/30/2021 | 16969.0655 | 14398.5013 | 14498.4184 |
12/31/2021 | 17557.2342 | 14993.5549 | 15240.7933 |
01/31/2022 | 16972.8588 | 14441.0338 | 14504.2965 |
02/28/2022 | 15953.4484 | 14155.1934 | 14247.8395 |
03/31/2022 | 15667.7538 | 14177.7637 | 14339.4171 |
04/30/2022 | 14648.3434 | 13287.4905 | 13411.7322 |
05/31/2022 | 14882.0935 | 13382.8375 | 13512.2774 |
06/30/2022 | 13797.7525 | 12231.5513 | 12258.5056 |
07/31/2022 | 14265.2528 | 12650.3057 | 12869.3466 |
08/31/2022 | 13609.4538 | 12243.4383 | 12258.1214 |
09/30/2022 | 12317.3348 | 11019.9271 | 11111.4106 |
10/31/2022 | 12635.4948 | 11349.2529 | 11708.923 |
11/30/2022 | 14635.3572 | 12688.9762 | 13027.7676 |
12/31/2022 | 14624.1139 | 12594.0806 | 13038.2364 |
01/31/2023 | 15935.5154 | 13615.6126 | 14094.035 |
02/28/2023 | 15213.5823 | 13137.6739 | 13799.9409 |
03/31/2023 | 15796.4274 | 13458.8242 | 14141.9588 |
04/30/2023 | 16101.0964 | 13692.6526 | 14541.2266 |
05/31/2023 | 15571.2372 | 13194.8018 | 13925.87 |
06/30/2023 | 16233.5612 | 13786.846 | 14559.6312 |
07/31/2023 | 16823.0296 | 14347.342 | 15030.7292 |
08/31/2023 | 16246.8077 | 13699.3735 | 14454.8655 |
09/30/2023 | 15531.4978 | 13266.6757 | 13961.1207 |
10/31/2023 | 15200.3358 | 12719.3207 | 13395.1119 |
11/30/2023 | 16378.9746 | 13864.2371 | 14638.4169 |
12/31/2023 | 16963.5327 | 14560.8069 | 15416.1415 |
01/31/2024 | 17004.2289 | 14416.1563 | 15504.8593 |
02/29/2024 | 17533.2795 | 14781.1433 | 15788.6688 |
03/31/2024 | 18279.3765 | 15243.1825 | 16307.952 |
04/30/2024 | 18069.1128 | 14969.4799 | 15890.3251 |
05/31/2024 | 19045.8216 | 15404.0336 | 16505.8361 |
06/30/2024 | 18855.906 | 15389.3378 | 16239.3678 |
07/31/2024 | 19493.4798 | 15745.6978 | 16715.7754 |
08/31/2024 | 19968.2688 | 16194.1448 | 17259.3077 |
09/30/2024 | 20558.3637 | 16630.2031 | 17418.6872 |

What were the Fund costs for the past year?
(based on a hypothetical $10,000 investment)
Class Name | Costs of a $10,000 investment | Costs paid as a percentage of a $10,000 investment |
|---|
Class I | $108.00 | 0.93% |
End Block
Thornburg International Equity Fund Tailored Shareholder Report
Thornburg International Equity Fund Tailored Shareholder Report | |
Annual Performance | 1 Year | 5 Year | 10 Year |
|---|
International Equity Fund Class I | 32.37% | 10.91% | 7.47% |
MSCI All Country World ex USA Net Total Return USD Index | 25.35% | 7.59% | 5.22% |
MSCI EAFE Net Total Return USD Index | 24.77% | 8.20% | 5.71% |
Key Fund Statistics
(as of September 30, 2024)
| |
|---|
Fund Size (Millions) | $2,969.1M |
Number of Holdings | 56 |
Annual Portfolio Turnover | 45.47% |
Total Advisory Fee | $17.2M |
What did the Fund invest in?
(as of September 30, 2024)
Market Capitalization Exposure | (%) |
|---|
| Small Cap (<$2.5 B) | 0.0 |
| Mid Cap ($2.5-12 B) | 3.5 |
| Large Cap (>$12 B) | 96.5 |
Market Capitalization Exposure | (%) |
Small Cap (<$2.5 B) | 0.0% |
Mid Cap ($2.5-12 B) | 3.5% |
Large Cap (>$12 B) | 96.5% |
Expressed as a percentage of the Fund’s net assets.
How has the Fund changed?
This is a summary of certain changes to the Fund since October 1, 2023. For more complete information, you may review the Fund’s next prospectus, which we expect to be available by February 1, 2025 at https://www.thornburg.com/download or upon request by calling 1-800-847-0200.
End Block
Changes In and Disagreements with Accountants
No changes and/or disagreements occurred in the current reporting period.
End Block
For additional information about the Fund, including its prospectus, financial information, holdings and proxy information, visit www.thornburg.com/download.

Thornburg International Equity Fund Tailored Shareholder Report | |
Thornburg International Equity Fund Tailored Shareholder Report
Thornburg International Equity Fund CLASS: R3 TICKER: TGVRX Annual Shareholder Report | |
This annual shareholder report contains important information about the Thornburg International Equity Fund Class R3 Shares for the period from October 1, 2023 to September 30, 2024. You can find additional information about the Fund at https://www.thornburg.com/download. You can also request this information by contacting us at 1-800-847-0200. This report also describes changes to the Fund that occurred during the reporting period.
How did the Fund perform last year and what affected its performance?
The Fund’s Class R3 shares outperformed the MSCI All Country World ex USA Net Total Return USD Index (the “Index”) during the 12-month period ended September 30, 2024. During the period, non-U.S. equities have posted strong returns but lagged their U.S. counterparts, as U.S. mega-cap and artificial intelligence beneficiaries have continued to lead the market. Stock selection was a major contributor of the Fund’s outperformance relative to its benchmark, consistent with the Fund’s bottom-up investment approach. Sector allocation was modestly additive to performance while geographic allocation detracted from relative results. The Fund’s cash allocation was a drag on performance. Within industrials and information technology, stock selection bolstered relative returns. Additionally, stock selection in Japan and the U.S. also drove positive relative performance. An underweight positioning and weaker stock selection within financials and India hampered relative returns.
How did the Fund perform over the past 10 years?
The line graph below reflects a hypothetical $10,000 investment. The returns shown in the line graph and table assume the reinvestment of dividends and capital gains, but do not reflect the deduction of taxes that a shareholder would pay on distributions or the redemption of Fund shares. The performance information shown below represents past performance and is no guarantee of future results. For Fund performance current to the most recent month end, visit https://www.thornburg.com/product/mutual-funds/fiv/TGVRX or call 1-800-847-0200. Performance for other share classes of the Fund will vary.
Cumulative Performance
Growth Table
Date | Thornburg International Equity Fund | MSCI All Country World ex USA Net Total Return USD Index | MSCI EAFE Net Total Return USD Index |
09/30/2014 | 9999.9946 | 10000 | 10000 |
10/31/2014 | 10013.3904 | 9900.9916 | 9854.8027 |
11/30/2014 | 10267.7119 | 9972.6147 | 9988.8459 |
12/31/2014 | 9816.7359 | 9613.0446 | 9642.8195 |
01/31/2015 | 10021.4797 | 9598.8003 | 9689.957 |
02/28/2015 | 10569.9007 | 10111.9989 | 10269.2311 |
03/31/2015 | 10540.6516 | 9948.5397 | 10113.2303 |
04/30/2015 | 11260.9112 | 10451.1052 | 10526.1436 |
05/31/2015 | 11374.2515 | 10287.947 | 10472.2625 |
06/30/2015 | 11057.7331 | 10000.9028 | 10175.5462 |
07/31/2015 | 11266.8541 | 9973.1163 | 10386.8244 |
08/31/2015 | 10518.4209 | 9210.8418 | 9622.7394 |
09/30/2015 | 10109.4819 | 8783.7614 | 9134.1379 |
10/31/2015 | 10668.8708 | 9437.6483 | 9848.1483 |
11/30/2015 | 10533.1142 | 9242.8415 | 9694.9419 |
12/31/2015 | 10412.1928 | 9068.7492 | 9564.3111 |
01/31/2016 | 9673.7088 | 8451.8776 | 8872.6782 |
02/29/2016 | 9405.9544 | 8355.2767 | 8710.1239 |
03/31/2016 | 9958.7377 | 9034.6429 | 9276.8694 |
04/30/2016 | 10191.9432 | 9272.3835 | 9545.445 |
05/31/2016 | 10127.1639 | 9115.896 | 9458.7334 |
06/30/2016 | 9654.3034 | 8976.4115 | 9141.226 |
07/31/2016 | 10041.869 | 9420.3444 | 9604.511 |
08/31/2016 | 10159.4451 | 9611.3298 |
09/30/2016 | 10278.7447 | 9596.794 | 9729.3984 |
10/31/2016 | 10103.3395 | 9458.8142 | 9530.3854 |
11/30/2016 | 9914.7789 | 9240.0327 | 9340.5777 |
12/31/2016 | 10112.1098 | 9476.419 | 9659.9725 |
01/31/2017 | 10300.6704 | 9812.1147 | 9940.1874 |
02/28/2017 | 10296.2852 | 9968.552 | 10082.3268 |
03/31/2017 | 10800.5752 | 10221.2893 | 10359.8799 |
04/30/2017 | 11138.2302 | 10440.0708 | 10623.4864 |
05/31/2017 | 11559.2027 | 10778.8762 | 11013.4103 |
06/30/2017 | 11747.6796 | 10812.3304 | 10993.9322 |
07/31/2017 | 12104.0699 | 11210.8719 | 11311.0613 |
08/31/2017 | 11866.4764 | 11269.5045 | 11306.7993 |
09/30/2017 | 12193.4782 | 11478.7062 | 11588.1173 |
10/31/2017 | 12330.2852 | 11694.6789 | 11764.0795 |
11/30/2017 | 12432.7653 | 11789.6748 | 11887.4756 |
12/31/2017 | 12618.2521 | 12053.1957 | 12078.2834 |
01/31/2018 | 13406.5708 | 12724.4868 | 12684.1237 |
02/28/2018 | 12602.7949 | 12124.5179 | 12111.613 |
03/31/2018 | 12309.1075 | 11910.6517 | 11893.318 |
04/30/2018 | 12401.8509 | 12100.8441 | 12164.8742 |
05/31/2018 | 12144.2304 | 11821.4237 | 11891.4326 |
06/30/2018 | 11726.8852 | 11599.2316 | 11746.1521 |
07/31/2018 | 12061.7918 | 11876.6458 | 12035.2871 |
08/31/2018 | 11685.6659 | 11628.0714 | 11802.8554 |
09/30/2018 | 11670.2086 | 11681.0364 | 11905.29 |
10/31/2018 | 10634.5742 | 10730.9268 | 10957.723 |
11/30/2018 | 10804.6038 | 10832.4932 | 10943.915 |
12/31/2018 | 10066.554 | 10342.216 | 10412.6559 |
01/31/2019 | 10957.9993 | 11123.6502 | 11096.9768 |
02/28/2019 | 11369.8365 | 11340.9771 | 11379.8535 |
03/31/2019 | 11630.493 | 11408.5376 | 11451.6124 |
04/30/2019 | 12287.3474 | 11709.9264 | 11773.5779 |
05/31/2019 | 11494.9517 | 11081.4186 | 11208.1415 |
06/30/2019 | 12130.9535 | 11748.6972 | 11873.0695 |
07/31/2019 | 12021.4778 | 11606.5043 | 11722.319 |
08/31/2019 | 11812.9526 | 11248.0376 | 11418.6413 |
09/30/2019 | 11932.8546 | 11537.4893 | 11745.855 |
10/31/2019 | 12308.1999 | 11940.0432 | 12167.8726 |
11/30/2019 | 12492.0079 | 12045.3212 | 12305.043 |
12/31/2019 | 12926.7936 | 12566.946 | 12704.9525 |
01/31/2020 | 12760.4256 | 12229.3444 | 12439.5754 |
02/29/2020 | 12050.5888 | 11262.6833 | 11315.0659 |
03/31/2020 | 10398 | 9631.9034 | 9804.8628 |
04/30/2020 | 11074.5632 | 10361.8271 | 10438.2833 |
05/31/2020 | 11801.0368 | 10700.9334 | 10892.8165 |
06/30/2020 | 12311.232 | 11184.5398 | 11263.7119 |
07/31/2020 | 13148.6176 | 11683.1931 | 11526.2569 |
08/31/2020 | 14041.4592 | 12183.301 | 12118.8319 |
09/30/2020 | 13736.4512 | 11883.8181 | 11803.9447 |
10/31/2020 | 13542.3552 | 11628.3222 | 11332.6268 |
11/30/2020 | 15159.0138 | 13192.4946 | 13089.3349 |
12/31/2020 | 15786.8344 | 13905.5658 | 13697.936 |
01/31/2021 | 15900.9836 | 13935.81 | 13552 |
02/28/2021 | 16334.7505 | 14211.6693 | 13855.9629 |
03/31/2021 | 16437.4848 | 14391.329 | 14174.5556 |
04/30/2021 | 16859.8368 | 14814.9987 | 14601.061 |
05/31/2021 | 17641.7589 | 15278.3922 | 15077.2152 |
06/30/2021 | 17110.9651 | 15179.3838 | 14907.5391 |
07/31/2021 | 16677.1981 | 14929.2546 | 15019.785 |
08/31/2021 | 16905.4965 | 15213.0386 | 15284.7244 |
09/30/2021 | 16408.9475 | 14725.9212 | 14841.1473 |
10/31/2021 | 16979.6935 | 15077.4162 | 15206.1705 |
11/30/2021 | 16348.9257 | 14398.5013 | 14498.4184 |
12/31/2021 | 16906.8849 | 14993.5549 | 15240.7933 |
01/31/2022 | 16334.4317 | 14441.0338 | 14504.2965 |
02/28/2022 | 15345.6489 | 14155.1934 | 14247.8395 |
03/31/2022 | 15065.9274 | 14177.7637 | 14339.4171 |
04/30/2022 | 14083.6498 | 13287.4905 | 13411.7322 |
05/31/2022 | 14304.8249 | 13382.8375 | 13512.2774 |
06/30/2022 | 13250.9905 | 12231.5513 | 12258.5056 |
07/31/2022 | 13693.3407 | 12650.3057 | 12869.3466 |
08/31/2022 | 13062.3412 | 12243.4383 | 12258.1214 |
09/30/2022 | 11819.8575 | 11019.9271 | 11111.4106 |
10/31/2022 | 12119.0945 | 11349.2529 | 11708.923 |
11/30/2022 | 14025.1034 | 12688.9762 | 13027.7676 |
12/31/2022 | 14010.656 | 12594.0806 | 13038.2364 |
01/31/2023 | 15259.7192 | 13615.6126 | 14094.035 |
02/28/2023 | 14565.7952 | 13137.6739 | 13799.9409 |
03/31/2023 | 15120.9344 | 13458.8242 | 14141.9588 |
04/30/2023 | 15405.1128 | 13692.6526 | 14541.2266 |
05/31/2023 | 14889.6264 | 13194.8018 | 13925.87 |
06/30/2023 | 15517.4624 | 13786.846 | 14559.6312 |
07/31/2023 | 16079.2104 | 14347.342 | 15030.7292 |
08/31/2023 | 15517.4624 | 13699.3735 | 14454.8655 |
09/30/2023 | 14830.1472 | 13266.6757 | 13961.1207 |
10/31/2023 | 14506.316 | 12719.3207 | 13395.1119 |
11/30/2023 | 15622.886 | 13864.2371 | 14638.4169 |
12/31/2023 | 16175.3055 | 14560.8069 | 15416.1415 |
01/31/2024 | 16209.0181 | 14416.1563 | 15504.8593 |
02/29/2024 | 16707.9646 | 14781.1433 | 15788.6688 |
03/31/2024 | 17409.1866 | 15243.1825 | 16307.952 |
04/30/2024 | 17200.1685 | 14969.4799 | 15890.3251 |
05/31/2024 | 18123.8938 | 15404.0336 | 16505.8361 |
06/30/2024 | 17941.8457 | 15389.3378 | 16239.3678 |
07/31/2024 | 18535.1875 | 15745.6978 | 16715.7754 |
08/31/2024 | 18980.1938 | 16194.1448 | 17259.3077 |
09/30/2024 | 19533.0804 | 16630.2031 | 17418.6872 |

What were the Fund costs for the past year?
(based on a hypothetical $10,000 investment)
Class Name | Costs of a $10,000 investment | Costs paid as a percentage of a $10,000 investment |
|---|
Class R3 | $164.00 | 1.42% |
End Block
Thornburg International Equity Fund Tailored Shareholder Report
Thornburg International Equity Fund Tailored Shareholder Report | |
Annual Performance | 1 Year | 5 Year | 10 Year |
|---|
International Equity Fund Class R3 | 31.71% | 10.36% | 6.92% |
MSCI All Country World ex USA Net Total Return USD Index | 25.35% | 7.59% | 5.22% |
MSCI EAFE Net Total Return USD Index | 24.77% | 8.20% | 5.71% |
Key Fund Statistics
(as of September 30, 2024)
| |
|---|
Fund Size (Millions) | $2,969.1M |
Number of Holdings | 56 |
Annual Portfolio Turnover | 45.47% |
Total Advisory Fee | $17.2M |
What did the Fund invest in?
(as of September 30, 2024)
Market Capitalization Exposure | (%) |
|---|
| Small Cap (<$2.5 B) | 0.0 |
| Mid Cap ($2.5-12 B) | 3.5 |
| Large Cap (>$12 B) | 96.5 |
Market Capitalization Exposure | (%) |
Small Cap (<$2.5 B) | 0.0% |
Mid Cap ($2.5-12 B) | 3.5% |
Large Cap (>$12 B) | 96.5% |
Expressed as a percentage of the Fund’s net assets.
How has the Fund changed?
This is a summary of certain changes to the Fund since October 1, 2023. For more complete information, you may review the Fund’s next prospectus, which we expect to be available by February 1, 2025 at https://www.thornburg.com/download or upon request by calling 1-800-847-0200.
End Block
Changes In and Disagreements with Accountants
No changes and/or disagreements occurred in the current reporting period.
End Block
For additional information about the Fund, including its prospectus, financial information, holdings and proxy information, visit www.thornburg.com/download.

Thornburg International Equity Fund Tailored Shareholder Report | |
Thornburg International Equity Fund Tailored Shareholder Report
Thornburg International Equity Fund CLASS: R4 TICKER: THVRX Annual Shareholder Report | |
This annual shareholder report contains important information about the Thornburg International Equity Fund Class R4 Shares for the period from October 1, 2023 to September 30, 2024. You can find additional information about the Fund at https://www.thornburg.com/download. You can also request this information by contacting us at 1-800-847-0200. This report also describes changes to the Fund that occurred during the reporting period.
How did the Fund perform last year and what affected its performance?
The Fund’s Class R4 shares outperformed the MSCI All Country World ex USA Net Total Return USD Index (the “Index”) during the 12-month period ended September 30, 2024.During the period, non-U.S. equities have posted strong returns but lagged their U.S. counterparts, as U.S. mega-cap and artificial intelligence beneficiaries have continued to lead the market. Stock selection was a major contributor of the Fund’s outperformance relative to its benchmark, consistent with the Fund’s bottom-up investment approach. Sector allocation was modestly additive to performance while geographic allocation detracted from relative results. The Fund’s cash allocation was a drag on performance.Within industrials and information technology, stock selection bolstered relative returns. Additionally, stock selection in Japan and the U.S. also drove positive relative performance. An underweight positioning and weaker stock selection within financials and India hampered relative returns.
How did the Fund perform over the past 10 years?
The line graph below reflects a hypothetical $10,000 investment. The returns shown in the line graph and table assume the reinvestment of dividends and capital gains, but do not reflect the deduction of taxes that a shareholder would pay on distributions or the redemption of Fund shares. The performance information shown below represents past performance and is no guarantee of future results. For Fund performance current to the most recent month end, visit https://www.thornburg.com/product/mutual-funds/fiv/THVRX or call 1-800-847-0200. Performance for other share classes of the Fund will vary.
Cumulative Performance
Growth Table
Date | Thornburg International Equity Fund | MSCI All Country World ex USA Net Total Return USD Index | MSCI EAFE Net Total Return USD Index |
09/30/2014 | 10000.0077 | 10000 | 10000 |
10/31/2014 | 10016.8484 | 9900.9916 | 9854.8027 |
11/30/2014 | 10269.0231 | 9972.6147 | 9988.8459 |
12/31/2014 | 9819.6274 | 9613.0446 | 9642.8195 |
01/31/2015 | 10029.417 | 9598.8003 | 9689.957 |
02/28/2015 | 10577.8145 | 10111.9989 | 10269.2311 |
03/31/2015 | 10552.0508 | 9948.5397 | 10113.2303 |
04/30/2015 | 11273.4328 | 10451.1052 | 10526.1436 |
05/31/2015 | 11391.2094 | 10287.947 | 10472.2625 |
06/30/2015 | 11072.9643 | 10000.9028 | 10175.5462 |
07/31/2015 | 11287.399 | 9973.1163 | 10386.8244 |
08/31/2015 | 10540.5747 | 9210.8418 | 9622.7394 |
09/30/2015 | 10129.7196 | 8783.7614 | 9134.1379 |
10/31/2015 | 10690.0081 | 9437.6483 | 9848.1483 |
11/30/2015 | 10561.1543 | 9242.8415 | 9694.9419 |
12/31/2015 | 10439.1105 | 9068.7492 | 9564.3111 |
01/31/2016 | 9698.1297 | 8451.8776 | 8872.6782 |
02/29/2016 | 9432.2484 | 8355.2767 | 8710.1239 |
03/31/2016 | 9985.8046 | 9034.6429 | 9276.8694 |
04/30/2016 | 10221.1749 | 9272.3835 | 9545.445 |
05/31/2016 | 10160.153 | 9115.896 | 9458.7334 |
06/30/2016 | 9686.556 | 8976.4115 | 9141.226 |
07/31/2016 | 10078.4212 | 9420.3444 | 9604.511 |
08/31/2016 | 10197.3017 | 9479.93 | 9611.3298 |
09/30/2016 | 10318.7408 | 9596.794 | 9729.3984 |
10/31/2016 | 10145.7266 | 9458.8142 | 9530.3854 |
11/30/2016 | 9959.4037 | 9240.0327 | 9340.5777 |
12/31/2016 | 10154.5991 | 9476.419 | 9659.9725 |
01/31/2017 | 10345.3583 | 9812.1147 | 9940.1874 |
02/28/2017 | 10345.3583 | 9968.552 | 10082.3268 |
03/31/2017 | 10851.092 | 10221.2893 | 10359.8799 |
04/30/2017 | 11197.1202 | 10440.0708 | 10623.4864 |
05/31/2017 | 11618.5649 | 10778.8762 | 11013.4103 |
06/30/2017 | 11815.4804 | 10812.3304 | 10993.9322 |
07/31/2017 | 12171.7708 | 11210.8719 | 11311.0613 |
08/31/2017 | 11935.7284 | 11269.5045 | 11306.7993 |
09/30/2017 | 12268.6951 | 11478.7062 | 11588.1173 |
10/31/2017 | 12407.2487 | 11694.6789 | 11764.0795 |
11/30/2017 | 12516.3206 | 11789.6748 | 11887.4756 |
12/31/2017 | 12699.155 | 12053.1957 | 12078.2834 |
01/31/2018 | 13493.1787 | 12724.4868 | 12684.1237 |
02/28/2018 | 12688.7074 | 12124.5179 | 12111.613 |
03/31/2018 | 12396.1723 | 11910.6517 | 11893.318 |
04/30/2018 | 12490.2014 | 12100.8441 | 12164.8742 |
05/31/2018 | 12234.2333 | 11821.4237 | 11891.4326 |
06/30/2018 | 11816.3261 | 11599.2316 | 11746.1521 |
07/31/2018 | 12155.8757 | 11876.6458 | 12035.2871 |
08/31/2018 | 11779.7592 | 11628.0714 | 11802.8554 |
09/30/2018 | 11764.0877 | 11681.0364 | 11905.29 |
10/31/2018 | 10719.3197 | 10730.9268 | 10957.723 |
11/30/2018 | 10891.7064 | 10832.4932 | 10943.915 |
12/31/2018 | 10149.9596 | 10342.216 | 10412.6559 |
01/31/2019 | 11056.3006 | 11123.6502 | 11096.9768 |
02/28/2019 | 11475.0196 | 11340.9771 | 11379.8535 |
03/31/2019 | 11734.7314 | 11408.5376 | 11451.6124 |
04/30/2019 | 12402.5616 | 11709.9264 | 11773.5779 |
05/31/2019 | 11607.5256 | 11081.4186 | 11208.1415 |
06/30/2019 | 12243.5544 | 11748.6972 | 11873.0695 |
07/31/2019 | 12137.5496 | 11606.5043 | 11722.319 |
08/31/2019 | 11925.54 | 11248.0376 | 11418.6413 |
09/30/2019 | 12052.7458 | 11537.4893 | 11745.855 |
10/31/2019 | 12434.363 | 11940.0432 | 12167.8726 |
11/30/2019 | 12621.2384 | 12045.3212 | 12305.043 |
12/31/2019 | 13060.9631 | 12566.946 | 12704.9525 |
01/31/2020 | 12897.0653 | 12229.3444 | 12439.5754 |
02/29/2020 | 12179.3057 | 11262.6833 | 11315.0659 |
03/31/2020 | 10512.069 | 9631.9034 | 9804.8628 |
04/30/2020 | 11201.5703 | 10361.8271 | 10438.2833 |
05/31/2020 | 11930.6331 | 10700.9334 | 10892.8165 |
06/30/2020 | 12450.585 | 11184.5398 | 11263.7119 |
07/31/2020 | 13303.9841 | 11683.1931 | 11526.2569 |
08/31/2020 | 14208.2481 | 12183.301 | 12118.8319 |
09/30/2020 | 13903.059 | 11883.8181 | 11803.9447 |
10/31/2020 | 13705.2513 | 11628.3222 | 11332.6268 |
11/30/2020 | 15341.3804 | 13192.4946 | 13089.3349 |
12/31/2020 | 15981.7603 | 13905.5658 | 13697.936 |
01/31/2021 | 16104.1143 | 13935.81 | 13552 |
02/28/2021 | 16541.0928 | 14211.6693 | 13855.9629 |
03/31/2021 | 16645.9677 | 14391.329 | 14174.5556 |
04/30/2021 | 17082.9462 | 14814.9987 | 14601.061 |
05/31/2021 | 17875.3338 | 15278.3922 | 15077.2152 |
06/30/2021 | 17339.3069 | 15179.3838 | 14907.5391 |
07/31/2021 | 16908.1548 | 14929.2546 | 15019.785 |
08/31/2021 | 17135.3836 | 15213.0386 | 15284.7244 |
09/30/2021 | 16640.1413 | 14725.9212 | 14841.1473 |
10/31/2021 | 17216.9529 | 15077.4162 | 15206.1705 |
11/30/2021 | 16578.8532 | 14398.5013 | 14498.4184 |
12/31/2021 | 17149.1978 | 14993.5549 | 15240.7933 |
01/31/2022 | 16576.2254 | 14441.0338 | 14504.2965 |
02/28/2022 | 15576.8549 | 14155.1934 | 14247.8395 |
03/31/2022 | 15290.3686 | 14177.7637 | 14339.4171 |
04/30/2022 | 14297.6606 | 13287.4905 | 13411.7322 |
05/31/2022 | 14524.1846 | 13382.8375 | 13512.2774 |
06/30/2022 | 13458.1894 | 12231.5513 | 12258.5056 |
07/31/2022 | 13911.2374 | 12650.3057 | 12869.3466 |
08/31/2022 | 13264.9778 | 12243.4383 | 12258.1214 |
09/30/2022 | 12012.4334 | 11019.9271 | 11111.4106 |
10/31/2022 | 12312.2446 | 11349.2529 | 11708.923 |
11/30/2022 | 14257.6858 | 12688.9762 | 13027.7676 |
12/31/2022 | 14242.7855 | 12594.0806 | 13038.2364 |
01/31/2023 | 15518.4614 | 13615.6126 | 14094.035 |
02/28/2023 | 14812.7683 | 13137.6739 | 13799.9409 |
03/31/2023 | 15375.9657 | 13458.8242 | 14141.9588 |
04/30/2023 | 15674.5281 | 13692.6526 | 14541.2266 |
05/31/2023 | 15145.2583 | 13194.8018 | 13925.87 |
06/30/2023 | 15789.8818 | 13786.846 | 14559.6312 |
07/31/2023 | 16359.8646 | 14347.342 | 15030.7292 |
08/31/2023 | 15796.6673 | 13699.3735 | 14454.8655 |
09/30/2023 | 15097.7598 | 13266.6757 | 13961.1207 |
10/31/2023 | 14772.0553 | 12719.3207 | 13395.1119 |
11/30/2023 | 15911.6941 | 13864.2371 | 14638.4169 |
12/31/2023 | 16478.2963 | 14560.8069 | 15416.1415 |
01/31/2024 | 16512.9874 | 14416.1563 | 15504.8593 |
02/29/2024 | 17026.4164 | 14781.1433 | 15788.6688 |
03/31/2024 | 17741.0541 | 15243.1825 | 16307.952 |
04/30/2024 | 17532.9072 | 14969.4799 | 15890.3251 |
05/31/2024 | 18476.5065 | 15404.0336 | 16505.8361 |
06/30/2024 | 18289.1743 | 15389.3378 | 16239.3678 |
07/31/2024 | 18906.6768 | 15745.6978 | 16715.7754 |
08/31/2024 | 19357.6617 | 16194.1448 | 17259.3077 |
09/30/2024 | 19926.5966 | 16630.2031 | 17418.6872 |
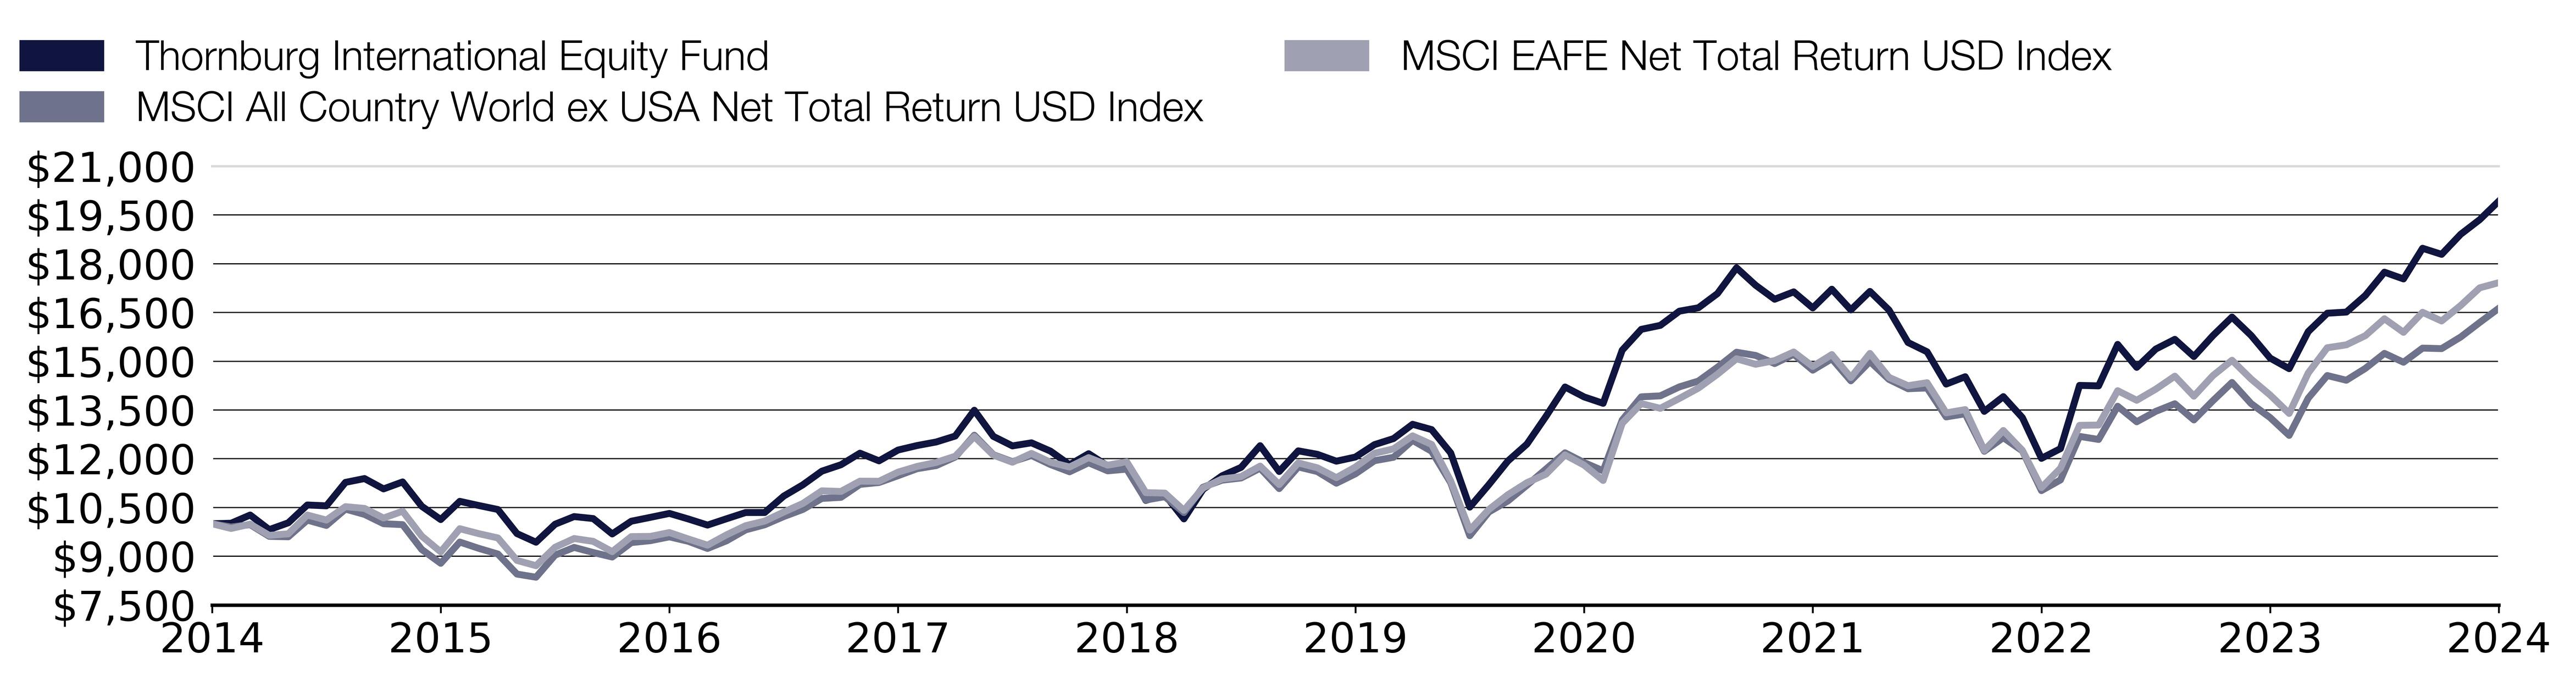
What were the Fund costs for the past year?
(based on a hypothetical $10,000 investment)
Class Name | Costs of a $10,000 investment | Costs paid as a percentage of a $10,000 investment |
|---|
Class R4 | $141.00 | 1.22% |
End Block
Thornburg International Equity Fund Tailored Shareholder Report
Thornburg International Equity Fund Tailored Shareholder Report | |
Annual Performance | 1 Year | 5 Year | 10 Year |
|---|
International Equity Fund Class R4 | 31.98% | 10.58% | 7.14% |
MSCI All Country World ex USA Net Total Return USD Index | 25.35% | 7.59% | 5.22% |
MSCI EAFE Net Total Return USD Index | 24.77% | 8.20% | 5.71% |
Key Fund Statistics
(as of September 30, 2024)
| |
|---|
Fund Size (Millions) | $2,969.1M |
Number of Holdings | 56 |
Annual Portfolio Turnover | 45.47% |
Total Advisory Fee | $17.2M |
What did the Fund invest in?
(as of September 30, 2024)
Market Capitalization Exposure | (%) |
|---|
| Small Cap (<$2.5 B) | 0.0 |
| Mid Cap ($2.5-12 B) | 3.5 |
| Large Cap (>$12 B) | 96.5 |
Market Capitalization Exposure | (%) |
Small Cap (<$2.5 B) | 0.0% |
Mid Cap ($2.5-12 B) | 3.5% |
Large Cap (>$12 B) | 96.5% |
Expressed as a percentage of the Fund’s net assets.
How has the Fund changed?
This is a summary of certain changes to the Fund since October 1, 2023. For more complete information, you may review the Fund’s next prospectus, which we expect to be available by February 1, 2025 at https://www.thornburg.com/download or upon request by calling 1-800-847-0200.
End Block
Changes In and Disagreements with Accountants
No changes and/or disagreements occurred in the current reporting period.
End Block
For additional information about the Fund, including its prospectus, financial information, holdings and proxy information, visit www.thornburg.com/download.

Thornburg International Equity Fund Tailored Shareholder Report | |
Thornburg International Equity Fund Tailored Shareholder Report
Thornburg International Equity Fund CLASS: R5 TICKER: TIVRX Annual Shareholder Report | |
This annual shareholder report contains important information about the Thornburg International Equity Fund Class R5 Shares for the period from October 1, 2023 to September 30, 2024. You can find additional information about the Fund at https://www.thornburg.com/download. You can also request this information by contacting us at 1-800-847-0200. This report also describes changes to the Fund that occurred during the reporting period.
How did the Fund perform last year and what affected its performance?
The Fund’s Class R5 shares outperformed the MSCI All Country World ex USA Net Total Return USD Index (the “Index”) during the 12-month period ended September 30, 2024. During the period, non-U.S. equities have posted strong returns but lagged their U.S. counterparts, as U.S. mega-cap and artificial intelligence beneficiaries have continued to lead the market. Stock selection was a major contributor of the Fund’s outperformance relative to its benchmark, consistent with the Fund’s bottom-up investment approach. Sector allocation was modestly additive to performance while geographic allocation detracted from relative results. The Fund’s cash allocation was a drag on performance. Within industrials and information technology, stock selection bolstered relative returns. Additionally, stock selection in Japan and the U.S. also drove positive relative performance. An underweight positioning and weaker stock selection within financials and India hampered relative returns.
How did the Fund perform over the past 10 years?
The line graph below reflects a hypothetical $10,000 investment. The returns shown in the line graph and table assume the reinvestment of dividends and capital gains, but do not reflect the deduction of taxes that a shareholder would pay on distributions or the redemption of Fund shares. The performance information shown below represents past performance and is no guarantee of future results. For Fund performance current to the most recent month end, visit https://www.thornburg.com/product/mutual-funds/fiv/TIVRX or call 1-800-847-0200. Performance for other share classes of the Fund will vary.
Cumulative Performance
Growth Table
Date | Thornburg International Equity Fund | MSCI All Country World ex USA Net Total Return USD Index | MSCI EAFE Net Total Return USD Index |
09/30/2014 | 9999.994 | 10000 | 10000 |
10/31/2014 | 10016.4359 | 9900.9916 | 9854.8027 |
11/30/2014 | 10272.7458 | 9972.6147 | 9988.8459 |
12/31/2014 | 9827.1485 | 9613.0446 | 9642.8195 |
01/31/2015 | 10035.2444 | 9598.8003 | 9689.957 |
02/28/2015 | 10591.3627 | 10111.9989 | 10269.2311 |
03/31/2015 | 10566.2477 | 9948.5397 | 10113.2303 |
04/30/2015 | 11290.9954 | 10451.1052 | 10526.1436 |
05/31/2015 | 11409.3948 | 10287.947 | 10472.2625 |
06/30/2015 | 11094.3232 | 10000.9028 | 10175.5462 |
07/31/2015 | 11310.7978 | 9973.1163 | 10386.8244 |
08/31/2015 | 10567.5684 | 9210.8418 | 9622.7394 |
09/30/2015 | 10156.6425 | 8783.7614 | 9134.1379 |
10/31/2015 | 10721.9069 | 9437.6483 | 9848.1483 |
11/30/2015 | 10592.075 | 9242.8415 | 9694.9419 |
12/31/2015 | 10475.1373 | 9068.7492 | 9564.3111 |
01/31/2016 | 9733.2721 | 8451.8776 | 8872.6782 |
02/29/2016 | 9466.2006 | 8355.2767 | 8710.1239 |
03/31/2016 | 10025.779 | 9034.6429 | 9276.8694 |
04/30/2016 | 10267.4151 | 9272.3835 | 9545.445 |
05/31/2016 | 10208.0658 | 9115.896 | 9458.7334 |
06/30/2016 | 9732.5115 | 8976.4115 | 9141.226 |
07/31/2016 | 10126.9569 | 9420.3444 | 9604.511 |
08/31/2016 | 10255.5804 | 9479.93 | 9611.3298 |
09/30/2016 | 10379.2589 | 9596.794 | 9729.3984 |
10/31/2016 | 10206.3433 | 9458.8142 | 9530.3854 |
11/30/2016 | 10020.459 | 9240.0327 | 9340.5777 |
12/31/2016 | 10219.312 | 9476.419 | 9659.9725 |
01/31/2017 | 10413.842 | 9812.1147 | 9940.1874 |
02/28/2017 | 10413.842 | 9968.552 | 10082.3268 |
03/31/2017 | 10929.0169 | 10221.2893 | 10359.8799 |
04/30/2017 | 11275.1457 | 10440.0708 | 10623.4864 |
05/31/2017 | 11703.48 | 10778.8762 | 11013.4103 |
06/30/2017 | 11905.7932 | 10812.3304 | 10993.9322 |
07/31/2017 | 12270.7883 | 11210.8719 | 11311.0613 |
08/31/2017 | 12031.8034 | 11269.5045 | 11306.7993 |
09/30/2017 | 12368.5664 | 11478.7062 | 11588.1173 |
10/31/2017 | 12512.5391 | 11694.6789 | 11764.0795 |
11/30/2017 | 12623.1128 | 11789.6748 | 11887.4756 |
12/31/2017 | 12812.9582 | 12053.1957 | 12078.2834 |
01/31/2018 | 13619.4746 | 12724.4868 | 12684.1237 |
02/28/2018 | 12807.8857 | 12124.5179 | 12111.613 |
03/31/2018 | 12513.6848 | 11910.6517 | 11893.318 |
04/30/2018 | 12615.1334 | 12100.8441 | 12164.8742 |
05/31/2018 | 12356.4395 | 11821.4237 | 11891.4326 |
06/30/2018 | 11935.4278 | 11599.2316 | 11746.1521 |
07/31/2018 | 12280.353 | 11876.6458 | 12035.2871 |
08/31/2018 | 11904.9932 | 11628.0714 | 11802.8554 |
09/30/2018 | 11889.7759 | 11681.0364 | 11905.29 |
10/31/2018 | 10839.7829 | 10730.9268 | 10957.723 |
11/30/2018 | 11017.318 | 10832.4932 | 10943.915 |
12/31/2018 | 10269.6537 | 10342.216 | 10412.6559 |
01/31/2019 | 11188.2458 | 11123.6502 | 11096.9768 |
02/28/2019 | 11611.4175 | 11340.9771 | 11379.8535 |
03/31/2019 | 11879.7703 | 11408.5376 | 11451.6124 |
04/30/2019 | 12555.8128 | 11709.9264 | 11773.5779 |
05/31/2019 | 11750.7545 | 11081.4186 | 11208.1415 |
06/30/2019 | 12400.9939 | 11748.6972 | 11873.0695 |
07/31/2019 | 12297.7813 | 11606.5043 | 11722.319 |
08/31/2019 | 12086.1955 | 11248.0376 | 11418.6413 |
09/30/2019 | 12215.2112 | 11537.4893 | 11745.855 |
10/31/2019 | 12607.4191 | 11940.0432 | 12167.8726 |
11/30/2019 | 12799.7251 | 12045.3212 | 12305.043 |
12/31/2019 | 13250.6794 | 12566.946 | 12704.9525 |
01/31/2020 | 13085.5276 | 12229.3444 | 12439.5754 |
02/29/2020 | 12364.3648 | 11262.6833 | 11315.0659 |
03/31/2020 | 10668.8063 | 9631.9034 | 9804.8628 |
04/30/2020 | 11367.9489 | 10361.8271 | 10438.2833 |
05/31/2020 | 12111.132 | 10700.9334 | 10892.8165 |
06/30/2020 | 12645.1228 | 11184.5398 | 11263.7119 |
07/31/2020 | 13509.4172 | 11683.1931 | 11526.2569 |
08/31/2020 | 14434.2673 | 12183.301 | 12118.8319 |
09/30/2020 | 14125.984 | 11883.8181 | 11803.9447 |
10/31/2020 | 13927.8018 | 11628.3222 | 11332.6268 |
11/30/2020 | 15598.6568 | 13192.4946 | 13089.3349 |
12/31/2020 | 16254.2997 | 13905.5658 | 13697.936 |
01/31/2021 | 16373.566 | 13935.81 | 13552 |
02/28/2021 | 16827.9141 | 14211.6693 | 13855.9629 |
03/31/2021 | 16935.8217 | 14391.329 | 14174.5556 |
04/30/2021 | 17384.4903 | 14814.9987 | 14601.061 |
05/31/2021 | 18190.958 | 15278.3922 | 15077.2152 |
06/30/2021 | 17657.0992 | 15179.3838 | 14907.5391 |
07/31/2021 | 17214.1099 | 14929.2546 | 15019.785 |
08/31/2021 | 17452.6425 | 15213.0386 | 15284.7244 |
09/30/2021 | 16947.1804 | 14725.9212 | 14841.1473 |
10/31/2021 | 17543.5122 | 15077.4162 | 15206.1705 |
11/30/2021 | 16898.9175 | 14398.5013 | 14498.4184 |
12/31/2021 | 17484.642 | 14993.5549 | 15240.7933 |
01/31/2022 | 16902.252 | 14441.0338 | 14504.2965 |
02/28/2022 | 15886.305 | 14155.1934 | 14247.8395 |
03/31/2022 | 15595.11 | 14177.7637 | 14339.4171 |
04/30/2022 | 14585.634 | 13287.4905 | 13411.7322 |
05/31/2022 | 14818.59 | 13382.8375 | 13512.2774 |
06/30/2022 | 13737.933 | 12231.5513 | 12258.5056 |
07/31/2022 | 14203.845 | 12650.3057 | 12869.3466 |
08/31/2022 | 13550.274 | 12243.4383 | 12258.1214 |
09/30/2022 | 12269.016 | 11019.9271 | 11111.4106 |
10/31/2022 | 12579.624 | 11349.2529 | 11708.923 |
11/30/2022 | 14566.221 | 12688.9762 | 13027.7676 |
12/31/2022 | 14558.7617 | 12594.0806 | 13038.2364 |
01/31/2023 | 15865.4865 | 13615.6126 | 14094.035 |
02/28/2023 | 15146.1279 | 13137.6739 | 13799.9409 |
03/31/2023 | 15726.8945 | 13458.8242 | 14141.9588 |
04/30/2023 | 16030.477 | 13692.6526 | 14541.2266 |
05/31/2023 | 15495.9078 | 13194.8018 | 13925.87 |
06/30/2023 | 16155.8698 | 13786.846 | 14559.6312 |
07/31/2023 | 16749.8356 | 14347.342 | 15030.7292 |
08/31/2023 | 16169.069 | 13699.3735 | 14454.8655 |
09/30/2023 | 15462.9097 | 13266.6757 | 13961.1207 |
10/31/2023 | 15126.329 | 12719.3207 | 13395.1119 |
11/30/2023 | 16300.7472 | 13864.2371 | 14638.4169 |
12/31/2023 | 16887.1175 | 14560.8069 | 15416.1415 |
01/31/2024 | 16920.9052 | 14416.1563 | 15504.8593 |
02/29/2024 | 17454.7517 | 14781.1433 | 15788.6688 |
03/31/2024 | 18191.3246 | 15243.1825 | 16307.952 |
04/30/2024 | 17981.8405 | 14969.4799 | 15890.3251 |
05/31/2024 | 18954.9277 | 15404.0336 | 16505.8361 |
06/30/2024 | 18765.7164 | 15389.3378 | 16239.3678 |
07/31/2024 | 19400.926 | 15745.6978 | 16715.7754 |
08/31/2024 | 19873.9546 | 16194.1448 | 17259.3077 |
09/30/2024 | 20455.1039 | 16630.2031 | 17418.6872 |

What were the Fund costs for the past year?
(based on a hypothetical $10,000 investment)
Class Name | Costs of a $10,000 investment | Costs paid as a percentage of a $10,000 investment |
|---|
Class R5 | $111.00 | 0.96% |
End Block
Thornburg International Equity Fund Tailored Shareholder Report
Thornburg International Equity Fund Tailored Shareholder Report | |
Annual Performance | 1 Year | 5 Year | 10 Year |
|---|
International Equity Fund Class R5 | 32.29% | 10.86% | 7.42% |
MSCI All Country World ex USA Net Total Return USD Index | 25.35% | 7.59% | 5.22% |
MSCI EAFE Net Total Return USD Index | 24.77% | 8.20% | 5.71% |
Key Fund Statistics
(as of September 30, 2024)
| |
|---|
Fund Size (Millions) | $2,969.1M |
Number of Holdings | 56 |
Annual Portfolio Turnover | 45.47% |
Total Advisory Fee | $17.2M |
What did the Fund invest in?
(as of September 30, 2024)
Market Capitalization Exposure | (%) |
|---|
| Small Cap (<$2.5 B) | 0.0 |
| Mid Cap ($2.5-12 B) | 3.5 |
| Large Cap (>$12 B) | 96.5 |
Market Capitalization Exposure | (%) |
Small Cap (<$2.5 B) | 0.0% |
Mid Cap ($2.5-12 B) | 3.5% |
Large Cap (>$12 B) | 96.5% |
Expressed as a percentage of the Fund’s net assets.
How has the Fund changed?
This is a summary of certain changes to the Fund since October 1, 2023. For more complete information, you may review the Fund’s next prospectus, which we expect to be available by February 1, 2025 at https://www.thornburg.com/download or upon request by calling 1-800-847-0200.
End Block
Changes In and Disagreements with Accountants
No changes and/or disagreements occurred in the current reporting period.
End Block
For additional information about the Fund, including its prospectus, financial information, holdings and proxy information, visit www.thornburg.com/download.

Thornburg International Equity Fund Tailored Shareholder Report | |
Thornburg International Equity Fund Tailored Shareholder Report
Thornburg International Equity Fund CLASS: R6 TICKER: TGIRX Annual Shareholder Report | |
This annual shareholder report contains important information about the Thornburg International Equity Fund Class R6 Shares for the period from October 1, 2023 to September 30, 2024. You can find additional information about the Fund at https://www.thornburg.com/download. You can also request this information by contacting us at 1-800-847-0200. This report also describes changes to the Fund that occurred during the reporting period.
How did the Fund perform last year and what affected its performance?
The Fund’s Class R6 shares outperformed the MSCI All Country World ex USA Net Total Return USD Index (the “Index”) during the 12-month period ended September 30, 2024. During the period, non-U.S. equities have posted strong returns but lagged their U.S. counterparts, as U.S. mega-cap and artificial intelligence beneficiaries have continued to lead the market. Stock selection was a major contributor of the Fund’s outperformance relative to its benchmark, consistent with the Fund’s bottom-up investment approach. Sector allocation was modestly additive to performance while geographic allocation detracted from relative results. The Fund’s cash allocation was a drag on performance. Within industrials and information technology, stock selection bolstered relative returns. Additionally, stock selection in Japan and the U.S. also drove positive relative performance. An underweight positioning and weaker stock selection within financials and India hampered relative returns.
How did the Fund perform over the past 10 years?
The line graph below reflects a hypothetical $10,000 investment. The returns shown in the line graph and table assume the reinvestment of dividends and capital gains, but do not reflect the deduction of taxes that a shareholder would pay on distributions or the redemption of Fund shares. The performance information shown below represents past performance and is no guarantee of future results. For Fund performance current to the most recent month end, visit https://www.thornburg.com/product/mutual-funds/fiv/TGIRX or call 1-800-847-0200. Performance for other share classes of the Fund will vary.
Cumulative Performance
Growth Table
Date | Thornburg International Equity Fund | MSCI All Country World ex USA Net Total Return USD Index | MSCI EAFE Net Total Return USD Index |
09/30/2014 | 10000.0072 | 10000 | 10000 |
10/31/2014 | 10019.77 | 9900.9916 | 9854.8027 |
11/30/2014 | 10276.2325 | 9972.6147 | 9988.8459 |
12/31/2014 | 9833.7606 | 9613.0446 | 9642.8195 |
01/31/2015 | 10045.9741 | 9598.8003 | 9689.957 |
02/28/2015 | 10603.4843 | 10111.9989 | 10269.2311 |
03/31/2015 | 10578.3064 | 9948.5397 | 10113.2303 |
04/30/2015 | 11308.465 | 10451.1052 | 10526.1436 |
05/31/2015 | 11427.1607 | 10287.947 | 10472.2625 |
06/30/2015 | 11115.2735 | 10000.9028 | 10175.5462 |
07/31/2015 | 11332.5809 | 9973.1163 | 10386.8244 |
08/31/2015 | 10590.114 | 9210.8418 | 9622.7394 |
09/30/2015 | 10181.2198 | 8783.7614 | 9134.1379 |
10/31/2015 | 10749.0676 | 9437.6483 | 9848.1483 |
11/30/2015 | 10622.8617 | 9242.8415 | 9694.9419 |
12/31/2015 | 10507.7034 | 9068.7492 | 9564.3111 |
01/31/2016 | 9761.7204 | 8451.8776 | 8872.6782 |
02/29/2016 | 9497.4293 | 8355.2767 | 8710.1239 |
03/31/2016 | 10064.3764 | 9034.6429 | 9276.8694 |
04/30/2016 | 10307.3537 | 9272.3835 | 9545.445 |
05/31/2016 | 10247.675 | 9115.896 | 9458.7334 |
06/30/2016 | 9771.6504 | 8976.4115 | 9141.226 |
07/31/2016 | 10173.0477 | 9420.3444 | 9604.511 |
08/31/2016 | 10298.2146 | 9479.93 | 9611.3298 |
09/30/2016 | 10425.6984 | 9596.794 | 9729.3984 |
10/31/2016 | 10251.5741 | 9458.8142 | 9530.3854 |
11/30/2016 | 10068.7434 | 9240.0327 | 9340.5777 |
12/31/2016 | 10273.3396 | 9476.419 | 9659.9725 |
01/31/2017 | 10469.2295 | 9812.1147 | 9940.1874 |
02/28/2017 | 10473.5827 | 9968.552 | 10082.3268 |
03/31/2017 | 10992.0888 | 10221.2893 | 10359.8799 |
04/30/2017 | 11341.044 | 10440.0708 | 10623.4864 |
05/31/2017 | 11772.8761 | 10778.8762 | 11013.4103 |
06/30/2017 | 11975.2576 | 10812.3304 | 10993.9322 |
07/31/2017 | 12343.4573 | 11210.8719 | 11311.0613 |
08/31/2017 | 12111.1408 | 11269.5045 | 11306.7993 |
09/30/2017 | 12448.7228 | 11478.7062 | 11588.1173 |
10/31/2017 | 12594.0386 | 11694.6789 | 11764.0795 |
11/30/2017 | 12710.0738 | 11789.6748 | 11887.4756 |
12/31/2017 | 12903.1385 | 12053.1957 | 12078.2834 |
01/31/2018 | 13717.9117 | 12724.4868 | 12684.1237 |
02/28/2018 | 12903.1385 | 12124.5179 | 12111.613 |
03/31/2018 | 12611.05 | 11910.6517 | 11893.318 |
04/30/2018 | 12713.5372 | 12100.8441 | 12164.8742 |
05/31/2018 | 12452.1948 | 11821.4237 | 11891.4326 |
06/30/2018 | 12031.9973 | 11599.2316 | 11746.1521 |
07/31/2018 | 12380.4538 | 11876.6458 | 12035.2871 |
08/31/2018 | 12006.3755 | 11628.0714 | 11802.8554 |
09/30/2018 | 11991.0024 | 11681.0364 | 11905.29 |
10/31/2018 | 10935.3842 | 10730.9268 | 10957.723 |
11/30/2018 | 11114.7368 | 10832.4932 | 10943.915 |
12/31/2018 | 10363.0059 | 10342.216 | 10412.6559 |
01/31/2019 | 11288.461 | 11123.6502 | 11096.9768 |
02/28/2019 | 11722.4315 | 11340.9771 | 11379.8535 |
03/31/2019 | 11994.3166 | 11408.5376 | 11451.6124 |
04/30/2019 | 12679.258 | 11709.9264 | 11773.5779 |
05/31/2019 | 11868.8312 | 11081.4186 | 11208.1415 |
06/30/2019 | 12527.6298 | 11748.6972 | 11873.0695 |
07/31/2019 | 12423.0586 | 11606.5043 | 11722.319 |
08/31/2019 | 12213.9162 | 11248.0376 | 11418.6413 |
09/30/2019 | 12344.6302 | 11537.4893 | 11745.855 |
10/31/2019 | 12742.0007 | 11940.0432 | 12167.8726 |
11/30/2019 | 12936.8293 | 12045.3212 | 12305.043 |
12/31/2019 | 13395.7724 | 12566.946 | 12704.9525 |
01/31/2020 | 13228.0457 | 12229.3444 | 12439.5754 |
02/29/2020 | 12501.23 | 11262.6833 | 11315.0659 |
03/31/2020 | 10790.4177 | 9631.9034 | 9804.8628 |
04/30/2020 | 11506.0516 | 10361.8271 | 10438.2833 |
05/31/2020 | 12260.8218 | 10700.9334 | 10892.8165 |
06/30/2020 | 12797.5472 | 11184.5398 | 11263.7119 |
07/31/2020 | 13680.9078 | 11683.1931 | 11526.2569 |
08/31/2020 | 14614.5865 | 12183.301 | 12118.8319 |
09/30/2020 | 14307.0875 | 11883.8181 | 11803.9447 |
10/31/2020 | 14111.4064 | 11628.3222 | 11332.6268 |
11/30/2020 | 15802.7365 | 13192.4946 | 13089.3349 |
12/31/2020 | 16469.4707 | 13905.5658 | 13697.936 |
01/31/2021 | 16596.6481 | 13935.81 | 13552 |
02/28/2021 | 17059.1113 | 14211.6693 | 13855.9629 |
03/31/2021 | 17168.9463 | 14391.329 | 14174.5556 |
04/30/2021 | 17625.6287 | 14814.9987 | 14601.061 |
05/31/2021 | 18452.2817 | 15278.3922 | 15077.2152 |
06/30/2021 | 17908.8874 | 15179.3838 | 14907.5391 |
07/31/2021 | 17463.7666 | 14929.2546 | 15019.785 |
08/31/2021 | 17706.5598 | 15213.0386 | 15284.7244 |
09/30/2021 | 17197.8502 | 14725.9212 | 14841.1473 |
10/31/2021 | 17804.8332 | 15077.4162 | 15206.1705 |
11/30/2021 | 17154.8759 | 14398.5013 | 14498.4184 |
12/31/2021 | 17749.2403 | 14993.5549 | 15240.7933 |
01/31/2022 | 17161.5609 | 14441.0338 | 14504.2965 |
02/28/2022 | 16131.471 | 14155.1934 | 14247.8395 |
03/31/2022 | 15840.9329 | 14177.7637 | 14339.4171 |
04/30/2022 | 14824.0493 | 13287.4905 | 13411.7322 |
05/31/2022 | 15061.7623 | 13382.8375 | 13512.2774 |
06/30/2022 | 13959.038 | 12231.5513 | 12258.5056 |
07/31/2022 | 14434.464 | 12650.3057 | 12869.3466 |
08/31/2022 | 13774.15 | 12243.4383 | 12258.1214 |
09/30/2022 | 12473.3315 | 11019.9271 | 11111.4106 |
10/31/2022 | 12796.8853 | 11349.2529 | 11708.923 |
11/30/2022 | 14817.4462 | 12688.9762 | 13027.7676 |
12/31/2022 | 14808.2055 | 12594.0806 | 13038.2364 |
01/31/2023 | 16144.5887 | 13615.6126 | 14094.035 |
02/28/2023 | 15415.6524 | 13137.6739 | 13799.9409 |
03/31/2023 | 16009.6005 | 13458.8242 | 14141.9588 |
04/30/2023 | 16320.0734 | 13692.6526 | 14541.2266 |
05/31/2023 | 15780.1206 | 13194.8018 | 13925.87 |
06/30/2023 | 16455.0616 | 13786.846 | 14559.6312 |
07/31/2023 | 17055.7591 | 14347.342 | 15030.7292 |
08/31/2023 | 16475.3098 | 13699.3735 | 14454.8655 |
09/30/2023 | 15753.1229 | 13266.6757 | 13961.1207 |
10/31/2023 | 15415.6524 | 12719.3207 | 13395.1119 |
11/30/2023 | 16616.7381 | 13864.2371 | 14638.4169 |
12/31/2023 | 17215.6992 | 14560.8069 | 15416.1415 |
01/31/2024 | 17257.2495 | 14416.1563 | 15504.8593 |
02/29/2024 | 17797.4042 | 14781.1433 | 15788.6688 |
03/31/2024 | 18552.2357 | 15243.1825 | 16307.952 |
04/30/2024 | 18344.4839 | 14969.4799 | 15890.3251 |
05/31/2024 | 19341.6926 | 15404.0336 | 16505.8361 |
06/30/2024 | 19154.716 | 15389.3378 | 16239.3678 |
07/31/2024 | 19805.6716 | 15745.6978 | 16715.7754 |
08/31/2024 | 20290.4258 | 16194.1448 | 17259.3077 |
09/30/2024 | 20885.981 | 16630.2031 | 17418.6872 |
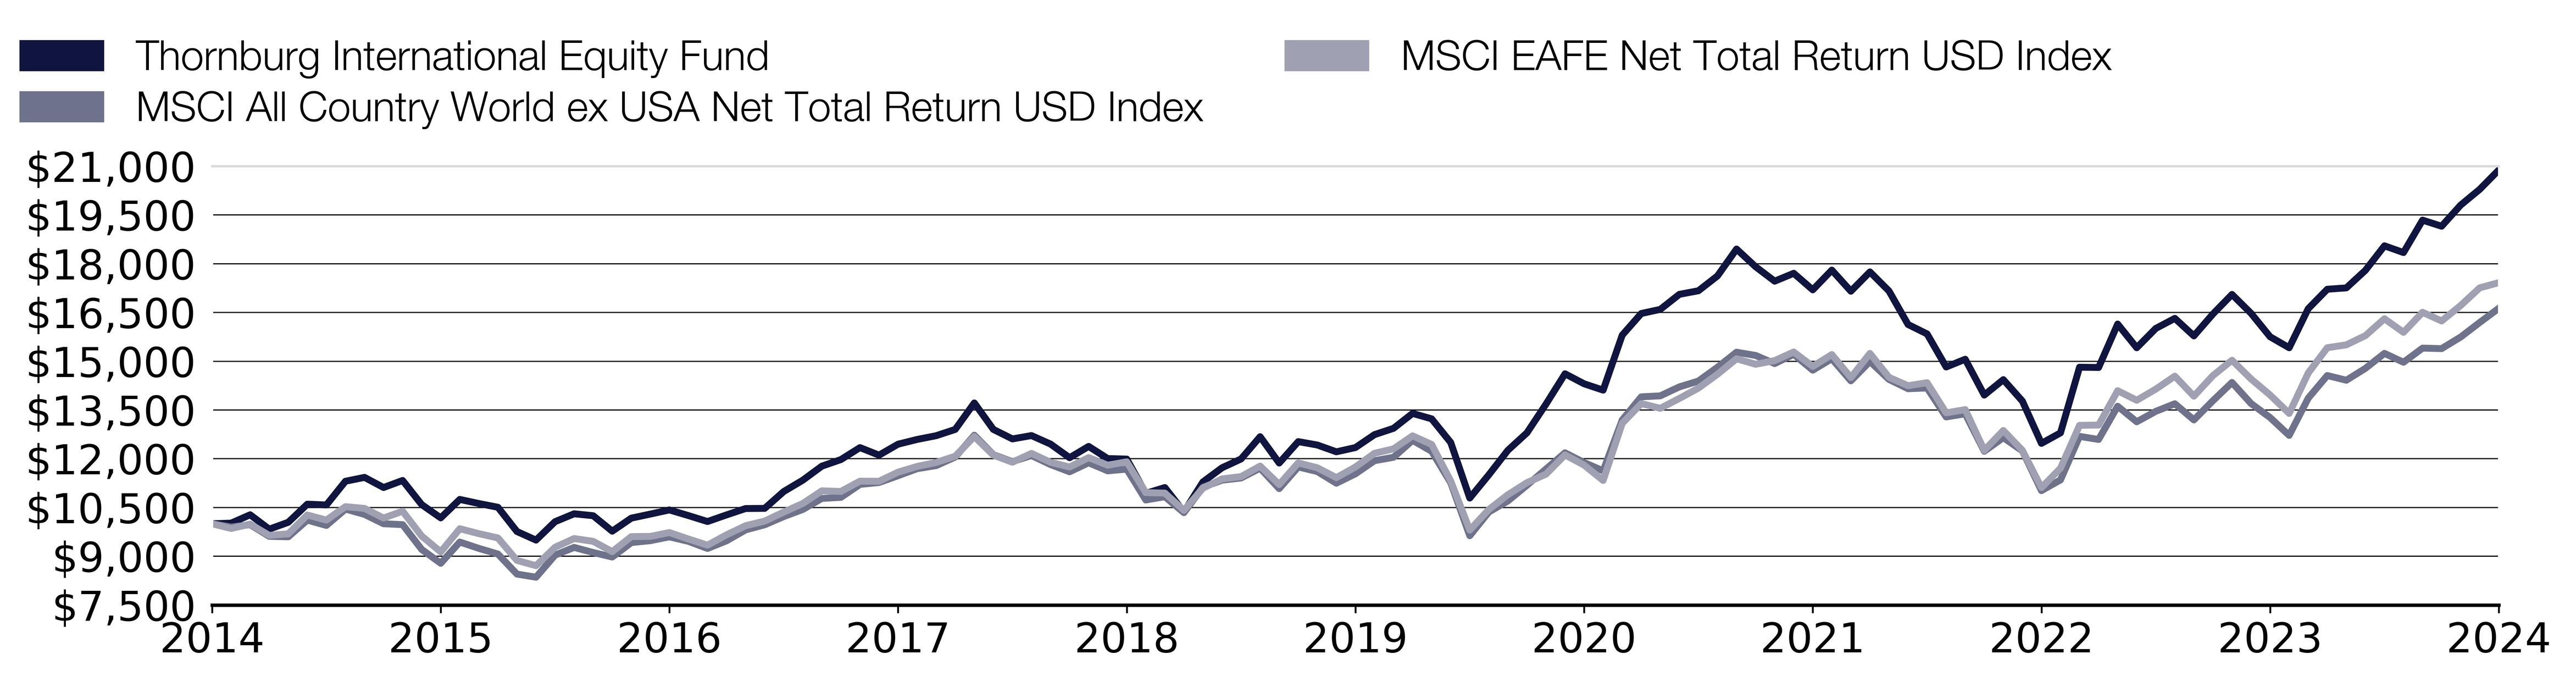
What were the Fund costs for the past year?
(based on a hypothetical $10,000 investment)
Class Name | Costs of a $10,000 investment | Costs paid as a percentage of a $10,000 investment |
|---|
Class R6 | $89.00 | 0.76% |
End Block
Thornburg International Equity Fund Tailored Shareholder Report
Thornburg International Equity Fund Tailored Shareholder Report | |
Annual Performance | 1 Year | 5 Year | 10 Year |
|---|
International Equity Fund Class R6 | 32.58% | 11.09% | 7.64% |
MSCI All Country World ex USA Net Total Return USD Index | 25.35% | 7.59% | 5.22% |
MSCI EAFE Net Total Return USD Index | 24.77% | 8.20% | 5.71% |
Key Fund Statistics
(as of September 30, 2024)
| |
|---|
Fund Size (Millions) | $2,969.1M |
Number of Holdings | 56 |
Annual Portfolio Turnover | 45.47% |
Total Advisory Fee | $17.2M |
What did the Fund invest in?
(as of September 30, 2024)
Market Capitalization Exposure | (%) |
|---|
| Small Cap (<$2.5 B) | 0.0 |
| Mid Cap ($2.5-12 B) | 3.5 |
| Large Cap (>$12 B) | 96.5 |
Market Capitalization Exposure | (%) |
Small Cap (<$2.5 B) | 0.0% |
Mid Cap ($2.5-12 B) | 3.5% |
Large Cap (>$12 B) | 96.5% |
Expressed as a percentage of the Fund’s net assets.
How has the Fund changed?
This is a summary of certain changes to the Fund since October 1, 2023. For more complete information, you may review the Fund’s next prospectus, which we expect to be available by February 1, 2025 at https://www.thornburg.com/download or upon request by calling 1-800-847-0200.
End Block
Changes In and Disagreements with Accountants
No changes and/or disagreements occurred in the current reporting period.
End Block
For additional information about the Fund, including its prospectus, financial information, holdings and proxy information, visit www.thornburg.com/download.

Thornburg International Equity Fund Tailored Shareholder Report | |
Thornburg Better World International Fund Tailored Shareholder Report
Thornburg Better World International Fund CLASS: A TICKER: TBWAX Annual Shareholder Report | |
This annual shareholder report contains important information about the Thornburg Better World International Fund Class A Shares for the period from October 1, 2023 to September 30, 2024. You can find additional information about the Fund at https://www.thornburg.com/download. You can also request this information by contacting us at 1-800-847-0200. This report also describes changes to the Fund that occurred during the reporting period.
How did the Fund perform last year and what affected its performance?
The Fund’s Class A shares underperformed the MSCI All Country World ex USA Net Total Return USD Index (the “Index”) during the 12-month period ended September 30, 2024. During the period, non-U.S. equities posted strong returns but lagged their U.S. counterparts, as U.S. mega-cap and artificial intelligence beneficiaries have continued to lead the market. Stock selection contributed positively to Fund performance relative to the Index over the period, aligning with the Fund’s focus on bottom-up security selection. Detractors from relative performance included sector and region/country allocations. Currency effects on the Fund’s performance were negative during the period. Within industrials, stock selection and a zero-weight positioning to energy contributed positively to relative results. However, stock selection in financials and consumer discretionary detracted from relative returns. From a geographic perspective, stock selection in Japan, the U.S., and Germany bolstered relative returns. The Fund’s stock selection in China, as well as an underweight positioning in Taiwan, were the largest detractors.
How did the Fund perform over the past 10 years?
The line graph below reflects a hypothetical $10,000 investment and assumes the deduction of the maximum sales charge associated with that investment. The returns shown in the line graph and table assume the reinvestment of dividends and capital gains, but do not reflect the deduction of taxes that a shareholder would pay on distributions or the redemption of Fund shares. The performance information shown below represents past performance and is no guarantee of future results. For Fund performance current to the most recent month end, visit https://www.thornburg.com/product/mutual-funds/fbwi/TBWAX or call 1-800-847-0200. Performance for other share classes of the Fund will vary.
Cumulative Performance
Growth Table
Date | Thornburg Better World International Fund | MSCI All Country World ex USA Net Total Return USD Index |
09/30/2015 | 9552 | 10000 |
10/31/2015 | 9920 | 10744.4269 |
11/30/2015 | 10000 | 10522.6463 |
12/31/2015 | 9944 | 10324.4484 |
01/31/2016 | 9480 | 9622.1621 |
02/29/2016 | 9440 | 9512.1854 |
03/31/2016 | 9968 | 10285.6197 |
04/30/2016 | 10072 | 10556.2788 |
05/31/2016 | 9984 | 10378.1234 |
06/30/2016 | 9872 | 10219.3253 |
07/31/2016 | 10416 | 10724.7271 |
08/31/2016 | 10584 | 10792.5632 |
09/30/2016 | 11138.0069 | 10925.6087 |
10/31/2016 | 10993.3574 | 10768.5236 |
11/30/2016 | 10573.3442 | 10519.4486 |
12/31/2016 | 10615.7733 | 10788.5661 |
01/31/2017 | 10768.5183 | 11170.7437 |
02/28/2017 | 10700.6316 | 11348.842 |
03/31/2017 | 11155.1824 | 11636.5744 |
04/30/2017 | 11274.1256 | 11885.6494 |
05/31/2017 | 11673.4353 | 12271.3672 |
06/30/2017 | 11746.8206 | 12309.4537 |
07/31/2017 | 12063.147 | 12763.1789 |
08/31/2017 | 12097.3444 | 12829.9301 |
09/30/2017 | 12096.4528 | 13068.0988 |
10/31/2017 | 12404.6427 | 13313.9761 |
11/30/2017 | 12613.7235 | 13422.1255 |
12/31/2017 | 12938.7289 | 13722.1347 |
01/31/2018 | 13448.1968 | 14486.3757 |
02/28/2018 | 12798.186 | 13803.3324 |
03/31/2018 | 12719.1306 | 13559.8534 |
04/30/2018 | 12894.8092 | 13776.3807 |
05/31/2018 | 12763.0503 | 13458.2705 |
06/30/2018 | 12736.6985 | 13205.3127 |
07/31/2018 | 12965.0807 | 13521.1388 |
08/31/2018 | 12657.6431 | 13238.1458 |
09/30/2018 | 12745.4824 | 13298.4446 |
10/31/2018 | 11550.8679 | 12216.7786 |
11/30/2018 | 11683.2545 | 12332.4083 |
12/31/2018 | 11090.4601 | 11774.2451 |
01/31/2019 | 11676.1901 | 12663.8801 |
02/28/2019 | 12050.6731 | 12911.2992 |
03/31/2019 | 12194.7051 | 12988.2143 |
04/30/2019 | 12751.6286 | 13331.3348 |
05/31/2019 | 11916.2433 | 12615.801 |
06/30/2019 | 12694.0159 | 13375.4739 |
07/31/2019 | 12444.3605 | 13213.5923 |
08/31/2019 | 12156.2966 | 12805.4908 |
09/30/2019 | 12338.7371 | 13135.0212 |
10/31/2019 | 12847.6499 | 13593.3146 |
11/30/2019 | 13193.3266 | 13713.1698 |
12/31/2019 | 13722.3688 | 14307.0212 |
01/31/2020 | 13432.4596 | 13922.6737 |
02/29/2020 | 12611.0502 | 12822.1644 |
03/31/2020 | 11035.8769 | 10965.5795 |
04/30/2020 | 12021.5682 | 11796.5717 |
05/31/2020 | 12804.323 | 12182.6321 |
06/30/2020 | 13558.0869 | 12733.2009 |
07/31/2020 | 14408.4872 | 13300.8999 |
08/31/2020 | 15316.8694 | 13870.2549 |
09/30/2020 | 15133.2602 | 13529.3043 |
10/31/2020 | 14833.6874 | 13238.4313 |
11/30/2020 | 16495.8335 | 15019.186 |
12/31/2020 | 17268.9247 | 15830.9922 |
01/31/2021 | 17162.6246 | 15865.4241 |
02/28/2021 | 18341.5887 | 16179.4802 |
03/31/2021 | 18824.7707 | 16384.0163 |
04/30/2021 | 19491.5619 | 16866.3492 |
05/31/2021 | 19858.7802 | 17393.9062 |
06/30/2021 | 21308.3262 | 17281.1886 |
07/31/2021 | 20912.117 | 16996.4255 |
08/31/2021 | 21598.2354 | 17319.5034 |
09/30/2021 | 20738.1714 | 16764.9376 |
10/31/2021 | 21337.3171 | 17165.1021 |
11/30/2021 | 20512.3745 | 16392.1817 |
12/31/2021 | 20789.5688 | 17069.6291 |
01/31/2022 | 20201.9169 | 16440.6034 |
02/28/2022 | 19281.632 | 16115.1843 |
03/31/2022 | 19148.5788 | 16140.8798 |
04/30/2022 | 17563.0277 | 15127.3354 |
05/31/2022 | 17563.0277 | 15235.8846 |
06/30/2022 | 16454.2507 | 13925.1861 |
07/31/2022 | 17174.9557 | 14401.9232 |
08/31/2022 | 16365.5485 | 13938.7191 |
09/30/2022 | 14946.314 | 12545.7951 |
10/31/2022 | 15267.8593 | 12920.7208 |
11/30/2022 | 17186.0435 | 14445.9481 |
12/31/2022 | 16947.1391 | 14337.9128 |
01/31/2023 | 18492.8427 | 15500.8908 |
02/28/2023 | 17647.7098 | 14956.7745 |
03/31/2023 | 18237.0788 | 15322.3928 |
04/30/2023 | 18570.6839 | 15588.5981 |
05/31/2023 | 18214.8385 | 15021.8126 |
06/30/2023 | 18937.6495 | 15695.8339 |
07/31/2023 | 19471.4177 | 16333.9386 |
08/31/2023 | 18748.6066 | 15596.2496 |
09/30/2023 | 17903.4737 | 15103.6385 |
10/31/2023 | 17269.624 | 14480.4943 |
11/30/2023 | 18337.1603 | 15783.9409 |
12/31/2023 | 19003.6778 | 16576.9609 |
01/31/2024 | 18823.8677 | 16412.2813 |
02/29/2024 | 19509.3937 | 16827.8059 |
03/31/2024 | 19880.252 | 17353.8212 |
04/30/2024 | 19408.2505 | 17042.2205 |
05/31/2024 | 20239.8721 | 17536.9444 |
06/30/2024 | 20206.1577 | 17520.2138 |
07/31/2024 | 20959.1125 | 17925.917 |
08/31/2024 | 21577.2096 | 18436.4579 |
09/30/2024 | 21712.0672 | 18932.8948 |

What were the Fund costs for the past year?
(based on a hypothetical $10,000 investment)
Class Name | Costs of a $10,000 investment | Costs paid as a percentage of a $10,000 investment |
|---|
Class A | $159.00 | 1.44% |
End Block
Thornburg Better World International Fund Tailored Shareholder Report
Thornburg Better World International Fund Tailored Shareholder Report | |
Annual Performance | 1 Year | 5 Year |
|---|
Better World International Fund Class A (with sales charge) | 15.81% | 10.93% |
Better World International Fund Class A (without sales charge) | 21.27% | 11.97% |
MSCI All Country World ex USA Net Total Return USD Index | 25.35% | 7.59% |
Key Fund Statistics
(as of September 30, 2024)
| |
|---|
Fund Size (Millions) | $570.1M |
Number of Holdings | 57 |
Annual Portfolio Turnover | 60.57% |
Total Advisory Fee | $4.7M |
What did the Fund invest in?
(as of September 30, 2024)
Market Capitalization Exposure | (%) |
|---|
| Small Cap (<$2.5 B) | 0.9 |
| Mid Cap ($2.5-12 B) | 14.4 |
| Large Cap (>$12 B) | 84.7 |
Market Capitalization Exposure | (%) |
Small Cap (<$2.5 B) | 0.9% |
Mid Cap ($2.5-12 B) | 14.4% |
Large Cap (>$12 B) | 84.7% |

Expressed as a percentage of the Fund’s net assets.
How has the Fund changed?
This is a summary of certain changes to the Fund since October 1, 2023. For more complete information, you may review the Fund’s next prospectus, which we expect to be available by February 1, 2025 at https://www.thornburg.com/download or upon request by calling 1-800-847-0200.
End Block
Changes In and Disagreements with Accountants
No changes and/or disagreements occurred in the current reporting period.
End Block
For additional information about the Fund, including its prospectus, financial information, holdings and proxy information, visit www.thornburg.com/download.

Thornburg Better World International Fund Tailored Shareholder Report | |
Thornburg Better World International Fund Tailored Shareholder Report
Thornburg Better World International Fund CLASS: C TICKER: TBWCX Annual Shareholder Report | |
This annual shareholder report contains important information about the Thornburg Better World International Fund Class C Shares for the period from October 1, 2023 to September 30, 2024. You can find additional information about the Fund at https://www.thornburg.com/download. You can also request this information by contacting us at 1-800-847-0200. This report also describes changes to the Fund that occurred during the reporting period.
How did the Fund perform last year and what affected its performance?
The Fund’s Class C shares underperformed the MSCI All Country World ex USA Net Total Return USD Index (the “Index”) during the 12-month period ended September 30, 2024. During the period, non-U.S. equities posted strong returns but lagged their U.S. counterparts, as U.S. mega-cap and artificial intelligence beneficiaries have continued to lead the market. Stock selection contributed positively to Fund performance relative to the Index over the period, aligning with the Fund’s focus on bottom-up security selection. Detractors from relative performance included sector and region/country allocations. Currency effects on the Fund’s performance were negative during the period. Within industrials, stock selection and a zero-weight positioning to energy contributed positively to relative results. However, stock selection in financials and consumer discretionary detracted from relative returns. From a geographic perspective, stock selection in Japan, the U.S., and Germany bolstered relative returns. The Fund’s stock selection in China, as well as an underweight positioning in Taiwan, were the largest detractors.
How did the Fund perform over the past 10 years?
The line graph below reflects a hypothetical $10,000 investment. The returns shown in the line graph and table assume the reinvestment of dividends and capital gains, but do not reflect the deduction of taxes that a shareholder would pay on distributions or the redemption of Fund shares. The performance information shown below represents past performance and is no guarantee of future results. For Fund performance current to the most recent month end, visit https://www.thornburg.com/product/mutual-funds/fbwi/TBWCX or call 1-800-847-0200. Performance for other share classes of the Fund will vary.
Cumulative Performance
Growth Table
Date | Thornburg Better World International Fund | MSCI All Country World ex USA Net Total Return USD Index |
09/30/2015 | 10000.0007 | 10000 |
10/31/2015 | 10385.2604 | 10744.4269 |
11/30/2015 | 10460.6373 | 10522.6463 |
12/31/2015 | 10393.6356 | 10324.4484 |
01/31/2016 | 9899.4982 | 9622.1621 |
02/29/2016 | 9865.9974 | 9512.1854 |
03/31/2016 | 10402.0108 | 10285.6197 |
04/30/2016 | 10502.5133 | 10556.2788 |
05/31/2016 | 10410.386 | 10378.1234 |
06/30/2016 | 10284.7579 | 10219.3253 |
07/31/2016 | 10845.897 | 10724.7271 |
08/31/2016 | 11021.7764 | 10792.5632 |
09/30/2016 | 11594.0942 | 10925.6087 |
10/31/2016 | 11425.942 | 10768.5236 |
11/30/2016 | 10994.938 | 10519.4486 |
12/31/2016 | 11030.4628 | 10788.5661 |
01/31/2017 | 11190.3246 | 11170.7437 |
02/28/2017 | 11110.3937 | 11348.842 |
03/31/2017 | 11581.0978 | 11636.5744 |
04/30/2017 | 11705.4348 | 11885.6494 |
05/31/2017 | 12105.0892 | 12271.3672 |
06/30/2017 | 12177.7784 | 12309.4537 |
07/31/2017 | 12499.186 | 12763.1789 |
08/31/2017 | 12525.97 | 12829.9301 |
09/30/2017 | 12518.0094 | 13068.0988 |
10/31/2017 | 12839.4418 | 13313.9761 |
11/30/2017 | 13048.5962 | 13422.1255 |
12/31/2017 | 13369.3131 | 13722.1347 |
01/31/2018 | 13900.7868 | 14486.3757 |
02/28/2018 | 13222.6996 | 13803.3324 |
03/31/2018 | 13131.0662 | 13559.8534 |
04/30/2018 | 13314.333 | 13776.3807 |
05/31/2018 | 13167.7196 | 13458.2705 |
06/30/2018 | 13131.0662 | 13205.3127 |
07/31/2018 | 13360.1497 | 13521.1388 |
08/31/2018 | 13039.4328 | 13238.1458 |
09/30/2018 | 13121.9029 | 13298.4446 |
10/31/2018 | 11884.852 | 12216.7786 |
11/30/2018 | 12023.7736 | 12332.4083 |
12/31/2018 | 11408.8117 | 11774.2451 |
01/31/2019 | 11994.6427 | 12663.8801 |
02/28/2019 | 12381.887 | 12911.2992 |
03/31/2019 | 12520.8977 | 12988.2143 |
04/30/2019 | 13076.9408 | 13331.3348 |
05/31/2019 | 12223.0175 | 12615.801 |
06/30/2019 | 13007.4354 | 13375.4739 |
07/31/2019 | 12759.2019 | 13213.5923 |
08/31/2019 | 12451.3924 | 12805.4908 |
09/30/2019 | 12630.1205 | 13135.0212 |
10/31/2019 | 13146.4462 | 13593.3146 |
11/30/2019 | 13493.9731 | 13713.1698 |
12/31/2019 | 14019.9218 | 14307.0212 |
01/31/2020 | 13721.837 | 13922.6737 |
02/29/2020 | 12887.1995 | 12822.1644 |
03/31/2020 | 11267.6054 | 10965.5795 |
04/30/2020 | 12271.1576 | 11796.5717 |
05/31/2020 | 13056.1142 | 12182.6321 |
06/30/2020 | 13821.1986 | 12733.2009 |
07/31/2020 | 14685.6445 | 13300.8999 |
08/31/2020 | 15599.7712 | 13870.2549 |
09/30/2020 | 15410.9842 | 13529.3043 |
10/31/2020 | 15093.027 | 13238.4313 |
11/30/2020 | 16782.1742 | 15019.186 |
12/31/2020 | 17557.1947 | 15830.9922 |
01/31/2021 | 17428.0246 | 15865.4241 |
02/28/2021 | 18620.3638 | 16179.4802 |
03/31/2021 | 19097.2995 | 16384.0163 |
04/30/2021 | 19763.0222 | 16866.3492 |
05/31/2021 | 20120.724 | 17393.9062 |
06/30/2021 | 21571.4034 | 17281.1886 |
07/31/2021 | 21154.0846 | 16996.4255 |
08/31/2021 | 21839.6797 | 17319.5034 |
09/30/2021 | 20945.4253 | 16764.9376 |
10/31/2021 | 21541.5949 | 17165.1021 |
11/30/2021 | 20693.368 | 16392.1817 |
12/31/2021 | 20956.3224 | 17069.6291 |
01/31/2022 | 20361.8168 | 16440.6034 |
02/28/2022 | 19412.8944 | 16115.1843 |
03/31/2022 | 19275.7008 | 16140.8798 |
04/30/2022 | 17663.676 | 15127.3354 |
05/31/2022 | 17652.2432 | 15235.8846 |
06/30/2022 | 16531.8288 | 13925.1861 |
07/31/2022 | 17252.0952 | 14401.9232 |
08/31/2022 | 16417.5008 | 13938.7191 |
09/30/2022 | 14988.4008 | 12545.7951 |
10/31/2022 | 15297.0864 | 12920.7208 |
11/30/2022 | 17274.9608 | 14445.9481 |
12/31/2022 | 16966.2752 | 14337.9128 |
01/31/2023 | 18509.7032 | 15500.8908 |
02/28/2023 | 17640.8104 | 14956.7745 |
03/31/2023 | 18223.8832 | 15322.3928 |
04/30/2023 | 18544.0016 | 15588.5981 |
05/31/2023 | 18189.5848 | 15021.8126 |
06/30/2023 | 18898.4184 | 15695.8339 |
07/31/2023 | 19412.8944 | 16333.9386 |
08/31/2023 | 18681.1952 | 15596.2496 |
09/30/2023 | 17823.7352 | 15103.6385 |
10/31/2023 | 17183.4984 | 14480.4943 |
11/30/2023 | 18235.316 | 15783.9409 |
12/31/2023 | 18880.7836 | 16576.9609 |
01/31/2024 | 18697.1407 | 16412.2813 |
02/29/2024 | 19362.8462 | 16827.8059 |
03/31/2024 | 19718.6542 | 17353.8212 |
04/30/2024 | 19236.5917 | 17042.2205 |
05/31/2024 | 20040.0293 | 17536.9444 |
06/30/2024 | 20005.5962 | 17520.2138 |
07/31/2024 | 20740.1678 | 17925.917 |
08/31/2024 | 21337.0071 | 18436.4579 |
09/30/2024 | 21463.2616 | 18932.8948 |
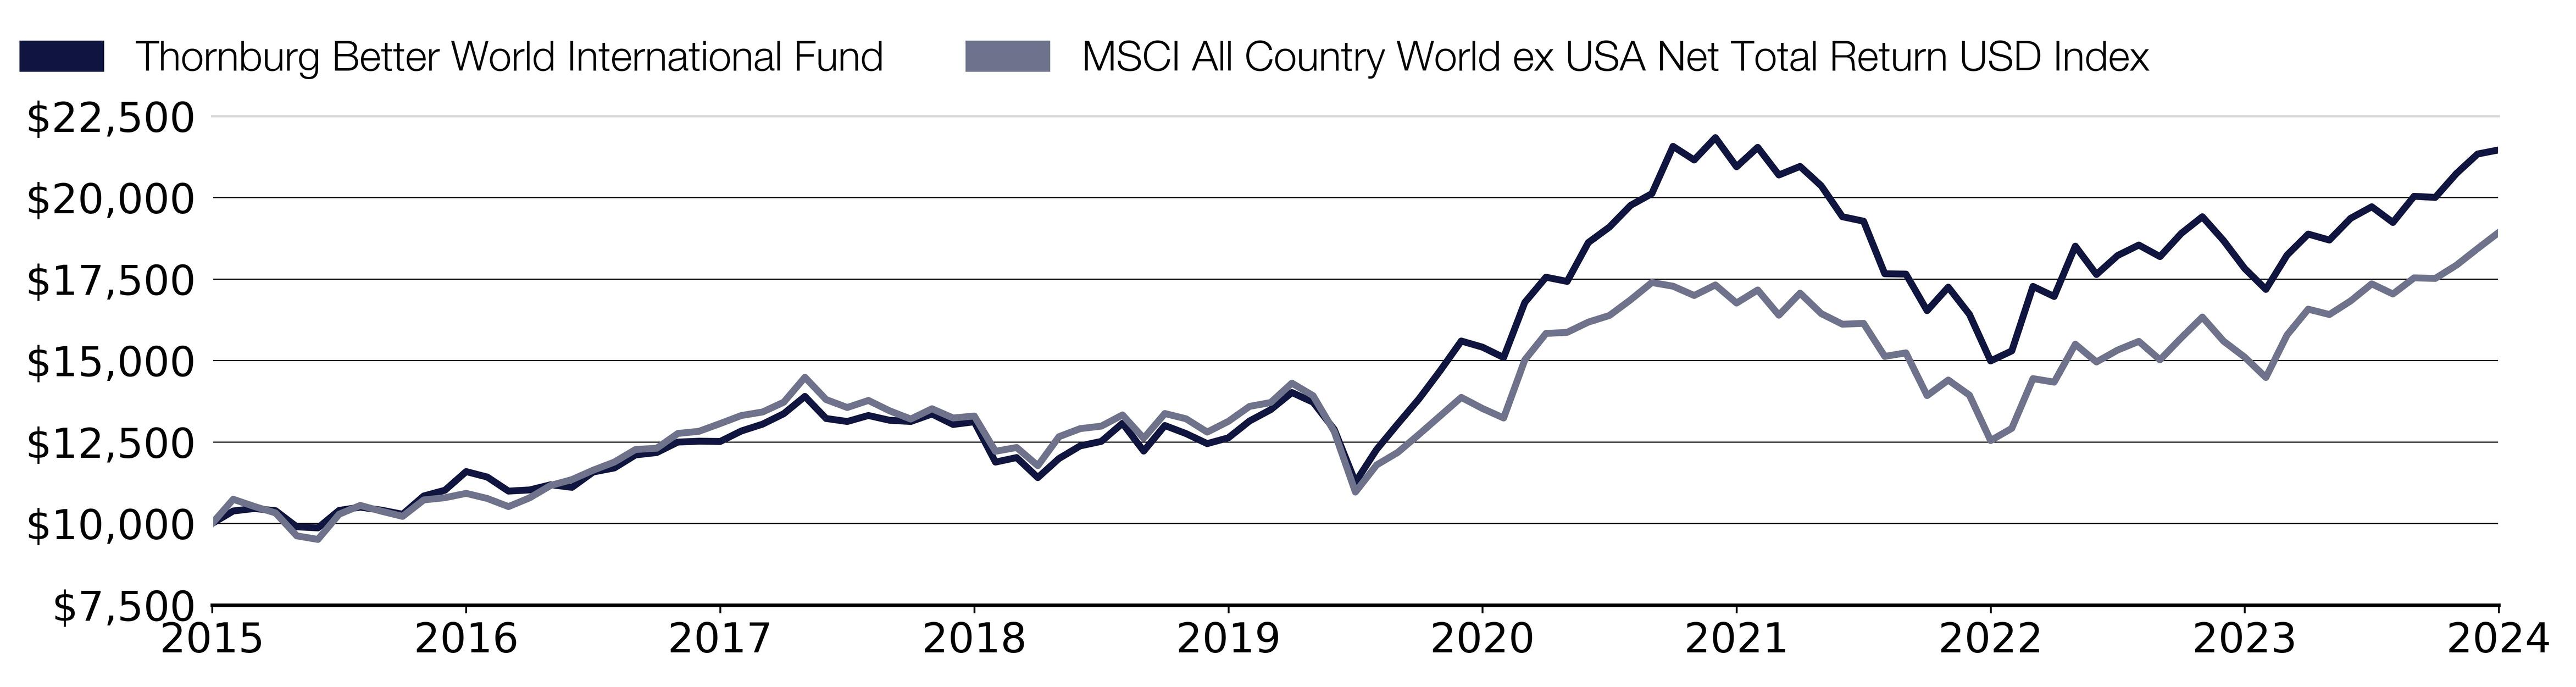
What were the Fund costs for the past year?
(based on a hypothetical $10,000 investment)
Class Name | Costs of a $10,000 investment | Costs paid as a percentage of a $10,000 investment |
|---|
Class C | $241.00 | 2.19% |
End Block
Thornburg Better World International Fund Tailored Shareholder Report
Thornburg Better World International Fund Tailored Shareholder Report | |
Annual Performance | 1 Year | 5 Year |
|---|
Better World International Fund Class C (with sales charge) | 19.42% | 11.19% |
Better World International Fund Class C (without sales charge) | 20.42% | 11.19% |
MSCI All Country World ex USA Net Total Return USD Index | 25.35% | 7.59% |
Key Fund Statistics
(as of September 30, 2024)
| |
|---|
Fund Size (Millions) | $570.1M |
Number of Holdings | 57 |
Annual Portfolio Turnover | 60.57% |
Total Advisory Fee | $4.7M |
What did the Fund invest in?
(as of September 30, 2024)
Market Capitalization Exposure | (%) |
|---|
| Small Cap (<$2.5 B) | 0.9 |
| Mid Cap ($2.5-12 B) | 14.4 |
| Large Cap (>$12 B) | 84.7 |
Market Capitalization Exposure | (%) |
Small Cap (<$2.5 B) | 0.9% |
Mid Cap ($2.5-12 B) | 14.4% |
Large Cap (>$12 B) | 84.7% |
Expressed as a percentage of the Fund’s net assets.
How has the Fund changed?
This is a summary of certain changes to the Fund since October 1, 2023. For more complete information, you may review the Fund’s next prospectus, which we expect to be available by February 1, 2025 at https://www.thornburg.com/download or upon request by calling 1-800-847-0200.
End Block
Changes In and Disagreements with Accountants
No changes and/or disagreements occurred in the current reporting period.
End Block
For additional information about the Fund, including its prospectus, financial information, holdings and proxy information, visit www.thornburg.com/download.

Thornburg Better World International Fund Tailored Shareholder Report | |
Thornburg Better World International Fund Tailored Shareholder Report
Thornburg Better World International Fund CLASS: I TICKER: TBWIX Annual Shareholder Report | |
This annual shareholder report contains important information about the Thornburg Better World International Fund Class I Shares for the period from October 1, 2023 to September 30, 2024. You can find additional information about the Fund at https://www.thornburg.com/download. You can also request this information by contacting us at 1-800-847-0200. This report also describes changes to the Fund that occurred during the reporting period.
How did the Fund perform last year and what affected its performance?
The Fund’s Class I shares underperformed the MSCI All Country World ex USA Net Total Return USD Index (the “Index”) during the 12-month period ended September 30, 2024. During the period, non-U.S. equities posted strong returns but lagged their U.S. counterparts, as U.S. mega-cap and artificial intelligence beneficiaries have continued to lead the market. Stock selection contributed positively to Fund performance relative to the Index over the period, aligning with the Fund’s focus on bottom-up security selection. Detractors from relative performance included sector and region/country allocations. Currency effects on the Fund’s performance were negative during the period. Within industrials, stock selection and a zero-weight positioning to energy contributed positively to relative results. However, stock selection in financials and consumer discretionary detracted from relative returns. From a geographic perspective, stock selection in Japan, the U.S., and Germany bolstered relative returns. The Fund’s stock selection in China, as well as an underweight positioning in Taiwan, were the largest detractors.
How did the Fund perform over the past 10 years?
The line graph below reflects a hypothetical $10,000 investment. The returns shown in the line graph and table assume the reinvestment of dividends and capital gains, but do not reflect the deduction of taxes that a shareholder would pay on distributions or the redemption of Fund shares. The performance information shown below represents past performance and is no guarantee of future results. For Fund performance current to the most recent month end, visit https://www.thornburg.com/product/mutual-funds/fbwi/TBWIX or call 1-800-847-0200. Performance for other share classes of the Fund will vary.
Cumulative Performance
Growth Table
Date | Thornburg Better World International Fund | MSCI All Country World ex USA Net Total Return USD Index |
09/30/2015 | 10000.0007 | 10000 |
10/31/2015 | 10393.6356 | 10744.4269 |
11/30/2015 | 10485.7629 | 10522.6463 |
12/31/2015 | 10427.1365 | 10324.4484 |
01/31/2016 | 9941.3743 | 9622.1621 |
02/29/2016 | 9916.2486 | 9512.1854 |
03/31/2016 | 10477.3877 | 10285.6197 |
04/30/2016 | 10594.6406 | 10556.2788 |
05/31/2016 | 10510.8885 | 10378.1234 |
06/30/2016 | 10393.6356 | 10219.3253 |
07/31/2016 | 10971.5251 | 10724.7271 |
08/31/2016 | 11155.7797 | 10792.5632 |
09/30/2016 | 11744.1432 | 10925.6087 |
10/31/2016 | 11592.7144 | 10768.5236 |
11/30/2016 | 11161.4184 | 10519.4486 |
12/31/2016 | 11214.6948 | 10788.5661 |
01/31/2017 | 11383.4036 | 11170.7437 |
02/28/2017 | 11321.2477 | 11348.842 |
03/31/2017 | 11816.9026 | 11636.5744 |
04/30/2017 | 11959.2749 | 11885.6494 |
05/31/2017 | 12377.4936 | 12271.3672 |
06/30/2017 | 12472.3061 | 12309.4537 |
07/31/2017 | 12812.7857 | 12763.1789 |
08/31/2017 | 12857.5856 | 12829.9301 |
09/30/2017 | 12868.8989 | 13068.0988 |
10/31/2017 | 13201.1733 | 13313.9761 |
11/30/2017 | 13429.6672 | 13422.1255 |
12/31/2017 | 13779.6859 | 13722.1347 |
01/31/2018 | 14341.5581 | 14486.3757 |
02/28/2018 | 13650.7316 | 13803.3324 |
03/31/2018 | 13586.2545 | 13559.8534 |
04/30/2018 | 13779.6859 | 13776.3807 |
05/31/2018 | 13650.7316 | 13458.2705 |
06/30/2018 | 13623.0986 | 13205.3127 |
07/31/2018 | 13881.0071 | 13521.1388 |
08/31/2018 | 13549.4104 | 13238.1458 |
09/30/2018 | 13659.9427 | 13298.4446 |
10/31/2018 | 12379.6109 | 12216.7786 |
11/30/2018 | 12537.4517 | 12332.4083 |
12/31/2018 | 11906.7674 | 11774.2451 |
01/31/2019 | 12544.088 | 12663.8801 |
02/28/2019 | 12948.736 | 12911.2992 |
03/31/2019 | 13110.5952 | 12988.2143 |
04/30/2019 | 13717.5672 | 13331.3348 |
05/31/2019 | 12827.3416 | 12615.801 |
06/30/2019 | 13677.1024 | 13375.4739 |
07/31/2019 | 13424.1974 | 13213.5923 |
08/31/2019 | 13110.5952 | 12805.4908 |
09/30/2019 | 13312.9192 | 13135.0212 |
10/31/2019 | 13869.3102 | 13593.3146 |
11/30/2019 | 14253.7258 | 13713.1698 |
12/31/2019 | 14838.5538 | 14307.0212 |
01/31/2020 | 14520.8775 | 13922.6737 |
02/29/2020 | 13649.8298 | 12822.1644 |
03/31/2020 | 11948.7249 | 10965.5795 |
04/30/2020 | 13034.9726 | 11796.5717 |
05/31/2020 | 13885.5251 | 12182.6321 |
06/30/2020 | 14715.5823 | 12733.2009 |
07/31/2020 | 15648.1157 | 13300.8999 |
08/31/2020 | 16642.1349 | 13870.2549 |
09/30/2020 | 16457.6777 | 13529.3043 |
10/31/2020 | 16140.0015 | 13238.4313 |
11/30/2020 | 17964.0779 | 15019.186 |
12/31/2020 | 18807.6705 | 15830.9922 |
01/31/2021 | 18694.4952 | 15865.4241 |
02/28/2021 | 19990.8664 | 16179.4802 |
03/31/2021 | 20525.8767 | 16384.0163 |
04/30/2021 | 21266.6602 | 16866.3492 |
05/31/2021 | 21678.2066 | 17393.9062 |
06/30/2021 | 23262.6603 | 17281.1886 |
07/31/2021 | 22830.5365 | 16996.4255 |
08/31/2021 | 23591.8974 | 17319.5034 |
09/30/2021 | 22665.918 | 16764.9376 |
10/31/2021 | 23324.3922 | 17165.1021 |
11/30/2021 | 22437.0878 | 16392.1817 |
12/31/2021 | 22742.5435 | 17069.6291 |
01/31/2022 | 22117.6836 | 16440.6034 |
02/28/2022 | 21115.5497 | 16115.1843 |
03/31/2022 | 20985.8618 | 16140.8798 |
04/30/2022 | 19252.7597 | 15127.3354 |
05/31/2022 | 19264.5495 | 15235.8846 |
06/30/2022 | 18050.1991 | 13925.1861 |
07/31/2022 | 18851.9062 | 14401.9232 |
08/31/2022 | 17967.6704 | 13938.7191 |
09/30/2022 | 16423.2053 | 12545.7951 |
10/31/2022 | 16776.8996 | 12920.7208 |
11/30/2022 | 18899.0654 | 14445.9481 |
12/31/2022 | 18647.1891 | 14337.9128 |
01/31/2023 | 20359.6861 | 15500.8908 |
02/28/2023 | 19432.0836 | 14956.7745 |
03/31/2023 | 20098.0546 | 15322.3928 |
04/30/2023 | 20466.7171 | 15588.5981 |
05/31/2023 | 20086.1623 | 15021.8126 |
06/30/2023 | 20894.8414 | 15695.8339 |
07/31/2023 | 21489.4584 | 16333.9386 |
08/31/2023 | 20704.5639 | 15596.2496 |
09/30/2023 | 19788.8538 | 15103.6385 |
10/31/2023 | 19087.2057 | 14480.4943 |
11/30/2023 | 20276.4397 | 15783.9409 |
12/31/2023 | 21018.3126 | 16576.9609 |
01/31/2024 | 20837.1202 | 16412.2813 |
02/29/2024 | 21598.1281 | 16827.8059 |
03/31/2024 | 22020.9103 | 17353.8212 |
04/30/2024 | 21501.4922 | 17042.2205 |
05/31/2024 | 22431.6129 | 17536.9444 |
06/30/2024 | 22407.454 | 17520.2138 |
07/31/2024 | 23265.0977 | 17925.917 |
08/31/2024 | 23965.7082 | 18436.4579 |
09/30/2024 | 24122.7415 | 18932.8948 |
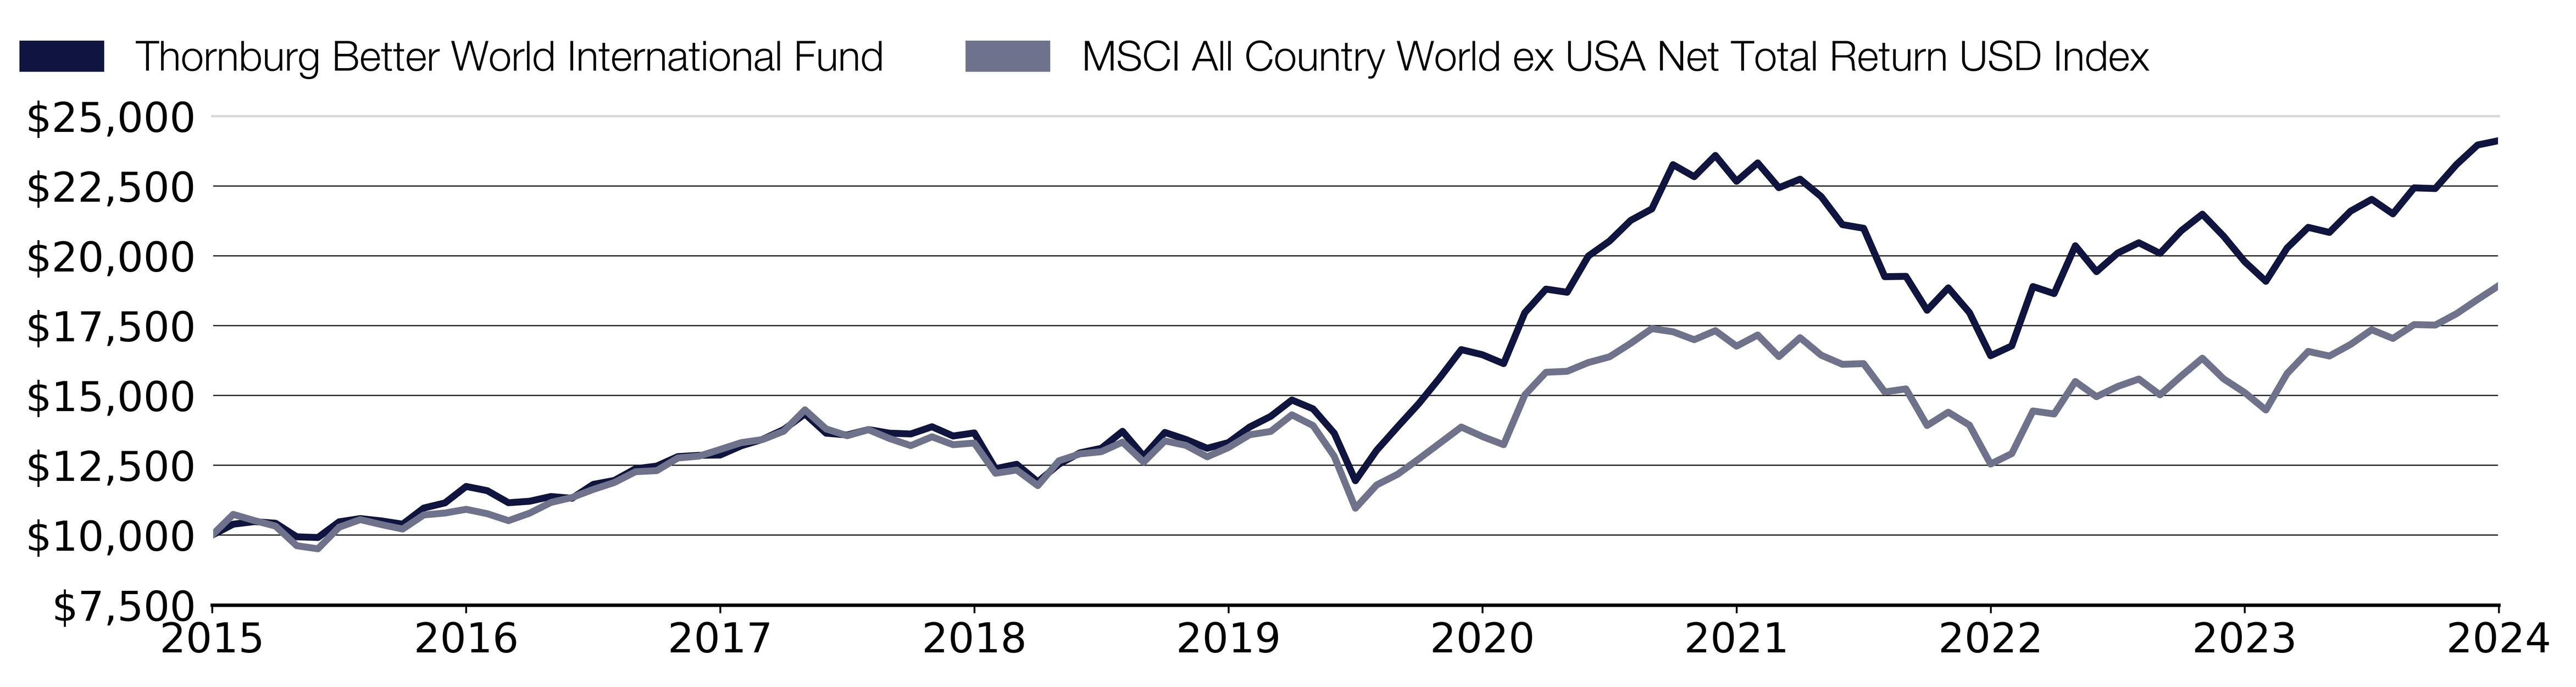
What were the Fund costs for the past year?
(based on a hypothetical $10,000 investment)
Class Name | Costs of a $10,000 investment | Costs paid as a percentage of a $10,000 investment |
|---|
Class I | $100.00 | 0.90% |
End Block
Thornburg Better World International Fund Tailored Shareholder Report
Thornburg Better World International Fund Tailored Shareholder Report | |
Annual Performance | 1 Year | 5 Year |
|---|
Better World International Fund Class I | 21.90% | 12.62% |
MSCI All Country World ex USA Net Total Return USD Index | 25.35% | 7.59% |
Key Fund Statistics
(as of September 30, 2024)
| |
|---|
Fund Size (Millions) | $570.1M |
Number of Holdings | 57 |
Annual Portfolio Turnover | 60.57% |
Total Advisory Fee | $4.7M |
What did the Fund invest in?
(as of September 30, 2024)
Market Capitalization Exposure | (%) |
|---|
| Small Cap (<$2.5 B) | 0.9 |
| Mid Cap ($2.5-12 B) | 14.4 |
| Large Cap (>$12 B) | 84.7 |
Market Capitalization Exposure | (%) |
Small Cap (<$2.5 B) | 0.9% |
Mid Cap ($2.5-12 B) | 14.4% |
Large Cap (>$12 B) | 84.7% |
Expressed as a percentage of the Fund’s net assets.
How has the Fund changed?
This is a summary of certain changes to the Fund since October 1, 2023. For more complete information, you may review the Fund’s next prospectus, which we expect to be available by February 1, 2025 at https://www.thornburg.com/download or upon request by calling 1-800-847-0200.
End Block
Changes In and Disagreements with Accountants
No changes and/or disagreements occurred in the current reporting period.
End Block
For additional information about the Fund, including its prospectus, financial information, holdings and proxy information, visit www.thornburg.com/download.

Thornburg Better World International Fund Tailored Shareholder Report | |
Thornburg International Growth Fund Tailored Shareholder Report
Thornburg International Growth Fund CLASS: A TICKER: TIGAX Annual Shareholder Report | |
This annual shareholder report contains important information about the Thornburg International Growth Fund Class A Shares for the period from October 1, 2023 to September 30, 2024. You can find additional information about the Fund at https://www.thornburg.com/download. You can also request this information by contacting us at 1-800-847-0200. This report also describes changes to the Fund that occurred during the reporting period.
How did the Fund perform last year and what affected its performance?
The Fund’s Class A shares underperformed the MSCI All Country World ex USA Growth Net Total Return USD Index (the “Index”) during the 12-month period ended September 30, 2024. During the period, non-U.S. equities have posted strong returns but lagged their U.S. counterparts, as U.S. mega-cap and artificial intelligence beneficiaries have continued to lead the market. The Fund’s underperformance relative to the Index was primarily driven by portfolio allocations across sectors and countries. However, strong stock selection added to relative results, consistent with the Fund’s bottom-up investment process. The Fund’s cash allocation was a drag on performance. Within information technology and consumer services, both stock selection and general positioning versus the Index bolstered relative returns. Security selection within South Korea and Brazil also contributed to relative returns. The Fund’s overweight exposure to consumer staples and the UK were detractors from relative performance as both underperformed other sectors and countries, respectively.
How did the Fund perform over the past 10 years?
The line graph below reflects a hypothetical $10,000 investment and assumes the deduction of the maximum sales charge associated with that investment. The returns shown in the line graph and table assume the reinvestment of dividends and capital gains, but do not reflect the deduction of taxes that a shareholder would pay on distributions or the redemption of Fund shares. The performance information shown below represents past performance and is no guarantee of future results. For Fund performance current to the most recent month end, visit https://www.thornburg.com/product/mutual-funds/fig/TIGAX or call 1-800-847-0200. Performance for other share classes of the Fund will vary.
Cumulative Performance
Growth Table
Date | Thornburg International Growth Fund | MSCI All Country World ex USA Growth Net Total Return USD Index | MSCI All Country World ex USA Net Total Return USD Index |
09/30/2014 | 9550 | 10000 | 10000 |
10/31/2014 | 9780 | 9965.2434 | 9900.9916 |
11/30/2014 | 9800.0074 | 10111.108 | 9972.6147 |
12/31/2014 | 9489.314 | 9769.5894 | 9613.0446 |
01/31/2015 | 9310.2703 | 9843.0021 | 9598.8003 |
02/28/2015 | 10115.9668 | 10348.0743 | 10111.9989 |
03/31/2015 | 9942.1891 | 10237.4749 | 9948.5397 |
04/30/2015 | 10431.9262 | 10688.4625 | 10451.1052 |
05/31/2015 | 10421.3942 | 10573.2855 | 10287.947 |
06/30/2015 | 10068.5729 | 10297.4371 | 10000.9028 |
07/31/2015 | 10194.9566 | 10324.4511 | 9973.1163 |
08/31/2015 | 9731.5495 | 9548.6733 | 9210.8418 |
09/30/2015 | 9357.6642 | 9188.0528 | 8783.7614 |
10/31/2015 | 10026.445 | 9884.1448 | 9437.6483 |
11/30/2015 | 10194.9566 | 9773.3194 | 9242.8415 |
12/31/2015 | 10089.6368 | 9647.1785 | 9068.7492 |
01/31/2016 | 9373.4622 | 9052.0218 | 8451.8776 |
02/29/2016 | 9204.9505 | 8938.3707 | 8355.2767 |
03/31/2016 | 9752.6135 | 9614.8521 | 9034.6429 |
04/30/2016 | 9620.9637 | 9760.6601 | 9272.3835 |
05/31/2016 | 9794.7414 | 9697.5896 | 9115.896 |
06/30/2016 | 9241.8124 | 9659.3857 | 8976.4115 |
07/31/2016 | 9852.6673 | 10124.0498 | 9420.3444 |
08/31/2016 | 10100.1688 | 10088.1065 | 9479.93 |
09/30/2016 | 10127.9213 | 10245.1609 | 9596.794 |
10/31/2016 | 9790.6753 | 9896.9171 | 9458.8142 |
11/30/2016 | 9543.0102 | 9519.9073 | 9240.0327 |
12/31/2016 | 9579.8965 | 9659.2161 | 9476.419 |
01/31/2017 | 9954.0288 | 10048.094 | 9812.1147 |
02/28/2017 | 10017.2625 | 10250.3038 | 9968.552 |
03/31/2017 | 10607.4431 | 10540.733 | 10221.2893 |
04/30/2017 | 11160.7375 | 10847.2124 | 10440.0708 |
05/31/2017 | 11645.5287 | 11329.4527 | 10778.8762 |
06/30/2017 | 11666.6066 | 11338.0994 | 10812.3304 |
07/31/2017 | 12272.5956 | 11730.9333 | 11210.8719 |
08/31/2017 | 12183.0146 | 11848.5405 | 11269.5045 |
09/30/2017 | 12571.168 | 12056.2887 | 11478.7062 |
10/31/2017 | 12560.6262 | 12346.2093 | 11694.6789 |
11/30/2017 | 12562.6316 | 12482.0707 | 11789.6748 |
12/31/2017 | 12868.3715 | 12751.4199 | 12053.1957 |
01/31/2018 | 13791.0506 | 13415.7507 | 12724.4868 |
02/28/2018 | 13305.1427 | 12815.5642 | 12124.5179 |
03/31/2018 | 13108.5956 | 12640.3685 | 11910.6517 |
04/30/2018 | 13174.1113 | 12735.1437 | 12100.8441 |
05/31/2018 | 13397.9566 | 12662.8048 | 11821.4237 |
06/30/2018 | 13370.6584 | 12460.4821 | 11599.2316 |
07/31/2018 | 13539.9072 | 12674.4469 | 11876.6458 |
08/31/2018 | 13316.062 | 12531.6341 | 11628.0714 |
09/30/2018 | 12983.0239 | 12428.0991 | 11681.0364 |
10/31/2018 | 11792.8224 | 11264.5737 | 10730.9268 |
11/30/2018 | 11570.9372 | 11435.2482 | 10832.4932 |
12/31/2018 | 10679.2036 | 10911.9218 | 10342.216 |
01/31/2019 | 11579.9958 | 11741.9537 | 11123.6502 |
02/28/2019 | 11868.9292 | 12059.2274 | 11340.9771 |
03/31/2019 | 12276.8351 | 12255.4466 | 11408.5376 |
04/30/2019 | 12922.6862 | 12641.2727 | 11709.9264 |
05/31/2019 | 11919.9174 | 11992.9922 | 11081.4186 |
06/30/2019 | 12458.1266 | 12789.0587 | 11748.6972 |
07/31/2019 | 12480.7881 | 12762.3273 | 11606.5043 |
08/31/2019 | 12248.5083 | 12531.5211 | 11248.0376 |
09/30/2019 | 12157.8626 | 12680.5505 | 11537.4893 |
10/31/2019 | 12560.1031 | 13141.5977 | 11940.0432 |
11/30/2019 | 12868.7112 | 13342.0554 | 12045.3212 |
12/31/2019 | 13444.8325 | 13895.2782 | 12566.946 |
01/31/2020 | 13478.9999 | 13761.7904 | 12229.3444 |
02/29/2020 | 12846.9048 | 12757.4105 | 11262.6833 |
03/31/2020 | 11463.1292 | 11360.0271 | 9631.9034 |
04/30/2020 | 12522.3154 | 12340.2187 | 10361.8271 |
05/31/2020 | 13701.0873 | 12877.1087 | 10700.9334 |
06/30/2020 | 14435.6843 | 13530.5886 | 11184.5398 |
07/31/2020 | 15608.7616 | 14447.8793 | 11683.1931 |
08/31/2020 | 16320.5803 | 15037.215 | 12183.301 |
09/30/2020 | 16155.4383 | 14905.253 | 11883.8181 |
10/31/2020 | 15904.8781 | 14643.7028 | 11628.3222 |
11/30/2020 | 17136.7577 | 16132.5836 | 13192.4946 |
12/31/2020 | 18007.7272 | 16980.1916 | 13905.5658 |
01/31/2021 | 17932.7431 | 17083.2179 | 13935.81 |
02/28/2021 | 17955.8151 | 17021.1648 | 14211.6693 |
03/31/2021 | 17407.8542 | 16967.4193 | 14391.329 |
04/30/2021 | 18296.1277 | 17593.433 | 14814.9987 |
05/31/2021 | 18013.4952 | 18018.1412 | 15278.3922 |
06/30/2021 | 18290.3597 | 18087.4848 | 15179.3838 |
07/31/2021 | 18192.3035 | 17812.7102 | 14929.2546 |
08/31/2021 | 18665.2804 | 18215.1516 | 15213.0386 |
09/30/2021 | 17459.7663 | 17432.253 | 14725.9212 |
10/31/2021 | 18036.5673 | 17972.3643 | 15077.4162 |
11/30/2021 | 16834.1595 | 17323.236 | 14398.5013 |
12/31/2021 | 17203.7349 | 17845.2061 | 14993.5549 |
01/31/2022 | 15805.5079 | 16406.3975 | 14441.0338 |
02/28/2022 | 15066.3571 | 15947.6674 | 14155.1934 |
03/31/2022 | 14653.6646 | 15922.2922 | 14177.7637 |
04/30/2022 | 13544.9384 | 14737.5738 | 13287.4905 |
05/31/2022 | 13471.0233 | 14610.9243 | 13382.8375 |
06/30/2022 | 12362.2971 | 13420.7805 | 12231.5513 |
07/31/2022 | 13193.8418 | 14159.4846 | 12650.3057 |
08/31/2022 | 12528.6061 | 13607.2226 | 12243.4383 |
09/30/2022 | 11222.773 | 12163.3841 | 11019.9271 |
10/31/2022 | 11493.7949 | 12402.2719 | 11349.2529 |
11/30/2022 | 13132.2459 | 13943.9939 | 12688.9762 |
12/31/2022 | 12674.5268 | 13731.1594 | 12594.0806 |
01/31/2023 | 13903.6842 | 14892.6503 | 13615.6126 |
02/28/2023 | 13496.024 | 14254.9945 | 13137.6739 |
03/31/2023 | 14169.281 | 14910.9045 | 13458.8242 |
04/30/2023 | 14286.6377 | 15061.7989 | 13692.6526 |
05/31/2023 | 13928.3908 | 14644.7201 | 13194.8018 |
06/30/2023 | 14484.2911 | 15200.8251 | 13786.846 |
07/31/2023 | 14712.8279 | 15674.4751 | 14347.342 |
08/31/2023 | 14175.4576 | 14875.1307 | 13699.3735 |
09/30/2023 | 13335.4305 | 14090.1975 | 13266.6757 |
10/31/2023 | 12866.0036 | 13541.835 | 12719.3207 |
11/30/2023 | 14292.8144 | 14943.2875 | 13864.2371 |
12/31/2023 | 14950.5647 | 15657.7468 | 14560.8069 |
01/31/2024 | 15173.4302 | 15538.1051 | 14416.1563 |
02/29/2024 | 15860.599 | 16132.1315 | 14781.1433 |
03/31/2024 | 16324.9023 | 16583.1756 | 15243.1825 |
04/30/2024 | 15643.9242 | 16124.502 | 14969.4799 |
05/31/2024 | 16232.0416 | 16549.4928 | 15404.0336 |
06/30/2024 | 16461.0979 | 16703.2129 | 15389.3378 |
07/31/2024 | 16163.9438 | 16879.5388 | 15745.6978 |
08/31/2024 | 16801.5869 | 17416.4288 | 16194.1448 |
09/30/2024 | 16776.8241 | 17859.1088 | 16630.2031 |

Effective September 30, 2024, the Fund adopted the MSCI All Country World ex USA Net Total Return USD Index as its broad-based securities market index that represents the overall applicable market in which the Fund invests, and the MSCI All Country World ex USA Growth Net Total Return USD Index as an additional index that represents the market sectors which the Fund’s advisor believes are more representative of the Fund’s investment universe.
What were the Fund costs for the past year?
(based on a hypothetical $10,000 investment)
Class Name | Costs of a $10,000 investment | Costs paid as a percentage of a $10,000 investment |
|---|
Class A | $154.00 | 1.37% |
End Block
Thornburg International Growth Fund Tailored Shareholder Report
Thornburg International Growth Fund Tailored Shareholder Report | |
Annual Performance | 1 Year | 5 Year | 10 Year |
|---|
International Growth Fund Class A (with sales charge) | 20.13% | 5.68% | 5.31% |
International Growth Fund Class A (without sales charge) | 25.81% | 6.65% | 5.80% |
MSCI All Country World ex USA Growth Net Total Return USD Index | 26.75% | 7.09% | 5.97% |
MSCI All Country World ex USA Net Total Return USD Index | 25.35% | 7.59% | 5.22% |
Key Fund Statistics
(as of September 30, 2024)
| |
|---|
Fund Size (Millions) | $881.6M |
Number of Holdings | 46 |
Annual Portfolio Turnover | 44.57% |
Total Advisory Fee | $7.3M |
What did the Fund invest in?
(as of September 30, 2024)
Market Capitalization Exposure | (%) |
|---|
| Small Cap (<$2.5 B) | 3.7 |
| Mid Cap ($2.5-12 B) | 14.0 |
| Large Cap (>$12 B) | 82.3 |
Market Capitalization Exposure | (%) |
Small Cap (<$2.5 B) | 3.7% |
Mid Cap ($2.5-12 B) | 14.0% |
Large Cap (>$12 B) | 82.3% |

Expressed as a percentage of the Fund’s net assets.
How has the Fund changed?
This is a summary of certain changes to the Fund since October 1, 2023. For more complete information, you may review the Fund’s next prospectus, which we expect to be available by February 1, 2025 at https://www.thornburg.com/download or upon request by calling 1-800-847-0200.
End Block
Changes In and Disagreements with Accountants
No changes and/or disagreements occurred in the current reporting period.
End Block
For additional information about the Fund, including its prospectus, financial information, holdings and proxy information, visit www.thornburg.com/download.

Thornburg International Growth Fund Tailored Shareholder Report | |
Thornburg International Growth Fund Tailored Shareholder Report
Thornburg International Growth Fund CLASS: C TICKER: TIGCX Annual Shareholder Report | |
This annual shareholder report contains important information about the Thornburg International Growth Fund Class C Shares for the period from October 1, 2023 to September 30, 2024. You can find additional information about the Fund at https://www.thornburg.com/download. You can also request this information by contacting us at 1-800-847-0200. This report also describes changes to the Fund that occurred during the reporting period.
How did the Fund perform last year and what affected its performance?
The Fund’s Class C shares underperformed the MSCI All Country World ex USA Growth Net Total Return USD Index (the “Index”) during the 12-month period ended September 30, 2024. During the period, non-U.S. equities have posted strong returns but lagged their U.S. counterparts, as U.S. mega-cap and artificial intelligence beneficiaries have continued to lead the market. The Fund’s underperformance relative to the Index was primarily driven by portfolio allocations across sectors and countries. However, strong stock selection added to relative results, consistent with the Fund’s bottom-up investment process. The Fund’s cash allocation was a drag on performance. Within information technology and consumer services, both stock selection and general positioning versus the Index bolstered relative returns. Security selection within South Korea and Brazil also contributed to relative returns. The Fund’s overweight exposure to consumer staples and the UK were detractors from relative performance as both underperformed other sectors and countries, respectively.
How did the Fund perform over the past 10 years?
The line graph below reflects a hypothetical $10,000 investment. The returns shown in the line graph and table assume the reinvestment of dividends and capital gains, but do not reflect the deduction of taxes that a shareholder would pay on distributions or the redemption of Fund shares. The performance information shown below represents past performance and is no guarantee of future results. For Fund performance current to the most recent month end, visit https://www.thornburg.com/product/mutual-funds/fig/TIGCX or call 1-800-847-0200. Performance for other share classes of the Fund will vary.
Cumulative Performance
Growth Table
Date | Thornburg International Growth Fund | MSCI All Country World ex USA Growth Net Total Return USD Index | MSCI All Country World ex USA Net Total Return USD Index |
09/30/2014 | 9999.9922 | 10000 | 10000 |
10/31/2014 | 10238.4744 | 9965.2434 | 9900.9916 |
11/30/2014 | 10254.6153 | 10111.108 | 9972.6147 |
12/31/2014 | 9917.1795 | 9769.5894 | 9613.0446 |
01/31/2015 | 9728.4443 | 9843.0021 | 9598.8003 |
02/28/2015 | 10563.4548 | 10348.0743 | 10111.9989 |
03/31/2015 | 10374.7195 | 10237.4749 | 9948.5397 |
04/30/2015 | 10883.7327 | 10688.4625 | 10451.1052 |
05/31/2015 | 10866.575 | 10573.2855 | 10287.947 |
06/30/2015 | 10489.1045 | 10297.4371 | 10000.9028 |
07/31/2015 | 10614.928 | 10324.4511 | 9973.1163 |
08/31/2015 | 10123.0725 | 9548.6733 | 9210.8418 |
09/30/2015 | 9728.4443 | 9188.0528 | 8783.7614 |
10/31/2015 | 10409.035 | 9884.1448 | 9437.6483 |
11/30/2015 | 10580.6125 | 9773.3194 | 9242.8415 |
12/31/2015 | 10466.2275 | 9647.1785 | 9068.7492 |
01/31/2016 | 9717.0057 | 9052.0218 | 8451.8776 |
02/29/2016 | 9533.9897 | 8938.3707 | 8355.2767 |
03/31/2016 | 10094.4763 | 9614.8521 | 9034.6429 |
04/30/2016 | 9957.2143 | 9760.6601 | 9272.3835 |
05/31/2016 | 10123.0725 | 9697.5896 | 9115.896 |
06/30/2016 | 9551.1475 | 9659.3857 | 8976.4115 |
07/31/2016 | 10174.5457 | 10124.0498 | 9420.3444 |
08/31/2016 | 10426.1928 | 10088.1065 | 9479.93 |
09/30/2016 | 10443.3505 | 10245.1609 | 9596.794 |
10/31/2016 | 10088.757 | 9896.9171 | 9458.8142 |
11/30/2016 | 9825.6715 | 9519.9073 | 9240.0327 |
12/31/2016 | 9859.987 | 9659.2161 | 9476.419 |
01/31/2017 | 10237.4575 | 10048.094 | 9812.1147 |
02/28/2017 | 10294.65 | 10250.3038 | 9968.552 |
03/31/2017 | 10900.8905 | 10540.733 | 10221.2893 |
04/30/2017 | 11461.377 | 10847.2124 | 10440.0708 |
05/31/2017 | 11953.2325 | 11329.4527 | 10778.8762 |
06/30/2017 | 11970.3902 | 11338.0994 | 10812.3304 |
07/31/2017 | 12582.35 | 11730.9333 | 11210.8719 |
08/31/2017 | 12479.4035 | 11848.5405 | 11269.5045 |
09/30/2017 | 12868.3125 | 12056.2887 | 11478.7062 |
10/31/2017 | 12851.1548 | 12346.2093 | 11694.6789 |
11/30/2017 | 12847.6031 | 12482.0707 | 11789.6748 |
12/31/2017 | 13150.3885 | 12751.4199 | 12053.1957 |
01/31/2018 | 14082.4928 | 13415.7507 | 12724.4868 |
02/28/2018 | 13577.8504 | 12815.5642 | 12124.5179 |
03/31/2018 | 13370.0564 | 12640.3685 | 11910.6517 |
04/30/2018 | 13423.4892 | 12735.1437 | 12100.8441 |
05/31/2018 | 13649.094 | 12662.8048 | 11821.4237 |
06/30/2018 | 13607.5352 | 12460.4821 | 11599.2316 |
07/31/2018 | 13773.7704 | 12674.4469 | 11876.6458 |
08/31/2018 | 13536.2916 | 12531.6341 | 11628.0714 |
09/30/2018 | 13186.0104 | 12428.0991 | 11681.0364 |
10/31/2018 | 11974.8685 | 11264.5737 | 10730.9268 |
11/30/2018 | 11739.3216 | 11435.2482 | 10832.4932 |
12/31/2018 | 10826.3318 | 10911.9218 | 10342.216 |
01/31/2019 | 11733.1527 | 11741.9537 | 11123.6502 |
02/28/2019 | 12023.0886 | 12059.2274 | 11340.9771 |
03/31/2019 | 12424.0639 | 12255.4466 | 11408.5376 |
04/30/2019 | 13071.7931 | 12641.2727 | 11709.9264 |
05/31/2019 | 12047.7641 | 11992.9922 | 11081.4186 |
06/30/2019 | 12584.454 | 12789.0587 | 11748.6972 |
07/31/2019 | 12602.9605 | 12762.3273 | 11606.5043 |
08/31/2019 | 12356.2066 | 12531.5211 | 11248.0376 |
09/30/2019 | 12257.505 | 12680.5505 | 11537.4893 |
10/31/2019 | 12652.3114 | 13141.5977 | 11940.0432 |
11/30/2019 | 12957.4612 | 13342.0554 | 12045.3212 |
12/31/2019 | 13528.1105 | 13895.2782 | 12566.946 |
01/31/2020 | 13552.9214 | 13761.7904 | 12229.3444 |
02/29/2020 | 12914.0422 | 12757.4105 | 11262.6833 |
03/31/2020 | 11512.2298 | 11360.0271 | 9631.9034 |
04/30/2020 | 12572.8932 | 12340.2187 | 10361.8271 |
05/31/2020 | 13739.0026 | 12877.1087 | 10700.9334 |
06/30/2020 | 14470.9224 | 13530.5886 | 11184.5398 |
07/31/2020 | 15637.0319 | 14447.8793 | 11683.1931 |
08/31/2020 | 16344.1408 | 15037.215 | 12183.301 |
09/30/2020 | 16164.2623 | 14905.253 | 11883.8181 |
10/31/2020 | 15903.7484 | 14643.7028 | 11628.3222 |
11/30/2020 | 17121.4072 | 16132.5836 | 13192.4946 |
12/31/2020 | 17976.8486 | 16980.1916 | 13905.5658 |
01/31/2021 | 17895.0784 | 17083.2179 | 13935.81 |
02/28/2021 | 17907.6585 | 17021.1648 | 14211.6693 |
03/31/2021 | 17347.8476 | 16967.4193 | 14391.329 |
04/30/2021 | 18222.159 | 17593.433 | 14814.9987 |
05/31/2021 | 17926.5285 | 18018.1412 | 15278.3922 |
06/30/2021 | 18190.7089 | 18087.4848 | 15179.3838 |
07/31/2021 | 18083.7788 | 17812.7102 | 14929.2546 |
08/31/2021 | 18542.9495 | 18215.1516 | 15213.0386 |
09/30/2021 | 17328.9775 | 17432.253 | 14725.9212 |
10/31/2021 | 17888.7884 | 17972.3643 | 15077.4162 |
11/30/2021 | 16683.9263 | 17323.236 | 14398.5013 |
12/31/2021 | 17035.594 | 17845.2061 | 14993.5549 |
01/31/2022 | 15642.4489 | 16406.3975 | 14441.0338 |
02/28/2022 | 14898.5365 | 15947.6674 | 14155.1934 |
03/31/2022 | 14479.2404 | 15922.2922 | 14177.7637 |
04/30/2022 | 13376.8975 | 14737.5738 | 13287.4905 |
05/31/2022 | 13295.7434 | 14610.9243 | 13382.8375 |
06/30/2022 | 12193.4005 | 13420.7805 | 12231.5513 |
07/31/2022 | 12998.1785 | 14159.4846 | 12650.3057 |
08/31/2022 | 12335.4202 | 13607.2226 | 12243.4383 |
09/30/2022 | 11043.7177 | 12163.3841 | 11019.9271 |
10/31/2022 | 11300.7056 | 12402.2719 | 11349.2529 |
11/30/2022 | 12903.4987 | 13943.9939 | 12688.9762 |
12/31/2022 | 12443.6256 | 13731.1594 | 12594.0806 |
01/31/2023 | 13640.6483 | 14892.6503 | 13615.6126 |
02/28/2023 | 13228.115 | 14254.9945 | 13137.6739 |
03/31/2023 | 13877.3477 | 14910.9045 | 13458.8242 |
04/30/2023 | 13985.5531 | 15061.7989 | 13692.6526 |
05/31/2023 | 13620.3598 | 14644.7201 | 13194.8018 |
06/30/2023 | 14154.6241 | 15200.8251 | 13786.846 |
07/31/2023 | 14371.035 | 15674.4751 | 14347.342 |
08/31/2023 | 13830.0078 | 14875.1307 | 13699.3735 |
09/30/2023 | 12998.1785 | 14090.1975 | 13266.6757 |
10/31/2023 | 12531.5425 | 13541.835 | 12719.3207 |
11/30/2023 | 13911.1619 | 14943.2875 | 13864.2371 |
12/31/2023 | 14540.106 | 15657.7468 | 14560.8069 |
01/31/2024 | 14742.9912 | 15538.1051 | 14416.1563 |
02/29/2024 | 15398.9867 | 16132.1315 | 14781.1433 |
03/31/2024 | 15838.5713 | 16583.1756 | 15243.1825 |
04/30/2024 | 15162.2873 | 16124.502 | 14969.4799 |
05/31/2024 | 15723.603 | 16549.4928 | 15404.0336 |
06/30/2024 | 15933.251 | 16703.2129 | 15389.3378 |
07/31/2024 | 15628.9232 | 16879.5388 | 15745.6978 |
08/31/2024 | 16230.816 | 17416.4288 | 16194.1448 |
09/30/2024 | 16197.0018 | 17859.1088 | 16630.2031 |
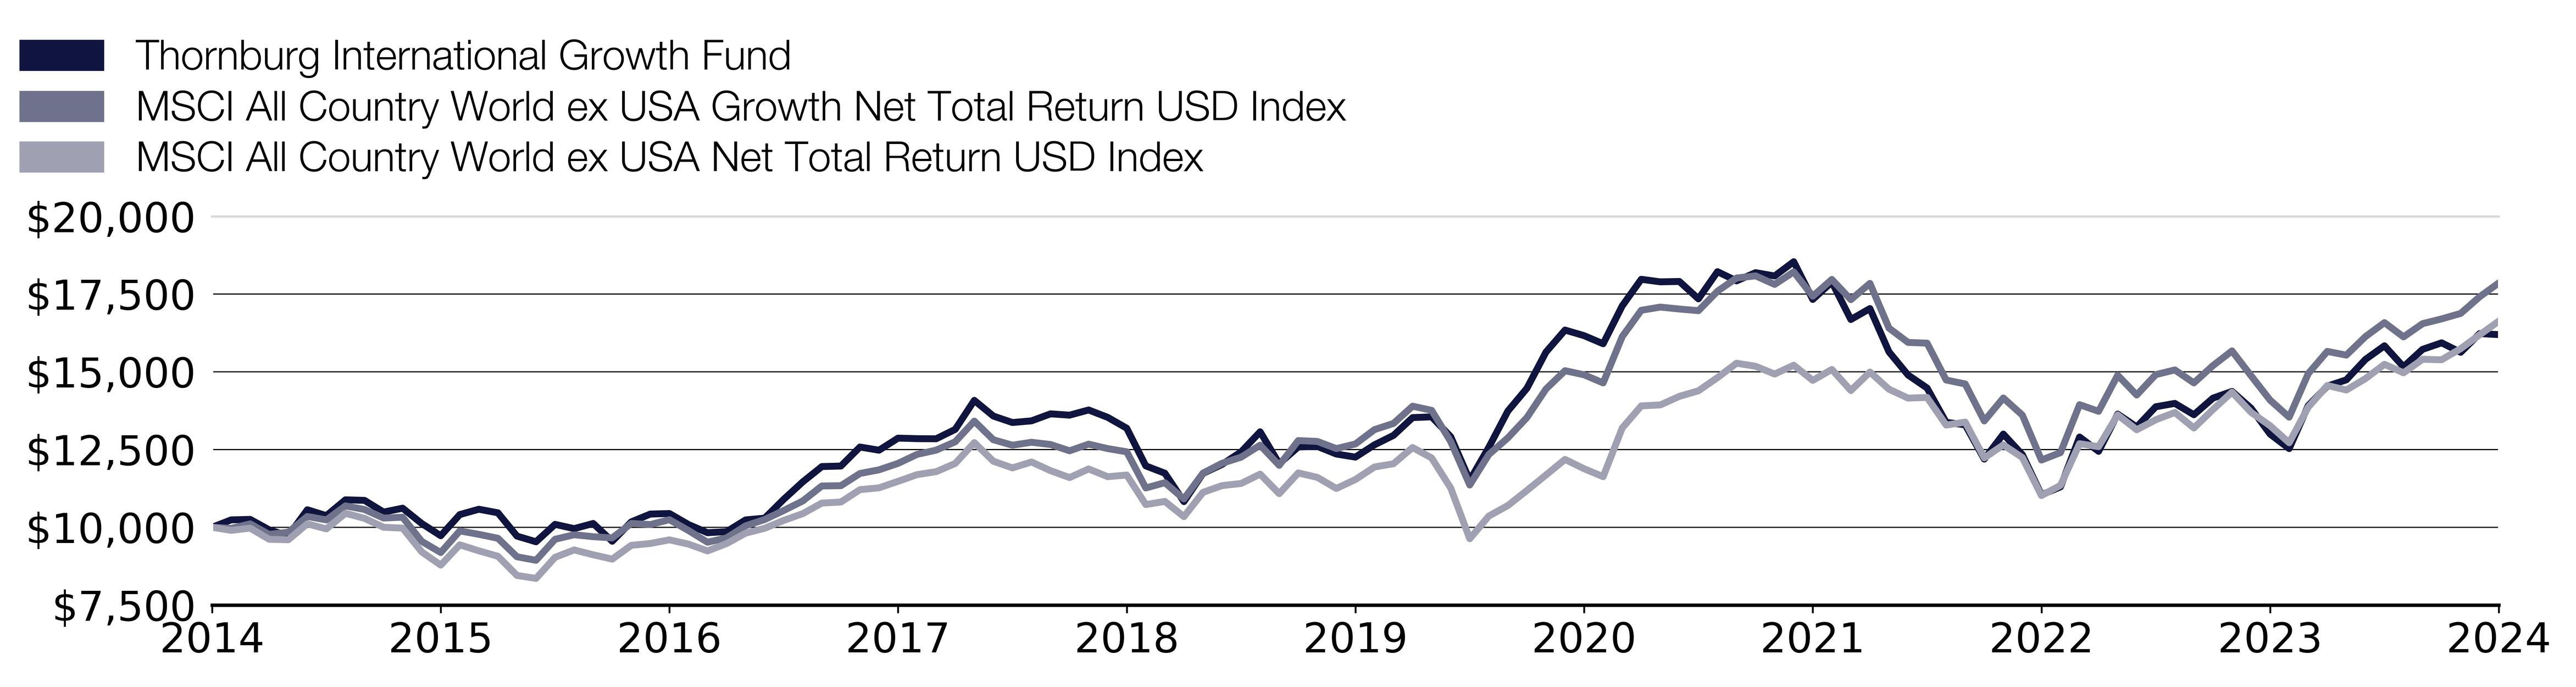
Effective September 30, 2024, the Fund adopted the MSCI All Country World ex USA Net Total Return USD Index as its broad-based securities market index that represents the overall applicable market in which the Fund invests, and the MSCI All Country World ex USA Growth Net Total Return USD Index as an additional index that represents the market sectors which the Fund’s advisor believes are more representative of the Fund’s investment universe.
What were the Fund costs for the past year?
(based on a hypothetical $10,000 investment)
Class Name | Costs of a $10,000 investment | Costs paid as a percentage of a $10,000 investment |
|---|
Class C | $265.00 | 2.36% |
End Block
Thornburg International Growth Fund Tailored Shareholder Report
Thornburg International Growth Fund Tailored Shareholder Report | |
Annual Performance | 1 Year | 5 Year | 10 Year |
|---|
International Growth Fund Class C (with sales charge) | 23.61% | 5.73% | 4.94% |
International Growth Fund Class C (without sales charge) | 24.61% | 5.73% | 4.94% |
MSCI All Country World ex USA Growth Net Total Return USD Index | 26.75% | 7.09% | 5.97% |
MSCI All Country World ex USA Net Total Return USD Index | 25.35% | 7.59% | 5.22% |
Key Fund Statistics
(as of September 30, 2024)
| |
|---|
Fund Size (Millions) | $881.6M |
Number of Holdings | 46 |
Annual Portfolio Turnover | 44.57% |
Total Advisory Fee | $7.3M |
What did the Fund invest in?
(as of September 30, 2024)
Market Capitalization Exposure | (%) |
|---|
| Small Cap (<$2.5 B) | 3.7 |
| Mid Cap ($2.5-12 B) | 14.0 |
| Large Cap (>$12 B) | 82.3 |
Market Capitalization Exposure | (%) |
Small Cap (<$2.5 B) | 3.7% |
Mid Cap ($2.5-12 B) | 14.0% |
Large Cap (>$12 B) | 82.3% |
Expressed as a percentage of the Fund’s net assets.
How has the Fund changed?
This is a summary of certain changes to the Fund since October 1, 2023. For more complete information, you may review the Fund’s next prospectus, which we expect to be available by February 1, 2025 at https://www.thornburg.com/download or upon request by calling 1-800-847-0200.
End Block
Changes In and Disagreements with Accountants
No changes and/or disagreements occurred in the current reporting period.
End Block
For additional information about the Fund, including its prospectus, financial information, holdings and proxy information, visit www.thornburg.com/download.

Thornburg International Growth Fund Tailored Shareholder Report | |
Thornburg International Growth Fund Tailored Shareholder Report
Thornburg International Growth Fund CLASS: I TICKER: TINGX Annual Shareholder Report | |
This annual shareholder report contains important information about the Thornburg International Growth Fund Class I Shares for the period from October 1, 2023 to September 30, 2024. You can find additional information about the Fund at https://www.thornburg.com/download. You can also request this information by contacting us at 1-800-847-0200. This report also describes changes to the Fund that occurred during the reporting period.
How did the Fund perform last year and what affected its performance?
The Fund’s Class I shares underperformed the MSCI All Country World ex USA Growth Net Total Return USD Index (the “Index”) during the 12-month period ended September 30, 2024. During the period, non-U.S. equities have posted strong returns but lagged their U.S. counterparts, as U.S. mega-cap and artificial intelligence beneficiaries have continued to lead the market. The Fund’s underperformance relative to the Index was primarily driven by portfolio allocations across sectors and countries. However, strong stock selection added to relative results, consistent with the Fund’s bottom-up investment process. The Fund’s cash allocation was a drag on performance. Within information technology and consumer services, both stock selection and general positioning versus the Index bolstered relative returns. Security selection within South Korea and Brazil also contributed to relative returns. The Fund’s overweight exposure to consumer staples and the UK were detractors from relative performance as both underperformed other sectors and countries, respectively.
How did the Fund perform over the past 10 years?
The line graph below reflects a hypothetical $10,000 investment. The returns shown in the line graph and table assume the reinvestment of dividends and capital gains, but do not reflect the deduction of taxes that a shareholder would pay on distributions or the redemption of Fund shares. The performance information shown below represents past performance and is no guarantee of future results. For Fund performance current to the most recent month end, visit https://www.thornburg.com/product/mutual-funds/fig/TINGX or call 1-800-847-0200. Performance for other share classes of the Fund will vary.
Cumulative Performance
Growth Table
Date | Thornburg International Growth Fund | MSCI All Country World ex USA Growth Net Total Return USD Index | MSCI All Country World ex USA Net Total Return USD Index |
09/30/2014 | 10000.0066 | 10000 | 10000 |
10/31/2014 | 10246.0344 | 9965.2434 | 9900.9916 |
11/30/2014 | 10271.8171 | 10111.108 | 9972.6147 |
12/31/2014 | 9940.0546 | 9769.5894 | 9613.0446 |
01/31/2015 | 9762.0721 | 9843.0021 | 9598.8003 |
02/28/2015 | 10603.4441 | 10348.0743 | 10111.9989 |
03/31/2015 | 10430.8549 | 10237.4749 | 9948.5397 |
04/30/2015 | 10948.6223 | 10688.4625 | 10451.1052 |
05/31/2015 | 10943.2289 | 10573.2855 | 10287.947 |
06/30/2015 | 10576.477 | 10297.4371 | 10000.9028 |
07/31/2015 | 10711.3123 | 10324.4511 | 9973.1163 |
08/31/2015 | 10231.2988 | 9548.6733 | 9210.8418 |
09/30/2015 | 9841.7046 | 9188.0528 | 8783.7614 |
10/31/2015 | 10544.6835 | 9884.1448 | 9437.6483 |
11/30/2015 | 10723.132 | 9773.3194 | 9242.8415 |
12/31/2015 | 10619.9281 | 9647.1785 | 9068.7492 |
01/31/2016 | 9867.9312 | 9052.0218 | 8451.8776 |
02/29/2016 | 9689.3995 | 8938.3707 | 8355.2767 |
03/31/2016 | 10273.6849 | 9614.8521 | 9034.6429 |
04/30/2016 | 10138.4337 | 9760.6601 | 9272.3835 |
05/31/2016 | 10322.3754 | 9697.5896 | 9115.896 |
06/30/2016 | 9746.8861 | 9659.3857 | 8976.4115 |
07/31/2016 | 10391.9803 | 10124.0498 | 9420.3444 |
08/31/2016 | 10663.0283 | 10088.1065 | 9479.93 |
09/30/2016 | 10690.6855 | 10245.1609 | 9596.794 |
10/31/2016 | 10337.768 | 9896.9171 | 9458.8142 |
11/30/2016 | 10082.5815 | 9519.9073 | 9240.0327 |
12/31/2016 | 10120.588 | 9659.2161 | 9476.419 |
01/31/2017 | 10516.9415 | 10048.094 | 9812.1147 |
02/28/2017 | 10592.9545 | 10250.3038 | 9968.552 |
03/31/2017 | 11222.7765 | 10540.733 | 10221.2893 |
04/30/2017 | 11814.592 | 10847.2124 | 10440.0708 |
05/31/2017 | 12330.3945 | 11329.4527 | 10778.8762 |
06/30/2017 | 12360.0739 | 11338.0994 | 10812.3304 |
07/31/2017 | 13007.1698 | 11730.9333 | 11210.8719 |
08/31/2017 | 12914.7275 | 11848.5405 | 11269.5045 |
09/30/2017 | 13326.5448 | 12056.2887 | 11478.7062 |
10/31/2017 | 13321.1009 | 12346.2093 | 11694.6789 |
11/30/2017 | 13328.6244 | 12482.0707 | 11789.6748 |
12/31/2017 | 13655.3616 | 12751.4199 | 12053.1957 |
01/31/2018 | 14641.2066 | 13415.7507 | 12724.4868 |
02/28/2018 | 14122.9338 | 12815.5642 | 12124.5179 |
03/31/2018 | 13925.7648 | 12640.3685 | 11910.6517 |
04/30/2018 | 13993.3656 | 12735.1437 | 12100.8441 |
05/31/2018 | 14235.6018 | 12662.8048 | 11821.4237 |
06/30/2018 | 14207.4348 | 12460.4821 | 11599.2316 |
07/31/2018 | 14398.9704 | 12674.4469 | 11876.6458 |
08/31/2018 | 14162.3676 | 12531.6341 | 11628.0714 |
09/30/2018 | 13807.4634 | 12428.0991 | 11681.0364 |
10/31/2018 | 12551.2152 | 11264.5737 | 10730.9268 |
11/30/2018 | 12316.7194 | 11435.2482 | 10832.4932 |
12/31/2018 | 11370.1215 | 10911.9218 | 10342.216 |
01/31/2019 | 12331.8027 | 11741.9537 | 11123.6502 |
02/28/2019 | 12642.59 | 12059.2274 | 11340.9771 |
03/31/2019 | 13082.3832 | 12255.4466 | 11408.5376 |
04/30/2019 | 13774.3246 | 12641.2727 | 11709.9264 |
05/31/2019 | 12707.093 | 11992.9922 | 11081.4186 |
06/30/2019 | 13287.6201 | 12789.0587 | 11748.6972 |
07/31/2019 | 13316.9396 | 12762.3273 | 11606.5043 |
08/31/2019 | 13064.7915 | 12531.5211 | 11248.0376 |
09/30/2019 | 12976.8328 | 12680.5505 | 11537.4893 |
10/31/2019 | 13404.8983 | 13141.5977 | 11940.0432 |
11/30/2019 | 13741.9396 | 13342.0554 | 12045.3212 |
12/31/2019 | 14362.3206 | 13895.2782 | 12566.946 |
01/31/2020 | 14403.6935 | 13761.7904 | 12229.3444 |
02/29/2020 | 13729.9057 | 12757.4105 | 11262.6833 |
03/31/2020 | 12252.3007 | 11360.0271 | 9631.9034 |
04/30/2020 | 13393.0117 | 12340.2187 | 10361.8271 |
05/31/2020 | 14651.9312 | 12877.1087 | 10700.9334 |
06/30/2020 | 15443.9275 | 13530.5886 | 11184.5398 |
07/31/2020 | 16702.8469 | 14447.8793 | 11683.1931 |
08/31/2020 | 17471.2015 | 15037.215 | 12183.301 |
09/30/2020 | 17299.7993 | 14905.253 | 11883.8181 |
10/31/2020 | 17033.8304 | 14643.7028 | 11628.3222 |
11/30/2020 | 18353.8174 | 16132.5836 | 13192.4946 |
12/31/2020 | 19293.351 | 16980.1916 | 13905.5658 |
01/31/2021 | 19221.5395 | 17083.2179 | 13935.81 |
02/28/2021 | 19245.4766 | 17021.1648 | 14211.6693 |
03/31/2021 | 18665.0005 | 16967.4193 | 14391.329 |
04/30/2021 | 19622.4869 | 17593.433 | 14814.9987 |
05/31/2021 | 19323.2724 | 18018.1412 | 15278.3922 |
06/30/2021 | 19622.4869 | 18087.4848 | 15179.3838 |
07/31/2021 | 19526.7383 | 17812.7102 | 14929.2546 |
08/31/2021 | 20035.4029 | 18215.1516 | 15213.0386 |
09/30/2021 | 18742.7963 | 17432.253 | 14725.9212 |
10/31/2021 | 19365.1624 | 17972.3643 | 15077.4162 |
11/30/2021 | 18081.9106 | 17323.236 | 14398.5013 |
12/31/2021 | 18483.5892 | 17845.2061 | 14993.5549 |
01/31/2022 | 16985.2644 | 16406.3975 | 14441.0338 |
02/28/2022 | 16194.659 | 15947.6674 | 14155.1934 |
03/31/2022 | 15754.7253 | 15922.2922 | 14177.7637 |
04/30/2022 | 14568.8173 | 14737.5738 | 13287.4905 |
05/31/2022 | 14498.6829 | 14610.9243 | 13382.8375 |
06/30/2022 | 13312.7748 | 13420.7805 | 12231.5513 |
07/31/2022 | 14205.3938 | 14159.4846 | 12650.3057 |
08/31/2022 | 13497.6745 | 13607.2226 | 12243.4383 |
09/30/2022 | 12094.9875 | 12163.3841 | 11019.9271 |
10/31/2022 | 12388.2766 | 12402.2719 | 11349.2529 |
11/30/2022 | 14160.7628 | 13943.9939 | 12688.9762 |
12/31/2022 | 13670.2025 | 13731.1594 | 12594.0806 |
01/31/2023 | 15005.7601 | 14892.6503 | 13615.6126 |
02/28/2023 | 14562.7146 | 14254.9945 | 13137.6739 |
03/31/2023 | 15294.7029 | 14910.9045 | 13458.8242 |
04/30/2023 | 15429.5428 | 15061.7989 | 13692.6526 |
05/31/2023 | 15050.7068 | 14644.7201 | 13194.8018 |
06/30/2023 | 15647.8551 | 15200.8251 | 13786.846 |
07/31/2023 | 15904.6931 | 15674.4751 | 14347.342 |
08/31/2023 | 15326.8076 | 14875.1307 | 13699.3735 |
09/30/2023 | 14421.4537 | 14090.1975 | 13266.6757 |
10/31/2023 | 13927.0405 | 13541.835 | 12719.3207 |
11/30/2023 | 15468.0685 | 14943.2875 | 13864.2371 |
12/31/2023 | 16186.3542 | 15657.7468 | 14560.8069 |
01/31/2024 | 16431.7978 | 15538.1051 | 14416.1563 |
02/29/2024 | 17181.0464 | 16132.1315 | 14781.1433 |
03/31/2024 | 17691.3106 | 16583.1756 | 15243.1825 |
04/30/2024 | 16961.439 | 16124.502 | 14969.4799 |
05/31/2024 | 17607.343 | 16549.4928 | 15404.0336 |
06/30/2024 | 17859.2456 | 16703.2129 | 15389.3378 |
07/31/2024 | 17542.7526 | 16879.5388 | 15745.6978 |
08/31/2024 | 18240.329 | 17416.4288 | 16194.1448 |
09/30/2024 | 18214.4928 | 17859.1088 | 16630.2031 |

Effective September 30, 2024, the Fund adopted the MSCI All Country World ex USA Net Total Return USD Index as its broad-based securities market index that represents the overall applicable market in which the Fund invests, and the MSCI All Country World ex USA Growth Net Total Return USD Index as an additional index that represents the market sectors which the Fund’s advisor believes are more representative of the Fund’s investment universe.
What were the Fund costs for the past year?
(based on a hypothetical $10,000 investment)
Class Name | Costs of a $10,000 investment | Costs paid as a percentage of a $10,000 investment |
|---|
Class I | $112.00 | 0.99% |
End Block
Thornburg International Growth Fund Tailored Shareholder Report
Thornburg International Growth Fund Tailored Shareholder Report | |
Annual Performance | 1 Year | 5 Year | 10 Year |
|---|
International Growth Fund Class I | 26.30% | 7.02% | 6.18% |
MSCI All Country World ex USA Growth Net Total Return USD Index | 26.75% | 7.09% | 5.97% |
MSCI All Country World ex USA Net Total Return USD Index | 25.35% | 7.59% | 5.22% |
Key Fund Statistics
(as of September 30, 2024)
| |
|---|
Fund Size (Millions) | $881.6M |
Number of Holdings | 46 |
Annual Portfolio Turnover | 44.57% |
Total Advisory Fee | $7.3M |
What did the Fund invest in?
(as of September 30, 2024)
Market Capitalization Exposure | (%) |
|---|
| Small Cap (<$2.5 B) | 3.7 |
| Mid Cap ($2.5-12 B) | 14.0 |
| Large Cap (>$12 B) | 82.3 |
Market Capitalization Exposure | (%) |
Small Cap (<$2.5 B) | 3.7% |
Mid Cap ($2.5-12 B) | 14.0% |
Large Cap (>$12 B) | 82.3% |
Expressed as a percentage of the Fund’s net assets.
How has the Fund changed?
This is a summary of certain changes to the Fund since October 1, 2023. For more complete information, you may review the Fund’s next prospectus, which we expect to be available by February 1, 2025 at https://www.thornburg.com/download or upon request by calling 1-800-847-0200.
End Block
Changes In and Disagreements with Accountants
No changes and/or disagreements occurred in the current reporting period.
End Block
For additional information about the Fund, including its prospectus, financial information, holdings and proxy information, visit www.thornburg.com/download.

Thornburg International Growth Fund Tailored Shareholder Report | |
Thornburg International Growth Fund Tailored Shareholder Report
Thornburg International Growth Fund CLASS: R3 TICKER: TIGVX Annual Shareholder Report | |
This annual shareholder report contains important information about the Thornburg International Growth Fund Class R3 Shares for the period from October 1, 2023 to September 30, 2024. You can find additional information about the Fund at https://www.thornburg.com/download. You can also request this information by contacting us at 1-800-847-0200. This report also describes changes to the Fund that occurred during the reporting period.
How did the Fund perform last year and what affected its performance?
The Fund’s Class R3 shares underperformed the MSCI All Country World ex USA Growth Net Total Return USD Index (the “Index”) during the 12-month period ended September 30, 2024. During the period, non-U.S. equities have posted strong returns but lagged their U.S. counterparts, as U.S. mega-cap and artificial intelligence beneficiaries have continued to lead the market. The Fund’s underperformance relative to the Index was primarily driven by portfolio allocations across sectors and countries. However, strong stock selection added to relative results, consistent with the Fund’s bottom-up investment process. The Fund’s cash allocation was a drag on performance. Within information technology and consumer services, both stock selection and general positioning versus the Index bolstered relative returns. Security selection within South Korea and Brazil also contributed to relative returns. The Fund’s overweight exposure to consumer staples and the UK were detractors from relative performance as both underperformed other sectors and countries, respectively.
How did the Fund perform over the past 10 years?
The line graph below reflects a hypothetical $10,000 investment. The returns shown in the line graph and table assume the reinvestment of dividends and capital gains, but do not reflect the deduction of taxes that a shareholder would pay on distributions or the redemption of Fund shares. The performance information shown below represents past performance and is no guarantee of future results. For Fund performance current to the most recent month end, visit https://www.thornburg.com/product/mutual-funds/fig/TIGVX or call 1-800-847-0200. Performance for other share classes of the Fund will vary.
Cumulative Performance
Growth Table
Date | Thornburg International Growth Fund | MSCI All Country World ex USA Growth Net Total Return USD Index | MSCI All Country World ex USA Net Total Return USD Index |
09/30/2014 | 10000.0011 | 10000 | 10000 |
10/31/2014 | 10242.2339 | 9965.2434 | 9900.9916 |
11/30/2014 | 10263.319 | 10111.108 | 9972.6147 |
12/31/2014 | 9936.0023 | 9769.5894 | 9613.0446 |
01/31/2015 | 9747.3792 | 9843.0021 | 9598.8003 |
02/28/2015 | 10585.0879 | 10348.0743 | 10111.9989 |
03/31/2015 | 10407.5602 | 10237.4749 | 9948.5397 |
04/30/2015 | 10923.5001 | 10688.4625 | 10451.1052 |
05/31/2015 | 10912.4046 | 10573.2855 | 10287.947 |
06/30/2015 | 10540.706 | 10297.4371 |
07/31/2015 | 10673.8518 | 10324.4511 | 9973.1163 |
08/31/2015 | 10185.6506 | 9548.6733 | 9210.8418 |
09/30/2015 | 9797.3088 | 9188.0528 | 8783.7614 |
10/31/2015 | 10490.7763 | 9884.1448 | 9437.6483 |
11/30/2015 | 10668.304 | 9773.3194 | 9242.8415 |
12/31/2015 | 10557.3492 | 9647.1785 | 9068.7492 |
01/31/2016 | 9802.8566 | 9052.0218 | 8451.8776 |
02/29/2016 | 9625.3289 | 8938.3707 | 8355.2767 |
03/31/2016 | 10196.7461 | 9614.8521 | 9034.6429 |
04/30/2016 | 10063.6004 | 9760.6601 | 9272.3835 |
05/31/2016 | 10241.128 | 9697.5896 | 9115.896 |
06/30/2016 | 9664.1631 | 9659.3857 | 8976.4115 |
07/31/2016 | 10302.1532 | 10124.0498 | 9420.3444 |
08/31/2016 | 10562.897 | 10088.1065 | 9479.93 |
09/30/2016 | 10584.1551 | 10245.1609 | 9596.794 |
10/31/2016 | 10234.495 | 9896.9171 | 9458.8142 |
11/30/2016 | 9973.6375 | 9519.9073 | 9240.0327 |
12/31/2016 | 10012.4886 | 9659.2161 | 9476.419 |
01/31/2017 | 10400.9998 | 10048.094 | 9812.1147 |
02/28/2017 | 10467.6018 | 10250.3038 | 9968.552 |
03/31/2017 | 11083.6695 | 10540.733 | 10221.2893 |
04/30/2017 | 11660.8862 | 10847.2124 | 10440.0708 |
05/31/2017 | 12171.5009 | 11329.4527 | 10778.8762 |
06/30/2017 | 12193.7015 | 11338.0994 | 10812.3304 |
07/31/2017 | 12820.8696 | 11730.9333 | 11210.8719 |
08/31/2017 | 12726.5169 | 11848.5405 | 11269.5045 |
09/30/2017 | 13131.6786 | 12056.2887 | 11478.7062 |
10/31/2017 | 13115.0281 | 12346.2093 | 11694.6789 |
11/30/2017 | 13122.7323 | 12482.0707 | 11789.6748 |
12/31/2017 | 13439.012 | 12751.4199 | 12053.1957 |
01/31/2018 | 14399.3522 | 13415.7507 | 12724.4868 |
02/28/2018 | 13887.5541 | 12815.5642 | 12124.5179 |
03/31/2018 | 13680.5347 | 12640.3685 | 11910.6517 |
04/30/2018 | 13743.7906 | 12735.1437 | 12100.8441 |
05/31/2018 | 13979.5627 | 12662.8048 | 11821.4237 |
06/30/2018 | 13945.0595 | 12460.4821 | 11599.2316 |
07/31/2018 | 14123.3262 | 12674.4469 | 11876.6458 |
08/31/2018 | 13881.8036 | 12531.6341 | 11628.0714 |
09/30/2018 | 13536.7712 | 12428.0991 | 11681.0364 |
10/31/2018 | 12294.6545 | 11264.5737 | 10730.9268 |
11/30/2018 | 12060.9237 | 11435.2482 | 10832.4932 |
12/31/2018 | 11130.8673 | 10911.9218 | 10342.216 |
01/31/2019 | 12066.8856 | 11741.9537 | 11123.6502 |
02/28/2019 | 12364.9806 | 12059.2274 | 11340.9771 |
03/31/2019 | 12788.2755 | 12255.4466 | 11408.5376 |
04/30/2019 | 13461.9702 | 12641.2727 | 11709.9264 |
05/31/2019 | 12412.6758 | 11992.9922 | 11081.4186 |
06/30/2019 | 12973.0944 | 12789.0587 | 11748.6972 |
07/31/2019 | 12996.942 | 12762.3273 | 11606.5043 |
08/31/2019 | 12746.5422 | 12531.5211 | 11248.0376 |
09/30/2019 | 12657.1137 | 12680.5505 | 11537.4893 |
10/31/2019 | 13068.4848 | 13141.5977 | 11940.0432 |
11/30/2019 | 13387.2673 | 13342.0554 | 12045.3212 |
12/31/2019 | 13986.5183 | 13895.2782 | 12566.946 |
01/31/2020 | 14022.4734 | 13761.7904 | 12229.3444 |
02/29/2020 | 13357.3048 | 12757.4105 | 11262.6833 |
03/31/2020 | 11919.1024 | 11360.0271 | 9631.9034 |
04/30/2020 | 13021.7242 | 12340.2187 | 10361.8271 |
05/31/2020 | 14238.2038 | 12877.1087 | 10700.9334 |
06/30/2020 | 15005.245 | 13530.5886 | 11184.5398 |
07/31/2020 | 16221.7246 | 14447.8793 | 11683.1931 |
08/31/2020 | 16958.8033 | 15037.215 | 12183.301 |
09/30/2020 | 16785.0205 | 14905.253 | 11883.8181 |
10/31/2020 | 16521.3501 | 14643.7028 | 11628.3222 |
11/30/2020 | 17793.6907 | 16132.5836 | 13192.4946 |
12/31/2020 | 18692.1779 | 16980.1916 | 13905.5658 |
01/31/2021 | 18613.2568 | 17083.2179 | 13935.81 |
02/28/2021 | 18631.4693 | 17021.1648 | 14211.6693 |
03/31/2021 | 18060.8085 | 16967.4193 | 14391.329 |
04/30/2021 | 18983.5792 | 17593.433 | 14814.9987 |
05/31/2021 | 18680.0362 | 18018.1412 | 15278.3922 |
06/30/2021 | 18965.3666 | 18087.4848 | 15179.3838 |
07/31/2021 | 18862.162 | 17812.7102 | 14929.2546 |
08/31/2021 | 19347.8308 | 18215.1516 | 15213.0386 |
09/30/2021 | 18091.1628 | 17432.253 | 14725.9212 |
10/31/2021 | 18692.1779 | 17972.3643 | 15077.4162 |
11/30/2021 | 17438.63 | 17323.236 | 14398.5013 |
12/31/2021 | 17815.05 | 17845.2061 | 14993.5549 |
01/31/2022 | 16367.78 | 16406.3975 | 14441.0338 |
02/28/2022 | 15601.96 | 15947.6674 | 14155.1934 |
03/31/2022 | 15173.62 | 15922.2922 | 14177.7637 |
04/30/2022 | 14024.89 | 14737.5738 | 13287.4905 |
05/31/2022 | 13953.5 | 14610.9243 | 13382.8375 |
06/30/2022 | 12804.77 | 13420.7805 | 12231.5513 |
07/31/2022 | 13661.45 | 14159.4846 | 12650.3057 |
08/31/2022 | 12973.51 | 13607.2226 | 12243.4383 |
09/30/2022 | 11617.1 | 12163.3841 | 11019.9271 |
10/31/2022 | 11896.17 | 12402.2719 | 11349.2529 |
11/30/2022 | 13590.06 | 13943.9939 | 12688.9762 |
12/31/2022 | 13118.2108 | 13731.1594 | 12594.0806 |
01/31/2023 | 14392.3284 | 14892.6503 | 13615.6126 |
02/28/2023 | 13963.2888 | 14254.9945 | 13137.6739 |
03/31/2023 | 14652.3524 | 14910.9045 | 13458.8242 |
04/30/2023 | 14775.8638 | 15061.7989 | 13692.6526 |
05/31/2023 | 14405.3296 | 14644.7201 | 13194.8018 |
06/30/2023 | 14977.3824 | 15200.8251 | 13786.846 |
07/31/2023 | 15217.9046 | 15674.4751 | 14347.342 |
08/31/2023 | 14658.853 | 14875.1307 | 13699.3735 |
09/30/2023 | 13787.7726 | 14090.1975 | 13266.6757 |
10/31/2023 | 13300.2276 | 13541.835 | 12719.3207 |
11/30/2023 | 14775.8638 | 14943.2875 | 13864.2371 |
12/31/2023 | 15453.7429 | 15657.7468 | 14560.8069 |
01/31/2024 | 15681.5782 | 15538.1051 | 14416.1563 |
02/29/2024 | 16391.1224 | 16132.1315 | 14781.1433 |
03/31/2024 | 16872.8314 | 16583.1756 | 15243.1825 |
04/30/2024 | 16163.2871 | 16124.502 | 14969.4799 |
05/31/2024 | 16768.6781 | 16549.4928 | 15404.0336 |
06/30/2024 | 17003.023 | 16703.2129 | 15389.3378 |
07/31/2024 | 16697.0727 | 16879.5388 | 15745.6978 |
08/31/2024 | 17354.5403 | 17416.4288 | 16194.1448 |
09/30/2024 | 17321.9924 | 17859.1088 | 16630.2031 |
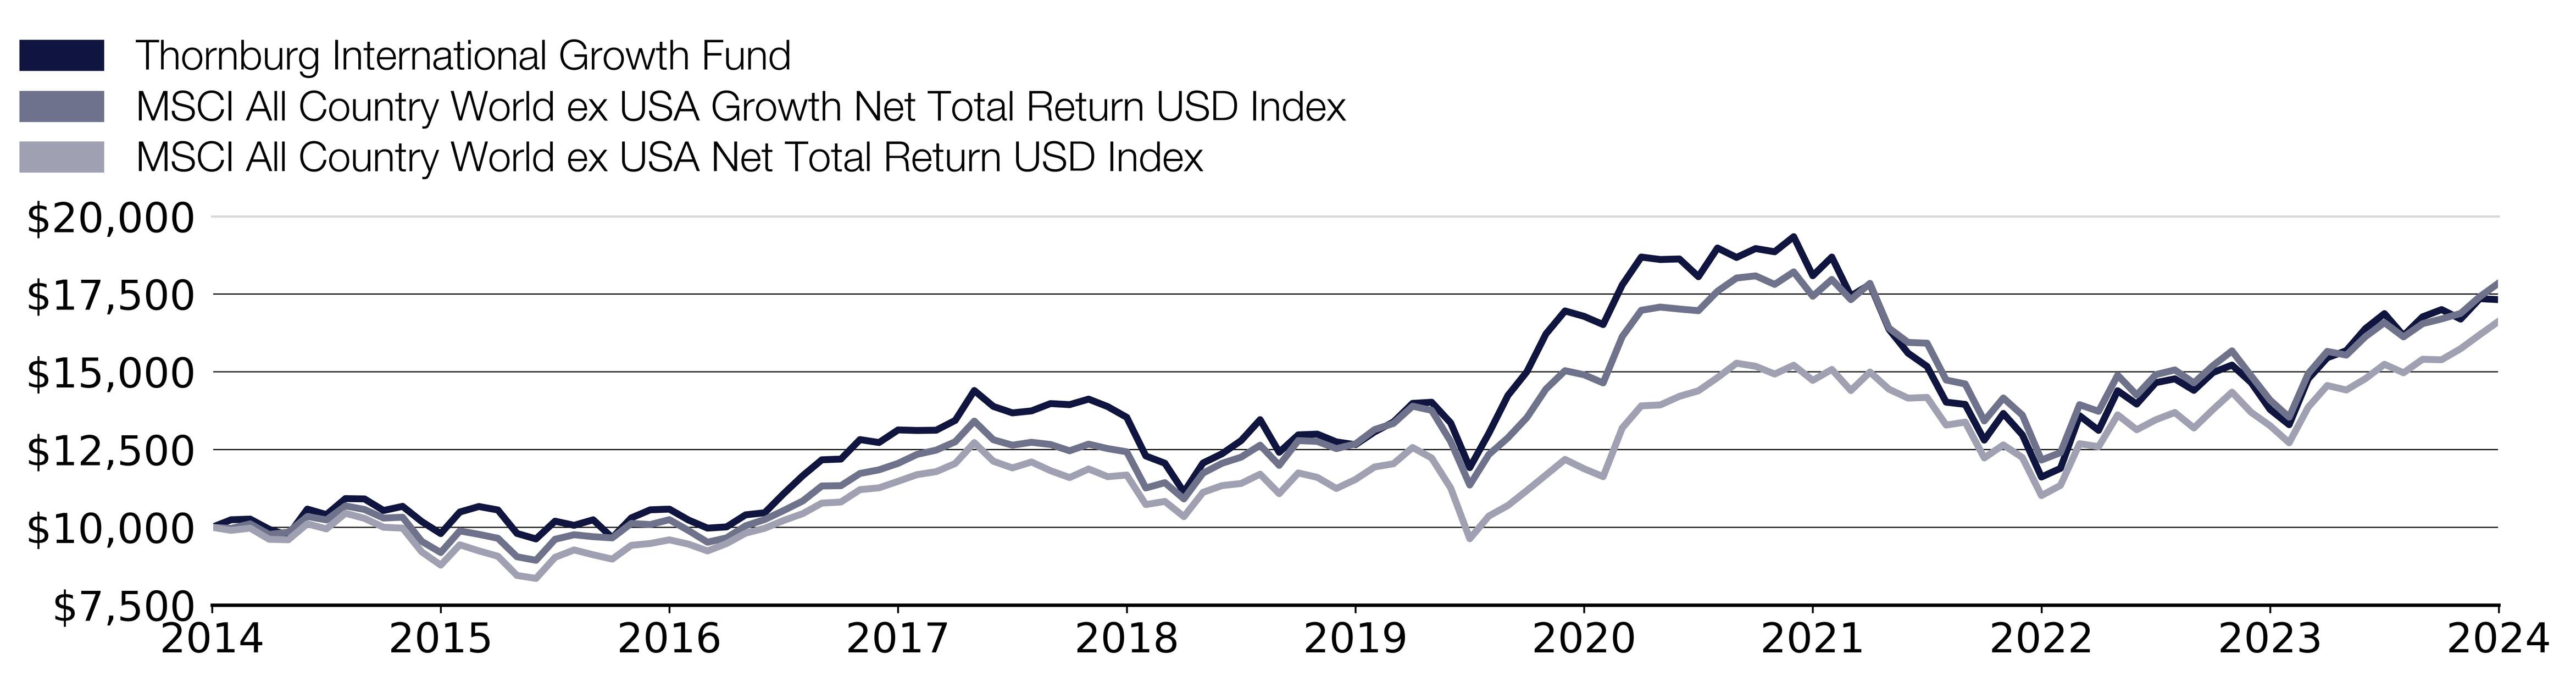
Effective September 30, 2024, the Fund adopted the MSCI All Country World ex USA Net Total Return USD Index as its broad-based securities market index that represents the overall applicable market in which the Fund invests, and the MSCI All Country World ex USA Growth Net Total Return USD Index as an additional index that represents the market sectors which the Fund’s advisor believes are more representative of the Fund’s investment universe.
What were the Fund costs for the past year?
(based on a hypothetical $10,000 investment)
Class Name | Costs of a $10,000 investment | Costs paid as a percentage of a $10,000 investment |
|---|
Class R3 | $169.00 | 1.50% |
End Block
Thornburg International Growth Fund Tailored Shareholder Report
Thornburg International Growth Fund Tailored Shareholder Report | |
Annual Performance | 1 Year | 5 Year | 10 Year |
|---|
International Growth Fund Class R3 | 25.63% | 6.48% | 5.65% |
MSCI All Country World ex USA Growth Net Total Return USD Index | 26.75% | 7.09% | 5.97% |
MSCI All Country World ex USA Net Total Return USD Index | 25.35% | 7.59% | 5.22% |
Key Fund Statistics
(as of September 30, 2024)
| |
|---|
Fund Size (Millions) | $881.6M |
Number of Holdings | 46 |
Annual Portfolio Turnover | 44.57% |
Total Advisory Fee | $7.3M |
What did the Fund invest in?
(as of September 30, 2024)
Market Capitalization Exposure | (%) |
|---|
| Small Cap (<$2.5 B) | 3.7 |
| Mid Cap ($2.5-12 B) | 14.0 |
| Large Cap (>$12 B) | 82.3 |
Market Capitalization Exposure | (%) |
Small Cap (<$2.5 B) | 3.7% |
Mid Cap ($2.5-12 B) | 14.0% |
Large Cap (>$12 B) | 82.3% |
Expressed as a percentage of the Fund’s net assets.
How has the Fund changed?
This is a summary of certain changes to the Fund since October 1, 2023. For more complete information, you may review the Fund’s next prospectus, which we expect to be available by February 1, 2025 at https://www.thornburg.com/download or upon request by calling 1-800-847-0200.
End Block
Changes In and Disagreements with Accountants
No changes and/or disagreements occurred in the current reporting period.
End Block
For additional information about the Fund, including its prospectus, financial information, holdings and proxy information, visit www.thornburg.com/download.

Thornburg International Growth Fund Tailored Shareholder Report | |
Thornburg International Growth Fund Tailored Shareholder Report
Thornburg International Growth Fund CLASS: R4 TICKER: TINVX Annual Shareholder Report | |
This annual shareholder report contains important information about the Thornburg International Growth Fund Class R4 Shares for the period from October 1, 2023 to September 30, 2024. You can find additional information about the Fund at https://www.thornburg.com/download. You can also request this information by contacting us at 1-800-847-0200. This report also describes changes to the Fund that occurred during the reporting period.
How did the Fund perform last year and what affected its performance?
The Fund’s Class R4 shares underperformed the MSCI All Country World ex USA Growth Net Total Return USD Index (the “Index”) during the 12-month period ended September 30, 2024. During the period, non-U.S. equities have posted strong returns but lagged their U.S. counterparts, as U.S. mega-cap and artificial intelligence beneficiaries have continued to lead the market. The Fund’s underperformance relative to the Index was primarily driven by portfolio allocations across sectors and countries. However, strong stock selection added to relative results, consistent with the Fund’s bottom-up investment process. The Fund’s cash allocation was a drag on performance. Within information technology and consumer services, both stock selection and general positioning versus the Index bolstered relative returns. Security selection within South Korea and Brazil also contributed to relative returns. The Fund’s overweight exposure to consumer staples and the UK were detractors from relative performance as both underperformed other sectors and countries, respectively.
How did the Fund perform over the past 10 years?
The line graph below reflects a hypothetical $10,000 investment. The returns shown in the line graph and table assume the reinvestment of dividends and capital gains, but do not reflect the deduction of taxes that a shareholder would pay on distributions or the redemption of Fund shares. The performance information shown below represents past performance and is no guarantee of future results. For Fund performance current to the most recent month end, visit https://www.thornburg.com/product/mutual-funds/fig/TINVX or call 1-800-847-0200. Performance for other share classes of the Fund will vary.
Cumulative Performance
Growth Table
Date | Thornburg International Growth Fund | MSCI All Country World ex USA Growth Net Total Return USD Index | MSCI All Country World ex USA Net Total Return USD Index |
09/30/2014 | 10000.004 | 10000 | 10000 |
10/31/2014 | 10242.1094 | 9965.2434 | 9900.9916 |
11/30/2014 | 10263.1842 | 10111.108 | 9972.6147 |
12/31/2014 | 9930.504 | 9769.5894 | 9613.0446 |
01/31/2015 | 9747.5299 | 9843.0021 | 9598.8003 |
02/28/2015 | 10590.3197 | 10348.0743 | 10111.9989 |
03/31/2015 | 10412.8903 | 10237.4749 | 9948.5397 |
04/30/2015 | 10922.9999 | 10688.4625 | 10451.1052 |
05/31/2015 | 10917.4552 | 10573.2855 | 10287.947 |
06/30/2015 | 10545.9623 | 10297.4371 | 10000.9028 |
07/31/2015 | 10673.4898 | 10324.4511 | 9973.1163 |
08/31/2015 | 10191.1035 | 9548.6733 | 9210.8418 |
09/30/2015 | 9802.9766 | 9188.0528 | 8783.7614 |
10/31/2015 | 10501.605 | 9884.1448 | 9437.6483 |
11/30/2015 | 10673.4898 | 9773.3194 | 9242.8415 |
12/31/2015 | 10568.141 | 9647.1785 | 9068.7492 |
01/31/2016 | 9814.0659 | 9052.0218 | 8451.8776 |
02/29/2016 | 9636.6365 | 8938.3707 | 8355.2767 |
03/31/2016 | 10213.2821 | 9614.8521 | 9034.6429 |
04/30/2016 | 10074.6654 | 9760.6601 | 9272.3835 |
05/31/2016 | 10257.6395 | 9697.5896 | 9115.896 |
06/30/2016 | 9675.4492 | 9659.3857 | 8976.4115 |
07/31/2016 | 10313.0862 | 10124.0498 | 9420.3444 |
08/31/2016 | 10579.2304 | 10088.1065 | 9479.93 |
09/30/2016 | 10603.8715 | 10245.1609 | 9596.794 |
10/31/2016 | 10254.2933 | 9896.9171 | 9458.8142 |
11/30/2016 | 9993.4969 | 9519.9073 | 9240.0327 |
12/31/2016 | 10026.79 | 9659.2161 | 9476.419 |
01/31/2017 | 10420.7591 | 10048.094 | 9812.1147 |
02/28/2017 | 10487.3454 | 10250.3038 | 9968.552 |
03/31/2017 | 11108.8177 | 10540.733 | 10221.2893 |
04/30/2017 | 11691.448 | 10847.2124 | 10440.0708 |
05/31/2017 | 12201.9431 | 11329.4527 | 10778.8762 |
06/30/2017 | 12224.1386 | 11338.0994 | 10812.3304 |
07/31/2017 | 12856.7086 | 11730.9333 | 11210.8719 |
08/31/2017 | 12762.378 | 11848.5405 | 11269.5045 |
09/30/2017 | 13168.6313 | 12056.2887 | 11478.7062 |
10/31/2017 | 13151.9832 | 12346.2093 | 11694.6789 |
11/30/2017 | 13159.667 | 12482.0707 | 11789.6748 |
12/31/2017 | 13475.867 | 12751.4199 | 12053.1957 |
01/31/2018 | 14441.7141 | 13415.7507 | 12724.4868 |
02/28/2018 | 13930.0451 | 12815.5642 | 12124.5179 |
03/31/2018 | 13728.8269 | 12640.3685 | 11910.6517 |
04/30/2018 | 13792.0669 | 12735.1437 | 12100.8441 |
05/31/2018 | 14027.7796 | 12662.8048 | 11821.4237 |
06/30/2018 | 13993.2851 | 12460.4821 | 11599.2316 |
07/31/2018 | 14177.2559 | 12674.4469 | 11876.6458 |
08/31/2018 | 13935.7942 | 12531.6341 | 11628.0714 |
09/30/2018 | 13585.0997 | 12428.0991 | 11681.0364 |
10/31/2018 | 12343.2962 | 11264.5737 | 10730.9268 |
11/30/2018 | 12109.643 | 11435.2482 | 10832.4932 |
12/31/2018 | 11174.0063 | 10911.9218 | 10342.216 |
01/31/2019 | 12121.562 | 11741.9537 | 11123.6502 |
02/28/2019 | 12419.5355 | 12059.2274 | 11340.9771 |
03/31/2019 | 12842.6578 | 12255.4466 | 11408.5376 |
04/30/2019 | 13522.0374 | 12641.2727 | 11709.9264 |
05/31/2019 | 12467.2112 | 11992.9922 | 11081.4186 |
06/30/2019 | 13033.3609 | 12789.0587 | 11748.6972 |
07/31/2019 | 13057.1988 | 12762.3273 | 11606.5043 |
08/31/2019 | 12806.901 | 12531.5211 | 11248.0376 |
09/30/2019 | 12717.509 | 12680.5505 | 11537.4893 |
10/31/2019 | 13134.6719 | 13141.5977 | 11940.0432 |
11/30/2019 | 13459.3053 | 13342.0554 | 12045.3212 |
12/31/2019 | 14058.2953 | 13895.2782 | 12566.946 |
01/31/2020 | 14094.2347 | 13761.7904 | 12229.3444 |
02/29/2020 | 13429.3558 | 12757.4105 | 11262.6833 |
03/31/2020 | 11979.8 | 11360.0271 | 9631.9034 |
04/30/2020 | 13093.9214 | 12340.2187 | 10361.8271 |
05/31/2020 | 14315.861 | 12877.1087 | 10700.9334 |
06/30/2020 | 15088.5581 | 13530.5886 | 11184.5398 |
07/31/2020 | 16310.4977 | 14447.8793 | 11683.1931 |
08/31/2020 | 17053.2453 | 15037.215 | 12183.301 |
09/30/2020 | 16879.5382 | 14905.253 | 11883.8181 |
10/31/2020 | 16615.9826 | 14643.7028 | 11628.3222 |
11/30/2020 | 17899.8035 | 16132.5836 | 13192.4946 |
12/31/2020 | 18803.8953 | 16980.1916 | 13905.5658 |
01/31/2021 | 18731.0825 | 17083.2179 | 13935.81 |
02/28/2021 | 18749.2857 | 17021.1648 | 14211.6693 |
03/31/2021 | 18178.9191 | 16967.4193 | 14391.329 |
04/30/2021 | 19101.214 | 17593.433 | 14814.9987 |
05/31/2021 | 18803.8953 | 18018.1412 | 15278.3922 |
06/30/2021 | 19095.1463 | 18087.4848 | 15179.3838 |
07/31/2021 | 18985.9272 | 17812.7102 | 14929.2546 |
08/31/2021 | 19477.4133 | 18215.1516 | 15213.0386 |
09/30/2021 | 18215.3255 | 17432.253 | 14725.9212 |
10/31/2021 | 18816.0307 | 17972.3643 | 15077.4162 |
11/30/2021 | 17563.3681 | 17323.236 | 14398.5013 |
12/31/2021 | 17945.8851 | 17845.2061 | 14993.5549 |
01/31/2022 | 16487.1336 | 16406.3975 | 14441.0338 |
02/28/2022 | 15709.1328 | 15947.6674 | 14155.1934 |
03/31/2022 | 15281.2324 | 15922.2922 | 14177.7637 |
04/30/2022 | 14127.1979 | 14737.5738 | 13287.4905 |
05/31/2022 | 14055.8811 | 14610.9243 | 13382.8375 |
06/30/2022 | 12895.3633 | 13420.7805 | 12231.5513 |
07/31/2022 | 13764.1308 | 14159.4846 | 12650.3057 |
08/31/2022 | 13070.4134 | 13607.2226 | 12243.4383 |
09/30/2022 | 11708.912 | 12163.3841 | 11019.9271 |
10/31/2022 | 11987.6957 | 12402.2719 | 11349.2529 |
11/30/2022 | 13699.2974 | 13943.9939 | 12688.9762 |
12/31/2022 | 13218.0381 | 13731.1594 | 12594.0806 |
01/31/2023 | 14506.0162 | 14892.6503 | 13615.6126 |
02/28/2023 | 14076.6902 | 14254.9945 | 13137.6739 |
03/31/2023 | 14772.7187 | 14910.9045 | 13458.8242 |
04/30/2023 | 14896.3126 | 15061.7989 | 13692.6526 |
05/31/2023 | 14525.531 | 14644.7201 | 13194.8018 |
06/30/2023 | 15104.4707 | 15200.8251 | 13786.846 |
07/31/2023 | 15345.1535 | 15674.4751 | 14347.342 |
08/31/2023 | 14779.2237 | 14875.1307 | 13699.3735 |
09/30/2023 | 13907.5617 | 14090.1975 | 13266.6757 |
10/31/2023 | 13419.6912 | 13541.835 | 12719.3207 |
11/30/2023 | 14902.8175 | 14943.2875 | 13864.2371 |
12/31/2023 | 15588.1245 | 15657.7468 | 14560.8069 |
01/31/2024 | 15822.8265 | 15538.1051 | 14416.1563 |
02/29/2024 | 16533.452 | 16132.1315 | 14781.1433 |
03/31/2024 | 17022.4145 | 16583.1756 | 15243.1825 |
04/30/2024 | 16311.789 | 16124.502 | 14969.4799 |
05/31/2024 | 16924.622 | 16549.4928 | 15404.0336 |
06/30/2024 | 17159.324 | 16703.2129 | 15389.3378 |
07/31/2024 | 16852.9075 | 16879.5388 | 15745.6978 |
08/31/2024 | 17517.8965 | 17416.4288 | 16194.1448 |
09/30/2024 | 17491.8185 | 17859.1088 | 16630.2031 |
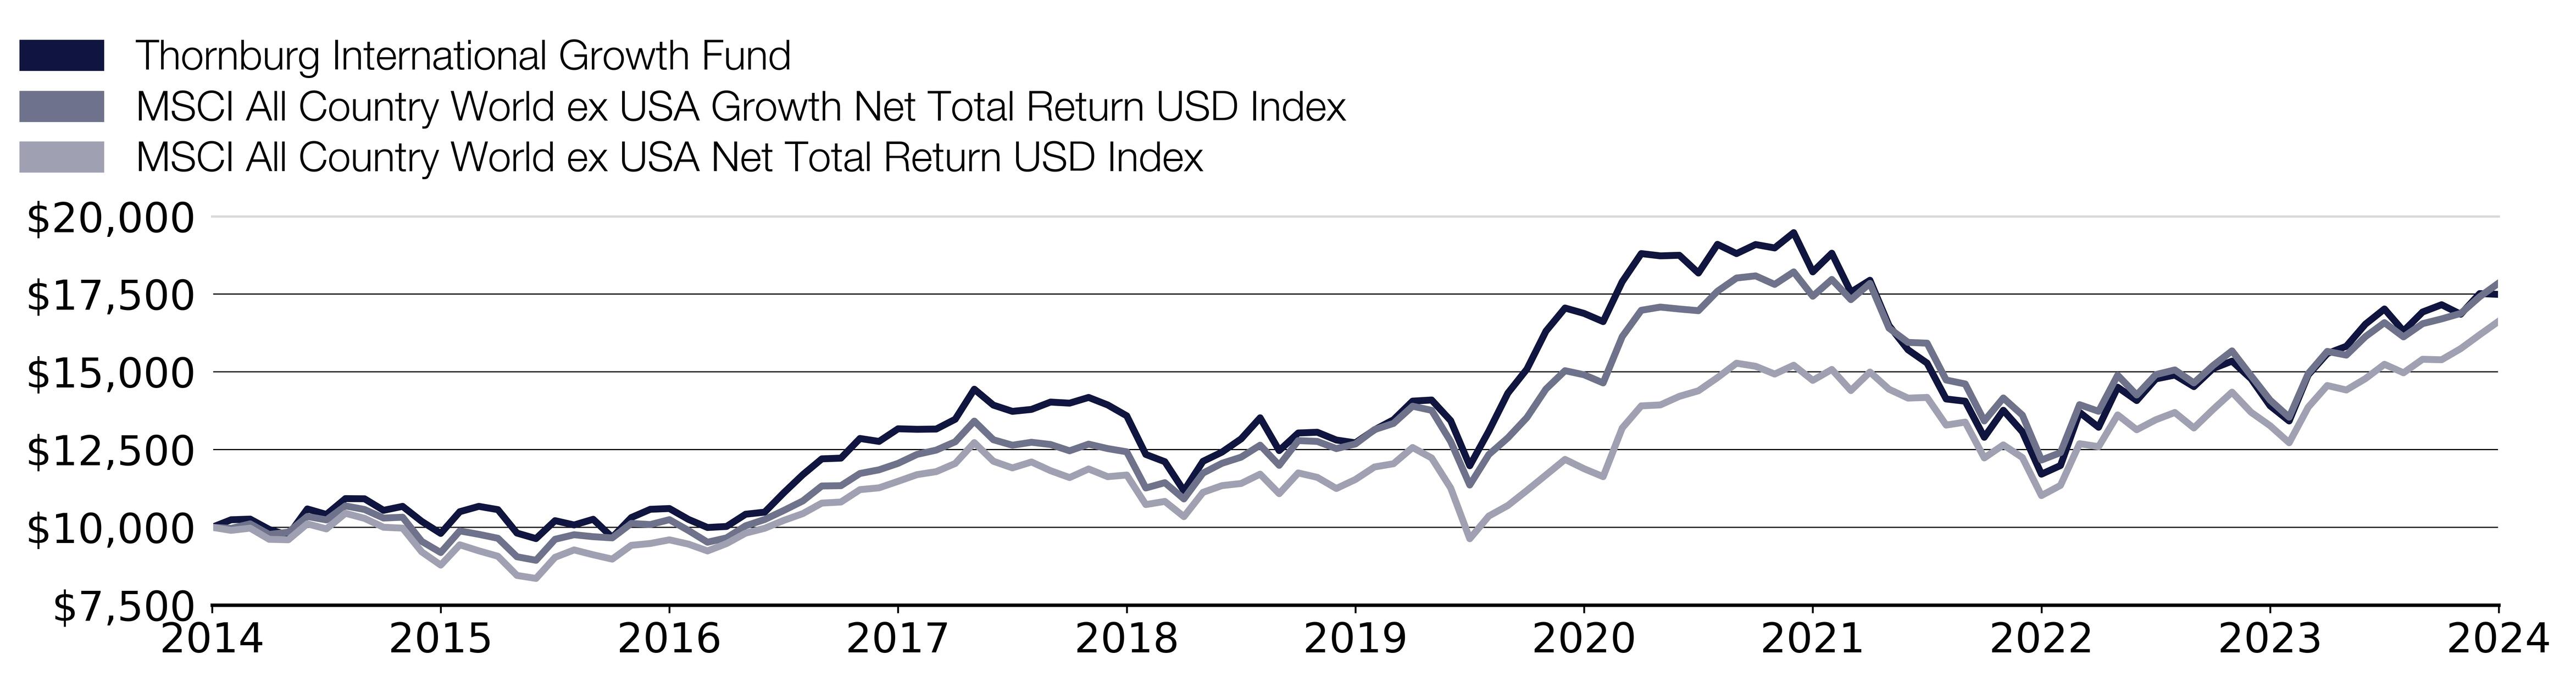
Effective September 30, 2024, the Fund adopted the MSCI All Country World ex USA Net Total Return USD Index as its broad-based securities market index that represents the overall applicable market in which the Fund invests, and the MSCI All Country World ex USA Growth Net Total Return USD Index as an additional index that represents the market sectors which the Fund’s advisor believes are more representative of the Fund’s investment universe.
What were the Fund costs for the past year?
(based on a hypothetical $10,000 investment)
Class Name | Costs of a $10,000 investment | Costs paid as a percentage of a $10,000 investment |
|---|
Class R4 | $158.00 | 1.40% |
End Block
Thornburg International Growth Fund Tailored Shareholder Report
Thornburg International Growth Fund Tailored Shareholder Report | |
Annual Performance | 1 Year | 5 Year | 10 Year |
|---|
International Growth Fund Class R4 | 25.77% | 6.58% | 5.75% |
MSCI All Country World ex USA Growth Net Total Return USD Index | 26.75% | 7.09% | 5.97% |
MSCI All Country World ex USA Net Total Return USD Index | 25.35% | 7.59% | 5.22% |
Key Fund Statistics
(as of September 30, 2024)
| |
|---|
Fund Size (Millions) | $881.6M |
Number of Holdings | 46 |
Annual Portfolio Turnover | 44.57% |
Total Advisory Fee | $7.3M |
What did the Fund invest in?
(as of September 30, 2024)
Market Capitalization Exposure | (%) |
|---|
| Small Cap (<$2.5 B) | 3.7 |
| Mid Cap ($2.5-12 B) | 14.0 |
| Large Cap (>$12 B) | 82.3 |
Market Capitalization Exposure | (%) |
Small Cap (<$2.5 B) | 3.7% |
Mid Cap ($2.5-12 B) | 14.0% |
Large Cap (>$12 B) | 82.3% |
Expressed as a percentage of the Fund’s net assets.
How has the Fund changed?
This is a summary of certain changes to the Fund since October 1, 2023. For more complete information, you may review the Fund’s next prospectus, which we expect to be available by February 1, 2025 at https://www.thornburg.com/download or upon request by calling 1-800-847-0200.
End Block
Changes In and Disagreements with Accountants
No changes and/or disagreements occurred in the current reporting period.
End Block
For additional information about the Fund, including its prospectus, financial information, holdings and proxy information, visit www.thornburg.com/download.

Thornburg International Growth Fund Tailored Shareholder Report | |
Thornburg International Growth Fund Tailored Shareholder Report
Thornburg International Growth Fund CLASS: R5 TICKER: TINFX Annual Shareholder Report | |
This annual shareholder report contains important information about the Thornburg International Growth Fund Class R5 Shares for the period from October 1, 2023 to September 30, 2024. You can find additional information about the Fund at https://www.thornburg.com/download. You can also request this information by contacting us at 1-800-847-0200. This report also describes changes to the Fund that occurred during the reporting period.
How did the Fund perform last year and what affected its performance?
The Fund’s Class R5 shares underperformed the MSCI All Country World ex USA Growth Net Total Return USD Index (the “Index”) during the 12-month period ended September 30, 2024. During the period, non-U.S. equities have posted strong returns but lagged their U.S. counterparts, as U.S. mega-cap and artificial intelligence beneficiaries have continued to lead the market. The Fund’s underperformance relative to the Index was primarily driven by portfolio allocations across sectors and countries. However, strong stock selection added to relative results, consistent with the Fund’s bottom-up investment process. The Fund’s cash allocation was a drag on performance. Within information technology and consumer services, both stock selection and general positioning versus the Index bolstered relative returns. Security selection within South Korea and Brazil also contributed to relative returns. The Fund’s overweight exposure to consumer staples and the UK were detractors from relative performance as both underperformed other sectors and countries, respectively.
How did the Fund perform over the past 10 years?
The line graph below reflects a hypothetical $10,000 investment. The returns shown in the line graph and table assume the reinvestment of dividends and capital gains, but do not reflect the deduction of taxes that a shareholder would pay on distributions or the redemption of Fund shares. The performance information shown below represents past performance and is no guarantee of future results. For Fund performance current to the most recent month end, visit https://www.thornburg.com/product/mutual-funds/fig/TINFX or call 1-800-847-0200. Performance for other share classes of the Fund will vary.
Cumulative Performance
Growth Table
Date | Thornburg International Growth Fund | MSCI All Country World ex USA Growth Net Total Return USD Index | MSCI All Country World ex USA Net Total Return USD Index |
09/30/2014 | 10000.0009 | 10000 | 10000 |
10/31/2014 | 10245.5253 | 9965.2434 | 9900.9916 |
11/30/2014 | 10270.9927 | 10111.108 | 9972.6147 |
12/31/2014 | 9945.0859 | 9769.5894 | 9613.0446 |
01/31/2015 | 9762.1136 | 9843.0021 | 9598.8003 |
02/28/2015 | 10607.0153 | 10348.0743 | 10111.9989 |
03/31/2015 | 10434.8061 | 10237.4749 | 9948.5397 |
04/30/2015 | 10951.4339 | 10688.4625 | 10451.1052 |
05/31/2015 | 10946.0524 | 10573.2855 | 10287.947 |
06/30/2015 | 10580.1076 | 10297.4371 | 10000.9028 |
07/31/2015 | 10714.6461 | 10324.4511 | 9973.1163 |
08/31/2015 | 10235.6891 | 9548.6733 | 9210.8418 |
09/30/2015 | 9846.7693 | 9188.0528 | 8783.7614 |
10/31/2015 | 10548.1829 | 9884.1448 | 9437.6483 |
11/30/2015 | 10726.2341 | 9773.3194 | 9242.8415 |
12/31/2015 | 10622.9885 | 9647.1785 | 9068.7492 |
01/31/2016 | 9872.6859 | 9052.0218 | 8451.8776 |
02/29/2016 | 9694.5566 | 8938.3707 | 8355.2767 |
03/31/2016 | 10277.5254 | 9614.8521 | 9034.6429 |
04/30/2016 | 10142.5789 | 9760.6601 | 9272.3835 |
05/31/2016 | 10326.1062 | 9697.5896 | 9115.896 |
06/30/2016 | 9752.1385 | 9659.3857 | 8976.4115 |
07/31/2016 | 10395.7905 | 10124.0498 | 9420.3444 |
08/31/2016 | 10666.2325 | 10088.1065 | 9479.93 |
09/30/2016 | 10689.8324 | 10245.1609 | 9596.794 |
10/31/2016 | 10343.0765 | 9896.9171 | 9458.8142 |
11/30/2016 | 10083.0097 | 9519.9073 | 9240.0327 |
12/31/2016 | 10126.3541 | 9659.2161 | 9476.419 |
01/31/2017 | 10521.8725 | 10048.094 | 9812.1147 |
02/28/2017 | 10592.3073 | 10250.3038 | 9968.552 |
03/31/2017 | 11226.2203 | 10540.733 | 10221.2893 |
04/30/2017 | 11816.7889 | 10847.2124 | 10440.0708 |
05/31/2017 | 12336.9226 | 11329.4527 | 10778.8762 |
06/30/2017 | 12364.4866 | 11338.0994 | 10812.3304 |
07/31/2017 | 13010.1092 | 11730.9333 | 11210.8719 |
08/31/2017 | 12917.8774 | 11848.5405 | 11269.5045 |
09/30/2017 | 13328.4593 | 12056.2887 | 11478.7062 |
10/31/2017 | 13323.028 | 12346.2093 | 11694.6789 |
11/30/2017 | 13330.5214 | 12482.0707 | 11789.6748 |
12/31/2017 | 13662.0984 | 12751.4199 | 12053.1957 |
01/31/2018 | 14645.5897 | 13415.7507 | 12724.4868 |
02/28/2018 | 14128.5543 | 12815.5642 | 12124.5179 |
03/31/2018 | 13926.2361 | 12640.3685 | 11910.6517 |
04/30/2018 | 13999.2954 | 12735.1437 | 12100.8441 |
05/31/2018 | 14240.9533 | 12662.8048 | 11821.4237 |
06/30/2018 | 14212.8535 | 12460.4821 | 11599.2316 |
07/31/2018 | 14398.3119 | 12674.4469 | 11876.6458 |
08/31/2018 | 14162.274 | 12531.6341 | 11628.0714 |
09/30/2018 | 13813.8371 | 12428.0991 | 11681.0364 |
10/31/2018 | 12549.3483 | 11264.5737 | 10730.9268 |
11/30/2018 | 12315.2241 | 11435.2482 | 10832.4932 |
12/31/2018 | 11375.2742 | 10911.9218 | 10342.216 |
01/31/2019 | 12334.4232 | 11741.9537 | 11123.6502 |
02/28/2019 | 12644.3921 | 12059.2274 | 11340.9771 |
03/31/2019 | 13083.0274 | 12255.4466 | 11408.5376 |
04/30/2019 | 13778.9953 | 12641.2727 | 11709.9264 |
05/31/2019 | 12708.7253 | 11992.9922 | 11081.4186 |
06/30/2019 | 13287.7238 | 12789.0587 | 11748.6972 |
07/31/2019 | 13322.8147 | 12762.3273 | 11606.5043 |
08/31/2019 | 13071.3304 | 12531.5211 | 11248.0376 |
09/30/2019 | 12977.7549 | 12680.5505 | 11537.4893 |
10/31/2019 | 13410.5417 | 13141.5977 | 11940.0432 |
11/30/2019 | 13746.6772 | 13342.0554 | 12045.3212 |
12/31/2019 | 14365.2621 | 13895.2782 | 12566.946 |
01/31/2020 | 14406.5246 | 13761.7904 | 12229.3444 |
02/29/2020 | 13728.6399 | 12757.4105 | 11262.6833 |
03/31/2020 | 12254.9774 | 11360.0271 | 9631.9034 |
04/30/2020 | 13392.6448 | 12340.2187 | 10361.8271 |
05/31/2020 | 14654.0999 | 12877.1087 | 10700.9334 |
06/30/2020 | 15449.8776 | 13530.5886 | 11184.5398 |
07/31/2020 | 16705.4381 | 14447.8793 | 11683.1931 |
08/31/2020 | 17477.6373 | 15037.215 | 12183.301 |
09/30/2020 | 17300.7977 | 14905.253 | 11883.8181 |
10/31/2020 | 17035.5385 | 14643.7028 | 11628.3222 |
11/30/2020 | 18357.9064 | 16132.5836 | 13192.4946 |
12/31/2020 | 19294.8996 | 16980.1916 | 13905.5658 |
01/31/2021 | 19223.2823 | 17083.2179 | 13935.81 |
02/28/2021 | 19247.1548 | 17021.1648 | 14211.6693 |
03/31/2021 | 18668.2481 | 16967.4193 | 14391.329 |
04/30/2021 | 19623.1457 | 17593.433 | 14814.9987 |
05/31/2021 | 19324.7402 | 18018.1412 | 15278.3922 |
06/30/2021 | 19629.1138 | 18087.4848 | 15179.3838 |
07/31/2021 | 19527.6559 | 17812.7102 | 14929.2546 |
08/31/2021 | 20040.9134 | 18215.1516 | 15213.0386 |
09/30/2021 | 18745.8335 | 17432.253 | 14725.9212 |
10/31/2021 | 19372.4851 | 17972.3643 | 15077.4162 |
11/30/2021 | 18080.275 | 17323.236 | 14398.5013 |
12/31/2021 | 18480.7874 | 17845.2061 | 14993.5549 |
01/31/2022 | 16986.8125 | 16406.3975 | 14441.0338 |
02/28/2022 | 16198.5023 | 15947.6674 | 14155.1934 |
03/31/2022 | 15759.8459 | 15922.2922 | 14177.7637 |
04/30/2022 | 14571.0233 | 14737.5738 | 13287.4905 |
05/31/2022 | 14501.0925 | 14610.9243 | 13382.8375 |
06/30/2022 | 13312.27 | 13420.7805 | 12231.5513 |
07/31/2022 | 14208.6549 | 14159.4846 | 12650.3057 |
08/31/2022 | 13502.9902 | 13607.2226 | 12243.4383 |
09/30/2022 | 12098.018 | 12163.3841 | 11019.9271 |
10/31/2022 | 12390.4557 | 12402.2719 | 11349.2529 |
11/30/2022 | 14164.1535 | 13943.9939 | 12688.9762 |
12/31/2022 | 13671.4725 | 13731.1594 | 12594.0806 |
01/31/2023 | 15009.804 | 14892.6503 | 13615.6126 |
02/28/2023 | 14567.9625 | 14254.9945 | 13137.6739 |
03/31/2023 | 15297.9615 | 14910.9045 | 13458.8242 |
04/30/2023 | 15432.435 | 15061.7989 | 13692.6526 |
05/31/2023 | 15048.225 | 14644.7201 | 13194.8018 |
06/30/2023 | 15656.5575 | 15200.8251 | 13786.846 |
07/31/2023 | 15906.294 | 15674.4751 | 14347.342 |
08/31/2023 | 15329.979 | 14875.1307 | 13699.3735 |
09/30/2023 | 14427.0855 | 14090.1975 | 13266.6757 |
10/31/2023 | 13927.6125 | 13541.835 | 12719.3207 |
11/30/2023 | 15470.856 | 14943.2875 | 13864.2371 |
12/31/2023 | 16191.7209 | 15657.7468 | 14560.8069 |
01/31/2024 | 16436.3672 | 15538.1051 | 14416.1563 |
02/29/2024 | 17183.1821 | 16132.1315 | 14781.1433 |
03/31/2024 | 17698.2269 | 16583.1756 | 15243.1825 |
04/30/2024 | 16964.2881 | 16124.502 | 14969.4799 |
05/31/2024 | 17608.0941 | 16549.4928 | 15404.0336 |
06/30/2024 | 17859.1784 | 16703.2129 | 15389.3378 |
07/31/2024 | 17537.2754 | 16879.5388 | 15745.6978 |
08/31/2024 | 18239.024 | 17416.4288 | 16194.1448 |
09/30/2024 | 18213.2717 | 17859.1088 | 16630.2031 |
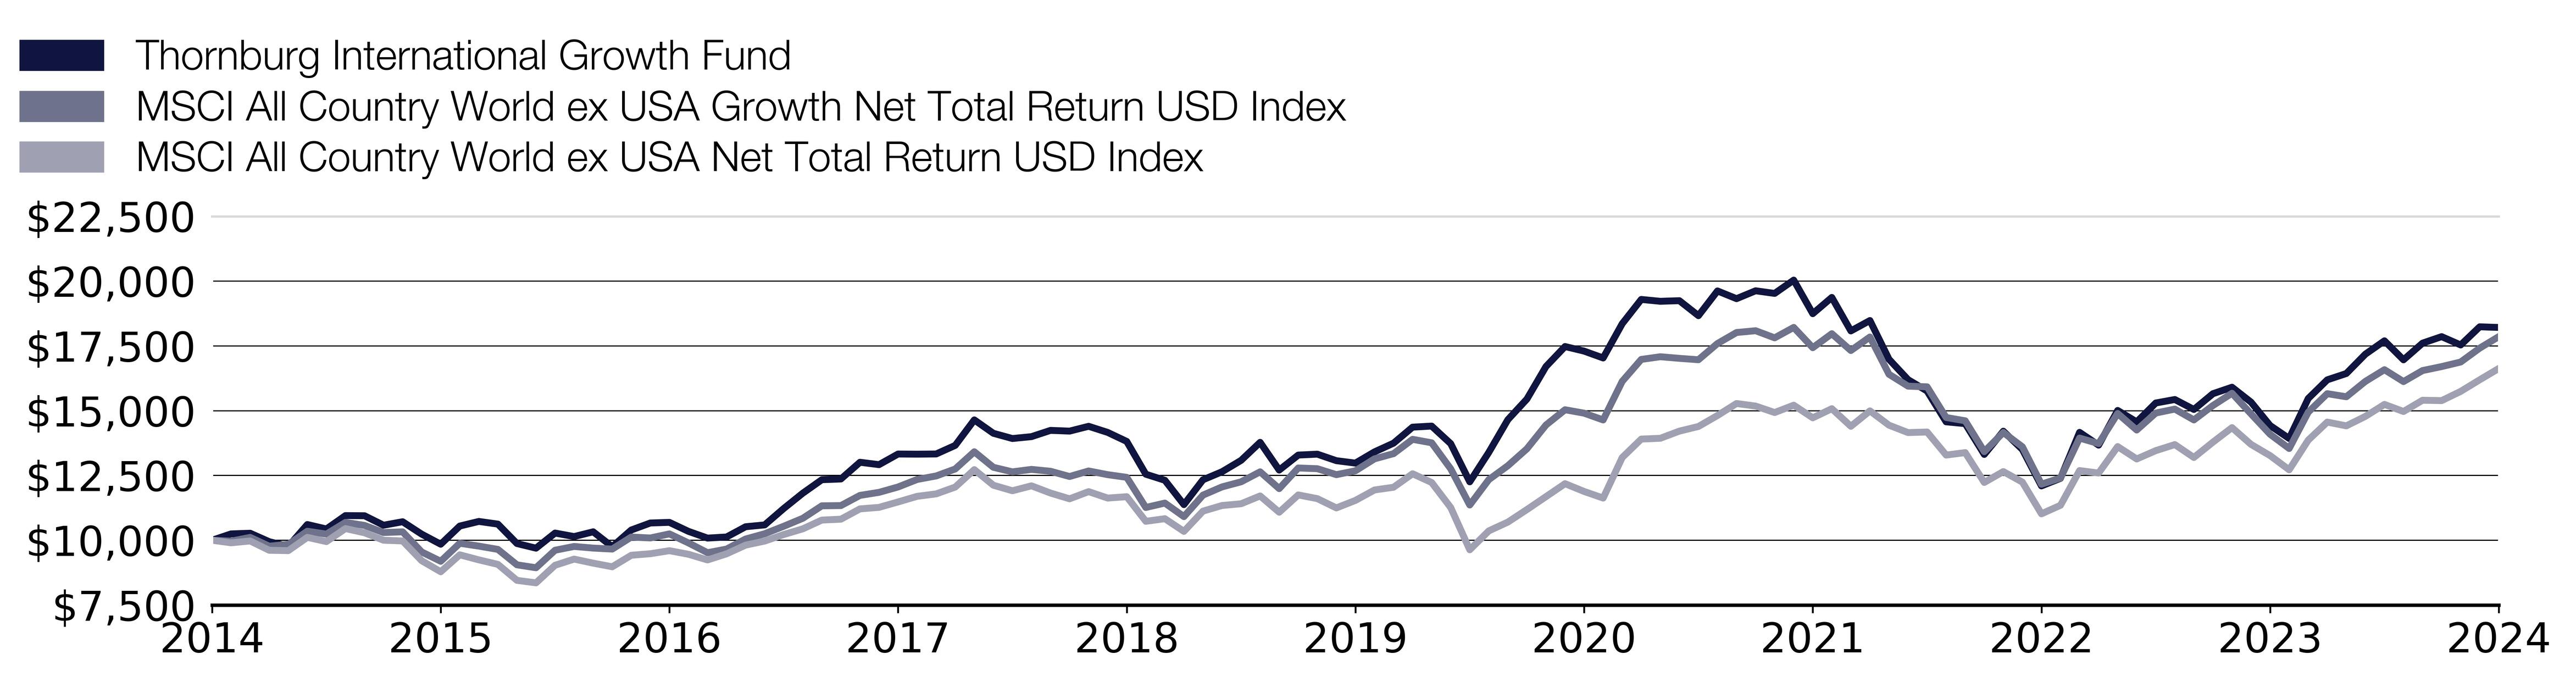
Effective September 30, 2024, the Fund adopted the MSCI All Country World ex USA Net Total Return USD Index as its broad-based securities market index that represents the overall applicable market in which the Fund invests, and the MSCI All Country World ex USA Growth Net Total Return USD Index as an additional index that represents the market sectors which the Fund’s advisor believes are more representative of the Fund’s investment universe.
What were the Fund costs for the past year?
(based on a hypothetical $10,000 investment)
Class Name | Costs of a $10,000 investment | Costs paid as a percentage of a $10,000 investment |
|---|
Class R5 | $112.00 | 0.99% |
End Block
Thornburg International Growth Fund Tailored Shareholder Report
Thornburg International Growth Fund Tailored Shareholder Report | |
Annual Performance | 1 Year | 5 Year | 10 Year |
|---|
International Growth Fund Class R5 | 26.24% | 7.01% | 6.18% |
MSCI All Country World ex USA Growth Net Total Return USD Index | 26.75% | 7.09% | 5.97% |
MSCI All Country World ex USA Net Total Return USD Index | 25.35% | 7.59% | 5.22% |
Key Fund Statistics
(as of September 30, 2024)
| |
|---|
Fund Size (Millions) | $881.6M |
Number of Holdings | 46 |
Annual Portfolio Turnover | 44.57% |
Total Advisory Fee | $7.3M |
What did the Fund invest in?
(as of September 30, 2024)
Market Capitalization Exposure | (%) |
|---|
| Small Cap (<$2.5 B) | 3.7 |
| Mid Cap ($2.5-12 B) | 14.0 |
| Large Cap (>$12 B) | 82.3 |
Market Capitalization Exposure | (%) |
Small Cap (<$2.5 B) | 3.7% |
Mid Cap ($2.5-12 B) | 14.0% |
Large Cap (>$12 B) | 82.3% |
Expressed as a percentage of the Fund’s net assets.
How has the Fund changed?
This is a summary of certain changes to the Fund since October 1, 2023. For more complete information, you may review the Fund’s next prospectus, which we expect to be available by February 1, 2025 at https://www.thornburg.com/download or upon request by calling 1-800-847-0200.
End Block
Changes In and Disagreements with Accountants
No changes and/or disagreements occurred in the current reporting period.
End Block
For additional information about the Fund, including its prospectus, financial information, holdings and proxy information, visit www.thornburg.com/download.

Thornburg International Growth Fund Tailored Shareholder Report | |
Thornburg International Growth Fund Tailored Shareholder Report
Thornburg International Growth Fund CLASS: R6 TICKER: THGIX Annual Shareholder Report | |
This annual shareholder report contains important information about the Thornburg International Growth Fund Class R6 Shares for the period from October 1, 2023 to September 30, 2024. You can find additional information about the Fund at https://www.thornburg.com/download. You can also request this information by contacting us at 1-800-847-0200. This report also describes changes to the Fund that occurred during the reporting period.
How did the Fund perform last year and what affected its performance?
The Fund’s Class R6 shares underperformed the MSCI All Country World ex USA Growth Net Total Return USD Index (the “Index”) during the 12-month period ended September 30, 2024. During the period, non-U.S. equities have posted strong returns but lagged their U.S. counterparts, as U.S. mega-cap and artificial intelligence beneficiaries have continued to lead the market. The Fund’s underperformance relative to the Index was primarily driven by portfolio allocations across sectors and countries. However, strong stock selection added to relative results, consistent with the Fund’s bottom-up investment process. The Fund’s cash allocation was a drag on performance. Within information technology and consumer services, both stock selection and general positioning versus the Index bolstered relative returns. Security selection within South Korea and Brazil also contributed to relative returns. The Fund’s overweight exposure to consumer staples and the UK were detractors from relative performance as both underperformed other sectors and countries, respectively.
How did the Fund perform over the past 10 years?
The line graph below reflects a hypothetical $10,000 investment. The returns shown in the line graph and table assume the reinvestment of dividends and capital gains, but do not reflect the deduction of taxes that a shareholder would pay on distributions or the redemption of Fund shares. The performance information shown below represents past performance and is no guarantee of future results. For Fund performance current to the most recent month end, visit https://www.thornburg.com/product/mutual-funds/fig/THGIX or call 1-800-847-0200. Performance for other share classes of the Fund will vary.
Cumulative Performance
Growth Table
Date | Thornburg International Growth Fund | MSCI All Country World ex USA Growth Net Total Return USD Index | MSCI All Country World ex USA Net Total Return USD Index |
09/30/2014 | 10000.0094 | 10000 | 10000 |
10/31/2014 | 10250.1372 | 9965.2434 | 9900.9916 |
11/30/2014 | 10275.8066 | 10111.108 | 9972.6147 |
12/31/2014 | 9947.8143 | 9769.5894 | 9613.0446 |
01/31/2015 | 9765.187 | 9843.0021 | 9598.8003 |
02/28/2015 | 10613.8666 | 10348.0743 | 10111.9989 |
03/31/2015 | 10436.6108 | 10237.4749 | 9948.5397 |
04/30/2015 | 10957.6356 | 10688.4625 | 10451.1052 |
05/31/2015 | 10952.2642 | 10573.2855 | 10287.947 |
06/30/2015 | 10587.0097 | 10297.4371 | 10000.9028 |
07/31/2015 | 10721.2944 | 10324.4511 | 9973.1163 |
08/31/2015 | 10243.2407 | 9548.6733 | 9210.8418 |
09/30/2015 | 9856.8468 | 9188.0528 | 8783.7614 |
10/31/2015 | 10557.4428 | 9884.1448 | 9437.6483 |
11/30/2015 | 10740.6756 | 9773.3194 | 9242.8415 |
12/31/2015 | 10634.8777 | 9647.1785 | 9068.7492 |
01/31/2016 | 9885.259 | 9052.0218 | 8451.8776 |
02/29/2016 | 9707.292 | 8938.3707 | 8355.2767 |
03/31/2016 | 10289.7295 | 9614.8521 | 9034.6429 |
04/30/2016 | 10160.299 | 9760.6601 | 9272.3835 |
05/31/2016 | 10343.6589 | 9697.5896 | 9115.896 |
06/30/2016 | 9764.4099 | 9659.3857 | 8976.4115 |
07/31/2016 | 10413.2079 | 10124.0498 | 9420.3444 |
08/31/2016 | 10683.5404 | 10088.1065 | 9479.93 |
09/30/2016 | 10709.8835 | 10245.1609 | 9596.794 |
10/31/2016 | 10363.1801 | 9896.9171 | 9458.8142 |
11/30/2016 | 10103.1526 | 9519.9073 | 9240.0327 |
12/31/2016 | 10146.4905 | 9659.2161 | 9476.419 |
01/31/2017 | 10547.3663 | 10048.094 | 9812.1147 |
02/28/2017 | 10617.7904 | 10250.3038 | 9968.552 |
03/31/2017 | 11251.6075 | 10540.733 | 10221.2893 |
04/30/2017 | 11842.0866 | 10847.2124 | 10440.0708 |
05/31/2017 | 12367.5589 | 11329.4527 | 10778.8762 |
06/30/2017 | 12394.4527 | 11338.0994 | 10812.3304 |
07/31/2017 | 13040.506 | 11730.9333 | 11210.8719 |
08/31/2017 | 12953.6417 | 11848.5405 | 11269.5045 |
09/30/2017 | 13367.8617 | 12056.2887 | 11478.7062 |
10/31/2017 | 13362.4254 | 12346.2093 | 11694.6789 |
11/30/2017 | 13375.5128 | 12482.0707 | 11789.6748 |
12/31/2017 | 13701.7448 | 12751.4199 | 12053.1957 |
01/31/2018 | 14691.6903 | 13415.7507 | 12724.4868 |
02/28/2018 | 14174.2188 | 12815.5642 | 12124.5179 |
03/31/2018 | 13977.3547 | 12640.3685 | 11910.6517 |
04/30/2018 | 14044.8509 | 12735.1437 | 12100.8441 |
05/31/2018 | 14292.3373 | 12662.8048 | 11821.4237 |
06/30/2018 | 14264.2138 | 12460.4821 | 11599.2316 |
07/31/2018 | 14455.4533 | 12674.4469 | 11876.6458 |
08/31/2018 | 14219.2163 | 12531.6341 | 11628.0714 |
09/30/2018 | 13864.8608 | 12428.0991 | 11681.0364 |
10/31/2018 | 12604.9303 | 11264.5737 | 10730.9268 |
11/30/2018 | 12370.815 | 11435.2482 | 10832.4932 |
12/31/2018 | 11422.134 | 10911.9218 | 10342.216 |
01/31/2019 | 12389.1181 | 11741.9537 | 11123.6502 |
02/28/2019 | 12699.7252 | 12059.2274 | 11340.9771 |
03/31/2019 | 13139.2634 | 12255.4466 | 11408.5376 |
04/30/2019 | 13836.6641 | 12641.2727 | 11709.9264 |
05/31/2019 | 12770.0513 | 11992.9922 | 11081.4186 |
06/30/2019 | 13350.2418 | 12789.0587 | 11748.6972 |
07/31/2019 | 13385.4048 | 12762.3273 | 11606.5043 |
08/31/2019 | 13133.4029 | 12531.5211 | 11248.0376 |
09/30/2019 | 13045.4953 | 12680.5505 | 11537.4893 |
10/31/2019 | 13479.173 | 13141.5977 | 11940.0432 |
11/30/2019 | 13815.9928 | 13342.0554 | 12045.3212 |
12/31/2019 | 14437.8366 | 13895.2782 | 12566.946 |
01/31/2020 | 14479.2227 | 13761.7904 | 12229.3444 |
02/29/2020 | 13805.2205 | 12757.4105 | 11262.6833 |
03/31/2020 | 12321.2332 | 11360.0271 | 9631.9034 |
04/30/2020 | 13468.2194 | 12340.2187 | 10361.8271 |
05/31/2020 | 14739.3639 | 12877.1087 | 10700.9334 |
06/30/2020 | 15537.5244 | 13530.5886 | 11184.5398 |
07/31/2020 | 16802.7566 | 14447.8793 | 11683.1931 |
08/31/2020 | 17577.2679 | 15037.215 | 12183.301 |
09/30/2020 | 17405.8112 | 14905.253 | 11883.8181 |
10/31/2020 | 17139.7577 | 14643.7028 | 11628.3222 |
11/30/2020 | 18466.0696 | 16132.5836 | 13192.4946 |
12/31/2020 | 19411.8197 | 16980.1916 | 13905.5658 |
01/31/2021 | 19339.9906 | 17083.2179 | 13935.81 |
02/28/2021 | 19369.9194 | 17021.1648 | 14211.6693 |
03/31/2021 | 18789.3006 | 16967.4193 | 14391.329 |
04/30/2021 | 19753.008 | 17593.433 | 14814.9987 |
05/31/2021 | 19453.72 | 18018.1412 | 15278.3922 |
06/30/2021 | 19758.9938 | 18087.4848 | 15179.3838 |
07/31/2021 | 19663.2216 | 17812.7102 | 14929.2546 |
08/31/2021 | 20177.997 | 18215.1516 | 15213.0386 |
09/30/2021 | 18879.087 | 17432.253 | 14725.9212 |
10/31/2021 | 19507.5918 | 17972.3643 | 15077.4162 |
11/30/2021 | 18211.8894 | 17323.236 | 14398.5013 |
12/31/2021 | 18619.8561 | 17845.2061 | 14993.5549 |
01/31/2022 | 17115.4788 | 16406.3975 | 14441.0338 |
02/28/2022 | 16318.6688 | 15947.6674 | 14155.1934 |
03/31/2022 | 15878.8297 | 15922.2922 | 14177.7637 |
04/30/2022 | 14680.4274 | 14737.5738 | 13287.4905 |
05/31/2022 | 14610.3082 | 14610.9243 | 13382.8375 |
06/30/2022 | 13418.2804 | 13420.7805 | 12231.5513 |
07/31/2022 | 14323.4566 | 14159.4846 | 12650.3057 |
08/31/2022 | 13609.5148 | 13607.2226 | 12243.4383 |
09/30/2022 | 12194.3802 | 12163.3841 | 11019.9271 |
10/31/2022 | 12493.9808 | 12402.2719 | 11349.2529 |
11/30/2022 | 14278.8352 | 13943.9939 | 12688.9762 |
12/31/2022 | 13786.8802 | 13731.1594 | 12594.0806 |
01/31/2023 | 15130.2173 | 14892.6503 | 13615.6126 |
02/28/2023 | 14693.1507 | 14254.9945 | 13137.6739 |
03/31/2023 | 15425.88 | 14910.9045 | 13458.8242 |
04/30/2023 | 15560.8565 | 15061.7989 | 13692.6526 |
05/31/2023 | 15181.6369 | 14644.7201 | 13194.8018 |
06/30/2023 | 15792.2447 | 15200.8251 | 13786.846 |
07/31/2023 | 16049.3426 | 15674.4751 | 14347.342 |
08/31/2023 | 15470.8722 | 14875.1307 | 13699.3735 |
09/30/2023 | 14558.1743 | 14090.1975 | 13266.6757 |
10/31/2023 | 14056.8331 | 13541.835 | 12719.3207 |
11/30/2023 | 15612.276 | 14943.2875 | 13864.2371 |
12/31/2023 | 16341.6485 | 15657.7468 | 14560.8069 |
01/31/2024 | 16594.0542 | 15538.1051 | 14416.1563 |
02/29/2024 | 17344.7992 | 16132.1315 | 14781.1433 |
03/31/2024 | 17869.0263 | 16583.1756 | 15243.1825 |
04/30/2024 | 17124.7532 | 16124.502 | 14969.4799 |
05/31/2024 | 17778.4192 | 16549.4928 | 15404.0336 |
06/30/2024 | 18037.2968 | 16703.2129 | 15389.3378 |
07/31/2024 | 17713.6998 | 16879.5388 | 15745.6978 |
08/31/2024 | 18425.6132 | 17416.4288 | 16194.1448 |
09/30/2024 | 18399.7254 | 17859.1088 | 16630.2031 |
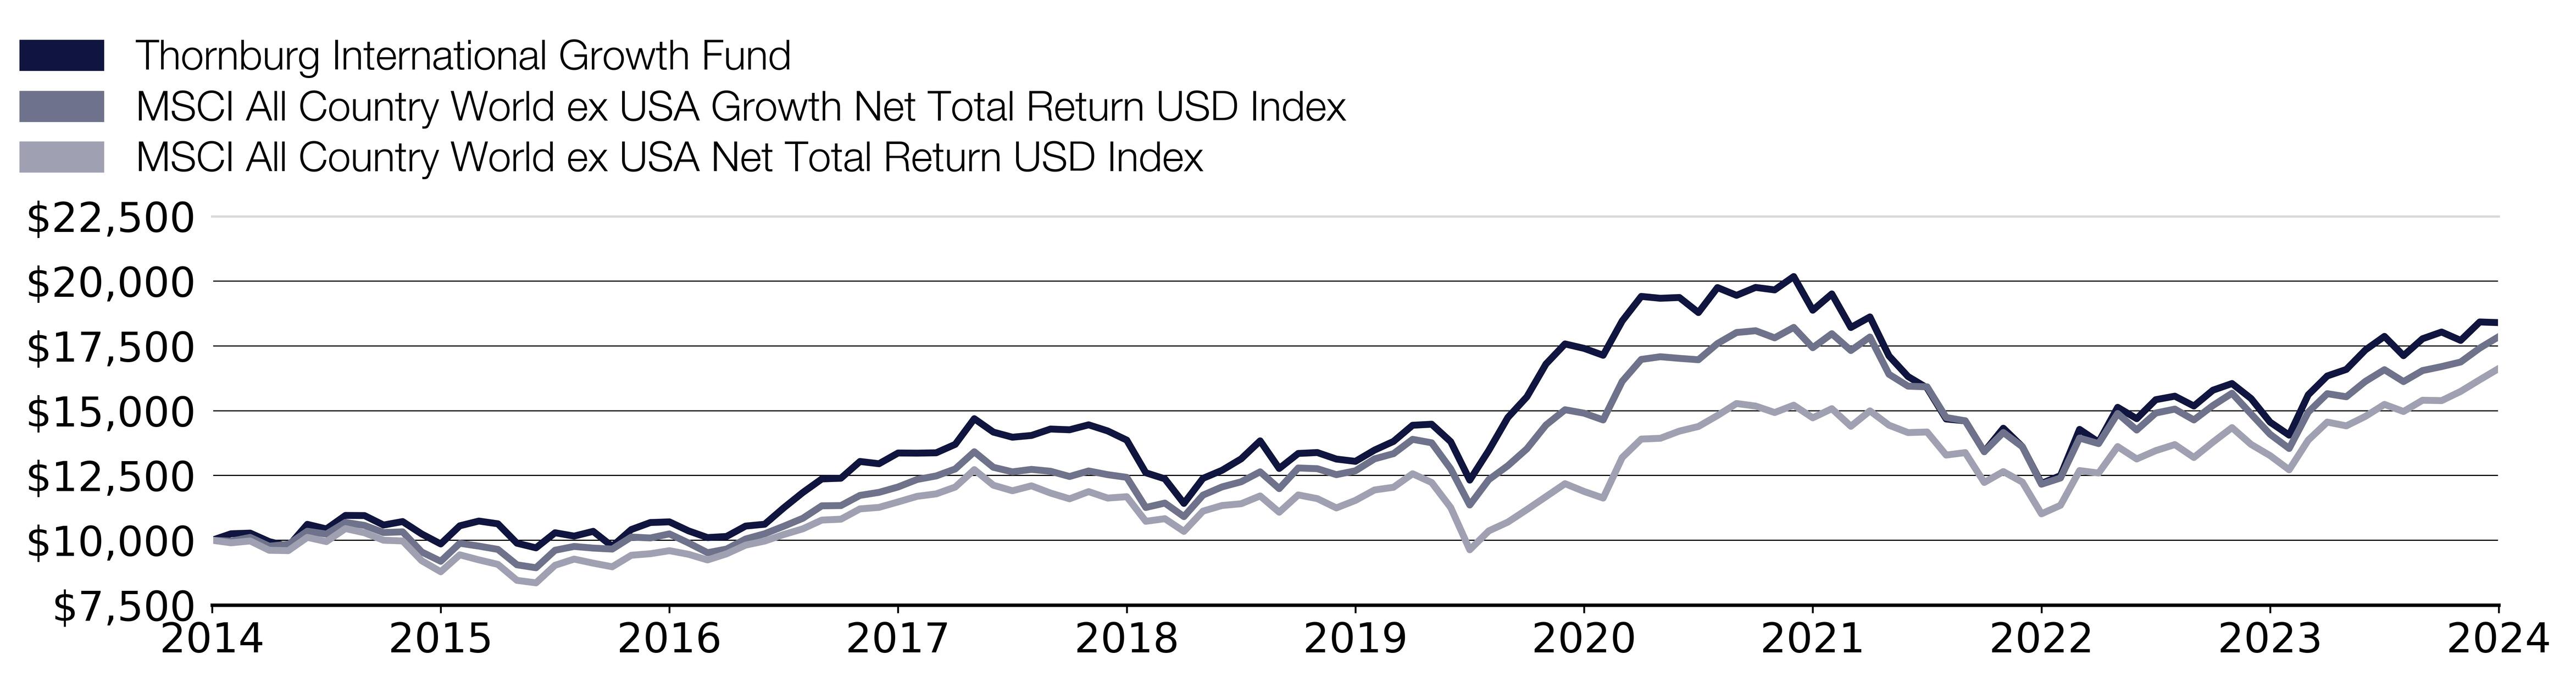
Effective September 30, 2024, the Fund adopted the MSCI All Country World ex USA Net Total Return USD Index as its broad-based securities market index that represents the overall applicable market in which the Fund invests, and the MSCI All Country World ex USA Growth Net Total Return USD Index as an additional index that represents the market sectors which the Fund’s advisor believes are more representative of the Fund’s investment universe.
What were the Fund costs for the past year?
(based on a hypothetical $10,000 investment)
Class Name | Costs of a $10,000 investment | Costs paid as a percentage of a $10,000 investment |
|---|
Class R6 | $101.00 | 0.89% |
End Block
Thornburg International Growth Fund Tailored Shareholder Report
Thornburg International Growth Fund Tailored Shareholder Report | |
Annual Performance | 1 Year | 5 Year | 10 Year |
|---|
International Growth Fund Class R6 | 26.39% | 7.12% | 6.29% |
MSCI All Country World ex USA Growth Net Total Return USD Index | 26.75% | 7.09% | 5.97% |
MSCI All Country World ex USA Net Total Return USD Index | 25.35% | 7.59% | 5.22% |
Key Fund Statistics
(as of September 30, 2024)
| |
|---|
Fund Size (Millions) | $881.6M |
Number of Holdings | 46 |
Annual Portfolio Turnover | 44.57% |
Total Advisory Fee | $7.3M |
What did the Fund invest in?
(as of September 30, 2024)
Market Capitalization Exposure | (%) |
|---|
| Small Cap (<$2.5 B) | 3.7 |
| Mid Cap ($2.5-12 B) | 14.0 |
| Large Cap (>$12 B) | 82.3 |
Market Capitalization Exposure | (%) |
Small Cap (<$2.5 B) | 3.7% |
Mid Cap ($2.5-12 B) | 14.0% |
Large Cap (>$12 B) | 82.3% |
Expressed as a percentage of the Fund’s net assets.
How has the Fund changed?
This is a summary of certain changes to the Fund since October 1, 2023. For more complete information, you may review the Fund’s next prospectus, which we expect to be available by February 1, 2025 at https://www.thornburg.com/download or upon request by calling 1-800-847-0200.
End Block
Changes In and Disagreements with Accountants
No changes and/or disagreements occurred in the current reporting period.
End Block
For additional information about the Fund, including its prospectus, financial information, holdings and proxy information, visit www.thornburg.com/download.

Thornburg International Growth Fund Tailored Shareholder Report | |
Thornburg Developing World Fund Tailored Shareholder Report
Thornburg Developing World Fund CLASS: A TICKER: THDAX Annual Shareholder Report | |
This annual shareholder report contains important information about the Thornburg Developing World Fund Class A Shares for the period from October 1, 2023 to September 30, 2024. You can find additional information about the Fund at https://www.thornburg.com/download. You can also request this information by contacting us at 1-800-847-0200. This report also describes changes to the Fund that occurred during the reporting period.
How did the Fund perform last year and what affected its performance?
The Fund’s Class A shares underperformed the MSCI Emerging Markets Net Total Return USD Index (the “Index”) during the 12-month period ended September 30, 2024. During the period, emerging market equities have posted strong returns but lagged their developed world counterparts. Much of emerging market underperformance was driven by China, where concerns around the real estate market, a weaker-than-expected recovery from COVID-19, and broadly slower economic growth weighed on sentiment. The Fund’s underperformance was primarily driven by weaker security selection as well as the Fund’s sector and country positioning. The currency effect on the Fund’s performance was modestly positive. Positive contributors included stock selection within the consumer staples, information technology and real estate sectors as well as an underweight allocation to materials. Stock selection in consumer discretionary and industrials hampered relative performance. On a geographic basis, positive stock selection in India and South Korea bolstered relative returns while weaker stock selection in China and Brazil were negative contributors to relative performance.
How did the Fund perform over the past 10 years?
The line graph below reflects a hypothetical $10,000 investment and assumes the deduction of the maximum sales charge associated with that investment. The returns shown in the line graph and table assume the reinvestment of dividends and capital gains, but do not reflect the deduction of taxes that a shareholder would pay on distributions or the redemption of Fund shares. The performance information shown below represents past performance and is no guarantee of future results. For Fund performance current to the most recent month end, visit https://www.thornburg.com/product/mutual-funds/fdw/THDAX or call 1-800-847-0200. Performance for other share classes of the Fund will vary.
Cumulative Performance
Growth Table
Date | Thornburg Developing World Fund | MSCI Emerging Markets Net Total Return USD Index |
09/30/2014 | 9548.4932 | 10000 |
10/31/2014 | 9779.381 | 10117.8941 |
11/30/2014 | 9799.9044 | 10010.8928 |
12/31/2014 | 9322.7363 | 9549.5193 |
01/31/2015 | 9230.3812 | 9606.7659 |
02/28/2015 | 9291.9512 | 9904.2244 |
03/31/2015 | 9122.6335 | 9763.3793 |
04/30/2015 | 9533.1007 | 10514.3152 |
05/31/2015 | 9394.568 | 10093.2546 |
06/30/2015 | 9194.4653 | 9831.1381 |
07/31/2015 | 8804.5214 | 9149.6497 |
08/31/2015 | 8045.1571 | 8322.0838 |
09/30/2015 | 7722.8499 | 8071.7401 |
10/31/2015 | 8118.4982 | 8647.5115 |
11/30/2015 | 7979.7644 | 8310.1921 |
12/31/2015 | 7892.4134 | 8124.9435 |
01/31/2016 | 7558.4246 | 7597.8566 |
02/29/2016 | 7455.6588 | 7585.4179 |
03/31/2016 | 8154.4662 | 8589.171 |
04/30/2016 | 8344.583 | 8635.8577 |
05/31/2016 | 8195.5726 | 8313.7121 |
06/30/2016 | 8277.7852 | 8645.9894 |
07/31/2016 | 8642.6038 | 9081.0822 |
08/31/2016 | 8740.2313 | 9306.7626 |
09/30/2016 | 8742.6284 | 9426.4404 |
10/31/2016 | 8665.3967 | 9448.9157 |
11/30/2016 | 8129.9236 | 9013.9656 |
12/31/2016 | 8093.8822 | 9033.8723 |
01/31/2017 | 8356.4699 | 9528.2332 |
02/28/2017 | 8510.9333 | 9819.9124 |
03/31/2017 | 8768.3723 | 10067.8064 |
04/30/2017 | 9061.8528 | 10288.2068 |
05/31/2017 | 9257.5064 | 10592.3722 |
06/30/2017 | 9474.9718 | 10699.0168 |
07/31/2017 | 9949.7525 | 11336.7677 |
08/31/2017 | 10104.5723 | 11589.6561 |
09/30/2017 | 10279.2778 | 11543.564 |
10/31/2017 | 10522.5437 | 11948.2379 |
11/30/2017 | 10698.5233 | 11972.2115 |
12/31/2017 | 10952.1409 | 12401.9769 |
01/31/2018 | 11795.8077 | 13435.6494 |
02/28/2018 | 11210.9344 | 12815.9976 |
03/31/2018 | 10884.8546 | 12577.7121 |
04/30/2018 | 10693.3474 | 12522.0591 |
05/31/2018 | 10470.785 | 12078.3567 |
06/30/2018 | 10139.5293 | 11576.5277 |
07/31/2018 | 10387.9711 | 11830.8432 |
08/31/2018 | 9958.3739 | 11510.9332 |
09/30/2018 | 9901.4393 | 11449.8575 |
10/31/2018 | 9109.5312 | 10452.7639 |
11/30/2018 | 9570.1836 | 10883.5281 |
12/31/2018 | 9289.4932 | 10595.25 |
01/31/2019 | 10192.856 | 11522.8962 |
02/28/2019 | 10375.6172 | 11548.7963 |
03/31/2019 | 10641.9265 | 11645.7135 |
04/30/2019 | 10965.675 | 11890.8962 |
05/31/2019 | 10255.517 | 11028.0596 |
06/30/2019 | 11049.223 | 11716.3501 |
07/31/2019 | 10876.9052 | 11573.0791 |
08/31/2019 | 10511.3827 | 11008.8189 |
09/30/2019 | 10668.0352 | 11218.9687 |
10/31/2019 | 11127.5493 | 11692.0435 |
11/30/2019 | 11174.545 | 11675.9422 |
12/31/2019 | 11988.1657 | 12547.0316 |
01/31/2020 | 11555.6846 | 11962.1512 |
02/29/2020 | 10922.7854 | 11331.345 |
03/31/2020 | 9013.5394 | 9586.0744 |
04/30/2020 | 9894.3242 | 10463.8945 |
05/31/2020 | 10131.6614 | 10544.2822 |
06/30/2020 | 10959.7045 | 11319.382 |
07/31/2020 | 11893.2308 | 12330.8884 |
08/31/2020 | 12278.2445 | 12603.4695 |
09/30/2020 | 12088.3747 | 12401.3109 |
10/31/2020 | 12510.3075 | 12656.8156 |
11/30/2020 | 13686.4452 | 13827.4089 |
12/31/2020 | 14704.3581 | 14843.9098 |
01/31/2021 | 15131.565 | 15299.0044 |
02/28/2021 | 15458.563 | 15416.0186 |
03/31/2021 | 14920.5986 | 15183.1795 |
04/30/2021 | 15163.21 | 15561.216 |
05/31/2021 | 15316.1606 | 15922.0809 |
06/30/2021 | 15558.772 | 15949.5269 |
07/31/2021 | 14720.1806 | 14876.1362 |
08/31/2021 | 15105.1942 | 15265.5412 |
09/30/2021 | 14546.1333 | 14658.8752 |
10/31/2021 | 14693.8098 | 14803.4543 |
11/30/2021 | 13929.0566 | 14200.1655 |
12/31/2021 | 14261.3286 | 14466.6105 |
01/31/2022 | 13765.5576 | 14192.7689 |
02/28/2022 | 13127.3842 | 13768.5451 |
03/31/2022 | 12763.4672 | 13457.5776 |
04/30/2022 | 11692.8127 | 12708.9725 |
05/31/2022 | 11988.1657 | 12764.9348 |
06/30/2022 | 11044.091 | 11916.7012 |
07/31/2022 | 10975.527 | 11887.4238 |
08/31/2022 | 10964.9786 | 11937.0597 |
09/30/2022 | 9720.2769 | 10537.6467 |
10/31/2022 | 9240.3283 | 10210.4828 |
11/30/2022 | 10711.819 | 11724.8646 |
12/31/2022 | 10584.9216 | 11560.0696 |
01/31/2023 | 11418.8851 | 12472.8751 |
02/28/2023 | 10734.6074 | 11664.0981 |
03/31/2023 | 11066.0544 | 12017.3761 |
04/30/2023 | 10916.3686 | 11881.1926 |
05/31/2023 | 10654.4186 | 11681.6264 |
06/30/2023 | 11124.8595 | 12125.1623 |
07/31/2023 | 11584.6086 | 12879.9749 |
08/31/2023 | 10948.4442 | 12086.5619 |
09/30/2023 | 10520.7706 | 11770.481 |
10/31/2023 | 10066.3674 | 11313.1508 |
11/30/2023 | 10857.5635 | 12218.5358 |
12/31/2023 | 11233.5456 | 12696.2008 |
01/31/2024 | 10766.1605 | 12106.6826 |
02/29/2024 | 11402.0216 | 12682.6205 |
03/31/2024 | 11662.8877 | 12996.8939 |
04/30/2024 | 11548.7588 | 13055.0442 |
05/31/2024 | 11733.5389 | 13128.7726 |
06/30/2024 | 12152.0116 | 13646.6316 |
07/31/2024 | 11842.2331 | 13687.2298 |
08/31/2024 | 11842.2331 | 13908.2248 |
09/30/2024 | 12450.9206 | 14836.9413 |
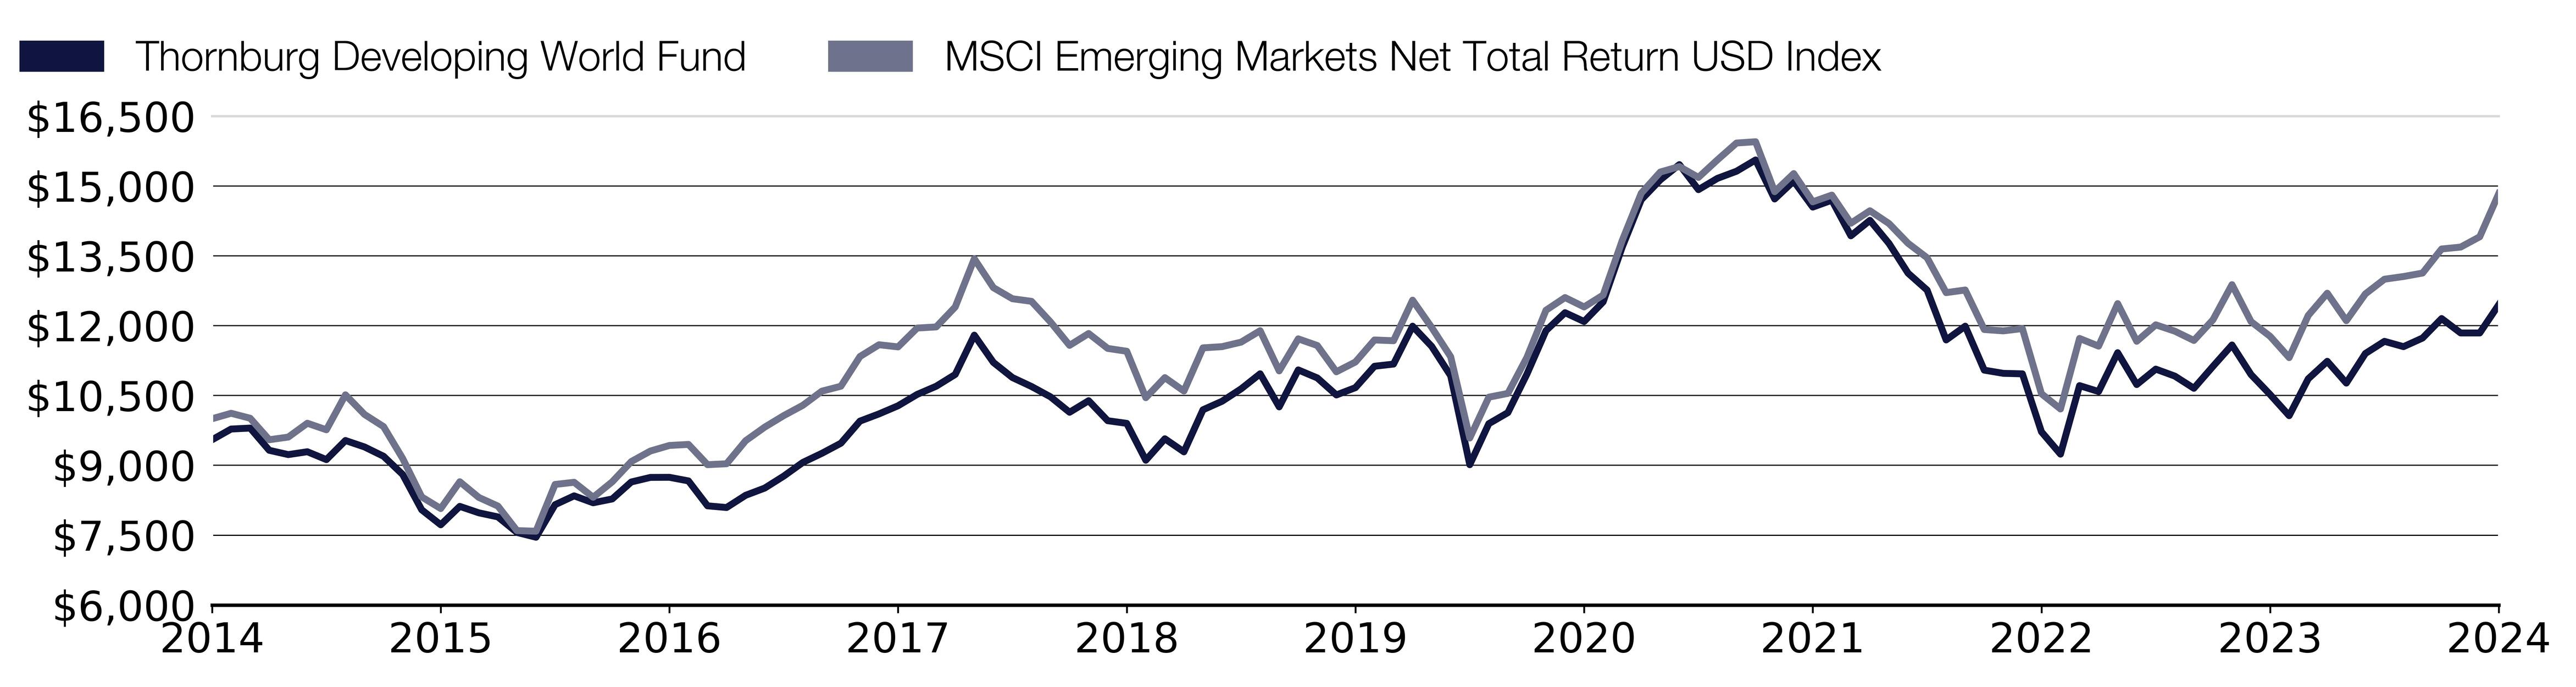
What were the Fund costs for the past year?
(based on a hypothetical $10,000 investment)
Class Name | Costs of a $10,000 investment | Costs paid as a percentage of a $10,000 investment |
|---|
Class A | $161.00 | 1.47% |
End Block
Thornburg Developing World Fund Tailored Shareholder Report
Thornburg Developing World Fund Tailored Shareholder Report | |
Annual Performance | 1 Year | 5 Year | 10 Year |
|---|
Developing World Fund Class A (with sales charge) | 13.01% | 2.20% | 2.22% |
Developing World Fund Class A (without sales charge) | 18.35% | 3.14% | 2.69% |
MSCI Emerging Markets Net Total Return USD Index | 26.05% | 5.75% | 4.02% |
Key Fund Statistics
(as of September 30, 2024)
| |
|---|
Fund Size (Millions) | $674.8M |
Number of Holdings | 65 |
Annual Portfolio Turnover | 90.88% |
Total Advisory Fee | $7.2M |
What did the Fund invest in?
(as of September 30, 2024)
Market Capitalization Exposure | (%) |
|---|
| Small Cap (<$2.5 B) | 5.7 |
| Mid Cap ($2.5-12 B) | 21.7 |
| Large Cap (>$12 B) | 72.6 |
Market Capitalization Exposure | (%) |
Small Cap (<$2.5 B) | 5.7% |
Mid Cap ($2.5-12 B) | 21.7% |
Large Cap (>$12 B) | 72.6% |
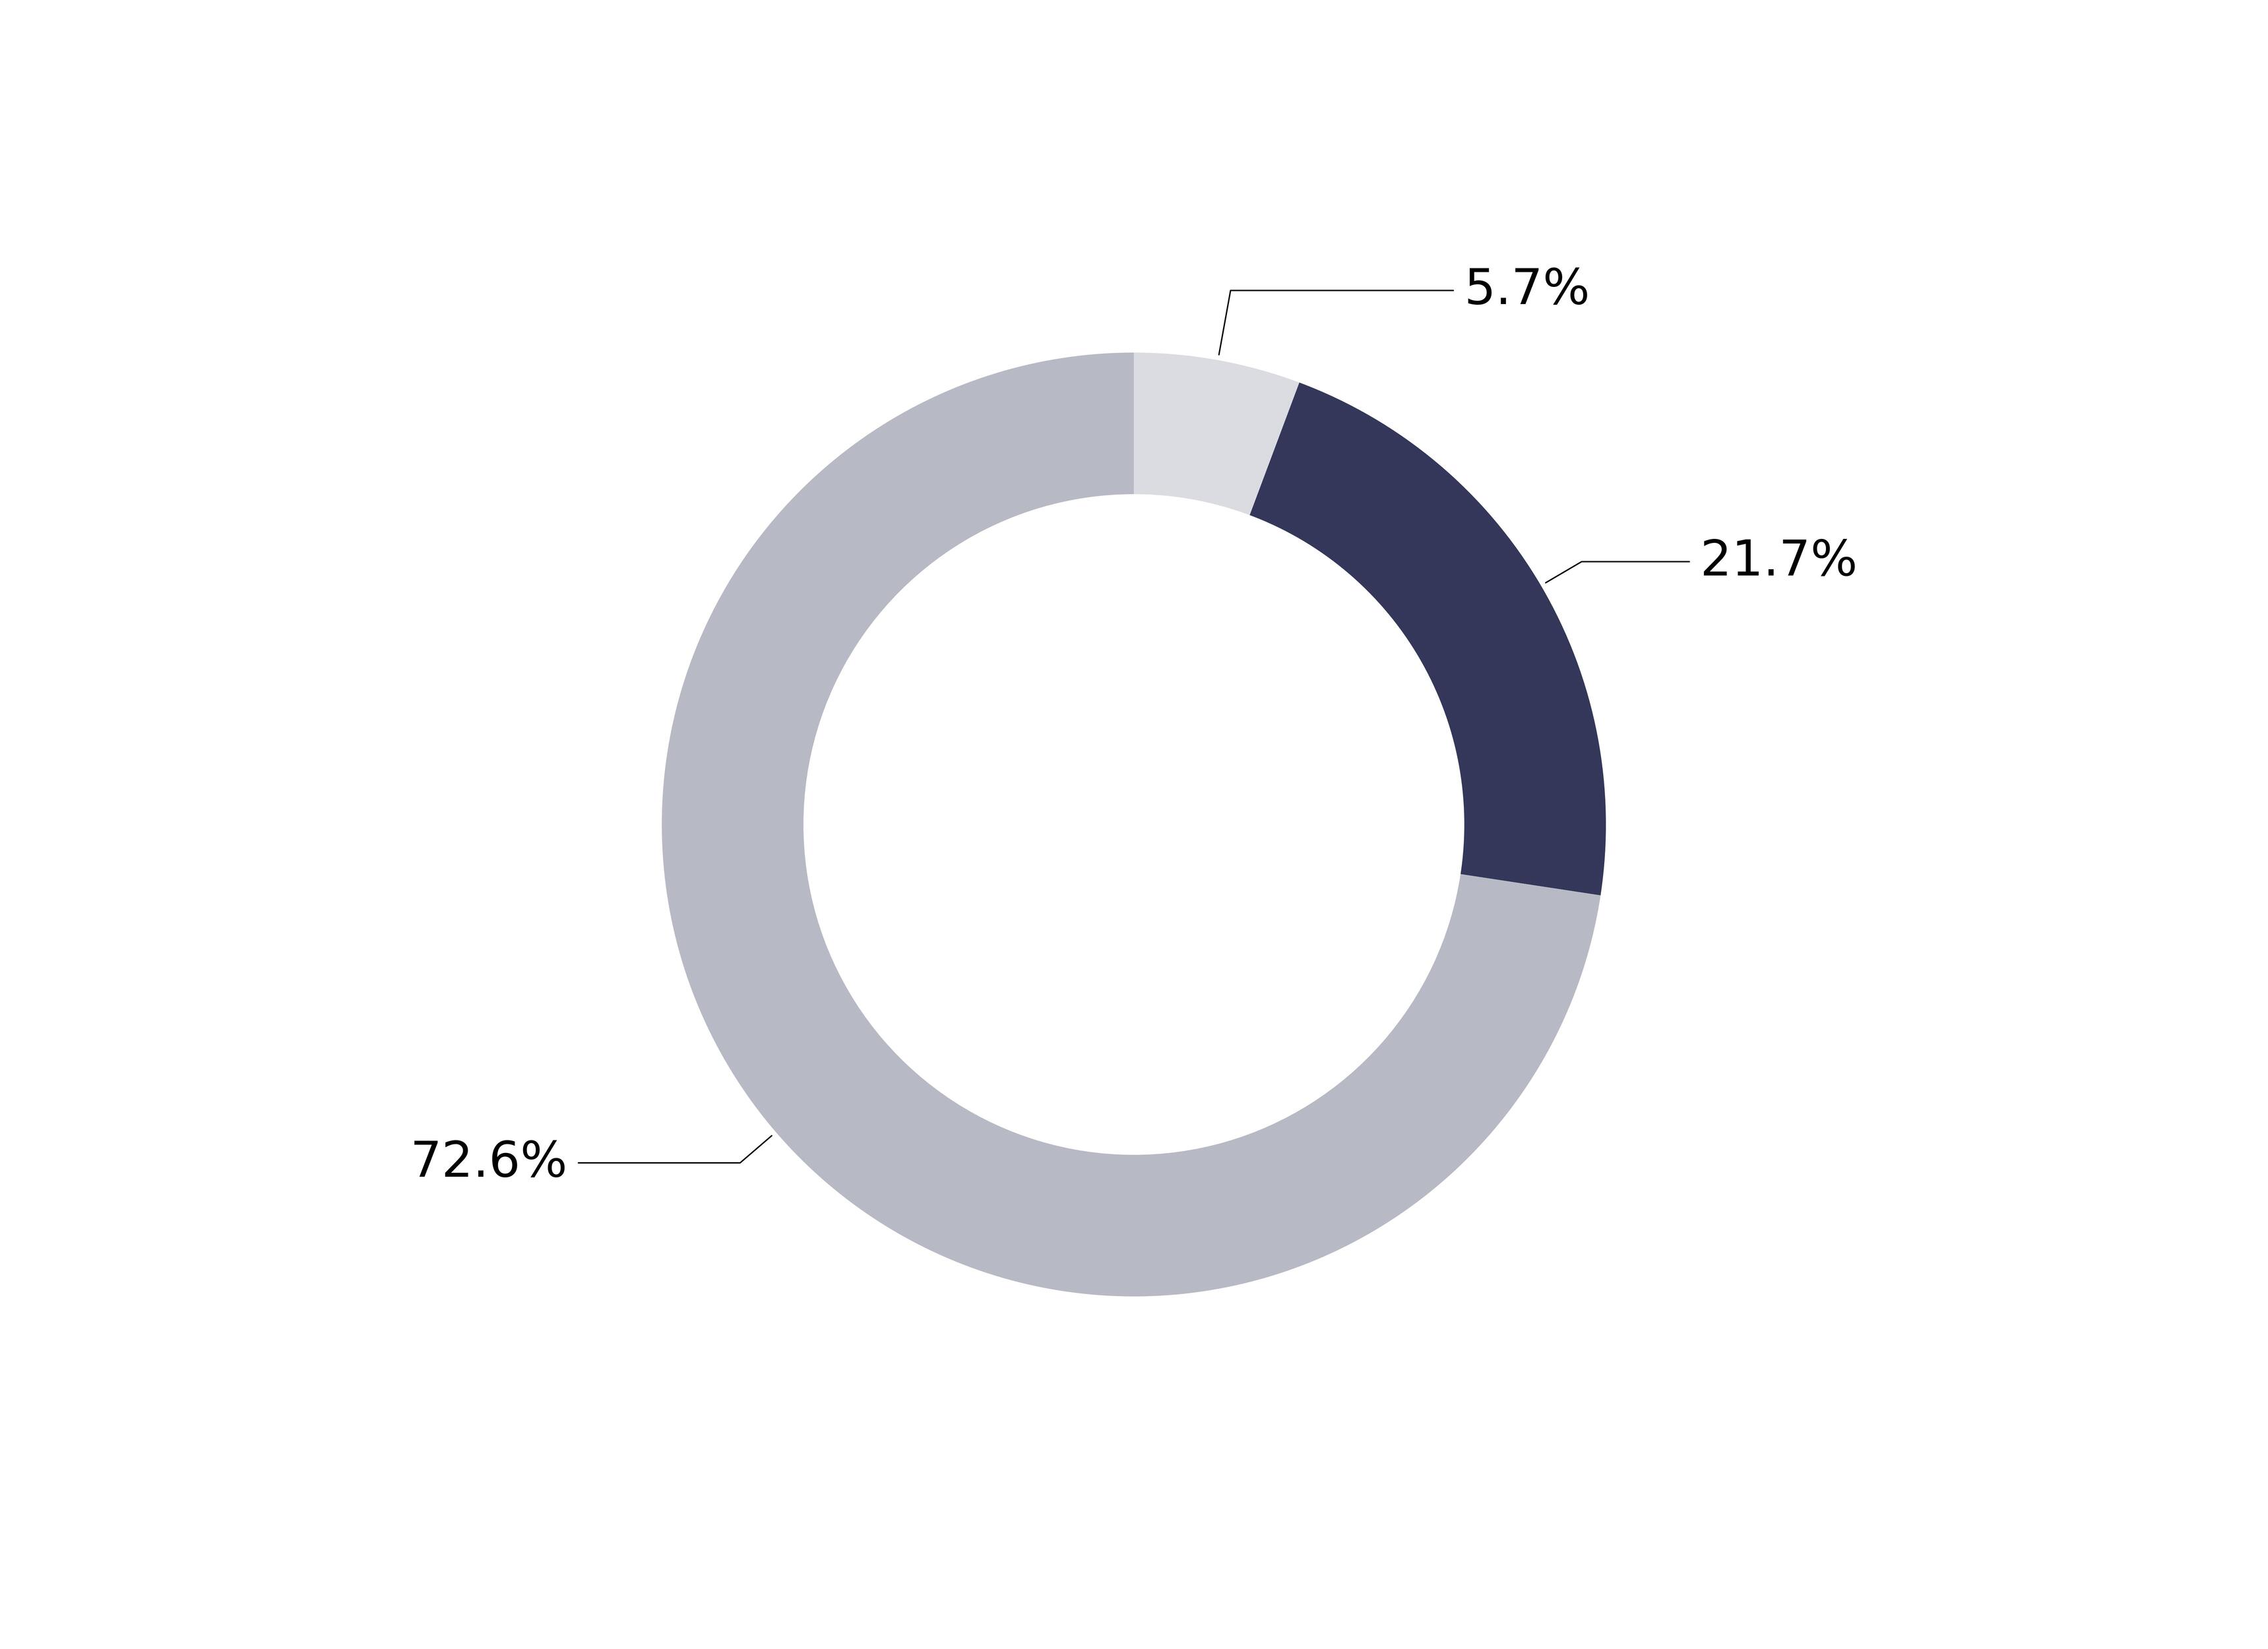
Expressed as a percentage of the Fund’s net assets.
How has the Fund changed?
This is a summary of certain changes to the Fund since October 1, 2023. For more complete information, you may review the Fund’s next prospectus, which we expect to be available by February 1, 2025 at https://www.thornburg.com/download or upon request by calling 1-800-847-0200.
End Block
Changes In and Disagreements with Accountants
No changes and/or disagreements occurred in the current reporting period.
End Block
For additional information about the Fund, including its prospectus, financial information, holdings and proxy information, visit www.thornburg.com/download.

Thornburg Developing World Fund Tailored Shareholder Report | |
Thornburg Developing World Fund Tailored Shareholder Report
Thornburg Developing World Fund CLASS: C TICKER: THDCX Annual Shareholder Report | |
This annual shareholder report contains important information about the Thornburg Developing World Fund Class C Shares for the period from October 1, 2023 to September 30, 2024. You can find additional information about the Fund at https://www.thornburg.com/download. You can also request this information by contacting us at 1-800-847-0200. This report also describes changes to the Fund that occurred during the reporting period.
How did the Fund perform last year and what affected its performance?
The Fund’s Class C shares underperformed the MSCI Emerging Markets Net Total Return USD Index (the “Index”) during the 12-month period ended September 30, 2024. During the period, emerging market equities have posted strong returns but lagged their developed world counterparts. Much of emerging market underperformance was driven by China, where concerns around the real estate market, a weaker-than-expected recovery from COVID-19, and broadly slower economic growth weighed on sentiment. The Fund’s underperformance was primarily driven by weaker security selection as well as the Fund’s sector and country positioning. The currency effect on the Fund’s performance was modestly positive. Positive contributors included stock selection within the consumer staples, information technology and real estate sectors as well as an underweight allocation to materials. Stock selection in consumer discretionary and industrials hampered relative performance. On a geographic basis, positive stock selection in India and South Korea bolstered relative returns while weaker stock selection in China and Brazil were negative contributors to relative performance.
How did the Fund perform over the past 10 years?
The line graph below reflects a hypothetical $10,000 investment. The returns shown in the line graph and table assume the reinvestment of dividends and capital gains, but do not reflect the deduction of taxes that a shareholder would pay on distributions or the redemption of Fund shares. The performance information shown below represents past performance and is no guarantee of future results. For Fund performance current to the most recent month end, visit https://www.thornburg.com/product/mutual-funds/fdw/THDCX or call 1-800-847-0200. Performance for other share classes of the Fund will vary.
Cumulative Performance
Growth Table
Date | Thornburg Developing World Fund | MSCI Emerging Markets Net Total Return USD Index |
09/30/2014 | 9999.9969 | 10000 |
10/31/2014 | 10232.9419 | 10117.8941 |
11/30/2014 | 10249.5809 | 10010.8928 |
12/31/2014 | 9739.3204 | 9549.5193 |
01/31/2015 | 9639.4868 | 9606.7659 |
02/28/2015 | 9694.9499 | 9904.2244 |
03/31/2015 | 9517.468 | 9763.3793 |
04/30/2015 | 9938.9875 | 10514.3152 |
05/31/2015 | 9789.2371 | 10093.2546 |
06/30/2015 | 9572.9311 | 9831.1381 |
07/31/2015 | 9168.0504 | 9149.6497 |
08/31/2015 | 8369.3818 | 8322.0838 |
09/30/2015 | 8031.0569 | 8071.7401 |
10/31/2015 | 8435.9375 | 8647.5115 |
11/30/2015 | 8280.6408 | 8310.1921 |
12/31/2015 | 8186.3536 | 8124.9435 |
01/31/2016 | 7836.936 | 7597.8566 |
02/29/2016 | 7726.0098 | 7585.4179 |
03/31/2016 | 8447.0301 | 8589.171 |
04/30/2016 | 8635.6047 | 8635.8577 |
05/31/2016 | 8474.7617 | 8313.7121 |
06/30/2016 | 8552.41 | 8645.9894 |
07/31/2016 | 8924.0128 | 9081.0822 |
08/31/2016 | 9018.3001 | 9306.7626 |
09/30/2016 | 9018.3001 | 9426.4404 |
10/31/2016 | 8929.5591 | 9448.9157 |
11/30/2016 | 8374.9281 | 9013.9656 |
12/31/2016 | 8330.5576 | 9033.8723 |
01/31/2017 | 8596.7805 | 9528.2332 |
02/28/2017 | 8746.5309 | 9819.9124 |
03/31/2017 | 9007.2074 | 10067.8064 |
04/30/2017 | 9306.7082 | 10288.2068 |
05/31/2017 | 9500.829 | 10592.3722 |
06/30/2017 | 9718.7504 | 10699.0168 |
07/31/2017 | 10196.0848 | 11336.7677 |
08/31/2017 | 10351.496 | 11589.6561 |
09/30/2017 | 10520.215 | 11543.564 |
10/31/2017 | 10764.7419 | 11948.2379 |
11/30/2017 | 10942.5797 | 11972.2115 |
12/31/2017 | 11192.664 | 12401.9769 |
01/31/2018 | 12048.5082 | 13435.6494 |
02/28/2018 | 11437.1909 | 12815.9976 |
03/31/2018 | 11098.1877 | 12577.7121 |
04/30/2018 | 10898.1202 | 12522.0591 |
05/31/2018 | 10664.7082 | 12078.3567 |
06/30/2018 | 10320.1475 | 11576.5277 |
07/31/2018 | 10564.6744 | 11830.8432 |
08/31/2018 | 10120.08 | 11510.9332 |
09/30/2018 | 10058.9483 | 11449.8575 |
10/31/2018 | 9247.5635 | 10452.7639 |
11/30/2018 | 9708.8302 | 10883.5281 |
12/31/2018 | 9414.2864 | 10595.25 |
01/31/2019 | 10325.7049 | 11522.8962 |
02/28/2019 | 10509.1001 | 11548.7963 |
03/31/2019 | 10764.7419 | 11645.7135 |
04/30/2019 | 11087.0728 | 11890.8962 |
05/31/2019 | 10364.6069 | 11028.0596 |
06/30/2019 | 11159.3194 | 11716.3501 |
07/31/2019 | 10975.9243 | 11573.0791 |
08/31/2019 | 10603.5764 | 11008.8189 |
09/30/2019 | 10753.6271 | 11218.9687 |
10/31/2019 | 11209.3363 | 11692.0435 |
11/30/2019 | 11248.2383 | 11675.9422 |
12/31/2019 | 12055.947 | 12547.0316 |
01/31/2020 | 11626.9692 | 11962.1512 |
02/29/2020 | 10975.1458 | 11331.345 |
03/31/2020 | 9053.1025 | 9586.0744 |
04/30/2020 | 9933.3426 | 10463.8945 |
05/31/2020 | 10161.7594 | 10544.2822 |
06/30/2020 | 10986.2881 | 11319.382 |
07/31/2020 | 11911.0973 | 12330.8884 |
08/31/2020 | 12289.9348 | 12603.4695 |
09/30/2020 | 12089.3738 | 12401.3109 |
10/31/2020 | 12507.2093 | 12656.8156 |
11/30/2020 | 13671.5776 | 13827.4089 |
12/31/2020 | 14679.9539 | 14843.9098 |
01/31/2021 | 15097.7894 | 15299.0044 |
02/28/2021 | 15415.3444 | 15416.0186 |
03/31/2021 | 14869.3727 | 15183.1795 |
04/30/2021 | 15097.7894 | 15561.216 |
05/31/2021 | 15248.2102 | 15922.0809 |
06/30/2021 | 15476.6269 | 15949.5269 |
07/31/2021 | 14635.3848 | 14876.1362 |
08/31/2021 | 15008.6512 | 15265.5412 |
09/30/2021 | 14445.966 | 14658.8752 |
10/31/2021 | 14579.6734 | 14803.4543 |
11/30/2021 | 13810.8561 | 14200.1655 |
12/31/2021 | 14128.411 | 14466.6105 |
01/31/2022 | 13627.0084 | 14192.7689 |
02/28/2022 | 12991.8985 | 13768.5451 |
03/31/2022 | 12618.6321 | 13457.5776 |
04/30/2022 | 11548.9732 | 12708.9725 |
05/31/2022 | 11833.1014 | 12764.9348 |
06/30/2022 | 10891.5787 | 11916.7012 |
07/31/2022 | 10824.725 | 11887.4238 |
08/31/2022 | 10802.4405 | 11937.0597 |
09/30/2022 | 9571.2185 | 10537.6467 |
10/31/2022 | 9092.1005 | 10210.4828 |
11/30/2022 | 10529.4546 | 11724.8646 |
12/31/2022 | 10398.8231 | 11560.0696 |
01/31/2023 | 11214.1981 | 12472.8751 |
02/28/2023 | 10532.8574 | 11664.0981 |
03/31/2023 | 10851.1887 | 12017.3761 |
04/30/2023 | 10694.8154 | 11881.1926 |
05/31/2023 | 10432.3317 | 11681.6264 |
06/30/2023 | 10884.6972 | 12125.1623 |
07/31/2023 | 11325.8933 | 12879.9749 |
08/31/2023 | 10700.4002 | 12086.5619 |
09/30/2023 | 10275.9584 | 11770.481 |
10/31/2023 | 9823.5928 | 11313.1508 |
11/30/2023 | 10588.705 | 12218.5358 |
12/31/2023 | 10948.0132 | 12696.2008 |
01/31/2024 | 10487.1626 | 12106.6826 |
02/29/2024 | 11094.1366 | 12682.6205 |
03/31/2024 | 11341.4223 | 12996.8939 |
04/30/2024 | 11223.3996 | 13055.0442 |
05/31/2024 | 11397.6236 | 13128.7726 |
06/30/2024 | 11791.0327 | 13646.6316 |
07/31/2024 | 11487.5457 | 13687.2298 |
08/31/2024 | 11470.6853 | 13908.2248 |
09/30/2024 | 12055.1789 | 14836.9413 |

What were the Fund costs for the past year?
(based on a hypothetical $10,000 investment)
Class Name | Costs of a $10,000 investment | Costs paid as a percentage of a $10,000 investment |
|---|
Class C | $253.00 | 2.33% |
End Block
Thornburg Developing World Fund Tailored Shareholder Report
Thornburg Developing World Fund Tailored Shareholder Report | |
Annual Performance | 1 Year | 5 Year | 10 Year |
|---|
Developing World Fund Class C (with sales charge) | 16.31% | 2.31% | 1.89% |
Developing World Fund Class C (without sales charge) | 17.31% | 2.31% | 1.89% |
MSCI Emerging Markets Net Total Return USD Index | 26.05% | 5.75% | 4.02% |
Key Fund Statistics
(as of September 30, 2024)
| |
|---|
Fund Size (Millions) | $674.8M |
Number of Holdings | 65 |
Annual Portfolio Turnover | 90.88% |
Total Advisory Fee | $7.2M |
What did the Fund invest in?
(as of September 30, 2024)
Market Capitalization Exposure | (%) |
|---|
| Small Cap (<$2.5 B) | 5.7 |
| Mid Cap ($2.5-12 B) | 21.7 |
| Large Cap (>$12 B) | 72.6 |
Market Capitalization Exposure | (%) |
Small Cap (<$2.5 B) | 5.7% |
Mid Cap ($2.5-12 B) | 21.7% |
Large Cap (>$12 B) | 72.6% |
Expressed as a percentage of the Fund’s net assets.
How has the Fund changed?
This is a summary of certain changes to the Fund since October 1, 2023. For more complete information, you may review the Fund’s next prospectus, which we expect to be available by February 1, 2025 at https://www.thornburg.com/download or upon request by calling 1-800-847-0200.
End Block
Changes In and Disagreements with Accountants
No changes and/or disagreements occurred in the current reporting period.
End Block
For additional information about the Fund, including its prospectus, financial information, holdings and proxy information, visit www.thornburg.com/download.

Thornburg Developing World Fund Tailored Shareholder Report | |
Thornburg Developing World Fund Tailored Shareholder Report
Thornburg Developing World Fund CLASS: I TICKER: THDIX Annual Shareholder Report | |
This annual shareholder report contains important information about the Thornburg Developing World Fund Class I Shares for the period from October 1, 2023 to September 30, 2024. You can find additional information about the Fund at https://www.thornburg.com/download. You can also request this information by contacting us at 1-800-847-0200. This report also describes changes to the Fund that occurred during the reporting period.
How did the Fund perform last year and what affected its performance?
The Fund’s Class I shares underperformed the MSCI Emerging Markets Net Total Return USD Index (the “Index”) during the 12-month period ended September 30, 2024. During the period, emerging market equities have posted strong returns but lagged their developed world counterparts. Much of emerging market underperformance was driven by China, where concerns around the real estate market, a weaker-than-expected recovery from COVID-19, and broadly slower economic growth weighed on sentiment. The Fund’s underperformance was primarily driven by weaker security selection as well as the Fund’s sector and country positioning. The currency effect on the Fund’s performance was modestly positive. Positive contributors included stock selection within the consumer staples, information technology and real estate sectors as well as an underweight allocation to materials. Stock selection in consumer discretionary and industrials hampered relative performance. On a geographic basis, positive stock selection in India and South Korea bolstered relative returns while weaker stock selection in China and Brazil were negative contributors to relative performance.
How did the Fund perform over the past 10 years?
The line graph below reflects a hypothetical $10,000 investment. The returns shown in the line graph and table assume the reinvestment of dividends and capital gains, but do not reflect the deduction of taxes that a shareholder would pay on distributions or the redemption of Fund shares. The performance information shown below represents past performance and is no guarantee of future results. For Fund performance current to the most recent month end, visit https://www.thornburg.com/product/mutual-funds/fdw/THDIX or call 1-800-847-0200. Performance for other share classes of the Fund will vary.
Cumulative Performance
Growth Table
Date | Thornburg Developing World Fund | MSCI Emerging Markets Net Total Return USD Index |
09/30/2014 | 9999.9957 | 10000 |
10/31/2014 | 10243.1246 | 10117.8941 |
11/30/2014 | 10269.5516 | 10010.8928 |
12/31/2014 | 9771.1706 | 9549.5193 |
01/31/2015 | 9675.9969 | 9606.7659 |
02/28/2015 | 9744.7335 | 9904.2244 |
03/31/2015 | 9570.2483 | 9763.3793 |
04/30/2015 | 10003.8176 | 10514.3152 |
05/31/2015 | 9861.0569 | 10093.2546 |
06/30/2015 | 9654.8472 | 9831.1381 |
07/31/2015 | 9253.0025 | 9149.6497 |
08/31/2015 | 8459.888 | 8322.0838 |
09/30/2015 | 8125.0601 | 8071.7401 |
10/31/2015 | 8540.0927 | 8647.5115 |
11/30/2015 | 8396.4275 | 8310.1921 |
12/31/2015 | 8306.2044 | 8124.9435 |
01/31/2016 | 7960.1126 | 7597.8566 |
02/29/2016 | 7858.9472 | 7585.4179 |
03/31/2016 | 8599.0514 | 8589.171 |
04/30/2016 | 8801.382 | 8635.8577 |
05/31/2016 | 8646.9718 | 8313.7121 |
06/30/2016 | 8737.4881 | 8645.9894 |
07/31/2016 | 9120.8514 | 9081.0822 |
08/31/2016 | 9227.3412 | 9306.7626 |
09/30/2016 | 9236.4474 | 9426.4404 |
10/31/2016 | 9156.177 | 9448.9157 |
11/30/2016 | 8594.2842 | 9013.9656 |
12/31/2016 | 8562.176 | 9033.8723 |
01/31/2017 | 8840.4467 | 9528.2332 |
02/28/2017 | 9006.3389 | 9819.9124 |
03/31/2017 | 9281.6014 | 10067.8064 |
04/30/2017 | 9597.5936 | 10288.2068 |
05/31/2017 | 9806.4698 | 10592.3722 |
06/30/2017 | 10044.7536 | 10699.0168 |
07/31/2017 | 10549.9472 | 11336.7677 |
08/31/2017 | 10716.5536 | 11589.6561 |
09/30/2017 | 10904.3257 | 11543.564 |
10/31/2017 | 11168.7057 | 11948.2379 |
11/30/2017 | 11362.9441 | 11972.2115 |
12/31/2017 | 11632.7196 | 12401.9769 |
01/31/2018 | 12533.7697 | 13435.6494 |
02/28/2018 | 11913.2861 | 12815.9976 |
03/31/2018 | 11567.9734 | 12577.7121 |
04/30/2018 | 11373.7351 | 12522.0591 |
05/31/2018 | 11136.3326 | 12078.3567 |
06/30/2018 | 10785.6245 | 11576.5277 |
07/31/2018 | 11050.0045 | 11830.8432 |
08/31/2018 | 10602.1772 | 11510.9332 |
09/30/2018 | 10548.2221 | 11449.8575 |
10/31/2018 | 9706.5225 | 10452.7639 |
11/30/2018 | 10197.5139 | 10883.5281 |
12/31/2018 | 9903.3811 | 10595.25 |
01/31/2019 | 10871.2985 | 11522.8962 |
02/28/2019 | 11073.6315 | 11548.7963 |
03/31/2019 | 11352.523 | 11645.7135 |
04/30/2019 | 11707.9729 | 11890.8962 |
05/31/2019 | 10953.3254 | 11028.0596 |
06/30/2019 | 11806.4051 | 11716.3501 |
07/31/2019 | 11620.4775 | 11573.0791 |
08/31/2019 | 11237.6853 | 11008.8189 |
09/30/2019 | 11407.2076 | 11218.9687 |
10/31/2019 | 11899.369 | 11692.0435 |
11/30/2019 | 11954.0536 | 11675.9422 |
12/31/2019 | 12824.0492 | 12547.0316 |
01/31/2020 | 12369.6101 | 11962.1512 |
02/29/2020 | 11693.4934 | 11331.345 |
03/31/2020 | 9654.0595 | 9586.0744 |
04/30/2020 | 10601.7312 | 10463.8945 |
05/31/2020 | 10856.6605 | 10544.2822 |
06/30/2020 | 11754.4547 | 11319.382 |
07/31/2020 | 12752.0039 | 12330.8884 |
08/31/2020 | 13167.6494 | 12603.4695 |
09/30/2020 | 12968.1396 | 12401.3109 |
10/31/2020 | 13428.1206 | 12656.8156 |
11/30/2020 | 14691.6829 | 13827.4089 |
12/31/2020 | 15790.7742 | 14843.9098 |
01/31/2021 | 16257.0044 | 15299.0044 |
02/28/2021 | 16606.6771 | 15416.0186 |
03/31/2021 | 16034.99 | 15183.1795 |
04/30/2021 | 16301.4073 | 15561.216 |
05/31/2021 | 16473.4685 | 15922.0809 |
06/30/2021 | 16734.3354 | 15949.5269 |
07/31/2021 | 15840.7274 | 14876.1362 |
08/31/2021 | 16257.0044 | 15265.5412 |
09/30/2021 | 15663.1159 | 14658.8752 |
10/31/2021 | 15824.0764 | 14803.4543 |
11/30/2021 | 15002.6231 | 14200.1655 |
12/31/2021 | 15368.9468 | 14466.6105 |
01/31/2022 | 14836.1123 | 14192.7689 |
02/28/2022 | 14153.418 | 13768.5451 |
03/31/2022 | 13764.8928 | 13457.5776 |
04/30/2022 | 12615.9683 | 12708.9725 |
05/31/2022 | 12937.8892 | 12764.9348 |
06/30/2022 | 11922.1733 | 11916.7012 |
07/31/2022 | 11855.569 | 11887.4238 |
08/31/2022 | 11844.4682 | 11937.0597 |
09/30/2022 | 10506.8315 | 10537.6467 |
10/31/2022 | 9990.648 | 10210.4828 |
11/30/2022 | 11583.6013 | 11724.8646 |
12/31/2022 | 11450.5027 | 11560.0696 |
01/31/2023 | 12359.9901 | 12472.8751 |
02/28/2023 | 11619.9724 | 11664.0981 |
03/31/2023 | 11975.8588 | 12017.3761 |
04/30/2023 | 11823.3361 | 11881.1926 |
05/31/2023 | 11546.5356 | 11681.6264 |
06/30/2023 | 12060.5936 | 12125.1623 |
07/31/2023 | 12563.3538 | 12879.9749 |
08/31/2023 | 11879.826 | 12086.5619 |
09/30/2023 | 11416.6088 | 11770.481 |
10/31/2023 | 10925.1467 | 11313.1508 |
11/30/2023 | 11795.0911 | 12218.5358 |
12/31/2023 | 12204.2416 | 12696.2008 |
01/31/2024 | 11702.4604 | 12106.6826 |
02/29/2024 | 12394.5724 | 12682.6205 |
03/31/2024 | 12688.72 | 12996.8939 |
04/30/2024 | 12561.8328 | 13055.0442 |
05/31/2024 | 12775.234 | 13128.7726 |
06/30/2024 | 13230.8744 | 13646.6316 |
07/31/2024 | 12902.1212 | 13687.2298 |
08/31/2024 | 12902.1212 | 13908.2248 |
09/30/2024 | 13576.9304 | 14836.9413 |

What were the Fund costs for the past year?
(based on a hypothetical $10,000 investment)
Class Name | Costs of a $10,000 investment | Costs paid as a percentage of a $10,000 investment |
|---|
Class I | $114.00 | 1.04% |
End Block
Thornburg Developing World Fund Tailored Shareholder Report
Thornburg Developing World Fund Tailored Shareholder Report | |
Annual Performance | 1 Year | 5 Year | 10 Year |
|---|
Developing World Fund Class I | 18.92% | 3.54% | 3.11% |
MSCI Emerging Markets Net Total Return USD Index | 26.05% | 5.75% | 4.02% |
Key Fund Statistics
(as of September 30, 2024)
| |
|---|
Fund Size (Millions) | $674.8M |
Number of Holdings | 65 |
Annual Portfolio Turnover | 90.88% |
Total Advisory Fee | $7.2M |
What did the Fund invest in?
(as of September 30, 2024)
Market Capitalization Exposure | (%) |
|---|
| Small Cap (<$2.5 B) | 5.7 |
| Mid Cap ($2.5-12 B) | 21.7 |
| Large Cap (>$12 B) | 72.6 |
Market Capitalization Exposure | (%) |
Small Cap (<$2.5 B) | 5.7% |
Mid Cap ($2.5-12 B) | 21.7% |
Large Cap (>$12 B) | 72.6% |
Expressed as a percentage of the Fund’s net assets.
How has the Fund changed?
This is a summary of certain changes to the Fund since October 1, 2023. For more complete information, you may review the Fund’s next prospectus, which we expect to be available by February 1, 2025 at https://www.thornburg.com/download or upon request by calling 1-800-847-0200.
End Block
Changes In and Disagreements with Accountants
No changes and/or disagreements occurred in the current reporting period.
End Block
For additional information about the Fund, including its prospectus, financial information, holdings and proxy information, visit www.thornburg.com/download.

Thornburg Developing World Fund Tailored Shareholder Report | |
Thornburg Developing World Fund Tailored Shareholder Report
Thornburg Developing World Fund CLASS: R5 TICKER: THDRX Annual Shareholder Report | |
This annual shareholder report contains important information about the Thornburg Developing World Fund Class R5 Shares for the period from October 1, 2023 to September 30, 2024. You can find additional information about the Fund at https://www.thornburg.com/download. You can also request this information by contacting us at 1-800-847-0200. This report also describes changes to the Fund that occurred during the reporting period.
How did the Fund perform last year and what affected its performance?
The Fund’s Class R5 shares underperformed the MSCI Emerging Markets Net Total Return USD Index (the “Index”) during the 12-month period ended September 30, 2024. During the period, emerging market equities have posted strong returns but lagged their developed world counterparts. Much of emerging market underperformance was driven by China, where concerns around the real estate market, a weaker-than-expected recovery from COVID-19, and broadly slower economic growth weighed on sentiment. The Fund’s underperformance was primarily driven by weaker security selection as well as the Fund’s sector and country positioning. The currency effect on the Fund’s performance was modestly positive. Positive contributors included stock selection within the consumer staples, information technology and real estate sectors as well as an underweight allocation to materials. Stock selection in consumer discretionary and industrials hampered relative performance. On a geographic basis, positive stock selection in India and South Korea bolstered relative returns while weaker stock selection in China and Brazil were negative contributors to relative performance.
How did the Fund perform over the past 10 years?
The line graph below reflects a hypothetical $10,000 investment. The returns shown in the line graph and table assume the reinvestment of dividends and capital gains, but do not reflect the deduction of taxes that a shareholder would pay on distributions or the redemption of Fund shares. The performance information shown below represents past performance and is no guarantee of future results. For Fund performance current to the most recent month end, visit https://www.thornburg.com/product/mutual-funds/fdw/THDRX or call 1-800-847-0200. Performance for other share classes of the Fund will vary.
Cumulative Performance
Growth Table
Date | Thornburg Developing World Fund | MSCI Emerging Markets Net Total Return USD Index |
09/30/2014 | 10000.0058 | 10000 |
10/31/2014 | 10243.9084 | 10117.8941 |
11/30/2014 | 10270.4195 | 10010.8928 |
12/31/2014 | 9769.3601 | 9549.5193 |
01/31/2015 | 9673.8941 | 9606.7659 |
02/28/2015 | 9742.8418 | 9904.2244 |
03/31/2015 | 9567.8207 | 9763.3793 |
04/30/2015 | 10008.0253 | 10514.3152 |
05/31/2015 | 9864.8262 | 10093.2546 |
06/30/2015 | 9657.9831 | 9831.1381 |
07/31/2015 | 9254.9042 | 9149.6497 |
08/31/2015 | 8459.3536 | 8322.0838 |
09/30/2015 | 8127.8605 | 8071.7401 |
10/31/2015 | 8544.4 | 8647.5115 |
11/30/2015 | 8400.2132 | 8310.1921 |
12/31/2015 | 8309.8578 | 8124.9435 |
01/31/2016 | 7967.8444 | 7597.8566 |
02/29/2016 | 7860.9652 | 7585.4179 |
03/31/2016 | 8603.7756 | 8589.171 |
04/30/2016 | 8806.8461 | 8635.8577 |
05/31/2016 | 8651.8712 | 8313.7121 |
06/30/2016 | 8737.3746 | 8645.9894 |
07/31/2016 | 9127.4837 | 9081.0822 |
08/31/2016 | 9234.3629 | 9306.7626 |
09/30/2016 | 9237.3632 | 9426.4404 |
10/31/2016 | 9162.1754 | 9448.9157 |
11/30/2016 | 8598.2666 | 9013.9656 |
12/31/2016 | 8566.0432 | 9033.8723 |
01/31/2017 | 8839.9418 | 9528.2332 |
02/28/2017 | 9006.4291 | 9819.9124 |
03/31/2017 | 9282.3832 | 10067.8064 |
04/30/2017 | 9599.5 | 10288.2068 |
05/31/2017 | 9809.1195 | 10592.3722 |
06/30/2017 | 10042.7529 | 10699.0168 |
07/31/2017 | 10549.7447 | 11336.7677 |
08/31/2017 | 10722.3376 | 11589.6561 |
09/30/2017 | 10905.4273 | 11543.564 |
10/31/2017 | 11170.753 | 11948.2379 |
11/30/2017 | 11365.6862 | 11972.2115 |
12/31/2017 | 11636.4267 | 12401.9769 |
01/31/2018 | 12535.2851 | 13435.6494 |
02/28/2018 | 11917.9968 | 12815.9976 |
03/31/2018 | 11571.449 | 12577.7121 |
04/30/2018 | 11376.5158 | 12522.0591 |
05/31/2018 | 11138.2642 | 12078.3567 |
06/30/2018 | 10786.3015 | 11576.5277 |
07/31/2018 | 11051.6272 | 11830.8432 |
08/31/2018 | 10602.198 | 11510.9332 |
09/30/2018 | 10548.0499 | 11449.8575 |
10/31/2018 | 9708.7543 | 10452.7639 |
11/30/2018 | 10201.502 | 10883.5281 |
12/31/2018 | 9904.9375 | 10595.25 |
01/31/2019 | 10870.7375 | 11522.8962 |
02/28/2019 | 11073.775 | 11548.7963 |
03/31/2019 | 11359.125 | 11645.7135 |
04/30/2019 | 11710.325 | 11890.8962 |
05/31/2019 | 10953.05 | 11028.0596 |
06/30/2019 | 11809.1 | 11716.3501 |
07/31/2019 | 11628.0125 | 11573.0791 |
08/31/2019 | 11238.4 | 11008.8189 |
09/30/2019 | 11408.5125 | 11218.9687 |
10/31/2019 | 11902.3875 | 11692.0435 |
11/30/2019 | 11957.2625 | 11675.9422 |
12/31/2019 | 12830.3805 | 12547.0316 |
01/31/2020 | 12374.3375 | 11962.1512 |
02/29/2020 | 11695.8345 | 11331.345 |
03/31/2020 | 9654.764 | 9586.0744 |
04/30/2020 | 10605.7805 | 10463.8945 |
05/31/2020 | 10861.6095 | 10544.2822 |
06/30/2020 | 11757.011 | 11319.382 |
07/31/2020 | 12758.081 | 12330.8884 |
08/31/2020 | 13175.1935 | 12603.4695 |
09/30/2020 | 12974.9795 | 12401.3109 |
10/31/2020 | 13431.0225 | 12656.8156 |
11/30/2020 | 14693.483 | 13827.4089 |
12/31/2020 | 15791.8855 | 14843.9098 |
01/31/2021 | 16259.7933 | 15299.0044 |
02/28/2021 | 16610.7241 | 15416.0186 |
03/31/2021 | 16042.5504 | 15183.1795 |
04/30/2021 | 16304.3559 | 15561.216 |
05/31/2021 | 16477.0361 | 15922.0809 |
06/30/2021 | 16738.8417 | 15949.5269 |
07/31/2021 | 15842.0185 | 14876.1362 |
08/31/2021 | 16265.3636 | 15265.5412 |
09/30/2021 | 15663.768 | 14658.8752 |
10/31/2021 | 15830.8779 | 14803.4543 |
11/30/2021 | 15006.469 | 14200.1655 |
12/31/2021 | 15374.1108 | 14466.6105 |
01/31/2022 | 14839.3591 | 14192.7689 |
02/28/2022 | 14159.7789 | 13768.5451 |
03/31/2022 | 13769.8558 | 13457.5776 |
04/30/2022 | 12616.7975 | 12708.9725 |
05/31/2022 | 12945.4469 | 12764.9348 |
06/30/2022 | 11926.0765 | 11916.7012 |
07/31/2022 | 11859.2326 | 11887.4238 |
08/31/2022 | 11848.0919 | 11937.0597 |
09/30/2022 | 10511.2127 | 10537.6467 |
10/31/2022 | 9993.172 | 10210.4828 |
11/30/2022 | 11586.2864 | 11724.8646 |
12/31/2022 | 11452.491 | 11560.0696 |
01/31/2023 | 12365.2885 | 12472.8751 |
02/28/2023 | 11622.5775 | 11664.0981 |
03/31/2023 | 11979.7592 | 12017.3761 |
04/30/2023 | 11826.6813 | 11881.1926 |
05/31/2023 | 11548.8733 | 11681.6264 |
06/30/2023 | 12064.8024 | 12125.1623 |
07/31/2023 | 12563.7228 | 12879.9749 |
08/31/2023 | 11883.3768 | 12086.5619 |
09/30/2023 | 11424.1432 | 11770.481 |
10/31/2023 | 10930.8924 | 11313.1508 |
11/30/2023 | 11798.3335 | 12218.5358 |
12/31/2023 | 12208.6214 | 12696.2008 |
01/31/2024 | 11704.994 | 12106.6826 |
02/29/2024 | 12399.6524 | 12682.6205 |
03/31/2024 | 12689.0934 | 12996.8939 |
04/30/2024 | 12567.5282 | 13055.0442 |
05/31/2024 | 12775.9257 | 13128.7726 |
06/30/2024 | 13233.2425 | 13646.6316 |
07/31/2024 | 12903.2798 | 13687.2298 |
08/31/2024 | 12909.0686 | 13908.2248 |
09/30/2024 | 13580.5717 | 14836.9413 |

What were the Fund costs for the past year?
(based on a hypothetical $10,000 investment)
Class Name | Costs of a $10,000 investment | Costs paid as a percentage of a $10,000 investment |
|---|
Class R5 | $114.00 | 1.04% |
End Block
Thornburg Developing World Fund Tailored Shareholder Report
Thornburg Developing World Fund Tailored Shareholder Report | |
Annual Performance | 1 Year | 5 Year | 10 Year |
|---|
Developing World Fund Class R5 | 18.88% | 3.55% | 3.11% |
MSCI Emerging Markets Net Total Return USD Index | 26.05% | 5.75% | 4.02% |
Key Fund Statistics
(as of September 30, 2024)
| |
|---|
Fund Size (Millions) | $674.8M |
Number of Holdings | 65 |
Annual Portfolio Turnover | 90.88% |
Total Advisory Fee | $7.2M |
What did the Fund invest in?
(as of September 30, 2024)
Market Capitalization Exposure | (%) |
|---|
| Small Cap (<$2.5 B) | 5.7 |
| Mid Cap ($2.5-12 B) | 21.7 |
| Large Cap (>$12 B) | 72.6 |
Market Capitalization Exposure | (%) |
Small Cap (<$2.5 B) | 5.7% |
Mid Cap ($2.5-12 B) | 21.7% |
Large Cap (>$12 B) | 72.6% |
Expressed as a percentage of the Fund’s net assets.
How has the Fund changed?
This is a summary of certain changes to the Fund since October 1, 2023. For more complete information, you may review the Fund’s next prospectus, which we expect to be available by February 1, 2025 at https://www.thornburg.com/download or upon request by calling 1-800-847-0200.
End Block
Changes In and Disagreements with Accountants
No changes and/or disagreements occurred in the current reporting period.
End Block
For additional information about the Fund, including its prospectus, financial information, holdings and proxy information, visit www.thornburg.com/download.

Thornburg Developing World Fund Tailored Shareholder Report | |
Thornburg Developing World Fund Tailored Shareholder Report
Thornburg Developing World Fund CLASS: R6 TICKER: TDWRX Annual Shareholder Report | |
This annual shareholder report contains important information about the Thornburg Developing World Fund Class R6 Shares for the period from October 1, 2023 to September 30, 2024. You can find additional information about the Fund at https://www.thornburg.com/download. You can also request this information by contacting us at 1-800-847-0200. This report also describes changes to the Fund that occurred during the reporting period.
How did the Fund perform last year and what affected its performance?
The Fund’s Class R6 shares underperformed the MSCI Emerging Markets Net Total Return USD Index (the “Index”) during the 12-month period ended September 30, 2024. During the period, emerging market equities have posted strong returns but lagged their developed world counterparts. Much of emerging market underperformance was driven by China, where concerns around the real estate market, a weaker-than-expected recovery from COVID-19, and broadly slower economic growth weighed on sentiment. The Fund’s underperformance was primarily driven by weaker security selection as well as the Fund’s sector and country positioning. The currency effect on the Fund’s performance was modestly positive. Positive contributors included stock selection within the consumer staples, information technology and real estate sectors as well as an underweight allocation to materials. Stock selection in consumer discretionary and industrials hampered relative performance. On a geographic basis, positive stock selection in India and South Korea bolstered relative returns while weaker stock selection in China and Brazil were negative contributors to relative performance.
How did the Fund perform over the past 10 years?
The line graph below reflects a hypothetical $10,000 investment. The returns shown in the line graph and table assume the reinvestment of dividends and capital gains, but do not reflect the deduction of taxes that a shareholder would pay on distributions or the redemption of Fund shares. The performance information shown below represents past performance and is no guarantee of future results. For Fund performance current to the most recent month end, visit https://www.thornburg.com/product/mutual-funds/fdw/TDWRX or call 1-800-847-0200. Performance for other share classes of the Fund will vary.
Cumulative Performance
Growth Table
Date | Thornburg Developing World Fund | MSCI Emerging Markets Net Total Return USD Index |
09/30/2014 | 10000.0051 | 10000 |
10/31/2014 | 10248.551 | 10117.8941 |
11/30/2014 | 10274.992 | 10010.8928 |
12/31/2014 | 9772.2923 | 9549.5193 |
01/31/2015 | 9682.347 | 9606.7659 |
02/28/2015 | 9745.8378 | 9904.2244 |
03/31/2015 | 9576.529 | 9763.3793 |
04/30/2015 | 10015.6737 | 10514.3152 |
05/31/2015 | 9867.5285 | 10093.2546 |
06/30/2015 | 9666.4743 | 9831.1381 |
07/31/2015 | 9264.3659 | 9149.6497 |
08/31/2015 | 8465.44 | 8322.0838 |
09/30/2015 | 8131.8032 | 8071.7401 |
10/31/2015 | 8553.0573 | 8647.5115 |
11/30/2015 | 8414.4167 | 8310.1921 |
12/31/2015 | 8325.2832 | 8124.9435 |
01/31/2016 | 7978.3964 | 7597.8566 |
02/29/2016 | 7876.9987 | 7585.4179 |
03/31/2016 | 8613.4661 | 8589.171 |
04/30/2016 | 8816.2614 | 8635.8577 |
05/31/2016 | 8661.4966 | 8313.7121 |
06/30/2016 | 8752.2208 | 8645.9894 |
07/31/2016 | 9141.8014 | 9081.0822 |
08/31/2016 | 9248.5358 | 9306.7626 |
09/30/2016 | 9254.8147 | 9426.4404 |
10/31/2016 | 9179.7032 | 9448.9157 |
11/30/2016 | 8616.3667 | 9013.9656 |
12/31/2016 | 8584.176 | 9033.8723 |
01/31/2017 | 8863.1617 | 9528.2332 |
02/28/2017 | 9029.4801 | 9819.9124 |
03/31/2017 | 9305.4475 | 10067.8064 |
04/30/2017 | 9622.2515 | 10288.2068 |
05/31/2017 | 9837.0339 | 10592.3722 |
06/30/2017 | 10071.6485 | 10699.0168 |
07/31/2017 | 10578.1948 | 11336.7677 |
08/31/2017 | 10750.636 | 11589.6561 |
09/30/2017 | 10935.6512 | 11543.564 |
10/31/2017 | 11206.2017 | 11948.2379 |
11/30/2017 | 11395.5871 | 11972.2115 |
12/31/2017 | 11671.5486 | 12401.9769 |
01/31/2018 | 12575.1872 | 13435.6494 |
02/28/2018 | 11952.9211 | 12815.9976 |
03/31/2018 | 11612.0275 | 12577.7121 |
04/30/2018 | 11411.8201 | 12522.0591 |
05/31/2018 | 11173.7356 | 12078.3567 |
06/30/2018 | 10827.431 | 11576.5277 |
07/31/2018 | 11092.5705 | 11830.8432 |
08/31/2018 | 10643.4567 | 11510.9332 |
09/30/2018 | 10589.3466 | 11449.8575 |
10/31/2018 | 9750.64 | 10452.7639 |
11/30/2018 | 10243.0419 | 10883.5281 |
12/31/2018 | 9941.9372 | 10595.25 |
01/31/2019 | 10919.1127 | 11522.8962 |
02/28/2019 | 11122.2335 | 11548.7963 |
03/31/2019 | 11407.7005 | 11645.7135 |
04/30/2019 | 11759.0445 | 11890.8962 |
05/31/2019 | 11001.459 | 11028.0596 |
06/30/2019 | 11857.86 | 11716.3501 |
07/31/2019 | 11682.188 | 11573.0791 |
08/31/2019 | 11292.4157 | 11008.8189 |
09/30/2019 | 11462.598 | 11218.9687 |
10/31/2019 | 11962.1652 | 11692.0435 |
11/30/2019 | 12017.0627 | 11675.9422 |
12/31/2019 | 12896.4376 | 12547.0316 |
01/31/2020 | 12434.2595 | 11962.1512 |
02/29/2020 | 11754.9135 | 11331.345 |
03/31/2020 | 9705.7386 | 9586.0744 |
04/30/2020 | 10663.5051 | 10463.8945 |
05/31/2020 | 10919.652 | 10544.2822 |
06/30/2020 | 11821.7344 | 11319.382 |
07/31/2020 | 12829.6166 | 12330.8884 |
08/31/2020 | 13247.2474 | 12603.4695 |
09/30/2020 | 13046.7846 | 12401.3109 |
10/31/2020 | 13514.5311 | 12656.8156 |
11/30/2020 | 14784.1285 | 13827.4089 |
12/31/2020 | 15890.1889 | 14843.9098 |
01/31/2021 | 16359.0248 | 15299.0044 |
02/28/2021 | 16716.2331 | 15416.0186 |
03/31/2021 | 16141.351 | 15183.1795 |
04/30/2021 | 16409.2572 | 15561.216 |
05/31/2021 | 16582.28 | 15922.0809 |
06/30/2021 | 16850.1862 | 15949.5269 |
07/31/2021 | 15946.0027 | 14876.1362 |
08/31/2021 | 16370.1875 | 15265.5412 |
09/30/2021 | 15772.9799 | 14658.8752 |
10/31/2021 | 15940.4213 | 14803.4543 |
11/30/2021 | 15114.377 | 14200.1655 |
12/31/2021 | 15482.7481 | 14466.6105 |
01/31/2022 | 14946.9356 | 14192.7689 |
02/28/2022 | 14260.4259 | 13768.5451 |
03/31/2022 | 13869.7293 | 13457.5776 |
04/30/2022 | 12714.3836 | 12708.9725 |
05/31/2022 | 13043.6851 | 12764.9348 |
06/30/2022 | 12016.7111 | 11916.7012 |
07/31/2022 | 11949.7346 | 11887.4238 |
08/31/2022 | 11938.5718 | 11937.0597 |
09/30/2022 | 10593.4592 | 10537.6467 |
10/31/2022 | 10074.3909 | 10210.4828 |
11/30/2022 | 11676.247 | 11724.8646 |
12/31/2022 | 11543.5544 | 11560.0696 |
01/31/2023 | 12464.7642 | 12472.8751 |
02/28/2023 | 11719.8353 | 11664.0981 |
03/31/2023 | 12083.77 | 12017.3761 |
04/30/2023 | 11930.235 | 11881.1926 |
05/31/2023 | 11645.911 | 11681.6264 |
06/30/2023 | 12169.0672 | 12125.1623 |
07/31/2023 | 12675.1639 | 12879.9749 |
08/31/2023 | 11987.0998 | 12086.5619 |
09/30/2023 | 11520.8085 | 11770.481 |
10/31/2023 | 11026.0847 | 11313.1508 |
11/30/2023 | 11901.8026 | 12218.5358 |
12/31/2023 | 12319.6168 | 12696.2008 |
01/31/2024 | 11814.0476 | 12106.6826 |
02/29/2024 | 12517.1956 | 12682.6205 |
03/31/2024 | 12807.7526 | 12996.8939 |
04/30/2024 | 12685.7186 | 13055.0442 |
05/31/2024 | 12900.7308 | 13128.7726 |
06/30/2024 | 13359.8109 | 13646.6316 |
07/31/2024 | 13028.5759 | 13687.2298 |
08/31/2024 | 13034.387 | 13908.2248 |
09/30/2024 | 13714.2904 | 14836.9413 |

What were the Fund costs for the past year?
(based on a hypothetical $10,000 investment)
Class Name | Costs of a $10,000 investment | Costs paid as a percentage of a $10,000 investment |
|---|
Class R6 | $103.00 | 0.94% |
End Block
Thornburg Developing World Fund Tailored Shareholder Report
Thornburg Developing World Fund Tailored Shareholder Report | |
Annual Performance | 1 Year | 5 Year | 10 Year |
|---|
Developing World Fund Class R6 | 19.04% | 3.65% | 3.21% |
MSCI Emerging Markets Net Total Return USD Index | 26.05% | 5.75% | 4.02% |
Key Fund Statistics
(as of September 30, 2024)
| |
|---|
Fund Size (Millions) | $674.8M |
Number of Holdings | 65 |
Annual Portfolio Turnover | 90.88% |
Total Advisory Fee | $7.2M |
What did the Fund invest in?
(as of September 30, 2024)
Market Capitalization Exposure | (%) |
|---|
| Small Cap (<$2.5 B) | 5.7 |
| Mid Cap ($2.5-12 B) | 21.7 |
| Large Cap (>$12 B) | 72.6 |
Market Capitalization Exposure | (%) |
Small Cap (<$2.5 B) | 5.7% |
Mid Cap ($2.5-12 B) | 21.7% |
Large Cap (>$12 B) | 72.6% |
Expressed as a percentage of the Fund’s net assets.
How has the Fund changed?
This is a summary of certain changes to the Fund since October 1, 2023. For more complete information, you may review the Fund’s next prospectus, which we expect to be available by February 1, 2025 at https://www.thornburg.com/download or upon request by calling 1-800-847-0200.
End Block
Changes In and Disagreements with Accountants
No changes and/or disagreements occurred in the current reporting period.
End Block
For additional information about the Fund, including its prospectus, financial information, holdings and proxy information, visit www.thornburg.com/download.

Thornburg Developing World Fund Tailored Shareholder Report | |
Thornburg Small/Mid Cap Core Fund Tailored Shareholder Report
Thornburg Small/Mid Cap Core Fund CLASS: A TICKER: TVAFX Annual Shareholder Report | |
This annual shareholder report contains important information about the Thornburg Small/Mid Cap Core Fund Class A Shares for the period from October 1, 2023 to September 30, 2024. You can find additional information about the Fund at https://www.thornburg.com/download. You can also request this information by contacting us at 1-800-847-0200. This report also describes changes to the Fund that occurred during the reporting period.
How did the Fund perform last year and what affected its performance?
The Fund’s Class A shares outperformed the Russell 2500 Index – Total Return (the “Index”) during the 12-month period ended September 30, 2024. Stock selection was the primary driver of the Fund’s relative outperformance. The Fund’s stock selection in the industrials and consumer discretionary sectors had a positive impact on performance relative to the Index during the period. Stock selection in and underweight allocations to health care and financials detracted from relative results. Returns of larger mid-cap companies outpaced smaller-cap companies within the Index during the period. Stock selection was a negative contributor to performance within the mid-cap (those ranging from approximately $2.5 - $12 billion market capitalization) and large-cap portions (those over approximately $12 billion market capitalization) of the Fund’s portfolio during the period. However, an overweight positioning in the Fund to larger stocks within the Index’s universe positively impacted the Fund’s performance relative to the Index for the period. Stock selection, as well as an underweight positioning to the smaller-cap segment of the universe, contributed positively to relative performance.
How did the Fund perform over the past 10 years?
The line graph below reflects a hypothetical $10,000 investment and assumes the deduction of the maximum sales charge associated with that investment. The returns shown in the line graph and table assume the reinvestment of dividends and capital gains, but do not reflect the deduction of taxes that a shareholder would pay on distributions or the redemption of Fund shares. The performance information shown below represents past performance and is no guarantee of future results. For Fund performance current to the most recent month end, visit https://www.thornburg.com/product/mutual-funds/fv/TVAFX or call 1-800-847-0200. Performance for other share classes of the Fund will vary.
Cumulative Performance
Growth Table
Date | Thornburg Small/Mid Cap Core Fund | Russell 2500 Index - Total Return | Russell 3000 Index - Total Return |
09/30/2014 | 9549.2313 | 10000 | 10000 |
10/31/2014 | 9654.4734 | 10442.5942 | 10275.133 |
11/30/2014 | 9984.0996 | 10533.251 | 10524.1387 |
12/31/2014 | 9957.9736 | 10676.6699 | 10524.0202 |
01/31/2015 | 9773.2356 | 10457.9285 | 10231.1204 |
02/28/2015 | 10359.2324 | 11081.4277 | 10823.5111 |
03/31/2015 | 10303.6124 | 11228.531 | 10713.4813 |
04/30/2015 | 10532.0519 | 11031.8505 | 10761.9405 |
05/31/2015 | 10722.7491 | 11268.3263 | 10910.7933 |
06/30/2015 | 10649.2512 | 11190.0848 | 10728.2506 |
07/31/2015 | 10790.2878 | 11169.2953 | 10907.6844 |
08/31/2015 | 10228.1281 | 10507.9662 | 10249.1933 |
09/30/2015 | 9767.2763 | 10037.8688 | 9950.534 |
10/31/2015 | 10351.2867 | 10598.8371 | 10736.4785 |
11/30/2015 | 10422.7982 | 10807.0053 | 10795.9966 |
12/31/2015 | 10297.6531 | 10366.9084 | 10574.4045 |
01/31/2016 | 9654.0498 | 9540.2877 | 9977.7406 |
02/29/2016 | 9439.5154 | 9607.3008 | 9974.5274 |
03/31/2016 | 10041.4036 | 10407.6184 | 10676.794 |
04/30/2016 | 10073.1865 | 10561.1175 | 10742.9652 |
05/31/2016 | 10293.6803 | 10783.7702 | 10935.16 |
06/30/2016 | 10220.1823 | 10779.4502 | 10957.6458 |
07/31/2016 | 10625.4141 | 11341.6249 | 11392.5207 |
08/31/2016 | 10655.2105 | 11432.0677 | 11421.5817 |
09/30/2016 | 10776.3053 | 11486.8731 | 11439.536 |
10/31/2016 | 10585.0099 | 11020.6417 | 11192.0343 |
11/30/2016 | 10881.9163 | 11958.1705 | 11692.9016 |
12/31/2016 | 10977.7089 | 12190.3391 | 11921.0671 |
01/31/2017 | 11224.8917 | 12359.5098 | 12145.4442 |
02/28/2017 | 11649.488 | 12657.2451 | 12597.1533 |
03/31/2017 | 11832.8818 | 12648.2611 | 12605.7226 |
04/30/2017 | 12173.7549 | 12745.8521 | 12739.3407 |
05/31/2017 | 12399.0102 | 12603.3544 | 12869.7154 |
06/30/2017 | 12564.4632 | 12918.2402 | 12985.8568 |
07/31/2017 | 12777.7581 | 13052.007 | 13230.7044 |
08/31/2017 | 12863.4747 | 12943.6937 | 13256.1965 |
09/30/2017 | 13008.9937 | 13530.7446 | 13579.4861 |
10/31/2017 | 13218.3017 | 13740.4631 | 13875.8204 |
11/30/2017 | 13511.333 | 14191.8661 | 14297.1609 |
12/31/2017 | 13538.7538 | 14239.6269 | 14440.0596 |
01/31/2018 | 14286.2308 | 14673.9183 | 15201.2038 |
02/28/2018 | 13608.8924 | 14070.4951 | 14640.8928 |
03/31/2018 | 13298.2786 | 14205.5593 | 14346.9915 |
04/30/2018 | 13464.6072 | 14239.2118 | 14401.5198 |
05/31/2018 | 13847.3636 | 14908.7918 | 14808.0786 |
06/30/2018 | 13849.3676 | 15016.5214 |
07/31/2018 | 14330.318 | 15307.063 | 15399.5545 |
08/31/2018 | 14554.7615 | 15963.6244 | 15940.3524 |
09/30/2018 | 14520.6942 | 15721.7583 | 15966.738 |
10/31/2018 | 13352.3855 | 14125.6248 | 14791.0638 |
11/30/2018 | 13580.8369 | 14392.419 | 15087.3096 |
12/31/2018 | 12227.2471 | 12815.3626 | 13683.1425 |
01/31/2019 | 13375.0618 | 14290.7738 | 14857.6224 |
02/28/2019 | 13654.9675 | 14965.7053 | 15380.151 |
03/31/2019 | 13928.8321 | 14842.4403 | 15604.728 |
04/30/2019 | 14476.5612 | 15362.5365 | 16227.8554 |
05/31/2019 | 13238.1295 | 14269.5432 | 15177.7201 |
06/30/2019 | 14138.2579 | 15281.9079 | 16243.7537 |
07/31/2019 | 14406.0813 | 15440.8687 | 16485.2181 |
08/31/2019 | 14136.2442 | 14823.1686 | 16149.1603 |
09/30/2019 | 14460.4515 | 15085.9475 | 16432.5919 |
10/31/2019 | 14742.3709 | 15374.7508 | 16786.3352 |
11/30/2019 | 15205.5242 | 16034.6203 | 17424.4142 |
12/31/2019 | 15756.8681 | 16373.6882 | 17927.5233 |
01/31/2020 | 15361.2813 | 16041.2367 | 17907.9411 |
02/29/2020 | 14297.6372 | 14696.1543 | 16441.7593 |
03/31/2020 | 11613.2982 | 11507.1307 | 14180.724 |
04/30/2020 | 13143.1696 | 13181.5316 | 16058.8224 |
05/31/2020 | 13621.5067 | 14155.1648 | 16917.6229 |
06/30/2020 | 13807.1903 | 14563.9768 | 17304.3924 |
07/31/2020 | 14564.0528 | 15144.3075 | 18286.9924 |
08/31/2020 | 15583.2943 | 15829.9744 | 19611.7831 |
09/30/2020 | 15098.9023 | 15420.7019 | 18897.6985 |
10/31/2020 | 15365.3179 | 15699.9633 | 18489.825 |
11/30/2020 | 16858.8599 | 18257.5481 | 20739.1715 |
12/31/2020 | 17601.5943 | 19647.3167 | 21672.1852 |
01/31/2021 | 17252.4284 | 20128.7527 | 21575.7888 |
02/28/2021 | 18588.543 | 21441.9079 | 22250.1888 |
03/31/2021 | 18745.9704 | 21794.5653 | 23047.7 |
04/30/2021 | 19740.9923 | 22665.269 | 24235.7902 |
05/31/2021 | 19440.2656 | 22712.2061 | 24346.427 |
06/30/2021 | 19567.4185 | 22980.6608 | 24946.7819 |
07/31/2021 | 19601.7296 | 22578.1215 | 25368.648 |
08/31/2021 | 20106.3046 | 23090.6283 | 26092.107 |
09/30/2021 | 19698.608 | 22364.3813 | 24921.4084 |
10/31/2021 | 20437.3058 | 23460.9617 | 26606.7068 |
11/30/2021 | 19173.2063 | 22482.217 | 26201.7175 |
12/31/2021 | 20035.5111 | 23219.6145 | 27233.5057 |
01/31/2022 | 18569.6315 | 21286.9299 | 25631.1915 |
02/28/2022 | 19045.4954 | 21526.6814 | 24985.5606 |
03/31/2022 | 19324.4501 | 21868.9407 | 25795.9975 |
04/30/2022 | 17716.3583 | 20005.6498 | 23481.0071 |
05/31/2022 | 17751.9114 | 20073.1949 | 23449.5237 |
06/30/2022 | 16127.4104 | 18155.3711 | 21487.7688 |
07/31/2022 | 17388.1763 | 20033.8601 | 23503.707 |
08/31/2022 | 16690.7896 | 19501.3551 | 22626.5647 |
09/30/2022 | 15137.3948 | 17643.8243 | 20528.4243 |
10/31/2022 | 16327.0545 | 19336.6212 | 22211.8772 |
11/30/2022 | 17139.305 | 20152.9477 | 23371.2533 |
12/31/2022 | 16118.2473 | 18954.3524 | 22002.7861 |
01/31/2023 | 17385.0523 | 20849.5055 | 23518.1774 |
02/28/2023 | 16763.9622 | 20360.1753 | 22968.4935 |
03/31/2023 | 16186.6493 | 19596.9612 | 23582.6516 |
04/30/2023 | 16162.0246 | 19341.298 | 23833.9098 |
05/31/2023 | 15521.7818 | 19002.1652 | 23926.6418 |
06/30/2023 | 16922.6548 | 20620.8915 | 25560.4836 |
07/31/2023 | 17393.2606 | 21646.0933 | 26476.7444 |
08/31/2023 | 17223.6236 | 20796.218 | 25965.6445 |
09/30/2023 | 16602.5334 | 19634.7846 | 24728.7907 |
10/31/2023 | 15721.5157 | 18442.2218 | 24073.2616 |
11/30/2023 | 16941.8074 | 20102.3781 | 26318.0536 |
12/31/2023 | 18235.9732 | 22256.8203 | 27714.0123 |
01/31/2024 | 17959.6291 | 21674.6733 | 28021.1577 |
02/29/2024 | 19119.727 | 22853.6855 | 29537.9574 |
03/31/2024 | 20121.1323 | 23796.8771 | 30490.7763 |
04/30/2024 | 19010.2838 | 22202.6637 | 29149.1283 |
05/31/2024 | 19776.3862 | 23126.2073 | 30526.3399 |
06/30/2024 | 19480.8896 | 22779.6538 | 31471.3556 |
07/31/2024 | 20454.9341 | 24472.081 | 32056.3767 |
08/31/2024 | 24409.1674 | 32754.2021 |
09/30/2024 | 21108.8572 | 24772.5666 | 33431.7499 |

Effective September 30, 2024, the Fund adopted the Russell 3000 Index – Total Return as its broad-based securities market index that represents the overall applicable market in which the Fund invests, and the Russell 2500 Index—Total Return as an additional index that represents the market sectors which the Fund’s advisor believes are more representative of the Fund’s investment universe.
What were the Fund costs for the past year?
(based on a hypothetical $10,000 investment)
Class Name | Costs of a $10,000 investment | Costs paid as a percentage of a $10,000 investment |
|---|
Class A | $156.00 | 1.38% |
End Block
Thornburg Small/Mid Cap Core Fund Tailored Shareholder Report
Thornburg Small/Mid Cap Core Fund Tailored Shareholder Report | |
Annual Performance | 1 Year | 5 Year | 10 Year |
|---|
Small/Mid Cap Core Fund Class A (with sales charge) | 21.42% | 6.87% | 7.76% |
Small/Mid Cap Core Fund Class A (without sales charge) | 27.14% | 7.86% | 8.26% |
Russell 2500 Index - Total Return | 26.17% | 10.43% | 9.50% |
Russell 3000 Index - Total Return | 35.19% | 15.26% | 12.83% |
Key Fund Statistics
(as of September 30, 2024)
| |
|---|
Fund Size (Millions) | $559.8M |
Number of Holdings | 49 |
Annual Portfolio Turnover | 32.79% |
Total Advisory Fee | $4.6M |
What did the Fund invest in?
(as of September 30, 2024)
Market Capitalization Exposure | (%) |
|---|
| Small Cap (<$2.5 B) | 9.0 |
| Mid Cap ($2.5-12 B) | 52.2 |
| Large Cap (>$12 B) | 38.8 |
Market Capitalization Exposure | (%) |
Small Cap (<$2.5 B) | 9.0% |
Mid Cap ($2.5-12 B) | 52.2% |
Large Cap (>$12 B) | 38.8% |
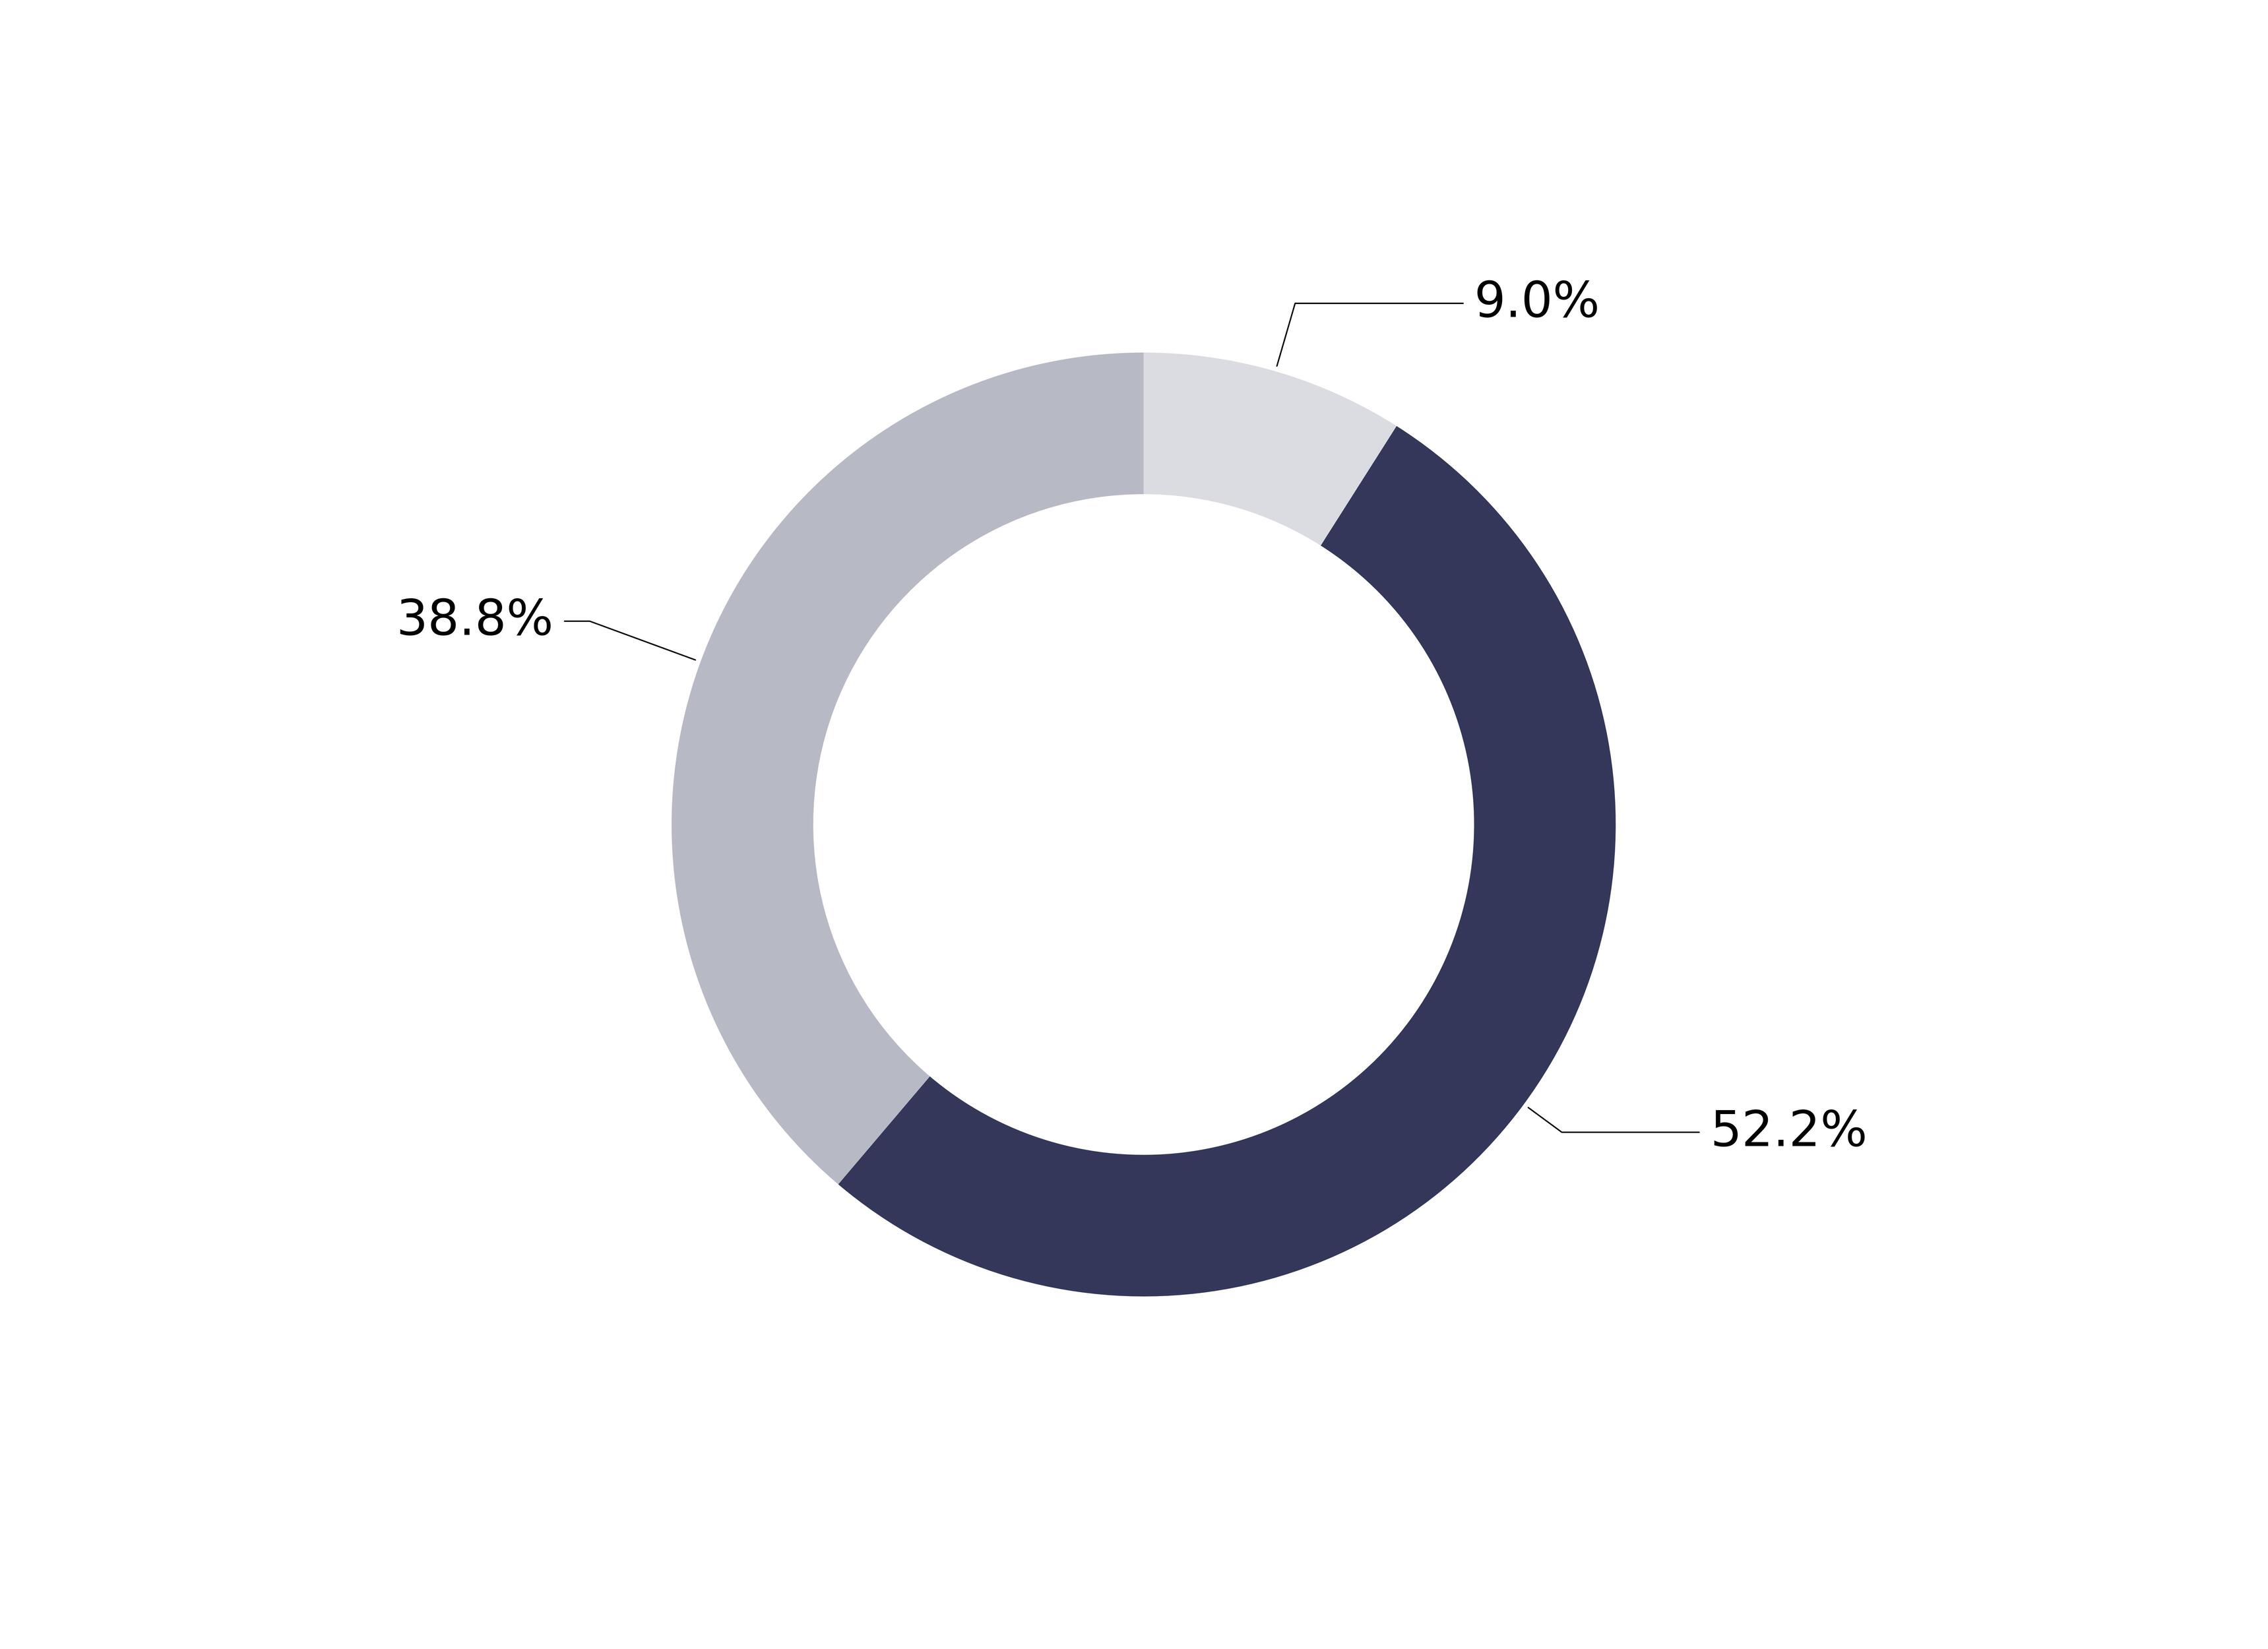
Expressed as a percentage of the Fund’s net assets.
How has the Fund changed?
This is a summary of certain changes to the Fund since October 1, 2023. For more complete information, you may review the Fund’s next prospectus, which we expect to be available by February 1, 2025 at https://www.thornburg.com/download or upon request by calling 1-800-847-0200.
End Block
Changes In and Disagreements with Accountants
No changes and/or disagreements occurred in the current reporting period.
End Block
For additional information about the Fund, including its prospectus, financial information, holdings and proxy information, visit www.thornburg.com/download.

Thornburg Small/Mid Cap Core Fund Tailored Shareholder Report | |
Thornburg Small/Mid Cap Core Fund Tailored Shareholder Report
Thornburg Small/Mid Cap Core Fund CLASS: C TICKER: TVCFX Annual Shareholder Report | |
This annual shareholder report contains important information about the Thornburg Small/Mid Cap Core Fund Class C Shares for the period from October 1, 2023 to September 30, 2024. You can find additional information about the Fund at https://www.thornburg.com/download. You can also request this information by contacting us at 1-800-847-0200. This report also describes changes to the Fund that occurred during the reporting period.
How did the Fund perform last year and what affected its performance?
The Fund’s Class C shares underperformed the Russell 2500 Index – Total Return (the “Index”) during the 12-month period ended September 30, 2024. The Fund’s stock selection in the industrials and consumer discretionary sectors had a positive impact on performance relative to the Index during the period. Stock selection in and underweight allocations to health care and financials detracted from relative results. Returns of larger mid-cap companies outpaced smaller-cap companies within the Index during the period. Stock selection was a negative contributor to performance within the mid-cap (those ranging from approximately $2.5 - $12 billion market capitalization) and large-cap portions (those over approximately $12 billion market capitalization) of the Fund’s portfolio during the period. However, an overweight positioning in the Fund to larger stocks within the Index’s universe positively impacted the Fund’s performance relative to the Index for the period. Stock selection, as well as an underweight positioning to the smaller-cap segment of the universe, contributed positively to relative performance.
How did the Fund perform over the past 10 years?
The line graph below reflects a hypothetical $10,000 investment. The returns shown in the line graph and table assume the reinvestment of dividends and capital gains, but do not reflect the deduction of taxes that a shareholder would pay on distributions or the redemption of Fund shares. The performance information shown below represents past performance and is no guarantee of future results. For Fund performance current to the most recent month end, visit https://www.thornburg.com/product/mutual-funds/fv/TVCFX or call 1-800-847-0200. Performance for other share classes of the Fund will vary.
Cumulative Performance
Growth Table
Date | Thornburg Small/Mid Cap Core Fund | Russell 2500 Index - Total Return | Russell 3000 Index - Total Return |
09/30/2014 | 9999.9816 | 10000 | 10000 |
10/31/2014 | 10102.3173 | 10442.5942 | 10275.133 |
11/30/2014 | 10442.6949 | 10533.251 | 10524.1387 |
12/31/2014 | 10407.0998 | 10676.6699 | 10524.0202 |
01/31/2015 | 10209.1024 | 10457.9285 | 10231.1204 |
02/28/2015 | 10814.2181 | 11081.4277 | 10823.5111 |
03/31/2015 | 10749.7021 | 11228.531 | 10713.4813 |
04/30/2015 | 10981.0698 | 11031.8505 | 10761.9405 |
05/31/2015 | 11174.6179 | 11268.3263 | 10910.7933 |
06/30/2015 | 11087.855 | 11190.0848 | 10728.2506 |
07/31/2015 | 11228.0104 | 11169.2953 | 10907.6844 |
08/31/2015 | 10638.4676 | 10507.9662 | 10249.1933 |
09/30/2015 | 10151.2605 | 10037.8688 | 9950.534 |
10/31/2015 | 10751.9268 | 10598.8371 | 10736.4785 |
11/30/2015 | 10818.6675 | 10807.0053 | 10795.9966 |
12/31/2015 | 10682.9614 | 10366.9084 | 10574.4045 |
01/31/2016 | 10008.8803 | 9540.2877 | 9977.7406 |
02/29/2016 | 9779.7372 | 9607.3008 | 9974.5274 |
03/31/2016 | 10395.9764 | 10407.6184 | 10676.794 |
04/30/2016 | 10422.6727 | 10561.1175 | 10742.9652 |
05/31/2016 | 10645.1417 | 10783.7702 | 10935.16 |
06/30/2016 | 10562.8281 | 10779.4502 | 10957.6458 |
07/31/2016 | 10974.3958 | 11341.6249 | 11392.5207 |
08/31/2016 | 10998.8674 | 11432.0677 | 11421.5817 |
09/30/2016 | 11116.7759 | 11486.8731 | 11439.536 |
10/31/2016 | 10912.1045 | 11020.6417 | 11192.0343 |
11/30/2016 | 11212.4376 | 11958.1705 | 11692.9016 |
12/31/2016 | 11303.6499 | 12190.3391 | 11921.0671 |
01/31/2017 | 11550.5905 | 12359.5098 | 12145.4442 |
02/28/2017 | 11982.1803 | 12657.2451 | 12597.1533 |
03/31/2017 | 12162.3802 | 12648.2611 | 12605.7226 |
04/30/2017 | 12504.9825 | 12745.8521 | 12739.3407 |
05/31/2017 | 12727.4515 | 12603.3544 | 12869.7154 |
06/30/2017 | 12889.8539 | 12918.2402 | 12985.8568 |
07/31/2017 | 13098.9747 | 13052.007 | 13230.7044 |
08/31/2017 | 13179.0636 | 12943.6937 | 13256.1965 |
09/30/2017 | 13319.219 | 13530.7446 | 13579.4861 |
10/31/2017 | 13523.8905 | 13740.4631 | 13875.8204 |
11/30/2017 | 13815.3249 | 14191.8661 | 14297.1609 |
12/31/2017 | 13836.7183 | 14239.6269 | 14440.0596 |
01/31/2018 | 14591.6515 | 14673.9183 | 15201.2038 |
02/28/2018 | 13890.3231 | 14070.4951 | 14640.8928 |
03/31/2018 | 13564.2277 | 14205.5593 | 14346.9915 |
04/30/2018 | 13725.0419 | 14239.2118 | 14401.5198 |
05/31/2018 | 14106.9755 | 14908.7918 | 14808.0786 |
06/30/2018 | 14100.2749 | 15016.5214 | 14904.9227 |
07/31/2018 | 14576.0168 | 15307.063 | 15399.5545 |
08/31/2018 | 14794.9027 | 15963.6244 | 15940.3524 |
09/30/2018 | 14747.9986 | 15721.7583 | 15966.738 |
10/31/2018 | 13550.8265 | 14125.6248 | 14791.0638 |
11/30/2018 | 13769.7125 | 14392.419 | 15087.3096 |
12/31/2018 | 12387.1574 | 12815.3626 | 13683.1425 |
01/31/2019 | 13539.6589 | 14290.7738 | 14857.6224 |
02/28/2019 | 13814.383 | 14965.7053 | 15380.151 |
03/31/2019 | 14080.1731 | 14842.4403 | 15604.728 |
04/30/2019 | 14622.9209 | 15362.5365 | 16227.8554 |
05/31/2019 | 13363.21 | 14269.5432 | 15177.7201 |
06/30/2019 | 14261.0891 | 15281.9079 | 16243.7537 |
07/31/2019 | 14524.6456 | 15440.8687 | 16485.2181 |
08/31/2019 | 14243.2208 | 14823.1686 | 16149.1603 |
09/30/2019 | 14562.6156 | 15085.9475 | 16432.5919 |
10/31/2019 | 14835.1063 | 15374.7508 | 16786.3352 |
11/30/2019 | 15290.7464 | 16034.6203 | 17424.4142 |
12/31/2019 | 15833.4942 | 16373.6882 | 17927.5233 |
01/31/2020 | 15431.4588 | 16041.2367 | 17907.9411 |
02/29/2020 | 14352.6638 | 14696.1543 | 16441.7593 |
03/31/2020 | 11647.859 | 11507.1307 | 14180.724 |
04/30/2020 | 13175.5935 | 13181.5316 | 16058.8224 |
05/31/2020 | 13644.6348 | 14155.1648 | 16917.6229 |
06/30/2020 | 13821.0836 | 14563.9768 | 17304.3924 |
07/31/2020 | 14569.3162 | 15144.3075 | 18286.9924 |
08/31/2020 | 15578.8718 | 15829.9744 | 19611.7831 |
09/30/2020 | 15085.2616 | 15420.7019 | 18897.6985 |
10/31/2020 | 15339.884 | 15699.9633 | 18489.825 |
11/30/2020 | 16820.7144 | 18257.5481 | 20739.1715 |
12/31/2020 | 17548.8452 | 19647.3167 | 21672.1852 |
01/31/2021 | 17187.0133 | 20128.7527 | 21575.7888 |
02/28/2021 | 18507.0296 | 21441.9079 | 22250.1888 |
03/31/2021 | 18652.209 | 21794.5653 | 23047.7 |
04/30/2021 | 19628.2616 | 22665.269 | 24235.7902 |
05/31/2021 | 19317.801 | 22712.2061 | 24346.427 |
06/30/2021 | 19431.711 | 22980.6608 | 24946.7819 |
07/31/2021 | 19451.8128 | 22578.1215 | 25368.648 |
08/31/2021 | 19936.4888 | 23090.6283 | 26092.107 |
09/30/2021 | 19521.0522 | 22364.3813 | 24921.4084 |
10/31/2021 | 20238.0153 | 23460.9617 | 26606.7068 |
11/30/2021 | 18973.6269 | 22482.217 | 26201.7175 |
12/31/2021 | 19812.7786 | 23219.6145 | 27233.5057 |
01/31/2022 | 18345.0489 | 21286.9299 | 25631.1915 |
02/28/2022 | 18803.9109 | 21526.6814 | 24985.5606 |
03/31/2022 | 19064.7707 | 21868.9407 | 25795.9975 |
04/30/2022 | 17461.8968 | 20005.6498 | 23481.0071 |
05/31/2022 | 17483.8971 | 20073.1949 | 23449.5237 |
06/30/2022 | 15871.5945 | 18155.3711 | 21487.7688 |
07/31/2022 | 17100.4645 | 20033.8601 | 23503.707 |
08/31/2022 | 16399.6 | 19501.3551 | 22626.5647 |
09/30/2022 | 14862.7268 | 17643.8243 | 20528.4243 |
10/31/2022 | 16019.3103 | 19336.6212 | 22211.8772 |
11/30/2022 | 16798.7471 | 20152.9477 | 23371.2533 |
12/31/2022 | 15786.7365 | 18954.3524 | 22002.7861 |
01/31/2023 | 17012.4636 | 20849.5055 | 23518.1774 |
02/28/2023 | 16393.3142 | 20360.1753 | 22968.4935 |
03/31/2023 | 15815.0225 | 19596.9612 | 23582.6516 |
04/30/2023 | 15780.4507 | 19341.298 | 23833.9098 |
05/31/2023 | 15142.444 | 19002.1652 | 23926.6418 |
06/30/2023 | 16493.8867 | 20620.8915 | 25560.4836 |
07/31/2023 | 16940.1771 | 21646.0933 | 26476.7444 |
08/31/2023 | 16761.0324 | 20796.218 | 25965.6445 |
09/30/2023 | 16141.883 | 19634.7846 | 24728.7907 |
10/31/2023 | 15274.4454 | 18442.2218 | 24073.2616 |
11/30/2023 | 16446.7434 | 20102.3781 | 26318.0536 |
12/31/2023 | 17688.1849 | 22256.8203 | 27714.0123 |
01/31/2024 | 17405.3248 | 21674.6733 | 28021.1577 |
02/29/2024 | 18514.765 | 22853.6855 | 29537.9574 |
03/31/2024 | 19463.9178 | 23796.8771 | 30490.7763 |
04/30/2024 | 18376.4778 | 22202.6637 | 29149.1283 |
05/31/2024 | 19102.4854 | 23126.2073 | 30526.3399 |
06/30/2024 | 18800.768 | 22779.6538 | 31471.3556 |
07/31/2024 | 19724.7776 | 24472.081 | 32056.3767 |
08/31/2024 | 20048.4953 | 24409.1674 | 32754.2021 |
09/30/2024 | 20321.9267 | 24772.5666 | 33431.7499 |
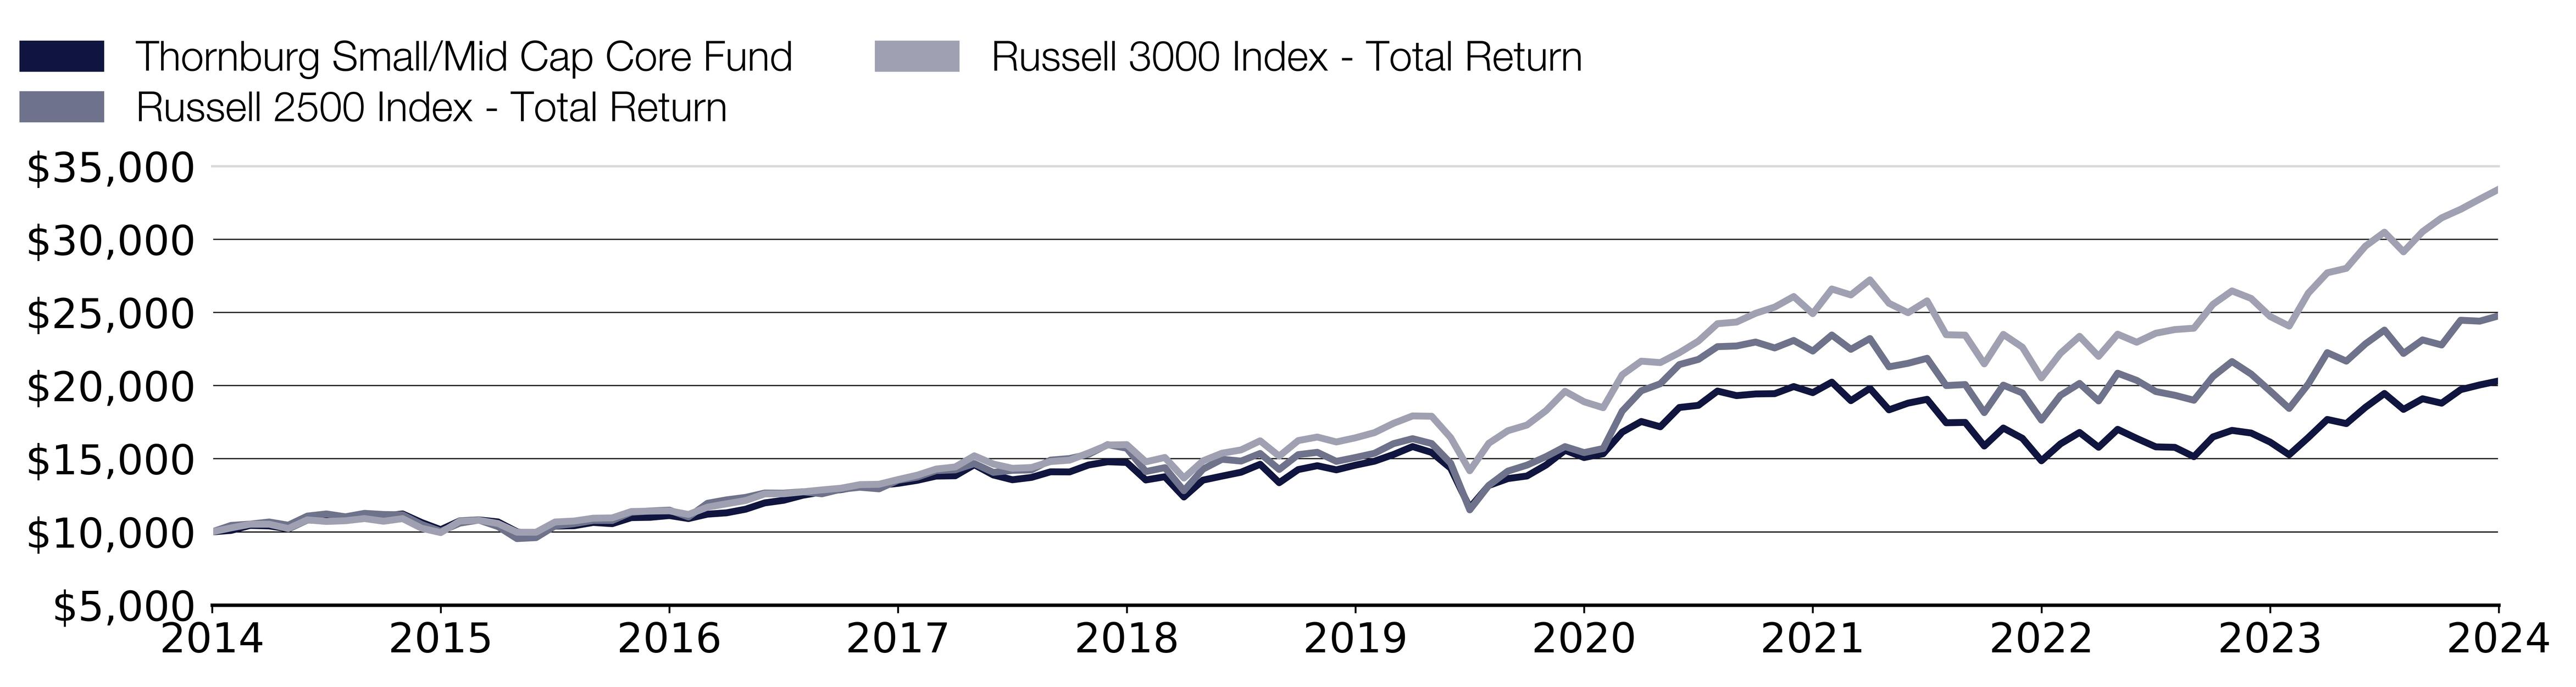
Effective September 30, 2024, the Fund adopted the Russell 3000 Index – Total Return as its broad-based securities market index that represents the overall applicable market in which the Fund invests, and the Russell 2500 Index—Total Return as an additional index that represents the market sectors which the Fund’s advisor believes are more representative of the Fund’s investment universe.
What were the Fund costs for the past year?
(based on a hypothetical $10,000 investment)
Class Name | Costs of a $10,000 investment | Costs paid as a percentage of a $10,000 investment |
|---|
Class C | $264.00 | 2.34% |
End Block
Thornburg Small/Mid Cap Core Fund Tailored Shareholder Report
Thornburg Small/Mid Cap Core Fund Tailored Shareholder Report | |
Annual Performance | 1 Year | 5 Year | 10 Year |
|---|
Small/Mid Cap Core Fund Class C (with sales charge) | 24.90% | 6.89% | 7.35% |
Small/Mid Cap Core Fund Class C (without sales charge) | 25.90% | 6.89% | 7.35% |
Russell 2500 Index - Total Return | 26.17% | 10.43% | 9.50% |
Russell 3000 Index - Total Return | 35.19% | 15.26% | 12.83% |
Key Fund Statistics
(as of September 30, 2024)
| |
|---|
Fund Size (Millions) | $559.8M |
Number of Holdings | 49 |
Annual Portfolio Turnover | 32.79% |
Total Advisory Fee | $4.6M |
What did the Fund invest in?
(as of September 30, 2024)
Market Capitalization Exposure | (%) |
|---|
| Small Cap (<$2.5 B) | 9.0 |
| Mid Cap ($2.5-12 B) | 52.2 |
| Large Cap (>$12 B) | 38.8 |
Market Capitalization Exposure | (%) |
Small Cap (<$2.5 B) | 9.0% |
Mid Cap ($2.5-12 B) | 52.2% |
Large Cap (>$12 B) | 38.8% |
Expressed as a percentage of the Fund’s net assets.
How has the Fund changed?
This is a summary of certain changes to the Fund since October 1, 2023. For more complete information, you may review the Fund’s next prospectus, which we expect to be available by February 1, 2025 at https://www.thornburg.com/download or upon request by calling 1-800-847-0200.
End Block
Changes In and Disagreements with Accountants
No changes and/or disagreements occurred in the current reporting period.
End Block
For additional information about the Fund, including its prospectus, financial information, holdings and proxy information, visit www.thornburg.com/download.

Thornburg Small/Mid Cap Core Fund Tailored Shareholder Report | |
Thornburg Small/Mid Cap Core Fund Tailored Shareholder Report
Thornburg Small/Mid Cap Core Fund CLASS: I TICKER: TVIFX Annual Shareholder Report | |
This annual shareholder report contains important information about the Thornburg Small/Mid Cap Core Fund Class I Shares for the period from October 1, 2023 to September 30, 2024. You can find additional information about the Fund at https://www.thornburg.com/download. You can also request this information by contacting us at 1-800-847-0200. This report also describes changes to the Fund that occurred during the reporting period.
How did the Fund perform last year and what affected its performance?
The Fund’s Class I shares outperformed the Russell 2500 Index – Total Return (the “Index”) during the 12-month period ended September 30, 2024. Stock selection was the primary driver of the Fund’s relative outperformance. The Fund’s stock selection in the industrials and consumer discretionary sectors had a positive impact on performance relative to the Index during the period. Stock selection in and underweight allocations to health care and financials detracted from relative results. Returns of larger mid-cap companies outpaced smaller-cap companies within the Index during the period. Stock selection was a negative contributor to performance within the mid-cap (those ranging from approximately $2.5 - $12 billion market capitalization) and large-cap portions (those over approximately $12 billion market capitalization) of the Fund’s portfolio during the period. However, an overweight positioning in the Fund to larger stocks within the Index’s universe positively impacted the Fund’s performance relative to the Index for the period. Stock selection, as well as an underweight positioning to the smaller-cap segment of the universe, contributed positively to relative performance.
How did the Fund perform over the past 10 years?
The line graph below reflects a hypothetical $10,000 investment. The returns shown in the line graph and table assume the reinvestment of dividends and capital gains, but do not reflect the deduction of taxes that a shareholder would pay on distributions or the redemption of Fund shares. The performance information shown below represents past performance and is no guarantee of future results. For Fund performance current to the most recent month end, visit https://www.thornburg.com/product/mutual-funds/fv/TVIFX or call 1-800-847-0200. Performance for other share classes of the Fund will vary.
Cumulative Performance
Growth Table
Date | Thornburg Small/Mid Cap Core Fund | Russell 2500 Index - Total Return | Russell 3000 Index - Total Return |
09/30/2014 | 9999.9962 | 10000 | 10000 |
10/31/2014 | 10113.6325 | 10442.5942 | 10275.133 |
11/30/2014 | 10462.6583 | 10533.251 | 10524.1387 |
12/31/2014 | 10437.6134 | 10676.6699 | 10524.0202 |
01/31/2015 | 10248.6514 | 10457.9285 | 10231.1204 |
02/28/2015 | 10864.302 | 11081.4277 | 10823.5111 |
03/31/2015 | 10809.442 | 11228.531 | 10713.4813 |
04/30/2015 | 11053.264 | 11031.8505 | 10761.9405 |
05/31/2015 | 11258.4808 | 11268.3263 | 10910.7933 |
06/30/2015 | 11182.096 | 11190.0848 | 10728.2506 |
07/31/2015 | 11334.496 | 11169.2953 | 10907.6844 |
08/31/2015 | 10749.28 | 10507.9662 | 10249.1933 |
09/30/2015 | 10267.696 | 10037.8688 | 9950.534 |
10/31/2015 | 10885.424 | 10598.8371 | 10736.4785 |
11/30/2015 | 10964.672 | 10807.0053 | 10795.9966 |
12/31/2015 | 10836.656 | 10366.9084 | 10574.4045 |
01/31/2016 | 10164.064 | 9540.2877 | 9977.7406 |
02/29/2016 | 9940.544 | 9607.3008 | 9974.5274 |
03/31/2016 | 10576.56 | 10407.6184 | 10676.794 |
04/30/2016 | 10613.136 | 10561.1175 | 10742.9652 |
05/31/2016 | 10850.88 | 10783.7702 | 10935.16 |
06/30/2016 | 10775.696 | 10779.4502 | 10957.6458 |
07/31/2016 | 11208.512 | 11341.6249 | 11392.5207 |
08/31/2016 | 11243.056 | 11432.0677 | 11421.5817 |
09/30/2016 | 11373.2242 | 11486.8731 | 11439.536 |
10/31/2016 | 11174.7351 | 11020.6417 | 11192.0343 |
11/30/2016 | 11491.9085 | 11958.1705 | 11692.9016 |
12/31/2016 | 11598.4154 | 12190.3391 | 11921.0671 |
01/31/2017 | 11864.8101 | 12359.5098 | 12145.4442 |
02/28/2017 | 12315.6319 | 12657.2451 | 12597.1533 |
03/31/2017 | 12514.4033 | 12648.2611 | 12605.7226 |
04/30/2017 | 12879.1592 | 12745.8521 | 12739.3407 |
05/31/2017 | 13120.9636 | 12603.3544 | 12869.7154 |
06/30/2017 | 13300.0056 | 12918.2402 | 12985.8568 |
07/31/2017 | 13529.8822 | 13052.007 | 13230.7044 |
08/31/2017 | 13626.3483 | 12943.6937 | 13256.1965 |
09/30/2017 | 13784.6214 | 13530.7446 | 13579.4861 |
10/31/2017 | 14010.5988 | 13740.4631 | 13875.8204 |
11/30/2017 | 14324.9128 | 14191.8661 | 14297.1609 |
12/31/2017 | 14360.0569 | 14239.6269 | 14440.0596 |
01/31/2018 | 15157.8379 | 14673.9183 | 15201.2038 |
02/28/2018 | 14442.7285 | 14070.4951 | 14640.8928 |
03/31/2018 | 14116.1757 | 14205.5593 | 14346.9915 |
04/30/2018 | 14295.9864 | 14239.2118 | 14401.5198 |
05/31/2018 | 14707.2776 | 14908.7918 | 14808.0786 |
06/30/2018 | 14713.478 | 15016.5214 | 14904.9227 |
07/31/2018 | 15228.1087 | 15307.063 | 15399.5545 |
08/31/2018 | 15471.9899 | 15963.6244 | 15940.3524 |
09/30/2018 | 15438.9213 | 15721.7583 | 15966.738 |
10/31/2018 | 14200.9141 | 14125.6248 | 14791.0638 |
11/30/2018 | 14446.8621 | 14392.419 | 15087.3096 |
12/31/2018 | 13011.1223 | 12815.3626 | 13683.1425 |
01/31/2019 | 14236.385 | 14290.7738 | 14857.6224 |
02/28/2019 | 14540.6168 | 14965.7053 | 15380.151 |
03/31/2019 | 14836.5136 | 14842.4403 | 15604.728 |
04/30/2019 | 15422.0558 | 15362.5365 | 16227.8554 |
05/31/2019 | 14109.2744 | 14269.5432 | 15177.7201 |
06/30/2019 | 15071.9807 | 15281.9079 | 16243.7537 |
07/31/2019 | 15361.6262 | 15440.8687 | 16485.2181 |
08/31/2019 | 15078.2321 | 14823.1686 | 16149.1603 |
09/30/2019 | 15428.3071 | 15085.9475 | 16432.5919 |
10/31/2019 | 15732.539 | 15374.7508 | 16786.3352 |
11/30/2019 | 16230.5624 | 16034.6203 | 17424.4142 |
12/31/2019 | 16824.3025 | 16373.6882 | 17927.5233 |
01/31/2020 | 16405.3185 | 16041.2367 | 17907.9411 |
02/29/2020 | 15274.0617 | 14696.1543 | 16441.7593 |
03/31/2020 | 12410.3061 | 11507.1307 | 14180.724 |
04/30/2020 | 14050.6284 | 13181.5316 | 16058.8224 |
05/31/2020 | 14565.9788 | 14155.1648 | 16917.6229 |
06/30/2020 | 14767.0911 | 14563.9768 | 17304.3924 |
07/31/2020 | 15582.015 | 15144.3075 | 18286.9924 |
08/31/2020 | 16677.6581 | 15829.9744 | 19611.7831 |
09/30/2020 | 16164.4027 | 15420.7019 | 18897.6985 |
10/31/2020 | 16455.5966 | 15699.9633 | 18489.825 |
11/30/2020 | 18060.3053 | 18257.5481 | 20739.1715 |
12/31/2020 | 18860.5648 | 19647.3167 | 21672.1852 |
01/31/2021 | 18489.7639 | 20128.7527 | 21575.7888 |
02/28/2021 | 19926.879 | 21441.9079 | 22250.1888 |
03/31/2021 | 20102.8523 | 21794.5653 | 23047.7 |
04/30/2021 | 21173.3564 | 22665.269 | 24235.7902 |
05/31/2021 | 20857.0235 | 22712.2061 | 24346.427 |
06/30/2021 | 20997.3832 | 22980.6608 | 24946.7819 |
07/31/2021 | 21041.3765 | 22578.1215 | 25368.648 |
08/31/2021 | 21588.1506 | 23090.6283 | 26092.107 |
09/30/2021 | 21156.5971 | 22364.3813 | 24921.4084 |
10/31/2021 | 21954.7616 | 23460.9617 | 26606.7068 |
11/30/2021 | 20600.735 | 22482.217 | 26201.7175 |
12/31/2021 | 21534.5645 | 23219.6145 | 27233.5057 |
01/31/2022 | 19967.0328 | 21286.9299 | 25631.1915 |
02/28/2022 | 20484.853 | 21526.6814 | 24985.5606 |
03/31/2022 | 20794.4194 | 21868.9407 | 25795.9975 |
04/30/2022 | 19069.2902 | 20005.6498 | 23481.0071 |
05/31/2022 | 19114.3181 | 20073.1949 | 23449.5237 |
06/30/2022 | 17372.3035 | 18155.3711 | 21487.7688 |
07/31/2022 | 18740.0242 | 20033.8601 | 23503.707 |
08/31/2022 | 17991.4363 | 19501.3551 | 22626.5647 |
09/30/2022 | 16325.4062 | 17643.8243 | 20528.4243 |
10/31/2022 | 17614.3282 | 19336.6212 | 22211.8772 |
11/30/2022 | 18495.1853 | 20152.9477 | 23371.2533 |
12/31/2022 | 17402.0394 | 18954.3524 | 22002.7861 |
01/31/2023 | 18773.9492 | 20849.5055 | 23518.1774 |
02/28/2023 | 18109.2094 | 20360.1753 | 22968.4935 |
03/31/2023 | 17492.5571 | 19596.9612 | 23582.6516 |
04/30/2023 | 17472.7564 | 19341.298 | 23833.9098 |
05/31/2023 | 16785.3871 | 19002.1652 | 23926.6418 |
06/30/2023 | 18307.217 | 20620.8915 | 25560.4836 |
07/31/2023 | 18822.0367 | 21646.0933 | 26476.7444 |
08/31/2023 | 18646.6586 | 20796.218 | 25965.6445 |
09/30/2023 | 17979.0901 | 19634.7846 | 24728.7907 |
10/31/2023 | 17031.4823 | 18442.2218 | 24073.2616 |
11/30/2023 | 18360.9619 | 20102.3781 | 26318.0536 |
12/31/2023 | 19769.6445 | 22256.8203 | 27714.0123 |
01/31/2024 | 19478.2905 | 21674.6733 | 28021.1577 |
02/29/2024 | 20739.8818 | 22853.6855 | 29537.9574 |
03/31/2024 | 21834.5809 | 23796.8771 | 30490.7763 |
04/30/2024 | 20638.0493 | 22202.6637 | 29149.1283 |
05/31/2024 | 21478.1672 | 23126.2073 | 30526.3399 |
06/30/2024 | 21164.1838 | 22779.6538 | 31471.3556 |
07/31/2024 | 22230.5961 | 24472.081 | 32056.3767 |
08/31/2024 | 22620.954 | 24409.1674 | 32754.2021 |
09/30/2024 | 22957.5669 | 24772.5666 | 33431.7499 |

Effective September 30, 2024, the Fund adopted the Russell 3000 Index – Total Return as its broad-based securities market index that represents the overall applicable market in which the Fund invests, and the Russell 2500 Index—Total Return as an additional index that represents the market sectors which the Fund’s advisor believes are more representative of the Fund’s investment universe.
What were the Fund costs for the past year?
(based on a hypothetical $10,000 investment)
Class Name | Costs of a $10,000 investment | Costs paid as a percentage of a $10,000 investment |
|---|
Class I | $108.00 | 0.95% |
End Block
Thornburg Small/Mid Cap Core Fund Tailored Shareholder Report
Thornburg Small/Mid Cap Core Fund Tailored Shareholder Report | |
Annual Performance | 1 Year | 5 Year | 10 Year |
|---|
Small/Mid Cap Core Fund Class I | 27.69% | 8.27% | 8.67% |
Russell 2500 Index - Total Return | 26.17% | 10.43% | 9.50% |
Russell 3000 Index - Total Return | 35.19% | 15.26% | 12.83% |
Key Fund Statistics
(as of September 30, 2024)
| |
|---|
Fund Size (Millions) | $559.8M |
Number of Holdings | 49 |
Annual Portfolio Turnover | 32.79% |
Total Advisory Fee | $4.6M |
What did the Fund invest in?
(as of September 30, 2024)
Market Capitalization Exposure | (%) |
|---|
| Small Cap (<$2.5 B) | 9.0 |
| Mid Cap ($2.5-12 B) | 52.2 |
| Large Cap (>$12 B) | 38.8 |
Market Capitalization Exposure | (%) |
Small Cap (<$2.5 B) | 9.0% |
Mid Cap ($2.5-12 B) | 52.2% |
Large Cap (>$12 B) | 38.8% |
Expressed as a percentage of the Fund’s net assets.
How has the Fund changed?
This is a summary of certain changes to the Fund since October 1, 2023. For more complete information, you may review the Fund’s next prospectus, which we expect to be available by February 1, 2025 at https://www.thornburg.com/download or upon request by calling 1-800-847-0200.
End Block
Changes In and Disagreements with Accountants
No changes and/or disagreements occurred in the current reporting period.
End Block
For additional information about the Fund, including its prospectus, financial information, holdings and proxy information, visit www.thornburg.com/download.

Thornburg Small/Mid Cap Core Fund Tailored Shareholder Report | |
Thornburg Small/Mid Cap Core Fund Tailored Shareholder Report
Thornburg Small/Mid Cap Core Fund CLASS: R3 TICKER: TVRFX Annual Shareholder Report | |
This annual shareholder report contains important information about the Thornburg Small/Mid Cap Core Fund Class R3 Shares for the period from October 1, 2023 to September 30, 2024. You can find additional information about the Fund at https://www.thornburg.com/download. You can also request this information by contacting us at 1-800-847-0200. This report also describes changes to the Fund that occurred during the reporting period.
How did the Fund perform last year and what affected its performance?
The Fund’s Class R3 shares outperformed the Russell 2500 Index – Total Return (the “Index”) during the 12-month period ended September 30, 2024. Stock selection was the primary driver of the Fund’s relative outperformance. The Fund’s stock selection in the industrials and consumer discretionary sectors had a positive impact on performance relative to the Index during the period. Stock selection in and underweight allocations to health care and financials detracted from relative results. Returns of larger mid-cap companies outpaced smaller-cap companies within the Index during the period. Stock selection was a negative contributor to performance within the mid-cap (those ranging from approximately $2.5 - $12 billion market capitalization) and large-cap portions (those over approximately $12 billion market capitalization) of the Fund’s portfolio during the period. However, an overweight positioning in the Fund to larger stocks within the Index’s universe positively impacted the Fund’s performance relative to the Index for the period. Stock selection, as well as an underweight positioning to the smaller-cap segment of the universe, contributed positively to relative performance.
How did the Fund perform over the past 10 years?
The line graph below reflects a hypothetical $10,000 investment. The returns shown in the line graph and table assume the reinvestment of dividends and capital gains, but do not reflect the deduction of taxes that a shareholder would pay on distributions or the redemption of Fund shares. The performance information shown below represents past performance and is no guarantee of future results. For Fund performance current to the most recent month end, visit https://www.thornburg.com/product/mutual-funds/fv/TVRFX or call 1-800-847-0200. Performance for other share classes of the Fund will vary.
Cumulative Performance
Growth Table
Date | Thornburg Small/Mid Cap Core Fund | Russell 2500 Index - Total Return | Russell 3000 Index - Total Return |
09/30/2014 | 10000.0097 | 10000 | 10000 |
10/31/2014 | 10108.8192 | 10442.5942 | 10275.133 |
11/30/2014 | 10456.1725 | 10533.251 | 10524.1387 |
12/31/2014 | 10427.2254 | 10676.6699 | 10524.0202 |
01/31/2015 | 10234.6326 | 10457.9285 | 10231.1204 |
02/28/2015 | 10847.9988 | 11081.4277 | 10823.5111 |
03/31/2015 | 10789.3836 | 11228.531 | 10713.4813 |
04/30/2015 | 11030.1246 | 11031.8505 | 10761.9405 |
05/31/2015 | 11228.9976 | 11268.3263 | 10910.7933 |
06/30/2015 | 11151.5418 | 11190.0848 | 10728.2506 |
07/31/2015 | 11300.1732 | 11169.2953 | 10907.6844 |
08/31/2015 | 10711.9278 | 10507.9662 | 10249.1933 |
09/30/2015 | 10228.3524 | 10037.8688 | 9950.534 |
10/31/2015 | 10841.7186 | 10598.8371 | 10736.4785 |
11/30/2015 | 10917.081 | 10807.0053 | 10795.9966 |
12/31/2015 | 10787.2902 | 10366.9084 | 10574.4045 |
01/31/2016 | 10113.2154 | 9540.2877 | 9977.7406 |
02/29/2016 | 9889.2216 | 9607.3008 | 9974.5274 |
03/31/2016 | 10519.335 | 10407.6184 | 10676.794 |
04/30/2016 | 10552.8294 | 10561.1175 | 10742.9652 |
05/31/2016 | 10785.1968 | 10783.7702 | 10935.16 |
06/30/2016 | 10707.741 | 10779.4502 | 10957.6458 |
07/31/2016 | 11132.7012 | 11341.6249 | 11392.5207 |
08/31/2016 | 11164.1022 | 11432.0677 | 11421.5817 |
09/30/2016 | 11292.288 | 11486.8731 | 11439.536 |
10/31/2016 | 11090.64 | 11020.6417 | 11192.0343 |
11/30/2016 | 11403.6145 | 11958.1705 | 11692.9016 |
12/31/2016 | 11504.4321 | 12190.3391 | 11921.0671 |
01/31/2017 | 11765.0367 | 12359.5098 | 12145.4442 |
02/28/2017 | 12208.4849 | 12657.2451 | 12597.1533 |
03/31/2017 | 12401.8367 | 12648.2611 | 12605.7226 |
04/30/2017 | 12759.1172 | 12745.8521 | 12739.3407 |
05/31/2017 | 12994.502 | 12603.3544 | 12869.7154 |
06/30/2017 | 13168.9389 | 12918.2402 | 12985.8568 |
07/31/2017 | 13391.7138 | 13052.007 | 13230.7044 |
08/31/2017 | 13482.0848 | 12943.6937 | 13256.1965 |
09/30/2017 | 13635.9594 | 13530.7446 | 13579.4861 |
10/31/2017 | 13854.5382 | 13740.4631 | 13875.8204 |
11/30/2017 | 14161.3894 | 14191.8661 | 14297.1609 |
12/31/2017 | 14191.1095 | 14239.6269 | 14440.0596 |
01/31/2018 | 14975.0436 | 14673.9183 | 15201.2038 |
02/28/2018 | 14265.0655 | 14070.4951 | 14640.8928 |
03/31/2018 | 13939.6589 | 14205.5593 | 14346.9915 |
04/30/2018 | 14112.9274 | 14239.2118 | 14401.5198 |
05/31/2018 | 14514.4031 | 14908.7918 | 14808.0786 |
06/30/2018 | 14514.4031 | 15016.5214 | 14904.9227 |
07/31/2018 | 15017.3042 | 15307.063 | 15399.5545 |
08/31/2018 | 15253.9636 | 15963.6244 | 15940.3524 |
09/30/2018 | 15218.0421 | 15721.7583 | 15966.738 |
10/31/2018 | 13992.4847 | 14125.6248 | 14791.0638 |
11/30/2018 | 14231.2571 | 14392.419 | 15087.3096 |
12/31/2018 | 12811.8736 | 12815.3626 | 13683.1425 |
01/31/2019 | 14014.3786 | 14290.7738 | 14857.6224 |
02/28/2019 | 14309.1725 | 14965.7053 | 15380.151 |
03/31/2019 | 14595.4832 | 14842.4403 | 15604.728 |
04/30/2019 | 15170.2255 | 15362.5365 | 16227.8554 |
05/31/2019 | 13872.2836 | 14269.5432 | 15177.7201 |
06/30/2019 | 14813.9277 | 15281.9079 | 16243.7537 |
07/31/2019 | 15095.9968 | 15440.8687 | 16485.2181 |
08/31/2019 | 14811.8069 | 14823.1686 | 16149.1603 |
09/30/2019 | 15153.2589 | 15085.9475 | 16432.5919 |
10/31/2019 | 15445.9321 | 15374.7508 | 16786.3352 |
11/30/2019 | 15929.479 | 16034.6203 | 17424.4142 |
12/31/2019 | 16508.9967 | 16373.6882 | 17927.5233 |
01/31/2020 | 16094.6782 | 16041.2367 | 17907.9411 |
02/29/2020 | 14979.2055 | 14696.1543 | 16441.7593 |
03/31/2020 | 12166.0895 | 11507.1307 | 14180.724 |
04/30/2020 | 13770.2455 | 13181.5316 | 16058.8224 |
05/31/2020 | 14271.6771 | 14155.1648 | 16917.6229 |
06/30/2020 | 14465.0257 | 14563.9768 | 17304.3924 |
07/31/2020 | 15259.6672 | 15144.3075 | 18286.9924 |
08/31/2020 | 16328.3964 | 15829.9744 | 19611.7831 |
09/30/2020 | 15820.5907 | 15420.7019 | 18897.6985 |
10/31/2020 | 16098.9277 | 15699.9633 | 18489.825 |
11/30/2020 | 17662.7142 | 18257.5481 | 20739.1715 |
12/31/2020 | 18440.3581 | 19647.3167 | 21672.1852 |
01/31/2021 | 18072.7833 | 20128.7527 | 21575.7888 |
02/28/2021 | 19472.9672 | 21441.9079 | 22250.1888 |
03/31/2021 | 19638.6945 | 21794.5653 | 23047.7 |
04/30/2021 | 20677.6777 | 22665.269 | 24235.7902 |
05/31/2021 | 20363.2206 | 22712.2061 | 24346.427 |
06/30/2021 | 20494.9527 | 22980.6608 | 24946.7819 |
07/31/2021 | 20531.0727 | 22578.1215 | 25368.648 |
08/31/2021 | 21058.0008 | 23090.6283 | 26092.107 |
09/30/2021 | 20630.9341 | 22364.3813 | 24921.4084 |
10/31/2021 | 21402.2038 | 23460.9617 | 26606.7068 |
11/30/2021 | 20077.4529 | 22482.217 | 26201.7175 |
12/31/2021 | 20982.1542 | 23219.6145 | 27233.5057 |
01/31/2022 | 19445.7498 | 21286.9299 | 25631.1915 |
02/28/2022 | 19947.3152 | 21526.6814 | 24985.5606 |
03/31/2022 | 20241.3363 | 21868.9407 | 25795.9975 |
04/30/2022 | 18557.9213 | 20005.6498 | 23481.0071 |
05/31/2022 | 18595.3946 | 20073.1949 | 23449.5237 |
06/30/2022 | 16894.6842 | 18155.3711 | 21487.7688 |
07/31/2022 | 18217.7792 | 20033.8601 | 23503.707 |
08/31/2022 | 17488.4915 | 19501.3551 | 22626.5647 |
09/30/2022 | 15862.7277 | 17643.8243 | 20528.4243 |
10/31/2022 | 17110.8762 | 19336.6212 | 22211.8772 |
11/30/2022 | 17961.2314 | 20152.9477 | 23371.2533 |
12/31/2022 | 16893.4732 | 18954.3524 | 22002.7861 |
01/31/2023 | 18220.9412 | 20849.5055 | 23518.1774 |
02/28/2023 | 17568.7504 | 20360.1753 | 22968.4935 |
03/31/2023 | 16965.6182 | 19596.9612 | 23582.6516 |
04/30/2023 | 16942.5318 | 19341.298 | 23833.9098 |
05/31/2023 | 16270.1404 | 19002.1652 | 23926.6418 |
06/30/2023 | 17739.0126 | 20620.8915 | 25560.4836 |
07/31/2023 | 18235.3702 | 21646.0933 | 26476.7444 |
08/31/2023 | 18059.3364 | 20796.218 | 25965.6445 |
09/30/2023 | 17407.1456 | 19634.7846 | 24728.7907 |
10/31/2023 | 16483.6896 | 18442.2218 | 24073.2616 |
11/30/2023 | 17764.9848 | 20102.3781 | 26318.0536 |
12/31/2023 | 19121.3108 | 22256.8203 | 27714.0123 |
01/31/2024 | 18835.6166 | 21674.6733 | 28021.1577 |
02/29/2024 | 20050.5384 | 22853.6855 | 29537.9574 |
03/31/2024 | 21100.9696 | 23796.8771 | 30490.7763 |
04/30/2024 | 19940.878 | 22202.6637 | 29149.1283 |
05/31/2024 | 20743.1304 | 23126.2073 | 30526.3399 |
06/30/2024 | 20434.3498 | 22779.6538 | 31471.3556 |
07/31/2024 | 21458.8088 | 24472.081 | 32056.3767 |
08/31/2024 | 21828.1912 | 24409.1674 | 32754.2021 |
09/30/2024 | 22145.6292 | 24772.5666 | 33431.7499 |

Effective September 30, 2024, the Fund adopted the Russell 3000 Index – Total Return as its broad-based securities market index that represents the overall applicable market in which the Fund invests, and the Russell 2500 Index—Total Return as an additional index that represents the market sectors which the Fund’s advisor believes are more representative of the Fund’s investment universe.
What were the Fund costs for the past year?
(based on a hypothetical $10,000 investment)
Class Name | Costs of a $10,000 investment | Costs paid as a percentage of a $10,000 investment |
|---|
Class R3 | $149.00 | 1.31% |
End Block
Thornburg Small/Mid Cap Core Fund Tailored Shareholder Report
Thornburg Small/Mid Cap Core Fund Tailored Shareholder Report | |
Annual Performance | 1 Year | 5 Year | 10 Year |
|---|
Small/Mid Cap Core Fund Class R3 | 27.22% | 7.88% | 8.28% |
Russell 2500 Index - Total Return | 26.17% | 10.43% | 9.50% |
Russell 3000 Index - Total Return | 35.19% | 15.26% | 12.83% |
Key Fund Statistics
(as of September 30, 2024)
| |
|---|
Fund Size (Millions) | $559.8M |
Number of Holdings | 49 |
Annual Portfolio Turnover | 32.79% |
Total Advisory Fee | $4.6M |
What did the Fund invest in?
(as of September 30, 2024)
Market Capitalization Exposure | (%) |
|---|
| Small Cap (<$2.5 B) | 9.0 |
| Mid Cap ($2.5-12 B) | 52.2 |
| Large Cap (>$12 B) | 38.8 |
Market Capitalization Exposure | (%) |
Small Cap (<$2.5 B) | 9.0% |
Mid Cap ($2.5-12 B) | 52.2% |
Large Cap (>$12 B) | 38.8% |
Expressed as a percentage of the Fund’s net assets.
How has the Fund changed?
This is a summary of certain changes to the Fund since October 1, 2023. For more complete information, you may review the Fund’s next prospectus, which we expect to be available by February 1, 2025 at https://www.thornburg.com/download or upon request by calling 1-800-847-0200.
End Block
Changes In and Disagreements with Accountants
No changes and/or disagreements occurred in the current reporting period.
End Block
For additional information about the Fund, including its prospectus, financial information, holdings and proxy information, visit www.thornburg.com/download.

Thornburg Small/Mid Cap Core Fund Tailored Shareholder Report | |
Thornburg Small/Mid Cap Core Fund Tailored Shareholder Report
Thornburg Small/Mid Cap Core Fund CLASS: R4 TICKER: TVIRX Annual Shareholder Report | |
This annual shareholder report contains important information about the Thornburg Small/Mid Cap Core Fund Class R4 Shares for the period from October 1, 2023 to September 30, 2024. You can find additional information about the Fund at https://www.thornburg.com/download. You can also request this information by contacting us at 1-800-847-0200. This report also describes changes to the Fund that occurred during the reporting period.
How did the Fund perform last year and what affected its performance?
The Fund’s Class R4 shares outperformed the Russell 2500 Index – Total Return (the “Index”) during the 12-month period ended September 30, 2024. Stock selection was the primary driver of the Fund’s relative outperformance. The Fund’s stock selection in the industrials and consumer discretionary sectors had a positive impact on performance relative to the Index during the period. Stock selection in and underweight allocations to health care and financials detracted from relative results. Returns of larger mid-cap companies outpaced smaller-cap companies within the Index during the period. Stock selection was a negative contributor to performance within the mid-cap (those ranging from approximately $2.5 - $12 billion market capitalization) and large-cap portions (those over approximately $12 billion market capitalization) of the Fund’s portfolio during the period. However, an overweight positioning in the Fund to larger stocks within the Index’s universe positively impacted the Fund’s performance relative to the Index for the period. Stock selection, as well as an underweight positioning to the smaller-cap segment of the universe, contributed positively to relative performance.
How did the Fund perform over the past 10 years?
The line graph below reflects a hypothetical $10,000 investment. The returns shown in the line graph and table assume the reinvestment of dividends and capital gains, but do not reflect the deduction of taxes that a shareholder would pay on distributions or the redemption of Fund shares. The performance information shown below represents past performance and is no guarantee of future results. For Fund performance current to the most recent month end, visit https://www.thornburg.com/product/mutual-funds/fv/TVIRX or call 1-800-847-0200. Performance for other share classes of the Fund will vary.
Cumulative Performance
Growth Table
Date | Thornburg Small/Mid Cap Core Fund | Russell 2500 Index - Total Return | Russell 3000 Index - Total Return |
09/30/2014 | 10000.0073 | 10000 | 10000 |
10/31/2014 | 10109.8747 | 10442.5942 | 10275.133 |
11/30/2014 | 10456.0607 | 10533.251 | 10524.1387 |
12/31/2014 | 10429.9826 | 10676.6699 | 10524.0202 |
01/31/2015 | 10239.1397 | 10457.9285 | 10231.1204 |
02/28/2015 | 10851.0818 | 11081.4277 | 10823.5111 |
03/31/2015 | 10795.0735 | 11228.531 | 10713.4813 |
04/30/2015 | 11035.7016 | 11031.8505 | 10761.9405 |
05/31/2015 | 11236.9165 | 11268.3263 | 10910.7933 |
06/30/2015 | 11160.1644 | 11190.0848 | 10728.2506 |
07/31/2015 | 11309.5198 | 11169.2953 | 10907.6844 |
08/31/2015 | 10722.4702 | 10507.9662 | 10249.1933 |
09/30/2015 | 10239.1397 | 10037.8688 | 9950.534 |
10/31/2015 | 10853.1562 | 10598.8371 | 10736.4785 |
11/30/2015 | 10929.9082 | 10807.0053 | 10795.9966 |
12/31/2015 | 10801.2967 | 10366.9084 | 10574.4045 |
01/31/2016 | 10127.1232 | 9540.2877 | 9977.7406 |
02/29/2016 | 9903.0901 | 9607.3008 | 9974.5274 |
03/31/2016 | 10533.7016 | 10407.6184 | 10676.794 |
04/30/2016 | 10568.9661 | 10561.1175 | 10742.9652 |
05/31/2016 | 10803.371 | 10783.7702 | 10935.16 |
06/30/2016 | 10726.619 | 10779.4502 | 10957.6458 |
07/31/2016 | 11153.9413 | 11341.6249 | 11392.5207 |
08/31/2016 | 11187.1313 | 11432.0677 | 11421.5817 |
09/30/2016 | 11314.2937 | 11486.8731 | 11439.536 |
10/31/2016 | 11114.2988 | 11020.6417 | 11192.0343 |
11/30/2016 | 11426.7908 | 11958.1705 | 11692.9016 |
12/31/2016 | 11529.7735 | 12190.3391 | 11921.0671 |
01/31/2017 | 11792.4772 | 12359.5098 | 12145.4442 |
02/28/2017 | 12238.6565 | 12657.2451 | 12597.1533 |
03/31/2017 | 12432.5569 | 12648.2611 | 12605.7226 |
04/30/2017 | 12793.2532 | 12745.8521 | 12739.3407 |
05/31/2017 | 13028.8525 | 12603.3544 | 12869.7154 |
06/30/2017 | 13205.1365 | 12918.2402 | 12985.8568 |
07/31/2017 | 13430.4018 | 13052.007 | 13230.7044 |
08/31/2017 | 13522.1766 | 12943.6937 | 13256.1965 |
09/30/2017 | 13676.0898 | 13530.7446 | 13579.4861 |
10/31/2017 | 13897.244 | 13740.4631 | 13875.8204 |
11/30/2017 | 14206.0252 | 14191.8661 | 14297.1609 |
12/31/2017 | 14238.1079 | 14239.6269 | 14440.0596 |
01/31/2018 | 15026.8996 | 14673.9183 | 15201.2038 |
02/28/2018 | 14313.6305 | 14070.4951 | 14640.8928 |
03/31/2018 | 13988.4638 | 14205.5593 | 14346.9915 |
04/30/2018 | 14164.6832 | 14239.2118 | 14401.5198 |
05/31/2018 | 14567.4704 | 14908.7918 | 14808.0786 |
06/30/2018 | 14569.5682 | 15016.5214 | 14904.9227 |
07/31/2018 | 15077.2479 | 15307.063 | 15399.5545 |
08/31/2018 | 15314.305 | 15963.6244 | 15940.3524 |
09/30/2018 | 15278.6416 | 15721.7583 | 15966.738 |
10/31/2018 | 14051.3993 | 14125.6248 | 14791.0638 |
11/30/2018 | 14290.5542 | 14392.419 | 15087.3096 |
12/31/2018 | 12867.9358 | 12815.3626 | 13683.1425 |
01/31/2019 | 14075.6881 | 14290.7738 | 14857.6224 |
02/28/2019 | 14372.8836 | 14965.7053 | 15380.151 |
03/31/2019 | 14661.6481 | 14842.4403 | 15604.728 |
04/30/2019 | 15239.1771 | 15362.5365 | 16227.8554 |
05/31/2019 | 13936.5752 | 14269.5432 | 15177.7201 |
06/30/2019 | 14885.0717 | 15281.9079 | 16243.7537 |
07/31/2019 | 15169.6207 | 15440.8687 | 16485.2181 |
08/31/2019 | 14885.0717 | 14823.1686 | 16149.1603 |
09/30/2019 | 15228.6382 | 15085.9475 | 16432.5919 |
10/31/2019 | 15525.8338 | 15374.7508 | 16786.3352 |
11/30/2019 | 16012.7287 | 16034.6203 | 17424.4142 |
12/31/2019 | 16596.8443 | 16373.6882 | 17927.5233 |
01/31/2020 | 16180.4966 | 16041.2367 | 17907.9411 |
02/29/2020 | 15060.3734 | 14696.1543 | 16441.7593 |
03/31/2020 | 12232.5907 | 11507.1307 | 14180.724 |
04/30/2020 | 13847.2589 | 13181.5316 | 16058.8224 |
05/31/2020 | 14352.371 | 14155.1648 | 16917.6229 |
06/30/2020 | 14548.921 | 14563.9768 | 17304.3924 |
07/31/2020 | 15347.8013 | 15144.3075 | 18286.9924 |
08/31/2020 | 16423.5422 | 15829.9744 | 19611.7831 |
09/30/2020 | 15914.2032 | 15420.7019 | 18897.6985 |
10/31/2020 | 16195.2907 | 15699.9633 | 18489.825 |
11/30/2020 | 17771.917 | 18257.5481 | 20739.1715 |
12/31/2020 | 18556.0032 | 19647.3167 | 21672.1852 |
01/31/2021 | 18188.2646 | 20128.7527 | 21575.7888 |
02/28/2021 | 19597.9291 | 21441.9079 | 22250.1888 |
03/31/2021 | 19764.8909 | 21794.5653 | 23047.7 |
04/30/2021 | 20813.1571 | 22665.269 | 24235.7902 |
05/31/2021 | 20498.2546 | 22712.2061 | 24346.427 |
06/30/2021 | 20633.5147 | 22980.6608 | 24946.7819 |
07/31/2021 | 20669.4432 | 22578.1215 | 25368.648 |
08/31/2021 | 21202.0301 | 23090.6283 | 26092.107 |
09/30/2021 | 20775.1152 | 22364.3813 | 24921.4084 |
10/31/2021 | 21554.9746 | 23460.9617 | 26606.7068 |
11/30/2021 | 20222.8308 | 22482.217 | 26201.7175 |
12/31/2021 | 21134.5877 | 23219.6145 | 27233.5057 |
01/31/2022 | 19588.6424 | 21286.9299 | 25631.1915 |
02/28/2022 | 20094.4322 | 21526.6814 | 24985.5606 |
03/31/2022 | 20391.6195 | 21868.9407 | 25795.9975 |
04/30/2022 | 18697.0805 | 20005.6498 | 23481.0071 |
05/31/2022 | 18737.0865 | 20073.1949 | 23449.5237 |
06/30/2022 | 17025.4021 | 18155.3711 | 21487.7688 |
07/31/2022 | 18362.7448 | 20033.8601 | 23503.707 |
08/31/2022 | 17625.4918 | 19501.3551 | 22626.5647 |
09/30/2022 | 15990.9617 | 17643.8243 | 20528.4243 |
10/31/2022 | 17248.2925 | 19336.6212 | 22211.8772 |
11/30/2022 | 18108.4211 | 20152.9477 | 23371.2533 |
12/31/2022 | 17030.2359 | 18954.3524 | 22002.7861 |
01/31/2023 | 18373.5223 | 20849.5055 | 23518.1774 |
02/28/2023 | 17717.6319 | 20360.1753 | 22968.4935 |
03/31/2023 | 17107.5679 | 19596.9612 | 23582.6516 |
04/30/2023 | 17087.5189 | 19341.298 | 23833.9098 |
05/31/2023 | 16411.5795 | 19002.1652 | 23926.6418 |
06/30/2023 | 17895.2092 | 20620.8915 | 25560.4836 |
07/31/2023 | 18396.4354 | 21646.0933 | 26476.7444 |
08/31/2023 | 18218.8581 | 20796.218 | 25965.6445 |
09/30/2023 | 17562.9678 | 19634.7846 | 24728.7907 |
10/31/2023 | 16634.9832 | 18442.2218 | 24073.2616 |
11/30/2023 | 17926.7149 | 20102.3781 | 26318.0536 |
12/31/2023 | 19298.6427 | 22256.8203 | 27714.0123 |
01/31/2024 | 19009.3635 | 21674.6733 | 28021.1577 |
02/29/2024 | 20238.0839 | 22853.6855 | 29537.9574 |
03/31/2024 | 21300.6835 | 23796.8771 | 30490.7763 |
04/30/2024 | 20132.1103 | 22202.6637 | 29149.1283 |
05/31/2024 | 20945.529 | 23126.2073 | 30526.3399 |
06/30/2024 | 20633.3366 | 22779.6538 | 31471.3556 |
07/31/2024 | 21670.1589 | 24472.081 | 32056.3767 |
08/31/2024 | 22045.3625 | 24409.1674 | 32754.2021 |
09/30/2024 | 22369.0115 | 24772.5666 | 33431.7499 |

Effective September 30, 2024, the Fund adopted the Russell 3000 Index – Total Return as its broad-based securities market index that represents the overall applicable market in which the Fund invests, and the Russell 2500 Index—Total Return as an additional index that represents the market sectors which the Fund’s advisor believes are more representative of the Fund’s investment universe.
What were the Fund costs for the past year?
(based on a hypothetical $10,000 investment)
Class Name | Costs of a $10,000 investment | Costs paid as a percentage of a $10,000 investment |
|---|
Class R4 | $138.00 | 1.21% |
End Block
Thornburg Small/Mid Cap Core Fund Tailored Shareholder Report
Thornburg Small/Mid Cap Core Fund Tailored Shareholder Report | |
Annual Performance | 1 Year | 5 Year | 10 Year |
|---|
Small/Mid Cap Core Fund Class R4 | 27.36% | 7.99% | 8.38% |
Russell 2500 Index - Total Return | 26.17% | 10.43% | 9.50% |
Russell 3000 Index - Total Return | 35.19% | 15.26% | 12.83% |
Key Fund Statistics
(as of September 30, 2024)
| |
|---|
Fund Size (Millions) | $559.8M |
Number of Holdings | 49 |
Annual Portfolio Turnover | 32.79% |
Total Advisory Fee | $4.6M |
What did the Fund invest in?
(as of September 30, 2024)
Market Capitalization Exposure | (%) |
|---|
| Small Cap (<$2.5 B) | 9.0 |
| Mid Cap ($2.5-12 B) | 52.2 |
| Large Cap (>$12 B) | 38.8 |
Market Capitalization Exposure | (%) |
Small Cap (<$2.5 B) | 9.0% |
Mid Cap ($2.5-12 B) | 52.2% |
Large Cap (>$12 B) | 38.8% |
Expressed as a percentage of the Fund’s net assets.
How has the Fund changed?
This is a summary of certain changes to the Fund since October 1, 2023. For more complete information, you may review the Fund’s next prospectus, which we expect to be available by February 1, 2025 at https://www.thornburg.com/download or upon request by calling 1-800-847-0200.
End Block
Changes In and Disagreements with Accountants
No changes and/or disagreements occurred in the current reporting period.
End Block
For additional information about the Fund, including its prospectus, financial information, holdings and proxy information, visit www.thornburg.com/download.

Thornburg Small/Mid Cap Core Fund Tailored Shareholder Report | |
Thornburg Small/Mid Cap Core Fund Tailored Shareholder Report
Thornburg Small/Mid Cap Core Fund CLASS: R5 TICKER: TVRRX Annual Shareholder Report | |
This annual shareholder report contains important information about the Thornburg Small/Mid Cap Core Fund Class R5 Shares for the period from October 1, 2023 to September 30, 2024. You can find additional information about the Fund at https://www.thornburg.com/download. You can also request this information by contacting us at 1-800-847-0200. This report also describes changes to the Fund that occurred during the reporting period.
How did the Fund perform last year and what affected its performance?
The Fund’s Class R5 shares outperformed the Russell 2500 Index – Total Return (the “Index”) during the 12-month period ended September 30, 2024. Stock selection was the primary driver of the Fund’s relative outperformance. The Fund’s stock selection in the industrials and consumer discretionary sectors had a positive impact on performance relative to the Index during the period. Stock selection in and underweight allocations to health care and financials detracted from relative results. Returns of larger mid-cap companies outpaced smaller-cap companies within the Index during the period. Stock selection was a negative contributor to performance within the mid-cap (those ranging from approximately $2.5 - $12 billion market capitalization) and large-cap portions (those over approximately $12 billion market capitalization) of the Fund’s portfolio during the period. However, an overweight positioning in the Fund to larger stocks within the Index’s universe positively impacted the Fund’s performance relative to the Index for the period. Stock selection, as well as an underweight positioning to the smaller-cap segment of the universe, contributed positively to relative performance.
How did the Fund perform over the past 10 years?
The line graph below reflects a hypothetical $10,000 investment. The returns shown in the line graph and table assume the reinvestment of dividends and capital gains, but do not reflect the deduction of taxes that a shareholder would pay on distributions or the redemption of Fund shares. The performance information shown below represents past performance and is no guarantee of future results. For Fund performance current to the most recent month end, visit https://www.thornburg.com/product/mutual-funds/fv/TVRRX or call 1-800-847-0200. Performance for other share classes of the Fund will vary.
Cumulative Performance
Growth Table
Date | Thornburg Small/Mid Cap Core Fund | Russell 2500 Index - Total Return | Russell 3000 Index - Total Return |
09/30/2014 | 10000.0133 | 10000 | 10000 |
10/31/2014 | 10111.7794 | 10442.5942 | 10275.133 |
11/30/2014 | 10461.3023 | 10533.251 | 10524.1387 |
12/31/2014 | 10436.2328 | 10676.6699 | 10524.0202 |
01/31/2015 | 10247.001 | 10457.9285 | 10231.1204 |
02/28/2015 | 10863.5302 | 11081.4277 | 10823.5111 |
03/31/2015 | 10808.592 | 11228.531 | 10713.4813 |
04/30/2015 | 11052.762 | 11031.8505 | 10761.9405 |
05/31/2015 | 11256.237 | 11268.3263 | 10910.7933 |
06/30/2015 | 11182.986 | 11190.0848 | 10728.2506 |
07/31/2015 | 11333.5575 | 11169.2953 | 10907.6844 |
08/31/2015 | 10749.5843 | 10507.9662 | 10249.1933 |
09/30/2015 | 10265.3138 | 10037.8688 | 9950.534 |
10/31/2015 | 10883.8777 | 10598.8371 | 10736.4785 |
11/30/2015 | 10963.233 | 10807.0053 | 10795.9966 |
12/31/2015 | 10837.0785 | 10366.9084 | 10574.4045 |
01/31/2016 | 10161.5415 | 9540.2877 | 9977.7406 |
02/29/2016 | 9939.7538 | 9607.3008 | 9974.5274 |
03/31/2016 | 10574.5957 | 10407.6184 | 10676.794 |
04/30/2016 | 10611.2213 | 10561.1175 | 10742.9652 |
05/31/2016 | 10849.287 | 10783.7702 | 10935.16 |
06/30/2016 | 10774.0013 | 10779.4502 | 10957.6458 |
07/31/2016 | 11207.403 | 11341.6249 | 11392.5207 |
08/31/2016 | 11241.9938 | 11432.0677 | 11421.5817 |
09/30/2016 | 11371.95 | 11486.8731 | 11439.536 |
10/31/2016 | 11173.197 | 11020.6417 | 11192.0343 |
11/30/2016 | 11490.792 | 11958.1705 | 11692.9016 |
12/31/2016 | 11597.3953 | 12190.3391 | 11921.0671 |
01/31/2017 | 11864.1436 | 12359.5098 | 12145.4442 |
02/28/2017 | 12315.5638 | 12657.2451 | 12597.1533 |
03/31/2017 | 12514.5991 | 12648.2611 | 12605.7226 |
04/30/2017 | 12877.7872 | 12745.8521 | 12739.3407 |
05/31/2017 | 13119.9125 | 12603.3544 | 12869.7154 |
06/30/2017 | 13298.9404 | 12918.2402 | 12985.8568 |
07/31/2017 | 13529.1183 | 13052.007 | 13230.7044 |
08/31/2017 | 13625.7108 | 12943.6937 | 13256.1965 |
09/30/2017 | 13784.2921 | 13530.7446 | 13579.4861 |
10/31/2017 | 14008.5105 | 13875.8204 |
11/30/2017 | 14323.2392 | 14191.8661 | 14297.1609 |
12/31/2017 | 14358.6073 | 14239.6269 | 14440.0596 |
01/31/2018 | 15157.4574 | 14673.9183 | 15201.2038 |
02/28/2018 | 14441.3897 | 14070.4951 | 14640.8928 |
03/31/2018 | 14116.4688 | 14205.5593 | 14346.9915 |
04/30/2018 | 14296.5205 | 14239.2118 | 14401.5198 |
05/31/2018 | 14706.2934 | 14908.7918 | 14808.0786 |
06/30/2018 | 14712.502 | 15016.5214 | 14904.9227 |
07/31/2018 | 15225.7529 | 15307.063 | 15399.5545 |
08/31/2018 | 15469.961 | 15963.6244 | 15940.3524 |
09/30/2018 | 15438.9176 | 15721.7583 | 15966.738 |
10/31/2018 | 14201.3207 | 14125.6248 | 14791.0638 |
11/30/2018 | 14445.5288 | 14392.419 | 15087.3096 |
12/31/2018 | 13009.764 | 12815.3626 | 13683.1425 |
01/31/2019 | 14236.6671 | 14290.7738 | 14857.6224 |
02/28/2019 | 14539.2198 | 14965.7053 | 15380.151 |
03/31/2019 | 14835.5127 | 14842.4403 | 15604.728 |
04/30/2019 | 15421.8389 | 15362.5365 | 16227.8554 |
05/31/2019 | 14107.2998 | 14269.5432 | 15177.7201 |
06/30/2019 | 15069.2085 | 15281.9079 | 16243.7537 |
07/31/2019 | 15361.3283 | 15440.8687 | 16485.2181 |
08/31/2019 | 15077.5548 | 14823.1686 | 16149.1603 |
09/30/2019 | 15428.0986 | 15085.9475 | 16432.5919 |
10/31/2019 | 15730.6512 | 15374.7508 | 16786.3352 |
11/30/2019 | 16229.3415 | 16034.6203 | 17424.4142 |
12/31/2019 | 16823.955 | 16373.6882 | 17927.5233 |
01/31/2020 | 16402.3073 | 16041.2367 | 17907.9411 |
02/29/2020 | 15271.62 | 14696.1543 | 16441.7593 |
03/31/2020 | 12408.1913 | 11507.1307 | 14180.724 |
04/30/2020 | 14048.6318 | 13181.5316 | 16058.8224 |
05/31/2020 | 14564.6782 | 14155.1648 | 16917.6229 |
06/30/2020 | 14766.0623 | 14563.9768 | 17304.3924 |
07/31/2020 | 15582.087 | 15144.3075 | 18286.9924 |
08/31/2020 | 16677.1125 | 15829.9744 | 19611.7831 |
09/30/2020 | 16163.1638 | 15420.7019 | 18897.6985 |
10/31/2020 | 16452.6532 | 15699.9633 | 18489.825 |
11/30/2020 | 18057.432 | 18257.5481 | 20739.1715 |
12/31/2020 | 18858.7725 | 19647.3167 | 21672.1852 |
01/31/2021 | 18487.4707 | 20128.7527 | 21575.7888 |
02/28/2021 | 19924.4295 | 21441.9079 | 22250.1888 |
03/31/2021 | 20100.6405 | 21794.5653 | 23047.7 |
04/30/2021 | 21170.493 | 22665.269 | 24235.7902 |
05/31/2021 | 20853.7327 | 22712.2061 | 24346.427 |
06/30/2021 | 20996.3798 | 22980.6608 | 24946.7819 |
07/31/2021 | 21038.3348 | 22578.1215 | 25368.648 |
08/31/2021 | 21585.8475 | 23090.6283 | 26092.107 |
09/30/2021 | 21153.711 | 22364.3813 | 24921.4084 |
10/31/2021 | 21952.9538 | 23460.9617 | 26606.7068 |
11/30/2021 | 20599.1696 | 22482.217 | 26201.7175 |
12/31/2021 | 21534.8827 | 23219.6145 | 27233.5057 |
01/31/2022 | 19964.4546 | 21286.9299 | 25631.1915 |
02/28/2022 | 20483.2316 | 21526.6814 | 24985.5606 |
03/31/2022 | 20790.5506 | 21868.9407 | 25795.9975 |
04/30/2022 | 19067.8727 | 20005.6498 | 23481.0071 |
05/31/2022 | 19112.9838 | 20073.1949 | 23449.5237 |
06/30/2022 | 17370.5698 | 18155.3711 | 21487.7688 |
07/31/2022 | 18737.9982 | 20033.8601 | 23503.707 |
08/31/2022 | 17990.8466 | 19501.3551 | 22626.5647 |
09/30/2022 | 16324.5576 | 17643.8243 | 20528.4243 |
10/31/2022 | 17613.0417 | 19336.6212 | 22211.8772 |
11/30/2022 | 18492.707 | 20152.9477 | 23371.2533 |
12/31/2022 | 17400.3393 | 18954.3524 | 22002.7861 |
01/31/2023 | 18774.5722 | 20849.5055 | 23518.1774 |
02/28/2023 | 18108.7068 | 20360.1753 | 22968.4935 |
03/31/2023 | 17491.0103 | 19596.9612 | 23582.6516 |
04/30/2023 | 17471.176 | 19341.298 | 23833.9098 |
05/31/2023 | 16785.4763 | 19002.1652 | 23926.6418 |
06/30/2023 | 18304.2162 | 20620.8915 | 25560.4836 |
07/31/2023 | 18819.9077 | 21646.0933 | 26476.7444 |
08/31/2023 | 18644.2326 | 20796.218 | 25965.6445 |
09/30/2023 | 17978.3672 | 19634.7846 | 24728.7907 |
10/31/2023 | 17029.1547 | 18442.2218 | 24073.2616 |
11/30/2023 | 18358.0521 | 20102.3781 | 26318.0536 |
12/31/2023 | 19766.2867 | 22256.8203 | 27714.0123 |
01/31/2024 | 19474.4393 | 21674.6733 | 28021.1577 |
02/29/2024 | 20738.1669 | 22853.6855 | 29537.9574 |
03/31/2024 | 21831.8863 | 23796.8771 | 30490.7763 |
04/30/2024 | 20636.162 | 22202.6637 | 29149.1283 |
05/31/2024 | 21474.8691 | 23126.2073 | 30526.3399 |
06/30/2024 | 21160.354 | 22779.6538 | 31471.3556 |
07/31/2024 | 22228.5721 | 24472.081 | 32056.3767 |
08/31/2024 | 22616.7575 | 24409.1674 | 32754.2021 |
09/30/2024 | 22953.9405 | 24772.5666 | 33431.7499 |

Effective September 30, 2024, the Fund adopted the Russell 3000 Index – Total Return as its broad-based securities market index that represents the overall applicable market in which the Fund invests, and the Russell 2500 Index—Total Return as an additional index that represents the market sectors which the Fund’s advisor believes are more representative of the Fund’s investment universe.
What were the Fund costs for the past year?
(based on a hypothetical $10,000 investment)
Class Name | Costs of a $10,000 investment | Costs paid as a percentage of a $10,000 investment |
|---|
Class R5 | $108.00 | 0.95% |
End Block
Thornburg Small/Mid Cap Core Fund Tailored Shareholder Report
Thornburg Small/Mid Cap Core Fund Tailored Shareholder Report | |
Annual Performance | 1 Year | 5 Year | 10 Year |
|---|
Small/Mid Cap Core Fund Class R5 | 27.68% | 8.27% | 8.66% |
Russell 2500 Index - Total Return | 26.17% | 10.43% | 9.50% |
Russell 3000 Index - Total Return | 35.19% | 15.26% | 12.83% |
Key Fund Statistics
(as of September 30, 2024)
| |
|---|
Fund Size (Millions) | $559.8M |
Number of Holdings | 49 |
Annual Portfolio Turnover | 32.79% |
Total Advisory Fee | $4.6M |
What did the Fund invest in?
(as of September 30, 2024)
Market Capitalization Exposure | (%) |
|---|
| Small Cap (<$2.5 B) | 9.0 |
| Mid Cap ($2.5-12 B) | 52.2 |
| Large Cap (>$12 B) | 38.8 |
Market Capitalization Exposure | (%) |
Small Cap (<$2.5 B) | 9.0% |
Mid Cap ($2.5-12 B) | 52.2% |
Large Cap (>$12 B) | 38.8% |
Expressed as a percentage of the Fund’s net assets.
How has the Fund changed?
This is a summary of certain changes to the Fund since October 1, 2023. For more complete information, you may review the Fund’s next prospectus, which we expect to be available by February 1, 2025 at https://www.thornburg.com/download or upon request by calling 1-800-847-0200.
End Block
Changes In and Disagreements with Accountants
No changes and/or disagreements occurred in the current reporting period.
End Block
For additional information about the Fund, including its prospectus, financial information, holdings and proxy information, visit www.thornburg.com/download.

Thornburg Small/Mid Cap Core Fund Tailored Shareholder Report | |
Thornburg Small/Mid Cap Growth Fund Tailored Shareholder Report
Thornburg Small/Mid Cap Growth Fund CLASS: A TICKER: THCGX Annual Shareholder Report | |
This annual shareholder report contains important information about the Thornburg Small/Mid Cap Growth Fund Class A Shares for the period from October 1, 2023 to September 30, 2024. You can find additional information about the Fund at https://www.thornburg.com/download. You can also request this information by contacting us at 1-800-847-0200. This report also describes changes to the Fund that occurred during the reporting period.
How did the Fund perform last year and what affected its performance?
The Fund’s Class A shares underperformed the Russell 2500 Growth Index - Total Return (the “Index”) during the 12-month period ended September 30, 2024. The Fund’s stock selection in the information technology and energy sectors had a positive impact on performance relative to the Index during the period. Stock selection in and underweight allocations to health care and consumer discretionary stocks detracted from relative results. Returns of mid-cap companies outpaced small-cap companies within the Index during the period. Stock selection was the primary detractor from performance within the mid-cap (those ranging from approximately $2.5 - $12 billion market capitalization) portion of the Fund’s portfolio. However, an underweight positioning in the Fund to smaller stocks (those under approximately $2.5 billion market capitalization) and an overweight positioning to larger stocks (those over approximately $12 billion market capitalization) within the Index’s universe had positive impacts on the Fund’s performance relative to the Index.
How did the Fund perform over the past 10 years?
The line graph below reflects a hypothetical $10,000 investment and assumes the deduction of the maximum sales charge associated with that investment. The returns shown in the line graph and table assume the reinvestment of dividends and capital gains, but do not reflect the deduction of taxes that a shareholder would pay on distributions or the redemption of Fund shares. The performance information shown below represents past performance and is no guarantee of future results. For Fund performance current to the most recent month end, visit https://www.thornburg.com/product/mutual-funds/fcg/THCGX or call 1-800-847-0200. Performance for other share classes of the Fund will vary.
Cumulative Performance
Growth Table
Date | Thornburg Small/Mid Cap Growth Fund | Russell 2500 Growth Index - Total Return | Russell 3000 Index - Total Return |
09/30/2014 | 9548.568 | 10000 | 10000 |
10/31/2014 | 9945.8231 | 10440.1539 | 10275.133 |
11/30/2014 | 9895.2634 | 10613.8136 | 10524.1387 |
12/31/2014 | 9873.5949 | 10748.8712 | 10524.0202 |
01/31/2015 | 9682.1902 | 10583.1968 | 10231.1204 |
02/28/2015 | 10227.5131 | 11362.1033 | 10823.5111 |
03/31/2015 | 10227.5131 | 11548.3692 | 10713.4813 |
04/30/2015 | 10238.3473 | 11308.2289 | 10761.9405 |
05/31/2015 | 10306.9641 | 11657.0691 | 10910.7933 |
06/30/2015 | 10335.8554 | 11618.9727 | 10728.2506 |
07/31/2015 | 10440.5863 | 11756.6519 | 10907.6844 |
08/31/2015 | 9758.0298 | 10932.9725 | 10249.1933 |
09/30/2015 | 9422.1687 | 10335.3979 | 9950.534 |
10/31/2015 | 10108.3366 | 10875.4516 | 10736.4785 |
11/30/2015 | 10433.3635 | 11121.7296 | 10795.9966 |
12/31/2015 | 10148.0621 | 10728.7855 | 10574.4045 |
01/31/2016 | 8974.3539 | 9667.8382 | 9977.7406 |
02/29/2016 | 8710.7209 | 9697.0839 | 9974.5274 |
03/31/2016 | 9418.5573 | 10443.495 | 10676.794 |
04/30/2016 | 9306.6036 | 10543.6262 | 10742.9652 |
05/31/2016 | 9563.0137 | 10805.4548 | 10935.16 |
06/30/2016 | 9321.0492 | 10725.3879 | 10957.6458 |
07/31/2016 | 9877.2064 | 11362.6518 | 11392.5207 |
08/31/2016 | 10028.8856 | 11441.5829 | 11421.5817 |
09/30/2016 | 10191.399 | 11474.5198 | 11439.536 |
10/31/2016 | 10003.6057 | 10875.3738 | 11192.0343 |
11/30/2016 | 10083.0567 | 11668.1758 | 11692.9016 |
12/31/2016 | 9909.709 | 11772.4747 | 11921.0671 |
01/31/2017 | 10426.1407 | 12051.3124 | 12145.4442 |
02/28/2017 | 10718.6649 | 12416.8331 | 12597.1533 |
03/31/2017 | 10812.5615 | 12508.3392 | 12605.7226 |
04/30/2017 | 11079.8059 | 12728.316 | 12739.3407 |
05/31/2017 | 11271.2106 | 12734.1543 | 12869.7154 |
06/30/2017 | 11357.8845 | 13024.4312 | 12985.8568 |
07/31/2017 | 11715.414 | 13197.7486 | 13230.7044 |
08/31/2017 | 11578.1805 | 13223.521 | 13256.1965 |
09/30/2017 | 11722.6369 | 13776.9956 | 13579.4861 |
10/31/2017 | 11827.3677 | 14145.5599 | 13875.8204 |
11/30/2017 | 12054.8866 | 14612.0578 | 14297.1609 |
12/31/2017 | 12278.794 | 14651.4962 | 14440.0596 |
01/31/2018 | 13163.5895 | 15382.9032 | 15201.2038 |
02/28/2018 | 13073.3042 | 14878.445 | 14640.8928 |
03/31/2018 | 13008.2988 | 15000.0019 | 14346.9915 |
04/30/2018 | 13214.1492 | 14904.7482 | 14401.5198 |
05/31/2018 | 13568.0674 | 15697.7623 | 14808.0786 |
06/30/2018 | 13860.5916 | 15829.152 | 14904.9227 |
07/31/2018 | 13994.2138 | 16125.5881 | 15399.5545 |
08/31/2018 | 14817.6152 | 17214.9293 | 15940.3524 |
09/30/2018 | 14600.9306 | 16963.5247 | 15966.738 |
10/31/2018 | 13224.9834 | 14926.0048 | 14791.0638 |
11/30/2018 | 13073.3042 | 15207.8413 | 15087.3096 |
12/31/2018 | 11964.6013 | 13557.5089 | 13683.1425 |
01/31/2019 | 13300.823 | 15172.0319 | 14857.6224 |
02/28/2019 | 13842.5345 | 16171.8137 | 15380.151 |
03/31/2019 | 14113.3903 | 16131.6617 | 15604.728 |
04/30/2019 | 14933.1803 | 16696.3052 | 16227.8554 |
05/31/2019 | 13665.5754 | 15587.31 | 15177.7201 |
06/30/2019 | 14535.9252 | 16799.8243 | 16243.7537 |
07/31/2019 | 14853.7293 | 17062.034 | 16485.2181 |
08/31/2019 | 14395.0803 | 16577.3348 | 16149.1603 |
09/30/2019 | 14218.1212 | 16265.5525 | 16432.5919 |
10/31/2019 | 14445.64 | 16682.9543 | 16786.3352 |
11/30/2019 | 15189.8183 | 17819.1862 | 17424.4142 |
12/31/2019 | 15423.8129 | 17984.6195 | 17927.5233 |
01/31/2020 | 15975.0883 | 18004.3493 | 17907.9411 |
02/29/2020 | 15233.4444 | 16783.1069 | 16441.7593 |
03/31/2020 | 13448.7399 | 13808.8142 | 14180.724 |
04/30/2020 | 15300.8666 | 16022.9423 | 16058.8224 |
05/31/2020 | 16807.9504 | 17696.2018 | 16917.6229 |
06/30/2020 | 17609.0844 | 18347.7442 | 17304.3924 |
07/31/2020 | 18648.179 | 19351.8531 | 18286.9924 |
08/31/2020 | 20040.2485 | 20222.8453 | 19611.7831 |
09/30/2020 | 19104.2702 | 20067.4919 | 18897.6985 |
10/31/2020 | 18671.9751 | 20304.3825 | 18489.825 |
11/30/2020 | 20801.6562 | 23261.6193 | 20739.1715 |
12/31/2020 | 21847.0294 | 25262.836 | 21672.1852 |
01/31/2021 | 21847.0294 | 25968.988 | 21575.7888 |
02/28/2021 | 22257.5605 | 26784.6666 | 22250.1888 |
03/31/2021 | 20822.8176 | 25891.2666 | 23047.7 |
04/30/2021 | 22185.6118 | 26800.8006 | 24235.7902 |
05/31/2021 | 21250.2779 | 26055.8928 | 24346.427 |
06/30/2021 | 22206.7732 | 27454.0778 | 24946.7819 |
07/31/2021 | 22574.9815 | 26859.9901 | 25368.648 |
08/31/2021 | 22769.6664 | 27531.9742 | 26092.107 |
09/30/2021 | 21910.5136 | 26484.4226 | 24921.4084 |
10/31/2021 | 23087.0874 | 27842.3583 | 26606.7068 |
11/30/2021 | 21143.202 | 26407.8058 | 26201.7175 |
12/31/2021 | 20902.6506 | 26537.2003 | 27233.5057 |
01/31/2022 | 17781.8127 | 23036.1894 | 25631.1915 |
02/28/2022 | 17984.3823 | 23105.4685 | 24985.5606 |
03/31/2022 | 17794.4733 | 23272.0162 | 25795.9975 |
04/30/2022 | 15407.9502 | 20614.5915 | 23481.0071 |
05/31/2022 | 14648.3142 | 20114.1512 | 23449.5237 |
06/30/2022 | 13356.933 | 18722.174 | 21487.7688 |
07/31/2022 | 14831.8929 | 20858.2091 | 23503.707 |
08/31/2022 | 14578.6809 | 20461.7857 | 22626.5647 |
09/30/2022 | 13401.2451 | 18699.3733 | 20528.4243 |
10/31/2022 | 14160.8811 | 20218.9499 | 22211.8772 |
11/30/2022 | 14616.6627 | 20820.7972 | 23371.2533 |
12/31/2022 | 13755.7419 | 19581.585 | 22002.7861 |
01/31/2023 | 14907.8565 | 21541.5216 | 23518.1774 |
02/28/2023 | 14426.7537 | 21201.0069 | 22968.4935 |
03/31/2023 | 14648.3142 | 20862.9602 | 23582.6516 |
04/30/2023 | 14825.5626 | 20599.5155 | 23833.9098 |
05/31/2023 | 14812.902 | 20576.9268 | 23926.6418 |
06/30/2023 | 16256.2104 | 22201.3119 | 25560.4836 |
07/31/2023 | 16452.4497 | 22942.7346 | 26476.7444 |
08/31/2023 | 16205.568 | 22008.7799 | 25965.6445 |
09/30/2023 | 15369.9684 | 20683.4408 | 24728.7907 |
10/31/2023 | 13945.6509 | 19247.8226 | 24073.2616 |
11/30/2023 | 15135.7473 | 20953.669 | 26318.0536 |
12/31/2023 | 16446.1194 | 23288.4146 | 27714.0123 |
01/31/2024 | 16522.083 | 22761.5874 | 28021.1577 |
02/29/2024 | 18123.6489 | 24605.9376 | 29537.9574 |
03/31/2024 | 18687.0456 | 25269.8333 | 30490.7763 |
04/30/2024 | 17515.9401 | 23386.8052 | 29149.1283 |
05/31/2024 | 18224.9337 | 24335.2077 | 30526.3399 |
06/30/2024 | 18142.6398 | 24204.6697 | 31471.3556 |
07/31/2024 | 18579.4305 | 25678.8142 | 32056.3767 |
08/31/2024 | 19066.8636 | 25480.0609 | 32754.2021 |
09/30/2024 | 19136.4969 | 25896.2783 | 33431.7499 |

Effective September 30, 2024, the Fund adopted the Russell 3000 Index – Total Return as its broad-based securities market index that represents the overall applicable market in which the Fund invests, and the Russell 2500 Index—Total Return as an additional index that represents the market sectors which the Fund’s advisor believes are more representative of the Fund’s investment universe.
What were the Fund costs for the past year?
(based on a hypothetical $10,000 investment)
Class Name | Costs of a $10,000 investment | Costs paid as a percentage of a $10,000 investment |
|---|
Class A | $160.00 | 1.42% |
End Block
Thornburg Small/Mid Cap Growth Fund Tailored Shareholder Report
Thornburg Small/Mid Cap Growth Fund Tailored Shareholder Report | |
Annual Performance | 1 Year | 5 Year | 10 Year |
|---|
Small/Mid Cap Growth Fund Class A (with sales charge) | 18.92% | 5.15% | 6.71% |
Small/Mid Cap Growth Fund Class A (without sales charge) | 24.51% | 6.12% | 7.20% |
Russell 2500 Growth Index - Total Return | 25.20% | 9.75% | 9.98% |
Russell 3000 Index - Total Return | 35.19% | 15.26% | 12.83% |
Key Fund Statistics
(as of September 30, 2024)
| |
|---|
Fund Size (Millions) | $275.6M |
Number of Holdings | 47 |
Annual Portfolio Turnover | 32.58% |
Total Advisory Fee | $2.3M |
What did the Fund invest in?
(as of September 30, 2024)
Market Capitalization Exposure | (%) |
|---|
| Small Cap (<$2.5 B) | 3.1 |
| Mid Cap ($2.5-12 B) | 52.2 |
| Large Cap (>$12 B) | 44.7 |
Market Capitalization Exposure | (%) |
Small Cap (<$2.5 B) | 3.1% |
Mid Cap ($2.5-12 B) | 52.2% |
Large Cap (>$12 B) | 44.7% |

Expressed as a percentage of the Fund’s net assets.
How has the Fund changed?
This is a summary of certain changes to the Fund since October 1, 2023. For more complete information, you may review the Fund’s next prospectus, which we expect to be available by February 1, 2025 at https://www.thornburg.com/download or upon request by calling 1-800-847-0200.
End Block
Changes In and Disagreements with Accountants
No changes and/or disagreements occurred in the current reporting period.
End Block
For additional information about the Fund, including its prospectus, financial information, holdings and proxy information, visit www.thornburg.com/download.

Thornburg Small/Mid Cap Growth Fund Tailored Shareholder Report | |
Thornburg Small/Mid Cap Growth Fund Tailored Shareholder Report
Thornburg Small/Mid Cap Growth Fund CLASS: C TICKER: TCGCX Annual Shareholder Report | |
This annual shareholder report contains important information about the Thornburg Small/Mid Cap Growth Fund Class C Shares for the period from October 1, 2023 to September 30, 2024. You can find additional information about the Fund at https://www.thornburg.com/download. You can also request this information by contacting us at 1-800-847-0200. This report also describes changes to the Fund that occurred during the reporting period.
How did the Fund perform last year and what affected its performance?
The Fund’s Class C shares underperformed the Russell 2500 Growth Index - Total Return (the “Index”) during the 12-month period ended September 30, 2024. The Fund’s stock selection in the information technology and energy sectors had a positive impact on performance relative to the Index during the period. Stock selection in and underweight allocations to health care and consumer discretionary stocks detracted from relative results. Returns of mid-cap companies outpaced small-cap companies within the Index during the period. Stock selection was the primary detractor from performance within the mid-cap (those ranging from approximately $2.5 - $12 billion market capitalization) portion of the Fund’s portfolio. However, an underweight positioning in the Fund to smaller stocks (those under approximately $2.5 billion market capitalization) and an overweight positioning to larger stocks (those over approximately $12 billion market capitalization) within the Index’s universe had positive impacts on the Fund’s performance relative to the Index.
How did the Fund perform over the past 10 years?
The line graph below reflects a hypothetical $10,000 investment. The returns shown in the line graph and table assume the reinvestment of dividends and capital gains, but do not reflect the deduction of taxes that a shareholder would pay on distributions or the redemption of Fund shares. The performance information shown below represents past performance and is no guarantee of future results. For Fund performance current to the most recent month end, visit https://www.thornburg.com/product/mutual-funds/fcg/TCGCX or call 1-800-847-0200. Performance for other share classes of the Fund will vary.
Cumulative Performance
Growth Table
Date | Thornburg Small/Mid Cap Growth Fund | Russell 2500 Growth Index - Total Return | Russell 3000 Index - Total Return |
09/30/2014 | 9999.9991 | 10000 | 10000 |
10/31/2014 | 10409.4545 | 10440.1539 | 10275.133 |
11/30/2014 | 10350.3579 | 10613.8136 | 10524.1387 |
12/31/2014 | 10320.8095 | 10748.8712 | 10524.0202 |
01/31/2015 | 10113.9712 | 10583.1968 | 10231.1204 |
02/28/2015 | 10679.6107 | 11362.1033 | 10823.5111 |
03/31/2015 | 10671.1683 | 11548.3692 | 10713.4813 |
04/30/2015 | 10675.3895 | 11308.2289 | 10761.9405 |
05/31/2015 | 10738.7074 | 11657.0691 | 10910.7933 |
06/30/2015 | 10759.8133 | 11618.9727 | 10728.2506 |
07/31/2015 | 10865.3431 | 11756.6519 | 10907.6844 |
08/31/2015 | 10147.7408 | 10932.9725 | 10249.1933 |
09/30/2015 | 9793.1608 | 10335.3979 | 9950.534 |
10/31/2015 | 10498.0995 | 10875.4516 | 10736.4785 |
11/30/2015 | 10827.3524 | 11121.7296 | 10795.9966 |
12/31/2015 | 10523.4267 | 10728.7855 | 10574.4045 |
01/31/2016 | 9303.5028 | 9667.8382 | 9977.7406 |
02/29/2016 | 9024.9042 | 9697.0839 | 9974.5274 |
03/31/2016 | 9750.9489 | 10443.495 | 10676.794 |
04/30/2016 | 9632.7556 | 10543.6262 | 10742.9652 |
05/31/2016 | 9890.2482 | 10805.4548 | 10935.16 |
06/30/2016 | 9632.7556 | 10725.3879 | 10957.6458 |
07/31/2016 | 10198.395 | 11362.6518 | 11392.5207 |
08/31/2016 | 10350.3579 | 11441.5829 | 11421.5817 |
09/30/2016 | 10510.7631 | 11474.5198 | 11439.536 |
10/31/2016 | 10312.3672 | 10875.3738 | 11192.0343 |
11/30/2016 | 10388.3486 | 11668.1758 | 11692.9016 |
12/31/2016 | 10202.6162 | 11772.4747 | 11921.0671 |
01/31/2017 | 10730.265 | 12051.3124 | 12145.4442 |
02/28/2017 | 11021.5271 | 12416.8331 | 12597.1533 |
03/31/2017 | 11110.1721 | 12508.3392 | 12605.7226 |
04/30/2017 | 11376.1071 | 12728.316 | 12739.3407 |
05/31/2017 | 11566.0606 | 12734.1543 | 12869.7154 |
06/30/2017 | 11650.4844 | 13024.4312 | 12985.8568 |
07/31/2017 | 12005.0644 | 13197.7486 | 13230.7044 |
08/31/2017 | 11857.3227 | 13223.521 | 13256.1965 |
09/30/2017 | 12000.8432 | 13776.9956 | 13579.4861 |
10/31/2017 | 12097.9305 | 14145.5599 | 13875.8204 |
11/30/2017 | 12325.8748 | 14612.0578 | 14297.1609 |
12/31/2017 | 12545.3767 | 14651.4962 | 14440.0596 |
01/31/2018 | 13440.269 | 15382.9032 | 15201.2038 |
02/28/2018 | 13338.9604 | 14878.445 | 14640.8928 |
03/31/2018 | 13262.979 | 15000.0019 | 14346.9915 |
04/30/2018 | 13465.5961 | 14904.7482 | 14401.5198 |
05/31/2018 | 13815.9549 | 15697.7623 | 14808.0786 |
06/30/2018 | 14107.217 | 15829.152 | 14904.9227 |
07/31/2018 | 14229.6315 | 16125.5881 | 15399.5545 |
08/31/2018 | 15056.9847 | 17214.9293 | 15940.3524 |
09/30/2018 | 14820.5981 | 16963.5247 | 15966.738 |
10/31/2018 | 13414.9418 | 14926.0048 | 14791.0638 |
11/30/2018 | 13254.5366 | 15207.8413 | 15087.3096 |
12/31/2018 | 12119.0365 | 13557.5089 | 13683.1425 |
01/31/2019 | 13461.3749 | 15172.0319 | 14857.6224 |
02/28/2019 | 14001.6872 | 16171.8137 | 15380.151 |
03/31/2019 | 14263.401 | 16131.6617 | 15604.728 |
04/30/2019 | 15082.3119 | 16696.3052 | 16227.8554 |
05/31/2019 | 13794.8489 | 15587.31 | 15177.7201 |
06/30/2019 | 14660.1929 | 16799.8243 | 16243.7537 |
07/31/2019 | 14972.5609 | 17062.034 | 16485.2181 |
08/31/2019 | 14504.0088 | 16577.3348 | 16149.1603 |
09/30/2019 | 14314.0553 | 16265.5525 | 16432.5919 |
10/31/2019 | 14537.7784 | 16682.9543 | 16786.3352 |
11/30/2019 | 15276.4109 | 17819.1862 | 17424.4142 |
12/31/2019 | 15502.5188 | 17984.6195 | 17927.5233 |
01/31/2020 | 16044.2355 | 18004.3493 | 17907.9411 |
02/29/2020 | 15290.5427 | 16783.1069 | 16441.7593 |
03/31/2020 | 13486.3905 | 13808.8142 | 14180.724 |
04/30/2020 | 15337.6485 | 16022.9423 | 16058.8224 |
05/31/2020 | 16835.6129 | 17696.2018 | 16917.6229 |
06/30/2020 | 17631.7009 | 18347.7442 | 17304.3924 |
07/31/2020 | 18658.6074 | 19351.8531 | 18286.9924 |
08/31/2020 | 20043.5179 | 20222.8453 | 19611.7831 |
09/30/2020 | 19091.9807 | 20067.4919 | 18897.6985 |
10/31/2020 | 18649.1862 | 20304.3825 | 18489.825 |
11/30/2020 | 20759.024 | 23261.6193 | 20739.1715 |
12/31/2020 | 21787.5555 | 25262.836 | 21672.1852 |
01/31/2021 | 21772.2802 | 25968.988 | 21575.7888 |
02/28/2021 | 22169.436 | 26784.6666 | 22250.1888 |
03/31/2021 | 20728.4735 | 25891.2666 | 23047.7 |
04/30/2021 | 22072.6929 | 26800.8006 | 24235.7902 |
05/31/2021 | 21125.6293 | 26055.8928 | 24346.427 |
06/30/2021 | 22062.5094 | 27454.0778 | 24946.7819 |
07/31/2021 | 22413.8395 | 26859.9901 | 25368.648 |
08/31/2021 | 22592.0504 | 27531.9742 | 26092.107 |
09/30/2021 | 21726.4546 | 26484.4226 | 24921.4084 |
10/31/2021 | 22877.1878 | 27842.3583 | 26606.7068 |
11/30/2021 | 20942.1167 | 26407.8058 | 26201.7175 |
12/31/2021 | 20686.4131 | 26537.2003 | 27233.5057 |
01/31/2022 | 17575.3539 | 23036.1894 | 25631.1915 |
02/28/2022 | 17762.8698 | 23105.4685 | 24985.5606 |
03/31/2022 | 17558.307 | 23272.0162 | 25795.9975 |
04/30/2022 | 15197.3114 | 20614.5915 | 23481.0071 |
05/31/2022 | 14438.7243 | 20114.1512 | 23449.5237 |
06/30/2022 | 13151.6833 | 18722.174 | 21487.7688 |
07/31/2022 | 14592.1464 | 20858.2091 | 23503.707 |
08/31/2022 | 14336.4429 | 20461.7857 | 22626.5647 |
09/30/2022 | 13168.7302 | 18699.3733 | 20528.4243 |
10/31/2022 | 13910.2704 | 20218.9499 | 22211.8772 |
11/30/2022 | 14344.9664 | 20820.7972 | 23371.2533 |
12/31/2022 | 13484.0979 | 19581.585 | 22002.7861 |
01/31/2023 | 14600.6699 | 21541.5216 | 23518.1774 |
02/28/2023 | 14123.3567 | 21201.0069 | 22968.4935 |
03/31/2023 | 14327.9195 | 20862.9602 | 23582.6516 |
04/30/2023 | 14489.865 | 20599.5155 | 23833.9098 |
05/31/2023 | 14464.2947 | 20576.9268 | 23926.6418 |
06/30/2023 | 15870.6639 | 22201.3119 | 25560.4836 |
07/31/2023 | 16049.6564 | 22942.7346 | 26476.7444 |
08/31/2023 | 15785.4294 | 22008.7799 | 25965.6445 |
09/30/2023 | 14967.1782 | 20683.4408 | 24728.7907 |
10/31/2023 | 13569.3324 | 19247.8226 | 24073.2616 |
11/30/2023 | 14711.4747 | 20953.669 | 26318.0536 |
12/31/2023 | 15981.4688 | 23288.4146 | 27714.0123 |
01/31/2024 | 16032.6095 | 22761.5874 | 28021.1577 |
02/29/2024 | 17583.8774 | 24605.9376 | 29537.9574 |
03/31/2024 | 18112.3313 | 25269.8333 | 30490.7763 |
04/30/2024 | 16961.6655 | 23386.8052 | 29149.1283 |
05/31/2024 | 17643.5415 | 24335.2077 | 30526.3399 |
06/30/2024 | 17541.2601 | 24204.6697 | 31471.3556 |
07/31/2024 | 17950.3857 | 25678.8142 | 32056.3767 |
08/31/2024 | 18410.652 | 25480.0609 | 32754.2021 |
09/30/2024 | 18461.7927 | 25896.2783 | 33431.7499 |
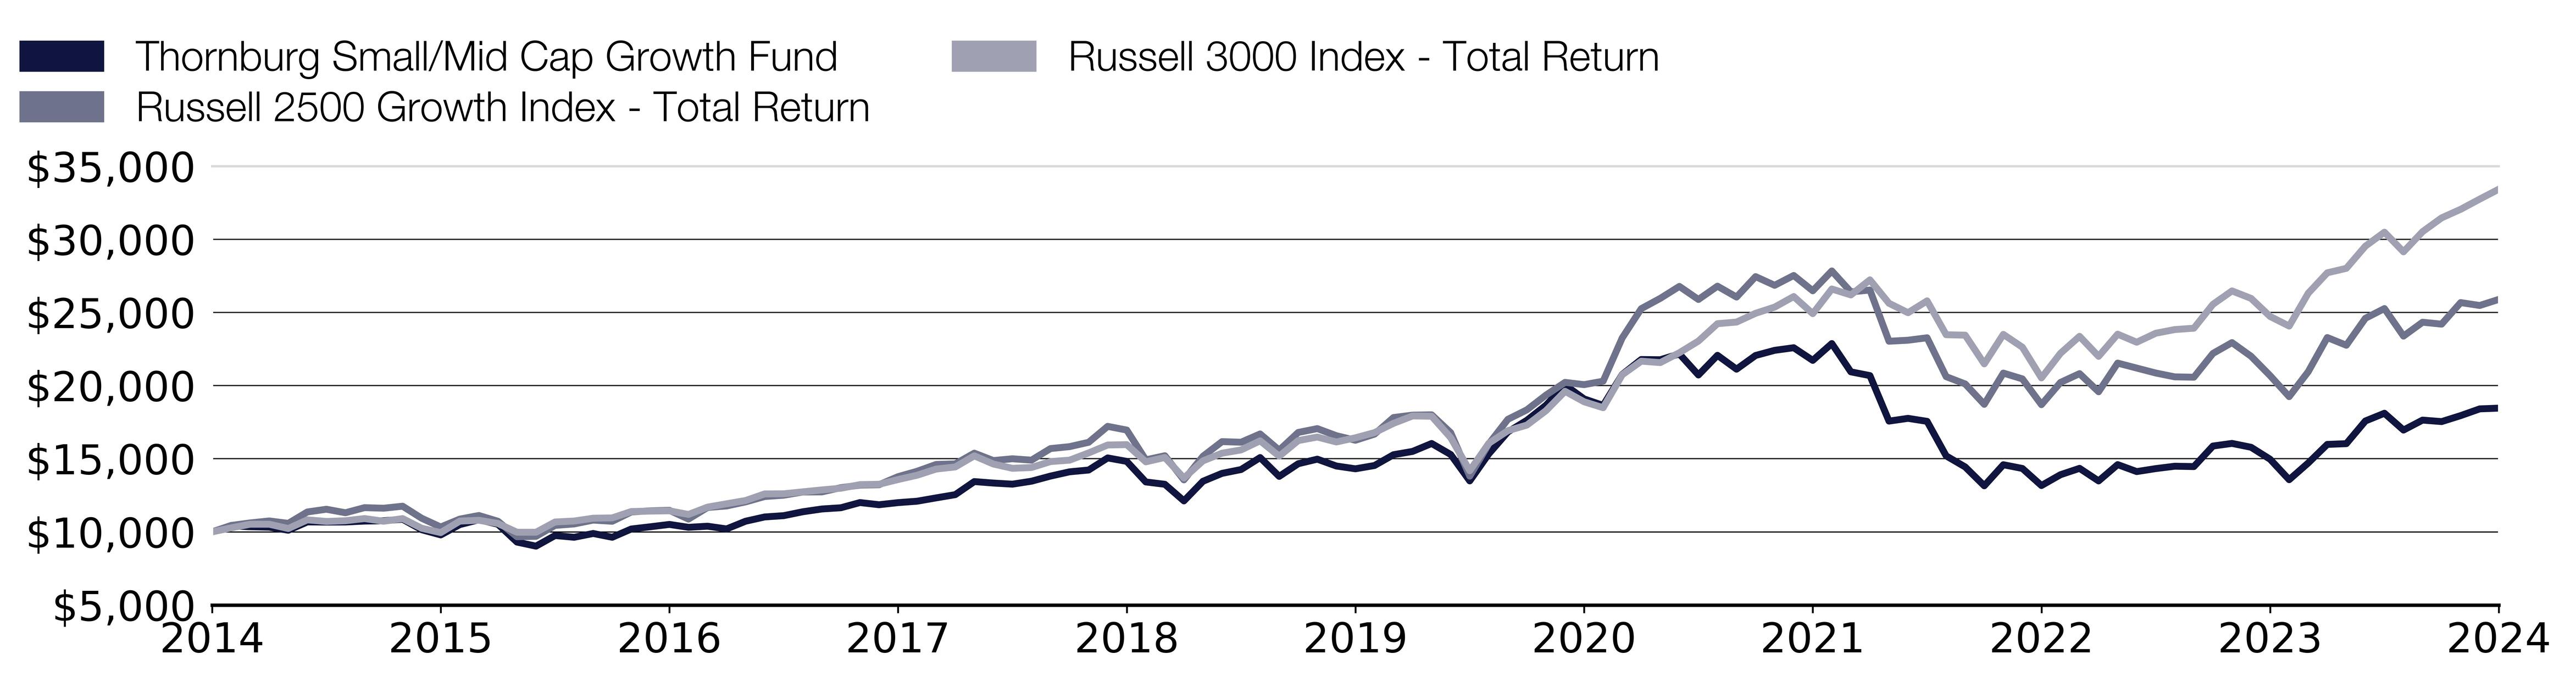
Effective September 30, 2024, the Fund adopted the Russell 3000 Index – Total Return as its broad-based securities market index that represents the overall applicable market in which the Fund invests, and the Russell 2500 Index—Total Return as an additional index that represents the market sectors which the Fund’s advisor believes are more representative of the Fund’s investment universe.
What were the Fund costs for the past year?
(based on a hypothetical $10,000 investment)
Class Name | Costs of a $10,000 investment | Costs paid as a percentage of a $10,000 investment |
|---|
Class C | $261.00 | 2.34% |
End Block
Thornburg Small/Mid Cap Growth Fund Tailored Shareholder Report
Thornburg Small/Mid Cap Growth Fund Tailored Shareholder Report | |
Annual Performance | 1 Year | 5 Year | 10 Year |
|---|
Small/Mid Cap Growth Fund Class C (with sales charge) | 22.35% | 5.22% | 6.32% |
Small/Mid Cap Growth Fund Class C (without sales charge) | 23.35% | 5.22% | 6.32% |
Russell 2500 Growth Index - Total Return | 25.20% | 9.75% | 9.98% |
Russell 3000 Index - Total Return | 35.19% | 15.26% | 12.83% |
Key Fund Statistics
(as of September 30, 2024)
| |
|---|
Fund Size (Millions) | $275.6M |
Number of Holdings | 47 |
Annual Portfolio Turnover | 32.58% |
Total Advisory Fee | $2.3M |
What did the Fund invest in?
(as of September 30, 2024)
Market Capitalization Exposure | (%) |
|---|
| Small Cap (<$2.5 B) | 3.1 |
| Mid Cap ($2.5-12 B) | 52.2 |
| Large Cap (>$12 B) | 44.7 |
Market Capitalization Exposure | (%) |
Small Cap (<$2.5 B) | 3.1% |
Mid Cap ($2.5-12 B) | 52.2% |
Large Cap (>$12 B) | 44.7% |
Expressed as a percentage of the Fund’s net assets.
How has the Fund changed?
This is a summary of certain changes to the Fund since October 1, 2023. For more complete information, you may review the Fund’s next prospectus, which we expect to be available by February 1, 2025 at https://www.thornburg.com/download or upon request by calling 1-800-847-0200.
End Block
Changes In and Disagreements with Accountants
No changes and/or disagreements occurred in the current reporting period.
End Block
For additional information about the Fund, including its prospectus, financial information, holdings and proxy information, visit www.thornburg.com/download.

Thornburg Small/Mid Cap Growth Fund Tailored Shareholder Report | |
Thornburg Small/Mid Cap Growth Fund Tailored Shareholder Report
Thornburg Small/Mid Cap Growth Fund CLASS: I TICKER: THIGX Annual Shareholder Report | |
This annual shareholder report contains important information about the Thornburg Small/Mid Cap Growth Fund Class I Shares for the period from October 1, 2023 to September 30, 2024. You can find additional information about the Fund at https://www.thornburg.com/download. You can also request this information by contacting us at 1-800-847-0200. This report also describes changes to the Fund that occurred during the reporting period.
How did the Fund perform last year and what affected its performance?
The Fund’s Class I shares underperformed the Russell 2500 Growth Index - Total Return (the “Index”) during the 12-month period ended September 30, 2024. The Fund’s stock selection in the information technology and energy sectors had a positive impact on performance relative to the Index during the period. Stock selection in and underweight allocations to health care and consumer discretionary stocks detracted from relative results. Returns of mid-cap companies outpaced small-cap companies within the Index during the period. Stock selection was the primary detractor from performance within the mid-cap (those ranging from approximately $2.5 - $12 billion market capitalization) portion of the Fund’s portfolio. However, an underweight positioning in the Fund to smaller stocks (those under approximately $2.5 billion market capitalization) and an overweight positioning to larger stocks (those over approximately $12 billion market capitalization) within the Index’s universe had positive impacts on the Fund’s performance relative to the Index.
How did the Fund perform over the past 10 years?
The line graph below reflects a hypothetical $10,000 investment. The returns shown in the line graph and table assume the reinvestment of dividends and capital gains, but do not reflect the deduction of taxes that a shareholder would pay on distributions or the redemption of Fund shares. The performance information shown below represents past performance and is no guarantee of future results. For Fund performance current to the most recent month end, visit https://www.thornburg.com/product/mutual-funds/fcg/THIGX or call 1-800-847-0200. Performance for other share classes of the Fund will vary.
Cumulative Performance
Growth Table
Date | Thornburg Small/Mid Cap Growth Fund | Russell 2500 Growth Index - Total Return | Russell 3000 Index - Total Return |
09/30/2014 | 10000.0017 | 10000 | 10000 |
10/31/2014 | 10419.3566 | 10440.1539 | 10275.133 |
11/30/2014 | 10372.7616 | 10613.8136 | 10524.1387 |
12/31/2014 | 10351.2562 | 10748.8712 | 10524.0202 |
01/31/2015 | 10150.5394 | 10583.1968 | 10231.1204 |
02/28/2015 | 10727.6004 | 11362.1033 | 10823.5111 |
03/31/2015 | 10731.1846 | 11548.3692 | 10713.4813 |
04/30/2015 | 10745.5215 | 11308.2289 | 10761.9405 |
05/31/2015 | 10820.7904 | 11657.0691 | 10910.7933 |
06/30/2015 | 10853.0484 | 11618.9727 | 10728.2506 |
07/31/2015 | 10971.328 | 11756.6519 | 10907.6844 |
08/31/2015 | 10254.482 | 10932.9725 | 10249.1933 |
09/30/2015 | 9906.8117 | 10335.3979 | 9950.534 |
10/31/2015 | 10630.8262 | 10875.4516 | 10736.4785 |
11/30/2015 | 10974.9123 | 11121.7296 | 10795.9966 |
12/31/2015 | 10681.0054 | 10728.7855 | 10574.4045 |
01/31/2016 | 9451.6145 | 9667.8382 | 9977.7406 |
02/29/2016 | 9175.6288 | 9697.0839 | 9974.5274 |
03/31/2016 | 9921.1486 | 10443.495 | 10676.794 |
04/30/2016 | 9810.0375 | 10543.6262 | 10742.9652 |
05/31/2016 | 10086.0232 | 10805.4548 | 10935.16 |
06/30/2016 | 9831.5429 | 10725.3879 | 10957.6458 |
07/31/2016 | 10419.3566 | 11362.6518 | 11392.5207 |
08/31/2016 | 10587.8154 | 11441.5829 | 11421.5817 |
09/30/2016 | 10756.2742 | 11474.5198 | 11439.536 |
10/31/2016 | 10562.7258 | 10875.3738 | 11192.0343 |
11/30/2016 | 10652.3316 | 11668.1758 | 11692.9016 |
12/31/2016 | 10473.1201 | 11772.4747 | 11921.0671 |
01/31/2017 | 11025.0915 | 12051.3124 | 12145.4442 |
02/28/2017 | 11336.9195 | 12416.8331 | 12597.1533 |
03/31/2017 | 11437.2779 | 12508.3392 | 12605.7226 |
04/30/2017 | 11724.0163 | 12728.316 | 12739.3407 |
05/31/2017 | 11931.9017 | 12734.1543 | 12869.7154 |
06/30/2017 | 12028.6759 | 13024.4312 | 12985.8568 |
07/31/2017 | 12408.6043 | 13197.7486 | 13230.7044 |
08/31/2017 | 12268.8193 | 13223.521 | 13256.1965 |
09/30/2017 | 12426.5254 | 13776.9956 | 13579.4861 |
10/31/2017 | 12541.2208 | 14145.5599 | 13875.8204 |
11/30/2017 | 12788.5326 | 14612.0578 | 14297.1609 |
12/31/2017 | 13028.676 | 14651.4962 | 14440.0596 |
01/31/2018 | 13974.9128 | 15382.9032 | 15201.2038 |
02/28/2018 | 13881.7228 | 14878.445 | 14640.8928 |
03/31/2018 | 13817.2067 | 15000.0019 | 14346.9915 |
04/30/2018 | 14039.4289 | 14904.7482 | 14401.5198 |
05/31/2018 | 14415.7731 | 15697.7623 | 14808.0786 |
06/30/2018 | 14731.1853 | 15829.152 | 14904.9227 |
07/31/2018 | 14881.723 | 16125.5881 | 15399.5545 |
08/31/2018 | 15759.8593 | 17214.9293 | 15940.3524 |
09/30/2018 | 15530.4686 | 16963.5247 | 15966.738 |
10/31/2018 | 14071.687 | 14926.0048 | 14791.0638 |
11/30/2018 | 13917.5651 | 15207.8413 | 15087.3096 |
12/31/2018 | 12741.9376 | 13557.5089 | 13683.1425 |
01/31/2019 | 14164.877 | 15172.0319 | 14857.6224 |
02/28/2019 | 14749.1065 | 16171.8137 | 15380.151 |
03/31/2019 | 15039.4291 | 16131.6617 | 15604.728 |
04/30/2019 | 15917.5654 | 16696.3052 | 16227.8554 |
05/31/2019 | 14573.4792 | 15587.31 | 15177.7201 |
06/30/2019 | 15501.7948 | 16799.8243 | 16243.7537 |
07/31/2019 | 15845.8808 | 17062.034 | 16485.2181 |
08/31/2019 | 15365.594 | 16577.3348 | 16149.1603 |
09/30/2019 | 15179.2141 | 16265.5525 | 16432.5919 |
10/31/2019 | 15430.1101 | 16682.9543 | 16786.3352 |
11/30/2019 | 16226.176 | 17819.1862 | 17424.4142 |
12/31/2019 | 16484.1687 | 17984.6195 | 17927.5233 |
01/31/2020 | 17078.3336 | 18004.3493 | 17907.9411 |
02/29/2020 | 16288.7197 | 16783.1069 | 16441.7593 |
03/31/2020 | 14381.1374 | 13808.8142 | 14180.724 |
04/30/2020 | 16366.8993 | 16022.9423 | 16058.8224 |
05/31/2020 | 17985.217 | 17696.2018 | 16917.6229 |
06/30/2020 | 18849.1016 | 18347.7442 | 17304.3924 |
07/31/2020 | 19967.0698 | 19351.8531 | 18286.9924 |
08/31/2020 | 21464.2092 | 20222.8453 | 19611.7831 |
09/30/2020 | 20467.4193 | 20067.4919 | 18897.6985 |
10/31/2020 | 20010.0686 | 20304.3825 | 18489.825 |
11/30/2020 | 22296.941 | 23261.6193 | 20739.1715 |
12/31/2020 | 23421.3308 | 25262.836 | 21672.1852 |
01/31/2021 | 23429.6289 | 25968.988 | 21575.7888 |
02/28/2021 | 23873.5762 | 26784.6666 | 22250.1888 |
03/31/2021 | 22342.5804 | 25891.2666 | 23047.7 |
04/30/2021 | 23811.3406 | 26800.8006 | 24235.7902 |
05/31/2021 | 22815.571 | 26055.8928 | 24346.427 |
06/30/2021 | 23848.6819 | 27454.0778 | 24946.7819 |
07/31/2021 | 24251.1388 | 26859.9901 | 25368.648 |
08/31/2021 | 24466.8889 | 27531.9742 | 26092.107 |
09/30/2021 | 23545.802 | 26484.4226 | 24921.4084 |
10/31/2021 | 24819.5573 | 27842.3583 | 26606.7068 |
11/30/2021 | 22736.6245 | 26407.8058 | 26201.7175 |
12/31/2021 | 22486.9021 | 26537.2003 | 27233.5057 |
01/31/2022 | 19133.4879 | 23036.1894 | 25631.1915 |
02/28/2022 | 19359.4271 | 23105.4685 | 24985.5606 |
03/31/2022 | 19157.2709 | 23272.0162 | 25795.9975 |
04/30/2022 | 16600.5898 | 20614.5915 | 23481.0071 |
05/31/2022 | 15786.0194 | 20114.1512 | 23449.5237 |
06/30/2022 | 14406.6007 | 18722.174 | 21487.7688 |
07/31/2022 | 16000.0671 | 20858.2091 | 23503.707 |
08/31/2022 | 15732.5074 | 20461.7857 | 22626.5647 |
09/30/2022 | 14472.0042 | 18699.3733 | 20528.4243 |
10/31/2022 | 15298.4662 | 20218.9499 | 22211.8772 |
11/30/2022 | 15797.9109 | 20820.7972 | 23371.2533 |
12/31/2022 | 14870.3708 | 19581.585 | 22002.7861 |
01/31/2023 | 16118.9825 | 21541.5216 | 23518.1774 |
02/28/2023 | 15607.6463 | 21201.0069 | 22968.4935 |
03/31/2023 | 15851.4228 | 20862.9602 | 23582.6516 |
04/30/2023 | 16053.579 | 20599.5155 | 23833.9098 |
05/31/2023 | 16041.6875 | 20576.9268 | 23926.6418 |
06/30/2023 | 17617.3165 | 22201.3119 | 25560.4836 |
07/31/2023 | 17837.31 | 22942.7346 | 26476.7444 |
08/31/2023 | 17569.7503 | 22008.7799 | 25965.6445 |
09/30/2023 | 16671.9391 | 20683.4408 | 24728.7907 |
10/31/2023 | 15137.9304 | 19247.8226 | 24073.2616 |
11/30/2023 | 16434.1083 | 20953.669 | 26318.0536 |
12/31/2023 | 17867.0389 | 23288.4146 | 27714.0123 |
01/31/2024 | 17950.2796 | 22761.5874 | 28021.1577 |
02/29/2024 | 19704.2818 | 24605.9376 | 29537.9574 |
03/31/2024 | 20322.6419 | 25269.8333 | 30490.7763 |
04/30/2024 | 19056.1928 | 23386.8052 | 29149.1283 |
05/31/2024 | 19835.0887 | 24335.2077 | 30526.3399 |
06/30/2024 | 19751.8479 | 24204.6697 | 31471.3556 |
07/31/2024 | 20233.4553 | 25678.8142 | 32056.3767 |
08/31/2024 | 20774.5204 | 25480.0609 | 32754.2021 |
09/30/2024 | 20857.7612 | 25896.2783 | 33431.7499 |

Effective September 30, 2024, the Fund adopted the Russell 3000 Index – Total Return as its broad-based securities market index that represents the overall applicable market in which the Fund invests, and the Russell 2500 Index—Total Return as an additional index that represents the market sectors which the Fund’s advisor believes are more representative of the Fund’s investment universe.
What were the Fund costs for the past year?
(based on a hypothetical $10,000 investment)
Class Name | Costs of a $10,000 investment | Costs paid as a percentage of a $10,000 investment |
|---|
Class I | $107.00 | 0.95% |
End Block
Thornburg Small/Mid Cap Growth Fund Tailored Shareholder Report
Thornburg Small/Mid Cap Growth Fund Tailored Shareholder Report | |
Annual Performance | 1 Year | 5 Year | 10 Year |
|---|
Small/Mid Cap Growth Fund Class I | 25.11% | 6.56% | 7.63% |
Russell 2500 Growth Index - Total Return | 25.20% | 9.75% | 9.98% |
Russell 3000 Index - Total Return | 35.19% | 15.26% | 12.83% |
Key Fund Statistics
(as of September 30, 2024)
| |
|---|
Fund Size (Millions) | $275.6M |
Number of Holdings | 47 |
Annual Portfolio Turnover | 32.58% |
Total Advisory Fee | $2.3M |
What did the Fund invest in?
(as of September 30, 2024)
Market Capitalization Exposure | (%) |
|---|
| Small Cap (<$2.5 B) | 3.1 |
| Mid Cap ($2.5-12 B) | 52.2 |
| Large Cap (>$12 B) | 44.7 |
Market Capitalization Exposure | (%) |
Small Cap (<$2.5 B) | 3.1% |
Mid Cap ($2.5-12 B) | 52.2% |
Large Cap (>$12 B) | 44.7% |
Expressed as a percentage of the Fund’s net assets.
How has the Fund changed?
This is a summary of certain changes to the Fund since October 1, 2023. For more complete information, you may review the Fund’s next prospectus, which we expect to be available by February 1, 2025 at https://www.thornburg.com/download or upon request by calling 1-800-847-0200.
End Block
Changes In and Disagreements with Accountants
No changes and/or disagreements occurred in the current reporting period.
End Block
For additional information about the Fund, including its prospectus, financial information, holdings and proxy information, visit www.thornburg.com/download.

Thornburg Small/Mid Cap Growth Fund Tailored Shareholder Report | |
Thornburg Small/Mid Cap Growth Fund Tailored Shareholder Report
Thornburg Small/Mid Cap Growth Fund CLASS: R3 TICKER: THCRX Annual Shareholder Report | |
This annual shareholder report contains important information about the Thornburg Small/Mid Cap Growth Fund Class R3 Shares for the period from October 1, 2023 to September 30, 2024. You can find additional information about the Fund at https://www.thornburg.com/download. You can also request this information by contacting us at 1-800-847-0200. This report also describes changes to the Fund that occurred during the reporting period.
How did the Fund perform last year and what affected its performance?
The Fund’s Class R3 shares underperformed the Russell 2500 Growth Index - Total Return (the “Index”) during the 12-month period ended September 30, 2024. The Fund’s stock selection in the information technology and energy sectors had a positive impact on performance relative to the Index during the period. Stock selection in and underweight allocations to health care and consumer discretionary stocks detracted from relative results. Returns of mid-cap companies outpaced small-cap companies within the Index during the period. Stock selection was the primary detractor from performance within the mid-cap (those ranging from approximately $2.5 - $12 billion market capitalization) portion of the Fund’s portfolio. However, an underweight positioning in the Fund to smaller stocks (those under approximately $2.5 billion market capitalization) and an overweight positioning to larger stocks (those over approximately $12 billion market capitalization) within the Index’s universe had positive impacts on the Fund’s performance relative to the Index.
How did the Fund perform over the past 10 years?
The line graph below reflects a hypothetical $10,000 investment. The returns shown in the line graph and table assume the reinvestment of dividends and capital gains, but do not reflect the deduction of taxes that a shareholder would pay on distributions or the redemption of Fund shares. The performance information shown below represents past performance and is no guarantee of future results. For Fund performance current to the most recent month end, visit https://www.thornburg.com/product/mutual-funds/fcg/THCRX or call 1-800-847-0200. Performance for other share classes of the Fund will vary.
Cumulative Performance
Growth Table
Date | Thornburg Small/Mid Cap Growth Fund | Russell 2500 Growth Index - Total Return | Russell 3000 Index - Total Return |
09/30/2014 | 9999.9891 | 10000 | 10000 |
10/31/2014 | 10416.8132 | 10440.1539 | 10275.133 |
11/30/2014 | 10363.7629 | 10613.8136 | 10524.1387 |
12/31/2014 | 10337.2377 | 10748.8712 | 10524.0202 |
01/31/2015 | 10136.4043 | 10583.1968 | 10231.1204 |
02/28/2015 | 10708.5901 | 11362.1033 | 10823.5111 |
03/31/2015 | 10704.8007 | 11548.3692 | 10713.4813 |
04/30/2015 | 10716.1687 | 11308.2289 | 10761.9405 |
05/31/2015 | 10784.3763 | 11657.0691 | 10910.7933 |
06/30/2015 | 10814.6907 | 11618.9727 | 10728.2506 |
07/31/2015 | 10924.5807 | 11756.6519 | 10907.6844 |
08/31/2015 | 10208.4011 | 10932.9725 | 10249.1933 |
09/30/2015 | 9855.9953 | 10335.3979 | 9950.534 |
10/31/2015 | 10572.1749 | 10875.4516 | 10736.4785 |
11/30/2015 | 10913.2128 | 11121.7296 | 10795.9966 |
12/31/2015 | 10613.8573 | 10728.7855 | 10574.4045 |
01/31/2016 | 9386.1209 | 9667.8382 | 9977.7406 |
02/29/2016 | 9109.5012 | 9697.0839 | 9974.5274 |
03/31/2016 | 9848.4167 | 10443.495 | 10676.794 |
04/30/2016 | 9730.9481 | 10543.6262 | 10742.9652 |
05/31/2016 | 9999.9891 | 10805.4548 | 10935.16 |
06/30/2016 | 9742.316 | 10725.3879 | 10957.6458 |
07/31/2016 | 10325.8697 | 11362.6518 | 11392.5207 |
08/31/2016 | 10485.0208 | 11441.5829 | 11421.5817 |
09/30/2016 | 10647.9611 | 11474.5198 | 11439.536 |
10/31/2016 | 10450.917 | 10875.3738 | 11192.0343 |
11/30/2016 | 10534.2818 | 11668.1758 | 11692.9016 |
12/31/2016 | 10352.3949 | 11772.4747 | 11921.0671 |
01/31/2017 | 10894.2663 | 12051.3124 | 12145.4442 |
02/28/2017 | 11197.411 | 12416.8331 | 12597.1533 |
03/31/2017 | 11292.1438 | 12508.3392 | 12605.7226 |
04/30/2017 | 11572.5527 | 12728.316 | 12739.3407 |
05/31/2017 | 11769.5969 | 12734.1543 | 12869.7154 |
06/30/2017 | 11860.5403 | 13024.4312 | 12985.8568 |
07/31/2017 | 12231.8927 | 13197.7486 | 13230.7044 |
08/31/2017 | 12087.8989 | 13223.521 | 13256.1965 |
09/30/2017 | 12239.4713 | 13776.9956 | 13579.4861 |
10/31/2017 | 12345.572 | 14145.5599 | 13875.8204 |
11/30/2017 | 12584.2985 | 14612.0578 | 14297.1609 |
12/31/2017 | 12815.4464 | 14651.4962 | 14440.0596 |
01/31/2018 | 13740.0381 | 15382.9032 | 15201.2038 |
02/28/2018 | 13641.516 | 14878.445 | 14640.8928 |
03/31/2018 | 13573.3084 | 15000.0019 | 14346.9915 |
04/30/2018 | 13785.5098 | 14904.7482 | 14401.5198 |
05/31/2018 | 14153.0728 | 15697.7623 | 14808.0786 |
06/30/2018 | 14456.2176 | 15829.152 | 14904.9227 |
07/31/2018 | 14592.6328 | 16125.5881 | 15399.5545 |
08/31/2018 | 15449.0169 | 17214.9293 | 15940.3524 |
09/30/2018 | 15217.869 | 16963.5247 | 15966.738 |
10/31/2018 | 13785.5098 | 14926.0048 | 14791.0638 |
11/30/2018 | 13626.3588 | 15207.8413 | 15087.3096 |
12/31/2018 | 12466.8299 | 13557.5089 | 13683.1425 |
01/31/2019 | 13857.5067 | 15172.0319 | 14857.6224 |
02/28/2019 | 14422.1139 | 16171.8137 | 15380.151 |
03/31/2019 | 14698.7335 | 16131.6617 | 15604.728 |
04/30/2019 | 15551.3282 | 16696.3052 | 16227.8554 |
05/31/2019 | 14228.8591 | 15587.31 | 15177.7201 |
06/30/2019 | 15134.5041 | 16799.8243 | 16243.7537 |
07/31/2019 | 15460.3848 | 17062.034 | 16485.2181 |
08/31/2019 | 14986.721 | 16577.3348 | 16149.1603 |
09/30/2019 | 14797.2555 | 16265.5525 | 16432.5919 |
10/31/2019 | 15035.9821 | 16682.9543 | 16786.3352 |
11/30/2019 | 15805.1883 | 17819.1862 | 17424.4142 |
12/31/2019 | 16046.7432 | 17984.6195 | 17927.5233 |
01/31/2020 | 16617.3126 | 18004.3493 | 17907.9411 |
02/29/2020 | 15846.8357 | 16783.1069 | 16441.7593 |
03/31/2020 | 13985.1969 | 13808.8142 | 14180.724 |
04/30/2020 | 15909.3068 | 16022.9423 | 16058.8224 |
05/31/2020 | 17475.249 | 17696.2018 | 16917.6229 |
06/30/2020 | 18308.197 | 18347.7442 | 17304.3924 |
07/31/2020 | 19382.7 | 19351.8531 | 18286.9924 |
08/31/2020 | 20827.8647 | 20222.8453 | 19611.7831 |
09/30/2020 | 19853.3156 | 20067.4919 | 18897.6985 |
10/31/2020 | 19399.3589 | 20304.3825 | 18489.825 |
11/30/2020 | 21610.8884 | 23261.6193 | 20739.1715 |
12/31/2020 | 22687.2076 | 25262.836 | 21672.1852 |
01/31/2021 | 22687.2076 | 25968.988 | 21575.7888 |
02/28/2021 | 23109.7296 | 26784.6666 | 22250.1888 |
03/31/2021 | 21615.336 | 25891.2666 | 23047.7 |
04/30/2021 | 23029.6728 | 26800.8006 | 24235.7902 |
05/31/2021 | 22055.6484 | 26055.8928 | 24346.427 |
06/30/2021 | 23043.0156 | 27454.0778 | 24946.7819 |
07/31/2021 | 23421.0616 | 26859.9901 | 25368.648 |
08/31/2021 | 23621.2036 | 27531.9742 | 26092.107 |
09/30/2021 | 22722.7884 | 26484.4226 | 24921.4084 |
10/31/2021 | 23941.4308 | 27842.3583 | 26606.7068 |
11/30/2021 | 21926.8292 | 26407.8058 | 26201.7175 |
12/31/2021 | 21672.3334 | 26537.2003 | 27233.5057 |
01/31/2022 | 18430.8595 | 23036.1894 | 25631.1915 |
02/28/2022 | 18645.1718 | 23105.4685 | 24985.5606 |
03/31/2022 | 18444.254 | 23272.0162 | 25795.9975 |
04/30/2022 | 15972.9651 | 20614.5915 | 23481.0071 |
05/31/2022 | 15182.6884 | 20114.1512 | 23449.5237 |
06/30/2022 | 13849.9337 | 18722.174 | 21487.7688 |
07/31/2022 | 15376.909 | 20858.2091 | 23503.707 |
08/31/2022 | 15115.7158 | 20461.7857 | 22626.5647 |
09/30/2022 | 13896.8145 | 18699.3733 | 20528.4243 |
10/31/2022 | 14680.3939 | 20218.9499 | 22211.8772 |
11/30/2022 | 15155.8994 | 20820.7972 | 23371.2533 |
12/31/2022 | 14258.4665 | 19581.585 | 22002.7861 |
01/31/2023 | 15457.2761 | 21541.5216 | 23518.1774 |
02/28/2023 | 14954.9816 | 21201.0069 | 22968.4935 |
03/31/2023 | 15182.6884 | 20862.9602 | 23582.6516 |
04/30/2023 | 15370.2117 | 20599.5155 | 23833.9098 |
05/31/2023 | 15356.8172 | 20576.9268 | 23926.6418 |
06/30/2023 | 16850.3062 | 22201.3119 | 25560.4836 |
07/31/2023 | 17057.9212 | 22942.7346 | 26476.7444 |
08/31/2023 | 16796.7281 | 22008.7799 | 25965.6445 |
09/30/2023 | 15926.0843 | 20683.4408 | 24728.7907 |
10/31/2023 | 14452.6871 | 19247.8226 | 24073.2616 |
11/30/2023 | 15684.9829 | 20953.669 | 26318.0536 |
12/31/2023 | 17044.5267 | 23288.4146 | 27714.0123 |
01/31/2024 | 17118.1966 | 22761.5874 | 28021.1577 |
02/29/2024 | 18785.8143 | 24605.9376 | 29537.9574 |
03/31/2024 | 19368.4759 | 25269.8333 | 30490.7763 |
04/30/2024 | 18149.5746 | 23386.8052 | 29149.1283 |
05/31/2024 | 18886.2732 | 24335.2077 | 30526.3399 |
06/30/2024 | 18799.2088 | 24204.6697 | 31471.3556 |
07/31/2024 | 19247.9252 | 25678.8142 | 32056.3767 |
08/31/2024 | 19756.917 | 25480.0609 | 32754.2021 |
09/30/2024 | 19823.8896 | 25896.2783 | 33431.7499 |

Effective September 30, 2024, the Fund adopted the Russell 3000 Index – Total Return as its broad-based securities market index that represents the overall applicable market in which the Fund invests, and the Russell 2500 Index—Total Return as an additional index that represents the market sectors which the Fund’s advisor believes are more representative of the Fund’s investment universe.
What were the Fund costs for the past year?
(based on a hypothetical $10,000 investment)
Class Name | Costs of a $10,000 investment | Costs paid as a percentage of a $10,000 investment |
|---|
Class R3 | $164.00 | 1.46% |
End Block
Thornburg Small/Mid Cap Growth Fund Tailored Shareholder Report
Thornburg Small/Mid Cap Growth Fund Tailored Shareholder Report | |
Annual Performance | 1 Year | 5 Year | 10 Year |
|---|
Small/Mid Cap Growth Fund Class R3 | 24.47% | 6.02% | 7.08% |
Russell 2500 Growth Index - Total Return | 25.20% | 9.75% | 9.98% |
Russell 3000 Index - Total Return | 35.19% | 15.26% | 12.83% |
Key Fund Statistics
(as of September 30, 2024)
| |
|---|
Fund Size (Millions) | $275.6M |
Number of Holdings | 47 |
Annual Portfolio Turnover | 32.58% |
Total Advisory Fee | $2.3M |
What did the Fund invest in?
(as of September 30, 2024)
Market Capitalization Exposure | (%) |
|---|
| Small Cap (<$2.5 B) | 3.1 |
| Mid Cap ($2.5-12 B) | 52.2 |
| Large Cap (>$12 B) | 44.7 |
Market Capitalization Exposure | (%) |
Small Cap (<$2.5 B) | 3.1% |
Mid Cap ($2.5-12 B) | 52.2% |
Large Cap (>$12 B) | 44.7% |
Expressed as a percentage of the Fund’s net assets.
How has the Fund changed?
This is a summary of certain changes to the Fund since October 1, 2023. For more complete information, you may review the Fund’s next prospectus, which we expect to be available by February 1, 2025 at https://www.thornburg.com/download or upon request by calling 1-800-847-0200.
End Block
Changes In and Disagreements with Accountants
No changes and/or disagreements occurred in the current reporting period.
End Block
For additional information about the Fund, including its prospectus, financial information, holdings and proxy information, visit www.thornburg.com/download.

Thornburg Small/Mid Cap Growth Fund Tailored Shareholder Report | |
Thornburg Small/Mid Cap Growth Fund Tailored Shareholder Report
Thornburg Small/Mid Cap Growth Fund CLASS: R4 TICKER: TCGRX Annual Shareholder Report | |
This annual shareholder report contains important information about the Thornburg Small/Mid Cap Growth Fund Class R4 Shares for the period from October 1, 2023 to September 30, 2024. You can find additional information about the Fund at https://www.thornburg.com/download. You can also request this information by contacting us at 1-800-847-0200. This report also describes changes to the Fund that occurred during the reporting period.
How did the Fund perform last year and what affected its performance?
The Fund’s Class R4 shares underperformed the Russell 2500 Growth Index - Total Return (the “Index”) during the 12-month period ended September 30, 2024. The Fund’s stock selection in the information technology and energy sectors had a positive impact on performance relative to the Index during the period. Stock selection in and underweight allocations to health care and consumer discretionary stocks detracted from relative results. Returns of mid-cap companies outpaced small-cap companies within the Index during the period. Stock selection was the primary detractor from performance within the mid-cap (those ranging from approximately $2.5 - $12 billion market capitalization) portion of the Fund’s portfolio. However, an underweight positioning in the Fund to smaller stocks (those under approximately $2.5 billion market capitalization) and an overweight positioning to larger stocks (those over approximately $12 billion market capitalization) within the Index’s universe had positive impacts on the Fund’s performance relative to the Index.
How did the Fund perform over the past 10 years?
The line graph below reflects a hypothetical $10,000 investment. The returns shown in the line graph and table assume the reinvestment of dividends and capital gains, but do not reflect the deduction of taxes that a shareholder would pay on distributions or the redemption of Fund shares. The performance information shown below represents past performance and is no guarantee of future results. For Fund performance current to the most recent month end, visit https://www.thornburg.com/product/mutual-funds/fcg/TCGRX or call 1-800-847-0200. Performance for other share classes of the Fund will vary.
Cumulative Performance
Growth Table
Date | Thornburg Small/Mid Cap Growth Fund | Russell 2500 Growth Index - Total Return | Russell 3000 Index - Total Return |
09/30/2014 | 10000.0066 | 10000 | 10000 |
10/31/2014 | 10418.2435 | 10440.1539 | 10275.133 |
11/30/2014 | 10365.4929 | 10613.8136 | 10524.1387 |
12/31/2014 | 10342.8855 | 10748.8712 | 10524.0202 |
01/31/2015 | 10139.4189 | 10583.1968 | 10231.1204 |
02/28/2015 | 10712.1397 | 11362.1033 | 10823.5111 |
03/31/2015 | 10712.1397 | 11548.3692 | 10713.4813 |
04/30/2015 | 10723.4434 | 11308.2289 | 10761.9405 |
05/31/2015 | 10795.0335 | 11657.0691 | 10910.7933 |
06/30/2015 | 10825.1767 | 11618.9727 | 10728.2506 |
07/31/2015 | 10934.4458 | 11756.6519 | 10907.6844 |
08/31/2015 | 10218.5448 | 10932.9725 | 10249.1933 |
09/30/2015 | 9868.1301 | 10335.3979 | 9950.534 |
10/31/2015 | 10587.799 | 10875.4516 | 10736.4785 |
11/30/2015 | 10926.91 | 11121.7296 | 10795.9966 |
12/31/2015 | 10629.2459 | 10728.7855 | 10574.4045 |
01/31/2016 | 9400.9105 | 9667.8382 | 9977.7406 |
02/29/2016 | 9125.8538 | 9697.0839 | 9974.5274 |
03/31/2016 | 9864.3622 | 10443.495 | 10676.794 |
04/30/2016 | 9747.5573 | 10543.6262 | 10742.9652 |
05/31/2016 | 10018.8461 | 10805.4548 | 10935.16 |
06/30/2016 | 9762.6289 | 10725.3879 | 10957.6458 |
07/31/2016 | 10346.6534 | 11362.6518 | 11392.5207 |
08/31/2016 | 10504.9052 | 11441.5829 | 11421.5817 |
09/30/2016 | 10674.4607 | 11474.5198 | 11439.536 |
10/31/2016 | 10478.5299 | 10875.3738 | 11192.0343 |
11/30/2016 | 10561.4237 | 11668.1758 | 11692.9016 |
12/31/2016 | 10380.5645 | 11772.4747 | 11921.0671 |
01/31/2017 | 10923.1421 | 12051.3124 | 12145.4442 |
02/28/2017 | 11228.342 | 12416.8331 | 12597.1533 |
03/31/2017 | 11322.5395 | 12508.3392 | 12605.7226 |
04/30/2017 | 11605.132 | 12728.316 | 12739.3407 |
05/31/2017 | 11804.8307 | 12734.1543 | 12869.7154 |
06/30/2017 | 11895.2603 | 13024.4312 | 12985.8568 |
07/31/2017 | 12272.0503 | 13197.7486 | 13230.7044 |
08/31/2017 | 12125.1022 | 13223.521 | 13256.1965 |
09/30/2017 | 12279.5861 | 13776.9956 | 13579.4861 |
10/31/2017 | 12385.0873 | 14145.5599 | 13875.8204 |
11/30/2017 | 12626.2329 | 14612.0578 | 14297.1609 |
12/31/2017 | 12859.8427 | 14651.4962 | 14440.0596 |
01/31/2018 | 13786.7461 | 15382.9032 | 15201.2038 |
02/28/2018 | 13692.5486 | 14878.445 | 14640.8928 |
03/31/2018 | 13624.7264 | 15000.0019 | 14346.9915 |
04/30/2018 | 13835.7288 | 14904.7482 | 14401.5198 |
05/31/2018 | 14204.983 | 15697.7623 | 14808.0786 |
06/30/2018 | 14513.9508 | 15829.152 | 14904.9227 |
07/31/2018 | 14653.3631 | 16125.5881 | 15399.5545 |
08/31/2018 | 15512.4443 | 17214.9293 | 15940.3524 |
09/30/2018 | 15282.6024 | 16963.5247 | 15966.738 |
10/31/2018 | 13843.2646 | 14926.0048 | 14791.0638 |
11/30/2018 | 13685.0128 | 15207.8413 | 15087.3096 |
12/31/2018 | 12524.4996 | 13557.5089 | 13683.1425 |
01/31/2019 | 13922.3905 | 15172.0319 | 14857.6224 |
02/28/2019 | 14487.5755 | 16171.8137 | 15380.151 |
03/31/2019 | 14770.168 | 16131.6617 | 15604.728 |
04/30/2019 | 15629.2492 | 16696.3052 | 16227.8554 |
05/31/2019 | 14302.9484 | 15587.31 | 15177.7201 |
06/30/2019 | 15211.0123 | 16799.8243 | 16243.7537 |
07/31/2019 | 15542.5875 | 17062.034 | 16485.2181 |
08/31/2019 | 15064.0642 | 16577.3348 | 16149.1603 |
09/30/2019 | 14879.4371 | 16265.5525 | 16432.5919 |
10/31/2019 | 15116.8148 | 16682.9543 | 16786.3352 |
11/30/2019 | 15893.0861 | 17819.1862 | 17424.4142 |
12/31/2019 | 16137.1497 | 17984.6195 | 17927.5233 |
01/31/2020 | 16716.2835 | 18004.3493 | 17907.9411 |
02/29/2020 | 15938.5895 | 16783.1069 | 16441.7593 |
03/31/2020 | 14068.8147 | 13808.8142 | 14180.724 |
04/30/2020 | 16004.7762 | 16022.9423 | 16058.8224 |
05/31/2020 | 17580.8475 | 17696.2018 | 16917.6229 |
06/30/2020 | 18420.5915 | 18347.7442 | 17304.3924 |
07/31/2020 | 19500.2624 | 19351.8531 | 18286.9924 |
08/31/2020 | 20960.5069 | 20222.8453 | 19611.7831 |
09/30/2020 | 19980.1161 | 20067.4919 | 18897.6985 |
10/31/2020 | 19525.0824 | 20304.3825 | 18489.825 |
11/30/2020 | 21750.7629 | 23261.6193 | 20739.1715 |
12/31/2020 | 22840.9492 | 25262.836 | 21672.1852 |
01/31/2021 | 22836.5355 | 25968.988 | 21575.7888 |
02/28/2021 | 23264.6654 | 26784.6666 | 22250.1888 |
03/31/2021 | 21768.4177 | 25891.2666 | 23047.7 |
04/30/2021 | 23189.6323 | 26800.8006 | 24235.7902 |
05/31/2021 | 22209.7887 | 26055.8928 | 24346.427 |
06/30/2021 | 23207.2872 | 27454.0778 | 24946.7819 |
07/31/2021 | 23591.28 | 26859.9901 | 25368.648 |
08/31/2021 | 23789.8969 | 27531.9742 | 26092.107 |
09/30/2021 | 22889.5001 | 26484.4226 | 24921.4084 |
10/31/2021 | 24120.9252 | 27842.3583 | 26606.7068 |
11/30/2021 | 22090.7408 | 26407.8058 | 26201.7175 |
12/31/2021 | 21840.0844 | 26537.2003 | 27233.5057 |
01/31/2022 | 18574.9555 | 23036.1894 | 25631.1915 |
02/28/2022 | 18786.0346 | 23105.4685 | 24985.5606 |
03/31/2022 | 18588.148 | 23272.0162 | 25795.9975 |
04/30/2022 | 16101.373 | 20614.5915 | 23481.0071 |
05/31/2022 | 15303.2304 | 20114.1512 | 23449.5237 |
06/30/2022 | 13957.6015 | 18722.174 | 21487.7688 |
07/31/2022 | 15501.117 | 20858.2091 | 23503.707 |
08/31/2022 | 15237.2682 | 20461.7857 | 22626.5647 |
09/30/2022 | 14010.3713 | 18699.3733 | 20528.4243 |
10/31/2022 | 14808.5139 | 20218.9499 | 22211.8772 |
11/30/2022 | 15283.4417 | 20820.7972 | 23371.2533 |
12/31/2022 | 14379.7596 | 19581.585 | 22002.7861 |
01/31/2023 | 15586.8679 | 21541.5216 | 23518.1774 |
02/28/2023 | 15085.5551 | 21201.0069 | 22968.4935 |
03/31/2023 | 15316.4228 | 20862.9602 | 23582.6516 |
04/30/2023 | 15507.7132 | 20599.5155 | 23833.9098 |
05/31/2023 | 15494.5208 | 20576.9268 | 23926.6418 |
06/30/2023 | 17005.0552 | 22201.3119 | 25560.4836 |
07/31/2023 | 17209.538 | 22942.7346 | 26476.7444 |
08/31/2023 | 16952.2854 | 22008.7799 | 25965.6445 |
09/30/2023 | 16074.9881 | 20683.4408 | 24728.7907 |
10/31/2023 | 14590.8386 | 19247.8226 | 24073.2616 |
11/30/2023 | 15837.5242 | 20953.669 | 26318.0536 |
12/31/2023 | 17209.538 | 23288.4146 | 27714.0123 |
01/31/2024 | 17282.0964 | 22761.5874 | 28021.1577 |
02/29/2024 | 18964.1325 | 24605.9376 | 29537.9574 |
03/31/2024 | 19557.7923 | 25269.8333 | 30490.7763 |
04/30/2024 | 18330.8954 | 23386.8052 | 29149.1283 |
05/31/2024 | 19076.2682 | 24335.2077 | 30526.3399 |
06/30/2024 | 18983.9212 | 24204.6697 | 31471.3556 |
07/31/2024 | 19445.6566 | 25678.8142 | 32056.3767 |
08/31/2024 | 19960.1617 | 25480.0609 | 32754.2021 |
09/30/2024 | 20026.1239 | 25896.2783 | 33431.7499 |
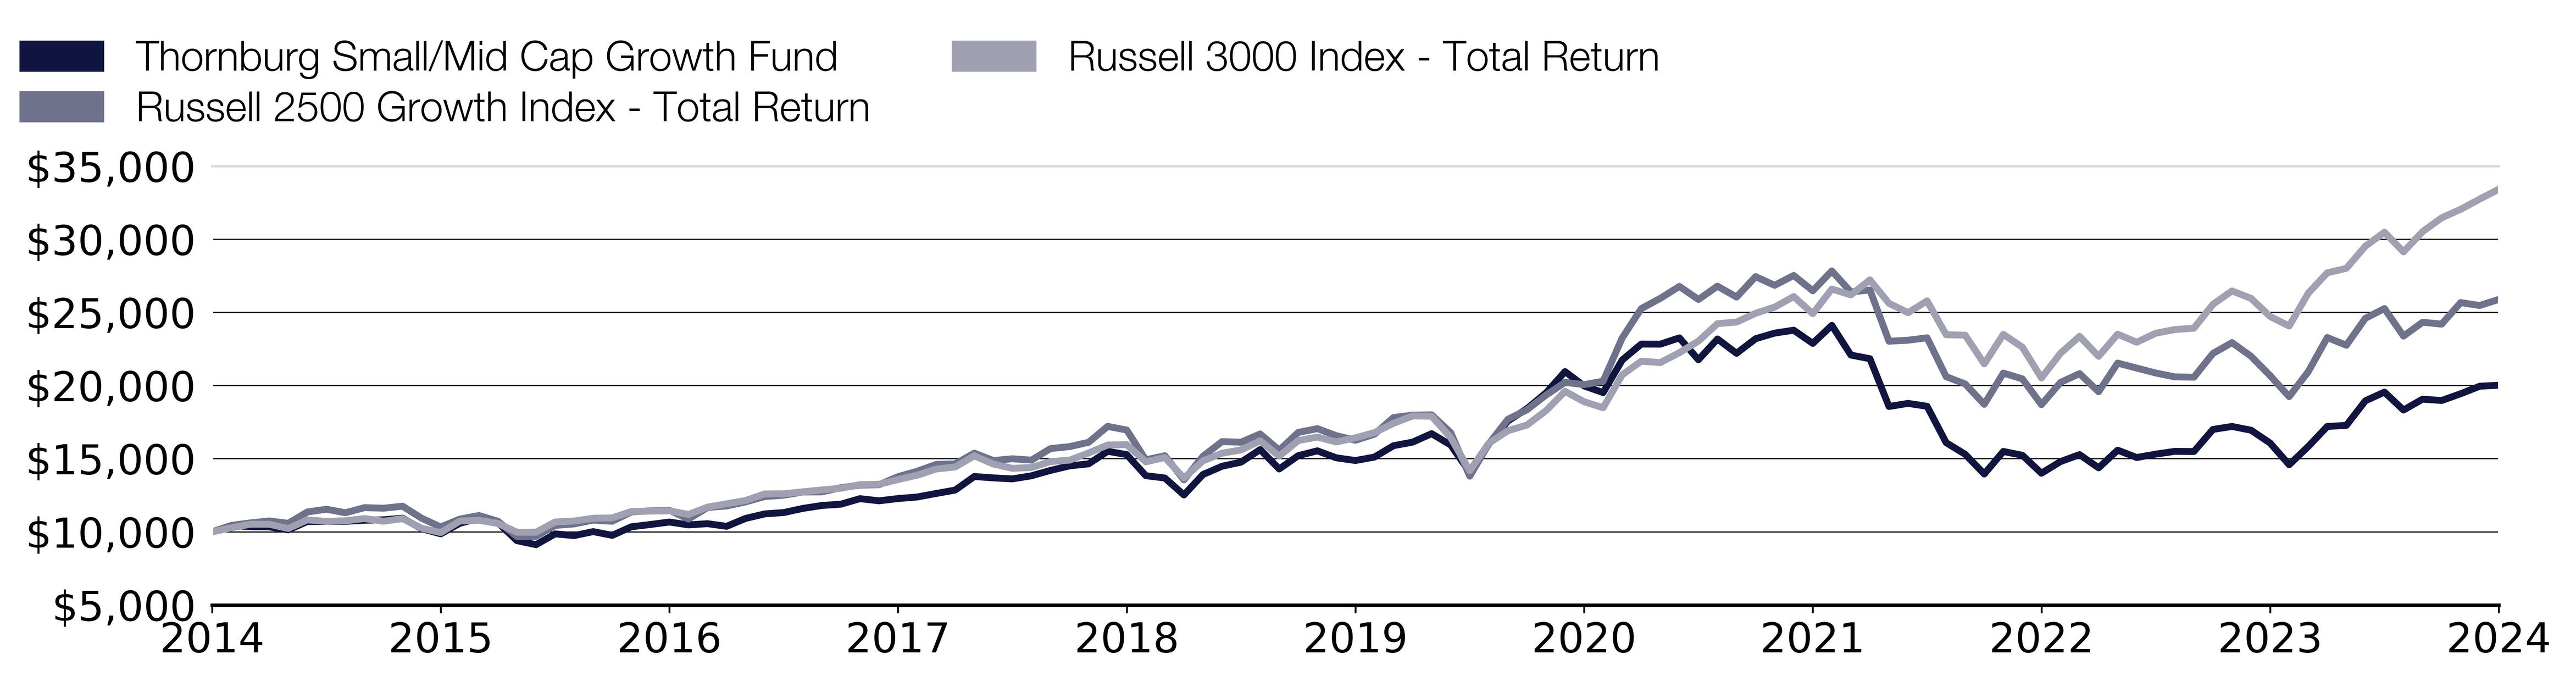
Effective September 30, 2024, the Fund adopted the Russell 3000 Index – Total Return as its broad-based securities market index that represents the overall applicable market in which the Fund invests, and the Russell 2500 Index—Total Return as an additional index that represents the market sectors which the Fund’s advisor believes are more representative of the Fund’s investment universe.
What were the Fund costs for the past year?
(based on a hypothetical $10,000 investment)
Class Name | Costs of a $10,000 investment | Costs paid as a percentage of a $10,000 investment |
|---|
Class R4 | $153.00 | 1.36% |
End Block
Thornburg Small/Mid Cap Growth Fund Tailored Shareholder Report
Thornburg Small/Mid Cap Growth Fund Tailored Shareholder Report | |
Annual Performance | 1 Year | 5 Year | 10 Year |
|---|
Small/Mid Cap Growth Fund Class R4 | 24.58% | 6.12% | 7.19% |
Russell 2500 Growth Index - Total Return | 25.20% | 9.75% | 9.98% |
Russell 3000 Index - Total Return | 35.19% | 15.26% | 12.83% |
Key Fund Statistics
(as of September 30, 2024)
| |
|---|
Fund Size (Millions) | $275.6M |
Number of Holdings | 47 |
Annual Portfolio Turnover | 32.58% |
Total Advisory Fee | $2.3M |
What did the Fund invest in?
(as of September 30, 2024)
Market Capitalization Exposure | (%) |
|---|
| Small Cap (<$2.5 B) | 3.1 |
| Mid Cap ($2.5-12 B) | 52.2 |
| Large Cap (>$12 B) | 44.7 |
Market Capitalization Exposure | (%) |
Small Cap (<$2.5 B) | 3.1% |
Mid Cap ($2.5-12 B) | 52.2% |
Large Cap (>$12 B) | 44.7% |
Expressed as a percentage of the Fund’s net assets.
How has the Fund changed?
This is a summary of certain changes to the Fund since October 1, 2023. For more complete information, you may review the Fund’s next prospectus, which we expect to be available by February 1, 2025 at https://www.thornburg.com/download or upon request by calling 1-800-847-0200.
End Block
Changes In and Disagreements with Accountants
No changes and/or disagreements occurred in the current reporting period.
End Block
For additional information about the Fund, including its prospectus, financial information, holdings and proxy information, visit www.thornburg.com/download.

Thornburg Small/Mid Cap Growth Fund Tailored Shareholder Report | |
Thornburg Small/Mid Cap Growth Fund Tailored Shareholder Report
Thornburg Small/Mid Cap Growth Fund CLASS: R5 TICKER: THGRX Annual Shareholder Report | |
This annual shareholder report contains important information about the Thornburg Small/Mid Cap Growth Fund Class R5 Shares for the period from October 1, 2023 to September 30, 2024. You can find additional information about the Fund at https://www.thornburg.com/download. You can also request this information by contacting us at 1-800-847-0200. This report also describes changes to the Fund that occurred during the reporting period.
How did the Fund perform last year and what affected its performance?
The Fund’s Class R5 shares underperformed the Russell 2500 Growth Index - Total Return (the “Index”) during the 12-month period ended September 30, 2024. The Fund’s stock selection in the information technology and energy sectors had a positive impact on performance relative to the Index during the period. Stock selection in and underweight allocations to health care and consumer discretionary stocks detracted from relative results. Returns of mid-cap companies outpaced small-cap companies within the Index during the period. Stock selection was the primary detractor from performance within the mid-cap (those ranging from approximately $2.5 - $12 billion market capitalization) portion of the Fund’s portfolio. However, an underweight positioning in the Fund to smaller stocks (those under approximately $2.5 billion market capitalization) and an overweight positioning to larger stocks (those over approximately $12 billion market capitalization) within the Index’s universe had positive impacts on the Fund’s performance relative to the Index.
How did the Fund perform over the past 10 years?
The line graph below reflects a hypothetical $10,000 investment. The returns shown in the line graph and table assume the reinvestment of dividends and capital gains, but do not reflect the deduction of taxes that a shareholder would pay on distributions or the redemption of Fund shares. The performance information shown below represents past performance and is no guarantee of future results. For Fund performance current to the most recent month end, visit https://www.thornburg.com/product/mutual-funds/fcg/THGRX or call 1-800-847-0200. Performance for other share classes of the Fund will vary.
Cumulative Performance
Growth Table
Date | Thornburg Small/Mid Cap Growth Fund | Russell 2500 Growth Index - Total Return | Russell 3000 Index - Total Return |
09/30/2014 | 10000.0068 | 10000 | 10000 |
10/31/2014 | 10419.8134 | 10440.1539 | 10275.133 |
11/30/2014 | 10373.1682 | 10613.8136 | 10524.1387 |
12/31/2014 | 10351.6396 | 10748.8712 | 10524.0202 |
01/31/2015 | 10150.7066 | 10583.1968 | 10231.1204 |
02/28/2015 | 10728.3891 | 11362.1033 | 10823.5111 |
03/31/2015 | 10731.9772 | 11548.3692 | 10713.4813 |
04/30/2015 | 10746.3296 | 11308.2289 | 10761.9405 |
05/31/2015 | 10821.6794 | 11657.0691 | 10910.7933 |
06/30/2015 | 10853.9723 | 11618.9727 | 10728.2506 |
07/31/2015 | 10968.7911 | 11756.6519 | 10907.6844 |
08/31/2015 | 10254.7612 | 10932.9725 | 10249.1933 |
09/30/2015 | 9906.7165 | 10335.3979 | 9950.534 |
10/31/2015 | 10631.5107 | 10875.4516 | 10736.4785 |
11/30/2015 | 10975.9673 | 11121.7296 | 10795.9966 |
12/31/2015 | 10678.1558 | 10728.7855 | 10574.4045 |
01/31/2016 | 9451.0291 | 9667.8382 | 9977.7406 |
02/29/2016 | 9174.7461 | 9697.0839 | 9974.5274 |
03/31/2016 | 9921.0689 | 10443.495 | 10676.794 |
04/30/2016 | 9809.8381 | 10543.6262 | 10742.9652 |
05/31/2016 | 10086.121 | 10805.4548 | 10935.16 |
06/30/2016 | 9831.3666 | 10725.3879 | 10957.6458 |
07/31/2016 | 10419.8134 | 11362.6518 | 11392.5207 |
08/31/2016 | 10584.8655 | 11441.5829 | 11421.5817 |
09/30/2016 | 10757.0938 | 11474.5198 | 11439.536 |
10/31/2016 | 10563.337 | 10875.3738 | 11192.0343 |
11/30/2016 | 10653.0392 | 11668.1758 | 11692.9016 |
12/31/2016 | 10473.6347 | 11772.4747 | 11921.0671 |
01/31/2017 | 11026.2006 | 12051.3124 | 12145.4442 |
02/28/2017 | 11338.3644 | 12416.8331 | 12597.1533 |
03/31/2017 | 11438.8309 | 12508.3392 | 12605.7226 |
04/30/2017 | 11725.8781 | 12728.316 | 12739.3407 |
05/31/2017 | 11930.3993 | 12734.1543 | 12869.7154 |
06/30/2017 | 12027.2777 | 13024.4312 | 12985.8568 |
07/31/2017 | 12411.2033 | 13197.7486 | 13230.7044 |
08/31/2017 | 12267.6797 | 13223.521 | 13256.1965 |
09/30/2017 | 12429.1438 | 13776.9956 | 13579.4861 |
10/31/2017 | 12540.3746 | 14145.5599 | 13875.8204 |
11/30/2017 | 12787.9528 | 14612.0578 | 14297.1609 |
12/31/2017 | 13031.9429 | 14651.4962 | 14440.0596 |
01/31/2018 | 13975.6105 | 15382.9032 | 15201.2038 |
02/28/2018 | 13882.3202 | 14878.445 | 14640.8928 |
03/31/2018 | 13814.1465 | 15000.0019 | 14346.9915 |
04/30/2018 | 14036.6081 | 14904.7482 | 14401.5198 |
05/31/2018 | 14416.9456 | 15697.7623 | 14808.0786 |
06/30/2018 | 14732.6975 | 15829.152 | 14904.9227 |
07/31/2018 | 14879.8092 | 16125.5881 | 15399.5545 |
08/31/2018 | 15762.4794 | 17214.9293 | 15940.3524 |
09/30/2018 | 15532.8416 | 16963.5247 | 15966.738 |
10/31/2018 | 14072.489 | 14926.0048 | 14791.0638 |
11/30/2018 | 13918.2011 | 15207.8413 | 15087.3096 |
12/31/2018 | 12741.3076 | 13557.5089 | 13683.1425 |
01/31/2019 | 14165.7793 | 15172.0319 | 14857.6224 |
02/28/2019 | 14747.0499 | 16171.8137 | 15380.151 |
03/31/2019 | 15041.2733 | 16131.6617 | 15604.728 |
04/30/2019 | 15920.3553 | 16696.3052 | 16227.8554 |
05/31/2019 | 14571.2335 | 15587.31 | 15177.7201 |
06/30/2019 | 15504.1369 | 16799.8243 | 16243.7537 |
07/31/2019 | 15845.0054 | 17062.034 | 16485.2181 |
08/31/2019 | 15364.2014 | 16577.3348 | 16149.1603 |
09/30/2019 | 15181.2088 | 16265.5525 | 16432.5919 |
10/31/2019 | 15428.787 | 16682.9543 | 16786.3352 |
11/30/2019 | 16225.7441 | 17819.1862 | 17424.4142 |
12/31/2019 | 16484.0411 | 17984.6195 | 17927.5233 |
01/31/2020 | 17074.9932 | 18004.3493 | 17907.9411 |
02/29/2020 | 16288.3616 | 16783.1069 | 16441.7593 |
03/31/2020 | 14382.4432 | 13808.8142 | 14180.724 |
04/30/2020 | 16366.6334 | 16022.9423 | 16058.8224 |
05/31/2020 | 17986.8596 | 17696.2018 | 16917.6229 |
06/30/2020 | 18851.763 | 18347.7442 | 17304.3924 |
07/31/2020 | 19967.1362 | 19351.8531 | 18286.9924 |
08/31/2020 | 21466.0412 | 20222.8453 | 19611.7831 |
09/30/2020 | 20468.0757 | 20067.4919 | 18897.6985 |
10/31/2020 | 20010.1857 | 20304.3825 | 18489.825 |
11/30/2020 | 22295.8598 | 23261.6193 | 20739.1715 |
12/31/2020 | 23421.6615 | 25262.836 | 21672.1852 |
01/31/2021 | 23429.97 | 25968.988 | 21575.7888 |
02/28/2021 | 23874.4748 | 26784.6666 | 22250.1888 |
03/31/2021 | 22345.7108 | 25891.2666 | 23047.7 |
04/30/2021 | 23812.161 | 26800.8006 | 24235.7902 |
05/31/2021 | 22815.141 | 26055.8928 | 24346.427 |
06/30/2021 | 23849.5492 | 27454.0778 | 24946.7819 |
07/31/2021 | 24252.5115 | 26859.9901 | 25368.648 |
08/31/2021 | 24464.3783 | 27531.9742 | 26092.107 |
09/30/2021 | 23546.289 | 26484.4226 | 24921.4084 |
10/31/2021 | 24821.6438 | 27842.3583 | 26606.7068 |
11/30/2021 | 22741.1534 | 26407.8058 | 26201.7175 |
12/31/2021 | 22485.0325 | 26537.2003 | 27233.5057 |
01/31/2022 | 19131.6356 | 23036.1894 | 25631.1915 |
02/28/2022 | 19357.975 | 23105.4685 | 24985.5606 |
03/31/2022 | 19161.4171 | 23272.0162 | 25795.9975 |
04/30/2022 | 16600.2081 | 20614.5915 | 23481.0071 |
05/31/2022 | 15784.195 | 20114.1512 | 23449.5237 |
06/30/2022 | 14402.3334 | 18722.174 | 21487.7688 |
07/31/2022 | 15998.6218 | 20858.2091 | 23503.707 |
08/31/2022 | 15730.5883 | 20461.7857 | 22626.5647 |
09/30/2022 | 14473.809 | 18699.3733 | 20528.4243 |
10/31/2022 | 15295.7784 | 20218.9499 | 22211.8772 |
11/30/2022 | 15796.1076 | 20820.7972 | 23371.2533 |
12/31/2022 | 14866.9248 | 19581.585 | 22002.7861 |
01/31/2023 | 16123.7041 | 21541.5216 | 23518.1774 |
02/28/2023 | 15605.506 | 21201.0069 | 22968.4935 |
03/31/2023 | 15849.7143 | 20862.9602 | 23582.6516 |
04/30/2023 | 16052.2285 | 20599.5155 | 23833.9098 |
05/31/2023 | 16046.2722 | 20576.9268 | 23926.6418 |
06/30/2023 | 17618.7354 | 22201.3119 | 25560.4836 |
07/31/2023 | 17839.1185 | 22942.7346 | 26476.7444 |
08/31/2023 | 17571.085 | 22008.7799 | 25965.6445 |
09/30/2023 | 16671.6837 | 20683.4408 | 24728.7907 |
10/31/2023 | 15134.9583 | 19247.8226 | 24073.2616 |
11/30/2023 | 16433.4317 | 20953.669 | 26318.0536 |
12/31/2023 | 17868.9 | 23288.4146 | 27714.0123 |
01/31/2024 | 17952.2882 | 22761.5874 | 28021.1577 |
02/29/2024 | 19703.4404 | 24605.9376 | 29537.9574 |
03/31/2024 | 20322.8956 | 25269.8333 | 30490.7763 |
04/30/2024 | 19054.2037 | 23386.8052 | 29149.1283 |
05/31/2024 | 19834.479 | 24335.2077 | 30526.3399 |
06/30/2024 | 19751.0908 | 24204.6697 | 31471.3556 |
07/31/2024 | 20233.5511 | 25678.8142 | 32056.3767 |
08/31/2024 | 20775.5744 | 25480.0609 | 32754.2021 |
09/30/2024 | 20858.9626 | 25896.2783 | 33431.7499 |

Effective September 30, 2024, the Fund adopted the Russell 3000 Index – Total Return as its broad-based securities market index that represents the overall applicable market in which the Fund invests, and the Russell 2500 Index—Total Return as an additional index that represents the market sectors which the Fund’s advisor believes are more representative of the Fund’s investment universe.
What were the Fund costs for the past year?
(based on a hypothetical $10,000 investment)
Class Name | Costs of a $10,000 investment | Costs paid as a percentage of a $10,000 investment |
|---|
Class R5 | $107.00 | 0.95% |
End Block
Thornburg Small/Mid Cap Growth Fund Tailored Shareholder Report
Thornburg Small/Mid Cap Growth Fund Tailored Shareholder Report | |
Annual Performance | 1 Year | 5 Year | 10 Year |
|---|
Small/Mid Cap Growth Fund Class R5 | 25.12% | 6.56% | 7.63% |
Russell 2500 Growth Index - Total Return | 25.20% | 9.75% | 9.98% |
Russell 3000 Index - Total Return | 35.19% | 15.26% | 12.83% |
Key Fund Statistics
(as of September 30, 2024)
| |
|---|
Fund Size (Millions) | $275.6M |
Number of Holdings | 47 |
Annual Portfolio Turnover | 32.58% |
Total Advisory Fee | $2.3M |
What did the Fund invest in?
(as of September 30, 2024)
Market Capitalization Exposure | (%) |
|---|
| Small Cap (<$2.5 B) | 3.1 |
| Mid Cap ($2.5-12 B) | 52.2 |
| Large Cap (>$12 B) | 44.7 |
Market Capitalization Exposure | (%) |
Small Cap (<$2.5 B) | 3.1% |
Mid Cap ($2.5-12 B) | 52.2% |
Large Cap (>$12 B) | 44.7% |
Expressed as a percentage of the Fund’s net assets.
How has the Fund changed?
This is a summary of certain changes to the Fund since October 1, 2023. For more complete information, you may review the Fund’s next prospectus, which we expect to be available by February 1, 2025 at https://www.thornburg.com/download or upon request by calling 1-800-847-0200.
End Block
Changes In and Disagreements with Accountants
No changes and/or disagreements occurred in the current reporting period.
End Block
For additional information about the Fund, including its prospectus, financial information, holdings and proxy information, visit www.thornburg.com/download.

Thornburg Small/Mid Cap Growth Fund Tailored Shareholder Report | |
Thornburg Investment Income Builder Fund Tailored Shareholder Report
Thornburg Investment Income Builder Fund CLASS: A TICKER: TIBAX Annual Shareholder Report | |
This annual shareholder report contains important information about the Thornburg Investment Income Builder Fund Class A Shares for the period from October 1, 2023 to September 30, 2024. You can find additional information about the Fund at https://www.thornburg.com/download. You can also request this information by contacting us at 1-800-847-0200. This report also describes changes to the Fund that occurred during the reporting period.
How did the Fund perform last year and what affected its performance?
The Fund’s Class A shares underperformed the benchmark composed of 25% Bloomberg U.S. Aggregate Bond Total Return Index Value USD and 75% MSCI World Net Total Return USD Index (the “Blended Index”) during the 12-month period ended September 30, 2024. During the period, major world events included the ongoing Russian/Ukraine conflict, moderating inflation figures in the U.S., Mideast tensions, and upcoming political contests in the U.S. Despite the conflicting economic and geo-political signals, the S&P 500, the Bloomberg U.S. Aggregate Bond, and the MSCI ACWI indexes reported varying positive returns for the period, +36.3%, +11.6%, and +31.8%, respectively. In brief, most equities repriced higher due to a surprising level of economic strength and resilient corporate profits, while interest rates declined along with inflation rates, creating a more favorable backdrop for the economy. A general overweight positioning to equities and underweight positioning to fixed income boosted the Fund’s relative performance during the period. Within equities, the Fund’s focus on dividend paying firms was a source of underperformance versus the broad based MSCI World Index. This underperformance is common during periods such as the current reporting period when growth stocks are outperforming. Security selection within the information technology and energy sectors, along with an overweight positioning to Taiwan, boosted relative performance. Mostly, the Fund’s equity holdings were relative detractors across the various sectors. Stock selection within the U.S. was beneficial to relative performance, however, the overall underweight positioning to U.S. stocks hampered performance. Among its fixed income holdings, the Fund’s shorter duration positioning during the period detracted from relative performance as yields across the curve declined during the period.
How did the Fund perform over the past 10 years?
The line graph below reflects a hypothetical $10,000 investment and assumes the deduction of the maximum sales charge associated with that investment. The returns shown in the line graph and table assume the reinvestment of dividends and capital gains, but do not reflect the deduction of taxes that a shareholder would pay on distributions or the redemption of Fund shares. The performance information shown below represents past performance and is no guarantee of future results. For Fund performance current to the most recent month end, visit https://www.thornburg.com/product/mutual-funds/fib/TIBAX or call 1-800-847-0200. Performance for other share classes of the Fund will vary.
Cumulative Performance
Growth Table
Date | Thornburg Investment Income Builder Fund | Thornburg Investment Income Builder Fund’s Blended Index | MSCI World Net Total Return USD Index | Bloomberg U.S. Aggregate Total Return Value Index USD |
09/30/2014 | 9548.9066 | 10000 | 10000 | 10000 |
10/31/2014 | 9560.472 | 10073.0867 | 10064.69 | 10098.2769 |
11/30/2014 | 9643.6575 | 10242.3546 | 10266.3941 | 10169.91 |
12/31/2014 | 9425.445 | 10120.8813 | 10100.8476 | 10179.4256 |
01/31/2015 | 9479.7737 | 10036.3974 | 9917.8235 | 10392.8789 |
02/28/2015 | 9838.9889 | 10453.8199 | 10498.8953 | 10295.1602 |
03/31/2015 | 9748.6944 | 10343.2268 | 10334.5512 | 10342.967 |
04/30/2015 | 10055.8788 | 10515.8799 | 10576.9224 | 10305.856 |
05/31/2015 | 9988.2825 | 10536.7172 | 10613.3579 | 10281.0356 |
06/30/2015 | 9742.1991 | 10324.242 | 10366.5728 | 10168.9318 |
07/31/2015 | 9875.8726 | 10481.1738 | 10552.6529 | 10239.6187 |
08/31/2015 | 9268.0964 | 9957.2209 | 9854.3359 | 10224.9146 |
09/30/2015 | 8859.9984 | 9698.6094 | 9490.8635 | 10294.0811 |
10/31/2015 | 9280.7869 | 10275.4309 | 10242.9602 | 10295.7875 |
11/30/2015 | 9195.971 | 10230.2994 | 10191.9941 | 10268.5908 |
12/31/2015 | 8919.4855 | 10087.1673 | 10012.846 | 10235.4031 |
01/31/2016 | 8639.9506 | 9669.277 | 9413.8342 | 10376.2558 |
02/29/2016 | 8577.6893 | 9632.4537 | 9343.7725 | 10449.8664 |
03/31/2016 | 9055.7193 | 10144.7832 | 9977.8307 | 10545.7404 |
04/30/2016 | 9190.4544 | 10274.9142 | 10135.7163 | 10586.2218 |
05/31/2016 | 9296.4935 | 10318.8548 | 10192.6431 | 10588.9383 |
06/30/2016 | 9279.9092 | 10278.4873 | 10078.4316 | 10779.1979 |
07/31/2016 | 9521.4657 | 10620.4196 | 10504.2293 | 10847.3436 |
08/31/2016 | 9605.195 | 10624.0038 | 10512.9592 | 10834.9414 |
09/30/2016 | 9599.4675 | 10664.7736 | 10568.8037 | 10828.5941 |
10/31/2016 | 9452.5016 | 10489.5834 | 10364.2659 | 10745.7655 |
11/30/2016 | 9561.0834 | 10540.6767 | 10513.2948 | 10491.5864 |
12/31/2016 | 9767.0867 | 10733.5596 | 10764.8605 | 10506.3861 |
01/31/2017 | 9799.5879 | 10933.1167 | 11024.6716 | 10527.0016 |
02/28/2017 | 9977.5625 | 11178.9791 | 11330.5349 | 10597.7522 |
03/31/2017 | 10129.2383 | 11266.8226 | 11451.2272 | 10592.197 |
04/30/2017 | 10181.5607 | 11413.6778 | 11620.783 | 10673.9358 |
05/31/2017 | 10412.4299 | 11616.7289 | 11866.6147 | 10756.0945 |
06/30/2017 | 10418.3077 | 11647.3279 | 11912.2713 | 10745.2712 |
07/31/2017 | 10637.9413 | 11868.9197 | 12197.361 | 10791.5097 |
08/31/2017 | 10630.5538 | 11908.0687 | 12214.5364 | 10888.3034 |
09/30/2017 | 10848.3625 | 12094.3409 | 12488.6825 | 10836.4459 |
10/31/2017 | 10847.1963 | 12267.5162 | 12724.6997 | 10842.724 |
11/30/2017 | 11116.7465 | 12462.9349 | 13000.4127 | 10828.8068 |
12/31/2017 | 11210.4843 | 12603.6423 | 13176.2249 | 10878.506 |
01/31/2018 | 11579.7753 | 13066.4582 | 13871.9304 | 10753.2186 |
02/28/2018 | 11031.3439 | 12629.5108 | 13297.2527 | 10651.2843 |
03/31/2018 | 10937.3901 | 12443.3 | 13007.4202 | 10719.5896 |
04/30/2018 | 11163.8188 | 12527.4041 | 13156.8892 | 10639.8655 |
05/31/2018 | 11025.345 | 12608.6325 | 13239.3369 | 10715.7993 |
06/30/2018 | 11024.6322 | 12600.2444 | 13233.0206 | 10702.6209 |
07/31/2018 | 11476.2682 | 12896.1549 | 13646.3345 | 10705.1619 |
08/31/2018 | 11299.2575 | 13036.5728 | 13815.1792 | 10774.0467 |
09/30/2018 | 11473.4082 | 13070.0277 | 13892.104 | 10704.6676 |
10/31/2018 | 11004.9345 | 12324.4287 | 12872.0373 | 10620.0741 |
11/30/2018 | 11197.727 | 12447.8246 | 13018.2615 | 10683.4727 |
12/31/2018 | 10692.1638 | 11795.1134 | 12028.3785 | 10879.7393 |
01/31/2019 | 11165.3008 | 12514.7251 | 12964.2573 | 10995.2773 |
02/28/2019 | 11325.6688 | 12795.1499 | 13354.0906 | 10988.9087 |
03/31/2019 | 11446.8494 | 12982.6158 | 13529.4894 | 11199.9166 |
04/30/2019 | 11803.3827 | 13328.7121 | 14009.2358 | 11202.782 |
05/31/2019 | 11190.5954 | 12811.0541 | 13200.8901 | 11401.6482 |
06/30/2019 | 11735.775 | 13484.4127 | 14070.7609 | 11544.8346 |
07/31/2019 | 11674.1254 | 13541.921 | 14140.4582 | 11570.2238 |
08/31/2019 | 11583.2064 | 13421.8997 | 13851.2213 | 11870.0302 |
09/30/2019 | 11949.6806 | 13618.2531 | 14145.9899 | 11806.8123 |
10/31/2019 | 12174.5335 | 13888.4201 | 14505.9686 | 11842.3764 |
11/30/2019 | 12257.6729 | 14176.7482 | 14909.9637 | 11836.3427 |
12/31/2019 | 12580.755 | 14492.8117 | 15356.6394 | 11828.0976 |
01/31/2020 | 12386.1866 | 14496.3784 | 15263.1682 | 12055.7234 |
02/29/2020 | 11526.9291 | 13642.6234 | 13973.0448 | 12272.7065 |
03/31/2020 | 9312.5587 | 12268.426 | 12123.8144 | 12200.4833 |
04/30/2020 | 10097.8433 | 13328.138 | 13448.2708 | 12417.3601 |
05/31/2020 | 10467.0317 | 13826.5465 | 14097.9331 | 12475.1769 |
06/30/2020 | 10687.2805 | 14122.6145 | 14470.8377 | 12553.758 |
07/31/2020 | 10934.8001 | 14682.0864 | 15163.1429 | 12741.2746 |
08/31/2020 | 11159.6535 | 15388.1891 | 16176.2576 | 12638.4313 |
09/30/2020 | 10780.8112 | 14987.9197 | 15618.1907 | 12631.4992 |
10/31/2020 | 10593.0346 | 14626.3723 | 15139.1022 | 12575.0965 |
11/30/2020 | 12078.6911 | 16064.8665 | 17074.8119 | 12698.4914 |
12/31/2020 | 12498.8485 | 16581.2227 | 17798.7274 | 12715.9864 |
01/31/2021 | 12695.1968 | 16427.9066 | 17621.8329 | 12624.817 |
02/28/2021 | 13128.5499 | 16684.314 | 18073.3803 | 12442.5048 |
03/31/2021 | 13570.861 | 17048.5724 | 18674.719 | 12287.1394 |
04/30/2021 | 13803.1149 | 17677.3262 | 19543.8431 | 12384.2096 |
05/31/2021 | 14132.9821 | 17882.752 | 19825.3813 | 12424.6696 |
06/30/2021 | 13977.523 | 18114.0665 | 20120.8745 | 12511.9637 |
07/31/2021 | 13993.3323 | 18408.0562 | 20481.2976 | 12651.8595 |
08/31/2021 | 14272.5108 | 18742.9043 | 20991.0431 | 12627.7727 |
09/30/2021 | 13894.1837 | 18118.6742 | 20119.4832 | 12518.4439 |
10/31/2021 | 14452.4358 | 18887.1147 | 21259.0619 | 12514.9938 |
11/30/2021 | 14295.1327 | 18590.6796 | 20793.2128 | 12552.0197 |
12/31/2021 | 15001.5348 | 19174.7125 | 21681.917 | 12519.9004 |
01/31/2022 | 15087.8288 | 18310.525 | 20534.7085 | 12250.172 |
02/28/2022 | 14647.893 | 17912.1323 | 20015.3596 | 12113.503 |
03/31/2022 | 14689.3904 | 18156.4024 | 20564.6499 | 11776.9683 |
04/30/2022 | 14017.2186 | 16852.9175 | 18856.2741 | 11330.0576 |
05/31/2022 | 14530.6992 | 16889.6563 | 18870.5558 | 11403.1101 |
06/30/2022 | 13423.3405 | 15726.1529 | 17235.9512 | 11224.2161 |
07/31/2022 | 13691.7097 | 16758.6665 | 18604.4217 | 11498.4738 |
08/31/2022 | 13312.9476 | 16114.7976 | 17826.6108 | 11173.5652 |
09/30/2022 | 12251.2618 | 14817.2114 | 16169.4523 | 10690.7981 |
10/31/2022 | 13012.7628 | 15567.2817 | 17330.6269 | 10552.327 |
11/30/2022 | 14095.4828 | 16522.2059 | 18535.6335 | 10940.3949 |
12/31/2022 | 13760.3738 | 15977.334 | 17748.4748 | 10891.0465 |
01/31/2023 | 14601.2351 | 16948.0856 | 19004.2874 | 11226.0979 |
02/28/2023 | 14537.0848 | 16532.9814 | 18547.4527 | 10935.8444 |
03/31/2023 | 14513.2809 | 17021.1245 | 19120.5636 | 11213.6426 |
04/30/2023 | 14892.0457 | 17270.692 | 19455.737 | 11281.6023 |
05/31/2023 | 14473.1294 | 17094.3629 | 19261.5027 | 11158.7602 |
06/30/2023 | 15013.9259 | 17854.4938 | 20426.3955 | 11118.9646 |
07/31/2023 | 15437.3 | 18301.2193 | 21112.5755 | 11111.2139 |
08/31/2023 | 15216.8431 | 17944.1406 | 20608.2862 | 11040.24 |
09/30/2023 | 14977.7232 | 17249.5813 | 19719.2775 | 10759.6881 |
10/31/2023 | 14701.453 | 16806.1446 | 19147.1067 | 10589.8898 |
11/30/2023 | 15573.9307 | 18178.1255 | 20942.1884 | 11069.4673 |
12/31/2023 | 16222.8636 | 19021.4164 | 21970.3293 | 11493.195 |
01/31/2024 | 16284.2824 | 19179.5571 | 22233.9831 | 11461.6339 |
02/29/2024 | 16314.9918 | 19721.6884 | 23176.6516 | 11299.6979 |
03/31/2024 | 17148.9407 | 20242.5314 | 23921.4297 | 11404.0404 |
04/30/2024 | 16918.6231 | 19550.778 | 23032.8744 | 11115.9877 |
05/31/2024 | 17580.0418 | 20288.3773 | 24061.3398 | 11304.4398 |
06/30/2024 | 17585.7243 | 20646.0169 | 24550.9362 | 11411.4668 |
07/31/2024 | 18248.5258 | 21039.4472 | 24983.5836 | 11678.0004 |
08/31/2024 | 18672.2149 | 21532.0945 | 25643.9116 | 11845.8158 |
09/30/2024 | 18696.1115 | 21899.9228 | 26113.5523 | 12004.424 |
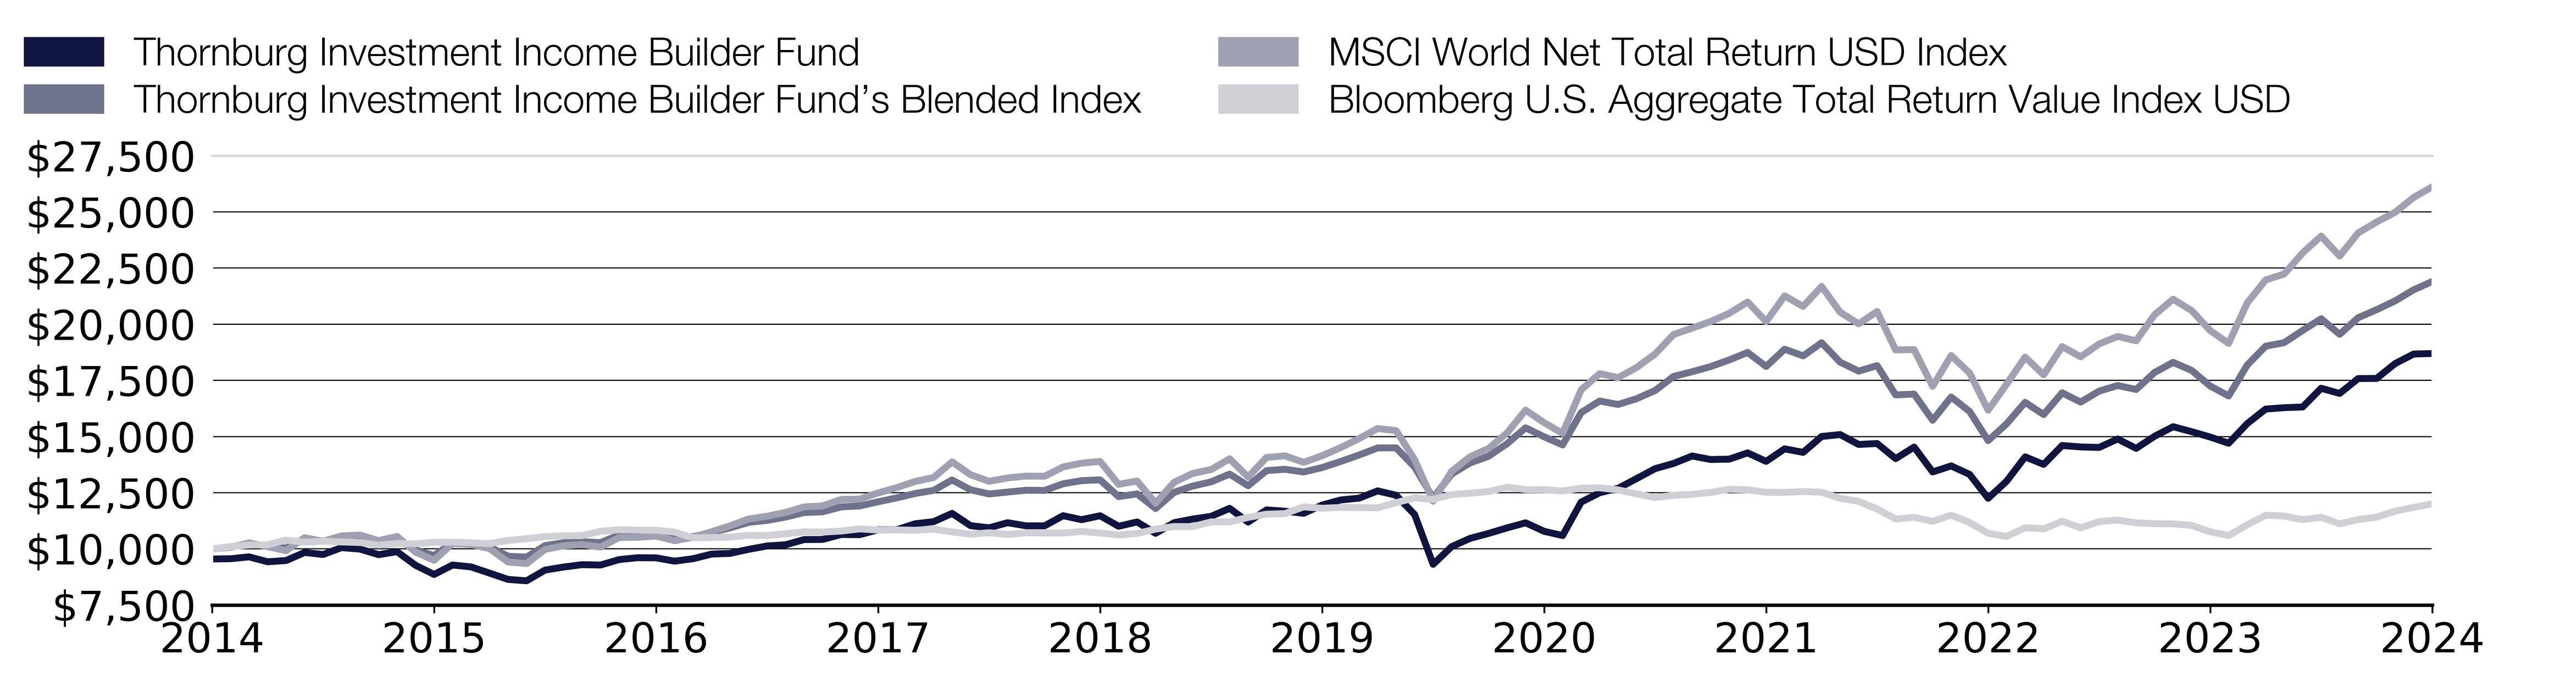
Effective September 30, 2024, the Fund adopted the MSCI World Net Total Return USD Index and the Bloomberg U.S. Aggregate Total Return Index Value USD as its broad-based securities market indices that represent the overall applicable markets in which the Fund invests, and a Blended Benchmark, comprised of 25% Bloomberg U.S. Aggregate Bond Total Return Value USD and 75% MSCI World Net Total Return USD Index, as an additional index that represents the market sectors which the Fund’s advisor believes are more representative of the Fund’s investment universe.
What were the Fund costs for the past year?
(based on a hypothetical $10,000 investment)
Class Name | Costs of a $10,000 investment | Costs paid as a percentage of a $10,000 investment |
|---|
Class A | $127.00 | 1.13% |
End Block
Thornburg Investment Income Builder Fund Tailored Shareholder Report
Thornburg Investment Income Builder Fund Tailored Shareholder Report | |
Annual Performance | 1 Year | 5 Year | 10 Year |
|---|
Investment Income Builder Fund Class A (with sales charge) | 19.24% | 8.37% | 6.46% |
Investment Income Builder Fund Class A (without sales charge) | 24.85% | 9.37% | 6.95% |
MSCI World Net Total Return USD Index | 32.43% | 13.04% | 10.07% |
Investment Income Builder Fund’s Blended Index | 26.96% | 9.97% | 8.15% |
Bloomberg U.S. Aggregate Total Return Value Index USD | 11.57% | 0.33% | 1.84% |
Key Fund Statistics
(as of September 30, 2024)
| |
|---|
Fund Size (Millions) | $13,932.0M |
Number of Holdings | 341 |
Annual Portfolio Turnover | 24.81% |
Total Advisory Fee | $87.8M |
What did the Fund invest in?
(as of September 30, 2024)
Portfolio Composition | (%) |
|---|
| Foreign Equity | 56.8 |
| Domestic Equity | 27.4 |
| Domestic Corporate Bonds | 4.5 |
| Domestic Other Bonds | 3.2 |
| Foreign Bonds | 2.8 |
| Other Assets Less Liabilities | 5.2 |
Portfolio Composition | (%) |
Foreign Equity | 56.8% |
Domestic Equity | 27.4% |
Domestic Corporate Bonds | 4.5% |
Domestic Other Bonds | 3.2% |
Foreign Bonds | 2.8% |
Other Assets Less Liabilities | 5.2% |

Expressed as a percentage of the Fund’s net assets.
How has the Fund changed?
This is a summary of certain changes to the Fund since October 1, 2023. For more complete information, you may review the Fund’s next prospectus, which we expect to be available by February 1, 2025 at https://www.thornburg.com/download or upon request by calling 1-800-847-0200.
End Block
Changes In and Disagreements with Accountants
No changes and/or disagreements occurred in the current reporting period.
End Block
For additional information about the Fund, including its prospectus, financial information, holdings and proxy information, visit www.thornburg.com/download.

Thornburg Investment Income Builder Fund Tailored Shareholder Report | |
Thornburg Investment Income Builder Fund Tailored Shareholder Report
Thornburg Investment Income Builder Fund CLASS: C TICKER: TIBCX Annual Shareholder Report | |
This annual shareholder report contains important information about the Thornburg Investment Income Builder Fund Class C Shares for the period from October 1, 2023 to September 30, 2024. You can find additional information about the Fund at https://www.thornburg.com/download. You can also request this information by contacting us at 1-800-847-0200. This report also describes changes to the Fund that occurred during the reporting period.
How did the Fund perform last year and what affected its performance?
The Fund’s Class C shares underperformed the benchmark composed of 25% Bloomberg U.S. Aggregate Bond Total Return Index Value USD and 75% MSCI World Net Total Return USD Index (the “Blended Index”) during the 12-month period ended September 30, 2024. During the period, major world events included the ongoing Russian/Ukraine conflict, moderating inflation figures in the U.S., Mideast tensions, and upcoming political contests in the U.S. Despite the conflicting economic and geo-political signals, the S&P 500, the Bloomberg U.S. Aggregate Bond, and the MSCI ACWI indexes reported varying positive returns for the period, +36.3%, +11.6%, and +31.8%, respectively. In brief, most equities repriced higher due to a surprising level of economic strength and resilient corporate profits, while interest rates declined along with inflation rates, creating a more favorable backdrop for the economy. A general overweight positioning to equities and underweight positioning to fixed income boosted the Fund’s relative performance during the period. Within equities, the Fund’s focus on dividend paying firms was a source of underperformance versus the broad based MSCI World Index. This underperformance is common during periods such as the current reporting period when growth stocks are outperforming. Security selection within the information technology and energy sectors, along with an overweight positioning to Taiwan, boosted relative performance. Mostly, the Fund’s equity holdings were relative detractors across the various sectors. Stock selection within the U.S. was beneficial to relative performance, however, the overall underweight positioning to U.S. stocks hampered performance. Among its fixed income holdings, the Fund’s shorter duration positioning during the period detracted from relative performance as yields across the curve declined during the period.
How did the Fund perform over the past 10 years?
The line graph below reflects a hypothetical $10,000 investment. The returns shown in the line graph and table assume the reinvestment of dividends and capital gains, but do not reflect the deduction of taxes that a shareholder would pay on distributions or the redemption of Fund shares. The performance information shown below represents past performance and is no guarantee of future results. For Fund performance current to the most recent month end, visit https://www.thornburg.com/product/mutual-funds/fib/TIBCX or call 1-800-847-0200. Performance for other share classes of the Fund will vary.
Cumulative Performance
Growth Table
Date | Thornburg Investment Income Builder Fund | Thornburg Investment Income Builder Fund’s Blended Index | MSCI World Net Total Return USD Index | Bloomberg U.S. Aggregate Total Return Value Index USD |
09/30/2014 | 10000.006 | 10000 | 10000 | 10000 |
10/31/2014 | 10006.1193 | 10073.0867 | 10064.69 | 10098.2769 |
11/30/2014 | 10087.3471 | 10242.3546 | 10266.3941 | 10169.91 |
12/31/2014 | 9853.8977 | 10120.8813 | 10100.8476 | 10179.4256 |
01/31/2015 | 9904.4979 | 10036.3974 | 9917.8235 | 10392.8789 |
02/28/2015 | 10274.4904 | 10453.8199 | 10498.8953 | 10295.1602 |
03/31/2015 | 10173.77 | 10343.2268 | 10334.5512 | 10342.967 |
04/30/2015 | 10488.1876 | 10515.8799 | 10576.9224 | 10305.856 |
05/31/2015 | 10410.955 | 10536.7172 | 10613.3579 | 10281.0356 |
06/30/2015 | 10148.3391 | 10324.242 | 10366.5728 | 10168.9318 |
07/31/2015 | 10281.4138 | 10481.1738 | 10552.6529 | 10239.6187 |
08/31/2015 | 9646.7727 | 9957.2209 | 9854.3359 | 10224.9146 |
09/30/2015 | 9211.3269 | 9698.6094 | 9490.8635 | 10294.0811 |
10/31/2015 | 9643.2547 | 10275.4309 | 10242.9602 | 10295.7875 |
11/30/2015 | 9549.368 | 10230.2994 | 10191.9941 | 10268.5908 |
12/31/2015 | 9257.5298 | 10087.1673 | 10012.846 | 10235.4031 |
01/31/2016 | 8961.9787 | 9669.277 | 9413.8342 | 10376.2558 |
02/29/2016 | 8892.486 | 9632.4537 | 9343.7725 | 10449.8664 |
03/31/2016 | 9383.1318 | 10144.7832 | 9977.8307 | 10545.7404 |
04/30/2016 | 9517.262 | 10274.9142 | 10135.7163 | 10586.2218 |
05/31/2016 | 9621.4687 | 10318.8548 | 10192.6431 | 10588.9383 |
06/30/2016 | 9598.0899 | 10278.4873 | 10078.4316 | 10779.1979 |
07/31/2016 | 9842.2199 | 10620.4196 | 10504.2293 | 10847.3436 |
08/31/2016 | 9922.7614 | 10624.0038 | 10512.9592 | 10834.9414 |
09/30/2016 | 9910.7573 | 10664.7736 | 10568.8037 | 10828.5941 |
10/31/2016 | 9753.1336 | 10489.5834 | 10364.2659 | 10745.7655 |
11/30/2016 | 9859.6668 | 10540.6767 | 10513.2948 | 10491.5864 |
12/31/2016 | 10062.4219 | 10733.5596 | 10764.8605 | 10506.3861 |
01/31/2017 | 10094.8963 | 10933.1167 | 11024.6716 | 10527.0016 |
02/28/2017 | 10267.7966 | 11178.9791 | 11330.5349 | 10597.7522 |
03/31/2017 | 10417.9102 | 11266.8226 | 11451.2272 | 10592.197 |
04/30/2017 | 10465.5773 | 11413.6778 | 11620.783 | 10673.9358 |
05/31/2017 | 10696.7363 | 11616.7289 | 11866.6147 | 10756.0945 |
06/30/2017 | 10701.5728 | 11647.3279 | 11912.2713 | 10745.2712 |
07/31/2017 | 10920.7351 | 11868.9197 | 12197.361 | 10791.5097 |
08/31/2017 | 10901.3841 | 11908.0687 | 12214.5364 | 10888.3034 |
09/30/2017 | 11118.7596 | 12094.3409 | 12488.6825 | 10836.4459 |
10/31/2017 | 11115.9404 | 12267.5162 | 12724.6997 | 10842.724 |
11/30/2017 | 11385.9106 | 12462.9349 | 13000.4127 | 10828.8068 |
12/31/2017 | 11470.7579 | 12603.6423 | 13176.2249 | 10878.506 |
01/31/2018 | 11841.7339 | 13066.4582 | 13871.9304 | 10753.2186 |
02/28/2018 | 11273.5209 | 12629.5108 | 13297.2527 | 10651.2843 |
03/31/2018 | 11169.7693 | 12443.3 | 13007.4202 | 10719.5896 |
04/30/2018 | 11394.2868 | 12527.4041 | 13156.8892 | 10639.8655 |
05/31/2018 | 11245.4687 | 12608.6325 | 13239.3369 | 10715.7993 |
06/30/2018 | 11238.0009 | 12600.2444 | 13233.0206 | 10702.6209 |
07/31/2018 | 11691.3999 | 12896.1549 | 13646.3345 | 10705.1619 |
08/31/2018 | 11503.3032 | 13036.5728 | 13815.1792 | 10774.0467 |
09/30/2018 | 11673.8413 | 13070.0277 | 13892.104 | 10704.6676 |
10/31/2018 | 11189.6791 | 12324.4287 | 12872.0373 | 10620.0741 |
11/30/2018 | 11379.0385 | 12447.8246 | 13018.2615 | 10683.4727 |
12/31/2018 | 10852.5217 | 11795.1134 | 12028.3785 | 10879.7393 |
01/31/2019 | 11332.1381 | 12514.7251 | 12964.2573 | 10995.2773 |
02/28/2019 | 11488.7509 | 12795.1499 | 13354.0906 | 10988.9087 |
03/31/2019 | 11604.5201 | 12982.6158 | 13529.4894 | 11199.9166 |
04/30/2019 | 11954.1198 | 13328.7121 | 14009.2358 | 11202.782 |
05/31/2019 | 11330.7055 | 12811.0541 | 13200.8901 | 11401.6482 |
06/30/2019 | 11871.2877 | 13484.4127 | 14070.7609 | 11544.8346 |
07/31/2019 | 11801.795 | 13541.921 | 14140.4582 | 11570.2238 |
08/31/2019 | 11702.82 | 13421.8997 | 13851.2213 | 11870.0302 |
09/30/2019 | 12067.1104 | 13618.2531 | 14145.9899 | 11806.8123 |
10/31/2019 | 12292.387 | 13888.4201 | 14505.9686 | 11842.3764 |
11/30/2019 | 12363.2446 | 14176.7482 | 14909.9637 | 11836.3427 |
12/31/2019 | 12682.6003 | 14492.8117 | 15356.6394 | 11828.0976 |
01/31/2020 | 12478.2018 | 14496.3784 | 15263.1682 | 12055.7234 |
02/29/2020 | 11603.4576 | 13642.6234 | 13973.0448 | 12272.7065 |
03/31/2020 | 9365.7033 | 12268.426 | 12123.8144 | 12200.4833 |
04/30/2020 | 10150.6172 | 13328.138 | 13448.2708 | 12417.3601 |
05/31/2020 | 10510.5864 | 13826.5465 | 14097.9331 | 12475.1769 |
06/30/2020 | 10726.1153 | 14122.6145 | 14470.8377 | 12553.758 |
07/31/2020 | 10974.1097 | 14682.0864 | 15163.1429 | 12741.2746 |
08/31/2020 | 11187.6785 | 15388.1891 | 16176.2576 | 12638.4313 |
09/30/2020 | 10806.6798 | 14987.9197 | 15618.1907 | 12631.4992 |
10/31/2020 | 10611.1234 | 14626.3723 | 15139.1022 | 12575.0965 |
11/30/2020 | 12095.7796 | 16064.8665 | 17074.8119 | 12698.4914 |
12/31/2020 | 12504.6796 | 16581.2227 | 17798.7274 | 12715.9864 |
01/31/2021 | 12692.8315 | 16427.9066 | 17621.8329 | 12624.817 |
02/28/2021 | 13119.1169 | 16684.314 | 18073.3803 | 12442.5048 |
03/31/2021 | 13553.3117 | 17048.5724 | 18674.719 | 12287.1394 |
04/30/2021 | 13776.7167 | 17677.3262 | 19543.8431 | 12384.2096 |
05/31/2021 | 14091.6048 | 17882.752 | 19825.3813 | 12424.6696 |
06/30/2021 | 13933.0645 | 18114.0665 | 20120.8745 | 12511.9637 |
07/31/2021 | 13939.6377 | 18408.0562 | 20481.2976 | 12651.8595 |
08/31/2021 | 14209.0203 | 18742.9043 | 20991.0431 | 12627.7727 |
09/30/2021 | 13822.7948 | 18118.6742 | 20119.4832 | 12518.4439 |
10/31/2021 | 14369.6496 | 18887.1147 | 21259.0619 | 12514.9938 |
11/30/2021 | 14203.4347 | 18590.6796 | 20793.2128 | 12552.0197 |
12/31/2021 | 14892.5591 | 19174.7125 | 21681.917 | 12519.9004 |
01/31/2022 | 14968.3749 | 18310.525 | 20534.7085 | 12250.172 |
02/28/2022 | 14521.9149 | 17912.1323 | 20015.3596 | 12113.503 |
03/31/2022 | 14559.5566 | 18156.4024 | 20564.6499 | 11776.9683 |
04/30/2022 | 13882.9367 | 16852.9175 | 18856.2741 | 11330.0576 |
05/31/2022 | 14377.1095 | 16889.6563 | 18870.5558 | 11403.1101 |
06/30/2022 | 13275.128 | 15726.1529 | 17235.9512 | 11224.2161 |
07/31/2022 | 13532.333 | 16758.6665 | 18604.4217 | 11498.4738 |
08/31/2022 | 13154.5961 | 16114.7976 | 17826.6108 | 11173.5652 |
09/30/2022 | 12090.2961 | 14817.2114 | 16169.4523 | 10690.7981 |
10/31/2022 | 12835.0987 | 15567.2817 | 17330.6269 | 10552.327 |
11/30/2022 | 13903.8525 | 16522.2059 | 18535.6335 | 10940.3949 |
12/31/2022 | 13565.2694 | 15977.334 | 17748.4748 | 10891.0465 |
01/31/2023 | 14379.9154 | 16948.0856 | 19004.2874 | 11226.0979 |
02/28/2023 | 14308.3826 | 16532.9814 | 18547.4527 | 10935.8444 |
03/31/2023 | 14275.1388 | 17021.1245 | 19120.5636 | 11213.6426 |
04/30/2023 | 14639.5661 | 17270.692 | 19455.737 | 11281.6023 |
05/31/2023 | 14217.8068 | 17094.3629 | 19261.5027 | 11158.7602 |
06/30/2023 | 14741.8045 | 17854.4938 | 20426.3955 | 11118.9646 |
07/31/2023 | 15145.3117 | 18301.2193 | 21112.5755 | 11111.2139 |
08/31/2023 | 14925.7105 | 17944.1406 | 20608.2862 | 11040.24 |
09/30/2023 | 14682.2229 | 17249.5813 | 19719.2775 | 10759.6881 |
10/31/2023 | 14401.606 | 16806.1446 | 19147.1067 | 10589.8898 |
11/30/2023 | 15249.129 | 18178.1255 | 20942.1884 | 11069.4673 |
12/31/2023 | 15871.1613 | 19021.4164 | 21970.3293 | 11493.195 |
01/31/2024 | 15920.874 | 19179.5571 | 22233.9831 | 11461.6339 |
02/29/2024 | 15941.1684 | 19721.6884 | 23176.6516 | 11299.6979 |
03/31/2024 | 16747.3006 | 20242.5314 | 23921.4297 | 11404.0404 |
04/30/2024 | 16511.4523 | 19550.778 | 23032.8744 | 11115.9877 |
05/31/2024 | 17147.567 | 20288.3773 | 24061.3398 | 11304.4398 |
06/30/2024 | 17142.4375 | 20646.0169 | 24550.9362 | 11411.4668 |
07/31/2024 | 17778.3772 | 21039.4472 | 24983.5836 | 11678.0004 |
08/31/2024 | 18180.728 | 21532.0945 | 25643.9116 | 11845.8158 |
09/30/2024 | 18186.007 | 21899.9228 | 26113.5523 | 12004.424 |

Effective September 30, 2024, the Fund adopted the MSCI World Net Total Return USD Index and the Bloomberg U.S. Aggregate Total Return Index Value USD as its broad-based securities market indices that represent the overall applicable markets in which the Fund invests, and a Blended Benchmark, comprised of 25% Bloomberg U.S. Aggregate Bond Total Return Value USD and 75% MSCI World Net Total Return USD Index, as an additional index that represents the market sectors which the Fund’s advisor believes are more representative of the Fund’s investment universe.
What were the Fund costs for the past year?
(based on a hypothetical $10,000 investment)
Class Name | Costs of a $10,000 investment | Costs paid as a percentage of a $10,000 investment |
|---|
Class C | $212.00 | 1.89% |
End Block
Thornburg Investment Income Builder Fund Tailored Shareholder Report
Thornburg Investment Income Builder Fund Tailored Shareholder Report | |
Annual Performance | 1 Year | 5 Year | 10 Year |
|---|
Investment Income Builder Fund Class C (with sales charge) | 22.88% | 8.55% | 6.16% |
Investment Income Builder Fund Class C (without sales charge) | 23.88% | 8.55% | 6.16% |
MSCI World Net Total Return USD Index | 32.43% | 13.04% | 10.07% |
Investment Income Builder Fund’s Blended Index | 26.96% | 9.97% | 8.15% |
Bloomberg U.S. Aggregate Total Return Value Index USD | 11.57% | 0.33% | 1.84% |
Key Fund Statistics
(as of September 30, 2024)
| |
|---|
Fund Size (Millions) | $13,932.0M |
Number of Holdings | 341 |
Annual Portfolio Turnover | 24.81% |
Total Advisory Fee | $87.8M |
What did the Fund invest in?
(as of September 30, 2024)
Portfolio Composition | (%) |
|---|
| Foreign Equity | 56.8 |
| Domestic Equity | 27.4 |
| Domestic Corporate Bonds | 4.5 |
| Domestic Other Bonds | 3.2 |
| Foreign Bonds | 2.8 |
| Other Assets Less Liabilities | 5.2 |
Portfolio Composition | (%) |
Foreign Equity | 56.8% |
Domestic Equity | 27.4% |
Domestic Corporate Bonds | 4.5% |
Domestic Other Bonds | 3.2% |
Foreign Bonds | 2.8% |
Other Assets Less Liabilities | 5.2% |
Expressed as a percentage of the Fund’s net assets.
How has the Fund changed?
This is a summary of certain changes to the Fund since October 1, 2023. For more complete information, you may review the Fund’s next prospectus, which we expect to be available by February 1, 2025 at https://www.thornburg.com/download or upon request by calling 1-800-847-0200.
End Block
Changes In and Disagreements with Accountants
No changes and/or disagreements occurred in the current reporting period.
End Block
For additional information about the Fund, including its prospectus, financial information, holdings and proxy information, visit www.thornburg.com/download.

Thornburg Investment Income Builder Fund Tailored Shareholder Report | |
Thornburg Investment Income Builder Fund Tailored Shareholder Report
Thornburg Investment Income Builder Fund CLASS: I TICKER: TIBIX Annual Shareholder Report | |
This annual shareholder report contains important information about the Thornburg Investment Income Builder Fund Class I Shares for the period from October 1, 2023 to September 30, 2024. You can find additional information about the Fund at https://www.thornburg.com/download. You can also request this information by contacting us at 1-800-847-0200. This report also describes changes to the Fund that occurred during the reporting period.
How did the Fund perform last year and what affected its performance?
The Fund’s Class I shares underperformed the benchmark composed of 25% Bloomberg U.S. Aggregate Bond Total Return Index Value USD and 75% MSCI World Net Total Return USD Index (the “Blended Index”) during the 12-month period ended September 30, 2024. During the period, major world events included the ongoing Russian/Ukraine conflict, moderating inflation figures in the U.S., Mideast tensions, and upcoming political contests in the U.S. Despite the conflicting economic and geo-political signals, the S&P 500, the Bloomberg U.S. Aggregate Bond, and the MSCI ACWI indexes reported varying positive returns for the period, +36.3%, +11.6%, and +31.8%, respectively. In brief, most equities repriced higher due to a surprising level of economic strength and resilient corporate profits, while interest rates declined along with inflation rates, creating a more favorable backdrop for the economy. A general overweight positioning to equities and underweight positioning to fixed income boosted the Fund’s relative performance during the period. Within equities, the Fund’s focus on dividend paying firms was a source of underperformance versus the broad based MSCI World Index. This underperformance is common during periods such as the current reporting period when growth stocks are outperforming. Security selection within the information technology and energy sectors, along with an overweight positioning to Taiwan, boosted relative performance. Mostly, the Fund’s equity holdings were relative detractors across the various sectors. Stock selection within the U.S. was beneficial to relative performance, however, the overall underweight positioning to U.S. stocks hampered performance. Among its fixed income holdings, the Fund’s shorter duration positioning during the period detracted from relative performance as yields across the curve declined during the period.
How did the Fund perform over the past 10 years?
The line graph below reflects a hypothetical $10,000 investment. The returns shown in the line graph and table assume the reinvestment of dividends and capital gains, but do not reflect the deduction of taxes that a shareholder would pay on distributions or the redemption of Fund shares. The performance information shown below represents past performance and is no guarantee of future results. For Fund performance current to the most recent month end, visit https://www.thornburg.com/product/mutual-funds/fib/TIBIX or call 1-800-847-0200. Performance for other share classes of the Fund will vary.
Cumulative Performance
Growth Table
Date | Thornburg Investment Income Builder Fund | Thornburg Investment Income Builder Fund’s Blended Index | MSCI World Net Total Return USD Index | Bloomberg U.S. Aggregate Total Return Value Index USD |
09/30/2014 | 9999.996 | 10000 | 10000 | 10000 |
10/31/2014 | 10015.0382 | 10073.0867 | 10064.69 | 10098.2769 |
11/30/2014 | 10104.6021 | 10242.3546 | 10266.3941 | 10169.91 |
12/31/2014 | 9880.0996 | 10120.8813 | 10100.8476 | 10179.4256 |
01/31/2015 | 9939.5484 | 10036.3974 | 9917.8235 | 10392.8789 |
02/28/2015 | 10320.7348 | 10453.8199 | 10498.8953 | 10295.1602 |
03/31/2015 | 10224.9708 | 10343.2268 | 10334.5512 | 10342.967 |
04/30/2015 | 10552.489 | 10515.8799 | 10576.9224 | 10305.856 |
05/31/2015 | 10480.3197 | 10536.7172 | 10613.3579 | 10281.0356 |
06/30/2015 | 10226.7677 | 10324.242 | 10366.5728 | 10168.9318 |
07/31/2015 | 10369.0431 | 10481.1738 | 10552.6529 | 10239.6187 |
08/31/2015 | 9738.6443 | 9957.2209 | 9854.3359 | 10224.9146 |
09/30/2015 | 9311.1707 | 9698.6094 | 9490.8635 | 10294.0811 |
10/31/2015 | 9752.9734 | 10275.4309 | 10242.9602 | 10295.7875 |
11/30/2015 | 9667.2898 | 10230.2994 | 10191.9941 | 10268.5908 |
12/31/2015 | 9376.3208 | 10087.1673 | 10012.846 | 10235.4031 |
01/31/2016 | 9087.1284 | 9669.277 | 9413.8342 | 10376.2558 |
02/29/2016 | 9024.6026 | 9632.4537 | 9343.7725 | 10449.8664 |
03/31/2016 | 9526.4755 | 10144.7832 | 9977.8307 | 10545.7404 |
04/30/2016 | 9674.9104 | 10274.9142 | 10135.7163 | 10586.2218 |
05/31/2016 | 9788.5738 | 10318.8548 | 10192.6431 | 10588.9383 |
06/30/2016 | 9774.2417 | 10278.4873 | 10078.4316 | 10779.1979 |
07/31/2016 | 10029.6416 | 10620.4196 | 10504.2293 | 10847.3436 |
08/31/2016 | 10120.2395 | 10624.0038 | 10512.9592 | 10834.9414 |
09/30/2016 | 10122.1883 | 10664.7736 | 10568.8037 | 10828.5941 |
10/31/2016 | 9966.4467 | 10489.5834 | 10364.2659 | 10745.7655 |
11/30/2016 | 10082.9683 | 10540.6767 | 10513.2948 | 10491.5864 |
12/31/2016 | 10301.1495 | 10733.5596 | 10764.8605 | 10506.3861 |
01/31/2017 | 10343.3838 | 10933.1167 | 11024.6716 | 10527.0016 |
02/28/2017 | 10527.3713 | 11178.9791 | 11330.5349 | 10597.7522 |
03/31/2017 | 10689.3579 | 11266.8226 | 11451.2272 | 10592.197 |
04/30/2017 | 10752.3602 | 11413.6778 | 11620.783 | 10673.9358 |
05/31/2017 | 10997.5465 | 11616.7289 | 11866.6147 | 10756.0945 |
06/30/2017 | 11006.9238 | 11647.3279 | 11912.2713 | 10745.2712 |
07/31/2017 | 11245.849 | 11868.9197 | 12197.361 | 10791.5097 |
08/31/2017 | 11236.1982 | 11908.0687 | 12214.5364 | 10888.3034 |
09/30/2017 | 11468.091 | 12094.3409 | 12488.6825 | 10836.4459 |
10/31/2017 | 11475.7266 | 12267.5162 | 12724.6997 | 10842.724 |
11/30/2017 | 11762.1862 | 12462.9349 | 13000.4127 | 10828.8068 |
12/31/2017 | 11863.9209 | 12603.6423 | 13176.2249 | 10878.506 |
01/31/2018 | 12261.0001 | 13066.4582 | 13871.9304 | 10753.2186 |
02/28/2018 | 11676.6864 | 12629.5108 | 13297.2527 | 10651.2843 |
03/31/2018 | 11580.9958 | 12443.3 | 13007.4202 | 10719.5896 |
04/30/2018 | 11821.8151 | 12527.4041 | 13156.8892 | 10639.8655 |
05/31/2018 | 11679.1304 | 12608.6325 | 13239.3369 | 10715.7993 |
06/30/2018 | 11681.1752 | 12600.2444 | 13233.0206 | 10702.6209 |
07/31/2018 | 12164.618 | 12896.1549 | 13646.3345 | 10705.1619 |
08/31/2018 | 11981.2661 | 13036.5728 | 13815.1792 | 10774.0467 |
09/30/2018 | 12167.3558 | 13070.0277 | 13892.104 | 10704.6676 |
10/31/2018 | 11671.4541 | 12324.4287 | 12872.0373 | 10620.0741 |
11/30/2018 | 11882.7464 | 12447.8246 | 13018.2615 | 10683.4727 |
12/31/2018 | 11342.0757 | 11795.1134 | 12028.3785 | 10879.7393 |
01/31/2019 | 11854.4358 | 12514.7251 | 12964.2573 | 10995.2773 |
02/28/2019 | 12025.9286 | 12795.1499 | 13354.0906 | 10988.9087 |
03/31/2019 | 12156.7468 | 12982.6158 | 13529.4894 | 11199.9166 |
04/30/2019 | 12535.1532 | 13328.7121 | 14009.2358 | 11202.782 |
05/31/2019 | 11886.3101 | 12811.0541 | 13200.8901 | 11401.6482 |
06/30/2019 | 12463.8047 | 13484.4127 | 14070.7609 | 11544.8346 |
07/31/2019 | 12401.5645 | 13541.921 | 14140.4582 | 11570.2238 |
08/31/2019 | 12308.4714 | 13421.8997 | 13851.2213 | 11870.0302 |
09/30/2019 | 12703.3362 | 13618.2531 | 14145.9899 | 11806.8123 |
10/31/2019 | 12943.6047 | 13888.4201 | 14505.9686 | 11842.3764 |
11/30/2019 | 13034.3343 | 14176.7482 | 14909.9637 | 11836.3427 |
12/31/2019 | 13378.2285 | 14492.8117 | 15356.6394 | 11828.0976 |
01/31/2020 | 13175.9325 | 14496.3784 | 15263.1682 | 12055.7234 |
02/29/2020 | 12265.675 | 13642.6234 | 13973.0448 | 12272.7065 |
03/31/2020 | 9913.0529 | 12268.426 | 12123.8144 | 12200.4833 |
04/30/2020 | 10751.0129 | 13328.138 | 13448.2708 | 12417.3601 |
05/31/2020 | 11143.2836 | 13826.5465 | 14097.9331 | 12475.1769 |
06/30/2020 | 11378.1236 | 14122.6145 | 14470.8377 | 12553.758 |
07/31/2020 | 11648.271 | 14682.0864 | 15163.1429 | 12741.2746 |
08/31/2020 | 11888.4439 | 15388.1891 | 16176.2576 | 12638.4313 |
09/30/2020 | 11489.996 | 14987.9197 | 15618.1907 | 12631.4992 |
10/31/2020 | 11287.6059 | 14626.3723 | 15139.1022 | 12575.0965 |
11/30/2020 | 12873.4585 | 16064.8665 | 17074.8119 | 12698.4914 |
12/31/2020 | 13326.5779 | 16581.2227 | 17798.7274 | 12715.9864 |
01/31/2021 | 13537.2106 | 16427.9066 | 17621.8329 | 12624.817 |
02/28/2021 | 14004.6184 | 16684.314 | 18073.3803 | 12442.5048 |
03/31/2021 | 14475.7821 | 17048.5724 | 18674.719 | 12287.1394 |
04/30/2021 | 14724.7735 | 17677.3262 | 19543.8431 | 12384.2096 |
05/31/2021 | 15077.2848 | 17882.752 | 19825.3813 | 12424.6696 |
06/30/2021 | 14916.0284 | 18114.0665 | 20120.8745 | 12511.9637 |
07/31/2021 | 14936.785 | 18408.0562 | 20481.2976 | 12651.8595 |
08/31/2021 | 15242.9689 | 18742.9043 | 20991.0431 | 12627.7727 |
09/30/2021 | 14839.7713 | 18118.6742 | 20119.4832 | 12518.4439 |
10/31/2021 | 15441.3939 | 18887.1147 | 21259.0619 | 12514.9938 |
11/30/2021 | 15271.6518 | 18590.6796 | 20793.2128 | 12552.0197 |
12/31/2021 | 16030.4615 | 19174.7125 | 21681.917 | 12519.9004 |
01/31/2022 | 16125.843 | 18310.525 | 20534.7085 | 12250.172 |
02/28/2022 | 15656.155 | 17912.1323 | 20015.3596 | 12113.503 |
03/31/2022 | 15710.3024 | 18156.4024 | 20564.6499 | 11776.9683 |
04/30/2022 | 14993.759 | 16852.9175 | 18856.2741 | 11330.0576 |
05/31/2022 | 15542.2371 | 16889.6563 | 18870.5558 | 11403.1101 |
06/30/2022 | 14364.0028 | 15726.1529 | 17235.9512 | 11224.2161 |
07/31/2022 | 14652.417 | 16758.6665 | 18604.4217 | 11498.4738 |
08/31/2022 | 14253.6782 | 16114.7976 | 17826.6108 | 11173.5652 |
09/30/2022 | 13115.4337 | 14817.2114 | 16169.4523 | 10690.7981 |
10/31/2022 | 13934.7399 | 15567.2817 | 17330.6269 | 10552.327 |
11/30/2022 | 15102.1755 | 16522.2059 | 18535.6335 | 10940.3949 |
12/31/2022 | 14742.6691 | 15977.334 | 17748.4748 | 10891.0465 |
01/31/2023 | 15647.168 | 16948.0856 | 19004.2874 | 11226.0979 |
02/28/2023 | 15582.2263 | 16532.9814 | 18547.4527 | 10935.8444 |
03/31/2023 | 15560.9396 | 17021.1245 | 19120.5636 | 11213.6426 |
04/30/2023 | 15967.3867 | 17270.692 | 19455.737 | 11281.6023 |
05/31/2023 | 15518.4259 | 17094.3629 | 19261.5027 | 11158.7602 |
06/30/2023 | 16104.4 | 17854.4938 | 20426.3955 | 11118.9646 |
07/31/2023 | 16557.8746 | 18301.2193 | 21112.5755 | 11111.2139 |
08/31/2023 | 16327.1209 | 17944.1406 | 20608.2862 | 11040.24 |
09/30/2023 | 16076.0482 | 17249.5813 | 19719.2775 | 10759.6881 |
10/31/2023 | 15785.69 | 16806.1446 | 19147.1067 | 10589.8898 |
11/30/2023 | 16725.8946 | 18178.1255 | 20942.1884 | 11069.4673 |
12/31/2023 | 17420.7858 | 19021.4164 | 21970.3293 | 11493.195 |
01/31/2024 | 17490.3509 | 19179.5571 | 22233.9831 | 11461.6339 |
02/29/2024 | 17526.9209 | 19721.6884 | 23176.6516 | 11299.6979 |
03/31/2024 | 18420.0358 | 20242.5314 | 23921.4297 | 11404.0404 |
04/30/2024 | 18185.8363 | 19550.778 | 23032.8744 | 11115.9877 |
05/31/2024 | 18902.75 | 20288.3773 | 24061.3398 | 11304.4398 |
06/30/2024 | 18905.7536 | 20646.0169 | 24550.9362 | 11411.4668 |
07/31/2024 | 19624.7571 | 21039.4472 | 24983.5836 | 11678.0004 |
08/31/2024 | 20088.6877 | 21532.0945 | 25643.9116 | 11845.8158 |
09/30/2024 | 20111.2964 | 21899.9228 | 26113.5523 | 12004.424 |

Effective September 30, 2024, the Fund adopted the MSCI World Net Total Return USD Index and the Bloomberg U.S. Aggregate Total Return Index Value USD as its broad-based securities market indices that represent the overall applicable markets in which the Fund invests, and a Blended Benchmark, comprised of 25% Bloomberg U.S. Aggregate Bond Total Return Value USD and 75% MSCI World Net Total Return USD Index, as an additional index that represents the market sectors which the Fund’s advisor believes are more representative of the Fund’s investment universe.
What were the Fund costs for the past year?
(based on a hypothetical $10,000 investment)
Class Name | Costs of a $10,000 investment | Costs paid as a percentage of a $10,000 investment |
|---|
Class I | $100.00 | 0.89% |
End Block
Thornburg Investment Income Builder Fund Tailored Shareholder Report
Thornburg Investment Income Builder Fund Tailored Shareholder Report | |
Annual Performance | 1 Year | 5 Year | 10 Year |
|---|
Investment Income Builder Fund Class I | 25.12% | 9.62% | 7.24% |
MSCI World Net Total Return USD Index | 32.43% | 13.04% | 10.07% |
Investment Income Builder Fund’s Blended Index | 26.96% | 9.97% | 8.15% |
Bloomberg U.S. Aggregate Total Return Value Index USD | 11.57% | 0.33% | 1.84% |
Key Fund Statistics
(as of September 30, 2024)
| |
|---|
Fund Size (Millions) | $13,932.0M |
Number of Holdings | 341 |
Annual Portfolio Turnover | 24.81% |
Total Advisory Fee | $87.8M |
What did the Fund invest in?
(as of September 30, 2024)
Portfolio Composition | (%) |
|---|
| Foreign Equity | 56.8 |
| Domestic Equity | 27.4 |
| Domestic Corporate Bonds | 4.5 |
| Domestic Other Bonds | 3.2 |
| Foreign Bonds | 2.8 |
| Other Assets Less Liabilities | 5.2 |
Portfolio Composition | (%) |
Foreign Equity | 56.8% |
Domestic Equity | 27.4% |
Domestic Corporate Bonds | 4.5% |
Domestic Other Bonds | 3.2% |
Foreign Bonds | 2.8% |
Other Assets Less Liabilities | 5.2% |
Expressed as a percentage of the Fund’s net assets.
How has the Fund changed?
This is a summary of certain changes to the Fund since October 1, 2023. For more complete information, you may review the Fund’s next prospectus, which we expect to be available by February 1, 2025 at https://www.thornburg.com/download or upon request by calling 1-800-847-0200.
End Block
Changes In and Disagreements with Accountants
No changes and/or disagreements occurred in the current reporting period.
End Block
For additional information about the Fund, including its prospectus, financial information, holdings and proxy information, visit www.thornburg.com/download.

Thornburg Investment Income Builder Fund Tailored Shareholder Report | |
Thornburg Investment Income Builder Fund Tailored Shareholder Report
Thornburg Investment Income Builder Fund CLASS: R3 TICKER: TIBRX Annual Shareholder Report | |
This annual shareholder report contains important information about the Thornburg Investment Income Builder Fund Class R3 Shares for the period from October 1, 2023 to September 30, 2024. You can find additional information about the Fund at https://www.thornburg.com/download. You can also request this information by contacting us at 1-800-847-0200. This report also describes changes to the Fund that occurred during the reporting period.
How did the Fund perform last year and what affected its performance?
The Fund’s Class R3 shares underperformed the benchmark composed of 25% Bloomberg U.S. Aggregate Bond Total Return Index Value USD and 75% MSCI World Net Total Return USD Index (the “Blended Index”) during the 12-month period ended September 30, 2024. During the period, major world events included the ongoing Russian/Ukraine conflict, moderating inflation figures in the U.S., Mideast tensions, and upcoming political contests in the U.S. Despite the conflicting economic and geo-political signals, the S&P 500, the Bloomberg U.S. Aggregate Bond, and the MSCI ACWI indexes reported varying positive returns for the period, +36.3%, +11.6%, and +31.8%, respectively. In brief, most equities repriced higher due to a surprising level of economic strength and resilient corporate profits, while interest rates declined along with inflation rates, creating a more favorable backdrop for the economy. A general overweight positioning to equities and underweight positioning to fixed income boosted the Fund’s relative performance during the period. Within equities, the Fund’s focus on dividend paying firms was a source of underperformance versus the broad based MSCI World Index. This underperformance is common during periods such as the current reporting period when growth stocks are outperforming. Security selection within the information technology and energy sectors, along with an overweight positioning to Taiwan, boosted relative performance. Mostly, the Fund’s equity holdings were relative detractors across the various sectors. Stock selection within the U.S. was beneficial to relative performance, however, the overall underweight positioning to U.S. stocks hampered performance. Among its fixed income holdings, the Fund’s shorter duration positioning during the period detracted from relative performance as yields across the curve declined during the period.
How did the Fund perform over the past 10 years?
The line graph below reflects a hypothetical $10,000 investment. The returns shown in the line graph and table assume the reinvestment of dividends and capital gains, but do not reflect the deduction of taxes that a shareholder would pay on distributions or the redemption of Fund shares. The performance information shown below represents past performance and is no guarantee of future results. For Fund performance current to the most recent month end, visit https://www.thornburg.com/product/mutual-funds/fib/TIBRX or call 1-800-847-0200. Performance for other share classes of the Fund will vary.
Cumulative Performance
Growth Table
Date | Thornburg Investment Income Builder Fund | Thornburg Investment Income Builder Fund’s Blended Index | MSCI World Net Total Return USD Index | Bloomberg U.S. Aggregate Total Return Value Index USD |
09/30/2014 | 10000.006 | 10000 | 10000 | 10000 |
10/31/2014 | 10009.4416 | 10073.0867 | 10064.69 | 10098.2769 |
11/30/2014 | 10093.9521 | 10242.3546 | 10266.3941 | 10169.91 |
12/31/2014 | 9867.8439 | 10120.8813 | 10100.8476 | 10179.4256 |
01/31/2015 | 9921.7967 | 10036.3974 | 9917.8235 | 10392.8789 |
02/28/2015 | 10295.28 | 10453.8199 | 10498.8953 | 10295.1602 |
03/31/2015 | 10197.9445 | 10343.2268 | 10334.5512 | 10342.967 |
04/30/2015 | 10516.3634 | 10515.8799 | 10576.9224 | 10305.856 |
05/31/2015 | 10437.791 | 10536.7172 | 10613.3579 | 10281.0356 |
06/30/2015 | 10177.8178 | 10324.242 | 10366.5728 | 10168.9318 |
07/31/2015 | 10319.5597 | 10481.1738 | 10552.6529 | 10239.6187 |
08/31/2015 | 9681.7097 | 9957.2209 | 9854.3359 | 10224.9146 |
09/30/2015 | 9252.9062 | 9698.6094 | 9490.8635 | 10294.0811 |
10/31/2015 | 9684.9384 | 10275.4309 | 10242.9602 | 10295.7875 |
11/30/2015 | 9593.8322 | 10230.2994 | 10191.9941 | 10268.5908 |
12/31/2015 | 9303.2182 | 10087.1673 | 10012.846 | 10235.4031 |
01/31/2016 | 9014.1358 | 9669.277 | 9413.8342 | 10376.2558 |
02/29/2016 | 8942.1722 | 9632.4537 | 9343.7725 | 10449.8664 |
03/31/2016 | 9438.4681 | 10144.7832 | 9977.8307 | 10545.7404 |
04/30/2016 | 9576.5062 | 10274.9142 | 10135.7163 | 10586.2218 |
05/31/2016 | 9684.5399 | 10318.8548 | 10192.6431 | 10588.9383 |
06/30/2016 | 9669.4684 | 10278.4873 | 10078.4316 | 10779.1979 |
07/31/2016 | 9913.5928 | 10620.4196 | 10504.2293 | 10847.3436 |
08/31/2016 | 9998.0618 | 10624.0038 | 10512.9592 | 10834.9414 |
09/30/2016 | 9994.2746 | 10664.7736 | 10568.8037 | 10828.5941 |
10/31/2016 | 9833.7343 | 10489.5834 | 10364.2659 | 10745.7655 |
11/30/2016 | 9949.3697 | 10540.6767 | 10513.2948 | 10491.5864 |
12/31/2016 | 10156.5649 | 10733.5596 | 10764.8605 | 10506.3861 |
01/31/2017 | 10187.6211 | 10933.1167 | 11024.6716 | 10527.0016 |
02/28/2017 | 10370.3021 | 11178.9791 | 11330.5349 | 10597.7522 |
03/31/2017 | 10525.2662 | 11266.8226 | 11451.2272 | 10592.197 |
04/30/2017 | 10576.8243 | 11413.6778 | 11620.783 | 10673.9358 |
05/31/2017 | 10813.8867 | 11616.7289 | 11866.6147 | 10756.0945 |
06/30/2017 | 10822.3355 | 11647.3279 | 11912.2713 | 10745.2712 |
07/31/2017 | 11047.5588 | 11868.9197 | 12197.361 | 10791.5097 |
08/31/2017 | 11031.7344 | 11908.0687 | 12214.5364 | 10888.3034 |
09/30/2017 | 11256.3063 | 12094.3409 | 12488.6825 | 10836.4459 |
10/31/2017 | 11257.2833 | 12267.5162 | 12724.6997 | 10842.724 |
11/30/2017 | 11534.1332 | 12462.9349 | 13000.4127 | 10828.8068 |
12/31/2017 | 11628.7046 | 12603.6423 | 13176.2249 | 10878.506 |
01/31/2018 | 12008.489 | 13066.4582 | 13871.9304 | 10753.2186 |
02/28/2018 | 11431.4595 | 12629.5108 | 13297.2527 | 10651.2843 |
03/31/2018 | 11330.391 | 12443.3 | 13007.4202 | 10719.5896 |
04/30/2018 | 11561.8758 | 12527.4041 | 13156.8892 | 10639.8655 |
05/31/2018 | 11414.7129 | 12608.6325 | 13239.3369 | 10715.7993 |
06/30/2018 | 11410.5553 | 12600.2444 | 13233.0206 | 10702.6209 |
07/31/2018 | 11879.8036 | 12896.1549 | 13646.3345 | 10705.1619 |
08/31/2018 | 11692.6186 | 13036.5728 | 13815.1792 | 10774.0467 |
09/30/2018 | 11869.5295 | 13070.0277 | 13892.104 | 10704.6676 |
10/31/2018 | 11381.3703 | 12324.4287 | 12872.0373 | 10620.0741 |
11/30/2018 | 11577.3645 | 12447.8246 | 13018.2615 | 10683.4727 |
12/31/2018 | 11045.7875 | 11795.1134 | 12028.3785 | 10879.7393 |
01/31/2019 | 11536.9214 | 12514.7251 | 12964.2573 | 10995.2773 |
02/28/2019 | 11699.4677 | 12795.1499 | 13354.0906 | 10988.9087 |
03/31/2019 | 11821.089 | 12982.6158 | 13529.4894 | 11199.9166 |
04/30/2019 | 12180.4392 | 13328.7121 | 14009.2358 | 11202.782 |
05/31/2019 | 11544.1891 | 12811.0541 | 13200.8901 | 11401.6482 |
06/30/2019 | 12103.7341 | 13484.4127 | 14070.7609 | 11544.8346 |
07/31/2019 | 12036.2058 | 13541.921 | 14140.4582 | 11570.2238 |
08/31/2019 | 11938.5933 | 13421.8997 | 13851.2213 | 11870.0302 |
09/30/2019 | 12312.8367 | 13618.2531 | 14145.9899 | 11806.8123 |
10/31/2019 | 12547.2979 | 13888.4201 | 14505.9686 | 11842.3764 |
11/30/2019 | 12624.3772 | 14176.7482 | 14909.9637 | 11836.3427 |
12/31/2019 | 12954.4395 | 14492.8117 | 15356.6394 | 11828.0976 |
01/31/2020 | 12750.6436 | 14496.3784 | 15263.1682 | 12055.7234 |
02/29/2020 | 11862.3432 | 13642.6234 | 13973.0448 | 12272.7065 |
03/31/2020 | 9583.4848 | 12268.426 | 12123.8144 | 12200.4833 |
04/30/2020 | 10387.7712 | 13328.138 | 13448.2708 | 12417.3601 |
05/31/2020 | 10757.5835 | 13826.5465 | 14097.9331 | 12475.1769 |
06/30/2020 | 10979.9412 | 14122.6145 | 14470.8377 | 12553.758 |
07/31/2020 | 11237.3037 | 14682.0864 | 15163.1429 | 12741.2746 |
08/31/2020 | 11459.6049 | 15388.1891 | 16176.2576 | 12638.4313 |
09/30/2020 | 11073.3377 | 14987.9197 | 15618.1907 | 12631.4992 |
10/31/2020 | 10871.168 | 14626.3723 | 15139.1022 | 12575.0965 |
11/30/2020 | 12394.1611 | 16064.8665 | 17074.8119 | 12698.4914 |
12/31/2020 | 12822.3205 | 16581.2227 | 17798.7274 | 12715.9864 |
01/31/2021 | 13019.618 | 16427.9066 | 17621.8329 | 12624.817 |
02/28/2021 | 13460.5217 | 16684.314 | 18073.3803 | 12442.5048 |
03/31/2021 | 13910.0734 | 17048.5724 | 18674.719 | 12287.1394 |
04/30/2021 | 14143.807 | 17677.3262 | 19543.8431 | 12384.2096 |
05/31/2021 | 14471.4661 | 17882.752 | 19825.3813 | 12424.6696 |
06/30/2021 | 14313.5607 | 18114.0665 | 20120.8745 | 12511.9637 |
07/31/2021 | 14325.2015 | 18408.0562 | 20481.2976 | 12651.8595 |
08/31/2021 | 14606.6222 | 18742.9043 | 20991.0431 | 12627.7727 |
09/30/2021 | 14214.9083 | 18118.6742 | 20119.4832 | 12518.4439 |
10/31/2021 | 14781.6842 | 18887.1147 | 21259.0619 | 12514.9938 |
11/30/2021 | 14615.9475 | 18590.6796 | 20793.2128 | 12552.0197 |
12/31/2021 | 15334.7247 | 19174.7125 | 21681.917 | 12519.9004 |
01/31/2022 | 15417.9876 | 18310.525 | 20534.7085 |
02/28/2022 | 14957.3316 | 17912.1323 | 20015.3596 | 12113.503 |
03/31/2022 | 15001.1731 | 18156.4024 | 20564.6499 | 11776.9683 |
04/30/2022 | 14309.6825 | 16852.9175 | 18856.2741 | 11330.0576 |
05/31/2022 | 14829.6907 | 16889.6563 | 18870.5558 | 11403.1101 |
06/30/2022 | 13693.817 | 15726.1529 | 17235.9512 | 11224.2161 |
07/31/2022 | 13969.9137 | 16758.6665 | 18604.4217 | 11498.4738 |
08/31/2022 | 13579.0033 | 16114.7976 | 17826.6108 | 11173.5652 |
09/30/2022 | 12485.7363 | 14817.2114 | 16169.4523 | 10690.7981 |
10/31/2022 | 13258.3365 | 15567.2817 | 17330.6269 | 10552.327 |
11/30/2022 | 14364.9031 | 16522.2059 | 18535.6335 | 10940.3949 |
12/31/2022 | 14012.8564 | 15977.334 | 17748.4748 | 10891.0465 |
01/31/2023 | 14864.9815 | 16948.0856 | 19004.2874 | 11226.0979 |
02/28/2023 | 14795.3445 | 16532.9814 | 18547.4527 | 10935.8444 |
03/31/2023 | 14766.0417 | 17021.1245 | 19120.5636 | 11213.6426 |
04/30/2023 | 15147.1383 | 17270.692 | 19455.737 | 11281.6023 |
05/31/2023 | 14715.9906 | 17094.3629 | 19261.5027 | 11158.7602 |
06/30/2023 | 15261.9611 | 17854.4938 | 20426.3955 | 11118.9646 |
07/31/2023 | 15682.5467 | 18301.2193 | 21112.5755 | 11111.2139 |
08/31/2023 | 15460.1766 | 17944.1406 | 20608.2862 | 11040.24 |
09/30/2023 | 15212.5666 | 17249.5813 | 19719.2775 | 10759.6881 |
10/31/2023 | 14926.8567 | 16806.1446 | 19147.1067 | 10589.8898 |
11/30/2023 | 15808.8049 | 18178.1255 | 20942.1884 | 11069.4673 |
12/31/2023 | 16464.0442 | 19021.4164 | 21970.3293 | 11493.195 |
01/31/2024 | 16521.1202 | 19179.5571 | 22233.9831 | 11461.6339 |
02/29/2024 | 16540.4576 | 19721.6884 | 23176.6516 | 11299.6979 |
03/31/2024 | 17381.5617 | 20242.5314 | 23921.4297 | 11404.0404 |
04/30/2024 | 17149.5846 | 19550.778 | 23032.8744 | 11115.9877 |
05/31/2024 | 17815.068 | 20288.3773 | 24061.3398 | 11304.4398 |
06/30/2024 | 17815.544 | 20646.0169 | 24550.9362 | 11411.4668 |
07/31/2024 | 18474.6399 | 21039.4472 | 24983.5836 | 11678.0004 |
08/31/2024 | 18905.376 | 21532.0945 | 25643.9116 | 11845.8158 |
09/30/2024 | 18916.8624 | 21899.9228 | 26113.5523 | 12004.424 |

Effective September 30, 2024, the Fund adopted the MSCI World Net Total Return USD Index and the Bloomberg U.S. Aggregate Total Return Index Value USD as its broad-based securities market indices that represent the overall applicable markets in which the Fund invests, and a Blended Benchmark, comprised of 25% Bloomberg U.S. Aggregate Bond Total Return Value USD and 75% MSCI World Net Total Return USD Index, as an additional index that represents the market sectors which the Fund’s advisor believes are more representative of the Fund’s investment universe.
What were the Fund costs for the past year?
(based on a hypothetical $10,000 investment)
Class Name | Costs of a $10,000 investment | Costs paid as a percentage of a $10,000 investment |
|---|
Class R3 | $168.00 | 1.50% |
End Block
Thornburg Investment Income Builder Fund Tailored Shareholder Report
Thornburg Investment Income Builder Fund Tailored Shareholder Report | |
Annual Performance | 1 Year | 5 Year | 10 Year |
|---|
Investment Income Builder Fund Class R3 | 24.37% | 8.97% | 6.58% |
MSCI World Net Total Return USD Index | 32.43% | 13.04% | 10.07% |
Investment Income Builder Fund’s Blended Index | 26.96% | 9.97% | 8.15% |
Bloomberg U.S. Aggregate Total Return Value Index USD | 11.57% | 0.33% | 1.84% |
Key Fund Statistics
(as of September 30, 2024)
| |
|---|
Fund Size (Millions) | $13,932.0M |
Number of Holdings | 341 |
Annual Portfolio Turnover | 24.81% |
Total Advisory Fee | $87.8M |
What did the Fund invest in?
(as of September 30, 2024)
Portfolio Composition | (%) |
|---|
| Foreign Equity | 56.8 |
| Domestic Equity | 27.4 |
| Domestic Corporate Bonds | 4.5 |
| Domestic Other Bonds | 3.2 |
| Foreign Bonds | 2.8 |
| Other Assets Less Liabilities | 5.2 |
Portfolio Composition | (%) |
Foreign Equity | 56.8% |
Domestic Equity | 27.4% |
Domestic Corporate Bonds | 4.5% |
Domestic Other Bonds | 3.2% |
Foreign Bonds | 2.8% |
Other Assets Less Liabilities | 5.2% |
Expressed as a percentage of the Fund’s net assets.
How has the Fund changed?
This is a summary of certain changes to the Fund since October 1, 2023. For more complete information, you may review the Fund’s next prospectus, which we expect to be available by February 1, 2025 at https://www.thornburg.com/download or upon request by calling 1-800-847-0200.
End Block
Changes In and Disagreements with Accountants
No changes and/or disagreements occurred in the current reporting period.
End Block
For additional information about the Fund, including its prospectus, financial information, holdings and proxy information, visit www.thornburg.com/download.

Thornburg Investment Income Builder Fund Tailored Shareholder Report | |
Thornburg Investment Income Builder Fund Tailored Shareholder Report
Thornburg Investment Income Builder Fund CLASS: R4 TICKER: TIBGX Annual Shareholder Report | |
This annual shareholder report contains important information about the Thornburg Investment Income Builder Fund Class R4 Shares for the period from October 1, 2023 to September 30, 2024. You can find additional information about the Fund at https://www.thornburg.com/download. You can also request this information by contacting us at 1-800-847-0200. This report also describes changes to the Fund that occurred during the reporting period.
How did the Fund perform last year and what affected its performance?
The Fund’s Class R4 shares underperformed the benchmark composed of 25% Bloomberg U.S. Aggregate Bond Total Return Index Value USD and 75% MSCI World Net Total Return USD Index (the “Blended Index”) during the 12-month period ended September 30, 2024. During the period, major world events included the ongoing Russian/Ukraine conflict, moderating inflation figures in the U.S., Mideast tensions, and upcoming political contests in the U.S. Despite the conflicting economic and geo-political signals, the S&P 500, the Bloomberg U.S. Aggregate Bond, and the MSCI ACWI indexes reported varying positive returns for the period, +36.3%, +11.6%, and +31.8%, respectively. In brief, most equities repriced higher due to a surprising level of economic strength and resilient corporate profits, while interest rates declined along with inflation rates, creating a more favorable backdrop for the economy. A general overweight positioning to equities and underweight positioning to fixed income boosted the Fund’s relative performance during the period. Within equities, the Fund’s focus on dividend paying firms was a source of underperformance versus the broad based MSCI World Index. This underperformance is common during periods such as the current reporting period when growth stocks are outperforming. Security selection within the information technology and energy sectors, along with an overweight positioning to Taiwan, boosted relative performance. Mostly, the Fund’s equity holdings were relative detractors across the various sectors. Stock selection within the U.S. was beneficial to relative performance, however, the overall underweight positioning to U.S. stocks hampered performance. Among its fixed income holdings, the Fund’s shorter duration positioning during the period detracted from relative performance as yields across the curve declined during the period.
How did the Fund perform over the past 10 years?
The line graph below reflects a hypothetical $10,000 investment. The returns shown in the line graph and table assume the reinvestment of dividends and capital gains, but do not reflect the deduction of taxes that a shareholder would pay on distributions or the redemption of Fund shares. The performance information shown below represents past performance and is no guarantee of future results. For Fund performance current to the most recent month end, visit https://www.thornburg.com/product/mutual-funds/fib/TIBGX or call 1-800-847-0200. Performance for other share classes of the Fund will vary.
Cumulative Performance
Growth Table
Date | Thornburg Investment Income Builder Fund | Thornburg Investment Income Builder Fund’s Blended Index | MSCI World Net Total Return USD Index | Bloomberg U.S. Aggregate Total Return Value Index USD |
09/30/2014 | 9999.9913 | 10000 | 10000 | 10000 |
10/31/2014 | 10010.9472 | 10073.0867 | 10064.69 | 10098.2769 |
11/30/2014 | 10096.222 | 10242.3546 | 10266.3941 | 10169.91 |
12/31/2014 | 9866.8482 | 10120.8813 | 10100.8476 | 10179.4256 |
01/31/2015 | 9922.2234 | 10036.3974 | 9917.8235 | 10392.8789 |
02/28/2015 | 10296.0075 | 10453.8199 | 10498.8953 | 10295.1602 |
03/31/2015 | 10199.837 | 10343.2268 | 10334.5512 | 10342.967 |
04/30/2015 | 10518.8177 | 10515.8799 | 10576.9224 | 10305.856 |
05/31/2015 | 10446.1855 | 10536.7172 | 10613.3579 | 10281.0356 |
06/30/2015 | 10187.5272 | 10324.242 | 10366.5728 | 10168.9318 |
07/31/2015 | 10325.195 | 10481.1738 | 10552.6529 | 10239.6187 |
08/31/2015 | 9689.1576 | 9957.2209 | 9854.3359 | 10224.9146 |
09/30/2015 | 9257.162 | 9698.6094 | 9490.8635 | 10294.0811 |
10/31/2015 | 9694.4166 | 10275.4309 | 10242.9602 | 10295.7875 |
11/30/2015 | 9604.2517 | 10230.2994 | 10191.9941 | 10268.5908 |
12/31/2015 | 9309.728 | 10087.1673 | 10012.846 | 10235.4031 |
01/31/2016 | 9021.8168 | 9669.277 | 9413.8342 | 10376.2558 |
02/29/2016 | 8950.6571 | 9632.4537 | 9343.7725 | 10449.8664 |
03/31/2016 | 9452.3528 | 10144.7832 | 9977.8307 | 10545.7404 |
04/30/2016 | 9591.1249 | 10274.9142 | 10135.7163 | 10586.2218 |
05/31/2016 | 9699.9433 | 10318.8548 | 10192.6431 | 10588.9383 |
06/30/2016 | 9680.8757 | 10278.4873 | 10078.4316 | 10779.1979 |
07/31/2016 | 9930.9251 | 10620.4196 | 10504.2293 | 10847.3436 |
08/31/2016 | 10016.256 | 10624.0038 | 10512.9592 | 10834.9414 |
09/30/2016 | 10008.435 | 10664.7736 | 10568.8037 | 10828.5941 |
10/31/2016 | 9854.4669 | 10489.5834 | 10364.2659 | 10745.7655 |
11/30/2016 | 9965.9033 | 10540.6767 | 10513.2948 | 10491.5864 |
12/31/2016 | 10173.856 | 10733.5596 | 10764.8605 | 10506.3861 |
01/31/2017 | 10210.9566 | 10933.1167 | 11024.6716 | 10527.0016 |
02/28/2017 | 10389.4121 | 11178.9791 | 11330.5349 | 10597.7522 |
03/31/2017 | 10545.3999 | 11266.8226 | 11451.2272 | 10592.197 |
04/30/2017 | 10603.0659 | 11413.6778 | 11620.783 | 10673.9358 |
05/31/2017 | 10836.0541 | 11616.7289 | 11866.6147 | 10756.0945 |
06/30/2017 | 10845.491 | 11647.3279 | 11912.2713 | 10745.2712 |
07/31/2017 | 11071.8576 | 11868.9197 | 12197.361 | 10791.5097 |
08/31/2017 | 11057.0145 | 11908.0687 | 12214.5364 | 10888.3034 |
09/30/2017 | 11281.6141 | 12094.3409 | 12488.6825 | 10836.4459 |
10/31/2017 | 11283.6087 | 12267.5162 | 12724.6997 | 10842.724 |
11/30/2017 | 11561.73 | 12462.9349 | 13000.4127 | 10828.8068 |
12/31/2017 | 11657.3259 | 12603.6423 | 13176.2249 | 10878.506 |
01/31/2018 | 12038.5609 | 13066.4582 | 13871.9304 | 10753.2186 |
02/28/2018 | 11463.2128 | 12629.5108 | 13297.2527 | 10651.2843 |
03/31/2018 | 11363.0919 | 12443.3 | 13007.4202 | 10719.5896 |
04/30/2018 | 11595.9225 | 12527.4041 | 13156.8892 | 10639.8655 |
05/31/2018 | 11449.549 | 12608.6325 | 13239.3369 | 10715.7993 |
06/30/2018 | 11446.341 | 12600.2444 | 13233.0206 | 10702.6209 |
07/31/2018 | 11917.4423 | 12896.1549 | 13646.3345 | 10705.1619 |
08/31/2018 | 11731.0049 | 13036.5728 | 13815.1792 | 10774.0467 |
09/30/2018 | 11909.2065 | 13070.0277 | 13892.104 | 10704.6676 |
10/31/2018 | 11415.6334 | 12324.4287 | 12872.0373 | 10620.0741 |
11/30/2018 | 11618.4487 | 12447.8246 | 13018.2615 | 10683.4727 |
12/31/2018 | 11086.8085 | 11795.1134 | 12028.3785 | 10879.7393 |
01/31/2019 | 11580.0971 | 12514.7251 | 12964.2573 | 10995.2773 |
02/28/2019 | 11738.4323 | 12795.1499 | 13354.0906 | 10988.9087 |
03/31/2019 | 11861.3777 | 12982.6158 | 13529.4894 | 11199.9166 |
04/30/2019 | 12228.1575 | 13328.7121 | 14009.2358 | 11202.782 |
05/31/2019 | 11591.3588 | 12811.0541 | 13200.8901 | 11401.6482 |
06/30/2019 | 12153.2481 | 13484.4127 | 14070.7609 | 11544.8346 |
07/31/2019 | 12086.6049 | 13541.921 | 14140.4582 | 11570.2238 |
08/31/2019 | 11989.8066 | 13421.8997 | 13851.2213 | 11870.0302 |
09/30/2019 | 12366.1534 | 13618.2531 | 14145.9899 | 11806.8123 |
10/31/2019 | 12595.6753 | 13888.4201 | 14505.9686 | 11842.3764 |
11/30/2019 | 12678.6685 | 14176.7482 | 14909.9637 | 11836.3427 |
12/31/2019 | 13009.8618 | 14492.8117 | 15356.6394 | 11828.0976 |
01/31/2020 | 12805.6076 | 14496.3784 | 15263.1682 | 12055.7234 |
02/29/2020 | 11914.834 | 13642.6234 | 13973.0448 | 12272.7065 |
03/31/2020 | 9623.7673 | 12268.426 | 12123.8144 | 12200.4833 |
04/30/2020 | 10432.7111 | 13328.138 | 13448.2708 | 12417.3601 |
05/31/2020 | 10806.4143 | 13826.5465 | 14097.9331 | 12475.1769 |
06/30/2020 | 11037.8856 | 14122.6145 | 14470.8377 | 12553.758 |
07/31/2020 | 11290.9951 | 14682.0864 | 15163.1429 | 12741.2746 |
08/31/2020 | 11520.6355 | 15388.1891 | 16176.2576 | 12638.4313 |
09/30/2020 | 11128.0174 | 14987.9197 | 15618.1907 | 12631.4992 |
10/31/2020 | 10931.9951 | 14626.3723 | 15139.1022 | 12575.0965 |
11/30/2020 | 12461.7436 | 16064.8665 | 17074.8119 | 12698.4914 |
12/31/2020 | 12892.601 | 16581.2227 | 17798.7274 | 12715.9864 |
01/31/2021 | 13091.8974 | 16427.9066 | 17621.8329 | 12624.817 |
02/28/2021 | 13541.7074 | 16684.314 | 18073.3803 | 12442.5048 |
03/31/2021 | 13988.3525 | 17048.5724 | 18674.719 | 12287.1394 |
04/30/2021 | 14224.3187 | 17677.3262 | 19543.8431 | 12384.2096 |
05/31/2021 | 14560.6931 | 17882.752 | 19825.3813 | 12424.6696 |
06/30/2021 | 14403.441 | 18114.0665 | 20120.8745 | 12511.9637 |
07/31/2021 | 14410.2646 | 18408.0562 | 20481.2976 | 12651.8595 |
08/31/2021 | 14694.2805 | 18742.9043 | 20991.0431 | 12627.7727 |
09/30/2021 | 14308.2374 | 18118.6742 | 20119.4832 | 12518.4439 |
10/31/2021 | 14872.8186 | 18887.1147 | 21259.0619 | 12514.9938 |
11/30/2021 | 14707.6069 | 18590.6796 | 20793.2128 | 12552.0197 |
12/31/2021 | 15431.0224 | 19174.7125 | 21681.917 | 12519.9004 |
01/31/2022 | 15516.0883 | 18310.525 | 20534.7085 | 12250.172 |
02/28/2022 | 15060.6794 | 17912.1323 | 20015.3596 | 12113.503 |
03/31/2022 | 15106.1389 | 18156.4024 | 20564.6499 | 11776.9683 |
04/30/2022 | 14412.313 | 16852.9175 | 18856.2741 | 11330.0576 |
05/31/2022 | 14929.995 | 16889.6563 | 18870.5558 | 11403.1101 |
06/30/2022 | 13789.4405 | 15726.1529 | 17235.9512 | 11224.2161 |
07/31/2022 | 14068.3015 | 16758.6665 | 18604.4217 | 11498.4738 |
08/31/2022 | 13676.5094 | 16114.7976 | 17826.6108 | 11173.5652 |
09/30/2022 | 12578.1658 | 14817.2114 | 16169.4523 | 10690.7981 |
10/31/2022 | 13356.4231 | 15567.2817 | 17330.6269 | 10552.327 |
11/30/2022 | 14470.6032 | 16522.2059 | 18535.6335 | 10940.3949 |
12/31/2022 | 14124.3234 | 15977.334 | 17748.4748 | 10891.0465 |
01/31/2023 | 14982.8993 | 16948.0856 | 19004.2874 | 11226.0979 |
02/28/2023 | 14914.0484 | 16532.9814 | 18547.4527 | 10935.8444 |
03/31/2023 | 14879.3632 | 17021.1245 | 19120.5636 | 11213.6426 |
04/30/2023 | 15264.1266 | 17270.692 | 19455.737 | 11281.6023 |
05/31/2023 | 14831.6126 | 17094.3629 | 19261.5027 | 11158.7602 |
06/30/2023 | 15382.2693 | 17854.4938 | 20426.3955 | 11118.9646 |
07/31/2023 | 15813.3359 | 18301.2193 | 21112.5755 | 11111.2139 |
08/31/2023 | 15584.1462 | 17944.1406 | 20608.2862 | 11040.24 |
09/30/2023 | 15336.1357 | 17249.5813 | 19719.2775 | 10759.6881 |
10/31/2023 | 15049.9159 | 16806.1446 | 19147.1067 | 10589.8898 |
11/30/2023 | 15939.1455 | 18178.1255 | 20942.1884 | 11069.4673 |
12/31/2023 | 16600.0621 | 19021.4164 | 21970.3293 | 11493.195 |
01/31/2024 | 16659.0068 | 19179.5571 | 22233.9831 | 11461.6339 |
02/29/2024 | 16686.8027 | 19721.6884 | 23176.6516 | 11299.6979 |
03/31/2024 | 17535.3518 | 20242.5314 | 23921.4297 | 11404.0404 |
04/30/2024 | 17296.1908 | 19550.778 | 23032.8744 | 11115.9877 |
05/31/2024 | 17975.0457 | 20288.3773 | 24061.3398 | 11304.4398 |
06/30/2024 | 17969.9986 | 20646.0169 | 24550.9362 | 11411.4668 |
07/31/2024 | 18642.6955 | 21039.4472 | 24983.5836 | 11678.0004 |
08/31/2024 | 19078.2752 | 21532.0945 | 25643.9116 | 11845.8158 |
09/30/2024 | 19091.4807 | 21899.9228 | 26113.5523 | 12004.424 |
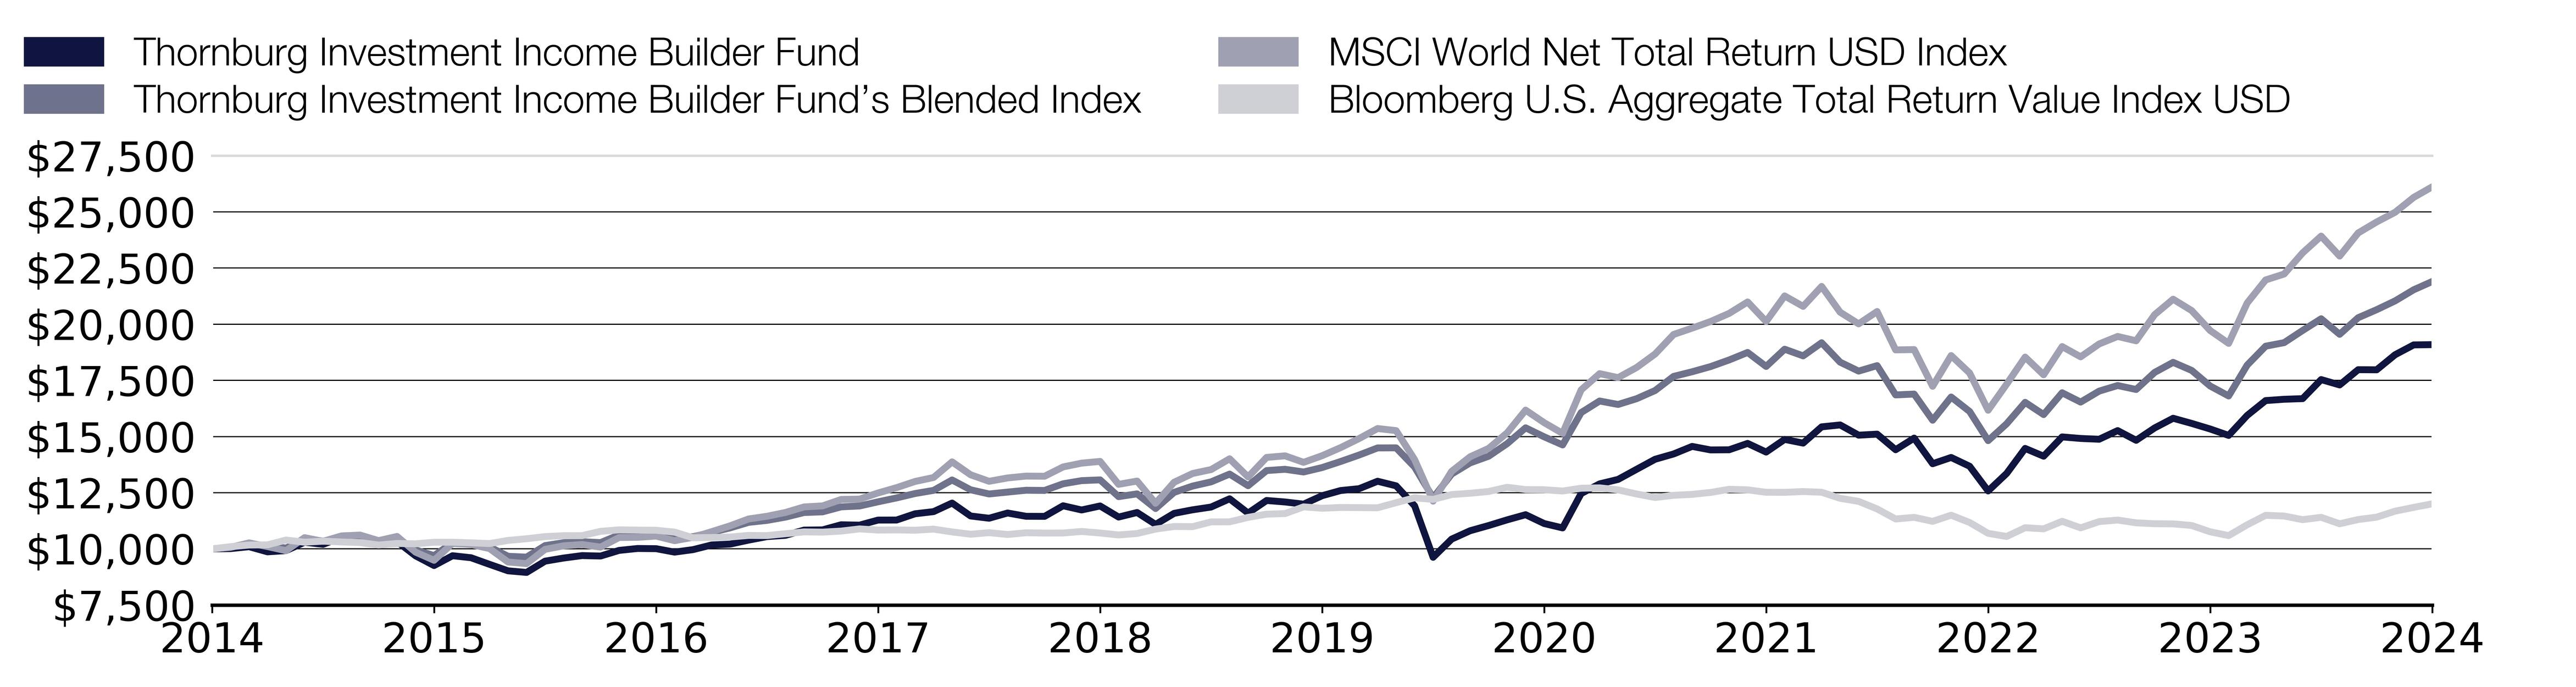
Effective September 30, 2024, the Fund adopted the MSCI World Net Total Return USD Index and the Bloomberg U.S. Aggregate Total Return Index Value USD as its broad-based securities market indices that represent the overall applicable markets in which the Fund invests, and a Blended Benchmark, comprised of 25% Bloomberg U.S. Aggregate Bond Total Return Value USD and 75% MSCI World Net Total Return USD Index, as an additional index that represents the market sectors which the Fund’s advisor believes are more representative of the Fund’s investment universe.
What were the Fund costs for the past year?
(based on a hypothetical $10,000 investment)
Class Name | Costs of a $10,000 investment | Costs paid as a percentage of a $10,000 investment |
|---|
Class R4 | $157.00 | 1.40% |
End Block
Thornburg Investment Income Builder Fund Tailored Shareholder Report
Thornburg Investment Income Builder Fund Tailored Shareholder Report | |
Annual Performance | 1 Year | 5 Year | 10 Year |
|---|
Investment Income Builder Fund Class R4 | 24.51% | 9.07% | 6.68% |
MSCI World Net Total Return USD Index | 32.43% | 13.04% | 10.07% |
Investment Income Builder Fund’s Blended Index | 26.96% | 9.97% | 8.15% |
Bloomberg U.S. Aggregate Total Return Value Index USD | 11.57% | 0.33% | 1.84% |
Key Fund Statistics
(as of September 30, 2024)
| |
|---|
Fund Size (Millions) | $13,932.0M |
Number of Holdings | 341 |
Annual Portfolio Turnover | 24.81% |
Total Advisory Fee | $87.8M |
What did the Fund invest in?
(as of September 30, 2024)
Portfolio Composition | (%) |
|---|
| Foreign Equity | 56.8 |
| Domestic Equity | 27.4 |
| Domestic Corporate Bonds | 4.5 |
| Domestic Other Bonds | 3.2 |
| Foreign Bonds | 2.8 |
| Other Assets Less Liabilities | 5.2 |
Portfolio Composition | (%) |
Foreign Equity | 56.8% |
Domestic Equity | 27.4% |
Domestic Corporate Bonds | 4.5% |
Domestic Other Bonds | 3.2% |
Foreign Bonds | 2.8% |
Other Assets Less Liabilities | 5.2% |
Expressed as a percentage of the Fund’s net assets.
How has the Fund changed?
This is a summary of certain changes to the Fund since October 1, 2023. For more complete information, you may review the Fund’s next prospectus, which we expect to be available by February 1, 2025 at https://www.thornburg.com/download or upon request by calling 1-800-847-0200.
End Block
Changes In and Disagreements with Accountants
No changes and/or disagreements occurred in the current reporting period.
End Block
For additional information about the Fund, including its prospectus, financial information, holdings and proxy information, visit www.thornburg.com/download.

Thornburg Investment Income Builder Fund Tailored Shareholder Report | |
Thornburg Investment Income Builder Fund Tailored Shareholder Report
Thornburg Investment Income Builder Fund CLASS: R5 TICKER: TIBMX Annual Shareholder Report | |
This annual shareholder report contains important information about the Thornburg Investment Income Builder Fund Class R5 Shares for the period from October 1, 2023 to September 30, 2024. You can find additional information about the Fund at https://www.thornburg.com/download. You can also request this information by contacting us at 1-800-847-0200. This report also describes changes to the Fund that occurred during the reporting period.
How did the Fund perform last year and what affected its performance?
The Fund’s Class R5 shares underperformed the benchmark composed of 25% Bloomberg U.S. Aggregate Bond Total Return Index Value USD and 75% MSCI World Net Total Return USD Index (the “Blended Index”) during the 12-month period ended September 30, 2024. During the period, major world events included the ongoing Russian/Ukraine conflict, moderating inflation figures in the U.S., Mideast tensions, and upcoming political contests in the U.S. Despite the conflicting economic and geo-political signals, the S&P 500, the Bloomberg U.S. Aggregate Bond, and the MSCI ACWI indexes reported varying positive returns for the period, +36.3%, +11.6%, and +31.8%, respectively. In brief, most equities repriced higher due to a surprising level of economic strength and resilient corporate profits, while interest rates declined along with inflation rates, creating a more favorable backdrop for the economy. A general overweight positioning to equities and underweight positioning to fixed income boosted the Fund’s relative performance during the period. Within equities, the Fund’s focus on dividend paying firms was a source of underperformance versus the broad based MSCI World Index. This underperformance is common during periods such as the current reporting period when growth stocks are outperforming. Security selection within the information technology and energy sectors, along with an overweight positioning to Taiwan, boosted relative performance. Mostly, the Fund’s equity holdings were relative detractors across the various sectors. Stock selection within the U.S. was beneficial to relative performance, however, the overall underweight positioning to U.S. stocks hampered performance. Among its fixed income holdings, the Fund’s shorter duration positioning during the period detracted from relative performance as yields across the curve declined during the period.
How did the Fund perform over the past 10 years?
The line graph below reflects a hypothetical $10,000 investment. The returns shown in the line graph and table assume the reinvestment of dividends and capital gains, but do not reflect the deduction of taxes that a shareholder would pay on distributions or the redemption of Fund shares. The performance information shown below represents past performance and is no guarantee of future results. For Fund performance current to the most recent month end, visit https://www.thornburg.com/product/mutual-funds/fib/TIBMX or call 1-800-847-0200. Performance for other share classes of the Fund will vary.
Cumulative Performance
Growth Table
Date | Thornburg Investment Income Builder Fund | Thornburg Investment Income Builder Fund’s Blended Index | MSCI World Net Total Return USD Index | Bloomberg U.S. Aggregate Total Return Value Index USD |
09/30/2014 | 9999.9997 | 10000 | 10000 | 10000 |
10/31/2014 | 10013.9552 | 10073.0867 | 10064.69 | 10098.2769 |
11/30/2014 | 10102.4859 | 10242.3546 | 10266.3941 | 10169.91 |
12/31/2014 | 9876.909 | 10120.8813 | 10100.8476 | 10179.4256 |
01/31/2015 | 9935.0788 | 10036.3974 | 9917.8235 | 10392.8789 |
02/28/2015 | 10310.7956 | 10453.8199 | 10498.8953 | 10295.1602 |
03/31/2015 | 10218.7232 | 10343.2268 | 10334.5512 | 10342.967 |
04/30/2015 | 10540.2516 | 10515.8799 | 10576.9224 | 10305.856 |
05/31/2015 | 10471.5365 | 10536.7172 | 10613.3579 | 10281.0356 |
06/30/2015 | 10216.9656 | 10324.242 | 10366.5728 | 10168.9318 |
07/31/2015 | 10358.0862 | 10481.1738 | 10552.6529 | 10239.6187 |
08/31/2015 | 9722.0901 | 9957.2209 | 9854.3359 | 10224.9146 |
09/30/2015 | 9298.8397 | 9698.6094 | 9490.8635 | 10294.0811 |
10/31/2015 | 9739.2498 | 10275.4309 | 10242.9602 | 10295.7875 |
11/30/2015 | 9647.7069 | 10230.2994 | 10191.9941 | 10268.5908 |
12/31/2015 | 9361.0105 | 10087.1673 | 10012.846 | 10235.4031 |
01/31/2016 | 9071.2438 | 9669.277 | 9413.8342 | 10376.2558 |
02/29/2016 | 9003.0659 | 9632.4537 | 9343.7725 | 10449.8664 |
03/31/2016 | 9508.3141 | 10144.7832 | 9977.8307 | 10545.7404 |
04/30/2016 | 9655.5437 | 10274.9142 | 10135.7163 | 10586.2218 |
05/31/2016 | 9767.9535 | 10318.8548 | 10192.6431 | 10588.9383 |
06/30/2016 | 9752.4934 | 10278.4873 | 10078.4316 | 10779.1979 |
07/31/2016 | 10006.5131 | 10620.4196 | 10504.2293 | 10847.3436 |
08/31/2016 | 10095.6688 | 10624.0038 | 10512.9592 | 10834.9414 |
09/30/2016 | 10091.3657 | 10664.7736 | 10568.8037 | 10828.5941 |
10/31/2016 | 9939.9947 | 10489.5834 | 10364.2659 | 10745.7655 |
11/30/2016 | 10055.2761 | 10540.6767 | 10513.2948 | 10491.5864 |
12/31/2016 | 10272.0974 | 10733.5596 | 10764.8605 | 10506.3861 |
01/31/2017 | 10307.9827 | 10933.1167 | 11024.6716 | 10527.0016 |
02/28/2017 | 10495.6906 | 11178.9791 | 11330.5349 | 10597.7522 |
03/31/2017 | 10656.1518 | 11266.8226 | 11451.2272 | 10592.197 |
04/30/2017 | 10717.828 | 11413.6778 | 11620.783 | 10673.9358 |
05/31/2017 | 10955.9189 | 11616.7289 | 11866.6147 | 10756.0945 |
06/30/2017 | 10969.2181 | 11647.3279 | 11912.2713 | 10745.2712 |
07/31/2017 | 11201.0082 | 11868.9197 | 12197.361 | 10791.5097 |
08/31/2017 | 11195.348 | 11908.0687 | 12214.5364 | 10888.3034 |
09/30/2017 | 11425.4374 | 12094.3409 | 12488.6825 | 10836.4459 |
10/31/2017 | 11426.3984 | 12267.5162 | 12724.6997 | 10842.724 |
11/30/2017 | 11715.8471 | 12462.9349 | 13000.4127 | 10828.8068 |
12/31/2017 | 11810.592 | 12603.6423 | 13176.2249 | 10878.506 |
01/31/2018 | 12204.6409 | 13066.4582 | 13871.9304 | 10753.2186 |
02/28/2018 | 11627.3074 | 12629.5108 | 13297.2527 | 10651.2843 |
03/31/2018 | 11530.8571 | 12443.3 | 13007.4202 | 10719.5896 |
04/30/2018 | 11769.9233 | 12527.4041 | 13156.8892 | 10639.8655 |
05/31/2018 | 11626.5472 | 12608.6325 | 13239.3369 | 10715.7993 |
06/30/2018 | 11627.3401 | 12600.2444 | 13233.0206 | 10702.6209 |
07/31/2018 | 12107.4497 | 12896.1549 | 13646.3345 | 10705.1619 |
08/31/2018 | 11918.0132 | 13036.5728 | 13815.1792 | 10774.0467 |
09/30/2018 | 12107.7136 | 13070.0277 | 13892.104 | 10704.6676 |
10/31/2018 | 11612.8303 | 12324.4287 | 12872.0373 | 10620.0741 |
11/30/2018 | 11816.5228 | 12447.8246 | 13018.2615 | 10683.4727 |
12/31/2018 | 11282.7389 | 11795.1134 | 12028.3785 | 10879.7393 |
01/31/2019 | 11786.0162 | 12514.7251 | 12964.2573 | 10995.2773 |
02/28/2019 | 11955.6598 | 12795.1499 | 13354.0906 | 10988.9087 |
03/31/2019 | 12084.5463 | 12982.6158 | 13529.4894 | 11199.9166 |
04/30/2019 | 12460.1008 | 13328.7121 | 14009.2358 | 11202.782 |
05/31/2019 | 11819.156 | 12811.0541 | 13200.8901 | 11401.6482 |
06/30/2019 | 12392.7715 | 13484.4127 | 14070.7609 | 11544.8346 |
07/31/2019 | 12329.6632 | 13541.921 | 14140.4582 | 11570.2238 |
08/31/2019 | 12235.9664 | 13421.8997 | 13851.2213 | 11870.0302 |
09/30/2019 | 12621.8612 | 13618.2531 | 14145.9899 | 11806.8123 |
10/31/2019 | 12865.7295 | 13888.4201 | 14505.9686 | 11842.3764 |
11/30/2019 | 12955.0973 | 14176.7482 | 14909.9637 | 11836.3427 |
12/31/2019 | 13296.2372 | 14492.8117 | 15356.6394 | 11828.0976 |
01/31/2020 | 13093.9577 | 14496.3784 | 15263.1682 | 12055.7234 |
02/29/2020 | 12181.9675 | 13642.6234 | 13973.0448 | 12272.7065 |
03/31/2020 | 9847.4647 | 12268.426 | 12123.8144 | 12200.4833 |
04/30/2020 | 10678.4518 | 13328.138 | 13448.2708 | 12417.3601 |
05/31/2020 | 11068.2429 | 13826.5465 | 14097.9331 | 12475.1769 |
06/30/2020 | 11301.7282 | 14122.6145 | 14470.8377 | 12553.758 |
07/31/2020 | 11569.6926 | 14682.0864 | 15163.1429 | 12741.2746 |
08/31/2020 | 11807.8315 | 15388.1891 | 16176.2576 | 12638.4313 |
09/30/2020 | 11411.6891 | 14987.9197 | 15618.1907 | 12631.4992 |
10/31/2020 | 11210.0871 | 14626.3723 | 15139.1022 | 12575.0965 |
11/30/2020 | 12785.4679 | 16064.8665 | 17074.8119 | 12698.4914 |
12/31/2020 | 13229.022 | 16581.2227 | 17798.7274 | 12715.9864 |
01/31/2021 | 13437.3976 | 16427.9066 | 17621.8329 | 12624.817 |
02/28/2021 | 13900.9587 | 16684.314 | 18073.3803 | 12442.5048 |
03/31/2021 | 14368.1076 | 17048.5724 | 18674.719 | 12287.1394 |
04/30/2021 | 14614.1968 | 17677.3262 | 19543.8431 | 12384.2096 |
05/31/2021 | 14963.0529 | 17882.752 | 19825.3813 | 12424.6696 |
06/30/2021 | 14807.781 | 18114.0665 | 20120.8745 | 12511.9637 |
07/31/2021 | 14820.2413 | 18408.0562 | 20481.2976 | 12651.8595 |
08/31/2021 | 15122.396 | 18742.9043 | 20991.0431 | 12627.7727 |
09/30/2021 | 14726.5754 | 18118.6742 | 20119.4832 | 12518.4439 |
10/31/2021 | 15316.2302 | 18887.1147 | 21259.0619 | 12514.9938 |
11/30/2021 | 15152.7308 | 18590.6796 | 20793.2128 | 12552.0197 |
12/31/2021 | 15898.3757 | 19174.7125 | 21681.917 | 12519.9004 |
01/31/2022 | 15991.3344 | 18310.525 | 20534.7085 | 12250.172 |
02/28/2022 | 15523.5719 | 17912.1323 | 20015.3596 | 12113.503 |
03/31/2022 | 15575.83 | 18156.4024 | 20564.6499 | 11776.9683 |
04/30/2022 | 14869.9065 | 16852.9175 | 18856.2741 | 11330.0576 |
05/31/2022 | 15406.2443 | 16889.6563 | 18870.5558 | 11403.1101 |
06/30/2022 | 14235.7303 | 15726.1529 | 17235.9512 | 11224.2161 |
07/31/2022 | 14527.1976 | 16758.6665 | 18604.4217 | 11498.4738 |
08/31/2022 | 14130.361 | 16114.7976 | 17826.6108 | 11173.5652 |
09/30/2022 | 13000.2926 | 14817.2114 | 16169.4523 | 10690.7981 |
10/31/2022 | 13804.9468 | 15567.2817 | 17330.6269 | 10552.327 |
11/30/2022 | 14961.5789 | 16522.2059 | 18535.6335 | 10940.3949 |
12/31/2022 | 14610.5504 | 15977.334 | 17748.4748 | 10891.0465 |
01/31/2023 | 15505.9703 | 16948.0856 | 19004.2874 | 11226.0979 |
02/28/2023 | 15433.4646 | 16532.9814 | 18547.4527 | 10935.8444 |
03/31/2023 | 15410.7994 | 17021.1245 | 19120.5636 | 11213.6426 |
04/30/2023 | 15812.355 | 17270.692 | 19455.737 | 11281.6023 |
05/31/2023 | 15365.8822 | 17094.3629 | 19261.5027 | 11158.7602 |
06/30/2023 | 15945.2717 | 17854.4938 | 20426.3955 | 11118.9646 |
07/31/2023 | 16393.6472 | 18301.2193 | 21112.5755 | 11111.2139 |
08/31/2023 | 16170.4089 | 17944.1406 | 20608.2862 | 11040.24 |
09/30/2023 | 15913.2156 | 17249.5813 | 19719.2775 | 10759.6881 |
10/31/2023 | 15623.982 | 16806.1446 | 19147.1067 | 10589.8898 |
11/30/2023 | 16554.0219 | 18178.1255 | 20942.1884 | 11069.4673 |
12/31/2023 | 17241.0684 | 19021.4164 | 21970.3293 | 11493.195 |
01/31/2024 | 17308.2345 | 19179.5571 | 22233.9831 | 11461.6339 |
02/29/2024 | 17342.831 | 19721.6884 | 23176.6516 | 11299.6979 |
03/31/2024 | 18232.9334 | 20242.5314 | 23921.4297 | 11404.0404 |
04/30/2024 | 17992.1011 | 19550.778 | 23032.8744 | 11115.9877 |
05/31/2024 | 18700.3172 | 20288.3773 | 24061.3398 | 11304.4398 |
06/30/2024 | 18701.6538 | 20646.0169 | 24550.9362 | 11411.4668 |
07/31/2024 | 19411.7437 | 21039.4472 | 24983.5836 | 11678.0004 |
08/31/2024 | 19869.2931 | 21532.0945 | 25643.9116 | 11845.8158 |
09/30/2024 | 19889.9942 | 21899.9228 | 26113.5523 | 12004.424 |

Effective September 30, 2024, the Fund adopted the MSCI World Net Total Return USD Index and the Bloomberg U.S. Aggregate Total Return Index Value USD as its broad-based securities market indices that represent the overall applicable markets in which the Fund invests, and a Blended Benchmark, comprised of 25% Bloomberg U.S. Aggregate Bond Total Return Value USD and 75% MSCI World Net Total Return USD Index, as an additional index that represents the market sectors which the Fund’s advisor believes are more representative of the Fund’s investment universe.
What were the Fund costs for the past year?
(based on a hypothetical $10,000 investment)
Class Name | Costs of a $10,000 investment | Costs paid as a percentage of a $10,000 investment |
|---|
Class R5 | $111.00 | 0.99% |
End Block
Thornburg Investment Income Builder Fund Tailored Shareholder Report
Thornburg Investment Income Builder Fund Tailored Shareholder Report | |
Annual Performance | 1 Year | 5 Year | 10 Year |
|---|
Investment Income Builder Fund Class R5 | 25.01% | 9.52% | 7.12% |
MSCI World Net Total Return USD Index | 32.43% | 13.04% | 10.07% |
Investment Income Builder Fund’s Blended Index | 26.96% | 9.97% | 8.15% |
Bloomberg U.S. Aggregate Total Return Value Index USD | 11.57% | 0.33% | 1.84% |
Key Fund Statistics
(as of September 30, 2024)
| |
|---|
Fund Size (Millions) | $13,932.0M |
Number of Holdings | 341 |
Annual Portfolio Turnover | 24.81% |
Total Advisory Fee | $87.8M |
What did the Fund invest in?
(as of September 30, 2024)
Portfolio Composition | (%) |
|---|
| Foreign Equity | 56.8 |
| Domestic Equity | 27.4 |
| Domestic Corporate Bonds | 4.5 |
| Domestic Other Bonds | 3.2 |
| Foreign Bonds | 2.8 |
| Other Assets Less Liabilities | 5.2 |
Portfolio Composition | (%) |
Foreign Equity | 56.8% |
Domestic Equity | 27.4% |
Domestic Corporate Bonds | 4.5% |
Domestic Other Bonds | 3.2% |
Foreign Bonds | 2.8% |
Other Assets Less Liabilities | 5.2% |
Expressed as a percentage of the Fund’s net assets.
How has the Fund changed?
This is a summary of certain changes to the Fund since October 1, 2023. For more complete information, you may review the Fund’s next prospectus, which we expect to be available by February 1, 2025 at https://www.thornburg.com/download or upon request by calling 1-800-847-0200.
End Block
Changes In and Disagreements with Accountants
No changes and/or disagreements occurred in the current reporting period.
End Block
For additional information about the Fund, including its prospectus, financial information, holdings and proxy information, visit www.thornburg.com/download.

Thornburg Investment Income Builder Fund Tailored Shareholder Report | |
Thornburg Investment Income Builder Fund Tailored Shareholder Report
Thornburg Investment Income Builder Fund CLASS: R6 TICKER: TIBOX Annual Shareholder Report | |
This annual shareholder report contains important information about the Thornburg Investment Income Builder Fund Class R6 Shares for the period from October 1, 2023 to September 30, 2024. You can find additional information about the Fund at https://www.thornburg.com/download. You can also request this information by contacting us at 1-800-847-0200. This report also describes changes to the Fund that occurred during the reporting period.
How did the Fund perform last year and what affected its performance?
The Fund’s Class R6 shares underperformed the benchmark composed of 25% Bloomberg U.S. Aggregate Bond Total Return Index Value USD and 75% MSCI World Net Total Return USD Index (the “Blended Index”) during the 12-month period ended September 30, 2024. During the period, major world events included the ongoing Russian/Ukraine conflict, moderating inflation figures in the U.S., Mideast tensions, and upcoming political contests in the U.S. Despite the conflicting economic and geo-political signals, the S&P 500, the Bloomberg U.S. Aggregate Bond, and the MSCI ACWI indexes reported varying positive returns for the period, +36.3%, +11.6%, and +31.8%, respectively. In brief, most equities repriced higher due to a surprising level of economic strength and resilient corporate profits, while interest rates declined along with inflation rates, creating a more favorable backdrop for the economy. A general overweight positioning to equities and underweight positioning to fixed income boosted the Fund’s relative performance during the period. Within equities, the Fund’s focus on dividend paying firms was a source of underperformance versus the broad based MSCI World Index. This underperformance is common during periods such as the current reporting period when growth stocks are outperforming. Security selection within the information technology and energy sectors, along with an overweight positioning to Taiwan, boosted relative performance. Mostly, the Fund’s equity holdings were relative detractors across the various sectors. Stock selection within the U.S. was beneficial to relative performance, however, the overall underweight positioning to U.S. stocks hampered performance. Among its fixed income holdings, the Fund’s shorter duration positioning during the period detracted from relative performance as yields across the curve declined during the period.
How did the Fund perform over the past 10 years?
The line graph below reflects a hypothetical $10,000 investment. The returns shown in the line graph and table assume the reinvestment of dividends and capital gains, but do not reflect the deduction of taxes that a shareholder would pay on distributions or the redemption of Fund shares. The performance information shown below represents past performance and is no guarantee of future results. For Fund performance current to the most recent month end, visit https://www.thornburg.com/product/mutual-funds/fib/TIBOX or call 1-800-847-0200. Performance for other share classes of the Fund will vary.
Cumulative Performance
Growth Table
Date | Thornburg Investment Income Builder Fund | Thornburg Investment Income Builder Fund’s Blended Index | MSCI World Net Total Return USD Index | Bloomberg U.S. Aggregate Total Return Value Index USD |
04/10/2017 | 9999.9999 | 10000 | 10000 | 10000 |
04/30/2017 | 10106.7258 | 10147.8431 | 10179.5324 | 10052.775 |
05/31/2017 | 10319.7344 | 10328.3747 | 10394.8752 | 10130.1526 |
06/30/2017 | 10330.8459 | 10355.5801 | 10434.8693 | 10119.9591 |
07/31/2017 | 10550.3568 | 10552.5963 | 10684.6012 | 10163.5068 |
08/31/2017 | 10546.5907 | 10587.4035 | 10699.6464 | 10254.6677 |
09/30/2017 | 10765.3118 | 10753.0171 | 10939.792 | 10205.8279 |
10/31/2017 | 10767.8542 | 10906.9864 | 11146.5375 | 10211.7408 |
11/30/2017 | 11037.9072 | 11080.7322 | 11388.0556 | 10198.6334 |
12/31/2017 | 11133.8625 | 11205.8345 | 11542.0629 | 10245.4405 |
01/31/2018 | 11508.1253 | 11617.3217 | 12151.4846 | 10127.444 |
02/28/2018 | 10963.3852 | 11228.834 | 11648.0804 | 10031.4417 |
03/31/2018 | 10874.094 | 11063.275 | 11394.194 | 10095.772 |
04/30/2018 | 11101.5887 | 11138.0515 | 11525.1253 | 10020.6874 |
05/31/2018 | 10967.6872 | 11210.2712 | 11597.3475 | 10092.2023 |
06/30/2018 | 10969.9822 | 11202.8134 | 11591.8146 | 10079.7908 |
07/31/2018 | 11425.9234 | 11465.9059 | 11953.8679 | 10082.184 |
08/31/2018 | 11253.6029 | 11590.7507 | 12101.7718 | 10147.06 |
09/30/2018 | 11429.5047 | 11620.4953 | 12169.1561 | 10081.7184 |
10/31/2018 | 10962.689 | 10957.587 | 11275.6018 | 10002.0477 |
11/30/2018 | 11162.3193 | 11067.2977 | 11403.6907 | 10061.7569 |
12/31/2018 | 10653.1376 | 10486.9755 | 10536.5765 | 10246.602 |
01/31/2019 | 11136.6211 | 11126.7786 | 11356.3843 | 10355.4163 |
02/28/2019 | 11298.7679 | 11376.1029 | 11697.8691 | 10349.4183 |
03/31/2019 | 11422.6767 | 11542.7779 | 11851.5143 | 10548.1468 |
04/30/2019 | 11780.0583 | 11850.4903 | 12271.7608 | 10550.8454 |
05/31/2019 | 11169.0867 | 11390.2432 | 11563.669 | 10738.1388 |
06/30/2019 | 11714.1952 | 11988.9229 | 12325.6554 | 10872.9926 |
07/31/2019 | 11656.1272 | 12040.0533 | 12386.7086 | 10896.9043 |
08/31/2019 | 11568.9393 | 11933.3429 | 12133.3439 | 11179.2637 |
09/30/2019 | 11941.9168 | 12107.9198 | 12391.5543 | 11119.7248 |
10/31/2019 | 12169.0164 | 12348.1238 | 12706.8871 | 11153.2192 |
11/30/2019 | 12255.0274 | 12604.4749 | 13060.7773 | 11147.5366 |
12/31/2019 | 12579.7115 | 12885.4854 | 13452.0547 | 11139.7713 |
01/31/2020 | 12389.3692 | 12888.6565 | 13370.1761 | 11354.1506 |
02/29/2020 | 11531.2498 | 12129.5873 | 12240.0584 | 11558.5066 |
03/31/2020 | 9323.8413 | 10907.7954 | 10620.1761 | 11490.4864 |
04/30/2020 | 10115.6169 | 11849.9799 | 11780.3687 | 11694.7422 |
05/31/2020 | 10481.6037 | 12293.1124 | 12349.4576 | 11749.1944 |
06/30/2020 | 10704.6086 | 12556.3449 | 12676.1133 | 11823.2026 |
07/31/2020 | 10960.7336 | 13053.7686 | 13282.5563 | 11999.8067 |
08/31/2020 | 11188.5453 | 13681.5609 | 14170.0209 | 11902.9483 |
09/30/2020 | 10813.7157 | 13325.6834 | 13681.1675 | 11896.4197 |
10/31/2020 | 10623.8586 | 13004.2334 | 13261.4973 | 11843.2992 |
11/30/2020 | 12122.106 | 14283.1914 | 14957.1333 | 11959.5133 |
12/31/2020 | 12545.0622 | 14742.281 | 15591.2664 | 11975.9902 |
01/31/2021 | 12745.1167 | 14605.9684 | 15436.3109 | 11890.1263 |
02/28/2021 | 13187.5477 | 14833.939 | 15831.8558 | 11718.4236 |
03/31/2021 | 13627.7088 | 15157.7992 | 16358.6144 | 11572.0996 |
04/30/2021 | 13869.653 | 15716.821 | 17119.9466 | 11663.5208 |
05/31/2021 | 14197.5476 | 15899.4641 | 17366.5674 | 11701.6264 |
06/30/2021 | 14051.8675 | 16105.1246 | 17625.4125 | 11783.8404 |
07/31/2021 | 14071.7884 | 16366.5094 | 17941.1347 | 11915.5951 |
08/31/2021 | 14355.3864 | 16664.2212 | 18387.6598 | 11892.91 |
09/30/2021 | 13980.8672 | 16109.2214 | 17624.1938 | 11789.9435 |
10/31/2021 | 14544.2438 | 16792.4379 | 18622.4379 | 11786.6942 |
11/30/2021 | 14390.7518 | 16528.879 | 18214.365 | 11821.5654 |
12/31/2021 | 15102.3635 | 17048.1397 | 18992.849 | 11791.3153 |
01/31/2022 | 15193.2238 | 16279.7949 | 17987.9214 | 11537.2834 |
02/28/2022 | 14756.0752 | 15925.586 | 17532.984 | 11408.5678 |
03/31/2022 | 14801.929 | 16142.7653 | 18014.1493 | 11091.6175 |
04/30/2022 | 14131.6381 | 14983.8435 | 16517.6524 | 10670.7144 |
05/31/2022 | 14651.0225 | 15016.5077 | 16530.1628 | 10739.5156 |
06/30/2022 | 13537.9624 | 13982.0427 | 15098.2876 | 10571.0322 |
07/31/2022 | 13817.8047 | 14900.0454 | 16297.0356 | 10829.3297 |
08/31/2022 | 13441.6187 | 14327.5848 | 15615.6915 | 10523.3289 |
09/30/2022 | 12365.9506 | 13173.9075 | 14164.0597 | 10068.656 |
10/31/2022 | 13135.1811 | 13840.7912 | 15181.2213 | 9938.2431 |
11/30/2022 | 14240.0623 | 14689.8094 | 16236.7787 | 10303.7277 |
12/31/2022 | 13907.1338 | 14205.3666 | 15547.2462 | 10257.2511 |
01/31/2023 | 14757.0809 | 15068.457 | 16647.3085 | 10572.8045 |
02/28/2023 | 14696.4459 | 14699.3899 | 16247.132 | 10299.4421 |
03/31/2023 | 14677.2244 | 15133.3954 | 16749.1637 | 10561.074 |
04/30/2023 | 15062.6561 | 15355.2846 | 17042.7678 | 10625.0789 |
05/31/2023 | 14638.7405 | 15198.5114 | 16872.623 | 10509.3854 |
06/30/2023 | 15193.9626 | 15874.3399 | 17893.0417 | 10471.9057 |
07/31/2023 | 15623.6287 | 16271.5212 | 18494.1193 | 10464.6061 |
08/31/2023 | 15406.0744 | 15954.0444 | 18052.3737 | 10397.7624 |
09/30/2023 | 15169.2008 | 15336.5152 | 17273.623 | 10133.5371 |
10/31/2023 | 14895.245 | 14942.2579 | 16772.4149 | 9973.62 |
11/30/2023 | 15779.1854 | 16162.0792 | 18344.8642 | 10425.2889 |
12/31/2023 | 16444.1891 | 16911.8449 | 19245.4914 | 10824.3581 |
01/31/2024 | 16510.9114 | 17052.4469 | 19476.446 | 10794.6337 |
02/29/2024 | 16539.4841 | 17534.4531 | 20302.2014 | 10642.1215 |
03/31/2024 | 17392.8081 | 17997.532 | 20954.6094 | 10740.3918 |
04/30/2024 | 17165.1029 | 17382.4976 | 20176.2559 | 10469.102 |
05/31/2024 | 17844.9303 | 18038.2933 | 21077.1674 | 10646.5874 |
06/30/2024 | 17855.7557 | 18356.2689 | 21506.0423 | 10747.386 |
07/31/2024 | 18530.7634 | 18706.0658 | 21885.0312 | 10998.4089 |
08/31/2024 | 18964.21 | 19144.076 | 22463.463 | 11156.4585 |
09/30/2024 | 18993.7208 | 19471.1103 | 22874.8572 | 11305.8365 |
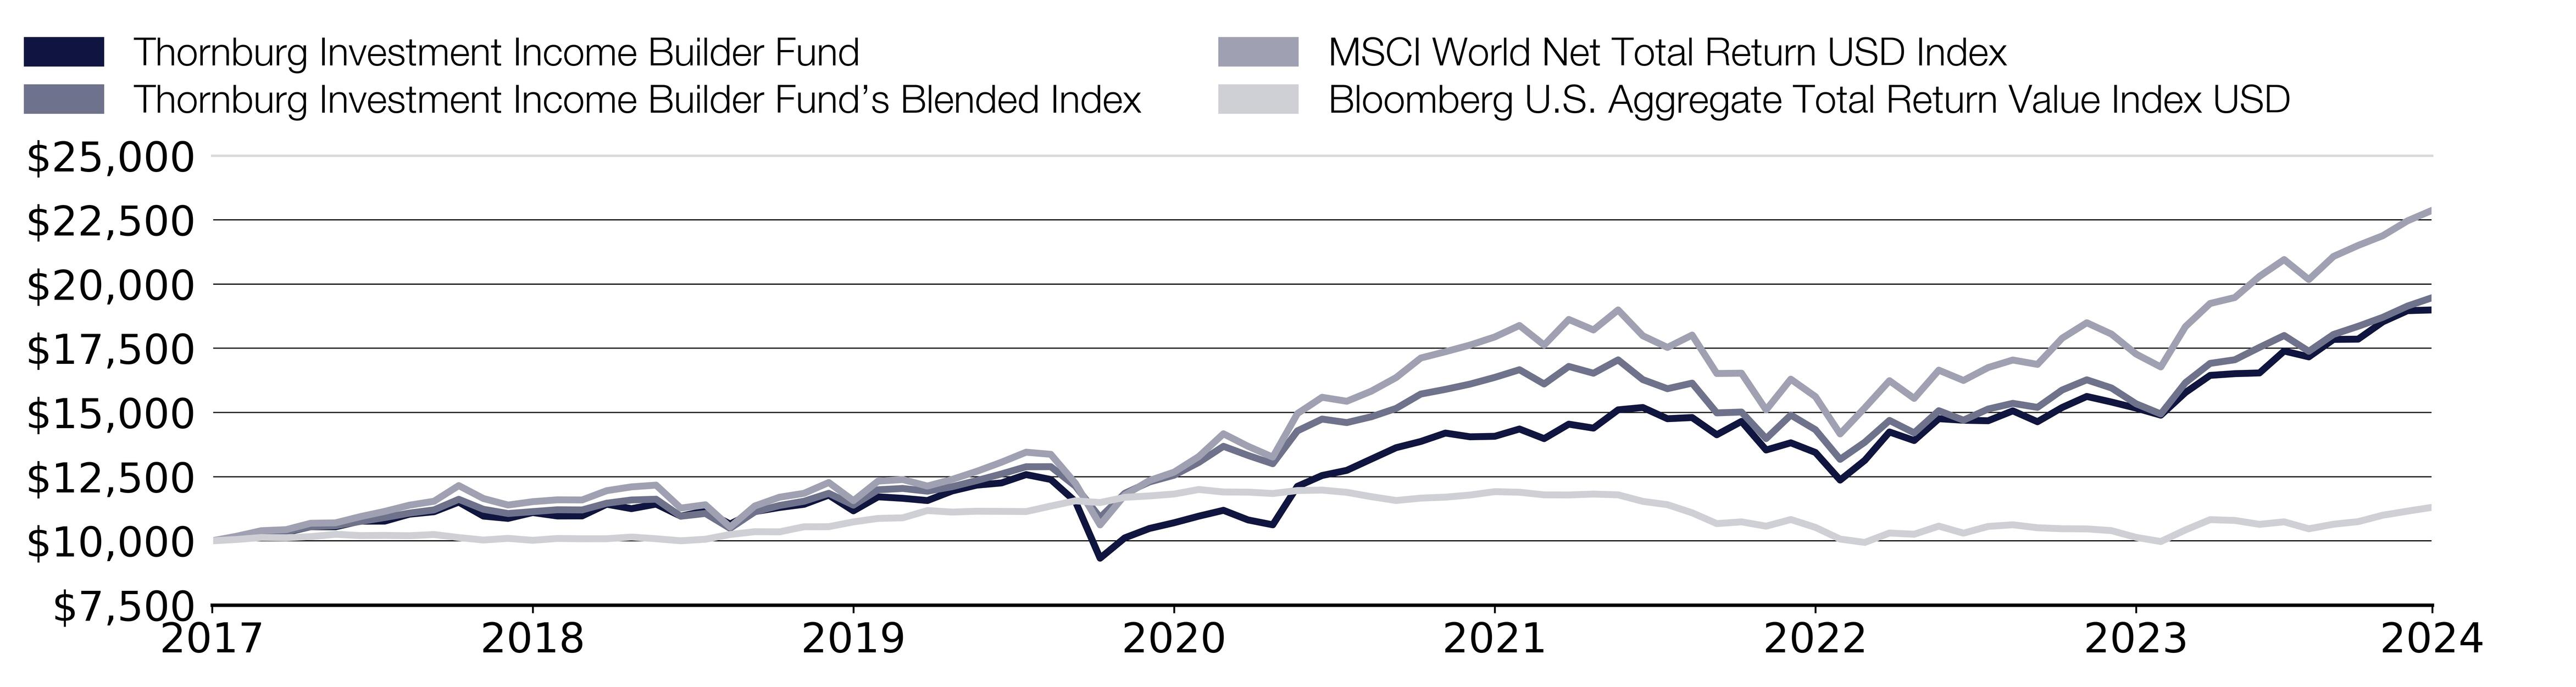
Effective September 30, 2024, the Fund adopted the MSCI World Net Total Return USD Index and the Bloomberg U.S. Aggregate Total Return Index Value USD as its broad-based securities market indices that represent the overall applicable markets in which the Fund invests, and a Blended Benchmark, comprised of 25% Bloomberg U.S. Aggregate Bond Total Return Value USD and 75% MSCI World Net Total Return USD Index, as an additional index that represents the market sectors which the Fund’s advisor believes are more representative of the Fund’s investment universe.
What were the Fund costs for the past year?
(based on a hypothetical $10,000 investment)
Class Name | Costs of a $10,000 investment | Costs paid as a percentage of a $10,000 investment |
|---|
Class R6 | $90.00 | 0.80% |
End Block
Thornburg Investment Income Builder Fund Tailored Shareholder Report
Thornburg Investment Income Builder Fund Tailored Shareholder Report | |
Annual Performance | 1 Year | 5 Year |
|---|
Investment Income Builder Fund Class R6 | 25.23% | 9.73% |
MSCI World Net Total Return USD Index | 32.43% | 13.04% |
Investment Income Builder Fund’s Blended Index | 26.96% | 9.97% |
Bloomberg U.S. Aggregate Total Return Value Index USD | 11.57% | 0.33% |
Key Fund Statistics
(as of September 30, 2024)
| |
|---|
Fund Size (Millions) | $13,932.0M |
Number of Holdings | 341 |
Annual Portfolio Turnover | 24.81% |
Total Advisory Fee | $87.8M |
What did the Fund invest in?
(as of September 30, 2024)
Portfolio Composition | (%) |
|---|
| Foreign Equity | 56.8 |
| Domestic Equity | 27.4 |
| Domestic Corporate Bonds | 4.5 |
| Domestic Other Bonds | 3.2 |
| Foreign Bonds | 2.8 |
| Other Assets Less Liabilities | 5.2 |
Portfolio Composition | (%) |
Foreign Equity | 56.8% |
Domestic Equity | 27.4% |
Domestic Corporate Bonds | 4.5% |
Domestic Other Bonds | 3.2% |
Foreign Bonds | 2.8% |
Other Assets Less Liabilities | 5.2% |
Expressed as a percentage of the Fund’s net assets.
How has the Fund changed?
This is a summary of certain changes to the Fund since October 1, 2023. For more complete information, you may review the Fund’s next prospectus, which we expect to be available by February 1, 2025 at https://www.thornburg.com/download or upon request by calling 1-800-847-0200.
End Block
Changes In and Disagreements with Accountants
No changes and/or disagreements occurred in the current reporting period.
End Block
For additional information about the Fund, including its prospectus, financial information, holdings and proxy information, visit www.thornburg.com/download.

Thornburg Investment Income Builder Fund Tailored Shareholder Report | |
Thornburg Summit Fund Tailored Shareholder Report
Thornburg Summit Fund CLASS: A TICKER: TSAMX Annual Shareholder Report | |
This annual shareholder report contains important information about the Thornburg Summit Fund Class A Shares for the period from October 1, 2023 to September 30, 2024. You can find additional information about the Fund at https://www.thornburg.com/download. You can also request this information by contacting us at 1-800-847-0200. This report also describes changes to the Fund that occurred during the reporting period.
How did the Fund perform last year and what affected its performance?
The Fund’s Class A shares underperformed the benchmark composed of 60% MSCI All Country World Index and 40% Bloomberg Global Aggregate Bond Index (the “Blended Index”) during the 12-month period ended September 30, 2024. Equity markets rebounded strongly in 2023 and continued to climb through the first three quarters of 2024. The Fund’s security selection within equities contributed positively to relative performance, but underweight positioning to equities versus the Blended Index was a headwind to relative results. Within the Fund’s equity holdings, selection effect from information technology and industrials, as well as an overweight positioning within communication services and underweight positioning within consumer staples, contributed positively to relative performance. Security selection within financials and health care hampered results relative to the Blended Index. Given spread tightening over the course of the period, the Fund’s relative overweight to credit versus government bonds contributed positively to relative performance. Selection effect within asset backed securities and corporate bonds was a detractor to the Fund’s relative performance.
How did the Fund perform over the past 10 years?
The line graph below reflects a hypothetical $10,000 investment and assumes the deduction of the maximum sales charge associated with that investment. The returns shown in the line graph and table assume the reinvestment of dividends and capital gains, but do not reflect the deduction of taxes that a shareholder would pay on distributions or the redemption of Fund shares. The performance information shown below represents past performance and is no guarantee of future results. For Fund performance current to the most recent month end, visit https://www.thornburg.com/product/mutual-funds/fs/TSAMX or call 1-800-847-0200. Performance for other share classes of the Fund will vary.
Cumulative Performance
Growth Table
Date | Thornburg Summit Fund | Thornburg Summit Fund’s Blended Index | MSCI All Country World Net Total Return USD Index | Bloomberg Global-Aggregate Total Return Index Value Unhedged USD |
01/26/2022 | 9548.698 | 10000.0105 | 10000 | 10000.0263 |
01/31/2022 | 9738.7218 | 10120.4367 | 10232.6804 | 9952.0707 |
02/28/2022 | 9596.2039 | 9915.4874 | 9968.384 | 9833.7943 |
03/31/2022 | 9620.8351 | 9923.5679 | 10184.3021 | 9534.3248 |
04/30/2022 | 9167.2474 | 9229.498 | 9369.1187 | 9011.9468 |
05/31/2022 | 9278.6549 | 9246.0653 | 9380.0999 | 9036.5447 |
06/30/2022 | 8695.4282 | 8659.7542 | 8589.3961 | 8746.5976 |
07/31/2022 | 9055.736 | 9096.2327 | 9189.2146 | 8932.5424 |
08/31/2022 | 8855.565 | 8751.7128 | 8850.8987 | 8580.0412 |
09/30/2022 | 8305.0658 | 8069.1688 | 8003.6014 | 8139.2048 |
10/31/2022 | 8530.6156 | 8339.1523 | 8486.6095 | 8083.2344 |
11/30/2022 | 9078.3794 | 8884.2103 | 9144.8471 | 8463.6349 |
12/31/2022 | 8926.5337 | 8693.6762 | 8785.0113 | 8509.3959 |
01/31/2023 | 9380.5626 | 9181.7092 | 9414.6756 | 8788.752 |
02/28/2023 | 9121.1175 | 8901.7208 | 9144.8471 | 8496.5722 |
03/31/2023 | 9323.7235 | 9179.0061 | 9426.8185 | 8765.2608 |
04/30/2023 | 9445.8684 | 9274.3607 | 9562.2998 | 8803.942 |
05/31/2023 | 9364.4385 | 9142.2328 | 9459.8729 | 8631.8325 |
06/30/2023 | 9578.0987 | 9460.4373 | 10009.128 | 8631.1646 |
07/31/2023 | 9775.9252 | 9694.4408 | 10375.547 | 8690.9325 |
08/31/2023 | 9635.7981 | 9478.8522 | 10085.6093 | 8572.0454 |
09/30/2023 | 9334.0373 | 9132.916 | 9668.5716 | 8321.6192 |
10/31/2023 | 9135.7923 | 8924.4894 | 9377.8594 | 8222.1586 |
11/30/2023 | 9689.2263 | 9598.7274 | 10243.4126 | 8636.775 |
12/31/2023 | 10041.7053 | 10034.9351 | 10735.4381 | 8995.7262 |
01/31/2024 | 10157.8903 | 10014.8379 | 10798.3658 | 8871.5913 |
02/29/2024 | 10323.8689 | 10222.3619 | 11261.7626 | 8760.1084 |
03/31/2024 | 10584.6909 | 10437.4411 | 11615.3472 | 8808.3311 |
04/30/2024 | 10351.1438 | 10125.4526 | 11232.1106 | 8586.0333 |
05/31/2024 | 10651.4187 | 10425.2753 | 11688.288 | 8698.5657 |
06/30/2024 | 10914.5315 | 10570.5838 | 11948.6289 | 8711.046 |
07/31/2024 | 10998.6188 | 10789.616 | 12141.3121 | 8951.5872 |
08/31/2024 | 11183.6109 | 11056.1505 | 12449.6717 | 9163.3894 |
09/30/2024 | 11375.9344 | 11285.5211 | 12738.8901 | 9319.3357 |

Effective September 30, 2024, the Fund adopted the MSCI All Country World Net Total Return USD Index and the Bloomberg Global-Aggregate Total Return Index Value Unhedged USD as its broad-based securities market indices that represent the overall applicable markets in which the Fund invests, and a Blended Benchmark, comprised of 60% MSCI All Country World Index and 40% Bloomberg Global Aggregate Bond Index, as an additional index that represents the market sectors which the Fund’s advisor believes are more representative of the Fund’s investment universe.
What were the Fund costs for the past year?
(based on a hypothetical $10,000 investment)
Class Name | Costs of a $10,000 investment | Costs paid as a percentage of a $10,000 investment |
|---|
Class A | $104.00 | 0.94% |
End Block
Thornburg Summit Fund Tailored Shareholder Report
Thornburg Summit Fund Tailored Shareholder Report | |
Annual Performance | 1 Year |
|---|
Summit Fund Class A (with sales charge) | 16.42% |
Summit Fund Class A (without sales charge) | 21.88% |
MSCI All Country World Net Total Return USD Index | 31.76% |
Summit Fund’s Blended Index | 23.57% |
Key Fund Statistics
(as of September 30, 2024)
| |
|---|
Fund Size (Millions) | $112.3M |
Number of Holdings | 201 |
Annual Portfolio Turnover | 66.54% |
Total Advisory Fee | $0.4M |
What did the Fund invest in?
(as of September 30, 2024)
Portfolio Composition | (%) |
|---|
| Domestic Equity | 31.7 |
| Domestic Other Bonds | 25.7 |
| Foreign Equity | 24.0 |
| Domestic Corporate Bonds | 4.6 |
| Foreign Bonds | 5.0 |
| Other Assets Less Liabilities | 8.9 |
Portfolio Composition | (%) |
Domestic Equity | 31.7% |
Domestic Other Bonds | 25.7% |
Foreign Equity | 24.0% |
Domestic Corporate Bonds | 4.6% |
Foreign Bonds | 5.0% |
Other Assets Less Liabilities | 8.9% |

Expressed as a percentage of the Fund’s net assets.
How has the Fund changed?
This is a summary of certain changes to the Fund since October 1, 2023. For more complete information, you may review the Fund’s next prospectus, which we expect to be available by February 1, 2025 at https://www.thornburg.com/download or upon request by calling 1-800-847-0200.
End Block
Changes In and Disagreements with Accountants
No changes and/or disagreements occurred in the current reporting period.
End Block
For additional information about the Fund, including its prospectus, financial information, holdings and proxy information, visit www.thornburg.com/download.

Thornburg Summit Fund Tailored Shareholder Report | |
Thornburg Summit Fund Tailored Shareholder Report
Thornburg Summit Fund CLASS: I TICKER: TSUMX Annual Shareholder Report | |
This annual shareholder report contains important information about the Thornburg Summit Fund Class I Shares for the period from October 1, 2023 to September 30, 2024. You can find additional information about the Fund at https://www.thornburg.com/download. You can also request this information by contacting us at 1-800-847-0200. This report also describes changes to the Fund that occurred during the reporting period.
How did the Fund perform last year and what affected its performance?
The Fund’s Class I shares underperformed the benchmark composed of 60% MSCI All Country World Index and 40% Bloomberg Global Aggregate Bond Index (the “Blended Index”) during the 12-month period ended September 30, 2024. Equity markets rebounded strongly in 2023 and continued to climb through the first three quarters of 2024. The Fund’s security selection within equities contributed positively to relative performance, but underweight positioning to equities versus the Blended Index was a headwind to relative results. Within the Fund’s equity holdings, selection effect from information technology and industrials, as well as an overweight positioning within communication services and underweight positioning within consumer staples, contributed positively to relative performance. Security selection within financials and health care hampered results relative to the Blended Index. Given spread tightening over the course of the period, the Fund’s relative overweight to credit versus government bonds contributed positively to relative performance. Selection effect within asset backed securities and corporate bonds was a detractor to the Fund’s relative performance.
How did the Fund perform over the past 10 years?
The line graph below reflects a hypothetical $10,000 investment. The returns shown in the line graph and table assume the reinvestment of dividends and capital gains, but do not reflect the deduction of taxes that a shareholder would pay on distributions or the redemption of Fund shares. The performance information shown below represents past performance and is no guarantee of future results. For Fund performance current to the most recent month end, visit https://www.thornburg.com/product/mutual-funds/fs/TSUMX or call 1-800-847-0200. Performance for other share classes of the Fund will vary.
Cumulative Performance
Growth Table
Date | Thornburg Summit Fund | Thornburg Summit Fund’s Blended Index | MSCI All Country World Net Total Return USD Index | Bloomberg Global-Aggregate Total Return Index Value Unhedged USD |
03/01/2019 | 10000 | 10000.0699 | 10000 | 10000.1747 |
03/31/2019 | 10190 | 10108.0383 | 10079.7834 | 10150.4215 |
04/30/2019 | 10390 | 10300.8625 | 10420.1522 | 10120.3721 |
05/31/2019 | 10200 | 9990.0287 | 9802.0325 | 10257.4088 |
06/30/2019 | 10461.1027 | 10471.1288 | 10443.8857 | 10484.8425 |
07/31/2019 | 10390.7591 | 10477.8874 | 10474.4693 | 10455.7056 |
08/31/2019 | 10511.3481 | 10413.9875 | 10226.0126 | 10668.3116 |
09/30/2019 | 10545.1327 | 10503.0742 | 10441.1457 | 10559.8103 |
10/31/2019 | 10605.5633 | 10703.5226 | 10726.9152 | 10630.1122 |
11/30/2019 | 10715.0891 | 10827.8471 | 10988.79 | 10549.5243 |
12/31/2019 | 10976.0451 | 11081.869 | 11375.7394 | 10611.0332 |
01/31/2020 | 10976.0451 | 11065.0217 | 11250.1007 | 10746.4938 |
02/29/2020 | 10629.8618 | 10558.5462 | 10341.4164 | 10818.7657 |
03/31/2020 | 9958.0419 | 9608.6507 | 8945.2879 | 10576.3593 |
04/30/2020 | 10737.4561 | 10301.7217 | 9903.5749 | 10784.0089 |
05/31/2020 | 11301.5059 | 10588.6117 | 10334.2843 | 10831.3122 |
06/30/2020 | 11660.4467 | 10829.2437 | 10664.4988 | 10927.5366 |
07/31/2020 | 12070.6647 | 11311.0289 | 11228.5028 | 11276.0594 |
08/31/2020 | 12634.7144 | 11719.5207 | 11915.7681 | 11258.8676 |
09/30/2020 | 12491.1381 | 11475.9284 | 11531.5588 | 11218.3663 |
10/31/2020 | 12286.0291 | 11312.9375 | 11251.229 | 11229.1085 |
11/30/2020 | 13179.7575 | 12231.8937 | 12638.0897 | 11433.2742 |
12/31/2020 | 14024.7232 | 12638.357 | 13224.8602 | 11586.8391 |
01/31/2021 | 13884.7989 | 12559.3689 | 13164.7406 | 11484.8081 |
02/28/2021 | 14842.7424 | 12647.4249 | 13469.6501 | 11287.1127 |
03/31/2021 | 14781.1732 | 12752.8039 | 13829.4409 | 11069.9859 |
04/30/2021 | 15316.4855 | 13151.8036 | 14434.1022 | 11209.8429 |
05/31/2021 | 15524.0555 | 13323.9939 | 14658.7044 | 11315.109 |
06/30/2021 | 15622.3782 | 13382.3212 | 14851.8769 | 11215.2763 |
07/31/2021 | 15709.7761 | 13508.9099 | 14954.2253 | 11364.5692 |
08/31/2021 | 15971.9699 | 13689.3108 | 15328.5222 | 11317.3073 |
09/30/2021 | 15567.7545 | 13252.705 | 14695.292 | 11116.2109 |
10/31/2021 | 15982.8946 | 13645.7809 | 15445.4169 | 11089.3344 |
11/30/2021 | 15661.6769 | 13432.644 | 15073.4571 | 11056.9002 |
12/31/2021 | 16078.1965 | 13747.5461 | 15676.426 | 11041.4711 |
01/31/2022 | 15795.6723 | 13229.7383 | 14906.5164 | 10815.1781 |
02/28/2022 | 15564.5161 | 12961.8224 | 14521.5012 | 10686.6439 |
03/31/2022 | 15608.8066 | 12972.3854 | 14836.0411 | 10361.2025 |
04/30/2022 | 14885.818 | 12065.0766 | 13648.518 | 9793.5205 |
05/31/2022 | 15053.6547 | 12086.7338 | 13664.5149 | 9820.2518 |
06/30/2022 | 14125.7715 | 11320.2904 | 12512.6525 | 9505.1586 |
07/31/2022 | 14697.5599 | 11890.8682 | 13386.4417 | 9707.2297 |
08/31/2022 | 14385.6753 | 11440.5014 | 12893.598 | 9324.1573 |
09/30/2022 | 13488.6039 | 10548.2594 | 11659.2927 | 8845.0888 |
10/31/2022 | 13854.9288 | 10901.1899 | 12362.9177 | 8784.2643 |
11/30/2022 | 14757.6578 | 11613.706 | 13321.8091 | 9197.6555 |
12/31/2022 | 14506.4017 | 11364.6342 | 12797.6162 | 9247.3853 |
01/31/2023 | 15244.2386 | 12002.6055 | 13714.8832 | 9550.9689 |
02/28/2023 | 14835.7932 | 11636.5964 | 13321.8091 | 9233.4493 |
03/31/2023 | 15161.0824 | 11999.0719 | 13732.5726 | 9525.4404 |
04/30/2023 | 15372.9403 | 12123.7224 | 13929.9357 | 9567.4763 |
05/31/2023 | 15240.5291 | 11951.0008 | 13780.7247 | 9380.4403 |
06/30/2023 | 15597.1558 | 12366.9673 | 14580.8552 | 9379.7144 |
07/31/2023 | 15905.612 | 12672.8637 | 15114.6382 | 9444.6659 |
08/31/2023 | 15691.0338 | 12391.0399 | 14692.2699 | 9315.4681 |
09/30/2023 | 15196.3304 | 11938.8216 | 14084.7477 | 9043.3233 |
10/31/2023 | 14887.0246 | 11666.3601 | 13661.2511 | 8935.2369 |
11/30/2023 | 15788.0459 | 12547.7442 | 14922.1508 | 9385.8114 |
12/31/2023 | 16371.4 | 13117.968 | 15638.9117 | 9775.8932 |
01/31/2024 | 16560.6648 | 13091.6964 | 15730.582 | 9640.9925 |
02/29/2024 | 16831.0429 | 13362.978 | 16405.638 | 9519.8411 |
03/31/2024 | 17252.7656 | 13644.136 | 16920.7243 | 9572.246 |
04/30/2024 | 16885.6855 | 13236.2952 | 16362.4422 | 9330.6691 |
05/31/2024 | 17388.7212 | 13628.2324 | 17026.9813 | 9452.9611 |
06/30/2024 | 17801.0446 | 13818.184 | 17406.2344 | 9466.5237 |
07/31/2024 | 17951.9009 | 14104.5096 | 17686.9268 | 9727.9262 |
08/31/2024 | 18253.6135 | 14452.9315 | 18136.1314 | 9958.0973 |
09/30/2024 | 18579.0767 | 14752.7715 | 18557.4521 | 10127.5682 |
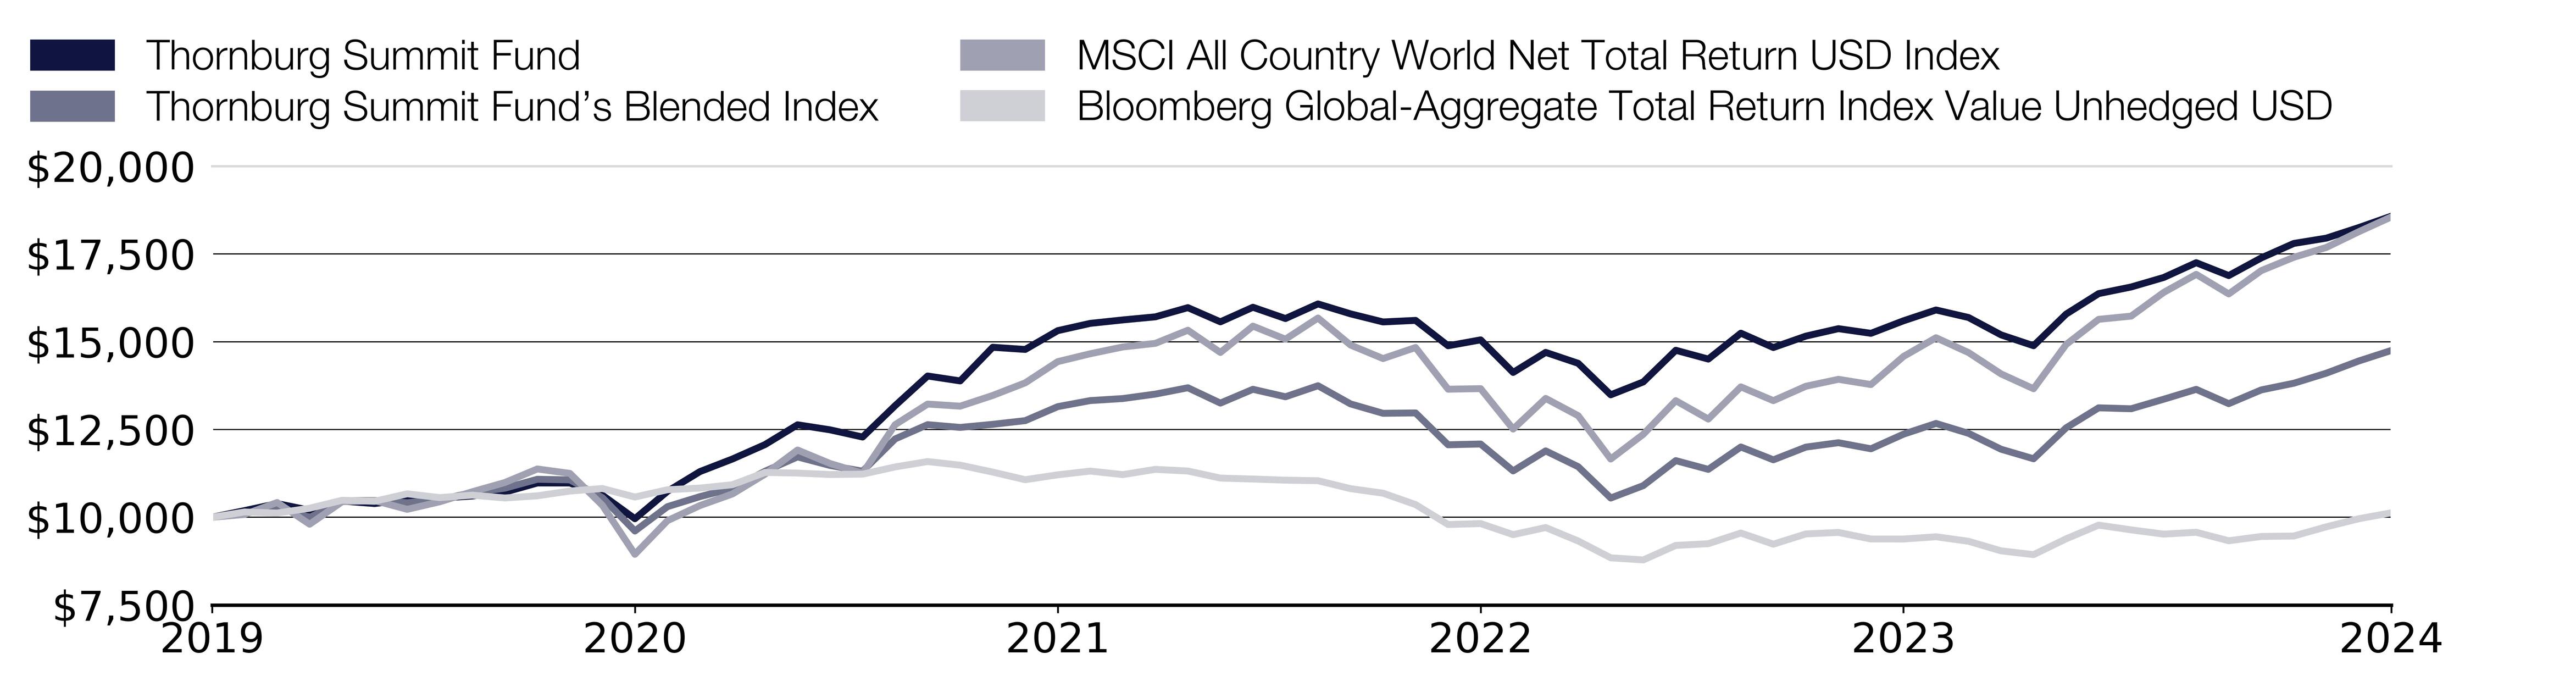
Effective September 30, 2024, the Fund adopted the MSCI All Country World Net Total Return USD Index and the Bloomberg Global-Aggregate Total Return Index Value Unhedged USD as its broad-based securities market indices that represent the overall applicable markets in which the Fund invests, and a Blended Benchmark, comprised of 60% MSCI All Country World Index and 40% Bloomberg Global Aggregate Bond Index, as an additional index that represents the market sectors which the Fund’s advisor believes are more representative of the Fund’s investment universe.
What were the Fund costs for the past year?
(based on a hypothetical $10,000 investment)
Class Name | Costs of a $10,000 investment | Costs paid as a percentage of a $10,000 investment |
|---|
Class I | $77.00 | 0.69% |
End Block
Thornburg Summit Fund Tailored Shareholder Report
Thornburg Summit Fund Tailored Shareholder Report | |
Annual Performance | 1 Year | 5 Year |
|---|
Summit Fund Class I | 22.26% | 11.99% |
MSCI All Country World Net Total Return USD Index | 31.76% | 12.19% |
Summit Fund’s Blended Index | 23.57% | 7.03% |
Key Fund Statistics
(as of September 30, 2024)
| |
|---|
Fund Size (Millions) | $112.3M |
Number of Holdings | 201 |
Annual Portfolio Turnover | 66.54% |
Total Advisory Fee | $0.4M |
What did the Fund invest in?
(as of September 30, 2024)
Portfolio Composition | (%) |
|---|
| Domestic Equity | 31.7 |
| Domestic Other Bonds | 25.7 |
| Foreign Equity | 24.0 |
| Domestic Corporate Bonds | 4.6 |
| Foreign Bonds | 5.0 |
| Other Assets Less Liabilities | 8.9 |
Portfolio Composition | (%) |
Domestic Equity | 31.7% |
Domestic Other Bonds | 25.7% |
Foreign Equity | 24.0% |
Domestic Corporate Bonds | 4.6% |
Foreign Bonds | 5.0% |
Other Assets Less Liabilities | 8.9% |
Expressed as a percentage of the Fund’s net assets.
How has the Fund changed?
This is a summary of certain changes to the Fund since October 1, 2023. For more complete information, you may review the Fund’s next prospectus, which we expect to be available by February 1, 2025 at https://www.thornburg.com/download or upon request by calling 1-800-847-0200.
End Block
Changes In and Disagreements with Accountants
No changes and/or disagreements occurred in the current reporting period.
End Block
For additional information about the Fund, including its prospectus, financial information, holdings and proxy information, visit www.thornburg.com/download.

Thornburg Summit Fund Tailored Shareholder Report | |
Thornburg Ultra Short Income Fund Tailored Shareholder Report
Thornburg Ultra Short Income Fund CLASS: A TICKER: TLDAX Annual Shareholder Report | |
This annual shareholder report contains important information about the Thornburg Ultra Short Income Fund Class A Shares for the period from October 1, 2023 to September 30, 2024. You can find additional information about the Fund at https://www.thornburg.com/download. You can also request this information by contacting us at 1-800-847-0200. This report also describes changes to the Fund that occurred during the reporting period.
How did the Fund perform last year and what affected its performance?
The Fund’s Class A shares outperformed the ICE BofA U.S. Treasury Bill Index (the “Index”) during the 12-month period ended September 30, 2024. Treasury yields fell meaningfully over the 12-month period as U.S. inflation continued to improve, and the market priced in anticipated interest rate cuts by the Federal Reserve. The Fund’s relatively longer duration versus the Index proved to be a positive contributor to relative performance. Additionally, the Fund’s allocation to asset-backed securities and investment-grade corporate bonds was beneficial. There were no material detractors to the Fund’s performance over the period.
How did the Fund perform over the past 10 years?
The line graph below reflects a hypothetical $10,000 investment and assumes the deduction of the maximum sales charge associated with that investment. The returns shown in the line graph and table assume the reinvestment of dividends and capital gains, but do not reflect the deduction of taxes that a shareholder would pay on distributions or the redemption of Fund shares. The performance information shown below represents past performance and is no guarantee of future results. For Fund performance current to the most recent month end, visit https://www.thornburg.com/product/mutual-funds/fldi/TLDAX or call 1-800-847-0200. Performance for other share classes of the Fund will vary.
Cumulative Performance
Growth Table
Date | Thornburg Ultra Short Income Fund | ICE BofA U.S. Treasury Bill Index | Bloomberg U.S. Aggregate Total Return Value Index USD |
09/30/2014 | 9848.8471 | 10000 | 10000 |
10/31/2014 | 9862.7621 | 10000.1038 | 10098.2769 |
11/30/2014 | 9876.8604 | 10000.3113 | 10169.91 |
12/31/2014 | 9850.5616 | 10000.3113 | 10179.4256 |
01/31/2015 | 9887.8964 | 10002.0235 | 10392.8789 |
02/28/2015 | 9878.0515 | 10002.231 | 10295.1602 |
03/31/2015 | 9899.5276 | 10002.2829 | 10342.967 |
04/30/2015 | 9904.7728 | 10003.9951 | 10305.856 |
05/31/2015 | 9909.9312 | 10004.462 | 10281.0356 |
06/30/2015 | 9907.2175 | 10005.1884 | 10168.9318 |
07/31/2015 | 9904.2847 | 10004.8252 | 10239.6187 |
08/31/2015 | 9901.7892 | 10005.3441 | 10224.9146 |
09/30/2015 | 9915.4886 | 10009.2873 | 10294.0811 |
10/31/2015 | 9912.2789 | 10007.9383 | 10295.7875 |
11/30/2015 | 9902.2177 | 10007.0044 | 10268.5908 |
12/31/2015 | 9878.6027 | 10008.8722 | 10235.4031 |
01/31/2016 | 9925.871 | 10011.5183 | 10376.2558 |
02/29/2016 | 9924.5218 | 10014.2681 | 10449.8664 |
03/31/2016 | 9972.886 | 10019.716 | 10545.7404 |
04/30/2016 | 9997.479 | 10022.9847 | 10586.2218 |
05/31/2016 | 10006.9803 | 10023.1403 | 10588.9383 |
06/30/2016 | 10049.0523 | 10029.7815 | 10779.1979 |
07/31/2016 | 10058.3101 | 10032.0125 | 10847.3436 |
08/31/2016 | 10051.408 | 10033.7766 | 10834.9414 |
09/30/2016 | 10073.9723 | 10038.6018 | 10828.5941 |
10/31/2016 | 10066.4978 | 10040.9366 | 10745.7655 |
11/30/2016 | 10035.9867 | 10041.8705 | 10491.5864 |
12/31/2016 | 10045.6261 | 10045.9175 | 10506.3861 |
01/31/2017 | 10066.5928 | 10051.3653 | 10527.0016 |
02/28/2017 | 10092.9888 | 10055.568 | 10597.7522 |
03/31/2017 | 10105.4957 | 10056.5019 | 10592.197 |
04/30/2017 | 10117.6549 | 10063.143 | 10673.9358 |
05/31/2017 | 10136.2548 | 10067.8126 | 10756.0945 |
06/30/2017 | 10140.5077 | 10075.8547 | 10745.2712 |
07/31/2017 | 10160.543 | 10083.7411 | 10791.5097 |
08/31/2017 | 10172.7617 | 10094.1698 | 10888.3034 |
09/30/2017 | 10178.0037 | 10102.4712 | 10836.4459 |
10/31/2017 | 10182.8394 | 10110.6171 | 10842.724 |
11/30/2017 | 10172.5222 | 10117.829 | 10828.8068 |
12/31/2017 | 10176.7 | 10127.5313 | 10878.506 |
01/31/2018 | 10165.0503 | 10138.6345 | 10753.2186 |
02/28/2018 | 10161.1418 | 10147.2992 | 10651.2843 |
03/31/2018 | 10169.488 | 10161.5673 | 10719.5896 |
04/30/2018 | 10177.9056 | 10175.2647 | 10639.8655 |
05/31/2018 | 10202.3187 | 10191.0375 | 10715.7993 |
06/30/2018 | 10211.5215 | 10207.5367 | 10702.6209 |
07/31/2018 | 10221.0277 | 10223.9321 | 10705.1619 |
08/31/2018 | 10255.0548 | 10242.8698 | 10774.0467 |
09/30/2018 | 10254.6039 | 10257.9162 | 10704.6676 |
10/31/2018 | 10255.4869 | 10276.4389 | 10620.0741 |
11/30/2018 | 10266.7447 | 10297.0369 | 10683.4727 |
12/31/2018 | 10320.5733 | 10317.5311 | 10879.7393 |
01/31/2019 | 10373.3742 | 10339.4781 | 10995.2773 |
02/28/2019 | 10400.7995 | 10358.4159 | 10988.9087 |
03/31/2019 | 10463.4052 | 10381.9713 | 11199.9166 |
04/30/2019 | 10483.5676 | 10402.258 | 11202.782 |
05/31/2019 | 10548.1753 | 10426.8511 | 11401.6482 |
06/30/2019 | 10586.2693 | 10451.3923 | 11544.8346 |
07/31/2019 | 10590.1194 | 10470.0187 | 11570.2238 |
08/31/2019 | 10661.5975 | 10492.3808 | 11870.0302 |
09/30/2019 | 10664.6365 | 10509.8658 | 11806.8123 |
10/31/2019 | 10684.0959 | 10531.709 | 11842.3764 |
11/30/2019 | 10695.3149 | 10544.4725 | 11836.3427 |
12/31/2019 | 10706.2822 | 10559.9859 | 11828.0976 |
01/31/2020 | 10759.1035 | 10574.6691 | 12055.7234 |
02/29/2020 | 10803.1625 | 10593.97 | 12272.7065 |
03/31/2020 | 10528.128 | 10628.5768 | 12200.4833 |
04/30/2020 | 10694.5981 | 10628.8362 | 12417.3601 |
05/31/2020 | 10834.2976 | 10628.8362 | 12475.1769 |
06/30/2020 | 10927.8657 | 10630.4446 | 12553.758 |
07/31/2020 | 10960.0482 | 10632.9869 | 12741.2746 |
08/31/2020 | 10983.7174 | 10633.6614 | 12638.4313 |
09/30/2020 | 10998.2463 | 10634.9585 | 12631.4992 |
10/31/2020 | 11003.4241 | 10636.0481 | 12575.0965 |
11/30/2020 | 11017.1299 | 10637.0858 | 12698.4914 |
12/31/2020 | 11032.6042 | 10638.2272 | 12715.9864 |
01/31/2021 | 11037.5642 | 10639.0574 | 12624.817 |
02/28/2021 | 11041.3254 | 10640.0951 | 12442.5048 |
03/31/2021 | 11035.8625 | 10641.0809 | 12287.1394 |
04/30/2021 | 11042.8586 | 10641.4959 | 12384.2096 |
05/31/2021 | 11046.048 | 10641.7553 | 12424.6696 |
06/30/2021 | 11048.8814 | 10641.2884 | 12511.9637 |
07/31/2021 | 11051.8206 | 10641.8072 | 12651.8595 |
08/31/2021 | 11054.0438 | 10642.3261 | 12627.7727 |
09/30/2021 | 11057.406 | 10642.8449 | 12518.4439 |
10/31/2021 | 11050.223 | 10642.7411 | 12514.9938 |
11/30/2021 | 11043.3656 | 10643.2081 | 12552.0197 |
12/31/2021 | 11045.6602 | 10643.5713 | 12519.9004 |
01/31/2022 | 11038.5303 | 10640.6658 | 12250.172 |
02/28/2022 | 10959.8585 | 10640.9252 | 12113.503 |
03/31/2022 | 10934.6596 | 10640.7177 | 11776.9683 |
04/30/2022 | 10920.8422 | 10642.378 | 11330.0576 |
05/31/2022 | 10924.8974 | 10649.071 | 11403.1101 |
06/30/2022 | 10913.904 | 10648.6041 | 11224.2161 |
07/31/2022 | 10923.1659 | 10656.231 | 11498.4738 |
08/31/2022 | 10953.8253 | 10673.0934 | 11173.5652 |
09/30/2022 | 10951.0247 | 10693.4839 | 10690.7981 |
10/31/2022 | 10952.4118 | 10709.6717 | 10552.327 |
11/30/2022 | 10993.8213 | 10744.0191 | 10940.3949 |
12/31/2022 | 11047.8221 | 10785.8377 | 10891.0465 |
01/31/2023 | 11112.4525 | 10821.067 | 11226.0979 |
02/28/2023 | 11141.3192 | 10856.4521 | 10935.8444 |
03/31/2023 | 11191.9546 | 10906.6241 | 11213.6426 |
04/30/2023 | 11234.3443 | 10943.2543 | 11281.6023 |
05/31/2023 | 11278.4973 | 10982.79 | 11158.7602 |
06/30/2023 | 11323.2218 | 11032.08 | 11118.9646 |
07/31/2023 | 11378.0738 | 11077.323 | 11111.2139 |
08/31/2023 | 11425.6828 | 11127.495 | 11040.24 |
09/30/2023 | 11473.2432 | 11178.0302 | 10759.6881 |
10/31/2023 | 11521.8623 | 11228.1503 | 10589.8898 |
11/30/2023 | 11586.6316 | 11280.6052 | 11069.4673 |
12/31/2023 | 11663.4071 | 11335.0836 | 11493.195 |
01/31/2024 | 11723.7458 | 11383.3358 | 11461.6339 |
02/29/2024 | 11764.567 | 11428.0081 | 11299.6979 |
03/31/2024 | 11816.142 | 11479.7885 | 11404.0404 |
04/30/2024 | 11860.1934 | 11527.4701 | 11115.9877 |
05/31/2024 | 11922.4256 | 11583.4012 | 11304.4398 |
06/30/2024 | 11977.5452 | 11631.3422 | 11411.4668 |
07/31/2024 | 12044.2615 | 11686.08 | 11678.0004 |
08/31/2024 | 12110.631 | 11744.6572 | 11845.8158 |
09/30/2024 | 12175.8823 | 11797.7866 | 12004.424 |
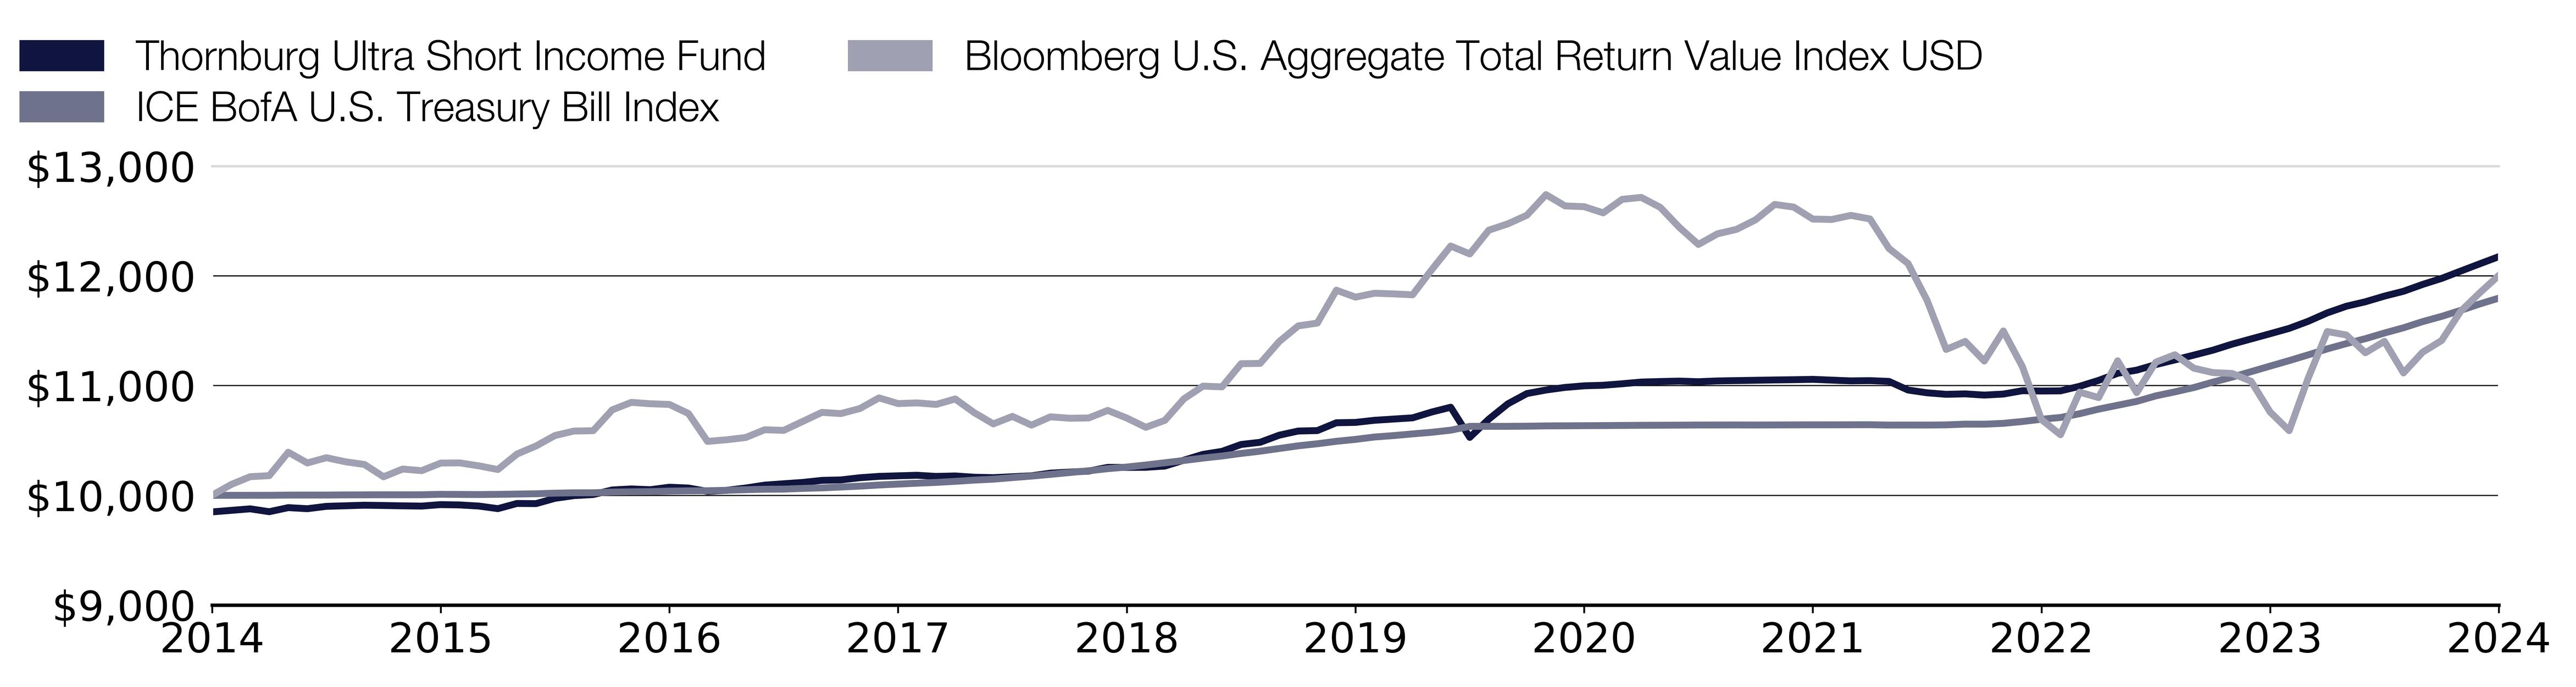
Effective September 30, 2024, the Fund adopted the Bloomberg U.S. Aggregate Total Return Index Value USD as its broad-based securities market index that represents the overall applicable market in which the Fund invests, and the ICE BofA U.S. Treasury Bill Index as an additional index that represents the market sectors which the Fund’s advisor believes are more representative of the Fund’s investment universe.
What were the Fund costs for the past year?
(based on a hypothetical $10,000 investment)
Class Name | Costs of a $10,000 investment | Costs paid as a percentage of a $10,000 investment |
|---|
Class A | $52.00 | 0.50% |
End Block
Thornburg Ultra Short Income Fund Tailored Shareholder Report
Thornburg Ultra Short Income Fund Tailored Shareholder Report | |
Annual Performance | 1 Year | 5 Year | 10 Year |
|---|
Ultra Short Income Fund Class A (with sales charge) | 3.74% | 2.38% | 1.99% |
Ultra Short Income Fund Class A (without sales charge) | 6.12% | 2.69% | 2.14% |
ICE BofA U.S. Treasury Bill Index | 5.54% | 2.34% | 1.67% |
Bloomberg U.S. Aggregate Total Return Value Index USD | 11.57% | 0.33% | 1.84% |
Key Fund Statistics
(as of September 30, 2024)
| |
|---|
Fund Size (Millions) | $264.2M |
Number of Holdings | 280 |
Annual Portfolio Turnover | 44.59% |
Total Advisory Fee | $0.6M |
What did the Fund invest in?
(as of September 30, 2024)
Credit Quality Ratings | (%) |
|---|
| U.S. Government | 5.3 |
| AAA | 16.3 |
| AA | 9.3 |
| A | 13.1 |
| BBB | 43.6 |
| NR | 0.8 |
| Below Invest. Grade | 0.9 |
| Cash Equivalents & Other | 10.7 |
Credit Quality Ratings | (%) |
U.S. Government | 5.3% |
AAA | 16.3% |
AA | 9.3% |
A | 13.1% |
BBB | 43.6% |
NR | 0.8% |
Below Invest. Grade | 0.9% |
Cash Equivalents & Other | 10.7% |
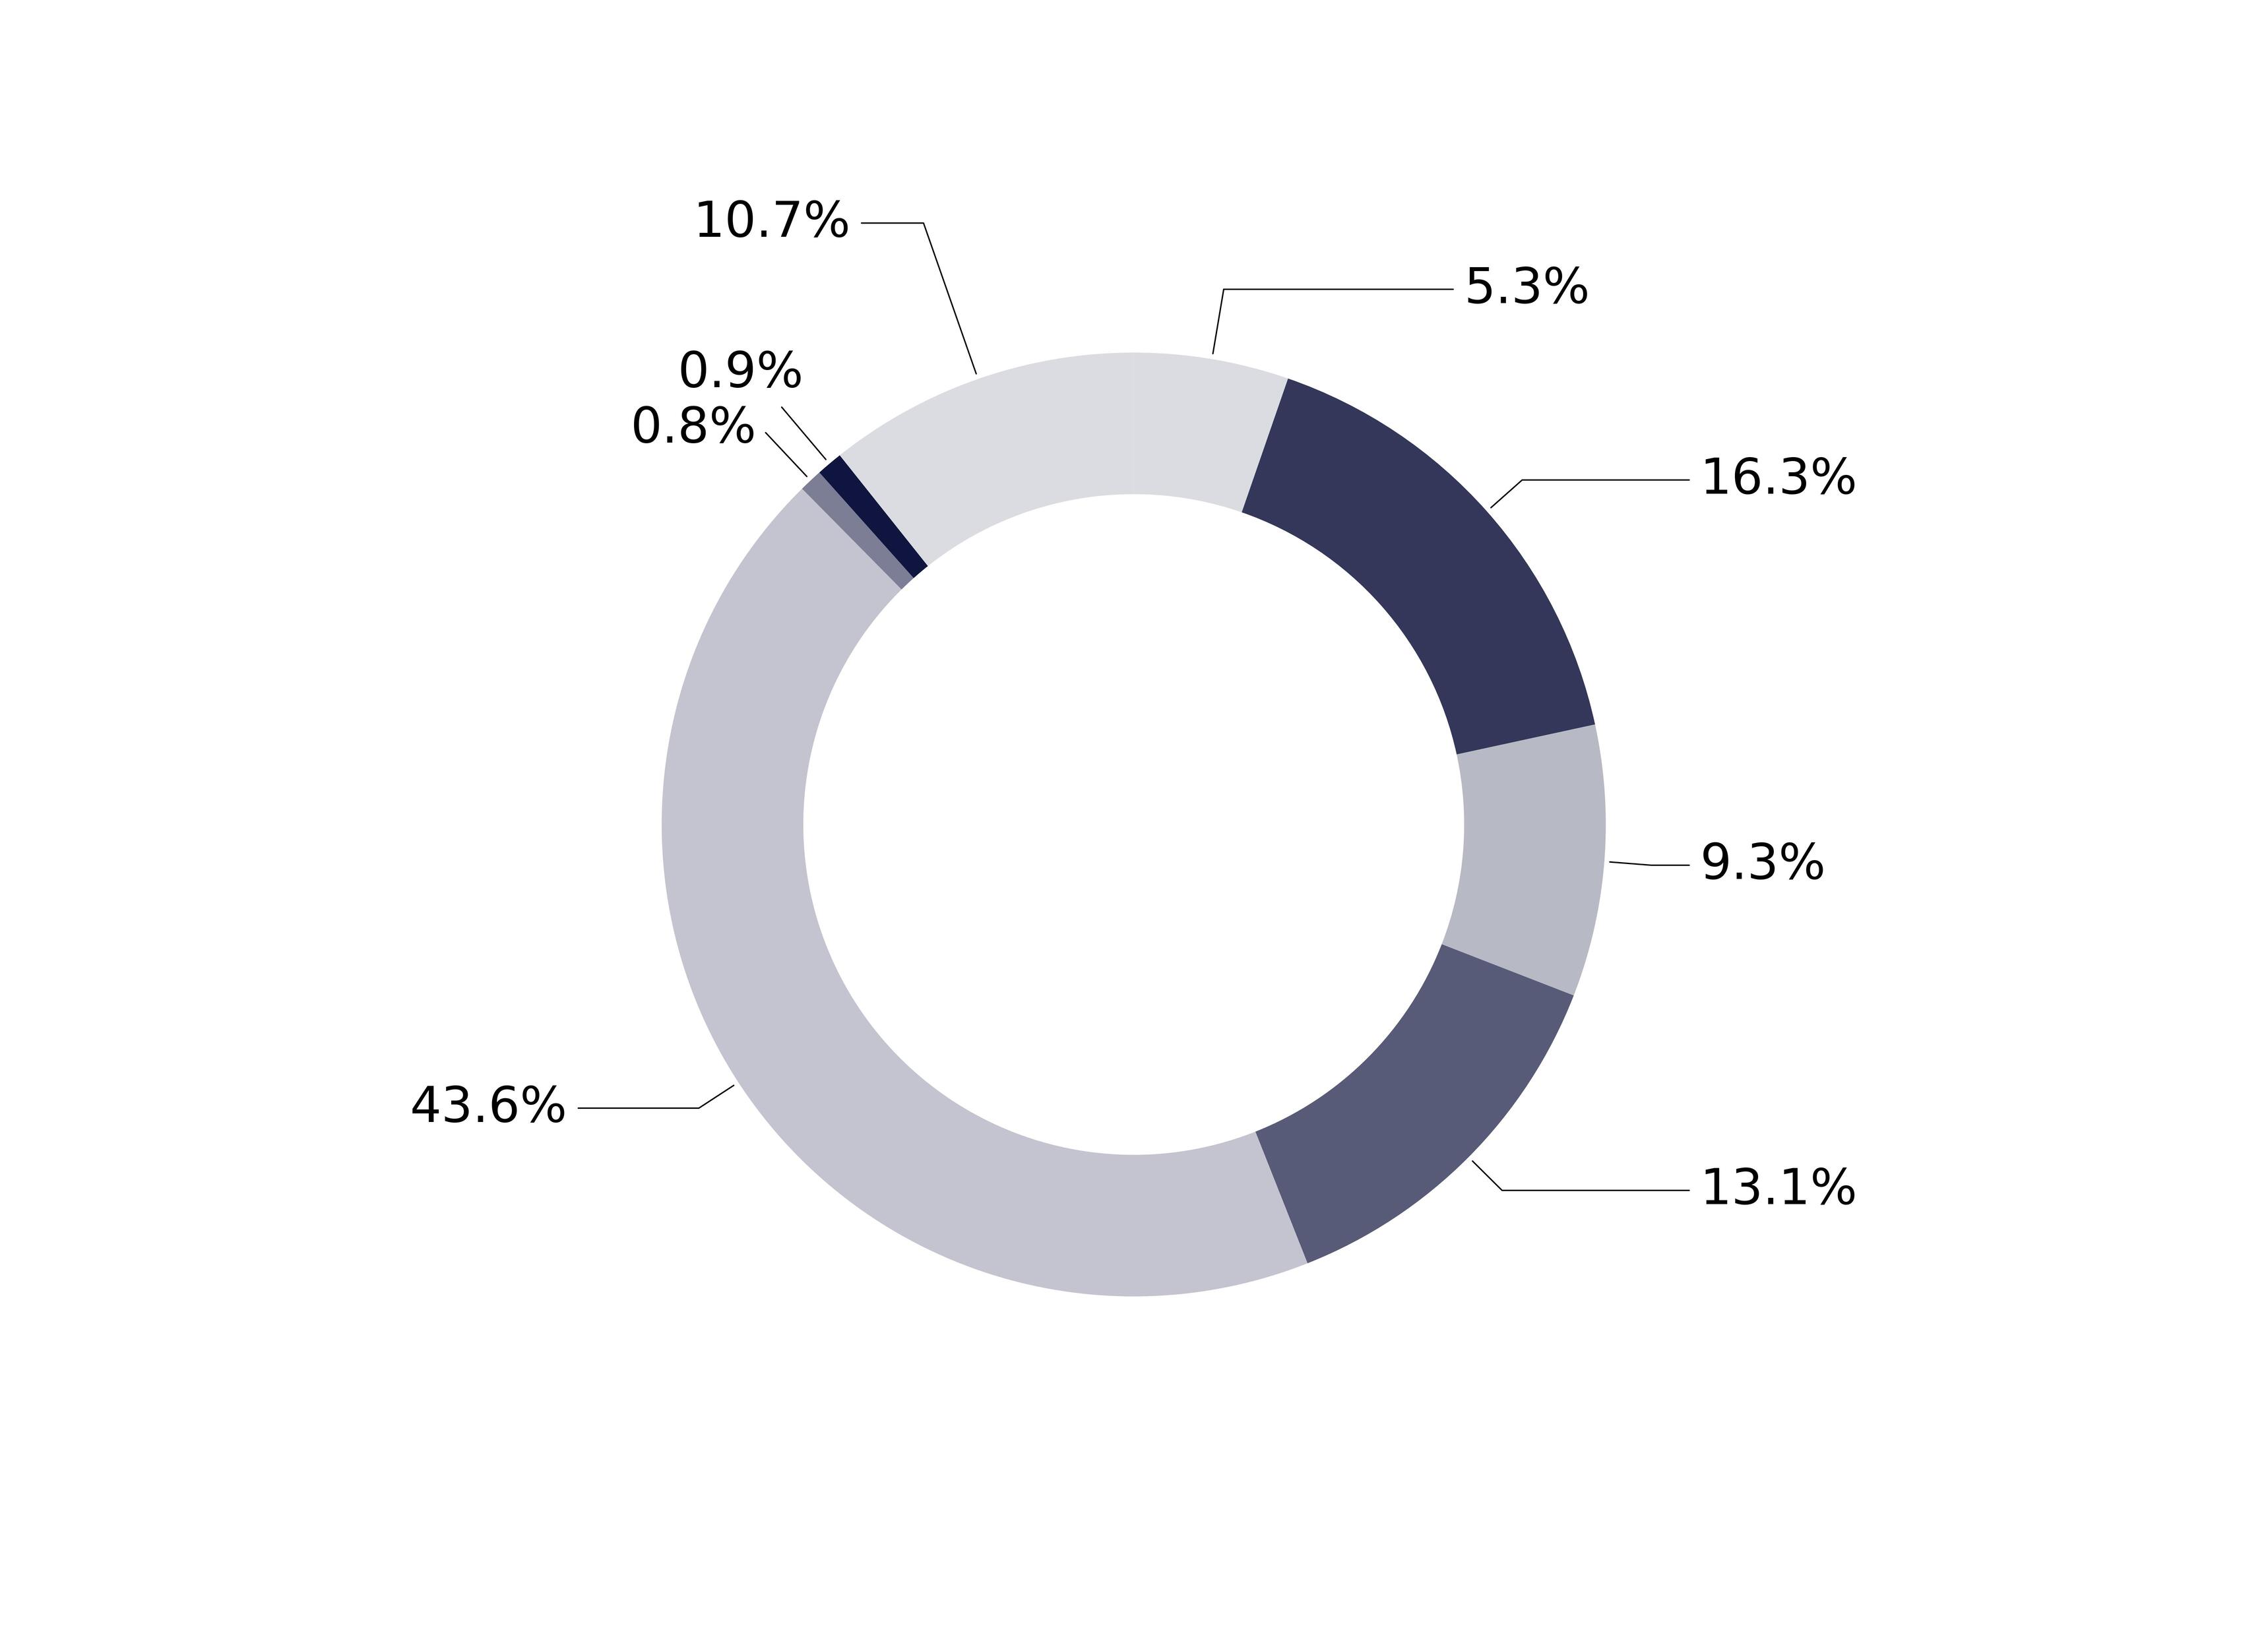
Expressed as a percentage of the Fund’s net assets. * Credit quality ratings shown above reflect the highest rating assigned by either S&P Global Ratings or Moody’s Investors Services, both of which are independent, nationally recognized statistical rating organizations. If a credit rating for an investment is not available from either S&P or Moody’s, then the Fund’s investment advisor will determine the credit quality of the investment. Investments are considered to be investment grade if they are rated within the four highest grades by S&P or Moody’s (BBB/Baa or higher) or, if no credit rating is available, have been judged to be of comparable quality by the Fund’s investment advisor. (NR = Not Rated)
How has the Fund changed?
This is a summary of certain changes to the Fund since October 1, 2023. For more complete information, you may review the Fund’s next prospectus, which we expect to be available by February 1, 2025 at https://www.thornburg.com/download or upon request by calling 1-800-847-0200.
End Block
Changes In and Disagreements with Accountants
No changes and/or disagreements occurred in the current reporting period.
End Block
For additional information about the Fund, including its prospectus, financial information, holdings and proxy information, visit www.thornburg.com/download.

Thornburg Ultra Short Income Fund Tailored Shareholder Report | |
Thornburg Ultra Short Income Fund Tailored Shareholder Report
Thornburg Ultra Short Income Fund CLASS: I TICKER: TLDIX Annual Shareholder Report | |
This annual shareholder report contains important information about the Thornburg Ultra Short Income Fund Class I Shares for the period from October 1, 2023 to September 30, 2024. You can find additional information about the Fund at https://www.thornburg.com/download. You can also request this information by contacting us at 1-800-847-0200. This report also describes changes to the Fund that occurred during the reporting period.
How did the Fund perform last year and what affected its performance?
The Fund’s Class I shares outperformed the ICE BofA U.S. Treasury Bill Index (the “Index”) during the 12-month period ended September 30, 2024. Treasury yields fell meaningfully over the 12-month period as U.S. inflation continued to improve, and the market priced in anticipated interest rate cuts by the Federal Reserve. The Fund’s relatively longer duration versus the Index proved to be a positive contributor to relative performance. Additionally, the Fund’s allocation to asset-backed securities and investment-grade corporate bonds was beneficial. There were no material detractors to the Fund’s performance over the period.
How did the Fund perform over the past 10 years?
The line graph below reflects a hypothetical $10,000 investment. The returns shown in the line graph and table assume the reinvestment of dividends and capital gains, but do not reflect the deduction of taxes that a shareholder would pay on distributions or the redemption of Fund shares. The performance information shown below represents past performance and is no guarantee of future results. For Fund performance current to the most recent month end, visit https://www.thornburg.com/product/mutual-funds/fldi/TLDIX or call 1-800-847-0200. Performance for other share classes of the Fund will vary.
Cumulative Performance
Growth Table
Date | Thornburg Ultra Short Income Fund | ICE BofA U.S. Treasury Bill Index | Bloomberg U.S. Aggregate Total Return Value Index USD |
09/30/2014 | 9999.9945 | 10000 | 10000 |
10/31/2014 | 10015.8282 | 10000.1038 | 10098.2769 |
11/30/2014 | 10031.786 | 10000.3113 | 10169.91 |
12/31/2014 | 10006.7796 | 10000.3113 | 10179.4256 |
01/31/2015 | 10046.418 | 10002.0235 | 10392.8789 |
02/28/2015 | 10037.9516 | 10002.231 | 10295.1602 |
03/31/2015 | 10061.484 | 10002.2829 | 10342.967 |
04/30/2015 | 10068.4652 | 10003.9951 | 10305.856 |
05/31/2015 | 10075.4092 | 10004.462 | 10281.0356 |
06/30/2015 | 10074.2966 | 10005.1884 | 10168.9318 |
07/31/2015 | 10073.0241 | 10004.8252 | 10239.6187 |
08/31/2015 | 10072.1983 | 10005.3441 | 10224.9146 |
09/30/2015 | 10079.645 | 10009.2873 | 10294.0811 |
10/31/2015 | 10078.0968 | 10007.9383 | 10295.7875 |
11/30/2015 | 10077.6618 | 10007.0044 | 10268.5908 |
12/31/2015 | 10055.325 | 10008.8722 | 10235.4031 |
01/31/2016 | 10096.9771 | 10011.5183 | 10376.2558 |
02/29/2016 | 10105.3752 | 10014.2681 | 10449.8664 |
03/31/2016 | 10156.3688 | 10019.716 | 10545.7404 |
04/30/2016 | 10183.0711 | 10022.9847 | 10586.2218 |
05/31/2016 | 10186.2645 | 10023.1403 | 10588.9383 |
06/30/2016 | 10239.005 | 10029.7815 | 10779.1979 |
07/31/2016 | 10241.9552 | 10032.0125 | 10847.3436 |
08/31/2016 | 10244.8874 | 10033.7766 | 10834.9414 |
09/30/2016 | 10261.6261 | 10038.6018 | 10828.5941 |
10/31/2016 | 10263.9952 | 10040.9366 | 10745.7655 |
11/30/2016 | 10234.5736 | 10041.8705 | 10491.5864 |
12/31/2016 | 10246.1335 | 10045.9175 | 10506.3861 |
01/31/2017 | 10264.9928 | 10051.3653 | 10527.0016 |
02/28/2017 | 10285.2094 | 10055.568 | 10597.7522 |
03/31/2017 | 10299.7043 | 10056.5019 | 10592.197 |
04/30/2017 | 10322.1005 | 10063.143 | 10673.9358 |
05/31/2017 | 10342.829 | 10067.8126 | 10756.0945 |
06/30/2017 | 10340.558 | 10075.8547 | 10745.2712 |
07/31/2017 | 10362.7636 | 10083.7411 | 10791.5097 |
08/31/2017 | 10385.3396 | 10094.1698 | 10888.3034 |
09/30/2017 | 10384.0179 | 10102.4712 | 10836.4459 |
10/31/2017 | 10390.7164 | 10110.6171 | 10842.724 |
11/30/2017 | 10381.9802 | 10117.829 | 10828.8068 |
12/31/2017 | 10388.0238 | 10127.5313 | 10878.506 |
01/31/2018 | 10386.2818 | 10138.6345 | 10753.2186 |
02/28/2018 | 10375.6558 | 10147.2992 | 10651.2843 |
03/31/2018 | 10393.7885 | 10161.5673 | 10719.5896 |
04/30/2018 | 10395.9267 | 10175.2647 | 10639.8655 |
05/31/2018 | 10431.0755 | 10191.0375 | 10715.7993 |
06/30/2018 | 10433.7061 | 10207.5367 | 10702.6209 |
07/31/2018 | 10445.2206 | 10223.9321 | 10705.1619 |
08/31/2018 | 10481.7402 | 10242.8698 | 10774.0467 |
09/30/2018 | 10482.9939 | 10257.9162 | 10704.6676 |
10/31/2018 | 10494.1506 | 10276.4389 | 10620.0741 |
11/30/2018 | 10507.384 | 10297.0369 | 10683.4727 |
12/31/2018 | 10564.2609 | 10317.5311 | 10879.7393 |
01/31/2019 | 10611.5063 | 10339.4781 | 10995.2773 |
02/28/2019 | 10641.1892 | 10358.4159 | 10988.9087 |
03/31/2019 | 10706.992 | 10381.9713 | 11199.9166 |
04/30/2019 | 10729.3187 | 10402.258 | 11202.782 |
05/31/2019 | 10797.3726 | 10426.8511 | 11401.6482 |
06/30/2019 | 10838.1566 | 10451.3923 | 11544.8346 |
07/31/2019 | 10852.6276 | 10470.0187 | 11570.2238 |
08/31/2019 | 10919.025 | 10492.3808 | 11870.0302 |
09/30/2019 | 10923.9187 | 10509.8658 | 11806.8123 |
10/31/2019 | 10945.6963 | 10531.709 | 11842.3764 |
11/30/2019 | 10958.9717 | 10544.4725 | 11836.3427 |
12/31/2019 | 10972.0764 | 10559.9859 | 11828.0976 |
01/31/2020 | 11028.0968 | 10574.6691 | 12055.7234 |
02/29/2020 | 11083.875 | 10593.97 | 12272.7065 |
03/31/2020 | 10803.5155 | 10628.5768 | 12200.4833 |
04/30/2020 | 10976.1167 | 10628.8362 | 12417.3601 |
05/31/2020 | 11121.3446 | 10628.8362 | 12475.1769 |
06/30/2020 | 11210.275 | 10630.4446 | 12553.758 |
07/31/2020 | 11245.21 | 10632.9869 | 12741.2746 |
08/31/2020 | 11271.3907 | 10633.6614 | 12638.4313 |
09/30/2020 | 11288.1472 | 10634.9585 | 12631.4992 |
10/31/2020 | 11295.3769 | 10636.0481 | 12575.0965 |
11/30/2020 | 11311.3447 | 10637.0858 | 12698.4914 |
12/31/2020 | 11329.1373 | 10638.2272 | 12715.9864 |
01/31/2021 | 11336.1589 | 10639.0574 | 12624.817 |
02/28/2021 | 11341.7536 | 10640.0951 | 12442.5048 |
03/31/2021 | 11338.0223 | 10641.0809 | 12287.1394 |
04/30/2021 | 11347.0656 | 10641.4959 | 12384.2096 |
05/31/2021 | 11352.264 | 10641.7553 | 12424.6696 |
06/30/2021 | 11357.0408 | 10641.2884 | 12511.9637 |
07/31/2021 | 11361.9821 | 10641.8072 | 12651.8595 |
08/31/2021 | 11366.1668 | 10642.3261 | 12627.7727 |
09/30/2021 | 11371.4736 | 10642.8449 | 12518.4439 |
10/31/2021 | 11365.9839 | 10642.7411 | 12514.9938 |
11/30/2021 | 11370.0312 | 10643.2081 | 12552.0197 |
12/31/2021 | 11365.1619 | 10643.5713 | 12519.9004 |
01/31/2022 | 11359.7176 | 10640.6658 | 12250.172 |
02/28/2022 | 11289.5166 | 10640.9252 | 12113.503 |
03/31/2022 | 11256.2819 | 10640.7177 | 11776.9683 |
04/30/2022 | 11253.1092 | 10642.378 | 11330.0576 |
05/31/2022 | 11249.9474 | 10649.071 | 11403.1101 |
06/30/2022 | 11240.4389 | 10648.6041 | 11224.2161 |
07/31/2022 | 11261.1303 | 10656.231 | 11498.4738 |
08/31/2022 | 11285.3574 | 10673.0934 | 11173.5652 |
09/30/2022 | 11284.2896 | 10693.4839 | 10690.7981 |
10/31/2022 | 11287.623 | 10709.6717 | 10552.327 |
11/30/2022 | 11332.1582 | 10744.0191 | 10940.3949 |
12/31/2022 | 11389.77 | 10785.8377 | 10891.0465 |
01/31/2023 | 11458.2519 | 10821.067 | 11226.0979 |
02/28/2023 | 11489.8059 | 10856.4521 | 10935.8444 |
03/31/2023 | 11543.9823 | 10906.6241 | 11213.6426 |
04/30/2023 | 11589.5934 | 10943.2543 | 11281.6023 |
05/31/2023 | 11637.1121 | 10982.79 | 11158.7602 |
06/30/2023 | 11685.1653 | 11032.08 | 11118.9646 |
07/31/2023 | 11743.7632 | 11077.323 | 11111.2139 |
08/31/2023 | 11794.9082 | 11127.495 | 11040.24 |
09/30/2023 | 11845.9437 | 11178.0302 | 10759.6881 |
10/31/2023 | 11898.1587 | 11228.1503 | 10589.8898 |
11/30/2023 | 11967.0083 | 11280.6052 | 11069.4673 |
12/31/2023 | 12048.1588 | 11335.0836 | 11493.195 |
01/31/2024 | 12112.5398 | 11383.3358 | 11461.6339 |
02/29/2024 | 12156.629 | 11428.0081 | 11299.6979 |
03/31/2024 | 12211.9804 | 11479.7885 | 11404.0404 |
04/30/2024 | 12259.483 | 11527.4701 | 11115.9877 |
05/31/2024 | 12325.8819 | 11583.4012 | 11304.4398 |
06/30/2024 | 12384.8693 | 11631.3422 | 11411.4668 |
07/31/2024 | 12455.9682 | 11686.08 | 11678.0004 |
08/31/2024 | 12527.3867 | 11744.6572 | 11845.8158 |
09/30/2024 | 12598.1479 | 11797.7866 | 12004.424 |
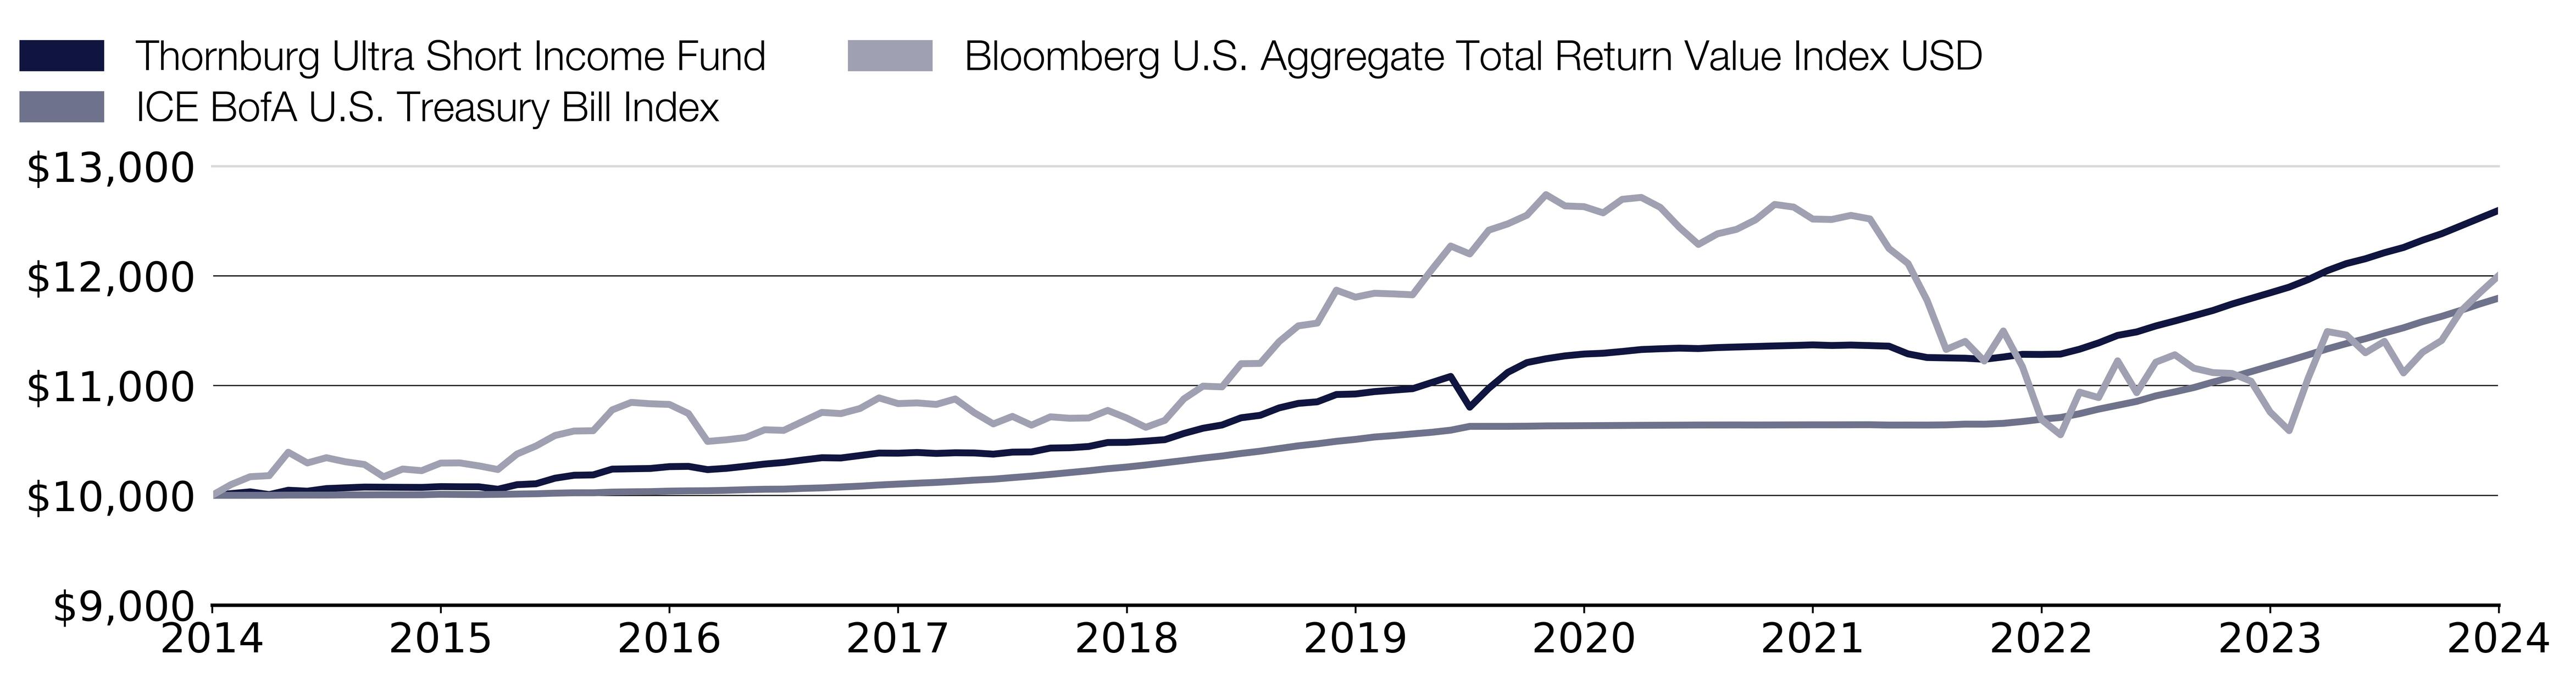
Effective September 30, 2024, the Fund adopted the Bloomberg U.S. Aggregate Total Return Index Value USD as its broad-based securities market index that represents the overall applicable market in which the Fund invests, and the ICE BofA U.S. Treasury Bill Index as an additional index that represents the market sectors which the Fund’s advisor believes are more representative of the Fund’s investment universe.
What were the Fund costs for the past year?
(based on a hypothetical $10,000 investment)
Class Name | Costs of a $10,000 investment | Costs paid as a percentage of a $10,000 investment |
|---|
Class I | $31.00 | 0.30% |
End Block
Thornburg Ultra Short Income Fund Tailored Shareholder Report
Thornburg Ultra Short Income Fund Tailored Shareholder Report | |
Annual Performance | 1 Year | 5 Year | 10 Year |
|---|
Ultra Short Income Fund Class I | 6.35% | 2.89% | 2.34% |
ICE BofA U.S. Treasury Bill Index | 5.54% | 2.34% | 1.67% |
Bloomberg U.S. Aggregate Total Return Value Index USD | 11.57% | 0.33% | 1.84% |
Key Fund Statistics
(as of September 30, 2024)
| |
|---|
Fund Size (Millions) | $264.2M |
Number of Holdings | 280 |
Annual Portfolio Turnover | 44.59% |
Total Advisory Fee | $0.6M |
What did the Fund invest in?
(as of September 30, 2024)
Credit Quality Ratings | (%) |
|---|
| U.S. Government | 5.3 |
| AAA | 16.3 |
| AA | 9.3 |
| A | 13.1 |
| BBB | 43.6 |
| NR | 0.8 |
| Below Invest. Grade | 0.9 |
| Cash Equivalents & Other | 10.7 |
Credit Quality Ratings | (%) |
U.S. Government | 5.3% |
AAA | 16.3% |
AA | 9.3% |
A | 13.1% |
BBB | 43.6% |
NR | 0.8% |
Below Invest. Grade | 0.9% |
Cash Equivalents & Other | 10.7% |
Expressed as a percentage of the Fund’s net assets. * Credit quality ratings shown above reflect the highest rating assigned by either S&P Global Ratings or Moody’s Investors Services, both of which are independent, nationally recognized statistical rating organizations. If a credit rating for an investment is not available from either S&P or Moody’s, then the Fund’s investment advisor will determine the credit quality of the investment. Investments are considered to be investment grade if they are rated within the four highest grades by S&P or Moody’s (BBB/Baa or higher) or, if no credit rating is available, have been judged to be of comparable quality by the Fund’s investment advisor. (NR = Not Rated)
How has the Fund changed?
This is a summary of certain changes to the Fund since October 1, 2023. For more complete information, you may review the Fund’s next prospectus, which we expect to be available by February 1, 2025 at https://www.thornburg.com/download or upon request by calling 1-800-847-0200.
End Block
Changes In and Disagreements with Accountants
No changes and/or disagreements occurred in the current reporting period.
End Block
For additional information about the Fund, including its prospectus, financial information, holdings and proxy information, visit www.thornburg.com/download.

Thornburg Ultra Short Income Fund Tailored Shareholder Report | |
Thornburg Limited Term U.S. Government Fund Tailored Shareholder Report
Thornburg Limited Term U.S. Government Fund CLASS: A TICKER: LTUSX Annual Shareholder Report | |
This annual shareholder report contains important information about the Thornburg Limited Term U.S. Government Fund Class A Shares for the period from October 1, 2023 to September 30, 2024. You can find additional information about the Fund at https://www.thornburg.com/download. You can also request this information by contacting us at 1-800-847-0200. This report also describes changes to the Fund that occurred during the reporting period.
How did the Fund perform last year and what affected its performance?
The Fund’s Class A shares outperformed the Bloomberg U.S. Government Intermediate Total Return Index Value Unhedged (the “Index”) during the 12-month period ended September 30, 2024. Treasury yields fell meaningfully over the 12-month period ended September 30, 2024, as U.S. inflation continued to improve, and the market priced in anticipated interest rate cuts by the Federal Reserve. The Fund’s long duration, compared to the Index, was a relative contributor in this environment. Positive relative returns from the Fund’s allocation to asset-backed securities, collateralized mortgage obligations, and commercial mortgage-backed securities also contributed. There were no meaningful detractors to the Fund’s performance over the period.
How did the Fund perform over the past 10 years?
The line graph below reflects a hypothetical $10,000 investment and assumes the deduction of the maximum sales charge associated with that investment. The returns shown in the line graph and table assume the reinvestment of dividends and capital gains, but do not reflect the deduction of taxes that a shareholder would pay on distributions or the redemption of Fund shares. The performance information shown below represents past performance and is no guarantee of future results. For Fund performance current to the most recent month end, visit https://www.thornburg.com/product/mutual-funds/fgov/LTUSX or call 1-800-847-0200. Performance for other share classes of the Fund will vary.
Cumulative Performance
Growth Table
Date | Thornburg Limited Term U.S. Government Fund | Bloomberg U.S. Government Intermediate Total Return Index Value Unhedged | Bloomberg U.S. Aggregate Total Return Value Index USD |
09/30/2014 | 9851.5153 | 10000 | 10000 |
10/31/2014 | 9899.6985 | 10070.1644 | 10098.2769 |
11/30/2014 | 9934.1958 | 10120.9308 | 10169.91 |
12/31/2014 | 9902.5783 | 10094.5925 | 10179.4256 |
01/31/2015 | 9985.5717 | 10255.4004 | 10392.8789 |
02/28/2015 | 9948.8922 | 10167.2664 | 10295.1602 |
03/31/2015 | 9973.7459 | 10220.968 | 10342.967 |
04/30/2015 | 9973.6755 | 10211.7143 | 10305.856 |
05/31/2015 | 9976.4707 | 10216.8621 | 10281.0356 |
06/30/2015 | 9954.0703 | 10177.0746 | 10168.9318 |
07/31/2015 | 9969.1242 | 10218.0552 | 10239.6187 |
08/31/2015 | 9975.7772 | 10223.7071 | 10224.9146 |
09/30/2015 | 10011.1674 | 10299.8931 | 10294.0811 |
10/31/2015 | 9989.6005 | 10267.1468 | 10295.7875 |
11/30/2015 | 9966.7951 | 10233.2913 | 10268.5908 |
12/31/2015 | 9936.6944 | 10213.8093 | 10235.4031 |
01/31/2016 | 10047.0775 | 10375.9447 | 10376.2558 |
02/29/2016 | 10071.1603 | 10427.2264 | 10449.8664 |
03/31/2016 | 10092.9062 | 10446.9605 | 10545.7404 |
04/30/2016 | 10098.8946 | 10443.9861 | 10586.2218 |
05/31/2016 | 10084.3426 | 10429.0917 | 10588.9383 |
06/30/2016 | 10161.8389 | 10576.8705 | 10779.1979 |
07/31/2016 | 10154.459 | 10580.7748 | 10847.3436 |
08/31/2016 | 10138.3976 | 10533.246 | 10834.9414 |
09/30/2016 | 10152.256 | 10551.2324 | 10828.5941 |
10/31/2016 | 10138.7353 | 10500.7461 | 10745.7655 |
11/30/2016 | 10035.0414 | 10324.3045 | 10491.5864 |
12/31/2016 | 10026.2343 | 10321.4869 | 10506.3861 |
01/31/2017 | 10035.3884 | 10342.0668 | 10527.0016 |
02/28/2017 | 10054.1376 | 10371.9788 | 10597.7522 |
03/31/2017 | 10046.219 | 10377.1322 | 10592.197 |
04/30/2017 | 10082.5605 | 10431.506 | 10673.9358 |
05/31/2017 | 10109.3836 | 10472.509 | 10756.0945 |
06/30/2017 | 10076.0889 | 10445.1736 | 10745.2712 |
07/31/2017 | 10103.1884 | 10478.4858 | 10791.5097 |
08/31/2017 | 10145.1823 | 10542.27 | 10888.3034 |
09/30/2017 | 10108.1195 | 10481.1129 | 10836.4459 |
10/31/2017 | 10098.5828 | 10467.9045 | 10842.724 |
11/30/2017 | 10083.7409 | 10436.0096 | 10828.8068 |
12/31/2017 | 10086.0853 | 10438.6871 | 10878.506 |
01/31/2018 | 10019.0753 | 10339.3165 | 10753.2186 |
02/28/2018 | 9991.1484 | 10308.9283 | 10651.2843 |
03/31/2018 | 10031.5366 | 10362.5739 | 10719.5896 |
04/30/2018 | 9993.3961 | 10303.7974 | 10639.8655 |
05/31/2018 | 10047.1333 | 10370.2928 | 10715.7993 |
06/30/2018 | 10040.4357 | 10369.1445 | 10702.6209 |
07/31/2018 | 10018.5431 | 10348.9063 | 10705.1619 |
08/31/2018 | 10064.748 | 10410.3267 | 10774.0467 |
09/30/2018 | 10030.3156 | 10357.6278 | 10704.6676 |
10/31/2018 | 10012.2094 | 10361.6441 | 10620.0741 |
11/30/2018 | 10066.528 | 10432.5927 | 10683.4727 |
12/31/2018 | 10169.3722 | 10587.519 | 10879.7393 |
01/31/2019 | 10219.289 | 10632.7567 | 10995.2773 |
02/28/2019 | 10221.9052 | 10625.3739 | 10988.9087 |
03/31/2019 | 10301.5508 | 10754.931 | 11199.9166 |
04/30/2019 | 10310.638 | 10759.8771 | 11202.782 |
05/31/2019 | 10407.7453 | 10917.1224 | 11401.6482 |
06/30/2019 | 10449.0176 | 11007.0825 | 11544.8346 |
07/31/2019 | 10449.4736 | 10987.8862 | 11570.2238 |
08/31/2019 | 10545.11 | 11185.5127 | 11870.0302 |
09/30/2019 | 10537.5221 | 11136.4716 | 11806.8123 |
10/31/2019 | 10553.9626 | 11168.5514 | 11842.3764 |
11/30/2019 | 10545.1897 | 11141.3729 | 11836.3427 |
12/31/2019 | 10536.6069 | 11138.0904 | 11828.0976 |
01/31/2020 | 10647.7428 | 11295.1397 | 12055.7234 |
02/29/2020 | 10742.9735 | 11480.5774 | 12272.7065 |
03/31/2020 | 10734.0679 | 11714.8825 | 12200.4833 |
04/30/2020 | 10813.7095 | 11747.2424 | 12417.3601 |
05/31/2020 | 10849.3286 | 11768.6793 | 12475.1769 |
06/30/2020 | 10899.527 | 11778.8685 | 12553.758 |
07/31/2020 | 10943.2475 | 11816.4937 | 12741.2746 |
08/31/2020 | 10923.2005 | 11793.494 | 12638.4313 |
09/30/2020 | 10927.1918 | 11802.2379 | 12631.4992 |
10/31/2020 | 10889.14 | 11758.6134 | 12575.0965 |
11/30/2020 | 10915.8685 | 11772.9365 | 12698.4914 |
12/31/2020 | 10933.7434 | 11776.6839 | 12715.9864 |
01/31/2021 | 10917.9644 | 11749.0013 | 12624.817 |
02/28/2021 | 10829.7288 | 11652.297 | 12442.5048 |
03/31/2021 | 10749.7044 | 11573.8479 | 12287.1394 |
04/30/2021 | 10793.3721 | 11616.9459 | 12384.2096 |
05/31/2021 | 10805.0446 | 11653.6973 | 12424.6696 |
06/30/2021 | 10792.7232 | 11645.1102 | 12511.9637 |
07/31/2021 | 10862.3263 | 11734.5102 | 12651.8595 |
08/31/2021 | 10841.3885 | 11715.5827 | 12627.7727 |
09/30/2021 | 10794.2337 | 11644.8189 | 12518.4439 |
10/31/2021 | 10753.574 | 11578.486 | 12514.9938 |
11/30/2021 | 10754.9276 | 11607.6138 | 12552.0197 |
12/31/2021 | 10733.8147 | 11577.136 | 12519.9004 |
01/31/2022 | 10611.556 | 11429.4021 | 12250.172 |
02/28/2022 | 10563.4512 | 11377.7898 | 12113.503 |
03/31/2022 | 10343.8973 | 11092.2646 | 11776.9683 |
04/30/2022 | 10149.4306 | 10915.9181 | 11330.0576 |
05/31/2022 | 10224.8523 | 10989.7403 | 11403.1101 |
06/30/2022 | 10128.8047 | 10908.8546 | 11224.2161 |
07/31/2022 | 10296.4164 | 11053.5022 | 11498.4738 |
08/31/2022 | 10084.1475 | 10833.0607 | 11173.5652 |
09/30/2022 | 9767.4965 | 10575.795 | 10690.7981 |
10/31/2022 | 9711.1861 | 10527.7061 | 10552.327 |
11/30/2022 | 9911.1501 | 10707.7832 | 10940.3949 |
12/31/2022 | 9878.7528 | 10682.5596 | 10891.0465 |
01/31/2023 | 10075.7362 | 10852.6772 | 11226.0979 |
02/28/2023 | 9916.7545 | 10664.59 | 10935.8444 |
03/31/2023 | 10084.6258 | 10923.7434 | 11213.6426 |
04/30/2023 | 10124.0247 | 10982.2287 | 11281.6023 |
05/31/2023 | 10067.1139 | 10901.147 | 11158.7602 |
06/30/2023 | 10003.5249 | 10800.9641 | 11118.9646 |
07/31/2023 | 10014.4289 | 10812.7161 | 11111.2139 |
08/31/2023 | 9983.825 | 10818.6537 | 11040.24 |
09/30/2023 | 9840.2198 | 10716.6503 | 10759.6881 |
10/31/2023 | 9760.637 | 10680.952 | 10589.8898 |
11/30/2023 | 10015.2908 | 10914.5906 | 11069.4673 |
12/31/2023 | 10258.8228 | 11142.342 | 11493.195 |
01/31/2024 | 10285.0629 | 11166.7533 | 11461.6339 |
02/29/2024 | 10183.7366 | 11049.0938 | 11299.6979 |
03/31/2024 | 10244.3234 | 11103.49 | 11404.0404 |
04/30/2024 | 10081.2122 | 10953.0281 | 11115.9877 |
05/31/2024 | 10214.2755 | 11074.7431 | 11304.4398 |
06/30/2024 | 10290.7174 | 11168.445 | 11411.4668 |
07/31/2024 | 10496.0142 | 11372.7933 | 11678.0004 |
08/31/2024 | 10611.0962 | 11495.8302 | 11845.8158 |
09/30/2024 | 10728.8091 | 11609.4455 | 12004.424 |

Effective September 30, 2024, the Fund adopted the Bloomberg U.S. Aggregate Total Return Index Value USD as its broad-based securities market index that represents the overall applicable market in which the Fund invests, and the Bloomberg U.S. Government Intermediate Total Return Index Value Unhedged as an additional index that represents the market sectors which the Fund’s advisor believes are more representative of the Fund’s investment universe.
What were the Fund costs for the past year?
(based on a hypothetical $10,000 investment)
Class Name | Costs of a $10,000 investment | Costs paid as a percentage of a $10,000 investment |
|---|
Class A | $103.00 | 0.99% |
End Block
Thornburg Limited Term U.S. Government Fund Tailored Shareholder Report
Thornburg Limited Term U.S. Government Fund Tailored Shareholder Report | |
Annual Performance | 1 Year | 5 Year | 10 Year |
|---|
Limited Term U.S. Government Fund Class A (with sales charge) | 6.62% | 0.06% | 0.71% |
Limited Term U.S. Government Fund Class A (without sales charge) | 9.03% | 0.36% | 0.86% |
Bloomberg U.S. Aggregate Total Return Index Value USD | 11.57% | 0.33% | 1.84% |
Bloomberg U.S. Government Intermediate Total Return Index Value Unhedged | 8.33% | 0.84% | 1.50% |
Key Fund Statistics
(as of September 30, 2024)
| |
|---|
Fund Size (Millions) | $139.7M |
Number of Holdings | 157 |
Annual Portfolio Turnover | 32.26% |
Total Advisory Fee | $0.6M |
What did the Fund invest in?
(as of September 30, 2024)
Types of Holdings | (%) |
|---|
| U.S. Treasury Securities | 20.0 |
| U.S. Government Agencies | 6.6 |
| Mortgage Backed | 62.5 |
| Corporate Bonds | 2.1 |
| Cash Equivalents & Other | 8.8 |
Types of Holdings | (%) |
U.S. Treasury Securities | 20.0% |
U.S. Government Agencies | 6.6% |
Mortgage Backed | 62.5% |
Corporate Bonds | 2.1% |
Cash Equivalents & Other | 8.8% |

Expressed as a percentage of the Fund’s net assets.
How has the Fund changed?
This is a summary of certain changes to the Fund since October 1, 2023. For more complete information, you may review the Fund’s next prospectus, which we expect to be available by February 1, 2025 at https://www.thornburg.com/download or upon request by calling 1-800-847-0200.
End Block
Changes In and Disagreements with Accountants
No changes and/or disagreements occurred in the current reporting period.
End Block
For additional information about the Fund, including its prospectus, financial information, holdings and proxy information, visit www.thornburg.com/download.

Thornburg Limited Term U.S. Government Fund Tailored Shareholder Report | |
Thornburg Limited Term U.S. Government Fund Tailored Shareholder Report
Thornburg Limited Term U.S. Government Fund CLASS: C TICKER: LTUCX Annual Shareholder Report | |
This annual shareholder report contains important information about the Thornburg Limited Term U.S. Government Fund Class C Shares for the period from October 1, 2023 to September 30, 2024. You can find additional information about the Fund at https://www.thornburg.com/download. You can also request this information by contacting us at 1-800-847-0200. This report also describes changes to the Fund that occurred during the reporting period.
How did the Fund perform last year and what affected its performance?
The Fund’s Class C shares outperformed the Bloomberg U.S. Government Intermediate Total Return Index Value Unhedged (the “Index”) during the 12-month period ended September 30, 2024. Treasury yields fell meaningfully over the 12-month period ended September 30, 2024, as U.S. inflation continued to improve, and the market priced in anticipated interest rate cuts by the Federal Reserve. The Fund’s long duration, compared to the Index, was a relative contributor in this environment. Positive relative returns from the Fund’s allocation to asset-backed securities, collateralized mortgage obligations, and commercial mortgage-backed securities also contributed. There were no meaningful detractors to the Fund’s performance over the period.
How did the Fund perform over the past 10 years?
The line graph below reflects a hypothetical $10,000 investment. The returns shown in the line graph and table assume the reinvestment of dividends and capital gains, but do not reflect the deduction of taxes that a shareholder would pay on distributions or the redemption of Fund shares. The performance information shown below represents past performance and is no guarantee of future results. For Fund performance current to the most recent month end, visit https://www.thornburg.com/product/mutual-funds/fgov/LTUCX or call 1-800-847-0200. Performance for other share classes of the Fund will vary.
Cumulative Performance
Growth Table
Date | Thornburg Limited Term U.S. Government Fund | Bloomberg U.S. Government Intermediate Total Return Index Value Unhedged | Bloomberg U.S. Aggregate Total Return Value Index USD |
09/30/2014 | 10000.0044 | 10000 | 10000 |
10/31/2014 | 10046.4099 | 10070.1644 | 10098.2769 |
11/30/2014 | 10078.7817 | 10120.9308 | 10169.91 |
12/31/2014 | 10044.6334 | 10094.5925 | 10179.4256 |
01/31/2015 | 10133.6033 | 10255.4004 | 10392.8789 |
02/28/2015 | 10087.0218 | 10167.2664 | 10295.1602 |
03/31/2015 | 10109.6649 | 10220.968 | 10342.967 |
04/30/2015 | 10107.5084 | 10211.7143 | 10305.856 |
05/31/2015 | 10108.0008 | 10216.8621 | 10281.0356 |
06/30/2015 | 10083.1734 | 10177.0746 | 10168.9318 |
07/31/2015 | 10095.9073 | 10218.0552 | 10239.6187 |
08/31/2015 | 10100.5464 | 10223.7071 | 10224.9146 |
09/30/2015 | 10133.7177 | 10299.8931 | 10294.0811 |
10/31/2015 | 10109.7822 | 10267.1468 | 10295.7875 |
11/30/2015 | 10084.1504 | 10233.2913 | 10268.5908 |
12/31/2015 | 10044.1718 | 10213.8093 | 10235.4031 |
01/31/2016 | 10160.4593 | 10375.9447 | 10376.2558 |
02/29/2016 | 10182.4856 | 10427.2264 | 10449.8664 |
03/31/2016 | 10202.0166 | 10446.9605 | 10545.7404 |
04/30/2016 | 10205.768 | 10443.9861 | 10586.2218 |
05/31/2016 | 10188.8449 | 10429.0917 | 10588.9383 |
06/30/2016 | 10264.4526 | 10576.8705 | 10779.1979 |
07/31/2016 | 10254.7085 | 10580.7748 | 10847.3436 |
08/31/2016 | 10236.4466 | 10533.246 | 10834.9414 |
09/30/2016 | 10248.1573 | 10551.2324 | 10828.5941 |
10/31/2016 | 10232.1688 | 10500.7461 | 10745.7655 |
11/30/2016 | 10126.0918 | 10324.3045 | 10491.5864 |
12/31/2016 | 10114.8246 | 10321.4869 | 10506.3861 |
01/31/2017 | 10121.5683 | 10342.0668 | 10527.0016 |
02/28/2017 | 10138.0669 | 10371.9788 | 10597.7522 |
03/31/2017 | 10127.6493 | 10377.1322 | 10592.197 |
04/30/2017 | 10154.0403 | 10431.506 | 10673.9358 |
05/31/2017 | 10186.0031 | 10472.509 | 10756.0945 |
06/30/2017 | 10150.0122 | 10445.1736 | 10745.2712 |
07/31/2017 | 10174.5006 | 10478.4858 | 10791.5097 |
08/31/2017 | 10213.8548 | 10542.27 | 10888.3034 |
09/30/2017 | 10173.8883 | 10481.1129 | 10836.4459 |
10/31/2017 | 10161.7901 | 10467.9045 | 10842.724 |
11/30/2017 | 10136.7155 | 10436.0096 | 10828.8068 |
12/31/2017 | 10144.3133 | 10438.6871 | 10878.506 |
01/31/2018 | 10067.0826 | 10339.3165 | 10753.2186 |
02/28/2018 | 10044.5731 | 10308.9283 | 10651.2843 |
03/31/2018 | 10074.5042 | 10362.5739 | 10719.5896 |
04/30/2018 | 10041.7009 | 10303.7974 | 10639.8655 |
05/31/2018 | 10092.757 | 10370.2928 | 10715.7993 |
06/30/2018 | 10075.7197 | 10369.1445 | 10702.6209 |
07/31/2018 | 10058.849 | 10348.9063 | 10705.1619 |
08/31/2018 | 10102.0982 | 10410.3267 | 10774.0467 |
09/30/2018 | 10064.5095 | 10357.6278 | 10704.6676 |
10/31/2018 | 10043.4735 | 10361.6441 | 10620.0741 |
11/30/2018 | 10094.7686 | 10432.5927 | 10683.4727 |
12/31/2018 | 10194.2756 | 10587.519 | 10879.7393 |
01/31/2019 | 10233.1382 | 10632.7567 | 10995.2773 |
02/28/2019 | 10233.1439 | 10625.3739 | 10988.9087 |
03/31/2019 | 10317.5155 | 10754.931 | 11199.9166 |
04/30/2019 | 10316.1514 | 10759.8771 | 11202.782 |
05/31/2019 | 10418.168 | 10917.1224 | 11401.6482 |
06/30/2019 | 10456.7057 | 11007.0825 | 11544.8346 |
07/31/2019 | 10446.0972 | 10987.8862 | 11570.2238 |
08/31/2019 | 10546.0186 | 11185.5127 | 11870.0302 |
09/30/2019 | 10527.4658 | 11136.4716 | 11806.8123 |
10/31/2019 | 10549.3379 | 11168.5514 | 11842.3764 |
11/30/2019 | 10538.3311 | 11141.3729 | 11836.3427 |
12/31/2019 | 10527.2256 | 11138.0904 | 11828.0976 |
01/31/2020 | 10635.0697 | 11295.1397 | 12055.7234 |
02/29/2020 | 10727.2276 | 11480.5774 | 12272.7065 |
03/31/2020 | 10715.881 | 11714.8825 | 12200.4833 |
04/30/2020 | 10792.8086 | 11747.2424 | 12417.3601 |
05/31/2020 | 10825.9811 | 11768.6793 | 12475.1769 |
06/30/2020 | 10873.6171 | 11778.8685 | 12553.758 |
07/31/2020 | 10914.6074 | 11816.4937 | 12741.2746 |
08/31/2020 | 10892.3539 | 11793.494 | 12638.4313 |
09/30/2020 | 10893.9991 | 11802.2379 | 12631.4992 |
10/31/2020 | 10853.3434 | 11758.6134 | 12575.0965 |
11/30/2020 | 10876.7758 | 11772.9365 | 12698.4914 |
12/31/2020 | 10891.0988 | 11776.6839 | 12715.9864 |
01/31/2021 | 10872.157 | 11749.0013 | 12624.817 |
02/28/2021 | 10781.793 | 11652.297 | 12442.5048 |
03/31/2021 | 10699.2158 | 11573.8479 | 12287.1394 |
04/30/2021 | 10731.2964 | 11616.9459 | 12384.2096 |
05/31/2021 | 10747.7881 | 11653.6973 | 12424.6696 |
06/30/2021 | 10732.105 | 11645.1102 | 12511.9637 |
07/31/2021 | 10797.107 | 11734.5102 | 12651.8595 |
08/31/2021 | 10772.4512 | 11715.5827 | 12627.7727 |
09/30/2021 | 10714.0931 | 11644.8189 | 12518.4439 |
10/31/2021 | 10678.7344 | 11578.486 | 12514.9938 |
11/30/2021 | 10676.8569 | 11607.6138 | 12552.0197 |
12/31/2021 | 10652.7677 | 11577.136 | 12519.9004 |
01/31/2022 | 10520.9589 | 11429.4021 | 12250.172 |
02/28/2022 | 10479.168 | 11377.7898 | 12113.503 |
03/31/2022 | 10259.9772 | 11092.2646 | 11776.9683 |
04/30/2022 | 10066.2589 | 10915.9181 | 11330.0576 |
05/31/2022 | 10130.3403 | 10989.7403 | 11403.1101 |
06/30/2022 | 10033.8046 | 10908.8546 | 11224.2161 |
07/31/2022 | 10196.2175 | 11053.5022 | 11498.4738 |
08/31/2022 | 9984.5812 | 10833.0607 | 11173.5652 |
09/30/2022 | 9670.4459 | 10575.795 | 10690.7981 |
10/31/2022 | 9612.509 | 10527.7061 | 10552.327 |
11/30/2022 | 9806.8585 | 10707.7832 | 10940.3949 |
12/31/2022 | 9763.9826 | 10682.5596 | 10891.0465 |
01/31/2023 | 9963.4359 | 10852.6772 | 11226.0979 |
02/28/2023 | 9796.6314 | 10664.59 | 10935.8444 |
03/31/2023 | 9967.6355 | 10923.7434 | 11213.6426 |
04/30/2023 | 9995.7033 | 10982.2287 | 11281.6023 |
05/31/2023 | 9945.7909 | 10901.147 | 11158.7602 |
06/30/2023 | 9881.0963 | 10800.9641 | 11118.9646 |
07/31/2023 | 9889.6036 | 10812.7161 | 11111.2139 |
08/31/2023 | 9857.5145 | 10818.6537 | 11040.24 |
09/30/2023 | 9706.294 | 10716.6503 | 10759.6881 |
10/31/2023 | 9634.4727 | 10680.952 | 10589.8898 |
11/30/2023 | 9882.1944 | 10914.5906 | 11069.4673 |
12/31/2023 | 10118.8298 | 11142.342 | 11493.195 |
01/31/2024 | 10134.0309 | 11166.7533 | 11461.6339 |
02/29/2024 | 10041.2922 | 11049.0938 | 11299.6979 |
03/31/2024 | 10090.3694 | 11103.49 | 11404.0404 |
04/30/2024 | 9928.8269 | 10953.0281 | 11115.9877 |
05/31/2024 | 10057.4813 | 11074.7431 | 11304.4398 |
06/30/2024 | 10139.0435 | 11168.445 | 11411.4668 |
07/31/2024 | 10329.4392 | 11372.7933 | 11678.0004 |
08/31/2024 | 10440.0358 | 11495.8302 | 11845.8158 |
09/30/2024 | 10561.8919 | 11609.4455 | 12004.424 |
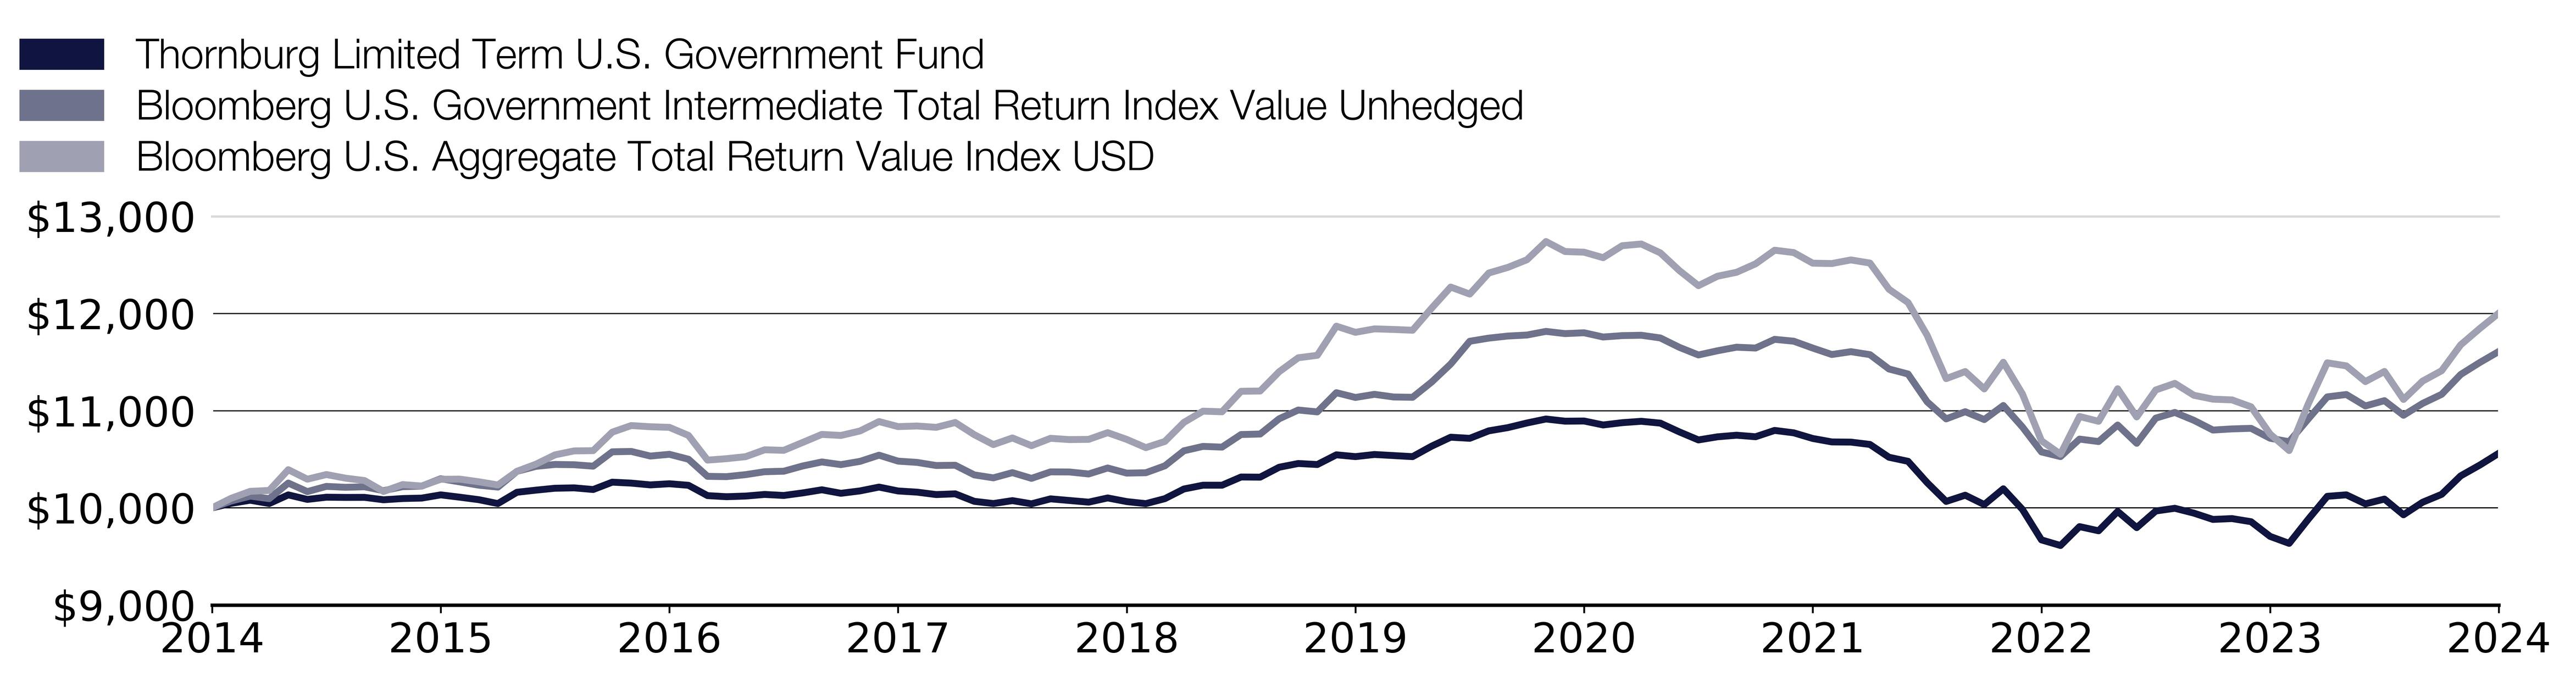
Effective September 30, 2024, the Fund adopted the Bloomberg U.S. Aggregate Total Return Index Value USD as its broad-based securities market index that represents the overall applicable market in which the Fund invests, and the Bloomberg U.S. Government Intermediate Total Return Index Value Unhedged as an additional index that represents the market sectors which the Fund’s advisor believes are more representative of the Fund’s investment universe.
What were the Fund costs for the past year?
(based on a hypothetical $10,000 investment)
Class Name | Costs of a $10,000 investment | Costs paid as a percentage of a $10,000 investment |
|---|
Class C | $129.00 | 1.24% |
End Block
Thornburg Limited Term U.S. Government Fund Tailored Shareholder Report
Thornburg Limited Term U.S. Government Fund Tailored Shareholder Report | |
Annual Performance | 1 Year | 5 Year | 10 Year |
|---|
Limited Term U.S. Government Fund Class C (with sales charge) | 8.32% | 0.07% | 0.55% |
Limited Term U.S. Government Fund Class C (without sales charge) | 8.82% | 0.07% | 0.55% |
Bloomberg U.S. Aggregate Total Return Index Value USD | 11.57% | 0.33% | 1.84% |
Bloomberg U.S. Government Intermediate Total Return Index Value Unhedged | 8.33% | 0.84% | 1.50% |
Key Fund Statistics
(as of September 30, 2024)
| |
|---|
Fund Size (Millions) | $139.7M |
Number of Holdings | 157 |
Annual Portfolio Turnover | 32.26% |
Total Advisory Fee | $0.6M |
What did the Fund invest in?
(as of September 30, 2024)
Types of Holdings | (%) |
|---|
| U.S. Treasury Securities | 20.0 |
| U.S. Government Agencies | 6.6 |
| Mortgage Backed | 62.5 |
| Corporate Bonds | 2.1 |
| Cash Equivalents & Other | 8.8 |
Types of Holdings | (%) |
U.S. Treasury Securities | 20.0% |
U.S. Government Agencies | 6.6% |
Mortgage Backed | 62.5% |
Corporate Bonds | 2.1% |
Cash Equivalents & Other | 8.8% |
Expressed as a percentage of the Fund’s net assets.
How has the Fund changed?
This is a summary of certain changes to the Fund since October 1, 2023. For more complete information, you may review the Fund’s next prospectus, which we expect to be available by February 1, 2025 at https://www.thornburg.com/download or upon request by calling 1-800-847-0200.
End Block
Changes In and Disagreements with Accountants
No changes and/or disagreements occurred in the current reporting period.
End Block
For additional information about the Fund, including its prospectus, financial information, holdings and proxy information, visit www.thornburg.com/download.

Thornburg Limited Term U.S. Government Fund Tailored Shareholder Report | |
Thornburg Limited Term U.S. Government Fund Tailored Shareholder Report
Thornburg Limited Term U.S. Government Fund CLASS: C2 TICKER: LTUQX Annual Shareholder Report | |
This annual shareholder report contains important information about the Thornburg Limited Term U.S. Government Fund Class C2 Shares for the period from October 1, 2023 to September 30, 2024. You can find additional information about the Fund at https://www.thornburg.com/download. You can also request this information by contacting us at 1-800-847-0200. This report also describes changes to the Fund that occurred during the reporting period.
How did the Fund perform last year and what affected its performance?
The Fund’s Class C2 shares outperformed the Bloomberg U.S. Government Intermediate Total Return Index Value Unhedged (the “Index”) during the 12-month period ended September 30, 2024. Treasury yields fell meaningfully over the 12-month period ended September 30, 2024, as U.S. inflation continued to improve, and the market priced in anticipated interest rate cuts by the Federal Reserve. The Fund’s long duration, compared to the Index, was a relative contributor in this environment. Positive relative returns from the Fund’s allocation to asset-backed securities, collateralized mortgage obligations, and commercial mortgage-backed securities also contributed. There were no meaningful detractors to the Fund’s performance over the period.
How did the Fund perform over the past 10 years?
The line graph below reflects a hypothetical $10,000 investment. The returns shown in the line graph and table assume the reinvestment of dividends and capital gains, but do not reflect the deduction of taxes that a shareholder would pay on distributions or the redemption of Fund shares. The performance information shown below represents past performance and is no guarantee of future results. For Fund performance current to the most recent month end, call 1-800-847-0200. Performance for other share classes of the Fund will vary.
Cumulative Performance
Growth Table
Date | Thornburg Limited Term U.S. Government Fund | Bloomberg U.S. Government Intermediate Total Return Index Value Unhedged | Bloomberg U.S. Aggregate Total Return Value Index USD |
09/30/2020 | 9999.9993 | 10000 | 10000 |
10/31/2020 | 9962.9134 | 9963.0371 | 9955.3475 |
11/30/2020 | 9984.1042 | 9975.173 | 10053.0358 |
12/31/2020 | 9997.104 | 9978.3481 | 10066.8861 |
01/31/2021 | 9979.1274 | 9954.8927 | 9994.7099 |
02/28/2021 | 9896.1365 | 9872.9555 | 9850.3785 |
03/31/2021 | 9819.6047 | 9806.4859 | 9727.3801 |
04/30/2021 | 9856.1792 | 9843.0026 | 9804.2278 |
05/31/2021 | 9863.7089 | 9874.142 | 9836.2589 |
06/30/2021 | 9849.6117 | 9866.8662 | 9905.3671 |
07/31/2021 | 9909.781 | 9942.6145 | 10016.1187 |
08/31/2021 | 9887.7246 | 9926.5773 | 9997.0498 |
09/30/2021 | 9842.1622 | 9866.6194 | 9910.4973 |
10/31/2021 | 9802.2305 | 9810.4157 | 9907.766 |
11/30/2021 | 9800.5134 | 9835.0956 | 9937.0783 |
12/31/2021 | 9778.4808 | 9809.2719 | 9911.6504 |
01/31/2022 | 9665.0096 | 9684.0973 | 9698.114 |
02/28/2022 | 9618.9824 | 9640.3664 | 9589.917 |
03/31/2022 | 9417.8069 | 9398.4418 | 9323.4921 |
04/30/2022 | 9239.9971 | 9249.024 | 8969.6856 |
05/31/2022 | 9306.3591 | 9311.5733 | 9027.5191 |
06/30/2022 | 9210.2192 | 9243.0391 | 8885.8938 |
07/31/2022 | 9366.4559 | 9365.5985 | 9103.0159 |
08/31/2022 | 9164.6489 | 9178.8191 | 8845.795 |
09/30/2022 | 8876.3088 | 8960.8387 | 8463.6019 |
10/31/2022 | 8823.1111 | 8920.0931 | 8353.9783 |
11/30/2022 | 9001.7103 | 9072.6719 | 8661.2006 |
12/31/2022 | 8970.0796 | 9051.3 | 8622.1329 |
01/31/2023 | 9145.615 | 9195.4401 | 8887.3836 |
02/28/2023 | 9000.1294 | 9036.0744 | 8657.5981 |
03/31/2023 | 9149.4734 | 9255.6543 | 8877.5231 |
04/30/2023 | 9182.916 | 9305.2087 | 8931.3249 |
05/31/2023 | 9129.4557 | 9236.5084 | 8834.0742 |
06/30/2023 | 9070.0682 | 9151.6238 | 8802.5692 |
07/31/2023 | 9077.8934 | 9161.5812 | 8796.4332 |
08/31/2023 | 9048.3937 | 9166.6121 | 8740.2452 |
09/30/2023 | 8909.5032 | 9080.185 | 8518.1402 |
10/31/2023 | 8851.0022 | 9049.9379 | 8383.7157 |
11/30/2023 | 9078.4 | 9247.8991 | 8763.3836 |
12/31/2023 | 9295.5908 | 9440.8722 | 9098.8368 |
01/31/2024 | 9309.5717 | 9461.5558 | 9073.8508 |
02/29/2024 | 9224.4966 | 9361.8633 | 8945.6507 |
03/31/2024 | 9269.5916 | 9407.953 | 9028.2556 |
04/30/2024 | 9121.3326 | 9280.4671 | 8800.2124 |
05/31/2024 | 9239.45 | 9383.5958 | 8949.4047 |
06/30/2024 | 9314.3978 | 9462.9892 | 9034.1349 |
07/31/2024 | 9489.2778 | 9636.1329 | 9245.142 |
08/31/2024 | 9590.8577 | 9740.3817 | 9377.9967 |
09/30/2024 | 9702.6988 | 9836.6476 | 9503.5623 |
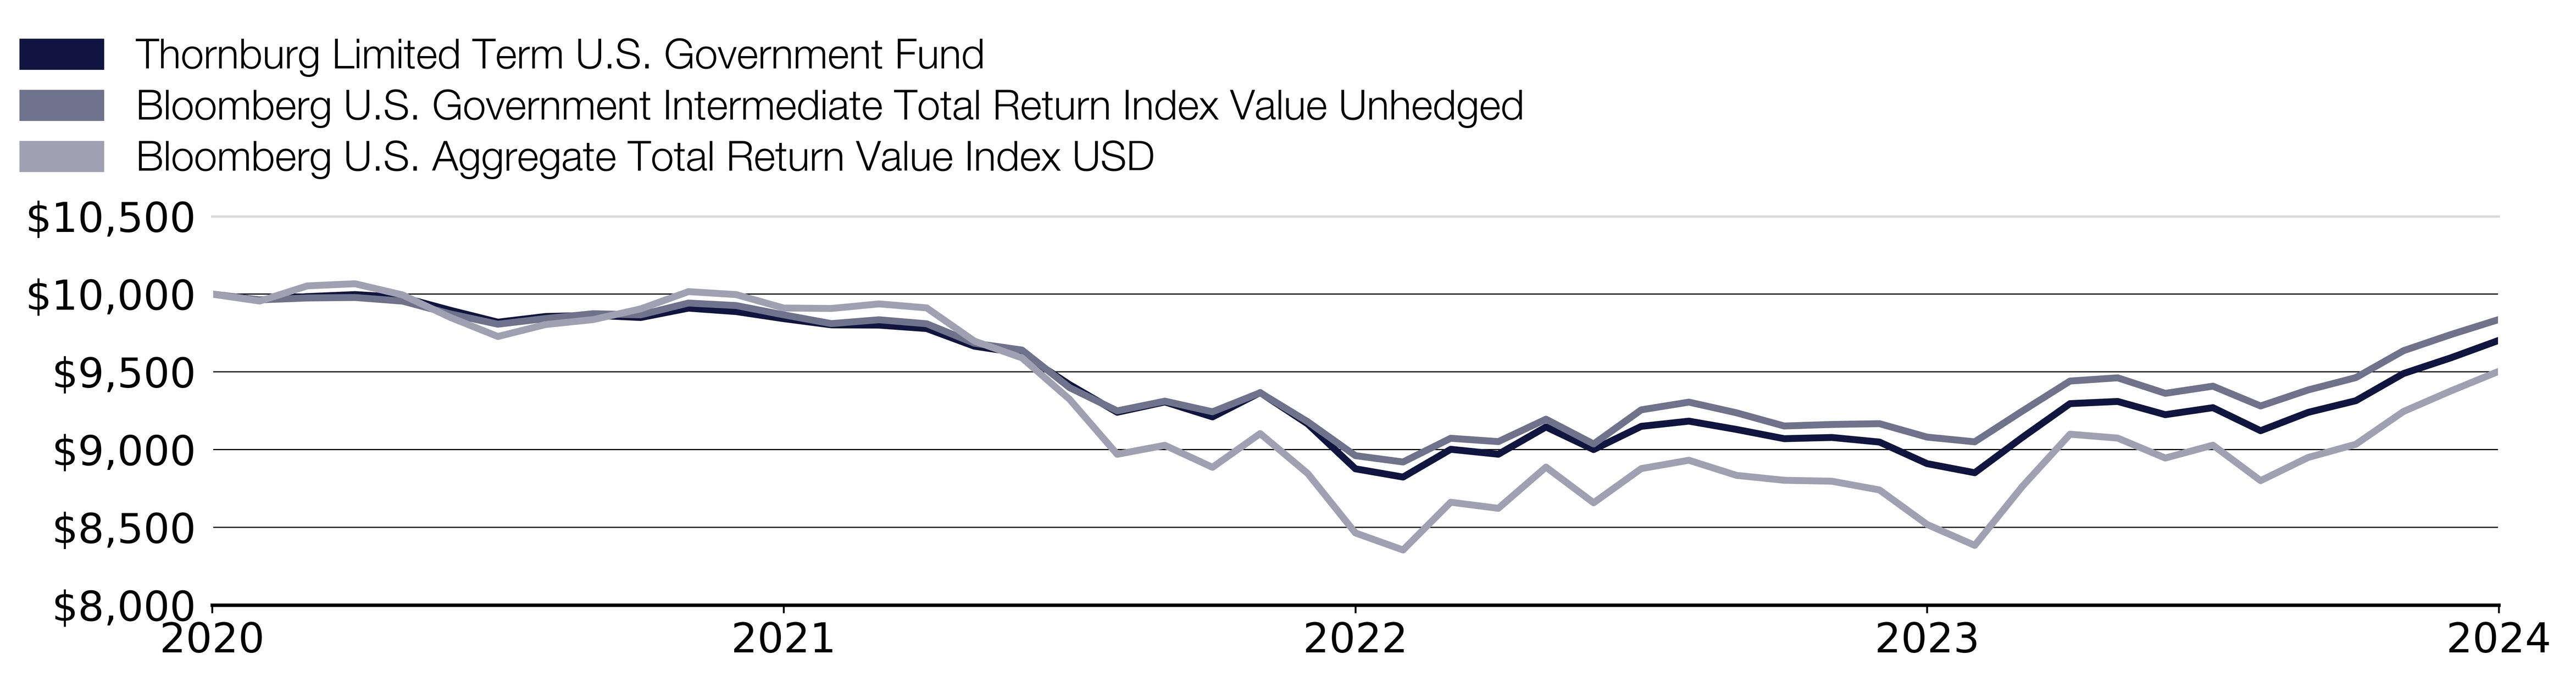
Effective September 30, 2024, the Fund adopted the Bloomberg U.S. Aggregate Total Return Index Value USD as its broad-based securities market index that represents the overall applicable market in which the Fund invests, and the Bloomberg U.S. Government Intermediate Total Return Index Value Unhedged as an additional index that represents the market sectors which the Fund’s advisor believes are more representative of the Fund’s investment universe.
What were the Fund costs for the past year?
(based on a hypothetical $10,000 investment)
Class Name | Costs of a $10,000 investment | Costs paid as a percentage of a $10,000 investment |
|---|
Class C2 | $130.00 | 1.24% |
End Block
Thornburg Limited Term U.S. Government Fund Tailored Shareholder Report
Thornburg Limited Term U.S. Government Fund Tailored Shareholder Report | |
Annual Performance | 1 Year |
|---|
Limited Term U.S. Government Fund Class C2 (with sales charge) | 8.25% |
Limited Term U.S. Government Fund Class C2 (without sales charge) | 8.90% |
Bloomberg U.S. Aggregate Total Return Index Value USD | 11.57% |
Bloomberg U.S. Government Intermediate Total Return Index Value Unhedged | 8.33% |
Key Fund Statistics
(as of September 30, 2024)
| |
|---|
Fund Size (Millions) | $139.7M |
Number of Holdings | 157 |
Annual Portfolio Turnover | 32.26% |
Total Advisory Fee | $0.6M |
What did the Fund invest in?
(as of September 30, 2024)
Types of Holdings | (%) |
|---|
| U.S. Treasury Securities | 20.0 |
| U.S. Government Agencies | 6.6 |
| Mortgage Backed | 62.5 |
| Corporate Bonds | 2.1 |
| Cash Equivalents & Other | 8.8 |
Types of Holdings | (%) |
U.S. Treasury Securities | 20.0% |
U.S. Government Agencies | 6.6% |
Mortgage Backed | 62.5% |
Corporate Bonds | 2.1% |
Cash Equivalents & Other | 8.8% |
Expressed as a percentage of the Fund’s net assets.
How has the Fund changed?
This is a summary of certain changes to the Fund since October 1, 2023. For more complete information, you may review the Fund’s next prospectus, which we expect to be available by February 1, 2025 at https://www.thornburg.com/download or upon request by calling 1-800-847-0200.
End Block
Changes In and Disagreements with Accountants
No changes and/or disagreements occurred in the current reporting period.
End Block
For additional information about the Fund, including its prospectus, financial information, holdings and proxy information, visit www.thornburg.com/download.
Thornburg Limited Term U.S. Government Fund Tailored Shareholder Report | |
Thornburg Limited Term U.S. Government Fund Tailored Shareholder Report
Thornburg Limited Term U.S. Government Fund CLASS: I TICKER: LTUIX Annual Shareholder Report | |
This annual shareholder report contains important information about the Thornburg Limited Term U.S. Government Fund Class I Shares for the period from October 1, 2023 to September 30, 2024. You can find additional information about the Fund at https://www.thornburg.com/download. You can also request this information by contacting us at 1-800-847-0200. This report also describes changes to the Fund that occurred during the reporting period.
How did the Fund perform last year and what affected its performance?
The Fund’s Class I shares outperformed the Bloomberg U.S. Government Intermediate Total Return Index Value Unhedged (the “Index”) during the 12-month period ended September 30, 2024. Treasury yields fell meaningfully over the 12-month period ended September 30, 2024, as U.S. inflation continued to improve, and the market priced in anticipated interest rate cuts by the Federal Reserve. The Fund’s long duration, compared to the Index, was a relative contributor in this environment. Positive relative returns from the Fund’s allocation to asset-backed securities, collateralized mortgage obligations, and commercial mortgage-backed securities also contributed. There were no meaningful detractors to the Fund’s performance over the period.
How did the Fund perform over the past 10 years?
The line graph below reflects a hypothetical $10,000 investment. The returns shown in the line graph and table assume the reinvestment of dividends and capital gains, but do not reflect the deduction of taxes that a shareholder would pay on distributions or the redemption of Fund shares. The performance information shown below represents past performance and is no guarantee of future results. For Fund performance current to the most recent month end, visit https://www.thornburg.com/product/mutual-funds/fgov/LTUIX or call 1-800-847-0200. Performance for other share classes of the Fund will vary.
Cumulative Performance
Growth Table
Date | Thornburg Limited Term U.S. Government Fund | Bloomberg U.S. Government Intermediate Total Return Index Value Unhedged | Bloomberg U.S. Aggregate Total Return Value Index USD |
09/30/2014 | 10000.0066 | 10000 | 10000 |
10/31/2014 | 10051.6854 | 10070.1644 | 10098.2769 |
11/30/2014 | 10089.3704 | 10120.9308 | 10169.91 |
12/31/2014 | 10059.9737 | 10094.5925 | 10179.4256 |
01/31/2015 | 10146.9075 | 10255.4004 | 10392.8789 |
02/28/2015 | 10111.7002 | 10167.2664 | 10295.1602 |
03/31/2015 | 10139.2379 | 10220.968 | 10342.967 |
04/30/2015 | 10141.4746 | 10211.7143 | 10305.856 |
05/31/2015 | 10146.6492 | 10216.8621 | 10281.0356 |
06/30/2015 | 10126.3757 | 10177.0746 | 10168.9318 |
07/31/2015 | 10144.3688 | 10218.0552 | 10239.6187 |
08/31/2015 | 10153.9324 | 10223.7071 | 10224.9146 |
09/30/2015 | 10192.5775 | 10299.8931 | 10294.0811 |
10/31/2015 | 10173.5303 | 10267.1468 | 10295.7875 |
11/30/2015 | 10153.2394 | 10233.2913 | 10268.5908 |
12/31/2015 | 10117.9047 | 10213.8093 | 10235.4031 |
01/31/2016 | 10241.0443 | 10375.9447 | 10376.2558 |
02/29/2016 | 10268.4189 | 10427.2264 | 10449.8664 |
03/31/2016 | 10293.6069 | 10446.9605 | 10545.7404 |
04/30/2016 | 10302.682 | 10443.9861 | 10586.2218 |
05/31/2016 | 10290.2808 | 10429.0917 | 10588.9383 |
06/30/2016 | 10372.3632 | 10576.8705 | 10779.1979 |
07/31/2016 | 10367.696 | 10580.7748 | 10847.3436 |
08/31/2016 | 10354.395 | 10533.246 | 10834.9414 |
09/30/2016 | 10378.6153 | 10551.2324 | 10828.5941 |
10/31/2016 | 10359.9588 | 10500.7461 | 10745.7655 |
11/30/2016 | 10257.2053 | 10324.3045 | 10491.5864 |
12/31/2016 | 10251.07 | 10321.4869 | 10506.3861 |
01/31/2017 | 10263.4058 | 10342.0668 | 10527.0016 |
02/28/2017 | 10285.1487 | 10371.9788 | 10597.7522 |
03/31/2017 | 10279.954 | 10377.1322 | 10592.197 |
04/30/2017 | 10319.9922 | 10431.506 | 10673.9358 |
05/31/2017 | 10350.3291 | 10472.509 | 10756.0945 |
06/30/2017 | 10319.0636 | 10445.1736 | 10745.2712 |
07/31/2017 | 10349.6899 | 10478.4858 | 10791.5097 |
08/31/2017 | 10395.6166 | 10542.27 | 10888.3034 |
09/30/2017 | 10360.1102 | 10481.1129 | 10836.4459 |
10/31/2017 | 10353.3153 | 10467.9045 | 10842.724 |
11/30/2017 | 10341.0398 | 10436.0096 | 10828.8068 |
12/31/2017 | 10346.5343 | 10438.6871 | 10878.506 |
01/31/2018 | 10280.8971 | 10339.3165 | 10753.2186 |
02/28/2018 | 10254.4164 | 10308.9283 | 10651.2843 |
03/31/2018 | 10298.3177 | 10362.5739 | 10719.5896 |
04/30/2018 | 10261.6368 | 10303.7974 | 10639.8655 |
05/31/2018 | 10319.4069 | 10370.2928 | 10715.7993 |
06/30/2018 | 10315.0181 | 10369.1445 | 10702.6209 |
07/31/2018 | 10295.011 | 10348.9063 | 10705.1619 |
08/31/2018 | 10344.8655 | 10410.3267 | 10774.0467 |
09/30/2018 | 10311.6783 | 10357.6278 | 10704.6676 |
10/31/2018 | 10295.3543 | 10361.6441 | 10620.0741 |
11/30/2018 | 10353.4337 | 10432.5927 | 10683.4727 |
12/31/2018 | 10461.4658 | 10587.519 | 10879.7393 |
01/31/2019 | 10515.2233 | 10632.7567 | 10995.2773 |
02/28/2019 | 10520.1536 | 10625.3739 | 10988.9087 |
03/31/2019 | 10604.6559 | 10754.931 | 11199.9166 |
04/30/2019 | 10616.6612 | 10759.8771 | 11202.782 |
05/31/2019 | 10719.4181 | 10917.1224 | 11401.6482 |
06/30/2019 | 10764.6449 | 11007.0825 | 11544.8346 |
07/31/2019 | 10767.6923 | 10987.8862 | 11570.2238 |
08/31/2019 | 10868.8433 | 11185.5127 | 11870.0302 |
09/30/2019 | 10863.5418 | 11136.4716 | 11806.8123 |
10/31/2019 | 10882.9953 | 11168.5514 | 11842.3764 |
11/30/2019 | 10876.4096 | 11141.3729 | 11836.3427 |
12/31/2019 | 10870.1049 | 11138.0904 | 11828.0976 |
01/31/2020 | 10987.3235 | 11295.1397 | 12055.7234 |
02/29/2020 | 11088.012 | 11480.5774 | 12272.7065 |
03/31/2020 | 11081.4612 | 11714.8825 | 12200.4833 |
04/30/2020 | 11166.6108 | 11747.2424 | 12417.3601 |
05/31/2020 | 11206.4271 | 11768.6793 | 12475.1769 |
06/30/2020 | 11261.2042 | 11778.8685 | 12553.758 |
07/31/2020 | 11309.0001 | 11816.4937 | 12741.2746 |
08/31/2020 | 11290.93 | 11793.494 | 12638.4313 |
09/30/2020 | 11297.6438 | 11802.2379 | 12631.4992 |
10/31/2020 | 11260.9411 | 11758.6134 | 12575.0965 |
11/30/2020 | 11291.1494 | 11772.9365 | 12698.4914 |
12/31/2020 | 11312.2426 | 11776.6839 | 12715.9864 |
01/31/2021 | 11298.4236 | 11749.0013 | 12624.817 |
02/28/2021 | 11209.374 | 11652.297 | 12442.5048 |
03/31/2021 | 11128.6206 | 11573.8479 | 12287.1394 |
04/30/2021 | 11176.256 | 11616.9459 | 12384.2096 |
05/31/2021 | 11190.8434 | 11653.6973 | 12424.6696 |
06/30/2021 | 11180.4832 | 11645.1102 | 12511.9637 |
07/31/2021 | 11254.9503 | 11734.5102 | 12651.8595 |
08/31/2021 | 11235.5773 | 11715.5827 | 12627.7727 |
09/30/2021 | 11188.7893 | 11644.8189 | 12518.4439 |
10/31/2021 | 11149.281 | 11578.486 | 12514.9938 |
11/30/2021 | 11153.24 | 11607.6138 | 12552.0197 |
12/31/2021 | 11133.9826 | 11577.136 | 12519.9004 |
01/31/2022 | 11009.8111 | 11429.4021 | 12250.172 |
02/28/2022 | 10962.3631 | 11377.7898 | 12113.503 |
03/31/2022 | 10737.2128 | 11092.2646 | 11776.9683 |
04/30/2022 | 10538.1697 | 10915.9181 | 11330.0576 |
05/31/2022 | 10619.3423 | 10989.7403 | 11403.1101 |
06/30/2022 | 10522.3504 | 10908.8546 | 11224.2161 |
07/31/2022 | 10699.0765 | 11053.5022 | 11498.4738 |
08/31/2022 | 10481.1495 | 10833.0607 | 11173.5652 |
09/30/2022 | 10154.573 | 10575.795 | 10690.7981 |
10/31/2022 | 10098.6542 | 10527.7061 | 10552.327 |
11/30/2022 | 10309.2434 | 10707.7832 | 10940.3949 |
12/31/2022 | 10269.2016 | 10682.5596 | 10891.0465 |
01/31/2023 | 10485.2782 | 10852.6772 | 11226.0979 |
02/28/2023 | 10322.0076 | 10664.59 | 10935.8444 |
03/31/2023 | 10499.1652 | 10923.7434 | 11213.6426 |
04/30/2023 | 10533.9186 | 10982.2287 | 11281.6023 |
05/31/2023 | 10486.0605 | 10901.147 | 11158.7602 |
06/30/2023 | 10422.2672 | 10800.9641 | 11118.9646 |
07/31/2023 | 10436.4508 | 10812.7161 | 11111.2139 |
08/31/2023 | 10407.5044 | 10818.6537 | 11040.24 |
09/30/2023 | 10251.7942 | 10716.6503 | 10759.6881 |
10/31/2023 | 10180.4685 | 10680.952 | 10589.8898 |
11/30/2023 | 10448.7642 | 10914.5906 | 11069.4673 |
12/31/2023 | 10705.6609 | 11142.342 | 11493.195 |
01/31/2024 | 10736.0491 | 11166.7533 | 11461.6339 |
02/29/2024 | 10633.1333 | 11049.0938 | 11299.6979 |
03/31/2024 | 10690.4528 | 11103.49 | 11404.0404 |
04/30/2024 | 10523.158 | 10953.0281 | 11115.9877 |
05/31/2024 | 10674.4716 | 11074.7431 | 11304.4398 |
06/30/2024 | 10757.3542 | 11168.445 | 11411.4668 |
07/31/2024 | 10975.0416 | 11372.7933 | 11678.0004 |
08/31/2024 | 11098.4879 | 11495.8302 | 11845.8158 |
09/30/2024 | 11224.6251 | 11609.4455 | 12004.424 |

Effective September 30, 2024, the Fund adopted the Bloomberg U.S. Aggregate Total Return Index Value USD as its broad-based securities market index that represents the overall applicable market in which the Fund invests, and the Bloomberg U.S. Government Intermediate Total Return Index Value Unhedged as an additional index that represents the market sectors which the Fund’s advisor believes are more representative of the Fund’s investment universe.
What were the Fund costs for the past year?
(based on a hypothetical $10,000 investment)
Class Name | Costs of a $10,000 investment | Costs paid as a percentage of a $10,000 investment |
|---|
Class I | $68.00 | 0.65% |
End Block
Thornburg Limited Term U.S. Government Fund Tailored Shareholder Report
Thornburg Limited Term U.S. Government Fund Tailored Shareholder Report | |
Annual Performance | 1 Year | 5 Year | 10 Year |
|---|
Limited Term U.S. Government Fund Class I | 9.49% | 0.66% | 1.16% |
Bloomberg U.S. Aggregate Total Return Index Value USD | 11.57% | 0.33% | 1.84% |
Bloomberg U.S. Government Intermediate Total Return Index Value Unhedged | 8.33% | 0.84% | 1.50% |
Key Fund Statistics
(as of September 30, 2024)
| |
|---|
Fund Size (Millions) | $139.7M |
Number of Holdings | 157 |
Annual Portfolio Turnover | 32.26% |
Total Advisory Fee | $0.6M |
What did the Fund invest in?
(as of September 30, 2024)
Types of Holdings | (%) |
|---|
| U.S. Treasury Securities | 20.0 |
| U.S. Government Agencies | 6.6 |
| Mortgage Backed | 62.5 |
| Corporate Bonds | 2.1 |
| Cash Equivalents & Other | 8.8 |
Types of Holdings | (%) |
U.S. Treasury Securities | 20.0% |
U.S. Government Agencies | 6.6% |
Mortgage Backed | 62.5% |
Corporate Bonds | 2.1% |
Cash Equivalents & Other | 8.8% |
Expressed as a percentage of the Fund’s net assets.
How has the Fund changed?
This is a summary of certain changes to the Fund since October 1, 2023. For more complete information, you may review the Fund’s next prospectus, which we expect to be available by February 1, 2025 at https://www.thornburg.com/download or upon request by calling 1-800-847-0200.
End Block
Changes In and Disagreements with Accountants
No changes and/or disagreements occurred in the current reporting period.
End Block
For additional information about the Fund, including its prospectus, financial information, holdings and proxy information, visit www.thornburg.com/download.

Thornburg Limited Term U.S. Government Fund Tailored Shareholder Report | |
Thornburg Limited Term U.S. Government Fund Tailored Shareholder Report
Thornburg Limited Term U.S. Government Fund CLASS: R3 TICKER: LTURX Annual Shareholder Report | |
This annual shareholder report contains important information about the Thornburg Limited Term U.S. Government Fund Class R3 Shares for the period from October 1, 2023 to September 30, 2024. You can find additional information about the Fund at https://www.thornburg.com/download. You can also request this information by contacting us at 1-800-847-0200. This report also describes changes to the Fund that occurred during the reporting period.
How did the Fund perform last year and what affected its performance?
The Fund’s Class R3 shares outperformed the Bloomberg U.S. Government Intermediate Total Return Index Value Unhedged (the “Index”) during the 12-month period ended September 30, 2024. Treasury yields fell meaningfully over the 12-month period ended September 30, 2024, as U.S. inflation continued to improve, and the market priced in anticipated interest rate cuts by the Federal Reserve. The Fund’s long duration, compared to the Index, was a relative contributor in this environment. Positive relative returns from the Fund’s allocation to asset-backed securities, collateralized mortgage obligations, and commercial mortgage-backed securities also contributed. There were no meaningful detractors to the Fund’s performance over the period.
How did the Fund perform over the past 10 years?
The line graph below reflects a hypothetical $10,000 investment. The returns shown in the line graph and table assume the reinvestment of dividends and capital gains, but do not reflect the deduction of taxes that a shareholder would pay on distributions or the redemption of Fund shares. The performance information shown below represents past performance and is no guarantee of future results. For Fund performance current to the most recent month end, visit https://www.thornburg.com/product/mutual-funds/fgov/LTURX or call 1-800-847-0200. Performance for other share classes of the Fund will vary.
Cumulative Performance
Growth Table
Date | Thornburg Limited Term U.S. Government Fund | Bloomberg U.S. Government Intermediate Total Return Index Value Unhedged | Bloomberg U.S. Aggregate Total Return Value Index USD |
09/30/2014 | 9999.9994 | 10000 | 10000 |
10/31/2014 | 10048.315 | 10070.1644 | 10098.2769 |
11/30/2014 | 10082.8256 | 10120.9308 | 10169.91 |
12/31/2014 | 10042.736 | 10094.5925 | 10179.4256 |
01/31/2015 | 10133.7176 | 10255.4004 | 10392.8789 |
02/28/2015 | 10095.894 | 10167.2664 | 10295.1602 |
03/31/2015 | 10120.4577 | 10220.968 | 10342.967 |
04/30/2015 | 10119.5636 | 10211.7143 | 10305.856 |
05/31/2015 | 10114.1552 | 10216.8621 | 10281.0356 |
06/30/2015 | 10090.9322 | 10177.0746 | 10168.9318 |
07/31/2015 | 10113.2347 | 10218.0552 | 10239.6187 |
08/31/2015 | 10119.9808 | 10223.7071 | 10224.9146 |
09/30/2015 | 10155.0666 | 10299.8931 | 10294.0811 |
10/31/2015 | 10132.6189 | 10267.1468 | 10295.7875 |
11/30/2015 | 10108.8292 | 10233.2913 | 10268.5908 |
12/31/2015 | 10070.1379 | 10213.8093 | 10235.4031 |
01/31/2016 | 10181.353 | 10375.9447 | 10376.2558 |
02/29/2016 | 10205.0281 | 10427.2264 | 10449.8664 |
03/31/2016 | 10234.2968 | 10446.9605 | 10545.7404 |
04/30/2016 | 10239.6635 | 10443.9861 | 10586.2218 |
05/31/2016 | 10224.2987 | 10429.0917 | 10588.9383 |
06/30/2016 | 10294.6195 | 10576.8705 | 10779.1979 |
07/31/2016 | 10294.3011 | 10580.7748 | 10847.3436 |
08/31/2016 | 10277.5347 | 10533.246 | 10834.9414 |
09/30/2016 | 10290.8738 | 10551.2324 | 10828.5941 |
10/31/2016 | 10268.8994 | 10500.7461 | 10745.7655 |
11/30/2016 | 10163.8463 | 10324.3045 | 10491.5864 |
12/31/2016 | 10162.1003 | 10321.4869 | 10506.3861 |
01/31/2017 | 10170.922 | 10342.0668 | 10527.0016 |
02/28/2017 | 10189.3467 | 10371.9788 | 10597.7522 |
03/31/2017 | 10180.8211 | 10377.1322 | 10592.197 |
04/30/2017 | 10209.5892 | 10431.506 | 10673.9358 |
05/31/2017 | 10243.9159 | 10472.509 | 10756.0945 |
06/30/2017 | 10209.8804 | 10445.1736 | 10745.2712 |
07/31/2017 | 10236.7651 | 10478.4858 | 10791.5097 |
08/31/2017 | 10278.6433 | 10542.27 | 10888.3034 |
09/30/2017 | 10242.6387 | 10481.1129 | 10836.4459 |
10/31/2017 | 10232.4049 | 10467.9045 |
11/30/2017 | 10209.0518 | 10436.0096 | 10828.8068 |
12/31/2017 | 10218.8603 | 10438.6871 | 10878.506 |
01/31/2018 | 10150.6492 | 10339.3165 | 10753.2186 |
02/28/2018 | 10123.8989 | 10308.9283 | 10651.2843 |
03/31/2018 | 10161.9268 | 10362.5739 | 10719.5896 |
04/30/2018 | 10122.582 | 10303.7974 | 10639.8655 |
05/31/2018 | 10176.2688 | 10370.2928 | 10715.7993 |
06/30/2018 | 10168.6871 | 10369.1445 | 10702.6209 |
07/31/2018 | 10145.6755 | 10348.9063 | 10705.1619 |
08/31/2018 | 10191.4375 | 10410.3267 | 10774.0467 |
09/30/2018 | 10155.7328 | 10357.6278 | 10704.6676 |
10/31/2018 | 10136.4822 | 10361.6441 | 10620.0741 |
11/30/2018 | 10190.5603 | 10432.5927 | 10683.4727 |
12/31/2018 | 10293.5882 | 10587.519 | 10879.7393 |
01/31/2019 | 10343.22 | 10632.7567 | 10995.2773 |
02/28/2019 | 10337.1311 | 10625.3739 | 10988.9087 |
03/31/2019 | 10424.9687 | 10754.931 | 11199.9166 |
04/30/2019 | 10433.6954 | 10759.8771 | 11202.782 |
05/31/2019 | 10531.4324 | 10917.1224 | 11401.6482 |
06/30/2019 | 10572.6969 | 11007.0825 | 11544.8346 |
07/31/2019 | 10564.0725 | 10987.8862 | 11570.2238 |
08/31/2019 | 10667.8667 | 11185.5127 | 11870.0302 |
09/30/2019 | 10651.1253 | 11136.4716 | 11806.8123 |
10/31/2019 | 10674.8962 | 11168.5514 | 11842.3764 |
11/30/2019 | 10665.0919 | 11141.3729 | 11836.3427 |
12/31/2019 | 10655.4685 | 11138.0904 | 11828.0976 |
01/31/2020 | 10758.5632 | 11295.1397 | 12055.7234 |
02/29/2020 | 10861.9727 | 11480.5774 | 12272.7065 |
03/31/2020 | 10851.8615 | 11714.8825 | 12200.4833 |
04/30/2020 | 10931.8172 | 11747.2424 | 12417.3601 |
05/31/2020 | 10967.2119 | 11768.6793 | 12475.1769 |
06/30/2020 | 11017.212 | 11778.8685 | 12553.758 |
07/31/2020 | 11052.0573 | 11816.4937 | 12741.2746 |
08/31/2020 | 11038.9334 | 11793.494 | 12638.4313 |
09/30/2020 | 11042.1171 | 11802.2379 | 12631.4992 |
10/31/2020 | 11002.422 | 11758.6134 | 12575.0965 |
11/30/2020 | 11028.1279 | 11772.9365 | 12698.4914 |
12/31/2020 | 11044.9258 | 11776.6839 | 12715.9864 |
01/31/2021 | 11027.6824 | 11749.0013 | 12624.817 |
02/28/2021 | 10937.6422 | 11652.297 | 12442.5048 |
03/31/2021 | 10855.8652 | 11573.8479 | 12287.1394 |
04/30/2021 | 10890.5078 | 11616.9459 | 12384.2096 |
05/31/2021 | 10909.4324 | 11653.6973 | 12424.6696 |
06/30/2021 | 10895.9832 | 11645.1102 | 12511.9637 |
07/31/2021 | 10965.1801 | 11734.5102 | 12651.8595 |
08/31/2021 | 10943.0314 | 11715.5827 | 12627.7727 |
09/30/2021 | 10886.2283 | 11644.8189 | 12518.4439 |
10/31/2021 | 10852.3826 | 11578.486 | 12514.9938 |
11/30/2021 | 10852.634 | 11607.6138 | 12552.0197 |
12/31/2021 | 10830.2702 | 11577.136 | 12519.9004 |
01/31/2022 | 10706.0736 | 11429.4021 | 12250.172 |
02/28/2022 | 10656.945 | 11377.7898 | 12113.503 |
03/31/2022 | 10434.9924 | 11092.2646 | 11776.9683 |
04/30/2022 | 10238.9232 | 10915.9181 | 11330.0576 |
05/31/2022 | 10314.9718 | 10989.7403 | 11403.1101 |
06/30/2022 | 10218.2016 | 10908.8546 | 11224.2161 |
07/31/2022 | 10386.4992 | 11053.5022 | 11498.4738 |
08/31/2022 | 10171.9579 | 10833.0607 | 11173.5652 |
09/30/2022 | 9852.3351 | 10575.795 | 10690.7981 |
10/31/2022 | 9795 | 10527.7061 | 10552.327 |
11/30/2022 | 9996.0808 | 10707.7832 | 10940.3949 |
12/31/2022 | 9962.723 | 10682.5596 | 10891.0465 |
01/31/2023 | 10160.7265 | 10852.6772 | 11226.0979 |
02/28/2023 | 10000.1782 | 10664.59 | 10935.8444 |
03/31/2023 | 10177.5307 | 10923.7434 | 11213.6426 |
04/30/2023 | 10208.294 | 10982.2287 | 11281.6023 |
05/31/2023 | 10150.627 | 10901.147 | 11158.7602 |
06/30/2023 | 10094.8428 | 10800.9641 | 11118.9646 |
07/31/2023 | 10097.0574 | 10812.7161 | 11111.2139 |
08/31/2023 | 10066.2094 | 10818.6537 | 11040.24 |
09/30/2023 | 9921.592 | 10716.6503 | 10759.6881 |
10/31/2023 | 9849.8338 | 10680.952 | 10589.8898 |
11/30/2023 | 10106.1769 | 10914.5906 | 11069.4673 |
12/31/2023 | 10351.2788 | 11142.342 | 11493.195 |
01/31/2024 | 10369.0127 | 11166.7533 | 11461.6339 |
02/29/2024 | 10275.7293 | 11049.0938 | 11299.6979 |
03/31/2024 | 10328.1757 | 11103.49 | 11404.0404 |
04/30/2024 | 10164.0939 | 10953.0281 | 11115.9877 |
05/31/2024 | 10298.4298 | 11074.7431 | 11304.4398 |
06/30/2024 | 10384.3998 | 11168.445 | 11411.4668 |
07/31/2024 | 10582.509 | 11372.7933 | 11678.0004 |
08/31/2024 | 10698.5498 | 11495.8302 | 11845.8158 |
09/30/2024 | 10817.2642 | 11609.4455 | 12004.424 |

Effective September 30, 2024, the Fund adopted the Bloomberg U.S. Aggregate Total Return Index Value USD as its broad-based securities market index that represents the overall applicable market in which the Fund invests, and the Bloomberg U.S. Government Intermediate Total Return Index Value Unhedged as an additional index that represents the market sectors which the Fund’s advisor believes are more representative of the Fund’s investment universe.
What were the Fund costs for the past year?
(based on a hypothetical $10,000 investment)
Class Name | Costs of a $10,000 investment | Costs paid as a percentage of a $10,000 investment |
|---|
Class R3 | $103.00 | 0.99% |
End Block
Thornburg Limited Term U.S. Government Fund Tailored Shareholder Report
Thornburg Limited Term U.S. Government Fund Tailored Shareholder Report | |
Annual Performance | 1 Year | 5 Year | 10 Year |
|---|
Limited Term U.S. Government Fund Class R3 | 9.03% | 0.31% | 0.79% |
Bloomberg U.S. Aggregate Total Return Index Value USD | 11.57% | 0.33% | 1.84% |
Bloomberg U.S. Government Intermediate Total Return Index Value Unhedged | 8.33% | 0.84% | 1.50% |
Key Fund Statistics
(as of September 30, 2024)
| |
|---|
Fund Size (Millions) | $139.7M |
Number of Holdings | 157 |
Annual Portfolio Turnover | 32.26% |
Total Advisory Fee | $0.6M |
What did the Fund invest in?
(as of September 30, 2024)
Types of Holdings | (%) |
|---|
| U.S. Treasury Securities | 20.0 |
| U.S. Government Agencies | 6.6 |
| Mortgage Backed | 62.5 |
| Corporate Bonds | 2.1 |
| Cash Equivalents & Other | 8.8 |
Types of Holdings | (%) |
U.S. Treasury Securities | 20.0% |
U.S. Government Agencies | 6.6% |
Mortgage Backed | 62.5% |
Corporate Bonds | 2.1% |
Cash Equivalents & Other | 8.8% |
Expressed as a percentage of the Fund’s net assets.
How has the Fund changed?
This is a summary of certain changes to the Fund since October 1, 2023. For more complete information, you may review the Fund’s next prospectus, which we expect to be available by February 1, 2025 at https://www.thornburg.com/download or upon request by calling 1-800-847-0200.
End Block
Changes In and Disagreements with Accountants
No changes and/or disagreements occurred in the current reporting period.
End Block
For additional information about the Fund, including its prospectus, financial information, holdings and proxy information, visit www.thornburg.com/download.

Thornburg Limited Term U.S. Government Fund Tailored Shareholder Report | |
Thornburg Limited Term U.S. Government Fund Tailored Shareholder Report
Thornburg Limited Term U.S. Government Fund CLASS: R4 TICKER: LTUGX Annual Shareholder Report | |
This annual shareholder report contains important information about the Thornburg Limited Term U.S. Government Fund Class R4 Shares for the period from October 1, 2023 to September 30, 2024. You can find additional information about the Fund at https://www.thornburg.com/download. You can also request this information by contacting us at 1-800-847-0200. This report also describes changes to the Fund that occurred during the reporting period.
How did the Fund perform last year and what affected its performance?
The Fund’s Class R4 shares outperformed the Bloomberg U.S. Government Intermediate Total Return Index Value Unhedged (the “Index”) during the 12-month period ended September 30, 2024. Treasury yields fell meaningfully over the 12-month period ended September 30, 2024, as U.S. inflation continued to improve, and the market priced in anticipated interest rate cuts by the Federal Reserve. The Fund’s long duration, compared to the Index, was a relative contributor in this environment. Positive relative returns from the Fund’s allocation to asset-backed securities, collateralized mortgage obligations, and commercial mortgage-backed securities also contributed. There were no meaningful detractors to the Fund’s performance over the period.
How did the Fund perform over the past 10 years?
The line graph below reflects a hypothetical $10,000 investment. The returns shown in the line graph and table assume the reinvestment of dividends and capital gains, but do not reflect the deduction of taxes that a shareholder would pay on distributions or the redemption of Fund shares. The performance information shown below represents past performance and is no guarantee of future results. For Fund performance current to the most recent month end, visit https://www.thornburg.com/product/mutual-funds/fgov/LTUGX or call 1-800-847-0200. Performance for other share classes of the Fund will vary.
Cumulative Performance
Growth Table
Date | Thornburg Limited Term U.S. Government Fund | Bloomberg U.S. Government Intermediate Total Return Index Value Unhedged | Bloomberg U.S. Aggregate Total Return Value Index USD |
09/30/2014 | 10000.0066 | 10000 | 10000 |
10/31/2014 | 10048.4777 | 10070.1644 | 10098.2769 |
11/30/2014 | 10075.4078 | 10120.9308 | 10169.91 |
12/31/2014 | 10042.8058 | 10094.5925 | 10179.4256 |
01/31/2015 | 10133.8583 | 10255.4004 | 10392.8789 |
02/28/2015 | 10096.0077 | 10167.2664 | 10295.1602 |
03/31/2015 | 10120.6425 | 10220.968 | 10342.967 |
04/30/2015 | 10112.2294 | 10211.7143 | 10305.856 |
05/31/2015 | 10114.4995 | 10216.8621 | 10281.0356 |
06/30/2015 | 10091.209 | 10177.0746 | 10168.9318 |
07/31/2015 | 10113.5329 | 10218.0552 | 10239.6187 |
08/31/2015 | 10120.2885 | 10223.7071 | 10224.9146 |
09/30/2015 | 10155.3964 | 10299.8931 | 10294.0811 |
10/31/2015 | 10132.9317 | 10267.1468 | 10295.7875 |
11/30/2015 | 10109.1259 | 10233.2913 | 10268.5908 |
12/31/2015 | 10070.3941 | 10213.8093 | 10235.4031 |
01/31/2016 | 10181.6792 | 10375.9447 | 10376.2558 |
02/29/2016 | 10205.3601 | 10427.2264 | 10449.8664 |
03/31/2016 | 10234.6437 | 10446.9605 | 10545.7404 |
04/30/2016 | 10240.0078 | 10443.9861 | 10586.2218 |
05/31/2016 | 10224.6732 | 10429.0917 | 10588.9383 |
06/30/2016 | 10294.9182 | 10576.8705 | 10779.1979 |
07/31/2016 | 10294.5896 | 10580.7748 | 10847.3436 |
08/31/2016 | 10277.8016 | 10533.246 | 10834.9414 |
09/30/2016 | 10290.586 | 10551.2324 | 10828.5941 |
10/31/2016 | 10268.5821 | 10500.7461 | 10745.7655 |
11/30/2016 | 10163.4487 | 10324.3045 | 10491.5864 |
12/31/2016 | 10161.6938 | 10321.4869 | 10506.3861 |
01/31/2017 | 10170.5089 | 10342.0668 | 10527.0016 |
02/28/2017 | 10181.1365 | 10371.9788 | 10597.7522 |
03/31/2017 | 10180.2989 | 10377.1322 | 10592.197 |
04/30/2017 | 10209.1334 | 10431.506 | 10673.9358 |
05/31/2017 | 10243.4818 | 10472.509 | 10756.0945 |
06/30/2017 | 10209.1552 | 10445.1736 | 10745.2712 |
07/31/2017 | 10236.0553 | 10478.4858 | 10791.5097 |
08/31/2017 | 10277.9474 | 10542.27 | 10888.3034 |
09/30/2017 | 10239.9368 | 10481.1129 | 10836.4459 |
10/31/2017 | 10229.6678 | 10467.9045 | 10842.724 |
11/30/2017 | 10206.2955 | 10436.0096 | 10828.8068 |
12/31/2017 | 10216.1223 | 10438.6871 | 10878.506 |
01/31/2018 | 10147.8885 | 10339.3165 | 10753.2186 |
02/28/2018 | 10121.0443 | 10308.9283 | 10651.2843 |
03/31/2018 | 10159.2395 | 10362.5739 | 10719.5896 |
04/30/2018 | 10119.8661 | 10303.7974 | 10639.8655 |
05/31/2018 | 10173.5369 | 10370.2928 | 10715.7993 |
06/30/2018 | 10165.943 | 10369.1445 | 10702.6209 |
07/31/2018 | 10142.9232 | 10348.9063 | 10705.1619 |
08/31/2018 | 10188.678 | 10410.3267 | 10774.0467 |
09/30/2018 | 10152.8629 | 10357.6278 | 10704.6676 |
10/31/2018 | 10133.5608 | 10361.6441 | 10620.0741 |
11/30/2018 | 10187.6479 | 10432.5927 | 10683.4727 |
12/31/2018 | 10290.7342 | 10587.519 | 10879.7393 |
01/31/2019 | 10340.3916 | 10632.7567 | 10995.2773 |
02/28/2019 | 10334.1584 | 10625.3739 | 10988.9087 |
03/31/2019 | 10422.0326 | 10754.931 | 11199.9166 |
04/30/2019 | 10422.7078 | 10759.8771 | 11202.782 |
05/31/2019 | 10528.5579 | 10917.1224 | 11401.6482 |
06/30/2019 | 10569.8214 | 11007.0825 | 11544.8346 |
07/31/2019 | 10561.199 | 10987.8862 | 11570.2238 |
08/31/2019 | 10665.0263 | 11185.5127 | 11870.0302 |
09/30/2019 | 10648.2569 | 11136.4716 | 11806.8123 |
10/31/2019 | 10672.0198 | 11168.5514 | 11842.3764 |
11/30/2019 | 10662.2054 | 11141.3729 | 11836.3427 |
12/31/2019 | 10652.5716 | 11138.0904 | 11828.0976 |
01/31/2020 | 10755.7269 | 11295.1397 | 12055.7234 |
02/29/2020 | 10851.0345 | 11480.5774 | 12272.7065 |
03/31/2020 | 10849.116 | 11714.8825 | 12200.4833 |
04/30/2020 | 10929.0939 | 11747.2424 | 12417.3601 |
05/31/2020 | 10964.4928 | 11768.6793 | 12475.1769 |
06/30/2020 | 11014.5738 | 11778.8685 | 12553.758 |
07/31/2020 | 11049.4241 | 11816.4937 | 12741.2746 |
08/31/2020 | 11036.2656 | 11793.494 | 12638.4313 |
09/30/2020 | 11031.1859 | 11802.2379 | 12631.4992 |
10/31/2020 | 10999.696 | 11758.6134 | 12575.0965 |
11/30/2020 | 11025.4033 | 11772.9365 | 12698.4914 |
12/31/2020 | 11042.1855 | 11776.6839 | 12715.9864 |
01/31/2021 | 11025.004 | 11749.0013 | 12624.817 |
02/28/2021 | 10934.8404 | 11652.297 | 12442.5048 |
03/31/2021 | 10853.0237 | 11573.8479 | 12287.1394 |
04/30/2021 | 10887.7107 | 11616.9459 | 12384.2096 |
05/31/2021 | 10898.3379 | 11653.6973 | 12424.6696 |
06/30/2021 | 10893.1609 | 11645.1102 | 12511.9637 |
07/31/2021 | 10962.3129 | 11734.5102 | 12651.8595 |
08/31/2021 | 10940.1523 | 11715.5827 | 12627.7727 |
09/30/2021 | 10883.3085 | 11644.8189 | 12518.4439 |
10/31/2021 | 10849.462 | 11578.486 | 12514.9938 |
11/30/2021 | 10849.7416 | 11607.6138 | 12552.0197 |
12/31/2021 | 10827.3525 | 11577.136 | 12519.9004 |
01/31/2022 | 10694.8024 | 11429.4021 | 12250.172 |
02/28/2022 | 10654.0049 | 11377.7898 | 12113.503 |
03/31/2022 | 10431.9476 | 11092.2646 | 11776.9683 |
04/30/2022 | 10235.7236 | 10915.9181 | 11330.0576 |
05/31/2022 | 10311.8002 | 10989.7403 | 11403.1101 |
06/30/2022 | 10214.9277 | 10908.8546 | 11224.2161 |
07/31/2022 | 10383.1896 | 11053.5022 | 11498.4738 |
08/31/2022 | 10160.0733 | 10833.0607 | 11173.5652 |
09/30/2022 | 9848.7553 | 10575.795 | 10690.7981 |
10/31/2022 | 9791.2853 | 10527.7061 | 10552.327 |
11/30/2022 | 9983.9849 | 10707.7832 | 10940.3949 |
12/31/2022 | 9950.5725 | 10682.5596 | 10891.0465 |
01/31/2023 | 10148.6601 | 10852.6772 | 11226.0979 |
02/28/2023 | 9988.0129 | 10664.59 | 10935.8444 |
03/31/2023 | 10165.3994 | 10923.7434 | 11213.6426 |
04/30/2023 | 10196.1058 | 10982.2287 | 11281.6023 |
05/31/2023 | 10138.3928 | 10901.147 | 11158.7602 |
06/30/2023 | 10082.5585 | 10800.9641 | 11118.9646 |
07/31/2023 | 10084.7553 | 10812.7161 | 11111.2139 |
08/31/2023 | 10053.87 | 10818.6537 | 11040.24 |
09/30/2023 | 9909.1624 | 10716.6503 | 10759.6881 |
10/31/2023 | 9837.351 | 10680.952 | 10589.8898 |
11/30/2023 | 10093.7817 | 10914.5906 | 11069.4673 |
12/31/2023 | 10338.9733 | 11142.342 | 11493.195 |
01/31/2024 | 10356.6894 | 11166.7533 | 11461.6339 |
02/29/2024 | 10263.3283 | 11049.0938 | 11299.6979 |
03/31/2024 | 10315.8727 | 11103.49 | 11404.0404 |
04/30/2024 | 10151.6684 | 10953.0281 | 11115.9877 |
05/31/2024 | 10286.031 | 11074.7431 | 11304.4398 |
06/30/2024 | 10372.0142 | 11168.445 | 11411.4668 |
07/31/2024 | 10570.1284 | 11372.7933 | 11678.0004 |
08/31/2024 | 10686.1262 | 11495.8302 | 11845.8158 |
09/30/2024 | 10804.7684 | 11609.4455 | 12004.424 |

Effective September 30, 2024, the Fund adopted the Bloomberg U.S. Aggregate Total Return Index Value USD as its broad-based securities market index that represents the overall applicable market in which the Fund invests, and the Bloomberg U.S. Government Intermediate Total Return Index Value Unhedged as an additional index that represents the market sectors which the Fund’s advisor believes are more representative of the Fund’s investment universe.
What were the Fund costs for the past year?
(based on a hypothetical $10,000 investment)
Class Name | Costs of a $10,000 investment | Costs paid as a percentage of a $10,000 investment |
|---|
Class R4 | $103.00 | 0.99% |
End Block
Thornburg Limited Term U.S. Government Fund Tailored Shareholder Report
Thornburg Limited Term U.S. Government Fund Tailored Shareholder Report | |
Annual Performance | 1 Year | 5 Year | 10 Year |
|---|
Limited Term U.S. Government Fund Class R4 | 9.04% | 0.29% | 0.78% |
Bloomberg U.S. Aggregate Total Return Index Value USD | 11.57% | 0.33% | 1.84% |
Bloomberg U.S. Government Intermediate Total Return Index Value Unhedged | 8.33% | 0.84% | 1.50% |
Key Fund Statistics
(as of September 30, 2024)
| |
|---|
Fund Size (Millions) | $139.7M |
Number of Holdings | 157 |
Annual Portfolio Turnover | 32.26% |
Total Advisory Fee | $0.6M |
What did the Fund invest in?
(as of September 30, 2024)
Types of Holdings | (%) |
|---|
| U.S. Treasury Securities | 20.0 |
| U.S. Government Agencies | 6.6 |
| Mortgage Backed | 62.5 |
| Corporate Bonds | 2.1 |
| Cash Equivalents & Other | 8.8 |
Types of Holdings | (%) |
U.S. Treasury Securities | 20.0% |
U.S. Government Agencies | 6.6% |
Mortgage Backed | 62.5% |
Corporate Bonds | 2.1% |
Cash Equivalents & Other | 8.8% |
Expressed as a percentage of the Fund’s net assets.
How has the Fund changed?
This is a summary of certain changes to the Fund since October 1, 2023. For more complete information, you may review the Fund’s next prospectus, which we expect to be available by February 1, 2025 at https://www.thornburg.com/download or upon request by calling 1-800-847-0200.
End Block
Changes In and Disagreements with Accountants
No changes and/or disagreements occurred in the current reporting period.
End Block
For additional information about the Fund, including its prospectus, financial information, holdings and proxy information, visit www.thornburg.com/download.

Thornburg Limited Term U.S. Government Fund Tailored Shareholder Report | |
Thornburg Limited Term U.S. Government Fund Tailored Shareholder Report
Thornburg Limited Term U.S. Government Fund CLASS: R5 TICKER: LTGRX Annual Shareholder Report | |
This annual shareholder report contains important information about the Thornburg Limited Term U.S. Government Fund Class R5 Shares for the period from October 1, 2023 to September 30, 2024. You can find additional information about the Fund at https://www.thornburg.com/download. You can also request this information by contacting us at 1-800-847-0200. This report also describes changes to the Fund that occurred during the reporting period.
How did the Fund perform last year and what affected its performance?
The Fund’s Class R5 shares outperformed the Bloomberg U.S. Government Intermediate Total Return Index Value Unhedged (the “Index”) during the 12-month period ended September 30, 2024. Treasury yields fell meaningfully over the 12-month period ended September 30, 2024, as U.S. inflation continued to improve, and the market priced in anticipated interest rate cuts by the Federal Reserve. The Fund’s long duration, compared to the Index, was a relative contributor in this environment. Positive relative returns from the Fund’s allocation to asset-backed securities, collateralized mortgage obligations, and commercial mortgage-backed securities also contributed. There were no meaningful detractors to the Fund’s performance over the period.
How did the Fund perform over the past 10 years?
The line graph below reflects a hypothetical $10,000 investment. The returns shown in the line graph and table assume the reinvestment of dividends and capital gains, but do not reflect the deduction of taxes that a shareholder would pay on distributions or the redemption of Fund shares. The performance information shown below represents past performance and is no guarantee of future results. For Fund performance current to the most recent month end, visit https://www.thornburg.com/product/mutual-funds/fgov/LTGRX or call 1-800-847-0200. Performance for other share classes of the Fund will vary.
Cumulative Performance
Growth Table
Date | Thornburg Limited Term U.S. Government Fund | Bloomberg U.S. Government Intermediate Total Return Index Value Unhedged | Bloomberg U.S. Aggregate Total Return Value Index USD |
09/30/2014 | 10000.0066 | 10000 | 10000 |
10/31/2014 | 10051.0864 | 10070.1644 | 10098.2769 |
11/30/2014 | 10088.2773 | 10120.9308 | 10169.91 |
12/31/2014 | 10058.4344 | 10094.5925 | 10179.4256 |
01/31/2015 | 10152.3025 | 10255.4004 | 10392.8789 |
02/28/2015 | 10109.3044 | 10167.2664 | 10295.1602 |
03/31/2015 | 10144.2563 | 10220.968 | 10342.967 |
04/30/2015 | 10138.4267 | 10211.7143 | 10305.856 |
05/31/2015 | 10143.3799 | 10216.8621 | 10281.0356 |
06/30/2015 | 10122.7479 | 10177.0746 | 10168.9318 |
07/31/2015 | 10147.8703 | 10218.0552 | 10239.6187 |
08/31/2015 | 10149.7517 | 10223.7071 | 10224.9146 |
09/30/2015 | 10195.3145 | 10299.8931 | 10294.0811 |
10/31/2015 | 10167.8722 | 10267.1468 | 10295.7875 |
11/30/2015 | 10146.6494 | 10233.2913 | 10268.5908 |
12/31/2015 | 10118.2358 | 10213.8093 | 10235.4031 |
01/31/2016 | 10232.7365 | 10375.9447 | 10376.2558 |
02/29/2016 | 10259.1299 | 10427.2264 | 10449.8664 |
03/31/2016 | 10291.3374 | 10446.9605 | 10545.7404 |
04/30/2016 | 10291.6945 | 10443.9861 | 10586.2218 |
05/31/2016 | 10279.022 | 10429.0917 | 10588.9383 |
06/30/2016 | 10375.6854 | 10576.8705 | 10779.1979 |
07/31/2016 | 10370.409 | 10580.7748 | 10847.3436 |
08/31/2016 | 10356.365 | 10533.246 | 10834.9414 |
09/30/2016 | 10379.1965 | 10551.2324 | 10828.5941 |
10/31/2016 | 10359.8896 | 10500.7461 | 10745.7655 |
11/30/2016 | 10248.9648 | 10324.3045 | 10491.5864 |
12/31/2016 | 10242.162 | 10321.4869 | 10506.3861 |
01/31/2017 | 10261.6991 | 10342.0668 | 10527.0016 |
02/28/2017 | 10274.9419 | 10371.9788 | 10597.7522 |
03/31/2017 | 10276.9935 | 10377.1322 | 10592.197 |
04/30/2017 | 10308.7282 | 10431.506 | 10673.9358 |
05/31/2017 | 10346.1789 | 10472.509 | 10756.0945 |
06/30/2017 | 10314.3135 | 10445.1736 | 10745.2712 |
07/31/2017 | 10344.2782 | 10478.4858 | 10791.5097 |
08/31/2017 | 10389.389 | 10542.27 | 10888.3034 |
09/30/2017 | 10354.806 | 10481.1129 | 10836.4459 |
10/31/2017 | 10355.254 | 10467.9045 | 10842.724 |
11/30/2017 | 10334.3849 | 10436.0096 | 10828.8068 |
12/31/2017 | 10347.1536 | 10438.6871 | 10878.506 |
01/31/2018 | 10272.1669 | 10339.3165 | 10753.2186 |
02/28/2018 | 10244.4958 | 10308.9283 | 10651.2843 |
03/31/2018 | 10290.9601 | 10362.5739 | 10719.5896 |
04/30/2018 | 10253.6903 | 10303.7974 | 10639.8655 |
05/31/2018 | 10310.8864 | 10370.2928 | 10715.7993 |
06/30/2018 | 10305.9391 | 10369.1445 | 10702.6209 |
07/31/2018 | 10293.5035 | 10348.9063 | 10705.1619 |
08/31/2018 | 10334.5664 | 10410.3267 | 10774.0467 |
09/30/2018 | 10301.0843 | 10357.6278 | 10704.6676 |
10/31/2018 | 10284.351 | 10361.6441 | 10620.0741 |
11/30/2018 | 10341.9236 | 10432.5927 | 10683.4727 |
12/31/2018 | 10449.3384 | 10587.519 | 10879.7393 |
01/31/2019 | 10502.5635 | 10632.7567 | 10995.2773 |
02/28/2019 | 10507.1215 | 10625.3739 | 10988.9087 |
03/31/2019 | 10591.0406 | 10754.931 | 11199.9166 |
04/30/2019 | 10602.8457 | 10759.8771 | 11202.782 |
05/31/2019 | 10704.9659 | 10917.1224 | 11401.6482 |
06/30/2019 | 10749.7252 | 11007.0825 | 11544.8346 |
07/31/2019 | 10752.1059 | 10987.8862 | 11570.2238 |
08/31/2019 | 10852.2603 | 11185.5127 | 11870.0302 |
09/30/2019 | 10846.2439 | 11136.4716 | 11806.8123 |
10/31/2019 | 10865.0829 | 11168.5514 | 11842.3764 |
11/30/2019 | 10857.9565 | 11141.3729 | 11836.3427 |
12/31/2019 | 10851.1011 | 11138.0904 | 11828.0976 |
01/31/2020 | 10967.3833 | 11295.1397 | 12055.7234 |
02/29/2020 | 11067.18 | 11480.5774 | 12272.7065 |
03/31/2020 | 11060.034 | 11714.8825 | 12200.4833 |
04/30/2020 | 11144.4577 | 11747.2424 | 12417.3601 |
05/31/2020 | 11183.5753 | 11768.6793 | 12475.1769 |
06/30/2020 | 11237.5616 | 11778.8685 | 12553.758 |
07/31/2020 | 11284.5197 | 11816.4937 | 12741.2746 |
08/31/2020 | 11265.7418 | 11793.494 | 12638.4313 |
09/30/2020 | 11271.9698 | 11802.2379 | 12631.4992 |
10/31/2020 | 11234.4707 | 11758.6134 | 12575.0965 |
11/30/2020 | 11263.6887 | 11772.9365 | 12698.4914 |
12/31/2020 | 11283.8827 | 11776.6839 | 12715.9864 |
01/31/2021 | 11269.4753 | 11749.0013 | 12624.817 |
02/28/2021 | 11180.1382 | 11652.297 | 12442.5048 |
03/31/2021 | 11099.5907 | 11573.8479 | 12287.1394 |
04/30/2021 | 11146.4255 | 11616.9459 | 12384.2096 |
05/31/2021 | 11160.3407 | 11653.6973 | 12424.6696 |
06/30/2021 | 11149.5306 | 11645.1102 | 12511.9637 |
07/31/2021 | 11223.3763 | 11734.5102 | 12651.8595 |
08/31/2021 | 11203.7684 | 11715.5827 | 12627.7727 |
09/30/2021 | 11157.0617 | 11644.8189 | 12518.4439 |
10/31/2021 | 11116.9019 | 11578.486 | 12514.9938 |
11/30/2021 | 11120.122 | 11607.6138 | 12552.0197 |
12/31/2021 | 11100.24 | 11577.136 | 12519.9004 |
01/31/2022 | 10976.0256 | 11429.4021 | 12250.172 |
02/28/2022 | 10928.3358 | 11377.7898 | 12113.503 |
03/31/2022 | 10703.7007 | 11092.2646 | 11776.9683 |
04/30/2022 | 10505.3834 | 10915.9181 | 11330.0576 |
05/31/2022 | 10586.2738 | 10989.7403 | 11403.1101 |
06/30/2022 | 10489.7491 | 10908.8546 | 11224.2161 |
07/31/2022 | 10665.4117 | 11053.5022 | 11498.4738 |
08/31/2022 | 10447.9869 | 10833.0607 | 11173.5652 |
09/30/2022 | 10122.417 | 10575.795 | 10690.7981 |
10/31/2022 | 10066.2702 | 10527.7061 | 10552.327 |
11/30/2022 | 10275.5863 | 10707.7832 | 10940.3949 |
12/31/2022 | 10235.3221 | 10682.5596 | 10891.0465 |
01/31/2023 | 10450.4781 | 10852.6772 | 11226.0979 |
02/28/2023 | 10287.8888 | 10664.59 | 10935.8444 |
03/31/2023 | 10464.3654 | 10923.7434 | 11213.6426 |
04/30/2023 | 10498.7818 | 10982.2287 | 11281.6023 |
05/31/2023 | 10451.0601 | 10901.147 | 11158.7602 |
06/30/2023 | 10387.5288 | 10800.9641 | 11118.9646 |
07/31/2023 | 10401.4639 | 10812.7161 | 11111.2139 |
08/31/2023 | 10372.4941 | 10818.6537 | 11040.24 |
09/30/2023 | 10217.3033 | 10716.6503 | 10759.6881 |
10/31/2023 | 10146.0991 | 10680.952 | 10589.8898 |
11/30/2023 | 10413.0742 | 10914.5906 | 11069.4673 |
12/31/2023 | 10668.6713 | 11142.342 | 11493.195 |
01/31/2024 | 10698.7887 | 11166.7533 | 11461.6339 |
02/29/2024 | 10596.225 | 11049.0938 | 11299.6979 |
03/31/2024 | 10653.3232 | 11103.49 | 11404.0404 |
04/30/2024 | 10486.6859 | 10953.0281 | 11115.9877 |
05/31/2024 | 10628.2683 | 11074.7431 | 11304.4398 |
06/30/2024 | 10719.8688 | 11168.445 | 11411.4668 |
07/31/2024 | 10927.4369 | 11372.7933 | 11678.0004 |
08/31/2024 | 11050.2525 | 11495.8302 | 11845.8158 |
09/30/2024 | 11184.9234 | 11609.4455 | 12004.424 |
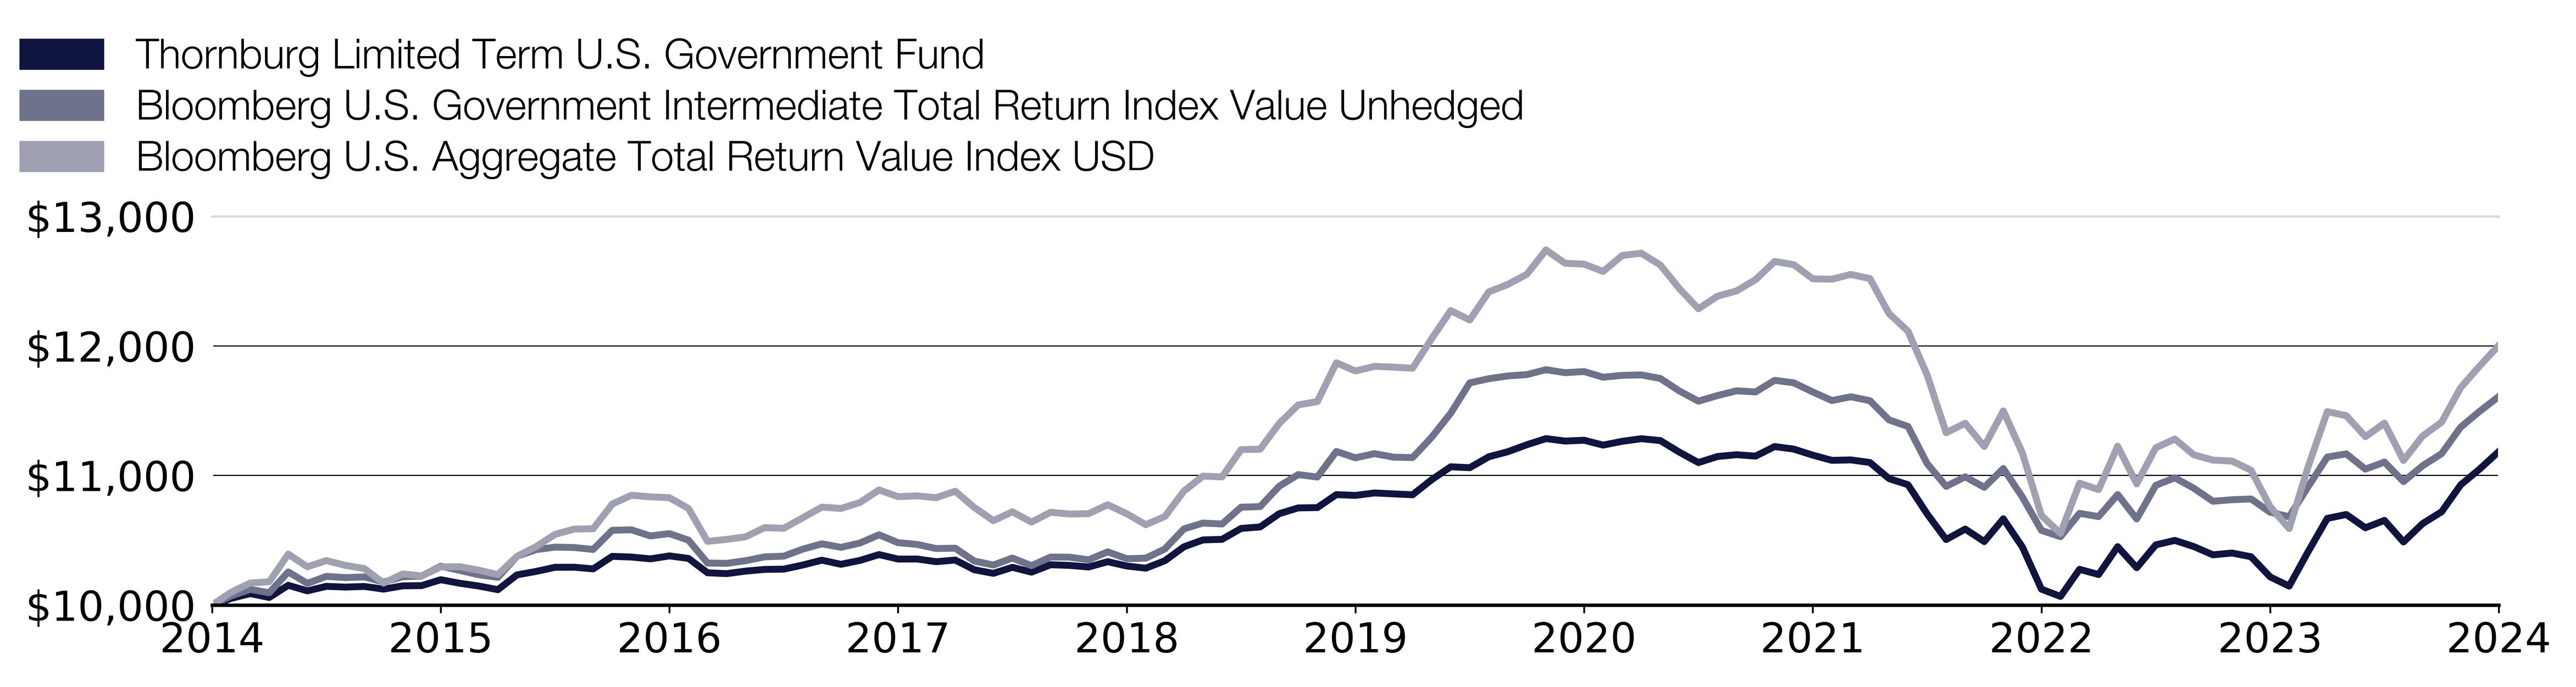
Effective September 30, 2024, the Fund adopted the Bloomberg U.S. Aggregate Total Return Index Value USD as its broad-based securities market index that represents the overall applicable market in which the Fund invests, and the Bloomberg U.S. Government Intermediate Total Return Index Value Unhedged as an additional index that represents the market sectors which the Fund’s advisor believes are more representative of the Fund’s investment universe.
What were the Fund costs for the past year?
(based on a hypothetical $10,000 investment)
Class Name | Costs of a $10,000 investment | Costs paid as a percentage of a $10,000 investment |
|---|
Class R5 | $70.00 | 0.67% |
End Block
Thornburg Limited Term U.S. Government Fund Tailored Shareholder Report
Thornburg Limited Term U.S. Government Fund Tailored Shareholder Report | |
Annual Performance | 1 Year | 5 Year | 10 Year |
|---|
Limited Term U.S. Government Fund Class R5 | 9.47% | 0.62% | 1.13% |
Bloomberg U.S. Aggregate Total Return Index Value USD | 11.57% | 0.33% | 1.84% |
Bloomberg U.S. Government Intermediate Total Return Index Value Unhedged | 8.33% | 0.84% | 1.50% |
Key Fund Statistics
(as of September 30, 2024)
| |
|---|
Fund Size (Millions) | $139.7M |
Number of Holdings | 157 |
Annual Portfolio Turnover | 32.26% |
Total Advisory Fee | $0.6M |
What did the Fund invest in?
(as of September 30, 2024)
Types of Holdings | (%) |
|---|
| U.S. Treasury Securities | 20.0 |
| U.S. Government Agencies | 6.6 |
| Mortgage Backed | 62.5 |
| Corporate Bonds | 2.1 |
| Cash Equivalents & Other | 8.8 |
Types of Holdings | (%) |
U.S. Treasury Securities | 20.0% |
U.S. Government Agencies | 6.6% |
Mortgage Backed | 62.5% |
Corporate Bonds | 2.1% |
Cash Equivalents & Other | 8.8% |
Expressed as a percentage of the Fund’s net assets.
How has the Fund changed?
This is a summary of certain changes to the Fund since October 1, 2023. For more complete information, you may review the Fund’s next prospectus, which we expect to be available by February 1, 2025 at https://www.thornburg.com/download or upon request by calling 1-800-847-0200.
End Block
Changes In and Disagreements with Accountants
No changes and/or disagreements occurred in the current reporting period.
End Block
For additional information about the Fund, including its prospectus, financial information, holdings and proxy information, visit www.thornburg.com/download.

Thornburg Limited Term U.S. Government Fund Tailored Shareholder Report | |
Thornburg Limited Term Income Fund Tailored Shareholder Report
Thornburg Limited Term Income Fund CLASS: A TICKER: THIFX Annual Shareholder Report | |
This annual shareholder report contains important information about the Thornburg Limited Term Income Fund Class A Shares for the period from October 1, 2023 to September 30, 2024. You can find additional information about the Fund at https://www.thornburg.com/download. You can also request this information by contacting us at 1-800-847-0200. This report also describes changes to the Fund that occurred during the reporting period.
How did the Fund perform last year and what affected its performance?
The Fund’s Class A shares outperformed the Bloomberg Intermediate U.S. Government/Credit Total Return Index Value Unhedged (the “Index”) during the 12-month period ended September 30, 2024. Treasury yields fell meaningfully over the 12-month period ended September 30, 2024, as U.S. inflation continued to improve, and the market priced in anticipated interest rate cuts by the Federal Reserve. The Fund’s slight short duration versus the Index was a relative detractor in this environment. However, this was offset by positive relative returns from the Fund’s allocation to collateralized mortgage obligations, corporate bonds, and asset-backed securities
How did the Fund perform over the past 10 years?
The line graph below reflects a hypothetical $10,000 investment and assumes the deduction of the maximum sales charge associated with that investment. The returns shown in the line graph and table assume the reinvestment of dividends and capital gains, but do not reflect the deduction of taxes that a shareholder would pay on distributions or the redemption of Fund shares. The performance information shown below represents past performance and is no guarantee of future results. For Fund performance current to the most recent month end, visit https://www.thornburg.com/product/mutual-funds/fli/THIFX or call 1-800-847-0200. Performance for other share classes of the Fund will vary.
Cumulative Performance
Growth Table
Date | Thornburg Limited Term Income Fund | Bloomberg Intermediate U.S. Government/Credit Total Return Index Value Unhedged | Bloomberg U.S. Aggregate Total Return Value Index USD |
09/30/2014 | 9846.7152 | 10000 | 10000 |
10/31/2014 | 9891.7695 | 10070.3226 | 10098.2769 |
11/30/2014 | 9916.0752 | 10121.0909 | 10169.91 |
12/31/2014 | 9866.5324 | 10089.052 | 10179.4256 |
01/31/2015 | 9957.4468 | 10256.6848 | 10392.8789 |
02/28/2015 | 9938.012 | 10185.2608 | 10295.1602 |
03/31/2015 | 9984.9473 | 10235.0557 | 10342.967 |
04/30/2015 | 9994.0096 | 10231.4031 | 10305.856 |
05/31/2015 | 10010.3501 | 10232.4021 | 10281.0356 |
06/30/2015 | 9960.3157 | 10171.3008 | 10168.9318 |
07/31/2015 | 9983.6877 | 10207.7402 | 10239.6187 |
08/31/2015 | 9955.3946 | 10199.1337 | 10224.9146 |
09/30/2015 | 9972.1778 | 10267.8682 | 10294.0811 |
10/31/2015 | 9979.9844 | 10257.2791 | 10295.7875 |
11/30/2015 | 9957.5705 | 10231.0957 | 10268.5908 |
12/31/2015 | 9912.9021 | 10196.936 | 10235.4031 |
01/31/2016 | 9972.9241 | 10321.7051 | 10376.2558 |
02/29/2016 | 10004.06 | 10371.956 | 10449.8664 |
03/31/2016 | 10089.3693 | 10446.3359 | 10545.7404 |
04/30/2016 | 10137.1137 | 10474.0715 | 10586.2218 |
05/31/2016 | 10154.5341 | 10462.0531 | 10588.9383 |
06/30/2016 | 10254.681 | 10611.9298 | 10779.1979 |
07/31/2016 | 10285.9214 | 10641.9861 | 10847.3436 |
08/31/2016 | 10293.6338 | 10614.6706 | 10834.9414 |
09/30/2016 | 10307.2924 | 10628.8508 | 10828.5941 |
10/31/2016 | 10306.1981 | 10584.9473 | 10745.7655 |
11/30/2016 | 10206.7808 | 10401.8279 | 10491.5864 |
12/31/2016 | 10222.2819 | 10409.1588 | 10506.3861 |
01/31/2017 | 10252.651 | 10437.2888 | 10527.0016 |
02/28/2017 | 10291.1121 | 10485.7672 | 10597.7522 |
03/31/2017 | 10299.1212 | 10490.5008 | 10592.197 |
04/30/2017 | 10346.0148 | 10555.767 | 10673.9358 |
05/31/2017 | 10392.3718 | 10608.4411 | 10756.0945 |
06/30/2017 | 10385.2578 | 10589.3632 | 10745.2712 |
07/31/2017 | 10424.447 | 10638.3641 | 10791.5097 |
08/31/2017 | 10464.2739 | 10701.3353 | 10888.3034 |
09/30/2017 | 10442.0736 | 10653.0567 | 10836.4459 |
10/31/2017 | 10450.9843 | 10652.1807 | 10842.724 |
11/30/2017 | 10445.1928 | 10619.4605 | 10828.8068 |
12/31/2017 | 10454.1622 | 10631.6377 | 10878.506 |
01/31/2018 | 10416.7595 | 10538.0724 | 10753.2186 |
02/28/2018 | 10387.8575 | 10489.6299 | 10651.2843 |
03/31/2018 | 10399.2095 | 10527.3501 | 10719.5896 |
04/30/2018 | 10379.5824 | 10472.3605 | 10639.8655 |
05/31/2018 | 10423.229 | 10534.932 | 10715.7993 |
06/30/2018 | 10420.7532 | 10528.0058 | 10702.6209 |
07/31/2018 | 10425.894 | 10530.7671 | 10705.1619 |
08/31/2018 | 10478.2645 | 10593.0723 | 10774.0467 |
09/30/2018 | 10451.1982 | 10550.4955 | 10704.6676 |
10/31/2018 | 10432.8593 | 10536.0027 | 10620.0741 |
11/30/2018 | 10462.8195 | 10583.559 | 10683.4727 |
12/31/2018 | 10557.1282 | 10724.993 | 10879.7393 |
01/31/2019 | 10627.1999 | 10818.0666 | 10995.2773 |
02/28/2019 | 10657.3062 | 10827.3493 | 10988.9087 |
03/31/2019 | 10768.5192 | 10973.8756 | 11199.9166 |
04/30/2019 | 10799.3682 | 10994.9821 | 11202.782 |
05/31/2019 | 10886.475 | 11138.4756 | 11401.6482 |
06/30/2019 | 10957.8408 | 11257.799 | 11544.8346 |
07/31/2019 | 10972.6135 | 11253.962 | 11570.2238 |
08/31/2019 | 11091.8672 | 11453.5004 | 11870.0302 |
09/30/2019 | 11081.6295 | 11411.9738 | 11806.8123 |
10/31/2019 | 11118.727 | 11457.2248 | 11842.3764 |
11/30/2019 | 11110.9185 | 11440.1193 | 11836.3427 |
12/31/2019 | 11123.6651 | 11454.4942 | 11828.0976 |
01/31/2020 | 11250.1064 | 11617.0809 | 12055.7234 |
02/29/2020 | 11351.0225 | 11781.061 | 12272.7065 |
03/31/2020 | 11048.8104 | 11729.4064 | 12200.4833 |
04/30/2020 | 11327.1334 | 11894.5341 | 12417.3601 |
05/31/2020 | 11495.9321 | 11984.9847 | 12475.1769 |
06/30/2020 | 11680.0199 | 12058.8984 | 12553.758 |
07/31/2020 | 11814.5518 | 12148.934 | 12741.2746 |
08/31/2020 | 11824.0513 | 12134.5437 | 12638.4313 |
09/30/2020 | 11833.2004 | 12133.0427 | 12631.4992 |
10/31/2020 | 11823.9119 | 12106.4393 | 12575.0965 |
11/30/2020 | 11895.7929 | 12166.4545 | 12698.4914 |
12/31/2020 | 11943.5116 | 12191.48 | 12715.9864 |
01/31/2021 | 11930.992 | 12157.6584 | 12624.817 |
02/28/2021 | 11859.7286 | 12058.3042 | 12442.5048 |
03/31/2021 | 11762.346 | 11964.6876 | 12287.1394 |
04/30/2021 | 11826.9305 | 12023.96 | 12384.2096 |
05/31/2021 | 11857.3104 | 12072.2334 | 12424.6696 |
06/30/2021 | 11861.8592 | 12082.0592 | 12511.9637 |
07/31/2021 | 11925.264 | 12174.5385 | 12651.8595 |
08/31/2021 | 11911.8695 | 12154.7844 | 12627.7727 |
09/30/2021 | 11872.1837 | 12084.8973 | 12518.4439 |
10/31/2021 | 11832.4646 | 12017.4282 | 12514.9938 |
11/30/2021 | 11819.093 | 12031.3473 | 12552.0197 |
12/31/2021 | 11815.4719 | 12015.8862 | 12519.9004 |
01/31/2022 | 11690.1709 | 11839.6059 | 12250.172 |
02/28/2022 | 11556.427 | 11761.9166 | 12113.503 |
03/31/2022 | 11355.6537 | 11474.0792 | 11776.9683 |
04/30/2022 | 11164.6533 | 11244.7048 | 11330.0576 |
05/31/2022 | 11200.7227 | 11328.4034 | 11403.1101 |
06/30/2022 | 11054.4774 | 11202.4406 | 11224.2161 |
07/31/2022 | 11189.5246 | 11385.3397 | 11498.4738 |
08/31/2022 | 11085.4586 | 11157.6558 | 11173.5652 |
09/30/2022 | 10817.0002 | 10859.3626 | 10690.7981 |
10/31/2022 | 10732.6369 | 10811.5758 | 10552.327 |
11/30/2022 | 10948.729 | 11046.3498 | 10940.3949 |
12/31/2022 | 10949.0778 | 11026.4011 | 10891.0465 |
01/31/2023 | 11207.5793 | 11232.1434 | 11226.0979 |
02/28/2023 | 11077.8348 | 11030.3918 | 10935.8444 |
03/31/2023 | 11223.664 | 11283.5469 | 11213.6426 |
04/30/2023 | 11290.183 | 11352.4197 | 11281.6023 |
05/31/2023 | 11231.9767 | 11268.3779 | 11158.7602 |
06/30/2023 | 11209.6995 | 11191.7746 | 11118.9646 |
07/31/2023 | 11257.2256 | 11221.0881 | 11111.2139 |
08/31/2023 | 11261.4539 | 11219.4692 | 11040.24 |
09/30/2023 | 11148.2618 | 11098.5986 | 10759.6881 |
10/31/2023 | 11083.6456 | 11047.2002 | 10589.8898 |
11/30/2023 | 11360.2349 | 11341.6308 | 11069.4673 |
12/31/2023 | 11635.8807 | 11604.5809 | 11493.195 |
01/31/2024 | 11701.3912 | 11628.8278 | 11461.6339 |
02/29/2024 | 11650.8244 | 11513.2748 | 11299.6979 |
03/31/2024 | 11724.2116 | 11587.1629 | 11404.0404 |
04/30/2024 | 11617.2793 | 11430.8211 | 11115.9877 |
05/31/2024 | 11750.6423 | 11568.7101 | 11304.4398 |
06/30/2024 | 11836.864 | 11660.9742 | 11411.4668 |
07/31/2024 | 12033.8513 | 11880.1489 | 11678.0004 |
08/31/2024 | 12146.8748 | 12016.8903 | 11845.8158 |
09/30/2024 | 12271.6168 | 12147.2281 | 12004.424 |

Effective September 30, 2024, the Fund adopted the Bloomberg U.S. Aggregate Total Return Index Value USD as its broad-based securities market index that represents the overall applicable market in which the Fund invests, and the Bloomberg U.S. Government/Credit Intermediate Total Return Index Value Unhedged as an additional index that represents the market sectors which the Fund’s advisor believes are more representative of the Fund’s investment universe.
What were the Fund costs for the past year?
(based on a hypothetical $10,000 investment)
Class Name | Costs of a $10,000 investment | Costs paid as a percentage of a $10,000 investment |
|---|
Class A | $80.00 | 0.76% |
End Block
Thornburg Limited Term Income Fund Tailored Shareholder Report
Thornburg Limited Term Income Fund Tailored Shareholder Report | |
Annual Performance | 1 Year | 5 Year | 10 Year |
|---|
Limited Term Income Fund Class A (with sales charge) | 7.56% | 1.75% | 2.07% |
Limited Term Income Fund Class A (without sales charge) | 10.08% | 2.06% | 2.23% |
Bloomberg Intermediate U.S. Government/Credit Total Return Index Value Unhedged | 9.45% | 1.26% | 1.96% |
Bloomberg U.S. Aggregate Total Return Value Index USD | 11.57% | 0.33% | 1.84% |
Key Fund Statistics
(as of September 30, 2024)
| |
|---|
Fund Size (Millions) | $6,430.2M |
Number of Holdings | 652 |
Annual Portfolio Turnover | 59.42% |
Total Advisory Fee | $20.8M |
What did the Fund invest in?
(as of September 30, 2024)
Credit Quality Ratings | (%) |
|---|
| U.S. Government | 30.1 |
| AAA | 19.9 |
| AA | 4.6 |
| A | 17.0 |
| BBB | 20.1 |
| NR | 0.3 |
| Below Invest. Grade | 0.1 |
| Cash Equivalents & Other | 7.7 |
Credit Quality Ratings | (%) |
U.S. Government | 30.1% |
AAA | 19.9% |
AA | 4.6% |
A | 17.0% |
BBB | 20.1% |
NR | 0.3% |
Below Invest. Grade | 0.1% |
Cash Equivalents & Other | 7.7% |

Expressed as a percentage of the Fund’s net assets. * Credit quality ratings shown above reflect the highest rating assigned by either S&P Global Ratings or Moody’s Investors Services, both of which are independent, nationally recognized statistical rating organizations. If a credit rating for an investment is not available from either S&P or Moody’s, then the Fund’s investment advisor will determine the credit quality of the investment. Investments are considered to be investment grade if they are rated within the four highest grades by S&P or Moody’s (BBB/Baa or higher) or, if no credit rating is available, have been judged to be of comparable quality by the Fund’s investment advisor. (NR = Not Rated)
How has the Fund changed?
This is a summary of certain changes to the Fund since October 1, 2023. For more complete information, you may review the Fund’s next prospectus, which we expect to be available by February 1, 2025 at https://www.thornburg.com/download or upon request by calling 1-800-847-0200.
End Block
Changes In and Disagreements with Accountants
No changes and/or disagreements occurred in the current reporting period.
End Block
For additional information about the Fund, including its prospectus, financial information, holdings and proxy information, visit www.thornburg.com/download.

Thornburg Limited Term Income Fund Tailored Shareholder Report | |
Thornburg Limited Term Income Fund Tailored Shareholder Report
Thornburg Limited Term Income Fund CLASS: C TICKER: THICX Annual Shareholder Report | |
This annual shareholder report contains important information about the Thornburg Limited Term Income Fund Class C Shares for the period from October 1, 2023 to September 30, 2024. You can find additional information about the Fund at https://www.thornburg.com/download. You can also request this information by contacting us at 1-800-847-0200. This report also describes changes to the Fund that occurred during the reporting period.
How did the Fund perform last year and what affected its performance?
The Fund’s Class C shares outperformed the Bloomberg Intermediate U.S. Government/Credit Total Return Index Value Unhedged (the “Index”) during the 12-month period ended September 30, 2024. Treasury yields fell meaningfully over the 12-month period ended September 30, 2024, as U.S. inflation continued to improve, and the market priced in anticipated interest rate cuts by the Federal Reserve. The Fund’s slight short duration versus the Index was a relative detractor in this environment. However, this was offset by positive relative returns from the Fund’s allocation to collateralized mortgage obligations, corporate bonds, and asset-backed securities
How did the Fund perform over the past 10 years?
The line graph below reflects a hypothetical $10,000 investment. The returns shown in the line graph and table assume the reinvestment of dividends and capital gains, but do not reflect the deduction of taxes that a shareholder would pay on distributions or the redemption of Fund shares. The performance information shown below represents past performance and is no guarantee of future results. For Fund performance current to the most recent month end, visit https://www.thornburg.com/product/mutual-funds/fli/THICX or call 1-800-847-0200. Performance for other share classes of the Fund will vary.
Cumulative Performance
Growth Table
Date | Thornburg Limited Term Income Fund | Bloomberg Intermediate U.S. Government/Credit Total Return Index Value Unhedged | Bloomberg U.S. Aggregate Total Return Value Index USD |
09/30/2014 | 9999.9933 | 10000 | 10000 |
10/31/2014 | 10043.8744 | 10070.3226 | 10098.2769 |
11/30/2014 | 10066.8408 | 10121.0909 | 10169.91 |
12/31/2014 | 10014.4556 | 10089.052 | 10179.4256 |
01/31/2015 | 10104.9066 | 10256.6848 | 10392.8789 |
02/28/2015 | 10083.4483 | 10185.2608 | 10295.1602 |
03/31/2015 | 10129.1816 | 10235.0557 | 10342.967 |
04/30/2015 | 10136.5152 | 10231.4031 | 10305.856 |
05/31/2015 | 10150.9901 | 10232.4021 | 10281.0356 |
06/30/2015 | 10098.1536 | 10171.3008 | 10168.9318 |
07/31/2015 | 10112.2779 | 10207.7402 | 10239.6187 |
08/31/2015 | 10089.1938 | 10199.1337 | 10224.9146 |
09/30/2015 | 10104.4888 | 10267.8682 | 10294.0811 |
10/31/2015 | 10110.3941 | 10257.2791 | 10295.7875 |
11/30/2015 | 10085.7421 | 10231.0957 | 10268.5908 |
12/31/2015 | 10030.82 | 10196.936 | 10235.4031 |
01/31/2016 | 10097.3831 | 10321.7051 | 10376.2558 |
02/29/2016 | 10127.1039 | 10371.956 | 10449.8664 |
03/31/2016 | 10211.5531 | 10446.3359 | 10545.7404 |
04/30/2016 | 10257.9453 | 10474.0715 | 10586.2218 |
05/31/2016 | 10273.5347 | 10462.0531 | 10588.9383 |
06/30/2016 | 10373.17 | 10611.9298 | 10779.1979 |
07/31/2016 | 10402.884 | 10641.9861 | 10847.3436 |
08/31/2016 | 10408.8975 | 10614.6706 | 10834.9414 |
09/30/2016 | 10421.1734 | 10628.8508 | 10828.5941 |
10/31/2016 | 10418.3176 | 10584.9473 | 10745.7655 |
11/30/2016 | 10315.9004 | 10401.8279 | 10491.5864 |
12/31/2016 | 10321.9582 | 10409.1588 | 10506.3861 |
01/31/2017 | 10358.5233 | 10437.2888 | 10527.0016 |
02/28/2017 | 10395.6964 | 10485.7672 | 10597.7522 |
03/31/2017 | 10402.0426 | 10490.5008 | 10592.197 |
04/30/2017 | 10447.779 | 10555.767 | 10673.9358 |
05/31/2017 | 10492.8096 | 10608.4411 | 10756.0945 |
06/30/2017 | 10483.8307 | 10589.3632 | 10745.2712 |
07/31/2017 | 10513.7829 | 10638.3641 | 10791.5097 |
08/31/2017 | 10559.8873 | 10701.3353 | 10888.3034 |
09/30/2017 | 10535.7602 | 10653.0567 | 10836.4459 |
10/31/2017 | 10542.9152 | 10652.1807 | 10842.724 |
11/30/2017 | 10535.2381 | 10619.4605 | 10828.8068 |
12/31/2017 | 10542.3653 | 10631.6377 | 10878.506 |
01/31/2018 | 10494.794 | 10538.0724 | 10753.2186 |
02/28/2018 | 10463.8848 | 10489.6299 | 10651.2843 |
03/31/2018 | 10481.3749 | 10527.3501 | 10719.5896 |
04/30/2018 | 10459.7666 | 10472.3605 | 10639.8655 |
05/31/2018 | 10501.9236 | 10534.932 | 10715.7993 |
06/30/2018 | 10497.5537 | 10528.0058 | 10702.6209 |
07/31/2018 | 10500.772 | 10530.7671 | 10705.1619 |
08/31/2018 | 10551.552 | 10593.0723 | 10774.0467 |
09/30/2018 | 10522.3149 | 10550.4955 | 10704.6676 |
10/31/2018 | 10501.9368 | 10536.0027 | 10620.0741 |
11/30/2018 | 10530.3433 | 10583.559 | 10683.4727 |
12/31/2018 | 10623.5426 | 10724.993 | 10879.7393 |
01/31/2019 | 10692.2995 | 10818.0666 | 10995.2773 |
02/28/2019 | 10720.9354 | 10827.3493 | 10988.9087 |
03/31/2019 | 10831.0637 | 10973.8756 | 11199.9166 |
04/30/2019 | 10860.4925 | 10994.9821 | 11202.782 |
05/31/2019 | 10946.52 | 11138.4756 | 11401.6482 |
06/30/2019 | 11016.7044 | 11257.799 | 11544.8346 |
07/31/2019 | 11029.2533 | 11253.962 | 11570.2238 |
08/31/2019 | 11146.9411 | 11453.5004 | 11870.0302 |
09/30/2019 | 11134.3414 | 11411.9738 | 11806.8123 |
10/31/2019 | 11160.976 | 11457.2248 | 11842.3764 |
11/30/2019 | 11158.9732 | 11440.1193 | 11836.3427 |
12/31/2019 | 11169.3375 | 11454.4942 | 11828.0976 |
01/31/2020 | 11294.2968 | 11617.0809 | 12055.7234 |
02/29/2020 | 11393.7009 | 11781.061 | 12272.7065 |
03/31/2020 | 11079.3921 | 11729.4064 | 12200.4833 |
04/30/2020 | 11365.3588 | 11894.5341 | 12417.3601 |
05/31/2020 | 11532.7842 | 11984.9847 | 12475.1769 |
06/30/2020 | 11715.578 | 12058.8984 | 12553.758 |
07/31/2020 | 11848.6554 | 12148.934 | 12741.2746 |
08/31/2020 | 11856.0732 | 12134.5437 | 12638.4313 |
09/30/2020 | 11863.2004 | 12133.0427 | 12631.4992 |
10/31/2020 | 11851.3949 | 12106.4393 | 12575.0965 |
11/30/2020 | 11921.0889 | 12166.4545 | 12698.4914 |
12/31/2020 | 11966.4536 | 12191.48 | 12715.9864 |
01/31/2021 | 11951.324 | 12157.6584 | 12624.817 |
02/28/2021 | 11877.4944 | 12058.3042 | 12442.5048 |
03/31/2021 | 11777.2469 | 11964.6876 | 12287.1394 |
04/30/2021 | 11839.8768 | 12023.96 | 12384.2096 |
05/31/2021 | 11868.1343 | 12072.2334 | 12424.6696 |
06/30/2021 | 11870.568 | 12082.0592 | 12511.9637 |
07/31/2021 | 11932.3855 | 12174.5385 | 12651.8595 |
08/31/2021 | 11917.2566 | 12154.7844 | 12627.7727 |
09/30/2021 | 11875.7852 | 12084.8973 | 12518.4439 |
10/31/2021 | 11833.47 | 12017.4282 | 12514.9938 |
11/30/2021 | 11817.6397 | 12031.3473 | 12552.0197 |
12/31/2021 | 11811.4687 | 12015.8862 | 12519.9004 |
01/31/2022 | 11683.8014 | 11839.6059 | 12250.172 |
02/28/2022 | 11547.9765 | 11761.9166 | 12113.503 |
03/31/2022 | 11344.8902 | 11474.0792 | 11776.9683 |
04/30/2022 | 11151.8904 | 11244.7048 | 11330.0576 |
05/31/2022 | 11186.0286 | 11328.4034 | 11403.1101 |
06/30/2022 | 11037.8724 | 11202.4406 | 11224.2161 |
07/31/2022 | 11170.8514 | 11385.3397 | 11498.4738 |
08/31/2022 | 11064.6902 | 11157.6558 | 11173.5652 |
09/30/2022 | 10794.3217 | 10859.3626 | 10690.7981 |
10/31/2022 | 10707.9437 | 10811.5758 | 10552.327 |
11/30/2022 | 10921.8628 | 11046.3498 | 10940.3949 |
12/31/2022 | 10920.0906 | 11026.4011 | 10891.0465 |
01/31/2023 | 11176.2413 | 11232.1434 | 11226.0979 |
02/28/2023 | 11044.7565 | 11030.3918 | 10935.8444 |
03/31/2023 | 11188.237 | 11283.5469 | 11213.6426 |
04/30/2023 | 11252.3778 | 11352.4197 | 11281.6023 |
05/31/2023 | 11191.9122 | 11158.7602 |
06/30/2023 | 11167.3841 | 11191.7746 | 11118.9646 |
07/31/2023 | 11212.5758 | 11221.0881 | 11111.2139 |
08/31/2023 | 11214.5505 | 11219.4692 | 11040.24 |
09/30/2023 | 11099.4773 | 11098.5986 | 10759.6881 |
10/31/2023 | 11032.6024 | 11047.2002 | 10589.8898 |
11/30/2023 | 11305.9694 | 11341.6308 | 11069.4673 |
12/31/2023 | 11578.2016 | 11604.5809 | 11493.195 |
01/31/2024 | 11640.988 | 11628.8278 | 11461.6339 |
02/29/2024 | 11588.2455 | 11513.2748 | 11299.6979 |
03/31/2024 | 11658.7884 | 11587.1629 | 11404.0404 |
04/30/2024 | 11549.8445 | 11430.8211 | 11115.9877 |
05/31/2024 | 11680.0932 | 11568.7101 | 11304.4398 |
06/30/2024 | 11763.4277 | 11660.9742 | 11411.4668 |
07/31/2024 | 11957.2142 | 11880.1489 | 11678.0004 |
08/31/2024 | 12067.3697 | 12016.8903 | 11845.8158 |
09/30/2024 | 12189.2278 | 12147.2281 | 12004.424 |

Effective September 30, 2024, the Fund adopted the Bloomberg U.S. Aggregate Total Return Index Value USD as its broad-based securities market index that represents the overall applicable market in which the Fund invests, and the Bloomberg U.S. Government/Credit Intermediate Total Return Index Value Unhedged as an additional index that represents the market sectors which the Fund’s advisor believes are more representative of the Fund’s investment universe.
What were the Fund costs for the past year?
(based on a hypothetical $10,000 investment)
Class Name | Costs of a $10,000 investment | Costs paid as a percentage of a $10,000 investment |
|---|
Class C | $106.00 | 1.01% |
End Block
Thornburg Limited Term Income Fund Tailored Shareholder Report
Thornburg Limited Term Income Fund Tailored Shareholder Report | |
Annual Performance | 1 Year | 5 Year | 10 Year |
|---|
Limited Term Income Fund Class C (with sales charge) | 9.32% | 1.83% | 2.00% |
Limited Term Income Fund Class C (without sales charge) | 9.82% | 1.83% | 2.00% |
Bloomberg Intermediate U.S. Government/Credit Total Return Index Value Unhedged | 9.45% | 1.26% | 1.96% |
Bloomberg U.S. Aggregate Total Return Value Index USD | 11.57% | 0.33% | 1.84% |
Key Fund Statistics
(as of September 30, 2024)
| |
|---|
Fund Size (Millions) | $6,430.2M |
Number of Holdings | 652 |
Annual Portfolio Turnover | 59.42% |
Total Advisory Fee | $20.8M |
What did the Fund invest in?
(as of September 30, 2024)
Credit Quality Ratings | (%) |
|---|
| U.S. Government | 30.1 |
| AAA | 19.9 |
| AA | 4.6 |
| A | 17.0 |
| BBB | 20.1 |
| NR | 0.3 |
| Below Invest. Grade | 0.1 |
| Cash Equivalents & Other | 7.7 |
Credit Quality Ratings | (%) |
U.S. Government | 30.1% |
AAA | 19.9% |
AA | 4.6% |
A | 17.0% |
BBB | 20.1% |
NR | 0.3% |
Below Invest. Grade | 0.1% |
Cash Equivalents & Other | 7.7% |
Expressed as a percentage of the Fund’s net assets. * Credit quality ratings shown above reflect the highest rating assigned by either S&P Global Ratings or Moody’s Investors Services, both of which are independent, nationally recognized statistical rating organizations. If a credit rating for an investment is not available from either S&P or Moody’s, then the Fund’s investment advisor will determine the credit quality of the investment. Investments are considered to be investment grade if they are rated within the four highest grades by S&P or Moody’s (BBB/Baa or higher) or, if no credit rating is available, have been judged to be of comparable quality by the Fund’s investment advisor. (NR = Not Rated)
How has the Fund changed?
This is a summary of certain changes to the Fund since October 1, 2023. For more complete information, you may review the Fund’s next prospectus, which we expect to be available by February 1, 2025 at https://www.thornburg.com/download or upon request by calling 1-800-847-0200.
End Block
Changes In and Disagreements with Accountants
No changes and/or disagreements occurred in the current reporting period.
End Block
For additional information about the Fund, including its prospectus, financial information, holdings and proxy information, visit www.thornburg.com/download.

Thornburg Limited Term Income Fund Tailored Shareholder Report | |
Thornburg Limited Term Income Fund Tailored Shareholder Report
Thornburg Limited Term Income Fund CLASS: C2 TICKER: THIQX Annual Shareholder Report | |
This annual shareholder report contains important information about the Thornburg Limited Term Income Fund Class C2 Shares for the period from October 1, 2023 to September 30, 2024. You can find additional information about the Fund at https://www.thornburg.com/download. You can also request this information by contacting us at 1-800-847-0200. This report also describes changes to the Fund that occurred during the reporting period.
How did the Fund perform last year and what affected its performance?
The Fund’s Class C2 shares outperformed the Bloomberg Intermediate U.S. Government/Credit Total Return Index Value Unhedged (the “Index”) during the 12-month period ended September 30, 2024. Treasury yields fell meaningfully over the 12-month period ended September 30, 2024, as U.S. inflation continued to improve, and the market priced in anticipated interest rate cuts by the Federal Reserve. The Fund’s slight short duration versus the Index was a relative detractor in this environment. However, this was offset by positive relative returns from the Fund’s allocation to collateralized mortgage obligations, corporate bonds, and asset-backed securities
How did the Fund perform over the past 10 years?
The line graph below reflects a hypothetical $10,000 investment. The returns shown in the line graph and table assume the reinvestment of dividends and capital gains, but do not reflect the deduction of taxes that a shareholder would pay on distributions or the redemption of Fund shares. The performance information shown below represents past performance and is no guarantee of future results. For Fund performance current to the most recent month end, call 1-800-847-0200. Performance for other share classes of the Fund will vary.
Cumulative Performance
Growth Table
Date | Thornburg Limited Term Income Fund | Bloomberg Intermediate U.S. Government/Credit Total Return Index Value Unhedged | Bloomberg U.S. Aggregate Total Return Value Index USD |
09/30/2020 | 9999.9958 | 10000 | 10000 |
10/31/2020 | 9987.147 | 9978.0736 | 9955.3475 |
11/30/2020 | 10042.9733 | 10027.5379 | 10053.0358 |
12/31/2020 | 10078.8574 | 10048.1638 | 10066.8861 |
01/31/2021 | 10063.928 | 10020.2882 | 9994.7099 |
02/28/2021 | 9999.8407 | 9938.4008 | 9850.3785 |
03/31/2021 | 9913.4636 | 9861.2425 | 9727.3801 |
04/30/2021 | 9964.0033 | 9910.0945 | 9804.2278 |
05/31/2021 | 9985.5453 | 9949.8813 | 9836.2589 |
06/30/2021 | 9985.477 | 9957.9796 | 9905.3671 |
07/31/2021 | 10035.2162 | 10034.2007 | 10016.1187 |
08/31/2021 | 10020.2428 | 10017.9195 | 9997.0498 |
09/30/2021 | 9983.2904 | 9960.3188 | 9910.4973 |
10/31/2021 | 9945.8975 | 9904.7111 | 9907.766 |
11/30/2021 | 9930.8516 | 9916.1831 | 9937.0783 |
12/31/2021 | 9923.5676 | 9903.4402 | 9911.6504 |
01/31/2022 | 9813.7243 | 9758.1507 | 9698.114 |
02/28/2022 | 9697.6487 | 9694.1195 | 9589.917 |
03/31/2022 | 9524.359 | 9456.8852 | 9323.4921 |
04/30/2022 | 9360.6173 | 9267.8359 | 8969.6856 |
05/31/2022 | 9387.6396 | 9336.8198 | 9027.5191 |
06/30/2022 | 9261.7516 | 9233.0019 | 8885.8938 |
07/31/2022 | 9371.2355 | 9383.7465 | 9103.0159 |
08/31/2022 | 9280.1082 | 9196.0905 | 8845.795 |
09/30/2022 | 9051.4258 | 8950.2385 | 8463.6019 |
10/31/2022 | 8976.5345 | 8910.8528 | 8353.9783 |
11/30/2022 | 9154.6486 | 9104.3525 | 8661.2006 |
12/31/2022 | 9151.2519 | 9087.9109 | 8622.1329 |
01/31/2023 | 9364.1164 | 9257.4828 | 8887.3836 |
02/28/2023 | 9252.365 | 9091.2 | 8657.5981 |
03/31/2023 | 9370.894 | 9299.8493 | 8877.5231 |
04/30/2023 | 9422.8031 | 9356.614 | 8931.3249 |
05/31/2023 | 9370.3176 | 9287.3471 | 8834.0742 |
06/30/2023 | 9348.0182 | 9224.211 | 8802.5692 |
07/31/2023 | 9383.9277 | 9248.371 | 8796.4332 |
08/31/2023 | 9383.6794 | 9247.0368 | 8740.2452 |
09/30/2023 | 9285.5405 | 9147.4158 | 8518.1402 |
10/31/2023 | 9227.7587 | 9105.0534 | 8383.7157 |
11/30/2023 | 9454.6243 | 9347.7218 | 8763.3836 |
12/31/2023 | 9680.4608 | 9564.4442 | 9098.8368 |
01/31/2024 | 9731.2049 | 9584.4283 | 9073.8508 |
02/29/2024 | 9685.4993 | 9489.1901 | 8945.6507 |
03/31/2024 | 9742.7569 | 9550.0883 | 9028.2556 |
04/30/2024 | 9649.9768 | 9421.2321 | 8800.2124 |
05/31/2024 | 9756.9976 | 9534.8796 | 8949.4047 |
06/30/2024 | 9824.8678 | 9610.9233 | 9034.1349 |
07/31/2024 | 9984.6054 | 9791.566 | 9245.142 |
08/31/2024 | 10074.4572 | 9904.2677 | 9377.9967 |
09/30/2024 | 10174.0877 | 10011.6916 | 9503.5623 |

Effective September 30, 2024, the Fund adopted the Bloomberg U.S. Aggregate Total Return Index Value USD as its broad-based securities market index that represents the overall applicable market in which the Fund invests, and the Bloomberg U.S. Government/Credit Intermediate Total Return Index Value Unhedged as an additional index that represents the market sectors which the Fund’s advisor believes are more representative of the Fund’s investment universe.
What were the Fund costs for the past year?
(based on a hypothetical $10,000 investment)
Class Name | Costs of a $10,000 investment | Costs paid as a percentage of a $10,000 investment |
|---|
Class C2 | $130.00 | 1.24% |
End Block
Thornburg Limited Term Income Fund Tailored Shareholder Report
Thornburg Limited Term Income Fund Tailored Shareholder Report | |
Annual Performance | 1 Year |
|---|
Limited Term Income Fund Class C2 (with sales charge) | 8.92% |
Limited Term Income Fund Class C2 (without sales charge) | 9.57% |
Bloomberg Intermediate U.S. Government/Credit Total Return Index Value Unhedged | 9.45% |
Bloomberg U.S. Aggregate Total Return Value Index USD | 11.57% |
Key Fund Statistics
(as of September 30, 2024)
| |
|---|
Fund Size (Millions) | $6,430.2M |
Number of Holdings | 652 |
Annual Portfolio Turnover | 59.42% |
Total Advisory Fee | $20.8M |
What did the Fund invest in?
(as of September 30, 2024)
Credit Quality Ratings | (%) |
|---|
| U.S. Government | 30.1 |
| AAA | 19.9 |
| AA | 4.6 |
| A | 17.0 |
| BBB | 20.1 |
| NR | 0.3 |
| Below Invest. Grade | 0.1 |
| Cash Equivalents & Other | 7.7 |
Credit Quality Ratings | (%) |
U.S. Government | 30.1% |
AAA | 19.9% |
AA | 4.6% |
A | 17.0% |
BBB | 20.1% |
NR | 0.3% |
Below Invest. Grade | 0.1% |
Cash Equivalents & Other | 7.7% |
Expressed as a percentage of the Fund’s net assets. * Credit quality ratings shown above reflect the highest rating assigned by either S&P Global Ratings or Moody’s Investors Services, both of which are independent, nationally recognized statistical rating organizations. If a credit rating for an investment is not available from either S&P or Moody’s, then the Fund’s investment advisor will determine the credit quality of the investment. Investments are considered to be investment grade if they are rated within the four highest grades by S&P or Moody’s (BBB/Baa or higher) or, if no credit rating is available, have been judged to be of comparable quality by the Fund’s investment advisor. (NR = Not Rated)
How has the Fund changed?
This is a summary of certain changes to the Fund since October 1, 2023. For more complete information, you may review the Fund’s next prospectus, which we expect to be available by February 1, 2025 at https://www.thornburg.com/download or upon request by calling 1-800-847-0200.
End Block
Changes In and Disagreements with Accountants
No changes and/or disagreements occurred in the current reporting period.
End Block
For additional information about the Fund, including its prospectus, financial information, holdings and proxy information, visit www.thornburg.com/download.
Thornburg Limited Term Income Fund Tailored Shareholder Report | |
Thornburg Limited Term Income Fund Tailored Shareholder Report
Thornburg Limited Term Income Fund CLASS: I TICKER: THIIX Annual Shareholder Report | |
This annual shareholder report contains important information about the Thornburg Limited Term Income Fund Class I Shares for the period from October 1, 2023 to September 30, 2024. You can find additional information about the Fund at https://www.thornburg.com/download. You can also request this information by contacting us at 1-800-847-0200. This report also describes changes to the Fund that occurred during the reporting period.
How did the Fund perform last year and what affected its performance?
The Fund’s Class I shares outperformed the Bloomberg Intermediate U.S. Government/Credit Total Return Index Value Unhedged (the “Index”) during the 12-month period ended September 30, 2024. Treasury yields fell meaningfully over the 12-month period ended September 30, 2024, as U.S. inflation continued to improve, and the market priced in anticipated interest rate cuts by the Federal Reserve. The Fund’s slight short duration versus the Index was a relative detractor in this environment. However, this was offset by positive relative returns from the Fund’s allocation to collateralized mortgage obligations, corporate bonds, and asset-backed securities
How did the Fund perform over the past 10 years?
The line graph below reflects a hypothetical $10,000 investment. The returns shown in the line graph and table assume the reinvestment of dividends and capital gains, but do not reflect the deduction of taxes that a shareholder would pay on distributions or the redemption of Fund shares. The performance information shown below represents past performance and is no guarantee of future results. For Fund performance current to the most recent month end, visit https://www.thornburg.com/product/mutual-funds/fli/THIIX or call 1-800-847-0200. Performance for other share classes of the Fund will vary.
Cumulative Performance
Growth Table
Date | Thornburg Limited Term Income Fund | Bloomberg Intermediate U.S. Government/Credit Total Return Index Value Unhedged | Bloomberg U.S. Aggregate Total Return Value Index USD |
09/30/2014 | 10000.0021 | 10000 | 10000 |
10/31/2014 | 10048.8798 | 10070.3226 | 10098.2769 |
11/30/2014 | 10076.6376 | 10121.0909 | 10169.91 |
12/31/2014 | 10029.3536 | 10089.052 | 10179.4256 |
01/31/2015 | 10124.7336 | 10256.6848 | 10392.8789 |
02/28/2015 | 10107.7538 | 10185.2608 | 10295.1602 |
03/31/2015 | 10158.5352 | 10235.0557 | 10342.967 |
04/30/2015 | 10178.1341 | 10231.4031 | 10305.856 |
05/31/2015 | 10190.0949 | 10232.4021 | 10281.0356 |
06/30/2015 | 10149.4793 | 10171.3008 | 10168.9318 |
07/31/2015 | 10168.6796 | 10207.7402 | 10239.6187 |
08/31/2015 | 10143.0202 | 10199.1337 | 10224.9146 |
09/30/2015 | 10170.7633 | 10267.8682 | 10294.0811 |
10/31/2015 | 10174.0309 | 10257.2791 | 10295.7875 |
11/30/2015 | 10154.1898 | 10231.0957 | 10268.5908 |
12/31/2015 | 10111.7487 | 10196.936 | 10235.4031 |
01/31/2016 | 10183.6585 | 10321.7051 | 10376.2558 |
02/29/2016 | 10210.6111 | 10371.956 | 10449.8664 |
03/31/2016 | 10300.6998 | 10446.3359 | 10545.7404 |
04/30/2016 | 10352.3312 | 10474.0715 | 10586.2218 |
05/31/2016 | 10373.1928 | 10462.0531 | 10588.9383 |
06/30/2016 | 10478.5515 | 10611.9298 | 10779.1979 |
07/31/2016 | 10513.6117 | 10641.9861 | 10847.3436 |
08/31/2016 | 10532.5802 | 10614.6706 | 10834.9414 |
09/30/2016 | 10549.8588 | 10628.8508 | 10828.5941 |
10/31/2016 | 10544.3371 | 10584.9473 | 10745.7655 |
11/30/2016 | 10453.6641 | 10401.8279 | 10491.5864 |
12/31/2016 | 10464.9765 | 10409.1588 | 10506.3861 |
01/31/2017 | 10499.3434 | 10437.2888 | 10527.0016 |
02/28/2017 | 10541.5989 | 10485.7672 | 10597.7522 |
03/31/2017 | 10553.2208 | 10490.5008 | 10592.197 |
04/30/2017 | 10604.5914 | 10555.767 | 10673.9358 |
05/31/2017 | 10655.4879 | 10608.4411 | 10756.0945 |
06/30/2017 | 10651.4673 | 10589.3632 | 10745.2712 |
07/31/2017 | 10695.0468 | 10638.3641 | 10791.5097 |
08/31/2017 | 10739.1327 | 10701.3353 | 10888.3034 |
09/30/2017 | 10719.5558 | 10653.0567 | 10836.4459 |
10/31/2017 | 10740.1325 | 10652.1807 | 10842.724 |
11/30/2017 | 10729.5542 | 10619.4605 | 10828.8068 |
12/31/2017 | 10750.217 | 10631.6377 | 10878.506 |
01/31/2018 | 10707.2554 | 10538.0724 | 10753.2186 |
02/28/2018 | 10680.0814 | 10489.6299 | 10651.2843 |
03/31/2018 | 10702.5968 | 10527.3501 | 10719.5896 |
04/30/2018 | 10677.084 | 10472.3605 | 10639.8655 |
05/31/2018 | 10724.7407 | 10534.932 | 10715.7993 |
06/30/2018 | 10724.8152 | 10528.0058 | 10702.6209 |
07/31/2018 | 10732.8167 | 10530.7671 | 10705.1619 |
08/31/2018 | 10789.2254 | 10593.0723 | 10774.0467 |
09/30/2018 | 10763.7746 | 10550.4955 | 10704.6676 |
10/31/2018 | 10755.7498 | 10536.0027 | 10620.0741 |
11/30/2018 | 10781.0845 | 10583.559 | 10683.4727 |
12/31/2018 | 10881.0638 | 10724.993 | 10879.7393 |
01/31/2019 | 10964.3133 | 10818.0666 | 10995.2773 |
02/28/2019 | 10998.2591 | 10827.3493 | 10988.9087 |
03/31/2019 | 11107.9021 | 10973.8756 | 11199.9166 |
04/30/2019 | 11143.2122 | 10994.9821 | 11202.782 |
05/31/2019 | 11236.7123 | 11138.4756 | 11401.6482 |
06/30/2019 | 11313.8886 | 11257.799 | 11544.8346 |
07/31/2019 | 11331.3074 | 11253.962 | 11570.2238 |
08/31/2019 | 11456.6225 | 11453.5004 | 11870.0302 |
09/30/2019 | 11456.5175 | 11411.9738 | 11806.8123 |
10/31/2019 | 11488.8497 | 11457.2248 | 11842.3764 |
11/30/2019 | 11491.6195 | 11440.1193 | 11836.3427 |
12/31/2019 | 11507.2785 | 11454.4942 | 11828.0976 |
01/31/2020 | 11640.6061 | 11617.0809 | 12055.7234 |
02/29/2020 | 11738.8732 | 11781.061 | 12272.7065 |
03/31/2020 | 11428.9421 | 11729.4064 | 12200.4833 |
04/30/2020 | 11728.6397 | 11894.5341 | 12417.3601 |
05/31/2020 | 11906.6204 | 11984.9847 | 12475.1769 |
06/30/2020 | 12100.3559 | 12058.8984 | 12553.758 |
07/31/2020 | 12242.4407 | 12148.934 | 12741.2746 |
08/31/2020 | 12246.3722 | 12134.5437 | 12638.4313 |
09/30/2020 | 12267.1585 | 12133.0427 | 12631.4992 |
10/31/2020 | 12251.6707 | 12106.4393 | 12575.0965 |
11/30/2020 | 12337.5579 | 12166.4545 | 12698.4914 |
12/31/2020 | 12381.0426 | 12191.48 | 12715.9864 |
01/31/2021 | 12370.8274 | 12157.6584 | 12624.817 |
02/28/2021 | 12299.4336 | 12058.3042 | 12442.5048 |
03/31/2021 | 12209.7018 | 11964.6876 | 12287.1394 |
04/30/2021 | 12270.5045 | 12023.96 | 12384.2096 |
05/31/2021 | 12313.6559 | 12072.2334 | 12424.6696 |
06/30/2021 | 12321.0816 | 12082.0592 | 12511.9637 |
07/31/2021 | 12390.1917 | 12174.5385 | 12651.8595 |
08/31/2021 | 12379.6319 | 12154.7844 | 12627.7727 |
09/30/2021 | 12332.8195 | 12084.8973 | 12518.4439 |
10/31/2021 | 12303.2525 | 12017.4282 | 12514.9938 |
11/30/2021 | 12292.06 | 12031.3473 | 12552.0197 |
12/31/2021 | 12282.1577 | 12015.8862 | 12519.9004 |
01/31/2022 | 12163.4017 | 11839.6059 | 12250.172 |
02/28/2022 | 12026.6608 | 11761.9166 | 12113.503 |
03/31/2022 | 11820.0222 | 11474.0792 | 11776.9683 |
04/30/2022 | 11624.5384 | 11244.7048 | 11330.0576 |
05/31/2022 | 11665.4072 | 11328.4034 | 11403.1101 |
06/30/2022 | 11507.4617 | 11202.4406 | 11224.2161 |
07/31/2022 | 11650.6456 | 11385.3397 | 11498.4738 |
08/31/2022 | 11544.9251 | 11157.6558 | 11173.5652 |
09/30/2022 | 11267.9417 | 10859.3626 | 10690.7981 |
10/31/2022 | 11191.8351 | 10811.5758 | 10552.327 |
11/30/2022 | 11410.5014 | 11046.3498 | 10940.3949 |
12/31/2022 | 11422.7798 | 11026.4011 | 10891.0465 |
01/31/2023 | 11686.093 | 11232.1434 | 11226.0979 |
02/28/2023 | 11553.5676 | 11030.3918 | 10935.8444 |
03/31/2023 | 11717.9841 | 11283.5469 | 11213.6426 |
04/30/2023 | 11790.0168 | 11352.4197 | 11281.6023 |
05/31/2023 | 11722.7559 | 11268.3779 | 11158.7602 |
06/30/2023 | 11702.1646 | 11191.7746 | 11118.9646 |
07/31/2023 | 11754.5381 | 11221.0881 | 11111.2139 |
08/31/2023 | 11761.7471 | 11219.4692 | 11040.24 |
09/30/2023 | 11646.2407 | 11098.5986 | 10759.6881 |
10/31/2023 | 11581.354 | 11047.2002 | 10589.8898 |
11/30/2023 | 11882.3629 | 11341.6308 | 11069.4673 |
12/31/2023 | 12163.7057 | 11604.5809 | 11493.195 |
01/31/2024 | 12235.1197 | 11628.8278 | 11461.6339 |
02/29/2024 | 12185.0318 | 11513.2748 | 11299.6979 |
03/31/2024 | 12274.3167 | 11587.1629 | 11404.0404 |
04/30/2024 | 12155.6633 | 11430.8211 | 11115.9877 |
05/31/2024 | 12298.1018 | 11568.7101 | 11304.4398 |
06/30/2024 | 12400.823 | 11660.9742 | 11411.4668 |
07/31/2024 | 12609.9013 | 11880.1489 | 11678.0004 |
08/31/2024 | 12731.1361 | 12016.8903 | 11845.8158 |
09/30/2024 | 12854.8357 | 12147.2281 | 12004.424 |
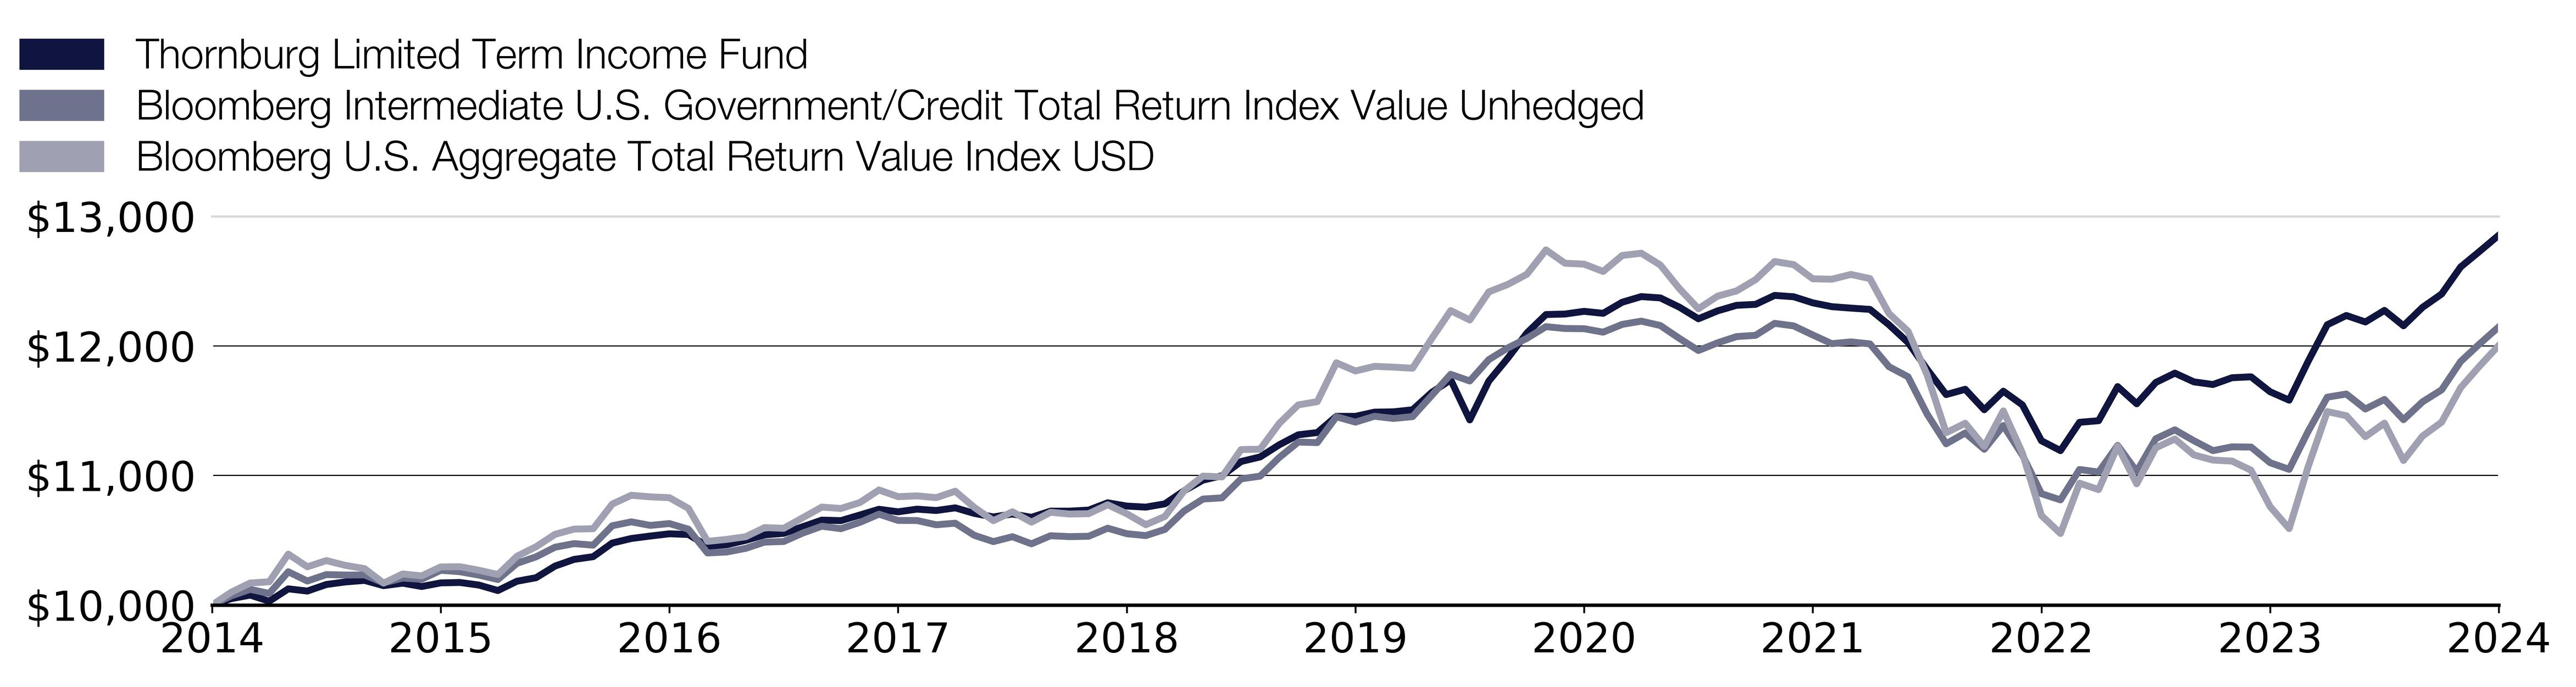
Effective September 30, 2024, the Fund adopted the Bloomberg U.S. Aggregate Total Return Index Value USD as its broad-based securities market index that represents the overall applicable market in which the Fund invests, and the Bloomberg U.S. Government/Credit Intermediate Total Return Index Value Unhedged as an additional index that represents the market sectors which the Fund’s advisor believes are more representative of the Fund’s investment universe.
What were the Fund costs for the past year?
(based on a hypothetical $10,000 investment)
Class Name | Costs of a $10,000 investment | Costs paid as a percentage of a $10,000 investment |
|---|
Class I | $52.00 | 0.49% |
End Block
Thornburg Limited Term Income Fund Tailored Shareholder Report
Thornburg Limited Term Income Fund Tailored Shareholder Report | |
Annual Performance | 1 Year | 5 Year | 10 Year |
|---|
Limited Term Income Fund Class I | 10.38% | 2.33% | 2.54% |
Bloomberg Intermediate U.S. Government/Credit Total Return Index Value Unhedged | 9.45% | 1.26% | 1.96% |
Bloomberg U.S. Aggregate Total Return Value Index USD | 11.57% | 0.33% | 1.84% |
Key Fund Statistics
(as of September 30, 2024)
| |
|---|
Fund Size (Millions) | $6,430.2M |
Number of Holdings | 652 |
Annual Portfolio Turnover | 59.42% |
Total Advisory Fee | $20.8M |
What did the Fund invest in?
(as of September 30, 2024)
Credit Quality Ratings | (%) |
|---|
| U.S. Government | 30.1 |
| AAA | 19.9 |
| AA | 4.6 |
| A | 17.0 |
| BBB | 20.1 |
| NR | 0.3 |
| Below Invest. Grade | 0.1 |
| Cash Equivalents & Other | 7.7 |
Credit Quality Ratings | (%) |
U.S. Government | 30.1% |
AAA | 19.9% |
AA | 4.6% |
A | 17.0% |
BBB | 20.1% |
NR | 0.3% |
Below Invest. Grade | 0.1% |
Cash Equivalents & Other | 7.7% |
Expressed as a percentage of the Fund’s net assets. * Credit quality ratings shown above reflect the highest rating assigned by either S&P Global Ratings or Moody’s Investors Services, both of which are independent, nationally recognized statistical rating organizations. If a credit rating for an investment is not available from either S&P or Moody’s, then the Fund’s investment advisor will determine the credit quality of the investment. Investments are considered to be investment grade if they are rated within the four highest grades by S&P or Moody’s (BBB/Baa or higher) or, if no credit rating is available, have been judged to be of comparable quality by the Fund’s investment advisor. (NR = Not Rated)
How has the Fund changed?
This is a summary of certain changes to the Fund since October 1, 2023. For more complete information, you may review the Fund’s next prospectus, which we expect to be available by February 1, 2025 at https://www.thornburg.com/download or upon request by calling 1-800-847-0200.
End Block
Changes In and Disagreements with Accountants
No changes and/or disagreements occurred in the current reporting period.
End Block
For additional information about the Fund, including its prospectus, financial information, holdings and proxy information, visit www.thornburg.com/download.

Thornburg Limited Term Income Fund Tailored Shareholder Report | |
Thornburg Limited Term Income Fund Tailored Shareholder Report
Thornburg Limited Term Income Fund CLASS: R3 TICKER: THIRX Annual Shareholder Report | |
This annual shareholder report contains important information about the Thornburg Limited Term Income Fund Class R3 Shares for the period from October 1, 2023 to September 30, 2024. You can find additional information about the Fund at https://www.thornburg.com/download. You can also request this information by contacting us at 1-800-847-0200. This report also describes changes to the Fund that occurred during the reporting period.
How did the Fund perform last year and what affected its performance?
The Fund’s Class R3 shares outperformed the Bloomberg Intermediate U.S. Government/Credit Total Return Index Value Unhedged (the “Index”) during the 12-month period ended September 30, 2024. Treasury yields fell meaningfully over the 12-month period ended September 30, 2024, as U.S. inflation continued to improve, and the market priced in anticipated interest rate cuts by the Federal Reserve. The Fund’s slight short duration versus the Index was a relative detractor in this environment. However, this was offset by positive relative returns from the Fund’s allocation to collateralized mortgage obligations, corporate bonds, and asset-backed securities
How did the Fund perform over the past 10 years?
The line graph below reflects a hypothetical $10,000 investment. The returns shown in the line graph and table assume the reinvestment of dividends and capital gains, but do not reflect the deduction of taxes that a shareholder would pay on distributions or the redemption of Fund shares. The performance information shown below represents past performance and is no guarantee of future results. For Fund performance current to the most recent month end, visit https://www.thornburg.com/product/mutual-funds/fli/THIRX or call 1-800-847-0200. Performance for other share classes of the Fund will vary.
Cumulative Performance
Growth Table
Date | Thornburg Limited Term Income Fund | Bloomberg Intermediate U.S. Government/Credit Total Return Index Value Unhedged | Bloomberg U.S. Aggregate Total Return Value Index USD |
09/30/2014 | 10000.0035 | 10000 | 10000 |
10/31/2014 | 10044.7438 | 10070.3226 | 10098.2769 |
11/30/2014 | 10068.5894 | 10121.0909 | 10169.91 |
12/31/2014 | 10017.2732 | 10089.052 | 10179.4256 |
01/31/2015 | 10108.3133 | 10256.6848 | 10392.8789 |
02/28/2015 | 10087.6608 | 10185.2608 | 10295.1602 |
03/31/2015 | 10134.1966 | 10235.0557 | 10342.967 |
04/30/2015 | 10142.3039 | 10231.4031 | 10305.856 |
05/31/2015 | 10157.6731 | 10232.4021 | 10281.0356 |
06/30/2015 | 10105.8471 | 10171.3008 |
07/31/2015 | 10128.5977 | 10207.7402 | 10239.6187 |
08/31/2015 | 10099.1946 | 10199.1337 | 10224.9146 |
09/30/2015 | 10115.5638 | 10267.8682 | 10294.0811 |
10/31/2015 | 10122.3608 | 10257.2791 | 10295.7875 |
11/30/2015 | 10098.5762 | 10231.0957 | 10268.5908 |
12/31/2015 | 10052.2573 | 10196.936 | 10235.4031 |
01/31/2016 | 10111.9893 | 10321.7051 | 10376.2558 |
02/29/2016 | 10142.4601 | 10371.956 | 10449.8664 |
03/31/2016 | 10227.7213 | 10446.3359 | 10545.7404 |
04/30/2016 | 10274.852 | 10474.0715 | 10586.2218 |
05/31/2016 | 10291.2536 | 10462.0531 | 10588.9383 |
06/30/2016 | 10392.4324 | 10611.9298 | 10779.1979 |
07/31/2016 | 10422.9031 | 10641.9861 | 10847.3436 |
08/31/2016 | 10429.7471 | 10614.6706 | 10834.9414 |
09/30/2016 | 10442.7398 | 10628.8508 | 10828.5941 |
10/31/2016 | 10440.684 | 10584.9473 | 10745.7655 |
11/30/2016 | 10339.0143 | 10401.8279 | 10491.5864 |
12/31/2016 | 10353.5792 | 10409.1588 | 10506.3861 |
01/31/2017 | 10383.1955 | 10437.2888 | 10527.0016 |
02/28/2017 | 10421.0996 | 10485.7672 | 10597.7522 |
03/31/2017 | 10428.2257 | 10490.5008 | 10592.197 |
04/30/2017 | 10474.6882 | 10555.767 | 10673.9358 |
05/31/2017 | 10520.4606 | 10608.4411 | 10756.0945 |
06/30/2017 | 10512.2573 | 10589.3632 | 10745.2712 |
07/31/2017 | 10550.9028 | 10638.3641 | 10791.5097 |
08/31/2017 | 10590.0885 | 10701.3353 | 10888.3034 |
09/30/2017 | 10566.9656 | 10653.0567 | 10836.4459 |
10/31/2017 | 10574.928 | 10652.1807 | 10842.724 |
11/30/2017 | 10568.0455 | 10619.4605 | 10828.8068 |
12/31/2017 | 10575.9902 | 10631.6377 | 10878.506 |
01/31/2018 | 10537.0851 | 10538.0724 | 10753.2186 |
02/28/2018 | 10498.6315 | 10489.6299 | 10651.2843 |
03/31/2018 | 10516.5988 | 10527.3501 | 10719.5896 |
04/30/2018 | 10495.3714 | 10472.3605 | 10639.8655 |
05/31/2018 | 10538.0205 | 10534.932 | 10715.7993 |
06/30/2018 | 10533.9843 | 10528.0058 | 10702.6209 |
07/31/2018 | 10537.6625 | 10530.7671 | 10705.1619 |
08/31/2018 | 10588.9348 | 10593.0723 | 10774.0467 |
09/30/2018 | 10560.325 | 10550.4955 | 10704.6676 |
10/31/2018 | 10540.4768 | 10536.0027 | 10620.0741 |
11/30/2018 | 10569.3611 | 10583.559 | 10683.4727 |
12/31/2018 | 10663.1727 | 10724.993 | 10879.7393 |
01/31/2019 | 10732.3781 | 10818.0666 | 10995.2773 |
02/28/2019 | 10761.4579 | 10827.3493 | 10988.9087 |
03/31/2019 | 10872.2776 | 10973.8756 | 11199.9166 |
04/30/2019 | 10902.3568 | 10994.9821 | 11202.782 |
05/31/2019 | 10989.1294 | 11138.4756 | 11401.6482 |
06/30/2019 | 11060.0384 | 11257.799 | 11544.8346 |
07/31/2019 | 11072.3621 | 11253.962 | 11570.2238 |
08/31/2019 | 11189.9988 | 11453.5004 | 11870.0302 |
09/30/2019 | 11177.1168 | 11411.9738 | 11806.8123 |
10/31/2019 | 11212.1346 | 11457.2248 | 11842.3764 |
11/30/2019 | 11202.0462 | 11440.1193 | 11836.3427 |
12/31/2019 | 11212.587 | 11454.4942 | 11828.0976 |
01/31/2020 | 11337.7475 | 11617.0809 | 12055.7234 |
02/29/2020 | 11437.2959 | 11781.061 | 12272.7065 |
03/31/2020 | 11130.9627 | 11729.4064 | 12200.4833 |
04/30/2020 | 11409.6801 | 11894.5341 | 12417.3601 |
05/31/2020 | 11577.7983 | 11984.9847 | 12475.1769 |
06/30/2020 | 11761.3771 | 12058.8984 | 12553.758 |
07/31/2020 | 11894.4964 | 12148.934 | 12741.2746 |
08/31/2020 | 11901.6782 | 12134.5437 | 12638.4313 |
09/30/2020 | 11908.6117 | 12133.0427 | 12631.4992 |
10/31/2020 | 11896.8484 | 12106.4393 | 12575.0965 |
11/30/2020 | 11966.7149 | 12166.4545 | 12698.4914 |
12/31/2020 | 12012.1751 | 12191.48 | 12715.9864 |
01/31/2021 | 11997.1372 | 12157.6584 | 12624.817 |
02/28/2021 | 11923.2721 | 12058.3042 | 12442.5048 |
03/31/2021 | 11823.0672 | 11964.6876 | 12287.1394 |
04/30/2021 | 11885.7123 | 12023.96 | 12384.2096 |
05/31/2021 | 11913.9119 | 12072.2334 | 12424.6696 |
06/30/2021 | 11916.2995 | 12082.0592 | 12511.9637 |
07/31/2021 | 11978.0588 | 12174.5385 | 12651.8595 |
08/31/2021 | 11962.7709 | 12154.7844 | 12627.7727 |
09/30/2021 | 11921.2362 | 12084.8973 | 12518.4439 |
10/31/2021 | 11878.6769 | 12017.4282 | 12514.9938 |
11/30/2021 | 11862.6613 | 12031.3473 | 12552.0197 |
12/31/2021 | 11856.4179 | 12015.8862 | 12519.9004 |
01/31/2022 | 11728.4153 | 11839.6059 | 12250.172 |
02/28/2022 | 11592.2864 | 11761.9166 | 12113.503 |
03/31/2022 | 11388.9651 | 11474.0792 | 11776.9683 |
04/30/2022 | 11196.0039 | 11244.7048 | 11330.0576 |
05/31/2022 | 11230.636 | 11328.4034 | 11403.1101 |
06/30/2022 | 11074.0307 | 11202.4406 | 11224.2161 |
07/31/2022 | 11215.8189 | 11385.3397 | 11498.4738 |
08/31/2022 | 11109.3809 | 11157.6558 | 11173.5652 |
09/30/2022 | 10829.8259 | 10859.3626 | 10690.7981 |
10/31/2022 | 10752.1028 | 10811.5758 | 10552.327 |
11/30/2022 | 10966.5073 | 11046.3498 | 10940.3949 |
12/31/2022 | 10964.8748 | 11026.4011 | 10891.0465 |
01/31/2023 | 11221.7241 | 11232.1434 | 11226.0979 |
02/28/2023 | 11081.4492 | 11030.3918 | 10935.8444 |
03/31/2023 | 11234.4443 | 11283.5469 | 11213.6426 |
04/30/2023 | 11298.8679 | 11352.4197 | 11281.6023 |
05/31/2023 | 11238.5276 | 11268.3779 | 11158.7602 |
06/30/2023 | 11214.2249 | 11191.7746 | 11118.9646 |
07/31/2023 | 11259.6399 | 11221.0881 | 11111.2139 |
08/31/2023 | 11261.7984 | 11219.4692 | 11040.24 |
09/30/2023 | 11146.6948 | 11098.5986 | 10759.6881 |
10/31/2023 | 11079.9758 | 11047.2002 | 10589.8898 |
11/30/2023 | 11354.127 | 11341.6308 | 11069.4673 |
12/31/2023 | 11627.1233 | 11604.5809 | 11493.195 |
01/31/2024 | 11690.4388 | 11628.8278 | 11461.6339 |
02/29/2024 | 11628.9367 | 11513.2748 | 11299.6979 |
03/31/2024 | 11709.2239 | 11587.1629 | 11404.0404 |
04/30/2024 | 11591.2835 | 11430.8211 | 11115.9877 |
05/31/2024 | 11731.3271 | 11568.7101 | 11304.4398 |
06/30/2024 | 11815.2523 | 11660.9742 | 11411.4668 |
07/31/2024 | 12009.4724 | 11880.1489 | 11678.0004 |
08/31/2024 | 12119.8628 | 12016.8903 | 11845.8158 |
09/30/2024 | 12241.953 | 12147.2281 | 12004.424 |
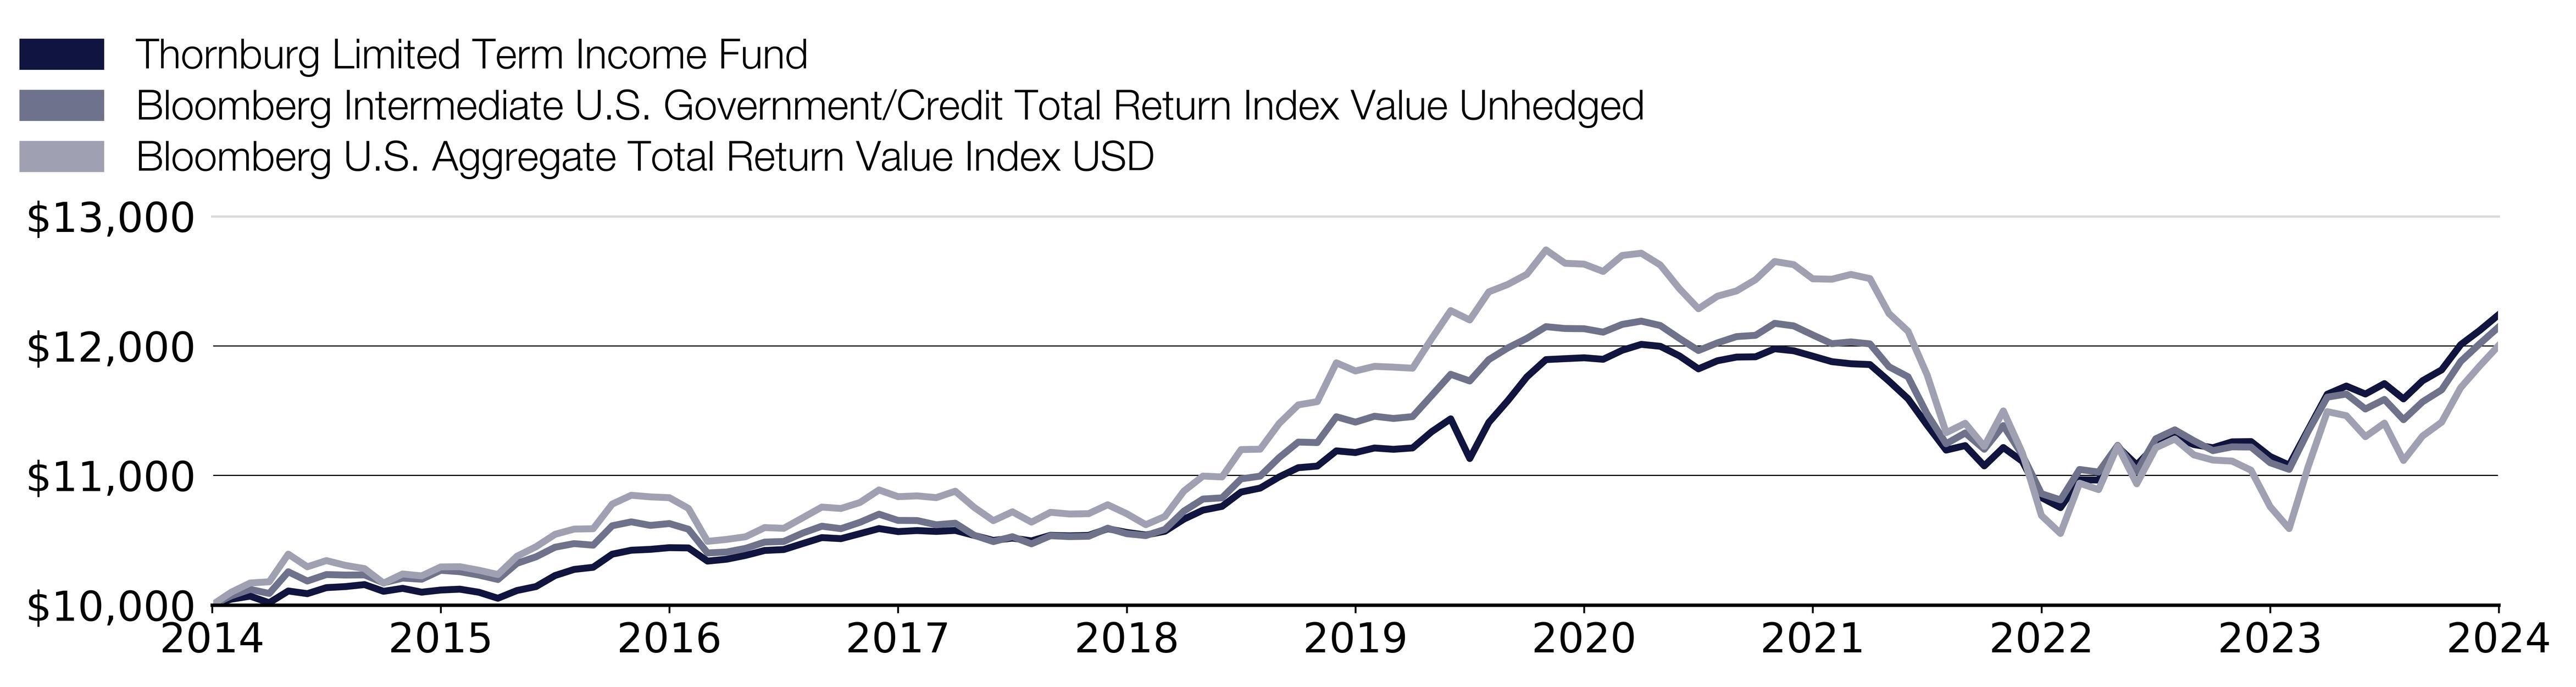
Effective September 30, 2024, the Fund adopted the Bloomberg U.S. Aggregate Total Return Index Value USD as its broad-based securities market index that represents the overall applicable market in which the Fund invests, and the Bloomberg U.S. Government/Credit Intermediate Total Return Index Value Unhedged as an additional index that represents the market sectors which the Fund’s advisor believes are more representative of the Fund’s investment universe.
What were the Fund costs for the past year?
(based on a hypothetical $10,000 investment)
Class Name | Costs of a $10,000 investment | Costs paid as a percentage of a $10,000 investment |
|---|
Class R3 | $104.00 | 0.99% |
End Block
Thornburg Limited Term Income Fund Tailored Shareholder Report
Thornburg Limited Term Income Fund Tailored Shareholder Report | |
Annual Performance | 1 Year | 5 Year | 10 Year |
|---|
Limited Term Income Fund Class R3 | 9.83% | 1.84% | 2.04% |
Bloomberg Intermediate U.S. Government/Credit Total Return Index Value Unhedged | 9.45% | 1.26% | 1.96% |
Bloomberg U.S. Aggregate Total Return Value Index USD | 11.57% | 0.33% | 1.84% |
Key Fund Statistics
(as of September 30, 2024)
| |
|---|
Fund Size (Millions) | $6,430.2M |
Number of Holdings | 652 |
Annual Portfolio Turnover | 59.42% |
Total Advisory Fee | $20.8M |
What did the Fund invest in?
(as of September 30, 2024)
Credit Quality Ratings | (%) |
|---|
| U.S. Government | 30.1 |
| AAA | 19.9 |
| AA | 4.6 |
| A | 17.0 |
| BBB | 20.1 |
| NR | 0.3 |
| Below Invest. Grade | 0.1 |
| Cash Equivalents & Other | 7.7 |
Credit Quality Ratings | (%) |
U.S. Government | 30.1% |
AAA | 19.9% |
AA | 4.6% |
A | 17.0% |
BBB | 20.1% |
NR | 0.3% |
Below Invest. Grade | 0.1% |
Cash Equivalents & Other | 7.7% |
Expressed as a percentage of the Fund’s net assets. * Credit quality ratings shown above reflect the highest rating assigned by either S&P Global Ratings or Moody’s Investors Services, both of which are independent, nationally recognized statistical rating organizations. If a credit rating for an investment is not available from either S&P or Moody’s, then the Fund’s investment advisor will determine the credit quality of the investment. Investments are considered to be investment grade if they are rated within the four highest grades by S&P or Moody’s (BBB/Baa or higher) or, if no credit rating is available, have been judged to be of comparable quality by the Fund’s investment advisor. (NR = Not Rated)
How has the Fund changed?
This is a summary of certain changes to the Fund since October 1, 2023. For more complete information, you may review the Fund’s next prospectus, which we expect to be available by February 1, 2025 at https://www.thornburg.com/download or upon request by calling 1-800-847-0200.
End Block
Changes In and Disagreements with Accountants
No changes and/or disagreements occurred in the current reporting period.
End Block
For additional information about the Fund, including its prospectus, financial information, holdings and proxy information, visit www.thornburg.com/download.

Thornburg Limited Term Income Fund Tailored Shareholder Report | |
Thornburg Limited Term Income Fund Tailored Shareholder Report
Thornburg Limited Term Income Fund CLASS: R4 TICKER: THRIX Annual Shareholder Report | |
This annual shareholder report contains important information about the Thornburg Limited Term Income Fund Class R4 Shares for the period from October 1, 2023 to September 30, 2024. You can find additional information about the Fund at https://www.thornburg.com/download. You can also request this information by contacting us at 1-800-847-0200. This report also describes changes to the Fund that occurred during the reporting period.
How did the Fund perform last year and what affected its performance?
The Fund’s Class R4 shares outperformed the Bloomberg Intermediate U.S. Government/Credit Total Return Index Value Unhedged (the “Index”) during the 12-month period ended September 30, 2024. Treasury yields fell meaningfully over the 12-month period ended September 30, 2024, as U.S. inflation continued to improve, and the market priced in anticipated interest rate cuts by the Federal Reserve. The Fund’s slight short duration versus the Index was a relative detractor in this environment. However, this was offset by positive relative returns from the Fund’s allocation to collateralized mortgage obligations, corporate bonds, and asset-backed securities
How did the Fund perform over the past 10 years?
The line graph below reflects a hypothetical $10,000 investment. The returns shown in the line graph and table assume the reinvestment of dividends and capital gains, but do not reflect the deduction of taxes that a shareholder would pay on distributions or the redemption of Fund shares. The performance information shown below represents past performance and is no guarantee of future results. For Fund performance current to the most recent month end, visit https://www.thornburg.com/product/mutual-funds/fli/THRIX or call 1-800-847-0200. Performance for other share classes of the Fund will vary.
Cumulative Performance
Growth Table
Date | Thornburg Limited Term Income Fund | Bloomberg Intermediate U.S. Government/Credit Total Return Index Value Unhedged | Bloomberg U.S. Aggregate Total Return Value Index USD |
09/30/2014 | 10000.0032 | 10000 | 10000 |
10/31/2014 | 10044.7786 | 10070.3226 | 10098.2769 |
11/30/2014 | 10068.6453 | 10121.0909 | 10169.91 |
12/31/2014 | 10017.2318 | 10089.052 | 10179.4256 |
01/31/2015 | 10108.3864 | 10256.6848 | 10392.8789 |
02/28/2015 | 10087.6798 | 10185.2608 | 10295.1602 |
03/31/2015 | 10134.2628 | 10235.0557 | 10342.967 |
04/30/2015 | 10142.3626 | 10231.4031 | 10305.856 |
05/31/2015 | 10157.7359 | 10232.4021 | 10281.0356 |
06/30/2015 | 10113.3621 | 10171.3008 | 10168.9318 |
07/31/2015 | 10128.5638 | 10207.7402 | 10239.6187 |
08/31/2015 | 10099.0956 | 10199.1337 | 10224.9146 |
09/30/2015 | 10123.866 | 10267.8682 | 10294.0811 |
10/31/2015 | 10123.0423 | 10257.2791 | 10295.7875 |
11/30/2015 | 10099.203 | 10231.0957 | 10268.5908 |
12/31/2015 | 10052.7795 | 10196.936 | 10235.4031 |
01/31/2016 | 10112.5886 | 10321.7051 | 10376.2558 |
02/29/2016 | 10143.087 | 10371.956 | 10449.8664 |
03/31/2016 | 10228.4583 | 10446.3359 | 10545.7404 |
04/30/2016 | 10275.6393 | 10474.0715 | 10586.2218 |
05/31/2016 | 10292.0432 | 10462.0531 | 10588.9383 |
06/30/2016 | 10392.5206 | 10611.9298 | 10779.1979 |
07/31/2016 | 10423.0055 | 10641.9861 | 10847.3436 |
08/31/2016 | 10437.5558 | 10614.6706 | 10834.9414 |
09/30/2016 | 10450.5119 | 10628.8508 | 10828.5941 |
10/31/2016 | 10440.7048 | 10584.9473 | 10745.7655 |
11/30/2016 | 10346.5974 | 10401.8279 | 10491.5864 |
12/31/2016 | 10353.411 | 10409.1588 | 10506.3861 |
01/31/2017 | 10383.0559 | 10437.2888 | 10527.0016 |
02/28/2017 | 10420.9996 | 10485.7672 | 10597.7522 |
03/31/2017 | 10428.0385 | 10490.5008 | 10592.197 |
04/30/2017 | 10474.6181 | 10555.767 | 10673.9358 |
05/31/2017 | 10520.4421 | 10608.4411 | 10756.0945 |
06/30/2017 | 10512.2081 | 10589.3632 | 10745.2712 |
07/31/2017 | 10550.8928 | 10638.3641 | 10791.5097 |
08/31/2017 | 10590.1172 | 10701.3353 | 10888.3034 |
09/30/2017 | 10566.8314 | 10653.0567 | 10836.4459 |
10/31/2017 | 10582.652 | 10652.1807 | 10842.724 |
11/30/2017 | 10567.8567 | 10619.4605 | 10828.8068 |
12/31/2017 | 10583.6702 | 10631.6377 | 10878.506 |
01/31/2018 | 10536.7816 | 10538.0724 | 10753.2186 |
02/28/2018 | 10506.1105 | 10489.6299 | 10651.2843 |
03/31/2018 | 10524.104 | 10527.3501 | 10719.5896 |
04/30/2018 | 10494.8873 | 10472.3605 | 10639.8655 |
05/31/2018 | 10537.5695 | 10534.932 | 10715.7993 |
06/30/2018 | 10533.5076 | 10528.0058 | 10702.6209 |
07/31/2018 | 10537.1721 | 10530.7671 | 10705.1619 |
08/31/2018 | 10588.5151 | 10593.0723 | 10774.0467 |
09/30/2018 | 10567.8353 | 10550.4955 | 10704.6676 |
10/31/2018 | 10547.8209 | 10536.0027 | 10620.0741 |
11/30/2018 | 10576.7274 | 10583.559 | 10683.4727 |
12/31/2018 | 10670.6549 | 10724.993 | 10879.7393 |
01/31/2019 | 10740.048 | 10818.0666 | 10995.2773 |
02/28/2019 | 10769.2035 | 10827.3493 | 10988.9087 |
03/31/2019 | 10872.0528 | 10973.8756 | 11199.9166 |
04/30/2019 | 10902.1514 | 10994.9821 | 11202.782 |
05/31/2019 | 10989.055 | 11138.4756 | 11401.6482 |
06/30/2019 | 11060.0579 | 11257.799 | 11544.8346 |
07/31/2019 | 11072.3798 | 11253.962 | 11570.2238 |
08/31/2019 | 11190.106 | 11453.5004 | 11870.0302 |
09/30/2019 | 11185.4057 | 11411.9738 | 11806.8123 |
10/31/2019 | 11212.2155 | 11457.2248 | 11842.3764 |
11/30/2019 | 11210.3055 | 11440.1193 | 11836.3427 |
12/31/2019 | 11220.8336 | 11454.4942 | 11828.0976 |
01/31/2020 | 11346.0593 | 11617.0809 | 12055.7234 |
02/29/2020 | 11437.403 | 11781.061 | 12272.7065 |
03/31/2020 | 11130.4184 | 11729.4064 | 12200.4833 |
04/30/2020 | 11417.853 | 11894.5341 | 12417.3601 |
05/31/2020 | 11586.384 | 11984.9847 | 12475.1769 |
06/30/2020 | 11770.2386 | 12058.8984 | 12553.758 |
07/31/2020 | 11903.5332 | 12148.934 | 12741.2746 |
08/31/2020 | 11902.3874 | 12134.5437 | 12638.4313 |
09/30/2020 | 11917.7152 | 12133.0427 | 12631.4992 |
10/31/2020 | 11897.4672 | 12106.4393 | 12575.0965 |
11/30/2020 | 11975.8601 | 12166.4545 | 12698.4914 |
12/31/2020 | 12012.8065 | 12191.48 | 12715.9864 |
01/31/2021 | 11997.7577 | 12157.6584 | 12624.817 |
02/28/2021 | 11923.7633 | 12058.3042 | 12442.5048 |
03/31/2021 | 11831.9855 | 11964.6876 | 12287.1394 |
04/30/2021 | 11886.4978 | 12023.96 | 12384.2096 |
05/31/2021 | 11923.3455 | 12072.2334 | 12424.6696 |
06/30/2021 | 11925.7261 | 12082.0592 | 12511.9637 |
07/31/2021 | 11987.6117 | 12174.5385 | 12651.8595 |
08/31/2021 | 11972.3049 | 12154.7844 | 12627.7727 |
09/30/2021 | 11930.6984 | 12084.8973 | 12518.4439 |
10/31/2021 | 11888.0679 | 12017.4282 | 12514.9938 |
11/30/2021 | 11871.9783 | 12031.3473 | 12552.0197 |
12/31/2021 | 11857.025 | 12015.8862 | 12519.9004 |
01/31/2022 | 11737.4682 | 11839.6059 | 12250.172 |
02/28/2022 | 11601.1362 | 11761.9166 | 12113.503 |
03/31/2022 | 11397.4915 | 11474.0792 | 11776.9683 |
04/30/2022 | 11204.2176 | 11244.7048 | 11330.0576 |
05/31/2022 | 11238.8754 | 11328.4034 | 11403.1101 |
06/30/2022 | 11082.1219 | 11202.4406 | 11224.2161 |
07/31/2022 | 11215.4928 | 11385.3397 | 11498.4738 |
08/31/2022 | 11108.944 | 11157.6558 | 11173.5652 |
09/30/2022 | 10837.691 | 10859.3626 | 10690.7981 |
10/31/2022 | 10759.8419 | 10811.5758 | 10552.327 |
11/30/2022 | 10965.7813 | 11046.3498 | 10940.3949 |
12/31/2022 | 10972.9196 | 11026.4011 | 10891.0465 |
01/31/2023 | 11230.1573 | 11232.1434 | 11226.0979 |
02/28/2023 | 11089.6863 | 11030.3918 | 10935.8444 |
03/31/2023 | 11242.8868 | 11283.5469 | 11213.6426 |
04/30/2023 | 11307.4058 | 11352.4197 | 11281.6023 |
05/31/2023 | 11246.9692 | 11268.3779 | 11158.7602 |
06/30/2023 | 11222.6112 | 11191.7746 | 11118.9646 |
07/31/2023 | 11259.1375 | 11221.0881 | 11111.2139 |
08/31/2023 | 11270.2389 | 11219.4692 | 11040.24 |
09/30/2023 | 11145.9616 | 11098.5986 | 10759.6881 |
10/31/2023 | 11079.0983 | 11047.2002 | 10589.8898 |
11/30/2023 | 11362.6571 | 11341.6308 | 11069.4673 |
12/31/2023 | 11627.0093 | 11604.5809 | 11493.195 |
01/31/2024 | 11699.4493 | 11628.8278 | 11461.6339 |
02/29/2024 | 11637.8473 | 11513.2748 | 11299.6979 |
03/31/2024 | 11718.05 | 11587.1629 | 11404.0404 |
04/30/2024 | 11599.8923 | 11430.8211 | 11115.9877 |
05/31/2024 | 11730.9538 | 11568.7101 | 11304.4398 |
06/30/2024 | 11824.1536 | 11660.9742 | 11411.4668 |
07/31/2024 | 12018.5597 | 11880.1489 | 11678.0004 |
08/31/2024 | 12128.9701 | 12016.8903 | 11845.8158 |
09/30/2024 | 12251.1184 | 12147.2281 | 12004.424 |
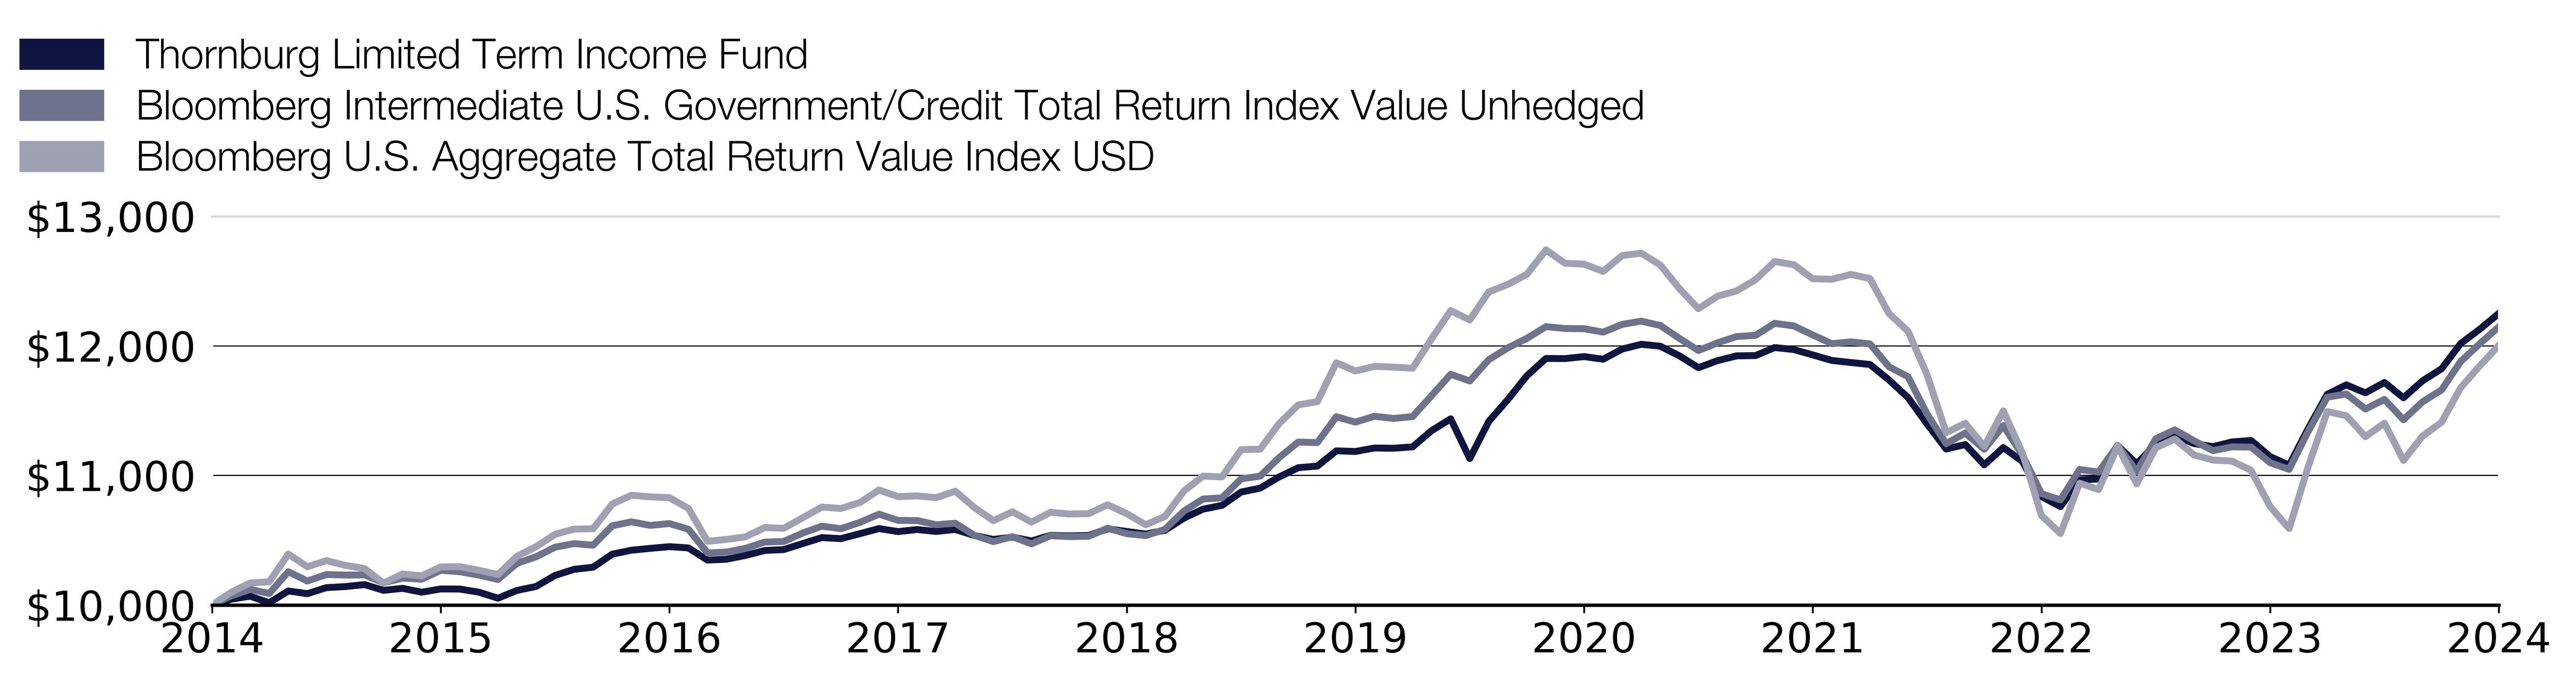
Effective September 30, 2024, the Fund adopted the Bloomberg U.S. Aggregate Total Return Index Value USD as its broad-based securities market index that represents the overall applicable market in which the Fund invests, and the Bloomberg U.S. Government/Credit Intermediate Total Return Index Value Unhedged as an additional index that represents the market sectors which the Fund’s advisor believes are more representative of the Fund’s investment universe.
What were the Fund costs for the past year?
(based on a hypothetical $10,000 investment)
Class Name | Costs of a $10,000 investment | Costs paid as a percentage of a $10,000 investment |
|---|
Class R4 | $104.00 | 0.99% |
End Block
Thornburg Limited Term Income Fund Tailored Shareholder Report
Thornburg Limited Term Income Fund Tailored Shareholder Report | |
Annual Performance | 1 Year | 5 Year | 10 Year |
|---|
Limited Term Income Fund Class R4 | 9.92% | 1.84% | 2.05% |
Bloomberg Intermediate U.S. Government/Credit Total Return Index Value Unhedged | 9.45% | 1.26% | 1.96% |
Bloomberg U.S. Aggregate Total Return Value Index USD | 11.57% | 0.33% | 1.84% |
Key Fund Statistics
(as of September 30, 2024)
| |
|---|
Fund Size (Millions) | $6,430.2M |
Number of Holdings | 652 |
Annual Portfolio Turnover | 59.42% |
Total Advisory Fee | $20.8M |
What did the Fund invest in?
(as of September 30, 2024)
Credit Quality Ratings | (%) |
|---|
| U.S. Government | 30.1 |
| AAA | 19.9 |
| AA | 4.6 |
| A | 17.0 |
| BBB | 20.1 |
| NR | 0.3 |
| Below Invest. Grade | 0.1 |
| Cash Equivalents & Other | 7.7 |
Credit Quality Ratings | (%) |
U.S. Government | 30.1% |
AAA | 19.9% |
AA | 4.6% |
A | 17.0% |
BBB | 20.1% |
NR | 0.3% |
Below Invest. Grade | 0.1% |
Cash Equivalents & Other | 7.7% |
Expressed as a percentage of the Fund’s net assets. * Credit quality ratings shown above reflect the highest rating assigned by either S&P Global Ratings or Moody’s Investors Services, both of which are independent, nationally recognized statistical rating organizations. If a credit rating for an investment is not available from either S&P or Moody’s, then the Fund’s investment advisor will determine the credit quality of the investment. Investments are considered to be investment grade if they are rated within the four highest grades by S&P or Moody’s (BBB/Baa or higher) or, if no credit rating is available, have been judged to be of comparable quality by the Fund’s investment advisor. (NR = Not Rated)
How has the Fund changed?
This is a summary of certain changes to the Fund since October 1, 2023. For more complete information, you may review the Fund’s next prospectus, which we expect to be available by February 1, 2025 at https://www.thornburg.com/download or upon request by calling 1-800-847-0200.
End Block
Changes In and Disagreements with Accountants
No changes and/or disagreements occurred in the current reporting period.
End Block
For additional information about the Fund, including its prospectus, financial information, holdings and proxy information, visit www.thornburg.com/download.

Thornburg Limited Term Income Fund Tailored Shareholder Report | |
Thornburg Limited Term Income Fund Tailored Shareholder Report
Thornburg Limited Term Income Fund CLASS: R5 TICKER: THRRX Annual Shareholder Report | |
This annual shareholder report contains important information about the Thornburg Limited Term Income Fund Class R5 Shares for the period from October 1, 2023 to September 30, 2024. You can find additional information about the Fund at https://www.thornburg.com/download. You can also request this information by contacting us at 1-800-847-0200. This report also describes changes to the Fund that occurred during the reporting period.
How did the Fund perform last year and what affected its performance?
The Fund’s Class R5 shares outperformed the Bloomberg Intermediate U.S. Government/Credit Total Return Index Value Unhedged (the “Index”) during the 12-month period ended September 30, 2024. Treasury yields fell meaningfully over the 12-month period ended September 30, 2024, as U.S. inflation continued to improve, and the market priced in anticipated interest rate cuts by the Federal Reserve. The Fund’s slight short duration versus the Index was a relative detractor in this environment. However, this was offset by positive relative returns from the Fund’s allocation to collateralized mortgage obligations, corporate bonds, and asset-backed securities
How did the Fund perform over the past 10 years?
The line graph below reflects a hypothetical $10,000 investment. The returns shown in the line graph and table assume the reinvestment of dividends and capital gains, but do not reflect the deduction of taxes that a shareholder would pay on distributions or the redemption of Fund shares. The performance information shown below represents past performance and is no guarantee of future results. For Fund performance current to the most recent month end, visit https://www.thornburg.com/product/mutual-funds/fli/THRRX or call 1-800-847-0200. Performance for other share classes of the Fund will vary.
Cumulative Performance
Growth Table
Date | Thornburg Limited Term Income Fund | Bloomberg Intermediate U.S. Government/Credit Total Return Index Value Unhedged | Bloomberg U.S. Aggregate Total Return Value Index USD |
09/30/2014 | 10000.0021 | 10000 | 10000 |
10/31/2014 | 10048.5551 | 10070.3226 | 10098.2769 |
11/30/2014 | 10075.4792 | 10121.0909 | 10169.91 |
12/31/2014 | 10027.1995 | 10089.052 | 10179.4256 |
01/31/2015 | 10121.121 | 10256.6848 | 10392.8789 |
02/28/2015 | 10102.8921 | 10185.2608 | 10295.1602 |
03/31/2015 | 10152.2717 | 10235.0557 | 10342.967 |
04/30/2015 | 10163.0672 | 10231.4031 | 10305.856 |
05/31/2015 | 10181.2382 | 10232.4021 | 10281.0356 |
06/30/2015 | 10131.9197 | 10171.3008 | 10168.9318 |
07/31/2015 | 10149.9157 | 10207.7402 | 10239.6187 |
08/31/2015 | 10130.7524 | 10199.1337 | 10224.9146 |
09/30/2015 | 10150.4527 | 10267.8682 | 10294.0811 |
10/31/2015 | 10161.2001 | 10257.2791 | 10295.7875 |
11/30/2015 | 10141.0756 | 10231.0957 | 10268.5908 |
12/31/2015 | 10098.1074 | 10196.936 | 10235.4031 |
01/31/2016 | 10161.6603 | 10321.7051 | 10376.2558 |
02/29/2016 | 10195.2295 | 10371.956 | 10449.8664 |
03/31/2016 | 10283.772 | 10446.3359 | 10545.7404 |
04/30/2016 | 10333.8932 | 10474.0715 | 10586.2218 |
05/31/2016 | 10353.2016 | 10462.0531 | 10588.9383 |
06/30/2016 | 10456.9515 | 10611.9298 | 10779.1979 |
07/31/2016 | 10490.4654 | 10641.9861 | 10847.3436 |
08/31/2016 | 10500.1882 | 10614.6706 | 10834.9414 |
09/30/2016 | 10516.0219 | 10628.8508 | 10828.5941 |
10/31/2016 | 10516.804 | 10584.9473 | 10745.7655 |
11/30/2016 | 10417.0993 | 10401.8279 | 10491.5864 |
12/31/2016 | 10426.9259 | 10409.1588 | 10506.3861 |
01/31/2017 | 10467.6535 | 10437.2888 | 10527.0016 |
02/28/2017 | 10508.7532 | 10485.7672 | 10597.7522 |
03/31/2017 | 10518.9814 | 10490.5008 | 10592.197 |
04/30/2017 | 10568.666 | 10555.767 | 10673.9358 |
05/31/2017 | 10617.7595 | 10608.4411 | 10756.0945 |
06/30/2017 | 10612.4397 | 10589.3632 | 10745.2712 |
07/31/2017 | 10646.6838 | 10638.3641 | 10791.5097 |
08/31/2017 | 10697.2462 | 10701.3353 | 10888.3034 |
09/30/2017 | 10676.8301 | 10653.0567 | 10836.4459 |
10/31/2017 | 10687.782 | 10652.1807 | 10842.724 |
11/30/2017 | 10675.6997 | 10619.4605 | 10828.8068 |
12/31/2017 | 10694.7537 | 10631.6377 | 10878.506 |
01/31/2018 | 10650.449 | 10538.0724 | 10753.2186 |
02/28/2018 | 10622.313 | 10489.6299 | 10651.2843 |
03/31/2018 | 10642.9963 | 10527.3501 | 10719.5896 |
04/30/2018 | 10616.2617 | 10472.3605 | 10639.8655 |
05/31/2018 | 10670.3919 | 10534.932 | 10715.7993 |
06/30/2018 | 10669.1244 | 10528.0058 | 10702.6209 |
07/31/2018 | 10675.7605 | 10530.7671 | 10705.1619 |
08/31/2018 | 10730.6608 | 10593.0723 | 10774.0467 |
09/30/2018 | 10704.4624 | 10550.4955 | 10704.6676 |
10/31/2018 | 10687.2065 | 10536.0027 | 10620.0741 |
11/30/2018 | 10719.3024 | 10583.559 | 10683.4727 |
12/31/2018 | 10817.418 | 10724.993 | 10879.7393 |
01/31/2019 | 10890.6226 | 10818.0666 | 10995.2773 |
02/28/2019 | 10924.3272 | 10827.3493 | 10988.9087 |
03/31/2019 | 11041.5413 | 10973.8756 | 11199.9166 |
04/30/2019 | 11076.6276 | 10994.9821 | 11202.782 |
05/31/2019 | 11169.5684 | 11138.4756 | 11401.6482 |
06/30/2019 | 11246.2834 | 11257.799 | 11544.8346 |
07/31/2019 | 11263.5897 | 11253.962 | 11570.2238 |
08/31/2019 | 11388.1541 | 11453.5004 | 11870.0302 |
09/30/2019 | 11379.7021 | 11411.9738 | 11806.8123 |
10/31/2019 | 11411.8303 | 11457.2248 | 11842.3764 |
11/30/2019 | 11414.5875 | 11440.1193 | 11836.3427 |
12/31/2019 | 11430.1579 | 11454.4942 | 11828.0976 |
01/31/2020 | 11562.699 | 11617.0809 | 12055.7234 |
02/29/2020 | 11668.8737 | 11781.061 | 12272.7065 |
03/31/2020 | 11352.3962 | 11729.4064 | 12200.4833 |
04/30/2020 | 11650.3059 | 11894.5341 | 12417.3601 |
05/31/2020 | 11827.1145 | 11984.9847 | 12475.1769 |
06/30/2020 | 12019.6685 | 12058.8984 | 12553.758 |
07/31/2020 | 12160.962 | 12148.934 | 12741.2746 |
08/31/2020 | 12173.4573 | 12134.5437 |
09/30/2020 | 12185.5268 | 12133.0427 | 12631.4992 |
10/31/2020 | 12178.6373 | 12106.4393 | 12575.0965 |
11/30/2020 | 12255.2195 | 12166.4545 | 12698.4914 |
12/31/2020 | 12306.9992 | 12191.48 | 12715.9864 |
01/31/2021 | 12296.7878 | 12157.6584 | 12624.817 |
02/28/2021 | 12225.7272 | 12058.3042 | 12442.5048 |
03/31/2021 | 12128.0706 | 11964.6876 | 12287.1394 |
04/30/2021 | 12197.3903 | 12023.96 | 12384.2096 |
05/31/2021 | 12231.5508 | 12072.2334 | 12424.6696 |
06/30/2021 | 12239.0176 | 12082.0592 | 12511.9637 |
07/31/2021 | 12307.716 | 12174.5385 | 12651.8595 |
08/31/2021 | 12297.2198 | 12154.7844 | 12627.7727 |
09/30/2021 | 12259.5344 | 12084.8973 | 12518.4439 |
10/31/2021 | 12220.875 | 12017.4282 | 12514.9938 |
11/30/2021 | 12209.4052 | 12031.3473 | 12552.0197 |
12/31/2021 | 12208.1109 | 12015.8862 | 12519.9004 |
01/31/2022 | 12081.3498 | 11839.6059 | 12250.172 |
02/28/2022 | 11945.6207 | 11761.9166 | 12113.503 |
03/31/2022 | 11740.9448 | 11474.0792 | 11776.9683 |
04/30/2022 | 11546.6352 | 11244.7048 | 11330.0576 |
05/31/2022 | 11587.2632 | 11328.4034 | 11403.1101 |
06/30/2022 | 11430.2556 | 11202.4406 | 11224.2161 |
07/31/2022 | 11581.5745 | 11385.3397 | 11498.4738 |
08/31/2022 | 11476.4691 | 11157.6558 | 11173.5652 |
09/30/2022 | 11192.0915 | 10859.3626 | 10690.7981 |
10/31/2022 | 11116.424 | 10811.5758 | 10552.327 |
11/30/2022 | 11342.8598 | 11046.3498 | 10940.3949 |
12/31/2022 | 11345.9714 | 11026.4011 | 10891.0465 |
01/31/2023 | 11616.8198 | 11232.1434 | 11226.0979 |
02/28/2023 | 11475.9183 | 11030.3918 | 10935.8444 |
03/31/2023 | 11639.3651 | 11283.5469 | 11213.6426 |
04/30/2023 | 11710.9478 | 11352.4197 | 11281.6023 |
05/31/2023 | 11653.2954 | 11268.3779 | 11158.7602 |
06/30/2023 | 11632.8208 | 11191.7746 | 11118.9646 |
07/31/2023 | 11684.8827 | 11221.0881 | 11111.2139 |
08/31/2023 | 11692.0444 | 11219.4692 | 11040.24 |
09/30/2023 | 11577.2036 | 11098.5986 | 10759.6881 |
10/31/2023 | 11512.6965 | 11047.2002 | 10589.8898 |
11/30/2023 | 11802.5346 | 11341.6308 | 11069.4673 |
12/31/2023 | 12091.6189 | 11604.5809 | 11493.195 |
01/31/2024 | 12162.6022 | 11628.8278 | 11461.6339 |
02/29/2024 | 12112.8175 | 11513.2748 | 11299.6979 |
03/31/2024 | 12192.0712 | 11587.1629 | 11404.0404 |
04/30/2024 | 12083.6342 | 11430.8211 | 11115.9877 |
05/31/2024 | 12225.21 | 11568.7101 | 11304.4398 |
06/30/2024 | 12317.7216 | 11660.9742 | 11411.4668 |
07/31/2024 | 12525.5311 | 11880.1489 | 11678.0004 |
08/31/2024 | 12646.0242 | 12016.8903 | 11845.8158 |
09/30/2024 | 12778.6631 | 12147.2281 | 12004.424 |

Effective September 30, 2024, the Fund adopted the Bloomberg U.S. Aggregate Total Return Index Value USD as its broad-based securities market index that represents the overall applicable market in which the Fund invests, and the Bloomberg U.S. Government/Credit Intermediate Total Return Index Value Unhedged as an additional index that represents the market sectors which the Fund’s advisor believes are more representative of the Fund’s investment universe.
What were the Fund costs for the past year?
(based on a hypothetical $10,000 investment)
Class Name | Costs of a $10,000 investment | Costs paid as a percentage of a $10,000 investment |
|---|
Class R5 | $52.00 | 0.49% |
End Block
Thornburg Limited Term Income Fund Tailored Shareholder Report
Thornburg Limited Term Income Fund Tailored Shareholder Report | |
Annual Performance | 1 Year | 5 Year | 10 Year |
|---|
Limited Term Income Fund Class R5 | 10.38% | 2.35% | 2.48% |
Bloomberg Intermediate U.S. Government/Credit Total Return Index Value Unhedged | 9.45% | 1.26% | 1.96% |
Bloomberg U.S. Aggregate Total Return Value Index USD | 11.57% | 0.33% | 1.84% |
Key Fund Statistics
(as of September 30, 2024)
| |
|---|
Fund Size (Millions) | $6,430.2M |
Number of Holdings | 652 |
Annual Portfolio Turnover | 59.42% |
Total Advisory Fee | $20.8M |
What did the Fund invest in?
(as of September 30, 2024)
Credit Quality Ratings | (%) |
|---|
| U.S. Government | 30.1 |
| AAA | 19.9 |
| AA | 4.6 |
| A | 17.0 |
| BBB | 20.1 |
| NR | 0.3 |
| Below Invest. Grade | 0.1 |
| Cash Equivalents & Other | 7.7 |
Credit Quality Ratings | (%) |
U.S. Government | 30.1% |
AAA | 19.9% |
AA | 4.6% |
A | 17.0% |
BBB | 20.1% |
NR | 0.3% |
Below Invest. Grade | 0.1% |
Cash Equivalents & Other | 7.7% |
Expressed as a percentage of the Fund’s net assets. * Credit quality ratings shown above reflect the highest rating assigned by either S&P Global Ratings or Moody’s Investors Services, both of which are independent, nationally recognized statistical rating organizations. If a credit rating for an investment is not available from either S&P or Moody’s, then the Fund’s investment advisor will determine the credit quality of the investment. Investments are considered to be investment grade if they are rated within the four highest grades by S&P or Moody’s (BBB/Baa or higher) or, if no credit rating is available, have been judged to be of comparable quality by the Fund’s investment advisor. (NR = Not Rated)
How has the Fund changed?
This is a summary of certain changes to the Fund since October 1, 2023. For more complete information, you may review the Fund’s next prospectus, which we expect to be available by February 1, 2025 at https://www.thornburg.com/download or upon request by calling 1-800-847-0200.
End Block
Changes In and Disagreements with Accountants
No changes and/or disagreements occurred in the current reporting period.
End Block
For additional information about the Fund, including its prospectus, financial information, holdings and proxy information, visit www.thornburg.com/download.

Thornburg Limited Term Income Fund Tailored Shareholder Report | |
Thornburg Limited Term Income Fund Tailored Shareholder Report
Thornburg Limited Term Income Fund CLASS: R6 TICKER: THRLX Annual Shareholder Report | |
This annual shareholder report contains important information about the Thornburg Limited Term Income Fund Class R6 Shares for the period from October 1, 2023 to September 30, 2024. You can find additional information about the Fund at https://www.thornburg.com/download. You can also request this information by contacting us at 1-800-847-0200. This report also describes changes to the Fund that occurred during the reporting period.
How did the Fund perform last year and what affected its performance?
The Fund’s Class R6 shares outperformed the Bloomberg Intermediate U.S. Government/Credit Total Return Index Value Unhedged (the “Index”) during the 12-month period ended September 30, 2024. Treasury yields fell meaningfully over the 12-month period ended September 30, 2024, as U.S. inflation continued to improve, and the market priced in anticipated interest rate cuts by the Federal Reserve. The Fund’s slight short duration versus the Index was a relative detractor in this environment. However, this was offset by positive relative returns from the Fund’s allocation to collateralized mortgage obligations, corporate bonds, and asset-backed securities
How did the Fund perform over the past 10 years?
The line graph below reflects a hypothetical $10,000 investment. The returns shown in the line graph and table assume the reinvestment of dividends and capital gains, but do not reflect the deduction of taxes that a shareholder would pay on distributions or the redemption of Fund shares. The performance information shown below represents past performance and is no guarantee of future results. For Fund performance current to the most recent month end, visit https://www.thornburg.com/product/mutual-funds/fli/THRLX or call 1-800-847-0200. Performance for other share classes of the Fund will vary.
Cumulative Performance
Growth Table
Date | Thornburg Limited Term Income Fund | Bloomberg Intermediate U.S. Government/Credit Total Return Index Value Unhedged | Bloomberg U.S. Aggregate Total Return Value Index USD |
04/10/2017 | 10000.0046 | 10000 | 10000 |
04/30/2017 | 10045.1968 | 10045.4473 | 10052.775 |
05/31/2017 | 10102.7155 | 10095.5748 | 10130.1526 |
06/30/2017 | 10113.7141 | 10077.4193 | 10119.9591 |
07/31/2017 | 10167.8831 | 10124.0512 | 10163.5068 |
08/31/2017 | 10217.8346 | 10183.978 | 10254.6677 |
09/30/2017 | 10192.4369 | 10138.0335 | 10205.8279 |
10/31/2017 | 10212.4385 | 10137.1998 | 10211.7408 |
11/30/2017 | 10202.8637 | 10106.0615 | 10198.6334 |
12/31/2017 | 10222.8192 | 10117.65 | 10245.4405 |
01/31/2018 | 10182.3553 | 10028.6081 | 10127.444 |
02/28/2018 | 10157.0885 | 9982.5075 | 10031.4417 |
03/31/2018 | 10179.1333 | 10018.4041 | 10095.772 |
04/30/2018 | 10155.5776 | 9966.073 | 10020.6874 |
05/31/2018 | 10209.179 | 10025.6195 | 10092.2023 |
06/30/2018 | 10202.1384 | 10019.0282 | 10079.7908 |
07/31/2018 | 10218.1464 | 10021.6559 | 10082.184 |
08/31/2018 | 10264.7734 | 10080.949 | 10147.06 |
09/30/2018 | 10249.4346 | 10040.4306 | 10081.7184 |
10/31/2018 | 10234.8511 | 10026.6385 | 10002.0477 |
11/30/2018 | 10267.4543 | 10071.8956 | 10061.7569 |
12/31/2018 | 10363.2128 | 10206.492 | 10246.602 |
01/31/2019 | 10435.2199 | 10295.0659 | 10355.4163 |
02/28/2019 | 10468.0754 | 10303.8999 | 10349.4183 |
03/31/2019 | 10580.8245 | 10443.3423 | 10548.1468 |
04/30/2019 | 10615.0451 | 10463.4284 | 10550.8454 |
05/31/2019 | 10704.5945 | 10599.9847 | 10738.1388 |
06/30/2019 | 10778.6374 | 10713.5394 | 10872.9926 |
07/31/2019 | 10795.9025 | 10709.8879 | 10896.9043 |
08/31/2019 | 10915.7371 | 10899.7796 | 11179.2637 |
09/30/2019 | 10908.3445 | 10860.2607 | 11119.7248 |
10/31/2019 | 10939.7789 | 10903.3239 | 11153.2192 |
11/30/2019 | 10943.0911 | 10887.0454 | 11147.5366 |
12/31/2019 | 10958.6901 | 10900.7254 | 11139.7713 |
01/31/2020 | 11086.1888 | 11055.4518 | 11354.1506 |
02/29/2020 | 11188.43 | 11211.5043 | 11558.5066 |
03/31/2020 | 10886.3243 | 11162.3469 | 11490.4864 |
04/30/2020 | 11172.0536 | 11319.4915 | 11694.7422 |
05/31/2020 | 11341.9589 | 11405.5692 | 11749.1944 |
06/30/2020 | 11526.915 | 11475.9096 | 11823.2026 |
07/31/2020 | 11662.8178 | 11561.5924 | 11999.8067 |
08/31/2020 | 11675.5142 | 11547.8978 | 11902.9483 |
09/30/2020 | 11687.7844 | 11546.4694 | 11896.4197 |
10/31/2020 | 11681.9165 | 11521.1521 | 11843.2992 |
11/30/2020 | 11755.9166 | 11578.2659 | 11959.5133 |
12/31/2020 | 11806.2208 | 11602.0815 | 11975.9902 |
01/31/2021 | 11797.1949 | 11569.895 | 11890.1263 |
02/28/2021 | 11729.8296 | 11475.3441 | 11718.4236 |
03/31/2021 | 11637.0619 | 11386.2534 | 11572.0996 |
04/30/2021 | 11704.1434 | 11442.6603 | 11663.5208 |
05/31/2021 | 11737.5909 | 11488.5999 | 11701.6264 |
06/30/2021 | 11745.4951 | 11497.9507 | 11783.8404 |
07/31/2021 | 11812.023 | 11585.959 | 11915.5951 |
08/31/2021 | 11802.7123 | 11567.16 | 11892.91 |
09/30/2021 | 11767.3479 | 11500.6516 | 11789.9435 |
10/31/2021 | 11731.104 | 11436.4443 | 11786.6942 |
11/30/2021 | 11720.8312 | 11449.6904 | 11821.5654 |
12/31/2021 | 11720.3488 | 11434.9768 | 11791.3153 |
01/31/2022 | 11599.663 | 11267.2188 | 11537.2834 |
02/28/2022 | 11470.2887 | 11193.2854 | 11408.5678 |
03/31/2022 | 11274.916 | 10919.3635 | 11091.6175 |
04/30/2022 | 11089.4145 | 10701.0783 | 10670.7144 |
05/31/2022 | 11129.0487 | 10780.7304 | 10739.5156 |
06/30/2022 | 10979.28 | 10660.8573 | 10571.0322 |
07/31/2022 | 11124.9852 | 10834.9141 | 10829.3297 |
08/31/2022 | 11016.351 | 10618.2377 | 10523.3289 |
09/30/2022 | 10753.1436 | 10334.3654 | 10068.656 |
10/31/2022 | 10681.3127 | 10288.8889 | 9938.2431 |
11/30/2022 | 10890.3375 | 10512.3127 | 10303.7277 |
12/31/2022 | 10902.7526 | 10493.3284 | 10257.2511 |
01/31/2023 | 11163.1095 | 10689.1241 | 10572.8045 |
02/28/2023 | 11028.6792 | 10497.1263 | 10299.4421 |
03/31/2023 | 11186.1091 | 10738.0425 | 10561.074 |
04/30/2023 | 11255.4705 | 10803.5857 | 10625.0789 |
05/31/2023 | 11200.9172 | 10723.6069 | 10509.3854 |
06/30/2023 | 11181.9974 | 10650.707 | 10471.9057 |
07/31/2023 | 11223.7776 | 10678.6033 | 10464.6061 |
08/31/2023 | 11240.2929 | 10677.0627 | 10397.7624 |
09/30/2023 | 11121.9413 | 10562.0356 | 10133.5371 |
10/31/2023 | 11060.7996 | 10513.122 | 9973.62 |
11/30/2023 | 11348.5186 | 10793.3183 | 10425.2889 |
12/31/2023 | 11617.5164 | 11043.5561 | 10824.3581 |
01/31/2024 | 11695.4064 | 11066.6308 | 10794.6337 |
02/29/2024 | 11639.2837 | 10956.6642 | 10642.1215 |
03/31/2024 | 11725.2055 | 11026.9802 | 10740.3918 |
04/30/2024 | 11612.7772 | 10878.1968 | 10469.102 |
05/31/2024 | 11749.4088 | 11009.4195 | 10646.5874 |
06/30/2024 | 11848.1458 | 11097.2231 | 10747.386 |
07/31/2024 | 12048.361 | 11305.8017 | 10998.4089 |
08/31/2024 | 12164.7924 | 11435.9324 | 11156.4585 |
09/30/2024 | 12292.8648 | 11559.969 | 11305.8365 |

Effective September 30, 2024, the Fund adopted the Bloomberg U.S. Aggregate Total Return Index Value USD as its broad-based securities market index that represents the overall applicable market in which the Fund invests, and the Bloomberg U.S. Government/Credit Intermediate Total Return Index Value Unhedged as an additional index that represents the market sectors which the Fund’s advisor believes are more representative of the Fund’s investment universe.
What were the Fund costs for the past year?
(based on a hypothetical $10,000 investment)
Class Name | Costs of a $10,000 investment | Costs paid as a percentage of a $10,000 investment |
|---|
Class R6 | $44.00 | 0.42% |
End Block
Thornburg Limited Term Income Fund Tailored Shareholder Report
Thornburg Limited Term Income Fund Tailored Shareholder Report | |
Annual Performance | 1 Year | 5 Year |
|---|
Limited Term Income Fund Class R6 | 10.53% | 2.42% |
Bloomberg Intermediate U.S. Government/Credit Total Return Index Value Unhedged | 9.45% | 1.26% |
Bloomberg U.S. Aggregate Total Return Value Index USD | 11.57% | 0.33% |
Key Fund Statistics
(as of September 30, 2024)
| |
|---|
Fund Size (Millions) | $6,430.2M |
Number of Holdings | 652 |
Annual Portfolio Turnover | 59.42% |
Total Advisory Fee | $20.8M |
What did the Fund invest in?
(as of September 30, 2024)
Credit Quality Ratings | (%) |
|---|
| U.S. Government | 30.1 |
| AAA | 19.9 |
| AA | 4.6 |
| A | 17.0 |
| BBB | 20.1 |
| NR | 0.3 |
| Below Invest. Grade | 0.1 |
| Cash Equivalents & Other | 7.7 |
Credit Quality Ratings | (%) |
U.S. Government | 30.1% |
AAA | 19.9% |
AA | 4.6% |
A | 17.0% |
BBB | 20.1% |
NR | 0.3% |
Below Invest. Grade | 0.1% |
Cash Equivalents & Other | 7.7% |
Expressed as a percentage of the Fund’s net assets. * Credit quality ratings shown above reflect the highest rating assigned by either S&P Global Ratings or Moody’s Investors Services, both of which are independent, nationally recognized statistical rating organizations. If a credit rating for an investment is not available from either S&P or Moody’s, then the Fund’s investment advisor will determine the credit quality of the investment. Investments are considered to be investment grade if they are rated within the four highest grades by S&P or Moody’s (BBB/Baa or higher) or, if no credit rating is available, have been judged to be of comparable quality by the Fund’s investment advisor. (NR = Not Rated)
How has the Fund changed?
This is a summary of certain changes to the Fund since October 1, 2023. For more complete information, you may review the Fund’s next prospectus, which we expect to be available by February 1, 2025 at https://www.thornburg.com/download or upon request by calling 1-800-847-0200.
End Block
Changes In and Disagreements with Accountants
No changes and/or disagreements occurred in the current reporting period.
End Block
For additional information about the Fund, including its prospectus, financial information, holdings and proxy information, visit www.thornburg.com/download.

Thornburg Limited Term Income Fund Tailored Shareholder Report | |
Thornburg Core Plus Bond Fund Tailored Shareholder Report
Thornburg Core Plus Bond Fund CLASS: A TICKER: THCAX Annual Shareholder Report | |
This annual shareholder report contains important information about the Thornburg Core Plus Bond Fund Class A Shares for the period from October 2, 2023 to September 30, 2024. You can find additional information about the Fund at https://www.thornburg.com/download. You can also request this information by contacting us at 1-800-847-0200. This report also describes changes to the Fund that occurred during the reporting period.
How did the Fund perform last year and what affected its performance?
The Fund’s Class A shares outperformed the Bloomberg U.S. Aggregate Total Return Index Value USD (the “Index”) during the period from the Fund’s inception on October 2, 2023 to September 30, 2024. Treasury yields fell meaningfully over the 12-month period ended September 30, 2024, as U.S. inflation continued to improve, and the market priced in anticipated interest rate cuts by the Federal Reserve. Security selection in corporate bonds, and to a lesser extent asset-backed securities, proved to be beneficial to the Fund’s relative performance. This was partially offset by performance from the Fund’s positioning along the U.S. Treasury yield curve. In particular, the Fund’s overweight to the 10-year part of the curve and underweight to the shorter part of the curve was a detractor to the Fund’s relative performance because longer-maturity securities tended to underperform shorter maturity securities during the period.
How did the Fund perform over the past 10 years?
The line graph below reflects a hypothetical $10,000 investment and assumes the deduction of the maximum sales charge associated with that investment. The returns shown in the line graph and table assume the reinvestment of dividends and capital gains, but do not reflect the deduction of taxes that a shareholder would pay on distributions or the redemption of Fund shares. The performance information shown below represents past performance and is no guarantee of future results. For Fund performance current to the most recent month end, visit https://www.thornburg.com/product/mutual-funds/fcb/THCAX or call 1-800-847-0200. Performance for other share classes of the Fund will vary.
Cumulative Performance
Growth Table
Date | Thornburg Core Plus Bond Fund | Bloomberg U.S. Aggregate Total Return Value Index USD |
10/02/2023 | 9551.1 | 10000 |
10/31/2023 | 9415.3767 | 9910.2343 |
11/30/2023 | 9886.1485 | 10359.0328 |
12/31/2023 | 10268.5481 | 10755.5657 |
01/31/2024 | 10275.269 | 10726.0302 |
02/29/2024 | 10125.3594 | 10574.4872 |
03/31/2024 | 10210.9892 | 10672.133 |
04/30/2024 | 9938.1227 | 10402.5674 |
05/31/2024 | 10121.9347 | 10578.9248 |
06/30/2024 | 10227.6145 | 10679.0828 |
07/31/2024 | 10460.2072 | 10928.5103 |
08/31/2024 | 10611.6763 | 11085.5555 |
09/30/2024 | 10745.2473 | 11233.9842 |

What were the Fund costs for the past year?
(based on a hypothetical $10,000 investment)
Class Name | Costs of a $10,000 investment | Costs paid as a percentage of a $10,000 investment |
|---|
Class A | $79.00 | 0.75% |
Fund costs may be higher for a full one year period.
End Block
Thornburg Core Plus Bond Fund Tailored Shareholder Report
Thornburg Core Plus Bond Fund Tailored Shareholder Report | |
Annual Performance | Since Inception |
|---|
Core Plus Bond Fund Class A (with sales charge) | 7.45% |
Core Plus Bond Fund Class A (without sales charge) | 12.50% |
Bloomberg U.S. Aggregate Total Return Value Index USD | 12.34% |
Key Fund Statistics
(as of September 30, 2024)
| |
|---|
Fund Size (Millions) | $165.5M |
Number of Holdings | 381 |
Annual Portfolio Turnover | 73.32% |
Total Advisory Fee | $0.0M |
What did the Fund invest in?
(as of September 30, 2024)
Credit Quality Ratings | (%) |
|---|
| U.S. Government | 46.7 |
| AAA | 10.6 |
| AA | 3.1 |
| A | 11.1 |
| BBB | 16.9 |
| NR | 2.6 |
| Below Invest. Grade | 5.7 |
| Cash Equivalents & Other | 3.3 |
Credit Quality Ratings | (%) |
U.S. Government | 46.7% |
AAA | 10.6% |
AA | 3.1% |
A | 11.1% |
BBB | 16.9% |
NR | 2.6% |
Below Invest. Grade | 5.7% |
Cash Equivalents & Other | 3.3% |

Expressed as a percentage of the Fund’s net assets. * Credit quality ratings shown above reflect the highest rating assigned by either S&P Global Ratings or Moody’s Investors Services, both of which are independent, nationally recognized statistical rating organizations. If a credit rating for an investment is not available from either S&P or Moody’s, then the Fund’s investment advisor will determine the credit quality of the investment. Investments are considered to be investment grade if they are rated within the four highest grades by S&P or Moody’s (BBB/Baa or higher) or, if no credit rating is available, have been judged to be of comparable quality by the Fund’s investment advisor. (NR = Not Rated)
How has the Fund changed?
This is a summary of certain changes to the Fund since October 2, 2023. For more complete information, you may review the Fund’s next prospectus, which we expect to be available by February 1, 2025 at https://www.thornburg.com/download or upon request by calling 1-800-847-0200.
End Block
Changes In and Disagreements with Accountants
No changes and/or disagreements occurred in the current reporting period.
End Block
For additional information about the Fund, including its prospectus, financial information, holdings and proxy information, visit www.thornburg.com/download.

Thornburg Core Plus Bond Fund Tailored Shareholder Report | |
Thornburg Core Plus Bond Fund Tailored Shareholder Report
Thornburg Core Plus Bond Fund CLASS: C TICKER: THCCX Annual Shareholder Report | |
This annual shareholder report contains important information about the Thornburg Core Plus Bond Fund Class C Shares for the period from October 2, 2023 to September 30, 2024. You can find additional information about the Fund at https://www.thornburg.com/download. You can also request this information by contacting us at 1-800-847-0200. This report also describes changes to the Fund that occurred during the reporting period.
How did the Fund perform last year and what affected its performance?
The Fund’s Class C shares underperformed the Bloomberg U.S. Aggregate Total Return Index Value USD (the “Index”) during the period from the Fund’s inception on October 2, 2023 to September 30, 2024. Treasury yields fell meaningfully over the 12-month period ended September 30, 2024, as U.S. inflation continued to improve, and the market priced in anticipated interest rate cuts by the Federal Reserve. Security selection in corporate bonds, and to a lesser extent asset-backed securities, proved to be beneficial to the Fund’s relative performance. This was partially offset by performance from the Fund’s positioning along the U.S. Treasury yield curve. In particular, the Fund’s overweight to the 10-year part of the curve and underweight to the shorter part of the curve was a detractor to the Fund’s relative performance because longer-maturity securities tended to underperform shorter maturity securities during the period.
How did the Fund perform over the past 10 years?
The line graph below reflects a hypothetical $10,000 investment. The returns shown in the line graph and table assume the reinvestment of dividends and capital gains, but do not reflect the deduction of taxes that a shareholder would pay on distributions or the redemption of Fund shares. The performance information shown below represents past performance and is no guarantee of future results. For Fund performance current to the most recent month end, visit https://www.thornburg.com/product/mutual-funds/fcb/THCCX or call 1-800-847-0200. Performance for other share classes of the Fund will vary.
Cumulative Performance
Growth Table
Date | Thornburg Core Plus Bond Fund | Bloomberg U.S. Aggregate Total Return Value Index USD |
10/02/2023 | 10000 | 10000 |
10/31/2023 | 9852.1409 | 9910.2343 |
11/30/2023 | 10336.9707 | 10359.0328 |
12/31/2023 | 10732.0267 | 10755.5657 |
01/31/2024 | 10732.2032 | 10726.0302 |
02/29/2024 | 10569.3459 | 10574.4872 |
03/31/2024 | 10662.1559 | 10672.133 |
04/30/2024 | 10371.7673 | 10402.5674 |
05/31/2024 | 10546.6426 | 10578.9248 |
06/30/2024 | 10649.9725 | 10679.0828 |
07/31/2024 | 10885.219 | 10928.5103 |
08/31/2024 | 11036.0102 | 11085.5555 |
09/30/2024 | 11178.2135 | 11233.9842 |

What were the Fund costs for the past year?
(based on a hypothetical $10,000 investment)
Class Name | Costs of a $10,000 investment | Costs paid as a percentage of a $10,000 investment |
|---|
Class C | $158.00 | 1.50% |
Fund costs may be higher for a full one year period.
End Block
Thornburg Core Plus Bond Fund Tailored Shareholder Report
Thornburg Core Plus Bond Fund Tailored Shareholder Report | |
Annual Performance | Since Inception |
|---|
Core Plus Bond Fund Class C (with sales charge) | 10.78% |
Core Plus Bond Fund Class C (without sales charge) | 11.78% |
Bloomberg U.S. Aggregate Total Return Value Index USD | 12.34% |
Key Fund Statistics
(as of September 30, 2024)
| |
|---|
Fund Size (Millions) | $165.5M |
Number of Holdings | 381 |
Annual Portfolio Turnover | 73.32% |
Total Advisory Fee | $0.0M |
What did the Fund invest in?
(as of September 30, 2024)
Credit Quality Ratings | (%) |
|---|
| U.S. Government | 46.7 |
| AAA | 10.6 |
| AA | 3.1 |
| A | 11.1 |
| BBB | 16.9 |
| NR | 2.6 |
| Below Invest. Grade | 5.7 |
| Cash Equivalents & Other | 3.3 |
Credit Quality Ratings | (%) |
U.S. Government | 46.7% |
AAA | 10.6% |
AA | 3.1% |
A | 11.1% |
BBB | 16.9% |
NR | 2.6% |
Below Invest. Grade | 5.7% |
Cash Equivalents & Other | 3.3% |
Expressed as a percentage of the Fund’s net assets. * Credit quality ratings shown above reflect the highest rating assigned by either S&P Global Ratings or Moody’s Investors Services, both of which are independent, nationally recognized statistical rating organizations. If a credit rating for an investment is not available from either S&P or Moody’s, then the Fund’s investment advisor will determine the credit quality of the investment. Investments are considered to be investment grade if they are rated within the four highest grades by S&P or Moody’s (BBB/Baa or higher) or, if no credit rating is available, have been judged to be of comparable quality by the Fund’s investment advisor. (NR = Not Rated)
How has the Fund changed?
This is a summary of certain changes to the Fund since October 2, 2023. For more complete information, you may review the Fund’s next prospectus, which we expect to be available by February 1, 2025 at https://www.thornburg.com/download or upon request by calling 1-800-847-0200.
End Block
Changes In and Disagreements with Accountants
No changes and/or disagreements occurred in the current reporting period.
End Block
For additional information about the Fund, including its prospectus, financial information, holdings and proxy information, visit www.thornburg.com/download.

Thornburg Core Plus Bond Fund Tailored Shareholder Report | |
Thornburg Core Plus Bond Fund Tailored Shareholder Report
Thornburg Core Plus Bond Fund CLASS: I TICKER: THCIX Annual Shareholder Report | |
This annual shareholder report contains important information about the Thornburg Core Plus Bond Fund Class I Shares for the period from October 2, 2023 to September 30, 2024. You can find additional information about the Fund at https://www.thornburg.com/download. You can also request this information by contacting us at 1-800-847-0200. This report also describes changes to the Fund that occurred during the reporting period.
How did the Fund perform last year and what affected its performance?
The Fund’s Class I shares outperformed the Bloomberg U.S. Aggregate Total Return Index Value USD (the “Index”) during the period from the Fund’s inception on October 2, 2023 to September 30, 2024. Treasury yields fell meaningfully over the 12-month period ended September 30, 2024, as U.S. inflation continued to improve, and the market priced in anticipated interest rate cuts by the Federal Reserve. Security selection in corporate bonds, and to a lesser extent asset-backed securities, proved to be beneficial to the Fund’s relative performance. This was partially offset by performance from the Fund’s positioning along the U.S. Treasury yield curve. In particular, the Fund’s overweight to the 10-year part of the curve and underweight to the shorter part of the curve was a detractor to the Fund’s relative performance because longer-maturity securities tended to underperform shorter maturity securities during the period.
How did the Fund perform over the past 10 years?
The line graph below reflects a hypothetical $10,000 investment. The returns shown in the line graph and table assume the reinvestment of dividends and capital gains, but do not reflect the deduction of taxes that a shareholder would pay on distributions or the redemption of Fund shares. The performance information shown below represents past performance and is no guarantee of future results. For Fund performance current to the most recent month end, visit https://www.thornburg.com/product/mutual-funds/fcb/THCIX or call 1-800-847-0200. Performance for other share classes of the Fund will vary.
Cumulative Performance
Growth Table
Date | Thornburg Core Plus Bond Fund | Bloomberg U.S. Aggregate Total Return Value Index USD |
10/02/2023 | 10000 | 10000 |
10/31/2023 | 9859.8496 | 9910.2343 |
11/30/2023 | 10345.5479 | 10359.0328 |
12/31/2023 | 10758.9632 | 10755.5657 |
01/31/2024 | 10768.3492 | 10726.0302 |
02/29/2024 | 10613.3489 | 10574.4872 |
03/31/2024 | 10705.3602 | 10672.133 |
04/30/2024 | 10422.4091 | 10402.5674 |
05/31/2024 | 10617.3382 | 10578.9248 |
06/30/2024 | 10730.397 | 10679.0828 |
07/31/2024 | 10976.7037 | 10928.5103 |
08/31/2024 | 11127.3458 | 11085.5555 |
09/30/2024 | 11280.3632 | 11233.9842 |

What were the Fund costs for the past year?
(based on a hypothetical $10,000 investment)
Class Name | Costs of a $10,000 investment | Costs paid as a percentage of a $10,000 investment |
|---|
Class I | $48.00 | 0.46% |
Fund costs may be higher for a full one year period.
End Block
Thornburg Core Plus Bond Fund Tailored Shareholder Report
Thornburg Core Plus Bond Fund Tailored Shareholder Report | |
Annual Performance | Since Inception |
|---|
Core Plus Bond Fund Class I | 12.80% |
Bloomberg U.S. Aggregate Total Return Value Index USD | 12.34% |
Key Fund Statistics
(as of September 30, 2024)
| |
|---|
Fund Size (Millions) | $165.5M |
Number of Holdings | 381 |
Annual Portfolio Turnover | 73.32% |
Total Advisory Fee | $0.0M |
What did the Fund invest in?
(as of September 30, 2024)
Credit Quality Ratings | (%) |
|---|
| U.S. Government | 46.7 |
| AAA | 10.6 |
| AA | 3.1 |
| A | 11.1 |
| BBB | 16.9 |
| NR | 2.6 |
| Below Invest. Grade | 5.7 |
| Cash Equivalents & Other | 3.3 |
Credit Quality Ratings | (%) |
U.S. Government | 46.7% |
AAA | 10.6% |
AA | 3.1% |
A | 11.1% |
BBB | 16.9% |
NR | 2.6% |
Below Invest. Grade | 5.7% |
Cash Equivalents & Other | 3.3% |
Expressed as a percentage of the Fund’s net assets. * Credit quality ratings shown above reflect the highest rating assigned by either S&P Global Ratings or Moody’s Investors Services, both of which are independent, nationally recognized statistical rating organizations. If a credit rating for an investment is not available from either S&P or Moody’s, then the Fund’s investment advisor will determine the credit quality of the investment. Investments are considered to be investment grade if they are rated within the four highest grades by S&P or Moody’s (BBB/Baa or higher) or, if no credit rating is available, have been judged to be of comparable quality by the Fund’s investment advisor. (NR = Not Rated)
How has the Fund changed?
This is a summary of certain changes to the Fund since October 2, 2023. For more complete information, you may review the Fund’s next prospectus, which we expect to be available by February 1, 2025 at https://www.thornburg.com/download or upon request by calling 1-800-847-0200.
End Block
Changes In and Disagreements with Accountants
No changes and/or disagreements occurred in the current reporting period.
End Block
For additional information about the Fund, including its prospectus, financial information, holdings and proxy information, visit www.thornburg.com/download.

Thornburg Core Plus Bond Fund Tailored Shareholder Report | |
Thornburg Core Plus Bond Fund Tailored Shareholder Report
Thornburg Core Plus Bond Fund CLASS: R3 TICKER: THCHX Annual Shareholder Report | |
This annual shareholder report contains important information about the Thornburg Core Plus Bond Fund Class R3 Shares for the period from October 2, 2023 to September 30, 2024. You can find additional information about the Fund at https://www.thornburg.com/download. You can also request this information by contacting us at 1-800-847-0200. This report also describes changes to the Fund that occurred during the reporting period.
How did the Fund perform last year and what affected its performance?
The Fund’s Class R3 shares performed in-line with the Bloomberg U.S. Aggregate Total Return Index Value USD (the “Index”) during the period from the Fund’s inception on October 2, 2023 to September 30, 2024. Treasury yields fell meaningfully over the 12-month period ended September 30, 2024, as U.S. inflation continued to improve, and the market priced in anticipated interest rate cuts by the Federal Reserve. Security selection in corporate bonds, and to a lesser extent asset-backed securities, proved to be beneficial to the Fund’s relative performance. This was partially offset by performance from the Fund’s positioning along the U.S. Treasury yield curve. In particular, the Fund’s overweight to the 10-year part of the curve and underweight to the shorter part of the curve was a detractor to the Fund’s relative performance because longer-maturity securities tended to underperform shorter maturity securities during the period.
How did the Fund perform over the past 10 years?
The line graph below reflects a hypothetical $10,000 investment. The returns shown in the line graph and table assume the reinvestment of dividends and capital gains, but do not reflect the deduction of taxes that a shareholder would pay on distributions or the redemption of Fund shares. The performance information shown below represents past performance and is no guarantee of future results. For Fund performance current to the most recent month end, visit https://www.thornburg.com/product/mutual-funds/fcb/THCHX or call 1-800-847-0200. Performance for other share classes of the Fund will vary.
Cumulative Performance
Growth Table
Date | Thornburg Core Plus Bond Fund | Bloomberg U.S. Aggregate Total Return Value Index USD |
10/02/2023 | 10000 | 10000 |
10/31/2023 | 9855.9412 | 9910.2343 |
11/30/2023 | 10335.5752 | 10359.0328 |
12/31/2023 | 10745.2186 | 10755.5657 |
01/31/2024 | 10750.0112 | 10726.0302 |
02/29/2024 | 10591.0611 | 10574.4872 |
03/31/2024 | 10678.3734 | 10672.133 |
04/30/2024 | 10390.4276 | 10402.5674 |
05/31/2024 | 10570.2126 | 10578.9248 |
06/30/2024 | 10688.7889 | 10679.0828 |
07/31/2024 | 10929.6346 | 10928.5103 |
08/31/2024 | 11075.4076 | 11085.5555 |
09/30/2024 | 11223.2152 | 11233.9842 |
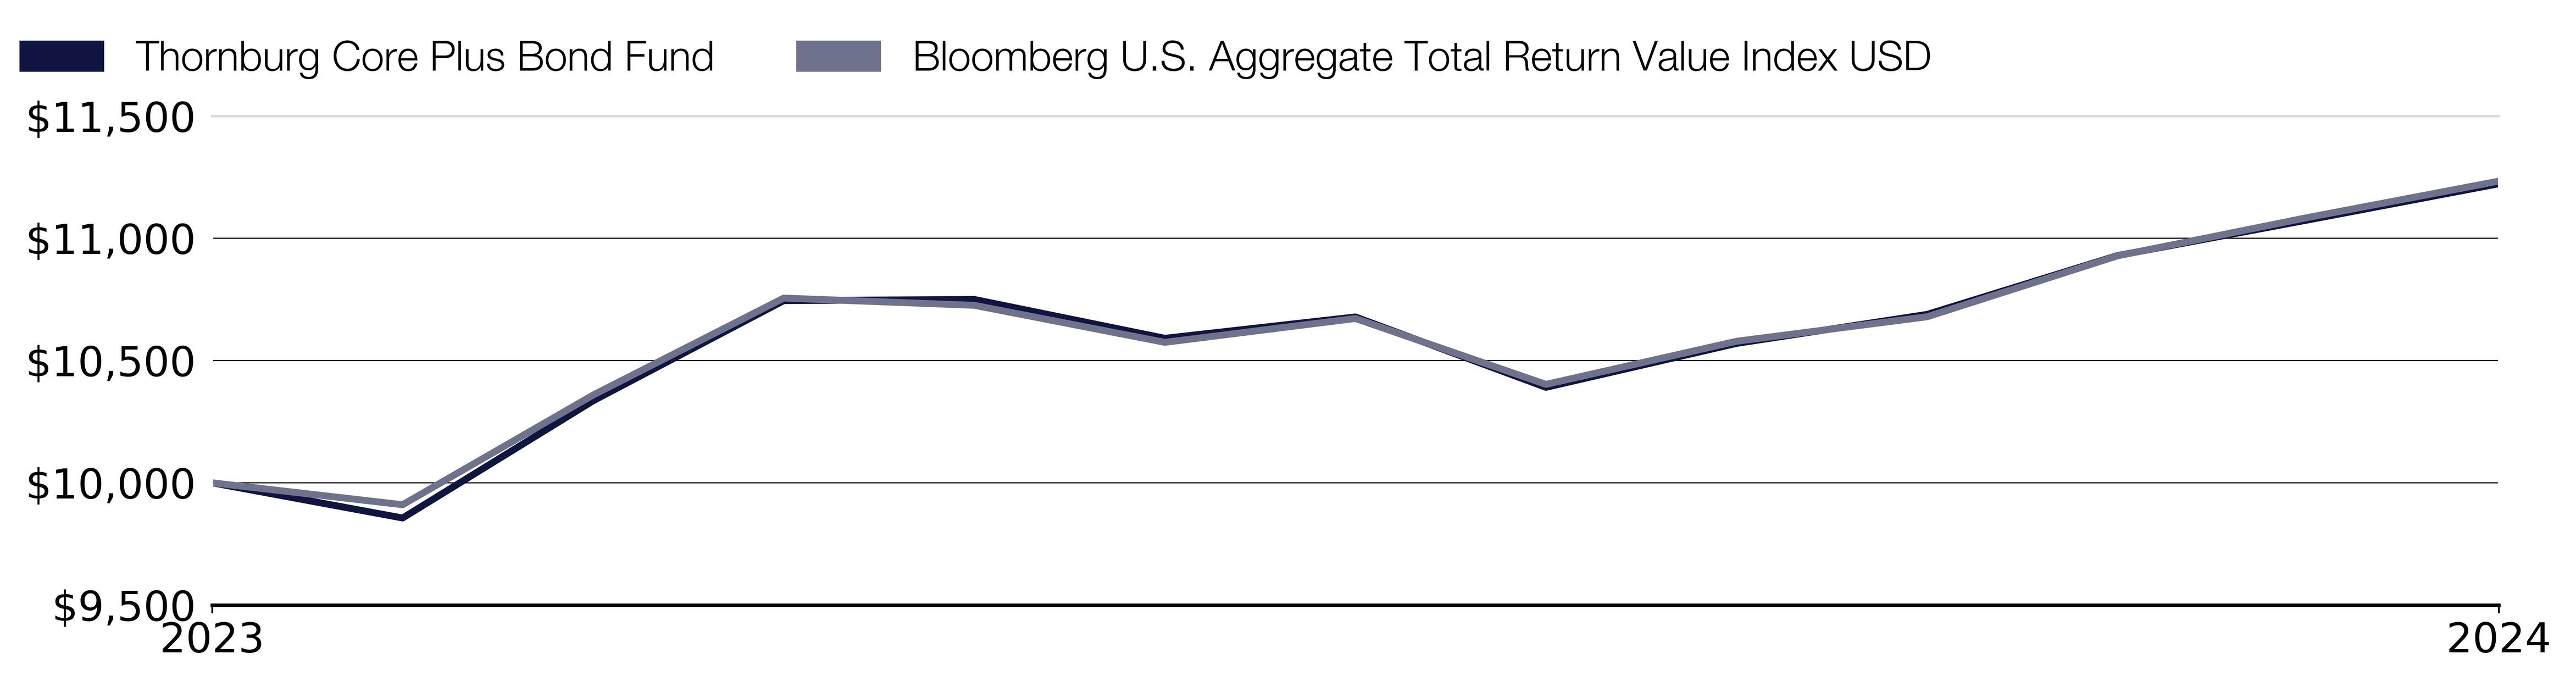
What were the Fund costs for the past year?
(based on a hypothetical $10,000 investment)
Class Name | Costs of a $10,000 investment | Costs paid as a percentage of a $10,000 investment |
|---|
Class R3 | $106.00 | 1.00% |
Fund costs may be higher for a full one year period.
End Block
Thornburg Core Plus Bond Fund Tailored Shareholder Report
Thornburg Core Plus Bond Fund Tailored Shareholder Report | |
Annual Performance | Since Inception |
|---|
Core Plus Bond Fund Class R3 | 12.23% |
Bloomberg U.S. Aggregate Total Return Value Index USD | 12.34% |
Key Fund Statistics
(as of September 30, 2024)
| |
|---|
Fund Size (Millions) | $165.5M |
Number of Holdings | 381 |
Annual Portfolio Turnover | 73.32% |
Total Advisory Fee | $0.0M |
What did the Fund invest in?
(as of September 30, 2024)
Credit Quality Ratings | (%) |
|---|
| U.S. Government | 46.7 |
| AAA | 10.6 |
| AA | 3.1 |
| A | 11.1 |
| BBB | 16.9 |
| NR | 2.6 |
| Below Invest. Grade | 5.7 |
| Cash Equivalents & Other | 3.3 |
Credit Quality Ratings | (%) |
U.S. Government | 46.7% |
AAA | 10.6% |
AA | 3.1% |
A | 11.1% |
BBB | 16.9% |
NR | 2.6% |
Below Invest. Grade | 5.7% |
Cash Equivalents & Other | 3.3% |
Expressed as a percentage of the Fund’s net assets. * Credit quality ratings shown above reflect the highest rating assigned by either S&P Global Ratings or Moody’s Investors Services, both of which are independent, nationally recognized statistical rating organizations. If a credit rating for an investment is not available from either S&P or Moody’s, then the Fund’s investment advisor will determine the credit quality of the investment. Investments are considered to be investment grade if they are rated within the four highest grades by S&P or Moody’s (BBB/Baa or higher) or, if no credit rating is available, have been judged to be of comparable quality by the Fund’s investment advisor. (NR = Not Rated)
How has the Fund changed?
This is a summary of certain changes to the Fund since October 2, 2023. For more complete information, you may review the Fund’s next prospectus, which we expect to be available by February 1, 2025 at https://www.thornburg.com/download or upon request by calling 1-800-847-0200.
End Block
Changes In and Disagreements with Accountants
No changes and/or disagreements occurred in the current reporting period.
End Block
For additional information about the Fund, including its prospectus, financial information, holdings and proxy information, visit www.thornburg.com/download.

Thornburg Core Plus Bond Fund Tailored Shareholder Report | |
Thornburg Core Plus Bond Fund Tailored Shareholder Report
Thornburg Core Plus Bond Fund CLASS: R4 TICKER: THCEX Annual Shareholder Report | |
This annual shareholder report contains important information about the Thornburg Core Plus Bond Fund Class R4 Shares for the period from October 2, 2023 to September 30, 2024. You can find additional information about the Fund at https://www.thornburg.com/download. You can also request this information by contacting us at 1-800-847-0200. This report also describes changes to the Fund that occurred during the reporting period.
How did the Fund perform last year and what affected its performance?
The Fund’s Class R4 shares outperformed the Bloomberg U.S. Aggregate Total Return Index Value USD (the “Index”) during the period from the Fund’s inception on October 2, 2023 to September 30, 2024. Treasury yields fell meaningfully over the 12-month period ended September 30, 2024, as U.S. inflation continued to improve, and the market priced in anticipated interest rate cuts by the Federal Reserve. Security selection in corporate bonds, and to a lesser extent asset-backed securities, proved to be beneficial to the Fund’s relative performance. This was partially offset by performance from the Fund’s positioning along the U.S. Treasury yield curve. In particular, the Fund’s overweight to the 10-year part of the curve and underweight to the shorter part of the curve was a detractor to the Fund’s relative performance because longer-maturity securities tended to underperform shorter maturity securities during the period.
How did the Fund perform over the past 10 years?
The line graph below reflects a hypothetical $10,000 investment. The returns shown in the line graph and table assume the reinvestment of dividends and capital gains, but do not reflect the deduction of taxes that a shareholder would pay on distributions or the redemption of Fund shares. The performance information shown below represents past performance and is no guarantee of future results. For Fund performance current to the most recent month end, visit https://www.thornburg.com/product/mutual-funds/fcb/THCEX or call 1-800-847-0200. Performance for other share classes of the Fund will vary.
Cumulative Performance
Growth Table
Date | Thornburg Core Plus Bond Fund | Bloomberg U.S. Aggregate Total Return Value Index USD |
10/02/2023 | 10000 | 10000 |
10/31/2023 | 9857.9052 | 9910.2343 |
11/30/2023 | 10339.7099 | 10359.0328 |
12/31/2023 | 10751.6922 | 10755.5657 |
01/31/2024 | 10758.7986 | 10726.0302 |
02/29/2024 | 10601.8251 | 10574.4872 |
03/31/2024 | 10691.4693 | 10672.133 |
04/30/2024 | 10405.3334 | 10402.5674 |
05/31/2024 | 10587.5484 | 10578.9248 |
06/30/2024 | 10708.559 | 10679.0828 |
07/31/2024 | 10952.1266 | 10928.5103 |
08/31/2024 | 11100.4732 | 11085.5555 |
09/30/2024 | 11250.9951 | 11233.9842 |
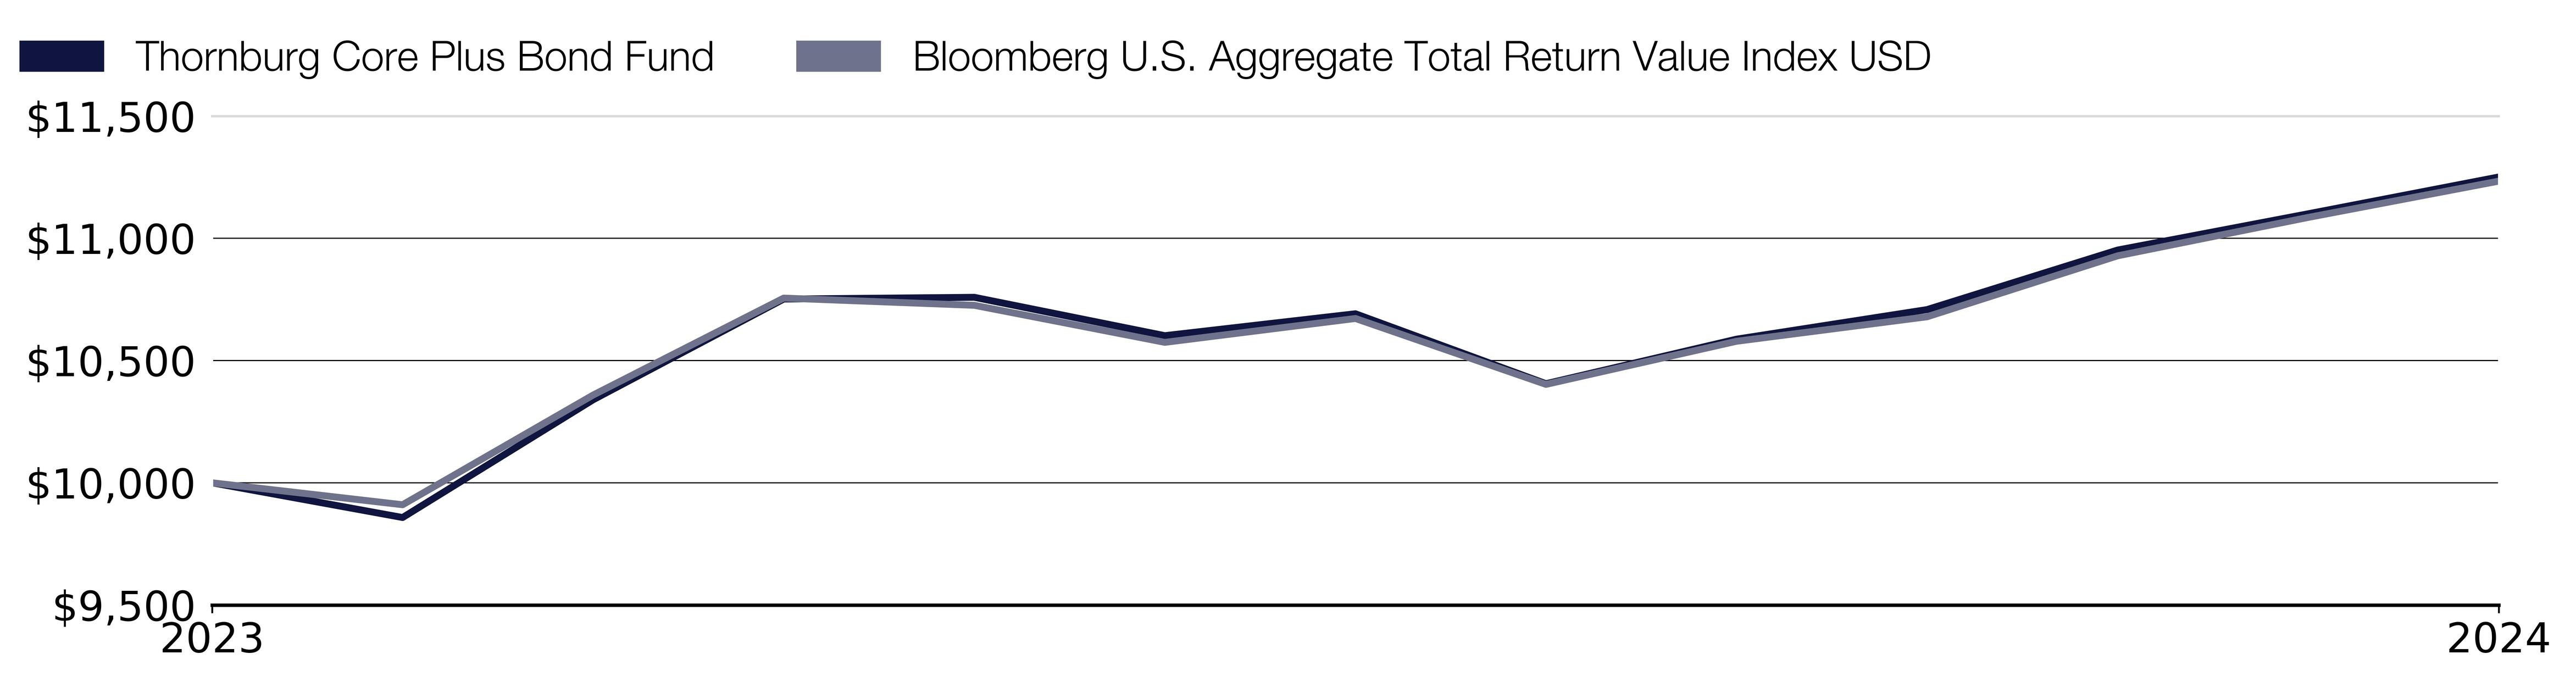
What were the Fund costs for the past year?
(based on a hypothetical $10,000 investment)
Class Name | Costs of a $10,000 investment | Costs paid as a percentage of a $10,000 investment |
|---|
Class R4 | $79.00 | 0.75% |
Fund costs may be higher for a full one year period.
End Block
Thornburg Core Plus Bond Fund Tailored Shareholder Report
Thornburg Core Plus Bond Fund Tailored Shareholder Report | |
Annual Performance | Since Inception |
|---|
Core Plus Bond Fund Class R4 | 12.51% |
Bloomberg U.S. Aggregate Total Return Value Index USD | 12.34% |
Key Fund Statistics
(as of September 30, 2024)
| |
|---|
Fund Size (Millions) | $165.5M |
Number of Holdings | 381 |
Annual Portfolio Turnover | 73.32% |
Total Advisory Fee | $0.0M |
What did the Fund invest in?
(as of September 30, 2024)
Credit Quality Ratings | (%) |
|---|
| U.S. Government | 46.7 |
| AAA | 10.6 |
| AA | 3.1 |
| A | 11.1 |
| BBB | 16.9 |
| NR | 2.6 |
| Below Invest. Grade | 5.7 |
| Cash Equivalents & Other | 3.3 |
Credit Quality Ratings | (%) |
U.S. Government | 46.7% |
AAA | 10.6% |
AA | 3.1% |
A | 11.1% |
BBB | 16.9% |
NR | 2.6% |
Below Invest. Grade | 5.7% |
Cash Equivalents & Other | 3.3% |
Expressed as a percentage of the Fund’s net assets. * Credit quality ratings shown above reflect the highest rating assigned by either S&P Global Ratings or Moody’s Investors Services, both of which are independent, nationally recognized statistical rating organizations. If a credit rating for an investment is not available from either S&P or Moody’s, then the Fund’s investment advisor will determine the credit quality of the investment. Investments are considered to be investment grade if they are rated within the four highest grades by S&P or Moody’s (BBB/Baa or higher) or, if no credit rating is available, have been judged to be of comparable quality by the Fund’s investment advisor. (NR = Not Rated)
How has the Fund changed?
This is a summary of certain changes to the Fund since October 2, 2023. For more complete information, you may review the Fund’s next prospectus, which we expect to be available by February 1, 2025 at https://www.thornburg.com/download or upon request by calling 1-800-847-0200.
End Block
Changes In and Disagreements with Accountants
No changes and/or disagreements occurred in the current reporting period.
End Block
For additional information about the Fund, including its prospectus, financial information, holdings and proxy information, visit www.thornburg.com/download.

Thornburg Core Plus Bond Fund Tailored Shareholder Report | |
Thornburg Core Plus Bond Fund Tailored Shareholder Report
Thornburg Core Plus Bond Fund CLASS: R5 TICKER: THCFX Annual Shareholder Report | |
This annual shareholder report contains important information about the Thornburg Core Plus Bond Fund Class R5 Shares for the period from October 2, 2023 to September 30, 2024. You can find additional information about the Fund at https://www.thornburg.com/download. You can also request this information by contacting us at 1-800-847-0200. This report also describes changes to the Fund that occurred during the reporting period.
How did the Fund perform last year and what affected its performance?
The Fund’s Class R5 shares outperformed the Bloomberg U.S. Aggregate Total Return Index Value USD (the “Index”) during the period from the Fund’s inception on October 2, 2023 to September 30, 2024. Treasury yields fell meaningfully over the 12-month period ended September 30, 2024, as U.S. inflation continued to improve, and the market priced in anticipated interest rate cuts by the Federal Reserve. Security selection in corporate bonds, and to a lesser extent asset-backed securities, proved to be beneficial to the Fund’s relative performance. This was partially offset by performance from the Fund’s positioning along the U.S. Treasury yield curve. In particular, the Fund’s overweight to the 10-year part of the curve and underweight to the shorter part of the curve was a detractor to the Fund’s relative performance because longer-maturity securities tended to underperform shorter maturity securities during the period.
How did the Fund perform over the past 10 years?
The line graph below reflects a hypothetical $10,000 investment. The returns shown in the line graph and table assume the reinvestment of dividends and capital gains, but do not reflect the deduction of taxes that a shareholder would pay on distributions or the redemption of Fund shares. The performance information shown below represents past performance and is no guarantee of future results. For Fund performance current to the most recent month end, visit https://www.thornburg.com/product/mutual-funds/fcb/THCFX or call 1-800-847-0200. Performance for other share classes of the Fund will vary.
Cumulative Performance
Growth Table
Date | Thornburg Core Plus Bond Fund | Bloomberg U.S. Aggregate Total Return Value Index USD |
10/02/2023 | 10000 | 10000 |
10/31/2023 | 9859.8594 | 9910.2343 |
11/30/2023 | 10343.8345 | 10359.0328 |
12/31/2023 | 10758.1659 | 10755.5657 |
01/31/2024 | 10767.586 | 10726.0302 |
02/29/2024 | 10612.589 | 10574.4872 |
03/31/2024 | 10704.5862 | 10672.133 |
04/30/2024 | 10420.2392 | 10402.5674 |
05/31/2024 | 10604.9047 | 10578.9248 |
06/30/2024 | 10728.3497 | 10679.0828 |
07/31/2024 | 10974.6503 | 10928.5103 |
08/31/2024 | 11125.5706 | 11085.5555 |
09/30/2024 | 11278.8288 | 11233.9842 |
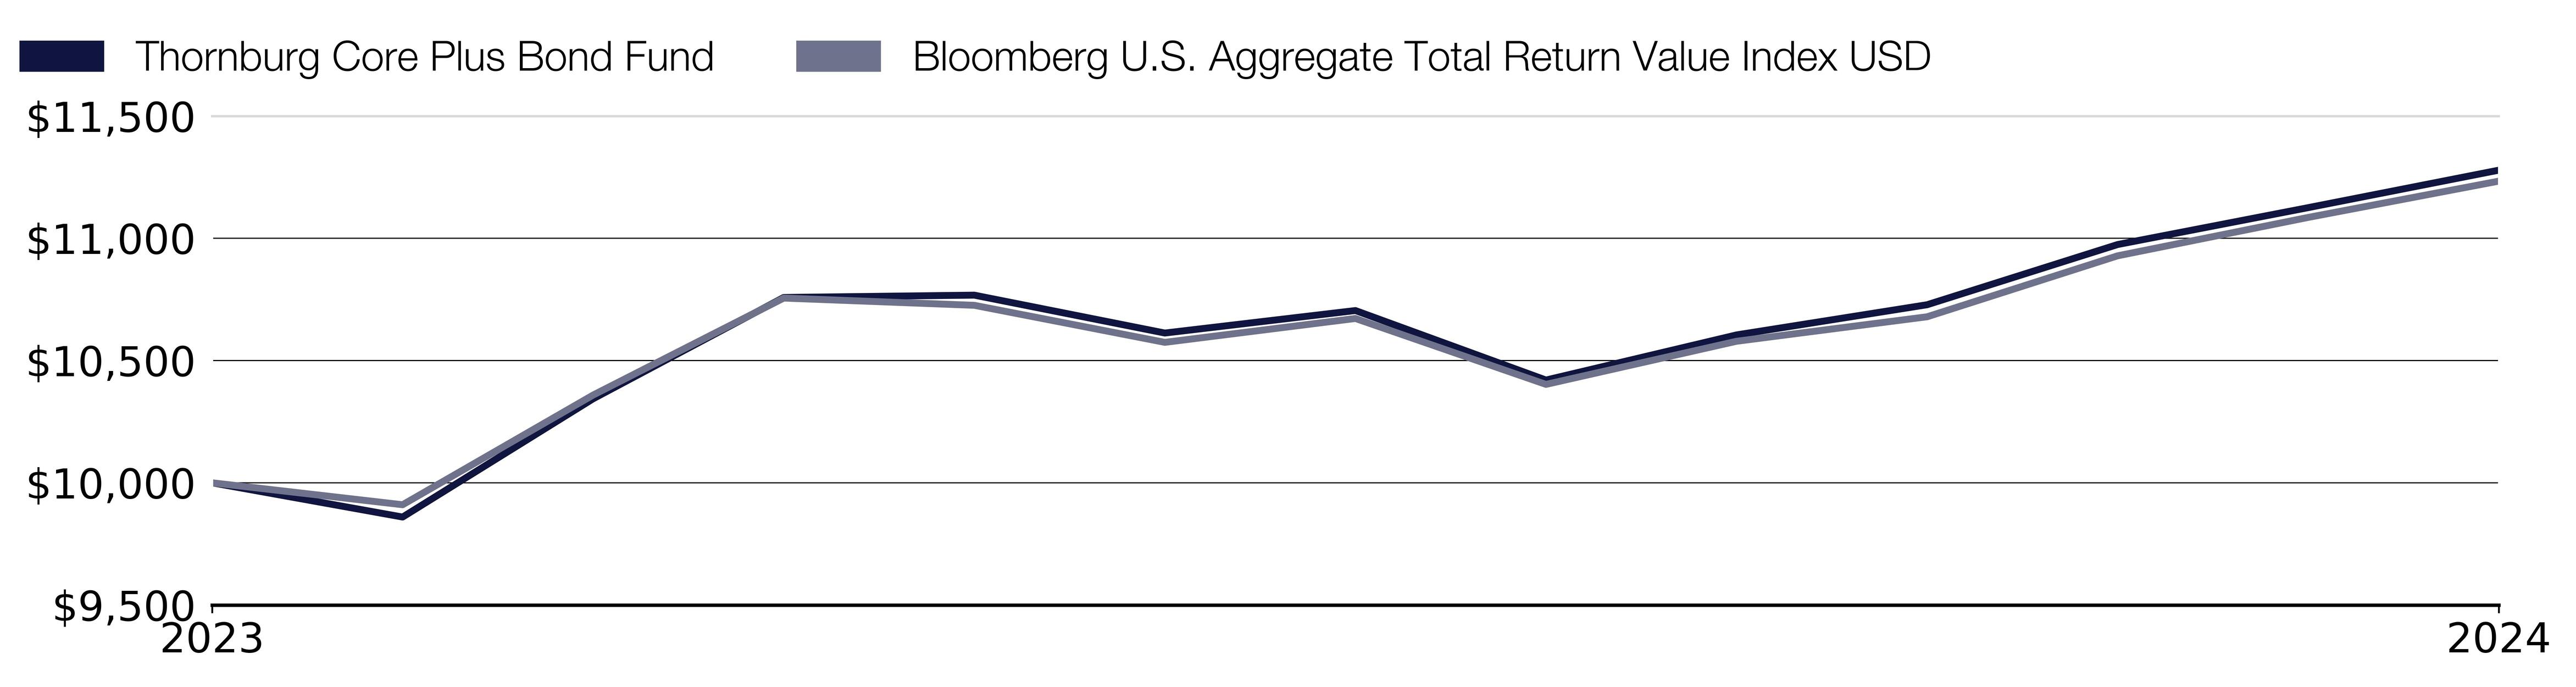
What were the Fund costs for the past year?
(based on a hypothetical $10,000 investment)
Class Name | Costs of a $10,000 investment | Costs paid as a percentage of a $10,000 investment |
|---|
Class R5 | $53.00 | 0.50% |
Fund costs may be higher for a full one year period.
End Block
Thornburg Core Plus Bond Fund Tailored Shareholder Report
Thornburg Core Plus Bond Fund Tailored Shareholder Report | |
Annual Performance | Since Inception |
|---|
Core Plus Bond Fund Class R5 | 12.79% |
Bloomberg U.S. Aggregate Total Return Value Index USD | 12.34% |
Key Fund Statistics
(as of September 30, 2024)
| |
|---|
Fund Size (Millions) | $165.5M |
Number of Holdings | 381 |
Annual Portfolio Turnover | 73.32% |
Total Advisory Fee | $0.0M |
What did the Fund invest in?
(as of September 30, 2024)
Credit Quality Ratings | (%) |
|---|
| U.S. Government | 46.7 |
| AAA | 10.6 |
| AA | 3.1 |
| A | 11.1 |
| BBB | 16.9 |
| NR | 2.6 |
| Below Invest. Grade | 5.7 |
| Cash Equivalents & Other | 3.3 |
Credit Quality Ratings | (%) |
U.S. Government | 46.7% |
AAA | 10.6% |
AA | 3.1% |
A | 11.1% |
BBB | 16.9% |
NR | 2.6% |
Below Invest. Grade | 5.7% |
Cash Equivalents & Other | 3.3% |
Expressed as a percentage of the Fund’s net assets. * Credit quality ratings shown above reflect the highest rating assigned by either S&P Global Ratings or Moody’s Investors Services, both of which are independent, nationally recognized statistical rating organizations. If a credit rating for an investment is not available from either S&P or Moody’s, then the Fund’s investment advisor will determine the credit quality of the investment. Investments are considered to be investment grade if they are rated within the four highest grades by S&P or Moody’s (BBB/Baa or higher) or, if no credit rating is available, have been judged to be of comparable quality by the Fund’s investment advisor. (NR = Not Rated)
How has the Fund changed?
This is a summary of certain changes to the Fund since October 2, 2023. For more complete information, you may review the Fund’s next prospectus, which we expect to be available by February 1, 2025 at https://www.thornburg.com/download or upon request by calling 1-800-847-0200.
End Block
Changes In and Disagreements with Accountants
No changes and/or disagreements occurred in the current reporting period.
End Block
For additional information about the Fund, including its prospectus, financial information, holdings and proxy information, visit www.thornburg.com/download.

Thornburg Core Plus Bond Fund Tailored Shareholder Report | |
Thornburg Core Plus Bond Fund Tailored Shareholder Report
Thornburg Core Plus Bond Fund CLASS: R6 TICKER: THCSX Annual Shareholder Report | |
This annual shareholder report contains important information about the Thornburg Core Plus Bond Fund Class R6 Shares for the period from October 2, 2023 to September 30, 2024. You can find additional information about the Fund at https://www.thornburg.com/download. You can also request this information by contacting us at 1-800-847-0200. This report also describes changes to the Fund that occurred during the reporting period.
How did the Fund perform last year and what affected its performance?
The Fund’s Class R6 shares outperformed the Bloomberg U.S. Aggregate Total Return Index Value USD (the “Index”) during the period from the Fund’s inception on October 2, 2023 to September 30, 2024. Treasury yields fell meaningfully over the 12-month period ended September 30, 2024, as U.S. inflation continued to improve, and the market priced in anticipated interest rate cuts by the Federal Reserve. Security selection in corporate bonds, and to a lesser extent asset-backed securities, proved to be beneficial to the Fund’s relative performance. This was partially offset by performance from the Fund’s positioning along the U.S. Treasury yield curve. In particular, the Fund’s overweight to the 10-year part of the curve and underweight to the shorter part of the curve was a detractor to the Fund’s relative performance because longer-maturity securities tended to underperform shorter maturity securities during the period.
How did the Fund perform over the past 10 years?
The line graph below reflects a hypothetical $10,000 investment. The returns shown in the line graph and table assume the reinvestment of dividends and capital gains, but do not reflect the deduction of taxes that a shareholder would pay on distributions or the redemption of Fund shares. The performance information shown below represents past performance and is no guarantee of future results. For Fund performance current to the most recent month end, visit https://www.thornburg.com/product/mutual-funds/fcb/THCSX or call 1-800-847-0200. Performance for other share classes of the Fund will vary.
Cumulative Performance
Growth Table
Date | Thornburg Core Plus Bond Fund | Bloomberg U.S. Aggregate Total Return Value Index USD |
10/02/2023 | 10000 | 10000 |
10/31/2023 | 9859.9379 | 9910.2343 |
11/30/2023 | 10344.0089 | 10359.0328 |
12/31/2023 | 10758.4317 | 10755.5657 |
01/31/2024 | 10767.9464 | 10726.0302 |
02/29/2024 | 10613.3802 | 10574.4872 |
03/31/2024 | 10705.4857 | 10672.133 |
04/30/2024 | 10422.6018 | 10402.5674 |
05/31/2024 | 10617.6672 | 10578.9248 |
06/30/2024 | 10730.8727 | 10679.0828 |
07/31/2024 | 10977.3144 | 10928.5103 |
08/31/2024 | 11128.345 | 11085.5555 |
09/30/2024 | 11281.7902 | 11233.9842 |

What were the Fund costs for the past year?
(based on a hypothetical $10,000 investment)
Class Name | Costs of a $10,000 investment | Costs paid as a percentage of a $10,000 investment |
|---|
Class R6 | $52.00 | 0.49% |
Fund costs may be higher for a full one year period.
End Block
Thornburg Core Plus Bond Fund Tailored Shareholder Report
Thornburg Core Plus Bond Fund Tailored Shareholder Report | |
Annual Performance | Since Inception |
|---|
Core Plus Bond Fund Class R6 | 12.82% |
Bloomberg U.S. Aggregate Total Return Value Index USD | 12.34% |
Key Fund Statistics
(as of September 30, 2024)
| |
|---|
Fund Size (Millions) | $165.5M |
Number of Holdings | 381 |
Annual Portfolio Turnover | 73.32% |
Total Advisory Fee | $0.0M |
What did the Fund invest in?
(as of September 30, 2024)
Credit Quality Ratings | (%) |
|---|
| U.S. Government | 46.7 |
| AAA | 10.6 |
| AA | 3.1 |
| A | 11.1 |
| BBB | 16.9 |
| NR | 2.6 |
| Below Invest. Grade | 5.7 |
| Cash Equivalents & Other | 3.3 |
Credit Quality Ratings | (%) |
U.S. Government | 46.7% |
AAA | 10.6% |
AA | 3.1% |
A | 11.1% |
BBB | 16.9% |
NR | 2.6% |
Below Invest. Grade | 5.7% |
Cash Equivalents & Other | 3.3% |
Expressed as a percentage of the Fund’s net assets. * Credit quality ratings shown above reflect the highest rating assigned by either S&P Global Ratings or Moody’s Investors Services, both of which are independent, nationally recognized statistical rating organizations. If a credit rating for an investment is not available from either S&P or Moody’s, then the Fund’s investment advisor will determine the credit quality of the investment. Investments are considered to be investment grade if they are rated within the four highest grades by S&P or Moody’s (BBB/Baa or higher) or, if no credit rating is available, have been judged to be of comparable quality by the Fund’s investment advisor. (NR = Not Rated)
How has the Fund changed?
This is a summary of certain changes to the Fund since October 2, 2023. For more complete information, you may review the Fund’s next prospectus, which we expect to be available by February 1, 2025 at https://www.thornburg.com/download or upon request by calling 1-800-847-0200.
End Block
Changes In and Disagreements with Accountants
No changes and/or disagreements occurred in the current reporting period.
End Block
For additional information about the Fund, including its prospectus, financial information, holdings and proxy information, visit www.thornburg.com/download.

Thornburg Core Plus Bond Fund Tailored Shareholder Report | |
Thornburg Strategic Income Fund Tailored Shareholder Report
Thornburg Strategic Income Fund CLASS: A TICKER: TSIAX Annual Shareholder Report | |
This annual shareholder report contains important information about the Thornburg Strategic Income Fund Class A Shares for the period from October 1, 2023 to September 30, 2024. You can find additional information about the Fund at https://www.thornburg.com/download. You can also request this information by contacting us at 1-800-847-0200. This report also describes changes to the Fund that occurred during the reporting period.
How did the Fund perform last year and what affected its performance?
The Fund’s Class A shares underperformed the Bloomberg U.S. Universal Total Return Index Value Unhedged (the “Index”) during the 12-month period ended September 30, 2024. Treasury yields fell meaningfully over the 12-month period ended September 30, 2024, as U.S. inflation continued to improve, and the market priced in anticipated interest rate cuts by the Federal Reserve. The Fund’s structural short duration versus the Index was a relative detractor in this environment. However, this was offset by positive relative returns from the Fund’s allocation to corporates and collateralized mortgage obligations. The Fund’s exposure to asset-backed securities was a modest detractor, while exposure to mortgage-passthrough securities proved to be neither a material contributor nor a detractor to the Fund’s performance.
How did the Fund perform over the past 10 years?
The line graph below reflects a hypothetical $10,000 investment and assumes the deduction of the maximum sales charge associated with that investment. The returns shown in the line graph and table assume the reinvestment of dividends and capital gains, but do not reflect the deduction of taxes that a shareholder would pay on distributions or the redemption of Fund shares. The performance information shown below represents past performance and is no guarantee of future results. For Fund performance current to the most recent month end, visit https://www.thornburg.com/product/mutual-funds/fsi/TSIAX or call 1-800-847-0200. Performance for other share classes of the Fund will vary.
Cumulative Performance
Growth Table
Date | Thornburg Strategic Income Fund | Bloomberg U.S. Universal Total Return Index Value Unhedged | Thornburg Strategic Income Fund’s Blended Index | Bloomberg U.S. Aggregate Total Return Value Index USD |
09/30/2014 | 9552.9445 | 10000 | 10000 | 10000 |
10/31/2014 | 9580.3982 | 10097.9156 | 10091.5595 | 10098.2769 |
11/30/2014 | 9545.3134 | 10152.4007 | 10189.2764 | 10169.91 |
12/31/2014 | 9407.5203 | 10134.0706 | 10164.0428 | 10179.4256 |
01/31/2015 | 9389.4936 | 10326.9713 | 10297.7135 | 10392.8789 |
02/28/2015 | 9485.957 | 10266.7871 | 10340.9202 | 10295.1602 |
03/31/2015 | 9469.8279 | 10309.1667 | 10346.9614 | 10342.967 |
04/30/2015 | 9583.1458 | 10297.2026 | 10365.7936 | 10305.856 |
05/31/2015 | 9599.3924 | 10279.1756 | 10352.9634 | 10281.0356 |
06/30/2015 | 9524.0148 | 10164.4658 | 10214.5069 | 10168.9318 |
07/31/2015 | 9491.3107 | 10223.6598 | 10307.9799 | 10239.6187 |
08/31/2015 | 9376.4644 | 10193.5273 | 10159.713 | 10224.9146 |
09/30/2015 | 9269.4479 | 10233.421 | 10139.7461 | 10294.0811 |
10/31/2015 | 9364.4538 | 10266.1404 | 10301.7941 | 10295.7875 |
11/30/2015 | 9316.6752 | 10228.692 | 10269.7724 | 10268.5908 |
12/31/2015 | 9187.7377 | 10177.6021 | 10207.116 | 10235.4031 |
01/31/2016 | 9122.0792 | 10289.9473 | 10197.36 | 10376.2558 |
02/29/2016 | 9114.7595 | 10363.0455 | 10240.0546 | 10449.8664 |
03/31/2016 | 9359.4312 | 10490.0427 | 10454.1897 | 10545.7404 |
04/30/2016 | 9543.8839 | 10561.5241 | 10519.3782 | 10586.2218 |
05/31/2016 | 9575.6135 | 10569.7697 | 10533.354 | 10588.9383 |
06/30/2016 | 9649.8268 | 10755.8396 | 10661.1569 | 10779.1979 |
07/31/2016 | 9790.1119 | 10844.4789 | 10805.1599 | 10847.3436 |
08/31/2016 | 9871.0609 | 10856.1803 | 10797.0727 | 10834.9414 |
09/30/2016 | 9890.2736 | 10858.7671 | 10803.4833 | 10828.5941 |
10/31/2016 | 9918.0817 | 10786.7199 | 10695.5582 | 10745.7655 |
11/30/2016 | 9833.4318 | 10544.2651 | 10523.9235 | 10491.5864 |
12/31/2016 | 9894.623 | 10575.59 | 10586.1638 | 10506.3861 |
01/31/2017 | 9981.74 | 10612.897 | 10653.881 | 10527.0016 |
02/28/2017 | 10076.5627 | 10694.7863 | 10770.279 | 10597.7522 |
03/31/2017 | 10106.841 | 10691.2092 | 10788.7073 | 10592.197 |
04/30/2017 | 10195.7671 | 10779.9092 | 10887.2607 | 10673.9358 |
05/31/2017 | 10276.2359 | 10863.0718 | 11000.3642 | 10756.0945 |
06/30/2017 | 10304.5903 | 10853.8764 | 10999.9736 | 10745.2712 |
07/31/2017 | 10368.0076 | 10907.9371 | 11090.4925 | 10791.5097 |
08/31/2017 | 10414.0614 | 11002.0533 | 11173.1962 | 10888.3034 |
09/30/2017 | 10425.0509 | 10963.3317 | 11180.7795 | 10836.4459 |
10/31/2017 | 10451.5159 | 10976.4881 | 11228.2216 | 10842.724 |
11/30/2017 | 10466.9904 | 10959.8758 | 11265.3495 | 10828.8068 |
12/31/2017 | 10489.146 | 11008.197 | 11337.1814 | 10878.506 |
01/31/2018 | 10493.5834 | 10902.2582 | 11352.4461 | 10753.2186 |
02/28/2018 | 10462.4327 | 10798.886 | 11172.294 | 10651.2843 |
03/31/2018 | 10449.7261 | 10853.351 | 11180.908 | 10719.5896 |
04/30/2018 | 10445.9258 | 10780.9399 | 11140.0801 | 10639.8655 |
05/31/2018 | 10462.9466 | 10839.7297 | 11217.6448 | 10715.7993 |
06/30/2018 | 10471.024 | 10824.0066 | 11205.5381 | 10702.6209 |
07/31/2018 | 10507.0322 | 10846.6616 | 11277.6641 | 10705.1619 |
08/31/2018 | 10561.1866 | 10900.0958 | 11363.6265 | 10774.0467 |
09/30/2018 | 10570.2314 | 10853.3914 | 11317.7408 | 10704.6676 |
10/31/2018 | 10506.7231 | 10762.5896 | 11079.9828 | 10620.0741 |
11/30/2018 | 10506.7238 | 10810.9916 | 11158.0714 | 10683.4727 |
12/31/2018 | 10520.407 | 10980.1461 | 11152.3723 | 10879.7393 |
01/31/2019 | 10689.6439 | 11131.5363 | 11420.6629 | 10995.2773 |
02/28/2019 | 10749.2909 | 11143.6621 | 11484.0545 | 10988.9087 |
03/31/2019 | 10845.9198 | 11344.9094 | 11690.6344 | 11199.9166 |
04/30/2019 | 10905.924 | 11360.7739 | 11775.9355 | 11202.782 |
05/31/2019 | 10948.0525 | 11534.8191 | 11807.2714 | 11401.6482 |
06/30/2019 | 11064.5924 | 11697.9511 | 12081.5035 | 11544.8346 |
07/31/2019 | 11097.1912 | 11732.7723 | 12114.7278 | 11570.2238 |
08/31/2019 | 11183.8279 | 11998.266 | 12316.2999 | 11870.0302 |
09/30/2019 | 11195.7646 | 11946.2869 | 12316.245 | 11806.8123 |
10/31/2019 | 11235.9126 | 11984.8873 | 12408.6071 | 11842.3764 |
11/30/2019 | 11247.2085 | 11982.4823 | 12472.666 | 11836.3427 |
12/31/2019 | 11315.2041 | 12000.3476 | 12540.447 | 11828.0976 |
01/31/2020 | 11392.848 | 12215.7215 | 12718.2487 | 12055.7234 |
02/29/2020 | 11421.336 | 12398.6185 | 12686.372 | 12272.7065 |
03/31/2020 | 10668.951 | 12156.4467 | 12290.8562 | 12200.4833 |
04/30/2020 | 10964.3092 | 12399.9523 | 12734.1838 | 12417.3601 |
05/31/2020 | 11279.557 | 12515.7534 | 12904.6506 | 12475.1769 |
06/30/2020 | 11520.7826 | 12620.1967 | 13037.9479 | 12553.758 |
07/31/2020 | 11735.7135 | 12841.8759 | 13318.4978 | 12741.2746 |
08/31/2020 | 11835.517 | 12767.8279 | 13410.469 | 12638.4313 |
09/30/2020 | 11875.6397 | 12744.8092 | 13312.0547 | 12631.4992 |
10/31/2020 | 11925.6077 | 12699.2567 | 13182.8319 | 12575.0965 |
11/30/2020 | 12092.5612 | 12864.9755 | 13623.4342 | 12698.4914 |
12/31/2020 | 12204.8969 | 12909.4165 | 13753.9673 | 12715.9864 |
01/31/2021 | 12239.206 | 12828.2749 | 13647.7392 | 12624.817 |
02/28/2021 | 12262.3281 | 12662.7379 | 13560.0148 | 12442.5048 |
03/31/2021 | 12235.1821 | 12515.3896 | 13514.7933 | 12287.1394 |
04/30/2021 | 12315.4246 | 12620.6211 | 13726.0044 | 12384.2096 |
05/31/2021 | 12362.1428 | 12668.7604 | 13801.4253 | 12424.6696 |
06/30/2021 | 12406.004 | 12761.1183 | 13920.1403 | 12511.9637 |
07/31/2021 | 12469.4828 | 12889.2473 | 14094.5228 | 12651.8595 |
08/31/2021 | 12512.5861 | 12880.6582 | 14143.214 | 12627.7727 |
09/30/2021 | 12505.557 | 12770.6573 | 13927.8078 | 12518.4439 |
10/31/2021 | 12488.4204 | 12760.2291 | 14082.5127 | 12514.9938 |
11/30/2021 | 12459.6697 | 12775.6288 | 14054.1256 | 12552.0197 |
12/31/2021 | 12501.2979 | 12767.0195 | 14145.4901 | 12519.9004 |
01/31/2022 | 12369.466 | 12487.1164 | 13752.0001 | 12250.172 |
02/28/2022 | 12236.7903 | 12316.8706 | 13559.6996 | 12113.503 |
03/31/2022 | 12072.5714 | 11986.4232 | 13332.7546 | 11776.9683 |
04/30/2022 | 11867.4244 | 11539.3461 | 12706.4755 | 11330.0576 |
05/31/2022 | 11877.961 | 11602.8447 | 12773.942 | 11403.1101 |
06/30/2022 | 11610.1355 | 11371 | 12392.3213 | 11224.2161 |
07/31/2022 | 11797.0087 | 11656.8852 | 12831.3419 | 11498.4738 |
08/31/2022 | 11715.5595 | 11353.842 | 12433.995 | 11173.5652 |
09/30/2022 | 11458.2729 | 10864.6885 | 11773.0422 | 10690.7981 |
10/31/2022 | 11441.5881 | 10745.472 | 11820.1424 | 10552.327 |
11/30/2022 | 11654.9455 | 11146.1276 | 12332.2684 | 10940.3949 |
12/31/2022 | 11673.3007 | 11108.275 | 12183.0234 | 10891.0465 |
01/31/2023 | 11944.344 | 11452.8489 | 12655.2662 | 11226.0979 |
02/28/2023 | 11814.9749 | 11171.4301 | 12332.6595 | 10935.8444 |
03/31/2023 | 11981.5991 | 11433.5083 | 12659.4992 | 11213.6426 |
04/30/2023 | 12052.8286 | 11503.3528 | 12765.2599 | 11281.6023 |
05/31/2023 | 12029.093 | 11384.0958 | 12628.574 | 11158.7602 |
06/30/2023 | 12038.1948 | 11366.4124 | 12745.2937 | 11118.9646 |
07/31/2023 | 12112.831 | 11377.7096 | 12823.8162 | 11111.2139 |
08/31/2023 | 12112.296 | 11309.1788 | 12697.0243 | 11040.24 |
09/30/2023 | 11961.1631 | 11039.5219 | 12329.3555 | 10759.6881 |
10/31/2023 | 11875.4192 | 10873.4999 | 12102.1509 | 10589.8898 |
11/30/2023 | 12225.1399 | 11362.8555 | 12767.5212 | 11069.4673 |
12/31/2023 | 12522.5663 | 11794.0277 | 13283.8655 | 11493.195 |
01/31/2024 | 12568.6627 | 11765.7948 | 13286.5653 | 11461.6339 |
02/29/2024 | 12514.9618 | 11624.7317 | 13249.0534 | 11299.6979 |
03/31/2024 | 12615.2879 | 11738.8554 | 13432.0791 | 11404.0404 |
04/30/2024 | 12460.7812 | 11464.5503 | 13060.87 | 11115.9877 |
05/31/2024 | 12629.2077 | 11654.5813 | 13354.6483 | 11304.4398 |
06/30/2024 | 12733.7012 | 11761.1264 | 13510.1462 | 11411.4668 |
07/31/2024 | 12955.003 | 12028.0752 | 13810.2039 | 11678.0004 |
08/31/2024 | 13109.6228 | 12205.1518 | 14041.9705 | 11845.8158 |
09/30/2024 | 13254.4009 | 12372.5481 | 14243.8138 | 12004.424 |
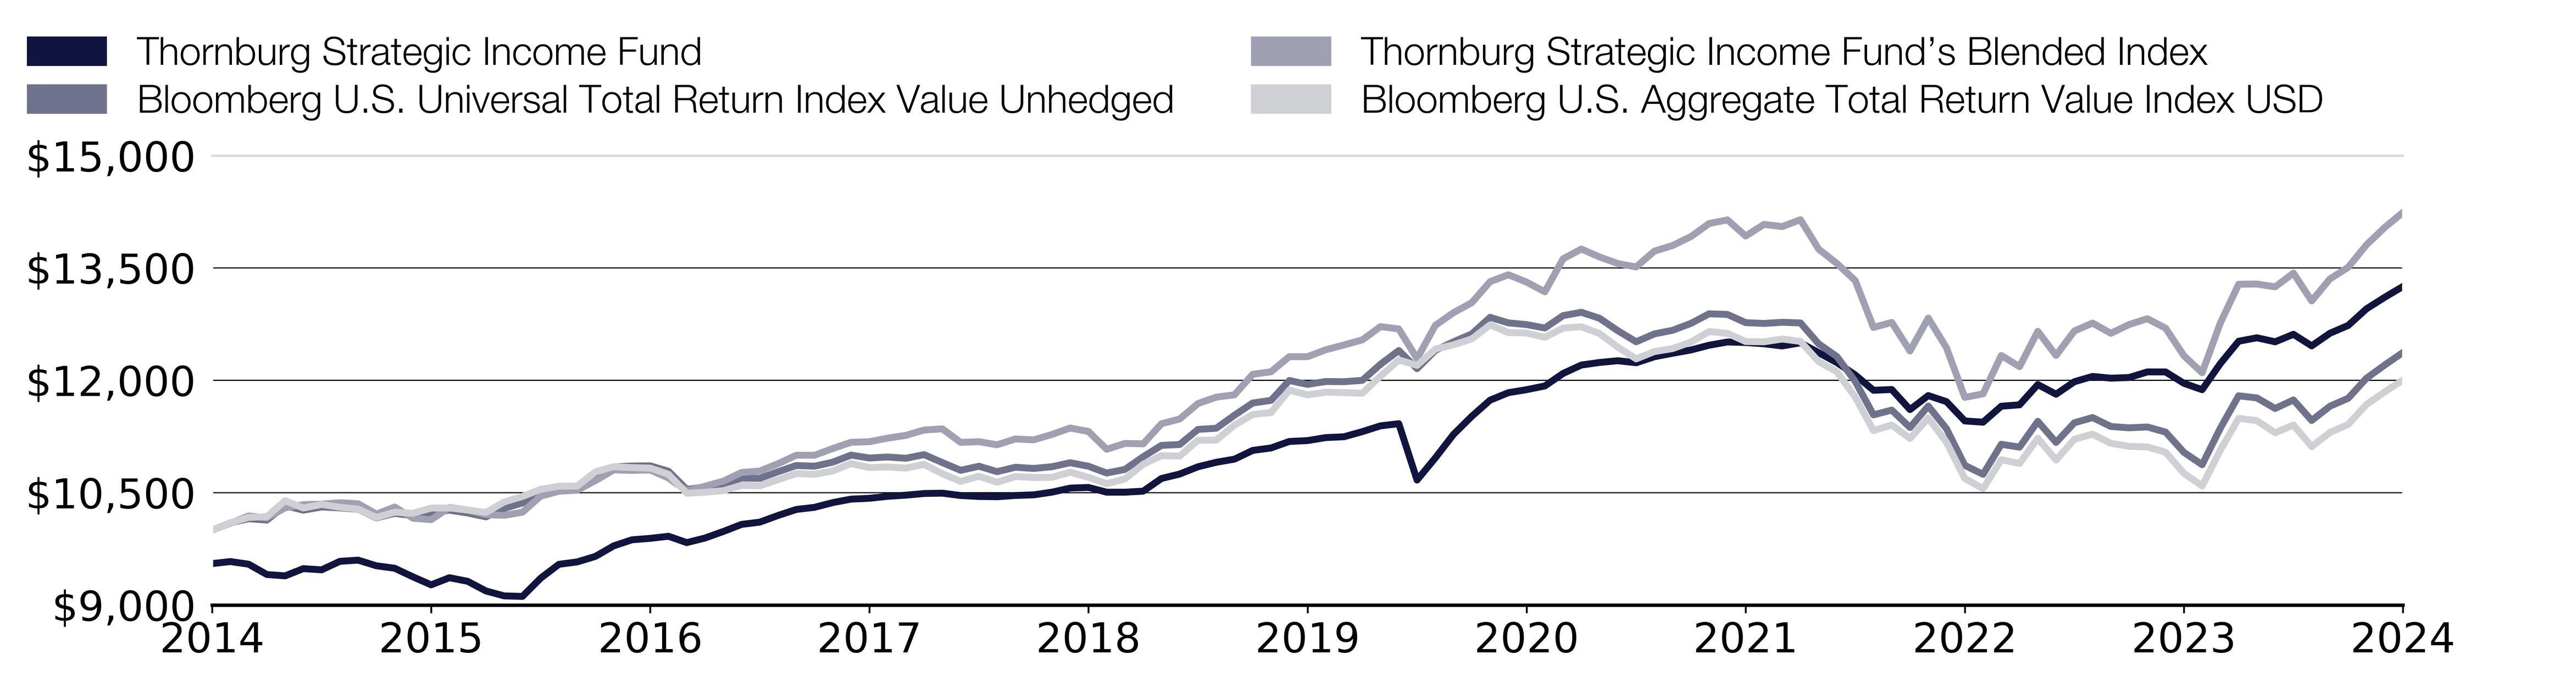
Effective September 30, 2024, the Fund adopted the Bloomberg U.S. Aggregate Total Return Index Value USD as its broad-based securities market index that represents the overall applicable market in which the Fund invests, and the Bloomberg U.S. Universal Total Return Index Value Unhedged as an additional index that represents the market sectors which the Fund’s advisor believes are more representative of the Fund’s investment universe.
What were the Fund costs for the past year?
(based on a hypothetical $10,000 investment)
Class Name | Costs of a $10,000 investment | Costs paid as a percentage of a $10,000 investment |
|---|
Class A | $102.00 | 0.97% |
End Block
Thornburg Strategic Income Fund Tailored Shareholder Report
Thornburg Strategic Income Fund Tailored Shareholder Report | |
Annual Performance | 1 Year | 5 Year | 10 Year |
|---|
Strategic Income Fund Class A (with sales charge) | 5.82% | 2.49% | 2.86% |
Strategic Income Fund Class A (without sales charge) | 10.81% | 3.43% | 3.33% |
Bloomberg U.S. Universal Total Return Index Value Unhedged | 12.08% | 0.70% | 2.15% |
Strategic Income Fund’s Blended Index | 15.53% | 2.95% | 3.60% |
Key Fund Statistics
(as of September 30, 2024)
| |
|---|
Fund Size (Millions) | $9,454.2M |
Number of Holdings | 1,154 |
Annual Portfolio Turnover | 60.47% |
Total Advisory Fee | $41.2M |
What did the Fund invest in?
(as of September 30, 2024)
Fixed Income Credit Quality | (%) |
|---|
| U.S. Government | 26.5 |
| AAA | 10.7 |
| AA | 2.4 |
| A | 11.8 |
| BBB | 22.1 |
| BB | 12.2 |
| B | 4.1 |
| CCC | 0.1 |
| D | 0.0 |
| NR | 4.2 |
| Cash Equivalents & Other | 5.9 |
Fixed Income Credit Quality | (%) |
U.S. Government | 26.5% |
AAA | 10.7% |
AA | 2.4% |
A | 11.8% |
BBB | 22.1% |
BB | 12.2% |
B | 4.1% |
CCC | 0.1% |
D | 0.0% |
NR | 4.2% |
Cash Equivalents & Other | 5.9% |
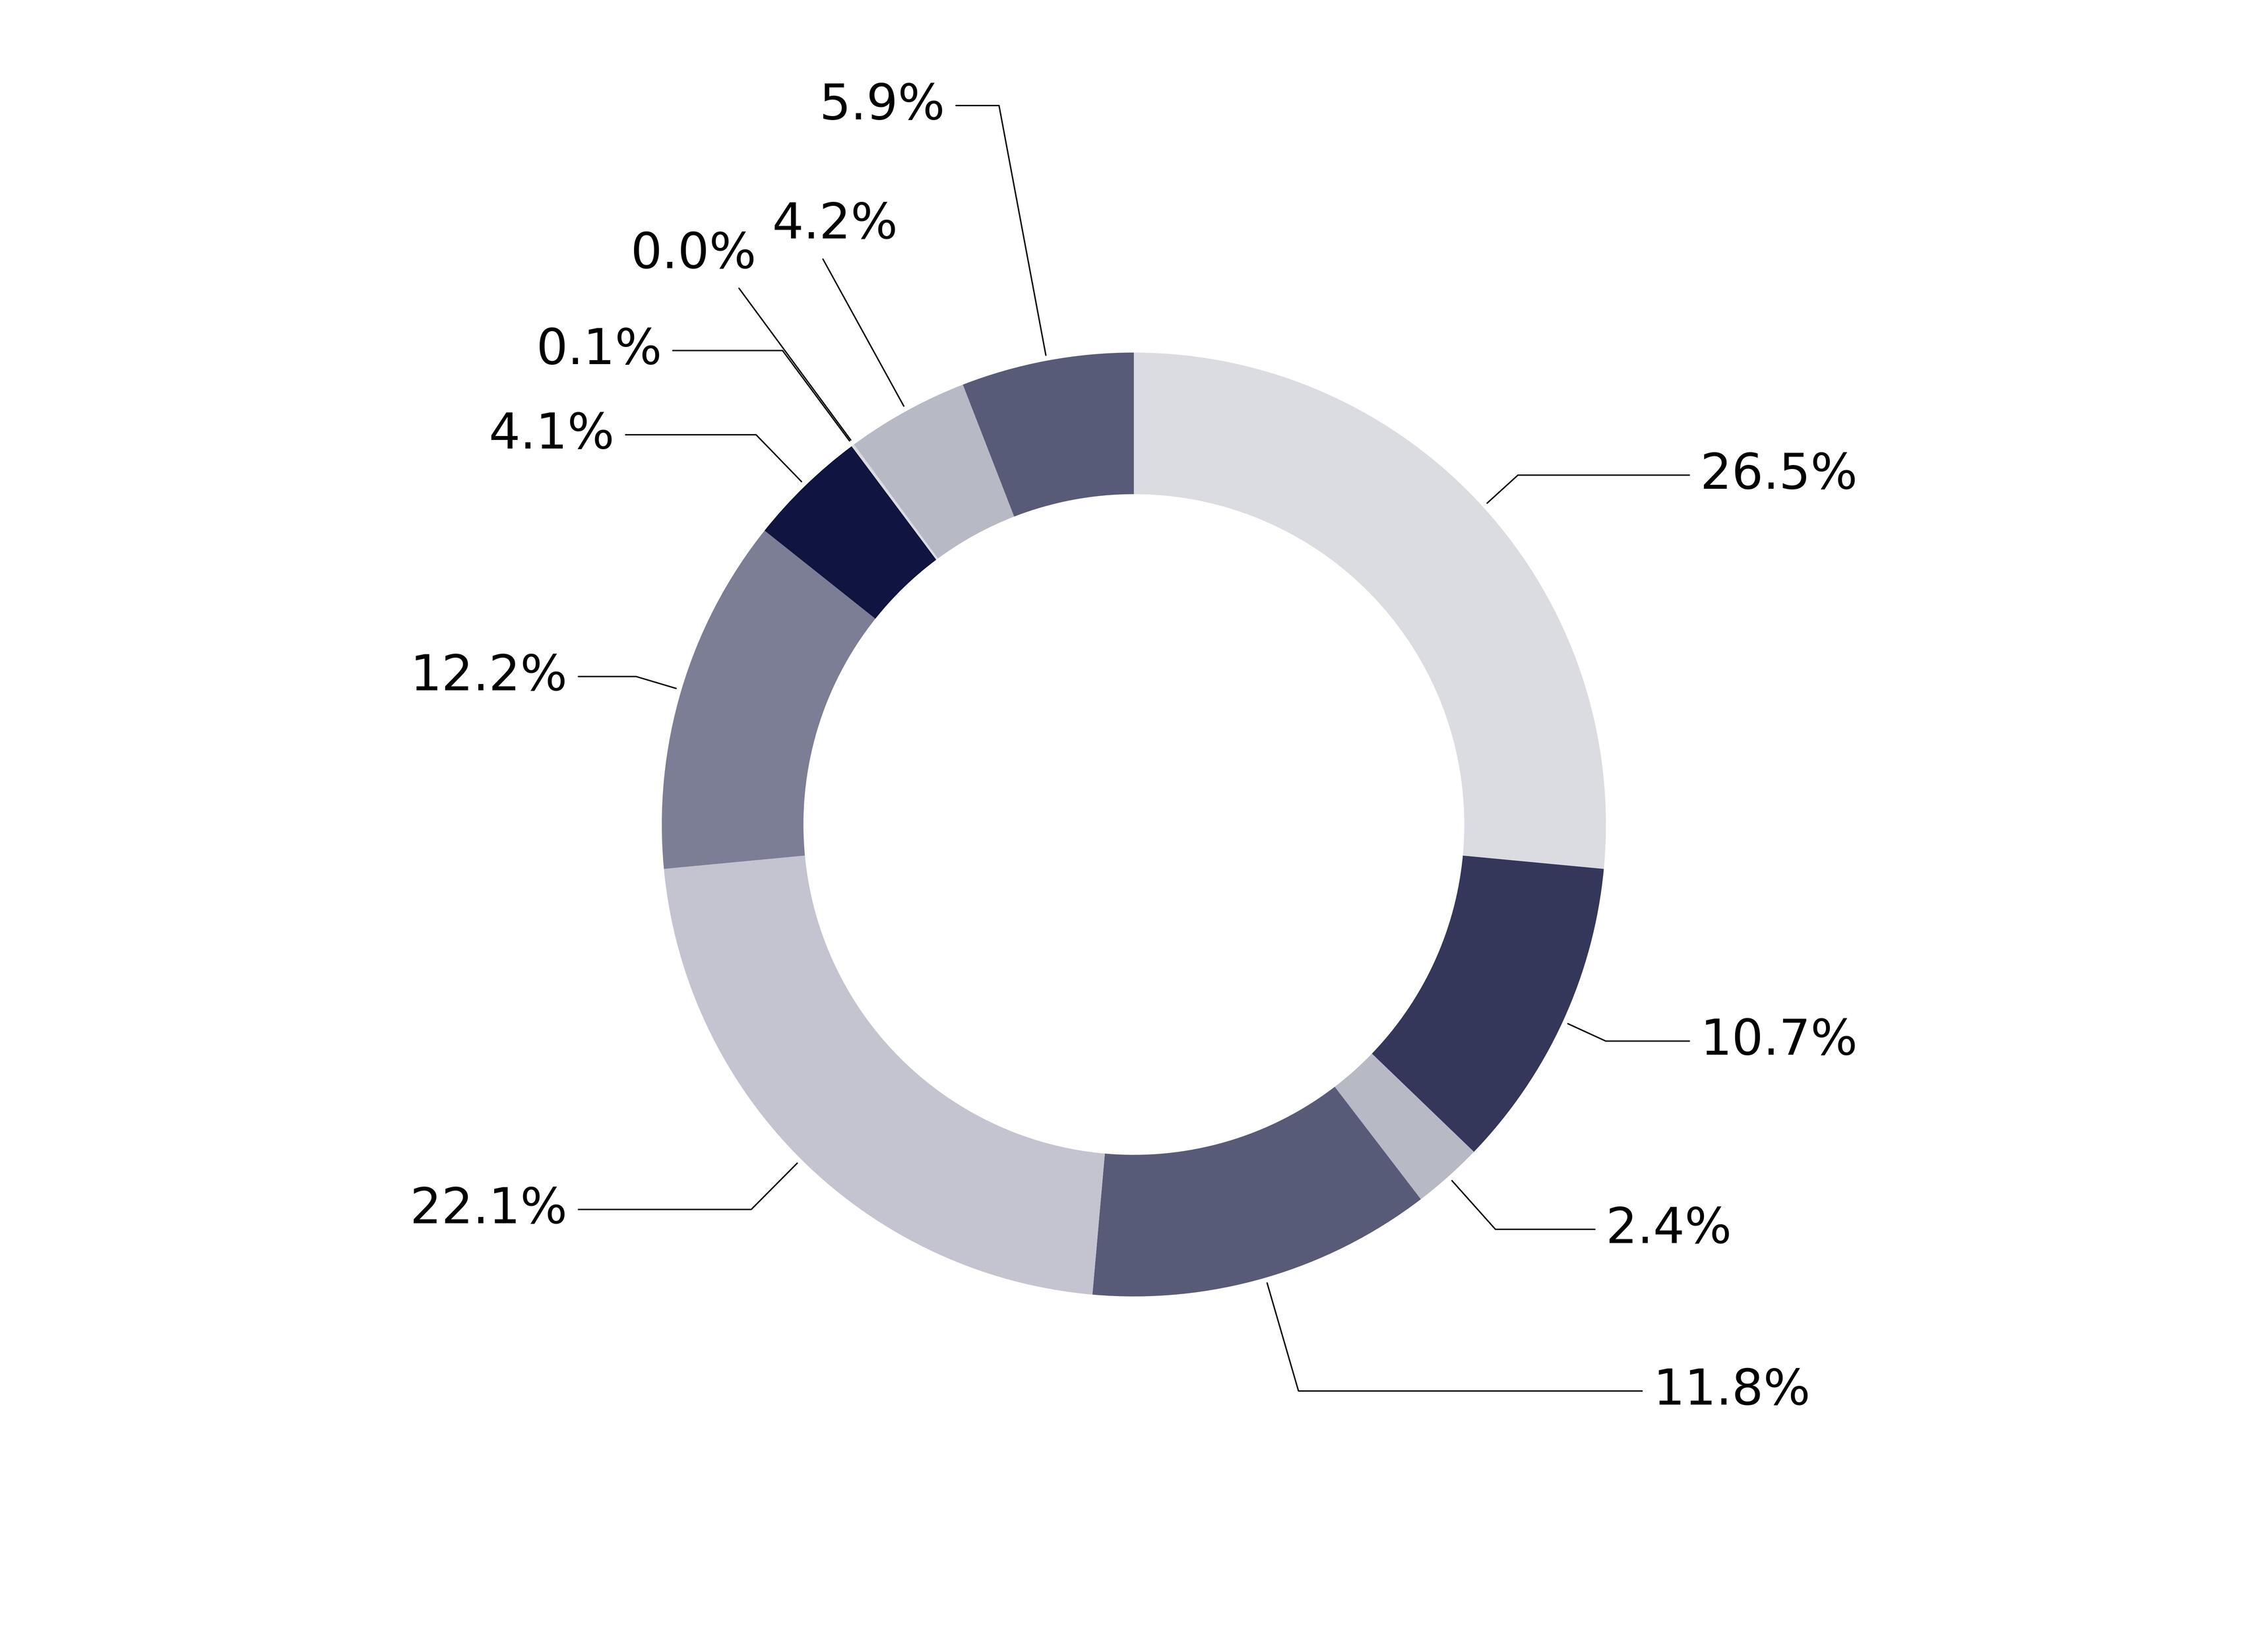
Expressed as a percentage of the Fund’s net assets. * Credit quality ratings shown above reflect the highest rating assigned by either S&P Global Ratings or Moody’s Investors Services, both of which are independent, nationally recognized statistical rating organizations. If a credit rating for an investment is not available from either S&P or Moody’s, then the Fund’s investment advisor will determine the credit quality of the investment. Investments are considered to be investment grade if they are rated within the four highest grades by S&P or Moody’s (BBB/Baa or higher) or, if no credit rating is available, have been judged to be of comparable quality by the Fund’s investment advisor. (NR = Not Rated)
How has the Fund changed?
This is a summary of certain changes to the Fund since October 1, 2023. For more complete information, you may review the Fund’s next prospectus, which we expect to be available by February 1, 2025 at https://www.thornburg.com/download or upon request by calling 1-800-847-0200.
End Block
Changes In and Disagreements with Accountants
No changes and/or disagreements occurred in the current reporting period.
End Block
For additional information about the Fund, including its prospectus, financial information, holdings and proxy information, visit www.thornburg.com/download.

Thornburg Strategic Income Fund Tailored Shareholder Report | |
Thornburg Strategic Income Fund Tailored Shareholder Report
Thornburg Strategic Income Fund CLASS: C TICKER: TSICX Annual Shareholder Report | |
This annual shareholder report contains important information about the Thornburg Strategic Income Fund Class C Shares for the period from October 1, 2023 to September 30, 2024. You can find additional information about the Fund at https://www.thornburg.com/download. You can also request this information by contacting us at 1-800-847-0200. This report also describes changes to the Fund that occurred during the reporting period.
How did the Fund perform last year and what affected its performance?
The Fund’s Class C shares underperformed the Bloomberg U.S. Universal Total Return Index Value Unhedged (the “Index”) during the 12-month period ended September 30, 2024. Treasury yields fell meaningfully over the 12-month period ended September 30, 2024, as U.S. inflation continued to improve, and the market priced in anticipated interest rate cuts by the Federal Reserve. The Fund’s structural short duration versus the Index was a relative detractor in this environment. However, this was offset by positive relative returns from the Fund’s allocation to corporates and collateralized mortgage obligations. The Fund’s exposure to asset-backed securities was a modest detractor, while exposure to mortgage-passthrough securities proved to be neither a material contributor nor a detractor to the Fund’s performance.
How did the Fund perform over the past 10 years?
The line graph below reflects a hypothetical $10,000 investment. The returns shown in the line graph and table assume the reinvestment of dividends and capital gains, but do not reflect the deduction of taxes that a shareholder would pay on distributions or the redemption of Fund shares. The performance information shown below represents past performance and is no guarantee of future results. For Fund performance current to the most recent month end, visit https://www.thornburg.com/product/mutual-funds/fsi/TSICX or call 1-800-847-0200. Performance for other share classes of the Fund will vary.
Cumulative Performance
Growth Table
Date | Thornburg Strategic Income Fund | Bloomberg U.S. Universal Total Return Index Value Unhedged | Thornburg Strategic Income Fund’s Blended Index | Bloomberg U.S. Aggregate Total Return Value Index USD |
09/30/2014 | 10000.0038 | 10000 | 10000 | 10000 |
10/31/2014 | 10015.3651 | 10097.9156 | 10091.5595 | 10098.2769 |
11/30/2014 | 9973.7067 | 10152.4007 | 10189.2764 | 10169.91 |
12/31/2014 | 9832.6608 | 10134.0706 | 10164.0428 | 10179.4256 |
01/31/2015 | 9800.3932 | 10326.9713 | 10297.7135 | 10392.8789 |
02/28/2015 | 9905.2147 | 10266.7871 | 10340.9202 | 10295.1602 |
03/31/2015 | 9883.5677 | 10309.1667 | 10346.9614 | 10342.967 |
04/30/2015 | 9997.1183 | 10297.2026 | 10365.7936 | 10305.856 |
05/31/2015 | 10000.5629 | 10279.1756 | 10352.9634 | 10281.0356 |
06/30/2015 | 9917.2615 | 10164.4658 | 10214.5069 | 10168.9318 |
07/31/2015 | 9878.484 | 10223.6598 | 10307.9799 | 10239.6187 |
08/31/2015 | 9754.1183 | 10193.5273 | 10159.713 | 10224.9146 |
09/30/2015 | 9639.1792 | 10233.421 | 10139.7461 | 10294.0811 |
10/31/2015 | 9742.182 | 10266.1404 | 10301.7941 | 10295.7875 |
11/30/2015 | 9679.2751 | 10228.692 | 10269.7724 | 10268.5908 |
12/31/2015 | 9540.586 | 10177.6021 | 10207.116 | 10235.4031 |
01/31/2016 | 9467.8195 | 10289.9473 | 10197.36 | 10376.2558 |
02/29/2016 | 9456.052 | 10363.0455 | 10240.0546 | 10449.8664 |
03/31/2016 | 9714.5628 | 10490.0427 | 10454.1897 | 10545.7404 |
04/30/2016 | 9901.7206 | 10561.5241 | 10519.3782 | 10586.2218 |
05/31/2016 | 9921.2177 | 10569.7697 | 10533.354 | 10588.9383 |
06/30/2016 | 9993.6265 | 10755.8396 | 10661.1569 | 10779.1979 |
07/31/2016 | 10134.3529 | 10844.4789 | 10805.1599 | 10847.3436 |
08/31/2016 | 10213.3154 | 10856.1803 | 10797.0727 | 10834.9414 |
09/30/2016 | 10237.1115 | 10858.7671 | 10803.4833 | 10828.5941 |
10/31/2016 | 10253.3393 | 10786.7199 | 10695.5582 | 10745.7655 |
11/30/2016 | 10161.0185 | 10544.2651 | 10523.9235 | 10491.5864 |
12/31/2016 | 10219.5075 | 10575.59 | 10586.1638 | 10506.3861 |
01/31/2017 | 10313.6716 | 10612.897 | 10653.881 | 10527.0016 |
02/28/2017 | 10397.7085 | 10694.7863 | 10770.279 | 10597.7522 |
03/31/2017 | 10423.0968 | 10691.2092 | 10788.7073 | 10592.197 |
04/30/2017 | 10509.1623 | 10779.9092 | 10887.2607 | 10673.9358 |
05/31/2017 | 10586.2109 | 10863.0718 | 11000.3642 | 10756.0945 |
06/30/2017 | 10609.6015 | 10853.8764 | 10999.9736 | 10745.2712 |
07/31/2017 | 10668.9228 | 10907.9371 | 11090.4925 | 10791.5097 |
08/31/2017 | 10710.2438 | 11002.0533 | 11173.1962 | 10888.3034 |
09/30/2017 | 10724.6846 | 10963.3317 | 11180.7795 | 10836.4459 |
10/31/2017 | 10745.671 | 10976.4881 | 11228.2216 | 10842.724 |
11/30/2017 | 10746.4671 | 10959.8758 | 10828.8068 |
12/31/2017 | 10762.9967 | 11008.197 | 11337.1814 | 10878.506 |
01/31/2018 | 10761.3345 | 10902.2582 | 11352.4461 | 10753.2186 |
02/28/2018 | 10723.7487 | 10798.886 | 10651.2843 |
03/31/2018 | 10704.1791 | 10853.351 | 11180.908 | 10719.5896 |
04/30/2018 | 10693.8659 | 10780.9399 | 11140.0801 | 10639.8655 |
05/31/2018 | 10713.875 | 10839.7297 | 11217.6448 | 10715.7993 |
06/30/2018 | 10706.475 | 10824.0066 | 11205.5381 | 10702.6209 |
07/31/2018 | 10736.6592 | 10846.6616 | 11277.6641 | 10705.1619 |
08/31/2018 | 10785.1972 | 10900.0958 | 11363.6265 | 10774.0467 |
09/30/2018 | 10788.1392 | 10853.3914 | 11317.7408 | 10704.6676 |
10/31/2018 | 10716.4893 | 10762.5896 | 11079.9828 | 10620.0741 |
11/30/2018 | 10719.286 | 10810.9916 | 11158.0714 | 10683.4727 |
12/31/2018 | 10717.2573 | 10980.1461 | 11152.3723 | 10879.7393 |
01/31/2019 | 10883.4819 | 11131.5363 | 11420.6629 | 10995.2773 |
02/28/2019 | 10938.1527 | 11143.6621 | 11484.0545 | 10988.9087 |
03/31/2019 | 11029.6486 | 11344.9094 | 11690.6344 | 11199.9166 |
04/30/2019 | 11084.3645 | 11360.7739 | 11775.9355 | 11202.782 |
05/31/2019 | 11120.5785 | 11534.8191 | 11807.2714 | 11401.6482 |
06/30/2019 | 11232.2028 | 11697.9511 | 12081.5035 | 11544.8346 |
07/31/2019 | 11258.0813 | 11732.7723 | 12114.7278 | 11570.2238 |
08/31/2019 | 11338.3278 | 11998.266 | 12316.2999 | 11870.0302 |
09/30/2019 | 11343.3775 | 11946.2869 | 12316.245 | 11806.8123 |
10/31/2019 | 11367.3203 | 11984.8873 | 12408.6071 | 11842.3764 |
11/30/2019 | 11381.2864 | 11982.4823 | 12472.666 | 11836.3427 |
12/31/2019 | 11433.3064 | 12000.3476 | 12540.447 | 11828.0976 |
01/31/2020 | 11514.3374 | 12215.7215 | 12718.2487 | 12055.7234 |
02/29/2020 | 11536.3806 | 12398.6185 | 12686.372 | 12272.7065 |
03/31/2020 | 10768.1612 | 12156.4467 | 12290.8562 | 12200.4833 |
04/30/2020 | 11059.5628 | 12399.9523 | 12734.1838 | 12417.3601 |
05/31/2020 | 11370.4248 | 12515.7534 | 12904.6506 | 12475.1769 |
06/30/2020 | 11606.8571 | 12620.1967 | 13037.9479 | 12553.758 |
07/31/2020 | 11816.8592 | 12841.8759 | 13318.4978 | 12741.2746 |
08/31/2020 | 11910.5529 | 12767.8279 | 13410.469 | 12638.4313 |
09/30/2020 | 11944.1579 | 12744.8092 | 13312.0547 | 12631.4992 |
10/31/2020 | 11976.7976 | 12699.2567 | 13182.8319 | 12575.0965 |
11/30/2020 | 12146.7282 | 12864.9755 | 13623.4342 | 12698.4914 |
12/31/2020 | 12241.9717 | 12909.4165 | 13753.9673 | 12715.9864 |
01/31/2021 | 12278.0394 | 12828.2749 | 13647.7392 | 12624.817 |
02/28/2021 | 12293.732 | 12662.7379 | 13560.0148 | 12442.5048 |
03/31/2021 | 12258.1161 | 12515.3896 | 13514.7933 | 12287.1394 |
04/30/2021 | 12320.5716 | 12620.6211 | 13726.0044 | 12384.2096 |
05/31/2021 | 12369.0932 | 12668.7604 | 13801.4253 | 12424.6696 |
06/30/2021 | 12404.7565 | 12761.1183 | 13920.1403 | 12511.9637 |
07/31/2021 | 12459.9427 | 12889.2473 | 14094.5228 | 12651.8595 |
08/31/2021 | 12495.2326 | 12880.6582 | 14143.214 | 12627.7727 |
09/30/2021 | 12480.4718 | 12770.6573 | 13927.8078 | 12518.4439 |
10/31/2021 | 12455.0211 | 12760.2291 | 14082.5127 | 12514.9938 |
11/30/2021 | 12418.2048 | 12775.6288 | 14054.1256 | 12552.0197 |
12/31/2021 | 12441.4185 | 12767.0195 | 14145.4901 | 12519.9004 |
01/31/2022 | 12302.0707 | 12487.1164 | 13752.0001 | 12250.172 |
02/28/2022 | 12172.9733 | 12316.8706 | 13559.6996 | 12113.503 |
03/31/2022 | 12001.4382 | 11986.4232 | 13332.7546 | 11776.9683 |
04/30/2022 | 11789.9136 | 11539.3461 | 12706.4755 | 11330.0576 |
05/31/2022 | 11793.066 | 11602.8447 | 12773.942 | 11403.1101 |
06/30/2022 | 11519.6538 | 11371 | 12392.3213 | 11224.2161 |
07/31/2022 | 11708.4508 | 11656.8852 | 12831.3419 | 11498.4738 |
08/31/2022 | 11620.2299 | 11353.842 | 12433.995 | 11173.5652 |
09/30/2022 | 11347.4996 | 10864.6885 | 11773.0422 | 10690.7981 |
10/31/2022 | 11334.2023 | 10745.472 | 11820.1424 | 10552.327 |
11/30/2022 | 11539.0716 | 11146.1276 | 12332.2684 | 10940.3949 |
12/31/2022 | 11550.3128 | 11108.275 | 12183.0234 | 10891.0465 |
01/31/2023 | 11801.4031 | 11452.8489 | 12655.2662 | 11226.0979 |
02/28/2023 | 11677.5273 | 11171.4301 | 12332.6595 | 10935.8444 |
03/31/2023 | 11835.5324 | 11433.5083 | 12659.4992 | 11213.6426 |
04/30/2023 | 11888.7478 | 11503.3528 | 12765.2599 | 11281.6023 |
05/31/2023 | 11858.3058 | 11384.0958 | 12628.574 | 11158.7602 |
06/30/2023 | 11871.0704 | 11366.4124 | 12745.2937 | 11118.9646 |
07/31/2023 | 11929.3396 | 11377.7096 | 12823.8162 | 11111.2139 |
08/31/2023 | 11921.7259 | 11309.1788 | 12697.0243 | 11040.24 |
09/30/2023 | 11765.82 | 11039.5219 | 12329.3555 | 10759.6881 |
10/31/2023 | 11674.2726 | 10873.4999 | 12102.1509 | 10589.8898 |
11/30/2023 | 12011.7535 | 11362.8555 | 12767.5212 | 11069.4673 |
12/31/2023 | 12296.9629 | 11794.0277 | 13283.8655 | 11493.195 |
01/31/2024 | 12334.6069 | 11765.7948 | 13286.5653 | 11461.6339 |
02/29/2024 | 12274.6024 | 11624.7317 | 13249.0534 | 11299.6979 |
03/31/2024 | 12365.4618 | 11738.8554 | 13432.0791 | 11404.0404 |
04/30/2024 | 12206.2297 | 11464.5503 | 13060.87 | 11115.9877 |
05/31/2024 | 12352.8329 | 11654.5813 | 13354.6483 | 11304.4398 |
06/30/2024 | 12447.6871 | 11761.1264 | 13510.1462 | 11411.4668 |
07/31/2024 | 12667.606 | 12028.0752 | 13810.2039 | 11678.0004 |
08/31/2024 | 12810.9635 | 12205.1518 | 14041.9705 | 11845.8158 |
09/30/2024 | 12944.7111 | 12372.5481 | 14243.8138 | 12004.424 |
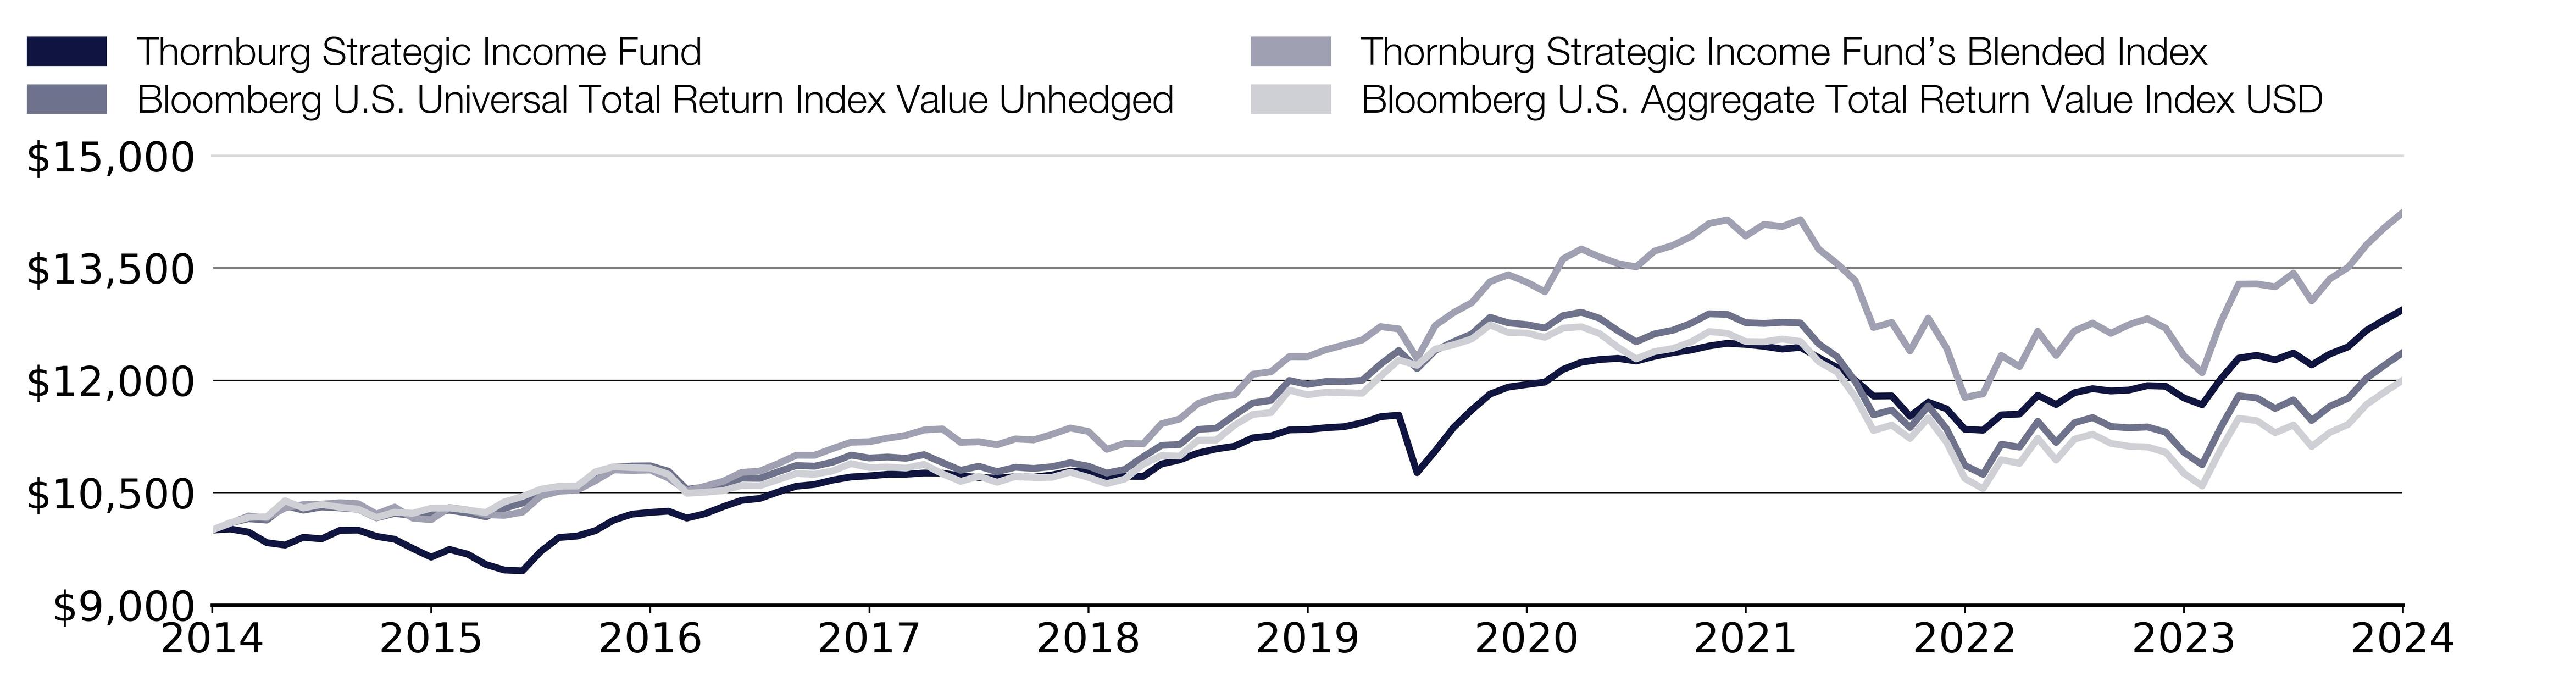
Effective September 30, 2024, the Fund adopted the Bloomberg U.S. Aggregate Total Return Index Value USD as its broad-based securities market index that represents the overall applicable market in which the Fund invests, and the Bloomberg U.S. Universal Total Return Index Value Unhedged as an additional index that represents the market sectors which the Fund’s advisor believes are more representative of the Fund’s investment universe.
What were the Fund costs for the past year?
(based on a hypothetical $10,000 investment)
Class Name | Costs of a $10,000 investment | Costs paid as a percentage of a $10,000 investment |
|---|
Class C | $180.00 | 1.72% |
End Block
Thornburg Strategic Income Fund Tailored Shareholder Report
Thornburg Strategic Income Fund Tailored Shareholder Report | |
Annual Performance | 1 Year | 5 Year | 10 Year |
|---|
Strategic Income Fund Class C (with sales charge) | 9.02% | 2.68% | 2.61% |
Strategic Income Fund Class C (without sales charge) | 10.02% | 2.68% | 2.61% |
Bloomberg U.S. Universal Total Return Index Value Unhedged | 12.08% | 0.70% | 2.15% |
Strategic Income Fund’s Blended Index | 15.53% | 2.95% | 3.60% |
Key Fund Statistics
(as of September 30, 2024)
| |
|---|
Fund Size (Millions) | $9,454.2M |
Number of Holdings | 1,154 |
Annual Portfolio Turnover | 60.47% |
Total Advisory Fee | $41.2M |
What did the Fund invest in?
(as of September 30, 2024)
Fixed Income Credit Quality | (%) |
|---|
| U.S. Government | 26.5 |
| AAA | 10.7 |
| AA | 2.4 |
| A | 11.8 |
| BBB | 22.1 |
| BB | 12.2 |
| B | 4.1 |
| CCC | 0.1 |
| D | 0.0 |
| NR | 4.2 |
| Cash Equivalents & Other | 5.9 |
Fixed Income Credit Quality | (%) |
U.S. Government | 26.5% |
AAA | 10.7% |
AA | 2.4% |
A | 11.8% |
BBB | 22.1% |
BB | 12.2% |
B | 4.1% |
CCC | 0.1% |
D | 0.0% |
NR | 4.2% |
Cash Equivalents & Other | 5.9% |
Expressed as a percentage of the Fund’s net assets. * Credit quality ratings shown above reflect the highest rating assigned by either S&P Global Ratings or Moody’s Investors Services, both of which are independent, nationally recognized statistical rating organizations. If a credit rating for an investment is not available from either S&P or Moody’s, then the Fund’s investment advisor will determine the credit quality of the investment. Investments are considered to be investment grade if they are rated within the four highest grades by S&P or Moody’s (BBB/Baa or higher) or, if no credit rating is available, have been judged to be of comparable quality by the Fund’s investment advisor. (NR = Not Rated)
How has the Fund changed?
This is a summary of certain changes to the Fund since October 1, 2023. For more complete information, you may review the Fund’s next prospectus, which we expect to be available by February 1, 2025 at https://www.thornburg.com/download or upon request by calling 1-800-847-0200.
End Block
Changes In and Disagreements with Accountants
No changes and/or disagreements occurred in the current reporting period.
End Block
For additional information about the Fund, including its prospectus, financial information, holdings and proxy information, visit www.thornburg.com/download.

Thornburg Strategic Income Fund Tailored Shareholder Report | |
Thornburg Strategic Income Fund Tailored Shareholder Report
Thornburg Strategic Income Fund CLASS: I TICKER: TSIIX Annual Shareholder Report | |
This annual shareholder report contains important information about the Thornburg Strategic Income Fund Class I Shares for the period from October 1, 2023 to September 30, 2024. You can find additional information about the Fund at https://www.thornburg.com/download. You can also request this information by contacting us at 1-800-847-0200. This report also describes changes to the Fund that occurred during the reporting period.
How did the Fund perform last year and what affected its performance?
The Fund’s Class I shares underperformed the Bloomberg U.S. Universal Total Return Index Value Unhedged (the “Index”) during the 12-month period ended September 30, 2024. Treasury yields fell meaningfully over the 12-month period ended September 30, 2024, as U.S. inflation continued to improve, and the market priced in anticipated interest rate cuts by the Federal Reserve. The Fund’s structural short duration versus the Index was a relative detractor in this environment. However, this was offset by positive relative returns from the Fund’s allocation to corporates and collateralized mortgage obligations. The Fund’s exposure to asset-backed securities was a modest detractor, while exposure to mortgage-passthrough securities proved to be neither a material contributor nor a detractor to the Fund’s performance.
How did the Fund perform over the past 10 years?
The line graph below reflects a hypothetical $10,000 investment. The returns shown in the line graph and table assume the reinvestment of dividends and capital gains, but do not reflect the deduction of taxes that a shareholder would pay on distributions or the redemption of Fund shares. The performance information shown below represents past performance and is no guarantee of future results. For Fund performance current to the most recent month end, visit https://www.thornburg.com/product/mutual-funds/fsi/TSIIX or call 1-800-847-0200. Performance for other share classes of the Fund will vary.
Cumulative Performance
Growth Table
Date | Thornburg Strategic Income Fund | Bloomberg U.S. Universal Total Return Index Value Unhedged | Thornburg Strategic Income Fund’s Blended Index | Bloomberg U.S. Aggregate Total Return Value Index USD |
09/30/2014 | 9999.9949 | 10000 | 10000 | 10000 |
10/31/2014 | 10031.623 | 10097.9156 | 10091.5595 | 10098.2769 |
11/30/2014 | 9989.4726 | 10152.4007 | 10189.2764 | 10169.91 |
12/31/2014 | 9856.145 | 10134.0706 | 10164.0428 | 10179.4256 |
01/31/2015 | 9831.7379 | 10326.9713 | 10297.7135 | 10392.8789 |
02/28/2015 | 9943.9326 | 10266.7871 | 10340.9202 | 10295.1602 |
03/31/2015 | 9929.7987 | 10309.1667 | 10346.9614 | 10342.967 |
04/30/2015 | 10051.5088 | 10297.2026 | 10365.7936 | 10305.856 |
05/31/2015 | 10062.747 | 10279.1756 | 10352.9634 | 10281.0356 |
06/30/2015 | 9986.1583 | 10164.4658 | 10214.5069 | 10168.9318 |
07/31/2015 | 9954.5079 | 10223.6598 | 10307.9799 | 10239.6187 |
08/31/2015 | 9836.2718 | 10193.5273 | 10159.713 | 10224.9146 |
09/30/2015 | 9726.818 | 10233.421 | 10139.7461 | 10294.0811 |
10/31/2015 | 9838.2415 | 10266.1404 | 10301.7941 | 10295.7875 |
11/30/2015 | 9781.9376 | 10228.692 | 10269.7724 | 10268.5908 |
12/31/2015 | 9648.9233 | 10177.6021 | 10207.116 | 10235.4031 |
01/31/2016 | 9582.3398 | 10289.9473 | 10197.36 | 10376.2558 |
02/29/2016 | 9576.9659 | 10363.0455 | 10240.0546 | 10449.8664 |
03/31/2016 | 9846.2088 | 10490.0427 | 10454.1897 | 10545.7404 |
04/30/2016 | 10043.2219 | 10561.5241 | 10519.3782 | 10586.2218 |
05/31/2016 | 10070.6062 | 10569.7697 | 10533.354 | 10588.9383 |
06/30/2016 | 10151.493 | 10755.8396 | 10661.1569 | 10779.1979 |
07/31/2016 | 10302.3108 | 10844.4789 | 10805.1599 | 10847.3436 |
08/31/2016 | 10856.1803 | 10797.0727 | 10834.9414 |
09/30/2016 | 10422.4895 | 10858.7671 | 10803.4833 | 10828.5941 |
10/31/2016 | 10447.5544 | 10786.7199 | 10695.5582 | 10745.7655 |
11/30/2016 | 10360.932 | 10544.2651 | 10523.9235 | 10491.5864 |
12/31/2016 | 10428.4781 | 10575.59 | 10586.1638 | 10506.3861 |
01/31/2017 | 10532.5356 | 10612.897 | 10653.881 | 10527.0016 |
02/28/2017 | 10626.7805 | 10694.7863 | 10770.279 | 10597.7522 |
03/31/2017 | 10662.6863 | 10691.2092 | 10788.7073 | 10592.197 |
04/30/2017 | 10760.5281 | 10779.9092 | 10887.2607 | 10673.9358 |
05/31/2017 | 10849.6327 | 10863.0718 | 11000.3642 | 10756.0945 |
06/30/2017 | 10883.4845 | 10853.8764 | 10999.9736 | 10745.2712 |
07/31/2017 | 10954.6431 | 10907.9371 | 11090.4925 | 10791.5097 |
08/31/2017 | 11016.7128 | 11002.0533 | 11173.1962 | 10888.3034 |
09/30/2017 | 11032.3392 | 10963.3317 | 11180.7795 | 10836.4459 |
10/31/2017 | 11064.3408 | 10976.4881 | 11228.2216 | 10842.724 |
11/30/2017 | 11075.2379 | 10959.8758 | 11265.3495 | 10828.8068 |
12/31/2017 | 11102.7207 | 11008.197 | 11337.1814 | 10878.506 |
01/31/2018 | 11111.4478 | 10902.2582 | 11352.4461 | 10753.2186 |
02/28/2018 | 11081.9826 | 10798.886 | 11172.294 | 10651.2843 |
03/31/2018 | 11081.6336 | 10853.351 | 11180.908 | 10719.5896 |
04/30/2018 | 11071.5507 | 10780.9399 | 11140.0801 | 10639.8655 |
05/31/2018 | 11102.6958 | 10839.7297 | 11217.6448 | 10715.7993 |
06/30/2018 | 11105.1208 | 10824.0066 | 11205.5381 | 10702.6209 |
07/31/2018 | 11156.4666 | 10846.6616 | 11277.6641 | 10705.1619 |
08/31/2018 | 11207.8301 | 10900.0958 | 11363.6265 | 10774.0467 |
09/30/2018 | 11221.097 | 10853.3914 | 11317.7408 | 10704.6676 |
10/31/2018 | 11166.6782 | 10762.5896 | 11079.9828 | 10620.0741 |
11/30/2018 | 11170.0765 | 10810.9916 | 11158.0714 | 10683.4727 |
12/31/2018 | 11178.467 | 10980.1461 | 11152.3723 | 10879.7393 |
01/31/2019 | 11362.0825 | 11131.5363 | 11420.6629 | 10995.2773 |
02/28/2019 | 11439.008 | 11143.6621 | 11484.0545 | 10988.9087 |
03/31/2019 | 11536.7812 | 11344.9094 | 11690.6344 | 11199.9166 |
04/30/2019 | 11614.4935 | 11360.7739 | 11775.9355 | 11202.782 |
05/31/2019 | 11663.4933 | 11534.8191 | 11807.2714 | 11401.6482 |
06/30/2019 | 11782.1943 | 11697.9511 | 12081.5035 | 11544.8346 |
07/31/2019 | 11821.1216 | 11732.7723 | 12114.7278 | 11570.2238 |
08/31/2019 | 11927.2712 | 11998.266 | 12316.2999 | 11870.0302 |
09/30/2019 | 11933.565 | 11946.2869 | 12316.245 | 11806.8123 |
10/31/2019 | 11970.4477 | 11984.8873 | 12408.6071 | 11842.3764 |
11/30/2019 | 11996.2577 | 11982.4823 | 12472.666 | 11836.3427 |
12/31/2019 | 12062.579 | 12000.3476 | 12540.447 | 11828.0976 |
01/31/2020 | 12158.7908 | 12215.7215 | 12718.2487 | 12055.7234 |
02/29/2020 | 12182.6354 | 12398.6185 | 12686.372 | 12272.7065 |
03/31/2020 | 11391.2525 | 12156.4467 | 12290.8562 | 12200.4833 |
04/30/2020 | 11711.7838 | 12399.9523 | 12734.1838 | 12417.3601 |
05/31/2020 | 12053.748 | 12515.7534 | 12904.6506 | 12475.1769 |
06/30/2020 | 12306.0207 | 12620.1967 | 13037.9479 | 12553.758 |
07/31/2020 | 12548.7052 | 12841.8759 | 13318.4978 | 12741.2746 |
08/31/2020 | 12649.4724 | 12767.8279 | 13410.469 | 12638.4313 |
09/30/2020 | 12696.2228 | 12744.8092 | 13312.0547 | 12631.4992 |
10/31/2020 | 12751.3792 | 12699.2567 | 13182.8319 | 12575.0965 |
11/30/2020 | 12944.6401 | 12864.9755 | 13623.4342 | 12698.4914 |
12/31/2020 | 13058.3108 | 12909.4165 | 13753.9673 | 12715.9864 |
01/31/2021 | 13109.6882 | 12828.2749 | 13647.7392 | 12624.817 |
02/28/2021 | 13127.2197 | 12662.7379 | 13560.0148 | 12442.5048 |
03/31/2021 | 13101.8654 | 12515.3896 | 13514.7933 | 12287.1394 |
04/30/2021 | 13191.7513 | 12620.6211 | 13726.0044 | 12384.2096 |
05/31/2021 | 13256.3971 | 12668.7604 | 13801.4253 | 12424.6696 |
06/30/2021 | 13306.7792 | 12761.1183 | 13920.1403 | 12511.9637 |
07/31/2021 | 13378.6253 | 12889.2473 | 14094.5228 | 12651.8595 |
08/31/2021 | 13418.2877 | 12880.6582 | 14143.214 | 12627.7727 |
09/30/2021 | 13425.5158 | 12770.6573 | 13927.8078 | 12518.4439 |
10/31/2021 | 13410.8478 | 12760.2291 | 14082.5127 | 12514.9938 |
11/30/2021 | 13372.4043 | 12775.6288 | 14054.1256 | 12552.0197 |
12/31/2021 | 13420.805 | 12767.0195 | 14145.4901 | 12519.9004 |
01/31/2022 | 13282.9747 | 12487.1164 | 13752.0001 | 12250.172 |
02/28/2022 | 13143.5761 | 12316.8706 | 13559.6996 | 12113.503 |
03/31/2022 | 12981.2937 | 11986.4232 | 13332.7546 | 11776.9683 |
04/30/2022 | 12764.0605 | 11539.3461 | 12706.4755 | 11330.0576 |
05/31/2022 | 12779.5572 | 11602.8447 | 12773.942 | 11403.1101 |
06/30/2022 | 12494.6304 | 11371 | 12392.3213 | 11224.2161 |
07/31/2022 | 12700.3435 | 11656.8852 | 12831.3419 | 11498.4738 |
08/31/2022 | 12616.5291 | 11353.842 | 12433.995 | 11173.5652 |
09/30/2022 | 12342.6259 | 10864.6885 | 11773.0422 | 10690.7981 |
10/31/2022 | 12339.7966 | 10745.472 | 11820.1424 | 10552.327 |
11/30/2022 | 12574.1969 | 11146.1276 | 12332.2684 | 10940.3949 |
12/31/2022 | 12598.2467 | 11108.275 | 12183.0234 | 10891.0465 |
01/31/2023 | 12884.1626 | 11452.8489 | 12655.2662 | 11226.0979 |
02/28/2023 | 12759.6991 | 11171.4301 | 12332.6595 | 10935.8444 |
03/31/2023 | 12944.2275 | 11433.5083 | 12659.4992 | 11213.6426 |
04/30/2023 | 13014.2354 | 11503.3528 | 12765.2599 | 11281.6023 |
05/31/2023 | 12993.1523 | 11384.0958 | 12628.574 | 11158.7602 |
06/30/2023 | 13018.9943 | 11366.4124 | 12745.2937 | 11118.9646 |
07/31/2023 | 13102.918 | 11377.7096 | 12823.8162 | 11111.2139 |
08/31/2023 | 13095.1942 | 11309.1788 | 12697.0243 | 11040.24 |
09/30/2023 | 12947.44 | 11039.5219 | 12329.3555 | 10759.6881 |
10/31/2023 | 12847.1769 | 10873.4999 | 12102.1509 | 10589.8898 |
11/30/2023 | 13242.5341 | 11362.8555 | 12767.5212 | 11069.4673 |
12/31/2023 | 13557.5516 | 11794.0277 | 13283.8655 | 11493.195 |
01/31/2024 | 13611.7432 | 11765.7948 | 13286.5653 | 11461.6339 |
02/29/2024 | 13557.2917 | 11624.7317 | 13249.0534 | 11299.6979 |
03/31/2024 | 13682.4023 | 11738.8554 | 13432.0791 | 11404.0404 |
04/30/2024 | 13506.5462 | 11464.5503 | 13060.87 | 11115.9877 |
05/31/2024 | 13693.7149 | 11654.5813 | 13354.6483 | 11304.4398 |
06/30/2024 | 13811.3509 | 11761.1264 | 13510.1462 | 11411.4668 |
07/31/2024 | 14068.3956 | 12028.0752 | 13810.2039 | 11678.0004 |
08/31/2024 | 14228.626 | 12205.1518 | 14041.9705 | 11845.8158 |
09/30/2024 | 14402.6387 | 12372.5481 | 14243.8138 | 12004.424 |
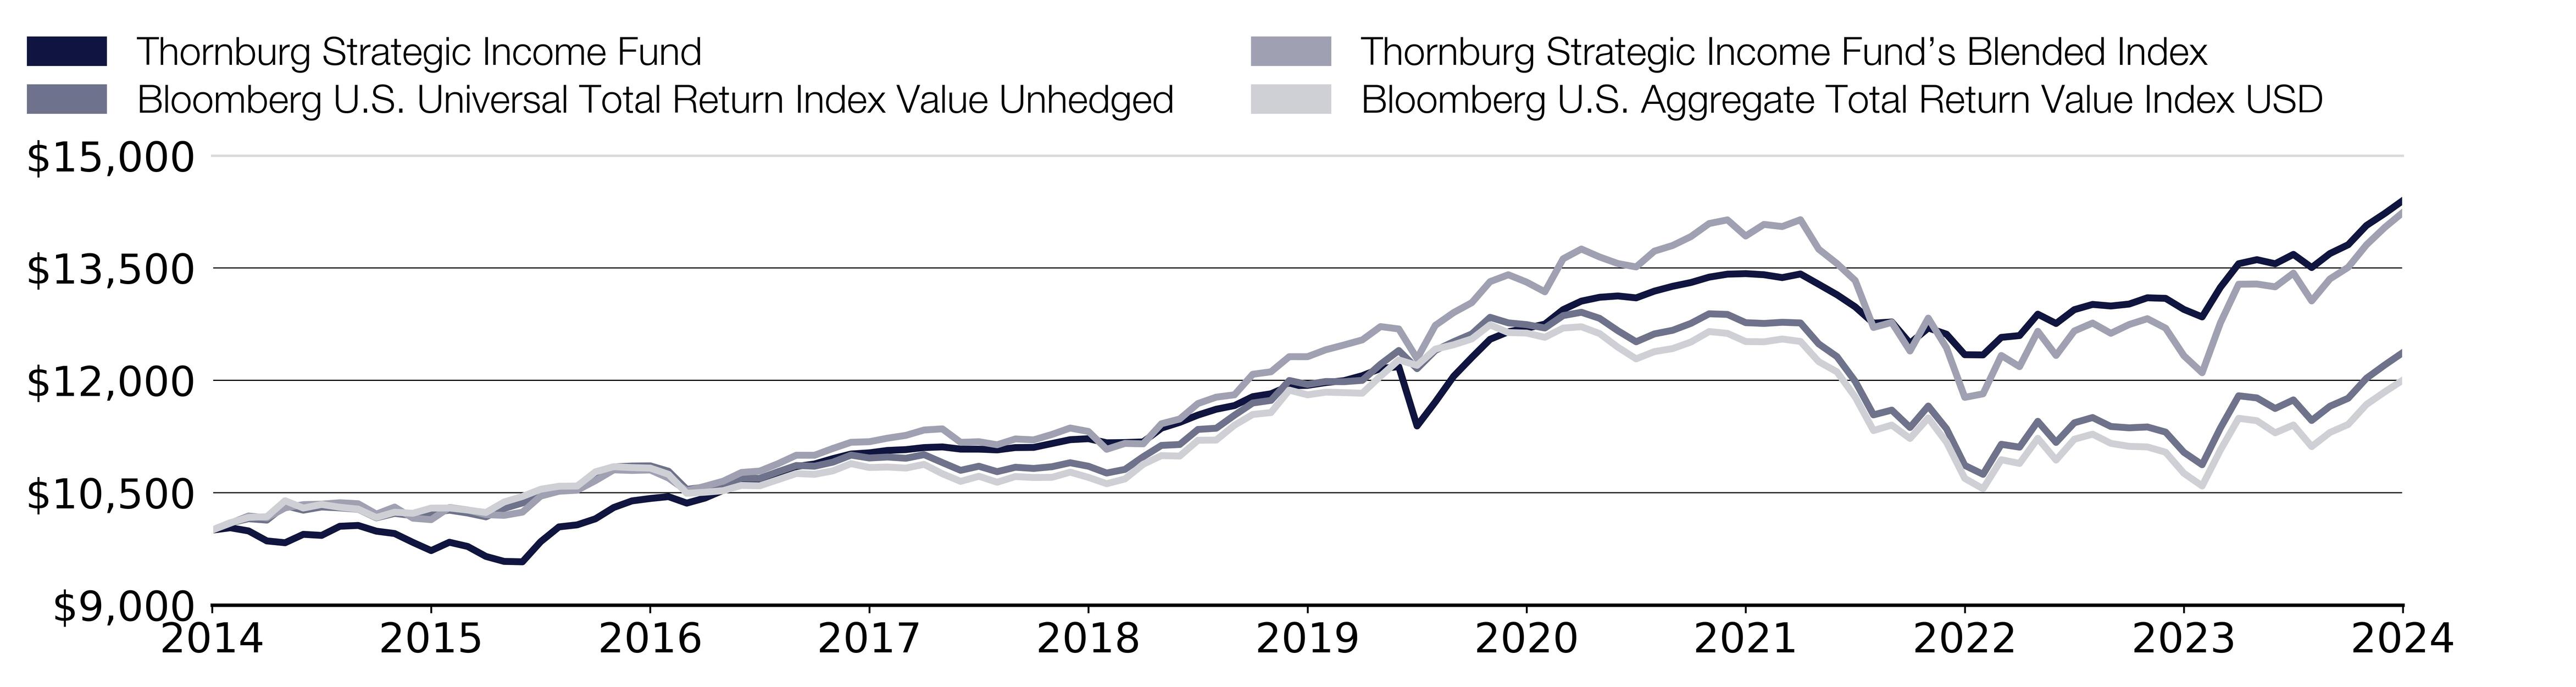
Effective September 30, 2024, the Fund adopted the Bloomberg U.S. Aggregate Total Return Index Value USD as its broad-based securities market index that represents the overall applicable market in which the Fund invests, and the Bloomberg U.S. Universal Total Return Index Value Unhedged as an additional index that represents the market sectors which the Fund’s advisor believes are more representative of the Fund’s investment universe.
What were the Fund costs for the past year?
(based on a hypothetical $10,000 investment)
Class Name | Costs of a $10,000 investment | Costs paid as a percentage of a $10,000 investment |
|---|
Class I | $63.00 | 0.60% |
End Block
Thornburg Strategic Income Fund Tailored Shareholder Report
Thornburg Strategic Income Fund Tailored Shareholder Report | |
Annual Performance | 1 Year | 5 Year | 10 Year |
|---|
Strategic Income Fund Class I | 11.24% | 3.83% | 3.72% |
Bloomberg U.S. Universal Total Return Index Value Unhedged | 12.08% | 0.70% | 2.15% |
Strategic Income Fund’s Blended Index | 15.53% | 2.95% | 3.60% |
Key Fund Statistics
(as of September 30, 2024)
| |
|---|
Fund Size (Millions) | $9,454.2M |
Number of Holdings | 1,154 |
Annual Portfolio Turnover | 60.47% |
Total Advisory Fee | $41.2M |
What did the Fund invest in?
(as of September 30, 2024)
Fixed Income Credit Quality | (%) |
|---|
| U.S. Government | 26.5 |
| AAA | 10.7 |
| AA | 2.4 |
| A | 11.8 |
| BBB | 22.1 |
| BB | 12.2 |
| B | 4.1 |
| CCC | 0.1 |
| D | 0.0 |
| NR | 4.2 |
| Cash Equivalents & Other | 5.9 |
Fixed Income Credit Quality | (%) |
U.S. Government | 26.5% |
AAA | 10.7% |
AA | 2.4% |
A | 11.8% |
BBB | 22.1% |
BB | 12.2% |
B | 4.1% |
CCC | 0.1% |
D | 0.0% |
NR | 4.2% |
Cash Equivalents & Other | 5.9% |
Expressed as a percentage of the Fund’s net assets. * Credit quality ratings shown above reflect the highest rating assigned by either S&P Global Ratings or Moody’s Investors Services, both of which are independent, nationally recognized statistical rating organizations. If a credit rating for an investment is not available from either S&P or Moody’s, then the Fund’s investment advisor will determine the credit quality of the investment. Investments are considered to be investment grade if they are rated within the four highest grades by S&P or Moody’s (BBB/Baa or higher) or, if no credit rating is available, have been judged to be of comparable quality by the Fund’s investment advisor. (NR = Not Rated)
How has the Fund changed?
This is a summary of certain changes to the Fund since October 1, 2023. For more complete information, you may review the Fund’s next prospectus, which we expect to be available by February 1, 2025 at https://www.thornburg.com/download or upon request by calling 1-800-847-0200.
End Block
Changes In and Disagreements with Accountants
No changes and/or disagreements occurred in the current reporting period.
End Block
For additional information about the Fund, including its prospectus, financial information, holdings and proxy information, visit www.thornburg.com/download.

Thornburg Strategic Income Fund Tailored Shareholder Report | |
Thornburg Strategic Income Fund Tailored Shareholder Report
Thornburg Strategic Income Fund CLASS: R3 TICKER: TSIRX Annual Shareholder Report | |
This annual shareholder report contains important information about the Thornburg Strategic Income Fund Class R3 Shares for the period from October 1, 2023 to September 30, 2024. You can find additional information about the Fund at https://www.thornburg.com/download. You can also request this information by contacting us at 1-800-847-0200. This report also describes changes to the Fund that occurred during the reporting period.
How did the Fund perform last year and what affected its performance?
The Fund’s Class R3 shares underperformed the Bloomberg U.S. Universal Total Return Index Value Unhedged (the “Index”) during the 12-month period ended September 30, 2024. Treasury yields fell meaningfully over the 12-month period ended September 30, 2024, as U.S. inflation continued to improve, and the market priced in anticipated interest rate cuts by the Federal Reserve. The Fund’s structural short duration versus the Index was a relative detractor in this environment. However, this was offset by positive relative returns from the Fund’s allocation to corporates and collateralized mortgage obligations. The Fund’s exposure to asset-backed securities was a modest detractor, while exposure to mortgage-passthrough securities proved to be neither a material contributor nor a detractor to the Fund’s performance.
How did the Fund perform over the past 10 years?
The line graph below reflects a hypothetical $10,000 investment. The returns shown in the line graph and table assume the reinvestment of dividends and capital gains, but do not reflect the deduction of taxes that a shareholder would pay on distributions or the redemption of Fund shares. The performance information shown below represents past performance and is no guarantee of future results. For Fund performance current to the most recent month end, visit https://www.thornburg.com/product/mutual-funds/fsi/TSIRX or call 1-800-847-0200. Performance for other share classes of the Fund will vary.
Cumulative Performance
Growth Table
Date | Thornburg Strategic Income Fund | Bloomberg U.S. Universal Total Return Index Value Unhedged | Thornburg Strategic Income Fund’s Blended Index | Bloomberg U.S. Aggregate Total Return Value Index USD |
09/30/2014 | 9999.9992 | 10000 | 10000 | 10000 |
10/31/2014 | 10020.0235 | 10097.9156 | 10091.5595 | 10098.2769 |
11/30/2014 | 9982.9027 | 10152.4007 | 10189.2764 | 10169.91 |
12/31/2014 | 9846.4671 | 10134.0706 | 10164.0428 | 10179.4256 |
01/31/2015 | 9818.7879 | 10326.9713 | 10297.7135 | 10392.8789 |
02/28/2015 | 9927.8861 | 10266.7871 | 10340.9202 | 10295.1602 |
03/31/2015 | 9902.4003 | 10309.1667 | 10346.9614 | 10342.967 |
04/30/2015 | 10020.6865 | 10297.2026 | 10365.7936 | 10305.856 |
05/31/2015 | 10028.8222 | 10279.1756 | 10352.9634 | 10281.0356 |
06/30/2015 | 9958.3343 | 10164.4658 | 10214.5069 | 10168.9318 |
07/31/2015 | 9924.075 | 10223.6598 | 10307.9799 | 10239.6187 |
08/31/2015 | 9803.8586 | 10193.5273 | 10159.713 | 10224.9146 |
09/30/2015 | 9692.861 | 10233.421 | 10139.7461 | 10294.0811 |
10/31/2015 | 9792.2523 | 10266.1404 | 10301.7941 | 10295.7875 |
11/30/2015 | 9742.1147 | 10228.692 | 10269.7724 | 10268.5908 |
12/31/2015 | 9607.1498 | 10177.6021 | 10207.116 | 10235.4031 |
01/31/2016 | 9538.3985 | 10289.9473 | 10197.36 | 10376.2558 |
02/29/2016 | 9530.7014 | 10363.0455 | 10240.0546 | 10449.8664 |
03/31/2016 | 9786.7365 | 10490.0427 | 10454.1897 | 10545.7404 |
04/30/2016 | 9979.7428 | 10561.5241 | 10519.3782 | 10586.2218 |
05/31/2016 | 10012.895 | 10569.7697 | 10533.354 | 10588.9383 |
06/30/2016 | 10090.4454 | 10755.8396 | 10661.1569 | 10779.1979 |
07/31/2016 | 10237.1522 | 10844.4789 | 10805.1599 | 10847.3436 |
08/31/2016 | 10321.6344 | 10856.1803 | 10797.0727 | 10834.9414 |
09/30/2016 | 10341.4427 | 10858.7671 | 10803.4833 | 10828.5941 |
10/31/2016 | 10372.2216 | 10786.7199 | 10695.5582 | 10745.7655 |
11/30/2016 | 10274.5984 | 10544.2651 | 10523.9235 | 10491.5864 |
12/31/2016 | 10347.5378 | 10575.59 | 10586.1638 | 10506.3861 |
01/31/2017 | 10438.6507 | 10612.897 | 10653.881 | 10527.0016 |
02/28/2017 | 10528.1389 | 10694.7863 | 10770.279 | 10597.7522 |
03/31/2017 | 10558.7491 | 10691.2092 | 10788.7073 | 10592.197 |
04/30/2017 | 10651.7151 | 10779.9092 | 10887.2607 | 10673.9358 |
05/31/2017 | 10734.7985 | 10863.0718 | 11000.3642 | 10756.0945 |
06/30/2017 | 10763.3518 | 10853.8764 | 10999.9736 | 10745.2712 |
07/31/2017 | 10828.565 | 10907.9371 | 11090.4925 | 10791.5097 |
08/31/2017 | 10884.7475 | 11002.0533 | 11173.1962 | 10888.3034 |
09/30/2017 | 10909.0326 | 10963.3317 | 11180.7795 | 10836.4459 |
10/31/2017 | 10935.5212 | 10976.4881 | 11228.2216 | 10842.724 |
11/30/2017 | 10941.2668 | 10959.8758 | 11265.3495 | 10828.8068 |
12/31/2017 | 10963.2384 | 11008.197 | 11337.1814 | 10878.506 |
01/31/2018 | 10975.9477 | 10902.2582 | 11352.4461 | 10753.2186 |
02/28/2018 | 10943.1164 | 10798.886 | 11172.294 | 10651.2843 |
03/31/2018 | 10928.2562 | 10853.351 | 11180.908 | 10719.5896 |
04/30/2018 | 10922.7149 | 10780.9399 | 11140.0801 | 10639.8655 |
05/31/2018 | 10938.8607 | 10839.7297 | 11217.6448 | 10715.7993 |
06/30/2018 | 10936.2908 | 10824.0066 | 11205.5381 | 10702.6209 |
07/31/2018 | 10981.6183 | 10846.6616 | 11277.6641 | 10705.1619 |
08/31/2018 | 11026.9436 | 10900.0958 | 11363.6265 | 10774.0467 |
09/30/2018 | 11035.0576 | 10853.3914 | 11317.7408 | 10704.6676 |
10/31/2018 | 10976.4617 | 10762.5896 | 11079.9828 | 10620.0741 |
11/30/2018 | 10974.793 | 10810.9916 | 11158.0714 | 10683.4727 |
12/31/2018 | 10977.8792 | 10980.1461 | 11152.3723 | 10879.7393 |
01/31/2019 | 11152.9591 | 11131.5363 | 11420.6629 | 10995.2773 |
02/28/2019 | 11223.1602 | 11143.6621 | 11484.0545 | 10988.9087 |
03/31/2019 | 11322.1943 | 11344.9094 | 11690.6344 | 11199.9166 |
04/30/2019 | 11383.0729 | 11360.7739 | 11775.9355 | 11202.782 |
05/31/2019 | 11425.2174 | 11534.8191 | 11807.2714 | 11401.6482 |
06/30/2019 | 11535.2423 | 11697.9511 | 12081.5035 | 11544.8346 |
07/31/2019 | 11567.1488 | 11732.7723 | 12114.7278 | 11570.2238 |
08/31/2019 | 11664.6278 | 11998.266 | 12316.2999 | 11870.0302 |
09/30/2019 | 11664.6897 | 11946.2869 | 12316.245 | 11806.8123 |
10/31/2019 | 11694.3099 | 11984.8873 | 12408.6071 | 11842.3764 |
11/30/2019 | 11703.4935 | 11982.4823 | 12472.666 | 11836.3427 |
12/31/2019 | 11771.6173 | 12000.3476 | 12540.447 | 11828.0976 |
01/31/2020 | 11858.9373 | 12215.7215 | 12718.2487 | 12055.7234 |
02/29/2020 | 11876.1094 | 12398.6185 | 12686.372 | 12272.7065 |
03/31/2020 | 11099.7072 | 12156.4467 | 12290.8562 | 12200.4833 |
04/30/2020 | 11395.4641 | 12399.9523 | 12734.1838 | 12417.3601 |
05/31/2020 | 11731.5643 | 12515.7534 | 12904.6506 | 12475.1769 |
06/30/2020 | 11970.8716 | 12620.1967 | 13037.9479 | 12553.758 |
07/31/2020 | 12199.9821 | 12841.8759 | 13318.4978 | 12741.2746 |
08/31/2020 | 12291.1204 | 12767.8279 | 13410.469 | 12638.4313 |
09/30/2020 | 12330.0167 | 12744.8092 | 13312.0547 | 12631.4992 |
10/31/2020 | 12376.6622 | 12699.2567 | 13182.8319 | 12575.0965 |
11/30/2020 | 12557.3931 | 12864.9755 | 13623.4342 | 12698.4914 |
12/31/2020 | 12660.9245 | 12909.4165 | 13753.9673 | 12715.9864 |
01/31/2021 | 12703.7459 | 12828.2749 | 13647.7392 | 12624.817 |
02/28/2021 | 12714.402 | 12662.7379 | 13560.0148 | 12442.5048 |
03/31/2021 | 12682.9832 | 12515.3896 | 13514.7933 | 12287.1394 |
04/30/2021 | 12763.131 | 12620.6211 | 13726.0044 | 12384.2096 |
05/31/2021 | 12818.7312 | 12668.7604 | 13801.4253 | 12424.6696 |
06/30/2021 | 12850.1026 | 12761.1183 | 13920.1403 | 12511.9637 |
07/31/2021 | 12922.8246 | 12889.2473 | 14094.5228 | 12651.8595 |
08/31/2021 | 12953.5516 | 12880.6582 | 14143.214 | 12627.7727 |
09/30/2021 | 12953.598 | 12770.6573 | 13927.8078 | 12518.4439 |
10/31/2021 | 12932.3766 | 12760.2291 | 14082.5127 | 12514.9938 |
11/30/2021 | 12888.5313 | 12775.6288 | 14054.1256 | 12552.0197 |
12/31/2021 | 12928.1945 | 12767.0195 | 14145.4901 | 12519.9004 |
01/31/2022 | 12788.6231 | 12487.1164 | 13752.0001 | 12250.172 |
02/28/2022 | 12648.3644 | 12316.8706 | 13559.6996 | 12113.503 |
03/31/2022 | 12485.592 | 11986.4232 | 13332.7546 | 11776.9683 |
04/30/2022 | 12270.4335 | 11539.3461 | 12706.4755 | 11330.0576 |
05/31/2022 | 12278.6148 | 11602.8447 | 12773.942 | 11403.1101 |
06/30/2022 | 11988.2318 | 11371 | 12392.3213 | 11224.2161 |
07/31/2022 | 12189.5382 | 11656.8852 | 12831.3419 | 11498.4738 |
08/31/2022 | 12102.5633 | 11353.842 | 12433.995 | 11173.5652 |
09/30/2022 | 11833.9146 | 10864.6885 | 11773.0422 | 10690.7981 |
10/31/2022 | 11813.9747 | 10745.472 | 11820.1424 | 10552.327 |
11/30/2022 | 12031.956 | 11146.1276 | 12332.2684 | 10940.3949 |
12/31/2022 | 12048.3477 | 11108.275 | 12183.0234 | 10891.0465 |
01/31/2023 | 12314.9288 | 11452.8489 | 12655.2662 | 11226.0979 |
02/28/2023 | 12189.9561 | 11171.4301 | 12332.6595 | 10935.8444 |
03/31/2023 | 12359.3926 | 11433.5083 | 12659.4992 | 11213.6426 |
04/30/2023 | 12430.5948 | 11503.3528 | 12765.2599 | 11281.6023 |
05/31/2023 | 12403.6585 | 11384.0958 | 12628.574 | 11158.7602 |
06/30/2023 | 12410.6864 | 11366.4124 | 12745.2937 | 11118.9646 |
07/31/2023 | 12486.0081 | 11377.7096 | 12823.8162 | 11111.2139 |
08/31/2023 | 12482.9709 | 11309.1788 | 12697.0243 | 11040.24 |
09/30/2023 | 12324.6711 | 11039.5219 | 12329.3555 | 10759.6881 |
10/31/2023 | 12233.7824 | 10873.4999 | 12102.1509 | 10589.8898 |
11/30/2023 | 12591.8405 | 11362.8555 | 12767.5212 | 11069.4673 |
12/31/2023 | 12895.4634 | 11794.0277 | 13283.8655 | 11493.195 |
01/31/2024 | 12939.912 | 11765.7948 | 13286.5653 | 11461.6339 |
02/29/2024 | 12881.6942 | 11624.7317 | 13249.0534 | 11299.6979 |
03/31/2024 | 12981.9354 | 11738.8554 | 13432.0791 | 11404.0404 |
04/30/2024 | 12819.7818 | 11464.5503 | 13060.87 | 11115.9877 |
05/31/2024 | 12978.6326 | 11654.5813 | 13354.6483 | 11304.4398 |
06/30/2024 | 13083.1249 | 11761.1264 | 13510.1462 | 11411.4668 |
07/31/2024 | 13319.208 | 12028.0752 | 13810.2039 | 11678.0004 |
08/31/2024 | 13475.067 | 12205.1518 | 14041.9705 | 11845.8158 |
09/30/2024 | 13620.8272 | 12372.5481 | 14243.8138 | 12004.424 |

Effective September 30, 2024, the Fund adopted the Bloomberg U.S. Aggregate Total Return Index Value USD as its broad-based securities market index that represents the overall applicable market in which the Fund invests, and the Bloomberg U.S. Universal Total Return Index Value Unhedged as an additional index that represents the market sectors which the Fund’s advisor believes are more representative of the Fund’s investment universe.
What were the Fund costs for the past year?
(based on a hypothetical $10,000 investment)
Class Name | Costs of a $10,000 investment | Costs paid as a percentage of a $10,000 investment |
|---|
Class R3 | $132.00 | 1.25% |
End Block
Thornburg Strategic Income Fund Tailored Shareholder Report
Thornburg Strategic Income Fund Tailored Shareholder Report | |
Annual Performance | 1 Year | 5 Year | 10 Year |
|---|
Strategic Income Fund Class R3 | 10.52% | 3.15% | 3.14% |
Bloomberg U.S. Universal Total Return Index Value Unhedged | 12.08% | 0.70% | 2.15% |
Strategic Income Fund’s Blended Index | 15.53% | 2.95% | 3.60% |
Key Fund Statistics
(as of September 30, 2024)
| |
|---|
Fund Size (Millions) | $9,454.2M |
Number of Holdings | 1,154 |
Annual Portfolio Turnover | 60.47% |
Total Advisory Fee | $41.2M |
What did the Fund invest in?
(as of September 30, 2024)
Fixed Income Credit Quality | (%) |
|---|
| U.S. Government | 26.5 |
| AAA | 10.7 |
| AA | 2.4 |
| A | 11.8 |
| BBB | 22.1 |
| BB | 12.2 |
| B | 4.1 |
| CCC | 0.1 |
| D | 0.0 |
| NR | 4.2 |
| Cash Equivalents & Other | 5.9 |
Fixed Income Credit Quality | (%) |
U.S. Government | 26.5% |
AAA | 10.7% |
AA | 2.4% |
A | 11.8% |
BBB | 22.1% |
BB | 12.2% |
B | 4.1% |
CCC | 0.1% |
D | 0.0% |
NR | 4.2% |
Cash Equivalents & Other | 5.9% |
Expressed as a percentage of the Fund’s net assets. * Credit quality ratings shown above reflect the highest rating assigned by either S&P Global Ratings or Moody’s Investors Services, both of which are independent, nationally recognized statistical rating organizations. If a credit rating for an investment is not available from either S&P or Moody’s, then the Fund’s investment advisor will determine the credit quality of the investment. Investments are considered to be investment grade if they are rated within the four highest grades by S&P or Moody’s (BBB/Baa or higher) or, if no credit rating is available, have been judged to be of comparable quality by the Fund’s investment advisor. (NR = Not Rated)
How has the Fund changed?
This is a summary of certain changes to the Fund since October 1, 2023. For more complete information, you may review the Fund’s next prospectus, which we expect to be available by February 1, 2025 at https://www.thornburg.com/download or upon request by calling 1-800-847-0200.
End Block
Changes In and Disagreements with Accountants
No changes and/or disagreements occurred in the current reporting period.
End Block
For additional information about the Fund, including its prospectus, financial information, holdings and proxy information, visit www.thornburg.com/download.

Thornburg Strategic Income Fund Tailored Shareholder Report | |
Thornburg Strategic Income Fund Tailored Shareholder Report
Thornburg Strategic Income Fund CLASS: R4 TICKER: TSRIX Annual Shareholder Report | |
This annual shareholder report contains important information about the Thornburg Strategic Income Fund Class R4 Shares for the period from October 1, 2023 to September 30, 2024. You can find additional information about the Fund at https://www.thornburg.com/download. You can also request this information by contacting us at 1-800-847-0200. This report also describes changes to the Fund that occurred during the reporting period.
How did the Fund perform last year and what affected its performance?
The Fund’s Class R4 shares underperformed the Bloomberg U.S. Universal Total Return Index Value Unhedged (the “Index”) during the 12-month period ended September 30, 2024. Treasury yields fell meaningfully over the 12-month period ended September 30, 2024, as U.S. inflation continued to improve, and the market priced in anticipated interest rate cuts by the Federal Reserve. The Fund’s structural short duration versus the Index was a relative detractor in this environment. However, this was offset by positive relative returns from the Fund’s allocation to corporates and collateralized mortgage obligations. The Fund’s exposure to asset-backed securities was a modest detractor, while exposure to mortgage-passthrough securities proved to be neither a material contributor nor a detractor to the Fund’s performance.
How did the Fund perform over the past 10 years?
The line graph below reflects a hypothetical $10,000 investment. The returns shown in the line graph and table assume the reinvestment of dividends and capital gains, but do not reflect the deduction of taxes that a shareholder would pay on distributions or the redemption of Fund shares. The performance information shown below represents past performance and is no guarantee of future results. For Fund performance current to the most recent month end, visit https://www.thornburg.com/product/mutual-funds/fsi/TSRIX or call 1-800-847-0200. Performance for other share classes of the Fund will vary.
Cumulative Performance
Growth Table
Date | Thornburg Strategic Income Fund | Bloomberg U.S. Universal Total Return Index Value Unhedged | Thornburg Strategic Income Fund’s Blended Index | Bloomberg U.S. Aggregate Total Return Value Index USD |
09/30/2014 | 9999.9992 | 10000 | 10000 | 10000 |
10/31/2014 | 10028.2568 | 10097.9156 | 10091.5595 | 10098.2769 |
11/30/2014 | 9982.9265 | 10152.4007 | 10189.2764 | 10169.91 |
12/31/2014 | 9846.5141 | 10134.0706 | 10164.0428 | 10179.4256 |
01/31/2015 | 9827.2366 | 10326.9713 | 10297.7135 | 10392.8789 |
02/28/2015 | 9927.9331 | 10266.7871 | 10340.9202 | 10295.1602 |
03/31/2015 | 9910.8945 | 10309.1667 | 10346.9614 | 10342.967 |
04/30/2015 | 10029.1976 | 10297.2026 | 10365.7936 | 10305.856 |
05/31/2015 | 10037.3501 | 10279.1756 | 10352.9634 | 10281.0356 |
06/30/2015 | 9958.3576 | 10164.4658 | 10214.5069 | 10168.9318 |
07/31/2015 | 9924.1213 | 10223.6598 | 10307.9799 | 10239.6187 |
08/31/2015 | 9803.9155 | 10193.5273 | 10159.713 | 10224.9146 |
09/30/2015 | 9692.9283 | 10233.421 | 10139.7461 | 10294.0811 |
10/31/2015 | 9800.9746 | 10266.1404 | 10301.7941 | 10295.7875 |
11/30/2015 | 9742.3273 | 10228.692 | 10269.7724 | 10268.5908 |
12/31/2015 | 9607.37 | 10177.6021 | 10207.116 | 10235.4031 |
01/31/2016 | 9538.6381 | 10289.9473 | 10197.36 | 10376.2558 |
02/29/2016 | 9530.9508 | 10363.0455 | 10240.0546 | 10449.8664 |
03/31/2016 | 9795.8055 | 10490.0427 | 10454.1897 | 10545.7404 |
04/30/2016 | 9988.8348 | 10561.5241 | 10519.3782 | 10586.2218 |
05/31/2016 | 10013.1432 | 10569.7697 | 10533.354 | 10588.9383 |
06/30/2016 | 10090.7176 | 10755.8396 | 10661.1569 | 10779.1979 |
07/31/2016 | 10237.4392 | 10844.4789 | 10805.1599 | 10847.3436 |
08/31/2016 | 10321.9347 | 10856.1803 | 10797.0727 | 10834.9414 |
09/30/2016 | 10350.6853 | 10858.7671 | 10803.4833 | 10828.5941 |
10/31/2016 | 10372.5221 | 10786.7199 | 10695.5582 | 10745.7655 |
11/30/2016 | 10283.885 | 10544.2651 | 10523.9235 | 10491.5864 |
12/31/2016 | 10347.848 | 10575.59 | 10586.1638 | 10506.3861 |
01/31/2017 | 10447.9855 | 10612.897 | 10653.881 | 10527.0016 |
02/28/2017 | 10537.4941 | 10694.7863 | 10770.279 | 10597.7522 |
03/31/2017 | 10568.119 | 10691.2092 | 10788.7073 | 10592.197 |
04/30/2017 | 10660.7254 | 10779.9092 | 10887.2607 | 10673.9358 |
05/31/2017 | 10743.8325 | 10863.0718 | 11000.3642 | 10756.0945 |
06/30/2017 | 10772.3983 | 10853.8764 | 10999.9736 | 10745.2712 |
07/31/2017 | 10837.6355 | 10907.9371 | 11090.4925 | 10791.5097 |
08/31/2017 | 10884.6529 | 11002.0533 | 11173.1962 | 10888.3034 |
09/30/2017 | 10904.2573 | 10963.3317 | 11180.7795 | 10836.4459 |
10/31/2017 | 10930.7105 | 10976.4881 | 11228.2216 | 10842.724 |
11/30/2017 | 10936.4878 | 10959.8758 | 11265.3495 | 10828.8068 |
12/31/2017 | 10958.4712 | 11008.197 | 11337.1814 | 10878.506 |
01/31/2018 | 10961.9261 | 10902.2582 | 11352.4461 | 10753.2186 |
02/28/2018 | 10929.3219 | 10798.886 | 11172.294 | 10651.2843 |
03/31/2018 | 10915.7776 | 10853.351 | 11180.908 | 10719.5896 |
04/30/2018 | 10910.2367 | 10780.9399 | 11140.0801 | 10639.8655 |
05/31/2018 | 10926.3865 | 10839.7297 | 11217.6448 | 10715.7993 |
06/30/2018 | 10923.8258 | 10824.0066 | 11205.5381 | 10702.6209 |
07/31/2018 | 10969.1369 | 10846.6616 | 11277.6641 | 10705.1619 |
08/31/2018 | 11014.4343 | 10900.0958 | 11363.6265 | 10774.0467 |
09/30/2018 | 11022.4372 | 10853.3914 | 11317.7408 | 10704.6676 |
10/31/2018 | 10963.854 | 10762.5896 | 11079.9828 | 10620.0741 |
11/30/2018 | 10962.1931 | 10810.9916 | 11158.0714 | 10683.4727 |
12/31/2018 | 10974.8229 | 10980.1461 | 11152.3723 | 10879.7393 |
01/31/2019 | 11149.8047 | 11131.5363 | 11420.6629 | 10995.2773 |
02/28/2019 | 11210.3887 | 11143.6621 | 11484.0545 | 10988.9087 |
03/31/2019 | 11309.3651 | 11344.9094 | 11690.6344 | 11199.9166 |
04/30/2019 | 11370.232 | 11360.7739 | 11775.9355 | 11202.782 |
05/31/2019 | 11412.3462 | 11534.8191 | 11807.2714 | 11401.6482 |
06/30/2019 | 11532.0018 | 11697.9511 | 12081.5035 | 11544.8346 |
07/31/2019 | 11563.8608 | 11732.7723 | 12114.7278 | 11570.2238 |
08/31/2019 | 11651.5657 | 11998.266 | 12316.2999 | 11870.0302 |
09/30/2019 | 11651.6113 | 11946.2869 | 12316.245 | 11806.8123 |
10/31/2019 | 11681.2185 | 11984.8873 | 12408.6071 | 11842.3764 |
11/30/2019 | 11700.2118 | 11982.4823 | 12472.666 | 11836.3427 |
12/31/2019 | 11758.4482 | 12000.3476 | 12540.447 | 11828.0976 |
01/31/2020 | 11845.7162 | 12215.7215 | 12718.2487 | 12055.7234 |
02/29/2020 | 11872.767 | 12398.6185 | 12686.372 | 12272.7065 |
03/31/2020 | 11086.6565 | 12156.4467 | 12290.8562 | 12200.4833 |
04/30/2020 | 11392.3524 | 12399.9523 | 12734.1838 | 12417.3601 |
05/31/2020 | 11718.3984 | 12515.7534 | 12904.6506 | 12475.1769 |
06/30/2020 | 11957.5882 | 12620.1967 | 13037.9479 | 12553.758 |
07/31/2020 | 12186.6201 | 12841.8759 | 13318.4978 | 12741.2746 |
08/31/2020 | 12277.7533 | 12767.8279 | 13410.469 | 12638.4313 |
09/30/2020 | 12326.6684 | 12744.8092 | 13312.0547 | 12631.4992 |
10/31/2020 | 12363.2795 | 12699.2567 | 13182.8319 | 12575.0965 |
11/30/2020 | 12543.9292 | 12864.9755 | 13623.4342 | 12698.4914 |
12/31/2020 | 12647.3357 | 12909.4165 | 13753.9673 | 12715.9864 |
01/31/2021 | 12689.986 | 12828.2749 | 13647.7392 | 12624.817 |
02/28/2021 | 12710.7316 | 12662.7379 | 13560.0148 | 12442.5048 |
03/31/2021 | 12679.3212 | 12515.3896 | 13514.7933 | 12287.1394 |
04/30/2021 | 12749.1546 | 12620.6211 | 13726.0044 | 12384.2096 |
05/31/2021 | 12804.7454 | 12668.7604 | 13801.4253 | 12424.6696 |
06/30/2021 | 12846.5839 | 12761.1183 | 13920.1403 | 12511.9637 |
07/31/2021 | 12908.8139 | 12889.2473 | 14094.5228 | 12651.8595 |
08/31/2021 | 12950.4192 | 12880.6582 | 14143.214 | 12627.7727 |
09/30/2021 | 12940.1532 | 12770.6573 | 13927.8078 | 12518.4439 |
10/31/2021 | 12918.9928 | 12760.2291 | 14082.5127 | 12514.9938 |
11/30/2021 | 12885.628 | 12775.6288 | 14054.1256 | 12552.0197 |
12/31/2021 | 12925.2766 | 12767.0195 | 14145.4901 | 12519.9004 |
01/31/2022 | 12785.7191 | 12487.1164 | 13752.0001 | 12250.172 |
02/28/2022 | 12645.451 | 12316.8706 | 13559.6996 | 12113.503 |
03/31/2022 | 12482.9342 | 11986.4232 | 13332.7546 | 11776.9683 |
04/30/2022 | 12257.1994 | 11539.3461 | 12706.4755 | 11330.0576 |
05/31/2022 | 12265.3595 | 11602.8447 | 12773.942 | 11403.1101 |
06/30/2022 | 11985.6872 | 11371 | 12392.3213 | 11224.2161 |
07/31/2022 | 12186.9459 | 11656.8852 | 12831.3419 | 11498.4738 |
08/31/2022 | 12099.9847 | 11353.842 | 12433.995 | 11173.5652 |
09/30/2022 | 11820.6357 | 10864.6885 | 11773.0422 | 10690.7981 |
10/31/2022 | 11811.4608 | 10745.472 | 11820.1424 | 10552.327 |
11/30/2022 | 12029.3808 | 11146.1276 | 12332.2684 | 10940.3949 |
12/31/2022 | 12045.766 | 11108.275 | 12183.0234 | 10891.0465 |
01/31/2023 | 12312.2643 | 11452.8489 | 12655.2662 | 11226.0979 |
02/28/2023 | 12187.316 | 11171.4301 | 12332.6595 | 10935.8444 |
03/31/2023 | 12356.7127 | 11433.5083 | 12659.4992 | 11213.6426 |
04/30/2023 | 12427.8852 | 11503.3528 | 12765.2599 | 11281.6023 |
05/31/2023 | 12389.9543 | 11384.0958 | 12628.574 | 11158.7602 |
06/30/2023 | 12408.0096 | 11366.4124 | 12745.2937 | 11118.9646 |
07/31/2023 | 12483.3242 | 11377.7096 | 12823.8162 | 11111.2139 |
08/31/2023 | 12469.177 | 11309.1788 | 12697.0243 | 11040.24 |
09/30/2023 | 12322.0287 | 11039.5219 | 12329.3555 | 10759.6881 |
10/31/2023 | 12231.1579 | 10873.4999 | 12102.1509 | 10589.8898 |
11/30/2023 | 12589.1262 | 11362.8555 | 12767.5212 | 11069.4673 |
12/31/2023 | 12892.6818 | 11794.0277 | 13283.8655 | 11493.195 |
01/31/2024 | 12937.119 | 11765.7948 | 13286.5653 | 11461.6339 |
02/29/2024 | 12867.5699 | 11624.7317 | 13249.0534 | 11299.6979 |
03/31/2024 | 12979.1635 | 11738.8554 | 13432.0791 | 11404.0404 |
04/30/2024 | 12817.0539 | 11464.5503 | 13060.87 | 11115.9877 |
05/31/2024 | 12975.8578 | 11654.5813 | 13354.6483 | 11304.4398 |
06/30/2024 | 13080.3264 | 11761.1264 | 13510.1462 | 11411.4668 |
07/31/2024 | 13316.3585 | 12028.0752 | 13810.2039 | 11678.0004 |
08/31/2024 | 13460.5958 | 12205.1518 | 14041.9705 | 11845.8158 |
09/30/2024 | 13617.9122 | 12372.5481 | 14243.8138 | 12004.424 |

Effective September 30, 2024, the Fund adopted the Bloomberg U.S. Aggregate Total Return Index Value USD as its broad-based securities market index that represents the overall applicable market in which the Fund invests, and the Bloomberg U.S. Universal Total Return Index Value Unhedged as an additional index that represents the market sectors which the Fund’s advisor believes are more representative of the Fund’s investment universe.
What were the Fund costs for the past year?
(based on a hypothetical $10,000 investment)
Class Name | Costs of a $10,000 investment | Costs paid as a percentage of a $10,000 investment |
|---|
Class R4 | $132.00 | 1.25% |
End Block
Thornburg Strategic Income Fund Tailored Shareholder Report
Thornburg Strategic Income Fund Tailored Shareholder Report | |
Annual Performance | 1 Year | 5 Year | 10 Year |
|---|
Strategic Income Fund Class R4 | 10.52% | 3.17% | 3.14% |
Bloomberg U.S. Universal Total Return Index Value Unhedged | 12.08% | 0.70% | 2.15% |
Strategic Income Fund’s Blended Index | 15.53% | 2.95% | 3.60% |
Key Fund Statistics
(as of September 30, 2024)
| |
|---|
Fund Size (Millions) | $9,454.2M |
Number of Holdings | 1,154 |
Annual Portfolio Turnover | 60.47% |
Total Advisory Fee | $41.2M |
What did the Fund invest in?
(as of September 30, 2024)
Fixed Income Credit Quality | (%) |
|---|
| U.S. Government | 26.5 |
| AAA | 10.7 |
| AA | 2.4 |
| A | 11.8 |
| BBB | 22.1 |
| BB | 12.2 |
| B | 4.1 |
| CCC | 0.1 |
| D | 0.0 |
| NR | 4.2 |
| Cash Equivalents & Other | 5.9 |
Fixed Income Credit Quality | (%) |
U.S. Government | 26.5% |
AAA | 10.7% |
AA | 2.4% |
A | 11.8% |
BBB | 22.1% |
BB | 12.2% |
B | 4.1% |
CCC | 0.1% |
D | 0.0% |
NR | 4.2% |
Cash Equivalents & Other | 5.9% |
Expressed as a percentage of the Fund’s net assets. * Credit quality ratings shown above reflect the highest rating assigned by either S&P Global Ratings or Moody’s Investors Services, both of which are independent, nationally recognized statistical rating organizations. If a credit rating for an investment is not available from either S&P or Moody’s, then the Fund’s investment advisor will determine the credit quality of the investment. Investments are considered to be investment grade if they are rated within the four highest grades by S&P or Moody’s (BBB/Baa or higher) or, if no credit rating is available, have been judged to be of comparable quality by the Fund’s investment advisor. (NR = Not Rated)
How has the Fund changed?
This is a summary of certain changes to the Fund since October 1, 2023. For more complete information, you may review the Fund’s next prospectus, which we expect to be available by February 1, 2025 at https://www.thornburg.com/download or upon request by calling 1-800-847-0200.
End Block
Changes In and Disagreements with Accountants
No changes and/or disagreements occurred in the current reporting period.
End Block
For additional information about the Fund, including its prospectus, financial information, holdings and proxy information, visit www.thornburg.com/download.

Thornburg Strategic Income Fund Tailored Shareholder Report | |
Thornburg Strategic Income Fund Tailored Shareholder Report
Thornburg Strategic Income Fund CLASS: R5 TICKER: TSRRX Annual Shareholder Report | |
This annual shareholder report contains important information about the Thornburg Strategic Income Fund Class R5 Shares for the period from October 1, 2023 to September 30, 2024. You can find additional information about the Fund at https://www.thornburg.com/download. You can also request this information by contacting us at 1-800-847-0200. This report also describes changes to the Fund that occurred during the reporting period.
How did the Fund perform last year and what affected its performance?
The Fund’s Class R5 shares underperformed the Bloomberg U.S. Universal Total Return Index Value Unhedged (the “Index”) during the 12-month period ended September 30, 2024. Treasury yields fell meaningfully over the 12-month period ended September 30, 2024, as U.S. inflation continued to improve, and the market priced in anticipated interest rate cuts by the Federal Reserve. The Fund’s structural short duration versus the Index was a relative detractor in this environment. However, this was offset by positive relative returns from the Fund’s allocation to corporates and collateralized mortgage obligations. The Fund’s exposure to asset-backed securities was a modest detractor, while exposure to mortgage-passthrough securities proved to be neither a material contributor nor a detractor to the Fund’s performance.
How did the Fund perform over the past 10 years?
The line graph below reflects a hypothetical $10,000 investment. The returns shown in the line graph and table assume the reinvestment of dividends and capital gains, but do not reflect the deduction of taxes that a shareholder would pay on distributions or the redemption of Fund shares. The performance information shown below represents past performance and is no guarantee of future results. For Fund performance current to the most recent month end, visit https://www.thornburg.com/product/mutual-funds/fsi/TSRRX or call 1-800-847-0200. Performance for other share classes of the Fund will vary.
Cumulative Performance
Growth Table
Date | Thornburg Strategic Income Fund | Bloomberg U.S. Universal Total Return Index Value Unhedged | Thornburg Strategic Income Fund’s Blended Index | Bloomberg U.S. Aggregate Total Return Value Index USD |
09/30/2014 | 9999.9968 | 10000 | 10000 | 10000 |
10/31/2014 | 10030.4568 | 10097.9156 | 10091.5595 | 10098.2769 |
11/30/2014 | 9995.3253 | 10152.4007 | 10189.2764 | 10169.91 |
12/31/2014 | 9860.6103 | 10134.0706 | 10164.0428 | 10179.4256 |
01/31/2015 | 9834.9533 | 10326.9713 | 10297.7135 | 10392.8789 |
02/28/2015 | 9937.8906 | 10266.7871 | 10340.9202 | 10295.1602 |
03/31/2015 | 9922.896 | 10309.1667 | 10346.9614 | 10342.967 |
04/30/2015 | 10052.2156 | 10297.2026 | 10365.7936 | 10305.856 |
05/31/2015 | 10062.5472 | 10279.1756 | 10352.9634 | 10281.0356 |
06/30/2015 | 9985.2984 | 10164.4658 | 10214.5069 | 10168.9318 |
07/31/2015 | 9953.0423 | 10223.6598 | 10307.9799 | 10239.6187 |
08/31/2015 | 9834.3861 | 10193.5273 | 10159.713 | 10224.9146 |
09/30/2015 | 9724.8821 | 10233.421 | 10139.7461 | 10294.0811 |
10/31/2015 | 9835.5996 | 10266.1404 | 10301.7941 | 10295.7875 |
11/30/2015 | 9778.5196 | 10228.692 | 10269.7724 | 10268.5908 |
12/31/2015 | 9644.9119 | 10177.6021 | 10207.116 | 10235.4031 |
01/31/2016 | 9577.8179 | 10289.9473 | 10197.36 | 10376.2558 |
02/29/2016 | 9571.9779 | 10363.0455 | 10240.0546 | 10449.8664 |
03/31/2016 | 9840.5247 | 10490.0427 | 10454.1897 | 10545.7404 |
04/30/2016 | 10036.8262 | 10561.5241 | 10519.3782 | 10586.2218 |
05/31/2016 | 10063.4561 | 10569.7697 | 10533.354 | 10588.9383 |
06/30/2016 | 10143.6596 | 10755.8396 | 10661.1569 | 10779.1979 |
07/31/2016 | 10293.6241 | 10844.4789 | 10805.1599 | 10847.3436 |
08/31/2016 | 10380.9548 | 10856.1803 | 10797.0727 | 10834.9414 |
09/30/2016 | 10412.0919 | 10858.7671 | 10803.4833 | 10828.5941 |
10/31/2016 | 10436.349 | 10786.7199 | 10695.5582 | 10745.7655 |
11/30/2016 | 10349.1809 | 10544.2651 | 10523.9235 | 10491.5864 |
12/31/2016 | 10415.9185 | 10575.59 | 10586.1638 | 10506.3861 |
01/31/2017 | 10510.0726 | 10612.897 | 10653.881 | 10527.0016 |
02/28/2017 | 10613.3013 | 10694.7863 | 10770.279 | 10597.7522 |
03/31/2017 | 10649.149 | 10691.2092 | 10788.7073 | 10592.197 |
04/30/2017 | 10746.8625 | 10779.9092 | 10887.2607 | 10673.9358 |
05/31/2017 | 10835.8382 | 10863.0718 | 11000.3642 | 10756.0945 |
06/30/2017 | 10869.6313 | 10853.8764 | 10999.9736 | 10745.2712 |
07/31/2017 | 10940.6838 | 10907.9371 | 11090.4925 | 10791.5097 |
08/31/2017 | 10993.3857 | 11002.0533 | 11173.1962 | 10888.3034 |
09/30/2017 | 11020.315 | 10963.3317 | 11180.7795 | 10836.4459 |
10/31/2017 | 11052.293 | 10976.4881 | 11228.2216 | 10842.724 |
11/30/2017 | 11063.293 | 10959.8758 | 11265.3495 | 10828.8068 |
12/31/2017 | 11090.7758 | 11008.197 | 11337.1814 | 10878.506 |
01/31/2018 | 11099.4761 | 10902.2582 | 11352.4461 | 10753.2186 |
02/28/2018 | 11079.4165 | 10798.886 | 11172.294 | 10651.2843 |
03/31/2018 | 11069.6252 | 10853.351 | 11180.908 | 10719.5896 |
04/30/2018 | 11069.058 | 10780.9399 | 11140.0801 | 10639.8655 |
05/31/2018 | 11090.6704 | 10839.7297 | 11217.6448 | 10715.7993 |
06/30/2018 | 11093.1032 | 10824.0066 | 11205.5381 | 10702.6209 |
07/31/2018 | 11144.405 | 10846.6616 | 11277.6641 | 10705.1619 |
08/31/2018 | 11195.7012 | 10900.0958 | 11363.6265 | 10774.0467 |
09/30/2018 | 11208.9541 | 10853.3914 | 11317.7408 | 10704.6676 |
10/31/2018 | 11154.6063 | 10762.5896 | 11079.9828 | 10620.0741 |
11/30/2018 | 11158.0015 | 10810.9916 | 11158.0714 | 10683.4727 |
12/31/2018 | 11176.1014 | 10980.1461 | 11152.3723 | 10879.7393 |
01/31/2019 | 11359.5444 | 11131.5363 | 11420.6629 | 10995.2773 |
02/28/2019 | 11426.6368 | 11143.6621 | 11484.0545 | 10988.9087 |
03/31/2019 | 11534.1207 | 11344.9094 | 11690.6344 | 11199.9166 |
04/30/2019 | 11601.9456 | 11360.7739 | 11775.9355 | 11202.782 |
05/31/2019 | 11650.9111 | 11534.8191 | 11807.2714 | 11401.6482 |
06/30/2019 | 11779.3994 | 11697.9511 | 12081.5035 | 11544.8346 |
07/31/2019 | 11818.324 | 11732.7723 | 12114.7278 | 11570.2238 |
08/31/2019 | 11914.4095 | 11998.266 | 12316.2999 | 11870.0302 |
09/30/2019 | 11920.6881 | 11946.2869 | 12316.245 | 11806.8123 |
10/31/2019 | 11967.9966 | 11984.8873 | 12408.6071 | 11842.3764 |
11/30/2019 | 11983.7362 | 11982.4823 | 12472.666 | 11836.3427 |
12/31/2019 | 12060.3818 | 12000.3476 | 12540.447 | 11828.0976 |
01/31/2020 | 12146.4019 | 12215.7215 | 12718.2487 | 12055.7234 |
02/29/2020 | 12180.4087 | 12398.6185 | 12686.372 | 12272.7065 |
03/31/2020 | 11389.8625 | 12156.4467 | 12290.8562 | 12200.4833 |
04/30/2020 | 11699.8966 | 12399.9523 | 12734.1838 | 12417.3601 |
05/31/2020 | 12051.7792 | 12515.7534 | 12904.6506 | 12475.1769 |
06/30/2020 | 12303.8275 | 12620.1967 | 13037.9479 | 12553.758 |
07/31/2020 | 12546.2966 | 12841.8759 | 13318.4978 | 12741.2746 |
08/31/2020 | 12646.9959 | 12767.8279 | 13410.469 | 12638.4313 |
09/30/2020 | 12693.748 | 12744.8092 | 13312.0547 | 12631.4992 |
10/31/2020 | 12748.8694 | 12699.2567 | 13182.8319 | 12575.0965 |
11/30/2020 | 12941.9706 | 12864.9755 | 13623.4342 | 12698.4914 |
12/31/2020 | 13055.5687 | 12909.4165 | 13753.9673 | 12715.9864 |
01/31/2021 | 13106.9502 | 12828.2749 | 13647.7392 | 12624.817 |
02/28/2021 | 13124.5164 | 12662.7379 | 13560.0148 | 12442.5048 |
03/31/2021 | 13099.24 | 12515.3896 | 13514.7933 | 12287.1394 |
04/30/2021 | 13189.0717 | 12620.6211 | 13726.0044 | 12384.2096 |
05/31/2021 | 13253.7061 | 12668.7604 | 13801.4253 | 12424.6696 |
06/30/2021 | 13293.3593 | 12761.1183 | 13920.1403 | 12511.9637 |
07/31/2021 | 13375.9053 | 12889.2473 | 14094.5228 | 12651.8595 |
08/31/2021 | 13415.7114 | 12880.6582 | 14143.214 | 12627.7727 |
09/30/2021 | 13422.9791 | 12770.6573 | 13927.8078 | 12518.4439 |
10/31/2021 | 13408.3602 | 12760.2291 | 14082.5127 | 12514.9938 |
11/30/2021 | 13369.9846 | 12775.6288 | 14054.1256 | 12552.0197 |
12/31/2021 | 13418.3682 | 12767.0195 | 14145.4901 | 12519.9004 |
01/31/2022 | 13280.7078 | 12487.1164 | 13752.0001 | 12250.172 |
02/28/2022 | 13141.4796 | 12316.8706 | 13559.6996 | 12113.503 |
03/31/2022 | 12979.1323 | 11986.4232 | 13332.7546 | 11776.9683 |
04/30/2022 | 12762.144 | 11539.3461 | 12706.4755 | 11330.0576 |
05/31/2022 | 12766.5735 | 11602.8447 | 12773.942 | 11403.1101 |
06/30/2022 | 12481.9296 | 11371 | 12392.3213 | 11224.2161 |
07/31/2022 | 12698.5715 | 11656.8852 | 12831.3419 | 11498.4738 |
08/31/2022 | 12614.85 | 11353.842 | 12433.995 | 11173.5652 |
09/30/2022 | 12330.0548 | 10864.6885 | 11773.0422 | 10690.7981 |
10/31/2022 | 12327.2276 | 10745.472 | 11820.1424 | 10552.327 |
11/30/2022 | 12561.4212 | 11146.1276 | 12332.2684 | 10940.3949 |
12/31/2022 | 12585.483 | 11108.275 | 12183.0234 | 10891.0465 |
01/31/2023 | 12871.1117 | 11452.8489 | 12655.2662 | 11226.0979 |
02/28/2023 | 12746.7772 | 11171.4301 | 12332.6595 | 10935.8444 |
03/31/2023 | 12931.1213 | 11433.5083 | 12659.4992 | 11213.6426 |
04/30/2023 | 13012.5516 | 11503.3528 | 12765.2599 | 11281.6023 |
05/31/2023 | 12979.9581 | 11384.0958 | 12628.574 | 11158.7602 |
06/30/2023 | 13005.8013 | 11366.4124 | 12745.2937 | 11118.9646 |
07/31/2023 | 13089.6447 | 11377.7096 | 12823.8162 | 11111.2139 |
08/31/2023 | 13093.6135 | 11309.1788 | 12697.0243 | 11040.24 |
09/30/2023 | 12934.339 | 11039.5219 | 12329.3555 | 10759.6881 |
10/31/2023 | 12845.9398 | 10873.4999 | 12102.1509 | 10589.8898 |
11/30/2023 | 13229.131 | 11362.8555 | 12767.5212 | 11069.4673 |
12/31/2023 | 13555.6832 | 11794.0277 | 13283.8655 | 11493.195 |
01/31/2024 | 13609.8654 | 11765.7948 | 13286.5653 | 11461.6339 |
02/29/2024 | 13555.5139 | 11624.7317 | 13249.0534 | 11299.6979 |
03/31/2024 | 13668.5213 | 11738.8554 | 13432.0791 | 11404.0404 |
04/30/2024 | 13504.8874 | 11464.5503 | 13060.87 | 11115.9877 |
05/31/2024 | 13679.7965 | 11654.5813 | 13354.6483 | 11304.4398 |
06/30/2024 | 13797.3028 | 11761.1264 | 13510.1462 | 11411.4668 |
07/31/2024 | 14054.08 | 12028.0752 | 13810.2039 | 11678.0004 |
08/31/2024 | 14214.1413 | 12205.1518 | 14041.9705 | 11845.8158 |
09/30/2024 | 14387.9947 | 12372.5481 | 14243.8138 | 12004.424 |

Effective September 30, 2024, the Fund adopted the Bloomberg U.S. Aggregate Total Return Index Value USD as its broad-based securities market index that represents the overall applicable market in which the Fund invests, and the Bloomberg U.S. Universal Total Return Index Value Unhedged as an additional index that represents the market sectors which the Fund’s advisor believes are more representative of the Fund’s investment universe.
What were the Fund costs for the past year?
(based on a hypothetical $10,000 investment)
Class Name | Costs of a $10,000 investment | Costs paid as a percentage of a $10,000 investment |
|---|
Class R5 | $63.00 | 0.60% |
End Block
Thornburg Strategic Income Fund Tailored Shareholder Report
Thornburg Strategic Income Fund Tailored Shareholder Report | |
Annual Performance | 1 Year | 5 Year | 10 Year |
|---|
Strategic Income Fund Class R5 | 11.24% | 3.83% | 3.71% |
Bloomberg U.S. Universal Total Return Index Value Unhedged | 12.08% | 0.70% | 2.15% |
Strategic Income Fund’s Blended Index | 15.53% | 2.95% | 3.60% |
Key Fund Statistics
(as of September 30, 2024)
| |
|---|
Fund Size (Millions) | $9,454.2M |
Number of Holdings | 1,154 |
Annual Portfolio Turnover | 60.47% |
Total Advisory Fee | $41.2M |
What did the Fund invest in?
(as of September 30, 2024)
Fixed Income Credit Quality | (%) |
|---|
| U.S. Government | 26.5 |
| AAA | 10.7 |
| AA | 2.4 |
| A | 11.8 |
| BBB | 22.1 |
| BB | 12.2 |
| B | 4.1 |
| CCC | 0.1 |
| D | 0.0 |
| NR | 4.2 |
| Cash Equivalents & Other | 5.9 |
Fixed Income Credit Quality | (%) |
U.S. Government | 26.5% |
AAA | 10.7% |
AA | 2.4% |
A | 11.8% |
BBB | 22.1% |
BB | 12.2% |
B | 4.1% |
CCC | 0.1% |
D | 0.0% |
NR | 4.2% |
Cash Equivalents & Other | 5.9% |
Expressed as a percentage of the Fund’s net assets. * Credit quality ratings shown above reflect the highest rating assigned by either S&P Global Ratings or Moody’s Investors Services, both of which are independent, nationally recognized statistical rating organizations. If a credit rating for an investment is not available from either S&P or Moody’s, then the Fund’s investment advisor will determine the credit quality of the investment. Investments are considered to be investment grade if they are rated within the four highest grades by S&P or Moody’s (BBB/Baa or higher) or, if no credit rating is available, have been judged to be of comparable quality by the Fund’s investment advisor. (NR = Not Rated)
How has the Fund changed?
This is a summary of certain changes to the Fund since October 1, 2023. For more complete information, you may review the Fund’s next prospectus, which we expect to be available by February 1, 2025 at https://www.thornburg.com/download or upon request by calling 1-800-847-0200.
End Block
Changes In and Disagreements with Accountants
No changes and/or disagreements occurred in the current reporting period.
End Block
For additional information about the Fund, including its prospectus, financial information, holdings and proxy information, visit www.thornburg.com/download.

Thornburg Strategic Income Fund Tailored Shareholder Report | |
Thornburg Strategic Income Fund Tailored Shareholder Report
Thornburg Strategic Income Fund CLASS: R6 TICKER: TSRSX Annual Shareholder Report | |
This annual shareholder report contains important information about the Thornburg Strategic Income Fund Class R6 Shares for the period from October 1, 2023 to September 30, 2024. You can find additional information about the Fund at https://www.thornburg.com/download. You can also request this information by contacting us at 1-800-847-0200. This report also describes changes to the Fund that occurred during the reporting period.
How did the Fund perform last year and what affected its performance?
The Fund’s Class R6 shares underperformed the Bloomberg U.S. Universal Total Return Index Value Unhedged (the “Index”) during the 12-month period ended September 30, 2024. Treasury yields fell meaningfully over the 12-month period ended September 30, 2024, as U.S. inflation continued to improve, and the market priced in anticipated interest rate cuts by the Federal Reserve. The Fund’s structural short duration versus the Index was a relative detractor in this environment. However, this was offset by positive relative returns from the Fund’s allocation to corporates and collateralized mortgage obligations. The Fund’s exposure to asset-backed securities was a modest detractor, while exposure to mortgage-passthrough securities proved to be neither a material contributor nor a detractor to the Fund’s performance.
How did the Fund perform over the past 10 years?
The line graph below reflects a hypothetical $10,000 investment. The returns shown in the line graph and table assume the reinvestment of dividends and capital gains, but do not reflect the deduction of taxes that a shareholder would pay on distributions or the redemption of Fund shares. The performance information shown below represents past performance and is no guarantee of future results. For Fund performance current to the most recent month end, visit https://www.thornburg.com/product/mutual-funds/fsi/TSRSX or call 1-800-847-0200. Performance for other share classes of the Fund will vary.
Cumulative Performance
Growth Table
Date | Thornburg Strategic Income Fund | Bloomberg U.S. Universal Total Return Index Value Unhedged | Thornburg Strategic Income Fund’s Blended Index | Bloomberg U.S. Aggregate Total Return Value Index USD |
04/10/2017 | 9999.9973 | 10000 | 10000 | 10000 |
04/30/2017 | 10059.5867 | 10056.6933 | 10078.1265 | 10052.775 |
05/31/2017 | 10174.3639 | 10134.2765 | 10182.8242 | 10130.1526 |
06/30/2017 | 10210.3613 | 10125.6981 | 10182.4626 | 10119.9591 |
07/31/2017 | 10273.6056 | 10176.1319 | 10266.2542 | 10163.5068 |
08/31/2017 | 10363.0857 | 10263.9339 | 10342.8114 | 10254.6677 |
09/30/2017 | 10399.086 | 10227.8101 | 10349.8311 | 10205.8279 |
10/31/2017 | 10436.8356 | 10240.0839 | 10393.7473 | 10211.7408 |
11/30/2017 | 10436.3077 | 10224.5861 | 10428.1159 | 10198.6334 |
12/31/2017 | 10461.5629 | 10269.6654 | 10494.6093 | 10245.4405 |
01/31/2018 | 10470.1518 | 10170.834 | 10508.7396 | 10127.444 |
02/28/2018 | 10450.779 | 10074.397 | 10341.9763 | 10031.4417 |
03/31/2018 | 10438.1316 | 10125.2079 | 10349.95 | 10095.772 |
04/30/2018 | 10437.8697 | 10057.6548 | 10312.1564 | 10020.6874 |
05/31/2018 | 10458.6469 | 10112.5004 | 10383.9566 | 10092.2023 |
06/30/2018 | 10461.3594 | 10097.8322 | 10372.7496 | 10079.7908 |
07/31/2018 | 10510.0592 | 10118.9673 | 10439.5153 | 10082.184 |
08/31/2018 | 10567.7954 | 10168.8166 | 10519.089 |
09/30/2018 | 10571.6644 | 10125.2456 | 10476.6135 | 10081.7184 |
10/31/2018 | 10520.9872 | 10040.5356 | 10256.5255 | 10002.0477 |
11/30/2018 | 10524.6186 | 10085.6904 | 10328.8107 | 10061.7569 |
12/31/2018 | 10542.1126 | 10243.4964 | 10323.5351 | 10246.602 |
01/31/2019 | 10715.1319 | 10384.73 | 10571.8865 | 10355.4163 |
02/28/2019 | 10778.8697 | 10396.0422 | 10630.5669 | 10349.4183 |
03/31/2019 | 10880.7989 | 10583.788 | 10821.7939 | 10548.1468 |
04/30/2019 | 10945.2937 | 10598.5882 | 10900.7554 | 10550.8454 |
05/31/2019 | 10992.0776 | 10760.9569 | 10929.7626 | 10738.1388 |
06/30/2019 | 11113.7495 | 10913.1445 | 11183.6138 | 10872.9926 |
07/31/2019 | 11151.1078 | 10945.6295 | 11214.3689 | 10896.9043 |
08/31/2019 | 11242.2971 | 11193.3114 | 11400.9604 | 11179.2637 |
09/30/2019 | 11248.2603 | 11144.8196 | 11400.9095 | 11119.7248 |
10/31/2019 | 11293.4391 | 11180.8302 | 11486.4073 | 11153.2192 |
11/30/2019 | 11308.9976 | 11178.5866 | 11545.7054 | 11147.5366 |
12/31/2019 | 11381.646 | 11195.2534 | 11608.449 | 11139.7713 |
01/31/2020 | 11463.384 | 11396.178 | 11773.0366 | 11354.1506 |
02/29/2020 | 11496.12 | 11566.8046 | 11743.5289 | 11558.5066 |
03/31/2020 | 10752.5829 | 11340.8799 | 11377.4076 | 11490.4864 |
04/30/2020 | 11045.1938 | 11568.0489 | 11787.7874 | 11694.7422 |
05/31/2020 | 11377.2586 | 11676.081 | 11945.5852 | 11749.1944 |
06/30/2020 | 11615.3048 | 11773.5172 | 12068.9759 | 11823.2026 |
07/31/2020 | 11844.4166 | 11980.3242 | 12328.6755 | 11999.8067 |
08/31/2020 | 11940.0588 | 11911.244 | 12413.8115 | 11902.9483 |
09/30/2020 | 11984.8694 | 11889.7696 | 12322.7113 | 11896.4197 |
10/31/2020 | 12037.6707 | 11847.2732 | 12203.0922 | 11843.2992 |
11/30/2020 | 12220.3685 | 12001.8741 | 12610.9493 | 11959.5133 |
12/31/2020 | 12328.1892 | 12043.3335 | 12731.7813 | 11975.9902 |
01/31/2021 | 12377.4414 | 11967.6356 | 12633.4479 | 11890.1263 |
02/28/2021 | 12394.7874 | 11813.2044 | 12552.2432 | 11718.4236 |
03/31/2021 | 12371.8348 | 11675.7416 | 12510.3825 | 11572.0996 |
04/30/2021 | 12457.3025 | 11773.9132 | 12705.8965 | 11663.5208 |
05/31/2021 | 12519.0219 | 11818.8228 | 12775.7122 | 11701.6264 |
06/30/2021 | 12557.2074 | 11904.9846 | 12885.6044 | 11783.8404 |
07/31/2021 | 12635.8411 | 12024.5174 | 13047.0269 | 11915.5951 |
08/31/2021 | 12674.0253 | 12016.5046 | 13092.0993 | 11892.91 |
09/30/2021 | 12681.6894 | 11913.8835 | 12892.702 | 11789.9435 |
10/31/2021 | 12668.7974 | 11904.155 | 13035.9093 | 11786.6942 |
11/30/2021 | 12633.4374 | 11918.5216 | 13009.6319 | 11821.5654 |
12/31/2021 | 12679.8736 | 11910.4899 | 13094.2063 | 11791.3153 |
01/31/2022 | 12550.9508 | 11649.3652 | 12729.9602 | 11537.2834 |
02/28/2022 | 12420.46 | 11490.5411 | 12551.9514 | 11408.5678 |
03/31/2022 | 12268.4459 | 11182.2631 | 12341.8727 | 11091.6175 |
04/30/2022 | 12054.2339 | 10765.1801 | 11762.1383 | 10670.7144 |
05/31/2022 | 12069.6538 | 10824.4186 | 11824.5908 | 10739.5156 |
06/30/2022 | 11802.0337 | 10608.1282 | 11471.3319 | 10571.0322 |
07/31/2022 | 12007.133 | 10874.8336 | 11877.7248 | 10829.3297 |
08/31/2022 | 11928.9948 | 10592.1214 | 11509.9084 | 10523.3289 |
09/30/2022 | 11661.1813 | 10135.7848 | 10898.0772 | 10068.656 |
10/31/2022 | 11659.3191 | 10024.5665 | 10941.677 | 9938.2431 |
11/30/2022 | 11880.9638 | 10398.3424 | 11415.7421 | 10303.7277 |
12/31/2022 | 11904.4836 | 10363.0293 | 11277.5889 | 10257.2511 |
01/31/2023 | 12174.7513 | 10684.486 | 11714.7349 | 10572.8045 |
02/28/2023 | 12058.2349 | 10421.9473 | 11416.1041 | 10299.4421 |
03/31/2023 | 12232.9908 | 10666.4429 | 11718.6533 | 10561.074 |
04/30/2023 | 12310.6749 | 10731.6016 | 11816.5539 | 10625.0789 |
05/31/2023 | 12280.7678 | 10620.3455 | 11690.0264 | 10509.3854 |
06/30/2023 | 12305.9838 | 10603.8484 | 11798.0716 | 10471.9057 |
07/31/2023 | 12385.7325 | 10614.3877 | 11870.7584 | 10464.6061 |
08/31/2023 | 12390.3457 | 10550.4546 | 11753.3896 | 10397.7624 |
09/30/2023 | 12240.8734 | 10298.8888 | 11413.0457 | 10133.5371 |
10/31/2023 | 12158.3004 | 10144.0051 | 11202.7268 | 9973.62 |
11/30/2023 | 12520.8267 | 10600.5302 | 11818.6472 | 10425.2889 |
12/31/2023 | 12829.9475 | 11002.7753 | 12296.6171 | 10824.3581 |
01/31/2024 | 12881.9884 | 10976.4366 | 12299.1162 | 10794.6337 |
02/29/2024 | 12831.5309 | 10844.8373 | 12264.3922 | 10642.1215 |
03/31/2024 | 12939.1169 | 10951.3045 | 12433.8155 | 10740.3918 |
04/30/2024 | 12785.4944 | 10695.4023 | 12090.1944 | 10469.102 |
05/31/2024 | 12951.5741 | 10872.6843 | 12362.1394 | 10646.5874 |
06/30/2024 | 13063.4187 | 10972.0813 | 12506.0807 | 10747.386 |
07/31/2024 | 13306.8376 | 11221.1207 | 12783.8383 | 10998.4089 |
08/31/2024 | 13470.5 | 11386.3174 | 12998.3802 | 11156.4585 |
09/30/2024 | 13624.0426 | 11542.4832 | 13185.2227 | 11305.8365 |
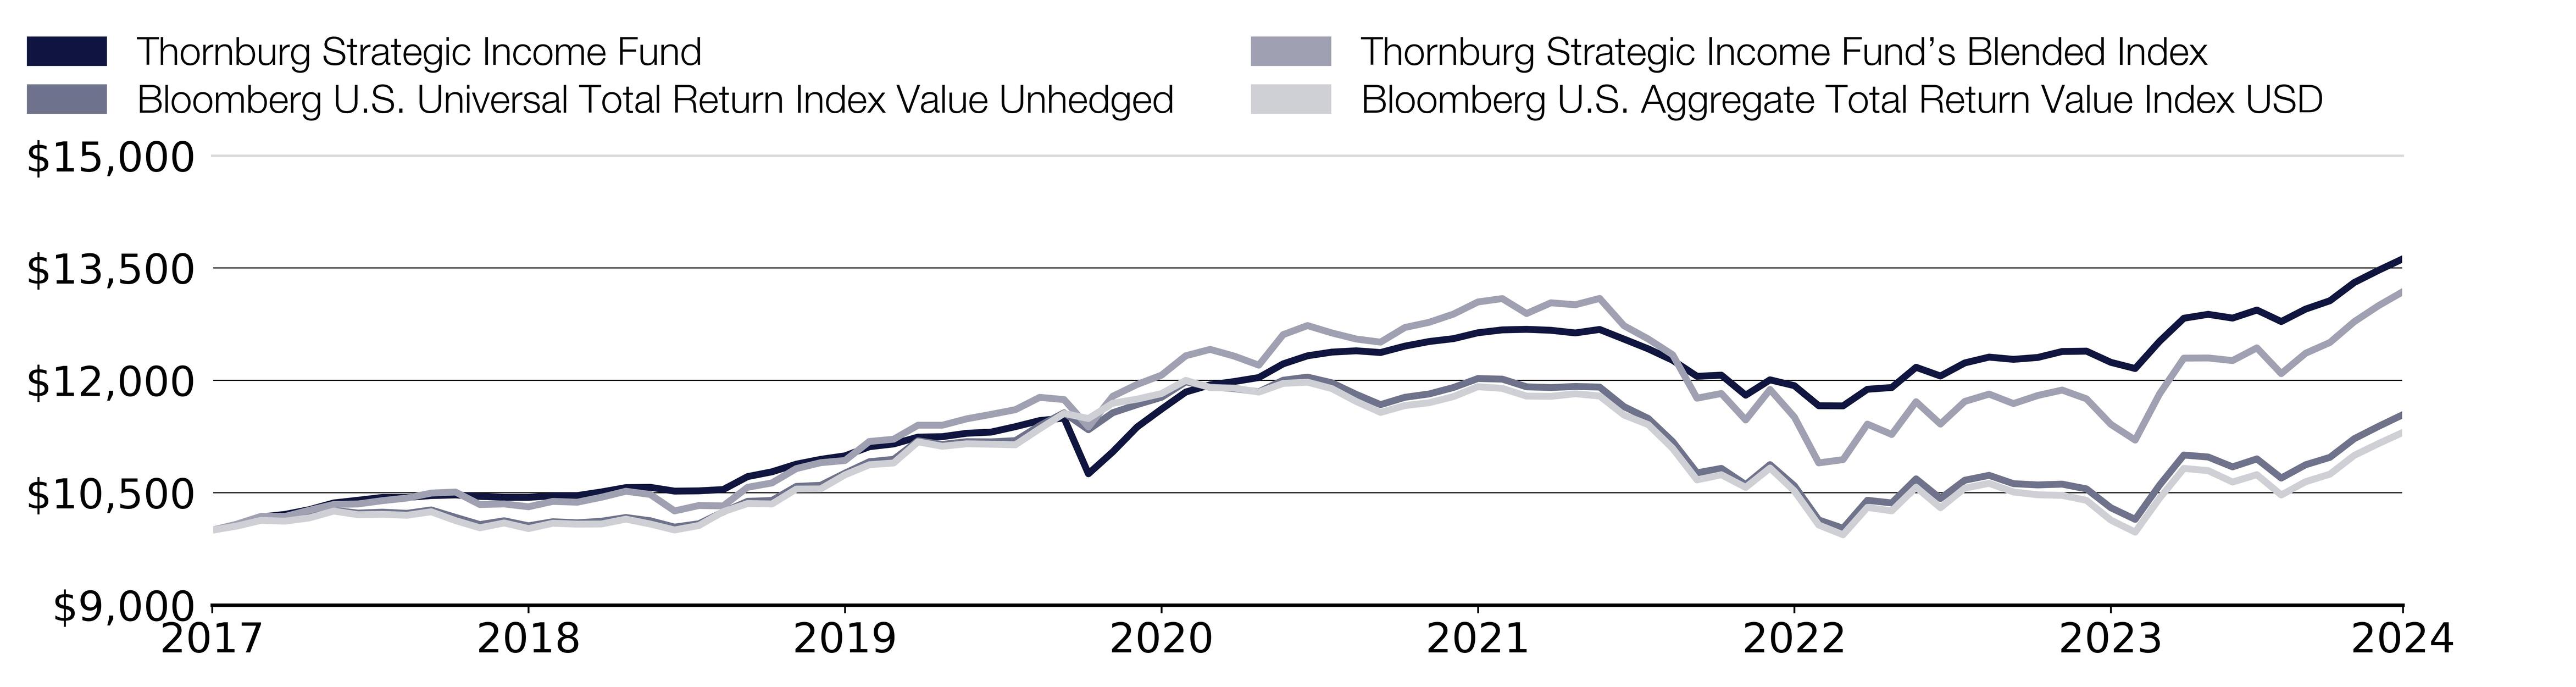
Effective September 30, 2024, the Fund adopted the Bloomberg U.S. Aggregate Total Return Index Value USD as its broad-based securities market index that represents the overall applicable market in which the Fund invests, and the Bloomberg U.S. Universal Total Return Index Value Unhedged as an additional index that represents the market sectors which the Fund’s advisor believes are more representative of the Fund’s investment universe.
What were the Fund costs for the past year?
(based on a hypothetical $10,000 investment)
Class Name | Costs of a $10,000 investment | Costs paid as a percentage of a $10,000 investment |
|---|
Class R6 | $56.00 | 0.53% |
End Block
Thornburg Strategic Income Fund Tailored Shareholder Report
Thornburg Strategic Income Fund Tailored Shareholder Report | |
Annual Performance | 1 Year | 5 Year |
|---|
Strategic Income Fund Class R6 | 11.30% | 3.91% |
Bloomberg U.S. Universal Total Return Index Value Unhedged | 12.08% | 0.70% |
Strategic Income Fund’s Blended Index | 15.53% | 2.95% |
Key Fund Statistics
(as of September 30, 2024)
| |
|---|
Fund Size (Millions) | $9,454.2M |
Number of Holdings | 1,154 |
Annual Portfolio Turnover | 60.47% |
Total Advisory Fee | $41.2M |
What did the Fund invest in?
(as of September 30, 2024)
Fixed Income Credit Quality | (%) |
|---|
| U.S. Government | 26.5 |
| AAA | 10.7 |
| AA | 2.4 |
| A | 11.8 |
| BBB | 22.1 |
| BB | 12.2 |
| B | 4.1 |
| CCC | 0.1 |
| D | 0.0 |
| NR | 4.2 |
| Cash Equivalents & Other | 5.9 |
Fixed Income Credit Quality | (%) |
U.S. Government | 26.5% |
AAA | 10.7% |
AA | 2.4% |
A | 11.8% |
BBB | 22.1% |
BB | 12.2% |
B | 4.1% |
CCC | 0.1% |
D | 0.0% |
NR | 4.2% |
Cash Equivalents & Other | 5.9% |
Expressed as a percentage of the Fund’s net assets. * Credit quality ratings shown above reflect the highest rating assigned by either S&P Global Ratings or Moody’s Investors Services, both of which are independent, nationally recognized statistical rating organizations. If a credit rating for an investment is not available from either S&P or Moody’s, then the Fund’s investment advisor will determine the credit quality of the investment. Investments are considered to be investment grade if they are rated within the four highest grades by S&P or Moody’s (BBB/Baa or higher) or, if no credit rating is available, have been judged to be of comparable quality by the Fund’s investment advisor. (NR = Not Rated)
How has the Fund changed?
This is a summary of certain changes to the Fund since October 1, 2023. For more complete information, you may review the Fund’s next prospectus, which we expect to be available by February 1, 2025 at https://www.thornburg.com/download or upon request by calling 1-800-847-0200.
End Block
Changes In and Disagreements with Accountants
No changes and/or disagreements occurred in the current reporting period.
End Block
For additional information about the Fund, including its prospectus, financial information, holdings and proxy information, visit www.thornburg.com/download.

Thornburg Strategic Income Fund Tailored Shareholder Report | |
Thornburg Short Duration Municipal Fund Tailored Shareholder Report
Thornburg Short Duration Municipal Fund CLASS: A TICKER: TLMAX Annual Shareholder Report | |
This annual shareholder report contains important information about the Thornburg Short Duration Municipal Fund Class A Shares for the period from October 1, 2023 to September 30, 2024. You can find additional information about the Fund at https://www.thornburg.com/download. You can also request this information by contacting us at 1-800-847-0200. This report also describes changes to the Fund that occurred during the reporting period.
How did the Fund perform last year and what affected its performance?
The Fund’s Class A shares underperformed the ICE BofA 1-3 Year U.S. Municipal Securities Index (the “Index”) during the 12-month period ended September 30, 2024. The period began with municipal bond yields peaking in October of 2023, which marked the end of the Federal Reserve rate hiking cycle, before falling precipitously throughout the period and ending significantly lower. The backdrop of falling municipal bond yields boosted bond prices due to the inverse relationship between the two, which produced strong absolute returns for the asset class. However, the Fund’s relative underperformance during the period was driven by its shorter duration and yield curve positioning versus its Index. The Fund’s relative performance benefited from active management with respect to its sector/quality returns thanks to its higher weighting to revenue and A-rated bonds. Specifically, within the revenue sector, multi-family housing bonds were a large contributor to relative performance during the period.
How did the Fund perform over the past 10 years?
The line graph below reflects a hypothetical $10,000 investment and assumes the deduction of the maximum sales charge associated with that investment. The returns shown in the line graph and table assume the reinvestment of dividends and capital gains, but do not reflect the deduction of taxes that a shareholder would pay on distributions or the redemption of Fund shares. The performance information shown below represents past performance and is no guarantee of future results. For Fund performance current to the most recent month end, visit https://www.thornburg.com/product/mutual-funds/fldm/TLMAX or call 1-800-847-0200. Performance for other share classes of the Fund will vary.
Cumulative Performance
Growth Table
Date | Thornburg Short Duration Municipal Fund | ICE BofA 1-3 Year U.S. Municipal Securities Index | ICE BofA U.S. Municipal Securities Index |
09/30/2014 | 9848.3689 | 10000 | 10000 |
10/31/2014 | 9857.6712 | 10005.9501 | 10061.0061 |
11/30/2014 | 9859.2767 | 10011.4622 | 10074.732 |
12/31/2014 | 9843.6308 | 10001.1681 | 10133.237 |
01/31/2015 | 9867.5813 | 10031.4662 | 10315.1349 |
02/28/2015 | 9852.9841 | 10032.8168 | 10213.0312 |
03/31/2015 | 9845.1351 | 10026.9762 | 10243.2441 |
04/30/2015 | 9838.7027 | 10028.0348 | 10191.582 |
05/31/2015 | 9823.5426 | 10020.1135 | 10157.4674 |
06/30/2015 | 9833.5604 | 10028.3269 | 10143.7215 |
07/31/2015 | 9850.6343 | 10050.9591 | 10223.9759 |
08/31/2015 | 9852.1139 | 10065.1226 | 10246.5455 |
09/30/2015 | 9870.3794 | 10085.2361 | 10315.6951 |
10/31/2015 | 9879.4469 | 10099.0345 | 10359.774 |
11/30/2015 | 9864.9168 | 10078.7749 | 10410.5357 |
12/31/2015 | 9857.5144 | 10076.9132 | 10493.2511 |
01/31/2016 | 9882.5245 | 10123.5649 | 10609.5409 |
02/29/2016 | 9901.0783 | 10147.4749 | 10618.4247 |
03/31/2016 | 9886.5539 | 10127.8359 | 10665.2047 |
04/30/2016 | 9889.718 | 10146.3432 | 10746.9397 |
05/31/2016 | 9884.2237 | 10140.1376 | 10780.454 |
06/30/2016 | 9911.5023 | 10175.7652 | 10955.589 |
07/31/2016 | 9921.4412 | 10196.0613 | 10949.7465 |
08/31/2016 | 9906.9598 | 10189.7826 | 10974.9373 |
09/30/2016 | 9885.4753 | 10157.2943 | 10921.9146 |
10/31/2016 | 9887.1288 | 10158.2434 | 10819.6708 |
11/30/2016 | 9849.3535 | 10094.9096 | 10425.262 |
12/31/2016 | 9858.9789 | 10110.0221 | 10539.3308 |
01/31/2017 | 9882.0198 | 10155.4692 | 10592.9738 |
02/28/2017 | 9904.7257 | 10197.9959 | 10661.5031 |
03/31/2017 | 9901.8531 | 10192.5204 | 10685.8535 |
04/30/2017 | 9924.3489 | 10215.1162 | 10762.9465 |
05/31/2017 | 9946.2717 | 10239.3911 | 10922.1347 |
06/30/2017 | 9929.2453 | 10226.0673 | 10897.224 |
07/31/2017 | 9952.0866 | 10256.3653 | 10976.8981 |
08/31/2017 | 9991.0396 | 10285.6778 | 11069.4177 |
09/30/2017 | 9982.254 | 10269.3971 | 11027.4598 |
10/31/2017 | 9972.5424 | 10259.7237 | 11047.8085 |
11/30/2017 | 9947.6854 | 10195.9882 | 11000.3481 |
12/31/2017 | 9946.7631 | 10209.8596 | 11110.0751 |
01/31/2018 | 9953.8291 | 10233.9886 | 10993.045 |
02/28/2018 | 9962.4584 | 10246.5093 | 10946.205 |
03/31/2018 | 9953.4252 | 10239.3911 | 10982.8206 |
04/30/2018 | 9953.8487 | 10222.3439 | 10940.1224 |
05/31/2018 | 9968.3084 | 10262.2789 | 11068.6574 |
06/30/2018 | 9984.0207 | 10299.9142 | 11080.8826 |
07/31/2018 | 9990.6135 | 10325.9413 | 11107.1138 |
08/31/2018 | 9991.2292 | 10327.292 | 11124.0611 |
09/30/2018 | 9984.2708 | 10298.7096 | 11053.4109 |
10/31/2018 | 9985.5003 | 10297.724 | 10973.8968 |
11/30/2018 | 10004.1727 | 10341.9665 | 11094.9286 |
12/31/2018 | 10030.6801 | 10389.0562 | 11225.6846 |
01/31/2019 | 10055.7066 | 10431.0719 | 11309.9006 |
02/28/2019 | 10076.8114 | 10458.7052 | 11374.1081 |
03/31/2019 | 10104.646 | 10495.5739 | 11556.5862 |
04/30/2019 | 10108.3559 | 10498.6037 | 11604.8669 |
05/31/2019 | 10135.5956 | 10549.3073 | 11776.3203 |
06/30/2019 | 10163.761 | 10585.227 | 11826.3817 |
07/31/2019 | 10182.1291 | 10630.455 | 11920.3619 |
08/31/2019 | 10200.1542 | 10647.6483 | 12108.5024 |
09/30/2019 | 10185.8389 | 10620.526 | 12018.0237 |
10/31/2019 | 10203.6914 | 10651.0066 | 12032.5099 |
11/30/2019 | 10213.0184 | 10668.9299 | 12055.2997 |
12/31/2019 | 10222.667 | 10687.8023 | 12094.0362 |
01/31/2020 | 10256.3376 | 10738.0314 | 12310.4889 |
02/29/2020 | 10274.2018 | 10766.1392 | 12480.4216 |
03/31/2020 | 10170.5294 | 10675.5371 | 12011.9411 |
04/30/2020 | 10129.9655 | 10702.8053 | 11828.8427 |
05/31/2020 | 10238.2648 | 10835.8612 | 12213.0072 |
06/30/2020 | 10263.8627 | 10846.6298 | 12331.8981 |
07/31/2020 | 10288.2774 | 10887.2584 | 12529.0824 |
08/31/2020 | 10295.65 | 10888.463 | 12486.8844 |
09/30/2020 | 10301.9834 | 10897.2239 | 12478.7409 |
10/31/2020 | 10297.0913 | 10885.4697 | 12453.9903 |
11/30/2020 | 10301.0218 | 10904.5611 | 12644.4318 |
12/31/2020 | 10312.0773 | 10918.177 | 12730.2285 |
01/31/2021 | 10322.3945 | 10939.4587 | 12814.1645 |
02/28/2021 | 10301.0115 | 10926.6824 | 12608.4364 |
03/31/2021 | 10310.9468 | 10938.8016 | 12685.0892 |
04/30/2021 | 10321.5527 | 10953.0745 | 12805.5408 |
05/31/2021 | 10314.9144 | 10959.0246 | 12861.4247 |
06/30/2021 | 10308.7179 | 10957.4915 | 12903.5827 |
07/31/2021 | 10326.7853 | 10976.0718 | 13000.3241 |
08/31/2021 | 10319.6112 | 10971.2169 | 12952.2436 |
09/30/2021 | 10296.3268 | 10955.8853 | 12854.4017 |
10/31/2021 | 10289.4792 | 10951.8334 | 12840.0155 |
11/30/2021 | 10283.7124 | 10956.1043 | 12944.6803 |
12/31/2021 | 10286.076 | 10955.0822 | 12962.708 |
01/31/2022 | 10162.9875 | 10843.235 | 12614.479 |
02/28/2022 | 10142.548 | 10818.4855 | 12543.3886 |
03/31/2022 | 10028.9156 | 10699.666 | 12161.105 |
04/30/2022 | 9976.0983 | 10628.9219 | 11801.7111 |
05/31/2022 | 10024.887 | 10722.8093 | 11990.3119 |
06/30/2022 | 10024.4534 | 10721.4952 | 11760.3534 |
07/31/2022 | 10084.0348 | 10805.1981 | 12081.5509 |
08/31/2022 | 10002.6373 | 10692.5478 | 11774.1193 |
09/30/2022 | 9897.2518 | 10566.026 | 11336.1319 |
10/31/2022 | 9903.0725 | 10571.8301 | 11235.8489 |
11/30/2022 | 10018.107 | 10727.2628 | 11804.6324 |
12/31/2022 | 10026.6127 | 10732.8478 | 11792.3671 |
01/31/2023 | 10110.6799 | 10839.4386 | 12154.9223 |
02/28/2023 | 10036.768 | 10723.1014 | 11859.776 |
03/31/2023 | 10141.6808 | 10851.8498 | 12125.9499 |
04/30/2023 | 10120.233 | 10814.4336 | 12111.7038 |
05/31/2023 | 10090.4813 | 10787.5303 | 12018.8841 |
06/30/2023 | 10155.4636 | 10840.1321 | 12128.6911 |
07/31/2023 | 10178.3088 | 10858.6395 | 12159.4442 |
08/31/2023 | 10185.2968 | 10859.5156 | 12012.0412 |
09/30/2023 | 10124.1722 | 10796.4737 | 11671.6555 |
10/31/2023 | 10140.9197 | 10815.9302 | 11525.4929 |
11/30/2023 | 10313.1006 | 11004.8367 | 12262.5884 |
12/31/2023 | 10373.2429 | 11092.1535 | 12561.5363 |
01/31/2024 | 10373.2185 | 11091.6425 | 12533.8245 |
02/29/2024 | 10382.3162 | 11103.0681 | 12535.4652 |
03/31/2024 | 10391.1109 | 11097.7021 | 12522.8598 |
04/30/2024 | 10391.7083 | 11081.1294 | 12382.8399 |
05/31/2024 | 10409.3007 | 11096.972 | 12356.9688 |
06/30/2024 | 10462.6804 | 11171.695 | 12555.7339 |
07/31/2024 | 10534.2497 | 11254.6314 | 12664.2203 |
08/31/2024 | 10597.3762 | 11342.7513 | 12763.903 |
09/30/2024 | 10642.7436 | 11391.2647 | 12899.3409 |
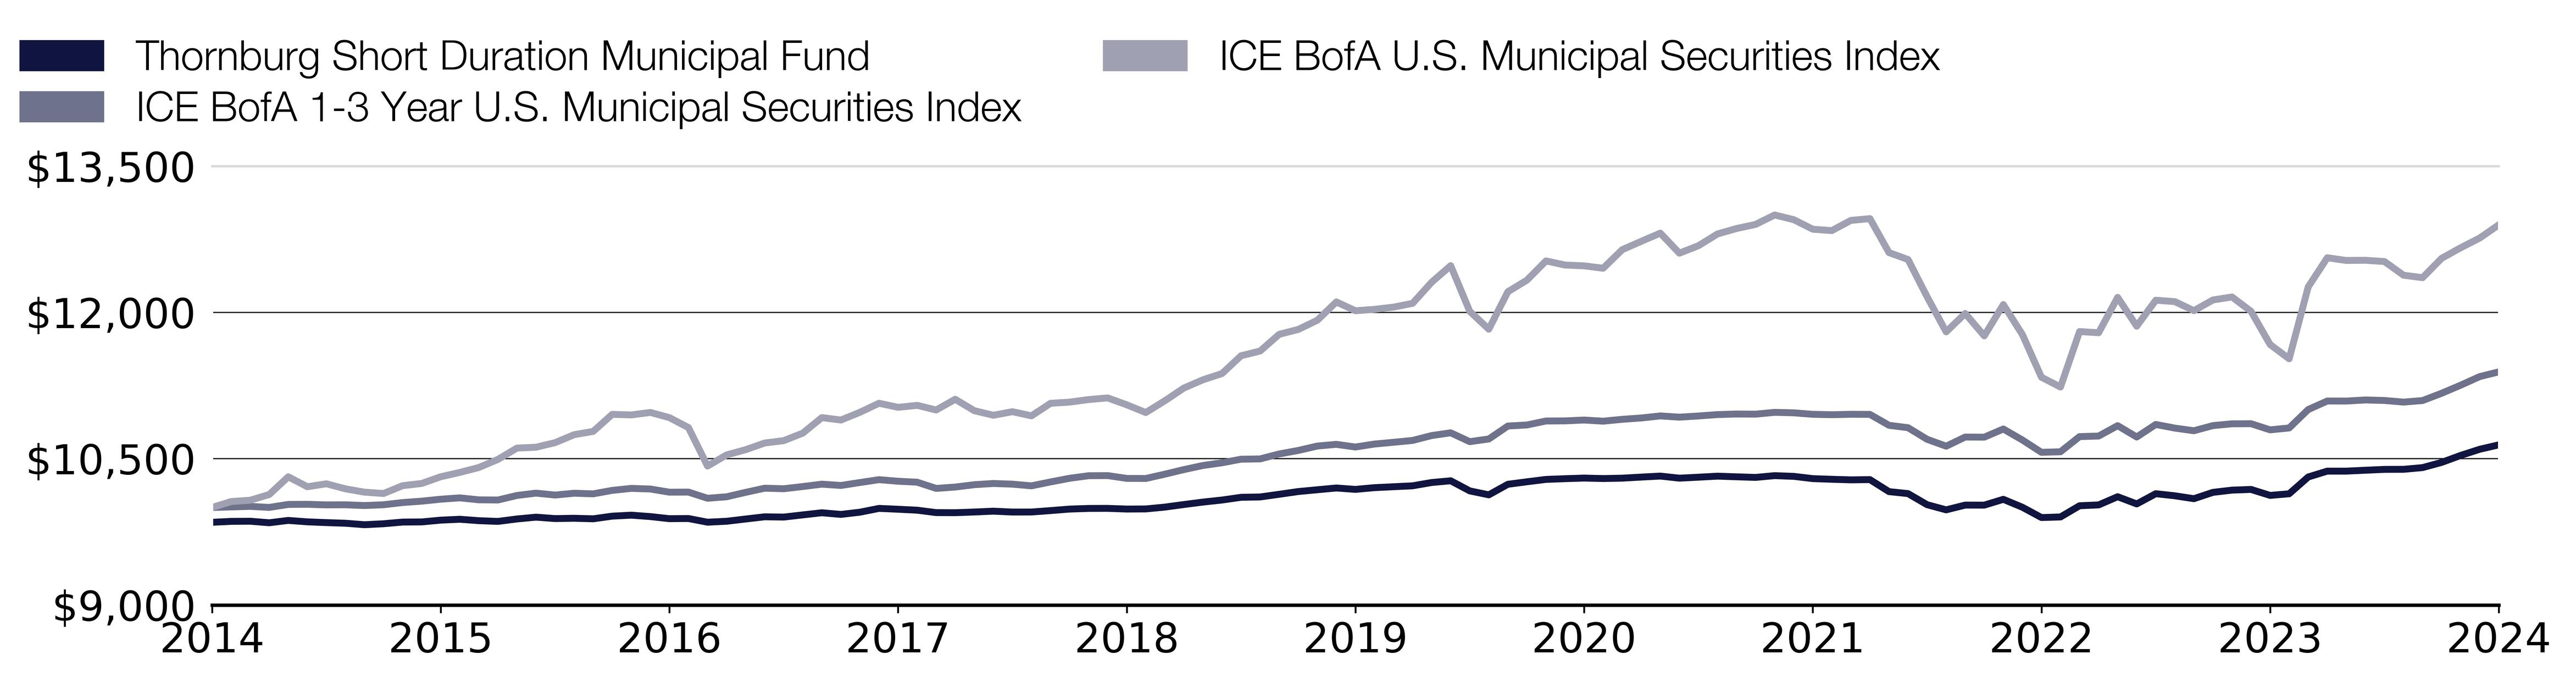
Effective September 30, 2024, the Fund adopted the ICE BofA U.S. Municipal Securities Index as its broad-based securities market index that represents the overall applicable market in which the Fund invests, and the ICE BofA 1-3 Year U.S. Municipal Securities Index as an additional index that represents the market sectors which the Fund’s advisor believes are more representative of the Fund’s investment universe.
What were the Fund costs for the past year?
(based on a hypothetical $10,000 investment)
Class Name | Costs of a $10,000 investment | Costs paid as a percentage of a $10,000 investment |
|---|
Class A | $72.00 | 0.70% |
End Block
Thornburg Short Duration Municipal Fund Tailored Shareholder Report
Thornburg Short Duration Municipal Fund Tailored Shareholder Report | |
Annual Performance | 1 Year | 5 Year | 10 Year |
|---|
Short Duration Municipal Fund Class A (with sales charge) | 2.76% | 0.57% | 0.62% |
Short Duration Municipal Fund Class A (without sales charge) | 5.12% | 0.88% | 0.78% |
ICE BofA 1-3 Year U.S. Municipal Securities Index | 5.51% | 1.41% | 1.31% |
ICE BofA U.S. Municipal Securities Index | 10.52% | 1.43% | 2.58% |
Key Fund Statistics
(as of September 30, 2024)
| |
|---|
Fund Size (Millions) | $117.9M |
Number of Holdings | 136 |
Annual Portfolio Turnover | 63.53% |
Total Advisory Fee | $0.5M |
What did the Fund invest in?
(as of September 30, 2024)
Credit Quality Ratings | (%) |
|---|
| AAA | 23.7 |
| AA | 30.2 |
| A | 31.1 |
| BBB | 9.2 |
| NR | 4.3 |
| Below Invest. Grade | 0.0 |
| Cash & Cash Equivalent | 1.6 |
Credit Quality Ratings | (%) |
AAA | 23.7% |
AA | 30.2% |
A | 31.1% |
BBB | 9.2% |
NR | 4.3% |
Below Invest. Grade | 0.0% |
Cash & Cash Equivalent | 1.6% |
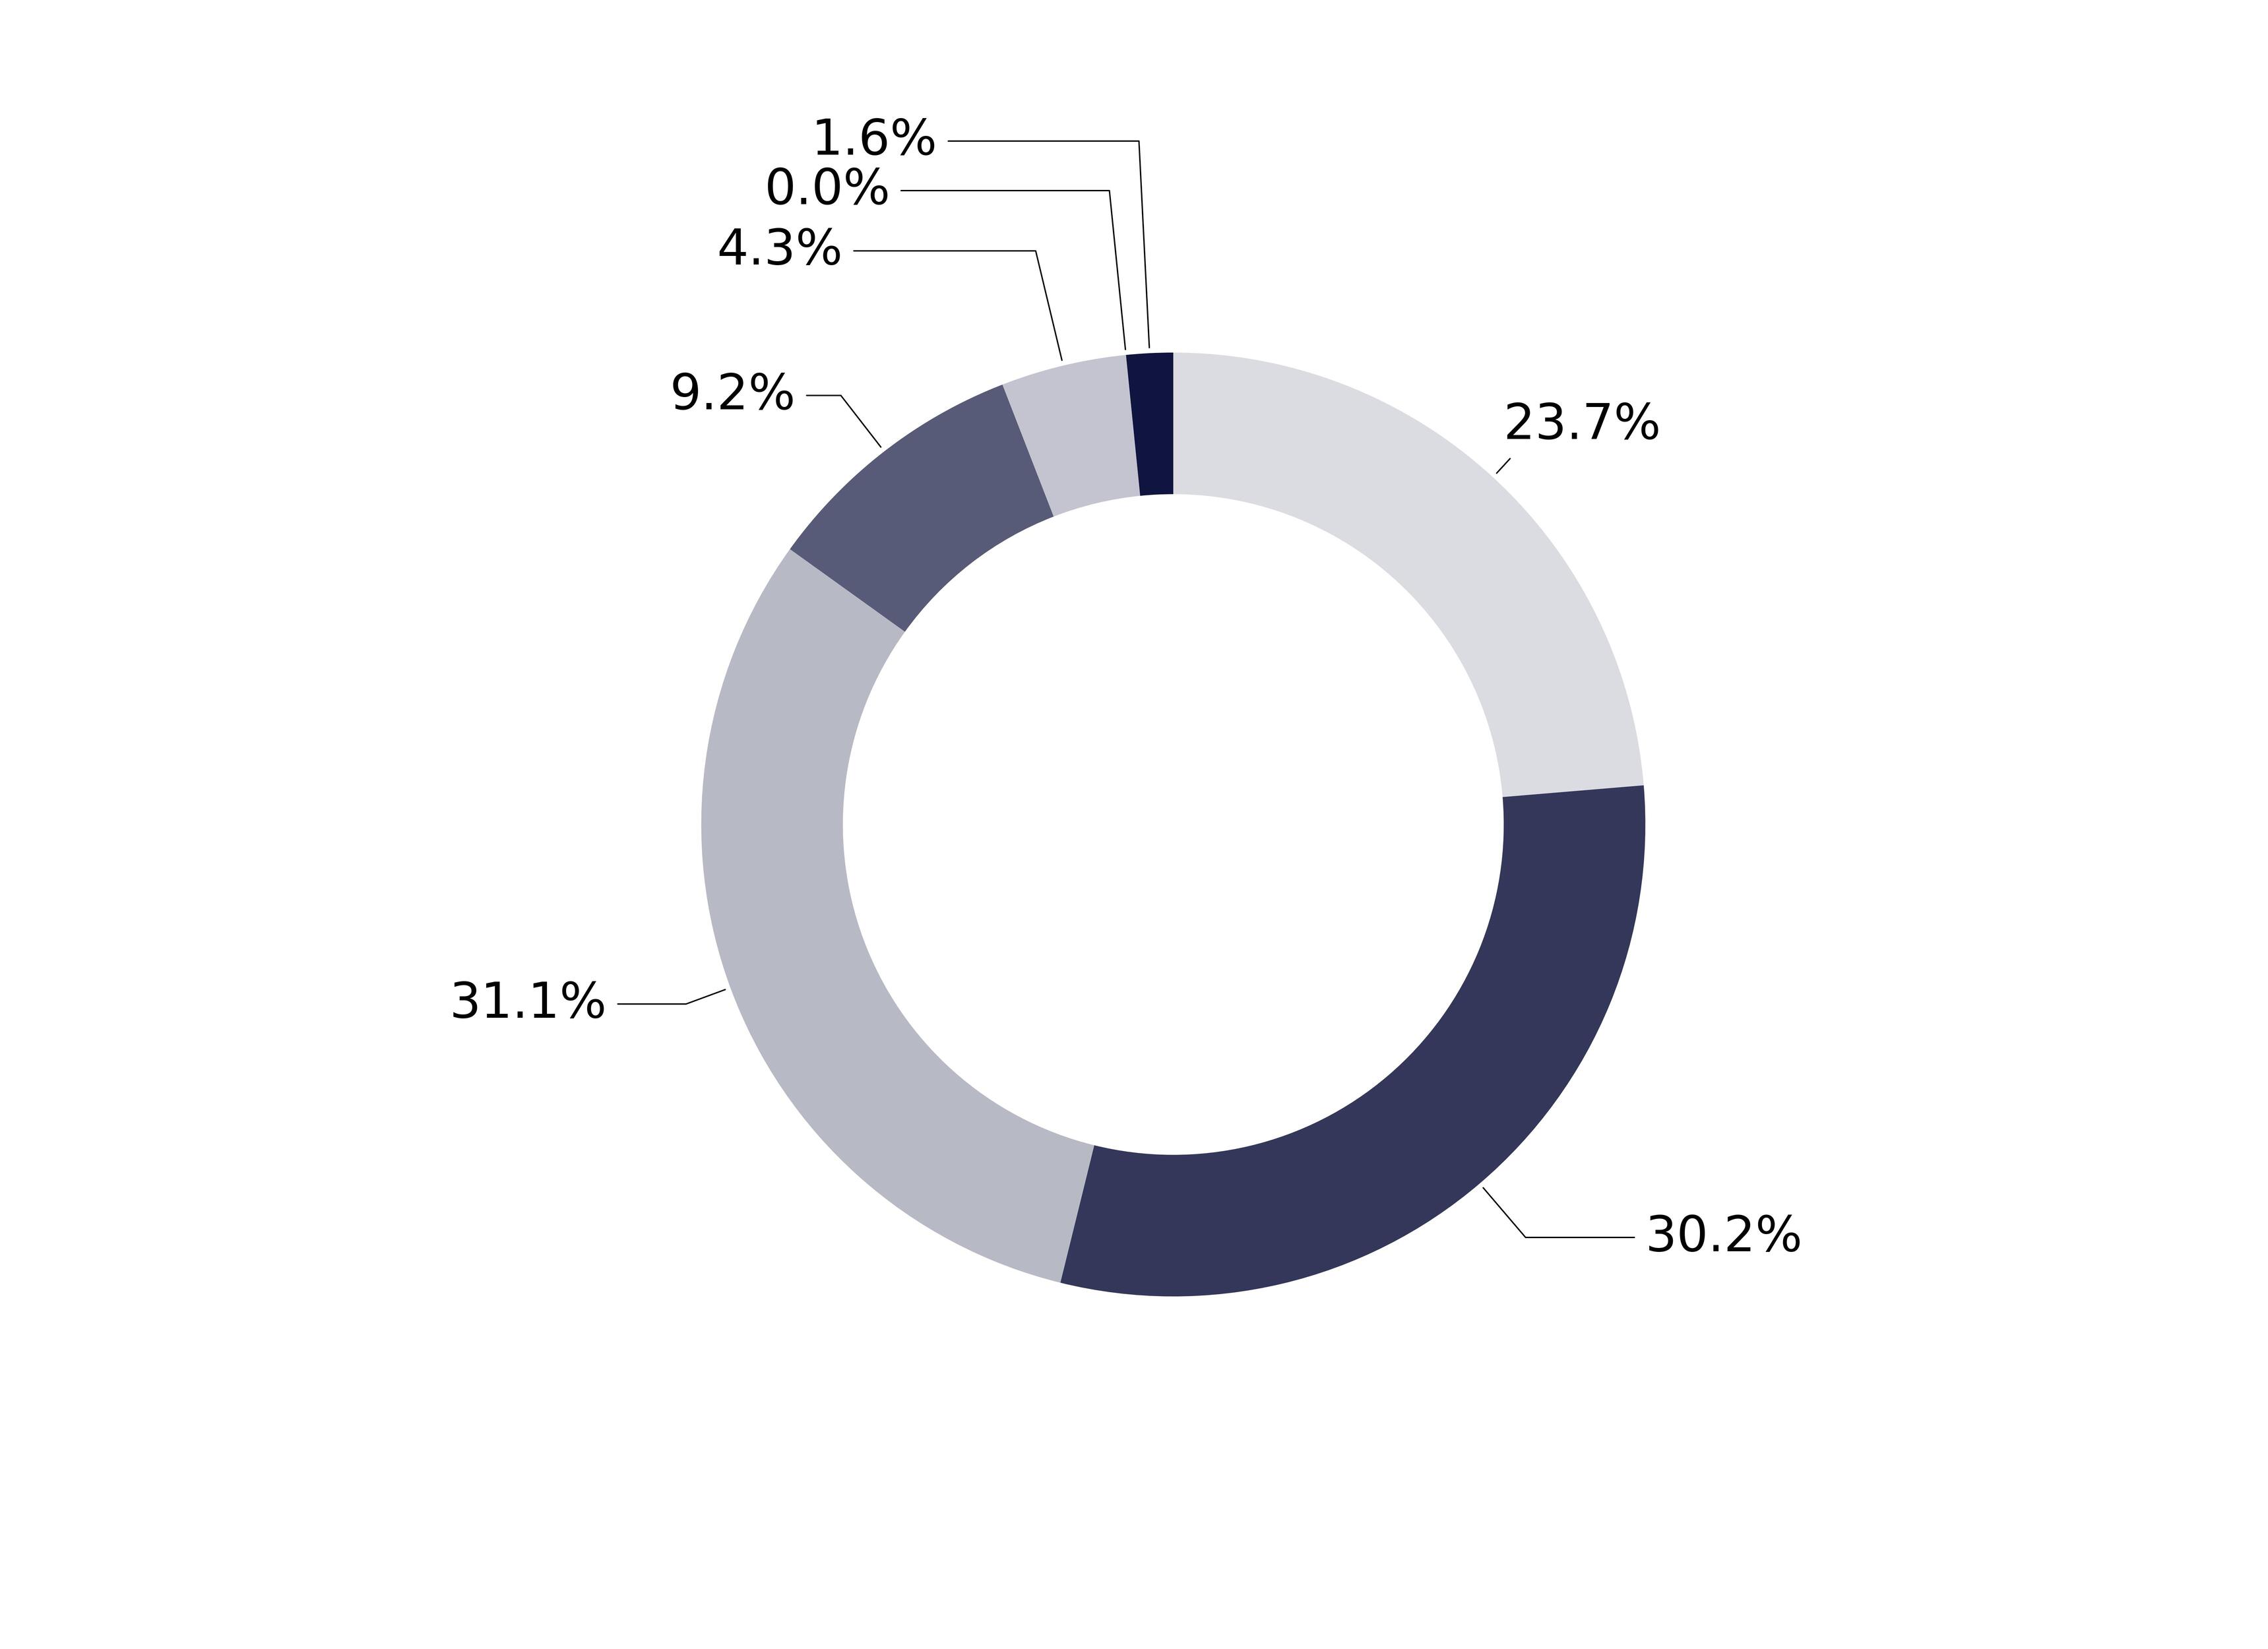
Expressed as a percentage of the Fund’s net assets. * Credit quality ratings shown above reflect the highest rating assigned by either S&P Global Ratings or Moody’s Investors Services, both of which are independent, nationally recognized statistical rating organizations. If a credit rating for an investment is not available from either S&P or Moody’s, then the Fund’s investment advisor will determine the credit quality of the investment. Investments are considered to be investment grade if they are rated within the four highest grades by S&P or Moody’s (BBB/Baa or higher) or, if no credit rating is available, have been judged to be of comparable quality by the Fund’s investment advisor. (NR = Not Rated)
How has the Fund changed?
This is a summary of certain changes to the Fund since October 1, 2023. For more complete information, you may review the Fund’s next prospectus, which we expect to be available by February 1, 2025 at https://www.thornburg.com/download or upon request by calling 1-800-847-0200.
End Block
Changes In and Disagreements with Accountants
No changes and/or disagreements occurred in the current reporting period.
End Block
For additional information about the Fund, including its prospectus, financial information, holdings and proxy information, visit www.thornburg.com/download.

Thornburg Short Duration Municipal Fund Tailored Shareholder Report | |
Thornburg Short Duration Municipal Fund Tailored Shareholder Report
Thornburg Short Duration Municipal Fund CLASS: I TICKER: TLMIX Annual Shareholder Report | |
This annual shareholder report contains important information about the Thornburg Short Duration Municipal Fund Class I Shares for the period from October 1, 2023 to September 30, 2024. You can find additional information about the Fund at https://www.thornburg.com/download. You can also request this information by contacting us at 1-800-847-0200. This report also describes changes to the Fund that occurred during the reporting period.
How did the Fund perform last year and what affected its performance?
The Fund’s Class I shares underperformed the ICE BofA 1-3 Year U.S. Municipal Securities Index (the “Index”) during the 12-month period ended September 30, 2024. The period began with municipal bond yields peaking in October of 2023, which marked the end of the Federal Reserve rate hiking cycle, before falling precipitously throughout the period and ending significantly lower. The backdrop of falling municipal bond yields boosted bond prices due to the inverse relationship between the two, which produced strong absolute returns for the asset class. However, the Fund’s relative underperformance during the period was driven by its shorter duration and yield curve positioning versus its Index. The Fund’s relative performance benefited from active management with respect to its sector/quality returns thanks to its higher weighting to revenue and A-rated bonds. Specifically, within the revenue sector, multi-family housing bonds were a large contributor to relative performance during the period.
How did the Fund perform over the past 10 years?
The line graph below reflects a hypothetical $10,000 investment. The returns shown in the line graph and table assume the reinvestment of dividends and capital gains, but do not reflect the deduction of taxes that a shareholder would pay on distributions or the redemption of Fund shares. The performance information shown below represents past performance and is no guarantee of future results. For Fund performance current to the most recent month end, visit https://www.thornburg.com/product/mutual-funds/fldm/TLMIX or call 1-800-847-0200. Performance for other share classes of the Fund will vary.
Cumulative Performance
Growth Table
Date | Thornburg Short Duration Municipal Fund | ICE BofA 1-3 Year U.S. Municipal Securities Index | ICE BofA U.S. Municipal Securities Index |
09/30/2014 | 10000.0028 | 10000 | 10000 |
10/31/2014 | 10011.1446 | 10005.9501 | 10061.0061 |
11/30/2014 | 10014.4174 | 10011.4622 | 10074.732 |
12/31/2014 | 9999.3464 | 10001.1681 | 10133.237 |
01/31/2015 | 10023.7622 | 10031.4662 | 10315.1349 |
02/28/2015 | 10010.4671 | 10032.8168 | 10213.0312 |
03/31/2015 | 10004.0688 | 10026.9762 | 10243.2441 |
04/30/2015 | 9999.183 | 10028.0348 | 10191.582 |
05/31/2015 | 9985.4721 | 10020.1135 | 10157.4674 |
06/30/2015 | 9997.2957 | 10028.3269 | 10143.7215 |
07/31/2015 | 10016.3495 | 10050.9591 | 10223.9759 |
08/31/2015 | 10027.6814 | 10065.1226 | 10246.5455 |
09/30/2015 | 10039.7719 | 10085.2361 | 10315.6951 |
10/31/2015 | 10050.6947 | 10099.0345 | 10359.774 |
11/30/2015 | 10029.4316 | 10078.7749 | 10410.5357 |
12/31/2015 | 10023.6013 | 10076.9132 | 10493.2511 |
01/31/2016 | 10058.9017 | 10123.5649 | 10609.5409 |
02/29/2016 | 10071.2458 | 10147.4749 | 10618.4247 |
03/31/2016 | 10058.1611 | 10127.8359 | 10665.2047 |
04/30/2016 | 10071.1752 | 10146.3432 | 10746.9397 |
05/31/2016 | 10067.2754 | 10140.1376 | 10780.454 |
06/30/2016 | 10096.7195 | 10175.7652 | 10955.589 |
07/31/2016 | 10108.5426 | 10196.0613 | 10949.7465 |
08/31/2016 | 10095.491 | 10189.7826 | 10974.9373 |
09/30/2016 | 10075.684 | 10157.2943 | 10921.9146 |
10/31/2016 | 10079.0775 | 10158.2434 | 10819.6708 |
11/30/2016 | 10042.2205 | 10094.9096 | 10425.262 |
12/31/2016 | 10045.76 | 10110.0221 | 10539.3308 |
01/31/2017 | 10069.5677 | 10155.4692 | 10592.9738 |
02/28/2017 | 10102.4495 | 10197.9959 | 10661.5031 |
03/31/2017 | 10101.2415 | 10192.5204 | 10685.8535 |
04/30/2017 | 10117.6771 | 10215.1162 | 10762.9465 |
05/31/2017 | 10141.7632 | 10239.3911 | 10922.1347 |
06/30/2017 | 10134.2497 | 10226.0673 | 10897.224 |
07/31/2017 | 10159.2773 | 10256.3653 | 10976.8981 |
08/31/2017 | 10192.5592 | 10285.6778 | 11069.4177 |
09/30/2017 | 10185.2601 | 10269.3971 | 11027.4598 |
10/31/2017 | 10185.3074 | 10259.7237 | 11047.8085 |
11/30/2017 | 10153.3372 | 10195.9882 | 11000.3481 |
12/31/2017 | 10153.9944 | 10209.8596 | 11110.0751 |
01/31/2018 | 10171.2483 | 10233.9886 | 10993.045 |
02/28/2018 | 10173.4038 | 10246.5093 | 10946.205 |
03/31/2018 | 10174.1659 | 10239.3911 | 10982.8206 |
04/30/2018 | 10167.9772 | 10222.3439 | 10940.1224 |
05/31/2018 | 10192.7852 | 10262.2789 | 11068.6574 |
06/30/2018 | 10210.5129 | 10299.9142 | 11080.8826 |
07/31/2018 | 10218.9876 | 10325.9413 | 11107.1138 |
08/31/2018 | 10221.3472 | 10327.292 | 11124.0611 |
09/30/2018 | 10215.9038 | 10298.7096 | 11053.4109 |
10/31/2018 | 10210.4975 | 10297.724 | 10973.8968 |
11/30/2018 | 10239.634 | 10341.9665 | 11094.9286 |
12/31/2018 | 10268.4671 | 10389.0562 | 11225.6846 |
01/31/2019 | 10287.4986 | 10431.0719 | 11309.9006 |
02/28/2019 | 10310.696 | 10458.7052 | 11374.1081 |
03/31/2019 | 10340.9491 | 10495.5739 | 11556.5862 |
04/30/2019 | 10346.4838 | 10498.6037 | 11604.8669 |
05/31/2019 | 10384.5963 | 10549.3073 | 11776.3203 |
06/30/2019 | 10406.7616 | 10585.227 | 11826.3817 |
07/31/2019 | 10435.7705 | 10630.455 | 11920.3619 |
08/31/2019 | 10456.0077 | 10647.6483 | 12108.5024 |
09/30/2019 | 10443.0505 | 10620.526 | 12018.0237 |
10/31/2019 | 10463.1274 | 10651.0066 | 12032.5099 |
11/30/2019 | 10474.3965 | 10668.9299 | 12055.2997 |
12/31/2019 | 10486.0366 | 10687.8023 | 12094.0362 |
01/31/2020 | 10522.3548 | 10738.0314 | 12310.4889 |
02/29/2020 | 10542.3446 | 10766.1392 | 12480.4216 |
03/31/2020 | 10437.5859 | 10675.5371 | 12011.9411 |
04/30/2020 | 10397.6575 | 10702.8053 | 11828.8427 |
05/31/2020 | 10510.5729 | 10835.8612 | 12213.0072 |
06/30/2020 | 10530.0428 | 10846.6298 | 12331.8981 |
07/31/2020 | 10556.8861 | 10887.2584 | 12529.0824 |
08/31/2020 | 10566.2303 | 10888.463 | 12486.8844 |
09/30/2020 | 10574.4991 | 10897.2239 | 12478.7409 |
10/31/2020 | 10571.2666 | 10885.4697 | 12453.9903 |
11/30/2020 | 10577.034 | 10904.5611 | 12644.4318 |
12/31/2020 | 10590.2087 | 10918.177 | 12730.2285 |
01/31/2021 | 10602.6115 | 10939.4587 | 12814.1645 |
02/28/2021 | 10582.2534 | 10926.6824 | 12608.4364 |
03/31/2021 | 10594.2499 | 10938.8016 | 12685.0892 |
04/30/2021 | 10606.8947 | 10953.0745 | 12805.5408 |
05/31/2021 | 10610.4544 | 10959.0246 | 12861.4247 |
06/30/2021 | 10597.2465 | 10957.4915 | 12903.5827 |
07/31/2021 | 10617.6355 | 10976.0718 | 13000.3241 |
08/31/2021 | 10612.1203 | 10971.2169 | 12952.2436 |
09/30/2021 | 10598.5228 | 10955.8853 | 12854.4017 |
10/31/2021 | 10584.6796 | 10951.8334 | 12840.0155 |
11/30/2021 | 10589.0374 | 10956.1043 | 12944.6803 |
12/31/2021 | 10584.6543 | 10955.0822 | 12962.708 |
01/31/2022 | 10459.6798 | 10843.235 | 12614.479 |
02/28/2022 | 10440.2165 | 10818.4855 | 12543.3886 |
03/31/2022 | 10333.5096 | 10699.666 | 12161.105 |
04/30/2022 | 10272.1606 | 10628.9219 | 11801.7111 |
05/31/2022 | 10332.7793 | 10722.8093 | 11990.3119 |
06/30/2022 | 10325.3856 | 10721.4952 | 11760.3534 |
07/31/2022 | 10397.2038 | 10805.1981 | 12081.5509 |
08/31/2022 | 10306.3401 | 10692.5478 | 11774.1193 |
09/30/2022 | 10199.401 | 10566.026 | 11336.1319 |
10/31/2022 | 10207.178 | 10571.8301 | 11235.8489 |
11/30/2022 | 10336.2178 | 10727.2628 | 11804.6324 |
12/31/2022 | 10338.0774 | 10732.8478 | 11792.3671 |
01/31/2023 | 10426.6408 | 10839.4386 | 12154.9223 |
02/28/2023 | 10351.9243 | 10723.1014 | 11859.776 |
03/31/2023 | 10461.9539 | 10851.8498 | 12125.9499 |
04/30/2023 | 10450.2875 | 10814.4336 | 12111.7038 |
05/31/2023 | 10421.3309 | 10787.5303 | 12018.8841 |
06/30/2023 | 10481.3168 | 10840.1321 | 12128.6911 |
07/31/2023 | 10506.683 | 10858.6395 | 12159.4442 |
08/31/2023 | 10515.6663 | 10859.5156 | 12012.0412 |
09/30/2023 | 10454.2218 | 10796.4737 | 11671.6555 |
10/31/2023 | 10482.1985 | 10815.9302 | 11525.4929 |
11/30/2023 | 10652.9829 | 11004.8367 | 12262.5884 |
12/31/2023 | 10725.9313 | 11092.1535 | 12561.5363 |
01/31/2024 | 10727.7065 | 11091.6425 | 12533.8245 |
02/29/2024 | 10738.8778 | 11103.0681 | 12535.4652 |
03/31/2024 | 10749.7847 | 11097.7021 | 12522.8598 |
04/30/2024 | 10743.1389 | 11081.1294 | 12382.8399 |
05/31/2024 | 10772.2188 | 11096.972 | 12356.9688 |
06/30/2024 | 10829.214 | 11171.695 | 12555.7339 |
07/31/2024 | 10905.1176 | 11254.6314 | 12664.2203 |
08/31/2024 | 10972.3244 | 11342.7513 | 12763.903 |
09/30/2024 | 11011.9202 | 11391.2647 | 12899.3409 |

Effective September 30, 2024, the Fund adopted the ICE BofA U.S. Municipal Securities Index as its broad-based securities market index that represents the overall applicable market in which the Fund invests, and the ICE BofA 1-3 Year U.S. Municipal Securities Index as an additional index that represents the market sectors which the Fund’s advisor believes are more representative of the Fund’s investment universe.
What were the Fund costs for the past year?
(based on a hypothetical $10,000 investment)
Class Name | Costs of a $10,000 investment | Costs paid as a percentage of a $10,000 investment |
|---|
Class I | $51.00 | 0.50% |
End Block
Thornburg Short Duration Municipal Fund Tailored Shareholder Report
Thornburg Short Duration Municipal Fund Tailored Shareholder Report | |
Annual Performance | 1 Year | 5 Year | 10 Year |
|---|
Short Duration Municipal Fund Class I | 5.34% | 1.07% | 0.97% |
ICE BofA 1-3 Year U.S. Municipal Securities Index | 5.51% | 1.41% | 1.31% |
ICE BofA U.S. Municipal Securities Index | 10.52% | 1.43% | 2.58% |
Key Fund Statistics
(as of September 30, 2024)
| |
|---|
Fund Size (Millions) | $117.9M |
Number of Holdings | 136 |
Annual Portfolio Turnover | 63.53% |
Total Advisory Fee | $0.5M |
What did the Fund invest in?
(as of September 30, 2024)
Credit Quality Ratings | (%) |
|---|
| AAA | 23.7 |
| AA | 30.2 |
| A | 31.1 |
| BBB | 9.2 |
| NR | 4.3 |
| Below Invest. Grade | 0.0 |
| Cash & Cash Equivalent | 1.6 |
Credit Quality Ratings | (%) |
AAA | 23.7% |
AA | 30.2% |
A | 31.1% |
BBB | 9.2% |
NR | 4.3% |
Below Invest. Grade | 0.0% |
Cash & Cash Equivalent | 1.6% |
Expressed as a percentage of the Fund’s net assets. * Credit quality ratings shown above reflect the highest rating assigned by either S&P Global Ratings or Moody’s Investors Services, both of which are independent, nationally recognized statistical rating organizations. If a credit rating for an investment is not available from either S&P or Moody’s, then the Fund’s investment advisor will determine the credit quality of the investment. Investments are considered to be investment grade if they are rated within the four highest grades by S&P or Moody’s (BBB/Baa or higher) or, if no credit rating is available, have been judged to be of comparable quality by the Fund’s investment advisor. (NR = Not Rated)
How has the Fund changed?
This is a summary of certain changes to the Fund since October 1, 2023. For more complete information, you may review the Fund’s next prospectus, which we expect to be available by February 1, 2025 at https://www.thornburg.com/download or upon request by calling 1-800-847-0200.
End Block
Changes In and Disagreements with Accountants
No changes and/or disagreements occurred in the current reporting period.
End Block
For additional information about the Fund, including its prospectus, financial information, holdings and proxy information, visit www.thornburg.com/download.

Thornburg Short Duration Municipal Fund Tailored Shareholder Report | |
Thornburg Limited Term Municipal Fund Tailored Shareholder Report
Thornburg Limited Term Municipal Fund CLASS: A TICKER: LTMFX Annual Shareholder Report | |
This annual shareholder report contains important information about the Thornburg Limited Term Municipal Fund Class A Shares for the period from October 1, 2023 to September 30, 2024. You can find additional information about the Fund at https://www.thornburg.com/download. You can also request this information by contacting us at 1-800-847-0200. This report also describes changes to the Fund that occurred during the reporting period.
How did the Fund perform last year and what affected its performance?
The Fund’s Class A shares underperformed the ICE BofA 1-10 Year U.S. Municipal Securities Index (the “Index”) during the 12-month period ended September 30, 2024. The period began with municipal bond yields peaking in October of 2023, which marked the end of the Federal Reserve rate hiking cycle, before falling precipitously throughout the period and ending significantly lower. The backdrop of falling municipal bond yields boosted bond prices due to the inverse relationship between the two, producing strong absolute returns for the asset class. However, the Fund’s underperformance during the period was driven by its shorter duration and yield curve positioning compared to the Index. The Fund’s relative performance benefited from active management with respect to its sector/quality returns thanks to the Fund’s higher weighting to revenue bonds and A-rated bonds. Specifically, within the revenue sector, hospital and other utility bonds were large contributors to relative performance during the period.
How did the Fund perform over the past 10 years?
The line graph below reflects a hypothetical $10,000 investment and assumes the deduction of the maximum sales charge associated with that investment. The returns shown in the line graph and table assume the reinvestment of dividends and capital gains, but do not reflect the deduction of taxes that a shareholder would pay on distributions or the redemption of Fund shares. The performance information shown below represents past performance and is no guarantee of future results. For Fund performance current to the most recent month end, visit https://www.thornburg.com/product/mutual-funds/flm/LTMFX or call 1-800-847-0200. Performance for other share classes of the Fund will vary.
Cumulative Performance
Growth Table
Date | Thornburg Limited Term Municipal Fund | ICE BofA 1-10 Year U.S. Municipal Securities Index | ICE BofA U.S. Municipal Securities Index |
09/30/2014 | 9851.3561 | 10000 | 10000 |
10/31/2014 | 9877.8928 | 10031.0861 | 10061.0061 |
11/30/2014 | 9877.4834 | 10036.9203 | 10074.732 |
12/31/2014 | 9869.6579 | 10037.6328 | 10133.237 |
01/31/2015 | 9976.9339 | 10163.3576 | 10315.1349 |
02/28/2015 | 9915.7851 | 10102.8334 | 10213.0312 |
03/31/2015 | 9914.2534 | 10101.9427 | 10243.2441 |
04/30/2015 | 9899.707 | 10091.7885 | 10191.582 |
05/31/2015 | 9871.307 | 10054.6901 | 10157.4674 |
06/30/2015 | 9871.1551 | 10061.5931 | 10143.7215 |
07/31/2015 | 9911.2559 | 10113.7892 | 10223.9759 |
08/31/2015 | 9917.0434 | 10123.0972 | 10246.5455 |
09/30/2015 | 9964.5823 | 10181.2611 | 10315.6951 |
10/31/2015 | 9991.3355 | 10221.0316 | 10359.774 |
11/30/2015 | 9997.9041 | 10219.8737 | 10410.5357 |
12/31/2015 | 10017.4784 | 10250.3808 | 10493.2511 |
01/31/2016 | 10105.6579 | 10357.5787 | 10609.5409 |
02/29/2016 | 10119.0041 | 10380.4701 | 10618.4247 |
03/31/2016 | 10103.94 | 10364.6599 | 10665.2047 |
04/30/2016 | 10145.1836 | 10412.4469 | 10746.9397 |
05/31/2016 | 10130.2964 | 10394.6771 | 10780.454 |
06/30/2016 | 10213.0206 | 10485.9311 | 10955.589 |
07/31/2016 | 10225.4506 | 10509.4015 | 10949.7465 |
08/31/2016 | 10224.0343 | 10512.5636 | 10974.9373 |
09/30/2016 | 10195.7055 | 10481.3439 | 10921.9146 |
10/31/2016 | 10145.6049 | 10435.7837 | 10819.6708 |
11/30/2016 | 9893.4221 | 10188.5204 | 10425.262 |
12/31/2016 | 9948.3689 | 10245.66 | 10539.3308 |
01/31/2017 | 9996.7343 | 10316.8283 | 10592.9738 |
02/28/2017 | 10046.8977 | 10379.8912 | 10661.5031 |
03/31/2017 | 10053.3903 | 10387.2396 | 10685.8535 |
04/30/2017 | 10116.9627 | 10452.3956 | 10762.9465 |
05/31/2017 | 10201.0297 | 10545.3865 | 10922.1347 |
06/30/2017 | 10172.9062 | 10509.8914 | 10897.224 |
07/31/2017 | 10214.5874 | 10573.934 | 10976.8981 |
08/31/2017 | 10270.3154 | 10635.349 | 11069.4177 |
09/30/2017 | 10220.4227 | 10584.3109 | 11027.4598 |
10/31/2017 | 10219.3558 | 10581.0598 | 11047.8085 |
11/30/2017 | 10140.8278 | 10488.0688 | 11000.3481 |
12/31/2017 | 10175.8839 | 10535.2323 | 11110.0751 |
01/31/2018 | 10132.3434 | 10494.8828 | 10993.045 |
02/28/2018 | 10119.0735 | 10474.2182 | 10946.205 |
03/31/2018 | 10111.5286 | 10475.3761 | 10982.8206 |
04/30/2018 | 10083.5868 | 10443.1321 | 10940.1224 |
05/31/2018 | 10147.5338 | 10529.888 | 11068.6574 |
06/30/2018 | 10162.3131 | 10554.65 | 11080.8826 |
07/31/2018 | 10190.7046 | 10595.7566 | 11107.1138 |
08/31/2018 | 10190.9223 | 10601.3236 | 11124.0611 |
09/30/2018 | 10155.2994 | 10553.8929 | 11053.4109 |
10/31/2018 | 10133.8716 | 10524.6328 | 10973.8968 |
11/30/2018 | 10192.5843 | 10616.4213 | 11094.9286 |
12/31/2018 | 10265.3582 | 10713.0196 | 11225.6846 |
01/31/2019 | 10330.714 | 10805.1198 | 11309.9006 |
02/28/2019 | 10362.4819 | 10853.9757 | 11374.1081 |
03/31/2019 | 10421.5807 | 10937.3469 | 11556.5862 |
04/30/2019 | 10430.5347 | 10949.2825 | 11604.8669 |
05/31/2019 | 10504.083 | 11066.0111 | 11776.3203 |
06/30/2019 | 10541.9798 | 11111.3932 | 11826.3817 |
07/31/2019 | 10608.7979 | 11194.319 | 11920.3619 |
08/31/2019 | 10653.5682 | 11268.4267 | 12108.5024 |
09/30/2019 | 10603.518 | 11192.2704 | 12018.0237 |
10/31/2019 | 10625.6249 | 11224.8261 | 12032.5099 |
11/30/2019 | 10633.9274 | 11243.7093 | 12055.2997 |
12/31/2019 | 10656.2434 | 11278.67 | 12094.0362 |
01/31/2020 | 10751.6128 | 11411.0752 | 12310.4889 |
02/29/2020 | 10804.0941 | 11478.9924 | 12480.4216 |
03/31/2020 | 10620.3544 | 11208.2587 | 12011.9411 |
04/30/2020 | 10576.5391 | 11168.7109 | 11828.8427 |
05/31/2020 | 10790.9784 | 11448.9307 | 12213.0072 |
06/30/2020 | 10835.3948 | 11498.7218 | 12331.8981 |
07/31/2020 | 10915.725 | 11617.7663 | 12529.0824 |
08/31/2020 | 10906.4123 | 11604.8954 | 12486.8844 |
09/30/2020 | 10912.2754 | 11606.3651 | 12478.7409 |
10/31/2020 | 10894.9288 | 11585.9676 | 12453.9903 |
11/30/2020 | 10945.2054 | 11664.3953 | 12644.4318 |
12/31/2020 | 10972.1478 | 11708.3968 | 12730.2285 |
01/31/2021 | 10998.6087 | 11755.4267 | 12814.1645 |
02/28/2021 | 10914.4672 | 11644.3096 | 12608.4364 |
03/31/2021 | 10940.657 | 11679.6266 | 12685.0892 |
04/30/2021 | 10974.8128 | 11734.3612 | 12805.5408 |
05/31/2021 | 10970.6587 | 11746.5195 | 12861.4247 |
06/30/2021 | 10974.3514 | 11755.8721 | 12903.5827 |
07/31/2021 | 11022.4322 | 11818.8903 | 13000.3241 |
08/31/2021 | 11003.0631 | 11802.1003 | 12952.2436 |
09/30/2021 | 10954.4261 | 11744.9162 | 12854.4017 |
10/31/2021 | 10920.3563 | 11724.6079 | 12840.0155 |
11/30/2021 | 10947.5534 | 11758.8114 | 12944.6803 |
12/31/2021 | 10951.2521 | 11765.1355 | 12962.708 |
01/31/2022 | 10735.2341 | 11516.7143 | 12614.479 |
02/28/2022 | 10710.2519 | 11477.4782 | 12543.3886 |
03/31/2022 | 10478.4832 | 11243.0413 | 12161.105 |
04/30/2022 | 10317.6006 | 11063.3835 | 11801.7111 |
05/31/2022 | 10423.2571 | 11210.4855 | 11990.3119 |
06/30/2022 | 10369.9446 | 11159.1802 | 11760.3534 |
07/31/2022 | 10515.0893 | 11355.0045 | 12081.5509 |
08/31/2022 | 10378.3901 | 11175.5694 | 11774.1193 |
09/30/2022 | 10165.8718 | 10912.5404 | 11336.1319 |
10/31/2022 | 10145.4517 | 10893.5681 | 11235.8489 |
11/30/2022 | 10372.0782 | 11188.4403 | 11804.6324 |
12/31/2022 | 10391.5568 | 11222.5102 | 11792.3671 |
01/31/2023 | 10557.1633 | 11436.9951 | 12154.9223 |
02/28/2023 | 10416.7075 | 11232.0409 | 11859.776 |
03/31/2023 | 10553.4254 | 11425.1485 | 12125.9499 |
04/30/2023 | 10528.0383 | 11387.1594 | 12111.7038 |
05/31/2023 | 10456.128 | 11297.3305 | 12018.8841 |
06/30/2023 | 10517.406 | 11365.8713 | 12128.6911 |
07/31/2023 | 10547.5477 | 11388.0947 | 12159.4442 |
08/31/2023 | 10500.24 | 11332.8702 | 12012.0412 |
09/30/2023 | 10359.6239 | 11153.6577 | 11671.6555 |
10/31/2023 | 10337.1177 | 11126.4908 | 11525.4929 |
11/30/2023 | 10685.592 | 11522.2813 | 12262.5884 |
12/31/2023 | 10837.5494 | 11703.5424 | 12561.5363 |
01/31/2024 | 10808.2629 | 11680.6955 | 12533.8245 |
02/29/2024 | 10827.4642 | 11690.627 | 12535.4652 |
03/31/2024 | 10822.1193 | 11680.3837 | 12522.8598 |
04/30/2024 | 10753.3017 | 11593.6278 | 12382.8399 |
05/31/2024 | 10716.323 | 11540.6301 | 12356.9688 |
06/30/2024 | 10808.3665 | 11666.8448 | 12555.7339 |
07/31/2024 | 10908.834 | 11771.5932 | 12664.2203 |
08/31/2024 | 11017.734 | 11895.1358 | 12763.903 |
09/30/2024 | 11078.8105 | 11981.8917 | 12899.3409 |

Effective September 30, 2024, the Fund adopted the ICE BofA U.S. Municipal Securities Index as its broad-based securities market index that represents the overall applicable market in which the Fund invests, and the ICE BofA 1-10 Year U.S. Municipal Securities Index as an additional index that represents the market sectors which the Fund’s advisor believes are more representative of the Fund’s investment universe
What were the Fund costs for the past year?
(based on a hypothetical $10,000 investment)
Class Name | Costs of a $10,000 investment | Costs paid as a percentage of a $10,000 investment |
|---|
Class A | $79.00 | 0.77% |
End Block
Thornburg Limited Term Municipal Fund Tailored Shareholder Report
Thornburg Limited Term Municipal Fund Tailored Shareholder Report | |
Annual Performance | 1 Year | 5 Year | 10 Year |
|---|
Limited Term Municipal Fund Class A (with sales charge) | 4.56% | 0.58% | 1.03% |
Limited Term Municipal Fund Class A (without sales charge) | 6.94% | 0.88% | 1.18% |
ICE BofA 1-10 Year U.S. Municipal Securities Index | 7.43% | 1.37% | 1.82% |
ICE BofA U.S. Municipal Securities Index | 10.52% | 1.43% | 2.58% |
Key Fund Statistics
(as of September 30, 2024)
| |
|---|
Fund Size (Millions) | $2,492.9M |
Number of Holdings | 801 |
Annual Portfolio Turnover | 39.61% |
Total Advisory Fee | $8.7M |
What did the Fund invest in?
(as of September 30, 2024)
Credit Quality Ratings | (%) |
|---|
| AAA | 12.9 |
| AA | 36.0 |
| A | 42.6 |
| BBB | 4.7 |
| NR | 1.4 |
| Below Invest. Grade | 0.0 |
| Cash & Cash Equivalent | 2.3 |
Credit Quality Ratings | (%) |
AAA | 12.9% |
AA | 36.0% |
A | 42.6% |
BBB | 4.7% |
NR | 1.4% |
Below Invest. Grade | 0.0% |
Cash & Cash Equivalent | 2.3% |
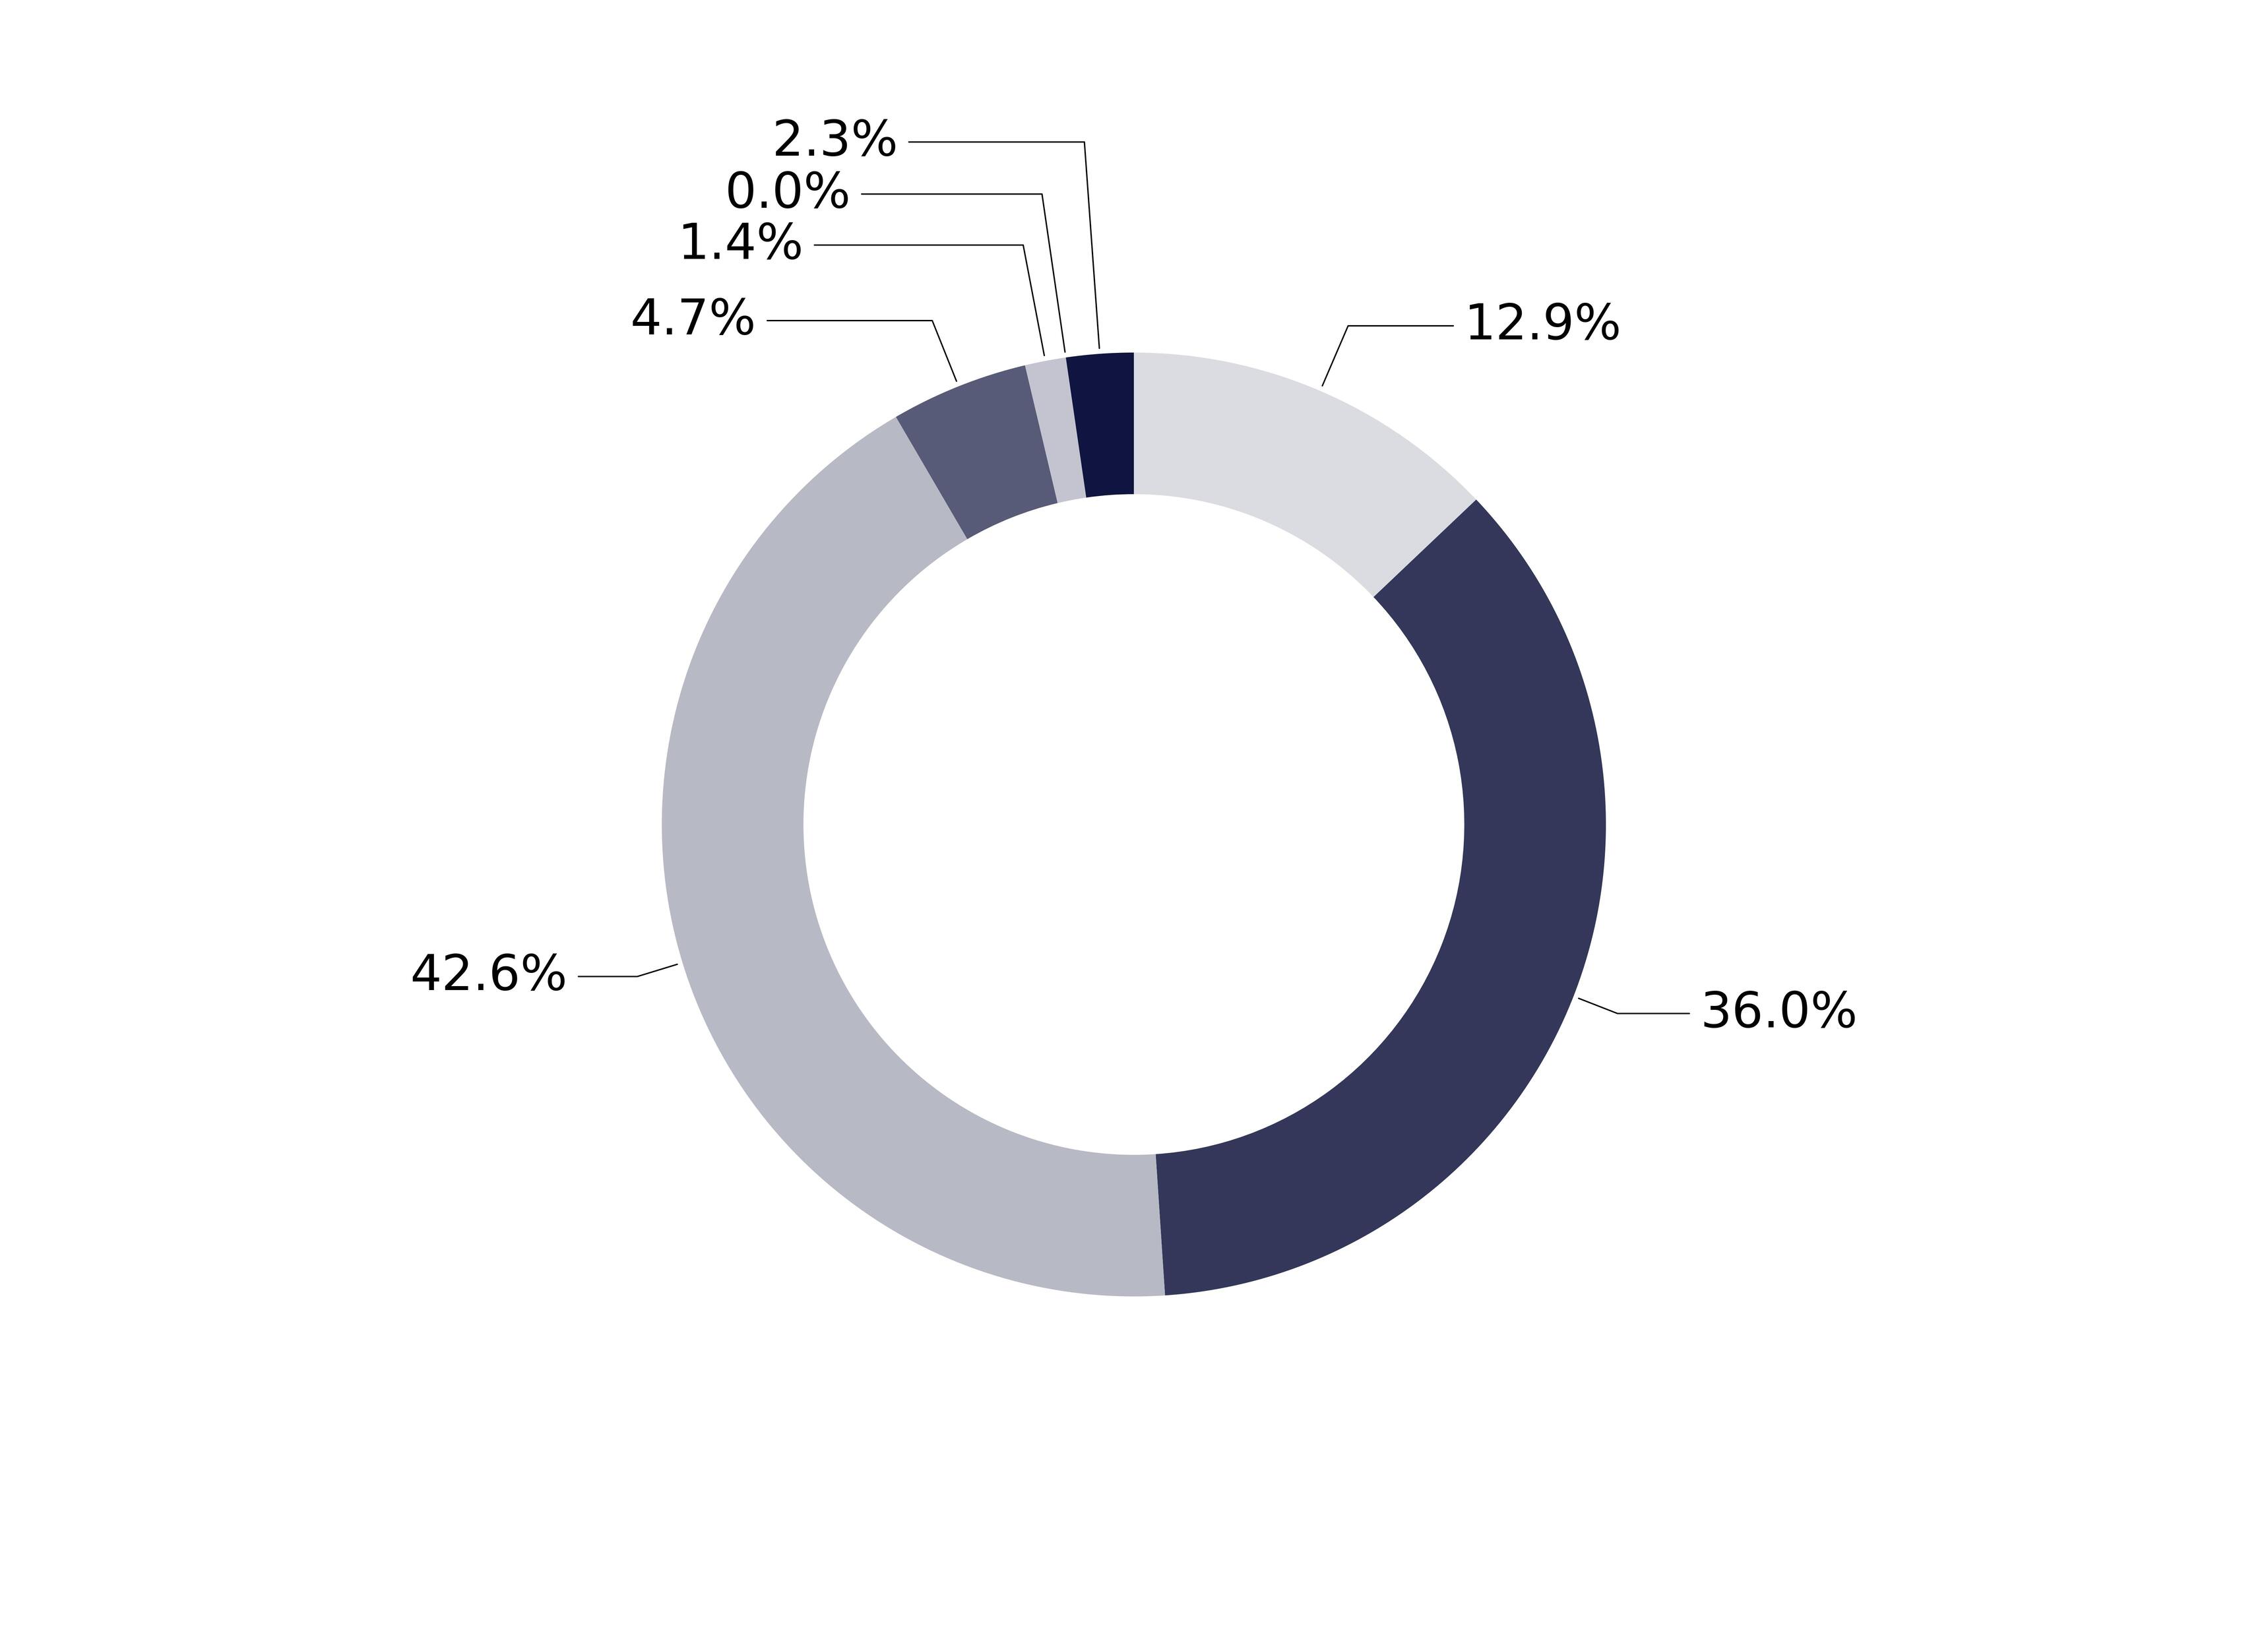
Expressed as a percentage of the Fund’s net assets. * Credit quality ratings shown above reflect the highest rating assigned by either S&P Global Ratings or Moody’s Investors Services, both of which are independent, nationally recognized statistical rating organizations. If a credit rating for an investment is not available from either S&P or Moody’s, then the Fund’s investment advisor will determine the credit quality of the investment. Investments are considered to be investment grade if they are rated within the four highest grades by S&P or Moody’s (BBB/Baa or higher) or, if no credit rating is available, have been judged to be of comparable quality by the Fund’s investment advisor. (NR = Not Rated)
How has the Fund changed?
This is a summary of certain changes to the Fund since October 1, 2023. For more complete information, you may review the Fund’s next prospectus, which we expect to be available by February 1, 2025 at https://www.thornburg.com/download or upon request by calling 1-800-847-0200.
End Block
Changes In and Disagreements with Accountants
No changes and/or disagreements occurred in the current reporting period
End Block
For additional information about the Fund, including its prospectus, financial information, holdings and proxy information, visit www.thornburg.com/download.

Thornburg Limited Term Municipal Fund Tailored Shareholder Report | |
Thornburg Limited Term Municipal Fund Tailored Shareholder Report
Thornburg Limited Term Municipal Fund CLASS: C TICKER: LTMCX Annual Shareholder Report | |
This annual shareholder report contains important information about the Thornburg Limited Term Municipal Fund Class C Shares for the period from October 1, 2023 to September 30, 2024. You can find additional information about the Fund at https://www.thornburg.com/download. You can also request this information by contacting us at 1-800-847-0200. This report also describes changes to the Fund that occurred during the reporting period.
How did the Fund perform last year and what affected its performance?
The Fund’s Class C shares underperformed the ICE BofA 1-10 Year U.S. Municipal Securities Index (the “Index”) during the 12-month period ended September 30, 2024. The period began with municipal bond yields peaking in October of 2023, which marked the end of the Federal Reserve rate hiking cycle, before falling precipitously throughout the period and ending significantly lower. The backdrop of falling municipal bond yields boosted bond prices due to the inverse relationship between the two, producing strong absolute returns for the asset class. However, the Fund’s underperformance during the period was driven by its shorter duration and yield curve positioning compared to the Index. The Fund’s relative performance benefited from active management with respect to its sector/quality returns thanks to the Fund’s higher weighting to revenue bonds and A-rated bonds. Specifically, within the revenue sector, hospital and other utility bonds were large contributors to relative performance during the period.
How did the Fund perform over the past 10 years?
The line graph below reflects a hypothetical $10,000 investment. The returns shown in the line graph and table assume the reinvestment of dividends and capital gains, but do not reflect the deduction of taxes that a shareholder would pay on distributions or the redemption of Fund shares. The performance information shown below represents past performance and is no guarantee of future results. For Fund performance current to the most recent month end, visit https://www.thornburg.com/product/mutual-funds/flm/LTMCX or call 1-800-847-0200. Performance for other share classes of the Fund will vary.
Cumulative Performance
Growth Table
Date | Thornburg Limited Term Municipal Fund | ICE BofA 1-10 Year U.S. Municipal Securities Index | ICE BofA U.S. Municipal Securities Index |
09/30/2014 | 10000.0072 | 10000 | 10000 |
10/31/2014 | 10024.8463 | 10031.0861 | 10061.0061 |
11/30/2014 | 10022.4328 | 10036.9203 | 10074.732 |
12/31/2014 | 10019.3468 | 10037.6328 | 10133.237 |
01/31/2015 | 10119.2002 | 10163.3576 | 10315.1349 |
02/28/2015 | 10062.433 | 10102.8334 | 10213.0312 |
03/31/2015 | 10058.9588 | 10101.9427 | 10243.2441 |
04/30/2015 | 10042.3809 | 10091.7885 | 10191.582 |
05/31/2015 | 10011.5757 | 10054.6901 | 10157.4674 |
06/30/2015 | 10009.5502 | 10061.5931 | 10143.7215 |
07/31/2015 | 10048.204 | 10113.7892 | 10223.9759 |
08/31/2015 | 10045.207 | 10123.0972 | 10246.5455 |
09/30/2015 | 10098.4857 | 10181.2611 | 10315.6951 |
10/31/2015 | 10123.542 | 10221.0316 | 10359.774 |
11/30/2015 | 10121.3292 | 10219.8737 | 10410.5357 |
12/31/2015 | 10146.0818 | 10250.3808 | 10493.2511 |
01/31/2016 | 10233.2225 | 10357.5787 | 10609.5409 |
02/29/2016 | 10244.849 | 10380.4701 | 10618.4247 |
03/31/2016 | 10227.6211 | 10364.6599 | 10665.2047 |
04/30/2016 | 10267.2654 | 10412.4469 | 10746.9397 |
05/31/2016 | 10250.196 | 10394.6771 | 10780.454 |
06/30/2016 | 10331.664 | 10485.9311 | 10955.589 |
07/31/2016 | 10342.1736 | 10509.4015 | 10949.7465 |
08/31/2016 | 10338.6362 | 10512.5636 | 10974.9373 |
09/30/2016 | 10307.9884 | 10481.3439 | 10921.9146 |
10/31/2016 | 10255.415 | 10435.7837 | 10819.6708 |
11/30/2016 | 9992.0646 | 10188.5204 | 10425.262 |
12/31/2016 | 10052.5628 | 10245.66 | 10539.3308 |
01/31/2017 | 10099.3607 | 10316.8283 | 10592.9738 |
02/28/2017 | 10148.1191 | 10379.8912 | 10661.5031 |
03/31/2017 | 10152.7487 | 10387.2396 | 10685.8535 |
04/30/2017 | 10207.8288 | 10452.3956 | 10762.9465 |
05/31/2017 | 10297.6164 | 10545.3865 | 10922.1347 |
06/30/2017 | 10260.212 | 10509.8914 | 10897.224 |
07/31/2017 | 10307.2442 | 10573.934 | 10976.8981 |
08/31/2017 | 10361.2587 | 10635.349 | 11069.4177 |
09/30/2017 | 10308.9678 | 10584.3109 | 11027.4598 |
10/31/2017 | 10298.691 | 10581.0598 | 11047.8085 |
11/30/2017 | 10217.6789 | 10488.0688 | 11000.3481 |
12/31/2017 | 10258.0473 | 10535.2323 | 11110.0751 |
01/31/2018 | 10212.1992 | 10494.8828 | 10993.045 |
02/28/2018 | 10189.8631 | 10474.2182 | 10946.205 |
03/31/2018 | 10187.4125 | 10475.3761 | 10982.8206 |
04/30/2018 | 10157.3505 | 10443.1321 | 10940.1224 |
05/31/2018 | 10219.598 | 10529.888 | 11068.6574 |
06/30/2018 | 10232.449 | 10554.65 | 11080.8826 |
07/31/2018 | 10258.8626 | 10595.7566 | 11107.1138 |
08/31/2018 | 10256.9724 | 10601.3236 | 11124.0611 |
09/30/2018 | 10211.9229 | 10553.8929 | 11053.4109 |
10/31/2018 | 10188.3262 | 10524.6328 | 10973.8968 |
11/30/2018 | 10252.5039 | 10616.4213 | 11094.9286 |
12/31/2018 | 10316.2042 | 10713.0196 | 11225.6846 |
01/31/2019 | 10379.6893 | 10805.1198 | 11309.9006 |
02/28/2019 | 10416.9216 | 10853.9757 | 11374.1081 |
03/31/2019 | 10474.0487 | 10937.3469 | 11556.5862 |
04/30/2019 | 10473.7493 | 10949.2825 | 11604.8669 |
05/31/2019 | 10552.752 | 11066.0111 | 11776.3203 |
06/30/2019 | 10588.7264 | 11111.3932 | 11826.3817 |
07/31/2019 | 10646.131 | 11194.319 | 11920.3619 |
08/31/2019 | 10696.0046 | 11268.4267 | 12108.5024 |
09/30/2019 | 10636.3274 | 11192.2704 | 12018.0237 |
10/31/2019 | 10656.1923 | 11224.8261 | 12032.5099 |
11/30/2019 | 10669.6535 | 11243.7093 | 12055.2997 |
12/31/2019 | 10689.69 | 11278.67 | 12094.0362 |
01/31/2020 | 10782.9543 | 11411.0752 | 12310.4889 |
02/29/2020 | 10826.0277 | 11478.9924 | 12480.4216 |
03/31/2020 | 10647.3625 | 11208.2587 | 12011.9411 |
04/30/2020 | 10601.2773 | 11168.7109 | 11828.8427 |
05/31/2020 | 10813.4174 | 11448.9307 | 12213.0072 |
06/30/2020 | 10848.1003 | 11498.7218 | 12331.8981 |
07/31/2020 | 10933.6782 | 11617.7663 | 12529.0824 |
08/31/2020 | 10914.7441 | 11604.8954 | 12486.8844 |
09/30/2020 | 10918.4748 | 11606.3651 | 12478.7409 |
10/31/2020 | 10905.9628 | 11585.9676 | 12453.9903 |
11/30/2020 | 10953.4673 | 11664.3953 | 12644.4318 |
12/31/2020 | 10970.1688 | 11708.3968 | 12730.2285 |
01/31/2021 | 10993.8421 | 11755.4267 | 12814.1645 |
02/28/2021 | 10914.8374 | 11644.3096 | 12608.4364 |
03/31/2021 | 10930.6988 | 11679.6266 | 12685.0892 |
04/30/2021 | 10962.3907 | 11734.3612 | 12805.5408 |
05/31/2021 | 10963.2456 | 11746.5195 | 12861.4247 |
06/30/2021 | 10956.9788 | 11755.8721 | 12903.5827 |
07/31/2021 | 11002.8678 | 11818.8903 | 13000.3241 |
08/31/2021 | 10988.9914 | 11802.1003 | 12952.2436 |
09/30/2021 | 10930.178 | 11744.9162 | 12854.4017 |
10/31/2021 | 10901.0942 | 11724.6079 | 12840.0155 |
11/30/2021 | 10918.0701 | 11758.8114 | 12944.6803 |
12/31/2021 | 10926.5902 | 11765.1355 | 12962.708 |
01/31/2022 | 10709.2356 | 11516.7143 | 12614.479 |
02/28/2022 | 10674.7911 | 11477.4782 | 12543.3886 |
03/31/2022 | 10449.454 | 11243.0413 | 12161.105 |
04/30/2022 | 10279.7205 | 11063.3835 | 11801.7111 |
05/31/2022 | 10382.6957 | 11210.4855 | 11990.3119 |
06/30/2022 | 10335.1556 | 11159.1802 | 11760.3534 |
07/31/2022 | 10477.2835 | 11355.0045 | 12081.5509 |
08/31/2022 | 10339.1497 | 11175.5694 | 11774.1193 |
09/30/2022 | 10118.1781 | 10912.5404 | 11336.1319 |
10/31/2022 | 10095.813 | 10893.5681 | 11235.8489 |
11/30/2022 | 10318.9005 | 11188.4403 | 11804.6324 |
12/31/2022 | 10343.8234 | 11222.5102 | 11792.3671 |
01/31/2023 | 10506.2149 | 11436.9951 | 12154.9223 |
02/28/2023 | 10357.1828 | 11232.0409 | 11859.776 |
03/31/2023 | 10490.8202 | 11425.1485 | 12125.9499 |
04/30/2023 | 10463.7184 | 11387.1594 | 12111.7038 |
05/31/2023 | 10390.394 | 11297.3305 | 12018.8841 |
06/30/2023 | 10449.297 | 11365.8713 | 12128.6911 |
07/31/2023 | 10484.8546 | 11388.0947 | 12159.4442 |
08/31/2023 | 10428.0915 | 11332.8702 | 12012.0412 |
09/30/2023 | 10286.5609 | 11153.6577 | 11671.6555 |
10/31/2023 | 10261.8129 | 11126.4908 | 11525.4929 |
11/30/2023 | 10604.815 | 11522.2813 | 12262.5884 |
12/31/2023 | 10752.7893 | 11703.5424 | 12561.5363 |
01/31/2024 | 10729.0967 | 11680.6955 | 12533.8245 |
02/29/2024 | 10737.8854 | 11690.627 | 12535.4652 |
03/31/2024 | 10737.8953 | 11680.3837 | 12522.8598 |
04/30/2024 | 10667.4873 | 11593.6278 | 12382.8399 |
05/31/2024 | 10620.5988 | 11540.6301 | 12356.9688 |
06/30/2024 | 10717.2789 | 11666.8448 | 12555.7339 |
07/31/2024 | 10814.4058 | 11771.5932 | 12664.2203 |
08/31/2024 | 10911.8314 | 11895.1358 | 12763.903 |
09/30/2024 | 10977.9757 | 11981.8917 | 12899.3409 |
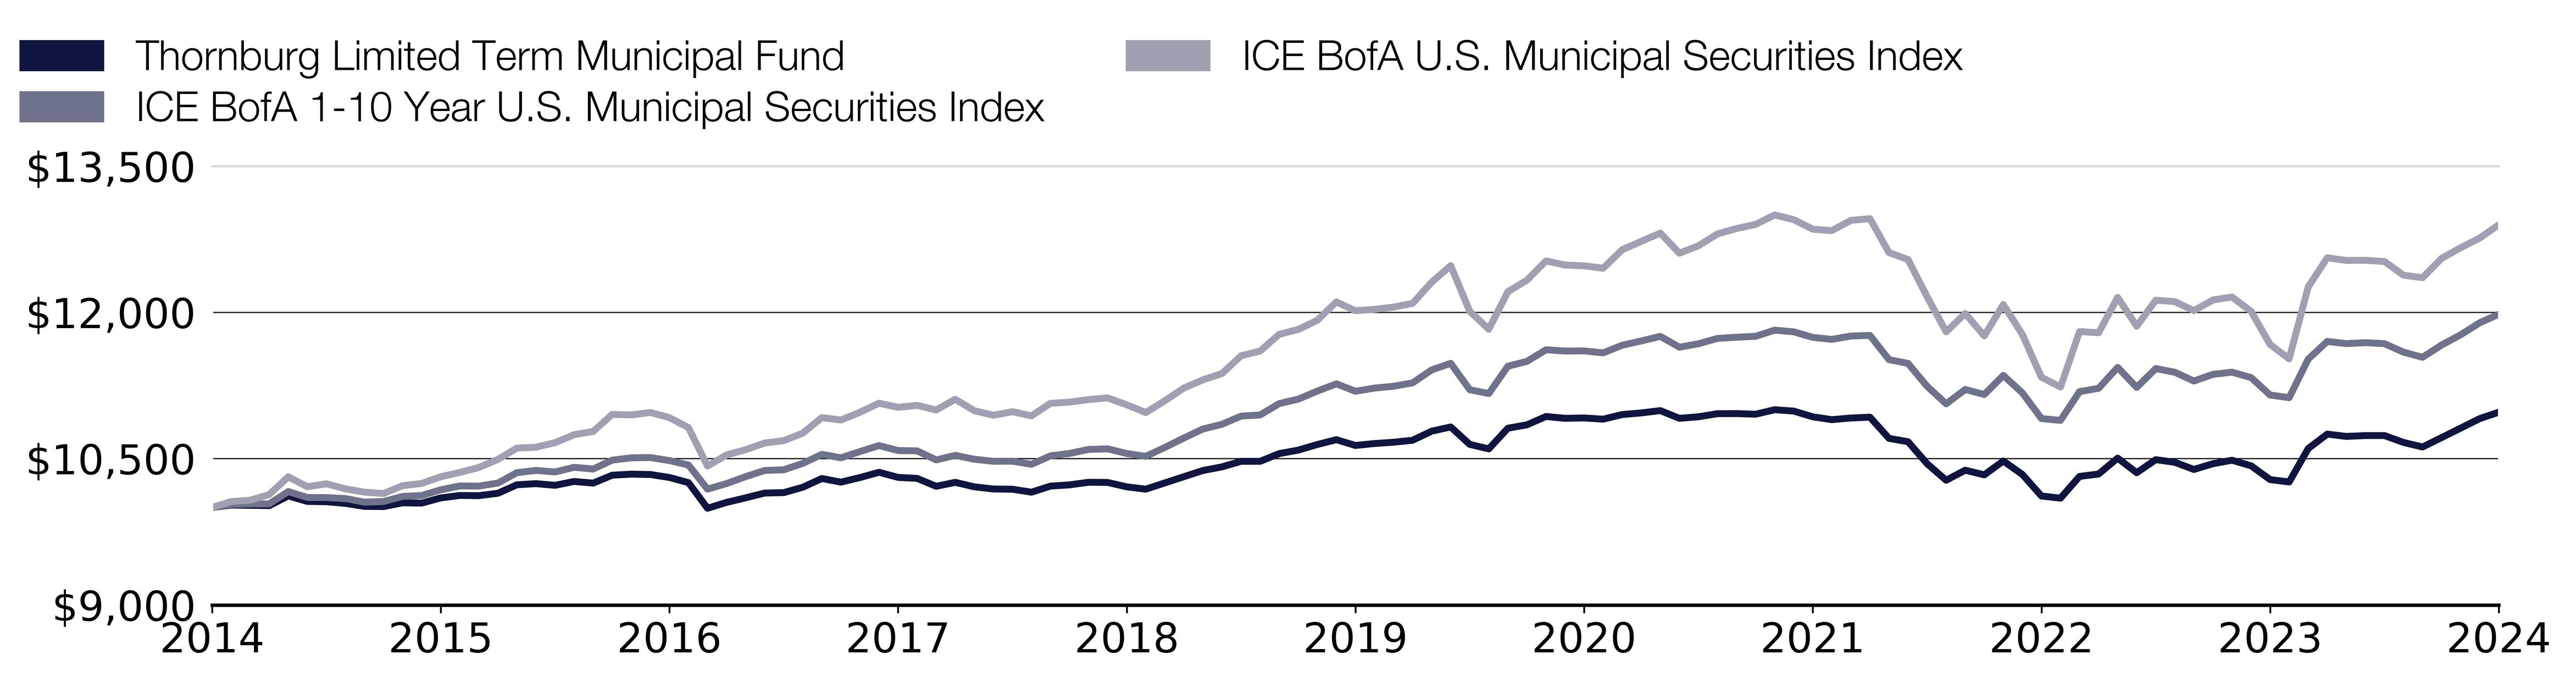
Effective September 30, 2024, the Fund adopted the ICE BofA U.S. Municipal Securities Index as its broad-based securities market index that represents the overall applicable market in which the Fund invests, and the ICE BofA 1-10 Year U.S. Municipal Securities Index as an additional index that represents the market sectors which the Fund’s advisor believes are more representative of the Fund’s investment universe
What were the Fund costs for the past year?
(based on a hypothetical $10,000 investment)
Class Name | Costs of a $10,000 investment | Costs paid as a percentage of a $10,000 investment |
|---|
Class C | $107.00 | 1.04% |
End Block
Thornburg Limited Term Municipal Fund Tailored Shareholder Report
Thornburg Limited Term Municipal Fund Tailored Shareholder Report | |
Annual Performance | 1 Year | 5 Year | 10 Year |
|---|
Limited Term Municipal Fund Class C (with sales charge) | 6.22% | 0.63% | 0.94% |
Limited Term Municipal Fund Class C (without sales charge) | 6.72% | 0.63% | 0.94% |
ICE BofA 1-10 Year U.S. Municipal Securities Index | 7.43% | 1.37% | 1.82% |
ICE BofA U.S. Municipal Securities Index | 10.52% | 1.43% | 2.58% |
Key Fund Statistics
(as of September 30, 2024)
| |
|---|
Fund Size (Millions) | $2,492.9M |
Number of Holdings | 801 |
Annual Portfolio Turnover | 39.61% |
Total Advisory Fee | $8.7M |
What did the Fund invest in?
(as of September 30, 2024)
Credit Quality Ratings | (%) |
|---|
| AAA | 12.9 |
| AA | 36.0 |
| A | 42.6 |
| BBB | 4.7 |
| NR | 1.4 |
| Below Invest. Grade | 0.0 |
| Cash & Cash Equivalent | 2.3 |
Credit Quality Ratings | (%) |
AAA | 12.9% |
AA | 36.0% |
A | 42.6% |
BBB | 4.7% |
NR | 1.4% |
Below Invest. Grade | 0.0% |
Cash & Cash Equivalent | 2.3% |
Expressed as a percentage of the Fund’s net assets. * Credit quality ratings shown above reflect the highest rating assigned by either S&P Global Ratings or Moody’s Investors Services, both of which are independent, nationally recognized statistical rating organizations. If a credit rating for an investment is not available from either S&P or Moody’s, then the Fund’s investment advisor will determine the credit quality of the investment. Investments are considered to be investment grade if they are rated within the four highest grades by S&P or Moody’s (BBB/Baa or higher) or, if no credit rating is available, have been judged to be of comparable quality by the Fund’s investment advisor. (NR = Not Rated)
How has the Fund changed?
This is a summary of certain changes to the Fund since October 1, 2023. For more complete information, you may review the Fund’s next prospectus, which we expect to be available by February 1, 2025 at https://www.thornburg.com/download or upon request by calling 1-800-847-0200.
End Block
Changes In and Disagreements with Accountants
No changes and/or disagreements occurred in the current reporting period
End Block
For additional information about the Fund, including its prospectus, financial information, holdings and proxy information, visit www.thornburg.com/download.

Thornburg Limited Term Municipal Fund Tailored Shareholder Report | |
Thornburg Limited Term Municipal Fund Tailored Shareholder Report
Thornburg Limited Term Municipal Fund CLASS: C2 TICKER: LTMQX Annual Shareholder Report | |
This annual shareholder report contains important information about the Thornburg Limited Term Municipal Fund Class C2 Shares for the period from October 1, 2023 to September 30, 2024. You can find additional information about the Fund at https://www.thornburg.com/download. You can also request this information by contacting us at 1-800-847-0200. This report also describes changes to the Fund that occurred during the reporting period.
How did the Fund perform last year and what affected its performance?
The Fund’s Class C2 shares underperformed the ICE BofA 1-10 Year U.S. Municipal Securities Index (the “Index”) during the 12-month period ended September 30, 2024. The period began with municipal bond yields peaking in October of 2023, which marked the end of the Federal Reserve rate hiking cycle, before falling precipitously throughout the period and ending significantly lower. The backdrop of falling municipal bond yields boosted bond prices due to the inverse relationship between the two, producing strong absolute returns for the asset class. However, the Fund’s underperformance during the period was driven by its shorter duration and yield curve positioning compared to the Index. The Fund’s relative performance benefited from active management with respect to its sector/quality returns thanks to the Fund’s higher weighting to revenue bonds and A-rated bonds. Specifically, within the revenue sector, hospital and other utility bonds were large contributors to relative performance during the period.
How did the Fund perform over the past 10 years?
The line graph below reflects a hypothetical $10,000 investment. The returns shown in the line graph and table assume the reinvestment of dividends and capital gains, but do not reflect the deduction of taxes that a shareholder would pay on distributions or the redemption of Fund shares. The performance information shown below represents past performance and is no guarantee of future results. For Fund performance current to the most recent month end, call 1-800-847-0200. Performance for other share classes of the Fund will vary.
Cumulative Performance
Growth Table
Date | Thornburg Limited Term Municipal Fund | ICE BofA 1-10 Year U.S. Municipal Securities Index | ICE BofA U.S. Municipal Securities Index |
09/30/2020 | 9999.9965 | 10000 | 10000 |
10/31/2020 | 9985.7504 | 9982.4256 | 9980.1658 |
11/30/2020 | 10026.9685 | 10049.9987 | 10132.7786 |
12/31/2020 | 10046.8179 | 10087.9101 | 10201.5329 |
01/31/2021 | 10059.0069 | 10128.4309 | 10268.796 |
02/28/2021 | 9984.5352 | 10032.6929 | 10103.9332 |
03/31/2021 | 10003.7446 | 10063.1219 | 10165.3599 |
04/30/2021 | 10030.2886 | 10110.281 | 10261.8853 |
05/31/2021 | 10021.7468 | 10120.7565 | 10306.6686 |
06/30/2021 | 10020.5753 | 10128.8147 | 10340.4525 |
07/31/2021 | 10059.78 | 10183.111 | 10417.9775 |
08/31/2021 | 10037.5072 | 10168.6447 | 10379.4475 |
09/30/2021 | 9988.791 | 10119.3752 | 10301.0406 |
10/31/2021 | 9953.1031 | 10101.8775 | 10289.5121 |
11/30/2021 | 9973.3175 | 10131.3472 | 10373.3866 |
12/31/2021 | 9972.018 | 10136.796 | 10387.8333 |
01/31/2022 | 9771.1205 | 9922.7573 | 10108.7755 |
02/28/2022 | 9737.4776 | 9888.9516 | 10051.8062 |
03/31/2022 | 9529.6086 | 9686.9616 | 9745.4583 |
04/30/2022 | 9372.8753 | 9532.1691 | 9457.4535 |
05/31/2022 | 9464.8231 | 9658.9117 | 9608.5911 |
06/30/2022 | 9419.6465 | 9614.7072 | 9424.3109 |
07/31/2022 | 9546.9825 | 9783.4287 | 9681.7067 |
08/31/2022 | 9418.8757 | 9628.8281 | 9435.3424 |
09/30/2022 | 9215.5763 | 9402.2033 | 9084.3555 |
10/31/2022 | 9193.0243 | 9385.8569 | 9003.9925 |
11/30/2022 | 9394.1775 | 9639.9176 | 9459.7944 |
12/31/2022 | 9414.5921 | 9669.2721 | 9449.9655 |
01/31/2023 | 9560.3943 | 9854.0715 | 9740.5038 |
02/28/2023 | 9422.9918 | 9677.4837 | 9503.9845 |
03/31/2023 | 9549.6232 | 9843.8645 | 9717.2864 |
04/30/2023 | 9515.759 | 9811.1332 | 9705.8701 |
05/31/2023 | 9453.8733 | 9733.737 | 9631.4878 |
06/30/2023 | 9498.2895 | 9792.7914 | 9719.4831 |
07/31/2023 | 9528.4228 | 9811.9391 | 9744.1275 |
08/31/2023 | 9481.768 | 9764.3578 | 9626.0041 |
09/30/2023 | 9344.0803 | 9609.9491 | 9353.2317 |
10/31/2023 | 9319.9705 | 9586.5422 | 9236.1024 |
11/30/2023 | 9629.9188 | 9927.5537 | 9826.7834 |
12/31/2023 | 9762.6306 | 10083.7276 | 10066.3492 |
01/31/2024 | 9739.539 | 10064.0428 | 10044.1419 |
02/29/2024 | 9746.0937 | 10072.5997 | 10045.4567 |
03/31/2024 | 9744.6103 | 10063.7742 | 10035.3552 |
04/30/2024 | 9679.1155 | 9989.0256 | 9923.1485 |
05/31/2024 | 9634.9618 | 9943.363 | 9902.4163 |
06/30/2024 | 9721.1503 | 10052.1091 | 10061.6993 |
07/31/2024 | 9807.4081 | 10142.36 | 10148.6363 |
08/31/2024 | 9893.9496 | 10248.8038 | 10228.5183 |
09/30/2024 | 9952.1313 | 10323.5523 | 10337.0532 |

Effective September 30, 2024, the Fund adopted the ICE BofA U.S. Municipal Securities Index as its broad-based securities market index that represents the overall applicable market in which the Fund invests, and the ICE BofA 1-10 Year U.S. Municipal Securities Index as an additional index that represents the market sectors which the Fund’s advisor believes are more representative of the Fund’s investment universe
What were the Fund costs for the past year?
(based on a hypothetical $10,000 investment)
Class Name | Costs of a $10,000 investment | Costs paid as a percentage of a $10,000 investment |
|---|
Class C2 | $128.00 | 1.24% |
End Block
Thornburg Limited Term Municipal Fund Tailored Shareholder Report
Thornburg Limited Term Municipal Fund Tailored Shareholder Report | |
Annual Performance | 1 Year |
|---|
Limited Term Municipal Fund Class C2 (with sales charge) | 5.86% |
Limited Term Municipal Fund Class C2 (without sales charge) | 6.51% |
ICE BofA 1-10 Year U.S. Municipal Securities Index | 7.43% |
ICE BofA U.S. Municipal Securities Index | 10.52% |
Key Fund Statistics
(as of September 30, 2024)
| |
|---|
Fund Size (Millions) | $2,492.9M |
Number of Holdings | 801 |
Annual Portfolio Turnover | 39.61% |
Total Advisory Fee | $8.7M |
What did the Fund invest in?
(as of September 30, 2024)
Credit Quality Ratings | (%) |
|---|
| AAA | 12.9 |
| AA | 36.0 |
| A | 42.6 |
| BBB | 4.7 |
| NR | 1.4 |
| Below Invest. Grade | 0.0 |
| Cash & Cash Equivalent | 2.3 |
Credit Quality Ratings | (%) |
AAA | 12.9% |
AA | 36.0% |
A | 42.6% |
BBB | 4.7% |
NR | 1.4% |
Below Invest. Grade | 0.0% |
Cash & Cash Equivalent | 2.3% |
Expressed as a percentage of the Fund’s net assets. * Credit quality ratings shown above reflect the highest rating assigned by either S&P Global Ratings or Moody’s Investors Services, both of which are independent, nationally recognized statistical rating organizations. If a credit rating for an investment is not available from either S&P or Moody’s, then the Fund’s investment advisor will determine the credit quality of the investment. Investments are considered to be investment grade if they are rated within the four highest grades by S&P or Moody’s (BBB/Baa or higher) or, if no credit rating is available, have been judged to be of comparable quality by the Fund’s investment advisor. (NR = Not Rated)
How has the Fund changed?
This is a summary of certain changes to the Fund since October 1, 2023. For more complete information, you may review the Fund’s next prospectus, which we expect to be available by February 1, 2025 at https://www.thornburg.com/download or upon request by calling 1-800-847-0200.
End Block
Changes In and Disagreements with Accountants
No changes and/or disagreements occurred in the current reporting period
End Block
For additional information about the Fund, including its prospectus, financial information, holdings and proxy information, visit www.thornburg.com/download.
Thornburg Limited Term Municipal Fund Tailored Shareholder Report | |
Thornburg Limited Term Municipal Fund Tailored Shareholder Report
Thornburg Limited Term Municipal Fund CLASS: I TICKER: LTMIX Annual Shareholder Report | |
This annual shareholder report contains important information about the Thornburg Limited Term Municipal Fund Class I Shares for the period from October 1, 2023 to September 30, 2024. You can find additional information about the Fund at https://www.thornburg.com/download. You can also request this information by contacting us at 1-800-847-0200. This report also describes changes to the Fund that occurred during the reporting period.
How did the Fund perform last year and what affected its performance?
The Fund’s Class I shares underperformed the ICE BofA 1-10 Year U.S. Municipal Securities Index (the “Index”) during the 12-month period ended September 30, 2024. The period began with municipal bond yields peaking in October of 2023, which marked the end of the Federal Reserve rate hiking cycle, before falling precipitously throughout the period and ending significantly lower. The backdrop of falling municipal bond yields boosted bond prices due to the inverse relationship between the two, producing strong absolute returns for the asset class. However, the Fund’s underperformance during the period was driven by its shorter duration and yield curve positioning compared to the Index. The Fund’s relative performance benefited from active management with respect to its sector/quality returns thanks to the Fund’s higher weighting to revenue bonds and A-rated bonds. Specifically, within the revenue sector, hospital and other utility bonds were large contributors to relative performance during the period.
How did the Fund perform over the past 10 years?
The line graph below reflects a hypothetical $10,000 investment. The returns shown in the line graph and table assume the reinvestment of dividends and capital gains, but do not reflect the deduction of taxes that a shareholder would pay on distributions or the redemption of Fund shares. The performance information shown below represents past performance and is no guarantee of future results. For Fund performance current to the most recent month end, visit https://www.thornburg.com/product/mutual-funds/flm/LTMIX or call 1-800-847-0200. Performance for other share classes of the Fund will vary.
Cumulative Performance
Growth Table
Date | Thornburg Limited Term Municipal Fund | ICE BofA 1-10 Year U.S. Municipal Securities Index | ICE BofA U.S. Municipal Securities Index |
09/30/2014 | 9999.9992 | 10000 | 10000 |
10/31/2014 | 10029.7912 | 10031.0861 | 10061.0061 |
11/30/2014 | 10032.1627 | 10036.9203 | 10074.732 |
12/31/2014 | 10027.1034 | 10037.6328 | 10133.237 |
01/31/2015 | 10138.8323 | 10163.3576 |
02/28/2015 | 10079.2415 | 10102.8334 | 10213.0312 |
03/31/2015 | 10080.4413 | 10101.9427 | 10243.2441 |
04/30/2015 | 10068.139 | 10091.7885 | 10191.582 |
05/31/2015 | 10041.7181 | 10054.6901 | 10157.4674 |
06/30/2015 | 10044.0597 | 10061.5931 | 10143.7215 |
07/31/2015 | 10087.463 | 10113.7892 | 10223.9759 |
08/31/2015 | 10096.1531 | 10123.0972 | 10246.5455 |
09/30/2015 | 10154.1888 | 10181.2611 | 10315.6951 |
10/31/2015 | 10184.1416 | 10221.0316 | 10359.774 |
11/30/2015 | 10186.5326 | 10219.8737 | 10410.5357 |
12/31/2015 | 10216.297 | 10250.3808 | 10493.2511 |
01/31/2016 | 10301.88 | 10357.5787 | 10609.5409 |
02/29/2016 | 10318.0829 | 10380.4701 | 10618.4247 |
03/31/2016 | 10305.4265 | 10364.6599 | 10665.2047 |
04/30/2016 | 10350.0931 | 10412.4469 | 10746.9397 |
05/31/2016 | 10337.6854 | 10394.6771 | 10780.454 |
06/30/2016 | 10431.7549 | 10485.9311 | 10955.589 |
07/31/2016 | 10440.0842 | 10509.4015 | 10949.7465 |
08/31/2016 | 10441.3729 | 10512.5636 | 10974.9373 |
09/30/2016 | 10422.1135 | 10481.3439 | 10921.9146 |
10/31/2016 | 10366.5983 | 10435.7837 | 10819.6708 |
11/30/2016 | 10111.5994 | 10188.5204 | 10425.262 |
12/31/2016 | 10170.4568 | 10245.66 | 10539.3308 |
01/31/2017 | 10222.6427 | 10316.8283 | 10592.9738 |
02/28/2017 | 10276.3614 | 10379.8912 | 10661.5031 |
03/31/2017 | 10285.7275 | 10387.2396 | 10685.8535 |
04/30/2017 | 10353.4418 | 10452.3956 | 10762.9465 |
05/31/2017 | 10442.252 | 10545.3865 | 10922.1347 |
06/30/2017 | 10416.1716 | 10509.8914 | 10897.224 |
07/31/2017 | 10461.6654 | 10573.934 | 10976.8981 |
08/31/2017 | 10521.555 | 10635.349 | 11069.4177 |
09/30/2017 | 10472.8467 | 10584.3109 | 11027.4598 |
10/31/2017 | 10474.5569 | 10581.0598 | 11047.8085 |
11/30/2017 | 10396.8253 | 10488.0688 | 11000.3481 |
12/31/2017 | 10435.6391 | 10535.2323 | 11110.0751 |
01/31/2018 | 10401.1666 | 10494.8828 | 10993.045 |
02/28/2018 | 10382.2696 | 10474.2182 | 10946.205 |
03/31/2018 | 10384.0594 | 10475.3761 | 10982.8206 |
04/30/2018 | 10350.2178 | 10443.1321 | 10940.1224 |
05/31/2018 | 10418.0957 | 10529.888 | 11068.6574 |
06/30/2018 | 10442.8043 | 10554.65 | 11080.8826 |
07/31/2018 | 10466.842 | 10595.7566 | 11107.1138 |
08/31/2018 | 10469.3203 | 10601.3236 | 11124.0611 |
09/30/2018 | 10434.8742 | 10553.8929 | 11053.4109 |
10/31/2018 | 10415.0823 | 10524.6328 | 10973.8968 |
11/30/2018 | 10477.5921 | 10616.4213 | 11094.9286 |
12/31/2018 | 10554.6497 | 10713.0196 | 11225.6846 |
01/31/2019 | 10624.085 | 10805.1198 | 11309.9006 |
02/28/2019 | 10658.8062 | 10853.9757 | 11374.1081 |
03/31/2019 | 10721.8746 | 10937.3469 | 11556.5862 |
04/30/2019 | 10733.213 | 10949.2825 | 11604.8669 |
05/31/2019 | 10818.6194 | 11066.0111 | 11776.3203 |
06/30/2019 | 10852.2809 | 11111.3932 | 11826.3817 |
07/31/2019 | 10923.186 | 11194.319 | 11920.3619 |
08/31/2019 | 10978.9243 | 11268.4267 | 12108.5024 |
09/30/2019 | 10921.9127 | 11192.2704 | 12018.0237 |
10/31/2019 | 10946.9891 | 11224.8261 | 12032.5099 |
11/30/2019 | 10957.7591 | 11243.7093 | 12055.2997 |
12/31/2019 | 10983.0628 | 11278.67 | 12094.0362 |
01/31/2020 | 11083.6723 | 11411.0752 | 12310.4889 |
02/29/2020 | 11139.9403 | 11478.9924 | 12480.4216 |
03/31/2020 | 10960.387 | 11208.2587 | 12011.9411 |
04/30/2020 | 10917.1313 | 11168.7109 | 11828.8427 |
05/31/2020 | 11140.3365 | 11448.9307 | 12213.0072 |
06/30/2020 | 11180.4483 | 11498.7218 | 12331.8981 |
07/31/2020 | 11265.4026 | 11617.7663 | 12529.0824 |
08/31/2020 | 11257.8804 | 11604.8954 | 12486.8844 |
09/30/2020 | 11265.9485 | 11606.3651 | 12478.7409 |
10/31/2020 | 11250.2198 | 11585.9676 | 12453.9903 |
11/30/2020 | 11304.2623 | 11664.3953 | 12644.4318 |
12/31/2020 | 11334.2914 | 11708.3968 | 12730.2285 |
01/31/2021 | 11363.8021 | 11755.4267 | 12814.1645 |
02/28/2021 | 11278.8458 | 11644.3096 | 12608.4364 |
03/31/2021 | 11308.073 | 11679.6266 | 12685.0892 |
04/30/2021 | 11345.4832 | 11734.3612 | 12805.5408 |
05/31/2021 | 11351.1204 | 11746.5195 | 12861.4247 |
06/30/2021 | 11349.2907 | 11755.8721 | 12903.5827 |
07/31/2021 | 11401.2175 | 11818.8903 | 13000.3241 |
08/31/2021 | 11391.1244 | 11802.1003 | 12952.2436 |
09/30/2021 | 11335.0379 | 11744.9162 | 12854.4017 |
10/31/2021 | 11302.0242 | 11724.6079 | 12840.0155 |
11/30/2021 | 11332.3397 | 11758.8114 | 12944.6803 |
12/31/2021 | 11338.4186 | 11765.1355 | 12962.708 |
01/31/2022 | 11116.9027 | 11516.7143 | 12614.479 |
02/28/2022 | 11092.9293 | 11477.4782 | 12543.3886 |
03/31/2022 | 10854.9778 | 11243.0413 | 12161.105 |
04/30/2022 | 10690.2701 | 11063.3835 | 11801.7111 |
05/31/2022 | 10801.687 | 11210.4855 | 11990.3119 |
06/30/2022 | 10748.2902 | 11159.1802 | 11760.3534 |
07/31/2022 | 10900.9197 | 11355.0045 | 12081.5509 |
08/31/2022 | 10761.4058 | 11175.5694 | 11774.1193 |
09/30/2022 | 10543.1453 | 10912.5404 | 11336.1319 |
10/31/2022 | 10524.0239 | 10893.5681 | 11235.8489 |
11/30/2022 | 10761.084 | 11188.4403 | 11804.6324 |
12/31/2022 | 10791.3255 | 11222.5102 | 11792.3671 |
01/31/2023 | 10957.2432 | 11436.9951 | 12154.9223 |
02/28/2023 | 10813.3467 | 11232.0409 | 11859.776 |
03/31/2023 | 10957.3429 | 11425.1485 | 12125.9499 |
04/30/2023 | 10932.953 | 11387.1594 | 12111.7038 |
05/31/2023 | 10860.2769 | 11297.3305 | 12018.8841 |
06/30/2023 | 10925.85 | 11365.8713 | 12128.6911 |
07/31/2023 | 10959.4379 | 11388.0947 | 12159.4442 |
08/31/2023 | 10912.558 | 11332.8702 | 12012.0412 |
09/30/2023 | 10768.593 | 11153.6577 | 11671.6555 |
10/31/2023 | 10747.4827 | 11126.4908 | 11525.4929 |
11/30/2023 | 11112.0207 | 11522.2813 | 12262.5884 |
12/31/2023 | 11272.3874 | 11703.5424 | 12561.5363 |
01/31/2024 | 11252.5772 | 11680.6955 | 12533.8245 |
02/29/2024 | 11266.573 | 11690.627 | 12535.4652 |
03/31/2024 | 11271.7227 | 11680.3837 | 12522.8598 |
04/30/2024 | 11194.1705 | 11593.6278 | 12382.8399 |
05/31/2024 | 11158.1172 | 11540.6301 | 12356.9688 |
06/30/2024 | 11256.3288 | 11666.8448 | 12555.7339 |
07/31/2024 | 11371.9313 | 11771.5932 | 12664.2203 |
08/31/2024 | 11479.6227 | 11895.1358 | 12763.903 |
09/30/2024 | 11545.8311 | 11981.8917 | 12899.3409 |

Effective September 30, 2024, the Fund adopted the ICE BofA U.S. Municipal Securities Index as its broad-based securities market index that represents the overall applicable market in which the Fund invests, and the ICE BofA 1-10 Year U.S. Municipal Securities Index as an additional index that represents the market sectors which the Fund’s advisor believes are more representative of the Fund’s investment universe
What were the Fund costs for the past year?
(based on a hypothetical $10,000 investment)
Class Name | Costs of a $10,000 investment | Costs paid as a percentage of a $10,000 investment |
|---|
Class I | $52.00 | 0.51% |
End Block
Thornburg Limited Term Municipal Fund Tailored Shareholder Report
Thornburg Limited Term Municipal Fund Tailored Shareholder Report | |
Annual Performance | 1 Year | 5 Year | 10 Year |
|---|
Limited Term Municipal Fund Class I | 7.22% | 1.12% | 1.45% |
ICE BofA 1-10 Year U.S. Municipal Securities Index | 7.43% | 1.37% | 1.82% |
ICE BofA U.S. Municipal Securities Index | 10.52% | 1.43% | 2.58% |
Key Fund Statistics
(as of September 30, 2024)
| |
|---|
Fund Size (Millions) | $2,492.9M |
Number of Holdings | 801 |
Annual Portfolio Turnover | 39.61% |
Total Advisory Fee | $8.7M |
What did the Fund invest in?
(as of September 30, 2024)
Credit Quality Ratings | (%) |
|---|
| AAA | 12.9 |
| AA | 36.0 |
| A | 42.6 |
| BBB | 4.7 |
| NR | 1.4 |
| Below Invest. Grade | 0.0 |
| Cash & Cash Equivalent | 2.3 |
Credit Quality Ratings | (%) |
AAA | 12.9% |
AA | 36.0% |
A | 42.6% |
BBB | 4.7% |
NR | 1.4% |
Below Invest. Grade | 0.0% |
Cash & Cash Equivalent | 2.3% |
Expressed as a percentage of the Fund’s net assets. * Credit quality ratings shown above reflect the highest rating assigned by either S&P Global Ratings or Moody’s Investors Services, both of which are independent, nationally recognized statistical rating organizations. If a credit rating for an investment is not available from either S&P or Moody’s, then the Fund’s investment advisor will determine the credit quality of the investment. Investments are considered to be investment grade if they are rated within the four highest grades by S&P or Moody’s (BBB/Baa or higher) or, if no credit rating is available, have been judged to be of comparable quality by the Fund’s investment advisor. (NR = Not Rated)
How has the Fund changed?
This is a summary of certain changes to the Fund since October 1, 2023. For more complete information, you may review the Fund’s next prospectus, which we expect to be available by February 1, 2025 at https://www.thornburg.com/download or upon request by calling 1-800-847-0200.
End Block
Changes In and Disagreements with Accountants
No changes and/or disagreements occurred in the current reporting period
End Block
For additional information about the Fund, including its prospectus, financial information, holdings and proxy information, visit www.thornburg.com/download.

Thornburg Limited Term Municipal Fund Tailored Shareholder Report | |
Thornburg Intermediate Municipal Fund Tailored Shareholder Report
Thornburg Intermediate Municipal Fund CLASS: A TICKER: THIMX Annual Shareholder Report | |
This annual shareholder report contains important information about the Thornburg Intermediate Municipal Fund Class A Shares for the period from October 1, 2023 to September 30, 2024. You can find additional information about the Fund at https://www.thornburg.com/download. You can also request this information by contacting us at 1-800-847-0200. This report also describes changes to the Fund that occurred during the reporting period.
How did the Fund perform last year and what affected its performance?
The Fund’s Class A shares performed in-line with the ICE BofA 3-15 Year U.S. Municipal Securities Index (the “Index”) during the 12-month period ended September 30, 2024. The period began with municipal bond yields peaking in October of 2023, which marked the end of the Federal Reserve rate hiking cycle, before falling precipitously throughout the period and ending significantly lower. The backdrop of falling municipal bond yields boosted bond prices due to the inverse relationship between the two, which produced strong absolute returns for the asset class. However, the Fund’s relative performance was hampered during the period by individual bond selection. The Fund’s relative performance benefited from active management due to its longer duration and sector/quality returns from its higher weighting to revenue and A-rated bonds. Specifically, within the revenue sector and other utilities bonds were a large contributor to relative performance during the period.
How did the Fund perform over the past 10 years?
The line graph below reflects a hypothetical $10,000 investment and assumes the deduction of the maximum sales charge associated with that investment. The returns shown in the line graph and table assume the reinvestment of dividends and capital gains, but do not reflect the deduction of taxes that a shareholder would pay on distributions or the redemption of Fund shares. The performance information shown below represents past performance and is no guarantee of future results. For Fund performance current to the most recent month end, visit https://www.thornburg.com/product/mutual-funds/fim/THIMX or call 1-800-847-0200. Performance for other share classes of the Fund will vary.
Cumulative Performance
Growth Table
Date | Thornburg Intermediate Municipal Fund | ICE BofA 3-15 Year U.S. Municipal Securities Index | ICE BofA U.S. Municipal Securities Index |
09/30/2014 | 9800.2721 | 10000 | 10000 |
10/31/2014 | 9852.3432 | 10047.8828 | 10061.0061 |
11/30/2014 | 9849.486 | 10053.6678 | 10074.732 |
12/31/2014 | 9887.3292 | 10084.4301 | 10133.237 |
01/31/2015 | 10015.0353 | 10254.7365 | 10315.1349 |
02/28/2015 | 9922.4152 | 10156.2738 | 10213.0312 |
03/31/2015 | 9939.1942 | 10171.2054 | 10243.2441 |
04/30/2015 | 9893.793 | 10142.593 | 10191.582 |
05/31/2015 | 9861.7469 | 10095.8047 | 10157.4674 |
06/30/2015 | 9850.6496 | 10091.6614 | 10143.7215 |
07/31/2015 | 9902.417 | 10164.9514 | 10223.9759 |
08/31/2015 | 9912 | 10178.2804 | 10246.5455 |
09/30/2015 | 9964.8966 | 10260.1697 | 10315.6951 |
10/31/2015 | 10004.0562 | 10309.2642 | 10359.774 |
11/30/2015 | 10029.4038 | 10336.704 | 10410.5357 |
12/31/2015 | 10095.9457 | 10403.1536 | 10493.2511 |
01/31/2016 | 10189.7892 | 10545.9421 | 10609.5409 |
02/29/2016 | 10192.0231 | 10558.2157 | 10618.4247 |
03/31/2016 | 10215.3363 | 10572.4828 | 10665.2047 |
04/30/2016 | 10274.912 | 10641.3168 | 10746.9397 |
05/31/2016 | 10291.4746 | 10632.3656 | 10780.454 |
06/30/2016 | 10430.1228 | 10781.0955 | 10955.589 |
07/31/2016 | 10411.1717 | 10791.4929 | 10949.7465 |
08/31/2016 | 10420.6081 | 10807.5581 | 10974.9373 |
09/30/2016 | 10380.8793 | 10772.5352 | 10921.9146 |
10/31/2016 | 10297.3517 | 10684.1963 | 10819.6708 |
11/30/2016 | 9969.9225 | 10291.4401 | 10425.262 |
12/31/2016 | 10045.0623 | 10397.3686 | 10539.3308 |
01/31/2017 | 10062.7255 | 10465.499 | 10592.9738 |
02/28/2017 | 10110.8434 | 10539.5316 | 10661.5031 |
03/31/2017 | 10128.9764 | 10563.688 | 10685.8535 |
04/30/2017 | 10198.8104 | 10656.2093 | 10762.9465 |
05/31/2017 | 10326.659 | 10805.9945 | 10922.1347 |
06/30/2017 | 10294.9485 | 10760.9261 | 10897.224 |
07/31/2017 | 10342.7897 | 10844.2226 | 10976.8981 |
08/31/2017 | 10412.4183 | 10935.1022 | 11069.4177 |
09/30/2017 | 10372.6999 | 10880.3008 | 11027.4598 |
10/31/2017 | 10376.4503 | 10886.9849 | 11047.8085 |
11/30/2017 | 10329.5088 | 10795.4017 | 11000.3481 |
12/31/2017 | 10407.3719 | 10879.48 | 11110.0751 |
01/31/2018 | 10308.4549 | 10775.5841 | 10993.045 |
02/28/2018 | 10277.6694 | 10732.2746 | 10946.205 |
03/31/2018 | 10297.2682 | 10752.9521 | 10982.8206 |
04/30/2018 | 10265.8 | 10716.9521 | 10940.1224 |
05/31/2018 | 10352.5036 | 10832.1835 | 11068.6574 |
06/30/2018 | 10365.4802 | 10844.8089 | 11080.8826 |
07/31/2018 | 10385.3989 | 10887.923 | 11107.1138 |
08/31/2018 | 10398.1234 | 10900.5093 | 11124.0611 |
09/30/2018 | 10350.8142 | 10842.2682 | 11053.4109 |
10/31/2018 | 10296.372 | 10780.9782 | 10973.8968 |
11/30/2018 | 10384.8491 | 10907.4279 | 11094.9286 |
12/31/2018 | 10465.7611 | 11037.0046 | 11225.6846 |
01/31/2019 | 10539.2255 | 11148.21 | 11309.9006 |
02/28/2019 | 10584.1889 | 11210.7117 | 11374.1081 |
03/31/2019 | 10688.3533 | 11343.3373 | 11556.5862 |
04/30/2019 | 10717.3894 | 11371.5979 | 11604.8669 |
05/31/2019 | 10838.0858 | 11536.2365 | 11776.3203 |
06/30/2019 | 10883.7225 | 11586.5037 | 11826.3817 |
07/31/2019 | 10959.9266 | 11687.9371 | 11920.3619 |
08/31/2019 | 11089.75 | 11824.3933 | 12108.5024 |
09/30/2019 | 11012.691 | 11725.0707 | 12018.0237 |
10/31/2019 | 11019.0864 | 11746.7645 | 12032.5099 |
11/30/2019 | 11033.7656 | 11765.8003 | 12055.2997 |
12/31/2019 | 11055.7733 | 11810.2043 | 12094.0362 |
01/31/2020 | 11232.367 | 12006.387 | 12310.4889 |
02/29/2020 | 11356.9325 | 12123.3774 | 12480.4216 |
03/31/2020 | 10945.6158 | 11719.2465 | 12011.9411 |
04/30/2020 | 10821.6392 | 11604.3278 | 11828.8427 |
05/31/2020 | 11070.9218 | 11977.5009 | 12213.0072 |
06/30/2020 | 11187.641 | 12060.0157 | 12331.8981 |
07/31/2020 | 11350.7889 | 12237.8661 | 12529.0824 |
08/31/2020 | 11317.7088 | 12208.4328 | 12486.8844 |
09/30/2020 | 11316.3319 | 12204.7586 | 12478.7409 |
10/31/2020 | 11282.7429 | 12179.5859 | 12453.9903 |
11/30/2020 | 11415.412 | 12323.1952 | 12644.4318 |
12/31/2020 | 11476.5147 | 12395.5471 | 12730.2285 |
01/31/2021 | 11545.8033 | 12465.5928 | 12814.1645 |
02/28/2021 | 11410.3164 | 12279.4948 | 12608.4364 |
03/31/2021 | 11463.6784 | 12337.4232 | 12685.0892 |
04/30/2021 | 11533.4843 | 12430.1791 | 12805.5408 |
05/31/2021 | 11555.0003 | 12459.2214 | 12861.4247 |
06/30/2021 | 11585.2363 | 12480.9153 | 12903.5827 |
07/31/2021 | 11654.6087 | 12575.5864 | 13000.3241 |
08/31/2021 | 11635.5585 | 12545.9186 | 12952.2436 |
09/30/2021 | 11560.36 | 12456.0944 | 12854.4017 |
10/31/2021 | 11516.4608 | 12428.3028 | 12840.0155 |
11/30/2021 | 11585.9913 | 12499.9902 | 12944.6803 |
12/31/2021 | 11590.0268 | 12512.5375 | 12962.708 |
01/31/2022 | 11326.46 | 12167.3123 | 12614.479 |
02/28/2022 | 11283.4129 | 12112.0809 | 12543.3886 |
03/31/2022 | 10978.7995 | 11777.5267 | 12161.105 |
04/30/2022 | 10757.6214 | 11497.6567 | 11801.7111 |
05/31/2022 | 10877.9503 | 11677.4615 | 11990.3119 |
06/30/2022 | 10794.7247 | 11554.9988 | 11760.3534 |
07/31/2022 | 10990.2517 | 11842.8819 | 12081.5509 |
08/31/2022 | 10833.5357 | 11611.2855 | 11774.1193 |
09/30/2022 | 10578.1666 | 11242.6075 | 11336.1319 |
10/31/2022 | 10520.9791 | 11202.2296 | 11235.8489 |
11/30/2022 | 10811.9074 | 11634.8946 | 11804.6324 |
12/31/2022 | 10846.9381 | 11681.9957 | 11792.3671 |
01/31/2023 | 11047.7281 | 11983.4423 | 12154.9223 |
02/28/2023 | 10893.2639 | 11726.2824 | 11859.776 |
03/31/2023 | 11053.9176 | 11967.0254 | 12125.9499 |
04/30/2023 | 11048.6491 | 11938.2566 | 12111.7038 |
05/31/2023 | 10976.6286 | 11817.0447 | 12018.8841 |
06/30/2023 | 11056.2166 | 11902.6474 | 12128.6911 |
07/31/2023 | 11102.367 | 11933.0188 | 12159.4442 |
08/31/2023 | 11013.2964 | 11829.2011 | 12012.0412 |
09/30/2023 | 10822.5449 | 11557.1486 | 11671.6555 |
10/31/2023 | 10759.6464 | 11480.6925 | 11525.4929 |
11/30/2023 | 11243.7403 | 12052.0418 | 12262.5884 |
12/31/2023 | 11438.2997 | 12314.205 | 12561.5363 |
01/31/2024 | 11426.5104 | 12277.4232 | 12533.8245 |
02/29/2024 | 11450.192 | 12288.2896 | 12535.4652 |
03/31/2024 | 11482.2258 | 12276.5241 | 12522.8598 |
04/30/2024 | 11385.0112 | 12144.3676 | 12382.8399 |
05/31/2024 | 11374.0107 | 12061.032 | 12356.9688 |
06/30/2024 | 11511.1108 | 12227.9768 | 12555.7339 |
07/31/2024 | 11604.8603 | 12337.7359 | 12664.2203 |
08/31/2024 | 11672.5322 | 12462.583 | 12763.903 |
09/30/2024 | 11776.1929 | 12575.0392 | 12899.3409 |

Effective September 30, 2024, the Fund adopted the ICE BofA U.S. Municipal Securities Index as its broad-based securities market index that represents the overall applicable market in which the Fund invests, and the ICE BofA 3-15 Year U.S. Municipal Securities Index as an additional index that represents the market sectors which the Fund’s advisor believes are more representative of the Fund’s investment universe.
What were the Fund costs for the past year?
(based on a hypothetical $10,000 investment)
Class Name | Costs of a $10,000 investment | Costs paid as a percentage of a $10,000 investment |
|---|
Class A | $77.00 | 0.74% |
End Block
Thornburg Intermediate Municipal Fund Tailored Shareholder Report
Thornburg Intermediate Municipal Fund Tailored Shareholder Report | |
Annual Performance | 1 Year | 5 Year | 10 Year |
|---|
Intermediate Municipal Fund Class A (with sales charge) | 6.63% | 0.94% | 1.65% |
Intermediate Municipal Fund Class A (without sales charge) | 8.81% | 1.35% | 1.85% |
ICE BofA 3-15 Year U.S. Municipal Securities Index | 8.81% | 1.41% | 2.32% |
ICE BofA U.S. Municipal Securities Index | 10.52% | 1.43% | 2.58% |
Key Fund Statistics
(as of September 30, 2024)
| |
|---|
Fund Size (Millions) | $1,020.5M |
Number of Holdings | 479 |
Annual Portfolio Turnover | 29.65% |
Total Advisory Fee | $4.5M |
What did the Fund invest in?
(as of September 30, 2024)
Credit Quality Ratings | (%) |
|---|
| AAA | 10.8 |
| AA | 38.6 |
| A | 38.3 |
| BBB | 7.4 |
| NR | 2.5 |
| Below Invest. Grade | 0.0 |
| Cash & Cash Equivalent | 2.5 |
Credit Quality Ratings | (%) |
AAA | 10.8% |
AA | 38.6% |
A | 38.3% |
BBB | 7.4% |
NR | 2.5% |
Below Invest. Grade | 0.0% |
Cash & Cash Equivalent | 2.5% |

Expressed as a percentage of the Fund’s net assets. * Credit quality ratings shown above reflect the highest rating assigned by either S&P Global Ratings or Moody’s Investors Services, both of which are independent, nationally recognized statistical rating organizations. If a credit rating for an investment is not available from either S&P or Moody’s, then the Fund’s investment advisor will determine the credit quality of the investment. Investments are considered to be investment grade if they are rated within the four highest grades by S&P or Moody’s (BBB/Baa or higher) or, if no credit rating is available, have been judged to be of comparable quality by the Fund’s investment advisor. (NR = Not Rated)
How has the Fund changed?
This is a summary of certain changes to the Fund since October 1, 2023. For more complete information, you may review the Fund’s next prospectus, which we expect to be available by February 1, 2025 at https://www.thornburg.com/download or upon request by calling 1-800-847-0200.
End Block
Changes In and Disagreements with Accountants
No changes and/or disagreements occurred in the current reporting period.
End Block
For additional information about the Fund, including its prospectus, financial information, holdings and proxy information, visit www.thornburg.com/download.

Thornburg Intermediate Municipal Fund Tailored Shareholder Report | |
Thornburg Intermediate Municipal Fund Tailored Shareholder Report
Thornburg Intermediate Municipal Fund CLASS: C TICKER: THMCX Annual Shareholder Report | |
This annual shareholder report contains important information about the Thornburg Intermediate Municipal Fund Class C Shares for the period from October 1, 2023 to September 30, 2024. You can find additional information about the Fund at https://www.thornburg.com/download. You can also request this information by contacting us at 1-800-847-0200. This report also describes changes to the Fund that occurred during the reporting period.
How did the Fund perform last year and what affected its performance?
The Fund’s Class C shares underperformed the ICE BofA 3-15 Year U.S. Municipal Securities Index (the “Index”) during the 12-month period ended September 30, 2024. The period began with municipal bond yields peaking in October of 2023, which marked the end of the Federal Reserve rate hiking cycle, before falling precipitously throughout the period and ending significantly lower. The backdrop of falling municipal bond yields boosted bond prices due to the inverse relationship between the two, which produced strong absolute returns for the asset class. However, the Fund’s relative performance was hampered during the period by individual bond selection. The Fund’s relative performance benefited from active management due to its longer duration and sector/quality returns from its higher weighting to revenue and A-rated bonds. Specifically, within the revenue sector and other utilities bonds were a large contributor to relative performance during the period.
How did the Fund perform over the past 10 years?
The line graph below reflects a hypothetical $10,000 investment. The returns shown in the line graph and table assume the reinvestment of dividends and capital gains, but do not reflect the deduction of taxes that a shareholder would pay on distributions or the redemption of Fund shares. The performance information shown below represents past performance and is no guarantee of future results. For Fund performance current to the most recent month end, visit https://www.thornburg.com/product/mutual-funds/fim/THMCX or call 1-800-847-0200. Performance for other share classes of the Fund will vary.
Cumulative Performance
Growth Table
Date | Thornburg Intermediate Municipal Fund | ICE BofA 3-15 Year U.S. Municipal Securities Index | ICE BofA U.S. Municipal Securities Index |
09/30/2014 | 9999.9945 | 10000 | 10000 |
10/31/2014 | 10050.2402 | 10047.8828 | 10061.0061 |
11/30/2014 | 10044.6673 | 10053.6678 | 10074.732 |
12/31/2014 | 10080.4275 | 10084.4301 | 10133.237 |
01/31/2015 | 10207.5743 | 10254.7365 | 10315.1349 |
02/28/2015 | 10110.8007 | 10156.2738 | 10213.0312 |
03/31/2015 | 10125.1293 | 10171.2054 | 10243.2441 |
04/30/2015 | 10076.1973 | 10142.593 | 10191.582 |
05/31/2015 | 10040.7999 | 10095.8047 | 10157.4674 |
06/30/2015 | 10019.7794 | 10091.6614 | 10143.7215 |
07/31/2015 | 10069.6879 | 10164.9514 | 10223.9759 |
08/31/2015 | 10084.1248 | 10178.2804 | 10246.5455 |
09/30/2015 | 10135.4062 | 10260.1697 | 10315.6951 |
10/31/2015 | 10165.2798 | 10309.2642 | 10359.774 |
11/30/2015 | 10195.4535 | 10336.704 | 10410.5357 |
12/31/2015 | 10260.2214 | 10403.1536 | 10493.2511 |
01/31/2016 | 10352.5475 | 10545.9421 | 10609.5409 |
02/29/2016 | 10352.7272 | 10558.2157 | 10618.4247 |
03/31/2016 | 10373.5296 | 10572.4828 | 10665.2047 |
04/30/2016 | 10431.2271 | 10641.3168 | 10746.9397 |
05/31/2016 | 10445.2388 | 10632.3656 | 10780.454 |
06/30/2016 | 10582.9616 | 10781.0955 | 10955.589 |
07/31/2016 | 10560.8772 | 10791.4929 | 10949.7465 |
08/31/2016 | 10567.621 | 10807.5581 | 10974.9373 |
09/30/2016 | 10524.3913 | 10772.5352 | 10921.9146 |
10/31/2016 | 10436.9129 | 10684.1963 | 10819.6708 |
11/30/2016 | 10102.7693 | 10291.4401 | 10425.262 |
12/31/2016 | 10176.0368 | 10397.3686 | 10539.3308 |
01/31/2017 | 10191.1306 | 10465.499 | 10592.9738 |
02/28/2017 | 10229.9768 | 10539.5316 | 10661.5031 |
03/31/2017 | 10252.9073 | 10563.688 | 10685.8535 |
04/30/2017 | 10320.7571 | 10656.2093 | 10762.9465 |
05/31/2017 | 10447.0783 | 10805.9945 | 10922.1347 |
06/30/2017 | 10412.3425 | 10760.9261 | 10897.224 |
07/31/2017 | 10457.8918 | 10844.2226 | 10976.8981 |
08/31/2017 | 10525.335 | 10935.1022 | 11069.4177 |
09/30/2017 | 10482.6401 | 10880.3008 | 11027.4598 |
10/31/2017 | 10476.1563 | 10886.9849 | 11047.8085 |
11/30/2017 | 10426.0273 | 10795.4017 | 11000.3481 |
12/31/2017 | 10509.1167 | 10879.48 | 11110.0751 |
01/31/2018 | 10406.5023 | 10775.5841 | 10993.045 |
02/28/2018 | 10372.6314 | 10732.2746 | 10946.205 |
03/31/2018 | 10389.2399 | 10752.9521 | 10982.8206 |
04/30/2018 | 10354.4929 | 10716.9521 | 10940.1224 |
05/31/2018 | 10438.6684 | 10832.1835 | 11068.6574 |
06/30/2018 | 10448.6582 | 10844.8089 | 11080.8826 |
07/31/2018 | 10465.4736 | 10887.923 | 11107.1138 |
08/31/2018 | 10475.1063 | 10900.5093 | 11124.0611 |
09/30/2018 | 10424.965 | 10842.2682 | 11053.4109 |
10/31/2018 | 10367.175 | 10780.9782 | 10973.8968 |
11/30/2018 | 10445.6616 | 10907.4279 | 11094.9286 |
12/31/2018 | 10531.5508 | 11037.0046 | 11225.6846 |
01/31/2019 | 10602.3548 | 11148.21 | 11309.9006 |
02/28/2019 | 10644.7811 | 11210.7117 | 11374.1081 |
03/31/2019 | 10746.3291 | 11343.3373 | 11556.5862 |
04/30/2019 | 10764.927 | 11371.5979 | 11604.8669 |
05/31/2019 | 10890.6808 | 11536.2365 | 11776.3203 |
06/30/2019 | 10933.5456 | 11586.5037 | 11826.3817 |
07/31/2019 | 11006.4232 | 11687.9371 | 11920.3619 |
08/31/2019 | 11132.9914 | 11824.3933 | 12108.5024 |
09/30/2019 | 11052.2839 | 11725.0707 | 12018.0237 |
10/31/2019 | 11055.3944 | 11746.7645 | 12032.5099 |
11/30/2019 | 11059.2116 | 11765.8003 | 12055.2997 |
12/31/2019 | 11085.7134 | 11810.2043 | 12094.0362 |
01/31/2020 | 11259.171 | 12006.387 | 12310.4889 |
02/29/2020 | 11380.5742 | 12123.3774 | 12480.4216 |
03/31/2020 | 10965.5284 | 11719.2465 | 12011.9411 |
04/30/2020 | 10830.4497 | 11604.3278 | 11828.8427 |
05/31/2020 | 11076.3525 | 11977.5009 | 12213.0072 |
06/30/2020 | 11189.6785 | 12060.0157 | 12331.8981 |
07/31/2020 | 11357.0012 | 12237.8661 | 12529.0824 |
08/31/2020 | 11320.3922 | 12208.4328 | 12486.8844 |
09/30/2020 | 11315.5909 | 12204.7586 | 12478.7409 |
10/31/2020 | 11278.4893 | 12179.5859 | 12453.9903 |
11/30/2020 | 11407.494 | 12323.1952 | 12644.4318 |
12/31/2020 | 11464.8879 | 12395.5471 | 12730.2285 |
01/31/2021 | 11522.5219 | 12465.5928 | 12814.1645 |
02/28/2021 | 11384.1485 | 12279.4948 | 12608.4364 |
03/31/2021 | 11441.7129 | 12337.4232 | 12685.0892 |
04/30/2021 | 11507.8174 | 12430.1791 | 12805.5408 |
05/31/2021 | 11525.6589 | 12459.2214 | 12861.4247 |
06/30/2021 | 11552.2598 | 12480.9153 | 12903.5827 |
07/31/2021 | 11617.7217 | 12575.5864 | 13000.3241 |
08/31/2021 | 11587.1422 | 12545.9186 | 12952.2436 |
09/30/2021 | 11516.8221 | 12456.0944 | 12854.4017 |
10/31/2021 | 11469.5541 | 12428.3028 | 12840.0155 |
11/30/2021 | 11535.2188 | 12499.9902 | 12944.6803 |
12/31/2021 | 11535.6213 | 12512.5375 | 12962.708 |
01/31/2022 | 11262.0412 | 12167.3123 | 12614.479 |
02/28/2022 | 11224.1666 | 12112.0809 | 12543.3886 |
03/31/2022 | 10918.1115 | 11777.5267 | 12161.105 |
04/30/2022 | 10695.2076 | 11497.6567 | 11801.7111 |
05/31/2022 | 10811.3378 | 11677.4615 | 11990.3119 |
06/30/2022 | 10717.3961 | 11554.9988 | 11760.3534 |
07/31/2022 | 10916.1358 | 11842.8819 | 12081.5509 |
08/31/2022 | 10757.3183 | 11611.2855 | 11774.1193 |
09/30/2022 | 10492.7461 | 11242.6075 | 11336.1319 |
10/31/2022 | 10440.9651 | 11202.2296 | 11235.8489 |
11/30/2022 | 10717.8345 | 11634.8946 | 11804.6324 |
12/31/2022 | 10757.3942 | 11681.9957 | 11792.3671 |
01/31/2023 | 10952.8526 | 11983.4423 | 12154.9223 |
02/28/2023 | 10788.6307 | 11726.2824 | 11859.776 |
03/31/2023 | 10952.5056 | 11967.0254 | 12125.9499 |
04/30/2023 | 10943.9866 | 11938.2566 | 12111.7038 |
05/31/2023 | 10869.3548 | 11817.0447 | 12018.8841 |
06/30/2023 | 10944.7565 | 11902.6474 | 12128.6911 |
07/31/2023 | 10986.9453 | 11933.0188 | 12159.4442 |
08/31/2023 | 10895.534 | 11829.2011 | 12012.0412 |
09/30/2023 | 10695.4914 | 11557.1486 | 11671.6555 |
10/31/2023 | 10638.4763 | 11480.6925 | 11525.4929 |
11/30/2023 | 11104.6884 | 12052.0418 | 12262.5884 |
12/31/2023 | 11301.6695 | 12314.205 | 12561.5363 |
01/31/2024 | 11286.5396 | 12277.4232 | 12533.8245 |
02/29/2024 | 11298.1326 | 12288.2896 | 12535.4652 |
03/31/2024 | 11326.2066 | 12276.5241 | 12522.8598 |
04/30/2024 | 11235.541 | 12144.3676 | 12382.8399 |
05/31/2024 | 11212.6469 | 12061.032 | 12356.9688 |
06/30/2024 | 11344.3176 | 12227.9768 | 12555.7339 |
07/31/2024 | 11433.1002 | 12337.7359 | 12664.2203 |
08/31/2024 | 11504.7238 | 12462.583 | 12763.903 |
09/30/2024 | 11603.194 | 12575.0392 | 12899.3409 |

Effective September 30, 2024, the Fund adopted the ICE BofA U.S. Municipal Securities Index as its broad-based securities market index that represents the overall applicable market in which the Fund invests, and the ICE BofA 3-15 Year U.S. Municipal Securities Index as an additional index that represents the market sectors which the Fund’s advisor believes are more representative of the Fund’s investment universe.
What were the Fund costs for the past year?
(based on a hypothetical $10,000 investment)
Class Name | Costs of a $10,000 investment | Costs paid as a percentage of a $10,000 investment |
|---|
Class C | $116.00 | 1.11% |
End Block
Thornburg Intermediate Municipal Fund Tailored Shareholder Report
Thornburg Intermediate Municipal Fund Tailored Shareholder Report | |
Annual Performance | 1 Year | 5 Year | 10 Year |
|---|
Intermediate Municipal Fund Class C (with sales charge) | 7.89% | 0.98% | 1.50% |
Intermediate Municipal Fund Class C (without sales charge) | 8.49% | 0.98% | 1.50% |
ICE BofA 3-15 Year U.S. Municipal Securities Index | 8.81% | 1.41% | 2.32% |
ICE BofA U.S. Municipal Securities Index | 10.52% | 1.43% | 2.58% |
Key Fund Statistics
(as of September 30, 2024)
| |
|---|
Fund Size (Millions) | $1,020.5M |
Number of Holdings | 479 |
Annual Portfolio Turnover | 29.65% |
Total Advisory Fee | $4.5M |
What did the Fund invest in?
(as of September 30, 2024)
Credit Quality Ratings | (%) |
|---|
| AAA | 10.8 |
| AA | 38.6 |
| A | 38.3 |
| BBB | 7.4 |
| NR | 2.5 |
| Below Invest. Grade | 0.0 |
| Cash & Cash Equivalent | 2.5 |
Credit Quality Ratings | (%) |
AAA | 10.8% |
AA | 38.6% |
A | 38.3% |
BBB | 7.4% |
NR | 2.5% |
Below Invest. Grade | 0.0% |
Cash & Cash Equivalent | 2.5% |
Expressed as a percentage of the Fund’s net assets. * Credit quality ratings shown above reflect the highest rating assigned by either S&P Global Ratings or Moody’s Investors Services, both of which are independent, nationally recognized statistical rating organizations. If a credit rating for an investment is not available from either S&P or Moody’s, then the Fund’s investment advisor will determine the credit quality of the investment. Investments are considered to be investment grade if they are rated within the four highest grades by S&P or Moody’s (BBB/Baa or higher) or, if no credit rating is available, have been judged to be of comparable quality by the Fund’s investment advisor. (NR = Not Rated)
How has the Fund changed?
This is a summary of certain changes to the Fund since October 1, 2023. For more complete information, you may review the Fund’s next prospectus, which we expect to be available by February 1, 2025 at https://www.thornburg.com/download or upon request by calling 1-800-847-0200.
End Block
Changes In and Disagreements with Accountants
No changes and/or disagreements occurred in the current reporting period.
End Block
For additional information about the Fund, including its prospectus, financial information, holdings and proxy information, visit www.thornburg.com/download.

Thornburg Intermediate Municipal Fund Tailored Shareholder Report | |
Thornburg Intermediate Municipal Fund Tailored Shareholder Report
Thornburg Intermediate Municipal Fund CLASS: C2 TICKER: THMQX Annual Shareholder Report | |
This annual shareholder report contains important information about the Thornburg Intermediate Municipal Fund Class C2 Shares for the period from October 1, 2023 to September 30, 2024. You can find additional information about the Fund at https://www.thornburg.com/download. You can also request this information by contacting us at 1-800-847-0200. This report also describes changes to the Fund that occurred during the reporting period.
How did the Fund perform last year and what affected its performance?
The Fund’s Class C2 shares underperformed the ICE BofA 3-15 Year U.S. Municipal Securities Index (the “Index”) during the 12-month period ended September 30, 2024. The period began with municipal bond yields peaking in October of 2023, which marked the end of the Federal Reserve rate hiking cycle, before falling precipitously throughout the period and ending significantly lower. The backdrop of falling municipal bond yields boosted bond prices due to the inverse relationship between the two, which produced strong absolute returns for the asset class. However, the Fund’s relative performance was hampered during the period by individual bond selection. The Fund’s relative performance benefited from active management due to its longer duration and sector/quality returns from its higher weighting to revenue and A-rated bonds. Specifically, within the revenue sector and other utilities bonds were a large contributor to relative performance during the period.
How did the Fund perform over the past 10 years?
The line graph below reflects a hypothetical $10,000 investment. The returns shown in the line graph and table assume the reinvestment of dividends and capital gains, but do not reflect the deduction of taxes that a shareholder would pay on distributions or the redemption of Fund shares. The performance information shown below represents past performance and is no guarantee of future results. For Fund performance current to the most recent month end, call 1-800-847-0200. Performance for other share classes of the Fund will vary.
Cumulative Performance
Growth Table
Date | Thornburg Intermediate Municipal Fund | ICE BofA 3-15 Year U.S. Municipal Securities Index | ICE BofA U.S. Municipal Securities Index |
09/30/2020 | 9999.9995 | 10000 | 10000 |
10/31/2020 | 9966.8632 | 9979.3747 | 9980.1658 |
11/30/2020 | 10079.9214 | 10097.0414 | 10132.7786 |
12/31/2020 | 10130.3016 | 10156.3231 | 10201.5329 |
01/31/2021 | 10188.2036 | 10213.7152 | 10268.796 |
02/28/2021 | 10065.9551 | 10061.2353 | 10103.9332 |
03/31/2021 | 10109.6237 | 10108.6991 | 10165.3599 |
04/30/2021 | 10168.0401 | 10184.6989 | 10261.8853 |
05/31/2021 | 10183.74 | 10208.4948 | 10306.6686 |
06/30/2021 | 10207.2706 | 10226.2697 | 10340.4525 |
07/31/2021 | 10265.0946 | 10303.8387 | 10417.9775 |
08/31/2021 | 10245.0676 | 10279.5304 | 10379.4475 |
09/30/2021 | 10175.8568 | 10205.9327 | 10301.0406 |
10/31/2021 | 10134.0965 | 10183.1616 | 10289.5121 |
11/30/2021 | 10192.1306 | 10241.8988 | 10373.3866 |
12/31/2021 | 10192.4991 | 10252.1794 | 10387.8333 |
01/31/2022 | 9957.8981 | 9969.3183 | 10108.7755 |
02/28/2022 | 9917.2608 | 9924.0643 | 10051.8062 |
03/31/2022 | 9646.776 | 9649.9465 | 9745.4583 |
04/30/2022 | 9449.8668 | 9420.6343 | 9457.4535 |
05/31/2022 | 9552.4913 | 9567.9578 | 9608.5911 |
06/30/2022 | 9476.6457 | 9467.6177 | 9424.3109 |
07/31/2022 | 9645.0654 | 9703.4954 | 9681.7067 |
08/31/2022 | 9504.757 | 9513.7363 | 9435.3424 |
09/30/2022 | 9271.0093 | 9211.6591 | 9084.3555 |
10/31/2022 | 9225.2761 | 9178.5753 | 9003.9925 |
11/30/2022 | 9477.0674 | 9533.0805 | 9459.7944 |
12/31/2022 | 9505.0137 | 9571.6729 | 9449.9655 |
01/31/2023 | 9677.7203 | 9818.664 | 9740.5038 |
02/28/2023 | 9532.6205 | 9607.9593 | 9503.9845 |
03/31/2023 | 9677.4234 | 9805.2127 | 9717.2864 |
04/30/2023 | 9669.9024 | 9781.6409 | 9705.8701 |
05/31/2023 | 9603.9583 | 9682.3257 | 9631.4878 |
06/30/2023 | 9670.5946 | 9752.4645 | 9719.4831 |
07/31/2023 | 9707.8846 | 9777.3493 | 9744.1275 |
08/31/2023 | 9627.137 | 9692.286 | 9626.0041 |
09/30/2023 | 9450.3828 | 9469.3791 | 9353.2317 |
10/31/2023 | 9400.0164 | 9406.7346 | 9236.1024 |
11/30/2023 | 9811.9777 | 9874.8711 | 9826.7834 |
12/31/2023 | 9986.0136 | 10089.6752 | 10066.3492 |
01/31/2024 | 9972.6725 | 10059.5379 | 10044.1419 |
02/29/2024 | 9990.3189 | 10068.4414 | 10045.4567 |
03/31/2024 | 10015.1314 | 10058.8013 | 10035.3552 |
04/30/2024 | 9927.4934 | 9950.5185 | 9923.1485 |
05/31/2024 | 9907.276 | 9882.2373 | 9902.4163 |
06/30/2024 | 10031.1984 | 10019.0239 | 10061.6993 |
07/31/2024 | 10109.6656 | 10108.9553 | 10148.6363 |
08/31/2024 | 10165.3978 | 10211.2491 | 10228.5183 |
09/30/2024 | 10252.4338 | 10303.3904 | 10337.0532 |
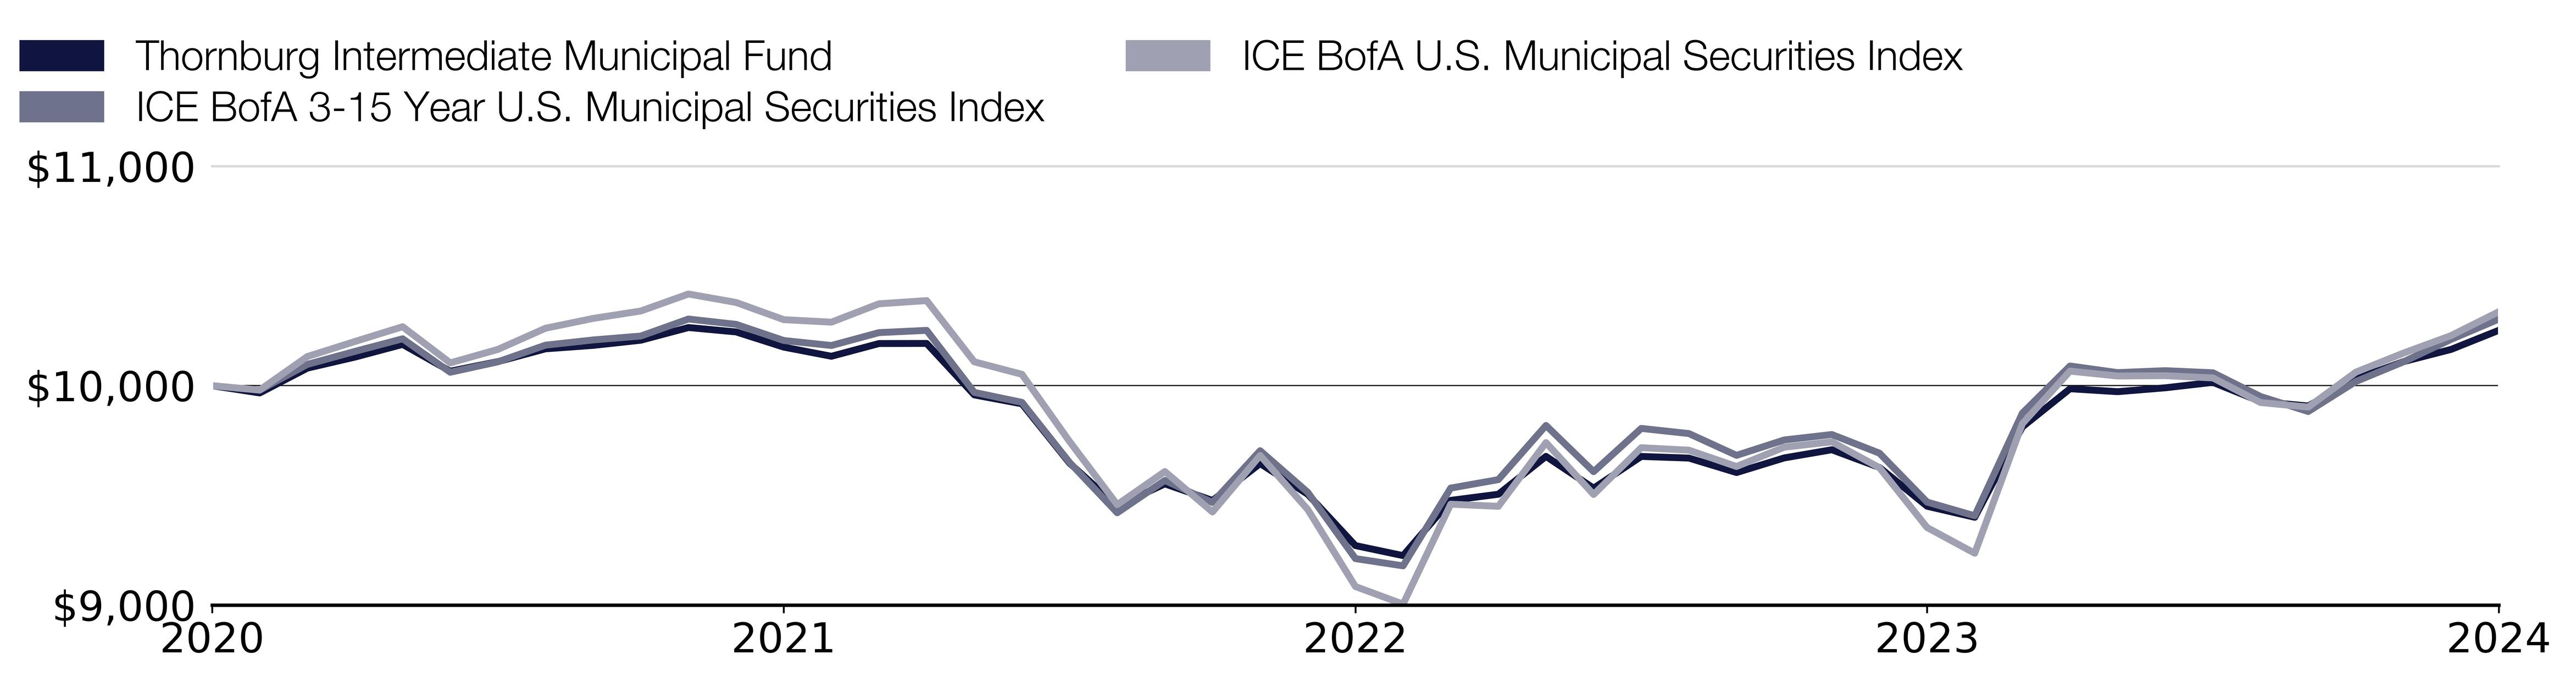
Effective September 30, 2024, the Fund adopted the ICE BofA U.S. Municipal Securities Index as its broad-based securities market index that represents the overall applicable market in which the Fund invests, and the ICE BofA 3-15 Year U.S. Municipal Securities Index as an additional index that represents the market sectors which the Fund’s advisor believes are more representative of the Fund’s investment universe.
What were the Fund costs for the past year?
(based on a hypothetical $10,000 investment)
Class Name | Costs of a $10,000 investment | Costs paid as a percentage of a $10,000 investment |
|---|
Class C2 | $115.00 | 1.11% |
End Block
Thornburg Intermediate Municipal Fund Tailored Shareholder Report
Thornburg Intermediate Municipal Fund Tailored Shareholder Report | |
Annual Performance | 1 Year |
|---|
Intermediate Municipal Fund Class C2 (with sales charge) | 7.84% |
Intermediate Municipal Fund Class C2 (without sales charge) | 8.49% |
ICE BofA 3-15 Year U.S. Municipal Securities Index | 8.81% |
ICE BofA U.S. Municipal Securities Index | 10.52% |
Key Fund Statistics
(as of September 30, 2024)
| |
|---|
Fund Size (Millions) | $1,020.5M |
Number of Holdings | 479 |
Annual Portfolio Turnover | 29.65% |
Total Advisory Fee | $4.5M |
What did the Fund invest in?
(as of September 30, 2024)
Credit Quality Ratings | (%) |
|---|
| AAA | 10.8 |
| AA | 38.6 |
| A | 38.3 |
| BBB | 7.4 |
| NR | 2.5 |
| Below Invest. Grade | 0.0 |
| Cash & Cash Equivalent | 2.5 |
Credit Quality Ratings | (%) |
AAA | 10.8% |
AA | 38.6% |
A | 38.3% |
BBB | 7.4% |
NR | 2.5% |
Below Invest. Grade | 0.0% |
Cash & Cash Equivalent | 2.5% |
Expressed as a percentage of the Fund’s net assets. * Credit quality ratings shown above reflect the highest rating assigned by either S&P Global Ratings or Moody’s Investors Services, both of which are independent, nationally recognized statistical rating organizations. If a credit rating for an investment is not available from either S&P or Moody’s, then the Fund’s investment advisor will determine the credit quality of the investment. Investments are considered to be investment grade if they are rated within the four highest grades by S&P or Moody’s (BBB/Baa or higher) or, if no credit rating is available, have been judged to be of comparable quality by the Fund’s investment advisor. (NR = Not Rated)
How has the Fund changed?
This is a summary of certain changes to the Fund since October 1, 2023. For more complete information, you may review the Fund’s next prospectus, which we expect to be available by February 1, 2025 at https://www.thornburg.com/download or upon request by calling 1-800-847-0200.
End Block
Changes In and Disagreements with Accountants
No changes and/or disagreements occurred in the current reporting period.
End Block
For additional information about the Fund, including its prospectus, financial information, holdings and proxy information, visit www.thornburg.com/download.
Thornburg Intermediate Municipal Fund Tailored Shareholder Report | |
Thornburg Intermediate Municipal Fund Tailored Shareholder Report
Thornburg Intermediate Municipal Fund CLASS: I TICKER: THMIX Annual Shareholder Report | |
This annual shareholder report contains important information about the Thornburg Intermediate Municipal Fund Class I Shares for the period from October 1, 2023 to September 30, 2024. You can find additional information about the Fund at https://www.thornburg.com/download. You can also request this information by contacting us at 1-800-847-0200. This report also describes changes to the Fund that occurred during the reporting period.
How did the Fund perform last year and what affected its performance?
The Fund’s Class I shares outperformed the ICE BofA 3-15 Year U.S. Municipal Securities Index (the “Index”) during the 12-month period ended September 30, 2024. The period began with municipal bond yields peaking in October of 2023, which marked the end of the Federal Reserve rate hiking cycle, before falling precipitously throughout the period and ending significantly lower. The backdrop of falling municipal bond yields boosted bond prices due to the inverse relationship between the two, which produced strong absolute returns for the asset class. However, the Fund’s relative performance was hampered during the period by individual bond selection. The Fund’s relative performance benefited from active management due to its longer duration and sector/quality returns from its higher weighting to revenue and A-rated bonds. Specifically, within the revenue sector and other utilities bonds were a large contributor to relative performance during the period.
How did the Fund perform over the past 10 years?
The line graph below reflects a hypothetical $10,000 investment. The returns shown in the line graph and table assume the reinvestment of dividends and capital gains, but do not reflect the deduction of taxes that a shareholder would pay on distributions or the redemption of Fund shares. The performance information shown below represents past performance and is no guarantee of future results. For Fund performance current to the most recent month end, visit https://www.thornburg.com/product/mutual-funds/fim/THMIX or call 1-800-847-0200. Performance for other share classes of the Fund will vary.
Cumulative Performance
Growth Table
Date | Thornburg Intermediate Municipal Fund | ICE BofA 3-15 Year U.S. Municipal Securities Index | ICE BofA U.S. Municipal Securities Index |
09/30/2014 | 10000.0017 | 10000 | 10000 |
10/31/2014 | 10048.8937 | 10047.8828 | 10061.0061 |
11/30/2014 | 10048.5287 | 10053.6678 | 10074.732 |
12/31/2014 | 10089.9482 | 10084.4301 | 10133.237 |
01/31/2015 | 10223.0878 | 10254.7365 | 10315.1349 |
02/28/2015 | 10130.8459 | 10156.2738 | 10213.0312 |
03/31/2015 | 10150.5675 | 10171.2054 | 10243.2441 |
04/30/2015 | 10113.573 | 10142.593 | 10191.582 |
05/31/2015 | 10076.1138 | 10095.8047 | 10157.4674 |
06/30/2015 | 10067.0303 | 10091.6614 | 10143.7215 |
07/31/2015 | 10122.3588 | 10164.9514 | 10223.9759 |
08/31/2015 | 10134.798 | 10178.2804 | 10246.5455 |
09/30/2015 | 10191.1979 | 10260.1697 | 10315.6951 |
10/31/2015 | 10233.7627 | 10309.2642 | 10359.774 |
11/30/2015 | 10269.4542 | 10336.704 | 10410.5357 |
12/31/2015 | 10333.0527 | 10403.1536 | 10493.2511 |
01/31/2016 | 10439.046 | 10545.9421 | 10609.5409 |
02/29/2016 | 10436.8555 | 10558.2157 | 10618.4247 |
03/31/2016 | 10470.6861 | 10572.4828 | 10665.2047 |
04/30/2016 | 10527.0759 | 10641.3168 | 10746.9397 |
05/31/2016 | 10546.9178 | 10632.3656 | 10780.454 |
06/30/2016 | 10699.0844 | 10781.0955 | 10955.589 |
07/31/2016 | 10675.0354 | 10791.4929 | 10949.7465 |
08/31/2016 | 10687.527 | 10807.5581 | 10974.9373 |
09/30/2016 | 10656.5139 | 10772.5352 | 10921.9146 |
10/31/2016 | 10573.3868 | 10684.1963 | 10819.6708 |
11/30/2016 | 10231.9734 | 10291.4401 | 10425.262 |
12/31/2016 | 10319.1883 | 10397.3686 | 10539.3308 |
01/31/2017 | 10332.501 | 10465.499 | 10592.9738 |
02/28/2017 | 10384.2823 | 10539.5316 | 10661.5031 |
03/31/2017 | 10405.4445 | 10563.688 | 10685.8535 |
04/30/2017 | 10479.7818 | 10656.2093 | 10762.9465 |
05/31/2017 | 10613.996 | 10805.9945 | 10922.1347 |
06/30/2017 | 10583.9958 | 10760.9261 | 10897.224 |
07/31/2017 | 10643.5026 | 10844.2226 | 10976.8981 |
08/31/2017 | 10710.4038 | 10935.1022 | 11069.4177 |
09/30/2017 | 10672.064 | 10880.3008 | 11027.4598 |
10/31/2017 | 10678.6879 | 10886.9849 | 11047.8085 |
11/30/2017 | 10632.9783 | 10795.4017 | 11000.3481 |
12/31/2017 | 10716.0141 | 10879.48 | 11110.0751 |
01/31/2018 | 10624.3898 | 10775.5841 | 10993.045 |
02/28/2018 | 10594.5068 | 10732.2746 | 10946.205 |
03/31/2018 | 10609.1491 | 10752.9521 | 10982.8206 |
04/30/2018 | 10578.6798 | 10716.9521 | 10940.1224 |
05/31/2018 | 10670.2424 | 10832.1835 | 11068.6574 |
06/30/2018 | 10685.6984 | 10844.8089 | 11080.8826 |
07/31/2018 | 10716.0794 | 10887.923 | 11107.1138 |
08/31/2018 | 10731.3775 | 10900.5093 | 11124.0611 |
09/30/2018 | 10676.992 | 10842.2682 | 11053.4109 |
10/31/2018 | 10622.9441 | 10780.9782 | 10973.8968 |
11/30/2018 | 10716.4887 | 10907.4279 | 11094.9286 |
12/31/2018 | 10802.3214 | 11037.0046 | 11225.6846 |
01/31/2019 | 10880.4566 | 11148.21 | 11309.9006 |
02/28/2019 | 10928.9461 | 11210.7117 | 11374.1081 |
03/31/2019 | 11046.7228 | 11343.3373 | 11556.5862 |
04/30/2019 | 11071.0217 | 11371.5979 | 11604.8669 |
05/31/2019 | 11197.978 | 11536.2365 | 11776.3203 |
06/30/2019 | 11247.2497 | 11586.5037 | 11826.3817 |
07/31/2019 | 11328.5601 | 11687.9371 | 11920.3619 |
08/31/2019 | 11465.4322 | 11824.3933 | 12108.5024 |
09/30/2019 | 11388.0554 | 11725.0707 | 12018.0237 |
10/31/2019 | 11397.1324 | 11746.7645 | 12032.5099 |
11/30/2019 | 11414.7037 | 11765.8003 | 12055.2997 |
12/31/2019 | 11439.965 | 11810.2043 | 12094.0362 |
01/31/2020 | 11625.4418 | 12006.387 | 12310.4889 |
02/29/2020 | 11764.7432 | 12123.3774 | 12480.4216 |
03/31/2020 | 11332.5754 | 11719.2465 | 12011.9411 |
04/30/2020 | 11206.2119 | 11604.3278 | 11828.8427 |
05/31/2020 | 11466.9902 | 11977.5009 | 12213.0072 |
06/30/2020 | 11590.2938 | 12060.0157 | 12331.8981 |
07/31/2020 | 11761.8809 | 12237.8661 | 12529.0824 |
08/31/2020 | 11729.9098 | 12208.4328 | 12486.8844 |
09/30/2020 | 11730.7519 | 12204.7586 | 12478.7409 |
10/31/2020 | 11698.2331 | 12179.5859 | 12453.9903 |
11/30/2020 | 11838.272 | 12323.1952 | 12644.4318 |
12/31/2020 | 11904.1073 | 12395.5471 | 12730.2285 |
01/31/2021 | 11978.4739 | 12465.5928 | 12814.1645 |
02/28/2021 | 11839.8759 | 12279.4948 | 12608.4364 |
03/31/2021 | 11897.7133 | 12337.4232 | 12685.0892 |
04/30/2021 | 11972.5854 | 12430.1791 | 12805.5408 |
05/31/2021 | 11997.3617 | 12459.2214 | 12861.4247 |
06/30/2021 | 12031.1336 | 12480.9153 | 12903.5827 |
07/31/2021 | 12105.7165 | 12575.5864 | 13000.3241 |
08/31/2021 | 12088.3498 | 12545.9186 | 12952.2436 |
09/30/2021 | 12020.8348 | 12456.0944 | 12854.4017 |
10/31/2021 | 11969.1877 | 12428.3028 | 12840.0155 |
11/30/2021 | 12043.8827 | 12499.9902 | 12944.6803 |
12/31/2021 | 12050.5141 | 12512.5375 | 12962.708 |
01/31/2022 | 11778.5054 | 12167.3123 | 12614.479 |
02/28/2022 | 11735.8025 | 12112.0809 | 12543.3886 |
03/31/2022 | 11429.2815 | 11777.5267 | 12161.105 |
04/30/2022 | 11201.0323 | 11497.6567 | 11801.7111 |
05/31/2022 | 11328.6485 | 11677.4615 | 11990.3119 |
06/30/2022 | 11235.5704 | 11554.9988 | 11760.3534 |
07/31/2022 | 11450.2017 | 11842.8819 | 12081.5509 |
08/31/2022 | 11289.0909 | 11611.2855 | 11774.1193 |
09/30/2022 | 11016.3584 | 11242.6075 | 11336.1319 |
10/31/2022 | 10958.9189 | 11202.2296 | 11235.8489 |
11/30/2022 | 11264.5785 | 11634.8946 | 11804.6324 |
12/31/2022 | 11312.0305 | 11681.9957 | 11792.3671 |
01/31/2023 | 11523.896 | 11983.4423 | 12154.9223 |
02/28/2023 | 11356.0049 | 11726.2824 | 11859.776 |
03/31/2023 | 11526.0286 | 11967.0254 | 12125.9499 |
04/30/2023 | 11522.7682 | 11938.2566 | 12111.7038 |
05/31/2023 | 11458.6081 | 11817.0447 | 12018.8841 |
06/30/2023 | 11535.1866 | 11902.6474 | 12128.6911 |
07/31/2023 | 11594.5364 | 11933.0188 | 12159.4442 |
08/31/2023 | 11503.7415 | 11829.2011 | 12012.0412 |
09/30/2023 | 11297.7041 | 11557.1486 | 11671.6555 |
10/31/2023 | 11243.0808 | 11480.6925 | 11525.4929 |
11/30/2023 | 11742.6099 | 12052.0418 | 12262.5884 |
12/31/2023 | 11957.4173 | 12314.205 | 12561.5363 |
01/31/2024 | 11938.4819 | 12277.4232 | 12533.8245 |
02/29/2024 | 11965.4788 | 12288.2896 | 12535.4652 |
03/31/2024 | 12001.3995 | 12276.5241 | 12522.8598 |
04/30/2024 | 11901.9395 | 12144.3676 | 12382.8399 |
05/31/2024 | 11892.8174 | 12061.032 | 12356.9688 |
06/30/2024 | 12038.7102 | 12227.9768 | 12555.7339 |
07/31/2024 | 12139.3191 | 12337.7359 | 12664.2203 |
08/31/2024 | 12212.6466 | 12462.583 | 12763.903 |
09/30/2024 | 12323.6381 | 12575.0392 | 12899.3409 |
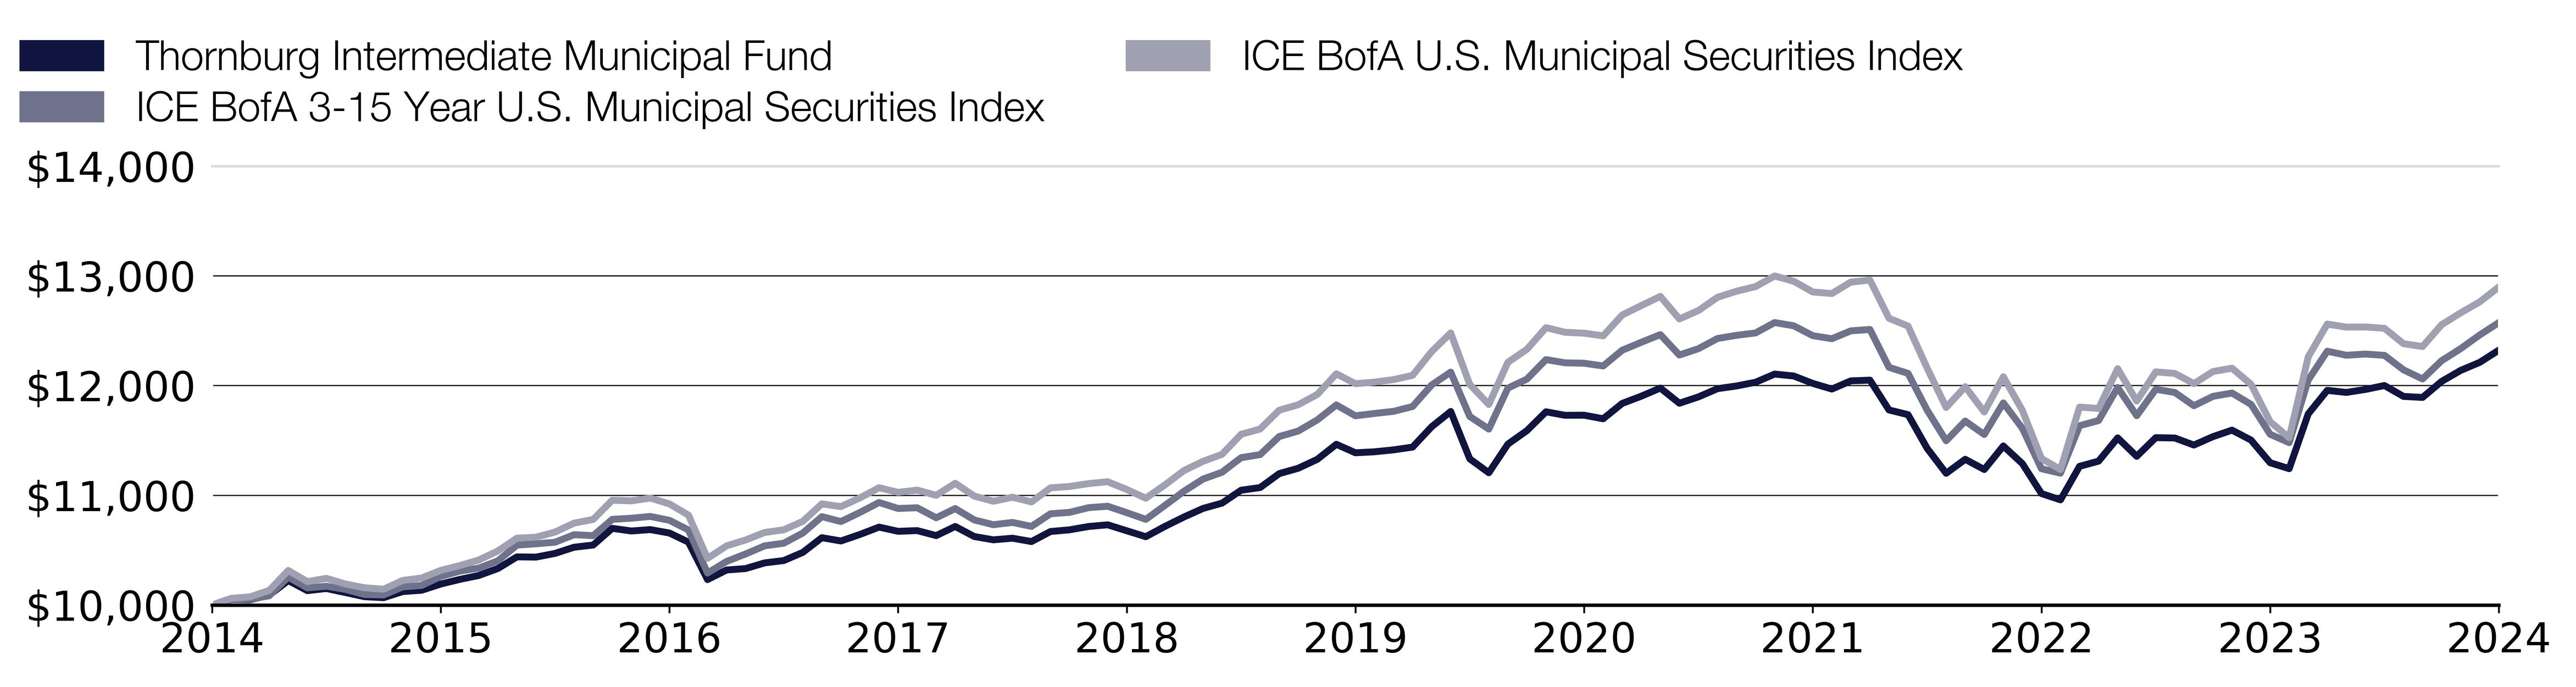
Effective September 30, 2024, the Fund adopted the ICE BofA U.S. Municipal Securities Index as its broad-based securities market index that represents the overall applicable market in which the Fund invests, and the ICE BofA 3-15 Year U.S. Municipal Securities Index as an additional index that represents the market sectors which the Fund’s advisor believes are more representative of the Fund’s investment universe.
What were the Fund costs for the past year?
(based on a hypothetical $10,000 investment)
Class Name | Costs of a $10,000 investment | Costs paid as a percentage of a $10,000 investment |
|---|
Class I | $52.00 | 0.50% |
End Block
Thornburg Intermediate Municipal Fund Tailored Shareholder Report
Thornburg Intermediate Municipal Fund Tailored Shareholder Report | |
Annual Performance | 1 Year | 5 Year | 10 Year |
|---|
Intermediate Municipal Fund Class I | 9.08% | 1.59% | 2.11% |
ICE BofA 3-15 Year U.S. Municipal Securities Index | 8.81% | 1.41% | 2.32% |
ICE BofA U.S. Municipal Securities Index | 10.52% | 1.43% | 2.58% |
Key Fund Statistics
(as of September 30, 2024)
| |
|---|
Fund Size (Millions) | $1,020.5M |
Number of Holdings | 479 |
Annual Portfolio Turnover | 29.65% |
Total Advisory Fee | $4.5M |
What did the Fund invest in?
(as of September 30, 2024)
Credit Quality Ratings | (%) |
|---|
| AAA | 10.8 |
| AA | 38.6 |
| A | 38.3 |
| BBB | 7.4 |
| NR | 2.5 |
| Below Invest. Grade | 0.0 |
| Cash & Cash Equivalent | 2.5 |
Credit Quality Ratings | (%) |
AAA | 10.8% |
AA | 38.6% |
A | 38.3% |
BBB | 7.4% |
NR | 2.5% |
Below Invest. Grade | 0.0% |
Cash & Cash Equivalent | 2.5% |
Expressed as a percentage of the Fund’s net assets. * Credit quality ratings shown above reflect the highest rating assigned by either S&P Global Ratings or Moody’s Investors Services, both of which are independent, nationally recognized statistical rating organizations. If a credit rating for an investment is not available from either S&P or Moody’s, then the Fund’s investment advisor will determine the credit quality of the investment. Investments are considered to be investment grade if they are rated within the four highest grades by S&P or Moody’s (BBB/Baa or higher) or, if no credit rating is available, have been judged to be of comparable quality by the Fund’s investment advisor. (NR = Not Rated)
How has the Fund changed?
This is a summary of certain changes to the Fund since October 1, 2023. For more complete information, you may review the Fund’s next prospectus, which we expect to be available by February 1, 2025 at https://www.thornburg.com/download or upon request by calling 1-800-847-0200.
End Block
Changes In and Disagreements with Accountants
No changes and/or disagreements occurred in the current reporting period.
End Block
For additional information about the Fund, including its prospectus, financial information, holdings and proxy information, visit www.thornburg.com/download.

Thornburg Intermediate Municipal Fund Tailored Shareholder Report | |
Thornburg Strategic Municipal Income Tailored Shareholder Report
Thornburg Strategic Municipal Income CLASS: A TICKER: TSSAX Annual Shareholder Report | |
This annual shareholder report contains important information about the Thornburg Strategic Municipal Income Class A Shares for the period from October 1, 2023 to September 30, 2024. You can find additional information about the Fund at https://www.thornburg.com/download. You can also request this information by contacting us at 1-800-847-0200. This report also describes changes to the Fund that occurred during the reporting period.
How did the Fund perform last year and what affected its performance?
The Fund’s Class A shares underperformed the ICE BofA U.S. Municipal Master Index (the “Index”) during the 12-month period ended September 30, 2024. The period began with municipal bond yields peaking in October of 2023, which marked the end of the Federal Reserve rate hiking cycle, before falling precipitously throughout the period and ending significantly lower. The backdrop of falling municipal bond yields boosted bond prices due to the inverse relationship between the two, producing strong absolute returns for the asset class. However, the Fund’s relative performance was hampered during the period by its shorter duration and yield curve positioning compared to its Index. The Fund’s relative performance benefited from active management with respect to its sector/quality returns thanks to its higher weighting to revenue and A-rated bonds. Specifically, within the revenue sector, healthcare and other utilities bonds were large contributors to relative performance during the period.
How did the Fund perform over the past 10 years?
The line graph below reflects a hypothetical $10,000 investment and assumes the deduction of the maximum sales charge associated with that investment. The returns shown in the line graph and table assume the reinvestment of dividends and capital gains, but do not reflect the deduction of taxes that a shareholder would pay on distributions or the redemption of Fund shares. The performance information shown below represents past performance and is no guarantee of future results. For Fund performance current to the most recent month end, visit https://www.thornburg.com/product/mutual-funds/fsm/TSSAX or call 1-800-847-0200. Performance for other share classes of the Fund will vary.
Cumulative Performance
Growth Table
Date | Thornburg Strategic Municipal Income Fund | ICE BofA U.S. Municipal Securities Index |
09/30/2014 | 9799.9956 | 10000 |
10/31/2014 | 9857.4932 | 10061.0061 |
11/30/2014 | 9864.4473 | 10074.732 |
12/31/2014 | 9921.2582 | 10133.237 |
01/31/2015 | 10068.0217 | 10315.1349 |
02/28/2015 | 9956.8147 | 10213.0312 |
03/31/2015 | 9987.7941 | 10243.2441 |
04/30/2015 | 9927.9932 | 10191.582 |
05/31/2015 | 9894.3807 | 10157.4674 |
06/30/2015 | 9881.1076 | 10143.7215 |
07/31/2015 | 9946.4047 | 10223.9759 |
08/31/2015 | 9959.5903 | 10246.5455 |
09/30/2015 | 10013.4377 | 10315.6951 |
10/31/2015 | 10041.3567 | 10359.774 |
11/30/2015 | 10056.2041 | 10410.5357 |
12/31/2015 | 10142.1928 | 10493.2511 |
01/31/2016 | 10239.7425 | 10609.5409 |
02/29/2016 | 10238.3272 | 10618.4247 |
03/31/2016 | 10275.7625 | 10665.2047 |
04/30/2016 | 10340.5151 | 10746.9397 |
05/31/2016 | 10377.6217 | 10780.454 |
06/30/2016 | 10522.0132 | 10955.589 |
07/31/2016 | 10497.9435 | 10949.7465 |
08/31/2016 | 10513.8189 | 10974.9373 |
09/30/2016 | 10477.3611 | 10921.9146 |
10/31/2016 | 10385.8471 | 10819.6708 |
11/30/2016 | 10038.5308 | 10425.262 |
12/31/2016 | 10103.1834 | 10539.3308 |
01/31/2017 | 10120.5866 | 10592.9738 |
02/28/2017 | 10162.4628 | 10661.5031 |
03/31/2017 | 10182.8871 | 10685.8535 |
04/30/2017 | 10245.0654 | 10762.9465 |
05/31/2017 | 10375.6593 | 10922.1347 |
06/30/2017 | 10348.6349 | 10897.224 |
07/31/2017 | 10403.8722 | 10976.8981 |
08/31/2017 | 10480.0094 | 11069.4177 |
09/30/2017 | 10453.1859 | 11027.4598 |
10/31/2017 | 10460.7266 | 11047.8085 |
11/30/2017 | 10427.3523 | 11000.3481 |
12/31/2017 | 10511.1439 | 11110.0751 |
01/31/2018 | 10427.8626 | 10993.045 |
02/28/2018 | 10401.2756 | 10946.205 |
03/31/2018 | 10422.4478 | 10982.8206 |
04/30/2018 | 10395.6426 | 10940.1224 |
05/31/2018 | 10480.4718 | 11068.6574 |
06/30/2018 | 10495.5486 | 11080.8826 |
07/31/2018 | 10517.3616 | 11107.1138 |
08/31/2018 | 10532.4985 | 11124.0611 |
09/30/2018 | 10491.1225 | 11053.4109 |
10/31/2018 | 10443.0451 | 10973.8968 |
11/30/2018 | 10516.2372 | 11094.9286 |
12/31/2018 | 10589.1171 | 11225.6846 |
01/31/2019 | 10654.5958 | 11309.9006 |
02/28/2019 | 10700.3578 | 11374.1081 |
03/31/2019 | 10809.5 | 11556.5862 |
04/30/2019 | 10840.4239 | 11604.8669 |
05/31/2019 | 10957.1775 | 11776.3203 |
06/30/2019 | 11002.7771 | 11826.3817 |
07/31/2019 | 11069.397 | 11920.3619 |
08/31/2019 | 11200.8328 | 12108.5024 |
09/30/2019 | 11129.214 | 12018.0237 |
10/31/2019 | 11136.8088 | 12032.5099 |
11/30/2019 | 11152.0367 | 12055.2997 |
12/31/2019 | 11181.24 | 12094.0362 |
01/31/2020 | 11349.038 | 12310.4889 |
02/29/2020 | 11490.1961 | 12480.4216 |
03/31/2020 | 11001.0155 | 12011.9411 |
04/30/2020 | 10834.4439 | 11828.8427 |
05/31/2020 | 11079.3 | 12213.0072 |
06/30/2020 | 11243.3342 | 12331.8981 |
07/31/2020 | 11437.2761 | 12529.0824 |
08/31/2020 | 11414.8915 | 12486.8844 |
09/30/2020 | 11414.3654 | 12478.7409 |
10/31/2020 | 11391.0382 | 12453.9903 |
11/30/2020 | 11525.0159 | 12644.4318 |
12/31/2020 | 11605.2375 | 12730.2285 |
01/31/2021 | 11684.5949 | 12814.1645 |
02/28/2021 | 11554.548 | 12608.4364 |
03/31/2021 | 11602.9795 | 12685.0892 |
04/30/2021 | 11681.699 | 12805.5408 |
05/31/2021 | 11706.8084 | 12861.4247 |
06/30/2021 | 11739.6861 | 12903.5827 |
07/31/2021 | 11817.7847 | 13000.3241 |
08/31/2021 | 11789.9633 | 12952.2436 |
09/30/2021 | 11717.1408 | 12854.4017 |
10/31/2021 | 11666.116 | 12840.0155 |
11/30/2021 | 11744.6122 | 12944.6803 |
12/31/2021 | 11746.3038 | 12962.708 |
01/31/2022 | 11473.1922 | 12614.479 |
02/28/2022 | 11423.3909 | 12543.3886 |
03/31/2022 | 11097.3417 | 12161.105 |
04/30/2022 | 10834.2224 | 11801.7111 |
05/31/2022 | 10932.7903 | 11990.3119 |
06/30/2022 | 10770.0877 | 11760.3534 |
07/31/2022 | 10992.5754 | 12081.5509 |
08/31/2022 | 10807.1759 | 11774.1193 |
09/30/2022 | 10459.442 | 11336.1319 |
10/31/2022 | 10360.7489 | 11235.8489 |
11/30/2022 | 10744.8999 | 11804.6324 |
12/31/2022 | 10779.8499 | 11792.3671 |
01/31/2023 | 11025.2379 | 12154.9223 |
02/28/2023 | 10842.4668 | 11859.776 |
03/31/2023 | 11012.7031 | 12125.9499 |
04/30/2023 | 11009.9793 | 12111.7038 |
05/31/2023 | 10928.7582 | 12018.8841 |
06/30/2023 | 11021.8443 | 12128.6911 |
07/31/2023 | 11068.0001 | 12159.4442 |
08/31/2023 | 10963.1167 | 12012.0412 |
09/30/2023 | 10722.4308 | 11671.6555 |
10/31/2023 | 10626.2302 | 11525.4929 |
11/30/2023 | 11188.8395 | 12262.5884 |
12/31/2023 | 11415.2031 | 12561.5363 |
01/31/2024 | 11383.5348 | 12533.8245 |
02/29/2024 | 11425.4513 | 12535.4652 |
03/31/2024 | 11491.4436 | 12522.8598 |
04/30/2024 | 11386.4934 | 12382.8399 |
05/31/2024 | 11395.6787 | 12356.9688 |
06/30/2024 | 11544.755 | 12555.7339 |
07/31/2024 | 11661.4135 | 12664.2203 |
08/31/2024 | 11754.0999 | 12763.903 |
09/30/2024 | 11838.235 | 12899.3409 |
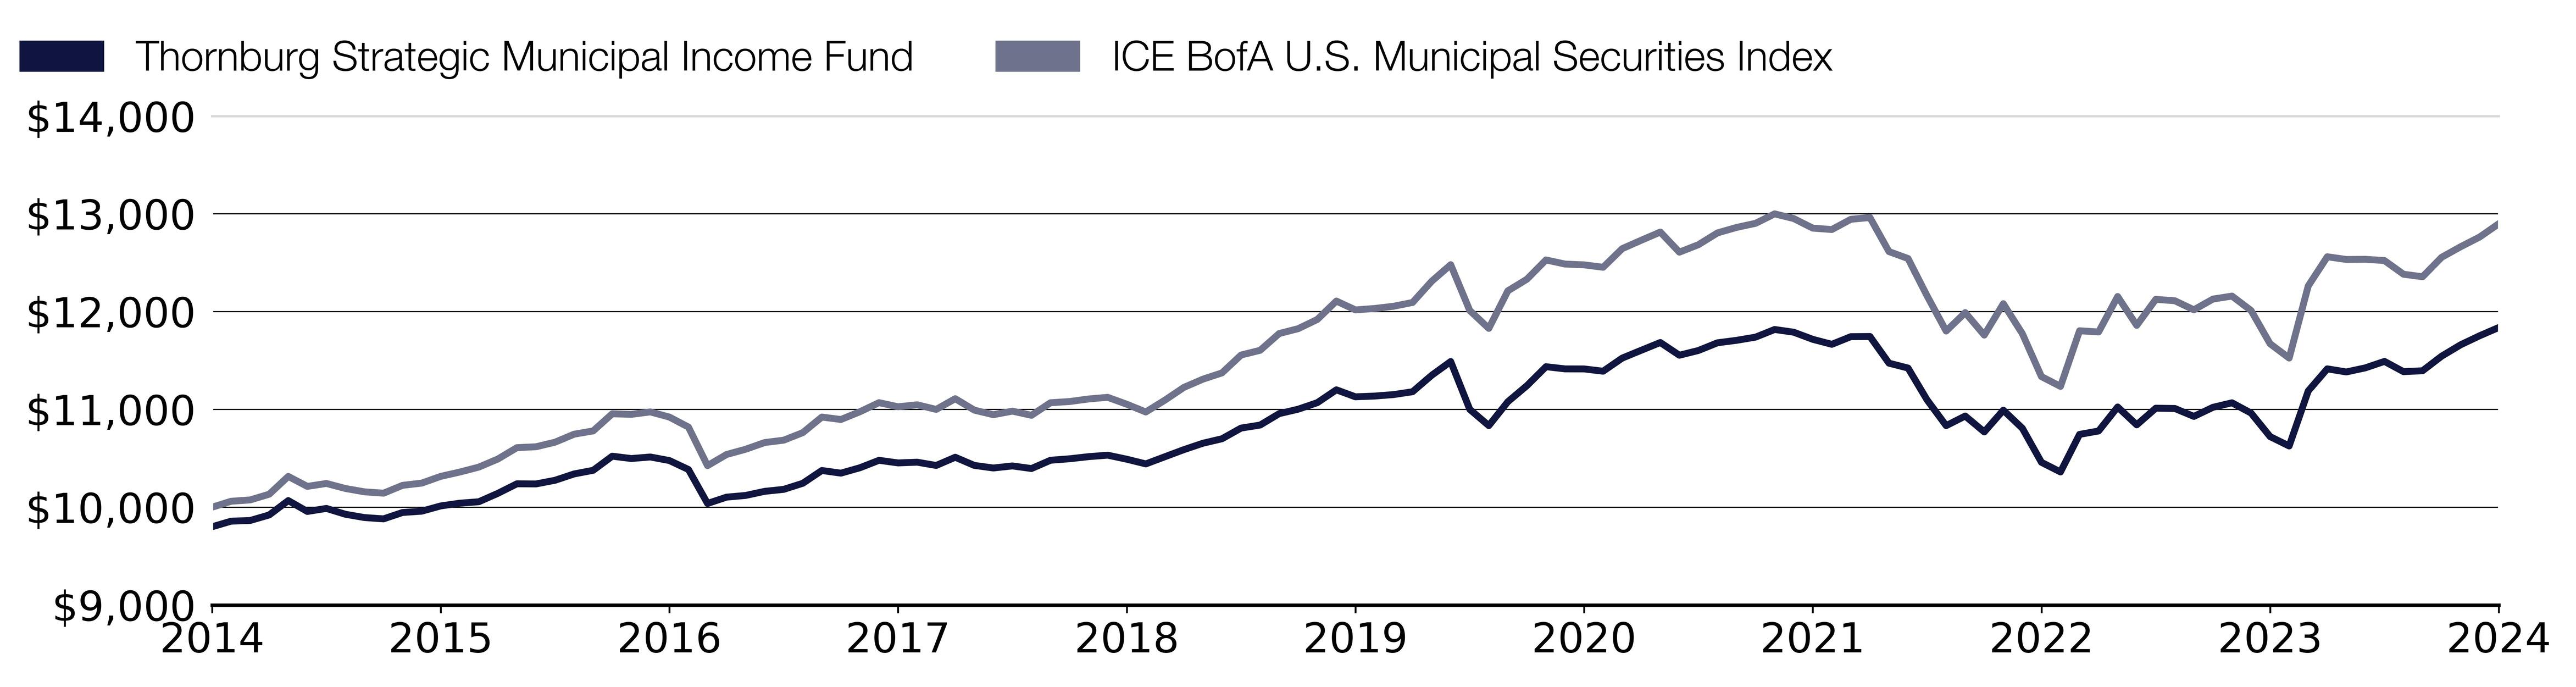
Effective September 30, 2024, the name of the Fund’s broad-based securities market index was changed from the ICE BofA U.S. Municipal Master Index to the ICE BofA U.S. Municipal Securities Index.
What were the Fund costs for the past year?
(based on a hypothetical $10,000 investment)
Class Name | Costs of a $10,000 investment | Costs paid as a percentage of a $10,000 investment |
|---|
Class A | $85.00 | 0.81% |
End Block
Thornburg Strategic Municipal Income Tailored Shareholder Report
Thornburg Strategic Municipal Income Tailored Shareholder Report | |
Annual Performance | 1 Year | 5 Year | 10 Year |
|---|
Strategic Municipal Income Fund Class A (with sales charge) | 8.22% | 0.84% | 1.70% |
Strategic Municipal Income Fund Class A (without sales charge) | 10.41% | 1.24% | 1.91% |
ICE BofA U.S. Municipal Securities Index | 10.52% | 1.43% | 2.58% |
Key Fund Statistics
(as of September 30, 2024)
| |
|---|
Fund Size (Millions) | $322.3M |
Number of Holdings | 258 |
Annual Portfolio Turnover | 23.43% |
Total Advisory Fee | $1.6M |
What did the Fund invest in?
(as of September 30, 2024)
Credit Quality Ratings | (%) |
|---|
| AAA | 5.1 |
| AA | 23.5 |
| A | 37.1 |
| BBB | 17.6 |
| NR | 12.2 |
| Below Invest. Grade | 1.3 |
| Cash & Cash Equivalent | 3.1 |
Credit Quality Ratings | (%) |
AAA | 5.1% |
AA | 23.5% |
A | 37.1% |
BBB | 17.6% |
NR | 12.2% |
Below Invest. Grade | 1.3% |
Cash & Cash Equivalent | 3.1% |
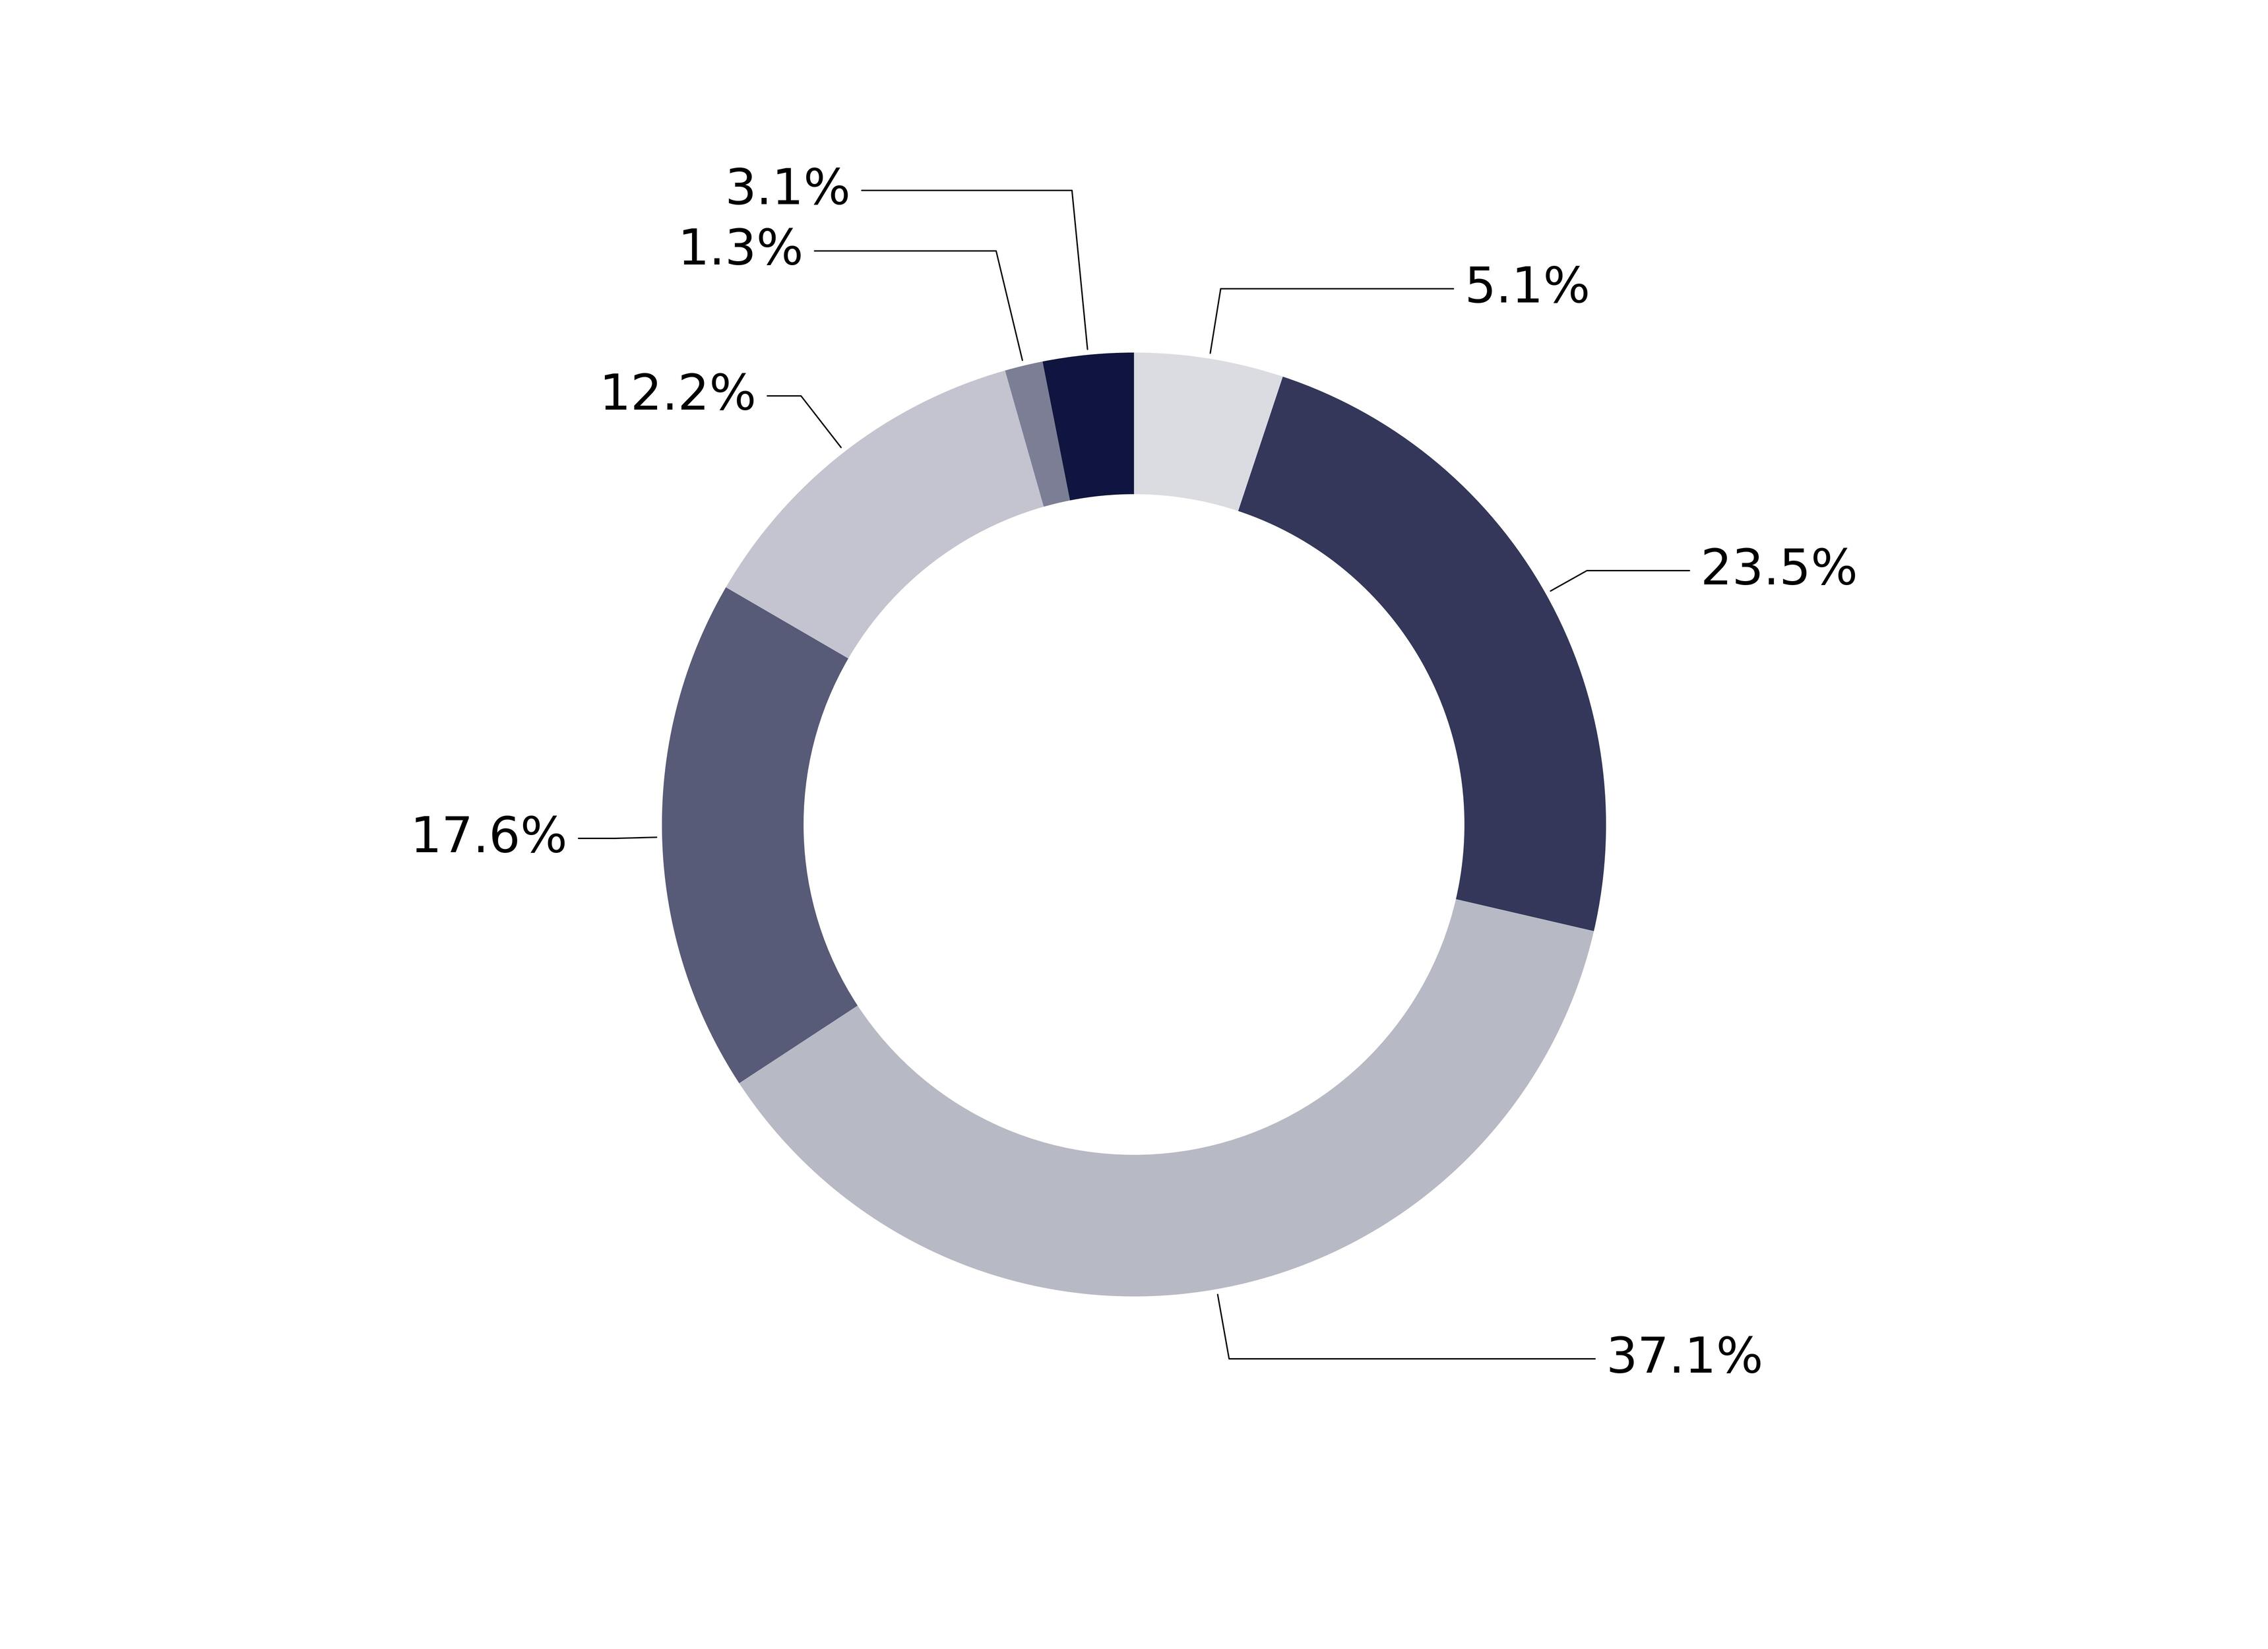
Expressed as a percentage of the Fund’s net assets. * Credit quality ratings shown above reflect the highest rating assigned by either S&P Global Ratings or Moody’s Investors Services, both of which are independent, nationally recognized statistical rating organizations. If a credit rating for an investment is not available from either S&P or Moody’s, then the Fund’s investment advisor will determine the credit quality of the investment. Investments are considered to be investment grade if they are rated within the four highest grades by S&P or Moody’s (BBB/Baa or higher) or, if no credit rating is available, have been judged to be of comparable quality by the Fund’s investment advisor. (NR = Not Rated)
How has the Fund changed?
This is a summary of certain changes to the Fund since October 1, 2023. For more complete information, you may review the Fund’s next prospectus, which we expect to be available by February 1, 2025 at https://www.thornburg.com/download or upon request by calling 1-800-847-0200.
End Block
Changes In and Disagreements with Accountants
No changes and/or disagreements occurred in the current reporting period.
End Block
For additional information about the Fund, including its prospectus, financial information, holdings and proxy information, visit www.thornburg.com/download.

Thornburg Strategic Municipal Income Tailored Shareholder Report | |
Thornburg Strategic Municipal Income Tailored Shareholder Report
Thornburg Strategic Municipal Income CLASS: C TICKER: TSSCX Annual Shareholder Report | |
This annual shareholder report contains important information about the Thornburg Strategic Municipal Income Class C Shares for the period from October 1, 2023 to September 30, 2024. You can find additional information about the Fund at https://www.thornburg.com/download. You can also request this information by contacting us at 1-800-847-0200. This report also describes changes to the Fund that occurred during the reporting period.
How did the Fund perform last year and what affected its performance?
The Fund’s Class C shares underperformed the ICE BofA U.S. Municipal Master Index (the “Index”) during the 12-month period ended September 30, 2024. The period began with municipal bond yields peaking in October of 2023, which marked the end of the Federal Reserve rate hiking cycle, before falling precipitously throughout the period and ending significantly lower. The backdrop of falling municipal bond yields boosted bond prices due to the inverse relationship between the two, producing strong absolute returns for the asset class. However, the Fund’s relative performance was hampered during the period by its shorter duration and yield curve positioning compared to its Index. The Fund’s relative performance benefited from active management with respect to its sector/quality returns thanks to its higher weighting to revenue and A-rated bonds. Specifically, within the revenue sector, healthcare and other utilities bonds were large contributors to relative performance during the period.
How did the Fund perform over the past 10 years?
The line graph below reflects a hypothetical $10,000 investment. The returns shown in the line graph and table assume the reinvestment of dividends and capital gains, but do not reflect the deduction of taxes that a shareholder would pay on distributions or the redemption of Fund shares. The performance information shown below represents past performance and is no guarantee of future results. For Fund performance current to the most recent month end, visit https://www.thornburg.com/product/mutual-funds/fsm/TSSCX or call 1-800-847-0200. Performance for other share classes of the Fund will vary.
Cumulative Performance
Growth Table
Date | Thornburg Strategic Municipal Income Fund | ICE BofA U.S. Municipal Securities Index |
09/30/2014 | 10000.004 | 10000 |
10/31/2014 | 10056.0806 | 10061.0061 |
11/30/2014 | 10067.3154 | 10074.732 |
12/31/2014 | 10122.6636 | 10133.237 |
01/31/2015 | 10263.0079 | 10315.1349 |
02/28/2015 | 10154.0286 | 10213.0312 |
03/31/2015 | 10183.0202 | 10243.2441 |
04/30/2015 | 10119.6432 | 10191.582 |
05/31/2015 | 10076.2244 | 10157.4674 |
06/30/2015 | 10060.2607 | 10143.7215 |
07/31/2015 | 10130.825 | 10223.9759 |
08/31/2015 | 10141.6693 | 10246.5455 |
09/30/2015 | 10187.2466 | 10315.6951 |
10/31/2015 | 10219.7712 | 10359.774 |
11/30/2015 | 10232.3826 | 10410.5357 |
12/31/2015 | 10317.1782 | 10493.2511 |
01/31/2016 | 10406.9181 | 10609.5409 |
02/29/2016 | 10409.7782 | 10618.4247 |
03/31/2016 | 10445.1732 | 10665.2047 |
04/30/2016 | 10508.3533 | 10746.9397 |
05/31/2016 | 10543.348 | 10780.454 |
06/30/2016 | 10687.2749 | 10955.589 |
07/31/2016 | 10660.1602 | 10949.7465 |
08/31/2016 | 10673.5707 | 10974.9373 |
09/30/2016 | 10627.1999 | 10921.9146 |
10/31/2016 | 10538.6103 | 10819.6708 |
11/30/2016 | 10184.1152 | 10425.262 |
12/31/2016 | 10247.1157 | 10539.3308 |
01/31/2017 | 10262.1401 | 10592.9738 |
02/28/2017 | 10300.55 | 10661.5031 |
03/31/2017 | 10310.4526 | 10685.8535 |
04/30/2017 | 10375.8726 | 10762.9465 |
05/31/2017 | 10503.5715 | 10922.1347 |
06/30/2017 | 10471.9104 | 10897.224 |
07/31/2017 | 10523.2051 | 10976.8981 |
08/31/2017 | 10595.5719 | 11069.4177 |
09/30/2017 | 10564.0792 | 11027.4598 |
10/31/2017 | 10560.3164 | 11047.8085 |
11/30/2017 | 10529.3195 | 11000.3481 |
12/31/2017 | 10609.2875 | 11110.0751 |
01/31/2018 | 10520.775 | 10993.045 |
02/28/2018 | 10490.1913 | 10946.205 |
03/31/2018 | 10500.2484 | 10982.8206 |
04/30/2018 | 10476.4337 | 10940.1224 |
05/31/2018 | 10557.6152 | 11068.6574 |
06/30/2018 | 10568.7203 | 11080.8826 |
07/31/2018 | 10586.4392 | 11107.1138 |
08/31/2018 | 10597.523 | 11124.0611 |
09/30/2018 | 10551.893 | 11053.4109 |
10/31/2018 | 10499.4199 | 10973.8968 |
11/30/2018 | 10568.8751 | 11094.9286 |
12/31/2018 | 10637.8162 | 11225.6846 |
01/31/2019 | 10692.1195 | 11309.9006 |
02/28/2019 | 10734.174 | 11374.1081 |
03/31/2019 | 10839.2929 | 11556.5862 |
04/30/2019 | 10866.1128 | 11604.8669 |
05/31/2019 | 10985.9321 | 11776.3203 |
06/30/2019 | 11027.3643 | 11826.3817 |
07/31/2019 | 11089.6578 | 11920.3619 |
08/31/2019 | 11209.474 | 12108.5024 |
09/30/2019 | 11140.8131 | 12018.0237 |
10/31/2019 | 11144.0897 | 12032.5099 |
11/30/2019 | 11155.0956 | 12055.2997 |
12/31/2019 | 11172.4572 | 12094.0362 |
01/31/2020 | 11342.9938 | 12310.4889 |
02/29/2020 | 11472.3674 | 12480.4216 |
03/31/2020 | 10987.2158 | 12011.9411 |
04/30/2020 | 10809.57 | 11828.8427 |
05/31/2020 | 11049.3713 | 12213.0072 |
06/30/2020 | 11215.9453 | 12331.8981 |
07/31/2020 | 11404.6634 | 12529.0824 |
08/31/2020 | 11377.8472 | 12486.8844 |
09/30/2020 | 11365.5594 | 12478.7409 |
10/31/2020 | 11337.7906 | 12453.9903 |
11/30/2020 | 11466.6502 | 12644.4318 |
12/31/2020 | 11541.8285 | 12730.2285 |
01/31/2021 | 11623.5444 | 12814.1645 |
02/28/2021 | 11490.1556 | 12608.4364 |
03/31/2021 | 11533.68 | 12685.0892 |
04/30/2021 | 11599.898 | 12805.5408 |
05/31/2021 | 11627.6682 | 12861.4247 |
06/30/2021 | 11655.7513 | 12903.5827 |
07/31/2021 | 11728.5488 | 13000.3241 |
08/31/2021 | 11696.3397 | 12952.2436 |
09/30/2021 | 11619.6978 | 12854.4017 |
10/31/2021 | 11557.0303 | 12840.0155 |
11/30/2021 | 11637.8382 | 12944.6803 |
12/31/2021 | 11634.8989 | 12962.708 |
01/31/2022 | 11360.1181 | 12614.479 |
02/28/2022 | 11306.7897 | 12543.3886 |
03/31/2022 | 10980.038 | 12161.105 |
04/30/2022 | 10708.368 | 11801.7111 |
05/31/2022 | 10809.0226 | 11990.3119 |
06/30/2022 | 10644.2775 | 11760.3534 |
07/31/2022 | 10859.583 | 12081.5509 |
08/31/2022 | 10672.3879 | 11774.1193 |
09/30/2022 | 10317.786 | 11336.1319 |
10/31/2022 | 10216.3786 | 11235.8489 |
11/30/2022 | 10590.8855 | 11804.6324 |
12/31/2022 | 10621.032 | 11792.3671 |
01/31/2023 | 10858.3834 | 12154.9223 |
02/28/2023 | 10674.6328 | 11859.776 |
03/31/2023 | 10837.8292 | 12125.9499 |
04/30/2023 | 10830.9753 | 12111.7038 |
05/31/2023 | 10754.572 | 12018.8841 |
06/30/2023 | 10834.1028 | 12128.6911 |
07/31/2023 | 10875.144 | 12159.4442 |
08/31/2023 | 10767.8869 | 12012.0412 |
09/30/2023 | 10527.5626 | 11671.6555 |
10/31/2023 | 10436.9057 | 11525.4929 |
11/30/2023 | 10976.7049 | 12262.5884 |
12/31/2023 | 11201.9749 | 12561.5363 |
01/31/2024 | 11166.5289 | 12533.8245 |
02/29/2024 | 11195.5271 | 12535.4652 |
03/31/2024 | 11255.6881 | 12522.8598 |
04/30/2024 | 11148.6823 | 12382.8399 |
05/31/2024 | 11153.2467 | 12356.9688 |
06/30/2024 | 11302.7637 | 12555.7339 |
07/31/2024 | 11404.2916 | 12664.2203 |
08/31/2024 | 11490.3288 | 12763.903 |
09/30/2024 | 11576.1718 | 12899.3409 |
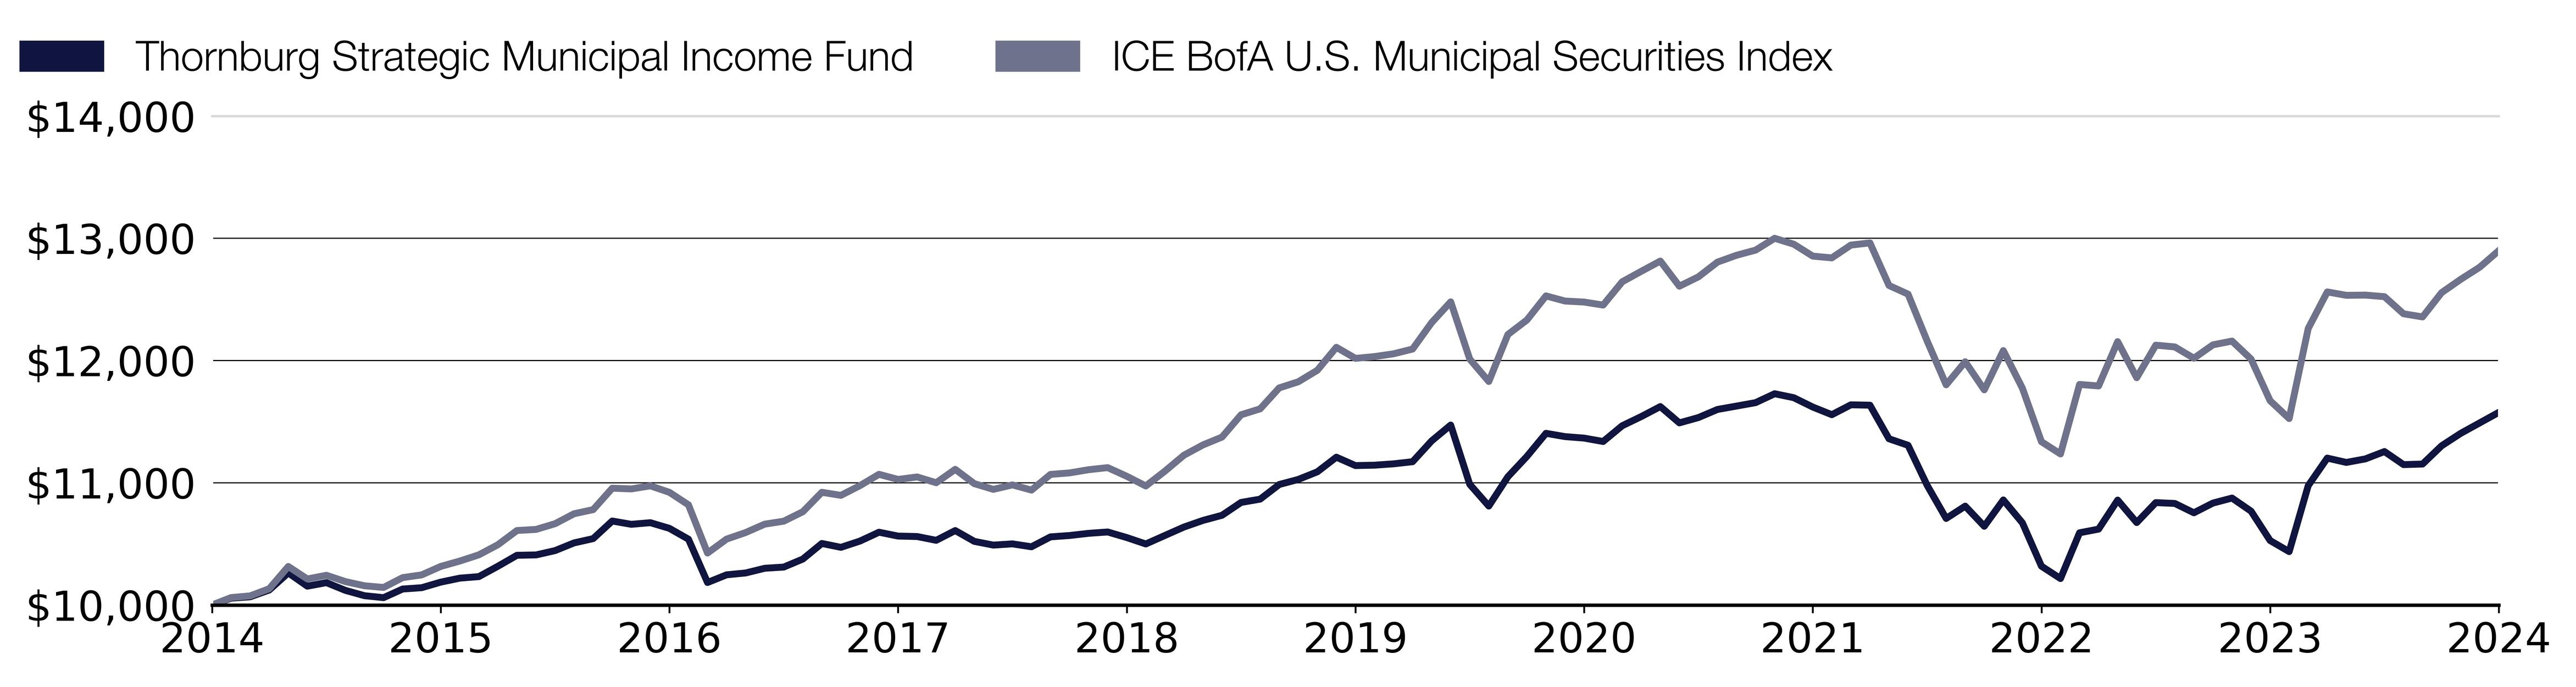
Effective September 30, 2024, the name of the Fund’s broad-based securities market index was changed from the ICE BofA U.S. Municipal Master Index to the ICE BofA U.S. Municipal Securities Index.
What were the Fund costs for the past year?
(based on a hypothetical $10,000 investment)
Class Name | Costs of a $10,000 investment | Costs paid as a percentage of a $10,000 investment |
|---|
Class C | $134.00 | 1.28% |
End Block
Thornburg Strategic Municipal Income Tailored Shareholder Report
Thornburg Strategic Municipal Income Tailored Shareholder Report | |
Annual Performance | 1 Year | 5 Year | 10 Year |
|---|
Strategic Municipal Income Fund Class C (with sales charge) | 9.36% | 0.77% | 1.47% |
Strategic Municipal Income Fund Class C (without sales charge) | 9.96% | 0.77% | 1.47% |
ICE BofA U.S. Municipal Securities Index | 10.52% | 1.43% | 2.58% |
Key Fund Statistics
(as of September 30, 2024)
| |
|---|
Fund Size (Millions) | $322.3M |
Number of Holdings | 258 |
Annual Portfolio Turnover | 23.43% |
Total Advisory Fee | $1.6M |
What did the Fund invest in?
(as of September 30, 2024)
Credit Quality Ratings | (%) |
|---|
| AAA | 5.1 |
| AA | 23.5 |
| A | 37.1 |
| BBB | 17.6 |
| NR | 12.2 |
| Below Invest. Grade | 1.3 |
| Cash & Cash Equivalent | 3.1 |
Credit Quality Ratings | (%) |
AAA | 5.1% |
AA | 23.5% |
A | 37.1% |
BBB | 17.6% |
NR | 12.2% |
Below Invest. Grade | 1.3% |
Cash & Cash Equivalent | 3.1% |
Expressed as a percentage of the Fund’s net assets. * Credit quality ratings shown above reflect the highest rating assigned by either S&P Global Ratings or Moody’s Investors Services, both of which are independent, nationally recognized statistical rating organizations. If a credit rating for an investment is not available from either S&P or Moody’s, then the Fund’s investment advisor will determine the credit quality of the investment. Investments are considered to be investment grade if they are rated within the four highest grades by S&P or Moody’s (BBB/Baa or higher) or, if no credit rating is available, have been judged to be of comparable quality by the Fund’s investment advisor. (NR = Not Rated)
How has the Fund changed?
This is a summary of certain changes to the Fund since October 1, 2023. For more complete information, you may review the Fund’s next prospectus, which we expect to be available by February 1, 2025 at https://www.thornburg.com/download or upon request by calling 1-800-847-0200.
End Block
Changes In and Disagreements with Accountants
No changes and/or disagreements occurred in the current reporting period.
End Block
For additional information about the Fund, including its prospectus, financial information, holdings and proxy information, visit www.thornburg.com/download.

Thornburg Strategic Municipal Income Tailored Shareholder Report | |
Thornburg Strategic Municipal Income Tailored Shareholder Report
Thornburg Strategic Municipal Income CLASS: I TICKER: TSSIX Annual Shareholder Report | |
This annual shareholder report contains important information about the Thornburg Strategic Municipal Income Class I Shares for the period from October 1, 2023 to September 30, 2024. You can find additional information about the Fund at https://www.thornburg.com/download. You can also request this information by contacting us at 1-800-847-0200. This report also describes changes to the Fund that occurred during the reporting period.
How did the Fund perform last year and what affected its performance?
The Fund’s Class I shares outperformed the ICE BofA U.S. Municipal Master Index (the “Index”) during the 12-month period ended September 30, 2024. The period began with municipal bond yields peaking in October of 2023, which marked the end of the Federal Reserve rate hiking cycle, before falling precipitously throughout the period and ending significantly lower. The backdrop of falling municipal bond yields boosted bond prices due to the inverse relationship between the two, producing strong absolute returns for the asset class. However, the Fund’s relative performance was hampered during the period by its shorter duration and yield curve positioning compared to its Index. The Fund’s relative performance benefited from active management with respect to its sector/quality returns thanks to its higher weighting to revenue and A-rated bonds. Specifically, within the revenue sector, healthcare and other utilities bonds were large contributors to relative performance during the period.
How did the Fund perform over the past 10 years?
The line graph below reflects a hypothetical $10,000 investment. The returns shown in the line graph and table assume the reinvestment of dividends and capital gains, but do not reflect the deduction of taxes that a shareholder would pay on distributions or the redemption of Fund shares. The performance information shown below represents past performance and is no guarantee of future results. For Fund performance current to the most recent month end, visit https://www.thornburg.com/product/mutual-funds/fsm/TSSIX or call 1-800-847-0200. Performance for other share classes of the Fund will vary.
Cumulative Performance
Growth Table
Date | Thornburg Strategic Municipal Income Fund | ICE BofA U.S. Municipal Securities Index |
09/30/2014 | 10000.004 | 10000 |
10/31/2014 | 10061.62 | 10061.0061 |
11/30/2014 | 10078.1053 | 10074.732 |
12/31/2014 | 10132.4536 | 10133.237 |
01/31/2015 | 10285.2826 | 10315.1349 |
02/28/2015 | 10174.2871 | 10213.0312 |
03/31/2015 | 10215.3607 | 10243.2441 |
04/30/2015 | 10157.2328 | 10191.582 |
05/31/2015 | 10119.0915 | 10157.4674 |
06/30/2015 | 10107.8654 | 10143.7215 |
07/31/2015 | 10183.8907 | 10223.9759 |
08/31/2015 | 10192.9061 | 10246.5455 |
09/30/2015 | 10250.187 | 10315.6951 |
10/31/2015 | 10288.0959 | 10359.774 |
11/30/2015 | 10305.6109 | 10410.5357 |
12/31/2015 | 10396.512 | 10493.2511 |
01/31/2016 | 10609.5409 |
02/29/2016 | 10500.784 | 10618.4247 |
03/31/2016 | 10542.0392 | 10665.2047 |
04/30/2016 | 10611.1669 | 10746.9397 |
05/31/2016 | 10652.189 | 10780.454 |
06/30/2016 | 10803.02 | 10955.589 |
07/31/2016 | 10781.277 | 10949.7465 |
08/31/2016 | 10800.5019 | 10974.9373 |
09/30/2016 | 10759.0879 | 10921.9146 |
10/31/2016 | 10675.0426 | 10819.6708 |
11/30/2016 | 10321.1955 | 10425.262 |
12/31/2016 | 10390.3626 | 10539.3308 |
01/31/2017 | 10411.0119 | 10592.9738 |
02/28/2017 | 10455.8057 | 10661.5031 |
03/31/2017 | 10471.8046 | 10685.8535 |
04/30/2017 | 10544.57 | 10762.9465 |
05/31/2017 | 10673.8528 | 10922.1347 |
06/30/2017 | 10655.0583 | 10897.224 |
07/31/2017 | 10713.8679 | 10976.8981 |
08/31/2017 | 10794.2016 | 11069.4177 |
09/30/2017 | 10768.5876 | 11027.4598 |
10/31/2017 | 10771.274 | 11047.8085 |
11/30/2017 | 10746.0329 | 11000.3481 |
12/31/2017 | 10827.2045 | 11110.0751 |
01/31/2018 | 10750.725 | 10993.045 |
02/28/2018 | 10725.1895 | 10946.205 |
03/31/2018 | 10741.833 | 10982.8206 |
04/30/2018 | 10716.1906 | 10940.1224 |
05/31/2018 | 10805.594 | 11068.6574 |
06/30/2018 | 10830.3347 | 11080.8826 |
07/31/2018 | 10854.8662 | 11107.1138 |
08/31/2018 | 10872.5933 | 11124.0611 |
09/30/2018 | 10831.9089 | 11053.4109 |
10/31/2018 | 10784.3736 | 10973.8968 |
11/30/2018 | 10861.8169 | 11094.9286 |
12/31/2018 | 10939.0469 | 11225.6846 |
01/31/2019 | 11001.3049 | 11309.9006 |
02/28/2019 | 11050.3985 | 11374.1081 |
03/31/2019 | 11165.1264 | 11556.5862 |
04/30/2019 | 11199.0737 | 11604.8669 |
05/31/2019 | 11321.7471 | 11776.3203 |
06/30/2019 | 11370.9032 | 11826.3817 |
07/31/2019 | 11449.3101 | 11920.3619 |
08/31/2019 | 11579.7719 | 12108.5024 |
09/30/2019 | 11507.8784 | 12018.0237 |
10/31/2019 | 11525.4198 | 12032.5099 |
11/30/2019 | 11543.2501 | 12055.2997 |
12/31/2019 | 11568.0676 | 12094.0362 |
01/31/2020 | 11751.2939 | 12310.4889 |
02/29/2020 | 11891.7436 | 12480.4216 |
03/31/2020 | 11387.9335 | 12011.9411 |
04/30/2020 | 11217.6695 | 11828.8427 |
05/31/2020 | 11473.1337 | 12213.0072 |
06/30/2020 | 11652.6244 | 12331.8981 |
07/31/2020 | 11847.9101 | 12529.0824 |
08/31/2020 | 11834.6485 | 12486.8844 |
09/30/2020 | 11828.5666 | 12478.7409 |
10/31/2020 | 11806.6268 | 12453.9903 |
11/30/2020 | 11947.557 | 12644.4318 |
12/31/2020 | 12032.9217 | 12730.2285 |
01/31/2021 | 12125.178 | 12814.1645 |
02/28/2021 | 11992.442 | 12608.4364 |
03/31/2021 | 12044.9138 | 12685.0892 |
04/30/2021 | 12120.9409 | 12805.5408 |
05/31/2021 | 12157.0704 | 12861.4247 |
06/30/2021 | 12193.377 | 12903.5827 |
07/31/2021 | 12268.854 | 13000.3241 |
08/31/2021 | 12242.3279 | 12952.2436 |
09/30/2021 | 12176.8711 | 12854.4017 |
10/31/2021 | 12118.3184 | 12840.0155 |
11/30/2021 | 12209.9057 | 12944.6803 |
12/31/2021 | 12213.9507 | 12962.708 |
01/31/2022 | 11932.6006 | 12614.479 |
02/28/2022 | 11882.843 | 12543.3886 |
03/31/2022 | 11538.329 | 12161.105 |
04/30/2022 | 11267.0116 | 11801.7111 |
05/31/2022 | 11371.5207 | 11990.3119 |
06/30/2022 | 11212.4254 | 11760.3534 |
07/31/2022 | 11437.8386 | 12081.5509 |
08/31/2022 | 11255.2281 | 11774.1193 |
09/30/2022 | 10887.5497 | 11336.1319 |
10/31/2022 | 10786.9159 | 11235.8489 |
11/30/2022 | 11188.5579 | 11804.6324 |
12/31/2022 | 11227.0176 | 11792.3671 |
01/31/2023 | 11484.6054 | 12154.9223 |
02/28/2023 | 11296.29 | 11859.776 |
03/31/2023 | 11475.6612 | 12125.9499 |
04/30/2023 | 11474.9213 | 12111.7038 |
05/31/2023 | 11400.7123 | 12018.8841 |
06/30/2023 | 11491.5165 | 12128.6911 |
07/31/2023 | 11541.7808 | 12159.4442 |
08/31/2023 | 11434.6341 | 12012.0412 |
09/30/2023 | 11185.8644 | 11671.6555 |
10/31/2023 | 11096.0402 | 11525.4929 |
11/30/2023 | 11676.3197 | 12262.5884 |
12/31/2023 | 11914.5902 | 12561.5363 |
01/31/2024 | 11883.7932 | 12533.8245 |
02/29/2024 | 11929.6294 | 12535.4652 |
03/31/2024 | 12000.7525 | 12522.8598 |
04/30/2024 | 11893.4128 | 12382.8399 |
05/31/2024 | 11905.2491 | 12356.9688 |
06/30/2024 | 12063.0771 | 12555.7339 |
07/31/2024 | 12187.1827 | 12664.2203 |
08/31/2024 | 12286.2933 | 12763.903 |
09/30/2024 | 12385.0716 | 12899.3409 |

Effective September 30, 2024, the name of the Fund’s broad-based securities market index was changed from the ICE BofA U.S. Municipal Master Index to the ICE BofA U.S. Municipal Securities Index.
What were the Fund costs for the past year?
(based on a hypothetical $10,000 investment)
Class Name | Costs of a $10,000 investment | Costs paid as a percentage of a $10,000 investment |
|---|
Class I | $62.00 | 0.59% |
End Block
Thornburg Strategic Municipal Income Tailored Shareholder Report
Thornburg Strategic Municipal Income Tailored Shareholder Report | |
Annual Performance | 1 Year | 5 Year | 10 Year |
|---|
Strategic Municipal Income Fund Class I | 10.72% | 1.48% | 2.16% |
ICE BofA U.S. Municipal Securities Index | 10.52% | 1.43% | 2.58% |
Key Fund Statistics
(as of September 30, 2024)
| |
|---|
Fund Size (Millions) | $322.3M |
Number of Holdings | 258 |
Annual Portfolio Turnover | 23.43% |
Total Advisory Fee | $1.6M |
What did the Fund invest in?
(as of September 30, 2024)
Credit Quality Ratings | (%) |
|---|
| AAA | 5.1 |
| AA | 23.5 |
| A | 37.1 |
| BBB | 17.6 |
| NR | 12.2 |
| Below Invest. Grade | 1.3 |
| Cash & Cash Equivalent | 3.1 |
Credit Quality Ratings | (%) |
AAA | 5.1% |
AA | 23.5% |
A | 37.1% |
BBB | 17.6% |
NR | 12.2% |
Below Invest. Grade | 1.3% |
Cash & Cash Equivalent | 3.1% |
Expressed as a percentage of the Fund’s net assets. * Credit quality ratings shown above reflect the highest rating assigned by either S&P Global Ratings or Moody’s Investors Services, both of which are independent, nationally recognized statistical rating organizations. If a credit rating for an investment is not available from either S&P or Moody’s, then the Fund’s investment advisor will determine the credit quality of the investment. Investments are considered to be investment grade if they are rated within the four highest grades by S&P or Moody’s (BBB/Baa or higher) or, if no credit rating is available, have been judged to be of comparable quality by the Fund’s investment advisor. (NR = Not Rated)
How has the Fund changed?
This is a summary of certain changes to the Fund since October 1, 2023. For more complete information, you may review the Fund’s next prospectus, which we expect to be available by February 1, 2025 at https://www.thornburg.com/download or upon request by calling 1-800-847-0200.
End Block
Changes In and Disagreements with Accountants
No changes and/or disagreements occurred in the current reporting period.
End Block
For additional information about the Fund, including its prospectus, financial information, holdings and proxy information, visit www.thornburg.com/download.

Thornburg Strategic Municipal Income Tailored Shareholder Report | |
Thornburg California Limited Term Municipal Fund Tailored Shareholder Report
Thornburg California Limited Term Municipal Fund CLASS: A TICKER: LTCAX Annual Shareholder Report | |
This annual shareholder report contains important information about the Thornburg California Limited Term Municipal Fund Class A Shares for the period from October 1, 2023 to September 30, 2024. You can find additional information about the Fund at https://www.thornburg.com/download. You can also request this information by contacting us at 1-800-847-0200. This report also describes changes to the Fund that occurred during the reporting period.
How did the Fund perform last year and what affected its performance?
The Fund’s Class A shares underperformed the ICE BofA 1-10 Year U.S. Municipal Securities Index (the “Index”) during the 12-month period ended September 30, 2024. The period began with municipal bond yields peaking in October of 2023, which marked the end of the Federal Reserve rate hiking cycle, before falling precipitously throughout the period and ending significantly lower. The backdrop of falling municipal bond yields boosted bond prices due to the inverse relationship between the two, producing strong absolute returns for the asset class. However, the Fund’s underperformance during the period was driven by its shorter duration and yield curve positioning compared to the Index. The Fund’s relative performance did benefit from its focus on California municipal bonds as opposed to the Index’s national focus. As a result, sector/quality returns and security selection contributed to relative performance during the period.
How did the Fund perform over the past 10 years?
The line graph below reflects a hypothetical $10,000 investment and assumes the deduction of the maximum sales charge associated with that investment. The returns shown in the line graph and table assume the reinvestment of dividends and capital gains, but do not reflect the deduction of taxes that a shareholder would pay on distributions or the redemption of Fund shares. The performance information shown below represents past performance and is no guarantee of future results. For Fund performance current to the most recent month end, visit https://www.thornburg.com/product/mutual-funds/fca/LTCAX or call 1-800-847-0200. Performance for other share classes of the Fund will vary.
Cumulative Performance
Growth Table
Date | Thornburg California Limited Term Municipal Fund | ICE BofA 1-10 Year U.S. Municipal Securities Index | ICE BofA U.S. Municipal Securities Index |
09/30/2014 | 9850.537 | 10000 | 10000 |
10/31/2014 | 9884.1781 | 10031.0861 | 10061.0061 |
11/30/2014 | 9874.4802 | 10036.9203 | 10074.732 |
12/31/2014 | 9878.7275 | 10037.6328 | 10133.237 |
01/31/2015 | 10003.8153 | 10163.3576 | 10315.1349 |
02/28/2015 | 9937.5664 | 10102.8334 | 10213.0312 |
03/31/2015 | 9941.4751 | 10101.9427 | 10243.2441 |
04/30/2015 | 9916.928 | 10091.7885 | 10191.582 |
05/31/2015 | 9884.6198 | 10054.6901 | 10157.4674 |
06/30/2015 | 9881.753 | 10061.5931 | 10143.7215 |
07/31/2015 | 9928.1519 | 10113.7892 | 10223.9759 |
08/31/2015 | 9940.3698 | 10123.0972 | 10246.5455 |
09/30/2015 | 9988.0512 | 10181.2611 | 10315.6951 |
10/31/2015 | 10006.3065 | 10221.0316 | 10359.774 |
11/30/2015 | 10010.4443 | 10219.8737 | 10410.5357 |
12/31/2015 | 10042.9203 | 10250.3808 | 10493.2511 |
01/31/2016 | 10126.0567 | 10357.5787 | 10609.5409 |
02/29/2016 | 10145.3279 | 10380.4701 | 10618.4247 |
03/31/2016 | 10126.7548 | 10364.6599 | 10665.2047 |
04/30/2016 | 10166.7593 | 10412.4469 | 10746.9397 |
05/31/2016 | 10147.9436 | 10394.6771 | 10780.454 |
06/30/2016 | 10224.601 | 10485.9311 | 10955.589 |
07/31/2016 | 10227.5479 | 10509.4015 | 10949.7465 |
08/31/2016 | 10230.3402 | 10512.5636 | 10974.9373 |
09/30/2016 | 10219.4639 | 10481.3439 | 10921.9146 |
10/31/2016 | 10156.5234 | 10435.7837 | 10819.6708 |
11/30/2016 | 9889.1685 | 10188.5204 | 10425.262 |
12/31/2016 | 9943.3175 | 10245.66 | 10539.3308 |
01/31/2017 | 9998.2922 | 10316.8283 | 10592.9738 |
02/28/2017 | 10039.8678 | 10379.8912 | 10661.5031 |
03/31/2017 | 10043.4243 | 10387.2396 | 10685.8535 |
04/30/2017 | 10092.1187 | 10452.3956 | 10762.9465 |
05/31/2017 | 10184.585 | 10545.3865 | 10922.1347 |
06/30/2017 | 10159.5584 | 10509.8914 | 10897.224 |
07/31/2017 | 10200.4356 | 10573.934 | 10976.8981 |
08/31/2017 | 10255.9842 | 10635.349 | 11069.4177 |
09/30/2017 | 10208.472 | 10584.3109 | 11027.4598 |
10/31/2017 | 10197.4813 | 10581.0598 | 11047.8085 |
11/30/2017 | 10112.9453 | 10488.0688 | 11000.3481 |
12/31/2017 | 10147.0005 | 10535.2323 | 11110.0751 |
01/31/2018 | 10106.9286 | 10494.8828 | 10993.045 |
02/28/2018 | 10076.4019 | 10474.2182 | 10946.205 |
03/31/2018 | 10066.8316 | 10475.3761 | 10982.8206 |
04/30/2018 | 10035.9838 | 10443.1321 | 10940.1224 |
05/31/2018 | 10116.0561 | 10529.888 | 11068.6574 |
06/30/2018 | 10129.3868 | 10554.65 | 11080.8826 |
07/31/2018 | 10149.3266 | 10595.7566 | 11107.1138 |
08/31/2018 | 10154.6422 | 10601.3236 | 11124.0611 |
09/30/2018 | 10114.9649 | 10553.8929 | 11053.4109 |
10/31/2018 | 10090.4144 | 10524.6328 | 10973.8968 |
11/30/2018 | 10141.838 | 10616.4213 | 11094.9286 |
12/31/2018 | 10200.2527 | 10713.0196 | 11225.6846 |
01/31/2019 | 10251.4549 | 10805.1198 | 11309.9006 |
02/28/2019 | 10281.6217 | 10853.9757 | 11374.1081 |
03/31/2019 | 10333.012 | 10937.3469 | 11556.5862 |
04/30/2019 | 10331.8682 | 10949.2825 | 11604.8669 |
05/31/2019 | 10406.1934 | 11066.0111 | 11776.3203 |
06/30/2019 | 10435.4213 | 11111.3932 | 11826.3817 |
07/31/2019 | 10494.296 | 11194.319 | 11920.3619 |
08/31/2019 | 10537.8172 | 11268.4267 | 12108.5024 |
09/30/2019 | 10482.2446 | 11192.2704 | 12018.0237 |
10/31/2019 | 10501.9809 | 11224.8261 | 12032.5099 |
11/30/2019 | 10506.8995 | 11243.7093 | 12055.2997 |
12/31/2019 | 10526.4752 | 11278.67 | 12094.0362 |
01/31/2020 | 10614.6495 | 11411.0752 | 12310.4889 |
02/29/2020 | 10659.3724 | 11478.9924 | 12480.4216 |
03/31/2020 | 10457.804 | 11208.2587 | 12011.9411 |
04/30/2020 | 10417.0383 | 11168.7109 | 11828.8427 |
05/31/2020 | 10606.2413 | 11448.9307 | 12213.0072 |
06/30/2020 | 10624.9629 | 11498.7218 | 12331.8981 |
07/31/2020 | 10688.7506 | 11617.7663 | 12529.0824 |
08/31/2020 | 10674.8934 | 11604.8954 | 12486.8844 |
09/30/2020 | 10684.4016 | 11606.3651 | 12478.7409 |
10/31/2020 | 10662.335 | 11585.9676 | 12453.9903 |
11/30/2020 | 10710.6493 | 11664.3953 | 12644.4318 |
12/31/2020 | 10727.8026 | 11708.3968 | 12730.2285 |
01/31/2021 | 10744.5408 | 11755.4267 | 12814.1645 |
02/28/2021 | 10663.1993 | 11644.3096 | 12608.4364 |
03/31/2021 | 10688.0224 | 11679.6266 | 12685.0892 |
04/30/2021 | 10713.78 | 11734.3612 | 12805.5408 |
05/31/2021 | 10716.2657 | 11746.5195 | 12861.4247 |
06/30/2021 | 10703.9454 | 11755.8721 | 12903.5827 |
07/31/2021 | 10737.5627 | 11818.8903 | 13000.3241 |
08/31/2021 | 10739.2902 | 11802.1003 | 12952.2436 |
09/30/2021 | 10694.5643 | 11744.9162 | 12854.4017 |
10/31/2021 | 10672.5639 | 11724.6079 | 12840.0155 |
11/30/2021 | 10690.4179 | 11758.8114 | 12944.6803 |
12/31/2021 | 10684.0133 | 11765.1355 | 12962.708 |
01/31/2022 | 10489.5355 | 11516.7143 | 12614.479 |
02/28/2022 | 10453.6482 | 11477.4782 | 12543.3886 |
03/31/2022 | 10258.1932 | 11243.0413 | 12161.105 |
04/30/2022 | 10105.2112 | 11063.3835 | 11801.7111 |
05/31/2022 | 10219.8292 | 11210.4855 | 11990.3119 |
06/30/2022 | 10177.0032 | 11159.1802 | 11760.3534 |
07/31/2022 | 10316.5438 | 11355.0045 | 12081.5509 |
08/31/2022 | 10204.399 | 11175.5694 | 11774.1193 |
09/30/2022 | 10005.6189 | 10912.5404 | 11336.1319 |
10/31/2022 | 9989.5927 | 10893.5681 | 11235.8489 |
11/30/2022 | 10181.9016 | 11188.4403 | 11804.6324 |
12/31/2022 | 10207.3088 | 11222.5102 | 11792.3671 |
01/31/2023 | 10344.7579 | 11436.9951 | 12154.9223 |
02/28/2023 | 10213.3464 | 11232.0409 | 11859.776 |
03/31/2023 | 10352.2708 | 11425.1485 | 12125.9499 |
04/30/2023 | 10331.814 | 11387.1594 | 12111.7038 |
05/31/2023 | 10271.2641 | 11297.3305 | 12018.8841 |
06/30/2023 | 10324.6464 | 11365.8713 | 12128.6911 |
07/31/2023 | 10354.1052 | 11388.0947 | 12159.4442 |
08/31/2023 | 10318.3044 | 11332.8702 | 12012.0412 |
09/30/2023 | 10194.7636 | 11153.6577 | 11671.6555 |
10/31/2023 | 10177.9609 | 11126.4908 | 11525.4929 |
11/30/2023 | 10486.8027 | 11522.2813 | 12262.5884 |
12/31/2023 | 10633.06 | 11703.5424 | 12561.5363 |
01/31/2024 | 10608.4069 | 11680.6955 | 12533.8245 |
02/29/2024 | 10616.9911 | 11690.627 | 12535.4652 |
03/31/2024 | 10633.4701 | 11680.3837 | 12522.8598 |
04/30/2024 | 10559.8464 | 11593.6278 | 12382.8399 |
05/31/2024 | 10518.6514 | 11540.6301 | 12356.9688 |
06/30/2024 | 10618.478 | 11666.8448 | 12555.7339 |
07/31/2024 | 10694.0948 | 11771.5932 | 12664.2203 |
08/31/2024 | 10811.068 | 11895.1358 | 12763.903 |
09/30/2024 | 10878.7079 | 11981.8917 | 12899.3409 |
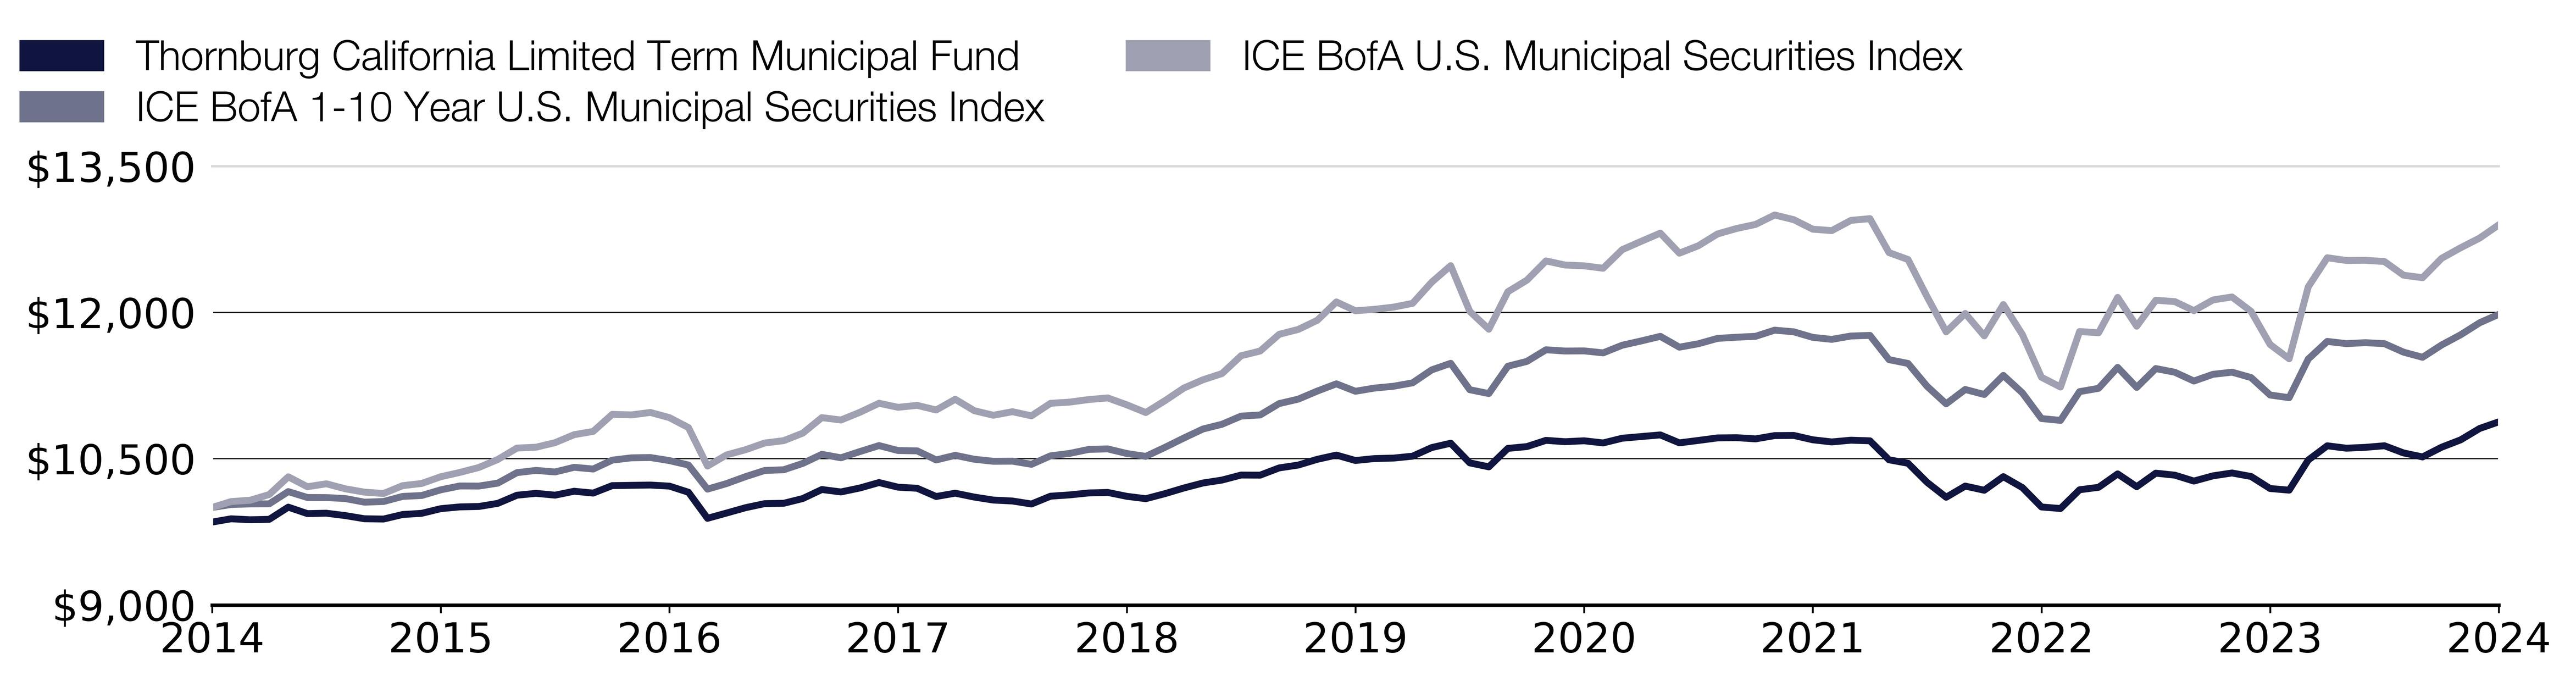
Effective September 30, 2024, the Fund changed its benchmark to the ICE BofA U.S. Municipal Securities Index, a broad-based securities market index that represents the overall applicable market in which the Fund invests.
What were the Fund costs for the past year?
(based on a hypothetical $10,000 investment)
Class Name | Costs of a $10,000 investment | Costs paid as a percentage of a $10,000 investment |
|---|
Class A | $76.00 | 0.74% |
End Block
Thornburg California Limited Term Municipal Fund Tailored Shareholder Report
Thornburg California Limited Term Municipal Fund Tailored Shareholder Report | |
Annual Performance | 1 Year | 5 Year | 10 Year |
|---|
California Limited Term Municipal Fund Class A (with sales charge) | 4.30% | 0.44% | 0.85% |
California Limited Term Municipal Fund Class A (without sales charge) | 6.71% | 0.75% | 1.00% |
ICE BofA 1-10 Year U.S. Municipal Securities Index | 7.43% | 1.37% | 1.82% |
ICE BofA U.S. Municipal Securities Index | 10.52% | 1.43% | 2.58% |
Key Fund Statistics
(as of September 30, 2024)
| |
|---|
Fund Size (Millions) | $273.4M |
Number of Holdings | 197 |
Annual Portfolio Turnover | 46.36% |
Total Advisory Fee | $1.2M |
What did the Fund invest in?
(as of September 30, 2024)
Credit Quality Ratings | (%) |
|---|
| AAA | 12.9 |
| AA | 51.6 |
| A | 24.8 |
| BBB | 8.6 |
| NR | 1.0 |
| Below Invest. Grade | 0.0 |
| Cash & Cash Equivalent | 1.1 |
Credit Quality Ratings | (%) |
AAA | 12.9% |
AA | 51.6% |
A | 24.8% |
BBB | 8.6% |
NR | 1.0% |
Below Invest. Grade | 0.0% |
Cash & Cash Equivalent | 1.1% |
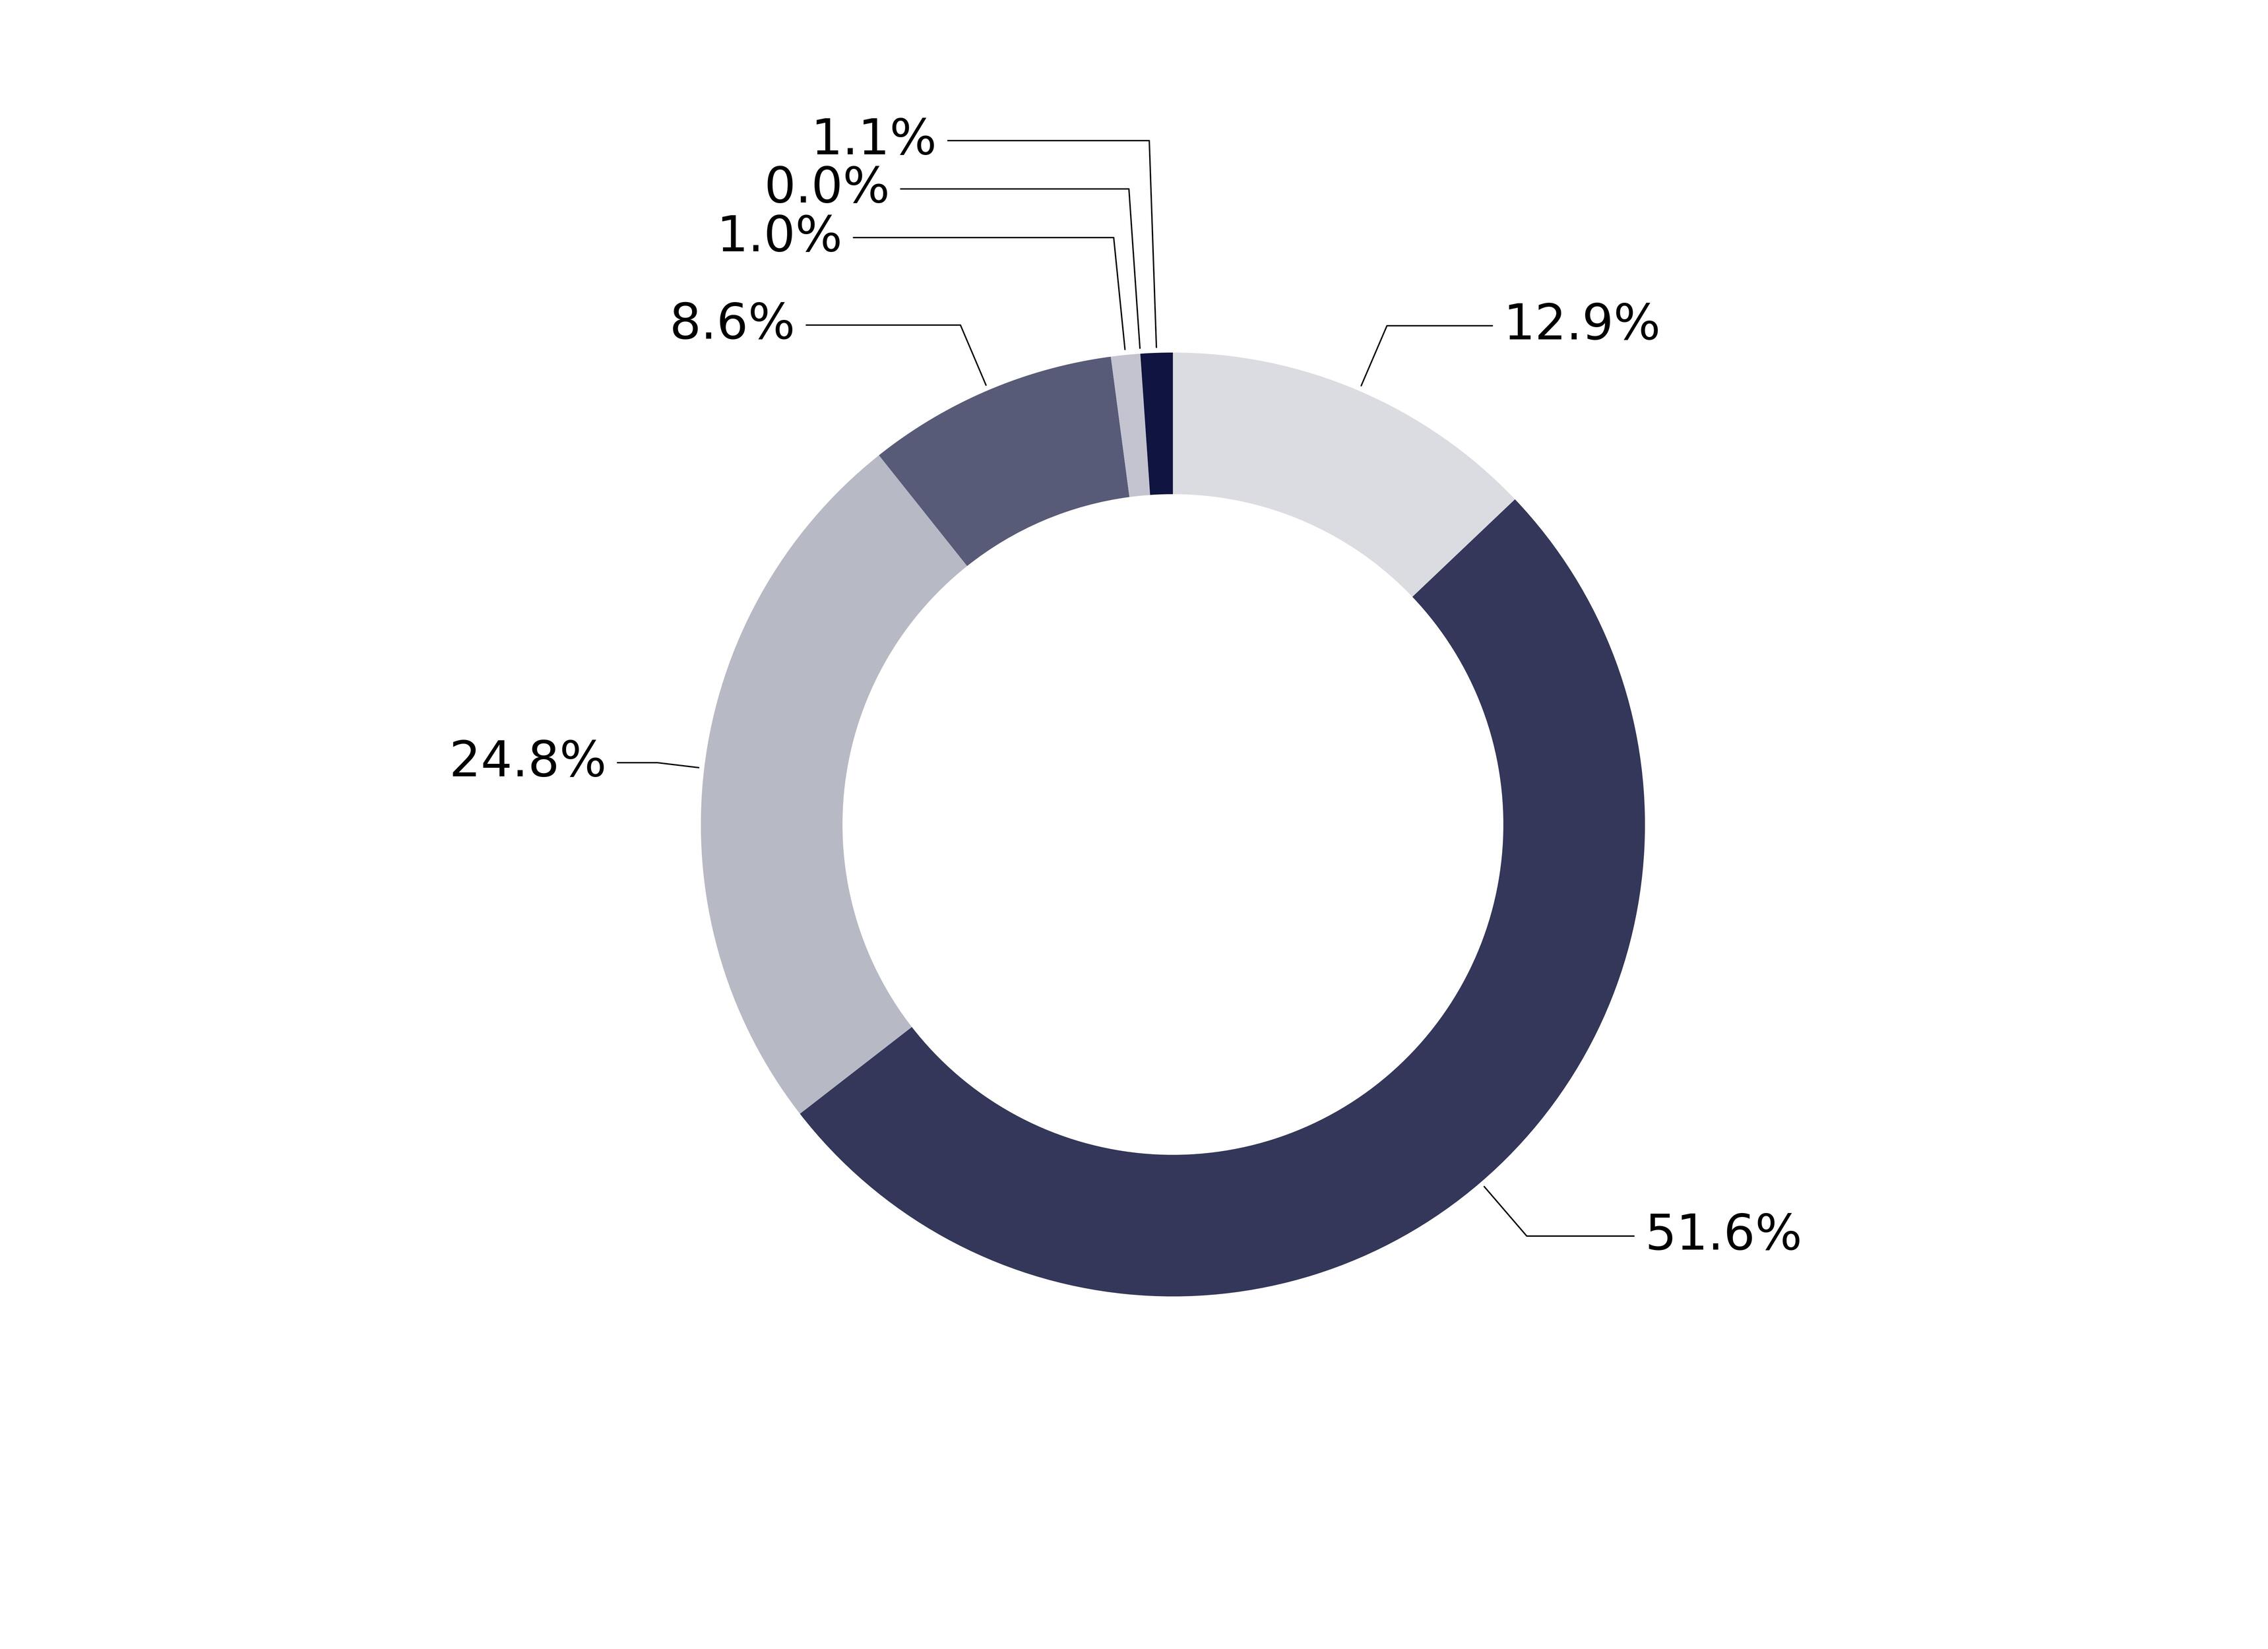
Expressed as a percentage of the Fund’s net assets. * Credit quality ratings shown above reflect the highest rating assigned by either S&P Global Ratings or Moody’s Investors Services, both of which are independent, nationally recognized statistical rating organizations. If a credit rating for an investment is not available from either S&P or Moody’s, then the Fund’s investment advisor will determine the credit quality of the investment. Investments are considered to be investment grade if they are rated within the four highest grades by S&P or Moody’s (BBB/Baa or higher) or, if no credit rating is available, have been judged to be of comparable quality by the Fund’s investment advisor. (NR = Not Rated)
How has the Fund changed?
This is a summary of certain changes to the Fund since October 1, 2023. For more complete information, you may review the Fund’s next prospectus, which we expect to be available by February 1, 2025 at https://www.thornburg.com/download or upon request by calling 1-800-847-0200.
End Block
Changes In and Disagreements with Accountants
No changes and/or disagreements occurred in the current reporting period.
End Block
For additional information about the Fund, including its prospectus, financial information, holdings and proxy information, visit www.thornburg.com/download.

Thornburg California Limited Term Municipal Fund Tailored Shareholder Report | |
Thornburg California Limited Term Municipal Fund Tailored Shareholder Report
Thornburg California Limited Term Municipal Fund CLASS: C TICKER: LTCCX Annual Shareholder Report | |
This annual shareholder report contains important information about the Thornburg California Limited Term Municipal Fund Class C Shares for the period from October 1, 2023 to September 30, 2024. You can find additional information about the Fund at https://www.thornburg.com/download. You can also request this information by contacting us at 1-800-847-0200. This report also describes changes to the Fund that occurred during the reporting period.
How did the Fund perform last year and what affected its performance?
The Fund’s Class C shares underperformed the ICE BofA 1-10 Year U.S. Municipal Securities Index (the “Index”) during the 12-month period ended September 30, 2024. The period began with municipal bond yields peaking in October of 2023, which marked the end of the Federal Reserve rate hiking cycle, before falling precipitously throughout the period and ending significantly lower. The backdrop of falling municipal bond yields boosted bond prices due to the inverse relationship between the two, producing strong absolute returns for the asset class. However, the Fund’s underperformance during the period was driven by its shorter duration and yield curve positioning compared to the Index. The Fund’s relative performance did benefit from its focus on California municipal bonds as opposed to the Index’s national focus. As a result, sector/quality returns and security selection contributed to relative performance during the period.
How did the Fund perform over the past 10 years?
The line graph below reflects a hypothetical $10,000 investment. The returns shown in the line graph and table assume the reinvestment of dividends and capital gains, but do not reflect the deduction of taxes that a shareholder would pay on distributions or the redemption of Fund shares. The performance information shown below represents past performance and is no guarantee of future results. For Fund performance current to the most recent month end, visit https://www.thornburg.com/product/mutual-funds/fca/LTCCX or call 1-800-847-0200. Performance for other share classes of the Fund will vary.
Cumulative Performance
Growth Table
Date | Thornburg California Limited Term Municipal Fund | ICE BofA 1-10 Year U.S. Municipal Securities Index | ICE BofA U.S. Municipal Securities Index |
09/30/2014 | 10000.0047 | 10000 | 10000 |
10/31/2014 | 10031.9088 | 10031.0861 | 10061.0061 |
11/30/2014 | 10019.9487 | 10036.9203 | 10074.732 |
12/31/2014 | 10029.2836 | 10037.6328 | 10133.237 |
01/31/2015 | 10146.85 | 10163.3576 | 10315.1349 |
02/28/2015 | 10077.7923 | 10102.8334 | 10213.0312 |
03/31/2015 | 10079.6144 | 10101.9427 | 10243.2441 |
04/30/2015 | 10052.8195 | 10091.7885 | 10191.582 |
05/31/2015 | 10018.1156 | 10054.6901 | 10157.4674 |
06/30/2015 | 10013.3138 | 10061.5931 | 10143.7215 |
07/31/2015 | 10058.3646 | 10113.7892 | 10223.9759 |
08/31/2015 | 10068.8526 | 10123.0972 | 10246.5455 |
09/30/2015 | 10115.3475 | 10181.2611 | 10315.6951 |
10/31/2015 | 10131.6877 | 10221.0316 | 10359.774 |
11/30/2015 | 10133.8095 | 10219.8737 | 10410.5357 |
12/31/2015 | 10164.5183 | 10250.3808 | 10493.2511 |
01/31/2016 | 10246.4872 | 10357.5787 | 10609.5409 |
02/29/2016 | 10263.9733 | 10380.4701 | 10618.4247 |
03/31/2016 | 10243.0805 | 10364.6599 | 10665.2047 |
04/30/2016 | 10281.4748 | 10412.4469 | 10746.9397 |
05/31/2016 | 10260.3366 | 10394.6771 | 10780.454 |
06/30/2016 | 10335.7145 | 10485.9311 | 10955.589 |
07/31/2016 | 10343.9419 | 10509.4015 | 10949.7465 |
08/31/2016 | 10344.6277 | 10512.5636 | 10974.9373 |
09/30/2016 | 10324.1723 | 10481.3439 | 10921.9146 |
10/31/2016 | 10258.4734 | 10435.7837 | 10819.6708 |
11/30/2016 | 9986.6055 | 10188.5204 | 10425.262 |
12/31/2016 | 10039.2217 | 10245.66 | 10539.3308 |
01/31/2017 | 10092.647 | 10316.8283 | 10592.9738 |
02/28/2017 | 10132.7371 | 10379.8912 | 10661.5031 |
03/31/2017 | 10134.2857 | 10387.2396 | 10685.8535 |
04/30/2017 | 10188.7738 | 10452.3956 | 10762.9465 |
05/31/2017 | 10272.3784 | 10545.3865 | 10922.1347 |
06/30/2017 | 10244.9764 | 10509.8914 | 10897.224 |
07/31/2017 | 10283.8789 | 10573.934 | 10976.8981 |
08/31/2017 | 10337.4497 | 10635.349 | 11069.4177 |
09/30/2017 | 10287.2297 | 10584.3109 | 11027.4598 |
10/31/2017 | 10273.8214 | 10581.0598 | 11047.8085 |
11/30/2017 | 10186.4623 | 10488.0688 | 11000.3481 |
12/31/2017 | 10225.9529 | 10535.2323 | 11110.0751 |
01/31/2018 | 10175.893 | 10494.8828 | 10993.045 |
02/28/2018 | 10143.1569 | 10474.2182 | 10946.205 |
03/31/2018 | 10138.7821 | 10475.3761 | 10982.8206 |
04/30/2018 | 10105.5633 | 10443.1321 | 10940.1224 |
05/31/2018 | 10176.2918 | 10529.888 | 11068.6574 |
06/30/2018 | 10187.4541 | 10554.65 | 11080.8826 |
07/31/2018 | 10212.635 | 10595.7566 | 11107.1138 |
08/31/2018 | 10208.0468 | 10601.3236 | 11124.0611 |
09/30/2018 | 10165.988 | 10553.8929 | 11053.4109 |
10/31/2018 | 10138.9792 | 10524.6328 | 10973.8968 |
11/30/2018 | 10188.3316 | 10616.4213 | 11094.9286 |
12/31/2018 | 10244.6042 | 10713.0196 | 11225.6846 |
01/31/2019 | 10293.6049 | 10805.1198 | 11309.9006 |
02/28/2019 | 10321.6865 | 10853.9757 | 11374.1081 |
03/31/2019 | 10370.7512 | 10937.3469 | 11556.5862 |
04/30/2019 | 10367.3397 | 10949.2825 | 11604.8669 |
05/31/2019 | 10447.1297 | 11066.0111 | 11776.3203 |
06/30/2019 | 10466.4666 | 11111.3932 | 11826.3817 |
07/31/2019 | 10530.5404 | 11194.319 | 11920.3619 |
08/31/2019 | 10571.5137 | 11268.4267 | 12108.5024 |
09/30/2019 | 10505.6468 | 11192.2704 | 12018.0237 |
10/31/2019 | 10522.7927 | 11224.8261 | 12032.5099 |
11/30/2019 | 10532.8229 | 11243.7093 | 12055.2997 |
12/31/2019 | 10542.1112 | 11278.67 | 12094.0362 |
01/31/2020 | 10635.6781 | 11411.0752 | 12310.4889 |
02/29/2020 | 10670.3888 | 11478.9924 | 12480.4216 |
03/31/2020 | 10466.288 | 11208.2587 | 12011.9411 |
04/30/2020 | 10430.8098 | 11168.7109 | 11828.8427 |
05/31/2020 | 10609.7994 | 11448.9307 | 12213.0072 |
06/30/2020 | 10626.0749 | 11498.7218 | 12331.8981 |
07/31/2020 | 10687.2342 | 11617.7663 | 12529.0824 |
08/31/2020 | 10670.8489 | 11604.8954 | 12486.8844 |
09/30/2020 | 10677.8782 | 11606.3651 | 12478.7409 |
10/31/2020 | 10653.2431 | 11585.9676 | 12453.9903 |
11/30/2020 | 10706.7573 | 11664.3953 | 12644.4318 |
12/31/2020 | 10713.5755 | 11708.3968 | 12730.2285 |
01/31/2021 | 10727.7438 | 11755.4267 | 12814.1645 |
02/28/2021 | 10644.2916 | 11644.3096 | 12608.4364 |
03/31/2021 | 10666.5269 | 11679.6266 | 12685.0892 |
04/30/2021 | 10689.745 | 11734.3612 | 12805.5408 |
05/31/2021 | 10689.6763 | 11746.5195 | 12861.4247 |
06/30/2021 | 10674.9283 | 11755.8721 | 12903.5827 |
07/31/2021 | 10705.8875 | 11818.8903 | 13000.3241 |
08/31/2021 | 10705.0538 | 11802.1003 | 12952.2436 |
09/30/2021 | 10658.0342 | 11744.9162 | 12854.4017 |
10/31/2021 | 10633.5808 | 11724.6079 | 12840.0155 |
11/30/2021 | 10648.898 | 11758.8114 | 12944.6803 |
12/31/2021 | 10639.9712 | 11765.1355 | 12962.708 |
01/31/2022 | 10443.9395 | 11516.7143 | 12614.479 |
02/28/2022 | 10405.9998 | 11477.4782 | 12543.3886 |
03/31/2022 | 10209.0682 | 11243.0413 | 12161.105 |
04/30/2022 | 10054.6144 | 11063.3835 | 11801.7111 |
05/31/2022 | 10166.1869 | 11210.4855 | 11990.3119 |
06/30/2022 | 10121.2924 | 11159.1802 | 11760.3534 |
07/31/2022 | 10257.5349 | 11355.0045 | 12081.5509 |
08/31/2022 | 10143.6953 | 11175.5694 | 11774.1193 |
09/30/2022 | 9943.9416 | 10912.5404 | 11336.1319 |
10/31/2022 | 9925.6703 | 10893.5681 | 11235.8489 |
11/30/2022 | 10114.304 | 11188.4403 | 11804.6324 |
12/31/2022 | 10137.1423 | 11222.5102 | 11792.3671 |
01/31/2023 | 10271.111 | 11436.9951 | 12154.9223 |
02/28/2023 | 10146.4765 | 11232.0409 | 11859.776 |
03/31/2023 | 10273.9323 | 11425.1485 | 12125.9499 |
04/30/2023 | 10251.3025 | 11387.1594 | 12111.7038 |
05/31/2023 | 10188.8638 | 11297.3305 | 12018.8841 |
06/30/2023 | 10239.4173 | 11365.8713 | 12128.6911 |
07/31/2023 | 10266.1791 | 11388.0947 | 12159.4442 |
08/31/2023 | 10228.2795 | 11332.8702 | 12012.0412 |
09/30/2023 | 10111.5901 | 11153.6577 | 11671.6555 |
10/31/2023 | 10084.5345 | 11126.4908 | 11525.4929 |
11/30/2023 | 10387.969 | 11522.2813 | 12262.5884 |
12/31/2023 | 10530.2896 | 11703.5424 | 12561.5363 |
01/31/2024 | 10511.4587 | 11680.6955 | 12533.8245 |
02/29/2024 | 10509.4927 | 11690.627 | 12535.4652 |
03/31/2024 | 10531.426 | 11680.3837 | 12522.8598 |
04/30/2024 | 10456.2228 | 11593.6278 | 12382.8399 |
05/31/2024 | 10404.7764 | 11540.6301 | 12356.9688 |
06/30/2024 | 10501.0671 | 11666.8448 | 12555.7339 |
07/31/2024 | 10573.295 | 11771.5932 | 12664.2203 |
08/31/2024 | 10686.3404 | 11895.1358 | 12763.903 |
09/30/2024 | 10750.7106 | 11981.8917 | 12899.3409 |

Effective September 30, 2024, the Fund changed its benchmark to the ICE BofA U.S. Municipal Securities Index, a broad-based securities market index that represents the overall applicable market in which the Fund invests.
What were the Fund costs for the past year?
(based on a hypothetical $10,000 investment)
Class Name | Costs of a $10,000 investment | Costs paid as a percentage of a $10,000 investment |
|---|
Class C | $105.00 | 1.02% |
End Block
Thornburg California Limited Term Municipal Fund Tailored Shareholder Report
Thornburg California Limited Term Municipal Fund Tailored Shareholder Report | |
Annual Performance | 1 Year | 5 Year | 10 Year |
|---|
California Limited Term Municipal Fund Class C (with sales charge) | 5.80% | 0.46% | 0.73% |
California Limited Term Municipal Fund Class C (without sales charge) | 6.32% | 0.46% | 0.73% |
ICE BofA 1-10 Year U.S. Municipal Securities Index | 7.43% | 1.37% | 1.82% |
ICE BofA U.S. Municipal Securities Index | 10.52% | 1.43% | 2.58% |
Key Fund Statistics
(as of September 30, 2024)
| |
|---|
Fund Size (Millions) | $273.4M |
Number of Holdings | 197 |
Annual Portfolio Turnover | 46.36% |
Total Advisory Fee | $1.2M |
What did the Fund invest in?
(as of September 30, 2024)
Credit Quality Ratings | (%) |
|---|
| AAA | 12.9 |
| AA | 51.6 |
| A | 24.8 |
| BBB | 8.6 |
| NR | 1.0 |
| Below Invest. Grade | 0.0 |
| Cash & Cash Equivalent | 1.1 |
Credit Quality Ratings | (%) |
AAA | 12.9% |
AA | 51.6% |
A | 24.8% |
BBB | 8.6% |
NR | 1.0% |
Below Invest. Grade | 0.0% |
Cash & Cash Equivalent | 1.1% |
Expressed as a percentage of the Fund’s net assets. * Credit quality ratings shown above reflect the highest rating assigned by either S&P Global Ratings or Moody’s Investors Services, both of which are independent, nationally recognized statistical rating organizations. If a credit rating for an investment is not available from either S&P or Moody’s, then the Fund’s investment advisor will determine the credit quality of the investment. Investments are considered to be investment grade if they are rated within the four highest grades by S&P or Moody’s (BBB/Baa or higher) or, if no credit rating is available, have been judged to be of comparable quality by the Fund’s investment advisor. (NR = Not Rated)
How has the Fund changed?
This is a summary of certain changes to the Fund since October 1, 2023. For more complete information, you may review the Fund’s next prospectus, which we expect to be available by February 1, 2025 at https://www.thornburg.com/download or upon request by calling 1-800-847-0200.
End Block
Changes In and Disagreements with Accountants
No changes and/or disagreements occurred in the current reporting period.
End Block
For additional information about the Fund, including its prospectus, financial information, holdings and proxy information, visit www.thornburg.com/download.

Thornburg California Limited Term Municipal Fund Tailored Shareholder Report | |
Thornburg California Limited Term Municipal Fund Tailored Shareholder Report
Thornburg California Limited Term Municipal Fund CLASS: C2 TICKER: LTCQX Annual Shareholder Report | |
This annual shareholder report contains important information about the Thornburg California Limited Term Municipal Fund Class C2 Shares for the period from October 1, 2023 to September 30, 2024. You can find additional information about the Fund at https://www.thornburg.com/download. You can also request this information by contacting us at 1-800-847-0200. This report also describes changes to the Fund that occurred during the reporting period.
How did the Fund perform last year and what affected its performance?
The Fund’s Class C2 shares underperformed the ICE BofA 1-10 Year U.S. Municipal Securities Index (the “Index”) during the 12-month period ended September 30, 2024. The period began with municipal bond yields peaking in October of 2023, which marked the end of the Federal Reserve rate hiking cycle, before falling precipitously throughout the period and ending significantly lower. The backdrop of falling municipal bond yields boosted bond prices due to the inverse relationship between the two, producing strong absolute returns for the asset class. However, the Fund’s underperformance during the period was driven by its shorter duration and yield curve positioning compared to the Index. The Fund’s relative performance did benefit from its focus on California municipal bonds as opposed to the Index’s national focus. As a result, sector/quality returns and security selection contributed to relative performance during the period.
How did the Fund perform over the past 10 years?
The line graph below reflects a hypothetical $10,000 investment. The returns shown in the line graph and table assume the reinvestment of dividends and capital gains, but do not reflect the deduction of taxes that a shareholder would pay on distributions or the redemption of Fund shares. The performance information shown below represents past performance and is no guarantee of future results. For Fund performance current to the most recent month end, call 1-800-847-0200. Performance for other share classes of the Fund will vary.
Cumulative Performance
Growth Table
Date | Thornburg California Limited Term Municipal Fund | ICE BofA 1-10 Year U.S. Municipal Securities Index | ICE BofA U.S. Municipal Securities Index |
09/30/2020 | 10000.0005 | 10000 | 10000 |
10/31/2020 | 9977.2187 | 9982.4256 | 9980.1658 |
11/30/2020 | 10020.0804 | 10049.9987 | 10132.7786 |
12/31/2020 | 10033.9554 | 10087.9101 | 10201.5329 |
01/31/2021 | 10047.6047 | 10128.4309 | 10268.796 |
02/28/2021 | 9969.7752 | 10032.6929 | 10103.9332 |
03/31/2021 | 9990.9173 | 10063.1219 | 10165.3599 |
04/30/2021 | 10013.0557 | 10110.281 | 10261.8853 |
05/31/2021 | 10013.0113 | 10120.7565 | 10306.6686 |
06/30/2021 | 9997.5445 | 10128.8147 | 10340.4525 |
07/31/2021 | 10026.555 | 10183.111 | 10417.9775 |
08/31/2021 | 10025.8032 | 10168.6447 | 10379.4475 |
09/30/2021 | 9981.7793 | 10119.3752 | 10301.0406 |
10/31/2021 | 9958.8958 | 10101.8775 | 10289.5121 |
11/30/2021 | 9973.2543 | 10131.3472 | 10373.3866 |
12/31/2021 | 9964.9368 | 10136.796 | 10387.8333 |
01/31/2022 | 9781.3102 | 9922.7573 | 10108.7755 |
02/28/2022 | 9745.7878 | 9888.9516 | 10051.8062 |
03/31/2022 | 9561.4235 | 9686.9616 | 9745.4583 |
04/30/2022 | 9416.9377 | 9532.1691 | 9457.4535 |
05/31/2022 | 9512.9146 | 9658.9117 | 9608.5911 |
06/30/2022 | 9478.2361 | 9614.7072 | 9424.3109 |
07/31/2022 | 9605.844 | 9783.4287 | 9681.7067 |
08/31/2022 | 9499.2468 | 9628.8281 | 9435.3424 |
09/30/2022 | 9304.8307 | 9402.2033 | 9084.3555 |
10/31/2022 | 9295.0978 | 9385.8569 | 9003.9925 |
11/30/2022 | 9471.7568 | 9639.9176 | 9459.7944 |
12/31/2022 | 9485.7472 | 9669.2721 | 9449.9655 |
01/31/2023 | 9618.6269 | 9854.0715 | 9740.5038 |
02/28/2023 | 9494.495 | 9677.4837 | 9503.9845 |
03/31/2023 | 9621.2914 | 9843.8645 | 9717.2864 |
04/30/2023 | 9600.1062 | 9811.1332 | 9705.8701 |
05/31/2023 | 9541.6418 | 9733.737 | 9631.4878 |
06/30/2023 | 9589.0024 | 9792.7914 | 9719.4831 |
07/31/2023 | 9614.077 | 9811.9391 | 9744.1275 |
08/31/2023 | 9578.6032 | 9764.3578 | 9626.0041 |
09/30/2023 | 9461.8412 | 9609.9491 | 9353.2317 |
10/31/2023 | 9444.0488 | 9586.5422 | 9236.1024 |
11/30/2023 | 9728.1627 | 9927.5537 | 9826.7834 |
12/31/2023 | 9861.4522 | 10083.7276 | 10066.3492 |
01/31/2024 | 9836.2901 | 10064.0428 | 10044.1419 |
02/29/2024 | 9842.0864 | 10072.5997 | 10045.4567 |
03/31/2024 | 9855.0262 | 10063.7742 | 10035.3552 |
04/30/2024 | 9784.6111 | 9989.0256 | 9923.1485 |
05/31/2024 | 9744.153 | 9943.363 | 9902.4163 |
06/30/2024 | 9834.3374 | 10052.1091 | 10061.6993 |
07/31/2024 | 9902.0023 | 10142.36 | 10148.6363 |
08/31/2024 | 10007.8857 | 10248.8038 | 10228.5183 |
09/30/2024 | 10068.171 | 10323.5523 | 10337.0532 |

Effective September 30, 2024, the Fund changed its benchmark to the ICE BofA U.S. Municipal Securities Index, a broad-based securities market index that represents the overall applicable market in which the Fund invests.
What were the Fund costs for the past year?
(based on a hypothetical $10,000 investment)
Class Name | Costs of a $10,000 investment | Costs paid as a percentage of a $10,000 investment |
|---|
Class C2 | $105.00 | 1.02% |
End Block
Thornburg California Limited Term Municipal Fund Tailored Shareholder Report
Thornburg California Limited Term Municipal Fund Tailored Shareholder Report | |
Annual Performance | 1 Year |
|---|
California Limited Term Municipal Fund Class C2 (with sales charge) | 5.76% |
California Limited Term Municipal Fund Class C2 (without sales charge) | 6.41% |
ICE BofA 1-10 Year U.S. Municipal Securities Index | 7.43% |
ICE BofA U.S. Municipal Securities Index | 10.52% |
Key Fund Statistics
(as of September 30, 2024)
| |
|---|
Fund Size (Millions) | $273.4M |
Number of Holdings | 197 |
Annual Portfolio Turnover | 46.36% |
Total Advisory Fee | $1.2M |
What did the Fund invest in?
(as of September 30, 2024)
Credit Quality Ratings | (%) |
|---|
| AAA | 12.9 |
| AA | 51.6 |
| A | 24.8 |
| BBB | 8.6 |
| NR | 1.0 |
| Below Invest. Grade | 0.0 |
| Cash & Cash Equivalent | 1.1 |
Credit Quality Ratings | (%) |
AAA | 12.9% |
AA | 51.6% |
A | 24.8% |
BBB | 8.6% |
NR | 1.0% |
Below Invest. Grade | 0.0% |
Cash & Cash Equivalent | 1.1% |
Expressed as a percentage of the Fund’s net assets. * Credit quality ratings shown above reflect the highest rating assigned by either S&P Global Ratings or Moody’s Investors Services, both of which are independent, nationally recognized statistical rating organizations. If a credit rating for an investment is not available from either S&P or Moody’s, then the Fund’s investment advisor will determine the credit quality of the investment. Investments are considered to be investment grade if they are rated within the four highest grades by S&P or Moody’s (BBB/Baa or higher) or, if no credit rating is available, have been judged to be of comparable quality by the Fund’s investment advisor. (NR = Not Rated)
How has the Fund changed?
This is a summary of certain changes to the Fund since October 1, 2023. For more complete information, you may review the Fund’s next prospectus, which we expect to be available by February 1, 2025 at https://www.thornburg.com/download or upon request by calling 1-800-847-0200.
End Block
Changes In and Disagreements with Accountants
No changes and/or disagreements occurred in the current reporting period.
End Block
For additional information about the Fund, including its prospectus, financial information, holdings and proxy information, visit www.thornburg.com/download.
Thornburg California Limited Term Municipal Fund Tailored Shareholder Report | |
Thornburg California Limited Term Municipal Fund Tailored Shareholder Report
Thornburg California Limited Term Municipal Fund CLASS: I TICKER: LTCIX Annual Shareholder Report | |
This annual shareholder report contains important information about the Thornburg California Limited Term Municipal Fund Class I Shares for the period from October 1, 2023 to September 30, 2024. You can find additional information about the Fund at https://www.thornburg.com/download. You can also request this information by contacting us at 1-800-847-0200. This report also describes changes to the Fund that occurred during the reporting period.
How did the Fund perform last year and what affected its performance?
The Fund’s Class I shares underperformed the ICE BofA 1-10 Year U.S. Municipal Securities Index (the “Index”) during the 12-month period ended September 30, 2024. The period began with municipal bond yields peaking in October of 2023, which marked the end of the Federal Reserve rate hiking cycle, before falling precipitously throughout the period and ending significantly lower. The backdrop of falling municipal bond yields boosted bond prices due to the inverse relationship between the two, producing strong absolute returns for the asset class. However, the Fund’s underperformance during the period was driven by its shorter duration and yield curve positioning compared to the Index. The Fund’s relative performance did benefit from its focus on California municipal bonds as opposed to the Index’s national focus. As a result, sector/quality returns and security selection contributed to relative performance during the period.
How did the Fund perform over the past 10 years?
The line graph below reflects a hypothetical $10,000 investment. The returns shown in the line graph and table assume the reinvestment of dividends and capital gains, but do not reflect the deduction of taxes that a shareholder would pay on distributions or the redemption of Fund shares. The performance information shown below represents past performance and is no guarantee of future results. For Fund performance current to the most recent month end, visit https://www.thornburg.com/product/mutual-funds/fca/LTCIX or call 1-800-847-0200. Performance for other share classes of the Fund will vary.
Cumulative Performance
Growth Table
Date | Thornburg California Limited Term Municipal Fund | ICE BofA 1-10 Year U.S. Municipal Securities Index | ICE BofA U.S. Municipal Securities Index |
09/30/2014 | 10000.0047 | 10000 | 10000 |
10/31/2014 | 10037.0305 | 10031.0861 | 10061.0061 |
11/30/2014 | 10029.9622 | 10036.9203 | 10074.732 |
12/31/2014 | 10044.4078 | 10037.6328 | 10133.237 |
01/31/2015 | 10166.94 | 10163.3576 | 10315.1349 |
02/28/2015 | 10102.0581 | 10102.8334 | 10213.0312 |
03/31/2015 | 10108.6791 | 10101.9427 | 10243.2441 |
04/30/2015 | 10093.4982 | 10091.7885 | 10191.582 |
05/31/2015 | 10063.2171 | 10054.6901 | 10157.4674 |
06/30/2015 | 10062.8531 | 10061.5931 | 10143.7215 |
07/31/2015 | 10105.4088 | 10113.7892 | 10223.9759 |
08/31/2015 | 10120.713 | 10123.0972 | 10246.5455 |
09/30/2015 | 10171.7585 | 10181.2611 | 10315.6951 |
10/31/2015 | 10200.4557 | 10221.0316 | 10359.774 |
11/30/2015 | 10207.3772 | 10219.8737 | 10410.5357 |
12/31/2015 | 10235.8476 | 10250.3808 | 10493.2511 |
01/31/2016 | 10323.2794 | 10357.5787 | 10609.5409 |
02/29/2016 | 10345.5071 | 10380.4701 | 10618.4247 |
03/31/2016 | 10336.7099 | 10364.6599 | 10665.2047 |
04/30/2016 | 10380.132 | 10412.4469 | 10746.9397 |
05/31/2016 | 10356.3266 | 10394.6771 | 10780.454 |
06/30/2016 | 10444.5452 | 10485.9311 | 10955.589 |
07/31/2016 | 10450.2809 | 10509.4015 | 10949.7465 |
08/31/2016 | 10455.8856 | 10512.5636 | 10974.9373 |
09/30/2016 | 10439.8416 | 10481.3439 | 10921.9146 |
10/31/2016 | 10385.7325 | 10435.7837 | 10819.6708 |
11/30/2016 | 10107.8307 | 10188.5204 | 10425.262 |
12/31/2016 | 10165.8027 | 10245.66 | 10539.3308 |
01/31/2017 | 10224.599 | 10316.8283 | 10592.9738 |
02/28/2017 | 10269.4371 | 10379.8912 | 10661.5031 |
03/31/2017 | 10275.653 | 10387.2396 | 10685.8535 |
04/30/2017 | 10335.4544 | 10452.3956 | 10762.9465 |
05/31/2017 | 10425.0617 | 10545.3865 | 10922.1347 |
06/30/2017 | 10401.8855 | 10509.8914 | 10897.224 |
07/31/2017 | 10446.2016 | 10573.934 | 10976.8981 |
08/31/2017 | 10505.5818 | 10635.349 | 11069.4177 |
09/30/2017 | 10459.2323 | 10584.3109 | 11027.4598 |
10/31/2017 | 10450.5136 | 10581.0598 | 11047.8085 |
11/30/2017 | 10366.4192 | 10488.0688 | 11000.3481 |
12/31/2017 | 10411.5505 | 10535.2323 | 11110.0751 |
01/31/2018 | 10365.5551 | 10494.8828 | 10993.045 |
02/28/2018 | 10343.8018 | 10474.2182 | 10946.205 |
03/31/2018 | 10335.9066 | 10475.3761 | 10982.8206 |
04/30/2018 | 10306.3315 | 10443.1321 | 10940.1224 |
05/31/2018 | 10382.9355 | 10529.888 | 11068.6574 |
06/30/2018 | 10406.3295 | 10554.65 | 11080.8826 |
07/31/2018 | 10428.893 | 10595.7566 | 11107.1138 |
08/31/2018 | 10428.8564 | 10601.3236 | 11124.0611 |
09/30/2018 | 10390.77 | 10553.8929 | 11053.4109 |
10/31/2018 | 10367.8476 | 10524.6328 | 10973.8968 |
11/30/2018 | 10422.8856 | 10616.4213 | 11094.9286 |
12/31/2018 | 10493.0021 | 10713.0196 | 11225.6846 |
01/31/2019 | 10548.0206 | 10805.1198 | 11309.9006 |
02/28/2019 | 10581.1944 | 10853.9757 | 11374.1081 |
03/31/2019 | 10628.6426 | 10937.3469 | 11556.5862 |
04/30/2019 | 10637.6425 | 10949.2825 | 11604.8669 |
05/31/2019 | 10716.5586 | 11066.0111 | 11776.3203 |
06/30/2019 | 10741.2508 | 11111.3932 | 11826.3817 |
07/31/2019 | 10811.7323 | 11194.319 | 11920.3619 |
08/31/2019 | 10858.6107 | 11268.4267 | 12108.5024 |
09/30/2019 | 10795.5969 | 11192.2704 | 12018.0237 |
10/31/2019 | 10818.134 | 11224.8261 | 12032.5099 |
11/30/2019 | 10833.2343 | 11243.7093 | 12055.2997 |
12/31/2019 | 10847.7575 | 11278.67 | 12094.0362 |
01/31/2020 | 10948.7158 | 11411.0752 | 12310.4889 |
02/29/2020 | 10989.0458 | 11478.9924 | 12480.4216 |
03/31/2020 | 10783.6712 | 11208.2587 | 12011.9411 |
04/30/2020 | 10751.8161 | 11168.7109 | 11828.8427 |
05/31/2020 | 10941.1814 | 11448.9307 | 12213.0072 |
06/30/2020 | 10962.7239 | 11498.7218 | 12331.8981 |
07/31/2020 | 11030.8122 | 11617.7663 | 12529.0824 |
08/31/2020 | 11018.8747 | 11604.8954 | 12486.8844 |
09/30/2020 | 11038.9185 | 11606.3651 | 12478.7409 |
10/31/2020 | 11010.5058 | 11585.9676 | 12453.9903 |
11/30/2020 | 11070.6246 | 11664.3953 | 12644.4318 |
12/31/2020 | 11090.6702 | 11708.3968 | 12730.2285 |
01/31/2021 | 11102.2958 | 11755.4267 | 12814.1645 |
02/28/2021 | 11020.4528 | 11644.3096 | 12608.4364 |
03/31/2021 | 11056.4713 | 11679.6266 | 12685.0892 |
04/30/2021 | 11085.3182 | 11734.3612 | 12805.5408 |
05/31/2021 | 11082.1975 | 11746.5195 | 12861.4247 |
06/30/2021 | 11071.7382 | 11755.8721 | 12903.5827 |
07/31/2021 | 11116.9242 | 11818.8903 | 13000.3241 |
08/31/2021 | 11112.9944 | 11802.1003 | 12952.2436 |
09/30/2021 | 11069.0228 | 11744.9162 | 12854.4017 |
10/31/2021 | 11048.6279 | 11724.6079 | 12840.0155 |
11/30/2021 | 11069.3783 | 11758.8114 | 12944.6803 |
12/31/2021 | 11065.1195 | 11765.1355 | 12962.708 |
01/31/2022 | 10866.1957 | 11516.7143 | 12614.479 |
02/28/2022 | 10831.121 | 11477.4782 | 12543.3886 |
03/31/2022 | 10630.9774 | 11243.0413 | 12161.105 |
04/30/2022 | 10474.7199 | 11063.3835 | 11801.7111 |
05/31/2022 | 10595.6554 | 11210.4855 | 11990.3119 |
06/30/2022 | 10553.4555 | 11159.1802 | 11760.3534 |
07/31/2022 | 10700.2953 | 11355.0045 | 12081.5509 |
08/31/2022 | 10594.5378 | 11175.5694 | 11774.1193 |
09/30/2022 | 10382.4361 | 10912.5404 | 11336.1319 |
10/31/2022 | 10368.0209 | 10893.5681 | 11235.8489 |
11/30/2022 | 10569.6128 | 11188.4403 | 11804.6324 |
12/31/2022 | 10598.2254 | 11222.5102 | 11792.3671 |
01/31/2023 | 10743.1013 | 11436.9951 | 12154.9223 |
02/28/2023 | 10617.0872 | 11232.0409 | 11859.776 |
03/31/2023 | 10755.2411 | 11425.1485 | 12125.9499 |
04/30/2023 | 10736.2441 | 11387.1594 | 12111.7038 |
05/31/2023 | 10675.6689 | 11297.3305 | 12018.8841 |
06/30/2023 | 10733.3197 | 11365.8713 | 12128.6911 |
07/31/2023 | 10766.2232 | 11388.0947 | 12159.4442 |
08/31/2023 | 10731.318 | 11332.8702 | 12012.0412 |
09/30/2023 | 10613.5699 | 11153.6577 | 11671.6555 |
10/31/2023 | 10589.9293 | 11126.4908 | 11525.4929 |
11/30/2023 | 10913.2323 | 11522.2813 | 12262.5884 |
12/31/2023 | 11067.6901 | 11703.5424 | 12561.5363 |
01/31/2024 | 11052.8913 | 11680.6955 | 12533.8245 |
02/29/2024 | 11055.509 | 11690.627 | 12535.4652 |
03/31/2024 | 11083.5629 | 11680.3837 | 12522.8598 |
04/30/2024 | 11009.2263 | 11593.6278 | 12382.8399 |
05/31/2024 | 10960.1099 | 11540.6301 | 12356.9688 |
06/30/2024 | 11066.3394 | 11666.8448 | 12555.7339 |
07/31/2024 | 11156.1017 | 11771.5932 | 12664.2203 |
08/31/2024 | 11280.334 | 11895.1358 | 12763.903 |
09/30/2024 | 11353.1476 | 11981.8917 | 12899.3409 |

Effective September 30, 2024, the Fund changed its benchmark to the ICE BofA U.S. Municipal Securities Index, a broad-based securities market index that represents the overall applicable market in which the Fund invests.
What were the Fund costs for the past year?
(based on a hypothetical $10,000 investment)
Class Name | Costs of a $10,000 investment | Costs paid as a percentage of a $10,000 investment |
|---|
Class I | $51.00 | 0.49% |
End Block
Thornburg California Limited Term Municipal Fund Tailored Shareholder Report
Thornburg California Limited Term Municipal Fund Tailored Shareholder Report | |
Annual Performance | 1 Year | 5 Year | 10 Year |
|---|
California Limited Term Municipal Fund Class I | 6.97% | 1.01% | 1.28% |
ICE BofA 1-10 Year U.S. Municipal Securities Index | 7.43% | 1.37% | 1.82% |
ICE BofA U.S. Municipal Securities Index | 10.52% | 1.43% | 2.58% |
Key Fund Statistics
(as of September 30, 2024)
| |
|---|
Fund Size (Millions) | $273.4M |
Number of Holdings | 197 |
Annual Portfolio Turnover | 46.36% |
Total Advisory Fee | $1.2M |
What did the Fund invest in?
(as of September 30, 2024)
Credit Quality Ratings | (%) |
|---|
| AAA | 12.9 |
| AA | 51.6 |
| A | 24.8 |
| BBB | 8.6 |
| NR | 1.0 |
| Below Invest. Grade | 0.0 |
| Cash & Cash Equivalent | 1.1 |
Credit Quality Ratings | (%) |
AAA | 12.9% |
AA | 51.6% |
A | 24.8% |
BBB | 8.6% |
NR | 1.0% |
Below Invest. Grade | 0.0% |
Cash & Cash Equivalent | 1.1% |
Expressed as a percentage of the Fund’s net assets. * Credit quality ratings shown above reflect the highest rating assigned by either S&P Global Ratings or Moody’s Investors Services, both of which are independent, nationally recognized statistical rating organizations. If a credit rating for an investment is not available from either S&P or Moody’s, then the Fund’s investment advisor will determine the credit quality of the investment. Investments are considered to be investment grade if they are rated within the four highest grades by S&P or Moody’s (BBB/Baa or higher) or, if no credit rating is available, have been judged to be of comparable quality by the Fund’s investment advisor. (NR = Not Rated)
How has the Fund changed?
This is a summary of certain changes to the Fund since October 1, 2023. For more complete information, you may review the Fund’s next prospectus, which we expect to be available by February 1, 2025 at https://www.thornburg.com/download or upon request by calling 1-800-847-0200.
End Block
Changes In and Disagreements with Accountants
No changes and/or disagreements occurred in the current reporting period.
End Block
For additional information about the Fund, including its prospectus, financial information, holdings and proxy information, visit www.thornburg.com/download.

Thornburg California Limited Term Municipal Fund Tailored Shareholder Report | |
Thornburg New Mexico Intermediate Municipal Fund Tailored Shareholder Report
Thornburg New Mexico Intermediate Municipal Fund CLASS: A TICKER: THNMX Annual Shareholder Report | |
This annual shareholder report contains important information about the Thornburg New Mexico Intermediate Municipal Fund Class A Shares for the period from October 1, 2023 to September 30, 2024. You can find additional information about the Fund at https://www.thornburg.com/download. You can also request this information by contacting us at 1-800-847-0200. This report also describes changes to the Fund that occurred during the reporting period.
How did the Fund perform last year and what affected its performance?
The Fund’s Class A shares underperformed the ICE BofA 3-15 Year U.S. Municipal Securities Index (the “Index”) during the 12-month period ended September 30, 2024. The period began with municipal bond yields peaking in October of 2023, which marked the end of the Federal Reserve rate hiking cycle, before falling precipitously throughout the period and ending significantly lower. The backdrop of falling municipal bond yields boosted bond prices due to the inverse relationship between the two, producing strong absolute returns for the asset class. However, the Fund’s relative underperformance during the period was driven by its shorter duration and its focus on New Mexico bonds. The Fund’s single-state focus and the impact on relative performance were evident in individual bond selection. The Fund’s relative performance benefited from active management with respect to its sector/quality returns thanks to the Fund’s higher weighting to revenue and AA-rated bonds. Specifically, within the revenue sector, single-family housing and education bonds were positive contributors to relative performance during the period.
How did the Fund perform over the past 10 years?
The line graph below reflects a hypothetical $10,000 investment and assumes the deduction of the maximum sales charge associated with that investment. The returns shown in the line graph and table assume the reinvestment of dividends and capital gains, but do not reflect the deduction of taxes that a shareholder would pay on distributions or the redemption of Fund shares. The performance information shown below represents past performance and is no guarantee of future results. For Fund performance current to the most recent month end, visit https://www.thornburg.com/product/mutual-funds/fnm/THNMX or call 1-800-847-0200. Performance for other share classes of the Fund will vary.
Cumulative Performance
Growth Table
Date | Thornburg New Mexico Intermediate Municipal Fund | ICE BofA 3-15 Year U.S. Municipal Securities Index | ICE BofA U.S. Municipal Securities Index |
09/30/2014 | 9798.2696 | 10000 | 10000 |
10/31/2014 | 9864.7876 | 10047.8828 | 10061.0061 |
11/30/2014 | 9859.6133 | 10053.6678 | 10074.732 |
12/31/2014 | 9888.1288 | 10084.4301 | 10133.237 |
01/31/2015 | 10010.4044 | 10254.7365 | 10315.1349 |
02/28/2015 | 9937.954 | 10156.2738 | 10213.0312 |
03/31/2015 | 9966.1244 | 10171.2054 | 10243.2441 |
04/30/2015 | 9936.8662 | 10142.593 | 10191.582 |
05/31/2015 | 9907.4504 | 10095.8047 | 10157.4674 |
06/30/2015 | 9890.408 | 10091.6614 | 10143.7215 |
07/31/2015 | 9936.432 | 10164.9514 | 10223.9759 |
08/31/2015 | 9953.712 | 10178.2804 | 10246.5455 |
09/30/2015 | 10008.8566 | 10260.1697 | 10315.6951 |
10/31/2015 | 10034.617 | 10309.2642 | 10359.774 |
11/30/2015 | 10053.5603 | 10336.704 | 10410.5357 |
12/31/2015 | 10101.3728 | 10403.1536 | 10493.2511 |
01/31/2016 | 10201.2134 | 10545.9421 | 10609.5409 |
02/29/2016 | 10197.8244 | 10558.2157 | 10618.4247 |
03/31/2016 | 10208.6193 | 10572.4828 | 10665.2047 |
04/30/2016 | 10264.865 | 10641.3168 | 10746.9397 |
05/31/2016 | 10260.7508 | 10632.3656 | 10780.454 |
06/30/2016 | 10369.2385 | 10781.0955 | 10955.589 |
07/31/2016 | 10342.1588 | 10791.4929 | 10949.7465 |
08/31/2016 | 10352.9389 | 10807.5581 | 10974.9373 |
09/30/2016 | 10320.2212 | 10772.5352 | 10921.9146 |
10/31/2016 | 10255.5365 | 10684.1963 | 10819.6708 |
11/30/2016 | 10002.3396 | 10291.4401 | 10425.262 |
12/31/2016 | 10059.9963 | 10397.3686 | 10539.3308 |
01/31/2017 | 10072.6875 | 10465.499 | 10592.9738 |
02/28/2017 | 10116.8755 | 10539.5316 | 10661.5031 |
03/31/2017 | 10129.4996 | 10563.688 | 10685.8535 |
04/30/2017 | 10187.9931 | 10656.2093 | 10762.9465 |
05/31/2017 | 10277.0094 | 10805.9945 | 10922.1347 |
06/30/2017 | 10251.7233 | 10760.9261 | 10897.224 |
07/31/2017 | 10295.0203 | 10844.2226 | 10976.8981 |
08/31/2017 | 10337.7918 | 10935.1022 | 11069.4177 |
09/30/2017 | 10280.7537 | 10880.3008 | 11027.4598 |
10/31/2017 | 10269.4987 | 10886.9849 | 11047.8085 |
11/30/2017 | 10212.5153 | 10795.4017 | 11000.3481 |
12/31/2017 | 10264.2804 | 10879.48 | 11110.0751 |
01/31/2018 | 10200.0553 | 10775.5841 | 10993.045 |
02/28/2018 | 10192.0239 | 10732.2746 | 10946.205 |
03/31/2018 | 10198.568 | 10752.9521 | 10982.8206 |
04/30/2018 | 10182.9787 | 10716.9521 | 10940.1224 |
05/31/2018 | 10260.8366 | 10832.1835 | 11068.6574 |
06/30/2018 | 10290.4833 | 10844.8089 | 11080.8826 |
07/31/2018 | 10319.8237 | 10887.923 | 11107.1138 |
08/31/2018 | 10340.043 | 10900.5093 | 11124.0611 |
09/30/2018 | 10305.165 | 10842.2682 | 11053.4109 |
10/31/2018 | 10270.6093 | 10780.9782 | 10973.8968 |
11/30/2018 | 10339.7542 | 10907.4279 | 11094.9286 |
12/31/2018 | 10407.7795 | 11037.0046 | 11225.6846 |
01/31/2019 | 10468.2886 | 11148.21 | 11309.9006 |
02/28/2019 | 10498.7764 | 11210.7117 | 11374.1081 |
03/31/2019 | 10583.3526 | 11343.3373 | 11556.5862 |
04/30/2019 | 10596.5091 | 11371.5979 | 11604.8669 |
05/31/2019 | 10681.4604 | 11536.2365 | 11776.3203 |
06/30/2019 | 10718.6598 | 11586.5037 | 11826.3817 |
07/31/2019 | 10787.7245 | 11687.9371 | 11920.3619 |
08/31/2019 | 10897.0151 | 11824.3933 | 12108.5024 |
09/30/2019 | 10835.8879 | 11725.0707 | 12018.0237 |
10/31/2019 | 10846.6073 | 11746.7645 | 12032.5099 |
11/30/2019 | 10857.365 | 11765.8003 | 12055.2997 |
12/31/2019 | 10875.2139 | 11810.2043 | 12094.0362 |
01/31/2020 | 11015.9369 | 12006.387 | 12310.4889 |
02/29/2020 | 11109.0805 | 12123.3774 | 12480.4216 |
03/31/2020 | 10848.6265 | 11719.2465 | 12011.9411 |
04/30/2020 | 10759.3313 | 11604.3278 | 11828.8427 |
05/31/2020 | 10997.186 | 11977.5009 | 12213.0072 |
06/30/2020 | 11069.4931 | 12060.0157 | 12331.8981 |
07/31/2020 | 11190.2834 | 12237.8661 | 12529.0824 |
08/31/2020 | 11138.3962 | 12208.4328 | 12486.8844 |
09/30/2020 | 11144.1721 | 12204.7586 | 12478.7409 |
10/31/2020 | 11116.5482 | 12179.5859 | 12453.9903 |
11/30/2020 | 11214.0699 | 12323.1952 | 12644.4318 |
12/31/2020 | 11251.5592 | 12395.5471 | 12730.2285 |
01/31/2021 | 11280.7702 | 12465.5928 | 12814.1645 |
02/28/2021 | 11137.7217 | 12279.4948 | 12608.4364 |
03/31/2021 | 11175.2232 | 12337.4232 | 12685.0892 |
04/30/2021 | 11238.6939 | 12430.1791 | 12805.5408 |
05/31/2021 | 11251.6616 | 12459.2214 | 12861.4247 |
06/30/2021 | 11265.4382 | 12480.9153 | 12903.5827 |
07/31/2021 | 11329.0128 | 12575.5864 | 13000.3241 |
08/31/2021 | 11308.896 | 12545.9186 | 12952.2436 |
09/30/2021 | 11239.0222 | 12456.0944 | 12854.4017 |
10/31/2021 | 11219.1001 | 12428.3028 | 12840.0155 |
11/30/2021 | 11250.6131 | 12499.9902 | 12944.6803 |
12/31/2021 | 11262.6953 | 12512.5375 | 12962.708 |
01/31/2022 | 10996.8566 | 12167.3123 | 12614.479 |
02/28/2022 | 10977.5908 | 12112.0809 | 12543.3886 |
03/31/2022 | 10703.2612 | 11777.5267 | 12161.105 |
04/30/2022 | 10505.8048 | 11497.6567 | 11801.7111 |
05/31/2022 | 10620.7906 | 11677.4615 | 11990.3119 |
06/30/2022 | 10533.5386 | 11554.9988 | 11760.3534 |
07/31/2022 | 10742.0764 | 11842.8819 | 12081.5509 |
08/31/2022 | 10560.0429 | 11611.2855 | 11774.1193 |
09/30/2022 | 10285.371 | 11242.6075 | 11336.1319 |
10/31/2022 | 10247.3144 | 11202.2296 | 11235.8489 |
11/30/2022 | 10508.7023 | 11634.8946 | 11804.6324 |
12/31/2022 | 10556.2613 | 11681.9957 | 11792.3671 |
01/31/2023 | 10750.2045 | 11983.4423 | 12154.9223 |
02/28/2023 | 10570.8912 | 11726.2824 | 11859.776 |
03/31/2023 | 10723.6392 | 11967.0254 | 12125.9499 |
04/30/2023 | 10697.6536 | 11938.2566 | 12111.7038 |
05/31/2023 | 10612.1523 | 11817.0447 | 12018.8841 |
06/30/2023 | 10666.1114 | 11902.6474 | 12128.6911 |
07/31/2023 | 10703.1042 | 11933.0188 | 12159.4442 |
08/31/2023 | 10602.4226 | 11829.2011 | 12012.0412 |
09/30/2023 | 10424.4278 | 11557.1486 | 11671.6555 |
10/31/2023 | 10368.3259 | 11480.6925 | 11525.4929 |
11/30/2023 | 10800.2019 | 12052.0418 | 12262.5884 |
12/31/2023 | 10970.8209 | 12314.205 | 12561.5363 |
01/31/2024 | 10923.1699 | 12277.4232 | 12533.8245 |
02/29/2024 | 10938.1977 | 12288.2896 | 12535.4652 |
03/31/2024 | 10961.0053 | 12276.5241 | 12522.8598 |
04/30/2024 | 10887.8498 | 12144.3676 | 12382.8399 |
05/31/2024 | 10831.6124 | 12061.032 | 12356.9688 |
06/30/2024 | 10935.4482 | 12227.9768 | 12555.7339 |
07/31/2024 | 11012.7146 | 12337.7359 | 12664.2203 |
08/31/2024 | 11081.9269 | 12462.583 | 12763.903 |
09/30/2024 | 11142.7321 | 12575.0392 | 12899.3409 |

Effective September 30, 2024, the Fund changed its benchmark to the ICE BofA U.S. Municipal Securities Index, a broad-based securities market index that represents the overall applicable market in which the Fund invests.
What were the Fund costs for the past year?
(based on a hypothetical $10,000 investment)
Class Name | Costs of a $10,000 investment | Costs paid as a percentage of a $10,000 investment |
|---|
Class A | $102.00 | 0.99% |
End Block
Thornburg New Mexico Intermediate Municipal Fund Tailored Shareholder Report
Thornburg New Mexico Intermediate Municipal Fund Tailored Shareholder Report | |
Annual Performance | 1 Year | 5 Year | 10 Year |
|---|
New Mexico Intermediate Municipal Fund Class A (with sales charge) | 4.71% | 0.16% | 1.09% |
New Mexico Intermediate Municipal Fund Class A (without sales charge) | 6.89% | 0.56% | 1.29% |
ICE BofA 3-15 Year U.S. Municipal Securities Index | 8.81% | 1.41% | 2.32% |
ICE BofA U.S. Municipal Securities Index | 10.52% | 1.43% | 2.58% |
Key Fund Statistics
(as of September 30, 2024)
| |
|---|
Fund Size (Millions) | $94.5M |
Number of Holdings | 94 |
Annual Portfolio Turnover | 19.49% |
Total Advisory Fee | $0.5M |
What did the Fund invest in?
(as of September 30, 2024)
Credit Quality Ratings | (%) |
|---|
| AAA | 40.6 |
| AA | 43.5 |
| A | 5.2 |
| BBB | 8.3 |
| NR | 0.4 |
| Below Invest. Grade | 0.0 |
| Cash & Cash Equivalent | 2.0 |
Credit Quality Ratings | (%) |
AAA | 40.6% |
AA | 43.5% |
A | 5.2% |
BBB | 8.3% |
NR | 0.4% |
Below Invest. Grade | 0.0% |
Cash & Cash Equivalent | 2.0% |
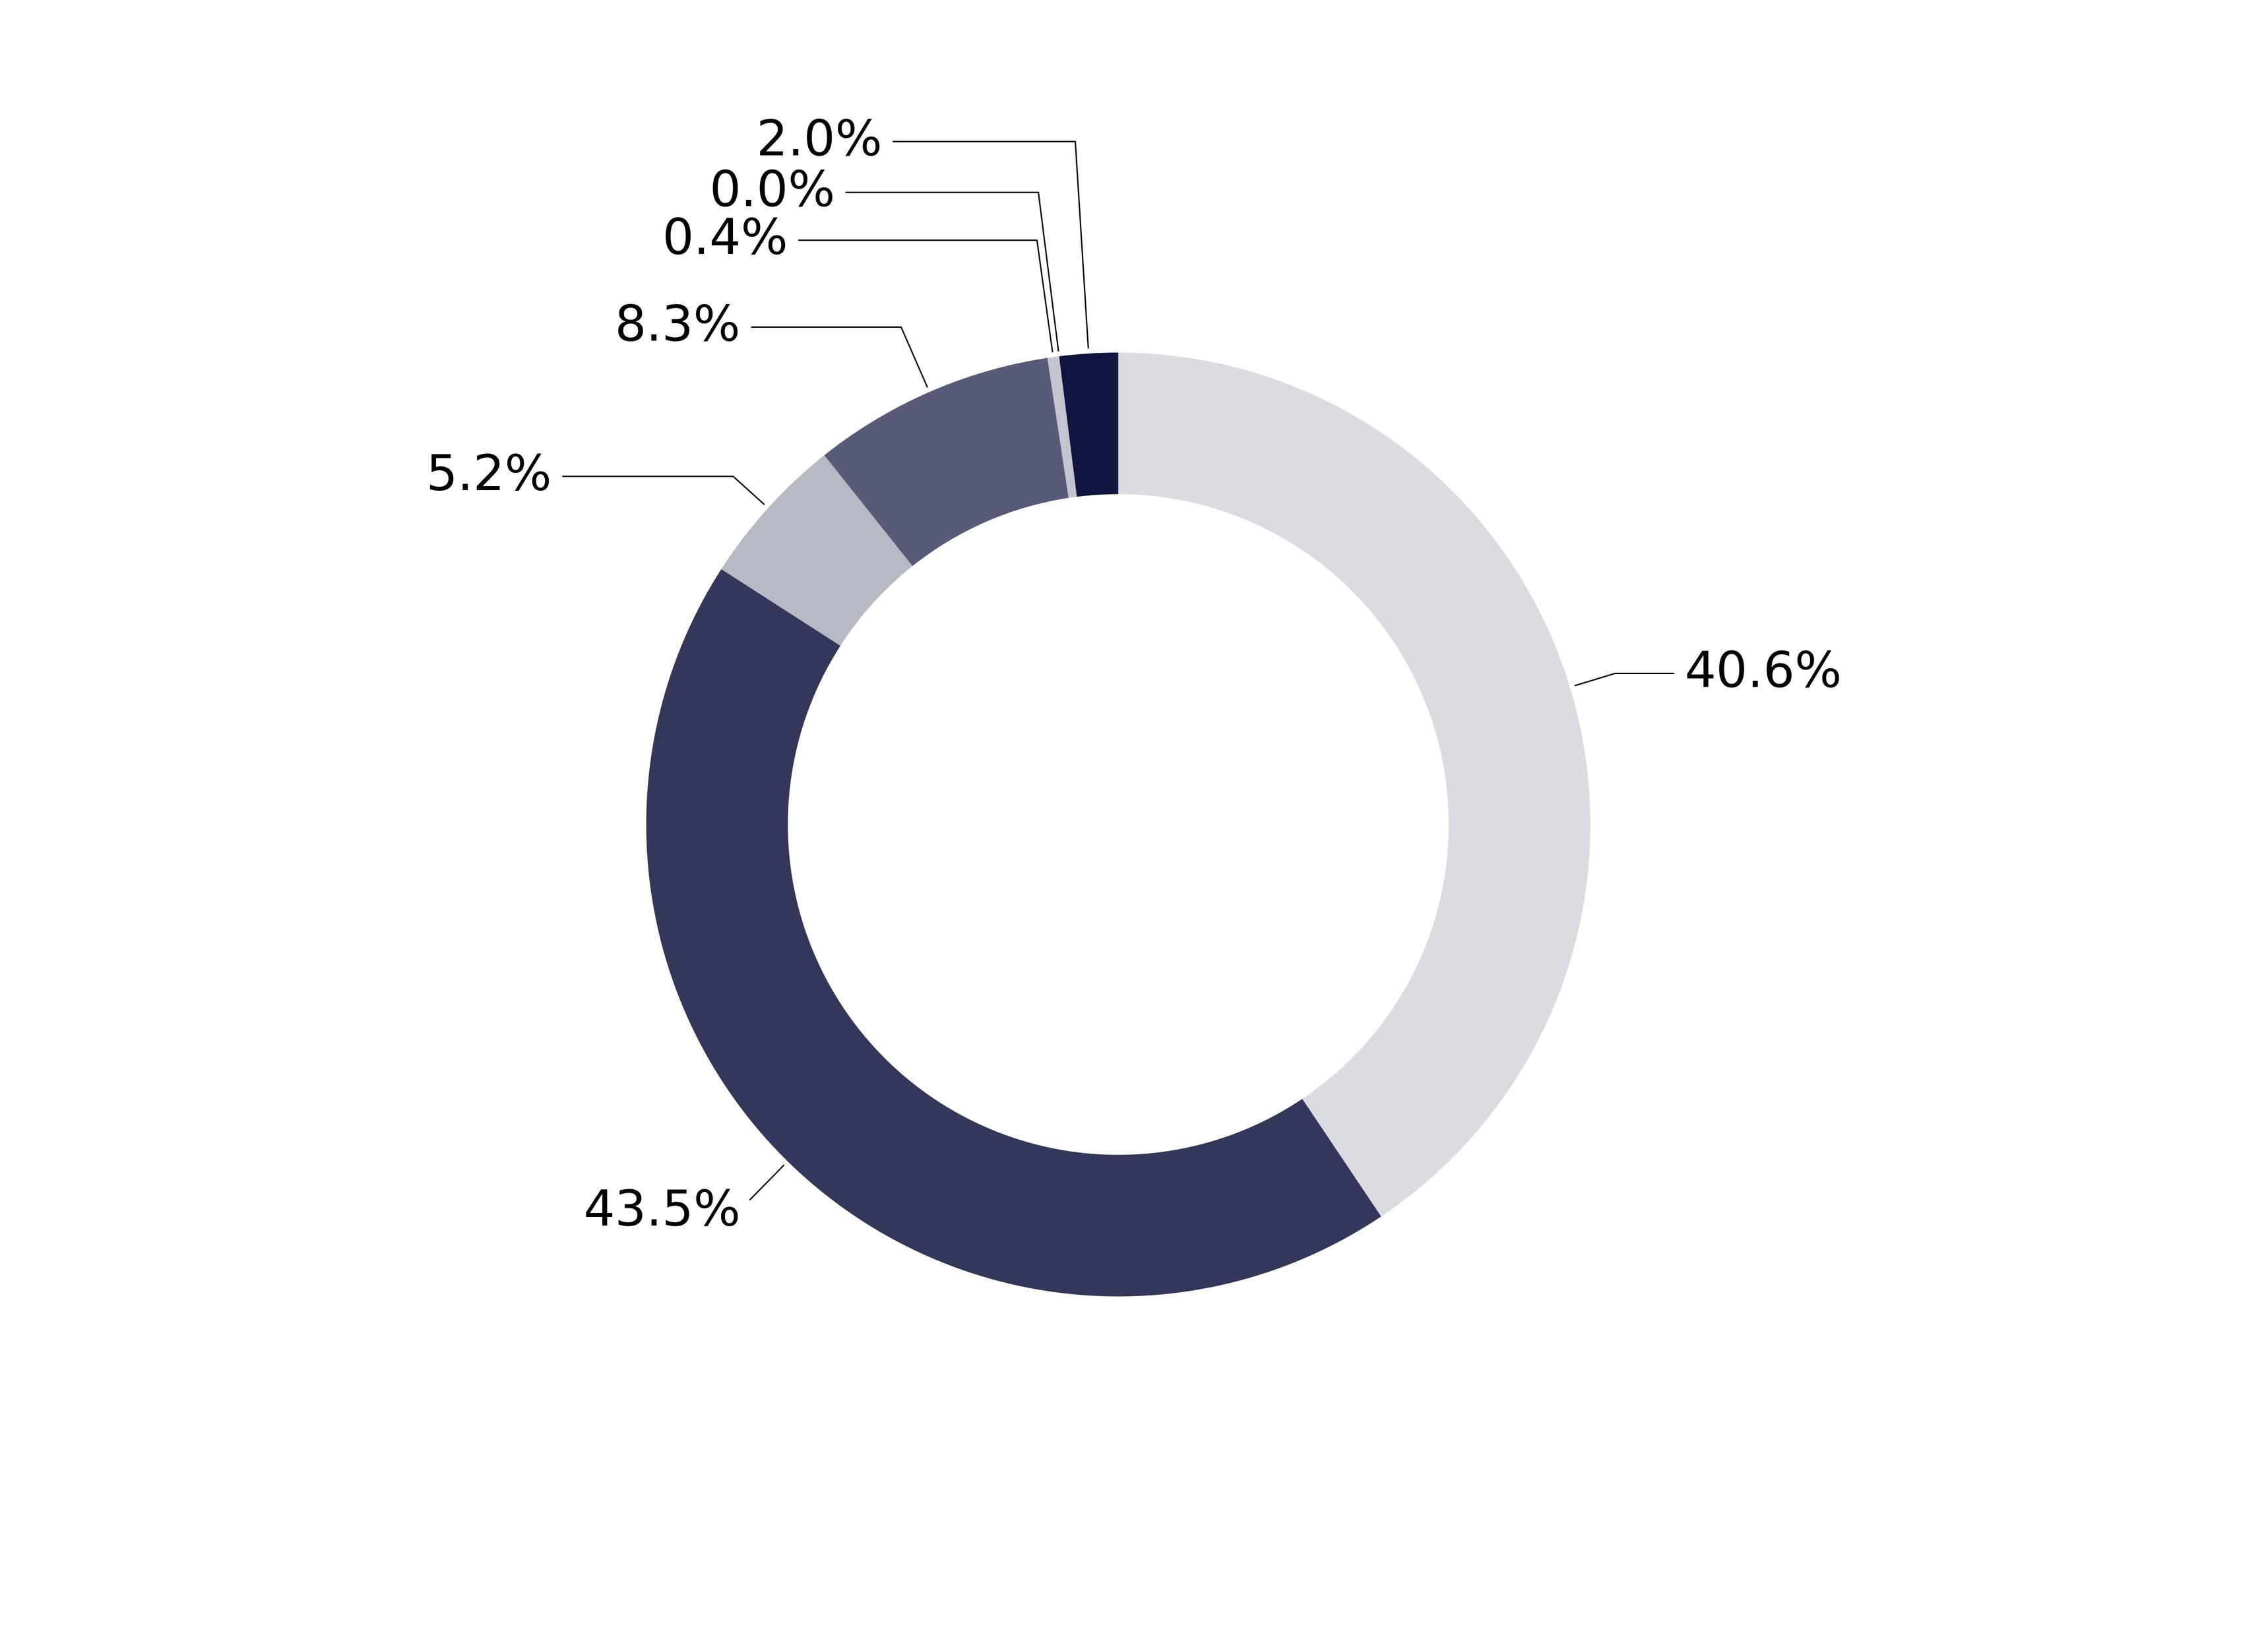
Expressed as a percentage of the Fund’s net assets. * Credit quality ratings shown above reflect the highest rating assigned by either S&P Global Ratings or Moody’s Investors Services, both of which are independent, nationally recognized statistical rating organizations. If a credit rating for an investment is not available from either S&P or Moody’s, then the Fund’s investment advisor will determine the credit quality of the investment. Investments are considered to be investment grade if they are rated within the four highest grades by S&P or Moody’s (BBB/Baa or higher) or, if no credit rating is available, have been judged to be of comparable quality by the Fund’s investment advisor. (NR = Not Rated)
How has the Fund changed?
This is a summary of certain changes to the Fund since October 1, 2023. For more complete information, you may review the Fund’s next prospectus, which we expect to be available by February 1, 2025 at https://www.thornburg.com/download or upon request by calling 1-800-847-0200.
End Block
Changes In and Disagreements with Accountants
No changes and/or disagreements occurred in the current reporting period.
End Block
For additional information about the Fund, including its prospectus, financial information, holdings and proxy information, visit www.thornburg.com/download.

Thornburg New Mexico Intermediate Municipal Fund Tailored Shareholder Report | |
Thornburg New Mexico Intermediate Municipal Fund Tailored Shareholder Report
Thornburg New Mexico Intermediate Municipal Fund CLASS: D TICKER: THNDX Annual Shareholder Report | |
This annual shareholder report contains important information about the Thornburg New Mexico Intermediate Municipal Fund Class D Shares for the period from October 1, 2023 to September 30, 2024. You can find additional information about the Fund at https://www.thornburg.com/download. You can also request this information by contacting us at 1-800-847-0200. This report also describes changes to the Fund that occurred during the reporting period.
How did the Fund perform last year and what affected its performance?
The Fund’s Class D shares underperformed the ICE BofA 3-15 Year U.S. Municipal Securities Index (the “Index”) during the 12-month period ended September 30, 2024. The period began with municipal bond yields peaking in October of 2023, which marked the end of the Federal Reserve rate hiking cycle, before falling precipitously throughout the period and ending significantly lower. The backdrop of falling municipal bond yields boosted bond prices due to the inverse relationship between the two, producing strong absolute returns for the asset class. However, the Fund’s relative underperformance during the period was driven by its shorter duration and its focus on New Mexico bonds. The Fund’s single-state focus and the impact on relative performance were evident in individual bond selection. The Fund’s relative performance benefited from active management with respect to its sector/quality returns thanks to the Fund’s higher weighting to revenue and AA-rated bonds. Specifically, within the revenue sector, single-family housing and education bonds were positive contributors to relative performance during the period.
How did the Fund perform over the past 10 years?
The line graph below reflects a hypothetical $10,000 investment. The returns shown in the line graph and table assume the reinvestment of dividends and capital gains, but do not reflect the deduction of taxes that a shareholder would pay on distributions or the redemption of Fund shares. The performance information shown below represents past performance and is no guarantee of future results. For Fund performance current to the most recent month end, visit https://www.thornburg.com/product/mutual-funds/fnm/THNDX or call 1-800-847-0200. Performance for other share classes of the Fund will vary.
Cumulative Performance
Growth Table
Date | Thornburg New Mexico Intermediate Municipal Fund | ICE BofA 3-15 Year U.S. Municipal Securities Index | ICE BofA U.S. Municipal Securities Index |
09/30/2014 | 10000.0019 | 10000 | 10000 |
10/31/2014 | 10058.2405 | 10061.0061 |
11/30/2014 | 10050.879 | 10053.6678 | 10074.732 |
12/31/2014 | 10077.8584 | 10084.4301 | 10133.237 |
01/31/2015 | 10207.7693 | 10254.7365 | 10315.1349 |
02/28/2015 | 10124.6446 | 10156.2738 | 10213.0312 |
03/31/2015 | 10151.2593 | 10171.2054 | 10243.2441 |
04/30/2015 | 10126.9418 | 10142.593 | 10191.582 |
05/31/2015 | 10095.2894 | 10095.8047 | 10157.4674 |
06/30/2015 | 10076.3008 | 10091.6614 | 10143.7215 |
07/31/2015 | 10121.5299 | 10164.9514 | 10223.9759 |
08/31/2015 | 10130.0355 | 10178.2804 | 10246.5455 |
09/30/2015 | 10184.4104 | 10260.1697 | 10315.6951 |
10/31/2015 | 10215.9302 | 10309.2642 | 10359.774 |
11/30/2015 | 10233.0827 | 10336.704 | 10410.5357 |
12/31/2015 | 10272.012 | 10403.1536 | 10493.2511 |
01/31/2016 | 10371.3819 | 10545.9421 | 10609.5409 |
02/29/2016 | 10373.488 | 10558.2157 | 10618.4247 |
03/31/2016 | 10382.3813 | 10572.4828 | 10665.2047 |
04/30/2016 | 10437.4773 | 10641.3168 | 10746.9397 |
05/31/2016 | 10431.1663 | 10632.3656 | 10780.454 |
06/30/2016 | 10539.5051 | 10781.0955 | 10955.589 |
07/31/2016 | 10509.8192 | 10791.4929 | 10949.7465 |
08/31/2016 | 10510.8939 | 10807.5581 | 10974.9373 |
09/30/2016 | 10483.5175 | 10772.5352 | 10921.9146 |
10/31/2016 | 10415.6535 | 10684.1963 | 10819.6708 |
11/30/2016 | 10156.601 | 10291.4401 | 10425.262 |
12/31/2016 | 10213.7272 | 10397.3686 | 10539.3308 |
01/31/2017 | 10224.4818 | 10465.499 | 10592.9738 |
02/28/2017 | 10259.7005 | 10539.5316 | 10661.5031 |
03/31/2017 | 10278.8093 | 10563.688 | 10685.8535 |
04/30/2017 | 10328.174 | 10656.2093 | 10762.9465 |
05/31/2017 | 10423.9685 | 10805.9945 | 10922.1347 |
06/30/2017 | 10396.8999 | 10760.9261 | 10897.224 |
07/31/2017 | 10430.8595 | 10844.2226 | 10976.8981 |
08/31/2017 | 10479.7273 | 10935.1022 | 11069.4177 |
09/30/2017 | 10419.7867 | 10880.3008 | 11027.4598 |
10/31/2017 | 10406.188 | 10886.9849 | 11047.8085 |
11/30/2017 | 10338.5223 | 10795.4017 | 11000.3481 |
12/31/2017 | 10396.587 | 10879.48 | 11110.0751 |
01/31/2018 | 10329.3893 | 10775.5841 | 10993.045 |
02/28/2018 | 10320.3254 | 10732.2746 | 10946.205 |
03/31/2018 | 10323.6115 | 10752.9521 | 10982.8206 |
04/30/2018 | 10305.6425 | 10716.9521 | 10940.1224 |
05/31/2018 | 10382.1123 | 10832.1835 | 11068.6574 |
06/30/2018 | 10409.8237 | 10844.8089 | 11080.8826 |
07/31/2018 | 10437.1206 | 10887.923 | 11107.1138 |
08/31/2018 | 10455.2626 | 10900.5093 | 11124.0611 |
09/30/2018 | 10418.0437 | 10842.2682 | 11053.4109 |
10/31/2018 | 10372.7951 | 10780.9782 | 10973.8968 |
11/30/2018 | 10440.3748 | 10907.4279 | 11094.9286 |
12/31/2018 | 10514.7758 | 11037.0046 | 11225.6846 |
01/31/2019 | 10573.5559 | 11148.21 | 11309.9006 |
02/28/2019 | 10602.2195 | 11210.7117 | 11374.1081 |
03/31/2019 | 10677.1335 | 11343.3373 | 11556.5862 |
04/30/2019 | 10688.0838 | 11371.5979 | 11604.8669 |
05/31/2019 | 10779.4864 | 11536.2365 | 11776.3203 |
06/30/2019 | 10814.6976 | 11586.5037 | 11826.3817 |
07/31/2019 | 10873.5274 | 11687.9371 | 11920.3619 |
08/31/2019 | 10989.1209 | 11824.3933 | 12108.5024 |
09/30/2019 | 10924.9129 | 11725.0707 | 12018.0237 |
10/31/2019 | 10925.0198 | 11746.7645 | 12032.5099 |
11/30/2019 | 10941.6014 | 11765.8003 | 12055.2997 |
12/31/2019 | 10957.0625 | 11810.2043 | 12094.0362 |
01/31/2020 | 11096.1051 | 12006.387 | 12310.4889 |
02/29/2020 | 11187.367 | 12123.3774 | 12480.4216 |
03/31/2020 | 10914.4722 | 11719.2465 | 12011.9411 |
04/30/2020 | 10822.5126 | 11604.3278 | 11828.8427 |
05/31/2020 | 11067.8156 | 11977.5009 | 12213.0072 |
06/30/2020 | 11130.0538 | 12060.0157 | 12331.8981 |
07/31/2020 | 11249.1636 | 12237.8661 | 12529.0824 |
08/31/2020 | 11202.9075 | 12208.4328 | 12486.8844 |
09/30/2020 | 11206.4802 | 12204.7586 | 12478.7409 |
10/31/2020 | 11176.2202 | 12179.5859 | 12453.9903 |
11/30/2020 | 11271.7657 | 12323.1952 | 12644.4318 |
12/31/2020 | 11306.904 | 12395.5471 | 12730.2285 |
01/31/2021 | 11333.7338 | 12465.5928 | 12814.1645 |
02/28/2021 | 11187.8476 | 12279.4948 | 12608.4364 |
03/31/2021 | 11214.7048 | 12337.4232 | 12685.0892 |
04/30/2021 | 11284.3041 | 12430.1791 | 12805.5408 |
05/31/2021 | 11294.7858 | 12459.2214 | 12861.4247 |
06/30/2021 | 11306.3737 | 12480.9153 | 12903.5827 |
07/31/2021 | 11359.3153 | 12575.5864 | 13000.3241 |
08/31/2021 | 11336.7465 | 12545.9186 | 12952.2436 |
09/30/2021 | 11272.7947 | 12456.0944 | 12854.4017 |
10/31/2021 | 11250.4673 | 12428.3028 | 12840.0155 |
11/30/2021 | 11279.7628 | 12499.9902 | 12944.6803 |
12/31/2021 | 11281.066 | 12512.5375 | 12962.708 |
01/31/2022 | 11020.8508 | 12167.3123 | 12614.479 |
02/28/2022 | 10999.4522 | 12112.0809 | 12543.3886 |
03/31/2022 | 10722.4996 | 11777.5267 | 12161.105 |
04/30/2022 | 10522.6786 | 11497.6567 | 11801.7111 |
05/31/2022 | 10627.0732 | 11677.4615 | 11990.3119 |
06/30/2022 | 10546.0843 | 11554.9988 | 11760.3534 |
07/31/2022 | 10743.9613 | 11842.8819 | 12081.5509 |
08/31/2022 | 10568.1352 | 11611.2855 | 11774.1193 |
09/30/2022 | 10282.8222 | 11242.6075 | 11336.1319 |
10/31/2022 | 10242.5906 | 11202.2296 | 11235.8489 |
11/30/2022 | 10510.2413 | 11634.8946 | 11804.6324 |
12/31/2022 | 10555.5389 | 11681.9957 | 11792.3671 |
01/31/2023 | 10738.5237 | 11983.4423 | 12154.9223 |
02/28/2023 | 10557.3652 | 11726.2824 | 11859.776 |
03/31/2023 | 10707.677 | 11967.0254 | 12125.9499 |
04/30/2023 | 10688.1133 | 11938.2566 | 12111.7038 |
05/31/2023 | 10591.8982 | 11817.0447 | 12018.8841 |
06/30/2023 | 10652.1657 | 11902.6474 | 12128.6911 |
07/31/2023 | 10686.8334 | 11933.0188 | 12159.4442 |
08/31/2023 | 10575.5191 | 11829.2011 | 12012.0412 |
09/30/2023 | 10404.4639 | 11557.1486 | 11671.6555 |
10/31/2023 | 10346.3521 | 11480.6925 | 11525.4929 |
11/30/2023 | 10766.1294 | 12052.0418 | 12262.5884 |
12/31/2023 | 10933.9322 | 12314.205 | 12561.5363 |
01/31/2024 | 10892.8537 | 12277.4232 | 12533.8245 |
02/29/2024 | 10905.6854 | 12288.2896 | 12535.4652 |
03/31/2024 | 10926.1152 | 12276.5241 | 12522.8598 |
04/30/2024 | 10842.2785 | 12144.3676 | 12382.8399 |
05/31/2024 | 10792.7569 | 12061.032 | 12356.9688 |
06/30/2024 | 10893.925 | 12227.9768 | 12555.7339 |
07/31/2024 | 10968.5427 | 12337.7359 | 12664.2203 |
08/31/2024 | 11035.128 | 12462.583 | 12763.903 |
09/30/2024 | 11084.548 | 12575.0392 | 12899.3409 |
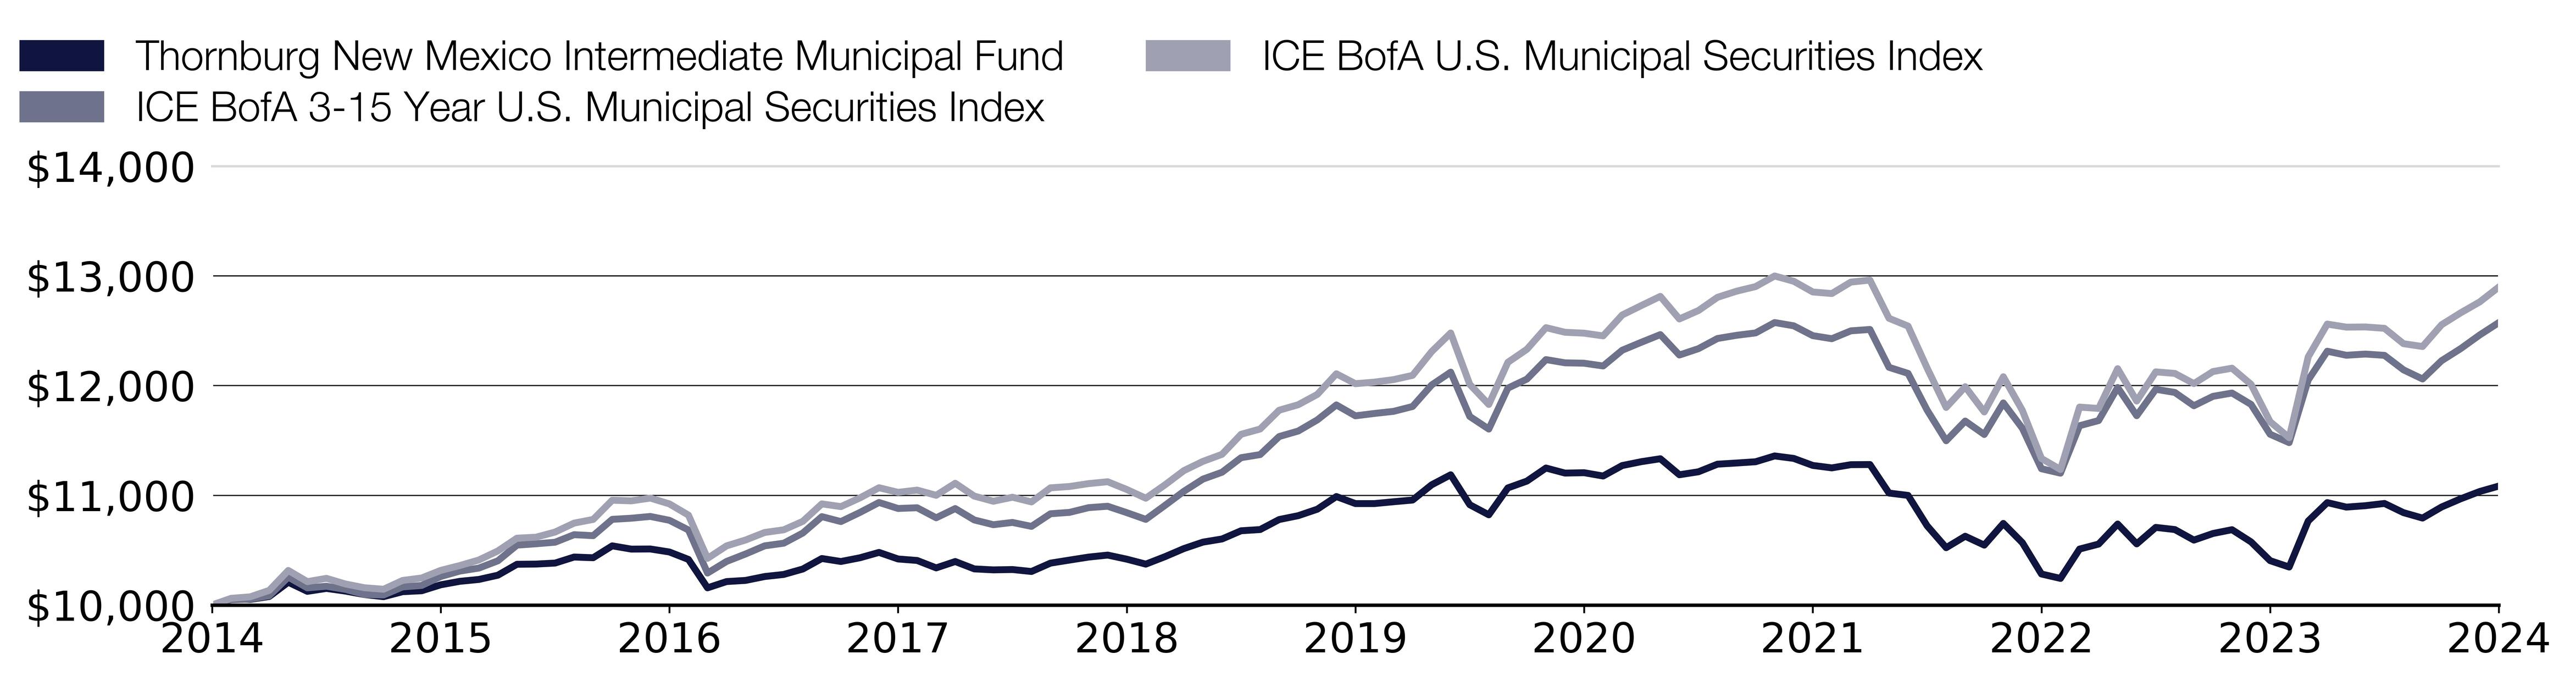
Effective September 30, 2024, the Fund changed its benchmark to the ICE BofA U.S. Municipal Securities Index, a broad-based securities market index that represents the overall applicable market in which the Fund invests.
What were the Fund costs for the past year?
(based on a hypothetical $10,000 investment)
Class Name | Costs of a $10,000 investment | Costs paid as a percentage of a $10,000 investment |
|---|
Class D | $128.00 | 1.24% |
End Block
Thornburg New Mexico Intermediate Municipal Fund Tailored Shareholder Report
Thornburg New Mexico Intermediate Municipal Fund Tailored Shareholder Report | |
Annual Performance | 1 Year | 5 Year | 10 Year |
|---|
New Mexico Intermediate Municipal Fund Class D | 6.54% | 0.29% | 1.03% |
ICE BofA 3-15 Year U.S. Municipal Securities Index | 8.81% | 1.41% | 2.32% |
ICE BofA U.S. Municipal Securities Index | 10.52% | 1.43% | 2.58% |
Key Fund Statistics
(as of September 30, 2024)
| |
|---|
Fund Size (Millions) | $94.5M |
Number of Holdings | 94 |
Annual Portfolio Turnover | 19.49% |
Total Advisory Fee | $0.5M |
What did the Fund invest in?
(as of September 30, 2024)
Credit Quality Ratings | (%) |
|---|
| AAA | 40.6 |
| AA | 43.5 |
| A | 5.2 |
| BBB | 8.3 |
| NR | 0.4 |
| Below Invest. Grade | 0.0 |
| Cash & Cash Equivalent | 2.0 |
Credit Quality Ratings | (%) |
AAA | 40.6% |
AA | 43.5% |
A | 5.2% |
BBB | 8.3% |
NR | 0.4% |
Below Invest. Grade | 0.0% |
Cash & Cash Equivalent | 2.0% |
Expressed as a percentage of the Fund’s net assets. * Credit quality ratings shown above reflect the highest rating assigned by either S&P Global Ratings or Moody’s Investors Services, both of which are independent, nationally recognized statistical rating organizations. If a credit rating for an investment is not available from either S&P or Moody’s, then the Fund’s investment advisor will determine the credit quality of the investment. Investments are considered to be investment grade if they are rated within the four highest grades by S&P or Moody’s (BBB/Baa or higher) or, if no credit rating is available, have been judged to be of comparable quality by the Fund’s investment advisor. (NR = Not Rated)
How has the Fund changed?
This is a summary of certain changes to the Fund since October 1, 2023. For more complete information, you may review the Fund’s next prospectus, which we expect to be available by February 1, 2025 at https://www.thornburg.com/download or upon request by calling 1-800-847-0200.
End Block
Changes In and Disagreements with Accountants
No changes and/or disagreements occurred in the current reporting period.
End Block
For additional information about the Fund, including its prospectus, financial information, holdings and proxy information, visit www.thornburg.com/download.

Thornburg New Mexico Intermediate Municipal Fund Tailored Shareholder Report | |
Thornburg New Mexico Intermediate Municipal Fund Tailored Shareholder Report
Thornburg New Mexico Intermediate Municipal Fund CLASS: I TICKER: THNIX Annual Shareholder Report | |
This annual shareholder report contains important information about the Thornburg New Mexico Intermediate Municipal Fund Class I Shares for the period from October 1, 2023 to September 30, 2024. You can find additional information about the Fund at https://www.thornburg.com/download. You can also request this information by contacting us at 1-800-847-0200. This report also describes changes to the Fund that occurred during the reporting period.
How did the Fund perform last year and what affected its performance?
The Fund’s Class I shares underperformed the ICE BofA 3-15 Year U.S. Municipal Securities Index (the “Index”) during the 12-month period ended September 30, 2024. The period began with municipal bond yields peaking in October of 2023, which marked the end of the Federal Reserve rate hiking cycle, before falling precipitously throughout the period and ending significantly lower. The backdrop of falling municipal bond yields boosted bond prices due to the inverse relationship between the two, producing strong absolute returns for the asset class. However, the Fund’s relative underperformance during the period was driven by its shorter duration and its focus on New Mexico bonds. The Fund’s single-state focus and the impact on relative performance were evident in individual bond selection. The Fund’s relative performance benefited from active management with respect to its sector/quality returns thanks to the Fund’s higher weighting to revenue and AA-rated bonds. Specifically, within the revenue sector, single-family housing and education bonds were positive contributors to relative performance during the period.
How did the Fund perform over the past 10 years?
The line graph below reflects a hypothetical $10,000 investment. The returns shown in the line graph and table assume the reinvestment of dividends and capital gains, but do not reflect the deduction of taxes that a shareholder would pay on distributions or the redemption of Fund shares. The performance information shown below represents past performance and is no guarantee of future results. For Fund performance current to the most recent month end, visit https://www.thornburg.com/product/mutual-funds/fnm/THNIX or call 1-800-847-0200. Performance for other share classes of the Fund will vary.
Cumulative Performance
Growth Table
Date | Thornburg New Mexico Intermediate Municipal Fund | ICE BofA 3-15 Year U.S. Municipal Securities Index | ICE BofA U.S. Municipal Securities Index |
09/30/2014 | 9999.9977 | 10000 | 10000 |
10/31/2014 | 10070.7789 | 10047.8828 | 10061.0061 |
11/30/2014 | 10068.2833 | 10053.6678 | 10074.732 |
12/31/2014 | 10100.3741 | 10084.4301 | 10133.237 |
01/31/2015 | 10228.0694 | 10254.7365 | 10315.1349 |
02/28/2015 | 10156.4081 | 10156.2738 | 10213.0312 |
03/31/2015 | 10187.8524 | 10171.2054 | 10243.2441 |
04/30/2015 | 10160.4289 | 10142.593 | 10191.582 |
05/31/2015 | 10133.073 | 10095.8047 | 10157.4674 |
06/30/2015 | 10118.3274 | 10091.6614 | 10143.7215 |
07/31/2015 | 10175.6655 | 10164.9514 | 10223.9759 |
08/31/2015 | 10188.7542 | 10178.2804 | 10246.5455 |
09/30/2015 | 10248.0875 | 10260.1697 | 10315.6951 |
10/31/2015 | 10284.9888 | 10309.2642 | 10359.774 |
11/30/2015 | 10307.295 | 10336.704 | 10410.5357 |
12/31/2015 | 10351.6525 | 10403.1536 | 10493.2511 |
01/31/2016 | 10456.9908 | 10545.9421 | 10609.5409 |
02/29/2016 | 10463.9414 | 10558.2157 | 10618.4247 |
03/31/2016 | 10477.932 | 10572.4828 | 10665.2047 |
04/30/2016 | 10538.5241 | 10641.3168 | 10746.9397 |
05/31/2016 | 10529.6328 | 10632.3656 | 10780.454 |
06/30/2016 | 10643.8296 | 10781.0955 | 10955.589 |
07/31/2016 | 10626.6325 | 10791.4929 | 10949.7465 |
08/31/2016 | 10632.9651 | 10807.5581 | 10974.9373 |
09/30/2016 | 10609.8475 | 10772.5352 | 10921.9146 |
10/31/2016 | 10546.2629 | 10684.1963 | 10819.6708 |
11/30/2016 | 10280.9191 | 10291.4401 | 10425.262 |
12/31/2016 | 10350.8735 | 10397.3686 | 10539.3308 |
01/31/2017 | 10358.9709 | 10465.499 | 10592.9738 |
02/28/2017 | 10407.0447 | 10539.5316 | 10661.5031 |
03/31/2017 | 10430.7536 | 10563.688 | 10685.8535 |
04/30/2017 | 10485.9461 | 10656.2093 | 10762.9465 |
05/31/2017 | 10588.4656 | 10805.9945 | 10922.1347 |
06/30/2017 | 10557.3867 | 10760.9261 | 10897.224 |
07/31/2017 | 10604.9943 | 10844.2226 | 10976.8981 |
08/31/2017 | 10652.0931 | 10935.1022 | 11069.4177 |
09/30/2017 | 10595.7316 | 10880.3008 | 11027.4598 |
10/31/2017 | 10595.0848 | 10886.9849 | 11047.8085 |
11/30/2017 | 10531.1906 | 10795.4017 | 11000.3481 |
12/31/2017 | 10595.5608 | 10879.48 | 11110.0751 |
01/31/2018 | 10532.1878 | 10775.5841 | 10993.045 |
02/28/2018 | 10518.1944 | 10732.2746 | 10946.205 |
03/31/2018 | 10527.3991 | 10752.9521 | 10982.8206 |
04/30/2018 | 10513.7803 | 10716.9521 | 10940.1224 |
05/31/2018 | 10604.9128 | 10832.1835 | 11068.6574 |
06/30/2018 | 10637.9838 | 10844.8089 | 11080.8826 |
07/31/2018 | 10670.7924 | 10887.923 | 11107.1138 |
08/31/2018 | 10686.136 | 10900.5093 | 11124.0611 |
09/30/2018 | 10661.209 | 10842.2682 | 11053.4109 |
10/31/2018 | 10619.9816 | 10780.9782 | 10973.8968 |
11/30/2018 | 10694.1831 | 10907.4279 | 11094.9286 |
12/31/2018 | 10775.6069 | 11037.0046 | 11225.6846 |
01/31/2019 | 10832.852 | 11148.21 | 11309.9006 |
02/28/2019 | 10875.2563 | 11210.7117 | 11374.1081 |
03/31/2019 | 10957.4171 | 11343.3373 | 11556.5862 |
04/30/2019 | 10973.7708 | 11371.5979 | 11604.8669 |
05/31/2019 | 11073.0017 | 11536.2365 | 11776.3203 |
06/30/2019 | 11106.0346 | 11586.5037 | 11826.3817 |
07/31/2019 | 11180.2709 | 11687.9371 | 11920.3619 |
08/31/2019 | 11304.6577 | 11824.3933 | 12108.5024 |
09/30/2019 | 11235.4016 | 11725.0707 | 12018.0237 |
10/31/2019 | 11249.3336 | 11746.7645 | 12032.5099 |
11/30/2019 | 11271.6614 | 11765.8003 | 12055.2997 |
12/31/2019 | 11293.0294 | 11810.2043 | 12094.0362 |
01/31/2020 | 11433.4438 | 12006.387 | 12310.4889 |
02/29/2020 | 11532.78 | 12123.3774 | 12480.4216 |
03/31/2020 | 11264.9603 | 11719.2465 | 12011.9411 |
04/30/2020 | 11175.2079 | 11604.3278 | 11828.8427 |
05/31/2020 | 11434.1577 | 11977.5009 | 12213.0072 |
06/30/2020 | 11503.8425 | 12060.0157 | 12331.8981 |
07/31/2020 | 11632.6087 | 12237.8661 | 12529.0824 |
08/31/2020 | 11581.7599 | 12208.4328 | 12486.8844 |
09/30/2020 | 11590.8811 | 12204.7586 | 12478.7409 |
10/31/2020 | 11565.1279 | 12179.5859 | 12453.9903 |
11/30/2020 | 11669.5717 | 12323.1952 | 12644.4318 |
12/31/2020 | 11720.2877 | 12395.5471 | 12730.2285 |
01/31/2021 | 11753.7888 | 12465.5928 | 12814.1645 |
02/28/2021 | 11607.5232 | 12279.4948 | 12608.4364 |
03/31/2021 | 11641.0333 | 12337.4232 | 12685.0892 |
04/30/2021 | 11718.7976 | 12430.1791 | 12805.5408 |
05/31/2021 | 11726.6587 | 12459.2214 | 12861.4247 |
06/30/2021 | 11744.1967 | 12480.9153 | 12903.5827 |
07/31/2021 | 11813.6924 | 12575.5864 | 13000.3241 |
08/31/2021 | 11795.8988 | 12545.9186 | 12952.2436 |
09/30/2021 | 11734.8088 | 12456.0944 | 12854.4017 |
10/31/2021 | 11708.444 | 12428.3028 | 12840.0155 |
11/30/2021 | 11753.2195 | 12499.9902 | 12944.6803 |
12/31/2021 | 11760.252 | 12512.5375 | 12962.708 |
01/31/2022 | 11494.4139 | 12167.3123 | 12614.479 |
02/28/2022 | 11477.0837 | 12112.0809 | 12543.3886 |
03/31/2022 | 11193.3622 | 11777.5267 | 12161.105 |
04/30/2022 | 10989.7749 | 11497.6567 | 11801.7111 |
05/31/2022 | 11104.1862 | 11677.4615 | 11990.3119 |
06/30/2022 | 11024.6503 | 11554.9988 | 11760.3534 |
07/31/2022 | 11237.0485 | 11842.8819 | 12081.5509 |
08/31/2022 | 11058.3954 | 11611.2855 | 11774.1193 |
09/30/2022 | 10764.7261 | 11242.6075 | 11336.1319 |
10/31/2022 | 10727.7884 | 11202.2296 | 11235.8489 |
11/30/2022 | 11013.4369 | 11634.8946 | 11804.6324 |
12/31/2022 | 11066.2916 | 11681.9957 | 11792.3671 |
01/31/2023 | 11263.6877 | 11983.4423 | 12154.9223 |
02/28/2023 | 11078.3904 | 11726.2824 | 11859.776 |
03/31/2023 | 11241.6221 | 11967.0254 | 12125.9499 |
04/30/2023 | 11226.3287 | 11938.2566 | 12111.7038 |
05/31/2023 | 11130.6158 | 11817.0447 | 12018.8841 |
06/30/2023 | 11190.1621 | 11902.6474 | 12128.6911 |
07/31/2023 | 11241.1019 | 11933.0188 | 12159.4442 |
08/31/2023 | 11129.3 | 11829.2011 | 12012.0412 |
09/30/2023 | 10954.309 | 11557.1486 | 11671.6555 |
10/31/2023 | 10898.3249 | 11480.6925 | 11525.4929 |
11/30/2023 | 11346.0348 | 12052.0418 | 12262.5884 |
12/31/2023 | 11528.5178 | 12314.205 | 12561.5363 |
01/31/2024 | 11490.6854 | 12277.4232 | 12533.8245 |
02/29/2024 | 11500.1688 | 12288.2896 | 12535.4652 |
03/31/2024 | 11536.5083 | 12276.5241 | 12522.8598 |
04/30/2024 | 11453.2542 | 12144.3676 | 12382.8399 |
05/31/2024 | 11397.1535 | 12061.032 | 12356.9688 |
06/30/2024 | 11518.7908 | 12227.9768 | 12555.7339 |
07/31/2024 | 11603.3229 | 12337.7359 | 12664.2203 |
08/31/2024 | 11679.4269 | 12462.583 | 12763.903 |
09/30/2024 | 11737.2375 | 12575.0392 | 12899.3409 |

Effective September 30, 2024, the Fund changed its benchmark to the ICE BofA U.S. Municipal Securities Index, a broad-based securities market index that represents the overall applicable market in which the Fund invests.
What were the Fund costs for the past year?
(based on a hypothetical $10,000 investment)
Class Name | Costs of a $10,000 investment | Costs paid as a percentage of a $10,000 investment |
|---|
Class I | $69.00 | 0.67% |
End Block
Thornburg New Mexico Intermediate Municipal Fund Tailored Shareholder Report
Thornburg New Mexico Intermediate Municipal Fund Tailored Shareholder Report | |
Annual Performance | 1 Year | 5 Year | 10 Year |
|---|
New Mexico Intermediate Municipal Fund Class I | 7.15% | 0.88% | 1.61% |
ICE BofA 3-15 Year U.S. Municipal Securities Index | 8.81% | 1.41% | 2.32% |
ICE BofA U.S. Municipal Securities Index | 10.52% | 1.43% | 2.58% |
Key Fund Statistics
(as of September 30, 2024)
| |
|---|
Fund Size (Millions) | $94.5M |
Number of Holdings | 94 |
Annual Portfolio Turnover | 19.49% |
Total Advisory Fee | $0.5M |
What did the Fund invest in?
(as of September 30, 2024)
Credit Quality Ratings | (%) |
|---|
| AAA | 40.6 |
| AA | 43.5 |
| A | 5.2 |
| BBB | 8.3 |
| NR | 0.4 |
| Below Invest. Grade | 0.0 |
| Cash & Cash Equivalent | 2.0 |
Credit Quality Ratings | (%) |
AAA | 40.6% |
AA | 43.5% |
A | 5.2% |
BBB | 8.3% |
NR | 0.4% |
Below Invest. Grade | 0.0% |
Cash & Cash Equivalent | 2.0% |
Expressed as a percentage of the Fund’s net assets. * Credit quality ratings shown above reflect the highest rating assigned by either S&P Global Ratings or Moody’s Investors Services, both of which are independent, nationally recognized statistical rating organizations. If a credit rating for an investment is not available from either S&P or Moody’s, then the Fund’s investment advisor will determine the credit quality of the investment. Investments are considered to be investment grade if they are rated within the four highest grades by S&P or Moody’s (BBB/Baa or higher) or, if no credit rating is available, have been judged to be of comparable quality by the Fund’s investment advisor. (NR = Not Rated)
How has the Fund changed?
This is a summary of certain changes to the Fund since October 1, 2023. For more complete information, you may review the Fund’s next prospectus, which we expect to be available by February 1, 2025 at https://www.thornburg.com/download or upon request by calling 1-800-847-0200.
End Block
Changes In and Disagreements with Accountants
No changes and/or disagreements occurred in the current reporting period.
End Block
For additional information about the Fund, including its prospectus, financial information, holdings and proxy information, visit www.thornburg.com/download.

Thornburg New Mexico Intermediate Municipal Fund Tailored Shareholder Report | |
Thornburg New York Intermediate Municipal Fund Tailored Shareholder Report
Thornburg New York Intermediate Municipal Fund CLASS: A TICKER: THNYX Annual Shareholder Report | |
This annual shareholder report contains important information about the Thornburg New York Intermediate Municipal Fund Class A Shares for the period from October 1, 2023 to September 30, 2024. You can find additional information about the Fund at https://www.thornburg.com/download. You can also request this information by contacting us at 1-800-847-0200. This report also describes changes to the Fund that occurred during the reporting period.
How did the Fund perform last year and what affected its performance?
The Fund’s Class A shares underperformed the ICE BofA 3-15 Year U.S. Municipal Securities Index (the “Index”) during the 12-month period ended September 30, 2024. The period began with municipal bond yields peaking in October of 2023, which marked the end of the Federal Reserve rate hiking cycle, before falling precipitously throughout the period and ending significantly lower. The backdrop of falling municipal bond yields boosted bond prices due to the inverse relationship between the two, which produced strong absolute returns for the asset class. However, the Fund’s relative underperformance during the period was driven by its shorter duration and its focus on New York bonds. The Fund’s single-state focus and the impact on relative performance were evident in individual bond selection. The Fund’s relative performance benefited from active management regarding its sector/quality returns and thanks to its higher weighting to revenue and AA-rated bonds. Specifically, within the revenue sector, multi-family housing and other utilities bonds were positive contributors to relative performance during the period.
How did the Fund perform over the past 10 years?
The line graph below reflects a hypothetical $10,000 investment and assumes the deduction of the maximum sales charge associated with that investment. The returns shown in the line graph and table assume the reinvestment of dividends and capital gains, but do not reflect the deduction of taxes that a shareholder would pay on distributions or the redemption of Fund shares. The performance information shown below represents past performance and is no guarantee of future results. For Fund performance current to the most recent month end, visit https://www.thornburg.com/product/mutual-funds/fny/THNYX or call 1-800-847-0200. Performance for other share classes of the Fund will vary.
Cumulative Performance
Growth Table
Date | Thornburg New York Intermediate Municipal Fund | ICE BofA 3-15 Year U.S. Municipal Securities Index | ICE BofA U.S. Municipal Securities Index |
09/30/2014 | 9799.8538 | 10000 | 10000 |
10/31/2014 | 9839.238 | 10047.8828 | 10061.0061 |
11/30/2014 | 9842.4585 | 10053.6678 | 10074.732 |
12/31/2014 | 9889.9187 | 10084.4301 | 10133.237 |
01/31/2015 | 10034.4922 | 10254.7365 | 10315.1349 |
02/28/2015 | 9919.2889 | 10156.2738 | 10213.0312 |
03/31/2015 | 9944.2859 | 10171.2054 | 10243.2441 |
04/30/2015 | 9894.5819 | 10142.593 | 10191.582 |
05/31/2015 | 9866.5418 | 10095.8047 | 10157.4674 |
06/30/2015 | 9855.4399 | 10091.6614 | 10143.7215 |
07/31/2015 | 9917.5858 | 10164.9514 | 10223.9759 |
08/31/2015 | 9927.1334 | 10178.2804 | 10246.5455 |
09/30/2015 | 9983.1251 | 10260.1697 | 10315.6951 |
10/31/2015 | 10008.7567 | 10309.2642 | 10359.774 |
11/30/2015 | 10042.3477 | 10336.704 | 10410.5357 |
12/31/2015 | 10105.2377 | 10403.1536 | 10493.2511 |
01/31/2016 | 10206.4112 | 10545.9421 | 10609.5409 |
02/29/2016 | 10209.6051 | 10558.2157 | 10618.4247 |
03/31/2016 | 10227.5209 | 10572.4828 | 10665.2047 |
04/30/2016 | 10284.5045 | 10641.3168 | 10746.9397 |
05/31/2016 | 10287.5906 | 10632.3656 | 10780.454 |
06/30/2016 | 10406.4116 | 10781.0955 | 10955.589 |
07/31/2016 | 10378.6022 | 10791.4929 | 10949.7465 |
08/31/2016 | 10404.8746 | 10807.5581 | 10974.9373 |
09/30/2016 | 10373.8244 | 10772.5352 | 10921.9146 |
10/31/2016 | 10300.1141 | 10684.1963 | 10819.6708 |
11/30/2016 | 9986.4674 | 10291.4401 | 10425.262 |
12/31/2016 | 10053.598 | 10397.3686 | 10539.3308 |
01/31/2017 | 10090.4686 | 10465.499 | 10592.9738 |
02/28/2017 | 10136.7806 | 10539.5316 | 10661.5031 |
03/31/2017 | 10142.8378 | 10563.688 | 10685.8535 |
04/30/2017 | 10204.1906 | 10656.2093 | 10762.9465 |
05/31/2017 | 10288.5602 | 10805.9945 | 10922.1347 |
06/30/2017 | 10263.1597 | 10760.9261 | 10897.224 |
07/31/2017 | 10308.9546 | 10844.2226 | 10976.8981 |
08/31/2017 | 10362.1722 | 10935.1022 | 11069.4177 |
09/30/2017 | 10319.881 | 10880.3008 | 11027.4598 |
10/31/2017 | 10315.6117 | 10886.9849 | 11047.8085 |
11/30/2017 | 10262.9386 | 10795.4017 | 11000.3481 |
12/31/2017 | 10321.657 | 10879.48 | 11110.0751 |
01/31/2018 | 10253.2693 | 10775.5841 | 10993.045 |
02/28/2018 | 10226.502 | 10732.2746 | 10946.205 |
03/31/2018 | 10214.5162 | 10752.9521 | 10982.8206 |
04/30/2018 | 10187.2615 | 10716.9521 | 10940.1224 |
05/31/2018 | 10247.4375 | 10832.1835 | 11068.6574 |
06/30/2018 | 10284.5797 | 10844.8089 | 11080.8826 |
07/31/2018 | 10296.8527 | 10887.923 | 11107.1138 |
08/31/2018 | 10301.6431 | 10900.5093 | 11124.0611 |
09/30/2018 | 10250.1394 | 10842.2682 | 11053.4109 |
10/31/2018 | 10198.2411 | 10780.9782 | 10973.8968 |
11/30/2018 | 10268.5256 | 10907.4279 | 11094.9286 |
12/31/2018 | 10338.5214 | 11037.0046 | 11225.6846 |
01/31/2019 | 10400.9397 | 11148.21 | 11309.9006 |
02/28/2019 | 10439.689 | 11210.7117 | 11374.1081 |
03/31/2019 | 10534.3744 | 11343.3373 | 11556.5862 |
04/30/2019 | 10555.7504 | 11371.5979 | 11604.8669 |
05/31/2019 | 10658.3283 | 11536.2365 | 11776.3203 |
06/30/2019 | 10687.5693 | 11586.5037 | 11826.3817 |
07/31/2019 | 10756.3452 | 11687.9371 | 11920.3619 |
08/31/2019 | 10867.034 | 11824.3933 | 12108.5024 |
09/30/2019 | 10778.9973 | 11725.0707 | 12018.0237 |
10/31/2019 | 10781.2279 | 11746.7645 | 12032.5099 |
11/30/2019 | 10792.2956 | 11765.8003 | 12055.2997 |
12/31/2019 | 10810.3707 | 11810.2043 | 12094.0362 |
01/31/2020 | 10970.2447 | 12006.387 | 12310.4889 |
02/29/2020 | 11081.004 | 12123.3774 | 12480.4216 |
03/31/2020 | 10755.1238 | 11719.2465 | 12011.9411 |
04/30/2020 | 10596.9391 | 11604.3278 | 11828.8427 |
05/31/2020 | 10884.3234 | 11977.5009 | 12213.0072 |
06/30/2020 | 10961.5177 | 12060.0157 | 12331.8981 |
07/31/2020 | 11080.2923 | 12237.8661 | 12529.0824 |
08/31/2020 | 11012.8181 | 12208.4328 | 12486.8844 |
09/30/2020 | 11005.3728 | 12204.7586 | 12478.7409 |
10/31/2020 | 10962.7774 | 12179.5859 | 12453.9903 |
11/30/2020 | 11090.9438 | 12323.1952 | 12644.4318 |
12/31/2020 | 11133.9076 | 12395.5471 | 12730.2285 |
01/31/2021 | 11176.6638 | 12465.5928 | 12814.1645 |
02/28/2021 | 11041.626 | 12279.4948 | 12608.4364 |
03/31/2021 | 11075.7863 | 12337.4232 | 12685.0892 |
04/30/2021 | 11144.9395 | 12430.1791 | 12805.5408 |
05/31/2021 | 11159.9444 | 12459.2214 | 12861.4247 |
06/30/2021 | 11176.3901 | 12480.9153 | 12903.5827 |
07/31/2021 | 11251.8144 | 12575.5864 | 13000.3241 |
08/31/2021 | 11224.304 | 12545.9186 | 12952.2436 |
09/30/2021 | 11137.2845 | 12456.0944 | 12854.4017 |
10/31/2021 | 11110.1513 | 12428.3028 | 12840.0155 |
11/30/2021 | 11161.8936 | 12499.9902 | 12944.6803 |
12/31/2021 | 11169.3601 | 12512.5375 | 12962.708 |
01/31/2022 | 10933.9014 | 12167.3123 | 12614.479 |
02/28/2022 | 10900.3758 | 12112.0809 | 12543.3886 |
03/31/2022 | 10630.0585 | 11777.5267 | 12161.105 |
04/30/2022 | 10456.6639 | 11497.6567 | 11801.7111 |
05/31/2022 | 10562.6425 | 11677.4615 | 11990.3119 |
06/30/2022 | 10477.2664 | 11554.9988 | 11760.3534 |
07/31/2022 | 10635.5491 | 11842.8819 | 12081.5509 |
08/31/2022 | 10487.3148 | 11611.2855 | 11774.1193 |
09/30/2022 | 10304.4114 | 11242.6075 | 11336.1319 |
10/31/2022 | 10279.1522 | 11202.2296 | 11235.8489 |
11/30/2022 | 10510.9681 | 11634.8946 | 11804.6324 |
12/31/2022 | 10539.2588 | 11681.9957 | 11792.3671 |
01/31/2023 | 10709.0278 | 11983.4423 | 12154.9223 |
02/28/2023 | 10579.1638 | 11726.2824 | 11859.776 |
03/31/2023 | 10705.716 | 11967.0254 | 12125.9499 |
04/30/2023 | 10698.8698 | 11938.2566 | 12111.7038 |
05/31/2023 | 10647.2215 | 11817.0447 | 12018.8841 |
06/30/2023 | 10704.1925 | 11902.6474 | 12128.6911 |
07/31/2023 | 10734.3943 | 11933.0188 | 12159.4442 |
08/31/2023 | 10658.6289 | 11829.2011 | 12012.0412 |
09/30/2023 | 10484.6195 | 11557.1486 | 11671.6555 |
10/31/2023 | 10427.4202 | 11480.6925 | 11525.4929 |
11/30/2023 | 10850.7339 | 12052.0418 | 12262.5884 |
12/31/2023 | 11040.1646 | 12314.205 | 12561.5363 |
01/31/2024 | 10999.2582 | 12277.4232 | 12533.8245 |
02/29/2024 | 11006.9158 | 12288.2896 | 12535.4652 |
03/31/2024 | 11022.3551 | 12276.5241 | 12522.8598 |
04/30/2024 | 10965.6068 | 12144.3676 | 12382.8399 |
05/31/2024 | 10936.422 | 12061.032 | 12356.9688 |
06/30/2024 | 11054.78 | 12227.9768 | 12555.7339 |
07/31/2024 | 11118.4628 | 12337.7359 | 12664.2203 |
08/31/2024 | 11182.7464 | 12462.583 | 12763.903 |
09/30/2024 | 11237.8992 | 12575.0392 | 12899.3409 |
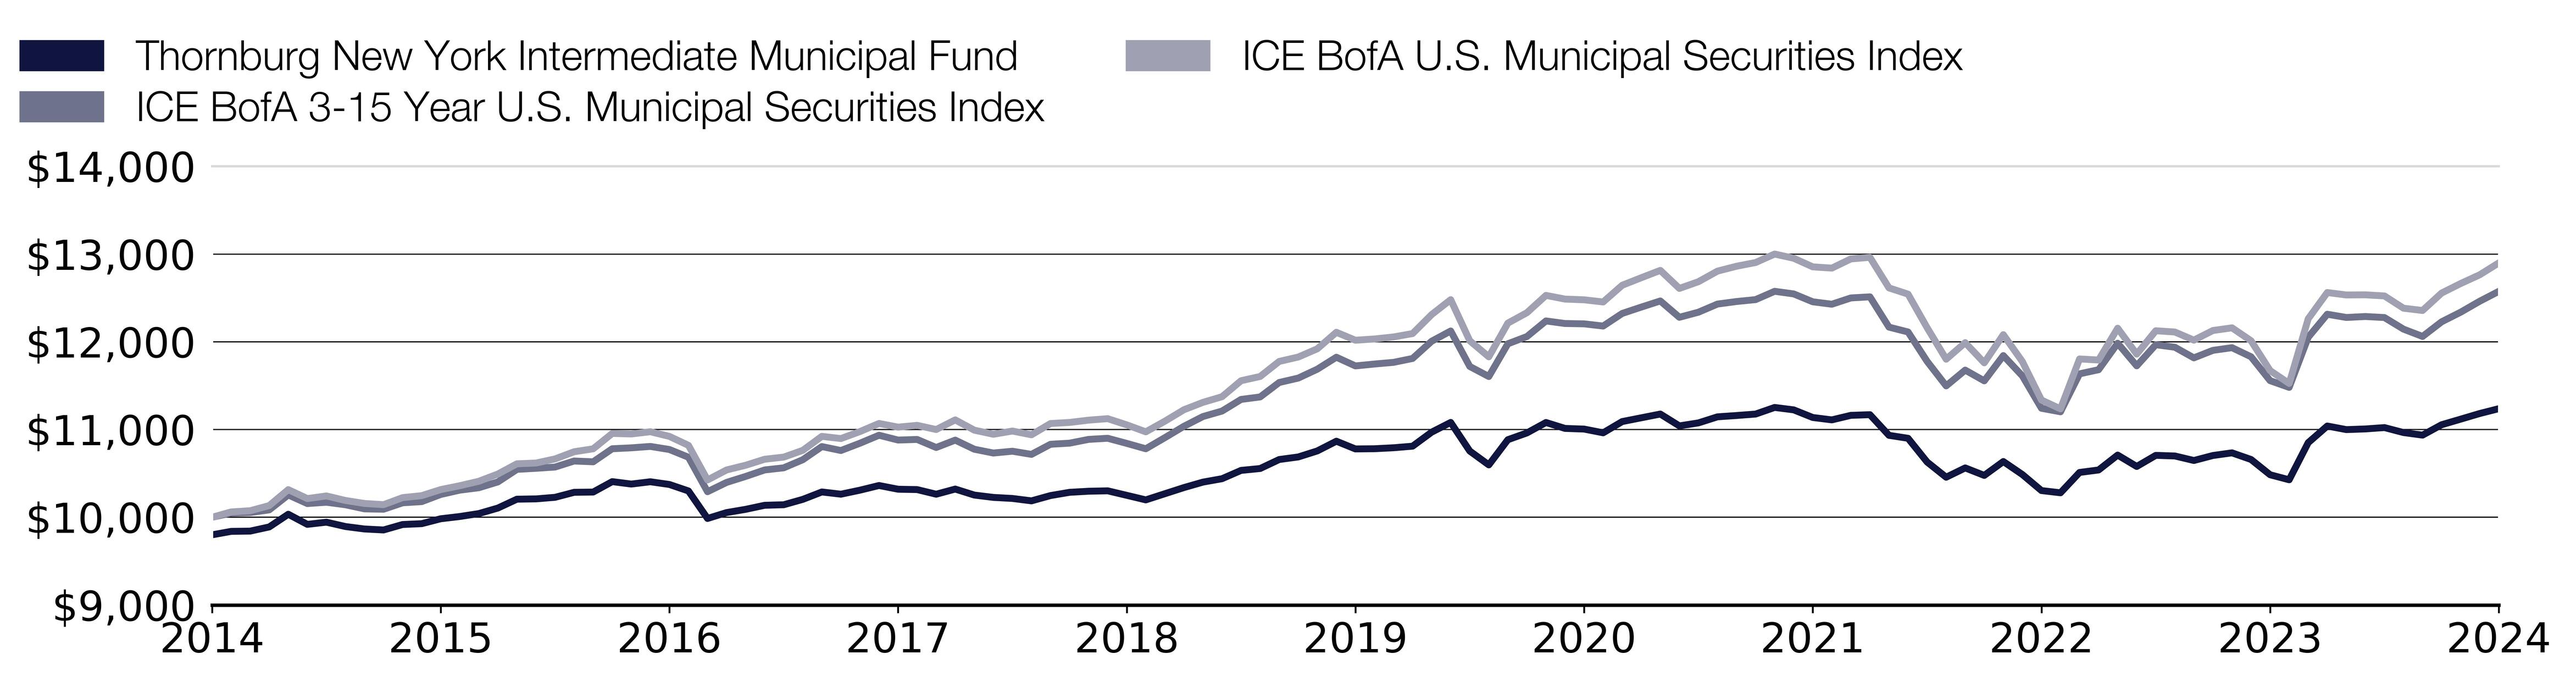
Effective September 30, 2024, the Fund changed its benchmark to the ICE BofA U.S. Municipal Securities Index, a broad-based securities market index that represents the overall applicable market in which the Fund invests.
What were the Fund costs for the past year?
(based on a hypothetical $10,000 investment)
Class Name | Costs of a $10,000 investment | Costs paid as a percentage of a $10,000 investment |
|---|
Class A | $103.00 | 0.99% |
End Block
Thornburg New York Intermediate Municipal Fund Tailored Shareholder Report
Thornburg New York Intermediate Municipal Fund Tailored Shareholder Report | |
Annual Performance | 1 Year | 5 Year | 10 Year |
|---|
New York Intermediate Municipal Fund Class A (with sales charge) | 5.01% | 0.44% | 1.17% |
New York Intermediate Municipal Fund Class A (without sales charge) | 7.18% | 0.84% | 1.38% |
ICE BofA 3-15 Year U.S. Municipal Securities Index | 8.81% | 1.41% | 2.32% |
ICE BofA U.S. Municipal Securities Index | 10.52% | 1.43% | 2.58% |
Key Fund Statistics
(as of September 30, 2024)
| |
|---|
Fund Size (Millions) | $25.3M |
Number of Holdings | 56 |
Annual Portfolio Turnover | 20.23% |
Total Advisory Fee | $0.1M |
What did the Fund invest in?
(as of September 30, 2024)
Credit Quality Ratings | (%) |
|---|
| AAA | 20.5 |
| AA | 50.0 |
| A | 17.5 |
| BBB | 4.0 |
| NR | 7.4 |
| Below Invest. Grade | 0.0 |
| Cash & Cash Equivalent | 0.7 |
Credit Quality Ratings | (%) |
AAA | 20.5% |
AA | 50.0% |
A | 17.5% |
BBB | 4.0% |
NR | 7.4% |
Below Invest. Grade | 0.0% |
Cash & Cash Equivalent | 0.7% |

Expressed as a percentage of the Fund’s net assets. * Credit quality ratings shown above reflect the highest rating assigned by either S&P Global Ratings or Moody’s Investors Services, both of which are independent, nationally recognized statistical rating organizations. If a credit rating for an investment is not available from either S&P or Moody’s, then the Fund’s investment advisor will determine the credit quality of the investment. Investments are considered to be investment grade if they are rated within the four highest grades by S&P or Moody’s (BBB/Baa or higher) or, if no credit rating is available, have been judged to be of comparable quality by the Fund’s investment advisor. (NR = Not Rated)
How has the Fund changed?
This is a summary of certain changes to the Fund since October 1, 2023. For more complete information, you may review the Fund’s next prospectus, which we expect to be available by February 1, 2025 at https://www.thornburg.com/download or upon request by calling 1-800-847-0200.
End Block
Changes In and Disagreements with Accountants
No changes and/or disagreements occurred in the current reporting period.
End Block
For additional information about the Fund, including its prospectus, financial information, holdings and proxy information, visit www.thornburg.com/download.

Thornburg New York Intermediate Municipal Fund Tailored Shareholder Report | |
Thornburg New York Intermediate Municipal Fund Tailored Shareholder Report
Thornburg New York Intermediate Municipal Fund CLASS: I TICKER: TNYIX Annual Shareholder Report | |
This annual shareholder report contains important information about the Thornburg New York Intermediate Municipal Fund Class I Shares for the period from October 1, 2023 to September 30, 2024. You can find additional information about the Fund at https://www.thornburg.com/download. You can also request this information by contacting us at 1-800-847-0200. This report also describes changes to the Fund that occurred during the reporting period.
How did the Fund perform last year and what affected its performance?
The Fund’s Class I shares underperformed the ICE BofA 3-15 Year U.S. Municipal Securities Index (the “Index”) during the 12-month period ended September 30, 2024. The period began with municipal bond yields peaking in October of 2023, which marked the end of the Federal Reserve rate hiking cycle, before falling precipitously throughout the period and ending significantly lower. The backdrop of falling municipal bond yields boosted bond prices due to the inverse relationship between the two, which produced strong absolute returns for the asset class. However, the Fund’s relative underperformance during the period was driven by its shorter duration and its focus on New York bonds. The Fund’s single-state focus and the impact on relative performance were evident in individual bond selection. The Fund’s relative performance benefited from active management regarding its sector/quality returns and thanks to its higher weighting to revenue and AA-rated bonds. Specifically, within the revenue sector, multi-family housing and other utilities bonds were positive contributors to relative performance during the period.
How did the Fund perform over the past 10 years?
The line graph below reflects a hypothetical $10,000 investment. The returns shown in the line graph and table assume the reinvestment of dividends and capital gains, but do not reflect the deduction of taxes that a shareholder would pay on distributions or the redemption of Fund shares. The performance information shown below represents past performance and is no guarantee of future results. For Fund performance current to the most recent month end, visit https://www.thornburg.com/product/mutual-funds/fny/TNYIX or call 1-800-847-0200. Performance for other share classes of the Fund will vary.
Cumulative Performance
Growth Table
Date | Thornburg New York Intermediate Municipal Fund | ICE BofA 3-15 Year U.S. Municipal Securities Index | ICE BofA U.S. Municipal Securities Index |
09/30/2014 | 10000.0046 | 10000 | 10000 |
10/31/2014 | 10042.9303 | 10047.8828 | 10061.0061 |
11/30/2014 | 10048.8597 | 10053.6678 | 10074.732 |
12/31/2014 | 10100.0624 | 10084.4301 | 10133.237 |
01/31/2015 | 10250.4864 | 10254.7365 | 10315.1349 |
02/28/2015 | 10135.3075 | 10156.2738 | 10213.0312 |
03/31/2015 | 10163.6124 | 10171.2054 | 10243.2441 |
04/30/2015 | 10115.4918 | 10142.593 | 10191.582 |
05/31/2015 | 10089.7261 | 10095.8047 | 10157.4674 |
06/30/2015 | 10079.4872 | 10091.6614 | 10143.7215 |
07/31/2015 | 10145.7882 | 10164.9514 | 10223.9759 |
08/31/2015 | 10158.3134 | 10178.2804 | 10246.5455 |
09/30/2015 | 10218.9285 | 10260.1697 | 10315.6951 |
10/31/2015 | 10247.9573 | 10309.2642 | 10359.774 |
11/30/2015 | 10285.0418 | 10336.704 | 10410.5357 |
12/31/2015 | 10352.2588 | 10403.1536 | 10493.2511 |
01/31/2016 | 10458.7312 | 10545.9421 | 10609.5409 |
02/29/2016 | 10464.6609 | 10558.2157 | 10618.4247 |
03/31/2016 | 10485.8498 | 10572.4828 | 10665.2047 |
04/30/2016 | 10547.0321 | 10641.3168 | 10746.9397 |
05/31/2016 | 10553.0607 | 10632.3656 | 10780.454 |
06/30/2016 | 10677.731 | 10781.0955 | 10955.589 |
07/31/2016 | 10652.0959 | 10791.4929 | 10949.7465 |
08/31/2016 | 10681.9525 | 10807.5581 | 10974.9373 |
09/30/2016 | 10652.866 | 10772.5352 | 10921.9146 |
10/31/2016 | 10580.0698 | 10684.1963 | 10819.6708 |
11/30/2016 | 10260.6607 | 10291.4401 | 10425.262 |
12/31/2016 | 10332.4281 | 10397.3686 | 10539.3308 |
01/31/2017 | 10373.1442 | 10465.499 | 10592.9738 |
02/28/2017 | 10423.3133 | 10539.5316 | 10661.5031 |
03/31/2017 | 10432.3703 | 10563.688 | 10685.8535 |
04/30/2017 | 10498.2322 | 10656.2093 | 10762.9465 |
05/31/2017 | 10587.9024 | 10805.9945 | 10922.1347 |
06/30/2017 | 10564.5493 | 10760.9261 | 10897.224 |
07/31/2017 | 10614.573 | 10844.2226 | 10976.8981 |
08/31/2017 | 10672.2598 | 10935.1022 | 11069.4177 |
09/30/2017 | 10631.504 | 10880.3008 | 11027.4598 |
10/31/2017 | 10630.0564 | 10886.9849 | 11047.8085 |
11/30/2017 | 10578.6016 | 10795.4017 | 11000.3481 |
12/31/2017 | 10642.0106 | 10879.48 | 11110.0751 |
01/31/2018 | 10574.3847 | 10775.5841 | 10993.045 |
02/28/2018 | 10549.3428 | 10732.2746 | 10946.205 |
03/31/2018 | 10539.8429 | 10752.9521 | 10982.8206 |
04/30/2018 | 10514.5225 | 10716.9521 | 10940.1224 |
05/31/2018 | 10579.5117 | 10832.1835 | 11068.6574 |
06/30/2018 | 10620.639 | 10844.8089 | 11080.8826 |
07/31/2018 | 10636.1969 | 10887.923 | 11107.1138 |
08/31/2018 | 10644.0605 | 10900.5093 | 11124.0611 |
09/30/2018 | 10593.6484 | 10842.2682 | 11053.4109 |
10/31/2018 | 10542.8666 | 10780.9782 | 10973.8968 |
11/30/2018 | 10618.2874 | 10907.4279 | 11094.9286 |
12/31/2018 | 10693.5664 | 11037.0046 | 11225.6846 |
01/31/2019 | 10761.0185 | 11148.21 | 11309.9006 |
02/28/2019 | 10803.7542 | 11210.7117 | 11374.1081 |
03/31/2019 | 10904.6784 | 11343.3373 | 11556.5862 |
04/30/2019 | 10929.6512 | 11371.5979 | 11604.8669 |
05/31/2019 | 11038.8525 | 11536.2365 | 11776.3203 |
06/30/2019 | 11072.0808 | 11586.5037 | 11826.3817 |
07/31/2019 | 11146.3531 | 11687.9371 | 11920.3619 |
08/31/2019 | 11264.1036 | 11824.3933 | 12108.5024 |
09/30/2019 | 11175.7982 | 11725.0707 | 12018.0237 |
10/31/2019 | 11181.1658 | 11746.7645 | 12032.5099 |
11/30/2019 | 11195.5676 | 11765.8003 | 12055.2997 |
12/31/2019 | 11217.3507 | 11810.2043 | 12094.0362 |
01/31/2020 | 11394.8778 | 12006.387 | 12310.4889 |
02/29/2020 | 11504.0244 | 12123.3774 | 12480.4216 |
03/31/2020 | 11168.714 | 11719.2465 | 12011.9411 |
04/30/2020 | 11007.3616 | 11604.3278 | 11828.8427 |
05/31/2020 | 11308.8753 | 11977.5009 | 12213.0072 |
06/30/2020 | 11392.0568 | 12060.0157 | 12331.8981 |
07/31/2020 | 11518.5979 | 12237.8661 | 12529.0824 |
08/31/2020 | 11460.371 | 12208.4328 | 12486.8844 |
09/30/2020 | 11446.8293 | 12204.7586 | 12478.7409 |
10/31/2020 | 11405.6263 | 12179.5859 | 12453.9903 |
11/30/2020 | 11541.9956 | 12323.1952 | 12644.4318 |
12/31/2020 | 11589.8485 | 12395.5471 | 12730.2285 |
01/31/2021 | 11637.5114 | 12465.5928 | 12814.1645 |
02/28/2021 | 11499.7179 | 12279.4948 | 12608.4364 |
03/31/2021 | 11538.4256 | 12337.4232 | 12685.0892 |
04/30/2021 | 11613.5175 | 12430.1791 | 12805.5408 |
05/31/2021 | 11632.3126 | 12459.2214 | 12861.4247 |
06/30/2021 | 11652.5224 | 12480.9153 | 12903.5827 |
07/31/2021 | 11734.3643 | 12575.5864 | 13000.3241 |
08/31/2021 | 11708.853 | 12545.9186 | 12952.2436 |
09/30/2021 | 11621.1474 | 12456.0944 | 12854.4017 |
10/31/2021 | 11595.9721 | 12428.3028 | 12840.0155 |
11/30/2021 | 11653.0257 | 12499.9902 | 12944.6803 |
12/31/2021 | 11663.9171 | 12512.5375 | 12962.708 |
01/31/2022 | 11421.1774 | 12167.3123 | 12614.479 |
02/28/2022 | 11388.9539 | 12112.0809 | 12543.3886 |
03/31/2022 | 11118.694 | 11777.5267 | 12161.105 |
04/30/2022 | 10931.2486 | 11497.6567 | 11801.7111 |
05/31/2022 | 11044.9942 | 11677.4615 | 11990.3119 |
06/30/2022 | 10958.5917 | 11554.9988 | 11760.3534 |
07/31/2022 | 11136.3318 | 11842.8819 | 12081.5509 |
08/31/2022 | 10975.065 | 11611.2855 | 11774.1193 |
09/30/2022 | 10786.5267 | 11242.6075 | 11336.1319 |
10/31/2022 | 10763.03 | 11202.2296 | 11235.8489 |
11/30/2022 | 11008.5704 | 11634.8946 | 11804.6324 |
12/31/2022 | 11041.177 | 11681.9957 | 11792.3671 |
01/31/2023 | 11222.0686 | 11983.4423 | 12154.9223 |
02/28/2023 | 11088.7207 | 11726.2824 | 11859.776 |
03/31/2023 | 11224.38 | 11967.0254 | 12125.9499 |
04/30/2023 | 11229.5129 | 11938.2566 | 12111.7038 |
05/31/2023 | 11169.0142 | 11817.0447 | 12018.8841 |
06/30/2023 | 11231.7252 | 11902.6474 | 12128.6911 |
07/31/2023 | 11266.4765 | 11933.0188 | 12159.4442 |
08/31/2023 | 11189.9852 | 11829.2011 | 12012.0412 |
09/30/2023 | 11010.2274 | 11557.1486 | 11671.6555 |
10/31/2023 | 10953.1238 | 11480.6925 | 11525.4929 |
11/30/2023 | 11400.7026 | 12052.0418 | 12262.5884 |
12/31/2023 | 11602.8536 | 12314.205 | 12561.5363 |
01/31/2024 | 11562.9876 | 12277.4232 | 12533.8245 |
02/29/2024 | 11573.9768 | 12288.2896 | 12535.4652 |
03/31/2024 | 11593.328 | 12276.5241 | 12522.8598 |
04/30/2024 | 11536.6734 | 12144.3676 | 12382.8399 |
05/31/2024 | 11509.1039 | 12061.032 | 12356.9688 |
06/30/2024 | 11636.7027 | 12227.9768 | 12555.7339 |
07/31/2024 | 11706.8862 | 12337.7359 | 12664.2203 |
08/31/2024 | 11777.7491 | 12462.583 | 12763.903 |
09/30/2024 | 11838.9304 | 12575.0392 | 12899.3409 |

Effective September 30, 2024, the Fund changed its benchmark to the ICE BofA U.S. Municipal Securities Index, a broad-based securities market index that represents the overall applicable market in which the Fund invests.
What were the Fund costs for the past year?
(based on a hypothetical $10,000 investment)
Class Name | Costs of a $10,000 investment | Costs paid as a percentage of a $10,000 investment |
|---|
Class I | $70.00 | 0.67% |
End Block
Thornburg New York Intermediate Municipal Fund Tailored Shareholder Report
Thornburg New York Intermediate Municipal Fund Tailored Shareholder Report | |
Annual Performance | 1 Year | 5 Year | 10 Year |
|---|
New York Intermediate Municipal Fund Class I | 7.53% | 1.16% | 1.70% |
ICE BofA 3-15 Year U.S. Municipal Securities Index | 8.81% | 1.41% | 2.32% |
ICE BofA U.S. Municipal Securities Index | 10.52% | 1.43% | 2.58% |
Key Fund Statistics
(as of September 30, 2024)
| |
|---|
Fund Size (Millions) | $25.3M |
Number of Holdings | 56 |
Annual Portfolio Turnover | 20.23% |
Total Advisory Fee | $0.1M |
What did the Fund invest in?
(as of September 30, 2024)
Credit Quality Ratings | (%) |
|---|
| AAA | 20.5 |
| AA | 50.0 |
| A | 17.5 |
| BBB | 4.0 |
| NR | 7.4 |
| Below Invest. Grade | 0.0 |
| Cash & Cash Equivalent | 0.7 |
Credit Quality Ratings | (%) |
AAA | 20.5% |
AA | 50.0% |
A | 17.5% |
BBB | 4.0% |
NR | 7.4% |
Below Invest. Grade | 0.0% |
Cash & Cash Equivalent | 0.7% |
Expressed as a percentage of the Fund’s net assets. * Credit quality ratings shown above reflect the highest rating assigned by either S&P Global Ratings or Moody’s Investors Services, both of which are independent, nationally recognized statistical rating organizations. If a credit rating for an investment is not available from either S&P or Moody’s, then the Fund’s investment advisor will determine the credit quality of the investment. Investments are considered to be investment grade if they are rated within the four highest grades by S&P or Moody’s (BBB/Baa or higher) or, if no credit rating is available, have been judged to be of comparable quality by the Fund’s investment advisor. (NR = Not Rated)
How has the Fund changed?
This is a summary of certain changes to the Fund since October 1, 2023. For more complete information, you may review the Fund’s next prospectus, which we expect to be available by February 1, 2025 at https://www.thornburg.com/download or upon request by calling 1-800-847-0200.
End Block
Changes In and Disagreements with Accountants
No changes and/or disagreements occurred in the current reporting period.
End Block
For additional information about the Fund, including its prospectus, financial information, holdings and proxy information, visit www.thornburg.com/download.

Thornburg New York Intermediate Municipal Fund Tailored Shareholder Report | |
Thornburg Emerging Markets Managed Account Fund Tailored Shareholder Report
Thornburg Emerging Markets Managed Account Fund CLASS: I TICKER: THMGX Annual Shareholder Report | |
This annual shareholder report contains important information about the Thornburg Emerging Markets Managed Account Fund Class I Shares for the period from October 2, 2023 to September 30, 2024. You can find additional information about the Fund at https://www.thornburg.com/download. You can also request this information by contacting us at 1-800-847-0200. This report also describes changes to the Fund that occurred during the reporting period.
How did the Fund perform last year and what affected its performance?
The Fund’s Class I shares underperformed the MSCI Emerging Markets Net Total Return USD Index (the “Index”) during the period from the Fund’s inception on October 2, 2023 to September 30, 2024. The Fund’s relative underperformance during the period was primarily driven by bottom-up stock selection, followed by country allocation decisions. During the period, the Fund’s underweight allocation to materials and stock selection in communication services contributed positively to relative performance. Stock selection in health care and consumer staples were primary detractors. On a geographic basis, stock selection within South Korea and Saudi Arabia aided relative performance, while stock selection within China and Taiwan hampered relative results.
How did the Fund perform over the past 10 years?
The line graph below reflects a hypothetical $10,000 investment. The returns shown in the line graph and table assume the reinvestment of dividends and capital gains, but do not reflect the deduction of taxes that a shareholder would pay on distributions or the redemption of Fund shares. The performance information shown below represents past performance and is no guarantee of future results. For Fund performance current to the most recent month end, call 1-800-847-0200.
Cumulative Performance
Growth Table
Date | Thornburg Emerging Markets Managed Account Fund | MSCI Emerging Markets Net Total Return USD Index |
10/02/2023 | 10000 | 10000 |
10/31/2023 | 9360 | 9624.4117 |
11/30/2023 | 9910 | 10394.6479 |
12/31/2023 | 10324.8726 | 10801.0108 |
01/31/2024 | 9691.5065 | 10299.4913 |
02/29/2024 | 10264.552 | 10789.4577 |
03/31/2024 | 10535.9946 | 11056.8188 |
04/30/2024 | 10214.2849 | 11106.2889 |
05/31/2024 | 10324.8726 | 11169.0117 |
06/30/2024 | 10747.1167 | 11609.5687 |
07/31/2024 | 10666.6892 | 11644.1067 |
08/31/2024 | 10666.6892 | 11832.1133 |
09/30/2024 | 10666.6892 | 12622.1982 |

What were the Fund costs for the past year?
(based on a hypothetical $10,000 investment)
Class Name | Costs of a $10,000 investment | Costs paid as a percentage of a $10,000 investment |
|---|
Class I | $0.00 | 0.00% |
Fund costs may be higher for a full one year period.
End Block
Thornburg Emerging Markets Managed Account Fund Tailored Shareholder Report
Thornburg Emerging Markets Managed Account Fund Tailored Shareholder Report | |
Annual Performance | Since Inception |
|---|
Emerging Markets Managed Account Fund Class I | 6.67% |
MSCI Emerging Markets Net Total Return USD Index | 26.22% |
Key Fund Statistics
(as of September 30, 2024)
| |
|---|
Fund Size (Millions) | $1.1M |
Number of Holdings | 29 |
Annual Portfolio Turnover | 145.98% |
Total Advisory Fee | $0.0M |
What did the Fund invest in?
(as of September 30, 2024)
Market Capitalization Exposure | (%) |
|---|
| Small Cap (<$2.5 B) | 10.2 |
| Mid Cap ($2.5-12 B) | 40.4 |
| Large Cap (>$12 B) | 49.4 |
Market Capitalization Exposure | (%) |
Small Cap (<$2.5 B) | 10.2% |
Mid Cap ($2.5-12 B) | 40.4% |
Large Cap (>$12 B) | 49.4% |
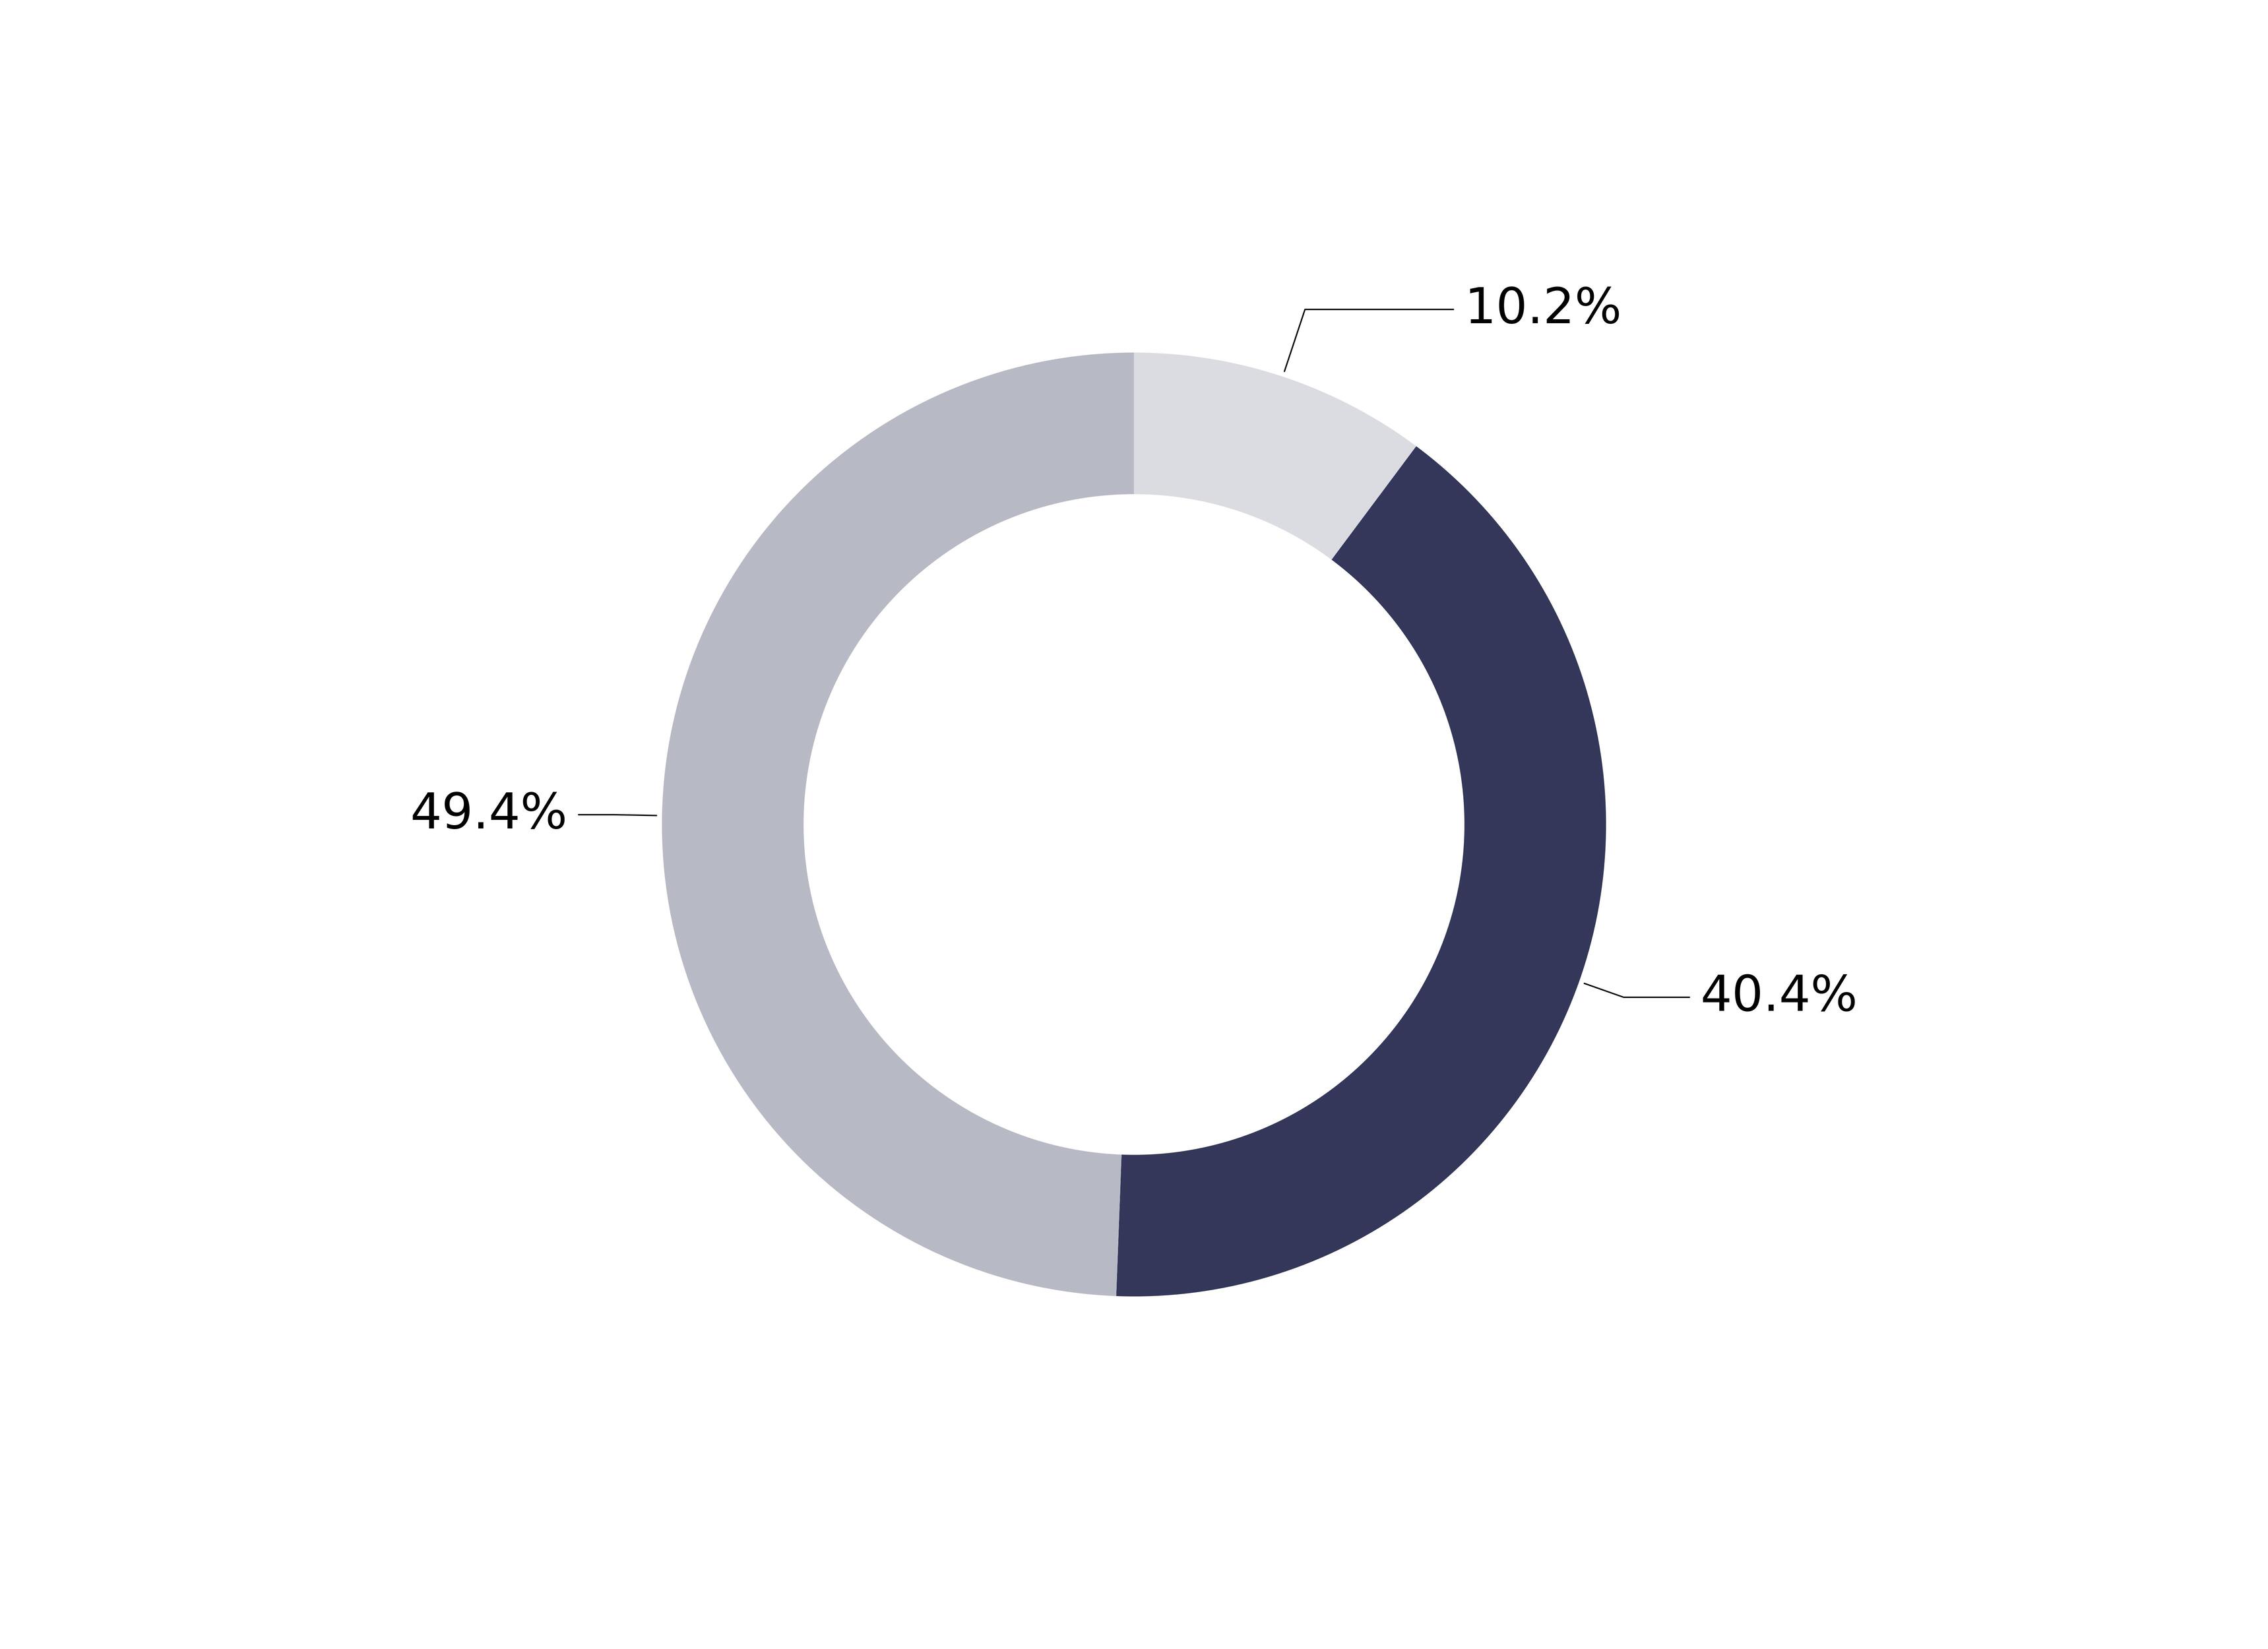
Expressed as a percentage of the Fund’s net assets.
How has the Fund changed?
This is a summary of certain changes to the Fund since October 2, 2023. For more complete information, you may review the Fund’s next prospectus, which we expect to be available by February 1, 2025 at https://www.thornburg.com/download or upon request by calling 1-800-847-0200.
End Block
Changes In and Disagreements with Accountants
No changes and/or disagreements occurred in the current reporting period.
End Block
For additional information about the Fund, including its prospectus, financial information, holdings and proxy information, visit www.thornburg.com/download.
Thornburg Emerging Markets Managed Account Fund Tailored Shareholder Report | |
Thornburg Municipal Managed Account Fund Tailored Shareholder Report
Thornburg Municipal Managed Account Fund CLASS: I TICKER: THMMX Annual Shareholder Report | |
This annual shareholder report contains important information about the Thornburg Municipal Managed Account Fund Class I Shares for the period from October 1, 2023 to September 30, 2024. You can find additional information about the Fund at https://www.thornburg.com/download. You can also request this information by contacting us at 1-800-847-0200. This report also describes changes to the Fund that occurred during the reporting period.
How did the Fund perform last year and what affected its performance?
The Fund’s Class I shares outperformed the ICE BofA U.S. Municipal Master Index (the “Index”) during the 12-month period ended September 30, 2024. The period began with municipal bond yields peaking in October of 2023, which marked the end of the Federal Reserve rate hiking cycle, before falling precipitously throughout the period and ending significantly lower. The backdrop of falling municipal yields boosted bond prices due to the inverse relationship between the two, which produced strong absolute returns for the asset class. However, the Fund’s relative performance during the period was negatively impacted by its yield curve positioning versus its Index. The Fund’s relative performance benefited from numerous factors, including its longer duration positioning versus the Index, sector/quality returns, and individual bond selection. The Fund benefited from our active management approach with respect to its sector/quality returns thanks to its higher weighting to revenue bonds and A-rated bonds. Specifically, within the revenue sector, hospital, and other utility bonds were large contributors to relative performance during the period
How did the Fund perform over the past 10 years?
The line graph below reflects a hypothetical $10,000 investment. The returns shown in the line graph and table assume the reinvestment of dividends and capital gains, but do not reflect the deduction of taxes that a shareholder would pay on distributions or the redemption of Fund shares. The performance information shown below represents past performance and is no guarantee of future results. For Fund performance current to the most recent month end, call 1-800-847-0200.
Cumulative Performance
Growth Table
Date | Thornburg Municipal Managed Account Fund | ICE BofA U.S. Municipal Securities Index |
05/15/2023 | 10000 | 10000 |
05/31/2023 | 9994.6706 | 9885.9154 |
06/30/2023 | 10033.7562 | 9976.2351 |
07/31/2023 | 10113.8107 | 10001.5306 |
08/31/2023 | 10041.3054 | 9880.2868 |
09/30/2023 | 9826.2067 | 9600.3087 |
10/31/2023 | 9701.8796 | 9480.0854 |
11/30/2023 | 10239.6294 | 10086.3699 |
12/31/2023 | 10460.5139 | 10332.2641 |
01/31/2024 | 10467.5432 | 10309.4702 |
02/29/2024 | 10535.4002 | 10310.8198 |
03/31/2024 | 10625.2902 | 10300.4514 |
04/30/2024 | 10538.0876 | 10185.2806 |
05/31/2024 | 10586.5591 | 10164.0008 |
06/30/2024 | 10731.8429 | 10327.4914 |
07/31/2024 | 10866.5678 | 10416.725 |
08/31/2024 | 10969.4906 | 10498.7171 |
09/30/2024 | 11105.7907 | 10610.1192 |
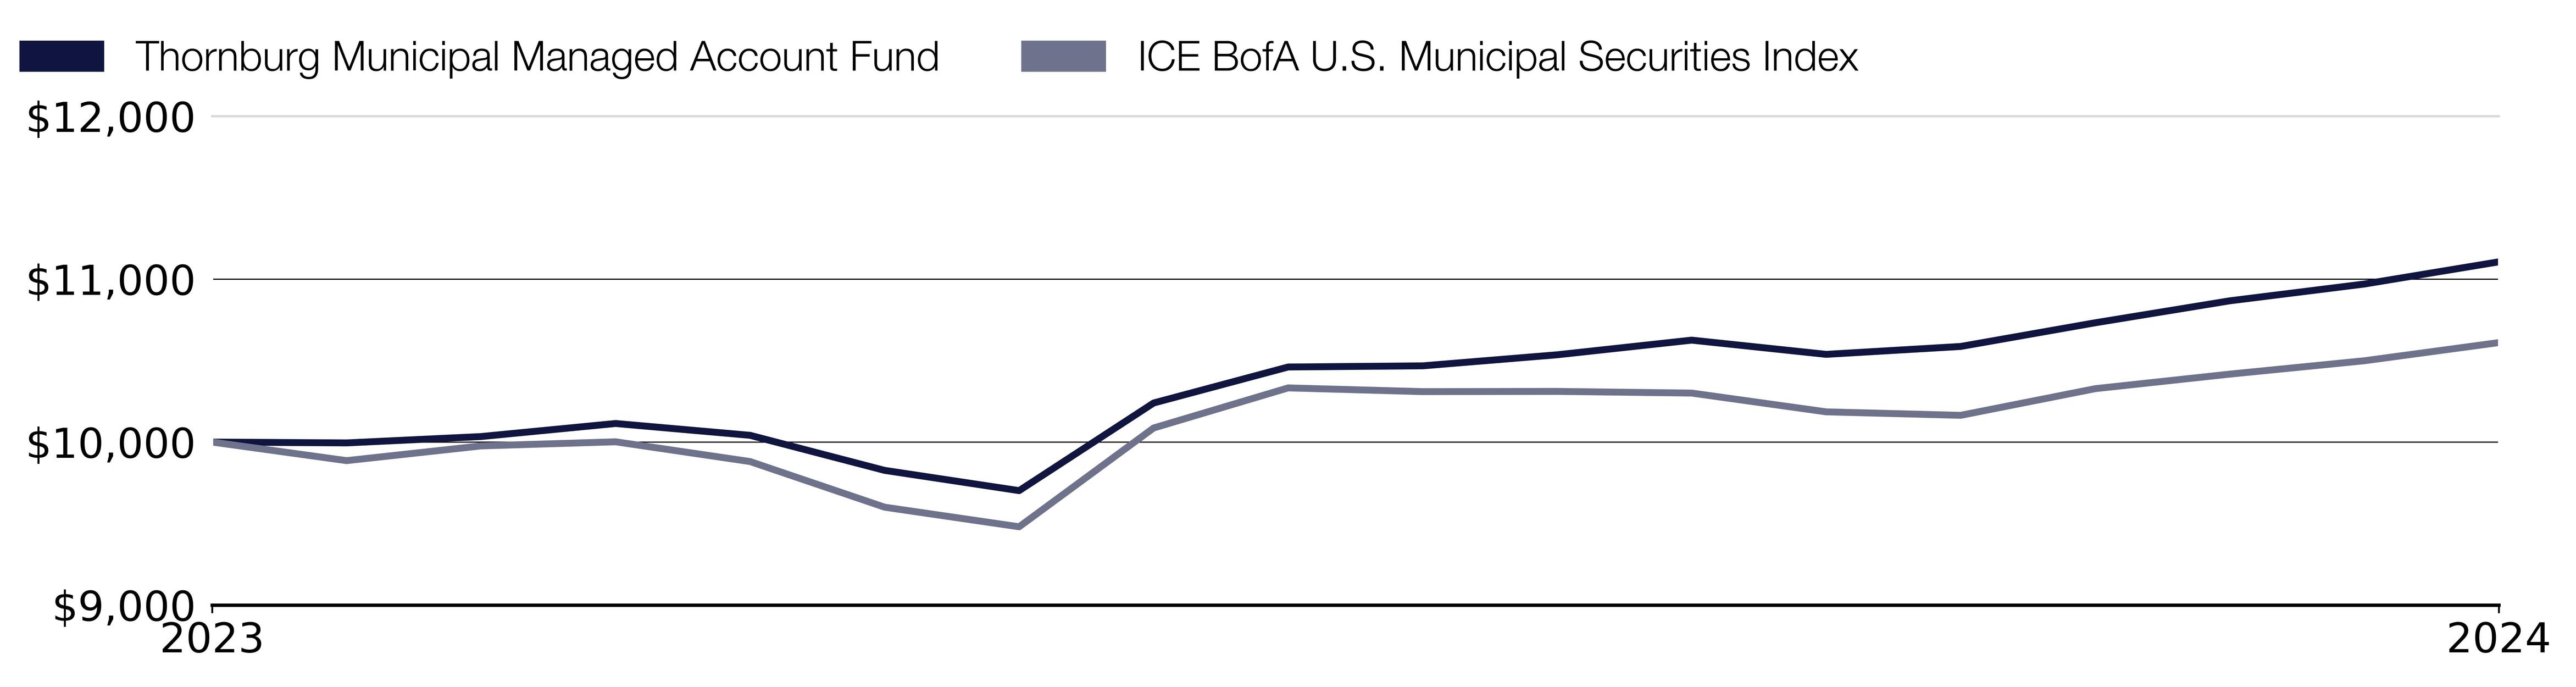
Effective September 30, 2024, the name of the Fund’s broad-based securities market index was changed from the ICE BofA U.S. Municipal Master Index to the ICE BofA U.S. Municipal Securities Index.
What were the Fund costs for the past year?
(based on a hypothetical $10,000 investment)
Class Name | Costs of a $10,000 investment | Costs paid as a percentage of a $10,000 investment |
|---|
Class I | $0.00 | 0.00% |
End Block
Thornburg Municipal Managed Account Fund Tailored Shareholder Report
Thornburg Municipal Managed Account Fund Tailored Shareholder Report | |
Annual Performance | 1 Year |
|---|
Municipal Managed Account Fund Class I | 13.02% |
ICE BofA U.S. Municipal Securities Index | 10.52% |
Key Fund Statistics
(as of September 30, 2024)
| |
|---|
Fund Size (Millions) | $11.3M |
Number of Holdings | 62 |
Annual Portfolio Turnover | 21.60% |
Total Advisory Fee | $0.0M |
What did the Fund invest in?
(as of September 30, 2024)
Credit Quality Ratings | (%) |
|---|
| AAA | 15.1 |
| AA | 17.6 |
| A | 30.9 |
| BBB | 21.8 |
| NR | 11.9 |
| Below Invest. Grade | 0.9 |
| Cash & Cash Equivalent | 1.7 |
Credit Quality Ratings | (%) |
AAA | 15.1% |
AA | 17.6% |
A | 30.9% |
BBB | 21.8% |
NR | 11.9% |
Below Invest. Grade | 0.9% |
Cash & Cash Equivalent | 1.7% |

Expressed as a percentage of the Fund’s net assets. * Credit quality ratings shown above reflect the highest rating assigned by either S&P Global Ratings or Moody’s Investors Services, both of which are independent, nationally recognized statistical rating organizations. If a credit rating for an investment is not available from either S&P or Moody’s, then the Fund’s investment advisor will determine the credit quality of the investment. Investments are considered to be investment grade if they are rated within the four highest grades by S&P or Moody’s (BBB/Baa or higher) or, if no credit rating is available, have been judged to be of comparable quality by the Fund’s investment advisor. (NR = Not Rated)
How has the Fund changed?
This is a summary of certain changes to the Fund since October 1, 2023. For more complete information, you may review the Fund’s next prospectus, which we expect to be available by February 1, 2025 at https://www.thornburg.com/download or upon request by calling 1-800-847-0200.
End Block
Changes In and Disagreements with Accountants
No changes and/or disagreements occurred in the current reporting period.
End Block
For additional information about the Fund, including its prospectus, financial information, holdings and proxy information, visit www.thornburg.com/download.
Thornburg Municipal Managed Account Fund Tailored Shareholder Report | |
Thornburg Capital Management Fund Tailored Shareholder Report
Thornburg Capital Management Fund CLASS: I TICKER: N/A Annual Shareholder Report | |
This annual shareholder report contains important information about the Thornburg Capital Management Fund Class I Shares for the period from October 1, 2023 to September 30, 2024. You can find additional information about the Fund at https://www.thornburg.com/download. You can also request this information by contacting us at 1-800-847-0200. This report also describes changes to the Fund that occurred during the reporting period.
How did the Fund perform last year and what affected its performance?
The Fund’s Class I shares generated positive total returns and outpaced the FTSE 1-Month Treasury Bill Local Currency Index (the “Index”) during the 12-month period ended September 30, 2024. Over the reporting period, the Fund accomplished its goal of 'safety of capital' by providing a share price of $10.00 that has not fluctuated since the Fund’s inception. The Fund has matched or beat the Index for all standard time periods since inception. As of September 30, 2024, throughout the life of the strategy, the Fund has never suffered a default on any cash equivalent investment.
How did the Fund perform over the past 10 years?
The line graph below reflects a hypothetical $10,000 investment. The returns shown in the line graph and table assume the reinvestment of dividends and capital gains, but do not reflect the deduction of taxes that a shareholder would pay on distributions or the redemption of Fund shares. The performance information shown below represents past performance and is no guarantee of future results. For Fund performance current to the most recent month end, call 1-800-847-0200.
Cumulative Performance
Growth Table
Date | Thornburg Capital Management Fund | FTSE 1-Month Treasury Bill Local Currency Index | ICE BofA U.S. 1-Month Treasury Bill Index |
07/31/2015 | 10000 | 10000 | 10000 |
08/31/2015 | 10002.22 | 10000.2559 | 10000.264 |
09/30/2015 | 10004.35 | 10000.2742 | 10000.33 |
10/31/2015 | 10006.68 | 10000.2193 | 10000.198 |
11/30/2015 | 10008.78 | 10000.2742 | 10000.264 |
12/31/2015 | 10012 | 10001.1698 | 10001.3198 |
01/31/2016 | 10016.22 | 10002.303 | 10001.9798 |
02/29/2016 | 10020.38 | 10004.1125 | 10003.6955 |
03/31/2016 | 10024.92 | 10006.1047 | 10005.8073 |
04/30/2016 | 10029.16 | 10007.5487 | 10006.5332 |
05/31/2016 | 10033.27 | 10008.9743 | 10007.655 |
06/30/2016 | 10037.25 | 10010.601 | 10009.8988 |
07/31/2016 | 10041.35 | 10012.1912 | 10011.9445 |
08/31/2016 | 10045.43 | 10013.7265 | 10013.7263 |
09/30/2016 | 10049.44 | 10015.9929 | 10015.97 |
10/31/2016 | 10053.48 | 10017.7293 | 10017.3558 |
11/30/2016 | 10057.49 | 10019.1367 | 10019.0056 |
12/31/2016 | 10062.52 | 10022.2987 | 10021.8433 |
01/31/2017 | 10068.57 | 10026.0639 | 10025.3408 |
02/28/2017 | 10074.14 | 10029.8291 | 10028.9044 |
03/31/2017 | 10081.11 | 10033.3018 | 10032.468 |
04/30/2017 | 10089.08 | 10039.4797 | 10038.0773 |
05/31/2017 | 10097.62 | 10045.2554 | 10043.5546 |
06/30/2017 | 10106.51 | 10052.4933 | 10050.0878 |
07/31/2017 | 10116.84 | 10059.8775 | 10056.8849 |
08/31/2017 | 10127.13 | 10068.5045 | 10065.1339 |
09/30/2017 | 10137.19 | 10076.5101 | 10074.9007 |
10/31/2017 | 10147.69 | 10084.7168 | 10082.8197 |
11/30/2017 | 10157.98 | 10092.96 | 10090.8707 |
12/31/2017 | 10170.04 | 10102.8116 | 10100.9674 |
01/31/2018 | 10183.61 | 10113.6686 | 10111.0642 |
02/28/2018 | 10196.14 | 10124.7448 | 10122.0848 |
03/31/2018 | 10211.83 | 10137.9047 | 10135.6131 |
04/30/2018 | 10228.92 | 10151.5946 | 10148.2176 |
05/31/2018 | 10245.76 | 10165.7598 | 10162.2078 |
06/30/2018 | 10262.9 | 10180.5281 | 10177.9799 |
07/31/2018 | 10280.98 | 10195.9179 | 10193.026 |
08/31/2018 | 10298.91 | 10212.5871 | 10211.2397 |
09/30/2018 | 10316.7 | 10229.0552 | 10226.6818 |
10/31/2018 | 10337.12 | 10247.607 | 10243.9716 |
11/30/2018 | 10357.26 | 10266.3416 | 10263.5052 |
12/31/2018 | 10378.93 | 10286.648 | 10282.7088 |
01/31/2019 | 10401.52 | 10308.2704 | 10301.7805 |
02/28/2019 | 10422.24 | 10327.4254 | 10320.1262 |
03/31/2019 | 10445.39 | 10348.8651 | 10342.1674 |
04/30/2019 | 10467.65 | 10369.665 | 10361.0411 |
05/31/2019 | 10490.48 | 10391.2874 | 10383.7423 |
06/30/2019 | 10512.24 | 10412.2519 | 10402.4179 |
07/31/2019 | 10533.99 | 10431.6079 | 10419.5098 |
08/31/2019 | 10554.09 | 10449.4834 | 10438.1195 |
09/30/2019 | 10573.02 | 10467.7062 | 10454.4195 |
10/31/2019 | 10590.86 | 10484.6861 | 10469.7956 |
11/30/2019 | 10606.27 | 10498.175 | 10483.5218 |
12/31/2019 | 10622.37 | 10513.1078 | 10496.7862 |
01/31/2020 | 10637.43 | 10526.4322 | 10511.4364 |
02/29/2020 | 10651.82 | 10539.7383 | 10524.1068 |
03/31/2020 | 10669.39 | 10553.1175 | 10535.9193 |
04/30/2020 | 10678.56 | 10553.4282 | 10536.3813 |
05/31/2020 | 10682.94 | 10554.2507 | 10537.1732 |
06/30/2020 | 10684.5 | 10555.3657 | 10538.0971 |
07/31/2020 | 10685.87 | 10556.5172 | 10539.4169 |
08/31/2020 | 10686.65 | 10557.3945 | 10540.2748 |
09/30/2020 | 10687.45 | 10558.1987 | 10541.1327 |
10/31/2020 | 10688.56 | 10558.8933 | 10542.0566 |
11/30/2020 | 10689.62 | 10559.6609 | 10542.7825 |
12/31/2020 | 10690.82 | 10560.4286 | 10543.5084 |
01/31/2021 | 10691.98 | 10560.9403 | 10544.1683 |
02/28/2021 | 10693.02 | 10561.3607 | 10544.6962 |
03/31/2021 | 10694.27 | 10561.6897 | 10545.0922 |
04/30/2021 | 10695.38 | 10561.8177 | 10545.1582 |
05/31/2021 | 10696.36 | 10561.9091 | 10545.2902 |
06/30/2021 | 10697.28 | 10562.0004 | 10545.3562 |
07/31/2021 | 10698.17 | 10562.4208 | 10545.8181 |
08/31/2021 | 10699.05 | 10562.7864 | 10546.1481 |
09/30/2021 | 10699.91 | 10563.0971 | 10546.478 |
10/31/2021 | 10700.87 | 10563.554 | 10547.0719 |
11/30/2021 | 10701.88 | 10564.011 | 10547.5339 |
12/31/2021 | 10703.45 | 10564.9797 | 10548.1278 |
01/31/2022 | 10705.19 | 10565.4366 | 10548.3918 |
02/28/2022 | 10706.92 | 10565.7656 | 10548.6557 |
03/31/2022 | 10711.53 | 10566.3688 | 10549.3157 |
04/30/2022 | 10717.36 | 10567.6665 | 10550.7675 |
05/31/2022 | 10725.91 | 10571.121 | 10553.5391 |
06/30/2022 | 10737.61 | 10577.4633 | 10559.4124 |
07/31/2022 | 10754.86 | 10587.2419 | 10569.5751 |
08/31/2022 | 10777.57 | 10607.1827 | 10588.9107 |
09/30/2022 | 10802.37 | 10627.7633 | 10610.622 |
10/31/2022 | 10834.46 | 10652.8037 | 10633.3892 |
11/30/2022 | 10870.89 | 10684.8627 | 10663.8774 |
12/31/2022 | 10911.34 | 10721.2717 | 10702.2186 |
01/31/2023 | 10953.8 | 10758.2656 | 10735.0166 |
02/28/2023 | 10994.1 | 10795.9175 | 10770.8501 |
03/31/2023 | 11040.79 | 10838.413 | 10815.7245 |
04/30/2023 | 11087.59 | 10881.3654 | 10854.5277 |
05/31/2023 | 11137.27 | 10922.088 | 10894.5847 |
06/30/2023 | 11186.24 | 10969.1529 | 10941.5049 |
07/31/2023 | 11237.22 | 11017.8262 | 10986.2473 |
08/31/2023 | 11289.67 | 11068.5283 | 11034.4873 |
09/30/2023 | 11341.14 | 11117.9327 | 11084.7731 |
10/31/2023 | 11394.79 | 11169.2015 | 11131.9572 |
11/30/2023 | 11447.05 | 11219.1177 | 11179.5373 |
12/31/2023 | 11501.61 | 11270.8251 | 11232.1987 |
01/31/2024 | 11555.95 | 11322.9346 | 11281.6926 |
02/29/2024 | 11606.89 | 11371.6627 | 11327.8868 |
03/31/2024 | 11661.64 | 11424.2109 | 11379.7564 |
04/30/2024 | 11714.92 | 11474.9496 | 11428.0623 |
05/31/2024 | 11770.27 | 11527.6074 | 11483.5614 |
06/30/2024 | 11824.01 | 11578.8031 | 11530.6796 |
07/31/2024 | 11879.78 | 11631.5889 | 11582.8131 |
08/31/2024 | 11935.66 | 11685.124 | 11638.9061 |
09/30/2024 | 11988.01 | 11736.1186 | 11685.8263 |
Effective September 30, 2024, the Fund changed its benchmark to the ICE Bof A U.S. 1-Month Treasury Bill Index, a broad-based securities market index that represents the overall applicable market in which the Fund invests.
What were the Fund costs for the past year?
(based on a hypothetical $10,000 investment)
Class Name | Costs of a $10,000 investment | Costs paid as a percentage of a $10,000 investment |
|---|
Class I | $1.00 | 0.01% |
End Block
Thornburg Capital Management Fund Tailored Shareholder Report
Thornburg Capital Management Fund Tailored Shareholder Report | |
Annual Performance | 1 Year | 5 Year |
|---|
Capital Management Fund Class I | 5.70% | 2.54% |
FTSE 1-Month Treasury Bill Local Currency Index | 5.56% | 2.31% |
ICE BofA U.S. 1-Month Treasury Bill Index | 5.42% | 2.25% |
Key Fund Statistics
(as of September 30, 2024)
| |
|---|
Fund Size (Millions) | $2,094.0M |
Number of Holdings | 62 |
Annual Portfolio Turnover | 0.00% |
Total Advisory Fee | $0.0M |
What did the Fund invest in?
(as of September 30, 2024)
Types of Holdings | (%) |
|---|
| Commercial Paper | 59.6 |
| Mutual Fund | 33.7 |
| Other Assets Less Liabilities | 6.7 |
Types of Holdings | (%) |
Commercial Paper | 59.6% |
Mutual Fund | 33.7% |
Other Assets Less Liabilities | 6.7% |
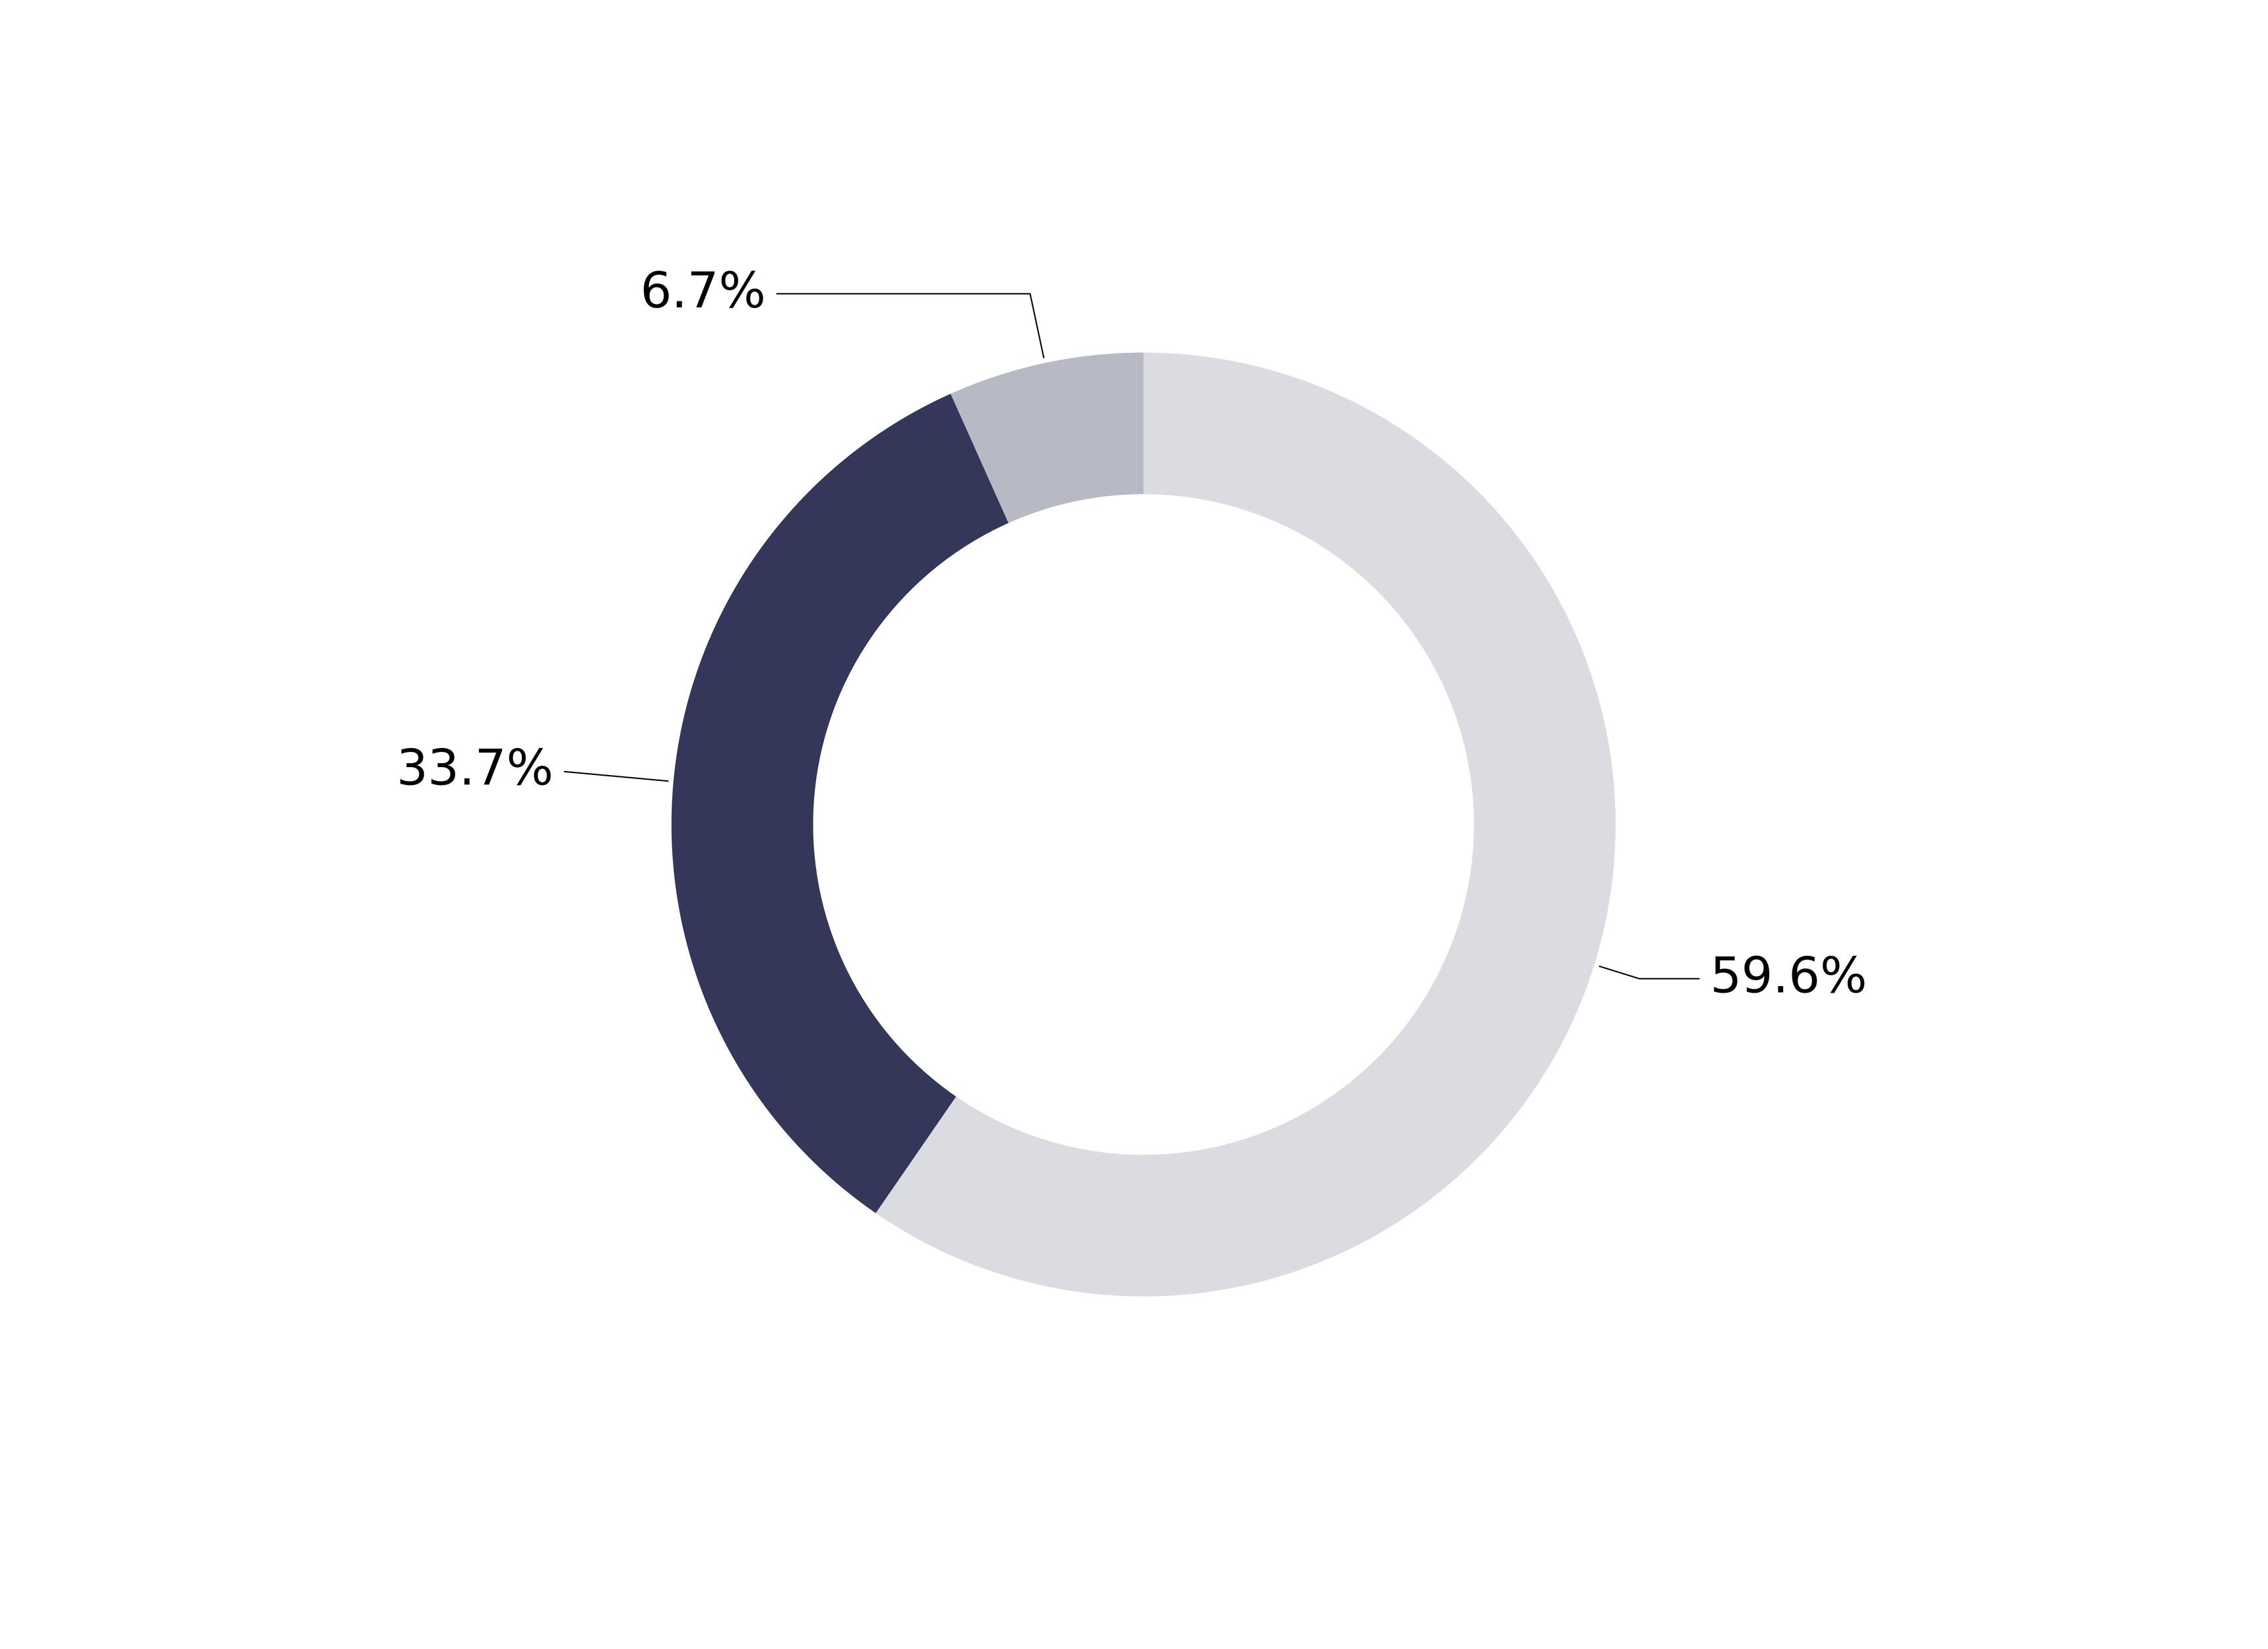
Expressed as a percentage of the Fund’s net assets.
How has the Fund changed?
This is a summary of certain changes to the Fund since October 1, 2023. For more complete information, you may review the Fund’s next prospectus, which we expect to be available by February 1, 2025 at https://www.thornburg.com/download or upon request by calling 1-800-847-0200.
End Block
Changes In and Disagreements with Accountants
No changes and/or disagreements occurred in the current reporting period.
End Block
For additional information about the Fund, including its prospectus, financial information, holdings and proxy information, visit www.thornburg.com/download.
Thornburg Capital Management Fund Tailored Shareholder Report | |
Item 2. Code of Ethics
Thornburg Investment Trust (the “Trust”) has adopted a code of ethics described in Item 2 of Form N-CSR. A copy of the code of ethics is filed as an exhibit to this Form N-CSR. The Trust has not made any substantive amendments to its code of ethics during the period covered by this report, nor has the Trust granted any waivers from any provisions of its code of ethics during the period covered by this report.
Item 3. Audit Committee Financial Expert
The Trustees of the Trust have determined that four members of the Trust’s audit committee, Sally Corning, James Weyhrauch, Susan Dubin, and Patrick Talamantes, are each audit committee financial experts as defined in Item 3 of Form N-CSR. Ms. Corning, Mr. Weyhrauch, Ms. Dubin, and Mr. Talamantes are each independent for purposes of Item 3 of Form N-CSR. The Trustees’ determinations in this regard were based upon their current understandings of the definition of “audit committee financial expert” and current interpretations of the definition. The Trustees call attention to the lack of clarity in the definition, and that shareholders and prospective investors may wish to evaluate independently this definition and the qualifications of the Trust’s audit committee. The definition of “audit committee financial expert,” together with comments on the definition, is set forth in the Securities and Exchange Commission’s website (www.sec.gov).
Item 4. Principal Accountant Fees and Services
The aggregate fees billed to the Trust in each of the last two fiscal years for the audit of the Trust’s financial statements and for services that are normally provided by PricewaterhouseCoopers LLP, registered independent public accounting firm (“PWC”), in connection with statutory and regulatory filings or requirements for those fiscal years are set out below.
| | Year Ended September 30, 2023
| Year Ended
September 30, 2024 |
| Thornburg Investment Trust | $844,627 | $901,610 |
The fees billed to the Trust by PWC in each of the last two fiscal years for assurance and related services that are reasonably related to the audit or review of the Trust’s financial statements (and that are not reflected in “Audit Fees,” above) are set out below.
| | Year Ended
September 30, 2023 | Year Ended
September 30, 2024 |
| Thornburg Investment Trust | $92,083 | $9,584 |
The fees billed to the Trust by PWC in each of the last two fiscal years for professional services rendered by PWC for tax compliance, tax advice or tax planning, including amounts paid in connection with filing foreign tax reclaims, are set out below.
| | Year Ended September 30, 2023 | Year Ended September 30, 2024 |
| Thornburg Investment Trust | $707,661 | $636,076 |
The fees billed to the Trust by PWC in each of the last two fiscal years for all other services rendered by PWC to the Trust are set out below.
| | Year Ended
September 30, 2023 | Year Ended September 30, 2024 |
| Thornburg Investment Trust | $0 | $0 |
The figure shown under All Other Fees for the year ended September 30, 2023 includes amounts from out of pocket expenses during the 2022 annual audit. The figure shown under All Other Fees for the year ended September 30, 2024 includes amounts from out of pocket expenses during the 2023 annual audit.
| (e) | Audit Committee Pre-Approval Policies and Procedures |
As of September 30, 2024, the Trust’s Audit Committee has not adopted pre-approval policies and procedures.
| (g) | The aggregate non-audit fees billed by PwC to the Trust for the fiscal years ended September 30, 2024 and September 20, 2023 were $636,076 and $707,661, respectively. PWC performs no services for the investment advisor, the Funds’ principal underwriter or any other person controlling, controlled by, or under common control with the investment advisor which provides ongoing services to the Funds, and accordingly PwC did not bill any non-audit fees to those persons in either of the Trust’s last two fiscal years. |
Item 5. Audit Committee of Listed Registrants
Not applicable.
Item 6. Schedule of Investments
| (a) | The schedule of investments for each Fund is filed as part of item 7 of this Form. |
Item 7. Financial Statements and Financial Highlights for Open-End Management Investment Companies
The following financial statements and financial highlights are attached hereto, in order:
Thornburg Global Opportunities Fund
Thornburg International Equity Fund
Thornburg Better World International Fund
Thornburg International Growth Fund
Thornburg Developing World Fund
Thornburg Small/Mid Cap Core Fund
Thornburg Small/Mid Cap Growth Fund
Thornburg Investment Income Builder Fund
Thornburg Summit Fund
Thornburg Ultra Short Income Fund
Thornburg Limited Term U.S. Government Fund
Thornburg Limited Term Income Fund
Thornburg Core Plus Bond Fund
Thornburg Strategic Income Fund
Thornburg Short Duration Municipal Fund
Thornburg Limited Term Municipal Fund
Thornburg Intermediate Municipal Fund
Thornburg Strategic Municipal Income Fund
Thornburg California Limited Term Municipal Fund
Thornburg New Mexico Intermediate Municipal Fund
Thornburg New York Intermediate Municipal Fund
Thornburg Emerging Markets Managed Account Fund
Thornburg Municipal Managed Account Fund
Thornburg Capital Management Fund

| ANNUAL FINANCIAL STATEMENTS | SEPTEMBER 30, 2024 | |
THORNBURG FUNDS - ALL
CLASSES
Annual Financial Statements | September 30, 2024
Table of Contents
Annual Financial Statements | 3
Investments carry risks, including possible loss of principal. Additional risks may be associated with investments outside the United States, especially in emerging markets, including currency fluctuations, illiquidity, volatility, and political and economic risks. Investments in small- and mid-capitalization companies may increase the risk of greater price fluctuations. Portfolios investing in bonds have the same interest rate, inflation, and credit risks that are associated with the underlying bonds. The value of bonds will fluctuate relative to changes in interest rates, decreasing when interest rates rise. A short position will lose value as the security’s price increases. Theoretically, the loss on a short sale can be unlimited. Investments in derivatives are subject to the risks associated with the securities or other assets underlying the pool of securities, including illiquidity and difficulty in valuation. Please see the Funds’ prospectus for a discussion of the risks associated with an investment in the Funds. Investments in the Funds are not FDIC insured, nor are they deposits of or guaranteed by a bank or any other entity.
4 | Annual Financial Statements
Schedule of Investments
Thornburg Global Opportunities Fund | September 30, 2024
| | ISSUER-DESCRIPTION | | SHARES | | | VALUE | |
| | | | | | | | |
| | COMMON STOCK — 97.2% | | | | | | | | |
| | | | | | | | | | |
| | AUTOMOBILES & COMPONENTS — 2.0% | | | | | | | | |
| | Automobiles — 2.0% | | | | | | | | |
| | Mercedes-Benz Group AG | | | 400,248 | | | $ | 25,858,899 | |
| | | | | | | | | 25,858,899 | |
| | BANKS — 11.4% | | | | | | | | |
| | Banks — 11.4% | | | | | | | | |
| | Bank of Ireland Group plc | | | 4,746,831 | | | | 52,997,839 | |
| | BNP Paribas SA | | | 698,676 | | | | 47,869,330 | |
| | Citigroup, Inc. | | | 765,740 | | | | 47,935,324 | |
| | | | | | | | | 148,802,493 | |
| | CAPITAL GOODS — 4.8% | | | | | | | | |
| | Aerospace & Defense — 1.3% | | | | | | | | |
| | L3Harris Technologies, Inc. | | | 72,951 | | | | 17,352,854 | |
| | Building Products — 1.3% | | | | | | | | |
| a | Builders FirstSource, Inc. | | | 85,214 | | | | 16,519,586 | |
| | Machinery — 2.2% | | | | | | | | |
| | Techtronic Industries Co. Ltd. | | | 1,871,669 | | | | 28,434,316 | |
| | | | | | | | | 62,306,756 | |
| | COMMERCIAL & PROFESSIONAL SERVICES — 2.6% | | | | | | | | |
| | Professional Services — 2.6% | | | | | | | | |
| a | CACI International, Inc. Class A | | | 67,141 | | | | 33,876,663 | |
| | | | | | | | | 33,876,663 | |
| | CONSUMER DISCRETIONARY DISTRIBUTION & RETAIL — 5.4% | | | | | | | | |
| | Broadline Retail — 2.8% | | | | | | | | |
| | Alibaba Group Holding Ltd. Sponsored ADR | | | 345,069 | | | | 36,618,722 | |
| | Specialty Retail — 2.6% | | | | | | | | |
| | TJX Cos., Inc. | | | 293,625 | | | | 34,512,683 | |
| | | | | | | | | 71,131,405 | |
| | CONSUMER DURABLES & APPAREL — 2.7% | | | | | | | | |
| | Household Durables — 2.7% | | | | | | | | |
| | Barratt Developments plc | | | 5,525,639 | | | | 35,363,983 | |
| | | | | | | | | 35,363,983 | |
| | CONSUMER SERVICES — 6.6% | | | | | | | | |
| | Hotels, Restaurants & Leisure — 6.6% | | | | | | | | |
| | Booking Holdings, Inc. | | | 7,525 | | | | 31,696,203 | |
| | Galaxy Entertainment Group Ltd. | | | 7,439,957 | | | | 37,372,772 | |
| | Round One Corp. | | | 2,236,116 | | | | 17,036,333 | |
| | | | | | | | | 86,105,308 | |
| | CONSUMER STAPLES DISTRIBUTION & RETAIL — 1.8% | | | | | | | | |
| | Consumer Staples Distribution & Retail — 1.8% | | | | | | | | |
| | Tesco plc | | | 4,801,589 | | | | 23,026,694 | |
| | | | | | | | | 23,026,694 | |
| | ENERGY — 9.5% | | | | | | | | |
| | Oil, Gas & Consumable Fuels — 9.5% | | | | | | | | |
| | Reliance Industries Ltd. | | | 1,366,133 | | | | 48,221,493 | |
| | Shell plc | | | 937,260 | | | | 30,845,473 | |
| | TotalEnergies SE | | | 698,605 | | | | 45,492,627 | |
| | | | | | | | | 124,559,593 | |
| | FINANCIAL SERVICES — 5.0% | | | | | | | | |
| | Capital Markets — 3.6% | | | | | | | | |
| | Charles Schwab Corp. | | | 722,760 | | | | 46,842,076 | |
| See notes to financial statements. | Annual Financial Statements | 5 |
Schedule of Investments, Continued
Thornburg Global Opportunities Fund | September 30, 2024
| | ISSUER-DESCRIPTION | | SHARES | | | VALUE | |
| | | | | | | | |
| | Consumer Finance — 1.4% | | | | | | | | |
| | Capital One Financial Corp. | | | 126,558 | | | $ | 18,949,529 | |
| | | | | | | | | 65,791,605 | |
| | FOOD, BEVERAGE & TOBACCO — 1.5% | | | | | | | | |
| | Beverages — 1.5% | | | | | | | | |
| | Coca-Cola Icecek AS | | | 12,062,120 | | | | 20,105,003 | |
| | | | | | | | | 20,105,003 | |
| | INSURANCE — 2.3% | | | | | | | | |
| | Insurance — 2.3% | | | | | | | | |
| | NN Group NV | | | 598,131 | | | | 29,814,935 | |
| | | | | | | | | 29,814,935 | |
| | MATERIALS — 7.6% | | | | | | | | |
| | Chemicals — 2.6% | | | | | | | | |
| | OCI NV | | | 1,191,376 | | | | 33,923,672 | |
| | Metals & Mining — 5.0% | | | | | | | | |
| | Freeport-McMoRan, Inc. | | | 882,426 | | | | 44,050,706 | |
| | Mineral Resources Ltd. | | | 598,705 | | | | 21,540,126 | |
| | | | | | | | | 99,514,504 | |
| | MEDIA & ENTERTAINMENT — 13.1% | | | | | | | | |
| | Interactive Media & Services — 13.1% | | | | | | | | |
| | Alphabet, Inc. Class A | | | 369,578 | | | | 61,294,511 | |
| | Meta Platforms, Inc. Class A | | | 138,630 | | | | 79,357,357 | |
| | Tencent Holdings Ltd. | | | 537,813 | | | | 30,758,461 | |
| | | | | | | | | 171,410,329 | |
| | PHARMACEUTICALS, BIOTECHNOLOGY & LIFE SCIENCES — 1.5% | | | | | | | | |
| | Pharmaceuticals — 1.5% | | | | | | | | |
| | Roche Holding AG | | | 61,299 | | | | 19,598,877 | |
| | | | | | | | | 19,598,877 | |
| | SEMICONDUCTORS & SEMICONDUCTOR EQUIPMENT — 3.6% | | | | | | | | |
| | Semiconductors & Semiconductor Equipment — 3.6% | | | | | | | | |
| | Taiwan Semiconductor Manufacturing Co. Ltd. | | | 1,534,114 | | | | 46,392,084 | |
| | | | | | | | | 46,392,084 | |
| | SOFTWARE & SERVICES — 3.4% | | | | | | | | |
| | Software — 3.4% | | | | | | | | |
| | SAP SE | | | 193,826 | | | | 44,100,792 | |
| | | | | | | | | 44,100,792 | |
| | TECHNOLOGY HARDWARE & EQUIPMENT — 3.8% | | | | | | | | |
| | Technology Hardware, Storage & Peripherals — 3.8% | | | | | | | | |
| | Samsung Electronics Co. Ltd. | | | 1,069,122 | | | | 50,279,883 | |
| | | | | | | | | 50,279,883 | |
| | TELECOMMUNICATION SERVICES — 8.6% | | | | | | | | |
| | Diversified Telecommunication Services — 8.6% | | | | | | | | |
| | AT&T, Inc. | | | 1,911,519 | | | | 42,053,418 | |
| | Converge Information & Communications Technology Solutions, Inc. | | | 53,806,615 | | | | 15,708,699 | |
| | Deutsche Telekom AG | | | 955,691 | | | | 28,074,391 | |
| a | Zegona Communications plc | | | 5,429,333 | | | | 26,421,843 | |
| | | | | | | | | 112,258,351 | |
| | TOTAL COMMON STOCK (Cost $762,090,761) | | | | | | | 1,270,298,157 | |
| 6 | Annual Financial Statements | See notes to financial statements. |
Schedule of Investments, Continued
Thornburg Global Opportunities Fund | September 30, 2024
| | ISSUER-DESCRIPTION | | SHARES | | | VALUE | |
| | | | | | | | |
| | SHORT-TERM INVESTMENTS — 2.8% | | | | | | | | |
| b | Thornburg Capital Management Fund | | | 3,618,696 | | | $ | 36,186,959 | |
| | TOTAL SHORT-TERM INVESTMENTS (Cost $36,186,959) | | | | | | | 36,186,959 | |
| | | | | | | | | | |
| | TOTAL INVESTMENTS — 100.0% (Cost $798,277,720) | | | | | | $ | 1,306,485,116 | |
| | | | | | | | | | |
| | LIABILITIES NET OF OTHER ASSETS — (0.0)% | | | | | | | (461,797 | ) |
| | | | | | | | | | |
| | NET ASSETS — 100.0% | | | | | | $ | 1,306,023,319 | |
OUTSTANDING FORWARD CURRENCY CONTRACTS TO BUY OR SELL AT SEPTEMBER 30, 2024
CONTRACT
DESCRIPTION | | CONTRACT
PARTY* | | BUY/SELL | | CONTRACT
AMOUNT | | CONTRACT
VALUE DATE | | | VALUE
USD | | | UNREALIZED
APPRECIATION | | UNREALIZED
DEPRECIATION | |
| | | | | | | | | | | | | | | | | | | | | |
| Euro | | SSB | | Sell | | | 77,089,000 | | | 12/20/2024 | | | 86,086,747 | | | $ | — | | | $ | (28,057) | |
| Euro | | BBH | | Sell | | | 77,089,000 | | | 12/20/2024 | | | 86,086,747 | | | | — | | | | (44,245) | |
| Great Britain Pound | | SSB | | Sell | | | 22,833,800 | | | 12/20/2024 | | | 30,522,213 | | | | — | | | | (352,141) | |
| Total | | | | | | | | | | | | | | | | | — | | | $ | (424,443) | |
| Net unrealized appreciation (depreciation) | | | | | | | | | | | | | | | | | | | | $ | (424,443) | |
* Counterparties include State Street Bank and Trust Company (“SSB”) and Brown Brothers Harriman & Co. (“BBH”).
Footnote Legend
| a | Non-income producing. |
| b | Investment in Affiliates. |
Portfolio Abbreviations
To simplify the listings of securities, abbreviations are used per the table below:
| ADR | American Depositary Receipt |
COUNTRY EXPOSURE *
(percent of equity holdings)
| United States | | 41.3% |
| Germany | | 7.7% |
| France | | 7.4% |
| United Kingdom | | 6.7% |
| China | | 5.3% |
| Netherlands | | 5.0% |
| Ireland | | 4.2% |
| South Korea | | 4.0% |
| India | | 3.8% |
| Taiwan | | 3.7% |
| Macao | | 2.9% |
| Hong Kong | | 2.2% |
| Australia | | 1.7% |
| Turkey | | 1.6% |
| Japan | | 1.3% |
| Philippines | | 1.2% |
* Holdings are classified by country of risk as determined by MSCI and Bloomberg.
| See notes to financial statements. | Annual Financial Statements | 7 |
Schedule of Investments
Thornburg International Equity Fund | September 30, 2024
| | ISSUER-DESCRIPTION | | SHARES | | | VALUE | |
| | | | | | | | |
| | COMMON STOCK — 95.4% | | | | | | | | |
| | | | | | | | | | |
| | BANKS — 6.3% | | | | | | | | |
| | Banks — 6.3% | | | | | | | | |
| | BNP Paribas SA | | | 696,455 | | | $ | 47,717,159 | |
| | HDFC Bank Ltd. | | | 712,104 | | | | 14,717,730 | |
| | ING Groep NV Series N | | | 2,695,163 | | | | 48,823,938 | |
| | Mitsubishi UFJ Financial Group, Inc. | | | 7,477,219 | | | | 75,617,588 | |
| | | | | | | | | 186,876,415 | |
| | CAPITAL GOODS — 17.1% | | | | | | | | |
| | Aerospace & Defense — 5.5% | | | | | | | | |
| | MTU Aero Engines AG | | | 108,954 | | | | 33,958,983 | |
| | Rheinmetall AG | | | 93,004 | | | | 50,355,702 | |
| | Safran SA | | | 335,183 | | | | 78,763,259 | |
| | Construction & Engineering — 2.0% | | | | | | | | |
| | Ferrovial SE | | | 1,377,111 | | | | 59,140,451 | |
| | Electrical Equipment — 6.7% | | | | | | | | |
| | ABB Ltd. | | | 1,369,613 | | | | 79,278,479 | |
| | Mitsubishi Electric Corp. | | | 1,899,700 | | | | 30,446,749 | |
| | Schneider Electric SE | | | 345,230 | | | | 90,769,905 | |
| | Industrial Conglomerates — 2.9% | | | | | | | | |
| | Hitachi Ltd. | | | 3,219,803 | | | | 84,703,949 | |
| | | | | | | | | 507,417,477 | |
| | COMMERCIAL & PROFESSIONAL SERVICES — 1.5% | | | | | | | | |
| | Professional Services — 1.5% | | | | | | | | |
| | Recruit Holdings Co. Ltd. | | | 738,258 | | | | 44,714,113 | |
| | | | | | | | | 44,714,113 | |
| | CONSUMER DURABLES & APPAREL — 5.7% | | | | | | | | |
| | Household Durables — 3.3% | | | | | | | | |
| | Sony Group Corp. | | | 5,042,360 | | | | 97,444,112 | |
| | Textiles, Apparel & Luxury Goods — 2.4% | | | | | | | | |
| | LVMH Moet Hennessy Louis Vuitton SE | | | 93,039 | | | | 71,305,403 | |
| | | | | | | | | 168,749,515 | |
| | CONSUMER SERVICES — 4.2% | | | | | | | | |
| | Diversified Consumer Services — 1.5% | | | | | | | | |
| | New Oriental Education & Technology Group, Inc. Sponsored ADR | | | 574,715 | | | | 43,586,386 | |
| | Hotels, Restaurants & Leisure — 2.7% | | | | | | | | |
| | Galaxy Entertainment Group Ltd. | | | 16,346,398 | | | | 82,112,060 | |
| | | | | | | | | 125,698,446 | |
| | CONSUMER STAPLES DISTRIBUTION & RETAIL — 1.3% | | | | | | | | |
| | Consumer Staples Distribution & Retail — 1.3% | | | | | | | | |
| | Alimentation Couche-Tard, Inc. | | | 698,573 | | | | 38,620,506 | |
| | | | | | | | | 38,620,506 | |
| | ENERGY — 4.2% | | | | | | | | |
| | Oil, Gas & Consumable Fuels — 4.2% | | | | | | | | |
| | Shell plc | | | 965,617 | | | | 31,778,709 | |
| | TotalEnergies SE | | | 1,417,038 | | | | 92,276,438 | |
| | | | | | | | | 124,055,147 | |
| | FINANCIAL SERVICES — 2.9% | | | | | | | | |
| | Capital Markets — 2.9% | | | | | | | | |
| | B3 SA - Brasil Bolsa Balcao | | | 17,564,731 | | | | 34,531,686 | |
| | Hong Kong Exchanges & Clearing Ltd. | | | 1,232,563 | | | | 51,719,811 | |
| | | | | | | | | 86,251,497 | |
| 8 | Annual Financial Statements | See notes to financial statements. |
Schedule of Investments, Continued
Thornburg International Equity Fund | September 30, 2024
| | ISSUER-DESCRIPTION | | SHARES | | | VALUE | |
| | | | | | | | |
| | FOOD, BEVERAGE & TOBACCO — 4.8% | | | | | | | | |
| | Beverages — 3.3% | | | | | | | | |
| | Diageo plc | | | 736,239 | | | $ | 25,621,717 | |
| | Kweichow Moutai Co. Ltd. Class A | | | 287,846 | | | | 71,714,315 | |
| | Food Products — 1.5% | | | | | | | | |
| | Danone SA | | | 404,284 | | | | 29,404,862 | |
| | Nissin Foods Holdings Co. Ltd. | | | 524,576 | | | | 14,624,986 | |
| | | | | | | | | 141,365,880 | |
| | HEALTH CARE EQUIPMENT & SERVICES — 1.1% | | | | | | | | |
| | Health Care Equipment & Supplies — 1.1% | | | | | | | | |
| | Alcon, Inc. | | | 323,070 | | | | 32,329,615 | |
| | | | | | | | | 32,329,615 | |
| | HOUSEHOLD & PERSONAL PRODUCTS — 2.9% | | | | | | | | |
| | Personal Care Products — 2.9% | | | | | | | | |
| | L’Oreal SA | | | 193,856 | | | | 86,758,648 | |
| | | | | | | | | 86,758,648 | |
| | INSURANCE — 4.3% | | | | | | | | |
| | Insurance — 4.3% | | | | | | | | |
| | Generali | | | 1,642,992 | | | | 47,459,840 | |
| | NN Group NV | | | 1,632,267 | | | | 81,363,337 | |
| | | | | | | | | 128,823,177 | |
| | MATERIALS — 5.7% | | | | | | | | |
| | Chemicals — 4.7% | | | | | | | | |
| | Air Liquide SA | | | 267,677 | | | | 51,625,328 | |
| | Linde plc | | | 188,179 | | | | 89,318,581 | |
| | Metals & Mining — 1.0% | | | | | | | | |
| | Freeport-McMoRan, Inc. | | | 593,997 | | | | 29,652,330 | |
| | | | | | | | | 170,596,239 | |
| | MEDIA & ENTERTAINMENT — 2.3% | | | | | | | | |
| | Entertainment — 1.2% | | | | | | | | |
| | Nexon Co. Ltd. | | | 1,794,141 | | | | 35,321,078 | |
| | Interactive Media & Services — 1.1% | | | | | | | | |
| | Kanzhun Ltd. ADR | | | 1,838,583 | | | | 31,917,801 | |
| | | | | | | | | 67,238,879 | |
| | PHARMACEUTICALS, BIOTECHNOLOGY & LIFE SCIENCES — 4.8% | | | | | | | | |
| | Life Sciences Tools & Services — 0.1% | | | | | | | | |
| | Stevanato Group SpA | | | 149,015 | | | | 2,980,300 | |
| | Pharmaceuticals — 4.7% | | | | | | | | |
| | AstraZeneca plc | | | 394,284 | | | | 61,084,761 | |
| | Roche Holding AG | | | 242,955 | | | | 77,679,002 | |
| | | | | | | | | 141,744,063 | |
| | SEMICONDUCTORS & SEMICONDUCTOR EQUIPMENT — 4.5% | | | | | | | | |
| | Semiconductors & Semiconductor Equipment — 4.5% | | | | | | | | |
| | Disco Corp. | | | 69,007 | | | | 18,000,156 | |
| | NVIDIA Corp. | | | 290,772 | | | | 35,311,352 | |
| | Taiwan Semiconductor Manufacturing Co. Ltd. Sponsored ADR | | | 459,453 | | | | 79,793,202 | |
| | | | | | | | | 133,104,710 | |
| | SOFTWARE & SERVICES — 3.4% | | | | | | | | |
| | Software — 3.4% | | | | | | | | |
| | Constellation Software, Inc. | | | 16,647 | | | | 54,158,601 | |
| | SAP SE | | | 212,048 | | | | 48,246,802 | |
| | | | | | | | | 102,405,403 | |
| | TECHNOLOGY HARDWARE & EQUIPMENT — 3.9% | | | | | | | | |
| | Electronic Equipment, Instruments & Components — 1.4% | | | | | | | | |
| | Keyence Corp. | | | 87,291 | | | | 41,518,266 | |
| See notes to financial statements. | Annual Financial Statements | 9 |
Schedule of Investments, Continued
Thornburg International Equity Fund | September 30, 2024
| | ISSUER-DESCRIPTION | | SHARES | | | VALUE | |
| | | | | | | | | | |
| | Technology Hardware, Storage & Peripherals — 2.5% | | | | | | | | |
| | Samsung Electronics Co. Ltd. | | | 1,559,494 | | | $ | 73,341,654 | |
| | | | | | | | | 114,859,920 | |
| | TELECOMMUNICATION SERVICES — 2.7% | | | | | | | | |
| | Diversified Telecommunication Services — 2.6% | | | | | | | | |
| | Internet Initiative Japan, Inc. | | | 661,331 | | | | 13,896,118 | |
| | Orange SA | | | 5,416,203 | | | | 62,008,709 | |
| | Wireless Telecommunication Services — 0.1% | | | | | | | | |
| | Vodafone Group plc | | | 4,265,388 | | | | 4,279,240 | |
| | | | | | | | | 80,184,067 | |
| | TRANSPORTATION — 3.8% | | | | | | | | |
| | Air Freight & Logistics — 1.0% | | | | | | | | |
| | Deutsche Post AG | | | 662,641 | | | | 29,526,866 | |
| | Ground Transportation — 2.8% | | | | | | | | |
| | Canadian Pacific Kansas City Ltd. | | | 990,290 | | | | 84,709,407 | |
| | | | | | | | | 114,236,273 | |
| | UTILITIES — 8.0% | | | | | | | | |
| | Electric Utilities — 6.0% | | | | | | | | |
| | Endesa SA | | | 2,280,834 | | | | 49,838,784 | |
| | Enel SpA | | | 8,772,378 | | | | 70,063,641 | |
| | Iberdrola SA | | | 3,777,457 | | | | 58,405,701 | |
| | Multi-Utilities — 2.0% | | | | | | | | |
| | E.ON SE | | | 3,912,110 | | | | 58,157,859 | |
| | | | | | | | | 236,465,985 | |
| | TOTAL COMMON STOCK (Cost $2,007,366,360) | | | | | | | 2,832,495,975 | |
| | | | | | | | | | |
| | WARRANT — 0.0% | | | | | | | | |
| | | | | | | | | | |
| | SOFTWARE & SERVICES — 0.0% | | | | | | | | |
| | Software — 0.0% | | | | | | | | |
| a,b | Constellation Software, Inc., 3/31/2040 | | | 16,647 | | | | 1 | |
| | | | | | | | | 1 | |
| | TOTAL WARRANTS (Cost $0) | | | | | | | 1 | |
| | | | | | | | | | |
| | SHORT-TERM INVESTMENTS — 4.1% | | | | | | | | |
| c | Thornburg Capital Management Fund | | | 12,099,663 | | | | 120,996,633 | |
| | TOTAL SHORT-TERM INVESTMENTS (Cost $120,996,633) | | | | | | | 120,996,633 | |
| | | | | | | | | | |
| | TOTAL INVESTMENTS — 99.5% (Cost $2,128,362,993) | | | | | | $ | 2,953,492,609 | |
| | | | | | | | | | |
| | OTHER ASSETS LESS LIABILITIES — 0.5% | | | | | | | 15,643,542 | |
| | | | | | | | | | |
| | NET ASSETS — 100.0% | | | | | | $ | 2,969,136,151 | |
OUTSTANDING FORWARD CURRENCY CONTRACTS TO BUY OR SELL AT SEPTEMBER 30, 2024
CONTRACT
DESCRIPTION | | CONTRACT
PARTY* | | BUY/SELL | | CONTRACT
AMOUNT | | CONTRACT
VALUE DATE | | | VALUE
USD | | | UNREALIZED
APPRECIATION | | UNREALIZED
DEPRECIATION | |
| | | | | | | | | | | | | | | | | | | | | |
| Euro | | BBH | | Sell | | | 177,770,200 | | | 11/20/2024 | | | 198,278,093 | | | $ | — | | | $ | (1,953,484) | |
| Net unrealized appreciation (depreciation) | | | | | | | | | | | | | | | | | | | | $ | (1,953,484) | |
* Counterparty includes Brown Brothers Harriman & Co. (“BBH”).
Footnote Legend
| a | Security currently fair valued by Thornburg Investment Management, Inc.’s Valuation and Pricing Committee. |
| b | Non-income producing. |
| c | Investment in Affiliates. |
| 10 | Annual Financial Statements | See notes to financial statements. |
Schedule of Investments, Continued
Thornburg International Equity Fund | September 30, 2024
Portfolio Abbreviations
To simplify the listings of securities, abbreviations are used per the table below:
| ADR | American Depositary Receipt |
COUNTRY EXPOSURE *
(percent of equity holdings)
| France | | 18.4% |
| Japan | | 16.1% |
| United States | | 15.7% |
| Germany | | 7.8% |
| Canada | | 6.3% |
| China | | 5.2% |
| Netherlands | | 4.6% |
| Italy | | 4.3% |
| Spain | | 3.8% |
| United Kingdom | | 3.2% |
| Macao | | 2.9% |
| Taiwan | | 2.8% |
| Switzerland | | 2.8% |
| South Korea | | 2.6% |
| Hong Kong | | 1.8% |
| Brazil | | 1.2% |
| India | | 0.5% |
* Holdings are classified by country of risk as determined by MSCI and Bloomberg.
| See notes to financial statements. | Annual Financial Statements | 11 |
Schedule of Investments
Thornburg Better World International Fund | September 30, 2024
| | ISSUER-DESCRIPTION | | SHARES | | | VALUE | |
| | | | | | | | |
| | COMMON STOCK — 95.9% | | | | | | | | |
| | | | | | | | | | |
| | AUTOMOBILES & COMPONENTS — 1.0% | | | | | | | | |
| | Automobiles — 1.0% | | | | | | | | |
| | Mercedes-Benz Group AG | | | 89,966 | | | $ | 5,812,451 | |
| | | | | | | | | 5,812,451 | |
| | BANKS — 6.9% | | | | | | | | |
| | Banks — 6.9% | | | | | | | | |
| | BNP Paribas SA | | | 201,002 | | | | 13,771,520 | |
| | HDFC Bank Ltd. ADR | | | 155,348 | | | | 9,718,571 | |
| | Mitsubishi UFJ Financial Group, Inc. | | | 1,543,577 | | | | 15,610,292 | |
| | | | | | | | | 39,100,383 | |
| | CAPITAL GOODS — 13.1% | | | | | | | | |
| | Building Products — 0.3% | | | | | | | | |
| a | Munters Group AB | | | 83,236 | | | | 1,899,802 | |
| | Electrical Equipment — 8.5% | | | | | | | | |
| | ABB Ltd. | | | 233,261 | | | | 13,502,046 | |
| | Mitsubishi Electric Corp. | | | 536,000 | | | | 8,590,544 | |
| | Nexans SA | | | 83,213 | | | | 12,189,911 | |
| | Schneider Electric SE | | | 54,138 | | | | 14,234,282 | |
| | Industrial Conglomerates — 3.0% | | | | | | | | |
| | Hitachi Ltd. | | | 641,200 | | | | 16,868,166 | |
| | Machinery — 1.3% | | | | | | | | |
| | FANUC Corp. | | | 262,200 | | | | 7,643,890 | |
| | | | | | | | | 74,928,641 | |
| | COMMERCIAL & PROFESSIONAL SERVICES — 7.3% | | | | | | | | |
| | Commercial Services & Supplies — 5.0% | | | | | | | | |
| | Daiei Kankyo Co. Ltd. | | | 172,300 | | | | 3,728,322 | |
| | Elis SA | | | 456,825 | | | | 9,529,561 | |
| | Tetra Tech, Inc. | | | 60,911 | | | | 2,872,563 | |
| | Waste Connections, Inc. | | | 70,034 | | | | 12,523,480 | |
| | Professional Services — 2.3% | | | | | | | | |
| | Recruit Holdings Co. Ltd. | | | 150,500 | | | | 9,115,342 | |
| | UL Solutions, Inc. Class A | | | 50,000 | | | | 2,465,000 | |
| b | Visional, Inc. | | | 23,400 | | | | 1,291,090 | |
| | | | | | | | | 41,525,358 | |
| | CONSUMER DURABLES & APPAREL — 7.0% | | | | | | | | |
| | Household Durables — 4.3% | | | | | | | | |
| | Barratt Developments plc | | | 766,272 | | | | 4,904,125 | |
| | Sony Group Corp. | | | 1,016,710 | | | | 19,648,023 | |
| | Textiles, Apparel & Luxury Goods — 2.7% | | | | | | | | |
| | LVMH Moet Hennessy Louis Vuitton SE | | | 20,364 | | | | 15,607,038 | |
| | | | | | | | | 40,159,186 | |
| | CONSUMER SERVICES — 2.1% | | | | | | | | |
| | Diversified Consumer Services — 2.1% | | | | | | | | |
| | New Oriental Education & Technology Group, Inc. Sponsored ADR | | | 155,741 | | | | 11,811,397 | |
| | | | | | | | | 11,811,397 | |
| | CONSUMER STAPLES DISTRIBUTION & RETAIL — 4.1% | | | | | | | | |
| | Consumer Staples Distribution & Retail — 4.1% | | | | | | | | |
| | Alimentation Couche-Tard, Inc. | | | 214,996 | | | | 11,886,022 | |
| | Costco Wholesale Corp. | | | 12,734 | | | | 11,288,946 | |
| | | | | | | | | 23,174,968 | |
| 12 | Annual Financial Statements | See notes to financial statements. |
Schedule of Investments, Continued
Thornburg Better World International Fund | September 30, 2024
| | ISSUER-DESCRIPTION | | SHARES | | | VALUE | |
| | | | | | | | |
| | FINANCIAL SERVICES — 3.7% | | | | | | | | |
| | Capital Markets — 3.7% | | | | | | | | |
| | B3 SA - Brasil Bolsa Balcao | | | 3,664,912 | | | $ | 7,205,097 | |
| | Hong Kong Exchanges & Clearing Ltd. | | | 333,700 | | | | 14,002,449 | |
| | | | | | | | | 21,207,546 | |
| | FOOD, BEVERAGE & TOBACCO — 3.1% | | | | | | | | |
| | Food Products — 3.1% | | | | | | | | |
| | Danone SA | | | 178,271 | | | | 12,966,217 | |
| | Nissin Foods Holdings Co. Ltd. | | | 174,700 | | | | 4,870,572 | |
| | | | | | | | | 17,836,789 | |
| | HEALTH CARE EQUIPMENT & SERVICES — 3.7% | | | | | | | | |
| | Health Care Equipment & Supplies — 2.7% | | | | | | | | |
| | Alcon, Inc. | | | 154,060 | | | | 15,348,661 | |
| | Health Care Technology — 1.0% | | | | | | | | |
| | Pro Medicus Ltd. | | | 48,086 | | | | 5,925,790 | |
| | | | | | | | | 21,274,451 | |
| | HOUSEHOLD & PERSONAL PRODUCTS — 4.5% | | | | | | | | |
| | Personal Care Products — 4.5% | | | | | | | | |
| b | BellRing Brands, Inc. | | | 142,147 | | | | 8,631,166 | |
| | L’Oreal SA | | | 38,131 | | | | 17,065,213 | |
| | | | | | | | | 25,696,379 | |
| | MATERIALS — 3.1% | | | | | | | | |
| | Chemicals — 3.1% | | | | | | | | |
| | Linde plc | | | 37,516 | | | | 17,806,853 | |
| | | | | | | | | 17,806,853 | |
| | MEDIA & ENTERTAINMENT — 1.8% | | | | | | | | |
| | Entertainment — 0.6% | | | | | | | | |
| | Walt Disney Co. | | | 37,348 | | | | 3,592,504 | |
| | Interactive Media & Services — 1.2% | | | | | | | | |
| | Kanzhun Ltd. ADR | | | 394,870 | | | | 6,854,943 | |
| | | | | | | | | 10,447,447 | |
| | PHARMACEUTICALS, BIOTECHNOLOGY & LIFE SCIENCES — 10.7% | | | | | | | | |
| | Life Sciences Tools & Services — 2.7% | | | | | | | | |
| | Lonza Group AG | | | 16,912 | | | | 10,682,525 | |
| | Stevanato Group SpA | | | 224,136 | | | | 4,482,720 | |
| | Pharmaceuticals — 8.0% | | | | | | | | |
| | Novartis AG | | | 49,019 | | | | 5,626,745 | |
| | Novo Nordisk AS Class B | | | 107,998 | | | | 12,689,046 | |
| | Pfizer, Inc. | | | 377,958 | | | | 10,938,105 | |
| | Roche Holding AG | | | 51,437 | | | | 16,445,740 | |
| | | | | | | | | 60,864,881 | |
| | SEMICONDUCTORS & SEMICONDUCTOR EQUIPMENT — 3.3% | | | | | | | | |
| | Semiconductors & Semiconductor Equipment — 3.3% | | | | | | | | |
| | ASML Holding NV | | | 6,015 | | | | 4,992,235 | |
| | Disco Corp. | | | 34,400 | | | | 8,973,080 | |
| | Taiwan Semiconductor Manufacturing Co. Ltd. Sponsored ADR | | | 26,909 | | | | 4,673,286 | |
| | | | | | | | | 18,638,601 | |
| | SOFTWARE & SERVICES — 6.8% | | | | | | | | |
| | Information Technology Services — 0.8% | | | | | | | | |
| b | Globant SA | | | 24,454 | | | | 4,845,315 | |
| | Software — 6.0% | | | | | | | | |
| | Constellation Software, Inc. | | | 5,355 | | | | 17,421,716 | |
| | SAP SE | | | 73,297 | | | | 16,677,101 | |
| | | | | | | | | 38,944,132 | |
| See notes to financial statements. | Annual Financial Statements | 13 |
Schedule of Investments, Continued
Thornburg Better World International Fund | September 30, 2024
| | ISSUER-DESCRIPTION | | SHARES | | | VALUE | |
| | | | | | | | |
| | TECHNOLOGY HARDWARE & EQUIPMENT — 4.0% | | | | | | | | |
| | Electronic Equipment, Instruments & Components — 1.1% | | | | | | | | |
| | Keyence Corp. | | | 12,300 | | | $ | 5,850,256 | |
| | Technology Hardware, Storage & Peripherals — 2.9% | | | | | | | | |
| | Samsung Electronics Co. Ltd. | | | 354,652 | | | | 16,678,977 | |
| | | | | | | | | 22,529,233 | |
| | TELECOMMUNICATION SERVICES — 2.4% | | | | | | | | |
| | Diversified Telecommunication Services — 2.4% | | | | | | | | |
| | Internet Initiative Japan, Inc. | | | 505,100 | | | | 10,613,338 | |
| | Orange SA | | | 245,838 | | | | 2,814,536 | |
| | | | | | | | | 13,427,874 | |
| | TRANSPORTATION — 3.2% | | | | | | | | |
| | Ground Transportation — 3.2% | | | | | | | | |
| | Canadian Pacific Kansas City Ltd. | | | 209,882 | | | | 17,953,306 | |
| | | | | | | | | 17,953,306 | |
| | UTILITIES — 4.1% | | | | | | | | |
| | Electric Utilities — 4.1% | | | | | | | | |
| | Endesa SA | | | 406,239 | | | | 8,876,779 | |
| | Enel SpA | | | 1,321,818 | | | | 10,557,158 | |
| | Iberdrola SA | | | 254,728 | | | | 3,938,514 | |
| | | | | | | | | 23,372,451 | |
| | TOTAL COMMON STOCK (Cost $439,109,284) | | | | | | | 546,512,327 | |
| | | | | | | | | | |
| | WARRANT — 0.0% | | | | | | | | |
| | | | | | | | | | |
| | SOFTWARE & SERVICES — 0.0% | | | | | | | | |
| | Software — 0.0% | | | | | | | | |
| b,c | Constellation Software, Inc., 3/31/2040 | | | 6,276 | | | | 1 | |
| | | | | | | | | 1 | |
| | TOTAL WARRANTS (Cost $0) | | | | | | | 1 | |
| | | | | | | | | | |
| | SHORT-TERM INVESTMENTS — 3.9% | | | | | | | | |
| d | Thornburg Capital Management Fund | | | 2,215,305 | | | | 22,153,050 | |
| | TOTAL SHORT-TERM INVESTMENTS (Cost $22,153,050) | | | | | | | 22,153,050 | |
| | | | | | | | | | |
| | TOTAL INVESTMENTS — 99.8% (Cost $461,262,334) | | | | | | $ | 568,665,378 | |
| | | | | | | | | | |
| | OTHER ASSETS LESS LIABILITIES — 0.2% | | | | | | | 1,390,666 | |
| | | | | | | | | | |
| | NET ASSETS — 100.0% | | | | | | $ | 570,056,044 | |
Footnote Legend
| a | Securities exempt from registration under Rule 144A of the Securities Act of 1933, as amended. These securities are restricted but liquid and may only be resold in the ordinary course of business in transactions exempt from registration, normally to qualified institutional buyers. As of September 30, 2024, the aggregate value of these securities in the Fund’s portfolio was $1,899,802, representing 0.33% of the Fund’s net assets. |
| b | Non-income producing. |
| c | Security currently fair valued by Thornburg Investment Management, Inc.’s Valuation and Pricing Committee. |
| d | Investment in Affiliates. |
Portfolio Abbreviations
To simplify the listings of securities, abbreviations are used per the table below:
| ADR | American Depositary Receipt |
| 14 | Annual Financial Statements | See notes to financial statements. |
Schedule of Investments, Continued
Thornburg Better World International Fund | September 30, 2024
COUNTRY EXPOSURE *
(percent of equity holdings)
| United States | | 22.1% |
| Japan | | 20.6% |
| France | | 15.4% |
| Canada | | 8.6% |
| Switzerland | | 5.5% |
| Germany | | 4.1% |
| China | | 3.4% |
| South Korea | | 3.1% |
| Italy | | 2.8% |
| Hong Kong | | 2.6% |
| Spain | | 2.3% |
| Denmark | | 2.3% |
| India | | 1.8% |
| Brazil | | 1.3% |
| Australia | | 1.1% |
| Netherlands | | 0.9% |
| United Kingdom | | 0.9% |
| Taiwan | | 0.9% |
| Sweden | | 0.3% |
* Holdings are classified by country of risk as determined by MSCI and Bloomberg.
| See notes to financial statements. | Annual Financial Statements | 15 |
Schedule of Investments
Thornburg International Growth Fund | September 30, 2024
| | ISSUER-DESCRIPTION | | SHARES | | | VALUE | |
| | | | | | | | |
| | COMMON STOCK — 98.3% | | | | | | | | |
| | | | | | | | | | |
| | AUTOMOBILES & COMPONENTS — 2.3% | | | | | | | | |
| | Automobiles — 2.3% | | | | | | | | |
| | Ferrari NV | | | 42,718 | | | $ | 20,082,159 | |
| | | | | | | | | 20,082,159 | |
| | BANKS — 1.4% | | | | | | | | |
| | Banks — 1.4% | | | | | | | | |
| a | NU Holdings Ltd. Class A | | | 934,928 | | | | 12,761,767 | |
| | | | | | | | | 12,761,767 | |
| | CAPITAL GOODS — 1.5% | | | | | | | | |
| | Trading Companies & Distributors — 1.5% | | | | | | | | |
| | Diploma plc | | | 220,687 | | | | 13,082,408 | |
| | | | | | | | | 13,082,408 | |
| | COMMERCIAL & PROFESSIONAL SERVICES — 1.4% | | | | | | | | |
| | Professional Services — 1.4% | | | | | | | | |
| | Wolters Kluwer NV | | | 72,801 | | | | 12,261,108 | |
| | | | | | | | | 12,261,108 | |
| | CONSUMER DISCRETIONARY DISTRIBUTION & RETAIL — 4.0% | | | | | | | | |
| | Broadline Retail — 4.0% | | | | | | | | |
| | B&M European Value Retail SA | | | 1,354,166 | | | | 7,516,999 | |
| a | MercadoLibre, Inc. | | | 13,566 | | | | 27,836,889 | |
| | | | | | | | | 35,353,888 | |
| | CONSUMER DURABLES & APPAREL — 1.5% | | | | | | | | |
| | Textiles, Apparel & Luxury Goods — 1.5% | | | | | | | | |
| | Brunello Cucinelli SpA | | | 125,730 | | | | 13,540,770 | |
| | | | | | | | | 13,540,770 | |
| | CONSUMER SERVICES — 1.6% | | | | | | | | |
| | Hotels, Restaurants & Leisure — 1.6% | | | | | | | | |
| a | Flutter Entertainment plc | | | 58,088 | | | | 13,783,121 | |
| | | | | | | | | 13,783,121 | |
| | CONSUMER STAPLES DISTRIBUTION & RETAIL — 0.9% | | | | | | | | |
| | Consumer Staples Distribution & Retail — 0.9% | | | | | | | | |
| | Raia Drogasil SA | | | 1,746,007 | | | | 8,169,635 | |
| | | | | | | | | 8,169,635 | |
| | FINANCIAL SERVICES — 11.1% | | | | | | | | |
| | Capital Markets — 6.9% | | | | | | | | |
| | Blue Owl Capital, Inc. Class A | | | 477,101 | | | | 9,236,675 | |
| | Deutsche Boerse AG | | | 78,642 | | | | 18,444,740 | |
| | Hong Kong Exchanges & Clearing Ltd. | | | 525,400 | | | | 22,046,410 | |
| a | M&A Research Institute Holdings, Inc. | | | 547,600 | | | | 11,373,011 | |
| | Financial Services — 4.2% | | | | | | | | |
| | Mastercard, Inc. Class A | | | 61,549 | | | | 30,392,896 | |
| | Visa, Inc. Class A | | | 22,762 | | | | 6,258,412 | |
| | | | | | | | | 97,752,144 | |
| | FOOD, BEVERAGE & TOBACCO — 3.0% | | | | | | | | |
| | Beverages — 3.0% | | | | | | | | |
| | Davide Campari-Milano NV | | | 1,602,347 | | | | 13,555,752 | |
| | Kweichow Moutai Co. Ltd. Class A | | | 51,983 | | | | 12,951,110 | |
| | | | | | | | | 26,506,862 | |
| 16 | Annual Financial Statements | See notes to financial statements. |
Schedule of Investments, Continued
Thornburg International Growth Fund | September 30, 2024
| | ISSUER-DESCRIPTION | | SHARES | | | VALUE | |
| | | | | | | | | | |
| | HEALTH CARE EQUIPMENT & SERVICES — 5.0% | | | | | | | | |
| | Health Care Equipment & Supplies — 5.0% | | | | | | | | |
| | Alcon, Inc. | | | 217,734 | | | $ | 21,692,362 | |
| | Hoya Corp. | | | 163,000 | | | | 22,438,372 | |
| | | | | | | | | 44,130,734 | |
| | HOUSEHOLD & PERSONAL PRODUCTS — 3.0% | | | | | | | | |
| | Personal Care Products — 3.0% | | | | | | | | |
| | Beiersdorf AG | | | 174,233 | | | | 26,211,986 | |
| | | | | | | | | 26,211,986 | |
| | INSURANCE — 1.3% | | | | | | | | |
| | Insurance — 1.3% | | | | | | | | |
| a | PB Fintech Ltd. | | | 598,322 | | | | 11,483,970 | |
| | | | | | | | | 11,483,970 | |
| | MATERIALS — 3.8% | | | | | | | | |
| | Chemicals — 2.2% | | | | | | | | |
| | Air Liquide SA | | | 101,570 | | | | 19,589,224 | |
| | Metals & Mining — 1.6% | | | | | | | | |
| | Teck Resources Ltd. Class B | | | 261,417 | | | | 13,654,107 | |
| | | | | | | | | 33,243,331 | |
| | MEDIA & ENTERTAINMENT — 9.3% | | | | | | | | |
| | Entertainment — 2.1% | | | | | | | | |
| a | Sea Ltd. ADR | | | 198,313 | | | | 18,696,950 | |
| | Interactive Media & Services — 5.6% | | | | | | | | |
| | Hemnet Group AB | | | 376,310 | | | | 13,850,606 | |
| | Tencent Holdings Ltd. | | | 620,700 | | | | 35,498,912 | |
| | Media — 1.6% | | | | | | | | |
| | Schibsted ASA Class A | | | 433,387 | | | | 13,987,711 | |
| | | | | | | | | 82,034,179 | |
| | PHARMACEUTICALS, BIOTECHNOLOGY & LIFE SCIENCES — 17.2% | | | | | | | | |
| | Biotechnology — 2.3% | | | | | | | | |
| a,b | BioArctic AB Class B | | | 416,113 | | | | 6,494,179 | |
| | CSL Ltd. | | | 69,919 | | | | 13,838,350 | |
| | Life Sciences Tools & Services — 5.3% | | | | | | | | |
| a | ICON plc ADR | | | 74,893 | | | | 21,517,508 | |
| | Lonza Group AG | | | 39,650 | | | | 25,045,064 | |
| | Pharmaceuticals — 9.6% | | | | | | | | |
| | AstraZeneca plc | | | 218,376 | | | | 33,832,075 | |
| | Novo Nordisk AS Sponsored ADR | | | 423,706 | | | | 50,450,673 | |
| | | | | | | | | 151,177,849 | |
| | SEMICONDUCTORS & SEMICONDUCTOR EQUIPMENT — 15.9% | | | | | | | | |
| | Semiconductors & Semiconductor Equipment — 15.9% | | | | | | | | |
| a | Advanced Micro Devices, Inc. | | | 94,133 | | | | 15,445,342 | |
| | ASML Holding NV | | | 52,490 | | | | 43,564,821 | |
| | BE Semiconductor Industries NV | | | 79,544 | | | | 10,054,212 | |
| | Disco Corp. | | | 54,200 | | | | 14,137,819 | |
| | SK Hynix, Inc. | | | 69,385 | | | | 9,264,067 | |
| | Taiwan Semiconductor Manufacturing Co. Ltd. | | | 1,585,000 | | | | 47,930,893 | |
| | | | | | | | | 140,397,154 | |
| | SOFTWARE & SERVICES — 9.4% | | | | | | | | |
| | Information Technology Services — 7.8% | | | | | | | | |
| a | Globant SA | | | 80,818 | | | | 16,013,279 | |
| | Nomura Research Institute Ltd. | | | 854,200 | | | | 31,499,461 | |
| a | Shopify, Inc. Class A | | | 267,209 | | | | 21,414,129 | |
| | Software — 1.6% | | | | | | | | |
| a | Money Forward, Inc. | | | 339,700 | | | | 13,843,262 | |
| | | | | | | | | 82,770,131 | |
| See notes to financial statements. | Annual Financial Statements | 17 |
Schedule of Investments, Continued
Thornburg International Growth Fund | September 30, 2024
| | ISSUER-DESCRIPTION | | SHARES | | | VALUE | |
| | | | | | | | | | |
| | TECHNOLOGY HARDWARE & EQUIPMENT — 2.3% | | | | | | | | |
| | Electronic Equipment, Instruments & Components — 2.3% | | | | | | | | |
| | Keyence Corp. | | | 41,700 | | | $ | 19,833,794 | |
| | | | | | | | | 19,833,794 | |
| | UTILITIES — 2.4% | | | | | | | | |
| | Multi-Utilities — 2.4% | | | | | | | | |
| | E.ON SE | | | 1,445,889 | | | | 21,494,745 | |
| | | | | | | | | 21,494,745 | |
| | TOTAL COMMON STOCK (Cost $557,986,232) | | | | | | | 866,071,735 | |
| | | | | | | | | | |
| | SHORT-TERM INVESTMENTS — 2.4% | | | | | | | | |
| c | Thornburg Capital Management Fund | | | 2,146,453 | | | | 21,464,529 | |
| | TOTAL SHORT-TERM INVESTMENTS (Cost $21,464,529) | | | | | | | 21,464,529 | |
| | | | | | | | | | |
| | TOTAL INVESTMENTS — 100.7% (Cost $579,450,761) | | | | | | $ | 887,536,264 | |
| | | | | | | | | | |
| | LIABILITIES NET OF OTHER ASSETS — (0.7)% | | | | | | | (5,932,728 | ) |
| | | | | | | | | | |
| | NET ASSETS — 100.0% | | | | | | $ | 881,603,536 | |
Footnote Legend
| b | Securities exempt from registration under Rule 144A of the Securities Act of 1933, as amended. These securities are restricted but liquid and may only be resold in the ordinary course of business in transactions exempt from registration, normally to qualified institutional buyers. As of September 30, 2024, the aggregate value of these securities in the Fund’s portfolio was $6,494,179, representing 0.74% of the Fund’s net assets. |
| c | Investment in Affiliates. |
| Portfolio Abbreviations |
| To simplify the listings of securities, abbreviations are used per the table below: |
| ADR | American Depositary Receipt |
COUNTRY EXPOSURE *
(percent of equity holdings)
| United States | 15.5% |
| Japan | 13.1% |
| United Kingdom | 7.9% |
| Germany | 7.6% |
| Netherlands | 7.6% |
| Denmark | 5.8% |
| Brazil | 5.6% |
| China | 5.6% |
| Taiwan | 5.5% |
| Italy | 5.4% |
| Canada | 4.1% |
| Switzerland | 2.9% |
| Hong Kong | 2.5% |
| Sweden | 2.4% |
| France | 2.3% |
| Singapore | 2.2% |
| Norway | 1.6% |
| India | 1.3% |
| South Korea | 1.1% |
* Holdings are classified by country of risk as determined by MSCI and Bloomberg.
| 18 | Annual Financial Statements | See notes to financial statements. |
Schedule of Investments
Thornburg Developing World Fund | September 30, 2024
| | ISSUER-DESCRIPTION | | SHARES | | | VALUE | |
| | | | | | | | | | |
| | COMMON STOCK — 98.0% | | | | | | | | |
| | | | | | | | | | |
| | AUTOMOBILES & COMPONENTS — 1.2% | | | | | | | | |
| | Automobiles — 1.2% | | | | | | | | |
| | Kia Corp. | | | 106,369 | | | $ | 8,125,918 | |
| | | | | | | | | 8,125,918 | |
| | BANKS — 13.7% | | | | | | | | |
| | Banks — 13.7% | | | | | | | | |
| | Al Rajhi Bank | | | 286,125 | | | | 6,650,877 | |
| | Bank Rakyat Indonesia Persero Tbk. PT | | | 20,161,400 | | | | 6,591,739 | |
| | China Construction Bank Corp. Class H | | | 23,825,500 | | | | 18,021,179 | |
| | Credicorp Ltd. | | | 38,215 | | | | 6,915,769 | |
| | Grupo Financiero Banorte SAB de CV Class O | | | 968,759 | | | | 6,894,966 | |
| | ICICI Bank Ltd. | | | 920,689 | | | | 13,996,351 | |
| | KB Financial Group, Inc. | | | 157,658 | | | | 9,753,408 | |
| a | NU Holdings Ltd. Class A | | | 458,634 | | | | 6,260,354 | |
| | SCB X PCL | | | 3,206,225 | | | | 10,860,960 | |
| | State Bank of India | | | 693,790 | | | | 6,523,847 | |
| | | | | | | | | 92,469,450 | |
| | CAPITAL GOODS — 2.5% | | | | | | | | |
| | Aerospace & Defense — 1.4% | | | | | | | | |
| | LIG Nex1 Co. Ltd. | | | 57,876 | | | | 9,338,408 | |
| | Machinery — 1.1% | | | | | | | | |
| | Techtronic Industries Co. Ltd. | | | 499,000 | | | | 7,580,787 | |
| | | | | | | | | 16,919,195 | |
| | CONSUMER DISCRETIONARY DISTRIBUTION & RETAIL — 12.2% | | | | | | | | |
| | Broadline Retail — 11.0% | | | | | | | | |
| | Alibaba Group Holding Ltd. | | | 1,291,700 | | | | 18,277,559 | |
| a | MercadoLibre, Inc. | | | 3,286 | | | | 6,742,740 | |
| | Naspers Ltd. Class N | | | 163,619 | | | | 39,725,964 | |
| a | PDD Holdings, Inc. ADR | | | 70,339 | | | | 9,482,401 | |
| | Specialty Retail — 1.2% | | | | | | | | |
| | K Car Co. Ltd. | | | 829,218 | | | | 8,198,967 | |
| | | | | | | | | 82,427,631 | |
| | CONSUMER DURABLES & APPAREL — 1.6% | | | | | | | | |
| | Textiles, Apparel & Luxury Goods — 1.6% | | | | | | | | |
| | Kalyan Jewellers India Ltd. | | | 1,228,229 | | | | 10,689,683 | |
| | | | | | | | | 10,689,683 | |
| | CONSUMER SERVICES — 5.1% | | | | | | | | |
| | Diversified Consumer Services — 1.3% | | | | | | | | |
| | New Oriental Education & Technology Group, Inc. Sponsored ADR | | | 109,914 | | | | 8,335,878 | |
| | Hotels, Restaurants & Leisure — 3.8% | | | | | | | | |
| a,b | Meituan Class B | | | 445,100 | | | | 9,848,042 | |
| a | Trip.com Group Ltd. ADR | | | 143,314 | | | | 8,517,151 | |
| a | Zomato Ltd. | | | 2,258,632 | | | | 7,355,268 | |
| | | | | | | | | 34,056,339 | |
| | CONSUMER STAPLES DISTRIBUTION & RETAIL — 2.8% | | | | | | | | |
| | Consumer Staples Distribution & Retail — 2.8% | | | | | | | | |
| | BIM Birlesik Magazalar AS | | | 425,729 | | | | 6,177,879 | |
| a,b | Dino Polska SA | | | 81,062 | | | | 7,385,930 | |
| a | Sendas Distribuidora SA | | | 3,986,700 | | | | 5,466,646 | |
| | | | | | | | | 19,030,455 | |
| | ENERGY — 6.3% | | | | | | | | |
| | Energy Equipment & Services — 1.6% | | | | | | | | |
| | ADNOC Drilling Co. PJSC | | | 8,447,457 | | | | 10,878,281 | |
| See notes to financial statements. | Annual Financial Statements | 19 |
Schedule of Investments, Continued
Thornburg Developing World Fund | September 30, 2024
| | ISSUER-DESCRIPTION | | SHARES | | | VALUE | |
| | | | | | | | | | |
| | Oil, Gas & Consumable Fuels — 4.7% | | | | | | | | |
| | PetroChina Co. Ltd. Class H | | | 7,408,000 | | | $ | 6,041,629 | |
| | PRIO SA | | | 821,093 | | | | 6,530,822 | |
| | Reliance Industries Ltd. | | | 374,831 | | | | 13,230,711 | |
| a | Vista Energy SAB de CV ADR | | | 128,824 | | | | 5,691,445 | |
| | | | | | | | | 42,372,888 | |
| | FINANCIAL SERVICES — 5.8% | | | | | | | | |
| | Capital Markets — 3.3% | | | | | | | | |
| | 360 ONE WAM Ltd. | | | 527,358 | | | | 6,532,094 | |
| | Hong Kong Exchanges & Clearing Ltd. | | | 217,900 | | | | 9,143,343 | |
| | Saudi Tadawul Group Holding Co. | | | 103,338 | | | | 6,247,550 | |
| | Financial Services — 2.5% | | | | | | | | |
| | FirstRand Ltd. | | | 2,089,020 | | | | 10,042,772 | |
| b | Home First Finance Co. India Ltd. | | | 490,768 | | | | 6,970,500 | |
| | | | | | | | | 38,936,259 | |
| | FOOD, BEVERAGE & TOBACCO — 4.7% | | | | | | | | |
| | Beverages — 3.3% | | | | | | | | |
| | Kweichow Moutai Co. Ltd. Class A | | | 33,150 | | | | 8,259,033 | |
| | Varun Beverages Ltd. | | | 1,885,052 | | | | 13,670,922 | |
| | Food Products — 1.4% | | | | | | | | |
| | China Mengniu Dairy Co. Ltd. | | | 3,961,200 | | | | 9,528,668 | |
| | | | | | | | | 31,458,623 | |
| | HEALTH CARE EQUIPMENT & SERVICES — 1.9% | | | | | | | | |
| | Health Care Providers & Services — 1.9% | | | | | | | | |
| | Max Healthcare Institute Ltd. | | | 1,103,320 | | | | 13,100,084 | |
| | | | | | | | | 13,100,084 | |
| | HOUSEHOLD & PERSONAL PRODUCTS — 1.3% | | | | | | | | |
| | Personal Care Products — 1.3% | | | | | | | | |
| | Proya Cosmetics Co. Ltd. Class A | | | 553,495 | | | | 8,684,920 | |
| | | | | | | | | 8,684,920 | |
| | INSURANCE — 3.7% | | | | | | | | |
| | Insurance — 3.7% | | | | | | | | |
| | AIA Group Ltd. | | | 948,692 | | | | 8,499,829 | |
| | Fubon Financial Holding Co. Ltd. | | | 3,654,050 | | | | 10,437,999 | |
| a | PB Fintech Ltd. | | | 319,287 | | | | 6,128,276 | |
| | | | | | | | | 25,066,104 | |
| | MEDIA & ENTERTAINMENT — 0.8% | | | | | | | | |
| | Entertainment — 0.8% | | | | | | | | |
| | Tencent Music Entertainment Group ADR | | | 449,612 | | | | 5,417,825 | |
| | | | | | | | | 5,417,825 | |
| | REAL ESTATE MANAGEMENT & DEVELOPMENT — 3.0% | | | | | | | | |
| | Real Estate Management & Development — 3.0% | | | | | | | | |
| | Aldar Properties PJSC | | | 3,375,914 | | | | 6,911,660 | |
| | Corp. Inmobiliaria Vesta SAB de CV ADR | | | 245,596 | | | | 6,616,356 | |
| b | Macrotech Developers Ltd. | | | 451,276 | | | | 6,666,723 | |
| | | | | | | | | 20,194,739 | |
| | SEMICONDUCTORS & SEMICONDUCTOR EQUIPMENT — 15.8% | | | | | | | | |
| | Semiconductors & Semiconductor Equipment — 15.8% | | | | | | | | |
| | Alchip Technologies Ltd. | | | 81,507 | | | | 5,086,702 | |
| | MediaTek, Inc. | | | 217,000 | | | | 8,056,973 | |
| | SK Hynix, Inc. | | | 155,934 | | | | 20,819,818 | |
| | Taiwan Semiconductor Manufacturing Co. Ltd. | | | 2,398,000 | | | | 72,516,266 | |
| | | | | | | | | 106,479,759 | |
| 20 | Annual Financial Statements | See notes to financial statements. |
Schedule of Investments, Continued
Thornburg Developing World Fund | September 30, 2024
| | ISSUER-DESCRIPTION | | SHARES | | | VALUE | |
| | | | | | | | | | |
| | SOFTWARE & SERVICES — 2.0% | | | | | | | | |
| | Information Technology Services — 2.0% | | | | | | | | |
| | HCL Technologies Ltd. | | | 642,634 | | | $ | 13,772,714 | |
| | | | | | | | | 13,772,714 | |
| | TECHNOLOGY HARDWARE & EQUIPMENT — 5.7% | | | | | | | | |
| | Electronic Equipment, Instruments & Components — 1.9% | | | | | | | | |
| | Hon Hai Precision Industry Co. Ltd. | | | 1,164,000 | | | | 6,896,497 | |
| | Lotes Co. Ltd. | | | 140,800 | | | | 6,162,072 | |
| | Technology Hardware, Storage & Peripherals — 3.8% | | | | | | | | |
| | Samsung Electronics Co. Ltd. | | | 546,816 | | | | 25,716,283 | |
| | | | | | | | | 38,774,852 | |
| | TELECOMMUNICATION SERVICES — 1.6% | | | | | | | | |
| | Diversified Telecommunication Services — 1.6% | | | | | | | | |
| | Converge Information & Communications Technology Solutions, Inc. | | | 37,887,634 | | | | 11,061,195 | |
| | | | | | | | | 11,061,195 | |
| | TRANSPORTATION — 4.1% | | | | | | | | |
| | Transportation Infrastructure — 4.1% | | | | | | | | |
| | Adani Ports & Special Economic Zone Ltd. | | | 763,689 | | | | 13,185,742 | |
| | Jiangsu Expressway Co. Ltd. Class H | | | 6,811,000 | | | | 6,895,241 | |
| | Salik Co. PJSC | | | 6,733,480 | | | | 7,571,166 | |
| | | | | | | | | 27,652,149 | |
| | UTILITIES — 2.2% | | | | | | | | |
| | Gas Utilities — 1.2% | | | | | | | | |
| | China Resources Gas Group Ltd. | | | 1,991,500 | | | | 8,031,223 | |
| | Independent Power and Renewable Electricity Producers — 1.0% | | | | | | | | |
| | NHPC Ltd. | | | 5,861,179 | | | | 6,623,453 | |
| | | | | | | | | 14,654,676 | |
| | TOTAL COMMON STOCK (Cost $484,425,546) | | | | | | | 661,345,458 | |
| | | | | | | | | | |
| | PREFERRED STOCK — 2.5% | | | | | | | | |
| | | | | | | | | | |
| | BANKS — 1.5% | | | | | | | | |
| | Banks — 1.5% | | | | | | | | |
| | Itau Unibanco Holding SA 6.508% | | | 1,565,060 | | | | 10,373,977 | |
| | | | | | | | | 10,373,977 | |
| | ENERGY — 1.0% | | | | | | | | |
| | Oil, Gas & Consumable Fuels — 1.0% | | | | | | | | |
| | Petroleo Brasileiro SA 13.568% | | | 966,282 | | | | 6,387,249 | |
| | | | | | | | | 6,387,249 | |
| | TOTAL PREFERRED STOCK (Cost $15,047,552) | | | | | | | 16,761,226 | |
| | | | | | | | | | |
| | SHORT-TERM INVESTMENTS — 0.2% | | | | | | | | |
| c | Thornburg Capital Management Fund | | | 110,824 | | | | 1,108,242 | |
| | TOTAL SHORT-TERM INVESTMENTS (Cost $1,108,242) | | | | | | | 1,108,242 | |
| | | | | | | | | | |
| | TOTAL INVESTMENTS — 100.7% (Cost $500,581,340) | | | | | | $ | 679,214,926 | |
| | | | | | | | | | |
| | LIABILITIES NET OF OTHER ASSETS — (0.7)% | | | | | | | (4,452,875 | ) |
| | | | | | | | | | |
| | NET ASSETS — 100.0% | | | | | | $ | 674,762,051 | |
Footnote Legend
| b | Securities exempt from registration under Rule 144A of the Securities Act of 1933, as amended. These securities are restricted but liquid and may only be resold in the ordinary course of business in transactions exempt from registration, normally to qualified institutional buyers. As of September 30, 2024, the aggregate value of these securities in the Fund’s portfolio was $30,871,195, representing 4.58% of the Fund’s net assets. |
| c | Investment in Affiliates. |
| See notes to financial statements. | Annual Financial Statements | 21 |
Schedule of Investments, Continued
Thornburg Developing World Fund | September 30, 2024
| Portfolio Abbreviations |
| To simplify the listings of securities, abbreviations are used per the table below: |
| ADR | American Depositary Receipt |
COUNTRY EXPOSURE *
(percent of equity holdings)
| India | 20.4% |
| China | 18.5% |
| Taiwan | 16.1% |
| South Korea | 12.1% |
| South Africa | 7.3% |
| Brazil | 6.2% |
| United Arab Emirates | 3.8% |
| Hong Kong | 3.7% |
| Mexico | 2.8% |
| Saudi Arabia | 1.9% |
| Philippines | 1.6% |
| Thailand | 1.6% |
| Poland | 1.1% |
| Peru | 1.0% |
| Indonesia | 1.0% |
| Turkey | 0.9% |
* Holdings are classified by country of risk as determined by MSCI and Bloomberg.
| 22 | Annual Financial Statements | See notes to financial statements. |
Schedule of Investments
Thornburg Small/Mid Cap Core Fund | September 30, 2024
| | ISSUER-DESCRIPTION | | SHARES | | | VALUE | |
| | | | | | | | |
| | COMMON STOCK — 98.4% | | | | | | | | |
| | | | | | | | | | |
| | BANKS — 5.3% | | | | | | | | |
| | Banks — 5.3% | | | | | | | | |
| | Pinnacle Financial Partners, Inc. | | | 150,346 | | | $ | 14,729,397 | |
| | Western Alliance Bancorp | | | 172,512 | | | | 14,920,563 | |
| | | | | | | | | 29,649,960 | |
| | CAPITAL GOODS — 14.9% | | | | | | | | |
| | Building Products — 2.6% | | | | | | | | |
| a | Builders FirstSource, Inc. | | | 74,383 | | | | 14,419,888 | |
| | Construction & Engineering — 3.4% | | | | | | | | |
| | Arcosa, Inc. | | | 113,819 | | | | 10,785,489 | |
| a | MYR Group, Inc. | | | 82,062 | | | | 8,389,198 | |
| | Electrical Equipment — 2.7% | | | | | | | | |
| | Vertiv Holdings Co. Class A | | | 154,133 | | | | 15,334,692 | |
| | Machinery — 2.4% | | | | | | | | |
| | ITT, Inc. | | | 88,518 | | | | 13,234,326 | |
| | Trading Companies & Distributors — 3.8% | | | | | | | | |
| | Air Lease Corp. Class A | | | 159,200 | | | | 7,210,168 | |
| | Applied Industrial Technologies, Inc. | | | 61,613 | | | | 13,747,709 | |
| | | | | | | | | 83,121,470 | |
| | COMMERCIAL & PROFESSIONAL SERVICES — 9.4% | | | | | | | | |
| | Commercial Services & Supplies — 6.5% | | | | | | | | |
| a | Casella Waste Systems, Inc. Class A | | | 190,669 | | | | 18,969,659 | |
| a | Clean Harbors, Inc. | | | 72,746 | | | | 17,583,435 | |
| | Professional Services — 2.9% | | | | | | | | |
| | TransUnion | | | 153,704 | | | | 16,092,809 | |
| | | | | | | | | 52,645,903 | |
| | CONSUMER DISCRETIONARY DISTRIBUTION & RETAIL — 3.7% | | | | | | | | |
| | Distributors — 1.5% | | | | | | | | |
| | Pool Corp. | | | 22,991 | | | | 8,663,009 | |
| | Specialty Retail — 2.2% | | | | | | | | |
| | Group 1 Automotive, Inc. | | | 31,769 | | | | 12,168,798 | |
| | | | | | | | | 20,831,807 | |
| | CONSUMER DURABLES & APPAREL — 7.5% | | | | | | | | |
| | Household Durables — 4.3% | | | | | | | | |
| | SharkNinja, Inc. | | | 131,705 | | | | 14,317,651 | |
| a | Smith Douglas Homes Corp. | | | 248,654 | | | | 9,394,148 | |
| | Leisure Products — 1.4% | | | | | | | | |
| | Acushnet Holdings Corp. | | | 122,371 | | | | 7,801,152 | |
| | Textiles, Apparel & Luxury Goods — 1.8% | | | | | | | | |
| a | Deckers Outdoor Corp. | | | 63,876 | | | | 10,185,028 | |
| | | | | | | | | 41,697,979 | |
| | CONSUMER SERVICES — 1.9% | | | | | | | | |
| | Hotels, Restaurants & Leisure — 1.9% | | | | | | | | |
| | Wyndham Hotels & Resorts, Inc. | | | 135,783 | | | | 10,610,084 | |
| | | | | | | | | 10,610,084 | |
| | CONSUMER STAPLES DISTRIBUTION & RETAIL — 2.1% | | | | | | | | |
| | Consumer Staples Distribution & Retail — 2.1% | | | | | | | | |
| a | BJ’s Wholesale Club Holdings, Inc. | | | 144,305 | | | | 11,902,276 | |
| | | | | | | | | 11,902,276 | |
| | ENERGY — 5.1% | | | | | | | | |
| | Energy Equipment & Services — 3.6% | | | | | | | | |
| | Liberty Energy, Inc. Class A | | | 354,387 | | | | 6,765,248 | |
| | TechnipFMC plc | | | 518,917 | | | | 13,611,193 | |
| See notes to financial statements. | Annual Financial Statements | 23 |
Schedule of Investments, Continued
Thornburg Small/Mid Cap Core Fund | September 30, 2024
| | ISSUER-DESCRIPTION | | SHARES | | | VALUE | |
| | | | | | | | | | |
| | Oil, Gas & Consumable Fuels — 1.5% | | | | | | | | |
| | Matador Resources Co. | | | 167,652 | | | $ | 8,285,362 | |
| | | | | | | | | 28,661,803 | |
| | EQUITY REAL ESTATE INVESTMENT TRUSTS (REITS) — 1.9% | | | | | | | | |
| | Retail REITs — 1.9% | | | | | | | | |
| | Kite Realty Group Trust | | | 409,532 | | | | 10,877,170 | |
| | | | | | | | | 10,877,170 | |
| | FINANCIAL SERVICES — 9.6% | | | | | | | | |
| | Capital Markets — 5.1% | | | | | | | | |
| | DigitalBridge Group, Inc. | | | 618,609 | | | | 8,740,945 | |
| | LPL Financial Holdings, Inc. | | | 48,467 | | | | 11,274,878 | |
| | PJT Partners, Inc. Class A | | | 63,896 | | | | 8,519,893 | |
| | Financial Services — 4.5% | | | | | | | | |
| a | Repay Holdings Corp. Class A | | | 1,265,266 | | | | 10,324,571 | |
| | Walker & Dunlop, Inc. | | | 132,826 | | | | 15,087,705 | |
| | | | | | | | | 53,947,992 | |
| | FOOD, BEVERAGE & TOBACCO — 2.3% | | | | | | | | |
| | Food Products — 2.3% | | | | | | | | |
| a | SunOpta, Inc. | | | 2,016,937 | | | | 12,868,058 | |
| | | | | | | | | 12,868,058 | |
| | HEALTH CARE EQUIPMENT & SERVICES — 1.6% | | | | | | | | |
| | Health Care Providers & Services — 1.6% | | | | | | | | |
| a | Tenet Healthcare Corp. | | | 52,178 | | | | 8,671,984 | |
| | | | | | | | | 8,671,984 | |
| | INSURANCE — 4.2% | | | | | | | | |
| | Insurance — 4.2% | | | | | | | | |
| | Assurant, Inc. | | | 61,567 | | | | 12,243,214 | |
| | Kemper Corp. | | | 179,758 | | | | 11,010,177 | |
| | | | | | | | | 23,253,391 | |
| | MATERIALS — 3.4% | | | | | | | | |
| | Chemicals — 3.4% | | | | | | | | |
| | Scotts Miracle-Gro Co. | | | 84,898 | | | | 7,360,656 | |
| | Sensient Technologies Corp. | | | 144,099 | | | | 11,559,622 | |
| | | | | | | | | 18,920,278 | |
| | PHARMACEUTICALS, BIOTECHNOLOGY & LIFE SCIENCES — 5.1% | | | | | | | | |
| | Biotechnology — 2.7% | | | | | | | | |
| a | BioMarin Pharmaceutical, Inc. | | | 88,664 | | | | 6,232,192 | |
| a | Cytokinetics, Inc. | | | 170,037 | | | | 8,977,954 | |
| | Life Sciences Tools & Services — 2.4% | | | | | | | | |
| a | Avantor, Inc. | | | 517,562 | | | | 13,389,329 | |
| | | | | | | | | 28,599,475 | |
| | SEMICONDUCTORS & SEMICONDUCTOR EQUIPMENT — 3.3% | | | | | | | | |
| | Semiconductors & Semiconductor Equipment — 3.3% | | | | | | | | |
| | Entegris, Inc. | | | 79,868 | | | | 8,987,546 | |
| a | MACOM Technology Solutions Holdings, Inc. | | | 87,263 | | | | 9,708,881 | |
| | | | | | | | | 18,696,427 | |
| | SOFTWARE & SERVICES — 8.3% | | | | | | | | |
| | Software — 8.3% | | | | | | | | |
| a | Agilysys, Inc. | | | 131,105 | | | | 14,286,512 | |
| a | Aspen Technology, Inc. | | | 40,696 | | | | 9,719,019 | |
| a | CCC Intelligent Solutions Holdings, Inc. | | | 1,095,603 | | | | 12,106,413 | |
| a | Nutanix, Inc. Class A | | | 175,581 | | | | 10,403,174 | |
| | | | | | | | | 46,515,118 | |
| 24 | Annual Financial Statements | See notes to financial statements. |
Schedule of Investments, Continued
Thornburg Small/Mid Cap Core Fund | September 30, 2024
| | ISSUER-DESCRIPTION | | SHARES | | | VALUE | |
| | | | | | | | | | |
| | TECHNOLOGY HARDWARE & EQUIPMENT — 4.4% | | | | | | | | |
| | Electronic Equipment, Instruments & Components — 2.9% | | | | | | | | |
| a | Coherent Corp. | | | 182,518 | | | $ | 16,227,676 | |
| | Technology Hardware, Storage & Peripherals — 1.5% | | | | | | | | |
| a | Pure Storage, Inc. Class A | | | 165,613 | | | | 8,320,397 | |
| | | | | | | | | 24,548,073 | |
| | TRANSPORTATION — 1.9% | | | | | | | | |
| | Ground Transportation — 1.9% | | | | | | | | |
| a | XPO, Inc. | | | 98,689 | | | | 10,610,054 | |
| | | | | | | | | 10,610,054 | |
| | UTILITIES — 2.5% | | | | | | | | |
| | Electric Utilities — 2.5% | | | | | | | | |
| | TXNM Energy, Inc. | | | 318,388 | | | | 13,935,843 | |
| | | | | | | | | 13,935,843 | |
| | TOTAL COMMON STOCK (Cost $407,845,530) | | | | | | | 550,565,145 | |
| | | | | | | | | | |
| | SHORT-TERM INVESTMENTS — 1.8% | | | | | | | | |
| b | Thornburg Capital Management Fund | | | 1,020,381 | | | | 10,203,814 | |
| | TOTAL SHORT-TERM INVESTMENTS (Cost $10,203,814) | | | | | | | 10,203,814 | |
| | | | | | | | | | |
| | TOTAL INVESTMENTS — 100.2% (Cost $418,049,344) | | | | | | $ | 560,768,959 | |
| | | | | | | | | | |
| | LIABILITIES NET OF OTHER ASSETS — (0.2)% | | | | | | | (919,849 | ) |
| | | | | | | | | | |
| | NET ASSETS — 100.0% | | | | | | $ | 559,849,110 | |
Footnote Legend
| b | Investment in Affiliates. |
| See notes to financial statements. | Annual Financial Statements | 25 |
Schedule of Investments
Thornburg Small/Mid Cap Growth Fund | September 30, 2024
| | ISSUER-DESCRIPTION | | SHARES | | | VALUE | |
| | | | | | | | | | |
| | COMMON STOCK — 98.0% | | | | | | | | |
| | | | | | | | | | |
| | CAPITAL GOODS — 13.2% | | | | | | | | |
| | Aerospace & Defense — 1.0% | | | | | | | | |
| | Woodward, Inc. | | | 16,239 | | | $ | 2,785,151 | |
| | Building Products — 2.3% | | | | | | | | |
| a | Builders FirstSource, Inc. | | | 32,516 | | | | 6,303,552 | |
| | Construction & Engineering — 3.3% | | | | | | | | |
| | Arcosa, Inc. | | | 47,049 | | | | 4,458,363 | |
| a | MYR Group, Inc. | | | 45,528 | | | | 4,654,327 | |
| | Electrical Equipment — 3.8% | | | | | | | | |
| | Vertiv Holdings Co. Class A | | | 106,771 | | | | 10,622,647 | |
| | Trading Companies & Distributors — 2.8% | | | | | | | | |
| | Applied Industrial Technologies, Inc. | | | 34,468 | | | | 7,690,845 | |
| | | | | | | | | 36,514,885 | |
| | COMMERCIAL & PROFESSIONAL SERVICES — 9.6% | | | | | | | | |
| | Commercial Services & Supplies — 6.4% | | | | | | | | |
| a | Casella Waste Systems, Inc. Class A | | | 107,311 | | | | 10,676,371 | |
| | Tetra Tech, Inc. | | | 144,110 | | | | 6,796,228 | |
| | Professional Services — 3.2% | | | | | | | | |
| | TransUnion | | | 84,915 | | | | 8,890,600 | |
| | | | | | | | | 26,363,199 | |
| | CONSUMER DISCRETIONARY DISTRIBUTION & RETAIL — 1.7% | | | | | | | | |
| | Distributors — 1.7% | | | | | | | | |
| | Pool Corp. | | | 12,806 | | | | 4,825,301 | |
| | | | | | | | | 4,825,301 | |
| | CONSUMER DURABLES & APPAREL — 6.3% | | | | | | | | |
| | Household Durables — 3.5% | | | | | | | | |
| | SharkNinja, Inc. | | | 88,045 | | | | 9,571,372 | |
| | Textiles, Apparel & Luxury Goods — 2.8% | | | | | | | | |
| a | On Holding AG Class A | | | 153,459 | | | | 7,695,969 | |
| | | | | | | | | 17,267,341 | |
| | CONSUMER SERVICES — 4.0% | | | | | | | | |
| | Hotels, Restaurants & Leisure — 4.0% | | | | | | | | |
| | Churchill Downs, Inc. | | | 49,544 | | | | 6,698,844 | |
| | Hyatt Hotels Corp. Class A | | | 27,601 | | | | 4,200,872 | |
| | | | | | | | | 10,899,716 | |
| | ENERGY — 2.6% | | | | | | | | |
| | Energy Equipment & Services — 2.6% | | | | | | | | |
| | TechnipFMC plc | | | 274,881 | | | | 7,210,129 | |
| | | | | | | | | 7,210,129 | |
| | FINANCIAL SERVICES — 4.2% | | | | | | | | |
| | Capital Markets — 1.6% | | | | | | | | |
| | Tradeweb Markets, Inc. Class A | | | 35,519 | | | | 4,392,635 | |
| | Financial Services — 2.6% | | | | | | | | |
| a | Shift4 Payments, Inc. Class A | | | 80,583 | | | | 7,139,654 | |
| | | | | | | | | 11,532,289 | |
| | FOOD, BEVERAGE & TOBACCO — 4.2% | | | | | | | | |
| | Beverages — 1.1% | | | | | | | | |
| a | Celsius Holdings, Inc. | | | 97,913 | | | | 3,070,552 | |
| | Food Products — 3.1% | | | | | | | | |
| a | Freshpet, Inc. | | | 61,589 | | | | 8,423,527 | |
| | | | | | | | | 11,494,079 | |
| 26 | Annual Financial Statements | See notes to financial statements. |
Schedule of Investments, Continued
Thornburg Small/Mid Cap Growth Fund | September 30, 2024
| | ISSUER-DESCRIPTION | | SHARES | | | VALUE | |
| | | | | | | | | | |
| | HEALTH CARE EQUIPMENT & SERVICES — 4.8% | | | | | | | | |
| | Health Care Equipment & Supplies — 3.7% | | | | | | | | |
| a | Glaukos Corp. | | | 38,511 | | | $ | 5,017,213 | |
| a | Inspire Medical Systems, Inc. | | | 25,241 | | | | 5,327,113 | |
| | Health Care Providers & Services — 1.1% | | | | | | | | |
| a | Surgery Partners, Inc. | | | 91,031 | | | | 2,934,840 | |
| | | | | | | | | 13,279,166 | |
| | HOUSEHOLD & PERSONAL PRODUCTS — 1.0% | | | | | | | | |
| | Personal Care Products — 1.0% | | | | | | | | |
| a | elf Beauty, Inc. | | | 26,580 | | | | 2,898,017 | |
| | | | | | | | | 2,898,017 | |
| | INSURANCE — 2.8% | | | | | | | | |
| | Insurance — 2.8% | | | | | | | | |
| | Ryan Specialty Holdings, Inc. Class A | | | 116,525 | | | | 7,736,095 | |
| | | | | | | | | 7,736,095 | |
| | MEDIA & ENTERTAINMENT — 2.2% | | | | | | | | |
| | Entertainment — 2.2% | | | | | | | | |
| a | Liberty Media Corp.-Liberty Formula One Class C | | | 77,241 | | | | 5,980,771 | |
| | | | | | | | | 5,980,771 | |
| | PHARMACEUTICALS, BIOTECHNOLOGY & LIFE SCIENCES — 12.8% | | | | | | | | |
| | Biotechnology — 6.8% | | | | | | | | |
| a | Cytokinetics, Inc. | | | 106,227 | | | | 5,608,786 | |
| a | Insmed, Inc. | | | 75,869 | | | | 5,538,437 | |
| a | Sarepta Therapeutics, Inc. | | | 32,186 | | | | 4,019,709 | |
| a | Syndax Pharmaceuticals, Inc. | | | 116,812 | | | | 2,248,631 | |
| a | Vera Therapeutics, Inc. Class A | | | 30,880 | | | | 1,364,896 | |
| | Life Sciences Tools & Services — 6.0% | | | | | | | | |
| a | Avantor, Inc. | | | 225,675 | | | | 5,838,212 | |
| a | Repligen Corp. | | | 33,316 | | | | 4,958,087 | |
| | Stevanato Group SpA | | | 281,144 | | | | 5,622,880 | |
| | | | | | | | | 35,199,638 | |
| | SEMICONDUCTORS & SEMICONDUCTOR EQUIPMENT — 7.0% | | | | | | | | |
| | Semiconductors & Semiconductor Equipment — 7.0% | | | | | | | | |
| a | Credo Technology Group Holding Ltd. | | | 192,665 | | | | 5,934,082 | |
| | Monolithic Power Systems, Inc. | | | 4,794 | | | | 4,432,053 | |
| a | Onto Innovation, Inc. | | | 29,189 | | | | 6,058,469 | |
| a | Rambus, Inc. | | | 69,048 | | | | 2,915,206 | |
| | | | | | | | | 19,339,810 | |
| | SOFTWARE & SERVICES — 17.5% | | | | | | | | |
| | Software — 17.5% | | | | | | | | |
| a | Agilysys, Inc. | | | 74,470 | | | | 8,114,996 | |
| | Bentley Systems, Inc. Class B | | | 143,778 | | | | 7,305,360 | |
| a | CCC Intelligent Solutions Holdings, Inc. | | | 637,774 | | | | 7,047,403 | |
| a | Clearwater Analytics Holdings, Inc. Class A | | | 283,767 | | | | 7,165,117 | |
| a | CyberArk Software Ltd. | | | 27,383 | | | | 7,985,156 | |
| a | JFrog Ltd. | | | 127,094 | | | | 3,690,810 | |
| a | Monday.com Ltd. | | | 25,114 | | | | 6,975,916 | |
| | | | | | | | | 48,284,758 | |
| | TECHNOLOGY HARDWARE & EQUIPMENT — 2.1% | | | | | | | | |
| | Technology Hardware, Storage & Peripherals — 2.1% | | | | | | | | |
| a | Pure Storage, Inc. Class A | | | 114,401 | | | | 5,747,506 | |
| | | | | | | | | 5,747,506 | |
| See notes to financial statements. | Annual Financial Statements | 27 |
Schedule of Investments, Continued
Thornburg Small/Mid Cap Growth Fund | September 30, 2024
| | ISSUER-DESCRIPTION | | SHARES | | | VALUE | |
| | | | | | | | | | |
| | TRANSPORTATION — 2.0% | | | | | | | | |
| | Ground Transportation — 2.0% | | | | | | | | |
| a | Saia, Inc. | | | 12,850 | | | $ | 5,618,791 | |
| | | | | | | | | 5,618,791 | |
| | TOTAL COMMON STOCK (Cost $200,312,571) | | | | | | | 270,191,491 | |
| | | | | | | | | | |
| | SHORT-TERM INVESTMENTS — 2.1% | | | | | | | | |
| b | Thornburg Capital Management Fund | | | 582,901 | | | | 5,829,012 | |
| | TOTAL SHORT-TERM INVESTMENTS (Cost $5,829,012) | | | | | | | 5,829,012 | |
| | | | | | | | | | |
| | TOTAL INVESTMENTS — 100.1% (Cost $206,141,583) | | | | | | $ | 276,020,503 | |
| | | | | | | | | | |
| | LIABILITIES NET OF OTHER ASSETS — (0.1)% | | | | | | | (408,978 | ) |
| | | | | | | | | | |
| | NET ASSETS — 100.0% | | | | | | $ | 275,611,525 | |
Footnote Legend
| b | Investment in Affiliates. |
| 28 | Annual Financial Statements | See notes to financial statements. |
Schedule of Investments
Thornburg Investment Income Builder Fund | September 30, 2024
| | ISSUER-DESCRIPTION | | SHARES/
PRINCIPAL AMOUNT | | VALUE | |
| | | | | | | | |
| | COMMON STOCK — 84.1% | | | | | | | | |
| | | | | | | | | | |
| | AUTOMOBILES & COMPONENTS — 0.5% | | | | | | | | |
| | Automobiles — 0.5% | | | | | | | | |
| | Mercedes-Benz Group AG | | | 930,600 | | | $ | 60,123,453 | |
| | Stellantis NV | | | 1,040,100 | | | | 14,365,817 | |
| | | | | | | | | 74,489,270 | |
| | BANKS — 9.7% | | | | | | | | |
| | Banks — 9.7% | | | | | | | | |
| | Bank of Ireland Group plc | | | 17,164,250 | | | | 191,636,939 | |
| | BNP Paribas SA | | | 6,576,800 | | | | 450,605,152 | |
| | Citigroup, Inc. | | | 6,315,017 | | | | 395,320,064 | |
| | JPMorgan Chase & Co. | | | 959,266 | | | | 202,270,829 | |
| | Regions Financial Corp. | | | 4,956,393 | | | | 115,632,649 | |
| | | | | | | | | 1,355,465,633 | |
| | CAPITAL GOODS — 1.3% | | | | | | | | |
| | Aerospace & Defense — 1.3% | | | | | | | | |
| | BAE Systems plc | | | 10,930,100 | | | | 180,835,871 | |
| | | | | | | | | 180,835,871 | |
| | CONSUMER DISCRETIONARY DISTRIBUTION & RETAIL — 1.5% | | | | | | | | |
| | Specialty Retail — 1.5% | | | | | | | | |
| | Home Depot, Inc. | | | 505,482 | | | | 204,821,306 | |
| | | | | | | | | 204,821,306 | |
| | CONSUMER STAPLES DISTRIBUTION & RETAIL — 3.2% | | | | | | | | |
| | Consumer Staples Distribution & Retail — 3.2% | | | | | | | | |
| | BIM Birlesik Magazalar AS | | | 2,799,600 | | | | 40,625,821 | |
| | Tesco plc | | | 83,026,330 | | | | 398,164,428 | |
| | | | | | | | | 438,790,249 | |
| | ENERGY — 8.6% | | | | | | | | |
| | Oil, Gas & Consumable Fuels — 8.6% | | | | | | | | |
| | Enbridge, Inc. | | | 3,309,521 | | | | 134,441,261 | |
| | Eni SpA | | | 4,369,900 | | | | 66,554,059 | |
| | Equinor ASA | | | 3,029,100 | | | | 76,553,094 | |
| a,b | Foresea Holding SA | | | 147,823 | | | | 1,840,396 | |
| a | LUKOIL PJSC | | | 314,000 | | | | 226,080 | |
| a,b,c | Malamute Energy, Inc. | | | 12,439 | | | | 12,439 | |
| | Petroleo Brasileiro SA Sponsored ADR | | | 7,310,155 | | | | 105,339,334 | |
| | Shell plc | | | 3,035,600 | | | | 98,417,318 | |
| | TC Energy Corp. | | | 3,702,454 | | | | 175,999,680 | |
| | TotalEnergies SE | | | 8,267,100 | | | | 538,347,274 | |
| | | | | | | | | 1,197,730,935 | |
| | EQUITY REAL ESTATE INVESTMENT TRUSTS (REITS) — 0.3% | | | | | | | | |
| | Residential REITs — 0.3% | | | | | | | | |
| | Elme Communities | | | 2,454,592 | | | | 43,176,273 | |
| | | | | | | | | 43,176,273 | |
| | FINANCIAL SERVICES — 4.8% | | | | | | | | |
| | Capital Markets — 2.6% | | | | | | | | |
| | CME Group, Inc. | | | 1,197,705 | | | | 264,273,608 | |
| | MidCap Financial Investment Corp. | | | 2,937,783 | | | | 39,336,915 | |
| c | SLR Investment Corp. | | | 4,307,900 | | | | 64,833,895 | |
| | Financial Services — 1.6% | | | | | | | | |
| | Equitable Holdings, Inc. | | | 5,226,798 | | | | 219,682,320 | |
| | Mortgage Real Estate Investment Trusts — 0.6% | | | | | | | | |
| c | Chimera Investment Corp. | | | 4,947,862 | | | | 78,324,655 | |
| | | | | | | | | 666,451,393 | |
| See notes to financial statements. | Annual Financial Statements | 29 |
Schedule of Investments, Continued
Thornburg Investment Income Builder Fund | September 30, 2024
| | ISSUER-DESCRIPTION | | SHARES/
PRINCIPAL AMOUNT | | VALUE | |
| | | | | | | | |
| | FOOD, BEVERAGE & TOBACCO — 0.5% | | | | | | | | |
| | Food Products — 0.5% | | | | | | | | |
| | Nestle SA | | | 729,900 | | | $ | 73,270,283 | |
| | | | | | | | | 73,270,283 | |
| | HEALTH CARE EQUIPMENT & SERVICES — 1.1% | | | | | | | | |
| | Health Care Equipment & Supplies — 1.1% | | | | | | | | |
| | Medtronic plc | | | 1,746,295 | | | | 157,218,939 | |
| | | | | | | | | 157,218,939 | |
| | INSURANCE — 4.8% | | | | | | | | |
| | Insurance — 4.8% | | | | | | | | |
| | AXA SA | | | 891,200 | | | | 34,255,098 | |
| | Generali | | | 5,694,247 | | | | 164,485,313 | |
| | NN Group NV | | | 9,329,916 | | | | 465,066,743 | |
| | | | | | | | | 663,807,154 | |
| | MATERIALS — 3.9% | | | | | | | | |
| | Chemicals — 2.1% | | | | | | | | |
| | LyondellBasell Industries NV Class A | | | 1,867,909 | | | | 179,132,473 | |
| | OCI NV | | | 3,878,000 | | | | 110,423,576 | |
| | Metals & Mining — 1.8% | | | | | | | | |
| | Glencore plc | | | 43,016,400 | | | | 245,973,631 | |
| a | GMK Norilskiy Nickel PAO | | | 35,140,000 | | | | 2,073,260 | |
| | | | | | | | | 537,602,940 | |
| | PHARMACEUTICALS, BIOTECHNOLOGY & LIFE SCIENCES — 8.8% | | | | | | | | |
| | Biotechnology — 1.1% | | | | | | | | |
| | AbbVie, Inc. | | | 799,560 | | | | 157,897,109 | |
| | Pharmaceuticals — 7.7% | | | | | | | | |
| | AstraZeneca plc | | | 1,549,800 | | | | 240,103,993 | |
| | Merck & Co., Inc. | | | 1,853,403 | | | | 210,472,445 | |
| | Novartis AG | | | 884,208 | | | | 101,495,607 | |
| | Pfizer, Inc. | | | 7,777,395 | | | | 225,077,811 | |
| | Roche Holding AG | | | 928,400 | | | | 296,833,509 | |
| | | | | | | | | 1,231,880,474 | |
| | SEMICONDUCTORS & SEMICONDUCTOR EQUIPMENT — 8.4% | | | | | | | | |
| | Semiconductors & Semiconductor Equipment — 8.4% | | | | | | | | |
| | Broadcom, Inc. | | | 3,567,290 | | | | 615,357,525 | |
| | Taiwan Semiconductor Manufacturing Co. Ltd. | | | 18,148,000 | | | | 548,801,163 | |
| | | | | | | | | 1,164,158,688 | |
| | SOFTWARE & SERVICES — 0.3% | | | | | | | | |
| | Information Technology Services — 0.3% | | | | | | | | |
| | HCL Technologies Ltd. | | | 2,092,600 | | | | 44,847,894 | |
| | | | | | | | | 44,847,894 | |
| | TECHNOLOGY HARDWARE & EQUIPMENT — 3.1% | | | | | | | | |
| | Communications Equipment — 0.7% | | | | | | | | |
| | Cisco Systems, Inc. | | | 1,898,387 | | | | 101,032,156 | |
| | Technology Hardware, Storage & Peripherals — 2.4% | | | | | | | | |
| | Samsung Electronics Co. Ltd. | | | 6,955,559 | | | | 327,113,924 | |
| | | | | | | | | 428,146,080 | |
| | TELECOMMUNICATION SERVICES — 15.9% | | | | | | | | |
| | Diversified Telecommunication Services — 14.1% | | | | | | | | |
| | AT&T, Inc. | | | 23,410,465 | | | | 515,030,230 | |
| | Deutsche Telekom AG | | | 8,055,000 | | | | 236,623,785 | |
| a,b | Digicel Holdings Ltd. | | | 220,592 | | | | 200,066 | |
| | Koninklijke KPN NV | | | 27,983,000 | | | | 114,286,635 | |
| | Orange SA | | | 67,934,880 | | | | 777,768,893 | |
| 30 | Annual Financial Statements | See notes to financial statements. |
Schedule of Investments, Continued
Thornburg Investment Income Builder Fund | September 30, 2024
| | ISSUER-DESCRIPTION | | SHARES/
PRINCIPAL AMOUNT | | VALUE | |
| | | | | | | | |
| | Singapore Telecommunications Ltd. | | | 74,703,000 | | | $ | 188,319,564 | |
| b | Zegona Communications plc | | | 28,443,000 | | | | 138,417,826 | |
| | Wireless Telecommunication Services — 1.8% | | | | | | | | |
| | Vodafone Group plc | | | 245,493,524 | | | | 246,290,753 | |
| | | | | | | | | 2,216,937,752 | |
| | TRANSPORTATION — 1.1% | | | | | | | | |
| | Air Freight & Logistics — 1.1% | | | | | | | | |
| | Deutsche Post AG | | | 3,560,700 | | | | 158,662,552 | |
| | | | | | | | | 158,662,552 | |
| | UTILITIES — 6.3% | | | | | | | | |
| | Electric Utilities — 5.0% | | | | | | | | |
| | Endesa SA | | | 11,381,457 | | | | 248,697,616 | |
| | Enel SpA | | | 56,959,871 | | | | 454,929,777 | |
| | Gas Utilities — 0.3% | | | | | | | | |
| | Snam SpA | | | 7,073,000 | | | | 35,988,881 | |
| | Multi-Utilities — 1.0% | | | | | | | | |
| | E.ON SE | | | 8,325,800 | | | | 123,772,262 | |
| | Engie SA | | | 1,208,672 | | | | 20,874,385 | |
| | | | | | | | | 884,262,921 | |
| | TOTAL COMMON STOCK (Cost $8,269,848,622) | | | | | | | 11,722,556,607 | |
| | | | | | | | | | |
| | PREFERRED STOCK — 0.1% | | | | | | | | |
| | | | | | | | | | |
| | BANKS — 0.1% | | | | | | | | |
| | Banks — 0.1% | | | | | | | | |
| d,e,f | First Horizon Bank 6.416% (TSFR3M + 1.11%), 10/29/2024 | | | 12,000 | | | | 8,340,000 | |
| | | | | | | | | 8,340,000 | |
| | FINANCIAL SERVICES — 0.0% | | | | | | | | |
| | Capital Markets — 0.0% | | | | | | | | |
| e,f | Morgan Stanley Series A, 6.263% (TSFR3M + 0.96%), 10/30/2024 | | | 120,000 | | | | 2,739,600 | |
| | | | | | | | | 2,739,600 | |
| | TOTAL PREFERRED STOCK (Cost $14,968,750) | | | | | | | 11,079,600 | |
| | | | | | | | | | |
| | ASSET BACKED SECURITIES — 1.0% | | | | | | | | |
| | | | | | | | | | |
| | AUTO RECEIVABLES — 0.4% | | | | | | | | |
| | Carvana Auto Receivables Trust, | | | | | | | | |
| d | Series 2019-4A Class R, due 10/15/2026 | | $ | 32,000 | | | | 9,721,095 | |
| d | Series 2021-P1 Class R, due 12/10/2027 | | | 24,000 | | | | 1,917,835 | |
| d | Series 2021-P2 Class R, due 5/10/2028 | | | 8,000 | | | | 1,560,641 | |
| d | Series 2021-P4 Class R, due 9/11/2028 | | | 17,500 | | | | 3,429,650 | |
| d | Series 2022-P1 Class R, due 1/10/2029 | | | 24,000 | | | | 5,460,707 | |
| d | CPS Auto Receivables Trust, Series 2020-C Class F, 6.67% due 11/15/2027 | | | 3,000,000 | | | | 3,003,359 | |
| d | CPS Auto Securitization Trust, Series 2021-1A Class A, 7.86% due 6/16/2026 | | | 14,000,000 | | | | 13,714,760 | |
| d | FHF Trust, Series 2022-2A Class A, 6.14% due 12/15/2027 | | | 2,559,150 | | | | 2,570,116 | |
| | Flagship Credit Auto Trust, | | | | | | | | |
| d | Series 2019-2 Class R, due 12/15/2026 | | | 33,000 | | | | 1,474,855 | |
| d | Series 2019-3 Class R, due 12/15/2026 | | | 60,000 | | | | 2,773,465 | |
| d | Series 2019-4 Class R, due 3/15/2027 | | | 60,000 | | | | 3,074,083 | |
| | JPMorgan Chase Bank NA - CACLN, | | | | | | | | |
| d | Series 2020-1 Class R, 33.784% due 1/25/2028 | | | 606,352 | | | | 612,697 | |
| d | Series 2020-2 Class R, 31.355% due 2/25/2028 | | | 1,733,987 | | | | 1,749,877 | |
| d | Series 2021-1 Class R, 28.348% due 9/25/2028 | | | 3,608,928 | | | | 3,967,698 | |
| d | Santander Consumer Auto Receivables Trust Series 2020-AA Class R, due 1/16/2029 | | | 53,500 | | | | 5,278,105 | |
| d | United Auto Credit Securitization Trust Series 2022-1 Class R, due 11/10/2028 | | | 37,000 | | | | 1,099,994 | |
| | | | | | | | | 61,408,937 | |
| See notes to financial statements. | Annual Financial Statements | 31 |
Schedule of Investments, Continued
Thornburg Investment Income Builder Fund | September 30, 2024
| | ISSUER-DESCRIPTION | | SHARES/
PRINCIPAL AMOUNT | | VALUE | |
| | | | | | | | |
| | OTHER ASSET BACKED — 0.5% | | | | | | | | |
| d | Aqua Finance Trust, Series 2020-AA Class D, 7.15% due 7/17/2046 | | $ | 8,018,170 | | | $ | 7,589,078 | |
| d,f | Consumer Loan Underlying Bond Certificate Issuer Trust I Series 2019-HP1 Class CERT, due 12/15/2026 | | | 400,000 | | | | 316,251 | |
| d | DataBank Issuer LLC, Series 2024-1A Class A2, 5.30% due 1/26/2054 | | | 10,000,000 | | | | 9,967,728 | |
| d | FAT Brands Fazoli’s Native I LLC, Series 2021-1 Class A2, 7.00% due 7/25/2051 | | | 13,903,260 | | | | 12,993,072 | |
| a,d | Goldman Home Improvement Trust Issuer Trust Series 2021-GRN2 Class R, due 6/20/2051 | | | 42,000 | | | | 2,237,280 | |
| d | LendingPoint Asset Securitization Trust, Series 2020-REV1 Class C, 7.699% due 10/15/2028 | | | 21,662,246 | | | | 21,358,189 | |
| | Marlette Funding Trust, | | | | | | | | |
| d | Series 2021-1A Class R, due 6/16/2031 | | | 9,550 | | | | 169,395 | |
| d | Series 2021-2A Class R, due 9/15/2031 | | | 26,000 | | | | 444,045 | |
| d | Series 2021-3A Class R, due 12/15/2031 | | | 23,881 | | | | 557,791 | |
| | Mosaic Solar Loan Trust, | | | | | | | | |
| d | Series 2020-2A Class R, due 8/20/2046 | | | 6,374,937 | | | | 2,606,144 | |
| d | Series 2021-1A Class R, due 12/20/2046 | | | 8,500,000 | | | | 877,412 | |
| d | Series 2021-2A Class R, due 4/22/2047 | | | 10,000,000 | | | | 792,641 | |
| d,f | Oportun Funding LLC Series 2022-1 Class CERT, due 6/15/2029 | | | 11,604 | | | | 330,854 | |
| | Prosper Pass-Thru Trust II, | | | | | | | | |
| d | Series 2019-ST1 Class CERT, due 7/15/2025 | | | 38,500,000 | | | | 26,895 | |
| d | Series 2019-ST2 Class R1, due 11/15/2025 | | | 17,477,134 | | | | 105,509 | |
| d | Series 2019-ST2 Class R2, due 11/15/2025 | | | 8,738,067 | | | | 52,079 | |
| d | Retained Vantage Data Centers Issuer LLC, Series 2023-1A Class A2A, 5.00% due 9/15/2048 | | | 5,000,000 | | | | 4,985,700 | |
| | Upstart Pass-Through Trust, | | | | | | | | |
| d | Series 2020-ST6 Class A, 3.00% due 1/20/2027 | | | 524,896 | | | | 518,343 | |
| d | Series 2021-ST4 Class CERT, due 7/20/2027 | | | 1,375,000 | | | | 140,517 | |
| d | Series 2021-ST8 Class CERT, due 10/20/2029 | | | 4,150,000 | | | | 1,384,718 | |
| d | Series 2021-ST9 Class CERT, due 11/20/2029 | | | 1,415,000 | | | | 471,164 | |
| d | Upstart Structured Pass-Through Trust, Series 2022-4A Class A, 7.01% due 11/15/2030 | | | 877,764 | | | | 878,412 | |
| | | | | | | | | 68,803,217 | |
| | STUDENT LOAN — 0.1% | | | | | | | | |
| d | College Ave Student Loans LLC Series 2023-A Class R, due 5/25/2055 | | | 35,000 | | | | 15,235,933 | |
| d | SoFi Professional Loan Program Trust Series 2021-B Class R1, due 2/15/2047 | | | 23,000 | | | | 722,852 | |
| | | | | | | | | 15,958,785 | |
| | TOTAL ASSET BACKED SECURITIES (Cost $142,057,923) | | | | | | | 146,170,939 | |
| | | | | | | | | | |
| | CORPORATE BONDS — 7.3% | | | | | | | | |
| | | | | | | | | | |
| | BANKS — 0.2% | | | | | | | | |
| | Banks — 0.2% | | | | | | | | |
| | Bank of New York Mellon Corp., | | | | | | | | |
| e,f | Series F, 4.625% (TSFR3M + 3.39%) due 9/20/2026 | | | 1,935,000 | | | | 1,916,211 | |
| e,f | Series I, 3.75% (5-Yr. CMT + 2.630%) due 12/20/2026 | | | 11,400,000 | | | | 10,746,324 | |
| | KeyBank NA, 5.00% due 1/26/2033 | | | 10,250,000 | | | | 10,156,418 | |
| | | | | | | | | 22,818,953 | |
| | CAPITAL GOODS — 0.3% | | | | | | | | |
| | Aerospace & Defense — 0.1% | | | | | | | | |
| d | BWX Technologies, Inc., 4.125% due 6/30/2028 | | | 7,500,000 | | | | 7,235,100 | |
| d | TransDigm, Inc., 6.75% due 8/15/2028 | | | 6,345,000 | | | | 6,536,619 | |
| | Construction & Engineering — 0.1% | | | | | | | | |
| d,g | IHS Netherlands Holdco BV, 8.00% due 9/18/2027 | | | 9,995,000 | | | | 10,005,795 | |
| | Trading Companies & Distributors — 0.1% | | | | | | | | |
| | LKQ Corp., 6.25% due 6/15/2033 | | | 5,840,000 | | | | 6,194,838 | |
| d | Windsor Holdings III LLC, 8.50% due 6/15/2030 | | | 7,470,000 | | | | 7,994,469 | |
| | | | | | | | | 37,966,821 | |
| | COMMERCIAL & PROFESSIONAL SERVICES — 0.2% | | | | | | | | |
| | Commercial Services & Supplies — 0.2% | | | | | | | | |
| d | ACCO Brands Corp., 4.25% due 3/15/2029 | | | 7,500,000 | | | | 7,025,100 | |
| | CoreCivic, Inc., 8.25% due 4/15/2029 | | | 12,869,000 | | | | 13,629,815 | |
| | GEO Group, Inc., 8.625% due 4/15/2029 | | | 8,975,000 | | | | 9,330,949 | |
| | | | | | | | | 29,985,864 | |
| 32 | Annual Financial Statements | See notes to financial statements. |
Schedule of Investments, Continued
Thornburg Investment Income Builder Fund | September 30, 2024
| | ISSUER-DESCRIPTION | | SHARES/
PRINCIPAL AMOUNT | | VALUE | |
| | | | | | | | |
| | CONSUMER DURABLES & APPAREL — 0.1% | | | | | | | | |
| | Household Durables — 0.1% | | | | | | | | |
| d,h | CD&R Smokey Buyer, Inc./Radio Systems Corp., 9.50% due 10/15/2029 | | $ | 9,225,000 | | | $ | 9,230,719 | |
| | Leisure Products — 0.0% | | | | | | | | |
| | Polaris, Inc., 6.95% due 3/15/2029 | | | 5,000,000 | | | | 5,425,550 | |
| | | | | | | | | 14,656,269 | |
| | CONSUMER SERVICES — 0.0% | | | | | | | | |
| | Hotels, Restaurants & Leisure — 0.0% | | | | | | | | |
| | Marriott International, Inc., 4.50% due 10/1/2034 | | | 4,497,000 | | | | 4,398,246 | |
| | | | | | | | | 4,398,246 | |
| | CONSUMER STAPLES DISTRIBUTION & RETAIL — 0.2% | | | | | | | | |
| | Consumer Staples Distribution & Retail — 0.2% | | | | | | | | |
| d | KeHE Distributors LLC/KeHE Finance Corp./NextWave Distribution, Inc., 9.00% due 2/15/2029 | | | 24,136,000 | | | | 25,109,164 | |
| d | U.S. Foods, Inc., 4.75% due 2/15/2029 | | | 5,880,000 | | | | 5,737,586 | |
| | | | | | | | | 30,846,750 | |
| | ENERGY — 1.7% | | | | | | | | |
| | Energy Equipment & Services — 0.1% | | | | | | | | |
| d,g | Empresa Generadora de Electricidad Haina SA, 5.625% due 11/8/2028 | | | 7,850,000 | | | | 7,414,482 | |
| | Oil, Gas & Consumable Fuels — 1.6% | | | | | | | | |
| d | CITGO Petroleum Corp., 7.00% due 6/15/2025 | | | 10,750,000 | | | | 10,750,107 | |
| d | Delek Logistics Partners LP/Delek Logistics Finance Corp., 8.625% due 3/15/2029 | | | 13,230,000 | | | | 13,928,941 | |
| | Energean Israel Finance Ltd., | | | | | | | | |
| d,g | 5.375% due 3/30/2028 | | | 6,500,000 | | | | 5,837,520 | |
| d,g | 8.50% due 9/30/2033 | | | 12,410,941 | | | | 11,738,889 | |
| f | Energy Transfer LP, 8.527% (TSFR3M + 3.28%) due 11/1/2066 | | | 13,820,000 | | | | 13,140,332 | |
| f | Enterprise TE Partners LP, Series 1, 8.055% (SOFR + 2.67%) due 6/1/2067 | | | 7,000,000 | | | | 5,166,280 | |
| | Kinder Morgan Energy Partners LP, | | | | | | | | |
| | 5.00% due 3/1/2043 | | | 10,000,000 | | | | 9,199,600 | |
| | 5.80% due 3/15/2035 | | | 10,000,000 | | | | 10,516,200 | |
| | Kinder Morgan, Inc., | | | | | | | | |
| | 5.30% due 12/1/2034 | | | 23,630,000 | | | | 23,997,210 | |
| | 5.55% due 6/1/2045 | | | 5,000,000 | | | | 4,936,050 | |
| d,g | Medco Maple Tree Pte. Ltd., 8.96% due 4/27/2029 | | | 7,000,000 | | | | 7,405,090 | |
| | ONEOK Partners LP, 4.90% due 3/15/2025 | | | 9,544,000 | | | | 9,531,211 | |
| | Petroleos Mexicanos, | | | | | | | | |
| g | 5.95% due 1/28/2031 | | | 10,000,000 | | | | 8,654,200 | |
| g | 6.70% due 2/16/2032 | | | 3,000,000 | | | | 2,687,850 | |
| g | 7.69% due 1/23/2050 | | | 5,650,000 | | | | 4,410,560 | |
| e | Summit Midstream Corp., Series A, 12.638% (SOFR + 7.32%) due 10/31/2024 | | | 16,097,000 | | | | 23,675,015 | |
| d | Sunoco LP, 7.25% due 5/1/2032 | | | 4,892,000 | | | | 5,181,704 | |
| | Sunoco LP/Sunoco Finance Corp., 5.875% due 3/15/2028 | | | 5,000,000 | | | | 5,027,200 | |
| | Transcontinental Gas Pipe Line Co. LLC, 7.85% due 2/1/2026 | | | 32,700,000 | | | | 33,821,283 | |
| | Williams Cos., Inc., 5.75% due 6/24/2044 | | | 14,198,000 | | | | 14,567,716 | |
| | | | | | | | | 231,587,440 | |
| | EQUITY REAL ESTATE INVESTMENT TRUSTS (REITS) — 0.3% | | | | | | | | |
| | Diversified REITs — 0.2% | | | | | | | | |
| d | Iron Mountain, Inc., 7.00% due 2/15/2029 | | | 7,500,000 | | | | 7,812,750 | |
| d | SBA Tower Trust, 2.836% due 1/15/2050 | | | 5,000,000 | | | | 4,964,088 | |
| d,g | Trust Fibra Uno, 5.25% due 1/30/2026 | | | 10,000,000 | | | | 9,956,100 | |
| | Vornado Realty LP, 2.15% due 6/1/2026 | | | 8,186,500 | | | | 7,793,712 | |
| | Retail REITs — 0.1% | | | | | | | | |
| | Retail Opportunity Investments Partnership LP, 6.75% due 10/15/2028 | | | 9,990,000 | | | | 10,727,362 | |
| | | | | | | | | 41,254,012 | |
| See notes to financial statements. | Annual Financial Statements | 33 |
Schedule of Investments, Continued
Thornburg Investment Income Builder Fund | September 30, 2024
| | ISSUER-DESCRIPTION | | SHARES/
PRINCIPAL AMOUNT | | VALUE | |
| | | | | | | | |
| | FINANCIAL SERVICES — 0.6% | | | | | | | | |
| | Capital Markets — 0.4% | | | | | | | | |
| | Blue Owl Credit Income Corp., 7.75% due 9/16/2027 | | $ | 2,500,000 | | | $ | 2,632,600 | |
| | Blue Owl Technology Finance Corp., | | | | | | | | |
| d | 3.75% due 6/17/2026 | | | 13,000,000 | | | | 12,505,220 | |
| d | 4.75% due 12/15/2025 | | | 13,250,000 | | | | 13,054,297 | |
| d | Burford Capital Global Finance LLC, 9.25% due 7/1/2031 | | | 11,500,000 | | | | 12,374,115 | |
| d | Compass Group Diversified Holdings LLC, 5.25% due 4/15/2029 | | | 6,272,000 | | | | 6,091,429 | |
| d,g | Foresea Holding SA, 7.50% due 6/15/2030 | | | 1,520,371 | | | | 1,447,104 | |
| | Hercules Capital, Inc., 2.625% due 9/16/2026 | | | 4,098,000 | | | | 3,875,602 | |
| d | Oaktree Strategic Credit Fund, 8.40% due 11/14/2028 | | | 3,000,000 | | | | 3,244,800 | |
| | Financial Services — 0.2% | | | | | | | | |
| | Antares Holdings LP, | | | | | | | | |
| d | 3.75% due 7/15/2027 | | | 3,000,000 | | | | 2,843,730 | |
| d | 7.95% due 8/11/2028 | | | 3,000,000 | | | | 3,183,090 | |
| d | 8.50% due 5/18/2025 | | | 11,500,000 | | | | 11,597,405 | |
| d | United Wholesale Mortgage LLC, 5.50% due 11/15/2025 | | | 5,000,000 | | | | 5,003,650 | |
| | | | | | | | | 77,853,042 | |
| | FOOD, BEVERAGE & TOBACCO — 0.5% | | | | | | | | |
| | Beverages — 0.1% | | | | | | | | |
| d,g | Central American Bottling Corp./CBC Bottling Holdco SL/Beliv Holdco SL, 5.25% due 4/27/2029 | | | 10,443,000 | | | | 10,140,884 | |
| | Food Products — 0.1% | | | | | | | | |
| d | Darling Ingredients, Inc., 6.00% due 6/15/2030 | | | 4,050,000 | | | | 4,087,341 | |
| d | Post Holdings, Inc., 5.50% due 12/15/2029 | | | 10,000,000 | | | | 9,928,600 | |
| | Tobacco — 0.3% | | | | | | | | |
| d,g | Imperial Brands Finance plc, 6.125% due 7/27/2027 | | | 5,000,000 | | | | 5,199,100 | |
| d,g | JT International Financial Services BV, 6.875% due 10/24/2032 | | | 5,000,000 | | | | 5,693,700 | |
| d | Vector Group Ltd., 10.50% due 11/1/2026 | | | 33,915,000 | | | | 34,317,232 | |
| | | | | | | | | 69,366,857 | |
| | INSURANCE — 0.5% | | | | | | | | |
| | Insurance — 0.5% | | | | | | | | |
| d,g | DaVinciRe Holdings Ltd., 4.75% due 5/1/2025 | | | 5,000,000 | | | | 4,962,300 | |
| f | Enstar Finance LLC, 5.75% (5-Yr. CMT + 5.470%) due 9/1/2040 | | | 15,964,000 | | | | 15,764,929 | |
| g | Enstar Group Ltd., 3.10% due 9/1/2031 | | | 8,354,000 | | | | 7,219,109 | |
| | Fidelity National Financial, Inc., | | | | | | | | |
| | 2.45% due 3/15/2031 | | | 1,617,000 | | | | 1,401,615 | |
| | 3.40% due 6/15/2030 | | | 8,383,000 | | | | 7,809,603 | |
| | Horace Mann Educators Corp., 7.25% due 9/15/2028 | | | 10,000,000 | | | | 10,849,700 | |
| d | MetLife, Inc., 9.25% due 4/8/2068 | | | 12,000,000 | | | | 14,301,600 | |
| | Stewart Information Services Corp., 3.60% due 11/15/2031 | | | 8,101,000 | | | | 7,101,661 | |
| | | | | | | | | 69,410,517 | |
| | MATERIALS — 0.3% | | | | | | | | |
| | Chemicals — 0.1% | | | | | | | | |
| d,g | Nufarm Australia Ltd./Nufarm Americas, Inc., 5.00% due 1/27/2030 | | | 3,000,000 | | | | 2,783,190 | |
| | OCP SA, | | | | | | | | |
| d,g | 3.75% due 6/23/2031 | | | 1,735,000 | | | | 1,561,084 | |
| d,g | 4.50% due 10/22/2025 | | | 5,000,000 | | | | 4,951,500 | |
| | Containers & Packaging — 0.2% | | | | | | | | |
| | Matthews International Corp., | | | | | | | | |
| d | 8.625% due 10/1/2027 | | | 7,670,000 | | | | 7,817,647 | |
| d | Class C, 5.25% due 12/1/2025 | | | 14,969,000 | | | | 14,962,414 | |
| | Metals & Mining — 0.0% | | | | | | | | |
| | WE Soda Investments Holding plc, | | | | | | | | |
| d,g | 9.375% due 2/14/2031 | | | 4,150,000 | | | | 4,311,850 | |
| d,g | 9.50% due 10/6/2028 | | | 2,000,000 | | | | 2,082,320 | |
| | | | | | | | | 38,470,005 | |
| 34 | Annual Financial Statements | See notes to financial statements. |
Schedule of Investments, Continued
Thornburg Investment Income Builder Fund | September 30, 2024
| | ISSUER-DESCRIPTION | | SHARES/
PRINCIPAL AMOUNT | | VALUE | |
| | | | | | | | |
| | MEDIA & ENTERTAINMENT — 0.2% | | | | | | | | |
| | Media — 0.2% | | | | | | | | |
| d | CCO Holdings LLC/CCO Holdings Capital Corp., 4.75% due 2/1/2032 | | $ | 8,000,000 | | | $ | 7,035,120 | |
| | Sirius XM Radio, Inc., | | | | | | | | |
| d | 3.125% due 9/1/2026 | | | 5,000,000 | | | | 4,833,200 | |
| d | 5.00% due 8/1/2027 | | | 7,500,000 | | | | 7,389,375 | |
| d,g | Telenet Finance Luxembourg Notes SARL, 5.50% due 3/1/2028 | | | 10,000,000 | | | | 9,796,900 | |
| | | | | | | | | 29,054,595 | |
| | REAL ESTATE MANAGEMENT & DEVELOPMENT — 0.0% | | | | | | | | |
| | Real Estate Management & Development — 0.0% | | | | | | | | |
| d | Cushman & Wakefield U.S. Borrower LLC, 6.75% due 5/15/2028 | | | 3,000,000 | | | | 3,028,440 | |
| d | Greystar Real Estate Partners LLC, 7.75% due 9/1/2030 | | | 2,490,000 | | | | 2,647,019 | |
| | | | | | | | | 5,675,459 | |
| | SEMICONDUCTORS & SEMICONDUCTOR EQUIPMENT — 0.1% | | | | | | | | |
| | Semiconductors & Semiconductor Equipment — 0.1% | | | | | | | | |
| d | Qorvo, Inc., 3.375% due 4/1/2031 | | | 9,800,000 | | | | 8,774,332 | |
| | | | | | | | | 8,774,332 | |
| | SOFTWARE & SERVICES — 0.4% | | | | | | | | |
| | Information Technology Services — 0.1% | | | | | | | | |
| d | Boost Newco Borrower LLC, 7.50% due 1/15/2031 | | | 5,000,000 | | | | 5,363,550 | |
| d | Science Applications International Corp., 4.875% due 4/1/2028 | | | 5,000,000 | | | | 4,898,600 | |
| | Internet Software & Services — 0.2% | | | | | | | | |
| d | Arches Buyer, Inc., 4.25% due 6/1/2028 | | | 6,500,000 | | | | 5,977,790 | |
| d | Cogent Communications Group LLC, 7.00% due 6/15/2027 | | | 10,000,000 | | | | 10,172,000 | |
| | Prosus NV, | | | | | | | | |
| d,g | 3.061% due 7/13/2031 | | | 11,800,000 | | | | 10,415,506 | |
| d,g | 3.832% due 2/8/2051 | | | 5,000,000 | | | | 3,501,100 | |
| d,g | 4.027% due 8/3/2050 | | | 5,000,000 | | | | 3,651,850 | |
| | Software — 0.1% | | | | | | | | |
| d | Fair Isaac Corp., 4.00% due 6/15/2028 | | | 7,000,000 | | | | 6,770,610 | |
| d | GoTo Group, Inc.,5.50% due 5/1/2028 | | | 4,354,350 | | | | 2,180,088 | |
| d,g | Open Text Corp., 3.875% due 12/1/2029 | | | 10,000,000 | | | | 9,301,600 | |
| | | | | | | | | 62,232,694 | |
| | TECHNOLOGY HARDWARE & EQUIPMENT — 0.1% | | | | | | | | |
| | Electronic Equipment, Instruments & Components — 0.1% | | | | | | | | |
| | CDW LLC/CDW Finance Corp., 4.25% due 4/1/2028 | | | 5,000,000 | | | | 4,942,200 | |
| | Vontier Corp., 2.40% due 4/1/2028 | | | 5,832,000 | | | | 5,364,332 | |
| | Technology Hardware, Storage & Peripherals — 0.0% | | | | | | | | |
| d,g | Lenovo Group Ltd., 5.831% due 1/27/2028 | | | 5,000,000 | | | | 5,158,050 | |
| | | | | | | | | 15,464,582 | |
| | TELECOMMUNICATION SERVICES — 1.2% | | | | | | | | |
| | Diversified Telecommunication Services — 0.9% | | | | | | | | |
| g | Deutsche Telekom International Finance BV (Guaranty: Deutsche Telekom AG), 8.75% due 6/15/2030 | | | 26,150,000 | | | | 31,578,217 | |
| g | Telefonica Emisiones SA (Guaranty: Telefonica SA), 7.045% due 6/20/2036 | | | 85,390,000 | | | | 98,469,186 | |
| | Wireless Telecommunication Services — 0.3% | | | | | | | | |
| g,i | Digicel Intermediate Holdings Ltd./Digicel International Finance Ltd./Difl U.S., 12.00% due 5/25/2027 PIK | | | 36,960,821 | | | | 37,205,502 | |
| | | | | | | | | 167,252,905 | |
| | TRANSPORTATION — 0.2% | | | | | | | | |
| | Passenger Airlines — 0.2% | | | | | | | | |
| | American Airlines Pass-Through Trust, | | | | | | | | |
| | Series 2016-3 Class B, 3.75% due 4/15/2027 | | | 7,848,480 | | | | 7,631,391 | |
| | Series 2019-1 Class B, 3.85% due 8/15/2029 | | | 5,789,991 | | | | 5,421,980 | |
| d,g | Pegasus Hava Tasimaciligi AS, 8.00% due 9/11/2031 | | | 14,750,000 | | | | 14,740,707 | |
| | | | | | | | | 27,794,078 | |
| See notes to financial statements. | Annual Financial Statements | 35 |
Schedule of Investments, Continued
Thornburg Investment Income Builder Fund | September 30, 2024
| | ISSUER-DESCRIPTION | | SHARES/
PRINCIPAL AMOUNT | | VALUE | |
| | | | | | | | |
| | UTILITIES — 0.2% | | | | | | | | |
| | Electric Utilities — 0.1% | | | | | | | | |
| d,g | AES Espana BV, 5.70% due 5/4/2028 | | $ | 4,850,000 | | | $ | 4,634,466 | |
| | Comision Federal de Electricidad, | | | | | | | | |
| g | 5.00% due 9/29/2036 | | | 9,296,000 | | | | 8,458,430 | |
| d,g | 6.45% due 1/24/2035 | | | 8,000,000 | | | | 7,960,960 | |
| | Multi-Utilities — 0.1% | | | | | | | | |
| d,g | Aegea Finance SARL, 9.00% due 1/20/2031 | | | 9,500,000 | | | | 10,269,120 | |
| | | | | | | | | 31,322,976 | |
| | TOTAL CORPORATE BONDS (Cost $933,482,798) | | | | | | | 1,016,186,397 | |
| | | | | | | | | | |
| | OTHER GOVERNMENT — 0.1% | | | | | | | | |
| d,g | Finance Department Government of Sharjah, 3.625% due 3/10/2033 | | | 7,000,000 | | | | 6,133,960 | |
| d,g | Nigeria Government International Bonds, 7.625% due 11/28/2047 | | | 6,000,000 | | | | 4,595,100 | |
| | TOTAL OTHER GOVERNMENT (Cost $9,437,580) | | | | | | | 10,729,060 | |
| | | | | | | | | | |
| | MORTGAGE BACKED — 2.0% | | | | | | | | |
| d,f | Angel Oak Mortgage Trust, Whole Loan Securities Trust CMO, Series 2022-6 Class A3, 4.30% due 7/25/2067 | | | 4,146,932 | | | | 3,936,502 | |
| d,f | Barclays Mortgage Loan Trust, Whole Loan Securities Trust CMO, Series 2022-INV1 Class A3, 4.53% due 2/25/2062 | | | 13,669,802 | | | | 13,102,520 | |
| | Barclays Mortgage Trust, Whole Loan Securities Trust CMO, | | | | | | | | |
| d,f | Series 2021-NPL1 Class A, 2.00% due 11/25/2051 | | | 7,008,166 | | | | 6,888,850 | |
| d,f | Series 2022-RPL1 Class A, 4.25% due 2/25/2028 | | | 11,832,854 | | | | 11,588,984 | |
| f | Bear Stearns ARM Trust, Whole Loan Securities Trust CMO, Series 2003-6 Class 2B1, 7.48% due 8/25/2033 | | | 18,608 | | | | 18,608 | |
| | Chase Home Lending Mortgage Trust, Whole Loan Securities Trust CMO, | | | | | | | | |
| d,f | Series 2019-1 Class B4, 3.886% due 3/25/2050 | | | 995,224 | | | | 866,792 | |
| d,f | Series 2019-1 Class B5, 3.886% due 3/25/2050 | | | 465,588 | | | | 371,373 | |
| d,f | Series 2019-1 Class B6, 3.659% due 3/25/2050 | | | 745,503 | | | | 470,293 | |
| d,f | Chase Mortgage Finance Corp., Whole Loan Securities Trust CMO, Series 2016-SH2 Class M4, 3.75% due 12/25/2045 | | | 642,216 | | | | 599,874 | |
| | CIM Trust, Whole Loan Securities Trust CMO, | | | | | | | | |
| d,f,j | Series 2020-J1 Class AIO1, 0.445% due 7/25/2050 | | | 53,053,362 | | | | 1,030,641 | |
| d,f,j | Series 2020-J1 Class AIO2, 0.50% due 7/25/2050 | | | 47,319,267 | | | | 1,149,115 | |
| d,f,j | Series 2020-J1 Class AIOS, 0.20% due 6/25/2050 | | | 65,324,650 | | | | 628,142 | |
| d,f | Series 2020-J1 Class B4, 3.445% due 7/25/2050 | | | 1,317,915 | | | | 1,125,933 | |
| d,f | Series 2020-J1 Class B5, 3.445% due 7/25/2050 | | | 666,694 | | | | 430,832 | |
| d,f | Series 2020-J1 Class B6, 3.445% due 7/25/2050 | | | 1,145,464 | | | | 462,688 | |
| d,f,j | Series 2020-J2 Class AX1, 0.254% due 1/25/2051 | | | 99,295,203 | | | | 1,351,557 | |
| d,f,j | Series 2020-J2 Class AXS, 0.21% due 1/25/2051 | | | 106,040,640 | | | | 1,133,171 | |
| d,f | Series 2020-J2 Class B4, 2.754% due 1/25/2051 | | | 491,000 | | | | 261,682 | |
| d,f | Series 2020-J2 Class B5, 2.754% due 1/25/2051 | | | 164,000 | | | | 86,379 | |
| d,f | Series 2020-J2 Class B6, 2.754% due 1/25/2051 | | | 655,000 | | | | 234,213 | |
| d,f | Series 2023-I1 Class M1, 7.112% due 4/25/2058 | | | 5,000,000 | | | | 5,077,682 | |
| | Citigroup Mortgage Loan Trust, Whole Loan Securities Trust CMO, | | | | | | | | |
| f | Series 2004-HYB2 Class B1, 6.253% due 3/25/2034 | | | 160,310 | | | | 123,959 | |
| d,f | Series 2020-EXP1 Class B1, 4.467% due 5/25/2060 | | | 2,150,000 | | | | 1,843,131 | |
| d,f | Series 2020-EXP1 Class B2, 4.467% due 5/25/2060 | | | 1,450,000 | | | | 1,178,894 | |
| d,f | Series 2020-EXP1 Class B3, 4.467% due 5/25/2060 | | | 725,000 | | | | 499,010 | |
| d,j | Series 2020-EXP1 Class XS, due 5/25/2060 | | | 35,090,282 | | | | 1,605,784 | |
| d,f | Series 2020-EXP2 Class B5, 4.135% due 8/25/2050 | | | 585,000 | | | | 333,246 | |
| d,f | Series 2020-EXP2 Class B6, 4.135% due 8/25/2050 | | | 1,400,000 | | | | 659,310 | |
| d,f | Series 2021-J1 Class B4, 2.61% due 4/25/2051 | | | 379,000 | | | | 171,353 | |
| d,f | Series 2021-J1 Class B5, 2.61% due 4/25/2051 | | | 615,000 | | | | 232,613 | |
| d,f | Series 2021-J1 Class B6, 2.61% due 4/25/2051 | | | 459,574 | | | | 171,329 | |
| d,f | Series 2021-J3 Class B4, 2.86% due 9/25/2051 | | | 1,033,000 | | | | 606,171 | |
| d,f | Series 2021-J3 Class B6, 2.86% due 9/25/2051 | | | 573,149 | | | | 205,621 | |
| d | Cogent Ipv4 LLC, CMBS, Series 2024-1A Class A2, 7.924% due 5/25/2054 | | | 9,025,000 | | | | 9,458,411 | |
| d,f | CSMC Trust, CMBS, Series 2020-522F Class A, 8.95% (TSFR1M + 3.85%) due 9/16/2025 | | | 15,450,000 | | | | 9,393,904 | |
| | CSMC Trust, Whole Loan Securities Trust CMO, | | | | | | | | |
| d,f | Series 2020-AFC1 Class M1, 2.841% due 2/25/2050 | | | 3,808,500 | | | | 3,180,118 | |
| d,f,j | Series 2021-AFC1 Class AIOS, 0.25% due 3/25/2056 | | | 76,806,146 | | | | 639,703 | |
| d,f | Series 2021-AFC1 Class B3, 4.321% due 3/25/2056 | | | 215,000 | | | | 158,557 | |
| 36 | Annual Financial Statements | See notes to financial statements. |
Schedule of Investments, Continued
Thornburg Investment Income Builder Fund | September 30, 2024
| | ISSUER-DESCRIPTION | | SHARES/
PRINCIPAL AMOUNT | | VALUE | |
| d,f,j | Series 2021-AFC1 Class XS, 3.266% due 3/25/2056 | | $ | 76,806,146 | | | $ | 13,294,376 | |
| d,f | Series 2022-NQM5 Class A3, 5.169% due 5/25/2067 | | | 3,502,288 | | | | 3,481,459 | |
| d | DC Office Trust, CMBS, Series 2019-MTC Class A, 2.965% due 9/15/2045 | | | 3,025,000 | | | | 2,671,178 | |
| | Flagstar Mortgage Trust, Whole Loan Securities Trust CMO, | | | | | | | | |
| d,f,j | Series 2020-2 Class AX1, 0.663% due 8/25/2050 | | | 97,346,112 | | | | 2,891,403 | |
| d,f,j | Series 2020-2 Class AX2, 0.50% due 8/25/2050 | | | 16,684,617 | | | | 402,188 | |
| d,f | Series 2020-2 Class B4, 3.663% due 8/25/2050 | | | 814,719 | | | | 710,969 | |
| d,f | Series 2020-2 Class B5, 3.663% due 8/25/2050 | | | 2,444,156 | | | | 1,995,102 | |
| d,f | Series 2020-2 Class B6C, 3.51% due 8/25/2050 | | | 3,258,875 | | | | 1,781,869 | |
| d,f,j | Series 2021-13IN Class AX1, 0.178% due 12/30/2051 | | | 161,019,168 | | | | 1,311,437 | |
| d,f,j | Series 2021-13IN Class AX17, 0.18% due 12/30/2051 | | | 13,348,739 | | | | 135,208 | |
| d,f,j | Series 2021-13IN Class AX4, 0.50% due 12/30/2051 | | | 12,180,725 | | | | 341,016 | |
| d,f | Series 2021-13IN Class B4, 3.358% due 12/30/2051 | | | 2,356,008 | | | | 1,887,987 | |
| d,f | Series 2021-13IN Class B5, 3.358% due 12/30/2051 | | | 461,778 | | | | 350,488 | |
| d,f | Series 2021-13IN Class B6C, 3.261% due 12/30/2051 | | | 4,052,198 | | | | 2,552,517 | |
| d,f | Galton Funding Mortgage Trust, Whole Loan Securities Trust CMO, Series 2020-H1 Class B1, 3.386% due 1/25/2060 | | | 4,379,900 | | | | 3,240,050 | |
| | GS Mortgage-Backed Securities Trust, Whole Loan Securities Trust CMO, | | | | | | | | |
| d,f,j | Series 2020-INV1 Class A11X, 3.404% due 10/25/2050 | | | 1,304,369 | | | | 199,835 | |
| d,f,j | Series 2020-INV1 Class A12X, 2.918% due 10/25/2050 | | | 15,617,557 | | | | 2,050,883 | |
| d,f,j | Series 2020-INV1 Class AIOS, 0.19% due 10/25/2050 | | | 85,402,844 | | | | 619,418 | |
| d,f,j | Series 2020-INV1 Class AX1, due 10/25/2050 | | | 56,468,206 | | | | 565 | |
| d,f,j | Series 2020-INV1 Class AX2, 0.418% due 10/25/2050 | | | 2,814,692 | | | | 37,893 | |
| d,f,j | Series 2020-INV1 Class AX4, 0.924% due 10/25/2050 | | | 3,030,256 | | | | 93,444 | |
| d,f | Series 2020-INV1 Class B4, 3.842% due 10/25/2050 | | | 1,828,717 | | | | 1,609,481 | |
| d,f | Series 2020-INV1 Class B5, 3.842% due 10/25/2050 | | | 1,833,045 | | | | 1,631,640 | |
| d,f | Series 2020-INV1 Class B6, 3.842% due 10/25/2050 | | | 4,401,541 | | | | 2,999,909 | |
| d,f,j | Series 2020-INV1 Class BX, 0.342% due 10/25/2050 | | | 20,871,123 | | | | 339,183 | |
| d,f | Homeward Opportunities Fund Trust, Whole Loan Securities Trust CMO, Series 2024-RTL1 Class A1, 7.12% due 7/25/2029 | | | 14,900,000 | | | | 15,111,830 | |
| d | Houston Galleria Mall Trust, CMBS, Series 2015-HGLR Class A1A2, 3.087% due 3/5/2037 | | | 8,033,750 | | | | 7,932,388 | |
| | JP Morgan Mortgage Trust, Whole Loan Securities Trust CMO, | | | | | | | | |
| d,f,j | Series 2020-3 Class AX1, 0.14% due 8/25/2050 | | | 13,327,638 | | | | 62,924 | |
| d,f,j | Series 2020-4 Class A11X, (TSFR1M + 5.14%) due 11/25/2050 | | | 2,649,814 | | | | 124,734 | |
| d,f,j | Series 2020-4 Class A3X, 0.50% due 11/25/2050 | | | 11,984,984 | | | | 284,202 | |
| d,f,j | Series 2020-4 Class AX1, 0.092% due 11/25/2050 | | | 44,268,213 | | | | 142,907 | |
| d,f,j | Series 2020-4 Class AX3, 3.50% due 11/25/2050 | | | 1,224,789 | | | | 205,949 | |
| d,f,j | Series 2020-4 Class AX4, 0.55% due 11/25/2050 | | | 2,826,606 | | | | 73,650 | |
| d,f | Series 2020-4 Class B4, 3.642% due 11/25/2050 | | | 1,888,568 | | | | 1,653,826 | |
| d,f | Series 2020-4 Class B5, 3.642% due 11/25/2050 | | | 871,786 | | | | 687,873 | |
| d,f | Series 2020-4 Class B6, 3.642% due 11/25/2050 | | | 1,582,548 | | | | 753,244 | |
| d,f | Series 2020-7 Class B4, 3.506% due 1/25/2051 | | | 2,301,029 | | | | 1,988,259 | |
| d,f | Series 2020-7 Class B5, 3.506% due 1/25/2051 | | | 1,612,532 | | | | 1,073,476 | |
| d,f | Series 2020-7 Class B6, 3.506% due 1/25/2051 | | | 2,289,984 | | | | 1,014,739 | |
| d,f | Series 2021-11 Class B5, 3.021% due 1/25/2052 | | | 3,619,516 | | | | 2,697,889 | |
| d,f | Series 2021-11 Class B6, 2.846% due 1/25/2052 | | | 4,136,638 | | | | 2,120,126 | |
| d,f | Series 2022-2 Class B4, 3.129% due 8/25/2052 | | | 3,170,076 | | | | 2,422,149 | |
| d,f | Series 2022-2 Class B5, 3.129% due 8/25/2052 | | | 1,683,809 | | | | 1,105,343 | |
| d,f | Series 2022-2 Class B6, 1.728% due 8/25/2052 | | | 1,802,416 | | | | 716,056 | |
| d,f | Series 2022-3 Class B4, 3.103% due 8/25/2052 | | | 2,603,949 | | | | 1,995,721 | |
| d,f | Series 2022-3 Class B5, 3.103% due 8/25/2052 | | | 1,657,316 | | | | 848,205 | |
| d,f | Series 2022-3 Class B6, 2.326% due 8/25/2052 | | | 1,459,907 | | | | 580,138 | |
| | Mello Mortgage Capital Acceptance, Whole Loan Securities Trust CMO, | | | | | | | | |
| d,f,j | Series 2021-INV2 Class AX1, 0.121% due 8/25/2051 | | | 96,413,365 | | | | 453,432 | |
| d,f,j | Series 2021-INV2 Class AX4, 0.70% due 8/25/2051 | | | 6,606,071 | | | | 257,641 | |
| d,f | Series 2021-INV2 Class B5, 3.321% due 8/25/2051 | | | 308,017 | | | | 231,618 | |
| d,f | Series 2021-INV2 Class B6, 3.149% due 8/25/2051 | | | 1,493,228 | | | | 780,645 | |
| d,f,j | Series 2021-INV3 Class AX1, 0.16% due 10/25/2051 | | | 116,068,722 | | | | 796,870 | |
| d,f,j | Series 2021-INV3 Class AX4, 0.55% due 10/25/2051 | | | 9,399,932 | | | | 260,040 | |
| d,f | Series 2021-INV3 Class B5, 3.21% due 10/25/2051 | | | 429,984 | | | | 321,940 | |
| d,f | Series 2021-INV3 Class B6, 3.084% due 10/25/2051 | | | 1,891,583 | | | | 1,008,610 | |
| f | Merrill Lynch Mortgage Investors Trust, Whole Loan Securities Trust CMO, Series 2004-A4 Class M1, 5.818% due 8/25/2034 | | | 700,653 | | | | 666,107 | |
| d | Morgan Stanley Capital I Trust, CMBS, Series 2024-BPR2 Class A, 7.291% due 5/5/2029 | | | 9,872,848 | | | | 10,444,571 | |
| See notes to financial statements. | Annual Financial Statements | 37 |
Schedule of Investments, Continued
Thornburg Investment Income Builder Fund | September 30, 2024
| | ISSUER-DESCRIPTION | | SHARES/
PRINCIPAL AMOUNT | | VALUE | |
| | | | | | | | |
| | New Residential Mortgage Loan Trust, Whole Loan Securities Trust CMO, | | | | | | | | |
| d,f,j | Series 2021-INV1 Class AX1, 0.748% due 6/25/2051 | | $ | 93,669,955 | | | $ | 3,520,323 | |
| d,f | Series 2021-INV1 Class B5, 3.248% due 6/25/2051 | | | 1,061,464 | | | | 817,878 | |
| d,f | Series 2021-INV1 Class B6, 3.201% due 6/25/2051 | | | 1,905,046 | | | | 1,140,161 | |
| d,f | Series 2024-RTL1 Class A1, 6.664% due 3/25/2039 | | | 5,000,000 | | | | 5,085,593 | |
| d | NYC Commercial Mortgage Trust, CMBS, Series 2021-909 Class A, 2.941% due 4/10/2043 | | | 5,000,000 | | | | 4,099,879 | |
| d,f | OBX Trust, Whole Loan Securities Trust CMO, Series 2021-NQM4 Class A1, 1.957% due 10/25/2061 | | | 17,370,468 | | | | 14,834,001 | |
| d,f | PRPM Trust, Whole Loan Securities Trust CMO, Series 2022-NQM1 Class A1, 5.50% due 8/25/2067 | | | 8,277,923 | | | | 8,248,520 | |
| d,f | Redwood Funding Trust, Whole Loan Securities Trust CMO, Series 2024-1 Class A, 7.745% due 12/25/2054 | | | 7,266,149 | | | | 7,296,435 | |
| d,f | Residential Mortgage Loan Trust, Whole Loan Securities Trust CMO, Series 2019-3 Class B1, 3.81% due 9/25/2059 | | | 1,500,000 | | | | 1,423,796 | |
| d,f | Saluda Grade Alternative Mortgage Trust, Whole Loan Securities Trust CMO, Series 2020-FIG1 Class C, due 9/25/2050 | | | 6,002,836 | | | | 2,293,358 | |
| d,f | Sequoia Mortgage Trust, Whole Loan Securities Trust CMO, Series 2017-7 Class B3, 3.724% due 10/25/2047 | | | 1,954,092 | | | | 1,771,982 | |
| d,f | SFO Commercial Mortgage Trust, CMBS, Series 2021-555 Class A, 6.362% (TSFR1M + 1.26%) due 5/15/2038 | | | 5,212,000 | | | | 4,972,297 | |
| | SG Residential Mortgage Trust, Whole Loan Securities Trust CMO, | | | | | | | | |
| d,f,j | Series 2019-3 Class AIOS, 0.375% due 9/25/2059 | | | 45,693,314 | | | | 624,180 | |
| d,f | Series 2019-3 Class B2, 5.663% due 9/25/2059 | | | 7,910,000 | | | | 7,205,103 | |
| d,f | Series 2019-3 Class B3, 6.301% due 9/25/2059 | | | 3,366,214 | | | | 2,809,675 | |
| a,d,f | Series 2019-3 Class C, due 9/25/2059 | | | 950 | | | | 950 | |
| d | Series 2019-3 Class XS1, due 9/25/2059 | | | 45,032,044 | | | | 450 | |
| d | Series 2019-3 Class XS2, due 9/25/2059 | | | 42,780,012 | | | | 2,151,984 | |
| d,f | Starwood Mortgage Residential Trust, Whole Loan Securities Trust CMO, Series 2019-INV1 Class B1, 3.657% due 9/27/2049 | | | 10,000,000 | | | | 9,183,838 | |
| d,f | Visio Trust, Whole Loan Securities Trust CMO, Series 2022-1 Class M1, 5.947% due 8/25/2057 | | | 5,351,000 | | | | 5,343,753 | |
| | Wells Fargo Mortgage Backed Securities Trust, Whole Loan Securities Trust CMO, | | | | | | | | |
| d,f,j | Series 2020-3 Class AIO1, 0.185% due 6/25/2050 | | | 149,529,217 | | | | 1,275,080 | |
| d,f | Series 2020-3 Class B5, 3.185% due 6/25/2050 | | | 1,046,000 | | | | 585,809 | |
| d,f | Series 2020-3 Class B6, 3.185% due 6/25/2050 | | | 1,912,755 | | | | 810,547 | |
| d,f,j | Series 2021-INV1 Class AIO2, 0.50% due 8/25/2051 | | | 170,536,408 | | | | 4,654,723 | |
| d,f | Series 2021-INV1 Class B4, 3.313% due 8/25/2051 | | | 3,291,143 | | | | 2,616,362 | |
| d,f | Series 2021-INV1 Class B5, 3.313% due 8/25/2051 | | | 2,538,882 | | | | 1,886,593 | |
| d,f | Series 2021-INV1 Class B6, 3.313% due 8/25/2051 | | | 1,936,723 | | | | 901,966 | |
| | TOTAL MORTGAGE BACKED (Cost $273,045,570) | | | | | | | 282,278,781 | |
| | | | | | | | | | |
| | LOAN PARTICIPATIONS — 0.2% | | | | | | | | |
| | | | | | | | | | |
| | COMMERCIAL & PROFESSIONAL SERVICES — 0.1% | | | | | | | | |
| | Commercial Services & Supplies — 0.1% | | | | | | | | |
| k | Imagefirst Holdings LLC, 8.854% (SOFR + 4.25%) due 4/27/2028 | | | 7,991,090 | | | | 7,931,157 | |
| | | | | | | | | 7,931,157 | |
| | CONSUMER SERVICES — 0.0% | | | | | | | | |
| | Commercial Services & Supplies — 0.0% | | | | | | | | |
| k | GEO Group, Inc., 10.095% (SOFR + 5.25%) due 4/13/2029 | | | 4,152,778 | | | | 4,215,069 | |
| | | | | | | | | 4,215,069 | |
| | MEDIA & ENTERTAINMENT — 0.0% | | | | | | | | |
| | Media — 0.0% | | | | | | | | |
| k | Century DE Buyer LLC, 9.255% (SOFR + 4.00%) due 10/30/2030 | | | 1,492,500 | | | | 1,488,142 | |
| | | | | | | | | 1,488,142 | |
| | TECHNOLOGY HARDWARE & EQUIPMENT — 0.1% | | | | | | | | |
| | Communications Equipment — 0.0% | | | | | | | | |
| k | GoTo Group, Inc., 9.968% (SOFR + 4.75%) due 4/28/2028 | | | 2,263,448 | | | | 1,221,560 | |
| | Technology Hardware, Storage & Peripherals — 0.1% | | | | | | | | |
| k | Xerox Holdings Corp., 8.604% - 8.845% (SOFR + 4.00%) due 11/17/2029 | | | 7,700,000 | | | | 7,659,575 | |
| | | | | | | | | 8,881,135 | |
| | TOTAL LOAN PARTICIPATIONS (Cost $23,547,745) | | | | | | | 22,515,503 | |
| 38 | Annual Financial Statements | See notes to financial statements. |
Schedule of Investments, Continued
Thornburg Investment Income Builder Fund | September 30, 2024
| | ISSUER-DESCRIPTION | | SHARES/
PRINCIPAL AMOUNT | | VALUE | |
| | | | | | | | |
| | SHORT-TERM INVESTMENTS — 5.0% | | | | | | | | |
| c | Thornburg Capital Management Fund | | | 68,734,344 | | | $ | 687,343,444 | |
| | TOTAL SHORT-TERM INVESTMENTS (Cost $687,343,444) | | | | | | | 687,343,444 | |
| | | | | | | | | | |
| | TOTAL INVESTMENTS — 99.8% (Cost $10,353,732,432) | | | | | | $ | 13,898,860,331 | |
| | | | | | | | | | |
| | OTHER ASSETS LESS LIABILITIES — 0.2% | | | | | | | 33,164,134 | |
| | | | | | | | | | |
| | NET ASSETS — 100.0% | | | | | | $ | 13,932,024,465 | |
OUTSTANDING FORWARD CURRENCY CONTRACTS TO BUY OR SELL AT SEPTEMBER 30, 2024
CONTRACT
DESCRIPTION | | CONTRACT
PARTY* | | BUY/SELL | | CONTRACT
AMOUNT | | | CONTRACT
VALUE DATE | | | VALUE
USD | | | UNREALIZED
APPRECIATION | | | UNREALIZED
DEPRECIATION | |
| | | | | | | | | | | | | | | | | | | | |
| Swiss Franc | | SSB | | Sell | | 79,587,200 | | | 12/20/2024 | | | 94,858,132 | | | $ | 231,537 | | | $ | — | |
| Euro | | SSB | | Sell | | 974,368,000 | | | 12/20/2024 | | | 1,088,095,209 | | | | — | | | | (354,620 | ) |
| Euro | | BBH | | Sell | | 974,368,000 | | | 12/20/2024 | | | 1,088,095,208 | | | | — | | | | (559,237 | ) |
| Great Britain Pound | | SSB | | Sell | | 370,577,600 | | | 12/20/2024 | | | 495,355,499 | | | | — | | | | (5,715,023 | ) |
| Total | | | | | | | | | | | | | | | $ | 231,537 | | | $ | (6,628,880 | ) |
| Net unrealized appreciation (depreciation) | | | | | | | | | | | | | | | | | | | $ | (6,397,343 | ) |
* Counterparties include State Street Bank and Trust Company (“SSB”) and Brown Brothers Harriman & Co. (“BBH”).
Footnote Legend
| a | Security currently fair valued by Thornburg Investment Management, Inc.’s Valuation and Pricing Committee. |
| c | Investment in Affiliates. |
| d | Securities exempt from registration under Rule 144A of the Securities Act of 1933, as amended. These securities are restricted but liquid and may only be resold in the ordinary course of business in transactions exempt from registration, normally to qualified institutional buyers. As of September 30, 2024, the aggregate value of these securities in the Fund’s portfolio was $957,520,314, representing 6.87% of the Fund’s net assets. |
| e | Securities are perpetual and, thus, do not have a predetermined maturity date. The date shown, if applicable, reflects the next call date. |
| f | Variable, floating, step, or fixed to floating rate securities are securities for which interest rate changes are based on changes in a designated base rate or on a predetermined schedule. The rates shown are those in effect on September 30, 2024. |
| g | Yankee bond denominated in U.S. dollars and is issued in the U.S. by foreign banks and corporations. |
| i | Pay-In-Kind Payments (PIK). The issuer may pay cash interest and/or interest in additional debt securities. Rates shown are the rates in effect at September 30, 2024. |
| k | The stated coupon rate represents the greater of the SOFR or the SOFR floor rate plus a spread at September 30, 2024. |
Portfolio Abbreviations
To simplify the listings of securities, abbreviations are used per the table below:
| ADR | American Depositary Receipt | PIK | Payment-in-kind |
| ARM | Adjustable Rate Mortgage | SOFR | Secured Overnight Financing Rate |
| CMBS | Commercial Mortgage-Backed Securities | TSFR1M | Term SOFR 1 Month |
| CMO | Collateralized Mortgage Obligation | TSFR3M | Term SOFR 3 Month |
| CMT | Constant Maturity Rate | | |
| See notes to financial statements. | Annual Financial Statements | 39 |
Schedule of Investments, Continued
Thornburg Investment Income Builder Fund | September 30, 2024
COUNTRY EXPOSURE *
(percent of net assets)
| United States | | | 38.5% | |
| France | | | 13.1% | |
| United Kingdom | | | 8.7% | |
| Italy | | | 5.2% | |
| Netherlands | | | 5.0% | |
| Germany | | | 4.4% | |
| Taiwan | | | 3.9% | |
| Spain | | | 2.5% | |
| Canada | | | 2.4% | |
| South Korea | | | 2.3% | |
| Australia | | | 1.8% | |
| Ireland | | | 1.4% | |
| Singapore | | | 1.4% | |
| Brazil | | | 0.8% | |
| Switzerland | | | 0.7% | |
| Norway | | | 0.6% | |
| Turkey | | | 0.4% | |
| India | | | 0.3% | |
| Mexico | | | 0.3% | |
| Jamaica | | | 0.3% | |
| China | | | 0.2% | |
| Israel | | | 0.1% | |
| Nigeria | | | 0.1% | |
| Dominican Republic | | | 0.1% | |
| Guatemala | | | 0.1% | |
| Belgium | | | 0.1% | |
| Indonesia | | | 0.1% | |
| Morocco | | | 0.0% | ** |
| United Arab Emirates | | | 0.0% | ** |
| Japan | | | 0.0% | ** |
| Bermuda | | | 0.0% | ** |
| Russian Federation | | | 0.0% | ** |
| Cayman Islands | | | 0.0% | ** |
| Luxembourg | | | 0.0% | ** |
| Other Assets Less Liabilities | | | 5.2% | |
| * | Holdings are classified by country of risk as determined by MSCI and Bloomberg. |
| ** | Country percentage was less than 0.1%. |
| 40 | Annual Financial Statements | See notes to financial statements. |
Schedule of Investments
Thornburg Summit Fund | September 30, 2024
| ISSUER-DESCRIPTION | | SHARES/
PRINCIPAL AMOUNT | | VALUE |
| | COMMON STOCK — 52.8% | | | | | | | | |
| | AUTOMOBILES & COMPONENTS — 0.1% | | | | | | | | |
| | Automobile Components — 0.1% | | | | | | | | |
| a | Mobileye Global, Inc. Class A | | | 8,943 | | | $ | 122,519 | |
| | | | | | | | | 122,519 | |
| | BANKS — 2.7% | | | | | | | | |
| | Banks — 2.7% | | | | | | | | |
| | BNP Paribas SA | | | 15,194 | | | | 1,041,007 | |
| | Citigroup, Inc. | | | 17,359 | | | | 1,086,674 | |
| | JPMorgan Chase & Co. | | | 4,512 | | | | 951,400 | |
| | | | | | | | | 3,079,081 | |
| | CAPITAL GOODS — 1.5% | | | | | | | | |
| | Aerospace & Defense — 0.5% | | | | | | | | |
| | L3Harris Technologies, Inc. | | | 2,560 | | | | 608,947 | |
| | Electrical Equipment — 0.5% | | | | | | | | |
| | Vertiv Holdings Co. Class A | | | 5,349 | | | | 532,172 | |
| | Trading Companies & Distributors — 0.5% | | | | | | | | |
| | ITOCHU Corp. | | | 10,000 | | | | 534,215 | |
| | | | | | | | | 1,675,334 | |
| | COMMERCIAL & PROFESSIONAL SERVICES — 0.9% | | | | | | | | |
| | Professional Services — 0.9% | | | | | | | | |
| a | Amentum Holdings, Inc. | | | 6,196 | | | | 199,821 | |
| | Jacobs Solutions, Inc. | | | 6,196 | | | | 811,056 | |
| | | | | | | | | 1,010,877 | |
| | CONSUMER DISCRETIONARY DISTRIBUTION & RETAIL — 4.4% | | | | | | | | |
| | Broadline Retail — 3.8% | | | | | | | | |
| a | Amazon.com, Inc. | | | 12,073 | | | | 2,249,562 | |
| a | MercadoLibre, Inc. | | | 554 | | | | 1,136,786 | |
| a | PDD Holdings, Inc. ADR | | | 6,299 | | | | 849,168 | |
| | Specialty Retail — 0.6% | | | | | | | | |
| | Home Depot, Inc. | | | 1,713 | | | | 694,108 | |
| | | | | | | | | 4,929,624 | |
| | CONSUMER DURABLES & APPAREL — 1.6% | | | | | | | | |
| | Textiles, Apparel & Luxury Goods — 1.6% | | | | | | | | |
| | Kalyan Jewellers India Ltd. | | | 102,899 | | | | 895,564 | |
| | LVMH Moet Hennessy Louis Vuitton SE | | | 1,131 | | | | 866,802 | |
| | | | | | | | | 1,762,366 | |
| | CONSUMER SERVICES — 3.3% | | | | | | | | |
| | Hotels, Restaurants & Leisure — 3.3% | | | | | | | | |
| a | Airbnb, Inc. Class A | | | 6,956 | | | | 882,090 | |
| | Galaxy Entertainment Group Ltd. | | | 205,000 | | | | 1,029,767 | |
| | Round One Corp. | | | 149,300 | | | | 1,137,474 | |
| | Wyndham Hotels & Resorts, Inc. | | | 9,043 | | | | 706,620 | |
| | | | | | | | | 3,755,951 | |
| | ENERGY — 1.6% | | | | | | | | |
| | Oil, Gas & Consumable Fuels — 1.6% | | | | | | | | |
| | Shell plc | | | 29,059 | | | | 956,339 | |
| | TotalEnergies SE | | | 12,107 | | | | 788,399 | |
| | | | | | | | | 1,744,738 | |
| | FINANCIAL SERVICES — 4.2% | | | | | | | | |
| | Capital Markets — 1.7% | | | | | | | | |
| | Charles Schwab Corp. | | | 13,405 | | | | 868,778 | |
| | CME Group, Inc. | | | 4,612 | | | | 1,017,638 | |
| See notes to financial statements. | Annual Financial Statements | 41 |
Schedule of Investments, Continued
Thornburg Summit Fund | September 30, 2024
| ISSUER-DESCRIPTION | | SHARES/
PRINCIPAL AMOUNT | | VALUE |
| | Financial Services — 2.5% | | | | | | |
| b | Home First Finance Co. India Ltd. | | | 24,326 | | | $ | 345,508 | |
| | Mastercard, Inc. Class A | | | 2,211 | | | | 1,091,792 | |
| | Visa, Inc. Class A | | | 4,906 | | | | 1,348,905 | |
| | | | | | | | | 4,672,621 | |
| | FOOD, BEVERAGE & TOBACCO — 0.7% | | | | | | | | |
| | Beverages — 0.7% | | | | | | | | |
| | Varun Beverages Ltd. | | | 109,597 | | | | 794,828 | |
| | | | | | | | | 794,828 | |
| | HEALTH CARE EQUIPMENT & SERVICES — 0.7% | | | | | | | | |
| | Health Care Equipment & Supplies — 0.7% | | | | | | | | |
| | Medtronic plc | | | 8,377 | | | | 754,181 | |
| | | | | | | | | 754,181 | |
| | INSURANCE — 0.8% | | | | | | | | |
| | Insurance — 0.8% | | | | | | | | |
| a | PB Fintech Ltd. | | | 49,562 | | | | 951,275 | |
| | | | | | | | | 951,275 | |
| | MATERIALS — 1.5% | | | | | | | | |
| | Chemicals — 0.9% | | | | | | | | |
| | Linde plc | | | 2,195 | | | | 1,046,707 | |
| | Metals & Mining — 0.6% | | | | | | | | |
| | Glencore plc | | | 109,401 | | | | 625,570 | |
| | | | | | | | | 1,672,277 | |
| | MEDIA & ENTERTAINMENT — 3.2% | | | | | | | | |
| | Interactive Media & Services — 3.2% | | | | | | | | |
| | Alphabet, Inc. Class A | | | 8,675 | | | | 1,438,749 | |
| | Meta Platforms, Inc. Class A | | | 3,718 | | | | 2,128,332 | |
| | | | | | | | | 3,567,081 | |
| | PHARMACEUTICALS, BIOTECHNOLOGY & LIFE SCIENCES — 6.9% | | | | | | | | |
| | Biotechnology — 1.1% | | | | | | | | |
| a | BioMarin Pharmaceutical, Inc. | | | 4,631 | | | | 325,513 | |
| a | Sarepta Therapeutics, Inc. | | | 7,273 | | | | 908,325 | |
| | Life Sciences Tools & Services — 0.3% | | | | | | | | |
| a | Repligen Corp. | | | 2,541 | | | | 378,152 | |
| | Pharmaceuticals — 5.5% | | | | | | | | |
| | AstraZeneca plc | | | 5,396 | | | | 835,980 | |
| | Merck & Co., Inc. | | | 5,273 | | | | 598,802 | |
| | Novo Nordisk AS Class B | | | 8,204 | | | | 963,915 | |
| | Pfizer, Inc. | | | 29,742 | | | | 860,733 | |
| | Roche Holding AG | | | 5,425 | | | | 1,734,513 | |
| | Zoetis, Inc. | | | 6,126 | | | | 1,196,898 | |
| | | | | | | | | 7,802,831 | |
| | SEMICONDUCTORS & SEMICONDUCTOR EQUIPMENT — 5.7% | | | | | | | | |
| | Semiconductors & Semiconductor Equipment — 5.7% | | | | | | | | |
| a | Advanced Micro Devices, Inc. | | | 5,073 | | | | 832,378 | |
| | ASML Holding NV | | | 712 | | | | 590,935 | |
| | Broadcom, Inc. | | | 9,130 | | | | 1,574,925 | |
| | NVIDIA Corp. | | | 14,753 | | | | 1,791,604 | |
| | Taiwan Semiconductor Manufacturing Co. Ltd. | | | 54,792 | | | | 1,656,927 | |
| | | | | | | | | 6,446,769 | |
| | SOFTWARE & SERVICES — 5.1% | | | | | | | | |
| | Information Technology Services — 1.2% | | | | | | | | |
| | Nomura Research Institute Ltd. | | | 13,900 | | | | 512,576 | |
| a | Shopify, Inc. Class A | | | 10,789 | | | | 864,630 | |
| 42 | Annual Financial Statements | See notes to financial statements. |
Schedule of Investments, Continued
Thornburg Summit Fund | September 30, 2024
| ISSUER-DESCRIPTION | | SHARES/
PRINCIPAL AMOUNT | | VALUE |
| | Software — 3.9% | | | | | | |
| | Microsoft Corp. | | | 3,588 | | | $ | 1,543,916 | |
| | Open Text Corp. | | | 25,762 | | | | 857,559 | |
| | SAP SE | | | 2,927 | | | | 665,974 | |
| a | ServiceNow, Inc. | | | 1,451 | | | | 1,297,760 | |
| | | | | | | | | 5,742,415 | |
| | TECHNOLOGY HARDWARE & EQUIPMENT — 3.1% | | | | | | | | |
| | Electronic Equipment, Instruments & Components — 0.7% | | | | | | | | |
| | Keyence Corp. | | | 1,719 | | | | 817,609 | |
| | Technology Hardware, Storage & Peripherals — 2.4% | | | | | | | | |
| | Apple, Inc. | | | 4,895 | | | | 1,140,535 | |
| | Samsung Electronics Co. Ltd. | | | 33,634 | | | | 1,581,778 | |
| | | | | | | | | 3,539,922 | |
| | TELECOMMUNICATION SERVICES — 3.7% | | | | | | | | |
| | Diversified Telecommunication Services — 3.7% | | | | | | | | |
| | AT&T, Inc. | | | 67,625 | | | | 1,487,750 | |
| | Orange SA | | | 119,713 | | | | 1,370,563 | |
| a | Zegona Communications plc | | | 265,022 | | | | 1,289,729 | |
| | | | | | | | | 4,148,042 | |
| | TRANSPORTATION — 1.1% | | | | | | | | |
| | Ground Transportation — 1.1% | | | | | | | | |
| | Canadian Pacific Kansas City Ltd. | | | 14,043 | | | | 1,201,238 | |
| | | | | | | | | 1,201,238 | |
| | TOTAL COMMON STOCK (Cost $44,713,496) | | | | | | | 59,373,970 | |
| | | | | | | | | | |
| | ASSET BACKED SECURITIES — 4.5% | | | | | | | | |
| | AUTO RECEIVABLES — 1.7% | | | | | | | | |
| b | Ally Auto Receivables Trust Series 2023-1 Class CERT, due 4/15/2034 | | $ | 1,000 | | | | 311,076 | |
| b | American Credit Acceptance Receivables Trust, Series 2022-1 Class D, 2.46% due 3/13/2028 | | | 216,938 | | | | 214,612 | |
| b | Carvana Auto Receivables Trust, Series 2023-N4 Class A, 6.42% due 1/10/2028 | | | 84,817 | | | | 85,483 | |
| | Exeter Automobile Receivables Trust, | | | | | | | | |
| | Series 2021-3A Class C, 0.96% due 10/15/2026 | | | 58,882 | | | | 58,627 | |
| | Series 2023-4A Class A3, 6.06% due 9/15/2026 | | | 289,914 | | | | 290,244 | |
| | Flagship Credit Auto Trust, | | | | | | | | |
| b | Series 2019-4 Class R, due 3/15/2027 | | | 5,000 | | | | 256,174 | |
| b | Series 2022-1 Class A, 1.79% due 10/15/2026 | | | 43,601 | | | | 43,444 | |
| | Harley-Davidson Motorcycle Trust, Series 2021-B Class A3, 0.56% due 11/16/2026 | | | 49,057 | | | | 48,789 | |
| b | Santander Retail Auto Lease Trust, Series 2022-B Class A3, 3.28% due 11/20/2025 | | | 33,326 | | | | 33,290 | |
| b | Tricolor Auto Securitization Trust, Series 2024-2A Class A, 6.36% due 12/15/2027 | | | 242,126 | | | | 243,997 | |
| b | Westlake Automobile Receivables Trust, Series 2021-2A Class D, 1.23% due 12/15/2026 | | | 300,000 | | | | 295,080 | |
| | | | | | | | | 1,880,816 | |
| | OTHER ASSET BACKED — 2.3% | | | | | | | | |
| b | Amur Equipment Finance Receivables IX LLC, Series 2021-1A Class F, 6.09% due 2/20/2029 | | | 600,000 | | | | 596,313 | |
| b | Aqua Finance Trust, Series 2019-A Class B, 3.47% due 7/16/2040 | | | 122,263 | | | | 119,133 | |
| b | DataBank Issuer LLC, Series 2024-1A Class A2, 5.30% due 1/26/2054 | | | 200,000 | | | | 199,355 | |
| b,c | ECAF I Ltd., Series 2015-1A Class A2, 4.947% due 6/15/2040 | | | 131,193 | | | | 86,589 | |
| b,d | Goldman Home Improvement Trust Issuer Trust Series 2021-GRN2 Class R, due 6/20/2051 | | | 2,000 | | | | 106,537 | |
| b | InStar Leasing III LLC, Series 2021-1A Class A, 2.30% due 2/15/2054 | | | 302,240 | | | | 274,089 | |
| b | LendingPoint Pass-Through Trust, Series 2022-ST1 Class A, 2.50% due 3/15/2028 | | | 41,444 | | | | 40,349 | |
| | Marlette Funding Trust, | | | | | | | | |
| b | Series 2021-1A Class R, due 6/16/2031 | | | 1,200 | | | | 21,285 | |
| b | Series 2021-2A Class R, due 9/15/2031 | | | 1,150 | | | | 19,640 | |
| b | Series 2021-3A Class R, due 12/15/2031 | | | 1,200 | | | | 28,029 | |
| b | Momnt Technologies Trust, Series 2023-1A Class A, 6.92% due 3/20/2045 | | | 100,241 | | | | 101,739 | |
| b | Mosaic Solar Loan Trust Series 2021-2A Class R, due 4/22/2047 | | | 1,150,000 | | | | 91,154 | |
| b | Oportun Issuance Trust, Series 2022-A Class A, 5.05% due 6/9/2031 | | | 186,259 | | | | 186,036 | |
| b,e | Pagaya AI Debt Trust, Series 2023-5 Class AB, 7.421% due 4/15/2031 | | | 70,070 | | | | 70,406 | |
| b | Republic Finance Issuance Trust, Series 2021-A Class A, 2.30% due 12/22/2031 | | | 100,000 | | | | 97,885 | |
| See notes to financial statements. | Annual Financial Statements | 43 |
Schedule of Investments, Continued
Thornburg Summit Fund | September 30, 2024
| ISSUER-DESCRIPTION | | SHARES/
PRINCIPAL AMOUNT | | VALUE |
| b,e | SBA Tower Trust, Series 2014-2A Class C, 3.869% due 10/15/2049 | | $ | 30,000 | | | $ | 29,979 | |
| b | SPS Servicer Advance Receivables Trust, Series 2020-T2 Class A, 1.83% due 11/15/2055 | | | 300,000 | | | | 289,728 | |
| b | Upstart Pass-Through Trust Series 2021-ST4 Class CERT, due 7/20/2027 | | | 500,000 | | | | 51,097 | |
| b | Upstart Securitization Trust, Series 2023-1 Class A, 6.59% due 2/20/2033 | | | 130,080 | | | | 130,204 | |
| | | | | | | | | 2,539,547 | |
| | STUDENT LOAN — 0.5% | | | | | | | | |
| b | EDvestinU Private Education Loan Issue No. 3 LLC, Series 2021-A Class A, 1.80% due 11/25/2045 | | | 290,796 | | | | 267,056 | |
| b | SMB Private Education Loan Trust, Series 2020-B Class A1A, 1.29% due 7/15/2053 | | | 95,449 | | | | 89,077 | |
| b | SoFi Professional Loan Program LLC, Series 2021-B Class AFX, 1.14% due 2/15/2047 | | | 295,294 | | | | 259,979 | |
| | | | | | | | | 616,112 | |
| | TOTAL ASSET BACKED SECURITIES (Cost $5,289,365) | | | | | | | 5,036,475 | |
| | | | | | | | | | |
| | CORPORATE BONDS — 8.0% | | | | | | | | |
| | BANKS — 0.1% | | | | | | | | |
| | Banks — 0.1% | | | | | | | | |
| e,f | Bank of New York Mellon Corp., Series F, 4.625% (TSFR3M + 3.39%) due 9/20/2026 | | | 100,000 | | | | 99,029 | |
| | | | | | | | | 99,029 | |
| | CAPITAL GOODS — 0.2% | | | | | | | | |
| | Machinery — 0.2% | | | | | | | | |
| | Regal Rexnord Corp., 6.05% due 2/15/2026 | | | 250,000 | | | | 254,235 | |
| | | | | | | | | 254,235 | |
| | ENERGY — 1.2% | | | | | | | | |
| | Energy Equipment & Services — 0.3% | | | | | | | | |
| b,c | Empresa Generadora de Electricidad Haina SA, 5.625% due 11/8/2028 | | | 350,000 | | | | 330,582 | |
| | Oil, Gas & Consumable Fuels — 0.9% | | | | | | | | |
| b | Delek Logistics Partners LP/Delek Logistics Finance Corp., 8.625% due 3/15/2029 Ecopetrol SA, | | | 200,000 | | | | 210,566 | |
| c | 6.875% due 4/29/2030 | | | 125,000 | | | | 125,188 | |
| c | 8.875% due 1/13/2033 | | | 117,000 | | | | 125,390 | |
| | Petroleos Mexicanos, | | | | | | | | |
| c | 5.95% due 1/28/2031 | | | 120,000 | | | | 103,850 | |
| c | 7.69% due 1/23/2050 | | | 315,000 | | | | 245,898 | |
| b,c | Raizen Fuels Finance SA, 6.45% due 3/5/2034 | | | 200,000 | | | | 211,740 | |
| | | | | | | | | 1,353,214 | |
| | EQUITY REAL ESTATE INVESTMENT TRUSTS (REITS) — 0.5% | | | | | | | | |
| | Diversified REITs — 0.3% | | | | | | | | |
| b | American Tower Trust #1, 3.652% due 3/15/2048 | | | 300,000 | | | | 291,434 | |
| b | SBA Tower Trust, 6.599% due 11/15/2052 | | | 13,000 | | | | 13,529 | |
| | Retail REITs — 0.2% | | | | | | | | |
| | Brixmor Operating Partnership LP, 3.85% due 2/1/2025 | | | 300,000 | | | | 298,356 | |
| | | | | | | | | 603,319 | |
| | FINANCIAL SERVICES — 1.8% | | | | | | | | |
| | Capital Markets — 1.1% | | | | | | | | |
| b | Blue Owl Technology Finance Corp., 4.75% due 12/15/2025 | | | 179,000 | | | | 176,356 | |
| b | Boost Newco Borrower LLC/GTCR W Dutch Finance Sub BV (GBP), 8.50% due 1/15/2031 | | | 250,000 | | | | 361,909 | |
| b | Burford Capital Global Finance LLC, 9.25% due 7/1/2031 | | | 250,000 | | | | 269,002 | |
| b | GTP Acquisition Partners I LLC, Series 2015-2 Class A, 3.482% due 6/15/2050 | | | 200,000 | | | | 197,874 | |
| | Hercules Capital, Inc., 2.625% due 9/16/2026 | | | 250,000 | | | | 236,433 | |
| | Financial Services — 0.7% | | | | | | | | |
| b | Antares Holdings LP, 6.50% due 2/8/2029 | | | 250,000 | | | | 253,828 | |
| c,e | HSBC Holdings plc, 3.973% (TSFR3M + 1.87%) due 5/22/2030 | | | 350,000 | | | | 341,099 | |
| e | Truist Financial Corp., 7.161% (SOFR + 2.45%) due 10/30/2029 | | | 200,000 | | | | 219,342 | |
| | | | | | | | | 2,055,843 | |
| 44 | Annual Financial Statements | See notes to financial statements. |
Schedule of Investments, Continued
Thornburg Summit Fund | September 30, 2024
| ISSUER-DESCRIPTION | | SHARES/
PRINCIPAL AMOUNT | | VALUE |
| | FOOD, BEVERAGE & TOBACCO — 0.2% | | | | | | |
| | Food Products — 0.2% | | | | | | |
| b | Darling Global Finance BV (EUR), 3.625% due 5/15/2026 | | $ | 200,000 | | | $ | 221,713 | |
| | | | | | | | | 221,713 | |
| | HEALTH CARE EQUIPMENT & SERVICES — 0.5% | | | | | | | | |
| | Health Care Equipment & Supplies — 0.5% | | | | | | | | |
| b | Dentsply Sirona, Inc., 5.456% due 10/28/2024 | | | 500,000 | | | | 497,994 | |
| | | | | | | | | 497,994 | |
| | INSURANCE — 0.5% | | | | | | | | |
| | Insurance — 0.5% | | | | | | | | |
| b,e | Nationwide Mutual Insurance Co., 7.498% (SOFR + 2.18%) due 12/15/2024 | | | 275,000 | | | | 275,608 | |
| b | Principal Life Global Funding II, 5.50% due 6/28/2028 | | | 250,000 | | | | 258,602 | |
| | | | | | | | | 534,210 | |
| | MATERIALS — 0.2% | | | | | | | | |
| | Metals & Mining — 0.2% | | | | | | | | |
| b,c | WE Soda Investments Holding plc, 9.375% due 2/14/2031 | | | 200,000 | | | | 207,800 | |
| | | | | | | | | 207,800 | |
| | MEDIA & ENTERTAINMENT — 0.6% | | | | | | | | |
| | Media — 0.6% | | | | | | | | |
| b | CCO Holdings LLC/CCO Holdings Capital Corp.,4.25% due 2/1/2031 - 1/15/2034 | | | 750,000 | | | | 646,895 | |
| | | | | | | | | 646,895 | |
| | PHARMACEUTICALS, BIOTECHNOLOGY & LIFE SCIENCES — 0.1% | | | | | | | | |
| | Life Sciences Tools & Services — 0.1% | | | | | | | | |
| b | Avantor Funding, Inc. (EUR), 2.625% due 11/1/2025 | | | 100,000 | | | | 110,334 | |
| | | | | | | | | 110,334 | |
| | SOFTWARE & SERVICES — 0.3% | | | | | | | | |
| | Internet Software & Services — 0.2% | | | | | | | | |
| b | Prosus NV (EUR), 1.288% due 7/13/2029 | | | 285,000 | | | | 283,600 | |
| | Software — 0.1% | | | | | | | | |
| b | GoTo Group, Inc.,5.50% due 5/1/2028 | | | 184,029 | | | | 92,138 | |
| | | | | | | | | 375,738 | |
| | TECHNOLOGY HARDWARE & EQUIPMENT — 0.2% | | | | | | | | |
| | Electronic Equipment, Instruments & Components — 0.2% | | | | | | | | |
| | CDW LLC/CDW Finance Corp., 3.25% due 2/15/2029 | | | 250,000 | | | | 235,873 | |
| | | | | | | | | 235,873 | |
| | TELECOMMUNICATION SERVICES — 0.2% | | | | | | | | |
| | Diversified Telecommunication Services — 0.2% | | | | | | | | |
| | AT&T, Inc., 5.539% due 2/20/2026 | | | 250,000 | | | | 249,980 | |
| | | | | | | | | 249,980 | |
| | TRANSPORTATION — 0.2% | | | | | | | | |
| | Passenger Airlines — 0.2% | | | | | | | | |
| b,c | Pegasus Hava Tasimaciligi AS, 8.00% due 9/11/2031 | | | 200,000 | | | | 199,874 | |
| | | | | | | | | 199,874 | |
| | UTILITIES — 1.2% | | | | | | | | |
| | Electric Utilities — 1.0% | | | | | | | | |
| | AEP Texas, Inc., 5.40% due 6/1/2033 | | | 300,000 | | | | 308,517 | |
| | Black Hills Corp., 6.15% due 5/15/2034 | | | 250,000 | | | | 269,883 | |
| b,c | Eskom Holdings SOC Ltd., 7.125% due 2/11/2025 | | | 250,000 | | | | 249,990 | |
| e | Pacific Gas & Electric Co., 5.908% (SOFRINDX + 0.95%) due 9/4/2025 | | | 275,000 | | | | 275,401 | |
| | Multi-Utilities — 0.2% | | | | | | | | |
| b,c | Aegea Finance SARL, 9.00% due 1/20/2031 | | | 250,000 | | | | 270,240 | |
| | | | | | | | | 1,374,031 | |
| | TOTAL CORPORATE BONDS (Cost $8,769,281) | | | | | | | 9,020,082 | |
| See notes to financial statements. | Annual Financial Statements | 45 |
Schedule of Investments, Continued
Thornburg Summit Fund | September 30, 2024
| ISSUER-DESCRIPTION | | SHARES/
PRINCIPAL AMOUNT | | VALUE |
| OTHER GOVERNMENT — 2.0% | | | | | | | | |
| | Australia Government Bonds (AUD), Series 166, 3.00% due 11/21/2033 | | $ | 1,000,000 | | | $ | 640,730 | |
| | Brazil Notas do Tesouro Nacional (BRL), Series F, 10.00% due 1/1/2029 | | | 1,000,000 | | | | 174,865 | |
| b | Dominican Republic International Bonds (DOP), 10.75% due 6/1/2036 | | | 13,000,000 | | | | 229,795 | |
| | Egypt Government Bonds (EGP), Series 3Y, 23.865% due 6/4/2027 | | | 7,075,000 | | | | 141,806 | |
| | Egypt Treasury Bills (EGP), Series 364D, due 3/11/2025 | | | 12,650,000 | | | | 231,714 | |
| c | Panama Bonos del Tesoro, 3.362% due 6/30/2031 | | | 100,000 | | | | 81,707 | |
| b | Republic of Uzbekistan International Bonds (UZS), 16.625% due 5/29/2027 | | | 4,500,000,000 | | | | 354,941 | |
| | U.K. Gilts (GBP), 1.625% due 10/22/2028 | | | 275,000 | | | | 339,668 | |
| | TOTAL OTHER GOVERNMENT (Cost $2,124,161) | | | | | | | 2,195,226 | |
| | | | | | | | | | |
| U.S. TREASURY SECURITIES — 10.5% | | | | | | | | |
| | U.S. Treasury Inflation-Indexed Bonds, 0.125%, 2/15/2052 | | | 564,935 | | | | 351,606 | |
| | U.S. Treasury Inflation-Indexed Notes, | | | | | | | | |
| | 0.125%, 1/15/2031 | | | 2,899,800 | | | | 2,665,777 | |
| | 1.125%, 1/15/2033 | | | 232,298 | | | | 224,186 | |
| | 1.25%, 4/15/2028 | | | 209,720 | | | | 207,762 | |
| | U.S. Treasury Notes, | | | | | | | | |
| | 0.875%, 9/30/2026 | | | 400,000 | | | | 378,875 | |
| | 1.125%, 2/15/2031 | | | 1,200,000 | | | | 1,032,094 | |
| | 2.125%, 11/30/2024 | | | 2,000,000 | | | | 1,991,016 | |
| | 3.875%, 8/15/2033 - 8/15/2034 | | | 1,625,000 | | | | 1,636,953 | |
| | 4.00%, 2/15/2034 | | | 800,000 | | | | 813,875 | |
| | 4.125%, 11/15/2032 | | | 550,000 | | | | 565,812 | |
| | 4.375%, 5/15/2034 | | | 505,000 | | | | 528,987 | |
| | 4.50%, 11/15/2033 | | | 1,300,000 | | | | 1,373,125 | |
| | TOTAL U.S. TREASURY SECURITIES (Cost $11,634,904) | | | | | | | 11,770,068 | |
| | | | | | | | | | |
| MORTGAGE BACKED — 10.7% | | | | | | | | |
| b,e | Arroyo Mortgage Trust, Whole Loan Securities Trust CMO, Series 2019-1 Class A1, 3.805% due 1/25/2049 | | | 27,256 | | | | 26,384 | |
| b | BXP Trust, CMBS, Series 2021-601L Class A, 2.618% due 1/15/2044 | | | 325,000 | | | | 273,687 | |
| b | Century Plaza Towers, CMBS, Series 2019-CPT Class A, 2.865% due 11/13/2039 | | | 245,000 | | | | 219,019 | |
| | Citigroup Mortgage Loan Trust, Whole Loan Securities Trust CMO, | | | | | | | | |
| b,e | Series 2021-J1 Class B4, 2.61% due 4/25/2051 | | | 100,000 | | | | 45,212 | |
| b,e | Series 2021-J1 Class B5, 2.61% due 4/25/2051 | | | 100,000 | | | | 37,823 | |
| b,e | Series 2021-J1 Class B6, 2.61% due 4/25/2051 | | | 99,907 | | | | 37,245 | |
| | COMM Mortgage Trust, CMBS, Series 2015-LC23 Class ASB, 3.598% due 10/10/2048 | | | 128,685 | | | | 127,750 | |
| b,e | CSMC Trust, CMBS, Series 2020-522F Class A, 8.95% (TSFR1M + 3.85%) due 9/16/2025 | | | 100,000 | | | | 60,802 | |
| b | DC Office Trust, CMBS, Series 2019-MTC Class A, 2.965% due 9/15/2045 | | | 250,000 | | | | 220,759 | |
| b,e | Ellington Financial Mortgage Trust,Whole Loan Securities Trust CMO, Series 2022-1 Class A1, 2.206% due 1/25/2067 | | | 232,396 | | | | 205,029 | |
| | Federal Home Loan Mtg Corp., Pool SE9046, 3.00% due 12/1/2051 | | | 242,807 | | | | 216,233 | |
| | Federal Home Loan Mtg Corp., Seasoned Credit Risk Transfer, Whole Loan Securities Trust CMO, Series 2019-1 Class MA, 3.50% due 7/25/2058 | | | 39,648 | | | | 38,461 | |
| | Federal Home Loan Mtg Corp., UMBS Collateral, | | | | | | | | |
| | Pool SD1669, 2.50% due 1/1/2052 | | | 268,590 | | | | 231,698 | |
| | Pool SD4175, 2.50% due 6/1/2052 | | | 1,064,084 | | | | 918,652 | |
| | Pool SD8242, 3.00% due 9/1/2052 | | | 581,606 | | | | 522,527 | |
| | Federal Home Loan Mtg Corp., Whole Loan Securities Trust CMO, Series 2017-SC02 Class 1A, 3.00% due 5/25/2047 | | | 63,656 | | | | 55,955 | |
| | Federal National Mtg Assoc., UMBS Collateral, | | | | | | | | |
| | Pool BV4119, 2.50% due 3/1/2052 | | | 616,699 | | | | 532,413 | |
| | Pool CB1388, 2.50% due 8/1/2051 | | | 527,659 | | | | 458,408 | |
| | Pool CB2301, 3.00% due 12/1/2051 | | | 466,176 | | | | 418,276 | |
| | Pool FM8658, 2.50% due 9/1/2051 | | | 907,782 | | | | 783,792 | |
| | Pool FM8761, 2.50% due 9/1/2051 | | | 375,690 | | | | 324,176 | |
| | Pool FS5447, 2.50% due 9/1/2052 | | | 349,658 | | | | 303,249 | |
| | Pool FS6130, 2.50% due 7/1/2052 | | | 530,300 | | | | 457,822 | |
| | Pool FS6157, 3.00% due 9/1/2052 | | | 993,834 | | | | 894,421 | |
| | Pool FS9157, 2.00% due 5/1/2042 | | | 250,000 | | | | 217,559 | |
| | Pool MA4512, 2.50% due 1/1/2052 | | | 731,837 | | | | 633,342 | |
| | Pool MA4548, 2.50% due 2/1/2052 | | | 527,510 | | | | 456,351 | |
| | Pool MA4653, 3.00% due 7/1/2052 | | | 516,105 | | | | 463,879 | |
| b,e | Flagstar Mortgage Trust, Whole Loan Securities Trust CMO, Series 2019-2 Class B3, 3.999% due 12/25/2049 | | | 111,783 | | | | 101,967 | |
| 46 | Annual Financial Statements | See notes to financial statements. |
Schedule of Investments, Continued
Thornburg Summit Fund | September 30, 2024
| ISSUER-DESCRIPTION | | SHARES/
PRINCIPAL AMOUNT | | VALUE |
| | GCAT Trust, Whole Loan Securities Trust CMO, | | | | | | |
| b,e | Series 2021-CM2 Class A1, 2.352% due 8/25/2066 | | $ | 184,350 | | | $ | 169,230 | |
| b,e | Series 2023-NQM4 Class A1, 4.25% due 5/25/2067 | | | 231,343 | | | | 220,960 | |
| b | Houston Galleria Mall Trust, CMBS, Series 2015-HGLR Class A1A2, 3.087% due 3/5/2037 | | | 215,000 | | | | 212,287 | |
| b,e | Hudson Yards Mortgage Trust, CMBS, Series 2019-55HY Class A, 3.041% due 12/10/2041 | | | 245,000 | | | | 222,873 | |
| | Imperial Fund Mortgage Trust, Whole Loan Securities Trust CMO, | | | | | | | | |
| b,e | Series 2021-NQM2 Class A1, 1.073% due 9/25/2056 | | | 190,198 | | | | 157,039 | |
| b,e | Series 2021-NQM3 Class A1, 1.595% due 11/25/2056 | | | 299,169 | | | | 254,950 | |
| b,e | Metlife Securitization Trust, Whole Loan Securities Trust CMO, Series 2019-1A Class A1A, 3.75% due 4/25/2058 | | | 32,353 | | | | 31,795 | |
| b,e | MFA Trust, Whole Loan Securities Trust CMO, Series 2022-CHM1 Class A1, 3.875% due 9/25/2056 | | | 250,406 | | | | 244,725 | |
| b,e | New Residential Mortgage Loan Trust, Whole Loan Securities Trust CMO, Series 2022-NQM3 Class A1, 3.90% due 4/25/2062 | | | 333,179 | | | | 319,208 | |
| b | One Bryant Park Trust, CMBS, Series 2019-OBP Class A, 2.516% due 9/15/2054 | | | 250,000 | | | | 222,543 | |
| b,e | SFO Commercial Mortgage Trust, CMBS, Series 2021-555 Class A, 6.362% (TSFR1M + 1.26%) due 5/15/2038 | | | 119,000 | | | | 113,527 | |
| b | SLG Office Trust, CMBS, Series 2021-OVA Class A, 2.585% due 7/15/2041 | | | 250,000 | | | | 216,624 | |
| b,e | TIAA Bank Mortgage Loan Trust, Whole Loan Securities Trust CMO, Series 2018-2 Class B3, 3.657% due 7/25/2048 | | | 149,179 | | | | 136,913 | |
| b,e | WB Commercial Mortgage Trust, CMBS, Series 2024-HQ Class A, 6.134% due 3/15/2040 | | | 205,000 | | | | 207,644 | |
| | TOTAL MORTGAGE BACKED (Cost $11,678,977) | | | | | | | 12,013,209 | |
| | | | | | | | | | |
| | LOAN PARTICIPATIONS — 0.2% | | | | | | | | |
| | COMMERCIAL & PROFESSIONAL SERVICES — 0.2% | | | | | | | | |
| | Commercial Services & Supplies — 0.2% | | | | | | | | |
| g | Imagefirst Holdings LLC, 8.854% (SOFR + 4.25%) due 4/27/2028 | | | 196,986 | | | | 195,508 | |
| | | | | | | | | 195,508 | |
| | TOTAL LOAN PARTICIPATIONS (Cost $196,986) | | | | | | | 195,508 | |
| | | | | | | | | | |
| | EXCHANGE-TRADED FUNDS — 2.9% | | | | | | | | |
| a | Invesco DB Base Metals Fund | | | 34,412 | | | | 715,426 | |
| a | SPDR Gold Shares Fund | | | 5,318 | | | | 1,292,593 | |
| a | U.S. Oil Fund LP | | | 18,036 | | | | 1,261,077 | |
| | TOTAL EXCHANGE-TRADED FUNDS (Cost $2,548,886) | | | | | | | 3,269,096 | |
| | | | | | | | | | |
| | SHORT-TERM INVESTMENTS — 8.2% | | | | | | | | |
| h | Thornburg Capital Management Fund | | | 925,596 | | | | 9,255,964 | |
| | TOTAL SHORT-TERM INVESTMENTS (Cost $9,255,964) | | | | | | | 9,255,964 | |
| | | | | | | | | | |
| | TOTAL INVESTMENTS — 99.8% (Cost $96,212,020) | | | | | | $ | 112,129,598 | |
| | | | | | | | | | |
| | OTHER ASSETS LESS LIABILITIES — 0.2% | | | | | | | 217,226 | |
| | | | | | | | | | |
| | NET ASSETS — 100.0% | | | | | | $ | 112,346,824 | |
| OUTSTANDING FORWARD CURRENCY CONTRACTS TO BUY OR SELL AT SEPTEMBER 30, 2024 |
CONTRACT
DESCRIPTION | | CONTRACT
PARTY* | | BUY/SELL | | CONTRACT
AMOUNT | | CONTRACT
VALUE DATE | | VALUE
USD | | | UNREALIZED
APPRECIATION | | | UNREALIZED
DEPRECIATION | |
| Euro | | SSB | | Buy | | 4,025,000 | | 10/31/2024 | | 4,485,828 | | | $ | 111,353 | | | $ | — | |
| Japanese Yen | | MSC | | Buy | | 614,060,000 | | 10/31/2024 | | 4,289,355 | | | | 247,707 | | | | — | |
| Japanese Yen | | MSC | | Sell | | 76,700,000 | | 10/31/2024 | | 535,768 | | | | — | | | | (8,668 | ) |
| Total | | | | | | | | | | | | | $ | 359,060 | | | $ | (8,668 | ) |
| Net unrealized appreciation (depreciation) | | | $ | 350,392 | | | | | |
* Counterparties include State Street Bank and Trust Company (“SSB”) and Morgan Stanely & Co. Inc. (“MSC”).
| See notes to financial statements. | Annual Financial Statements | 47 |
Schedule of Investments, Continued
Thornburg Summit Fund | September 30, 2024
Footnote Legend
| b | Securities exempt from registration under Rule 144A of the Securities Act of 1933, as amended. These securities are restricted but liquid and may only be resold in the ordinary course of business in transactions exempt from registration, normally to qualified institutional buyers. As of September 30, 2024, the aggregate value of these securities in the Fund’s portfolio was $15,158,912, representing 13.49% of the Fund’s net assets. |
| c | Yankee bond denominated in U.S. dollars and is issued in the U.S. by foreign banks and corporations. |
| d | Security currently fair valued by Thornburg Investment Management, Inc.’s Valuation and Pricing Committee. |
| e | Variable, floating, step, or fixed to floating rate securities are securities for which interest rate changes are based on changes in a designated base rate or on a predetermined schedule. The rates shown are those in effect on September 30, 2024. |
| f | Securities are perpetual and, thus, do not have a predetermined maturity date. The date shown, if applicable, reflects the next call date. |
| g | The stated coupon rate represents the greater of the SOFR or the SOFR floor rate plus a spread at September 30, 2024. |
| h | Investment in Affiliates. |
Portfolio Abbreviations
To simplify the listings of securities, abbreviations are used per the table below:
| ADR | American Depositary Receipt | Mtg | Mortgage |
| AUD | Denominated in Australian Dollar | SBA | Small Business Administration |
| BRL | Denominated in Brazilian Real | SOFR | Secured Overnight Financing Rate |
| CMBS | Commercial Mortgage-Backed Securities | SOFRINDX | Secured Overnight Financing Rate Index |
| CMO | Collateralized Mortgage Obligation | TSFR1M | Term SOFR 1 Month |
| DOP | Denominated in Dominican Peso | TSFR3M | Term SOFR 3 Month |
| EGP | Denominated in Egyptian Pound | UMBS | Uniform Mortgage Backed Securities |
| EUR | Denominated in Euro | UZS | Denominated in Uzbekistani Som |
| GBP | Denominated in Pound Sterling | | |
COUNTRY EXPOSURE *
(percent of net assets)
| United States | 64.9% |
| France | 3.6% |
| Canada | 2.8% |
| Japan | 2.7% |
| India | 2.7% |
| United Kingdom | 2.5% |
| Brazil | 1.6% |
| Taiwan | 1.5% |
| South Korea | 1.4% |
| Australia | 1.1% |
| China | 1.0% |
| Macao | 0.9% |
| Denmark | 0.9% |
| Netherlands | 0.9% |
| Germany | 0.6% |
| Dominican Republic | 0.5% |
| Turkey | 0.4% |
| Egypt | 0.3% |
| Uzbekistan | 0.3% |
| Mexico | 0.3% |
| Colombia | 0.2% |
| South Africa | 0.2% |
| Israel | 0.1% |
| Cayman Islands | 0.1% |
| Panama | 0.1% |
| Other Assets Less Liabilities | 8.4% |
* Holdings are classified by country of risk as determined by MSCI and Bloomberg.
| 48 | Annual Financial Statements | See notes to financial statements. |
This page intentionally left blank.
Annual Financial Statements | 49
Statements of Assets and Liabilities
September 30, 2024
| | | THORNBURG
GLOBAL
OPPORTUNITIES
FUND | | | THORNBURG
INTERNATIONAL
EQUITY
FUND | | | THORNBURG
BETTER WORLD
INTERNATIONAL
FUND | | | THORNBURG
INTERNATIONAL
GROWTH
FUND | | | THORNBURG
DEVELOPING
WORLD
FUND | |
| ASSETS | | | | | | | | | | | | | | | | | | | | |
| Investments at cost | | | | | | | | | | | | | | | | | | | | |
| Non-affiliated issuers | | $ | 762,090,761 | | | $ | 2,007,366,360 | | | $ | 439,109,284 | | | $ | 557,986,232 | | | $ | 499,473,098 | |
| Non-controlled affiliated issuers | | | 36,186,959 | | | | 120,996,633 | | | | 22,153,050 | | | | 21,464,529 | | | | 1,108,242 | |
| Investments at value | | | | | | | | | | | | | | | | | | | | |
| Non-affiliated issuers | | | 1,270,298,157 | | | | 2,832,495,976 | | | | 546,512,328 | | | | 866,071,735 | | | | 678,106,684 | |
| Non-controlled affiliated issuers | | | 36,186,959 | | | | 120,996,633 | | | | 22,153,050 | | | | 21,464,529 | | | | 1,108,242 | |
| Cash | | | - | | | | 4,967 | | | | - | | | | - | | | | 1,172,474 | |
| Foreign currency at value (a) | | | 21 | | | | 7,082,617 | | | | 28,374 | | | | 102,687 | | | | 10 | |
| Receivable for investments sold | | | - | | | | 14,112,155 | | | | 3,934,983 | | | | 23,188,071 | | | | 2,385,567 | |
| Receivable for fund shares sold | | | 2,784,503 | | | | 4,005,237 | | | | 846,235 | | | | 349,031 | | | | 326,739 | |
| Dividends receivable | | | 2,598,383 | | | | 7,503,663 | | | | 1,144,059 | | | | 777,618 | | | | 1,091,052 | |
| Tax reclaims receivable | | | 1,393,767 | | | | 7,938,314 | | | | 982,816 | | | | 1,993,699 | | | | - | |
| Prepaid expenses and other assets | | | 98,806 | | | | 49,384 | | | | 56,500 | | | | 32,566 | | | | 22,082 | |
| Total Assets | | | 1,313,360,596 | | | | 2,994,188,946 | | | | 575,658,345 | | | | 913,979,936 | | | | 684,212,850 | |
| | | | | | | | | | | | | | | | | | | | | |
| LIABILITIES | | | | | | | | | | | | | | | | | | | | |
| | | | | | | | | | | | | | | | | | | | | |
| Unrealized depreciation on forward currency contracts | | | 424,443 | | | | 1,953,484 | | | | - | | | | - | | | | - | |
| Payable for investments purchased | | | 187,775 | | | | 12,603,824 | | | | 1,713,364 | | | | 29,426,230 | | | | 316,133 | |
| Payable for fund shares redeemed | | | 625,701 | | | | 2,321,655 | | | | 3,212,396 | | | | 468,849 | | | | 1,772,806 | |
| Payable to investment advisor and other affiliates | | | 991,978 | | | | 2,033,416 | | | | 304,141 | | | | 686,085 | | | | 427,738 | |
| IRS compliance fees for foreign withholding tax claims payable | | | - | | | | 3,355,756 | | | | - | | | | - | | | | - | |
| Deferred taxes payable | | | 4,586,646 | | | | 1,226,567 | | | | - | | | | 1,265,623 | | | | 5,914,443 | |
| Accounts payable and accrued expenses | | | 520,724 | | | | 1,554,617 | | | | 372,400 | | | | 529,613 | | | | 1,019,679 | |
| Dividends payable | | | 10 | | | | 3,476 | | | | - | | | | - | | | | - | |
| Total Liabilities | | | 7,337,277 | | | | 25,052,795 | | | | 5,602,301 | | | | 32,376,400 | | | | 9,450,799 | |
| NET ASSETS | | $ | 1,306,023,319 | | | $ | 2,969,136,151 | | | $ | 570,056,044 | | | $ | 881,603,536 | | | $ | 674,762,051 | |
| | | | | | | | | | | | | | | | | | | | | |
| NET ASSETS CONSIST OF | | | | | | | | | | | | | | | | | | | | |
| | | | | | | | | | | | | | | | | | | | | |
| Net capital paid in on shares of beneficial interest | | $ | 762,771,113 | | | $ | 1,984,859,552 | | | $ | 516,039,112 | | | $ | 523,429,100 | | | $ | 650,842,382 | |
| Distributable earnings | | | 543,252,206 | | | | 984,276,599 | | | | 54,016,932 | | | | 358,174,436 | | | | 23,919,669 | |
| NET ASSETS | | $ | 1,306,023,319 | | | $ | 2,969,136,151 | | | $ | 570,056,044 | | | $ | 881,603,536 | | | $ | 674,762,051 | |
50 | Annual Financial Statements
Statements of Assets and Liabilities, Continued
September 30, 2024
| | | THORNBURG
GLOBAL
OPPORTUNITIES
FUND | | | THORNBURG
INTERNATIONAL
EQUITY
FUND | | | THORNBURG
BETTER
WORLD
INTERNATIONAL
FUND | | | THORNBURG
INTERNATIONAL
GROWTH
FUND | | | THORNBURG
DEVELOPING
WORLD
FUND | |
| NET ASSET VALUE | | | | | | | | | | | | | | | | | | | | |
| Class A Shares: | | | | | | | | | | | | | | | | | | | | |
| Net assets applicable to shares outstanding | | $ | 347,531,687 | | | $ | 432,976,003 | | | $ | 38,158,990 | | | $ | 92,100,556 | | | $ | 76,267,535 | |
| Shares outstanding | | | 8,756,709 | | | | 14,910,513 | | | | 1,974,792 | | | | 3,398,536 | | | | 3,328,246 | |
| Net asset value and redemption price per share | | $ | 39.69 | | | $ | 29.04 | | | $ | 19.32 | | | $ | 27.10 | | | $ | 22.92 | |
| Maximum offering price per share (net asset value, plus 4.50% of offering price) | | $ | 41.56 | | | $ | 30.41 | | | $ | 20.23 | | | $ | 28.38 | | | $ | 24.00 | |
| | | | | | | | | | | | | | | | | | | | | |
| Class C Shares: | | | | | | | | | | | | | | | | | | | | |
| Net assets applicable to shares outstanding | | | 27,358,415 | | | | 10,054,947 | | | | 6,574,594 | | | | 6,985,251 | | | | 7,493,223 | |
| Shares outstanding | | | 728,497 | | | | 405,749 | | | | 351,656 | | | | 291,717 | | | | 349,276 | |
| Net asset value and redemption price per share* | | | 37.55 | | | | 24.78 | | | | 18.70 | | | | 23.95 | | | | 21.45 | |
| | | | | | | | | | | | | | | | | | | | | |
| Class I Shares: | | | | | | | | | | | | | | | | | | | | |
| Net assets applicable to shares outstanding | | | 829,382,521 | | | | 1,747,825,760 | | | | 525,322,460 | | | | 673,334,756 | | | | 519,162,608 | |
| Shares outstanding | | | 20,770,281 | | | | 57,663,326 | | | | 26,309,316 | | | | 23,874,977 | | | | 22,058,068 | |
| Net asset value and redemption price per share | | | 39.93 | | | | 30.31 | | | | 19.97 | | | | 28.20 | | | | 23.54 | |
| | | | | | | | | | | | | | | | | | | | | |
| Class R3 Shares: | | | | | | | | | | | | | | | | | | | | |
| Net assets applicable to shares outstanding | | | 2,833,055 | | | | 128,724,693 | | | | - | | | | 4,770,946 | | | | - | |
| Shares outstanding | | | 72,336 | | | | 4,443,795 | | | | - | | | | 179,258 | | | | - | |
| Net asset value and redemption price per share | | | 39.17 | | | | 28.97 | | | | - | | | | 26.61 | | | | - | |
| | | | | | | | | | | | | | | | | | | | | |
| Class R4 Shares: | | | | | | | | | | | | | | | | | | | | |
| Net assets applicable to shares outstanding | | | 4,931,399 | | | | 93,021,410 | | | | - | | | | 7,102,862 | | | | - | |
| Shares outstanding | | | 125,319 | | | | 3,239,399 | | | | - | | | | 264,777 | | | | - | |
| Net asset value and redemption price per share | | | 39.35 | | | | 28.72 | | | | - | | | | 26.83 | | | | - | |
| | | | | | | | | | | | | | | | | | | | | |
| Class R5 Shares: | | | | | | | | | | | | | | | | | | | | |
| Net assets applicable to shares outstanding | | | 18,133,885 | | | | 117,461,348 | | | | - | | | | 6,386,970 | | | | 3,379,753 | |
| Shares outstanding | | | 453,360 | | | | 3,880,135 | | | | - | | | | 225,731 | | | | 144,094 | |
| Net asset value and redemption price per share | | | 40.00 | | | | 30.27 | | | | - | | | | 28.29 | | | | 23.46 | |
| | | | | | | | | | | | | | | | | | | | | |
| Class R6 Shares: | | | | | | | | | | | | | | | | | | | | |
| Net assets applicable to shares outstanding | | | 75,852,357 | | | | 439,071,990 | | | | - | | | | 90,922,195 | | | | 68,458,932 | |
| Shares outstanding | | | 1,890,292 | | | | 14,557,343 | | | | - | | | | 3,197,598 | | | | 2,901,222 | |
| Net asset value and redemption price per share | | | 40.13 | | | | 30.16 | | | | - | | | | 28.43 | | | | 23.60 | |
| (a) | Cost of foreign currency is $20; $7,082,503; $28,494; $103,095; $10 respectively. |
| * | Redemption price per share is equal to net asset value less any applicable contingent deferred sales charge. |
See notes to financial statements.
Annual Financial Statements | 51
Statements of Assets and Liabilities, Continued
September 30, 2024
| | | THORNBURG
SMALL/MID CAP
CORE
FUND | | | THORNBURG
SMALL/MID CAP
GROWTH
FUND | | | THORNBURG
INVESTMENT
INCOME BUILDER
FUND | | | THORNBURG
SUMMIT
FUND | |
| ASSETS | | | | | | | | | | | | | | | | |
| Investments at cost | | | | | | | | | | | | | | | | |
| Non-affiliated issuers | | $ | 407,845,530 | | | $ | 200,312,571 | | | $ | 9,457,434,949 | | | $ | 86,956,056 | |
| Non-controlled affiliated issuers | | | 10,203,814 | | | | 5,829,012 | | | | 896,297,483 | | | | 9,255,964 | |
| Investments at value | | | | | | | | | | | | | | | | |
| Non-affiliated issuers | | | 550,565,145 | | | | 270,191,491 | | | | 13,068,345,898 | | | | 102,873,634 | |
| Non-controlled affiliated issuers | | | 10,203,814 | | | | 5,829,012 | | | | 830,514,433 | | | | 9,255,964 | |
| Cash | | | - | | | | - | | | | 6,449,395 | | | | - | |
| Foreign currency at value (a) | | | - | | | | - | | | | 143 | | | | 114 | |
| Unrealized appreciation on forward currency contracts | | | - | | | | - | | | | 231,537 | | | | 359,060 | |
| Receivable for investments sold | | | - | | | | - | | | | 14,353,230 | | | | 224,936 | |
| Receivable for fund shares sold | | | 65,373 | | | | 17,807 | | | | 11,122,694 | | | | 66,928 | |
| Dividends receivable | | | 65,499 | | | | 20,514 | | | | 27,477,871 | | | | 118,916 | |
| Tax reclaims receivable | | | - | | | | 1,687 | | | | 39,005,278 | | | | 41,223 | |
| Principal and interest receivable | | | - | | | | - | | | | 19,719,745 | | | | 263,141 | |
| Prepaid expenses and other assets | | | 44,212 | | | | 31,180 | | | | 1,918 | | | | 13,331 | |
| Total Assets | | | 560,944,043 | | | | 276,091,691 | | | | 14,017,222,142 | | | | 113,217,247 | |
| | | | | | | | | | | | | | | | | |
| LIABILITIES | | | | | | | | | | | | | | | | |
| Unrealized depreciation on forward currency contracts | | | - | | | | - | | | | 6,628,880 | | | | 8,668 | |
| Payable for investments purchased | | | 25,882 | | | | 14,522 | | | | 40,395,986 | | | | 528,465 | |
| Payable for fund shares redeemed | | | 173,876 | | | | 20,378 | | | | 4,211,835 | | | | - | |
| Payable to investment advisor and other affiliates | | | 533,723 | | | | 262,937 | | | | 11,002,934 | | | | 21,571 | |
| Deferred taxes payable | | | - | | | | - | | | | 2,686,189 | | | | 196,970 | |
| Accounts payable and accrued expenses | | | 361,452 | | | | 182,329 | | | | 2,974,520 | | | | 114,749 | |
| Dividends payable | | | - | | | | - | | | | 17,297,333 | | | | - | |
| Total Liabilities | | | 1,094,933 | | | | 480,166 | | | | 85,197,677 | | | | 870,423 | |
| NET ASSETS | | $ | 559,849,110 | | | $ | 275,611,525 | | | $ | 13,932,024,465 | | | $ | 112,346,824 | |
| | | | | | | | | | | | | | | | | |
| NET ASSETS CONSIST OF | | | | | | | | | | | | | | | | |
| Net capital paid in on shares of beneficial interest | | $ | 455,821,371 | | | $ | 312,442,794 | | | $ | 10,429,620,965 | | | $ | 94,788,550 | |
| Distributable earnings (accumulated loss) | | | 104,027,739 | | | | (36,831,269 | ) | | | 3,502,403,500 | | | | 17,558,274 | |
| NET ASSETS | | $ | 559,849,110 | | | $ | 275,611,525 | | | $ | 13,932,024,465 | | | $ | 112,346,824 | |
52 | Annual Financial Statements
Statements of Assets and Liabilities, Continued
September 30, 2024
| | | THORNBURG
SMALL/MID CAP
CORE
FUND | | | THORNBURG
SMALL/MID CAP
GROWTH
FUND | | | THORNBURG
INVESTMENT
INCOME BUILDER
FUND | | | THORNBURG
SUMMIT
FUND | |
| NET ASSET VALUE | | | | | | | | | | | | | | | | |
| Class A Shares: | | | | | | | | | | | | | | | | |
| Net assets applicable to shares outstanding | | $ | 306,851,682 | | | $ | 140,412,487 | | | $ | 4,501,106,115 | | | $ | 13,638,595 | |
| Shares outstanding | | | 3,977,253 | | | | 4,645,361 | | | | 168,801,564 | | | | 1,013,088 | |
| Net asset value and redemption price per share | | $ | 77.15 | | | $ | 30.23 | | | $ | 26.67 | | | $ | 13.46 | |
| Maximum offering price per share (net asset value, plus 4.50% of offering price) | | $ | 80.79 | | | $ | 31.65 | | | $ | 27.93 | | | $ | 14.09 | |
| | | | | | | | | | | | | | | | | |
| Class C Shares: | | | | | | | | | | | | | | | | |
| Net assets applicable to shares outstanding | | | 3,194,667 | | | | 2,668,653 | | | | 510,172,529 | | | | - | |
| Shares outstanding | | | 49,404 | | | | 123,213 | | | | 19,161,750 | | | | - | |
| Net asset value and redemption price per share* | | | 64.66 | | | | 21.66 | | | | 26.62 | | | | - | |
| | | | | | | | | | | | | | | | | |
| Class I Shares: | | | | | | | | | | | | | | | | |
| Net assets applicable to shares outstanding | | | 232,076,496 | | | | 107,769,794 | | | | 8,599,135,397 | | | | 98,708,229 | |
| Shares outstanding | | | 2,859,447 | | | | 3,072,404 | | | | 320,057,928 | | | | 7,328,763 | |
| Net asset value and redemption price per share | | | 81.16 | | | | 35.08 | | | | 26.87 | | | | 13.47 | |
| | | | | | | | | | | | | | | | | |
| Class R3 Shares: | | | | | | | | | | | | | | | | |
| Net assets applicable to shares outstanding | | | 12,245,379 | | | | 15,029,953 | | | | 21,650,439 | | | | - | |
| Shares outstanding | | | 159,561 | | | | 507,775 | | | | 812,369 | | | | - | |
| Net asset value and redemption price per share | | | 76.74 | | | | 29.60 | | | | 26.65 | | | | - | |
| | | | | | | | | | | | | | | | | |
| Class R4 Shares: | | | | | | | | | | | | | | | | |
| Net assets applicable to shares outstanding | | | 2,722,973 | | | | 893,784 | | | | 12,740,948 | | | | - | |
| Shares outstanding | | | 34,867 | | | | 29,436 | | | | 477,357 | | | | - | |
| Net asset value and redemption price per share | | | 78.10 | | | | 30.36 | | | | 26.69 | | | | - | |
| | | | | | | | | | | | | | | | | |
| Class R5 Shares: | | | | | | | | | | | | | | | | |
| Net assets applicable to shares outstanding | | | 2,757,913 | | | | 8,836,854 | | | | 19,236,491 | | | | - | |
| Shares outstanding | | | 34,043 | | | | 252,368 | | | | 716,520 | | | | - | |
| Net asset value and redemption price per share | | | 81.01 | | | | 35.02 | | | | 26.85 | | | | - | |
| | | | | | | | | | | | | | | | | |
| Class R6 Shares: | | | | | | | | | | | | | | | | |
| Net assets applicable to shares outstanding | | | - | | | | - | | | | 267,982,546 | | | | - | |
| Shares outstanding | | | - | | | | - | | | | 10,004,637 | | | | - | |
| Net asset value and redemption price per share | | | - | | | | - | | | | 26.79 | | | | - | |
| (a) | Cost of foreign currency is $0; $0; $143; $111 respectively. |
| * | Redemption price per share is equal to net asset value less any applicable contingent deferred sales charge. |
See notes to financial statements.
Annual Financial Statements | 53
Statements of Operations
Year Ended September 30, 2024
| | | THORNBURG
GLOBAL
OPPORTUNITIES
FUND | | | THORNBURG
INTERNATIONAL
EQUITY
FUND | | | THORNBURG
BETTER WORLD
INTERNATIONAL
FUND | | | THORNBURG
INTERNATIONAL
GROWTH
FUND | | | THORNBURG
DEVELOPING
WORLD
FUND | |
| INVESTMENT INCOME | | | | | | | | | | | | | | | | | | | | |
| Dividend income | | | | | | | | | | | | | | | | | | | | |
| Non-affiliated issuers | | $ | 30,326,012 | | | $ | 69,621,469 | | | $ | 11,540,524 | | | $ | 13,276,059 | | | $ | 17,945,985 | |
| Non-controlled affiliated issuers | | | 1,956,399 | | | | 8,114,126 | | | | 2,292,714 | | | | 902,530 | | | | 656,379 | |
| Dividend taxes withheld | | | (2,287,170 | ) | | | (5,512,390 | ) | | | (731,416 | ) | | | (1,541,910 | ) | | | (2,194,693 | ) |
| Interest income | | | 833 | | | | 9,769 | | | | 128 | | | | 2,488 | | | | 135 | |
| Foreign withholding tax claims | | | 206,901 | | | | 10,555,554 | | | | 72,230 | | | | 164,556 | | | | - | |
| Adjusted for: IRS compliance fees for foreign | | | | | | | | | | | | | | | | | | | | |
| withholding tax claims | | | - | | | | (3,355,756 | ) | | | - | | | | - | | | | - | |
| Total Income | | | 30,202,975 | | | | 79,432,772 | | | | 13,174,180 | | | | 12,803,723 | | | | 16,407,806 | |
| | | | | | | | | | | | | | | | | | | | | |
| EXPENSES | | | | | | | | | | | | | | | | | | | | |
| Investment management fees | | | 9,702,226 | | | | 20,091,491 | | | | 5,502,240 | | | | 7,426,184 | | | | 8,582,976 | |
| Administration fees | | | 1,005,286 | | | | 2,268,581 | | | | 494,639 | | | | 757,593 | | | | 785,284 | |
| Distribution and service fees | | | | | | | | | | | | | | | | | | | | |
| Class A Shares | | | 788,149 | | | | 998,531 | | | | 98,371 | | | | 229,143 | | | | 197,243 | |
| Class C Shares | | | 316,506 | | | | 108,013 | | | | 61,840 | | | | 77,656 | | | | 93,286 | |
| Class R3 Shares | | | 13,576 | | | | 593,296 | | | | - | | | | 24,320 | | | | - | |
| Class R4 Shares | | | 12,278 | | | | 221,983 | | | | - | | | | 17,804 | | | | - | |
| Transfer agent fees | | | | | | | | | | | | | | | | | | | | |
| Class A Shares | | | 344,925 | | | | 498,552 | | | | 62,443 | | | | 111,225 | | | | 140,518 | |
| Class C Shares | | | 47,488 | | | | 15,188 | | | | 8,514 | | | | 15,275 | | | | 19,116 | |
| Class I Shares | | | 728,945 | | | | 1,238,543 | | | | 582,866 | | | | 326,916 | | | | 861,623 | |
| Class R3 Shares | | | 12,178 | | | | 312,482 | | | | - | | | | 18,517 | | | | - | |
| Class R4 Shares | | | 29,721 | | | | 288,508 | | | | - | | | | 42,093 | | | | - | |
| Class R5 Shares | | | 51,411 | | | | 286,821 | | | | - | | | | 47,900 | | | | 12,816 | |
| Class R6 Shares | | | 12,078 | | | | 38,512 | | | | - | | | | 13,355 | | | | 26,530 | |
| Registration and filing fees | | | | | | | | | | | | | | | | | | | | |
| Class A Shares | | | 20,238 | | | | 18,479 | | | | 17,665 | | | | 16,917 | | | | 15,323 | |
| Class C Shares | | | 15,368 | | | | 14,382 | | | | 17,607 | | | | 14,495 | | | | 15,157 | |
| Class I Shares | | | 32,803 | | | | 34,994 | | | | 32,571 | | | | 20,927 | | | | 30,711 | |
| Class R3 Shares | | | 15,515 | | | | 14,732 | | | | - | | | | 14,927 | | | | - | |
| Class R4 Shares | | | 15,515 | | | | 14,439 | | | | - | | | | 14,935 | | | | - | |
| Class R5 Shares | | | 15,497 | | | | 14,439 | | | | - | | | | 14,854 | | | | 15,564 | |
| Class R6 Shares | | | 15,558 | | | | 16,181 | | | | - | | | | 14,923 | | | | 15,564 | |
| Custodian fees | | | 205,232 | | | | 393,975 | | | | 161,318 | | | | 169,874 | | | | 864,502 | |
| Audit and tax fees | | | 67,954 | | | | 110,620 | | | | 72,429 | | | | 103,521 | | | | 62,409 | |
| Legal fees | | | 12,342 | | | | 28,853 | | | | 2,689 | | | | 10,341 | | | | 11,110 | |
| Trustee and officer fees | | | 73,871 | | | | 168,455 | | | | 40,017 | | | | 59,805 | | | | 65,570 | |
| Tax reclaim collection fees | | | - | | | | 1,537,849 | | | | - | | | | - | | | | - | |
| Other expenses | | | 176,556 | | | | 300,067 | | | | 110,386 | | | | 70,214 | | | | 192,028 | |
| Total Expenses | | | 13,731,216 | | | | 29,627,966 | | | | 7,265,595 | | | | 9,633,714 | | | | 12,007,330 | |
| Less: | | | | | | | | | | | | | | | | | | | | |
| Expenses reimbursed | | | (586,944 | ) | | | (984,343 | ) | | | (1,084,005 | ) | | | (499,479 | ) | | | (905,368 | ) |
| Investment management fees waived | | | (421,427 | ) | | | (2,842,124 | ) | | | (779,118 | ) | | | (101,674 | ) | | | (1,335,363 | ) |
| Net Expenses | | | 12,722,845 | | | | 25,801,499 | | | | 5,402,472 | | | | 9,032,561 | | | | 9,766,599 | |
| Net Investment Income (Loss) | | $ | 17,480,130 | | | $ | 53,631,273 | | | $ | 7,771,708 | | | $ | 3,771,162 | | | $ | 6,641,207 | |
54 | Annual Financial Statements
Statements of Operations, Continued
Year Ended September 30, 2024
| | | THORNBURG
GLOBAL
OPPORTUNITIES
FUND | | | THORNBURG INTERNATIONAL EQUITY FUND | | | THORNBURG
BETTER WORLD
INTERNATIONAL
FUND | | | THORNBURG INTERNATIONAL GROWTH FUND | | | THORNBURG
DEVELOPING
WORLD
FUND | |
REALIZED AND UNREALIZED GAIN (LOSS) | | | | | | | | | | | | | | | | | | | | |
| Net realized gain (loss) on: | | | | | | | | | | | | | | | | | | | | |
| Non-affiliated issuers investments* | | $ | 37,533,892 | | | $ | 118,566,274 | | | $ | (11,231,496 | ) | | $ | 64,569,406 | | | $ | 47,114,518 | |
| Forward currency contracts | | | (2,205,370 | ) | | | 12,419,554 | | | | - | | | | - | | | | - | |
| Foreign currency transactions | | | (128,948 | ) | | | (929,354 | ) | | | (114,001 | ) | | | (10,128 | ) | | | (864,688 | ) |
| Net realized gain (loss) | | | 35,199,574 | | | | 130,056,474 | | | | (11,345,497 | ) | | | 64,559,278 | | | | 46,249,830 | |
| | | | | | | | | | | | | | | | | | | | | |
| Net change in unrealized appreciation (depreciation) on: | | | | | | | | | | | | | | | | | | | | |
| Non-affiliated issuers investments** | | | 244,262,251 | | | | 558,990,974 | | | | 116,045,024 | | | | 132,499,628 | | | | 87,914,685 | |
| Forward currency contracts | | | (5,705,680 | ) | | | (10,951,245 | ) | | | - | | | | - | | | | - | |
| Foreign currency translations | | | 94,917 | | | | 608,271 | | | | 59,411 | | | | 158,475 | | | | 19,298 | |
| Change in net unrealized appreciation | | | | | | | | | | | | | | | | | | | | |
| (depreciation) | | | 238,651,488 | | | | 548,648,000 | | | | 116,104,435 | | | | 132,658,103 | | | | 87,933,983 | |
| Net Realized and Unrealized Gain (Loss) | | | 273,851,062 | | | | 678,704,474 | | | | 104,758,938 | | | | 197,217,381 | | | | 134,183,813 | |
| Change in Net Assets Resulting from | | | | | | | | | | | | | | | | | | | | |
| Operations | | $ | 291,331,192 | | | $ | 732,335,747 | | | $ | 112,530,646 | | | $ | 200,988,543 | | | $ | 140,825,020 | |
| * Net of foreign capital gain taxes | | $ | 651,917 | | | $ | 2,034,945 | | | $ | - | | | $ | 597,785 | | | $ | 9,372,652 | |
| ** Net of change in deferred taxes | | $ | (1,497,963 | ) | | $ | (425,383 | ) | | $ | - | | | $ | (1,265,623 | ) | | $ | (2,791,366 | ) |
See notes to financial statements.
Annual Financial Statements | 55
Statements of Operations, Continued
Year Ended September 30, 2024
| | | THORNBURG
SMALL/MID CAP
CORE
FUND | | | THORNBURG
SMALL/MID CAP
GROWTH
FUND | | | THORNBURG
INVESTMENT
INCOME BUILDER
FUND | | | THORNBURG
SUMMIT
FUND | |
| INVESTMENT INCOME | | | | | | | | | | | | | | | | |
| Dividend income | | | | | | | | | | | | | | | | |
| Non-affiliated issuers | | $ | 3,885,209 | | | $ | 527,289 | | | $ | 568,330,951 | | | $ | 937,280 | |
| Non-controlled affiliated issuers | | | 341,662 | | | | 172,698 | | | | 41,344,666 | | | | 362,037 | |
| Dividend taxes withheld | | | - | | | | (2,300 | ) | | | (34,973,030 | ) | | | (37,008 | ) |
| Interest income | | | - | | | | - | | | | 104,660,331 | | | | 1,776,731 | |
| Foreign withholding tax claims | | | - | | | | - | | | | 1,741,240 | | | | 27,333 | |
| Total Income | | | 4,226,871 | | | | 697,687 | | | | 681,104,158 | | | | 3,066,373 | |
| | | | | | | | | | | | | | | | | |
| EXPENSES | | | | | | | | | | | | | | | | |
| Investment management fees | | | 4,557,438 | | | | 2,306,894 | | | | 87,822,670 | | | | 733,704 | |
| Administration fees | | | 454,808 | | | | 229,590 | | | | 11,003,220 | | | | 85,127 | |
| Distribution and service fees | | | | | | | | | | | | | | | | |
| Class A Shares | | | 723,071 | | | | 338,903 | | | | 10,466,602 | | | | 22,215 | |
| Class C Shares | | | 37,317 | | | | 30,820 | | | | 4,964,977 | | | | - | |
| Class R3 Shares | | | 61,846 | | | | 72,276 | | | | 103,726 | | | | - | |
| Class R4 Shares | | | 6,201 | | | | 2,123 | | | | 29,005 | | | | - | |
| Transfer agent fees | | | | | | | | | | | | | | | | |
| Class A Shares | | | 364,121 | | | | 191,576 | | | | 2,879,750 | | | | 22,353 | |
| Class C Shares | | | 21,309 | | | | 19,392 | | | | 372,636 | | | | - | |
| Class I Shares | | | 153,091 | | | | 45,920 | | | | 5,888,347 | | | | 41,280 | |
| Class R3 Shares | | | 33,208 | | | | 37,966 | | | | 53,370 | | | | - | |
| Class R4 Shares | | | 7,733 | | | | 4,027 | | | | 34,347 | | | | - | |
| Class R5 Shares | | | 9,980 | | | | 11,988 | | | | 60,733 | | | | - | |
| Class R6 Shares | | | - | | | | - | | | | 28,359 | | | | - | |
| Registration and filing fees | | | | | | | | | | | | | | | | |
| Class A Shares | | | 16,718 | | | | 14,975 | | | | 71,093 | | | | 17,385 | |
| Class C Shares | | | 15,273 | | | | 14,509 | | | | 34,456 | | | | - | |
| Class I Shares | | | 16,213 | | | | 14,550 | | | | 118,747 | | | | 17,371 | |
| Class R3 Shares | | | 14,750 | | | | 14,610 | | | | 24,577 | | | | - | |
| Class R4 Shares | | | 14,880 | | | | 14,791 | | | | 24,541 | | | | - | |
| Class R5 Shares | | | 14,887 | | | | 14,413 | | | | 24,671 | | | | - | |
| Class R6 Shares | | | - | | | | - | | | | 24,754 | | | | - | |
| Custodian fees | | | 44,060 | | | | 38,642 | | | | 1,102,398 | | | | 95,775 | |
| Audit and tax fees | | | 61,344 | | | | 55,142 | | | | 121,589 | | | | 85,481 | |
| Legal fees | | | 4,906 | | | | 2,676 | | | | 144,503 | | | | 1,149 | |
| Trustee and officer fees | | | 34,450 | | | | 18,704 | | | | 837,359 | | | | 6,567 | |
| Tax reclaim collection fees | | | - | | | | - | | | | 253,844 | | | | - | |
| Other expenses | | | 40,607 | | | | 38,267 | | | | 1,088,776 | | | | 53,316 | |
| Total Expenses | | | 6,708,211 | | | | 3,532,754 | | | | 127,579,050 | | | | 1,181,723 | |
| Less: | | | | | | | | | | | | | | | | |
| Expenses reimbursed | | | (409,135 | ) | | | (267,249 | ) | | | (181,781 | ) | | | (183,900 | ) |
| Investment management fees waived | | | - | | | | - | | | | - | | | | (300,600 | ) |
| Net Expenses | | | 6,299,076 | | | | 3,265,505 | | | | 127,397,269 | | | | 697,223 | |
| Net Investment Income (Loss) | | $ | (2,072,205 | ) | | $ | (2,567,818 | ) | | $ | 553,706,889 | | | $ | 2,369,150 | |
56 | Annual Financial Statements
Statements of Operations, Continued
Year Ended September 30, 2024
| | | THORNBURG
SMALL/MID CAP
CORE FUND | | | THORNBURG
SMALL/MID CAP
GROWTH FUND | | | THORNBURG
INVESTMENT
INCOME BUILDER
FUND | | | THORNBURG
SUMMIT
FUND | |
| REALIZED AND UNREALIZED GAIN (LOSS) | | | | | | | | | | | | | | | | |
Net realized gain (loss) on: Non-affiliated issuers investments* | | $ | 11,004,011 | | | $ | 3,142,354 | | | $ | 390,187,470 | | | $ | 3,334,592 | |
| Forward currency contracts | | | - | | | | - | | | | (35,193,851 | ) | | | (324,636 | ) |
| Foreign currency transactions | | | - | | | | (788 | ) | | | 545,315 | | | | (5,838 | ) |
| Net realized gain (loss) | | | 11,004,011 | | | | 3,141,566 | | | | 355,538,934 | | | | 3,004,118 | |
| | | | | | | | | | | | | | | | | |
Net change in unrealized appreciation (depreciation) on: Non-affiliated issuers investments** | | | 117,384,529 | | | | 56,135,991 | | | | 2,000,376,616 | | | | 13,499,929 | |
| Non-controlled affiliated issuers | | | - | | | | - | | | | (4,186,016 | ) | | | - | |
| Forward currency contracts | | | - | | | | - | | | | (82,794,489 | ) | | | 567,481 | |
| Foreign currency translations | | | - | | | | - | | | | 2,115,296 | | | | (122 | ) |
| Change in net unrealized appreciation (depreciation) | | | 117,384,529 | | | | 56,135,991 | | | | 1,915,511,407 | | | | 14,067,288 | |
| Net Realized and Unrealized Gain (Loss) | | | 128,388,540 | | | | 59,277,557 | | | | 2,271,050,341 | | | | 17,071,406 | |
| Change in Net Assets Resulting from Operations | | $ | 126,316,335 | | | $ | 56,709,739 | | | $ | 2,824,757,230 | | | $ | 19,440,556 | |
| * Net of foreign capital gain taxes | | $ | - | | | $ | - | | | $ | - | | | $ | 19,658 | |
| ** Net of change in deferred taxes | | $ | - | | | $ | - | | | $ | (1,960,385 | ) | | $ | (196,970 | ) |
See notes to financial statements.
Annual Financial Statements | 57
Statements of Changes in Net Assets
| | | THORNBURG GLOBAL OPPORTUNITIES FUND | | | THORNBURG INTERNATIONAL EQUITY FUND | |
| | | YEAR ENDED
SEPTEMBER 30, 2024 | | | YEAR ENDED
SEPTEMBER 30, 2023 | | | YEAR ENDED
SEPTEMBER 30, 2024 | | | YEAR ENDED
SEPTEMBER 30, 2023 | |
| INCREASE (DECREASE) IN NET ASSETS FROM | | | | | | | | | | | | | | | | |
| | | | | | | | | | | | | | | | | |
| OPERATIONS | | | | | | | | | | | | | | | | |
| Net investment income (loss) | | $ | 17,480,130 | | | $ | 22,966,683 | | | $ | 53,631,273 | | | $ | 45,245,909 | |
| Net realized gain (loss) | | | 35,199,574 | | | | 42,293,182 | | | | 130,056,474 | | | | 42,874,938 | |
| Net change in unrealized appreciation (depreciation) | | | 238,651,488 | | | | 121,450,660 | | | | 548,648,000 | | | | 445,485,130 | |
| | | | | | | | | | | | | | | | | |
| Net Increase (Decrease) in Net Assets Resulting from Operations | | | 291,331,192 | | | | 186,710,525 | | | | 732,335,747 | | | | 533,605,977 | |
| | | | | | | | | | | | | | | | | |
| DIVIDENDS TO SHAREHOLDERS | | | | | | | | | | | | | | | | |
| From distributable earnings | | | | | | | | | | | | | | | | |
| Class A Shares | | | (16,081,299 | ) | | | (9,456,995 | ) | | | (8,698,557 | ) | | | (6,396,784 | ) |
| Class C Shares | | | (1,610,419 | ) | | | (1,959,214 | ) | | | (175,163 | ) | | | (180,196 | ) |
| Class I Shares | | | (36,940,875 | ) | | | (22,157,893 | ) | | | (34,545,635 | ) | | | (27,585,467 | ) |
| Class R3 Shares | | | (144,111 | ) | | | (100,397 | ) | | | (2,284,889 | ) | | | (1,851,400 | ) |
| Class R4 Shares | | | (268,120 | ) | | | (189,199 | ) | | | (1,907,091 | ) | | | (1,536,366 | ) |
| Class R5 Shares | | | (1,026,988 | ) | | | (660,145 | ) | | | (2,400,229 | ) | | | (2,007,059 | ) |
| Class R6 Shares | | | (3,542,681 | ) | | | (2,165,798 | ) | | | (8,275,441 | ) | | | (6,118,423 | ) |
| | | | | | | | | | | | | | | | | |
| FUND SHARE TRANSACTIONS | | | | | | | | | | | | | | | | |
| Class A Shares | | | 124,241 | | | | 25,050,330 | | | | (40,461,493 | ) | | | (48,099,827 | ) |
| Class C Shares | | | (18,677,008 | ) | | | (35,106,383 | ) | | | (5,017,561 | ) | | | (4,907,521 | ) |
| Class I Shares | | | 58,862,091 | | | | 94,529,948 | | | | (38,628,419 | ) | | | (150,959,707 | ) |
| Class R3 Shares | | | (464,923 | ) | | | (347,655 | ) | | | (12,029,387 | ) | | | (14,278,178 | ) |
| Class R4 Shares | | | (1,058,349 | ) | | | (381,691 | ) | | | (12,350,791 | ) | | | (4,541,851 | ) |
| Class R5 Shares | | | (3,020,448 | ) | | | (642,889 | ) | | | (11,388,544 | ) | | | (5,295,441 | ) |
| Class R6 Shares | | | 4,112,053 | | | | 2,091,987 | | | | 51,235,272 | | | | (4,922,712 | ) |
| Net Increase (Decrease) in Net Assets | | | 271,594,356 | | | | 235,214,531 | | | | 605,407,819 | | | | 254,925,045 | |
| | | | | | | | | | | | | | | | | |
| NET ASSETS | | | | | | | | | | | | | | | | |
| Beginning of Year | | | 1,034,428,963 | | | | 799,214,432 | | | | 2,363,728,332 | | | | 2,108,803,287 | |
| End of Year | | $ | 1,306,023,319 | | | $ | 1,034,428,963 | | | $ | 2,969,136,151 | | | $ | 2,363,728,332 | |
See notes to financial statements.
58 | Annual Financial Statements
Statements of Changes in Net Assets, Continued
| | THORNBURG BETTER WORLD INTERNATIONAL FUND | | THORNBURG INTERNATIONAL GROWTH FUND | |
| | | YEAR ENDED
SEPTEMBER 30, 2024 | | | YEAR ENDED
SEPTEMBER 30, 2023 | | | YEAR ENDED
SEPTEMBER 30, 2024 | | | YEAR ENDED
SEPTEMBER 30, 2023 | |
| INCREASE (DECREASE) IN NET ASSETS FROM | | | | | | | | | | | | | | | | |
| | | | | | | | | | | | | | | | | |
| OPERATIONS | | | | | | | | | | | | | | | | |
| Net investment income (loss) | | $ | 7,771,708 | | | $ | 6,931,440 | | | $ | 3,771,162 | | | $ | 3,980,329 | |
| Net realized gain (loss) | | | (11,345,497 | ) | | | 2,557,196 | | | | 64,559,278 | | | | 33,111,710 | |
| Net change in unrealized appreciation (depreciation) | | | 116,104,435 | | | | 65,793,514 | | | | 132,658,103 | | | | 136,078,025 | |
| | | | | | | | | | | | | | | | | |
| Net Increase (Decrease) in Net Assets Resulting from Operations | | | 112,530,646 | | | | 75,282,150 | | | | 200,988,543 | | | | 173,170,064 | |
| | | | | | | | | | | | | | | | | |
| DIVIDENDS TO SHAREHOLDERS | | | | | | | | | | | | | | | | |
| From distributable earnings | | | | | | | | | | | | | | | | |
| Class A Shares | | | (441,083 | ) | | | (110,786 | ) | | | (205,276 | ) | | | (255,104 | ) |
| Class C Shares | | | (23,443 | ) | | | - | | | | - | | | | - | |
| Class I Shares | | | (8,100,820 | ) | | | (3,365,207 | ) | | | (3,944,778 | ) | | | (5,140,255 | ) |
| Class R3 Shares | | | - | | | | - | | | | (6,666 | ) | | | (7,298 | ) |
| Class R4 Shares | | | - | | | | - | | | | (16,845 | ) | | | (24,867 | ) |
| Class R5 Shares | | | - | | | | - | | | | (74,501 | ) | | | (170,516 | ) |
| Class R6 Shares | | | - | | | | - | | | | (555,216 | ) | | | (626,086 | ) |
| | | | | | | | | | | | | | | | | |
| FUND SHARE TRANSACTIONS | | | | | | | | | | | | | | | | |
| Class A Shares | | | (9,514,437 | ) | | | 1,010,983 | | | | (15,437,862 | ) | | | (14,839,351 | ) |
| Class C Shares | | | (720,715 | ) | | | 1,007,401 | | | | (3,332,466 | ) | | | (4,338,314 | ) |
| Class I Shares | | | (83,768,709 | ) | | | 102,433,867 | | | | (103,544,621 | ) | | | (228,228,192 | ) |
| Class R3 Shares | | | - | | | | - | | | | (832,150 | ) | | | (570,566 | ) |
| Class R4 Shares | | | - | | | | - | | | | (1,659,413 | ) | | | (800,493 | ) |
| Class R5 Shares | | | - | | | | - | | | | (9,218,052 | ) | | | (12,274,626 | ) |
| Class R6 Shares | | | - | | | | - | | | | (861,939 | ) | | | (6,278,518 | ) |
| Net Increase (Decrease) in Net Assets | | | 9,961,439 | | | | 176,258,408 | | | | 61,298,758 | | | | (100,384,122 | ) |
| | | | | | | | | | | | | | | | | |
| NET ASSETS | | | | | | | | | | | | | | | | |
| Beginning of Year | | | 560,094,605 | | | | 383,836,197 | | | | 820,304,778 | | | | 920,688,900 | |
| End of Year | | $ | 570,056,044 | | | $ | 560,094,605 | | | $ | 881,603,536 | | | $ | 820,304,778 | |
See notes to financial statements.
Annual Financial Statements | 59
Statements of Changes in Net Assets, Continued
| | | THORNBURG DEVELOPING WORLD FUND | | | THORNBURG SMALL/MID CAP CORE FUND |
| | | YEAR ENDED
SEPTEMBER 30, 2024 | | | YEAR ENDED
SEPTEMBER 30, 2023 | | | YEAR ENDED
SEPTEMBER 30, 2024 | | | YEAR ENDED
SEPTEMBER 30, 2023 | |
| INCREASE (DECREASE) IN NET ASSETS FROM | | | | | | | | | | | | | | | | |
| | | | | | | | | | | | | | | | | |
| OPERATIONS | | | | | | | | | | | | | | | | |
| Net investment income (loss) | | $ | 6,641,207 | | | $ | 13,014,821 | | | $ | (2,072,205 | ) | | $ | (1,293,541 | ) |
| Net realized gain (loss) | | | 46,249,830 | | | | (78,110,701 | ) | | | 11,004,011 | | | | (21,084,817 | ) |
| Net change in unrealized appreciation (depreciation) | | | 87,933,983 | | | | 141,980,715 | | | | 117,384,529 | | | | 73,412,671 | |
| | | | | | | | | | | | | | | | | |
| Net Increase (Decrease) in Net Assets Resulting from Operations | | | 140,825,020 | | | | 76,884,835 | | | | 126,316,335 | | | | 51,034,313 | |
| | | | | | | | | | | | | | | | | |
| DIVIDENDS TO SHAREHOLDERS | | | | | | | | | | | | | | | | |
| From distributable earnings | | | | | | | | | | | | | | | | |
| Class A Shares | | | (1,337,723 | ) | | | (1,251,706 | ) | | | - | | | | (136,460 | ) |
| Class C Shares | | | (66,116 | ) | | | (41,004 | ) | | | - | | | | - | |
| Class I Shares | | | (16,040,523 | ) | | | (13,972,476 | ) | | | - | | | | (1,088,874 | ) |
| Class R3 Shares | | | - | | | | - | | | | - | | | | (15,650 | ) |
| Class R4 Shares | | | - | | | | - | | | | - | | | | (6,736 | ) |
| Class R5 Shares | | | (66,847 | ) | | | (57,870 | ) | | | - | | | | (29,855 | ) |
| Class R6 Shares | | | (1,351,847 | ) | | | (1,105,768 | ) | | | - | | | | - | |
| | | | | | | | | | | | | | | | | |
| FUND SHARE TRANSACTIONS | | | | | | | | | | | | | | | | |
| Class A Shares | | | (19,028,382 | ) | | | (10,748,385 | ) | | | (39,097,518 | ) | | | (44,442,447 | ) |
| Class C Shares | | | (5,545,682 | ) | | | (6,854,299 | ) | | | (2,170,037 | ) | | | (3,590,500 | ) |
| Class I Shares | | | (381,273,036 | ) | | | (19,576,461 | ) | | | (16,390,792 | ) | | | (29,769,151 | ) |
| Class R3 Shares | | | - | | | | - | | | | (3,415,074 | ) | | | (2,018,695 | ) |
| Class R4 Shares | | | - | | | | - | | | | (177,546 | ) | | | (806,342 | ) |
| Class R5 Shares | | | (316,668 | ) | | | 593,489 | | | | (827,396 | ) | | | (3,866,821 | ) |
| Class R6 Shares | | | (2,277,891 | ) | | | 2,710,356 | | | | - | | | | - | |
| Net Increase (Decrease) in Net Assets | | | (286,479,695 | ) | | | 26,580,711 | | | | 64,237,972 | | | | (34,737,218 | ) |
| | | | | | | | | | | | | | | | | |
| NET ASSETS | | | | | | | | | | | | | | | | |
| Beginning of Year | | | 961,241,746 | | | | 934,661,035 | | | | 495,611,138 | | | | 530,348,356 | |
| End of Year | | $ | 674,762,051 | | | $ | 961,241,746 | | | $ | 559,849,110 | | | $ | 495,611,138 | |
See notes to financial statements.
60 | Annual Financial Statements
Statements of Changes in Net Assets, Continued
| | | THORNBURG SMALL/MID CAP GROWTH FUND | | | THORNBURG INVESTMENT INCOME BUILDER FUND | |
| | | YEAR ENDED
SEPTEMBER 30, 2024 | | | YEAR ENDED
SEPTEMBER 30, 2023 | | | YEAR ENDED
SEPTEMBER 30, 2024 | | | YEAR ENDED
SEPTEMBER 30, 2023 | |
| INCREASE (DECREASE) IN NET ASSETS FROM | | | | | | | | | | | | | | | | |
| | | | | | | | | | | | | | | | | |
| OPERATIONS | | | | | | | | | | | | | | | | |
| Net investment income (loss) | | $ | (2,567,818 | ) | | $ | (2,881,209 | ) | | $ | 553,706,889 | | | $ | 568,370,299 | |
| Net realized gain (loss) | | | 3,141,566 | | | | (16,541,247 | ) | | | 355,538,934 | | | | 17,376,938 | |
| Net change in unrealized appreciation (depreciation) | | | 56,135,991 | | | | 59,027,788 | | | | 1,915,511,407 | | | | 1,497,653,372 | |
| | | | | | | | | | | | | | | | | |
| Net Increase (Decrease) in Net Assets Resulting from Operations | | | 56,709,739 | | | | 39,605,332 | | | | 2,824,757,230 | | | | 2,083,400,609 | |
| | | | | | | | | | | | | | | | | |
| DIVIDENDS TO SHAREHOLDERS | | | | | | | | | | | | | | | | |
| From distributable earnings | | | | | | | | | | | | | | | | |
| Class A Shares | | | - | | | | - | | | | (191,766,530 | ) | | | (198,693,407 | ) |
| Class C Shares | | | - | | | | - | | | | (19,015,451 | ) | | | (25,228,489 | ) |
| Class I Shares | | | - | | | | - | | | | (368,729,466 | ) | | | (340,484,174 | ) |
| Class R3 Shares | | | - | | | | - | | | | (874,451 | ) | | | (1,007,983 | ) |
| Class R4 Shares | | | - | | | | - | | | | (499,487 | ) | | | (558,366 | ) |
| Class R5 Shares | | | - | | | | - | | | | (915,948 | ) | | | (1,414,560 | ) |
| Class R6 Shares | | | - | | | | - | | | | (12,250,664 | ) | | | (9,645,525 | ) |
| | | | | | | | | | | | | | | | | |
| FUND SHARE TRANSACTIONS | | | | | | | | | | | | | | | | |
| Class A Shares | | | (21,776,888 | ) | | | (34,425,116 | ) | | | (126,515,271 | ) | | | 1,283,935 | |
| Class C Shares | | | (1,735,505 | ) | | | (2,503,123 | ) | | | (70,918,155 | ) | | | (165,858,454 | ) |
| Class I Shares | | | (24,461,842 | ) | | | (18,693,030 | ) | | | 449,575,518 | | | | 742,990,448 | |
| Class R3 Shares | | | (2,000,257 | ) | | | (2,165,143 | ) | | | (1,983,630 | ) | | | (2,989,507 | ) |
| Class R4 Shares | | | (150,578 | ) | | | (407,355 | ) | | | 514,762 | | | | (1,677,122 | ) |
| Class R5 Shares | | | (834,107 | ) | | | (2,576,183 | ) | | | (2,508,851 | ) | | | (15,865,894 | ) |
| Class R6 Shares | | | - | | | | - | | | | 23,641,459 | | | | 43,901,859 | |
| Net Increase (Decrease) in Net Assets | | | 5,750,562 | | | | (21,164,618 | ) | | | 2,502,511,065 | | | | 2,108,153,370 | |
| | | | | | | | | | | | | | | | | |
| NET ASSETS | | | | | | | | | | | | | | | | |
| Beginning of Year | | | 269,860,963 | | | | 291,025,581 | | | | 11,429,513,400 | | | | 9,321,360,030 | |
| End of Year | | $ | 275,611,525 | | | $ | 269,860,963 | | | $ | 13,932,024,465 | | | $ | 11,429,513,400 | |
See notes to financial statements.
Annual Financial Statements | 61
Statements of Changes in Net Assets, Continued
| | | THORNBURG SUMMIT FUND | |
| | | YEAR ENDED
SEPTEMBER 30, 2024 | | | YEAR ENDED
SEPTEMBER 30, 2023 | |
| INCREASE (DECREASE) IN NET ASSETS FROM | | | | | | | | |
| | | | | | | | | |
| OPERATIONS | | | | | | | | |
| Net investment income (loss) | | $ | 2,369,150 | | | $ | 1,912,535 | |
| Net realized gain (loss) | | | 3,004,118 | | | | 369,559 | |
| Net change in unrealized appreciation (depreciation) | | | 14,067,288 | | | | 5,120,076 | |
| Net Increase (Decrease) in Net Assets Resulting from Operations | | | 19,440,556 | | | | 7,402,170 | |
| | | | | | | | | |
| DIVIDENDS TO SHAREHOLDERS | | | | | | | | |
| From distributable earnings | | | | | | | | |
| Class A Shares | | | (221,769 | ) | | | (110,469 | ) |
| Class I Shares | | | (2,343,748 | ) | | | (1,952,484 | ) |
| | | | | | | | | |
| FUND SHARE TRANSACTIONS | | | | | | | | |
| Class A Shares | | | 6,165,772 | | | | 5,450,972 | |
| Class I Shares | | | 8,459,156 | | | | 13,513,853 | |
| Net Increase (Decrease) in Net Assets | | | 31,499,967 | | | | 24,304,042 | |
| | | | | | | | | |
| NET ASSETS | | | | | | | | |
| Beginning of Year | | | 80,846,857 | | | | 56,542,815 | |
| End of Year | | $ | 112,346,824 | | | $ | 80,846,857 | |
See notes to financial statements.
62 | Annual Financial Statements
Notes to Financial Statements
September 30, 2024
NOTE 1 – ORGANIZATION
Thornburg Global Opportunities Fund (“Global Opportunities Fund”), Thornburg International Equity Fund (“International Equity Fund”), Thornburg Better World International Fund (“Better World International Fund”), Thornburg International Growth Fund (“International Growth Fund”), Thornburg Developing World Fund (“Developing World Fund”), Thornburg Small/Mid Cap Core Fund (“Small/Mid Cap Core Fund”), Thornburg Small/Mid Cap Growth Fund (“Small/Mid Cap Growth Fund”), Thornburg Investment Income Builder Fund (“Income Builder Fund”), and Thornburg Summit Fund (“Summit Fund”), collectively the “Funds”, are diversified series of Thornburg Investment Trust (the “Trust”). The Trust is organized as a Massachusetts business trust under a Declaration of Trust dated June 3, 1987 and is registered as a diversified, open-end management investment company under the Investment Company Act of 1940, as amended (the “1940 Act”). As of September 30, 2024, the Funds are nine of twenty-four separate series of the Trust. Each series is considered to be a separate entity for financial reporting and tax purposes and bears expenses directly attributable to it.
Global Opportunities Fund: The Fund’s investment goal is to seek long-term capital appreciation by investing in equity and debt securities of all types from issuers around the world. The Fund’s investments subject it to certain risks. As of the date of this report, the principal risks of investing in the Fund include credit risk, cybersecurity and operational risk, developing country risk, equity risk, foreign currency risk, foreign investment risk, liquidity risk, management risk, market and economic risk, real estate risk, redemption risk, risks affecting specific countries or regions, risks affecting specific issuers, and small and mid-cap company risk. Please see the Fund’s prospectus for a discussion of those principal risks and other risks associated with an investment in the Fund.
International Equity Fund: The Fund’s investment goal is to seek long-term capital appreciation by investing in equity and debt securities of all types. The secondary, non-fundamental goal of the Fund is to seek some current income. The Fund’s investments subject it to certain risks. As of the date of this report, the principal risks of investing in the Fund include credit risk, cybersecurity and operational risk, developing country risk, equity risk, foreign currency risk, foreign investment risk, liquidity risk, management risk, market and economic risk, redemption risk, risks affecting investments in China, risks affecting specific countries or regions, risks affecting specific issuers, and small and mid-cap company risk. Please see the Fund’s prospectus for a discussion of those principal risks and other risks associated with an investment in the Fund.
Better World International Fund: The Fund’s investment goal is to seek long-term capital appreciation. The Fund’s investments subject it to certain risks. As of the date of this report, the principal risks of investing in the Fund include credit risk, cybersecurity and operational risk, developing country risk, equity risk, Environmental, Social and Governance (“ESG”) investing risk, foreign currency risk, foreign investment risk, liquidity risk, management risk, market and economic risk, real estate risk, redemption risk, risks affecting investments in China, risks affecting specific countries or regions, risks affecting specific issuers, and small and mid-cap company risk. Please see the Fund’s prospectus for a discussion of those principal risks and other risks associated with an investment in the Fund.
International Growth Fund: The Fund’s investment goal is to seek long-term growth of capital by investing in equity securities selected for their growth potential. The Fund’s investments subject it to certain risks. As of the date of this report, the principal risks of investing in the Fund include credit risk, cybersecurity and operational risk, developing country risk, equity risk, foreign currency risk, foreign investment risk, liquidity risk, management risk, market and economic risk, redemption risk, risks affecting specific countries or regions, risks affecting specific issuers, and small and mid-cap company risk. Please see the Fund’s prospectus for a discussion of those principal risks and other risks associated with an investment in the Fund.
Developing World Fund: The Fund’s investment goal is to seek long-term capital appreciation. The Fund’s investments subject it to certain risks. As of the date of this report, the principal risks of investing in the Fund include credit risk, cybersecurity and operational risk, developing country risk, equity risk, foreign currency risk, foreign investment risk, liquidity risk, management risk, market and economic risk, redemption risk, risks affecting investments in China, risks affecting specific countries or regions, risks affecting specific issuers, and small and mid-cap company risk. Please see the Fund’s prospectus for a discussion of those principal risks and other risks associated with an investment in the Fund.
Small/Mid Cap Core Fund: The Fund’s investment goal is to seek long-term capital appreciation by investing in equity and debt securities of all types. The secondary, non-fundamental goal the Fund to seek some current income. The Fund’s investments subject it to certain risks. As of the date of this report, the principal risks of investing in the Fund include cybersecurity and operational risk, equity risk, foreign investment risk, liquidity risk, management risk, market and economic risk, redemption risk, risks affecting specific issuers, and small and mid-cap company risk. Please see the Fund’s prospectus for a discussion of those principal risks and other risks associated with an investment in the Fund.
Small/Mid Cap Growth Fund: The Fund’s investment goal is to seek long-term growth of capital by investing in equity securities selected for their growth potential. The Fund’s investments subject it to certain risks. As of the date of this report, the principal risks of investing in the Fund include cybersecurity and operational risk, equity risk, foreign investment risk, information technology securities risk, liquidity risk, management risk, market and economic risk, redemption risk, risks affecting specific issuers, and small and mid-cap company risk. Please see the Fund’s prospectus for a discussion of those principal risks and other risks associated with an investment in the Fund.
Annual Financial Statements | 63
Notes to Financial Statements, Continued
September 30, 2024
Income Builder Fund: The Fund’s primary investment goal is to provide a level of current income which exceeds the average yield on U.S. stocks generally, and which will generally grow, subject to periodic fluctuations, over the years on a per share basis. The Fund’s secondary investment goal is long-term capital appreciation. The Fund’s investments subject it to certain risks. As of the date of this report, the principal risks of investing in the Fund include credit risk, cybersecurity and operational risk, developing country risk, equity risk, foreign currency risk, foreign investment risk, high yield risk, interest rate risk, liquidity risk, management risk, market and economic risk, prepayment and extension risk, real estate risk, redemption risk, risks affecting specific countries or regions, risks affecting specific issuers, and small and mid-cap company risk. Please see the Fund’s prospectus for a discussion of those principal risks and other risks associated with an investment in the Fund.
Summit Fund: The Fund’s investment goal is to seek to grow real wealth over time. The Fund’s investments subject it to certain risks. As of the date of this report, the principal risks of investing in the Fund include commodities-related investment risk, credit risk, cybersecurity and operational risk, derivatives risk, developing country risk, equity risk, foreign currency risk, foreign investment risk, high yield risk, inflation risk, interest rate risk, liquidity risk, management risk, market and economic risk, prepayment and extension risk, real estate risk, redemption risk, risks affecting specific issuers, short sale risk, small and mid-cap company risk, and structured products risk. Please see the Fund’s prospectus for a discussion of those principal risks and other risks associated with an investment in the Fund.
As of September 30, 2024, the Funds each currently offer up to seven classes of shares of beneficial interest.
Each class of shares of the Funds represents an interest in the same portfolio of investments, except that (i) Class A shares are sold subject to a front-end sales charge collected at the time the shares are purchased and bear a service fee, (ii) Class C shares are sold at net asset value without a sales charge at the time of purchase, but are subject to a contingent deferred sales charge upon redemption within one year of purchase, and bear both a service fee and a distribution fee, (iii) Class I and Class R5 shares are sold at net asset value without a sales charge at the time of purchase and may be subject to a service fee, (iv) Class R3 shares are sold at net asset value without a sales charge, but bear both a service fee and a distribution fee, (v) Class R4 shares are sold at net asset value without a sales charge at the time of purchase but bear a service fee, (vi) Class R6 shares are sold at net asset value without a sales charge at the time of purchase, and (vii) the respective classes may have different reinvestment privileges and conversion rights. Additionally, each Fund may allocate among its classes certain expenses, to the extent allocable to specific classes, including administration fees, transfer agent fees, government registration fees, certain printing and postage costs and legal expenses. Currently, class specific expenses of the Funds are limited to distribution and service fees, transfer agent fees, and certain registration and filing fees.
At September 30, 2024, the following classes of shares are offered in each respective Fund:
| | CLASS A | CLASS C | CLASS I | CLASS R3 | CLASS R4 | CLASS R5 | CLASS R6 |
| Global Opportunities Fund | X | X | X | X | X | X | X |
| International Equity Fund | X | X | X | X | X | X | X |
| Better World International Fund | X | X | X | | | | |
| International Growth Fund | X | X | X | X | X | X | X |
| Developing World Fund | X | X | X | | | X | X |
| Small/Mid Cap Core Fund | X | X | X | X | X | X | |
| Small/Mid Cap Growth Fund | X | X | X | X | X | X | |
| Income Builder Fund | X | X | X | X | X | X | X |
| Summit Fund | X | | X | | | | |
NOTE 2 – SIGNIFICANT ACCOUNTING POLICIES
The following is a summary of significant accounting policies followed by each of the Funds in the preparation of its financial statements. Each Fund prepares its financial statements in conformity with United States generally accepted accounting principles (“GAAP”), including investment company accounting and reporting guidance in the Financial Accounting Standards Board (the “FASB”) Accounting Standard Codification Topic 946.
Allocation of Income, Gains, Losses and Expenses: Net investment income (other than class specific expenses) and realized and unrealized gains and losses are allocated daily to each class of shares based upon the relative net asset value of outstanding shares (or the value of the dividend-eligible shares, as appropriate) of each class of shares at the beginning of the day (after adjusting for the current capital shares activity of the respective class). Expenses common to all Funds are allocated daily among the Funds comprising the Trust based upon their relative net asset values or other appropriate allocation methods. Operating expenses directly attributable to a specific class are charged against the operating income of that class.
Dividends and Distributions to Shareholders: Dividends and distributions to shareholders, which are determined in accordance with federal income tax regulations and may differ from GAAP, are recorded on the ex-dividend date. Ordinary income dividends, if any, are declared daily and paid quarterly or annually. Capital gain distributions, if any, are declared and paid annually and more often if deemed necessary by
64 | Annual Financial Statements
Notes to Financial Statements, Continued
September 30, 2024
Thornburg Investment Management, Inc., the Trust’s investment advisor (the “Advisor”). Dividends and distributions are paid and are reinvested in additional shares of the Funds at net asset value per share at the close of business on the ex-dividend date, or at the shareholder’s option, paid in cash.
Foreign Currency Translation: Portfolio investments and other assets and liabilities denominated in foreign currencies are translated into U.S. dollars based on the exchange rate of such currencies against the U.S. dollar on the date of valuation. Purchases and sales of investments and income items denominated in foreign currencies are translated into U.S. dollars at the exchange rate in effect on the transaction date. When the Funds purchase or sell foreign investments, they will customarily enter into a foreign exchange contract to minimize foreign exchange risk from the trade date to the settlement date of such transactions. The values of such spot contracts are included in receivable for investments sold and payable for investments purchased on the Statement of Assets and Liabilities.
The Funds do not separately report the effect of changes in foreign exchange rates from changes in market prices on investments held. Such changes are included in net unrealized appreciation (depreciation) from investments in the Statement of Operations.
Reported net realized gains and losses from foreign currency transactions arise due to purchases and sales of foreign currencies, currency gains and losses realized between the trade and settlement dates on investment transactions and the difference between the amounts of dividends, interest, and foreign withholding taxes recorded on the Funds’ books, and the U.S. dollar equivalent of the amounts actually received or paid. These amounts are included in foreign currency transactions in the Statement of Operations.
Net change in unrealized appreciation (depreciation) on foreign currency translations arise from changes in the fair value of assets and liabilities, other than investments at period end, resulting from changes in exchange rates.
Guarantees and Indemnifications: Under the Trust’s organizational documents (and under separate agreements with the independent Trustees), its officers and Trustees are provided with an indemnification against certain liabilities arising out of the performance of their duties to the Funds. In the normal course of business the Trust may also enter into contracts with service providers that contain general indemnifications. The Trust’s maximum exposure under these arrangements is unknown. However, based on experience, the Trust expects the risk of loss to be remote.
Investment Income: Dividend income is recorded on the ex-dividend date. Certain income from foreign investments is recognized as soon as information is available to the Funds. Interest income is accrued as earned. Premiums and discounts are amortized and accreted, respectively, to first call dates or maturity dates using the effective yield method of the respective investments. These amounts are included in Investment Income in the Statement of Operations.
Investment Transactions: Investment transactions are accounted for on a trade date basis. Realized gains and losses from the sale of investments are recorded on an identified cost basis.
Repurchase Agreements: The Funds may invest excess cash in repurchase agreements whereby the Funds purchase investments, which serve as collateral, with an agreement to resell such collateral to the seller at an agreed upon price at the maturity date of the repurchase agreement. Investments pledged as collateral for repurchase agreements are held in custody until maturity of the repurchase agreement. Provisions in the agreements require that the market value of the collateral is at least equal to the repurchase value in the event of default. In the event of default, the Funds have the right to liquidate the collateral and apply the proceeds in satisfaction of the obligation. Under certain circumstances, in the event of default or bankruptcy by the other party to the agreement, realization and/or retention of the collateral may be subject to legal proceedings. During the fiscal year ended September 30, 2024, the Funds did not enter into repurchase agreements.
Security Valuation: All investments in securities held by the Funds are valued as described in Note 3.
Use of Estimates: The preparation of financial statements in conformity with GAAP requires management to make estimates and assumptions that affect the reported amounts of assets and liabilities and disclosure of contingent assets and liabilities at the date of the financial statements and the reported amounts of increases (decreases) in net assets from operations during the reporting period. Actual results could differ from those estimates.
When-Issued and Delayed Delivery Transactions: The Funds may engage in when-issued or delayed delivery transactions. To the extent the Funds engage in such transactions, they will do so for the purpose of acquiring portfolio investments consistent with the Funds’ investment objectives and not for the purpose of investment leverage or to speculate on interest rate or market changes. At the time the Funds make a commitment to purchase an investment on a when-issued or delayed delivery basis, the Funds will record the transaction and reflect the value in determining its net asset value. Pursuant to current U.S. Securities and Exchange Commission (“SEC”) guidance, a transaction involving a when-issued security will not be deemed to involve a senior security as long as the Funds intend to settle the transaction physically and the transaction settles within 35 days. Investments purchased on a when-issued or delayed delivery basis do not earn interest until the settlement date. The values of these securities held at September 30, 2024 are detailed in the Schedule of Investments.
Annual Financial Statements | 65
Notes to Financial Statements, Continued
September 30, 2024
NOTE 3 – SECURITY VALUATION
Valuation of the Funds’ portfolio investment securities is performed by the Advisor, which has been designated by the Trustees of the Trust (the “Trustees”) as the Funds’ “valuation designee,” as that term is defined in rule 2a-5 under the 1940 Act. The Advisor performs this valuation function under the supervision of the Trustees and in accordance with policies and procedures that have been adopted by the Advisor and approved by the Trustees (the “Valuation Policy and Procedures”).
In its capacity as the Funds’ valuation designee, the Advisor makes good faith determinations of the fair value of portfolio securities for which market quotations are not readily available, and otherwise complies with and administers the Valuation Policy and Procedures. The Advisor performs those functions in significant measure through its Valuation and Pricing Committee (the “Committee”), though the Advisor may also obtain the assistance of others, including professional pricing service providers selected and approved by the Committee. In accordance with the Valuation Policy and Procedures, the Committee: assesses and manages the material risks associated with determining the fair value of those Fund investments for which market quotations are not readily available; selects and applies methodologies for determining and calculating such fair values; periodically reviews and tests the appropriateness and accuracy of those methodologies; monitors for circumstances that may necessitate the use of fair value; and approves, monitors, and evaluates pricing services engaged to provide evaluated prices for the Funds’ investments. The Committee provides reports on its activities to the Trustees’ Audit Committee, which is responsible for overseeing the Committee’s and the Advisor’s work in discharging the functions under the Valuation Policy and Procedures.
In those instances when the Committee assists in calculating a fair value for a portfolio investment, the Committee seeks to determine the price that the Funds would reasonably expect to receive upon a sale of the investment in an orderly transaction between market participants on the valuation date. The Committee customarily utilizes quotations from securities broker dealers in calculating valuations, but also may utilize prices obtained from pricing service providers or other methods selected by the Committee. Because fair values calculated by the Committee are estimates, the calculation of a fair value for an investment may differ from the price that would be realized by the Funds upon a sale of the investment, and the difference could be material to the Funds’ financial statements. The Committee’s calculation of a fair value for an investment may also differ from the prices obtained by other persons (including other mutual funds) for the investment.
Valuation of Securities: Securities and other portfolio investments which are listed or traded on a United States securities exchange are generally valued at the last reported sale price on the valuation date or, if there has been no sale of the investment on that date, at the mean between the last reported bid and asked prices for the investment on that date. Portfolio investments reported by NASDAQ are valued at the official closing price on the valuation date. If an investment is traded on more than one exchange, the investment is considered traded on the exchange that is normally the primary market for that investment. For securities and other portfolio investments which are primarily listed or traded on an exchange outside the United States, the time for determining the investment’s value in accordance with the first sentence of this paragraph will be the close of that investment’s primary exchange preceding the Fund’s valuation time.
In any case when a market quotation is not readily available for a portfolio investment ordinarily valued by market quotation, the Committee calculates a fair value for the investment using methodologies selected and approved by the Committee as described in the Valuation Policy and Procedures, subject to changes or additions by the Committee. For this purpose, a market quotation is considered to be readily available if it is a quoted price (unadjusted) in active markets for identical investments that the Funds can access at the measurement date. Pursuant to the Valuation Policy and Procedures, the Committee shall monitor for circumstances that may necessitate the use of fair valuation methodologies, including circumstances in which a market quotation for an investment is no longer reliable or is otherwise not readily available. For that purpose, a market quotation is not readily available when the primary market or exchange for the applicable investment is not open for the entire scheduled day of trading. A market quotation may also not be readily available if: (a) developments occurring after the most recent close of the applicable investment’s primary exchange, but prior to the close of business on any business day; or (b) an unusual event or significant period of time occurring since the availability of the market quotation, create a serious question concerning the reliability of that market quotation. Additionally, a market quotation will be considered unreliable if it would require adjustment under GAAP, or where GAAP would require consideration of additional inputs in determining the value of the investment. The Committee customarily obtains valuations in those instances from pricing service providers approved by the Committee. Such pricing service providers ordinarily calculate valuations using multi-factor models to adjust market prices based upon various inputs, including exchange data, depository receipt prices, futures, index data, and other data.
Investments in U.S. mutual funds are valued at net asset value (“NAV”) each business day.
Debt obligations held by the Funds which are not listed or traded on exchanges or for which no reported market exists are ordinarily valued at the valuation obtained from a pricing service provider approved by the Committee.
Over-the-counter options are valued by a third-party pricing service provider.
Forward currency contracts are valued by a third-party pricing service provider.
66 | Annual Financial Statements
Notes to Financial Statements, Continued
September 30, 2024
In any case when a pricing service provider fails to provide a valuation for a debt obligation held by the Funds, the Committee may calculate a fair value for the obligation using alternative methods selected and approved by the Committee. Additionally, in cases when the Committee believes that a valuation obtained from a pricing service provider is stale, does not reflect material factors affecting the valuation of the investment, is significantly different than the value the Funds are likely to obtain if they sought a bid for the investment, or is otherwise unreliable, the Committee may calculate a fair value for the obligation using an alternative method selected and approved by the Committee.
If the market quotation for an investment is expressed in a foreign currency, that market quotation will be converted to U.S. dollars using a foreign exchange quotation from a third-party service at the time of valuation. Foreign investments held by the Funds may be traded on days and at times when the Funds are not open for business. Consequently, the value of Funds’ investments may be significantly affected on days when shareholders cannot purchase or sell Funds’ shares.
Valuation Hierarchy: The Funds categorize their investments based upon the inputs used in valuing those investments, according to a three-level hierarchy established in guidance from the FASB. Categorization of investments using this hierarchy is intended by the FASB to maximize the use of observable inputs in valuing investments and minimize the use of unobservable inputs by requiring that the most observable inputs be used when available. Observable inputs are those that market participants would use in valuing an investment based on available market information. Unobservable inputs are those that reflect assumptions about the information market participants would use in valuing an investment. An investment’s level within the hierarchy is based on the lowest level input that is deemed significant to the valuation. The methodologies and inputs used to value investments are not necessarily indications of the risk or liquidity associated with those investments.
Various inputs are used in calculating valuations for the Fund’s investments. These inputs are generally summarized according to the three-level hierarchy below:
Level 1: Quoted prices in active markets for identical investments.
Level 2: Other direct or indirect significant observable inputs (including quoted prices for similar investments in active markets and other observable inputs, such as interest rates, prepayment rates, credit ratings, etc.).
Level 3: Significant unobservable inputs (including the Committee’s own assumptions in calculating the fair values of investments).
Valuations for debt obligations held by the Funds are typically calculated by pricing service providers approved by the Committee and are generally characterized as Level 2 within the valuation hierarchy.
On days when market volatility thresholds established by the Committee are exceeded, foreign securities for which valuations are obtained from pricing service providers are fair valued. On these days, the foreign securities are characterized as Level 2 within the valuation hierarchy and revert to Level 1 after the threshold is no longer exceeded.
In any case when a pricing service provider fails to provide a valuation for a debt obligation held by the Funds, the Committee calculates a fair value for the obligation using alternative methods under procedures approved by the Committee. Additionally, in cases when management believes that a valuation obtained from a pricing service provider is stale, does not reflect material factors affecting the valuation of the investment, is significantly different than the value the Funds are likely to obtain if they sought a bid for the investment, or is otherwise unreliable, the Committee calculates a fair value for the obligation using an alternative method approved by the Committee.
In a limited number of cases the Committee calculates a fair value for investments using broker quotations or other methods approved by the Committee. When the Committee uses a single broker quotation to calculate a fair value for an investment without other significant observable inputs, or if a fair value is calculated using other significant inputs that are considered unobservable, the investment is characterized as Level 3 within the hierarchy. Other significant unobservable inputs used to calculate a fair value in these instances might include an income-based valuation approach which considers discounted anticipated future cash flows from the investment and application of discounts due to the nature or duration of any restrictions on the disposition of the investment.
Valuations based upon the use of inputs from Levels 1, 2 or 3 may not represent the actual price received upon the disposition of an investment, and a Fund may receive a price that is lower than the valuation based upon these inputs when it sells the investment.
Annual Financial Statements | 67
Notes to Financial Statements, Continued
September 30, 2024
The following table displays a summary of the fair value hierarchy measurements of the Fund’s investments as of September 30, 2024:
| GLOBAL OPPORTUNITIES FUND | | TOTAL | | | LEVEL 1 | | | LEVEL 2 | | | LEVEL 3 | |
| Assets | | | | | | | | | | | | | | | | |
| Investments in Securities | | | | | | | | | | | | | | | | |
| Common Stock | | $ | 1,270,298,157 | | | $ | 1,270,298,157 | | | $ | — | | | $ | — | |
| Short-Term Investments | | | 36,186,959 | | | | 36,186,959 | | | | — | | | | — | |
| Total Investments in Securities | | $ | 1,306,485,116 | | | $ | 1,306,485,116 | | | $ | — | | | $ | — | |
| Total Assets | | $ | 1,306,485,116 | | | $ | 1,306,485,116 | | | $ | — | | | $ | — | |
| | | | | | | | | | | | | | | | | |
| Liabilities | | | | | | | | | | | | | | | | |
| Other Financial Instruments | | | | | | | | | | | | | | | | |
| Forward Currency Contracts | | $ | (424,443 | ) | | $ | — | | | $ | (424,443 | ) | | $ | — | |
| Total Other Financial Instruments | | $ | (424,443 | ) | | $ | — | | | $ | (424,443 | ) | | $ | — | |
| Total Liabilities | | $ | (424,443 | ) | | $ | — | | | $ | (424,443 | ) | | $ | — | |
| INTERNATIONAL EQUITY FUND | | TOTAL | | | LEVEL 1 | | | LEVEL 2 | | | LEVEL 3 | |
| Assets | | | | | | | | | | | | | | | | |
| Investments in Securities | | | | | | | | | | | | | | | | |
| Common Stock | | $ | 2,832,495,975 | | | $ | 2,832,495,975 | | | $ | — | | | $ | — | |
| Warrant | | | 1 | | | | — | | | | — | | | | 1 | |
| Short-Term Investments | | | 120,996,633 | | | | 120,996,633 | | | | — | | | | — | |
| Total Investments in Securities | | $ | 2,953,492,609 | | | $ | 2,953,492,608 | | | $ | — | | | $ | 1 | |
| Total Assets | | $ | 2,953,492,609 | | | $ | 2,953,492,608 | | | $ | — | | | $ | 1 | (a) |
| | | | | | | | | | | | | | | | | |
| Liabilities | | | | | | | | | | | | | | | | |
| Other Financial Instruments | | | | | | | | | | | | | | | | |
| Forward Currency Contracts | | $ | (1,953,484 | ) | | $ | — | | | $ | (1,953,484 | ) | | $ | — | |
| Total Other Financial Instruments | | $ | (1,953,484 | ) | | $ | — | | | $ | (1,953,484 | ) | | $ | — | |
| Total Liabilities | | $ | (1,953,484 | ) | | $ | — | | | $ | (1,953,484 | ) | | $ | — | |
| (a) | Level 3 investments at the beginning and/or end of the period in relation to net assets were not significant and accordingly, a reconciliation of Level 3 assets for the period ended September 30, 2024 is not presented. |
| BETTER WORLD INTERNATIONAL FUND | | TOTAL | | | LEVEL 1 | | | LEVEL 2 | | | LEVEL 3 | |
| Assets | | | | | | | | | | | | | | | | |
| Investments in Securities | | | | | | | | | | | | | | | | |
| Common Stock | | $ | 546,512,327 | | | $ | 546,512,327 | | | $ | — | | | $ | — | |
| Warrant | | | 1 | | | | — | | | | — | | | | 1 | |
| Short-Term Investments | | | 22,153,050 | | | | 22,153,050 | | | | — | | | | — | |
| Total Investments in Securities | | $ | 568,665,378 | | | $ | 568,665,377 | | | $ | — | | | $ | 1 | (a) |
| Total Assets | | $ | 568,665,378 | | | $ | 568,665,377 | | | $ | — | | | $ | 1 | |
| (a) | Level 3 investments at the beginning and/or end of the period in relation to net assets were not significant and accordingly, a reconciliation of Level 3 assets for the period ended September 30, 2024 is not presented. |
| INTERNATIONAL GROWTH FUND | | TOTAL | | | LEVEL 1 | | | LEVEL 2 | | | LEVEL 3 | |
| Assets | | | | | | | | | | | | | | | | |
| Investments in Securities | | | | | | | | | | | | | | | | |
| Common Stock | | $ | 866,071,735 | | | $ | 866,071,735 | | | $ | — | | | $ | — | |
| Short-Term Investments | | | 21,464,529 | | | | 21,464,529 | | | | — | | | | — | |
| Total Investments in Securities | | $ | 887,536,264 | | | $ | 887,536,264 | | | $ | — | | | $ | — | |
| Total Assets | | $ | 887,536,264 | | | $ | 887,536,264 | | | $ | — | | | $ | — | |
68 | Annual Financial Statements
Notes to Financial Statements, Continued
September 30, 2024
| DEVELOPING WORLD FUND | | TOTAL | | | LEVEL 1 | | | LEVEL 2 | | | LEVEL 3 | |
| Assets | | | | | | | | | | | | | | | | |
| Investments in Securities | | | | | | | | | | | | | | | | |
| Common Stock | | $ | 661,345,458 | | | $ | 661,345,458 | | | $ | — | | | $ | — | |
| Preferred Stock | | | 16,761,226 | | | | 16,761,226 | | | | — | | | | — | |
| Short-Term Investments | | | 1,108,242 | | | | 1,108,242 | | | | — | | | | — | |
| Total Investments in Securities | | $ | 679,214,926 | | | $ | 679,214,926 | | | $ | — | | | $ | — | |
| Total Assets | | $ | 679,214,926 | | | $ | 679,214,926 | | | $ | — | | | $ | — | |
| SMALL/MID CAP CORE FUND | | TOTAL | | | LEVEL 1 | | | LEVEL 2 | | | LEVEL 3 | |
| Assets | | | | | | | | | | | | | | | | |
| Investments in Securities | | | | | | | | | | | | | | | | |
| Common Stock | | $ | 550,565,145 | | | $ | 550,565,145 | | | $ | — | | | $ | — | |
| Short-Term Investments | | | 10,203,814 | | | | 10,203,814 | | | | — | | | | — | |
| Total Investments in Securities | | $ | 560,768,959 | | | $ | 560,768,959 | | | $ | — | | | $ | — | |
| Total Assets | | $ | 560,768,959 | | | $ | 560,768,959 | | | $ | — | | | $ | — | |
| SMALL/MID CAP GROWTH FUND | | TOTAL | | | LEVEL 1 | | | LEVEL 2 | | | LEVEL 3 | |
| Assets | | | | | | | | | | | | | | | | |
| Investments in Securities | | | | | | | | | | | | | | | | |
| Common Stock | | $ | 270,191,491 | | | $ | 270,191,491 | | | $ | — | | | $ | — | |
| Short-Term Investments | | | 5,829,012 | | | | 5,829,012 | | | | — | | | | — | |
| Total Investments in Securities | | $ | 276,020,503 | | | $ | 276,020,503 | | | $ | — | | | $ | — | |
| Total Assets | | $ | 276,020,503 | | | $ | 276,020,503 | | | $ | — | | | $ | — | |
| INCOME BUILDER FUND | | TOTAL | | | LEVEL 1 | | | LEVEL 2 | | | LEVEL 3 | |
| Assets | | | | | | | | | | | | | | | | |
| Investments in Securities | | | | | | | | | | | | | | | | |
| Common Stock | | $ | 11,722,556,607 | | | $ | 11,718,204,366 | | | $ | — | | | $ | 4,352,241 | |
| Preferred Stock | | | 11,079,600 | | | | 2,739,600 | | | | 8,340,000 | | | | — | |
| Asset Backed Securities | | | 146,170,939 | | | | — | | | | 143,933,659 | | | | 2,237,280 | |
| Corporate Bonds | | | 1,016,186,397 | | | | — | | | | 1,016,186,397 | | | | — | |
| Other Government | | | 10,729,060 | | | | — | | | | 10,729,060 | | | | — | |
| Mortgage Backed | | | 282,278,781 | | | | — | | | | 282,277,831 | | | | 950 | |
| Loan Participations | | | 22,515,503 | | | | — | | | | 22,515,503 | | | | — | |
| Short-Term Investments | | | 687,343,444 | | | | 687,343,444 | | | | — | | | | — | |
| Total Investments in Securities | | $ | 13,898,860,331 | | | $ | 12,408,287,410 | | | $ | 1,483,982,450 | | | $ | 6,590,471 | |
| | | | | | | | | | | | | | | | | |
| Other Financial Instruments | | | | | | | | | | | | | | | | |
| Forward Currency Contracts | | $ | 231,537 | | | $ | — | | | $ | 231,537 | | | $ | — | |
| Total Assets | | $ | 13,899,091,868 | | | $ | 12,408,287,410 | | | $ | 1,484,213,987 | | | $ | 6,590,471 | (a) |
| | | | | | | | | | | | | | | | | |
| Liabilities | | | | | | | | | | | | | | | | |
| Other Financial Instruments | | | | | | | | | | | | | | | | |
| Forward Currency Contracts | | $ | (6,628,880 | ) | | $ | — | | | $ | (6,628,880 | ) | | $ | — | |
| Total Other Financial Instruments | | $ | (6,628,880 | ) | | $ | — | | | $ | (6,628,880 | ) | | $ | — | |
| Total Liabilities | | $ | (6,628,880 | ) | | $ | — | | | $ | (6,628,880 | ) | | $ | — | |
| (a) | Level 3 investments at the beginning and/or end of the period in relation to net assets were not significant and accordingly, a reconciliation of Level 3 assets for the period ended September 30, 2024 is not presented. |
Annual Financial Statements | 69
Notes to Financial Statements, Continued
September 30, 2024
| SUMMIT FUND | | TOTAL | | | LEVEL 1 | | | LEVEL 2 | | | LEVEL 3 | |
| Assets | | | | | | | | | | | | | | | | |
| Investments in Securities | | | | | | | | | | | | | | | | |
| Common Stock | | $ | 59,373,970 | | | $ | 59,373,970 | | | $ | — | | | $ | — | |
| Asset Backed Securities | | | 5,036,475 | | | | — | | | | 4,929,938 | | | | 106,537 | |
| Corporate Bonds | | | 9,020,082 | | | | — | | | | 9,020,082 | | | | — | |
| Other Government | | | 2,195,226 | | | | — | | | | 2,195,226 | | | | — | |
| U.S. Treasury Securities | | | 11,770,068 | | | | 11,770,068 | | | | — | | | | — | |
| Mortgage Backed | | | 12,013,209 | | | | — | | | | 12,013,209 | | | | — | |
| Loan Participations | | | 195,508 | | | | — | | | | 195,508 | | | | — | |
| Exchange-Traded Funds | | | 3,269,096 | | | | 3,269,096 | | | | — | | | | — | |
| Short-Term Investments | | | 9,255,964 | | | | 9,255,964 | | | | — | | | | — | |
| Total Investments in Securities | | $ | 112,129,598 | | | $ | 83,669,098 | | | $ | 28,353,963 | | | $ | 106,537 | |
| | | | | | | | | | | | | | | | | |
| Other Financial Instruments | | | | | | | | | | | | | | | | |
| Forward Currency Contracts | | $ | 359,060 | | | $ | — | | | $ | 359,060 | | | $ | — | |
| Total Assets | | $ | 112,488,658 | | | $ | 83,669,098 | | | $ | 28,713,023 | | | $ | 106,537 | (a) |
| | | | | | | | | | | | | | | | | |
| Liabilities | | | | | | | | | | | | | | | | |
| Other Financial Instruments | | | | | | | | | | | | | | | | |
| Forward Currency Contracts | | $ | (8,668 | ) | | $ | — | | | $ | (8,668 | ) | | $ | — | |
| Total Other Financial Instruments | | $ | (8,668 | ) | | $ | — | | | $ | (8,668 | ) | | $ | — | |
| Total Liabilities | | $ | (8,668 | ) | | $ | — | | | $ | (8,668 | ) | | $ | — | |
| (a) | Level 3 investments at the beginning and/or end of the period in relation to net assets were not significant and accordingly, a reconciliation of Level 3 assets for the period ended September 30, 2024 is not presented. |
NOTE 4 – INVESTMENT MANAGEMENT FEE AND OTHER TRANSACTIONS WITH AFFILIATES
Pursuant to an investment advisory agreement with the Trust, the Advisor serves as the investment advisor and performs advisory services for the Funds for which the Advisor’s management fees are payable at the end of each month. Under the investment advisory agreement, each Fund pays the Advisor a management fee based on the average daily net assets of that Fund at an annual rate as shown in the following table:
GLOBAL OPPORTUNITIES FUND, INTERNATIONAL EQUITY FUND, INTERNATIONAL GROWTH FUND, SMALL/MID CAP CORE FUND, SMALL/MID CAP GROWTH FUND, INCOME BUILDER FUND | BETTER WORLD INTERNATIONAL FUND, DEVELOPING WORLD FUND | SUMMIT FUND |
| DAILY NET ASSETS | FEE RATE | DAILY NET ASSETS | FEE RATE | DAILY NET ASSETS | FEE RATE |
| | | | | | |
| Up to $500 million | 0.875% | Up to $500 million | 0.975% | Up to $500 million | 0.750% |
| | | | | | |
| Next $500 million | 0.825 | Next $500 million | 0.925 | Next $500 million | 0.700 |
| | | | | | |
| Next $500 million | 0.775 | Next $500 million | 0.875 | Next $500 million | 0.650 |
| | | | | | |
| Next $500 million | 0.725 | Next $500 million | 0.825 | Next $500 million | 0.625 |
| | | | | | |
| Over $2 billion | 0.675 | Over $2 billion | 0.775 | Over $2 billion | 0.600 |
The Funds’ effective management fees, calculated on the basis of the Funds’ average daily net assets (before applicable management fee waivers) for the year ended September 30, 2024 were as shown in the following table. Total management fees incurred by the Funds for the year ended September 30, 2024 are set forth in the Statement of Operations.
70 | Annual Financial Statements
Notes to Financial Statements, Continued
September 30, 2024
| | | EFFECTIVE
MANAGEMENT
FEE | |
| | | | | |
| Global Opportunities Fund | | | 0.840 | % |
| | | | | |
| International Equity Fund | | | 0.771 | |
| | | | | |
| Better World International Fund | | | 0.969 | |
| | | | | |
| International Growth Fund | | | 0.854 | |
| | | | | |
| Developing World Fund | | | 0.953 | |
| | | | | |
| Small/Mid Cap Core Fund | | | 0.873 | |
| | | | | |
| Small/Mid Cap Growth Fund | | | 0.875 | |
| | | | | |
| Income Builder Fund | | | 0.695 | |
| | | | | |
| Summit Fund | | | 0.750 | |
The Trust has entered into an administrative services agreement with the Advisor, whereby the Advisor will perform certain administrative services. The administrative services fees are computed as an annual percentage of the aggregate average daily net assets of all applicable Funds in the Trust as follows:
| ADMINISTRATIVE SERVICES FEE SCHEDULE | |
| DAILY NET ASSETS | | FEE RATE | |
| | | | |
| Up to $20 billion | | | 0.100 | % |
| | | | | |
| $20 billion to $40 billion | | | 0.075 | |
| | | | | |
| $40 billion to $60 billion | | | 0.040 | |
| | | | | |
| Over $60 billion | | | 0.030 | |
The aggregate administrative services fee amount is allocated on a daily basis to each Fund based on net assets and subsequently allocated to each class of shares of the Funds. Total administrative services fees incurred by each class of shares of the Funds for the year ended September 30, 2024, are set forth in the Statement of Operations.
The Trust has an underwriting agreement with Thornburg Securities LLC (the “Distributor”), an affiliate of the Advisor, which acts as the distributor of the Funds’ shares. For the year ended September 30, 2024, the Distributor has advised the Funds that they earned net commissions from the sale of Class A shares and collected contingent deferred sales charges ("CDSC Fees") from redemptions of Class C shares as follows:
| | | COMMISSIONS | | | CDSC FEES | |
| Global Opportunities Fund | | $ | 20,142 | | | $ | 859 | |
| International Equity Fund | | | 3,743 | | | | 629 | |
| Better World International Fund | | | 1,216 | | | | 880 | |
| International Growth Fund | | | 728 | | | | 4 | |
| Developing World Fund | | | 406 | | | | 13 | |
| Small/Mid Cap Core Fund | | | 1,825 | | | | 122 | |
| Small/Mid Cap Growth Fund | | | 1,722 | | | | 104 | |
| Income Builder Fund | | | 285,410 | | | | 23,332 | |
| Summit Fund | | | 5,670 | | | | — | |
Pursuant to a service plan under Rule 12b-1 of the 1940 Act, the Funds may reimburse to the Distributor an amount not to exceed .25 of 1% per annum of the average daily net assets attributable to the applicable Class A, Class C, Class I, Class R3, Class R4, and Class R5 shares of the Global Opportunities Fund, International Equity Fund, International Growth Fund, Small/Mid Cap Core Fund, Small/Mid Cap Growth Fund and Income Builder Fund, Class A, Class C, Class I, and Class R5 shares of the Developing World Fund, Class A, Class C, Class I shares of the Better World International Fund and Class A and Class I shares of the Summit Fund. For the year ended September 30, 2024, there were no 12b-1 service plan fees charged for Class I or Class R5 shares. Class R6 shares are not subject to a service plan. The Advisor and Distributor each may pay out of its own resources additional expenses for distribution of each Fund’s shares and shareholder services.
The Trust has also adopted a distribution plan pursuant to Rule 12b-1, applicable only to the Funds’ Class C and Class R3 shares, under which the Funds compensate the Distributor for services in promoting the sale of Class C and Class R3 shares of the Funds at an annual
Annual Financial Statements | 71
Notes to Financial Statements, Continued
September 30, 2024
rate of up to .75 of 1% per annum of the average daily net assets attributable to Class C shares and an annual rate of up to .25 of 1% per annum of the average daily net assets attributable to Class R3 shares. Total fees incurred by each class of shares of the Funds under their respective service and distribution plans for the year ended September 30, 2024 are set forth in the Statements of Operations.
The Advisor has contractually agreed to waive certain fees and reimburse certain expenses incurred by certain classes of the Funds. The agreement may be terminated by the Trust at any time, but may not be terminated by the Advisor before February 1, 2025 unless the Advisor ceases to be the investment advisor to the Funds prior to that date. The Advisor may recoup amounts waived or reimbursed during the year ended September 30, 2024 if, during the fiscal year, expenses fall below the contractual limit that was in place at the time these fees and expenses were waived or reimbursed. The Advisor will not recoup fees or expenses as described in the preceding sentence if that recoupment would cause the Funds’ total annual operating expenses (after the recoupment is taken into account) to exceed the lesser of: (a) the expense cap that was in place at the time the waiver or reimbursement occurred; or (b) the expense cap that is in place at the time of the recoupment. Expense caps exclude taxes, interest expenses, acquired fund fees and expenses, brokerage commissions, borrowing costs, expenses relating to short sales, and unusual expenses such as contingency fees or litigation costs.
Actual expenses of certain share classes do not exceed levels as specified in each Fund’s most recent prospectus as shown in the following table:
| | | CLASS A | | | CLASS C | | | CLASS I | | | CLASS R3 | | | CLASS R4 | | | CLASS R5 | | | CLASS R6 | |
| Global Opportunities Fund | | | — | % | | | — | % | | | 0.99 | % | | | 1.50 | % | | | 1.40 | % | | | 0.99 | % | | | 0.85 | % |
| International Equity Fund | | | — | | | | — | | | | 0.90 | | | | 1.36 | | | | 1.16 | | | | 0.90 | | | | 0.70 | |
| Better World International Fund | | | — | | | | 2.19 | | | | 0.90 | | | | — | | | | — | | | | — | | | | — | |
| International Growth Fund | | | — | | | | — | | | | 0.99 | | | | 1.50 | | | | 1.40 | | | | 0.99 | | | | 0.89 | |
| Developing World Fund | | | — | | | | 2.33 | | | | 1.04 | | | | — | | | | — | | | | 1.04 | | | | 0.94 | |
| Small/Mid Cap Core Fund | | | — | | | | 2.34 | | | | 0.95 | | | | 1.31 | | | | 1.21 | | | | 0.95 | | | | — | |
| Small/Mid Cap Growth Fund | | | — | | | | 2.34 | | | | 0.95 | | | | 1.46 | | | | 1.36 | | | | 0.95 | | | | — | |
| Income Builder Fund | | | — | | | | — | | | | — | | | | 1.50 | | | | 1.40 | | | | 0.99 | | | | 0.80 | |
| Summit Fund | | | 0.94 | | | | — | | | | 0.69 | | | | — | | | | — | | | | — | | | | — | |
For the year ended September 30, 2024, the Advisor contractually reimbursed certain class specific expenses and distribution fees and voluntarily waived certain expenses as follows:
| | | CLASS | | | CLASS | | | CLASS | | | CLASS | | | CLASS | | | CLASS | | | CLASS | | | | |
| CONTRACTUAL: | | A | | | C | | | I | | | R3 | | | R4 | | | R5 | | | R6 | | | TOTAL | |
| Global Opportunities Fund | | $ | — | | | $ | — | | | $ | 381,354 | | | $ | 25,968 | | | $ | 34,802 | | | $ | 57,524 | | | $ | 87,296 | | | $ | 586,944 | |
| International Equity Fund | | | — | | | | — | | | | — | | | | 241,098 | | | | 194,076 | | | | 182,026 | | | | 367,143 | | | | 984,343 | |
| Better World International Fund | | | — | | | | 13,584 | | | | 1,070,421 | | | | — | | | | — | | | | — | | | | — | | | | 1,084,005 | |
| International Growth Fund | | | — | | | | — | | | | 259,446 | | | | 32,307 | | | | 44,676 | | | | 61,186 | | | | 101,864 | | | | 499,479 | |
| Developing World Fund | | | — | | | | 5,729 | | | | 773,096 | | | | — | | | | — | | | | 27,948 | | | | 98,595 | | | | 905,368 | |
| Small/Mid Cap Core Fund | | | — | | | | 15,533 | | | | 265,006 | | | | 70,812 | | | | 23,487 | | | | 26,146 | | | | — | | | | 400,984 | |
| Small/Mid Cap Growth Fund | | | — | | | | 24,011 | | | | 131,705 | | | | 61,283 | | | | 18,060 | | | | 32,190 | | | | — | | | | 267,249 | |
| Income Builder Fund | | | — | | | | — | | | | — | | | | 38,124 | | | | 19,217 | | | | 50,003 | | | | 74,437 | | | | 181,781 | |
| Summit Fund | | | 47,855 | | | | — | | | | 136,045 | | | | — | | | | — | | | | — | | | | — | | | | 183,900 | |
| | | CLASS | | | CLASS | | | CLASS | | | CLASS | | | CLASS | | | CLASS | | | CLASS | | | | |
| VOLUNTARY: | | A | | | C | | | I | | | R3 | | | R4 | | | R5 | | | R6 | | | TOTAL | |
| Global Opportunities Fund | | $ | 114,996 | | | $ | 11,526 | | | $ | 260,614 | | | $ | 989 | | | $ | 1,791 | | | $ | 6,500 | | | $ | 25,011 | | | $ | 421,427 | |
| International Equity Fund | | | 435,454 | | | | 11,761 | | | | 1,661,470 | | | | 129,373 | | | | 96,788 | | | | 115,591 | | | | 391,687 | | | | 2,842,124 | |
| Better World International Fund | | | 53,954 | | | | 8,487 | | | | 716,677 | | | | — | | | | — | | | | — | | | | — | | | | 779,118 | |
| International Growth Fund | | | 10,711 | | | | 907 | | | | 77,519 | | | | 569 | | | | 832 | | | | 1,255 | | | | 9,881 | | | | 101,674 | |
| Developing World Fund | | | 117,004 | | | | 13,819 | | | | 1,103,521 | | | | — | | | | — | | | | 4,867 | | | | 96,152 | | | | 1,335,363 | |
| Small/Mid Cap Core Fund | | | — | | | | 8,151 | | | | — | | | | — | | | | — | | | | — | | | | — | | | | 8,151 | |
| Summit Fund | | | 27,346 | | | | — | | | | 273,254 | | | | — | | | | — | | | | — | | | | — | | | | 300,600 | |
Certain officers and Trustees of the Trust are also officers or directors of the Advisor and Distributor. The compensation of the independent Trustees is borne by the Trust. The Trust also pays a portion of the Chief Compliance Officer’s compensation. These amounts are reflected as Trustee and officer fees in the Statement of Operations.
As of September 30, 2024, the percentage of direct investments in the Funds held by the Trustees, officers of the Trust, and the Advisor is approximately as follows.
72 | Annual Financial Statements
Notes to Financial Statements, Continued
September 30, 2024
| | | PERCENTAGE OF DIRECT INVESTMENTS |
| Global Opportunities Fund | | | 5.05 | % |
| International Equity Fund | | | 1.63 | |
| Better World International Fund | | | 7.84 | |
| International Growth Fund | | | 4.22 | |
| Developing World Fund | | | 5.28 | |
| Small/Mid Cap Core Fund | | | 7.41 | |
| Small/Mid Cap Growth Fund | | | 9.02 | |
| Income Builder Fund | | | 1.61 | |
| Summit Fund | | | 37.69 | |
The Funds may purchase or sell securities from or to an affiliated fund, provided the affiliation is due solely to having a common investment advisor, common officers, or common trustees, and provided that all such transactions will comply with Rule 17a-7 under the 1940 Act. For the year ended September 30, 2024, the Funds had no such transactions with affiliated funds.
Shown below are holdings of voting securities of each portfolio company which is considered "affiliated" to the Funds under the 1940 Act, including companies for which the Funds’ holding represented 5% or more of the company’s voting securities, and a series of the Thornburg Investment Trust in which the Funds invested for cash management purposes during the period:
| GLOBAL OPPORTUNITIES FUND | | MARKET VALUE 9/30/23 | | | PURCHASES AT COST | | | SALES PROCEEDS | | | REALIZED GAIN (LOSS) | | | CHANGE IN UNREALIZED APPR./(DEPR.) | | | MARKET VALUE 9/30/24 | | | DIVIDEND INCOME | |
| Thornburg Capital Mgmt. Fund | | $ | 28,657,059 | | | $ | 249,246,816 | | | $ | (241,716,916 | ) | | $ | - | | | $ | - | | | $ | 36,186,959 | | | $ | 1,956,399 | |
| | | | | | | | | | | | | | | | | | | | | | | | | | | | | |
| INTERNATIONAL EQUITY FUND | | | | | | | | | | | | | | | | | | | | | | | | | | | | |
| Thornburg Capital Mgmt. Fund | | $ | 204,881,109 | | | $ | 650,800,242 | | | $ | (734,684,718 | ) | | $ | - | | | $ | - | | | $ | 120,996,633 | | | $ | 8,114,126 | |
| | | | | | | | | | | | | | | | | | | | | | | | | | | | | |
| BETTER WORLD INTERNATIONAL FUND | | | | | | | | | | | | | | | | | | | | | | | | | | | | |
| Thornburg Capital Mgmt. Fund | | $ | 60,081,518 | | | $ | 202,456,709 | | | $ | (240,385,177 | ) | | $ | - | | | $ | - | | | $ | 22,153,050 | | | $ | 2,292,714 | |
| | | | | | | | | | | | | | | | | | | | | | | | | | | | | |
| INTERNATIONAL GROWTH FUND | | | | | | | | | | | | | | | | | | | | | | | | | | | | |
| Thornburg Capital Mgmt. Fund | | $ | 25,575,164 | | | $ | 271,847,996 | | | $ | (275,958,631 | ) | | $ | - | | | $ | - | | | $ | 21,464,529 | | | $ | 902,530 | |
| | | | | | | | | | | | | | | | | | | | | | | | | | | | | |
| DEVELOPING WORLD FUND | | | | | | | | | | | | | | | | | | | | | | | | | | | | |
| Thornburg Capital Mgmt. Fund | | $ | 31,140,363 | | | $ | 307,305,964 | | | $ | (337,338,085 | ) | | $ | - | | | $ | - | | | $ | 1,108,242 | | | $ | 656,379 | |
| | | | | | | | | | | | | | | | | | | | | | | | | | | | | |
| SMALL/MID CAP CORE FUND | | | | | | | | | | | | | | | | | | | | | | | | | | | | |
| Thornburg Capital Mgmt. Fund | | $ | 2,222,573 | | | $ | 112,968,019 | | | $ | (104,986,778 | ) | | $ | - | | | $ | - | | | $ | 10,203,814 | | | $ | 341,662 | |
| | | | | | | | | | | | | | | | | | | | | | | | | | | | | |
| SMALL/MID CAP GROWTH FUND | | | | | | | | | | | | | | | | | | | | | | | | | | | | |
| Thornburg Capital Mgmt. Fund | | $ | 3,331,787 | | | $ | 64,444,748 | | | $ | (61,947,523 | ) | | $ | - | | | $ | - | | | $ | 5,829,012 | | | $ | 172,698 | |
| | | | | | | | | | | | | | | | | | | | | | | | | �� | | | | |
| INCOME BUILDER FUND | | | | | | | | | | | | | | | | | | | | | | | | | | | | |
| Chimera Investment Corp | | $ | 81,045,985 | | | $ | - | | | $ | - | | | $ | - | | | $ | (2,721,330 | ) | | $ | 78,324,655 | | | $ | 6,828,050 | |
| Malamute Energy, Inc. | | | 12,439 | | | | - | | | | - | | | | - | | | | - | | | | 12,439 | | | | - | |
| SLR Investment Corp. | | | 66,298,581 | | | | - | | | | - | | | | - | | | | (1,464,686 | ) | | | 64,833,895 | | | | 7,064,956 | |
| Thornburg Capital Mgmt. Fund | | | 616,523,198 | | | | 2,010,913,363 | | | | (1,940,093,117 | ) | | | - | | | | - | | | | 687,343,444 | | | | 27,451,660 | |
| Total | | $ | 763,880,203 | | | $ | 2,010,913,363 | | | $ | (1,940,093,117 | ) | | $ | - | | | $ | (4,186,016 | ) | | $ | 830,514,433 | | | $ | 41,344,666 | |
| | | | | | | | | | | | | | | | | | | | | | | | | | | | | |
| SUMMIT FUND | | | | | | | | | | | | | | | | | | | | | | | | | | | | |
| Thornburg Capital Mgmt. Fund | | $ | 4,641,593 | | | $ | 53,265,548 | | | $ | (48,651,177 | ) | | $ | - | | | $ | - | | | $ | 9,255,964 | | | $ | 362,037 | |
Annual Financial Statements | 73
Notes to Financial Statements, Continued
September 30, 2024
NOTE 5 – TAXES
Federal Income Taxes: It is the policy of the Trust to comply with the provisions of the Internal Revenue Code of 1986 applicable to regulated investment companies and to distribute to shareholders substantially all investment company taxable income including net realized gains on investments (if any), and tax exempt income of the Funds. Therefore, no provision for federal income or excise tax is required.
The Funds file income tax returns in United States federal and applicable state jurisdictions. The statute of limitations on the Funds’ tax return filings generally remains open for the three years following a return’s filing date. The Funds have analyzed each uncertain tax position believed to be material in the preparation of the Funds’ financial statements for the fiscal year ended September 30, 2024, including open tax years, to assess whether it is more likely than not that the position would be sustained upon examination, based on the technical merits of the position. The Funds have not identified any such position for which an asset or liability must be reflected in the Statements of Assets and Liabilities.
At September 30, 2024, information on the tax components of capital was as follows:
| | | COST | | | UNREALIZED APPRECIATION | | | UNREALIZED DEPRECIATION | | | NET UNREALIZED APPRECIATION (DEPRECIATION) | |
| Global Opportunities Fund | | $ | 798,901,922 | | | $ | 508,863,688 | | | $ | (1,704,937 | ) | | $ | 507,158,751 | |
| International Equity Fund | | | 2,126,409,746 | | | | 848,258,077 | | | | (23,128,697 | ) | | | 825,129,380 | |
| Better World International Fund | | | 461,273,514 | | | | 118,345,953 | | | | (10,954,089 | ) | | | 107,391,864 | |
| International Growth Fund | | | 581,973,723 | | | | 315,664,691 | | | | (10,102,150 | ) | | | 305,562,541 | |
| Developing World Fund | | | 522,952,151 | | | | 174,555,424 | | | | (18,292,649 | ) | | | 156,262,775 | |
| Small/Mid Cap Core Fund | | | 420,164,572 | | | | 161,620,671 | | | | (21,016,284 | ) | | | 140,604,387 | |
| Small/Mid Cap Growth Fund | | | 208,020,061 | | | | 76,816,202 | | | | (8,815,760 | ) | | | 68,000,442 | |
| Income Builder Fund | | | 10,413,219,543 | | | | 3,913,978,571 | | | | (434,735,126 | ) | | | 3,479,243,445 | |
| Summit Fund | | | 97,094,693 | | | | 17,176,139 | | | | (1,790,842 | ) | | | 15,385,297 | |
Temporary differences between book and tax basis appreciation (depreciation) on cost of investments is primarily attributed to tax deferral of losses on wash sales, premium amortization accruals, distributions from real estate investment trusts (“REITs”), distributions from non-REIT securities, partnership basis adjustments, tax treatment of corporate actions, grantor trust adjustments, and mark-to-market of forward currency contracts and passive foreign investment companies.
At September 30, 2024, the Funds had deferred tax basis late-year ordinary investment losses occurring subsequent to October 31, 2023 through September 30, 2024 per the following table. For tax purposes, such losses will be recognized in the year ending September 30, 2025.
| | | DEFERRED TAX BASIS |
| | | LATE-YEAR ORDINARY LOSSES |
| Small/Mid Cap Core Fund | | $ | 1,630,509 | |
| Small/Mid Cap Growth Fund | | | 2,034,681 | |
At September 30, 2024, the Funds had cumulative tax basis capital losses from prior fiscal years as shown on the following table, which may be carried forward to offset future capital gains. To the extent such carryforwards are used, capital gain distributions may be reduced to the extent provided by regulations. Such capital loss carryforwards do not expire.
| | | | CUMULATIVE CAPITAL LOSSES | |
| | | | SHORT-TERM | | | | LONG-TERM | |
| Better World International Fund | | $ | 55,660,223 | | | $ | 4,207,639 | |
| Developing World Fund | | | 127,358,989 | | | | 16,043,846 | |
| Small/Mid Cap Core Fund | | | 6,690,321 | | | | 28,255,818 | |
| Small/Mid Cap Growth Fund | | | 36,438,048 | | | | 66,358,981 | |
During the year ended September 30, 2024, the Funds utilized capital loss carryforwards as shown on the following table.
74 | Annual Financial Statements
Notes to Financial Statements, Continued
September 30, 2024
| | | UTILIZED CAPITAL LOSS CARRYFORWARDS |
| International Growth Fund | | $ | 8,719,523 | |
| Developing World Fund | | | 50,630,838 | |
| Small/Mid Cap Core Fund | | | 11,006,478 | |
| Small/Mid Cap Growth Fund | | | 3,777,054 | |
| Income Builder Fund | | | 249,869,290 | |
| Summit Fund | | | 1,047,983 | |
At September 30, 2024, the effect of permanent "book/tax" reclassifications resulted in increases and decreases to components of the Funds’ net assets as follows:
| | | DISTRIBUTABLE EARNINGS | | | NET CAPITAL PAID | |
| Global Opportunities Fund | | $ | (2,698,054 | ) | | $ | 2,698,054 | |
| International Equity Fund | | | (11,490,184 | ) | | | 11,490,184 | |
| International Growth Fund | | | (4,236,679 | ) | | | 4,236,679 | |
| Small/Mid Cap Core Fund | | | 1,824,267 | | | | (1,824,267 | ) |
| Small/Mid Cap Growth Fund | | | 2,751,008 | | | | (2,751,008 | ) |
| Income Builder Fund | | | (11,995,897 | ) | | | 11,995,897 | |
| Summit Fund | | | 407 | | | | (407 | ) |
These differences are primarily due to the tax treatment of non-deductible excise tax, equalization credits and net operating losses.
Foreign Withholding Taxes: The Funds are subject to foreign tax withholding imposed by certain foreign countries in which the Funds may invest. Withholding taxes are incurred on certain foreign dividends and are accrued at the time the dividend is recognized based on applicable foreign tax laws. The Funds may file withholding tax reclaims in certain jurisdictions to recover a portion of amounts previously withheld, in view of various considerations, including recent decisions rendered by the courts in those and other jurisdictions. The Funds would expect to record a receivable for such a tax reclaim based on a variety of factors, including assessment of a jurisdiction’s legal obligation to pay reclaims, the jurisdiction’s administrative practices and payment history, and industry convention.
As a result of several court rulings in France and Sweden, the French and Swedish tax authorities recently paid several of the Funds’ tax reclaims for prior tax withholding. These tax reclaim payments are reflected as “Foreign withholding tax claims” in the Statements of Operations and any related interest is included in “Interest Income”. Reducing the “Foreign withholding tax claim” payments for the calculation of Net Investment Income/Loss in the Statement of Operations are fees paid by the Funds to a third-party service provider that assisted in the recovery of the tax reclaims by pursuing administrative and judicial proceedings on the Funds’ behalf. These third-party service provider fees are reflected in the Statement of Operations under “Tax Reclaim Collection Fees” and are excluded from the expense limitation agreement; therefore, certain net expenses are above the contractual limit. For U.S. income tax purposes, tax reclaims paid by France and Sweden and received by the Funds will reduce the amount of foreign taxes paid in a fiscal year that Fund shareholders can use as tax credits in their individual income tax returns.
In the event that tax reclaims received by the Funds during the fiscal year ending September 30, 2024, exceed the foreign withholding taxes paid by the Funds for other foreign investments, and the Funds have previously passed foreign tax credits on to their shareholders, the Funds will have a U.S. tax liability. The Funds will enter into a closing agreement with the Internal Revenue Service (IRS) in order to pay the associated tax liability (fees) on behalf of the Funds’ shareholders. These IRS fees are estimated through the year ended September 30, 2024 and are reflected as “IRS Compliance Fees” in the Statements of Operations.
Deferred Foreign Capital Gain Taxes: The Funds are subject to a tax imposed on net realized gains of securities of certain foreign countries. The Funds record an estimated deferred tax liability for net unrealized gains on these investments as reflected in the accompanying financial statements. Such changes are included in net unrealized appreciation (depreciation) from investments in the Statement of Operations.
Annual Financial Statements | 75
Notes to Financial Statements, Continued
September 30, 2024
At September 30, 2024, the Funds had undistributed tax basis ordinary investment income and undistributed tax basis capital gains as follows:
| | | UNDISTRIBUTED TAX BASIS ORDINARY INVESTMENT INCOME | | | UNDISTRIBUTED TAX BASIS CAPITAL GAINS | |
| Global Opportunities Fund | | $ | 16,482,334 | | | $ | 24,119,897 | |
| International Equity Fund | | | 56,116,881 | | | | 102,933,763 | |
| Better World International Fund | | | 6,459,841 | | | | — | |
| International Growth Fund | | | 2,931,613 | | | | 50,828,947 | |
| Developing World Fund | | | 16,971,433 | | | | — | |
| Income Builder Fund | | | 40,467,539 | | | | — | |
| Summit Fund | | | 205,327 | | | | 2,187,818 | |
The tax character of distributions paid for the Funds during the years ended September 30, 2024, and September 30, 2023, were as follows:
| | | DISTRIBUTIONS FROM: | |
| | | ORDINARY INCOME | | | CAPITAL GAINS |
| | | 2024 | | | 2023 | | | 2024 | | | 2023 | |
| Global Opportunities Fund | | $ | 27,584,800 | | | $ | 12,565,759 | | | $ | 32,029,693 | | | $ | 24,123,882 | |
| International Equity Fund | | | 48,346,564 | | | | 45,675,695 | | | | 9,940,441 | | | | — | |
| Better World International Fund | | | 8,565,346 | | | | 3,475,993 | | | | — | | | | — | |
| International Growth Fund | | | 4,803,282 | | | | 6,224,126 | | | | — | | | | — | |
| Developing World Fund | | | 18,863,056 | | | | 16,428,824 | | | | — | | | | — | |
| Small/Mid Cap Core Fund | | | — | | | | 1,277,575 | | | | — | | | | — | |
| Income Builder Fund | | | 594,051,997 | | | | 577,032,504 | | | | — | | | | — | |
| Summit Fund | | | 2,565,517 | | | | 2,062,953 | | | | — | | | | — | |
NOTE 6 – SHARES OF BENEFICIAL INTEREST
At September 30, 2024, there were an unlimited number of shares of each Fund with no par value of beneficial interest authorized. Transactions in each Fund’s shares of beneficial interest were as follows:
| | | YEAR ENDED SEPTEMBER 30, 2024 | | | YEAR ENDED SEPTEMBER 30, 2023 | |
| GLOBAL OPPORTUNITIES FUND | | SHARES | | | AMOUNT | | | SHARES | | | AMOUNT | |
| Class A Shares | | | | | | | | | | | | |
| Shares sold | | | 1,012,957 | | | $ | 35,674,509 | | | | 1,973,169 | | | $ | 62,289,387 | |
| Shares issued to shareholders in reinvestment of dividends | | | 474,492 | | | | 15,180,833 | | | | 286,501 | | | | 8,832,745 | |
| Shares repurchased | | | (1,443,942 | ) | | | (50,731,101 | ) | | | (1,435,099 | ) | | | (46,071,802 | ) |
| Net increase (decrease) | | | 43,507 | | | $ | 124,241 | | | | 824,571 | | | $ | 25,050,330 | |
| | | | | | | | | | | | | | | | | |
| Class C Shares | | | | | | | | | | | | | | | | |
| Shares sold | | | 43,651 | | | $ | 1,454,992 | | | | 70,051 | | | $ | 2,092,029 | |
| Shares issued to shareholders in reinvestment of dividends | | | 52,823 | | | | 1,582,206 | | | | 66,415 | | | | 1,933,568 | |
| Shares repurchased | | | (662,983 | ) | | | (21,714,206 | ) | | | (1,282,660 | ) | | | (39,131,980 | ) |
| Net increase (decrease) | | | (566,509 | ) | | $ | (18,677,008 | ) | | | (1,146,194 | ) | | $ | (35,106,383 | ) |
| | | | | | | | | | | | | | | | | |
| Class I Shares | | | | | | | | | | | | | | | | |
| Shares sold | | | 5,352,423 | | | $ | 191,322,020 | | | | 6,841,982 | | | $ | 213,696,940 | |
| Shares issued to shareholders in reinvestment of dividends | | | 1,077,890 | | | | 34,707,454 | | | | 667,251 | | | | 20,667,164 | |
| Shares repurchased | | | (4,763,476 | ) | | | (167,167,383 | ) | | | (4,395,367 | ) | | | (139,834,156 | ) |
| Net increase (decrease) | | | 1,666,837 | | | $ | 58,862,091 | | | | 3,113,866 | | | $ | 94,529,948 | |
76 | Annual Financial Statements
Notes to Financial Statements, Continued
September 30, 2024
| | | | | | | | | | | | | |
| | | YEAR ENDED SEPTEMBER 30, 2024 | | | YEAR ENDED SEPTEMBER 30, 2023 | |
| GLOBAL OPPORTUNITIES FUND | | SHARES | | | AMOUNT | | | SHARES | | | AMOUNT | |
| Class R3 Shares | | | | | | | | | | | | |
| Shares sold | | | 5,679 | | | $ | 199,489 | | | | 10,289 | | | $ | 322,839 | |
| Shares issued to shareholders in reinvestment of dividends | | | 4,569 | | | | 144,105 | | | | 3,300 | | | | 100,393 | |
| Shares repurchased | | | (23,648 | ) | | | (808,517 | ) | | | (24,277 | ) | | | (770,887 | ) |
| Net increase (decrease) | | | (13,400 | ) | | $ | (464,923 | ) | | | (10,688 | ) | | $ | (347,655 | ) |
| | | | | | | | | | | | | | | | | |
| Class R4 Shares | | | | | | | | | | | | | | | | |
| Shares sold | | | 31,850 | | | $ | 1,098,403 | | | | 31,219 | | | $ | 985,890 | |
| Shares issued to shareholders in reinvestment of dividends | | | 6,692 | | | | 212,163 | | | | 4,888 | | | | 149,433 | |
| Shares repurchased | | | (68,458 | ) | | | (2,368,915 | ) | | | (47,011 | ) | | | (1,517,014 | ) |
| Net increase (decrease) | | | (29,916 | ) | | $ | (1,058,349 | ) | | | (10,904 | ) | | $ | (381,691 | ) |
| | | | | | | | | | | | | | | | | |
| Class R5 Shares | | | | | | | | | | | | | | | | |
| Shares sold | | | 123,947 | | | $ | 4,387,721 | | | | 165,294 | | | $ | 5,364,183 | |
| Shares issued to shareholders in reinvestment of dividends | | | 26,661 | | | | 859,773 | | | | 18,221 | | | | 565,110 | |
| Shares repurchased | | | (232,450 | ) | | | (8,267,942 | ) | | | (203,337 | ) | | | (6,572,182 | ) |
| Net increase (decrease) | | | (81,842 | ) | | $ | (3,020,448 | ) | | | (19,822 | ) | | $ | (642,889 | ) |
| | | | | | | | | | | | | | | | | |
| Class R6 Shares | | | | | | | | | | | | | | | | |
| Shares sold | | | 192,348 | | | $ | 6,688,651 | | | | 79,117 | | | $ | 2,576,009 | |
| Shares issued to shareholders in reinvestment of dividends | | | 103,441 | | | | 3,343,892 | | | | 65,982 | | | | 2,052,294 | |
| Shares repurchased | | | (160,006 | ) | | | (5,920,490 | ) | | | (78,043 | ) | | | (2,536,316 | ) |
| Net increase (decrease) | | | 135,783 | | | $ | 4,112,053 | | | | 67,056 | | | $ | 2,091,987 | |
| | | YEAR ENDED SEPTEMBER 30, 2024 | | | YEAR ENDED SEPTEMBER 30, 2023 | |
| INTERNATIONAL EQUITY FUND | | SHARES | | | AMOUNT | | | SHARES | | | AMOUNT | |
| Class A Shares | | | | | | | | | | | | |
| Shares sold | | | 935,850 | | | $ | 23,364,618 | | | | 958,627 | | | $ | 21,441,973 | |
| Shares issued to shareholders in reinvestment of dividends | | | 332,207 | | | | 7,864,729 | | | | 272,209 | | | | 5,792,603 | |
| Shares repurchased | | | (2,843,485 | ) | | | (71,690,840 | ) | | | (3,414,315 | ) | | | (75,334,403 | ) |
| Net increase (decrease) | | | (1,575,428 | ) | | $ | (40,461,493 | ) | | | (2,183,479 | ) | | $ | (48,099,827 | ) |
| | | | | | | | | | | | | | | | | |
| Class C Shares | | | | | | | | | | | | | | | | |
| Shares sold | | | 53,478 | | | $ | 1,143,654 | | | | 38,922 | | | $ | 720,919 | |
| Shares issued to shareholders in reinvestment of dividends | | | 8,282 | | | | 167,683 | | | | 9,319 | | | | 170,731 | |
| Shares repurchased | | | (298,442 | ) | | | (6,328,898 | ) | | | (301,230 | ) | | | (5,799,171 | ) |
| Net increase (decrease) | | | (236,682 | ) | | $ | (5,017,561 | ) | | | (252,989 | ) | | $ | (4,907,521 | ) |
| | | | | | | | | | | | | | | | | |
| Class I Shares | | | | | | | | | | | | | | | | |
| Shares sold | | | 8,569,673 | | | $ | 229,751,406 | | | | 7,966,745 | | | $ | 184,784,897 | |
| Shares issued to shareholders in reinvestment of dividends | | | 1,295,190 | | | | 31,956,670 | | | | 1,155,316 | | | | 25,578,700 | |
| Shares repurchased | | | (11,502,083 | ) | | | (300,336,495 | ) | | | (15,936,850 | ) | | | (361,323,304 | ) |
| Net increase (decrease) | | | (1,637,220 | ) | | $ | (38,628,419 | ) | | | (6,814,789 | ) | | $ | (150,959,707 | ) |
Annual Financial Statements | 77
Notes to Financial Statements, Continued
September 30, 2024
| | | | | | | | | | | | | |
| | | YEAR ENDED SEPTEMBER 30, 2024 | | | YEAR ENDED SEPTEMBER 30, 2023 | |
| INTERNATIONAL EQUITY FUND | | SHARES | | | AMOUNT | | | SHARES | | | AMOUNT | |
| Class R3 Shares | | | | | | | | | | | | |
| Shares sold | | | 727,534 | | | $ | 18,322,479 | | | | 767,878 | | | $ | 17,159,971 | |
| Shares issued to shareholders in reinvestment of dividends | | | 96,113 | | | | 2,271,486 | | | | 86,320 | | | | 1,835,166 | |
| Shares repurchased | | | (1,293,681 | ) | | | (32,623,352 | ) | | | (1,487,151 | ) | | | (33,273,315 | ) |
| Net increase (decrease) | | | (470,034 | ) | | $ | (12,029,387 | ) | | | (632,953 | ) | | $ | (14,278,178 | ) |
| | | | | | | | | | | | | | | | | |
| Class R4 Shares | | | | | | | | | | | | | | | | |
| Shares sold | | | 467,006 | | | $ | 11,501,773 | | | | 1,086,901 | | | $ | 23,264,851 | |
| Shares issued to shareholders in reinvestment of dividends | | | 66,517 | | | | 1,557,309 | | | | 60,137 | | | | 1,265,884 | |
| Shares repurchased | | | (1,006,130 | ) | | | (25,409,873 | ) | | | (1,308,585 | ) | | | (29,072,586 | ) |
| Net increase (decrease) | | | (472,607 | ) | | $ | (12,350,791 | ) | | | (161,547 | ) | | $ | (4,541,851 | ) |
| | | | | | | | | | | | | | | | | |
| Class R5 Shares | | | | | | | | | | | | | | | | |
| Shares sold | | | 822,970 | | | $ | 21,660,544 | | | | 910,913 | | | $ | 21,417,736 | |
| Shares issued to shareholders in reinvestment of dividends | | | 96,280 | | | | 2,372,344 | | | | 87,952 | | | | 1,945,490 | |
| Shares repurchased | | | (1,369,086 | ) | | | (35,421,432 | ) | | | (1,230,400 | ) | | | (28,658,667 | ) |
| Net increase (decrease) | | | (449,836 | ) | | $ | (11,388,544 | ) | | | (231,535 | ) | | $ | (5,295,441 | ) |
| | | | | | | | | | | | | | | | | |
| Class R6 Shares | | | | | | | | | | | | | | | | |
| Shares sold | | | 3,752,690 | | | $ | 100,729,703 | | | | 2,065,947 | | | $ | 47,957,012 | |
| Shares issued to shareholders in reinvestment of dividends | | | 298,157 | | | | 7,313,121 | | | | 243,087 | | | | 5,347,922 | |
| Shares repurchased | | | (2,130,225 | ) | | | (56,807,552 | ) | | | (2,559,868 | ) | | | (58,227,646 | ) |
| Net increase (decrease) | | | 1,920,622 | | | $ | 51,235,272 | | | | (250,834 | ) | | $ | (4,922,712 | ) |
| | | YEAR ENDED SEPTEMBER 30, 2024 | | | YEAR ENDED SEPTEMBER 30, 2023 | |
| BETTER WORLD INTERNATIONAL FUND | | SHARES | | | AMOUNT | | | SHARES | | | AMOUNT | |
| Class A Shares | | | | | | | | | | | | |
| Shares sold | | | 314,663 | | | $ | 5,494,322 | | | | 670,874 | | | $ | 10,677,311 | |
| Shares issued to shareholders in reinvestment of dividends | | | 26,486 | | | | 440,725 | | | | 7,172 | | | | 109,299 | |
| Shares repurchased | | | (886,558 | ) | | | (15,449,484 | ) | | | (609,070 | ) | | | (9,775,627 | ) |
| Net increase (decrease) | | | (545,409 | ) | | $ | (9,514,437 | ) | | | 68,976 | | | $ | 1,010,983 | |
| | | | | | | | | | | | | | | | | |
| Class C Shares | | | | | | | | | | | | | | | | |
| Shares sold | | | 34,558 | | | $ | 583,973 | | | | 125,030 | | | $ | 1,989,268 | |
| Shares issued to shareholders in reinvestment of dividends | | | 1,448 | | | | 23,443 | | | | - | | | | - | |
| Shares repurchased | | | (80,425 | ) | | | (1,328,131 | ) | | | (63,960 | ) | | | (981,867 | ) |
| Net increase (decrease) | | | (44,419 | ) | | $ | (720,715 | ) | | | 61,070 | | | $ | 1,007,401 | |
| | | | | | | | | | | | | | | | | |
| Class I Shares | | | | | | | | | | | | | | | | |
| Shares sold | | | 6,674,995 | | | $ | 117,530,957 | | | | 13,217,836 | | | $ | 219,934,154 | |
| Shares issued to shareholders in reinvestment of dividends | | | 459,511 | | | | 7,866,834 | | | | 207,000 | | | | 3,245,758 | |
| Shares repurchased | | | (11,682,808 | ) | | | (209,166,500 | ) | | | (7,435,794 | ) | | | (120,746,045 | ) |
| Net increase (decrease) | | | (4,548,302 | ) | | $ | (83,768,709 | ) | | | 5,989,042 | | | $ | 102,433,867 | |
78 | Annual Financial Statements
Notes to Financial Statements, Continued
September 30, 2024
| | | | | | | | | | | | | |
| | | YEAR ENDED SEPTEMBER 30, 2024 | | | YEAR ENDED SEPTEMBER 30, 2023 | |
| INTERNATIONAL GROWTH FUND | | SHARES | | | AMOUNT | | | SHARES | | | AMOUNT | |
| Class A Shares | | | | | | | | | | | | |
| Shares sold | | | 560,328 | | | $ | 13,997,423 | | | | 578,109 | | | $ | 12,679,011 | |
| Shares issued to shareholders in reinvestment of dividends | | | 8,080 | | | | 192,231 | | | | 11,150 | | | | 232,369 | |
| Shares repurchased | | | (1,198,879 | ) | | | (29,627,516 | ) | | | (1,288,447 | ) | | | (27,750,731 | ) |
| Net increase (decrease) | | | (630,471 | ) | | $ | (15,437,862 | ) | | | (699,188 | ) | | $ | (14,839,351 | ) |
| | | | | | | | | | | | | | | | | |
| Class C Shares | | | | | | | | | | | | | | | | |
| Shares sold | | | 4,915 | | | $ | 107,512 | | | | 8,990 | | | $ | 174,379 | |
| Shares issued to shareholders in reinvestment of dividends | | | - | | | | - | | | | - | | | | - | |
| Shares repurchased | | | (159,144 | ) | | | (3,439,978 | ) | | | (233,053 | ) | | | (4,512,693 | ) |
| Net increase (decrease) | | | (154,229 | ) | | $ | (3,332,466 | ) | | | (224,063 | ) | | $ | (4,338,314 | ) |
| | | | | | | | | | | | | | | | | |
| Class I Shares | | | | | | | | | | | | | | | | |
| Shares sold | | | 2,076,789 | | | $ | 53,519,336 | | | | 3,789,292 | | | $ | 84,031,408 | |
| Shares issued to shareholders in reinvestment of dividends | | | 149,145 | | | | 3,680,897 | | | | 221,806 | | | | 4,795,444 | |
| Shares repurchased | | | (6,263,849 | ) | | | (160,744,854 | ) | | | (14,293,232 | ) | | | (317,055,044 | ) |
| Net increase (decrease) | | | (4,037,915 | ) | | $ | (103,544,621 | ) | | | (10,282,134 | ) | | $ | (228,228,192 | ) |
| | | | | | | | | | | | | | | | | |
| Class R3 Shares | | | | | | | | | | | | | | | | |
| Shares sold | | | 25,629 | | | $ | 627,655 | | | | 38,644 | | | $ | 837,250 | |
| Shares issued to shareholders in reinvestment of dividends | | | 282 | | | | 6,584 | | | | 351 | | | | 7,201 | |
| Shares repurchased | | | (59,218 | ) | | | (1,466,389 | ) | | | (68,867 | ) | | | (1,415,017 | ) |
| Net increase (decrease) | | | (33,307 | ) | | $ | (832,150 | ) | | | (29,872 | ) | | $ | (570,566 | ) |
| | | | | | | | | | | | | | | | | |
| Class R4 Shares | | | | | | | | | | | | | | | | |
| Shares sold | | | 47,405 | | | $ | 1,171,152 | | | | 53,972 | | | $ | 1,179,309 | |
| Shares issued to shareholders in reinvestment of dividends | | | 307 | | | | 7,228 | | | | 545 | | | | 11,257 | |
| Shares repurchased | | | (114,285 | ) | | | (2,837,793 | ) | | | (92,569 | ) | | | (1,991,059 | ) |
| Net increase (decrease) | | | (66,573 | ) | | $ | (1,659,413 | ) | | | (38,052 | ) | | $ | (800,493 | ) |
| | | | | | | | | | | | | | | | | |
| Class R5 Shares | | | | | | | | | | | | | | | | |
| Shares sold | | | 68,817 | | | $ | 1,796,055 | | | | 140,396 | | | $ | 3,239,664 | |
| Shares issued to shareholders in reinvestment of dividends | | | 2,995 | | | | 74,150 | | | | 7,816 | | | | 169,448 | |
| Shares repurchased | | | (422,194 | ) | | | (11,088,257 | ) | | | (688,032 | ) | | | (15,683,738 | ) |
| Net increase (decrease) | | | (350,382 | ) | | $ | (9,218,052 | ) | | | (539,820 | ) | | $ | (12,274,626 | ) |
| | | | | | | | | | | | | | | | | |
| Class R6 Shares | | | | | | | | | | | | | | | | |
| Shares sold | | | 113,329 | | | $ | 2,953,129 | | | | 184,989 | | | $ | 4,241,064 | |
| Shares issued to shareholders in reinvestment of dividends | | | 19,758 | | | | 491,183 | | | | 25,612 | | | | 557,839 | |
| Shares repurchased | | | (164,346 | ) | | | (4,306,251 | ) | | | (477,558 | ) | | | (11,077,421 | ) |
| Net increase (decrease) | | | (31,259 | ) | | $ | (861,939 | ) | | | (266,957 | ) | | $ | (6,278,518 | ) |
Annual Financial Statements | 79
Notes to Financial Statements, Continued
September 30, 2024
| | | | | | | | | | | | | |
| | | YEAR ENDED SEPTEMBER 30, 2024 | | | YEAR ENDED SEPTEMBER 30, 2023 | |
| DEVELOPING WORLD FUND | | SHARES | | | AMOUNT | | | SHARES | | | AMOUNT | |
| Class A Shares | | | | | | | | | | | | |
| Shares sold | | | 911,509 | | | $ | 19,135,420 | | | | 831,891 | | | $ | 16,932,746 | |
| Shares issued to shareholders in reinvestment of dividends | | | 63,772 | | | | 1,288,201 | | | | 60,652 | | | | 1,196,665 | |
| Shares repurchased | | | (1,883,964 | ) | | | (39,452,003 | ) | | | (1,423,791 | ) | | | (28,877,796 | ) |
| Net increase (decrease) | | | (908,683 | ) | | $ | (19,028,382 | ) | | | (531,248 | ) | | $ | (10,748,385 | ) |
| | | | | | | | | | | | | | | | | |
| Class C Shares | | | | | | | | | | | | | | | | |
| Shares sold | | | 43,412 | | | $ | 845,771 | | | | 46,605 | | | $ | 859,875 | |
| Shares issued to shareholders in reinvestment of dividends | | | 3,471 | | | | 66,087 | | | | 2,206 | | | | 40,950 | |
| Shares repurchased | | | (329,219 | ) | | | (6,457,540 | ) | | | (409,111 | ) | | | (7,755,124 | ) |
| Net increase (decrease) | | | (282,336 | ) | | $ | (5,545,682 | ) | | | (360,300 | ) | | $ | (6,854,299 | ) |
| | | | | | | | | | | | | | | | | |
| Class I Shares | | | | | | | | | | | | | | | | |
| Shares sold | | | 5,731,667 | | | $ | 122,155,929 | | | | 13,630,885 | | | $ | 284,495,601 | |
| Shares issued to shareholders in reinvestment of dividends | | | 762,019 | | | | 15,758,554 | | | | 680,314 | | | | 13,735,542 | |
| Shares repurchased | | | (24,126,800 | ) | | | (519,187,519 | ) | | | (15,447,650 | ) | | | (317,807,604 | ) |
| Net increase (decrease) | | | (17,633,114 | ) | | $ | (381,273,036 | ) | | | (1,136,451 | ) | | $ | (19,576,461 | ) |
| | | | | | | | | | | | | | | | | |
| Class R5 Shares | | | | | | | | | | | | | | | | |
| Shares sold | | | 29,859 | | | $ | 645,915 | | | | 64,298 | | | $ | 1,260,653 | |
| Shares issued to shareholders in reinvestment of dividends | | | 3,239 | | | | 66,745 | | | | 2,871 | | | | 57,789 | |
| Shares repurchased | | | (48,166 | ) | | | (1,029,328 | ) | | | (35,359 | ) | | | (724,953 | ) |
| Net increase (decrease) | | | (15,068 | ) | | $ | (316,668 | ) | | | 31,810 | | | $ | 593,489 | |
| | | | | | | | | | | | | | | | | |
| Class R6 Shares | | | | | | | | | | | | | | | | |
| Shares sold | | | 408,275 | | | $ | 8,831,367 | | | | 402,990 | | | $ | 8,389,832 | |
| Shares issued to shareholders in reinvestment of dividends | | | 59,957 | | | | 1,241,706 | | | | 50,092 | | | | 1,013,358 | |
| Shares repurchased | | | (564,666 | ) | | | (12,350,964 | ) | | | (322,162 | ) | | | (6,692,834 | ) |
| Net increase (decrease) | | | (96,434 | ) | | $ | (2,277,891 | ) | | | 130,920 | | | $ | 2,710,356 | |
| | | YEAR ENDED SEPTEMBER 30, 2024 | | | YEAR ENDED SEPTEMBER 30, 2023 | |
| SMALL/MID CAP CORE FUND | | SHARES | | | AMOUNT | | | SHARES | | | AMOUNT | |
| Class A Shares | | | | | | | | | | | | |
| Shares sold | | | 55,814 | | | $ | 3,776,195 | | | | 80,057 | | | $ | 4,815,941 | |
| Shares issued to shareholders in reinvestment of dividends | | | - | | | | - | | | | 2,209 | | | | 130,588 | |
| Shares repurchased | | | (635,440 | ) | | | (42,873,713 | ) | | | (823,989 | ) | | | (49,388,976 | ) |
| Net increase (decrease) | | | (579,626 | ) | | $ | (39,097,518 | ) | | | (741,723 | ) | | $ | (44,442,447 | ) |
| | | | | | | | | | | | | | | | | |
| Class C Shares | | | | | | | | | | | | | | | | |
| Shares sold | | | 1,783 | | | $ | 101,849 | | | | 3,207 | | | $ | 164,823 | |
| Shares issued to shareholders in reinvestment of dividends | | | - | | | | - | | | | - | | | | - | |
| Shares repurchased | | | (40,379 | ) | | | (2,271,886 | ) | | | (73,298 | ) | | | (3,755,323 | ) |
| Net increase (decrease) | | | (38,596 | ) | | $ | (2,170,037 | ) | | | (70,091 | ) | | $ | (3,590,500 | ) |
80 | Annual Financial Statements
Notes to Financial Statements, Continued
September 30, 2024
| | | | | | | | | | | | | |
| | | YEAR ENDED SEPTEMBER 30, 2024 | | | YEAR ENDED SEPTEMBER 30, 2023 | |
| SMALL/MID CAP CORE FUND | | SHARES | | | AMOUNT | | | SHARES | | | AMOUNT | |
| Class I Shares | | | | | | | | | | | | |
| Shares sold | | | 100,014 | | | $ | 7,162,244 | | | | 101,666 | | | $ | 6,454,179 | |
| Shares issued to shareholders in reinvestment of dividends | | | - | | | | - | | | | 16,489 | | | | 1,017,848 | |
| Shares repurchased | | | (336,034 | ) | | | (23,553,036 | ) | | | (595,212 | ) | | | (37,241,178 | ) |
| Net increase (decrease) | | | (236,020 | ) | | $ | (16,390,792 | ) | | | (477,057 | ) | | $ | (29,769,151 | ) |
| | | | | | | | | | | | | | | | | |
| Class R3 Shares | | | | | | | | | | | | | | | | |
| Shares sold | | | 15,531 | | | $ | 1,048,927 | | | | 25,100 | | | $ | 1,501,124 | |
| Shares issued to shareholders in reinvestment of dividends | | | - | | | | - | | | | 266 | | | | 15,650 | |
| Shares repurchased | | | (65,541 | ) | | | (4,464,001 | ) | | | (59,406 | ) | | | (3,535,469 | ) |
| Net increase (decrease) | | | (50,010 | ) | | $ | (3,415,074 | ) | | | (34,040 | ) | | $ | (2,018,695 | ) |
| | | | | | | | | | | | | | | | | |
| Class R4 Shares | | | | | | | | | | | | | | | | |
| Shares sold | | | 3,334 | | | $ | 230,467 | | | | 5,518 | | | $ | 336,921 | |
| Shares issued to shareholders in reinvestment of dividends | | | - | | | | - | | | | 107 | | | | 6,387 | |
| Shares repurchased | | | (5,779 | ) | | | (408,013 | ) | | | (18,697 | ) | | | (1,149,650 | ) |
| Net increase (decrease) | | | (2,445 | ) | | $ | (177,546 | ) | | | (13,072 | ) | | $ | (806,342 | ) |
| | | | | | | | | | | | | | | | | |
| Class R5 Shares | | | | | | | | | | | | | | | | |
| Shares sold | | | 5,662 | | | $ | 398,737 | | | | 9,468 | | | $ | 593,423 | |
| Shares issued to shareholders in reinvestment of dividends | | | - | | | | - | | | | 484 | | | | 29,855 | |
| Shares repurchased | | | (17,269 | ) | | | (1,226,133 | ) | | | (69,751 | ) | | | (4,490,099 | ) |
| Net increase (decrease) | | | (11,607 | ) | | $ | (827,396 | ) | | | (59,799 | ) | | $ | (3,866,821 | ) |
| | | YEAR ENDED SEPTEMBER 30, 2024 | | | YEAR ENDED SEPTEMBER 30, 2023 | |
| SMALL/MID CAP GROWTH FUND | | SHARES | | | AMOUNT | | | SHARES | | | AMOUNT | |
| Class A Shares | | | | | | | | | | | | |
| Shares sold | | | 129,010 | | | $ | 3,465,995 | | | | 195,052 | | | $ | 4,608,839 | |
| Shares issued to shareholders in reinvestment of dividends | | | - | | | | - | | | | - | | | | - | |
| Shares repurchased | | | (947,543 | ) | | | (25,242,883 | ) | | | (1,697,313 | ) | | | (39,033,955 | ) |
| Net increase (decrease) | | | (818,533 | ) | | $ | (21,776,888 | ) | | | (1,502,261 | ) | | $ | (34,425,116 | ) |
| | | | | | | | | | | | | | | | | |
| Class C Shares | | | | | | | | | | | | | | | | |
| Shares sold | | | 7,053 | | | $ | 130,584 | | | | 5,569 | | | $ | 94,146 | |
| Shares issued to shareholders in reinvestment of dividends | | | - | | | | - | | | | - | | | | - | |
| Shares repurchased | | | (97,002 | ) | | | (1,866,089 | ) | | | (154,543 | ) | | | (2,597,269 | ) |
| Net increase (decrease) | | | (89,949 | ) | | $ | (1,735,505 | ) | | | (148,974 | ) | | $ | (2,503,123 | ) |
| | | | | | | | | | | | | | | | | |
| Class I Shares | | | | | | | | | | | | | | | | |
| Shares sold | | | 95,955 | | | $ | 3,037,908 | | | | 134,409 | | | $ | 3,559,163 | |
| Shares issued to shareholders in reinvestment of dividends | | | - | | | | - | | | | - | | | | - | |
| Shares repurchased | | | (977,419 | ) | | | (27,499,750 | ) | | | (842,729 | ) | | | (22,252,193 | ) |
| Net increase (decrease) | | | (881,464 | ) | | $ | (24,461,842 | ) | | | (708,320 | ) | | $ | (18,693,030 | ) |
Annual Financial Statements | 81
Notes to Financial Statements, Continued
September 30, 2024
| | | | | | | | | | | | | |
| | | YEAR ENDED SEPTEMBER 30, 2024 | | | YEAR ENDED SEPTEMBER 30, 2023 | |
| SMALL/MID CAP GROWTH FUND | | SHARES | | | AMOUNT | | | SHARES | | | AMOUNT | |
| Class R3 Shares | | | | | | | | | | | | |
| Shares sold | | | 46,030 | | | $ | 1,222,974 | | | | 67,079 | | | $ | 1,543,065 | |
| Shares issued to shareholders in reinvestment of dividends | | | - | | | | - | | | | - | | | | - | |
| Shares repurchased | | | (121,332 | ) | | | (3,223,231 | ) | | | (164,259 | ) | | | (3,708,208 | ) |
| Net increase (decrease) | | | (75,302 | ) | | $ | (2,000,257 | ) | | | (97,180 | ) | | $ | (2,165,143 | ) |
| | | | | | | | | | | | | | | | | |
| Class R4 Shares | | | | | | | | | | | | | | | | |
| Shares sold | | | 1,596 | | | $ | 43,170 | | | | 4,685 | | | $ | 107,643 | |
| Shares issued to shareholders in reinvestment of dividends | | | - | | | | - | | | | - | | | | - | |
| Shares repurchased | | | (7,491 | ) | | | (193,748 | ) | | | (21,567 | ) | | | (514,998 | ) |
| Net increase (decrease) | | | (5,895 | ) | | $ | (150,578 | ) | | | (16,882 | ) | | $ | (407,355 | ) |
| | | | | | | | | | | | | | | | | |
| Class R5 Shares | | | | | | | | | | | | | | | | |
| Shares sold | | | 32,632 | | | $ | 983,342 | | | | 63,782 | | | $ | 1,783,353 | |
| Shares issued to shareholders in reinvestment of dividends | | | - | | | | - | | | | - | | | | - | |
| Shares repurchased | | | (60,754 | ) | | | (1,817,449 | ) | | | (163,354 | ) | | | (4,359,536 | ) |
| Net increase (decrease) | | | (28,122 | ) | | $ | (834,107 | ) | | | (99,572 | ) | | $ | (2,576,183 | ) |
| | | YEAR ENDED SEPTEMBER 30, 2024 | | | YEAR ENDED SEPTEMBER 30, 2023 | |
| INCOME BUILDER FUND | | SHARES | | | AMOUNT | | | SHARES | | | AMOUNT | |
| Class A Shares | | | | | | | | | | | | |
| Shares sold | | | 11,027,278 | | | $ | 269,303,570 | | | | 17,596,421 | | | $ | 385,599,031 | |
| Shares issued to shareholders in reinvestment of dividends | | | 7,166,809 | | | | 179,871,887 | | | | 8,296,992 | | | | 183,332,988 | |
| Shares repurchased | | | (23,509,784 | ) | | | (575,690,728 | ) | | | (25,830,307 | ) | | | (567,648,084 | ) |
| Net increase (decrease) | | | (5,315,697 | ) | | $ | (126,515,271 | ) | | | 63,106 | | | $ | 1,283,935 | |
| | | | | | | | | | | | | | | | | |
| Class C Shares | | | | | | | | | | | | | | | | |
| Shares sold | | | 2,947,051 | | | $ | 72,015,318 | | | | 2,870,931 | | | $ | 63,315,846 | |
| Shares issued to shareholders in reinvestment of dividends | | | 738,145 | | | | 18,457,774 | | | | 1,113,980 | | | | 24,504,174 | |
| Shares repurchased | | | (6,651,961 | ) | | | (161,391,247 | ) | | | (11,575,054 | ) | | | (253,678,474 | ) |
| Net increase (decrease) | | | (2,966,765 | ) | | $ | (70,918,155 | ) | | | (7,590,143 | ) | | $ | (165,858,454 | ) |
| | | | | | | | | | | | | | | | | |
| Class I Shares | | | | | | | | | | | | | | | | |
| Shares sold | | | 52,973,673 | | | $ | 1,303,553,642 | | | | 64,411,465 | | | $ | 1,435,919,240 | |
| Shares issued to shareholders in reinvestment of dividends | | | 13,614,797 | | | | 344,755,089 | | | | 14,007,229 | | | | 312,275,940 | |
| Shares repurchased | | | (48,708,667 | ) | | | (1,198,733,213 | ) | | | (45,547,584 | ) | | | (1,005,204,732 | ) |
| Net increase (decrease) | | | 17,879,803 | | | $ | 449,575,518 | | | | 32,871,110 | | | $ | 742,990,448 | |
| | | | | | | | | | | | | | | | | |
| Class R3 Shares | | | | | | | | | | | | | | | | |
| Shares sold | | | 72,490 | | | $ | 1,785,321 | | | | 73,395 | | | $ | 1,622,458 | |
| Shares issued to shareholders in reinvestment of dividends | | | 34,638 | | | | 867,874 | | | | 44,819 | | | | 988,379 | |
| Shares repurchased | | | (190,585 | ) | | | (4,636,825 | ) | | | (255,363 | ) | | | (5,600,344 | ) |
| Net increase (decrease) | | | (83,457 | ) | | $ | (1,983,630 | ) | | | (137,149 | ) | | $ | (2,989,507 | ) |
82 | Annual Financial Statements
Notes to Financial Statements, Continued
September 30, 2024
| | | | | | | | | | | | | |
| | | YEAR ENDED SEPTEMBER 30, 2024 | | | YEAR ENDED SEPTEMBER 30, 2023 | |
| INCOME BUILDER FUND | | SHARES | | | AMOUNT | | | SHARES | | | AMOUNT | |
| Class R4 Shares | | | | | | | | | | | | |
| Shares sold | | | 82,236 | | | $ | 1,988,854 | | | | 59,372 | | | $ | 1,302,050 | |
| Shares issued to shareholders in reinvestment of dividends | | | 17,334 | | | | 435,598 | | | | 21,972 | | | | 485,428 | |
| Shares repurchased | | | (77,696 | ) | | | (1,909,690 | ) | | | (155,126 | ) | | | (3,464,600 | ) |
| Net increase (decrease) | | | 21,874 | | | $ | 514,762 | | | | (73,782 | ) | | $ | (1,677,122 | ) |
| | | | | | | | | | | | | | | | | |
| Class R5 Shares | | | | | | | | | | | | | | | | |
| Shares sold | | | 145,487 | | | $ | 3,561,552 | | | | 172,160 | | | $ | 3,781,989 | |
| Shares issued to shareholders in reinvestment of dividends | | | 34,391 | | | | 867,789 | | | | 50,269 | | | | 1,114,795 | |
| Shares repurchased | | | (278,319 | ) | | | (6,938,192 | ) | | | (922,962 | ) | | | (20,762,678 | ) |
| Net increase (decrease) | | | (98,441 | ) | | $ | (2,508,851 | ) | | | (700,533 | ) | | $ | (15,865,894 | ) |
| | | | | | | | | | | | | | | | | |
| Class R6 Shares | | | | | | | | | | | | | | | | |
| Shares sold | | | 2,331,683 | | | $ | 54,950,079 | | | | 1,979,752 | | | $ | 43,778,848 | |
| Shares issued to shareholders in reinvestment of dividends | | | 455,731 | | | | 11,506,085 | | | | 397,853 | | | | 8,855,951 | |
| Shares repurchased | | | (1,695,423 | ) | | | (42,814,705 | ) | | | (393,241 | ) | | | (8,732,940 | ) |
| Net increase (decrease) | | | 1,091,991 | | | $ | 23,641,459 | | | | 1,984,364 | | | $ | 43,901,859 | |
| | | YEAR ENDED SEPTEMBER 30, 2024 | | | YEAR ENDED SEPTEMBER 30, 2023 | |
| SUMMIT FUND | | SHARES | | | AMOUNT | | | SHARES | | | AMOUNT | |
| Class A Shares | | | | | | | | | | | | |
| Shares sold | | | 658,773 | | | $ | 8,228,023 | | | | 579,948 | | | $ | 6,585,955 | |
| Shares issued to shareholders in reinvestment of dividends | | | 17,242 | | | | 221,769 | | | | 9,556 | | | | 110,469 | |
| Shares repurchased | | | (192,124 | ) | | | (2,284,020 | ) | | | (109,451 | ) | | | (1,245,452 | ) |
| Net increase (decrease) | | | 483,891 | | | $ | 6,165,772 | | | | 480,053 | | | $ | 5,450,972 | |
| | | | | | | | | | | | | | | | | |
| Class I Shares | | | | | | | | | | | | | | | | |
| Shares sold | | | 1,583,992 | | | $ | 19,799,578 | | | | 1,638,376 | | | $ | 18,606,705 | |
| Shares issued to shareholders in reinvestment of dividends | | | 164,909 | | | | 2,109,866 | | | | 153,205 | | | | 1,755,389 | |
| Shares repurchased | | | (1,044,719 | ) | | | (13,450,288 | ) | | | (601,699 | ) | | | (6,848,241 | ) |
| Net increase (decrease) | | | 704,182 | | | $ | 8,459,156 | | | | 1,189,882 | | | $ | 13,513,853 | |
NOTE 7 – INVESTMENT TRANSACTIONS
For the year ended September 30, 2024, the Funds had purchase and sale transactions of investments as listed in the table below (excluding short-term investments).
| | | PURCHASES | | | SALES | |
| Global Opportunities Fund | | $ | 167,469,586 | | | $ | 182,995,418 | |
| International Equity Fund | | | 1,133,046,543 | | | | 1,116,863,984 | |
| Better World International Fund | | | 318,141,972 | | | | 376,759,475 | |
| International Growth Fund | | | 378,275,037 | | | | 504,405,536 | |
| Developing World Fund | | | 802,423,133 | | | | 1,193,240,991 | |
| Small/Mid Cap Core Fund | | | 170,386,674 | | | | 240,320,317 | |
| Small/Mid Cap Growth Fund | | | 85,131,011 | | | | 141,863,794 | |
| Income Builder Fund | | | 3,209,452,495 | | | | 2,998,254,122 | |
| Summit Fund | | | 66,814,475 | | | | 60,164,232 | |
Annual Financial Statements | 83
Notes to Financial Statements, Continued
September 30, 2024
NOTE 8 – DERIVATIVE FINANCIAL INSTRUMENTS
The Funds may use a variety of derivative financial instruments to hedge or adjust the risks affecting its investment portfolio or to enhance investment returns. Provisions of the FASB Accounting Standards Codification 815-10-50 (“ASC 815”) require certain disclosures. The disclosures are intended to provide users of financial statements with an understanding of the use of derivative instruments by the Funds and how these derivatives affect the financial position, financial performance and cash flows of the Funds. The Funds do not designate any derivative instruments as hedging instruments under ASC 815. During the year ended September 30, 2024, certain Funds’ principal exposures to derivative financial instruments of the type addressed by ASC 815 were investments in forward currency contracts.
Forward Currency Contracts: During the year ended September 30, 2024, some of the Funds entered into forward currency contracts in the normal course of pursuing their investment objectives, with the intent of reducing the risk to the value of the Funds’ foreign investments from adverse changes in the relationship between the U.S. dollar and foreign currencies. Each of the forward currency contracts entered into by the Funds is an agreement between two parties to exchange different currencies at a specified rate of exchange at an agreed upon future date. Forward currency contracts involve risks to the Funds, including the risk that a contract’s counterparty will not meet its obligations to the Funds, the risk that a change in a contract’s value may not correlate perfectly with the currency the contract was intended to track, and the risk that the Advisor is unable to correctly implement its strategy in using a contract. In any such instance, the Funds may not achieve the intended benefit of entering into a contract and may experience a loss.
The monthly average values of open forward currency contracts for the year ended September 30, 2024 were as follows:
| | | FORWARD CURRENCY PURCHASE | | FORWARD CURRENCY SELL |
| Global Opportunities Fund | | $ | — | | | $ | 165,829,384 | |
| International Equity Fund | | | 20,670,669 | | | | 163,577,297 | |
| Income Builder Fund | | | 2,075,511 | | | | 2,446,252,765 | |
| Summit Fund | | | 6,050,379 | | | | 81,092 | |
These contracts are accounted for by the Funds under ASC 815. Unrealized appreciation and depreciation on outstanding contracts are reported in each Fund’s Statement of Assets and Liabilities, as measured by the difference between the forward exchange rates at the reporting date and the forward exchange rates at each contract’s inception date. Net realized gain (loss) on contracts closed during the period, and changes in net unrealized appreciation (depreciation) on outstanding contracts are recognized in each Fund’s Statement of Operations.
These outstanding forward currency contracts in the table located in each Fund’s Schedule of Investments which were entered into with State Street Bank and Trust Company (“SSB”) and with Morgan Stanley & Co. Inc. (“MSC”) were entered into pursuant to International Swaps and Derivatives Association (“ISDA”) Master Agreements. Outstanding forward currency contracts, which were entered into with Brown Brothers Harriman & Co. (“BBH”), were entered into pursuant to a written agreement with BBH. In the event of a default or termination under the ISDA Master Agreement with SSB or MSC or the agreement with BBH, the non-defaulting party has the right to close out all outstanding forward currency contracts between the parties and to net any payment amounts under those contracts, resulting in a single net amount payable by one party to the other.
Because the ISDA Master Agreement with SSB, the ISDA Master Agreement with MSC, and the agreement with BBH do not result in an offset of reported amounts of financial assets and liabilities in the Statement of Assets and Liabilities unless there has been an event of default or termination event under such agreements, the Funds do not net their respective outstanding forward currency contracts for the purpose of disclosure in the Statement of Assets and Liabilities. Instead the Funds recognize the unrealized appreciation (depreciation) on those forward currency contracts on a gross basis in each Fund’s Statement of Assets and Liabilities.
Option Contracts: Each Fund may engage in option transactions and in doing so achieves similar objectives to what it would achieve through the sale or purchase of individual securities. A call option, upon payment of a premium, gives the purchaser of the option the right to buy, and the seller of the option the obligation to sell, the underlying security, index or other instrument at the exercise price.
A put option gives the purchaser of the option, upon payment of a premium, the right to sell, and the seller the obligation to buy, the underlying security, index, or other instrument at the exercise price. To seek to offset some of the risk of a potential decline in value of certain long positions, each Fund may also purchase put options on individual securities, broad-based securities indexes or certain exchange-traded funds (“ETFs”). Each Fund may also seek to generate income from option premiums by writing (selling) options on a portion of the equity securities (including securities that are convertible into equity securities) in the Fund’s portfolio, on broad-based securities indexes, or certain ETFs.
When the Fund purchases an option, it pays a premium and an amount equal to that premium is recorded as an asset. When the Fund writes an option, it receives a premium and an amount equal to that premium is recorded as a liability. The asset or liability is adjusted daily to reflect the current market value of the option. If an option expires unexercised, the Fund realizes a gain or loss to the extent of the
84 | Annual Financial Statements
Notes to Financial Statements, Continued
September 30, 2024
premium received or paid. If an option is exercised, the premium received or paid is recorded as an adjustment to the proceeds from the sale or the cost basis of the purchase. The difference between the premium and the amount received or paid on a closing purchase or sale transaction is also treated as a realized gain or loss. The cost of securities acquired through the exercise of call options is increased by premiums paid. The proceeds from securities sold through the exercise of put options are decreased by the premiums paid. Gain or loss on written options and purchased options is presented separately on the Statements of Operations as net realized gain or loss on written options and net realized gain or loss on purchased options, respectively.
During the year ended September 30, 2024, no Fund engaged in over-the-counter (“OTC”) option trades.
Options written by a Fund do not typically give rise to counterparty credit risk since options written obligate the Fund and not the counterparty to perform. Exchange-traded purchased options have minimal counterparty credit risk to a Fund since the exchange’s clearinghouse, as counterparty to such instruments, guarantees against a possible default.
The unrealized appreciation (depreciation) of the outstanding forward currency contracts recognized in each Fund’s Statement of Assets and Liabilities at September 30, 2024 is disclosed in the following table:
| | | | | | PRINCIPAL | | COUNTER | | | ASSET | | | LIABILITY | | | NET | |
| | | | TYPE OF DERIVATIVE(a) | | RISK | | PARTY | | | DERIVATIVES | | | DERIVATIVES | | | AMOUNT | |
| Global Opportunities Fund | | | Forward currency contracts | | Foreign currency risk | | SSB | | | $ | — | | | $ | (380,198 | ) | | $ | (380,198 | ) |
| | | | Forward currency contracts | | Foreign currency risk | | BBH | | | | — | | | | (44,245 | ) | | | (44,245 | ) |
| | | | | | | | | | | $ | — | | | $ | (424,443 | ) | | $ | (424,443 | ) |
| International Equity Fund | | | Forward currency contracts | | Foreign currency risk | | BBH | | | | — | | | | (1,953,484 | ) | | | (1,953,484 | ) |
| Income Builder Fund | | | Forward currency contracts | | Foreign currency risk | | SSB | | | | 231,537 | | | | (6,069,643 | ) | | | (5,838,106 | ) |
| | | | Forward currency contracts | | Foreign currency risk | | BBH | | | | — | | | | (559,237 | ) | | | (559,237 | ) |
| | | | | | | | | | | $ | 231,537 | | | $ | (6,628,880 | ) | | $ | (6,397,343 | ) |
| Summit Fund | | | Forward currency contracts | | Foreign currency risk | | MSC | | | | 247,707 | | | | (8,668 | ) | | | 239,039 | |
| | | | Forward currency contracts | | Foreign currency risk | | SSB | | | | 111,353 | | | | — | | | | 111,353 | |
| | | | | | | | | | | $ | 359,060 | | | $ | (8,668 | ) | | $ | 350,392 | |
| (a) | Generally, the Statement of Assets and Liabilities location for forward currency contracts is Assets - Unrealized appreciation on forward currency contracts for asset derivatives and Liabilities - Unrealized depreciation on forward currency contracts for liabilities derivatives. |
Because the Funds did not receive or post cash collateral in connection with their forward currency contracts during the period, the net amounts of each Fund’s assets and liabilities which are attributable to those contracts at September 30, 2024 can be determined by offsetting the dollar amounts shown in the asset and liability columns in the preceding table, the results of which are reflected in the “Net Amount” column. The Funds’ forward currency contracts and written options are valued each day, and the net amounts of each Fund’s assets and liabilities which are attributable to those contracts and options are expected to vary over time.
The net realized gain (loss) from forward currency contracts and net change in unrealized appreciation (depreciation) on outstanding forward currency contracts recognized in each Fund’s Statement of Operations for the year ended September 30, 2024 are disclosed in the following table:
| | | | TYPE OF DERIVATIVE(a) | | PRINCIPAL RISK | | NET REALIZED
GAIN (LOSS) | | | NET CHANGE IN UNREALIZED
APPRECIATION (DEPRECIATION) |
| Global Opportunities Fund | | | Forward currency contracts | | Foreign currency risk | | $ | (2,205,370 | ) | | $ | (5,705,680 | ) |
| International Equity Fund | | | Forward currency contracts | | Foreign currency risk | | | 12,419,554 | | | | (10,951,245 | ) |
| Income Builder Fund | | | Forward currency contracts | | Foreign currency risk | | | (35,193,851 | ) | | | (82,794,489 | ) |
| Summit Fund | | | Forward currency contracts | | Foreign currency risk | | | (324,636 | ) | | | 567,481 | |
| (a) | Generally, the Statement of Operations location for forward currency contracts is Net realized gain (loss) on: forward currency contracts and Net change in unrealized appreciation (depreciation) on: forward currency contracts. |
Annual Financial Statements | 85
Financial Highlights
Global Opportunities Fund
| | | | | | | PER SHARE PERFORMANCE (FOR A SHARE OUTSTANDING THROUGHOUT THE YEAR) |
| UNLESS OTHERWISE | | | NET ASSET | | NET | | NET REALIZED & | | | | | DIVIDENDS | | DIVIDENDS | | DIVIDENDS | | | | | NET ASSET |
| NOTED, PERIODS ARE | | | VALUE, | | INVESTMENT | | UNREALIZED | | TOTAL FROM | | FROM NET | | FROM NET | | FROM | | | | | VALUE, |
| FISCAL YEARS ENDED | | | BEGINNING | | INCOME | | GAIN (LOSS) ON | | INVESTMENT | | INVESTMENT | | REALIZED | | RETURN OF | TOTAL | | END OF |
| SEPTEMBER 30, | | | OF PERIOD | | (LOSS)+ | | INVESTMENTS | | OPERATIONS | | INCOME | | GAINS | | CAPITAL | | DIVIDENDS | | PERIOD |
| | | | | | | | | | | | | | | | | | | | | | | | | | | | | | | |
| CLASS A SHARES(c) | | | | | | | | | | | | | | | |
| | | | | | | | | | | | | | | | | | | | | | | | | | | | | | | |
| 2024 | | | $ | 32.63 | | | 0.46 | | | 8.43 | | | 8.89 | | | (0.63 | ) | | (1.20 | ) | | — | | | (1.83 | ) | | $ | 39.69 | |
| 2023 | | | $ | 27.76 | | | 0.67 | | | 5.35 | | | 6.02 | | | (0.36 | ) | | (0.79 | ) | | — | | | (1.15 | ) | | $ | 32.63 | |
| 2022 | | | $ | 39.32 | | | 0.28 | | | (6.80 | ) | | (6.52 | ) | | (0.49 | ) | | (4.55 | ) | | — | | | (5.04 | ) | | $ | 27.76 | |
| 2021 | | | $ | 31.69 | | | 0.53 | | | 9.40 | | | 9.93 | | | — | (d) | | (2.30 | ) | | — | | | (2.30 | ) | | $ | 39.32 | |
| 2020 | | | $ | 27.56 | | | 0.08 | | | 4.47 | | | 4.55 | | | (0.14 | ) | | (0.28 | ) | | — | | | (0.42 | ) | | $ | 31.69 | |
| | | | | | | | | | | | | | | | | | | | | | | | | | | | | | | |
| CLASS C SHARES | | | | | | | | | | | | | | | |
| | | | | | | | | | | | | | | | | | | | | | | | | | | | | | | |
| 2024 | | | $ | 30.82 | | | 0.12 | | | 8.02 | | | 8.14 | | | (0.21 | ) | | (1.20 | ) | | — | | | (1.41 | ) | | $ | 37.55 | |
| 2023 | | | $ | 26.21 | | | 0.40 | | | 5.06 | | | 5.46 | | | (0.06 | ) | | (0.79 | ) | | — | | | (0.85 | ) | | $ | 30.82 | |
| 2022 | | | $ | 37.36 | | | — | (e) | | (6.41 | ) | | (6.41 | ) | | (0.19 | ) | | (4.55 | ) | | — | | | (4.74 | ) | | $ | 26.21 | |
| 2021 | | | $ | 30.44 | | | 0.22 | | | 9.00 | | | 9.22 | | | — | | | (2.30 | ) | | — | | | (2.30 | ) | | $ | 37.36 | |
| 2020 | | | $ | 26.55 | | | (0.14 | ) | | 4.31 | | | 4.17 | | | — | | | (0.28 | ) | | — | | | (0.28 | ) | | $ | 30.44 | |
| | | | | | | | | | | | | | | | | | | | | | | | | | | | | | | |
| CLASS I SHARES | | | | | | | | | | | | | | | |
| | | | | | | | | | | | | | | | | | | | | | | | | | | | | | | |
| 2024 | | | $ | 32.82 | | | 0.59 | | | 8.45 | | | 9.04 | | | (0.73 | ) | | (1.20 | ) | | — | | | (1.93 | ) | | $ | 39.93 | |
| 2023 | | | $ | 27.91 | | | 0.78 | | | 5.37 | | | 6.15 | | | (0.45 | ) | | (0.79 | ) | | — | | | (1.24 | ) | | $ | 32.82 | |
| 2022 | | | $ | 39.49 | | | 0.39 | | | (6.83 | ) | | (6.44 | ) | | (0.59 | ) | | (4.55 | ) | | — | | | (5.14 | ) | | $ | 27.91 | |
| 2021 | | | $ | 31.81 | | | 0.64 | | | 9.43 | | | 10.07 | | | (0.09 | ) | | (2.30 | ) | | — | | | (2.39 | ) | | $ | 39.49 | |
| 2020 | | | $ | 27.67 | | | 0.15 | | | 4.50 | | | 4.65 | | | (0.23 | ) | | (0.28 | ) | | — | | | (0.51 | ) | | $ | 31.81 | |
| | | | | | | | | | | | | | | | | | | | | | | | | | | | | | | |
| CLASS R3 SHARES | | | | | | | | | | | | | | | |
| | | | | | | | | | | | | | | | | | | | | | | | | | | | | | | |
| 2024 | | | $ | 32.20 | | | 0.37 | | | 8.35 | | | 8.72 | | | (0.55 | ) | | (1.20 | ) | | — | | | (1.75 | ) | | $ | 39.17 | |
| 2023 | | | $ | 27.37 | | | 0.61 | | | 5.28 | | | 5.89 | | | (0.27 | ) | | (0.79 | ) | | — | | | (1.06 | ) | | $ | 32.20 | |
| 2022 | | | $ | 38.81 | | | 0.20 | | | (6.69 | ) | | (6.49 | ) | | (0.40 | ) | | (4.55 | ) | | — | | | (4.95 | ) | | $ | 27.37 | |
| 2021 | | | $ | 31.38 | | | 0.42 | | | 9.31 | | | 9.73 | | | — | | | (2.30 | ) | | — | | | (2.30 | ) | | $ | 38.81 | |
| 2020 | | | $ | 27.28 | | | 0.01 | | | 4.42 | | | 4.43 | | | (0.05 | ) | | (0.28 | ) | | — | | | (0.33 | ) | | $ | 31.38 | |
| | | | | | | | | | | | | | | | | | | | | | | | | | | | | | | |
| CLASS R4 SHARES | | | | | | | | | | | | | | | |
| | | | | | | | | | | | | | | | | | | | | | | | | | | | | | | |
| 2024 | | | $ | 32.36 | | | 0.40 | | | 8.38 | | | 8.78 | | | (0.59 | ) | | (1.20 | ) | | — | | | (1.79 | ) | | $ | 39.35 | |
| 2023 | | | $ | 27.53 | | | 0.64 | | | 5.30 | | | 5.94 | | | (0.32 | ) | | (0.79 | ) | | — | | | (1.11 | ) | | $ | 32.36 | |
| 2022 | | | $ | 39.01 | | | 0.24 | | | (6.73 | ) | | (6.49 | ) | | (0.44 | ) | | (4.55 | ) | | — | | | (4.99 | ) | | $ | 27.53 | |
| 2021 | | | $ | 31.50 | | | 0.49 | | | 9.32 | | | 9.81 | | | — | | | (2.30 | ) | | — | | | (2.30 | ) | | $ | 39.01 | |
| 2020 | | | $ | 27.32 | | | 0.03 | | | 4.43 | | | 4.46 | | | — | | | (0.28 | ) | | — | | | (0.28 | ) | | $ | 31.50 | |
| | | | | | | | | | | | | | | | | | | | | | | | | | | | | | | |
| CLASS R5 SHARES | | | | | | | | | | | | | | | |
| | | | | | | | | | | | | | | | | | | | | | | | | | | | | | | |
| 2024 | | | $ | 32.87 | | | 0.56 | | | 8.50 | | | 9.06 | | | (0.73 | ) | | (1.20 | ) | | — | | | (1.93 | ) | | $ | 40.00 | |
| 2023 | | | $ | 27.95 | | | 0.79 | | | 5.37 | | | 6.16 | | | (0.45 | ) | | (0.79 | ) | | — | | | (1.24 | ) | | $ | 32.87 | |
| 2022 | | | $ | 39.53 | | | 0.38 | | | (6.83 | ) | | (6.45 | ) | | (0.58 | ) | | (4.55 | ) | | — | | | (5.13 | ) | | $ | 27.95 | |
| 2021 | | | $ | 31.84 | | | 0.61 | | | 9.47 | | | 10.08 | | | (0.09 | ) | | (2.30 | ) | | — | | | (2.39 | ) | | $ | 39.53 | |
| 2020 | | | $ | 27.70 | | | 0.15 | | | 4.50 | | | 4.65 | | | (0.23 | ) | | (0.28 | ) | | — | | | (0.51 | ) | | $ | 31.84 | |
| | | | | | | | | | | | | | | | | | | | | | | | | | | | | | | |
| CLASS R6 SHARES | | | | | | | | | | | | | | | |
| | | | | | | | | | | | | | | | | | | | | | | | | | | | | | | |
| 2024 | | | $ | 32.97 | | | 0.63 | | | 8.51 | | | 9.14 | | | (0.78 | ) | | (1.20 | ) | | — | | | (1.98 | ) | | $ | 40.13 | |
| 2023 | | | $ | 28.03 | | | 0.82 | | | 5.40 | | | 6.22 | | | (0.49 | ) | | (0.79 | ) | | — | | | (1.28 | ) | | $ | 32.97 | |
| 2022 | | | $ | 39.64 | | | 0.44 | | | (6.86 | ) | | (6.42 | ) | | (0.64 | ) | | (4.55 | ) | | — | | | (5.19 | ) | | $ | 28.03 | |
| 2021 | | | $ | 31.93 | | | 0.70 | | | 9.44 | | | 10.14 | | | (0.13 | ) | | (2.30 | ) | | — | | | (2.43 | ) | | $ | 39.64 | |
| 2020 | | | $ | 27.77 | | | 0.21 | | | 4.50 | | | 4.71 | | | (0.27 | ) | | (0.28 | ) | | — | | | (0.55 | ) | | $ | 31.93 | |
| (a) | Net investment income (loss) includes income from foreign withholding tax claims adjusted for IRS compliance fees and/or tax reclaim collection fees. Without these proceeds, the Net Investment Income (Loss) ratios would have been as follows: |
| | | Class A | | Class C | | Class I | | Class R3 | | Class R4 | | Class R5 | | Class R6 |
| 2024 | | 1.28 | % | | 0.34 | % | | 1.62 | % | | 1.03 | % | | 1.13 | % | | 1.54 | % | | 1.75 | % |
| 2023 | | 2.07 | % | | 1.28 | % | | 2.38 | % | | 1.91 | % | | 1.97 | % | | 2.41 | % | | 2.52 | % |
| 2022 | | 0.79 | % | | (0.04 | )% | | 1.10 | % | | 0.56 | % | | 0.67 | % | | 1.08 | % | | 1.24 | % |
| 2021 | | 1.36 | % | | 0.57 | % | | 1.64 | % | | 1.10 | % | | 1.27 | % | | 1.60 | % | | 1.80 | % |
| (b) | Not annualized for periods less than one year. |
| (c) | Sales loads are not reflected in computing total return. |
| (d) | Dividends From Net Investment Income was less than 0.01. |
| (e) | Net investment income (loss) was less than $0.01 per share. |
| (f) | Net investment income (loss) was less than 0.01%. |
| + | Based on weighted average shares outstanding. |
See notes to financial statements.
86 | Annual Financial Statements
Financial Highlights, Continued
Global Opportunities Fund
| | | RATIOS TO AVERAGE NET ASSETS | | SUPPLEMENTAL DATA |
| UNLESS OTHERWISE | | | | | | | | | | | | NET |
| NOTED, PERIODS ARE | | | | EXPENSES, AFTER | | EXPENSES, | | | | PORTFOLIO | | ASSETS |
| FISCAL YEARS ENDED | | NET INVESTMENT | | EXPENSE | | BEFORE EXPENSE | | TOTAL | | TURNOVER | | AT END OF PERIOD |
| SEPTEMBER 30, | | INCOME (LOSS) (%)(a) | | REDUCTIONS (%) | | REDUCTIONS (%) | | RETURN (%)(b) | | RATE (%)(b) | | (THOUSANDS) |
| | | | | | | | | | | | | | | | | | | | |
| CLASS A SHARES(c) | | | | | | | | | |
| | | | | | | | | | | | | | | | | | | | |
| 2024 | | 1.29 | | | 1.30 | | | 1.34 | | | 28.68 | | | 14.91 | | | $ | 347,532 | |
| 2023 | | 2.09 | | | 1.29 | | | 1.33 | | | 21.93 | | | 17.07 | | | $ | 284,351 | |
| 2022 | | 0.83 | | | 1.29 | | | 1.35 | | | (19.31 | ) | | 26.92 | | | $ | 218,968 | |
| 2021 | | 1.42 | | | 1.27 | | | 1.31 | | | 32.82 | | | 25.48 | | | $ | 277,126 | |
| 2020 | | 0.27 | | | 1.28 | | | 1.32 | | | 16.59 | | | 35.63 | | | $ | 215,473 | |
| | | | | | | | | | | | | | | | | | | | |
| CLASS C SHARES | | | | | | | | | |
| | | | | | | | | | | | | | | | | | | | |
| 2024 | | 0.36 | | | 2.14 | | | 2.17 | | | 27.59 | | | 14.91 | | | $ | 27,358 | |
| 2023 | | 1.31 | | | 2.09 | | | 2.13 | | | 20.99 | | | 17.07 | | | $ | 39,916 | |
| 2022 | | — | (f) | | 2.06 | | | 2.11 | | | (19.94 | ) | | 26.92 | | | $ | 63,994 | |
| 2021 | | 0.63 | | | 2.04 | | | 2.08 | | | 31.77 | | | 25.48 | | | $ | 112,420 | |
| 2020 | | (0.49 | ) | | 2.02 | | | 2.06 | | | 15.78 | | | 35.63 | | | $ | 116,705 | |
| | | | | | | | | | | | | | | | | | | | |
| CLASS I SHARES | | | | | | | | | |
| | | | | | | | | | | | | | | | | | | | |
| 2024 | | 1.64 | | | 0.99 | | | 1.08 | | | 29.05 | | | 14.91 | | | $ | 829,383 | |
| 2023 | | 2.41 | | | 0.99 | | | 1.06 | | | 22.32 | | | 17.07 | | | $ | 626,942 | |
| 2022 | | 1.14 | | | 0.99 | | | 1.06 | | | (19.06 | ) | | 26.92 | | | $ | 446,228 | |
| 2021 | | 1.69 | | | 0.99 | | | 1.06 | | | 33.17 | | | 25.48 | | | $ | 605,581 | |
| 2020 | | 0.50 | | | 0.99 | | | 1.08 | | | 16.91 | | | 35.63 | | | $ | 523,175 | |
| | | | | | | | | | | | | | | | | | | | |
| CLASS R3 SHARES | | | | | | | | | |
| | | | | | | | | | | | | | | | | | | | |
| 2024 | | 1.05 | | | 1.50 | | | 2.49 | | | 28.47 | | | 14.91 | | | $ | 2,833 | |
| 2023 | | 1.94 | | | 1.50 | | | 2.43 | | | 21.76 | | | 17.07 | | | $ | 2,761 | |
| 2022 | | 0.61 | | | 1.50 | | | 2.40 | | | (19.47 | ) | | 26.92 | | | $ | 2,639 | |
| 2021 | | 1.15 | | | 1.50 | | | 2.07 | | | 32.48 | | | 25.48 | | | $ | 3,776 | |
| 2020 | | 0.03 | | | 1.50 | | | 2.00 | | | 16.32 | | | 35.63 | | | $ | 3,633 | |
| | | | | | | | | | | | | | | | | | | | |
| CLASS R4 SHARES | | | | | | | | | |
| | | | | | | | | | | | | | | | | | | | |
| 2024 | | 1.15 | | | 1.40 | | | 2.15 | | | 28.53 | | | 14.91 | | | $ | 4,931 | |
| 2023 | | 2.00 | | | 1.40 | | | 2.10 | | | 21.82 | | | 17.07 | | | $ | 5,023 | |
| 2022 | | 0.72 | | | 1.40 | | | 2.09 | | | (19.37 | ) | | 26.92 | | | $ | 4,573 | |
| 2021 | | 1.32 | | | 1.40 | | | 1.83 | | | 32.62 | | | 25.48 | | | $ | 6,177 | |
| 2020 | | 0.09 | | | 1.40 | | | 1.62 | | | 16.41 | | | 35.63 | | | $ | 5,093 | |
| | | | | | | | | | | | | | | | | | | | |
| CLASS R5 SHARES | | | | | | | | | |
| | | | | | | | | | | | | | | | | | | | |
| 2024 | | 1.56 | | | 0.99 | | | 1.35 | | | 29.06 | | | 14.91 | | | $ | 18,134 | |
| 2023 | | 2.43 | | | 0.99 | | | 1.20 | | | 22.32 | | | 17.07 | | | $ | 17,592 | |
| 2022 | | 1.12 | | | 0.99 | | | 1.38 | | | (19.06 | ) | | 26.92 | | | $ | 15,512 | |
| 2021 | | 1.64 | | | 0.99 | | | 1.36 | | | 33.18 | | | 25.48 | | | $ | 20,673 | |
| 2020 | | 0.53 | | | 0.99 | | | 1.28 | | | 16.89 | | | 35.63 | | | $ | 32,817 | |
| | | | | | | | | | | | | | | | | | | | |
| CLASS R6 SHARES | | | | | | | | | |
| | | | | | | | | | | | | | | | | | | | |
| 2024 | | 1.77 | | | 0.85 | | | 1.01 | | | 29.25 | | | 14.91 | | | $ | 75,852 | |
| 2023 | | 2.54 | | | 0.85 | | | 1.02 | | | 22.50 | | | 17.07 | | | $ | 57,844 | |
| 2022 | | 1.28 | | | 0.85 | | | 1.03 | | | (18.95 | ) | | 26.92 | | | $ | 47,300 | |
| 2021 | | 1.85 | | | 0.85 | | | 1.00 | | | 33.32 | | | 25.48 | | | $ | 57,072 | |
| 2020 | | 0.70 | | | 0.85 | | | 1.03 | | | 17.08 | | | 35.63 | | | $ | 43,911 | |
Annual Financial Statements | 87
Financial Highlights
International Equity Fund
| | | | PER SHARE PERFORMANCE (FOR A SHARE OUTSTANDING THROUGHOUT THE YEAR) |
| UNLESS OTHERWISE | | | NET ASSET | | NET | | NET REALIZED & | | | | DIVIDENDS | | DIVIDENDS | | DIVIDENDS | | | | NET ASSET |
| NOTED, PERIODS ARE | | | VALUE, | | INVESTMENT | | UNREALIZED | | TOTAL FROM | | FROM NET | | FROM NET | | FROM | | | | VALUE, |
| FISCAL YEARS ENDED | | | BEGINNING | | INCOME | | GAIN (LOSS) ON | | INVESTMENT | | INVESTMENT | | REALIZED | | RETURN OF | | TOTAL | | END OF |
| SEPTEMBER 30, | | | OF YEAR | | (LOSS)+ | | INVESTMENTS | | OPERATIONS | | INCOME | | GAINS | | CAPITAL | | DIVIDENDS | | YEAR |
| | | | | | | | | | | | | | | | | | | | | | | | | | | | | | | |
| CLASS A SHARES(d) | | | | | | | | | | | | | | | |
| | | | | | | | | | | | | | | | | | | | | | | | | | | | | | | |
| 2024 | | | $ | 22.51 | | | 0.46 | | | 6.61 | | | 7.07 | | | (0.44 | ) | | (0.10 | ) | | — | | | (0.54 | ) | | $ | 29.04 | |
| 2023 | | | $ | 18.19 | | | 0.38 | | | 4.30 | | | 4.68 | | | (0.36 | ) | | — | | | — | | | (0.36 | ) | | $ | 22.51 | |
| 2022 | | | $ | 28.75 | | | 0.29 | | | (7.15 | ) | | (6.86 | ) | | (0.27 | ) | | (3.43 | ) | | — | | | (3.70 | ) | | $ | 18.19 | |
| 2021 | | | $ | 24.78 | | | 0.31 | | | 4.49 | | | 4.80 | | | (0.06 | ) | | (0.77 | ) | | — | | | (0.83 | ) | | $ | 28.75 | |
| 2020 | | | $ | 22.91 | | | 0.07 | | | 3.29 | | | 3.36 | | | (0.21 | ) | | (1.28 | ) | | — | | | (1.49 | ) | | $ | 24.78 | |
| | | | | | | | | | | | | | | | | | | | | | | | | | | | | | | |
| CLASS C SHARES | | | | | | | | | | | | | | | |
| | | | | | | | | | | | | | | | | | | | | | | | | | | | | | | |
| 2024 | | | $ | 19.24 | | | 0.18 | | | 5.67 | | | 5.85 | | | (0.21 | ) | | (0.10 | ) | | — | | | (0.31 | ) | | $ | 24.78 | |
| 2023 | | | $ | 15.61 | | | 0.15 | | | 3.69 | | | 3.84 | | | (0.21 | ) | | — | | | — | | | (0.21 | ) | | $ | 19.24 | |
| 2022 | | | $ | 25.20 | | | 0.11 | | | (6.13 | ) | | (6.02 | ) | | (0.14 | ) | | (3.43 | ) | | — | | | (3.57 | ) | | $ | 15.61 | |
| 2021 | | | $ | 21.91 | | | 0.06 | | | 4.00 | | | 4.06 | | | — | | | (0.77 | ) | | — | | | (0.77 | ) | | $ | 25.20 | |
| 2020 | | | $ | 20.33 | | | (0.08 | ) | | 2.94 | | | 2.86 | | | — | | | (1.28 | ) | | — | | | (1.28 | ) | | $ | 21.91 | |
| | | | | | | | | | | | | | | | | | | | | | | | | | | | | | | |
| CLASS I SHARES | | | | | | | | | | | | | | | |
| | | | | | | | | | | | | | | | | | | | | | | | | | | | | | | |
| 2024 | | | $ | 23.46 | | | 0.56 | | | 6.88 | | | 7.44 | | | (0.49 | ) | | (0.10 | ) | | — | | | (0.59 | ) | | $ | 30.31 | |
| 2023 | | | $ | 18.98 | | | 0.44 | | | 4.48 | | | 4.92 | | | (0.44 | ) | | — | | | — | | | (0.44 | ) | | $ | 23.46 | |
| 2022 | | | $ | 29.88 | | | 0.41 | | | (7.47 | ) | | (7.06 | ) | | (0.41 | ) | | (3.43 | ) | | — | | | (3.84 | ) | | $ | 18.98 | |
| 2021 | | | $ | 25.70 | | | 0.39 | | | 4.68 | | | 5.07 | | | (0.12 | ) | | (0.77 | ) | | — | | | (0.89 | ) | | $ | 29.88 | |
| 2020 | | | $ | 23.69 | | | 0.15 | | | 3.42 | | | 3.57 | | | (0.28 | ) | | (1.28 | ) | | — | | | (1.56 | ) | | $ | 25.70 | |
| | | | | | | | | | | | | | | | | | | | | | | | | | | | | | | |
| CLASS R3 SHARES | | | | | | | | | | | | | | | |
| | | | | | | | | | | | | | | | | | | | | | | | | | | | | | | |
| 2024 | | | $ | 22.44 | | | 0.41 | | | 6.60 | | | 7.01 | | | (0.38 | ) | | (0.10 | ) | | — | | | (0.48 | ) | | $ | 28.97 | |
| 2023 | | | $ | 18.17 | | | 0.32 | | | 4.29 | | | 4.61 | | | (0.34 | ) | | — | | | — | | | (0.34 | ) | | $ | 22.44 | |
| 2022 | | | $ | 28.75 | | | 0.27 | | | (7.16 | ) | | (6.89 | ) | | (0.26 | ) | | (3.43 | ) | | — | | | (3.69 | ) | | $ | 18.17 | |
| 2021 | | | $ | 24.77 | | | 0.23 | | | 4.52 | | | 4.75 | | | — | | | (0.77 | ) | | — | | | (0.77 | ) | | $ | 28.75 | |
| 2020 | | | $ | 22.89 | | | 0.03 | | | 3.29 | | | 3.32 | | | (0.16 | ) | | (1.28 | ) | | — | | | (1.44 | ) | | $ | 24.77 | |
| | | | | | | | | | | | | | | | | | | | | | | | | | | | | | | |
| CLASS R4 SHARES |
| | | | | | | | | | | | | | | | | | | | | | | | | | | | | | | |
| 2024 | | | $ | 22.25 | | | 0.45 | | | 6.55 | | | 7.00 | | | (0.43 | ) | | (0.10 | ) | | — | | | (0.53 | ) | | $ | 28.72 | |
| 2023 | | | $ | 18.03 | | | 0.36 | | | 4.25 | | | 4.61 | | | (0.39 | ) | | — | | | — | | | (0.39 | ) | | $ | 22.25 | |
| 2022 | | | $ | 28.56 | | | 0.32 | | | (7.10 | ) | | (6.78 | ) | | (0.32 | ) | | (3.43 | ) | | — | | | (3.75 | ) | | $ | 18.03 | |
| 2021 | | | $ | 24.60 | | | 0.28 | | | 4.49 | | | 4.77 | | | (0.04 | ) | | (0.77 | ) | | — | | | (0.81 | ) | | $ | 28.56 | |
| 2020 | | | $ | 22.74 | | | 0.07 | | | 3.27 | | | 3.34 | | | (0.20 | ) | | (1.28 | ) | | — | | | (1.48 | ) | | $ | 24.60 | |
| | | | | | | | | | | | | | | | |
| CLASS R5 SHARES | | | | | | | | | | | | | | | |
| | | | | | | | | | | | | | | | | | | | | | | | | | | | | | | |
| 2024 | | | $ | 23.43 | | | 0.55 | | | 6.88 | | | 7.43 | | | (0.49 | ) | | (0.10 | ) | | — | | | (0.59 | ) | | $ | 30.27 | |
| 2023 | | | $ | 18.96 | | | 0.44 | | | 4.47 | | | 4.91 | | | (0.44 | ) | | — | | | — | | | (0.44 | ) | | $ | 23.43 | |
| 2022 | | | $ | 29.84 | | | 0.39 | | | (7.44 | ) | | (7.05 | ) | | (0.40 | ) | | (3.43 | ) | | — | | | (3.83 | ) | | $ | 18.96 | |
| 2021 | | | $ | 25.66 | | | 0.38 | | | 4.67 | | | 5.05 | | | (0.10 | ) | | (0.77 | ) | | — | | | (0.87 | ) | | $ | 29.84 | |
| 2020 | | | $ | 23.67 | | | 0.13 | | | 3.42 | | | 3.55 | | | (0.28 | ) | | (1.28 | ) | | — | | | (1.56 | ) | | $ | 25.66 | |
| | | | | | | | | | | | | | | | | | | | | | | | | | | | | | | |
| CLASS R6 SHARES |
| | | | | | | | | | | | | | | | | | | | | | | | | | | | | | | |
| 2024 | | | $ | 23.34 | | | 0.62 | | | 6.84 | | | 7.46 | | | (0.54 | ) | | (0.10 | ) | | — | | | (0.64 | ) | | $ | 30.16 | |
| 2023 | | | $ | 18.89 | | | 0.48 | | | 4.46 | | | 4.94 | | | (0.49 | ) | | — | | | — | | | (0.49 | ) | | $ | 23.34 | |
| 2022 | | | $ | 29.75 | | | 0.45 | | | (7.43 | ) | | (6.98 | ) | | (0.45 | ) | | (3.43 | ) | | — | | | (3.88 | ) | | $ | 18.89 | |
| 2021 | | | $ | 25.59 | | | 0.44 | | | 4.65 | | | 5.09 | | | (0.16 | ) | | (0.77 | ) | | — | | | (0.93 | ) | | $ | 29.75 | |
| 2020 | | | $ | 23.61 | | | 0.18 | | | 3.41 | | | 3.59 | | | (0.33 | ) | | (1.28 | ) | | — | | | (1.61 | ) | | $ | 25.59 | |
| (a) | Net investment income (loss) includes income from foreign withholding tax claims adjusted for IRS compliance fees and/or tax reclaim collection fees. Without these proceeds, the Net Investment Income (Loss) ratios would have been as follows: |
| | | Class A | | Class C | | Class I | | Class R3 | | Class R4 | | Class R5 | | Class R6 |
| 2024 | | 1.60 | % | | 0.63 | % | | 1.90 | % | | 1.41 | % | | 1.61 | % | | 1.86 | % | | 2.11 | % |
| 2023 | | 1.77 | % | | 0.87 | % | | 1.99 | % | | 1.51 | % | | 1.72 | % | | 1.98 | % | | 2.18 | % |
| 2022 | | 1.20 | % | | 0.52 | % | | 1.61 | % | | 1.11 | % | | 1.32 | % | | 1.53 | % | | 1.80 | % |
| 2021 | | 0.99 | % | | 0.16 | % | | 1.23 | % | | 0.71 | % | | 0.90 | % | | 1.18 | % | | 1.40 | % |
| (b) | Net expenses include tax reclaim collection fees that are excluded from the expense limitation agreement. If such expenses and fees had not occurred, the Expenses After Expense Reductions ratios for 2024 would have been: Class A, 1.17%; Class C, 2.06%; Class I, 0.87%; Class R3, 1.36%; Class R4, 1.16%; Class R5, 0.90%; Class R6, 0.70% and 2021 would have been: Class A, 1.25%; Class C, 1.96%; Class I, 0.94%; Class R3, 1.45%; Class R4, 1.25%; Class R5, 0.99%; Class R6, 0.79%. |
| (c) | Not annualized for periods less than one year. |
| (d) | Sales loads are not reflected in computing total return. |
| (e) | The total return based on the NAV which reflects adjustments in accordance with U.S. GAAP is 26.15%. |
| + | Based on weighted average shares outstanding. |
See notes to financial statements.
88 | Annual Financial Statements
Financial Highlights, Continued
International Equity Fund
| | | RATIOS TO AVERAGE NET ASSETS | | SUPPLEMENTAL DATA |
| UNLESS OTHERWISE | | | | | | | | | | | | NET |
| NOTED, PERIODS ARE | | | | EXPENSES, AFTER | | EXPENSES, | | | | PORTFOLIO | | ASSETS |
| FISCAL YEARS ENDED | | NET INVESTMENT | | EXPENSE | | BEFORE EXPENSE | | TOTAL | | TURNOVER | | AT END OF YEAR |
| SEPTEMBER 30, | | INCOME (LOSS) (%)(a) | | REDUCTIONS (%)(b) | | REDUCTIONS (%) | | RETURN (%)(c) | | RATE (%)(c) | | (THOUSANDS) |
| | | | | | | | | | | | | | | | | | | | |
| CLASS A SHARES(d) | | | | |
| 2024 | | 1.81 | | | 1.22 | | | 1.33 | | | 31.94 | | | 45.47 | | | $ | 432,976 | |
| 2023 | | 1.68 | | | 1.10 | | | 1.23 | | | 25.83 | | | 43.13 | | | $ | 371,073 | |
| 2022 | | 1.25 | | | 1.30 | | | 1.38 | | | (27.88 | ) | | 48.88 | | | $ | 339,638 | |
| 2021 | | 1.07 | | | 1.58 | | | 1.58 | | | 19.66 | | | 42.85 | | | $ | 543,262 | |
| 2020 | | 0.31 | | | 1.25 | | | 1.26 | | | 15.33 | | | 79.05 | | | $ | 825,677 | |
| | | | | | | | | | | | | | | | | | | | |
| CLASS C SHARES | | | | |
| 2024 | | 0.83 | | | 2.11 | | | 2.22 | | | 30.76 | | | 45.47 | | | $ | 10,055 | |
| 2023 | | 0.77 | | | 1.98 | | | 2.12 | | | 24.70 | | | 43.13 | | | $ | 12,360 | |
| 2022 | | 0.56 | | | 1.96 | | | 2.05 | | | (28.38 | ) | | 48.88 | | | $ | 13,978 | |
| 2021 | | 0.24 | | | 2.26 | | | 2.26 | | | 18.83 | | | 42.85 | | | $ | 27,189 | |
| 2020 | | (0.40 | ) | | 1.93 | | | 1.94 | | | 14.69 | | | 79.05 | | | $ | 44,594 | |
| | | | | | | | | | | | | | | | | | | | |
| CLASS I SHARES | | | | |
| 2024 | | 2.11 | | | 0.93 | | | 1.04 | | | 32.37 | | | 45.47 | | | $ | 1,747,826 | |
| 2023 | | 1.90 | | | 0.88 | | | 1.01 | | | 26.09 | (e) | | 43.13 | | | $ | 1,390,996 | |
| 2022 | | 1.66 | | | 0.90 | | | 1.00 | | | (27.64 | ) | | 48.88 | | | $ | 1,254,672 | |
| 2021 | | 1.32 | | | 1.24 | | | 1.24 | | | 20.05 | | | 42.85 | | | $ | 2,000,723 | |
| 2020 | | 0.64 | | | 0.92 | | | 0.93 | | | 15.74 | | | 79.05 | | | $ | 1,713,358 | |
| | | | | | | | | | | | | | | | | | | | |
| CLASS R3 SHARES | | | | |
| 2024 | | 1.62 | | | 1.42 | | | 1.73 | | | 31.71 | | | 45.47 | | | $ | 128,725 | |
| 2023 | | 1.42 | | | 1.36 | | | 1.71 | | | 25.47 | | | 43.13 | | | $ | 110,275 | |
| 2022 | | 1.16 | | | 1.40 | | | 1.70 | | | (27.97 | ) | | 48.88 | | | $ | 100,783 | |
| 2021 | | 0.80 | | | 1.75 | | | 1.91 | | | 19.46 | | | 42.85 | | | $ | 157,724 | |
| 2020 | | 0.12 | | | 1.45 | | | 1.58 | | | 15.11 | | | 79.05 | | | $ | 152,764 | |
| | | | | | | | | | | | | | | | | | | | |
| CLASS R4 SHARES | | | | |
| 2024 | | 1.82 | | | 1.22 | | | 1.54 | | | 31.98 | | | 45.47 | | | $ | 93,021 | |
| 2023 | | 1.62 | | | 1.16 | | | 1.48 | | | 25.68 | | | 43.13 | | | $ | 82,599 | |
| 2022 | | 1.37 | | | 1.19 | | | 1.50 | | | (27.81 | ) | | 48.88 | | | $ | 69,822 | |
| 2021 | | 0.99 | | | 1.55 | | | 1.70 | | | 19.69 | | | 42.85 | | | $ | 104,735 | |
| 2020 | | 0.30 | | | 1.25 | | | 1.32 | | | 15.35 | | | 79.05 | | | $ | 102,266 | |
| | | | | | | | | | | | | | | | | | | | |
| CLASS R5 SHARES | | | | |
| 2024 | | 2.07 | | | 0.96 | | | 1.24 | | | 32.29 | | | 45.47 | | | $ | 117,461 | |
| 2023 | | 1.90 | | | 0.90 | | | 1.23 | | | 26.03 | | | 43.13 | | | $ | 101,451 | |
| 2022 | | 1.57 | | | 0.94 | | | 1.28 | | | (27.60 | ) | | 48.88 | | | $ | 86,468 | |
| 2021 | | 1.26 | | | 1.29 | | | 1.46 | | | 19.97 | | | 42.85 | | | $ | 160,007 | |
| 2020 | | 0.55 | | | 0.99 | | | 1.02 | | | 15.64 | | | 79.05 | | | $ | 133,705 | |
| | | | | | | | | | | | | | | | | | | | |
| CLASS R6 SHARES | | | | |
| 2024 | | 2.34 | | | 0.76 | | | 0.97 | | | 32.58 | | | 45.47 | | | $ | 439,072 | |
| 2023 | | 2.09 | | | 0.70 | | | 0.94 | | | 26.29 | | | 43.13 | | | $ | 294,974 | |
| 2022 | | 1.85 | | | 0.73 | | | 0.92 | | | (27.47 | ) | | 48.88 | | | $ | 243,442 | |
| 2021 | | 1.49 | | | 1.09 | | | 1.18 | | | 20.21 | | | 42.85 | | | $ | 331,621 | |
| 2020 | | 0.78 | | | 0.79 | | | 0.90 | | | 15.90 | | | 79.05 | | | $ | 250,391 | |
Annual Financial Statements | 89
Financial Highlights
Better World International Fund
| | | | PER SHARE PERFORMANCE (FOR A SHARE OUTSTANDING THROUGHOUT THE YEAR) |
| UNLESS OTHERWISE | | | NET ASSET | | NET | | NET REALIZED & | | | | DIVIDENDS | | DIVIDENDS | | DIVIDENDS | | | | NET ASSET |
| NOTED, PERIODS ARE | | | VALUE, | | INVESTMENT | | UNREALIZED | | TOTAL FROM | | FROM NET | | FROM NET | | FROM | | | | VALUE, |
| FISCAL YEARS ENDED | | | BEGINNING | | INCOME | | GAIN (LOSS) ON | | INVESTMENT | | INVESTMENT | | REALIZED | | RETURN OF | | TOTAL | | END OF |
| SEPTEMBER 30, | | | OF YEAR | | (LOSS)+ | | INVESTMENTS | | OPERATIONS | | INCOME | | GAINS | | CAPITAL | | DIVIDENDS | | YEAR |
| | | | | | | | | | | | | | | | | | | | | | | | | | | | | | | |
| CLASS A SHARES(c) | | | | | | | | | | | | | | | |
| 2024 | | | $ | 16.10 | | | 0.15 | | | 3.25 | | | 3.40 | | | (0.18 | ) | | — | | | — | | | (0.18 | ) | | $ | 19.32 | |
| 2023 | | | $ | 13.48 | | | 0.14 | | | 2.52 | | | 2.66 | | | (0.04 | ) | | — | | | — | | | (0.04 | ) | | $ | 16.10 | |
| 2022 | | | $ | 21.46 | | | 0.06 | | | (5.18 | ) | | (5.12 | ) | | — | | | (2.86 | ) | | — | | | (2.86 | ) | | $ | 13.48 | |
| 2021 | | | $ | 15.66 | | | 0.01 | | | 5.79 | | | 5.80 | | | — | | | — | | | — | | | — | | | $ | 21.46 | |
| 2020 | | | $ | 12.85 | | | — | (d) | | 2.90 | | | 2.90 | | | (0.09 | ) | | — | | | — | | | (0.09 | ) | | $ | 15.66 | |
| | | | | | | | | | | | | | | | | | | | | | | | | | | | | | | |
| CLASS C SHARES | | | | | | | | | | | | | | | |
| 2024 | | | $ | 15.59 | | | 0.02 | | | 3.15 | | | 3.17 | | | (0.06 | ) | | — | | | — | | | (0.06 | ) | | $ | 18.70 | |
| 2023 | | | $ | 13.11 | | | 0.02 | | | 2.46 | | | 2.48 | | | — | | | — | | | — | | | — | | | $ | 15.59 | |
| 2022 | | | $ | 21.08 | | | (0.07 | ) | | (5.04 | ) | | (5.11 | ) | | — | | | (2.86 | ) | | — | | | (2.86 | ) | | $ | 13.11 | |
| 2021 | | | $ | 15.51 | | | (0.15 | ) | | 5.72 | | | 5.57 | | | — | | | — | | | — | | | — | | | $ | 21.08 | |
| 2020 | | | $ | 12.72 | | | (0.08 | ) | | 2.88 | | | 2.80 | | | (0.01 | ) | | — | | | — | | | (0.01 | ) | | $ | 15.51 | |
| | | | | | | | | | | | | | | | | | | | | | | | | | | | | | | |
| CLASS I SHARES | | | | | | | | | | | | | | | |
| 2024 | | | $ | 16.64 | | | 0.25 | | | 3.35 | | | 3.60 | | | (0.27 | ) | | — | | | — | | | (0.27 | ) | | $ | 19.97 | |
| 2023 | | | $ | 13.93 | | | 0.24 | | | 2.61 | | | 2.85 | | | (0.14 | ) | | — | | | — | | | (0.14 | ) | | $ | 16.64 | |
| 2022 | | | $ | 22.03 | | | 0.15 | | | (5.34 | ) | | (5.19 | ) | | (0.05 | ) | | (2.86 | ) | | — | | | (2.91 | ) | | $ | 13.93 | |
| 2021 | | | $ | 16.06 | | | 0.11 | | | 5.93 | | | 6.04 | | | (0.07 | ) | | — | | | — | | | (0.07 | ) | | $ | 22.03 | |
| 2020 | | | $ | 13.16 | | | 0.10 | | | 2.99 | | | 3.09 | | | (0.19 | ) | | — | | | — | | | (0.19 | ) | | $ | 16.06 | |
| (a) | Net investment income (loss) includes income from foreign withholding tax claims adjusted for IRS compliance fees and/or tax reclaim collection fees. Without these proceeds, the Net Investment Income (Loss) ratios would have been as follows: |
| | | Class A | | Class C | | Class I |
| 2024 | | 0.87 | % | | 0.13 | % | | 1.41 | % |
| 2023 | | 0.85 | % | | 0.12 | % | | 1.42 | % |
| 2022 | | 0.32 | % | | (0.43 | )% | | 0.88 | % |
| 2021 | | 0.04 | % | | (0.78 | )% | | 0.51 | % |
| (b) | Not annualized for periods less than one year. |
| (c) | Sales loads are not reflected in computing total return. |
| (d) | Net investment income (loss) was less than $0.01 per share. |
| + | Based on weighted average shares outstanding. |
See notes to financial statements.
90 | Annual Financial Statements
Financial Highlights, Continued
Better World International Fund
| | | RATIOS TO AVERAGE NET ASSETS | | SUPPLEMENTAL DATA |
| UNLESS OTHERWISE | | | | | | | | | | | | NET |
| NOTED, PERIODS ARE | | | | EXPENSES, AFTER | | EXPENSES, | | | | PORTFOLIO | | ASSETS |
| FISCAL YEARS ENDED | | NET INVESTMENT | | EXPENSE | | BEFORE EXPENSE | | TOTAL | | TURNOVER | | AT END OF YEAR |
| SEPTEMBER 30, | | INCOME (LOSS) (%)(a) | | REDUCTIONS (%) | | REDUCTIONS (%) | | RETURN (%)(b) | | RATE (%)(b) | | (THOUSANDS) |
| | | | | | | | | | | | | | | | | | | | |
| CLASS A SHARES(c) | | | | |
| 2024 | | 0.89 | | | 1.44 | | | 1.58 | | | 21.27 | | | 60.57 | | | $ | 38,159 | |
| 2023 | | 0.87 | | | 1.46 | | | 1.60 | | | 19.79 | | | 80.23 | | | $ | 40,587 | |
| 2022 | | 0.34 | | | 1.47 | | | 1.58 | | | (27.93 | ) | | 140.89 | | | $ | 33,050 | |
| 2021 | | 0.05 | | | 1.57 | | | 1.57 | | | 37.04 | | | 119.96 | | | $ | 40,287 | |
| 2020 | | (0.02 | ) | | 1.83 | | | 1.94 | | | 22.65 | | | 42.87 | | | $ | 11,859 | |
| | | | | | | | | | | | | | | | | | | | |
| CLASS C SHARES | | | | |
| 2024 | | 0.15 | | | 2.19 | | | 2.55 | | | 20.42 | | | 60.57 | | | $ | 6,575 | |
| 2023 | | 0.14 | | | 2.19 | | | 2.82 | | | 18.92 | | | 80.23 | | | $ | 6,177 | |
| 2022 | | (0.42 | ) | | 2.24 | | | 2.50 | | | (28.44 | ) | | 140.89 | | | $ | 4,391 | |
| 2021 | | (0.77 | ) | | 2.38 | | | 2.85 | | | 35.91 | | | 119.96 | | | $ | 5,597 | |
| 2020 | | (0.56 | ) | | 2.38 | | | 3.31 | | | 22.02 | | | 42.87 | | | $ | 2,159 | |
| | | | | | | | | | | | | | | | | | | | |
| CLASS I SHARES | | | | |
| 2024 | | 1.42 | | | 0.90 | | | 1.24 | | | 21.90 | | | 60.57 | | | $ | 525,322 | |
| 2023 | | 1.44 | | | 0.90 | | | 1.26 | | | 20.49 | | | 80.23 | | | $ | 513,331 | |
| 2022 | | 0.89 | | | 0.96 | | | 1.25 | | | (27.54 | ) | | 140.89 | | | $ | 346,395 | |
| 2021 | | 0.53 | | | 1.09 | | | 1.21 | | | 37.72 | | | 119.96 | | | $ | 302,026 | |
| 2020 | | 0.74 | | | 1.09 | | | 1.33 | | | 23.62 | | | 42.87 | | | $ | 83,208 | |
Annual Financial Statements | 91
Financial Highlights
International Growth Fund
| | | PER SHARE PERFORMANCE (FOR A SHARE OUTSTANDING THROUGHOUT THE YEAR) |
| UNLESS OTHERWISE | | NET ASSET | | NET | | NET REALIZED & | | | | DIVIDENDS | | DIVIDENDS | | DIVIDENDS | | | | NET ASSET |
| NOTED, PERIODS ARE | | VALUE, | | INVESTMENT | | UNREALIZED | | TOTAL FROM | | FROM NET | | FROM NET | | FROM | | | | VALUE, |
| FISCAL YEARS ENDED | | BEGINNING | | INCOME | | GAIN (LOSS) ON | | INVESTMENT | | INVESTMENT | | REALIZED | | RETURN OF | | TOTAL | | END OF |
| SEPTEMBER 30, | | OF YEAR | | (LOSS)+ | | INVESTMENTS | | OPERATIONS | | INCOME | | GAINS | | CAPITAL | | DIVIDENDS | | YEAR |
| | | | | | | | | | | | | | | | | | | | | | | | | | | | | | | |
| CLASS A SHARES(d) | | | | | | | | | | | | | | | |
| 2024 | | | $ | 21.59 | | | 0.03 | | | 5.53 | | | 5.56 | | | (0.05 | ) | | — | | | — | | | (0.05 | ) | | $ | 27.10 | |
| 2023 | | | $ | 18.22 | | | 0.02 | | | 3.41 | | | 3.43 | | | (0.06 | ) | | — | | | — | | | (0.06 | ) | | $ | 21.59 | |
| 2022 | | | $ | 30.27 | | | 0.03 | | | (10.09 | ) | | (10.06 | ) | | — | | | (1.99 | ) | | — | | | (1.99 | ) | | $ | 18.22 | |
| 2021 | | | $ | 28.37 | | | (0.09 | ) | | 2.37 | | | 2.28 | | | — | | | (0.38 | ) | | — | | | (0.38 | ) | | $ | 30.27 | |
| 2020 | | | $ | 21.46 | | | (0.08 | ) | | 7.10 | | | 7.02 | | | — | (e) | | (0.11 | ) | | — | | | (0.11 | ) | | $ | 28.37 | |
| | | | | | | | | | | | | | | | | | | | | | | | | | | | | | | |
| CLASS C SHARES | | | | | | | | | | | | | | | |
| 2024 | | | $ | 19.22 | | | (0.20 | ) | | 4.93 | | | 4.73 | | | — | | | — | | | — | | | — | | | $ | 23.95 | |
| 2023 | | | $ | 16.33 | | | (0.16 | ) | | 3.05 | | | 2.89 | | | — | | | — | | | — | | | — | | | $ | 19.22 | |
| 2022 | | | $ | 27.55 | | | (0.17 | ) | | (9.06 | ) | | (9.23 | ) | | — | | | (1.99 | ) | | — | | | (1.99 | ) | | $ | 16.33 | |
| 2021 | | | $ | 26.06 | | | (0.31 | ) | | 2.18 | | | 1.87 | | | — | | | (0.38 | ) | | — | | | (0.38 | ) | | $ | 27.55 | |
| 2020 | | | $ | 19.87 | | | (0.25 | ) | | 6.55 | | | 6.30 | | | — | | | (0.11 | ) | | — | | | (0.11 | ) | | $ | 26.06 | |
| | | | | | | | | | | | | | | | | | | | | | | | | | | | | | | |
| CLASS I SHARES | | | | | | | | | | | | | | | |
| 2024 | | | $ | 22.46 | | | 0.12 | | | 5.77 | | | 5.89 | | | (0.15 | ) | | — | | | — | | | (0.15 | ) | | $ | 28.20 | |
| 2023 | | | $ | 18.97 | | | 0.11 | | | 3.53 | | | 3.64 | | | (0.15 | ) | | — | | | — | | | (0.15 | ) | | $ | 22.46 | |
| 2022 | | | $ | 31.32 | | | 0.12 | | | (10.48 | ) | | (10.36 | ) | | — | | | (1.99 | ) | | — | | | (1.99 | ) | | $ | 18.97 | |
| 2021 | | | $ | 29.27 | | | (0.01 | ) | | 2.44 | | | 2.43 | | | — | | | (0.38 | ) | | — | | | (0.38 | ) | | $ | 31.32 | |
| 2020 | | | $ | 22.13 | | | (0.01 | ) | | 7.33 | | | 7.32 | | | (0.07 | ) | | (0.11 | ) | | — | | | (0.18 | ) | | $ | 29.27 | |
| | | | | | | | | | | | | | | | | | | | | | | | | | | | | | | |
| CLASS R3 SHARES | | | | | | | | | | | | | | | |
| 2024 | | | $ | 21.21 | | | — | (f) | | 5.43 | | | 5.43 | | | (0.03 | ) | | — | | | — | | | (0.03 | ) | | $ | 26.61 | |
| 2023 | | | $ | 17.90 | | | (0.01 | ) | | 3.35 | | | 3.34 | | | (0.03 | ) | | — | | | — | | | (0.03 | ) | | $ | 21.21 | |
| 2022 | | | $ | 29.80 | | | — | (f) | | (9.91 | ) | | (9.91 | ) | | — | | | (1.99 | ) | | — | | | (1.99 | ) | | $ | 17.90 | |
| 2021 | | | $ | 28.01 | | | (0.16 | ) | | 2.33 | | | 2.17 | | | — | | | (0.38 | ) | | — | | | (0.38 | ) | | $ | 29.80 | |
| 2020 | | | $ | 21.23 | | | (0.13 | ) | | 7.02 | | | 6.89 | | | — | | | (0.11 | ) | | — | | | (0.11 | ) | | $ | 28.01 | |
| | | | | | | | | | | | | | | | | | | | | | | | | | | | | | | |
| CLASS R4 SHARES | | | | | | | | | | | | | | | |
| 2024 | | | $ | 21.38 | | | 0.01 | | | 5.49 | | | 5.50 | | | (0.05 | ) | | — | | | — | | | (0.05 | ) | | $ | 26.83 | |
| 2023 | | | $ | 18.06 | | | 0.02 | | | 3.37 | | | 3.39 | | | (0.07 | ) | | — | | | — | | | (0.07 | ) | | $ | 21.38 | |
| 2022 | | | $ | 30.02 | | | 0.03 | | | (10.00 | ) | | (9.97 | ) | | — | | | (1.99 | ) | | — | | | (1.99 | ) | | $ | 18.06 | |
| 2021 | | | $ | 28.18 | | | (0.13 | ) | | 2.35 | | | 2.22 | | | — | | | (0.38 | ) | | — | | | (0.38 | ) | | $ | 30.02 | |
| 2020 | | | $ | 21.34 | | | (0.03 | ) | | 6.98 | | | 6.95 | | | — | | | (0.11 | ) | | — | | | (0.11 | ) | | $ | 28.18 | |
| | | | | | | | | | | | | | | | | | | | | | | | | | | | | | | |
| CLASS R5 SHARES | | | | | | | | | | | | | | | |
| 2024 | | | $ | 22.53 | | | 0.11 | | | 5.78 | | | 5.89 | | | (0.13 | ) | | — | | | — | | | (0.13 | ) | | $ | 28.29 | |
| 2023 | | | $ | 19.03 | | | 0.11 | | | 3.55 | | | 3.66 | | | (0.16 | ) | | — | | | — | | | (0.16 | ) | | $ | 22.53 | |
| 2022 | | | $ | 31.41 | | | 0.12 | | | (10.51 | ) | | (10.39 | ) | | — | | | (1.99 | ) | | — | | | (1.99 | ) | | $ | 19.03 | |
| 2021 | | | $ | 29.35 | | | (0.01 | ) | | 2.45 | | | 2.44 | | | — | | | (0.38 | ) | | — | | | (0.38 | ) | | $ | 31.41 | |
| 2020 | | | $ | 22.19 | | | (0.03 | ) | | 7.37 | | | 7.34 | | | (0.07 | ) | | (0.11 | ) | | — | | | (0.18 | ) | | $ | 29.35 | |
| | | | | | | | | | | | | | | | | | | | | | | | | | | | | | | |
| CLASS R6 SHARES | | | | | | | | | | | | | | | |
| 2024 | | | $ | 22.65 | | | 0.16 | | | 5.79 | | | 5.95 | | | (0.17 | ) | | — | | | — | | | (0.17 | ) | | $ | 28.43 | |
| 2023 | | | $ | 19.13 | | | 0.14 | | | 3.56 | | | 3.70 | | | (0.18 | ) | | — | | | — | | | (0.18 | ) | | $ | 22.65 | |
| 2022 | | | $ | 31.54 | | | 0.15 | | | (10.57 | ) | | (10.42 | ) | | — | | | (1.99 | ) | | — | | | (1.99 | ) | | $ | 19.13 | |
| 2021 | | | $ | 29.44 | | | 0.02 | | | 2.46 | | | 2.48 | | | — | | | (0.38 | ) | | — | | | (0.38 | ) | | $ | 31.54 | |
| 2020 | | | $ | 22.26 | | | 0.02 | | | 7.37 | | | 7.39 | | | (0.10 | ) | | (0.11 | ) | | — | | | (0.21 | ) | | $ | 29.44 | |
| (a) | Net investment income (loss) includes income from foreign withholding tax claims adjusted for IRS compliance fees and/or tax reclaim collection fees. Without these proceeds, the Net Investment Income (Loss) ratios would have been as follows: |
| | | Class A | | Class C | | Class I | | Class R3 | | Class R4 | | Class R5 | | Class R6 |
| 2024 | | 0.09 | % | | (0.93 | )% | | 0.46 | % | | (0.02 | )% | | 0.02 | % | | 0.42 | % | | 0.58 | % |
| 2023 | | 0.08 | % | | (0.83 | )% | | 0.45 | % | | (0.05 | )% | | 0.05 | % | | 0.48 | % | | 0.58 | % |
| 2022 | | 0.08 | % | | (0.83 | )% | | 0.42 | % | | (0.06 | )% | | 0.07 | % | | 0.44 | % | | 0.56 | % |
| 2021 | | (0.37 | )% | | (1.18 | )% | | (0.10 | )% | | (0.60 | )% | | (0.51 | )% | | (0.11 | )% | | (0.02 | )% |
See notes to financial statements.
92 | Annual Financial Statements
Financial Highlights, Continued
International Growth Fund
| | | RATIOS TO AVERAGE NET ASSETS | | SUPPLEMENTAL DATA |
| UNLESS OTHERWISE | | | | | | | | | | | | NET |
| NOTED, PERIODS ARE | | | | EXPENSES, AFTER | | EXPENSES, | | | | PORTFOLIO | | ASSETS |
| FISCAL YEARS ENDED | | NET INVESTMENT | | EXPENSE | | BEFORE EXPENSE | | TOTAL | | TURNOVER | | AT END OF YEAR |
| SEPTEMBER 30, | | INCOME (LOSS) (%)(a) | | REDUCTIONS (%)(b) | | REDUCTIONS (%) | | RETURN (%)(c) | | RATE (%)(c) | | (THOUSANDS) |
| | | | | | | | | | | | | | | | | | | | |
| CLASS A SHARES(d) | | | | |
| 2024 | | 0.11 | | | 1.37 | | | 1.38 | | | 25.81 | | | 44.57 | | | $ | 92,101 | |
| 2023 | | 0.10 | | | 1.37 | | | 1.38 | | | 18.82 | | | 37.24 | | | $ | 86,983 | |
| 2022 | | 0.13 | | | 1.36 | | | 1.36 | | | (35.72 | ) | | 63.54 | | | $ | 86,145 | |
| 2021 | | (0.29 | ) | | 1.27 | | | 1.27 | | | 8.07 | | | 34.41 | | | $ | 154,613 | |
| 2020 | | (0.35 | ) | | 1.31 | | | 1.31 | | | 32.88 | | | 35.88 | | | $ | 139,429 | |
| | | | | | | | | | | | | | | | | | | | |
| CLASS C SHARES | | | | |
| 2024 | | (0.91 | ) | | 2.36 | | | 2.37 | | | 24.61 | | | 44.57 | | | $ | 6,985 | |
| 2023 | | (0.81 | ) | | 2.27 | | | 2.28 | | | 17.70 | | | 37.24 | | | $ | 8,572 | |
| 2022 | | (0.78 | ) | | 2.22 | | | 2.23 | | | (36.27 | ) | | 63.54 | | | $ | 10,939 | |
| 2021 | | (1.10 | ) | | 2.07 | | | 2.07 | | | 7.21 | | | 34.41 | | | $ | 27,864 | |
| 2020 | | (1.13 | ) | | 2.07 | | | 2.07 | | | 31.87 | | | 35.88 | | | $ | 42,164 | |
| | | | | | | | | | | | | | | | | | | | |
| CLASS I SHARES | | | | |
| 2024 | | 0.48 | | | 0.99 | | | 1.04 | | | 26.30 | | | 44.57 | | | $ | 673,335 | |
| 2023 | | 0.47 | | | 0.99 | | | 1.06 | | | 19.23 | | | 37.24 | | | $ | 627,050 | |
| 2022 | | 0.47 | | | 0.99 | | | 1.06 | | | (35.47 | ) | | 63.54 | | | $ | 724,495 | |
| 2021 | | (0.02 | ) | | 1.00 | | | 1.00 | | | 8.34 | | | 34.41 | | | $ | 1,584,102 | |
| 2020 | | (0.03 | ) | | 0.99 | | | 1.02 | | | 33.31 | | | 35.88 | | | $ | 1,454,322 | |
| | | | | | | | | | | | | | | | | | | | |
| CLASS R3 SHARES | | | | |
| 2024 | | (0.01 | ) | | 1.50 | | | 2.18 | | | 25.63 | | | 44.57 | | | $ | 4,771 | |
| 2023 | | (0.03 | ) | | 1.50 | | | 2.25 | | | 18.69 | | | 37.24 | | | $ | 4,508 | |
| 2022 | | (0.01 | ) | | 1.50 | | | 2.29 | | | (35.79 | ) | | 63.54 | | | $ | 4,340 | |
| 2021 | | (0.52 | ) | | 1.51 | | | 1.89 | | | 7.78 | | | 34.41 | | | $ | 7,643 | |
| 2020 | | (0.56 | ) | | 1.50 | | | 2.03 | | | 32.61 | | | 35.88 | | | $ | 6,424 | |
| | | | | | | | | | | | | | | | | | | | |
| CLASS R4 SHARES | | | | |
| 2024 | | 0.04 | | | 1.40 | | | 2.04 | | | 25.77 | | | 44.57 | | | $ | 7,103 | |
| 2023 | | 0.08 | | | 1.40 | | | 2.01 | | | 18.78 | | | 37.24 | | | $ | 7,083 | |
| 2022 | | 0.12 | | | 1.40 | | | 2.00 | | | (35.72 | ) | | 63.54 | | | $ | 6,670 | |
| 2021 | | (0.42 | ) | | 1.41 | | | 1.63 | | | 7.91 | | | 34.41 | | | $ | 9,903 | |
| 2020 | | (0.44 | ) | | 1.40 | | | 1.45 | | | 32.73 | | | 35.88 | | | $ | 8,436 | |
| | | | | | | | | | | | | | | | | | | | |
| CLASS R5 SHARES | | | | |
| 2024 | | 0.44 | | | 0.99 | | | 1.57 | | | 26.24 | | | 44.57 | | | $ | 6,387 | |
| 2023 | | 0.50 | | | 0.99 | | | 1.38 | | | 19.25 | | | 37.24 | | | $ | 12,979 | |
| 2022 | | 0.49 | | | 0.99 | | | 1.45 | | | (35.46 | ) | | 63.54 | | | $ | 21,233 | |
| 2021 | | (0.02 | ) | | 1.00 | | | 1.27 | | | 8.35 | | | 34.41 | | | $ | 36,396 | |
| 2020 | | (0.03 | ) | | 0.99 | | | 1.31 | | | 33.31 | | | 35.88 | | | $ | 34,152 | |
| | | | | | | | | | | | | | | | | | | | |
| CLASS R6 SHARES | | | | |
| 2024 | | 0.60 | | | 0.89 | | | 1.02 | | | 26.39 | | | 44.57 | | | $ | 90,922 | |
| 2023 | | 0.60 | | | 0.89 | | | 1.02 | | | 19.38 | | | 37.24 | | | $ | 73,130 | |
| 2022 | | 0.61 | | | 0.89 | | | 1.01 | | | (35.41 | ) | | 63.54 | | | $ | 66,867 | |
| 2021 | | 0.06 | | | 0.90 | | | 0.96 | | | 8.46 | | | 34.41 | | | $ | 107,884 | |
| 2020 | | 0.07 | | | 0.89 | | | 0.99 | | | 33.42 | | | 35.88 | | | $ | 61,130 | |
| (b) | Net expenses include tax reclaim collection fees that are excluded from the expense limitation agreement. If such expenses and fees had not occurred, the Expenses After Expense Reductions ratios for 2021 would have been: Class A, 1.26%; Class C, 2.07%; Class I, 0.99%; Class R3, 1.50%; Class R4, 1.40%; Class R5, 0.99%; Class R6, 0.89%. |
| (c) | Not annualized for periods less than one year. |
| (d) | Sales loads are not reflected in computing total return. |
| (e) | Dividends from net investment income per share were less than $(0.01). |
| (f) | Net investment income (loss) was less than $0.01 per share. |
| + | Based on weighted average shares outstanding. |
Annual Financial Statements | 93
Financial Highlights
Developing World Fund
| | | | PER SHARE PERFORMANCE (FOR A SHARE OUTSTANDING THROUGHOUT THE YEAR) |
| UNLESS OTHERWISE | | | NET ASSET | | NET | | NET REALIZED & | | | | DIVIDENDS | | DIVIDENDS | | DIVIDENDS | | | | NET ASSET |
| NOTED, PERIODS ARE | | | VALUE, | | INVESTMENT | | UNREALIZED | | TOTAL FROM | | FROM NET | | FROM NET | | FROM | | | | VALUE, |
| FISCAL YEARS ENDED | | | BEGINNING | | INCOME | | GAIN (LOSS) ON | | INVESTMENT | | INVESTMENT | | REALIZED | | RETURN OF | | TOTAL | | END OF |
| SEPTEMBER 30, | | | OF YEAR | | (LOSS)+ | | INVESTMENTS | | OPERATIONS | | INCOME | | GAINS | | CAPITAL | | DIVIDENDS | | YEAR |
| | | | | | | | | | | | | | | | | | | | | | | | | | | | | | | |
| CLASS A SHARES(d) | | | | | | | | | | | | | | |
| 2024 | | | $ | 19.68 | | | 0.07 | | | 3.51 | | | 3.58 | | | (0.34 | ) | | — | | | — | | | (0.34 | ) | | $ | 22.92 | |
| 2023 | | | $ | 18.43 | | | 0.18 | | | 1.34 | | | 1.52 | | | (0.27 | ) | | — | | | — | | | (0.27 | ) | | $ | 19.68 | |
| 2022 | | | $ | 27.58 | | | 0.39 | | | (9.54 | ) | | (9.15 | ) | | — | | | — | | | — | | | — | | | $ | 18.43 | |
| 2021 | | | $ | 22.92 | | | — | (f) | | 4.66 | | | 4.66 | | | — | | | — | | | — | | | — | | | $ | 27.58 | |
| 2020 | | | $ | 20.43 | | | 0.03 | | | 2.69 | | | 2.72 | | | (0.23 | ) | | — | | | — | | | (0.23 | ) | | $ | 22.92 | |
| | | | | | | | | | | | | | | | | | | | | | | | | | | | | | | |
| CLASS C SHARES | | | | | | | | | | | | | | |
| 2024 | | | $ | 18.40 | | | (0.10 | ) | | 3.27 | | | 3.17 | | | (0.12 | ) | | — | | | — | | | (0.12 | ) | | $ | 21.45 | |
| 2023 | | | $ | 17.18 | | | 0.01 | | | 1.26 | | | 1.27 | | | (0.05 | ) | | — | | | — | | | (0.05 | ) | | $ | 18.40 | |
| 2022 | | | $ | 25.93 | | | 0.14 | | | (8.89 | ) | | (8.75 | ) | | — | | | — | | | — | | | — | | | $ | 17.18 | |
| 2021 | | | $ | 21.71 | | | (0.21 | ) | | 4.43 | | | 4.22 | | | — | | | — | | | — | | | — | | | $ | 25.93 | |
| 2020 | | | $ | 19.35 | | | (0.13 | ) | | 2.54 | | | 2.41 | | | (0.05 | ) | | — | | | — | | | (0.05 | ) | | $ | 21.71 | |
| | | | | | | | | | | | | | | | | | | | | | | | | | | | | | | |
| CLASS I SHARES | | | | | | | | | | | | | | |
| 2024 | | | $ | 20.21 | | | 0.17 | | | 3.59 | | | 3.76 | | | (0.43 | ) | | — | | | — | | | (0.43 | ) | | $ | 23.54 | |
| 2023 | | | $ | 18.93 | | | 0.27 | | | 1.37 | | | 1.64 | | | (0.36 | ) | | — | | | — | | | (0.36 | ) | | $ | 20.21 | |
| 2022 | | | $ | 28.22 | | | 0.50 | | | (9.79 | ) | | (9.29 | ) | | — | | | — | | | — | | | — | | | $ | 18.93 | |
| 2021 | | | $ | 23.40 | | | 0.10 | | | 4.76 | | | 4.86 | | | (0.04 | ) | | — | | | — | | | (0.04 | ) | | $ | 28.22 | |
| 2020 | | | $ | 20.86 | | | 0.11 | | | 2.74 | | | 2.85 | | | (0.31 | ) | | — | | | — | | | (0.31 | ) | | $ | 23.40 | |
| | | | | | | | | | | | | | | | | | | | | | | | | | | | | | | |
| CLASS R5 SHARES | | | | | | | | | | | | | | |
| 2024 | | | $ | 20.15 | | | 0.17 | | | 3.57 | | | 3.74 | | | (0.43 | ) | | — | | | — | | | (0.43 | ) | | $ | 23.46 | |
| 2023 | | | $ | 18.87 | | | 0.27 | | | 1.37 | | | 1.64 | | | (0.36 | ) | | — | | | — | | | (0.36 | ) | | $ | 20.15 | |
| 2022 | | | $ | 28.12 | | | 0.48 | | | (9.73 | ) | | (9.25 | ) | | — | | | — | | | — | | | — | | | $ | 18.87 | |
| 2021 | | | $ | 23.33 | | | 0.10 | | | 4.73 | | | 4.83 | | | (0.04 | ) | | — | | | — | | | (0.04 | ) | | $ | 28.12 | |
| 2020 | | | $ | 20.79 | | | 0.10 | | | 2.75 | | | 2.85 | | | (0.31 | ) | | — | | | — | | | (0.31 | ) | | $ | 23.33 | |
| | | | | | | | | | | | | | | | | | | | | | | | | | | | | | | |
| CLASS R6 SHARES | | | | | | | | | | | | | | |
| 2024 | | | $ | 20.26 | | | 0.20 | | | 3.59 | | | 3.79 | | | (0.45 | ) | | — | | | — | | | (0.45 | ) | | $ | 23.60 | |
| 2023 | | | $ | 18.98 | | | 0.29 | | | 1.37 | | | 1.66 | | | (0.38 | ) | | — | | | — | | | (0.38 | ) | | $ | 20.26 | |
| 2022 | | | $ | 28.26 | | | 0.52 | | | (9.80 | ) | | (9.28 | ) | | — | | | — | | | — | | | — | | | $ | 18.98 | |
| 2021 | | | $ | 23.43 | | | 0.12 | | | 4.78 | | | 4.90 | | | (0.07 | ) | | — | | | — | | | (0.07 | ) | | $ | 28.26 | |
| 2020 | | | $ | 20.88 | | | 0.13 | | | 2.75 | | | 2.88 | | | (0.33 | ) | | — | | | — | | | (0.33 | ) | | $ | 23.43 | |
| (a) | Net investment income (loss) includes income from foreign withholding tax claims adjusted for IRS compliance fees and/or tax reclaim collection fees. Without these proceeds, the Net Investment Income (Loss) ratios would have been as follows: |
| | | Class A | | Class C | | Class I | | Class R5 | | Class R6 |
| 2022 | | 1.63 | % | | 0.61 | % | | 2.06 | % | | 1.94 | % | | 2.14 | % |
| 2021 | | (0.02 | )% | | (0.82 | )% | | 0.33 | % | | 0.34 | % | | 0.42 | % |
| (b) | Net expenses include tax reclaim collection fees that are excluded from the expense limitation agreement. If such expenses and fees had not occurred, the Expenses After Expense Reductions ratios for 2021 would have been: Class A, 1.43%; Class C, 2.19%; Class I, 1.09%; Class R5, 1.09%; Class R6, 0.99%. |
| (c) | Not annualized for periods less than one year. |
| (d) | Sales loads are not reflected in computing total return. |
| (e) | The total return based on the NAV which reflects adjustments in accordance with U.S. GAAP is 18.40% |
| (f) | Net investment income (loss) was less than $0.01 per share. |
| (g) | The total return based on the NAV which reflects adjustments in accordance with U.S. GAAP is 12.47% for 2020 and 19.44% for 2021. |
| + | Based on weighted average shares outstanding. |
See notes to financial statements.
94 | Annual Financial Statements
Financial Highlights, Continued
Developing World Fund
| | | RATIOS TO AVERAGE NET ASSETS | | SUPPLEMENTAL DATA |
| UNLESS OTHERWISE | | | | | | | | | | | | NET |
| NOTED, PERIODS ARE | | | | EXPENSES, AFTER | | EXPENSES, | | | | PORTFOLIO | | ASSETS |
| FISCAL YEARS ENDED | | NET INVESTMENT | | EXPENSE | | BEFORE EXPENSE | | TOTAL | | TURNOVER | | AT END OF YEAR |
| SEPTEMBER 30, | | INCOME (LOSS) (%)(a) | | REDUCTIONS (%)(b) | | REDUCTIONS (%) | | RETURN (%)(c) | | RATE (%)(c) | | (THOUSANDS) |
| | | | | | | | | | | | | | | | | | | | |
| CLASS A SHARES(d) | | | | |
| 2024 | | 0.36 | | | 1.47 | | | 1.62 | | | 18.35 | (e) | | 90.88 | | | $ | 76,267 | |
| 2023 | | 0.87 | | | 1.45 | | | 1.60 | | | 8.24 | | | 37.64 | | | $ | 83,389 | |
| 2022 | | 1.63 | | | 1.44 | | | 1.54 | | | (33.18 | ) | | 68.24 | | | $ | 87,897 | |
| 2021 | | (0.01 | ) | | 1.43 | | | 1.43 | | | 20.33 | | | 61.50 | | | $ | 131,471 | |
| 2020 | | 0.13 | | | 1.45 | | | 1.48 | | | 13.31 | | | 56.55 | | | $ | 101,723 | |
| | | | | | | | | | | | | | | | | | | | |
| CLASS C SHARES | | | | |
| 2024 | | (0.53 | ) | | 2.33 | | | 2.54 | | | 17.31 | | | 90.88 | | | $ | 7,493 | |
| 2023 | | 0.04 | | | 2.27 | | | 2.42 | | | 7.36 | | | 37.64 | | | $ | 11,621 | |
| 2022 | | 0.62 | | | 2.26 | | | 2.36 | | | (33.74 | ) | | 68.24 | | | $ | 17,044 | |
| 2021 | | (0.81 | ) | | 2.19 | | | 2.19 | | | 19.49 | (g) | | 61.50 | | | $ | 40,933 | |
| 2020 | | (0.64 | ) | | 2.20 | | | 2.23 | | | 12.42 | (g) | | 56.55 | | | $ | 48,977 | |
| | | | | | | | | | | | | | | | | | | | |
| CLASS I SHARES | | | | |
| 2024 | | 0.78 | | | 1.04 | | | 1.29 | | | 18.92 | | | 90.88 | | | $ | 519,163 | |
| 2023 | | 1.31 | | | 1.04 | | | 1.28 | | | 8.66 | | | 37.64 | | | $ | 802,285 | |
| 2022 | | 2.07 | | | 1.06 | | | 1.23 | | | (32.92 | ) | | 68.24 | | | $ | 772,911 | |
| 2021 | | 0.34 | | | 1.09 | | | 1.15 | | | 20.78 | | | 61.50 | | | $ | 925,280 | |
| 2020 | | 0.50 | | | 1.09 | | | 1.18 | | | 13.68 | | | 56.55 | | | $ | 668,427 | |
| | | | | | | | | | | | | | | | | | | | |
| CLASS R5 SHARES | | | | |
| 2024 | | 0.80 | | | 1.04 | | | 2.04 | | | 18.88 | | | 90.88 | | | $ | 3,380 | |
| 2023 | | 1.31 | | | 1.04 | | | 2.05 | | | 8.69 | | | 37.64 | | | $ | 3,206 | |
| 2022 | | 1.94 | | | 1.06 | | | 2.15 | | | (32.89 | ) | | 68.24 | | | $ | 2,403 | |
| 2021 | | 0.35 | | | 1.09 | | | 1.70 | | | 20.72 | | | 61.50 | | | $ | 4,157 | |
| 2020 | | 0.49 | | | 1.09 | | | 1.89 | | | 13.73 | | | 56.55 | | | $ | 2,735 | |
| | | | | | | | | | | | | | | | | | | | |
| CLASS R6 SHARES | | | | |
| 2024 | | 0.91 | | | 0.94 | | | 1.24 | | | 19.04 | | | 90.88 | | | $ | 68,459 | |
| 2023 | | 1.40 | | | 0.94 | | | 1.24 | | | 8.75 | | | 37.64 | | | $ | 60,741 | |
| 2022 | | 2.14 | | | 0.96 | | | 1.20 | | | (32.84 | ) | | 68.24 | | | $ | 54,406 | |
| 2021 | | 0.43 | | | 0.99 | | | 1.11 | | | 20.90 | | | 61.50 | | | $ | 78,006 | |
| 2020 | | 0.60 | | | 0.99 | | | 1.15 | | | 13.82 | | | 56.55 | | | $ | 62,993 | |
Annual Financial Statements | 95
Financial Highlights
Small/Mid Cap Core Fund
| | | | PER SHARE PERFORMANCE (FOR A SHARE OUTSTANDING THROUGHOUT THE YEAR) |
| UNLESS OTHERWISE | | | NET ASSET | | NET | | NET REALIZED & | | | | DIVIDENDS | | DIVIDENDS | | DIVIDENDS | | | | NET ASSET |
| NOTED, PERIODS ARE | | | VALUE, | | INVESTMENT | | UNREALIZED | | TOTAL FROM | | FROM NET | | FROM NET | | FROM | | | | VALUE, |
| FISCAL YEARS ENDED | | | BEGINNING | | INCOME | | GAIN (LOSS) ON | | INVESTMENT | | INVESTMENT | | REALIZED | | RETURN OF | | TOTAL | | END OF |
| SEPTEMBER 30, | | | OF YEAR | | (LOSS)+ | | INVESTMENTS | | OPERATIONS | | INCOME | | GAINS | | CAPITAL | | DIVIDENDS | | YEAR |
| | | | | | | | | | | | | | | | | | | | | | | | | | | | | | | |
| CLASS A SHARES(d) | | | | | | | | | | | | | | | |
| 2024 | | | $ | 60.68 | | | (0.39 | ) | | 16.86 | | | 16.47 | | | — | | | — | | | — | | | — | | | $ | 77.15 | |
| 2023 | | | $ | 55.35 | | | (0.24 | ) | | 5.60 | | | 5.36 | | | (0.03 | ) | | — | | | — | | | (0.03 | ) | | $ | 60.68 | |
| 2022 | | | $ | 97.60 | | | (0.27 | ) | | (15.33 | ) | | (15.60 | ) | | (0.30 | ) | | (26.35 | ) | | — | | | (26.65 | ) | | $ | 55.35 | |
| 2021 | | | $ | 74.81 | | | (0.05 | ) | | 22.84 | | | 22.79 | | | — | | | — | | | — | | | — | | | $ | 97.60 | |
| 2020 | | | $ | 71.81 | | | 0.07 | | | 3.11 | | | 3.18 | | | (0.18 | ) | | — | | | — | | | (0.18 | ) | | $ | 74.81 | |
| | | | | | | | | | | | | | | | | | | | | | | | | | | | | | | |
| CLASS C SHARES | | | | | | | | | | | | | | | |
| 2024 | | | $ | 51.36 | | | (0.88 | ) | | 14.18 | | | 13.30 | | | — | | | — | | | — | | | — | | | $ | 64.66 | |
| 2023 | | | $ | 47.29 | | | (0.70 | ) | | 4.77 | | | 4.07 | | | — | | | — | | | — | | | — | | | $ | 51.36 | |
| 2022 | | | $ | 87.40 | | | (0.81 | ) | | (12.95 | ) | | (13.76 | ) | | — | | | (26.35 | ) | | — | | | (26.35 | ) | | $ | 47.29 | |
| 2021 | | | $ | 67.54 | | | (0.71 | ) | | 20.57 | | | 19.86 | | | — | | | — | | | — | | | — | | | $ | 87.40 | |
| 2020 | | | $ | 65.19 | | | (0.45 | ) | | 2.80 | | | 2.35 | | | — | | | — | | | — | | | — | | | $ | 67.54 | |
| | | | | | | | | | | | | | | | | | | | | | | | | | | | | | | |
| CLASS I SHARES | | | | | | | | | | | | | | | |
| 2024 | | | $ | 63.56 | | | (0.10 | ) | | 17.70 | | | 17.60 | | | — | | | — | | | — | | | — | | | $ | 81.16 | |
| 2023 | | | $ | 58.01 | | | 0.01 | | | 5.86 | | | 5.87 | | | (0.32 | ) | | — | | | — | | | (0.32 | ) | | $ | 63.56 | |
| 2022 | | | $ | 100.99 | | | 0.01 | | | (16.09 | ) | | (16.08 | ) | | (0.55 | ) | | (26.35 | ) | | — | | | (26.90 | ) | | $ | 58.01 | |
| 2021 | | | $ | 77.16 | | | 0.25 | | | 23.58 | | | 23.83 | | | — | | | — | | | — | | | — | | | $ | 100.99 | |
| 2020 | | | $ | 74.04 | | | 0.33 | | | 3.22 | | | 3.55 | | | (0.43 | ) | | — | | | — | | | (0.43 | ) | | $ | 77.16 | |
| | | | | | | | | | | | | | | | | | | | | | | | | | | | | | | |
| CLASS R3 SHARES | | | | | | | | | | | | | | | |
| 2024 | | | $ | 60.32 | | | (0.34 | ) | | 16.76 | | | 16.42 | | | — | | | — | | | — | | | — | | | $ | 76.74 | |
| 2023 | | | $ | 55.03 | | | (0.21 | ) | | 5.57 | | | 5.36 | | | (0.07 | ) | | — | | | — | | | (0.07 | ) | | $ | 60.32 | |
| 2022 | | | $ | 97.10 | | | (0.25 | ) | | (15.21 | ) | | (15.46 | ) | | (0.26 | ) | | (26.35 | ) | | — | | | (26.61 | ) | | $ | 55.03 | |
| 2021 | | | $ | 74.46 | | | (0.08 | ) | | 22.72 | | | 22.64 | | | — | | | — | | | — | | | — | | | $ | 97.10 | |
| 2020 | | | $ | 71.44 | | | 0.06 | | | 3.10 | | | 3.16 | | | (0.14 | ) | | — | | | — | | | (0.14 | ) | | $ | 74.46 | |
| | | | | | | | | | | | | | | | | | | | | | | | | | | | | | | |
| CLASS R4 SHARES | | | | | | | | | | | | | | | |
| 2024 | | | $ | 61.32 | | | (0.28 | ) | | 17.06 | | | 16.78 | | | — | | | — | | | — | | | — | | | $ | 78.10 | |
| 2023 | | | $ | 55.96 | | | (0.15 | ) | | 5.65 | | | 5.50 | | | (0.14 | ) | | — | | | — | | | (0.14 | ) | | $ | 61.32 | |
| 2022 | | | $ | 98.30 | | | (0.16 | ) | | (15.50 | ) | | (15.66 | ) | | (0.33 | ) | | (26.35 | ) | | — | | | (26.68 | ) | | $ | 55.96 | |
| 2021 | | | $ | 75.30 | | | 0.01 | | | 22.99 | | | 23.00 | | | — | | | — | | | — | | | — | | | $ | 98.30 | |
| 2020 | | | $ | 72.25 | | | 0.12 | | | 3.14 | | | 3.26 | | | (0.21 | ) | | — | | | — | | | (0.21 | ) | | $ | 75.30 | |
| | | | | | | | | | | | | | | | | | | | | | | | | | | | | | | |
| CLASS R5 SHARES | | | | | | | | | | | | | | | |
| 2024 | | | $ | 63.45 | | | (0.10 | ) | | 17.66 | | | 17.56 | | | — | | | — | | | — | | | — | | | $ | 81.01 | |
| 2023 | | | $ | 57.90 | | | 0.02 | | | 5.84 | | | 5.86 | | | (0.31 | ) | | — | | | — | | | (0.31 | ) | | $ | 63.45 | |
| 2022 | | | $ | 100.84 | | | — | (f) | | (16.04 | ) | | (16.04 | ) | | (0.55 | ) | | (26.35 | ) | | — | | | (26.90 | ) | | $ | 57.90 | |
| 2021 | | | $ | 77.05 | | | 0.26 | | | 23.53 | | | 23.79 | | | — | | | — | | | — | | | — | | | $ | 100.84 | |
| 2020 | | | $ | 73.93 | | | 0.33 | | | 3.22 | | | 3.55 | | | (0.43 | ) | | — | | | — | | | (0.43 | ) | | $ | 77.05 | |
| (a) | Net investment income (loss) includes income from foreign withholding tax claims adjusted for IRS compliance fees and/or tax reclaim collection fees. Without these proceeds, the Net Investment Income (Loss) ratios would have been as follows: |
| | | Class A | | Class C | | Class I | | Class R3 | | Class R4 | | Class R5 |
| 2021 | | (0.15 | )% | | (0.95 | )% | | 0.17 | % | | (0.17 | )% | | (0.09 | )% | | 0.18 | % |
| (b) | Net expenses include tax reclaim collection fees that are excluded from the expense limitation agreement. If such expenses and fees had not occurred, the Expenses After Expense Reductions ratios for 2021 would have been: Class A, 1.16%; Class C, 1.98%; Class I, 0.84%; Class R3, 1.20%; Class R4, 1.10%; Class R5, 0.84%. |
| (c) | Not annualized for periods less than one year. |
| (d) | Sales loads are not reflected in computing total return. |
| (e) | The Fund modified its strategy in December 2020 and due to the change, the Fund experienced a higher portfolio turnover from higher purchases and sales. |
| (f) | Net investment income (loss) was less than $0.01 per share. |
| (g) | Net investment income (loss) was less than 0.01%. |
| + | Based on weighted average shares outstanding. |
See notes to financial statements.
96 | Annual Financial Statements
Financial Highlights, Continued
Small/Mid Cap Core Fund
| | | RATIOS TO AVERAGE NET ASSETS | | SUPPLEMENTAL DATA |
| UNLESS OTHERWISE | | | | | | | | | | | | NET |
| NOTED, PERIODS ARE | | | | EXPENSES, AFTER | | EXPENSES, | | | | PORTFOLIO | | ASSETS |
| FISCAL YEARS ENDED | | NET INVESTMENT | | EXPENSE | | BEFORE EXPENSE | | TOTAL | | TURNOVER | | AT END OF YEAR |
| SEPTEMBER 30, | | INCOME (LOSS) (%)(a) | | REDUCTIONS (%)(b) | | REDUCTIONS (%) | | RETURN (%)(c) | | RATE (%)(c) | | (THOUSANDS) |
| | | | | | | | | | | | | | | | | | | | |
| CLASS A SHARES(d) | | | | | | | | | |
| 2024 | | (0.57 | ) | | 1.38 | | | 1.38 | | | 27.14 | | | 32.79 | | | $ | 306,852 | |
| 2023 | | (0.40 | ) | | 1.36 | | | 1.36 | | | 9.68 | | | 37.54 | | | $ | 276,512 | |
| 2022 | | (0.38 | ) | | 1.31 | | | 1.37 | | | (23.16 | ) | | 46.19 | | | $ | 293,290 | |
| 2021 | | (0.06 | ) | | 1.18 | | | 1.33 | | | 30.46 | | | 135.80 | (e) | | $ | 454,488 | |
| 2020 | | 0.10 | | | 1.33 | | | 1.34 | | | 4.42 | | | 20.39 | | | $ | 388,895 | |
| | | | | | | | | | | | | | | | | | | | |
| CLASS C SHARES | | | | | | | | | |
| 2024 | | (1.53 | ) | | 2.34 | | | 2.97 | | | 25.90 | | | 32.79 | | | $ | 3,195 | |
| 2023 | | (1.36 | ) | | 2.34 | | | 2.59 | | | 8.61 | | | 37.54 | | | $ | 4,520 | |
| 2022 | | (1.31 | ) | | 2.22 | | | 2.34 | | | (23.86 | ) | | 46.19 | | | $ | 7,476 | |
| 2021 | | (0.86 | ) | | 2.00 | | | 2.15 | | | 29.40 | | | 135.80 | (e) | | $ | 17,364 | |
| 2020 | | (0.69 | ) | | 2.12 | | | 2.12 | | | 3.59 | | | 20.39 | | | $ | 22,951 | |
| | | | | | | | | | | | | | | | | | | | |
| CLASS I SHARES | | | | | | | | | |
| 2024 | | (0.14 | ) | | 0.95 | | | 1.08 | | | 27.69 | | | 32.79 | | | $ | 232,076 | |
| 2023 | | 0.01 | | | 0.95 | | | 1.08 | | | 10.13 | | | 37.54 | | | $ | 196,754 | |
| 2022 | | 0.02 | | | 0.91 | | | 1.09 | | | (22.84 | ) | | 46.19 | | | $ | 207,251 | |
| 2021 | | 0.26 | | | 0.86 | | | 1.08 | | | 30.88 | | | 135.80 | (e) | | $ | 332,235 | |
| 2020 | | 0.44 | | | 0.99 | | | 1.09 | | | 4.77 | | | 20.39 | | | $ | 287,746 | |
| | | | | | | | | | | | | | | | | | | | |
| CLASS R3 SHARES | | | | | | | | | |
| 2024 | | (0.50 | ) | | 1.31 | | | 1.88 | | | 27.22 | | | 32.79 | | | $ | 12,245 | |
| 2023 | | (0.34 | ) | | 1.31 | | | 1.93 | | | 9.74 | | | 37.54 | | | $ | 12,641 | |
| 2022 | | (0.35 | ) | | 1.27 | | | 1.87 | | | (23.11 | ) | | 46.19 | | | $ | 13,406 | |
| 2021 | | (0.08 | ) | | 1.22 | | | 1.81 | | | 30.41 | | | 135.80 | (e) | | $ | 23,594 | |
| 2020 | | 0.09 | | | 1.35 | | | 1.73 | | | 4.40 | | | 20.39 | | | $ | 24,939 | |
| | | | | | | | | | | | | | | | | | | | |
| CLASS R4 SHARES | | | | | | | | | |
| 2024 | | (0.40 | ) | | 1.21 | | | 2.16 | | | 27.36 | | | 32.79 | | | $ | 2,723 | |
| 2023 | | (0.24 | ) | | 1.21 | | | 2.30 | | | 9.83 | | | 37.54 | | | $ | 2,288 | |
| 2022 | | (0.23 | ) | | 1.17 | | | 2.04 | | | (23.03 | ) | | 46.19 | | | $ | 2,819 | |
| 2021 | | 0.01 | | | 1.12 | | | 1.78 | | | 30.54 | | | 135.80 | (e) | | $ | 4,386 | |
| 2020 | | 0.17 | | | 1.25 | | | 1.74 | | | 4.50 | | | 20.39 | | | $ | 4,548 | |
| | | | | | | | | | | | | | | | | | | | |
| CLASS R5 SHARES | | | | | | | | | |
| 2024 | | (0.14 | ) | | 0.95 | | | 1.87 | | | 27.68 | | | 32.79 | | | $ | 2,758 | |
| 2023 | | 0.03 | | | 0.95 | | | 1.75 | | | 10.13 | | | 37.54 | | | $ | 2,896 | |
| 2022 | | — | (g) | | 0.90 | | | 1.64 | | | (22.83 | ) | | 46.19 | | | $ | 6,106 | |
| 2021 | | 0.27 | | | 0.86 | | | 1.48 | | | 30.88 | | | 135.80 | (e) | | $ | 14,710 | |
| 2020 | | 0.45 | | | 0.99 | | | 1.43 | | | 4.76 | | | 20.39 | | | $ | 14,156 | |
Annual Financial Statements | 97
Financial Highlights
Small/Mid Cap Growth Fund
| | | | PER SHARE PERFORMANCE (FOR A SHARE OUTSTANDING THROUGHOUT THE YEAR) |
| UNLESS OTHERWISE | | | NET ASSET | | NET | | NET REALIZED & | | | | DIVIDENDS | | DIVIDENDS | | DIVIDENDS | | | | NET ASSET |
| NOTED, PERIODS ARE | | | VALUE, | | INVESTMENT | | UNREALIZED | | TOTAL FROM | | FROM NET | | FROM NET | | FROM | | | | VALUE, |
| FISCAL YEARS ENDED | | | BEGINNING | | INCOME | | GAIN (LOSS) ON | | INVESTMENT | | INVESTMENT | | REALIZED | | RETURN OF | | TOTAL | | END OF |
| SEPTEMBER 30, | | | OF YEAR | | (LOSS)+ | | INVESTMENTS | | OPERATIONS | | INCOME | | GAINS | | CAPITAL | | DIVIDENDS | | YEAR |
| | | | | | | | | | | | | | | | | | | | | | | | | | | | | | | |
| CLASS A SHARES(b) | | | | | | | | | | | | | | | |
| 2024 | | | $ | 24.28 | | | (0.31 | ) | | 6.26 | | | 5.95 | | | — | | | — | | | — | | | — | | | $ | 30.23 | |
| 2023 | | | $ | 21.17 | | | (0.28 | ) | | 3.39 | | | 3.11 | | | — | | | — | | | — | | | — | | | $ | 24.28 | |
| 2022 | | | $ | 51.77 | | | (0.35 | ) | | (12.37 | ) | | (12.72 | ) | | — | | | (17.88 | ) | | — | | | (17.88 | ) | | $ | 21.17 | |
| 2021 | | | $ | 48.17 | | | (0.51 | ) | | 7.33 | | | 6.82 | | | — | | | (3.22 | ) | | — | | | (3.22 | ) | | $ | 51.77 | |
| 2020 | | | $ | 39.37 | | | (0.30 | ) | | 12.72 | | | 12.42 | | | — | | | (3.62 | ) | | — | | | (3.62 | ) | | $ | 48.17 | |
| | | | | | | | | | | | | | | | | | | | | | | | | | | | | | | |
| CLASS C SHARES | | | | | | | | | | | | | | | |
| 2024 | | | $ | 17.56 | | | (0.40 | ) | | 4.50 | | | 4.10 | | | — | | | — | | | — | | | — | | | $ | 21.66 | |
| 2023 | | | $ | 15.45 | | | (0.36 | ) | | 2.47 | | | 2.11 | | | — | | | — | | | — | | | — | | | $ | 17.56 | |
| 2022 | | | $ | 42.67 | | | (0.48 | ) | | (8.86 | ) | | (9.34 | ) | | — | | | (17.88 | ) | | — | | | (17.88 | ) | | $ | 15.45 | |
| 2021 | | | $ | 40.53 | | | (0.75 | ) | | 6.11 | | | 5.36 | | | — | | | (3.22 | ) | | — | | | (3.22 | ) | | $ | 42.67 | |
| 2020 | | | $ | 33.91 | | | (0.51 | ) | | 10.75 | | | 10.24 | | | — | | | (3.62 | ) | | — | | | (3.62 | ) | | $ | 40.53 | |
| | | | | | | | | | | | | | | | | | | | | | | | | | | | | | | |
| CLASS I SHARES | | | | | | | | | | | | | | | |
| 2024 | | | $ | 28.04 | | | (0.22 | ) | | 7.26 | | | 7.04 | | | — | | | — | | | — | | | — | | | $ | 35.08 | |
| 2023 | | | $ | 24.34 | | | (0.20 | ) | | 3.90 | | | 3.70 | | | — | | | — | | | — | | | — | | | $ | 28.04 | |
| 2022 | | | $ | 56.75 | | | (0.26 | ) | | (14.27 | ) | | (14.53 | ) | | — | | | (17.88 | ) | | — | | | (17.88 | ) | | $ | 24.34 | |
| 2021 | | | $ | 52.36 | | | (0.38 | ) | | 7.99 | | | 7.61 | | | — | | | (3.22 | ) | | — | | | (3.22 | ) | | $ | 56.75 | |
| 2020 | | | $ | 42.35 | | | (0.17 | ) | | 13.80 | | | 13.63 | | | — | | | (3.62 | ) | | — | | | (3.62 | ) | | $ | 52.36 | |
| | | | | | | | | | | | | | | | | | | | | | | | | | | | | | | |
| CLASS R3 SHARES | | | | | | | | | | | | | | | |
| 2024 | | | $ | 23.78 | | | (0.32 | ) | | 6.14 | | | 5.82 | | | — | | | — | | | — | | | — | | | $ | 29.60 | |
| 2023 | | | $ | 20.75 | | | (0.28 | ) | | 3.31 | | | 3.03 | | | — | | | — | | | — | | | — | | | $ | 23.78 | |
| 2022 | | | $ | 51.09 | | | (0.36 | ) | | (12.10 | ) | | (12.46 | ) | | — | | | (17.88 | ) | | — | | | (17.88 | ) | | $ | 20.75 | |
| 2021 | | | $ | 47.67 | | | (0.60 | ) | | 7.24 | | | 6.64 | | | — | | | (3.22 | ) | | — | | | (3.22 | ) | | $ | 51.09 | |
| 2020 | | | $ | 39.05 | | | (0.36 | ) | | 12.60 | | | 12.24 | | | — | | | (3.62 | ) | | — | | | (3.62 | ) | | $ | 47.67 | |
| | | | | | | | | | | | | | | | | | | | | | | | | | | | | | | |
| CLASS R4 SHARES | | | | | | | | | | | | | | | |
| 2024 | | | $ | 24.37 | | | (0.30 | ) | | 6.29 | | | 5.99 | | | — | | | — | | | — | | | — | | | $ | 30.36 | |
| 2023 | | | $ | 21.24 | | | (0.27 | ) | | 3.40 | | | 3.13 | | | — | | | — | | | — | | | — | | | $ | 24.37 | |
| 2022 | | | $ | 51.86 | | | (0.34 | ) | | (12.40 | ) | | (12.74 | ) | | — | | | (17.88 | ) | | — | | | (17.88 | ) | | $ | 21.24 | |
| 2021 | | | $ | 48.30 | | | (0.55 | ) | | 7.33 | | | 6.78 | | | — | | | (3.22 | ) | | — | | | (3.22 | ) | | $ | 51.86 | |
| 2020 | | | $ | 39.49 | | | (0.32 | ) | | 12.75 | | | 12.43 | | | — | | | (3.62 | ) | | — | | | (3.62 | ) | | $ | 48.30 | |
| | | | | | | | | | | | | | | | | | | | | | | | | | | | | | | |
| CLASS R5 SHARES | | | | | | | | | | | | | | | |
| 2024 | | | $ | 27.99 | | | (0.21 | ) | | 7.24 | | | 7.03 | | | — | | | — | | | — | | | — | | | $ | 35.02 | |
| 2023 | | | $ | 24.30 | | | (0.20 | ) | | 3.89 | | | 3.69 | | | — | | | — | | | — | | | — | | | $ | 27.99 | |
| 2022 | | | $ | 56.68 | | | (0.26 | ) | | (14.24 | ) | | (14.50 | ) | | — | | | (17.88 | ) | | — | | | (17.88 | ) | | $ | 24.30 | |
| 2021 | | | $ | 52.30 | | | (0.38 | ) | | 7.98 | | | 7.60 | | | — | | | (3.22 | ) | | — | | | (3.22 | ) | | $ | 56.68 | |
| 2020 | | | $ | 42.31 | | | (0.16 | ) | | 13.77 | | | 13.61 | | | — | | | (3.62 | ) | | — | | | (3.62 | ) | | $ | 52.30 | |
| (a) | Not annualized for periods less than one year. |
| (b) | Sales loads are not reflected in computing total return. |
| (c) | The Fund modified its strategy in December 2020 and due to the change, the Fund experienced a higher portfolio turnover from higher purchases and sales. |
| + | Based on weighted average shares outstanding. |
See notes to financial statements.
98 | Annual Financial Statements
Financial Highlights, Continued
Small/Mid Cap Growth Fund
| | | RATIOS TO AVERAGE NET ASSETS | | SUPPLEMENTAL DATA |
| UNLESS OTHERWISE | | | | | | | | | | | | NET |
| NOTED, PERIODS ARE | | | | EXPENSES, AFTER | | EXPENSES, | | | | PORTFOLIO | | ASSETS |
| FISCAL YEARS ENDED | | NET INVESTMENT | | EXPENSE | | BEFORE EXPENSE | | TOTAL | | TURNOVER | | AT END OF YEAR |
| SEPTEMBER 30, | | INCOME (LOSS) (%) | | REDUCTIONS (%) | | REDUCTIONS (%) | | RETURN (%)(a) | | RATE (%)(a) | | (THOUSANDS) |
| | | | | | | | | | | | | | | | | | | | |
| CLASS A SHARES(b) | | | | |
| 2024 | | (1.16 | ) | | 1.42 | | | 1.42 | | | 24.51 | | | 32.58 | | | $ | 140,412 | |
| 2023 | | (1.20 | ) | | 1.42 | | | 1.42 | | | 14.69 | | | 45.46 | | | $ | 132,659 | |
| 2022 | | (1.20 | ) | | 1.33 | | | 1.40 | | | (38.84 | ) | | 57.56 | | | $ | 147,493 | |
| 2021 | | (0.99 | ) | | 1.16 | | | 1.31 | | | 14.69 | | | 161.43 | (c) | | $ | 340,545 | |
| 2020 | | (0.72 | ) | | 1.33 | | | 1.33 | | | 34.37 | | | 43.82 | | | $ | 326,035 | |
| | | | | | | | | | | | | | | | | | | | |
| CLASS C SHARES | | | | |
| 2024 | | (2.08 | ) | | 2.34 | | | 3.12 | | | 23.35 | | | 32.58 | | | $ | 2,669 | |
| 2023 | | (2.12 | ) | | 2.34 | | | 2.72 | | | 13.66 | | | 45.46 | | | $ | 3,743 | |
| 2022 | | (2.09 | ) | | 2.21 | | | 2.40 | | | (39.39 | ) | | 57.56 | | | $ | 5,596 | |
| 2021 | | (1.76 | ) | | 1.94 | | | 2.09 | | | 13.80 | | | 161.43 | (c) | | $ | 23,433 | |
| 2020 | | (1.47 | ) | | 2.09 | | | 2.09 | | | 33.38 | | | 43.82 | | | $ | 36,917 | |
| | | | | | | | | | | | | | | | | | | | |
| CLASS I SHARES | | | | |
| 2024 | | (0.69 | ) | | 0.95 | | | 1.08 | | | 25.11 | | | 32.58 | | | $ | 107,770 | |
| 2023 | | (0.73 | ) | | 0.95 | | | 1.09 | | | 15.20 | | | 45.46 | | | $ | 110,878 | |
| 2022 | | (0.76 | ) | | 0.90 | | | 1.10 | | | (38.54 | ) | | 57.56 | | | $ | 113,478 | |
| 2021 | | (0.67 | ) | | 0.84 | | | 1.04 | | | 15.04 | | | 161.43 | (c) | | $ | 274,357 | |
| 2020 | | (0.37 | ) | | 0.99 | | | 1.06 | | | 34.84 | | | 43.82 | | | $ | 277,991 | |
| | | | | | | | | | | | | | | | | | | | |
| CLASS R3 SHARES | | | | |
| 2024 | | (1.19 | ) | | 1.46 | | | 1.88 | | | 24.47 | | | 32.58 | | | $ | 15,030 | |
| 2023 | | (1.24 | ) | | 1.46 | | | 1.93 | | | 14.60 | | | 45.46 | | | $ | 13,868 | |
| 2022 | | (1.27 | ) | | 1.41 | | | 1.92 | | | (38.84 | ) | | 57.56 | | | $ | 14,115 | |
| 2021 | | (1.17 | ) | | 1.35 | | | 1.79 | | | 14.45 | | | 161.43 | (c) | | $ | 26,881 | |
| 2020 | | (0.88 | ) | | 1.50 | | | 1.71 | | | 34.17 | | | 43.82 | | | $ | 33,505 | |
| | | | | | | | | | | | | | | | | | | | |
| CLASS R4 SHARES | | | | |
| 2024 | | (1.10 | ) | | 1.36 | | | 3.49 | | | 24.58 | | | 32.58 | | | $ | 894 | |
| 2023 | | (1.14 | ) | | 1.36 | | | 3.29 | | | 14.74 | | | 45.46 | | | $ | 861 | |
| 2022 | | (1.18 | ) | | 1.31 | | | 2.97 | | | (38.79 | ) | | 57.56 | | | $ | 1,109 | |
| 2021 | | (1.07 | ) | | 1.25 | | | 2.17 | | | 14.56 | | | 161.43 | (c) | | $ | 2,076 | |
| 2020 | | (0.78 | ) | | 1.40 | | | 2.00 | | | 34.28 | | | 43.82 | | | $ | 2,771 | |
| | | | | | | | | | | | | | | | | | | | |
| CLASS R5 SHARES | | | | |
| 2024 | | (0.68 | ) | | 0.95 | | | 1.34 | | | 25.12 | | | 32.58 | | | $ | 8,837 | |
| 2023 | | (0.73 | ) | | 0.95 | | | 1.55 | | | 15.19 | | | 45.46 | | | $ | 7,852 | |
| 2022 | | (0.77 | ) | | 0.90 | | | 1.52 | | | (38.53 | ) | | 57.56 | | | $ | 9,235 | |
| 2021 | | (0.67 | ) | | 0.84 | | | 1.31 | | | 15.04 | | | 161.43 | (c) | | $ | 22,945 | |
| 2020 | | (0.37 | ) | | 0.99 | | | 1.26 | | | 34.83 | | | 43.82 | | | $ | 22,691 | |
Annual Financial Statements | 99
Financial Highlights
Income Builder Fund
| | | | PER SHARE PERFORMANCE (FOR A SHARE OUTSTANDING THROUGHOUT THE YEAR) |
| UNLESS OTHERWISE | | | NET ASSET | | NET | | NET REALIZED & | | | | DIVIDENDS | | DIVIDENDS | | DIVIDENDS | | | | NET ASSET |
| NOTED, PERIODS ARE | | | VALUE, | | INVESTMENT | | UNREALIZED | | TOTAL FROM | | FROM NET | | FROM NET | | FROM | | | | VALUE, |
| FISCAL YEARS ENDED | | | BEGINNING | | INCOME | | GAIN (LOSS) ON | | INVESTMENT | | INVESTMENT | | REALIZED | | RETURN OF | | TOTAL | | END OF |
| SEPTEMBER 30, | | | OF PERIOD | | (LOSS)+ | | INVESTMENTS | | OPERATIONS | | INCOME | | GAINS | | CAPITAL | | DIVIDENDS | | PERIOD |
| | | | | | | | | | | | | | | | | | | | | | | | | | | | | | | |
| CLASS A SHARES(d) | | | | | | | | | | | | | | | |
| 2024 | | | $ | 22.33 | | | 1.04 | | | 4.42 | | | 5.46 | | | (1.12 | ) | | — | | | — | | | (1.12 | ) | | $ | 26.67 | |
| 2023 | | | $ | 19.22 | | | 1.11 | | | 3.14 | | | 4.25 | | | (1.14 | ) | | — | | | — | | | (1.14 | ) | | $ | 22.33 | |
| 2022 | | | $ | 22.96 | | | 1.18 | | | (3.75 | ) | | (2.57 | ) | | (1.17 | ) | | — | | | — | | | (1.17 | ) | | $ | 19.22 | |
| 2021 | | | $ | 18.70 | | | 1.19 | | | 4.19 | | | 5.38 | | | (1.12 | ) | | — | | | — | | | (1.12 | ) | | $ | 22.96 | |
| 2020 | | | $ | 21.72 | | | 0.86 | | | (2.98 | ) | | (2.12 | ) | | (0.90 | ) | | — | | | — | | | (0.90 | ) | | $ | 18.70 | |
| | | | | | | | | | | | | | | | | | | | | | | | | | | | | | | |
| CLASS C SHARES | | | | | | | | | | | | | | | |
| 2024 | | | $ | 22.30 | | | 0.85 | | | 4.41 | | | 5.26 | | | (0.94 | ) | | — | | | — | | | (0.94 | ) | | $ | 26.62 | |
| 2023 | | | $ | 19.19 | | | 0.94 | | | 3.15 | | | 4.09 | | | (0.98 | ) | | — | | | — | | | (0.98 | ) | | $ | 22.30 | |
| 2022 | | | $ | 22.93 | | | 0.98 | | | (3.72 | ) | | (2.74 | ) | | (1.00 | ) | | — | | | — | | | (1.00 | ) | | $ | 19.19 | |
| 2021 | | | $ | 18.68 | | | 1.00 | | | 4.19 | | | 5.19 | | | (0.94 | ) | | — | | | — | | | (0.94 | ) | | $ | 22.93 | |
| 2020 | | | $ | 21.69 | | | 0.69 | | | (2.95 | ) | | (2.26 | ) | | (0.75 | ) | | — | | | — | | | (0.75 | ) | | $ | 18.68 | |
| | | | | | | | | | | | | | | | | | | | | | | | | | | | | | | |
| CLASS I SHARES | | | | | | | | | | | | | | | |
| 2024 | | | $ | 22.50 | | | 1.11 | | | 4.45 | | | 5.56 | | | (1.19 | ) | | — | | | — | | | (1.19 | ) | | $ | 26.87 | |
| 2023 | | | $ | 19.36 | | | 1.19 | | | 3.15 | | | 4.34 | | | (1.20 | ) | | — | | | — | | | (1.20 | ) | | $ | 22.50 | |
| 2022 | | | $ | 23.13 | | | 1.25 | | | (3.78 | ) | | (2.53 | ) | | (1.24 | ) | | — | | | — | | | (1.24 | ) | | $ | 19.36 | |
| 2021 | | | $ | 18.84 | | | 1.25 | | | 4.22 | | | 5.47 | | | (1.18 | ) | | — | | | — | | | (1.18 | ) | | $ | 23.13 | |
| 2020 | | | $ | 21.88 | | | 0.89 | | | (2.98 | ) | | (2.09 | ) | | (0.95 | ) | | — | | | — | | | (0.95 | ) | | $ | 18.84 | |
| | | | | | | | | | | | | | | | | | | | | | | | | | | | | | | |
| CLASS R3 SHARES | | | | | | | | | | | | | | | |
| 2024 | | | $ | 22.32 | | | 0.95 | | | 4.41 | | | 5.36 | | | (1.03 | ) | | — | | | — | | | (1.03 | ) | | $ | 26.65 | |
| 2023 | | | $ | 19.21 | | | 1.02 | | | 3.15 | | | 4.17 | | | (1.06 | ) | | — | | | — | | | (1.06 | ) | | $ | 22.32 | |
| 2022 | | | $ | 22.95 | | | 1.09 | | | (3.74 | ) | | (2.65 | ) | | (1.09 | ) | | — | | | — | | | (1.09 | ) | | $ | 19.21 | |
| 2021 | | | $ | 18.70 | | | 1.10 | | | 4.18 | | | 5.28 | | | (1.03 | ) | | — | | | — | | | (1.03 | ) | | $ | 22.95 | |
| 2020 | | | $ | 21.71 | | | 0.78 | | | (2.96 | ) | | (2.18 | ) | | (0.83 | ) | | — | | | — | | | (0.83 | ) | | $ | 18.70 | |
| | | | | | | | | | | | | | | | | | | | | | | | | | | | | | | |
| CLASS R4 SHARES | | | | | | | | | | | | | | | |
| 2024 | | | $ | 22.35 | | | 0.99 | | | 4.41 | | | 5.40 | | | (1.06 | ) | | — | | | — | | | (1.06 | ) | | $ | 26.69 | |
| 2023 | | | $ | 19.24 | | | 1.06 | | | 3.13 | | | 4.19 | | | (1.08 | ) | | — | | | — | | | (1.08 | ) | | $ | 22.35 | |
| 2022 | | | $ | 22.98 | | | 1.12 | | | (3.75 | ) | | (2.63 | ) | | (1.11 | ) | | — | | | — | | | (1.11 | ) | | $ | 19.24 | |
| 2021 | | | $ | 18.72 | | | 1.12 | | | 4.20 | | | 5.32 | | | (1.06 | ) | | — | | | — | | | (1.06 | ) | | $ | 22.98 | |
| 2020 | | | $ | 21.74 | | | 0.77 | | | (2.94 | ) | | (2.17 | ) | | (0.85 | ) | | — | | | — | | | (0.85 | ) | | $ | 18.72 | |
| | | | | | | | | | | | | | | | | | | | | | | | | | | | | | | |
| CLASS R5 SHARES | | | | | | | | | | | | | | | |
| 2024 | | | $ | 22.48 | | | 1.08 | | | 4.45 | | | 5.53 | | | (1.16 | ) | | — | | | — | | | (1.16 | ) | | $ | 26.85 | |
| 2023 | | | $ | 19.35 | | | 1.09 | | | 3.22 | | | 4.31 | | | (1.18 | ) | | — | | | — | | | (1.18 | ) | | $ | 22.48 | |
| 2022 | | | $ | 23.11 | | | 1.21 | | | (3.76 | ) | | (2.55 | ) | | (1.21 | ) | | — | | | — | | | (1.21 | ) | | $ | 19.35 | |
| 2021 | | | $ | 18.83 | | | 1.22 | | | 4.21 | | | 5.43 | | | (1.15 | ) | | — | | | — | | | (1.15 | ) | | $ | 23.11 | |
| 2020 | | | $ | 21.86 | | | 0.90 | | | (3.00 | ) | | (2.10 | ) | | (0.93 | ) | | — | | | — | | | (0.93 | ) | | $ | 18.83 | |
| | | | | | | | | | | | | | | | | | | | | | | | | | | | | | | |
| CLASS R6 SHARES | | | | | | | | | | | | | | | |
| 2024 | | | $ | 22.43 | | | 1.14 | | | 4.43 | | | 5.57 | | | (1.21 | ) | | — | | | — | | | (1.21 | ) | | $ | 26.79 | |
| 2023 | | | $ | 19.30 | | | 1.21 | | | 3.13 | | | 4.34 | | | (1.21 | ) | | — | | | — | | | (1.21 | ) | | $ | 22.43 | |
| 2022 | | | $ | 23.06 | | | 1.27 | | | (3.78 | ) | | (2.51 | ) | | (1.25 | ) | | — | | | — | | | (1.25 | ) | | $ | 19.30 | |
| 2021 | | | $ | 18.78 | | | 1.27 | | | 4.20 | | | 5.47 | | | (1.19 | ) | | — | | | — | | | (1.19 | ) | | $ | 23.06 | |
| 2020 | | | $ | 21.81 | | | 0.92 | | | (2.98 | ) | | (2.06 | ) | | (0.97 | ) | | — | | | — | | | (0.97 | ) | | $ | 18.78 | |
| (a) | Net investment income (loss) includes income from foreign withholding tax claims adjusted for IRS compliance fees and/or tax reclaim collection fees. Without these proceeds, the Net Investment Income (Loss) ratios would have been as follows: |
| | | Class A | | Class C | | Class I | | Class R3 | | Class R4 | | Class R5 | | Class R6 |
| 2024 | | 4.24 | % | | 3.46 | % | | 4.49 | % | | 3.86 | % | | 4.02 | % | | 4.38 | % | | 4.62 | % |
| 2023 | | 5.05 | % | | 4.25 | % | | 5.34 | % | | 4.63 | % | | 4.81 | % | | 4.88 | % | | 5.45 | % |
| 2022 | | 4.71 | % | | 3.83 | % | | 4.96 | % | | 4.32 | % | | 4.44 | % | | 4.79 | % | | 5.14 | % |
| 2021 | | 5.07 | % | | 4.25 | % | | 5.28 | % | | 4.68 | % | | 4.77 | % | | 5.18 | % | | 5.40 | % |
| (b) | Net expenses include tax reclaim collection fees that are excluded from the expense limitation agreement. If such expenses and fees had not occurred, the Expenses After Expense Reductions ratios for 2024 would have been: Class A, 1.13%; Class C, 1.89%; Class I, 0.89%; Class R3, 1.50%; Class R4, 1.40%; Class R5, 0.99%; Class R6, 0.80% and 2021 would have been: Class A, 1.13%; Class C, 1.90%; Class I, 0.89%; Class R3, 1.50%; Class R4, 1.40%; Class R5, 0.99%; Class R6, 0.80%. |
| (c) | Not annualized for periods less than one year. |
| (d) | Sales loads are not reflected in computing total return. |
| (e) | The total return based on the NAV which reflects adjustments in accordance with U.S. GAAP is 28.55%. |
| (f) | The total return based on the NAV which reflects adjustments in accordance with U.S. GAAP is 29.02%. |
| + | Based on weighted average shares outstanding. |
See notes to financial statements.
100 | Annual Financial Statements
Financial Highlights, Continued
Income Builder Fund
| | | RATIOS TO AVERAGE NET ASSETS | | SUPPLEMENTAL DATA |
| UNLESS OTHERWISE | | | | | | | | | | | | NET |
| NOTED, PERIODS ARE | | | | EXPENSES, AFTER | | EXPENSES, | | | | PORTFOLIO | | ASSETS |
| FISCAL YEARS ENDED | | NET INVESTMENT | | EXPENSE | | BEFORE EXPENSE | | TOTAL | | TURNOVER | | AT END OF PERIOD |
| SEPTEMBER 30, | | INCOME (LOSS) (%)(a) | | REDUCTIONS (%)(b) | | REDUCTIONS (%) | | RETURN (%)(c) | | RATE (%)(c) | | (THOUSANDS) |
| | | | | | | | | | | | | | | | | | | | |
| CLASS A SHARES(d) | | | | |
| 2024 | | 4.25 | | | 1.13 | | | 1.13 | | | 24.85 | | | 24.81 | | | $ | 4,501,106 | |
| 2023 | | 5.07 | | | 1.13 | | | 1.13 | | | 22.29 | | | 26.28 | | | $ | 3,888,316 | |
| 2022 | | 5.14 | | | 1.14 | | | 1.14 | | | (11.81 | ) | | 25.31 | | | $ | 3,344,513 | |
| 2021 | | 5.32 | | | 1.26 | | | 1.26 | | | 28.90 | | | 18.99 | | | $ | 3,876,333 | |
| 2020 | | 4.27 | | | 1.15 | | | 1.15 | | | (9.78 | ) | | 47.60 | | | $ | 2,912,063 | |
| | | | | | | | | | | | | | | | | | | | |
| CLASS C SHARES | | | | |
| 2024 | | 3.48 | | | 1.89 | | | 1.89 | | | 23.88 | | | 24.81 | | | $ | 510,173 | |
| 2023 | | 4.26 | | | 1.86 | | | 1.86 | | | 21.46 | | | 26.28 | | | $ | 493,453 | |
| 2022 | | 4.26 | | | 1.89 | | | 1.89 | | | (12.52 | ) | | 25.31 | | | $ | 570,348 | |
| 2021 | | 4.49 | | | 2.03 | | | 2.03 | | | 27.93 | | | 18.99 | | | $ | 922,523 | |
| 2020 | | 3.40 | | | 1.88 | | | 1.88 | | | (10.44 | ) | | 47.60 | | | $ | 1,452,643 | |
| | | | | | | | | | | | | | | | | | | | |
| CLASS I SHARES | | | | |
| 2024 | | 4.50 | | | 0.89 | | | 0.89 | | | 25.12 | | | 24.81 | | | $ | 8,599,135 | |
| 2023 | | 5.35 | | | 0.88 | | | 0.88 | | | 22.61 | | | 26.28 | | | $ | 6,799,321 | |
| 2022 | | 5.40 | | | 0.89 | | | 0.89 | | | (11.61 | ) | | 25.31 | | | $ | 5,213,452 | |
| 2021 | | 5.54 | | | 1.02 | | | 1.02 | | | 29.18 | | | 18.99 | | | $ | 5,858,020 | |
| 2020 | | 4.40 | | | 0.91 | | | 0.91 | | | (9.55 | ) | | 47.60 | | | $ | 5,094,055 | |
| | | | | | | | | | | | | | | | | | | | |
| CLASS R3 SHARES | | | | |
| 2024 | | 3.88 | | | 1.50 | | | 1.69 | | | 24.37 | | | 24.81 | | | $ | 21,650 | |
| 2023 | | 4.65 | | | 1.50 | | | 1.63 | | | 21.87 | | | 26.28 | | | $ | 19,995 | |
| 2022 | | 4.76 | | | 1.50 | | | 1.63 | | | (12.15 | ) | | 25.31 | | | $ | 19,842 | |
| 2021 | | 4.93 | | | 1.63 | | | 1.71 | | | 28.39 | | | 18.99 | | | $ | 24,971 | |
| 2020 | | 3.86 | | | 1.49 | | | 1.49 | | | (10.06 | ) | | 47.60 | | | $ | 24,343 | |
| | | | | | | | | | | | | | | | | | | | |
| CLASS R4 SHARES | | | | |
| 2024 | | 4.04 | | | 1.40 | | | 1.57 | | | 24.51 | | | 24.81 | | | $ | 12,741 | |
| 2023 | | 4.82 | | | 1.40 | | | 1.44 | | | 21.96 | | | 26.28 | | | $ | 10,181 | |
| 2022 | | 4.87 | | | 1.40 | | | 1.50 | | | (12.08 | ) | | 25.31 | | | $ | 10,181 | |
| 2021 | | 5.02 | | | 1.53 | | | 1.59 | | | 28.60 | (e) | | 18.99 | | | $ | 12,751 | |
| 2020 | | 3.79 | | | 1.40 | | | 1.51 | | | (10.01 | ) | | 47.60 | | | $ | 13,044 | |
| | | | | | | | | | | | | | | | | | | | |
| CLASS R5 SHARES | | | | |
| 2024 | | 4.39 | | | 0.99 | | | 1.25 | | | 25.01 | | | 24.81 | | | $ | 19,236 | |
| 2023 | | 4.91 | | | 0.99 | | | 1.16 | | | 22.44 | | | 26.28 | | | $ | 18,323 | |
| 2022 | | 5.21 | | | 0.99 | | | 1.12 | | | (11.71 | ) | | 25.31 | | | $ | 29,318 | |
| 2021 | | 5.43 | | | 1.12 | | | 1.22 | | | 29.07 | (f) | | 18.99 | | | $ | 38,749 | |
| 2020 | | 4.44 | | | 0.99 | | | 1.05 | | | (9.58 | ) | | 47.60 | | | $ | 45,308 | |
| | | | | | | | | | | | | | | | | | | | |
| CLASS R6 SHARES | | | | |
| 2024 | | 4.64 | | | 0.80 | | | 0.83 | | | 25.23 | | | 24.81 | | | $ | 267,983 | |
| 2023 | | 5.47 | | | 0.80 | | | 0.83 | | | 22.70 | | | 26.28 | | | $ | 199,924 | |
| 2022 | | 5.55 | | | 0.80 | | | 0.85 | | | (11.54 | ) | | 25.31 | | | $ | 133,706 | |
| 2021 | | 5.66 | | | 0.93 | | | 0.97 | | | 29.32 | | | 18.99 | | | $ | 113,387 | |
| 2020 | | 4.58 | | | 0.80 | | | 0.84 | | | (9.44 | ) | | 47.60 | | | $ | 86,889 | |
Annual Financial Statements | 101
Financial Highlights
Summit Fund
| | | | PER SHARE PERFORMANCE (FOR A SHARE OUTSTANDING THROUGHOUT THE YEAR) |
| UNLESS OTHERWISE | | | NET ASSET | | NET | | NET REALIZED & | | | | DIVIDENDS | | DIVIDENDS | | DIVIDENDS | | | | NET ASSET |
| NOTED, PERIODS ARE | | | VALUE, | | INVESTMENT | | UNREALIZED | | TOTAL FROM | | FROM NET | | FROM NET | | FROM | | | | VALUE, |
| FISCAL YEARS ENDED | | | BEGINNING | | INCOME | | GAIN (LOSS) ON | | INVESTMENT | | INVESTMENT | | REALIZED | | RETURN OF | | TOTAL | | END OF |
| SEPTEMBER 30, | | | OF YEAR | | (LOSS)+ | | INVESTMENTS | | OPERATIONS | | INCOME | | GAINS | | CAPITAL | | DIVIDENDS | | YEAR |
| | | | | | | | | | | | | | | | | | | | | | | | | | | | | | | |
| CLASS A SHARES(e)(f) | | | | | | | | | | | | | | | |
| 2024 | | | $ | 11.30 | | | 0.27 | | | 2.18 | | | 2.45 | | | (0.29 | ) | | — | | | — | | | (0.29 | ) | | $ | 13.46 | |
| 2023 | | | $ | 10.31 | | | 0.29 | | | 0.99 | | | 1.28 | | | (0.29 | ) | | — | | | — | | | (0.29 | ) | | $ | 11.30 | |
| 2022 | | | $ | 12.06 | | | 0.18 | | | (1.74 | ) | | (1.56 | ) | | (0.19 | ) | | — | | | — | | | (0.19 | ) | | $ | 10.31 | |
| | | | | | | | | | | | | | | | | | | | | | | | | | | | | | | |
| CLASS I SHARES | | | | | | | | | | | | | | | |
| 2024 | | | $ | 11.30 | | | 0.30 | | | 2.19 | | | 2.49 | | | (0.32 | ) | | — | | | — | | | (0.32 | ) | | $ | 13.47 | |
| 2023 | | | $ | 10.31 | | | 0.30 | | | 1.01 | | | 1.31 | | | (0.32 | ) | | — | | | — | | | (0.32 | ) | | $ | 11.30 | |
| 2022 | | | $ | 14.25 | | | 0.28 | | | (1.81 | ) | | (1.53 | ) | | (0.24 | ) | | (2.17 | ) | | — | | | (2.41 | ) | | $ | 10.31 | |
| 2021 | | | $ | 12.18 | | | 0.16 | | | 2.71 | | | 2.87 | | | (0.22 | ) | | (0.58 | ) | | — | | | (0.80 | ) | | $ | 14.25 | |
| 2020 | | | $ | 10.47 | | | 0.09 | | | 1.80 | | | 1.89 | | | (0.13 | ) | | (0.05 | ) | | — | | | (0.18 | ) | | $ | 12.18 | |
| (a) | Net investment income (loss) includes income from foreign withholding tax claims adjusted for IRS compliance fees and/or tax reclaim collection fees. Without these proceeds, the Net Investment Income (Loss) ratios would have been as follows: |
| | | Class A | | Class I |
| 2024 | | 2.17 | % | | 2.42 | % |
| 2023 | | 2.57 | % | | 2.61 | % |
| (b) | The Fund incurs certain expenses and fees in connection with investments in short positions. If such expenses and fees had not occurred, the Expenses After Expense Reductions ratios for 2021 and 2020 Class I would have been 0.99% and 0.99% respectively. |
| (c) | The Fund incurs certain expenses and fees in connection with investments in short positions. If such expenses and fees had not occurred, the Expenses Before Expense Reductions ratios for 2021 and 2020 Class I would have been 1.19% and 1.31% respectively. |
| (d) | Not annualized for periods less than one year. |
| (e) | Effective date of this class of shares was January 26, 2022. |
| (f) | Sales loads are not reflected in computing total return. |
| (h) | Due to the size of net assets and fixed expenses, ratios may appear disproportionate. |
| + | Based on weighted average shares outstanding. |
See notes to financial statements.
102 | Annual Financial Statements
Financial Highlights, Continued
Summit Fund
| | | RATIOS TO AVERAGE NET ASSETS | | SUPPLEMENTAL DATA |
| UNLESS OTHERWISE | | | | | | | | | | | | NET |
| NOTED, PERIODS ARE | | | | EXPENSES, AFTER | | EXPENSES, | | | | PORTFOLIO | | ASSETS |
| FISCAL YEARS ENDED | | NET INVESTMENT | | EXPENSE | | BEFORE EXPENSE | | TOTAL | | TURNOVER | | AT END OF YEAR |
| SEPTEMBER 30, | | INCOME (LOSS) (%)(a) | | REDUCTIONS (%)(b) | | REDUCTIONS (%)(c) | | RETURN (%)(d) | | RATE (%)(d) | | (THOUSANDS) |
| | | | | | | | | | | | | | | | | | | | |
| CLASS A SHARES(e)(f) | | | | |
| 2024 | | 2.19 | | | 0.94 | | | 1.79 | | | 21.88 | | | 66.54 | | | $ | 13,639 | |
| 2023 | | 2.58 | | | 0.94 | | | 2.03 | | | 12.39 | | | 80.17 | | | $ | 5,978 | |
| 2022 | | 2.40 | (g) | | 0.99 | (g) | | 9.32 | (g)(h) | | (13.02 | ) | | 128.69 | | | $ | 507 | |
| | | | | | | | | | | | | | | | | | | | |
| CLASS I SHARES | | | | |
| 2024 | | 2.44 | | | 0.69 | | | 1.15 | | | 22.26 | | | 66.54 | | | $ | 98,708 | |
| 2023 | | 2.63 | | | 0.69 | | | 1.20 | | | 12.66 | | | 80.17 | | | $ | 74,869 | |
| 2022 | | 2.38 | | | 0.88 | | | 1.22 | | | (13.36 | ) | | 128.69 | | | $ | 56,036 | |
| 2021 | | 1.20 | | | 1.01 | | | 1.21 | | | 24.63 | | | 155.26 | | | $ | 62,466 | |
| 2020 | | 0.81 | | | 1.09 | | | 1.41 | | | 18.45 | | | 139.88 | | | $ | 45,886 | |
Annual Financial Statements | 103
Report of Independent Registered Public Accounting Firm
Thornburg Equity Funds
To the Board of Trustees of Thornburg Investment Trust and Shareholders of Thornburg Global Opportunities Fund, Thornburg International Equity Fund, Thornburg Better World International Fund, Thornburg International Growth Fund, Thornburg Developing World Fund, Thornburg Small/Mid Cap Core Fund, Thornburg Small/Mid Cap Growth Fund, Thornburg Investment Income Builder Fund and Thornburg Summit Fund
Opinions on the Financial Statements
We have audited the accompanying statements of assets and liabilities, including the schedules of investments, of Thornburg Global Opportunities Fund, Thornburg International Equity Fund, Thornburg Better World International Fund, Thornburg International Growth Fund, Thornburg Developing World Fund, Thornburg Small/Mid Cap Core Fund, Thornburg Small/Mid Cap Growth Fund, Thornburg Investment Income Builder Fund and Thornburg Summit Fund (nine of the funds constituting Thornburg Investment Trust, hereafter collectively referred to as the "Funds") as of September 30, 2024, the related statements of operations for the year ended September 30, 2024, the statements of changes in net assets for each of the two years in the period ended September 30, 2024, including the related notes, and the financial highlights for each of the periods indicated therein (collectively referred to as the " financial statements"). In our opinion, the financial statements present fairly, in all material respects, the financial position of each of the Funds as of September 30, 2024, the results of each of their operations for the year then ended, the changes in each of their net assets for each of the two years in the period ended September 30, 2024 and each of the financial highlights for each of the periods indicated therein in conformity with accounting principles generally accepted in the United States of America.
Basis for Opinions
These financial statements are the responsibility of the Funds’ management. Our responsibility is to express an opinion on the Funds’ financial statements based on our audits. We are a public accounting firm registered with the Public Company Accounting Oversight Board (United States) (PCAOB) and are required to be independent with respect to the Funds in accordance with the U.S. federal securities laws and the applicable rules and regulations of the Securities and Exchange Commission and the PCAOB.
We conducted our audits of these financial statements in accordance with the standards of the PCAOB. Those standards require that we plan and perform the audit to obtain reasonable assurance about whether the financial statements are free of material misstatement, whether due to error or fraud.
Our audits included performing procedures to assess the risks of material misstatement of the financial statements, whether due to error or fraud, and performing procedures that respond to those risks. Such procedures included examining, on a test basis, evidence regarding the amounts and disclosures in the financial statements. Our audits also included evaluating the accounting principles used and significant estimates made by management, as well as evaluating the overall presentation of the financial statements. Our procedures included confirmation of securities owned as of September 30, 2024 by correspondence with the custodian, transfer agent and brokers; when replies were not received from brokers, we performed other auditing procedures. We believe that our audits provide a reasonable basis for our opinions.
/s/PricewaterhouseCoopers LLP
New York, New York
November 14, 2024
We have served as the auditor of one or more investment companies in Thornburg Investment Trust since 1999.
104 | Annual Financial Statements
Tax Information
September 30, 2024
For the tax year ended September 30, 2024, taxable ordinary income dividends and long term capital gain dividends paid by the Funds for federal income tax purposes are as follows:
| | TAXABLE ORDINARY | LONG TERM CAPITAL GAIN |
| Global Opportunities Fund | $ 27,584,800 | $34,727,747 |
| International Equity Fund | 48,696,097 | 21,081,092 |
| Better World International Fund | 8,565,346 | — |
| International Growth Fund | 4,803,282 | 4,236,679 |
| Developing World Fund | 18,863,056 | — |
| Income Builder Fund | 594,974,096 | 11,073,798 |
| Summit Fund | 2,565,517 | — |
Certain funds may utilize earnings and profits distributed to shareholders on redemption of shares as part of the dividends paid deduction for income tax purposes.
For the tax year ended September 30, 2024, the dividend ratio (or the maximum allowed) paid from tax basis net ordinary income as qualifying for the reduced rate under the Jobs and Growth Tax Relief and Reconciliation Act of 2003 and the ordinary income distributions ratio (or the maximum allowed) paid as qualified for the corporate dividend received deduction are as follows:
| | | QUALIFIED
DIVIDEND INCOME | | DIVIDENDS
RECEIVED DEDUCTION |
| Global Opportunities Fund | | | 99.20 | % | | | 16.92 | % |
| International Equity Fund | | | 100.00 | | | | 1.10 | |
| Better World International Fund | | | 100.00 | | | | 8.62 | |
| International Growth Fund | | | 100.00 | | | | 5.61 | |
| Developing World Fund | | | 51.02 | | | | 1.35 | |
| Income Builder Fund | | | 94.07 | | | | 19.72 | |
| Summit Fund | | | 30.18 | | | | 13.55 | |
For the year ended September 30, 2024, foreign source income and foreign tax credit to be passed through to shareholders are as follows:
| | FOREIGN SOURCE INCOME | | FOREIGN TAX CREDIT |
| Global Opportunities Fund | | $ | 24,282,362 | | | | $ | 2,732,186 | |
| Better World International Fund | | | 10,365,626 | | | | | 659,186 | |
| International Growth Fund | | | 12,734,269 | | | | | 1,975,139 | |
| Developing World Fund | | | 17,814,318 | | | | | 11,556,647 | |
| Income Builder Fund | | | 462,666,615 | | | | | 32,963,809 | |
The information and the distributions reported herein may differ from information and distributions reported to the shareholders for the calendar year ending December 31, 2024. Complete information will be reported in conjunction with your 2024 Form 1099.
Annual Financial Statements | 105
Schedule of Investments
Thornburg Ultra Short Income Fund | September 30, 2024
| | ISSUER-DESCRIPTION | | SHARES/PRINCIPAL AMOUNT | | VALUE | |
| | | | | | | | | | |
| | U.S. TREASURY SECURITIES — 8.3% | | | | | | | | |
| | U.S. Treasury Bills, | | | | | | | | |
| | 5.26% due 2/20/2025 | | | $3,000,000 | | | $ | 2,948,540 | |
| | 5.372% due 10/10/2024 | | | 3,000,000 | | | | 2,996,514 | |
| | 5.376% due 10/31/2024 | | | 3,000,000 | | | | 2,988,304 | |
| | 5.382% due 11/21/2024 | | | 3,000,000 | | | | 2,980,346 | |
| | U.S. Treasury Notes, | | | | | | | | |
| | 0.75% due 4/30/2026 | | | 1,500,000 | | | | 1,431,445 | |
| | 2.875% due 7/31/2025 | | | 2,500,000 | | | | 2,475,879 | |
| | 4.00% due 2/15/2026 | | | 1,000,000 | | | | 1,002,617 | |
| | 4.25% due 5/31/2025 | | | 3,000,000 | | | | 3,000,469 | |
| | 5.00% due 8/31/2025 | | | 2,000,000 | | | | 2,016,562 | |
| | TOTAL U.S. TREASURY SECURITIES (Cost $21,729,156) | | | | | | | 21,840,676 | |
| | | | | | | | | | |
| | U.S. GOVERNMENT AGENCIES — 0.0% | | | | | | | | |
| a,b | Petroleos Mexicanos (Guaranty: Export-Import Bank of the United States), 5.913% (TSFR3M + 0.61%) due 4/15/2025 | | | 7,500 | | | | 7,406 | |
| | Small Business Administration Participation Certificates, | | | | | | | | |
| | Series 2005-20K Class 1, 5.36% due 11/1/2025 | | | 2,016 | | | | 2,020 | |
| | Series 2009-20E Class 1, 4.43% due 5/1/2029 | | | 11,991 | | | | 11,998 | |
| | TOTAL U.S. GOVERNMENT AGENCIES (Cost $21,584) | | | | | | | 21,424 | |
| | | | | | | | | | |
| | MORTGAGE BACKED — 1.4% | | | | | | | | |
| | Arroyo Mortgage Trust, Whole Loan Securities Trust CMO, | | | | | | | | |
| a,c | Series 2019-1 Class A1, 3.805% due 1/25/2049 | | | 15,575 | | | | 15,077 | |
| a,c | Series 2019-3 Class A1, 2.962% due 10/25/2048 | | | 15,824 | | | | 14,951 | |
| c | BRAVO Residential Funding Trust, Whole Loan Securities Trust CMO, Series 2019-1 Class A1C, 3.50% due 3/25/2058 | | | 1,515 | | | | 1,507 | |
| a,c | COLT Mortgage Pass-Through Certificates, Whole Loan Securities Trust CMO, Series 2021-1R Class A1, 0.857% due 5/25/2065 | | | 210,086 | | | | 178,774 | |
| a,c | CSMC Trust, CMBS, Series 2021-BPNY Class A, 8.926% (TSFR1M + 3.83%) due 8/15/2026 | | | 288,679 | | | | 254,870 | |
| a,c | CSMC Trust, Whole Loan Securities Trust CMO, Series 2020-NQM1 Class A1, 2.208% due 5/25/2065 | | | 70,952 | | | | 66,115 | |
| | Federal Home Loan Mtg Corp., Seasoned Credit Risk Transfer, Whole Loan Securities Trust CMO, | | | | | | | | |
| a | Series 2017-3 Class HA, 3.25% due 7/25/2056 | | | 24,463 | | | | 23,272 | |
| a | Series 2018-1 Class HA, 3.00% due 5/25/2057 | | | 17,594 | | | | 16,571 | |
| a | Series 2018-2 Class HA, 3.00% due 11/25/2057 | | | 65,417 | | | | 62,055 | |
| | Federal National Mtg Assoc., UMBS Collateral, Pool MA3557, 4.00% due 1/1/2029 | | | 20,021 | | | | 19,938 | |
| a,c | Flagstar Mortgage Trust, Whole Loan Securities Trust CMO, Series 2017-1 Class 2A2, 3.00% due 3/25/2047 | | | 9,099 | | | | 8,453 | |
| | GCAT Trust, Whole Loan Securities Trust CMO, | | | | | | | | |
| a,c | Series 2021-CM1 Class A, 2.469% due 4/25/2065 | | | 166,730 | | | | 159,098 | |
| a,c | Series 2021-CM2 Class A1, 2.352% due 8/25/2066 | | | 116,431 | | | | 106,882 | |
| a,b,c | Greystone Commercial Real Estate Notes Ltd., CMBS, Series 2021-FL3 Class A, 6.231% (TSFR1M + 1.13%) due 7/15/2039 | | | 94,746 | | | | 94,391 | |
| c | Houston Galleria Mall Trust, CMBS, Series 2015-HGLR Class A1A2, 3.087% due 3/5/2037 | | | 750,000 | | | | 740,537 | |
| a,c | Metlife Securitization Trust, Whole Loan Securities Trust CMO, Series 2019-1A Class A1A, 3.75% due 4/25/2058 | | | 48,530 | | | | 47,693 | |
| a,c | MFA Trust, Whole Loan Securities Trust CMO, Series 2022-CHM1 Class A1, 3.875% due 9/25/2056 | | | 469,512 | | | | 458,860 | |
| a,c | New Residential Mortgage Loan Trust, Whole Loan Securities Trust CMO, Series 2017-5A Class A1, 6.469% (TSFR1M + 1.61%) due 6/25/2057 | | | 11,944 | | | | 12,097 | |
| a,c | Redwood Funding Trust, Whole Loan Securities Trust CMO, Series 2024-1 Class A, 7.745% due 12/25/2054 | | | 629,733 | | | | 632,358 | |
| a,c | Residential Mortgage Loan Trust, Whole Loan Securities Trust CMO, Series 2020-2 Class A1, 1.654% due 5/25/2060 | | | 47,639 | | | | 47,209 | |
| a,c | SG Residential Mortgage Trust, Whole Loan Securities Trust CMO, Series 2019-3 Class A1, 2.703% due 9/25/2059 | | | 199,254 | | | | 197,025 | |
| | Towd Point Mortgage Trust, Whole Loan Securities Trust CMO, | | | | | | | | |
| a,c | Series 2018-2 Class A1, 3.25% due 3/25/2058 | | | 14,702 | | | | 14,398 | |
| a,c | Series 2018-6 Class A1A, 3.75% due 3/25/2058 | | | 495,360 | | | | 489,157 | |
| a,c | Verus Securitization Trust, Whole Loan Securities Trust CMO, Series 2019-INV3 Class A1B, 3.192% due 11/25/2059 | | | 164,660 | | | | 161,941 | |
| | TOTAL MORTGAGE BACKED (Cost $3,921,051) | | | | | | | 3,823,229 | |
| | | | | | | | | | |
| | ASSET BACKED SECURITIES — 30.6% | | | | | | | | |
| | | | | | | | | | |
| | AUTO RECEIVABLES — 17.5% | | | | | | | | |
| c | ACM Auto Trust, Series 2023-2A Class A, 7.97% due 6/20/2030 | | | 1,440,653 | | | | 1,450,059 | |
| c | American Credit Acceptance Receivables Trust, Series 2022-1 Class D, 2.46% due 3/13/2028 | | | 2,603,258 | | | | 2,575,350 | |
| | Arivo Acceptance Auto Loan Receivables Trust, | | | | | | | | |
| c | Series 2022-1A Class A, 3.93% due 5/15/2028 | | | 432,248 | | | | 429,178 | |
| c | Series 2024-1A Class A, 6.46% due 4/17/2028 | | | 1,524,537 | | | | 1,536,953 | |
| 106 | Annual Financial Statements | See notes to financial statements. |
Schedule of Investments, Continued
Thornburg Ultra Short Income Fund | September 30, 2024
| | ISSUER-DESCRIPTION | | SHARES/PRINCIPAL
AMOUNT | | VALUE | |
| | | | | | | | | | |
| c | Avid Automobile Receivables Trust, Series 2021-1 Class D, 1.99% due 4/17/2028 | | $ | 1,826,011 | | | $ | 1,810,601 | |
| c | Avis Budget Rental Car Funding AESOP LLC, Series 2020-1A Class A, 2.33% due 8/20/2026 | | | 1,500,000 | | | | 1,474,996 | |
| | BOF URSA VI Funding Trust I, | | | | | | | | |
| c | Series 2023-CAR1 Class B, 6.029% due 10/27/2031 | | | 145,601 | | | | 146,881 | |
| c | Series 2023-CAR2 Class B, 6.029% due 10/27/2031 | | | 412,219 | | | | 415,035 | |
| c | BOF VII AL Funding Trust I, Series 2023-CAR3 Class A2, 6.291% due 7/26/2032 | | | 713,610 | | | | 725,798 | |
| | CarMax Auto Owner Trust, Series 2021-3 Class A3, 0.55% due 6/15/2026 | | | 1,146,302 | | | | 1,129,981 | |
| c | CarNow Auto Receivables Trust, Series 2021-2A Class D, 2.25% due 3/15/2027 | | | 877,049 | | | | 870,473 | |
| | Carvana Auto Receivables Trust, | | | | | | | | |
| | Series 2021-P1 Class A4, 0.86% due 1/11/2027 | | | 431,162 | | | | 424,713 | |
| c | Series 2022-N1 Class A1, 2.31% due 12/11/2028 | | | 49,458 | | | | 49,370 | |
| c | Series 2023-N1 Class A, 6.36% due 4/12/2027 | | | 197,355 | | | | 197,998 | |
| c | Series 2023-N3 Class A, 6.41% due 9/10/2027 | | | 311,758 | | | | 313,692 | |
| c | Series 2023-N4 Class A, 6.42% due 1/10/2028 | | | 1,086,541 | | | | 1,095,074 | |
| | CPS Auto Receivables Trust, | | | | | | | | |
| c | Series 2020-B Class E, 7.38% due 6/15/2027 | | | 869,994 | | | | 870,573 | |
| c | Series 2021-B Class D, 1.52% due 3/15/2027 | | | 720,675 | | | | 715,654 | |
| | Drive Auto Receivables Trust, Series 2021-3 Class C, 1.47% due 1/15/2027 | | | 767,443 | | | | 763,428 | |
| c | DT Auto Owner Trust, Series 2022-3A Class A, 6.05% due 10/15/2026 | | | 1,110 | | | | 1,110 | |
| | Enterprise Fleet Financing LLC, | | | | | | | | |
| c | Series 2021-3 Class A2, 0.77% due 8/20/2027 | | | 174,276 | | | | 172,949 | |
| c | Series 2022-2 Class A2, 4.65% due 5/21/2029 | | | 524,876 | | | | 524,111 | |
| | Exeter Automobile Receivables Trust, | | | | | | | | |
| | Series 2021-1A Class D, 1.08% due 11/16/2026 | | | 701,453 | | | | 690,867 | |
| | Series 2021-3A Class C, 0.96% due 10/15/2026 | | | 145,734 | | | | 145,103 | |
| | Series 2023-4A Class A3, 6.06% due 9/15/2026 | | | 1,244,146 | | | | 1,245,560 | |
| | FHF Trust, | | | | | | | | |
| c | Series 2021-1A Class A, 1.27% due 3/15/2027 | | | 10,238 | | | | 10,108 | |
| c | Series 2021-2A Class A, 0.83% due 12/15/2026 | | | 19,742 | | | | 19,492 | |
| c | Series 2022-2A Class A, 6.14% due 12/15/2027 | | | 482,858 | | | | 484,928 | |
| c | First Investors Auto Owner Trust, Series 2021-2A Class A, 0.48% due 3/15/2027 | | | 11,324 | | | | 11,301 | |
| | Flagship Credit Auto Trust, | | | | | | | | |
| c | Series 2019-4 Class D, 3.12% due 1/15/2026 | | | 146,386 | | | | 145,767 | |
| c | Series 2020-1 Class D, 2.48% due 3/16/2026 | | | 707,037 | | | | 701,741 | |
| c | Series 2021-4 Class B, 1.49% due 2/15/2027 | | | 1,220,212 | | | | 1,208,076 | |
| c | Series 2022-1 Class A, 1.79% due 10/15/2026 | | | 145,337 | | | | 144,812 | |
| | GLS Auto Receivables Issuer Trust, | | | | | | | | |
| c | Series 2021-1A Class D, 1.68% due 1/15/2027 | | | 493,402 | | | | 486,865 | |
| c | Series 2021-4A Class C, 1.94% due 10/15/2027 | | | 1,072,795 | | | | 1,062,702 | |
| c | Series 2024-3A Class A2, 5.35% due 8/16/2027 | | | 750,000 | | | | 752,341 | |
| c | Hertz Vehicle Financing LLC, Series 2021-1A Class A, 1.21% due 12/26/2025 | | | 1,000,000 | | | | 994,085 | |
| a,c | Kinetic Advantage Master Owner Trust, Series 2024-1A Class A, 7.992% (SOFR30A + 2.65%) due 11/15/2027 | | | 1,350,000 | | | | 1,354,434 | |
| | Lendbuzz Securitization Trust, | | | | | | | | |
| c | Series 2021-1A Class A, 1.46% due 6/15/2026 | | | 49,869 | | | | 49,052 | |
| c | Series 2022-1A Class A, 4.22% due 5/17/2027 | | | 322,192 | | | | 319,553 | |
| c | Series 2024-3A Class A2, 4.97% due 10/15/2029 | | | 1,000,000 | | | | 999,691 | |
| | Lobel Automobile Receivables Trust, | | | | | | | | |
| c | Series 2023-1 Class A, 6.97% due 7/15/2026 | | | 248,729 | | | | 249,174 | |
| c | Series 2023-2 Class A, 7.59% due 4/16/2029 | | | 311,742 | | | | 315,239 | |
| | Octane Receivables Trust, | | | | | | | | |
| c | Series 2022-1A Class A2, 4.18% due 3/20/2028 | | | 790,834 | | | | 788,789 | |
| c | Series 2022-2A Class A, 5.11% due 2/22/2028 | | | 193,711 | | | | 193,721 | |
| c | Series 2023-3A Class A2, 6.44% due 3/20/2029 | | | 1,157,455 | | | | 1,173,410 | |
| c | OneMain Direct Auto Receivables Trust, Series 2021-1A Class A, 0.87% due 7/14/2028 | | | 1,437,823 | | | | 1,409,317 | |
| b,c | Oscar U.S. Funding XV LLC, Series 2023-1A Class A2, 6.07% due 9/10/2026 | | | 663,010 | | | | 665,845 | |
| c | Prestige Auto Receivables Trust, Series 2022-1A Class B, 6.55% due 7/17/2028 | | | 1,340,913 | | | | 1,344,720 | |
| | Research-Driven Pagaya Motor Asset Trust, | | | | | | | | |
| c | Series 2023-3A Class A, 7.13% due 1/26/2032 | | | 956,557 | | | | 967,432 | |
| c | Series 2023-4A Class A, 7.54% due 3/25/2032 | | | 1,225,822 | | | | 1,245,518 | |
| c | Research-Driven Pagaya Motor Trust, Series 2024-1A Class A, 7.09% due 6/25/2032 | | | 223,031 | | | | 225,484 | |
| c | SAFCO Auto Receivables Trust, Series 2024-1A Class A, 6.51% due 3/20/2028 | | | 660,332 | | | | 665,625 | |
| c | Santander Consumer Auto Receivables Trust, Series 2021-AA Class A4, 0.48% due 6/15/2026 | | | 364,408 | | | | 363,183 | |
| See notes to financial statements. | Annual Financial Statements | 107 |
Schedule of Investments, Continued
Thornburg Ultra Short Income Fund | September 30, 2024
| | ISSUER-DESCRIPTION | | SHARES/PRINCIPAL
AMOUNT | | | VALUE | |
| | | | | | | | | | |
| | Santander Drive Auto Receivables Trust, | | | | | | | | |
| | Series 2020-4 Class D, 1.48% due 1/15/2027 | | $ | 152,443 | | | $ | 151,466 | |
| | Series 2022-1 Class C, 2.56% due 4/17/2028 | | | 507,688 | | | | 504,823 | |
| | Series 2024-4 Class A2, 5.41% due 7/15/2027 | | | 1,400,000 | | | | 1,404,874 | |
| | Tricolor Auto Securitization Trust, | | | | | | | | |
| c | Series 2021-1A Class F, 5.08% due 5/15/2028 | | | 969,710 | | | | 968,086 | |
| c | Series 2024-2A Class A, 6.36% due 12/15/2027 | | | 1,210,631 | | | | 1,219,987 | |
| c | United Auto Credit Securitization Trust, Series 2024-1 Class A, 6.17% due 8/10/2026 | | | 731,909 | | | | 733,714 | |
| c | Veros Auto Receivables Trust, Series 2024-1 Class A, 6.28% due 11/15/2027 | | | 759,796 | | | | 765,214 | |
| | Westlake Automobile Receivables Trust, | | | | | | | | |
| c | Series 2021-2A Class C, 0.89% due 7/15/2026 | | | 116,623 | | | | 116,400 | |
| c | Series 2021-2A Class D, 1.23% due 12/15/2026 | | | 1,344,000 | | | | 1,321,957 | |
| c | Series 2021-3A Class C, 1.58% due 1/15/2027 | | | 882,019 | | | | 876,199 | |
| | | | | | | | | 46,190,632 | |
| | CREDIT CARD — 0.5% | | | | | | | | |
| c | Mercury Financial Credit Card Master Trust, Series 2023-1A Class A, 8.04% due 9/20/2027 | | | 700,000 | | | | 703,385 | |
| c | Mission Lane Credit Card Master Trust, Series 2023-B Class A, 7.69% due 11/15/2028 | | | 500,000 | | | | 507,325 | |
| | | | | | | | | 1,210,710 | |
| | OTHER ASSET BACKED — 11.8% | | | | | | | | |
| c | Affirm Asset Securitization Trust, Series 2021-Z2 Class A, 1.17% due 11/16/2026 | | | 65,067 | | | | 64,310 | |
| c | AMCR ABS Trust, Series 2023-1A Class A, 7.66% due 1/21/2031 | | | 488,329 | | | | 490,616 | |
| c | Aqua Finance Trust, Series 2020-AA Class A, 1.90% due 7/17/2046 | | | 409,164 | | | | 372,681 | |
| c | Auxilior Term Funding LLC, Series 2024-1A Class A2, 5.84% due 3/15/2027 | | | 1,500,000 | | | | 1,516,891 | |
| | BHG Securitization Trust, | | | | | | | | |
| c | Series 2021-B Class A, 0.90% due 10/17/2034 | | | 18,480 | | | | 18,300 | |
| c | Series 2022-C Class A, 5.32% due 10/17/2035 | | | 1,372,924 | | | | 1,372,323 | |
| c | CCG Receivables Trust, Series 2022-1 Class A2, 3.91% due 7/16/2029 | | | 246,075 | | | | 244,941 | |
| c | CFMT Issuer Trust, Series 2021-GRN1 Class A, 1.10% due 3/20/2041 | | | 1,080,451 | | | | 1,053,955 | |
| c | ClickLease Equipment Receivables Trust, Series 2024-1 Class A, 6.86% due 2/15/2030 | | | 482,283 | | | | 484,384 | |
| c | Crossroads Asset Trust, Series 2022-A Class A, 6.35% due 4/21/2031 | | | 487,915 | | | | 490,829 | |
| | Dext ABS LLC, | | | | | | | | |
| c | Series 2021-1 Class A, 1.12% due 2/15/2028 | | | 37,671 | | | | 37,610 | |
| c | Series 2023-2 Class A2, 6.56% due 5/15/2034 | | | 447,053 | | | | 452,738 | |
| | Foundation Finance Trust, | | | | | | | | |
| c | Series 2019-1A Class B, 4.22% due 11/15/2034 | | | 2,039,074 | | | | 2,021,227 | |
| c | Series 2020-1A Class A, 3.54% due 7/16/2040 | | | 107,673 | | | | 106,347 | |
| a,c | Gracie Point International Funding LLC, Series 2023-2A Class A, 7.619% (SOFR90A + 2.25%) due 3/1/2027 | | | 398,700 | | | | 399,702 | |
| | GreenSky Home Improvement Trust, | | | | | | | | |
| c | Series 2024-1 Class A1, 5.85% due 6/25/2025 | | | 76,861 | | | | 76,889 | |
| c | Series 2024-1 Class A2, 5.88% due 6/25/2059 | | | 1,000,000 | | | | 1,006,625 | |
| c | Hilton Grand Vacations Trust, Series 2019-AA Class A, 2.34% due 7/25/2033 | | | 26,455 | | | | 25,822 | |
| c | Kubota Credit Owner Trust, Series 2021-1A Class A3, 0.62% due 8/15/2025 | | | 4,305 | | | | 4,297 | |
| | LendingPoint Asset Securitization Trust, | | | | | | | | |
| c | Series 2022-B Class A, 4.77% due 10/15/2029 | | | 21,813 | | | | 21,767 | |
| c | Series 2022-C Class A, 6.56% due 2/15/2030 | | | 33,210 | | | | 33,220 | |
| | LendingPoint Pass-Through Trust, | | | | | | | | |
| c | Series 2022-ST1 Class A, 2.50% due 3/15/2028 | | | 69,072 | | | | 67,248 | |
| c | Series 2022-ST2 Class A, 3.25% due 4/15/2028 | | | 67,629 | | | | 66,826 | |
| c | Series 2022-ST3 Class A, 4.00% due 5/15/2028 | | | 98,708 | | | | 97,882 | |
| | Marlette Funding Trust, | | | | | | | | |
| c | Series 2023-2A Class A, 6.04% due 6/15/2033 | | | 63,554 | | | | 63,562 | |
| c | Series 2024-1A Class A, 5.95% due 7/17/2034 | | | 716,207 | | | | 719,250 | |
| c | MMAF Equipment Finance LLC, Series 2020-BA Class A3, 0.49% due 8/14/2025 | | | 27,267 | | | | 27,086 | |
| c | Mosaic Solar Loan Trust, Series 2018-1A Class C, Zero Coupon due 6/22/2043 | | | 49,809 | | | | 47,500 | |
| c | NetCredit Combined Receivables LLC, Series 2024-A Class A, 7.43% due 10/21/2030 | | | 1,076,216 | | | | 1,083,930 | |
| c | NMEF Funding LLC, Series 2022-A Class A2, 2.58% due 10/16/2028 | | | 54,839 | | | | 54,780 | |
| c | OneMain Financial Issuance Trust, Series 2018-2A Class C, 4.04% due 3/14/2033 | | | 2,650,000 | | | | 2,636,250 | |
| c | Oportun Funding XIV LLC, Series 2021-A Class A, 1.21% due 3/8/2028 | | | 321,726 | | | | 314,644 | |
| | Oportun Issuance Trust, | | | | | | | | |
| c | Series 2021-B Class A, 1.47% due 5/8/2031 | | | 634,245 | | | | 609,712 | |
| c | Series 2021-C Class A, 2.18% due 10/8/2031 | | | 1,500,000 | | | | 1,455,317 | |
| c | Pagaya AI Debt Selection Trust, Series 2021-HG1 Class A, 1.22% due 1/16/2029 | | | 199,101 | | | | 195,889 | |
| 108 | Annual Financial Statements | See notes to financial statements. |
Schedule of Investments, Continued
Thornburg Ultra Short Income Fund | September 30, 2024
| | ISSUER-DESCRIPTION | | SHARES/PRINCIPAL AMOUNT | | VALUE | |
| | | | | | | | | | |
| | Pagaya AI Debt Trust, | | | | | | | | |
| c | Series 2023-1 Class A, 7.556% due 7/15/2030 | | $ | 87,895 | | | $ | 88,113 | |
| a,c | Series 2023-5 Class AB, 7.421% due 4/15/2031 | | | 700,700 | | | | 704,064 | |
| c | Series 2024-1 Class A, 6.66% due 7/15/2031 | | | 383,313 | | | | 388,717 | |
| c | Pawnee Equipment Receivables LLC, Series 2021-1 Class A2, 1.10% due 7/15/2027 | | | 235,368 | | | | 234,547 | |
| | Prosper Marketplace Issuance Trust, | | | | | | | | |
| c | Series 2023-1A Class A, 7.06% due 7/16/2029 | | | 865,239 | | | | 868,156 | |
| c | Series 2024-1A Class A, 6.12% due 8/15/2029 | | | 968,111 | | | | 971,075 | |
| c | Reach ABS Trust, Series 2024-2A Class A, 5.88% due 7/15/2031 | | | 1,111,991 | | | | 1,118,884 | |
| c | Reach Financial LLC, Series 2023-1A Class A, 7.05% due 2/18/2031 | | | 822,043 | | | | 825,309 | |
| c | Republic Finance Issuance Trust, Series 2021-A Class A, 2.30% due 12/22/2031 | | | 1,500,000 | | | | 1,468,272 | |
| a,c | SBA Tower Trust, Series 2014-2A Class C, 3.869% due 10/15/2049 | | | 1,548,000 | | | | 1,546,930 | |
| c | Service Experts Issuer LLC, Series 2021-1A Class A, 2.67% due 2/2/2032 | | | 1,193,473 | | | | 1,150,926 | |
| c | SpringCastle America Funding LLC, Series 2020-AA Class A, 1.97% due 9/25/2037 | | | 216,300 | | | | 202,390 | |
| c | SPS Servicer Advance Receivables Trust, Series 2020-T2 Class A, 1.83% due 11/15/2055 | | | 1,660,000 | | | | 1,603,162 | |
| c | Theorem Funding Trust, Series 2022-3A Class A, 7.60% due 4/15/2029 | | | 216,207 | | | | 217,878 | |
| | Upstart Pass-Through Trust, | | | | | | | | |
| c | Series 2020-ST6 Class A, 3.00% due 1/20/2027 | | | 231,715 | | | | 228,822 | |
| c | Series 2021-ST4 Class A, 2.00% due 7/20/2027 | | | 129,328 | | | | 126,404 | |
| c | Series 2021-ST8 Class A, 1.75% due 10/20/2029 | | | 18,297 | | | | 18,255 | |
| | Upstart Securitization Trust, | | | | | | | | |
| c | Series 2020-3 Class C, 6.25% due 11/20/2030 | | | 118,032 | | | | 118,038 | |
| c | Series 2023-1 Class A, 6.59% due 2/20/2033 | | | 863,950 | | | | 864,774 | |
| c | Series 2023-3 Class A, 6.90% due 10/20/2033 | | | 243,480 | | | | 246,203 | |
| c | Upstart Structured Pass-Through Trust, Series 2022-1A Class A, 3.40% due 4/15/2030 | | | 564,426 | | | | 557,579 | |
| | | | | | | | | 31,283,848 | |
| | STUDENT LOAN — 0.8% | | | | | | | | |
| | Laurel Road Prime Student Loan Trust, | | | | | | | | |
| c | Series 2017-B Class BFX, 3.02% due 8/25/2042 | | | 398,870 | | | | 393,329 | |
| c | Series 2019-A Class A2FX, 2.73% due 10/25/2048 | | | 128,267 | | | | 127,324 | |
| a | National Collegiate Student Loan Trust, Series 2006-4 Class A4, 5.279% (TSFR1M + 0.42%) due 5/25/2032 | | | 155,357 | | | | 150,975 | |
| a,c | Navient Private Education Loan Trust, Series 2018-BA Class A2B, 5.931% (TSFR1M + 0.83%) due 12/15/2059 | | | 23,709 | | | | 23,650 | |
| a,c | Navient Student Loan Trust, Series 2019-BA Class A2B, 6.191% (TSFR1M + 1.09%) due 12/15/2059 | | | 211,617 | | | | 210,848 | |
| | Nelnet Student Loan Trust, | | | | | | | | |
| a,c | Series 2012-2A Class A, 6.195% (SOFR30A + 0.91%) due 12/26/2033 | | | 47,445 | | | | 47,268 | |
| a,c | Series 2015-3A Class A2, 5.995% (SOFR30A + 0.71%) due 2/27/2051 | | | 13,584 | | | | 13,541 | |
| a,c | Series 2021-DA Class AFL, 5.765% (TSFR1M + 0.80%) due 4/20/2062 | | | 108,997 | | | | 106,438 | |
| a,b,c | Prodigy Finance DAC, Series 2021-1A Class A, 6.219% (TSFR1M + 1.36%) due 7/25/2051 | | | 45,616 | | | | 44,723 | |
| | SLM Student Loan Trust, | | | | | | | | |
| a | Series 2013-4 Class A, 5.945% (SOFR30A + 0.66%) due 6/25/2043 | | | 16,481 | | | | 16,146 | |
| a | Series 2013-6 Class A3, 6.045% (SOFR30A + 0.76%) due 6/26/2028 | | | 106,447 | | | | 105,617 | |
| | SMB Private Education Loan Trust, | | | | | | | | |
| a,c | Series 2016-A Class A2B, 6.711% (TSFR1M + 1.61%) due 5/15/2031 | | | 14,804 | | | | 14,809 | |
| a,c | Series 2016-B Class A2B, 6.661% (TSFR1M + 1.56%) due 2/17/2032 | | | 58,678 | | | | 58,747 | |
| a,c | Series 2017-A Class A2B, 6.111% (TSFR1M + 1.01%) due 9/15/2034 | | | 84,479 | | | | 84,399 | |
| a,c | Series 2017-B Class A2B, 5.961% (TSFR1M + 0.86%) due 10/15/2035 | | | 217,409 | | | | 216,492 | |
| a,c | Series 2018-B Class A2B, 5.931% (TSFR1M + 0.83%) due 1/15/2037 | | | 329,280 | | | | 327,150 | |
| a,c | Series 2018-C Class A2B, 5.961% (TSFR1M + 0.86%) due 11/15/2035 | | | 80,676 | | | | 80,178 | |
| a,c | Towd Point Asset Trust, Series 2021-SL1 Class A2, 5.775% (TSFR1M + 0.81%) due 11/20/2061 | | | 86,092 | | | | 85,808 | |
| | | | | | | | | 2,107,442 | |
| | TOTAL ASSET BACKED SECURITIES (Cost $80,494,194) | | | | | | | 80,792,632 | |
| | | | | | | | | | |
| | CORPORATE BONDS — 52.0% | | | | | | | | |
| | | | | | | | | | |
| | AUTOMOBILES & COMPONENTS — 0.8% | | | | | | | | |
| | Automobiles — 0.8% | | | | | | | | |
| | Hyundai Capital America, | | | | | | | | |
| c | 5.45% due 6/24/2026 | | | 500,000 | | | | 508,310 | |
| c | 5.80% due 6/26/2025 | | | 500,000 | | | | 503,610 | |
| c | Mercedes-Benz Finance North America LLC, 5.50% due 11/27/2024 | | | 1,000,000 | | | | 1,000,030 | |
| | | | | | | | | 2,011,950 | |
| See notes to financial statements. | Annual Financial Statements | 109 |
Schedule of Investments, Continued
Thornburg Ultra Short Income Fund | September 30, 2024
| | ISSUER-DESCRIPTION | | SHARES/PRINCIPAL
AMOUNT | | VALUE | |
| | | | | | | | | | |
| | BANKS — 0.7% | | | | | | | | |
| | Banks — 0.7% | | | | | | | | |
| c | National Securities Clearing Corp., 5.15% due 5/30/2025 | | $ | 2,000,000 | | | $ | 2,007,920 | |
| | | | | | | | | 2,007,920 | |
| | CAPITAL GOODS — 2.6% | | | | | | | | |
| | Aerospace & Defense — 0.7% | | | | | | | | |
| | RTX Corp., 3.95% due 8/16/2025 | | | 1,750,000 | | | | 1,740,760 | |
| | Industrial Conglomerates — 0.5% | | | | | | | | |
| | Lennox International, Inc., 1.35% due 8/1/2025 | | | 1,500,000 | | | | 1,457,940 | |
| | Machinery — 1.4% | | | | | | | | |
| c | ITT, Inc., 5.058% due 10/7/2024 | | | 2,500,000 | | | | 2,497,925 | |
| | Regal Rexnord Corp., 6.05% due 2/15/2026 | | | 1,250,000 | | | | 1,271,175 | |
| | | | | | | | | 6,967,800 | |
| | COMMERCIAL & PROFESSIONAL SERVICES — 1.7% | | | | | | | | |
| | Commercial Services & Supplies — 1.7% | | | | | | | | |
| | Equifax, Inc., 2.60% due 12/1/2024 | | | 2,400,000 | | | | 2,387,640 | |
| | Quanta Services, Inc., 0.95% due 10/1/2024 | | | 2,050,000 | | | | 2,050,000 | |
| | | | | | | | | 4,437,640 | |
| | CONSUMER DURABLES & APPAREL — 1.2% | | | | | | | | |
| | Household Durables — 1.2% | | | | | | | | |
| | Harman International Industries, Inc., 4.15% due 5/15/2025 | | | 2,000,000 | | | | 1,988,320 | |
| | Leggett & Platt, Inc., 3.80% due 11/15/2024 | | | 1,250,000 | | | | 1,247,137 | |
| | | | | | | | | 3,235,457 | |
| | CONSUMER SERVICES — 0.6% | | | | | | | | |
| | Hotels, Restaurants & Leisure — 0.6% | | | | | | | | |
| | Warnermedia Holdings, Inc., 6.412% due 3/15/2026 | | | 1,500,000 | | | | 1,500,150 | |
| | | | | | | | | 1,500,150 | |
| | CONSUMER STAPLES DISTRIBUTION & RETAIL — 0.4% | | | | | | | | |
| | Consumer Staples Distribution & Retail — 0.4% | | | | | | | | |
| | Kroger Co., 4.70% due 8/15/2026 | | | 1,000,000 | | | | 1,007,170 | |
| | | | | | | | | 1,007,170 | |
| | ENERGY — 4.8% | | | | | | | | |
| | Gas Utilities — 0.3% | | | | | | | | |
| | Eastern Energy Gas Holdings LLC, 3.60% due 12/15/2024 | | | 1,000,000 | | | | 997,000 | |
| | Oil, Gas & Consumable Fuels — 4.5% | | | | | | | | |
| | Columbia Pipeline Group, Inc., 4.50% due 6/1/2025 | | | 1,500,000 | | | | 1,495,845 | |
| | Energy Transfer LP, 5.75% due 4/1/2025 | | | 1,635,000 | | | | 1,635,425 | |
| c | Florida Gas Transmission Co. LLC, 4.35% due 7/15/2025 | | | 1,859,000 | | | | 1,848,013 | |
| c | Gray Oak Pipeline LLC, 2.60% due 10/15/2025 | | | 821,000 | | | | 800,574 | |
| c | Gulfstream Natural Gas System LLC, 6.19% due 11/1/2025 | | | 750,000 | | | | 760,920 | |
| | Kinder Morgan, Inc., 4.30% due 6/1/2025 | | | 1,455,000 | | | | 1,448,729 | |
| | NuStar Logistics LP, 6.00% due 6/1/2026 | | | 1,000,000 | | | | 1,006,680 | |
| | ONEOK Partners LP, 4.90% due 3/15/2025 | | | 1,600,000 | | | | 1,597,856 | |
| | TC PipeLines LP, 4.375% due 3/13/2025 | | | 1,250,000 | | | | 1,245,000 | |
| | | | | | | | | 12,836,042 | |
| | EQUITY REAL ESTATE INVESTMENT TRUSTS (REITS) — 1.8% | | | | | | | | |
| | Diversified REITs — 1.2% | | | | | | | | |
| | American Tower Corp., 2.40% due 3/15/2025 | | | 1,000,000 | | | | 987,880 | |
| | Crown Castle, Inc., 1.35% due 7/15/2025 | | | 1,218,000 | | | | 1,186,527 | |
| c | SBA Tower Trust, 2.836% due 1/15/2050 | | | 1,000,000 | | | | 992,818 | |
| | Retail REITs — 0.6% | | | | | | | | |
| | Brixmor Operating Partnership LP, 3.85% due 2/1/2025 | | | 1,500,000 | | | | 1,491,780 | |
| | | | | | | | | 4,659,005 | |
| 110 | Annual Financial Statements | See notes to financial statements. |
Schedule of Investments, Continued
Thornburg Ultra Short Income Fund | September 30, 2024
| | ISSUER-DESCRIPTION | | SHARES/PRINCIPAL
AMOUNT | | VALUE | |
| | | | | | | | | | |
| | FINANCIAL SERVICES — 3.2% | | | | | | | | |
| | Capital Markets — 2.4% | | | | | | | | |
| | Ares Capital Corp., 3.25% due 7/15/2025 | | $ | 1,000,000 | | | $ | 984,140 | |
| c | Ares Finance Co. LLC, 4.00% due 10/8/2024 | | | 705,000 | | | | 704,267 | |
| c | Blue Owl Technology Finance Corp., 4.75% due 12/15/2025 | | | 1,250,000 | | | | 1,231,537 | |
| c | GTP Acquisition Partners I LLC, Series 2015-2 Class A, 3.482% due 6/15/2050 | | | 1,500,000 | | | | 1,484,055 | |
| | Sixth Street Specialty Lending, Inc., 3.875% due 11/1/2024 | | | 2,000,000 | | | | 1,995,660 | |
| | Financial Services — 0.8% | | | | | | | | |
| c | Antares Holdings LP, 8.50% due 5/18/2025 | | | 750,000 | | | | 756,353 | |
| a | Citigroup, Inc., 5.833% (SOFR + 0.69%) due 10/30/2024 | | | 1,250,000 | | | | 1,250,112 | |
| | | | | | | | | 8,406,124 | |
| | FOOD, BEVERAGE & TOBACCO — 0.8% | | | | | | | | |
| | Beverages — 0.8% | | | | | | | | |
| | Constellation Brands, Inc., 5.00% due 2/2/2026 | | | 700,000 | | | | 699,727 | |
| | Huntington Ingalls Industries, Inc., 3.844% due 5/1/2025 | | | 1,500,000 | | | | 1,490,115 | |
| | | | | | | | | 2,189,842 | |
| | HEALTH CARE EQUIPMENT & SERVICES — 2.2% | | | | | | | | |
| | Health Care Equipment & Supplies — 1.1% | | | | | | | | |
| a | Baxter International, Inc., 5.436% (SOFRINDX + 0.44%) due 11/29/2024 | | | 1,000,000 | | | | 998,620 | |
| c | Dentsply Sirona, Inc., 5.456% due 10/28/2024 | | | 2,000,000 | | | | 1,991,975 | |
| | Health Care Providers & Services — 1.1% | | | | | | | | |
| c | Blue Cross & Blue Shield of Minnesota, 3.79% due 5/1/2025 | | | 1,420,000 | | | | 1,404,806 | |
| | Humana, Inc., 5.70% due 3/13/2026 | | | 1,500,000 | | | | 1,500,375 | |
| | | | | | | | | 5,895,776 | |
| | INDUSTRIALS — 0.4% | | | | | | | | |
| | Transportation Infrastructure — 0.4% | | | | | | | | |
| c | Penske Truck Leasing Co. LP/PTL Finance Corp., 2.70% due 11/1/2024 | | | 1,000,000 | | | | 997,720 | |
| | | | | | | | | 997,720 | |
| | INSURANCE — 5.2% | | | | | | | | |
| | Insurance — 5.2% | | | | | | | | |
| c | Equitable Financial Life Global Funding, 1.30% due 7/12/2026 | | | 1,000,000 | | | | 951,070 | |
| c | F&G Global Funding, 5.15% due 7/7/2025 | | | 1,000,000 | | | | 1,000,630 | |
| | First American Financial Corp., 4.60% due 11/15/2024 | | | 1,300,000 | | | | 1,297,296 | |
| c | GA Global Funding Trust, 3.85% due 4/11/2025 | | | 1,750,000 | | | | 1,738,817 | |
| | Lincoln National Corp., 3.35% due 3/9/2025 | | | 1,250,000 | | | | 1,241,050 | |
| a,c | Nationwide Mutual Insurance Co., 7.498% (SOFR + 2.18%) due 12/15/2024 | | | 2,000,000 | | | | 2,004,420 | |
| a,c | Pacific Life Global Funding II, 5.669% (SOFRINDX + 0.80%) due 3/30/2025 | | | 235,000 | | | | 235,449 | |
| c | Prudential Insurance Co. of America, 8.30% due 7/1/2025 | | | 1,000,000 | | | | 1,024,020 | |
| | Reliance Standard Life Global Funding II, | | | | | | | | |
| c | 2.50% due 10/30/2024 | | | 1,000,000 | | | | 997,720 | |
| c | 2.75% due 5/7/2025 | | | 500,000 | | | | 492,705 | |
| c | 5.243% due 2/2/2026 | | | 850,000 | | | | 854,165 | |
| | RenaissanceRe Finance, Inc., 3.70% due 4/1/2025 | | | 1,965,000 | | | | 1,952,562 | |
| | | | | | | | | 13,789,904 | |
| | MATERIALS — 3.5% | | | | | | | | |
| | Chemicals — 0.4% | | | | | | | | |
| c | International Flavors & Fragrances, Inc., 1.23% due 10/1/2025 | | | 1,000,000 | | | | 965,110 | |
| | Containers & Packaging — 3.1% | | | | | | | | |
| | Amcor Flexibles North America, Inc., 4.00% due 5/17/2025 | | | 1,250,000 | | | | 1,241,463 | |
| c | Berry Global, Inc., 4.875% due 7/15/2026 | | | 1,520,000 | | | | 1,515,349 | |
| c | Silgan Holdings, Inc., 1.40% due 4/1/2026 | | | 1,190,000 | | | | 1,129,155 | |
| | Sonoco Products Co., | | | | | | | | |
| | 1.80% due 2/1/2025 | | | 1,000,000 | | | | 988,990 | |
| | 4.45% due 9/1/2026 | | | 1,000,000 | | | | 1,000,290 | |
| | WRKCo, Inc., 3.75% due 3/15/2025 | | | 2,400,000 | | | | 2,383,656 | |
| | | | | | | | | 9,224,013 | |
| See notes to financial statements. | Annual Financial Statements | 111 |
Schedule of Investments, Continued
Thornburg Ultra Short Income Fund | September 30, 2024
| | ISSUER-DESCRIPTION | | SHARES/PRINCIPAL
AMOUNT | | VALUE | |
| | | | | | | | | | |
| | MEDIA & ENTERTAINMENT — 0.9% | | | | | | | | |
| | Media — 0.9% | | | | | | | | |
| | Charter Communications Operating LLC/Charter Communications Operating Capital, 4.908% due 7/23/2025 | | $ | 1,750,000 | | | $ | 1,747,463 | |
| c | Cox Communications, Inc., 3.85% due 2/1/2025 | | | 650,000 | | | | 646,308 | |
| | | | | | | | | 2,393,771 | |
| | PHARMACEUTICALS, BIOTECHNOLOGY & LIFE SCIENCES — 1.5% | | | | | | | | |
| | Biotechnology — 1.1% | | | | | | | | |
| | Amgen, Inc., 5.507% due 3/2/2026 | | | 250,000 | | | | 250,007 | |
| | Illumina, Inc., 4.65% due 9/9/2026 | | | 850,000 | | | | 855,287 | |
| b | Royalty Pharma plc, 1.20% due 9/2/2025 | | | 2,000,000 | | | | 1,937,440 | |
| | Pharmaceuticals — 0.4% | | | | | | | | |
| | Cigna Group, 5.685% due 3/15/2026 | | | 500,000 | | | | 500,005 | |
| c | PRA Health Sciences, Inc., 2.875% due 7/15/2026 | | | 500,000 | | | | 484,570 | |
| | | | | | | | | 4,027,309 | |
| | SEMICONDUCTORS & SEMICONDUCTOR EQUIPMENT — 2.2% | | | | | | | | |
| | Semiconductors & Semiconductor Equipment — 2.2% | | | | | | | | |
| | Intel Corp., 3.70% due 7/29/2025 | | | 1,500,000 | | | | 1,486,470 | |
| | Qorvo, Inc., 1.75% due 12/15/2024 | | | 2,250,000 | | | | 2,231,977 | |
| b,c | Renesas Electronics Corp., 1.543% due 11/26/2024 | | | 2,000,000 | | | | 1,988,960 | |
| | | | | | | | | 5,707,407 | |
| | SOFTWARE & SERVICES — 3.1% | | | | | | | | |
| | Information Technology Services — 1.8% | | | | | | | | |
| b | Genpact Luxembourg SARL, 3.375% due 12/1/2024 | | | 1,250,000 | | | | 1,244,437 | |
| | Global Payments, Inc., 1.50% due 11/15/2024 | | | 1,815,000 | | | | 1,805,943 | |
| | Leidos, Inc., 3.625% due 5/15/2025 | | | 1,611,000 | | | | 1,597,162 | |
| | Software — 1.3% | | | | | | | | |
| c | Fair Isaac Corp., 5.25% due 5/15/2026 | | | 1,000,000 | | | | 999,840 | |
| | Oracle Corp., | | | | | | | | |
| | 2.50% due 4/1/2025 | | | 1,082,000 | | | | 1,069,146 | |
| | 2.95% due 5/15/2025 | | | 1,500,000 | | | | 1,483,230 | |
| | | | | | | | | 8,199,758 | |
| | TECHNOLOGY HARDWARE & EQUIPMENT — 1.9% | | | | | | | | |
| | Electronic Equipment, Instruments & Components — 0.5% | | | | | | | | |
| | Trimble, Inc., 4.75% due 12/1/2024 | | | 1,250,000 | | | | 1,246,700 | |
| | Technology Hardware, Storage & Peripherals — 1.4% | | | | | | | | |
| | Hewlett Packard Enterprise Co., | | | | | | | | |
| | 5.90% due 10/1/2024 | | | 1,250,000 | | | | 1,250,000 | |
| | 6.102% due 4/1/2026 | | | 500,000 | | | | 500,000 | |
| | HP, Inc., 2.20% due 6/17/2025 | | | 2,000,000 | | | | 1,963,260 | |
| | | | | | | | | 4,959,960 | |
| | TELECOMMUNICATION SERVICES — 2.1% | | | | | | | | |
| | Diversified Telecommunication Services — 1.5% | | | | | | | | |
| | AT&T, Inc., 5.539% due 2/20/2026 | | | 1,500,000 | | | | 1,499,880 | |
| b,c | Bell Telephone Co. of Canada or Bell Canada, 5.063% due 10/28/2024 | | | 2,500,000 | | | | 2,490,681 | |
| | Wireless Telecommunication Services — 0.6% | | | | | | | | |
| | Sprint LLC, 7.625% due 2/15/2025 | | | 1,500,000 | | | | 1,506,240 | |
| | | | | | | | | 5,496,801 | |
| | TRANSPORTATION — 0.4% | | | | | | | | |
| | Ground Transportation — 0.4% | | | | | | | | |
| | GATX Corp., 3.25% due 3/30/2025 | | | 1,000,000 | | | | 989,500 | |
| | | | | | | | | 989,500 | |
| | UTILITIES — 10.0% | | | | | | | | |
| | Electric Utilities — 10.0% | | | | | | | | |
| c | AES Corp., 3.30% due 7/15/2025 | | | 750,000 | | | | 739,208 | |
| | Allegion U.S. Holding Co., Inc., 3.20% due 10/1/2024 | | | 1,463,000 | | | | 1,463,000 | |
| | American Electric Power Co., Inc., Series N, 1.00% due 11/1/2025 | | | 1,742,000 | | | | 1,676,954 | |
| 112 | Annual Financial Statements | See notes to financial statements. |
Schedule of Investments, Continued
Thornburg Ultra Short Income Fund | September 30, 2024
| | ISSUER-DESCRIPTION | | SHARES/PRINCIPAL
AMOUNT | | VALUE | |
| | | | | | | | | | |
| | Avangrid, Inc., | | | | | | | | |
| | 3.15% due 12/1/2024 | | $ | 2,000,000 | | | $ | 1,991,400 | |
| | 3.20% due 4/15/2025 | | | 515,000 | | | | 509,778 | |
| c | Dominion Energy, Inc., 4.993% due 10/1/2024 | | | 2,500,000 | | | | 2,500,000 | |
| a | DTE Energy Co., 4.22% due 11/1/2024 | | | 1,907,000 | | | | 1,904,769 | |
| b,c | Electricite de France SA, 3.625% due 10/13/2025 | | | 1,479,000 | | | | 1,465,423 | |
| | Enel Finance International NV, | | | | | | | | |
| b,c | 4.50% due 6/15/2025 | | | 1,000,000 | | | | 995,000 | |
| b,c | 6.80% due 10/14/2025 | | | 1,000,000 | | | | 1,023,090 | |
| c | Evergy Kansas Central, Inc., 4.997% due 10/8/2024 | | | 2,500,000 | | | | 2,497,608 | |
| | Eversource Energy, Series Q, 0.80% due 8/15/2025 | | | 1,750,000 | | | | 1,692,145 | |
| | Exelon Corp., 3.95% due 6/15/2025 | | | 1,150,000 | | | | 1,143,917 | |
| c | Niagara Mohawk Power Corp., 3.508% due 10/1/2024 | | | 1,750,000 | | | | 1,750,000 | |
| a | Pacific Gas & Electric Co., 5.908% (SOFRINDX + 0.95%) due 9/4/2025 | | | 1,325,000 | | | | 1,326,934 | |
| | Puget Energy, Inc., 3.65% due 5/15/2025 | | | 1,650,000 | | | | 1,632,774 | |
| c | Vistra Operations Co. LLC, 5.125% due 5/13/2025 | | | 1,000,000 | | | | 996,310 | |
| | Xcel Energy, Inc., 3.30% due 6/1/2025 | | | 1,250,000 | | | | 1,236,700 | |
| | | | | | | | | 26,545,010 | |
| | TOTAL CORPORATE BONDS (Cost $137,226,254) | | | | | | | 137,486,029 | |
| | | | | | | | | | |
| | SHORT-TERM INVESTMENTS — 9.2% | | | | | | | | |
| | | | | | | | | | |
| d | Thornburg Capital Management Fund | | | 2,414,490 | | | | 24,144,899 | |
| | TOTAL SHORT-TERM INVESTMENTS (Cost $24,144,899) | | | | | | | 24,144,899 | |
| | | | | | | | | | |
| | TOTAL INVESTMENTS — 101.5% (Cost $267,537,138) | | | | | | $ | 268,108,889 | |
| | | | | | | | | | |
| | LIABILITIES NET OF OTHER ASSETS — (1.5)% | | | | | | | (3,898,657 | ) |
| | | | | | | | | | |
| | NET ASSETS — 100.0% | | | | | | $ | 264,210,232 | |
Footnote Legend
| a | Variable, floating, step, or fixed to floating rate securities are securities for which interest rate changes are based on changes in a designated base rate or on a predetermined schedule. The rates shown are those in effect on September 30, 2024. |
| b | Yankee bond denominated in U.S. dollars and is issued in the U.S. by foreign banks and corporations. |
| c | Securities exempt from registration under Rule 144A of the Securities Act of 1933, as amended. These securities are restricted but liquid and may only be resold in the ordinary course of business in transactions exempt from registration, normally to qualified institutional buyers. As of September 30, 2024, the aggregate value of these securities in the Fund’s portfolio was $128,736,913, representing 48.73% of the Fund’s net assets. |
| d | Investment in Affiliates. |
| Portfolio Abbreviations | | |
| To simplify the listings of securities, abbreviations are used per the table below: | | |
| ABS | Asset Backed Securities | SOFR30A | Secured Overnight Financing Rate 30-Day Average |
| CMBS | Commercial Mortgage-Backed Securities | SOFR90A | Secured Overnight Financing Rate 90-Day Average |
| CMO | Collateralized Mortgage Obligation | SOFRINDX | Secured Overnight Financing Rate Index |
| DAC | Designated Activity Company | TSFR1M | Term SOFR 1 Month |
| Mtg | Mortgage | TSFR3M | Term SOFR 3 Month |
| SOFR | Secured Overnight Financing Rate | UMBS | Uniform Mortgage Backed Securities |
| See notes to financial statements. | Annual Financial Statements | 113 |
Schedule of Investments
Thornburg Limited Term U.S. Government Fund | September 30, 2024
| | ISSUER-DESCRIPTION | | PRINCIPAL
AMOUNT | | | VALUE | |
| | | | | | | | | | |
| | U.S. TREASURY SECURITIES — 20.0% | | | | | | | | |
| | U.S. Treasury Inflation-Indexed Bonds, | | | | | | | | |
| | 1.75% due 1/15/2028 | | $ | 2,495,244 | | | $ | 2,515,810 | |
| | 2.375% due 1/15/2025 | | | 403,804 | | | | 401,138 | |
| | U.S. Treasury Inflation-Indexed Notes, 0.125% due 4/15/2027 - 1/15/2031 | | | 13,792,957 | | | | 12,836,860 | |
| | U.S. Treasury Notes, | | | | | | | | |
| | 1.875% due 2/15/2032 | | | 2,050,000 | | | | 1,810,406 | |
| | 3.375% due 5/15/2033 | | | 2,433,000 | | | | 2,366,092 | |
| | 3.50% due 2/15/2033 | | | 1,700,000 | | | | 1,670,781 | |
| | 4.00% due 2/28/2030 - 2/15/2034 | | | 3,330,000 | | | | 3,392,067 | |
| | 4.375% due 5/15/2034 | | | 1,934,000 | | | | 2,025,865 | |
| | 4.50% due 11/15/2033 | | | 850,000 | | | | 897,813 | |
| | TOTAL U.S. TREASURY SECURITIES (Cost $26,994,058) | | | | | | | 27,916,832 | |
| | | | | | | | | | |
| | U.S. GOVERNMENT AGENCIES — 6.6% | | | | | | | | |
| a | Durrah MSN 35603 (Guaranty: Export-Import Bank of the United States), 1.684% due 1/22/2025 | | | 65,760 | | | | 65,369 | |
| | HNA Group LLC (Guaranty: Export-Import Bank of the United States), 2.291% due 6/30/2027 | | | 775,060 | | | | 747,500 | |
| | Petroleos Mexicanos (Guaranty: Export-Import Bank of the United States), | | | | | | | | |
| a | 2.46% due 12/15/2025 | | | 375,000 | | | | 356,647 | |
| a,b | 5.913% (TSFR3M + 0.61%) due 4/15/2025 | | | 262,500 | | | | 259,206 | |
| | Reliance Industries Ltd. (Guaranty: Export-Import Bank of the United States), | | | | | | | | |
| a | 2.06% due 1/15/2026 | | | 525,000 | | | | 513,119 | |
| a | 2.512% due 1/15/2026 | | | 791,250 | | | | 775,330 | |
| | Small Business Administration Participation Certificates, | | | | | | | | |
| | Series 2005-20H Class 1, 5.11% due 8/1/2025 | | | 7,822 | | | | 7,831 | |
| | Series 2007-20D Class 1, 5.32% due 4/1/2027 | | | 40,951 | | | | 41,329 | |
| | Series 2007-20F Class 1, 5.71% due 6/1/2027 | | | 28,435 | | | | 28,731 | |
| | Series 2007-20I Class 1, 5.56% due 9/1/2027 | | | 83,977 | | | | 85,004 | |
| | Series 2007-20K Class 1, 5.51% due 11/1/2027 | | | 72,397 | | | | 73,076 | |
| | Series 2008-20G Class 1, 5.87% due 7/1/2028 | | | 156,863 | | | | 159,566 | |
| | Series 2011-20G Class 1, 3.74% due 7/1/2031 | | | 307,024 | | | | 303,876 | |
| | Series 2011-20K Class 1, 2.87% due 11/1/2031 | | | 523,996 | | | | 507,449 | |
| | Series 2014-20H Class 1, 2.88% due 8/1/2034 | | | 342,529 | | | | 328,548 | |
| | Series 2015-20B Class 1, 2.46% due 2/1/2035 | | | 327,567 | | | | 309,338 | |
| | Series 2015-20G Class 1, 2.88% due 7/1/2035 | | | 675,814 | | | | 645,609 | |
| | Series 2015-20I Class 1, 2.82% due 9/1/2035 | | | 687,240 | | | | 654,074 | |
| | Series 2017-20I Class 1, 2.59% due 9/1/2037 | | | 1,534,297 | | | | 1,435,539 | |
| | Series 2017-20K Class 1, 2.79% due 11/1/2037 | | | 788,395 | | | | 745,156 | |
| | Thirax 1 LLC (Guaranty: Export-Import Bank of the United States), 0.968% due 1/14/2033 | | | 1,084,384 | | | | 949,693 | |
| | Ulani MSN 35940 LLC (Guaranty: Export-Import Bank of the United States), 2.227% due 5/16/2025 | | | 312,500 | | | | 307,816 | |
| | TOTAL U.S. GOVERNMENT AGENCIES (Cost $9,799,281) | | | | | | | 9,299,806 | |
| | | | | | | | | | |
| | MORTGAGE BACKED — 62.5% | | | | | | | | |
| b,c | Federal Agricultural Mortgage Corp. Mtg Trust, Whole Loan Securities Trust CMO, Seies 2021-1 Class A, 2.18% due 1/25/2051 | | | 4,081,782 | | | | 3,367,329 | |
| | Federal Home Loan Mtg Corp., | | | | | | | | |
| b | Pool 1L0049, 7.154% (H15T1Y + 2.15%) due 2/1/2046 | | | 1,253,449 | | | | 1,296,782 | |
| | Pool D98887, 3.50% due 1/1/2032 | | | 179,619 | | | | 177,063 | |
| | Pool E09025, 2.50% due 3/1/2028 | | | 24,862 | | | | 24,314 | |
| | Pool G13804, 5.00% due 3/1/2025 | | | 1,461 | | | | 1,457 | |
| | Pool G16710, 3.00% due 11/1/2030 | | | 735,914 | | | | 720,334 | |
| | Pool J11371, 4.50% due 12/1/2024 | | | 1,735 | | | | 1,729 | |
| | Pool J21208, 2.50% due 11/1/2027 | | | 436,934 | | | | 427,972 | |
| | Pool J37586, 3.50% due 9/1/2032 | | | 130,179 | | | | 128,334 | |
| | Pool RE6097, 2.00% due 5/1/2051 | | | 2,010,304 | | | | 1,621,276 | |
| | Pool RE6119, 2.50% due 12/1/2051 | | | 1,741,829 | | | | 1,483,606 | |
| | Pool SE9046, 3.00% due 12/1/2051 | | | 2,023,389 | | | | 1,801,941 | |
| | Pool T61943, 3.50% due 8/1/2045 | | | 86,421 | | | | 81,685 | |
| | Pool T65457, 3.00% due 1/1/2048 | | | 372,904 | | | | 335,729 | |
| | Federal Home Loan Mtg Corp., CMO REMIC, | | | | | | | | |
| | Series 3922 Class PQ, 2.00% due 4/15/2041 | | | 51,869 | | | | 50,557 | |
| b | Series 4105 Class FG, 5.857% (SOFR30A + 0.51%) due 9/15/2042 | | | 449,711 | | | | 442,943 | |
| 114 | Annual Financial Statements | See notes to financial statements. |
Schedule of Investments, Continued
Thornburg Limited Term U.S. Government Fund | September 30, 2024
| | ISSUER-DESCRIPTION | | PRINCIPAL
AMOUNT | | | VALUE | |
| | | | | | | | | | |
| | Series 4120 Class TC, 1.50% due 10/15/2027 | | $ | 225,091 | | | $ | 216,756 | |
| | Series 4120 Class UE, 2.00% due 10/15/2027 | | | 291,987 | | | | 283,285 | |
| | Federal Home Loan Mtg Corp., Multifamily Structured Pass-Through Certificates, CMBS, | | | | | | | | |
| | Series K043 Class A2, 3.062% due 12/25/2024 | | | 1,210,644 | | | | 1,203,995 | |
| b | Series K047 Class A2, 3.329% due 5/25/2025 | | | 1,236,575 | | | | 1,225,625 | |
| | Series K055 Class A1, 2.263% due 4/25/2025 | | | 60 | | | | 60 | |
| | Series K095 Class A2, 2.785% due 6/25/2029 | | | 577,000 | | | | 548,373 | |
| | Series K729 Class A2, 3.136% due 10/25/2024 | | | 1,250,238 | | | | 1,250,238 | |
| b | Series K730 Class A2, 3.59% due 1/25/2025 | | | 154,389 | | | | 153,623 | |
| | Series KHG1 Class A3, 3.341% due 12/25/2027 | | | 300,000 | | | | 294,531 | |
| | Series KJ46 Class A2, 4.796% due 10/25/2031 | | | 216,000 | | | | 223,437 | |
| b | Series KJ47 Class A2, 5.43% due 6/25/2031 | | | 149,000 | | | | 158,010 | |
| | Series KJ48 Class A2, 5.028% due 10/25/2031 | | | 379,000 | | | | 396,135 | |
| | Federal Home Loan Mtg Corp., Seasoned Credit Risk Transfer, Whole Loan Securities Trust CMO, | | | | | | | | |
| b | Series 2017-3 Class HA, 3.25% due 7/25/2056 | | | 815,421 | | | | 775,719 | |
| b | Series 2017-4 Class HT, 3.25% due 6/25/2057 | | | 2,493,707 | | | | 2,289,744 | |
| | Series 2017-4 Class MT, 3.50% due 6/25/2057 | | | 560,310 | | | | 516,315 | |
| b | Series 2018-1 Class HA, 3.00% due 5/25/2057 | | | 1,055,637 | | | | 994,256 | |
| b | Series 2018-2 Class HA, 3.00% due 11/25/2057 | | | 572,401 | | | | 542,984 | |
| | Series 2018-3 Class HA, 3.00% due 8/25/2057 | | | 763,930 | | | | 720,898 | |
| b | Series 2018-3 Class MA, 3.50% due 8/25/2057 | | | 828,993 | | | | 806,170 | |
| | Series 2018-4 Class HA, 3.00% due 3/25/2058 | | | 965,893 | | | | 909,381 | |
| | Series 2018-4 Class MA, 3.50% due 3/25/2058 | | | 653,084 | | | | 634,245 | |
| | Series 2019-1 Class MA, 3.50% due 7/25/2058 | | | 1,817,188 | | | | 1,762,805 | |
| | Series 2019-2 Class MA, 3.50% due 8/26/2058 | | | 1,619,295 | | | | 1,568,200 | |
| | Series 2019-3 Class MA, 3.50% due 10/25/2058 | | | 628,366 | | | | 609,988 | |
| | Series 2019-4 Class MA, 3.00% due 2/25/2059 | | | 987,005 | | | | 934,377 | |
| | Series 2020-1 Class MA, 2.50% due 8/25/2059 | | | 1,455,728 | | | | 1,354,545 | |
| | Series 2020-2 Class MA, 2.00% due 11/25/2059 | | | 1,409,066 | | | | 1,285,963 | |
| | Series 2020-3 Class MA, 2.00% due 5/25/2060 | | | 470,305 | | | | 428,216 | |
| | Series 2020-3 Class MT, 2.00% due 5/25/2060 | | | 602,729 | | | | 494,972 | |
| | Series 2022-1 Class MTU, 3.25% due 11/25/2061 | | | 984,864 | | | | 880,589 | |
| | Federal Home Loan Mtg Corp., UMBS Collateral, | | | | | | | | |
| | Pool RA6808, 3.00% due 2/1/2052 | | | 1,974,872 | | | | 1,785,360 | |
| | Pool RD5043, 2.00% due 12/1/2030 | | | 1,569,080 | | | | 1,495,724 | |
| | Pool SB8010, 2.50% due 10/1/2034 | | | 469,938 | | | | 441,670 | |
| | Pool SB8030, 2.00% due 12/1/2034 | | | 734,198 | | | | 671,739 | |
| | Pool SB8502, 2.00% due 8/1/2035 | | | 443,439 | | | | 410,202 | |
| | Pool ZS4730, 3.50% due 8/1/2047 | | | 718,228 | | | | 678,213 | |
| | Pool ZS7299, 3.00% due 10/1/2030 | | | 391,047 | | | | 382,108 | |
| | Federal Home Loan Mtg Corp., Whole Loan Securities Trust CMO, | | | | | | | | |
| | Series 2015-SC02 Class 2A, 3.50% due 9/25/2045 | | | 189,452 | | | | 173,854 | |
| | Series 2016-SC01 Class 1A, 3.00% due 7/25/2046 | | | 730,839 | | | | 646,393 | |
| | Series 2016-SC01 Class 2A, 3.50% due 7/25/2046 | | | 235,146 | | | | 215,664 | |
| | Series 2016-SC02 Class 2A, 3.50% due 10/25/2046 | | | 142,581 | | | | 130,725 | |
| | Series 2017-SC01 Class 1A, 3.00% due 12/25/2046 | | | 1,342,122 | | | | 1,164,714 | |
| | Series 2017-SC01 Class 2A, 3.50% due 12/25/2046 | | | 448,804 | | | | 402,173 | |
| | Series 2017-SC02 Class 1A, 3.00% due 5/25/2047 | | | 286,876 | | | | 252,171 | |
| | Series 2017-SC02 Class 2A, 3.50% due 5/25/2047 | | | 133,314 | | | | 120,244 | |
| | Federal National Mtg Assoc., | | | | | | | | |
| b | Pool 895572, 7.82% (RFUCCT1Y + 1.82%) due 6/1/2036 | | | 51,900 | | | | 53,639 | |
| | Pool BF0130, 3.50% due 8/1/2056 | | | 308,196 | | | | 285,791 | |
| | Pool BF0144, 3.50% due 10/1/2056 | | | 437,628 | | | | 405,814 | |
| b | Pool BH4524, 2.316% (5-Yr. CMT + 1.150%) due 6/1/2046 | | | 1,353,997 | | | | 1,314,187 | |
| b | Pool BM6885, 1.611% (2.19% - SOFR30A) due 12/1/2051 | | | 463,372 | | | | 424,115 | |
| | Pool BM6983, 3.00% due 3/1/2052 | | | 1,023,586 | | | | 903,289 | |
| b | Pool CB2214, 1.528% (2.20% - SOFR30A) due 11/1/2051 | | | 496,762 | | | | 455,924 | |
| | Federal National Mtg Assoc., CMBS, | | | | | | | | |
| b | Series 2015-SB5 Class A10, 3.15% due 9/25/2035 | | | 284,246 | | | | 279,449 | |
| b | Series 2018-SB47 Class A5H, 6.161% (SOFR30A + 0.81%) due 1/25/2038 | | | 328,784 | | | | 320,932 | |
| | Federal National Mtg Assoc., CMO REMIC, | | | | | | | | |
| b | Series 2009-17 Class AH, 0.491% due 3/25/2039 | | | 185,234 | | | | 150,238 | |
| | Series 2011-70 Class CA, 3.00% due 8/25/2026 | | | 360,572 | | | | 355,446 | |
| See notes to financial statements. | Annual Financial Statements | 115 |
Schedule of Investments, Continued
Thornburg Limited Term U.S. Government Fund | September 30, 2024
| | ISSUER-DESCRIPTION | | PRINCIPAL
AMOUNT | | | VALUE | |
| | | | | | | | | | |
| b | Series 2013-81 Class FW, 5.695% (SOFR30A + 0.41%) due 1/25/2043 | | $ | 756,001 | | | $ | 744,969 | |
| b | Series 2013-92 Class FA, 5.945% (SOFR30A + 0.66%) due 9/25/2043 | | | 543,012 | | | | 533,783 | |
| | Series 2024-25 Class VB, 5.50% due 3/25/2035 | | | 514,954 | | | | 528,667 | |
| | Series 2024-70 Class MP, 4.50% due 10/25/2054 | | | 495,000 | | | | 486,272 | |
| | Federal National Mtg Assoc., Grantor Trust, CMO, Series 2017-T1 Class A, 2.898% due 6/25/2027 | | | 989,288 | | | | 954,793 | |
| | Federal National Mtg Assoc., UMBS Collateral, | | | | | | | | |
| | Pool AE0704, 4.00% due 1/1/2026 | | | 86,467 | | | | 85,908 | |
| | Pool AJ1752, 3.50% due 9/1/2026 | | | 144,276 | | | | 142,857 | |
| | Pool AL6582, 3.50% due 4/1/2030 | | | 286,610 | | | | 283,461 | |
| | Pool AL7801, 2.50% due 11/1/2030 | | | 1,062,846 | | | | 1,028,479 | |
| | Pool AL9445, 3.00% due 7/1/2031 | | | 8,583 | | | | 8,382 | |
| | Pool AL9821, 2.50% due 1/1/2032 | | | 1,383,138 | | | | 1,328,714 | |
| | Pool AS9749, 4.00% due 6/1/2047 | | | 269,314 | | | | 262,200 | |
| | Pool AU2669, 2.50% due 10/1/2028 | | | 301,557 | | | | 294,036 | |
| | Pool AZ3778, 3.00% due 4/1/2030 | | | 636,649 | | | | 623,843 | |
| | Pool BM4153, 3.00% due 6/1/2033 | | | 945,167 | | | | 917,248 | |
| | Pool BM4864, 3.50% due 5/1/2033 | | | 603,536 | | | | 594,782 | |
| | Pool CA0942, 2.50% due 12/1/2032 | | | 606,264 | | | | 580,072 | |
| | Pool CA4102, 3.50% due 8/1/2029 | | | 398,855 | | | | 393,992 | |
| | Pool CA5271, 2.50% due 3/1/2035 | | | 873,513 | | | | 828,337 | |
| | Pool CA5282, 3.00% due 3/1/2035 | | | 1,795,227 | | | | 1,737,612 | |
| | Pool CA7535, 1.50% due 10/1/2030 | | | 1,778,996 | | | | 1,677,343 | |
| | Pool FM1523, 2.50% due 8/1/2029 | | | 358,378 | | | | 349,326 | |
| | Pool FM2831, 2.50% due 5/1/2032 | | | 1,033,692 | | | | 995,597 | |
| | Pool FM3494, 2.50% due 4/1/2048 | | | 349,178 | | | | 309,723 | |
| | Pool FM4936, 2.00% due 12/1/2035 | | | 1,156,504 | | | | 1,067,687 | |
| | Pool FM5458, 1.50% due 12/1/2035 | | | 1,144,176 | | | | 1,022,535 | |
| | Pool FS0916, 3.00% due 3/1/2052 | | | 2,548,891 | | | | 2,287,122 | |
| | Pool FS6157, 3.00% due 9/1/2052 | | | 6,756,943 | | | | 6,081,046 | |
| | Pool FS6212, 1.50% due 5/1/2032 | | | 328,800 | | | | 306,889 | |
| | Pool MA2353, 3.00% due 8/1/2035 | | | 544,773 | | | | 521,883 | |
| | Pool MA3465, 4.00% due 9/1/2038 | | | 311,535 | | | | 306,918 | |
| | Pool MA3681, 3.00% due 6/1/2034 | | | 251,940 | | | | 243,832 | |
| | Pool MA3826, 3.00% due 11/1/2029 | | | 476,859 | | | | 466,625 | |
| | Pool MA3896, 2.50% due 1/1/2035 | | | 80,807 | | | | 75,946 | |
| | Pool MA4148, 2.00% due 10/1/2030 | | | 362,400 | | | | 345,861 | |
| | Pool MA4390, 2.00% due 7/1/2031 | | | 2,632,626 | | | | 2,502,398 | |
| | Government National Mtg Assoc., | | | | | | | | |
| b | Pool 894205, 3.625% (H15T1Y + 1.50%) due 8/20/2039 | | | 77,076 | | | | 77,249 | |
| b | Pool MA0100, 4.875% (H15T1Y + 1.50%) due 5/20/2042 | | | 134,510 | | | | 136,648 | |
| | Pool MA0907, 2.00% due 4/20/2028 | | | 282,832 | | | | 274,603 | |
| | Government National Mtg Assoc., CMBS, | | | | | | | | |
| | Series 2022-147 Class B, 2.20% due 10/16/2063 | | | 1,250,000 | | | | 937,807 | |
| | Series 2023-104 Class AD, 4.00% due 1/16/2065 | | | 420,314 | | | | 402,734 | |
| | Government National Mtg Assoc., CMO, | | | | | | | | |
| | Series 2016-H04 Class HA, 2.25% due 7/20/2065 | | | 456,344 | | | | 439,794 | |
| | Series 2017-186 Class VA, 3.00% due 2/20/2031 | | | 1,617,315 | | | | 1,594,056 | |
| | Seasoned Loans Structured Transaction Trust, Whole Loan Securities Trust CMO, | | | | | | | | |
| | Series 2020-2 Class A1C, 2.00% due 9/25/2030 | | | 1,716,482 | | | | 1,577,795 | |
| | Series 2020-2 Class A1D, 1.75% due 9/25/2030 | | | 1,716,482 | | | | 1,575,687 | |
| | TOTAL MORTGAGE BACKED (Cost $91,459,907) | | | | | | | 87,281,775 | |
| | | | | | | | | | |
| | CORPORATE BONDS — 2.1% | | | | | | | | |
| | | | | | | | | | |
| | UTILITIES — 2.1% | | | | | | | | |
| | Electric Utilities — 2.1% | | | | | | | | |
| c | Caledonia Generating LLC, 1.95% due 2/28/2034 | | | 3,413,184 | | | | 2,913,627 | |
| | | | | | | | | 2,913,627 | |
| | TOTAL CORPORATE BONDS (Cost $3,322,237) | | | | | | | 2,913,627 | |
| 116 | Annual Financial Statements | See notes to financial statements. |
Schedule of Investments, Continued
Thornburg Limited Term U.S. Government Fund | September 30, 2024
| ISSUER-DESCRIPTION | | PRINCIPAL
AMOUNT | | | VALUE | |
| | | | | | | | | |
| SHORT-TERM INVESTMENTS — 7.4% | | | | | | | | |
| U.S. Treasury Bills | | | | | | | | |
| 4.629% due 10/24/2024 | | $ | 1,500,000 | | | $ | 1,495,641 | |
| 4.673% due 10/22/2024 | | | 1,000,000 | | | | 997,321 | |
| 4.688% due 10/24/2024 | | | 500,000 | | | | 498,528 | |
| 4.705% due 10/22/2024 | | | 1,000,000 | | | | 997,303 | |
| 4.747% due 10/15/2024 | | | 2,000,000 | | | | 1,996,371 | |
| 4.779% due 10/17/2024 | | | 2,000,000 | | | | 1,995,825 | |
| 5.153% due 10/3/2024 | | | 2,000,000 | | | | 1,999,437 | |
| 6.72% due 10/1/2024 | | | 390,000 | | | | 390,000 | |
| TOTAL SHORT-TERM INVESTMENTS (Cost $10,370,426) | | | | | | | 10,370,426 | |
| | | | | | | | | |
| TOTAL INVESTMENTS — 98.6% (Cost $141,945,909) | | | | | | $ | 137,782,466 | |
| | | | | | | | | |
| OTHER ASSETS LESS LIABILITIES — 1.4% | | | | | | | 1,945,244 | |
| | | | | | | | | |
| NET ASSETS — 100.0% | | | | | | $ | 139,727,710 |
|
Footnote Legend
| a | Yankee bond denominated in U.S. dollars and is issued in the U.S. by foreign banks and corporations. |
| b | Variable, floating, step, or fixed to floating rate securities are securities for which interest rate changes are based on changes in a designated base rate or on a predetermined schedule. The rates shown are those in effect on September 30, 2024. |
| c | Securities exempt from registration under Rule 144A of the Securities Act of 1933, as amended. These securities are restricted but liquid and may only be resold in the ordinary course of business in transactions exempt from registration, normally to qualified institutional buyers. As of September 30, 2024, the aggregate value of these securities in the Fund’s portfolio was $6,280,956, representing 4.50% of the Fund’s net assets. |
| Portfolio Abbreviations | | |
| To simplify the listings of securities, abbreviations are used per the table below: | | |
| CMBS | Commercial Mortgage-Backed Securities | REMIC | Real Estate Mortgage Investment Conduit |
| CMO | Collateralized Mortgage Obligation | RFUCCT1Y | Refinitiv USD Interbank Offered Rate Consumer Cash Fallbacks Term 1 Year |
| CMT | Constant Maturity Rate | SOFR30A | Secured Overnight Financing Rate 30-Day Average |
| H15T1Y | US Treasury Yield Curve Rate T-Note Constant Maturity 1 Year | TSFR3M | Term SOFR 3 Month |
| Mtg | Mortgage | UMBS | Uniform Mortgage Backed Securities |
| See notes to financial statements. | Annual Financial Statements | 117 |
Schedule of Investments
Thornburg Limited Term Income Fund | September 30, 2024
| ISSUER-DESCRIPTION | | SHARES/PRINCIPAL
AMOUNT | | | VALUE | |
| | | | | | | | | | |
| | U.S. TREASURY SECURITIES — 12.6% | | | | | | | | |
| | U.S. Treasury Inflation-Indexed Bonds, | | | | | | | | |
| | 1.75% due 1/15/2028 | | $ | 107,996,610 | | | $ | 108,886,738 | |
| | 2.375% due 1/15/2025 | | | 21,693,599 | | | | 21,550,387 | |
| | U.S. Treasury Inflation-Indexed Notes, | | | | | | | | |
| | 0.125% due 4/15/2027 - 1/15/2032 | | | 290,343,633 | | | | 270,669,205 | |
| | 1.125% due 1/15/2033 | | | 7,333,226 | | | | 7,077,136 | |
| | 1.25% due 4/15/2028 | | | 24,222,660 | | | | 23,996,519 | |
| | 1.375% due 7/15/2033 | | | 5,701,143 | | | | 5,621,416 | |
| | U.S. Treasury Notes, | | | | | | | | |
| | 2.375% due 3/31/2029 | | | 22,000,000 | | | | 20,900,000 | |
| | 2.75% due 8/15/2032 | | | 309,513,000 | | | | 289,297,932 | |
| | 3.50% due 2/15/2033 | | | 20,245,000 | | | | 19,897,039 | |
| | 4.375% due 5/15/2034 | | | 35,624,000 | | | | 37,316,140 | |
| | 4.625% due 9/30/2028 | | | 4,200,000 | | | | 4,363,078 | |
| | TOTAL U.S. TREASURY SECURITIES (Cost $773,711,003) | | | | | | | 809,575,590 | |
| | | | | | | | | | |
| | U.S. GOVERNMENT AGENCIES — 0.4% | | | | | | | | |
| | Petroleos Mexicanos (Guaranty: Export-Import Bank of the United States), | | | | | | | | |
| a,b | 5.913% (TSFR3M + 0.61%) due 4/15/2025 | | | 777,000 | | | | 767,249 | |
| b | 6.50% due 1/23/2029 | | | 10,007,000 | | | | 9,440,404 | |
| | Reliance Industries Ltd. (Guaranty: Export-Import Bank of the United States), | | | | | | | | |
| b | 2.06% due 1/15/2026 | | | 225,000 | | | | 219,908 | |
| b | 2.512% due 1/15/2026 | | | 975,000 | | | | 955,383 | |
| | Small Business Administration Participation Certificates, | | | | | | | | |
| | Series 2008-20D Class 1, 5.37% due 4/1/2028 | | | 193,300 | | | | 195,809 | |
| | Series 2009-20E Class 1, 4.43% due 5/1/2029 | | | 119,907 | | | | 119,985 | |
| | Series 2009-20K Class 1, 4.09% due 11/1/2029 | | | 862,551 | | | | 859,441 | |
| | Series 2011-20E Class 1, 3.79% due 5/1/2031 | | | 1,119,191 | | | | 1,109,763 | |
| | Series 2011-20F Class 1, 3.67% due 6/1/2031 | | | 239,710 | | | | 237,017 | |
| | Series 2011-20G Class 1, 3.74% due 7/1/2031 | | | 1,228,096 | | | | 1,215,502 | |
| | Series 2011-20I Class 1, 2.85% due 9/1/2031 | | | 2,321,435 | | | | 2,241,204 | |
| | Series 2011-20K Class 1, 2.87% due 11/1/2031 | | | 2,039,656 | | | | 1,975,245 | |
| | Series 2012-20D Class 1, 2.67% due 4/1/2032 | | | 1,751,833 | | | | 1,680,112 | |
| | Series 2012-20J Class 1, 2.18% due 10/1/2032 | | | 1,507,593 | | | | 1,414,590 | |
| | Series 2012-20K Class 1, 2.09% due 11/1/2032 | | | 1,044,290 | | | | 989,646 | |
| | TOTAL U.S. GOVERNMENT AGENCIES (Cost $24,566,082) | | | | | | | 23,421,258 | |
| | | | | | | | | | |
| | OTHER GOVERNMENT — 0.1% | | | | | | | | |
| b,c | Bermuda Government International Bonds, 2.375% due 8/20/2030 | | | 6,800,000 | | | | 6,002,972 | |
| b,c | Carpintero Finance Ltd. (Guaranty: Export Credits Guarantee Department), 2.581% due 11/11/2024 | | | 243,058 | | | | 242,283 | |
| b,c | Khadrawy Ltd. (Guaranty: Export Credits Guarantee Department), 2.471% due 3/31/2025 | | | 340,868 | | | | 336,658 | |
| | TOTAL OTHER GOVERNMENT (Cost $7,379,100) | | | | | | | 6,581,913 | |
| | | | | | | | | | |
| | MORTGAGE BACKED — 34.5% | | | | | | | | |
| a,c | Ajax Mortgage Loan Trust, Whole Loan Securities Trust CMO, Series 2023-C Class A1, 3.50% due 5/25/2063 | | | 7,229,223 | | | | 6,841,462 | |
| | Angel Oak Mortgage Trust, Whole Loan Securities Trust CMO, | | | | | | | | |
| a,c | Series 2020-2 Class A3, 5.00% due 1/26/2065 | | | 4,253,858 | | | | 4,248,547 | |
| a,c | Series 2023-1 Class A1, 4.75% due 9/26/2067 | | | 13,055,349 | | | | 12,787,071 | |
| a,c | Series 2023-2 Class A1, 4.65% due 10/25/2067 | | | 4,575,232 | | | | 4,554,823 | |
| a,b,c | Arbor Realty Commercial Real Estate Notes Ltd., CMBS, Series 2022-FL1 Class A, 6.792% (SOFR30A + 1.45%) due 1/15/2037 | | | 15,045,954 | | | | 15,008,370 | |
| | Arroyo Mortgage Trust, Whole Loan Securities Trust CMO, | | | | | | | | |
| a,c | Series 2019-1 Class A1, 3.805% due 1/25/2049 | | | 3,352,444 | | | | 3,245,271 | |
| a,c | Series 2019-1 Class A3, 4.208% due 1/25/2049 | | | 1,754,473 | | | | 1,709,715 | |
| a,c | Series 2019-2 Class A1, 3.347% due 4/25/2049 | | | 1,499,319 | | | | 1,441,786 | |
| a,c | Series 2019-3 Class A1, 2.962% due 10/25/2048 | | | 3,607,924 | | | | 3,408,735 | |
| c | Series 2020-1 Class A2, 2.927% due 3/25/2055 | | | 6,518,000 | | | | 5,937,907 | |
| c | Series 2020-1 Class A3, 3.328% due 3/25/2055 | | | 4,500,000 | | | | 4,015,194 | |
| c | Series 2020-1 Class M1, 4.277% due 3/25/2055 | | | 3,189,000 | | | | 2,869,219 | |
| a,c | Series 2021-1R Class A1, 1.175% due 10/25/2048 | | | 7,241,362 | | | | 6,452,941 | |
| c | Series 2022-1 Class M1, 3.65% due 12/25/2056 | | | 7,338,000 | | | | 5,706,089 | |
| 118 | Annual Financial Statements | See notes to financial statements. |
Schedule of Investments, Continued
Thornburg Limited Term Income Fund | September 30, 2024
| ISSUER-DESCRIPTION | | SHARES/PRINCIPAL
AMOUNT | | | VALUE | |
| | | | | | | | | | |
| a,c | ATLX Trust, Whole Loan Securities Trust CMO, Series 2024-RPL1 Class A1, 3.85% due 4/25/2064 | | $ | 12,305,956 | | | $ | 11,923,678 | |
| a,c | BPR Trust, CMBS, Series 2023-BRK2 Class A, 7.147% due 10/5/2038 | | | 4,250,000 | | | | 4,466,709 | |
| | BRAVO Residential Funding Trust, Whole Loan Securities Trust CMO, | | | | | | | | |
| c | Series 2019-1 Class A1C, 3.50% due 3/25/2058 | | | 134,095 | | | | 133,375 | |
| a,c | Series 2024-NQM4 Class A1A, 4.35% due 1/25/2060 | | | 19,658,827 | | | | 19,313,320 | |
| a,c | Bunker Hill Loan Depositary Trust, Whole Loan Securities Trust CMO, Series 2020-1 Class A3, 3.253% due 2/25/2055 | | | 3,285,000 | | | | 3,147,265 | |
| c | Century Plaza Towers, CMBS, Series 2019-CPT Class A, 2.865% due 11/13/2039 | | | 4,600,000 | | | | 4,112,197 | |
| | Chase Mortgage Finance Corp., Whole Loan Securities Trust CMO, | | | | | | | | |
| a,c | Series 2016-SH1 Class M3, 3.75% due 4/25/2045 | | | 1,639,388 | | | | 1,522,619 | |
| a,c | Series 2016-SH2 Class M3, 3.75% due 12/25/2045 | | | 2,024,197 | | | | 1,889,974 | |
| | CHNGE Mortgage Trust, Whole Loan Securities Trust CMO, | | | | | | | | |
| a,c | Series 2022-1 Class A1, 3.007% due 1/25/2067 | | | 12,317,835 | | | | 11,536,601 | |
| a,c | Series 2022-2 Class M1, 4.609% due 3/25/2067 | | | 14,163,000 | | | | 12,530,510 | |
| a,c | Series 2023-1 Class A1, 7.065% due 3/25/2058 | | | 7,251,286 | | | | 7,343,517 | |
| | CIM Trust, Whole Loan Securities Trust CMO, | | | | | | | | |
| a,c | Series 2018-INV1 Class A4, 4.00% due 8/25/2048 | | | 647,313 | | | | 616,411 | |
| a,c | Series 2024-R1 Class A1, 4.75% due 6/25/2064 | | | 12,388,825 | | | | 12,323,064 | |
| | Citigroup Mortgage Loan Trust, Whole Loan Securities Trust CMO, | | | | | | | | |
| a | Series 2004-HYB2 Class B1, 6.253% due 3/25/2034 | | | 44,486 | | | | 34,399 | |
| a,c | Series 2014-A Class A, 4.00% due 1/25/2035 | | | 422,017 | | | | 411,656 | |
| a,c | Series 2014-J1 Class B4, 3.63% due 6/25/2044 | | | 1,489,969 | | | | 1,251,652 | |
| a,c | Series 2021-J2 Class A7A, 2.50% due 7/25/2051 | | | 32,884,166 | | | | 29,485,079 | |
| c | COMM Mortgage Trust, CMBS, Series 2024-277P Class A, 6.338% due 8/10/2044 | | | 6,575,000 | | | | 6,904,726 | |
| | CSMC Trust, Whole Loan Securities Trust CMO, | | | | | | | | |
| a,c | Series 2021-AFC1 Class-A1, 0.83% due 3/25/2056 | | | 8,049,822 | | | | 6,661,231 | |
| a,c | Series 2021-NQM3 Class A1, 1.015% due 4/25/2066 | | | 9,873,721 | | | | 8,453,358 | |
| a,c | Series 2021-NQM8 Class-A1, 1.841% due 10/25/2066 | | | 2,038,257 | | | | 1,839,018 | |
| a,c | Series 2022-ATH2 Class A1, 4.547% due 5/25/2067 | | | 10,605,485 | | | | 10,541,399 | |
| a,c | Series 2022-NQM1 Class A1, 2.265% due 11/25/2066 | | | 11,748,116 | | | | 10,680,619 | |
| c | DC Office Trust, CMBS, Series 2019-MTC Class A, 2.965% due 9/15/2045 | | | 6,670,000 | | | | 5,889,837 | |
| a,c | Deephaven Residential Mortgage Trust, Whole Loan Securities Trust CMO, Series 2021-1 Class A1, 0.715% due 5/25/2065 | | | 2,605,553 | | | | 2,431,797 | |
| | Ellington Financial Mortgage Trust, Whole Loan Securities Trust CMO, | | | | | | | | |
| a,c | Series 2019-2 Class A1, 2.739% due 11/25/2059 | | | 2,431,436 | | | | 2,326,441 | |
| a,c | Series 2021-2 Class A1, 0.931% due 6/25/2066 | | | 9,599,251 | | | | 8,077,728 | |
| a,c | Series 2022-1 Class A1, 2.206% due 1/25/2067 | | | 16,809,988 | | | | 14,830,405 | |
| a,c | FARM Mortgage Trust, Whole Loan Securities Trust CMO, Series 2024-1 Class A, 4.721% due 10/1/2053 | | | 7,700,356 | | | | 7,515,801 | |
| | Federal Home Loan Mtg Corp., | | | | | | | | |
| a | Pool 1L0322, 4.783% (H15T1Y + 2.07%) due 2/1/2048 | | | 2,207,571 | | | | 2,282,564 | |
| a | Pool 760025, 3.664% (5-Yr. CMT + 1.310%) due 10/1/2047 | | | 3,210,800 | | | | 3,161,183 | |
| a | Pool 841097, 3.131% (5-Yr. CMT + 1.300%) due 9/1/2048 | | | 4,623,700 | | | | 4,531,831 | |
| a | Pool 841362, 1.713% (2.15% - SOFR30A) due 2/1/2052 | | | 6,077,140 | | | | 5,561,873 | |
| a | Pool 841377, 1.95% (2.23% - SOFR30A) due 4/1/2052 | | | 6,294,130 | | | | 5,816,445 | |
| a | Pool 841463, 2.156% (2.18% - SOFR30A) due 7/1/2052 | | | 14,241,825 | | | | 12,718,378 | |
| | Pool D98887, 3.50% due 1/1/2032 | | | 601,274 | | | | 592,716 | |
| | Pool G16710, 3.00% due 11/1/2030 | | | 199,609 | | | | 195,383 | |
| | Pool RE6097, 2.00% due 5/1/2051 | | | 25,426,320 | | | | 20,505,899 | |
| | Pool SE9046, 3.00% due 12/1/2051 | | | 21,743,471 | | | | 19,363,776 | |
| | Federal Home Loan Mtg Corp., CMO REMIC, | | | | | | | | |
| | Series 3195 Class PD, 6.50% due 7/15/2036 | | | 149,667 | | | | 154,296 | |
| | Series 3922 Class PQ, 2.00% due 4/15/2041 | | | 77,803 | | | | 75,836 | |
| | Series 4120 Class TC, 1.50% due 10/15/2027 | | | 292,283 | | | | 281,460 | |
| | Series 5461 Class PA, 4.50% due 8/25/2054 | | | 22,750,000 | | | | 22,401,197 | |
| | Series 5462 Class P, 4.50% due 10/25/2054 | | | 14,129,583 | | | | 14,044,585 | |
| | Federal Home Loan Mtg Corp., Multifamily Structured Pass-Through Certificates, CMBS, | | | | | | | | |
| | Series KJ46 Class A2, 4.796% due 10/25/2031 | | | 8,741,000 | | | | 9,041,970 | |
| a | Series KJ47 Class A2, 5.43% due 6/25/2031 | | | 5,968,000 | | | | 6,328,868 | |
| | Series KJ48 Class A2, 5.028% due 10/25/2031 | | | 15,306,000 | | | | 15,998,018 | |
| | Federal Home Loan Mtg Corp., Seasoned Credit Risk Transfer, Whole Loan Securities Trust CMO, | | | | | | | | |
| a | Series 2017-1 Class HA, 3.00% due 1/25/2056 | | | 3,926,278 | | | | 3,731,740 | |
| a | Series 2017-3 Class HA, 3.25% due 7/25/2056 | | | 6,804,852 | | | | 6,473,528 | |
| a | Series 2017-4 Class HT, 3.25% due 6/25/2057 | | | 6,684,624 | | | | 6,137,882 | |
| a | Series 2018-1 Class HA, 3.00% due 5/25/2057 | | | 4,196,158 | | | | 3,952,168 | |
| a | Series 2018-2 Class HA, 3.00% due 11/25/2057 | | | 9,158,419 | | | | 8,687,742 | |
| See notes to financial statements. | Annual Financial Statements | 119 |
Schedule of Investments, Continued
Thornburg Limited Term Income Fund | September 30, 2024
| ISSUER-DESCRIPTION | | SHARES/PRINCIPAL
AMOUNT | | | VALUE | |
| | | | | | | | | | |
| | Series 2018-3 Class HA, 3.00% due 8/25/2057 | | $ | 11,000,591 | | | $ | 10,380,937 | |
| a | Series 2018-3 Class MA, 3.50% due 8/25/2057 | | | 7,016,281 | | | | 6,823,113 | |
| | Series 2018-4 Class HA, 3.00% due 3/25/2058 | | | 9,499,347 | | | | 8,943,567 | |
| | Series 2019-1 Class MA, 3.50% due 7/25/2058 | | | 18,307,342 | | | | 17,759,459 | |
| | Series 2019-2 Class MA, 3.50% due 8/26/2058 | | | 19,397,208 | | | | 18,785,146 | |
| | Series 2019-3 Class MA, 3.50% due 10/25/2058 | | | 8,870,015 | | | | 8,610,585 | |
| | Series 2019-4 Class MA, 3.00% due 2/25/2059 | | | 15,227,773 | | | | 14,415,811 | |
| | Series 2020-1 Class MA, 2.50% due 8/25/2059 | | | 2,501,784 | | | | 2,327,893 | |
| | Series 2020-2 Class MA, 2.00% due 11/25/2059 | | | 18,616,750 | | | | 16,990,296 | |
| | Series 2020-3 Class MA, 2.00% due 5/25/2060 | | | 10,821,710 | | | | 9,853,240 | |
| | Series 2020-3 Class MT, 2.00% due 5/25/2060 | | | 3,489,799 | | | | 2,865,890 | |
| | Series 2022-1 Class MTU, 3.25% due 11/25/2061 | | | 14,453,499 | | | | 12,923,205 | |
| | Series 2024-1 Class MT, 3.00% due 11/25/2063 | | | 7,760,826 | | | | 6,626,468 | |
| | Series 2024-2 Class MT, 3.50% due 5/25/2064 | | | 7,044,549 | | | | 6,362,802 | |
| | Federal Home Loan Mtg Corp., UMBS Collateral, | | | | | | | | |
| | Pool RA6808, 3.00% due 2/1/2052 | | | 10,913,142 | | | | 9,865,899 | |
| | Pool RA7021, 2.50% due 3/1/2052 | | | 21,988,199 | | | | 19,002,967 | |
| | Pool RA7373, 3.00% due 5/1/2052 | | | 5,412,665 | | | | 4,886,872 | |
| | Pool SD1374, 3.00% due 3/1/2052 | | | 13,815,493 | | | | 12,395,540 | |
| | Pool SD1852, 2.50% due 6/1/2051 | | | 42,942,496 | | | | 37,085,495 | |
| | Pool SD4175, 2.50% due 6/1/2052 | | | 126,768,602 | | | | 109,442,732 | |
| | Pool SD5171, 2.50% due 1/1/2054 | | | 15,809,327 | | | | 13,648,616 | |
| | Pool SD5345, 2.50% due 4/1/2052 | | | 21,933,529 | | | | 19,079,870 | |
| | Pool SD8140, 2.00% due 4/1/2051 | | | 25,469,781 | | | | 21,143,771 | |
| | Pool SD8189, 2.50% due 1/1/2052 | | | 13,544,433 | | | | 11,721,533 | |
| | Pool SD8225, 3.00% due 7/1/2052 | | | 11,612,496 | | | | 10,425,398 | |
| | Pool SD8367, 5.50% due 10/1/2053 | | | 6,490,531 | | | | 6,569,640 | |
| | Federal Home Loan Mtg Corp., Whole Loan Securities Trust CMO, | | | | | | | | |
| | Series 2016-SC01 Class 2A, 3.50% due 7/25/2046 | | | 901,394 | | | | 826,714 | |
| | Series 2017-SC01 Class 1A, 3.00% due 12/25/2046 | | | 8,105,297 | | | | 7,033,897 | |
| | Series 2017-SC02 Class 2A, 3.50% due 5/25/2047 | | | 508,258 | | | | 458,430 | |
| | Federal National Mtg Assoc., | | | | | | | | |
| a | Pool BH4523, 1.869% (5-Yr. CMT + 1.150%) due 4/1/2047 | | | 4,948,244 | | | | 4,769,742 | |
| a | Pool BH4524, 2.316% (5-Yr. CMT + 1.150%) due 6/1/2046 | | | 9,470,151 | | | | 9,191,710 | |
| a | Pool BM6929, 1.92% (2.13% - SOFR30A) due 7/1/2051 | | | 4,359,914 | | | | 4,077,173 | |
| | Pool BM7067, 2.50% due 6/1/2051 | | | 3,233,907 | | | | 2,757,902 | |
| a | Pool BO9998, 2.752% (H15T1Y + 2.03%) due 3/1/2048 | | | 3,811,637 | | | | 3,807,474 | |
| a | Pool BU9934, 1.838% (2.37% - SOFR30A) due 2/1/2052 | | | 8,690,553 | | | | 7,717,922 | |
| a | Pool CB2214, 1.528% (2.20% - SOFR30A) due 11/1/2051 | | | 5,004,691 | | | | 4,593,269 | |
| | Federal National Mtg Assoc., CMO REMIC, | | | | | | | | |
| a | Series 2009-17 Class AH, 0.491% due 3/25/2039 | | | 308,724 | | | | 250,396 | |
| | Series 2012-129 Class LA, 3.50% due 12/25/2042 | | | 1,098,992 | | | | 1,041,959 | |
| a | Series 2013-81 Class FW, 5.695% (SOFR30A + 0.41%) due 1/25/2043 | | | 2,746,906 | | | | 2,706,821 | |
| | Series 2024-25 Class VB, 5.50% due 3/25/2035 | | | 10,791,687 | | | | 11,079,059 | |
| | Series 2024-70 Class MP, 4.50% due 10/25/2054 | | | 15,334,016 | | | | 15,063,651 | |
| | Federal National Mtg Assoc., Grantor Trust, CMO, Series 2017-T1 Class A, 2.898% due 6/25/2027 | | | 17,807,178 | | | | 17,186,274 | |
| | Federal National Mtg Assoc., UMBS Collateral, | | | | | | | | |
| | Pool AE0704, 4.00% due 1/1/2026 | | | 224,898 | | | | 223,446 | |
| | Pool AS9749, 4.00% due 6/1/2047 | | | 7,733 | | | | 7,529 | |
| | Pool BM4324, 3.50% due 7/1/2033 | | | 1,871,141 | | | | 1,842,942 | |
| | Pool BP9550, 2.50% due 7/1/2035 | | | 6,988 | | | | 6,631 | |
| | Pool BP9589, 2.50% due 8/1/2035 | | | 561,931 | | | | 533,241 | |
| | Pool BV4119, 2.50% due 3/1/2052 | | | 38,968,881 | | | | 33,642,879 | |
| | Pool CB2301, 3.00% due 12/1/2051 | | | 29,624,922 | | | | 26,580,912 | |
| | Pool CB3050, 2.50% due 3/1/2052 | | | 18,778,154 | | | | 16,228,735 | |
| | Pool FS5447, 2.50% due 9/1/2052 | | | 40,560,341 | | | | 35,176,844 | |
| | Pool FS6130, 2.50% due 7/1/2052 | | | 18,351,286 | | | | 15,843,157 | |
| | Pool FS6157, 3.00% due 9/1/2052 | | | 120,123,439 | | | | 108,107,486 | |
| | Pool FS6212, 1.50% due 5/1/2032 | | | 2,081,011 | | | | 1,942,334 | |
| | Pool FS7577, 2.50% due 1/1/2054 | | | 22,236,156 | | | | 19,197,070 | |
| | Pool FS7757, 2.50% due 2/1/2052 | | | 19,397,862 | | | | 16,758,568 | |
| | Pool FS7879, 2.50% due 7/1/2052 | | | 15,618,630 | | | | 13,473,354 | |
| | Pool FS9157, 2.00% due 5/1/2042 | | | 23,800,345 | | | | 20,711,891 | |
| 120 | Annual Financial Statements | See notes to financial statements. |
Schedule of Investments, Continued
Thornburg Limited Term Income Fund | September 30, 2024
| ISSUER-DESCRIPTION | | SHARES/PRINCIPAL
AMOUNT | | | VALUE | |
| | | | | | | | | | |
| | Pool MA3465, 4.00% due 9/1/2038 | | $ | 2,793,849 | | | $ | 2,752,442 | |
| | Pool MA4390, 2.00% due 7/1/2031 | | | 974,072 | | | | 925,887 | |
| | Pool MA5138, 5.50% due 9/1/2053 | | | 4,615,175 | | | | 4,671,713 | |
| | Pool MA5139, 6.00% due 9/1/2053 | | | 4,066,974 | | | | 4,156,582 | |
| a,c | Flagstar Mortgage Trust, Whole Loan Securities Trust CMO, Series 2017-1 Class 2A2, 3.00% due 3/25/2047 | | | 1,173,699 | | | | 1,090,412 | |
| | GCAT Trust, Whole Loan Securities Trust CMO, | | | | | | | | |
| a,c | Series 2019-NQM3 Class A1, 3.686% due 11/25/2059 | | | 2,927,230 | | | | 2,833,015 | |
| a,c | Series 2021-CM1 Class A, 2.469% due 4/25/2065 | | | 7,052,391 | | | | 6,729,574 | |
| a,c | Series 2021-CM2 Class A1, 2.352% due 8/25/2066 | | | 17,082,819 | | | | 15,681,780 | |
| a,c | Series 2021-NQM4 Class A1, 1.093% due 8/25/2066 | | | 11,411,245 | | | | 9,288,777 | |
| | Government National Mtg Assoc., CMBS, Series 2023-104 Class AD, 4.00% due 1/16/2065 | | | 23,127,169 | | | | 22,159,851 | |
| a,b,c | Greystone Commercial Real Estate Notes Ltd., CMBS, Series 2021-FL3 Class A, 6.231% (TSFR1M + 1.13%) due 7/15/2039 | | | 12,678,884 | | | | 12,631,349 | |
| | GS Mortgage-Backed Securities Corp. Trust, Whole Loan Securities Trust CMO, | | | | | | | | |
| a,c | Series 2020-PJ2 Class B3, 3.548% due 7/25/2050 | | | 4,962,210 | | | | 4,381,591 | |
| a,c | Series 2023-CCM1 Class A1, 6.65% due 8/25/2053 | | | 10,863,931 | | | | 10,976,602 | |
| | GS Mortgage-Backed Securities Trust, Whole Loan Securities Trust CMO, | | | | | | | | |
| a,c | Series 2023-PJ2 Class A4, 5.50% due 5/25/2053 | | | 3,517,777 | | | | 3,520,267 | |
| a,c | Series 2024-RPL2 Class A1, 3.75% due 7/25/2061 | | | 4,949,655 | | | | 4,837,987 | |
| a,c | Series 2024-RPL4 Class A1, 3.90% due 9/25/2061 | | | 3,999,381 | | | | 3,896,849 | |
| | Harvest Commercial Capital Loan Trust, CMBS, Series 2024-1 Class A, 6.164% due 10/25/2056 | | | 15,327,177 | | | | 15,716,984 | |
| a,c | HOMES Trust, Whole Loan Securities Trust CMO, Series 2024-NQM1 Class A1, 5.915% due 7/25/2069 | | | 4,621,601 | | | | 4,667,577 | |
| | Homeward Opportunities Fund Trust, Whole Loan Securities Trust CMO, | | | | | | | | |
| a,c | Series 2022-1 A Class A1, 5.082% due 7/25/2067 | | | 5,068,116 | | | | 5,047,330 | |
| a,c | Series 2024-RRTL2 Class A1, 5.989% due 9/25/2039 | | | 9,700,000 | | | | 9,760,840 | |
| c | Houston Galleria Mall Trust, CMBS, Series 2015-HGLR Class A1A2, 3.087% due 3/5/2037 | | | 12,383,750 | | | | 12,227,504 | |
| a,c | Hudson Yards Mortgage Trust, CMBS, Series 2019-55HY Class A, 3.041% due 12/10/2041 | | | 5,870,000 | | | | 5,339,847 | |
| | Imperial Fund Mortgage Trust, Whole Loan Securities Trust CMO, | | | | | | | | |
| a,c | Series 2021-NQM3 Class A1, 1.595% due 11/25/2056 | | | 14,659,260 | | | | 12,492,536 | |
| a,c | Series 2021-NQM4 Class A1, 2.091% due 1/25/2057 | | | 19,240,207 | | | | 16,606,380 | |
| a,c | Series 2022-NQM1 Class A1, 2.493% due 2/25/2067 | | | 32,285,953 | | | | 29,052,810 | |
| a,c | Series 2022-NQM2 Class A1, 3.638% due 3/25/2067 | | | 20,183,879 | | | | 19,234,845 | |
| a,c | Series 2022-NQM4 Class A1, 4.767% due 6/25/2067 | | | 24,432,992 | | | | 24,310,376 | |
| | JP Morgan Mortgage Trust, Whole Loan Securities Trust CMO, | | | | | | | | |
| a,c | Series 2014-IVR3 Class B4, 6.466% due 9/25/2044 | | | 1,940,616 | | | | 1,905,786 | |
| a,c | Series 2018-3 Class B2, 3.702% due 9/25/2048 | | | 2,292,754 | | | | 2,142,385 | |
| a,c | Series 2018-6 Class B2, 3.889% due 12/25/2048 | | | 928,557 | | | | 847,127 | |
| a,c | Series 2019-5 Class B3, 4.457% due 11/25/2049 | | | 7,617,157 | | | | 7,211,427 | |
| a,c | Series 2019-HYB1 Class B3, 4.921% due 10/25/2049 | | | 5,456,845 | | | | 5,249,416 | |
| a,c | Series 2019-INV2 Class B3A, 3.724% due 2/25/2050 | | | 8,928,518 | | | | 7,804,200 | |
| a,c | Series 2021-LTV2 Class A1, 2.52% due 5/25/2052 | | | 31,885,288 | | | | 26,845,267 | |
| a,c | Series 2022- LTV1 Class A1, 3.25% due 7/25/2052 | | | 12,233,708 | | | | 10,646,509 | |
| a,c | Series 2022-2 Class A6A, 2.50% due 8/25/2052 | | | 28,272,707 | | | | 25,931,886 | |
| a,c | Series 2022-DSC1 Class A1, 4.75% due 1/25/2063 | | | 8,042,882 | | | | 7,912,648 | |
| a,c,d | LEX Mortgage Trust, CMBS, Series 2024-BBG Class A, 4.874% due 10/13/2033 | | | 3,740,000 | | | | 3,736,264 | |
| c | Manhattan West Mortgage Trust, CMBS, Series 2020-1MW Class A, 2.13% due 9/10/2039 | | | 3,697,000 | | | | 3,425,998 | |
| a | Merrill Lynch Mortgage Investors Trust, Whole Loan Securities Trust CMO, Series 2004-A4 Class M1, 5.818% due 8/25/2034 | | | 95,197 | | | | 90,504 | |
| a,c | Metlife Securitization Trust, Whole Loan Securities Trust CMO, Series 2019-1A Class A1A, 3.75% due 4/25/2058 | | | 849,266 | | | | 834,632 | |
| | MFA Trust, Whole Loan Securities Trust CMO, | | | | | | | | |
| a,c | Series 2020-NQM3 Class A1, 1.014% due 1/26/2065 | | | 2,403,698 | | | | 2,219,405 | |
| a,c | Series 2021-AEI1 Class A4, 2.50% due 8/25/2051 | | | 15,231,901 | | | | 13,484,418 | |
| a,c | Series 2021-INV1 Class A1, 0.852% due 1/25/2056 | | | 2,299,942 | | | | 2,146,482 | |
| a,c | Series 2021-INV2 Class A1, 1.906% due 11/25/2056 | | | 20,650,958 | | | | 17,832,188 | |
| a,c | Series 2022-CHM1 Class A1, 3.875% due 9/25/2056 | | | 16,792,879 | | | | 16,411,884 | |
| a,c | Series 2022-INV1 Class A3, 4.25% due 4/25/2066 | | | 4,995,000 | | | | 4,375,838 | |
| a,c | Series 2022-NQM1 Class A3, 4.20% due 12/25/2066 | | | 13,129,000 | | | | 11,476,439 | |
| a,c | Series 2022-NQM2 Class A1, 4.00% due 5/25/2067 | | | 5,434,094 | | | | 5,311,921 | |
| a,c | Series 2024-RPL1 Class A1, 4.25% due 2/25/2066 | | | 9,903,292 | | | | 9,600,644 | |
| a,c | Mill City Mortgage Loan Trust, Whole Loan Securities Trust CMO, Series 2023-NQM1 Class A1, 6.05% due 10/25/2067 | | | 12,329,747 | | | | 12,426,717 | |
| a,c | Mill City Securities Ltd., Whole Loan Securities Trust CMO, Series 2024-RS1 Class A1, 3.00% due 11/1/2069 | | | 8,146,000 | | | | 7,520,518 | |
| | Morgan Stanley Bank of America Merrill Lynch Trust, CMBS, Series 2015-C22 Class A4, 3.306% due 4/15/2048 | | | 1,100,000 | | | | 1,088,701 | |
| c | Morgan Stanley Capital I Trust, CMBS, Series 2024-BPR2 Class A, 7.291% due 5/5/2029 | | | 7,878,333 | | | | 8,334,556 | |
| a,c | Morgan Stanley Residential Mortgage Loan Trust, Whole Loan Securities Trust CMO, Series 2024-NQM1 Class A1, 6.152% due 12/25/2068 | | | 12,306,642 | | | | 12,459,751 | |
| See notes to financial statements. | Annual Financial Statements | 121 |
Schedule of Investments, Continued
Thornburg Limited Term Income Fund | September 30, 2024
| ISSUER-DESCRIPTION | | SHARES/PRINCIPAL
AMOUNT | | | VALUE | |
| | | | | | | | | | |
| | New Residential Mortgage Loan Trust, Whole Loan Securities Trust CMO, | | | | | | |
| a,c | Series 2017-2A Class A3, 4.00% due 3/25/2057 | | $ | 2,423,593 | | | $ | 2,351,448 | |
| a,c | Series 2017-3A Class A1, 4.00% due 4/25/2057 | | | 3,009,147 | | | | 2,934,264 | |
| a,c | Series 2017-4A Class A1, 4.00% due 5/25/2057 | | | 3,304,042 | | | | 3,199,605 | |
| a,c | Series 2017-5A Class A1, 6.469% (TSFR1M + 1.61%) due 6/25/2057 | | | 226,925 | | | | 229,836 | |
| a,c | Series 2017-6A Class A1, 4.00% due 8/27/2057 | | | 1,417,145 | | | | 1,378,865 | |
| a,c | Series 2018-1A Class A1A, 4.00% due 12/25/2057 | | | 1,750,811 | | | | 1,708,863 | |
| a,c | Series 2018-2A Class A1, 4.50% due 2/25/2058 | | | 2,996,495 | | | | 2,968,516 | |
| a,c | Series 2018-RPL1 Class A1, 3.50% due 12/25/2057 | | | 1,821,065 | | | | 1,765,962 | |
| a,c | Series 2022-NQM3 Class A1, 3.90% due 4/25/2062 | | | 36,380,680 | | | | 34,855,111 | |
| a,c | Series 2024-RPL1 Class A, 3.80% due 1/25/2064 | | | 24,621,475 | | | | 23,376,855 | |
| a,c | Series 2024-RTL1 Class A1, 6.664% due 3/25/2039 | | | 7,600,000 | | | | 7,730,101 | |
| c | NYC Commercial Mortgage Trust, CMBS, Series 2021-909 Class A, 2.941% due 4/10/2043 | | | 4,900,000 | | | | 4,017,881 | |
| a,c | NYMT Loan Trust, Whole Loan Securities Trust CMO, Series 2024-BPL2 Class A1, 6.509% due 5/25/2039 | | | 8,675,000 | | | | 8,802,503 | |
| | OBX Trust, Whole Loan Securities Trust CMO, | | | | | | | | |
| a,c | Series 2021-NQM4 Class A1, 1.957% due 10/25/2061 | | | 23,574,107 | | | | 20,131,772 | |
| a,c | Series 2024-NQM11 Class A1, 5.875% due 6/25/2064 | | | 4,500,056 | | | | 4,554,162 | |
| c | One Bryant Park Trust, CMBS, Series 2019-OBP Class A, 2.516% due 9/15/2054 | | | 18,455,652 | | | | 16,428,694 | |
| a,c | PRET Trust, Whole Loan Securities Trust CMO, Series 2024-RPL1 Class A1, 3.90% due 10/25/2063 | | | 3,581,374 | | | | 3,458,120 | |
| | PRKCM Trust, Whole Loan Securities Trust CMO, | | | | | | | | |
| a,c | Series 2021-AFC1 Class A1, 1.51% due 8/25/2056 | | | 26,691,463 | | | | 22,441,815 | |
| a,c | Series 2021-AFC2 Class A1, 2.071% due 11/25/2056 | | | 15,511,921 | | | | 13,624,780 | |
| a,c | Series 2024-HOME1 Class A1, 6.431% due 5/25/2059 | | | 12,708,734 | | | | 12,951,155 | |
| a,c | PRPM LLC, Whole Loan Securities Trust CMO, Series 2024-RPL2 Class A1, 3.50% due 5/25/2054 | | | 14,117,294 | | | | 13,650,351 | |
| a,c | PRPM Trust, Whole Loan Securities Trust CMO, Series 2022-INV1 Class A1, 4.40% due 4/25/2067 | | | 28,854,018 | | | | 28,913,641 | |
| | RAMP Trust, Whole Loan Securities Trust CMO, Series 2003-SL1 Class A31, 7.125% due 4/25/2031 | | | 201,380 | | | | 201,380 | |
| a,c | Rate Mortgage Trust, Whole Loan Securities Trust CMO, Series 2022-J1 Class A9, 2.50% due 1/25/2052 | | | 46,263,032 | | | | 40,784,913 | |
| a,c | RCKT Mortgage Trust, Whole Loan Securities Trust CMO, Series 2020-1 Class B3, 3.466% due 2/25/2050 | | | 2,994,562 | | | | 2,694,702 | |
| | Seasoned Loans Structured Transaction Trust, Whole Loan Securities Trust CMO, | | | | | | | | |
| | Series 2019-2 Class A1C, 2.75% due 9/25/2029 | | | 13,810,689 | | | | 13,058,769 | |
| | Series 2019-3 Class A1C, 2.75% due 11/25/2029 | | | 2,269,999 | | | | 2,119,261 | |
| | Series 2020-2 Class A1C, 2.00% due 9/25/2030 | | | 20,003,931 | | | | 18,387,662 | |
| | Series 2020-2 Class A1D, 1.75% due 9/25/2030 | | | 26,894,825 | | | | 24,688,761 | |
| | Sequoia Mortgage Trust, Whole Loan Securities Trust CMO, | | | | | | | | |
| a | Series 2013-6 Class B4, 3.522% due 5/25/2043 | | | 716,584 | | | | 573,017 | |
| a | Series 2013-7 Class B4, 3.506% due 6/25/2043 | | | 408,200 | | | | 326,438 | |
| a,c | Series 2023-3 Class A1, 6.00% due 9/25/2053 | | | 3,896,637 | | | | 3,927,053 | |
| a,c | SFO Commercial Mortgage Trust, CMBS, Series 2021-555 Class A, 6.362% (TSFR1M + 1.26%) due 5/15/2038 | | | 5,212,000 | | | | 4,972,297 | |
| | SG Residential Mortgage Trust, Whole Loan Securities Trust CMO, | | | | | | | | |
| a,c | Series 2019-3 Class A1, 2.703% due 9/25/2059 | | | 111,314 | | | | 110,068 | |
| a,c | Series 2019-3 Class A3, 3.082% due 9/25/2059 | | | 193,436 | | | | 191,499 | |
| a,c | Series 2020-2 Class A1, 1.381% due 5/25/2065 | | | 8,072,685 | | | | 7,351,711 | |
| a,c | Series 2020-2 Class A2, 1.587% due 5/25/2065 | | | 1,568,518 | | | | 1,435,075 | |
| a,c | Series 2020-2 Class A3, 1.895% due 5/25/2065 | | | 535,509 | | | | 493,966 | |
| a,c | Series 2021-2 Class A1, 1.737% due 12/25/2061 | | | 13,612,599 | | | | 11,341,850 | |
| a,c | Shellpoint Asset Funding Trust, Whole Loan Securities Trust CMO, Series 2013-1 Class A1, 3.75% due 7/25/2043 | | | 799,699 | | | | 769,985 | |
| c | SLG Office Trust, CMBS, Series 2021-OVA Class A, 2.585% due 7/15/2041 | | | 13,752,000 | | | | 11,916,049 | |
| a,c | Starwood Mortgage Residential Trust, Whole Loan Securities Trust CMO, Series 2021-5 Class A1, 1.92% due 9/25/2066 | | | 21,043,764 | | | | 18,016,535 | |
| a | Structured Asset Securities Corp., Mortgage Pass-Through Certificates, Whole Loan Securities Trust CMO, Series 2003-9A Class 2A2, 6.698% due 3/25/2033 | | | 251,731 | | | | 251,731 | |
| | Towd Point Mortgage Trust, Whole Loan Securities Trust CMO, | | | | | | | | |
| a,c | Series 2018-1 Class A1, 3.00% due 1/25/2058 | | | 172,970 | | | | 169,790 | |
| a,c | Series 2018-2 Class A1, 3.25% due 3/25/2058 | | | 8,111,966 | | | | 7,944,127 | |
| a,c | Series 2018-6 Class A1A, 3.75% due 3/25/2058 | | | 4,710,316 | | | | 4,651,326 | |
| a,c | TRK Trust, Whole Loan Securities Trust CMO, Series 2022-INV2 Class A1, 4.35% due 6/25/2057 | | | 21,400,840 | | | | 20,866,563 | |
| | Verus Securitization Trust, Whole Loan Securities Trust CMO, | | | | | | | | |
| a,c | Series 2020-1 Class M1, 3.021% due 1/25/2060 | | | 5,000,000 | | | | 4,538,827 | |
| a,c | Series 2021-R1 Class A1, 0.82% due 10/25/2063 | | | 4,018,738 | | | | 3,764,063 | |
| a,c | Vista Point Securitization Trust, Whole Loan Securities Trust CMO, Series 2020-2 Class A1, 1.475% due 4/25/2065 | | | 3,329,656 | | | | 3,145,522 | |
| a,c | WB Commercial Mortgage Trust, CMBS, Series 2024-HQ Class A, 6.134% due 3/15/2040 | | | 4,050,000 | | | | 4,102,232 | |
| a,c | WinWater Mortgage Loan Trust, Whole Loan Securities Trust CMO, Series 2015-3 Class B4, 3.839% due 3/20/2045 | | | 998,938 | | | | 937,535 | |
| | TOTAL MORTGAGE BACKED (Cost $2,250,779,442) | | | | | | | 2,219,709,236 | |
| 122 | Annual Financial Statements | See notes to financial statements. |
Schedule of Investments, Continued
Thornburg Limited Term Income Fund | September 30, 2024
| ISSUER-DESCRIPTION | | SHARES/PRINCIPAL
AMOUNT | | | VALUE | |
| | | | | | | | | | |
| | ASSET BACKED SECURITIES — 11.9% | | | | | | |
| | | | | | | | |
| | AUTO RECEIVABLES — 2.0% | | | | | | |
| c | ACM Auto Trust, Series 2023-2A Class A, 7.97% due 6/20/2030 | | $ | 2,622,438 | | | $ | 2,639,560 | |
| c | Arivo Acceptance Auto Loan Receivables Trust, Series 2024-1A Class A, 6.46% due 4/17/2028 | | | 2,862,319 | | | | 2,885,628 | |
| c | Avid Automobile Receivables Trust, Series 2023-1 Class A, 6.63% due 7/15/2026 | | | 344,165 | | | | 344,316 | |
| | BOF URSA VI Funding Trust I, | | | | | | | | |
| c | Series 2023-CAR1 Class B, 6.029% due 10/27/2031 | | | 2,002,567 | | | | 2,020,177 | |
| c | Series 2023-CAR2 Class A2, 5.542% due 10/27/2031 | | | 3,877,113 | | | | 3,902,037 | |
| c | Series 2023-CAR2 Class B, 6.029% due 10/27/2031 | | | 5,261,695 | | | | 5,297,645 | |
| c | BOF VII AL Funding Trust I, Series 2023-CAR3 Class A2, 6.291% due 7/26/2032 | | | 7,521,446 | | | | 7,649,909 | |
| | Carvana Auto Receivables Trust, | | | | | | | | |
| c | Series 2023-N1 Class A, 6.36% due 4/12/2027 | | | 2,306,589 | | | | 2,314,103 | |
| c | Series 2023-N3 Class A, 6.41% due 9/10/2027 | | | 1,993,959 | | | | 2,006,329 | |
| c | Series 2023-N4 Class A, 6.42% due 1/10/2028 | | | 5,266,398 | | | | 5,307,756 | |
| c | CPS Auto Receivables Trust, Series 2020-B Class E, 7.38% due 6/15/2027 | | | 1,510,178 | | | | 1,511,184 | |
| | Drive Auto Receivables Trust, Series 2021-3 Class C, 1.47% due 1/15/2027 | | | 3,347,043 | | | | 3,329,533 | |
| | FHF Trust, | | | | | | | | |
| c | Series 2021-1A Class A, 1.27% due 3/15/2027 | | | 2,033,277 | | | | 2,007,452 | |
| c | Series 2021-2A Class A, 0.83% due 12/15/2026 | | | 1,532,961 | | | | 1,513,555 | |
| c | Series 2023-1A Class A2, 6.57% due 6/15/2028 | | | 2,822,433 | | | | 2,846,874 | |
| c | Flagship Credit Auto Trust, Series 2021-4 Class B, 1.49% due 2/15/2027 | | | 3,196,956 | | | | 3,165,159 | |
| c | GLS Auto Receivables Issuer Trust, Series 2021-4A Class C, 1.94% due 10/15/2027 | | | 3,123,366 | | | | 3,093,979 | |
| a,c | Kinetic Advantage Master Owner Trust, Series 2024-1A Class A, 7.992% (SOFR30A + 2.65%) due 11/15/2027 | | | 15,673,000 | | | | 15,724,476 | |
| | Lendbuzz Securitization Trust, | | | | | | | | |
| c | Series 2021-1A Class A, 1.46% due 6/15/2026 | | | 3,007,290 | | | | 2,958,072 | |
| c | Series 2022-1A Class A, 4.22% due 5/17/2027 | | | 3,834,091 | | | | 3,802,675 | |
| c | Series 2023-2A Class A2, 7.09% due 10/16/2028 | | | 3,123,495 | | | | 3,180,162 | |
| c | Series 2024-3A Class A2, 4.97% due 10/15/2029 | | | 7,265,000 | | | | 7,262,752 | |
| | Lobel Automobile Receivables Trust, | | | | | | | | |
| c | Series 2023-1 Class A, 6.97% due 7/15/2026 | | | 870,619 | | | | 872,176 | |
| c | Series 2023-2 Class A, 7.59% due 4/16/2029 | | | 1,870,454 | | | | 1,891,434 | |
| | Research-Driven Pagaya Motor Asset Trust, | | | | | | | | |
| c | Series 2023-3A Class A, 7.13% due 1/26/2032 | | | 12,398,447 | | | | 12,539,401 | |
| c | Series 2023-4A Class A, 7.54% due 3/25/2032 | | | 7,354,934 | | | | 7,473,106 | |
| c | SAFCO Auto Receivables Trust, Series 2024-1A Class A, 6.51% due 3/20/2028 | | | 4,094,059 | | | | 4,126,874 | |
| | Tricolor Auto Securitization Trust, | | | | | | | | |
| c | Series 2023-1A Class A, 6.48% due 8/17/2026 | | | 225,731 | | | | 225,792 | |
| c | Series 2024-2A Class A, 6.36% due 12/15/2027 | | | 7,062,016 | | | | 7,116,592 | |
| c | United Auto Credit Securitization Trust, Series 2024-1 Class A, 6.17% due 8/10/2026 | | | 2,342,110 | | | | 2,347,884 | |
| c | Veros Auto Receivables Trust, Series 2024-1 Class A, 6.28% due 11/15/2027 | | | 9,687,404 | | | | 9,756,479 | |
| | | | | | | | | 131,113,071 | |
| | | | | | | | | | |
| | CREDIT CARD — 0.6% | | | | | | | | |
| c | Brex Commercial Charge Card Master Trust, Series 2024-1 Class A1, 6.05% due 7/15/2027 | | | 8,627,000 | | | | 8,765,136 | |
| | Mercury Financial Credit Card Master Trust, | | | | | | | | |
| c | Series 2023-1A Class A, 8.04% due 9/20/2027 | | | 14,600,000 | | | | 14,670,608 | |
| c | Series 2024-2A Class A, 6.56% due 7/20/2029 | | | 9,800,000 | | | | 9,985,274 | |
| c | Mission Lane Credit Card Master Trust, Series 2023-B Class A, 7.69% due 11/15/2028 | | | 5,000,000 | | | | 5,073,244 | |
| | | | | | | | | 38,494,262 | |
| | | | | | | | | | |
| | OTHER ASSET BACKED — 6.6% | | | | | | | | |
| c | AFG ABS I LLC, Series 2023-1 Class A2, 6.30% due 9/16/2030 | | | 5,322,108 | | | | 5,358,583 | |
| c | AMCR ABS Trust, Series 2023-1A Class A, 7.66% due 1/21/2031 | | | 1,790,539 | | | | 1,798,924 | |
| c | Amur Equipment Finance Receivables X LLC, Series 2022-1A Class A2, 1.64% due 10/20/2027 | | | 7,350,878 | | | | 7,263,880 | |
| | Aqua Finance Trust, | | | | | | | | |
| c | Series 2020-AA Class A, 1.90% due 7/17/2046 | | | 7,411,004 | | | | 6,750,201 | |
| c | Series 2020-AA Class C, 3.97% due 7/17/2046 | | | 6,160,301 | | | | 5,787,088 | |
| c | Series 2021-A Class A, 1.54% due 7/17/2046 | | | 8,031,732 | | | | 7,407,944 | |
| c | Auxilior Term Funding LLC, Series 2023-1A Class A2, 6.18% due 12/15/2028 | | | 2,633,447 | | | | 2,661,085 | |
| | BHG Securitization Trust, | | | | | | | | |
| c | Series 2021-B Class A, 0.90% due 10/17/2034 | | | 1,459,909 | | | | 1,445,680 | |
| c | Series 2022-A Class A, 1.71% due 2/20/2035 | | | 4,525,974 | | | | 4,496,250 | |
| b,c | CFG Investments Ltd., Series 2023-1 Class A, 8.56% due 7/25/2034 | | | 5,000,000 | | | | 5,026,927 | |
| See notes to financial statements. | Annual Financial Statements | 123 |
Schedule of Investments, Continued
Thornburg Limited Term Income Fund | September 30, 2024
| ISSUER-DESCRIPTION | | SHARES/PRINCIPAL
AMOUNT | | | VALUE | |
| | | | | | | | | | |
| c | CFMT Issuer Trust, Series 2021-GRN1 Class A, 1.10% due 3/20/2041 | | $ | 4,814,011 | | | $ | 4,695,954 | |
| c | ClickLease Equipment Receivables Trust, Series 2024-1 Class A, 6.86% due 2/15/2030 | | | 4,697,567 | | | | 4,718,029 | |
| c | CP EF Asset Securitization I LLC, Series 2022-1A Class A, 5.96% due 4/15/2030 | | | 2,572,642 | | | | 2,575,823 | |
| c | Crockett Partners Equipment Co. IIA LLC, Series 2024-1C Class A, 6.05% due 1/20/2031 | | | 7,936,000 | | | | 8,078,391 | |
| c | DataBank Issuer LLC, Series 2024-1A Class A2, 5.30% due 1/26/2054 | | | 13,300,000 | | | | 13,257,078 | |
| | Dext ABS LLC, | | | | | | | | |
| c | Series 2021-1 Class A, 1.12% due 2/15/2028 | | | 395,549 | | | | 394,902 | |
| c | Series 2023-2 Class A2, 6.56% due 5/15/2034 | | | 3,402,917 | | | | 3,446,190 | |
| c | Diamond Infrastructure Funding LLC, Series 2021-1A Class A, 1.76% due 4/15/2049 | | | 36,000,000 | | | | 33,496,643 | |
| c | Diamond Issuer LLC, Series 2021-1A Class A, 2.305% due 11/20/2051 | | | 27,894,000 | | | | 26,015,387 | |
| b,c | ECAF I Ltd., Series 2015-1A Class A2, 4.947% due 6/15/2040 | | | 2,623,868 | | | | 1,731,785 | |
| c | EverBright Solar Trust, Series 2024-A Class A, 6.43% due 6/22/2054 | | | 9,153,324 | | | | 9,220,892 | |
| | Foundation Finance Trust, | | | | | | | | |
| c | Series 2019-1A Class B, 4.22% due 11/15/2034 | | | 1,773,994 | | | | 1,758,467 | |
| c | Series 2020-1A Class A, 3.54% due 7/16/2040 | | | 2,026,768 | | | | 2,001,815 | |
| c | Series 2020-1A Class B, 4.62% due 7/16/2040 | | | 3,000,000 | | | | 2,964,802 | |
| c | Series 2021-1A Class A, 1.27% due 5/15/2041 | | | 10,383,144 | | | | 9,592,369 | |
| c | Series 2021-2A Class A, 2.19% due 1/15/2042 | | | 7,024,322 | | | | 6,587,024 | |
| | Goldman Home Improvement Trust Issuer Trust, | | | | | | | | |
| c | Series 2021-GRN2 Class A, 1.15% due 6/25/2051 | | | 5,505,035 | | | | 5,302,925 | |
| c | Series 2022-GRN1 Class A, 4.50% due 6/25/2052 | | | 3,100,314 | | | | 3,079,673 | |
| c | Goodgreen Trust, Series 2021-1A Class A, 2.66% due 10/15/2056 | | | 15,490,534 | | | | 13,280,219 | |
| | GoodLeap Sustainable Home Solutions Trust, | | | | | | | | |
| c | Series 2021-3CS Class A, 2.10% due 5/20/2048 | | | 13,959,839 | | | | 11,027,589 | |
| c | Series 2021-4GS Class A, 1.93% due 7/20/2048 | | | 13,157,131 | | | | 10,134,356 | |
| c | Series 2021-5CS Class A, 2.31% due 10/20/2048 | | | 7,653,030 | | | | 6,170,419 | |
| a,c | Gracie Point International Funding LLC, Series 2023-2A Class A, 7.619% (SOFR90A + 2.25%) due 3/1/2027 | | | 3,747,781 | | | | 3,757,198 | |
| c | GreenSky Home Improvement Trust, Series 2024-1 Class A2, 5.88% due 6/25/2059 | | | 11,000,000 | | | | 11,072,877 | |
| | HERO Funding Trust, | | | | | | | | |
| c | Series 2015-1A Class A, 3.84% due 9/21/2040 | | | 1,791,042 | | | | 1,678,092 | |
| c | Series 2017-2A Class A1, 3.28% due 9/20/2048 | | | 386,654 | | | | 346,842 | |
| | Hilton Grand Vacations Trust, | | | | | | | | |
| c | Series 2019-AA Class A, 2.34% due 7/25/2033 | | | 2,292,728 | | | | 2,237,873 | |
| c | Series 2020-AA Class A, 2.74% due 2/25/2039 | | | 485,198 | | | | 470,366 | |
| c | HIN Timeshare Trust, Series 2020-A Class A, 1.39% due 10/9/2039 | | | 2,594,944 | | | | 2,419,253 | |
| c | InStar Leasing III LLC, Series 2021-1A Class A, 2.30% due 2/15/2054 | | | 8,395,548 | | | | 7,613,596 | |
| c | LendingPoint Asset Securitization Trust, Series 2022-B Class A, 4.77% due 10/15/2029 | | | 978,052 | | | | 975,973 | |
| | LendingPoint Pass-Through Trust, | | | | | | | | |
| c | Series 2022-ST1 Class A, 2.50% due 3/15/2028 | | | 909,271 | | | | 885,257 | |
| c | Series 2022-ST3 Class A, 4.00% due 5/15/2028 | | | 2,198,385 | | | | 2,179,986 | |
| c | Loanpal Solar Loan Ltd., Series 2021-1GS Class A, 2.29% due 1/20/2048 | | | 14,479,972 | | | | 11,427,830 | |
| c | Momnt Technologies Trust, Series 2023-1A Class A, 6.92% due 3/20/2045 | | | 3,136,553 | | | | 3,183,398 | |
| | Mosaic Solar Loan Trust, | | | | | | | | |
| c | Series 2019-1A Class A, 4.37% due 12/21/2043 | | | 916,387 | | | | 885,802 | |
| c | Series 2020-1A Class A, 2.10% due 4/20/2046 | | | 3,020,820 | | | | 2,652,423 | |
| c | OneMain Financial Issuance Trust, Series 2018-2A Class C, 4.04% due 3/14/2033 | | | 4,510,000 | | | | 4,486,599 | |
| c | Oportun Funding XIV LLC, Series 2021-A Class A, 1.21% due 3/8/2028 | | | 1,244,006 | | | | 1,216,622 | |
| | Oportun Issuance Trust, | | | | | | | | |
| c | Series 2021-C Class A, 2.18% due 10/8/2031 | | | 11,492,000 | | | | 11,149,668 | |
| c | Series 2022-A Class A, 5.05% due 6/9/2031 | | | 16,410,123 | | | | 16,390,492 | |
| c | Pagaya AI Debt Selection Trust, Series 2021-HG1 Class A, 1.22% due 1/16/2029 | | | 1,106,115 | | | | 1,088,273 | |
| | Pagaya AI Debt Trust, | | | | | | | | |
| c | Series 2022-2 Class A, 4.97% due 1/15/2030 | | | 656,289 | | | | 655,665 | |
| c | Series 2023-1 Class A, 7.556% due 7/15/2030 | | | 1,274,482 | | | | 1,277,634 | |
| a,c | Series 2023-5 Class AB, 7.421% due 4/15/2031 | | | 1,716,714 | | | | 1,724,958 | |
| c | Series 2024-1 Class A, 6.66% due 7/15/2031 | | | 1,533,252 | | | | 1,554,867 | |
| c | Pawnee Equipment Receivables LLC, Series 2021-1 Class A2, 1.10% due 7/15/2027 | | | 421,097 | | | | 419,627 | |
| c | PowerPay Issuance Trust, Series 2024-1A Class A, 6.53% due 2/18/2039 | | | 5,627,155 | | | | 5,730,321 | |
| | Prosper Marketplace Issuance Trust, | | | | | | | | |
| c | Series 2023-1A Class A, 7.06% due 7/16/2029 | | | 692,191 | | | | 694,525 | |
| c | Series 2024-1A Class A, 6.12% due 8/15/2029 | | | 4,149,047 | | | | 4,161,752 | |
| c | Reach ABS Trust, Series 2024-2A Class A, 5.88% due 7/15/2031 | | | 6,894,345 | | | | 6,937,080 | |
| c | Reach Financial LLC, Series 2023-1A Class A, 7.05% due 2/18/2031 | | | 510,532 | | | | 512,561 | |
| 124 | Annual Financial Statements | See notes to financial statements. |
Schedule of Investments, Continued
Thornburg Limited Term Income Fund | September 30, 2024
| ISSUER-DESCRIPTION | | SHARES/PRINCIPAL
AMOUNT | | | VALUE | |
| | | | | | | | | | |
| c | Retained Vantage Data Centers Issuer LLC, Series 2023-1A Class A2A, 5.00% due 9/15/2048 | | $ | 12,300,000 | | | $ | 12,264,821 | |
| a,c | SBA Tower Trust, Series 2014-2A Class C, 3.869% due 10/15/2049 | | | 4,610,000 | | | | 4,606,813 | |
| c | Service Experts Issuer LLC, Series 2021-1A Class A, 2.67% due 2/2/2032 | | | 10,381,081 | | | | 10,010,998 | |
| c | SpringCastle America Funding LLC, Series 2020-AA Class A, 1.97% due 9/25/2037 | | | 12,919,012 | | | | 12,088,202 | |
| c | SPS Servicer Advance Receivables Trust, Series 2020-T2 Class A, 1.83% due 11/15/2055 | | | 12,915,000 | | | | 12,472,792 | |
| c | Stack Infrastructure Issuer LLC, Series 2021-1A Class A2, 1.877% due 3/26/2046 | | | 7,500,000 | | | | 7,161,757 | |
| c | Sunnova Hestia II Issuer LLC, Series 2024-GRID1 Class 1A, 5.63% due 7/20/2051 | | | 9,419,589 | | | | 9,696,292 | |
| | Upstart Pass-Through Trust, | | | | | | | | |
| c | Series 2021-ST4 Class A, 2.00% due 7/20/2027 | | | 601,373 | | | | 587,780 | |
| c | Series 2021-ST5 Class A, 2.00% due 7/20/2027 | | | 506,102 | | | | 497,116 | |
| c | Series 2021-ST6 Class A, 1.85% due 8/20/2027 | | | 481,112 | | | | 479,114 | |
| c | Series 2021-ST8 Class A, 1.75% due 10/20/2029 | | | 239,472 | | | | 238,932 | |
| | Upstart Securitization Trust, | | | | | | | | |
| c | Series 2023-1 Class A, 6.59% due 2/20/2033 | | | 457,991 | | | | 458,428 | |
| c | Series 2023-3 Class A, 6.90% due 10/20/2033 | | | 2,703,217 | | | | 2,733,454 | |
| | Upstart Structured Pass-Through Trust, | | | | | | | | |
| c | Series 2022-1A Class A, 3.40% due 4/15/2030 | | | 9,860,822 | | | | 9,741,208 | |
| c | Series 2022-4A Class A, 7.01% due 11/15/2030 | | | 860,209 | | | | 860,844 | |
| | | | | | | | | 421,213,255 | |
| | | | | | | | | | |
| | STUDENT LOAN — 2.7% | | | | | | | | |
| c | Ascent Education Funding Trust, Series 2024-A Class A, 6.14% due 10/25/2050 | | | 9,348,210 | | | | 9,611,811 | |
| | College Ave Student Loans LLC, | | | | | | | | |
| a,c | Series 2021-A Class A1, 6.069% (TSFR1M + 1.21%) due 7/25/2051 | | | 6,662,955 | | | | 6,439,231 | |
| c | Series 2021-A Class A2, 1.60% due 7/25/2051 | | | 1,540,822 | | | | 1,391,411 | |
| a,c | Series 2021-C Class A1, 5.869% (TSFR1M + 1.01%) due 7/26/2055 | | | 11,354,526 | | | | 10,589,356 | |
| | Commonbond Student Loan Trust, | | | | | | | | |
| c | Series 18-CGS Class A1, 3.87% due 2/25/2046 | | | 1,297,489 | | | | 1,255,958 | |
| c | Series 2020-1 Class A, 1.69% due 10/25/2051 | | | 9,115,598 | | | | 8,254,690 | |
| c | Series 2021-AGS Class A, 1.20% due 3/25/2052 | | | 7,634,227 | | | | 6,486,159 | |
| c | Series 2021-BGS Class A, 1.17% due 9/25/2051 | | | 8,711,625 | | | | 7,326,142 | |
| c | MPOWER Education Trust, Series 2024-A Class A, 6.78% due 7/22/2041 | | | 9,440,932 | | | | 9,710,764 | |
| | Navient Private Education Refi Loan Trust, | | | | | | | | |
| a,c | Series 2019-D Class A2B, 6.261% (TSFR1M + 1.16%) due 12/15/2059 | | | 6,155,035 | | | | 6,149,702 | |
| c | Series 2021-A Class A, 0.84% due 5/15/2069 | | | 2,378,988 | | | | 2,161,191 | |
| c | Series 2022-BA Class A, 4.16% due 10/15/2070 | | | 17,732,669 | | | | 17,405,281 | |
| | Navient Student Loan Trust, | | | | | | | | |
| a | Series 2014-1 Class A3, 5.905% (SOFR30A + 0.62%) due 6/25/2031 | | | 2,913,930 | | | | 2,869,457 | |
| a,c | Series 2019-BA Class A2B, 6.191% (TSFR1M + 1.09%) due 12/15/2059 | | | 846,467 | | | | 843,394 | |
| | Nelnet Student Loan Trust, | | | | | | | | |
| a,c | Series 2013-1A Class A, 5.995% (SOFR30A + 0.71%) due 6/25/2041 | | | 1,912,807 | | | | 1,878,951 | |
| a,c | Series 2015-2A Class A2, 5.995% (SOFR30A + 0.71%) due 9/25/2042 | | | 14,306,143 | | | | 14,036,933 | |
| a,c | Series 2015-3A Class A2, 5.995% (SOFR30A + 0.71%) due 2/27/2051 | | | 682,614 | | | | 680,424 | |
| a,c | Series 2021-CA Class AFL, 5.815% (TSFR1M + 0.85%) due 4/20/2062 | | | 8,679,022 | | | | 8,466,574 | |
| a,c | Series 2021-DA Class AFL, 5.765% (TSFR1M + 0.80%) due 4/20/2062 | | | 12,437,751 | | | | 12,145,714 | |
| a,b,c | Prodigy Finance DAC, Series 2021-1A Class A, 6.219% (TSFR1M + 1.36%) due 7/25/2051 | | | 1,277,256 | | | | 1,252,234 | |
| | SLM Student Loan Trust, | | | | | | | | |
| a | Series 2011-2 Class A2, 6.595% (SOFR30A + 1.31%) due 10/25/2034 | | | 5,564,399 | | | | 5,595,635 | |
| a | Series 2013-6 Class A3, 6.045% (SOFR30A + 0.76%) due 6/26/2028 | | | 18,038,679 | | | | 17,898,019 | |
| | SMB Private Education Loan Trust, | | | | | | | | |
| a,c | Series 2017-B Class A2B, 5.961% (TSFR1M + 0.86%) due 10/15/2035 | | | 391,336 | | | | 389,686 | |
| a,c | Series 2021-D Class A1B, 5.811% (TSFR1M + 0.71%) due 3/17/2053 | | | 5,271,140 | | | | 5,205,367 | |
| a,c | Series 2021-E Class A1B, 5.841% (TSFR1M + 0.74%) due 2/15/2051 | | | 15,301,324 | | | | 15,114,805 | |
| a,c | Towd Point Asset Trust, Series 2021-SL1 Class A2, 5.775% (TSFR1M + 0.81%) due 11/20/2061 | | | 3,586,234 | | | | 3,574,429 | |
| | | | | | | | | 176,733,318 | |
| | TOTAL ASSET BACKED SECURITIES (Cost $790,847,472) | | | | | | | 767,553,906 | |
| | | | | | | | | | |
| | CORPORATE BONDS — 32.2% | | | | | | | | |
| | | | | | | | | | |
| | AUTOMOBILES & COMPONENTS — 0.8% | | | | | | | | |
| | Automobiles — 0.8% | | | | | | | | |
| a | American Honda Finance Corp., 5.732% (SOFRINDX + 0.70%) due 11/22/2024 | | | 22,550,000 | | | | 22,551,579 | |
| a,c | Daimler Truck Finance North America LLC, 5.691% (SOFR + 0.75%) due 12/13/2024 | | | 10,414,000 | | | | 10,422,539 | |
| See notes to financial statements. | Annual Financial Statements | 125 |
Schedule of Investments, Continued
Thornburg Limited Term Income Fund | September 30, 2024
| ISSUER-DESCRIPTION | | SHARES/PRINCIPAL
AMOUNT | | | VALUE | |
| | | | | | | | | | |
| | Hyundai Capital America, | | | | | | |
| c | 1.80% due 10/15/2025 | | $ | 3,353,000 | | | $ | 3,258,211 | |
| c | 3.00% due 2/10/2027 | | | 1,455,000 | | | | 1,408,949 | |
| c | 5.30% due 3/19/2027 | | | 2,000,000 | | | | 2,041,600 | |
| c | 5.45% due 6/24/2026 | | | 4,100,000 | | | | 4,168,142 | |
| b,c | Kia Corp., 2.375% due 2/14/2025 | | | 4,800,000 | | | | 4,757,760 | |
| | | | | | | | | 48,608,780 | |
| | BANKS — 1.1% | | | | | | | | |
| | Banks — 1.1% | | | | | | | | |
| a,b,c | DNB Bank ASA, 5.896% (SOFRINDX + 1.95%) due 10/9/2026 | | | 7,500,000 | | | | 7,597,425 | |
| | FNB Corp., 5.15% due 8/25/2025 | | | 5,748,000 | | | | 5,744,551 | |
| | KeyBank NA, 5.00% due 1/26/2033 | | | 7,100,000 | | | | 7,035,177 | |
| a,b,c | NBK SPC Ltd., 1.625% (SOFR + 1.05%) due 9/15/2027 | | | 13,033,000 | | | | 12,284,124 | |
| | Santander Holdings USA, Inc., | | | | | | | | |
| | 3.244% due 10/5/2026 | | | 4,023,000 | | | | 3,913,856 | |
| | 3.45% due 6/2/2025 | | | 4,453,000 | | | | 4,403,616 | |
| b,c | Sumitomo Mitsui Trust Bank Ltd., 5.65% due 3/9/2026 | | | 3,800,000 | | | | 3,870,338 | |
| | Synchrony Bank, 5.40% due 8/22/2025 | | | 7,250,000 | | | | 7,265,515 | |
| a | U.S. Bancorp, 5.775% (SOFR + 2.02%) due 6/12/2029 | | | 5,381,000 | | | | 5,638,320 | |
| | Wells Fargo & Co., | | | | | | | | |
| a | 3.908% (SOFR + 1.32%) due 4/25/2026 | | | 8,792,000 | | | | 8,736,786 | |
| a | 4.808% (SOFR + 1.98%) due 7/25/2028 | | | 3,448,000 | | | | 3,487,790 | |
| | | | | | | | | 69,977,498 | |
| | CAPITAL GOODS — 0.1% | | | | | | |
| | Machinery — 0.1% | | | | | | |
| | Regal Rexnord Corp., 6.05% due 2/15/2026 | | | 4,906,000 | | | | 4,989,108 | |
| | | | | | | | | 4,989,108 | |
| | COMMERCIAL & PROFESSIONAL SERVICES — 0.7% | | | | | | | | |
| | Commercial Services & Supplies — 0.7% | | | | | | | | |
| | Element Fleet Management Corp., | | | | | | | | |
| b,c | 5.643% due 3/13/2027 | | | 4,400,000 | | | | 4,512,816 | |
| b,c | 6.271% due 6/26/2026 | | | 11,400,000 | | | | 11,709,510 | |
| b,c | 6.319% due 12/4/2028 | | | 3,422,000 | | | | 3,644,943 | |
| | Quanta Services, Inc., | | | | | | | | |
| | 0.95% due 10/1/2024 | | | 5,296,000 | | | | 5,296,000 | |
| | 4.75% due 8/9/2027 | | | 3,500,000 | | | | 3,537,205 | |
| c | UL Solutions, Inc., 6.50% due 10/20/2028 | | | 12,800,000 | | | | 13,693,568 | |
| | | | | | | | | 42,394,042 | |
| | CONSUMER SERVICES — 0.1% | | | | | | | | |
| | Hotels, Restaurants & Leisure — 0.1% | | | | | | | | |
| | Warnermedia Holdings, Inc., 6.412% due 3/15/2026 | | | 10,000,000 | | | | 10,001,000 | |
| | | | | | | | | 10,001,000 | |
| | ENERGY — 2.1% | | | | | | | | |
| | Oil, Gas & Consumable Fuels — 2.1% | | | | | | | | |
| c | Colorado Interstate Gas Co. LLC/Colorado Interstate Issuing Corp., 4.15% due 8/15/2026 | | | 9,092,000 | | | | 9,023,173 | |
| c | El Paso Natural Gas Co. LLC, 3.50% due 2/15/2032 | | | 4,068,000 | | | | 3,619,544 | |
| c | Florida Gas Transmission Co. LLC, 2.30% due 10/1/2031 | | | 2,934,000 | | | | 2,488,912 | |
| | Galaxy Pipeline Assets Bidco Ltd., | | | | | | | | |
| b,c | 1.75% due 9/30/2027 | | | 20,035,653 | | | | 19,170,313 | |
| b,c | 2.16% due 3/31/2034 | | | 7,773,571 | | | | 6,898,966 | |
| b,c,e,f | Gazprom PJSC via Gaz Finance plc, 3.50% due 7/14/2031 | | | 32,475,000 | | | | 17,112,376 | |
| c | Gray Oak Pipeline LLC, 3.45% due 10/15/2027 | | | 12,955,000 | | | | 12,526,449 | |
| b,c | Greensaif Pipelines Bidco SARL, 5.853% due 2/23/2036 | | | 4,160,000 | | | | 4,306,515 | |
| c | Midwest Connector Capital Co. LLC, 4.625% due 4/1/2029 | | | 13,090,000 | | | | 13,026,383 | |
| b,c,d | SA Global Sukuk Ltd., 4.25% due 10/2/2029 | | | 24,040,000 | | | | 23,817,390 | |
| c | South Bow USA Infrastructure Holdings LLC, 4.911% due 9/1/2027 | | | 2,000,000 | | | | 2,015,320 | |
| 126 | Annual Financial Statements | See notes to financial statements. |
Schedule of Investments, Continued
Thornburg Limited Term Income Fund | September 30, 2024
| ISSUER-DESCRIPTION | | SHARES/PRINCIPAL
AMOUNT | | | VALUE | |
| | | | | | | | | | |
| b,c | TMS Issuer SARL, 5.78% due 8/23/2032 | | $ | 10,700,000 | | | $ | 11,253,939 | |
| c | Whistler Pipeline LLC, 5.40% due 9/30/2029 | | | 6,985,000 | | | | 7,132,314 | |
| | | | | | | | | 132,391,594 | |
| | | | | | | | | | |
| | EQUITY REAL ESTATE INVESTMENT TRUSTS (REITS) — 1.6% | | | | | | | | |
| | Diversified REITs — 1.6% | | | | | | | | |
| | American Tower Corp., 2.40% due 3/15/2025 | | | 12,850,000 | | | | 12,694,258 | |
| c | American Tower Trust #1, 3.652% due 3/15/2048 | | | 8,015,000 | | | | 7,786,154 | |
| | Crown Castle, Inc., | | | | | | | | |
| | 2.90% due 3/15/2027 | | | 2,750,000 | | | | 2,660,763 | |
| | 4.90% due 9/1/2029 | | | 6,181,000 | | | | 6,284,841 | |
| | Realty Income Corp., 5.05% due 1/13/2026 | | | 6,146,000 | | | | 6,148,950 | |
| | SBA Tower Trust, | | | | | | | | |
| c | 1.631% due 5/15/2051 | | | 26,000,000 | | | | 24,343,649 | |
| c | 1.84% due 4/15/2027 | | | 8,140,000 | | | | 7,572,201 | |
| c | 2.836% due 1/15/2050 | | | 12,661,000 | | | | 12,570,065 | |
| c,d | 4.831% due 10/15/2029 | | | 6,480,000 | | | | 6,444,684 | |
| c | 6.599% due 11/15/2052 | | | 7,950,000 | | | | 8,273,350 | |
| | Vornado Realty LP, 2.15% due 6/1/2026 | | | 7,000,000 | | | | 6,664,140 | |
| | | | | | | | | 101,443,055 | |
| | | | | | | | | | |
| | FINANCIAL SERVICES — 5.4% | | | | | | | | |
| | Capital Markets — 2.0% | | | | | | | | |
| b,c | Abu Dhabi Developmental Holding Co. PJSC, 5.375% due 5/8/2029 | | | 15,500,000 | | | | 16,145,885 | |
| | Ares Capital Corp., 3.25% due 7/15/2025 | | | 9,335,000 | | | | 9,186,947 | |
| | Blue Owl Credit Income Corp., 3.125% due 9/23/2026 | | | 19,056,000 | | | | 18,199,433 | |
| | Blue Owl Technology Finance Corp., | | | | | | | | |
| c | 3.75% due 6/17/2026 | | | 12,276,000 | | | | 11,808,775 | |
| c | 4.75% due 12/15/2025 | | | 25,494,000 | | | | 25,117,454 | |
| | Hercules Capital, Inc., | | | | | | | | |
| | 2.625% due 9/16/2026 | | | 14,120,000 | | | | 13,353,708 | |
| | 3.375% due 1/20/2027 | | | 7,458,000 | | | | 7,100,090 | |
| | Main Street Capital Corp., 3.00% due 7/14/2026 | | | 8,163,000 | | | | 7,822,276 | |
| | Sixth Street Specialty Lending, Inc., 3.875% due 11/1/2024 | | | 21,673,000 | | | | 21,625,970 | |
| | Financial Services — 3.4% | | | | | | | | |
| | Antares Holdings LP, | | | | | | | | |
| c | 2.75% due 1/15/2027 | | | 7,360,000 | | | | 6,881,968 | |
| c | 3.95% due 7/15/2026 | | | 14,391,000 | | | | 13,983,879 | |
| b | Banco Santander SA, 5.147% due 8/18/2025 | | | 10,000,000 | | | | 10,027,400 | |
| | Bank of America Corp., | | | | | | | | |
| a | 1.319% (SOFR + 1.15%) due 6/19/2026 | | | 6,665,000 | | | | 6,500,708 | |
| a | 4.948% (SOFR + 2.04%) due 7/22/2028 | | | 6,007,000 | | | | 6,111,221 | |
| | BNP Paribas SA, | | | | | | | | |
| a,b,c | 2.219% (SOFR + 2.07%) due 6/9/2026 | | | 3,500,000 | | | | 3,432,940 | |
| a,b,c | 2.591% (SOFR + 1.23%) due 1/20/2028 | | | 3,650,000 | | | | 3,501,992 | |
| a,b,c | 2.819% (TSFR3M + 1.37%) due 11/19/2025 | | | 4,775,000 | | | | 4,756,759 | |
| a | Charles Schwab Corp., 6.033% (SOFRINDX + 1.05%) due 3/3/2027 | | | 18,833,000 | | | | 18,925,282 | |
| | Citigroup, Inc., | | | | | | | | |
| a | 1.122% (SOFR + 0.77%) due 1/28/2027 | | | 1,332,000 | | | | 1,274,351 | |
| a | 1.462% (SOFR + 0.77%) due 6/9/2027 | | | 7,328,000 | | | | 6,983,731 | |
| a | 3.106% (SOFR + 2.84%) due 4/8/2026 | | | 4,265,000 | | | | 4,223,459 | |
| | 3.40% due 5/1/2026 | | | 2,425,000 | | | | 2,394,421 | |
| a,b | Deutsche Bank AG, 2.552% (SOFR + 1.32%) due 1/7/2028 | | | 4,940,000 | | | | 4,707,672 | |
| a | Goldman Sachs Group, Inc., 5.761% (SOFR + 0.82%) due 9/10/2027 | | | 10,881,000 | | | | 10,863,373 | |
| | HSBC Holdings plc, | | | | | | | | |
| a,b | 1.645% (SOFR + 1.54%) due 4/18/2026 | | | 3,025,000 | | | | 2,969,128 | |
| a,b | 4.041% (TSFR3M + 1.81%) due 3/13/2028 | | | 6,100,000 | | | | 6,035,096 | |
| a,b | 4.18% (SOFR + 1.51%) due 12/9/2025 | | | 5,400,000 | | | | 5,386,176 | |
| a,b | 4.583% (TSFR3M + 1.80%) due 6/19/2029 | | | 3,000,000 | | | | 3,001,710 | |
| a,b | 5.887% (SOFR + 1.57%) due 8/14/2027 | | | 6,500,000 | | | | 6,678,100 | |
| | JPMorgan Chase & Co., | | | | | | | | |
| a | 1.04% (TSFR3M + 0.70%) due 2/4/2027 | | | 4,690,000 | | | | 4,483,077 | |
| a | 3.54% (TSFR3M + 1.64%) due 5/1/2028 | | | 3,040,000 | | | | 2,985,402 | |
| See notes to financial statements. | Annual Financial Statements | 127 |
Schedule of Investments, Continued
Thornburg Limited Term Income Fund | September 30, 2024
| ISSUER-DESCRIPTION | | SHARES/PRINCIPAL
AMOUNT | | | VALUE | |
| | | | | | | | | | |
| a | 4.08% (SOFR + 1.32%) due 4/26/2026 | | $ | 5,500,000 | | | $ | 5,473,545 | |
| a | 5.943% (SOFR + 0.92%) due 2/24/2026 | | | 10,418,000 | | | | 10,437,690 | |
| a,b | Mitsubishi UFJ Financial Group, Inc., 5.017% (H15T1Y + 1.95%) due 7/20/2028 | | | 3,285,000 | | | | 3,349,714 | |
| | Morgan Stanley, | | | | | | | | |
| a | 5.70% (SOFR + 0.51%) due 1/22/2025 | | | 11,785,000 | | | | 11,787,239 | |
| a | Series I, 0.864% (SOFR + 0.75%) due 10/21/2025 | | | 6,165,000 | | | | 6,149,033 | |
| | Societe Generale SA, | | | | | | | | |
| a,b,c | 1.792% (H15T1Y + 1.00%) due 6/9/2027 | | | 4,933,000 | | | | 4,682,157 | |
| b,c | 2.625% due 1/22/2025 | | | 4,000,000 | | | | 3,964,120 | |
| a,b,c | 6.267% (SOFR + 1.05%) due 1/21/2026 | | | 6,400,000 | | | | 6,407,424 | |
| b | Sumitomo Mitsui Financial Group, Inc., 1.402% due 9/17/2026 | | | 11,650,000 | | | | 11,040,938 | |
| | UBS Group AG, | | | | | | | | |
| a,b,c | 1.494% (H15T1Y + 0.85%) due 8/10/2027 | | | 7,121,000 | | | | 6,730,342 | |
| a,b,c | 6.373% (SOFR + 3.34%) due 7/15/2026 | | | 4,300,000 | | | | 4,347,214 | |
| | Western Union Co., 2.85% due 1/10/2025 | | | 7,256,000 | | | | 7,201,362 | |
| | | | | | | | | 348,039,161 | |
| | | | | | | | | | |
| | FOOD, BEVERAGE & TOBACCO — 0.8% | | | | | | | | |
| | Beverages — 0.5% | | | | | | | | |
| b,c | Becle SAB de CV, 2.50% due 10/14/2031 | | | 28,038,000 | | | | 23,349,486 | |
| | Constellation Brands, Inc., 5.00% due 2/2/2026 | | | 2,750,000 | | | | 2,748,927 | |
| | Huntington Ingalls Industries, Inc., 3.483% due 12/1/2027 | | | 2,640,000 | | | | 2,570,515 | |
| | Tobacco — 0.3% | | | | | | | | |
| | BAT Capital Corp., 3.215% due 9/6/2026 | | | 4,632,000 | | | | 4,533,570 | |
| b,c | Imperial Brands Finance plc, 5.50% due 2/1/2030 | | | 16,500,000 | | | | 17,022,390 | |
| | | | | | | | | 50,224,888 | |
| | | | | | | | | | |
| | HEALTH CARE EQUIPMENT & SERVICES — 1.3% | | | | | | | | |
| | Health Care Equipment & Supplies — 0.4% | | | | | | | | |
| c | Dentsply Sirona, Inc., 5.456% due 10/28/2024 | | | 12,200,000 | | | | 12,151,048 | |
| b,c | Olympus Corp., 2.143% due 12/8/2026 | | | 14,061,000 | | | | 13,395,071 | |
| | Health Care Providers & Services — 0.9% | | | | | | | | |
| | Centene Corp., 4.625% due 12/15/2029 | | | 4,906,000 | | | | 4,803,121 | |
| c | Highmark, Inc., 1.45% due 5/10/2026 | | | 20,542,000 | | | | 19,506,067 | |
| | Humana, Inc., 5.70% due 3/13/2026 | | | 14,746,000 | | | | 14,749,686 | |
| | Laboratory Corp. of America Holdings, | | | | | | | | |
| | 1.55% due 6/1/2026 | | | 4,855,000 | | | | 4,637,059 | |
| | 4.55% due 4/1/2032 | | | 13,906,000 | | | | 13,750,392 | |
| | | | | | | | | 82,992,444 | |
| | | | | | | | | | |
| | INSURANCE — 6.7% | | | | | | | | |
| | Insurance — 6.7% | | | | | | | | |
| c | American National Group, Inc., 6.144% due 6/13/2032 | | | 25,662,000 | | | | 25,510,594 | |
| b,c | Ascot Group Ltd., 4.25% due 12/15/2030 | | | 12,308,000 | | | | 10,744,761 | |
| c | Belrose Funding Trust, 2.33% due 8/15/2030 | | | 9,685,000 | | | | 8,307,793 | |
| | Brighthouse Financial Global Funding, | | | | | | | | |
| c | 1.55% due 5/24/2026 | | | 7,538,000 | | | | 7,174,668 | |
| c | 2.00% due 6/28/2028 | | | 10,733,000 | | | | 9,692,221 | |
| | Brown & Brown, Inc., 5.65% due 6/11/2034 | | | 9,676,000 | | | | 10,147,318 | |
| | CNO Global Funding, | | | | | | | | |
| c | 1.65% due 1/6/2025 | | | 5,359,000 | | | | 5,305,088 | |
| c | 1.75% due 10/7/2026 | | | 9,414,000 | | | | 8,916,376 | |
| b,c | DaVinciRe Holdings Ltd., 4.75% due 5/1/2025 | | | 11,510,000 | | | | 11,423,215 | |
| b | Enstar Group Ltd., 3.10% due 9/1/2031 | | | 10,476,000 | | | | 9,052,835 | |
| | Equitable Financial Life Global Funding, | | | | | | | | |
| c | 1.00% due 1/9/2026 | | | 8,665,000 | | | | 8,306,442 | |
| c | 1.40% due 7/7/2025 - 8/27/2027 | | | 16,048,000 | | | | 15,425,000 | |
| c | 1.80% due 3/8/2028 | | | 6,800,000 | | | | 6,221,796 | |
| | F&G Global Funding, | | | | | | | | |
| c | 1.75% due 6/30/2026 | | | 16,912,000 | | | | 16,018,708 | |
| c | 2.00% due 9/20/2028 | | | 6,795,000 | | | | 6,054,549 | |
| c | 2.30% due 4/11/2027 | | | 11,752,000 | | | | 10,998,462 | |
| b,c | Fidelis Insurance Holdings Ltd., 4.875% due 6/30/2030 | | | 17,531,000 | | | | 17,802,906 | |
| 128 | Annual Financial Statements | See notes to financial statements. |
Schedule of Investments, Continued
Thornburg Limited Term Income Fund | September 30, 2024
| ISSUER-DESCRIPTION | | SHARES/PRINCIPAL
AMOUNT | | | VALUE | |
| | | | | | | | | | |
| | Fidelity National Financial, Inc., | | | | | | |
| | 2.45% due 3/15/2031 | | $ | 8,797,000 | | | $ | 7,625,240 | |
| | 4.50% due 8/15/2028 | | | 3,720,000 | | | | 3,734,322 | |
| | First American Financial Corp., | | | | | | | | |
| | 2.40% due 8/15/2031 | | | 2,261,000 | | | | 1,898,697 | |
| | 4.00% due 5/15/2030 | | | 4,316,000 | | | | 4,103,135 | |
| | GA Global Funding Trust, | | | | | | | | |
| c | 1.625% due 1/15/2026 | | | 1,940,000 | | | | 1,867,793 | |
| c | 2.25% due 1/6/2027 | | | 6,479,000 | | | | 6,170,146 | |
| c | 3.85% due 4/11/2025 | | | 12,460,000 | | | | 12,380,381 | |
| c | Global Atlantic Fin Co., 4.40% due 10/15/2029 | | | 13,200,000 | | | | 12,713,316 | |
| | Horace Mann Educators Corp., | | | | | | | | |
| | 4.50% due 12/1/2025 | | | 6,533,000 | | | | 6,495,501 | |
| | 7.25% due 9/15/2028 | | | 2,952,000 | | | | 3,202,831 | |
| | Jackson National Life Global Funding, | | | | | | | | |
| c | 5.25% due 4/12/2028 | | | 8,153,000 | | | | 8,242,765 | |
| c | 5.50% due 1/9/2026 | | | 12,660,000 | | | | 12,783,815 | |
| | Mercury General Corp., 4.40% due 3/15/2027 | | | 2,901,000 | | | | 2,870,888 | |
| | Mutual of Omaha Cos Global Funding, | | | | | | | | |
| c | 5.35% due 4/9/2027 | | | 13,420,000 | | | | 13,762,478 | |
| c | 5.45% due 12/12/2028 | | | 7,740,000 | | | | 8,022,742 | |
| a,c | Nationwide Mutual Insurance Co., 7.498% (SOFR + 2.18%) due 12/15/2024 | | | 22,246,000 | | | | 22,295,164 | |
| a,c | New York Life Global Funding, 5.426% (SOFR + 0.48%) due 6/9/2026 | | | 22,760,000 | | | | 22,770,242 | |
| | Pacific Life Global Funding II, | | | | | | | | |
| a,c | 5.596% (SOFR + 0.62%) due 6/4/2026 | | | 10,530,000 | | | | 10,529,895 | |
| a,c | 5.669% (SOFRINDX + 0.80%) due 3/30/2025 | | | 653,000 | | | | 654,247 | |
| c | Protective Life Corp., 3.40% due 1/15/2030 | | | 6,698,000 | | | | 6,338,987 | |
| c | Protective Life Global Funding, 1.17% due 7/15/2025 | | | 4,000,000 | | | | 3,893,600 | |
| | Reliance Standard Life Global Funding II, | | | | | | | | |
| c | 1.512% due 9/28/2026 | | | 10,762,000 | | | | 10,080,227 | |
| c | 5.243% due 2/2/2026 | | | 17,412,000 | | | | 17,497,319 | |
| | RGA Global Funding, | | | | | | | | |
| c | 2.70% due 1/18/2029 | | | 4,515,000 | | | | 4,193,938 | |
| c | 5.448% due 5/24/2029 | | | 6,000,000 | | | | 6,245,460 | |
| c | 5.50% due 1/11/2031 | | | 4,148,000 | | | | 4,335,614 | |
| c | Sammons Financial Group, Inc., 4.45% due 5/12/2027 | | | 7,950,000 | | | | 7,868,115 | |
| | Stewart Information Services Corp., 3.60% due 11/15/2031 | | | 22,401,000 | | | | 19,637,613 | |
| | Willis North America, Inc., 4.65% due 6/15/2027 | | | 4,541,000 | | | | 4,579,462 | |
| | | | | | | | | 433,896,665 | |
| | | | | | | | | | |
| | MATERIALS — 0.9% | | | | | | | | |
| | Chemicals — 0.0% | | | | | | | | |
| b,e,f | Phosagro OAO Via Phosagro Bond Funding DAC, 3.05% due 1/23/2025 | | | 2,525,000 | | | | 2,090,978 | |
| | Containers & Packaging — 0.5% | | | | | | | | |
| c | Graphic Packaging International LLC, 1.512% due 4/15/2026 | | | 6,873,000 | | | | 6,494,641 | |
| c | Silgan Holdings, Inc., 1.40% due 4/1/2026 | | | 14,004,000 | | | | 13,287,975 | |
| | Sonoco Products Co., 1.80% due 2/1/2025 | | | 8,725,000 | | | | 8,628,938 | |
| | Metals & Mining — 0.4% | | | | | | | | |
| b | AngloGold Ashanti Holdings plc, 3.375% due 11/1/2028 | | | 19,785,000 | | | | 18,642,614 | |
| b,c,e,f | Metalloinvest Finance DAC, 3.375% due 10/22/2028 | | | 12,700,000 | | | | 6,366,510 | |
| b,c | POSCO, 5.625% due 1/17/2026 | | | 2,400,000 | | | | 2,429,280 | |
| | | | | | | | | 57,940,936 | |
| | | | | | | | | | |
| | MEDIA & ENTERTAINMENT — 0.4% | | | | | | | | |
| | Media — 0.4% | | | | | | | | |
| | Charter Communications Operating LLC/Charter Communications Operating Capital, 6.65% due 2/1/2034 | | | 14,750,000 | | | | 15,420,535 | |
| | Comcast Corp., | | | | | | | | |
| | 4.20% due 8/15/2034 | | | 6,290,000 | | | | 6,082,618 | |
| | 4.25% due 1/15/2033 | | | 4,664,000 | | | | 4,581,121 | |
| | | | | | | | | 26,084,274 | |
| See notes to financial statements. | Annual Financial Statements | 129 |
Schedule of Investments, Continued
Thornburg Limited Term Income Fund | September 30, 2024
| ISSUER-DESCRIPTION | | SHARES/PRINCIPAL
AMOUNT | | | VALUE | |
| | | | | | | | | | |
| | PHARMACEUTICALS, BIOTECHNOLOGY & LIFE SCIENCES — 0.5% | | | | | | |
| | Biotechnology — 0.3% | | | | | | |
| | Amgen, Inc., 5.507% due 3/2/2026 | | $ | 7,240,000 | | | $ | 7,240,217 | |
| | Bio-Rad Laboratories, Inc., 3.30% due 3/15/2027 | | | 2,320,000 | | | | 2,261,281 | |
| | Illumina, Inc., | | | | | | | | |
| | 4.65% due 9/9/2026 | | | 2,634,000 | | | | 2,650,384 | |
| | 5.80% due 12/12/2025 | | | 5,600,000 | | | | 5,672,520 | |
| | Pharmaceuticals — 0.2% | | | | | | | | |
| c | Bayer U.S. Finance II LLC, 4.25% due 12/15/2025 | | | 1,750,000 | | | | 1,736,892 | |
| | Cigna Group, 5.685% due 3/15/2026 | | | 11,172,000 | | | | 11,172,112 | |
| | Viatris, Inc., 2.30% due 6/22/2027 | | | 4,935,000 | | | | 4,651,484 | |
| | | | | | | | | 35,384,890 | |
| | | | | | | | | | |
| | SEMICONDUCTORS & SEMICONDUCTOR EQUIPMENT — 1.1% | | | | | | | | |
| | Semiconductors & Semiconductor Equipment — 1.1% | | | | | | | | |
| | Microchip Technology, Inc., 4.25% due 9/1/2025 | | | 10,634,000 | | | | 10,595,505 | |
| | Qorvo, Inc., | | | | | | | | |
| | 1.75% due 12/15/2024 | | | 9,528,000 | | | | 9,451,681 | |
| c | 3.375% due 4/1/2031 | | | 14,210,000 | | | | 12,722,781 | |
| b,c | Renesas Electronics Corp., 1.543% due 11/26/2024 | | | 23,271,000 | | | | 23,142,544 | |
| b,c | SK Hynix, Inc., 1.50% due 1/19/2026 | | | 10,200,000 | | | | 9,795,774 | |
| | Skyworks Solutions, Inc., 1.80% due 6/1/2026 | | | 3,574,000 | | | | 3,417,316 | |
| | | | | | | | | 69,125,601 | |
| | | | | | | | | | |
| | SOFTWARE & SERVICES — 1.7% | | | | | | | | |
| | Information Technology Services — 0.9% | | | | | | | | |
| | Block Financial LLC, 2.50% due 7/15/2028 | | | 10,392,000 | | | | 9,649,076 | |
| | DXC Technology Co., 2.375% due 9/15/2028 | | | 18,253,000 | | | | 16,536,488 | |
| b | Genpact Luxembourg SARL, 3.375% due 12/1/2024 | | | 5,100,000 | | | | 5,077,305 | |
| b | Genpact Luxembourg SARL/Genpact USA, Inc., 1.75% due 4/10/2026 | | | 5,335,000 | | | | 5,108,529 | |
| | Global Payments, Inc., | | | | | | | | |
| | 1.20% due 3/1/2026 | | | 3,534,000 | | | | 3,378,610 | |
| | 1.50% due 11/15/2024 | | | 2,044,000 | | | | 2,033,800 | |
| | Kyndryl Holdings, Inc., 2.05% due 10/15/2026 | | | 7,614,000 | | | | 7,239,620 | |
| c | Wipro IT Services LLC, 1.50% due 6/23/2026 | | | 10,647,000 | | | | 10,135,838 | |
| | Internet Software & Services — 0.4% | | | | | | | | |
| | Prosus NV, | | | | | | | | |
| b,c | 3.061% due 7/13/2031 | | | 7,816,000 | | | | 6,898,949 | |
| b,c | 3.257% due 1/19/2027 | | | 6,400,000 | | | | 6,171,904 | |
| b,c | 4.193% due 1/19/2032 | | | 13,254,000 | | | | 12,416,877 | |
| | Software — 0.4% | | | | | | | | |
| c | Infor, Inc., 1.75% due 7/15/2025 | | | 12,382,000 | | | | 12,046,819 | |
| b,c | Open Text Corp., 6.90% due 12/1/2027 | | | 9,723,000 | | | | 10,260,390 | |
| | VMware LLC, 4.50% due 5/15/2025 | | | 4,543,000 | | | | 4,531,552 | |
| | | | | | | | | 111,485,757 | |
| | | | | | | | | | |
| | TECHNOLOGY HARDWARE & EQUIPMENT — 1.1% | | | | | | | | |
| | Electronic Equipment, Instruments & Components — 0.9% | | | | | | | | |
| | Avnet, Inc., 6.25% due 3/15/2028 | | | 3,938,000 | | | | 4,138,759 | |
| | CDW LLC/CDW Finance Corp., 3.25% due 2/15/2029 | | | 9,124,000 | | | | 8,608,403 | |
| | TD SYNNEX Corp., 1.75% due 8/9/2026 | | | 27,306,000 | | | | 25,954,080 | |
| | Trimble, Inc., 4.75% due 12/1/2024 | | | 17,000,000 | | | | 16,955,120 | |
| | Vontier Corp., 1.80% due 4/1/2026 | | | 5,272,000 | | | | 5,045,515 | |
| | Technology Hardware, Storage & Peripherals — 0.2% | | | | | | | | |
| b,c | Lenovo Group Ltd., 5.831% due 1/27/2028 | | | 10,065,000 | | | | 10,383,155 | |
| | | | | | | | | 71,085,032 | |
| | | | | | | | | | |
| | TELECOMMUNICATION SERVICES — 0.8% | | | | | | | | |
| | Diversified Telecommunication Services — 0.8% | | | | | | | | |
| | AT&T, Inc., 5.539% due 2/20/2026 | | | 31,242,000 | | | | 31,239,500 | |
| b,c | NBN Co. Ltd., 1.45% due 5/5/2026 | | | 20,000,000 | | | | 19,135,400 | |
| 130 | Annual Financial Statements | See notes to financial statements. |
Schedule of Investments, Continued
Thornburg Limited Term Income Fund | September 30, 2024
| ISSUER-DESCRIPTION | | SHARES/PRINCIPAL
AMOUNT | | | VALUE | |
| | | | | | | | | | |
| | Wireless Telecommunication Services — 0.0% | | | | | | |
| | T-Mobile USA, Inc., 2.25% due 2/15/2026 | | $ | 4,275,000 | | | $ | 4,156,369 | |
| | | | | | | | | 54,531,269 | |
| | | | | | | | | | |
| | TRANSPORTATION — 0.0% | | | | | | | | |
| | Diversified Consumer Services — 0.0% | | | | | | | | |
| | University of Chicago, Series 12-B, 3.065% due 10/1/2024 | | | 183,000 | | | | 183,000 | |
| | | | | | | | | 183,000 | |
| | | | | | | | | | |
| | UTILITIES — 5.0% | | | | | | | | |
| | Electric Utilities — 4.5% | | | | | | | | |
| | AEP Texas, Inc., | | | | | | | | |
| | 5.40% due 6/1/2033 | | | 4,350,000 | | | | 4,473,497 | |
| | Series I, 2.10% due 7/1/2030 | | | 8,375,000 | | | | 7,377,789 | |
| c | Alliant Energy Finance LLC, 1.40% due 3/15/2026 | | | 5,240,000 | | | | 4,961,651 | |
| | Appalachian Power Co., | | | | | | | | |
| | 3.40% due 6/1/2025 | | | 3,000,000 | | | | 2,969,820 | |
| | Series AA, 2.70% due 4/1/2031 | | | 5,750,000 | | | | 5,137,683 | |
| | Arizona Public Service Co., 5.70% due 8/15/2034 | | | 4,517,000 | | | | 4,771,307 | |
| | Avangrid, Inc., | | | | | | | | |
| | 3.15% due 12/1/2024 | | | 8,870,000 | | | | 8,831,859 | |
| | 3.20% due 4/15/2025 | | | 10,395,000 | | | | 10,289,595 | |
| | Black Hills Corp., 2.50% due 6/15/2030 | | | 5,490,000 | | | | 4,886,594 | |
| c | Caledonia Generating LLC, 1.95% due 2/28/2034 | | | 16,340,051 | | | | 13,948,505 | |
| | CenterPoint Energy, Inc., 5.40% due 6/1/2029 | | | 12,000,000 | | | | 12,462,840 | |
| | Comision Federal de Electricidad, | | | | | | | | |
| b,c | 3.348% due 2/9/2031 | | | 8,740,000 | | | | 7,519,721 | |
| b | 5.00% due 9/29/2036 | | | 16,732,800 | | | | 15,225,175 | |
| | Connecticut Light & Power Co., 4.95% due 8/15/2034 | | | 4,066,000 | | | | 4,181,271 | |
| | Dominion Energy, Inc., Series B, 3.60% due 3/15/2027 | | | 8,076,000 | | | | 7,947,915 | |
| | DTE Energy Co., | | | | | | | | |
| | 4.875% due 6/1/2028 | | | 3,477,000 | | | | 3,551,234 | |
| | 5.85% due 6/1/2034 | | | 6,458,000 | | | | 6,935,311 | |
| b,c | Electricite de France SA, 5.65% due 4/22/2029 | | | 16,730,000 | | | | 17,539,732 | |
| | Enel Finance International NV, | | | | | | | | |
| b,c | 1.625% due 7/12/2026 | | | 9,500,000 | | | | 9,042,100 | |
| b,c | 2.125% due 7/12/2028 | | | 8,844,000 | | | | 8,121,268 | |
| b,c | 2.50% due 7/12/2031 | | | 3,049,000 | | | | 2,648,971 | |
| | Entergy Mississippi LLC, 3.25% due 12/1/2027 | | | 4,727,000 | | | | 4,581,030 | |
| | Entergy Texas, Inc., | | | | | | | | |
| | 1.50% due 9/1/2026 | | | 8,640,000 | | | | 8,184,499 | |
| | 3.45% due 12/1/2027 | | | 9,000,000 | | | | 8,730,630 | |
| | Evergy Missouri West, Inc., | | | | | | | | |
| c | 5.15% due 12/15/2027 | | | 9,711,000 | | | | 9,943,676 | |
| c | 5.65% due 6/1/2034 | | | 6,650,000 | | | | 7,042,084 | |
| | FirstEnergy Pennsylvania Electric Co., | | | | | | | | |
| c | 5.15% due 3/30/2026 | | | 980,000 | | | | 987,830 | |
| c | 5.20% due 4/1/2028 | | | 1,475,000 | | | | 1,511,359 | |
| | FirstEnergy Transmission LLC, | | | | | | | | |
| c | 4.55% due 1/15/2030 | | | 2,585,000 | | | | 2,607,619 | |
| c | 5.00% due 1/15/2035 | | | 4,735,000 | | | | 4,809,482 | |
| | Interstate Power & Light Co., 4.95% due 9/30/2034 | | | 4,747,000 | | | | 4,820,863 | |
| | ITC Holdings Corp., | | | | | | | | |
| c | 2.95% due 5/14/2030 | | | 1,883,000 | | | | 1,738,160 | |
| c | 4.95% due 9/22/2027 | | | 12,703,000 | | | | 12,888,972 | |
| c | 5.65% due 5/9/2034 | | | 14,000,000 | | | | 14,762,440 | |
| c | Jersey Central Power & Light Co., 4.30% due 1/15/2026 | | | 5,914,000 | | | | 5,891,704 | |
| c | Liberty Utilities Co., 5.577% due 1/31/2029 | | | 5,240,000 | | | | 5,418,422 | |
| c | Liberty Utilities Finance GP 1, 2.05% due 9/15/2030 | | | 9,518,000 | | | | 8,194,332 | |
| c | Midland Cogeneration Venture LP, 6.00% due 3/15/2025 | | | 138,052 | | | | 136,541 | |
| | NextEra Energy Capital Holdings, Inc., | | | | | | | | |
| | 5.749% due 9/1/2025 | | | 7,416,000 | | | | 7,493,794 | |
| | 6.051% due 3/1/2025 | | | 4,701,000 | | | | 4,721,496 | |
| See notes to financial statements. | Annual Financial Statements | 131 |
Schedule of Investments, Continued
Thornburg Limited Term Income Fund | September 30, 2024
| ISSUER-DESCRIPTION | | SHARES/PRINCIPAL
AMOUNT | | | VALUE | |
| | | | | | | | | | |
| | Puget Energy, Inc., | | | | | | |
| | 2.379% due 6/15/2028 | | $ | 2,734,000 | | | $ | 2,531,547 | |
| | 4.10% due 6/15/2030 | | | 2,616,000 | | | | 2,518,789 | |
| | Tucson Electric Power Co., 5.20% due 9/15/2034 | | | 5,985,000 | | | | 6,125,348 | |
| | Wisconsin Power & Light Co., 5.375% due 3/30/2034 | | | 4,510,000 | | | | 4,723,819 | |
| | Gas Utilities — 0.5% | | | | | | | | |
| c | Brooklyn Union Gas Co., 3.407% due 3/10/2026 | | | 10,931,000 | | | | 10,732,165 | |
| c | KeySpan Gas East Corp., 5.994% due 3/6/2033 | | | 8,132,000 | | | | 8,520,222 | |
| | Southwest Gas Corp., | | | | | | | | |
| | 4.05% due 3/15/2032 | | | 3,024,000 | | | | 2,876,580 | |
| | 5.80% due 12/1/2027 | | | 4,828,000 | | | | 5,015,471 | |
| | Spire Missouri, Inc., Series 2034, 5.15% due 8/15/2034 | | | 2,327,000 | | | | 2,418,055 | |
| | | | | | | | | 322,750,767 | |
| | TOTAL CORPORATE BONDS (Cost $2,122,711,668) | | | | | | | 2,073,529,761 | |
| | | | | | | | | | |
| | LONG-TERM MUNICIPAL BONDS — 0.1% | | | | | | | | |
| | Canadian County Educational Facilities Authority (Mustang Public Schools Project) ISD, Series B, 5.50% due 9/1/2031 | | | 5,035,000 | | | | 5,350,503 | |
| | TOTAL LONG-TERM MUNICIPAL BONDS (Cost $5,035,000) | | | | | | | 5,350,503 | |
| | | | | | | | | | |
| | PREFERRED STOCK — 0.6% | | | | | | | | |
| | | | | | | | | | |
| | FINANCIAL SERVICES — 0.6% | | | | | | | | |
| | Capital Markets — 0.6% | | | | | | | | |
| g | Calamos Strategic Total Return Fund, 6.24% due 9/9/2029 | | | 370,000 | | | | 9,250,000 | |
| a,g | Gabelli Dividend & Income Trust, Series J, 4.50% due 3/26/2028 | | | 1,162 | | | | 27,778,772 | |
| | | | | | | | | 37,028,772 | |
| | TOTAL PREFERRED STOCK (Cost $38,269,196) | | | | | | | 37,028,772 | |
| | | | | | | | | | |
| | SHORT-TERM INVESTMENTS — 8.1% | | | | | | | | |
| h | Thornburg Capital Management Fund | | | 52,153,999 | | | | 521,539,993 | |
| | TOTAL SHORT-TERM INVESTMENTS (Cost $521,539,993) | | | | | | | 521,539,993 | |
| | | | | | | | | | |
| | TOTAL INVESTMENTS — 100.5% (Cost $6,534,838,956) | | | | | | $ | 6,464,290,932 | |
| | | | | | | | | | |
| | LIABILITIES NET OF OTHER ASSETS — (0.5)% | | | | | | | (34,131,315 | ) |
| | | | | | | | | | |
| | NET ASSETS — 100.0% | | | | | | $ | 6,430,159,617 | |
Footnote Legend
| a | Variable, floating, step, or fixed to floating rate securities are securities for which interest rate changes are based on changes in a designated base rate or on a predetermined schedule. The rates shown are those in effect on September 30, 2024. |
| b | Yankee bond denominated in U.S. dollars and is issued in the U.S. by foreign banks and corporations. |
| c | Securities exempt from registration under Rule 144A of the Securities Act of 1933, as amended. These securities are restricted but liquid and may only be resold in the ordinary course of business in transactions exempt from registration, normally to qualified institutional buyers. As of September 30, 2024, the aggregate value of these securities in the Fund’s portfolio was $3,022,010,935, representing 47.00% of the Fund’s net assets. |
| g | Security currently fair valued by Thornburg Investment Management, Inc.’s Valuation and Pricing Committee. |
| h | Investment in Affiliates. |
| 132 | Annual Financial Statements | See notes to financial statements. |
Schedule of Investments, Continued
Thornburg Limited Term Income Fund | September 30, 2024
Portfolio Abbreviations
To simplify the listings of securities, abbreviations are used per the table below:
| ABS | Asset Backed Securities | REMIC | Real Estate Mortgage Investment Conduit |
| CMBS | Commercial Mortgage-Backed Securities | SOFR | Secured Overnight Financing Rate |
| CMO | Collateralized Mortgage Obligation | SOFR30A | Secured Overnight Financing Rate 30-Day Average |
| CMT | Constant Maturity Rate | SOFR90A | Secured Overnight Financing Rate 90-Day Average |
| DAC | Designated Activity Company | SOFRINDX | Secured Overnight Financing Rate Index |
| H15T1Y | US Treasury Yield Curve Rate T-Note Constant Maturity 1 Year | TSFR1M | Term SOFR 1 Month |
| ISD | Independent School District | TSFR3M | Term SOFR 3 Month |
| Mtg | Mortgage | UMBS | Uniform Mortgage Backed Securities |
| See notes to financial statements. | Annual Financial Statements | 133 |
Schedule of Investments
Thornburg Core Plus Bond Fund | September 30, 2024
| | ISSUER-DESCRIPTION | | SHARES/PRINCIPAL
AMOUNT | | VALUE | |
| | | | | | | | |
| | U.S. TREASURY SECURITIES — 27.7% | | | | | | | | |
| | U.S. Treasury Inflation-Indexed Bonds, | | | | | | | | |
| | 1.50% due 2/15/2053 | | $ | 629,576 | | | $ | 569,618 | |
| | 2.125% due 2/15/2054 | | | 2,818,310 | | | | 2,934,015 | |
| | U.S. Treasury Inflation-Indexed Notes, 1.125% due 1/15/2033 | | | 770,807 | | | | 743,889 | |
| | U.S. Treasury Notes, | | | | | | | | |
| | 1.125% due 8/15/2040 | | | 5,275,000 | | | | 3,454,301 | |
| | 1.375% due 11/15/2040 | | | 2,660,000 | | | | 1,805,059 | |
| | 1.75% due 8/15/2041 | | | 4,287,000 | | | | 3,039,081 | |
| | 1.875% due 11/15/2051 | | | 295,000 | | | | 183,776 | |
| | 2.375% due 2/15/2042 | | | 1,403,000 | | | | 1,092,805 | |
| | 3.75% due 12/31/2030 | | | 300,000 | | | | 301,805 | |
| | 3.875% due 8/15/2033 - 8/15/2034 | | | 6,172,000 | | | | 6,219,557 | |
| | 4.00% due 2/15/2034 | | | 1,625,000 | | | | 1,653,184 | |
| | 4.125% due 8/15/2053 | | | 155,000 | | | | 154,395 | |
| | 4.25% due 2/15/2054 | | | 2,505,000 | | | | 2,553,534 | |
| | 4.375% due 5/15/2034 | | | 6,255,000 | | | | 6,552,112 | |
| | 4.50% due 11/15/2033 | | | 6,477,000 | | | | 6,841,331 | |
| | U.S. Treasury Strip Coupon, | | | | | | | | |
| | 6.351% due 11/15/2036 | | | 1,000,000 | | | | 612,064 | |
| | 6.986% due 11/15/2040 | | | 4,625,000 | | | | 2,310,259 | |
| | 7.646% due 11/15/2041 | | | 3,500,000 | | | | 1,664,002 | |
| | 7.668% due 2/15/2043 | | | 1,775,000 | | | | 789,023 | |
| | 7.936% due 5/15/2044 | | | 5,475,000 | | | | 2,295,629 | |
| | TOTAL U.S. TREASURY SECURITIES (Cost $43,271,155) | | | | | | | 45,769,439 | |
| | | | | | | | | | |
| | U.S. GOVERNMENT AGENCIES — 0.6% | | | | | | | | |
| a,b,c | Farm Credit Bank of Texas, Series 4, 5.70% (5-Yr. CMT + 5.420%) due 9/15/2025 | | | 465,000 | | | | 465,316 | |
| | Federal Home Loan Banks, 2.90% due 2/18/2037 | | | 625,000 | | | | 522,263 | |
| | TOTAL U.S. GOVERNMENT AGENCIES (Cost $963,908) | | | | | | | 987,579 | |
| | | | | | | | | | |
| | OTHER GOVERNMENT — 0.5% | | | | | | | | |
| a,d | Corp. Financiera de Desarrollo SA, 5.95% due 4/30/2029 | | | 250,000 | | | | 258,580 | |
| a | Dominican Republic International Bonds (DOP), 10.75% due 6/1/2036 | | | 16,000,000 | | | | 282,824 | |
| | Egypt Government Bonds (EGP), Series 3Y, 23.865% due 6/4/2027 | | | 8,000,000 | | | | 160,346 | |
| a,d | Finance Department Government of Sharjah, 4.00% due 7/28/2050 | | | 250,000 | | | | 174,393 | |
| | TOTAL OTHER GOVERNMENT (Cost $844,698) | | | | | | | 876,143 | |
| | | | | | | | | | |
| | MORTGAGE BACKED — 28.9% | | | | | | | | |
| | Ajax Mortgage Loan Trust, Whole Loan Securities Trust CMO, | | | | | | | | |
| a,c | Series 2021-G Class A, 1.875% due 6/25/2061 | | | 516,256 | | | | 506,498 | |
| a,c | Series 2023-B Class A, 4.25% due 10/25/2062 | | | 580,227 | | | | 565,690 | |
| a,c | Series 2023-C Class A1, 3.50% due 5/25/2063 | | | 547,858 | | | | 518,472 | |
| | Angel Oak Mortgage Trust, Whole Loan Securities Trust CMO, | | | | | | | | |
| a,c | Series 2022-1 Class A1, 2.881% due 12/25/2066 | | | 112,155 | | | | 104,961 | |
| a,c | Series 2024-3 Class A1, 4.80% due 11/26/2068 | | | 185,694 | | | | 184,822 | |
| | Barclays Mortgage Trust, Whole Loan Securities Trust CMO, | | | | | | | | |
| a,c | Series 2021-NPL1 Class A, 2.00% due 11/25/2051 | | | 340,397 | | | | 334,601 | |
| a,c | Series 2022-RPL1 Class A, 4.25% due 2/25/2028 | | | 381,705 | | | | 373,838 | |
| | BRAVO Residential Funding Trust, Whole Loan Securities Trust CMO, | | | | | | | | |
| a,c | Series 2021-NQM3 Class A1, 1.699% due 4/25/2060 | | | 36,438 | | | | 33,310 | |
| a,c | Series 2022-NQM3 Class A1, 5.108% due 7/25/2062 | | | 76,090 | | | | 76,286 | |
| a,c | Series 2024-NQM4 Class A1A, 4.35% due 1/25/2060 | | | 325,414 | | | | 319,695 | |
| a | Century Plaza Towers, CMBS, Series 2019-CPT Class A, 2.865% due 11/13/2039 | | | 400,000 | | | | 357,582 | |
| | CHNGE Mortgage Trust, Whole Loan Securities Trust CMO, | | | | | | | | |
| a,c | Series 2022-1 Class A1, 3.007% due 1/25/2067 | | | 100,043 | | | | 93,698 | |
| a,c | Series 2023-1 Class A1, 7.065% due 3/25/2058 | | | 279,972 | | | | 283,533 | |
| a,c | CIM Trust, Whole Loan Securities Trust CMO, Series 2024-R1 Class A1, 4.75% due 6/25/2064 | | | 461,979 | | | | 459,527 | |
| | Citigroup Mortgage Loan Trust, Whole Loan Securities Trust CMO, | | | | | | | | |
| a,c | Series 2021-INV2 Class A3A, 2.50% due 5/25/2051 | | | 77,052 | | | | 66,270 | |
| a,c | Series 2021-J2 Class A7A, 2.50% due 7/25/2051 | | | 300,470 | | | | 269,411 | |
| 134 | Annual Financial Statements | See notes to financial statements. |
Schedule of Investments, Continued
Thornburg Core Plus Bond Fund | September 30, 2024
| | ISSUER-DESCRIPTION | | SHARES/PRINCIPAL
AMOUNT | | VALUE | |
| | | | | | | | |
| a | Cogent Ipv4 LLC, CMBS, Series 2024-1A Class A2, 7.924% due 5/25/2054 | | $ | 250,000 | | | $ | 262,006 | |
| a | COMM Mortgage Trust, CMBS, Series 2024-277P Class A, 6.338% due 8/10/2044 | | | 485,000 | | | | 509,322 | |
| | Cross Mortgage Trust, Whole Loan Securities Trust CMO, | | | | | | | | |
| a,c | Series 2023-H1 Class A1, 6.615% due 3/25/2068 | | | 367,112 | | | | 372,528 | |
| a,c | Series 2024-H4 Class A1, 6.147% due 7/25/2069 | | | 311,898 | | | | 316,634 | |
| | CSMC Trust, Whole Loan Securities Trust CMO, | | | | | | | | |
| a,c | Series 2021-AFC1 Class-A1, 0.83% due 3/25/2056 | | | 50,311 | | | | 41,633 | |
| a,c | Series 2022-ATH2 Class A1, 4.547% due 5/25/2067 | | | 110,771 | | | | 110,101 | |
| a | DC Office Trust, CMBS, Series 2019-MTC Class A, 2.965% due 9/15/2045 | | | 200,000 | | | | 176,607 | |
| a,c | FARM Mortgage Trust, Whole Loan Securities Trust CMO, Series 2024-1 Class A, 4.721% due 10/1/2053 | | | 316,186 | | | | 308,608 | |
| c | Federal Home Loan Mtg Corp., Pool 841463, 2.156% (2.18% - SOFR30A) due 7/1/2052 | | | 108,069 | | | | 96,509 | |
| | Federal Home Loan Mtg Corp., CMO REMIC, Series 5461 Class PA, 4.50% due 8/25/2054 | | | 575,000 | | | | 566,184 | |
| | Federal Home Loan Mtg Corp., Multifamily Structured Pass-Through Certificates, CMBS, | | | | | | | | |
| c | Series K-154 Class A2, 4.35% due 1/25/2033 | | | 107,000 | | | | 108,335 | |
| | Series KJ46 Class A2, 4.796% due 10/25/2031 | | | 32,000 | | | | 33,102 | |
| c | Series KJ47 Class A2, 5.43% due 6/25/2031 | | | 22,000 | | | | 23,330 | |
| | Series KJ48 Class A2, 5.028% due 10/25/2031 | | | 56,000 | | | | 58,532 | |
| | Federal Home Loan Mtg Corp., Seasoned Credit Risk Transfer, Whole Loan Securities Trust CMO, | | | | | | | | |
| | Series 2024-1 Class MT, 3.00% due 11/25/2063 | | | 498,979 | | | | 426,046 | |
| | Series 2024-2 Class MT, 3.50% due 5/25/2064 | | | 622,750 | | | | 562,483 | |
| | Federal Home Loan Mtg Corp., UMBS Collateral, | | | | | | | | |
| | Pool RA6665, 3.00% due 2/1/2052 | | | 1,182,283 | | | | 1,060,802 | |
| | Pool SD8140, 2.00% due 4/1/2051 | | | 421,083 | | | | 349,562 | |
| | Pool SD8206, 3.00% due 4/1/2052 | | | 1,461,047 | | | | 1,314,333 | |
| | Pool SD8213, 3.00% due 5/1/2052 | | | 1,138,483 | | | | 1,022,244 | |
| | Pool SD8225, 3.00% due 7/1/2052 | | | 192,054 | | | | 172,421 | |
| | Pool SD8244, 4.00% due 9/1/2052 | | | 1,165,580 | | | | 1,119,835 | |
| | Federal National Mtg Assoc., | | | | | | | | |
| | Pool BL8603, 2.07% due 10/1/2050 | | | 467,057 | | | | 335,528 | |
| c | Pool BM7277, 1.972% (2.07% - SOFR30A) due 8/1/2051 | | | 114,397 | | | | 103,287 | |
| c | Pool BM7341, 2.409% (RFUCCT1Y + 1.61%) due 12/1/2050 | | | 515,822 | | | | 481,734 | |
| | Pool BS1289, 2.17% due 3/1/2051 | | | 476,973 | | | | 334,644 | |
| | Federal National Mtg Assoc., CMO REMIC, | | | | | | | | |
| | Series 2024-25 Class VB, 5.50% due 3/25/2035 | | | 340,064 | | | | 349,120 | |
| | Series 2024-70 Class MP, 4.50% due 10/25/2054 | | | 575,000 | | | | 564,862 | |
| | Federal National Mtg Assoc., UMBS Collateral, | | | | | | | | |
| | Pool BV4119, 2.50% due 3/1/2052 | | | 639,729 | | | | 552,295 | |
| | Pool CB0199, 3.00% due 4/1/2051 | | | 407,513 | | | | 365,640 | |
| | Pool CB1134, 2.50% due 7/1/2051 | | | 2,044,402 | | | | 1,763,596 | |
| | Pool CB2301, 3.00% due 12/1/2051 | | | 486,480 | | | | 436,493 | |
| | Pool CB2399, 2.50% due 12/1/2051 | | | 562,262 | | | | 486,998 | |
| | Pool CB2404, 2.50% due 12/1/2051 | | | 305,647 | | | | 263,841 | |
| | Pool CB2665, 3.00% due 1/1/2052 | | | 272,788 | | | | 244,758 | |
| | Pool CB3050, 2.50% due 3/1/2052 | | | 366,473 | | | | 316,719 | |
| | Pool FM8761, 2.50% due 9/1/2051 | | | 769,486 | | | | 663,976 | |
| | Pool FS0957, 3.00% due 3/1/2052 | | | 507,589 | | | | 456,815 | |
| | Pool FS2676, 3.00% due 6/1/2052 | | | 340,967 | | | | 305,932 | |
| | Pool FS4198, 3.00% due 4/1/2052 | | | 1,950,272 | | | | 1,749,878 | |
| | Pool FS4862, 2.50% due 10/1/2051 | | | 275,001 | | | | 237,517 | |
| | Pool FS4919, 2.50% due 5/1/2053 | | | 381,897 | | | | 329,702 | |
| | Pool FS7059, 3.00% due 7/1/2052 | | | 545,578 | | | | 491,349 | |
| | Pool FS7065, 3.00% due 3/1/2053 | | | 2,931,550 | | | | 2,636,036 | |
| | Pool FS7879, 2.50% due 7/1/2052 | | | 1,058,162 | | | | 912,820 | |
| | Pool FS9157, 2.00% due 5/1/2042 | | | 675,000 | | | | 587,409 | |
| | Pool MA4399, 2.50% due 8/1/2051 | | | 342,031 | | | | 296,528 | |
| | Pool MA4548, 2.50% due 2/1/2052 | | | 1,918,449 | | | | 1,659,657 | |
| | Pool MA4578, 2.50% due 4/1/2052 | | | 2,086,455 | | | | 1,801,293 | |
| | Pool MA4599, 3.00% due 5/1/2052 | | | 2,257,889 | | | | 2,026,615 | |
| | Pool MA4730, 3.00% due 9/1/2052 | | | 467,616 | | | | 420,116 | |
| | Pool MA5442, 4.50% due 8/1/2054 | | | 1,192,880 | | | | 1,172,672 | |
| See notes to financial statements. | Annual Financial Statements | 135 |
Schedule of Investments, Continued
Thornburg Core Plus Bond Fund | September 30, 2024
| | ISSUER-DESCRIPTION | | SHARES/PRINCIPAL
AMOUNT | | VALUE | |
| | | | | | | | |
| | GCAT Trust, Whole Loan Securities Trust CMO, | | | | | | | | |
| a,c | Series 2021-CM1 Class A, 2.469% due 4/25/2065 | | $ | 80,839 | | | $ | 77,139 | |
| a,c | Series 2023-INV1 Class A1, 6.00% due 8/25/2053 | | | 260,020 | | | | 262,226 | |
| a,c | Series 2023-NQM4 Class A1, 4.25% due 5/25/2067 | | | 425,670 | | | | 406,566 | |
| | Government National Mtg Assoc., CMBS, Series 2023-104 Class AD, 4.00% due 1/16/2065 | | | 64,283 | | | | 61,595 | |
| | GS Mortgage-Backed Securities Trust, Whole Loan Securities Trust CMO, | | | | | | | | |
| a,c | Series 2024-RPL2 Class A1, 3.75% due 7/25/2061 | | | 184,020 | | | | 179,868 | |
| a,c | Series 2024-RPL4 Class A1, 3.90% due 9/25/2061 | | | 457,156 | | | | 445,436 | |
| | Harvest Commercial Capital Loan Trust, CMBS, Series 2024-1 Class A, 6.164% due 10/25/2056 | | | 319,337 | | | | 327,458 | |
| a,c | HOMES Trust, Whole Loan Securities Trust CMO, Series 2024-NQM1 Class A1, 5.915% due 7/25/2069 | | | 427,207 | | | | 431,457 | |
| | Homeward Opportunities Fund Trust, Whole Loan Securities Trust CMO, | | | | | | | | |
| a,c | Series 2022-1 A Class A1, 5.082% due 7/25/2067 | | | 173,161 | | | | 172,450 | |
| a,c | Series 2024-RRTL2 Class A1, 5.989% due 9/25/2039 | | | 300,000 | | | | 301,882 | |
| a,c | Series 2024-RTL1 Class A1, 7.12% due 7/25/2029 | | | 325,000 | | | | 329,620 | |
| a | Houston Galleria Mall Trust, CMBS, Series 2015-HGLR Class A1A2, 3.087% due 3/5/2037 | | | 165,000 | | | | 162,918 | |
| a,c | Hudson Yards Mortgage Trust, CMBS, Series 2019-55HY Class A, 3.041% due 12/10/2041 | | | 250,000 | | | | 227,421 | |
| a,c | Imperial Fund Mortgage Trust, Whole Loan Securities Trust CMO, Series 2022-NQM4 Class A1, 4.767% due 6/25/2067 | | | 97,110 | | | | 96,623 | |
| | JP Morgan Mortgage Trust, Whole Loan Securities Trust CMO, | | | | | | | | |
| a,c | Series 2021-1 Class A3A, 2.00% due 6/25/2051 | | | 368,324 | | | | 298,416 | |
| a,c | Series 2021-INV6 Class A2, 3.00% due 4/25/2052 | | | 75,731 | | | | 66,494 | |
| a,c,e | LEX Mortgage Trust, CMBS, Series 2024-BBG Class A, 4.874% due 10/13/2033 | | | 410,000 | | | | 409,590 | |
| a | Manhattan West Mortgage Trust, CMBS, Series 2020-1MW Class A, 2.13% due 9/10/2039 | | | 350,000 | | | | 324,344 | |
| | MFA Trust, Whole Loan Securities Trust CMO, | | | | | | | | |
| a,c | Series 2021-INV2 Class A1, 1.906% due 11/25/2056 | | | 72,869 | | | | 62,922 | |
| a,c | Series 2022-NQM2 Class A1, 4.00% due 5/25/2067 | | | 420,729 | | | | 411,270 | |
| a,c | Series 2024-RPL1 Class A1, 4.25% due 2/25/2066 | | | 462,679 | | | | 448,539 | |
| a,c | Mill City Securities Ltd., Whole Loan Securities Trust CMO, Series 2024-RS1 Class A1, 3.00% due 11/1/2069 | | | 600,000 | | | | 553,930 | |
| a | Morgan Stanley Capital I Trust, CMBS, Series 2024-BPR2 Class A, 7.291% due 5/5/2029 | | | 299,177 | | | | 316,502 | |
| a,c | Morgan Stanley Residential Mortgage Loan Trust, Whole Loan Securities Trust CMO, Series 2024-NQM1 Class A1, 6.152% due 12/25/2068 | | | 187,411 | | | | 189,742 | |
| | New Residential Mortgage Loan Trust, Whole Loan Securities Trust CMO, | | | | | | | | |
| a,c | Series 2022-NQM3 Class A1, 3.90% due 4/25/2062 | | | 108,283 | | | | 103,743 | |
| a,c | Series 2024-RPL1 Class A, 3.80% due 1/25/2064 | | | 366,391 | | | | 347,870 | |
| a,c | NMLT Trust, Whole Loan Securities Trust CMO, Series 2021-INV1 Class A1, 1.185% due 5/25/2056 | | | 60,581 | | | | 50,717 | |
| a,c | NYMT Loan Trust, Whole Loan Securities Trust CMO, Series 2024-BPL2 Class A1, 6.509% due 5/25/2039 | | | 325,000 | | | | 329,777 | |
| | OBX Trust, Whole Loan Securities Trust CMO, | | | | | | | | |
| a,c | Series 2022-NQM5 Class A1, 4.31% due 5/25/2062 | | | 98,469 | | | | 98,163 | |
| a,c | Series 2024-NQM11 Class A1, 5.875% due 6/25/2064 | | | 426,729 | | | | 431,860 | |
| a | One Bryant Park Trust, CMBS, Series 2019-OBP Class A, 2.516% due 9/15/2054 | | | 280,000 | | | | 249,248 | |
| a,c | OSAT Trust, Whole Loan Securities Trust CMO, Series 2021-RPL1 Class A1, 5.116% due 5/25/2065 | | | 242,924 | | | | 242,481 | |
| a,c | PRET LLC, Whole Loan Securities Trust CMO, Series 2021-RN3 Class A1, 4.843% due 9/25/2051 | | | 314,120 | | | | 313,062 | |
| a,c | PRET Trust, Whole Loan Securities Trust CMO, Series 2024-RPL1 Class A1, 3.90% due 10/25/2063 | | | 180,457 | | | | 174,246 | |
| a,c | PRKCM Trust, Whole Loan Securities Trust CMO, Series 2024-HOME1 Class A1, 6.431% due 5/25/2059 | | | 306,792 | | | | 312,644 | |
| a,c | PRPM LLC, Whole Loan Securities Trust CMO, Series 2021-5 Class A1, 4.793% due 6/25/2026 | | | 88,775 | | | | 88,382 | |
| a,c | RCKT Mortgage Trust, Whole Loan Securities Trust CMO, Series 2019-1 Class A13, 3.50% due 9/25/2049 | | | 29,544 | | | | 27,181 | |
| a,c | Redwood Funding Trust, Whole Loan Securities Trust CMO, Series 2024-1 Class A, 7.745% due 12/25/2054 | | | 314,866 | | | | 316,179 | |
| a | Saluda Grade Alternative Mortgage Trust, Whole Loan Securities Trust CMO, Series 2020-FIG1 Class M1, 7.00% due 9/25/2050 | | | 335,136 | | | | 331,679 | |
| a,c | SFO Commercial Mortgage Trust, CMBS, Series 2021-555 Class A, 6.362% (TSFR1M + 1.26%) due 5/15/2038 | | | 171,000 | | | | 163,136 | |
| a | SLG Office Trust, CMBS, Series 2021-OVA Class A, 2.585% due 7/15/2041 | | | 380,000 | | | | 329,268 | |
| a,c | Spruce Hill Mortgage Loan Trust, Whole Loan Securities Trust CMO, Series 2022-SH1 Class A1A, 4.10% due 7/25/2057 | | | 102,510 | | | | 99,823 | |
| a,c | Toorak Mortgage Trust, Whole Loan Securities Trust CMO, Series 2024-RRTL1 Class A1, 6.597% due 2/25/2039 | | | 300,000 | | | | 304,458 | |
| a,c | Towd Point Mortgage Trust, Whole Loan Securities Trust CMO, Series 2020-1 Class A2A, 3.10% due 1/25/2060 | | | 100,000 | | | | 90,750 | |
| a,c | TRK Trust, Whole Loan Securities Trust CMO, Series 2022-INV2 Class A1, 4.35% due 6/25/2057 | | | 376,999 | | | | 367,587 | |
| a,c | UWM Mortgage Trust, Whole Loan Securities Trust CMO, Series 2021-1 Class A3, 2.50% due 6/25/2051 | | | 73,533 | | | | 61,903 | |
| | Verus Securitization Trust, Whole Loan Securities Trust CMO, | | | | | | | | |
| a,c | Series 2023-3 Class A1, 5.93% due 3/25/2068 | | | 90,069 | | | | 90,504 | |
| a,c | Series 2023-4 Class A1, 5.811% due 5/25/2068 | | | 216,328 | | | | 217,267 | |
| a,c | WB Commercial Mortgage Trust, CMBS, Series 2024-HQ Class A, 6.134% due 3/15/2040 | | | 195,000 | | | | 197,515 | |
| a,c | Wells Fargo Mortgage Backed Securities Trust, Whole Loan Securities Trust CMO, Series 2021-1 Class A1, 2.50% due 12/25/2050 | | | 38,431 | | | | 32,645 | |
| | TOTAL MORTGAGE BACKED (Cost $46,390,256) | | | | | | | 47,843,677 |
|
| 136 | Annual Financial Statements | See notes to financial statements. |
Schedule of Investments, Continued
Thornburg Core Plus Bond Fund | September 30, 2024
| | ISSUER-DESCRIPTION | | SHARES/PRINCIPAL
AMOUNT | | VALUE | |
| | | | | | | | |
| | ASSET BACKED SECURITIES — 8.5% | | | | | | | | |
| | | | | | | | | | |
| | AUTO RECEIVABLES — 2.0% | | | | | | | | |
| a | Arivo Acceptance Auto Loan Receivables Trust, Series 2024-1A Class A, 6.46% due 4/17/2028 | | $ | 247,737 | | | $ | 249,755 | |
| a | CarNow Auto Receivables Trust, Series 2021-2A Class D, 2.25% due 3/15/2027 | | | 248,497 | | | | 246,634 | |
| a | Carvana Auto Receivables Trust, Series 2023-N4 Class A, 6.42% due 1/10/2028 | | | 19,403 | | | | 19,555 | |
| | Exeter Automobile Receivables Trust, | | | | | | | | |
| | Series 2021-1A Class D, 1.08% due 11/16/2026 | | | 56,116 | | | | 55,269 | |
| | Series 2021-3A Class C, 0.96% due 10/15/2026 | | | 19,137 | | | | 19,054 | |
| a | GLS Auto Receivables Issuer Trust, Series 2021-4A Class C, 1.94% due 10/15/2027 | | | 459,769 | | | | 455,444 | |
| a,c | Kinetic Advantage Master Owner Trust, Series 2024-1A Class A, 7.992% (SOFR30A + 2.65%) due 11/15/2027 | | | 515,000 | | | | 516,691 | |
| a | Lendbuzz Securitization Trust, Series 2024-3A Class A2, 4.97% due 10/15/2029 | | | 585,000 | | | | 584,819 | |
| a | Lobel Automobile Receivables Trust, Series 2023-2 Class A, 7.59% due 4/16/2029 | | | 20,783 | | | | 21,016 | |
| | Octane Receivables Trust, | | | | | | | | |
| a | Series 2022-2A Class A, 5.11% due 2/22/2028 | | | 60,880 | | | | 60,884 | |
| a | Series 2023-3A Class A2, 6.44% due 3/20/2029 | | | 480,519 | | | | 487,143 | |
| a | OneMain Direct Auto Receivables Trust, Series 2022-1A Class A1, 4.65% due 3/14/2029 | | | 197,125 | | | | 196,881 | |
| a | Research-Driven Pagaya Motor Asset Trust, Series 2023-4A Class A, 7.54% due 3/25/2032 | | | 28,603 | | | | 29,062 | |
| a | Tricolor Auto Securitization Trust, Series 2024-2A Class A, 6.36% due 12/15/2027 | | | 201,772 | | | | 203,331 | |
| a | United Auto Credit Securitization Trust, Series 2024-1 Class A, 6.17% due 8/10/2026 | | | 146,382 | | | | 146,743 | |
| | | | | | | | | 3,292,281 | |
| | CREDIT CARD — 0.5% | | | | | | | | |
| a | Brex Commercial Charge Card Master Trust, Series 2024-1 Class A1, 6.05% due 7/15/2027 | | | 200,000 | | | | 203,202 | |
| a | Mercury Financial Credit Card Master Trust, Series 2024-2A Class A, 6.56% due 7/20/2029 | | | 275,000 | | | | 280,199 | |
| a | Mission Lane Credit Card Master Trust, Series 2024-A Class A1, 6.20% due 8/15/2029 | | | 375,000 | | | | 379,103 | |
| | | | | | | | | 862,504 | |
| | OTHER ASSET BACKED — 5.2% | | | | | | | | |
| a | Amur Equipment Finance Receivables X LLC, Series 2022-1A Class A2, 1.64% due 10/20/2027 | | | 205,825 | | | | 203,389 | |
| a | Aqua Finance Trust, Series 2020-AA Class D, 7.15% due 7/17/2046 | | | 161,341 | | | | 152,707 | |
| a | Auxilior Term Funding LLC, Series 2023-1A Class A2, 6.18% due 12/15/2028 | | | 96,560 | | | | 97,573 | |
| a | BHG Securitization Trust, Series 2022-C Class A, 5.32% due 10/17/2035 | | | 11,684 | | | | 11,679 | |
| a | CFMT Issuer Trust, Series 2021-GRN1 Class A, 1.10% due 3/20/2041 | | | 540,226 | | | | 526,977 | |
| a | ClickLease Equipment Receivables Trust, Series 2024-1 Class A, 6.86% due 2/15/2030 | | | 200,430 | | | | 201,303 | |
| a | Crockett Partners Equipment Co. IIA LLC, Series 2024-1C Class A, 6.05% due 1/20/2031 | | | 499,394 | | | | 508,354 | |
| a | DataBank Issuer LLC, Series 2024-1A Class A2, 5.30% due 1/26/2054 | | | 275,000 | | | | 274,113 | |
| a | Diamond Infrastructure Funding LLC, Series 2021-1A Class A, 1.76% due 4/15/2049 | | | 100,000 | | | | 93,046 | |
| a | EverBright Solar Trust, Series 2024-A Class A, 6.43% due 6/22/2054 | | | 153,515 | | | | 154,648 | |
| a | Foundation Finance Trust, Series 2019-1A Class B, 4.22% due 11/15/2034 | | | 265,080 | | | | 262,760 | |
| | GoodLeap Sustainable Home Solutions Trust, | | | | | | | | |
| a | Series 2021-3CS Class A, 2.10% due 5/20/2048 | | | 227,987 | | | | 180,099 | |
| a | Series 2021-4GS Class A, 1.93% due 7/20/2048 | | | 186,242 | | | | 143,454 | |
| a | Series 2021-5CS Class A, 2.31% due 10/20/2048 | | | 350,086 | | | | 282,264 | |
| a,c | Gracie Point International Funding LLC, Series 2023-2A Class A, 7.619% (SOFR90A + 2.25%) due 3/1/2027 | | | 39,870 | | | | 39,970 | |
| a | GreenSky Home Improvement Trust, Series 2024-1 Class A2, 5.88% due 6/25/2059 | | | 515,000 | | | | 518,412 | |
| a | InStar Leasing III LLC, Series 2021-1A Class A, 2.30% due 2/15/2054 | | | 545,711 | | | | 494,884 | |
| a | Loanpal Solar Loan Ltd., Series 2021-1GS Class A, 2.29% due 1/20/2048 | | | 14,509 | | | | 11,451 | |
| a,d | Mill City Solar Loan Ltd., Series 2019-2GS Class A, 3.69% due 7/20/2043 | | | 100,670 | | | | 89,454 | |
| a | MMAF Equipment Finance LLC, Series 2020-BA Class A3, 0.49% due 8/14/2025 | | | 30,748 | | | | 30,544 | |
| a | Momnt Technologies Trust, Series 2023-1A Class A, 6.92% due 3/20/2045 | | | 62,651 | | | | 63,587 | |
| a | NetCredit Combined Receivables LLC, Series 2024-A Class A, 7.43% due 10/21/2030 | | | 358,739 | | | | 361,310 | |
| a | New Economy Assets Phase 1 Sponsor LLC, Series 2021-1 Class A1, 1.91% due 10/20/2061 | | | 135,000 | | | | 124,431 | |
| a | NMEF Funding LLC, Series 2023-A Class A2, 6.57% due 6/17/2030 | | | 70,133 | | | | 71,076 | |
| | Oportun Issuance Trust, | | | | | | | | |
| a | Series 2021-B Class A, 1.47% due 5/8/2031 | | | 76,415 | | | | 73,459 | |
| a | Series 2021-C Class A, 2.18% due 10/8/2031 | | | 465,000 | | | | 451,148 | |
| a | Series 2022-A Class A, 5.05% due 6/9/2031 | | | 316,639 | | | | 316,261 | |
| | Pagaya AI Debt Trust, | | | | | | | | |
| a | Series 2023-3 Class A, 7.60% due 12/16/2030 | | | 29,534 | | | | 29,685 | |
| a | Series 2024-3 Class A, 6.258% due 10/15/2031 | | | 88,404 | | | | 89,267 | |
| a | PFS Financing Corp., Series 2023-B Class A, 5.27% due 5/15/2028 | | | 160,000 | | | | 162,163 | |
| a | PowerPay Issuance Trust, Series 2024-1A Class A, 6.53% due 2/18/2039 | | | 161,383 | | | | 164,341 | |
| a | Prosper Marketplace Issuance Trust, Series 2023-1A Class A, 7.06% due 7/16/2029 | | | 705,502 | | | | 707,881 | |
| See notes to financial statements. | Annual Financial Statements | 137 |
Schedule of Investments, Continued
Thornburg Core Plus Bond Fund | September 30, 2024
| | ISSUER-DESCRIPTION | | SHARES/PRINCIPAL
AMOUNT | | VALUE | |
| a | Retained Vantage Data Centers Issuer LLC, Series 2023-1A Class A2A, 5.00% due 9/15/2048 | | $ | 25,000 | | | $ | 24,929 | |
| a,c | SBA Tower Trust, Series 2014-2A Class C, 3.869% due 10/15/2049 | | | 50,000 | | | | 49,965 | |
| a | Service Experts Issuer LLC, Series 2021-1A Class A, 2.67% due 2/2/2032 | | | 42,624 | | | | 41,104 | |
| a | SPS Servicer Advance Receivables Trust, Series 2020-T2 Class A, 1.83% due 11/15/2055 | | | 395,000 | | | | 381,475 | |
| a | Stream Innovations Issuer Trust, Series 2024-1A Class A, 6.27% due 7/15/2044 | | | 238,303 | | | | 242,135 | |
| a | Sunnova Hestia II Issuer LLC, Series 2024-GRID1 Class 1A, 5.63% due 7/20/2051 | | | 258,004 | | | | 265,583 | |
| a | Upstart Securitization Trust, Series 2021-2 Class C, 3.61% due 6/20/2031 | | | 268,607 | | | | 265,862 | |
| a | Upstart Structured Pass-Through Trust, Series 2022-1A Class A, 3.40% due 4/15/2030 | | | 484,812 | | | | 478,931 | |
| | | | | | | | | 8,641,674 | |
| | STUDENT LOAN — 0.8% | | | | | | | | |
| a | Ascent Education Funding Trust, Series 2024-A Class A, 6.14% due 10/25/2050 | | | 315,362 | | | | 324,254 | |
| a | Commonbond Student Loan Trust, Series 18-CGS Class A1, 3.87% due 2/25/2046 | | | 530,791 | | | | 513,801 | |
| a | EDvestinU Private Education Loan Issue No. 3 LLC, Series 2021-A Class A, 1.80% due 11/25/2045 | | | 50,573 | | | | 46,444 | |
| a | MPOWER Education Trust, Series 2024-A Class A, 6.78% due 7/22/2041 | | | 240,572 | | | | 247,448 | |
| a | Navient Private Education Refi Loan Trust, Series 2020-IA Class A1A, 1.33% due 4/15/2069 | | | 125,275 | | | | 114,285 | |
| a | SoFi Professional Loan Program LLC, Series 2021-B Class AFX, 1.14% due 2/15/2047 | | | 56,787 | | | | 49,996 | |
| | | | | | | | | 1,296,228 | |
| | TOTAL ASSET BACKED SECURITIES (Cost $13,970,331) | | | | | | | 14,092,687 | |
| | | | | | | | | | |
| | CORPORATE BONDS — 29.1% | | | | | | | | |
| | | | | | | | | | |
| | AUTOMOBILES & COMPONENTS — 0.5% | | | | | | | | |
| | Automobiles — 0.5% | | | | | | | | |
| c | American Honda Finance Corp., 5.732% (SOFRINDX + 0.70%) due 11/22/2024 | | | 400,000 | | | | 400,028 | |
| a | Hyundai Capital America, 4.30% due 9/24/2027 | | | 410,000 | | | | 408,913 | |
| | | | | | | | | 808,941 | |
| | BANKS — 1.1% | | | | | | | | |
| | Banks — 1.1% | | | | | | | | |
| c | Bank of New York Mellon Corp., 4.975% (SOFR + 1.09%) due 3/14/2030 | | | 260,000 | | | | 268,219 | |
| c,d | Mizuho Financial Group, Inc., 5.376% (H15T1Y + 1.12%) due 5/26/2030 | | | 407,000 | | | | 422,083 | |
| c | Morgan Stanley Bank NA, 4.968% (SOFR + 0.93%) due 7/14/2028 | | | 300,000 | | | | 306,438 | |
| c | Santander Holdings USA, Inc., 6.174% (SOFR + 2.50%) due 1/9/2030 | | | 277,000 | | | | 289,013 | |
| c | U.S. Bancorp, 5.775% (SOFR + 2.02%) due 6/12/2029 | | | 274,000 | | | | 287,103 | |
| c | Wells Fargo & Co., 5.574% (SOFR + 1.74%) due 7/25/2029 | | | 277,000 | | | | 288,163 | |
| | | | | | | | | 1,861,019 | |
| | CAPITAL GOODS — 1.0% | | | | | | | | |
| | Aerospace & Defense — 0.2% | | | | | | | | |
| a | BWX Technologies, Inc., 4.125% due 4/15/2029 | | | 85,000 | | | | 81,694 | |
| a | TransDigm, Inc., 6.375% due 3/1/2029 | | | 300,000 | | | | 309,414 | |
| | Machinery — 0.6% | | | | | | | | |
| a | Mueller Water Products, Inc., 4.00% due 6/15/2029 | | | 365,500 | | | | 348,596 | |
| d | nVent Finance SARL, 2.75% due 11/15/2031 | | | 343,000 | | | | 296,822 | |
| | Regal Rexnord Corp., 6.30% due 2/15/2030 | | | 274,000 | | | | 291,171 | |
| | Trading Companies & Distributors — 0.2% | | | | | | | | |
| | LKQ Corp., 6.25% due 6/15/2033 | | | 269,000 | | | | 285,345 | |
| | | | | | | | | 1,613,042 | |
| | COMMERCIAL & PROFESSIONAL SERVICES — 0.2% | | | | | | | | |
| | Commercial Services & Supplies — 0.2% | | | | | | | | |
| | CoreCivic, Inc., 8.25% due 4/15/2029 | | | 168,000 | | | | 177,932 | |
| | Equifax, Inc., 2.60% due 12/1/2024 | | | 85,000 | | | | 84,562 | |
| a | UL Solutions, Inc., 6.50% due 10/20/2028 | | | 35,000 | | | | 37,444 | |
| | Professional Services — 0.0% | | | | | | | | |
| a | Gartner, Inc., 3.625% due 6/15/2029 | | | 35,000 | | | | 33,428 | |
| a | Korn Ferry, 4.625% due 12/15/2027 | | | 75,000 | | | | 73,391 | |
| | | | | | | | | 406,757 | |
| 138 | Annual Financial Statements | See notes to financial statements. |
Schedule of Investments, Continued
Thornburg Core Plus Bond Fund | September 30, 2024
| | ISSUER-DESCRIPTION | | SHARES/PRINCIPAL
AMOUNT | | VALUE | |
| | | | | | | | |
| | CONSUMER DISCRETIONARY DISTRIBUTION & RETAIL — 0.4% | | | | | | | | |
| | Broadline Retail — 0.1% | | | | | | | | |
| | MercadoLibre, Inc., 2.375% due 1/14/2026 | | $ | 296,000 | | | $ | 286,279 | |
| | Specialty Retail — 0.3% | | | | | | | | |
| | Genuine Parts Co., 4.95% due 8/15/2029 | | | 450,000 | | | | 457,484 | |
| | | | | | | | | 743,763 | |
| | CONSUMER DURABLES & APPAREL — 0.2% | | | | | | | | |
| | Leisure Products — 0.2% | | | | | | | | |
| | Polaris, Inc., 6.95% due 3/15/2029 | | | 265,000 | | | | 287,554 | |
| | | | | | | | | 287,554 | |
| | CONSUMER SERVICES — 0.0% | | | | | | | | |
| | Hotels, Restaurants & Leisure — 0.0% | | | | | | | | |
| a | Papa John’s International, Inc., 3.875% due 9/15/2029 | | | 48,000 | | | | 44,427 | |
| | | | | | | | | 44,427 | |
| | CONSUMER STAPLES DISTRIBUTION & RETAIL — 0.4% | | | | | | | | |
| | Consumer Staples Distribution & Retail — 0.4% | | | | | | | | |
| a | KeHE Distributors LLC/KeHE Finance Corp./NextWave Distribution, Inc., 9.00% due 2/15/2029 | | | 300,000 | | | | 312,096 | |
| a | U.S. Foods, Inc., 4.75% due 2/15/2029 | | | 300,000 | | | | 292,734 | |
| | | | | | | | | 604,830 | |
| | ENERGY — 2.8% | | | | | | | | |
| | Oil, Gas & Consumable Fuels — 2.8% | | | | | | | | |
| a | Chesapeake Energy Corp., 5.50% due 2/1/2026 | | | 450,000 | | | | 449,446 | |
| a | CITGO Petroleum Corp., 7.00% due 6/15/2025 | | | 250,000 | | | | 250,002 | |
| a | Columbia Pipelines Holding Co. LLC, 5.097% due 10/1/2031 | | | 400,000 | | | | 403,520 | |
| a | Columbia Pipelines Operating Co. LLC, 5.927% due 8/15/2030 | | | 345,000 | | | | 365,427 | |
| | Ecopetrol SA, | | | | | | | | |
| d | 4.625% due 11/2/2031 | | | 70,000 | | | | 59,889 | |
| d | 8.375% due 1/19/2036 | | | 125,000 | | | | 127,814 | |
| a,d | Energean Israel Finance Ltd., 8.50% due 9/30/2033 | | | 210,000 | | | | 198,629 | |
| a,d | Greensaif Pipelines Bidco SARL, 5.853% due 2/23/2036 | | | 440,000 | | | | 455,497 | |
| | Kinder Morgan Energy Partners LP, 5.80% due 3/15/2035 | | | 280,000 | | | | 294,454 | |
| a,d | Parkland Corp., 5.875% due 7/15/2027 | | | 250,000 | | | | 249,442 | |
| d | Petroleos Mexicanos, 7.69% due 1/23/2050 | | | 285,000 | | | | 222,480 | |
| a,d | Raizen Fuels Finance SA, 5.70% due 1/17/2035 | | | 330,000 | | | | 327,050 | |
| a | South Bow USA Infrastructure Holdings LLC, 5.026% due 10/1/2029 | | | 375,000 | | | | 376,181 | |
| | Sunoco LP, | | | | | | | | |
| a | 7.00% due 5/1/2029 | | | 300,000 | | | | 313,620 | |
| a | 7.25% due 5/1/2032 | | | 150,000 | | | | 158,883 | |
| a | Whistler Pipeline LLC, 5.70% due 9/30/2031 | | | 440,000 | | | | 455,426 | |
| | | | | | | | | 4,707,760 | |
| | EQUITY REAL ESTATE INVESTMENT TRUSTS (REITS) — 2.1% | | | | | | | | |
| | Diversified REITs — 1.9% | | | | | | | | |
| a | American Tower Trust #1, 3.652% due 3/15/2048 | | | 550,000 | | | | 534,296 | |
| | Crown Castle, Inc., | | | | | | | | |
| | 4.90% due 9/1/2029 | | | 146,000 | | | | 148,453 | |
| | 5.80% due 3/1/2034 | | | 345,000 | | | | 365,900 | |
| | Extra Space Storage LP, 3.90% due 4/1/2029 | | | 305,000 | | | | 297,808 | |
| a | Iron Mountain Information Management Services, Inc., 5.00% due 7/15/2032 | | | 220,000 | | | | 212,155 | |
| | SBA Tower Trust, | | | | | | | | |
| a | 1.631% due 5/15/2051 | | | 70,000 | | | | 65,541 | |
| a | 1.884% due 7/15/2050 | | | 610,000 | | | | 588,685 | |
| a | 2.328% due 7/15/2052 | | | 111,000 | | | | 102,666 | |
| a | 2.836% due 1/15/2050 | | | 365,000 | | | | 362,378 | |
| a,e | 4.831% due 10/15/2029 | | | 440,000 | | | | 437,602 | |
| | Retail REITs — 0.2% | | | | | | | | |
| | Retail Opportunity Investments Partnership LP, 6.75% due 10/15/2028 | | | 271,000 | | | | 291,003 | |
| | | | | | | | | 3,406,487 | |
| See notes to financial statements. | Annual Financial Statements | 139 |
Schedule of Investments, Continued
Thornburg Core Plus Bond Fund | September 30, 2024
| | ISSUER-DESCRIPTION | | SHARES/PRINCIPAL
AMOUNT | | VALUE | |
| | | | | | | | |
| | FINANCIAL SERVICES — 3.4% | | | | | | | | |
| | Capital Markets — 1.5% | | | | | | | | |
| a,d | Abu Dhabi Developmental Holding Co. PJSC, 5.375% due 5/8/2029 | | $ | 250,000 | | | $ | 260,417 | |
| a | Ares Finance Co. LLC, 4.00% due 10/8/2024 | | | 200,000 | | | | 199,792 | |
| a | Blue Owl Technology Finance Corp., 3.75% due 6/17/2026 | | | 370,000 | | | | 355,918 | |
| | Hercules Capital, Inc., 3.375% due 1/20/2027 | | | 440,000 | | | | 418,884 | |
| a | LPL Holdings, Inc., 4.00% due 3/15/2029 | | | 300,000 | | | | 286,950 | |
| | Main Street Capital Corp., 6.50% due 6/4/2027 | | | 406,000 | | | | 415,103 | |
| | Nasdaq, Inc., 5.55% due 2/15/2034 | | | 280,000 | | | | 295,257 | |
| a | Oaktree Strategic Credit Fund, 8.40% due 11/14/2028 | | | 265,000 | | | | 286,624 | |
| | Consumer Finance — 0.3% | | | | | | | | |
| a | FirstCash, Inc., 6.875% due 3/1/2032 | | | 500,000 | | | | 515,215 | |
| | Financial Services — 1.3% | | | | | | | | |
| a | Antares Holdings LP, 3.95% due 7/15/2026 | | | 500,000 | | | | 485,855 | |
| c | Capital One Financial Corp., 7.149% (SOFR + 2.44%) due 10/29/2027 | | | 330,000 | | | | 347,810 | |
| c | Citigroup, Inc., 3.785% (SOFR + 1.94%) due 3/17/2033 | | | 395,000 | | | | 369,878 | |
| c,d | HSBC Holdings plc, 5.546% (SOFR + 1.46%) due 3/4/2030 | | | 250,000 | | | | 259,533 | |
| d | Sumitomo Mitsui Financial Group, Inc., 3.544% due 1/17/2028 | | | 296,000 | | | | 289,000 | |
| c | Truist Financial Corp., 5.867% (SOFR + 2.36%) due 6/8/2034 | | | 277,000 | | | | 294,589 | |
| | Mortgage Real Estate Investment Trusts — 0.3% | | | | | | | | |
| a | Prologis Targeted U.S. Logistics Fund LP, 5.25% due 4/1/2029 - 1/15/2035 | | | 512,000 | | | | 525,231 | |
| | | | | | | | | 5,606,056 | |
| | FOOD, BEVERAGE & TOBACCO — 1.1% | | | | | | | | |
| | Beverages — 0.5% | | | | | | | | |
| a,d | Becle SAB de CV, 2.50% due 10/14/2031 | | | 650,000 | | | | 541,307 | |
| a,d | Central American Bottling Corp./CBC Bottling Holdco SL/Beliv Holdco SL, 5.25% due 4/27/2029 | | | 350,000 | | | | 339,875 | |
| | Food Products — 0.2% | | | | | | | | |
| | Post Holdings, Inc., | | | | | | | | |
| a | 4.625% due 4/15/2030 | | | 150,000 | | | | 143,469 | |
| a | 5.50% due 12/15/2029 | | | 44,000 | | | | 43,686 | |
| a | 6.25% due 2/15/2032 | | | 50,000 | | | | 51,507 | |
| | Tobacco — 0.4% | | | | | | | | |
| | BAT Capital Corp., | | | | | | | | |
| | 5.834% due 2/20/2031 | | | 120,000 | | | | 127,225 | |
| | 7.75% due 10/19/2032 | | | 160,000 | | | | 189,136 | |
| a,d | Imperial Brands Finance plc, 5.50% due 2/1/2030 | | | 350,000 | | | | 361,081 | |
| | | | | | | | | 1,797,286 | |
| | HEALTH CARE EQUIPMENT & SERVICES — 1.4% | | | | | | | | |
| | Health Care Equipment & Supplies — 0.0% | | | | | | | | |
| a | Hologic, Inc., 3.25% due 2/15/2029 | | | 50,000 | | | | 46,603 | |
| | Health Care Providers & Services — 1.4% | | | | | | | | |
| | Centene Corp., 3.00% due 10/15/2030 | | | 328,000 | | | | 293,576 | |
| a | Highmark, Inc., 1.45% due 5/10/2026 | | | 374,000 | | | | 355,139 | |
| | Humana, Inc., 5.70% due 3/13/2026 | | | 250,000 | | | | 250,063 | |
| | Laboratory Corp. of America Holdings, 4.55% due 4/1/2032 | | | 580,000 | | | | 573,510 | |
| | Tenet Healthcare Corp., 6.75% due 5/15/2031 | | | 350,000 | | | | 365,085 | |
| | Universal Health Services, Inc., | | | | | | | | |
| | 2.65% due 10/15/2030 | | | 333,000 | | | | 297,196 | |
| | 4.625% due 10/15/2029 | | | 200,000 | | | | 198,818 | |
| | | | | | | | | 2,379,990 | |
| | INSURANCE — 3.6% | | | | | | | | |
| | Insurance — 3.6% | | | | | | | | |
| | Aon North America, Inc., 5.45% due 3/1/2034 | | | 350,000 | | | | 367,510 | |
| a | Brighthouse Financial Global Funding, 5.55% due 4/9/2027 | | | 409,000 | | | | 417,577 | |
| | CNA Financial Corp., 5.125% due 2/15/2034 | | | 365,000 | | | | 373,238 | |
| | CNO Financial Group, Inc., 6.45% due 6/15/2034 | | | 405,000 | | | | 427,692 | |
| c | Enstar Finance LLC, 5.75% (5-Yr. CMT + 5.470%) due 9/1/2040 | | | 350,000 | | | | 345,635 | |
| a | F&G Global Funding, 2.00% due 9/20/2028 | | | 476,000 | | | | 424,130 | |
| d | Fairfax Financial Holdings Ltd., 5.625% due 8/16/2032 | | | 85,000 | | | | 88,145 | |
| 140 | Annual Financial Statements | See notes to financial statements. |
Schedule of Investments, Continued
Thornburg Core Plus Bond Fund | September 30, 2024
| | ISSUER-DESCRIPTION | | SHARES/PRINCIPAL
AMOUNT | | VALUE | |
| | | | | | | | |
| a | GA Global Funding Trust, 4.40% due 9/23/2027 | | $ | 577,000 | | | $ | 576,002 | |
| | Globe Life, Inc., 5.85% due 9/15/2034 | | | 308,000 | | | | 318,186 | |
| | Horace Mann Educators Corp., 7.25% due 9/15/2028 | | | 265,000 | | | | 287,517 | |
| a,d | Intact Financial Corp., 5.459% due 9/22/2032 | | | 285,000 | | | | 292,305 | |
| a | Mutual of Omaha Cos Global Funding, 5.45% due 12/12/2028 | | | 276,000 | | | | 286,082 | |
| a,c | Nationwide Mutual Insurance Co., 7.498% (SOFR + 2.18%) due 12/15/2024 | | | 500,000 | | | | 501,105 | |
| a | Prudential Insurance Co. of America, 8.30% due 7/1/2025 | | | 225,000 | | | | 230,405 | |
| a | Reliance Standard Life Global Funding II, 5.243% due 2/2/2026 | | | 281,000 | | | | 282,377 | |
| | RenaissanceRe Finance, Inc., 3.70% due 4/1/2025 | | | 160,000 | | | | 158,987 | |
| d | RenaissanceRe Holdings Ltd., 5.75% due 6/5/2033 | | | 188,000 | | | | 197,242 | |
| a | RGA Global Funding, 2.70% due 1/18/2029 | | | 65,000 | | | | 60,378 | |
| | Stewart Information Services Corp., 3.60% due 11/15/2031 | | | 338,000 | | | | 296,304 | |
| | | | | | | | | 5,930,817 | |
| | MATERIALS — 0.6% | | | | | | | | |
| | Containers & Packaging — 0.6% | | | | | | | | |
| d | Amcor Group Finance plc, 5.45% due 5/23/2029 | | | 404,000 | | | | 418,734 | |
| | Ball Corp., 2.875% due 8/15/2030 | | | 95,000 | | | | 84,520 | |
| a | Berry Global, Inc., 4.875% due 7/15/2026 | | | 250,000 | | | | 249,235 | |
| a,d | CCL Industries, Inc., 3.05% due 6/1/2030 | | | 185,000 | | | | 169,808 | |
| | | | | | | | | 922,297 | |
| | MEDIA & ENTERTAINMENT — 0.4% | | | | | | | | |
| | Media — 0.4% | | | | | | | | |
| a | CCO Holdings LLC/CCO Holdings Capital Corp., 4.25% due 1/15/2034 | | | 330,000 | | | | 270,983 | |
| a | Sirius XM Radio, Inc., 5.50% due 7/1/2029 | | | 350,000 | | | | 341,796 | |
| | | | | | | | | 612,779 | |
| | PHARMACEUTICALS, BIOTECHNOLOGY & LIFE SCIENCES — 0.2% | | | | | | | | |
| | Biotechnology — 0.2% | | | | | | | | |
| | Illumina, Inc., 4.65% due 9/9/2026 | | | 398,000 | | | | 400,476 | |
| | | | | | | | | 400,476 | |
| | SEMICONDUCTORS & SEMICONDUCTOR EQUIPMENT — 0.8% | | | | | | | | |
| | Semiconductors & Semiconductor Equipment — 0.8% | | | | | | | | |
| a | Broadcom, Inc., 3.187% due 11/15/2036 | | | 445,000 | | | | 376,933 | |
| | Micron Technology, Inc., 6.75% due 11/1/2029 | | | 261,000 | | | | 286,813 | |
| a | Qorvo, Inc., 3.375% due 4/1/2031 | | | 331,000 | | | | 296,357 | |
| a,d | Renesas Electronics Corp., 1.543% due 11/26/2024 | | | 400,000 | | | | 397,792 | |
| | | | | | | | | 1,357,895 | |
| | SOFTWARE & SERVICES — 1.4% | | | | | | | | |
| | Information Technology Services — 0.3% | | | | | | | | |
| a | Insight Enterprises, Inc., 6.625% due 5/15/2032 | | | 250,000 | | | | 261,245 | |
| a | Science Applications International Corp., 4.875% due 4/1/2028 | | | 250,000 | | | | 244,930 | |
| | Internet Software & Services — 0.1% | | | | | | | | |
| a,d | Prosus NV, 3.832% due 2/8/2051 | | | 200,000 | | | | 140,044 | |
| a | Prosus NV (EUR), 1.985% due 7/13/2033 | | | 100,000 | | | | 92,657 | |
| | Software — 1.0% | | | | | | | | |
| a,d | Constellation Software, Inc., 5.158% due 2/16/2029 | | | 351,000 | | | | 362,025 | |
| | Fair Isaac Corp., | | | | | | | | |
| a | 4.00% due 6/15/2028 | | | 85,000 | | | | 82,215 | |
| a | 5.25% due 5/15/2026 | | | 350,000 | | | | 349,944 | |
| a | MSCI, Inc., 3.625% due 9/1/2030 | | | 317,000 | | | | 297,539 | |
| a,d | Open Text Corp., 3.875% due 12/1/2029 | | | 300,000 | | | | 279,048 | |
| a | SS&C Technologies, Inc., 6.50% due 6/1/2032 | | | 250,000 | | | | 258,415 | |
| | | | | | | | | 2,368,062 | |
| | TECHNOLOGY HARDWARE & EQUIPMENT — 1.1% | | | | | | | | |
| | Electronic Equipment, Instruments & Components — 1.0% | | | | | | | | |
| | CDW LLC/CDW Finance Corp., 3.25% due 2/15/2029 | | | 310,000 | | | | 292,482 | |
| d | Flex Ltd., 4.875% due 5/12/2030 | | | 360,000 | | | | 360,396 | |
| a | Sensata Technologies, Inc., 6.625% due 7/15/2032 | | | 200,000 | | | | 208,430 | |
| See notes to financial statements. | Annual Financial Statements | 141 |
Schedule of Investments, Continued
Thornburg Core Plus Bond Fund | September 30, 2024
| | ISSUER-DESCRIPTION | | SHARES/PRINCIPAL
AMOUNT | | VALUE | |
| | | | | | | |
| | Vontier Corp., 2.40% due 4/1/2028 | | $ | 317,000 | | | $ | 291,580 | |
| a | WESCO Distribution, Inc., 6.375% due 3/15/2029 | | | 200,000 | | | | 206,692 | |
| a | Zebra Technologies Corp., 6.50% due 6/1/2032 | | | 200,000 | | | | 208,948 | |
| | Technology Hardware, Storage & Peripherals — 0.1% | | | | | | | | |
| | Hewlett Packard Enterprise Co., 6.102% due 4/1/2026 | | | 200,000 | | | | 200,000 | |
| | | | | | | | | 1,768,528 | |
| | TELECOMMUNICATION SERVICES — 0.2% | | | | | | | | |
| | Wireless Telecommunication Services — 0.2% | | | | | | | | |
| | Crown Castle Towers LLC, | | | | | | | | |
| a | 3.663% due 5/15/2045 | | | 200,000 | | | | 198,446 | |
| a | 4.241% due 7/15/2048 | | | 125,000 | | | | 122,447 | |
| | | | | | | | | 320,893 | |
| | TRANSPORTATION — 0.3% | | | | | | | | |
| | Air Freight & Logistics — 0.2% | | | | | | | | |
| | Ryder System, Inc., 5.30% due 3/15/2027 | | | 280,000 | | | | 286,563 | |
| | Passenger Airlines — 0.1% | | | | | | | | |
| a,d | Pegasus Hava Tasimaciligi AS, 8.00% due 9/11/2031 | | | 250,000 | | | | 249,843 | |
| | | | | | | | | 536,406 | |
| | UTILITIES — 5.9% | | | | | | | | |
| | Electric Utilities — 5.5% | | | | | | | | |
| | AEP Texas, Inc., Series I, 2.10% due 7/1/2030 | | | 360,000 | | | | 317,135 | |
| | Allegion U.S. Holding Co., Inc., 3.20% due 10/1/2024 | | | 350,000 | | | | 350,000 | |
| | American Electric Power Co., Inc., 2.30% due 3/1/2030 | | | 350,000 | | | | 314,293 | |
| | Black Hills Corp., 6.15% due 5/15/2034 | | | 335,000 | | | | 361,643 | |
| a | Boston Gas Co., 3.757% due 3/16/2032 | | | 400,000 | | | | 364,468 | |
| | Comision Federal de Electricidad, | | | | | | | | |
| a,d | 3.348% due 2/9/2031 | | | 200,000 | | | | 172,076 | |
| d | 5.00% due 9/29/2036 | | | 132,800 | | | | 120,835 | |
| | Connecticut Light & Power Co., 4.95% due 8/15/2034 | | | 447,000 | | | | 459,672 | |
| | DTE Energy Co., 5.85% due 6/1/2034 | | | 300,000 | | | | 322,173 | |
| a,d | Electricite de France SA, 5.65% due 4/22/2029 | | | 375,000 | | | | 393,150 | |
| a,d | Enel Finance International NV, 5.125% due 6/26/2029 | | | 322,000 | | | | 329,809 | |
| a | Evergy Missouri West, Inc., 3.75% due 3/15/2032 | | | 65,000 | | | | 59,452 | |
| | FirstEnergy Transmission LLC, | | | | | | | | |
| a | 4.55% due 1/15/2030 | | | 400,000 | | | | 403,500 | |
| a | 5.00% due 1/15/2035 | | | 250,000 | | | | 253,933 | |
| | Idaho Power Co., 5.20% due 8/15/2034 | | | 375,000 | | | | 388,312 | |
| | ITC Holdings Corp., 5.30% due 7/1/2043 | | | 300,000 | | | | 290,526 | |
| a | Kentucky Power Co., 7.00% due 11/15/2033 | | | 261,000 | | | | 289,347 | |
| a | Liberty Utilities Finance GP 1, 2.05% due 9/15/2030 | | | 350,000 | | | | 301,326 | |
| a | Midland Cogeneration Venture LP, 6.00% due 3/15/2025 | | | 101,722 | | | | 100,609 | |
| a | Monongahela Power Co., 3.55% due 5/15/2027 | | | 295,000 | | | | 289,469 | |
| a | Niagara Mohawk Power Corp., 3.508% due 10/1/2024 | | | 411,000 | | | | 411,000 | |
| c | Pacific Gas & Electric Co., 5.908% (SOFRINDX + 0.95%) due 9/4/2025 | | | 250,000 | | | | 250,365 | |
| | PPL Capital Funding, Inc., 5.25% due 9/1/2034 | | | 400,000 | | | | 411,776 | |
| | Public Service Co. of Oklahoma, Series J, 2.20% due 8/15/2031 | | | 348,000 | | | | 297,227 | |
| | Puget Energy, Inc., | | | | | | | | |
| | 4.10% due 6/15/2030 | | | 200,000 | | | | 192,568 | |
| | 4.224% due 3/15/2032 | | | 205,000 | | | | 192,702 | |
| | Southwestern Public Service Co., 6.00% due 6/1/2054 | | | 250,000 | | | | 273,790 | |
| | Tucson Electric Power Co., 5.20% due 9/15/2034 | | | 450,000 | | | | 460,552 | |
| | Virginia Electric & Power Co., 5.05% due 8/15/2034 | | | 375,000 | | | | 385,166 | |
| | Wisconsin Power & Light Co., 5.375% due 3/30/2034 | | | 282,000 | | | | 295,370 | |
| | Gas Utilities — 0.4% | | | | | | | | |
| a,d | APA Infrastructure Ltd., 5.125% due 9/16/2034 | | | 410,000 | | | | 407,868 | |
| a | KeySpan Gas East Corp., 5.994% due 3/6/2033 | | | 280,000 | | | | 293,367 | |
| | | | | | | | | 9,753,479 | |
| | TOTAL CORPORATE BONDS (Cost $46,829,866) | | | | | | | 48,239,544 | |
| 142 | Annual Financial Statements | See notes to financial statements. |
Schedule of Investments, Continued
Thornburg Core Plus Bond Fund | September 30, 2024
| | ISSUER-DESCRIPTION | | SHARES/PRINCIPAL
AMOUNT | | VALUE | |
| | | | | | | | |
| | LONG-TERM MUNICIPAL BONDS — 0.1% | | | | | | | | |
| | County of Miami-Dade Seaport Department, 6.224% due 11/1/2055 | | $ | 100,000 | | | $ | 107,939 | |
| | TOTAL LONG-TERM MUNICIPAL BONDS (Cost $100,000) | | | | | | | 107,939 | |
| | | | | | | | | | |
| | PREFERRED STOCK — 0.4% | | | | | | | | |
| | | | | | | | | | |
| | FINANCIAL SERVICES — 0.4% | | | | | | | | |
| | Capital Markets — 0.4% | | | | | | | | |
| f | Calamos Strategic Total Return Fund, 6.24% due 9/9/2029 | | | 14,000 | | | | 350,000 | |
| c,f | Gabelli Dividend & Income Trust, Series J, 4.50% due 3/26/2028 | | | 12 | | | | 286,872 | |
| | | | | | | | | 636,872 | |
| | TOTAL PREFERRED STOCK (Cost $617,000) | | | | | | | 636,872 | |
| | | | | | | | | | |
| | SHORT-TERM INVESTMENTS — 3.8% | | | | | | | | |
| g | Thornburg Capital Management Fund | | | 629,217 | | | | 6,292,172 | |
| | TOTAL SHORT-TERM INVESTMENTS (Cost $6,292,172) | | | | | | | 6,292,172 | |
| | | | | | | | | | |
| | TOTAL INVESTMENTS — 99.6% (Cost $159,279,386) | | | | | | $ | 164,846,052 | |
| | | | | | | | | | |
| | OTHER ASSETS LESS LIABILITIES — 0.4% | | | | | | | 629,054 | |
| | | | | | | | | | |
| | NET ASSETS — 100.0% | | | | | | $ | 165,475,106 | |
OUTSTANDING FORWARD CURRENCY CONTRACTS TO BUY OR SELL AT SEPTEMBER 30, 2024
CONTRACT
DESCRIPTION | | CONTRACT
PARTY* | | BUY/SELL | | | CONTRACT
AMOUNT | | | CONTRACT
VALUE DATE | | | VALUE
USD | | | UNREALIZED
APPRECIATION | | UNREALIZED
DEPRECIATION |
| | | | | | | | | | | | | | | | | | | | | |
| Euro | | SSB | | Sell | | | 78,400 | | | 3/25/2025 | | | 87,951 | | | $ | — | | | $ | (192 | ) |
| Net unrealized appreciation (depreciation) | | | | | | | | | | $ | (192 | ) |
* Counterparty includes State Street Bank and Trust Company (“SSB”).
Footnote Legend
| a | Securities exempt from registration under Rule 144A of the Securities Act of 1933, as amended. These securities are restricted but liquid and may only be resold in the ordinary course of business in transactions exempt from registration, normally to qualified institutional buyers. As of September 30, 2024, the aggregate value of these securities in the Fund’s portfolio was $59,245,312, representing 35.80% of the Fund’s net assets. |
| b | Securities are perpetual and, thus, do not have a predetermined maturity date. The date shown, if applicable, reflects the next call date. |
| c | Variable, floating, step, or fixed to floating rate securities are securities for which interest rate changes are based on changes in a designated base rate or on a predetermined schedule. The rates shown are those in effect on September 30, 2024. |
| d | Yankee bond denominated in U.S. dollars and is issued in the U.S. by foreign banks and corporations. |
| f | Security currently fair valued by Thornburg Investment Management, Inc.’s Valuation and Pricing Committee. |
| g | Investment in Affiliates. |
Portfolio Abbreviations
To simplify the listings of securities, abbreviations are used per the table below:
| ABS | Asset Backed Securities | REMIC | Real Estate Mortgage Investment Conduit |
| CMBS | Commercial Mortgage-Backed Securities | RFUCCT1Y | Refinitiv USD Interbank Offered Rate Consumer Cash Fallbacks Term 1 Year |
| CMO | Collateralized Mortgage Obligation | SOFR | Secured Overnight Financing Rate |
| CMT | Constant Maturity Rate | SOFR30A | Secured Overnight Financing Rate 30-Day Average |
| DOP | Denominated in Dominican Peso | SOFR90A | Secured Overnight Financing Rate 90-Day Average |
| EGP | Denominated in Egyptian Pound | SOFRINDX | Secured Overnight Financing Rate Index |
| EUR | Denominated in Euro | TSFR1M | Term SOFR 1 Month |
| H15T1Y | US Treasury Yield Curve Rate T-Note Constant Maturity 1 Year | UMBS | Uniform Mortgage Backed Securities |
| Mtg | Mortgage | | |
| See notes to financial statements. | Annual Financial Statements | 143 |
Schedule of Investments
Thornburg Strategic Income Fund | September 30, 2024
| | | | SHARES/ | | | | |
| | ISSUER-DESCRIPTION | | PRINCIPAL AMOUNT | | | VALUE | |
| | | | | | | | |
| COMMON STOCK — 0.0% | | | | | | | | |
| | | | | | | | | | |
| | ENERGY — 0.0% | | | | | | | | |
| | Oil, Gas & Consumable Fuels — 0.0% | | | | | | | | |
| a,b | Foresea Holding SA | | | 19,278 | | | $ | 240,011 | |
| a,b | Malamute Energy, Inc. | | | 847 | | | | 847 | |
| | | | | | | | | 240,858 | |
| | TELECOMMUNICATION SERVICES — 0.0% | | | | | | | | |
| | Diversified Telecommunication Services — 0.0% | | | | | | | | |
| a,b | Digicel Holdings Ltd. | | | 24,516 | | | | 22,235 | |
| | | | | | | | | 22,235 | |
| | TOTAL COMMON STOCK (Cost $1,763,028) | | | | | | | 263,093 | |
| | | | | | | | | | |
| PREFERRED STOCK — 0.4% | | | | | | | | |
| | | | | | | | | | |
| | CAPITAL GOODS — 0.1% | | | | | | | | |
| | Trading Companies & Distributors — 0.1% | | | | | | | | |
| c,d | WESCO International, Inc. Series A 10.625% (5-Yr. CMT + 10.330%), 6/22/2025 | | | 262,183 | | | | 6,777,430 | |
| | | | | | | | | 6,777,430 | |
| | FINANCIAL SERVICES — 0.3% | | | | | | | | |
| | Capital Markets — 0.3% | | | | | | | | |
| a | Calamos Strategic Total Return Fund 6.24%, 9/9/2029 | | | 510,000 | | | | 12,750,000 | |
| a,d | Gabelli Dividend & Income Trust Series J, 4.50%, 3/26/2028 | | | 864 | | | | 20,654,784 | |
| | | | | | | | | 33,404,784 | |
| | TOTAL PREFERRED STOCK (Cost $40,392,875) | | | | | | | 40,182,214 | |
| | | | | | | | | | |
| ASSET BACKED SECURITIES — 9.6% | | | | | | | | |
| | | | | | | | | | |
| | AUTO RECEIVABLES — 2.3% | | | | | | | | |
| e | ACM Auto Trust, Series 2023-2A Class A, 7.97% due 6/20/2030 | | $ | 2,622,438 | | | | 2,639,560 | |
| e | Ally Auto Receivables Trust Series 2023-1 Class CERT, due 4/15/2034 | | | 17,000 | | | | 5,288,287 | |
| | Arivo Acceptance Auto Loan Receivables Trust, | | | | | | | | |
| e | Series 2021-1A Class C, 3.77% due 3/15/2027 | | | 900,000 | | | | 890,881 | |
| e | Series 2021-1A Class D, 5.83% due 1/18/2028 | | | 850,000 | | | | 836,734 | |
| e | Series 2024-1A Class A, 6.46% due 4/17/2028 | | | 3,658,889 | | | | 3,688,686 | |
| e | Avid Automobile Receivables Trust, Series 2023-1 Class A, 6.63% due 7/15/2026 | | | 344,165 | | | | 344,316 | |
| | BOF URSA VI Funding Trust I, | | | | | | | | |
| e | Series 2023-CAR1 Class B, 6.029% due 10/27/2031 | | | 2,003,015 | | | | 2,020,629 | |
| e | Series 2023-CAR2 Class A2, 5.542% due 10/27/2031 | | | 4,456,451 | | | | 4,485,100 | |
| e | Series 2023-CAR2 Class B, 6.029% due 10/27/2031 | | | 5,261,249 | | | | 5,297,196 | |
| e | BOF VII AL Funding Trust I, Series 2023-CAR3 Class A2, 6.291% due 7/26/2032 | | | 7,521,446 | | | | 7,649,909 | |
| e | CarNow Auto Receivables Trust, Series 2021-2A Class D, 2.25% due 3/15/2027 | | | 1,604,999 | | | | 1,592,966 | |
| | Carvana Auto Receivables Trust, | | | | | | | | |
| e | Series 2019-4A Class R, due 10/15/2026 | | | 8,000 | | | | 2,430,274 | |
| e | Series 2020-P1 Class R, due 9/8/2027 | | | 20,000 | | | | 1,576,808 | |
| e | Series 2021-N4 Class R, due 9/12/2028 | | | 11,650 | | | | 572,780 | |
| e | Series 2021-P1 Class R, due 12/10/2027 | | | 23,500 | | | | 1,877,880 | |
| e | Series 2021-P2 Class R, due 5/10/2028 | | | 7,500 | | | | 1,463,101 | |
| e | Series 2021-P3 Class R, due 9/11/2028 | | | 9,000 | | | | 1,542,812 | |
| e | Series 2021-P4 Class R, due 9/11/2028 | | | 8,250 | | | | 1,616,835 | |
| e | Series 2022-N1 Class E, 6.01% due 12/11/2028 | | | 6,000,000 | | | | 5,998,202 | |
| e | Series 2022-P1 Class R, due 1/10/2029 | | | 24,000 | | | | 5,460,707 | |
| e | Series 2022-P1 Class XS, due 1/10/2029 | | | 304,777,639 | | | | 1,285,034 | |
| e | Series 2023-N1 Class A, 6.36% due 4/12/2027 | | | 2,306,589 | | | | 2,314,103 | |
| e | Series 2023-N3 Class A, 6.41% due 9/10/2027 | | | 1,994,389 | | | | 2,006,762 | |
| e | Series 2023-N4 Class A, 6.42% due 1/10/2028 | | | 2,635,971 | | | | 2,656,672 | |
| e | CPS Auto Receivables Trust, Series 2020-C Class F, 6.67% due 11/15/2027 | | | 1,000,000 | | | | 1,001,120 | |
| e | CPS Auto Securitization Trust, Series 2021-1A Class A, 7.86% due 6/16/2026 | | | 10,000,000 | | | | 9,796,257 | |
| 144 | Annual Financial Statements | See notes to financial statements. |
Schedule of Investments, Continued
Thornburg Strategic Income Fund | September 30, 2024
| | | | SHARES/ | | | | |
| | ISSUER-DESCRIPTION | | PRINCIPAL AMOUNT | | | VALUE | |
| | Exeter Automobile Receivables Trust, | | | | | | | | |
| | Series 2021-1A Class D, 1.08% due 11/16/2026 | | $ | 1,412,726 | | | $ | 1,391,405 | |
| | Series 2021-3A Class C, 0.96% due 10/15/2026 | | | 2,067,650 | | | | 2,058,705 | |
| | FHF Trust, | | | | | | | | |
| e | Series 2021-2A Class A, 0.83% due 12/15/2026 | | | 549,582 | | | | 542,625 | |
| e | Series 2022-2A Class A, 6.14% due 12/15/2027 | | | 2,559,150 | | | | 2,570,116 | |
| e | Series 2023-1A Class A2, 6.57% due 6/15/2028 | | | 2,822,433 | | | | 2,846,874 | |
| e | First Investors Auto Owner Trust, Series 2022-1A Class E, 5.41% due 6/15/2029 | | | 5,000,000 | | | | 4,933,033 | |
| | Flagship Credit Auto Trust, | | | | | | | | |
| e | Series 2019-2 Class R, due 12/15/2026 | | | 33,000 | | | | 1,474,855 | |
| e | Series 2019-3 Class R, due 12/15/2026 | | | 31,000 | | | | 1,432,957 | |
| e | Series 2019-4 Class D, 3.12% due 1/15/2026 | | | 396,776 | | | | 395,098 | |
| e | Series 2019-4 Class R, due 3/15/2027 | | | 26,000 | | | | 1,332,103 | |
| e | Series 2022-1 Class E, 5.37% due 6/15/2029 | | | 6,120,000 | | | | 5,388,342 | |
| e | GLS Auto Receivables Issuer Trust, Series 2021-4A Class C, 1.94% due 10/15/2027 | | | 2,758,616 | | | | 2,732,661 | |
| e | Hertz Vehicle Financing LLC, Series 2021-1A Class A, 1.21% due 12/26/2025 | | | 8,767,500 | | | | 8,715,639 | |
| | JPMorgan Chase Bank NA - CACLN, | | | | | | | | |
| e | Series 2020-1 Class R, 33.784% due 1/25/2028 | | | 606,352 | | | | 612,697 | |
| e | Series 2020-2 Class R, 31.355% due 2/25/2028 | | | 5,576,033 | | | | 5,627,132 | |
| e | Series 2021-1 Class R, 28.348% due 9/25/2028 | | | 3,197,784 | | | | 3,515,682 | |
| e | Series 2021-2 Class G, 8.482% due 12/26/2028 | | | 3,950,000 | | | | 4,016,967 | |
| d,e | Kinetic Advantage Master Owner Trust, Series 2024-1A Class A, 7.992% (SOFR30A + 2.65%) due 11/15/2027 | | | 17,500,000 | | | | 17,557,477 | |
| | Lendbuzz Securitization Trust, | | | | | | | | |
| e | Series 2021-1A Class A, 1.46% due 6/15/2026 | | | 802,233 | | | | 789,103 | |
| e | Series 2022-1A Class A, 4.22% due 5/17/2027 | | | 5,973,449 | | | | 5,924,504 | |
| e | Series 2023-2A Class A2, 7.09% due 10/16/2028 | | | 3,123,495 | | | | 3,180,161 | |
| | Lobel Automobile Receivables Trust, | | | | | | | | |
| e | Series 2023-1 Class A, 6.97% due 7/15/2026 | | | 870,487 | | | | 872,043 | |
| e | Series 2023-2 Class A, 7.59% due 4/16/2029 | | | 3,961,206 | | | | 4,005,636 | |
| e,f | Oscar U.S. Funding XV LLC, Series 2023-1A Class A2, 6.07% due 9/10/2026 | | | 1,436,521 | | | | 1,442,665 | |
| | Research-Driven Pagaya Motor Asset Trust, | | | | | | | | |
| e | Series 2023-3A Class A, 7.13% due 1/26/2032 | | | 12,398,447 | | | | 12,539,401 | |
| e | Series 2023-4A Class A, 7.54% due 3/25/2032 | | | 7,734,939 | | | | 7,859,217 | |
| e | Research-Driven Pagaya Motor Trust, Series 2024-1A Class A, 7.09% due 6/25/2032 | | | 8,698,192 | | | | 8,793,890 | |
| e | SAFCO Auto Receivables Trust, Series 2024-1A Class A, 6.51% due 3/20/2028 | | | 6,603,321 | | | | 6,656,248 | |
| | Santander Consumer Auto Receivables Trust, | | | | | | | | |
| e | Series 2020-AA Class R, due 1/16/2029 | | | 30,500 | | | | 3,009,013 | |
| e | Series 2021-AA Class F, 5.79% due 8/15/2028 | | | 3,000,000 | | | | 2,991,807 | |
| e | Series 2021-AA Class R, due 8/15/2028 | | | 28,500 | | | | 1,471,267 | |
| e | Santander Drive Auto Receivables Trust, Series 2023-S1 Class R1, 8.14% due 4/18/2028 | | | 10,767,731 | | | | 10,937,158 | |
| | Tricolor Auto Securitization Trust, | | | | | | | | |
| e | Series 2023-1A Class A, 6.48% due 8/17/2026 | | | 225,731 | | | | 225,792 | |
| e | Series 2024-2A Class A, 6.36% due 12/15/2027 | | | 5,568,904 | | | | 5,611,941 | |
| | United Auto Credit Securitization Trust, | | | | | | | | |
| e | Series 2022-1 Class R, due 11/10/2028 | | | 37,000 | | | | 1,099,994 | |
| e | Series 2024-1 Class A, 6.17% due 8/10/2026 | | | 2,342,110 | | | | 2,347,884 | |
| | | | | | | | | 223,235,703 | |
| | CREDIT CARD — 0.5% | | | | | | | | |
| e | Brex Commercial Charge Card Master Trust, Series 2024-1 Class A1, 6.05% due 7/15/2027 | | | 11,173,000 | | | | 11,351,903 | |
| e | Continental Finance Credit Card ABS Master Trust, Series 2020-1A Class B, 3.66% due 12/15/2028 | | | 162,755 | | | | 162,657 | |
| e | Genesis Private Label Amortizing Trust, Series 2020-1 Class D, 6.63% due 7/20/2030 | | | 318,005 | | | | 318,463 | |
| | Mercury Financial Credit Card Master Trust, | | | | | | | | |
| e | Series 2023-1A Class A, 8.04% due 9/20/2027 | | | 14,600,000 | | | | 14,670,608 | |
| e | Series 2024-2A Class A, 6.56% due 7/20/2029 | | | 9,800,000 | | | | 9,985,274 | |
| | Mission Lane Credit Card Master Trust, | | | | | | | | |
| e | Series 2023-B Class A, 7.69% due 11/15/2028 | | | 8,000,000 | | | | 8,117,190 | |
| e | Series 2024-A Class A1, 6.20% due 8/15/2029 | | | 4,700,000 | | | | 4,751,420 | |
| | | | | | | | | 49,357,515 | |
| | OTHER ASSET BACKED — 5.3% | | | | | | | | |
| d,e | 321 Henderson Receivables I LLC, Series 2006-3A Class A1, 5.411% (TSFR1M + 0.31%) due 9/15/2041 | | | 472,333 | | | | 467,198 | |
| e | Affirm Asset Securitization Trust, Series 2021-Z2 Class A, 1.17% due 11/16/2026 | | | 117,933 | | | | 116,562 | |
| e | AFG ABS I LLC, Series 2023-1 Class A2, 6.30% due 9/16/2030 | | | 5,322,108 | | | | 5,358,583 | |
| See notes to financial statements. | Annual Financial Statements | 145 |
Schedule of Investments, Continued
Thornburg Strategic Income Fund | September 30, 2024
| | | | SHARES/ | | | | |
| | ISSUER-DESCRIPTION | | PRINCIPAL AMOUNT | | | VALUE | |
| e | AMCR ABS Trust, Series 2023-1A Class A, 7.66% due 1/21/2031 | | $ | 1,790,539 | | | $ | 1,798,924 | |
| e | Amur Equipment Finance Receivables IX LLC, Series 2021-1A Class F, 6.09% due 2/20/2029 | | | 8,152,000 | | | | 8,101,904 | |
| | Aqua Finance Trust, | | | | | | | | |
| e | Series 2019-A Class D, 6.07% due 7/16/2040 | | | 11,553,883 | | | | 11,078,379 | |
| e | Series 2020-AA Class A, 1.90% due 7/17/2046 | | | 1,519,146 | | | | 1,383,691 | |
| e | Series 2020-AA Class D, 7.15% due 7/17/2046 | | | 3,148,598 | | | | 2,980,101 | |
| e | Series 2021-A Class A, 1.54% due 7/17/2046 | | | 3,937,050 | | | | 3,631,277 | |
| e | Arm Master Trust LLC Agricultural Loan Backed Notes, Series 2021-T1 Class A, 2.43% due 11/15/2027 | | | 11,357,750 | | | | 11,208,026 | |
| e | Auxilior Term Funding LLC, Series 2023-1A Class A2, 6.18% due 12/15/2028 | | | 3,195,250 | | | | 3,228,784 | |
| | BHG Securitization Trust, | | | | | | | | |
| e | Series 2021-A Class C, 3.69% due 11/17/2033 | | | 2,200,000 | | | | 2,043,074 | |
| e | Series 2021-B Class A, 0.90% due 10/17/2034 | | | 554,396 | | | | 548,993 | |
| e | Series 2022-A Class A, 1.71% due 2/20/2035 | | | 2,315,076 | | | | 2,299,872 | |
| d,e,f | Blackbird Capital Aircraft Lease Securitization Ltd., Series 2016-1A Class A, 4.213% due 12/16/2041 | | | 2,638,862 | | | | 2,622,554 | |
| d,e | Cascade MH Asset Trust, Series 2021-MH1 Class B3, 7.708% due 2/25/2046 | | | 1,936,119 | | | | 1,602,594 | |
| e,f | CFG Investments Ltd., Series 2023-1 Class A, 8.56% due 7/25/2034 | | | 7,400,000 | | | | 7,439,852 | |
| e | CFMT Issuer Trust, Series 2021-GRN1 Class A, 1.10% due 3/20/2041 | | | 600,251 | | | | 585,530 | |
| e | ClickLease Equipment Receivables Trust, Series 2024-1 Class A, 6.86% due 2/15/2030 | | | 6,363,637 | | | | 6,391,357 | |
| d,e | Consumer Loan Underlying Bond Certificate Issuer Trust I Series 2019-HP1 Class CERT, due 12/15/2026 | | | 100,000 | | | | 79,063 | |
| e | CP EF Asset Securitization I LLC, Series 2022-1A Class A, 5.96% due 4/15/2030 | | | 2,555,491 | | | | 2,558,651 | |
| e | Crockett Partners Equipment Co. IIA LLC, Series 2024-1C Class A, 6.05% due 1/20/2031 | | | 10,958,545 | | | | 11,155,168 | |
| e | Crossroads Asset Trust, Series 2022-A Class A, 6.35% due 4/21/2031 | | | 2,695,729 | | | | 2,711,828 | |
| e | DataBank Issuer LLC, Series 2024-1A Class A2, 5.30% due 1/26/2054 | | | 16,375,000 | | | | 16,322,154 | |
| | Dext ABS LLC, | | | | | | | | |
| e | Series 2021-1 Class A, 1.12% due 2/15/2028 | | | 226,028 | | | | 225,659 | |
| e | Series 2023-2 Class A2, 6.56% due 5/15/2034 | | | 3,402,917 | | | | 3,446,190 | |
| e | Diamond Infrastructure Funding LLC, Series 2021-1A Class A, 1.76% due 4/15/2049 | | | 19,150,000 | | | | 17,818,353 | |
| e | Diamond Issuer LLC, Series 2021-1A Class A, 2.305% due 11/20/2051 | | | 10,983,000 | | | | 10,243,314 | |
| e,f | ECAF I Ltd., Series 2015-1A Class B1, 5.802% due 6/15/2040 | | | 4,600,055 | | | | 1,403,127 | |
| e | EverBright Solar Trust, Series 2024-A Class A, 6.43% due 6/22/2054 | | | 11,609,563 | | | | 11,695,261 | |
| e | FAT Brands Fazoli’s Native I LLC, Series 2021-1 Class A2, 7.00% due 7/25/2051 | | | 11,086,740 | | | | 10,360,938 | |
| | Foundation Finance Trust, | | | | | | | | |
| e | Series 2019-1A Class C, 5.66% due 11/15/2034 | | | 575,000 | | | | 567,656 | |
| e | Series 2020-1A Class A, 3.54% due 7/16/2040 | | | 1,148,514 | | | | 1,134,374 | |
| e | Series 2020-1A Class C, 5.75% due 7/16/2040 | | | 4,025,000 | | | | 3,914,491 | |
| e | Series 2021-1A Class A, 1.27% due 5/15/2041 | | | 1,149,150 | | | | 1,061,631 | |
| e | Series 2021-1A Class D, 4.96% due 5/15/2041 | | | 1,737,323 | | | | 1,584,069 | |
| e | Series 2021-2A Class A, 2.19% due 1/15/2042 | | | 1,122,694 | | | | 1,052,801 | |
| e | Series 2021-2A Class D, 5.73% due 1/15/2042 | | | 3,750,000 | | | | 3,500,346 | |
| | Goldman Home Improvement Trust Issuer Trust, | | | | | | | | |
| e | Series 2021-GRN2 Class A, 1.15% due 6/25/2051 | | | 2,929,850 | | | | 2,822,285 | |
| a,e | Series 2021-GRN2 Class R, due 6/20/2051 | | | 41,500 | | | | 2,210,646 | |
| e | Series 2022-GRN1 Class A, 4.50% due 6/25/2052 | | | 1,550,157 | | | | 1,539,837 | |
| e | Goodgreen Trust, Series 2021-1A Class A, 2.66% due 10/15/2056 | | | 8,843,021 | | | | 7,581,227 | |
| | GoodLeap Sustainable Home Solutions Trust, | | | | | | | | |
| e | Series 2021-3CS Class A, 2.10% due 5/20/2048 | | | 1,882,380 | | | | 1,486,988 | |
| e | Series 2021-3CS Class C, 3.50% due 5/20/2048 | | | 4,007,773 | | | | 2,729,782 | |
| e | Series 2021-4GS Class A, 1.93% due 7/20/2048 | | | 10,601,045 | | | | 8,165,516 | |
| e | Series 2021-5CS Class A, 2.31% due 10/20/2048 | | | 13,919,574 | | | | 11,222,953 | |
| d,e | Gracie Point International Funding LLC, Series 2023-2A Class A, 7.619% (SOFR90A + 2.25%) due 3/1/2027 | | | 7,774,651 | | | | 7,794,187 | |
| | GreenSky Home Improvement Trust, | | | | | | | | |
| e | Series 2024-1 Class A2, 5.88% due 6/25/2059 | | | 7,260,000 | | | | 7,308,099 | |
| e | Series 2024-1 Class E, 9.00% due 6/25/2059 | | | 5,000,000 | | | | 4,955,832 | |
| e | HERO Funding Trust, Series 2017-2A Class A1, 3.28% due 9/20/2048 | | | 773,308 | | | | 693,685 | |
| e | Hilton Grand Vacations Trust, Series 2019-AA Class A, 2.34% due 7/25/2033 | | | 679,000 | | | | 662,755 | |
| | InStar Leasing III LLC, | | | | | | | | |
| e | Series 2021-1A Class A, 2.30% due 2/15/2054 | | | 4,164,192 | | | | 3,776,344 | |
| e | Series 2021-1A Class C, 5.29% due 2/15/2054 | | | 4,162,552 | | | | 3,779,952 | |
| | LendingPoint Asset Securitization Trust, | | | | | | | | |
| e | Series 2020-REV1 Class C, 7.699% due 10/15/2028 | | | 3,894,336 | | | | 3,839,674 | |
| e | Series 2021-A Class D, 5.73% due 12/15/2028 | | | 9,000,000 | | | | 7,859,726 | |
| e | Series 2021-B Class D, 6.12% due 2/15/2029 | | | 5,000,000 | | | | 1,414,286 | |
| e | Series 2022-A Class E, 7.02% due 6/15/2029 | | | 6,000,000 | | | | 60 | |
| 146 | Annual Financial Statements | See notes to financial statements. |
Schedule of Investments, Continued
Thornburg Strategic Income Fund | September 30, 2024
| | | | SHARES/ | | | | |
| | ISSUER-DESCRIPTION | | PRINCIPAL AMOUNT | | | VALUE | |
| e | Series 2022-B Class A, 4.77% due 10/15/2029 | | $ | 485,980 | | | $ | 484,947 | |
| e | Series 2022-C Class A, 6.56% due 2/15/2030 | | | 212,545 | | | | 212,605 | |
| e | LendingPoint Pass-Through Trust, Series 2022-ST3 Class A, 4.00% due 5/15/2028 | | | 270,148 | | | | 267,888 | |
| | Loanpal Solar Loan Ltd., | | | | | | | | |
| e | Series 2021-1GS Class A, 2.29% due 1/20/2048 | | | 1,146,210 | | | | 904,608 | |
| e,g | Series 2021-1GS Class R, due 1/20/2048 | | | 13,252,480 | | | | 8,612,204 | |
| e | Series 2021-2GS Class C, 3.50% due 3/20/2048 | | | 2,880,183 | | | | 1,891,293 | |
| e | LP LMS Asset Securitization Trust, Series 2021-2A Class D, 6.61% due 1/15/2029 | | | 2,947,000 | | | | 2,687,198 | |
| | Marlette Funding Trust, | | | | | | | | |
| e | Series 2018-1A Class CERT, due 3/15/2028 | | | 58,592 | | | | 2,828 | |
| e | Series 2021-1A Class R, due 6/16/2031 | | | 9,520 | | | | 168,863 | |
| e | Series 2021-2A Class R, due 9/15/2031 | | | 16,347 | | | | 279,185 | |
| e | Series 2021-3A Class R, due 12/15/2031 | | | 53,946 | | | | 1,260,023 | |
| e | Series 2023-2A Class A, 6.04% due 6/15/2033 | | | 699,096 | | | | 699,179 | |
| e | Momnt Technologies Trust, Series 2023-1A Class A, 6.92% due 3/20/2045 | | | 5,012,069 | | | | 5,086,926 | |
| | Mosaic Solar Loan Trust, | | | | | | | | |
| e | Series 2020-2A Class D, 5.42% due 8/20/2046 | | | 655,924 | | | | 621,191 | |
| e | Series 2020-2A Class R, due 8/20/2046 | | | 1,549,937 | | | | 633,631 | |
| e | Series 2021-1A Class R, due 12/20/2046 | | | 8,600,000 | | | | 887,735 | |
| e | Series 2021-2A Class R, due 4/22/2047 | | | 9,930,000 | | | | 787,092 | |
| e | Series 2021-3A Class R, due 6/20/2052 | | | 12,320,000 | | | | 468,098 | |
| | NetCredit Combined Receivables LLC, | | | | | | | | |
| e | Series 2023-A Class A, 7.78% due 12/20/2027 | | | 2,386,640 | | | | 2,398,920 | |
| e | Series 2024-A Class A, 7.43% due 10/21/2030 | | | 3,515,639 | | | | 3,540,838 | |
| e | New Economy Assets Phase 1 Sponsor LLC, Series 2021-1 Class A1, 1.91% due 10/20/2061 | | | 19,365,000 | | | | 17,848,901 | |
| d,e | Oportun Funding LLC Series 2022-1 Class CERT, due 6/15/2029 | | | 11,000 | | | | 313,633 | |
| e | Oportun Funding XIV LLC, Series 2021-A Class A, 1.21% due 3/8/2028 | | | 3,192,161 | | | | 3,121,894 | |
| | Oportun Issuance Trust, | | | | | | | | |
| e | Series 2021-B Class A, 1.47% due 5/8/2031 | | | 5,578,303 | | | | 5,362,532 | |
| e | Series 2021-C Class A, 2.18% due 10/8/2031 | | | 16,293,000 | | | | 15,807,653 | |
| e | Series 2022-A Class A, 5.05% due 6/9/2031 | | | 11,110,695 | | | | 11,097,403 | |
| | Pagaya AI Debt Selection Trust, | | | | | | | | |
| e | Series 2020-4 Class B, 8.25% due 1/25/2028 | | | 227,763 | | | | 228,017 | |
| e | Series 2021-HG1 Class A, 1.22% due 1/16/2029 | | | 973,381 | | | | 957,680 | |
| | Pagaya AI Debt Trust, | | | | | | | | |
| e | Series 2022-2 Class A, 4.97% due 1/15/2030 | | | 306,756 | | | | 306,464 | |
| e | Series 2023-1 Class A, 7.556% due 7/15/2030 | | | 1,274,482 | | | | 1,277,634 | |
| d,e | Series 2023-5 Class AB, 7.421% due 4/15/2031 | | | 2,767,764 | | | | 2,781,055 | |
| e | Series 2024-1 Class A, 6.66% due 7/15/2031 | | | 2,299,878 | | | | 2,332,300 | |
| e | PowerPay Issuance Trust, Series 2024-1A Class A, 6.53% due 2/18/2039 | | | 7,100,833 | | | | 7,231,016 | |
| | Prosper Marketplace Issuance Trust, | | | | | | | | |
| d,e | Series 2019-2A Class CERT, due 9/15/2025 | | | 16,385 | | | | 3,824 | |
| d,e | Series 2019-3A Class CERT, due 7/15/2025 | | | 101,327,127 | | | | 21,177 | |
| e | Series 2023-1A Class A, 7.06% due 7/16/2029 | | | 1,011,664 | | | | 1,015,074 | |
| e | Series 2024-1A Class A, 6.12% due 8/15/2029 | | | 5,545,892 | | | | 5,562,874 | |
| | Prosper Pass-Thru Trust II, | | | | | | | | |
| e | Series 2019-ST1 Class CERT, due 7/15/2025 | | | 13,363,728 | | | | 9,335 | |
| e | Series 2019-ST2 Class R1, due 11/15/2025 | | | 6,385,267 | | | | 38,548 | |
| e | Series 2019-ST2 Class R2, due 11/15/2025 | | | 3,193,133 | | | | 19,031 | |
| e | Reach Financial LLC, Series 2023-1A Class A, 7.05% due 2/18/2031 | | | 510,532 | | | | 512,561 | |
| e | Republic Finance Issuance Trust, Series 2021-A Class A, 2.30% due 12/22/2031 | | | 8,400,000 | | | | 8,222,324 | |
| e | Retained Vantage Data Centers Issuer LLC, Series 2023-1A Class A2A, 5.00% due 9/15/2048 | | | 12,100,000 | | | | 12,065,393 | |
| d,e | SBA Tower Trust, Series 2014-2A Class C, 3.869% due 10/15/2049 | | | 18,307,000 | | | | 18,294,344 | |
| e | Service Experts Issuer LLC, Series 2021-1A Class A, 2.67% due 2/2/2032 | | | 10,538,790 | | | | 10,163,085 | |
| e | Sierra Timeshare Receivables Funding LLC, Series 2023-1A Class D, 9.80% due 1/20/2040 | | | 1,821,342 | | | | 1,925,039 | |
| e | SolarCity LMC Series I LLC, Series 2013-1 Class A, 4.80% due 11/20/2038 | | | 671,528 | | | | 666,405 | |
| e | SpringCastle America Funding LLC, Series 2020-AA Class A, 1.97% due 9/25/2037 | | | 2,621,819 | | | | 2,453,212 | |
| e | SPS Servicer Advance Receivables Trust, Series 2020-T2 Class A, 1.83% due 11/15/2055 | | | 11,890,000 | | | | 11,482,888 | |
| e | Stack Infrastructure Issuer LLC, Series 2021-1A Class A2, 1.877% due 3/26/2046 | | | 7,500,000 | | | | 7,161,757 | |
| e | Stream Innovations Issuer Trust, Series 2024-1A Class A, 6.27% due 7/15/2044 | | | 5,939,913 | | | | 6,035,445 | |
| e | Sunnova Hestia II Issuer LLC, Series 2024-GRID1 Class 1A, 5.63% due 7/20/2051 | | | 5,661,489 | | | | 5,827,797 | |
| e | Theorem Funding Trust, Series 2022-3A Class A, 7.60% due 4/15/2029 | | | 1,945,864 | | | | 1,960,899 | |
| See notes to financial statements. | Annual Financial Statements | 147 |
Schedule of Investments, Continued
Thornburg Strategic Income Fund | September 30, 2024
| | | | SHARES/ | | | | |
| | ISSUER-DESCRIPTION | | PRINCIPAL AMOUNT | | | VALUE | |
| | Upstart Pass-Through Trust, | | | | | | | | |
| e | Series 2020-ST5 Class A, 3.00% due 12/20/2026 | | $ | 766,824 | | | $ | 758,117 | |
| e | Series 2021-ST1 Class A, 2.75% due 2/20/2027 | | | 621,751 | | | | 614,355 | |
| e | Series 2021-ST2 Class A, 2.50% due 4/20/2027 | | | 752,561 | | | | 740,604 | |
| e | Series 2021-ST4 Class A, 2.00% due 7/20/2027 | | | 775,966 | | | | 758,426 | |
| e | Series 2021-ST5 Class A, 2.00% due 7/20/2027 | | | 506,102 | | | | 497,116 | |
| e | Series 2021-ST6 Class A, 1.85% due 8/20/2027 | | | 304,501 | | | | 303,236 | |
| e | Series 2021-ST8 Class A, 1.75% due 10/20/2029 | | | 39,284 | | | | 39,196 | |
| e | Series 2021-ST8 Class CERT, due 10/20/2029 | | | 5,400,000 | | | | 1,801,802 | |
| e | Series 2021-ST9 Class CERT, due 11/20/2029 | | | 1,414,000 | | | | 470,831 | |
| | Upstart Securitization Trust, | | | | | | | | |
| e | Series 2020-3 Class C, 6.25% due 11/20/2030 | | | 665,407 | | | | 665,441 | |
| e | Series 2021-2 Class C, 3.61% due 6/20/2031 | | | 16,798,415 | | | | 16,626,717 | |
| e | Series 2021-3 Class C, 3.28% due 7/20/2031 | | | 14,088,925 | | | | 13,833,152 | |
| e | Series 2021-3 Class CERT, due 7/20/2031 | | | 7,165 | | | | 315,281 | |
| e | Series 2021-4 Class CERT, due 9/20/2031 | | | 4,706 | | | | 275,081 | |
| e | Series 2023-1 Class A, 6.59% due 2/20/2033 | | | 457,991 | | | | 458,428 | |
| e | Series 2023-3 Class A, 6.90% due 10/20/2033 | | | 2,703,811 | | | | 2,734,055 | |
| | Upstart Structured Pass-Through Trust, | | | | | | | | |
| e | Series 2022-1A Class A, 3.40% due 4/15/2030 | | | 2,889,268 | | | | 2,854,220 | |
| e | Series 2022-4A Class A, 7.01% due 11/15/2030 | | | 877,765 | | | | 878,412 | |
| e | Verdant Receivables LLC, Series 2023-1A Class A2, 6.24% due 1/13/2031 | | | 8,216,907 | | | | 8,359,127 | |
| | | | | | | | | 500,552,206 | |
| | STUDENT LOAN — 1.5% | | | | | | | | |
| e | Ascent Education Funding Trust, Series 2024-A Class A, 6.14% due 10/25/2050 | | | 12,614,452 | | | | 12,970,155 | |
| | College Ave Student Loans LLC, | | | | | | | | |
| d,e | Series 2021-A Class A1, 6.069% (TSFR1M + 1.21%) due 7/25/2051 | | | 2,311,233 | | | | 2,233,628 | |
| e | Series 2021-A Class A2, 1.60% due 7/25/2051 | | | 220,117 | | | | 198,773 | |
| d,e | Series 2021-C Class A1, 5.869% (TSFR1M + 1.01%) due 7/26/2055 | | | 4,614,322 | | | | 4,303,367 | |
| e | Series 2023-A Class R, due 5/25/2055 | | | 35,000 | | | | 15,235,933 | |
| e | College Avenue Student Loans LLC Series 2021-C Class R, due 7/26/2055 | | | 38,750 | | | | 9,495,977 | |
| | Commonbond Student Loan Trust, | | | | | | | | |
| e | Series 18-CGS Class A1, 3.87% due 2/25/2046 | | | 353,860 | | | | 342,534 | |
| e | Series 2020-1 Class A, 1.69% due 10/25/2051 | | | 1,302,228 | | | | 1,179,241 | |
| e | Series 2021-BGS Class A, 1.17% due 9/25/2051 | | | 4,148,393 | | | | 3,488,639 | |
| e | EDvestinU Private Education Loan Issue No. 3 LLC, Series 2021-A Class A, 1.80% due 11/25/2045 | | | 16,943,051 | | | | 15,559,866 | |
| e | MPOWER Education Trust, Series 2024-A Class A, 6.78% due 7/22/2041 | | | 12,188,705 | | | | 12,537,072 | |
| | National Collegiate Student Loan Trust, | | | | | | | | |
| d | Series 2004-2 Class B, 5.509% (TSFR1M + 0.65%) due 12/26/2033 | | | 4,256,926 | | | | 4,189,505 | |
| d | Series 2006-1 Class A5, 5.319% (TSFR1M + 0.46%) due 3/25/2033 | | | 7,639,558 | | | | 7,325,709 | |
| d | Series 2006-4 Class A4, 5.279% (TSFR1M + 0.42%) due 5/25/2032 | | | 2,404,760 | | | | 2,336,928 | |
| d | Series 2007-2 Class A4, 5.259% (TSFR1M + 0.40%) due 1/25/2033 | | | 1,543,430 | | | | 1,452,075 | |
| d,e | Navient Private Education Refi Loan Trust, Series 2019-D Class A2B, 6.261% (TSFR1M + 1.16%) due 12/15/2059 | | | 2,564,598 | | | | 2,562,376 | |
| | Nelnet Student Loan Trust, | | | | | | | | |
| d,e | Series 2015-2A Class A2, 5.995% (SOFR30A + 0.71%) due 9/25/2042 | | | 1,298,451 | | | | 1,274,017 | |
| d,e | Series 2021-CA Class AFL, 5.815% (TSFR1M + 0.85%) due 4/20/2062 | | | 2,460,548 | | | | 2,400,317 | |
| d,e | Series 2021-DA Class AFL, 5.765% (TSFR1M + 0.80%) due 4/20/2062 | | | 2,906,582 | | | | 2,838,336 | |
| d,e,f | Prodigy Finance DAC, Series 2021-1A Class A, 6.219% (TSFR1M + 1.36%) due 7/25/2051 | | | 456,163 | | | | 447,226 | |
| | SLM Student Loan Trust, | | | | | | | | |
| d | Series 2008-2 Class A3, 6.371% (SOFR90A + 1.01%) due 4/25/2023 | | | 68,253 | | | | 67,968 | |
| d | Series 2008-5 Class A4, 7.321% (SOFR90A + 1.96%) due 7/25/2023 | | | 410,888 | | | | 410,736 | |
| d | Series 2011-2 Class A2, 6.595% (SOFR30A + 1.31%) due 10/25/2034 | | | 2,083,732 | | | | 2,095,430 | |
| d | Series 2012-1 Class A3, 6.345% (SOFR30A + 1.06%) due 9/25/2028 | | | 1,150,440 | | | | 1,134,605 | |
| d | Series 2013-6 Class A3, 6.045% (SOFR30A + 0.76%) due 6/26/2028 | | | 1,310,117 | | | | 1,299,901 | |
| | SMB Private Education Loan Trust, | | | | | | | | |
| e | Series 2021-A Class R, due 1/15/2053 | | | 2,742 | | | | 6,344,903 | |
| d,e | Series 2021-D Class A1B, 5.811% (TSFR1M + 0.71%) due 3/17/2053 | | | 1,928,466 | | | | 1,904,403 | |
| e | Series 2022-A Class D, 4.75% due 11/16/2054 | | | 4,583,520 | | | | 4,415,461 | |
| e | SoFi Professional Loan Program LLC, Series 2021-B Class AFX, 1.14% due 2/15/2047 | | | 16,197,977 | | | | 14,260,855 | |
| 148 | Annual Financial Statements | See notes to financial statements. |
Schedule of Investments, Continued
Thornburg Strategic Income Fund | September 30, 2024
| | | | SHARES/ | | | | |
| | ISSUER-DESCRIPTION | | PRINCIPAL AMOUNT | | | VALUE | |
| e | SoFi Professional Loan Program Trust Series 2021-B Class R1, due 2/15/2047 | | $ | 90,000 | | | $ | 2,828,551 | |
| d,e | Towd Point Asset Trust, Series 2021-SL1 Class A2, 5.775% (TSFR1M + 0.81%) due 11/20/2061 | | | 1,549,650 | | | | 1,544,549 | |
| | | | | | | | | 138,679,036 | |
| | TOTAL ASSET BACKED SECURITIES (Cost $927,100,627) | | | | | | | 911,824,460 | |
| | | | | | | | | | |
| CORPORATE BONDS — 41.6% | | | | | | | | |
| | | | | | | | | | |
| | AUTOMOBILES & COMPONENTS — 0.7% | | | | | | | | |
| | | | | | | | | | |
| | Automobile Components — 0.1% | | | | | | | | |
| e | LKQ European Holdings BV (EUR), 4.125% due 4/1/2028 | | | 6,600,000 | | | | 7,363,390 | |
| e | Real Hero Merger Sub 2, Inc., 6.25% due 2/1/2029 | | | 4,616,000 | | | | 4,007,796 | |
| | Automobiles — 0.6% | | | | | | | | |
| d | American Honda Finance Corp., 5.732% (SOFRINDX + 0.70%) due 11/22/2024 | | | 29,050,000 | | | | 29,052,033 | |
| d,e | Daimler Truck Finance North America LLC, 5.691% (SOFR + 0.75%) due 12/13/2024 | | | 4,099,000 | | | | 4,102,361 | |
| | Hyundai Capital America, | | | | | | | | |
| e | 1.80% due 10/15/2025 | | | 1,528,000 | | | | 1,484,803 | |
| e | 3.00% due 2/10/2027 | | | 1,930,000 | | | | 1,868,916 | |
| e | 5.30% due 3/19/2027 | | | 4,750,000 | | | | 4,848,800 | |
| e | 5.45% due 6/24/2026 | | | 5,400,000 | | | | 5,489,748 | |
| e | 5.50% due 3/30/2026 | | | 3,000,000 | | | | 3,043,680 | |
| e | 5.80% due 6/26/2025 | | | 4,500,000 | | | | 4,532,490 | |
| e | 6.50% due 1/16/2029 | | | 3,000,000 | | | | 3,217,020 | |
| | | | | | | | | 69,011,037 | |
| | BANKS — 1.4% | | | | | | | | |
| | | | | | | | | | |
| | Banks — 1.4% | | | | | | | | |
| d,e,f | Bank Leumi Le-Israel BM, 7.129% (5-Yr. CMT + 3.470%) due 7/18/2033 | | | 8,239,000 | | | | 8,244,355 | |
| | Bank of New York Mellon Corp., | | | | | | | | |
| c,d | Series F, 4.625% (TSFR3M + 3.39%) due 9/20/2026 | | | 1,935,000 | | | | 1,916,211 | |
| c,d | Series I, 3.75% (5-Yr. CMT + 2.630%) due 12/20/2026 | | | 19,575,000 | | | | 18,452,570 | |
| d,e,f | DNB Bank ASA, 5.896% (SOFRINDX + 1.95%) due 10/9/2026 | | | 6,900,000 | | | | 6,989,631 | |
| | FNB Corp., 5.15% due 8/25/2025 | | | 3,170,000 | | | | 3,168,098 | |
| | KeyBank NA, 5.00% due 1/26/2033 | | | 7,100,000 | | | | 7,035,177 | |
| e,f | Macquarie Bank Ltd., 3.624% due 6/3/2030 | | | 2,800,000 | | | | 2,619,036 | |
| d | Morgan Stanley Bank NA, 4.968% (SOFR + 0.93%) due 7/14/2028 | | | 6,700,000 | | | | 6,843,782 | |
| d,e,f | NBK SPC Ltd., 1.625% (SOFR + 1.05%) due 9/15/2027 | | | 5,177,000 | | | | 4,879,530 | |
| | Santander Holdings USA, Inc., | | | | | | | | |
| | 3.45% due 6/2/2025 | | | 1,185,000 | | | | 1,171,858 | |
| d | 6.124% (SOFR + 1.23%) due 5/31/2027 | | | 5,000,000 | | | | 5,106,300 | |
| d | 6.174% (SOFR + 2.50%) due 1/9/2030 | | | 11,370,000 | | | | 11,863,117 | |
| d | 7.66% (SOFR + 3.28%) due 11/9/2031 | | | 12,000,000 | | | | 13,493,880 | |
| e,f | Sumitomo Mitsui Trust Bank Ltd., 5.65% due 3/9/2026 | | | 5,800,000 | | | | 5,907,358 | |
| | Synchrony Bank, 5.40% due 8/22/2025 | | | 6,660,000 | | | | 6,674,252 | |
| | U.S. Bancorp, | | | | | | | | |
| d | 4.653% (SOFR + 1.23%) due 2/1/2029 | | | 7,808,000 | | | | 7,880,302 | |
| d | 5.775% (SOFR + 2.02%) due 6/12/2029 | | | 6,950,000 | | | | 7,282,349 | |
| | Wells Fargo & Co., | | | | | | | | |
| d | 4.808% (SOFR + 1.98%) due 7/25/2028 | | | 3,350,000 | | | | 3,388,659 | |
| d | 5.574% (SOFR + 1.74%) due 7/25/2029 | | | 10,000,000 | | | | 10,403,000 | |
| | | | | | | | | 133,319,465 | |
| | CAPITAL GOODS — 1.4% | | | | | | | | |
| | Aerospace & Defense — 0.5% | | | | | | | | |
| e | BWX Technologies, Inc.,4.125% due 6/30/2028 - 4/15/2029 | | | 16,461,000 | | | | 15,836,468 | |
| | TransDigm, Inc., | | | | | | | | |
| e | 6.375% due 3/1/2029 | | | 14,860,000 | | | | 15,326,307 | |
| e | 6.75% due 8/15/2028 | | | 11,165,000 | | | | 11,502,183 | |
| | Construction & Engineering — 0.2% | | | | | | | | |
| e,f | Aeropuertos Dominicanos Siglo XXI SA, 7.00% due 6/30/2034 | | | 5,000,000 | | | | 5,232,550 | |
| e,f | IHS Netherlands Holdco BV, 8.00% due 9/18/2027 | | | 18,475,000 | | | | 18,494,953 | |
| See notes to financial statements. | Annual Financial Statements | 149 |
Schedule of Investments, Continued
Thornburg Strategic Income Fund | September 30, 2024
| | | | SHARES/ | | | | |
| | ISSUER-DESCRIPTION | | PRINCIPAL AMOUNT | | | VALUE | |
| | Machinery — 0.5% | | | | | | |
| e,f | ATS Corp., 4.125% due 12/15/2028 | | $ | 9,620,000 | | | $ | 9,050,977 | |
| e | Esab Corp., 6.25% due 4/15/2029 | | | 970,000 | | | | 997,500 | |
| | Flowserve Corp., 3.50% due 10/1/2030 | | | 3,431,000 | | | | 3,197,109 | |
| e | Mueller Water Products, Inc., 4.00% due 6/15/2029 | | | 20,714,000 | | | | 19,755,977 | |
| | nVent Finance SARL, | | | | | | | | |
| f | 2.75% due 11/15/2031 | | | 4,097,000 | | | | 3,545,421 | |
| f | 4.55% due 4/15/2028 | | | 3,000,000 | | | | 3,003,840 | |
| | Regal Rexnord Corp., | | | | | | | | |
| | 6.05% due 2/15/2026 | | | 4,350,000 | | | | 4,423,689 | |
| | 6.30% due 2/15/2030 | | | 6,000,000 | | | | 6,376,020 | |
| | Trading Companies & Distributors — 0.2% | | | | | | | | |
| | LKQ Corp., 6.25% due 6/15/2033 | | | 5,840,000 | | | | 6,194,838 | |
| e | Windsor Holdings III LLC, 8.50% due 6/15/2030 | | | 8,470,000 | | | | 9,064,679 | |
| | | | | | | | | 132,002,511 | |
| | COMMERCIAL & PROFESSIONAL SERVICES — 1.9% | | | | | | | | |
| | | | | | | | | | |
| | Commercial Services & Supplies — 1.6% | | | | | | | | |
| e | ACCO Brands Corp., 4.25% due 3/15/2029 | | | 16,611,000 | | | | 15,559,191 | |
| | Avery Dennison Corp., 5.75% due 3/15/2033 | | | 16,449,000 | | | | 17,631,683 | |
| | Clean Harbors, Inc., | | | | | | | | |
| e | 5.125% due 7/15/2029 | | | 2,000,000 | | | | 1,976,320 | |
| e | 6.375% due 2/1/2031 | | | 3,000,000 | | | | 3,072,570 | |
| | CoreCivic, Inc., 8.25% due 4/15/2029 | | | 12,869,000 | | | | 13,629,815 | |
| | Element Fleet Management Corp., | | | | | | | | |
| e,f | 5.643% due 3/13/2027 | | | 5,400,000 | | | | 5,538,456 | |
| e,f | 6.271% due 6/26/2026 | | | 17,735,000 | | | | 18,216,505 | |
| e,f | 6.319% due 12/4/2028 | | | 3,422,000 | | | | 3,644,943 | |
| | Equifax, Inc., | | | | | | | | |
| | 2.35% due 9/15/2031 | | | 9,394,000 | | | | 8,156,810 | |
| | 5.10% due 6/1/2028 | | | 4,667,000 | | | | 4,778,588 | |
| | GEO Group, Inc., 8.625% due 4/15/2029 | | | 8,975,000 | | | | 9,330,949 | |
| | Quanta Services, Inc., | | | | | | | | |
| | 0.95% due 10/1/2024 | | | 13,381,000 | | | | 13,381,000 | |
| | 4.75% due 8/9/2027 | | | 10,565,000 | | | | 10,677,306 | |
| e | UL Solutions, Inc., 6.50% due 10/20/2028 | | | 16,950,000 | | | | 18,133,280 | |
| e | VT Topco, Inc., 8.50% due 8/15/2030 | | | 1,450,000 | | | | 1,548,310 | |
| | Professional Services — 0.3% | | | | | | | | |
| | Gartner, Inc., | | | | | | | | |
| e | 3.625% due 6/15/2029 | | | 7,155,000 | | | | 6,833,598 | |
| e | 4.50% due 7/1/2028 | | | 3,749,000 | | | | 3,713,272 | |
| e | Korn Ferry, 4.625% due 12/15/2027 | | | 17,229,000 | | | | 16,859,438 | |
| | Verisk Analytics, Inc., 5.75% due 4/1/2033 | | | 3,540,000 | | | | 3,810,208 | |
| | | | | | | | | 176,492,242 | |
| | CONSUMER DISCRETIONARY DISTRIBUTION & RETAIL — 0.4% | | | | | | | | |
| | | | | | | | | | |
| | Broadline Retail — 0.3% | | | | | | | | |
| e,f,h | Meituan, 4.50% due 4/2/2028 | | | 11,600,000 | | | | 11,509,636 | |
| | MercadoLibre, Inc., | | | | | | | | |
| | 2.375% due 1/14/2026 | | | 6,460,000 | | | | 6,247,854 | |
| | 3.125% due 1/14/2031 | | | 9,965,000 | | | | 8,980,159 | |
| | Specialty Retail — 0.1% | | | | | | | | |
| | Genuine Parts Co., 4.95% due 8/15/2029 | | | 8,613,000 | | | | 8,756,234 | |
| | | | | | | | | 35,493,883 | |
| | CONSUMER DURABLES & APPAREL — 0.3% | | | | | | | | |
| | | | | | | | | | |
| | Household Durables — 0.2% | | | | | | | | |
| e | CD&R Smokey Buyer, Inc., 6.75% due 7/15/2025 | | | 13,833,000 | | | | 13,833,138 | |
| e,h | CD&R Smokey Buyer, Inc./Radio Systems Corp., 9.50% due 10/15/2029 | | | 9,225,000 | | | | 9,230,720 | |
| | Leisure Products — 0.1% | | | | | | | | |
| | Polaris, Inc., 6.95% due 3/15/2029 | | | 9,875,000 | | | | 10,715,461 | |
| | | | | | | | | 33,779,319 | |
| 150 | Annual Financial Statements | See notes to financial statements. |
Schedule of Investments, Continued
Thornburg Strategic Income Fund | September 30, 2024
| | | | SHARES/ | | | | |
| | ISSUER-DESCRIPTION | | PRINCIPAL AMOUNT | | | VALUE | |
| | CONSUMER SERVICES — 0.7% | | | | | | | | |
| | Diversified Consumer Services — 0.1% | | | | | | | | |
| | Service Corp. International, 5.75% due 10/15/2032 | | $ | 5,950,000 | | | $ | 5,988,437 | |
| | Hotels, Restaurants & Leisure — 0.6% | | | | | | | | |
| | Marriott International, Inc., Series GG, 3.50% due 10/15/2032 | | | 8,825,000 | | | | 8,074,699 | |
| e | Papa John’s International, Inc., 3.875% due 9/15/2029 | | | 12,568,000 | | | | 11,632,438 | |
| e | TKC Holdings, Inc., 6.875% due 5/15/2028 | | | 8,650,000 | | | | 8,539,193 | |
| | Warnermedia Holdings, Inc., 6.412% due 3/15/2026 | | | 13,000,000 | | | | 13,001,300 | |
| e | WMG Acquisition Corp. (EUR), 2.25% due 8/15/2031 | | | 19,018,000 | | | | 19,217,378 | |
| | | | | | | | | 66,453,445 | |
| | CONSUMER STAPLES DISTRIBUTION & RETAIL — 0.7% | | | | | | | | |
| | Consumer Staples Distribution & Retail — 0.7% | | | | | | | | |
| | Albertsons Cos., Inc./Safeway, Inc./New Albertsons LP/Albertsons LLC, | | | | | | | | |
| e | 5.875% due 2/15/2028 | | | 13,948,000 | | | | 13,992,912 | |
| e | 6.50% due 2/15/2028 | | | 4,725,000 | | | | 4,810,381 | |
| e | KeHE Distributors LLC/KeHE Finance Corp./NextWave Distribution, Inc., 9.00% due 2/15/2029 | | | 24,136,000 | | | | 25,109,163 | |
| | U.S. Foods, Inc., | | | | | | | | |
| e | 4.75% due 2/15/2029 | | | 13,800,000 | | | | 13,465,764 | |
| e,h | 5.75% due 4/15/2033 | | | 5,465,000 | | | | 5,471,777 | |
| | | | | | | | | 62,849,997 | |
| | ENERGY — 3.3% | | | | | | | | |
| | Energy Equipment & Services — 0.1% | | | | | | | | |
| e,f | Empresa Generadora de Electricidad Haina SA, 5.625% due 11/8/2028 | | | 10,800,000 | | | | 10,200,816 | |
| | Oil, Gas & Consumable Fuels — 3.2% | | | | | | | | |
| e | Chesapeake Energy Corp., 5.50% due 2/1/2026 | | | 8,773,000 | | | | 8,762,209 | |
| e | CITGO Petroleum Corp., 7.00% due 6/15/2025 | | | 12,200,000 | | | | 12,200,122 | |
| e | Colorado Interstate Gas Co. LLC/Colorado Interstate Issuing Corp., 4.15% due 8/15/2026 | | | 725,000 | | | | 719,512 | |
| e | Columbia Pipelines Holding Co. LLC, 5.097% due 10/1/2031 | | | 9,600,000 | | | | 9,684,480 | |
| e | Columbia Pipelines Operating Co. LLC, 5.927% due 8/15/2030 | | | 11,960,000 | | | | 12,668,152 | |
| e | Delek Logistics Partners LP/Delek Logistics Finance Corp., 8.625% due 3/15/2029 | | | 16,145,000 | | | | 16,997,940 | |
| | Ecopetrol SA, | | | | | | | | |
| f | 6.875% due 4/29/2030 | | | 4,860,000 | | | | 4,867,290 | |
| f | 8.875% due 1/13/2033 | | | 10,588,000 | | | | 11,347,266 | |
| e | El Paso Natural Gas Co. LLC, 3.50% due 2/15/2032 | | | 1,989,000 | | | | 1,769,733 | |
| | Energean Israel Finance Ltd., | | | | | | | | |
| e,f | 5.375% due 3/30/2028 | | | 6,500,000 | | | | 5,837,520 | |
| e,f | 8.50% due 9/30/2033 | | | 13,060,000 | | | | 12,352,801 | |
| | Energy Transfer LP, | | | | | | | | |
| | 6.05% due 12/1/2026 | | | 14,520,000 | | | | 15,024,860 | |
| d | 8.527% (TSFR3M + 3.28%) due 11/1/2066 | | | 1,200,000 | | | | 1,140,984 | |
| e | Florida Gas Transmission Co. LLC, 2.30% due 10/1/2031 | | | 2,101,000 | | | | 1,782,278 | |
| | Galaxy Pipeline Assets Bidco Ltd., | | | | | | | | |
| e,f | 1.75% due 9/30/2027 | | | 4,968,524 | | | | 4,753,933 | |
| e,f | 2.16% due 3/31/2034 | | | 3,375,773 | | | | 2,995,965 | |
| e,f | 2.625% due 3/31/2036 | | | 6,630,000 | | | | 5,671,567 | |
| b,e,f,i | Gazprom PJSC via Gaz Finance plc, 3.50% due 7/14/2031 | | | 16,000,000 | | | | 8,431,040 | |
| e | Gray Oak Pipeline LLC, 3.45% due 10/15/2027 | | | 6,730,000 | | | | 6,507,372 | |
| e,f | Greensaif Pipelines Bidco SARL, 5.853% due 2/23/2036 | | | 10,000,000 | | | | 10,352,200 | |
| | Gulfstream Natural Gas System LLC, | | | | | | | | |
| e | 4.60% due 9/15/2025 | | | 5,000,000 | | | | 4,984,600 | |
| e | 6.19% due 11/1/2025 | | | 3,584,000 | | | | 3,636,183 | |
| | Kinder Morgan Energy Partners LP, 5.80% due 3/15/2035 | | | 4,450,000 | | | | 4,679,709 | |
| e,f | Medco Maple Tree Pte. Ltd., 8.96% due 4/27/2029 | | | 13,000,000 | | | | 13,752,310 | |
| e | Midwest Connector Capital Co. LLC, 4.625% due 4/1/2029 | | | 5,487,000 | | | | 5,460,333 | |
| | MPLX LP, 4.95% due 9/1/2032 | | | 2,790,000 | | | | 2,800,574 | |
| | NuStar Logistics LP, 6.00% due 6/1/2026 | | | 4,000,000 | | | | 4,026,720 | |
| | Parkland Corp., | | | | | | | | |
| e,f | 5.875% due 7/15/2027 | | | 5,456,000 | | | | 5,443,833 | |
| e,f | 6.625% due 8/15/2032 | | | 2,135,000 | | | | 2,167,303 | |
| See notes to financial statements. | Annual Financial Statements | 151 |
Schedule of Investments, Continued
Thornburg Strategic Income Fund | September 30, 2024
| | | | SHARES/ | | | | |
| | ISSUER-DESCRIPTION | | PRINCIPAL AMOUNT | | | VALUE | |
| | Petroleos Mexicanos, | | | | | | | | |
| f | 5.95% due 1/28/2031 | | $ | 8,312,000 | | | $ | 7,193,371 | |
| f | 6.84% due 1/23/2030 | | | 10,950,000 | | | | 10,142,766 | |
| | Petroleos Mexicanos (EUR), 3.75% due 4/16/2026 | | | 6,500,000 | | | | 7,017,973 | |
| | Raizen Fuels Finance SA, | | | | | | | | |
| e,f | 5.70% due 1/17/2035 | | | 11,670,000 | | | | 11,565,670 | |
| e,f | 6.45% due 3/5/2034 | | | 4,800,000 | | | | 5,081,760 | |
| e | South Bow USA Infrastructure Holdings LLC, 5.026% due 10/1/2029 | | | 4,460,000 | | | | 4,474,049 | |
| c | Summit Midstream Corp., Series A, 12.638% (SOFR + 7.32%) due 10/31/2024 | | | 2,114,000 | | | | 3,109,212 | |
| e | Summit Midstream Holdings LLC, 8.625% due 10/31/2029 | | | 4,950,000 | | | | 5,179,185 | |
| | Sunoco LP, | | | | | | | | |
| e | 7.00% due 5/1/2029 | | | 2,083,000 | | | | 2,177,568 | |
| e | 7.25% due 5/1/2032 | | | 7,893,000 | | | | 8,360,424 | |
| | Sunoco LP/Sunoco Finance Corp., | | | | | | | | |
| | 5.875% due 3/15/2028 | | | 12,530,000 | | | | 12,598,163 | |
| e | 7.00% due 9/15/2028 | | | 2,387,000 | | | | 2,477,897 | |
| | Tennessee Gas Pipeline Co. LLC, 7.00% due 3/15/2027 | | | 2,251,000 | | | | 2,377,371 | |
| e,f | TMS Issuer SARL, 5.78% due 8/23/2032 | | | 10,700,000 | | | | 11,253,939 | |
| | Whistler Pipeline LLC, | | | | | | | | |
| e | 5.40% due 9/30/2029 | | | 5,000,000 | | | | 5,105,450 | |
| e | 5.70% due 9/30/2031 | | | 6,560,000 | | | | 6,789,994 | |
| | | | | | | | | 315,924,397 | |
| | EQUITY REAL ESTATE INVESTMENT TRUSTS (REITS) — 2.0% | | | | | | | | |
| | | | | | | | | | |
| | Diversified REITs — 1.7% | | | | | | | | |
| | American Tower Corp., | | | | | | | | |
| | 1.875% due 10/15/2030 | | | 6,000,000 | | | | 5,171,460 | |
| | 5.80% due 11/15/2028 | | | 5,000,000 | | | | 5,256,300 | |
| e | American Tower Trust #1, 3.652% due 3/15/2048 | | | 14,250,000 | | | | 13,843,131 | |
| | Crown Castle, Inc., | | | | | | | | |
| | 2.90% due 3/15/2027 | | | 2,750,000 | | | | 2,660,762 | |
| | 4.90% due 9/1/2029 | | | 8,536,000 | | | | 8,679,405 | |
| | 5.00% due 1/11/2028 | | | 7,100,000 | | | | 7,222,617 | |
| | Digital Realty Trust LP, 4.45% due 7/15/2028 | | | 4,800,000 | | | | 4,811,952 | |
| | Extra Space Storage LP, 5.70% due 4/1/2028 | | | 3,257,000 | | | | 3,391,123 | |
| e | Iron Mountain Information Management Services, Inc., 5.00% due 7/15/2032 | | | 6,085,000 | | | | 5,868,009 | |
| | Iron Mountain, Inc., | | | | | | | | |
| e | 4.875% due 9/15/2029 | | | 2,000,000 | | | | 1,958,400 | |
| e | 7.00% due 2/15/2029 | | | 7,985,000 | | | | 8,317,974 | |
| | Realty Income Corp., 4.70% due 12/15/2028 | | | 4,503,000 | | | | 4,573,022 | |
| | SBA Tower Trust, | | | | | | | | |
| e | 1.631% due 5/15/2051 | | | 13,500,000 | | | | 12,639,972 | |
| e | 1.84% due 4/15/2027 | | | 3,400,000 | | | | 3,162,836 | |
| e | 1.884% due 7/15/2050 | | | 2,420,000 | | | | 2,335,437 | |
| e,h | 4.831% due 10/15/2029 | | | 16,980,000 | | | | 16,887,459 | |
| e | 6.599% due 11/15/2052 | | | 15,000,000 | | | | 15,610,095 | |
| | Sun Communities Operating LP, | | | | | | | | |
| | 2.70% due 7/15/2031 | | | 9,377,000 | | | | 8,189,966 | |
| | 5.50% due 1/15/2029 | | | 5,100,000 | | | | 5,247,849 | |
| e,f | Trust Fibra Uno, 5.25% due 1/30/2026 | | | 16,342,000 | | | | 16,270,259 | |
| | Vornado Realty LP, 2.15% due 6/1/2026 | | | 9,336,500 | | | | 8,888,535 | |
| | Retail REITs — 0.3% | | | | | | | | |
| | Brixmor Operating Partnership LP, 3.85% due 2/1/2025 | | | 4,362,000 | | | | 4,338,096 | |
| | Retail Opportunity Investments Partnership LP, 6.75% due 10/15/2028 | | | 20,016,000 | | | | 21,493,381 | |
| | | | | | | | | 186,818,040 | |
| | FINANCIAL SERVICES — 4.2% | | | | | | | | |
| | | | | | | | | | |
| | Capital Markets — 1.8% | | | | | | | | |
| | Ares Capital Corp., 3.25% due 7/15/2025 | | | 8,227,000 | | | | 8,096,520 | |
| | Blue Owl Credit Income Corp., | | | | | | | | |
| | 3.125% due 9/23/2026 | | | 2,176,000 | | | | 2,078,189 | |
| | 7.75% due 9/16/2027 | | | 1,350,000 | | | | 1,421,604 | |
| 152 | Annual Financial Statements | See notes to financial statements. |
Schedule of Investments, Continued
Thornburg Strategic Income Fund | September 30, 2024
| | | | SHARES/ | | | | |
| | ISSUER-DESCRIPTION | | PRINCIPAL AMOUNT | | | VALUE | |
| | Blue Owl Technology Finance Corp., | | | | | | | | |
| e | 3.75% due 6/17/2026 | | $ | 4,232,000 | | | $ | 4,070,930 | |
| e | 4.75% due 12/15/2025 | | | 27,846,000 | | | | 27,434,715 | |
| e | Boost Newco Borrower LLC/GTCR W Dutch Finance Sub BV (GBP), 8.50% due 1/15/2031 | | | 150,000 | | | | 217,145 | |
| e | Burford Capital Global Finance LLC, 9.25% due 7/1/2031 | | | 18,500,000 | | | | 19,906,185 | |
| d | Citigroup Global Markets Holdings, Inc., 6.40% due 1/29/2035 | | | 4,108,000 | | | | 2,967,056 | |
| | Compass Group Diversified Holdings LLC, | | | | | | | | |
| e | 5.00% due 1/15/2032 | | | 800,000 | | | | 740,096 | |
| e | 5.25% due 4/15/2029 | | | 9,633,000 | | | | 9,355,666 | |
| a | CRA Loan Funding 1, 11.00% due 12/15/2026 | | | 18,000,000 | | | | 18,450,000 | |
| e,f | Foresea Holding SA, 7.50% due 6/15/2030 | | | 198,293 | | | | 188,737 | |
| | Hercules Capital, Inc., | | | | | | | | |
| | 2.625% due 9/16/2026 | | | 9,316,000 | | | | 8,810,421 | |
| | 3.375% due 1/20/2027 | | | 4,157,000 | | | | 3,957,506 | |
| | LPL Holdings, Inc., | | | | | | | | |
| e | 4.00% due 3/15/2029 | | | 16,905,000 | | | | 16,169,632 | |
| e | 4.625% due 11/15/2027 | | | 3,515,000 | | | | 3,480,377 | |
| e,f | LSEGA Financing plc, 2.00% due 4/6/2028 | | | 2,065,000 | | | | 1,911,405 | |
| | Main Street Capital Corp., | | | | | | | | |
| | 3.00% due 7/14/2026 | | | 2,258,000 | | | | 2,163,751 | |
| | 6.50% due 6/4/2027 | | | 18,514,000 | | | | 18,929,084 | |
| | Nasdaq, Inc., 5.55% due 2/15/2034 | | | 10,156,000 | | | | 10,709,400 | |
| e | Oaktree Strategic Credit Fund, 8.40% due 11/14/2028 | | | 6,938,000 | | | | 7,504,141 | |
| | Sixth Street Specialty Lending, Inc., 3.875% due 11/1/2024 | | | 4,054,000 | | | | 4,045,203 | |
| | Consumer Finance — 0.2% | | | | | | | | |
| e | FirstCash, Inc., 5.625% due 1/1/2030 | | | 17,215,000 | | | | 17,065,746 | |
| | Financial Services — 2.0% | | | | | | | | |
| | Antares Holdings LP, | | | | | | | | |
| e | 2.75% due 1/15/2027 | | | 1,630,000 | | | | 1,524,132 | |
| e | 3.75% due 7/15/2027 | | | 6,480,000 | | | | 6,142,457 | |
| e | 3.95% due 7/15/2026 | | | 9,951,000 | | | | 9,669,486 | |
| e | 7.95% due 8/11/2028 | | | 5,000,000 | | | | 5,305,150 | |
| e | 8.50% due 5/18/2025 | | | 3,210,000 | | | | 3,237,189 | |
| f | Banco Santander SA, 5.147% due 8/18/2025 | | | 9,500,000 | | | | 9,526,030 | |
| | Bank of America Corp., | | | | | | | | |
| d | 1.319% (SOFR + 1.15%) due 6/19/2026 | | | 1,275,000 | | | | 1,243,571 | |
| d | 4.948% (SOFR + 2.04%) due 7/22/2028 | | | 4,900,000 | | | | 4,985,015 | |
| | BNP Paribas SA, | | | | | | | | |
| d,e,f | 2.591% (SOFR + 1.23%) due 1/20/2028 | | | 1,350,000 | | | | 1,295,258 | |
| d,e,f | 2.819% (TSFR3M + 1.37%) due 11/19/2025 | | | 5,000,000 | | | | 4,980,900 | |
| d | Capital One Financial Corp., 7.149% (SOFR + 2.44%) due 10/29/2027 | | | 3,737,000 | | | | 3,938,686 | |
| d | Charles Schwab Corp., 6.033% (SOFRINDX + 1.05%) due 3/3/2027 | | | 20,000,000 | | | | 20,098,000 | |
| | Citigroup, Inc., | | | | | | | | |
| d | 1.122% (SOFR + 0.77%) due 1/28/2027 | | | 1,070,000 | | | | 1,023,690 | |
| d | 1.462% (SOFR + 0.77%) due 6/9/2027 | | | 5,881,000 | | | | 5,604,711 | |
| d,f | Deutsche Bank AG, 2.552% (SOFR + 1.32%) due 1/7/2028 | | | 4,760,000 | | | | 4,536,137 | |
| d | Goldman Sachs Group, Inc., 5.761% (SOFR + 0.82%) due 9/10/2027 | | | 3,687,000 | | | | 3,681,027 | |
| | HSBC Holdings plc, | | | | | | | | |
| d,f | 1.645% (SOFR + 1.54%) due 4/18/2026 | | | 3,750,000 | | | | 3,680,738 | |
| d,f | 4.041% (TSFR3M + 1.81%) due 3/13/2028 | | | 3,500,000 | | | | 3,462,760 | |
| d,f | 4.18% (SOFR + 1.51%) due 12/9/2025 | | | 2,600,000 | | | | 2,593,344 | |
| d,f | 4.583% (TSFR3M + 1.80%) due 6/19/2029 | | | 3,000,000 | | | | 3,001,710 | |
| d,f | 4.755% (SOFR + 2.11%) due 6/9/2028 | | | 1,370,000 | | | | 1,379,576 | |
| | JPMorgan Chase & Co., | | | | | | | | |
| d | 1.04% (TSFR3M + 0.70%) due 2/4/2027 | | | 1,896,000 | | | | 1,812,348 | |
| d | 3.54% (TSFR3M + 1.64%) due 5/1/2028 | | | 6,314,000 | | | | 6,200,601 | |
| d | 5.04% (SOFR + 1.19%) due 1/23/2028 | | | 2,925,000 | | | | 2,974,403 | |
| d | 5.943% (SOFR + 0.92%) due 2/24/2026 | | | 7,590,000 | | | | 7,604,345 | |
| | Mitsubishi UFJ Financial Group, Inc., | | | | | | | | |
| d,f | 0.962% (H15T1Y + 0.45%) due 10/11/2025 | | | 9,714,000 | | | | 9,702,440 | |
| d,f | 2.309% (H15T1Y + 0.95%) due 7/20/2032 | | | 7,000,000 | | | | 6,060,390 | |
| d,f | 5.017% (H15T1Y + 1.95%) due 7/20/2028 | | | 1,750,000 | | | | 1,784,475 | |
| d,f | 5.475% (H15T1Y + 1.53%) due 2/22/2031 | | | 2,000,000 | | | | 2,095,680 | |
| See notes to financial statements. | Annual Financial Statements | 153 |
Schedule of Investments, Continued
Thornburg Strategic Income Fund | September 30, 2024
| | | | SHARES/ | | | | |
| | ISSUER-DESCRIPTION | | PRINCIPAL AMOUNT | | | VALUE | |
| d | Morgan Stanley, 4.679% (SOFR + 1.67%) due 7/17/2026 | | $ | 1,560,000 | | | $ | 1,558,144 | |
| | Societe Generale SA, | | | | | | | | |
| d,e,f | 1.792% (H15T1Y + 1.00%) due 6/9/2027 | | | 1,667,000 | | | | 1,582,233 | |
| e,f | 2.625% due 1/22/2025 | | | 3,000,000 | | | | 2,973,090 | |
| d,e,f | 5.634% (H15T1Y + 1.75%) due 1/19/2030 | | | 2,000,000 | | | | 2,047,680 | |
| d,e,f | 6.267% (SOFR + 1.05%) due 1/21/2026 | | | 2,600,000 | | | | 2,603,016 | |
| f | Sumitomo Mitsui Financial Group, Inc., 5.852% due 7/13/2030 | | | 14,550,000 | | | | 15,547,693 | |
| d | Truist Financial Corp., 7.161% (SOFR + 2.45%) due 10/30/2029 | | | 6,250,000 | | | | 6,854,437 | |
| | UBS Group AG, | | | | | | | | |
| d,e,f | 1.494% (H15T1Y + 0.85%) due 8/10/2027 | | | 2,679,000 | | | | 2,532,030 | |
| d,e,f | 6.373% (SOFR + 3.34%) due 7/15/2026 | | | 3,600,000 | | | | 3,639,528 | |
| e | United Wholesale Mortgage LLC, 5.50% due 11/15/2025 | | | 12,301,000 | | | | 12,309,980 | |
| | Western Union Co., 2.85% due 1/10/2025 | | | 2,338,000 | | | | 2,320,395 | |
| | Mortgage Real Estate Investment Trusts — 0.2% | | | | | | | | |
| e | Prologis Targeted U.S. Logistics Fund LP, 5.25% due 4/1/2029 - 1/15/2035 | | | 17,475,000 | | | | 17,905,389 | |
| | | | | | | | | 400,691,373 | |
| | FOOD, BEVERAGE & TOBACCO — 1.7% | | | | | | | | |
| | Beverages — 0.6% | | | | | | | | |
| e,f | Becle SAB de CV, 2.50% due 10/14/2031 | | | 34,064,000 | | | | 28,367,818 | |
| e,f | Central American Bottling Corp./CBC Bottling Holdco SL/Beliv Holdco SL, 5.25% due 4/27/2029 | | | 24,655,000 | | | | 23,941,731 | |
| | Constellation Brands, Inc., 5.00% due 2/2/2026 | | | 2,763,000 | | | | 2,761,922 | |
| | Huntington Ingalls Industries, Inc., | | | | | | | | |
| | 2.043% due 8/16/2028 | | | 2,960,000 | | | | 2,718,227 | |
| | 3.483% due 12/1/2027 | | | 1,745,000 | | | | 1,699,072 | |
| | Food Products — 0.4% | | | | | | | | |
| e | Darling Global Finance BV (EUR), 3.625% due 5/15/2026 | | | 9,700,000 | | | | 10,753,063 | |
| | Darling Ingredients, Inc., | | | | | | | | |
| e | 5.25% due 4/15/2027 | | | 3,700,000 | | | | 3,680,649 | |
| e | 6.00% due 6/15/2030 | | | 1,000,000 | | | | 1,009,220 | |
| | Post Holdings, Inc., | | | | | | | | |
| e | 4.625% due 4/15/2030 | | | 8,860,000 | | | | 8,474,236 | |
| e | 5.50% due 12/15/2029 | | | 8,247,000 | | | | 8,188,116 | |
| e | 6.25% due 2/15/2032 | | | 2,950,000 | | | | 3,038,943 | |
| e | 6.375% due 3/1/2033 | | | 5,000,000 | | | | 5,083,450 | |
| | Tobacco — 0.7% | | | | | | | | |
| | Altria Group, Inc., 2.45% due 2/4/2032 | | | 9,890,000 | | | | 8,436,368 | |
| | BAT Capital Corp., 7.75% due 10/19/2032 | | | 4,862,000 | | | | 5,747,370 | |
| | Imperial Brands Finance plc, | | | | | | | | |
| e,f | 5.50% due 2/1/2030 | | | 22,500,000 | | | | 23,212,350 | |
| e,f | 6.125% due 7/27/2027 | | | 5,000,000 | | | | 5,199,100 | |
| e | Vector Group Ltd., 10.50% due 11/1/2026 | | | 20,927,000 | | | | 21,175,194 | |
| | | | | | | | | 163,486,829 | |
| | HEALTH CARE EQUIPMENT & SERVICES — 1.9% | | | | | | | | |
| | Health Care Equipment & Supplies — 0.5% | | | | | | | | |
| e | Dentsply Sirona, Inc., 5.456% due 10/28/2024 | | | 18,000,000 | | | | 17,927,775 | |
| | Hologic, Inc., | | | | | | | | |
| e | 3.25% due 2/15/2029 | | | 11,957,000 | | | | 11,144,641 | |
| e | 4.625% due 2/1/2028 | | | 2,000,000 | | | | 1,963,200 | |
| e | Medline Borrower LP, 3.875% due 4/1/2029 | | | 2,000,000 | | | | 1,893,420 | |
| e | Medline Borrower LP/Medline Co-Issuer, Inc., 6.25% due 4/1/2029 | | | 7,950,000 | | | | 8,198,120 | |
| e,f | Olympus Corp., 2.143% due 12/8/2026 | | | 5,510,000 | | | | 5,249,046 | |
| | Health Care Providers & Services — 1.4% | | | | | | | | |
| | Centene Corp., | | | | | | | | |
| | 2.625% due 8/1/2031 | | | 3,950,000 | | | | 3,387,836 | |
| | 3.00% due 10/15/2030 | | | 6,962,000 | | | | 6,231,338 | |
| | 4.625% due 12/15/2029 | | | 5,775,000 | | | | 5,653,898 | |
| | Charles River Laboratories International, Inc., | | | | | | | | |
| e | 3.75% due 3/15/2029 | | | 6,567,000 | | | | 6,179,678 | |
| e | 4.25% due 5/1/2028 | | | 6,480,000 | | | | 6,296,810 | |
| e | Highmark, Inc., 1.45% due 5/10/2026 | | | 10,580,000 | | | | 10,046,451 | |
| 154 | Annual Financial Statements | See notes to financial statements. |
Schedule of Investments, Continued
Thornburg Strategic Income Fund | September 30, 2024
| | | | SHARES/ | | | | |
| | ISSUER-DESCRIPTION | | PRINCIPAL AMOUNT | | | VALUE | |
| | Humana, Inc., | | | | | | | | |
| | 5.375% due 4/15/2031 | | $ | 6,569,000 | | | $ | 6,799,835 | |
| | 5.70% due 3/13/2026 | | | 23,835,000 | | | | 23,840,959 | |
| | IQVIA, Inc., 5.70% due 5/15/2028 | | | 5,000,000 | | | | 5,196,050 | |
| | IQVIA, Inc. (EUR), | | | | | | | | |
| e | 2.25% due 3/15/2029 | | | 9,460,000 | | | | 9,852,236 | |
| e | 2.875% due 6/15/2028 | | | 5,000,000 | | | | 5,407,402 | |
| | Tenet Healthcare Corp., | | | | | | | | |
| | 6.125% due 6/15/2030 | | | 4,500,000 | | | | 4,575,915 | |
| | 6.75% due 5/15/2031 | | | 16,224,000 | | | | 16,923,255 | |
| | Universal Health Services, Inc., | | | | | | | | |
| | 1.65% due 9/1/2026 | | | 6,179,000 | | | | 5,851,822 | |
| | 2.65% due 10/15/2030 | | | 4,646,000 | | | | 4,146,462 | |
| | 4.625% due 10/15/2029 | | | 14,035,000 | | | | 13,952,053 | |
| | | | | | | | | 180,718,202 | |
| | HOUSEHOLD & PERSONAL PRODUCTS — 0.5% | | | | | | | | |
| | Household Products — 0.4% | | | | | | | | |
| e | Energizer Holdings, Inc., 4.75% due 6/15/2028 | | | 7,268,000 | | | | 7,059,845 | |
| | Prestige Brands, Inc., | | | | | | | | |
| e | 3.75% due 4/1/2031 | | | 6,386,000 | | | | 5,851,747 | |
| e | 5.125% due 1/15/2028 | | | 12,321,000 | | | | 12,211,220 | |
| | Scotts Miracle-Gro Co., | | | | | | | | |
| | 4.375% due 2/1/2032 | | | 13,166,000 | | | | 12,187,766 | |
| | 5.25% due 12/15/2026 | | | 2,000,000 | | | | 1,990,760 | |
| | Personal Care Products — 0.1% | | | | | | | | |
| e | Edgewell Personal Care Co., 5.50% due 6/1/2028 | | | 9,892,000 | | | | 9,830,175 | |
| | | | | | | | | 49,131,513 | |
| | INDUSTRIALS — 0.2% | | | | | | | | |
| | Transportation Infrastructure — 0.2% | | | | | | | | |
| | Penske Truck Leasing Co. LP/PTL Finance Corp., | | | | | | | | |
| e | 5.35% due 3/30/2029 | | | 3,060,000 | | | | 3,158,838 | |
| e | 5.55% due 5/1/2028 | | | 9,940,000 | | | | 10,273,586 | |
| e | 5.75% due 5/24/2026 | | | 2,480,000 | | | | 2,525,781 | |
| e | 6.20% due 6/15/2030 | | | 2,400,000 | | | | 2,590,152 | |
| | | | | | | | | 18,548,357 | |
| | INSURANCE — 4.8% | | | | | | | | |
| | Insurance — 4.8% | | | | | | | | |
| | American National Group, Inc., | | | | | | | | |
| h | 5.75% due 10/1/2029 | | | 4,408,000 | | | | 4,431,362 | |
| e | 6.144% due 6/13/2032 | | | 12,684,000 | | | | 12,609,164 | |
| | Aon North America, Inc., 5.45% due 3/1/2034 | | | 11,280,000 | | | | 11,844,338 | |
| e,f | Ascot Group Ltd., 4.25% due 12/15/2030 | | | 6,889,000 | | | | 6,014,028 | |
| | Brighthouse Financial Global Funding, | | | | | | | | |
| e | 1.55% due 5/24/2026 | | | 2,089,000 | | | | 1,988,310 | |
| e | 2.00% due 6/28/2028 | | | 4,823,000 | | | | 4,355,314 | |
| e | 5.55% due 4/9/2027 | | | 16,438,000 | | | | 16,782,705 | |
| e | 5.65% due 6/10/2029 | | | 4,056,000 | | | | 4,192,241 | |
| | Brown & Brown, Inc., 5.65% due 6/11/2034 | | | 9,677,000 | | | | 10,148,367 | |
| | CNA Financial Corp., 5.125% due 2/15/2034 | | | 6,785,000 | | | | 6,938,137 | |
| | CNO Financial Group, Inc., 6.45% due 6/15/2034 | | | 11,385,000 | | | | 12,022,902 | |
| e | CNO Global Funding, 4.95% due 9/9/2029 | | | 6,755,000 | | | | 6,784,317 | |
| e | Corebridge Global Funding, 5.75% due 7/2/2026 | | | 8,940,000 | | | | 9,168,059 | |
| e,f | DaVinciRe Holdings Ltd., 4.75% due 5/1/2025 | | | 7,678,000 | | | | 7,620,108 | |
| d | Enstar Finance LLC, 5.75% (5-Yr. CMT + 5.470%) due 9/1/2040 | | | 20,000,000 | | | | 19,750,600 | |
| f | Enstar Group Ltd., 3.10% due 9/1/2031 | | | 12,701,000 | | | | 10,975,569 | |
| | Equitable Financial Life Global Funding, | | | | | | | | |
| e | 1.00% due 1/9/2026 | | | 3,000,000 | | | | 2,875,860 | |
| e | 1.40% due 8/27/2027 | | | 4,620,000 | | | | 4,269,712 | |
| e | 1.80% due 3/8/2028 | | | 5,919,000 | | | | 5,415,707 | |
| See notes to financial statements. | Annual Financial Statements | 155 |
Schedule of Investments, Continued
Thornburg Strategic Income Fund | September 30, 2024
| | | | SHARES/ | | | | |
| | ISSUER-DESCRIPTION | | PRINCIPAL AMOUNT | | | VALUE | |
| | F&G Annuities & Life, Inc., | | | | | | | | |
| | 6.50% due 6/4/2029 | | $ | 4,650,000 | | | $ | 4,788,989 | |
| | 7.40% due 1/13/2028 | | | 11,590,000 | | | | 12,239,156 | |
| | F&G Global Funding, | | | | | | | | |
| e | 1.75% due 6/30/2026 | | | 7,973,000 | | | | 7,551,866 | |
| e | 2.00% due 9/20/2028 | | | 8,458,000 | | | | 7,536,332 | |
| e | 2.30% due 4/11/2027 | | | 4,200,000 | | | | 3,930,696 | |
| | Fairfax Financial Holdings Ltd., | | | | | | | | |
| f | 4.625% due 4/29/2030 | | | 4,673,000 | | | | 4,667,953 | |
| f | 5.625% due 8/16/2032 | | | 3,249,000 | | | | 3,369,213 | |
| e,f | Fidelis Insurance Holdings Ltd., 4.875% due 6/30/2030 | | | 4,409,000 | | | | 4,477,384 | |
| | Fidelity National Financial, Inc., | | | | | | | | |
| | 2.45% due 3/15/2031 | | | 3,857,000 | | | | 3,343,248 | |
| | 4.50% due 8/15/2028 | | | 1,280,000 | | | | 1,284,928 | |
| | First American Financial Corp., | | | | | | | | |
| | 2.40% due 8/15/2031 | | | 2,261,000 | | | | 1,898,697 | |
| | 4.00% due 5/15/2030 | | | 1,457,000 | | | | 1,385,141 | |
| e | Five Corners Funding Trust III, 5.791% due 2/15/2033 | | | 7,260,000 | | | | 7,783,954 | |
| | GA Global Funding Trust, | | | | | | | | |
| e | 1.625% due 1/15/2026 | | | 610,000 | | | | 587,296 | |
| e | 2.25% due 1/6/2027 | | | 2,971,000 | | | | 2,829,372 | |
| e | 3.85% due 4/11/2025 | | | 5,860,000 | | | | 5,822,555 | |
| e | 4.40% due 9/23/2027 | | | 9,223,000 | | | | 9,207,044 | |
| e | Global Atlantic Fin Co., 4.40% due 10/15/2029 | | | 7,275,000 | | | | 7,006,771 | |
| | Globe Life, Inc., 5.85% due 9/15/2034 | | | 7,582,000 | | | | 7,832,737 | |
| e | Guardian Life Global Funding, 5.55% due 10/28/2027 | | | 4,545,000 | | | | 4,727,527 | |
| | Horace Mann Educators Corp., 7.25% due 9/15/2028 | | | 6,000,000 | | | | 6,509,820 | |
| e,f | Intact Financial Corp., 5.459% due 9/22/2032 | | | 5,922,000 | | | | 6,073,781 | |
| | Jackson National Life Global Funding, | | | | | | | | |
| e | 5.25% due 4/12/2028 | | | 6,697,000 | | | | 6,770,734 | |
| e | 5.50% due 1/9/2026 | | | 17,000,000 | | | | 17,166,260 | |
| e | 5.55% due 7/2/2027 | | | 5,350,000 | | | | 5,493,861 | |
| | Lincoln National Corp., 5.852% due 3/15/2034 | | | 5,000,000 | | | | 5,261,150 | |
| | Mercury General Corp., 4.40% due 3/15/2027 | | | 9,408,000 | | | | 9,310,345 | |
| d,e | Nationwide Mutual Insurance Co., 7.498% (SOFR + 2.18%) due 12/15/2024 | | | 6,178,000 | | | | 6,191,653 | |
| e | New York Life Global Funding, 4.55% due 1/28/2033 | | | 4,400,000 | | | | 4,411,660 | |
| d,e | Pacific Life Global Funding II, 5.596% (SOFR + 0.62%) due 6/4/2026 | | | 4,533,000 | | | | 4,532,955 | |
| f | Pentair Finance SARL, 5.90% due 7/15/2032 | | | 9,193,000 | | | | 9,848,645 | |
| e | Principal Life Global Funding II, 5.50% due 6/28/2028 | | | 6,400,000 | | | | 6,620,224 | |
| e | Protective Life Corp., 3.40% due 1/15/2030 | | | 4,902,000 | | | | 4,639,253 | |
| e | Protective Life Global Funding, 5.467% due 12/8/2028 | | | 4,850,000 | | | | 5,070,239 | |
| | Reinsurance Group of America, Inc., 6.00% due 9/15/2033 | | | 7,001,000 | | | | 7,507,172 | |
| | Reliance Standard Life Global Funding II, | | | | | | | | |
| e | 1.512% due 9/28/2026 | | | 4,000,000 | | | | 3,746,600 | |
| e | 5.243% due 2/2/2026 | | | 17,289,000 | | | | 17,373,716 | |
| f | RenaissanceRe Holdings Ltd., 5.75% due 6/5/2033 | | | 9,395,000 | | | | 9,856,858 | |
| | RGA Global Funding, | | | | | | | | |
| e | 2.70% due 1/18/2029 | | | 9,687,000 | | | | 8,998,157 | |
| e | 5.448% due 5/24/2029 | | | 4,000,000 | | | | 4,163,640 | |
| e | 5.50% due 1/11/2031 | | | 5,458,000 | | | | 5,704,865 | |
| | Sammons Financial Group, Inc., | | | | | | | | |
| e | 4.45% due 5/12/2027 | | | 2,000,000 | | | | 1,979,400 | |
| e | 6.875% due 4/15/2034 | | | 6,610,000 | | | | 7,074,286 | |
| | Stewart Information Services Corp., 3.60% due 11/15/2031 | | | 16,620,000 | | | | 14,569,757 | |
| | Willis North America, Inc., | | | | | | | | |
| | 2.95% due 9/15/2029 | | | 3,000,000 | | | | 2,785,260 | |
| | 5.35% due 5/15/2033 | | | 9,835,000 | | | | 10,117,363 | |
| | | | | | | | | 452,235,313 | |
| | MATERIALS — 2.8% | | | | | | | | |
| | Chemicals — 0.7% | | | | | | | | |
| | FMC Corp., 5.15% due 5/18/2026 | | | 4,860,000 | | | | 4,907,822 | |
| | International Flavors & Fragrances, Inc. (EUR), 1.80% due 9/25/2026 | | | 13,400,000 | | | | 14,542,551 | |
| 156 | Annual Financial Statements | See notes to financial statements. |
Schedule of Investments, Continued
Thornburg Strategic Income Fund | September 30, 2024
| | | | SHARES/ | | | | |
| | ISSUER-DESCRIPTION | | PRINCIPAL AMOUNT | | | VALUE | |
| | NOVA Chemicals Corp., | | | | | | | | |
| e,f | 5.25% due 6/1/2027 | | $ | 9,300,000 | | | $ | 9,200,490 | |
| e,f | 9.00% due 2/15/2030 | | | 5,000,000 | | | | 5,415,750 | |
| e,f | Nufarm Australia Ltd./Nufarm Americas, Inc., 5.00% due 1/27/2030 | | | 12,383,000 | | | | 11,488,081 | |
| | OCP SA, | | | | | | | | |
| e,f | 3.75% due 6/23/2031 | | | 7,200,000 | | | | 6,478,272 | |
| e,f | 4.50% due 10/22/2025 | | | 4,800,000 | | | | 4,753,440 | |
| b,f,i | Phosagro OAO Via Phosagro Bond Funding DAC, 3.05% due 1/23/2025 | | | 933,000 | | | | 772,627 | |
| e,f | SNF Group SACA, 3.125% due 3/15/2027 | | | 8,405,000 | | | | 7,994,668 | |
| | Containers & Packaging — 1.4% | | | | | | | | |
| f | Amcor Group Finance plc, 5.45% due 5/23/2029 | | | 4,400,000 | | | | 4,560,468 | |
| e,f | Ardagh Metal Packaging Finance USA LLC/Ardagh Metal Packaging Finance plc, 3.25% due 9/1/2028 | | | 16,310,000 | | | | 14,933,599 | |
| | Ball Corp., | | | | | | | | |
| | 2.875% due 8/15/2030 | | | 14,300,000 | | | | 12,722,567 | |
| | 3.125% due 9/15/2031 | | | 5,414,000 | | | | 4,806,549 | |
| | 6.00% due 6/15/2029 | | | 1,000,000 | | | | 1,034,750 | |
| e | Berry Global, Inc., 4.875% due 7/15/2026 | | | 8,222,000 | | | | 8,196,841 | |
| e | Berry Global, Inc. (EUR), 1.00% due 1/15/2025 | | | 4,019,000 | | | | 4,437,555 | |
| | Graphic Packaging International LLC, | | | | | | | | |
| e | 3.50% due 3/15/2028 - 3/1/2029 | | | 12,150,000 | | | | 11,492,122 | |
| e | 6.375% due 7/15/2032 | | | 1,000,000 | | | | 1,033,060 | |
| | Matthews International Corp., | | | | | | | | |
| e | 8.625% due 10/1/2027 | | | 7,730,000 | | | | 7,878,803 | |
| e | Class C, 5.25% due 12/1/2025 | | | 15,091,000 | | | | 15,084,360 | |
| e | OI European Group BV (EUR), 6.25% due 5/15/2028 | | | 3,000,000 | | | | 3,473,026 | |
| | Sealed Air Corp., | | | | | | | | |
| e | 1.573% due 10/15/2026 | | | 13,352,000 | | | | 12,540,332 | |
| e | 5.00% due 4/15/2029 | | | 8,460,000 | | | | 8,333,692 | |
| e | 6.50% due 7/15/2032 | | | 4,000,000 | | | | 4,124,720 | |
| e | Sealed Air Corp./Sealed Air Corp. U.S., 7.25% due 2/15/2031 | | | 500,000 | | | | 529,530 | |
| e | Silgan Holdings, Inc., 1.40% due 4/1/2026 | | | 20,082,000 | | | | 19,055,207 | |
| | Metals & Mining — 0.7% | | | | | | | | |
| f | AngloGold Ashanti Holdings plc, 3.375% due 11/1/2028 | | | 15,715,000 | | | | 14,807,616 | |
| e,f | Antofagasta plc, 2.375% due 10/14/2030 | | | 3,700,000 | | | | 3,195,505 | |
| e,f | Cia de Minas Buenaventura SAA, 5.50% due 7/23/2026 | | | 350,000 | | | | 345,698 | |
| | Cleveland-Cliffs, Inc., 7.00% due 3/15/2027 | | | 5,000,000 | | | | 4,983,700 | |
| b,e,f,i | Metalloinvest Finance DAC, 3.375% due 10/22/2028 | | | 7,500,000 | | | | 3,759,750 | |
| e,f | POSCO, 5.625% due 1/17/2026 | | | 2,350,000 | | | | 2,378,670 | |
| | Stillwater Mining Co., | | | | | | | | |
| e | 4.00% due 11/16/2026 | | | 14,328,000 | | | | 13,665,903 | |
| e | 4.50% due 11/16/2029 | | | 3,050,000 | | | | 2,594,086 | |
| | WE Soda Investments Holding plc, | | | | | | | | |
| e,f | 9.375% due 2/14/2031 | | | 4,150,000 | | | | 4,311,850 | |
| e,f | 9.50% due 10/6/2028 | | | 16,000,000 | | | | 16,658,560 | |
| | | | | | | | | 266,492,220 | |
| | MEDIA & ENTERTAINMENT — 0.7% | | | | | | | | |
| | Media — 0.7% | | | | | | | | |
| | CCO Holdings LLC/CCO Holdings Capital Corp., | | | | | | | | |
| e | 4.25% due 2/1/2031 - 1/15/2034 | | | 11,548,000 | | | | 9,889,059 | |
| e | 4.75% due 3/1/2030 - 2/1/2032 | | | 9,273,000 | | | | 8,484,061 | |
| e | Directv Financing LLC/Directv Financing Co-Obligor, Inc., 5.875% due 8/15/2027 | | | 3,880,000 | | | | 3,804,495 | |
| | News Corp., | | | | | | | | |
| e | 3.875% due 5/15/2029 | | | 2,000,000 | | | | 1,891,520 | |
| e | 5.125% due 2/15/2032 | | | 4,980,000 | | | | 4,895,240 | |
| e | Sirius XM Radio, Inc., 5.00% due 8/1/2027 | | | 21,775,000 | | | | 21,453,819 | |
| e,f | Telenet Finance Luxembourg Notes SARL, 5.50% due 3/1/2028 | | | 14,200,000 | | | | 13,911,598 | |
| | | | | | | | | 64,329,792 | |
| See notes to financial statements. | Annual Financial Statements | 157 |
Schedule of Investments, Continued
Thornburg Strategic Income Fund | September 30, 2024
| | | | SHARES/ | | | | |
| | ISSUER-DESCRIPTION | | PRINCIPAL AMOUNT | | | VALUE | |
| | PHARMACEUTICALS, BIOTECHNOLOGY & LIFE SCIENCES — 0.7% | | | | | | | | |
| | Biotechnology — 0.3% | | | | | | | | |
| | Amgen, Inc., | | | | | | | | |
| | 5.25% due 3/2/2033 | | $ | 5,000,000 | | | $ | 5,204,400 | |
| | 5.507% due 3/2/2026 | | | 6,800,000 | | | | 6,800,204 | |
| | Bio-Rad Laboratories, Inc., 3.30% due 3/15/2027 | | | 2,505,000 | | | | 2,441,599 | |
| | Illumina, Inc., | | | | | | | | |
| | 4.65% due 9/9/2026 | | | 2,902,000 | | | | 2,920,050 | |
| | 5.80% due 12/12/2025 | | | 5,579,000 | | | | 5,651,248 | |
| f | Royalty Pharma plc, 1.75% due 9/2/2027 | | | 4,086,000 | | | | 3,807,335 | |
| | Life Sciences Tools & Services — 0.1% | | | | | | | | |
| e | Avantor Funding, Inc. (EUR), 2.625% due 11/1/2025 | | | 11,000,000 | | | | 12,136,768 | |
| | Pharmaceuticals — 0.3% | | | | | | | | |
| a,b,i | Atlas U.S. Royalty LLC Participation Rights, Zero Coupon due 3/15/2027 | | | 5,450,000 | | | | 545 | |
| e | Bayer U.S. Finance II LLC, 4.25% due 12/15/2025 | | | 2,500,000 | | | | 2,481,275 | |
| | Cigna Group, 5.685% due 3/15/2026 | | | 16,515,000 | | | | 16,515,165 | |
| e | PRA Health Sciences, Inc., 2.875% due 7/15/2026 | | | 5,402,000 | | | | 5,235,294 | |
| | | | | | | | | 63,193,883 | |
| | REAL ESTATE MANAGEMENT & DEVELOPMENT — 0.2% | | | | | | | | |
| | Real Estate Management & Development — 0.2% | | | | | | | | |
| e | Cushman & Wakefield U.S. Borrower LLC, 6.75% due 5/15/2028 | | | 13,774,000 | | | | 13,904,578 | |
| e | Greystar Real Estate Partners LLC, 7.75% due 9/1/2030 | | | 2,490,000 | | | | 2,647,019 | |
| | | | | | | | | 16,551,597 | |
| | SEMICONDUCTORS & SEMICONDUCTOR EQUIPMENT — 0.9% | | | | | | | | |
| | Semiconductors & Semiconductor Equipment — 0.9% | | | | | | | | |
| e | Broadcom, Inc., 3.187% due 11/15/2036 | | | 4,861,000 | | | | 4,117,461 | |
| | Microchip Technology, Inc., 4.25% due 9/1/2025 | | | 11,300,000 | | | | 11,259,094 | |
| | Micron Technology, Inc., | | | | | | | | |
| | 4.663% due 2/15/2030 | | | 1,186,000 | | | | 1,192,808 | |
| | 6.75% due 11/1/2029 | | | 9,820,000 | | | | 10,791,198 | |
| | Qorvo, Inc., | | | | | | | | |
| | 1.75% due 12/15/2024 | | | 8,500,000 | | | | 8,431,915 | |
| e | 3.375% due 4/1/2031 | | | 14,904,000 | | | | 13,344,147 | |
| e,f | Renesas Electronics Corp., 1.543% due 11/26/2024 | | | 23,340,000 | | | | 23,211,163 | |
| | SK Hynix, Inc., | | | | | | | | |
| e,f | 1.50% due 1/19/2026 | | | 4,400,000 | | | | 4,225,628 | |
| e,f | 6.25% due 1/17/2026 | | | 4,800,000 | | | | 4,894,512 | |
| | Skyworks Solutions, Inc., 1.80% due 6/1/2026 | | | 1,160,000 | | | | 1,109,146 | |
| | | | | | | | | 82,577,072 | |
| | SOFTWARE & SERVICES — 2.7% | | | | | | | | |
| | Information Technology Services — 0.9% | | | | | | | | |
| | Block Financial LLC, 2.50% due 7/15/2028 | | | 3,605,000 | | | | 3,347,279 | |
| e | Boost Newco Borrower LLC, 7.50% due 1/15/2031 | | | 8,000,000 | | | | 8,581,680 | |
| | Booz Allen Hamilton, Inc., 5.95% due 8/4/2033 | | | 7,440,000 | | | | 7,955,815 | |
| | DXC Technology Co., 2.375% due 9/15/2028 | | | 11,657,000 | | | | 10,560,776 | |
| f | Genpact Luxembourg SARL, 3.375% due 12/1/2024 | | | 9,909,000 | | | | 9,864,905 | |
| | Genpact Luxembourg SARL/Genpact USA, Inc., | | | | | | | | |
| f | 1.75% due 4/10/2026 | | | 1,626,000 | | | | 1,556,976 | |
| f | 6.00% due 6/4/2029 | | | 4,424,000 | | | | 4,626,487 | |
| | Global Payments, Inc., | | | | | | | | |
| | 1.20% due 3/1/2026 | | | 1,401,000 | | | | 1,339,398 | |
| | 1.50% due 11/15/2024 | | | 810,000 | | | | 805,958 | |
| | 5.30% due 8/15/2029 | | | 4,441,000 | | | | 4,567,746 | |
| e | Insight Enterprises, Inc., 6.625% due 5/15/2032 | | | 4,700,000 | | | | 4,911,406 | |
| | Kyndryl Holdings, Inc., 2.05% due 10/15/2026 | | | 3,968,000 | | | | 3,772,893 | |
| e | Science Applications International Corp., 4.875% due 4/1/2028 | | | 25,550,000 | | | | 25,031,846 | |
| e | Wipro IT Services LLC, 1.50% due 6/23/2026 | | | 3,953,000 | | | | 3,763,216 | |
| | Internet Software & Services — 0.6% | | | | | | | | |
| e | Arches Buyer, Inc., 4.25% due 6/1/2028 | | | 19,319,000 | | | | 17,766,912 | |
| e | Cogent Communications Group LLC, 7.00% due 6/15/2027 | | | 11,067,000 | | | | 11,257,352 | |
| 158 | Annual Financial Statements | See notes to financial statements. |
Schedule of Investments, Continued
Thornburg Strategic Income Fund | September 30, 2024
| | | | SHARES/ | | | | |
| | ISSUER-DESCRIPTION | | PRINCIPAL AMOUNT | | | VALUE | |
| | eBay, Inc., 5.90% due 11/22/2025 | | $ | 3,650,000 | | | $ | 3,704,166 | |
| | Prosus NV, | | | | | | | | |
| e,f | 3.061% due 7/13/2031 | | | 656,000 | | | | 579,031 | |
| e,f | 4.193% due 1/19/2032 | | | 11,494,000 | | | | 10,768,039 | |
| | Prosus NV (EUR), | | | | | | | | |
| e | 1.288% due 7/13/2029 | | | 8,715,000 | | | | 8,672,199 | |
| e | 2.031% due 8/3/2032 | | | 7,000,000 | | | | 6,720,562 | |
| | Software — 1.2% | | | | | | | | |
| e,f | Constellation Software, Inc., 5.158% due 2/16/2029 | | | 9,218,000 | | | | 9,507,537 | |
| | Fair Isaac Corp., | | | | | | | | |
| e | 4.00% due 6/15/2028 | | | 16,087,000 | | | | 15,559,829 | |
| e | 5.25% due 5/15/2026 | | | 20,710,000 | | | | 20,706,686 | |
| | Fidelity National Information Services, Inc., 1.15% due 3/1/2026 | | | 2,000,000 | | | | 1,912,420 | |
| e | GoTo Group, Inc.,5.50% due 5/1/2028 | | | 5,292,209 | | | | 2,649,645 | |
| e | Infor, Inc., 1.75% due 7/15/2025 | | | 2,250,000 | | | | 2,189,093 | |
| | MSCI, Inc., | | | | | | | | |
| e | 3.875% due 2/15/2031 | | | 9,973,000 | | | | 9,437,051 | |
| e | 4.00% due 11/15/2029 | | | 6,289,000 | | | | 6,088,570 | |
| | Open Text Corp., | | | | | | | | |
| e,f | 3.875% due 2/15/2028 - 12/1/2029 | | | 20,088,000 | | | | 18,995,988 | |
| e,f | 6.90% due 12/1/2027 | | | 9,150,000 | | | | 9,655,721 | |
| | SS&C Technologies, Inc., | | | | | | | | |
| e | 5.50% due 9/30/2027 | | | 2,000,000 | | | | 2,000,240 | |
| e | 6.50% due 6/1/2032 | | | 6,700,000 | | | | 6,925,522 | |
| | VMware LLC, 4.50% due 5/15/2025 | | | 4,040,000 | | | | 4,029,819 | |
| | | | | | | | | 259,812,763 | |
| | TECHNOLOGY HARDWARE & EQUIPMENT — 1.1% | | | | | | | | |
| | Electronic Equipment, Instruments & Components — 1.0% | | | | | | | | |
| | Avnet, Inc., 6.25% due 3/15/2028 | | | 14,700,000 | | | | 15,449,406 | |
| | CDW LLC/CDW Finance Corp., | | | | | | | | |
| | 3.25% due 2/15/2029 | | | 5,238,000 | | | | 4,942,001 | |
| | 4.25% due 4/1/2028 | | | 8,103,000 | | | | 8,009,329 | |
| | 5.10% due 3/1/2030 | | | 9,391,000 | | | | 9,537,969 | |
| | Flex Ltd., | | | | | | | | |
| f | 4.875% due 5/12/2030 | | | 4,671,000 | | | | 4,676,138 | |
| f | 6.00% due 1/15/2028 | | | 3,886,000 | | | | 4,029,316 | |
| | Sensata Technologies BV, | | | | | | | | |
| e,f | 4.00% due 4/15/2029 | | | 2,000,000 | | | | 1,906,360 | |
| e,f | 5.875% due 9/1/2030 | | | 4,375,000 | | | | 4,394,906 | |
| e | Sensata Technologies, Inc., 6.625% due 7/15/2032 | | | 800,000 | | | | 833,720 | |
| | TD SYNNEX Corp., 1.75% due 8/9/2026 | | | 10,068,000 | | | | 9,569,533 | |
| | Trimble, Inc., 4.75% due 12/1/2024 | | | 6,525,000 | | | | 6,507,774 | |
| | Vontier Corp., | | | | | | | | |
| | 1.80% due 4/1/2026 | | | 4,453,000 | | | | 4,261,699 | |
| | 2.40% due 4/1/2028 | | | 11,254,000 | | | | 10,351,542 | |
| e | WESCO Distribution, Inc., 6.375% due 3/15/2029 | | | 4,690,000 | | | | 4,846,928 | |
| e | Zebra Technologies Corp., 6.50% due 6/1/2032 | | | 5,630,000 | | | | 5,881,886 | |
| | Technology Hardware, Storage & Peripherals — 0.1% | | | | | | | | |
| | Dell International LLC/EMC Corp., 4.90% due 10/1/2026 | | | 3,464,000 | | | | 3,501,515 | |
| e,f | Lenovo Group Ltd., 5.831% due 1/27/2028 | | | 3,885,000 | | | | 4,007,805 | |
| | | | | | | | | 102,707,827 | |
| | TELECOMMUNICATION SERVICES — 0.6% | | | | | | | | |
| | Diversified Telecommunication Services — 0.3% | | | | | | | | |
| | AT&T, Inc., 5.539% due 2/20/2026 | | | 22,242,000 | | | | 22,240,221 | |
| e,f,h | Sable International Finance Ltd., 7.125% due 10/15/2032 | | | 1,500,000 | | | | 1,502,790 | |
| e,f | Videotron Ltd., 5.125% due 4/15/2027 | | | 7,150,000 | | | | 7,133,269 | |
| | Virgin Media Secured Finance plc, | | | | | | | | |
| e,f | 4.50% due 8/15/2030 | | | 1,500,000 | | | | 1,332,735 | |
| e,f | 5.50% due 5/15/2029 | | | 1,800,000 | | | | 1,725,840 | |
| See notes to financial statements. | Annual Financial Statements | 159 |
Schedule of Investments, Continued
Thornburg Strategic Income Fund | September 30, 2024
| | | | SHARES/ | | | | |
| | ISSUER-DESCRIPTION | | PRINCIPAL AMOUNT | | | VALUE | |
| | Wireless Telecommunication Services — 0.3% | | | | | | | | |
| e | Crown Castle Towers LLC, 4.241% due 7/15/2048 | | $ | 455,000 | | | $ | 445,708 | |
| f,j | Digicel Intermediate Holdings Ltd./Digicel International Finance Ltd./Difl U.S., 12.00% due 5/25/2027 PIK | | | 4,890,050 | | | | 4,922,422 | |
| | T-Mobile USA, Inc., | | | | | | | | |
| | 2.25% due 2/15/2026 - 11/15/2031 | | | 13,747,000 | | | | 12,103,016 | |
| | 5.375% due 4/15/2027 | | | 2,965,000 | | | | 2,990,321 | |
| e,f | Vmed O2 U.K. Financing I plc, 4.25% due 1/31/2031 | | | 7,818,000 | | | | 6,934,019 | |
| | | | | | | | | 61,330,341 | |
| | TRANSPORTATION — 0.4% | | | | | | | | |
| | Air Freight & Logistics — 0.2% | | | | | | | | |
| | Ryder System, Inc., | | | | | | | | |
| | 5.25% due 6/1/2028 | | | 6,533,000 | | | | 6,736,830 | |
| | 5.65% due 3/1/2028 | | | 7,244,000 | | | | 7,549,045 | |
| | Passenger Airlines — 0.2% | | | | | | | | |
| | American Airlines Pass-Through Trust, Series 2016-3 Class B, 3.75% due 4/15/2027 | | | 553,159 | | | | 537,859 | |
| e | British Airways Pass-Through Trust, Series 2020-1 Class A, 4.25% due 5/15/2034 | | | 884,946 | | | | 846,344 | |
| e,f | Pegasus Hava Tasimaciligi AS, 8.00% due 9/11/2031 | | | 19,800,000 | | | | 19,787,526 | |
| | | | | | | | | 35,457,604 | |
| | UTILITIES — 5.4% | | | | | | | | |
| | Electric Utilities — 4.2% | | | | | | | | |
| | AEP Texas, Inc., | | | | | | | | |
| | 5.40% due 6/1/2033 | | | 5,106,000 | | | | 5,250,959 | |
| | Series I, 2.10% due 7/1/2030 | | | 2,612,000 | | | | 2,300,989 | |
| e,f | AES Espana BV, 5.70% due 5/4/2028 | | | 20,027,000 | | | | 19,137,000 | |
| | Allegion U.S. Holding Co., Inc., 5.411% due 7/1/2032 | | | 4,659,000 | | | | 4,854,305 | |
| | Alliant Energy Finance LLC, | | | | | | | | |
| e | 1.40% due 3/15/2026 | | | 1,500,000 | | | | 1,420,320 | |
| e | 5.95% due 3/30/2029 | | | 3,415,000 | | | | 3,606,411 | |
| | American Electric Power Co., Inc., 5.699% due 8/15/2025 | | | 4,750,000 | | | | 4,789,282 | |
| | Arizona Public Service Co., 5.70% due 8/15/2034 | | | 6,776,000 | | | | 7,157,489 | |
| | Black Hills Corp., | | | | | | | | |
| | 2.50% due 6/15/2030 | | | 1,000,000 | | | | 890,090 | |
| | 5.95% due 3/15/2028 | | | 5,387,000 | | | | 5,650,101 | |
| | 6.15% due 5/15/2034 | | | 6,135,000 | | | | 6,622,917 | |
| e | Boston Gas Co., 3.757% due 3/16/2032 | | | 6,140,000 | | | | 5,594,584 | |
| | Comision Federal de Electricidad, | | | | | | | | |
| e,f | 3.348% due 2/9/2031 | | | 16,177,000 | | | | 13,918,367 | |
| f | 5.00% due 9/29/2036 | | | 6,241,600 | | | | 5,679,232 | |
| e,f | 6.45% due 1/24/2035 | | | 4,000,000 | | | | 3,980,480 | |
| | Dominion Energy, Inc., 5.375% due 11/15/2032 | | | 5,000,000 | | | | 5,233,850 | |
| | DTE Energy Co., 4.875% due 6/1/2028 | | | 9,605,000 | | | | 9,810,067 | |
| e,f | Electricite de France SA, 5.65% due 4/22/2029 | | | 21,720,000 | | | | 22,771,248 | |
| | Enel Finance International NV, | | | | | | | | |
| e,f | 2.125% due 7/12/2028 | | | 16,900,000 | | | | 15,518,932 | |
| e,f | 2.50% due 7/12/2031 | | | 1,951,000 | | | | 1,695,029 | |
| e,f | 5.00% due 6/15/2032 | | | 3,819,000 | | | | 3,863,682 | |
| e,f | 5.125% due 6/26/2029 | | | 9,739,000 | | | | 9,975,171 | |
| e,f | 7.50% due 10/14/2032 | | | 2,400,000 | | | | 2,797,560 | |
| | Entergy Texas, Inc., | | | | | | | | |
| | 1.50% due 9/1/2026 | | | 5,866,000 | | | | 5,556,744 | |
| | 3.45% due 12/1/2027 | | | 3,000,000 | | | | 2,910,210 | |
| e,f | Eskom Holdings SOC Ltd., 7.125% due 2/11/2025 | | | 24,000,000 | | | | 23,999,040 | |
| | Evergy Metro, Inc., 4.95% due 4/15/2033 | | | 4,663,000 | | | | 4,748,519 | |
| | Eversource Energy, | | | | | | | | |
| | 5.125% due 5/15/2033 | | | 4,950,000 | | | | 5,041,624 | |
| | 5.45% due 3/1/2028 | | | 5,181,000 | | | | 5,371,350 | |
| | FirstEnergy Pennsylvania Electric Co., | | | | | | | | |
| e | 5.15% due 3/30/2026 | | | 5,230,000 | | | | 5,271,788 | |
| e | 5.20% due 4/1/2028 | | | 1,475,000 | | | | 1,511,359 | |
| | Idaho Power Co., 5.20% due 8/15/2034 | | | 2,625,000 | | | | 2,718,187 | |
| 160 | Annual Financial Statements | See notes to financial statements. |
Schedule of Investments, Continued
Thornburg Strategic Income Fund | September 30, 2024
| | | | SHARES/ | | | | |
| | ISSUER-DESCRIPTION | | PRINCIPAL AMOUNT | | | VALUE | |
| | ITC Holdings Corp., | | | | | | | | |
| e | 2.95% due 5/14/2030 | | $ | 1,742,000 | | | $ | 1,608,005 | |
| e | 4.95% due 9/22/2027 | | | 4,910,000 | | | | 4,981,882 | |
| e | 5.40% due 6/1/2033 | | | 13,817,000 | | | | 14,299,628 | |
| e | 5.65% due 5/9/2034 | | | 21,000,000 | | | | 22,143,660 | |
| e | Kentucky Power Co., 7.00% due 11/15/2033 | | | 10,114,000 | | | | 11,212,482 | |
| e | Mid-Atlantic Interstate Transmission LLC, 4.10% due 5/15/2028 | | | 945,000 | | | | 937,043 | |
| e | Midland Cogeneration Venture LP, 6.00% due 3/15/2025 | | | 2,307,003 | | | | 2,281,764 | |
| e | Monongahela Power Co., 3.55% due 5/15/2027 | | | 17,987,000 | | | | 17,649,744 | |
| e | New York State Electric & Gas Corp., 5.65% due 8/15/2028 | | | 15,000,000 | | | | 15,650,550 | |
| | NextEra Energy Capital Holdings, Inc., | | | | | | | | |
| | 5.749% due 9/1/2025 | | | 7,416,000 | | | | 7,493,794 | |
| | 6.051% due 3/1/2025 | | | 4,700,000 | | | | 4,720,492 | |
| | Niagara Mohawk Power Corp., | | | | | | | | |
| e | 3.508% due 10/1/2024 | | | 2,236,000 | | | | 2,236,000 | |
| e | 4.278% due 12/15/2028 | | | 7,700,000 | | | | 7,583,961 | |
| | PPL Capital Funding, Inc., 5.25% due 9/1/2034 | | | 4,000,000 | | | | 4,117,760 | |
| | Public Service Enterprise Group, Inc., 5.20% due 4/1/2029 | | | 9,543,000 | | | | 9,892,369 | |
| | Puget Energy, Inc., | | | | | | | | |
| | 2.379% due 6/15/2028 | | | 737,000 | | | | 682,425 | |
| | 4.10% due 6/15/2030 | | | 6,876,000 | | | | 6,620,488 | |
| | 4.224% due 3/15/2032 | | | 8,255,000 | | | | 7,759,783 | |
| | Southern Co., | | | | | | | | |
| | 3.25% due 7/1/2026 | | | 6,725,000 | | | | 6,612,827 | |
| | 5.113% due 8/1/2027 | | | 6,096,000 | | | | 6,236,879 | |
| | System Energy Resources, Inc., 6.00% due 4/15/2028 | | | 2,212,000 | | | | 2,319,149 | |
| e | Toledo Edison Co., 2.65% due 5/1/2028 | | | 3,933,000 | | | | 3,656,235 | |
| | Tucson Electric Power Co., 5.20% due 9/15/2034 | | | 8,325,000 | | | | 8,520,221 | |
| | Virginia Electric & Power Co., 5.05% due 8/15/2034 | | | 5,961,000 | | | | 6,122,603 | |
| | Xcel Energy, Inc., 5.45% due 8/15/2033 | | | 3,183,000 | | | | 3,301,567 | |
| | Gas Utilities — 1.0% | | | | | | | | |
| e,f | APA Infrastructure Ltd., 5.125% due 9/16/2034 | | | 9,210,000 | | | | 9,162,108 | |
| e | Brooklyn Union Gas Co., 3.407% due 3/10/2026 | | | 6,711,000 | | | | 6,588,927 | |
| | CenterPoint Energy Resources Corp., 5.40% due 7/1/2034 | | | 6,427,000 | | | | 6,696,677 | |
| e,f | ENN Clean Energy International Investment Ltd., 3.375% due 5/12/2026 | | | 9,524,000 | | | | 9,259,328 | |
| e | KeySpan Gas East Corp., 5.994% due 3/6/2033 | | | 14,587,000 | | | | 15,283,383 | |
| | NiSource, Inc., 5.25% due 3/30/2028 | | | 3,444,000 | | | | 3,547,664 | |
| | Piedmont Natural Gas Co., Inc., 5.40% due 6/15/2033 | | | 4,945,000 | | | | 5,176,031 | |
| | Southern Co. Gas Capital Corp., 5.15% due 9/15/2032 | | | 6,950,000 | | | | 7,187,690 | |
| | Southwest Gas Corp., | | | | | | | | |
| | 2.20% due 6/15/2030 | | | 7,880,000 | | | | 6,991,136 | |
| | 4.05% due 3/15/2032 | | | 3,026,000 | | | | 2,878,483 | |
| | 5.80% due 12/1/2027 | | | 4,610,000 | | | | 4,789,006 | |
| | Spire Missouri, Inc., Series 2034, 5.15% due 8/15/2034 | | | 2,327,000 | | | | 2,418,056 | |
| | Spire, Inc., 5.30% due 3/1/2026 | | | 9,300,000 | | | | 9,400,533 | |
| | Multi-Utilities — 0.2% | | | | | | | | |
| e,f | Aegea Finance SARL, 9.00% due 1/20/2031 | | | 18,400,000 | | | | 19,889,664 | |
| | | | | | | | | 507,556,883 | |
| | TOTAL CORPORATE BONDS (Cost $3,896,901,324) | | | | | | | 3,936,965,905 | |
| | | | | | | | | | |
| | CONVERTIBLE BONDS — 0.2% | | | | | | | | |
| | | | | | | | | | |
| | FINANCIAL SERVICES — 0.1% | | | | | | | | |
| | Financial Services — 0.1% | | | | | | | | |
| e | Repay Holdings Corp., Zero Coupon due 2/1/2026 | | | 5,460,000 | | | | 5,053,503 | |
| | | | | | | | | 5,053,503 | |
| | MEDIA & ENTERTAINMENT — 0.1% | | | | | | | | |
| | Media — 0.1% | | | | | | | | |
| | Comcast Holdings Corp. (Guaranty: Comcast Corp.), 2.00% due 10/15/2029 | | | 15,486,000 | | | | 8,950,134 | |
| | | | | | | | | 8,950,134 | |
| | TOTAL CONVERTIBLE BONDS (Cost $14,653,654) | | | | | | | 14,003,637 | |
| See notes to financial statements. | Annual Financial Statements | 161 |
Schedule of Investments, Continued
Thornburg Strategic Income Fund | September 30, 2024
| | | | SHARES/ | | | | |
| | ISSUER-DESCRIPTION | | PRINCIPAL AMOUNT | | | VALUE | |
| | LONG-TERM MUNICIPAL BONDS — 0.0% | | | | | | | | |
| | California (California Mtg Insurance) HFFA, 7.875% due 2/1/2026 | | $ | 865,000 | | | $ | 867,124 | |
| | City of Detroit GO, Series B, 2.511% due 4/1/2025 | | | 465,000 | | | | 457,789 | |
| | New York Transportation Development Corp. (Research Foundation of State University of New York), 4.248% due 9/1/2035 | | | 2,175,000 | | | | 2,138,001 | |
| | TOTAL LONG-TERM MUNICIPAL BONDS (Cost $3,503,650) | | | | | | | 3,462,914 | |
| | | | | | | | | | |
| | OTHER GOVERNMENT — 1.8% | | | | | | | | |
| | Australia Government Bonds (AUD), Series 166, 3.00% due 11/21/2033 | | | 36,873,000 | | | | 23,625,619 | |
| | Brazil Notas do Tesouro Nacional (BRL), Series F, 10.00% due 1/1/2029 | | | 98,800,000 | | | | 17,276,634 | |
| e,f | Corp. Financiera de Desarrollo SA, 5.95% due 4/30/2029 | | | 8,725,000 | | | | 9,024,442 | |
| e | Dominican Republic International Bonds (DOP), 10.75% due 6/1/2036 | | | 1,301,000,000 | | | | 22,997,155 | |
| | Egypt Government Bonds (EGP), Series 3Y, 23.865% due 6/4/2027 | | | 580,450,000 | | | | 11,634,127 | |
| | Egypt Treasury Bills (EGP), Series 364D, due 3/11/2025 | | | 952,450,000 | | | | 17,446,327 | |
| e,f | Finance Department Government of Sharjah, 3.625% due 3/10/2033 | | | 15,632,000 | | | | 13,698,009 | |
| e | Finance Department Government of Sharjah (EUR), 4.625% due 1/17/2031 | | | 5,000,000 | | | | 5,573,595 | |
| | Indonesia Treasury Bonds (IDR), | | | | | | | | |
| | Series 101, 6.875% due 4/15/2029 | | | 216,734,000,000 | | | | 14,718,300 | |
| | Series FR82, 7.00% due 9/15/2030 | | | 45,000,000,000 | | | | 3,073,940 | |
| | Nigeria Government International Bonds, | | | | | | | | |
| e,f | 7.625% due 11/28/2047 | | | 10,000,000 | | | | 7,658,500 | |
| e,f | 8.25% due 9/28/2051 | | | 4,300,000 | | | | 3,426,240 | |
| f | Panama Bonos del Tesoro, 3.362% due 6/30/2031 | | | 12,610,000 | | | | 10,303,253 | |
| e | Republic of Uzbekistan International Bonds (UZS), 16.625% due 5/29/2027 | | | 95,500,000,000 | | | | 7,532,647 | |
| | TOTAL OTHER GOVERNMENT (Cost $160,157,626) | | | | | | | 167,988,788 | |
| | | | | | | | | | |
| | U.S. TREASURY SECURITIES — 13.4% | | | | | | | | |
| | U.S. Treasury Inflation-Indexed Bonds, | | | | | | | | |
| | 1.50%, 2/15/2053 | | | 50,344,874 | | | | 45,550,311 | |
| | 1.75%, 1/15/2028 | | | 109,106,107 | | | | 110,005,380 | |
| | 2.125%, 2/15/2054 | | | 39,456,340 | | | | 41,076,208 | |
| | U.S. Treasury Inflation-Indexed Notes, | | | | | | | | |
| | 0.125%, 4/15/2025 - 4/15/2027 | | | 63,773,099 | | | | 61,703,285 | |
| | 1.25%, 4/15/2028 | | | 80,187,491 | | | | 79,438,865 | |
| | 1.625%, 10/15/2027 | | | 63,230,527 | | | | 63,655,357 | |
| | 1.75%, 1/15/2034 | | | 117,107,529 | | | | 118,489,032 | |
| | U.S. Treasury Notes, | | | | | | | | |
| | 1.125%, 8/31/2028 | | | 32,000,000 | | | | 29,147,500 | |
| | 2.75%, 8/15/2032 | | | 178,519,000 | | | | 166,859,478 | |
| | 2.875%, 5/15/2032 | | | 187,583,000 | | | | 177,383,174 | |
| | 4.00%, 2/15/2034 | | | 12,083,000 | | | | 12,292,565 | |
| | 4.125%, 11/15/2032 | | | 81,246,000 | | | | 83,581,823 | |
| | 4.50%, 11/15/2033 | | | 92,240,000 | | | | 97,428,500 | |
| | U.S. Treasury Strip Coupon, | | | | | | | | |
| | 6.11%, 11/15/2036 | | | 50,000,000 | | | | 30,603,193 | |
| | 6.236%, 5/15/2037 | | | 110,000,000 | | | | 65,659,976 | |
| | 7.105%, 8/15/2040 | | | 80,000,000 | | | | 40,506,781 | |
| | 7.691%, 11/15/2042 | | | 40,000,000 | | | | 18,013,138 | |
| | 7.844%, 8/15/2043 | | | 50,000,000 | | | | 21,752,998 | |
| | TOTAL U.S. TREASURY SECURITIES (Cost $1,205,607,406) | | | | | | | 1,263,147,564 | |
| | | | | | | | | | |
| | U.S. GOVERNMENT AGENCIES — 0.5% | | | | | | | | |
| c,d,e | Farm Credit Bank of Texas, Series 4, 5.70% (5-Yr. CMT + 5.420%), 9/15/2025 | | | 23,362,000 | | | | 23,377,886 | |
| | Federal Home Loan Banks, 2.90%, 2/18/2037 | | | 22,380,000 | | | | 18,701,176 | |
| | TOTAL U.S. GOVERNMENT AGENCIES (Cost $41,343,447) | | | | | | | 42,079,062 | |
| 162 | Annual Financial Statements | See notes to financial statements. |
Schedule of Investments, Continued
Thornburg Strategic Income Fund | September 30, 2024
| | ISSUER-DESCRIPTION | | SHARES/
PRINCIPAL AMOUNT | | VALUE | |
| | | | | | | | |
| | MORTGAGE BACKED — 25.4% | | | | | | | | |
| | Ajax Mortgage Loan Trust, Whole Loan Securities Trust CMO, | | | | | | | | |
| d,e | Series 2021-G Class A, 1.875% due 6/25/2061 | | $ | 3,061,953 | | | $ | 3,004,080 | |
| d,e | Series 2023-B Class A, 4.25% due 10/25/2062 | | | 9,801,414 | | | | 9,555,839 | |
| d,e | Series 2023-C Class A1, 3.50% due 5/25/2063 | | | 10,063,049 | | | | 9,523,288 | |
| | Angel Oak Mortgage Trust, Whole Loan Securities Trust CMO, | | | | | | | | |
| d,e | Series 2022-1 Class B1, 4.015% due 12/25/2066 | | | 4,575,000 | | | | 3,017,959 | |
| d,e | Series 2022-6 Class A3, 4.30% due 7/25/2067 | | | 4,146,932 | | | | 3,936,502 | |
| d,e | Series 2023-1 Class A1, 4.75% due 9/26/2067 | | | 13,055,349 | | | | 12,787,071 | |
| d,e | Series 2023-2 Class A1, 4.65% due 10/25/2067 | | | 6,238,952 | | | | 6,211,122 | |
| d,e | AOA Mortgage Trust, CMBS, Series 2021-1177 Class A, 6.086% (TSFR1M + 0.99%) due 10/15/2038 | | | 12,740,000 | | | | 12,016,004 | |
| d,e,f | Arbor Realty Commercial Real Estate Notes Ltd., CMBS, Series 2022-FL1 Class A, 6.792% (SOFR30A + 1.45%) due 1/15/2037 | | | 18,292,953 | | | | 18,247,259 | |
| | Arroyo Mortgage Trust, Whole Loan Securities Trust CMO, | | | | | | | | |
| d,e | Series 2019-1 Class A1, 3.805% due 1/25/2049 | | | 622,986 | | | | 603,070 | |
| d,e | Series 2019-3 Class A1, 2.962% due 10/25/2048 | | | 1,276,224 | | | | 1,205,765 | |
| d,e | Series 2021-1R Class A1, 1.175% due 10/25/2048 | | | 2,544,262 | | | | 2,267,249 | |
| d,e | ATLX Trust, Whole Loan Securities Trust CMO, Series 2024-RPL1 Class A1, 3.85% due 4/25/2064 | | | 12,304,962 | | | | 11,922,714 | |
| d,e | Barclays Mortgage Loan Trust, Whole Loan Securities Trust CMO, Series 2022-INV1 Class A3, 4.53% due 2/25/2062 | | | 13,669,802 | | | | 13,102,520 | |
| | Barclays Mortgage Trust, Whole Loan Securities Trust CMO, | | | | | | | | |
| d,e | Series 2021-NPL1 Class A, 2.00% due 11/25/2051 | | | 6,940,810 | | | | 6,822,641 | |
| d,e | Series 2022-RPL1 Class A, 4.25% due 2/25/2028 | | | 16,413,313 | | | | 16,075,043 | |
| d | Bear Stearns ARM Trust, Whole Loan Securities Trust CMO, Series 2003-6 Class 2B1, 7.48% due 8/25/2033 | | | 18,608 | | | | 18,608 | |
| d,e | BPR Trust, CMBS, Series 2023-BRK2 Class A, 7.147% due 10/5/2038 | | | 4,250,000 | | | | 4,466,709 | |
| | BRAVO Residential Funding Trust, Whole Loan Securities Trust CMO, | | | | | | | | |
| e | Series 2019-1 Class A1C, 3.50% due 3/25/2058 | | | 166,823 | | | | 165,927 | |
| d,e | Series 2024-NQM4 Class A1A, 4.35% due 1/25/2060 | | | 26,837,074 | | | | 26,365,409 | |
| e | BXP Trust, CMBS, Series 2021-601L Class A, 2.618% due 1/15/2044 | | | 6,760,000 | | | | 5,692,689 | |
| e | Century Plaza Towers, CMBS, Series 2019-CPT Class A, 2.865% due 11/13/2039 | | | 5,080,000 | | | | 4,541,296 | |
| | Chase Home Lending Mortgage Trust, Whole Loan Securities Trust CMO, | | | | | | | | |
| d,e | Series 2019-1 Class B4, 3.886% due 3/25/2050 | | | 694,847 | | | | 605,179 | |
| d,e | Series 2019-1 Class B5, 3.886% due 3/25/2050 | | | 358,503 | | | | 285,957 | |
| d,e | Series 2019-1 Class B6, 3.659% due 3/25/2050 | | | 521,093 | | | | 328,726 | |
| d,e | Chase Mortgage Finance Corp., Whole Loan Securities Trust CMO, Series 2016-SH2 Class M4, 3.75% due 12/25/2045 | | | 2,183,536 | | | | 2,039,571 | |
| | CHNGE Mortgage Trust, Whole Loan Securities Trust CMO, | | | | | | | | |
| d,e | Series 2022-1 Class A1, 3.007% due 1/25/2067 | | | 18,970,716 | | | | 17,767,537 | |
| d,e | Series 2022-1 Class B2, 4.542% due 1/25/2067 | | | 4,700,000 | | | | 3,621,509 | |
| d,e | Series 2022-2 Class B2, 4.624% due 3/25/2067 | | | 7,015,000 | | | | 5,194,071 | |
| d,e | Series 2023-1 Class A1, 7.065% due 3/25/2058 | | | 10,498,966 | | | | 10,632,506 | |
| | CIM Trust, Whole Loan Securities Trust CMO, | | | | | | | | |
| d,e | Series 2018-INV1 Class A4, 4.00% due 8/25/2048 | | | 145,464 | | | | 138,519 | |
| d,e,g | Series 2020-J1 Class AIO1, 0.445% due 7/25/2050 | | | 13,263,437 | | | | 257,662 | |
| d,e,g | Series 2020-J1 Class AIO2, 0.50% due 7/25/2050 | | | 11,829,817 | | | | 287,279 | |
| d,e,g | Series 2020-J1 Class AIOS, 0.20% due 6/25/2050 | | | 16,331,114 | | | | 157,035 | |
| d,e | Series 2020-J1 Class B4, 3.445% due 7/25/2050 | | | 329,707 | | | | 281,678 | |
| d,e | Series 2020-J1 Class B5, 3.445% due 7/25/2050 | | | 166,673 | | | | 107,708 | |
| d,e | Series 2020-J1 Class B6, 3.445% due 7/25/2050 | | | 286,799 | | | | 115,847 | |
| d,e,g | Series 2020-J2 Class AX1, 0.254% due 1/25/2051 | | | 99,295,203 | | | | 1,351,557 | |
| d,e,g | Series 2020-J2 Class AXS, 0.21% due 1/25/2051 | | | 106,040,331 | | | | 1,133,168 | |
| d,e | Series 2020-J2 Class B4, 2.754% due 1/25/2051 | | | 491,000 | | | | 261,682 | |
| d,e | Series 2020-J2 Class B5, 2.754% due 1/25/2051 | | | 164,000 | | | | 86,379 | |
| d,e | Series 2020-J2 Class B6, 2.754% due 1/25/2051 | | | 654,523 | | | | 234,042 | |
| d,e | Series 2023-I1 Class M1, 7.112% due 4/25/2058 | | | 10,705,000 | | | | 10,871,318 | |
| d,e | Series 2023-I2 Class A1, 6.639% due 12/25/2067 | | | 12,371,682 | | | | 12,565,649 | |
| d,e | Series 2024-R1 Class A1, 4.75% due 6/25/2064 | | | 16,533,995 | | | | 16,446,231 | |
| | Citigroup Mortgage Loan Trust, Whole Loan Securities Trust CMO, | | | | | | | | |
| d | Series 2004-HYB2 Class B1, 6.253% due 3/25/2034 | | | 20,039 | | | | 15,495 | |
| d,e | Series 2014-A Class A, 4.00% due 1/25/2035 | | | 324,953 | | | | 316,975 | |
| d,e | Series 2020-EXP1 Class B1, 4.467% due 5/25/2060 | | | 1,180,900 | | | | 1,012,351 | |
| d,e | Series 2020-EXP1 Class B2, 4.467% due 5/25/2060 | | | 770,600 | | | | 626,521 | |
| d,e | Series 2020-EXP1 Class B3, 4.467% due 5/25/2060 | | | 386,242 | | | | 265,846 | |
| e,g | Series 2020-EXP1 Class XS, due 5/25/2060 | | | 19,225,065 | | | | 879,768 | |
| d,e | Series 2020-EXP2 Class B5, 4.135% due 8/25/2050 | | | 153,000 | | | | 87,157 | |
| d,e | Series 2020-EXP2 Class B6, 4.135% due 8/25/2050 | | | 372,000 | | | | 175,188 | |
| See notes to financial statements. | Annual Financial Statements | 163 |
Schedule of Investments, Continued
Thornburg Strategic Income Fund | September 30, 2024
| | ISSUER-DESCRIPTION | | SHARES/
PRINCIPAL AMOUNT | | VALUE | |
| | | | | | | | |
| d,e | Series 2021-J1 Class B4, 2.61% due 4/25/2051 | | $ | 375,000 | | | $ | 169,545 | |
| d,e | Series 2021-J1 Class B5, 2.61% due 4/25/2051 | | | 616,000 | | | | 232,991 | |
| d,e | Series 2021-J1 Class B6, 2.61% due 4/25/2051 | | | 453,829 | | | | 169,187 | |
| d,e | Series 2021-J2 Class A7A, 2.50% due 7/25/2051 | | | 11,974,951 | | | | 10,737,155 | |
| d,e | Series 2021-J2 Class B4, 2.77% due 7/25/2051 | | | 2,281,541 | | | | 1,220,080 | |
| d,e | Series 2021-J2 Class B5, 2.77% due 7/25/2051 | | | 623,000 | | | | 328,280 | |
| d,e | Series 2021-J2 Class B6, 2.77% due 7/25/2051 | | | 1,247,350 | | | | 447,241 | |
| d,e | Series 2021-J3 Class B4, 2.86% due 9/25/2051 | | | 1,032,000 | | | | 605,585 | |
| d,e | Series 2021-J3 Class B5, 2.86% due 9/25/2051 | | | 173,000 | | | | 91,380 | |
| d,e | Series 2021-J3 Class B6, 2.86% due 9/25/2051 | | | 573,357 | | | | 205,696 | |
| d,e,g | Series 2022-INV1 Class A5IX, 0.291% due 11/27/2051 | | | 191,556,066 | | | | 2,863,418 | |
| d,e | Series 2022-INV1 Class B4, 3.291% due 11/27/2051 | | | 1,301,118 | | | | 1,034,848 | |
| d,e | Series 2022-INV1 Class B6, 3.291% due 11/27/2051 | | | 3,280,137 | | | | 1,575,317 | |
| d,e | Series 2022-J1 Class B4, 2.905% due 2/25/2052 | | | 700,598 | | | | 387,093 | |
| d,e | Series 2022-J1 Class B5, 2.905% due 2/25/2052 | | | 527,000 | | | | 249,807 | |
| d,e | Series 2022-J1 Class B6, 2.905% due 2/25/2052 | | | 1,404,735 | | | | 526,440 | |
| e | Cogent Ipv4 LLC, CMBS, Series 2024-1A Class A2, 7.924% due 5/25/2054 | | | 9,000,000 | | | | 9,432,211 | |
| e | COMM Mortgage Trust, CMBS, Series 2024-277P Class A, 6.338% due 8/10/2044 | | | 9,000,000 | | | | 9,451,336 | |
| | Cross Mortgage Trust, Whole Loan Securities Trust CMO, | | | | | | | | |
| d,e | Series 2023-H1 Class A1, 6.615% due 3/25/2068 | | | 7,728,672 | | | | 7,842,703 | |
| d,e | Series 2024-H4 Class A1, 6.147% due 7/25/2069 | | | 12,475,927 | | | | 12,665,345 | |
| | CSMC Trust, CMBS, | | | | | | | | |
| d,e | Series 2020-522F Class A, 8.95% (TSFR1M + 3.85%) due 9/16/2025 | | | 15,450,000 | | | | 9,393,904 | |
| d,e | Series 2021-BPNY Class A, 8.926% (TSFR1M + 3.83%) due 8/15/2026 | | | 13,086,792 | | | | 11,554,131 | |
| | CSMC Trust, Whole Loan Securities Trust CMO, | | | | | | | | |
| d,e | Series 2019-AFC1 Class B2, 5.182% due 7/25/2049 | | | 2,366,448 | | | | 2,139,003 | |
| d,e,g | Series 2021-AFC1 Class AIOS, 0.25% due 3/25/2056 | | | 48,118,535 | | | | 400,770 | |
| d,e | Series 2021-AFC1 Class B3, 4.321% due 3/25/2056 | | | 146,228 | | | | 107,840 | |
| d,e,g | Series 2021-AFC1 Class XS, 3.266% due 3/25/2056 | | | 48,118,535 | | | | 8,328,837 | |
| d,e | Series 2021-NQM3 Class A1, 1.015% due 4/25/2066 | | | 2,244,028 | | | | 1,921,218 | |
| d,e | Series 2021-NQM3 Class B2, 4.128% due 4/25/2066 | | | 2,650,000 | | | | 2,021,046 | |
| d,e | Series 2021-NQM8 Class B2, 4.289% due 10/25/2066 | | | 3,478,650 | | | | 2,879,167 | |
| d,e | Series 2022-ATH2 Class A1, 4.547% due 5/25/2067 | | | 5,139,751 | | | | 5,108,693 | |
| d,e | Series 2022-NQM5 Class A3, 5.169% due 5/25/2067 | | | 3,502,288 | | | | 3,481,459 | |
| e | DC Office Trust, CMBS, Series 2019-MTC Class A, 2.965% due 9/15/2045 | | | 8,282,000 | | | | 7,313,288 | |
| d,e | Deephaven Residential Mortgage Trust, Whole Loan Securities Trust CMO, Series 2021-1 Class A1, 0.715% due 5/25/2065 | | | 601,282 | | | | 561,184 | |
| | Ellington Financial Mortgage Trust, Whole Loan Securities Trust CMO, | | | | | | | | |
| d,e | Series 2019-2 Class A1, 2.739% due 11/25/2059 | | | 711,324 | | | | 680,608 | |
| d,e | Series 2021-2 Class A1, 0.931% due 6/25/2066 | | | 2,666,459 | | | | 2,243,813 | |
| d,e | Series 2022-1 Class B2, 3.875% due 1/25/2067 | | | 6,901,000 | | | | 4,991,341 | |
| d,e | FARM Mortgage Trust, Whole Loan Securities Trust CMO, Series 2024-1 Class A, 4.721% due 10/1/2053 | | | 9,865,017 | | | | 9,628,581 | |
| | Federal Home Loan Mtg Corp., | | | | | | | | |
| d | Pool 1L0322, 4.783% (H15T1Y + 2.07%) due 2/1/2048 | | | 2,315,825 | | | | 2,394,495 | |
| d | Pool 760025, 3.664% (5-Yr. CMT + 1.310%) due 10/1/2047 | | | 3,314,720 | | | | 3,263,498 | |
| d | Pool 841097, 3.131% (5-Yr. CMT + 1.300%) due 9/1/2048 | | | 4,698,420 | | | | 4,605,067 | |
| d | Pool 841355, 1.906% (2.15% - SOFR30A) due 11/1/2051 | | | 4,856,448 | | | | 4,520,839 | |
| d | Pool 841362, 1.713% (2.15% - SOFR30A) due 2/1/2052 | | | 6,077,280 | | | | 5,562,001 | |
| d | Pool 841377, 1.95% (2.23% - SOFR30A) due 4/1/2052 | | | 6,294,130 | | | | 5,816,445 | |
| d | Pool 841463, 2.156% (2.18% - SOFR30A) due 7/1/2052 | | | 16,210,418 | | | | 14,476,391 | |
| | Pool RE6097, 2.00% due 5/1/2051 | | | 12,061,822 | | | | 9,727,656 | |
| | Federal Home Loan Mtg Corp., CMO REMIC, | | | | | | | | |
| | Series 5461 Class PA, 4.50% due 8/25/2054 | | | 30,455,000 | | | | 29,988,064 | |
| | Series 5462 Class P, 4.50% due 10/25/2054 | | | 20,436,000 | | | | 20,313,065 | |
| | Federal Home Loan Mtg Corp., Multifamily Structured Pass-Through Certificates, CMBS, | | | | | | | | |
| d,g | Series KIR1 Class X, 1.157% due 3/25/2026 | | | 32,119,334 | | | | 376,473 | |
| | Series KJ46 Class A2, 4.796% due 10/25/2031 | | | 10,518,000 | | | | 10,880,155 | |
| d | Series KJ47 Class A2, 5.43% due 6/25/2031 | | | 7,257,000 | | | | 7,695,811 | |
| | Series KJ48 Class A2, 5.028% due 10/25/2031 | | | 18,483,000 | | | | 19,318,657 | |
| | Federal Home Loan Mtg Corp., Seasoned Credit Risk Transfer, Whole Loan Securities Trust CMO, | | | | | | | | |
| | Series 2020-2 Class MA, 2.00% due 11/25/2059 | | | 2,561,938 | | | | 2,338,114 | |
| | Series 2022-1 Class MTU, 3.25% due 11/25/2061 | | | 21,680,249 | | | | 19,384,807 | |
| | Series 2024-1 Class MT, 3.00% due 11/25/2063 | | | 10,028,033 | | | | 8,562,291 | |
| | Series 2024-2 Class MT, 3.50% due 5/25/2064 | | | 13,949,602 | | | | 12,599,609 | |
| 164 | Annual Financial Statements | See notes to financial statements. |
Schedule of Investments, Continued
Thornburg Strategic Income Fund | September 30, 2024
| | ISSUER-DESCRIPTION | | SHARES/
PRINCIPAL AMOUNT | | VALUE | |
| | | | | | | | |
| | Federal Home Loan Mtg Corp., UMBS Collateral, | | | | | | | | |
| | Pool RA7373, 3.00% due 5/1/2052 | | $ | 3,101,089 | | | $ | 2,799,846 | |
| | Pool SD1374, 3.00% due 3/1/2052 | | | 7,910,923 | | | | 7,097,841 | |
| | Pool SD1588, 5.00% due 9/1/2052 | | | 5,146,863 | | | | 5,199,493 | |
| | Pool SD1626, 5.00% due 10/1/2052 | | | 7,364,634 | | | | 7,454,537 | |
| | Pool SD3632, 2.50% due 7/1/2052 | | | 36,805,969 | | | | 31,775,580 | |
| | Pool SD4175, 2.50% due 6/1/2052 | | | 104,594,671 | | | | 90,299,383 | |
| | Pool SD4176, 3.00% due 9/1/2052 | | | 113,296,581 | | | | 101,875,746 | |
| | Pool SD5171, 2.50% due 1/1/2054 | | | 33,813,730 | | | | 29,192,299 | |
| | Pool SD8140, 2.00% due 4/1/2051 | | | 33,935,763 | | | | 28,171,816 | |
| | Pool SD8189, 2.50% due 1/1/2052 | | | 17,934,036 | | | | 15,520,354 | |
| | Pool SD8225, 3.00% due 7/1/2052 | | | 15,443,655 | | | | 13,864,913 | |
| | Pool SD8367, 5.50% due 10/1/2053 | | | 16,319,583 | | | | 16,518,492 | |
| | Federal Home Loan Mtg Corp., Whole Loan Securities Trust CMO, | | | | | | | | |
| d,e | Series 2017-SC01 Class M1, 3.641% due 12/25/2046 | | | 226,481 | | | | 221,588 | |
| d,e | Series 2017-SC02 Class M1, 3.86% due 5/25/2047 | | | 86,563 | | | | 84,567 | |
| | Federal National Mtg Assoc., | | | | | | | | |
| d | Pool BH4523, 1.869% (5-Yr. CMT + 1.150%) due 4/1/2047 | | | 4,954,824 | | | | 4,776,085 | |
| d | Pool BH4524, 2.316% (5-Yr. CMT + 1.150%) due 6/1/2046 | | | 9,532,138 | | | | 9,251,874 | |
| | Pool BL8603, 2.07% due 10/1/2050 | | | 11,498,524 | | | | 8,260,407 | |
| d | Pool BM6885, 1.611% (2.19% - SOFR30A) due 12/1/2051 | | | 7,007,835 | | | | 6,414,129 | |
| | Pool BM6899, 2.50% due 1/1/2052 | | | 10,439,286 | | | | 8,891,680 | |
| d | Pool BM6929, 1.92% (2.13% - SOFR30A) due 7/1/2051 | | | 7,135,995 | | | | 6,673,224 | |
| d | Pool BO9998, 2.752% (H15T1Y + 2.03%) due 3/1/2048 | | | 3,872,810 | | | | 3,868,580 | |
| | Pool BS1289, 2.17% due 3/1/2051 | | | 16,056,453 | | | | 11,265,210 | |
| d | Pool BU9934, 1.838% (2.37% - SOFR30A) due 2/1/2052 | | | 14,649,318 | | | | 13,009,793 | |
| d | Pool CB2214, 1.528% (2.20% - SOFR30A) due 11/1/2051 | | | 7,767,339 | | | | 7,128,807 | |
| | Federal National Mtg Assoc., CMO REMIC, | | | | | | | | |
| | Series 2024-25 Class VB, 5.50% due 3/25/2035 | | | 14,391,507 | | | | 14,774,739 | |
| | Series 2024-70 Class MP, 4.50% due 10/25/2054 | | | 21,937,984 | | | | 21,551,179 | |
| | Federal National Mtg Assoc., UMBS Collateral, | | | | | | | | |
| | Pool BV4119, 2.50% due 3/1/2052 | | | 51,606,515 | | | | 44,553,287 | |
| | Pool BW8669, 5.00% due 9/1/2052 | | | 4,753,023 | | | | 4,755,753 | |
| | Pool CB2301, 3.00% due 12/1/2051 | | | 39,215,642 | | | | 35,186,170 | |
| | Pool CB3050, 2.50% due 3/1/2052 | | | 24,864,482 | | | | 21,488,751 | |
| | Pool CB3880, 5.00% due 6/1/2052 | | | 2,679,371 | | | | 2,709,563 | |
| | Pool FS5447, 2.50% due 9/1/2052 | | | 37,914,042 | | | | 32,881,783 | |
| | Pool FS6130, 2.50% due 7/1/2052 | | | 147,881,102 | | | | 127,669,719 | |
| | Pool FS6157, 3.00% due 9/1/2052 | | | 125,577,567 | | | | 113,016,037 | |
| | Pool FS7577, 2.50% due 1/1/2054 | | | 28,954,150 | | | | 24,996,894 | |
| | Pool FS7757, 2.50% due 2/1/2052 | | | 27,932,922 | | | | 24,132,339 | |
| | Pool FS7879, 2.50% due 7/1/2052 | | | 20,499,452 | | | | 17,683,777 | |
| | Pool FS9157, 2.00% due 5/1/2042 | | | 34,000,000 | | | | 29,587,986 | |
| | Pool MA5138, 5.50% due 9/1/2053 | | | 9,138,047 | | | | 9,249,992 | |
| | Pool MA5139, 6.00% due 9/1/2053 | | | 8,224,325 | | | | 8,405,532 | |
| | Pool MA5166, 6.00% due 10/1/2053 | | | 15,897,987 | | | | 16,248,269 | |
| | First Republic Mortgage Trust, Whole Loan Securities Trust CMO, | | | | | | | | |
| d,e,g | Series 2020-1 Class A2IO, 1.244% due 4/25/2050 | | | 114,993,996 | | | | 2,599,474 | |
| d,e | Series 2020-1 Class B3, 2.884% due 4/25/2050 | | | 1,408,183 | | | | 1,248,471 | |
| d,e | Series 2020-1 Class B4, 2.884% due 4/25/2050 | | | 1,325,000 | | | | 1,139,398 | |
| d,e | Series 2020-1 Class B5, 2.884% due 4/25/2050 | | | 470,000 | | | | 397,573 | |
| d,e | Series 2020-1 Class B6, 2.884% due 4/25/2050 | | | 755,000 | | | | 534,143 | |
| | Flagstar Mortgage Trust, Whole Loan Securities Trust CMO, | | | | | | | | |
| d,e | Series 2017-1 Class 2A2, 3.00% due 3/25/2047 | | | 181,969 | | | | 169,056 | |
| d,e | Series 2018-3INV Class B4, 4.451% due 5/25/2048 | | | 5,062,450 | | | | 4,732,647 | |
| d,e | Series 2019-2 Class B3, 3.999% due 12/25/2049 | | | 3,481,360 | | | | 3,175,654 | |
| d,e,g | Series 2020-2 Class AX1, 0.663% due 8/25/2050 | | | 23,869,589 | | | | 708,982 | |
| d,e,g | Series 2020-2 Class AX2, 0.50% due 8/25/2050 | | | 4,090,608 | | | | 98,605 | |
| d,e | Series 2020-2 Class B4, 3.663% due 8/25/2050 | | | 200,476 | | | | 174,946 | |
| d,e | Series 2020-2 Class B5, 3.663% due 8/25/2050 | | | 598,681 | | | | 488,688 | |
| d,e | Series 2020-2 Class B6C, 3.51% due 8/25/2050 | | | 800,209 | | | | 437,533 | |
| d,e,g | Series 2021-13IN Class AX1, 0.178% due 12/30/2051 | | | 160,725,120 | | | | 1,309,042 | |
| d,e,g | Series 2021-13IN Class AX17, 0.18% due 12/30/2051 | | | 13,287,544 | | | | 134,588 | |
| See notes to financial statements. | Annual Financial Statements | 165 |
Schedule of Investments, Continued
Thornburg Strategic Income Fund | September 30, 2024
| | ISSUER-DESCRIPTION | | SHARES/
PRINCIPAL AMOUNT | | VALUE | |
| | | | | | | | |
| d,e,g | Series 2021-13IN Class AX4, 0.50% due 12/30/2051 | | $ | 12,152,916 | | | $ | 340,238 | |
| d,e | Series 2021-13IN Class B4, 3.358% due 12/30/2051 | | | 2,518,148 | | | | 2,017,918 | |
| d,e | Series 2021-13IN Class B5, 3.358% due 12/30/2051 | | | 459,059 | | | | 348,424 | |
| d,e | Series 2021-13IN Class B6C, 3.261% due 12/30/2051 | | | 4,001,140 | | | | 2,520,354 | |
| d,e | FREMF Mortgage Trust, CMBS, Series 2016-KF24 Class B, 10.461% (SOFR30A + 5.11%) due 10/25/2026 | | | 295,845 | | | | 286,095 | |
| | GCAT Trust, Whole Loan Securities Trust CMO, | | | | | | | | |
| d,e | Series 2019-NQM3 Class A1, 3.686% due 11/25/2059 | | | 530,656 | | | | 513,576 | |
| d,e | Series 2021-CM1 Class A, 2.469% due 4/25/2065 | | | 2,526,218 | | | | 2,410,582 | |
| d,e | Series 2021-CM2 Class A1, 2.352% due 8/25/2066 | | | 6,597,781 | | | | 6,056,667 | |
| d,e | Series 2021-NQM1 Class M1, 2.316% due 1/25/2066 | | | 6,112,000 | | | | 4,260,860 | |
| d,e | Series 2021-NQM4 Class A1, 1.093% due 8/25/2066 | | | 3,523,887 | | | | 2,868,451 | |
| d,e | Series 2023-NQM4 Class A1, 4.25% due 5/25/2067 | | | 17,790,243 | | | | 16,991,823 | |
| d,e,f | Greystone Commercial Real Estate Notes Ltd., CMBS, Series 2021-FL3 Class A, 6.231% (TSFR1M + 1.13%) due 7/15/2039 | | | 13,264,414 | | | | 13,214,683 | |
| d,e | GS Mortgage-Backed Securities Corp. Trust, Whole Loan Securities Trust CMO, Series 2023-CCM1 Class A1, 6.65% due 8/25/2053 | | | 10,863,931 | | | | 10,976,602 | |
| | GS Mortgage-Backed Securities Trust, Whole Loan Securities Trust CMO, | | | | | | | | |
| d,e,g | Series 2020-INV1 Class A11X, 3.404% due 10/25/2050 | | | 869,580 | | | | 133,223 | |
| d,e,g | Series 2020-INV1 Class A12X, 2.918% due 10/25/2050 | | | 10,411,915 | | | | 1,367,283 | |
| d,e,g | Series 2020-INV1 Class AIOS, 0.19% due 10/25/2050 | | | 56,935,444 | | | | 412,947 | |
| d,e,g | Series 2020-INV1 Class AX1, due 10/25/2050 | | | 37,645,471 | | | | 376 | |
| d,e,g | Series 2020-INV1 Class AX2, 0.418% due 10/25/2050 | | | 1,876,461 | | | | 25,262 | |
| d,e,g | Series 2020-INV1 Class AX4, 0.924% due 10/25/2050 | | | 2,019,987 | | | | 62,291 | |
| d,e | Series 2020-INV1 Class B4, 3.842% due 10/25/2050 | | | 1,219,447 | | | | 1,073,253 | |
| d,e | Series 2020-INV1 Class B5, 3.842% due 10/25/2050 | | | 1,222,333 | | | | 1,088,029 | |
| d,e | Series 2020-INV1 Class B6, 3.842% due 10/25/2050 | | | 2,934,928 | | | | 2,000,326 | |
| d,e,g | Series 2020-INV1 Class BX, 0.342% due 10/25/2050 | | | 13,913,478 | | | | 226,112 | |
| d,e,g | Series 2020-PJ3 Class A11X, 3.50% due 10/25/2050 | | | 2,291,977 | | | | 298,552 | |
| d,e | Series 2023-PJ2 Class A4, 5.50% due 5/25/2053 | | | 6,683,776 | | | | 6,688,506 | |
| d,e | Series 2024-RPL2 Class A1, 3.75% due 7/25/2061 | | | 6,237,793 | | | | 6,097,063 | |
| d,e | Series 2024-RPL4 Class A1, 3.90% due 9/25/2061 | | | 5,491,775 | | | | 5,350,983 | |
| | Harvest Commercial Capital Loan Trust, CMBS, Series 2024-1 Class A, 6.164% due 10/25/2056 | | | 20,317,816 | | | | 20,834,546 | |
| d,e | HOMES Trust, Whole Loan Securities Trust CMO, Series 2024-NQM1 Class A1, 5.915% due 7/25/2069 | | | 10,175,291 | | | | 10,276,514 | |
| d,e | Homeward Opportunities Fund I Trust, Whole Loan Securities Trust CMO, Series 2020-2 Class B3, 5.651% due 5/25/2065 | | | 14,305,000 | | | | 13,536,412 | |
| | Homeward Opportunities Fund Trust, Whole Loan Securities Trust CMO, | | | | | | | | |
| d,e | Series 2022-1 A Class A1, 5.082% due 7/25/2067 | | | 5,068,116 | | | | 5,047,330 | |
| d,e | Series 2024-RTL1 Class A1, 7.12% due 7/25/2029 | | | 22,320,000 | | | | 22,637,319 | |
| e | Houston Galleria Mall Trust, CMBS, Series 2015-HGLR Class A1A2, 3.087% due 3/5/2037 | | | 16,067,500 | | | | 15,864,776 | |
| d,e | Hudson Yards Mortgage Trust, CMBS, Series 2019-55HY Class A, 3.041% due 12/10/2041 | | | 5,870,000 | | | | 5,339,847 | |
| | Imperial Fund Mortgage Trust, Whole Loan Securities Trust CMO, | | | | | | | | |
| d,e | Series 2021-NQM3 Class B2, 4.137% due 11/25/2056 | | | 5,408,000 | | | | 4,093,442 | |
| d,e | Series 2021-NQM4 Class A1, 2.091% due 1/25/2057 | | | 3,863,495 | | | | 3,334,615 | |
| d,e | Series 2021-NQM4 Class B2, 4.10% due 1/25/2057 | | | 2,500,000 | | | | 1,849,697 | |
| d,e | Series 2022-NQM1 Class A1, 2.493% due 2/25/2067 | | | 14,642,155 | | | | 13,175,878 | |
| d,e | Series 2022-NQM2 Class B2, 4.20% due 3/25/2067 | | | 15,600,000 | | | | 11,955,294 | |
| d,e | Series 2022-NQM4 Class A1, 4.767% due 6/25/2067 | | | 11,902,506 | | | | 11,842,773 | |
| d,e | Series 2022-NQM4 Class A3, 5.04% due 6/25/2067 | | | 3,605,226 | | | | 3,547,051 | |
| d,e | Series 2022-NQM6 Class A1, 6.819% due 10/25/2067 | | | 7,811,985 | | | | 7,855,945 | |
| | JP Morgan Mortgage Trust, Whole Loan Securities Trust CMO, | | | | | | | | |
| d,e | Series 2015-4 Class B4, 3.53% due 6/25/2045 | | | 830,166 | | | | 624,980 | |
| d,e | Series 2017-5 Class B6, 5.425% due 10/26/2048 | | | 3,073,725 | | | | 2,253,580 | |
| d,e | Series 2019-8 Class B4, 4.168% due 3/25/2050 | | | 3,257,594 | | | | 3,007,118 | |
| d,e,g | Series 2020-3 Class AX1, 0.14% due 8/25/2050 | | | 8,737,007 | | | | 41,250 | |
| d,e,g | Series 2020-4 Class A11X, (TSFR1M + 5.14%) due 11/25/2050 | | | 1,766,543 | | | | 83,156 | |
| d,e,g | Series 2020-4 Class A3X, 0.50% due 11/25/2050 | | | 7,989,989 | | | | 189,468 | |
| d,e,g | Series 2020-4 Class AX1, 0.092% due 11/25/2050 | | | 29,512,142 | | | | 95,271 | |
| d,e,g | Series 2020-4 Class AX3, 3.50% due 11/25/2050 | | | 816,477 | | | | 137,291 | |
| d,e,g | Series 2020-4 Class AX4, 0.55% due 11/25/2050 | | | 1,884,404 | | | | 49,100 | |
| d,e | Series 2020-4 Class B4, 3.642% due 11/25/2050 | | | 1,259,650 | | | | 1,103,080 | |
| d,e | Series 2020-4 Class B5, 3.642% due 11/25/2050 | | | 580,889 | | | | 458,343 | |
| d,e | Series 2020-4 Class B6, 3.642% due 11/25/2050 | | | 1,054,996 | | | | 502,145 | |
| d,e | Series 2020-7 Class B4, 3.506% due 1/25/2051 | | | 596,093 | | | | 515,069 | |
| d,e | Series 2020-7 Class B5, 3.506% due 1/25/2051 | | | 415,816 | | | | 276,812 | |
| d,e | Series 2020-7 Class B6, 3.506% due 1/25/2051 | | | 588,627 | | | | 260,833 | |
| d,e | Series 2020-LTV1 Class B3A, 3.756% due 6/25/2050 | | | 2,658,402 | | | | 2,352,965 | |
| 166 | Annual Financial Statements | See notes to financial statements. |
Schedule of Investments, Continued
Thornburg Strategic Income Fund | September 30, 2024
| | ISSUER-DESCRIPTION | | SHARES/
PRINCIPAL AMOUNT | | VALUE | |
| | | | | | | | |
| d,e | Series 2021-11 Class B5, 3.021% due 1/25/2052 | | $ | 2,274,325 | | | $ | 1,695,220 | |
| d,e | Series 2021-11 Class B6, 2.846% due 1/25/2052 | | | 2,603,319 | | | | 1,334,263 | |
| d,e | Series 2021-LTV2 Class A1, 2.52% due 5/25/2052 | | | 12,335,457 | | | | 10,385,625 | |
| d,e | Series 2022- LTV1 Class A1, 3.25% due 7/25/2052 | | | 16,280,347 | | | | 14,168,138 | |
| d,e | Series 2022-2 Class B4, 3.129% due 8/25/2052 | | | 3,171,016 | | | | 2,422,868 | |
| d,e | Series 2022-2 Class B5, 3.129% due 8/25/2052 | | | 1,686,631 | | | | 1,107,195 | |
| d,e | Series 2022-2 Class B6, 1.728% due 8/25/2052 | | | 1,813,305 | | | | 720,382 | |
| d,e | Series 2022-3 Class B4, 3.103% due 8/25/2052 | | | 2,604,893 | | | | 1,996,445 | |
| d,e | Series 2022-3 Class B5, 3.103% due 8/25/2052 | | | 1,657,316 | | | | 848,205 | |
| d,e | Series 2022-3 Class B6, 2.326% due 8/25/2052 | | | 1,460,644 | | | | 580,430 | |
| d,e | Series 2022-DSC1 Class A1, 4.75% due 1/25/2063 | | | 8,042,044 | | | | 7,911,823 | |
| d,e | Series 2023-1 Class A2, 5.50% due 6/25/2053 | | | 6,627,989 | | | | 6,631,987 | |
| d,e | Series 2023-3 Class A4B, 5.50% due 10/25/2053 | | | 7,991,268 | | | | 8,034,701 | |
| d,e | JP Morgan Wealth Management, Whole Loan Securities Trust CMO, Series 2021-CL1 Class M1, 6.58% (SOFR30A + 1.30%) due | | | | | | | | |
| | 3/25/2051 | | | 3,981,126 | | | | 3,892,598 | |
| d,e,h | LEX Mortgage Trust, CMBS, Series 2024-BBG Class A, 4.874% due 10/13/2033 | | | 5,400,000 | | | | 5,394,606 | |
| e | Manhattan West Mortgage Trust, CMBS, Series 2020-1MW Class A, 2.13% due 9/10/2039 | | | 3,698,000 | | | | 3,426,925 | |
| | Mello Mortgage Capital Acceptance, Whole Loan Securities Trust CMO, | | | | | | | | |
| d,e,g | Series 2021-INV2 Class AX1, 0.121% due 8/25/2051 | | | 96,413,365 | | | | 453,432 | |
| d,e,g | Series 2021-INV2 Class AX4, 0.70% due 8/25/2051 | | | 6,606,071 | | | | 257,641 | |
| d,e | Series 2021-INV2 Class B5, 3.321% due 8/25/2051 | | | 308,953 | | | | 232,322 | |
| d,e | Series 2021-INV2 Class B6, 3.149% due 8/25/2051 | | | 1,492,284 | | | | 780,151 | |
| d,e,g | Series 2021-INV3 Class AX1, 0.16% due 10/25/2051 | | | 115,159,790 | | | | 790,630 | |
| d,e,g | Series 2021-INV3 Class AX4, 0.55% due 10/25/2051 | | | 9,367,236 | | | | 259,135 | |
| d,e | Series 2021-INV3 Class B5, 3.21% due 10/25/2051 | | | 427,180 | | | | 319,840 | |
| d,e | Series 2021-INV3 Class B6, 3.084% due 10/25/2051 | | | 1,890,632 | | | | 1,008,103 | |
| d | Merrill Lynch Mortgage Investors Trust, Whole Loan Securities Trust CMO, Series 2004-A4 Class M1, 5.818% due 8/25/2034 | | | 38,079 | | | | 36,201 | |
| d,e | Metlife Securitization Trust, Whole Loan Securities Trust CMO, Series 2019-1A Class A1A, 3.75% due 4/25/2058 | | | 323,530 | | | | 317,955 | |
| | MFA Trust, Whole Loan Securities Trust CMO, | | | | | | | | |
| d,e | Series 2020-NQM3 Class M1, 2.654% due 1/26/2065 | | | 800,000 | | | | 727,181 | |
| d,e | Series 2021-INV1 Class A1, 0.852% due 1/25/2056 | | | 2,753,320 | | | | 2,569,609 | |
| d,e | Series 2021-INV2 Class A1, 1.906% due 11/25/2056 | | | 8,088,413 | | | | 6,984,378 | |
| d,e | Series 2022-CHM1 Class A1, 3.875% due 9/25/2056 | | | 7,199,184 | | | | 7,035,849 | |
| d,e | Series 2022-INV1 Class A3, 4.25% due 4/25/2066 | | | 4,950,000 | | | | 4,336,416 | |
| d,e | Series 2022-NQM2 Class A1, 4.00% due 5/25/2067 | | | 17,301,022 | | | | 16,912,049 | |
| d,e | Series 2022-NQM3 Class A1, 5.57% due 9/25/2067 | | | 7,539,744 | | | | 7,549,352 | |
| d,e | Series 2024-RPL1 Class A1, 4.25% due 2/25/2066 | | | 13,781,917 | | | | 13,360,737 | |
| d,e | Mill City Mortgage Loan Trust, Whole Loan Securities Trust CMO, Series 2023-NQM1 Class A1, 6.05% due 10/25/2067 | | | 16,690,013 | | | | 16,821,276 | |
| d,e | Mill City Securities Ltd., Whole Loan Securities Trust CMO, Series 2024-RS1 Class A1, 3.00% due 11/1/2069 | | | 15,128,000 | | | | 13,966,412 | |
| e | Morgan Stanley Capital I Trust, CMBS, Series 2024-BPR2 Class A, 7.291% due 5/5/2029 | | | 14,859,134 | | | | 15,719,606 | |
| d,e | Morgan Stanley Residential Mortgage Loan Trust, Whole Loan Securities Trust CMO, Series 2024-NQM1 Class A1, 6.152% due | | | | | | | | |
| | 12/25/2068 | | | 16,658,738 | | | | 16,865,992 | |
| | New Residential Mortgage Loan Trust, Whole Loan Securities Trust CMO, | | | | | | | | |
| d,e | Series 2017-3A Class A1, 4.00% due 4/25/2057 | | | 757,018 | | | | 738,180 | |
| d,e | Series 2017-4A Class A1, 4.00% due 5/25/2057 | | | 629,341 | | | | 609,449 | |
| d,e | Series 2017-5A Class A1, 6.469% (TSFR1M + 1.61%) due 6/25/2057 | | | 358,303 | | | | 362,899 | |
| d,e | Series 2017-6A Class A1, 4.00% due 8/27/2057 | | | 327,033 | | | | 318,200 | |
| d,e | Series 2018-1A Class A1A, 4.00% due 12/25/2057 | | | 625,290 | | | | 610,308 | |
| d,e,g | Series 2021-INV1 Class AX1, 0.748% due 6/25/2051 | | | 96,404,766 | | | | 3,623,103 | |
| d,e | Series 2021-INV1 Class B5, 3.248% due 6/25/2051 | | | 1,157,793 | | | | 892,101 | |
| d,e | Series 2021-INV1 Class B6, 3.201% due 6/25/2051 | | | 2,037,482 | | | | 1,219,424 | |
| d,e | Series 2022-NQM3 Class A1, 3.90% due 4/25/2062 | | | 16,992,977 | | | | 16,280,402 | |
| d,e | Series 2024-RPL1 Class A, 3.80% due 1/25/2064 | | | 15,144,161 | | | | 14,378,621 | |
| d,e | Series 2024-RTL1 Class A1, 6.664% due 3/25/2039 | | | 10,000,000 | | | | 10,171,186 | |
| e | NYC Commercial Mortgage Trust, CMBS, Series 2021-909 Class A, 2.941% due 4/10/2043 | | | 4,450,000 | | | | 3,648,892 | |
| d,e | NYMT Loan Trust, Whole Loan Securities Trust CMO, Series 2024-BPL2 Class A1, 6.509% due 5/25/2039 | | | 11,000,000 | | | | 11,161,676 | |
| | OBX Trust, Whole Loan Securities Trust CMO, | | | | | | | | |
| d,e | Series 2021-NQM2 Class A1, 1.101% due 5/25/2061 | | | 5,510,051 | | | | 4,533,581 | |
| d,e | Series 2021-NQM4 Class A1, 1.957% due 10/25/2061 | | | 14,423,793 | | | | 12,317,604 | |
| d,e | Series 2024-NQM11 Class A1, 5.875% due 6/25/2064 | | | 13,480,772 | | | | 13,642,855 | |
| e | One Bryant Park Trust, CMBS, Series 2019-OBP Class A, 2.516% due 9/15/2054 | | | 25,449,348 | | | | 22,654,282 | |
| d,e | OSAT Trust, Whole Loan Securities Trust CMO, Series 2021-RPL1 Class A1, 5.116% due 5/25/2065 | | | 20,219,033 | | | | 20,182,208 | |
| d,e | PRET LLC, Whole Loan Securities Trust CMO, Series 2021-RN3 Class A1, 4.843% due 9/25/2051 | | | 9,423,597 | | | | 9,391,851 | |
| See notes to financial statements. | Annual Financial Statements | 167 |
Schedule of Investments, Continued
Thornburg Strategic Income Fund | September 30, 2024
| | ISSUER-DESCRIPTION | | SHARES/
PRINCIPAL AMOUNT | | VALUE | |
| | | | | | | | |
| d,e | PRET Trust, Whole Loan Securities Trust CMO, Series 2024-RPL1 Class A1, 3.90% due 10/25/2063 | | $ | 5,372,061 | | | $ | 5,187,180 | |
| | PRKCM Trust, Whole Loan Securities Trust CMO, | | | | | | | | |
| d,e | Series 2021-AFC1 Class A1, 1.51% due 8/25/2056 | | | 4,116,935 | | | | 3,461,462 | |
| d,e | Series 2021-AFC1 Class B2, 3.95% due 8/25/2056 | | | 2,729,000 | | | | 1,991,177 | |
| d,e | Series 2024-HOME1 Class A1, 6.431% due 5/25/2059 | | | 6,843,818 | | | | 6,974,365 | |
| d,e | PRPM LLC, Whole Loan Securities Trust CMO, Series 2024-RPL2 Class A1, 3.50% due 5/25/2054 | | | 9,636,608 | | | | 9,317,869 | |
| | PRPM Trust, Whole Loan Securities Trust CMO, | | | | | | | | |
| d,e | Series 2022-INV1 Class A1, 4.40% due 4/25/2067 | | | 24,732,015 | | | | 24,783,121 | |
| d,e | Series 2022-INV1 Class A3, 4.432% due 4/25/2067 | | | 8,309,275 | | | | 8,016,497 | |
| d,e | Series 2022-NQM1 Class A1, 5.50% due 8/25/2067 | | | 8,277,923 | | | | 8,248,520 | |
| d,e | Rate Mortgage Trust, Whole Loan Securities Trust CMO, Series 2022-J1 Class A9, 2.50% due 1/25/2052 | | | 12,066,839 | | | | 10,637,975 | |
| d,e | Redwood Funding Trust, Whole Loan Securities Trust CMO, Series 2024-1 Class A, 7.745% due 12/25/2054 | | | 9,688,198 | | | | 9,728,581 | |
| | Saluda Grade Alternative Mortgage Trust, Whole Loan Securities Trust CMO, | | | | | | | | |
| d,e | Series 2020-FIG1 Class C, due 9/25/2050 | | | 1,601,029 | | | | 611,666 | |
| e | Series 2020-FIG1 Class M1, 7.00% due 9/25/2050 | | | 14,430,002 | | | | 14,281,158 | |
| | Seasoned Loans Structured Transaction Trust, Whole Loan Securities Trust CMO, Series 2020-2 Class A1C, 2.00% due 9/25/2030 | | | 5,394,659 | | | | 4,958,783 | |
| | Sequoia Mortgage Trust, Whole Loan Securities Trust CMO, | | | | | | | | |
| d,e | Series 2015-4 Class B4, 3.116% due 11/25/2030 | | | 1,686,000 | | | | 1,549,865 | |
| d,e | Series 2016-3 Class B3, 3.602% due 11/25/2046 | | | 2,268,937 | | | | 1,859,802 | |
| d,e | Series 2017-7 Class B3, 3.724% due 10/25/2047 | | | 1,254,527 | | | | 1,137,613 | |
| d,e | Series 2018-7 Class B4, 4.25% due 9/25/2048 | | | 1,802,000 | | | | 1,534,361 | |
| d,e | Series 2021-9 Class A1, 2.50% due 1/25/2052 | | | 12,891,197 | | | | 10,780,415 | |
| d,e | Series 2023-3 Class A1, 6.00% due 9/25/2053 | | | 7,823,887 | | | | 7,884,958 | |
| d,e | SFO Commercial Mortgage Trust, CMBS, Series 2021-555 Class A, 6.362% (TSFR1M + 1.26%) due 5/15/2038 | | | 5,212,000 | | | | 4,972,297 | |
| | SG Residential Mortgage Trust, Whole Loan Securities Trust CMO, | | | | | | | | |
| d,e | Series 2019-3 Class A1, 2.703% due 9/25/2059 | | | 35,431 | | | | 35,035 | |
| d,e,g | Series 2019-3 Class AIOS, 0.375% due 9/25/2059 | | | 11,423,355 | | | | 156,045 | |
| d,e | Series 2019-3 Class B2, 5.663% due 9/25/2059 | | | 1,978,000 | | | | 1,801,731 | |
| d,e | Series 2019-3 Class B3, 6.301% due 9/25/2059 | | | 842,000 | | | | 702,792 | |
| e | Series 2019-3 Class XS1, due 9/25/2059 | | | 11,258,037 | | | | 113 | |
| e | Series 2019-3 Class XS2, due 9/25/2059 | | | 10,695,028 | | | | 537,997 | |
| d,e | Series 2020-2 Class A3, 1.895% due 5/25/2065 | | | 992,466 | | | | 915,472 | |
| d,e | Series 2021-2 Class A1, 1.737% due 12/25/2061 | | | 5,886,529 | | | | 4,904,584 | |
| d,e | Series 2022-1 Class B2, 3.969% due 3/27/2062 | | | 4,204,000 | | | | 2,895,541 | |
| d,e | Shellpoint Co-Originator Trust, Whole Loan Securities Trust CMO, Series 2016-1 Class B4, 3.554% due 11/25/2046 | | | 2,447,907 | | | | 2,008,527 | |
| e | SLG Office Trust, CMBS, Series 2021-OVA Class A, 2.585% due 7/15/2041 | | | 18,658,000 | | | | 16,167,077 | |
| d,e | Spruce Hill Mortgage Loan Trust, Whole Loan Securities Trust CMO, Series 2022-SH1 Class A1A, 4.10% due 7/25/2057 | | | 5,286,513 | | | | 5,147,946 | |
| d,e | Starwood Mortgage Residential Trust, Whole Loan Securities Trust CMO, Series 2021-5 Class A1, 1.92% due 9/25/2066 | | | 14,467,588 | | | | 12,386,368 | |
| | TIAA Bank Mortgage Loan Trust, Whole Loan Securities Trust CMO, | | | | | | | | |
| d,e | Series 2018-2 Class B3, 3.657% due 7/25/2048 | | | 2,352,999 | | | | 2,159,518 | |
| d,e | Series 2018-2 Class B4, 3.657% due 7/25/2048 | | | 2,040,000 | | | | 1,477,664 | |
| d,e | Toorak Mortgage Trust, Whole Loan Securities Trust CMO, Series 2024-RRTL1 Class A1, 6.597% due 2/25/2039 | | | 11,200,000 | | | | 11,366,416 | |
| d,e | Towd Point Mortgage Trust, Whole Loan Securities Trust CMO, Series 2018-2 Class A1, 3.25% due 3/25/2058 | | | 1,029,157 | | | | 1,007,864 | |
| d,e | TRK Trust, Whole Loan Securities Trust CMO, Series 2022-INV2 Class A1, 4.35% due 6/25/2057 | | | 10,267,070 | | | | 10,010,750 | |
| d,e | Visio Trust, Whole Loan Securities Trust CMO, Series 2022-1 Class M1, 5.947% due 8/25/2057 | | | 10,000,000 | | | | 9,986,456 | |
| d,e | Vista Point Securitization Trust, Whole Loan Securities Trust CMO, Series 2020-2 Class A2, 1.986% due 4/25/2065 | | | 848,357 | | | | 808,088 | |
| d,e | WB Commercial Mortgage Trust, CMBS, Series 2024-HQ Class A, 6.134% due 3/15/2040 | | | 4,050,000 | | | | 4,102,232 | |
| | Wells Fargo Commercial Mortgage Trust, CMBS, | | | | | | | | |
| | Series 2016-C34 Class A2, 2.603% due 6/15/2049 | | | 960,626 | | | | 938,995 | |
| d,e | Series 2018-1745 Class A, 3.874% due 6/15/2036 | | | 4,000,000 | | | | 3,635,079 | |
| | Wells Fargo Mortgage Backed Securities Trust, Whole Loan Securities Trust CMO, | | | | | | | | |
| d,e,g | Series 2021-INV1 Class AIO2, 0.50% due 8/25/2051 | | | 85,454,244 | | | | 2,332,439 | |
| d,e | Series 2021-INV1 Class B4, 3.313% due 8/25/2051 | | | 1,613,601 | | | | 1,282,765 | |
| d,e | Series 2021-INV1 Class B5, 3.313% due 8/25/2051 | | | 1,294,830 | | | | 962,162 | |
| d,e | Series 2021-INV1 Class B6, 3.313% due 8/25/2051 | | | 987,307 | | | | 459,807 | |
| | TOTAL MORTGAGE BACKED (Cost $2,344,958,788) | | | | | | | 2,401,841,675 | |
| | | | | | | | | | |
| | LOAN PARTICIPATIONS — 0.6% | | | | | | | | |
| | | | | | | | | | |
| | COMMERCIAL & PROFESSIONAL SERVICES — 0.2% | | | | | | | | |
| | Commercial Services & Supplies — 0.2% | | | | | | | | |
| k | Imagefirst Holdings LLC, 8.854% (SOFR + 4.25%) due 4/27/2028 | | | 12,659,097 | | | | 12,564,154 | |
| 168 | Annual Financial Statements | See notes to financial statements. |
Schedule of Investments, Continued
Thornburg Strategic Income Fund | September 30, 2024
| | ISSUER-DESCRIPTION | | SHARES/
PRINCIPAL AMOUNT | | VALUE | |
| | | | | | | | | | |
| | Professional Services — 0.0% | | | | | | | | |
| k | GTCR W Merger Sub LLC, 7.668% (SOFR + 3.00%) due 1/31/2031 | | $ | 3,000,000 | | | $ | 2,998,740 | |
| | | | | | | | | 15,562,894 | |
| | CONSUMER DURABLES & APPAREL — 0.0% | | | | | | | | |
| | Textiles, Apparel & Luxury Goods — 0.0% | | | | | | | | |
| k | Hanesbrands, Inc., 8.595% (SOFR + 3.75%) due 3/8/2030 | | | 4,925,000 | | | | 4,912,688 | |
| | | | | | | | | 4,912,688 | |
| | CONSUMER SERVICES — 0.1% | | | | | | | | |
| | Commercial Services & Supplies — 0.0% | | | | | | | | |
| k | GEO Group, Inc., 10.095% (SOFR + 5.25%) due 4/13/2029 | | | 4,152,778 | | | | 4,215,070 | |
| | Hotels, Restaurants & Leisure — 0.1% | | | | | | | | |
| k | TKC Holdings, Inc., 9.965% (PRIME + 4.00%) due 5/15/2028 | | | 4,445,953 | | | | 4,426,524 | |
| | | | | | | | | 8,641,594 | |
| | MEDIA & ENTERTAINMENT — 0.1% | | | | | | | | |
| | Media — 0.1% | | | | | | | | |
| k | Century DE Buyer LLC, 9.255% (SOFR + 4.00%) due 10/30/2030 | | | 3,482,500 | | | | 3,472,331 | |
| k | DirecTV Financing LLC, 9.96% (SOFR + 5.00%) due 8/2/2027 | | | 3,730,121 | | | | 3,727,323 | |
| | | | | | | | | 7,199,654 | |
| | SOFTWARE & SERVICES — 0.1% | | | | | | | | |
| | Internet Software & Services — 0.1% | | | | | | | | |
| k | Titan AcquisitionCo New Zealand Ltd., 8.865% (SOFR + 4.00%) due 10/18/2028 | | | 7,273,500 | | | | 7,287,174 | |
| | | | | | | | | 7,287,174 | |
| | TECHNOLOGY HARDWARE & EQUIPMENT — 0.1% | | | | | | | | |
| | Communications Equipment — 0.0% | | | | | | | | |
| k | GoTo Group, Inc., 9.968% (SOFR + 4.75%) due 4/28/2028 | | | 5,075,129 | | | | 2,738,995 | |
| | Technology Hardware, Storage & Peripherals — 0.1% | | | | | | | | |
| k | Xerox Holdings Corp., 8.604% - 8.845% (SOFR + 4.00%) due 11/17/2029 | | | 11,550,000 | | | | 11,489,362 | |
| | | | | | | | | 14,228,357 | |
| | TOTAL LOAN PARTICIPATIONS (Cost $60,209,715) | | | | | | | 57,832,361 | |
| | | | | | | | | | |
| | SHORT-TERM INVESTMENTS — 6.4% | | | | | | | | |
| l | Thornburg Capital Management Fund | | | 60,311,324 | | | | 603,113,236 | |
| | TOTAL SHORT-TERM INVESTMENTS (Cost $603,113,236) | | | | | | | 603,113,236 | |
| | | | | | | | | | |
| | TOTAL INVESTMENTS — 99.9% (Cost $9,299,705,376) | | | | | | $ | 9,442,704,909 | |
| | | | | | | | | | |
| | OTHER ASSETS LESS LIABILITIES — 0.1% | | | | | | | 11,491,148 | |
| | | | | | | | | | |
| | NET ASSETS — 100.0% | | | | | | $ | 9,454,196,057 | |
OUTSTANDING FORWARD CURRENCY CONTRACTS TO BUY OR SELL AT SEPTEMBER 30, 2024
CONTRACT
DESCRIPTION | | CONTRACT
PARTY* | | BUY/SELL | | | CONTRACT
AMOUNT | | | CONTRACT
VALUE DATE | | | VALUE
USD | | | UNREALIZED
APPRECIATION | | UNREALIZED
DEPRECIATION |
| | | | | | | | | | | | | | | | | | | | | |
| Euro | | SSB | | Sell | | | 98,911,000 | | | 3/25/2025 | | | 110,843,846 | | | $ | — | | | $ | (125,345 | ) |
| Net unrealized appreciation (depreciation) | | | | | | | | | | | | $ | (125,345 | ) |
* Counterparty includes State Street Bank and Trust Company (“SSB”).
| See notes to financial statements. | Annual Financial Statements | 169 |
Schedule of Investments, Continued
Thornburg Strategic Income Fund | September 30, 2024
Footnote Legend
| a | Security currently fair valued by Thornburg Investment Management, Inc.’s Valuation and Pricing Committee. |
| c | Securities are perpetual and, thus, do not have a predetermined maturity date. The date shown, if applicable, reflects the next call date. |
| d | Variable, floating, step, or fixed to floating rate securities are securities for which interest rate changes are based on changes in a designated base rate or on a predetermined schedule. The rates shown are those in effect on September 30, 2024. |
| e | Securities exempt from registration under Rule 144A of the Securities Act of 1933, as amended. These securities are restricted but liquid and may only be resold in the ordinary course of business in transactions exempt from registration, normally to qualified institutional buyers. As of September 30, 2024, the aggregate value of these securities in the Fund’s portfolio was $4,575,516,216, representing 48.40% of the Fund’s net assets. |
| f | Yankee bond denominated in U.S. dollars and is issued in the U.S. by foreign banks and corporations. |
| j | Pay-In-Kind Payments (PIK). The issuer may pay cash interest and/or interest in additional debt securities. Rates shown are the rates in effect at September 30, 2024. |
| k | The stated coupon rate represents the greater of the SOFR or the SOFR floor rate plus a spread at September 30, 2024. |
| l | Investment in Affiliates. |
Portfolio Abbreviations
To simplify the listings of securities, abbreviations are used per the table below:
| ABS | Asset Backed Securities | HFFA | Health Facilities Financing Authority |
| ARM | Adjustable Rate Mortgage | IDR | Denominated in Indonesian Rupiah |
| AUD | Denominated in Australian Dollar | Mtg | Mortgage |
| BRL | Denominated in Brazilian Real | PIK | Payment-in-kind |
| CMBS | Commercial Mortgage-Backed Securities | REMIC | Real Estate Mortgage Investment Conduit |
| CMO | Collateralized Mortgage Obligation | SOFR | Secured Overnight Financing Rate |
| CMT | Constant Maturity Rate | SOFR30A | Secured Overnight Financing Rate 30-Day Average |
| DAC | Designated Activity Company | SOFR90A | Secured Overnight Financing Rate 90-Day Average |
| DOP | Denominated in Dominican Peso | SOFRINDX | Secured Overnight Financing Rate Index |
| EGP | Denominated in Egyptian Pound | TSFR1M | Term SOFR 1 Month |
| EUR | Denominated in Euro | TSFR3M | Term SOFR 3 Month |
| GBP | Denominated in Pound Sterling | UMBS | Uniform Mortgage Backed Securities |
| GO | General Obligation | UZS | Denominated in Uzbekistani Som |
| H15T1Y | US Treasury Yield Curve Rate T-Note Constant Maturity 1 Year | | |
| 170 | Annual Financial Statements | See notes to financial statements. |
Schedule of Investments, Continued
Thornburg Strategic Income Fund | September 30, 2024
COUNTRY EXPOSURE *
(percent of net assets)
| United States | | | 81.0% | |
| Canada | | | 1.6% | |
| Mexico | | | 1.0% | |
| United Kingdom | | | 0.8% | |
| Japan | | | 0.8% | |
| Brazil | | | 0.7% | |
| Australia | | | 0.7% | |
| Dominican Republic | | | 0.6% | |
| China | | | 0.5% | |
| France | | | 0.5% | |
| Turkey | | | 0.4% | |
| South Africa | | | 0.4% | |
| Cayman Islands | | | 0.4% | |
| Italy | | | 0.4% | |
| United Arab Emirates | | | 0.3% | |
| Indonesia | | | 0.3% | |
| Nigeria | | | 0.3% | |
| Egypt | | | 0.3% | |
| Israel | | | 0.3% | |
| Guatemala | | | 0.3% | |
| Bermuda | | | 0.2% | |
| Saudi Arabia | | | 0.2% | |
| Colombia | | | 0.2% | |
| Belgium | | | 0.1% | |
| Russian Federation | | | 0.1% | |
| Panama | | | 0.1% | |
| South Korea | | | 0.1% | |
| Morocco | | | 0.1% | |
| Germany | | | 0.1% | |
| Spain | | | 0.1% | |
| Peru | | | 0.1% | |
| Uzbekistan | | | 0.1% | |
| Norway | | | 0.1% | |
| Switzerland | | | 0.1% | |
| Jamaica | | | 0.1% | |
| Kuwait | | | 0.1% | |
| India | | | 0.0% | ** |
| Chile | | | 0.0% | ** |
| Netherlands | | | 0.0% | ** |
| Luxembourg | | | 0.0% | ** |
| Other Assets Less Liabilities | | | 6.5% | |
| * | Holdings are classified by country of risk as determined by MSCI and Bloomberg. |
| ** | Country percentage was less than 0.1%. |
| See notes to financial statements. | Annual Financial Statements | 171 |
Statements of Assets and Liabilities
September 30, 2024
| | | THORNBURG
ULTRA SHORT
INCOME FUND | | | THORNBURG
LIMITED TERM U.S.
GOVERNMENT FUND | | | THORNBURG
LIMITED TERM
INCOME FUND | | | THORNBURG
CORE PLUS
BOND FUND | | | THORNBURG
STRATEGIC
INCOME FUND | |
| ASSETS | | | | | | | | | | | | | | | |
| Investments at cost | | | | | | | | | | | | | | | | | | | | |
| Non-affiliated issuers | | $ | 243,392,239 | | | $ | 141,945,909 | | | $ | 6,013,298,963 | | | $ | 152,987,214 | | | $ | 8,696,592,140 | |
| Non-controlled affiliated issuers | | | 24,144,899 | | | | - | | | | 521,539,993 | | | | 6,292,172 | | | | 603,113,236 | |
| Investments at value | | | | | | | | | | | | | | | | | | | | |
| Non-affiliated issuers | | | 243,963,990 | | | | 137,782,466 | | | | 5,942,750,939 | | | | 158,553,880 | | | | 8,839,591,673 | |
| Non-controlled affiliated issuers | | | 24,144,899 | | | | - | | | | 521,539,993 | | | | 6,292,172 | | | | 603,113,236 | |
| Cash | | | 69,248 | | | | 1,827,050 | | | | 7,489,099 | | | | 17,176 | | | | - | |
| Foreign currency at value (a) | | | 152 | | | | - | | | | - | | | | 10 | | | | - | |
| Receivable for investments sold | | | 1,008,013 | | | | - | | | | - | | | | - | | | | 6,233,253 | |
| Receivable for fund shares sold | | | 105,171 | | | | 124,449 | | | | 9,232,240 | | | | 761,011 | | | | 27,249,070 | |
| Dividends receivable | | | 121,627 | | | | - | | | | 2,227,522 | | | | 35,435 | | | | 2,076,562 | |
| Principal and interest receivable | | | 1,621,131 | | | | 410,246 | | | | 28,169,090 | | | | 1,027,941 | | | | 68,423,357 | |
| Prepaid expenses and other assets | | | 13,546 | | | | 41,534 | | | | 99,040 | | | | 65,369 | | | | 41,459 | |
| | | | | | | | | | | | | | | | | | | | | |
| Total Assets | | | 271,047,777 | | | | 140,185,745 | | | | 6,511,507,923 | | | | 166,752,994 | | | | 9,546,728,610 | |
| | | | | | | | | | | | | | | | | | | | | |
| LIABILITIES | | | | | | | | | | | | | | | | | | | | |
| Unrealized depreciation on forward currency contracts | | | - | | | | - | | | | - | | | | 192 | | | | 125,345 | |
| Payable for investments purchased | | | 5,938,448 | | | | - | | | | 36,372,173 | | | | 887,103 | | | | 58,223,774 | |
| Payable for fund shares redeemed | | | 761,657 | | | | 154,548 | | | | 38,505,337 | | | | 267,527 | | | | 26,265,749 | |
| Payable to investment advisor and other affiliates | | | 15,896 | | | | 76,312 | | | | 2,454,811 | | | | 2,620 | | | | 3,354,990 | |
| Deferred taxes payable | | | - | | | | - | | | | - | | | | - | | | | 56,168 | |
| Accounts payable and accrued expenses | | | 119,319 | | | | 152,052 | | | | 1,799,047 | | | | 120,446 | | | | 1,833,718 | |
| Dividends payable | | | 2,225 | | | | 75,123 | | | | 2,216,938 | | | | - | | | | 2,672,809 | |
| | | | | | | | | | | | | | | | | | | | | |
| Total Liabilities | | | 6,837,545 | | | | 458,035 | | | | 81,348,306 | | | | 1,277,888 | | | | 92,532,553 | |
| | | | | | | | | | | | | | | | | | | | | |
| NET ASSETS | | $ | 264,210,232 | | | $ | 139,727,710 | | | $ | 6,430,159,617 | | | $ | 165,475,106 | | | $ | 9,454,196,057 | |
| | | | | | | | | | | | | | | | | | | | | |
| NET ASSETS CONSIST OF | | | | | | | | | | | | | | | | | | | | |
| Net capital paid in on shares of beneficial interest | | $ | 264,090,793 | | | $ | 175,996,828 | | | $ | 6,924,723,007 | | | $ | 159,694,011 | | | $ | 9,473,196,552 | |
| Distributable earnings (accumulated loss) | | | 119,439 | | | | (36,269,118 | ) | | | (494,563,390 | ) | | | 5,781,095 | | | | (19,000,495 | ) |
| | | | | | | | | | | | | | | | | | | | | |
| NET ASSETS | | $ | 264,210,232 | | | $ | 139,727,710 | | | $ | 6,430,159,617 | | | $ | 165,475,106 | | | $ | 9,454,196,057 | |
172 | Annual Financial Statements
Statements of Assets and Liabilities, Continued
September 30, 2024
| | | THORNBURG
ULTRA SHORT
INCOME FUND | | | THORNBURG
LIMITED TERM U.S.
GOVERNMENT FUND | | | THORNBURG
LIMITED TERM
INCOME FUND | | | THORNBURG
CORE PLUS
BOND FUND | | | THORNBURG
STRATEGIC
INCOME FUND | |
| NET ASSET VALUE | | | | | | | | | | | | | | | |
| Class A Shares: | | | | | | | | | | | | | | | |
| Net assets applicable to shares outstanding | | $ | 50,153,841 | | | $ | 38,447,280 | | | $ | 480,421,627 | | | $ | 272,255 | | | $ | 294,969,978 | |
| Shares outstanding | | | 4,100,420 | | | | 3,154,428 | | | | 36,562,577 | | | | 25,362 | | | | 25,266,137 | |
| Net asset value and redemption price per share | | $ | 12.23 | | | $ | 12.19 | | | $ | 13.14 | | | $ | 10.73 | | | $ | 11.67 | |
| | | | | | | | | | | | | | | | | | | | | |
| Maximum offering price per share (net asset value, plus 2.25% of offering price) | | $ | 12.51 | | | $ | 12.47 | | | $ | 13.44 | | | $ | 11.24 | * | | $ | 12.22 | * |
| | | | | | | | | | | | | | | | | | | | | |
| Class C Shares: | | | | | | | | | | | | | | | | | | | | |
| Net assets applicable to shares outstanding | | | - | | | | 2,664,662 | | | | 106,222,110 | | | | 818,930 | | | | 101,093,875 | |
| Shares outstanding | | | - | | | | 217,407 | | | | 8,097,249 | | | | 76,270 | | | | 8,676,418 | |
| Net asset value and redemption price per share** | | | - | | | | 12.26 | | | | 13.12 | | | | 10.74 | | | | 11.65 | |
| | | | | | | | | | | | | | | | | | | | | |
| Class C2 Shares: | | | | | | | | | | | | | | | | | | | | |
| Net assets applicable to shares outstanding | | | - | | | | 304,998 | | | | 5,160,405 | | | | - | | | | - | |
| Shares outstanding | | | - | | | | 24,867 | | | | 393,343 | | | | - | | | | - | |
| Net asset value and redemption price per share** | | | - | | | | 12.27 | | | | 13.12 | | | | - | | | | - | |
| | | | | | | | | | | | | | | | | | | | | |
| Class I Shares: | | | | | | | | | | | | | | | | | | | | |
| Net assets applicable to shares outstanding | | | 214,056,391 | | | | 93,488,050 | | | | 5,543,889,514 | | | | 163,387,851 | | | | 8,778,650,992 | |
| Shares outstanding | | | 17,515,747 | | | | 7,670,828 | | | | 421,815,285 | | | | 15,218,295 | | | | 753,848,421 | |
| Net asset value and redemption price per share | | | 12.22 | | | | 12.19 | | | | 13.14 | | | | 10.74 | | | | 11.65 | |
| | | | | | | | | | | | | | | | | | | | | |
| Class R3 Shares: | | | | | | | | | | | | | | | | | | | | |
| Net assets applicable to shares outstanding | | | - | | | | 2,579,114 | | | | 35,717,425 | | | | 112,254 | | | | 1,129,763 | |
| Shares outstanding | | | - | | | | 211,377 | | | | 2,716,423 | | | | 10,460 | | | | 96,888 | |
| Net asset value and redemption price per share | | | - | | | | 12.20 | | | | 13.15 | | | | 10.73 | | | | 11.66 | |
| | | | | | | | | | | | | | | | | | | | | |
| Class R4 Shares: | | | | | | | | | | | | | | | | | | | | |
| Net assets applicable to shares outstanding | | | - | | | | 1,035,052 | | | | 16,302,574 | | | | 112,530 | | | | 2,429,773 | |
| Shares outstanding | | | - | | | | 84,968 | | | | 1,241,052 | | | | 10,486 | | | | 208,440 | |
| Net asset value and redemption price per share | | | - | | | | 12.18 | | | | 13.14 | | | | 10.73 | | | | 11.66 | |
| | | | | | | | | | | | | | | | | | | | | |
| Class R5 Shares: | | | | | | | | | | | | | | | | | | | | |
| Net assets applicable to shares outstanding | | | - | | | | 1,208,554 | | | | 70,838,597 | | | | 112,810 | | | | 91,965,378 | |
| Shares outstanding | | | - | | | | 99,092 | | | | 5,391,489 | | | | 10,512 | | | | 7,894,761 | |
| Net asset value and redemption price per share | | | - | | | | 12.20 | | | | 13.14 | | | | 10.73 | | | | 11.65 | |
| | | | | | | | | | | | | | | | | | | | | |
| Class R6 Shares: | | | | | | | | | | | | | | | | | | | | |
| Net assets applicable to shares outstanding | | | - | | | | - | | | | 171,607,365 | | | | 658,476 | | | | 183,956,298 | |
| Shares outstanding | | | - | | | | - | | | | 13,034,880 | | | | 61,348 | | | | 15,747,970 | |
| Net asset value and redemption price per share | | | - | | | | - | | | | 13.17 | | | | 10.73 | | | | 11.68 | |
| (a) | Cost of foreign currency is $140; $0; $0; $10; $0; respectively. |
| * | Net asset value, plus 4.50% of offering price. |
| ** | Redemption price per share is equal to net asset value less any applicable contingent deferred sales charge. |
See notes to financial statements.
Annual Financial Statements | 173
Statements of Operations
Year Ended September 30, 2024
| | | THORNBURG
ULTRA SHORT
INCOME FUND | | | THORNBURG
LIMITED TERM U.S.
GOVERNMENT FUND | | | THORNBURG
LIMITED TERM
INCOME FUND | | | THORNBURG
CORE PLUS
BOND FUND† | | | THORNBURG
STRATEGIC
INCOME FUND | |
| INVESTMENT INCOME | | | | | | | | | | | | | | | |
| Dividend income | | | | | | | | | | | | | | | |
| Non-affiliated issuers | | $ | - | | | $ | - | | | $ | 900,550 | | | $ | 7,600 | | | $ | 1,004,443 | |
| Non-controlled affiliated issuers | | | 1,232,199 | | | | - | | | | 19,230,593 | | | | 236,206 | | | | 25,913,949 | |
| Dividend taxes withheld | | | - | | | | - | | | | - | | | | - | | | | (6,276 | ) |
| Interest income | | | 14,506,128 | | | | 5,362,524 | | | | 269,086,383 | | | | 4,056,825 | | | | 430,715,931 | |
| Foreign withholding tax claims | | | - | | | | - | | | | - | | | | - | | | | 63,244 | |
| Total Income | | | 15,738,327 | | | | 5,362,524 | | | | 289,217,526 | | | | 4,300,631 | | | | 457,691,291 | |
| | | | | | | | | | | | | | | | | | | | | |
| EXPENSES | | | | | | | | | | | | | | | | | | | | |
| Investment management fees | | | 661,436 | | | | 580,040 | | | | 20,762,105 | | | | 370,678 | | | | 44,034,571 | |
| Administration fees | | | 230,556 | | | | 134,860 | | | | 5,627,156 | | | | 65,342 | | | | 7,120,451 | |
| Distribution and service fees | | | | | | | | | | | | | | | | | | | | |
| Class A Shares | | | 59,821 | | | | 101,160 | | | | 1,247,882 | | | | 372 | | | | 735,984 | |
| Class C Shares | | | - | | | | 14,152 | | | | 601,250 | | | | 3,687 | | | | 989,644 | |
| Class C2 Shares | | | - | | | | 2,043 | | | | 36,375 | | | | - | | | | - | |
| Class R3 Shares | | | - | | | | 12,962 | | | | 189,070 | | | | 529 | | | | 4,522 | |
| Class R4 Shares | | | - | | | | 2,504 | | | | 41,940 | | | | 264 | | | | 7,098 | |
| Transfer agent fees | | | | | | | | | | | | | | | | | | | | |
| Class A Shares | | | 63,220 | | | | 58,068 | | | | 384,322 | | | | 11,015 | | | | 264,213 | |
| Class C Shares | | | - | | | | 7,135 | | | | 80,084 | | | | 1,099 | | | | 77,143 | |
| Class C2 Shares | | | - | | | | 1,907 | | | | 4,633 | | | | - | | | | - | |
| Class I Shares | | | 265,299 | | | | 65,372 | | | | 4,776,972 | | | | 60,420 | | | | 6,747,181 | |
| Class R3 Shares | | | - | | | | 7,563 | | | | 40,977 | | | | 2,568 | | | | 4,328 | |
| Class R4 Shares | | | - | | | | 3,498 | | | | 73,143 | | | | 777 | | | | 17,380 | |
| Class R5 Shares | | | - | | | | 6,485 | | | | 144,388 | | | | 2,568 | | | | 130,159 | |
| Class R6 Shares | | | - | | | | - | | | | 44,639 | | | | 2,363 | | | | 48,310 | |
| Registration and filing fees | | | | | | | | | | | | | | | | | | | | |
| Class A Shares | | | 18,259 | | | | 14,935 | | | | 25,135 | | | | 3,038 | | | | 28,552 | |
| Class C Shares | | | - | | | | 14,494 | | | | 15,586 | | | | 4,175 | | | | 22,719 | |
| Class C2 Shares | | | - | | | | 5,209 | | | | 14,143 | | | | - | | | | - | |
| Class I Shares | | | 29,007 | | | | 19,113 | | | | 95,585 | | | | 4,842 | | | | 268,085 | |
| Class R3 Shares | | | - | | | | 14,383 | | | | 15,469 | | | | 2,557 | | | | 15,709 | |
| Class R4 Shares | | | - | | | | 14,773 | | | | 15,350 | | | | 2,557 | | | | 15,721 | |
| Class R5 Shares | | | - | | | | 14,761 | | | | 15,335 | | | | 2,557 | | | | 15,704 | |
| Class R6 Shares | | | - | | | | - | | | | 15,966 | | | | 2,557 | | | | 16,472 | |
| Custodian fees | | | 73,874 | | | | 60,994 | | | | 350,598 | | | | 44,830 | | | | 499,960 | |
| Audit and tax fees | | | 52,989 | | | | 52,998 | | | | 56,281 | | | | 64,576 | | | | 83,008 | |
| Legal fees | | | 3,369 | | | | 3,201 | | | | 73,910 | | | | 17,455 | | | | 96,636 | |
| Trustee and officer fees | | | 19,054 | | | | 10,698 | | | | 443,672 | | | | 5,474 | | | | 546,914 | |
| Prepaid offering expense | | | - | | | | - | | | | - | | | | 173,286 | | | | - | |
| Other expenses | | | 44,430 | | | | 42,572 | | | | 635,995 | | | | 31,707 | | | | 825,988 | |
| Total Expenses | | | 1,521,314 | | | | 1,265,880 | | | | 35,827,961 | | | | 881,293 | | | | 62,616,452 | |
| Less: | | | | | | | | | | | | | | | | | | | | |
| Expenses reimbursed | | | (607,041 | ) | | | (90,210 | ) | | | (1,978,145 | ) | | | (37,307 | ) | | | (8,637,393 | ) |
| Investment management fees waived | | | (60,729 | ) | | | - | | | | - | | | | (493,474 | ) | | | (2,790,104 | ) |
| Net Expenses | | | 853,544 | | | | 1,175,670 | | | | 33,849,816 | | | | 350,512 | | | | 51,188,955 | |
| Net Investment Income (Loss) | | $ | 14,884,783 | | | $ | 4,186,854 | | | $ | 255,367,710 | | | $ | 3,950,119 | | | $ | 406,502,336 | |
174 | Annual Financial Statements
Statements of Operations, Continued
Year Ended September 30, 2024
| | | THORNBURG
ULTRA SHORT
INCOME FUND | | | THORNBURG
LIMITED TERM U.S.
GOVERNMENT FUND | | | THORNBURG
LIMITED TERM
INCOME FUND | | | THORNBURG
CORE PLUS
BOND FUND† | | | THORNBURG
STRATEGIC
INCOME FUND | |
| REALIZED AND UNREALIZED GAIN (LOSS) | | | | | | | | | | | | | | | |
| Net realized gain (loss) on: | | | | | | | | | | | | | | | | | | | | |
| Non-affiliated issuers investments* | | $ | 140,358 | | | $ | (4,022,061 | ) | | $ | (132,603,366 | ) | | $ | 185,820 | | | $ | (100,804,433 | ) |
| Forward currency contracts | | | - | | | | - | | | | - | | | | (2,808 | ) | | | (2,746,362 | ) |
| Foreign currency transactions | | | - | | | | - | | | | (14 | ) | | | (1,032 | ) | | | (348,219 | ) |
| Net realized gain (loss) | | | 140,358 | | | | (4,022,061 | ) | | | (132,603,380 | ) | | | 181,980 | | | | (103,899,014 | ) |
| | | | | | | | | | | | | | | | | | | | | |
| Net change in unrealized appreciation | | | | | | | | | | | | | | | | | | | | |
| (depreciation) on: | | | | | | | | | | | | | | | | | | | | |
| Non-affiliated issuers investments** | | | 1,336,173 | | | | 13,501,437 | | | | 512,857,936 | | | | 5,566,666 | | | | 565,215,891 | |
| Forward currency contracts | | | - | | | | - | | | | - | | | | (192 | ) | | | (895,633 | ) |
| Foreign currency translations | | | 8 | | | | - | | | | - | | | | (71 | ) | | | 64,168 | |
| Change in net unrealized appreciation (depreciation) | | | 1,336,181 | | | | 13,501,437 | | | | 512,857,936 | | | | 5,566,403 | | | | 564,384,426 | |
| Net Realized and Unrealized Gain (Loss) | | | 1,476,539 | | | | 9,479,376 | | | | 380,254,556 | | | | 5,748,383 | | | | 460,485,412 | |
| Change in Net Assets Resulting from Operations | | $ | 16,361,322 | | | $ | 13,666,230 | | | $ | 635,622,266 | | | $ | 9,698,502 | | | $ | 866,987,748 | |
| * Net of foreign capital gain taxes | | $ | - | | | $ | - | | | $ | - | | | $ | - | | | $ | 25,492 | |
| ** Net of change in deferred taxes | | $ | - | | | $ | - | | | $ | - | | | $ | - | | | $ | (31,577 | ) |
† The Fund commenced operations on October 2, 2023.
See notes to financial statements.
Annual Financial Statements | 175
Statements of Changes in Net Assets
| | | THORNBURG ULTRA SHORT INCOME FUND | | | THORNBURG LIMITED TERM U.S. GOVERNMENT FUND | |
| | | YEAR ENDED
SEPTEMBER 30, 2024 | | | YEAR ENDED
SEPTEMBER 30, 2023 | | | YEAR ENDED
SEPTEMBER 30, 2024 | | | YEAR ENDED
SEPTEMBER 30, 2023 | |
| INCREASE (DECREASE) IN NET ASSETS FROM | | | | | | | | | | | | | | | | |
| | | | | | | | | | | | | | | | | |
| OPERATIONS | | | | | | | | | | | | | | | | |
| Net investment income (loss) | | $ | 14,884,783 | | | $ | 11,567,185 | | | $ | 4,186,854 | | | $ | 4,156,957 | |
| Net realized gain (loss) | | | 140,358 | | | | 81,945 | | | | (4,022,061 | ) | | | (6,846,424 | ) |
| Net change in unrealized appreciation (depreciation) | | | 1,336,181 | | | | 955,945 | | | | 13,501,437 | | | | 5,340,615 | |
| | | | | | | | | | | | | | | | | |
| Net Increase (Decrease) in Net Assets Resulting from | | | | | | | | | | | | | | | | |
| Operations | | | 16,361,322 | | | | 12,605,075 | | | | 13,666,230 | | | | 2,651,148 | |
| | | | | | | | | | | | | | | | | |
| DIVIDENDS TO SHAREHOLDERS | | | | | | | | | | | | | | | | |
| From distributable earnings | | | | | | | | | | | | | | | | |
| Class A Shares | | | (1,636,744 | ) | | | (1,413,188 | ) | | | (1,070,885 | ) | | | (1,074,414 | ) |
| Class C Shares | | | - | | | | - | | | | (67,642 | ) | | | (80,233 | ) |
| Class C2 Shares | | | - | | | | - | | | | (7,543 | ) | | | (13,629 | ) |
| Class I Shares | | | (13,269,924 | ) | | | (10,148,755 | ) | | | (3,170,675 | ) | | | (3,285,693 | ) |
| Class R3 Shares | | | - | | | | - | | | | (68,263 | ) | | | (68,173 | ) |
| Class R4 Shares | | | - | | | | - | | | | (26,575 | ) | | | (20,131 | ) |
| Class R5 Shares | | | - | | | | - | | | | (37,684 | ) | | | (38,667 | ) |
| | | | | | | | | | | | | | | | | |
| FUND SHARE TRANSACTIONS | | | | | | | | | | | | | | | | |
| Class A Shares | | | 21,744,350 | | | | (6,040,854 | ) | | | (7,288,906 | ) | | | (13,232,202 | ) |
| Class C Shares | | | - | | | | - | | | | (812,728 | ) | | | (2,484,963 | ) |
| Class C2 Shares | | | - | | | | - | | | | (286,237 | ) | | | 356,417 | |
| Class I Shares | | | (22,233,932 | ) | | | 88,353,098 | | | | (32,157,692 | ) | | | (35,246,726 | ) |
| Class R3 Shares | | | - | | | | - | | | | (402,064 | ) | | | (606,847 | ) |
| Class R4 Shares | | | - | | | | - | | | | 44,308 | | | | (201,923 | ) |
| Class R5 Shares | | | - | | | | - | | | | (334,971 | ) | | | (523,625 | ) |
| | | | | | | | | | | | | | | | | |
| Net Increase (Decrease) in Net Assets | | | 965,072 | | | | 83,355,376 | | | | (32,021,327 | ) | | | (53,869,661 | ) |
| | | | | | | | | | | | | | | | | |
| NET ASSETS | | | | | | | | | | | | | | | | |
| Beginning of Year | | | 263,245,160 | | | | 179,889,784 | | | | 171,749,037 | | | | 225,618,698 | |
| | | | | | | | | | | | | | | | | |
| End of Year | | $ | 264,210,232 | | | $ | 263,245,160 | | | $ | 139,727,710 | | | $ | 171,749,037 | |
See notes to financial statements.
176 | Annual Financial Statements
Statements of Changes in Net Assets, Continued
| | | THORNBURG LIMITED TERM INCOME FUND | | | THORNBURG CORE PLUS BOND FUND | |
| | | YEAR ENDED
SEPTEMBER 30, 2024 | | | YEAR ENDED
SEPTEMBER 30, 2023 | | | PERIOD ENDED
SEPTEMBER 30, 2024† | |
| INCREASE (DECREASE) IN NET ASSETS FROM | | | | | | | | | | | | |
| | | | | | | | | | | | | |
| OPERATIONS | | | | | | | | | | | | |
| Net investment income (loss) | | $ | 255,367,710 | | | $ | 230,700,976 | | | $ | 3,950,119 | |
| Net realized gain (loss) | | | (132,603,380 | ) | | | (159,239,483 | ) | | | 181,980 | |
| Net change in unrealized appreciation (depreciation) | | | 512,857,936 | | | | 180,031,652 | | | | 5,566,403 | |
| | | | | | | | | | | | | |
| Net Increase (Decrease) in Net Assets Resulting from Operations | | | 635,622,266 | | | | 251,493,145 | | | | 9,698,502 | |
| | | | | | | | | | | | | |
| DIVIDENDS TO SHAREHOLDERS | | | | | | | | | | | | |
| From distributable earnings | | | | | | | | | | | | |
| Class A Shares | | | (18,591,860 | ) | | | (16,933,118 | ) | | | (7,136 | ) |
| Class C Shares | | | (4,165,084 | ) | | | (4,699,291 | ) | | | (15,524 | ) |
| Class C2 Shares | | | (181,629 | ) | | | (201,735 | ) | | | - | |
| Class I Shares | | | (222,070,996 | ) | | | (200,761,802 | ) | | | (3,857,677 | ) |
| Class R3 Shares | | | (1,322,749 | ) | | | (1,202,278 | ) | | | (4,781 | ) |
| Class R4 Shares | | | (583,088 | ) | | | (501,476 | ) | | | (5,051 | ) |
| Class R5 Shares | | | (2,856,128 | ) | | | (2,746,692 | ) | | | (5,320 | ) |
| Class R6 Shares | | | (6,717,354 | ) | | | (5,444,781 | ) | | | (21,918 | ) |
| | | | | | | | | | | | | |
| FUND SHARE TRANSACTIONS | | | | | | | | | | | | |
| Class A Shares | | | (82,682,858 | ) | | | (66,492,152 | ) | | | 261,797 | |
| Class C Shares | | | (41,573,185 | ) | | | (81,423,823 | ) | | | 791,278 | |
| Class C2 Shares | | | (1,896,840 | ) | | | (2,919,625 | ) | | | - | |
| Class I Shares | | | (550,128,321 | ) | | | (1,136,009,720 | ) | | | 157,693,678 | |
| Class R3 Shares | | | (3,908,688 | ) | | | (12,461,630 | ) | | | 104,780 | |
| Class R4 Shares | | | (3,445,473 | ) | | | 786,251 | | | | 105,040 | |
| Class R5 Shares | | | (4,040,027 | ) | | | (41,358,252 | ) | | | 105,320 | |
| Class R6 Shares | | | 4,541,187 | | | | (23,831,523 | ) | | | 632,118 | |
| Net Increase (Decrease) in Net Assets | | | (304,000,827 | ) | | | (1,344,708,502 | ) | | | 165,475,106 | |
| | | | | | | | | | | | | |
| NET ASSETS | | | | | | | | | | | | |
| Beginning of Year | | | 6,734,160,444 | | | | 8,078,868,946 | | | | - | |
| End of Year | | $ | 6,430,159,617 | | | $ | 6,734,160,444 | | | $ | 165,475,106 | |
† The Fund commenced operations on October 2, 2023.
See notes to financial statements.
Annual Financial Statements | 177
Statements of Changes in Net Assets, Continued
| | | THORNBURG STRATEGIC INCOME FUND | |
| | | YEAR ENDED SEPTEMBER 30, 2024 | | | YEAR ENDED SEPTEMBER 30, 2023 | |
| INCREASE (DECREASE) IN NET ASSETS FROM | | | | | | | | |
| | | | | | | | | |
| OPERATIONS | | | | | | | | |
| Net investment income (loss) | | $ | 406,502,336 | | | $ | 261,668,783 | |
| Net realized gain (loss) | | | (103,899,014 | ) | | | (27,857,506 | ) |
| Net change in unrealized appreciation (depreciation) | | | 564,384,426 | | | | 9,528,122 | |
| Net Increase (Decrease) in Net Assets Resulting from Operations | | | 866,987,748 | | | | 243,339,399 | |
| | | | | | | | | |
| DIVIDENDS TO SHAREHOLDERS | | | | | | | | |
| From distributable earnings | | | | | | | | |
| Class A Shares | | | (13,391,194 | ) | | | (11,128,378 | ) |
| Class C Shares | | | (3,777,260 | ) | | | (2,985,734 | ) |
| Class I Shares | | | (372,843,601 | ) | | | (239,667,614 | ) |
| Class R3 Shares | | | (38,871 | ) | | | (24,114 | ) |
| Class R4 Shares | | | (120,909 | ) | | | (96,895 | ) |
| Class R5 Shares | | | (3,342,014 | ) | | | (2,489,823 | ) |
| Class R6 Shares | | | (8,168,383 | ) | | | (5,679,657 | ) |
| | | | | | | | | |
| FUND SHARE TRANSACTIONS | | | | | | | | |
| Class A Shares | | | 6,293,504 | | | | (50,739,155 | ) |
| Class C Shares | | | 2,440,741 | | | | 12,663,012 | |
| Class I Shares | | | 1,921,586,003 | | | | 2,266,443,833 | |
| Class R3 Shares | | | 407,259 | | | | 27,510 | |
| Class R4 Shares | | | (525,276 | ) | | | 770,776 | |
| Class R5 Shares | | | 25,093,125 | | | | 22,511,555 | |
| Class R6 Shares | | | 36,590,491 | | | | 28,836,792 | |
| Net Increase (Decrease) in Net Assets | | | 2,457,191,363 | | | | 2,261,781,507 | |
| | | | | | | | | |
| NET ASSETS | | | | | | | | |
| Beginning of Year | | | 6,997,004,694 | | | | 4,735,223,187 | |
| End of Year | | $ | 9,454,196,057 | | | $ | 6,997,004,694 | |
See notes to financial statements.
178 | Annual Financial Statements
Notes to Financial Statements
September 30, 2024
NOTE 1 – ORGANIZATION
Thornburg Ultra Short Income Fund (the “Ultra Short Income Fund”), Thornburg Limited Term U.S. Government Fund (the “Limited Term U.S. Government Fund”), Thornburg Limited Term Income Fund (the “Limited Term Income Fund”), Thornburg Core Plus Bond Fund (the “Core Plus Bond Fund”) and Thornburg Strategic Income Fund (the “Strategic Income Fund”), collectively the “Funds”, are diversified series of Thornburg Investment Trust (the “Trust”). The Trust is organized as a Massachusetts business trust under a Declaration of Trust dated June 3, 1987 and is registered as a diversified, open-end management investment company under the Investment Company Act of 1940, as amended (the "1940 Act"). As of September 30, 2024, the Funds are five of twenty-four separate series of the Trust. Each series is considered to be a separate entity for financial reporting and tax purposes and bears expenses directly attributable to it.
Ultra Short Income Fund: The Fund’s investment goal is to seek current income, consistent with preservation of capital. The Fund’s investments subject it to certain risks. As of the date of this report, the principal risks of investing in the Fund include credit risk, cybersecurity and operational risk, derivatives risk, foreign investment risk, high yield risk, interest rate risk, liquidity risk, management risk, market and economic risk, prepayment and extension risk, redemption risk, risks affecting specific issuers, and structured products risk. Please see the Fund’s prospectus for a discussion of those principal risks and other risks associated with an investment in the Fund.
Limited Term U.S. Government Fund: The Fund’s primary investment goal is to provide a high level of current income as is consistent, in the view of the Trust’s investment advisor, Thornburg Investment Management, Inc. (the “Advisor”), with safety of capital. As a secondary goal, the Fund seeks to reduce changes in its share price compared to longer term portfolios. The Fund’s investments subject it to certain risks. As of the date of this report, the principal risks of investing in the Fund include credit risk, cybersecurity and operational risk, interest rate risk, liquidity risk, management risk, market and economic risk, prepayment and extension risk, redemption risk, and structured products risk. Please see the Fund’s prospectus for a discussion of those principal risks and other risks associated with an investment in the Fund.
Limited Term Income Fund: The Fund’s primary investment goal is to provide a high level of current income as is consistent, in the view of the Advisor, with safety of capital. As a secondary goal, the Fund seeks to reduce changes in its share prices compared to longer term portfolios. The Fund’s investments subject it to certain risks. As of the date of this report, the principal risks of investing in the Fund include credit risk, cybersecurity and operational risk, foreign investment risk, interest rate risk, liquidity risk, management risk, market and economic risk, prepayment and extension risk, redemption risk, risks affecting specific issuers, and structured products risk. Please see the Fund’s prospectus for a discussion of those principal risks and other risks associated with an investment in the Fund.
Core Plus Bond Fund: The Fund’s investment goal is to seek to maximize total return, consistent with the long-term preservation of capital. The Fund’s investments subject it to certain risks. As of the date of this report, the principal risks of investing in the Fund include credit risk, cybersecurity and operational risk, derivatives risk, emerging markets risk, foreign currency risk, foreign investment risk, high yield risk, interest rate risk, liquidity risk, management risk, market and economic risk, prepayment and extension risk, redemption risk, risks affecting specific issuers, small and mid-cap company risk, and structured products risk. Please see the Fund’s prospectus for a discussion of those principal risks and other risks associated with an investment in the Fund.
Strategic Income Fund: The Fund’s primary investment goal is to seek a high level of current income. As a secondary investment goal, the Fund seeks some long-term capital appreciation. The Fund’s investments subject it to certain risks. As of the date of this report, the principal risks of investing in the Fund include credit risk, cybersecurity and operational risk, developing country risk, foreign currency risk, foreign investment risk, high yield risk, interest rate risk, liquidity risk, management risk, market and economic risk, prepayment and extension risk, redemption risk, risks affecting specific issuers, small and mid-cap company risk, and structured products risk. Please see the Fund’s prospectus for a discussion of those principal risks and other risks associated with an investment in the Fund.
As of September 30, 2024, the Funds each currently offer up to eight classes of shares of beneficial interest.
Each class of shares of the Funds represents an interest in the same portfolio of investments, except that (i) Class A shares are sold subject to a front-end sales charge collected at the time the shares are purchased and bear a service fee, (ii) Class C shares are sold at net asset value without a sales charge at the time of purchase, but are subject to a contingent deferred sales charge upon redemption within one year of purchase, and bear both a service fee and a distribution fee, (iii) Class C2 shares are sold at net asset value without a sales charge at the time of purchase, but are subject to a contingent deferred sales charge upon redemption within one year of purchase, and bear both a service fee and a distribution fee, (iv) Class I and Class R5 shares are sold at net asset value without a sales charge at the time of purchase and may be subject to a service fee, (v) Class R3 shares are sold at net asset value without a sales charge, but bear both a service fee and a distribution fee, (vi) Class R4 shares are sold at net asset value without a sales charge at the time of purchase but bear a service fee, (vii) Class R6 shares are sold at net asset value without a sales charge at the time of purchase, and (viii) the respective classes may have different reinvestment privileges and conversion rights. Additionally, each Fund may allocate among its classes certain expenses, to the extent allocable to specific classes, including administration fees, transfer agent fees, government registration fees, certain printing and postage costs, and legal expenses. Currently, class specific expenses of the Funds are limited to distribution and service fees, transfer agent fees, and certain registration and filing fees.
Annual Financial Statements | 179
Notes to Financial Statements, Continued
September 30, 2024
At September 30, 2024, the following class of shares are offered in each respective Fund:
| | CLASS A | CLASS C | CLASS C2 | CLASS I | CLASS R3 | CLASS R4 | CLASS R5 | CLASS R6 |
| Ultra Short Income Fund | X | | | X | | | | |
| Limited Term U.S. Government Fund | X | X | X | X | X | X | X | |
| Limited Term Income Fund | X | X | X | X | X | X | X | X |
| Core Plus Bond Fund | X | X | | X | X | X | X | X |
| Strategic Income Fund | X | X | | X | X | X | X | X |
NOTE 2 – SIGNIFICANT ACCOUNTING POLICIES
The following is a summary of significant accounting policies followed by each of the Funds in the preparation of its financial statements. Each Fund prepares its financial statements in conformity with United States generally accepted accounting principles (“GAAP”), including investment company accounting and reporting guidance in the Financial Accounting Standards Board (the “FASB”) Accounting Standard Codification Topic 946.
Allocation of Income, Gains, Losses and Expenses: Net investment income (other than class specific expenses) and realized and unrealized gains and losses are allocated daily to each class of shares based upon the relative net asset value of outstanding shares (or the value of the dividend-eligible shares, as appropriate) of each class of shares at the beginning of the day (after adjusting for the current capital shares activity of the respective class). Expenses common to all Funds are allocated daily among the Funds comprising the Trust based upon their relative net asset values or other appropriate allocation methods. Operating expenses directly attributable to a specific class are charged against the operating income of that class.
Dividends and Distributions to Shareholders: Dividends and distributions to shareholders, which are determined in accordance with federal income tax regulations and may differ from GAAP, are recorded on the ex-dividend date. Ordinary income dividends, if any, are declared daily and paid monthly. Capital gain distributions, if any, are declared and paid annually and more often if deemed necessary by the Advisor. Dividends and distributions are paid and are reinvested in additional shares of the Funds at net asset value per share at the close of business on the ex-dividend date, or at the shareholder’s option, paid in cash.
Foreign Currency Translation: Portfolio investments and other assets and liabilities denominated in foreign currencies are translated into U.S. dollars based on the exchange rate of such currencies against the U.S. dollar on the date of valuation. Purchases and sales of investments and income items denominated in foreign currencies are translated into U.S. dollars at the exchange rate in effect on the transaction date. When the Funds purchase or sell foreign investments, they will customarily enter into a foreign exchange contract to minimize foreign exchange risk from the trade date to the settlement date of such transactions. The values of such spot contracts are included in receivable for investments sold and payable for investments purchased on the Statement of Assets and Liabilities.
The Funds do not separately report the effect of changes in foreign exchange rates from changes in market prices on investments held. Such changes are included in net unrealized appreciation (depreciation) from investments in the Statement of Operations.
Reported net realized gains and losses from foreign currency transactions arise due to purchases and sales of foreign currencies, currency gains and losses realized between the trade and settlement dates on investment transactions and the difference between the amounts of dividends, interest, and foreign withholding taxes recorded on the Funds’ books, and the U.S. dollar equivalent of the amounts actually received or paid. These amounts are included in foreign currency transactions in the Statement of Operations.
Net change in unrealized appreciation (depreciation) on foreign currency translations arise from changes in the fair value of assets and liabilities, other than investments at period end, resulting from changes in exchange rates.
Guarantees and Indemnifications: Under the Trust’s organizational documents (and under separate agreements with the independent Trustees), its officers and Trustees are provided with an indemnification against certain liabilities arising out of the performance of their duties to the Funds. In the normal course of business the Trust may also enter into contracts with service providers that contain general indemnifications. The Trust’s maximum exposure under these arrangements is unknown. However, based on experience, the Trust expects the risk of loss to be remote.
Investment Income: Dividend income is recorded on the ex-dividend date. Certain income from foreign investments is recognized as soon as information is available to the Funds. Interest income is accrued as earned. Premiums and discounts are amortized and accreted, respectively, to first call dates or maturity dates using the effective yield method of the respective investments. These amounts are included in Investment Income in the Statement of Operations.
Investment Transactions: Investment transactions are accounted for on a trade date basis. Realized gains and losses from the sale of investments are recorded on an identified cost basis.
180 | Annual Financial Statements
Notes to Financial Statements, Continued
September 30, 2024
Repurchase Agreements: The Funds may invest excess cash in repurchase agreements whereby the Funds purchase investments, which serve as collateral, with an agreement to resell such collateral to the seller at an agreed upon price at the maturity date of the repurchase agreement. Investments pledged as collateral for repurchase agreements are held in custody until maturity of the repurchase agreement. Provisions in the agreements require that the market value of the collateral is at least equal to the repurchase value in the event of default. In the event of default, the Funds have the right to liquidate the collateral and apply the proceeds in satisfaction of the obligation. Under certain circumstances, in the event of default or bankruptcy by the other party to the agreement, realization and/or retention of the collateral may be subject to legal proceedings. During the fiscal year ended September 30, 2024, the Funds did not enter into repurchase agreements.
Security Valuation: All investments in securities held by the Funds are valued as described in Note 3.
Use of Estimates: The preparation of financial statements in conformity with GAAP requires management to make estimates and assumptions that affect the reported amounts of assets and liabilities and disclosure of contingent assets and liabilities at the date of the financial statements and the reported amounts of increases (decreases) in net assets from operations during the reporting period. Actual results could differ from those estimates.
When-Issued and Delayed Delivery Transactions: The Funds may engage in when-issued or delayed delivery transactions. To the extent the Funds engage in such transactions, they will do so for the purpose of acquiring portfolio investments consistent with the Funds’ investment objectives and not for the purpose of investment leverage or to speculate on interest rate or market changes. At the time the Funds make a commitment to purchase an investment on a when-issued or delayed delivery basis, the Funds will record the transaction and reflect the value in determining its net asset value. Pursuant to current U.S. Securities and Exchange Commission (“SEC”) guidance, a transaction involving a when-issued security will not be deemed to involve a senior security as long as the Funds intend to settle the transaction physically and the transaction settles within 35 days. Investments purchased on a when-issued or delayed delivery basis do not earn interest until the settlement date. The values of these securities held at September 30, 2024 are detailed in the Schedule of Investments.
NOTE 3 – SECURITY VALUATION
Valuation of the Funds’ portfolio investment securities is performed by the Advisor, which has been designated by the Trustees of the Trust (the "Trustees") as the Funds’ “valuation designee,” as that term is defined in rule 2a-5 under the 1940 Act. The Advisor performs this valuation function under the supervision of the Trustees and in accordance with policies and procedures that have been adopted by the Advisor and approved by the Trustees (the “Valuation Policy and Procedures”).
In its capacity as the Funds’ valuation designee, the Advisor makes good faith determinations of the fair value of portfolio securities for which market quotations are not readily available, and otherwise complies with and administers the Valuation Policy and Procedures. The Advisor performs those functions in significant measure through its Valuation and Pricing Committee (the “Committee”), though the Advisor may also obtain the assistance of others, including professional pricing service providers selected and approved by the Committee. In accordance with the Valuation Policy and Procedures, the Committee: assesses and manages the material risks associated with determining the fair value of those Fund investments for which market quotations are not readily available; selects and applies methodologies for determining and calculating such fair values; periodically reviews and tests the appropriateness and accuracy of those methodologies; monitors for circumstances that may necessitate the use of fair value; and approves, monitors, and evaluates pricing services engaged to provide evaluated prices for the Funds’ investments. The Committee provides reports on its activities to the Trustees’ Audit Committee, which is responsible for overseeing the Committee’s and the Advisor’s work in discharging the functions under the Valuation Policy and Procedures.
In those instances when the Committee assists in calculating a fair value for a portfolio investment, the Committee seeks to determine the price that the Funds would reasonably expect to receive upon a sale of the investment in an orderly transaction between market participants on the valuation date. The Committee customarily utilizes quotations from securities broker dealers in calculating valuations, but also may utilize prices obtained from pricing service providers or other methods selected by the Committee. Because fair values calculated by the Committee are estimates, the calculation of a fair value for an investment may differ from the price that would be realized by the Funds upon a sale of the investment, and the difference could be material to the Funds’ financial statements. The Committee’s calculation of a fair value for an investment may also differ from the prices obtained by other persons (including other mutual funds) for the investment.
Valuation of Securities: Securities and other portfolio investments which are listed or traded on a United States securities exchange are generally valued at the last reported sale price on the valuation date or, if there has been no sale of the investment on that date, at the mean between the last reported bid and asked prices for the investment on that date. Portfolio investments reported by NASDAQ are valued at the official closing price on the valuation date. If an investment is traded on more than one exchange, the investment is considered traded on the exchange that is normally the primary market for that investment. For securities and other portfolio investments
Annual Financial Statements | 181
Notes to Financial Statements, Continued
September 30, 2024
which are primarily listed or traded on an exchange outside the United States, the time for determining the investment’s value in accordance with the first sentence of this paragraph will be the close of that investment’s primary exchange preceding the Fund’s valuation time.
In any case when a market quotation is not readily available for a portfolio investment ordinarily valued by market quotation, the Committee calculates a fair value for the investment using methodologies selected and approved by the Committee as described in the Valuation Policy and Procedures, subject to changes or additions by the Committee. For this purpose, a market quotation is considered to be readily available if it is a quoted price (unadjusted) in active markets for identical investments that the Funds can access at the measurement date. Pursuant to the Valuation Policy and Procedures, the Committee shall monitor for circumstances that may necessitate the use of fair valuation methodologies, including circumstances in which a market quotation for an investment is no longer reliable or is otherwise not readily available. For that purpose, a market quotation is not readily available when the primary market or exchange for the applicable investment is not open for the entire scheduled day of trading. A market quotation may also not be readily available if: (a) developments occurring after the most recent close of the applicable investment’s primary exchange, but prior to the close of business on any business day; or (b) an unusual event or significant period of time occurring since the availability of the market quotation, create a serious question concerning the reliability of that market quotation. Additionally, a market quotation will be considered unreliable if it would require adjustment under GAAP, or where GAAP would require consideration of additional inputs in determining the value of the investment. The Committee customarily obtains valuations in those instances from pricing service providers approved by the Committee. Such pricing service providers ordinarily calculate valuations using multi-factor models to adjust market prices based upon various inputs, including exchange data, depository receipt prices, futures, index data, and other data.
Securities held with a maturity of less than 60 days from trade date and other short-term investments are valued using the amortized cost method unless the Committee determines such method does not represent fair value. The amortized cost method of valuation involves valuing a security at its cost initially and thereafter assuming a constant amortization to maturity of any discount or premium, regardless of the impact of fluctuating interest rates on the market value of the security. This method may result in periods during which value, as determined by amortized cost, is higher or lower than the price each Fund would receive if it sold the security. The market value of securities in the Funds can be expected to vary inversely with changes in prevailing interest rates.
Investments in U.S. mutual funds are valued at net asset value (“NAV”) each business day.
Debt obligations held by the Funds which are not listed or traded on exchanges or for which no reported market exists are ordinarily valued at the valuation obtained from a pricing service provider approved by the Committee.
Forward currency contracts are valued by a third-party pricing service provider.
In any case when a pricing service provider fails to provide a valuation for a debt obligation held by the Funds, the Committee may calculate a fair value for the obligation using alternative methods selected and approved by the Committee. Additionally, in cases when the Committee believes that a valuation obtained from a pricing service provider is stale, does not reflect material factors affecting the valuation of the investment, is significantly different than the value the Funds are likely to obtain if they sought a bid for the investment, or is otherwise unreliable, the Committee may calculate a fair value for the obligation using an alternative method selected and approved by the Committee.
If the market quotation for an investment is expressed in a foreign currency, that market quotation will be converted to U.S. dollars using a foreign exchange quotation from a third-party service at the time of valuation. Foreign investments held by the Funds may be traded on days and at times when the Funds are not open for business. Consequently, the value of Funds’ investments may be significantly affected on days when shareholders cannot purchase or sell Funds’ shares.
Valuation Hierarchy: The Funds categorize their investments based upon the inputs used in valuing those investments, according to a three-level hierarchy established in guidance from the FASB. Categorization of investments using this hierarchy is intended by the FASB to maximize the use of observable inputs in valuing investments and minimize the use of unobservable inputs by requiring that the most observable inputs be used when available. Observable inputs are those that market participants would use in valuing an investment based on available market information. Unobservable inputs are those that reflect assumptions about the information market participants would use in valuing an investment. An investment’s level within the hierarchy is based on the lowest level input that is deemed significant to the valuation. The methodologies and inputs used to value investments are not necessarily indications of the risk or liquidity associated with those investments.
Various inputs are used in calculating valuations for the Funds’ investments. These inputs are generally summarized according to the three-level hierarchy below:
Level 1: Quoted prices in active markets for identical investments.
182 | Annual Financial Statements
Notes to Financial Statements, Continued
September 30, 2024
Level 2: Other direct or indirect significant observable inputs (including quoted prices for similar investments in active markets and other observable inputs, such as interest rates, prepayment rates, credit ratings, etc.).
Level 3: Significant unobservable inputs (including the Committee’s own assumptions in calculating the fair values of investments).
Valuations for debt obligations held by the Funds are typically calculated by pricing service providers approved by the Committee and are generally characterized as Level 2 within the valuation hierarchy.
On days when market volatility thresholds established by the Committee are exceeded, foreign securities for which valuations are obtained from pricing service providers are fair valued. On these days, the foreign securities are characterized as Level 2 within the valuation hierarchy and revert to Level 1 after the threshold is no longer exceeded.
In a limited number of cases the Committee calculates a fair value for investments using broker quotations or other methods approved by the Committee. When the Committee uses a single broker quotation to calculate a fair value for an investment without other significant observable inputs, or if a fair value is calculated using other significant inputs that are considered unobservable, the investment is characterized as Level 3 within the hierarchy. Other significant unobservable inputs used to calculate a fair value in these instances might include an income-based valuation approach which considers discounted anticipated future cash flows from the investment and application of discounts due to the nature or duration of any restrictions on the disposition of the investment.
Valuations based upon the use of inputs from Levels 1, 2 or 3 may not represent the actual price received upon the disposition of an investment, and a Fund may receive a price that is lower than the valuation based upon these inputs when it sells the investment.
The following tables display a summary of the fair value hierarchy measurements of each Fund’s investments as of September 30, 2024:
| ULTRA SHORT INCOME FUND | | TOTAL | | | LEVEL 1 | | | LEVEL 2 | | | LEVEL 3 | |
| Assets | | | | | | | | | | | | | | | | |
| Investments in Securities | | | | | | | | | | | | | | | | |
| U.S. Treasury Securities | | $ | 21,840,676 | | | $ | 21,840,676 | | | $ | — | | | $ | — | |
| U.S. Government Agencies | | | 21,424 | | | | — | | | | 21,424 | | | | — | |
| Mortgage Backed | | | 3,823,229 | | | | — | | | | 3,823,229 | | | | — | |
| Asset Backed Securities | | | 80,792,632 | | | | — | | | | 80,792,632 | | | | — | |
| Corporate Bonds | | | 137,486,029 | | | | — | | | | 137,486,029 | | | | — | |
| Short-Term Investments | | | 24,144,899 | | | | 24,144,899 | | | | — | | | | — | |
| Total Investments in Securities | | $ | 268,108,889 | | | $ | 45,985,575 | | | $ | 222,123,314 | | | $ | — | |
| Total Assets | | $ | 268,108,889 | | | $ | 45,985,575 | | | $ | 222,123,314 | | | $ | — | |
| LIMITED TERM U.S. GOVERNMENT FUND | | TOTAL | | | LEVEL 1 | | | LEVEL 2 | | | LEVEL 3 | |
| Assets | | | | | | | | | | | | | | | | |
| Investments in Securities | | | | | | | | | | | | | | | | |
| U.S. Treasury Securities | | $ | 27,916,832 | | | $ | 27,916,832 | | | $ | — | | | $ | — | |
| U.S. Government Agencies | | | 9,299,806 | | | | — | | | | 9,299,806 | | | | — | |
| Mortgage Backed | | | 87,281,775 | | | | — | | | | 87,281,775 | | | | — | |
| Corporate Bonds | | | 2,913,627 | | | | — | | | | 2,913,627 | | | | — | |
| Short-Term Investments | | | 10,370,426 | | | | — | | | | 10,370,426 | | | | — | |
| Total Investments in Securities | | $ | 137,782,466 | | | $ | 27,916,832 | | | $ | 109,865,634 | | | $ | — | |
| Total Assets | | $ | 137,782,466 | | | $ | 27,916,832 | | | $ | 109,865,634 | | | $ | — | |
Annual Financial Statements | 183
Notes to Financial Statements, Continued
September 30, 2024
| LIMITED TERM INCOME FUND | | TOTAL | | | LEVEL 1 | | | LEVEL 2 | | | LEVEL 3 | |
| Assets | | | | | | | | | | | | | | | | |
| Investments in Securities | | | | | | | | | | | | | | | | |
| U.S. Treasury Securities | | $ | 809,575,590 | | | $ | 809,575,590 | | | $ | — | | | $ | — | |
| U.S. Government Agencies | | | 23,421,258 | | | | — | | | | 23,421,258 | | | | — | |
| Other Government | | | 6,581,913 | | | | — | | | | 6,581,913 | | | | — | |
| Mortgage Backed | | | 2,219,709,236 | | | | — | | | | 2,219,709,236 | | | | — | |
| Asset Backed Securities | | | 767,553,906 | | | | — | | | | 767,553,906 | | | | — | |
| Corporate Bonds | | | 2,073,529,761 | | | | — | | | | 2,073,529,761 | | | | — | |
| Long-Term Municipal Bonds | | | 5,350,503 | | | | — | | | | 5,350,503 | | | | — | |
| Preferred Stock | | | 37,028,772 | | | | — | | | | — | | | | 37,028,772 | |
| Short-Term Investments | | | 521,539,993 | | | | 521,539,993 | | | | — | | | | — | |
| Total Investments in Securities | | $ | 6,464,290,932 | | | $ | 1,331,115,583 | | | $ | 5,096,146,577 | | | $ | 37,028,772 | |
| Total Assets | | $ | 6,464,290,932 | | | $ | 1,331,115,583 | | | $ | 5,096,146,577 | | | $ | 37,028,772 | (a) |
| (a) | Level 3 investments at the beginning and/or end of the period in relation to net assets were not significant and accordingly, a reconciliation of Level 3 assets for the period ended September 30, 2024 is not presented. |
| CORE PLUS BOND FUND | | TOTAL | | | LEVEL 1 | | | LEVEL 2 | | | LEVEL 3 | |
| Assets | | | | | | | | | | | | | | | | |
| Investments in Securities | | | | | | | | | | | | | | | | |
| U.S. Treasury Securities | | $ | 45,769,439 | | | $ | 45,769,439 | | | $ | — | | | $ | — | |
| U.S. Government Agencies | | | 987,579 | | | | — | | | | 987,579 | | | | — | |
| Other Government | | | 876,143 | | | | — | | | | 876,143 | | | | — | |
| Mortgage Backed | | | 47,843,677 | | | | — | | | | 47,843,677 | | | | — | |
| Asset Backed Securities | | | 14,092,687 | | | | — | | | | 14,092,687 | | | | — | |
| Corporate Bonds | | | 48,239,544 | | | | — | | | | 48,239,544 | | | | — | |
| Long-Term Municipal Bonds | | | 107,939 | | | | — | | | | 107,939 | | | | — | |
| Preferred Stock | | | 636,872 | | | | — | | | | — | | | | 636,872 | |
| Short-Term Investments | | | 6,292,172 | | | | 6,292,172 | | | | — | | | | — | |
| Total Investments in Securities | | $ | 164,846,052 | | | $ | 52,061,611 | | | $ | 112,147,569 | | | $ | 636,872 | |
| Total Assets | | $ | 164,846,052 | | | $ | 52,061,611 | | | $ | 112,147,569 | | | $ | 636,872 | (a) |
| | | | | | | | | | | | | | | | | |
| Liabilities | | | | | | | | | | | | | | | | |
| Other Financial Instruments | | | | | | | | | | | | | | | | |
| Forward Currency Contracts | | $ | (192 | ) | | $ | — | | | $ | (192 | ) | | $ | — | |
| Total Liabilities | | $ | (192 | ) | | $ | — | | | $ | (192 | ) | | $ | — | |
| (a) | Level 3 investments at the beginning and/or end of the period in relation to net assets were not significant and accordingly, a reconciliation of Level 3 assets for the period ended September 30, 2024 is not presented. |
184 | Annual Financial Statements
Notes to Financial Statements, Continued
September 30, 2024
| STRATEGIC INCOME FUND | | TOTAL | | | LEVEL 1 | | | LEVEL 2 | | | LEVEL 3 | |
| Assets | | | | | | | | | | | | | | | | |
| Investments in Securities | | | | | | | | | | | | | | | | |
| Common Stock | | $ | 263,093 | | | $ | — | | | $ | — | | | $ | 263,093 | |
| Preferred Stock | | | 40,182,214 | | | | 6,777,430 | | | | — | | | | 33,404,784 | |
| Asset Backed Securities | | | 911,824,460 | | | | — | | | | 909,613,814 | | | | 2,210,646 | |
| Corporate Bonds | | | 3,936,965,905 | | | | — | | | | 3,918,515,360 | | | | 18,450,545 | |
| Convertible Bonds | | | 14,003,637 | | | | — | | | | 14,003,637 | | | | — | |
| Long-Term Municipal Bonds | | | 3,462,914 | | | | — | | | | 3,462,914 | | | | — | |
| Other Government | | | 167,988,788 | | | | — | | | | 167,988,788 | | | | — | |
| U.S. Treasury Securities | | | 1,263,147,564 | | | | 1,263,147,564 | | | | — | | | | — | |
| U.S. Government Agencies | | | 42,079,062 | | | | — | | | | 42,079,062 | | | | — | |
| Mortgage Backed | | | 2,401,841,675 | | | | — | | | | 2,401,841,675 | | | | — | |
| Loan Participations | | | 57,832,361 | | | | — | | | | 57,832,361 | | | | — | |
| Short-Term Investments | | | 603,113,236 | | | | 603,113,236 | | | | — | | | | — | |
| Total Investments in Securities | | $ | 9,442,704,909 | | | $ | 1,873,038,230 | | | $ | 7,515,337,611 | | | $ | 54,329,068 | |
| Total Assets | | $ | 9,442,704,909 | | | $ | 1,873,038,230 | | | $ | 7,515,337,611 | | | $ | 54,329,068 | (a) |
| | | | | | | | | | | | | | | | | |
| Liabilities | | | | | | | | | | | | | | | | |
| Other Financial Instruments | | | | | | | | | | | | | | | | |
| Forward Currency Contracts | | $ | (125,345 | ) | | $ | — | | | $ | (125,345 | ) | | $ | — | |
| Total Other Financial Instruments | | $ | (125,345 | ) | | $ | — | | | $ | (125,345 | ) | | $ | — | |
| Total Liabilities | | $ | (125,345 | ) | | $ | — | | | $ | (125,345 | ) | | $ | — | |
| (a) | Level 3 investments at the beginning and/or end of the period in relation to net assets were not significant and accordingly, a reconciliation of Level 3 assets for the period ended September 30, 2024 is not presented. |
NOTE 4 – INVESTMENT MANAGEMENT FEE AND OTHER TRANSACTIONS WITH AFFILIATES
Pursuant to an investment advisory agreement with the Trust, the Advisor serves as the investment advisor and performs advisory services for the Funds for which the Advisor’s management fees are payable at the end of each month. Under the investment advisory agreement, each Fund pays the Advisor a management fee based on the average daily net assets of that Fund at an annual rate as shown in the following table:
| ULTRA SHORT INCOME FUND | | LIMITED TERM U.S. GOVERNMENT FUND | | LIMITED TERM INCOME FUND | | CORE PLUS BOND FUND | | STRATEGIC INCOME FUND |
| DAILY NET ASSETS | FEE RATE | | DAILY NET ASSETS | FEE RATE | | DAILY NET ASSETS | FEE RATE | | DAILY NET ASSETS | FEE RATE | | DAILY NET ASSETS | FEE RATE |
| Up to $5 billion | | 0.250 | % | | Up to $1 billion | | 0.375 | % | | Up to $500 million | | 0.500 | % | | Up to $500 million | | 0.490 | % | | Up to $500 million | | 0.750 | % |
| Next $5 billion | | 0.225 | | | Next $1 billion | | 0.325 | | | Next $500 million | | 0.450 | | | Next $500 million | | 0.460 | | | Next $500 million | | 0.675 | |
| Over $10 billion | | 0.200 | | | Over $2 billion | | 0.275 | | | Next $500 million | | 0.400 | | | Next $500 million | | 0.430 | | | Next $500 million | | 0.625 | |
| | | | | | | | | | | Next $500 million | | 0.350 | | | Next $500 million | | 0.400 | | | Next $500 million | | 0.575 | |
| | | | | | | | | | | Over $2 billion | | 0.275 | | | Over $2 billion | | 0.370 | | | Over $2 billion | | 0.500 | |
The Funds’ effective management fees, calculated on the basis of the Funds’ average daily net assets (before applicable management fee waivers) for the year ended September 30, 2024 were as shown in the following table. Total management fees incurred by the Funds for the year ended September 30, 2024 are set forth in the Statement of Operations.
Annual Financial Statements | 185
Notes to Financial Statements, Continued
September 30, 2024
| | | EFFECTIVE MANAGEMENT FEE |
| Ultra Short Income Fund | | | 0.250 | % |
| Limited Term U.S. Government Fund | | | 0.375 | |
| Limited Term Income Fund | | | 0.321 | |
| Core Plus Bond Fund | | | 0.490 | |
| Strategic Income Fund | | | 0.538 | |
The Trust has entered into an administrative services agreement with the Advisor, whereby the Advisor will perform certain administrative services. The administrative services fees are computed as an annual percentage of the aggregate average daily net assets of all applicable Funds in the Trust as follows:
| ADMINISTRATIVE SERVICES FEE SCHEDULE |
| DAILY NET ASSETS | | FEE RATE |
| Up to $20 billion | | | 0.100 | % |
| $20 billion to $40 billion | | | 0.075 | |
| $40 billion to $60 billion | | | 0.040 | |
| Over $60 billion | | | 0.030 | |
The aggregate administrative services fee amount is allocated on a daily basis to each Fund based on net assets and subsequently allocated to each class of shares of the Funds. Total administrative services fees incurred by each class of shares of the Funds for the year ended September 30, 2024, are set forth in the Statement of Operations.
The Trust has an underwriting agreement with Thornburg Securities LLC (the “Distributor”), an affiliate of the Advisor, which acts as the distributor of the Funds’ shares. For the year ended September 30, 2024, the Distributor has advised the Funds that they earned net commissions from the sale of Class A shares and collected contingent deferred sales charges ("CDSC Fees") from redemptions of Class C and Class C2 shares as follows:
| | | COMMISSIONS | | | CDSC FEES | |
| Ultra Short Income Fund | | $ | 1,102 | | | $ | — | |
| Limited Term U.S. Government Fund | | | 231 | | | | 31 | |
| Limited Term Income Fund | | | 7,710 | | | | 2,124 | |
| Strategic Income Fund | | | 28,230 | | | | 10,692 | |
Pursuant to a service plan under Rule 12b-1 of the 1940 Act, the Funds may reimburse to the Distributor an amount not to exceed .25 of 1% per annum of the average daily net assets attributable to the applicable Class A, Class C, Class C2, Class I, Class R3, Class R4, and Class R5 shares of the Limited Term U.S. Government Fund and Limited Term Income Fund, Class A, Class C, Class I, Class R3, Class R4, and Class R5 shares of the Core Plus Bond Fund and Strategic Income Fund and .20 of 1% per annum of the average daily net assets attributable to the applicable Class A and Class I of the Ultra Short Income Fund for payments made by the Distributor to securities dealers and other financial institutions to obtain various shareholder and distribution related services. For the year ended September 30, 2024, there were no 12b-1 service plan fees charged for Class I or Class R5 shares. Class R6 shares are not subject to a service plan. The Advisor and Distributor each may pay out of its own resources additional expenses for distribution of each Funds’ shares and shareholder services.
The Trust has also adopted a distribution plan pursuant to Rule 12b-1, applicable only to the Funds’ Class C, Class C2, and Class R3 shares, under which the Funds compensate the Distributor for services in promoting the sale of Class C, Class C2 and Class R3 shares of the Funds at an annual rate of up to .25 of 1% per annum of the average daily net assets attributable to Class C shares of Limited Term U.S. Government Fund and Limited Term Income Fund, .40 of 1% per annum of the average daily net assets attributable to Class C2 shares of the Limited Term U.S. Government Fund and Limited Term Income Fund, .75 of 1% per annum of the average daily net assets attributable to Class C shares of Core Plus Bond Fund and Strategic Income Fund, and .25 of 1% per annum of the average daily net assets attributable to Class R3 shares. Total fees incurred by each class of shares of the Funds under their respective service and distribution plans for the year ended September 30, 2024 are set forth in the Statements of Operations.
The Advisor has contractually agreed to waive certain fees and reimburse certain expenses incurred by certain classes of the Funds. The agreement may be terminated by the Trust at any time, but may not be terminated by the Advisor before February 1, 2025 unless the Advisor ceases to be the investment advisor to the Funds prior to that date. The Advisor may recoup amounts waived or reimbursed
186 | Annual Financial Statements
Notes to Financial Statements, Continued
September 30, 2024
during the year ended September 30, 2024 if, during the fiscal year, expenses fall below the contractual limit that was in place at the time these fees and expenses were waived or reimbursed. The Advisor will not recoup fees or expenses as described in the preceding sentence if that recoupment would cause the Funds’ total annual operating expenses (after the recoupment is taken into account) to exceed the lesser of: (a) the expense cap that was in place at the time the waiver or reimbursement occurred; or (b) the expense cap that is in place at the time of the recoupment. Expense caps exclude taxes, interest expenses, acquired fund fees and expenses, brokerage commissions, borrowing costs, expenses relating to short sales, and unusual expenses such as contingency fees or litigation costs.
Actual expenses of certain share classes do not exceed levels as specified in each Fund’s most recent prospectus as shown on the following table:
| | | CLASS A | | | CLASS C | | | CLASS C2 | | | CLASS I | | | CLASS R3 | | | CLASS R4 | | | CLASS R5 | | | CLASS R6 | |
| Ultra Short Income Fund | | 0.50 | % | | — | % | | — | % | | 0.30 | % | | — | % | | — | % | | — | % | | — | % |
| Limited Term U.S. Government Fund | | — | | | 1.24 | | | 1.24 | | | — | | | 0.99 | | | 0.99 | | | 0.67 | | | — | |
| Limited Term Income Fund | | — | | | — | | | 1.24 | | | 0.49 | | | 0.99 | | | 0.99 | | | 0.49 | | | 0.42 | |
| Core Plus Bond Fund | | 0.75 | | | 1.50 | | | — | | | 0.50 | | | 1.00 | | | 0.75 | | | 0.50 | | | 0.49 | |
| Strategic Income Fund | | 1.05 | | | — | | | — | | | 0.60 | | | 1.25 | | | 1.25 | | | 0.60 | | | 0.53 | |
For the year ended September 30, 2024, the Advisor contractually reimbursed certain class specific expenses and distribution fees and voluntarily waived certain expenses as follows:
| CONTRACTUAL: | | CLASS
A | | | CLASS C | | | CLASS
C2 | | | CLASS I | | | CLASS
R3 | | | CLASS R4 | | | CLASS
R5 | | | CLASS
R6 | | | TOTAL | |
| Ultra Short Income Fund | | $ | 108,214 | | | $ | — | | | $ | — | | | $ | 498,827 | | | $ | — | | | $ | — | | | $ | — | | | $ | — | | | $ | 607,041 | |
| Limited Term U.S. Government Fund | | | — | | | | 16,881 | | | | 7,059 | | | | — | | | | 24,105 | | | | 16,618 | | | | 20,013 | | | | — | | | | 84,676 | |
| Limited Term Income Fund | | | — | | | | — | | | | 9,958 | | | | 1,695,223 | | | | 34,875 | | | | 36,898 | | | | 119,020 | | | | 82,171 | | | | 1,978,145 | |
| Core Plus Bond Fund | | | 14,158 | | | | 4,788 | | | | — | | | | — | | | | 5,217 | | | | 3,425 | | | | 5,216 | | | | 4,503 | | | | 37,307 | |
| Strategic Income Fund | | | 76,912 | | | | 25,850 | | | | — | | | | 10,193,037 | | | | 19,067 | | | | 22,956 | | | | 175,330 | | | | 249,241 | | | | 10,762,393 | |
| | | | | | | | | | | | | | | | | | | | | | | | | | | | | | | | | | | | | |
| VOLUNTARY: | | | CLASS A | | | | CLASS C | | | | CLASS C2 | | | | CLASS I | | | | CLASS R3 | | | | CLASS R4 | | | | CLASS R5 | | | | CLASS R6 | | | | TOTAL | |
| Ultra Short Income Fund | | $ | 6,875 | | | $ | — | | | $ | — | | | $ | 53,854 | | | $ | — | | | $ | — | | | $ | — | | | $ | — | | | $ | 60,729 | |
| Limited Term U.S. Government Fund | | | 5,534 | | | | — | | | | — | | | | — | | | | — | | | | — | | | | — | | | | — | | | | 5,534 | |
| Core Plus Bond Fund | | | 973 | | | | 2,408 | | | | — | | | | 485,277 | | | | 689 | | | | 690 | | | | 691 | | | | 2,746 | | | | 493,474 | |
| Strategic Income Fund | | | 23,941 | | | | 8,045 | | | | — | | | | 614,041 | | | | 74 | | | | 231 | | | | 5,501 | | | | 13,271 | | | | 665,104 | |
Certain officers and Trustees of the Trust are also officers or directors of the Advisor and Distributor. The compensation of the independent Trustees is borne by the Trust. The Trust also pays a portion of the Chief Compliance Officer’s compensation. These amounts are reflected as Trustee and officer fees in the Statement of Operations.
As of September 30, 2024, the percentage of direct investments in the Funds held by the Trustees, officers of the Trust, and the Advisor is approximately as follows.
| | | PERCENTAGE OF DIRECT INVESTMENTS |
| Ultra Short Income Fund | | | 1.11 | % |
| Limited Term U.S. Government Fund | | | 17.28 | |
| Limited Term Income Fund | | | 0.12 | |
| Core Plus Bond Fund | | | 0.69 | |
| Strategic Income Fund | | | 0.11 | |
The Funds may purchase or sell securities from or to an affiliated fund, provided the affiliation is due solely to having a common investment advisor, common officers, or common trustees, and provided that all such transactions will comply with Rule 17a-7 under the 1940 Act. For the year ended September 30, 2024, the Funds had no such transactions with affiliated funds.
Shown below are holdings of voting securities of each portfolio company which is considered "affiliated" to the Funds under the 1940 Act, including companies for which the Funds’ holding represented 5% or more of the company’s voting securities, and a series of the Thornburg Investment Trust in which the Funds invested for cash management purposes during the period:
| ULTRA SHORT INCOME FUND | | MARKET VALUE 9/30/23 | | PURCHASES AT COST | | | SALES PROCEEDS | | | REALIZED GAIN (LOSS) | | | CHANGE IN UNREALIZED APPR./(DEPR.) | | MARKET VALUE 9/30/24 | | DIVIDEND INCOME | |
| Thornburg Capital Mgmt. Fund | | $ | 18,968,697 | | | $ | 284,540,936 | | | $ | (279,364,734 | ) | | $ | - | | | $ | - | | | $ | 24,144,899 | | | $ | 1,232,199 | |
Annual Financial Statements | 187
Notes to Financial Statements, Continued
September 30, 2024
| LIMITED TERM INCOME FUND | | MARKET VALUE 9/30/23 | | PURCHASES AT COST | | | SALES PROCEEDS | | | REALIZED GAIN (LOSS) | | | CHANGE IN UNREALIZED APPR./(DEPR.) | | MARKET VALUE 9/30/24 | | DIVIDEND INCOME | |
| Thornburg Capital Mgmt. Fund | | $ | 122,751,672 | | | $ | 2,441,746,623 | | | $ | (2,042,958,302 | ) | | $ | - | | | $ | - | | | $ | 521,539,993 | | | $ | 19,230,593 | |
| | | | | | | | | | | | | | | | | | | | | | | | | | | | | |
| CORE PLUS BOND FUND | | | | | | | | | | | | | | | | | | | | | | | | | | | | |
| Thornburg Capital Mgmt. Fund | | $ | - | | | $ | 89,921,120 | | | $ | (83,628,948 | ) | | $ | - | | | $ | - | | | $ | 6,292,172 | | | $ | 236,206 | |
| | | | | | | | | | | | | | | | | | | | | | | | | | | | | |
| STRATEGIC INCOME FUND | | | | | | | | | | | | | | | | | | | | | | | | | | | | |
| Thornburg Capital Mgmt. Fund | | $ | 570,141,195 | | | $ | 3,262,002,558 | | | $ | (3,229,030,517 | ) | | $ | - | | | $ | - | | | $ | 603,113,236 | | | $ | 25,913,949 | |
NOTE 5 – TAXES
Federal Income Taxes: It is the policy of the Trust to comply with the provisions of the Internal Revenue Code of 1986 applicable to regulated investment companies and to distribute to shareholders substantially all investment company taxable income including net realized gains on investments (if any), and tax exempt income of the Funds. Therefore, no provision for federal income or excise tax is required.
The Funds file income tax returns in United States federal and applicable state jurisdictions. The statute of limitations on the Funds’ tax return filings generally remains open for the three years following a return’s filing date. The Funds have analyzed each uncertain tax position believed to be material in the preparation of the Funds’ financial statements for the fiscal year ended September 30, 2024, including open tax years, to assess whether it is more likely than not that the position would be sustained upon examination, based on the technical merits of the position. The Funds have not identified any such position for which an asset or liability must be reflected in the Statements of Assets and Liabilities.
At September 30, 2024, information on the tax components of capital was as follows:
| | | COST | | | UNREALIZED
APPRECIATION | | | UNREALIZED
DEPRECIATION | | | NET UNREALIZED
APPRECIATION
(DEPRECIATION) | |
| Ultra Short Income Fund | | $ | 267,537,205 | | | $ | 909,228 | | | $ | (337,544 | ) | | $ | 571,684 | |
| Limited Term U.S. Government Fund | | | 141,946,454 | | | | 2,006,614 | | | | (6,170,602 | ) | | | (4,163,988 | ) |
| Limited Term Income Fund | | | 6,535,301,135 | | | | 123,523,739 | | | | (194,533,942 | ) | | | (71,010,203 | ) |
| Core Plus Bond Fund | | | 159,314,425 | | | | 5,666,766 | | | | (135,331 | ) | | | 5,531,435 | |
| Strategic Income Fund | | | 9,300,951,388 | | | | 311,160,992 | | | | (169,532,816 | ) | | | 141,628,176 | |
Temporary differences between book and tax basis appreciation (depreciation) on cost of investments is primarily attributed to tax deferral of losses on wash sales, premium amortization accruals, mark-to-market of forward currency contracts and partnership basis adjustments.
At September 30, 2024, the Funds had cumulative tax basis capital losses from prior fiscal years as shown on the following table, which may be carried forward to offset future capital gains. To the extent such carryforwards are used, capital gain distributions may be reduced to the extent provided by regulations. Such capital loss carryforwards do not expire.
| | | | CUMULATIVE CAPITAL LOSSES | |
| | | | SHORT-TERM | | | | LONG-TERM | |
| Ultra Short Income Fund | | $ | 395,864 | | | $ | 123,978 | |
| Limited Term U.S. Government Fund | | | 6,176,390 | | | | 25,887,149 | |
| Limited Term Income Fund | | | 146,957,304 | | | | 275,144,101 | |
| Strategic Income Fund | | | 70,415,209 | | | | 100,135,251 | |
During the year ended September 30, 2024, the Funds utilized capital loss carryforwards as shown on the following table.
| | UTILIZED CAPITAL LOSS CARRYFORWARDS |
| Ultra Short Income Fund | | $ | 115,274 | |
Foreign Withholding Taxes: The Funds are subject to foreign tax withholding imposed by certain foreign countries in which the Funds may invest. Withholding taxes are incurred on certain foreign dividends and are accrued at the time the dividend is recognized based on applicable foreign tax laws. The Funds may file withholding tax reclaims in certain jurisdictions to recover a portion of amounts previously
188 | Annual Financial Statements
Notes to Financial Statements, Continued
September 30, 2024
withheld, in view of various considerations, including recent decisions rendered by the courts in those and other jurisdictions. The Funds would expect to record a receivable for such a tax reclaim based on a variety of factors, including assessment of a jurisdiction’s legal obligation to pay reclaims, the jurisdiction’s administrative practices and payment history, and industry convention.
Deferred Foreign Capital Gain Taxes: The Funds are subject to a tax imposed on net realized gains of securities of certain foreign countries. The Funds record an estimated deferred tax liability for net unrealized gains on these investments as reflected in the accompanying financial statements. Such changes are included in net unrealized appreciation (depreciation) from investments in the Statement of Operations.
At September 30, 2024, the Funds had undistributed tax basis ordinary investment income and undistributed tax basis capital gains as follows:
| | | UNDISTRIBUTED TAX BASIS ORDINARY INVESTMENT INCOME | | | UNDISTRIBUTED TAX BASIS CAPITAL GAINS |
| Ultra Short Income Fund | | $ | 69,810 | | | $ | — | |
| Limited Term U.S. Government Fund | | | 33,531 | | | | — | |
| Limited Term Income Fund | | | 765,158 | | | | — | |
| Core Plus Bond Fund | | | 249,731 | | | | — | |
| Strategic Income Fund | | | 12,779,961 | | | | — | |
The tax character of distributions paid for the Funds during the years ended September 30, 2024, and September 30, 2023, were as follows:
| | | DISTRIBUTIONS FROM: ORDINARY INCOME | |
| | | | 2024 | | | | 2023 | |
| Ultra Short Income Fund | | $ | 14,906,668 | | | $ | 11,561,943 | |
| Limited Term U.S. Government Fund | | | 4,449,267 | | | | 4,580,940 | |
| Limited Term Income Fund | | | 256,488,888 | | | | 232,491,173 | |
| Core Plus Bond Fund | | | 3,917,407 | | | | — | |
| Strategic Income Fund | | | 401,682,232 | | | | 262,072,215 | |
NOTE 6 – SHARES OF BENEFICIAL INTEREST
At September 30, 2024, there were an unlimited number of shares of each Fund with no par value of beneficial interest authorized. Transactions in each Fund’s shares of beneficial interest were as follows:
| | | YEAR ENDED SEPTEMBER 30, 2024 | | | YEAR ENDED SEPTEMBER 30, 2023 | |
| ULTRA SHORT INCOME FUND | | SHARES | | | AMOUNT | | | SHARES | | | AMOUNT | |
| Class A Shares | | | | | | | | | | | | |
| Shares sold | | | 2,182,583 | | | $ | 26,661,777 | | | | 1,453,234 | | | $ | 17,630,385 | |
| Shares issued to shareholders in | | | | | | | | | | | | | | | | |
| reinvestment of dividends | | | 133,703 | | | | 1,632,242 | | | | 115,522 | | | | 1,403,778 | |
| Shares repurchased | | | (536,688 | ) | | | (6,549,669 | ) | | | (2,064,019 | ) | | | (25,075,017 | ) |
| Net increase (decrease) | | | 1,779,598 | | | $ | 21,744,350 | | | | (495,263 | ) | | $ | (6,040,854 | ) |
| | | | | | | | | | | | | | | | | |
| Class I Shares | | | | | | | | | | | | | | | | |
| Shares sold | | | 11,210,970 | | | $ | 136,639,043 | | | | 20,384,068 | | | $ | 247,111,472 | |
| Shares issued to shareholders in | | | | | | | | | | | | | | | | |
| reinvestment of dividends | | | 1,086,862 | | | | 13,255,212 | | | | 834,289 | | | | 10,131,349 | |
| Shares repurchased | | | (14,114,344 | ) | | | (172,128,187 | ) | | | (13,912,802 | ) | | | (168,889,723 | ) |
| Net increase (decrease) | | | (1,816,512 | ) | | $ | (22,233,932 | ) | | | 7,305,555 | | | $ | 88,353,098 | |
Annual Financial Statements | 189
Notes to Financial Statements, Continued
September 30, 2024
| | | YEAR ENDED SEPTEMBER 30, 2024 | | | YEAR ENDED SEPTEMBER 30, 2023 | |
| LIMITED TERM U.S. GOVERNMENT FUND | | SHARES | | | AMOUNT | | | SHARES | | | AMOUNT | |
| | | | | | | | | | | | | |
| Class A Shares | | | | | | | | | | | | |
| Shares sold | | | 305,317 | | | $ | 3,591,544 | | | | 484,272 | | | $ | 5,696,911 | |
| Shares issued to shareholders in | | | | | | | | | | | | | | | | |
| reinvestment of dividends | | | 87,029 | | | | 1,024,478 | | | | 87,114 | | | | 1,024,639 | |
| Shares repurchased | | | (1,013,271 | ) | | | (11,904,928 | ) | | | (1,694,530 | ) | | | (19,953,752 | ) |
| Net increase (decrease) | | | (620,925 | ) | | $ | (7,288,906 | ) | | | (1,123,144 | ) | | $ | (13,232,202 | ) |
| | | | | | | | | | | | | | | | | |
| Class C Shares | | | | | | | | | | | | | | | | |
| Shares sold | | | 47,675 | | | $ | 570,108 | | | | 38,665 | | | $ | 452,840 | |
| Shares issued to shareholders in | | | | | | | | | | | | | | | | |
| reinvestment of dividends | | | 5,377 | | | | 63,608 | | | | 6,392 | | | | 75,633 | |
| Shares repurchased | | | (122,518 | ) | | | (1,446,444 | ) | | | (255,356 | ) | | | (3,013,436 | ) |
| Net increase (decrease) | | | (69,466 | ) | | $ | (812,728 | ) | | | (210,299 | ) | | $ | (2,484,963 | ) |
| | | | | | | | | | | | | | | | | |
| Class C2 Shares | | | | | | | | | | | | | | | | |
| Shares sold | | | - | | | $ | - | | | | 55,309 | | | $ | 651,242 | |
| Shares issued to shareholders in | | | | | | | | | | | | | | | | |
| reinvestment of dividends | | | 638 | | | | 7,543 | | | | 1,151 | | | | 13,629 | |
| Shares repurchased | | | (25,627 | ) | | | (293,780 | ) | | | (26,208 | ) | | | (308,454 | ) |
| Net increase (decrease) | | | (24,989 | ) | | $ | (286,237 | ) | | | 30,252 | | | $ | 356,417 | |
| | | | | | | | | | | | | | | | | |
| Class I Shares | | | | | | | | | | | | | | | | |
| Shares sold | | | 1,618,955 | | | $ | 19,180,589 | | | | 1,955,400 | | | $ | 23,052,895 | |
| Shares issued to shareholders in | | | | | | | | | | | | | | | | |
| reinvestment of dividends | | | 189,900 | | | | 2,233,776 | | | | 211,345 | | | | 2,484,791 | |
| Shares repurchased | | | (4,537,015 | ) | | | (53,572,057 | ) | | | (5,162,638 | ) | | | (60,784,412 | ) |
| Net increase (decrease) | | | (2,728,160 | ) | | $ | (32,157,692 | ) | | | (2,995,893 | ) | | $ | (35,246,726 | ) |
| | | | | | | | | | | | | | | | | |
| Class R3 Shares | | | | | | | | | | | | | | | | |
| Shares sold | | | 44,353 | | | $ | 524,193 | | | | 39,410 | | | $ | 466,739 | |
| Shares issued to shareholders in | | | | | | | | | | | | | | | | |
| reinvestment of dividends | | | 5,717 | | | | 67,421 | | | | 5,733 | | | | 67,500 | |
| Shares repurchased | | | (84,256 | ) | | | (993,678 | ) | | | (97,420 | ) | | | (1,141,086 | ) |
| Net increase (decrease) | | | (34,186 | ) | | $ | (402,064 | ) | | | (52,277 | ) | | $ | (606,847 | ) |
| | | | | | | | | | | | | | | | | |
| Class R4 Shares | | | | | | | | | | | | | | | | |
| Shares sold | | | 14,989 | | | $ | 175,957 | | | | 17,318 | | | $ | 204,243 | |
| Shares issued to shareholders in | | | | | | | | | | | | | | | | |
| reinvestment of dividends | | | 2,256 | | | | 26,570 | | | | 1,705 | | | | 20,038 | |
| Shares repurchased | | | (13,409 | ) | | | (158,219 | ) | | | (36,415 | ) | | | (426,204 | ) |
| Net increase (decrease) | | | 3,836 | | | $ | 44,308 | | | | (17,392 | ) | | $ | (201,923 | ) |
| | | | | | | | | | | | | | | | | |
| Class R5 Shares | | | | | | | | | | | | | | | | |
| Shares sold | | | 8,248 | | | $ | 97,043 | | | | 11,488 | | | $ | 135,557 | |
| Shares issued to shareholders in | | | | | | | | | | | | | | | | |
| reinvestment of dividends | | | 3,177 | | | | 37,414 | | | | 3,166 | | | | 37,252 | |
| Shares repurchased | | | (39,535 | ) | | | (469,428 | ) | | | (58,727 | ) | | | (696,434 | ) |
| Net increase (decrease) | | | (28,110 | ) | | $ | (334,971 | ) | | | (44,073 | ) | | $ | (523,625 | ) |
190 | Annual Financial Statements
Notes to Financial Statements, Continued
September 30, 2024
| | | YEAR ENDED SEPTEMBER 30, 2024 | | | YEAR ENDED SEPTEMBER 30, 2023 | |
| LIMITED TERM INCOME FUND | | SHARES | | | AMOUNT | | | SHARES | | | AMOUNT | |
| | | | | | | | | | | | | |
| Class A Shares | | | | | | | | | | | | | | | | |
| Shares sold | | | 4,348,986 | | | $ | 55,363,238 | | | | 7,767,621 | | | $ | 97,211,011 | |
| Shares issued to shareholders in | | | | | | | | | | | | | | | | |
| reinvestment of dividends | | | 1,287,268 | | | | 16,455,807 | | | | 1,109,321 | | | | 13,922,644 | |
| Shares repurchased | | | (12,139,047 | ) | | | (154,501,903 | ) | | | (14,188,210 | ) | | | (177,625,807 | ) |
| Net increase (decrease) | | | (6,502,793 | ) | | $ | (82,682,858 | ) | | | (5,311,268 | ) | | $ | (66,492,152 | ) |
| | | | | | | | | | | | | | | | | |
| Class C Shares | | | | | | | | | | | | | | | | |
| Shares sold | | | 456,256 | | | $ | 5,821,819 | | | | 535,634 | | | $ | 6,695,779 | |
| Shares issued to shareholders in | | | | | | | | | | | | | | | | |
| reinvestment of dividends | | | 292,785 | | | | 3,733,818 | | | | 333,115 | | | | 4,173,355 | |
| Shares repurchased | | | (4,027,966 | ) | | | (51,128,822 | ) | | | (7,384,523 | ) | | | (92,292,957 | ) |
| Net increase (decrease) | | | (3,278,925 | ) | | $ | (41,573,185 | ) | | | (6,515,774 | ) | | $ | (81,423,823 | ) |
| | | | | | | | | | | | | | | | | |
| Class C2 Shares | | | | | | | | | | | | | | | | |
| Shares sold | | | 30,438 | | | $ | 388,438 | | | | 13,644 | | | $ | 172,557 | |
| Shares issued to shareholders in | | | | | | | | | | | | | | | | |
| reinvestment of dividends | | | 14,241 | | | | 181,629 | | | | 16,098 | | | | 201,734 | |
| Shares repurchased | | | (195,611 | ) | | | (2,466,907 | ) | | | (263,643 | ) | | | (3,293,916 | ) |
| Net increase (decrease) | | | (150,932 | ) | | $ | (1,896,840 | ) | | | (233,901 | ) | | $ | (2,919,625 | ) |
| | | | | | | | | | | | | | | | | |
| Class I Shares | | | | | | | | | | | | | | | | |
| Shares sold | | | 109,034,980 | | | $ | 1,393,542,594 | | | | 149,123,931 | | | $ | 1,871,085,459 | |
| Shares issued to shareholders in | | | | | | | | | | | | | | | | |
| reinvestment of dividends | | | 15,548,347 | | | | 198,857,654 | | | | 14,369,488 | | | | 180,390,754 | |
| Shares repurchased | | | (168,298,127 | ) | | | (2,142,528,569 | ) | | | (254,623,845 | ) | | | (3,187,485,933 | ) |
| Net increase (decrease) | | | (43,714,800 | ) | | $ | (550,128,321 | ) | | | (91,130,426 | ) | | $ | (1,136,009,720 | ) |
| | | | | | | | | | | | | | | | | |
| Class R3 Shares | | | | | | | | | | | | | | | | |
| Shares sold | | | 980,546 | | | $ | 12,461,660 | | | | 1,022,834 | | | $ | 12,778,746 | |
| Shares issued to shareholders in | | | | | | | | | | | | | | | | |
| reinvestment of dividends | | | 102,718 | | | | 1,313,888 | | | | 95,094 | | | | 1,194,229 | |
| Shares repurchased | | | (1,383,168 | ) | | | (17,684,236 | ) | | | (2,100,002 | ) | | | (26,434,605 | ) |
| Net increase (decrease) | | | (299,904 | ) | | $ | (3,908,688 | ) | | | (982,074 | ) | | $ | (12,461,630 | ) |
| | | | | | | | | | | | | | | | | |
| Class R4 Shares | | | | | | | | | | | | | | | | |
| Shares sold | | | 508,077 | | | $ | 6,506,932 | | | | 400,976 | | | $ | 5,039,463 | |
| Shares issued to shareholders in | | | | | | | | | | | | | | | | |
| reinvestment of dividends | | | 7,862 | | | | 100,154 | | | | 10,075 | | | | 126,436 | |
| Shares repurchased | | | (790,839 | ) | | | (10,052,559 | ) | | | (349,159 | ) | | | (4,379,648 | ) |
| Net increase (decrease) | | | (274,900 | ) | | $ | (3,445,473 | ) | | | 61,892 | | | $ | 786,251 | |
| | | | | | | | | | | | | | | | | |
| Class R5 Shares | | | | | | | | | | | | | | | | |
| Shares sold | | | 1,980,357 | | | $ | 25,107,698 | | | | 1,748,755 | | | $ | 21,951,346 | |
| Shares issued to shareholders in | | | | | | | | | | | | | | | | |
| reinvestment of dividends | | | 215,351 | | | | 2,753,112 | | | | 209,812 | | | | 2,631,955 | |
| Shares repurchased | | | (2,502,466 | ) | | | (31,900,837 | ) | | | (5,242,828 | ) | | | (65,941,553 | ) |
| Net increase (decrease) | | | (306,758 | ) | | $ | (4,040,027 | ) | | | (3,284,261 | ) | | $ | (41,358,252 | ) |
| | | | | | | | | | | | | | | | | |
| Class R6 Shares | | | | | | | | | | | | | | | | |
| Shares sold | | | 4,699,966 | | | $ | 60,019,507 | | | | 4,137,670 | | | $ | 52,080,541 | |
| Shares issued to shareholders in | | | | | | | | | | | | | | | | |
| reinvestment of dividends | | | 493,056 | | | | 6,318,652 | | | | 407,058 | | | | 5,118,693 | |
| Shares repurchased | | | (4,834,285 | ) | | | (61,796,972 | ) | | | (6,413,880 | ) | | | (81,030,757 | ) |
| Net increase (decrease) | | | 358,737 | | | $ | 4,541,187 | | | | (1,869,152 | ) | | $ | (23,831,523 | ) |
Annual Financial Statements | 191
Notes to Financial Statements, Continued
September 30, 2024
| | | PERIOD ENDED SEPTEMBER 30, 2024† | |
| CORE PLUS BOND FUND | | SHARES | | | AMOUNT | |
| | | | | | | |
| Class A Shares | | | | | | |
| Shares sold | | | 28,326 | | | $ | 292,048 | |
| Shares issued to shareholders in | | | | | | | | |
| reinvestment of dividends | | | 679 | | | | 7,080 | |
| Shares repurchased | | | (3,643 | ) | | | (37,331 | ) |
| Net increase (decrease) | | | 25,362 | | | $ | 261,797 | |
| | | | | | | | | |
| Class C Shares | | | | | | | | |
| Shares sold | | | 81,686 | | | $ | 846,394 | |
| Shares issued to shareholders in | | | | | | | | |
| reinvestment of dividends | | | 1,473 | | | | 15,402 | |
| Shares repurchased | | | (6,889 | ) | | | (70,518 | ) |
| Net increase (decrease) | | | 76,270 | | | $ | 791,278 | |
| | | | | | | | | |
| Class I Shares | | | | | | | | |
| Shares sold | | | 15,423,496 | | | $ | 159,850,278 | |
| Shares issued to shareholders in | | | | | | | | |
| reinvestment of dividends | | | 368,142 | | | | 3,854,232 | |
| Shares repurchased | | | (573,343 | ) | | | (6,010,832 | ) |
| Net increase (decrease) | | | 15,218,295 | | | $ | 157,693,678 | |
| | | | | | | | | |
| Class R3 Shares | | | | | | | | |
| Shares sold | | | 10,000 | | | $ | 100,000 | |
| Shares issued to shareholders in | | | | | | | | |
| reinvestment of dividends | | | 460 | | | | 4,780 | |
| Net increase (decrease) | | | 10,460 | | | $ | 104,780 | |
| | | | | | | | | |
| Class R4 Shares | | | | | | | | |
| Shares sold | | | 10,206 | | | $ | 102,144 | |
| Shares issued to shareholders in | | | | | | | | |
| reinvestment of dividends | | | 486 | | | | 5,051 | |
| Shares repurchased | | | (206 | ) | | | (2,155 | ) |
| Net increase (decrease) | | | 10,486 | | | $ | 105,040 | |
| | | | | | | | | |
| Class R5 Shares | | | | | | | | |
| Shares sold | | | 10,000 | | | $ | 100,000 | |
| Shares issued to shareholders in | | | | | | | | |
| reinvestment of dividends | | | 512 | | | | 5,320 | |
| Net increase (decrease) | | | 10,512 | | | $ | 105,320 | |
| | | | | | | | | |
| Class R6 Shares | | | | | | | | |
| Shares sold | | | 59,247 | | | $ | 610,200 | |
| Shares issued to shareholders in | | | | | | | | |
| reinvestment of dividends | | | 2,101 | | | | 21,918 | |
| Net increase (decrease) | | | 61,348 | | | $ | 632,118 | |
| † | The Fund commenced operations on October 2, 2023. |
| | | YEAR ENDED SEPTEMBER 30, 2024 | | | YEAR ENDED SEPTEMBER 30, 2023 | |
| STRATEGIC INCOME FUND | | SHARES | | | AMOUNT | | | SHARES | | | AMOUNT | |
| | | | | | | | | | | | | |
| Class A Shares | | | | | | | | | | | | |
| Shares sold | | | 7,900,567 | | | $ | 89,120,269 | | | | 8,657,794 | | | $ | 96,602,148 | |
| Shares issued to shareholders in | | | | | | | | | | | | | | | | |
| reinvestment of dividends | | | 1,114,529 | | | | 12,656,188 | | | | 934,483 | | | | 10,441,785 | |
| Shares repurchased | | | (8,408,976 | ) | | | (95,482,953 | ) | | | (14,202,566 | ) | | | (157,783,088 | ) |
| Net increase (decrease) | | | 606,120 | | | $ | 6,293,504 | | | | (4,610,289 | ) | | $ | (50,739,155 | ) |
192 | Annual Financial Statements
Notes to Financial Statements, Continued
September 30, 2024
| | | YEAR ENDED SEPTEMBER 30, 2024 | | | YEAR ENDED SEPTEMBER 30, 2023 | |
| STRATEGIC INCOME FUND | | SHARES | | | AMOUNT | | | SHARES | | | AMOUNT | |
| | | | | | | | | | | | | |
| Class C Shares | | | | | | | | | | | | |
| Shares sold | | | 2,216,211 | | | $ | 25,044,729 | | | | 3,206,423 | | | $ | 35,705,220 | |
| Shares issued to shareholders in | | | | | | | | | | | | | | | | |
| reinvestment of dividends | | | 316,760 | | | | 3,590,531 | | | | 251,686 | | | | 2,809,155 | |
| Shares repurchased | | | (2,313,861 | ) | | | (26,194,519 | ) | | | (2,322,708 | ) | | | (25,851,363 | ) |
| Net increase (decrease) | | | 219,110 | | | $ | 2,440,741 | | | | 1,135,401 | | | $ | 12,663,012 | |
| | | | | | | | | | | | | | | | | |
| Class I Shares | | | | | | | | | | | | | | | | |
| Shares sold | | | 354,012,172 | | | $ | 4,002,206,085 | | | | 359,137,452 | | | $ | 4,001,961,036 | |
| Shares issued to shareholders in | | | | | | | | | | | | | | | | |
| reinvestment of dividends | | | 30,849,100 | | | | 349,781,098 | | | | 20,114,084 | | | | 224,360,437 | |
| Shares repurchased | | | (215,528,422 | ) | | | (2,430,401,180 | ) | | | (176,222,506 | ) | | | (1,959,877,640 | ) |
| Net increase (decrease) | | | 169,332,850 | | | $ | 1,921,586,003 | | | | 203,029,030 | | | $ | 2,266,443,833 | |
| | | | | | | | | | | | | | | | | |
| Class R3 Shares | | | | | | | | | | | | | | | | |
| Shares sold | | | 47,387 | | | $ | 534,898 | | | | 9,122 | | | $ | 102,123 | |
| Shares issued to shareholders in | | | | | | | | | | | | | | | | |
| reinvestment of dividends | | | 3,374 | | | | 38,331 | | | | 2,099 | | | | 23,424 | |
| Shares repurchased | | | (14,707 | ) | | | (165,970 | ) | | | (8,829 | ) | | | (98,037 | ) |
| Net increase (decrease) | | | 36,054 | | | $ | 407,259 | | | | 2,392 | | | $ | 27,510 | |
| | | | | | | | | | | | | | | | | |
| Class R4 Shares | | | | | | | | | | | | | | | | |
| Shares sold | | | 95,966 | | | $ | 1,085,320 | | | | 87,654 | | | $ | 981,829 | |
| Shares issued to shareholders in | | | | | | | | | | | | | | | | |
| reinvestment of dividends | | | 9,288 | | | | 105,233 | | | | 7,454 | | | | 83,223 | |
| Shares repurchased | | | (151,714 | ) | | | (1,715,829 | ) | | | (26,458 | ) | | | (294,276 | ) |
| Net increase (decrease) | | | (46,460 | ) | | $ | (525,276 | ) | | | 68,650 | | | $ | 770,776 | |
| | | | | | | | | | | | | | | | | |
| Class R5 Shares | | | | | | | | | | | | | | | | |
| Shares sold | | | 3,962,219 | | | $ | 45,357,741 | | | | 2,698,674 | | | $ | 30,030,333 | |
| Shares issued to shareholders in | | | | | | | | | | | | | | | | |
| reinvestment of dividends | | | 292,397 | | | | 3,316,314 | | | | 220,858 | | | | 2,464,408 | |
| Shares repurchased | | | (2,078,594 | ) | | | (23,580,930 | ) | | | (895,507 | ) | | | (9,983,186 | ) |
| Net increase (decrease) | | | 2,176,022 | | | $ | 25,093,125 | | | | 2,024,025 | | | $ | 22,511,555 | |
| | | | | | | | | | | | | | | | | |
| Class R6 Shares | | | | | | | | | | | | | | | | |
| Shares sold | | | 6,631,922 | | | $ | 75,205,503 | | | | 4,613,451 | | | $ | 51,669,559 | |
| Shares issued to shareholders in | | | | | | | | | | | | | | | | |
| reinvestment of dividends | | | 533,798 | | | | 6,072,389 | | | | 339,635 | | | | 3,799,157 | |
| Shares repurchased | | | (3,938,579 | ) | | | (44,687,401 | ) | | | (2,379,658 | ) | | | (26,631,924 | ) |
| Net increase (decrease) | | | 3,227,141 | | | $ | 36,590,491 | | | | 2,573,428 | | | $ | 28,836,792 | |
NOTE 7 – INVESTMENT TRANSACTIONS
For the year ended September 30, 2024, the Funds had purchase and sale transactions of investments as listed in the table below (excluding short-term investments and U.S. Government obligations).
| | | PURCHASES | | | SALES | |
| Ultra Short Income Fund | | $ | 174,390,178 | | | $ | 72,556,883 | |
| Limited Term U.S. Government Fund | | | 47,122,451 | | | | 77,284,916 | |
| Limited Term Income Fund | | | 3,591,631,458 | | | | 4,075,875,345 | |
| Core Plus Bond Fund | | | 206,145,039 | | | | 56,919,198 | |
| Strategic Income Fund | | | 7,100,454,079 | | | | 4,573,896,030 | |
Annual Financial Statements | 193
Notes to Financial Statements, Continued
September 30, 2024
NOTE 8 – DERIVATIVE FINANCIAL INSTRUMENTS
The Funds may use a variety of derivative financial instruments to hedge or adjust the risks affecting its investment portfolio or to enhance investment returns. Provisions of the FASB Accounting Standards Codification 815-10-50 (“ASC 815”) require certain disclosures. The disclosures are intended to provide users of financial statements with an understanding of the use of derivative instruments by the Funds and how these derivatives affect the financial position, financial performance and cash flows of the Funds. The Funds do not designate any derivative instruments as hedging instruments under ASC 815. During the year ended September 30, 2024, the Funds’ principal exposure to derivative financial instruments of the type addressed by ASC 815 was investment in foreign currency contracts.
During the year ended September 30, 2024, some of the Funds entered into forward currency contracts in the normal course of pursuing its investment objectives, with the intent of reducing the risk to the value of the Funds’ foreign investments from adverse changes in the relationship between the U.S. dollar and foreign currencies. Each of the forward currency contracts entered into by the Funds is an agreement between two parties to exchange different currencies at a specified rate of exchange at an agreed upon future date. Forward currency contracts involve risks to the Funds, including the risk that a contract’s counterparty will not meet its obligations to the Funds, the risk that a change in a contract’s value may not correlate perfectly with the currency the contract was intended to track, and the risk that the Advisor is unable to correctly implement its strategy in using a contract. In any such instance, the Funds may not achieve the intended benefit of entering into a contract and may experience a loss.
The monthly average value of open forward currency sell contracts for the year ended September 30, 2024 were as follows:
| | | FORWARD CURRENCY SELL |
| Core Plus Bond Fund | | $ | 77,538 | |
| Strategic Income Fund | | | 99,493,702 | |
These contracts are accounted for by the Funds under ASC 815. Unrealized appreciation and depreciation on outstanding contracts are reported in each Fund’s Statement of Assets and Liabilities, as measured by the difference between the forward exchange rates at the reporting date and the forward exchange rates at each contract’s inception date. Net realized gain (loss) on contracts closed during the period, and changes in net unrealized appreciation (depreciation) on outstanding contracts are recognized in each Fund’s Statement of Operations.
The outstanding forward currency contracts in the table located in each Fund’s Schedule of Investments, which were entered into with State Street Bank and Trust Company (“SSB”), were entered into pursuant to an International Swaps and Derivatives Association (“ISDA”) Master Agreement. In the event of a default or termination under the ISDA Master Agreement with SSB, the non-defaulting party has the right to close out all outstanding forward currency contracts between the parties and to net any payment amounts under those contracts, resulting in a single net amount payable by one party to the other.
Because the ISDA Master Agreement with SSB does not result in an offset of reported amounts of financial assets and liabilities in the Statement of Assets and Liabilities unless there has been an event of default or termination event under that agreement, the Funds do not net their respective outstanding forward currency contracts for purposes of the disclosure in the Statement of Assets and Liabilities. Instead the Funds recognize the unrealized appreciation (depreciation) on those forward currency contracts on a gross basis in each Fund’s Statement of Assets and Liabilities.
The unrealized appreciation (depreciation) of the outstanding forward currency contracts recognized in each Fund’s Statement of Assets and Liabilities at September 30, 2024 is disclosed in the following table:
| | | TYPE OF DERIVATIVE(a) | | PRINCIPAL
RISK | | COUNTER PARTY | | ASSET DERIVATIVES | | | LIABILITY DERIVATIVES | | | NET AMOUNT | |
| Core Plus Bond Fund | | Forward currency contracts | | Foreign currency risk | | SSB | | $ | — | | | $ | (192 | ) | | $ | (192 | ) |
| Strategic Income Fund | | Forward currency contracts | | Foreign currency risk | | SSB | | | — | | | | (125,345 | ) | | | (125,345 | ) |
| (a) | Generally, the Statement of Assets and Liabilities location for forward currency contracts is Assets - Unrealized appreciation on forward currency contracts for asset derivatives and Liabilities - Unrealized depreciation on forward currency contracts for liabilities derivatives. |
Because the Funds did not receive or post cash collateral in connection with their forward currency contracts during the period, the net amounts of each Fund’s assets and liabilities which are attributable to those contracts at September 30, 2024 can be determined by offsetting the dollar amounts shown in the asset and liability columns in the preceding table, the results of which are reflected in the "Net Amount" column. The Funds’ forward currency contracts are valued each day, and the net amounts of each Fund’s assets and liabilities which are attributable to those contracts are expected to vary over time.
194 | Annual Financial Statements
Notes to Financial Statements, Continued
September 30, 2024
The net realized gain (loss) from forward currency contracts and the net change in unrealized appreciation (depreciation) on outstanding forward currency contracts recognized in each Fund’s Statement of Operations for the year ended September 30, 2024 are disclosed in the following table:
| | | TYPE OF DERIVATIVE(a) | | PRINCIPAL RISK | | NET REALIZED GAIN (LOSS) | | | NET CHANGE IN UNREALIZED APPRECIATION (DEPRECIATION) |
| Core Plus Bond Fund | | Forward currency contracts | | Foreign currency risk | | $ | (2,808 | ) | | $ | (192 | ) |
| Strategic Income Fund | | Forward currency contracts | | Foreign currency risk | | | (2,746,362 | ) | | | (895,633 | ) |
| (a) | Generally, the Statement of Operations location for forward currency contracts is Net realized gain (loss) on: forward currency contracts and Net change in unrealized appreciation (depreciation) on: forward currency contracts. |
Annual Financial Statements | 195
Financial Highlights
Ultra Short Income Fund
| | | PER SHARE PERFORMANCE (FOR A SHARE OUTSTANDING THROUGHOUT THE YEAR) | |
UNLESS OTHERWISE
NOTED, PERIODS ARE
FISCAL YEARS ENDED
SEPTEMBER 30, | | NET ASSET
VALUE,
BEGINNING
OF PERIOD | | NET
INVESTMENT
INCOME
(LOSS)+ | | NET REALIZED &
UNREALIZED
GAIN (LOSS) ON
INVESTMENTS | | TOTAL FROM
INVESTMENT
OPERATIONS | | DIVIDENDS
FROM NET
INVESTMENT
INCOME | | DIVIDENDS
FROM NET
REALIZED
GAINS | | DIVIDENDS
FROM
RETURN OF
CAPITAL | | TOTAL
DIVIDENDS | | NET ASSET
VALUE,
END OF
PERIOD | |
| | | | | | | | | | | | | | | | | | | | | | | | | | | | | |
| CLASS A SHARES(b) | | | | | | | | | | | | | | | | | | | | | | | | |
| | | | | | | | | | | | | | | | | | | | | | | | | | | | | |
| 2024 | | $ | 12.17 | | 0.66 | | | 0.07 | | | 0.73 | | | (0.67 | ) | | — | | | — | | | (0.67 | ) | | $ | 12.23 | |
| 2023 | | $ | 12.13 | | 0.52 | | | 0.05 | | | 0.57 | | | (0.53 | ) | | — | | | — | | | (0.53 | ) | | $ | 12.17 | |
| 2022 | | $ | 12.44 | | 0.19 | | | (0.31 | ) | | (0.12 | ) | | (0.19 | ) | | — | | | — | | | (0.19 | ) | | $ | 12.13 | |
| 2021 | | $ | 12.59 | | 0.15 | | | (0.08 | ) | | 0.07 | | | (0.18 | ) | | (0.04 | ) | | — | | | (0.22 | ) | | $ | 12.44 | |
| 2020 | | $ | 12.49 | | 0.23 | | | 0.15 | | | 0.38 | | | (0.24 | ) | | (0.04 | ) | | — | | | (0.28 | ) | | $ | 12.59 | |
| | | | | | | | | | | | | | | | | | | | | | | | | | | | | |
| CLASS I SHARES | | | | | | | | | | | | | | | | | | | | | | | | | |
| | | | | | | | | | | | | | | | | | | | | | | | | | | | | |
| 2024 | | $ | 12.16 | | 0.69 | | | 0.06 | | | 0.75 | | | (0.69 | ) | | — | | | — | | | (0.69 | ) | | $ | 12.22 | |
| 2023 | | $ | 12.12 | | 0.55 | | | 0.04 | | | 0.59 | | | (0.55 | ) | | — | | | — | | | (0.55 | ) | | $ | 12.16 | |
| 2022 | | $ | 12.43 | | 0.21 | | | (0.31 | ) | | (0.10 | ) | | (0.21 | ) | | — | | | — | | | (0.21 | ) | | $ | 12.12 | |
| 2021 | | $ | 12.58 | | 0.18 | | | (0.08 | ) | | 0.10 | | | (0.21 | ) | | (0.04 | ) | | — | | | (0.25 | ) | | $ | 12.43 | |
| 2020 | | $ | 12.48 | | 0.25 | | | 0.16 | | | 0.41 | | | (0.27 | ) | | (0.04 | ) | | — | | | (0.31 | ) | | $ | 12.58 | |
| (a) | Not annualized for periods less than one year. |
| (b) | Sales loads are not reflected in computing total return. |
| + | Based on weighted average shares outstanding. |
See notes to financial statements.
196 | Annual Financial Statements
Financial Highlights, Continued
Ultra Short Income Fund
| | | | RATIOS TO AVERAGE NET ASSETS | | SUPPLEMENTAL DATA | |
UNLESS OTHERWISE
NOTED, PERIODS ARE
FISCAL YEARS ENDED
SEPTEMBER 30, | | | NET INVESTMENT
INCOME (LOSS) (%) | | EXPENSES, AFTER
EXPENSE
REDUCTIONS (%) | | EXPENSES,
BEFORE EXPENSE
REDUCTIONS (%) | | TOTAL
RETURN (%)(a) | | PORTFOLIO
TURNOVER
RATE (%)(a) | | NET
ASSETS
AT END OF PERIOD
(THOUSANDS) |
| | | | | | | | | | | | | | | | | | | | |
| CLASS A SHARES(b) | |
| | | | | |
| 2024 | | | 5.46 | | | 0.50 | | | 0.88 | | | 6.12 | | | 44.59 | | | $ | 50,154 | |
| 2023 | | | 4.29 | | | 0.50 | | | 0.86 | | | 4.77 | | | 29.46 | | | $ | 28,234 | |
| 2022 | | | 1.54 | | | 0.50 | | | 1.05 | | | (0.96 | ) | | 39.29 | | | $ | 34,147 | |
| 2021 | | | 1.22 | | | 0.50 | | | 1.38 | | | 0.54 | | | 37.51 | | | $ | 10,930 | |
| 2020 | | | 1.83 | | | 0.70 | | | 1.84 | | | 3.13 | | | 46.29 | | | $ | 8,127 | |
| | | | | | | | | | | | | | | | | | | | | |
| CLASS I SHARES | | | | | | | | | | | | | | | | | |
| | | | | | | | | | | | | | | | | | | | | |
| 2024 | | | 5.65 | | | 0.30 | | | 0.54 | | | 6.35 | | | 44.59 | | | $ | 214,056 | |
| 2023 | | | 4.56 | | | 0.30 | | | 0.52 | | | 4.98 | | | 29.46 | | | $ | 235,011 | |
| 2022 | | | 1.75 | | | 0.30 | | | 0.60 | | | (0.77 | ) | | 39.29 | | | $ | 145,743 | |
| 2021 | | | 1.40 | | | 0.30 | | | 0.76 | | | 0.74 | | | 37.51 | | | $ | 42,587 | |
| 2020 | | | 2.02 | | | 0.50 | | | 1.06 | | | 3.33 | | | 46.29 | | | $ | 28,249 | |
Annual Financial Statements | 197
Financial Highlights
Limited Term U.S. Government Fund
| | | PER SHARE PERFORMANCE (FOR A SHARE OUTSTANDING THROUGHOUT THE YEAR) | |
UNLESS OTHERWISE
NOTED, PERIODS ARE
FISCAL YEARS ENDED
SEPTEMBER 30, | | NET ASSET
VALUE,
BEGINNING
OF PERIOD | | NET
INVESTMENT
INCOME
(LOSS)+ | | NET REALIZED &
UNREALIZED
GAIN (LOSS) ON
INVESTMENTS | | TOTAL FROM
INVESTMENT
OPERATIONS | | DIVIDENDS
FROM NET
INVESTMENT
INCOME | | DIVIDENDS
FROM NET
REALIZED
GAINS | | DIVIDENDS
FROM
RETURN OF
CAPITAL | | TOTAL
DIVIDENDS | | NET ASSET
VALUE,
END OF
PERIOD | |
| | | | | | | | | | | | | | | | | | | | | | | | | | | |
| CLASS A SHARES(b) | | | | | |
| | | | | | |
| 2024 | | $ | 11.48 | | 0.29 | | | 0.73 | | | 1.02 | | | (0.31 | ) | | — | | | — | | | (0.31 | ) | | $ | 12.19 | |
| 2023 | | $ | 11.64 | | 0.22 | | | (0.13 | ) | | 0.09 | | | (0.25 | ) | | — | | | — | | | (0.25 | ) | | $ | 11.48 | |
| 2022 | | $ | 13.06 | | 0.13 | | | (1.36 | ) | | (1.23 | ) | | (0.19 | ) | | — | | | — | | | (0.19 | ) | | $ | 11.64 | |
| 2021 | | $ | 13.38 | | 0.08 | | | (0.24 | ) | | (0.16 | ) | | (0.16 | ) | | — | | | — | | | (0.16 | ) | | $ | 13.06 | |
| 2020 | | $ | 13.10 | | 0.15 | | | 0.33 | | | 0.48 | | | (0.20 | ) | | — | | | — | | | (0.20 | ) | | $ | 13.38 | |
| | | | | | | | | | | | | | | | | | | | | | | | | | | | | |
| CLASS C SHARES | | | | | | | | | | | | | | | | | | | | | | | | | | | | |
| | | | | | | | | | | | | | | | | | | | | | | | | | | | | |
| 2024 | | $ | 11.54 | | 0.26 | | | 0.74 | | | 1.00 | | | (0.28 | ) | | — | | | — | | | (0.28 | ) | | $ | 12.26 | |
| 2023 | | $ | 11.71 | | 0.19 | | | (0.14 | ) | | 0.05 | | | (0.22 | ) | | — | | | — | | | (0.22 | ) | | $ | 11.54 | |
| 2022 | | $ | 13.13 | | 0.09 | | | (1.36 | ) | | (1.27 | ) | | (0.15 | ) | | — | | | — | | | (0.15 | ) | | $ | 11.71 | |
| 2021 | | $ | 13.46 | | 0.03 | | | (0.25 | ) | | (0.22 | ) | | (0.11 | ) | | — | | | — | | | (0.11 | ) | | $ | 13.13 | |
| 2020 | | $ | 13.17 | | 0.11 | | | 0.35 | | | 0.46 | | | (0.17 | ) | | — | | | — | | | (0.17 | ) | | $ | 13.46 | |
| | | | | | | | | | | | | | | | | | | | | | | | | | | | | |
| CLASS C2 SHARES | | | | | | | | | | | | | | | | | | | | | | | | | | | | |
| | | | | | | | | | | | | | | | | | | | | | | | | | | | | |
| 2024 | | $ | 11.55 | | 0.26 | | | 0.74 | | | 1.00 | | | (0.28 | ) | | — | | | — | | | (0.28 | ) | | $ | 12.27 | |
| 2023 | | $ | 11.71 | | 0.20 | | | (0.14 | ) | | 0.06 | | | (0.22 | ) | | — | | | — | | | (0.22 | ) | | $ | 11.55 | |
| 2022 | | $ | 13.14 | | 0.08 | | | (1.36 | ) | | (1.28 | ) | | (0.15 | ) | | — | | | — | | | (0.15 | ) | | $ | 11.71 | |
| 2021(e) | | $ | 13.46 | | 0.04 | | | (0.25 | ) | | (0.21 | ) | | (0.11 | ) | | — | | | — | | | (0.11 | ) | | $ | 13.14 | |
| | | | | | | | | | | | | | | | | | | | | | | | | | | | | |
| CLASS I SHARES | | | | | | | | | | | | | | | | | | | | | | | | | | | | |
| | | | | | | | | | | | | | | | | | | | | | | | | | | | | |
| 2024 | | $ | 11.47 | | 0.33 | | | 0.74 | | | 1.07 | | | (0.35 | ) | | — | | | — | | | (0.35 | ) | | $ | 12.19 | |
| 2023 | | $ | 11.64 | | 0.26 | | | (0.14 | ) | | 0.12 | | | (0.29 | ) | | — | | | — | | | (0.29 | ) | | $ | 11.47 | |
| 2022 | | $ | 13.06 | | 0.16 | | | (1.36 | ) | | (1.20 | ) | | (0.22 | ) | | — | | | — | | | (0.22 | ) | | $ | 11.64 | |
| 2021 | | $ | 13.38 | | 0.11 | | | (0.24 | ) | | (0.13 | ) | | (0.19 | ) | | — | | | — | | | (0.19 | ) | | $ | 13.06 | |
| 2020 | | $ | 13.10 | | 0.18 | | | 0.34 | | | 0.52 | | | (0.24 | ) | | — | | | — | | | (0.24 | ) | | $ | 13.38 | |
| | | | | | | | | | | | | | | | | | | | | | | | | | | | | |
| CLASS R3 SHARES | | | | | | | | | | | | | | | | | | | | | | | | | | | | |
| | | | | | | | | | | | | | | | | | | | | | | | | | | | | |
| 2024 | | $ | 11.49 | | 0.29 | | | 0.73 | | | 1.02 | | | (0.31 | ) | | — | | | — | | | (0.31 | ) | | $ | 12.20 | |
| 2023 | | $ | 11.65 | | 0.22 | | | (0.13 | ) | | 0.09 | | | (0.25 | ) | | — | | | — | | | (0.25 | ) | | $ | 11.49 | |
| 2022 | | $ | 13.06 | | 0.11 | | | (1.34 | ) | | (1.23 | ) | | (0.18 | ) | | — | | | — | | | (0.18 | ) | | $ | 11.65 | |
| 2021 | | $ | 13.39 | | 0.06 | | | (0.25 | ) | | (0.19 | ) | | (0.14 | ) | | — | | | — | | | (0.14 | ) | | $ | 13.06 | |
| 2020 | | $ | 13.10 | | 0.13 | | | 0.35 | | | 0.48 | | | (0.19 | ) | | — | | | — | | | (0.19 | ) | | $ | 13.39 | |
| | | | | | | | | | | | | | | | | | | | | | | | | | | | | |
| CLASS R4 SHARES | | | | | | | | | | | | | | | | | | | | | | | | | | | | |
| | | | | | | | | | | | | | | | | | | | | | | | | | | | | |
| 2024 | | $ | 11.47 | | 0.29 | | | 0.73 | | | 1.02 | | | (0.31 | ) | | — | | | — | | | (0.31 | ) | | $ | 12.18 | |
| 2023 | | $ | 11.64 | | 0.22 | | | (0.15 | ) | | 0.07 | | | (0.24 | ) | | — | | | — | | | (0.24 | ) | | $ | 11.47 | |
| 2022 | | $ | 13.05 | | 0.12 | | | (1.35 | ) | | (1.23 | ) | | (0.18 | ) | | — | | | — | | | (0.18 | ) | | $ | 11.64 | |
| 2021 | | $ | 13.37 | | 0.06 | | | (0.24 | ) | | (0.18 | ) | | (0.14 | ) | | — | | | — | | | (0.14 | ) | | $ | 13.05 | |
| 2020 | | $ | 13.09 | | 0.13 | | | 0.34 | | | 0.47 | | | (0.19 | ) | | — | | | — | | | (0.19 | ) | | $ | 13.37 | |
| | | | | | | | | | | | | | | | | | | | | | | | | | | | | |
| CLASS R5 SHARES | | | | | | | | | | | | | | | | | | | | | | | | | | | | |
| | | | | | | | | | | | | | | | | | | | | | | | | | | | | |
| 2024 | | $ | 11.48 | | 0.33 | | | 0.74 | | | 1.07 | | | (0.35 | ) | | — | | | — | | | (0.35 | ) | | $ | 12.20 | |
| 2023 | | $ | 11.65 | | 0.25 | | | (0.14 | ) | | 0.11 | | | (0.28 | ) | | — | | | — | | | (0.28 | ) | | $ | 11.48 | |
| 2022 | | $ | 13.07 | | 0.16 | | | (1.36 | ) | | (1.20 | ) | | (0.22 | ) | | — | | | — | | | (0.22 | ) | | $ | 11.65 | |
| 2021 | | $ | 13.39 | | 0.11 | | | (0.25 | ) | | (0.14 | ) | | (0.18 | ) | | — | | | — | | | (0.18 | ) | | $ | 13.07 | |
| 2020 | | $ | 13.11 | | 0.17 | | | 0.34 | | | 0.51 | | | (0.23 | ) | | — | | | — | | | (0.23 | ) | | $ | 13.39 | |
| (a) | Not annualized for periods less than one year. |
| (b) | Sales loads are not reflected in computing total return. |
| (c) | The total return based on the NAV which reflects the adjustments in accordance with U.S. GAAP is 8.81%. |
| (d) | The total return based on the NAV which reflects the adjustments in accordance with U.S. GAAP is 0.46%. |
| (e) | Effective date of this class of shares was October 1, 2020. |
| + | Based on weighted average shares outstanding. |
See notes to financial statements.
198 | Annual Financial Statements
Financial Highlights, Continued
Limited Term U.S. Government Fund
| | | | RATIOS TO AVERAGE NET ASSETS | | SUPPLEMENTAL DATA | |
UNLESS OTHERWISE
NOTED, PERIODS ARE
FISCAL YEARS ENDED
SEPTEMBER 30, | | | NET INVESTMENT
INCOME (LOSS) (%) | | EXPENSES, AFTER
EXPENSE
REDUCTIONS (%) | | EXPENSES,
BEFORE EXPENSE
REDUCTIONS (%) | | TOTAL
RETURN (%)(a) | | PORTFOLIO
TURNOVER
RATE (%)(a) | | NET
ASSETS
AT END OF PERIOD
(THOUSANDS) |
| | | | | | | | | | | | | | | | | | | | |
| CLASS A SHARES(b) | | | | |
| | | | | |
| 2024 | | | 2.48 | | | 0.99 | | | 1.00 | | | 9.03 | | | 32.26 | | | $ | 38,447 | |
| 2023 | | | 1.89 | | | 0.95 | | | 0.95 | | | 0.74 | | | 38.65 | | | $ | 43,326 | |
| 2022 | | | 1.01 | | | 0.92 | | | 0.92 | | | (9.51 | ) | | 28.92 | | | $ | 57,028 | |
| 2021 | | | 0.60 | | | 0.87 | | | 0.87 | | | (1.22 | ) | | 9.50 | | | $ | 92,786 | |
| 2020 | | | 1.10 | | | 0.89 | | | 0.89 | | | 3.70 | | | 11.66 | | | $ | 86,955 | |
| | | | | | | | | | | | | | | | | | | | | |
| CLASS C SHARES | | | | | | | | | | | | | | | | | | | | |
| | | | | | | | | | | | | | | | | | | | | |
| 2024 | | | 2.22 | | | 1.24 | | | 1.84 | | | 8.82 | | | 32.26 | | | $ | 2,665 | |
| 2023 | | | 1.57 | | | 1.24 | | | 1.56 | | | 0.37 | | | 38.65 | | | $ | 3,311 | |
| 2022 | | | 0.68 | | | 1.24 | | | 1.39 | | | (9.74 | ) | | 28.92 | | | $ | 5,821 | |
| 2021 | | | 0.21 | | | 1.24 | | | 1.24 | | | (1.65 | ) | | 9.50 | | | $ | 10,084 | |
| 2020 | | | 0.82 | | | 1.16 | | | 1.16 | | | 3.48 | | | 11.66 | | | $ | 17,994 | |
| | | | | | | | | | | | | | | | | | | | | |
| CLASS C2 SHARES | | | | | | | | | | | | | | | | | | | | |
| | | | | | | | | | | | | | | | | | | | | |
| 2024 | | | 2.23 | | | 1.24 | | | 3.49 | | | 8.90 | (c) | | 32.26 | | | $ | 305 | |
| 2023 | | | 1.69 | | | 1.24 | | | 2.63 | | | 0.37 | (d) | | 38.65 | | | $ | 576 | |
| 2022 | | | 0.62 | | | 1.24 | | | 2.28 | | | (9.81 | ) | | 28.92 | | | $ | 230 | |
| 2021(e) | | 0.28 | | | 1.24 | | | 3.37 | | | (1.58 | ) | | 9.50 | | | $ | 680 | |
| | | | | | | | | | | | | | | | | | | | | |
| CLASS I SHARES | | | | | | | | | | | | | | | | | | | | |
| | | | | | | | | | | | | | | | | | | | | |
| 2024 | | | 2.82 | | | 0.65 | | | 0.65 | | | 9.49 | | | 32.26 | | | $ | 93,488 | |
| 2023 | | | 2.18 | | | 0.65 | | | 0.65 | | | 0.96 | | | 38.65 | | | $ | 119,323 | |
| 2022 | | | 1.31 | | | 0.62 | | | 0.62 | | | (9.24 | ) | | 28.92 | | | $ | 155,928 | |
| 2021 | | | 0.85 | | | 0.61 | | | 0.61 | | | (0.96 | ) | | 9.50 | | | $ | 219,833 | |
| 2020 | | | 1.36 | | | 0.60 | | | 0.60 | | | 4.00 | | | 11.66 | | | $ | 243,793 | |
| | | | | | | | | | | | | | | | | | | | | |
| CLASS R3 SHARES | | | | | | | | | | | | | | | | | | | | |
| | | | | | | | | | | | | | | | | | | | | |
| 2024 | | | 2.46 | | | 0.99 | | | 1.92 | | | 9.03 | | | 32.26 | | | $ | 2,579 | |
| 2023 | | | 1.86 | | | 0.99 | | | 1.75 | | | 0.70 | | | 38.65 | | | $ | 2,821 | |
| 2022 | | | 0.89 | | | 0.99 | | | 1.52 | | | (9.50 | ) | | 28.92 | | | $ | 3,471 | |
| 2021 | | | 0.46 | | | 0.99 | | | 1.31 | | | (1.41 | ) | | 9.50 | | | $ | 7,601 | |
| 2020 | | | 1.02 | | | 0.99 | | | 1.29 | | | 3.67 | | | 11.66 | | | $ | 9,222 | |
| | | | | | | | | | | | | | | | | | | | | |
| CLASS R4 SHARES | | | | | | | | | | | | | | | | | | | | |
| | | | | | | | | | | | | | | | | | | | | |
| 2024 | | | 2.48 | | | 0.99 | | | 2.65 | | | 9.04 | | | 32.26 | | | $ | 1,035 | |
| 2023 | | | 1.85 | | | 0.99 | | | 2.91 | | | 0.61 | | | 38.65 | | | $ | 931 | |
| 2022 | | | 0.92 | | | 0.99 | | | 2.30 | | | (9.51 | ) | | 28.92 | | | $ | 1,146 | |
| 2021 | | | 0.47 | | | 0.99 | | | 1.63 | | | (1.34 | ) | | 9.50 | | | $ | 2,011 | |
| 2020 | | | 1.01 | | | 0.99 | | | 1.60 | | | 3.60 | | | 11.66 | | | $ | 2,779 | |
| | | | | | | | | | | | | | | | | | | | | |
| CLASS R5 SHARES | | | | | | | | | | | | | | | | | | | | |
| | | | | | | | | | | | | | | | | | | | | |
| 2024 | | | 2.79 | | | 0.67 | | | 2.24 | | | 9.47 | | | 32.26 | | | $ | 1,209 | |
| 2023 | | | 2.16 | | | 0.67 | | | 2.01 | | | 0.94 | | | 38.65 | | | $ | 1,461 | |
| 2022 | | | 1.30 | | | 0.67 | | | 1.64 | | | (9.27 | ) | | 28.92 | | | $ | 1,995 | |
| 2021 | | | 0.80 | | | 0.67 | | | 1.56 | | | (1.02 | ) | | 9.50 | | | $ | 2,198 | |
| 2020 | | | 1.27 | | | 0.67 | | | 2.12 | | | 3.93 | | | 11.66 | | | $ | 2,307 | |
Annual Financial Statements | 199
Financial Highlights
Limited Term Income Fund
| | | PER SHARE PERFORMANCE (FOR A SHARE OUTSTANDING THROUGHOUT THE YEAR) | |
UNLESS OTHERWISE
NOTED, PERIODS ARE
FISCAL YEARS ENDED
SEPTEMBER 30, | | NET ASSET
VALUE,
BEGINNING
OF PERIOD | | NET
INVESTMENT
INCOME
(LOSS)+ | | NET REALIZED &
UNREALIZED
GAIN (LOSS) ON
INVESTMENTS | | TOTAL FROM
INVESTMENT
OPERATIONS | | DIVIDENDS
FROM NET
INVESTMENT
INCOME | | DIVIDENDS
FROM NET
REALIZED
GAINS | | DIVIDENDS
FROM
RETURN OF
CAPITAL | | TOTAL
DIVIDENDS | | NET ASSET
VALUE,
END OF
PERIOD | |
| | | | | | | | | | | | | | | | | | | | | | | | | | | |
| CLASS A SHARES(b) | | | |
| | | | |
| 2024 | | $ | 12.39 | | 0.47 | | | 0.76 | | | 1.23 | | | (0.48 | ) | | — | | | — | | | (0.48 | ) | | $ | 13.14 | |
| 2023 | | $ | 12.38 | | 0.36 | | | 0.02 | | | 0.38 | | | (0.37 | ) | | — | | | — | | | (0.37 | ) | | $ | 12.39 | |
| 2022 | | $ | 13.83 | | 0.21 | | | (1.43 | ) | | (1.22 | ) | | (0.23 | ) | | — | | | — | | | (0.23 | ) | | $ | 12.38 | |
| 2021 | | $ | 14.14 | | 0.16 | | | (0.11 | ) | | 0.05 | | | (0.19 | ) | | (0.17 | ) | | — | | | (0.36 | ) | | $ | 13.83 | |
| 2020 | | $ | 13.61 | | 0.27 | | | 0.64 | | | 0.91 | | | (0.28 | ) | | (0.10 | ) | | — | | | (0.38 | ) | | $ | 14.14 | |
| | | | | | | | | | | | | | | | | | | | | | | | | | | | | |
| CLASS C SHARES | | | | | | | | | | | | | | | | | | | | | | | | | | | | |
| | | | | | | | | | | | | | | | | | | | | | | | | | | | | |
| 2024 | | $ | 12.37 | | 0.44 | | | 0.75 | | | 1.19 | | | (0.44 | ) | | — | | | — | | | (0.44 | ) | | $ | 13.12 | |
| 2023 | | $ | 12.36 | | 0.33 | | | 0.02 | | | 0.35 | | | (0.34 | ) | | — | | | — | | | (0.34 | ) | | $ | 12.37 | |
| 2022 | | $ | 13.81 | | 0.18 | | | (1.43 | ) | | (1.25 | ) | | (0.20 | ) | | — | | | — | | | (0.20 | ) | | $ | 12.36 | |
| 2021 | | $ | 14.12 | | 0.13 | | | (0.11 | ) | | 0.02 | | | (0.16 | ) | | (0.17 | ) | | — | | | (0.33 | ) | | $ | 13.81 | |
| 2020 | | $ | 13.59 | | 0.24 | | | 0.64 | | | 0.88 | | | (0.25 | ) | | (0.10 | ) | | — | | | (0.35 | ) | | $ | 14.12 | |
| | | | | | | | | | | | | | | | | | | | | | | | | | | | | |
| CLASS C2 SHARES | | | | | | | | | | | | | | | | | | | | | | | | | | | | |
| | | | | | | | | | | | | | | | | | | | | | | | | | | | | |
| 2024 | | $ | 12.37 | | 0.41 | | | 0.76 | | | 1.17 | | | (0.42 | ) | | — | | | — | | | (0.42 | ) | | $ | 13.12 | |
| 2023 | | $ | 12.36 | | 0.30 | | | 0.02 | | | 0.32 | | | (0.31 | ) | | — | | | — | | | (0.31 | ) | | $ | 12.37 | |
| 2022 | | $ | 13.81 | | 0.15 | | | (1.43 | ) | | (1.28 | ) | | (0.17 | ) | | — | | | — | | | (0.17 | ) | | $ | 12.36 | |
| 2021(c) | | $ | 14.12 | | 0.09 | | | (0.11 | ) | | (0.02 | ) | | (0.12 | ) | | (0.17 | ) | | — | | | (0.29 | ) | | $ | 13.81 | |
| | | | | | | | | | | | | | | | | | | | | | | | | | | | | |
| CLASS I SHARES | | | | | | | | | | | | | | | | | | | | | | | | | | | | |
| | | | | | | | | | | | | | | | | | | | | | | | | | | | | |
| 2024 | | $ | 12.39 | | 0.51 | | | 0.75 | | | 1.26 | | | (0.51 | ) | | — | | | — | | | (0.51 | ) | | $ | 13.14 | |
| 2023 | | $ | 12.38 | | 0.40 | | | 0.02 | | | 0.42 | | | (0.41 | ) | | — | | | — | | | (0.41 | ) | | $ | 12.39 | |
| 2022 | | $ | 13.84 | | 0.25 | | | (1.44 | ) | | (1.19 | ) | | (0.27 | ) | | — | | | — | | | (0.27 | ) | | $ | 12.38 | |
| 2021 | | $ | 14.15 | | 0.20 | | | (0.11 | ) | | 0.09 | | | (0.23 | ) | | (0.17 | ) | | — | | | (0.40 | ) | | $ | 13.84 | |
| 2020 | | $ | 13.62 | | 0.30 | | | 0.65 | | | 0.95 | | | (0.32 | ) | | (0.10 | ) | | — | | | (0.42 | ) | | $ | 14.15 | |
| | | | | | | | | | | | | | | | | | | | | | | | | | | | | |
| CLASS R3 SHARES | | | | | | | | | | | | | | | | | | | | | | | | | | | | |
| | | | | | | | | | | | | | | | | | | | | | | | | | | | | |
| 2024 | | $ | 12.40 | | 0.44 | | | 0.76 | | | 1.20 | | | (0.45 | ) | | — | | | — | | | (0.45 | ) | | $ | 13.15 | |
| 2023 | | $ | 12.38 | | 0.33 | | | 0.03 | | | 0.36 | | | (0.34 | ) | | — | | | — | | | (0.34 | ) | | $ | 12.40 | |
| 2022 | | $ | 13.84 | | 0.18 | | | (1.44 | ) | | (1.26 | ) | | (0.20 | ) | | — | | | — | | | (0.20 | ) | | $ | 12.38 | |
| 2021 | | $ | 14.15 | | 0.13 | | | (0.11 | ) | | 0.02 | | | (0.16 | ) | | (0.17 | ) | | — | | | (0.33 | ) | | $ | 13.84 | |
| 2020 | | $ | 13.63 | | 0.24 | | | 0.63 | | | 0.87 | | | (0.25 | ) | | (0.10 | ) | | — | | | (0.35 | ) | | $ | 14.15 | |
| | | | | | | | | | | | | | | | | | | | | | | | | | | | | |
| CLASS R4 SHARES | | | | | | | | | | | | | | | | | | | | | | | | | | | | |
| | | | | | | | | | | | | | | | | | | | | | | | | | | | | |
| 2024 | | $ | 12.38 | | 0.44 | | | 0.77 | | | 1.21 | | | (0.45 | ) | | — | | | — | | | (0.45 | ) | | $ | 13.14 | |
| 2023 | | $ | 12.37 | | 0.34 | | | 0.01 | | | 0.35 | | | (0.34 | ) | | — | | | — | | | (0.34 | ) | | $ | 12.38 | |
| 2022 | | $ | 13.83 | | 0.20 | | | (1.46 | ) | | (1.26 | ) | | (0.20 | ) | | — | | | — | | | (0.20 | ) | | $ | 12.37 | |
| 2021 | | $ | 14.14 | | 0.13 | | | (0.11 | ) | | 0.02 | | | (0.16 | ) | | (0.17 | ) | | — | | | (0.33 | ) | | $ | 13.83 | |
| 2020 | | $ | 13.61 | | 0.24 | | | 0.64 | | | 0.88 | | | (0.25 | ) | | (0.10 | ) | | — | | | (0.35 | ) | | $ | 14.14 | |
| | | | | | | | | | | | | | | | | | | | | | | | | | | | | |
| CLASS R5 SHARES | | | | | | | | | | | | | | | | | | | | | | | | | | | | |
| | | | | | | | | | | | | | | | | | | | | | | | | | | | | |
| 2024 | | $ | 12.39 | | 0.51 | | | 0.75 | | | 1.26 | | | (0.51 | ) | | — | | | — | | | (0.51 | ) | | $ | 13.14 | |
| 2023 | | $ | 12.37 | | 0.40 | | | 0.02 | | | 0.42 | | | (0.40 | ) | | — | | | — | | | (0.40 | ) | | $ | 12.39 | |
| 2022 | | $ | 13.83 | | 0.25 | | | (1.44 | ) | | (1.19 | ) | | (0.27 | ) | | — | | | — | | | (0.27 | ) | | $ | 12.37 | |
| 2021 | | $ | 14.14 | | 0.20 | | | (0.11 | ) | | 0.09 | | | (0.23 | ) | | (0.17 | ) | | — | | | (0.40 | ) | | $ | 13.83 | |
| 2020 | | $ | 13.61 | | 0.31 | | | 0.64 | | | 0.95 | | | (0.32 | ) | | (0.10 | ) | | — | | | (0.42 | ) | | $ | 14.14 | |
| | | | | | | | | | | | | | | | | | | | | | | | | | | | | |
| CLASS R6 SHARES | | | | | | | | | | | | | | | | | | | | | | | | | | | | |
| | | | | | | | | | | | | | | | | | | | | | | | | | | | | |
| 2024 | | $ | 12.41 | | 0.52 | | | 0.76 | | | 1.28 | | | (0.52 | ) | | — | | | — | | | (0.52 | ) | | $ | 13.17 | |
| 2023 | | $ | 12.40 | | 0.41 | | | 0.01 | | | 0.42 | | | (0.41 | ) | | — | | | — | | | (0.41 | ) | | $ | 12.41 | |
| 2022 | | $ | 13.86 | | 0.26 | | | (1.44 | ) | | (1.18 | ) | | (0.28 | ) | | — | | | — | | | (0.28 | ) | | $ | 12.40 | |
| 2021 | | $ | 14.17 | | 0.21 | | | (0.11 | ) | | 0.10 | | | (0.24 | ) | | (0.17 | ) | | — | | | (0.41 | ) | | $ | 13.86 | |
| 2020 | | $ | 13.64 | | 0.32 | | | 0.64 | | | 0.96 | | | (0.33 | ) | | (0.10 | ) | | — | | | (0.43 | ) | | $ | 14.17 | |
| (a) | Not annualized for periods less than one year. |
| (b) | Sales loads are not reflected in computing total return. |
| (c) | Effective date of this class of shares was October 1, 2020. |
| (d) | The total return based on the NAV which reflects the adjustments in accordance with U.S. GAAP is (8.70)%. |
| (e) | The total return based on the NAV which reflects the adjustments in accordance with U.S. GAAP is 0.61%. |
| (f) | The total return based on the NAV which reflects the adjustments in accordance with U.S. GAAP is 6.47%. |
| + | Based on weighted average shares outstanding. |
See notes to financial statements.
200 | Annual Financial Statements
Financial Highlights, Continued
Limited Term Income Fund
| | | | RATIOS TO AVERAGE NET ASSETS | | SUPPLEMENTAL DATA | |
UNLESS OTHERWISE
NOTED, PERIODS ARE
FISCAL YEARS ENDED
SEPTEMBER 30, | | | NET INVESTMENT
INCOME (LOSS) (%) | | EXPENSES, AFTER
EXPENSE
REDUCTIONS (%) | | EXPENSES,
BEFORE EXPENSE
REDUCTIONS (%) | | TOTAL
RETURN (%)(a) | | PORTFOLIO
TURNOVER
RATE (%)(a) | | NET
ASSETS
AT END OF PERIOD
(THOUSANDS) |
| | | | | | | | | | | | | | | | | | | | |
| CLASS A SHARES(b) | | | | |
| | | | | |
| 2024 | | | 3.71 | | | 0.76 | | | 0.76 | | | 10.08 | | | 59.42 | | | $ | 480,422 | |
| 2023 | | | 2.90 | | | 0.78 | | | 0.78 | | | 3.06 | | | 37.65 | | | $ | 533,551 | |
| 2022 | | | 1.58 | | | 0.77 | | | 0.77 | | | (8.89 | ) | | 46.77 | | | $ | 598,675 | |
| 2021 | | | 1.17 | | | 0.77 | | | 0.77 | | | 0.33 | | | 33.37 | | | $ | 818,846 | |
| 2020 | | | 1.94 | | | 0.77 | | | 0.77 | | | 6.78 | | | 53.84 | | | $ | 768,798 | |
| | | | | | | | | | | | | | | | | | | | | |
| CLASS C SHARES | | | | | | | | | | | | | | | | | | | | |
| | | | | | | | | | | | | | | | | | | | | |
| 2024 | | | 3.45 | | | 1.01 | | | 1.01 | | | 9.82 | | | 59.42 | | | $ | 106,222 | |
| 2023 | | | 2.64 | | | 1.01 | | | 1.01 | | | 2.83 | | | 37.65 | | | $ | 140,716 | |
| 2022 | | | 1.33 | | | 0.99 | | | 0.99 | | | (9.11 | ) | | 46.77 | | | $ | 221,057 | |
| 2021 | | | 0.94 | | | 0.99 | | | 0.99 | | | 0.11 | | | 33.37 | | | $ | 360,840 | |
| 2020 | | | 1.72 | | | 1.00 | | | 1.00 | | | 6.55 | | | 53.84 | | | $ | 412,659 | |
| | | | | | | | | | | | | | | | | | | | | |
| CLASS C2 SHARES | | | | | | | | | | | | | | | | | | | | |
| | | | | | | | | | | | | | | | | | | | | |
| 2024 | | | 3.23 | | | 1.24 | | | 1.42 | | | 9.57 | | | 59.42 | | | $ | 5,160 | |
| 2023 | | | 2.43 | | | 1.24 | | | 1.44 | | | 2.59 | | | 37.65 | | | $ | 6,733 | |
| 2022 | | | 1.10 | | | 1.24 | | | 1.30 | | | (9.33 | ) | | 46.77 | | | $ | 9,615 | |
| 2021(c) | | | 0.65 | | | 1.24 | | | 1.32 | | | (0.17 | ) | | 33.37 | | | $ | 12,902 | |
| | | | | | | | | | | | | | | | | | | | | |
| CLASS I SHARES | | | | | | | | | | | | | | | | | | | | |
| | | | | | | | | | | | | | | | | | | | | |
| 2024 | | | 3.99 | | | 0.49 | | | 0.52 | | | 10.38 | | | 59.42 | | | $ | 5,543,890 | |
| 2023 | | | 3.18 | | | 0.49 | | | 0.54 | | | 3.36 | | | 37.65 | | | $ | 5,769,043 | |
| 2022 | | | 1.86 | | | 0.49 | | | 0.51 | | | (8.63 | )(d) | | 46.77 | | | $ | 6,890,513 | |
| 2021 | | | 1.44 | | | 0.49 | | | 0.50 | | | 0.53 | (e) | | 33.37 | | | $ | 8,840,331 | |
| 2020 | | | 2.21 | | | 0.49 | | | 0.51 | | | 7.08 | | | 53.84 | | | $ | 6,999,911 | |
| | | | | | | | | | | | | | | | | | | | | |
| CLASS R3 SHARES | | | | | | | | | | | | | | | | | | | | |
| | | | | | | | | | | | | | | | | | | | | |
| 2024 | | | 3.48 | | | 0.99 | | | 1.08 | | | 9.83 | | | 59.42 | | | $ | 35,717 | |
| 2023 | | | 2.66 | | | 0.99 | | | 1.06 | | | 2.93 | | | 37.65 | | | $ | 37,395 | |
| 2022 | | | 1.39 | | | 0.99 | | | 1.04 | | | (9.16 | ) | | 46.77 | | | $ | 49,513 | |
| 2021 | | | 0.94 | | | 0.99 | | | 1.02 | | | 0.11 | | | 33.37 | | | $ | 51,825 | |
| 2020 | | | 1.75 | | | 0.99 | | | 1.02 | | | 6.54 | (f) | | 53.84 | | | $ | 61,041 | |
| | | | | | | | | | | | | | | | | | | | | |
| CLASS R4 SHARES | | | | | | | | | | | | | | | | | | | | |
| | | | | | | | | | | | | | | | | | | | | |
| 2024 | | | 3.46 | | | 0.99 | | | 1.21 | | | 9.92 | | | 59.42 | | | $ | 16,303 | |
| 2023 | | | 2.71 | | | 0.99 | | | 1.15 | | | 2.84 | | | 37.65 | | | $ | 18,774 | |
| 2022 | | | 1.51 | | | 0.99 | | | 1.24 | | | (9.16 | ) | | 46.77 | | | $ | 17,988 | |
| 2021 | | | 0.94 | | | 0.99 | | | 1.19 | | | 0.11 | | | 33.37 | | | $ | 10,777 | |
| 2020 | | | 1.74 | | | 0.99 | | | 1.32 | | | 6.55 | | | 53.84 | | | $ | 6,413 | |
| | | | | | | | | | | | | | | | | | | | | |
| CLASS R5 SHARES | | | | | | | | | | | | | | | | | | | | |
| | | | | | | | | | | | | | | | | | | | | |
| 2024 | | | 3.98 | | | 0.49 | | | 0.66 | | | 10.38 | | | 59.42 | | | $ | 70,839 | |
| 2023 | | | 3.15 | | | 0.49 | | | 0.74 | | | 3.44 | | | 37.65 | | | $ | 70,594 | |
| 2022 | | | 1.88 | | | 0.49 | | | 0.71 | | | (8.71 | ) | | 46.77 | | | $ | 111,149 | |
| 2021 | | | 1.44 | | | 0.49 | | | 0.69 | | | 0.61 | | | 33.37 | | | $ | 134,974 | |
| 2020 | | | 2.24 | | | 0.49 | | | 0.64 | | | 7.08 | | | 53.84 | | | $ | 149,322 | |
| | | | | | | | | | | | | | | | | | | | | |
| CLASS R6 SHARES | | | | | | | | | | | | | | | | | | | | |
| | | | | | | | | | | | | | | | | | | | | |
| 2024 | | | 4.07 | | | 0.42 | | | 0.47 | | | 10.53 | | | 59.42 | | | $ | 171,607 | |
| 2023 | | | 3.25 | | | 0.42 | | | 0.46 | | | 3.43 | | | 37.65 | | | $ | 157,354 | |
| 2022 | | | 2.00 | | | 0.42 | | | 0.45 | | | (8.62 | ) | | 46.77 | | | $ | 180,359 | |
| 2021 | | | 1.51 | | | 0.42 | | | 0.43 | | | 0.68 | | | 33.37 | | | $ | 127,763 | |
| 2020 | | | 2.31 | | | 0.42 | | | 0.46 | | | 7.15 | | | 53.84 | | | $ | 98,639 | |
Annual Financial Statements | 201
Financial Highlights
Core Plus Bond Fund
| | | PER SHARE PERFORMANCE (FOR A SHARE OUTSTANDING THROUGHOUT THE YEAR) | |
UNLESS OTHERWISE
NOTED, PERIODS ARE
FISCAL YEARS ENDED
SEPTEMBER 30, | | NET ASSET
VALUE,
BEGINNING
OF YEAR | | NET
INVESTMENT
INCOME
(LOSS)+ | | NET REALIZED &
UNREALIZED
GAIN (LOSS) ON
INVESTMENTS | | TOTAL FROM
INVESTMENT
OPERATIONS | | DIVIDENDS
FROM NET
INVESTMENT
INCOME | | DIVIDENDS
FROM NET
REALIZED
GAINS | | DIVIDENDS
FROM
RETURN OF
CAPITAL | | TOTAL
DIVIDENDS | | NET ASSET
VALUE,
END OF
YEAR | |
| | | | | | | | | | | | | | | | | | | | | | | | | | | | | |
| CLASS A SHARES(b)(c) | | | | | | | | | | | | | | | | | | | | | | | | | | | | |
| | | | | | | | | | | | | | | | | | | | | | | | | | | | | |
| 2024 | | $ | 10.00 | | 0.50 | | | 0.72 | | | 1.22 | | | (0.49 | ) | | — | | | — | | | (0.49 | ) | | $ | 10.73 | |
| | | | | | | | | | | | | | | | | | | | | | | | | | | | | |
| CLASS C SHARES(b) | | | | | | | | | | | | | | | | | | | | | | | | | | | | |
| | | | | | | | | | | | | | | | | | | | | | | | | | | | | |
| 2024 | | $ | 10.00 | | 0.44 | | | 0.72 | | | 1.16 | | | (0.42 | ) | | — | | | — | | | (0.42 | ) | | $ | 10.74 | |
| | | | | | | | | | | | | | | | | | | | | | | | | | | | | |
| CLASS I SHARES(b) | | | | | | | | | | | | | | | | | | | | | | | | | | | | |
| | | | | | | | | | | | | | | | | | | | | | | | | | | | | |
| 2024 | | $ | 10.00 | | 0.54 | | | 0.72 | | | 1.26 | | | (0.52 | ) | | — | | | — | | | (0.52 | ) | | $ | 10.74 | |
| | | | | | | | | | | | | | | | | | | | | | | | | | | | | |
| CLASS R3 SHARES(b) | | | | | | | | | | | | | | | | | | | | | | | | | | | | |
| | | | | | | | | | | | | | | | | | | | | | | | | | | | | |
| 2024 | | $ | 10.00 | | 0.47 | | | 0.73 | | | 1.20 | | | (0.47 | ) | | — | | | — | | | (0.47 | ) | | $ | 10.73 | |
| | | | | | | | | | | | | | | | | | | | | | | | | | | | | |
| CLASS R4 SHARES(b) | | | | | | | | | | | | | | | | | | | | | | | | | | | | |
| | | | | | | | | | | | | | | | | | | | | | | | | | | | | |
| 2024 | | $ | 10.00 | | 0.49 | | | 0.73 | | | 1.22 | | | (0.49 | ) | | — | | | — | | | (0.49 | ) | | $ | 10.73 | |
| | | | | | | | | | | | | | | | | | | | | | | | | | | | | |
| CLASS R5 SHARES(b) | | | | | | | | | | | | | | | | | | | | | | | | | | | | |
| | | | | | | | | | | | | | | | | | | | | | | | | | | | | |
| 2024 | | $ | 10.00 | | 0.52 | | | 0.73 | | | 1.25 | | | (0.52 | ) | | — | | | — | | | (0.52 | ) | | $ | 10.73 | |
| | | | | | | | | | | | | | | | | | | | | | | | | | | | | |
| CLASS R6 SHARES(b) | | | | | | | | | | | | | | | | | | | | | | | | | | | | |
| | | | | | | | | | | | | | | | | | | | | | | | | | | | | |
| 2024 | | $ | 10.00 | | 0.54 | | | 0.71 | | | 1.25 | | | (0.52 | ) | | — | | | — | | | (0.52 | ) | | $ | 10.73 | |
| (a) | Not annualized for periods less than one year. |
| (b) | The Fund commenced operations on October 2, 2023. |
| (c) | Sales loads are not reflected in computing total return. |
| (d) | Annualized. |
| (e) | The total return based on the NAV which reflects the adjustments in accordance with U.S. GAAP is 12.91% |
| + | Based on weighted average shares outstanding. |
See notes to financial statements.
202 | Annual Financial Statements
Financial Highlights, Continued
Core Plus Bond Fund
| | | | RATIOS TO AVERAGE NET ASSETS | | SUPPLEMENTAL DATA | |
UNLESS OTHERWISE
NOTED, PERIODS ARE
FISCAL YEARS ENDED
SEPTEMBER 30, | | | NET INVESTMENT
INCOME (LOSS) (%) | | EXPENSES, AFTER
EXPENSE
REDUCTIONS (%) | | EXPENSES,
BEFORE EXPENSE
REDUCTIONS (%) | | TOTAL
RETURN (%)(a) | | PORTFOLIO
TURNOVER
RATE (%)(a) | | NET
ASSETS
AT END OF YEAR
(THOUSANDS) |
| | | | | | | | | | | | | | | | | | | | | |
| CLASS A SHARES(b)(c) | | | | | | | | | | | | | | | | | | | | |
| | | | | | | | | | | | | | | | | | | | | |
| 2024 | | | 4.80 | (d) | | 0.75 | (d) | | 10.92 | (d) | | 12.50 | | | 73.32 | | | $ | 272 | |
| | | | | | | | | | | | | | | | | | | | | |
| CLASS C SHARES(b) | | | | | | | | | | | | | | | | | | | | |
| | | | | | | | | | | | | | | | | | | | | |
| 2024 | | | 4.21 | (d) | | 1.50 | (d) | | 3.45 | (d) | | 11.78 | | | 73.32 | | | $ | 819 | |
| | | | | | | | | | | | | | | | | | | | | |
| CLASS I SHARES(b) | | | | | | | | | | | | | | | | | | | | |
| | | | | | | | | | | | | | | | | | | | | |
| 2024 | | | 5.23 | (d) | | 0.46 | (d) | | 1.11 | (d) | | 12.80 | (e) | | 73.32 | | | $ | 163,388 | |
| | | | | | | | | | | | | | | | | | | | | |
| CLASS R3 SHARES(b) | | | | | | | | | | | | | | | | | | | | |
| | | | | | | | | | | | | | | | | | | | | |
| 2024 | | | 4.54 | (d) | | 1.00 | (d) | | 6.60 | (d) | | 12.23 | | | 73.32 | | | $ | 112 | |
| | | | | | | | | | | | | | | | | | | | | |
| CLASS R4 SHARES(b) | | | | | | | | | | | | | | | | | | | | |
| | | | | | | | | | | | | | | | | | | | | |
| 2024 | | | 4.78 | (d) | | 0.75 | (d) | | 4.65 | (d) | | 12.51 | | | 73.32 | | | $ | 113 | |
| | | | | | | | | | | | | | | | | | | | | |
| CLASS R5 SHARES(b) | | | | | | | | | | | | | | | | | | | | |
| | | | | | | | | | | | | | | | | | | | | |
| 2024 | | | 5.04 | (d) | | 0.50 | (d) | | 6.09 | (d) | | 12.79 | | | 73.32 | | | $ | 113 | |
| | | | | | | | | | | | | | | | | | | | | |
| CLASS R6 SHARES(b) | | | | | | | | | | | | | | | | | | | | |
| | | | | | | | | | | | | | | | | | | | | |
| 2024 | | | 5.26 | (d) | | 0.49 | (d) | | 2.23 | (d) | | 12.82 | | | 73.32 | | | $ | 658 | |
Annual Financial Statements | 203
Financial Highlights
Strategic Income Fund
| | | PER SHARE PERFORMANCE (FOR A SHARE OUTSTANDING THROUGHOUT THE YEAR) | |
UNLESS OTHERWISE
NOTED, PERIODS ARE
FISCAL YEARS ENDED
SEPTEMBER 30, | | NET ASSET
VALUE,
BEGINNING
OF PERIOD | | NET
INVESTMENT
INCOME
(LOSS)+ | | NET REALIZED &
UNREALIZED
GAIN (LOSS) ON
INVESTMENTS | | TOTAL FROM
INVESTMENT
OPERATIONS | | DIVIDENDS
FROM NET
INVESTMENT
INCOME | | DIVIDENDS
FROM NET
REALIZED
GAINS | | DIVIDENDS
FROM
RETURN OF
CAPITAL | | TOTAL
DIVIDENDS | | NET ASSET
VALUE,
END OF
PERIOD | |
| | | | | | | | | | | | | | | | | | | | | | | | | | | |
| CLASS A SHARES(c) | | | |
| | | | |
| 2024 | | $ | 11.02 | | 0.52 | | | 0.65 | | | 1.17 | | | (0.52 | ) | | — | | | — | | | (0.52 | ) | | $ | 11.67 | |
| 2023 | | $ | 10.99 | | 0.45 | | | 0.03 | | | 0.48 | | | (0.45 | ) | | — | | | — | | | (0.45 | ) | | $ | 11.02 | |
| 2022 | | $ | 12.41 | | 0.36 | | | (1.38 | ) | | (1.02 | ) | | (0.37 | ) | | (0.03 | ) | | — | | | (0.40 | ) | | $ | 10.99 | |
| 2021 | | $ | 12.24 | | 0.43 | | | 0.21 | | | 0.64 | | | (0.47 | ) | | — | | | — | | | (0.47 | ) | | $ | 12.41 | |
| 2020 | | $ | 11.92 | | 0.40 | | | 0.31 | | | 0.71 | | | (0.39 | ) | | — | | | — | | | (0.39 | ) | | $ | 12.24 | |
| | | | | | | | | | | | | | | | | | | | | | | | | | | | | |
| CLASS C SHARES | | | | | | | | | | | | | | | | | | | | | | | | | | | | |
| | | | | | | | | | | | | | | | | | | | | | | | | | | | | |
| 2024 | | $ | 11.00 | | 0.44 | | | 0.64 | | | 1.08 | | | (0.43 | ) | | — | | | — | | | (0.43 | ) | | $ | 11.65 | |
| 2023 | | $ | 10.97 | | 0.37 | | | 0.03 | | | 0.40 | | | (0.37 | ) | | — | | | — | | | (0.37 | ) | | $ | 11.00 | |
| 2022 | | $ | 12.39 | | 0.27 | | | (1.38 | ) | | (1.11 | ) | | (0.28 | ) | | (0.03 | ) | | — | | | (0.31 | ) | | $ | 10.97 | |
| 2021 | | $ | 12.22 | | 0.33 | | | 0.21 | | | 0.54 | | | (0.37 | ) | | — | | | — | | | (0.37 | ) | | $ | 12.39 | |
| 2020 | | $ | 11.90 | | 0.31 | | | 0.31 | | | 0.62 | | | (0.30 | ) | | — | | | — | | | (0.30 | ) | | $ | 12.22 | |
| | | | | | | | | | | | | | | | | | | | | | | | | | | | | |
| CLASS I SHARES | | | | | | | | | | | | | | | | | | | | | | | | | | | | |
| | | | | | | | | | | | | | | | | | | | | | | | | | | | | |
| 2024 | | $ | 11.00 | | 0.56 | | | 0.65 | | | 1.21 | | | (0.56 | ) | | — | | | — | | | (0.56 | ) | | $ | 11.65 | |
| 2023 | | $ | 10.96 | | 0.49 | | | 0.04 | | | 0.53 | | | (0.49 | ) | | — | | | — | | | (0.49 | ) | | $ | 11.00 | |
| 2022 | | $ | 12.38 | | 0.40 | | | (1.38 | ) | | (0.98 | ) | | (0.41 | ) | | (0.03 | ) | | — | | | (0.44 | ) | | $ | 10.96 | |
| 2021 | | $ | 12.20 | | 0.47 | | | 0.22 | | | 0.69 | | | (0.51 | ) | | — | | | — | | | (0.51 | ) | | $ | 12.38 | |
| 2020 | | $ | 11.89 | | 0.44 | | | 0.30 | | | 0.74 | | | (0.43 | ) | | — | | | — | | | (0.43 | ) | | $ | 12.20 | |
| | | | | | | | | | | | | | | | | | | | | | | | | | | | | |
| CLASS R3 SHARES | | | | | | | | | | | | | | | | | | | | | | | | | | | | |
| | | | | | | | | | | | | | | | | | | | | | | | | | | | | |
| 2024 | | $ | 11.01 | | 0.49 | | | 0.64 | | | 1.13 | | | (0.48 | ) | | — | | | — | | | (0.48 | ) | | $ | 11.66 | |
| 2023 | | $ | 10.98 | | 0.42 | | | 0.03 | | | 0.45 | | | (0.42 | ) | | — | | | — | | | (0.42 | ) | | $ | 11.01 | |
| 2022 | | $ | 12.40 | | 0.33 | | | (1.38 | ) | | (1.05 | ) | | (0.34 | ) | | (0.03 | ) | | — | | | (0.37 | ) | | $ | 10.98 | |
| 2021 | | $ | 12.22 | | 0.40 | | | 0.21 | | | 0.61 | | | (0.43 | ) | | — | | | — | | | (0.43 | ) | | $ | 12.40 | |
| 2020 | | $ | 11.91 | | 0.35 | | | 0.31 | | | 0.66 | | | (0.35 | ) | | — | | | — | | | (0.35 | ) | | $ | 12.22 | |
| | | | | | | | | | | | | | | | | | | | | | | | | | | | | |
| CLASS R4 SHARES | | | | | | | | | | | | | | | | | | | | | | | | | | | | |
| | | | | | | | | | | | | | | | | | | | | | | | | | | | | |
| 2024 | | $ | 11.01 | | 0.49 | | | 0.64 | | | 1.13 | | | (0.48 | ) | | — | | | — | | | (0.48 | ) | | $ | 11.66 | |
| 2023 | | $ | 10.97 | | 0.42 | | | 0.04 | | | 0.46 | | | (0.42 | ) | | — | | | — | | | (0.42 | ) | | $ | 11.01 | |
| 2022 | | $ | 12.39 | | 0.32 | | | (1.37 | ) | | (1.05 | ) | | (0.34 | ) | | (0.03 | ) | | — | | | (0.37 | ) | | $ | 10.97 | |
| 2021 | | $ | 12.22 | | 0.40 | | | 0.20 | | | 0.60 | | | (0.43 | ) | | — | | | — | | | (0.43 | ) | | $ | 12.39 | |
| 2020 | | $ | 11.90 | | 0.36 | | | 0.31 | | | 0.67 | | | (0.35 | ) | | — | | | — | | | (0.35 | ) | | $ | 12.22 | |
| | | | | | | | | | | | | | | | | | | | | | | | | | | | | |
| CLASS R5 SHARES | | | | | | | | | | | | | | | | | | | | | | | | | | | | |
| | | | | | | | | | | | | | | | | | | | | | | | | | | | | |
| 2024 | | $ | 11.00 | | 0.56 | | | 0.65 | | | 1.21 | | | (0.56 | ) | | — | | | — | | | (0.56 | ) | | $ | 11.65 | |
| 2023 | | $ | 10.96 | | 0.50 | | | 0.03 | | | 0.53 | | | (0.49 | ) | | — | | | — | | | (0.49 | ) | | $ | 11.00 | |
| 2022 | | $ | 12.39 | | 0.40 | | | (1.39 | ) | | (0.99 | ) | | (0.41 | ) | | (0.03 | ) | | — | | | (0.44 | ) | | $ | 10.96 | |
| 2021 | | $ | 12.21 | | 0.47 | | | 0.22 | | | 0.69 | | | (0.51 | ) | | — | | | — | | | (0.51 | ) | | $ | 12.39 | |
| 2020 | | $ | 11.89 | | 0.45 | | | 0.30 | | | 0.75 | | | (0.43 | ) | | — | | | — | | | (0.43 | ) | | $ | 12.21 | |
| | | | | | | | | | | | | | | | | | | | | | | | | | | | | |
| CLASS R6 SHARES | | | | | | | | | | | | | | | | | | | | | | | | | | | | |
| | | | | | | | | | | | | | | | | | | | | | | | | | | | | |
| 2024 | | $ | 11.03 | | 0.58 | | | 0.64 | | | 1.22 | | | (0.57 | ) | | — | | | — | | | (0.57 | ) | | $ | 11.68 | |
| 2023 | | $ | 10.99 | | 0.50 | | | 0.04 | | | 0.54 | | | (0.50 | ) | | — | | | — | | | (0.50 | ) | | $ | 11.03 | |
| 2022 | | $ | 12.42 | | 0.41 | | | (1.39 | ) | | (0.98 | ) | | (0.42 | ) | | (0.03 | ) | | — | | | (0.45 | ) | | $ | 10.99 | |
| 2021 | | $ | 12.24 | | 0.48 | | | 0.22 | | | 0.70 | | | (0.52 | ) | | — | | | — | | | (0.52 | ) | | $ | 12.42 | |
| 2020 | | $ | 11.93 | | 0.45 | | | 0.30 | | | 0.75 | | | (0.44 | ) | | — | | | — | | | (0.44 | ) | | $ | 12.24 | |
| (a) | Net investment income (loss) includes income from foreign withholding tax claims adjusted for IRS compliance fees and/or tax reclaim collection fees. Without these proceeds, the Net Investment Income (Loss) ratios would have been as follows: |
| | Class A | Class C | Class I | Class R3 | Class R4 | Class R5 | Class R6 |
| 2024 | 4.61% | 3.86% | 4.99% | 4.36% | 4.35% | 4.98% | 5.08% |
| 2021 | 3.48% | 2.71% | 3.81% | 3.19% | 3.21% | 3.84% | 3.89% |
| (b) | Not annualized for periods less than one year. |
| (c) | Sales loads are not reflected in computing total return. |
| (d) | The total return based on the NAV which reflects adjustments in accordance with U.S. GAAP is 6.46% for 2020. |
| + | Based on weighted average shares outstanding. |
See notes to financial statements.
204 | Annual Financial Statements
Financial Highlights, Continued
Strategic Income Fund
| | | | RATIOS TO AVERAGE NET ASSETS | | SUPPLEMENTAL DATA |
UNLESS OTHERWISE
NOTED, PERIODS ARE
FISCAL YEARS ENDED
SEPTEMBER 30, | | | NET INVESTMENT
INCOME (LOSS) (%)(a) | | EXPENSES, AFTER
EXPENSE
REDUCTIONS (%) | | EXPENSES,
BEFORE EXPENSE
REDUCTIONS (%) | | TOTAL
RETURN (%)(b) | | PORTFOLIO
TURNOVER
RATE (%)(b) | | NET
ASSETS
AT END OF PERIOD
(THOUSANDS) |
| | | | | | | | | | | | | | | | | | | | |
| CLASS A SHARES(c) | | | | |
| | | | | |
| 2024 | | | 4.61 | | | 0.97 | | | 1.00 | | | 10.81 | | | 60.47 | | | $ | 294,970 | |
| 2023 | | | 4.00 | | | 1.02 | | | 1.07 | | | 4.39 | | | 22.34 | | | $ | 271,826 | |
| 2022 | | | 3.03 | | | 0.99 | | | 1.06 | | | (8.37 | ) | | 27.19 | | | $ | 321,614 | |
| 2021 | | | 3.48 | | | 0.95 | | | 1.05 | | | 5.30 | | | 28.55 | | | $ | 376,252 | |
| 2020 | | | 3.35 | | | 0.96 | | | 1.13 | | | 6.07 | | | 58.91 | | | $ | 249,520 | |
| | | | | | | | | | | | | | | | | | | | | |
| CLASS C SHARES | | | | | | | | | | | | | | | | | | | | |
| | | | | | | | | | | | | | | | | | | | | |
| 2024 | | | 3.86 | | | 1.72 | | | 1.75 | | | 10.02 | | | 60.47 | | | $ | 101,094 | |
| 2023 | | | 3.31 | | | 1.72 | | | 1.77 | | | 3.69 | | | 22.34 | | | $ | 93,062 | |
| 2022 | | | 2.29 | | | 1.72 | | | 1.79 | | | (9.08 | ) | | 27.19 | | | $ | 80,326 | |
| 2021 | | | 2.71 | | | 1.73 | | | 1.83 | | | 4.49 | | | 28.55 | | | $ | 100,385 | |
| 2020 | | | 2.57 | | | 1.70 | | | 1.88 | | | 5.30 | | | 58.91 | | | $ | 103,302 | |
| | | | | | | | | | | | | | | | | | | | | |
| CLASS I SHARES | | | | | | | | | | | | | | | | | | | | |
| | | | | | | | | | | | | | | | | | | | | |
| 2024 | | | 4.99 | | | 0.60 | | | 0.74 | | | 11.24 | | | 60.47 | | | $ | 8,778,651 | |
| 2023 | | | 4.44 | | | 0.60 | | | 0.77 | | | 4.90 | | | 22.34 | | | $ | 6,427,625 | |
| 2022 | | | 3.45 | | | 0.60 | | | 0.77 | | | (8.07 | ) | | 27.19 | | | $ | 4,180,742 | |
| 2021 | | | 3.81 | | | 0.60 | | | 0.81 | | | 5.74 | | | 28.55 | | | $ | 3,255,002 | |
| 2020 | | | 3.73 | | | 0.60 | | | 0.88 | | | 6.39 | | | 58.91 | | | $ | 1,758,843 | |
| | | | | | | | | | | | | | | | | | | | | |
| CLASS R3 SHARES | | | | | | | | | | | | | | | | | | | | |
| | | | | | | | | | | | | | | | | | | | | |
| 2024 | | | 4.36 | | | 1.25 | | | 3.37 | | | 10.52 | | | 60.47 | | | $ | 1,130 | |
| 2023 | | | 3.78 | | | 1.25 | | | 4.49 | | | 4.15 | | | 22.34 | | | $ | 670 | |
| 2022 | | | 2.77 | | | 1.25 | | | 3.96 | | | (8.64 | ) | | 27.19 | | | $ | 641 | |
| 2021 | | | 3.20 | | | 1.25 | | | 3.16 | | | 5.06 | | | 28.55 | | | $ | 837 | |
| 2020 | | | 2.96 | | | 1.25 | | | 2.53 | | | 5.70 | | | 58.91 | | | $ | 1,105 | |
| | | | | | | | | | | | | | | | | | | | | |
| CLASS R4 SHARES | | | | | | | | | | | | | | | | | | | | |
| | | | | | | | | | | | | | | | | | | | | |
| 2024 | | | 4.35 | | | 1.25 | | | 2.07 | | | 10.52 | | | 60.47 | | | $ | 2,430 | |
| 2023 | | | 3.81 | | | 1.25 | | | 2.10 | | | 4.24 | | | 22.34 | | | $ | 2,806 | |
| 2022 | | | 2.76 | | | 1.25 | | | 2.44 | | | (8.65 | ) | | 27.19 | | | $ | 2,044 | |
| 2021 | | | 3.21 | | | 1.25 | | | 2.28 | | | 4.98 | | | 28.55 | | | $ | 2,139 | |
| 2020 | | | 3.06 | | | 1.25 | | | 2.70 | | | 5.79 | | | 58.91 | | | $ | 1,633 | |
| | | | | | | | | | | | | | | | | | | | | |
| CLASS R5 SHARES | | | | | | | | | | | | | | | | | | | | |
| | | | | | | | | | | | | | | | | | | | | |
| 2024 | | | 4.98 | | | 0.60 | | | 0.87 | | | 11.24 | | | 60.47 | | | $ | 91,965 | |
| 2023 | | | 4.46 | | | 0.60 | | | 0.88 | | | 4.90 | | | 22.34 | | | $ | 62,908 | |
| 2022 | | | 3.38 | | | 0.60 | | | 0.96 | | | (8.14 | ) | | 27.19 | | | $ | 40,507 | |
| 2021 | | | 3.84 | | | 0.60 | | | 0.92 | | | 5.74 | | | 28.55 | | | $ | 64,449 | |
| 2020 | | | 3.78 | | | 0.60 | | | 1.00 | | | 6.48 | | | 58.91 | | | $ | 43,715 | |
| | | | | | | | | | | | | | | | | | | | | |
| CLASS R6 SHARES | | | | | | | | | | | | | | | | | | | | |
| | | | | | | | | | | | | | | | | | | | | |
| 2024 | | | 5.08 | | | 0.53 | | | 0.69 | | | 11.30 | | | 60.47 | | | $ | 183,956 | |
| 2023 | | | 4.52 | | | 0.53 | | | 0.70 | | | 4.97 | | | 22.34 | | | $ | 138,108 | |
| 2022 | | | 3.53 | | | 0.53 | | | 0.72 | | | (8.05 | ) | | 27.19 | | | $ | 109,349 | |
| 2021 | | | 3.89 | | | 0.53 | | | 0.75 | | | 5.81 | | | 28.55 | | | $ | 77,415 | |
| 2020 | | | 3.77 | | | 0.53 | | | 0.88 | | | 6.55 | (d) | | 58.91 | | | $ | 39,115 | |
Annual Financial Statements | 205
Report of Independent Registered Public Accounting Firm
Thornburg Taxable Fixed Income Funds
To the Board of Trustees of Thornburg Investment Trust and Shareholders of each of the five funds listed in the table below
Opinions on the Financial Statements
We have audited the accompanying statements of assets and liabilities, including the schedules of investments, of each of the funds listed in the table below (five of the funds constituting Thornburg Investment Trust, hereafter collectively referred to as the "Funds") as of September 30, 2024, the related statements of operations and of changes in net assets for each of the periods indicated in the table below, including the related notes, and the financial highlights for each of the periods indicated therein (collectively referred to as the "financial statements"). In our opinion, the financial statements present fairly, in all material respects, the financial position of each of the Funds listed in the table below as of September 30, 2024, the results of each of their operations and the changes in each of their net assets for the periods indicated in the table below, and each of the financial highlights for each of the periods indicated therein, in conformity with accounting principles generally accepted in the United States of America.
Fund
Thornburg Ultra Short Income Fund (1)
Thornburg Limited Term U.S. Government Fund (1)
Thornburg Limited Term Income Fund (1)
Thornburg Core Plus Bond Fund (2)
Thornburg Strategic Income Fund (1)
(1) Statement of operations for the year ended September 30, 2024, and statements of changes in net assets for year ended September 30, 2024, and September 30, 2023
(2) Statement of operations and statement of changes in net assets for the period October 2, 2023 (commencement of operations) through September 30, 2024
Basis for Opinions
These financial statements are the responsibility of the Funds’ management. Our responsibility is to express an opinion on the Funds’ financial statements based on our audits. We are a public accounting firm registered with the Public Company Accounting Oversight Board (United States) (PCAOB) and are required to be independent with respect to the Funds in accordance with the U.S. federal securities laws and the applicable rules and regulations of the Securities and Exchange Commission and the PCAOB.
We conducted our audits of these financial statements in accordance with the standards of the PCAOB. Those standards require that we plan and perform the audit to obtain reasonable assurance about whether the financial statements are free of material misstatement, whether due to error or fraud.
Our audits included performing procedures to assess the risks of material misstatement of the financial statements, whether due to error or fraud, and performing procedures that respond to those risks. Such procedures included examining, on a test basis, evidence regarding the amounts and disclosures in the financial statements. Our audits also included evaluating the accounting principles used and significant estimates made by management, as well as evaluating the overall presentation of the financial statements. Our procedures included confirmation of securities owned as of September 30, 2024, by correspondence with the custodian, agent banks, transfer agent and brokers; when replies were not received from brokers we performed other auditing procedures. We believe that our audits provide a reasonable basis for our opinions.
/s/PricewaterhouseCoopers LLP
New York, New York
November 14, 2024
We have served as the auditor of one or more investment companies in Thornburg Investment Trust since 1999.
206 | Annual Financial Statements
Tax Information
September 30, 2024
For the tax year ended September 30, 2024, taxable ordinary income dividends paid by the Funds for federal income tax purposes are as follows:
| | TAXABLE ORDINARY |
| Ultra Short Income Fund | $ 14,906,668 |
| Limited Term U.S. Government Fund | 4,449,267 |
| Limited Term Income Fund | 256,488,888 |
| Core Plus Bond Fund | 3,917,407 |
| Strategic Income Fund | 401,682,232 |
For the tax year ended September 30, 2024, the dividend ratio (or the maximum allowed) paid from tax basis net ordinary income as qualifying for the reduced rate under the Jobs and Growth Tax Relief and Reconciliation Act of 2003 and the ordinary income distributions ratio (or the maximum allowed) paid as qualified for the corporate dividend received deduction are as follows:
| | QUALIFIED | DIVIDENDS |
| | DIVIDEND INCOME | RECEIVED DEDUCTION |
| Limited Term Income Fund | 0.10% | —% |
| Strategic Income Fund | 0.11 | 0.06 |
The information and the distributions reported herein may differ from information and distributions reported to the shareholders for the calendar year ending December 31, 2024. Complete information will be reported in conjunction with your 2024 Form 1099.
Annual Financial Statements | 207
Schedule of Investments
Thornburg Short Duration Municipal Fund | September 30, 2024
| ISSUER-DESCRIPTION | | PRINCIPAL
AMOUNT | | | VALUE | |
| | | | | | | | | | |
| | LONG-TERM MUNICIPAL BONDS — 97.6% | | | | | | | | |
| | | | | | | | | | |
| | ALABAMA — 2.2% | | | | | | | | |
| a | Chatom (PowerSouth Energy Cooperative; SPA National Rural Utilities Cooperative Finance) IDB, Series A, 3.85% due 8/1/2037 (put 2/1/2025) | | $ | 1,500,000 | | | $ | 1,593,018 | |
| a | City of Mobile Alabama (Alabama Power Co.) IDB, Series C, 3.78% due 6/1/2034 (put 6/16/2026) | | | 1,000,000 | | | | 1,009,845 | |
| | ARIZONA — 2.2% | | | | | | | | |
| a | Arizona (Banner Health Obligated Group) HFA, Series B, 3.40% (MUNIPSA + 0.25%) due 1/1/2046 (pre-refunded 11/4/2025) | | | 155,000 | | | | 155,049 | |
| a | Arizona (Gunsmoke Ranch Apartments LP) IDA, 5.00% due 3/1/2058 (put 11/1/2026) | | | 1,500,000 | | | | 1,560,952 | |
| | Arizona HFA, | | | | | | | | |
| | Series B, | | | | | | | | |
| a | 3.40% (MUNIPSA + 0.25%) due 1/1/2046 (pre-refunded 11/4/2025) | | | 35,000 | | | | 34,843 | |
| a | 3.40% (MUNIPSA + 0.25%) due 1/1/2046 (put 11/4/2026) | | | 810,000 | | | | 808,920 | |
| | CALIFORNIA — 4.7% | | | | | | | | |
| | California (PIH Health, Inc. Obligated Group) HFFA, Series A, 5.00% due 6/1/2027 | | | 365,000 | | | | 385,135 | |
| a | California Municipal Finance Authority (Waste Management, Inc.; Guaranty: Waste Management Holdings) AMT, 3.95% due 10/1/2045 (put 12/2/2024) | | | 2,000,000 | | | | 1,999,086 | |
| a,b | California Pollution Control Financing Authority (Republic Services, Inc.) AMT, 4.05% due 7/1/2043 (put 2/18/2025) | | | 1,000,000 | | | | 988,602 | |
| | City of Stockton Redevelopment Successor Agency (Redevelopment of Midtown, North & South Stockton & Waterfront Areas) (AGM), Series A, 5.00% due 9/1/2027 | | | 1,000,000 | | | | 1,039,059 | |
| | Tulare Public Financing Authority (BAM), 5.00% due 4/1/2027 - 4/1/2028 | | | 1,055,000 | | | | 1,089,686 | |
| | COLORADO — 0.9% | | | | | | | | |
| a | Adams County Housing Authority (647 Oat LLLP), 4.50% due 5/1/2042 (put 5/1/2026) | | | 1,000,000 | | | | 1,016,278 | |
| | FLORIDA — 7.0% | | | | | | | | |
| a | Broward County Housing Finance Authority (Pinnacle 441 Phase 2 LLC), 4.05% due 9/1/2056 (put 3/1/2026) | | | 500,000 | | | | 506,188 | |
| | City of Orlando (Senior Tourist Development) (AGM), Series A, 5.00% due 11/1/2025 | | | 1,000,000 | | | | 1,023,863 | |
| | City of Tampa (State of Florida Cigarette Tax Revenue), Series A, 5.00% due 9/1/2026 | | | 300,000 | | | | 312,733 | |
| | County of Manatee (Public Utilities System Improvements), 5.00% due 10/1/2026 | | | 370,000 | | | | 373,937 | |
| a | Florida Housing Finance Corp. (GNMA), Series B, 3.35% due 10/1/2027 (put 10/1/2026) | | | 1,000,000 | | | | 1,005,656 | |
| a | Florida Housing Finance Corp. (Hampton Point Preservation Ltd.), Series E, 5.00% due 5/1/2026 (put 5/1/2025) | | | 1,000,000 | | | | 1,011,114 | |
| a | Miami-Dade County Housing Finance Authority (Fairfield Miami Gardens LP), Series B, 4.05% due 9/1/2026 (put 9/1/2025) | | | 1,000,000 | | | | 1,007,774 | |
| a | Miami-Dade County Housing Finance Authority (Quail Roost Transit Village I Ltd.) (HUD), 5.00% due 9/1/2026 (put 9/1/2025) | | | 1,000,000 | | | | 1,018,068 | |
| a | Miami-Dade County Housing Finance Authority (St. Mary Towers Apartments LLLP) (HUD), 3.40% due 4/1/2041 (put 10/1/2026) | | | 1,000,000 | | | | 1,001,269 | |
| | Northern Palm Beach County Improvement District (Unit of Development No. 2C) (BAM), 5.00% due 8/1/2028 - 8/1/2029 | | | 935,000 | | | | 1,008,351 | |
| | GEORGIA — 2.7% | | | | | | | | |
| a | Bartow County Development Authority (Georgia Power Co.), 3.95% due 12/1/2032 (put 3/8/2028) | | | 1,300,000 | | | | 1,344,169 | |
| a | Development Authority of Burke County (Georgia Power Co.), Series REMK, 3.80% due 10/1/2032 (put 5/21/2026) | | | 1,000,000 | | | | 1,013,254 | |
| | Private Colleges & Universities Authority (Corp. of Mercer University), 5.00% due 10/1/2024 - 10/1/2026 | | | 870,000 | | | | 888,020 | |
| | HAWAII — 0.9% | | | | | | | | |
| a | City & County of Honolulu (Komohale Maunakea Venture LP) (HUD), 5.00% due 6/1/2027 (put 6/1/2026) | | | 1,000,000 | | | | 1,031,351 | |
| | ILLINOIS — 8.0% | | | | | | | | |
| | Chicago Park District GO, Series A, 5.00% due 1/1/2027 | | | 825,000 | | | | 845,244 | |
| a | City of Chicago (New City Redevelopment LP), 3.50% due 8/1/2027 (put 8/1/2026) | | | 1,270,000 | | | | 1,278,473 | |
| | City of Chicago (Water System), 5.00% due 11/1/2027 | | | 560,000 | | | | 583,769 | |
| a | City of Chicago Heights (Olympic Village LLC) (FHA, GNMA, HUD), 2.875% due 8/1/2027 (put 8/1/2025) | | | 1,000,000 | | | | 995,921 | |
| | City of Chicago Waterworks Revenue, 5.00% due 11/1/2029 | | | 385,000 | | | | 398,550 | |
| | Clinton Bond Fayette Etc Counties Community College District No. 501 Kaskaskia (AGM) GO, 5.00% due 12/1/2027 | | | 220,000 | | | | 233,752 | |
| | Greene Jersey & Macoupin Counties Community Unit School District No. 9 Southwest (BAM) GO, 5.00% due 12/1/2029 | | | 350,000 | | | | 382,070 | |
| a | Illinois (South Shore IL Preservation LP) (FHA, HUD) HDA, 4.00% due 6/1/2026 (put 6/1/2025) | | | 550,000 | | | | 553,637 | |
| | Illinois Finance Authority (Ascension Health Credit Group), Series C, 5.00% due 2/15/2029 | | | 275,000 | | | | 287,788 | |
| | Metropolitan Pier & Exposition Authority, Series A, 5.00% due 12/15/2028 | | | 440,000 | | | | 468,135 | |
| | Southern Illinois University (BAM), Series A, 5.00% due 4/1/2026 | | | 320,000 | | | | 328,687 | |
| | State of Illinois (State Facilities Improvements) GO, Series D, 5.00% due 11/1/2024 | | | 1,000,000 | | | | 1,001,433 | |
| | State of Illinois GO, Series B, 5.00% due 3/1/2025 - 9/1/2027 | | | 1,995,000 | | | | 2,080,001 | |
| | INDIANA — 5.1% | | | | | | | | |
| | City of Rockport (AEP Generating Co.; Guaranty: American Electric Power Co.), Series A, 3.125% due 7/1/2025 | | | 1,000,000 | | | | 995,907 | |
| a | Indiana Finance Authority (Republic Services, Inc.) AMT, Series A, 3.95% due 5/1/2028 (put 12/2/2024) | | | 2,500,000 | | | | 2,487,135 | |
| c | North Lawrence Community Schools Building Corp. (North Lawrence Community School Improvement Corp.) (State Intercept), 5.00% due 1/15/2029 - 7/15/2029 | | | 910,000 | | | | 980,152 | |
| | Warsaw Community Schools (State Intercept) GO, 5.00% due 1/15/2025 | | | 500,000 | | | | 502,988 | |
| | Westfield-Washington Schools (State Intercept) GO, Series C, 6.00% due 7/15/2025 - 1/15/2026 | | | 1,010,000 | | | | 1,043,126 | |
| | IOWA — 2.6% | | | | | | | | |
| a | PEFA, Inc. (Guaranty: Goldman Sachs Group, Inc.), 5.00% due 9/1/2049 (put 9/1/2026) | | | 3,000,000 | | | | 3,071,142 | |
| 208 | Annual Financial Statements | See notes to financial statements. |
Schedule of Investments, Continued
Thornburg Short Duration Municipal Fund | September 30, 2024
| ISSUER-DESCRIPTION | | PRINCIPAL
AMOUNT | | | VALUE | |
| | | | | | | | | | |
| | KENTUCKY — 2.0% | | | | | | | | |
| | County of Boone (Duke Energy Kentucky, Inc.), Series A, 3.70% due 8/1/2027 | | $ | 1,000,000 | | | $ | 1,001,383 | |
| | Kentucky (Norton Healthcare Obligated Group) (NPFG) EDFA, Series B, Zero Coupon due 10/1/2025 | | | 125,000 | | | | 121,636 | |
| a | Kentucky Public Energy Authority (Guaranty: Morgan Stanley Group), Series C-1, 4.00% due 12/1/2049 (put 6/1/2025) | | | 1,230,000 | | | | 1,234,615 | |
| | LOUISIANA — 4.8% | | | | | | | | |
| | City of Shreveport (AGM) GO, Series A, 5.00% due 3/1/2025 - 3/1/2026 | | | 1,000,000 | | | | 1,016,186 | |
| a | Louisiana Offshore Terminal Authority (Loop LLC), Series A-R, 4.20% due 9/1/2033 (put 9/1/2028) | | | 1,000,000 | | | | 1,030,000 | |
| a | Louisiana Public Facilities Authority (Ochsner Clinic Foundation Obligated Group), Series B, 5.00% due 5/15/2050 (put 5/15/2025) | | | 1,065,000 | | | | 1,075,938 | |
| | Plaquemines Port Harbor & Terminal District (International Marine Terminals Partnership; LOC Wells Fargo Bank NA), Series A, 4.00% due 3/15/2025 (put 3/15/2024) | | | 1,500,000 | | | | 1,509,124 | |
| a | State of Louisiana Gasoline & Fuels Tax Revenue, Series A, 3.888% (SOFR + 0.50%) due 5/1/2043 (put 5/1/2026) | | | 975,000 | | | | 977,439 | |
| | MASSACHUSETTS — 2.1% | | | | | | | | |
| a,b | Massachusetts (Mass General Brigham, Inc.) DFA, Series T-1, 3.75% (MUNIPSA + 0.60%) due 7/1/2049 (put 1/29/2026) | | | 2,500,000 | | | | 2,502,953 | |
| | MICHIGAN — 0.8% | | | | | | | | |
| a,c | Michigan Strategic Fund (Consumers Energy Co.) AMT, 3.35% due 10/1/2049 (put 10/1/2027) | | | 1,000,000 | | | | 1,000,630 | |
| | MINNESOTA — 0.8% | | | | | | | | |
| a | City of Mounds View Multifamily Housing Revenue (Sherman Forbes Project) (HUD), Series A, 4.05% due 11/1/2026 (put 11/1/2024) | | | 1,000,000 | | | | 1,000,380 | |
| | MONTANA — 0.9% | | | | | | | | |
| | City of Forsyth (NorthWestern Corp.), 3.875% due 7/1/2028 | | | 1,000,000 | | | | 1,026,654 | |
| | NEBRASKA — 2.2% | | | | | | | | |
| a | Central Plains Energy Project (Guaranty: Goldman Sachs Group, Inc.), Series 1, 5.00% due 5/1/2053 (put 10/1/2029) | | | 1,000,000 | | | | 1,065,110 | |
| a | Central Plains Energy Project (Guaranty: Royal Bank of Canada), 4.00% due 12/1/2049 (put 8/1/2025) | | | 1,000,000 | | | | 1,005,240 | |
| | Gretna Public Schools GO, Series B, 5.00% due 12/15/2027 | | | 500,000 | | | | 512,847 | |
| | NEVADA — 2.2% | | | | | | | | |
| a | County of Clark (Nevada Power Co.), 3.75% due 1/1/2036 (put 3/31/2026) | | | 1,000,000 | | | | 1,002,896 | |
| a | Nevada Housing Division (Fairfield Woodcreek LLC) (FHA), 5.00% due 12/1/2025 (put 12/1/2024) | | | 1,000,000 | | | | 1,003,378 | |
| | Reno-Tahoe Airport Authority AMT, Series A, 5.00% due 7/1/2029 | | | 500,000 | | | | 535,314 | |
| | NEW JERSEY — 0.9% | | | | | | | | |
| | Jersey City Municipal Utilities Authority Sewer Fund, Series B, 5.00% due 5/1/2025 | | | 1,000,000 | | | | 1,010,523 | |
| | NEW MEXICO — 1.2% | | | | | | | | |
| a | City of Farmington (Public Service Co. of New Mexico), Series B, 3.875% due 6/1/2040 (put 6/1/2029) | | | 1,000,000 | | | | 1,030,918 | |
| | City of Santa Fe Gasoline Tax GRT, 5.00% due 6/1/2025 | | | 380,000 | | | | 385,914 | |
| | NEW YORK — 3.4% | | | | | | | | |
| a | Metropolitan Transportation Authority (Green Bond), Series A-1, 5.00% due 11/15/2048 (put 11/15/2024) | | | 500,000 | | | | 501,271 | |
| a | New York City Housing Development Corp. (FHA) (Green Bond), Series F-2A, 3.40% due 11/1/2062 (put 12/22/2026) | | | 1,100,000 | | | | 1,099,436 | |
| a | Rockland County (Rockland Gardens Housing Partners LP) (FHA, HUD) IDA, 4.65% due 5/1/2027 (put 5/1/2025) | | | 1,600,000 | | | | 1,601,360 | |
| a | Triborough Bridge & Tunnel Authority (Metropolitan Transportation Authority Payroll Mobility Tax Revenue), Series B2, 5.00% due 5/15/2050 (put 5/15/2026) | | | 500,000 | | | | 515,940 | |
| | Westchester County Local Development Corp. (Miriam Osborn Memorial Home Association Obligated Group), 5.00% due 7/1/2027 | | | 270,000 | | | | 277,273 | |
| | NORTH CAROLINA — 0.9% | | | | | | | | |
| a,c | North Carolina Housing Finance Agency (FHLMC, FNMA, GNMA), Series 56, 3.375% due 7/1/2048 (put 7/15/2025) | | | 450,000 | | | | 450,000 | |
| | North Carolina Medical Care Commission (United Methodist Retirement Homes Inc Obligated Group), | | | | | | | | |
| | Series 2024B-1, 4.25% due 10/1/2028 | | | 150,000 | | | | 150,296 | |
| | Series 2024B-2, 3.75% due 10/1/2028 | | | 500,000 | | | | 493,190 | |
| | OHIO — 2.3% | | | | | | | | |
| | Akron, Bath & Copley Joint Township Hospital District (Summa Health System Obligated Group), 5.00% due 11/15/2027 | | | 180,000 | | | | 190,624 | |
| | City of Elyria GO, 4.625% due 6/26/2025 | | | 1,250,000 | | | | 1,264,326 | |
| | Northeast Ohio Medical University (BAM), 5.00% due 12/1/2029 | | | 260,000 | | | | 283,387 | |
| c | Ohio Air Quality Development Authority (American Electric Power Co., Inc.) AMT, Series A, 3.75% due 1/1/2029 | | | 1,000,000 | | | | 1,001,249 | |
| | OKLAHOMA — 2.6% | | | | | | | | |
| | Canadian County Educational Facilities Authority (Mustang Public Schools Project) ISD, 5.00% due 9/1/2027 | | | 1,000,000 | | | | 1,038,941 | |
| | Chouteau Educational Facilities Authority (Mayes County ISD No. 32 Chouteau-Mazie), 4.00% due 9/1/2028 | | | 975,000 | | | | 985,197 | |
| | Cushing Educational Facilities Authority (Payne County No. 67 Cushing) ISD, 5.00% due 9/1/2028 | | | 500,000 | | | | 537,428 | |
| | Muskogee Industrial Trust (Muskogee County No. 20) ISD, 5.00% due 9/1/2027 | | | 475,000 | | | | 494,685 | |
| | PENNSYLVANIA — 5.6% | | | | | | | | |
| | Allegheny County Hospital Development Authority (UPMC Obligated Group), Series A, 5.00% due 7/15/2025 | | | 1,500,000 | | | | 1,526,029 | |
| a | Bethlehem Area School District Authority (State Aid Withholding), Series B, 3.586% (SOFR + 0.35%) due 7/1/2031 (put 11/1/2025) | | | 1,745,000 | | | | 1,727,615 | |
| a | Montgomery County (Constellation Energy Generation LLC) IDA, Series A, 4.10% due 4/1/2053 (put 4/3/2028) | | | 1,140,000 | | | | 1,174,478 | |
| | Northeastern Pennsylvania Hospital & Education Authority (King’s College), 5.00% due 5/1/2026 | | | 485,000 | | | | 493,314 | |
| | Pennsylvania (UPMC Obligated Group) EDFA, 5.00% due 3/15/2026 | | | 220,000 | | | | 227,185 | |
| See notes to financial statements. | Annual Financial Statements | 209 |
Schedule of Investments, Continued
Thornburg Short Duration Municipal Fund | September 30, 2024
| ISSUER-DESCRIPTION | | PRINCIPAL
AMOUNT | | | VALUE | |
| | | | | | | | | | |
| a | Pennsylvania (Waste Management, Inc.; Guaranty: Waste Management Holdings) EDFA AMT, Series A, 4.25% due 8/1/2038 (put 8/1/2025) | | $ | 1,000,000 | | | $ | 1,005,426 | |
| a | Pennsylvania Housing Finance Agency (Cambridge Community Partners LP) (HUD), Series B, 5.00% due 11/1/2026 (put 11/1/2025) | | | 500,000 | | | | 510,421 | |
| | TENNESSEE — 5.3% | | | | | | | | |
| | Johnson City Health & Educational Facilities Board (Ballad Health Obligated Group), Series A, 5.00% due 7/1/2025 | | | 1,100,000 | | | | 1,114,336 | |
| a | Knox County Health Educational & Housing Facility Board (Gleason Partners LP) (HUD), 3.95% due 12/1/2027 (put 12/1/2025) | | | 2,000,000 | | | | 2,012,978 | |
| a | Metropolitan Government Nashville & Davidson County Health & Educational Facilities Board (Northview Housing Development LP), Series B, 3.85% due 2/1/2045 (put 2/1/2025) | | | 1,000,000 | | | | 999,584 | |
| a | Tennergy Corp. (Guaranty: Royal Bank of Canada), Series A, 5.00% due 10/1/2054 (put 12/1/2029) | | | 2,000,000 | | | | 2,155,980 | |
| | TEXAS — 14.0% | | | | | | | | |
| a | Boerne School District (PSF-GTD) ISD GO, 3.125% due 2/1/2053 (put 2/1/2027) | | | 995,000 | | | | 1,009,447 | |
| a | Capital Area Housing Finance Corp. (LDG Redwood LP), 3.65% due 1/1/2041 (put 1/1/2026) | | | 1,000,000 | | | | 1,004,664 | |
| | City of Aubrey Jackson Ridge Public Improvement District (BAM), 5.00% due 9/1/2025 | | | 200,000 | | | | 202,928 | |
| a | City of Dallas Housing Finance Corp. (Ash Creek Housing LLC) (FHA), 5.00% due 7/1/2026 (put 12/1/2025) | | | 500,000 | | | | 512,195 | |
| | City of Georgetown Utility System Revenue (BAM), 5.00% due 8/15/2025 - 8/15/2026 | | | 920,000 | | | | 946,785 | |
| a | Dickinson (PSF-GTD) ISD GO, 3.50% due 8/1/2037 (put 8/1/2025) | | | 1,000,000 | | | | 1,006,007 | |
| a | Grand Parkway Transportation Corp., 5.00% due 10/1/2052 (put 4/1/2028) | | | 1,000,000 | | | | 1,065,443 | |
| | Harris County Cultural Education Facilities Finance Corp. (Texas Medical Center), Series A, 5.00% due 5/15/2027 | | | 2,000,000 | | | | 2,103,806 | |
| | Hays Consolidated (PSF-GTD) ISD GO, 5.00% due 8/15/2027 | | | 385,000 | | | | 400,472 | |
| a | Houston Housing Finance Corp. (Cordova Apartments), 3.65% due 2/1/2048 (put 2/1/2028) | | | 1,000,000 | | | | 1,015,252 | |
| a | North East (PSF-GTD) ISD GO, 3.75% due 8/1/2049 (put 8/1/2027) | | | 1,000,000 | | | | 1,033,449 | |
| a | Northside (PSF-GTD) ISD GO, Series B, 3.45% due 8/1/2054 (put 8/1/2027) | | | 1,000,000 | | | | 1,025,652 | |
| | Texas Municipal Gas Acquisition & Supply Corp. III (Guaranty: Macquarie Group Ltd.), 5.00% due 12/15/2025 - 12/15/2026 | | | 1,125,000 | | | | 1,155,827 | |
| a | Texas State Affordable Housing Corp. (AHFC-FC Norman Housing LP), 3.625% due 1/1/2045 (put 1/1/2027) | | | 1,000,000 | | | | 1,010,484 | |
| a | Texas State Affordable Housing Corp. (Eden Court Senior Housing LP) (HUD), 5.00% due 4/1/2043 (put 4/1/2026) | | | 1,000,000 | | | | 1,018,837 | |
| a | Travis County Housing Finance Corp. (Austin Gateway Apartments LP), 4.125% due 6/1/2045 (put 6/1/2027) | | | 2,000,000 | | | | 2,022,444 | |
| | VIRGINIA — 2.9% | | | | | | | | |
| a | Halifax County (Virginia Electric & Power Co.) IDA, Series A, 3.80% due 12/1/2041 (put 5/28/2027) | | | 1,500,000 | | | | 1,542,194 | |
| a | Harrisonburg Redevelopment & Housing Authority (John Early Seniors Housing LP) (FHA), 4.00% due 12/1/2027 (put 12/1/2025) | | | 910,000 | | | | 921,817 | |
| | Virginia Small Business Financing Authority (National Senior Campuses, Inc. Obligated Group), Series A, 5.00% due 1/1/2025 - 1/1/2027 | | | 900,000 | | | | 914,346 | |
| | WASHINGTON — 0.9% | | | | | | | | |
| a | Washington State Housing Finance Commission (Ardea Twg LLLP), 5.00% due 12/1/2043 (put 2/1/2027) | | | 1,000,000 | | | | 1,031,736 | |
| | WISCONSIN — 5.5% | | | | | | | | |
| | City of Watertown, 4.00% due 10/1/2025 | | | 1,000,000 | | | | 1,004,926 | |
| | Peshtigo School District, 4.75% due 3/1/2027 | | | 1,000,000 | | | | 1,010,462 | |
| | Public Finance Authority (National Senior Communities Obligated Group), 4.00% due 1/1/2025 | | | 605,000 | | | | 604,880 | |
| | Public Finance Authority (Renown Regional Medical Center), Series A, 5.00% due 6/1/2027 | | | 350,000 | | | | 365,913 | |
| | Public Finance Authority (United Methodist Retirement Homes, Inc. Obligated Group), Series A, 4.00% due 10/1/2025 - 10/1/2026 | | | 590,000 | | | | 592,423 | |
| | Racine USD, Series B, 4.125% due 4/1/2025 | | | 1,500,000 | | | | 1,501,476 | |
| a | Wisconsin Housing & EDA Housing Revenue (HUD), Series E, 3.875% due 11/1/2054 (put 5/1/2027) | | | 1,000,000 | | | | 1,008,835 | |
| a | Wisconsin Housing (Flats at Bishops Woods LP) EDA, Series F, 5.00% due 12/1/2027 (put 12/1/2026) | | | 350,000 | | | | 364,411 | |
| | TOTAL LONG-TERM MUNICIPAL BONDS — 97.6% (Cost $113,911,973) | | | | | | | 115,022,268 | |
| | | | | | | | | | |
| | SHORT-TERM MUNICIPAL BONDS — 4.4% | | | | | | | | |
| | | | | | | | | | |
| | NEW YORK — 0.5% | | | | | | | | |
| a | New York City Transitional Finance Authority Future Tax Secured Revenue (SPA JP Morgan Chase Bank NA), Series E-4, 4.05% due 2/1/2045 (put 10/1/2024) | | | 600,000 | | | | 600,000 | |
| | TEXAS — 3.9% | | | | | | | | |
| a | Port of Port Arthur Navigation District (Motiva Enterprises LLC), 4.30% due 4/1/2040 (put 10/1/2024) | | | 4,605,000 | | | | 4,605,000 | |
| | TOTAL SHORT-TERM MUNICIPAL BONDS — 4.4% (Cost $5,205,000) | | | | | | | 5,205,000 | |
| | | | | | | | | | |
| | TOTAL INVESTMENTS — 102.0% (Cost $119,116,973) | | | | | | $ | 120,227,268 | |
| | | | | | | | | | |
| | LIABILITIES NET OF OTHER ASSETS — (2.0)% | | | | | | | (2,345,568 | ) |
| | | | | | | | | | |
| | NET ASSETS — 100.0% | | | | | | $ | 117,881,700 | |
| 210 | Annual Financial Statements | See notes to financial statements. |
Schedule of Investments, Continued
Thornburg Short Duration Municipal Fund | September 30, 2024
Footnote Legend
| a | Variable, floating, step, or fixed to floating rate securities are securities for which interest rate changes are based on changes in a designated base rate or on a predetermined schedule. The rates shown are those in effect on September 30, 2024. |
| b | Securities exempt from registration under Rule 144A of the Securities Act of 1933, as amended. These securities are restricted but liquid and may only be resold in the ordinary course of business in transactions exempt from registration, normally to qualified institutional buyers. As of September 30, 2024, the aggregate value of these securities in the Fund’s portfolio was $3,491,555, representing 2.96% of the Fund’s net assets. |
| Portfolio Abbreviations | | |
| To simplify the listings of securities, abbreviations are used per the table below: | | |
| AGM | Insured by Assured Guaranty Municipal Corp. | HFFA | Health Facilities Financing Authority |
| AMT | Alternative Minimum Tax | HUD | Insured by Housing and Urban Development |
| BAM | Insured by Build America Mutual Insurance Co. | IDA | Industrial Development Authority/Agency |
| DFA | Development Finance Authority/Agency | IDB | Industrial Development Board |
| EDA | Economic Development Authority | ISD | Independent School District |
| EDFA | Economic Development Financing Authority | LOC | Letter of Credit |
| FHA | Insured by Federal Housing Administration | MUNIPSA | Securities Industry and Financial Markets Association (SIFMA) Municipal Swap Index |
| FHLMC | Collateralized by Federal Home Loan Mortgage Corp. | NPFG | Insured by National Public Finance Guarantee Corp. |
| FNMA | Collateralized by Federal National Mortgage Association | PSF-GTD | Guaranteed by Permanent School Fund |
| GNMA | Collateralized by Government National Mortgage Association | SOFR | Secured Overnight Financing Rate |
| GO | General Obligation | SPA | Stand-by Purchase Agreement |
| GRT | Gross Receipts Tax | USD | Unified School District |
| HDA | Housing Development Authority | | |
| HFA | Health Facilities Authority | | |
| See notes to financial statements. | Annual Financial Statements | 211 |
Schedule of Investments
Thornburg Limited Term Municipal Fund | September 30, 2024
| ISSUER-DESCRIPTION | | PRINCIPAL
AMOUNT | | | VALUE | |
| | | | | | | | | | |
| | LONG-TERM MUNICIPAL BONDS — 96.1% | | | | | | | | |
| | | | | | | | | | |
| | ALABAMA — 3.6% | | | | | | | | |
| | Alabama Special Care Facilities Financing Authority-Birmingham (Children’s Hospital of Alabama Obligated Group), | | | | | | | | |
| | 4.00% due 6/1/2032 | | $ | 905,000 | | | $ | 907,044 | |
| | 5.00% due 6/1/2033 | | | 3,470,000 | | | | 3,506,674 | |
| a | Black Belt Energy Gas District (Guaranty: Canadian Imperial Bank), Series E, 5.00% due 5/1/2053 (put 6/1/2028) | | | 1,750,000 | | | | 1,840,738 | |
| a | Black Belt Energy Gas District (Guaranty: Goldman Sachs Group, Inc.), Series F, 5.50% due 11/1/2053 (put 12/1/2028) | | | 4,825,000 | | | | 5,176,984 | |
| a | Black Belt Energy Gas District (Guaranty: Morgan Stanley Group), Series C-1, 5.25% due 2/1/2053 (put 6/1/2029) | | | 13,240,000 | | | | 14,254,237 | |
| | Black Belt Energy Gas District (Guaranty: Royal Bank of Canada), | | | | | | | | |
| | Series B, | | | | | | | | |
| | 5.00% due 12/1/2030 | | | 1,750,000 | | | | 1,903,289 | |
| a | 5.25% due 12/1/2053 (put 12/1/2030) | | | 4,000,000 | | | | 4,404,080 | |
| a | Series D1, 4.00% due 7/1/2052 (put 6/1/2027) | | | 14,500,000 | | | | 14,720,255 | |
| | Chatom (Powersouth Energy Cooperative Projects) (AGM) IDB, 5.00% due 8/1/2025 | | | 425,000 | | | | 432,649 | |
| a | Chatom (PowerSouth Energy Cooperative; SPA National Rural Utilities Cooperative Finance) IDB, Series A, 3.85% due 8/1/2037 (put 2/1/2025) | | | 5,000,000 | | | | 5,310,060 | |
| | City of Mobile Alabama (Alabama Power Co.) IDB, | | | | | | | | |
| a | Series A, 3.65% due 7/15/2034 (put 1/10/2025) | | | 5,000,000 | | | | 5,003,355 | |
| a | Series C, 3.78% due 6/1/2034 (put 6/16/2026) | | | 2,000,000 | | | | 2,019,690 | |
| | County of Jefferson, 5.00% due 9/15/2032 - 9/15/2034 | | | 5,875,000 | | | | 6,155,903 | |
| a | Energy Southeast A Cooperative District (Guaranty: Morgan Stanley Group), Series B-1, 5.75% due 4/1/2054 (put 11/1/2031) | | | 7,000,000 | | | | 7,946,792 | |
| | Homewood Educational Building Authority (CHF - Horizons I LLC), Series A, 5.25% due 10/1/2034 | | | 260,000 | | | | 290,612 | |
| a,b | Selma IDB, Series A, 3.45% due 11/1/2033 (put 10/1/2031) | | | 4,525,000 | | | | 4,545,200 | |
| a | Southeast Alabama Gas Supply District (Guaranty: Pacific Life Insurance Co.), Series A, 5.00% due 8/1/2054 (put 4/1/2032) | | | 1,925,000 | | | | 2,098,750 | |
| a | Southeast Energy Authority A Cooperative District (Guaranty: Goldman Sachs Groups, Inc.), Series B-1, 5.00% due 5/1/2053 (put 8/1/2028) | | | 5,000,000 | | | | 5,280,770 | |
| a | Southeast Energy Authority A Cooperative District (Guaranty: Morgan Stanley Group), Series A-1, 5.50% due 1/1/2053 (put 12/1/2029) | | | 3,500,000 | | | | 3,811,570 | |
| | UAB Medicine Finance Authority (UAB Medicine Obligated Group), Series B2, 5.00% due 9/1/2030 | | | 560,000 | | | | 588,566 | |
| | ARIZONA — 1.7% | | | | | | |
| a | Arizona (Banner Health Obligated Group) HFA, Series B, 3.40% (MUNIPSA + 0.25%) due 1/1/2046 (pre-refunded 11/4/2025) | | | 630,000 | | | | 630,198 | |
| a | Arizona (Gunsmoke Ranch Apartments LP) IDA, 5.00% due 3/1/2058 (put 11/1/2026) | | | 2,500,000 | | | | 2,601,588 | |
| a | Arizona (Ironwood Ranch Apartments LP) IDA, 5.00% due 2/1/2058 (put 9/1/2026) | | | 3,200,000 | | | | 3,317,718 | |
| | Arizona (Scottsdale Lincoln Hospitals) HFA, Series A, 5.00% due 12/1/2024 | | | 260,000 | | | | 260,678 | |
| a | Arizona (TWG Glendale LP) IDA, 5.00% due 3/1/2045 (put 9/1/2026) | | | 1,100,000 | | | | 1,134,207 | |
| | Arizona HFA, | | | | | | | | |
| | Series B, | | | | | | | | |
| a | 3.40% (MUNIPSA + 0.25%) due 1/1/2046 (pre-refunded 11/4/2025) | | | 130,000 | | | | 129,415 | |
| a | 3.40% (MUNIPSA + 0.25%) due 1/1/2046 (put 11/4/2026) | | | 3,240,000 | | | | 3,235,681 | |
| a | Chandler (Intel Corp.) IDA, 3.80% due 12/1/2035 (put 6/15/2028) | | | 7,500,000 | | | | 7,679,490 | |
| | Maricopa County (Banner Health Obligated Group) IDA, | | | | | | | | |
| | Series A, 5.00% due 1/1/2031 - 1/1/2034 | | | 3,985,000 | | | | 4,153,678 | |
| a | Series A-3, 5.00% due 1/1/2053 (put 11/1/2030) | | | 12,960,000 | | | | 14,375,789 | |
| | Salt River Project Agricultural Improvement & Power District, Series A, 4.00% due 12/1/2034 | | | 2,500,000 | | | | 2,508,720 | |
| | Salt River Project Agricultural Improvement & Power District (Salt River Electric System), Series A, 5.00% due 1/1/2029 | | | 1,405,000 | | | | 1,513,040 | |
| | CALIFORNIA — 3.5% | | | | | | |
| a | Bay Area Toll Authority (San Francisco Bay Area Toll Bridge), Series E, 3.56% (MUNIPSA + 0.41%) due 4/1/2056 (put 4/1/2028) | | | 4,000,000 | | | | 3,944,988 | |
| | California (PIH Health, Inc. Obligated Group) HFFA, Series A, 5.00% due 6/1/2028 - 6/1/2030 | | | 2,950,000 | | | | 3,248,543 | |
| a | California Community Choice Financing Authority (Guaranty: Deutsche Bank AG) (Green Bond), Series C, 5.25% due 1/1/2054 (put 10/1/2031) | | | 16,955,000 | | | | 18,319,962 | |
| | California Community Choice Financing Authority (Guaranty: Morgan Stanley Group) (Green Bond), | | | | | | | | |
| a | Series B-1, 4.00% due 2/1/2052 (put 8/1/2031) | | | 13,175,000 | | | | 13,587,325 | |
| a | Series E-1, 5.00% due 2/1/2054 (put 3/1/2031) | | | 14,980,000 | | | | 16,278,167 | |
| | California Municipal Finance Authority (Biola University), 5.00% due 10/1/2024 - 10/1/2025 | | | 1,040,000 | | | | 1,045,429 | |
| | California Municipal Finance Authority (CHF-Davis II LLC) (BAM), 5.00% due 5/15/2028 | | | 2,905,000 | | | | 3,121,574 | |
| a | California Municipal Finance Authority (Waste Management, Inc.; Guaranty: Waste Management Holdings) AMT, 3.95% due 10/1/2045 (put 12/2/2024) | | | 2,500,000 | | | | 2,498,857 | |
| a,c | California Pollution Control Financing Authority (Republic Services, Inc.) AMT, 4.05% due 7/1/2043 (put 2/18/2025) | | | 4,000,000 | | | | 3,954,408 | |
| | California Statewide Communities Development Authority (CHF-Irvine LLC), Series A, 5.00% due 5/15/2027 | | | 500,000 | | | | 525,976 | |
| a | California Statewide Communities Development Authority (Kaiser Foundation Hospitals), Series 2004-M-R, 5.00% due 4/1/2038 (put 11/1/2029) | | | 3,250,000 | | | | 3,636,409 | |
| | Lammersville Joint (BAM) USD, 5.00% due 9/1/2030 | | | 1,365,000 | | | | 1,547,716 | |
| | Long Beach Bond Finance Authority (Guaranty: Merrill Lynch & Co.), Series A, 5.00% due 11/15/2024 | | | 2,000,000 | | | | 2,003,516 | |
| a | Los Angeles County Development Authority (2111 Firestone LP) (HUD), Series E, 5.00% due 7/1/2043 (put 7/1/2026) | | | 2,450,000 | | | | 2,529,559 | |
| | Los Angeles Housing Authority (FNMA), Series A, 3.75% due 4/1/2034 | | | 2,000,000 | | | | 2,029,612 | |
| | Santa Clara County Financing Authority, Series Q, 4.00% due 5/15/2032 | | | 1,000,000 | | | | 1,010,046 | |
| | Semitropic Water Storage Improvement District (Irrigation Water System) (AGM), Series A, 5.00% due 12/1/2025 | | | 1,110,000 | | | | 1,141,710 | |
| 212 | Annual Financial Statements | See notes to financial statements. |
Schedule of Investments, Continued
Thornburg Limited Term Municipal Fund | September 30, 2024
| ISSUER-DESCRIPTION | | PRINCIPAL
AMOUNT | | | VALUE | |
| | | | | | | | | | |
| | State of California GO, 4.00% due 9/1/2034 | | $ | 2,000,000 | | | $ | 2,032,026 | |
| | Temecula Valley Financing Authority (BAM) USD, 5.00% due 9/1/2027 | | | 2,220,000 | | | | 2,239,092 | |
| | Tustin (Community Facilities) (BAM) USD, Series A, 5.00% due 9/1/2033 | | | 1,500,000 | | | | 1,528,033 | |
| | COLORADO — 2.1% | | | | | | | | |
| a | Adams County Housing Authority (647 Oat LLLP), 4.50% due 5/1/2042 (put 5/1/2026) | | | 3,500,000 | | | | 3,556,973 | |
| | Colorado (AdventHealth Obligated Group) HFA, | | | | | | | | |
| a | Series A, 5.00% due 11/15/2059 (put 11/15/2031) | | | 2,750,000 | | | | 3,164,714 | |
| a | Series B, 5.00% due 11/15/2049 (put 11/19/2026) | | | 7,000,000 | | | | 7,324,233 | |
| a | Colorado (Adventhealth Obligation Group) HFA, Series A-2, 5.00% due 11/15/2057 (put 11/15/2033) | | | 14,815,000 | | | | 17,056,924 | |
| a | Colorado (Adventist Health System/Sunbelt Obligated Group) HFA, Series C, 5.00% due 11/15/2036 (put 11/15/2026) | | | 1,460,000 | | | | 1,527,281 | |
| | Colorado (CommonSpirit Health Obligated Group) HFA, | | | | | | | | |
| | 5.00% due 11/1/2029 - 11/1/2032 | | | 4,550,000 | | | | 5,113,129 | |
| | Series A-2, 5.00% due 8/1/2031 | | | 850,000 | | | | 929,030 | |
| a | Series B-2, 5.00% due 8/1/2049 (put 8/1/2026) | | | 5,475,000 | | | | 5,650,759 | |
| a | Colorado (Intermountain Healthcare Obligated Group) HFA, Series B, 5.00% due 5/15/2062 (put 8/17/2026) | | | 1,690,000 | | | | 1,754,705 | |
| | Denver Convention Center Hotel Authority, 5.00% due 12/1/2028 | | | 1,000,000 | | | | 1,030,953 | |
| | Regional Transportation District (Denver Transit Partners LLC), Series A, 5.00% due 1/15/2030 - 7/15/2032 | | | 3,430,000 | | | | 3,749,265 | |
| | Sierra Ridge Metropolitan District No. 2 (AGM) GO, 4.00% due 12/1/2025 | | | 275,000 | | | | 278,017 | |
| | CONNECTICUT — 2.5% | | | | | | | | |
| | City of New Haven (AGM) GO, Series B, 5.00% due 2/1/2028 - 2/1/2030 | | | 1,470,000 | | | | 1,609,686 | |
| | City of New Haven (BAM) GO, 5.00% due 8/1/2032 - 8/1/2033 | | | 1,100,000 | | | | 1,270,999 | |
| a | Connecticut Housing Finance Authority (Green Bond), Series D2, 3.85% due 11/15/2064 (put 5/15/2027) | | | 8,500,000 | | | | 8,527,013 | |
| | State of Connecticut (Various Capital Projects) GO, Series B, 5.00% due 5/15/2027 | | | 16,615,000 | | | | 17,240,638 | |
| | State of Connecticut GO, | | | | | | | | |
| | Series B, 4.00% due 6/15/2034 | | | 1,000,000 | | | | 1,005,300 | |
| | Series C, 5.00% due 6/15/2026 - 6/15/2028 | | | 10,705,000 | | | | 11,439,482 | |
| | Series D, 4.00% due 8/15/2029 | | | 2,325,000 | | | | 2,380,105 | |
| | Series E, 5.00% due 9/15/2028 | | | 2,560,000 | | | | 2,811,456 | |
| | Series F, 5.00% due 11/15/2031 | | | 2,500,000 | | | | 2,558,877 | |
| | State of Connecticut Special Tax Revenue (Transportation Infrastructure Purposes), Series A, 5.00% due 8/1/2033 | | | 1,000,000 | | | | 1,014,899 | |
| | State of Connecticut Special Tax Revenue (Transportation Infrastructure Purposes) (BAM), Series A, 5.00% due 9/1/2031 | | | 11,600,000 | | | | 12,056,588 | |
| | DELAWARE — 0.2% | | | | | | | | |
| | Delaware State (Beebe Medical Center, Inc.) HFA, 5.00% due 6/1/2031 | | | 1,200,000 | | | | 1,264,908 | |
| | Delaware Transportation Authority, 5.00% due 9/1/2029 | | | 2,665,000 | | | | 2,966,883 | |
| | DISTRICT OF COLUMBIA — 0.6% | | | | | | | | |
| a | District of Columbia Housing Finance Agency (Barry Farm Building 1A LLC), 5.00% due 12/1/2028 (put 12/1/2027) | | | 3,750,000 | | | | 3,962,325 | |
| a | District of Columbia Housing Finance Agency (Benning Corridor Titleholder LLC), 4.00% due 9/1/2040 (put 9/1/2025) | | | 3,000,000 | | | | 3,008,814 | |
| a | District of Columbia Housing Finance Agency (Cascade Park Community Partners II LLC), 3.55% due 8/1/2042 (put 8/1/2025) | | | 2,000,000 | | | | 2,004,510 | |
| a | District of Columbia Housing Finance Agency (ECD Edgewood Commons 5 LP) (FHA, HUD), 5.00% due 6/1/2027 (put 6/1/2026) | | | 2,000,000 | | | | 2,044,822 | |
| a | District of Columbia Housing Finance Agency (Wesley Hawaii LLC), 3.65% due 7/1/2028 (put 7/1/2027) | | | 3,620,000 | | | | 3,668,124 | |
| | FLORIDA — 4.2% | | | | | | | | |
| a | Broward County Housing Finance Authority (Pinnacle 441 Phase 2 LLC), 4.05% due 9/1/2056 (put 3/1/2026) | | | 2,150,000 | | | | 2,176,606 | |
| | Broward County School Board (Educational Facilities) COP, Series B, 5.00% due 7/1/2032 | | | 2,000,000 | | | | 2,027,674 | |
| | Broward County School Board COP, | | | | | | | | |
| | Series A, 5.00% due 7/1/2029 - 7/1/2030 | | | 4,345,000 | | | | 4,459,237 | |
| | Series B, 5.00% due 7/1/2029 | | | 1,005,000 | | | | 1,019,731 | |
| | City of Jacksonville, Series B, 5.00% due 10/1/2029 | | | 1,350,000 | | | | 1,407,140 | |
| | City of Orlando (Senior Tourist Development) (AGM), Series A, 5.00% due 11/1/2025 | | | 1,675,000 | | | | 1,714,971 | |
| | County of Lee Airport Revenue, 5.00% due 10/1/2033 | | | 3,305,000 | | | | 3,359,004 | |
| b | County of Lee Airport Revenue AMT, 5.00% due 10/1/2034 | | | 2,000,000 | | | | 2,225,436 | |
| | County of Miami-Dade Aviation Revenue, Series A, 5.00% due 10/1/2032 | | | 500,000 | | | | 561,073 | |
| a | County of Okeechobee (Waste Management, Inc.), Series A, 3.80% due 7/1/2039 (put 7/2/2029) | | | 4,000,000 | | | | 4,151,256 | |
| | Duval County Public Schools (AGM) COP, Series A, 5.00% due 7/1/2025 - 7/1/2033 | | | 11,390,000 | | | | 12,116,470 | |
| | Florida Development Finance Corp. (Mater Academy Miami-Dade Osceola County Facilities Obligated Group), Series A, 5.00% due 6/15/2025 - 6/15/2027 | | | 770,000 | | | | 792,216 | |
| a | Florida Housing Finance Corp. (GNMA), Series B, 3.35% due 10/1/2027 (put 10/1/2026) | | | 1,250,000 | | | | 1,257,070 | |
| a | Florida Housing Finance Corp. (Hampton Point Preservation Ltd.), Series E, 5.00% due 5/1/2026 (put 5/1/2025) | | | 1,625,000 | | | | 1,643,060 | |
| a | Florida Housing Finance Corp. (Vineland Family Apartments Ltd.), Series E, 3.80% due 6/1/2042 (put 6/1/2027) | | | 5,250,000 | | | | 5,301,886 | |
| | Florida Insurance Assistance Interlocal Agency, Inc., Series A-1, 5.00% due 9/1/2027 - 9/1/2028 | | | 11,000,000 | | | | 11,448,065 | |
| | Greater Orlando Aviation Authority AMT, Series A, 4.00% due 10/1/2035 | | | 3,500,000 | | | | 3,519,796 | |
| | Highlands County School Board (AGC) COP, 5.00% due 3/1/2032 - 3/1/2034 | | | 1,290,000 | | | | 1,452,886 | |
| | Hillsborough County Aviation Authority AMT, Series B, 5.00% due 10/1/2034 | | | 4,115,000 | | | | 4,600,875 | |
| See notes to financial statements. | Annual Financial Statements | 213 |
Schedule of Investments, Continued
Thornburg Limited Term Municipal Fund | September 30, 2024
| ISSUER-DESCRIPTION | | PRINCIPAL
AMOUNT | | | VALUE | |
| | | | | | | | | | |
| | JEA Electric System Revenue, Series III B, 5.00% due 10/1/2031 | | $ | 2,110,000 | | | $ | 2,240,413 | |
| | Lee County (Shell Point Obligated Group) IDA, Series B-2, 4.375% due 11/15/2029 | | | 1,500,000 | | | | 1,519,499 | |
| | Miami-Dade County Expressway Authority (Toll System), Series B, 5.00% due 7/1/2025 | | | 3,350,000 | | | | 3,354,787 | |
| | Miami-Dade County Transit System, 4.00% due 7/1/2034 | | | 3,425,000 | | | | 3,450,756 | |
| | Northern Palm Beach County Improvement District (Unit of Development No. 2C) (BAM), 5.00% due 8/1/2033 - 8/1/2034 | | | 1,045,000 | | | | 1,176,402 | |
| | Orange County School Board COP, Series C, 5.00% due 8/1/2033 (pre-refunded 8/1/2026) | | | 2,000,000 | | | | 2,089,106 | |
| | Palm Beach County (Jupiter Medical Center Obligated Group) HFA, Series A, 5.00% due 11/1/2028 - 11/1/2031 | | | 1,415,000 | | | | 1,508,893 | |
| | Palm Beach County School District COP, Series D, 5.00% due 8/1/2027 - 8/1/2031 | | | 3,300,000 | | | | 3,353,521 | |
| a | Polk County Housing Finance Authority (Episcopal Catholic Apartments Owner LLLP) (HUD), 4.15% due 12/1/2040 (put 6/1/2026) | | | 2,000,000 | | | | 2,029,070 | |
| | School Board of Miami-Dade County COP, | | | | | | | | |
| | Series B, 5.00% due 8/1/2026 | | | 10,665,000 | | | | 11,093,872 | |
| | Series C, 5.00% due 2/1/2033 | | | 5,220,000 | | | | 5,338,645 | |
| | State of Florida GO, Series C, 4.00% due 6/1/2031 | | | 1,540,000 | | | | 1,571,037 | |
| | Town of Davie (Nova Southeastern University, Inc.), 5.00% due 4/1/2032 | | | 400,000 | | | | 426,730 | |
| | Volusia County Educational Facilities Authority (Embry-Riddle Aeronautical University, Inc.), Series B, 5.00% due 10/15/2024 - 10/15/2025 | | | 1,050,000 | | | | 1,059,981 | |
| | GEORGIA — 7.3% | | | | | | | | |
| a | Bartow County Development Authority (Georgia Power Co.), 3.95% due 12/1/2032 (put 3/8/2028) | | | 3,060,000 | | | | 3,163,967 | |
| | Development Authority of Burke County (Georgia Power Co.), | | | | | | | | |
| | Series 1995, 2.20% due 10/1/2032 | | | 1,225,000 | | | | 1,069,138 | |
| a | Series 2013, 3.375% due 11/1/2053 (put 3/12/2027) | | | 3,000,000 | | | | 3,032,502 | |
| a | Series REMK, 3.80% due 10/1/2032 (put 5/21/2026) | | | 2,100,000 | | | | 2,127,833 | |
| a | Development Authority of Monroe County (Georgia Power Co.), Series 1, 3.875% due 6/1/2042 (put 3/6/2026) | | | 2,000,000 | | | | 2,024,654 | |
| | Gwinnett County School District GO, 4.00% due 2/1/2032 - 2/1/2033 | | | 5,000,000 | | | | 5,043,466 | |
| | Main Street Natural Gas, Inc. (Guaranty: Citigroup, Inc.), | | | | | | | | |
| a | Series A, 4.00% due 9/1/2052 (put 12/1/2029) | | | 29,500,000 | | | | 30,134,250 | |
| a | Series B, 5.00% due 12/1/2052 (put 6/1/2029) | | | 755,000 | | | | 802,784 | |
| a | Series C, 4.00% due 5/1/2052 (put 12/1/2028) | | | 5,160,000 | | | | 5,265,006 | |
| a | Series D, 5.00% due 5/1/2054 (put 12/1/2030) | | | 47,520,000 | | | | 51,222,283 | |
| | Main Street Natural Gas, Inc. (Guaranty: Macquarie Group Ltd.), Series A, 5.00% due 5/15/2028 | | | 2,350,000 | | | | 2,478,634 | |
| | Main Street Natural Gas, Inc. (Guaranty: Royal Bank of Canada), | | | | | | | | |
| | Series A, | | | | | | | | |
| a | 4.00% due 7/1/2052 (put 9/1/2027) | | | 12,645,000 | | | | 12,854,401 | |
| a | 5.00% due 5/1/2054 (put 9/1/2031) | | | 3,500,000 | | | | 3,822,350 | |
| a | Series B, 5.00% due 7/1/2053 (put 3/1/2030) | | | 26,675,000 | | | | 28,724,174 | |
| a | Series C, 5.00% due 9/1/2053 (put 9/1/2030) | | | 1,500,000 | | | | 1,624,590 | |
| a | Series E-1, 5.00% due 12/1/2053 (put 6/1/2031) | | | 25,250,000 | | | | 27,470,990 | |
| | Private Colleges & Universities Authority (Corp. of Mercer University), 5.00% due 10/1/2032 | | | 125,000 | | | | 138,583 | |
| | State of Georgia GO, Series A, 4.00% due 2/1/2033 | | | 500,000 | | | | 501,603 | |
| | GUAM — 0.0% | | | | | | | | |
| | Guam Power Authority (Electric Power System), Series A, 5.00% due 10/1/2026 | | | 500,000 | | | | 521,258 | |
| | IDAHO — 0.1% | | | | | | | | |
| | Idaho Housing & Finance Association Illinois (FHLMC, FNMA, GNMA) HDA, Series A, 3.75% due 1/1/2033 | | | 1,625,000 | | | | 1,612,874 | |
| | ILLINOIS — 9.5% | | | | | | | | |
| | Chicago O’Hare International Airport (2016 Airport Projects), Series C, 5.00% due 1/1/2030 | | | 765,000 | | | | 783,719 | |
| | Chicago O’Hare International Airport (2017 Airport Projects), Series B, 5.00% due 1/1/2034 | | | 2,000,000 | | | | 2,084,518 | |
| | Chicago Park District GO, | | | | | | | | |
| | Series A, 5.00% due 1/1/2032 | | | 1,550,000 | | | | 1,585,053 | |
| | Series D, 4.00% due 1/1/2034 | | | 1,660,000 | | | | 1,721,354 | |
| | City of Chicago (Chicago O’Hare International Airport Customer Facility Charge Revenue) (BAM), 5.00% due 1/1/2031 - 1/1/2033 | | | 5,400,000 | | | | 6,126,957 | |
| | City of Chicago (Chicago O’Hare International Airport), Series C, 5.00% due 1/1/2031 | | | 500,000 | | | | 511,990 | |
| | City of Chicago (Wastewater Transmission System) (AGM), Series B, 5.00% due 1/1/2034 | | | 1,375,000 | | | | 1,432,344 | |
| | City of Chicago (Water System), | | | | | | | | |
| | 5.00% due 11/1/2024 - 11/1/2027 | | | 5,755,000 | | | | 5,958,479 | |
| | Series A-1, 5.00% due 11/1/2024 | | | 4,000,000 | | | | 4,006,632 | |
| a | City of Chicago Heights (Olympic Village LLC) (FHA, GNMA, HUD), 2.875% due 8/1/2027 (put 8/1/2025) | | | 1,500,000 | | | | 1,493,882 | |
| | City of Chicago Wastewater Transmission Revenue, | | | | | | | | |
| | Series B, 5.00% due 1/1/2033 | | | 2,710,000 | | | | 2,825,045 | |
| | Series C, 5.00% due 1/1/2025 - 1/1/2026 | | | 2,950,000 | | | | 2,961,940 | |
| | City of Chicago Wastewater Transmission Revenue, ETM, Series C, 5.00% due 1/1/2025 | | | 795,000 | | | | 798,008 | |
| | City of Chicago Waterworks Revenue, | | | | | | | | |
| | 5.00% due 11/1/2028 | | | 1,250,000 | | | | 1,294,978 | |
| | Series A-1, 5.00% due 11/1/2030 | | | 1,495,000 | | | | 1,555,382 | |
| 214 | Annual Financial Statements | See notes to financial statements. |
Schedule of Investments, Continued
Thornburg Limited Term Municipal Fund | September 30, 2024
| ISSUER-DESCRIPTION | | PRINCIPAL
AMOUNT | | | VALUE | |
| | | | | | | | | | |
| | City of Joliet (Rock Run Crossing Project) (BAM) GO, 5.00% due 12/15/2031 - 12/15/2032 | | $ | 2,030,000 | | | $ | 2,297,783 | |
| | Cook County School District No.170 (AGM) GO, Series D, 5.00% due 12/1/2024 | | | 1,190,000 | | | | 1,194,033 | |
| | Greene Jersey & Macoupin Counties Community Unit School District No. 9 Southwest (BAM) GO, 5.00% due 12/1/2032 - 12/1/2033 | | | 635,000 | | | | 697,850 | |
| | Illinois (FHLMC, FNMA, GNMA) HDA (Green Bond), Series K, 4.60% due 4/1/2031 | | | 1,700,000 | | | | 1,833,389 | |
| | Illinois (FHLMC, FNMA, GNMA) HDA (Green Bond), | | | | | | | | |
| | Series K, | | | | | | | | |
| | 4.65% due 10/1/2031 | | | 1,700,000 | | | | 1,839,677 | |
| | 4.70% due 4/1/2032 | | | 1,980,000 | | | | 2,151,579 | |
| | 4.75% due 10/1/2032 | | | 1,650,000 | | | | 1,800,135 | |
| | 4.80% due 4/1/2033 | | | 1,000,000 | | | | 1,091,615 | |
| a | Illinois (South Shore HHDC LIHTC LLC) (HUD) HDA, 5.00% due 2/1/2027 (put 2/1/2026) | | | 1,000,000 | | | | 1,024,587 | |
| a | Illinois (South Shore IL Preservation LP) (FHA, HUD) HDA, 4.00% due 6/1/2026 (put 6/1/2025) | | | 1,750,000 | | | | 1,761,571 | |
| a | Illinois Finance Authority, Series 2020-REMK, 3.875% due 5/1/2040 (put 9/1/2028) | | | 2,500,000 | | | | 2,538,155 | |
| | Illinois Finance Authority (Advocate Aurora Health Obligated Group), Series B, 4.00% due 5/1/2041 | | | 4,745,000 | | | | 4,777,703 | |
| | Illinois Finance Authority (Ascension Health Credit Group), Series C, 5.00% due 2/15/2029 - 2/15/2033 | | | 1,900,000 | | | | 1,987,427 | |
| a | Illinois Finance Authority (Carle Foundation Obligated Group), Series B, 5.00% due 8/15/2053 (put 8/15/2031) | | | 10,330,000 | | | | 11,502,403 | |
| | Illinois Finance Authority (Northwestern Memorial Healthcare Obligated Group), Series A, 5.00% due 7/15/2032 | | | 800,000 | | | | 911,379 | |
| | Illinois Finance Authority (Peoples Gas Light & Coke Co.), 3.90% due 3/1/2030 | | | 5,000,000 | | | | 5,001,665 | |
| | Illinois Finance Authority (Rush Obligated Group), | | | | | | | | |
| | Series A, 5.00% due 11/15/2025 - 11/15/2034 | | | 5,870,000 | | | | 5,916,225 | |
| | Series B, 5.00% due 11/15/2033 | | | 805,000 | | | | 810,798 | |
| | Illinois Finance Authority (Southern Illinois Healthcare), 5.00% due 3/1/2032 - 3/1/2034 | | | 700,000 | | | | 725,704 | |
| | Illinois Finance Authority (State of Illinois Water Revolving Fund - Clean Water Program) (Green Bond), 4.00% due 7/1/2032 | | | 575,000 | | | | 578,809 | |
| a | Illinois Finance Authority (University of Chicago Medical Center Obligated Group), Series B-1, 5.00% due 8/15/2052 (put 8/15/2025) | | | 10,000,000 | | | | 10,124,360 | |
| | Illinois State Toll Highway Authority, | | | | | | | | |
| | Series A, 5.00% due 12/1/2031 | | | 3,000,000 | | | | 3,070,656 | |
| | Series B, 5.00% due 1/1/2031 - 1/1/2033 | | | 1,950,000 | | | | 1,995,838 | |
| | Series C, 5.00% due 1/1/2025 - 1/1/2029 | | | 3,500,000 | | | | 3,515,451 | |
| | Knox & Warren Counties Community Unit School District No. 205 Galesburg GO, Series B, 5.00% due 12/1/2030 | | | 1,875,000 | | | | 1,992,917 | |
| | Madison-Macoupin Etc Counties Community College District No. 536 (AGM) GO, Series A, 5.00% due 11/1/2032 | | | 1,620,000 | | | | 1,676,269 | |
| | Metropolitan Pier & Exposition Authority, Series A, 5.00% due 12/15/2027 - 12/15/2028 | | | 6,000,000 | | | | 6,387,768 | |
| | Metropolitan Water Reclamation District of Greater Chicago GO, | | | | | | | | |
| | Series A, 5.00% due 12/1/2030 - 12/1/2031 | | | 3,120,000 | | | | 3,260,969 | |
| | Series B, 5.00% due 12/1/2031 | | | 775,000 | | | | 809,382 | |
| | Peoria Metropolitan Airport Authority GO, Series D, 5.00% due 12/1/2027 | | | 2,000,000 | | | | 2,088,198 | |
| | Peoria Tazewell Etc Counties Community College District No. 514 GO, Series B, 6.25% due 12/1/2027 - 12/1/2028 | | | 5,000,000 | | | | 5,612,607 | |
| | Sales Tax Securitization Corp., Series A, 5.00% due 1/1/2028 - 1/1/2029 | | | 6,445,000 | | | | 6,890,862 | |
| | Sangamon County School District No. 186 Springfield (AGM) GO, Series B, 5.00% due 2/1/2030 | | | 1,570,000 | | | | 1,737,604 | |
| | Southern Illinois University (BAM), Series A, 5.00% due 4/1/2025 - 4/1/2032 | | | 4,435,000 | | | | 4,787,073 | |
| | State of Illinois (State Facilities Improvements) GO, Series D, 5.00% due 11/1/2024 | | | 3,650,000 | | | | 3,655,230 | |
| | State of Illinois GO, | | | | | | | | |
| | 4.00% due 6/1/2032 | | | 2,400,000 | | | | 2,417,858 | |
| | 5.50% due 5/1/2025 - 5/1/2030 | | | 1,175,000 | | | | 1,284,427 | |
| | Series A, 5.00% due 10/1/2024 - 3/1/2032 | | | 9,525,000 | | | | 10,484,671 | |
| | Series B, | | | | | | | | |
| | 4.00% due 10/1/2033 - 11/1/2033 | | | 3,090,000 | | | | 3,199,682 | |
| | 5.00% due 3/1/2029 - 12/1/2032 | | | 2,500,000 | | | | 2,791,363 | |
| | Series D, 5.00% due 11/1/2027 - 11/1/2028 | | | 35,470,000 | | | | 37,637,014 | |
| | State of Illinois Sales Tax Revenue, | | | | | | | | |
| | Series B, 5.00% due 6/15/2026 - 6/15/2029 | | | 20,000,000 | | | | 21,193,835 | |
| | Series C, 5.00% due 6/15/2028 | | | 500,000 | | | | 537,900 | |
| | State of Illinois Sales Tax Revenue (BAM), Series A, 5.00% due 6/15/2031 | | | 1,200,000 | | | | 1,289,417 | |
| | State of Illinois Sales Tax Revenue (BAM, NPFG), 6.00% due 6/15/2026 | | | 235,000 | | | | 247,728 | |
| | University of Illinois (University of Illinois Auxiliary Facilities System), Series A, 4.00% due 4/1/2032 | | | 11,465,000 | | | | 11,485,648 | |
| | INDIANA — 2.1% | | | | | | | | |
| | City of Indianapolis Department of Public Utilities Gas Utility Revenue, Series A, 5.00% due 8/15/2027 | | | 6,865,000 | | | | 7,355,758 | |
| | City of Rockport (AEP Generating Co.; Guaranty: American Electric Power Co.), Series A, 3.125% due 7/1/2025 | | | 3,000,000 | | | | 2,987,721 | |
| | Clark-Pleasant Community School Building Corp. (State Intercept), 5.00% due 7/15/2033 | | | 955,000 | | | | 1,088,879 | |
| | Indiana Finance Authority (CWA Authority, Inc. Wastewater System Project), Series A, 5.00% due 10/1/2024 | | | 500,000 | | | | 500,031 | |
| | Indiana Finance Authority (Department of Transportation), Series C, 5.00% due 6/1/2029 | | | 8,040,000 | | | | 8,954,389 | |
| a | Indiana Finance Authority (Indiana University Health, Inc. Obligated Group), Series B-2, 5.00% due 10/1/2060 (put 7/1/2030) | | | 12,820,000 | | | | 14,192,381 | |
| a | Indiana Finance Authority (Republic Services, Inc.) AMT, 3.95% due 5/1/2028 (put 12/2/2024) | | | 7,500,000 | | | | 7,461,405 | |
| | Mount Vernon of Hancock County Multi-School Building Corp. (State Intercept), 5.00% due 1/15/2031 | | | 500,000 | | | | 563,757 | |
| See notes to financial statements. | Annual Financial Statements | 215 |
Schedule of Investments, Continued
Thornburg Limited Term Municipal Fund | September 30, 2024
| ISSUER-DESCRIPTION | | PRINCIPAL
AMOUNT | | | VALUE | |
| | | | | | | | | | |
| | Noblesville Redevelopment Authority, 5.00% due 1/15/2028 | | $ | 300,000 | | | $ | 322,702 | |
| b | North Lawrence Community Schools Building Corp. (North Lawrence Community School Improvement Corp.) (State Intercept), 5.00% due 1/15/2032 - 1/15/2034 | | | 1,190,000 | | | | 1,322,334 | |
| | Warsaw Community Schools (State Intercept) GO, 5.00% due 1/15/2025 - 1/15/2026 | | | 4,990,000 | | | | 5,084,025 | |
| | Westfield-Washington Schools (State Intercept) GO, Series C, 6.00% due 1/15/2025 | | | 1,300,000 | | | | 1,312,505 | |
| | IOWA — 2.4% | | | | | | | | |
| | Clinton Community School District/IA Infrastructure Sales Services & Use Tax (AGM), 5.00% due 7/1/2032 - 7/1/2033 | | | 3,050,000 | | | | 3,460,403 | |
| a | PEFA, Inc. (Guaranty: Goldman Sachs Group, Inc.), 5.00% due 9/1/2049 (put 9/1/2026) | | | 53,720,000 | | | | 54,993,916 | |
| | Pleasant Valley Community School District (Pleasant Valley Community School District Infrastructure Sales Service & Use Tax) (AGM), 5.00% due 7/1/2032 - 7/1/2033 | | | 1,795,000 | | | | 2,023,200 | |
| | KANSAS — 0.6% | | | | | | | | |
| a | City of Burlington (Evergy Metro, Inc.), 4.30% due 3/1/2045 (put 6/1/2026) | | | 7,240,000 | | | | 7,378,139 | |
| a | Kansas (AdventHealth Obligated Group) DFA, Series B, 5.00% due 11/15/2054 (put 11/15/2031) | | | 5,220,000 | | | | 5,865,547 | |
| | Wyandotte County No. 500 (General Improvement) USD GO, Series A, 5.00% due 9/1/2026 | | | 2,375,000 | | | | 2,481,811 | |
| | KENTUCKY — 3.0% | | | | | | | | |
| | County of Boone (Duke Energy Kentucky, Inc.), Series A, 3.70% due 8/1/2027 | | | 5,000,000 | | | | 5,006,915 | |
| a | County of Owen (American Water/Kentucky-American Water Co. Obligated Group), 3.875% due 6/1/2040 (put 9/1/2028) | | | 2,350,000 | | | | 2,385,866 | |
| | Kenton County Airport Board AMT, Series A, 5.00% due 1/1/2035 | | | 2,810,000 | | | | 3,068,551 | |
| | Kentucky Public Energy Authority (Guaranty: Morgan Stanley Group), | | | | | | | | |
| | Series A-1, | | | | | | | | |
| a | 4.00% due 8/1/2052 (put 8/1/2030) | | | 18,690,000 | | | | 19,166,576 | |
| a | 5.25% due 4/1/2054 (put 2/1/2032) | | | 13,000,000 | | | | 14,430,884 | |
| a | Series C-1, 4.00% due 12/1/2049 (put 6/1/2025) | | | 3,785,000 | | | | 3,799,201 | |
| | Kentucky State Property & Building Commission, Series A, 5.00% due 6/1/2030 - 6/1/2032 | | | 3,000,000 | | | | 3,417,875 | |
| | Louisville/Jefferson County Metropolitan Government (Norton Healthcare Obligated Group), | | | | | | | | |
| | Series A, 5.00% due 10/1/2027 - 10/1/2033 | | | 7,740,000 | | | | 7,996,963 | |
| a | Series C, 5.00% due 10/1/2047 (put 10/1/2026) | | | 8,500,000 | | | | 8,821,682 | |
| a | Series D, 5.00% due 10/1/2047 (put 10/1/2029) | | | 6,575,000 | | | | 7,178,526 | |
| | LOUISIANA — 0.9% | | | | | | | | |
| | City of Shreveport (AGM) GO, Series A, 5.00% due 3/1/2028 - 3/1/2032 | | | 3,800,000 | | | | 4,159,187 | |
| | City of Shreveport (Water & Sewer System) (BAM), Series C, 5.00% due 12/1/2029 | | | 1,500,000 | | | | 1,628,541 | |
| a | Louisiana Housing Corp. (Arbours at Lafayette Phase II LLC) (FHA), 5.00% due 4/1/2028 (put 4/1/2027) | | | 1,000,000 | | | | 1,050,273 | |
| a | Louisiana Offshore Terminal Authority (Loop LLC), Series A-R, 4.20% due 9/1/2033 (put 9/1/2028) | | | 2,000,000 | | | | 2,060,000 | |
| | Louisiana Public Facilities Authority (Ochsner Clinic Foundation Obligated Group), | | | | | | | | |
| | Series A, 5.00% due 5/15/2031 | | | 875,000 | | | | 959,590 | |
| a | Series B, 5.00% due 5/15/2050 (put 5/15/2025) | | | 1,735,000 | | | | 1,752,818 | |
| | Plaquemines Port Harbor & Terminal District (International Marine Terminals Partnership; LOC Wells Fargo Bank NA), | | | | | | | | |
| | Series A, 4.00% due 3/15/2025 (put 3/15/2024) | | | 2,500,000 | | | | 2,515,207 | |
| | Series B, 4.00% due 3/15/2025 (put 3/15/2024) | | | 5,000,000 | | | | 5,030,415 | |
| | State of Louisiana (Garvee), 5.00% due 9/1/2025 | | | 1,200,000 | | | | 1,225,583 | |
| a | State of Louisiana Gasoline & Fuels Tax Revenue, Series A, 3.888% (SOFR + 0.50%) due 5/1/2043 (put 5/1/2026) | | | 2,920,000 | | | | 2,927,306 | |
| | MARYLAND — 0.1% | | | | | | | | |
| | Maryland Stadium Authority (Baltimore City Public School Construction Financing Fund) (State Intercept), 5.00% due 5/1/2033 | | | 3,245,000 | | | | 3,344,274 | |
| | MASSACHUSETTS — 0.3% | | | | | | | | |
| | Massachusetts (CareGroup Healthcare System) DFA, Series I, 5.00% due 7/1/2027 | | | 1,900,000 | | | | 1,964,588 | |
| a,c | Massachusetts (Mass General Brigham, Inc.) DFA, Series T-1, 3.75% (MUNIPSA + 0.60%) due 7/1/2049 (put 1/29/2026) | | | 3,750,000 | | | | 3,754,429 | |
| | Massachusetts School Building Authority, Series D, 4.75% due 8/15/2032 | | | 2,700,000 | | | | 2,742,884 | |
| | MICHIGAN — 0.8% | | | | | | | | |
| | Michigan Finance Authority (BHSH System Obligated Group), Series A, 5.00% due 4/15/2030 - 4/15/2032 | | | 5,215,000 | | | | 5,919,952 | |
| a | Michigan Finance Authority (Bronson Health Care Group Obligated Group), Series B, 5.00% due 11/15/2044 (put 11/16/2026) | | | 1,730,000 | | | | 1,778,629 | |
| | Michigan Finance Authority (Henry Ford Health System), 5.00% due 11/15/2027 | | | 1,000,000 | | | | 1,039,760 | |
| | Michigan Finance Authority (McLaren Health Care Corp. Obligated Group), Series A, 5.00% due 5/15/2032 | | | 1,000,000 | | | | 1,009,209 | |
| | Michigan Finance Authority (Trinity Health Corp. Obligated Group), Series A, 5.00% due 12/1/2034 | | | 295,000 | | | | 310,601 | |
| | Michigan State Building Authority, Series I, 5.00% due 10/15/2032 | | | 1,250,000 | | | | 1,303,015 | |
| a,b | Michigan Strategic Fund (Consumers Energy Co.) AMT, 3.35% due 10/1/2049 (put 10/1/2027) | | | 1,000,000 | | | | 1,000,630 | |
| | Michigan Strategic Fund (Waste Management of Michigan, Inc.; Guaranty: Waste Management, Inc.) AMT, 4.125% due 8/1/2027 | | | 4,300,000 | | | | 4,379,743 | |
| | Wayne State University, Series A, 4.00% due 11/15/2034 | | | 1,875,000 | | | | 1,891,913 | |
| | MINNESOTA — 0.1% | | | | | | | | |
| | Minnesota Higher Education Facilities Authority (University of St. Thomas) (Green Bond), | | | | | | | | |
| a | Series B-1, 5.00% due 10/1/2053 (put 10/1/2027) | | | 1,000,000 | | | | 1,053,922 | |
| a | Series B-2, 5.00% due 10/1/2053 (put 10/1/2029) | | | 1,000,000 | | | | 1,092,277 | |
| | St. Paul Housing & Redevelopment Authority (HealthPartners), Series A, 5.00% due 7/1/2025 | | | 250,000 | | | | 253,423 | |
| 216 | Annual Financial Statements | See notes to financial statements. |
Schedule of Investments, Continued
Thornburg Limited Term Municipal Fund | September 30, 2024
| ISSUER-DESCRIPTION | | PRINCIPAL
AMOUNT | | | VALUE | |
| | | | | | | | | | |
| | MISSISSIPPI — 0.1% | | | | | | | | |
| | Mississippi Development Bank (Jackson Public School District) (BAM), 5.00% due 10/1/2024 - 10/1/2028 | | $ | 1,475,000 | | | $ | 1,547,302 | |
| | MISSOURI — 0.6% | | | | | | | | |
| a | Health & Educational Facilities Authority of the State of Missouri (BJC Healthcare Obligated Group), Series C, 5.00% due 5/1/2052 (put 5/1/2028) | | | 9,265,000 | | | | 9,990,570 | |
| | Health & Educational Facilities Authority of the State of Missouri (Lutheran Senior Services Obligated Group), Series A, 5.00% due 2/1/2025 -2/1/2027 | | | 1,630,000 | | | | 1,662,068 | |
| | Health & Educational Facilities Authority of the State of Missouri (SSM Health Care Obligated Group), Series A, 5.00% due 6/1/2031 | | | 680,000 | | | | 764,538 | |
| | Poplar Bluff R-I School District (AGM) COP, 5.00% due 3/1/2031 - 3/1/2033 | | | 1,575,000 | | | | 1,770,166 | |
| | MONTANA — 0.3% | | | | | | | | |
| | City of Forsyth (Avista Corp.), Series A, 3.875% due 10/1/2032 | | | 6,350,000 | | | | 6,431,134 | |
| | City of Forsyth (NorthWestern Corp.), 3.875% due 7/1/2028 | | | 1,000,000 | | | | 1,026,654 | |
| | Montana Facility Finance Authority (Billings Clinic Obligated Group), Series A, 5.00% due 8/15/2031 | | | 1,000,000 | | | | 1,125,780 | |
| | NEBRASKA — 1.0% | | | | | | | | |
| a | Central Plains Energy Project (Guaranty: Bank of Montreal), Series A, 5.00% due 5/1/2054 (put 11/1/2029) | | | 11,500,000 | | | | 12,341,915 | |
| a | Central Plains Energy Project (Guaranty: Goldman Sachs Group, Inc.), Series 1, 5.00% due 5/1/2053 (put 10/1/2029) | | | 7,825,000 | | | | 8,334,486 | |
| | Douglas County Hospital Authority No. 3 (Nebraska Methodist Health System), 5.00% due 11/1/2025 | | | 2,005,000 | | | | 2,050,012 | |
| | Gretna Public Schools GO, Series B, 5.00% due 12/15/2027 | | | 3,000,000 | | | | 3,077,082 | |
| | NEVADA — 0.8% | | | | | | | | |
| | Carson City (Carson Tahoe Regional Healthcare), Series A, 5.00% due 9/1/2027 - 9/1/2032 | | | 1,090,000 | | | | 1,137,433 | |
| | City of Las Vegas GO, Series C, 5.00% due 9/1/2031 | | | 1,000,000 | | | | 1,028,999 | |
| | Clark County School District GO, | | | | | | | | |
| | Series A, 4.00% due 6/15/2034 | | | 2,500,000 | | | | 2,537,560 | |
| | Series C, 4.00% due 6/15/2030 | | | 2,015,000 | | | | 2,041,171 | |
| a | County of Clark (Nevada Power Co.), 3.75% due 1/1/2036 (put 3/31/2026) | | | 1,000,000 | | | | 1,002,896 | |
| | County of Clark GO, | | | | | | | | |
| | 4.00% due 11/1/2033 | | | 2,550,000 | | | | 2,562,490 | |
| | Series C, 4.00% due 7/1/2032 | | | 1,985,000 | | | | 2,081,570 | |
| | Reno-Tahoe Airport Authority AMT, Series A, 5.00% due 7/1/2033 - 7/1/2034 | | | 2,325,000 | | | | 2,546,793 | |
| | Truckee Meadows Water Authority, 5.00% due 7/1/2033 (pre-refunded 7/1/2026) | | | 5,070,000 | | | | 5,278,884 | |
| | NEW HAMPSHIRE — 0.3% | | | | | | | | |
| | New Hampshire Business Finance Authority (United Illuminating Co.), Series A, 4.50% due 10/1/2033 | | | 7,000,000 | | | | 7,411,299 | |
| | NEW JERSEY — 4.5% | | | | | | | | |
| a | Camden County Improvement Authority (HUD), 5.00% due 3/1/2027 (put 3/1/2026) | | | 3,200,000 | | | | 3,287,773 | |
| | New Jersey (New Jersey Transit Corp.) (State Aid Withholding) EDA, Series B, 5.00% due 11/1/2024 | | | 8,000,000 | | | | 8,011,192 | |
| | New Jersey (New Jersey Transit Corp.) EDA, Series A, 5.00% due 11/1/2029 - 11/1/2032 | | | 3,630,000 | | | | 4,137,278 | |
| | New Jersey (School Facilities Construction) EDA, 5.00% due 6/15/2028 | | | 900,000 | | | | 975,748 | |
| | New Jersey (State of New Jersey Department of the Treasury) EDA, Series DDD, 5.00% due 6/15/2033 (pre-refunded 6/15/2027) | | | 1,500,000 | | | | 1,597,728 | |
| | New Jersey Health Care Facilities Financing Authority (Hackensack Meridian Health Obligated Group), Series A, 4.00% due 7/1/2034 | | | 4,900,000 | | | | 4,950,225 | |
| | New Jersey Transportation Trust Fund Authority, | | | | | | | | |
| | Series 2014-BB-2, 5.00% due 6/15/2030 | | | 1,200,000 | | | | 1,344,394 | |
| | Series A, 5.00% due 12/15/2032 - 6/15/2033 | | | 4,100,000 | | | | 4,537,033 | |
| | Series BB1, 5.00% due 6/15/2033 | | | 1,425,000 | | | | 1,540,908 | |
| | New Jersey Transportation Trust Fund Authority (Transportation System), Series D, 5.00% due 6/15/2032 | | | 6,380,000 | | | | 6,400,237 | |
| | New Jersey Transportation Trust Fund Authority (State Transportation System Improvements), | | | | | | | | |
| | Series A, 5.00% due 6/15/2028 | | | 4,240,000 | | | | 4,386,878 | |
| | Series A-1, 5.00% due 6/15/2025 - 6/15/2027 | | | 31,285,000 | | | | 32,374,479 | |
| | New Jersey Transportation Trust Fund Authority (Transportation System), | | | | | | | | |
| | Series A, 5.00% due 12/15/2025 - 6/15/2032 | | | 25,965,000 | | | | 28,100,895 | |
| | Series BB-1, 5.00% due 6/15/2031 | | | 2,500,000 | | | | 2,721,485 | |
| | State of New Jersey (COVID-19 GO Emergency Bonds) GO, Series A, 5.00% due 6/1/2029 | | | 7,500,000 | | | | 8,343,225 | |
| | NEW MEXICO — 1.8% | | | | | | | | |
| | Albuquerque Bernalillo County Water Utility Authority, 5.00% due 7/1/2032 | | | 1,575,000 | | | | 1,668,796 | |
| | Albuquerque Bernalillo County Water Utility Authority (2005 NMFA Loan & Joint Water & Sewer System Improvements), Series A, 5.00% due 7/1/2026 | | | 2,000,000 | | | | 2,003,246 | |
| | Albuquerque Municipal School District No. 12 (Bernalillo & Sandoval Counties School Facilities) (State Aid Withholding) GO, 5.00% due 8/1/2034 | | | 1,260,000 | | | | 1,365,744 | |
| | Albuquerque Municipal School District No. 12 (State Aid Withholding) GO, Series 2017, 5.00% due 8/1/2026 | | | 550,000 | | | | 575,000 | |
| | City of Albuquerque (City Infrastructure Improvements) GO, Series A, 5.00% due 7/1/2026 | | | 870,000 | | | | 907,032 | |
| | City of Farmington (Public Service Co. of New Mexico), | | | | | | | | |
| a | Series A, 0.875% due 6/1/2040 (put 10/1/2026) | | | 1,000,000 | | | | 947,550 | |
| a | Series D, 3.90% due 6/1/2040 (put 6/1/2028) | | | 2,000,000 | | | | 2,052,582 | |
| | City of Santa Fe (El Castillo Retirement Residences Obligated Group), 4.50% due 5/15/2027 | | | 1,055,000 | | | | 1,055,367 | |
| | City of Santa Fe (Public Facilities) GRT, 5.00% due 6/1/2029 | | | 950,000 | | | | 951,386 | |
| See notes to financial statements. | Annual Financial Statements | 217 |
Schedule of Investments, Continued
Thornburg Limited Term Municipal Fund | September 30, 2024
| ISSUER-DESCRIPTION | | PRINCIPAL
AMOUNT | | | VALUE | |
| | | | | | | | | | |
| | County of Sandoval GO, 5.00% due 8/1/2027 | | $ | 210,000 | | | $ | 224,736 | |
| | County of Santa Fe (County Buildings & Facilities) GRT, Series A, 5.00% due 6/1/2025 | | | 1,250,000 | | | | 1,269,995 | |
| | Hobbs School District No. 16 (State Aid Withholding) GO, 5.00% due 9/15/2028 - 9/15/2030 | | | 1,355,000 | | | | 1,490,927 | |
| | New Mexico Finance Authority (Public Project Revolving Fund), Series A, 5.00% due 6/15/2031 | | | 1,000,000 | | | | 1,013,120 | |
| | New Mexico Finance Authority (State of New Mexico Department of Transportation), Series A, 5.00% due 6/15/2026 | | | 1,500,000 | | | | 1,564,056 | |
| | New Mexico Hospital Equipment Loan Council (Presbyterian Healthcare Services Obligated Group), | | | | | | | | |
| | Series A, 5.00% due 8/1/2032 | | | 1,000,000 | | | | 1,102,578 | |
| a | Series B, 5.00% due 8/1/2049 (put 8/1/2025) | | | 3,650,000 | | | | 3,702,432 | |
| | New Mexico Hospital Equipment Loan Council (San Juan Regional Medical Center, Inc.), 5.00% due 6/1/2030 - 6/1/2031 | | | 1,215,000 | | | | 1,304,376 | |
| a | New Mexico Mortgage Finance Authority (JLG NM ABQ 2023 LLLP) (HUD), 5.00% due 2/1/2042 (put 9/1/2025) | | | 3,100,000 | | | | 3,129,329 | |
| a | New Mexico Mortgage Finance Authority (JLG SAF 2023 LLLP) (HUD), 5.00% due 2/1/2042 (put 6/1/2025) | | | 4,050,000 | | | | 4,055,990 | |
| | Santa Fe Public School District (State Aid Withholding) GO, 5.00% due 8/1/2032 | | | 1,500,000 | | | | 1,689,210 | |
| | State of New Mexico Severance Tax Permanent Fund, Series A, 5.00% due 7/1/2025 | | | 11,705,000 | | | | 11,899,233 | |
| | Village of Los Ranchos de Albuquerque (Albuquerque Academy), 5.00% due 9/1/2029 - 9/1/2032 | | | 1,030,000 | | | | 1,122,576 | |
| | NEW YORK — 6.1% | | | | | | | | |
| | City of New York GO, | | | | | | | | |
| | Series A-1, 5.00% due 9/1/2033 | | | 1,300,000 | | | | 1,500,008 | |
| | Series C, 5.00% due 8/1/2025 | | | 2,500,000 | | | | 2,544,642 | |
| | Series C-1, 5.00% due 8/1/2032 | | | 1,000,000 | | | | 1,120,598 | |
| | Series F-1, 5.00% due 8/1/2033 | | | 1,000,000 | | | | 1,170,741 | |
| | City of Yonkers (AGM) GO, Series A, 5.00% due 2/15/2029 | | | 850,000 | | | | 944,641 | |
| | Long Island Power Authority, 5.00% due 9/1/2033 | | | 400,000 | | | | 435,554 | |
| | Metropolitan Transportation Authority, | | | | | | | | |
| | Series A-1, 5.00% due 11/15/2025 | | | 1,265,000 | | | | 1,280,554 | |
| | Series B, | | | | | | | | |
| | 4.00% due 11/15/2026 | | | 1,660,000 | | | | 1,706,141 | |
| | 5.00% due 11/15/2028 | | | 1,230,000 | | | | 1,282,551 | |
| | Series C-1, | | | | | | | | |
| | 5.00% due 11/15/2027 | | | 1,070,000 | | | | 1,093,757 | |
| | 5.25% due 11/15/2028 - 11/15/2029 | | | 16,100,000 | | | | 16,491,826 | |
| | Series D-1, 5.00% due 11/15/2028 - 11/15/2029 | | | 4,990,000 | | | | 5,098,070 | |
| | Series F, 5.00% due 11/15/2025 | | | 1,055,000 | | | | 1,081,312 | |
| | Metropolitan Transportation Authority (Green Bond), | | | | | | | | |
| a | Series A-1, 5.00% due 11/15/2048 (put 11/15/2024) | | | 710,000 | | | | 711,805 | |
| | Series A2, 5.00% due 11/15/2027 | | | 3,450,000 | | | | 3,600,361 | |
| | Series B, 5.00% due 11/15/2025 - 11/15/2027 | | | 6,650,000 | | | | 6,899,251 | |
| | Series C-1, 5.00% due 11/15/2024 - 11/15/2026 | | | 6,840,000 | | | | 7,028,256 | |
| a | Monroe County Industrial Development Corp. (Andrews Terrace Community Partners LP) (HUD), Series B-2, 5.00% due 7/1/2028 (put 7/1/2027) | | | 4,000,000 | | | | 4,198,956 | |
| a | New York City Housing Development Corp. (FHA) (Green Bond), Series F-2A, 3.40% due 11/1/2062 (put 12/22/2026) | | | 2,500,000 | | | | 2,498,718 | |
| a | New York City Housing Development Corp. (Green Bond), Series D, 4.30% due 11/1/2063 (put 11/1/2028) | | | 2,250,000 | | | | 2,328,289 | |
| | New York City Municipal Water Finance Authority (New York City Water & Sewer System), Series AA-2, 5.00% due 6/15/2029 | | | 4,495,000 | | | | 4,837,065 | |
| | New York City Transitional Finance Authority Building Aid Revenue (State Aid Withholding), Series S, 5.00% due 7/15/2034 | | | 1,000,000 | | | | 1,080,737 | |
| | New York City Transitional Finance Authority Future Tax Secured Revenue, | | | | | | | | |
| | Series A, 5.00% due 11/1/2031 | | | 7,980,000 | | | | 9,032,785 | |
| | Series A1, 5.00% due 8/1/2031 - 8/1/2032 | | | 8,500,000 | | | | 8,647,017 | |
| | Series B-1, 5.00% due 8/1/2034 | | | 1,000,000 | | | | 1,059,291 | |
| | Series F-1, 5.00% due 5/1/2030 | | | 3,705,000 | | | | 3,921,246 | |
| | Series F-3, 4.00% due 2/1/2034 | | | 4,000,000 | | | | 4,030,700 | |
| | New York State Dormitory Authority, | | | | | | | | |
| | Series A, | | | | | | | | |
| | 5.00% due 3/15/2028 | | | 370,000 | | | | 386,045 | |
| | 5.00% due 3/15/2028 (pre-refunded 9/15/2026) | | | 810,000 | | | | 849,737 | |
| | New York State Dormitory Authority (AGM), Series A, 5.00% due 10/1/2032 | | | 400,000 | | | | 434,221 | |
| | New York State Dormitory Authority (AGM, State Aid Withholding), Series A, 5.00% due 10/1/2034 | | | 2,000,000 | | | | 2,310,708 | |
| | New York State Dormitory Authority (BAM), Series A, 5.00% due 10/1/2032 | | | 3,500,000 | | | | 3,944,094 | |
| | New York State Dormitory Authority (State Aid Withholding), Series A, 5.00% due 10/1/2029 | | | 1,000,000 | | | | 1,068,935 | |
| | New York State Dormitory Authority (State of New York Personal Income Tax Revenue), | | | | | | | | |
| | Series A, 5.00% due 3/15/2030 | | | 7,250,000 | | | | 8,144,877 | |
| | Series A1, 5.00% due 3/15/2031 | | | 4,545,000 | | | | 5,200,725 | |
| | Series E, 5.00% due 3/15/2033 | | | 2,000,000 | | | | 2,313,374 | |
| | New York State Dormitory Authority (State of New York Sales Tax Revenue), | | | | | | | | |
| | Series A, 5.00% due 3/15/2032 - 3/15/2033 | | | 3,465,000 | | | | 3,606,802 | |
| | Series E, 5.00% due 3/15/2029 (pre-refunded 9/15/2028) | | | 4,135,000 | | | | 4,563,907 | |
| 218 | Annual Financial Statements | See notes to financial statements. |
Schedule of Investments, Continued
Thornburg Limited Term Municipal Fund | September 30, 2024
| ISSUER-DESCRIPTION | | PRINCIPAL
AMOUNT | | | VALUE | |
| | | | | | | | | | |
| | New York State Energy Research & Development Authority (New York State Electric & Gas Corp.), Series C, 4.00% due 4/1/2034 | | $ | 1,700,000 | | | $ | 1,759,600 | |
| | New York State Urban Development Corp. (State of New York Personal Income Tax Revenue), | | | | | | | | |
| | Series A-G, 5.00% due 3/15/2034 | | | 3,220,000 | | | | 3,380,269 | |
| | Series C, 4.00% due 3/15/2034 | | | 1,000,000 | | | | 1,055,104 | |
| | Series C-2, 5.00% due 3/15/2032 | | | 4,715,000 | | | | 5,014,355 | |
| | Oneida County Local Development Corp. (Utica College), 5.00% due 7/1/2025 - 7/1/2032 | | | 855,000 | | | | 893,883 | |
| | Triborough Bridge & Tunnel Authority, | | | | | | | | |
| | Series A, 5.00% due 11/15/2033 | | | 750,000 | | | | 758,909 | |
| | Series B, 5.00% due 11/15/2031 | | | 4,170,000 | | | | 4,410,530 | |
| | Triborough Bridge & Tunnel Authority (Metropolitan Transportation Authority Payroll Mobility Tax Revenue) (Green Bond), | | | | | | | | |
| | Series D-1A, 5.00% due 11/15/2031 | | | 1,000,000 | | | | 1,160,324 | |
| | Series E, 5.00% due 11/15/2032 | | | 2,000,000 | | | | 2,332,658 | |
| | Troy Capital Resource Corp. (Rensselaer Polytechnic Institute), 4.00% due 8/1/2035 | | | 1,000,000 | | | | 999,996 | |
| | Utility Debt Securitization Authority, 5.00% due 12/15/2034 | | | 2,000,000 | | | | 2,049,114 | |
| | Westchester County Local Development Corp. (Miriam Osborn Memorial Home Association Obligated Group), 5.00% due 7/1/2034 | | | 200,000 | | | | 206,301 | |
| | NORTH CAROLINA — 1.0% | | | | | | | | |
| | Charlotte-Mecklenburg Hospital Authority (Atrium Health Obligated Group), | | | | | | | | |
| | Series D, | | | | | | | | |
| a | 3.625% due 1/15/2048 (put 6/15/2027) | | | 1,350,000 | | | | 1,364,715 | |
| a | 5.00% due 1/15/2049 (put 12/1/2031) | | | 7,000,000 | | | | 7,875,140 | |
| | Columbus County Industrial Facilities & Pollution Control Financing Authority (International Paper Co.), | | | | | | | | |
| a,b | Series A, 3.45% due 11/1/2033 (put 10/1/2031) | | | 1,100,000 | | | | 1,100,135 | |
| a,b | Series B, 3.45% due 11/1/2033 (put 10/1/2031) | | | 1,400,000 | | | | 1,400,174 | |
| | County of Buncombe, 5.00% due 6/1/2031 | | | 1,000,000 | | | | 1,013,152 | |
| | Greater Asheville Regional Airport Authority (AGM) AMT, 5.00% due 7/1/2035 | | | 1,050,000 | | | | 1,148,169 | |
| | North Carolina Housing Finance Agency (Green Bond), Series 51, 3.85% due 7/1/2032 | | | 1,495,000 | | | | 1,514,979 | |
| | North Carolina Turnpike Authority, 5.00% due 1/1/2029 | | | 2,680,000 | | | | 2,889,104 | |
| | State of North Carolina, 5.00% due 3/1/2033 | | | 5,000,000 | | | | 5,471,170 | |
| | OHIO — 2.0% | | | | | | | | |
| | Akron, Bath & Copley Joint Township Hospital District (Summa Health System Obligated Group), 5.00% due 11/15/2027 - 11/15/2032 | | | 3,835,000 | | | | 4,159,584 | |
| | City of Cincinnati Water System Revenue, Series C, 4.00% due 12/1/2030 | | | 1,000,000 | | | | 1,026,135 | |
| | City of Columbus GO, Series A, 4.00% due 4/1/2031 | | | 600,000 | | | | 619,024 | |
| | City of Delaware GO, 4.50% due 7/1/2025 | | | 3,650,000 | | | | 3,684,109 | |
| | City of Louisville GO, 4.375% due 6/25/2025 | | | 2,800,000 | | | | 2,831,150 | |
| | City of Middletown GO, 4.625% due 6/26/2025 | | | 2,550,000 | | | | 2,574,067 | |
| | City of Parma Heights GO, 4.625% due 6/26/2025 | | | 925,000 | | | | 936,531 | |
| a | Columbus-Franklin County Finance Authority (Dering Family Homes Owner LLC), 5.00% due 7/1/2045 (put 2/1/2027) | | | 2,000,000 | | | | 2,072,356 | |
| | County of Allen Hospital Facilities Revenue (Bon Secours Mercy Health, Inc.), | | | | | | | | |
| a | Series B-1, 5.00% due 10/1/2049 (put 8/3/2027) | | | 4,765,000 | | | | 5,016,721 | |
| a | Series B-2, 5.00% due 10/1/2051 (put 6/4/2030) | | | 10,590,000 | | | | 11,480,407 | |
| | County of Cuyahoga (Musical Arts Association), 5.00% due 1/1/2030 - 1/1/2032 | | | 820,000 | | | | 894,381 | |
| | County of Franklin (Nationwide Children’s Hospital, Inc.), Series A, 5.00% due 11/1/2032 | | | 1,195,000 | | | | 1,272,038 | |
| | County of Hamilton Sales Tax Revenue, Series A, 4.00% due 12/1/2031 | | | 1,100,000 | | | | 1,119,941 | |
| | Northeast Ohio Medical University (BAM), 5.00% due 12/1/2031 - 12/1/2032 | | | 615,000 | | | | 686,325 | |
| a | Ohio Air Quality Development Authority (Duke Energy Corp.), Series B, 4.00% due 9/1/2030 (put 6/1/2027) | | | 4,515,000 | | | | 4,569,884 | |
| a | Ohio Air Quality Development Authority (Ohio Valley Electric Corp.), Series B, 1.375% due 2/1/2026 (put 11/1/2024) | | | 800,000 | | | | 797,964 | |
| | Ohio Water Development Authority, 4.00% due 12/1/2032 | | | 2,000,000 | | | | 2,033,808 | |
| a | State of Ohio (Children’s Hospital Medical Center of Akron Obligated Group), Series B, 5.00% due 8/15/2054 (put 8/15/2032) | | | 1,250,000 | | | | 1,408,909 | |
| | State of Ohio (Cleveland Clinic Health System Obligated Group), | | | | | | | | |
| | Series A, | | | | | | | | |
| | 4.00% due 1/1/2034 | | | 1,170,000 | | | | 1,193,013 | |
| | 5.00% due 1/1/2032 | | | 800,000 | | | | 856,759 | |
| | State of Ohio Department of Administrative Services, Series A-2, 4.00% due 4/1/2032 | | | 1,000,000 | | | | 1,005,255 | |
| | OKLAHOMA — 3.5% | | | | | | | | |
| | Caddo County Educational Facilities Authority (Fort Cobb-Broxton Public Schools Project) ISD, 5.00% due 9/1/2027 - 9/1/2034 | | | 3,170,000 | | | | 3,375,625 | |
| | Canadian County Educational Facilities Authority (Mustang Public Schools Project) ISD, Series A, 5.00% due 9/1/2032 - 9/1/2033 | | | 11,000,000 | | | | 12,567,505 | |
| | Canadian County Educational Facilities Authority (Yukon Public Schools Project) ISD, 5.00% due 9/1/2027 - 9/1/2029 | | | 10,850,000 | | | | 11,857,482 | |
| | Cleveland County Educational Facilities Authority (Moore Public Schools) ISD, 4.00% due 6/1/2030 - 6/1/2031 | | | 9,240,000 | | | | 9,948,615 | |
| | Cleveland County Educational Facilities Authority (Norman Public Schools) ISD, Series A, 5.00% due 6/1/2028 - 6/1/2033 | | | 15,850,000 | | | | 17,789,059 | |
| | Clinton Public Works Authority, 5.00% due 10/1/2029 - 10/1/2032 | | | 4,295,000 | | | | 4,733,597 | |
| | Cushing Educational Facilities Authority (Payne County No. 67 Cushing) ISD, 5.00% due 9/1/2028 - 9/1/2032 | | | 9,000,000 | | | | 9,884,407 | |
| | Muskogee Industrial Trust (Muskogee County No. 20) ISD, 5.00% due 9/1/2026 | | | 475,000 | | | | 487,883 | |
| | Oklahoma (Oklahoma State Regents for Higher Education) DFA, Series A, 5.00% due 6/1/2028 | | | 425,000 | | | | 430,576 | |
| See notes to financial statements. | Annual Financial Statements | 219 |
Schedule of Investments, Continued
Thornburg Limited Term Municipal Fund | September 30, 2024
| ISSUER-DESCRIPTION | | PRINCIPAL
AMOUNT | | | VALUE | |
| | | | | | | | | | |
| | Payne County (Stillwater Public Schools) (BAM) EDA, 5.00% due 9/1/2032 | | $ | 1,250,000 | | | $ | 1,431,084 | |
| | Rogers County Educational Facilities Authority (School District No. 2 Catoosa), 5.00% due 9/1/2029 - 9/1/2032 | | | 12,000,000 | | | | 13,526,404 | |
| | Texas County Development Authority (Texas County ISD No. 8 Guymon), 5.00% due 10/1/2032 - 10/1/2033 | | | 1,160,000 | | | | 1,327,490 | |
| | Tulsa County Industrial Authority (Tulsa County ISD No. 2 Sand Springs) (BAM), 5.00% due 9/1/2034 | | | 665,000 | | | | 773,153 | |
| | OREGON — 0.5% | | | | | | | | |
| a | Oregon Health & Science University (Oregon Health & Science University Obligated Group), Series B2, 5.00% due 7/1/2046 (put 2/1/2032) | | | 11,780,000 | | | | 13,220,883 | |
| | PENNSYLVANIA — 5.2% | | | | | | | | |
| | Allegheny County Hospital Development Authority (UPMC Obligated Group), Series A, 5.00% due 7/15/2031 | | | 2,520,000 | | | | 2,746,142 | |
| | Allegheny County Sanitary Authority (BAM), 5.00% due 12/1/2029 | | | 2,830,000 | | | | 2,896,819 | |
| | Allentown City School District (BAM, State Aid Withholding) GO, Series B, 5.00% due 2/1/2031 | | | 3,750,000 | | | | 4,056,334 | |
| | Bethlehem Area School District Authority (State Aid Withholding), | | | | | | | | |
| a | Series A, 3.586% (SOFR + 0.35%) due 1/1/2030 (put 11/1/2025) | | | 2,985,000 | | | | 2,967,406 | |
| a | Series C, 3.586% (SOFR + 0.35%) due 1/1/2032 (put 11/1/2025) | | | 2,985,000 | | | | 2,984,499 | |
| | City of Philadelphia (AGM) GO, 5.00% due 8/1/2027 | | | 6,005,000 | | | | 6,399,517 | |
| | City of Philadelphia (Pennsylvania Gas Works), Series 14, 5.00% due 10/1/2024 - 10/1/2032 | | | 3,070,000 | | | | 3,150,164 | |
| | City of Philadelphia (Pennsylvania Gas Works) (AGM), Series A, 5.00% due 8/1/2025 - 8/1/2032 | | | 2,210,000 | | | | 2,418,035 | |
| | City of Philadelphia Airport Revenue, Series A, 5.00% due 7/1/2030 | | | 750,000 | | | | 840,186 | |
| | City of Philadelphia GO, Series B, 5.00% due 8/1/2033 | | | 1,060,000 | | | | 1,075,757 | |
| | City of Philadelphia IDA, 5.00% due 5/1/2027 - 5/1/2028 | | | 1,450,000 | | | | 1,552,082 | |
| | City of Philadelphia Water & Wastewater Revenue, Series B, 5.00% due 7/1/2032 | | | 2,500,000 | | | | 2,532,450 | |
| | City of Scranton (BAM) GO, 5.00% due 9/1/2028 | | | 2,085,000 | | | | 2,193,610 | |
| | Commonwealth Financing Authority (Pennsylvania Department of Community & Economic Development) (AGM), Series B-1, 5.00% due 6/1/2025 | | | 3,000,000 | | | | 3,041,121 | |
| | Commonwealth Financing Authority (Tobacco Master Settlement Paym) (BAM), 5.00% due 6/1/2031 | | | 10,000,000 | | | | 10,740,520 | |
| | Commonwealth of Pennsylvania GO, | | | | | | | | |
| | 5.00% due 7/15/2030 | | | 12,930,000 | | | | 14,391,206 | |
| | Series 1, 5.00% due 3/15/2025 | | | 12,005,000 | | | | 12,134,750 | |
| | Dauphin County General Authority (UPMC Obligated Group), Series A, 5.00% due 6/1/2034 | | | 1,375,000 | | | | 1,412,249 | |
| | Geisinger Authority (Geisinger Health System Obligated group), | | | | | | | | |
| a | Series B, 5.00% due 4/1/2043 (put 2/15/2027) | | | 5,115,000 | | | | 5,327,999 | |
| a | Series C, 5.00% due 4/1/2043 (put 4/1/2030) | | | 3,530,000 | | | | 3,887,956 | |
| a | Montgomery County (Constellation Energy Generation LLC) IDA, Series A, 4.10% due 4/1/2053 (put 4/3/2028) | | | 5,000,000 | | | | 5,151,220 | |
| | Northeastern Pennsylvania Hospital & Education Authority (King’s College), 5.00% due 5/1/2027 - 5/1/2029 | | | 3,825,000 | | | | 3,966,785 | |
| | Pennsylvania (UPMC Obligated Group) EDFA, Series A, 5.00% due 10/15/2033 | | | 1,150,000 | | | | 1,283,771 | |
| a | Pennsylvania (Waste Management Obligated Group; Guaranty: Waste Management, Inc.) EDFA, 0.95% due 12/1/2033 (put 12/1/2026) | | | 1,000,000 | | | | 948,068 | |
| a | Pennsylvania (Waste Management, Inc.; Guaranty: Waste Management Holdings) EDFA AMT, Series A, 4.25% due 8/1/2038 (put 8/1/2025) | | | 16,500,000 | | | | 16,589,529 | |
| | Pennsylvania Turnpike Commission, Series A-1, 5.00% due 12/1/2033 | | | 1,000,000 | | | | 1,011,745 | |
| | Pittsburgh Water & Sewer Authority (AGM), Series B, 5.00% due 9/1/2033 | | | 1,000,000 | | | | 1,165,831 | |
| | School District of Philadelphia (State Aid Withholding) GO, Series A, 5.00% due 9/1/2026 - 9/1/2028 | | | 1,510,000 | | | | 1,602,466 | |
| | Sports & Exhibition Authority of Pittsburgh & Allegheny County (Allegheny County Hotel Room Excise Tax Revenue) (AGM), Series A, 5.00% due 2/1/2033 | | | 4,000,000 | | | | 4,541,892 | |
| | State Public School Building Authority (BAM), Series A, 4.00% due 10/1/2033 | | | 2,325,000 | | | | 2,336,727 | |
| | State Public School Building Authority (School District of Philadelphia) (AGM, State Aid Withholding), Series A, 5.00% due 6/1/2030 | | | 3,550,000 | | | | 3,702,079 | |
| | RHODE ISLAND — 0.1% | | | | | | | | |
| a | Rhode Island Housing & Mortgage Finance Corp. (FHA) (Green Bond), Series 1-A, 3.60% due 10/1/2054 (put 10/1/2027) | | | 3,000,000 | | | | 3,006,513 | |
| | SOUTH CAROLINA — 0.7% | | | | | | | | |
| | Berkeley County School District (School Facility Equipment Acquisition), 5.00% due 12/1/2024 | | | 2,000,000 | | | | 2,007,182 | |
| | Lancaster County School District GO, 4.00% due 3/1/2034 | | | 2,500,000 | | | | 2,548,848 | |
| a | Patriots Energy Group Financing Agency (Guaranty: Sumitomo Mitsui Banking Corp.), Series A1, 5.25% due 10/1/2054 (put 8/1/2031) | | | 10,090,000 | | | | 10,978,051 | |
| | SCAGO Educational Facilities Corp. (School District of Pickens County), 5.00% due 12/1/2029 | | | 2,000,000 | | | | 2,024,698 | |
| | TENNESSEE — 2.8% | | | | | | | | |
| | Knox County Health Educational & Housing Facility Board (BAM), Series B-1, 5.00% due 7/1/2031 - 7/1/2034 | | | 3,570,000 | | | | 4,036,423 | |
| a | Knox County Health Educational & Housing Facility Board (Gleason Partners LP) (HUD), 3.95% due 12/1/2027 (put 12/1/2025) | | | 1,500,000 | | | | 1,509,733 | |
| | Knox County Health Educational & Housing Facility Board (Provident Group - UTK Properties LLC) (BAM), Series A-1, 5.00% due 7/1/2031 -7/1/2034 | | | 1,245,000 | | | | 1,404,965 | |
| a | Metropolitan Government Nashville & Davidson County Health & Educational Facilities Board (Northview Housing Development LP), Series B, 3.85% due 2/1/2045 (put 2/1/2025) | | | 2,500,000 | | | | 2,498,960 | |
| | Shelby County Health Educational & Housing Facilities Board (Methodist Le Bonheur Healthcare), Series A, 5.00% due 5/1/2031 | | | 1,260,000 | | | | 1,314,877 | |
| a | Tennergy Corp. (Guaranty: Morgan Stanley Group), Series A, 4.00% due 12/1/2051 (put 9/1/2028) | | | 14,730,000 | | | | 15,002,358 | |
| a | Tennessee Energy Acquisition Corp. (Guaranty: Goldman Sachs Group, Inc.), Series A-1, 5.00% due 5/1/2053 (put 5/1/2028) | | | 1,000,000 | | | | 1,052,579 | |
| a | Tennessee Energy Acquisition Corp. (Tennessee Energy Acquisition Corp.; Guaranty: Goldman Sachs Group, Inc.), Series A, 5.00% due 5/1/2052 (put 11/1/2031) | | | 35,310,000 | | | | 38,405,381 | |
| 220 | Annual Financial Statements | See notes to financial statements. |
Schedule of Investments, Continued
Thornburg Limited Term Municipal Fund | September 30, 2024
| ISSUER-DESCRIPTION | | PRINCIPAL
AMOUNT | | | VALUE | |
| | | | | | | | | | |
| | Tennessee HDA (Green Bond), | | | | | | | | |
| | Series 2A, | | | | | | | | |
| | 3.80% due 1/1/2032 | | $ | 400,000 | | | $ | 406,358 | |
| | 3.875% due 1/1/2033 | | | 500,000 | | | | 508,035 | |
| | 3.90% due 7/1/2033 | | | 500,000 | | | | 507,692 | |
| | 3.95% due 1/1/2034 | | | 1,000,000 | | | | 1,016,231 | |
| a | Williamson County (ECG Wood Duck LP) (HUD) IDB, 5.00% due 5/1/2042 (put 5/1/2027) | | | 2,000,000 | | | | 2,075,912 | |
| | TEXAS — 14.4% | | | | | | | | |
| | Amarillo Junior College District GO, 5.00% due 2/15/2030 | | | 2,325,000 | | | | 2,601,717 | |
| | Arlington Higher Education Finance Corp. (Kipp Texas, Inc.) (PSF-GTD), 4.00% due 8/15/2031 | | | 1,000,000 | | | | 1,032,063 | |
| b | Arlington Higher Education Finance Corp. (Lifeschool of Dallas) (PSF-GTD), 5.00% due 8/15/2033 - 8/15/2035 | | | 760,000 | | | | 870,384 | |
| a | Austin Affordable PFC, Inc. (1000 Collinwood West Drive Owner LP) (FNMA), Series B, 5.00% due 9/1/2028 (put 9/1/2027) | | | 800,000 | | | | 842,568 | |
| a | Austin Affordable PFC, Inc. (8000 Decker Lane Owner LP) (FNMA), Series B, 5.00% due 9/1/2028 (put 9/1/2027) | | | 1,000,000 | | | | 1,052,734 | |
| | Bexar County Hospital District (CTFS Obligation) GO, 5.00% due 2/15/2033 | | | 820,000 | | | | 858,141 | |
| a | Bexar County Housing Finance Corp. (Culebra Road Apartments LP), 4.05% due 3/1/2028 (put 3/1/2026) | | | 2,500,000 | | | | 2,522,970 | |
| | Central Texas Turnpike System, | | | | | | | | |
| a | Series B, 5.00% due 8/15/2042 (put 8/15/2030) | | | 3,000,000 | | | | 3,354,624 | |
| | Series C, 5.00% due 8/15/2031 | | | 2,800,000 | | | | 2,805,099 | |
| | City of Aubrey Jackson Ridge Public Improvement District (BAM), 5.00% due 9/1/2026 - 9/1/2034 | | | 2,180,000 | | | | 2,376,931 | |
| | City of Austin Electric Utility Revenue, Series A, 5.00% due 11/15/2033 | | | 1,000,000 | | | | 1,020,463 | |
| | City of Austin Water & Wastewater System Revenue, 5.00% due 11/15/2033 | | | 2,000,000 | | | | 2,129,064 | |
| | City of Conroe GO, Series B, 5.00% due 11/15/2030 | | | 1,750,000 | | | | 1,906,186 | |
| a | City of Dallas Housing Finance Corp. (Ash Creek Housing LLC) (FHA), 5.00% due 7/1/2026 (put 12/1/2025) | | | 1,500,000 | | | | 1,536,585 | |
| a | City of Dallas Housing Finance Corp. (Mondello Apartments LLC) (FHA), 5.00% due 8/1/2027 (put 8/1/2026) | | | 1,785,000 | | | | 1,853,626 | |
| | City of Galveston Wharves & Terminal Revenue AMT, Series A, 5.00% due 8/1/2032 - 8/1/2034 | | | 6,685,000 | | | | 7,225,097 | |
| | City of Georgetown Utility System Revenue (BAM), 5.00% due 8/15/2028 - 8/15/2029 | | | 1,300,000 | | | | 1,418,854 | |
| | City of Houston (Public Improvements) GO, Series A, 5.00% due 3/1/2027 | | | 2,875,000 | | | | 3,041,661 | |
| | City of Houston Combined Utility System Revenue, Series B, 4.00% due 11/15/2031 | | | 1,725,000 | | | | 1,755,803 | |
| | City of Hutto (AGM) GO, 5.00% due 8/1/2033 | | | 400,000 | | | | 446,720 | |
| | City of Lubbock Electric Light & Power System Revenue, 5.00% due 4/15/2025 | | | 725,000 | | | | 733,720 | |
| | City of Lubbock GO, 4.00% due 2/15/2034 | | | 6,575,000 | | | | 6,586,237 | |
| | City of Mansfield GO, Series A, 5.00% due 2/15/2031 - 2/15/2033 | | | 1,500,000 | | | | 1,712,411 | |
| | City of Port Arthur (CTFS Obligation) (BAM) GO, 5.00% due 2/15/2033 | | | 1,025,000 | | | | 1,170,360 | |
| | City of San Antonio (Public Facilities Corp.), 5.00% due 9/15/2027 - 9/15/2032 | | | 4,155,000 | | | | 4,638,383 | |
| | City of San Antonio Electric & Gas Systems Revenue, 4.00% due 2/1/2032 | | | 4,100,000 | | | | 4,158,921 | |
| | City of Waco (CTFS Obligation) GO, Series A, 5.00% due 2/1/2033 - 2/1/2034 | | | 1,800,000 | | | | 2,099,479 | |
| | Clear Creek (PSF-GTD) ISD GO, | | | | | | | | |
| | Series A, 4.00% due 2/15/2033 | | | 5,000,000 | | | | 5,016,930 | |
| a | Series B, 3.60% due 2/15/2035 (put 8/15/2025) | | | 1,500,000 | | | | 1,513,075 | |
| | Clifton Higher Education Finance Corp. (Idea Public Schools) (PSF-GTD), | | | | | | | | |
| | 4.00% due 8/15/2028 | | | 2,000,000 | | | | 2,057,016 | |
| | Series T, 5.00% due 8/15/2026 | | | 400,000 | | | | 416,456 | |
| | Clifton Higher Education Finance Corp. (YES Prep Public Schools, Inc.) (PSF-GTD), 5.00% due 4/1/2027 - 4/1/2029 | | | 1,700,000 | | | | 1,807,691 | |
| | Conroe (PSF-GTD) ISD GO, Series A, 4.00% due 2/15/2033 | | | 1,050,000 | | | | 1,063,723 | |
| | Cotulla (PSF-GTD) ISD GO, 5.00% due 2/15/2032 - 2/15/2033 | | | 2,265,000 | | | | 2,551,942 | |
| | County of Bexar GO, 4.00% due 6/15/2033 | | | 2,750,000 | | | | 2,800,141 | |
| | County of Harris (Harris County Toll Road Revenue), Series B, 5.00% due 8/15/2030 - 8/15/2033 | | | 5,370,000 | | | | 5,461,902 | |
| | County of Hays GO, 4.00% due 2/15/2034 | | | 850,000 | | | | 865,965 | |
| | Cypress-Fairbanks (PSF-GTD) ISD GO, 5.00% due 2/15/2028 | | | 2,955,000 | | | | 2,977,491 | |
| a | Denton County Housing Finance Corp. (THF Pathway on Woodrow LP), 5.00% due 2/1/2026 (put 2/1/2025) | | | 450,000 | | | | 452,405 | |
| a | Dickinson (PSF-GTD) ISD GO, 3.50% due 8/1/2037 (put 8/1/2025) | | | 1,045,000 | | | | 1,051,277 | |
| a | Eagle Mountain & Saginaw (PSF-GTD) ISD GO, 4.00% due 8/1/2050 (put 8/1/2027) | | | 1,700,000 | | | | 1,766,837 | |
| a | El Paso Housing Finance Corp. (Columbia Housing Partners LP) (HUD), 4.50% due 3/1/2026 (put 3/1/2025) | | | 2,300,000 | | | | 2,311,732 | |
| a | Fort Bend (PSF-GTD) ISD GO, Series B, 4.00% due 8/1/2054 (put 8/1/2027) | | | 10,000,000 | | | | 10,428,390 | |
| | Franklin (PSF-GTD) ISD GO, 4.00% due 2/15/2032 | | | 2,000,000 | | | | 2,007,442 | |
| | Frisco (PSF-GTD) ISD GO, 5.00% due 8/15/2033 | | | 1,465,000 | | | | 1,597,556 | |
| a | Grand Parkway Transportation Corp., 5.00% due 10/1/2052 (put 4/1/2028) | | | 4,000,000 | | | | 4,261,772 | |
| | Harris County Cultural Education Facilities Finance Corp. (Memorial Hermann Health System Obligated Group), | | | | | | | | |
| | Series A, 4.00% due 12/1/2031 | | | 825,000 | | | | 826,132 | |
| a | Series B, 5.00% due 6/1/2050 (put 12/1/2028) | | | 2,250,000 | | | | 2,429,201 | |
| | Hays Consolidated (PSF-GTD) ISD GO, 5.00% due 2/15/2033 | | | 1,250,000 | | | | 1,437,344 | |
| a | Houston Housing Finance Corp. (Cordova Apartments), 3.65% due 2/1/2048 (put 2/1/2028) | | | 2,700,000 | | | | 2,741,180 | |
| a | Houston Housing Finance Corp. (Summerdale Apartments LP), 5.00% due 8/1/2041 (put 8/1/2026) | | | 3,650,000 | | | | 3,790,072 | |
| See notes to financial statements. | Annual Financial Statements | 221 |
Schedule of Investments, Continued
Thornburg Limited Term Municipal Fund | September 30, 2024
| ISSUER-DESCRIPTION | | PRINCIPAL
AMOUNT | | | VALUE | |
| | | | | | | | | | |
| a | Houston Housing Finance Corp. (Sunset Gardens Preservation LP) (FHA, HUD), 4.00% due 10/1/2025 (put 10/1/2024) | | $ | 3,000,000 | | | $ | 3,000,000 | |
| | Humble (PSF-GTD) ISD GO, | | | | | | | | |
| | 4.00% due 2/15/2033 | | | 1,605,000 | | | | 1,691,034 | |
| | Series A, 4.00% due 2/15/2029 | | | 2,500,000 | | | | 2,509,757 | |
| | Hutto (PSF-GTD) ISD GO, Series C, 4.00% due 8/1/2032 | | | 1,245,000 | | | | 1,329,294 | |
| a | Jacksboro (PSF-GTD) ISD GO, 4.00% due 2/15/2048 (put 8/15/2028) | | | 2,500,000 | | | | 2,628,420 | |
| a | Lakeside Place PFC (Brookside Gardens Apartments LLC) (FHA), 4.15% due 11/1/2026 (put 11/1/2025) | | | 5,000,000 | | | | 5,033,305 | |
| | Laredo College District Combined Fee Revenue (BAM), 4.00% due 8/1/2033 | | | 1,180,000 | | | | 1,195,969 | |
| | Llano (PSF-GTD) ISD GO, 5.00% due 2/15/2032 | | | 1,200,000 | | | | 1,231,738 | |
| | Lower Colorado River Authority, Series D, 5.00% due 5/15/2026 - 5/15/2027 | | | 2,200,000 | | | | 2,225,439 | |
| | Lower Colorado River Authority (LCRA Transmission Services Corp.), | | | | | | | | |
| | Series A, | | | | | | | | |
| | 5.00% due 5/15/2031 - 5/15/2032 | | | 900,000 | | | | 1,023,651 | |
| | 5.25% due 5/15/2033 | | | 350,000 | | | | 405,255 | |
| a | Mission Economic Development Corp. (Republic Services, Inc.) AMT, 4.25% due 1/1/2026 (put 11/1/2024) | | | 11,800,000 | | | | 11,793,911 | |
| a | Mission Economic Development Corp. (Waste Management, Inc.) AMT, Series A, 4.00% due 5/1/2046 (put 12/2/2024) | | | 7,800,000 | | | | 7,789,595 | |
| | Montgomery (PSF-GTD) ISD GO, 4.00% due 2/15/2033 | | | 3,930,000 | | | | 3,938,143 | |
| | Newark Higher Education Finance Corp. (Abilene Christian University), 4.00% due 4/1/2033 | | | 1,760,000 | | | | 1,774,898 | |
| | North East (PSF-GTD) ISD GO, | | | | | | | | |
| a | 3.75% due 8/1/2049 (put 8/1/2027) | | | 5,250,000 | | | | 5,425,607 | |
| | 4.00% due 8/1/2034 | | | 1,500,000 | | | | 1,526,242 | |
| | North Texas Tollway Authority (North Texas Tollway System), Series A, 5.00% due 1/1/2031 - 1/1/2032 | | | 2,750,000 | | | | 2,764,233 | |
| | Northside (PSF-GTD) ISD GO, | | | | | | | | |
| | 4.00% due 6/15/2033 - 8/15/2034 | | | 2,175,000 | | | | 2,210,274 | |
| a | Series B, 3.45% due 8/1/2054 (put 8/1/2027) | | | 2,500,000 | | | | 2,564,130 | |
| | Pecos Barstow Toyah (PSF-GTD) ISD GO, 5.00% due 2/15/2031 - 2/15/2033 | | | 5,500,000 | | | | 5,874,396 | |
| a | Ponder (PSF-GTD) ISD GO, 4.00% due 2/15/2051 (put 8/15/2027) | | | 1,665,000 | | | | 1,730,939 | |
| | Prosper (PSF-GTD) ISD GO, 5.00% due 2/15/2033 | | | 1,000,000 | | | | 1,143,443 | |
| | Round Rock (Educational Facilities Improvements) (PSF-GTD) ISD GO, 5.00% due 8/1/2028 - 8/1/2029 (pre-refunded 8/1/2025) | | | 5,820,000 | | | | 5,931,587 | |
| | San Antonio (PSF-GTD) ISD GO, | | | | | | | | |
| | 4.00% due 8/15/2034 | | | 2,350,000 | | | | 2,471,291 | |
| | 5.00% due 8/15/2033 | | | 2,080,000 | | | | 2,405,593 | |
| a | San Antonio Housing Trust Finance Corp. (Arbors at West Avenue LP) (HUD), 1.45% due 3/1/2026 (put 3/1/2025) | | | 2,000,000 | | | | 1,978,508 | |
| a | San Antonio Housing Trust Public Facility Corp. (Palladium San Antonio Ltd.), 3.45% due 7/1/2029 (put 7/1/2027) | | | 4,500,000 | | | | 4,562,509 | |
| a | San Antonio Housing Trust Public Facility Corp. (PV Country Club Village LP), 4.00% due 8/1/2026 (put 8/1/2025) | | | 1,000,000 | | | | 1,008,184 | |
| a | San Antonio Municipal Facilities Corp. (City of San Antonio), 5.00% due 8/1/2050 (put 8/1/2027) | | | 5,800,000 | | | | 6,208,378 | |
| | Southwest (PSF-GTD) ISD GO, 5.00% due 2/1/2032 - 2/1/2033 | | | 2,600,000 | | | | 2,975,496 | |
| | State of Texas GO, | | | | | | | | |
| | 5.00% due 10/1/2027 | | | 1,875,000 | | | | 1,885,695 | |
| | Series A, 4.00% due 10/1/2032 - 10/1/2033 | | | 20,430,000 | | | | 20,497,486 | |
| | Tarrant County College District GO, 4.00% due 8/15/2033 | | | 890,000 | | | | 943,339 | |
| | Tarrant County Cultural Education Facilities Finance Corp. (Christus Health Obligated Group), | | | | | | | | |
| a | Series A, 5.00% due 7/1/2053 (put 7/1/2032) | | | 5,520,000 | | | | 6,172,563 | |
| | Series B, 5.00% due 7/1/2032 | | | 1,560,000 | | | | 1,684,895 | |
| | Tarrant County Cultural Education Facilities Finance Corp. (Cumberland Rest, Inc. Obligated Group), 5.00% due 10/1/2032 - 10/1/2034 | | | 6,605,000 | | | | 7,461,760 | |
| | Tarrant County Hospital District GO, 5.00% due 8/15/2025 | | | 500,000 | | | | 509,798 | |
| a | Tarrant County Housing Finance Corp. (4450 Marine Creek Parkway Owner LP), Series B, 5.00% due 9/1/2028 (put 9/1/2027) | | | 1,000,000 | | | | 1,049,903 | |
| | Texas Municipal Gas Acquisition & Supply Corp. III (Guaranty: Macquarie Group Ltd.), 5.00% due 12/15/2025 - 12/15/2032 | | | 69,065,000 | | | | 74,496,642 | |
| a | Texas Municipal Gas Acquisition & Supply Corp. IV (Guaranty: BP plc), Series B, 5.50% due 1/1/2054 (put 1/1/2034) | | | 1,000,000 | | | | 1,137,440 | |
| | Texas Public Finance Authority (Texas Southern University) (BAM), 5.00% due 5/1/2032 - 5/1/2033 | | | 1,700,000 | | | | 1,887,923 | |
| a | Texas State Affordable Housing Corp. (FC Juniper Creek Housing LP), 3.75% due 7/1/2044 (put 7/1/2026) | | | 2,000,000 | | | | 2,023,810 | |
| | Texas State Technical College (AGM), | | | | | | | | |
| | Series A, | | | | | | | | |
| | 5.00% due 8/1/2031 - 8/1/2032 | | | 4,250,000 | | | | 4,835,430 | |
| | 5.25% due 8/1/2033 | | | 2,300,000 | | | | 2,667,016 | |
| | Texas Transportation Commission (Central Texas Turnpike System), Series C, 5.00% due 8/15/2025 | | | 240,000 | | | | 240,435 | |
| | Texas Water Development Board (State Water Implementation Revenue Fund for Texas), Series A, 4.00% due 10/15/2034 | | | 5,000,000 | | | | 5,092,780 | |
| | Texas Woman’s University, Series A, 5.00% due 7/1/2031 - 7/1/2033 | | | 4,275,000 | | | | 4,933,277 | |
| | UTAH — 0.2% | | | | | | | | |
| a | County of Utah (Intermountain Healthcare Obligated Group), Series B, 5.00% due 5/15/2060 (put 8/1/2026) | | | 1,740,000 | | | | 1,805,829 | |
| a | Utah Housing Corp., 3.70% due 8/1/2043 (put 8/1/2027) | | | 1,500,000 | | | | 1,513,206 | |
| 222 | Annual Financial Statements | See notes to financial statements. |
Schedule of Investments, Continued
Thornburg Limited Term Municipal Fund | September 30, 2024
| ISSUER-DESCRIPTION | | PRINCIPAL
AMOUNT | | | VALUE | |
| | | | | | | | | | |
| | Utah Telecommunication Open Infrastructure Agency, | | | | | | | | |
| | 5.00% due 6/1/2031 | | $ | 600,000 | | | $ | 681,143 | |
| | 5.25% due 6/1/2033 | | | 500,000 | | | | 580,897 | |
| | VIRGINIA — 1.0% | | | | | | | | |
| a | Fairfax County Redevelopment & Housing Authority (Apah Tysons North Four LP), 5.00% due 1/1/2045 (put 1/1/2028) | | | 2,000,000 | | | | 2,118,004 | |
| a | Halifax County (Virginia Electric & Power Co.) IDA, Series A, 3.80% due 12/1/2041 (put 5/28/2027) | | | 8,320,000 | | | | 8,554,033 | |
| a | Harrisonburg Redevelopment & Housing Authority, 4.00% due 12/1/2028 (put 12/1/2026) | | | 1,615,000 | | | | 1,654,627 | |
| | Virginia Commonwealth Transportation Board, | | | | | | | | |
| | 4.00% due 5/15/2032 | | | 2,500,000 | | | | 2,541,005 | |
| | 5.00% due 9/15/2028 | | | 3,945,000 | | | | 4,214,692 | |
| | Virginia Small Business Financing Authority (National Senior Campuses, Inc. Obligated Group), Series A, 5.00% due 1/1/2029 - 1/1/2033 | | | 4,400,000 | | | | 4,635,023 | |
| | WASHINGTON — 0.9% | | | | | | | | |
| | City of Seattle GO, 4.00% due 12/1/2032 | | | 1,000,000 | | | | 1,006,138 | |
| | Clark County Public Utility District No. 1, 5.00% due 1/1/2028 | | | 500,000 | | | | 539,147 | |
| | King County School District No. 414 (School Bond Guaranteed) GO, 4.00% due 12/1/2033 | | | 2,000,000 | | | | 2,030,930 | |
| | State of Washington COP, Series B, 5.00% due 7/1/2032 | | | 650,000 | | | | 706,385 | |
| | State of Washington GO, | | | | | | | | |
| | Series B, 5.00% due 2/1/2033 | | | 1,000,000 | | | | 1,006,393 | |
| | Series R-2015E, 5.00% due 7/1/2032 | | | 4,000,000 | | | | 4,019,288 | |
| | University of Washington, Series C, 4.00% due 12/1/2031 | | | 1,000,000 | | | | 1,007,542 | |
| | Vancouver Housing Authority, 4.00% due 8/1/2034 | | | 5,000,000 | | | | 5,060,985 | |
| | Washington Health Care Facilities Authority (CommonSpirit Health Obligated Group), Series A1, 5.00% due 8/1/2031 | | | 780,000 | | | | 844,619 | |
| | Washington Health Care Facilities Authority (Providence St. Joseph Health Obligated Group), Series B, 5.00% due 10/1/2030 | | | 2,500,000 | | | | 2,659,380 | |
| a | Washington State Housing Finance Commission (Ardea Twg LLLP), 5.00% due 12/1/2043 (put 2/1/2027) | | | 1,000,000 | | | | 1,031,736 | |
| a | Washington State Housing Finance Commission (Camas Flats Oak Harbor 1 LLLP), Series B, 5.00% due 2/1/2028 (put 2/1/2027) | | | 1,000,000 | | | | 1,040,747 | |
| c | Washington State Housing Finance Commission (Seattle Academy of Arts & Sciences), 5.125% due 7/1/2033 | | | 735,000 | | | | 816,086 | |
| | Washington State Housing Finance Commission (SRMAHMILL LLC) (FNMA), 4.15% due 7/1/2034 | | | 1,400,000 | | | | 1,444,848 | |
| | WISCONSIN — 2.7% | | | | | | | | |
| | City of Milwaukee (AGM) GO, | | | | | | | | |
| | 5.00% due 4/1/2032 - 4/1/2033 | | | 4,845,000 | | | | 5,530,786 | |
| | Series N3, 5.00% due 4/1/2031 - 4/1/2032 | | | 6,550,000 | | | | 7,388,235 | |
| | County of Waushara GO, Series A, 4.50% due 6/1/2027 | | | 5,260,000 | | | | 5,309,444 | |
| | Peshtigo School District, 4.75% due 3/1/2027 | | | 10,500,000 | | | | 10,609,851 | |
| | Public Finance Authority (Duke Energy Progress LLC), | | | | | | | | |
| a | Series A-1, 3.30% due 10/1/2046 (put 10/1/2026) | | | 13,980,000 | | | | 14,061,559 | |
| a | Series A-2, 3.70% due 10/1/2046 (put 10/1/2030) | | | 1,270,000 | | | | 1,291,604 | |
| a | Public Finance Authority (Providence St. Joseph Health Obligated Group), Series C, 4.00% due 10/1/2041 (put 10/1/2030) | | | 4,050,000 | | | | 4,129,465 | |
| a | Public Finance Authority (St. John’s College), 3.00% due 10/1/2045 (put 10/1/2026) | | | 1,535,000 | | | | 1,505,570 | |
| | Racine USD, Series B, 4.125% due 4/1/2025 | | | 1,500,000 | | | | 1,501,476 | |
| a | Wisconsin Health & Educational Facilities Authority (Advocate Aurora Health Obligated Group), Series B1, 5.00% due 8/15/2054 (put 7/1/2027) | | | 1,375,000 | | | | 1,426,075 | |
| a | Wisconsin Health & Educational Facilities Authority (Fort Healthcare, Inc. Obligated Group), Series B, 5.00% due 10/1/2054 (put 10/3/2034) | | | 2,820,000 | | | | 3,172,232 | |
| a | Wisconsin Housing & EDA (East National LLC), Series J, 5.00% due 8/1/2058 (put 8/1/2026) | | | 2,000,000 | | | | 2,071,334 | |
| a | Wisconsin Housing & EDA (East Washington Apartments LLC), Series I, 5.00% due 11/1/2058 (put 2/1/2027) | | | 2,250,000 | | | | 2,349,018 | |
| | Wisconsin Housing & EDA Home Ownership Revenue (FHLMC, FNMA, GNMA) (Green Bond), Series B, 3.90% due 9/1/2033 | | | 1,815,000 | | | | 1,846,541 | |
| | Wisconsin Housing & EDA Housing Revenue (HUD), | | | | | | | | |
| | Series B, | | | | | | | | |
| a | 0.50% due 11/1/2050 (put 11/1/2024) | | | 995,000 | | | | 991,397 | |
| a | 3.75% due 5/1/2054 (put 11/1/2026) | | | 3,475,000 | | | | 3,484,351 | |
| a | Wisconsin Housing (Flats at Bishops Woods LP) EDA, Series F, 5.00% due 12/1/2027 (put 12/1/2026) | | | 1,000,000 | | | | 1,041,176 | |
| | TOTAL LONG-TERM MUNICIPAL BONDS — 96.1% (Cost $2,321,204,075) | | | | | | | 2,394,768,025 | |
| | | | | | | | |
| | SHORT-TERM MUNICIPAL BONDS — 2.9% | | | | | | | | |
| | | | | | | | | | |
| | FLORIDA — 0.4% | | | | | | | | |
| a | City of Gainesville Utilities System Revenue (SPA Truist Bank), Series B, 4.05% due 10/1/2042 (put 10/1/2024) | | | 9,555,000 | | | | 9,555,000 | |
| | ILLINOIS — 0.0% | | | | | | | | |
| a | Phoenix Realty Special Account-U LP (LOC Northern Trust Co.), 3.72% due 4/1/2025 (put 10/7/2024) | | | 1,000,000 | | | | 1,000,000 | |
| | INDIANA — 0.4% | | | | | | | | |
| a | Indiana Finance Authority (Franciscan Alliance, Inc. Obligated Group; LOC Barclays Bank plc), Series J-R, 4.15% due 11/1/2037 (put 10/1/2024) | | | 9,750,000 | | | | 9,750,000 | |
| See notes to financial statements. | Annual Financial Statements | 223 |
Schedule of Investments, Continued
Thornburg Limited Term Municipal Fund | September 30, 2024
| ISSUER-DESCRIPTION | | PRINCIPAL
AMOUNT | | | VALUE | |
| | | | | | | | | | |
| | NEW YORK — 1.2% | | | | | | | | |
| | City of New York (SPA Barclays Bank plc) GO, | | | | | | | | |
| a | Series B-4, 4.15% due 10/1/2046 (put 10/1/2024) | | $ | 780,000 | | | $ | 780,000 | |
| a | Series B-5, 4.15% due 10/1/2046 (put 10/1/2024) | | | 2,800,000 | | | | 2,800,000 | |
| a | Series F5, 4.15% due 6/1/2044 (put 10/1/2024) | | | 600,000 | | | | 600,000 | |
| a | Metropolitan Transportation Authority (LOC Barclays Bank plc), Series E-1-REMK, 4.15% due 11/15/2050 (put 10/1/2024) | | | 5,000,000 | | | | 5,000,000 | |
| a | New York City Transitional Finance Authority Future Tax Secured Revenue (SPA JP Morgan Chase Bank NA), Series B-4, 4.05% due 8/1/2042 (put 10/1/2024) | | | 21,200,000 | | | | 21,200,000 | |
| | OHIO — 0.1% | | | | | | | | |
| a | Ohio Higher Educational Facility Commission (Cleveland Clinic Health System Obligated Group; SPA Barclays Bank plc), 4.10% due 1/1/2043 (put 10/1/2024) | | | 1,850,000 | | | | 1,850,000 | |
| | TEXAS — 0.8% | | | | | | | | |
| | Port of Port Arthur Navigation District (Motiva Enterprises LLC), | | | | | | | | |
| a | 4.30% due 4/1/2040 (put 10/1/2024) | | | 17,845,000 | | | | 17,845,000 | |
| a | Series C, 4.35% due 4/1/2040 (put 10/1/2024) | | | 3,000,000 | | | | 3,000,000 | |
| | TOTAL SHORT-TERM MUNICIPAL BONDS — 2.9% (Cost $73,380,000) | | | | | | | 73,380,000 | |
| | | | | | | | | | |
| | TOTAL INVESTMENTS — 99.0% (Cost $2,394,584,075) | | | | | | $ | 2,468,148,025 | |
| | | | | | | | | | |
| | OTHER ASSETS LESS LIABILITIES — 1.0% | | | | | | | 24,772,275 | |
| | | | | | | | | | |
| | NET ASSETS — 100.0% | | | | | | $ | 2,492,920,300 | |
Footnote Legend
| a | Variable, floating, step, or fixed to floating rate securities are securities for which interest rate changes are based on changes in a designated base rate or on a predetermined schedule. The rates shown are those in effect on September 30, 2024. |
| c | Securities exempt from registration under Rule 144A of the Securities Act of 1933, as amended. These securities are restricted but liquid and may only be resold in the ordinary course of business in transactions exempt from registration, normally to qualified institutional buyers. As of September 30, 2024, the aggregate value of these securities in the Fund’s portfolio was $8,524,923, representing 0.34% of the Fund’s net assets. |
| Portfolio Abbreviations | | |
| To simplify the listings of securities, abbreviations are used per the table below: |
| AGC | Insured by Assured Guaranty Corp. | HFA | Health Facilities Authority |
| AGM | Insured by Assured Guaranty Municipal Corp. | HFFA | Health Facilities Financing Authority |
| AMT | Alternative Minimum Tax | HUD | Insured by Housing and Urban Development |
| BAM | Insured by Build America Mutual Insurance Co. | IDA | Industrial Development Authority/Agency |
| COP | Certificates of Participation | IDB | Industrial Development Board |
| DFA | Development Finance Authority/Agency | ISD | Independent School District |
| EDA | Economic Development Authority | JEA | Jacksonville Electric Authority |
| EDFA | Economic Development Financing Authority | LOC | Letter of Credit |
| ETM | Escrowed to Maturity | MUNIPSA | Securities Industry and Financial Markets Association (SIFMA) Municipal Swap Index |
| FHA | Insured by Federal Housing Administration | NMFA | New Mexico Finance Authority |
| FHLMC | Collateralized by Federal Home Loan Mortgage Corp. | NPFG | Insured by National Public Finance Guarantee Corp. |
| FNMA | Collateralized by Federal National Mortgage Association | PSF-GTD | Guaranteed by Permanent School Fund |
| GNMA | Collateralized by Government National Mortgage Association | SOFR | Secured Overnight Financing Rate |
| GO | General Obligation | SPA | Stand-by Purchase Agreement |
| GRT | Gross Receipts Tax | USD | Unified School District |
| HDA | Housing Development Authority | | |
| 224 | Annual Financial Statements | See notes to financial statements. |
Schedule of Investments
Thornburg Intermediate Municipal Fund | September 30, 2024
| | ISSUER-DESCRIPTION | | PRINCIPAL
AMOUNT | | | VALUE | |
| | | | | | | | |
| | LONG-TERM MUNICIPAL BONDS — 96.0% | | | | | | | | |
| | | | | | | | | | |
| | ALABAMA — 4.3% | | | | | | | | |
| a | Black Belt Energy Gas District (Guaranty: Morgan Stanley Group), Series C-1, 5.25% due 2/1/2053 (put 6/1/2029) | | $ | 4,000,000 | | | $ | 4,306,416 | |
| a | Black Belt Energy Gas District (Guaranty: Royal Bank of Canada), Series B, 5.25% due 12/1/2053 (put 12/1/2030) | | | 1,375,000 | | | | 1,513,903 | |
| a | Chatom (PowerSouth Energy Cooperative; SPA National Rural Utilities Cooperative Finance) IDB, Series A, 3.85% due 8/1/2037 (put 2/1/2025) | | | 3,250,000 | | | | 3,451,539 | |
| a | Energy Southeast A Cooperative District (Guaranty: Morgan Stanley Group), Series B, 5.25% due 7/1/2054 (put 6/1/2032) | | | 3,110,000 | | | | 3,440,058 | |
| | Homewood Educational Building Authority (CHF - Horizons I LLC), Series A, 5.50% due 10/1/2042 - 10/1/2044 | | | 3,195,000 | | | | 3,501,639 | |
| a | Southeast Alabama Gas Supply District (Guaranty: Morgan Stanley Group), 5.00% due 6/1/2049 (put 5/1/2032) | | | 4,750,000 | | | | 5,165,103 | |
| a | Southeast Alabama Gas Supply District (Guaranty: Pacific Life Insurance Co.), Series A, 5.00% due 8/1/2054 (put 4/1/2032) | | | 5,000,000 | | | | 5,451,300 | |
| a | Southeast Energy Authority A Cooperative District, Series B, 5.00% due 1/1/2054 (put 6/1/2030) | | | 5,000,000 | | | | 5,398,500 | |
| a | Southeast Energy Authority A Cooperative District (Guaranty: Morgan Stanley Group), Series A-1, 5.50% due 1/1/2053 (put 12/1/2029) | | | 6,000,000 | | | | 6,534,120 | |
| | UAB Medicine Finance Authority (UAB Medicine Obligated Group), Series B, 5.00% due 9/1/2034 | | | 5,430,000 | | | | 5,622,781 | |
| | ALASKA — 0.1% | | | | | | | | |
| | State of Alaska International Airports System AMT, Series C, 5.00% due 10/1/2029 | | | 750,000 | | | | 809,492 | |
| | ARIZONA — 1.3% | | | | | | | | |
| | Arizona (Scottsdale Lincoln Hospitals) HFA, Series A, 5.00% due 12/1/2031 | | | 2,500,000 | | | | 2,508,663 | |
| | Arizona Board of Regents (University of Arizona SPEED), 5.00% due 8/1/2029 | | | 1,000,000 | | | | 1,001,556 | |
| a | Chandler (Intel Corp.) IDA AMT, 4.00% due 6/1/2049 (put 6/1/2029) | | | 5,000,000 | | | | 5,056,500 | |
| | City of Phoenix Civic Improvement Corp. (Phoenix Airport Revenue) AMT, Series A, 5.00% due 7/1/2031 | | | 2,200,000 | | | | 2,287,650 | |
| | County of Pima (GNMA) IDA, Series C, 4.60% due 7/1/2044 | | | 725,000 | | | | 736,214 | |
| | Salt Verde Financial Corp. (Gas Supply Acquisition; Guaranty: Citigroup, Inc.), 5.25% due 12/1/2028 | | | 770,000 | | | | 828,355 | |
| | Yavapai County (Waste Management, Inc.) IDA AMT, 1.30% due 6/1/2027 | | | 750,000 | | | | 693,118 | |
| | ARKANSAS — 0.1% | | | | | | | | |
| | County of Pulaski (Arkansas Children’s Hospital), 5.00% due 3/1/2042 - 3/1/2043 | | | 1,000,000 | | | | 1,092,334 | |
| | CALIFORNIA — 4.2% | | | | | | | | |
| | California (Adventist Health System/West) HFFA, Series A, 5.00% due 3/1/2026 | | | 2,815,000 | | | | 2,817,899 | |
| | California (Children’s Hospital Los Angeles) HFFA, Series A, 5.00% due 8/15/2032 - 8/15/2033 | | | 950,000 | | | | 993,137 | |
| a | California Community Choice Financing Authority (Guaranty: Deutsche Bank AG) (Green Bond), Series C, 5.25% due 1/1/2054 (put 10/1/2031) | | | 3,250,000 | | | | 3,511,641 | |
| | California Infrastructure & Economic Development Bank (King City Joint Union High School District), 5.75% due 8/15/2029 | | | 1,500,000 | | | | 1,501,751 | |
| a | California Municipal Finance Authority (Republic Services, Inc.) AMT, Series B, 4.15% due 7/1/2051 (put 1/15/2025) | | | 3,000,000 | | | | 3,010,008 | |
| a | California Municipal Finance Authority (Waste Management, Inc.; Guaranty: Waste Management Holdings) AMT, 3.95% due 10/1/2045 (put 12/2/2024) | | | 5,000,000 | | | | 4,997,715 | |
| a,b | California Pollution Control Financing Authority (Republic Services, Inc.) AMT, 4.05% due 7/1/2043 (put 2/18/2025) | | | 1,000,000 | | | | 988,602 | |
| a | California Pollution Control Financing Authority (Waste Management, Inc.) AMT, Series A, 4.25% due 11/1/2038 (put 7/2/2029) | | | 2,000,000 | | | | 2,065,882 | |
| | City of Los Angeles Department of Airports AMT, | | | | | | | | |
| | Series A, 4.75% due 5/15/2040 | | | 1,500,000 | | | | 1,510,147 | |
| | Series B, 5.00% due 5/15/2034 | | | 1,750,000 | | | | 1,791,226 | |
| | Series C, 5.00% due 5/15/2033 | | | 2,000,000 | | | | 2,229,754 | |
| | Series D, 5.00% due 5/15/2041 | | | 4,000,000 | | | | 4,023,724 | |
| | City of San Mateo (City of San Mateo Community Facilities District No. 2008-1) (BAM), 5.25% due 9/1/2040 | | | 5,000,000 | | | | 5,639,300 | |
| | Delano Financing Authority (City of Delano Police Station & Woollomes Avenue Bridge), Series A, 5.00% due 12/1/2025 | | | 1,340,000 | | | | 1,342,017 | |
| | Franklin-McKinley School District (NPFG) GO, 5.25% due 8/1/2027 | | | 1,000,000 | | | | 1,078,428 | |
| | Fresno (Educational Facilities & Improvements) (NPFG) USD GO, Series A, 6.00% due 8/1/2026 | | | 470,000 | | | | 481,416 | |
| | M-S-R Energy Authority (Guaranty: Citigroup Global Markets), Series B, 6.125% due 11/1/2029 | | | 1,865,000 | | | | 2,022,440 | |
| | Oakland (County of Alameda Educational Facilities) USD GO, Series A, 5.00% due 8/1/2032 - 8/1/2034 (pre-refunded 8/1/2025) | | | 3,000,000 | | | | 3,064,029 | |
| | COLORADO — 0.9% | | | | | | | | |
| | City & County of Denver Airport System Revenue AMT, Series A, 5.00% due 11/15/2041 | | | 1,660,000 | | | | 1,803,768 | |
| | Colorado (CommonSpirit Health Obligated Group) HFA, | | | | | | | | |
| | 5.00% due 11/1/2041 | | | 1,500,000 | | | | 1,644,024 | |
| | Series A-2, 5.00% due 8/1/2038 | | | 1,000,000 | | | | 1,060,484 | |
| | Colorado Housing & Finance Authority (Fitz Affordable Owner LLC) (FNMA) (Green Bond), Series A, 4.48% due 3/1/2044 | | | 2,000,000 | | | | 2,005,208 | |
| | Colorado School of Mines (AGM) (Green Bond), Series A, 5.00% due 12/1/2039 - 12/1/2043 | | | 1,310,000 | | | | 1,436,016 | |
| | Denver City & County Housing Authority (Three Towers Rehabilitation) (AGM) AMT, 5.20% due 11/1/2027 | | | 1,025,000 | | | | 1,026,157 | |
| | CONNECTICUT — 2.3% | | | | | | | | |
| | City of Hartford (Various Public Improvements) (AGM) GO, Series A, 5.00% due 7/1/2031 | | | 1,700,000 | | | | 1,722,676 | |
| | City of New Haven (BAM) GO, 5.25% due 8/1/2043 | | | 1,900,000 | | | | 2,165,578 | |
| | State of Connecticut (Various Capital Projects) GO, Series B, 5.00% due 5/15/2027 | | | 1,000,000 | | | | 1,037,655 | |
| | State of Connecticut GO, | | | | | | | | |
| | Series A, 5.00% due 4/15/2033 - 4/15/2035 | | | 12,415,000 | | | | 13,369,206 | |
| | Series C, 5.00% due 6/15/2028 - 6/15/2029 | | | 1,890,000 | | | | 2,059,627 | |
| | Series E, 5.00% due 9/15/2033 | | | 2,650,000 | | | | 2,890,342 | |
| See notes to financial statements. | Annual Financial Statements | 225 |
Schedule of Investments, Continued
Thornburg Intermediate Municipal Fund | September 30, 2024
| | ISSUER-DESCRIPTION | | PRINCIPAL
AMOUNT | | | VALUE | |
| | | | | | | | |
| | DELAWARE — 0.1% | | | | | | | | |
| | Delaware State Housing Authority (FHLMC, FNMA, GNMA), Series C, 4.45% due 7/1/2044 | | $ | 1,000,000 | | | $ | 1,015,085 | |
| | DISTRICT OF COLUMBIA — 0.7% | | | | | | | | |
| | Metropolitan Washington Airports Authority (Dulles Toll Road Revenue) (AGC), Series B, Zero Coupon due 10/1/2024 | | | 5,000,000 | | | | 4,999,585 | |
| | Metropolitan Washington Airports Authority Aviation Revenue AMT, Series A, 4.00% due 10/1/2041 | | | 1,750,000 | | | | 1,729,735 | |
| | FLORIDA — 4.5% | | | | | | | | |
| | Broward County School Board (Educational Facilities) COP, Series B, 5.00% due 7/1/2032 | | | 200,000 | | | | 202,767 | |
| | City of Lakeland (Electric Power System Smart Grid Project), 5.25% due 10/1/2036 | | | 2,770,000 | | | | 3,291,214 | |
| | City of Lakeland (Electric Power System Smart Grid Project) (AGM), 5.25% due 10/1/2027 | | | 3,680,000 | | | | 3,968,987 | |
| | City of Orlando (Senior Tourist Development) (AGM), Series A, 5.00% due 11/1/2036 | | | 935,000 | | | | 986,519 | |
| | County of Broward (Airport System Improvements) AMT, 5.00% due 10/1/2037 | | | 1,000,000 | | | | 1,027,556 | |
| | County of Broward Airport System Revenue AMT, 5.00% due 10/1/2042 | | | 2,850,000 | | | | 2,926,674 | |
| | County of Broward Port Facilities Revenue AMT, | | | | | | | | |
| | 5.00% due 9/1/2037 - 9/1/2041 | | | 2,050,000 | | | | 2,235,605 | |
| | Series B, 4.00% due 9/1/2039 | | | 1,500,000 | | | | 1,509,244 | |
| | County of Miami-Dade, Series A, 5.00% due 4/1/2043 | | | 500,000 | | | | 547,812 | |
| | County of Miami-Dade (Miami International Airport), Series B, 5.00% due 10/1/2028 - 10/1/2031 | | | 5,335,000 | | | | 5,344,256 | |
| | County of Miami-Dade Aviation Revenue AMT, | | | | | | | | |
| | Series A, 5.00% due 10/1/2032 - 10/1/2035 | | | 4,000,000 | | | | 4,003,914 | |
| | Series B, 5.00% due 10/1/2040 | | | 4,500,000 | | | | 4,651,231 | |
| | County of Miami-Dade Seaport Department AMT, Series A, 5.00% due 10/1/2041 - 10/1/2042 | | | 3,050,000 | | | | 3,237,146 | |
| | Miami-Dade County (Nicklaus Children’s Hospital) HFA, 5.00% due 8/1/2035 - 8/1/2037 | | | 3,405,000 | | | | 3,552,850 | |
| | Orange County (Presbyterian Retirement Communities Inc Obligated Group) HFA, 5.00% due 8/1/2040 | | | 1,750,000 | | | | 1,768,816 | |
| | Orange County Convention Center (Tourist Development), Series A, 5.00% due 10/1/2031 | | | 2,000,000 | | | | 2,079,844 | |
| | Palm Beach County (Boca Raton Regional Hospital) HFA, 5.00% due 12/1/2025 (pre-refunded 12/1/2024) | | | 500,000 | | | | 501,717 | |
| | Palm Beach County (Jupiter Medical Center Obligated Group) HFA, Series A, 5.00% due 11/1/2040 - 11/1/2041 | | | 715,000 | | | | 743,583 | |
| | Palm Beach County Housing Finance Authority (Lake Worth Towers Preservation LP) (FNMA), 4.85% due 6/1/2041 | | | 1,335,937 | | | | 1,451,766 | |
| | School District of Manatee County (School Facilities Improvement) (AGM), 5.00% due 10/1/2032 | | | 2,250,000 | | | | 2,356,875 | |
| | GEORGIA — 5.3% | | | | | | | | |
| | Athens-Clarke County Unified Government Development Authority (UGAREF Bolton Commons LLC), 5.00% due 6/15/2025 - 6/15/2028 | | | 1,835,000 | | | | 1,837,927 | |
| c | Atlanta Urban Residential Finance Authority (Flats at Stone Hogan LP) (FNMA), Series A, 4.37% due 5/1/2044 | | | 3,000,000 | | | | 2,999,982 | |
| | Georgia Housing & Finance Authority, Series B, 5.05% due 12/1/2043 | | | 1,470,000 | | | | 1,573,329 | |
| a | Main Street Natural Gas, Inc. (Guaranty: Citigroup Global Markets), Series C, 5.00% due 12/1/2054 (put 12/1/2031) | | | 3,400,000 | | | | 3,695,902 | |
| a | Main Street Natural Gas, Inc. (Guaranty: Citigroup, Inc.), Series D, 5.00% due 5/1/2054 (put 12/1/2030) | | | 5,000,000 | | | | 5,389,550 | |
| | Main Street Natural Gas, Inc. (Guaranty: Macquarie Group Ltd.), Series A, 5.00% due 5/15/2034 - 5/15/2043 | | | 15,410,000 | | | | 17,025,894 | |
| | Main Street Natural Gas, Inc. (Guaranty: Royal Bank of Canada), | | | | | | | | |
| a | Series A, 5.00% due 5/1/2054 (put 9/1/2031) | | | 7,840,000 | | | | 8,562,064 | |
| a | Series B, 5.00% due 7/1/2053 (put 3/1/2030) | | | 2,000,000 | | | | 2,153,640 | |
| a | Series E-1, 5.00% due 12/1/2053 (put 6/1/2031) | | | 8,000,000 | | | | 8,703,680 | |
| | Municipal Electric Authority of Georgia, Series A, 5.00% due 1/1/2034 | | | 2,295,000 | | | | 2,461,982 | |
| | GUAM — 0.1% | | | | | | | | |
| | Guam Power Authority (Electric Power System), Series A, 5.00% due 10/1/2024 | | | 1,350,000 | | | | 1,350,072 | |
| | IDAHO — 0.6% | | | | | | | | |
| | Idaho Housing & Finance Association (FHLMC, FNMA, GNMA), | | | | | | | | |
| | Series A, 4.45% due 1/1/2044 | | | 1,990,000 | | | | 2,013,597 | |
| | Series C, 4.65% due 7/1/2043 | | | 3,485,000 | | | | 3,615,071 | |
| | ILLINOIS — 12.6% | | | | | | | | |
| | Chicago Board of Education Dedicated Capital Improvement Tax, 5.50% due 4/1/2042 - 4/1/2043 | | | 2,375,000 | | | | 2,628,215 | |
| | Chicago O’Hare International Airport, | | | | | | | | |
| | Series C, 5.00% due 1/1/2038 | | | 2,920,000 | | | | 2,978,274 | |
| | Series D, 4.00% due 1/1/2035 | | | 430,000 | | | | 430,441 | |
| | Chicago O’Hare International Airport (2017 Airport Projects), Series B, 5.00% due 1/1/2035 | | | 4,400,000 | | | | 4,579,216 | |
| | Chicago Park District (Capital Improvement Plan) GO, Series B, 5.00% due 1/1/2025 | | | 1,000,000 | | | | 1,001,635 | |
| | City of Chicago (Chicago O’Hare International Airport Customer Facility Charge Revenue) (BAM), 5.25% due 1/1/2043 | | | 1,500,000 | | | | 1,656,547 | |
| | City of Chicago (Chicago O’Hare International Airport) AMT, Series A, 5.00% due 1/1/2028 | | | 1,475,000 | | | | 1,479,913 | |
| | City of Chicago (Wastewater Transmission System), Series C, 5.00% due 1/1/2033 | | | 500,000 | | | | 501,934 | |
| | City of Chicago (Water System), Series A-1, 5.00% due 11/1/2024 | | | 1,000,000 | | | | 1,001,658 | |
| | City of Chicago (Water System) (AGM), Series 2017-2, 5.00% due 11/1/2036 - 11/1/2037 | | | 5,500,000 | | | | 5,769,498 | |
| | City of Chicago (Water System) (BHAC, AMBAC), 5.75% due 11/1/2030 | | | 1,100,000 | | | | 1,198,864 | |
| 226 | Annual Financial Statements | See notes to financial statements. |
Schedule of Investments, Continued
Thornburg Intermediate Municipal Fund | September 30, 2024
| | ISSUER-DESCRIPTION | | PRINCIPAL
AMOUNT | | | VALUE | |
| | | | | | | | |
| | City of Chicago GO, | | | | | | | | |
| | Series A, | | | | | | | | |
| | 5.625% due 1/1/2031 | | $ | 1,585,000 | | | $ | 1,657,799 | |
| | 6.00% due 1/1/2038 | | | 7,500,000 | | | | 7,842,300 | |
| | City of Chicago Wastewater Transmission Revenue, | | | | | | | | |
| | Series C, | | | | | | | | |
| | 5.00% due 1/1/2028 - 1/1/2029 | | | 3,880,000 | | | | 3,897,093 | |
| | 5.00% due 1/1/2028 - 1/1/2029 (pre-refunded 1/1/2025) | | | 3,985,000 | | | | 4,005,611 | |
| | City of Joliet (Rock Run Crossing Project) (BAM) GO, 5.50% due 12/15/2042 | | | 2,750,000 | | | | 3,103,716 | |
| | Cook County Community College District No. 508 (City Colleges of Chicago) (BAM) GO, 5.00% due 12/1/2043 | | | 1,650,000 | | | | 1,791,247 | |
| | County of Cook Sales Tax Revenue, | | | | | | | | |
| | 5.00% due 11/15/2038 | | | 435,000 | | | | 455,957 | |
| | Series A, 5.00% due 11/15/2036 - 11/15/2038 | | | 3,160,000 | | | | 3,452,328 | |
| | Illinois (FHLMC, FNMA, GNMA) (Green Bond) HDA, | | | | | | | | |
| | Series C, 4.70% due 10/1/2044 | | | 1,000,000 | | | | 1,023,173 | |
| | Series K, 5.25% due 10/1/2043 | | | 2,000,000 | | | | 2,144,304 | |
| | Illinois Finance Authority (Ascension Health Credit Group), | | | | | | | | |
| | Series C, | | | | | | | | |
| | 4.00% due 2/15/2033 | | | 800,000 | | | | 815,670 | |
| | 5.00% due 2/15/2041 | | | 1,305,000 | | | | 1,345,054 | |
| | Illinois Finance Authority (Carle Foundation Obligated Group), Series A, 5.00% due 8/15/2034 | | | 1,700,000 | | | | 1,911,432 | |
| | Illinois Finance Authority (Silver Cross Hospital & Medical Centers), Series C, 5.00% due 8/15/2035 | | | 1,500,000 | | | | 1,513,437 | |
| | Monroe & St. Clair Counties Community Unit School District No. 5 (BAM) GO, 5.00% due 4/15/2027 - 4/15/2031 | | | 6,285,000 | | | | 6,449,379 | |
| | Moultrie Shelby & Coles Counties Community Unit School District No. 300 (BAM) GO, 5.00% due 12/1/2043 - 12/1/2044 | | | 1,875,000 | | | | 1,954,002 | |
| | Regional Transportation Authority (AGM), Series A, 5.75% due 6/1/2034 | | | 1,400,000 | | | | 1,682,671 | |
| | Sales Tax Securitization Corp., | | | | | | | | |
| | Series A, | | | | | | | | |
| | 4.00% due 1/1/2038 | | | 2,000,000 | | | | 2,044,026 | |
| | 5.00% due 1/1/2029 - 1/1/2040 | | | 5,350,000 | | | | 5,654,194 | |
| | Sales Tax Securitization Corp. (BAM), Series A, 5.00% due 1/1/2038 | | | 3,075,000 | | | | 3,241,210 | |
| | Sales Tax Securitization Corp. (Green Bond), Series A, 5.00% due 1/1/2044 | | | 1,000,000 | | | | 1,061,284 | |
| | Southern Illinois University (BAM), | | | | | | | | |
| | Series A, | | | | | | | | |
| | 4.00% due 4/1/2035 | | | 600,000 | | | | 604,800 | |
| | 5.00% due 4/1/2037 - 4/1/2042 | | | 2,040,000 | | | | 2,190,105 | |
| | State of Illinois (AGM) GO, 5.00% due 4/1/2036 | | | 500,000 | | | | 503,080 | |
| | State of Illinois (BAM) GO, 4.00% due 6/1/2041 | | | 1,280,000 | | | | 1,269,559 | |
| | State of Illinois GO, | | | | | | | | |
| | 5.00% due 2/1/2039 | | | 670,000 | | | | 674,374 | |
| | 5.50% due 5/1/2039 | | | 1,500,000 | | | | 1,656,091 | |
| | Series A, 5.00% due 12/1/2034 - 5/1/2040 | | | 12,810,000 | | | | 13,784,644 | |
| | Series B, | | | | | | | | |
| | 4.00% due 11/1/2038 | | | 2,170,000 | | | | 2,170,022 | |
| | 5.25% due 5/1/2043 | | | 3,500,000 | | | | 3,826,942 | |
| | Series D, 5.00% due 11/1/2027 - 11/1/2028 | | | 4,250,000 | | | | 4,508,686 | |
| | State of Illinois Sales Tax Revenue, Series B, 5.00% due 6/15/2030 - 6/15/2032 | | | 12,165,000 | | | | 12,994,647 | |
| | Tazewell County School District (NPFG) GO Partial ETM, 9.00% due 12/1/2024 | | | 1,205,000 | | | | 1,217,022 | |
| | Will County School District No. 114 Manhattan (BAM) GO, | | | | | | | | |
| | 5.25% due 1/1/2040 - 1/1/2041 | | | 1,000,000 | | | | 1,117,907 | |
| | 5.50% due 1/1/2043 | | | 2,000,000 | | | | 2,247,900 | |
| | INDIANA — 3.4% | | | | | | | | |
| | Brownsburg 1999 School Building Corp. (Brownsburg Community School Corp.) (State Intercept), 5.00% due 1/15/2042 | | | 1,000,000 | | | | 1,094,101 | |
| a | City of Mount Vernon (Southern Indiana Gas & Electric Co.) AMT, 4.25% due 9/1/2055 (put 9/1/2028) | | | 2,000,000 | | | | 2,003,222 | |
| | City of Whiting (BP Products North America, Inc.; Guaranty: BP plc) AMT, | | | | | | | | |
| a | 5.00% due 11/1/2047 (put 11/1/2024) | | | 250,000 | | | | 250,065 | |
| a | Series A, 5.00% due 12/1/2044 (put 6/5/2026) | | | 1,110,000 | | | | 1,137,444 | |
| | Indiana (Ascension Health Credit Group) HFFA, Series 2001-A-1, 5.00% due 11/15/2036 | | | 4,000,000 | | | | 4,076,664 | |
| | Indiana Finance Authority (CWA Authority, Inc.), Series A, 5.00% due 10/1/2035 | | | 500,000 | | | | 571,438 | |
| | Indiana Finance Authority (Ohio Valley Electric Corp.), Series A, 4.25% due 11/1/2030 | | | 8,000,000 | | | | 8,359,896 | |
| | Indiana Finance Authority (Reid Hospital & Health Care Services, Inc. Obligated Group) (AGM), 5.00% due 1/1/2041 - 1/1/2042 | | | 2,000,000 | | | | 2,159,766 | |
| a | Indiana Finance Authority (Republic Services, Inc.) AMT, Series A, 3.95% due 5/1/2028 (put 12/2/2024) | | | 2,500,000 | | | | 2,487,135 | |
| See notes to financial statements. | Annual Financial Statements | 227 |
Schedule of Investments, Continued
Thornburg Intermediate Municipal Fund | September 30, 2024
| | ISSUER-DESCRIPTION | | PRINCIPAL
AMOUNT | | | VALUE | |
| | | | | | | | |
| | Indiana Finance Authority (Southern Indiana Gas & Electric Co.) AMT, | | | | | | | | |
| a | Series A, 4.00% due 3/1/2038 (put 8/1/2028) | | $ | 1,500,000 | | | $ | 1,539,625 | |
| a | Series B, 4.00% due 5/1/2043 (put 8/1/2028) | | | 2,500,000 | | | | 2,563,007 | |
| | Indiana Housing & Community Development Authority (FHLMC, FNMA, GNMA) (Green Bond), Series B-1, 4.65% due 7/1/2044 | | | 2,000,000 | | | | 2,047,198 | |
| | Indiana Municipal Power Agency, Series C, 5.00% due 1/1/2036 | | | 1,000,000 | | | | 1,030,886 | |
| | IPS Multi-School Building Corp. (Indianapolis Board of School Commissioners) (State Intercept) (Green Bond), 5.50% due 7/15/2042 | | | 1,000,000 | | | | 1,135,477 | |
| | Mount Vernon of Hancock County Multi-School Building Corp. (State Intercept), 5.50% due 1/15/2042 | | | 1,000,000 | | | | 1,127,742 | |
| | Noblesville Redevelopment Authority, 5.50% due 7/15/2041 | | | 1,000,000 | | | | 1,133,135 | |
| | Silver Creek School Building Corp. (State Intercept), 5.25% due 1/15/2042 | | | 2,000,000 | | | | 2,230,494 | |
| | IOWA — 1.3% | | | | | | | | |
| a | Iowa Finance Authority (Iowa Fertilizer Co. LLC; Guaranty: OCI NV), 5.00% due 12/1/2050 (pre-refunded 12/1/2032) | | | 3,000,000 | | | | 3,493,686 | |
| | Iowa Finance Authority (UnityPoint Health), Series C, 5.00% due 2/15/2030 - 2/15/2032 | | | 4,100,000 | | | | 4,105,282 | |
| a | PEFA, Inc. (Guaranty: Goldman Sachs Group, Inc.), 5.00% due 9/1/2049 (put 9/1/2026) | | | 5,350,000 | | | | 5,476,870 | |
| | KENTUCKY — 3.3% | | | | | | | | |
| a | County of Trimble (Louisville Gas & Electric Co.) AMT, Series A, 4.70% due 6/1/2054 (put 6/1/2027) | | | 1,250,000 | | | | 1,267,223 | |
| | Kentucky (Baptist Healthcare System Obligated Group) EDFA, Series B, 5.00% due 8/15/2041 | | | 5,000,000 | | | | 5,136,520 | |
| | Kentucky Housing Corp. (FHLMC, FNMA, GNMA), Series A, 4.35% due 7/1/2044 | | | 1,500,000 | | | | 1,507,213 | |
| a | Kentucky Public Energy Authority (Guaranty: BP Corp. North America, Inc.), Series B, 5.00% due 1/1/2055 (put 8/1/2032) | | | 8,000,000 | | | | 8,789,200 | |
| | Kentucky Public Energy Authority (Guaranty: Morgan Stanley Group), | | | | | | | | |
| | Series A-1, | | | | | | | | |
| a | 4.00% due 8/1/2052 (put 8/1/2030) | | | 1,220,000 | | | | 1,251,109 | |
| a | 5.25% due 4/1/2054 (put 2/1/2032) | | | 10,000,000 | | | | 11,100,680 | |
| | Kentucky State Property & Building Commission, | | | | | | | | |
| | Series A, | | | | | | | | |
| | 4.00% due 11/1/2035 | | | 1,000,000 | | | | 1,021,857 | |
| | 5.25% due 6/1/2039 | | | 3,000,000 | | | | 3,419,637 | |
| | LOUISIANA — 0.3% | | | | | | | | |
| | Jefferson Sales Tax District (AGM), Series B, 5.00% due 12/1/2034 | | | 1,000,000 | | | | 1,059,515 | |
| | Louisiana Public Facilities Authority (Ochsner Clinic Foundation Obligated Group), Series A, 5.00% due 5/15/2035 - 5/15/2037 | | | 1,925,000 | | | | 2,073,456 | |
| | MAINE — 0.1% | | | | | | | | |
| | Maine Health & Higher Educational Facilities Authority (AGM), Series A, 5.00% due 7/1/2041 - 7/1/2043 | | | 625,000 | | | | 688,521 | |
| | MASSACHUSETTS — 0.1% | | | | | | | | |
| | Massachusetts Bay Transportation Authority Assessment Revenue (Transportation Capital Program), Series A, 5.25% due 7/1/2030 | | | 1,000,000 | | | | 1,145,071 | |
| | MICHIGAN — 2.0% | | | | | | | | |
| | Detroit City School District (School Building & Site Improvement) (AGM, Q-SBLF) GO, Series A, 5.25% due 5/1/2026 | | | 3,150,000 | | | | 3,276,923 | |
| | Detroit City School District (School Building & Site) (AGM, Q-SBLF) GO, Series A, 5.25% due 5/1/2027 | | | 1,100,000 | | | | 1,173,672 | |
| | Kalamazoo Hospital Finance Authority (Bronson Health Care Group Obligated Group), 4.00% due 5/15/2036 | | | 1,985,000 | | | | 1,989,494 | |
| | Kalamazoo Hospital Finance Authority (Bronson Healthcare), Series A, 5.25% due 5/15/2026 | | | 75,000 | | | | 75,109 | |
| | Michigan Finance Authority (BHSH System Obligated Group), Series A, 5.00% due 4/15/2036 | | | 2,000,000 | | | | 2,249,922 | |
| | Michigan Finance Authority (Government Loan Program), Series F, 5.00% due 4/1/2026 | | | 680,000 | | | | 681,041 | |
| | Michigan Finance Authority (Henry Ford Health System Obligated Group), 4.00% due 11/15/2035 | | | 450,000 | | | | 451,488 | |
| | Michigan Finance Authority (Trinity Health Corp. Obligated Group), | | | | | | | | |
| | Series A, 4.00% due 12/1/2040 | | | 6,200,000 | | | | 6,148,205 | |
| | Series A-MI, 4.00% due 12/1/2036 | | | 1,445,000 | | | | 1,455,050 | |
| | Michigan HDA, Series B, 2.95% due 12/1/2039 | | | 2,000,000 | | | | 1,804,600 | |
| | Wayne County Airport Authority (AGM) AMT, Series B, 5.50% due 12/1/2043 | | | 675,000 | | | | 755,342 | |
| | MINNESOTA — 0.7% | | | | | | | | |
| | City of Coon Rapids (Mississippi View Housing Partners LP) (FNMA), Series M, 5.60% due 12/1/2039 | | | 1,495,262 | | | | 1,645,362 | |
| | Dakota County Community Development Agency (Roers Burnsville Affordable Apartments Owner LLC) (FNMA), 4.20% due 5/1/2043 | | | 1,000,000 | | | | 999,365 | |
| | Duluth Multifamily Tax-Exempt Mtg (Steele Pennel Park LLC) HDA, Series 2024-08FN Class PT, 4.50% due 8/1/2041 | | | 4,597,934 | | | | 4,734,599 | |
| | MISSISSIPPI — 1.0% | | | | | | | | |
| a | County of Warren (International Paper Co.), Series A, 1.375% due 5/1/2034 (put 6/16/2025) | | | 1,625,000 | | | | 1,594,619 | |
| | Mississippi Development Bank (Jackson Public School District) (BAM), 5.25% due 10/1/2037 - 10/1/2038 | | | 5,250,000 | | | | 5,648,317 | |
| | Mississippi Home Corp. (FHLMC, FNMA, GNMA), Series A, 4.375% due 12/1/2044 | | | 3,000,000 | | | | 3,003,684 | |
| | MISSOURI — 0.1% | | | | | | | | |
| | Health & Educational Facilities Authority of the State of Missouri (Lutheran Senior Services Obligated Group), Series A, 5.25% due 2/1/2044 | | | 700,000 | | | | 760,275 | |
| | MONTANA — 0.2% | | | | | | | | |
| | Montana Board of Housing, Series B, 4.80% due 12/1/2043 | | | 2,000,000 | | | | 2,096,984 | |
| 228 | Annual Financial Statements | See notes to financial statements. |
Schedule of Investments, Continued
Thornburg Intermediate Municipal Fund | September 30, 2024
| | ISSUER-DESCRIPTION | | PRINCIPAL
AMOUNT | | | VALUE | |
| | | | | | | | |
| | NEBRASKA — 0.4% | | | | | | | | |
| a | Central Plains Energy Project (Guaranty: Bank of Montreal), Series A, 5.00% due 5/1/2054 (put 11/1/2029) | | $ | 2,000,000 | | | $ | 2,146,420 | |
| | Central Plains Energy Project (Guaranty: Goldman Sachs Group, Inc.), | | | | | | | | |
| a | Series 1, 5.00% due 5/1/2053 (put 10/1/2029) | | | 500,000 | | | | 532,555 | |
| | Series A, 5.00% due 9/1/2031 | | | 1,000,000 | | | | 1,080,886 | |
| | NEVADA — 0.4% | | | | | | | | |
| | Carson City (Carson Tahoe Regional Healthcare), Series A, 5.00% due 9/1/2037 | | | 1,060,000 | | | | 1,095,613 | |
| | City of Las Vegas Special Improvement District No. 814 (Summerlin Village 21 & 24A), 4.00% due 6/1/2039 - 6/1/2044 | | | 1,015,000 | | | | 879,615 | |
| a | County of Washoe (Sierra Pacific Power Co.) AMT, Series F, 4.125% due 3/1/2036 (put 10/1/2029) | | | 1,000,000 | | | | 1,033,810 | |
| | Reno-Tahoe Airport Authority AMT, Series A, 5.25% due 7/1/2044 | | | 1,000,000 | | | | 1,080,243 | |
| | NEW JERSEY — 3.9% | | | | | | | | |
| | New Jersey (New Jersey Transit Corp.) EDA, Series A, 5.25% due 11/1/2042 | | | 4,000,000 | | | | 4,476,440 | |
| | New Jersey (School Facilities Construction) (AMBAC) EDA, Series N-1, 5.50% due 9/1/2026 | | | 3,000,000 | | | | 3,159,039 | |
| | New Jersey (School Facilities Construction) (NPFG) EDA, Series N1, 5.50% due 9/1/2027 | | | 1,700,000 | | | | 1,837,802 | |
| | New Jersey (State of New Jersey Department of the Treasury) EDA, Series EEE, 5.00% due 6/15/2043 | | | 545,000 | | | | 574,975 | |
| | New Jersey Health Care Facilities Financing Authority (Virtua Health Obligated Group), 5.00% due 7/1/2027 - 7/1/2028 | | | 2,815,000 | | | | 2,819,240 | |
| | New Jersey Higher Education Student Assistance Authority AMT, | | | | | | | | |
| | Series A, 5.00% due 12/1/2032 | | | 1,500,000 | | | | 1,642,554 | |
| | Series B, 5.00% due 12/1/2032 | | | 750,000 | | | | 821,036 | |
| | New Jersey Transportation Trust Fund Authority, | | | | | | | | |
| | Series A, 5.00% due 12/15/2032 - 12/15/2035 | | | 5,300,000 | | | | 5,669,642 | |
| | Series AA, | | | | | | | | |
| | 5.00% due 6/15/2035 - 6/15/2040 | | | 1,800,000 | | | | 1,977,429 | |
| | 5.25% due 6/15/2043 | | | 3,100,000 | | | | 3,311,017 | |
| | Series BB-1, 5.00% due 6/15/2034 | | | 2,000,000 | | | | 2,159,708 | |
| | New Jersey Transportation Trust Fund Authority (State Transportation System Improvements), Series A, 5.00% due 6/15/2031 | | | 1,000,000 | | | | 1,031,079 | |
| | New Jersey Transportation Trust Fund Authority (Transportation Program Bonds), | | | | | | | | |
| | Series AA, 5.00% due 6/15/2038 | | | 3,500,000 | | | | 3,736,407 | |
| | Series CC, 5.00% due 6/15/2042 | | | 3,750,000 | | | | 4,128,270 | |
| | New Jersey Transportation Trust Fund Authority (Transportation System), Series A, 5.00% due 12/15/2034 - 12/15/2039 | | | 2,000,000 | | | | 2,158,414 | |
| | NEW MEXICO — 1.3% | | | | | | | | |
| | Albuquerque Municipal School District No. 12 (State Aid Withholding) GO, Series A, 5.00% due 8/1/2035 | | | 500,000 | | | | 558,411 | |
| a | City of Farmington (Public Service Co. of New Mexico), Series E, 3.875% due 6/1/2040 (put 6/1/2029) | | | 2,000,000 | | | | 2,061,836 | |
| | City of Santa Fe (El Castillo Retirement Residences Obligated Group), 4.50% due 5/15/2027 | | | 1,000,000 | | | | 1,000,348 | |
| | New Mexico Hospital Equipment Loan Council (Haverland Carter Lifestyle Obligated Group), | | | | | | | | |
| | Series A, 5.00% due 7/1/2033 | | | 360,000 | | | | 366,744 | |
| | Series LA, 5.00% due 7/1/2032 | | | 575,000 | | | | 586,330 | |
| | New Mexico Hospital Equipment Loan Council (Presbyterian Healthcare Services Obligated Group), Series A, 5.00% due 8/1/2036 - 8/1/2037 | | | 1,955,000 | | | | 2,121,954 | |
| | New Mexico Institute of Mining & Technology (Campus Buildings Acquisition & Improvements) (AGM), 4.00% due 12/1/2035 - 12/1/2040 | | | 1,910,000 | | | | 1,943,482 | |
| | New Mexico Mortgage Finance Authority (FHLMC, FNMA, GNMA), | | | | | | | | |
| | Series A Class I, 4.50% due 9/1/2044 | | | 2,965,000 | | | | 3,016,549 | |
| | Series E Class I, 4.45% due 9/1/2044 | | | 970,000 | | | | 981,626 | |
| | Village of Los Ranchos de Albuquerque (Albuquerque Academy), 4.00% due 9/1/2040 | | | 825,000 | | | | 807,509 | |
| | NEW YORK — 6.8% | | | | | | | | |
| | Build NYC Resource Corp. (Kipp NYC Public Charter Schools) (Green Bond), 5.00% due 7/1/2042 | | | 2,300,000 | | | | 2,403,505 | |
| | City of Long Beach (BAM) GO, Series B, 5.25% due 7/15/2042 | | | 1,000,000 | | | | 1,077,990 | |
| | City of New York (City Budget Financial Management) GO, | | | | | | | | |
| | Series G, 5.00% due 8/1/2027 | | | 4,530,000 | | | | 4,540,723 | |
| | Series J, 5.00% due 8/1/2030 - 8/1/2031 | | | 9,000,000 | | | | 9,011,917 | |
| | City of New York GO, | | | | | | | | |
| | Series A, 5.00% due 8/1/2039 | | | 500,000 | | | | 541,605 | |
| | Series D-1, 5.25% due 5/1/2040 - 5/1/2041 | | | 2,500,000 | | | | 2,838,376 | |
| | Dutchess County Local Development Corp. (Tompkins Terrace Housing LP) (FNMA) (Green Bond), 5.00% due 10/1/2040 | | | 3,100,000 | | | | 3,444,026 | |
| | Metropolitan Transportation Authority, | | | | | | | | |
| | Series D, 5.00% due 11/15/2030 - 11/15/2035 | | | 8,295,000 | | | | 8,671,741 | |
| | Series D-1, 5.00% due 11/15/2031 | | | 2,285,000 | | | | 2,332,425 | |
| | Metropolitan Transportation Authority (Green Bond), Series A1, 5.00% due 11/15/2035 - 11/15/2036 | | | 1,820,000 | | | | 1,888,222 | |
| | New York City Housing Development Corp. (CSA Preservation Partners LLC) (HUD) (Green Bond), Series A, 4.45% due 8/1/2043 | | | 1,500,000 | | | | 1,513,046 | |
| | New York City Housing Development Corp. (HUD) (Green Bond), Series B, 5.05% due 11/1/2043 | | | 4,250,000 | | | | 4,492,590 | |
| See notes to financial statements. | Annual Financial Statements | 229 |
Schedule of Investments, Continued
Thornburg Intermediate Municipal Fund | September 30, 2024
| | ISSUER-DESCRIPTION | | PRINCIPAL
AMOUNT | | | VALUE | |
| | | | | | | | |
| | New York City Transitional Finance Authority Future Tax Secured Revenue, | | | | | | | | |
| | Series A, 5.00% due 11/1/2036 | | $ | 1,230,000 | | | $ | 1,368,740 | |
| | Series A2, 5.00% due 5/1/2039 | | | 1,000,000 | | | | 1,080,237 | |
| | Series A-3, 4.00% due 8/1/2042 | | | 2,500,000 | | | | 2,504,280 | |
| | New York State Dormitory Authority (BAM), Series A, 5.00% due 10/1/2042 | | | 5,000,000 | | | | 5,395,230 | |
| | New York State Thruway Authority (State of New York Personal Income Tax Revenue), 5.00% due 3/15/2041 | | | 1,500,000 | | | | 1,679,522 | |
| | New York State Urban Development Corp. (State of New York Personal Income Tax Revenue), Series A, 5.00% due 3/15/2041 - 3/15/2042 | | | 4,300,000 | | | | 4,715,769 | |
| | Port Authority of New York & New Jersey AMT, | | | | | | | | |
| | Series 186, 5.00% due 10/15/2037 | | | 3,000,000 | | | | 3,002,616 | |
| | Series 207, 5.00% due 9/15/2030 | | | 1,400,000 | | | | 1,481,536 | |
| | State of New York Mortgage Agency (SONYMA) (Green Bond) AMT , Series 253, 4.70% due 10/1/2038 | | | 990,000 | | | | 1,003,622 | |
| | State of New York Mortgage Agency (SONYMA) AMT (Green Bond), Series 248, 4.05% due 10/1/2031 | | | 2,035,000 | | | | 2,035,665 | |
| | Triborough Bridge & Tunnel Authority, Series D, 5.00% due 11/15/2033 | | | 250,000 | | | | 282,884 | |
| | Triborough Bridge & Tunnel Authority (Metropolitan Transportation Authority Payroll Mobility Tax Revenue), Series A, 4.00% due 5/15/2040 | | | 1,500,000 | | | | 1,537,028 | |
| | Westchester County Local Development Corp. (Miriam Osborn Memorial Home Association Obligated Group), 5.00% due 7/1/2029 | | | 250,000 | | | | 259,831 | |
| | NORTH CAROLINA — 1.0% | | | | | | | | |
| | Charlotte-Mecklenburg Hospital Authority (Carolinas HealthCare System), Series A, 5.00% due 1/15/2028 | | | 2,190,000 | | | | 2,193,300 | |
| | City of Shelby (Standard Laurel Venture LP) (FNMA), 4.25% due 8/1/2040 | | | 2,100,000 | | | | 2,142,408 | |
| | Greater Asheville Regional Airport Authority (AGM) AMT, 5.25% due 7/1/2042 - 7/1/2043 | | | 1,450,000 | | | | 1,596,955 | |
| | North Carolina Medical Care Commission (Plantation Village Obligated Group), Series A, 4.00% due 1/1/2041 | | | 1,020,000 | | | | 948,365 | |
| | North Carolina Medical Care Commission (Vidant Health), 5.00% due 6/1/2030 (pre-refunded 6/1/2025) | | | 3,000,000 | | | | 3,043,545 | |
| | OHIO — 1.3% | | | | | | | | |
| | Cincinnati City School District (School Improvement Project) COP, 5.00% due 12/15/2031 (pre-refunded 12/15/2024) | | | 3,075,000 | | | | 3,088,044 | |
| | City of Cleveland (Various Municipal Capital Improvements) GO, 5.00% due 12/1/2024 | | | 1,000,000 | | | | 1,001,645 | |
| | City of Cleveland GO, 5.00% due 12/1/2026 | | | 15,000 | | | | 15,023 | |
| | Cleveland-Cuyahoga County Port Authority (County Administration Offices), 5.00% due 7/1/2025 | | | 1,780,000 | | | | 1,810,044 | |
| | Northeast Ohio Medical University (BAM), | | | | | | | | |
| | 5.00% due 12/1/2038 - 12/1/2041 | | | 2,420,000 | | | | 2,617,348 | |
| | Series B, 4.00% due 12/1/2038 - 12/1/2042 | | | 1,860,000 | | | | 1,791,331 | |
| | Ohio Higher Educational Facility Commission (Ashtabula County Medical Center Obligated Group), 5.25% due 1/1/2037 | | | 840,000 | | | | 930,065 | |
| | Ohio Housing Finance Agency (FHLMC, FNMA, GNMA) (Green Bond), Series B, 4.80% due 9/1/2043 | | | 965,000 | | | | 965,696 | |
| | Polaris Career Center COP, 5.00% due 11/1/2041 | | | 1,150,000 | | | | 1,167,747 | |
| | OKLAHOMA — 0.9% | | | | | | | | |
| | Clinton Public Works Authority, 5.00% due 10/1/2039 | | | 3,335,000 | | | | 3,643,828 | |
| | Muskogee Industrial Trust (Muskogee County No. 20) ISD, 5.00% due 9/1/2025 | | | 850,000 | | | | 860,233 | |
| | Oklahoma County Finance Authority (Oklahoma County ISD No. 4 Choctaw-Nicoma Park), 4.00% due 9/1/2038 | | | 5,000,000 | | | | 5,116,835 | |
| | OREGON — 0.3% | | | | | | | | |
| | Salem Hospital Facility Authority (Capital Manor, Inc. Obligated Group), 4.00% due 5/15/2040 | | | 500,000 | | | | 460,811 | |
| | State of Oregon Housing & Community Services Department (VBT Redmond Landing LP) (FNMA), Series K-1, 4.33% due 11/1/2043 | | | 3,000,000 | | | | 3,004,053 | |
| | PENNSYLVANIA — 6.1% | | | | | | | | |
| | Allegheny County Hospital Development Authority (UPMC Obligated Group), Series A, 4.00% due 7/15/2038 | | | 1,415,000 | | | | 1,424,871 | |
| | City of Philadelphia (Pennsylvania Gas Works), Series 14, 5.00% due 10/1/2034 | | | 500,000 | | | | 518,345 | |
| | City of Philadelphia (Philadelphia Gas Works), Series 15, 5.00% due 8/1/2042 | | | 2,500,000 | | | | 2,597,625 | |
| | City of Philadelphia Airport Revenue (AGM) AMT, 4.00% due 7/1/2041 | | | 2,000,000 | | | | 1,980,180 | |
| | City of Philadelphia Airport Revenue AMT, | | | | | | | | |
| | Series B, 5.00% due 7/1/2033 - 7/1/2037 | | | 2,250,000 | | | | 2,311,342 | |
| | Series C, 5.00% due 7/1/2032 | | | 1,380,000 | | | | 1,483,623 | |
| | City of Pittsburgh (Capital Projects) GO, 5.00% due 9/1/2035 - 9/1/2036 | | | 1,215,000 | | | | 1,284,438 | |
| | County of Luzerne (AGM) GO, Series A, 5.00% due 11/15/2029 | | | 3,000,000 | | | | 3,066,687 | |
| | Luzerne County (AGM) IDA GO, 5.00% due 12/15/2025 | | | 545,000 | | | | 559,360 | |
| | Monroeville Financing Authority (University of Pittsburgh Medical Center), 5.00% due 2/15/2026 | | | 3,490,000 | | | | 3,597,199 | |
| a | Montgomery County (Constellation Energy Generation LLC) IDA AMT, Series C, 4.45% due 10/1/2034 (put 4/3/2028) | | | 1,000,000 | | | | 1,021,746 | |
| | Pennsylvania (Pennsylvania Department of Transportation) EDFA AMT, 5.50% due 6/30/2043 | | | 6,000,000 | | | | 6,601,962 | |
| | Pennsylvania (Presbyterian Homes Obligated Group) EDFA, Series B-2, 5.00% due 7/1/2042 | | | 1,250,000 | | | | 1,324,111 | |
| | Pennsylvania (UPMC Obligated Group) EDFA, | | | | | | | | |
| | Series A, | | | | | | | | |
| | 4.00% due 10/15/2037 | | | 1,000,000 | | | | 1,023,274 | |
| | 5.00% due 2/15/2036 | | | 1,000,000 | | | | 1,111,077 | |
| a | Pennsylvania (Waste Management, Inc.; Guaranty: Waste Management Holdings) EDFA AMT, Series A, 4.25% due 8/1/2038 (put 8/1/2025) | | | 10,000,000 | | | | 10,054,260 | |
| | Pennsylvania Higher Educational Facilities Authority (University of Pennsylvania Health System Obligated Group), Series A, 4.00% due 8/15/2042 | | | 1,000,000 | | | | 998,760 | |
| | Pennsylvania Housing Finance Agency (Cambridge Community Partners LP) (FNMA, HUD) (Green Bond), Series A, 5.55% due 11/1/2042 | | | 1,100,000 | | | | 1,287,390 | |
| | Pennsylvania Housing Finance Agency AMT (Green Bond), 5.00% due 4/1/2027 | | | 1,500,000 | | | | 1,554,393 | |
| 230 | Annual Financial Statements | See notes to financial statements. |
Schedule of Investments, Continued
Thornburg Intermediate Municipal Fund | September 30, 2024
| | ISSUER-DESCRIPTION | | PRINCIPAL
AMOUNT | | | VALUE | |
| | | | | | | | |
| | Pennsylvania State Public School Building Authority (Philadelphia School District) (AGM, State Aid Withholding), Series B, 5.00% due 6/1/2027 | | $ | 5,000,000 | | | $ | 5,304,580 | |
| | Pennsylvania Turnpike Commission, Series 2, 5.00% due 12/1/2036 | | | 1,150,000 | | | | 1,212,153 | |
| | Philadelphia Municipal Authority (Juvenile Justice Services Center), 5.00% due 4/1/2032 - 4/1/2036 | | | 11,125,000 | | | | 11,652,496 | |
| | RHODE ISLAND — 0.6% | | | | | | | | |
| | Rhode Island Housing & Mortgage Finance Corp. (GNMA) (Green Bond), Series 81-A, 5.25% due 10/1/2043 | | | 2,000,000 | | | | 2,169,756 | |
| | State of Rhode Island & Providence Plantations (Training School Project) COP, Series B, 5.00% due 10/1/2024 | | | 3,595,000 | | | | 3,595,212 | |
| | SOUTH CAROLINA — 2.5% | | | | | | | | |
| | City of Myrtle Beach (Municipal Sports Complex), Series B, 5.00% due 6/1/2028 - 6/1/2030 | | | 2,000,000 | | | | 2,002,851 | |
| a | Patriots Energy Group Financing Agency (Guaranty: Royal Bank of Canada), Series B-1, 5.25% due 2/1/2054 (put 3/1/2031) | | | 6,000,000 | | | | 6,591,900 | |
| a | Patriots Energy Group Financing Agency (Guaranty: Sumitomo Mitsui Banking Corp.), Series A1, 5.25% due 10/1/2054 (put 8/1/2031) | | | 9,500,000 | | | | 10,336,124 | |
| a | South Carolina Jobs-EDA (Guaranty: International Paper Co.) AMT, Series A, 4.00% due 4/1/2033 (put 4/1/2026) | | | 2,000,000 | | | | 2,017,128 | |
| | South Carolina State Housing Finance & Development Authority, Series A, 4.50% due 7/1/2044 | | | 5,000,000 | | | | 5,073,520 | |
| | SOUTH DAKOTA — 0.9% | | | | | | | | |
| | South Dakota (FHLMC, FNMA, GNMA) HDA, | | | | | | | | |
| | Series A, 4.45% due 11/1/2044 | | | 2,500,000 | | | | 2,527,597 | |
| | Series C, 4.50% due 11/1/2044 | | | 5,000,000 | | | | 5,070,660 | |
| | South Dakota Health & Educational Facilities Authority (Sanford Health), 5.00% due 11/1/2028 - 11/1/2029 | | | 1,800,000 | | | | 1,835,473 | |
| | TENNESSEE — 2.6% | | | | | | | | |
| | Knox County Health Educational & Housing Facility Board (Provident Group - UTK Properties LLC) (BAM), Series A-1, 5.00% due 7/1/2043 - 7/1/2044 | | | 975,000 | | | | 1,053,721 | |
| | Memphis-Shelby County Airport Authority AMT, Series A, 5.00% due 7/1/2026 - 7/1/2033 | | | 2,320,000 | | | | 2,444,036 | |
| a | Tennergy Corp. (Guaranty: Morgan Stanley Group), Series A, 4.00% due 12/1/2051 (put 9/1/2028) | | | 2,000,000 | | | | 2,036,980 | |
| | Tennessee (FHLMC, FNMA, GNMA) (Green Bond) HDA, Series 3A, 5.20% due 7/1/2043 | | | 1,975,000 | | | | 2,124,912 | |
| | Tennessee (Green Bond) HDA, Series 2A, 4.45% due 7/1/2043 | | | 1,000,000 | | | | 1,014,195 | |
| a | Tennessee Energy Acquisition Corp. (Guaranty: Goldman Sachs Group, Inc.), Series A-1, 5.00% due 5/1/2053 (put 5/1/2028) | | | 5,000,000 | | | | 5,262,895 | |
| a | Tennessee Energy Acquisition Corp. (Tennessee Energy Acquisition Corp.; Guaranty: Goldman Sachs Group, Inc.), Series A, 5.00% due 5/1/2052 (put 11/1/2031) | | | 11,785,000 | | | | 12,818,109 | |
| | TEXAS — 12.6% | | | | | | | | |
| | Austin Affordable PFC, Inc., Series 2024-16FN, 4.35% due 5/1/2043 | | | 2,800,000 | | | | 2,881,122 | |
| | Austin Affordable PFC, Inc. (1000 Collinwood West Drive Owner LP) (FNMA), Series A, 4.45% due 3/1/2043 | | | 3,350,000 | | | | 3,408,936 | |
| | Calallen (PSF-GTD) ISD GO, 5.00% due 2/15/2043 | | | 750,000 | | | | 829,018 | |
| | Celina (PSF-GTD) ISD GO, 5.00% due 2/15/2042 - 2/15/2043 | | | 1,250,000 | | | | 1,387,248 | |
| | City of Austin Airport System Revenue AMT, 5.00% due 11/15/2035 - 11/15/2042 | | | 5,740,000 | | | | 6,204,909 | |
| | City of Dallas (Public Improvements) GO, 5.00% due 2/15/2025 - 2/15/2034 | | | 9,720,000 | | | | 9,791,221 | |
| | City of Grapevine (CTFS Obligation) GO, 4.00% due 2/15/2044 | | | 2,405,000 | | | | 2,421,215 | |
| | City of Houston Airport System Revenue (AGM) AMT, Series A, 5.25% due 7/1/2042 | | | 1,000,000 | | | | 1,098,822 | |
| | City of Houston Airport System Revenue AMT, | | | | | | | | |
| | Series A, | | | | | | | | |
| | 4.00% due 7/1/2041 | | | 1,310,000 | | | | 1,303,827 | |
| | 5.00% due 7/1/2033 - 7/1/2041 | | | 4,250,000 | | | | 4,457,524 | |
| | City of McAllen (International Toll Bridge Revenue) (AGM), Series A, 5.00% due 3/1/2029 - 3/1/2032 | | | 4,730,000 | | | | 4,857,634 | |
| | City of New Braunfels Utility System Revenue, 5.00% due 7/1/2042 | | | 1,750,000 | | | | 1,937,801 | |
| | City of Port Arthur (CTFS Obligation) (BAM) GO, | | | | | | | | |
| | 4.00% due 2/15/2040 - 2/15/2042 | | | 1,750,000 | | | | 1,773,050 | |
| | 5.00% due 2/15/2039 - 2/15/2043 | | | 2,350,000 | | | | 2,592,134 | |
| | City of San Antonio (Airport System Capital Improvements) AMT, 5.00% due 7/1/2025 | | | 1,160,000 | | | | 1,161,318 | |
| | City of San Antonio (Public Facilities Corp.), 5.00% due 9/15/2040 | | | 2,000,000 | | | | 2,238,598 | |
| a | City of San Antonio Electric & Gas Systems Revenue, Series A, 1.75% due 2/1/2033 (put 12/1/2024) | | | 3,995,000 | | | | 3,978,620 | |
| | Clifton Higher Education Finance Corp. (Braination, Inc.) (PSF-GTD), 5.25% due 8/15/2044 | | | 750,000 | | | | 824,762 | |
| | Clifton Higher Education Finance Corp. (IDEA Public Schools) (PSF-GTD), 4.00% due 8/15/2044 | | | 5,000,000 | | | | 4,995,555 | |
| | Clifton Higher Education Finance Corp. (International Leadership of Texas, Inc.) (PSF-GTD), Series A, 4.00% due 8/15/2044 | | | 1,280,000 | | | | 1,261,612 | |
| | Corpus Christi (PSF-GTD) ISD GO, 4.00% due 8/15/2043 | | | 1,500,000 | | | | 1,526,404 | |
| | County of Bexar GO, 4.00% due 6/15/2036 | | | 1,000,000 | | | | 1,009,268 | |
| | Crosby (PSF-GTD) ISD GO, 4.00% due 2/15/2042 | | | 1,000,000 | | | | 1,021,978 | |
| | Greater Texas Cultural Education Facilities Finance Corp. (County of Fort Bend), Series A, 5.00% due 3/1/2034 | | | 1,185,000 | | | | 1,330,686 | |
| | Harris County Cultural Education Facilities Finance Corp. (Memorial Hermann Health System Obligated Group), | | | | | | | | |
| | 5.00% due 7/1/2040 | | | 5,000,000 | | | | 5,165,030 | |
| | Series A, 5.00% due 12/1/2028 | | | 3,000,000 | | | | 3,009,369 | |
| | Hays Consolidated (PSF-GTD) ISD GO, 4.00% due 2/15/2043 | | | 1,000,000 | | | | 1,017,012 | |
| | Houston (PSF-GTD) ISD GO, Series A, 4.00% due 2/15/2041 | | | 4,900,000 | | | | 4,908,947 | |
| See notes to financial statements. | Annual Financial Statements | 231 |
Schedule of Investments, Continued
Thornburg Intermediate Municipal Fund | September 30, 2024
| | ISSUER-DESCRIPTION | | PRINCIPAL
AMOUNT | | | VALUE | |
| | | | | | | | |
| | Lower Colorado River Authority (LCRA Transmission Services Corp.), | | | | | | | | |
| | 5.00% due 5/15/2039 | | $ | 750,000 | | | $ | 777,503 | |
| | Series A, | | | | | | | | |
| | 5.00% due 5/15/2039 | | | 500,000 | | | | 542,968 | |
| | 5.25% due 5/15/2042 | | | 1,410,000 | | | | 1,569,069 | |
| | Matagorda County Navigation District No. 1 (AEP Texas, Inc.) AMT, 4.25% due 5/1/2030 | | | 2,000,000 | | | | 2,069,458 | |
| | Mission Economic Development Corp. (Republic Services, Inc.) AMT, | | | | | | | | |
| a | 4.00% due 6/1/2054 (put 6/1/2034) | | | 1,000,000 | | | | 1,037,073 | |
| a | Series A, 4.25% due 5/1/2050 (put 11/1/2024) | | | 5,000,000 | | | | 4,997,490 | |
| | Newark Higher Education Finance Corp. (Hughen Center, Inc.) (PSF-GTD), Series A, 5.00% due 8/15/2042 | | | 600,000 | | | | 648,338 | |
| | North Texas Tollway Authority (North Texas Tollway System), Series A, 4.125% due 1/1/2040 | | | 1,500,000 | | | | 1,521,312 | |
| | Pecos Barstow Toyah (PSF-GTD) ISD GO, 5.00% due 2/15/2043 | | | 1,000,000 | | | | 1,017,451 | |
| | San Antonio Housing Trust Public Facility Corp. (Brooks Family Apartments LP) (FNMA), Series A, 4.55% due 3/1/2043 | | | 5,500,000 | | | | 5,597,937 | |
| | Tarrant County Cultural Education Facilities Finance Corp. (Baylor Scott & White Health Obligated Group), Series A, 4.00% due 11/15/2036 | | | 1,000,000 | | | | 1,001,727 | |
| | Tarrant County Cultural Education Facilities Finance Corp. (Christus Health Obligated Group), | | | | | | | | |
| a | Series A, 5.00% due 7/1/2053 (put 7/1/2032) | | | 2,000,000 | | | | 2,236,436 | |
| | Series B, 5.00% due 7/1/2036 | | | 1,185,000 | | | | 1,263,424 | |
| | Tarrant County Cultural Education Facilities Finance Corp. (Cumberland Rest, Inc. Obligated Group), 5.00% due 10/1/2044 | | | 1,000,000 | | | | 1,073,805 | |
| | Tarrant County Cultural Education Facilities Finance Corp. (Methodist Hospitals of Dallas Obligated Group), 5.00% due 10/1/2040 | | | 3,520,000 | | | | 3,859,814 | |
| | Tarrant County Housing Finance Corp. (4450 Marine Creek Parkway TX Owner LP) (FNMA), Series A, 4.60% due 3/1/2043 | | | 7,000,000 | | | | 7,102,478 | |
| a | Texas Municipal Gas Acquisition & Supply Corp. IV (Guaranty: BP plc), Series B, 5.50% due 1/1/2054 (put 1/1/2034) | | | 6,000,000 | | | | 6,824,640 | |
| | Texas Public Finance Authority (Texas Southern University) (BAM), 5.25% due 5/1/2040 | | | 500,000 | | | | 549,961 | |
| | Texas State Technical College (AGM), Series A, 5.50% due 8/1/2042 | | | 2,000,000 | | | | 2,280,632 | |
| | Texas Transportation Commission (Central Texas Turnpike System), Series C, 5.00% due 8/15/2034 | | | 3,350,000 | | | | 3,356,104 | |
| | Waco Educational Finance Corp. (Baylor University Issue), 4.00% due 3/1/2041 | | | 850,000 | | | | 855,170 | |
| | UTAH — 0.8% | | | | | | | | |
| | City of Salt Lake City Airport Revenue AMT, Series A, 5.00% due 7/1/2030 - 7/1/2031 | | | 5,275,000 | | | | 5,481,539 | |
| | Utah Charter School Finance Authority (Summit Academy, Inc.), Series A, 5.00% due 4/15/2039 | | | 500,000 | | | | 523,287 | |
| | Utah Housing Corp. (FHLMC, FNMA, GNMA), Series C, 4.45% due 1/1/2044 | | | 1,350,000 | | | | 1,369,667 | |
| | Utah Telecommunication Open Infrastructure Agency, 5.50% due 6/1/2040 | | | 500,000 | | | | 584,704 | |
| | VIRGINIA — 1.2% | | | | | | | | |
| | Richmond Redevelopment & Housing Authority (Chippenham Place LP) (FNMA), Series FN, 4.50% due 5/1/2040 | | | 998,056 | | | | 1,029,091 | |
| | Virginia HDA, Series D, 4.50% due 8/1/2043 | | | 2,000,000 | | | | 2,054,404 | |
| | Virginia Small Business Financing Authority (National Senior Campuses, Inc. Obligated Group), Series A, 5.00% due 1/1/2029 | | | 850,000 | | | | 891,724 | |
| a | Wise County (Virginia Electric & Power Co.) IDA, Series A, 3.80% due 11/1/2040 (put 5/28/2027) | | | 8,250,000 | | | | 8,444,560 | |
| | WASHINGTON — 0.6% | | | | | | | | |
| | Clark County Public Utility District No. 1, 5.00% due 1/1/2040 - 1/1/2041 | | | 1,000,000 | | | | 1,105,788 | |
| | State of Washington GO, Series 2021A, 5.00% due 6/1/2040 | | | 2,225,000 | | | | 2,451,276 | |
| | Washington State Housing Finance Commission (Eastside Retirement Association Obligated Group), Series A, 5.00% due 7/1/2043 | | | 1,000,000 | | | | 1,064,593 | |
| b | Washington State Housing Finance Commission (Seattle Academy of Arts & Sciences), 5.875% due 7/1/2043 | | | 1,000,000 | | | | 1,114,383 | |
| | WISCONSIN — 2.2% | | | | | | | | |
| | Public Finance Authority (National Senior Communities Obligated Group), 4.00% due 1/1/2028 - 1/1/2042 | | | 5,235,000 | | | | 5,195,634 | |
| | Public Finance Authority (Texas Biomedical Research Institute), Series A, 4.00% due 6/1/2040 - 6/1/2041 | | | 525,000 | | | | 516,872 | |
| | Racine (AGM) USD GO, 5.00% due 4/1/2039 - 4/1/2042 | | | 3,850,000 | | | | 4,173,353 | |
| | Wisconsin Health & Educational Facilities Authority (Ascension Health Credit Group), Series A, 4.50% due 11/15/2039 | | | 500,000 | | | | 502,668 | |
| | Wisconsin Health & Educational Facilities Authority (Ascension Health), Series A, 5.00% due 11/15/2036 | | | 2,380,000 | | | | 2,438,998 | |
| | Wisconsin Housing & EDA (Flats at Bishops Woods LP) (FNMA), Series E, 4.75% due 6/1/2043 | | | 3,601,000 | | | | 3,813,696 | |
| | Wisconsin Housing & EDA Home Ownership Revenue (FHLMC, FNMA, GNMA) (Green Bond), Series A, 4.85% due 9/1/2043 | | | 5,000,000 | | | | 5,271,155 | |
| | WPPI Energy, Series A, 5.00% due 7/1/2033 - 7/1/2034 | | | 940,000 | | | | 1,013,150 | |
| | TOTAL LONG-TERM MUNICIPAL BONDS — 96.0% (Cost $947,159,713) | | | | | | | 980,128,894 | |
| | | | | | | | | | |
| | SHORT-TERM MUNICIPAL BONDS — 2.8% | | | | | | |
| | | | | | | | |
| | FLORIDA — 0.1% | | | | | | |
| a | City of Gainesville Utilities System Revenue (SPA Truist Bank), Series B, 4.05% due 10/1/2042 (put 10/1/2024) | | | 1,350,000 | | | | 1,350,000 | |
| | NEW YORK — 0.7% | | | | | | | | |
| a | City of New York (SPA JP Morgan Chase Bank NA) GO, Series F-6, 4.05% due 6/1/2044 (put 10/1/2024) | | | 3,000,000 | | | | 3,000,000 | |
| a | New York City Municipal Water Finance Authority (New York City Water & Sewer System; SPA JP Morgan Chase Bank NA), 4.05% due 6/15/2044 (put 10/1/2024) | | | 3,700,000 | | | | 3,700,000 | |
| 232 | Annual Financial Statements | See notes to financial statements. |
Schedule of Investments, Continued
Thornburg Intermediate Municipal Fund | September 30, 2024
| | ISSUER-DESCRIPTION | | PRINCIPAL
AMOUNT | | | VALUE | |
| | | | | | | | |
| | TEXAS — 2.0% | | | | | | | | |
| a | Port of Port Arthur Navigation District (Motiva Enterprises LLC), 4.30% due 4/1/2040 (put 10/1/2024) | | $ | 20,310,000 | | | $ | 20,310,000 | |
| | TOTAL SHORT-TERM MUNICIPAL BONDS — 2.8% (Cost $28,360,000) | | | | | | | 28,360,000 | |
| | | | | | | | | | |
| | TOTAL INVESTMENTS — 98.8% (Cost $975,519,713) | | | | | | $ | 1,008,488,894 | |
| | | | | | | | | | |
| | OTHER ASSETS LESS LIABILITIES — 1.2% | | | | | | | 11,964,795 | |
| | | | | | | | | | |
| | NET ASSETS — 100.0% | | | | | | $ | 1,020,453,689 | |
Footnote Legend
| a | Variable, floating, step, or fixed to floating rate securities are securities for which interest rate changes are based on changes in a designated base rate or on a predetermined schedule. The rates shown are those in effect on September 30, 2024. |
| b | Securities exempt from registration under Rule 144A of the Securities Act of 1933, as amended. These securities are restricted but liquid and may only be resold in the ordinary course of business in transactions exempt from registration, normally to qualified institutional buyers. As of September 30, 2024, the aggregate value of these securities in the Fund’s portfolio was $2,102,985, representing 0.21% of the Fund’s net assets. |
| Portfolio Abbreviations | | |
| To simplify the listings of securities, abbreviations are used per the table below: | | |
| AGC | Insured by Assured Guaranty Corp. | HDA | Housing Development Authority |
| AGM | Insured by Assured Guaranty Municipal Corp. | HFA | Health Facilities Authority |
| AMBAC | Insured by American Municipal Bond Assurance Corp. | HFFA | Health Facilities Financing Authority |
| AMT | Alternative Minimum Tax | HUD | Insured by Housing and Urban Development |
| BAM | Insured by Build America Mutual Insurance Co. | IDA | Industrial Development Authority/Agency |
| BHAC | Insured by Berkshire Hathaway Assurance Corp. | IDB | Industrial Development Board |
| COP | Certificates of Participation | ISD | Independent School District |
| EDA | Economic Development Authority | Mtg | Mortgage |
| EDFA | Economic Development Financing Authority | NPFG | Insured by National Public Finance Guarantee Corp. |
| ETM | Escrowed to Maturity | PSF-GTD | Guaranteed by Permanent School Fund |
| FHLMC | Collateralized by Federal Home Loan Mortgage Corp. | Q-SBLF | Insured by Qualified School Bond Loan Fund |
| FNMA | Collateralized by Federal National Mortgage Association | SONYMA | State of New York Mortgage Agency |
| GNMA | Collateralized by Government National Mortgage Association | SPA | Stand-by Purchase Agreement |
| GO | General Obligation | USD | Unified School District |
| See notes to financial statements. | Annual Financial Statements | 233 |
Schedule of Investments
Thornburg Strategic Municipal Income Fund | September 30, 2024
| | ISSUER-DESCRIPTION | | PRINCIPAL
AMOUNT | | | VALUE | |
| | | | | | | | |
| | LONG-TERM MUNICIPAL BONDS — 95.3% | | | | | | | | |
| | | | | | | | | | |
| | ALABAMA — 2.0% | | | | | | | | |
| | Alabama Housing Finance Authority (TBG Southtown Senior LP) (FNMA), Series 2023-04FN Class PT, 5.23% due 10/1/2041 | | $ | 1,500,000 | | | $ | 1,652,590 | |
| | Homewood Educational Building Authority (CHF - Horizons II LLC), Series C, 5.00% due 10/1/2056 | | | 500,000 | | | | 512,969 | |
| a | Southeast Alabama Gas Supply District (Guaranty: Morgan Stanley Group), 5.00% due 6/1/2049 (put 5/1/2032) | | | 1,000,000 | | | | 1,087,390 | |
| a | Southeast Alabama Gas Supply District (Guaranty: Pacific Life Insurance Co.), Series A, 5.00% due 8/1/2054 (put 4/1/2032) | | | 1,000,000 | | | | 1,090,260 | |
| a | Southeast Energy Authority A Cooperative District, Series B, 5.00% due 1/1/2054 (put 6/1/2030) | | | 1,000,000 | | | | 1,079,700 | |
| a | Southeast Energy Authority A Cooperative District (Guaranty: Morgan Stanley Group), Series A-1, 5.50% due 1/1/2053 (put 12/1/2029) | | | 1,000,000 | | | | 1,089,020 | |
| | ARIZONA — 4.8% | | | | | | | | |
| | Arizona (Scottsdale Lincoln Hospitals) HFA, Series A, 5.00% due 12/1/2031 | | | 2,500,000 | | | | 2,508,663 | |
| | Chandler (Intel Corp.) IDA AMT, | | | | | | | | |
| a | 4.10% due 12/1/2037 (put 6/15/2028) | | | 850,000 | | | | 859,252 | |
| a | Series 2022-2, 5.00% due 9/1/2052 (put 9/1/2027) | | | 1,985,000 | | | | 2,046,223 | |
| | City of Phoenix Civic Improvement Corp. (Phoenix Airport Revenue) AMT, | | | | | | | | |
| | 5.00% due 7/1/2048 | | | 1,765,000 | | | | 1,805,662 | |
| | Series B, 5.00% due 7/1/2044 | | | 1,000,000 | | | | 1,036,666 | |
| a | Coconino County Pollution Control Corp. (Nevada Power Co.) AMT, Series A, 4.125% due 9/1/2032 (put 3/31/2026) | | | 1,065,000 | | | | 1,075,795 | |
| b | County of Pima (La Posada at Park Centre, Inc. Obligated Group) IDA, Series A, 5.75% due 11/15/2024 | | | 415,000 | | | | 415,708 | |
| | County of Pima (TMC HealthCare Obligated Group) IDA, Series A, 4.00% due 4/1/2041 | | | 1,000,000 | | | | 992,352 | |
| a | Maricopa County (Banner Health Obligated Group) IDA, Series A-3, 5.00% due 1/1/2053 (put 11/1/2030) | | | 1,000,000 | | | | 1,109,243 | |
| a | Maricopa County Pollution Control Corp. (Public Service Co. of New Mexico), Series A, 0.875% due 6/1/2043 (put 10/1/2026) | | | 3,000,000 | | | | 2,839,146 | |
| | Yavapai County (Waste Management, Inc.) IDA AMT, 1.30% due 6/1/2027 | | | 1,000,000 | | | | 924,157 | |
| | CALIFORNIA — 6.2% | | | | | | | | |
| | Benicia (Benicia High School) (AGM) USD GO, Series C, Zero Coupon due 8/1/2026 | | | 830,000 | | | | 778,236 | |
| | California (Children’s Hospital Los Angeles) HFFA, Series A, 5.00% due 8/15/2036 | | | 500,000 | | | | 518,936 | |
| | California (Community Program Developmental Disabilities) (California Mtg Insurance) HFFA, Series A, 6.25% due 2/1/2026 | | | 820,000 | | | | 822,249 | |
| a | California Community Choice Financing Authority (Guaranty: Deutsche Bank AG) (Green Bond), Series C, 5.25% due 1/1/2054 (put 10/1/2031) | | | 3,700,000 | | | | 3,997,869 | |
| a | California Community Choice Financing Authority (Guaranty: Morgan Stanley Group) (Green Bond), Series B-1, 4.00% due 2/1/2052 (put 8/1/2031) | | | 1,000,000 | | | | 1,031,296 | |
| | California Educational Facilities Authority (University of Redlands), Series A, 5.00% due 10/1/2044 | | | 500,000 | | | | 525,594 | |
| | California Municipal Finance Authority (CHF-Davis II LLC) (BAM) (Green Bond), 4.00% due 5/15/2041 | | | 500,000 | | | | 508,920 | |
| | California Municipal Finance Authority (Greenfield Commons Eah LP) (FNMA) (Green Bond), Series A, 5.28% due 9/1/2046 | | | 1,400,000 | | | | 1,622,279 | |
| b | California Pollution Control Financing Authority (Poseidon Resources (Channelside) LP Desalination Project) AMT, 5.00% due 11/21/2045 | | | 1,000,000 | | | | 1,001,185 | |
| a,b | California Pollution Control Financing Authority (Republic Services, Inc.) AMT, 4.05% due 7/1/2043 (put 2/18/2025) | | | 1,000,000 | | | | 988,602 | |
| a | California Pollution Control Financing Authority (Waste Management, Inc.) AMT, Series A, 4.25% due 11/1/2038 (put 7/2/2029) | | | 1,250,000 | | | | 1,291,176 | |
| b | California School Finance Authority, Series A, 5.00% due 10/1/2042 | | | 1,000,000 | | | | 1,041,119 | |
| | California Statewide Communities Development Authority (Methodist Hospital of Southern California Obligated Group), 5.00% due 1/1/2030 | | | 175,000 | | | | 187,195 | |
| | Calipatria (Educational Facilities) (BAM) USD GO, Series B, Zero Coupon due 8/1/2025 | | | 325,000 | | | | 314,268 | |
| | City of Long Beach Airport System Revenue (AGM) AMT, | | | | | | | | |
| | Series C, | | | | | | | | |
| | 5.00% due 6/1/2042 | | | 750,000 | | | | 816,341 | |
| | 5.25% due 6/1/2047 | | | 500,000 | | | | 544,568 | |
| | County of El Dorado (El Dorado Hills Development-Community Facilities), 5.00% due 9/1/2026 | | | 625,000 | | | | 626,023 | |
| | M-S-R Energy Authority (Guaranty: Citigroup Global Markets), Series A, 6.50% due 11/1/2039 | | | 1,245,000 | | | | 1,628,304 | |
| | Oakland (County of Alameda Educational Facilities) USD GO, Series A, 5.00% due 8/1/2035 (pre-refunded 8/1/2025) | | | 1,000,000 | | | | 1,021,343 | |
| | Union Elementary School District (Santa Clara County District Schools) (NPFG) GO, Series D, Zero Coupon due 9/1/2027 | | | 905,000 | | | | 845,010 | |
| | COLORADO — 2.9% | | | | | | | | |
| | City & County of Denver Airport System Revenue AMT, Series A, 5.00% due 11/15/2036 - 11/15/2039 | | | 1,565,000 | | | | 1,721,739 | |
| | Colorado (CommonSpirit Health Obligated Group) HFA, 5.50% due 11/1/2047 | | | 1,000,000 | | | | 1,123,747 | |
| | Colorado (Sanford Obligated Group) HFA, Series A, 5.00% due 11/1/2039 - 11/1/2044 | | | 3,015,000 | | | | 3,216,377 | |
| | Public Authority for Colorado Energy (Natural Gas Purchase; Guaranty: Merrill Lynch & Co.), 6.50% due 11/15/2038 | | | 260,000 | | | | 319,221 | |
| | Regional Transportation District (Denver Transit Partners LLC), Series A, 5.00% due 7/15/2032 | | | 1,215,000 | | | | 1,331,724 | |
| | Village Metropolitan District GO, 5.00% due 12/1/2040 | | | 1,000,000 | | | | 1,019,410 | |
| | Wild Plum Metropolitan District GO, Series A, 5.00% due 12/1/2049 (pre-refunded 12/1/2024) | | | 595,000 | | | | 614,808 | |
| | CONNECTICUT — 1.4% | | | | | | | | |
| | Connecticut Housing Finance Authority (Green Bond), Series B, 4.65% due 11/15/2048 | | | 850,000 | | | | 865,260 | |
| | State of Connecticut GO, | | | | | | | | |
| | Series A, 5.00% due 4/15/2035 | | | 2,000,000 | | | | 2,146,642 | |
| | Series E, 5.00% due 9/15/2033 | | | 1,350,000 | | | | 1,472,438 | |
| | DELAWARE — 0.7% | | | | | | | | |
| | Delaware State (ACTS Retirement-Life Communities, Inc. Obligated Group) EDA, Series B, 5.25% due 11/15/2053 | | | 1,000,000 | | | | 1,042,795 | |
| | Delaware State (Beebe Medical Center, Inc.) HFA, 4.00% due 6/1/2035 | | | 1,080,000 | | | | 1,054,682 | |
| 234 | Annual Financial Statements | See notes to financial statements. |
Schedule of Investments, Continued
Thornburg Strategic Municipal Income Fund | September 30, 2024
| | ISSUER-DESCRIPTION | | PRINCIPAL
AMOUNT | | | VALUE | |
| | | | | | | | |
| | DISTRICT OF COLUMBIA — 0.4% | | | | | | | | |
| | Metropolitan Washington Airports Authority (Dulles Toll Road) (AGC), Series B, Zero Coupon due 10/1/2027 | | $ | 1,500,000 | | | $ | 1,375,776 | |
| | FLORIDA — 6.8% | | | | | | | | |
| b | Capital Projects Finance Authority (Kissimmee Charter Academy), 6.625% due 6/15/2059 | | | 300,000 | | | | 312,762 | |
| b | Capital Trust Agency, Inc. (Southeastern University Obligated Group), Series A, 6.25% due 5/1/2048 | | | 3,000,000 | | | | 3,091,755 | |
| b | Charlotte County (Town & Country Utilities Projects) IDA AMT, 5.00% due 10/1/2029 | | | 330,000 | | | | 337,964 | |
| | City of Pompano Beach (John Knox Village of Florida, Inc. Obligated Group), | | | | | | | | |
| | 4.00% due 9/1/2040 | | | 1,000,000 | | | | 927,867 | |
| | Series A, 4.00% due 9/1/2036 | | | 500,000 | | | | 486,293 | |
| | County of Broward Airport System Revenue AMT, 5.00% due 10/1/2042 | | | 2,000,000 | | | | 2,053,806 | |
| | County of Miami-Dade Aviation Revenue AMT, | | | | | | | | |
| | Series A, 5.00% due 10/1/2035 | | | 1,840,000 | | | | 1,841,581 | |
| | Series B, 5.00% due 10/1/2040 | | | 2,000,000 | | | | 2,067,214 | |
| | County of Miami-Dade Seaport Department AMT, Series A, 5.25% due 10/1/2052 | | | 500,000 | | | | 530,817 | |
| | Florida Development Finance Corp. (Mater Academy Miami-Dade Osceola County Facilities Obligated Group), Series A, 5.00% due 6/15/2056 | | | 1,000,000 | | | | 1,006,734 | |
| b | Florida Development Finance Corp. (SFP - Tampa I LLC), Series A1, 5.25% due 6/1/2054 | | | 1,000,000 | | | | 1,044,105 | |
| | Lee County (Shell Point Obligated Group) IDA, Series B-1, 4.75% due 11/15/2029 | | | 1,500,000 | | | | 1,514,890 | |
| | Miami-Dade County School Board (District School Facilities & Infrastructure) COP, Series A, 5.00% due 8/1/2027 | | | 1,100,000 | | | | 1,101,515 | |
| | Orange County (Presbyterian Retirement Communities Inc Obligated Group) HFA, 5.00% due 8/1/2040 | | | 2,020,000 | | | | 2,041,719 | |
| | Orange County Convention Center (Tourist Development), Series A, 5.00% due 10/1/2031 | | | 1,000,000 | | | | 1,039,922 | |
| | Palm Beach County (Jupiter Medical Center Obligated Group) HFA, Series A, 5.00% due 11/1/2047 | | | 250,000 | | | | 256,149 | |
| | Palm Beach County (Lifespace Communities, Inc. Obligated Group) HFA, Series C, 7.625% due 5/15/2058 | | | 500,000 | | | | 570,471 | |
| | Volusia County Educational Facilities Authority (Embry-Riddle Aeronautical University, Inc.), Series B, 5.00% due 10/15/2030 | | | 1,500,000 | | | | 1,515,097 | |
| | GEORGIA — 4.1% | | | | | | | | |
| c | Atlanta Urban Residential Finance Authority (Flats at Stone Hogan LP) (FNMA), Series A, 4.37% due 5/1/2044 | | | 1,000,000 | | | | 999,994 | |
| | City of Atlanta (Airport Passenger Facility) (Green Bond) AMT, Series E, 5.00% due 7/1/2040 | | | 100,000 | | | | 109,322 | |
| | Main Street Natural Gas, Inc. (Guaranty: Citigroup, Inc.), | | | | | | | | |
| a | Series C, 4.00% due 5/1/2052 (put 12/1/2028) | | | 1,500,000 | | | | 1,530,525 | |
| a | Series D, 5.00% due 5/1/2054 (put 12/1/2030) | | | 1,000,000 | | | | 1,077,910 | |
| | Main Street Natural Gas, Inc. (Guaranty: Macquarie Group Ltd.), Series A, 5.00% due 5/15/2036 | | | 3,700,000 | | | | 4,147,171 | |
| | Main Street Natural Gas, Inc. (Guaranty: Royal Bank of Canada), | | | | | | | | |
| a | Series A, 4.00% due 7/1/2052 (put 9/1/2027) | | | 1,250,000 | | | | 1,270,700 | |
| a | Series E-1, 5.00% due 12/1/2053 (put 6/1/2031) | | | 3,000,000 | | | | 3,263,880 | |
| a,c | Savannah (International Paper Co.) EDA, Series A, 3.45% due 11/1/2033 (put 10/1/2031) | | | 830,000 | | | | 830,103 | |
| | ILLINOIS — 12.6% | | | | | | | | |
| | Chicago Board of Education Dedicated Capital Improvement Tax, | | | | | | | | |
| | 5.50% due 4/1/2042 | | | 500,000 | | | | 555,161 | |
| | 5.75% due 4/1/2048 | | | 1,000,000 | | | | 1,107,045 | |
| | Chicago Board of Education GO, Series A, 6.00% due 12/1/2049 | | | 1,000,000 | | | | 1,118,103 | |
| | City of Chicago (Chicago O’Hare International Airport) AMT, Series A, 5.00% due 1/1/2028 - 1/1/2042 | | | 2,000,000 | | | | 2,065,503 | |
| | City of Chicago (Midway International Airport) AMT, Series A, 5.00% due 1/1/2026 | | | 1,000,000 | | | | 1,020,853 | |
| | City of Chicago (Wastewater Transmission System), Series C, 5.00% due 1/1/2030 | | | 1,500,000 | | | | 1,506,467 | |
| | City of Chicago (Water System) (AGM), Series 2017-2, 5.00% due 11/1/2037 | | | 1,500,000 | | | | 1,573,510 | |
| | City of Chicago GO, | | | | | | | | |
| | Series A, | | | | | | | | |
| | 5.00% due 1/1/2039 | | | 1,000,000 | | | | 1,039,961 | |
| | 5.625% due 1/1/2031 | | | 500,000 | | | | 522,965 | |
| | 6.00% due 1/1/2038 | | | 3,330,000 | | | | 3,481,981 | |
| | Illinois Finance Authority (Plymouth Place Obligated Group), Series A, 6.625% due 5/15/2052 | | | 1,000,000 | | | | 1,084,698 | |
| | Illinois Finance Authority (Silver Cross Hospital & Medical Centers), Series C, 5.00% due 8/15/2035 | | | 2,355,000 | | | | 2,376,096 | |
| | Illinois Finance Authority (Washington & Jane Smith Community-Orland Park), 4.00% due 10/15/2024 - 10/15/2027 | | | 1,225,000 | | | | 1,211,400 | |
| | Illinois State Toll Highway Authority (Move Illinois Program), Series A, 5.00% due 1/1/2037 | | | 1,000,000 | | | | 1,011,610 | |
| | Illinois State University (AGM), Series A, 5.00% due 4/1/2025 - 4/1/2036 | | | 1,515,000 | | | | 1,602,963 | |
| | Metropolitan Pier & Exposition Authority, Series A, 5.00% due 6/15/2050 | | | 1,500,000 | | | | 1,570,631 | |
| | Moultrie Shelby & Coles Counties Community Unit School District No. 300 (BAM) GO, 5.00% due 12/1/2042 | | | 1,500,000 | | | | 1,569,332 | |
| | Sales Tax Securitization Corp., | | | | | | | | |
| | Series A, | | | | | | | | |
| | 4.00% due 1/1/2038 | | | 1,000,000 | | | | 1,022,013 | |
| | 5.00% due 1/1/2029 | | | 1,000,000 | | | | 1,065,579 | |
| | State of Illinois GO, | | | | | | | | |
| | 5.00% due 2/1/2039 | | | 600,000 | | | | 603,917 | |
| | 5.50% due 5/1/2039 | | | 375,000 | | | | 414,023 | |
| | 5.75% due 5/1/2045 | | | 1,600,000 | | | | 1,764,493 | |
| See notes to financial statements. | Annual Financial Statements | 235 |
Schedule of Investments, Continued
Thornburg Strategic Municipal Income Fund | September 30, 2024
| | ISSUER-DESCRIPTION | | PRINCIPAL
AMOUNT | | | VALUE | |
| | | | | | | | |
| | Series A, 5.50% due 3/1/2042 | | $ | 1,000,000 | | | $ | 1,118,772 | |
| | Series D, 5.00% due 11/1/2028 | | | 3,000,000 | | | | 3,178,209 | |
| | State of Illinois Sales Tax Revenue, Series B, 5.00% due 6/15/2032 - 6/15/2035 | | | 4,500,000 | | | | 4,777,865 | |
| | State of Illinois Sales Tax Revenue (BAM), Series B, 4.75% due 6/15/2043 | | | 2,005,000 | | | | 2,076,781 | |
| | INDIANA — 1.6% | | | | | | | | |
| | Indiana Finance Authority (Ohio Valley Electric Corp.), Series A, 4.25% due 11/1/2030 | | | 1,300,000 | | | | 1,358,483 | |
| a | Indiana Finance Authority (Republic Services, Inc.) AMT, Series A, 3.95% due 5/1/2028 (put 12/2/2024) | | | 2,400,000 | | | | 2,387,650 | |
| a | Indiana Finance Authority (Southern Indiana Gas & Electric Co.) AMT, Series B, 4.00% due 5/1/2043 (put 8/1/2028) | | | 1,500,000 | | | | 1,537,804 | |
| | IOWA — 1.5% | | | | | | | | |
| a | Iowa Finance Authority (Iowa Fertilizer Co. LLC; Guaranty: OCI NV), 5.00% due 12/1/2050 (pre-refunded 12/1/2032) | | | 2,075,000 | | | | 2,416,466 | |
| | Iowa Higher Education Loan Authority (Des Moines University Osteopathic Medical Center), 5.00% due 10/1/2047 | | | 750,000 | | | | 775,951 | |
| a | PEFA, Inc. (Guaranty: Goldman Sachs Group, Inc.), 5.00% due 9/1/2049 (put 9/1/2026) | | | 1,650,000 | | | | 1,689,128 | |
| | KANSAS — 1.1% | | | | | | | | |
| a | Kansas (AdventHealth Obligated Group) DFA, Series B, 5.00% due 11/15/2054 (put 11/15/2031) | | | 1,500,000 | | | | 1,685,502 | |
| | Unified Government of Wyandotte County/Kansas City (Utility System Improvement), Series A, 5.00% due 9/1/2031 - 9/1/2032 | | | 2,000,000 | | | | 2,002,438 | |
| | KENTUCKY — 4.6% | | | | | | | | |
| b | City of Henderson (Guaranty: Pratt Industries, Inc.) AMT, Series B, 4.45% due 1/1/2042 | | | 1,000,000 | | | | 966,931 | |
| | Kentucky (Baptist Healthcare System Obligated Group) EDFA, Series B, 5.00% due 8/15/2041 | | | 1,500,000 | | | | 1,540,956 | |
| a | Kentucky Public Energy Authority (Guaranty: BP Corp. North America, Inc.), Series B, 5.00% due 1/1/2055 (put 8/1/2032) | | | 2,000,000 | | | | 2,197,300 | |
| | Kentucky Public Energy Authority (Guaranty: Morgan Stanley Group), | | | | | | | | |
| | Series A-1, | | | | | | | | |
| a | 4.00% due 8/1/2052 (put 8/1/2030) | | | 5,500,000 | | | | 5,640,245 | |
| a | 5.25% due 4/1/2054 (put 2/1/2032) | | | 4,000,000 | | | | 4,440,272 | |
| | LOUISIANA — 1.3% | | | | | | | | |
| | City of New Orleans (Water System Facilities Improvement), 5.00% due 12/1/2034 (pre-refunded 12/1/2024) | | | 400,000 | | | | 401,373 | |
| | Louisiana Public Facilities Authority (Ochsner Clinic Foundation Obligated Group), 5.00% due 5/15/2046 | | | 3,000,000 | | | | 3,061,671 | |
| | New Orleans Aviation Board (Louis Armstrong New Orleans International Airport CFC Revenue) (AGM), 5.00% due 1/1/2029 | | | 700,000 | | | | 746,068 | |
| | MASSACHUSETTS — 0.3% | | | | | | | | |
| | Massachusetts (Jordan Hospital & Milton Hospital) DFA, Series H-1, 5.00% due 7/1/2032 - 7/1/2033 | | | 555,000 | | | | 561,684 | |
| | Massachusetts Housing Finance Agency (HUD) (Green Bond), Series C1, 5.20% due 12/1/2053 | | | 500,000 | | | | 529,713 | |
| | MICHIGAN — 5.4% | | | | | | | | |
| | City of Detroit GO (Green Bond), Series A, 5.00% due 4/1/2032 | | | 300,000 | | | | 331,463 | |
| | Detroit City School District (School Building & Site) (AGM, Q-SBLF) GO, Series A, 5.25% due 5/1/2027 | | | 1,000,000 | | | | 1,066,974 | |
| | Gerald R Ford International Airport Authority AMT, 5.00% due 1/1/2041 | | | 1,200,000 | | | | 1,298,072 | |
| | Kalamazoo Hospital Finance Authority (Bronson Methodist Hospital), Series A, 5.25% due 5/15/2041 | | | 140,000 | | | | 140,163 | |
| | Michigan Finance Authority (BHSH System Obligated Group), Series A, 4.00% due 4/15/2042 | | | 1,000,000 | | | | 1,006,842 | |
| | Michigan Finance Authority (State Department of Human Services Office Buildings), Series F, 5.00% due 4/1/2031 | | | 1,000,000 | | | | 1,001,391 | |
| | Michigan Finance Authority (Trinity Health Corp. Obligated Group), | | | | | | | | |
| | Series 2017-MI, 5.00% due 12/1/2027 | | | 165,000 | | | | 174,417 | |
| | Series A, 4.00% due 12/1/2040 | | | 1,000,000 | | | | 991,646 | |
| | Michigan HDA, Series B, 2.95% due 12/1/2039 | | | 3,000,000 | | | | 2,706,900 | |
| | Michigan HDA (Green Bond), Series A, 4.90% due 12/1/2048 | | | 1,400,000 | | | | 1,454,233 | |
| | Michigan State (HUD) HDA, Series A, 4.70% due 10/1/2054 | | | 850,000 | | | | 868,021 | |
| | Michigan State Hospital Finance Authority (Ascension Health Credit Group), Series F-4, 5.00% due 11/15/2047 | | | 2,250,000 | | | | 2,371,963 | |
| | Wayne County Airport Authority (Detroit Metropolitan Wayne County Airport), Series B, 5.00% due 12/1/2031 - 12/1/2034 | | | 2,615,000 | | | | 2,622,302 | |
| | Wayne State University (Educational Facilities & Equipment), Series A, 5.00% due 11/15/2033 | | | 1,250,000 | | | | 1,254,087 | |
| | MINNESOTA — 0.5% | | | | | | | | |
| | City of Coon Rapids (Mississippi View Housing Partners LP) (FNMA), Series M, 5.60% due 12/1/2039 | | | 996,841 | | | | 1,096,909 | |
| | Dakota County Community Development Agency (Roers Burnsville Affordable Apartments Owner LLC) (FNMA), 4.20% due 5/1/2043 | | | 650,000 | | | | 649,587 | |
| | MISSOURI — 0.4% | | | | | | | | |
| | Health & Educational Facilities Authority of the State of Missouri (Lutheran Senior Services Obligated Group), Series A, 5.25% due 2/1/2054 | | | 1,150,000 | | | | 1,223,723 | |
| | NEBRASKA — 1.1% | | | | | | | | |
| | Central Plains Energy Project (Guaranty: Goldman Sachs Group, Inc.), Series A, 5.00% due 9/1/2031 | | | 1,500,000 | | | | 1,621,329 | |
| | Douglas County Hospital Authority No. 3 (Nebraska Methodist Health System), 5.00% due 11/1/2029 - 11/1/2030 | | | 1,750,000 | | | | 1,783,417 | |
| | NEVADA — 1.2% | | | | | | | | |
| a | County of Washoe (Sierra Pacific Power Co.) AMT, Series F, 4.125% due 3/1/2036 (put 10/1/2029) | | | 750,000 | | | | 775,357 | |
| a,b | State of Nevada Department of Business & Industry (Republic Services, Inc.) AMT, Series 2001-REMK, 4.15% due 12/1/2026 (put 12/2/2024) | | | 3,200,000 | | | | 3,203,434 | |
| | NEW HAMPSHIRE — 0.1% | | | | | | | | |
| | New Hampshire Business Finance Authority (Presbyterian Homes Obligated Group), Series A, 5.25% due 7/1/2048 | | | 400,000 | | | | 426,360 | |
| 236 | Annual Financial Statements | See notes to financial statements. |
Schedule of Investments, Continued
Thornburg Strategic Municipal Income Fund | September 30, 2024
| | ISSUER-DESCRIPTION | | PRINCIPAL
AMOUNT | | | VALUE | |
| | | | | | | | |
| | NEW JERSEY — 4.7% | | | | | | | | |
| | Camden County Improvement Authority (Kipp Cooper Norcross Obligated Group) (Green Bond), 6.00% due 6/15/2052 | | $ | 1,000,000 | | | $ | 1,087,529 | |
| | New Jersey (New Jersey Transit Corp.) EDA, Series A, 5.00% due 11/1/2033 | | | 500,000 | | | | 548,559 | |
| | New Jersey (School Facilities Construction) (NPFG) EDA, Series N1, 5.50% due 9/1/2027 | | | 1,000,000 | | | | 1,081,060 | |
| | New Jersey Higher Education Student Assistance Authority AMT, | | | | | | | | |
| | Series A, 5.00% due 12/1/2033 | | | 1,000,000 | | | | 1,096,430 | |
| | Series C, 5.25% due 12/1/2054 | | | 300,000 | | | | 308,886 | |
| | New Jersey Housing & Mortgage Finance Agency (Riverview Towers Preservation LLC) (FHA, GNMA), Series B, 5.25% due 12/20/2065 | | | 1,600,000 | | | | 1,682,449 | |
| | New Jersey Transportation Trust Fund Authority, Series A, 5.00% due 12/15/2035 | | | 2,000,000 | | | | 2,137,880 | |
| | New Jersey Transportation Trust Fund Authority (State Transportation System Improvements), Series A-1, 5.00% due 6/15/2027 | | | 3,000,000 | | | | 3,105,441 | |
| | New Jersey Transportation Trust Fund Authority (Transportation Program Bonds), Series AA, 5.00% due 6/15/2038 | | | 1,500,000 | | | | 1,601,318 | |
| | New Jersey Transportation Trust Fund Authority (Transportation System), Series A, 5.00% due 12/15/2034 | | | 700,000 | | | | 752,802 | |
| | South Jersey Transportation Authority, Series A, 5.25% due 11/1/2052 | | | 1,500,000 | | | | 1,621,891 | |
| | NEW MEXICO — 1.9% | | | | | | | | |
| a | City of Farmington (Public Service Co. of New Mexico), Series D, 3.90% due 6/1/2040 (put 6/1/2028) | | | 750,000 | | | | 769,718 | |
| | City of Santa Fe (El Castillo Retirement Residences Obligated Group), | | | | | | | | |
| | 5.00% due 5/15/2034 | | | 1,465,000 | | | | 1,465,804 | |
| | Series A, 5.00% due 5/15/2049 | | | 1,450,000 | | | | 1,456,321 | |
| | New Mexico Hospital Equipment Loan Council (Haverland Carter Lifestyle Obligated Group), Series A, 5.00% due 7/1/2033 - 7/1/2034 | | | 1,070,000 | | | | 1,089,585 | |
| a | New Mexico Hospital Equipment Loan Council (Presbyterian Healthcare Services Obligated Group), Series B, 5.00% due 8/1/2049 (put 8/1/2025) | | | 1,250,000 | | | | 1,267,956 | |
| | NEW YORK — 2.5% | | | | | | | | |
| | Build NYC Resource Corp. (Kipp NYC Public Charter Schools) (Green Bond), 5.25% due 7/1/2052 | | | 1,000,000 | | | | 1,039,742 | |
| | City of New York (City Budget Financial Management) GO, Series J, 5.00% due 8/1/2031 | | | 1,500,000 | | | | 1,501,970 | |
| | Dutchess County Local Development Corp. (Tompkins Terrace Housing LP) (FNMA) (Green Bond), 5.00% due 10/1/2040 | | | 1,000,000 | | | | 1,110,976 | |
| | Metropolitan Transportation Authority (Green Bond), Series A1, 5.00% due 11/15/2030 | | | 1,045,000 | | | | 1,077,404 | |
| | New York Transportation Development Corp. (Delta Air Lines, Inc.) AMT, 6.00% due 4/1/2035 | | | 1,000,000 | | | | 1,130,078 | |
| | Port Authority of New York & New Jersey AMT, Series 186, 5.00% due 10/15/2037 | | | 500,000 | | | | 500,436 | |
| | State of New York Mortgage Agency (SONYMA) AMT (Green Bond), | | | | | | | | |
| | Series 248, | | | | | | | | |
| | 4.10% due 4/1/2032 | | | 770,000 | | | | 769,752 | |
| | 4.125% due 10/1/2032 | | | 210,000 | | | | 209,346 | |
| | 4.20% due 4/1/2033 | | | 845,000 | | | | 844,199 | |
| | NORTH CAROLINA — 1.2% | | | | | | | | |
| | Greater Asheville Regional Airport Authority (AGM) AMT, Series A, 5.25% due 7/1/2039 | | | 1,000,000 | | | | 1,102,793 | |
| | North Carolina Medical Care Commission (Vidant Health), 5.00% due 6/1/2029 (pre-refunded 6/1/2025) | | | 1,500,000 | | | | 1,521,773 | |
| | North Carolina Turnpike Authority, 5.00% due 1/1/2029 - 1/1/2030 | | | 1,000,000 | | | | 1,075,948 | |
| | OHIO — 1.6% | | | | | | | | |
| | Akron, Bath & Copley Joint Township Hospital District (Summa Health System Obligated Group), 5.25% due 11/15/2030 | | | 1,420,000 | | | | 1,475,654 | |
| | Buckeye Tobacco Settlement Financing Authority, Series B-2, 5.00% due 6/1/2055 | | | 1,000,000 | | | | 939,183 | |
| | County of Hamilton (Life Enriching Communities Obligated Group), Series A, 5.50% due 1/1/2043 | | | 500,000 | | | | 540,961 | |
| | Northeast Ohio Medical University (BAM), 5.00% due 12/1/2043 | | | 775,000 | | | | 825,554 | |
| a | Ohio Air Quality Development Authority (Ohio Valley Electric Corp.), Series B, 1.375% due 2/1/2026 (put 11/1/2024) | | | 200,000 | | | | 199,491 | |
| | Ohio Higher Educational Facility Commission (Ashtabula County Medical Center Obligated Group), 5.25% due 1/1/2038 | | | 1,105,000 | | | | 1,219,712 | |
| | OREGON — 0.7% | | | | | | | | |
| a | Oregon Health & Science University (Oregon Health & Science University Obligated Group), Series B2, 5.00% due 7/1/2046 (put 2/1/2032) | | | 1,900,000 | | | | 2,132,400 | |
| | PENNSYLVANIA — 4.3% | | | | | | | | |
| | City of Philadelphia (Pennsylvania Gas Works), Series 15, 5.00% due 8/1/2047 | | | 1,000,000 | | | | 1,024,650 | |
| | City of Philadelphia Airport Revenue AMT, Series B, 5.00% due 7/1/2042 | | | 1,000,000 | | | | 1,023,201 | |
| | City of Philadelphia Municipal Authority (Juvenile Justice Services Center), 5.00% due 4/1/2038 | | | 1,360,000 | | | | 1,407,261 | |
| | Commonwealth Financing Authority, 5.00% due 6/1/2029 | | | 1,000,000 | | | | 1,074,309 | |
| | County of Luzerne (AGM) GO, Series A, 5.00% due 11/15/2029 | | | 1,000,000 | | | | 1,022,229 | |
| a | Montgomery County (Constellation Energy Generation LLC) IDA AMT, Series C, 4.45% due 10/1/2034 (put 4/3/2028) | | | 500,000 | | | | 510,873 | |
| | Northeastern Pennsylvania Hospital & Education Authority (King’s College), 5.00% due 5/1/2030 - 5/1/2031 | | | 2,230,000 | | | | 2,356,064 | |
| | Pennsylvania (Pennsylvania Department of Transportation) EDFA AMT, 5.75% due 6/30/2048 | | | 1,000,000 | | | | 1,103,904 | |
| | Pennsylvania (Presbyterian Homes Obligated Group) EDFA, 4.00% due 7/1/2033 - 7/1/2046 | | | 2,800,000 | | | | 2,770,048 | |
| a | Pennsylvania (Waste Management Obligated Group; Guaranty: Waste Management, Inc.) EDFA, 0.95% due 12/1/2033 (put 12/1/2026) | | | 1,500,000 | | | | 1,422,102 | |
| | School District of Philadelphia (State Aid Withholding) GO, Series A, 5.00% due 9/1/2038 | | | 100,000 | | | | 105,495 | |
| | SOUTH CAROLINA — 2.5% | | | | | | | | |
| a | Patriots Energy Group Financing Agency (Guaranty: Royal Bank of Canada), Series B-1, 5.25% due 2/1/2054 (put 3/1/2031) | | | 1,350,000 | | | | 1,483,178 | |
| a | Patriots Energy Group Financing Agency (Guaranty: Sumitomo Mitsui Banking Corp.), Series A1, 5.25% due 10/1/2054 (put 8/1/2031) | | | 5,000,000 | | | | 5,440,065 | |
| a | South Carolina Jobs-EDA (Guaranty: International Paper Co.) AMT, Series A, 4.00% due 4/1/2033 (put 4/1/2026) | | | 1,000,000 | | | | 1,008,564 | |
| See notes to financial statements. | Annual Financial Statements | 237 |
Schedule of Investments, Continued
Thornburg Strategic Municipal Income Fund | September 30, 2024
| | ISSUER-DESCRIPTION | | PRINCIPAL
AMOUNT | | | VALUE | |
| | | | | | | | |
| | TENNESSEE — 0.8% | | | | | | | | |
| | Shelby County Health Educational & Housing Facility Board (Methodist Le Bonheur Healthcare), Series A, 5.00% due 5/1/2036 | | $ | 1,000,000 | | | $ | 1,035,535 | |
| a | Tennessee Energy Acquisition Corp. (Tennessee Energy Acquisition Corp.; Guaranty: Goldman Sachs Group, Inc.), Series A, 5.00% due 5/1/2052 (put 11/1/2031) | | | 1,500,000 | | | | 1,631,495 | |
| | TEXAS — 7.0% | | | | | | | | |
| | City of Aubrey Jackson Ridge Public Improvement District (BAM), 5.00% due 9/1/2045 | | | 1,000,000 | | | | 1,060,975 | |
| | City of Austin Airport System Revenue AMT, 5.00% due 11/15/2038 | | | 2,000,000 | | | | 2,177,260 | |
| | City of Dallas (Public Improvements) GO, 5.00% due 2/15/2031 | | | 1,930,000 | | | | 1,943,608 | |
| | City of Houston Airport System Revenue AMT, Series A, 4.00% due 7/1/2040 | | | 1,500,000 | | | | 1,505,751 | |
| | Greater Texas Cultural Education Facilities Finance Corp. (Fort County Bend), Series A, 4.00% due 3/1/2040 - 3/1/2041 | | | 2,000,000 | | | | 2,043,713 | |
| | Harris County Cultural Education Facilities Finance Corp. (Memorial Hermann Health System Obligated Group), Series A, 5.00% due 7/1/2052 | | | 1,500,000 | | | | 1,598,763 | |
| | Matagorda County Navigation District No. 1 (AEP Texas, Inc.) AMT, 4.25% due 5/1/2030 | | | 1,350,000 | | | | 1,396,884 | |
| a | Mission Economic Development Corp. (Republic Services, Inc.) AMT, 4.25% due 1/1/2026 (put 11/1/2024) | | | 1,000,000 | | | | 999,484 | |
| | Newark Higher Education Finance Corp. (Hughen Center, Inc.) (PSF-GTD), Series A, 5.00% due 8/15/2052 | | | 500,000 | | | | 530,409 | |
| | Tarrant County Cultural Education Facilities Finance Corp. (Cumberland Rest, Inc. Obligated Group), 5.00% due 10/1/2049 | | | 1,000,000 | | | | 1,054,532 | |
| | Texas Municipal Gas Acquisition & Supply Corp. III (Guaranty: Macquarie Group Ltd.), 5.00% due 12/15/2029 | | | 1,435,000 | | | | 1,537,394 | |
| a | Texas Municipal Gas Acquisition & Supply Corp. IV (Guaranty: BP plc), Series B, 5.50% due 1/1/2054 (put 1/1/2034) | | | 2,000,000 | | | | 2,274,880 | |
| | Texas Private Activity Bond Surface Transportation Corp. (NTE Mobility Partners LLC) AMT, 5.50% due 12/31/2058 | | | 850,000 | | | | 925,345 | |
| | Texas State Technical College (AGM), Series A, 5.75% due 8/1/2047 | | | 545,000 | | | | 617,831 | |
| | Texas Transportation Commission (Central Texas Turnpike System), Series C, 5.00% due 8/15/2034 | | | 3,000,000 | | | | 3,005,466 | |
| | U. S. VIRGIN ISLANDS — 0.2% | | | | | | | | |
| | Matching Fund Special Purpose Securitization Corp., Series A, 5.00% due 10/1/2025 | | | 500,000 | | | | 507,368 | |
| | UTAH — 1.0% | | | | | | | | |
| b | Black Desert Public Infrastructure District (Black Desert Assessment Area No. 1), 5.625% due 12/1/2053 | | | 1,000,000 | | | | 1,037,102 | |
| b | Utah Charter School Finance Authority (Freedom Academy Foundation), Series A, 5.00% due 6/15/2041 | | | 900,000 | | | | 854,868 | |
| | Utah Charter School Finance Authority (Summit Academy, Inc.), Series A, 5.00% due 4/15/2039 - 4/15/2049 | | | 1,200,000 | | | | 1,239,595 | |
| | VIRGINIA — 1.2% | | | | | | | | |
| | Virginia Beach Development Authority (Westminster-Canterbury on Chesapeake Bay Obligated Group), Series A, 7.00% due 9/1/2053 | | | 1,000,000 | | | | 1,155,618 | |
| | Virginia HDA, | | | | | | | | |
| | Series C, 4.70% due 7/1/2043 | | | 1,205,000 | | | | 1,247,453 | |
| | Series D, 4.70% due 8/1/2048 | | | 1,500,000 | | | | 1,544,784 | |
| | WASHINGTON — 1.3% | | | | | | | | |
| | Washington Health Care Facilities Authority (CommonSpirit Health Obligated Group), Series A2, 5.00% due 8/1/2044 | | | 1,000,000 | | | | 1,042,772 | |
| | Washington State Housing Finance Commission (Camas Flats Oak Harbor 1 LLLP) (FNMA), Series A FN, 4.55% due 8/1/2043 | | | 1,000,000 | | | | 1,018,299 | |
| | Washington State Housing Finance Commission (Eastside Retirement Association Obligated Group), Series A, 5.00% due 7/1/2048 | | | 1,000,000 | | | | 1,047,428 | |
| b | Washington State Housing Finance Commission (Seattle Academy of Arts & Sciences), 6.125% due 7/1/2053 | | | 900,000 | | | | 994,520 | |
| | WEST VIRGINIA — 0.5% | | | | | | | | |
| a | West Virginia (Kentucky Power Co.) EDA AMT, Series 2014-A, 4.70% due 4/1/2036 (put 6/17/2026) | | | 1,720,000 | | | | 1,756,056 | |
| | WISCONSIN — 2.9% | | | | | | | | |
| a | Public Finance Authority (Duke Energy Progress LLC) AMT, Series B, 4.00% due 10/1/2046 (put 10/1/2030) | | | 1,000,000 | | | | 1,052,542 | |
| | Public Finance Authority (National Senior Communities Obligated Group), 4.00% due 1/1/2026 - 1/1/2032 | | | 2,270,000 | | | | 2,284,048 | |
| | Public Finance Authority (Texas Biomedical Research Institute), Series A, 4.00% due 6/1/2039 | | | 245,000 | | | | 245,109 | |
| | Public Finance Authority (United Methodist Retirement Homes, Inc. Obligated Group), Series A, 4.00% due 10/1/2035 - 10/1/2046 | | | 3,145,000 | | | | 2,999,780 | |
| | Wisconsin Health & Educational Facilities Authority (HOPE Christian Schools Obligated Group), 4.00% due 12/1/2051 | | | 1,700,000 | | | | 1,259,688 | |
| | Wisconsin Housing & EDA Housing Revenue (HUD), Series D, 4.85% due 11/1/2048 | | | 1,500,000 | | | | 1,556,570 | |
| | TOTAL LONG-TERM MUNICIPAL BONDS — 95.3% (Cost $294,753,068) | | | | | | | 307,184,219 | |
| | | | | | | | | | |
| | SHORT-TERM MUNICIPAL BONDS — 3.7% | | | | | | | | |
| | | | | | | | | | |
| | ARIZONA — 0.3% | | | | | | |
| a | Arizona (Banner Health Obligated Group; LOC Bank of America NA) HFA, Series C-RMK, 4.05% due 1/1/2046 (put 10/1/2024) | | | 1,000,000 | | | | 1,000,000 | |
| | FLORIDA — 0.4% | | | | | | | | |
| a | City of Gainesville Utilities System Revenue (SPA Truist Bank), Series B, 4.05% due 10/1/2042 (put 10/1/2024) | | | 1,250,000 | | | | 1,250,000 | |
| | NEW YORK — 1.0% | | | | | | | | |
| a | City of New York (SPA JP Morgan Chase Bank NA) GO, Series F-6, 4.05% due 6/1/2044 (put 10/1/2024) | | | 275,000 | | | | 275,000 | |
| | New York City Municipal Water Finance Authority (New York City Water & Sewer System; SPA JP Morgan Chase Bank NA), | | | | | | | | |
| a | 4.05% due 6/15/2043 (put 10/1/2024) | | | 900,000 | | | | 900,000 | |
| a | Series AA-1, 4.05% due 6/15/2050 (put 10/1/2024) | | | 2,070,000 | | | | 2,070,000 | |
| 238 | Annual Financial Statements | See notes to financial statements. |
Schedule of Investments, Continued
Thornburg Strategic Municipal Income Fund | September 30, 2024
| | ISSUER-DESCRIPTION | | PRINCIPAL
AMOUNT | | | VALUE | |
| | | | | | | | |
| | TEXAS — 2.0% | | | | | | | | |
| a | Port of Port Arthur Navigation District (Motiva Enterprises LLC), 4.30% due 4/1/2040 (put 10/1/2024) | | $ | 6,350,000 | | | $ | 6,350,000 | |
| | TOTAL SHORT-TERM MUNICIPAL BONDS — 3.7% (Cost $11,845,000) | | | | | | | 11,845,000 | |
| | | | | | | | | | |
| | TOTAL INVESTMENTS — 99.0% (Cost $306,598,068) | | | | | | $ | 319,029,219 | |
| | | | | | | | | | |
| | OTHER ASSETS LESS LIABILITIES — 1.0% | | | | | | | 3,232,559 | |
| | | | | | | | | | |
| | NET ASSETS — 100.0% | | | | | | $ | 322,261,778 | |
Footnote Legend
| a | Variable, floating, step, or fixed to floating rate securities are securities for which interest rate changes are based on changes in a designated base rate or on a predetermined schedule. The rates shown are those in effect on September 30, 2024. |
| b | Securities exempt from registration under Rule 144A of the Securities Act of 1933, as amended. These securities are restricted but liquid and may only be resold in the ordinary course of business in transactions exempt from registration, normally to qualified institutional buyers. As of September 30, 2024, the aggregate value of these securities in the Fund’s portfolio was $15,290,055, representing 4.74% of the Fund’s net assets. |
| Portfolio Abbreviations | | |
| To simplify the listings of securities, abbreviations are used per the table below: | | |
| AGC | Insured by Assured Guaranty Corp. | HFA | Health Facilities Authority |
| AGM | Insured by Assured Guaranty Municipal Corp. | HFFA | Health Facilities Financing Authority |
| AMT | Alternative Minimum Tax | HUD | Insured by Housing and Urban Development |
| BAM | Insured by Build America Mutual Insurance Co. | IDA | Industrial Development Authority/Agency |
| COP | Certificates of Participation | LOC | Letter of Credit |
| DFA | Development Finance Authority/Agency | Mtg | Mortgage |
| EDA | Economic Development Authority | NPFG | Insured by National Public Finance Guarantee Corp. |
| EDFA | Economic Development Financing Authority | PSF-GTD | Guaranteed by Permanent School Fund |
| FHA | Insured by Federal Housing Administration | Q-SBLF | Insured by Qualified School Bond Loan Fund |
| FNMA | Collateralized by Federal National Mortgage Association | SONYMA | State of New York Mortgage Agency |
| GNMA | Collateralized by Government National Mortgage Association | SPA | Stand-by Purchase Agreement |
| GO | General Obligation | USD | Unified School District |
| HDA | Housing Development Authority | | |
| See notes to financial statements. | Annual Financial Statements | 239 |
Schedule of Investments
Thornburg California Limited Term Municipal Fund | September 30, 2024
| | ISSUER-DESCRIPTION | | PRINCIPAL
AMOUNT | | | VALUE | |
| | LONG-TERM MUNICIPAL BONDS — 96.1% | | | | | | | | |
| a | Antonio B Won Pat International Airport Authority AMT, Series A, 5.00% due 10/1/2031 - 10/1/2032 | | $ | 700,000 | | | $ | 751,351 | |
| | Apple Valley Public Financing Authority (BAM), Series A, 4.00% due 6/1/2028 | | | 460,000 | | | | 482,293 | |
| | Bay Area Toll Authority (San Francisco Bay Area Toll Bridge), | | | | | | | | |
| b | Series A, 2.95% due 4/1/2047 (put 4/1/2026) | | | 5,465,000 | | | | 5,452,709 | |
| b | Series E, 3.56% (MUNIPSA + 0.41%) due 4/1/2056 (put 4/1/2028) | | | 1,000,000 | | | | 986,247 | |
| | Burbank-Glendale-Pasadena Airport Authority Brick Campaign AMT, Series B, 5.00% due 7/1/2034 | | | 1,000,000 | | | | 1,134,133 | |
| | California (Cedars-Sinai Medical Center Obligated Group) HFFA, Series A, 5.00% due 8/15/2033 | | | 1,000,000 | | | | 1,042,451 | |
| | California (Children’s Hospital Los Angeles) HFFA, Series A, 5.00% due 8/15/2033 | | | 770,000 | | | | 804,856 | |
| | California (Episcopal Communities & Services for Seniors Obligated Group) HFFA, Series A, 3.85% due 11/15/2027 | | | 1,500,000 | | | | 1,508,068 | |
| b | California (Kaiser Foundation Hospitals) HFFA, Series C, 5.00% due 6/1/2041 (put 11/1/2029) | | | 4,075,000 | | | | 4,559,302 | |
| b | California (Providence St. Joseph Health Obligated Group) HFFA, Series B, 5.00% due 10/1/2039 (put 10/1/2027) | | | 460,000 | | | | 484,034 | |
| | California (Stanford Health Care Obligated Group) HFFA, | | | | | | | | |
| | Series A, | | | | | | | | |
| b | 3.00% due 8/15/2054 (put 8/15/2025) | | | 3,000,000 | | | | 3,006,252 | |
| | 5.00% due 8/15/2033 | | | 1,500,000 | | | | 1,790,239 | |
| b | California Community Choice Financing Authority (Guaranty: Deutsche Bank AG) (Green Bond), Series C, 5.25% due 1/1/2054 (put 10/1/2031) | | | 5,000,000 | | | | 5,402,525 | |
| | California Community Choice Financing Authority (Guaranty: Goldman Sachs Group, Inc.) (Green Bond), | | | | | | | | |
| b | Series A, 4.00% due 10/1/2052 (put 12/1/2027) | | | 2,440,000 | | | | 2,489,776 | |
| b | Series A-1, 5.00% due 12/1/2053 (put 8/1/2029) | | | 500,000 | | | | 535,069 | |
| b | Series G, 5.25% due 11/1/2054 (put 4/1/2030) | | | 3,000,000 | | | | 3,271,755 | |
| | California Community Choice Financing Authority (Guaranty: Morgan Stanley Group) (Green Bond), | | | | | | | | |
| b | Series B-1, 4.00% due 2/1/2052 (put 8/1/2031) | | | 4,500,000 | | | | 4,640,832 | |
| b | Series E-1, 5.00% due 2/1/2054 (put 3/1/2031) | | | 7,000,000 | | | | 7,606,620 | |
| | California Educational Facilities Authority (Art Center College of Design), Series A, 5.00% due 12/1/2033 | | | 375,000 | | | | 411,266 | |
| b | California Housing Finance Agency (Del Sur Family Housing LP), Series V, 5.00% due 5/1/2054 (put 11/1/2026) | | | 3,875,000 | | | | 4,045,260 | |
| b | California Housing Finance Agency (FHA) (Green Bond), Series A-2, 3.60% due 8/1/2063 (put 8/1/2026) | | | 2,500,000 | | | | 2,512,522 | |
| b | California Infrastructure & Economic Development Bank (J Paul Getty Trust), Series B-2, 3.00% due 10/1/2047 (put 10/1/2026) | | | 1,420,000 | | | | 1,421,451 | |
| | California Municipal Finance Authority (Aldersly) (California Mtg Insurance), | | | | | | | | |
| | Series B-1, 4.00% due 11/15/2028 | | | 595,000 | | | | 595,441 | |
| | Series B-2, 3.75% due 11/15/2028 | | | 2,990,000 | | | | 2,992,649 | |
| | California Municipal Finance Authority (Ararat Home of Los Angeles, Inc.) (California Mtg Insurance), 5.00% due 5/15/2033 - 5/15/2034 | | | 200,000 | | | | 221,202 | |
| | California Municipal Finance Authority (Biola University), 5.00% due 10/1/2027 | | | 430,000 | | | | 452,499 | |
| | California Municipal Finance Authority (Caritas Corp. CMFA Mobile Home Park Financing 2024 Portfolio) (Green Bond), Series A, 5.00% due 8/15/2032 - 8/15/2034 | | | 835,000 | | | | 954,755 | |
| | California Municipal Finance Authority (CHF-Davis II LLC) (BAM), 5.00% due 5/15/2028 | | | 2,100,000 | | | | 2,256,559 | |
| | California Municipal Finance Authority (CHF-Davis II LLC) (BAM) (Green Bond), | | | | | | | | |
| | 4.00% due 5/15/2032 | | | 600,000 | | | | 640,648 | |
| | 5.00% due 5/15/2025 - 5/15/2031 | | | 2,295,000 | | | | 2,501,019 | |
| | California Municipal Finance Authority (Congregational Homes, Inc. Obligated Group), Series B-1, 2.75% due 11/15/2027 | | | 405,000 | | | | 405,040 | |
| | California Municipal Finance Authority (Palomar Health Obligated Group) (AGM) COP, Series A, 5.00% due 11/1/2027 - 11/1/2032 | | | 500,000 | | | | 556,837 | |
| | California Municipal Finance Authority (Republic Services, Inc.) AMT, | | | | | | | | |
| | Series A, | | | | | | | | |
| b | 3.875% due 3/1/2054 (put 3/1/2034) | | | 2,000,000 | | | | 2,055,794 | |
| b | 4.375% due 9/1/2053 (put 9/1/2033) | | | 3,000,000 | | | | 3,144,252 | |
| b | Series B, 4.15% due 7/1/2051 (put 1/15/2025) | | | 3,000,000 | | | | 3,010,008 | |
| b | California Municipal Finance Authority (Roseville Affordable LP), Series B, 3.75% due 6/1/2028 (put 6/1/2027) | | | 1,000,000 | | | | 1,018,656 | |
| | California Municipal Finance Authority (Waste Management, Inc.; Guaranty: Waste Management Holdings) AMT, | | | | | | | | |
| b | 3.95% due 10/1/2045 (put 12/2/2024) | | | 2,000,000 | | | | 1,999,086 | |
| b | Series A, 4.125% due 10/1/2041 (put 10/1/2025) | | | 750,000 | | | | 753,805 | |
| b | Series B, 4.80% due 11/1/2041 (put 6/2/2025) | | | 1,000,000 | | | | 1,005,496 | |
| | California Pollution Control Financing Authority (Guaranty: Waste Management, Inc.) AMT, Series A1, 3.375% due 7/1/2025 | | | 2,750,000 | | | | 2,745,438 | |
| b,c | California Pollution Control Financing Authority (Republic Services, Inc.) AMT, 4.05% due 7/1/2043 (put 2/18/2025) | | | 3,000,000 | | | | 2,965,806 | |
| b | California Pollution Control Financing Authority (Waste Management, Inc.) AMT, Series A, 4.25% due 11/1/2038 (put 7/2/2029) | | | 3,000,000 | | | | 3,098,823 | |
| | California State Public Works Board, | | | | | | | | |
| | Series C, 5.00% due 9/1/2033 | | | 1,500,000 | | | | 1,776,505 | |
| | Series D, 4.00% due 4/1/2033 | | | 1,045,000 | | | | 1,068,492 | |
| b | California State University, Series B-3, 3.125% due 11/1/2051 (put 11/1/2026) | | | 4,200,000 | | | | 4,220,807 | |
| | California Statewide Communities Development Authority (CHF-Irvine LLC), 5.00% due 5/15/2027 | | | 500,000 | | | | 514,473 | |
| | California Statewide Communities Development Authority (CHF-Irvine LLC) (BAM), 5.00% due 5/15/2030 - 5/15/2032 | | | 4,420,000 | | | | 4,979,729 | |
| b | California Statewide Communities Development Authority (Kaiser Foundation Hospitals), Series 2004-M-R, 5.00% due 4/1/2038 (put 11/1/2029) | | | 4,815,000 | | | | 5,387,479 | |
| | California Statewide Communities Development Authority (Methodist Hospital of Southern California Obligated Group), 5.00% due 1/1/2031 | | | 200,000 | | | | 213,924 | |
| 240 | Annual Financial Statements | See notes to financial statements. |
Schedule of Investments, Continued
Thornburg California Limited Term Municipal Fund | September 30, 2024
| | ISSUER-DESCRIPTION | | PRINCIPAL
AMOUNT | | | VALUE | |
| | California Statewide Communities Development Authority (Odd Fellows Home of California) (California Mtg Insurance), Series A, 5.00% due 4/1/2026 - 4/1/2033 | | $ | 2,345,000 | | | $ | 2,576,871 | |
| | California Statewide Communities Development Authority (Southern California Edison Co.), | | | | | | | | |
| | Series A, 1.75% due 9/1/2029 | | | 2,500,000 | | | | 2,237,090 | |
| | Series D, 4.50% due 11/1/2033 | | | 3,500,000 | | | | 3,800,377 | |
| b | California Statewide Communities Development Authority (Vintage at Folsom LP), Series E, 5.00% due 10/1/2028 (put 10/1/2027) | | | 650,000 | | | | 696,563 | |
| | Calipatria (Educational Facilities) (BAM) USD GO, Series B, Zero Coupon due 8/1/2025 | | | 665,000 | | | | 643,041 | |
| | Cathedral City Redevelopment Successor Agency (Merged Redevelopment Area) (BAM), Series A, 5.00% due 8/1/2029 - 8/1/2034 | | | 2,090,000 | | | | 2,380,897 | |
| | Chino Basin Regional Financing Authority, Series B, 4.00% due 11/1/2025 | | | 650,000 | | | | 657,662 | |
| | City of Chula Vista (Police Facility Project) COP, 5.00% due 10/1/2024 | | | 1,700,000 | | | | 1,700,112 | |
| | City of Chula Vista Redevelopment Successor Agency (AGM), 5.00% due 10/1/2032 | | | 1,070,000 | | | | 1,112,844 | |
| | City of Colton Redevelopment Successor Agency (Multiple Redevelopment Project Areas) (BAM), 5.00% due 8/1/2025 | | | 950,000 | | | | 968,284 | |
| | City of Fresno (Fresno Airport Revenue) (BAM) AMT, Series A, 5.00% due 7/1/2030 - 7/1/2033 | | | 3,255,000 | | | | 3,626,549 | |
| | City of Los Angeles Department of Airports AMT, | | | | | | | | |
| | Series B, 5.00% due 5/15/2030 - 5/15/2032 | | | 4,600,000 | | | | 4,851,435 | |
| | Series C, 5.00% due 5/15/2031 | | | 400,000 | | | | 426,314 | |
| | Series D, 5.00% due 5/15/2033 | | | 5,435,000 | | | | 6,009,012 | |
| b | City of San Jose (Allied 1510 Parkmoor LP) (HUD), Series F-2, 5.00% due 6/1/2027 (put 6/1/2026) | | | 2,000,000 | | | | 2,071,748 | |
| | City of San Mateo (San Mateo Community Facilities District No. 2008-1) (BAM), 5.00% due 9/1/2027 - 9/1/2032 | | | 3,915,000 | | | | 4,361,063 | |
| | City of Stockton Redevelopment Successor Agency (Redevelopment of Midtown, North & South Stockton & Waterfront Areas) (AGM), Series A, 5.00% due 9/1/2025 | | | 1,155,000 | | | | 1,177,981 | |
| | City of Victorville Electric Revenue, Series A, 5.00% due 5/1/2028 - 5/1/2032 | | | 1,090,000 | | | | 1,239,873 | |
| | Commerce CDC Successor Agency (Multiple Redevelopment Project Areas) (AGM), Series A, 5.00% due 8/1/2027 | | | 1,760,000 | | | | 1,827,887 | |
| | County of Sacramento CA Airport System Revenue AMT, Series C, 5.00% due 7/1/2027 | | | 1,925,000 | | | | 2,037,260 | |
| | Elk Grove Finance Authority (Poppy Ridge CFD No. 2003-1 & East Franklin CFD No. 2002-1), 5.00% due 9/1/2025 | | | 750,000 | | | | 763,333 | |
| | Fremont Union High School District GO, 5.00% due 8/1/2025 | | | 500,000 | | | | 511,179 | |
| | Guam Power Authority (Electric Power System), Series A, 5.00% due 10/1/2027 | | | 1,230,000 | | | | 1,306,337 | |
| | Guam Waterworks Authority (Water & Wastewater System), 5.00% due 7/1/2025 - 7/1/2027 | | | 1,225,000 | | | | 1,258,319 | |
| | Hacienda La Puente (Educational Facilities) (AGM) USD COP, Series C, 5.00% due 6/1/2025 | | | 1,300,000 | | | | 1,320,002 | |
| | Hesperia Community Redevelopment Successor Agency (AGM), Series A, 5.00% due 9/1/2030 | | | 500,000 | | | | 542,869 | |
| | Indian Wells Redevelopment Successor Agency (NPFG), Series A, 5.00% due 9/1/2029 | | | 500,000 | | | | 518,538 | |
| | Indio Finance Authority (BAM), Series A, 5.00% due 11/1/2028 - 11/1/2032 | | | 1,815,000 | | | | 2,051,821 | |
| | Jurupa Public Financing Authority (AGM), 5.00% due 9/1/2030 - 9/1/2033 | | | 3,785,000 | | | | 4,425,257 | |
| | Lammersville Joint (BAM) USD, 5.00% due 9/1/2028 - 9/1/2032 | | | 4,905,000 | | | | 5,566,502 | |
| | Lodi Public Financing Authority (Lodi Electric System Revenue) (AGM), 5.00% due 9/1/2031 | | | 1,405,000 | | | | 1,531,800 | |
| | Los Angeles Community College District GO, 5.00% due 8/1/2026 - 8/1/2034 | | | 6,000,000 | | | | 6,817,308 | |
| b | Los Angeles County Development Authority (2111 Firestone LP) (HUD), Series E, 5.00% due 7/1/2043 (put 7/1/2026) | | | 2,605,000 | | | | 2,689,592 | |
| b | Los Angeles County Development Authority (Century Wlava 2 LP) (HUD), Series C, 3.75% due 12/1/2046 (put 12/1/2026) | | | 2,500,000 | | | | 2,502,067 | |
| b | Los Angeles County Development Authority (VA Building 402 LP) (HUD), Series F, 3.375% due 1/1/2046 (put 7/1/2026) | | | 3,980,000 | | | | 4,000,497 | |
| | Los Angeles Department of Water & Power, | | | | | | | | |
| | Series A, 5.00% due 7/1/2033 - 7/1/2034 | | | 2,500,000 | | | | 2,512,266 | |
| | Series B, 5.00% due 7/1/2033 | | | 1,050,000 | | | | 1,106,154 | |
| | Los Angeles Housing Authority (FNMA), Series A, 3.75% due 4/1/2034 | | | 3,000,000 | | | | 3,044,418 | |
| | Los Angeles USD (Green Bond) COP, Series A, 5.00% due 10/1/2033 | | | 3,000,000 | | | | 3,560,934 | |
| | Los Angeles USD GO, Series A, 5.00% due 7/1/2034 | | | 500,000 | | | | 605,010 | |
| | Moreno Valley Public Financing Authority (Public Improvements) ETM, 5.00% due 11/1/2024 | | | 1,455,000 | | | | 1,457,772 | |
| | Municipal Improvement Corp. (Los Angeles), Series B, 4.00% due 11/1/2033 | | | 1,225,000 | | | | 1,257,230 | |
| | Norman Y Mineta San Jose International Airport SJC AMT, Series A, 5.00% due 3/1/2025 - 3/1/2028 | | | 2,575,000 | | | | 2,633,627 | |
| b | Northern California Energy Authority (Guaranty: Paclife Life Insurance Co.), Series A-1, 5.00% due 12/1/2054 (put 8/1/2030) | | | 1,000,000 | | | | 1,080,588 | |
| | Oakland (County of Alameda Educational Facilities) USD GO, Series A, 5.00% due 8/1/2025 | | | 1,300,000 | | | | 1,326,848 | |
| | Peralta Community College District GO, 5.00% due 8/1/2031 - 8/1/2033 | | | 2,065,000 | | | | 2,398,519 | |
| | Pittsburg Redevelopment Successor Agency (AGM), Series A, 5.00% due 9/1/2026 - 9/1/2029 | | | 1,535,000 | | | | 1,597,481 | |
| | Port of Los Angeles AMT, Series A-1, 5.00% due 8/1/2033 - 8/1/2034 | | | 1,450,000 | | | | 1,651,490 | |
| | Poway Redevelopment Successor Agency (Paguay Redevelopment Project), Series A, 5.00% due 6/15/2025 | | | 4,665,000 | | | | 4,738,604 | |
| | Rancho Santa Fe Community Services District Financing Authority, Series A, 5.00% due 9/1/2025 | | | 1,745,000 | | | | 1,783,517 | |
| | Riverside County Public Financing Authority (Capital Facilities Project) ETM, 5.00% due 11/1/2025 | | | 1,000,000 | | | | 1,028,776 | |
| | Riverside County Public Financing Authority (Redevelopment Project Area No. 1) (AGM), Series A, 5.00% due 10/1/2033 - 10/1/2034 | | | 1,600,000 | | | | 1,896,102 | |
| | Riverside County Redevelopment Successor Agency (AGM), Series B, 5.00% due 10/1/2030 | | | 500,000 | | | | 509,954 | |
| | Riverside County Redevelopment Successor Agency (BAM), Series B, 5.00% due 10/1/2030 | | | 750,000 | | | | 764,947 | |
| | Rosemead CDC Successor Agency (Rosemead Merged Project Area) (BAM), 5.00% due 10/1/2024 - 10/1/2026 | | | 1,770,000 | | | | 1,813,912 | |
| | Sacramento City Schools Joint Power Financing Authority (Sacramento City USD Educational Facility Sublease) (BAM), Series A, 5.00% due 3/1/2025 | | | 2,175,000 | | | | 2,177,279 | |
| b | Sacramento Municipal Utility District, Series B, 5.00% due 8/15/2049 (put 10/15/2025) | | | 1,270,000 | | | | 1,284,194 | |
| | San Diego County Regional Airport Authority, Series A, 5.00% due 7/1/2033 | | | 500,000 | | | | 553,724 | |
| See notes to financial statements. | Annual Financial Statements | 241 |
Schedule of Investments, Continued
Thornburg California Limited Term Municipal Fund | September 30, 2024
| | ISSUER-DESCRIPTION | | PRINCIPAL
AMOUNT | | | VALUE | |
| | San Diego County Regional Airport Authority AMT, | | | | | | | | |
| | Series B, 5.00% due 7/1/2030 - 7/1/2033 | | $ | 5,380,000 | | | $ | 5,969,821 | |
| | Series C, 5.00% due 7/1/2031 - 7/1/2033 | | | 2,560,000 | | | | 2,788,709 | |
| | San Francisco City & County Airport Comm-San Francisco International Airport AMT, Series A, 5.00% due 5/1/2032 - 5/1/2034 | | | 5,000,000 | | | | 5,553,687 | |
| | San Francisco Community College District (BAM) GO, Series B, 5.00% due 6/15/2033 - 6/15/2034 | | | 1,150,000 | | | | 1,357,156 | |
| | San Marcos Redevelopment Successor Agency, Series A, 5.00% due 10/1/2033 | | | 1,000,000 | | | | 1,018,375 | |
| | San Mateo County Transit District Sales Tax Revenue, Series A, 5.00% due 6/1/2029 | | | 1,000,000 | | | | 1,015,504 | |
| | Santa Clara County Financing Authority, Series Q, 4.00% due 5/15/2032 | | | 1,040,000 | | | | 1,050,448 | |
| | Santa Clara County Financing Authority (Multiple Facilities Projects), Series P, 5.00% due 5/15/2025 | | | 2,255,000 | | | | 2,292,686 | |
| | Santa Cruz County Capital Financing Authority, Series A-1, 4.00% due 6/1/2029 - 6/1/2034 | | | 2,685,000 | | | | 2,848,806 | |
| | Santa Margarita Water District (Talega Community Facilities), Series A, 5.00% due 9/1/2027 | | | 350,000 | | | | 369,797 | |
| | State of California GO, | | | | | | | | |
| | 4.00% due 9/1/2034 | | | 1,000,000 | | | | 1,016,013 | |
| | 5.00% due 8/1/2027 - 8/1/2033 | | | 2,640,000 | | | | 2,812,494 | |
| | Stockton Public Financing Authority (Stockton Water Revenue) (BAM) (Green Bond), Series A, 5.00% due 10/1/2024 - 10/1/2027 | | | 2,130,000 | | | | 2,225,263 | |
| | Torrance USD GO, 4.25% due 8/1/2033 | | | 1,320,000 | | | | 1,357,929 | |
| | Tustin (Community Facilities District No. 97-1) USD, Series A, 5.00% due 9/1/2031 | | | 450,000 | | | | 455,224 | |
| | Vallejo City (BAM) USD GO, 5.00% due 8/1/2032 | | | 460,000 | | | | 532,569 | |
| | Ventura County Community College District GO, 4.00% due 8/1/2032 | | | 1,000,000 | | | | 1,007,972 | |
| | Ventura County Public Financing Authority (Office Building Purchase & Improvements), Series B, 5.00% due 11/1/2024 | | | 1,060,000 | | | | 1,061,362 | |
| | West Valley-Mission Community College District GO, Series B, 4.00% due 8/1/2034 | | | 1,150,000 | | | | 1,155,770 | |
| | TOTAL LONG-TERM MUNICIPAL BONDS — 96.1% (Cost $256,517,546) | | | | | | $ | 262,755,448 | |
| | SHORT-TERM INVESTMENTS — 2.0% | | | | | | | | |
| | MUNICIPAL BONDS — 1.3% | | | | | | | | |
| b | State of California (LOC Barclays Bank plc) GO, Series A-1-REMK, 3.00% due 5/1/2033 (put 10/1/2024) | | | 2,460,000 | | | | 2,460,000 | |
| b | Los Angeles Department of Water & Power (SPA Barclays Bank plc), Series B-4, 3.10% due 7/1/2035 (put 10/1/2024) | | | 1,200,000 | | | | 1,200,000 | |
| | TOTAL MUNICIPAL BONDS — 1.3% (Cost $3,660,000) | | | | | | $ | 3,660,000 | |
| | U.S. TREASURY SECURITIES — 0.7% | | | | | | | | |
| | U.S. Treasury Bills, | | | | | | | | |
| | 4.593% due 10/3/2024 | | | 1,400,000 | | | | 1,399,648 | |
| | 4.662% due 10/8/2024 | | | 470,000 | | | | 469,580 | |
| | TOTAL U.S. TREASURY SECURITIES — 0.7% (Cost $1,869,228) | | | | | | $ | 1,869,228 | |
| | TOTAL SHORT-TERM INVESTMENTS — 2.0% (Cost $5,529,228) | | | | | | $ | 5,529,228 | |
| | TOTAL INVESTMENTS — 98.1% (Cost $262,046,774) | | | | | | $ | 268,284,676 | |
| | OTHER ASSETS LESS LIABILITIES — 1.9% | | | | | | | 5,087,376 | |
| | NET ASSETS — 100.0% | | | | | | $ | 273,372,052 | |
Footnote Legend
| b | Variable, floating, step, or fixed to floating rate securities are securities for which interest rate changes are based on changes in a designated base rate or on a predetermined schedule. The rates shown are those in effect on September 30, 2024. |
| c | Securities exempt from registration under Rule 144A of the Securities Act of 1933, as amended. These securities are restricted but liquid and may only be resold in the ordinary course of business in transactions exempt from registration, normally to qualified institutional buyers. As of September 30, 2024, the aggregate value of these securities in the Fund’s portfolio was $2,965,806, representing 1.08% of the Fund’s net assets. |
| 242 | Annual Financial Statements | See notes to financial statements. |
Schedule of Investments, Continued
Thornburg California Limited Term Municipal Fund | September 30, 2024
Portfolio Abbreviations
To simplify the listings of securities, abbreviations are used per the table below:
| AGM | Insured by Assured Guaranty Municipal Corp. | HUD | Insured by Housing and Urban Development |
| AMT | Alternative Minimum Tax | LOC | Letter of Credit |
| BAM | Insured by Build America Mutual Insurance Co. | Mtg | Mortgage |
| CDC | Community Development Commission | MUNIPSA | Securities Industry and Financial Markets Association (SIFMA) Municipal Swap Index |
| COP | Certificates of Participation | NPFG | Insured by National Public Finance Guarantee Corp. |
| ETM | Escrowed to Maturity | SPA | Stand-by Purchase Agreement |
| FHA | Insured by Federal Housing Administration | USD | Unified School District |
| FNMA | Collateralized by Federal National Mortgage Association | VA | Veterans Affairs |
| GO | General Obligation | | |
| HFFA | Health Facilities Financing Authority | | |
| See notes to financial statements. | Annual Financial Statements | 243 |
Schedule of Investments
Thornburg New Mexico Intermediate Municipal Fund | September 30, 2024
| | ISSUER-DESCRIPTION | | PRINCIPAL
AMOUNT | | | VALUE | |
| | LONG-TERM MUNICIPAL BONDS — 94.6% | | | | | | | | |
| | Albuquerque Bernalillo County Water Utility Authority (2007 NMFA Loan & Joint Water & Sewer System Improvements), 5.00% due 7/1/2032 | | $ | 2,000,000 | | | $ | 2,034,462 | |
| | Albuquerque Municipal School District No. 12 (Bernalillo & Sandoval Counties School Facilities) (State Aid Withholding) GO, Series 2017, 5.00% due 8/1/2031 | | | 1,000,000 | | | | 1,038,741 | |
| | Albuquerque Municipal School District No. 12 (State Aid Withholding) GO, | | | | | | | | |
| | 5.00% due 8/1/2033 | | | 250,000 | | | | 271,013 | |
| | Series 2017, 5.00% due 8/1/2028 | | | 600,000 | | | | 624,542 | |
| | Series A, 5.00% due 8/1/2032 | | | 1,100,000 | | | | 1,238,798 | |
| | Antonio B Won Pat International Airport Authority AMT, | | | | | | | | |
| | Series A, | | | | | | | | |
| a | 5.00% due 10/1/2033 - 10/1/2034 | | | 300,000 | | | | 324,245 | |
| a | 5.25% due 10/1/2039 | | | 100,000 | | | | 109,559 | |
| | City of Albuquerque (City Infrastructure Improvements) GRT, Series A, 5.00% due 7/1/2033 - 7/1/2034 | | | 2,300,000 | | | | 2,331,620 | |
| | City of Albuquerque GO, Series A, 5.00% due 7/1/2025 | | | 500,000 | | | | 508,714 | |
| | City of Albuquerque GRT, | | | | | | | | |
| | Series B, 5.00% due 7/1/2040 | | | 500,000 | | | | 565,531 | |
| | Series C, 4.00% due 7/1/2032 | | | 1,215,000 | | | | 1,237,203 | |
| | City of Albuquerque Refuse Removal & Disposal Revenue, 5.00% due 7/1/2030 | | | 40,000 | | | | 45,236 | |
| | City of Albuquerque Transportation Infrastructure GRT, 4.00% due 7/1/2031 | | | 800,000 | | | | 835,801 | |
| | City of Farmington (Public Service Co. of New Mexico), | | | | | | | | |
| b | Series C, 3.875% due 6/1/2040 (put 6/1/2029) | | | 2,000,000 | | | | 2,061,836 | |
| b | Series D, 3.90% due 6/1/2040 (put 6/1/2028) | | | 2,085,000 | | | | 2,139,817 | |
| | City of Las Cruces (Joint Utility System), 4.00% due 6/1/2028 | | | 475,000 | | | | 484,126 | |
| | City of Roswell (Joint Water & Sewer Improvement) (BAM), 5.00% due 6/1/2035 - 6/1/2036 | | | 1,220,000 | | | | 1,254,314 | |
| | City of Roswell GRT, 4.00% due 8/1/2030 | | | 200,000 | | | | 206,678 | |
| | City of Santa Fe (Public Facilities) GRT, Series A, 5.00% due 6/1/2034 - 6/1/2038 | | | 1,870,000 | | | | 2,020,517 | |
| | County of Bernalillo (Government Services) (AMBAC) GRT, 5.25% due 10/1/2025 | | | 3,850,000 | | | | 3,937,399 | |
| | County of Bernalillo (Government Services) (NPFG) GRT, Series B, 5.70% due 4/1/2027 | | | 430,000 | | | | 454,034 | |
| | County of Bernalillo (Government Services) GRT, | | | | | | | | |
| | 5.25% due 4/1/2027 | | | 170,000 | | | | 175,712 | |
| | Series B, 5.70% due 4/1/2027 | | | 1,590,000 | | | | 1,678,868 | |
| | County of McKinley (BAM) GRT, 4.00% due 6/1/2043 | | | 750,000 | | | | 750,316 | |
| | County of San Juan (County Capital Improvements) GRT, Series B, 5.00% due 6/15/2028 - 6/15/2030 | | | 2,645,000 | | | | 2,648,767 | |
| | County of Santa Fe (County Correctional System) (AGM), 6.00% due 2/1/2027 | | | 595,000 | | | | 619,688 | |
| | County of Santa Fe GO, 4.25% due 7/1/2038 | | | 1,065,000 | | | | 1,126,548 | |
| | Guam Power Authority, Series A, 5.00% due 10/1/2042 | | | 1,750,000 | | | | 1,868,975 | |
| | Guam Power Authority (Electric Power System), Series A, 5.00% due 10/1/2024 - 10/1/2026 | | | 1,230,000 | | | | 1,261,063 | |
| | Hobbs School District No. 16 (State Aid Withholding) GO, 5.00% due 9/15/2026 - 9/15/2027 | | | 650,000 | | | | 686,529 | |
| a | Inspiration Public Improvement District (BAM), 4.00% due 10/1/2044 | | | 350,000 | | | | 347,614 | |
| | Lea County Public School District No. 8 Eunice (State Aid Withholding) GO, 5.00% due 9/15/2032 - 9/15/2033 (pre-refunded 9/15/2029) | | | 2,185,000 | | | | 2,435,984 | |
| a | Los Diamantes Public Improvement District (BAM), 4.00% due 10/1/2044 | | | 500,000 | | | | 490,784 | |
| | Loving Municipal School District No. 10 (State Aid Withholding) GO, 5.00% due 9/15/2027 | | | 1,085,000 | | | | 1,156,963 | |
| | New Mexico Educational Assistance Foundation AMT, Series 1A, 5.00% due 9/1/2029 | | | 2,600,000 | | | | 2,786,776 | |
| | New Mexico Finance Authority, Series D, 5.00% due 6/1/2040 | | | 845,000 | | | | 919,291 | |
| | New Mexico Finance Authority (Public Project Revolving Fund), | | | | | | | | |
| | Series B, | | | | | | | | |
| | 4.00% due 6/1/2029 - 6/1/2030 | | | 2,425,000 | | | | 2,440,380 | |
| | 5.00% due 6/1/2043 | | | 1,000,000 | | | | 1,118,245 | |
| | Series C, 5.00% due 6/1/2032 | | | 250,000 | | | | 253,014 | |
| | Series D, 4.00% due 6/1/2033 - 6/1/2034 | | | 5,245,000 | | | | 5,339,028 | |
| | New Mexico Finance Authority (State of New Mexico Department of Transportation), Series A, 5.00% due 6/15/2025 - 6/15/2026 | | | 1,230,000 | | | | 1,276,601 | |
| | New Mexico Hospital Equipment Loan Council (Haverland Carter Lifestyle Obligated Group), Series A, 5.00% due 7/1/2034 | | | 375,000 | | | | 381,795 | |
| | New Mexico Hospital Equipment Loan Council (Presbyterian Healthcare Services Obligated Group), | | | | | | | | |
| | 5.00% due 8/1/2031 (pre-refunded 8/1/2025) | | | 600,000 | | | | 611,021 | |
| | Series A, | | | | | | | | |
| | 4.00% due 8/1/2036 - 8/1/2037 | | | 3,965,000 | | | | 3,993,566 | |
| | 5.00% due 8/1/2039 | | | 1,440,000 | | | | 1,549,816 | |
| | New Mexico Institute of Mining & Technology (Campus Buildings Acquisition & Improvements) (AGM), 4.00% due 12/1/2040 | | | 700,000 | | | | 705,021 | |
| | New Mexico Mortgage Finance Authority, Series A-1, 3.20% due 9/1/2031 | | | 460,000 | | | | 445,121 | |
| | New Mexico Mortgage Finance Authority (FHLMC, FNMA, GNMA), | | | | | | | | |
| | Series A Class I, 4.50% due 9/1/2044 | | | 220,000 | | | | 223,825 | |
| | Series A, 4.25% due 9/1/2043 | | | 995,000 | | | | 1,011,506 | |
| | Series B, 4.55% due 9/1/2043 | | | 1,485,000 | | | | 1,541,605 | |
| 244 | Annual Financial Statements | See notes to financial statements. |
Schedule of Investments, Continued
Thornburg New Mexico Intermediate Municipal Fund | September 30, 2024
| | ISSUER-DESCRIPTION | | PRINCIPAL
AMOUNT | | | VALUE | |
| | Series C, | | | | | | | | |
| | 4.55% due 9/1/2043 | | $ | 2,220,000 | | | $ | 2,281,314 | |
| | 4.60% due 9/1/2044 | | | 1,500,000 | | | | 1,537,890 | |
| | Series E Class I, 4.45% due 9/1/2044 | | | 1,200,000 | | | | 1,214,383 | |
| | Series F, 2.85% due 7/1/2039 | | | 775,000 | | | | 640,579 | |
| b | New Mexico Mortgage Finance Authority (JLG SAF 2023 LLLP) (HUD), 5.00% due 2/1/2042 (put 6/1/2025) | | | 1,000,000 | | | | 1,001,479 | |
| | New Mexico Municipal Energy Acquisition Authority (Guaranty: Royal Bank of Canada), | | | | | | | | |
| | Series A, | | | | | | | | |
| | 4.00% due 11/1/2024 | | | 1,500,000 | | | | 1,500,351 | |
| b | 5.00% due 11/1/2039 (put 5/1/2025) | | | 1,000,000 | | | | 1,009,428 | |
| | Regents of New Mexico State University (Campus Buildings Acquisition & Improvements), | | | | | | | | |
| | Series A, | | | | | | | | |
| | 4.50% due 6/1/2035 - 6/1/2036 | | | 3,000,000 | | | | 3,064,773 | |
| | 5.00% due 4/1/2032 - 4/1/2036 | | | 4,280,000 | | | | 4,491,205 | |
| | Santa Fe Public School District (State Aid Withholding) GO, 5.00% due 8/1/2025 - 8/1/2031 | | | 1,470,000 | | | | 1,533,384 | |
| | State of New Mexico GO, 5.00% due 3/1/2025 | | | 2,040,000 | | | | 2,059,778 | |
| | State of New Mexico Severance Tax Permanent Fund, | | | | | | | | |
| | 5.00% due 7/1/2028 | | | 465,000 | | | | 505,501 | |
| | Series A, 5.00% due 7/1/2025 - 7/1/2029 | | | 1,500,000 | | | | 1,570,845 | |
| | Town of Silver City (BAM) GRT, 5.00% due 6/1/2037 | | | 610,000 | | | | 659,101 | |
| | University of New Mexico, Series A, 4.00% due 6/1/2032 | | | 385,000 | | | | 392,305 | |
| | University of New Mexico (AGM), 4.375% due 6/1/2043 | | | 1,005,000 | | | | 1,050,096 | |
| | Village of Los Ranchos de Albuquerque (Albuquerque Academy), 5.00% due 9/1/2031 | | | 300,000 | | | | 328,316 | |
| a | Volterra Public Improvement District (BAM), 4.00% due 10/1/2043 | | | 1,000,000 | | | | 1,005,071 | |
| | TOTAL LONG-TERM MUNICIPAL BONDS — 94.6% (Cost $87,872,826) | | | | | | $ | 89,414,407 | |
| | SHORT-TERM INVESTMENTS — 6.8% | | | | | | | | |
| | MUNICIPAL BONDS — 4.3% | | | | | | | | |
| b | New Mexico Hospital Equipment Loan Council (Presbyterian Healthcare Services Obligated Group; SPA JP Morgan Chase Bank NA), Series B, 4.05% due 8/1/2034 (put 10/1/2024) | | | 4,100,000 | | | | 4,100,000 | |
| | TOTAL MUNICIPAL BONDS — 4.3% (Cost $4,100,000) | | | | | | $ | 4,100,000 | |
| | U.S. TREASURY SECURITIES — 2.5% | | | | | | | | |
| | U.S. Treasury Bills, | | | | | | | | |
| | 4.641% due 10/3/2024 | | | 940,000 | | | | 939,761 | |
| | 4.576% due 10/1/2024 | | | 815,000 | | | | 815,000 | |
| | 4.676% due 10/8/2024 | | | 580,000 | | | | 579,481 | |
| | TOTAL U.S. TREASURY SECURITIES — 2.5% (Cost $2,334,242) | | | | | | $ | 2,334,242 | |
| | TOTAL SHORT-TERM INVESTMENTS — 6.8% (Cost $6,434,242) | | | | | | $ | 6,434,242 | |
| | TOTAL INVESTMENTS — 101.4% (Cost $94,307,068) | | | | | | $ | 95,848,649 | |
| | LIABILITIES NET OF OTHER ASSETS — (1.4)% | | | | | | | (1,348,724 | ) |
| | NET ASSETS — 100.0% | | | | | | $ | 94,499,925 | |
Footnote Legend
| b | Variable, floating, step, or fixed to floating rate securities are securities for which interest rate changes are based on changes in a designated base rate or on a predetermined schedule. The rates shown are those in effect on September 30, 2024. |
Portfolio Abbreviations
To simplify the listings of securities, abbreviations are used per the table below:
| AGM | Insured by Assured Guaranty Municipal Corp. | GO | General Obligation |
| AMBAC | Insured by American Municipal Bond Assurance Corp. | GRT | Gross Receipts Tax |
| AMT | Alternative Minimum Tax | HUD | Insured by Housing and Urban Development |
| BAM | Insured by Build America Mutual Insurance Co. | NMFA | New Mexico Finance Authority |
| FHLMC | Collateralized by Federal Home Loan Mortgage Corp. | NPFG | Insured by National Public Finance Guarantee Corp. |
| FNMA | Collateralized by Federal National Mortgage Association | SPA | Stand-by Purchase Agreement |
| GNMA | Collateralized by Government National Mortgage Association | | |
| See notes to financial statements. | Annual Financial Statements | 245 |
Schedule of Investments
Thornburg New York Intermediate Municipal Fund | September 30, 2024
| | ISSUER-DESCRIPTION | | PRINCIPAL
AMOUNT | | | VALUE | |
| | LONG-TERM MUNICIPAL BONDS — 98.3% | | | | | | | | |
| a | Antonio B Won Pat International Airport Authority AMT, Series A, 5.25% due 10/1/2040 | | $ | 200,000 | | | $ | 218,466 | |
| | City of Long Beach (BAM) GO, Series B, 5.25% due 7/15/2042 | | | 500,000 | | | | 538,995 | |
| | City of New York (City Budget Financial Management) GO, Series G, 5.00% due 8/1/2030 | | | 1,000,000 | | | | 1,002,367 | |
| | City of New York GO, Series A, 5.00% due 8/1/2043 | | | 800,000 | | | | 886,870 | |
| | City of Yonkers (AGM) GO, Series C, 5.00% due 3/15/2025 | | | 350,000 | | | | 354,011 | |
| | Dutchess County Local Development Corp. (Tompkins Terrace Housing LP) (FNMA) (Green Bond), 5.00% due 10/1/2040 | | | 500,000 | | | | 555,488 | |
| | Guam Power Authority, Series A, 5.00% due 10/1/2042 | | | 250,000 | | | | 266,997 | |
| | Guam Power Authority (Electric Power System), Series A, 5.00% due 10/1/2024 | | | 250,000 | | | | 250,013 | |
| | Guam Waterworks Authority (Water & Wastewater System), 5.00% due 7/1/2026 | | | 510,000 | | | | 528,097 | |
| | Hudson Yards Infrastructure Corp. (Hudson Yards Subway Station), Series A, 5.00% due 2/15/2035 | | | 1,000,000 | | | | 1,053,383 | |
| | Long Island Power Authority (Electric System Capital Improvements) (AGC), Series C, 5.25% due 9/1/2029 | | | 645,000 | | | | 714,155 | |
| | Metropolitan Transportation Authority, | | | | | | | | |
| | Series A-1, 5.00% due 11/15/2040 | | | 205,000 | | | | 206,575 | |
| | Series D-1, 5.00% due 11/15/2031 | | | 1,000,000 | | | | 1,020,755 | |
| | Monroe County (Monroe Community College Association, Inc.) (AGM) IDC, 5.00% due 1/15/2028 - 1/15/2029 | | | 550,000 | | | | 550,490 | |
| | Nassau County Sewer & Storm Water Finance Authority (Sewerage & Storm Water Resource Facilities), Series A, 5.00% due 10/1/2028 - 10/1/2031 | | | 1,400,000 | | | | 1,400,757 | |
| | New York City Housing Development Corp. (CSA Preservation Partners LLC) (HUD) (Green Bond), Series A, 4.45% due 8/1/2043 | | | 200,000 | | | | 201,739 | |
| | New York City Housing Development Corp. (FHA) (Green Bond), Series A-1, 4.55% due 11/1/2044 | | | 300,000 | | | | 305,658 | |
| | New York City Housing Development Corp. (Green Bond), Series G, 4.60% due 11/1/2043 | | | 250,000 | | | | 253,655 | |
| | New York City Housing Development Corp. (HUD) (Green Bond), Series B-1-A, 4.50% due 11/1/2044 | | | 100,000 | | | | 101,178 | |
| | New York City Municipal Water Finance Authority (New York City Water & Sewer System), | | | | | | | | |
| | Series AA-2, 4.00% due 6/15/2042 | | | 350,000 | | | | 356,848 | |
| | Series EE, 4.00% due 6/15/2042 | | | 250,000 | | | | 254,134 | |
| | New York City Transitional Finance Authority Future Tax Secured Revenue, | | | | | | | | |
| | Series A, 5.00% due 11/1/2036 | | | 1,000,000 | | | | 1,112,797 | |
| | Series A1, 5.00% due 8/1/2038 | | | 1,000,000 | | | | 1,068,656 | |
| | Series C, 5.00% due 11/1/2026 | | | 500,000 | | | | 500,878 | |
| | New York State Dormitory Authority (AGM, State Aid Withholding), | | | | | | | | |
| | Series A, 5.00% due 10/1/2043 - 10/1/2044 | | | 600,000 | | | | 656,650 | |
| | Series H, 5.00% due 10/1/2024 | | | 155,000 | | | | 155,010 | |
| | New York State Dormitory Authority (Barnard College), Series A, 5.00% due 7/1/2041 | | | 250,000 | | | | 271,084 | |
| | New York State Dormitory Authority (Orange & Ulster Counties Board Coop Educational Services Sole Supervisory District), Series A, 4.25% due 8/15/2044 | | | 300,000 | | | | 306,307 | |
| | New York State Dormitory Authority (School District Financing Program) (AGM, State Aid Withholding), Series A, 5.00% due 10/1/2028 | | | 200,000 | | | | 200,325 | |
| | New York State Dormitory Authority (State Aid Withholding), Series A, 5.00% due 10/1/2032 - 10/1/2033 | | | 450,000 | | | | 471,802 | |
| | New York State Dormitory Authority (State of New York Personal Income Tax Revenue), | | | | | | | | |
| | Series A, 4.00% due 3/15/2040 - 3/15/2042 | | | 750,000 | | | | 770,358 | |
| | Series E, 4.00% due 3/15/2039 | | | 350,000 | | | | 364,021 | |
| | New York State Dormitory Authority (State of New York Sales Tax Revenue), Series A-1, 4.00% due 3/15/2043 | | | 500,000 | | | | 507,907 | |
| | New York State Energy Research & Development Authority (New York State Electric & Gas Corp.), Series C, 4.00% due 4/1/2034 | | | 550,000 | | | | 569,282 | |
| b | New York State Environmental Facilities Corp. (Waste Management, Inc.) AMT, 4.25% due 5/1/2030 (put 11/1/2024) | | | 500,000 | | | | 499,787 | |
| | New York State Housing Finance Agency (HUD, SONYMA) (Green Bond), Series C-1, 4.50% due 11/1/2043 | | | 250,000 | | | | 252,578 | |
| | New York Transportation Development Corp. (JFK NTO LLC) (Green Bond) AMT, 5.25% due 6/30/2044 | | | 250,000 | | | | 268,902 | |
| | Port Authority of New York & New Jersey AMT, | | | | | | | | |
| | Series 186, 5.00% due 10/15/2037 | | | 500,000 | | | | 500,436 | |
| | Series 238, 5.00% due 7/15/2040 | | | 400,000 | | | | 441,930 | |
| | Sales Tax Asset Receivable Corp. (New York Local Government Assistance Corp.), Series A, 5.00% due 10/15/2029 - 10/15/2031 (pre-refunded 10/15/2024) | | | 1,250,000 | | | | 1,250,960 | |
| | State of New York Mortgage Agency Homeowner Mortgage Revenue (SONYMA) (Green Bond) AMT, Series 262, 4.45% due 4/1/2036 | | | 210,000 | | | | 212,094 | |
| | Tompkins County Development Corp. (Ithaca College), 5.00% due 7/1/2027 - 7/1/2034 | | | 610,000 | | | | 628,440 | |
| | Town of Hempstead GO, 4.00% due 5/1/2044 | | | 300,000 | | | | 307,271 | |
| | Triborough Bridge & Tunnel Authority, Series A, 5.00% due 11/15/2033 | | | 250,000 | | | | 252,970 | |
| | Triborough Bridge & Tunnel Authority (MTA Bridges & Tunnels), Series A, 5.00% due 11/15/2029 | | | 1,000,000 | | | | 1,003,022 | |
| | Troy Capital Resource Corp. (Rensselaer Polytechnic Institute), Series A, 5.00% due 9/1/2033 | | | 645,000 | | | | 710,153 | |
| | Westchester County Local Development Corp. (Miriam Osborn Memorial Home Association Obligated Group), 5.00% due 7/1/2026 - 7/1/2028 | | | 580,000 | | | | 598,179 | |
| | TOTAL LONG-TERM MUNICIPAL BONDS — 98.3% (Cost $24,444,213) | | | | | | $ | 24,902,430 | |
| 246 | Annual Financial Statements | See notes to financial statements. |
Schedule of Investments, Continued
Thornburg New York Intermediate Municipal Fund | September 30, 2024
| | ISSUER-DESCRIPTION | | PRINCIPAL
AMOUNT | | | VALUE | |
| | SHORT-TERM MUNICIPAL BONDS — 1.3% | | | | | | | | |
| b | Metropolitan Transportation Authority (LOC Barclays Bank plc), Series 2012G-1, 4.15% due 11/1/2032 (put 10/1/2024) | | $ | 330,000 | | | $ | 330,000 | |
| | TOTAL SHORT-TERM MUNICIPAL BONDS — 1.3% (Cost $330,000) | | | | | | $ | 330,000 | |
| | TOTAL INVESTMENTS — 99.6% (Cost $24,774,213) | | | | | | $ | 25,232,430 | |
| | OTHER ASSETS LESS LIABILITIES — 0.4% | | | | | | | 95,808 | |
| | NET ASSETS — 100.0% | | | | | | $ | 25,328,238 | |
Footnote Legend
| b | Variable, floating, step, or fixed to floating rate securities are securities for which interest rate changes are based on changes in a designated base rate or on a predetermined schedule. The rates shown are those in effect on September 30, 2024. |
Portfolio Abbreviations
To simplify the listings of securities, abbreviations are used per the table below:
| AGC | Insured by Assured Guaranty Corp. | GO | General Obligation |
| AGM | Insured by Assured Guaranty Municipal Corp. | HUD | Insured by Housing and Urban Development |
| AMT | Alternative Minimum Tax | IDC | Industrial Development Corp. |
| BAM | Insured by Build America Mutual Insurance Co. | LOC | Letter of Credit |
| FHA | Insured by Federal Housing Administration | SONYMA | State of New York Mortgage Agency |
| FNMA | Collateralized by Federal National Mortgage Association | | |
| See notes to financial statements. | Annual Financial Statements | 247 |
Statements of Assets and Liabilities
September 30, 2024
| | | THORNBURG
SHORT DURATION
MUNICIPAL FUND | | | THORNBURG
LIMITED TERM
MUNICIPAL FUND | | | THORNBURG
INTERMEDIATE
MUNICIPAL FUND | | | THORNBURG
STRATEGIC MUNICIPAL
INCOME FUND | |
| ASSETS | | | | | | | | | | | | | | | | |
| Investment in securities, at cost | | $ | 119,116,973 | | | $ | 2,394,584,075 | | | $ | 975,519,713 | | | $ | 306,598,068 | |
| Investments at value | | | 120,227,268 | | | | 2,468,148,025 | | | | 1,008,488,894 | | | | 319,029,219 | |
| Cash | | | 36,535 | | | | 21,797 | | | | 6,897 | | | | 12,635 | |
| Receivable for investments sold | | | - | | | | 7,125,000 | | | | 2,355,000 | | | | 835,000 | |
| Receivable for fund shares sold | | | - | | | | 7,762,950 | | | | 2,442,537 | | | | 658,910 | |
| Principal and interest receivable | | | 1,304,931 | | | | 29,271,494 | | | | 12,896,526 | | | | 4,226,401 | |
| Prepaid expenses and other assets | | | 8,706 | | | | 51,257 | | | | 63,496 | | | | 20,202 | |
| Total Assets | | | 121,577,440 | | | | 2,512,380,523 | | | | 1,026,253,350 | | | | 324,782,367 | |
| LIABILITIES | | | | | | | | | | | | | | | | |
| Payable for investments purchased | | | 3,429,983 | | | | 12,447,731 | | | | 3,008,012 | | | | 1,832,671 | |
| Payable for fund shares redeemed | | | 26,444 | | | | 4,293,887 | | | | 1,805,963 | | | | 414,077 | |
| Payable to investment advisor and other affiliates | | | 31,065 | | | | 1,168,219 | | | | 419,907 | | | | 122,417 | |
| Accounts payable and accrued expenses | | | 88,844 | | | | 994,954 | | | | 224,878 | | | | 139,585 | |
| Dividends payable | | | 119,404 | | | | 555,432 | | | | 340,901 | | | | 11,839 | |
| Total Liabilities | | | 3,695,740 | | | | 19,460,223 | | | | 5,799,661 | | | | 2,520,589 | |
| NET ASSETS | | $ | 117,881,700 | | | $ | 2,492,920,300 | | | $ | 1,020,453,689 | | | $ | 322,261,778 | |
| NET ASSETS CONSIST OF | | | | | | | | | | | | | | | | |
| Net capital paid in on shares of beneficial interest | | $ | 124,372,083 | | | $ | 2,681,696,362 | | | $ | 1,027,449,546 | | | $ | 334,058,156 | |
| Accumulated loss | | | (6,490,383 | ) | | | (188,776,062 | ) | | | (6,995,857 | ) | | | (11,796,378 | ) |
| NET ASSETS | | $ | 117,881,700 | | | $ | 2,492,920,300 | | | $ | 1,020,453,689 | | | $ | 322,261,778 | |
248 | Annual Financial Statements
Statements of Assets and Liabilities, Continued
September 30, 2024
| | | THORNBURG
SHORT DURATION
MUNICIPAL FUND | | | THORNBURG
LIMITED TERM
MUNICIPAL FUND | | | THORNBURG
INTERMEDIATE
MUNICIPAL FUND | | | THORNBURG
STRATEGIC MUNICIPAL
INCOME FUND | |
| NET ASSET VALUE | | | | | | | | | | | | | | | | |
| Class A Shares: | | | | | | | | | | | | | | | | |
| Net assets applicable to shares outstanding | | $ | 6,366,917 | | | $ | 543,243,278 | | | $ | 260,419,718 | | | $ | 69,372,379 | |
| Shares outstanding | | | 531,196 | | | | 39,673,199 | | | | 19,464,010 | | | | 4,860,118 | |
| Net asset value and redemption price per share | | $ | 11.99 | | | $ | 13.69 | | | $ | 13.38 | | | $ | 14.27 | |
| Maximum offering price per share (net asset value, plus 2.25% of offering | | | | | | | | | | | | | | | | |
| price) | | $ | 12.27 | | | $ | 14.01 | | | $ | 13.65 | * | | $ | 14.56 | * |
| Class C Shares: | | | | | | | | | | | | | | | | |
| Net assets applicable to shares outstanding | | | - | | | | 39,586,466 | | | | 13,044,053 | | | | 4,118,758 | |
| Shares outstanding | | | - | | | | 2,885,776 | | | | 973,759 | | | | 288,229 | |
| Net asset value and redemption price per share** | | | - | | | | 13.72 | | | | 13.40 | | | | 14.29 | |
| Class C2 Shares: | | | | | | | | | | | | | | | | |
| Net assets applicable to shares outstanding | | | - | | | | 2,695,220 | | | | 1,503,401 | | | | - | |
| Shares outstanding | | | - | | | | 196,433 | | | | 112,224 | | | | - | |
| Net asset value and redemption price per share** | | | - | | | | 13.72 | | | | 13.40 | | | | - | |
| Class I Shares: | | | | | | | | | | | | | | | | |
| Net assets applicable to shares outstanding | | | 111,514,783 | | | | 1,907,395,336 | | | | 745,486,517 | | | | 248,770,641 | |
| Shares outstanding | | | 9,306,334 | | | | 139,283,980 | | | | 55,790,971 | | | | 17,412,800 | |
| Net asset value and redemption price per share | | | 11.98 | | | | 13.69 | | | | 13.36 | | | | 14.29 | |
| * | Net asset value, plus 2.00% of offering price. |
| ** | Redemption price per share is equal to net asset value less any applicable contingent deferred sales charge. |
See notes to financial statements.
Annual Financial Statements | 249
Statements of Assets and Liabilities, Continued
September 30, 2024
| | | THORNBURG
CALIFORNIA LIMITED TERM
MUNICIPAL FUND | | | THORNBURG
NEW MEXICO INTERMEDIATE
MUNICIPAL FUND | | | THORNBURG
NEW YORK INTERMEDIATE
MUNICIPAL FUND | |
| ASSETS | | | | | | | | | | | | |
| Investment in securities, at cost | | $ | 262,046,774 | | | $ | 94,307,068 | | | $ | 24,774,213 | |
| Investments at value | | | 268,284,676 | | | | 95,848,649 | | | | 25,232,430 | |
| Cash | | | 16,929 | | | | 4,810 | | | | 77,123 | |
| Receivable for investments sold | | | 3,030,000 | | | | - | | | | - | |
| Receivable for fund shares sold | | | 330,412 | | | | 6,333 | | | | 1,600 | |
| Principal and interest receivable | | | 3,220,323 | | | | 1,124,149 | | | | 321,491 | |
| Prepaid expenses and other assets | | | 12,908 | | | | 10,811 | | | | 7,522 | |
| Total Assets | | | 274,895,248 | | | | 96,994,752 | | | | 25,640,166 | |
| LIABILITIES | | | | | | | | | | | | |
| Payable for investments purchased | | | 752,940 | | | | 2,270,841 | | | | 218,848 | |
| Payable for fund shares redeemed | | | 441,697 | | | | 69,718 | | | | 11,853 | |
| Payable to investment advisor and other affiliates | | | 114,020 | | | | 63,280 | | | | 6,688 | |
| Accounts payable and accrued expenses | | | 139,777 | | | | 81,186 | | | | 65,155 | |
| Dividends payable | | | 74,762 | | | | 9,802 | | | | 9,384 | |
| Total Liabilities | | | 1,523,196 | | | | 2,494,827 | | | | 311,928 | |
| NET ASSETS | | $ | 273,372,052 | | | $ | 94,499,925 | | | $ | 25,328,238 | |
| NET ASSETS CONSIST OF | | | | | | | | | | | | |
| Net capital paid in on shares of beneficial interest | | $ | 285,422,428 | | | $ | 98,413,069 | | | $ | 26,193,750 | |
| Accumulated loss | | | (12,050,376 | ) | | | (3,913,144 | ) | | | (865,512 | ) |
| NET ASSETS | | $ | 273,372,052 | | | $ | 94,499,925 | | | $ | 25,328,238 | |
250 | Annual Financial Statements
Statements of Assets and Liabilities, Continued
September 30, 2024
| | | THORNBURG
CALIFORNIA LIMITED TERM
MUNICIPAL FUND | | | THORNBURG
NEW MEXICO INTERMEDIATE
MUNICIPAL FUND | | | THORNBURG
NEW YORK INTERMEDIATE
MUNICIPAL FUND | |
| NET ASSET VALUE | | | | | | | | | | | | |
| Class A Shares: | | | | | | | | | | | | |
| Net assets applicable to shares outstanding | | $ | 60,071,448 | | | $ | 37,430,111 | | | $ | 12,740,205 | |
| Shares outstanding | | | 4,609,601 | | | | 2,992,788 | | | | 1,053,228 | |
| Net asset value and redemption price per share | | $ | 13.03 | | | $ | 12.51 | | | $ | 12.10 | |
| Maximum offering price per share (net asset value, plus 2.00% of offering price) | | $ | 13.33 | * | | $ | 12.77 | | | $ | 12.35 | |
| Class C Shares: | | | | | | | | | | | | |
| Net assets applicable to shares outstanding | | | 1,216,297 | | | | - | | | | - | |
| Shares outstanding | | | 93,251 | | | | - | | | | - | |
| Net asset value and redemption price per share** | | | 13.04 | | | | - | | | | - | |
| Class C2 Shares: | | | | | | | | | | | | |
| Net assets applicable to shares outstanding | | | 523,755 | | | | - | | | | - | |
| Shares outstanding | | | 40,160 | | | | - | | | | - | |
| Net asset value and redemption price per share** | | | 13.04 | | | | - | | | | - | |
| Class D Shares: | | | | | | | | | | | | |
| Net assets applicable to shares outstanding | | | - | | | | 7,696,459 | | | | - | |
| Shares outstanding | | | - | | | | 615,110 | | | | - | |
| Net asset value and redemption price per share | | | - | | | | 12.51 | | | | - | |
| Class I Shares: | | | | | | | | | | | | |
| Net assets applicable to shares outstanding | | | 211,560,552 | | | | 49,373,355 | | | | 12,588,033 | |
| Shares outstanding | | | 16,217,706 | | | | 3,949,566 | | | | 1,040,601 | |
| Net asset value and redemption price per share | | | 13.05 | | | | 12.50 | | | | 12.10 | |
| * | Net asset value, plus 2.25% of offering price. |
| ** | Redemption price per share is equal to net asset value less any applicable contingent deferred sales charge. |
See notes to financial statements.
Annual Financial Statements | 251
Statements of Operations
Year Ended September 30, 2024
| | | THORNBURG
SHORT DURATION
MUNICIPAL FUND | | | THORNBURG
LIMITED TERM
MUNICIPAL FUND | | | THORNBURG
INTERMEDIATE
MUNICIPAL FUND | | | THORNBURG
STRATEGIC MUNICIPAL
INCOME FUND | |
| INVESTMENT INCOME | | | | | | | | | | | | | | | | |
| Interest income | | $ | 4,713,519 | | | $ | 99,004,380 | | | $ | 39,927,824 | | | $ | 13,393,543 | |
| EXPENSES | | | | | | | | | | | | | | | | |
| Investment management fees | | | 500,998 | | | | 8,694,995 | | | | 4,568,045 | | | | 2,306,792 | |
| Administration fees | | | 109,172 | | | | 2,303,100 | | | | 835,635 | | | | 267,881 | |
| Distribution and service fees | | | | | | | | | | | | | | | | |
| Class A Shares | | | 16,774 | | | | 1,425,230 | | | | 650,413 | | | | 169,230 | |
| Class C Shares | | | - | | | | 241,678 | | | | 87,489 | | | | 28,843 | |
| Class C2 Shares | | | - | | | | 19,211 | | | | 10,900 | | | | - | |
| Transfer agent fees | | | | | | | | | | | | | | | | |
| Class A Shares | | | 19,575 | | | | 391,167 | | | | 187,449 | | | | 63,015 | |
| Class C Shares | | | - | | | | 30,269 | | | | 12,797 | | | | 6,446 | |
| Class C2 Shares | | | - | | | | 4,283 | | | | 3,231 | | | | - | |
| Class I Shares | | | 46,937 | | | | 1,277,606 | | | | 459,742 | | | | 250,284 | |
| Registration and filing fees | | | | | | | | | | | | | | | | |
| Class A Shares | | | 18,674 | | | | 28,906 | | | | 32,531 | | | | 22,427 | |
| Class C Shares | | | - | | | | 17,750 | | | | 16,541 | | | | 16,412 | |
| Class C2 Shares | | | - | | | | 14,314 | | | | 10,459 | | | | - | |
| Class I Shares | | | 18,814 | | | | 45,501 | | | | 75,932 | | | | 23,960 | |
| Custodian fees | | | 37,818 | | | | 223,513 | | | | 99,758 | | | | 58,208 | |
| Audit and tax fees | | | 49,679 | | | | 49,783 | | | | 49,611 | | | | 52,711 | |
| Legal fees | | | 1,622 | | | | 29,634 | | | | 11,123 | | | | 3,097 | |
| Trustee and officer fees | | | 9,510 | | | | 193,036 | | | | 63,914 | | | | 21,817 | |
| Other expenses | | | 13,595 | | | | 164,372 | | | | 63,715 | | | | 31,939 | |
| Total Expenses | | | 843,168 | | | | 15,154,348 | | | | 7,239,285 | | | | 3,323,062 | |
| Less: | | | | | | | | | | | | | | | | |
| Expenses reimbursed | | | (200,146 | ) | | | (14,181 | ) | | | (1,655,182 | ) | | | (666,727 | ) |
| Investment management fees waived | | | - | | | | - | | | | (102,141 | ) | | | (659,567 | ) |
| Net Expenses | | | 643,022 | | | | 15,140,167 | | | | 5,481,962 | | | | 1,996,768 | |
| Net Investment Income (Loss) | | $ | 4,070,497 | | | $ | 83,864,213 | | | $ | 34,445,862 | | | $ | 11,396,775 | |
| REALIZED AND UNREALIZED GAIN (LOSS) | | | | | | | | | | | | | | | | |
| Net realized gain (loss) | | | (382,299 | ) | | | (20,284,187 | ) | | | (2,799,885 | ) | | | (1,124,137 | ) |
| Net change in unrealized appreciation (depreciation) | | | 2,879,584 | | | | 125,889,865 | | | | 47,874,395 | | | | 20,618,433 | |
| Net Realized and Unrealized Gain (Loss) | | | 2,497,285 | | | | 105,605,678 | | | | 45,074,510 | | | | 19,494,296 | |
| Change in Net Assets Resulting from Operations | | $ | 6,567,782 | | | $ | 189,469,891 | | | $ | 79,520,372 | | | $ | 30,891,071 | |
See notes to financial statements.
252 | Annual Financial Statements
Statements of Operations, Continued
Year Ended September 30, 2024
| | | THORNBURG
CALIFORNIA LIMITED TERM
MUNICIPAL FUND | | | THORNBURG
NEW MEXICO INTERMEDIATE
MUNICIPAL FUND | | | THORNBURG
NEW YORK INTERMEDIATE
MUNICIPAL FUND | |
| INVESTMENT INCOME | | | | | | | | | | | | |
| Interest income | | $ | 9,782,560 | | | $ | 3,571,458 | | | $ | 951,822 | |
| EXPENSES | | | | | | | | | | | | |
| Investment management fees | | | 1,374,207 | | | | 498,553 | | | | 125,254 | |
| Administration fees | | | 239,459 | | | | 86,908 | | | | 21,819 | |
| Distribution and service fees | | | | | | | | | | | | |
| Class A Shares | | | 155,838 | | | | 103,000 | | | | 32,234 | |
| Class C Shares | | | 9,967 | | | | - | | | | - | |
| Class C2 Shares | | | 2,580 | | | | - | | | | - | |
| Class D Shares | | | - | | | | 40,198 | | | | - | |
| Transfer agent fees | | | | | | | | | | | | |
| Class A Shares | | | 32,015 | | | | 37,217 | | | | 17,690 | |
| Class C Shares | | | 5,384 | | | | - | | | | - | |
| Class C2 Shares | | | 1,701 | | | | - | | | | - | |
| Class D Shares | | | - | | | | 7,296 | | | | - | |
| Class I Shares | | | 143,241 | | | | 21,353 | | | | 14,356 | |
| Registration and filing fees | | | | | | | | | | | | |
| Class A Shares | | | 8,946 | | | | 8,617 | | | | 8,846 | |
| Class C Shares | | | 5,846 | | | | - | | | | - | |
| Class C2 Shares | | | 4,655 | | | | - | | | | - | |
| Class D Shares | | | - | | | | 6,066 | | | | - | |
| Class I Shares | | | 11,038 | | | | 7,292 | | | | 7,721 | |
| Custodian fees | | | 51,227 | | | | 35,922 | | | | 28,247 | |
| Audit and tax fees | | | 49,725 | | | | 49,690 | | | | 49,679 | |
| Legal fees | | | 3,251 | | | | 1,274 | | | | 373 | |
| Trustee and officer fees | | | 19,422 | | | | 7,324 | | | | 1,650 | |
| Other expenses | | | 25,090 | | | | 13,301 | | | | 7,840 | |
| Total Expenses | | | 2,143,592 | | | | 924,011 | | | | 315,709 | |
| Less: | | | | | | | | | | | | |
| Expenses reimbursed | | | (452,340 | ) | | | (78,285 | ) | | | (61,355 | ) |
| Investment management fees waived | | | (176,023 | ) | | | - | | | | (45,253 | ) |
| Net Expenses | | | 1,515,229 | | | | 845,726 | | | | 209,101 | |
| Net Investment Income (Loss) | | $ | 8,267,331 | | | $ | 2,725,732 | | | $ | 742,721 | |
| REALIZED AND UNREALIZED GAIN (LOSS) | | | | | | | | | | | | |
| Net realized gain (loss) | | | (769,106 | ) | | | (909,461 | ) | | | 18,357 | |
| Net change in unrealized appreciation (depreciation) | | | 11,175,612 | | | | 5,068,490 | | | | 1,014,903 | |
| Net Realized and Unrealized Gain (Loss) | | | 10,406,506 | | | | 4,159,029 | | | | 1,033,260 | |
| Change in Net Assets Resulting from Operations | | $ | 18,673,837 | | | $ | 6,884,761 | | | $ | 1,775,981 | |
See notes to financial statements.
Annual Financial Statements | 253
Statements of Changes in Net Assets
| | | THORNBURG SHORT DURATION
MUNICIPAL FUND | | | THORNBURG LIMITED TERM
MUNICIPAL FUND | |
| | | YEAR ENDED
SEPTEMBER 30, 2024 | | | YEAR ENDED
SEPTEMBER 30, 2023 | | | YEAR ENDED
SEPTEMBER 30, 2024 | | | YEAR ENDED
SEPTEMBER 30, 2023 | |
| INCREASE (DECREASE) IN NET ASSETS FROM | | | | | | | | | | | | | | | | |
| OPERATIONS | | | | | | | | | | | | | | | | |
| Net investment income (loss) | | $ | 4,070,497 | | | $ | 4,314,666 | | | $ | 83,864,213 | | | $ | 88,174,231 | |
| Net realized gain (loss) | | | (382,299 | ) | | | (1,499,341 | ) | | | (20,284,187 | ) | | | (65,366,632 | ) |
| Net change in unrealized appreciation (depreciation) | | | 2,879,584 | | | | 1,661,186 | | | | 125,889,865 | | | | 62,076,109 | |
| Net Increase (Decrease) in Net Assets Resulting from | | | | | | | | | | | | | | | | |
| Operations | | | 6,567,782 | | | | 4,476,511 | | | | 189,469,891 | | | | 84,883,708 | |
| DIVIDENDS TO SHAREHOLDERS | | | | | | | | | | | | | | | | |
| From distributable earnings | | | | | | | | | | | | | | | | |
| Class A Shares | | | (255,037 | ) | | | (374,436 | ) | | | (17,060,008 | ) | | | (16,547,402 | ) |
| Class C Shares | | |
- | | | | - | | | | (1,308,308 | ) | | | (1,596,072 | ) |
| Class C2 Shares | | | - | | | | - | | | | (74,108 | ) | | | (81,757 | ) |
| Class I Shares | | | (3,811,389 | ) | | | (3,940,027 | ) | | | (65,608,814 | ) | | | (69,956,736 | ) |
| FUND SHARE TRANSACTIONS | | | | | | | | | | | | | | | | |
| Class A Shares | | | (7,422,532 | ) | | | (6,545,486 | ) | | | (90,432,418 | ) | | | (142,496,782 | ) |
| Class C Shares | | | - | | | | - | | | | (22,019,306 | ) | | | (31,507,397 | ) |
| Class C2 Shares | | | - | | | | - | | | | (943,547 | ) | | | (1,181,993 | ) |
| Class I Shares | | | (21,505,483 | ) | | | (18,282,140 | ) | | | (477,181,796 | ) | | | (856,389,436 | ) |
| Net Increase (Decrease) in Net Assets | | | (26,426,659 | ) | | | (24,665,578 | ) | | | (485,158,414 | ) | | | (1,034,873,867 | ) |
| NET ASSETS | | | | | | | | | | | | | | | | |
| Beginning of Year | | | 144,308,359 | | | | 168,973,937 | | | | 2,978,078,714 | | | | 4,012,952,581 | |
| End of Year | | $ | 117,881,700 | | | $ | 144,308,359 | | | $ | 2,492,920,300 | | | $ | 2,978,078,714 | |
See notes to financial statements.
254 | Annual Financial Statements
Statements of Changes in Net Assets, Continued
| | | THORNBURG INTERMEDIATE
MUNICIPAL FUND | | | THORNBURG STRATEGIC MUNICIPAL
INCOME FUND | |
| | | YEAR ENDED
SEPTEMBER 30, 2024 | | | YEAR ENDED
SEPTEMBER 30, 2023 | | | YEAR ENDED
SEPTEMBER 30, 2024 | | | YEAR ENDED
SEPTEMBER 30, 2023 | |
| INCREASE (DECREASE) IN NET ASSETS FROM | | | | | | | | | | | | | | | | |
| OPERATIONS | | | | | | | | | | | | | | | | |
| Net investment income (loss) | | $ | 34,445,862 | | | $ | 28,744,462 | | | $ | 11,396,775 | | | $ | 10,058,287 | |
| Net realized gain (loss) | | | (2,799,885 | ) | | | (12,731,956 | ) | | | (1,124,137 | ) | | | (10,961,557 | ) |
| Net change in unrealized appreciation (depreciation) | | | 47,874,395 | | | | 6,007,875 | | | | 20,618,433 | | | | 8,710,314 | |
| Net Increase (Decrease) in Net Assets Resulting from | | | | | | | | | | | | | | | | |
| Operations | | | 79,520,372 | | | | 22,020,381 | | | | 30,891,071 | | | | 7,807,044 | |
| DIVIDENDS TO SHAREHOLDERS | | | | | | | | | | | | | | | | |
| From distributable earnings | | | | | | | | | | | | | | | | |
| Class A Shares | | | (8,828,632 | ) | | | (8,456,757 | ) | | | (2,400,032 | ) | | | (1,982,075 | ) |
| Class C Shares | | | (440,530 | ) | | | (512,526 | ) | | | (147,421 | ) | | | (164,395 | ) |
| Class C2 Shares | | | (50,647 | ) | | | (40,311 | ) | | | - | | | | - | |
| Class I Shares | | | (24,815,075 | ) | | | (19,698,247 | ) | | | (8,843,004 | ) | | | (7,913,674 | ) |
| FUND SHARE TRANSACTIONS | | | | | | | | | | | | | | | | |
| Class A Shares | | | (15,862,933 | ) | | | (7,187,354 | ) | | | 4,257,606 | | | | 5,667,489 | |
| Class C Shares | | | (4,029,386 | ) | | | (5,698,642 | ) | | | (1,203,677 | ) | | | (3,326,832 | ) |
| Class C2 Shares | | | (82,899 | ) | | | 1,826 | | | | - | | | | - | |
| Class I Shares | | | 130,570,295 | | | | 32,482,766 | | | | 6,216,638 | | | | (7,458,735 | ) |
| Net Increase (Decrease) in Net Assets | | | 155,980,565 | | | | 12,911,136 | | | | 28,771,181 | | | | (7,371,178 | ) |
| NET ASSETS | | | | | | | | | | | | | | | | |
| Beginning of Year | | | 864,473,124 | | | | 851,561,988 | | | | 293,490,597 | | | | 300,861,775 | |
| End of Year | | $ | 1,020,453,689 | | | $ | 864,473,124 | | | $ | 322,261,778 | | | $ | 293,490,597 | |
See notes to financial statements.
Annual Financial Statements | 255
Statements of Changes in Net Assets, Continued
| | | THORNBURG CALIFORNIA LIMITED TERM MUNICIPAL FUND | | | | THORNBURG NEW MEXICO INTERMEDIATE MUNICIPAL FUND | |
| | | YEAR ENDED
SEPTEMBER 30, 2024 | | | YEAR ENDED
SEPTEMBER 30, 2023 | | | YEAR ENDED
SEPTEMBER 30, 2024 | | | YEAR ENDED
SEPTEMBER 30, 2023 | |
| INCREASE (DECREASE) IN NET ASSETS | | | | | | | | | | | | | | | | |
| FROM | | | | | | | | | | | | | | | | |
| OPERATIONS | | | | | | | | | | | | | | | | |
| Net investment income (loss) | | $ | 8,267,331 | | | $ | 7,786,453 | | | $ | 2,725,732 | | | $ | 2,377,948 | |
| Net realized gain (loss) | | | (769,106 | ) | | | (6,411,427 | ) | | | (909,461 | ) | | | (2,676,994 | ) |
| Net change in unrealized appreciation | | | | | | | | | | | | | | | | |
| (depreciation) | | | 11,175,612 | | | | 6,686,800 | | | | 5,068,490 | | | | 2,278,602 | |
| Net Increase (Decrease) in Net Assets | | | | | | | | | | | | | | | | |
| Resulting from Operations | | | 18,673,837 | | | | 8,061,826 | | | | 6,884,761 | | | | 1,979,556 | |
| DIVIDENDS TO SHAREHOLDERS | | | | | | | | | | | | | | | | |
| From distributable earnings | | | | | | | | | | | | | | | | |
| Class A Shares | | | (1,759,123 | ) | | | (1,638,746 | ) | | | (1,064,354 | ) | | | (972,353 | ) |
| Class C Shares | | | (50,284 | ) | | | (85,110 | ) | | | - | | | | - | |
| Class C2 Shares | | | (10,133 | ) | | | (2,826 | ) | | | - | | | | - | |
| Class D Shares | | | - | | | | - | | | | (187,963 | ) | | | (164,159 | ) |
| Class I Shares | | | (6,449,579 | ) | | | (6,049,751 | ) | | | (1,467,356 | ) | | | (1,247,241 | ) |
| FUND SHARE TRANSACTIONS | | | | | | | | | | | | | | | | |
| Class A Shares | | | (9,643,683 | ) | | | (11,698,219 | ) | | | (11,029,191 | ) | | | (6,615,029 | ) |
| Class C Shares | | | (1,766,937 | ) | | | (3,111,724 | ) | | | - | | | | - | |
| Class C2 Shares | | | 369,820 | | | | 12,376 | | | | - | | | | - | |
| Class D Shares | | | - | | | | - | | | | (1,528,354 | ) | | | (1,477,519 | ) |
| Class I Shares | | | (1,324,244 | ) | | | (72,022,974 | ) | | | (5,133,892 | ) | | | (4,924,956 | ) |
| Net Increase (Decrease) in Net Assets | | | (1,960,326 | ) | | | (86,535,148 | ) | | | (13,526,349 | ) | | | (13,421,701 | ) |
| NET ASSETS | | | | | | | | | | | | | | | | |
| Beginning of Year | | | 275,332,378 | | | | 361,867,526 | | | | 108,026,274 | | | | 121,447,975 | |
| End of Year | | $ | 273,372,052 | | | $ | 275,332,378 | | | $ | 94,499,925 | | | $ | 108,026,274 | |
See notes to financial statements.
256 | Annual Financial Statements
Statements of Changes in Net Assets, Continued
| | | THORNBURG NEW YORK INTERMEDIATE MUNICIPAL FUND | |
| | | YEAR ENDED
SEPTEMBER 30, 2024 | | | YEAR ENDED
SEPTEMBER 30, 2023 | |
| INCREASE (DECREASE) IN NET ASSETS FROM | | | | | | | | |
| OPERATIONS | | | | | | | | |
| Net investment income (loss) | | $ | 742,721 | | | $ | 677,913 | |
| Net realized gain (loss) | | | 18,357 | | | | (342,396 | ) |
| Net change in unrealized appreciation (depreciation) | | | 1,014,903 | | | | 212,562 | |
| Net Increase (Decrease) in Net Assets Resulting from Operations | | | 1,775,981 | | | | 548,079 | |
| DIVIDENDS TO SHAREHOLDERS | | | | | | | | |
| From distributable earnings | | | | | | | | |
| Class A Shares | | | (362,275 | ) | | | (335,662 | ) |
| Class I Shares | | | (380,376 | ) | | | (342,326 | ) |
| FUND SHARE TRANSACTIONS | | | | | | | | |
| Class A Shares | | | (897,200 | ) | | | (2,041,154 | ) |
| Class I Shares | | | (16,981 | ) | | | (2,455,088 | ) |
| Net Increase (Decrease) in Net Assets | | | 119,149 | | | | (4,626,151 | ) |
| NET ASSETS | | | | | | | | |
| Beginning of Year | | | 25,209,089 | | | | 29,835,240 | |
| End of Year | | $ | 25,328,238 | | | $ | 25,209,089 | |
See notes to financial statements.
Annual Financial Statements | 257
Notes to Financial Statements
September 30, 2024
NOTE 1 – ORGANIZATION
Thornburg Short Duration Municipal Fund (“Short Duration Municipal Fund”), Thornburg Limited Term Municipal Fund (“Limited Term Municipal Fund”), Thornburg Intermediate Municipal Fund (“Intermediate Municipal Fund”), Thornburg Strategic Municipal Income Fund (“Strategic Municipal Income Fund”), Thornburg California Limited Term Municipal Fund (“Limited Term California Fund”), Thornburg New Mexico Intermediate Municipal Fund (“Intermediate New Mexico Fund”) and Thornburg New York Intermediate Municipal Fund (“Intermediate New York Fund”), collectively the "Funds", are series of Thornburg Investment Trust (the “Trust”). The Short Duration Municipal Fund, Limited Term Municipal Fund, Intermediate Municipal Fund, Strategic Municipal Income Fund, and Limited Term California Fund are diversified. The Intermediate New Mexico Fund and Intermediate New York Fund are non-diversified. The Trust is organized as a Massachusetts business trust under a Declaration of Trust dated June 3, 1987 and is registered as a diversified, open-end management investment company under the Investment Company Act of 1940, as amended (the "1940 Act"). As of September 30, 2024, the Funds are currently seven of twenty-four separate series of the Trust. Each series is considered to be a separate entity for financial reporting and tax purposes and bears expenses directly attributable to it.
Short Duration Municipal Fund: The Fund’s investment goal is to seek current income exempt from federal income tax, consistent with preservation of capital. The Fund’s investments subject it to certain risks. As of the date of this report, the principal risks of investing in the Fund include credit risk, cybersecurity and operational risk, high yield risk, interest rate risk, liquidity risk, management risk, market and economic risk, redemption risk, and tax risk. Please see the Fund’s prospectus for a discussion of those principal risks and other risks associated with an investment in the Fund.
Limited Term Municipal Fund: The Fund’s primary investment goal is to obtain as high a level of current income exempt from federal individual income tax as is consistent, in the view of Thornburg Investment Management, Inc., the Trust’s investment advisor (the “Advisor”), with preservation of capital. The Fund’s secondary goal is to reduce expected changes in its share price compared to longer intermediate and long-term bond portfolios. The Fund’s investments subject it to certain risks. As of the date of this report, the principal risks of investing in the Fund include credit risk, cybersecurity and operational risk, high yield risk, interest rate risk, liquidity risk, management risk, market and economic risk, redemption risk, and tax risk. Please see the Fund’s prospectus for a discussion of those principal risks and other risks associated with an investment in the Fund.
Intermediate Municipal Fund: The Fund’s primary investment goal is to obtain as high a level of current income exempt from federal individual income tax as is consistent, in the view of the Advisor, with preservation of capital. The Fund’s secondary goal is to reduce expected changes in its share price compared to long-term bond portfolios. The Fund’s investments subject it to certain risks. As of the date of this report, the principal risks of investing in the Fund include credit risk, cybersecurity and operational risk, high yield risk, interest rate risk, liquidity risk, management risk, market and economic risk, redemption risk, and tax risk. Please see the Fund’s prospectus for a discussion of those principal risks and other risks associated with an investment in the Fund.
Strategic Municipal Income Fund: The Fund’s investment goal is to seek a high level of current income exempt from federal individual income tax. The Fund’s investments subject it to certain risks. As of the date of this report, the principal risks of investing in the Fund include credit risk, cybersecurity and operational risk, high yield risk, interest rate risk, liquidity risk, management risk, market and economic risk, redemption risk, and tax risk. Please see the Fund’s prospectus for a discussion of those principal risks and other risks associated with an investment in the Fund.
Limited Term California Fund: The Fund’s primary investment goal is to obtain as high a level of current income exempt from federal and California state individual income taxes as is consistent, in the view of the Advisor, with preservation of capital. The Fund’s secondary goal is to reduce expected changes in its share price compared to longer intermediate and long-term bond portfolios. The Fund’s investments subject it to certain risks. As of the date of this report, the principal risks of investing in the Fund include credit risk, cybersecurity and operational risk, high yield risk, interest rate risk, liquidity risk, management risk, market and economic risk, redemption risk, single state risk, and tax risk. Please see the Fund’s prospectus for a discussion of those principal risks and other risks associated with an investment in the Fund.
Intermediate New Mexico Fund: The Fund’s primary investment goal is to obtain as high a level of current income exempt from federal and New Mexico state individual income taxes as is consistent, in the view of the Advisor, with preservation of capital. The Fund’s secondary goal is to reduce expected changes in its share price compared to long-term bond portfolios. The Fund’s investments subject it to certain risks. As of the date of this report, the principal risks of investing in the Fund include credit risk, cybersecurity and operational risk, high yield risk, interest rate risk, liquidity risk, management risk, market and economic risk, non-diversification risk, redemption risk, single state risk, and tax risk. Please see the Fund’s prospectus for a discussion of those principal risks and other risks associated with an investment in the Fund.
Intermediate New York Fund: The Fund’s primary investment goal is to obtain as high a level of current income exempt from federal, New York State, and New York City individual income taxes as is consistent, in the view of the Advisor, with preservation of capital. The Fund’s secondary goal is to reduce expected changes in its share price compared to long-term bond portfolios. The Fund’s investments subject it to certain risks. As of the date of this report, the principal risks of investing in the Fund include credit risk, cybersecurity and operational
258 | Annual Financial Statements
Notes to Financial Statements, Continued
September 30, 2024
risk, high yield risk, interest rate risk, liquidity risk, management risk, market and economic risk, non-diversification risk, redemption risk, single state risk, and tax risk. Please see the Fund’s prospectus for a discussion of those principal risks and other risks associated with an investment in the Fund.
As of September 30, 2024, the Funds each currently offer up to four classes of shares of beneficial interest.
Each class of shares of the Funds represents an interest in the same portfolio of investments, except that (i) Class A shares are sold subject to a front-end sales charge collected at the time the shares are purchased and bear a service fee, (ii) Class C shares are sold at net asset value without a sales charge at the time of purchase, but are subject to a contingent deferred sales charge upon redemption within one year of purchase, and bear both a service fee and a distribution fee, (iii) Class C2 shares are sold at net asset value without a sales charge at the time of purchase, but are subject to a contingent deferred sales charge upon redemption within one year of purchase, and bear both a service fee and a distribution fee, (iv) Class D shares are sold at net asset value without a sales charge at the time of purchase or redemption, and bear both a service fee and a distribution fee, (v) Class I shares are sold at net asset value without a sales charge at the time of purchase and may be subject to a service fee, and (vi) the respective classes may have different reinvestment privileges and conversion rights. Additionally, each Fund may allocate among its classes certain expenses, to the extent allocable to specific classes, including administration fees, transfer agent fees, government registration fees, certain printing and postage costs, and legal expenses. Currently, class specific expenses of the Funds are limited to distribution and service fees, transfer agent fees, and certain registration and filing fees.
At September 30, 2024, the following classes of shares are offered in each respective Fund:
| | | CLASS A | | CLASS C | | CLASS C2 | | CLASS D | | CLASS I |
| Short Duration Municipal Fund | | X | | | | | | | | X |
| Limited Term Municipal Fund | | X | | X | | X | | | | X |
| Intermediate Municipal Fund | | X | | X | | X | | | | X |
| Strategic Municipal Income Fund | | X | | X | | | | | | X |
| Limited Term California Fund | | X | | X | | X | | | | X |
| Intermediate New Mexico Fund | | X | | | | | | X | | X |
| Intermediate New York Fund | | X | | | | | | | | X |
NOTE 2 – SIGNIFICANT ACCOUNTING POLICIES
The following is a summary of significant accounting policies followed by each of the Funds in the preparation of its financial statements. Each Fund prepares its financial statements in conformity with United States generally accepted accounting principles (“GAAP”), including investment company accounting and reporting guidance in the Financial Accounting Standards Board (the “FASB”) Accounting Standard Codification Topic 946.
Allocation of Income, Gains, Losses and Expenses: Net investment income (other than class specific expenses) and realized and unrealized gains and losses are allocated daily to each class of shares based upon the relative net asset value of outstanding shares (or the value of the dividend-eligible shares, as appropriate) of each class of shares at the beginning of the day (after adjusting for the current capital shares activity of the respective class). Expenses common to all Funds are allocated daily among the Funds comprising the Trust based upon their relative net asset values or other appropriate allocation methods. Operating expenses directly attributable to a specific class are charged against the operating income of that class.
Dividends and Distributions to Shareholders: Dividends and distributions to shareholders, which are determined in accordance with federal income tax regulations and may differ from GAAP, are recorded on the ex-dividend date. Ordinary income dividends, if any, are declared daily and paid monthly. Capital gain distributions, if any, are declared and paid annually and more often if deemed necessary by the Advisor. Dividends and distributions are paid and are reinvested in additional shares of the Funds at net asset value per share at the close of business on the ex-dividend date, or at the shareholder’s option, paid in cash.
Guarantees and Indemnifications: Under the Trust’s organizational documents (and under separate agreements with the independent Trustees), its officers and Trustees are provided with an indemnification against certain liabilities arising out of the performance of their duties to the Funds. In the normal course of business the Trust may also enter into contracts with service providers that contain general indemnifications. The Trust’s maximum exposure under these arrangements is unknown. However, based on experience, the Trust expects the risk of loss to be remote.
Investment Income: Interest income is accrued as earned. Premiums and discounts are amortized and accreted, respectively, to first call dates or maturity dates using the effective yield method of the respective investments. These amounts are included in Investment Income in the Statement of Operations.
Annual Financial Statements | 259
Notes to Financial Statements, Continued
September 30, 2024
Investment Transactions: Investment transactions are accounted for on a trade date basis. Realized gains and losses from the sale of investments are recorded on an identified cost basis.
Security Valuation: All investments in securities held by the Funds are valued as described in Note 3.
Use of Estimates: The preparation of financial statements in conformity with GAAP requires management to make estimates and assumptions that affect the reported amounts of assets and liabilities and disclosure of contingent assets and liabilities at the date of the financial statements and the reported amounts of increases (decreases) in net assets from operations during the reporting period. Actual results could differ from those estimates.
When-Issued and Delayed Delivery Transactions: The Funds may engage in when-issued or delayed delivery transactions. To the extent the Funds engage in such transactions, they will do so for the purpose of acquiring portfolio investments consistent with the Funds’ investment objectives and not for the purpose of investment leverage or to speculate on interest rate or market changes. At the time the Funds make a commitment to purchase an investment on a when-issued or delayed delivery basis, the Funds will record the transaction and reflect the value in determining its net asset value. Pursuant to current U.S. Securities and Exchange Commission (“SEC”) guidance, a transaction involving a when-issued security will not be deemed to involve a senior security as long as the Funds intend to settle the transaction physically and the transaction settles within 35 days. Investments purchased on a when-issued or delayed delivery basis do not earn interest until the settlement date. The values of these securities held at September 30, 2024 are detailed in the Schedule of Investments.
NOTE 3 – SECURITY VALUATION
Valuation of the Funds’ portfolio investment securities is performed by the Advisor, which has been designated by the Trustees of the Trust (the "Trustees") as the Funds’ “valuation designee,” as that term is defined in rule 2a-5 under the 1940 Act. The Advisor performs this valuation function under the supervision of the Trustees and in accordance with policies and procedures that have been adopted by the Advisor and approved by the Trustees (the “Valuation Policy and Procedures”).
In its capacity as the Funds’ valuation designee, the Advisor makes good faith determinations of the fair value of portfolio securities for which market quotations are not readily available, and otherwise complies with and administers the Valuation Policy and Procedures. The Advisor performs those functions in significant measure through its Valuation and Pricing Committee (the “Committee”), though the Advisor may also obtain the assistance of others, including professional pricing service providers selected and approved by the Committee. In accordance with the Valuation Policy and Procedures, the Committee: assesses and manages the material risks associated with determining the fair value of those Fund investments for which market quotations are not readily available; selects and applies methodologies for determining and calculating such fair values; periodically reviews and tests the appropriateness and accuracy of those methodologies; monitors for circumstances that may necessitate the use of fair value; and approves, monitors, and evaluates pricing services engaged to provide evaluated prices for the Funds’ investments. The Committee provides reports on its activities to the Trustees’ Audit Committee, which is responsible for overseeing the Committee��s and the Advisor’s work in discharging the functions under the Valuation Policy and Procedures.
In those instances when the Committee assists in calculating a fair value for a portfolio investment, the Committee seeks to determine the price that the Funds would reasonably expect to receive upon a sale of the investment in an orderly transaction between market participants on the valuation date. The Committee customarily utilizes quotations from securities broker dealers in calculating valuations, but also may utilize prices obtained from pricing service providers or other methods selected by the Committee. Because fair values calculated by the Committee are estimates, the calculation of a fair value for an investment may differ from the price that would be realized by the Funds upon a sale of the investment, and the difference could be material to the Funds’ financial statements. The Committee’s calculation of a fair value for an investment may also differ from the prices obtained by other persons (including other mutual funds) for the investment.
Valuation of Securities: Debt obligations held by the Funds which are not listed or traded on exchanges or for which no reported market exists are ordinarily valued at the valuation obtained from a pricing service provider approved by the Committee.
In any case when a pricing service provider fails to provide a valuation for a debt obligation held by the Funds, the Committee may calculate a fair value for the obligation using alternative methods selected and approved by the Committee. Additionally, in cases when the Committee believes that a valuation obtained from a pricing service provider is stale, does not reflect material factors affecting the valuation of the investment, is significantly different than the value the Funds are likely to obtain if it sought a bid for the investment, or is otherwise unreliable, the Committee may calculate a fair value for the obligation using an alternative method selected and approved by the Committee.
Valuation Hierarchy: The Funds categorize their investments based upon the inputs used in valuing those investments, according to a three-level hierarchy established in guidance from the FASB. Categorization of investments using this hierarchy is intended by the FASB to maximize the use of observable inputs in valuing investments and minimize the use of unobservable inputs by requiring that the most
260 | Annual Financial Statements
Notes to Financial Statements, Continued
September 30, 2024
observable inputs be used when available. Observable inputs are those that market participants would use in valuing an investment based on available market information. Unobservable inputs are those that reflect assumptions about the information market participants would use in valuing an investment. An investment’s level within the hierarchy is based on the lowest level input that is deemed significant to the valuation. The methodologies and inputs used to value investments are not necessarily indications of the risk or liquidity associated with those investments.
Various inputs are used in calculating valuations for the Funds’ investments. These inputs are generally summarized according to the three-level hierarchy below:
Level 1: Quoted prices in active markets for identical investments.
Level 2: Other direct or indirect significant observable inputs (including quoted prices for similar investments in active markets and other observable inputs, such as interest rates, prepayment rates, credit ratings, etc.).
Level 3: Significant unobservable inputs (including the Committee’s own assumptions in calculating the fair values of investments).
Valuations for debt obligations held by the Funds are typically calculated by pricing service providers approved by the Committee and are generally characterized as Level 2 within the valuation hierarchy.
In a limited number of cases the Committee calculates a fair value for investments using broker quotations or other methods approved by the Committee. When the Committee uses a single broker quotation to calculate a fair value for an investment without other significant observable inputs, or if a fair value is calculated using other significant inputs that are considered unobservable, the investment is characterized as Level 3 within the hierarchy. Other significant unobservable inputs used to calculate a fair value in these instances might include an income-based valuation approach which considers discounted anticipated future cash flows from the investment and application of discounts due to the nature or duration of any restrictions on the disposition of the investment.
Valuations based upon the use of inputs from Levels 1, 2 or 3 may not represent the actual price received upon the disposition of an investment, and a Fund may receive a price that is lower than the valuation based upon these inputs when it sells the investment.
The following tables display a summary of the fair value hierarchy measurements of each Fund’s investments as of September 30, 2024:
| SHORT DURATION MUNICIPAL FUND | | TOTAL | | | LEVEL 1 | | LEVEL 2 | | | LEVEL 3 |
| Assets | | | | | | | | | | | | |
| Investments in Securities | | | | | | | | | | | | | | | | |
| Long-Term Municipal Bonds | | $ | 115,022,268 | | | $ | — | | | $ | 115,022,268 | | | $ | — | |
| Short-Term Municipal Bonds | | | 5,205,000 | | | | — | | | | 5,205,000 | | | | — | |
| Total Investments in Securities | | $ | 120,227,268 | | | $ | — | | | $ | 120,227,268 | | | $ | — | |
| Total Assets | | $ | 120,227,268 | | | $ | — | | | $ | 120,227,268 | | | $ | — | |
| LIMITED TERM MUNICIPAL FUND | | TOTAL | | | LEVEL 1 | | LEVEL 2 | | | LEVEL 3 |
| Assets | | | | | | | | | | | | |
| Investments in Securities | | | | | | | | | | | | | | | | |
| Long-Term Municipal Bonds | | $ | 2,394,768,025 | | | $ | — | | | $ | 2,394,768,025 | | | $ | — | |
| Short-Term Municipal Bonds | | | 73,380,000 | | | | — | | | | 73,380,000 | | | | — | |
| Total Investments in Securities | | $ | 2,468,148,025 | | | $ | — | | | $ | 2,468,148,025 | | | $ | — | |
| Total Assets | | $ | 2,468,148,025 | | | $ | — | | | $ | 2,468,148,025 | | | $ | — | |
| INTERMEDIATE MUNICIPAL FUND | | TOTAL | | | LEVEL 1 | | LEVEL 2 | | | LEVEL 3 |
| Assets | | | | | | | | | | | | |
| Investments in Securities | | | | | | | | | | | | | | | | |
| Long-Term Municipal Bonds | | $ | 980,128,894 | | | $ | — | | | $ | 980,128,894 | | | $ | — | |
| Short-Term Municipal Bonds | | | 28,360,000 | | | | — | | | | 28,360,000 | | | | — | |
| Total Investments in Securities | | $ | 1,008,488,894 | | | $ | — | | | $ | 1,008,488,894 | | | $ | — | |
| Total Assets | | $ | 1,008,488,894 | | | $ | — | | | $ | 1,008,488,894 | | | $ | — | |
Annual Financial Statements | 261
Notes to Financial Statements, Continued
September 30, 2024
| STRATEGIC MUNICIPAL INCOME FUND | | TOTAL | | | LEVEL 1 | | LEVEL 2 | | | LEVEL 3 |
| Assets | | | | | | | | | | | | |
| Investments in Securities | | | | | | | | | | | | | | | | |
| Long-Term Municipal Bonds | | $ | 307,184,219 | | | $ | — | | | $ | 307,184,219 | | | $ | — | |
| Short-Term Municipal Bonds | | | 11,845,000 | | | | — | | | | 11,845,000 | | | | — | |
| Total Investments in Securities | | $ | 319,029,219 | | | $ | — | | | $ | 319,029,219 | | | $ | — | |
| Total Assets | | $ | 319,029,219 | | | $ | — | | | $ | 319,029,219 | | | $ | — | |
| LIMITED TERM CALIFORNIA FUND | | TOTAL | | | LEVEL 1 | | LEVEL 2 | | | LEVEL 3 |
| Assets | | | | | | | | | | | | |
| Investments in Securities | | | | | | | | | | | | | | | | |
| Long-Term Municipal Bonds | | $ | 262,755,448 | | | $ | — | | | $ | 262,755,448 | | | $ | — | |
| Short-Term Investments | | | | | | | | | | | | | | | | |
| Municipal Bonds | | | 3,660,000 | | | | — | | | | 3,660,000 | | | | — | |
| U.S. Treasury Securities | | | 1,869,228 | | | | — | | | | 1,869,228 | | | | — | |
| Total Investments in Securities | | $ | 268,284,676 | | | $ | — | | | $ | 268,284,676 | | | $ | — | |
| Total Assets | | $ | 268,284,676 | | | $ | — | | | $ | 268,284,676 | | | $ | — | |
| INTERMEDIATE NEW MEXICO FUND | | TOTAL | | | LEVEL 1 | | LEVEL 2 | | | LEVEL 3 |
| Assets | | | | | | | | | | | | |
| Investments in Securities | | | | | | | | | | | | | | | | |
| Long-Term Municipal Bonds | | $ | 89,414,407 | | | $ | — | | | $ | 89,414,407 | | | $ | — | |
| Short-Term Investments | | | | | | | | | | | | | | | | |
| Municipal Bonds | | | 4,100,000 | | | | — | | | | 4,100,000 | | | | — | |
| U.S. Treasury Securities | | | 2,334,242 | | | | — | | | | 2,334,242 | | | | — | |
| Total Investments in Securities | | $ | 95,848,649 | | | $ | — | | | $ | 95,848,649 | | | $ | — | |
| Total Assets | | $ | 95,848,649 | | | $ | — | | | $ | 95,848,649 | | | $ | — | |
| INTERMEDIATE NEW YORK FUND | | TOTAL | | | LEVEL 1 | | LEVEL 2 | | | LEVEL 3 |
| Assets | | | | | | | | | | | | |
| Investments in Securities | | | | | | | | | | | | | | | | |
| Long-Term Municipal Bonds | | $ | 24,902,430 | | | $ | — | | | $ | 24,902,430 | | | $ | — | |
| Short-Term Municipal Bonds | | | 330,000 | | | | — | | | | 330,000 | | | | — | |
| Total Investments in Securities | | $ | 25,232,430 | | | $ | — | | | $ | 25,232,430 | | | $ | — | |
| Total Assets | | $ | 25,232,430 | | | $ | — | | | $ | 25,232,430 | | | $ | — | |
NOTE 4 – INVESTMENT MANAGEMENT FEE AND OTHER TRANSACTIONS WITH AFFILIATES
Pursuant to an investment advisory agreement with the Trust, the Advisor serves as the investment advisor and performs advisory services for the Funds for which the Advisor’s management fees are payable at the end of each month. Under the investment advisory agreement, each Fund pays the Advisor a management fee based on the average daily net assets of that Fund at an annual rate as shown in the following table:
| SHORT DURATION MUNICIPAL FUND | | | LIMITED TERM MUNICIPAL FUND,
LIMITED TERM CALIFORNIA FUND | | | INTERMEDIATE MUNICIPAL FUND,
INTERMEDIATE NEW MEXICO FUND,
INTERMEDIATE NEW YORK FUND | | | STRATEGIC MUNICIPAL INCOME FUND |
| DAILY NET ASSETS | | | FEE RATE | | DAILY NET ASSETS | | | FEE RATE | | DAILY NET ASSETS | | | FEE RATE | | DAILY NET ASSETS | | | FEE RATE |
| Up to $1 billion | | | 0.400 | % | | Up to $500 million | | | 0.500 | % | | Up to $500 million | | | 0.500 | % | | Up to $500 million | | | 0.750 | % |
| Next $500 million | | | 0.300 | | | Next $500 million | | | 0.400 | | | Next $500 million | | | 0.450 | | | Next $500 million | | | 0.675 | |
| Next $500 million | | | 0.250 | | | Next $500 million | | | 0.300 | | | Next $500 million | | | 0.400 | | | Next $500 million | | | 0.625 | |
| Over $2 billion | | | 0.225 | | | Next $500 million | | | 0.250 | | | Next $500 million | | | 0.350 | | | Next $500 million | | | 0.575 | |
| | | | | | | Over $2 billion | | | 0.225 | | | Over $2 billion | | | 0.275 | | | Over $2 billion | | | 0.500 | |
262 | Annual Financial Statements
Notes to Financial Statements, Continued
September 30, 2024
The Funds’ effective management fees, calculated on the basis of the Funds’ average daily net assets (before applicable management fee waivers) for the year ended September 30, 2024 were as shown in the following table. Total management fees incurred by the Funds for the year ended September 30, 2024 are set forth in the Statement of Operations.
| | | EFFECTIVE |
| | | MANAGEMENT |
| | | FEE |
| Short Duration Municipal Fund | | 0.400 | % |
| Limited Term Municipal Fund | | 0.329 | |
| Intermediate Municipal Fund | | 0.476 | |
| Strategic Municipal Income Fund | | 0.750 | |
| Limited Term California Fund | | 0.500 | |
| Intermediate New Mexico Fund | | 0.500 | |
| Intermediate New York Fund | | 0.500 | |
The Trust has entered into an administrative services agreement with the Advisor, whereby the Advisor will perform certain administrative services. The administrative services fees are computed as an annual percentage of the aggregate average daily net assets of all applicable Funds in the Trust as follows:
ADMINISTRATIVE SERVICES FEE SCHEDULE
| DAILY NET ASSETS | | FEE RATE |
| Up to $20 billion | | 0.100 | % |
| $20 billion to $40 billion | | 0.075 | |
| $40 billion to $60 billion | | 0.040 | |
| Over $60 billion | | 0.030 | |
The aggregate administrative services fee amount is allocated on a daily basis to each Fund based on net assets and subsequently allocated to each class of shares of the Funds. Total administrative services fees incurred by each class of shares of the Funds for the year ended September 30, 2024, are set forth in the Statement of Operations.
The Trust has an underwriting agreement with Thornburg Securities LLC (the “Distributor”), an affiliate of the Advisor, which acts as the distributor of the Funds’ shares. For the year ended September 30, 2024, the Distributor has advised the Funds that they earned net commissions from the sale of Class A shares and collected contingent deferred sales charges ("CDSC Fees") from redemptions of Class C and Class C2 shares as follows:
| | | COMMISSIONS | | | CDSC FEES |
| Limited Term Municipal Fund | | $ | 1,846 | | | $ | 1,095 |
| Intermediate Municipal Fund | | | 1,258 | | | | 3,042 |
| Strategic Municipal Income Fund | | | 544 | | | | 25 |
| Limited Term California Fund | | | 28 | | | | 38 |
| Intermediate New Mexico Fund | | | (49 | ) | | | — |
Pursuant to a service plan under Rule 12b-1 of the 1940 Act, the Funds may reimburse to the Distributor an amount not to exceed .25 of 1% per annum of the average daily net assets attributable to the applicable Class A, Class C, Class C2 and Class I shares of the Limited Term Municipal Fund, Intermediate Municipal Fund and Limited Term California Fund, Class A, Class C, and Class I shares of the Strategic Municipal Income Fund, Class A and Class I shares of the Intermediate New York Fund and Class A, Class D and Class I shares of the Intermediate New Mexico Fund and .20 of 1% per annum of the average daily net assets attributable to the applicable Class A and Class I shares of Short Duration Municipal Fund for payments made by the Distributor to securities dealers and other financial institutions to obtain various shareholder and distribution related services. For the year ended September 30, 2024, there were no 12b-1 service plan fees charged for Class I. The Advisor and Distributor each may pay out of its own resources additional expenses for distribution of each Fund’s shares and shareholder services.
The Trust has also adopted a distribution plan pursuant to Rule 12b-1, applicable only to the Funds’ Class C, Class C2, and Class D shares, under which the Funds compensate the Distributor for services in promoting the sale of Class C and Class D shares of the Funds at an annual rate of up to .25 of 1% per annum of the average daily net assets attributable to Class C of the Limited Term Municipal Fund and Limited Term California Fund and Class D shares of the Intermediate New Mexico Fund, .35 of 1% per annum of the average daily net
Annual Financial Statements | 263
Notes to Financial Statements, Continued
September 30, 2024
assets attributable to Class C of the Intermediate Municipal Fund and Strategic Municipal Income Fund and .40 of 1% per annum of the average daily net assets attributed to Class C2 shares of the Limited Term Municipal Fund, Intermediate Municipal Fund, and Limited Term California Fund. Total fees incurred by each class of shares of the Funds under their respective service and distribution plans for the year ended September 30, 2024, are set forth in the Statements of Operations.
The Advisor has contractually agreed to waive certain fees and reimburse certain expenses incurred by certain classes of the Funds. The agreement may be terminated by the Trust at any time, but may not be terminated by the Advisor before February 1, 2025 unless the Advisor ceases to be the investment advisor to the Funds prior to that date. The Advisor may recoup amounts waived or reimbursed during the year ended September 30, 2024 if, during the fiscal year, expenses fall below the contractual limit that was in place at the time these fees and expenses were waived or reimbursed. The Advisor will not recoup fees or expenses as described in the preceding sentence if that recoupment would cause the Funds’ total annual operating expenses (after the recoupment is taken into account) to exceed the lesser of: (a) the expense cap that was in place at the time the waiver or reimbursement occurred; or (b) the expense cap that is in place at the time of the recoupment. Expense caps exclude taxes, interest expenses, acquired fund fees and expenses, brokerage commissions, borrowing costs, expenses relating to short sales, and unusual expenses such as contingency fees or litigation costs.
Actual expenses of certain share classes do not exceed levels as specified in each Fund’s most recent prospectus as shown in the following table:
| | | CLASS A | | | CLASS C | | | CLASS C2 | | | CLASS D | | | CLASS I | |
| Short Duration Municipal Fund | | | 0.70 | % | | | —% | | | | —% | | | | —% | | | | 0.50 | % |
| Limited Term Municipal Fund | | | — | | | | — | | | | 1.24 | | | | — | | | | — | |
| Intermediate Municipal Fund(a) | | | 0.72 | | | | 1.09 | | | | 1.09 | | | | — | | | | 0.48 | |
| Strategic Municipal Income Fund | | | 0.81 | | | | 1.28 | | | | — | | | | — | | | | 0.59 | |
| Limited Term California Fund | | | 0.74 | | | | 1.02 | | | | 1.02 | | | | — | | | | 0.49 | |
| Intermediate New Mexico Fund | | | 0.99 | | | | — | | | | — | | | | 1.24 | | | | 0.67 | |
| Intermediate New York Fund | | | 0.99 | | | | — | | | | — | | | | — | | | | 0.67 | |
| (a) | Effective February 1, 2024 through September 30, 2024, the expense ratio level maximum was: Class A, 0.72%; Class C, 1.09%; Class C2, 1.09%; Class I, 0.48%. For the period from October 1, 2023 through January 31, 2024, the expense ratio level maximum was: Class A, 0.77%; Class C, 1.14%; Class C2, 1.14%; Class I, 0.53%. |
For the year ended September 30, 2024, the Advisor contractually reimbursed certain class specific expenses and distribution fees and voluntarily waived certain expenses as follows:
| CONTRACTUAL: | | CLASS
A | | | CLASS
C | | | CLASS
C2 | | | CLASS
D | | | CLASS
I | | | TOTAL |
| Short Duration Municipal Fund | | $ | 44,477 | | | $ | — | | | $ | — | | | $ | — | | | $ | 155,669 | | | $ | 200,146 |
| Limited Term Municipal Fund | | | — | | | | — | | | | 14,181 | | | | — | | | | — | | | | 14,181 |
| Intermediate Municipal Fund | | | 468,830 | | | | 40,177 | | | | 15,777 | | | | — | | | | 1,130,398 | | | | 1,655,182 |
| Strategic Municipal Income Fund | | | 266,718 | | | | 29,876 | | | | — | | | | — | | | | 831,491 | | | | 1,128,085 |
| Limited Term California Fund | | | 95,534 | | | | 12,338 | | | | 7,181 | | | | — | | | | 337,287 | | | | 452,340 |
| Intermediate New Mexico Fund | | | 27,154 | | | | — | | | | — | | | | 9,780 | | | | 41,351 | | | | 78,285 |
| Intermediate New York Fund | | | 28,697 | | | | — | | | | — | | | | — | | | | 32,658 | | | | 61,355 |
| VOLUNTARY: | | CLASS
A | | | CLASS
C | | | CLASS
C2 | | | CLASS
I | | | TOTAL | | | | |
| Intermediate Municipal Fund | | $ | 27,696 | | | $ | 1,552 | | | $ | 178 | | | $ | 72,715 | | | $ | 102,141 | | | | |
| Strategic Municipal Income Fund | | | 43,654 | | | | 3,094 | | | | — | | | | 151,461 | | | | 198,209 | | | | |
| Limited Term California Fund | | | 39,950 | | | | 1,275 | | | | 255 | | | | 134,543 | | | | 176,023 | | | | |
| Intermediate New York Fund | | | 23,302 | | | | — | | | | — | | | | 21,951 | | | | 45,253 | | | | |
Certain officers and Trustees of the Trust are also officers or directors of the Advisor and Distributor. The compensation of the independent Trustees is borne by the Trust. The Trust also pays a portion of the Chief Compliance Officer’s compensation. These amounts are reflected as Trustee and officer fees in the Statement of Operations.
As of September 30, 2024, the percentage of direct investments in the Funds held by the Trustees, officers of the Trust, and the Advisor is approximately as follows.
264 | Annual Financial Statements
Notes to Financial Statements, Continued
September 30, 2024
| | | PERCENTAGE OF DIRECT INVESTMENTS |
| Short Duration Municipal Fund | | 69.79 | % |
| Limited Term Municipal Fund | | 6.82 | |
| Intermediate Municipal Fund | | 0.25 | |
| Strategic Municipal Income Fund | | 8.93 | |
| Limited Term California Fund | | — | |
| Intermediate New Mexico Fund | | 21.76 | |
| Intermediate New York Fund | | — | |
The Funds may purchase or sell securities from or to an affiliated fund, provided the affiliation is due solely to having a common investment advisor, common officers, or common trustees, and provided that all such transactions will comply with Rule 17a-7 under the 1940 Act. For the year ended September 30, 2024 the Rule 17a-7 purchases, sales and gains/(losses) were as follows.
| | | PURCHASES | | | SALES | | | | REALIZED GAINS/(LOSSES) |
| Short Duration Municipal Fund | | $ | 10,276,346 | | | $ | 22,890,920 | | | $ | (273,821 | ) |
| Limited Term Municipal Fund | | | 67,842,309 | | | | 49,488,427 | | | | (1,030,848 | ) |
| Intermediate Municipal Fund | | | 41,316,933 | | | | 13,251,629 | | | | (207,808 | ) |
| Strategic Municipal Income Fund | | | 3,721,235 | | | | 13,709,708 | | | | (281,937 | ) |
| Limited Term California Fund | | | 10,898,391 | | | | 18,995,097 | | | | (202,342 | ) |
| Intermediate New Mexico Fund | | | 1,580,340 | | | | 18,485,597 | | | | (803,629 | ) |
| Intermediate New York Fund | | | 1,393,260 | | | | 207,437 | | | | (2,075 | ) |
NOTE 5 – TAXES
Federal Income Taxes: It is the policy of the Trust to comply with the provisions of the Internal Revenue Code of 1986 applicable to regulated investment companies and to distribute to shareholders substantially all investment company taxable income including net realized gains on investments (if any), and tax exempt income of the Funds. Therefore, no provision for federal income or excise tax is required.
The Funds file income tax returns in United States federal and applicable state jurisdictions. The statute of limitations on the Funds’ tax return filings generally remains open for the three years following a return’s filing date. The Funds have analyzed each uncertain tax position believed to be material in the preparation of the Funds’ financial statements for the fiscal year ended September 30, 2024, including open tax years, to assess whether it is more likely than not that the position would be sustained upon examination, based on the technical merits of the position. The Funds have not identified any such position for which an asset or liability must be reflected in the Statements of Assets and Liabilities.
At September 30, 2024, information on the tax components of capital was as follows:
| | | COST | | | UNREALIZED
APPRECIATION | | | UNREALIZED
DEPRECIATION | | | NET UNREALIZED
APPRECIATION
(DEPRECIATION) |
| Short Duration Municipal Fund | | $ | 119,113,766 | | | $ | 1,182,891 | | | $ | (69,389 | ) | | $ | 1,113,502 |
| Limited Term Municipal Fund | | | 2,395,317,668 | | | | 73,245,036 | | | | (414,679 | ) | | | 72,830,357 |
| Intermediate Municipal Fund | | | 975,516,949 | | | | 33,171,282 | | | | (199,337 | ) | | | 32,971,945 |
| Strategic Municipal Income Fund | | | 306,749,870 | | | | 12,454,337 | | | | (174,988 | ) | | | 12,279,349 |
| Limited Term California Fund | | | 262,046,774 | | | | 6,314,105 | | | | (76,203 | ) | | | 6,237,902 |
| Intermediate New Mexico Fund | | | 94,307,018 | | | | 1,572,897 | | | | (31,266 | ) | | | 1,541,631 |
| Intermediate New York Fund | | | 24,774,212 | | | | 462,740 | | | | (4,522 | ) | | | 458,218 |
At September 30, 2024, the Funds had cumulative tax basis capital losses from prior fiscal years as shown on the following table, which may be carried forward to offset future capital gains. To the extent such carryforwards are used, capital gain distributions may be reduced to the extent provided by regulations. Such capital loss carryforwards do not expire.
| | | | CUMULATIVE CAPITAL LOSSES |
| | | SHORT-TERM | | | LONG-TERM |
| Short Duration Municipal Fund | | $ | 3,986,280 | | | $ | 3,617,849 |
| Limited Term Municipal Fund | | | 125,240,030 | | | | 135,963,753 |
| Intermediate Municipal Fund | | | 17,852,819 | | | | 22,194,845 |
| Strategic Municipal Income Fund | | | 11,245,641 | | | | 12,830,152 |
| Limited Term California Fund | | | 7,233,740 | | | | 11,065,017 |
Annual Financial Statements | 265
Notes to Financial Statements, Continued
September 30, 2024
| | | CUMULATIVE CAPITAL LOSSES |
| | | SHORT-TERM | | | LONG-TERM |
| Intermediate New Mexico Fund | | $ | 880,696 | | | $ | 4,568,229 |
| Intermediate New York Fund | | | 564,805 | | | | 749,712 |
During the year ended September 30, 2024, the Funds utilized capital loss carryforwards as shown on the following table.
| | UTILIZED CAPITAL LOSS CARRYFORWARDS |
| Intermediate New York Fund | | $ 18,357 |
At September 30, 2024 the Funds had undistributed net tax-exempt income, undistributed tax basis net ordinary income and undistributed tax basis capital gains as follows:
| | | UNDISTRIBUTED NET | | UNDISTRIBUTED TAX BASIS | | UNDISTRIBUTED TAX BASIS |
| | | TAX EXEMPT INCOME | | ORDINARY INCOME | | CAPITAL GAINS |
| Short Duration Municipal Fund | | $ | 119,649 | | | $ | — | | | $ | — | |
| Limited Term Municipal Fund | | | 152,796 | | | | — | | | | — | |
| Intermediate Municipal Fund | | | 420,761 | | | | — | | | | — | |
| Strategic Municipal Income Fund | | | 11,905 | | | | — | | | | — | |
| Limited Term California Fund | | | 85,243 | | | | — | | | | — | |
| Intermediate New Mexico Fund | | | 3,952 | | | | — | | | | — | |
| Intermediate New York Fund | | | 170 | | | | — | | | | — | |
The tax character of distributions paid for the Funds during the years ended September 30, 2024, and September 30, 2023, were as follows:
| | | DISTRIBUTIONS FROM: | |
| | | TAX EXEMPT INCOME | | | ORDINARY INCOME | |
| | | 2024 | | | 2023 | | | 2024 | | | 2023 | |
| Short Duration Municipal Fund | | $ | 3,993,892 | | | $ | 4,276,444 | | | $ | 72,534 | | | $ | 38,019 | |
| Limited Term Municipal Fund | | | 83,020,456 | | | | 87,245,566 | | | | 1,030,782 | | | | 936,401 | |
| Intermediate Municipal Fund | | | 33,428,055 | | | | 28,003,870 | | | | 706,829 | | | | 703,971 | |
| Strategic Municipal Income Fund | | | 10,989,622 | | | | 9,726,714 | | | | 400,835 | | | | 333,430 | |
| Limited Term California Fund | | | 8,061,198 | | | | 7,574,144 | | | | 207,921 | | | | 202,289 | |
| Intermediate New Mexico Fund | | | 2,688,653 | | | | 2,353,508 | | | | 31,020 | | | | 30,245 | |
| Intermediate New York Fund | | | 734,222 | | | | 672,810 | | | | 8,429 | | | | 5,178 | |
NOTE 6 – SHARES OF BENEFICIAL INTEREST
At September 30, 2024, there were an unlimited number of shares of each Fund with no par value of beneficial interest authorized. Transactions in each Fund’s shares of beneficial interest were as follows:
| | | YEAR ENDED | | | YEAR ENDED | |
| | | SEPTEMBER 30, 2024 | | | SEPTEMBER 30, 2023 | |
| SHORT DURATION MUNICIPAL FUND | | SHARES | | | AMOUNT | | | SHARES | | | AMOUNT | |
| Class A Shares | | | | | | | | | | | | |
| Shares sold | | | 83,080 | | | $ | 980,177 | | | | 770,467 | | | $ | 9,099,088 | |
| Shares issued to shareholders in reinvestment of dividends | | | 20,303 | | | | 241,580 | | | | 30,366 | | | | 360,159 | |
| Shares repurchased | | | (727,625 | ) | | | (8,644,289 | ) | | | (1,348,494 | ) | | | (16,004,733 | ) |
| Net increase (decrease) | | | (624,242 | ) | | $ | (7,422,532 | ) | | | (547,661 | ) | | $ | (6,545,486 | ) |
| | | | | | | | | | | | | | | | | |
| Class I Shares | | | | | | | | | | | | | | | | |
| Shares sold | | | 252,397 | | | $ | 2,994,028 | | | | 5,612,475 | | | $ | 66,530,697 | |
| Shares issued to shareholders in reinvestment of dividends | | | 195,524 | | | | 2,326,782 | | | | 240,300 | | | | 2,849,344 | |
| Shares repurchased | | | (2,264,393 | ) | | | (26,826,293 | ) | | | (7,389,911 | ) | | | (87,662,181 | ) |
| Net increase (decrease) | | | (1,816,472 | ) | | $ | (21,505,483 | ) | | | (1,537,136 | ) | | $ | (18,282,140 | ) |
266 | Annual Financial Statements
Notes to Financial Statements, Continued
September 30, 2024
| | | YEAR ENDED | | | YEAR ENDED | |
| | | SEPTEMBER 30, 2024 | | | SEPTEMBER 30, 2023 | |
| LIMITED TERM MUNICIPAL FUND | | SHARES | | | AMOUNT | | | SHARES | | | AMOUNT | |
| Class A Shares | | | | | | | | | | | | |
| Shares sold | | | 2,820,914 | | | $ | 38,096,955 | | | | 6,556,278 | | | $ | 88,290,088 | |
| Shares issued to shareholders in reinvestment of dividends | | | 1,146,065 | | | | 15,506,725 | | | | 1,121,568 | | | | 15,086,727 | |
| Shares repurchased | | | (10,658,521 | ) | | | (144,036,098 | ) | | | (18,280,941 | ) | | | (245,873,597 | ) |
| Net increase (decrease) | | | (6,691,542 | ) | | $ | (90,432,418 | ) | | | (10,603,095 | ) | | $ | (142,496,782 | ) |
| | | | | | | | | | | | | | | | | |
| Class C Shares | | | | | | | | | | | | | | | | |
| Shares sold | | | 166,854 | | | $ | 2,266,121 | | | | 371,585 | | | $ | 5,009,348 | |
| Shares issued to shareholders in reinvestment of dividends | | | 92,961 | | | | 1,259,673 | | | | 113,301 | | | | 1,526,706 | |
| Shares repurchased | | | (1,889,926 | ) | | | (25,545,100 | ) | | | (2,822,351 | ) | | | (38,043,451 | ) |
| Net increase (decrease) | | | (1,630,111 | ) | | $ | (22,019,306 | ) | | | (2,337,465 | ) | | $ | (31,507,397 | ) |
| | | | | | | | | | | | | | | | | |
| Class C2 Shares | | | | | | | | | | | | | | | | |
| Shares sold | | | 21,379 | | | $ | 290,228 | | | | 40,364 | | | $ | 540,715 | |
| Shares issued to shareholders in reinvestment of dividends | | | 5,468 | | | | 74,109 | | | | 6,067 | | | | 81,756 | |
| Shares repurchased | | | (96,549 | ) | | | (1,307,884 | ) | | | (133,724 | ) | | | (1,804,464 | ) |
| Net increase (decrease) | | | (69,702 | ) | | $ | (943,547 | ) | | | (87,293 | ) | | $ | (1,181,993 | ) |
| | | | | | | | | | | | | | | | | |
| Class I Shares | | | | | | | | | | | | | | | | |
| Shares sold | | | 29,611,993 | | | $ | 400,369,449 | | | | 63,184,332 | | | $ | 850,921,981 | |
| Shares issued to shareholders in reinvestment of dividends | | | 4,386,113 | | | | 59,348,527 | | | | 4,723,244 | | | | 63,533,966 | |
| Shares repurchased | | | (69,401,713 | ) | | | (936,899,772 | ) | | | (131,709,944 | ) | | | (1,770,845,383 | ) |
| Net increase (decrease) | | | (35,403,607 | ) | | $ | (477,181,796 | ) | | | (63,802,368 | ) | | $ | (856,389,436 | ) |
| | | YEAR ENDED | | | YEAR ENDED | |
| | | SEPTEMBER 30, 2024 | | | SEPTEMBER 30, 2023 | |
| INTERMEDIATE MUNICIPAL FUND | | SHARES | | | AMOUNT | | | SHARES | | | AMOUNT | |
| Class A Shares | | | | | | | | | | | | |
| Shares sold | | | 2,865,862 | | | $ | 37,742,830 | | | | 5,073,658 | | | $ | 66,223,527 | |
| Shares issued to shareholders in reinvestment of dividends | | | 610,283 | | | | 8,044,769 | | | | 589,411 | | | | 7,682,624 | |
| Shares repurchased | | | (4,689,890 | ) | | | (61,650,532 | ) | | | (6,218,714 | ) | | | (81,093,505 | ) |
| Net increase (decrease) | | | (1,213,745 | ) | | $ | (15,862,933 | ) | | | (555,645 | ) | | $ | (7,187,354 | ) |
| | | | | | | | | | | | | | | | | |
| Class C Shares | | | | | | | | | | | | | | | | |
| Shares sold | | | 138,168 | | | $ | 1,824,372 | | | | 291,664 | | | $ | 3,802,556 | |
| Shares issued to shareholders in reinvestment of dividends | | | 30,557 | | | | 403,093 | | | | 34,603 | | | | 451,628 | |
| Shares repurchased | | | (475,714 | ) | | | (6,256,851 | ) | | | (762,674 | ) | | | (9,952,826 | ) |
| Net increase (decrease) | | | (306,989 | ) | | $ | (4,029,386 | ) | | | (436,407 | ) | | $ | (5,698,642 | ) |
| | | | | | | | | | | | | | | | | |
| Class C2 Shares | | | | | | | | | | | | | | | | |
| Shares sold | | | 49,503 | | | $ | 649,410 | | | | 41,998 | | | $ | 551,057 | |
| Shares issued to shareholders in reinvestment of dividends | | | 3,834 | | | | 50,648 | | | | 3,098 | | | | 40,438 | |
| Shares repurchased | | | (59,026 | ) | | | (782,957 | ) | | | (45,707 | ) | | | (589,669 | ) |
| Net increase (decrease) | | | (5,689 | ) | | $ | (82,899 | ) | | | (611 | ) | | $ | 1,826 | |
Annual Financial Statements | 267
Notes to Financial Statements, Continued
September 30, 2024
| | | YEAR ENDED | | | YEAR ENDED | |
| | | SEPTEMBER 30, 2024 | | | SEPTEMBER 30, 2023 | |
| INTERMEDIATE MUNICIPAL FUND | | SHARES | | | AMOUNT | | | SHARES | | | AMOUNT | |
| Class I Shares | | | | | | | | | | | | |
| Shares sold | | | 22,582,199 | | | $ | 297,324,990 | | | | 23,818,200 | | | $ | 310,040,322 | |
| Shares issued to shareholders in reinvestment of dividends | | | 1,529,407 | | | | 20,149,283 | | | | 1,202,918 | | | | 15,662,375 | |
| Shares repurchased | | | (14,279,716 | ) | | | (186,903,978 | ) | | | (22,496,384 | ) | | | (293,219,931 | ) |
| Net increase (decrease) | | | 9,831,890 | | | $ | 130,570,295 | | | | 2,524,734 | | | $ | 32,482,766 | |
| | | YEAR ENDED | | | YEAR ENDED | |
| | | SEPTEMBER 30, 2024 | | | SEPTEMBER 30, 2023 | |
| STRATEGIC MUNICIPAL INCOME FUND | | SHARES | | | AMOUNT | | | SHARES | | | AMOUNT | |
| Class A Shares | | | | | | | | | | | | |
| Shares sold | | | 928,851 | | | $ | 12,883,229 | | | | 1,778,612 | | | $ | 24,523,113 | |
| Shares issued to shareholders in reinvestment of dividends | | | 167,962 | | | | 2,351,365 | | | | 140,576 | | | | 1,937,301 | |
| Shares repurchased | | | (786,892 | ) | | | (10,976,988 | ) | | | (1,513,130 | ) | | | (20,792,925 | ) |
| Net increase (decrease) | | | 309,921 | | | $ | 4,257,606 | | | | 406,058 | | | $ | 5,667,489 | |
| | | | | | | | | | | | | | | | | |
| Class C Shares | | | | | | | | | | | | | | | | |
| Shares sold | | | 92,456 | | | $ | 1,285,508 | | | | 68,747 | | | $ | 942,034 | |
| Shares issued to shareholders in reinvestment of dividends | | | 9,875 | | | | 138,222 | | | | 11,464 | | | | 158,006 | |
| Shares repurchased | | | (187,087 | ) | | | (2,627,407 | ) | | | (320,725 | ) | | | (4,426,872 | ) |
| Net increase (decrease) | | | (84,756 | ) | | $ | (1,203,677 | ) | | | (240,514 | ) | | $ | (3,326,832 | ) |
| | | | | | | | | | | | | | | | | |
| Class I Shares | | | | | | | | | | | | | | | | |
| Shares sold | | | 5,833,470 | | | $ | 81,239,072 | | | | 9,311,440 | | | $ | 128,025,135 | |
| Shares issued to shareholders in reinvestment of dividends | | | 630,368 | | | | 8,829,398 | | | | 572,986 | | | | 7,901,463 | |
| Shares repurchased | | | (6,037,501 | ) | | | (83,851,832 | ) | | | (10,444,002 | ) | | | (143,385,333 | ) |
| Net increase (decrease) | | | 426,337 | | | $ | 6,216,638 | | | | (559,576 | ) | | $ | (7,458,735 | ) |
| | | YEAR ENDED | | | YEAR ENDED | |
| | | SEPTEMBER 30, 2024 | | | SEPTEMBER 30, 2023 | |
| LIMITED TERM CALIFORNIA FUND | | SHARES | | | AMOUNT | | | SHARES | | | AMOUNT | |
| Class A Shares | | | | | | | | | | | | |
| Shares sold | | | 389,917 | | | $ | 4,990,232 | | | | 432,078 | | | $ | 5,528,145 | |
| Shares issued to shareholders in reinvestment of dividends | | | 118,342 | | | | 1,522,036 | | | | 111,835 | | | | 1,428,549 | |
| Shares repurchased | | | (1,255,859 | ) | | | (16,155,951 | ) | | | (1,457,276 | ) | | | (18,654,913 | ) |
| Net increase (decrease) | | | (747,600 | ) | | $ | (9,643,683 | ) | | | (913,363 | ) | | $ | (11,698,219 | ) |
| | | | | | | | | | | | | | | | | |
| Class C Shares | | | | | | | | | | | | | | | | |
| Shares sold | | | 4,047 | | | $ | 52,039 | | | | 12,919 | | | $ | 164,839 | |
| Shares issued to shareholders in reinvestment of dividends | | | 2,960 | | | | 38,084 | | | | 5,392 | | | | 68,954 | |
| Shares repurchased | | | (144,134 | ) | | | (1,857,060 | ) | | | (261,563 | ) | | | (3,345,517 | ) |
| Net increase (decrease) | | | (137,127 | ) | | $ | (1,766,937 | ) | | | (243,252 | ) | | $ | (3,111,724 | ) |
| | | | | | | | | | | | | | | | | |
| Class C2 Shares | | | | | | | | | | | | | | | | |
| Shares sold | | | 29,957 | | | $ | 382,773 | | | | 789 | | | $ | 9,993 | |
| Shares issued to shareholders in reinvestment of dividends | | | 786 | | | | 10,133 | | | | 221 | | | | 2,825 | |
| Shares repurchased | | | (1,795 | ) | | | (23,086 | ) | | | (34 | ) | | | (442 | ) |
| Net increase (decrease) | | | 28,948 | | | $ | 369,820 | | | | 976 | | | $ | 12,376 | |
268 | Annual Financial Statements
Notes to Financial Statements, Continued
September 30, 2024
| | | YEAR ENDED | | | YEAR ENDED | |
| | | SEPTEMBER 30, 2024 | | | SEPTEMBER 30, 2023 | |
| LIMITED TERM CALIFORNIA FUND | | SHARES | | | AMOUNT | | | SHARES | | | AMOUNT | |
| Class I Shares | | | | | | | | | | | | |
| Shares sold | | | 7,030,536 | | | $ | 89,998,482 | | | | 6,688,914 | | | $ | 85,430,741 | |
| Shares issued to shareholders in reinvestment of dividends | | | 448,614 | | | | 5,778,722 | | | | 416,213 | | | | 5,322,522 | |
| Shares repurchased | | | (7,558,676 | ) | | | (97,101,448 | ) | | | (12,736,859 | ) | | | (162,776,237 | ) |
| Net increase (decrease) | | | (79,526 | ) | | $ | (1,324,244 | ) | | | (5,631,732 | ) | | $ | (72,022,974 | ) |
| | | YEAR ENDED | | | YEAR ENDED | |
| | | SEPTEMBER 30, 2024 | | | SEPTEMBER 30, 2023 | |
| INTERMEDIATE NEW MEXICO FUND | | SHARES | | | AMOUNT | | | SHARES | | | AMOUNT | |
| Class A Shares | | | | | | | | | | | | |
| Shares sold | | | 60,975 | | | $ | 759,680 | | | | 131,430 | | | $ | 1,630,549 | |
| Shares issued to shareholders in reinvestment of dividends | | | 78,372 | | | | 970,653 | | | | 72,302 | | | | 890,105 | |
| Shares repurchased | | | (1,033,938 | ) | | | (12,759,524 | ) | | | (743,503 | ) | | | (9,135,683 | ) |
| Net increase (decrease) | | | (894,591 | ) | | $ | (11,029,191 | ) | | | (539,771 | ) | | $ | (6,615,029 | ) |
| | | | | | | | | | | | | | | | | |
| Class D Shares | | | | | | | | | | | | | | | | |
| Shares sold | | | 194 | | | $ | 2,400 | | | | 4,130 | | | $ | 51,433 | |
| Shares issued to shareholders in reinvestment of dividends | | | 12,718 | | | | 157,600 | | | | 11,529 | | | | 142,000 | |
| Shares repurchased | | | (137,546 | ) | | | (1,688,354 | ) | | | (135,532 | ) | | | (1,670,952 | ) |
| Net increase (decrease) | | | (124,634 | ) | | $ | (1,528,354 | ) | | | (119,873 | ) | | $ | (1,477,519 | ) |
| | | | | | | | | | | | | | | | | |
| Class I Shares | | | | | | | | | | | | | | | | |
| Shares sold | | | 532,926 | | | $ | 6,611,620 | | | | 357,813 | | | $ | 4,431,166 | |
| Shares issued to shareholders in reinvestment of dividends | | | 110,785 | | | | 1,371,958 | | | | 94,857 | | | | 1,167,329 | |
| Shares repurchased | | | (1,061,145 | ) | | | (13,117,470 | ) | | | (855,053 | ) | | | (10,523,451 | ) |
| Net increase (decrease) | | | (417,434 | ) | | $ | (5,133,892 | ) | | | (402,383 | ) | | $ | (4,924,956 | ) |
| | | YEAR ENDED | | | YEAR ENDED | |
| | | SEPTEMBER 30, 2024 | | | SEPTEMBER 30, 2023 | |
| INTERMEDIATE NEW YORK FUND | | SHARES | | | AMOUNT | | | SHARES | | | AMOUNT | |
| Class A Shares | | | | | | | | | | | | |
| Shares sold | | | 31,434 | | | $ | 375,050 | | | | 55,967 | | | $ | 661,805 | |
| Shares issued to shareholders in reinvestment of dividends | | | 26,170 | | | | 313,597 | | | | 24,387 | | | | 289,441 | |
| Shares repurchased | | | (132,861 | ) | | | (1,585,847 | ) | | | (252,591 | ) | | | (2,992,400 | ) |
| Net increase (decrease) | | | (75,257 | ) | | $ | (897,200 | ) | | | (172,237 | ) | | $ | (2,041,154 | ) |
| | | | | | | | | | | | | | | | | |
| Class I Shares | | | | | | | | | | | | | | | | |
| Shares sold | | | 316,003 | | | $ | 3,781,567 | | | | 375,693 | | | $ | 4,462,151 | |
| Shares issued to shareholders in reinvestment of dividends | | | 26,951 | | | | 322,961 | | | | 23,831 | | | | 282,778 | |
| Shares repurchased | | | (346,068 | ) | | | (4,121,509 | ) | | | (609,238 | ) | | | (7,200,017 | ) |
| Net increase (decrease) | | | (3,114 | ) | | $ | (16,981 | ) | | | (209,714 | ) | | $ | (2,455,088 | ) |
NOTE 7 – INVESTMENT TRANSACTIONS
For the year ended September 30, 2024, the Funds had purchase and sale transactions of investments as listed in the table below (excluding short-term investments).
Annual Financial Statements | 269
Notes to Financial Statements, Continued
September 30, 2024
| | | PURCHASES | | | SALES |
| Short Duration Municipal Fund | | $ | 71,809,824 | | | $ | 81,008,927 |
| Limited Term Municipal Fund | | | 1,006,107,903 | | | | 1,507,676,111 |
| Intermediate Municipal Fund | | | 393,789,233 | | | | 265,751,774 |
| Strategic Municipal Income Fund | | | 89,628,626 | | | | 69,081,072 |
| Limited Term California Fund | | | 120,945,685 | | | | 120,756,940 |
| Intermediate New Mexico Fund | | | 18,783,497 | | | | 37,889,480 |
| Intermediate New York Fund | | | 4,815,481 | | | | 5,635,668 |
270 | Annual Financial Statements
This page intentionally left blank.
Annual Financial Statements | 271
Financial Highlights
Short Duration Municipal Fund
| | | | | PER SHARE PERFORMANCE (FOR A SHARE OUTSTANDING THROUGHOUT THE YEAR) | | | | |
UNLESS OTHERWISE
NOTED, PERIODS ARE
FISCAL YEARS ENDED
SEPTEMBER 30, | | NET ASSET
VALUE,
BEGINNING
OF YEAR | | NET
INVESTMENT
INCOME
(LOSS)+ | | NET REALIZED &
UNREALIZED
GAIN (LOSS) ON
INVESTMENTS | | TOTAL FROM
INVESTMENT
OPERATIONS | | DIVIDENDS
FROM NET
INVESTMENT
INCOME | | DIVIDENDS
FROM NET
REALIZED
GAINS | | DIVIDENDS
FROM
RETURN OF
CAPITAL | | TOTAL
DIVIDENDS | | NET ASSET
VALUE,
END OF
YEAR |
| |
| CLASS A SHARES(b) |
| |
| | 2024 | | $ | 11.76 | | | | 0.36 | | | | 0.23 | | | | 0.59 | | | | (0.36 | ) | | | — | | | | — | | | | (0.36 | ) | | $ | 11.99 | |
| | 2023 | | $ | 11.77 | | | | 0.27 | | | | — | | | | 0.27 | | | | (0.28 | ) | | | — | | | | — | | | | (0.28 | ) | | $ | 11.76 | |
| | 2022 | | $ | 12.33 | | | | 0.09 | | | | (0.57 | ) | | | (0.48 | ) | | | (0.08 | ) | | | — | | | | — | | | | (0.08 | ) | | $ | 11.77 | |
| | 2021 | | $ | 12.37 | | | | 0.03 | | | | (0.04 | ) | | | (0.01 | ) | | | (0.03 | ) | | | — | | | | — | | | | (0.03 | ) | | $ | 12.33 | |
| | 2020 | | $ | 12.36 | | | | 0.13 | | | | 0.01 | | | | 0.14 | | | | (0.13 | ) | | | — | | | | — | | | | (0.13 | ) | | $ | 12.37 | |
| | | | | | | | | | | | | | | | | | | | | | | | | | | | | | | | | | | | | | |
| CLASS I SHARES |
| |
| | 2024 | | $ | 11.75 | | | | 0.39 | | | | 0.23 | | | | 0.62 | | | | (0.39 | ) | | | — | | | | — | | | | (0.39 | ) | | $ | 11.98 | |
| | 2023 | | $ | 11.76 | | | | 0.30 | | | | (0.01 | ) | | | 0.29 | | | | (0.30 | ) | | | — | | | | — | | | | (0.30 | ) | | $ | 11.75 | |
| | 2022 | | $ | 12.33 | | | | 0.11 | | | | (0.57 | ) | | | (0.46 | ) | | | (0.11 | ) | | | — | | | | — | | | | (0.11 | ) | | $ | 11.76 | |
| | 2021 | | $ | 12.36 | | | | 0.06 | | | | (0.03 | ) | | | 0.03 | | | | (0.06 | ) | | | — | | | | — | | | | (0.06 | ) | | $ | 12.33 | |
| | 2020 | | $ | 12.36 | | | | 0.16 | | | | (0.01 | ) | | | 0.15 | | | | (0.15 | ) | | | — | | | | — | | | | (0.15 | ) | | $ | 12.36 | |
| (a) | Not annualized for periods less than one year. |
| (b) | Sales loads are not reflected in computing total return. |
| + | Based on weighted average shares outstanding. |
See notes to financial statements.
272 | Annual Financial Statements
Financial Highlights, Continued
Short Duration Municipal Fund
| | | RATIOS TO AVERAGE NET ASSETS | | SUPPLEMENTAL DATA |
UNLESS OTHERWISE
NOTED, PERIODS ARE
FISCAL YEARS ENDED
SEPTEMBER 30, | | NET INVESTMENT
INCOME (LOSS) (%) | | EXPENSES, AFTER
EXPENSE
REDUCTIONS (%) | | EXPENSES,
BEFORE EXPENSE
REDUCTIONS (%) | | TOTAL
RETURN (%)(a) | | PORTFOLIO
TURNOVER
RATE (%)(a) | | NET
ASSETS
AT END OF YEAR
(THOUSANDS) |
| |
| CLASS A SHARES(b) |
| | | | | | | | | | | | | | | | | | | | | | | | | | |
| | 2024 | | | 3.04 | | | | 0.70 | | | | 1.23 | | | | 5.12 | | | | 63.53 | | | $ | 6,367 | |
| | 2023 | | | 2.29 | | | | 0.70 | | | | 1.06 | | | | 2.29 | | | | 56.32 | | | $ | 13,585 | |
| | 2022 | | | 0.71 | | | | 0.70 | | | | 1.10 | | | | (3.88 | ) | | | 89.01 | | | $ | 20,045 | |
| | 2021 | | | 0.27 | | | | 0.70 | | | | 0.98 | | | | (0.05 | ) | | | 34.71 | | | $ | 16,332 | |
| | 2020 | | | 1.04 | | | | 0.70 | | | | 1.03 | | | | 1.14 | | | | 38.44 | | | $ | 24,581 | |
| | | | | | | | | | | | | | | | | | | | | | | | | | |
| CLASS I SHARES |
| | | | | | | | | | | | | | | | | | | | | | | | | | |
| | 2024 | | | 3.26 | | | | 0.50 | | | | 0.63 | | | | 5.34 | | | | 63.53 | | | $ | 111,515 | |
| | 2023 | | | 2.52 | | | | 0.50 | | | | 0.60 | | | | 2.50 | | | | 56.32 | | | $ | 130,723 | |
| | 2022 | | | 0.88 | | | | 0.50 | | | | 0.58 | | | | (3.77 | ) | | | 89.01 | | | $ | 148,929 | |
| | 2021 | | | 0.46 | | | | 0.50 | | | | 0.65 | | | | 0.23 | | | | 34.71 | | | $ | 179,245 | |
| | 2020 | | | 1.28 | | | | 0.50 | | | | 0.65 | | | | 1.26 | | | | 38.44 | | | $ | 132,539 | |
Annual Financial Statements | 273
Financial Highlights
Limited Term Municipal Fund
| | | PER SHARE PERFORMANCE (FOR A SHARE OUTSTANDING THROUGHOUT THE YEAR) |
UNLESS OTHERWISE
NOTED, PERIODS ARE
FISCAL YEARS ENDED
SEPTEMBER 30, | | NET ASSET
VALUE,
BEGINNING
OF YEAR | | NET
INVESTMENT
INCOME
(LOSS)+ | | NET REALIZED &
UNREALIZED
GAIN (LOSS) ON
INVESTMENTS | | TOTAL FROM
INVESTMENT
OPERATIONS | | DIVIDENDS
FROM NET
INVESTMENT
INCOME | | DIVIDENDS
FROM NET
REALIZED
GAINS | | DIVIDENDS
FROM
RETURN OF
CAPITAL | | TOTAL
DIVIDENDS | | NET ASSET
VALUE,
END OF
YEAR |
| |
| CLASS A SHARES(b) |
| | | | | | | | | | | | | | | | | | | | | | | | | | | | | | | | | | | | | | |
| | 2024 | | $ | 13.19 | | | | 0.40 | | | | 0.51 | | | | 0.91 | | | | (0.41 | ) | | | — | | | | — | | | | (0.41 | ) | | $ | 13.69 | |
| | 2023 | | $ | 13.26 | | | | 0.32 | | | | (0.06 | ) | | | 0.26 | | | | (0.33 | ) | | | — | | | | — | | | | (0.33 | ) | | $ | 13.19 | |
| | 2022 | | $ | 14.51 | | | | 0.21 | | | | (1.25 | ) | | | (1.04 | ) | | | (0.21 | ) | | | — | | | | — | | | | (0.21 | ) | | $ | 13.26 | |
| | 2021 | | $ | 14.64 | | | | 0.19 | | | | (0.13 | ) | | | 0.06 | | | | (0.19 | ) | | | — | | | | — | | | | (0.19 | ) | | $ | 14.51 | |
| | 2020 | | $ | 14.46 | | | | 0.24 | | | | 0.18 | | | | 0.42 | | | | (0.24 | ) | | | — | | | | — | | | | (0.24 | ) | | $ | 14.64 | |
| |
| CLASS C SHARES |
| | | | | | | | | | | | | | | | | | | | | | | | | | | | | | | | | | | | | | |
| | 2024 | | $ | 13.21 | | | | 0.37 | | | | 0.51 | | | | 0.88 | | | | (0.37 | ) | | | — | | | | — | | | | (0.37 | ) | | $ | 13.72 | |
| | 2023 | | $ | 13.28 | | | | 0.29 | | | | (0.07 | ) | | | 0.22 | | | | (0.29 | ) | | | — | | | | — | | | | (0.29 | ) | | $ | 13.21 | |
| | 2022 | | $ | 14.53 | | | | 0.17 | | | | (1.24 | ) | | | (1.07 | ) | | | (0.18 | ) | | | — | | | | — | | | | (0.18 | ) | | $ | 13.28 | |
| | 2021 | | $ | 14.66 | | | | 0.15 | | | | (0.13 | ) | | | 0.02 | | | | (0.15 | ) | | | — | | | | — | | | | (0.15 | ) | | $ | 14.53 | |
| | 2020 | | $ | 14.48 | | | | 0.20 | | | | 0.18 | | | | 0.38 | | | | (0.20 | ) | | | — | | | | — | | | | (0.20 | ) | | $ | 14.66 | |
| |
| CLASS C2 SHARES |
| | | | | | | | | | | | | | | | | | | | | | | | | | | | | | | | | | | | | | |
| | 2024 | | $ | 13.21 | | | | 0.34 | | | | 0.51 | | | | 0.85 | | | | (0.34 | ) | | | — | | | | — | | | | (0.34 | ) | | $ | 13.72 | |
| | 2023 | | $ | 13.28 | | | | 0.26 | | | | (0.07 | ) | | | 0.19 | | | | (0.26 | ) | | | — | | | | — | | | | (0.26 | ) | | $ | 13.21 | |
| | 2022 | | $ | 14.54 | | | | 0.14 | | | | (1.26 | ) | | | (1.12 | ) | | | (0.14 | ) | | | — | | | | — | | | | (0.14 | ) | | $ | 13.28 | |
| | 2021(c) | | $ | 14.66 | | | | 0.10 | | | | (0.12 | ) | | | (0.02 | ) | | | (0.10 | ) | | | — | | | | — | | | | (0.10 | ) | | $ | 14.54 | |
| |
| CLASS I SHARES |
| | | | | | | | | | | | | | | | | | | | | | | | | | | | | | | | | | | | | | |
| | 2024 | | $ | 13.19 | | | | 0.44 | | | | 0.50 | | | | 0.94 | | | | (0.44 | ) | | | — | | | | — | | | | (0.44 | ) | | $ | 13.69 | |
| | 2023 | | $ | 13.26 | | | | 0.35 | | | | (0.06 | ) | | | 0.29 | | | | (0.36 | ) | | | — | | | | — | | | | (0.36 | ) | | $ | 13.19 | |
| | 2022 | | $ | 14.51 | | | | 0.24 | | | | (1.25 | ) | | | (1.01 | ) | | | (0.24 | ) | | | — | | | | — | | | | (0.24 | ) | | $ | 13.26 | |
| | 2021 | | $ | 14.64 | | | | 0.22 | | | | (0.13 | ) | | | 0.09 | | | | (0.22 | ) | | | — | | | | — | | | | (0.22 | ) | | $ | 14.51 | |
| | 2020 | | $ | 14.46 | | | | 0.27 | | | | 0.18 | | | | 0.45 | | | | (0.27 | ) | | | — | | | | — | | | | (0.27 | ) | | $ | 14.64 | |
| (a) | Not annualized for periods less than one year. |
| (b) | Sales loads are not reflected in computing total return. |
| (c) | Effective date of this class of shares was October 1, 2020. |
| + | Based on weighted average shares outstanding. |
See notes to financial statements.
274 | Annual Financial Statements
Financial Highlights, Continued
Limited Term Municipal Fund
| | | RATIOS TO AVERAGE NET ASSETS | | SUPPLEMENTAL DATA |
UNLESS OTHERWISE
NOTED, PERIODS ARE
FISCAL YEARS ENDED
SEPTEMBER 30, | | NET INVESTMENT
INCOME (LOSS) (%) | | EXPENSES, AFTER
EXPENSE
REDUCTIONS (%) | | EXPENSES,
BEFORE EXPENSE
REDUCTIONS (%) | | TOTAL
RETURN (%)(a) | | PORTFOLIO
TURNOVER
RATE (%)(a) | | NET
ASSETS
AT END OF YEAR
(THOUSANDS) |
| |
| CLASS A SHARES(b) |
| | | | | | | | | | | | | | | | | | | | | | | | | | |
| | 2024 | | | 2.99 | | | | 0.77 | | | | 0.77 | | | | 6.94 | | | | 39.61 | | | $ | 543,244 | |
| | 2023 | | | 2.40 | | | | 0.74 | | | | 0.74 | | | | 1.91 | | | | 37.26 | | | $ | 611,338 | |
| | 2022 | | | 1.51 | | | | 0.71 | | | | 0.71 | | | | (7.20 | ) | | | 37.69 | | | $ | 755,222 | |
| | 2021 | | | 1.28 | | | | 0.69 | | | | 0.69 | | | | 0.39 | | | | 22.29 | | | $ | 978,221 | |
| | 2020 | | | 1.63 | | | | 0.69 | | | | 0.69 | | | | 2.91 | | | | 20.62 | | | $ | 942,857 | |
| |
| CLASS C SHARES |
| | | | | | | | | | | | | | | | | | | | | | | | | | |
| | 2024 | | | 2.70 | | | | 1.04 | | | | 1.04 | | | | 6.72 | | | | 39.61 | | | $ | 39,586 | |
| | 2023 | | | 2.15 | | | | 0.98 | | | | 0.98 | | | | 1.66 | | | | 37.26 | | | $ | 59,652 | |
| | 2022 | | | 1.23 | | | | 0.97 | | | | 0.97 | | | | (7.43 | ) | | | 37.69 | | | $ | 91,018 | |
| | 2021 | | | 1.00 | | | | 0.97 | | | | 0.97 | | | | 0.11 | | | | 22.29 | | | $ | 146,806 | |
| | 2020 | | | 1.39 | | | | 0.94 | | | | 0.94 | | | | 2.65 | | | | 20.62 | | | $ | 231,226 | |
| |
| CLASS C2 SHARES |
| | | | | | | | | | | | | | | | | | | | | | | | | | |
| | 2024 | | | 2.50 | | | | 1.24 | | | | 1.72 | | | | 6.51 | | | | 39.61 | | | $ | 2,695 | |
| | 2023 | | | 1.89 | | | | 1.24 | | | | 1.67 | | | | 1.39 | | | | 37.26 | | | $ | 3,516 | |
| | 2022 | | | 0.99 | | | | 1.24 | | | | 1.48 | | | | (7.74 | ) | | | 37.69 | | | $ | 4,695 | |
| | 2021(c) | | | 0.69 | | | | 1.24 | | | | 1.72 | | | | (0.11 | ) | | | 22.29 | | | $ | 5,477 | |
| |
| CLASS I SHARES |
| | | | | | | | | | | | | | | | | | | | | | | | | | |
| | 2024 | | | 3.24 | | | | 0.51 | | | | 0.51 | | | | 7.22 | | | | 39.61 | | | $ | 1,907,395 | |
| | 2023 | | | 2.62 | | | | 0.51 | | | | 0.51 | | | | 2.14 | | | | 37.26 | | | $ | 2,303,573 | |
| | 2022 | | | 1.72 | | | | 0.48 | | | | 0.48 | | | | (6.99 | ) | | | 37.69 | | | $ | 3,162,018 | |
| | 2021 | | | 1.50 | | | | 0.46 | | | | 0.46 | | | | 0.61 | | | | 22.29 | | | $ | 4,502,575 | |
| | 2020 | | | 1.87 | | | | 0.46 | | | | 0.46 | | | | 3.15 | | | | 20.62 | | | $ | 4,566,389 | |
Annual Financial Statements | 275
Financial Highlights
Intermediate Municipal Fund
| | | PER SHARE PERFORMANCE (FOR A SHARE OUTSTANDING THROUGHOUT THE YEAR) |
UNLESS OTHERWISE
NOTED, PERIODS ARE
FISCAL YEARS ENDED
SEPTEMBER 30, | | NET ASSET
VALUE,
BEGINNING
OF YEAR | | NET
INVESTMENT
INCOME
(LOSS)+ | | NET REALIZED &
UNREALIZED
GAIN (LOSS) ON
INVESTMENTS | | TOTAL FROM
INVESTMENT
OPERATIONS | | DIVIDENDS
FROM NET
INVESTMENT
INCOME | | DIVIDENDS
FROM NET
REALIZED
GAINS | | DIVIDENDS
FROM
RETURN OF
CAPITAL | | TOTAL
DIVIDENDS | | NET ASSET
VALUE,
END OF
YEAR |
| |
| CLASS A SHARES(b) |
| | | | | | | | | | | | | | | | | | | | | | | | | | | | | | | | | | | | | | |
| | 2024 | | $ | 12.72 | | | | 0.45 | | | | 0.66 | | | | 1.11 | | | | (0.45 | ) | | | — | | | | — | | | | (0.45 | ) | | $ | 13.38 | |
| | 2023 | | $ | 12.82 | | | | 0.40 | | | | (0.10 | ) | | | 0.30 | | | | (0.40 | ) | | | — | | | | — | | | | (0.40 | ) | | $ | 12.72 | |
| | 2022 | | $ | 14.35 | | | | 0.32 | | | | (1.52 | ) | | | (1.20 | ) | | | (0.33 | ) | | | — | | | | — | | | | (0.33 | ) | | $ | 12.82 | |
| | 2021 | | $ | 14.37 | | | | 0.33 | | | | (0.02 | ) | | | 0.31 | | | | (0.33 | ) | | | — | | | | — | | | | (0.33 | ) | | $ | 14.35 | |
| | 2020 | | $ | 14.33 | | | | 0.35 | | | | 0.04 | | | | 0.39 | | | | (0.35 | ) | | | — | | | | — | | | | (0.35 | ) | | $ | 14.37 | |
| |
| CLASS C SHARES |
| | | | | | | | | | | | | | | | | | | | | | | | | | | | | | | | | | | | | | |
| | 2024 | | $ | 12.73 | | | | 0.40 | | | | 0.67 | | | | 1.07 | | | | (0.40 | ) | | | — | | | | — | | | | (0.40 | ) | | $ | 13.40 | |
| | 2023 | | $ | 12.83 | | | | 0.35 | | | | (0.10 | ) | | | 0.25 | | | | (0.35 | ) | | | — | | | | — | | | | (0.35 | ) | | $ | 12.73 | |
| | 2022 | | $ | 14.37 | | | | 0.27 | | | | (1.54 | ) | | | (1.27 | ) | | | (0.27 | ) | | | — | | | | — | | | | (0.27 | ) | | $ | 12.83 | |
| | 2021 | | $ | 14.39 | | | | 0.27 | | | | (0.01 | ) | | | 0.26 | | | | (0.28 | ) | | | — | | | | — | | | | (0.28 | ) | | $ | 14.37 | |
| | 2020 | | $ | 14.35 | | | | 0.30 | | | | 0.04 | | | | 0.34 | | | | (0.30 | ) | | | — | | | | — | | | | (0.30 | ) | | $ | 14.39 | |
| |
| CLASS C2 SHARES |
| | | | | | | | | | | | | | | | | | | | | | | | | | | | | | | | | | | | | | |
| | 2024 | | $ | 12.73 | | | | 0.40 | | | | 0.67 | | | | 1.07 | | | | (0.40 | ) | | | — | | | | — | | | | (0.40 | ) | | $ | 13.40 | |
| | 2023 | | $ | 12.83 | | | | 0.35 | | | | (0.10 | ) | | | 0.25 | | | | (0.35 | ) | | | — | | | | — | | | | (0.35 | ) | | $ | 12.73 | |
| | 2022 | | $ | 14.37 | | | | 0.27 | | | | (1.54 | ) | | | (1.27 | ) | | | (0.27 | ) | | | — | | | | — | | | | (0.27 | ) | | $ | 12.83 | |
| | 2021(c) | | $ | 14.39 | | | | 0.27 | | | | (0.02 | ) | | | 0.25 | | | | (0.27 | ) | | | — | | | | — | | | | (0.27 | ) | | $ | 14.37 | |
| |
| CLASS I SHARES |
| | | | | | | | | | | | | | | | | | | | | | | | | | | | | | | | | | | | | | |
| | 2024 | | $ | 12.70 | | | | 0.48 | | | | 0.66 | | | | 1.14 | | | | (0.48 | ) | | | — | | | | — | | | | (0.48 | ) | | $ | 13.36 | |
| | 2023 | | $ | 12.80 | | | | 0.43 | | | | (0.10 | ) | | | 0.33 | | | | (0.43 | ) | | | — | | | | — | | | | (0.43 | ) | | $ | 12.70 | |
| | 2022 | | $ | 14.34 | | | | 0.36 | | | | (1.54 | ) | | | (1.18 | ) | | | (0.36 | ) | | | — | | | | — | | | | (0.36 | ) | | $ | 12.80 | |
| | 2021 | | $ | 14.35 | | | | 0.36 | | | | (0.01 | ) | | | 0.35 | | | | (0.36 | ) | | | — | | | | — | | | | (0.36 | ) | | $ | 14.34 | |
| | 2020 | | $ | 14.31 | | | | 0.38 | | | | 0.04 | | | | 0.42 | | | | (0.38 | ) | | | — | | | | — | | | | (0.38 | ) | | $ | 14.35 | |
| (a) | Not annualized for periods less than one year. |
| (b) | Sales loads are not reflected in computing total return. |
| (c) | Effective date of this class of shares was October 1, 2020. |
| + | Based on weighted average shares outstanding. |
See notes to financial statements.
276 | Annual Financial Statements
Financial Highlights, Continued
Intermediate Municipal Fund
| | | RATIOS TO AVERAGE NET ASSETS | | SUPPLEMENTAL DATA |
UNLESS OTHERWISE
NOTED, PERIODS ARE
FISCAL YEARS ENDED
SEPTEMBER 30, | | NET INVESTMENT
INCOME (LOSS) (%) | | EXPENSES, AFTER
EXPENSE
REDUCTIONS (%) | | EXPENSES,
BEFORE EXPENSE
REDUCTIONS (%) | | TOTAL
RETURN (%)(a) | | PORTFOLIO
TURNOVER
RATE (%)(a) | | NET
ASSETS
AT END OF YEAR
(THOUSANDS) |
| |
| CLASS A SHARES(b) |
| | | | | | | | | | | | | | | | | | | | | | | | | | |
| | 2024 | | | 3.43 | | | | 0.74 | | | | 0.93 | | | | 8.81 | | | | 29.65 | | | $ | 260,420 | |
| | 2023 | | | 3.06 | | | | 0.77 | | | | 0.92 | | | | 2.31 | | | | 39.98 | | | $ | 262,957 | |
| | 2022 | | | 2.37 | | | | 0.77 | | | | 0.91 | | | | (8.50 | ) | | | 19.48 | | | $ | 272,111 | |
| | 2021 | | | 2.26 | | | | 0.77 | | | | 0.91 | | | | 2.16 | | | | 10.20 | | | $ | 328,170 | |
| | 2020 | | | 2.45 | | | | 0.81 | | | | 0.90 | | | | 2.76 | | | | 17.84 | | | $ | 326,770 | |
| |
| CLASS C SHARES |
| | | | | | | | | | | | | | | | | | | | | | | | | | |
| | 2024 | | | 3.05 | | | | 1.11 | | | | 1.39 | | | | 8.49 | | | | 29.65 | | | $ | 13,044 | |
| | 2023 | | | 2.68 | | | | 1.14 | | | | 1.36 | | | | 1.93 | | | | 39.98 | | | $ | 16,306 | |
| | 2022 | | | 1.98 | | | | 1.14 | | | | 1.33 | | | | (8.89 | ) | | | 19.48 | | | $ | 22,032 | |
| | 2021 | | | 1.89 | | | | 1.14 | | | | 1.30 | | | | 1.78 | | | | 10.20 | | | $ | 34,344 | |
| | 2020 | | | 2.08 | | | | 1.18 | | | | 1.28 | | | | 2.38 | | | | 17.84 | | | $ | 52,996 | |
| |
| CLASS C2 SHARES |
| | | | | | | | | | | | | | | | | | | | | | | | | | |
| | 2024 | | | 3.05 | | | | 1.11 | | | | 2.06 | | | | 8.49 | | | | 29.65 | | | $ | 1,503 | |
| | 2023 | | | 2.70 | | | | 1.14 | | | | 2.48 | | | | 1.93 | | | | 39.98 | | | $ | 1,501 | |
| | 2022 | | | 2.00 | | | | 1.14 | | | | 2.07 | | | | (8.89 | ) | | | 19.48 | | | $ | 1,521 | |
| | 2021(c) | | | 1.85 | | | | 1.14 | | | | 2.62 | | | | 1.76 | | | | 10.20 | | | $ | 1,860 | |
| |
| CLASS I SHARES |
| | | | | | | | | | | | | | | | | | | | | | | | | | |
| | 2024 | | | 3.66 | | | | 0.50 | | | | 0.67 | | | | 9.08 | | | | 29.65 | | | $ | 745,487 | |
| | 2023 | | | 3.30 | | | | 0.53 | | | | 0.67 | | | | 2.55 | | | | 39.98 | | | $ | 583,709 | |
| | 2022 | | | 2.60 | | | | 0.53 | | | | 0.67 | | | | (8.36 | ) | | | 19.48 | | | $ | 555,898 | |
| | 2021 | | | 2.50 | | | | 0.53 | | | | 0.67 | | | | 2.47 | | | | 10.20 | | | $ | 666,356 | |
| | 2020 | | | 2.69 | | | | 0.56 | | | | 0.65 | | | | 3.01 | | | | 17.84 | | | $ | 668,185 | |
Annual Financial Statements | 277
Financial Highlights
Strategic Municipal Income Fund
| | | PER SHARE PERFORMANCE (FOR A SHARE OUTSTANDING THROUGHOUT THE YEAR) |
UNLESS OTHERWISE
NOTED, PERIODS ARE
FISCAL YEARS ENDED
SEPTEMBER 30, | | NET ASSET
VALUE,
BEGINNING
OF YEAR | | NET
INVESTMENT
INCOME
(LOSS)+ | | NET REALIZED &
UNREALIZED
GAIN (LOSS) ON
INVESTMENTS | | TOTAL FROM
INVESTMENT
OPERATIONS | | DIVIDENDS
FROM NET
INVESTMENT
INCOME | | DIVIDENDS
FROM NET
REALIZED
GAINS | | DIVIDENDS
FROM
RETURN OF
CAPITAL | | TOTAL
DIVIDENDS | | NET ASSET
VALUE,
END OF
YEAR |
| |
| CLASS A SHARES(b) |
| | | | | | | | | | | | | | | | | | | | | | | | | | | | | | | | | | | | | | |
| | 2024 | | $ | 13.39 | | | | 0.50 | | | | 0.88 | | | | 1.38 | | | | (0.50 | ) | | | — | | | | — | | | | (0.50 | ) | | $ | 14.27 | |
| | 2023 | | $ | 13.48 | | | | 0.44 | | | | (0.09 | ) | | | 0.35 | | | | (0.44 | ) | | | — | | | | — | | | | (0.44 | ) | | $ | 13.39 | |
| | 2022 | | $ | 15.43 | | | | 0.31 | | | | (1.95 | ) | | | (1.64 | ) | | | (0.31 | ) | | | — | | | | — | | | | (0.31 | ) | | $ | 13.48 | |
| | 2021 | | $ | 15.33 | | | | 0.30 | | | | 0.10 | | | | 0.40 | | | | (0.30 | ) | | | — | | | | — | | | | (0.30 | ) | | $ | 15.43 | |
| | 2020 | | $ | 15.32 | | | | 0.38 | | | | 0.01 | | | | 0.39 | | | | (0.38 | ) | | | — | | | | — | | | | (0.38 | ) | | $ | 15.33 | |
| |
| CLASS C SHARES |
| | | | | | | | | | | | | | | | | | | | | | | | | | | | | | | | | | | | | | |
| | 2024 | | $ | 13.40 | | | | 0.43 | | | | 0.89 | | | | 1.32 | | | | (0.43 | ) | | | — | | | | — | | | | (0.43 | ) | | $ | 14.29 | |
| | 2023 | | $ | 13.49 | | | | 0.37 | | | | (0.09 | ) | | | 0.28 | | | | (0.37 | ) | | | — | | | | — | | | | (0.37 | ) | | $ | 13.40 | |
| | 2022 | | $ | 15.45 | | | | 0.24 | | | | (1.96 | ) | | | (1.72 | ) | | | (0.24 | ) | | | — | | | | — | | | | (0.24 | ) | | $ | 13.49 | |
| | 2021 | | $ | 15.34 | | | | 0.23 | | | | 0.11 | | | | 0.34 | | | | (0.23 | ) | | | — | | | | — | | | | (0.23 | ) | | $ | 15.45 | |
| | 2020 | | $ | 15.34 | | | | 0.30 | | | | — | (c) | | | 0.30 | | | | (0.30 | ) | | | — | | | | — | | | | (0.30 | ) | | $ | 15.34 | |
| |
| CLASS I SHARES |
| | | | | | | | | | | | | | | | | | | | | | | | | | | | | | | | | | | | | | |
| | 2024 | | $ | 13.40 | | | | 0.53 | | | | 0.89 | | | | 1.42 | | | | (0.53 | ) | | | — | | | | — | | | | (0.53 | ) | | $ | 14.29 | |
| | 2023 | | $ | 13.49 | | | | 0.47 | | | | (0.09 | ) | | | 0.38 | | | | (0.47 | ) | | | — | | | | — | | | | (0.47 | ) | | $ | 13.40 | |
| | 2022 | | $ | 15.45 | | | | 0.34 | | | | (1.96 | ) | | | (1.62 | ) | | | (0.34 | ) | | | — | | | | — | | | | (0.34 | ) | | $ | 13.49 | |
| | 2021 | | $ | 15.34 | | | | 0.34 | | | | 0.11 | | | | 0.45 | | | | (0.34 | ) | | | — | | | | — | | | | (0.34 | ) | | $ | 15.45 | |
| | 2020 | | $ | 15.33 | | | | 0.41 | | | | 0.01 | | | | 0.42 | | | | (0.41 | ) | | | — | | | | — | | | | (0.41 | ) | | $ | 15.34 | |
| (a) | Not annualized for periods less than one year. |
| (b) | Sales loads are not reflected in computing total return. |
| (c) | Net realized and unrealized gain (loss) on investments was less than $0.01 per share. |
| + | Based on weighted average shares outstanding. |
See notes to financial statements.
278 | Annual Financial Statements
Financial Highlights, Continued
Strategic Municipal Income Fund
| | | RATIOS TO AVERAGE NET ASSETS | | SUPPLEMENTAL DATA |
UNLESS OTHERWISE
NOTED, PERIODS ARE
FISCAL YEARS ENDED
SEPTEMBER 30, | | NET INVESTMENT
INCOME (LOSS) (%) | | EXPENSES, AFTER
EXPENSE
REDUCTIONS (%) | | EXPENSES,
BEFORE EXPENSE
REDUCTIONS (%) | | TOTAL
RETURN (%)(a) | | PORTFOLIO
TURNOVER
RATE (%)(a) | | NET
ASSETS
AT END OF YEAR
(THOUSANDS) |
| |
| CLASS A SHARES(b) |
| | | | | | | | | | | | | | | | | | | | | | | | | | |
| | 2024 | | | 3.55 | | | | 0.81 | | | | 1.27 | | | | 10.41 | | | | 23.43 | | | $ | 69,372 | |
| | 2023 | | | 3.15 | | | | 0.81 | | | | 1.27 | | | | 2.51 | | | | 48.80 | | | $ | 60,908 | |
| | 2022 | | | 2.12 | | | | 0.81 | | | | 1.27 | | | | (10.73 | ) | | | 46.24 | | | $ | 55,859 | |
| | 2021 | | | 1.96 | | | | 0.81 | | | | 1.26 | | | | 2.65 | | | | 10.43 | | | $ | 65,220 | |
| | 2020 | | | 2.47 | | | | 0.87 | | | | 1.26 | | | | 2.56 | | | | 32.45 | | | $ | 61,537 | |
| |
| CLASS C SHARES |
| | | | | | | | | | | | | | | | | | | | | | | | | | |
| | 2024 | | | 3.07 | | | | 1.28 | | | | 1.97 | | | | 9.96 | | | | 23.43 | | | $ | 4,119 | |
| | 2023 | | | 2.65 | | | | 1.28 | | | | 1.92 | | | | 2.03 | | | | 48.80 | | | $ | 4,998 | |
| | 2022 | | | 1.64 | | | | 1.28 | | | | 1.77 | | | | (11.20 | ) | | | 46.24 | | | $ | 8,278 | |
| | 2021 | | | 1.50 | | | | 1.28 | | | | 1.71 | | | | 2.24 | | | | 10.43 | | | $ | 11,753 | |
| | 2020 | | | 2.00 | | | | 1.35 | | | | 1.65 | | | | 2.02 | | | | 32.45 | | | $ | 15,591 | |
| |
| CLASS I SHARES |
| | | | | | | | | | | | | | | | | | | | | | | | | | |
| | 2024 | | | 3.76 | | | | 0.59 | | | | 1.01 | | | | 10.72 | | | | 23.43 | | | $ | 248,771 | |
| | 2023 | | | 3.37 | | | | 0.59 | | | | 1.01 | | | | 2.74 | | | | 48.80 | | | $ | 227,585 | |
| | 2022 | | | 2.33 | | | | 0.59 | | | | 0.99 | | | | (10.59 | ) | | | 46.24 | | | $ | 236,725 | |
| | 2021 | | | 2.17 | | | | 0.59 | | | | 0.97 | | | | 2.94 | | | | 10.43 | | | $ | 298,871 | |
| | 2020 | | | 2.68 | | | | 0.65 | | | | 0.99 | | | | 2.79 | | | | 32.45 | | | $ | 225,486 | |
Annual Financial Statements | 279
Financial Highlights
Limited Term California Fund
| | | PER SHARE PERFORMANCE (FOR A SHARE OUTSTANDING THROUGHOUT THE YEAR) |
UNLESS OTHERWISE
NOTED, PERIODS ARE
FISCAL YEARS ENDED
SEPTEMBER 30, | | NET ASSET
VALUE,
BEGINNING
OF YEAR | | NET
INVESTMENT
INCOME
(LOSS)+ | | NET REALIZED &
UNREALIZED
GAIN (LOSS) ON
INVESTMENTS | | TOTAL FROM
INVESTMENT
OPERATIONS | | DIVIDENDS
FROM NET
INVESTMENT
INCOME | | DIVIDENDS
FROM NET
REALIZED
GAINS | | DIVIDENDS
FROM
RETURN OF
CAPITAL | | TOTAL
DIVIDENDS | | NET ASSET
VALUE,
END OF
YEAR |
| |
| CLASS A SHARES(b) |
| | | | | | | | | | | | | | | | | | | | | | | | | | | | | | | | | | | | | | |
| | 2024 | | $ | 12.56 | | | | 0.36 | | | | 0.47 | | | | 0.83 | | | | (0.36 | ) | | | — | | | | — | | | | (0.36 | ) | | $ | 13.03 | |
| | 2023 | | $ | 12.61 | | | | 0.29 | | | | (0.05 | ) | | | 0.24 | | | | (0.29 | ) | | | — | | | | — | | | | (0.29 | ) | | $ | 12.56 | |
| | 2022 | | $ | 13.66 | | | | 0.17 | | | | (1.04 | ) | | | (0.87 | ) | | | (0.18 | ) | | | — | | | | — | | | | (0.18 | ) | | $ | 12.61 | |
| | 2021 | | $ | 13.80 | | | | 0.15 | | | | (0.14 | ) | | | 0.01 | | | | (0.15 | ) | | | — | | | | — | | | | (0.15 | ) | | $ | 13.66 | |
| | 2020 | | $ | 13.72 | | | | 0.18 | | | | 0.08 | | | | 0.26 | | | | (0.18 | ) | | | — | | | | — | | | | (0.18 | ) | | $ | 13.80 | |
| |
| CLASS C SHARES |
| | | | | | | | | | | | | | | | | | | | | | | | | | | | | | | | | | | | | | |
| | 2024 | | $ | 12.58 | | | | 0.33 | | | | 0.46 | | | | 0.79 | | | | (0.33 | ) | | | — | | | | — | | | | (0.33 | ) | | $ | 13.04 | |
| | 2023 | | $ | 12.62 | | | | 0.25 | | | | (0.04 | ) | | | 0.21 | | | | (0.25 | ) | | | — | | | | — | | | | (0.25 | ) | | $ | 12.58 | |
| | 2022 | | $ | 13.67 | | | | 0.13 | | | | (1.04 | ) | | | (0.91 | ) | | | (0.14 | ) | | | — | | | | — | | | | (0.14 | ) | | $ | 12.62 | |
| | 2021 | | $ | 13.81 | | | | 0.11 | | | | (0.14 | ) | | | (0.03 | ) | | | (0.11 | ) | | | — | | | | — | | | | (0.11 | ) | | $ | 13.67 | |
| | 2020 | | $ | 13.73 | | | | 0.15 | | | | 0.07 | | | | 0.22 | | | | (0.14 | ) | | | — | | | | — | | | | (0.14 | ) | | $ | 13.81 | |
| |
| CLASS C2 SHARES |
| | | | | | | | | | | | | | | | | | | | | | | | | | | | | | | | | | | | | | |
| | 2024 | | $ | 12.57 | | | | 0.33 | | | | 0.47 | | | | 0.80 | | | | (0.33 | ) | | | — | | | | — | | | | (0.33 | ) | | $ | 13.04 | |
| | 2023 | | $ | 12.61 | | | | 0.26 | | | | (0.05 | ) | | | 0.21 | | | | (0.25 | ) | | | — | | | | — | | | | (0.25 | ) | | $ | 12.57 | |
| | 2022 | | $ | 13.67 | | | | 0.14 | | | | (1.06 | ) | | | (0.92 | ) | | | (0.14 | ) | | | — | | | | — | | | | (0.14 | ) | | $ | 12.61 | |
| | 2021(d) | | $ | 13.81 | | | | 0.11 | | | | (0.13 | ) | | | (0.02 | ) | | | (0.12 | ) | | | — | | | | — | | | | (0.12 | ) | | $ | 13.67 | |
| |
| CLASS I SHARES |
| | | | | | | | | | | | | | | | | | | | | | | | | | | | | | | | | | | | | | |
| | 2024 | | $ | 12.58 | | | | 0.39 | | | | 0.48 | | | | 0.87 | | | | (0.40 | ) | | | — | | | | — | | | | (0.40 | ) | | $ | 13.05 | |
| | 2023 | | $ | 12.62 | | | | 0.32 | | | | (0.04 | ) | | | 0.28 | | | | (0.32 | ) | | | — | | | | — | | | | (0.32 | ) | | $ | 12.58 | |
| | 2022 | | $ | 13.67 | | | | 0.21 | | | | (1.05 | ) | | | (0.84 | ) | | | (0.21 | ) | | | — | | | | — | | | | (0.21 | ) | | $ | 12.62 | |
| | 2021 | | $ | 13.82 | | | | 0.19 | | | | (0.15 | ) | | | 0.04 | | | | (0.19 | ) | | | — | | | | — | | | | (0.19 | ) | | $ | 13.67 | |
| | 2020 | | $ | 13.73 | | | | 0.21 | | | | 0.10 | | | | 0.31 | | | | (0.22 | ) | | | — | | | | — | | | | (0.22 | ) | | $ | 13.82 | |
| (a) | Not annualized for periods less than one year. |
| (b) | Sales loads are not reflected in computing total return. |
| (c) | Due to the size of net assets and fixed expenses, ratios may appear disproportionate. |
| (d) | Effective date of this class of shares was October 1, 2020. |
| + | Based on weighted average shares outstanding. |
See notes to financial statements.
280 | Annual Financial Statements
Financial Highlights, Continued
Limited Term California Fund
| | | RATIOS TO AVERAGE NET ASSETS | | SUPPLEMENTAL DATA |
UNLESS OTHERWISE
NOTED, PERIODS ARE
FISCAL YEARS ENDED
SEPTEMBER 30, | | NET INVESTMENT
INCOME (LOSS) (%) | | EXPENSES, AFTER
EXPENSE
REDUCTIONS (%) | | EXPENSES,
BEFORE EXPENSE
REDUCTIONS (%) | | TOTAL
RETURN (%)(a) | | PORTFOLIO
TURNOVER
RATE (%)(a) | | NET
ASSETS
AT END OF YEAR
(THOUSANDS) |
| |
| CLASS A SHARES(b) |
| | | | | | | | | | | | | | | | | | | | | | | | | | |
| | 2024 | | | 2.82 | | | | 0.74 | | | | 0.96 | | | | 6.71 | | | | 46.36 | | | $ | 60,071 | |
| | 2023 | | | 2.26 | | | | 0.74 | | | | 0.96 | | | | 1.89 | | | | 45.63 | | | $ | 67,312 | |
| | 2022 | | | 1.32 | | | | 0.74 | | | | 0.95 | | | | (6.44 | ) | | | 41.92 | | | $ | 79,046 | |
| | 2021 | | | 1.11 | | | | 0.74 | | | | 0.92 | | | | 0.10 | | | | 16.22 | | | $ | 101,949 | |
| | 2020 | | | 1.33 | | | | 0.80 | | | | 0.92 | | | | 1.93 | | | | 25.88 | | | $ | 109,102 | |
| |
| CLASS C SHARES |
| | | | | | | | | | | | | | | | | | | | | | | | | | |
| | 2024 | | | 2.52 | | | | 1.02 | | | | 1.70 | | | | 6.32 | | | | 46.36 | | | $ | 1,216 | |
| | 2023 | | | 1.95 | | | | 1.02 | | | | 1.42 | | | | 1.69 | | | | 45.63 | | | $ | 2,897 | |
| | 2022 | | | 1.02 | | | | 1.02 | | | | 1.31 | | | | (6.70 | ) | | | 41.92 | | | $ | 5,976 | |
| | 2021 | | | 0.82 | | | | 1.02 | | | | 1.27 | | | | (0.19 | ) | | | 16.22 | | | $ | 9,623 | |
| | 2020 | | | 1.06 | | | | 1.09 | | | | 1.20 | | | | 1.64 | | | | 25.88 | | | $ | 17,573 | |
| |
| CLASS C2 SHARES |
| | | | | | | | | | | | | | | | | | | | | | | | | | |
| | 2024 | | | 2.55 | | | | 1.02 | | | | 2.89 | (c) | | | 6.41 | | | | 46.36 | | | $ | 524 | |
| | 2023 | | | 2.00 | | | | 1.02 | | | | 8.02 | (c) | | | 1.69 | | | | 45.63 | | | $ | 141 | |
| | 2022 | | | 1.05 | | | | 1.02 | | | | 4.46 | (c) | | | (6.78 | ) | | | 41.92 | | | $ | 129 | |
| | 2021(d) | | | 0.84 | | | | 1.02 | | | | 6.50 | (c) | | | (0.18 | ) | | | 16.22 | | | $ | 149 | |
| |
| CLASS I SHARES |
| | | | | | | | | | | | | | | | | | | | | | | | | | |
| | 2024 | | | 3.07 | | | | 0.49 | | | | 0.71 | | | | 6.97 | | | | 46.36 | | | $ | 211,561 | |
| | 2023 | | | 2.50 | | | | 0.49 | | | | 0.71 | | | | 2.23 | | | | 45.63 | | | $ | 204,982 | |
| | 2022 | | | 1.56 | | | | 0.49 | | | | 0.71 | | | | (6.20 | ) | | | 41.92 | | | $ | 276,717 | |
| | 2021 | | | 1.35 | | | | 0.49 | | | | 0.70 | | | | 0.27 | | | | 16.22 | | | $ | 366,861 | |
| | 2020 | | | 1.56 | | | | 0.54 | | | | 0.69 | | | | 2.25 | | | | 25.88 | | | $ | 449,964 | |
Annual Financial Statements | 281
Financial Highlights
Intermediate New Mexico Fund
| | | PER SHARE PERFORMANCE (FOR A SHARE OUTSTANDING THROUGHOUT THE YEAR) |
UNLESS OTHERWISE
NOTED, PERIODS ARE
FISCAL YEARS ENDED
SEPTEMBER 30, | | NET ASSET
VALUE,
BEGINNING
OF YEAR | | NET
INVESTMENT
INCOME
(LOSS)+ | | NET REALIZED &
UNREALIZED
GAIN (LOSS) ON
INVESTMENTS | | TOTAL FROM
INVESTMENT
OPERATIONS | | DIVIDENDS
FROM NET
INVESTMENT
INCOME | | DIVIDENDS
FROM NET
REALIZED
GAINS | | DIVIDENDS
FROM
RETURN OF
CAPITAL | | TOTAL
DIVIDENDS | | NET ASSET
VALUE,
END OF
YEAR |
| |
| CLASS A SHARES(b) |
| | | | | | | | | | | | | | | | | | | | | | | | | | | | | | | | | | | | | | |
| | 2024 | | $ | 12.01 | | | | 0.32 | | | | 0.50 | | | | 0.82 | | | | (0.32 | ) | | | — | | | | — | | | | (0.32 | ) | | $ | 12.51 | |
| | 2023 | | $ | 12.08 | | | | 0.24 | | | | (0.07 | ) | | | 0.17 | | | | (0.24 | ) | | | — | | | | — | | | | (0.24 | ) | | $ | 12.01 | |
| | 2022 | | $ | 13.40 | | | | 0.19 | | | | (1.32 | ) | | | (1.13 | ) | | | (0.19 | ) | | | — | | | | — | | | | (0.19 | ) | | $ | 12.08 | |
| | 2021 | | $ | 13.48 | | | | 0.20 | | | | (0.09 | ) | | | 0.11 | | | | (0.19 | ) | | | — | | | | — | | | | (0.19 | ) | | $ | 13.40 | |
| | 2020 | | $ | 13.35 | | | | 0.24 | | | | 0.14 | | | | 0.38 | | | | (0.25 | ) | | | — | | | | — | | | | (0.25 | ) | | $ | 13.48 | |
| |
| CLASS D SHARES |
| | | | | | | | | | | | | | | | | | | | | | | | | | | | | | | | | | | | | | |
| | 2024 | | $ | 12.02 | | | | 0.29 | | | | 0.49 | | | | 0.78 | | | | (0.29 | ) | | | — | | | | — | | | | (0.29 | ) | | $ | 12.51 | |
| | 2023 | | $ | 12.08 | | | | 0.20 | | | | (0.05 | ) | | | 0.15 | | | | (0.21 | ) | | | — | | | | — | | | | (0.21 | ) | | $ | 12.02 | |
| | 2022 | | $ | 13.41 | | | | 0.16 | | | | (1.33 | ) | | | (1.17 | ) | | | (0.16 | ) | | | — | | | | — | | | | (0.16 | ) | | $ | 12.08 | |
| | 2021 | | $ | 13.49 | | | | 0.16 | | | | (0.08 | ) | | | 0.08 | | | | (0.16 | ) | | | — | | | | — | | | | (0.16 | ) | | $ | 13.41 | |
| | 2020 | | $ | 13.36 | | | | 0.21 | | | | 0.13 | | | | 0.34 | | | | (0.21 | ) | | | — | | | | — | | | | (0.21 | ) | | $ | 13.49 | |
| |
| CLASS I SHARES |
| | | | | | | | | | | | | | | | | | | | | | | | | | | | | | | | | | | | | | |
| | 2024 | | $ | 12.01 | | | | 0.36 | | | | 0.49 | | | | 0.85 | | | | (0.36 | ) | | | — | | | | — | | | | (0.36 | ) | | $ | 12.50 | |
| | 2023 | | $ | 12.07 | | | | 0.27 | | | | (0.05 | ) | | | 0.22 | | | | (0.28 | ) | | | — | | | | — | | | | (0.28 | ) | | $ | 12.01 | |
| | 2022 | | $ | 13.40 | | | | 0.23 | | | | (1.33 | ) | | | (1.10 | ) | | | (0.23 | ) | | | — | | | | — | | | | (0.23 | ) | | $ | 12.07 | |
| | 2021 | | $ | 13.47 | | | | 0.24 | | | | (0.07 | ) | | | 0.17 | | | | (0.24 | ) | | | — | | | | — | | | | (0.24 | ) | | $ | 13.40 | |
| | 2020 | | $ | 13.34 | | | | 0.29 | | | | 0.13 | | | | 0.42 | | | | (0.29 | ) | | | — | | | | — | | | | (0.29 | ) | | $ | 13.47 | |
| (a) | Not annualized for periods less than one year. |
| (b) | Sales loads are not reflected in computing total return. |
| + | Based on weighted average shares outstanding. |
See notes to financial statements.
282 | Annual Financial Statements
Financial Highlights, Continued
Intermediate New Mexico Fund
| | | RATIOS TO AVERAGE NET ASSETS | | SUPPLEMENTAL DATA |
UNLESS OTHERWISE
NOTED, PERIODS ARE
FISCAL YEARS ENDED
SEPTEMBER 30, | | NET INVESTMENT
INCOME (LOSS) (%) | | EXPENSES, AFTER
EXPENSE
REDUCTIONS (%) | | EXPENSES,
BEFORE EXPENSE
REDUCTIONS (%) | | TOTAL
RETURN (%)(a) | | PORTFOLIO
TURNOVER
RATE (%)(a) | | NET
ASSETS
AT END OF YEAR
(THOUSANDS) |
| |
| CLASS A SHARES(b) |
| | | | | | | | | | | | | | | | | | | | | | | | | | |
| | 2024 | | | 2.59 | | | | 0.99 | | | | 1.06 | | | | 6.89 | | | | 19.49 | | | $ | 37,430 | |
| | 2023 | | | 1.91 | | | | 0.99 | | | | 1.02 | | | | 1.35 | | | | 48.90 | | | $ | 46,699 | |
| | 2022 | | | 1.50 | | | | 0.99 | | | | 1.01 | | | | (8.49 | ) | | | 8.83 | | | $ | 53,476 | |
| | 2021 | | | 1.46 | | | | 0.98 | | | | 0.98 | | | | 0.85 | | | | 7.43 | | | $ | 70,051 | |
| | 2020 | | | 1.83 | | | | 0.98 | | | | 0.98 | | | | 2.84 | | | | 22.92 | | | $ | 80,463 | |
| |
| CLASS D SHARES |
| | | | | | | | | | | | | | | | | | | | | | | | | | |
| | 2024 | | | 2.34 | | | | 1.24 | | | | 1.36 | | | | 6.54 | | | | 19.49 | | | $ | 7,697 | |
| | 2023 | | | 1.65 | | | | 1.24 | | | | 1.34 | | | | 1.18 | | | | 48.90 | | | $ | 8,891 | |
| | 2022 | | | 1.25 | | | | 1.24 | | | | 1.29 | | | | (8.78 | ) | | | 8.83 | | | $ | 10,388 | |
| | 2021 | | | 1.20 | | | | 1.24 | | | | 1.29 | | | | 0.59 | | | | 7.43 | | | $ | 12,917 | |
| | 2020 | | | 1.57 | | | | 1.24 | | | | 1.26 | | | | 2.58 | | | | 22.92 | | | $ | 14,475 | |
| |
| CLASS I SHARES |
| | | | | | | | | | | | | | | | | | | | | | | | | | |
| | 2024 | | | 2.91 | | | | 0.67 | | | | 0.75 | | | | 7.15 | | | | 19.49 | | | $ | 49,373 | |
| | 2023 | | | 2.23 | | | | 0.67 | | | | 0.74 | | | | 1.76 | | | | 48.90 | | | $ | 52,436 | |
| | 2022 | | | 1.82 | | | | 0.67 | | | | 0.73 | | | | (8.27 | ) | | | 8.83 | | | $ | 57,584 | |
| | 2021 | | | 1.77 | | | | 0.67 | | | | 0.71 | | | | 1.24 | | | | 7.43 | | | $ | 66,312 | |
| | 2020 | | | 2.13 | | | | 0.67 | | | | 0.71 | | | | 3.16 | | | | 22.92 | | | $ | 65,715 | |
Annual Financial Statements | 283
Financial Highlights
Intermediate New York Fund
| | | PER SHARE PERFORMANCE (FOR A SHARE OUTSTANDING THROUGHOUT THE YEAR) |
UNLESS OTHERWISE
NOTED, PERIODS ARE
FISCAL YEARS ENDED
SEPTEMBER 30, | | NET ASSET
VALUE,
BEGINNING
OF YEAR | | NET
INVESTMENT
INCOME
(LOSS)+ | | NET REALIZED &
UNREALIZED
GAIN (LOSS) ON
INVESTMENTS | | TOTAL FROM
INVESTMENT
OPERATIONS | | DIVIDENDS
FROM NET
INVESTMENT
INCOME | | DIVIDENDS
FROM NET
REALIZED
GAINS | | DIVIDENDS
FROM
RETURN OF
CAPITAL | | TOTAL
DIVIDENDS | | NET ASSET
VALUE,
END OF
YEAR |
| |
| CLASS A SHARES(b) |
| | | | | | | | | | | | | | | | | | | | | | | | | | | | | | | | | | | | | | |
| | 2024 | | $ | 11.60 | | | | 0.34 | | | | 0.50 | | | | 0.84 | | | | (0.34 | ) | | | — | | | | — | | | | (0.34 | ) | | $ | 12.10 | |
| | 2023 | | $ | 11.68 | | | | 0.28 | | | | (0.08 | ) | | | 0.20 | | | | (0.28 | ) | | | — | | | | — | | | | (0.28 | ) | | $ | 11.60 | |
| | 2022 | | $ | 12.88 | | | | 0.25 | | | | (1.20 | ) | | | (0.95 | ) | | | (0.25 | ) | | | — | | | | — | | | | (0.25 | ) | | $ | 11.68 | |
| | 2021 | | $ | 12.96 | | | | 0.23 | | | | (0.07 | ) | | | 0.16 | | | | (0.24 | ) | | | — | | | | — | | | | (0.24 | ) | | $ | 12.88 | |
| | 2020 | | $ | 12.95 | | | | 0.26 | | | | 0.01 | | | | 0.27 | | | | (0.26 | ) | | | — | | | | — | | | | (0.26 | ) | | $ | 12.96 | |
| |
| CLASS I SHARES |
| | | | | | | | | | | | | | | | | | | | | | | | | | | | | | | | | | | | | | |
| | 2024 | | $ | 11.61 | | | | 0.37 | | | | 0.49 | | | | 0.86 | | | | (0.37 | ) | | | — | | | | — | | | | (0.37 | ) | | $ | 12.10 | |
| | 2023 | | $ | 11.68 | | | | 0.31 | | | | (0.06 | ) | | | 0.25 | | | | (0.32 | ) | | | — | | | | — | | | | (0.32 | ) | | $ | 11.61 | |
| | 2022 | | $ | 12.88 | | | | 0.28 | | | | (1.19 | ) | | | (0.91 | ) | | | (0.29 | ) | | | — | | | | — | | | | (0.29 | ) | | $ | 11.68 | |
| | 2021 | | $ | 12.96 | | | | 0.27 | | | | (0.07 | ) | | | 0.20 | | | | (0.28 | ) | | | — | | | | — | | | | (0.28 | ) | | $ | 12.88 | |
| | 2020 | | $ | 12.95 | | | | 0.30 | | | | 0.01 | | | | 0.31 | | | | (0.30 | ) | | | — | | | | — | | | | (0.30 | ) | | $ | 12.96 | |
| (a) | Not annualized for periods less than one year. |
| (b) | Sales loads are not reflected in computing total return. |
| (c) | The total return based on the NAV which reflects the adjustments in accordance with U.S. GAAP is 7.27%. |
| (d) | The total return based on the NAV which reflects the adjustments in accordance with U.S. GAAP is 1.66%. |
| + | Based on weighted average shares outstanding. |
See notes to financial statements.
284 | Annual Financial Statements
Financial Highlights, Continued
Intermediate New York Fund
| | | RATIOS TO AVERAGE NET ASSETS | | SUPPLEMENTAL DATA |
UNLESS OTHERWISE
NOTED, PERIODS ARE
FISCAL YEARS ENDED
SEPTEMBER 30, | | NET INVESTMENT
INCOME (LOSS) (%) | | EXPENSES, AFTER
EXPENSE
REDUCTIONS (%) | | EXPENSES,
BEFORE EXPENSE
REDUCTIONS (%) | | TOTAL
RETURN (%)(a) | | PORTFOLIO
TURNOVER
RATE (%)(a) | | NET
ASSETS
AT END OF YEAR
(THOUSANDS) |
| |
| CLASS A SHARES(b) |
| | | | | | | | | | | | | | | | | | | | | | | | | | |
| | 2024 | | | 2.81 | | | | 0.99 | | | | 1.39 | | | | 7.18 | (c) | | | 20.23 | | | $ | 12,740 | |
| | 2023 | | | 2.33 | | | | 0.99 | | | | 1.33 | | | | 1.75 | (d) | | | 42.70 | | | $ | 13,096 | |
| | 2022 | | | 1.98 | | | | 0.99 | | | | 1.22 | | | | (7.48 | ) | | | 6.02 | | | $ | 15,193 | |
| | 2021 | | | 1.77 | | | | 0.99 | | | | 1.14 | | | | 1.20 | | | | 11.29 | | | $ | 23,885 | |
| | 2020 | | | 2.01 | | | | 0.99 | | | | 1.14 | | | | 2.10 | | | | 18.61 | | | $ | 27,120 | |
| |
| CLASS I SHARES |
| | | | | | | | | | | | | | | | | | | | | | | | | | |
| | 2024 | | | 3.13 | | | | 0.67 | | | | 1.12 | | | | 7.53 | | | | 20.23 | | | $ | 12,588 | |
| | 2023 | | | 2.64 | | | | 0.67 | | | | 1.11 | | | | 2.07 | | | | 42.70 | | | $ | 12,113 | |
| | 2022 | | | 2.30 | | | | 0.67 | | | | 0.98 | | | | (7.18 | ) | | | 6.02 | | | $ | 14,642 | |
| | 2021 | | | 2.09 | | | | 0.67 | | | | 0.93 | | | | 1.52 | | | | 11.29 | | | $ | 20,454 | |
| | 2020 | | | 2.33 | | | | 0.67 | | | | 0.91 | | | | 2.43 | | | | 18.61 | | | $ | 21,197 | |
Annual Financial Statements | 285
Report of Independent Registered Public Accounting Firm
Thornburg Municipal Funds
To the Board of Trustees of Thornburg Investment Trust and Shareholders of Thornburg Short Duration Municipal Fund, Thornburg Limited Term Municipal Fund, Thornburg Intermediate Municipal Fund, Thornburg Strategic Municipal Income Fund, Thornburg California Limited Term Municipal Fund, Thornburg New Mexico Intermediate Municipal Fund and Thornburg New York Intermediate Municipal Fund
Opinions on the Financial Statements
We have audited the accompanying statements of assets and liabilities, including the schedules of investments, of Thornburg Short Duration Municipal Fund, Thornburg Limited Term Municipal Fund, Thornburg Intermediate Municipal Fund, Thornburg Strategic Municipal Income Fund, Thornburg California Limited Term Municipal Fund, Thornburg New Mexico Intermediate Municipal Fund and Thornburg New York Intermediate Municipal Fund (seven of the funds constituting Thornburg Investment Trust, hereafter collectively referred to as the “Funds”) as of September 30, 2024, the related statements of operations for the year ended September 30, 2024, the statements of changes in net assets for each of the two years in the period ended September 30, 2024, including the related notes, and the financial highlights for each of the periods indicated therein (collectively referred to as the “financial statements”). In our opinion, the financial statements present fairly, in all material respects, the financial position of each of the Funds as of September 30, 2024, the results of each of their operations for the year then ended, the changes in each of their net assets for each of the two years in the period ended September 30, 2024, and each of the financial highlights for each of the periods indicated therein in conformity with accounting principles generally accepted in the United States of America.
Basis for Opinions
These financial statements are the responsibility of the Funds’ management. Our responsibility is to express an opinion on the Funds’ financial statements based on our audits. We are a public accounting firm registered with the Public Company Accounting Oversight Board (United States) (PCAOB) and are required to be independent with respect to the Funds in accordance with the U.S. federal securities laws and the applicable rules and regulations of the Securities and Exchange Commission and the PCAOB.
We conducted our audits of these financial statements in accordance with the standards of the PCAOB. Those standards require that we plan and perform the audit to obtain reasonable assurance about whether the financial statements are free of material misstatement, whether due to error or fraud.
Our audits included performing procedures to assess the risks of material misstatement of the financial statements, whether due to error or fraud, and performing procedures that respond to those risks. Such procedures included examining, on a test basis, evidence regarding the amounts and disclosures in the financial statements. Our audits also included evaluating the accounting principles used and significant estimates made by management, as well as evaluating the overall presentation of the financial statements. Our procedures included confirmation of securities owned as of September 30, 2024 by correspondence with the custodian and brokers; when replies were not received from brokers, we performed other auditing procedures. We believe that our audits provide a reasonable basis for our opinions.
/s/PricewaterhouseCoopers LLP
New York, New York
November 14, 2024
We have served as the auditor of one or more investment companies in Thornburg Investment Trust since 1999.
286 | Annual Financial Statements
Tax Information
September 30, 2024
For the tax year ended September 30, 2024, tax exempt (or the maximum allowed) and taxable ordinary income dividends paid by funds for federal income tax purposes are as follows:
| | | TAX EXEMPT | | TAXABLE ORDINARY |
| Short Duration Municipal Fund | | $ | 3,993,892 | | | $ | 72,534 | |
| Limited Term Municipal Fund | | | 83,020,456 | | | | 1,030,782 | |
| Intermediate Municipal Fund | | | 33,428,055 | | | | 706,829 | |
| Strategic Municipal Income Fund | | | 10,989,622 | | | | 400,835 | |
| Limited Term California Fund | | | 8,061,198 | | | | 207,921 | |
| Intermediate New Mexico Fund | | | 2,688,653 | | | | 31,020 | |
| Intermediate New York Fund | | | 734,222 | | | | 8,429 | |
The information and the distributions reported herein may differ from information and distributions reported to the shareholders for the calendar year ending December 31, 2024. Complete information will be reported in conjunction with your 2024 Form 1099.
Annual Financial Statements | 287
Schedule of Investments
Thornburg Emerging Markets Managed Account Fund | September 30, 2024
| | ISSUER-DESCRIPTION | | SHARES | | | VALUE | |
| | | | | | | | |
| | COMMON STOCK — 102.0% | | | | | | | | |
| | | | | | | | | | |
| | AUTOMOBILES & COMPONENTS — 3.2% | | | | | | | | |
| | Automobiles — 3.2% | | | | | | | | |
| | Kia Corp. | | | 461 | | | $ | 35,217 | |
| | | | | | | | | 35,217 | |
| | BANKS — 9.6% | | | | | | | | |
| | Banks — 9.6% | | | | | | | | |
| | Al Rajhi Bank | | | 1,245 | | | | 28,939 | |
| | SCB X PCL | | | 13,900 | | | | 47,086 | |
| | State Bank of India | | | 3,020 | | | | 28,398 | |
| | | | | | | | | 104,423 | |
| | CAPITAL GOODS — 3.7% | | | | | | | | |
| | Aerospace & Defense — 3.7% | | | | | | | | |
| | LIG Nex1 Co. Ltd. | | | 251 | | | | 40,499 | |
| | | | | | | | | 40,499 | |
| | CONSUMER DISCRETIONARY DISTRIBUTION & RETAIL — 3.3% | | | | | | | | |
| | Specialty Retail — 3.3% | | | | | | | | |
| | K Car Co. Ltd. | | | 3,592 | | | | 35,516 | |
| | | | | | | | | 35,516 | |
| | CONSUMER DURABLES & APPAREL — 4.3% | | | | | | | | |
| | Textiles, Apparel & Luxury Goods — 4.3% | | | | | | | | |
| | Kalyan Jewellers India Ltd. | | | 5,450 | | | | 47,433 | |
| | | | | | | | | 47,433 | |
| | CONSUMER SERVICES — 2.9% | | | | | | | | |
| | Hotels, Restaurants & Leisure — 2.9% | | | | | | | | |
| a | Zomato Ltd. | | | 9,826 | | | | 31,999 | |
| | | | | | | | | 31,999 | |
| | CONSUMER STAPLES DISTRIBUTION & RETAIL — 2.5% | | | | | | | | |
| | Consumer Staples Distribution & Retail — 2.5% | | | | | | | | |
| | BIM Birlesik Magazalar AS | | | 1,845 | | | | 26,773 | |
| | | | | | | | | 26,773 | |
| | ENERGY — 9.6% | | | | | | | | |
| | Energy Equipment & Services — 4.3% | | | | | | | | |
| | ADNOC Drilling Co. PJSC | | | 36,737 | | | | 47,308 | |
| | Oil, Gas & Consumable Fuels — 5.3% | | | | | | | | |
| | Reliance Industries Ltd. | | | 1,625 | | | | 57,359 | |
| | | | | | | | | 104,667 | |
| | FINANCIAL SERVICES — 7.8% | | | | | | | | |
| | Capital Markets — 5.0% | | | | | | | | |
| | 360 ONE WAM Ltd. | | | 2,279 | | | | 28,229 | |
| | Saudi Tadawul Group Holding Co. | | | 447 | | | | 27,024 | |
| | Financial Services — 2.8% | | | | | | | | |
| b | Home First Finance Co. India Ltd. | | | 2,137 | | | | 30,353 | |
| | | | | | | | | 85,606 | |
| | FOOD, BEVERAGE & TOBACCO — 5.4% | | | | | | | | |
| | Beverages — 5.4% | | | | | | | | |
| | Varun Beverages Ltd. | | | 8,168 | | | | 59,237 | |
| | | | | | | | | 59,237 | |
| | HEALTH CARE EQUIPMENT & SERVICES — 5.3% | | | | | | | | |
| | Health Care Providers & Services — 5.3% | | | | | | | | |
| | Max Healthcare Institute Ltd. | | | 4,859 | | | | 57,693 | |
| | | | | | | | | 57,693 | |
| 288 | Annual Financial Statements | See notes to financial statements. |
Schedule of Investments, Continued
Thornburg Emerging Markets Managed Account Fund | September 30, 2024
| | ISSUER-DESCRIPTION | | SHARES | | | VALUE | |
| | | | | | | | |
| | HOUSEHOLD & PERSONAL PRODUCTS — 3.5% | | | | | | | | |
| | Personal Care Products — 3.5% | | | | | | | | |
| | Proya Cosmetics Co. Ltd. Class A | | | 2,439 | | | $ | 38,271 | |
| | | | | | | | | 38,271 | |
| | INSURANCE — 2.4% | | | | | | | | |
| | Insurance — 2.4% | | | | | | | | |
| a | PB Fintech Ltd. | | | 1,385 | | | | 26,583 | |
| | | | | | | | | 26,583 | |
| | REAL ESTATE MANAGEMENT & DEVELOPMENT — 5.4% | | | | | | | | |
| | Real Estate Management & Development — 5.4% | | | | | | | | |
| | Aldar Properties PJSC | | | 14,597 | | | | 29,885 | |
| b | Macrotech Developers Ltd. | | | 1,951 | | | | 28,822 | |
| | | | | | | | | 58,707 | |
| | SEMICONDUCTORS & SEMICONDUCTOR EQUIPMENT — 5.2% | | | | | | | | |
| | Semiconductors & Semiconductor Equipment — 5.2% | | | | | | | | |
| | Alchip Technologies Ltd. | | | 352 | | | | 21,968 | |
| | MediaTek, Inc. | | | 943 | | | | 35,012 | |
| | | | | | | | | 56,980 | |
| | TECHNOLOGY HARDWARE & EQUIPMENT — 12.7% | | | | | | | | |
| | Electronic Equipment, Instruments & Components — 2.5% | | | | | | | | |
| | Lotes Co. Ltd. | | | 611 | | | | 26,740 | |
| | Technology Hardware, Storage & Peripherals — 10.2% | | | | | | | | |
| | Samsung Electronics Co. Ltd. | | | 2,368 | | | | 111,365 | |
| | | | | | | | | 138,105 | |
| | TELECOMMUNICATION SERVICES — 4.4% | | | | | | | | |
| | Diversified Telecommunication Services — 4.4% | | | | | | | | |
| | Converge Information & Communications Technology Solutions, Inc. | | | 163,987 | | | | 47,876 | |
| | | | | | | | | 47,876 | |
| | TRANSPORTATION — 8.2% | | | | | | | | |
| | Transportation Infrastructure — 8.2% | | | | | | | | |
| | Adani Ports & Special Economic Zone Ltd. | | | 3,307 | | | | 57,098 | |
| | Salik Co. PJSC | | | 29,129 | | | | 32,753 | |
| | | | | | | | | 89,851 | |
| | UTILITIES — 2.6% | | | | | | | | |
| | Independent Power and Renewable Electricity Producers — 2.6% | | | | | | | | |
| | NHPC Ltd. | | | 25,368 | | | | 28,667 | |
| | | | | | | | | 28,667 | |
| | TOTAL COMMON STOCK (Cost $1,022,418) | | | | | | | 1,114,103 | |
| | | | | | | | | | |
| | SHORT-TERM INVESTMENTS — 2.9% | | | | | | | | |
| c | Thornburg Capital Management Fund | | | 3,176 | | | | 31,758 | |
| | TOTAL SHORT-TERM INVESTMENTS (Cost $31,758) | | | | | | | 31,758 | |
| | | | | | | | | | |
| | TOTAL INVESTMENTS — 104.9% (Cost $1,054,176) | | | | | | $ | 1,145,861 | |
| | | | | | | | | | |
| | LIABILITIES NET OF OTHER ASSETS — (4.9)% | | | | | | | (53,497 | ) |
| | | | | | | | | | |
| | NET ASSETS — 100.0% | | | | | | $ | 1,092,364 | |
Footnote Legend
| b | Securities exempt from registration under Rule 144A of the Securities Act of 1933, as amended. These securities are restricted but liquid and may only be resold in the ordinary course of business in transactions exempt from registration, normally to qualified institutional buyers. As of September 30, 2024, the aggregate value of these securities in the Fund’s portfolio was $59,175, representing 5.42% of the Fund’s net assets. |
| c | Investment in Affiliates. |
| See notes to financial statements. | Annual Financial Statements | 289 |
Schedule of Investments, Continued
Thornburg Emerging Markets Managed Account Fund | September 30, 2024
COUNTRY EXPOSURE *
(percent of equity holdings)
| India | 43.3% |
| South Korea | 20.0% |
| United Arab Emirates | 9.9% |
| Taiwan | 7.5% |
| Saudi Arabia | 5.0% |
| Philippines | 4.3% |
| Thailand | 4.2% |
| China | 3.4% |
| Turkey | 2.4% |
* Holdings are classified by country of risk as determined by MSCI and Bloomberg.
| 290 | Annual Financial Statements | See notes to financial statements. |
Schedule of Investments
Thornburg Municipal Managed Account Fund | September 30, 2024
| | | | PRINCIPAL | | | | |
| | ISSUER-DESCRIPTION | | AMOUNT | | | VALUE | |
| | | | | | | | |
| | LONG-TERM MUNICIPAL BONDS — 97.3% | | | | | | | | |
| | | | | | | | | | |
| | ALABAMA — 14.0% | | | | | | | | |
| a | Black Belt Energy Gas District (Guaranty: Goldman Sachs Group, Inc.), Series D-1, 5.50% due 6/1/2049 (put 2/1/2029) | | $ | 150,000 | | | $ | 161,441 | |
| | Black Belt Energy Gas District (Guaranty: Royal Bank of Canada), Series B, 5.00% due 12/1/2030 | | | 250,000 | | | | 271,898 | |
| a | Chatom (PowerSouth Energy Cooperative; SPA National Rural Utilities Cooperative Finance) IDB, Series A, 3.85% due 8/1/2037 (put 2/1/2025) | | | 250,000 | | | | 265,503 | |
| a | Energy Southeast A Cooperative District (Guaranty: Morgan Stanley Group), Series B, 5.25% due 7/1/2054 (put 6/1/2032) | | | 300,000 | | | | 331,838 | |
| a | Southeast Alabama Gas Supply District (Guaranty: Morgan Stanley Group), 5.00% due 6/1/2049 (put 5/1/2032) | | | 250,000 | | | | 271,848 | |
| a | Southeast Alabama Gas Supply District (Guaranty: Pacific Life Insurance Co.), Series A, 5.00% due 8/1/2054 (put 4/1/2032) | | | 250,000 | | | | 272,565 | |
| | ARIZONA — 2.7% | | | | | | | | |
| a | Chandler (Intel Corp.) IDA AMT, 4.10% due 12/1/2037 (put 6/15/2028) | | | 150,000 | | | | 151,633 | |
| | City of Phoenix Civic Improvement Corp. (Phoenix Airport Revenue) AMT, 5.00% due 7/1/2048 | | | 150,000 | | | | 153,455 | |
| | CALIFORNIA — 6.2% | | | | | | | | |
| a | California Community Choice Financing Authority (Guaranty: Morgan Stanley Group), Series A-1, 5.00% due 5/1/2054 (put 4/1/2032) | | | 250,000 | | | | 273,882 | |
| | California Municipal Finance Authority (Greenfield Commons Eah LP) (FNMA) (Green Bond), Series A, 5.28% due 9/1/2046 | | | 150,000 | | | | 173,816 | |
| a | California Municipal Finance Authority (Republic Services, Inc.) AMT, Series B, 4.15% due 7/1/2051 (put 1/15/2025) | | | 250,000 | | | | 250,834 | |
| | CONNECTICUT — 1.4% | | | | | | | | |
| | Connecticut Housing Finance Authority (Green Bond), Series B, 4.65% due 11/15/2048 | | | 150,000 | | | | 152,693 | |
| | FLORIDA — 8.6% | | | | | | | | |
| b | Capital Projects Finance Authority (Kissimmee Charter Academy), 6.625% due 6/15/2059 | | | 145,000 | | | | 151,168 | |
| b | Capital Trust Agency, Inc. (Southeastern University Obligated Group), Series A, 6.25% due 5/1/2048 | | | 100,000 | | | | 103,059 | |
| | County of Broward Airport System Revenue AMT, 5.00% due 10/1/2042 | | | 150,000 | | | | 154,035 | |
| | County of Miami-Dade Aviation Revenue AMT, Series A, 5.00% due 10/1/2035 | | | 150,000 | | | | 150,129 | |
| | Florida Development Finance Corp. (Mater Academy Miami-Dade Osceola County Facilities Obligated Group), Series A, 5.00% due 6/15/2042 | | | 150,000 | | | | 152,471 | |
| b | Florida Development Finance Corp. (SFP - Tampa I LLC), Series A1, 5.25% due 6/1/2054 | | | 250,000 | | | | 261,026 | |
| | GEORGIA — 4.3% | | | | | | | | |
| a | Bartow County Development Authority (Georgia Power Co.), 3.95% due 12/1/2032 (put 3/8/2028) | | | 100,000 | | | | 103,398 | |
| | Main Street Natural Gas, Inc. (Guaranty: Royal Bank of Canada), | | | | | | | | |
| a | Series A, 5.00% due 5/1/2054 (put 9/1/2031) | | | 200,000 | | | | 218,420 | |
| a | Series B, 5.00% due 7/1/2053 (put 3/1/2030) | | | 150,000 | | | | 161,523 | |
| | ILLINOIS — 4.0% | | | | | | | | |
| | City of Chicago (Chicago O’Hare International Airport) AMT, Series A, 5.00% due 1/1/2028 | | | 150,000 | | | | 150,500 | |
| | State of Illinois GO, Series B, 4.00% due 11/1/2038 - 11/1/2039 | | | 300,000 | | | | 299,048 | |
| | INDIANA — 0.9% | | | | | | | | |
| a | Indiana Finance Authority (Republic Services, Inc.) AMT, Series A, 3.95% due 5/1/2028 (put 12/2/2024) | | | 100,000 | | | | 99,485 | |
| | IOWA — 1.6% | | | | | | | | |
| a | Iowa Finance Authority (Iowa Fertilizer Co. LLC; Guaranty: OCI NV), 5.00% due 12/1/2050 (pre-refunded 12/1/2032) | | | 150,000 | | | | 174,684 | |
| | KENTUCKY — 4.1% | | | | | | | | |
| a | County of Owen (American Water/Kentucky-American Water Co. Obligated Group), 3.875% due 6/1/2040 (put 9/1/2028) | | | 150,000 | | | | 152,289 | |
| | Kentucky Housing Corp. (FHLMC, FNMA, GNMA), Series A, 4.35% due 7/1/2044 | | | 150,000 | | | | 150,721 | |
| | Louisville/Jefferson County Metropolitan Government (Norton Healthcare Obligated Group), Series A, 5.00% due 10/1/2033 | | | 150,000 | | | | 154,649 | |
| | MICHIGAN — 5.7% | | | | | | | | |
| | City of Detroit GO, Series C, 6.00% due 5/1/2043 | | | 250,000 | | | | 287,266 | |
| | Michigan State (HUD) HDA, Series A, 4.70% due 10/1/2054 | | | 150,000 | | | | 153,180 | |
| | Michigan Strategic Fund (Waste Management of Michigan, Inc.; Guaranty: Waste Management, Inc.) AMT, 4.125% due 8/1/2027 | | | 200,000 | | | | 203,709 | |
| | MISSOURI — 0.9% | | | | | | | | |
| | Health & Educational Facilities Authority of the State of Missouri (Lutheran Senior Services Obligated Group), Series A, 5.25% due 2/1/2054 | | | 100,000 | | | | 106,411 | |
| | NEVADA — 2.3% | | | | | | | | |
| a | County of Washoe (Sierra Pacific Power Co.) AMT, Series F, 4.125% due 3/1/2036 (put 10/1/2029) | | | 250,000 | | | | 258,452 | |
| | NEW HAMPSHIRE — 1.7% | | | | | | | | |
| | New Hampshire Business Finance Authority (Presbyterian Homes Obligated Group), Series A, 5.25% due 7/1/2048 | | | 175,000 | | | | 186,533 | |
| | NEW JERSEY — 2.9% | | | | | | | | |
| | New Jersey Higher Education Student Assistance Authority AMT, Series C, 5.25% due 12/1/2054 | | | 140,000 | | | | 144,147 | |
| | New Jersey Housing & Mortgage Finance Agency (Riverview Towers Preservation LLC) (FHA, GNMA), Series B, 5.25% due 12/20/2065 | | | 175,000 | | | | 184,018 | |
| | NEW MEXICO — 7.3% | | | | | | | | |
| a | City of Farmington (Public Service Co. of New Mexico), Series D, 3.90% due 6/1/2040 (put 6/1/2028) | | | 250,000 | | | | 256,573 | |
| | New Mexico Educational Assistance Foundation AMT, Series 1A, 5.00% due 9/1/2029 | | | 150,000 | | | | 160,775 | |
| | New Mexico Hospital Equipment Loan Council (Haverland Carter Lifestyle Obligated Group), Series A, 5.00% due 7/1/2049 | | | 150,000 | | | | 149,548 | |
| | New Mexico Mortgage Finance Authority (FHLMC, FNMA, GNMA), Series C, 4.60% due 9/1/2044 | | | 250,000 | | | | 256,315 | |
| See notes to financial statements. | Annual Financial Statements | 291 |
Schedule of Investments, Continued
Thornburg Municipal Managed Account Fund | September 30, 2024
| | | | PRINCIPAL | | | | |
| | ISSUER-DESCRIPTION | | AMOUNT | | | VALUE | |
| | | | | | | | |
| | NORTH CAROLINA — 1.3% | | | | | | | | |
| | North Carolina Medical Care Commission (United Methodist Retirement Homes Inc Obligated Group), Series 2024B-1, 4.25% due 10/1/2028 | | $ | 150,000 | | | $ | 150,296 | |
| | OHIO — 1.3% | | | | | | | | |
| a | Ohio Air Quality Development Authority (Ohio Valley Electric Corp.), Series C, 1.50% due 2/1/2026 (put 11/4/2025) | | | 155,000 | | | | 149,112 | |
| | PENNSYLVANIA — 1.4% | | | | | | | | |
| | Northeastern Pennsylvania Hospital & Education Authority (King’s College), 5.00% due 5/1/2031 | | | 145,000 | | | | 153,691 | |
| | SOUTH DAKOTA — 1.4% | | | | | | | | |
| | South Dakota Health & Educational Facilities Authority (Monument Health Obligated Group), 5.00% due 9/1/2040 | | | 150,000 | | | | 154,969 | |
| | TENNESSEE — 3.3% | | | | | | | | |
| | Knox County Health Educational & Housing Facility Board (Provident Group - UTK Properties LLC) (BAM), Series A-1, 5.00% due 7/1/2044 | | | 200,000 | | | | 215,630 | |
| | Tennessee (Green Bond) HDA, Series 2A, 4.70% due 7/1/2053 | | | 150,000 | | | | 152,634 | |
| | TEXAS — 7.3% | | | | | | | | |
| | Clifton Higher Education Finance Corp. (YES Prep Public Schools, Inc.) (PSF-GTD), 4.25% due 4/1/2048 | | | 150,000 | | | | 150,782 | |
| | Matagorda County Navigation District No. 1 (AEP Texas, Inc.) AMT, 4.25% due 5/1/2030 | | | 150,000 | | | | 155,210 | |
| a | Mission Economic Development Corp. (Waste Management, Inc.) AMT, Series A, 4.00% due 5/1/2046 (put 12/2/2024) | | | 200,000 | | | | 199,733 | |
| | Texas Private Activity Bond Surface Transportation Corp. (NTE Mobility Partners LLC) AMT, 5.50% due 12/31/2058 | | | 150,000 | | | | 163,296 | |
| | Texas Transportation Commission (Central Texas Turnpike System), Series C, 5.00% due 8/15/2034 | | | 150,000 | | | | 150,273 | |
| | UTAH — 4.2% | | | | | | | | |
| b | Black Desert Public Infrastructure District (Black Desert Assessment Area No. 1), 5.625% due 12/1/2053 | | | 200,000 | | | | 207,421 | |
| b | Utah Charter School Finance Authority (Freedom Academy Foundation), Series A, 5.00% due 6/15/2041 | | | 120,000 | | | | 113,982 | |
| | Utah Charter School Finance Authority (Summit Academy, Inc.), Series A, 5.00% due 4/15/2049 | | | 150,000 | | | | 154,542 | |
| | VIRGINIA — 1.8% | | | | | | | | |
| | Virginia HDA, Series D, 4.70% due 8/1/2048 | | | 200,000 | | | | 205,971 | |
| | WASHINGTON — 1.9% | | | | | | | | |
| | Washington State Housing Finance Commission (Camas Flats Oak Harbor 1 LLLP) (FNMA), Series A FN, 4.55% due 8/1/2043 | | | 100,000 | | | | 101,830 | |
| b | Washington State Housing Finance Commission (Seattle Academy of Arts & Sciences), 6.125% due 7/1/2053 | | | 100,000 | | | | 110,502 | |
| | WEST VIRGINIA — 3.2% | | | | | | | | |
| | West Virginia (Kentucky Power Co.) EDA AMT, | | | | | | | | |
| a | 1.00% due 1/1/2041 (put 9/1/2025) | | | 105,000 | | | | 102,357 | |
| a | Series 2014-A, 4.70% due 4/1/2036 (put 6/17/2026) | | | 250,000 | | | | 255,241 | |
| | WISCONSIN — 1.6% | | | | | | | | |
| | Wisconsin Housing & EDA (Flats at Bishops Woods LP) (FNMA), Series E, 4.75% due 6/1/2043 | | | 175,000 | | | | 185,337 | |
| | TOTAL LONG-TERM MUNICIPAL BONDS — 97.3% (Cost $10,513,758) | | | | | | | 10,947,747 | |
| | | | | | | | | | |
| | SHORT-TERM MUNICIPAL BONDS — 0.9% | | | | | | | | |
| | | | | | | | | | |
| | TEXAS — 0.9% | | | | | | | | |
| a | Port of Port Arthur Navigation District (Motiva Enterprises LLC), 4.30% due 4/1/2040 (put 10/1/2024) | | | 100,000 | | | | 100,000 | |
| | TOTAL SHORT-TERM MUNICIPAL BONDS — 0.9% (Cost $100,000) | | | | | | | 100,000 | |
| | | | | | | | | | |
| | TOTAL INVESTMENTS — 98.2% (Cost $10,613,758) | | | | | | $ | 11,047,747 | |
| | | | | | | | | | |
| | OTHER ASSETS LESS LIABILITIES — 1.8% | | | | | | | 206,760 | |
| | | | | | | | | | |
| | NET ASSETS — 100.0% | | | | | | $ | 11,254,507 | |
Footnote Legend
| a | Variable, floating, step, or fixed to floating rate securities are securities for which interest rate changes are based on changes in a designated base rate or on a predetermined schedule. The rates shown are those in effect on September 30, 2024. |
| b | Securities exempt from registration under Rule 144A of the Securities Act of 1933, as amended. These securities are restricted but liquid and may only be resold in the ordinary course of business in transactions exempt from registration, normally to qualified institutional buyers. As of September 30, 2024, the aggregate value of these securities in the Fund’s portfolio was $947,158, representing 8.42% of the Fund’s net assets. |
| 292 | Annual Financial Statements | See notes to financial statements. |
Schedule of Investments, Continued
Thornburg Municipal Managed Account Fund | September 30, 2024
| Portfolio Abbreviations | | |
| To simplify the listings of securities, abbreviations are used per the table below: | | |
| AMT | Alternative Minimum Tax | GO | General Obligation |
| BAM | Insured by Build America Mutual Insurance Co. | HDA | Housing Development Authority |
| EDA | Economic Development Authority | HUD | Insured by Housing and Urban Development |
| FHA | Insured by Federal Housing Administration | IDA | Industrial Development Authority/Agency |
| FHLMC | Collateralized by Federal Home Loan Mortgage Corp. | IDB | Industrial Development Board |
| FNMA | Collateralized by Federal National Mortgage Association | PSF-GTD | Guaranteed by Permanent School Fund |
| GNMA | Collateralized by Government National Mortgage Association | SPA | Stand-by Purchase Agreement |
| See notes to financial statements. | Annual Financial Statements | 293 |
Statements of Assets and Liabilities
September 30, 2024
| | | THORNBURG
EMERGING MARKETS
MANAGED ACCOUNT
FUND | | | THORNBURG
MUNICIPAL
MANAGED ACCOUNT
FUND | |
| ASSETS | | | | | | |
| Investments at cost | | | | | | | | |
| Non-affiliated issuers | | $ | 1,022,418 | | | $ | 10,613,758 | |
| Non-controlled affiliated issuers | | | 31,758 | | | | — | |
| Investments at value | | | | | | | | |
| Non-affiliated issuers | | | 1,114,103 | | | | 11,047,747 | |
| Non-controlled affiliated issuers | | | 31,758 | | | | — | |
| Cash | | | — | | | | 96,184 | |
| Foreign currency at value (a) | | | 328 | | | | — | |
| Receivable for fund shares sold | | | — | | | | 5 | |
| Receivable from investment advisor | | | 23,858 | | | | 20,146 | |
| Dividends receivable | | | 1,361 | | | | — | |
| Principal and interest receivable | | | — | | | | 144,916 | |
| Prepaid expenses and other assets | | | 14,397 | | | | 12,839 | |
| | | | | | | | | |
| Total Assets | | | 1,185,805 | | | | 11,321,837 | |
| | | | | | | | | |
| LIABILITIES | | | | | | | | |
| Payable for investments purchased | | | 7,012 | | | | — | |
| Deferred taxes payable | | | 4,174 | | | | — | |
| Accounts payable and accrued expenses | | | 82,255 | | | | 67,330 | |
| | | | | | | | | |
| Total Liabilities | | | 93,441 | | | | 67,330 | |
| NET ASSETS | | $ | 1,092,364 | | | $ | 11,254,507 | |
| | | | | | | | | |
| NET ASSETS CONSIST OF | | | | | | | | |
| Net capital paid in on shares of beneficial interest | | $ | 987,306 | | | $ | 10,843,602 | |
| Distributable earnings | | | 105,058 | | | | 410,905 | |
| | | | | | | | | |
| NET ASSETS | | $ | 1,092,364 | | | $ | 11,254,507 | |
| | | | | | | | | |
| NET ASSET VALUE | | | | | | | | |
| Class I Shares: | | | | | | | | |
| Net assets applicable to shares outstanding | | $ | 1,092,364 | | | $ | 11,254,507 | |
| Shares outstanding | | | 102,985 | | | | 1,074,753 | |
| Net asset value and redemption price per share | | $ | 10.61 | | | $ | 10.47 | |
(a) Cost of foreign currency is $329; $0 respectively.
See notes to financial statements.
294 | Annual Financial Statements
Statements of Operations
Year Ended September 30, 2024
| | | THORNBURG EMERGING MARKETS MANAGED ACCOUNT FUND(a) | | | THORNBURG MUNICIPAL MANAGED ACCOUNT FUND | |
| INVESTMENT INCOME | | | | | | |
| Dividend income | | | | | | |
| Non-affiliated issuers | | $ | 29,875 | | | $ | — | |
| Non-controlled affiliated issuers | | | 4,827 | | | | — | |
| Dividend taxes withheld | | | (4,249 | ) | | | — | |
| Interest income | | | — | | | | 386,920 | |
| Total Income | | | 30,453 | | | | 386,920 | |
| | | | | | | | | |
| EXPENSES | | | | | | | | |
| Transfer agent fees | | | | | | | | |
| Class I Shares | | | 3,107 | | | | 10,067 | |
| Registration and filing fees | | | | | | | | |
| Class I Shares | | | 3,966 | | | | 20,420 | |
| Custodian fees | | | 45,760 | | | | 31,596 | |
| Audit and tax fees | | | 55,704 | | | | 54,455 | |
| Legal fees | | | 4,727 | | | | 1,453 | |
| Trustee and officer fees | | | 728 | | | | 1,007 | |
| Prepaid offering expense | | | 58,616 | | | | 35,203 | |
| Other expenses | | | 11,231 | | | | 10,363 | |
| Total Expenses | | | 183,839 | | | | 164,564 | |
| Less: | | | | | | | | |
| Expenses reimbursed | | | (183,839 | ) | | | (164,564 | ) |
| Net Expenses | | | — | | | | — | |
| Net Investment Income (Loss) | | $ | 30,453 | | | $ | 386,920 | |
| | | | | | | | | |
| REALIZED AND UNREALIZED GAIN (LOSS) | | | | | | | | |
| Net realized gain (loss) on: | | | | | | | | |
| Non-affiliated issuers investments* | | | (5,555 | ) | | | (12,353 | ) |
| Foreign currency transactions | | | (595 | ) | | | — | |
| Net realized gain (loss) | | | (6,150 | ) | | | (12,353 | ) |
| Net change in unrealized appreciation (depreciation) on: | | | | | | | | |
| Non-affiliated issuers investments** | | | 87,902 | | | | 599,187 | |
| Foreign currency translations | | | (63 | ) | | | — | |
| Change in net unrealized appreciation (depreciation) | | | 87,839 | | | | 599,187 | |
| Net Realized and Unrealized Gain (Loss) | | | 81,689 | | | | 586,834 | |
| Change in Net Assets Resulting from Operations | | $ | 112,142 | | | $ | 973,754 | |
| * Net of foreign capital gain taxes | | $ | 1,693 | | | $ | — | |
| ** Net of change in deferred taxes | | $ | (3,783 | ) | | $ | — | |
(a) The Fund commenced operations on October 2, 2023.
See notes to financial statements.
Annual Financial Statements | 295
Statements of Changes in Net Assets
| | | THORNBURG | | | | | | | |
| | | EMERGING MARKETS | | | | | | | |
| | | MANAGED ACCOUNT FUND | | | THORNBURG MUNICIPAL MANAGED ACCOUNT FUND | |
| | | PERIOD ENDED | | | YEAR ENDED | | | PERIOD ENDED | |
| | | SEPTEMBER 30, 2024(a) | | | SEPTEMBER 30, 2024 | | | SEPTEMBER 30, 2023(b) | |
| INCREASE (DECREASE) IN NET ASSETS FROM | | | | | | | | | | | | |
| | | | | | | | | | | | | |
| OPERATIONS | | | | | | | | | | | | |
| Net investment income (loss) | | $ | 30,453 | | | $ | 386,920 | | | $ | 80,674 | |
| Net realized gain (loss) | | | (6,150 | ) | | | (12,353 | ) | | | (10,731 | ) |
| Net change in unrealized appreciation (depreciation) | | | 87,839 | | | | 599,187 | | | | (165,198 | ) |
| Net Increase (Decrease) in Net Assets Resulting from Operations | | | 112,142 | | | | 973,754 | | | | (95,255 | ) |
| | | | | | | | | | | | | |
| DIVIDENDS TO SHAREHOLDERS | | | | | | | | | | | | |
| From distributable earnings | | | | | | | | | | | | |
| Class I Shares | | | (7,084 | ) | | | (387,301 | ) | | | (80,656 | ) |
| | | | | | | | | | | | | |
| FUND SHARE TRANSACTIONS | | | | | | | | | | | | |
| Class I Shares | | | 987,306 | | | | 5,375,309 | | | | 5,468,656 | |
| Net Increase (Decrease) in Net Assets | | | 1,092,364 | | | | 5,961,762 | | | | 5,292,745 | |
| | | | | | | | | | | | | |
| NET ASSETS | | | | | | | | | | | | |
| Beginning of Period | | | - | | | | 5,292,745 | | | | — | |
| End of Period | | $ | 1,092,364 | | | $ | 11,254,507 | | | $ | 5,292,745 | |
(a) The Fund commenced operations on October 2, 2023.
(b) The Fund commenced operations on May 15, 2023.
See notes to financial statements.
296 | Annual Financial Statements
Notes to Financial Statements
September 30, 2024
NOTE 1 – ORGANIZATION
Thornburg Emerging Markets Managed Account Fund (“Emerging Markets Managed Account Fund”) and Thornburg Municipal Managed Account Fund (“Municipal Managed Account Fund”) are non-diversified series of Thornburg Investment Trust (the “Trust”). The Trust is organized as a Massachusetts business trust under a Declaration of Trust dated June 3, 1987 and is registered as a diversified, open-end management investment company under the Investment Company Act of 1940, as amended (the "1940 Act"). Emerging Markets Managed Account Fund commenced operations on October 2, 2023. As of September 30, 2024, the Funds are two of twenty-four separate series of the Trust. Each series is considered to be a separate entity for financial reporting and tax purposes and bears expenses directly attributable to it.
Emerging Markets Managed Account Fund: The Fund’s investment goal is long-term capital appreciation. The Fund’s investments subject it to certain risks. As of the date of this report, the principal risks of investing in the Fund include credit risk, cybersecurity and operational risk, emerging markets risk, equity risk, foreign currency risk, foreign investment risk, liquidity risk, management risk, market and economic risk, non-diversification risk, redemption risk, risks affecting investments in China, risks affecting specific countries and regions, risks affecting specific issuers, and small and mid-cap company risk. Please see the Fund’s prospectus for a discussion of those principal risks and other risks associated with an investment in the Fund.
Municipal Managed Account Fund: The Fund’s investment goal is to seek a high level of current income exempt from federal individual income tax. The Fund’s investments subject it to certain risks. As of the date of this report, the principal risks of investing in the Fund include credit risk, cybersecurity and operational risk, high yield risk, interest rate risk, liquidity risk, management risk, market and economic risk, non-diversification risk, redemption risk, and tax risk. Please see the Fund’s prospectus for a discussion of those principal risks and other risks associated with an investment in the Fund.
As of September 30, 2024, the Funds currently offer one class of shares of beneficial interest: Institutional Class (“Class I”). This class of shares of the Funds represents all interest in the portfolio of investments. Class I shares are sold at net asset value without a sales charge at the time of purchase and may be subject to a service fee. All expenses are allocated to the class including transfer agent fees, government registration fees, printing and postage costs, and legal expenses.
Shares of the Funds are available for purchase and redemption exclusively by or on behalf of separately managed account clients where Thornburg Investment Management, Inc., the Funds’ investment advisor (the “Advisor”), has an agreement with the managed account program’s sponsor, or directly with the client, to provide advisory services to the managed account or to the managed account program’s sponsor for its use in managing such account.
NOTE 2 – SIGNIFICANT ACCOUNTING POLICIES
The following is a summary of significant accounting policies followed by each of the Funds in the preparation of its financial statements. Each Fund prepares its financial statements in conformity with United States generally accepted accounting principles (“GAAP”), including investment company accounting and reporting guidance in the Financial Accounting Standards Board (the “FASB”) Accounting Standard Codification Topic 946.
Allocation of Expenses: Expenses common to all Funds are allocated among the Funds comprising the Trust based upon their relative net asset values or other appropriate allocation methods.
Dividends and Distributions to Shareholders: Dividends and distributions to shareholders, which are determined in accordance with federal income tax regulations and may differ from GAAP, are recorded on the ex-dividend date. Ordinary income dividends, if any, are declared daily and paid monthly. Capital gain distributions, if any, are declared and paid annually and more often if deemed necessary by the Advisor. Dividends and distributions are paid and are reinvested in additional shares of the Funds at net asset value per share at the close of business on the ex-dividend date, or at the shareholder’s option, paid in cash.
Foreign Currency Translation: Portfolio investments and other assets and liabilities denominated in foreign currencies are translated into U.S. dollars based on the exchange rate of such currencies against the U.S. dollar on the date of valuation. Purchases and sales of investments and income items denominated in foreign currencies are translated into U.S. dollars at the exchange rate in effect on the transaction date. When the Funds purchase or sell foreign investments, they will customarily enter into a foreign exchange contract to minimize foreign exchange risk from the trade date to the settlement date of such transactions. The values of such spot contracts are included in receivable for investments sold and payable for investments purchased on the Statement of Assets and Liabilities.
The Funds do not separately report the effect of changes in foreign exchange rates from changes in market prices on investments held. Such changes are included in net unrealized appreciation (depreciation) from investments in the Statement of Operations.
Annual Financial Statements | 297
Notes to Financial Statements, Continued
September 30, 2024
Reported net realized gains and losses from foreign currency transactions arise due to purchases and sales of foreign currencies, currency gains and losses realized between the trade and settlement dates on investment transactions and the difference between the amounts of dividends, interest, and foreign withholding taxes recorded on the Funds’ books, and the U.S. dollar equivalent of the amounts actually received or paid. These amounts are included in foreign currency transactions in the Statement of Operations.
Net change in unrealized appreciation (depreciation) on foreign currency translations arise from changes in the fair value of assets and liabilities, other than investments at period end, resulting from changes in exchange rates.
Guarantees and Indemnifications: Under the Trust’s organizational documents (and under separate agreements with the independent Trustees), its officers and Trustees are provided with an indemnification against certain liabilities arising out of the performance of their duties to the Funds. In the normal course of business the Trust may also enter into contracts with service providers that contain general indemnifications. The Trust’s maximum exposure under these arrangements is unknown. However, based on experience, the Trust expects the risk of loss to be remote.
Investment Income: Interest income is accrued as earned. Premiums and discounts are amortized and accreted, respectively, to first call dates or maturity dates using the effective yield method of the respective investments. These amounts are included in Investment Income in the Statement of Operations.
Investment Transactions: Investment transactions are accounted for on a trade date basis. Realized gains and losses from the sale of investments are recorded on an identified cost basis.
Repurchase Agreements: The Funds may invest excess cash in repurchase agreements whereby the Funds purchase investments, which serve as collateral, with an agreement to resell such collateral to the seller at an agreed upon price at the maturity date of the repurchase agreement. Investments pledged as collateral for repurchase agreements are held in custody until maturity of the repurchase agreement. Provisions in the agreements require that the market value of the collateral is at least equal to the repurchase value in the event of default. In the event of default, the Funds have the right to liquidate the collateral and apply the proceeds in satisfaction of the obligation. Under certain circumstances, in the event of default or bankruptcy by the other party to the agreement, realization and/or retention of the collateral may be subject to legal proceedings. During the fiscal year ended September 30, 2024, the Funds did not enter into repurchase agreements.
Security Valuation: All investments in securities held by the Funds are valued as described in Note 3.
Use of Estimates: The preparation of financial statements in conformity with GAAP requires management to make estimates and assumptions that affect the reported amounts of assets and liabilities and disclosure of contingent assets and liabilities at the date of the financial statements and the reported amounts of increases (decreases) in net assets from operations during the reporting period. Actual results could differ from those estimates.
When-Issued and Delayed Delivery Transactions: The Funds may engage in when-issued or delayed delivery transactions. To the extent the Funds engage in such transactions, they will do so for the purpose of acquiring portfolio investments consistent with the Funds’ investment objectives and not for the purpose of investment leverage or to speculate on interest rate or market changes. At the time the Funds make a commitment to purchase an investment on a when-issued or delayed delivery basis, the Funds will record the transaction and reflect the value in determining its net asset value. Pursuant to current U.S. Securities and Exchange Commission (“SEC”) guidance, a transaction involving a when-issued security will not be deemed to involve a senior security as long as the Funds intend to settle the transaction physically and the transaction settles within 35 days. Investments purchased on a when-issued or delayed delivery basis do not earn interest until the settlement date. The values of these securities held at September 30, 2024 are detailed in the Schedule of Investments.
Organizational and Offering Costs: The Funds incurred certain costs related to their launch and initial operation. Those organizational costs are charged to expense as incurred. Offering costs are amortized to expense daily over the span of one year from commencement of operations. These amounts are included in Prepaid expenses and other assets in the Statement of Assets and Liabilities and Other expenses in the Statement of Operations.
NOTE 3 – SECURITY VALUATION
Valuation of the Funds’ portfolio investment securities is performed by the Advisor, which has been designated by the Trustees of the Trust (the "Trustees") as the Funds’ “valuation designee,” as that term is defined in rule 2a-5 under the 1940 Act. The Advisor performs this valuation function under the supervision of the Trustees and in accordance with policies and procedures that have been adopted by the Advisor and approved by the Trustees (the “Valuation Policy and Procedures”).
In its capacity as the Funds’ valuation designee, the Advisor makes good faith determinations of the fair value of portfolio securities for which market quotations are not readily available, and otherwise complies with and administers the Valuation Policy and Procedures. The
298 | Annual Financial Statements
Notes to Financial Statements, Continued
September 30, 2024
Advisor performs those functions in significant measure through its Valuation and Pricing Committee (the “Committee”), though the Advisor may also obtain the assistance of others, including professional pricing service providers selected and approved by the Committee. In accordance with the Valuation Policy and Procedures, the Committee: assesses and manages the material risks associated with determining the fair value of those Fund investments for which market quotations are not readily available; selects and applies methodologies for determining and calculating such fair values; periodically reviews and tests the appropriateness and accuracy of those methodologies; monitors for circumstances that may necessitate the use of fair value; and approves, monitors, and evaluates pricing services engaged to provide evaluated prices for the Funds’ investments. The Committee provides reports on its activities to the Trustees’ Audit Committee, which is responsible for overseeing the Committee’s and the Advisor’s work in discharging the functions under the Valuation Policy and Procedures.
In those instances when the Committee assists in calculating a fair value for a portfolio investment, the Committee seeks to determine the price that the Funds would reasonably expect to receive upon a sale of the investment in an orderly transaction between market participants on the valuation date. The Committee customarily utilizes quotations from securities broker dealers in calculating valuations, but also may utilize prices obtained from pricing service providers or other methods selected by the Committee. Because fair values calculated by the Committee are estimates, the calculation of a fair value for an investment may differ from the price that would be realized by the Funds upon a sale of the investment, and the difference could be material to the Funds’ financial statements. The Committee’s calculation of a fair value for an investment may also differ from the prices obtained by other persons (including other mutual funds) for the investment.
Valuation of Securities: Securities and other portfolio investments which are listed or traded on a United States securities exchange are generally valued at the last reported sale price on the valuation date or, if there has been no sale of the investment on that date, at the mean between the last reported bid and asked prices for the investment on that date. Portfolio investments reported by NASDAQ are valued at the official closing price on the valuation date. If an investment is traded on more than one exchange, the investment is considered traded on the exchange that is normally the primary market for that investment. For securities and other portfolio investments which are primarily listed or traded on an exchange outside the United States, the time for determining the investment’s value in accordance with the first sentence of this paragraph will be the close of that investment’s primary exchange preceding the Fund’s valuation time.
In any case when a market quotation is not readily available for a portfolio investment ordinarily valued by market quotation, the Committee calculates a fair value for the investment using methodologies selected and approved by the Committee as described in the Valuation Policy and Procedures, subject to changes or additions by the Committee. For this purpose, a market quotation is considered to be readily available if it is a quoted price (unadjusted) in active markets for identical investments that the Funds can access at the measurement date. Pursuant to the Valuation Policy and Procedures, the Committee shall monitor for circumstances that may necessitate the use of fair valuation methodologies, including circumstances in which a market quotation for an investment is no longer reliable or is otherwise not readily available. For that purpose, a market quotation is not readily available when the primary market or exchange for the applicable investment is not open for the entire scheduled day of trading. A market quotation may also not be readily available if: (a) developments occurring after the most recent close of the applicable investment’s primary exchange, but prior to the close of business on any business day; or (b) an unusual event or significant period of time occurring since the availability of the market quotation, create a serious question concerning the reliability of that market quotation. Additionally, a market quotation will be considered unreliable if it would require adjustment under GAAP, or where GAAP would require consideration of additional inputs in determining the value of the investment. The Committee customarily obtains valuations in those instances from pricing service providers approved by the Committee. Such pricing service providers ordinarily calculate valuations using multi-factor models to adjust market prices based upon various inputs, including exchange data, depository receipt prices, futures, index data, and other data.
Investments in U.S. mutual funds are valued at net asset value (“NAV”) each business day.
Debt obligations held by the Funds which are not listed or traded on exchanges or for which no reported market exists are ordinarily valued at the valuation obtained from a pricing service provider approved by the Committee.
In any case when a pricing service provider fails to provide a valuation for a debt obligation held by the Funds, the Committee may calculate a fair value for the obligation using alternative methods selected and approved by the Committee. Additionally, in cases when the Committee believes that a valuation obtained from a pricing service provider is stale, does not reflect material factors affecting the valuation of the investment, is significantly different than the value the Funds are likely to obtain if they sought a bid for the investment, or is otherwise unreliable, the Committee may calculate a fair value for the obligation using an alternative method selected and approved by the Committee.
If the market quotation for an investment is expressed in a foreign currency, that market quotation will be converted to U.S. dollars using a foreign exchange quotation from a third-party service at the time of valuation. Foreign investments held by the Funds may be traded on days and at times when the Funds are not open for business. Consequently, the value of Funds’ investments may be significantly affected on days when shareholders cannot purchase or sell Funds’ shares.
Annual Financial Statements | 299
Notes to Financial Statements, Continued
September 30, 2024
Valuation Hierarchy: The Funds categorize their investments based upon the inputs used in valuing those investments, according to a three-level hierarchy established in guidance from the FASB. Categorization of investments using this hierarchy is intended by the FASB to maximize the use of observable inputs in valuing investments and minimize the use of unobservable inputs by requiring that the most observable inputs be used when available. Observable inputs are those that market participants would use in valuing an investment based on available market information. Unobservable inputs are those that reflect assumptions about the information market participants would use in valuing an investment. An investment’s level within the hierarchy is based on the lowest level input that is deemed significant to the valuation. The methodologies and inputs used to value investments are not necessarily indications of the risk or liquidity associated with those investments.
Various inputs are used in calculating valuations for the Fund’s investments. These inputs are generally summarized according to the three-level hierarchy below:
Level 1: Quoted prices in active markets for identical investments.
Level 2: Other direct or indirect significant observable inputs (including quoted prices for similar investments in active markets and other observable inputs, such as interest rates, prepayment rates, credit ratings, etc.).
Level 3: Significant unobservable inputs (including the Committee’s own assumptions in calculating the fair values of investments).
Valuations for debt obligations held by the Funds are typically calculated by pricing service providers approved by the Committee and are generally characterized as Level 2 within the valuation hierarchy.
On days when market volatility thresholds established by the Committee are exceeded, foreign securities for which valuations are obtained from pricing service providers are fair valued. On these days, the foreign securities are characterized as Level 2 within the valuation hierarchy and revert to Level 1 after the threshold is no longer exceeded.
In any case when a pricing service provider fails to provide a valuation for a debt obligation held by the Funds, the Committee calculates a fair value for the obligation using alternative methods under procedures approved by the Committee. Additionally, in cases when management believes that a valuation obtained from a pricing service provider is stale, does not reflect material factors affecting the valuation of the investment, is significantly different than the value the Funds are likely to obtain if they sought a bid for the investment, or is otherwise unreliable, the Committee calculates a fair value for the obligation using an alternative method approved by the Committee.
In a limited number of cases the Committee calculates a fair value for investments using broker quotations or other methods approved by the Committee. When the Committee uses a single broker quotation to calculate a fair value for an investment without other significant observable inputs, or if a fair value is calculated using other significant inputs that are considered unobservable, the investment is characterized as Level 3 within the hierarchy. Other significant unobservable inputs used to calculate a fair value in these instances might include an income-based valuation approach which considers discounted anticipated future cash flows from the investment and application of discounts due to the nature or duration of any restrictions on the disposition of the investment.
Valuations based upon the use of inputs from Levels 1, 2 or 3 may not represent the actual price received upon the disposition of an investment, and a Fund may receive a price that is lower than the valuation based upon these inputs when it sells the investment.
The following table displays a summary of the fair value hierarchy measurements of the Fund’s investments as of September 30, 2024:
| EMERGING MARKETS MANAGED ACCOUNT FUND | | TOTAL | | | LEVEL 1 | | | LEVEL 2 | | | LEVEL 3 | |
| Assets | | | | | | | | | | | | | | | | |
| Investments in Securities | | | | | | | | | | | | | | | | |
| Common Stock | | $ | 1,114,103 | | | $ | 1,114,103 | | | $ | — | | | $ | — | |
| Short-Term Investments | | | 31,758 | | | | 31,758 | | | | — | | | | — | |
| Total Investments in Securities | | $ | 1,145,861 | | | $ | 1,145,861 | | | $ | — | | | $ | — | |
| Total Assets | | $ | 1,145,861 | | | $ | 1,145,861 | | | $ | — | | | $ | — | |
| MUNICIPAL MANAGED ACCOUNT FUND | | TOTAL | | | LEVEL 1 | | | LEVEL 2 | | | LEVEL 3 | |
| Assets | | | | | | | | | | | | | | | | |
| Investments in Securities | | | | | | | | | | | | | | | | |
| Long-Term Municipal Bonds | | $ | 10,947,747 | | | $ | — | | | $ | 10,947,747 | | | $ | — | |
| Short-Term Municipal Bonds | | | 100,000 | | | | — | | | | 100,000 | | | | — | |
| Total Investments in Securities | | $ | 11,047,747 | | | $ | — | | | $ | 11,047,747 | | | $ | — | |
| Total Assets | | $ | 11,047,747 | | | $ | — | | | $ | 11,047,747 | | | $ | — | |
300 | Annual Financial Statements
Notes to Financial Statements, Continued
September 30, 2024
NOTE 4 – INVESTMENT MANAGEMENT FEE AND OTHER TRANSACTIONS WITH AFFILIATES
Pursuant to an investment advisory agreement with the Trust, the Advisor serves as the investment advisor and performs services for the Funds. The Funds do not pay an advisory fee to the Advisor under this agreement.
The Advisor provides certain administrative services to the Funds. No fees are charged for these services.
Thornburg and Thornburg Securities LLC ("TSL") have contractually agreed, irrevocably during the existence of the Funds, to waive, pay or reimburse all expenses of the Funds, except for taxes, interest expense, acquired fund fees and expenses, brokerage commissions, borrowing costs, expenses relating to short sales, and unusual expenses such as contingency fees or litigation costs.
For the year ended September 30, 2024, the Advisor contractually reimbursed certain expenses and distribution fees of $183,839 for Class I shares of Emerging Markets Managed Account Fund and $164,564 for Class I shares of Municipal Managed Account Fund.
Certain officers and Trustees of the Trust are also officers or directors of the Advisor and Distributor. The compensation of the independent Trustees is borne by the Trust. The Trust also pays a portion of the Chief Compliance Officer’s compensation. These amounts are reflected as Trustee and officer fees in the Statement of Operations.
The Funds may purchase or sell securities from or to an affiliated fund, provided the affiliation is due solely to having a common investment advisor, common officers, or common trustees, and provided that all such transactions will comply with Rule 17a-7 under the 1940 Act. For the year ended September 30, 2024, the Funds had no such transactions with affiliated funds.
Shown below are holdings of voting securities of the portfolio company which is considered "affiliated" to the Funds under the 1940 Act, including companies for which the Funds’ holding represented 5% or more of the company’s voting securities, and a series of the Thornburg Investment Trust in which the Funds invested for cash management purposes during the period:
| EMERGING MARKETS MANAGED ACCOUNT FUND | | MARKET VALUE 9/30/23 | | | PURCHASES AT COST | | | SALES PROCEEDS | | | REALIZED GAIN (LOSS) | | | CHANGE IN UNREALIZED APPR./(DEPR.) | | | MARKET VALUE 9/30/24 | | | DIVIDEND INCOME | |
| Thornburg Capital Mgmt. Fund | | $ | - | | | $ | 2,372,308 | | | $ | (2,340,550 | ) | | $ | - | | | $ | - | | | $ | 31,758 | | | $ | 4,827 | |
NOTE 5 – TAXES
Federal Income Taxes: It is the policy of the Trust to comply with the provisions of the Internal Revenue Code of 1986 applicable to regulated investment companies and to distribute to shareholders substantially all investment company taxable income including net realized gains on investments (if any), and tax exempt income of the Funds. Therefore, no provision for federal income or excise tax is required.
The Funds file income tax returns in United States federal and applicable state jurisdictions. The statute of limitations on the Funds’ tax return filings generally remains open for the three years following a return’s filing date. The Funds have analyzed each uncertain tax position believed to be material in the preparation of the Funds’ financial statements for the fiscal year ended September 30, 2024, including open tax years, to assess whether it is more likely than not that the position would be sustained upon examination, based on the technical merits of the position. The Funds have not identified any such position for which an asset or liability must be reflected in the Statements of Assets and Liabilities.
At September 30, 2024, information on the tax components of capital was as follows:
| | | COST | | | UNREALIZED APPRECIATION | | | UNREALIZED DEPRECIATION | | | NET UNREALIZED APPRECIATION (DEPRECIATION) | |
| Emerging Markets Managed Account Fund | | $ | 1,076,147 | | | $ | 102,487 | | | $ | (32,773 | ) | | $ | 69,714 | |
| Municipal Managed Account Fund | | | 10,613,758 | | | | 434,771 | | | | (782 | ) | | | 433,989 | |
Temporary differences between book and tax basis appreciation (depreciation) on cost of investments is primarily attributed to tax deferral of losses on wash sales and passive foreign investment companies.
At September 30, 2024, Municipal Managed Account Fund had cumulative tax basis of short-term capital losses of $23,084 from prior fiscal year, which may be carried forward to offset future capital gains. To the extent such carry forwards are used, capital gain distributions may be reduced to the extent provided by regulations. Such capital loss carry forwards do not expire.
Annual Financial Statements | 301
Notes to Financial Statements, Continued
September 30, 2024
At September 30, 2024, the effect of permanent "book/tax" reclassifications resulted in increases and decreases to components of the Funds’ net assets as follows:
| | | DISTRIBUTABLE EARNINGS | | NET CAPITAL PAID |
| Municipal Managed Account Fund | | $ | 363 | | | $ | (363 | ) |
These differences are primarily due to the tax treatment of distributions in excess of current year earnings.
Foreign Withholding Taxes: The Funds are subject to foreign tax withholding imposed by certain foreign countries in which the Funds may invest. Withholding taxes are incurred on certain foreign dividends and are accrued at the time the dividend is recognized based on applicable foreign tax laws. The Funds may file withholding tax reclaims in certain jurisdictions to recover a portion of amounts previously withheld, in view of various considerations, including recent decisions rendered by the courts in those and other jurisdictions. The Funds would expect to record a receivable for such a reclaim based on a variety of factors, including assessment of a jurisdiction’s legal obligation to pay reclaims, the jurisdiction’s administrative practices and payment history, and industry convention. To date the Funds have recorded no such receivable because there is limited precedent for collecting such prior year reclaims in countries other than Finland, and the likelihood of collection in those other countries remains uncertain.
Deferred Foreign Capital Gain Taxes: The Funds are subject to a tax imposed on net realized gains of securities of certain foreign countries. The Funds record an estimated deferred tax liability for net unrealized gains on these investments as reflected in the accompanying financial statements. Such changes are included in net unrealized appreciation (depreciation) from investments in the Statement of Operations.
At September 30, 2024, Emerging Markets Managed Account Fund had $39,190 of undistributed tax basis net ordinary income.
The tax character of distributions paid during the years ended September 30, 2024, and September 30, 2023, were as follows:
| | | DISTRIBUTIONS FROM: | |
| | | TAX EXEMPT INCOME | | | ORDINARY INCOME | |
| | | 2024 | | | 2023 | | | 2024 | | | 2023 | |
| Emerging Markets Managed Account Fund | | $ | — | | | $ | — | | | $ | 7,084 | | | $ | — | |
| Municipal Managed Account Fund | | | 381,270 | | | | 80,067 | | | | 6,031 | | | | 589 | |
NOTE 6 – SHARES OF BENEFICIAL INTEREST
At September 30, 2024, there were an unlimited number of shares of each Fund with no par value of beneficial interest authorized. Transactions in each Fund’s shares of beneficial interest were as follows:
| | | PERIOD ENDED SEPTEMBER 30, 2024† | |
| EMERGING MARKETS MANAGED ACCOUNT FUND | | SHARES | | | AMOUNT | |
| Class I Shares | | | | | | |
| Shares sold | | | 150,570 | | | $ | 1,487,666 | |
| Shares issued to shareholders in | | | | | | | | |
| reinvestment of dividends | | | 723 | | | | 7,084 | |
| Shares repurchased | | | (48,308 | ) | | | (507,444 | ) |
| Net increase (decrease) | | | 102,985 | | | $ | 987,306 | |
| † | The Fund commenced operations on October 2, 2023. |
| | | YEAR ENDED SEPTEMBER 30, 2024 | | | PERIOD ENDED SEPTEMBER 30, 2023* | |
| MUNICIPAL MANAGED ACCOUNT FUND | | SHARES | | | AMOUNT | | | SHARES | | | AMOUNT | |
| Class I Shares | | | | | | | | | | | | |
| Shares sold | | | 489,757 | | | $ | 4,988,008 | | | | 538,878 | | | $ | 5,388,000 | |
| Shares issued to shareholders in | | | | | | | | | | | | | | | | |
| reinvestment of dividends | | | 37,976 | | | | 387,301 | | | | 8,142 | | | | 80,656 | |
| Net increase (decrease) | | | 527,733 | | | $ | 5,375,309 | | | | 547,020 | | | $ | 5,468,656 | |
| * | The Fund commenced operations on May 15, 2023. |
302 | Annual Financial Statements
Notes to Financial Statements, Continued
September 30, 2024
NOTE 7 – INVESTMENT TRANSACTIONS
For the year ended September 30, 2024, the Funds had purchase and sale transactions of investments as listed in the table below (excluding short-term investments).
| | | PURCHASES | | | SALES | |
| Emerging Markets Managed Account Fund | | $ | 2,874,309 | | | $ | 1,848,028 | |
| Municipal Managed Account Fund | | | 7,145,821 | | | | 1,732,588 | |
Annual Financial Statements | 303
Financial Highlights
Emerging Markets Managed Account Fund
| | | PER SHARE PERFORMANCE (FOR A SHARE OUTSTANDING THROUGHOUT THE YEAR) |
UNLESS OTHERWISE
NOTED, PERIODS ARE
FISCAL YEARS ENDED
SEPTEMBER 30, | | NET ASSET
VALUE,
BEGINNING
OF YEAR | | NET
INVESTMENT
INCOME
(LOSS)+ | | NET REALIZED &
UNREALIZED
GAIN (LOSS) ON
INVESTMENTS | | | TOTAL FROM
INVESTMENT
OPERATIONS | | | DIVIDENDS
FROM NET
INVESTMENT
INCOME | | | DIVIDENDS
FROM NET
REALIZED
GAINS | | | DIVIDENDS
FROM
RETURN OF
CAPITAL | | | TOTAL
DIVIDENDS | | | NET ASSET
VALUE,
END OF
YEAR | |
| | | | | | | | | | | | | | | | | | | | | | | | | | | | | | | | | | | |
| CLASS I SHARES | | | | | | | | | | | | | | | | | | | | | | | | | | | | | | | | | | |
| 2024(b) | | $ | 10.00 | | | 0.23 | | | 0.43 | | | | 0.66 | | | | (0.05) | | | | — | | | | — | | | | (0.05) | | | $ | 10.61 | |
| (a) | Not annualized for periods less than one year. |
| (b) | The Fund commenced operations on October 2, 2023. |
| (d) | Due to the size of net assets and fixed expenses, ratios may appear disproportionate. |
| + | Based on weighted average shares outstanding. |
See notes to financial statements.
304 | Annual Financial Statements
Financial Highlights, Continued
Emerging Markets Managed Account Fund
| | | RATIOS TO AVERAGE NET ASSETS | | | SUPPLEMENTAL DATA |
UNLESS OTHERWISE
NOTED, PERIODS ARE
FISCAL YEARS ENDED
SEPTEMBER 30, | | NET INVESTMENT
INCOME (LOSS) (%) | | EXPENSES, AFTER
EXPENSE
REDUCTIONS (%) | | | EXPENSES,
BEFORE EXPENSE
REDUCTIONS (%) | | | TOTAL
RETURN (%)(a) | | PORTFOLIO
TURNOVER
RATE (%)(a) | | NET
ASSETS
AT END OF YEAR
(THOUSANDS) | |
| | | | | | | | | | | | | | | | | | | | | | |
| CLASS I SHARES | | | | | | | | | | | | | | | | | | | | | |
| 2024(b) | | | 2.30(c) | | | —(c) | | | | 13.87(c)(d) | | | | 6.67 | | | 145.98 | | $ | 1,092 | |
Annual Financial Statements | 305
Financial Highlights
Municipal Managed Account Fund
| | | PER SHARE PERFORMANCE (FOR A SHARE OUTSTANDING THROUGHOUT THE YEAR) |
UNLESS OTHERWISE
NOTED, PERIODS ARE
FISCAL YEARS ENDED
SEPTEMBER 30, | | NET ASSET
VALUE,
BEGINNING
OF PERIOD | | | NET
INVESTMENT
INCOME
(LOSS)+ | | | NET REALIZED &
UNREALIZED
GAIN (LOSS) ON
INVESTMENTS | | | TOTAL FROM
INVESTMENT
OPERATIONS | | | DIVIDENDS
FROM NET
INVESTMENT
INCOME | | | DIVIDENDS
FROM NET
REALIZED
GAINS | | | DIVIDENDS
FROM
RETURN OF
CAPITAL | | | TOTAL
DIVIDENDS | | | NET ASSET
VALUE,
END OF
PERIOD | |
| | | | | | | | | | | | | | | | | | | | | | | | | | | | | | | | | | | | | |
| CLASS I SHARES | | | | | | | | | | | | | | | | | | | | | | | | | | | | | | | | | | | | |
| | | | | | | | | | | | | | | | | | | | | | | | | | | | | | | | | | | | | |
| 2024 | | $ | 9.68 | | | | 0.45 | | | | 0.79 | | | | 1.24 | | | | (0.45) | | | | — | | | | — | | | | (0.45) | | | $ | 10.47 | |
| 2023(b) | | $ | 10.00 | | | | 0.15 | | | | (0.32) | | | | (0.17) | | | | (0.15) | | | | — | | | | — | | | | (0.15) | | | $ | 9.68 | |
| (a) | Not annualized for periods less than one year. |
| (b) | The Fund commenced operations on May 15, 2023. |
| + | Based on weighted average shares outstanding. |
See notes to financial statements.
306 | Annual Financial Statements
Financial Highlights, Continued
Municipal Managed Account Fund
| | | RATIOS TO AVERAGE NET ASSETS | | | | SUPPLEMENTAL DATA | |
UNLESS OTHERWISE
NOTED, PERIODS ARE
FISCAL YEARS ENDED
SEPTEMBER 30, | | NET INVESTMENT
INCOME (LOSS) (%) | | | EXPENSES, AFTER
EXPENSE
REDUCTIONS (%) | | | EXPENSES,
BEFORE EXPENSE
REDUCTIONS (%) | | | TOTAL
RETURN (%)(a) | | | PORTFOLIO
TURNOVER
RATE (%)(a) | | | NET
ASSETS
AT END OF YEAR
(THOUSANDS) | |
| | | | | | | | | | | | | | | | | | | | | | | | | |
| CLASS I SHARES | | | | | | | | | | | | | | | | | | | | | | | | |
| 2024 | | | 4.39 | | | | — | | | | 1.87 | | | | 13.02 | | | | 21.60 | | | $ | 11,255 | |
| 2023(b) | | | 4.00(c) | | | | — (c) | | | | 3.65(c) | | | | (1.74) | | | | 39.98 | | | $ | 5,293 | |
Annual Financial Statements | 307
Report of Independent Registered Public Accounting Firm
Thornburg Managed Account Funds
To the Board of Trustees of Thornburg Investment Trust and Shareholders of each of the funds listed in the table below
Opinions on the Financial Statements
We have audited the accompanying statements of assets and liabilities, including the schedules of investments, of each of the funds listed in the table below (two of the funds constituting Thornburg Investment Trust, hereafter collectively referred to as the "Funds") as of September 30, 2024, the related statements of operations and of changes in net assets for each of the periods indicated in the table below, including the related notes, and the financial highlights for each of the periods indicated therein (collectively referred to as the "financial statements"). In our opinion, the financial statements present fairly, in all material respects, the financial position of the each of the Funds listed in the table below as of September 30, 2024, and the results of each of their operations and the changes in each of their net assets for the periods indicated in the table below, and each of the financial highlights for each of the periods indicated therein, in conformity with accounting principles generally accepted in the United States of America.
Fund
Thornburg Emerging Markets Managed Account Fund (1)
Thornburg Municipal Managed Account Fund (2)
(1) Statement of operations and statement of changes in net assets for the period October 2, 2023 (commencement of operations) through September 30, 2024
(2) Statement of operations for the year ended September 30, 2024, and statements of changes in net assets for year ended September 30, 2024, and for the period May 15, 2023 (commencement of operations) through September 30, 2023
Basis for Opinions
These financial statements are the responsibility of the Funds’ management. Our responsibility is to express an opinion on the Funds’ financial statements based on our audits. We are a public accounting firm registered with the Public Company Accounting Oversight Board (United States) (PCAOB) and are required to be independent with respect to the Funds in accordance with the U.S. federal securities laws and the applicable rules and regulations of the Securities and Exchange Commission and the PCAOB.
We conducted our audits of these financial statements in accordance with the standards of the PCAOB. Those standards require that we plan and perform the audit to obtain reasonable assurance about whether the financial statements are free of material misstatement, whether due to error or fraud.
Our audits included performing procedures to assess the risks of material misstatement of the financial statements, whether due to error or fraud, and performing procedures that respond to those risks. Such procedures included examining, on a test basis, evidence regarding the amounts and disclosures in the financial statements. Our audits also included evaluating the accounting principles used and significant estimates made by management, as well as evaluating the overall presentation of the financial statements. Our procedures included confirmation of securities owned as of September 30, 2024 by correspondence with the custodian, transfer agent and broker. We believe that our audits provide a reasonable basis for our opinion.
/s/PricewaterhouseCoopers LLP
New York, New York
November 14, 2024
We have served as the auditor of one or more investment companies in Thornburg Investment Trust since 1999.
308 | Annual Financial Statements
Tax Information
September 30, 2024
For the tax year ended September 30, 2024, tax exempt (or the maximum allowed) and taxable ordinary income dividends paid by funds for federal income tax purposes are as follows:
| | | TAXABLE ORDINARY | | TAXABLE ORDINARY |
| Emerging Markets Managed Account Fund | | $ | — | | | $ | 7,084 | |
| Municipal Managed Account Fund | | | 381,270 | | | | 6,031 | |
For the tax year ended September 30, 2024, the dividend ratio (or the maximum allowed) paid from tax basis net ordinary income as qualifying for the reduced rate under the Jobs and Growth Tax Relief and Reconciliation Act of 2003 and the ordinary income distributions ratio (or the maximum allowed) paid as qualified for the corporate dividend received deduction are as follows:
| | | QUALIFIED
DIVIDEND INCOME | | DIVIDENDS
RECEIVED DEDUCTION |
| Emerging Markets Managed Account Fund | | | 34.14 | % | | | — | % |
For the year ended September 30, 2024, foreign source income and foreign tax credit to be passed through to shareholders are as follows:
| | | FOREIGN SOURCE INCOME | | FOREIGN TAX CREDIT |
| Emerging Markets Managed Account Fund | | | $29,498 | | | | $5,391 | |
The information and the distributions reported herein may differ from information and distributions reported to the shareholders for the calendar year ending December 31, 2024. Complete information will be reported in conjunction with your 2024 Form 1099.
Annual Financial Statements | 309
Schedule of Investments
Thornburg Capital Management Fund | September 30, 2024
| | ISSUER-DESCRIPTION | | SHARES/PRINCIPAL
AMOUNT | | VALUE | |
| | COMMERCIAL PAPER — 59.6% | | | | | | | | |
| | Ameren Corp., | | | | | | | | |
| | 5.018% due 10/25/2024 | | $ | 50,000,000 | | | $ | 49,835,667 | |
| | 5.02% due 11/1/2024 | | | 2,000,000 | | | | 1,991,509 | |
| | American Honda Finance Corp., 5.016% due 11/5/2024 | | | 54,000,000 | | | | 53,741,700 | |
| | Avangrid, Inc., | | | | | | | | |
| a | 5.324% due 10/9/2024 | | | 2,000,000 | | | | 1,997,676 | |
| a | 5.044% due 10/30/2024 | | | 50,000,000 | | | | 49,800,625 | |
| a | 5.047% due 11/4/2024 | | | 2,000,000 | | | | 1,990,650 | |
| | BAT International Finance plc, | | | | | | | | |
| a,b | 4.989% due 10/1/2024 | | | 32,000,000 | | | | 32,000,000 | |
| a,b | 5.009% due 10/1/2024 | | | 3,000,000 | | | | 3,000,000 | |
| a,b | 5.025% due 10/3/2024 | | | 15,000,000 | | | | 14,995,875 | |
| | Bell Telephone Co. of Canada or Bell Canada, | | | | | | | | |
| a,b | 5.089% due 10/21/2024 | | | 38,000,000 | | | | 37,894,444 | |
| a,b | 5.091% due 10/23/2024 | | | 11,950,000 | | | | 11,913,486 | |
| a,b | 5.063% due 10/28/2024 | | | 2,000,000 | | | | 1,992,545 | |
| | Canadian National Railway Co., | | | | | | | | |
| a,b | 5.36% due 10/1/2024 | | | 500,000 | | | | 500,000 | |
| a,b | 5.364% due 10/1/2024 | | | 5,000,000 | | | | 5,000,000 | |
| a | Consolidated Edison Co. of New York, Inc., 5.021% due 10/28/2024 | | | 54,000,000 | | | | 53,800,335 | |
| a | CVS Health Corp., 5.019% due 10/1/2024 | | | 50,975,000 | | | | 50,975,000 | |
| | DTE Electric Co., 5.344% due 10/8/2024 | | | 151,000 | | | | 150,846 | |
| a | Duke Energy Corp., 5.396% due 10/3/2024 | | | 4,225,000 | | | | 4,223,756 | |
| | Enbridge U.S., Inc., | | | | | | | | |
| a | 5.355% due 10/1/2024 | | | 3,000,000 | | | | 3,000,000 | |
| a | 5.008% due 10/9/2024 | | | 50,000,000 | | | | 49,945,222 | |
| a | Entergy Corp., 5.038% due 10/23/2024 | | | 290,000 | | | | 289,123 | |
| a | Evergy Kansas Central, Inc., 4.997% due 10/8/2024 | | | 54,100,000 | | | | 54,048,244 | |
| | Eversource Energy, | | | | | | | | |
| a | 5.024% due 10/4/2024 | | | 3,664,000 | | | | 3,662,489 | |
| a | 5.089% due 10/28/2024 | | | 48,000,000 | | | | 47,820,000 | |
| a | Exelon Corp., 5.008% due 10/9/2024 | | | 52,000,000 | | | | 51,943,031 | |
| a | HP, Inc., 4.994% due 10/4/2024 | | | 54,000,000 | | | | 53,977,860 | |
| | Intercontinental Exchange, Inc., | | | | | | | | |
| a | 5.39% due 10/3/2024 | | | 11,000,000 | | | | 10,996,761 | |
| a | 5.416% due 10/8/2024 | | | 1,000,000 | | | | 998,966 | |
| a | 5.019% due 10/10/2024 | | | 36,000,000 | | | | 35,955,540 | |
| a | 5.375% due 10/10/2024 | | | 4,000,000 | | | | 3,994,720 | |
| | McCormick & Co., Inc., | | | | | | | | |
| a | 5.446% due 10/1/2024 | | | 46,000,000 | | | | 46,000,000 | |
| a | 5.232% due 10/2/2024 | | | 6,350,000 | | | | 6,349,092 | |
| | Mitsubishi HC Finance America LLC, 5.137% due 10/21/2024 | | | 1,000,000 | | | | 997,194 | |
| a | Mondelez International, Inc., 5.213% due 10/4/2024 | | | 40,000,000 | | | | 39,982,900 | |
| | Oglethorpe Power Corp., | | | | | | | | |
| a | 5.447% due 10/3/2024 | | | 2,382,000 | | | | 2,381,292 | |
| a | 5.046% due 10/7/2024 | | | 281,000 | | | | 280,767 | |
| a | 5.345% due 10/10/2024 | | | 17,117,000 | | | | 17,094,534 | |
| a | 5.053% due 10/29/2024 | | | 1,733,000 | | | | 1,726,314 | |
| | ONE Gas, Inc., | | | | | | | | |
| a | 5.024% due 10/1/2024 | | | 20,000,000 | | | | 20,000,000 | |
| a | 5.024% due 10/2/2024 | | | 2,600,000 | | | | 2,599,642 | |
| a | 5.024% due 10/3/2024 | | | 15,600,000 | | | | 15,595,710 | |
| a | 5.397% due 10/11/2024 | | | 4,500,000 | | | | 4,493,375 | |
| a | 5.084% due 10/17/2024 | | | 6,100,000 | | | | 6,086,444 | |
| a | 5.094% due 10/17/2024 | | | 5,000,000 | | | | 4,988,867 | |
| | Penske Truck Leasing Co. LP, | | | | | | | | |
| | 5.488% due 10/1/2024 | | | 5,000,000 | | | | 5,000,000 | |
| | 5.37% due 10/2/2024 | | | 29,000,000 | | | | 28,995,747 | |
| | 5.364% due 10/7/2024 | | | 273,000 | | | | 272,760 | |
| | 5.267% due 10/8/2024 | | | 11,800,000 | | | | 11,788,115 | |
| | 5.04% due 11/25/2024 | | | 8,000,000 | | | | 7,939,745 | |
| a | Rockwell Automation, Inc., 5.028% due 10/23/2024 | | | 54,000,000 | | | | 53,836,980 | |
| 310 | Annual Financial Statements | See notes to financial statements. |
Schedule of Investments, Continued
Thornburg Capital Management Fund | September 30, 2024
| | ISSUER-DESCRIPTION | | SHARES/PRINCIPAL
AMOUNT | | VALUE | |
| | Ryder System, Inc., | | | | | | | | |
| | 5.029% due 10/9/2024 | | $ | 250,000 | | | $ | 249,725 | |
| | 5.091% due 10/21/2024 | | | 34,000,000 | | | | 33,905,556 | |
| | 5.04% due 10/25/2024 | | | 2,000,000 | | | | 1,993,400 | |
| | 5.065% due 10/31/2024 | | | 18,000,000 | | | | 17,925,450 | |
| | Sherwin-Williams Co., | | | | | | | | |
| a | 5.015% due 10/21/2024 | | | 24,000,000 | | | | 23,934,267 | |
| a | 5.01% due 10/28/2024 | | | 1,000,000 | | | | 996,310 | |
| | Southern California Edison Co., | | | | | | | | |
| a | 5.019% due 10/1/2024 | | | 500,000 | | | | 500,000 | |
| a | 5.074% due 10/7/2024 | | | 40,000,000 | | | | 39,966,667 | |
| | Spire, Inc., | | | | | | | | |
| a | 5.025% due 10/3/2024 | | | 2,500,000 | | | | 2,499,312 | |
| a | 5.319% due 10/9/2024 | | | 1,059,000 | | | | 1,057,769 | |
| a | 5.324% due 10/10/2024 | | | 30,000,000 | | | | 29,960,775 | |
| a | 5.089% due 10/21/2024 | | | 2,000,000 | | | | 1,994,444 | |
| a | 5.069% due 10/24/2024 | | | 18,000,000 | | | | 17,942,730 | |
| | Union Electric Co., 4.995% due 10/7/2024 | | | 52,000,000 | | | | 51,957,360 | |
| | Western Union Co., | | | | | | | | |
| a | 5.074% due 10/2/2024 | | | 50,000,000 | | | | 49,993,056 | |
| a | 5.105% due 10/2/2024 | | | 4,000,000 | | | | 3,999,441 | |
| | TOTAL COMMERCIAL PAPER (Cost $1,247,721,810) | | | | | | | 1,247,721,810 | |
| | | | | | | | | | |
| | MUTUAL FUND — 33.7% | | | | | | | | |
| c | State Street Institutional Treasury Money Market Fund, Premier Class, 4.97% | | | 706,055,409 | | | | 706,055,409 | |
| | TOTAL MUTUAL FUND (Cost $706,055,409) | | | | | | | 706,055,409 | |
| | | | | | | | | | |
| | TOTAL INVESTMENTS — 93.3% (Cost $1,953,777,219) | | | | | | $ | 1,953,777,219 | |
| | | | | | | | | | |
| | OTHER ASSETS LESS LIABILITIES — 6.7% | | | | | | | 140,269,846 | |
| | | | | | | | | | |
| | NET ASSETS — 100.0% | | | | | | $ | 2,094,047,065 | |
Footnote Legend
| a | Securities exempt from registration under Rule 144A of the Securities Act of 1933, as amended. These securities are restricted but liquid and may only be resold in the ordinary course of business in transactions exempt from registration, normally to qualified institutional buyers. As of September 30, 2024, the aggregate value of these securities in the Fund’s portfolio was $980,977,036, representing 46.85% of the Fund’s net assets. |
| b | Yankee bond denominated in U.S. dollars and is issued in the U.S. by foreign banks and corporations. |
| c | Rate represents the money market fund annualized seven-day yield at September 30, 2024. |
| See notes to financial statements. | Annual Financial Statements | 311 |
Statement of Assets and Liabilities
Thornburg Capital Management Fund | September 30, 2024
| ASSETS | | | |
| Investment in securities, at cost | | $ | 1,953,777,219 | |
| Investments at value | | | 1,953,777,219 | |
| Cash | | | 187,685,859 | |
| Dividends receivable | | | 1,662,389 | |
| Principal and interest receivable | | | 852,949 | |
| Total Assets | | | 2,143,978,416 | |
| | | | | |
| LIABILITIES | | | | |
| Payable for investments purchased | | | 49,811,509 | |
| Accounts payable and accrued expenses | | | 119,842 | |
| Total Liabilities | | | 49,931,351 | |
| NET ASSETS | | $ | 2,094,047,065 | |
| | | | | |
| NET ASSETS CONSIST OF | | | | |
| Net capital paid in on shares of beneficial interest | | $ | 2,093,971,103 | |
| Distributable earnings | | | 75,962 | |
| NET ASSETS | | $ | 2,094,047,065 | |
| | | | | |
| NET ASSET VALUE | | | | |
| Class I Shares: | | | | |
| Net assets applicable to shares outstanding | | $ | 2,094,047,065 | |
| Shares outstanding | | | 209,399,480 | |
| Net asset value and redemption price per share | | $ | 10.00 | |
See notes to financial statements.
312 | Annual Financial Statements
Statement of Operations
Thornburg Capital Management Fund | Year Ended September 30, 2024
| INVESTMENT INCOME | | | |
| Interest income | | $ | 89,111,993 | |
| Dividend income | | | 1,708,203 | |
| Total Income | | | 90,820,196 | |
| | | | | |
| EXPENSES | | | | |
| Transfer agent fees | | | 1,321 | |
| Custodian fees | | | 99,829 | |
| Audit and tax fees | | | 32,699 | |
| Legal fees | | | 2,194 | |
| Prepaid insurance expense | | | 11,301 | |
| Other expenses | | | 5,102 | |
| Total Expenses | | | 152,446 | |
| Net Investment Income (Loss) | | $ | 90,667,750 | |
| | | | |
| REALIZED AND UNREALIZED GAIN (LOSS) | | | |
| Net realized gain (loss) | | | 80,563 | |
| Net Realized and Unrealized Gain (Loss) | | | 80,563 | |
| Change in Net Assets Resulting from Operations | | $ | 90,748,313 | |
See notes to financial statements.
Annual Financial Statements | 313
Statement of Changes in Net Assets
Thornburg Capital Management Fund
| | | YEAR ENDED
SEPTEMBER 30, 2024 | | | YEAR ENDED
SEPTEMBER 30, 2023 | |
| INCREASE (DECREASE) IN NET ASSETS FROM | | | | | | | | |
| | | | | | | | | |
| OPERATIONS | | | | | | | | |
| Net investment income | | $ | 90,667,750 | | | $ | 70,926,529 | |
| Net realized gain (loss) | | | 80,563 | | | | 42,197 | |
| Net Increase (Decrease) in Net Assets Resulting from Operations | | | 90,748,313 | | | | 70,968,726 | |
| | | | | | | | | |
| DIVIDENDS TO SHAREHOLDERS | | | | | | | | |
| From distributable earnings | | | | | | | | |
| Class I Shares | | | (90,710,663 | ) | | | (71,182,725 | ) |
| | | | | | | | | |
| FUND SHARE TRANSACTIONS | | | | | | | | |
| Class I Shares | | | 363,622,675 | | | | 201,697,890 | |
| Net Increase (Decrease) in Net Assets | | | 363,660,325 | | | | 201,483,891 | |
| | | | | | | | | |
| NET ASSETS | | | | | | | | |
| Beginning of Year | | | 1,730,386,740 | | | | 1,528,902,849 | |
| End of Year | | $ | 2,094,047,065 | | | $ | 1,730,386,740 | |
See notes to financial statements.
314 | Annual Financial Statements
Notes to Financial Statements
Thornburg Capital Management Fund | September 30, 2024
NOTE 1 – ORGANIZATION
Thornburg Capital Management Fund (the “Fund”) is a diversified series of Thornburg Investment Trust (the “Trust”). The Trust is organized as a Massachusetts business trust under a Declaration of Trust dated June 3, 1987 and is registered as a diversified, open-end management investment company under the Investment Company Act of 1940, as amended (the "1940 Act"). As of September 30, 2024, the Fund is currently one of twenty-four separate series of the Trust. Each series is considered to be a separate entity for financial reporting and tax purposes and bears expenses directly attributable to it. The Fund’s investment goal is to seek current income consistent with liquidity management and safety of capital. The Fund’s investments subject it to certain risks. As of the date of this report, the principal risks of investing in the Fund include credit risk, cybersecurity and operational risk, foreign investment risk, interest rate risk, liquidity risk, management risk, market and economic risk, and prepayment and extension risk. Please see the Fund’s prospectus for a discussion of those principal risks and other risks associated with an investment in the Fund.
As of September 30, 2024, the Fund currently offers one class of shares of beneficial interest: Institutional Class (“Class I”). This class of shares of the Fund represents all interest in the portfolio of investments. Class I shares are sold at net asset value without a sales charge at the time of purchase and may be subject to a service fee. All expenses are allocated to the class including transfer agent fees, government registration fees, printing and postage costs, and legal expenses.
Shares of the Fund are issued solely in private placement transactions that do not involve any “public offering” within the meaning of Section 4(2) of the Securities Act of 1933 (the "1933 Act"). Investments in the Fund may only be made by investment companies, or other persons that are “accredited investors” within the meaning of Regulation D under the 1933 Act. Thornburg Investment Management, Inc. (the "Advisor"), acting as the agent for the other series of the Trust, will effect all purchases and sales of shares of the Fund on behalf of any series of the Trust.
NOTE 2 – SIGNIFICANT ACCOUNTING POLICIES
The following is a summary of significant accounting policies followed by the Fund in the preparation of its financial statements. The Fund prepares its financial statements in conformity with United States generally accepted accounting principles (“GAAP”), including investment company accounting and reporting guidance in the Financial Accounting Standards Board (the “FASB”) Accounting Standard Codification Topic 946.
Allocation of Expenses: Expenses common to all Funds are allocated among the Funds comprising the Trust based upon their relative net asset values or other appropriate allocation methods.
Dividends and Distributions to Shareholders: Dividends and distributions to shareholders, which are determined in accordance with federal income tax regulations and may differ from GAAP, are recorded on the ex-dividend date. Ordinary income dividends, if any, are declared daily and paid monthly. Capital gain distributions, if any, are declared and paid annually and more often if deemed necessary by the Advisor. Dividends and distributions are paid and are reinvested in additional shares of the Fund at net asset value per share at the close of business on the ex-dividend date, or at the shareholder’s option, paid in cash.
Guarantees and Indemnifications: Under the Trust’s organizational documents (and under separate agreements with the independent Trustees), its officers and Trustees are provided with an indemnification against certain liabilities arising out of the performance of their duties to the Fund. In the normal course of business the Trust may also enter into contracts with service providers that contain general indemnifications. The Trust’s maximum exposure under these arrangements is unknown. However, based on experience, the Trust expects the risk of loss to be remote.
Investment Income: Interest income is accrued as earned. Premiums and discounts are amortized and accreted, respectively, to first call dates or maturity dates using the effective yield method of the respective investments. These amounts are included in Investment Income in the Statement of Operations.
Investment Transactions: Investment transactions are accounted for on a trade date basis. Realized gains and losses from the sale of investments are recorded on an identified cost basis.
Repurchase Agreements: The Fund may invest excess cash in repurchase agreements whereby the Fund purchases investments, which serve as collateral, with an agreement to resell such collateral to the seller at an agreed upon price at the maturity date of the repurchase agreement. Investments pledged as collateral for repurchase agreements are held in custody until maturity of the repurchase agreement. Provisions in the agreements require that the market value of the collateral is at least equal to the repurchase value in the event of default. In the event of default, the Fund has the right to liquidate the collateral and apply the proceeds in satisfaction of the obligation. Under certain circumstances, in the event of default or bankruptcy by the other party to the agreement, realization and/or retention of the collateral may be subject to legal proceedings.
Annual Financial Statements | 315
Notes to Financial Statements, Continued
Thornburg Capital Management Fund | September 30, 2024
Security Valuation: All investments in securities held by the Fund are valued as described in Note 3.
Use of Estimates: The preparation of financial statements in conformity with GAAP requires management to make estimates and assumptions that affect the reported amounts of assets and liabilities and disclosure of contingent assets and liabilities at the date of the financial statements and the reported amounts of increases (decreases) in net assets from operations during the reporting period. Actual results could differ from those estimates.
When-Issued and Delayed Delivery Transactions: The Fund may engage in when-issued or delayed delivery transactions. To the extent the Fund engages in such transactions, it will do so for the purpose of acquiring portfolio investments consistent with the Fund’s investment objectives and not for the purpose of investment leverage or to speculate on interest rate or market changes. At the time the Fund makes a commitment to purchase an investment on a when-issued or delayed delivery basis, the Fund will record the transaction and reflect the value in determining its net asset value. Pursuant to current U.S. Securities and Exchange Commission (“SEC”) guidance, a transaction involving a when-issued security will not be deemed to involve a senior security as long as the Fund intends to settle the transaction physically and the transaction settles within 35 days. Investments purchased on a when-issued or delayed delivery basis do not earn interest until the settlement date. The values of these securities held at September 30, 2024 are detailed in the Schedule of Investments.
NOTE 3 – SECURITY VALUATION
Valuation of the Fund’s portfolio investment securities is performed by the Advisor, which has been designated by the Trustees of the Trust (the "Trustees") as the Fund’s “valuation designee,” as that term is defined in rule 2a-5 under the 1940 Act. The Advisor performs this valuation function under the supervision of the Trustees and in accordance with policies and procedures that have been adopted by the Advisor and approved by the Trustees (the “Valuation Policy and Procedures”).
In its capacity as the Fund’s valuation designee, the Advisor makes good faith determinations of the fair value of portfolio securities for which market quotations are not readily available, and otherwise complies with and administers the Valuation Policy and Procedures. The Advisor performs those functions in significant measure through its Valuation and Pricing Committee (the “Committee”), though the Advisor may also obtain the assistance of others, including professional pricing service providers selected and approved by the Committee. In accordance with the Valuation Policy and Procedures, the Committee: assesses and manages the material risks associated with determining the fair value of those Fund investments for which market quotations are not readily available; selects and applies methodologies for determining and calculating such fair values; periodically reviews and tests the appropriateness and accuracy of those methodologies; monitors for circumstances that may necessitate the use of fair value; and approves, monitors, and evaluates pricing services engaged to provide evaluated prices for the Fund’s investments. The Committee provides reports on its activities to the Trustees’ Audit Committee, which is responsible for overseeing the Committee’s and the Advisor’s work in discharging the functions under the Valuation Policy and Procedures.
In those instances when the Committee assists in calculating a fair value for a portfolio investment, the Committee seeks to determine the price that the Fund would reasonably expect to receive upon a sale of the investment in an orderly transaction between market participants on the valuation date. The Committee customarily utilizes quotations from securities broker dealers in calculating valuations, but also may utilize prices obtained from pricing service providers or other methods selected by the Committee. Because fair values calculated by the Committee are estimates, the calculation of a fair value for an investment may differ from the price that would be realized by the Fund upon a sale of the investment, and the difference could be material to the Fund’s financial statements. The Committee’s calculation of a fair value for an investment may also differ from the prices obtained by other persons (including other mutual funds) for the investment.
Valuation of Securities: Securities held with a maturity of less than 60 days from trade date and other short-term investments are valued using the amortized cost method unless the Committee determines such method does not represent fair value. The amortized cost method of valuation involves valuing a security at its cost initially and thereafter assuming a constant amortization to maturity of any discount or premium, regardless of the impact of fluctuating interest rates on the market value of the security. This method may result in periods during which value, as determined by amortized cost, is higher or lower than the price the Fund would receive if it sold the security. The market value of securities in the Fund can be expected to vary inversely with changes in prevailing interest rates.
Debt obligations held by the Fund which are not listed or traded on exchanges or for which no reported market exists are ordinarily valued at the valuation obtained from a pricing service provider approved by the Committee.
In any case when a pricing service provider fails to provide a valuation for a debt obligation held by the Fund, the Committee may calculate a fair value for the obligation using alternative methods selected and approved by the Committee. Additionally, in cases when the Committee believes that a valuation obtained from a pricing service provider is stale, does not reflect material factors affecting the valuation of the investment, is significantly different than the value the Fund is likely to obtain if it sought a bid for the investment, or is otherwise unreliable, the Committee may calculate a fair value for the obligation using an alternative method selected and approved by the Committee.
316 | Annual Financial Statements
Notes to Financial Statements, Continued
Thornburg Capital Management Fund | September 30, 2024
If the market quotation for an investment is expressed in a foreign currency, that market quotation will be converted to U.S. dollars using a foreign exchange quotation from a third-party service at the time of valuation. Foreign investments held by the Fund may be traded on days and at times when the Fund is not open for business. Consequently, the value of the Fund’s investments may be significantly affected on days when shareholders cannot purchase or sell Fund’s shares.
Valuation Hierarchy: The Fund categorizes its investments based upon the inputs used in valuing those investments, according to a three-level hierarchy established in guidance from the FASB. Categorization of investments using this hierarchy is intended by the FASB to maximize the use of observable inputs in valuing investments and minimize the use of unobservable inputs by requiring that the most observable inputs be used when available. Observable inputs are those that market participants would use in valuing an investment based on available market information. Unobservable inputs are those that reflect assumptions about the information market participants would use in valuing an investment. An investment’s level within the hierarchy is based on the lowest level input that is deemed significant to the valuation. The methodologies and inputs used to value investments are not necessarily indications of the risk or liquidity associated with those investments.
Various inputs are used in calculating valuations for the Fund’s investments. These inputs are generally summarized according to the three-level hierarchy below:
Level 1: Quoted prices in active markets for identical investments.
Level 2: Other direct or indirect significant observable inputs (including quoted prices for similar investments in active markets and other observable inputs, such as interest rates, prepayment rates, credit ratings, etc.).
Level 3: Significant unobservable inputs (including the Committee’s own assumptions in calculating the fair values of investments).
Valuations for debt obligations held by the Fund are typically calculated by pricing service providers approved by the Committee and are generally characterized as Level 2 within the valuation hierarchy.
In a limited number of cases the Committee calculates a fair value for investments using broker quotations or other methods approved by the Committee. When the Committee uses a single broker quotation to calculate a fair value for an investment without other significant observable inputs, or if a fair value is calculated using other significant inputs that are considered unobservable, the investment is characterized as Level 3 within the hierarchy. Other significant unobservable inputs used to calculate a fair value in these instances might include an income-based valuation approach which considers discounted anticipated future cash flows from the investment and application of discounts due to the nature or duration of any restrictions on the disposition of the investment.
Valuations based upon the use of inputs from Levels 1, 2 or 3 may not represent the actual price received upon the disposition of an investment, and the Fund may receive a price that is lower than the valuation based upon these inputs when it sells the investment.
The following table displays a summary of the fair value hierarchy measurements of the Fund’s investments as of September 30, 2024:
| | | TOTAL | | | LEVEL 1 | | | LEVEL 2 | | | LEVEL 3 | |
| Assets | | | | | | | | | | | | | | | | |
| Investments in Securities | | | | | | | | | | | | | | | | |
| Commercial Paper | | $ | 1,247,721,810 | | | $ | — | | | $ | 1,247,721,810 | | | $ | — | |
| Mutual Fund | | | 706,055,409 | | | | 706,055,409 | | | | — | | | | — | |
| Total Investments in Securities | | $ | 1,953,777,219 | | | $ | 706,055,409 | | | $ | 1,247,721,810 | | | $ | — | |
| Total Assets | | $ | 1,953,777,219 | | | $ | 706,055,409 | | | $ | 1,247,721,810 | | | $ | — | |
NOTE 4 – INVESTMENT MANAGEMENT FEE AND OTHER TRANSACTIONS WITH AFFILIATES
Pursuant to an investment advisory agreement with the Trust, the Advisor serves as the investment advisor and performs services for the Fund. The Fund does not pay an advisory fee to the Advisor under this agreement.
The Advisor provides certain administrative services to the Fund. No fees are charged for these services.
The Fund may purchase or sell securities from or to an affiliated fund, provided the affiliation is due solely to having a common investment advisor, common officers, or common trustees, and provided that all such transactions will comply with Rule 17a-7 under the 1940 Act. For the year ended September 30, 2024, the Fund had no such transactions with affiliated funds.
Annual Financial Statements | 317
Notes to Financial Statements, Continued
Thornburg Capital Management Fund | September 30, 2024
NOTE 5 – TAXES
Federal Income Taxes: It is the policy of the Trust to comply with the provisions of the Internal Revenue Code of 1986 applicable to regulated investment companies and to distribute to shareholders substantially all investment company taxable income including net realized gains on investments (if any), and tax exempt income of the Fund. Therefore, no provision for federal income or excise tax is required.
The Fund files income tax returns in United States federal and applicable state jurisdictions. The statute of limitations on the Fund’s tax return filings generally remains open for the three years following a return’s filing date. The Fund has analyzed each uncertain tax position believed to be material in the preparation of the Fund’s financial statements for the fiscal year ended September 30, 2024, including open tax years, to assess whether it is more likely than not that the position would be sustained upon examination, based on the technical merits of the position. The Fund has not identified any such position for which an asset or liability must be reflected in the Statement of Assets and Liabilities.
At September 30, 2024, information on the tax components of capital was as follows:
| Cost of investments for tax purposes | | $ | 1,953,777,219 | |
| Net unrealized appreciation (depreciation) on investments (tax basis) | | $ | - | |
There is no unrealized appreciation (depreciation) in the Fund at September 30, 2024 due to all securities with less than 60 days to maturity being valued by the amortized cost method.
At September 30, 2024, the Fund had $75,962 of undistributed tax basis ordinary investment income and no undistributed tax basis capital gains.
The tax character of distributions paid during the years ended September 30, 2024, and September 30, 2023, were as follows:
| | | 2024 | | | 2023 | |
| Distributions from: | | | | | | | | |
| Ordinary income | | $ | 90,710,663 | | | $ | 71,182,725 | |
| Total | | $ | 90,710,663 | | | $ | 71,182,725 | |
NOTE 6 – SHARES OF BENEFICIAL INTEREST
At September 30, 2024, there were an unlimited number of shares of the Fund with no par value of beneficial interest authorized. Transactions in the Fund’s shares of beneficial interest were as follows:
| | | YEAR ENDED
SEPTEMBER 30, 2024 | | | YEAR ENDED
SEPTEMBER 30, 2023 | |
| | | SHARES | | | AMOUNT | | | SHARES | | | AMOUNT | |
| Class I Shares | | | | | | | | | | | | |
| Shares sold | | | 1,016,559,527 | | | $ | 10,165,595,270 | | | | 882,916,619 | | | $ | 8,829,166,189 | |
| Shares issued to shareholders in reinvestment of | | | | | | | | | | | | | | | | |
| dividends | | | 9,071,066 | | | | 90,710,658 | | | | 7,118,272 | | | | 71,182,724 | |
| Shares repurchased | | | (989,268,325 | ) | | | (9,892,683,253 | ) | | | (869,865,102 | ) | | | (8,698,651,023 | ) |
| Net increase (decrease) | | | 36,362,268 | | | $ | 363,622,675 | | | | 20,169,789 | | | $ | 201,697,890 | |
NOTE 7 – INVESTMENT TRANSACTIONS
For the year ended September 30, 2024, the Fund had no purchase and sale transactions of investments other than short-term investments.
318 | Annual Financial Statements
This page intentionally left blank.
Annual Financial Statements | 319
Financial Highlights
Thornburg Capital Management Fund
| | PER SHARE PERFORMANCE (FOR A SHARE OUTSTANDING THROUGHOUT THE YEAR) | |
UNLESS OTHERWISE
NOTED, PERIODS ARE
FISCAL YEARS ENDED
SEPTEMBER 30, | | NET ASSET
VALUE,
BEGINNING OF
PERIOD | | | NET
INVESTMENT
INCOME
(LOSS)+ | | | NET REALIZED &
UNREALIZED GAIN
(LOSS) ON
INVESTMENTS | | | | TOTAL FROM
INVESTMENT
OPERATIONS | | | DIVIDENDS
FROM NET
INVESTMENT
INCOME | | | DIVIDENDS
FROM NET
REALIZED
GAINS | | | TOTAL
DIVIDENDS | | | | NET ASSET
VALUE,
END
OF PERIOD | |
| CLASS I(b) | | | | | | | | | | | | | | | | | | | | | | | | | | |
| 2024 | $ | 10.00 | | | 0.56 | | | — | (c) | | | 0.56 | | | (0.56 | ) | | — | | | (0.56 | ) | | $ | 10.00 | |
| 2023 | $ | 10.00 | | | 0.49 | | | — | (c) | | | 0.49 | | | (0.49 | ) | | — | | | (0.49 | ) | | $ | 10.00 | |
| 2022 | $ | 10.00 | | | 0.10 | | | — | (c) | | | 0.10 | | | (0.10 | ) | | — | | | (0.10 | ) | | $ | 10.00 | |
| 2021 | $ | 10.00 | | | 0.01 | | | — | (c) | | | 0.01 | | | (0.01 | ) | | — | | | (0.01 | ) | | $ | 10.00 | |
| 2020 | $ | 10.00 | | | 0.10 | | | 0.01 | | | | 0.11 | | | (0.11 | ) | | — | | | (0.11 | ) | | $ | 10.00 | |
| (a) | Not annualized for periods less than one year. |
| (b) | Sales loads are not reflected in computing total return. |
| (c) | Net realized and unrealized gain (loss) on investments was less than $0.01 per share. |
| (d) | Portfolio turnover rate equals zero due to no long term investment transactions in the period. |
| + | Based on weighted average shares outstanding. |
See notes to financial statements.
320 | Annual Financial Statements
Financial Highlights, Continued
Thornburg Capital Management Fund
| | RATIOS TO AVERAGE NET ASSETS | | | SUPPLEMENTAL DATA | | | | |
UNLESS OTHERWISE
NOTED, PERIODS ARE
FISCAL YEARS ENDED
SEPTEMBER 30, | NET INVESTMENT
INCOME (LOSS) (%) | | | | EXPENSES, AFTER
EXPENSE
REDUCTIONS (%) | | | | EXPENSES,
BEFORE EXPENSE
REDUCTIONS (%) | | | | TOTAL
RETURN (%)(a) | | | | PORTFOLIO
TURNOVER
RATE (%)(a) | | | | NET ASSETS
AT END OF PERIOD
(THOUSANDS) | |
| CLASS I(b) | | | | | | | | | | | | | | | | | | | | | | |
| 2024 | 5.55 | | | | 0.01 | | | | 0.01 | | | | 5.70 | | | | — | (d) | | $ | 2,094,047 | |
| 2023 | 4.88 | | | | 0.01 | | | | 0.01 | | | | 4.99 | | | | — | (d) | | $ | 1,730,387 | |
| 2022 | 0.96 | | | | 0.01 | | | | 0.01 | | | | 0.96 | | | | — | (d) | | $ | 1,528,903 | |
| 2021 | 0.12 | | | | 0.01 | | | | 0.01 | | | | 0.12 | | | | — | (d) | | $ | 2,060,113 | |
| 2020 | 1.00 | | | | 0.01 | | | | 0.01 | | | | 1.08 | | | | — | (d) | | $ | 1,661,288 | |
Annual Financial Statements | 321
Report of Independent Registered Public Accounting Firm
Thornburg Capital Management Fund
To the Board of Trustees of Thornburg Investment Trust and Shareholders of Thornburg Capital Management Fund
Opinion on the Financial Statements
We have audited the accompanying statement of assets and liabilities, including the schedule of investments of Thornburg Capital Management Fund (one of the funds constituting Thornburg Investment Trust, referred to hereafter as the "Fund") as of September 30, 2024, the related statement of operations for the year ended September 30, 2024, the statement of changes in net assets for each of the two years in the period ended September 30, 2024, including the related notes, and the financial highlights for each of the five years in the period ended September 30, 2024 (collectively referred to as the "financial statements"). In our opinion, the financial statements present fairly, in all material respects, the financial position of the Fund as of September 30, 2024, the results of its operations for the year then ended, the changes in its net assets for each of the two years in the period ended September 30, 2024 and the financial highlights for each of the five years in the period ended September 30, 2024 in conformity with accounting principles generally accepted in the United States of America.
Basis for Opinion
These financial statements are the responsibility of the Fund’s management. Our responsibility is to express an opinion on the Fund’s financial statements based on our audits. We are a public accounting firm registered with the Public Company Accounting Oversight Board (United States) (PCAOB) and are required to be independent with respect to the Fund in accordance with the U.S. federal securities laws and the applicable rules and regulations of the Securities and Exchange Commission and the PCAOB.
We conducted our audits of these financial statements in accordance with the standards of the PCAOB. Those standards require that we plan and perform the audit to obtain reasonable assurance about whether the financial statements are free of material misstatement, whether due to error or fraud.
Our audits included performing procedures to assess the risks of material misstatement of the financial statements, whether due to error or fraud, and performing procedures that respond to those risks. Such procedures included examining, on a test basis, evidence regarding the amounts and disclosures in the financial statements. Our audits also included evaluating the accounting principles used and significant estimates made by management, as well as evaluating the overall presentation of the financial statements. Our procedures included confirmation of securities owned as of September 30, 2024 by correspondence with the custodian, transfer agent and brokers; when replies were not received from brokers, we performed other auditing procedures. We believe that our audits provide a reasonable basis for our opinion.
/s/PricewaterhouseCoopers LLP
New York, New York
November 14, 2024
We have served as the auditor of one or more investment companies in Thornburg Investment Trust since 1999.
322 | Annual Financial Statements
Other Information
September 30, 2024 (Unaudited)
CHANGES IN AND DISAGREEMENTS WITH ACCOUNTANTS FOR OPEN-END MANAGEMENT INVESTMENT COMPANIES
No changes and/or disagreements occurred in the current reporting period.
PROXY DISCLOSURES FOR OPEN-END MANAGEMENT INVESTMENT COMPANIES
Effective September 10, 2024, the Advisor executed a written action in lieu of a shareholder meeting, approving a change to the Thornburg Emerging Market Managed Account Fund’s fundamental investment policy with respect to industry concentration to allow that Fund to invest 25% or more of its total assets in particular industries. The Advisor was the beneficial owner of all of the issued and outstanding shares of the Thornburg Emerging Market Managed Account Fund as of August 16, 2024, which was the record date for the action, and therefore no proxy solicitation was required. An information statement describing this change to the Thornburg Emerging Market Managed Account Fund’s industry concentration policy was also filed with the U.S. Securities and Exchange Commission and delivered to the Advisor. Other than the one action described above, there were no matters submitted to the Funds’ shareholders through the solicitation of proxies or otherwise during the period covered by this report.
REMUNERATION PAID TO DIRECTORS, OFFICERS, AND OTHERS OF OPEN-END MANAGEMENT INVESTMENT COMPANIES
Remuneration is reflected in the Trustee and officer fees in the Statement of Operations.
STATEMENT REGARDING BASIS FOR APPROVAL OF INVESTMENT ADVISORY CONTRACT
Equity Funds
Thornburg Investment Management, Inc. (the “Advisor”) provides investment management services to each of the Funds pursuant to an investment advisory agreement (the “Agreement”). The Board of Trustees (the “Trustees”) consider the renewal of the Agreement annually, and most recently determined to renew the Agreement on September 17, 2024.
Planning for their recent consideration of the Agreement’s renewal, those Trustees who are not “interested persons” of the Trust, as defined in Section 2(a)(19) of the Investment Company Act of 1940, as amended (the “independent Trustees”), met in March 2024 and May 2024 to consider aspects of their annual evaluation of the Advisor’s service to the Funds and to each other series of the Trust, to plan the annual evaluation of the Advisor’s performance, and to discuss preliminarily the information the Advisor would present to the Trustees for their review. The independent Trustees met in another independent session in July 2024 to further define certain portions of the information to be submitted by the Advisor. The independent Trustees met again in independent session in September 2024 to discuss various matters relating to the consideration of the Agreement’s renewal, including discussions with representatives of a mutual fund analyst firm engaged by the independent Trustees to provide explanations of comparative cost and expense information and other data obtained and analyzed by the analyst firm. In that session the independent Trustees discussed their evaluations of the Advisor’s services to the Funds and the Funds’ fee and expense levels, investment performance, and other information presented for the Funds, conferred independently with legal counsel respecting the factors typically considered in evaluating renewal of an advisory agreement, and conferred with representatives of the Advisor to receive explanations of certain aspects of the information they had requested. Representatives of the Advisor subsequently reviewed portions of the information with the Trustees and addressed questions from the Trustees at a full meeting session of the Trustees scheduled in September 2024 for that purpose, and the independent Trustees thereafter met again in independent session to consider the Advisor’s presentations and various specific issues respecting their consideration of the Agreement’s renewal. Following these sessions, the Trustees met to consider renewal of the Agreement, and the independent Trustees voted unanimously at that meeting to renew the Agreement for an additional term of one year.
The information below summarizes certain factors considered by the Trustees in connection with the determination to renew the Agreement. In determining to renew the Agreement, the Trustees considered a wide range of information and did not identify any single factor as controlling, and this summary does not describe all of the factors and other matters considered by the Trustees in making their determination.
Nature, Extent, and Quality of Services. The Trustees considered in their evaluation of the Agreement the written and oral reports provided to the Trustees and their standing committees throughout the year on a wide variety of topics by personnel from the Advisor’s portfolio management, fund administration, trading, operations, marketing, distribution, and compliance staffs. The Trustees also considered in this evaluation the presentations and explanations made by representatives of the Advisor in meeting sessions scheduled for consideration of the renewal of the Agreement. The Trustees further noted in their evaluation the consideration they had given to a number of topics in previous years, reports from their standing committees, and advice received from counsel.
Annual Financial Statements | 323
Other Information, Continued
September 30, 2024 (Unaudited)
Information noted by the Trustees as having been considered in relation to the nature, extent, and quality of services provided by the Advisor under the Agreement, as more fully reflected in the minutes and other records of their quarterly and committee meetings throughout the year and in previous years, and contributing to their conclusions respecting the nature, extent, and quality of the services rendered to each Fund by the Advisor under the Agreement included: (1) reports from portfolio managers throughout the year demonstrating that each Fund was managed in conformity with stated strategies and objectives, and conformed to investment restrictions and limitations; (2) reports demonstrating that each Fund’s portfolio managers are cognizant of the Fund’s objectives and able to pursue those objectives and execute the Fund’s strategies in varying environments, are aware of pertinent market and economic trends and conditions, and are able to competently evaluate and select individual investments, manage the Fund to achieve tax efficiencies, effectively structure the Fund’s portfolio, and manage the Fund’s liquidity requirements; (3) each Fund’s achievement of its investment objectives over different periods of time; (4) presentations by, and interactions with, members of the Advisor’s fund administration, trading, operations, marketing, distribution, and compliance staffs; (5) reports from standing committees of the Trustees on their respective proceedings throughout the year, including particularly interactions with the Advisor’s personnel; (6) the sufficiency of the resources the Advisor devotes to the services it provides to each Fund, including the expertise of its personnel and staffing levels, the hiring of a new Chief Executive Officer for the Advisor and other recent additions to the Advisor’s senior management team, changes in the structure of various business departments within the Advisor, the Advisor’s enhancements to the electronic systems it utilizes in providing these services, and the Advisor’s own financial management and sufficiency of its resources; (7) steps taken by the Advisor to improve its investment management process, including the appointment of a new Head of Equity, the hiring of additional investment personnel to support the investment management function, plans to add other investment personnel in the future, efforts to increase the diversity of backgrounds and experiences among its investment personnel, and the increased integration of risk management procedures and consideration of environmental, social, and governance factors into the investment process; (8) the measures employed by the Advisor’s personnel to achieve efficient trade execution for each Fund, including the evaluation and selection of firms to execute transactions for each Fund; and (9) steps taken to facilitate continued collaboration among the Advisor’s personnel. As in past years, the Trustees noted their assessments of the Advisor’s personnel developed in formal and informal meetings throughout the year, measures to expand and improve the depth and expertise of the Advisor’s staff, and the Advisor’s collaborative approach to investment management, continued commitment to observance of compliance and regulatory requirements in managing investments by the Funds, responsiveness to the Trustees, and other factors and circumstances.
Based upon these and other considerations, the Trustees concluded that the Advisor’s management of the Funds’ investments continued to conform to the Funds’ stated objectives and policies, and that the nature, extent, and quality of the services provided to the Funds by the Advisor remained sufficient.
Investment Performance. The Trustees noted in their evaluation of each Fund’s investment performance the written and oral reports and investment and market analyses they had received from the Advisor’s portfolio management personnel throughout the year. The Trustees also noted their consideration of information provided to them at their request in anticipation of their annual evaluation of the Advisor’s services, including the following items of information respecting the investment performance of each Fund: (1) the Fund’s absolute investment performance and achievement of stated objectives; (2) the Advisor’s explanations and written commentary on the Fund’s performance in the context of the Fund’s objectives and reasonable expectations, and business, market, and economic conditions; (3) performance data for the ten most recent calendar years (or lesser number of years for each Fund having fewer calendar years of operations) comparing the Fund’s investment performance to one or more broad-based securities indices, and to the applicable Morningstar category of funds; (4) the Fund’s investment performance for the three-month, year-to-date and, if applicable, one-year, three-year, five-year, ten-year, fifteen-year, and since inception periods ending with the second quarter of the current year, comparing the Fund’s annualized returns to one or more broad-based securities indices, and to the applicable Morningstar category of funds, and assigning a percentage rank to the Fund’s performance for each period relative to its Morningstar category; (5) analyses of specified risk and performance metrics for the Fund relative to its benchmark and to a selected peer group of funds, prepared by an independent financial analyst firm; (6) information respecting positive cash flows resulting from share purchases and investment appreciation or negative cash flows resulting from redemptions and investment depreciation; (7) various risk and return statistics; and (8) oral commentary from the Advisor. The Trustees noted their understanding that strategies pursued for a Fund may produce intermittent lower relative performance, that underperforming Funds have, generally in the past, returned to favor as conditions changed or the strategies of those Funds gained traction, and the Advisor has in general been successful over time in remediating lower relative performance of Funds in cases where execution of investment strategies had contributed to lower performance. In those instances where a Fund had exhibited lower relative performance in certain periods, the Trustees also considered the reports they received from the Advisor throughout the year, explanations of that underperformance by reference to the stated investment strategies of the Fund, the effects of market and economic conditions on the Fund during relevant periods, and the investment decisions by the Advisor in view of the Fund’s stated strategies. The Trustees also noted in their evaluations that to the extent pertinent they attach additional significance to the performance of each Fund from the perspective of longer-term shareholders.
Further detail considered by the Trustees with respect to the investment performance of each Fund is set forth below:
● Thornburg Global Opportunities Fund – the Trustees considered that the Fund outperformed its Morningstar category and its benchmark index for the year-to-date (through June 30, 2024), one-, three-, five-, and ten-year periods, that the Fund’s performance ranked in the first
324 | Annual Financial Statements
Other Information, Continued
September 30, 2024 (Unaudited)
decile of its Morningstar category for the five-year period, and that two representative share classes of the Fund delivered positive total returns in eight of the last ten calendar years. The Trustees also considered the contribution of the Advisor’s security selection and other factors to the Fund’s investment performance, and the Advisor’s success in achieving the Fund’s investment objective over time.
● Thornburg International Equity Fund – the Trustees considered that the Fund outperformed its Morningstar category and its primary benchmark index for the year-to-date (through June 30, 2024), one-, five-, and ten-year periods, also outperformed its Morningstar category for the three-year period, and outperformed a second benchmark index over all such periods. The Trustees also noted that the Fund’s performance ranked in the first decile of its Morningstar category for the year-to-date (through June 30, 2024), one-, five- and ten-year periods, and considered the contribution of the Advisor’s security selection and other factors to the Fund’s investment performance, and the Advisor’s success in achieving the Fund’s investment objective over time.
● Thornburg Better World International Fund – the Trustees considered that the Fund outperformed its benchmark index and its Morningstar category for the year-to-date (through June 30, 2024) and five-year periods, also outperformed its benchmark index since the Fund’s inception, and ranked in the top decile of its Morningstar category for the five-year period. The Trustees noted that two representative share classes of the Fund delivered positive total returns in six of the eight calendar years since the Fund’s inception. The Trustees also considered the contribution of the Advisor’s security selection and other factors to the Fund’s investment performance, noted explanations from the Advisor about its process for evaluating environmental, social, and governance characteristics and the potential for those characteristics to contribute positively to an investment, and observed the Advisor’s success in achieving the Fund’s investment objective over time.
● Thornburg International Growth Fund – The Trustees considered that the Fund outperformed its Morningstar category and benchmark index for the year-to-date (through June 30, 2024) and one-year periods, also outperformed its benchmark index for the five- and ten-year periods, and that its underperformance in certain other periods was not significant. The Trustees observed that steps the Advisor has taken in recent years with respect to the management of the Fund, including changes in the composition of the Fund’s investment team, appear to have had a positive effect on the Fund’s recent investment performance. The Trustees also considered the contribution of the Advisor’s security selection and other factors to the Fund’s investment performance and the Advisor’s success in achieving the Fund’s investment objective over time.
● Thornburg Developing World Fund – the Trustees considered explanations from the Advisor respecting reasons for the Fund’s underperformance in certain periods relative to the Fund’s Morningstar category and benchmark index and steps the Advisor has taken to remediate that underperformance, including enhancements to the Fund’s investment process. The Trustees noted that the steps the Advisor has taken appear to have had a positive effect on the Fund’s performance, as illustrated by the Fund’s outperformance relative to both its Morningstar category and benchmark index for the year-to-date (through June 30, 2024). The Trustees also noted that the degree of the Fund’s underperformance in longer periods such as the five- and ten-year periods was not significant, considered the contribution of the Advisor’s security selection and other factors to the Fund’s investment performance, and acknowledged the Advisor’s success in achieving the Fund’s investment objective over time.
● Thornburg Small/Mid Cap Core Fund – the Trustees considered that, because of the changes to the Fund’s principal investment strategies which took effect in late 2020, performance for periods prior to that date was not representative of the Fund’s current investment strategies. The Trustees considered explanations from the Advisor respecting the market and economic conditions that contributed to the Fund’s underperformance compared to its Morningstar category and benchmark index over certain periods since the commencement of the Fund’s current investment strategies and steps the Advisor has taken to remediate that underperformance, including enhancements to the Fund’s investment team and investment process. The Trustees noted that the Fund outperformed its benchmark index for the year-to-date (through June 30, 2024), one-, and three-year periods, and outperformed both the Morningstar small blend category and the Morningstar mid-cap blend category for the year-to-date (through June 30, 2024) and one-year periods. The Trustees also noted that, notwithstanding underperformance in certain periods since the commencement of the Fund’s current investment strategies, the Advisor has generally had success in achieving the Fund’s investment objectives over time.
● Thornburg Small/Mid Cap Growth Fund – the Trustees considered that, because of the changes to the Fund’s principal investment strategies which took effect in late 2020, performance for periods prior to that date was not representative of the Fund’s current investment strategies. The Trustees considered explanations from the Advisor respecting the market and economic conditions that have contributed to the Fund’s underperformance compared to its Morningstar category and benchmark index since the commencement of the Fund’s current investment strategies and steps the Advisor has taken to remediate the Fund’s underperformance, including enhancements to the Fund’s investment team and investment process. The Trustees noted that the Fund outperformed its benchmark index for the year-to-date (through June 30, 2024) and one-year periods, outperformed Morningstar’s small growth category over those same periods, and outperformed Morningstar’s mid-cap growth category over the year-to-date (through June 30, 2024). The Trustees also noted that, notwithstanding underperformance in certain periods since the commencement of the Fund’s current investment strategies, the Advisor has generally had success in achieving the Fund’s investment objectives over time.
● Thornburg Investment Income Builder Fund – the Trustees considered that the Fund outperformed its Morningstar category over the year-to-date (through June 30, 2024), one-, three-, five-, and ten-year periods while ranking in the top decile of the Morningstar category
Annual Financial Statements | 325
Other Information, Continued
September 30, 2024 (Unaudited)
over most of those periods, and outperformed its benchmark index for the one- and three-year periods while performing nearly in line with its benchmark index over the year-to-date (through June 30, 2024) and five-year periods. The Trustees also considered the contribution of the Advisor’s security selection and other factors to the Fund’s investment performance, and the Advisor’s success in achieving the Fund’s investment objective over time, including particularly the Fund’s ability to continue to generate current income for its shareholders.
● Thornburg Summit Fund – the Trustees considered that the Fund outperformed its Morningstar category and benchmark index for the year-to-date (through June 30, 2024), one-, three-, and five-year periods, while ranking in the top decile of the Morningstar category over the five-year period. The Trustees also considered that two representative share classes of the Fund delivered positive total returns in three of the four calendar years since the Fund’s inception, the contribution of the Advisor’s security selection and other factors to the Fund’s investment performance, and the Advisor’s success in achieving the Fund’s investment objective over time.
Based upon their consideration of this and other information, the Trustees concluded that the Funds’ absolute and relative investment performance over a range of pertinent holding periods was generally satisfactory in view of the Funds’ objectives and strategies, and that where there was underperformance in certain periods and for certain Funds, the Advisor has taken appropriate steps to seek to mitigate that underperformance.
Comparisons of Fee and Expense Levels. Information noted by the Trustees as having been considered in this context included a variety of comparative data respecting the Funds’ fee and expense levels. This information included comparisons of each Fund’s advisory fee and overall Fund expenses to median and average fees and expenses charged to funds in the applicable Morningstar category, comparisons of the advisory fee and total expenses for a representative share class of each Fund to the fee levels and expenses of fund peer groups selected from the category by an independent mutual fund analyst firm engaged by the independent Trustees, the perspectives and advice from that mutual fund analyst firm respecting comparisons of fund fee levels and expenses to fund peer groups, explanations from representatives of the Advisor respecting the fees and expenses of certain Funds, and other information. In evaluating comparative fee and expense data, the Trustees considered whether the advisory fees charged to each Fund were at least generally comparable to the comparatives presented, and whether those advisory fees and overall Fund expense levels were within the range of figures established for the selected peer groups. The Trustees also considered the extent to which the Advisor had waived fees or reimbursed expenses for certain Funds and share classes thereof, and noted that information about the Funds’ current fee and expense levels is disclosed in the prospectuses for each Fund.
Further detail considered by the Trustees with respect to the comparison of the fee and expense levels of each Fund is set forth below:
● Thornburg Global Opportunities Fund – Comparative fee and expense data considered by the Trustees showed that the level of total expense for one representative share class of the Fund was lower than the median and average levels charged to funds in the applicable Morningstar category, and that the level of total expense for a second representative share class of the Fund was higher than such median and average levels but within the range of total expenses for the category. Peer group data showed that the Fund’s management fee and the total expense level for a representative share class of the Fund were both lower than median levels for the peer group.
● Thornburg International Equity Fund – Comparative fee and expense data considered by the Trustees showed that the level of total expense for one representative share class of the Fund was lower than the median and average levels charged to funds in the applicable Morningstar category, and that the level of total expense for a second representative share class of the Fund was higher than such median and average levels but within the range of total expenses for the category. Peer group data showed that the Fund’s management fee was lower than the median level for the peer group, and that the total expense level for a representative share class of the Fund, while higher than the median level for the peer group, was within the range of the total expenses for that peer group.
● Thornburg Better World International Fund – Comparative fee and expense data considered by the Trustees showed that the level of total expense for one representative share class of the Fund was lower than the median and average levels charged to funds in the applicable Morningstar category, and that the level of total expense for a second representative share class of the Fund was higher than those median and average levels but within the range of total expenses for the Morningstar category. Peer group data showed that the Fund’s management fee and the total expense level for a representative share class of the Fund, while both higher than median levels for the peer group, were within the range of the management fees and total expenses for that peer group.
● Thornburg International Growth Fund – Comparative fee and expense data considered by the Trustees showed that the level of total expense for one representative share class of the Fund was lower than the average level charged to funds in the applicable Morningstar category, that the level of total expense for that same share class was higher than the median level but within the range of total expenses for the category, and that the level of total expense for a second representative share class of the Fund was higher than such median and average levels but within the range of total expenses for the category. Peer group data showed that the Fund’s management fee and the total expense level for a representative share class of the Fund, while both higher than median levels for the peer group, were within the range of the management fees and total expenses for that peer group.
● Thornburg Developing World Fund – Comparative fee and expense data considered by the Trustees showed that the level of total expense for one representative share class of the Fund was lower than the median and average levels charged to funds in the applicable
326 | Annual Financial Statements
Other Information, Continued
September 30, 2024 (Unaudited)
Morningstar category, and that the level of total expense for a second representative share class of the Fund was higher than such median and average levels but within the range of total expenses for the category. Peer group data showed that the Fund’s management fee and the total expense level of a representative share class of the Fund were both lower than the median levels for the peer group.
● Thornburg Small/Mid Cap Core Fund – Comparative fee and expense data considered by the Trustees showed that the level of total expense for one representative share class of the Fund was lower than the median and average levels charged to funds in the applicable Morningstar category, and that the level of total expense for a second representative share class of the Fund was higher than such median and average levels but within the range of total expenses for the category. Peer group data showed that the Fund’s management fee and the total expense level for a representative share class of the Fund, while both higher than median levels for the peer group, were within the range of the management fees and total expenses for that peer group.
● Thornburg Small/Mid Cap Growth Fund – Comparative fee and expense data considered by the Trustees showed that the level of total expense for one representative share class of the Fund was lower than the median and average levels charged to funds in the applicable Morningstar category, and that the level of total expense for a second representative share class of the Fund was higher than such median and average levels but within the range of total expenses for the category. Peer group data showed that the Fund’s management fee and the total expense level for a representative share class of the Fund, while both higher than median levels for the peer group, were within the range of the management fees and total expenses for that peer group.
● Thornburg Investment Income Builder Fund – Comparative fee and expense data considered by the Trustees showed that the level of total expense for one representative share class of the Fund was lower than the median and average levels charged to funds in the applicable Morningstar category, and that the level of total expense for a second representative share class of the Fund was higher than such median and average levels but within the range of total expenses for the category. Peer group data showed that the Fund’s management fee was higher than the median level for the peer group but within the range of management fees paid by funds in the peer group, and that the total expense level for a representative share class of the Fund was equal to the median level for the peer group.
● Thornburg Summit Fund – Comparative fee and expense data considered by the Trustees showed that the level of total expense for two representative share classes of the Fund were lower than the median and average levels charged to funds in the applicable Morningstar category. Peer group data showed that the Fund’s management fee and the total expense level of a representative share class of the Fund were both lower than the median levels for the peer group.
The Trustees did not find any of the differences between the Funds’ fee and expense data and the comparable fee and expense data significant in view of their findings and conclusions respecting the other factors considered, including the quality of services provided by the Advisor to each Fund.
The Trustees also noted their consideration of information respecting the advisory fees charged by the Advisor to other investment management clients, including the Advisor’s institutional clients, together with information about fees charged by other advisors to different clients, analysis of the differences between the requirements of institutional clients and mutual funds, analysis of the differences between the requirements of a sub-advised mutual fund and a fund as to which the Advisor is the primary advisor and sponsor, and the consequently different investment management services provided to the different categories of clients and the differing contexts in which these arrangements are entered into. The Trustees confirmed their previous observations that the differences between the fees charged by the Advisor to different types of clients did not appear exceptional, and that the fee rates charged by the Advisor or by other investment advisors to different types of clients had limited relevance to the evaluation of the fee rates charged by the Advisor to the Funds.
Costs and Profitability of Advisor. In reviewing the profitability of the Advisor’s services to the Funds under the Agreement, the Trustees considered an analysis of the Advisor’s costs and the estimated profitability to the Advisor of its services, together with figures for the profitability of a selection of other, publicly listed investment management firms. The Trustees noted that the comparability of the Advisor’s profitability to the publicly disclosed information about the profitability of other investment management firms is limited due to the nature of those firms and other factors. The Trustees considered information from the Advisor respecting investment of its profits to support staffing levels and noted that the Advisor’s profits are an important element in the compensation of employees who work for the benefit of the Funds and their shareholders. The Trustees considered information from the Advisor respecting the use of profits to enhance staff competencies through training and other measures, hire personnel to expand and develop the scope of senior management expertise, pay competitive levels of compensation, and add to the Advisor’s electronic and information technology systems to maintain or improve service levels. The Trustees also considered the contribution of the Advisor’s cost management to its profitability, and the relationship of the Advisor’s financial resources and profitability in previous years to its ability to attract necessary personnel, invest in systems and other assets required for its service to the Funds, and maintain or improve service levels for the Funds notwithstanding fluctuations in revenues and profitability. The information considered did not indicate to the Trustees that the Advisor’s profitability was excessive.
Potential Economies of Scale. In reviewing the extent to which economies of scale would be realized by each Fund as it grows and whether fee levels reflect potential economies of scale, the Trustees considered the breakpoint structure for advisory fees chargeable to each Fund, comparisons of the fee breakpoint structure for each Fund with breakpoint structures (or the absence of such structures) for other funds in a peer group selected by an independent mutual fund analyst firm, the effects of the breakpoint structure and other expense
Annual Financial Statements | 327
Other Information, Continued
September 30, 2024 (Unaudited)
factors realized by certain funds of the Trust as their asset levels had increased, the Advisor’s undertakings to waive or reimburse certain fees and expenses for certain Funds and share classes, and the Advisor’s expenditures from its own profits and resources to support staffing levels, pay competitive levels of compensation, and add to its electronic and information technology systems to maintain or improve service levels. The information provided demonstrated to the Trustees that the Funds’ advisory fee breakpoint structures are reasonable in relation to the structures observed in the other funds in their respective peer groups, and that shareholders may be expected to benefit from any economies of scale, due to the advisory agreement’s breakpoint fee structure for each Fund and other factors.
Potential Ancillary Benefits. In reviewing potential benefits to the Advisor because of its relationship to the Funds, the Trustees considered explanations from the Advisor respecting its receipt of certain research services from broker dealers, and the benefits to both the Funds and the Advisor of the Advisor’s expansion of its staffing, compliance, and systems capabilities and other resources to serve a broader variety of investment management clients. The Trustees also considered how the establishment of additional investment products by the Advisor may benefit the Funds. No unusual or unfair benefits to the Advisor from its relationship to the Funds were identified by the Trustees.
Summary of Conclusions. The Trustees concluded that the general nature, extent, and quality of the Advisor’s services performed under the Agreement remained sufficient, the Advisor continued to actively and competently pursue the Funds’ investment objectives and adhere to the Funds’ investment policies, and that the absolute and relative investment performance of the Funds over pertinent holding periods on the whole was satisfactory in the context of the Funds’ objectives and strategies. The Trustees further concluded that the level of the advisory fee charged to each Fund by the Advisor is fair and reasonable in relation to the services provided by the Advisor, in view of the nature, extent, and quality of those services, the investment performance of each such Fund after fees and expenses, the clear disclosure of fees and expenses in the Funds’ prospectuses, comparisons of fees and expenses charged to each Fund to fees and expenses charged to other mutual funds, and the other factors and relevant circumstances considered. The Trustees accordingly determined to renew the Agreement for an additional term of one year for each of the Funds.
Taxable Fixed Income Funds
Thornburg Investment Management, Inc. (the “Advisor”) provides investment management services to each of the Funds pursuant to an investment advisory agreement (the “Agreement”). The Board of Trustees (the “Trustees”) consider the renewal of the Agreement annually, and most recently determined to renew the Agreement on September 17, 2024.
Planning for their recent consideration of the Agreement’s renewal, those Trustees who are not “interested persons” of the Trust, as defined in Section 2(a)(19) of the Investment Company Act of 1940, as amended (the “independent Trustees”), met in March 2024 and May 2024 to consider aspects of their annual evaluation of the Advisor’s service to the Funds and to each other series of the Trust, to plan the annual evaluation of the Advisor’s performance, and to discuss preliminarily the information the Advisor would present to the Trustees for their review. The independent Trustees met in another independent session in July 2024 to further define certain portions of the information to be submitted by the Advisor. The independent Trustees met again in independent session in September 2024 to discuss various matters relating to the consideration of the Agreement’s renewal, including discussions with representatives of a mutual fund analyst firm engaged by the independent Trustees to provide explanations of comparative cost and expense information and other data obtained and analyzed by the analyst firm. In that session the independent Trustees discussed their evaluations of the Advisor’s services to the Funds and the Funds’ fee and expense levels, investment performance, and other information presented for the Funds, conferred independently with legal counsel respecting the factors typically considered in evaluating renewal of an advisory agreement, and conferred with representatives of the Advisor to receive explanations of certain aspects of the information they had requested. Representatives of the Advisor subsequently reviewed portions of the information with the Trustees and addressed questions from the Trustees at a full meeting session of the Trustees scheduled in September 2024 for that purpose, and the independent Trustees thereafter met again in independent session to consider the Advisor’s presentations and various specific issues respecting their consideration of the Agreement’s renewal. Following these sessions, the Trustees met to consider renewal of the Agreement, and the independent Trustees voted unanimously at that meeting to renew the Agreement for an additional term of one year.
The information below summarizes certain factors considered by the Trustees in connection with the determination to renew the Agreement. In determining to renew the Agreement, the Trustees considered a wide range of information and did not identify any single factor as controlling, and this summary does not describe all of the factors and other matters considered by the Trustees in making their determination.
Nature, Extent, and Quality of Services. The Trustees considered in their evaluation of the Agreement the written and oral reports provided to the Trustees and their standing committees throughout the year on a wide variety of topics by personnel from the Advisor’s portfolio management, fund administration, trading, operations, marketing, distribution, and compliance staffs. The Trustees also considered in this evaluation the presentations and explanations made by representatives of the Advisor in meeting sessions scheduled for consideration of the renewal of the Agreement. The Trustees further noted in their evaluation the consideration they had given to a number of topics in previous years, reports from their standing committees, and advice received from counsel.
328 | Annual Financial Statements
Other Information, Continued
September 30, 2024 (Unaudited)
Information noted by the Trustees as having been considered in relation to the nature, extent, and quality of services provided by the Advisor under the Agreement, as more fully reflected in the minutes and other records of their quarterly and committee meetings throughout the year and in previous years, and contributing to their conclusions respecting the nature, extent, and quality of the services rendered to each Fund by the Advisor under the Agreement included: (1) reports from portfolio managers throughout the year demonstrating that each Fund was managed in conformity with stated strategies and objectives, and conformed to investment restrictions and limitations; (2) reports demonstrating that each Fund’s portfolio managers are cognizant of the Fund’s objectives and able to pursue those objectives and execute the Fund’s strategies in varying environments, are aware of pertinent market and economic trends and conditions, and are able to competently evaluate and select individual investments, manage the Fund to achieve tax efficiencies, effectively structure the Fund’s portfolio, and manage the Fund’s liquidity requirements; (3) each Fund’s achievement of its investment objectives over different periods of time; (4) presentations by, and interactions with, members of the Advisor’s fund administration, trading, operations, marketing, distribution, and compliance staffs; (5) reports from standing committees of the Trustees on their respective proceedings throughout the year, including particularly interactions with the Advisor’s personnel; (6) the sufficiency of the resources the Advisor devotes to the services it provides to each Fund, including the expertise of its personnel and staffing levels, the hiring of a new Chief Executive Officer for the Advisor and other recent additions to the Advisor’s senior management team, changes in the structure of various business departments within the Advisor, the Advisor’s enhancements to the electronic systems it utilizes in providing these services, and the Advisor’s own financial management and sufficiency of its resources; (7) steps taken by the Advisor to improve its investment management process, including the appointment of a new Head of Fixed Income, the hiring of additional investment personnel to support the investment management function, plans to add other investment personnel in the future, efforts to increase the diversity of backgrounds and experiences among its investment personnel, and the increased integration of risk management procedures and consideration of environmental, social, and governance factors into the investment process; (8) the measures employed by the Advisor’s personnel to achieve efficient trade execution for each Fund, including the evaluation and selection of firms to execute transactions for each Fund; and (9) steps taken to facilitate continued collaboration among the Advisor’s personnel. As in past years, the Trustees noted their assessments of the Advisor’s personnel developed in formal and informal meetings throughout the year, measures to expand and improve the depth and expertise of the Advisor’s staff, and the Advisor’s collaborative approach to investment management, continued commitment to observance of compliance and regulatory requirements in managing investments by the Funds, responsiveness to the Trustees, and other factors and circumstances.
Based upon these and other considerations, the Trustees concluded that the Advisor’s management of the Funds’ investments continued to conform to the Funds’ stated objectives and policies, and that the nature, extent, and quality of the services provided to the Funds by the Advisor remained sufficient.
Investment Performance. The Trustees noted in their evaluation of each Fund’s investment performance the written and oral reports and investment and market analyses they had received from the Advisor’s portfolio management personnel throughout the year. The Trustees also noted their consideration of information provided to them at their request in anticipation of their annual evaluation of the Advisor’s services, including the following items of information respecting the investment performance of each Fund: (1) the Fund’s absolute investment performance and achievement of stated objectives; (2) the Advisor’s explanations and written commentary on the Fund’s performance in the context of the Fund’s objectives and reasonable expectations, and business, market, and economic conditions; (3) performance data for the ten most recent calendar years (or lesser number of years for each Fund having fewer calendar years of operations) comparing the Fund’s investment performance to one or more broad-based securities indices, and to the applicable Morningstar category of funds; (4) the Fund’s investment performance for the three-month, year-to-date and, if applicable, one-year, three-year, five-year, ten-year, fifteen-year, and since inception periods ending with the second quarter of the current year, comparing the Fund’s annualized returns to one or more broad-based securities indices, and to the applicable Morningstar category of funds, and assigning a percentage rank to the Fund’s performance for each period relative to its Morningstar category; (5) analyses of specified risk and performance metrics for the Fund relative to its benchmark and to a selected peer group of funds, prepared by an independent financial analyst firm; (6) information respecting positive cash flows resulting from share purchases and investment appreciation or negative cash flows resulting from redemptions and investment depreciation; (7) various risk and return statistics; and (8) oral commentary from the Advisor. The Trustees noted their understanding that strategies pursued for a Fund may produce intermittent lower relative performance, that underperforming Funds have, generally in the past, returned to favor as conditions changed or the strategies of those Funds gained traction, and the Advisor has in general been successful over time in remediating lower relative performance of Funds in cases where execution of investment strategies had contributed to lower performance. In those instances where a Fund had exhibited lower relative performance in certain periods, the Trustees also considered the reports they received from the Advisor throughout the year, explanations of that underperformance by reference to the stated investment strategies of the Fund, the effects of market and economic conditions on the Fund during relevant periods, and the investment decisions by the Advisor in view of the Fund’s stated strategies. The Trustees also noted in their evaluations that to the extent pertinent they attach additional significance to the performance of each Fund from the perspective of longer-term shareholders.
Further detail considered by the Trustees with respect to the investment performance of each Fund is set forth below:
● Thornburg Ultra Short Income Fund – the Trustees considered that the Fund outperformed its Morningstar category for the three, five-year and ten-year periods, and outperformed its benchmark index in each of those periods, in the year-to-date (through June 30,
Annual Financial Statements | 329
Other Information, Continued
September 30, 2024 (Unaudited)
2024) and one-year periods and since the Fund’s inception. The Trustees also noted that the Fund delivered positive total returns in each calendar year since the Fund’s inception and has met its investment objective over time.
● Thornburg Limited Term U.S. Government Fund – the Trustees considered that the degree of the Fund’s underperformance versus its Morningstar category and benchmark index was small in all periods, that two representative share classes of the Fund delivered positive total returns in eight of the last ten calendar years, and that the Fund has met both its primary and secondary investment objectives over time.
● Thornburg Limited Term Income Fund – the Trustees considered that the Fund outperformed its Morningstar category for the one-, five, ten, and fifteen-year periods and matched the performance of its Morningstar category for the year-to-date (through June 30, 2024), and outperformed its benchmark index for all such periods. The Trustees also noted that one representative share class of the Fund delivered positive total returns in nine of the last ten calendar years, another representative share class of the Fund delivered positive total returns in eight of the last ten calendar years, and the Fund has met both its primary and secondary investment objectives over time.
● Thornburg Core Plus Bond Fund – the Trustees considered that, while the Fund only commenced investment operations in 2023 and therefore has a limited performance history, the Fund outperformed its benchmark index for the year-to-date (through June 30, 2024 period) and has met its investment objective since its inception.
● Thornburg Strategic Income Fund – the Trustees considered that the Fund outperformed its Morningstar category for the three-, five-, and ten-year periods, and outperformed both its benchmark index and an additional benchmark index in all periods since the Fund’s inception. The Trustees also noted that two representative share classes of the Fund delivered positive total returns in eight of the last ten calendar years, and the Fund has met both its primary and secondary investment objectives over time.
Based upon their consideration of this and other information, the Trustees concluded that the Funds’ absolute and relative investment performance over a range of pertinent holding periods was generally satisfactory in view of the Funds’ objectives and strategies, and that where there was underperformance in certain periods and for certain Funds, the Advisor has taken appropriate steps to seek to mitigate that underperformance.
Comparisons of Fee and Expense Levels. Information noted by the Trustees as having been considered in this context included a variety of comparative data respecting the Funds’ fee and expense levels. This information included comparisons of each Fund’s advisory fee and overall Fund expenses to median and average fees and expenses charged to funds in the applicable Morningstar category, comparisons of the advisory fee and total expenses for a representative share class of each Fund to the fee levels and expenses of fund peer groups selected from the category by an independent mutual fund analyst firm engaged by the independent Trustees, the perspectives and advice from that mutual fund analyst firm respecting comparisons of fund fee levels and expenses to fund peer groups, explanations from representatives of the Advisor respecting the fees and expenses of certain Funds, and other information. In evaluating comparative fee and expense data, the Trustees considered whether the advisory fees charged to each Fund were at least generally comparable to the comparatives presented, and whether those advisory fees and overall Fund expense levels were within the range of figures established for the selected peer groups. The Trustees also considered the extent to which the Advisor had waived fees or reimbursed expenses for certain Funds and share classes thereof, and noted that information about the Funds’ current fee and expense levels is disclosed in the prospectuses for each Fund.
Further detail considered by the Trustees with respect to the comparison of the fee and expense levels of each Fund is set forth below:
● Thornburg Ultra Short Income Fund – Comparative fee and expense data considered by the Trustees showed that the level of total expense for one representative share class of the Fund was lower than the median and average levels charged to funds in the applicable Morningstar category, and that the level of total expense for a second representative share class was higher than such median and average levels but within the range of total expenses for the category. Peer group data showed that the Fund’s management fee and the total expense level for a representative share class of the Fund were both lower than the median levels for the peer group.
● Thornburg Limited Term U.S. Government Fund – Comparative fee and expense data considered by the Trustees showed that the level of total expense for one representative share class of the Fund was lower than the median and average levels charged to funds in the applicable Morningstar category, and that the level of total expense for a second representative share class was higher than such median and average levels but within the range of total expenses for the category. Peer group data showed that the Fund’s management fee and the total expense level for a representative share class of the Fund, while both higher than the median levels for the peer group, were within the range of the management fees and total expenses for that peer group.
● Thornburg Limited Term Income Fund – Comparative fee and expense data considered by the Trustees showed that the level of total expense for one representative share class of the Fund was lower than the median and average levels charged to funds in the applicable Morningstar category, and that the level of total expense for a second representative share class was higher than such median and average levels but within the range of total expenses for the category. Peer group data showed that the Fund’s management fee was nearly
330 | Annual Financial Statements
Other Information, Continued
September 30, 2024 (Unaudited)
identical to the median level for the peer group and that the total expense level for a representative share class of the Fund, while higher than the median level for the peer group, was within the range of the total expenses for the peer group.
● Thornburg Core Plus Bond Fund – Comparative fee and expense data considered by the Trustees showed that the level of total expense for one representative share class of the Fund was lower than the median and average levels charged to funds in the applicable Morningstar category, and that the level of total expense for a second representative share class was lower than such median level, higher than such average level, and within the range of total expenses for that category. Peer group data showed that the Fund’s management fee was equal to, and the total expense level for a representative share class of the Fund was higher than, the median levels for the peer group.
● Thornburg Strategic Income Fund – Comparative fee and expense data considered by the Trustees showed that the level of total expense for one representative share class of the Fund was lower than the median and average levels charged to funds in the applicable Morningstar category, and that the level of total expense for a second representative share class was higher than such median and average levels but within the range of total expenses for the category. Peer group data showed that the Fund’s management fee and the total expense level for a representative share class of the Fund were both lower than the median levels for the peer group.
The Trustees did not find any of the differences between the Funds’ fee and expense data and the comparable fee and expense data significant in view of their findings and conclusions respecting the other factors considered, including the quality of services provided by the Advisor to each Fund.
The Trustees also noted their consideration of information respecting the advisory fees charged by the Advisor to other investment management clients, including the Advisor’s institutional clients, together with information about fees charged by other advisors to different clients, analysis of the differences between the requirements of institutional clients and mutual funds, analysis of the differences between the requirements of a sub-advised mutual fund and a fund as to which the Advisor is the primary advisor and sponsor, and the consequently different investment management services provided to the different categories of clients and the differing contexts in which these arrangements are entered into. The Trustees confirmed their previous observations that the differences between the fees charged by the Advisor to different types of clients did not appear exceptional, and that the fee rates charged by the Advisor or by other investment advisors to different types of clients had limited relevance to the evaluation of the fee rates charged by the Advisor to the Funds.
Costs and Profitability of Advisor. In reviewing the profitability of the Advisor’s services to the Funds under the Agreement, the Trustees considered an analysis of the Advisor’s costs and the estimated profitability to the Advisor of its services, together with figures for the profitability of a selection of other, publicly listed investment management firms. The Trustees noted that the comparability of the Advisor’s profitability to the publicly disclosed information about the profitability of other investment management firms is limited due to the nature of those firms and other factors. The Trustees considered information from the Advisor respecting investment of its profits to support staffing levels and noted that the Advisor’s profits are an important element in the compensation of employees who work for the benefit of the Funds and their shareholders. The Trustees considered information from the Advisor respecting the use of profits to enhance staff competencies through training and other measures, hire personnel to expand and develop the scope of senior management expertise, pay competitive levels of compensation, and add to the Advisor’s electronic and information technology systems to maintain or improve service levels. The Trustees also considered the contribution of the Advisor’s cost management to its profitability, and the relationship of the Advisor’s financial resources and profitability in previous years to its ability to attract necessary personnel, invest in systems and other assets required for its service to the Funds, and maintain or improve service levels for the Funds notwithstanding fluctuations in revenues and profitability. The information considered did not indicate to the Trustees that the Advisor’s profitability was excessive.
Potential Economies of Scale. In reviewing the extent to which economies of scale would be realized by each Fund as it grows and whether fee levels reflect potential economies of scale, the Trustees considered the breakpoint structure for advisory fees chargeable to each Fund, comparisons of the fee breakpoint structure for each Fund with breakpoint structures (or the absence of such structures) for other funds in a peer group selected by an independent mutual fund analyst firm, the effects of the breakpoint structure and other expense factors realized by certain funds of the Trust as their asset levels had increased, the Advisor’s undertakings to waive or reimburse certain fees and expenses for certain Funds and share classes, and the Advisor’s expenditures from its own profits and resources to support staffing levels, pay competitive levels of compensation, and add to its electronic and information technology systems to maintain or improve service levels. The Trustees also considered oral commentary from the Advisor respecting the advisory fee breakpoint structures of certain Funds. The information provided demonstrated to the Trustees that the Funds’ advisory fee breakpoint structures are reasonable in relation to the structures observed in the other funds in their respective peer groups, and that shareholders may be expected to benefit from any economies of scale, due to the advisory agreement’s breakpoint fee structure for each Fund and other factors.
Potential Ancillary Benefits. In reviewing potential benefits to the Advisor because of its relationship to the Funds, the Trustees considered explanations from the Advisor respecting its receipt of certain research services from broker dealers, and the benefits to both the Funds and the Advisor of the Advisor’s expansion of its staffing, compliance, and systems capabilities and other resources to serve a broader variety of investment management clients. The Trustees also considered how the establishment of additional investment products by the Advisor may benefit the Funds. No unusual or unfair benefits to the Advisor from its relationship to the Funds were identified by the Trustees.
Annual Financial Statements | 331
Other Information, Continued
September 30, 2024 (Unaudited)
Summary of Conclusions. The Trustees concluded that the general nature, extent, and quality of the Advisor’s services performed under the Agreement remained sufficient, the Advisor continued to actively and competently pursue the Funds’ investment objectives and adhere to the Funds’ investment policies, and that the absolute and relative investment performance of the Funds over pertinent holding periods on the whole was satisfactory in the context of the Funds’ objectives and strategies. The Trustees further concluded that the level of the advisory fee charged to each Fund by the Advisor is fair and reasonable in relation to the services provided by the Advisor, in view of the nature, extent, and quality of those services, the investment performance of each such Fund after fees and expenses, the clear disclosure of fees and expenses in the Funds’ prospectuses, comparisons of fees and expenses charged to each Fund to fees and expenses charged to other mutual funds, and the other factors and relevant circumstances considered. The Trustees accordingly determined to renew the Agreement for an additional term of one year for each of the Funds.
Municipal Funds
Thornburg Investment Management, Inc. (the “Advisor”) provides investment management services to each of the Funds pursuant to an investment advisory agreement (the “Agreement”). The Board of Trustees (the “Trustees”) consider the renewal of the Agreement annually, and most recently determined to renew the Agreement on September 17, 2024.
Planning for their recent consideration of the Agreement’s renewal, those Trustees who are not “interested persons” of the Trust, as defined in Section 2(a)(19) of the Investment Company Act of 1940, as amended (the “independent Trustees”), met in March 2024 and May 2024 to consider aspects of their annual evaluation of the Advisor’s service to the Funds and to each other series of the Trust, to plan the annual evaluation of the Advisor’s performance, and to discuss preliminarily the information the Advisor would present to the Trustees for their review. The independent Trustees met in another independent session in July 2024 to further define certain portions of the information to be submitted by the Advisor. The independent Trustees met again in independent session in September 2024 to discuss various matters relating to the consideration of the Agreement’s renewal, including discussions with representatives of a mutual fund analyst firm engaged by the independent Trustees to provide explanations of comparative cost and expense information and other data obtained and analyzed by the analyst firm. In that session the independent Trustees discussed their evaluations of the Advisor’s services to the Funds and the Funds’ fee and expense levels, investment performance, and other information presented for the Funds, conferred independently with legal counsel respecting the factors typically considered in evaluating renewal of an advisory agreement, and conferred with representatives of the Advisor to receive explanations of certain aspects of the information they had requested. Representatives of the Advisor subsequently reviewed portions of the information with the Trustees and addressed questions from the Trustees at a full meeting session of the Trustees scheduled in September 2024 for that purpose, and the independent Trustees thereafter met again in independent session to consider the Advisor’s presentations and various specific issues respecting their consideration of the Agreement’s renewal. Following these sessions, the Trustees met to consider renewal of the Agreement, and the independent Trustees voted unanimously at that meeting to renew the Agreement for an additional term of one year.
The information below summarizes certain factors considered by the Trustees in connection with the determination to renew the Agreement. In determining to renew the Agreement, the Trustees considered a wide range of information and did not identify any single factor as controlling, and this summary does not describe all of the factors and other matters considered by the Trustees in making their determination.
Nature, Extent, and Quality of Services. The Trustees considered in their evaluation of the Agreement the written and oral reports provided to the Trustees and their standing committees throughout the year on a wide variety of topics by personnel from the Advisor’s portfolio management, fund administration, trading, operations, marketing, distribution, and compliance staffs. The Trustees also considered in this evaluation the presentations and explanations made by representatives of the Advisor in meeting sessions scheduled for consideration of the renewal of the Agreement. The Trustees further noted in their evaluation the consideration they had given to a number of topics in previous years, reports from their standing committees, and advice received from counsel.
Information noted by the Trustees as having been considered in relation to the nature, extent, and quality of services provided by the Advisor under the Agreement, as more fully reflected in the minutes and other records of their quarterly and committee meetings throughout the year and in previous years, and contributing to their conclusions respecting the nature, extent, and quality of the services rendered to each Fund by the Advisor under the Agreement included: (1) reports from portfolio managers throughout the year demonstrating that each Fund was managed in conformity with stated strategies and objectives, and conformed to investment restrictions and limitations; (2) reports demonstrating that each Fund’s portfolio managers are cognizant of the Fund’s objectives and able to pursue those objectives and execute the Fund’s strategies in varying environments, are aware of pertinent market and economic trends and conditions, and are able to competently evaluate and select individual investments, manage the Fund to achieve tax efficiencies, effectively structure the Fund’s portfolio, and manage the Fund’s liquidity requirements; (3) each Fund’s achievement of its investment objectives over different periods of time; (4) presentations by, and interactions with, members of the Advisor’s fund administration, trading, operations, marketing, distribution, and compliance staffs; (5) reports from standing committees of the Trustees on their respective proceedings throughout the year, including particularly interactions with the Advisor’s personnel; (6) the sufficiency of the resources the Advisor devotes to the services it provides to each Fund, including the expertise of its personnel and staffing levels, the hiring of a new Chief Executive Officer for the Advisor and other recent additions to the Advisor’s senior management team, changes in the structure of various business
332 | Annual Financial Statements
Other Information, Continued
September 30, 2024 (Unaudited)
departments within the Advisor, the Advisor’s enhancements to the electronic systems it utilizes in providing these services, and the Advisor’s own financial management and sufficiency of its resources; (7) steps taken by the Advisor to improve its investment management process, including the appointment of a new Head of Fixed Income, the hiring of additional investment personnel to support the investment management function, plans to add other investment personnel in the future, efforts to increase the diversity of backgrounds and experiences among its investment personnel, and the increased integration of risk management procedures and consideration of environmental, social, and governance factors into the investment process; (8) the measures employed by the Advisor’s personnel to achieve efficient trade execution for each Fund, including the evaluation and selection of firms to execute transactions for each Fund; and (9) steps taken to facilitate continued collaboration among the Advisor’s personnel. As in past years, the Trustees noted their assessments of the Advisor’s personnel developed in formal and informal meetings throughout the year, measures to expand and improve the depth and expertise of the Advisor’s staff, and the Advisor’s collaborative approach to investment management, continued commitment to observance of compliance and regulatory requirements in managing investments by the Funds, responsiveness to the Trustees, and other factors and circumstances.
Based upon these and other considerations, the Trustees concluded that the Advisor’s management of the Funds’ investments continued to conform to the Funds’ stated objectives and policies, and that the nature, extent, and quality of the services provided to the Funds by the Advisor remained sufficient.
Investment Performance. The Trustees noted in their evaluation of each Fund’s investment performance the written and oral reports and investment and market analyses they had received from the Advisor’s portfolio management personnel throughout the year. The Trustees also noted their consideration of information provided to them at their request in anticipation of their annual evaluation of the Advisor’s services, including the following items of information respecting the investment performance of each Fund: (1) the Fund’s absolute investment performance and achievement of stated objectives; (2) the Advisor’s explanations and written commentary on the Fund’s performance in the context of the Fund’s objectives and reasonable expectations, and business, market, and economic conditions; (3) performance data for the ten most recent calendar years (or lesser number of years for each Fund having fewer calendar years of operations) comparing the Fund’s investment performance to one or more broad-based securities indices, and to the applicable Morningstar category of funds; (4) the Fund’s investment performance for the three-month, year-to-date, one-year, three-year, five-year, since inception and, if applicable, ten-year and fifteen-year periods ending with the second quarter of the current year, comparing the Fund’s annualized returns to one or more broad-based securities indices, and to the applicable Morningstar category of funds, and assigning a percentage rank to the Fund’s performance for each period relative to its Morningstar category; (5) analyses of specified risk and performance metrics for the Fund relative to its benchmark and to a selected peer group of funds, prepared by an independent financial analyst firm; (6) information respecting positive cash flows resulting from share purchases and investment appreciation or negative cash flows resulting from redemptions and investment depreciation; (7) various risk and return statistics; and (8) oral commentary from the Advisor. The Trustees noted their understanding that strategies pursued for a Fund may produce intermittent lower relative performance, that underperforming Funds have, generally in the past, returned to favor as conditions changed or the strategies of those Funds gained traction, and the Advisor has in general been successful over time in remediating lower relative performance of Funds in cases where execution of investment strategies had contributed to lower performance. In those instances where a Fund had exhibited lower relative performance in certain periods, the Trustees also considered the reports they received from the Advisor throughout the year, explanations of that underperformance by reference to the stated investment strategies of the Fund, the effects of market and economic conditions on the Fund during relevant periods, and the investment decisions by the Advisor in view of the Fund’s stated strategies. The Trustees also noted in their evaluations that to the extent pertinent they attach additional significance to the performance of each Fund from the perspective of longer-term shareholders.
Further detail considered by the Trustees with respect to the investment performance of each Fund is set forth below:
● Thornburg Short Duration Municipal Fund – the Trustees considered that the Fund outperformed its Morningstar category and its benchmark index over the year-to-date (through June 30, 2024), one-, and three-year periods and that the degree of the Fund’s underperformance in other periods relative to its Morningstar category and its benchmark index was not significant. The Trustees observed that the Fund has delivered positive total returns in eight of the last ten calendar years and that the Fund has met its investment objective over time.
● Thornburg Limited Term Municipal Fund – the Trustees considered that the Fund outperformed its Morningstar category over the ten-and fifteen-year periods, outperformed its benchmark index over the year-to-date (through June 30, 2024) and one-year period and performed in line with its benchmark index over the three-year period, and that the degree of the Fund’s underperformance in other periods relative to its Morningstar category and its benchmark index was not significant. The Trustees observed that a representative share class of the Fund delivered positive total returns in nine of the last ten calendar years, that another representative share class of the Fund delivered positive total returns in eight of the last ten calendar years and that the Fund has met both its primary and secondary investment objectives over time.
● Thornburg Intermediate Municipal Fund – the Trustees considered that the Fund outperformed its Morningstar category over the year-to-date (through June 30, 2024), one-, three-, five-, ten-, and fifteen-year periods, and outperformed its benchmark index over each
Annual Financial Statements | 333
Other Information, Continued
September 30, 2024 (Unaudited)
of those periods except the ten-year period. The Trustees also considered that two representative share classes of the Fund delivered positive total returns in eight of the last ten calendar years and that the Fund has met both its primary and secondary investment objectives over time.
● Thornburg Strategic Municipal Income Fund – the Trustees considered that the Fund outperformed its Morningstar category over the year-to-date (through June 30, 2024), one-, three-, five-, ten-, and fifteen-year periods, outperformed its benchmark index over the year-to-date (through June 30, 2024), one-, three-, and fifteen-year periods and performed in line with its benchmark index over the five-year period. The Trustees observed that two representative share classes of the Fund delivered positive total returns in eight of the last ten calendar years and that the Fund has met its investment objective over time.
● Thornburg California Limited Term Municipal Fund – the Trustees considered that the Fund outperformed its Morningstar category over the one-, three-, and fifteen-year periods, outperformed its benchmark index over the year-to-date (through June 30, 2024), one-, and three-year periods, and that the degree of the Fund’s underperformance in other periods relative to its Morningstar category and its benchmark index was not significant. The Trustees observed that two representative share classes of the Fund delivered positive total returns in seven of the last ten calendar years and that the Fund has met both its primary and secondary investment objectives over time.
● Thornburg New Mexico Intermediate Municipal Fund – the Trustees considered the limited utility of comparisons between the Fund’s investment performance and its Morningstar category or benchmark index given the lack of other funds focused on investments in New Mexico debt obligations. Nonetheless, the Trustees noted that the Fund outperformed its Morningstar category over the year-to-date (through June 30, 2024), one-, three, and five-year periods and outperformed its benchmark index over the year-to-date (through June 30, 2024), one-, and three-year periods. The Trustees also observed that two representative share classes of the Fund delivered positive total returns in eight of the last ten calendar years and that the Fund has met both its primary and secondary investment objectives over time.
● Thornburg New York Intermediate Municipal Fund – the Trustees considered that the Fund outperformed its Morningstar category over the year-to-date (through June 30, 2024), one-, three-, five-, ten-, and fifteen-year periods, outperformed its benchmark index over the year-to-date (through June 30, 2024), one-, and three-year periods, and that the degree of the Fund’s underperformance in other periods relative to its benchmark index was not significant. The Trustees observed that the Fund delivered positive total returns in eight of the last ten calendar years and that the Fund has met both its primary and secondary investment objectives over time.
Based upon their consideration of this and other information, the Trustees concluded that the Funds’ absolute and relative investment performance over a range of pertinent holding periods was generally satisfactory in view of the Funds’ objectives and strategies, and that where there was underperformance in certain periods and for certain Funds, the Advisor has taken appropriate steps to seek to mitigate that underperformance.
Comparisons of Fee and Expense Levels. Information noted by the Trustees as having been considered in this context included a variety of comparative data respecting the Funds’ fee and expense levels. This information included comparisons of each Fund’s advisory fee and overall Fund expenses to median and average fees and expenses charged to funds in the applicable Morningstar category, comparisons of the advisory fee and total expenses for a representative share class of each Fund to the fee levels and expenses of fund peer groups selected from the category by an independent mutual fund analyst firm engaged by the independent Trustees, the perspectives and advice from that mutual fund analyst firm respecting comparisons of fund fee levels and expenses to fund peer groups, explanations from representatives of the Advisor respecting the fees and expenses of certain Funds, and other information. In evaluating comparative fee and expense data, the Trustees considered whether the advisory fees charged to each Fund were at least generally comparable to the comparatives presented, and whether those advisory fees and overall Fund expense levels were within the range of figures established for the selected peer groups. The Trustees also considered the extent to which the Advisor had waived fees or reimbursed expenses for certain Funds and share classes thereof, and noted that information about the Funds’ current fee and expense levels is disclosed in the prospectuses for each Fund.
Further detail considered by the Trustees with respect to the comparison of the fee and expense levels of each Fund is set forth below:
● Thornburg Short Duration Municipal Fund – Comparative fee and expense data considered by the Trustees showed that the level of total expense for one representative share class of the Fund was nearly identical to the median and lower than the average levels charged to funds in the applicable Morningstar category, and that the level of total expense for a second representative share class was higher than such median and average levels but within the range of total expenses for the category. Peer group data showed that the Fund’s management fee and the total expense level for a representative share class of the Fund, while both higher than the median levels for the peer group, were within the range of the management fees and total expenses for that peer group.
● Thornburg Limited Term Municipal Fund – Comparative fee and expense data considered by the Trustees showed that the level of total expense for one representative share class of the Fund was substantially similar to the median and lower than the average levels charged to funds in the applicable Morningstar category, and that the level of total expense for a second representative share class was higher than such median and average levels but within the range of total expenses for the category. Peer group data showed that the Fund’s
334 | Annual Financial Statements
Other Information, Continued
September 30, 2024 (Unaudited)
management fee and the total expense level for a representative share class of the Fund, while both higher than the median levels for the peer group, were within the range of the management fees and total expenses for that peer group.
● Thornburg Intermediate Municipal Fund – Comparative fee and expense data considered by the Trustees showed that the levels of total expenses for two representative share classes of the Fund were each lower than the median and average levels charged to funds in the applicable Morningstar category. Peer group data showed that the Fund’s management fee was higher than the median level for the peer group but within the range of management fees for that peer group, and that the total expense level of one representative share class of the Fund was lower than the median level of the peer group.
● Thornburg Strategic Municipal Income Fund – Comparative fee and expense data considered by the Trustees showed that the level of total expense for one representative share class of the Fund was lower than the median and average levels charged to funds in the applicable Morningstar category, and that the level of total expense for a second representative share class was higher than such median and average levels but within the range of total expenses for the category. Peer group data showed that the Fund’s management fee was lower than the median level for the peer group, and that the total expense level of one representative share class was higher than the median level, but within the range of, the total expenses of the peer group.
● Thornburg California Limited Term Municipal Fund – Comparative fee and expense data considered by the Trustees showed that the level of total expense for one representative share class of the Fund was lower than the median and average levels charged to funds in the applicable Morningstar category, and that the level of total expense for a second representative share class was higher than such median but lower than such average level. Peer group data showed that the Fund’s management fee and the total expense level for a representative share class of the Fund were lower than the median levels for the peer group,.
● Thornburg New Mexico Intermediate Municipal Fund – Comparative fee and expense data considered by the Trustees showed that the level of total expense for one representative share class of the Fund was lower than the median and average levels charged to funds in the applicable Morningstar category, and that the level of total expense for a second representative share class was higher than such median and average levels but within the range of total expenses for the category. Peer group data showed that the Fund’s management fee and the total expense level for a representative share class of the Fund, while both higher than the median levels for the peer group, were within the range of the management fees and total expenses for that peer group.
● Thornburg New York Intermediate Municipal Fund – Comparative fee and expense data considered by the Trustees showed that the level of total expense for one representative share class of the Fund was equal to the median level and lower than the average level charged to funds in the applicable Morningstar category, and that the level of total expense for a second representative share class was higher than such median and average levels but within the range of total expenses for the category. Peer group data showed that the Fund’s management fee was lower than the median level for the peer group, and that the total expense level of one representative share class was higher than the median level, but within the range of, the total expenses of the peer group.
The Trustees did not find any of the differences between the Funds’ fee and expense data and the comparable fee and expense data significant in view of their findings and conclusions respecting the other factors considered, including the quality of services provided by the Advisor to each Fund.
The Trustees also noted their consideration of information respecting the advisory fees charged by the Advisor to other investment management clients, including the Advisor’s institutional clients, together with information about fees charged by other advisors to different clients, analysis of the differences between the requirements of institutional clients and mutual funds, analysis of the differences between the requirements of a sub-advised mutual fund and a fund as to which the Advisor is the primary advisor and sponsor, and the consequently different investment management services provided to the different categories of clients and the differing contexts in which these arrangements are entered into. The Trustees confirmed their previous observations that the differences between the fees charged by the Advisor to different types of clients did not appear exceptional, and that the fee rates charged by the Advisor or by other investment advisors to different types of clients had limited relevance to the evaluation of the fee rates charged by the Advisor to the Funds.
Costs and Profitability of Advisor. In reviewing the profitability of the Advisor’s services to the Funds under the Agreement, the Trustees considered an analysis of the Advisor’s costs and the estimated profitability to the Advisor of its services, together with figures for the profitability of a selection of other, publicly listed investment management firms. The Trustees noted that the comparability of the Advisor’s profitability to the publicly disclosed information about the profitability of other investment management firms is limited due to the nature of those firms and other factors. The Trustees considered information from the Advisor respecting investment of its profits to support staffing levels and noted that the Advisor’s profits are an important element in the compensation of employees who work for the benefit of the Funds and their shareholders. The Trustees considered information from the Advisor respecting the use of profits to enhance staff competencies through training and other measures, hire personnel to expand and develop the scope of senior management expertise, pay competitive levels of compensation, and add to the Advisor’s electronic and information technology systems to maintain or improve service levels. The Trustees also considered the contribution of the Advisor’s cost management to its profitability, and the relationship of the Advisor’s financial resources and profitability in previous years to its ability to attract necessary personnel, invest in systems and other
Annual Financial Statements | 335
Other Information, Continued
September 30, 2024 (Unaudited)
assets required for its service to the Funds, and maintain or improve service levels for the Funds notwithstanding fluctuations in revenues and profitability. The information considered did not indicate to the Trustees that the Advisor’s profitability was excessive.
Potential Economies of Scale. In reviewing the extent to which economies of scale would be realized by each Fund as it grows and whether fee levels reflect potential economies of scale, the Trustees considered the breakpoint structure for advisory fees chargeable to each Fund, comparisons of the fee breakpoint structure for each Fund with breakpoint structures (or the absence of such structures) for other funds in a peer group selected by an independent mutual fund analyst firm, the effects of the breakpoint structure and other expense factors realized by certain funds of the Trust as their asset levels had increased, the Advisor’s undertakings to waive or reimburse certain fees and expenses for certain Funds and share classes, and the Advisor’s expenditures from its own profits and resources to support staffing levels, pay competitive levels of compensation, and add to its electronic and information technology systems to maintain or improve service levels. The Trustees also considered oral commentary from the Advisor respecting the advisory fee breakpoint structures of certain Funds. The information provided demonstrated to the Trustees that the Funds’ advisory fee breakpoint structures are reasonable in relation to the structures observed in the other funds in their respective peer groups, and that shareholders may be expected to benefit from any economies of scale, due to the advisory agreement’s breakpoint fee structure for each Fund and other factors.
Potential Ancillary Benefits. In reviewing potential benefits to the Advisor because of its relationship to the Funds, the Trustees considered explanations from the Advisor respecting its receipt of certain research services from broker dealers, and the benefits to both the Funds and the Advisor of the Advisor’s expansion of its staffing, compliance, and systems capabilities and other resources to serve a broader variety of investment management clients. The Trustees also considered how the establishment of additional investment products by the Advisor may benefit the Funds. No unusual or unfair benefits to the Advisor from its relationship to the Funds were identified by the Trustees.
Summary of Conclusions. The Trustees concluded that the general nature, extent, and quality of the Advisor’s services performed under the Agreement remained sufficient, the Advisor continued to actively and competently pursue the Funds’ investment objectives and adhere to the Funds’ investment policies, and that the absolute and relative investment performance of the Funds over pertinent holding periods on the whole was satisfactory in the context of the Funds’ objectives and strategies. The Trustees further concluded that the level of the advisory fee charged to each Fund by the Advisor is fair and reasonable in relation to the services provided by the Advisor, in view of the nature, extent, and quality of those services, the investment performance of each such Fund after fees and expenses, the clear disclosure of fees and expenses in the Funds’ prospectuses, comparisons of fees and expenses charged to each Fund to fees and expenses charged to other mutual funds, and the other factors and relevant circumstances considered. The Trustees accordingly determined to renew the Agreement for an additional term of one year for each of the Funds.
Managed Account Funds
Thornburg Investment Management, Inc. (the “Advisor”) provides investment management services to each of the Funds pursuant to an investment advisory agreement (the “Agreement”). The Board of Trustees (the “Trustees”) consider the renewal of the Agreement annually, and most recently determined to renew the Agreement on September 17, 2024.
Planning for their recent consideration of the Agreement’s renewal, those Trustees who are not “interested persons” of the Trust, as defined in Section 2(a)(19) of the Investment Company Act of 1940, as amended (the “independent Trustees”), met in March 2024 and May 2024 to consider aspects of their annual evaluation of the Advisor’s service to the Funds and to each other series of the Trust, to plan the annual evaluation of the Advisor’s performance, and to discuss preliminarily the information the Advisor would present to the Trustees for their review. The independent Trustees met in another independent session in July 2024 to further define certain portions of the information to be submitted by the Advisor. The independent Trustees met again in independent session in September 2024 to discuss various matters relating to the consideration of the Agreement’s renewal. In that session the independent Trustees discussed their evaluations of the Advisor’s services to the Funds and the Funds’ fee and expense levels, investment performance, and other information presented for the Funds, conferred independently with legal counsel respecting the factors typically considered in evaluating renewal of an advisory agreement, and conferred with representatives of the Advisor to receive explanations of certain aspects of the information they had requested. Representatives of the Advisor subsequently reviewed portions of the information with the Trustees and addressed questions from the Trustees at a full meeting session of the Trustees scheduled in September 2024 for that purpose, and the independent Trustees thereafter met again in independent session to consider the Advisor’s presentations and various specific issues respecting their consideration of the Agreement’s renewal. Following these sessions, the Trustees met to consider renewal of the Agreement, and the independent Trustees voted unanimously at that meeting to renew the Agreement for an additional term of one year.
The information below summarizes certain factors considered by the Trustees in connection with the determination to renew the Agreement. In determining to renew the Agreement, the Trustees considered a wide range of information and did not identify any single factor as controlling, and this summary does not describe all of the factors and other matters considered by the Trustees in making their determination.
Nature, Extent, and Quality of Services. The Trustees considered in their evaluation of the Agreement the written and oral reports provided to the Trustees and their standing committees throughout the year on a wide variety of topics by personnel from the Advisor’s portfolio
336 | Annual Financial Statements
Other Information, Continued
September 30, 2024 (Unaudited)
management, fund administration, trading, operations, marketing, distribution, and compliance staffs. The Trustees also considered in this evaluation the presentations and explanations made by representatives of the Advisor in meeting sessions scheduled for consideration of the renewal of the Agreement. The Trustees further noted in their evaluation the consideration they had given to a number of topics in previous years, reports from their standing committees, and advice received from counsel.
Information noted by the Trustees as having been considered in relation to the nature, extent, and quality of services provided by the Advisor under the Agreement, as more fully reflected in the minutes and other records of their quarterly and committee meetings throughout the year and in previous years, and contributing to their conclusions respecting the nature, extent, and quality of the services rendered to each Fund by the Advisor under the Agreement included: (1) reports from portfolio managers throughout the year demonstrating that each Fund was managed in conformity with stated strategies and objectives, and conformed to investment restrictions and limitations; (2) reports demonstrating that each Fund’s portfolio managers are cognizant of the Fund’s objectives and able to pursue those objectives and execute the Fund’s strategies in varying environments, are aware of pertinent market and economic trends and conditions, and are able to competently evaluate and select individual investments, manage the Fund to achieve tax efficiencies, effectively structure the Fund’s portfolio, and manage the Fund’s liquidity requirements; (3) each Fund’s achievement of its investment objectives; (4) presentations by, and interactions with, members of the Advisor’s fund administration, trading, operations, marketing, distribution, and compliance staffs; (5) reports from standing committees of the Trustees on their respective proceedings throughout the year, including particularly interactions with the Advisor’s personnel; (6) the sufficiency of the resources the Advisor devotes to the services it provides to each Fund, including the expertise of its personnel and staffing levels, the hiring of a new Chief Executive Officer for the Advisor and other recent additions to the Advisor’s senior management team, changes in the structure of various business departments within the Advisor, the Advisor’s enhancements to the electronic systems it utilizes in providing these services, and the Advisor’s own financial management and sufficiency of its resources; (7) steps taken by the Advisor to improve its investment management process, including the appointment of a new Head of Fixed Income and a new Head of Equity, the hiring of additional investment personnel to support the investment management function, plans to add other investment personnel in the future, efforts to increase the diversity of backgrounds and experiences among its investment personnel, and the increased integration of risk management procedures and consideration of environmental, social, and governance factors into the investment process; (8) the measures employed by the Advisor’s personnel to achieve efficient trade execution for each Fund, including the evaluation and selection of firms to execute transactions for each Fund; and (9) steps taken to facilitate continued collaboration among the Advisor’s personnel. As in past years, the Trustees noted their assessments of the Advisor’s personnel developed in formal and informal meetings throughout the year, measures to expand and improve the depth and expertise of the Advisor’s staff, and the Advisor’s collaborative approach to investment management, continued commitment to observance of compliance and regulatory requirements in managing investments by the Funds, responsiveness to the Trustees, and other factors and circumstances.
Based upon these and other considerations, the Trustees concluded that the Advisor’s management of the Funds’ investments continued to conform to the Funds’ stated objectives and policies, and that the nature, extent, and quality of the services provided to the Funds by the Advisor remained sufficient.
Investment Performance. The Trustees noted in their evaluation of each Fund’s investment performance the written and oral reports and investment and market analyses they had received from the Advisor’s portfolio management personnel throughout the year. The Trustees also noted their consideration of information provided to them at their request in anticipation of their annual evaluation of the Advisor’s services, including the following items of information respecting the investment performance of each Fund: (1) the Fund’s absolute investment performance and achievement of stated objectives; (2) the Advisor’s explanations on the Fund’s performance in the context of the Fund’s objectives; (3) information respecting positive cash flows resulting from share purchases and investment appreciation or negative cash flows resulting from redemptions and investment depreciation; and (4) oral commentary from the Advisor. The Trustees also noted that each of the Funds has a limited performance history, and that each Fund is intended to be a component of a separately managed account and, accordingly, the performance of each Fund is only one contributing factor to the investment returns for investors in those separately managed accounts.
Further detail considered by the Trustees with respect to the investment performance of each Fund is set forth below:
● Thornburg Emerging Markets Managed Account Fund – the Trustees considered that the Fund has delivered positive total returns since its inception and met its investment objective.
● Thornburg Municipal Managed Account Fund – the Trustees considered that the Fund has delivered positive total returns since its inception, outperformed its benchmark index over that period, and met its investment objective.
Based upon their consideration of this and other information, the Trustees concluded that the Funds’ investment performance was generally satisfactory in view of the Funds’ objectives and strategies.
Comparisons of Fee and Expense Levels. The Trustees did not consider fee levels because the Advisor does not charge fees to either of the Funds under the Agreement. Expense levels were also not considered because the Advisor has agreed to waive nearly all operating expenses for the Funds.
Annual Financial Statements | 337
Other Information, Continued
September 30, 2024 (Unaudited)
Costs and Profitability of Advisor. The Trustees did not consider the profitability of the Advisor in reviewing the Advisory Agreement, because the Advisor does not charge fees to the Funds under the Advisory Agreement.
Potential Economies of Scale. The Trustees did not consider any economies of scale potentially available to the Funds in reviewing the Advisory Agreement, because the Advisor does not receive a fee from the Funds under the Advisory Agreement.
Potential Ancillary Benefits. The Trustees noted that because the Funds are intended to be components of separately managed accounts, the existence of the Funds may help the Advisor develop and grow its separately managed account business. The Trustees did not identify this as an unusual or unfair benefit to the Advisor, and the Trustees likewise identified no other unusual or unfair benefits to the Advisor from its relationship to the Funds.
Summary of Conclusions. After considering the factors identified above, and in light of the other information received by the Trustees respecting the Funds, the Trustees determined to renew the Advisory Agreement for an additional term of one year for each of the Funds.
Capital Management Fund
Thornburg Investment Management, Inc. (the “Advisor”) provides investment management services to the Thornburg Capital Management Fund pursuant to an investment advisory agreement (the “Agreement”). The Board of Trustees (the “Trustees”) consider the renewal of the Agreement annually, and most recently determined to renew the Agreement on September 17, 2024.
The information below summarizes certain factors considered by the Trustees in connection with the determination to renew the Agreement. In determining to renew the Agreement, the Trustees considered a wide range of information and did not identify any single factor as controlling, and this summary does not describe all of the factors and other matters considered by the Trustees in making their determination.
Nature, Extent, and Quality of Services. The Trustees considered in their evaluation of the Agreement the written and oral reports provided to the Trustees and their standing committees throughout the year on a wide variety of topics by personnel from the Advisor’s portfolio management, fund administration, trading, operations, marketing, distribution, and compliance staffs. The Trustees also considered in this evaluation the presentations and explanations made by representatives of the Advisor in meeting sessions scheduled for consideration of the renewal of the Agreement. The Trustees further noted in their evaluation the consideration they had given to a number of topics in previous years, reports from their standing committees, and advice received from counsel.
Information noted by the Trustees as having been considered in relation to the nature, extent, and quality of services provided by the Advisor under the Agreement and contributing (together with other information considered) to their conclusions respecting the nature, extent, and quality of the services rendered to the Fund by the Advisor under the Agreement included: (1) reports from the Fund’s portfolio managers throughout the year demonstrating that the Fund was managed in conformity with stated strategies and objectives, and conformed to investment restrictions and limitations; (2) the Fund’s portfolio managers are cognizant of the Fund’s objective and able to pursue that objective and execute the Fund’s strategies in varying environments, are aware of pertinent market and economic trends and conditions, and are able to competently evaluate and select individual investments, effectively structure the Fund’s portfolio, and manage the Fund’s liquidity requirements; (3) the Fund’s achievement of its investment objective over different periods of time; (4) presentations by, and interactions with, members of the Advisor’s fund administration, trading, operations, marketing, and compliance staffs; (5) reports from standing committees of the Trustees on their respective proceedings throughout the year, including particularly interactions with the Advisor’s personnel; (6) the sufficiency of the resources the Advisor devotes to the services it provides to the Fund, including the expertise of its personnel and staffing levels, the hiring of a new Chief Executive Officer for the Advisor and other recent additions to the Advisor’s senior management team, changes to the structure of various business departments within the Advisor, the Advisor’s enhancements to the electronic systems it utilizes in providing these services, and the Advisor’s own financial management and sufficiency of its resources; (7) steps taken by the Advisor to improve its investment management process, including the appointment of a new Head of Fixed Income, the hiring of additional investment personnel to support the investment management function, plans to add other investment personnel in the future, efforts to increase the diversity of backgrounds and experiences among its investment personnel, and the increased integration of risk management procedures and consideration of environmental, social, and governance factors into the investment process; (8) the measures employed by the Advisor’s personnel to achieve efficient trade execution for the Fund; and (9) steps taken to facilitate continued collaboration among the Advisor’s personnel. As in past years, the Trustees noted their assessments of the Advisor’s personnel developed in formal and informal meetings throughout the year, measures to expand and improve the depth and experience of the Advisor’s staff, and the Advisor’s collaborative approach to investment management, continued commitment to observance of compliance and regulatory requirements in managing investments by the Fund, responsiveness to the Trustees, and other factors and circumstances.
Based upon these and other considerations, the Trustees concluded that the Advisor’s management of the Fund’s investments continued to conform to the Fund’s stated objective and policies, and that the nature, extent, and quality of the services provided to the Fund by the Advisor remained sufficient.
338 | Annual Financial Statements
Other Information, Continued
September 30, 2024 (Unaudited)
Investment Performance. Dividend distribution and other information received by the Trustees respecting the investments by the Fund was viewed as consistent with expectations respecting the Fund’s investment performance in view of current market conditions.
Comparisons of Fee and Expense Levels. The Trustees did not consider fee levels because the Advisor does not charge fees to the Fund. Expense levels were consistent with expectations.
Costs and Profitability of Advisor. The Trustees did not consider the profitability of the Advisor in reviewing the Agreement, because the Advisor does not charge fees to the Fund under that Agreement.
Potential Economies of Scale. The Trustees did not consider any economies of scale potentially available to the Fund in reviewing the Agreement, because the Advisor does not receive a fee from the Fund under that Agreement.
Potential Ancillary Benefits. The Trustees did not identify any collateral benefits to the Advisor because of its relationship to the Fund.
Summary of Conclusions. The Trustees concluded that the general nature, extent, and quality of the Advisor’s services performed under the Agreement remained sufficient, that the Advisor had continued to actively and competently pursue the Fund’s investment objective and adhere to the Fund’s investment policies, and that the Fund’s investment performance remained satisfactory in the context of its objective and strategies. The Trustees further concluded that the level of the Fund’s expenses was reasonable. The Trustees accordingly determined to renew the Agreement for an additional term of one year for the Fund.
Annual Financial Statements | 339
| To receive shareholder reports, prospectuses, and proxy statements electronically, go to | |
| www.thornburg.com/edelivery. | TH6386 |
Item 8. Changes in and Disagreements with Accountants for Open-End Management Investment Companies
Filed as part of item 7 of this Form.
Item 9. Proxy Disclosures for Open-End Management Investment Companies
Filed as part of item 7 of this Form.
Item 10. Remuneration Paid to Directors, Officers, and Others of Open-End Management Investment Companies
Filed as part of item 7 of this Form.
Item 11. Statement Regarding Basis for Approval of Investment Advisory Contract
Filed as part of item 7 of this Form.
Item 12. Disclosure of Proxy Voting Policies and Procedures for Closed-End Management Investment Companies
Not applicable.
Item 13. Portfolio Managers of Closed-End Management Investment Companies
Not applicable.
Item 14. Purchases of Equity Securities by Closed-End Management Investment Company and Affiliated Purchasers
Not applicable.
Item 15. Submission of Matters to a Vote of Security Holders
The authority to consider candidates recommended by the shareholders in accordance with the Trust’s Procedures for Shareholder Communications is committed to the Governance and Nominating Committee.
Item 16. Controls and Procedures
(a) The principal executive officer and the principal financial officer have concluded that the Trust’s disclosure controls and procedures provide reasonable assurance that material information relating to the Trust is made known to them by the appropriate persons, based on their evaluation of these controls and procedures as of a date within 90 days prior to the filing date of this report.
(b) There was no change in the Trust’s internal control over financial reporting that occurred during the period covered by this report that has materially affected, or is reasonably likely to materially affect, the registrant’s internal control over financial reporting.
Item 17. Disclosure of Securities Lending Activities for Closed-End Management Investment Companies
Not applicable.
Item 18. Recovery of Erroneously Awarded Compensation
Not applicable.
Item 19. Exhibits
SIGNATURES
Pursuant to the requirements of the Securities Exchange Act of 1934 and the Investment Company Act of 1940, the registrant has duly caused this report to be signed on its behalf by the undersigned, thereunto duly authorized.
Thornburg Investment Trust, in respect of the following Thornburg Funds: Global Opportunities Fund, International Equity Fund, Better World International Fund, International Growth Fund, Developing World Fund, Small/Mid Cap Core Fund, Small/Mid Cap Growth Fund, Investment Income Builder Fund, Summit Fund, Ultra Short Income Fund, Limited Term U.S. Government Fund, Limited Term Income Fund, Core Plus Bond Fund, Strategic Income Fund, Short Duration Municipal Fund, Limited Term Municipal Fund, Intermediate Municipal Fund, Strategic Municipal Income Fund, California Limited Term Municipal Fund, New Mexico Intermediate Municipal Fund, New York Intermediate Municipal Fund, Emerging Markets Managed Account Fund, Municipal Managed Account Fund, and Capital Management Fund.
| By: | /s/ Nimish Bhatt | |
| | Nimish Bhatt | |
| | President and principal executive officer | |
Pursuant to the requirements of the Securities Exchange Act of 1934 and the Investment Company Act of 1940, this report has been signed below by the following persons on behalf of the registrant and in the capacities and on the dates indicated.
| By: | /s/ Nimish Bhatt | |
| | Nimish Bhatt | |
| | President and principal executive officer | |
| | | |
| Date: | December 3, 2024 | |
| | | |
| By: | /s/ Curtis Holloway | |
| | Curtis Holloway | |
| | Treasurer and principal financial officer | |
