UNITED STATES SECURITIES AND EXCHANGE COMMISSION
Washington, D.C. 20549
____________
FORM 10-K
(Mark One)
| x | ANNUAL REPORT PURSUANT TO SECTION 13 OR 15(d) OF THE SECURITIES EXCHANGE ACT OF 1934 |
| For the fiscal year ended | | December 31, 2008 |
OR
| ¨ | TRANSITION REPORT PURSUANT TO SECTION 13 or 15(d) OF THE SECURITIES EXCHANGE ACT OF 1934 |
For the transition period from _________________________________ to _________________________________
AIR METHODS CORPORATION
(Exact name of registrant as specified in its charter)
Commission file number 0-16079
| Delaware | 84-0915893 |
| (State or other jurisdiction of incorporation or organization) | (I.R.S. employer identification no.) |
7301 South Peoria, Englewood, Colorado 80112
(Address of principal executive offices and zip code)
303-792-7400
(Registrant’s telephone number, including area code)
Securities registered pursuant to Section 12(b) of the Act:
Not Applicable
Securities registered pursuant to Section 12(g) of the Act:
COMMON STOCK, $.06 PAR VALUE PER SHARE (the "Common Stock")
(Title of Class)
Indicate by check mark if the registrant is a well-known seasoned issuer, as defined in Rule 405 of the Securities Act.
Yes ¨ No x
Indicate by check mark if the registrant is not required to file reports pursuant to Section 13 or Section 15(d) of the Act.
Yes ¨ No x
Indicate by check mark whether the registrant (1) has filed all reports required to be filed by Section 13 or 15(d) of the Securities Exchange Act of 1934 during the preceding 12 months (or for such shorter period that the registrant was required to file such reports), and (2) has been subject to such filing requirements for the past 90 days. Yes x No ¨
Indicate by check mark if disclosure of delinquent filers pursuant to Item 405 of Regulation S-K is not contained herein, and will not be contained, to the best of registrant's knowledge, in definitive proxy or information statements incorporated by reference in Part III of this Form 10-K or any amendment to this Form 10-K. ¨
Indicate by check mark whether the registrant is a large accelerated filer, an accelerated filer, a non-accelerated filer, or a smaller reporting company. See definition of “accelerated filer,” large accelerated filer,” and “smaller reporting company” in Rule 12b-2 of the Exchange Act. (Check one):
Large accelerated Filer ¨ | | Accelerated Filer x |
Non-accelerated Filer ¨ (Do not check if a smaller reporting company) | | Smaller reporting company ¨ |
Indicate by check mark whether the registrant is a shell company (as defined in Rule 12b-2 of the Exchange Act.) Yes ¨ No x
State the aggregate market value of the voting and non-voting common equity held by non-affiliates computed by reference to the price at which the common equity was last sold, or the average bid and asked price of such common equity, as of the last business day of the registrant’s most recently completed second fiscal quarter: $270,106,000
The number of outstanding shares of Common Stock as of February 27, 2009, was 12,097,062.
DOCUMENTS INCORPORATED BY REFERENCE
Certain information required for Part III of this Annual Report on Form 10-K is incorporated by reference to the registrant’s definitive proxy statement for the 2009 annual meeting of stockholders.
To Form 10-K
| | | | Page |
| | | | |
| PART I |
| | | | |
| ITEM 1. | | | 1 |
| | | General | 1 |
| | | Employees | 3 |
| | | Government Regulation | 3 |
| | | Available Information | 4 |
| | | | |
| ITEM 1A. | | | 4 |
| | | | |
| ITEM 1B. | | | 8 |
| | | | |
| ITEM 2. | | | 8 |
| | | Facilities | 8 |
| | | Equipment and Parts | 9 |
| | | | |
| ITEM 3. | | | 10 |
| | | | |
| ITEM 4. | | | 10 |
| | | | |
| PART II |
| | | | |
| ITEM 5. | | | 11 |
| | | | |
| ITEM 6. | | | 13 |
| | | | |
| ITEM 7. | | | 15 |
| | | Overview | 15 |
| | | Results of Operations | 17 |
| | | Liquidity and Capital Resources | 23 |
| | | Outlook for 2009 | 26 |
| | | Critical Accounting Policies | 26 |
| | | New Accounting Standards | 28 |
| | | | |
| ITEM 7A. | | | 29 |
| | | | |
| ITEM 8. | | | 30 |
| | | | |
| ITEM 9. | | | 30 |
| | | | |
| ITEM 9A. | | | 30 |
| | | | |
| ITEM 9B. | | | 30 |
| PART III |
| | | | |
| ITEM 10. | | | 31 |
| | | | |
| ITEM 11. | | | 31 |
| | | | |
| ITEM 12. | | | 31 |
| | | | |
| ITEM 13. | | | 31 |
| | | | |
| ITEM 14. | | | 31 |
| | | | |
| | | | |
| PART IV |
| | | | |
| ITEM 15. | | | IV-1 |
| | | | |
| SIGNATURES | | | IV-4 |
PART I
General
Air Methods Corporation, a Delaware corporation, (Air Methods or the Company) was established in Colorado in 1982 and now serves as the largest provider of air medical emergency transport services and systems throughout the United States of America. We provide air medical emergency transport services under two service delivery models: Community-Based Services (CBS) and Hospital-Based Services (HBS). Rocky Mountain Holdings, LLC (RMH), FSS Airholdings, Inc. (FSS), Mercy Air Service, Inc. (Mercy Air), and LifeNet, Inc. (LifeNet) all operate as wholly-owned subsidiaries of Air Methods. We acquired 100% of the outstanding common stock of FSS, the parent company of CJ Systems Aviation Group, Inc. (CJ), in October 2007.
As of December 31, 2008, our CBS Division provided air medical transportation services in twenty states, while our HBS Division provided air medical transportation services to hospitals located in 32 states under operating agreements with original terms ranging from two to eight years. Under both CBS and HBS operations, we transport persons requiring intensive medical care from either the scene of an accident or general care hospitals to highly skilled trauma centers or tertiary care centers. Under the CBS delivery model, our employees provide medical care to patients en route, while under the HBS delivery model, medical care en route is provided by employees or contractors of our customer hospitals. Our Products Division designs, manufactures, and installs aircraft medical interiors and other aerospace or medical transport products. Financial information for each of our operating segments is included in the notes to our consolidated financial statements included in Item 8 of this report.
Community-Based Services
Services provided by our CBS Division include medical care, aircraft operation and maintenance, 24-hour communications and dispatch, and medical billing and collections. CBS aircraft are typically based at fire stations, airports, or hospital locations. CBS revenue consists of flight fees billed directly to patients, their insurers, or governmental agencies. Due to weather conditions and other factors, the number of flights is generally higher during the summer months than during the remainder of the year, causing revenue generated from operations to fluctuate accordingly.
The division operates 131 helicopters and four fixed wing aircraft under both Instrument Flight Rules (IFR) and Visual Flight Rules (VFR) in 20 states. Although the division does not generally contract directly with specific hospitals, it has long-standing relationships with several leading healthcare institutions in the metropolitan areas in which it operates.
In 2008 the CBS Division opened one new base in the southwest region and one in the Midwest and converted one HBS contract in the southeast region to CBS operations. The CBS Division also closed five bases due to insufficient flight volume and sold two ground ambulance operations obtained in the CJ acquisition. In 2007, we entered into a contract with the Federal Emergency Management Agency (FEMA) to support its disaster recovery efforts as needed. During the third quarter of 2008, we mobilized 25 aircraft to respond to the threat posed by Hurricane Gustav in Louisiana and fifteen aircraft to respond to the threat posed by Hurricane Ike in Texas.
Our aircraft are dispatched in response to requests for transport received by our communications centers from sending or receiving hospitals or local emergency personnel, such as firemen or police officers, at the scene of an accident. Communications and dispatch operations for substantially all CBS locations are conducted from our national center in Omaha, Nebraska, or from the regional center in St. Louis, Missouri. Medical billing and collections are processed primarily from our offices in San Bernardino, California.
Competition for the CBS Division comes primarily from four national operators (OmniFlight, Inc.; PHI, Inc.; Med-Trans, Inc.; and Air Evac Lifeteam) and from smaller regional carriers and alternative air ambulance providers such as local governmental entities. We believe that our competitive strengths center on the quality of our patient care and customer service, the medical capability of the aircraft we deploy, as well as our ability to tailor the service delivery model to a hospital’s or community’s specific needs. Unlike many operators, we maintain in-house core competencies in hiring, training, and managing medical staff; billing and collection services; dispatch and communication functions; and aviation operations. We believe that choosing not to outsource these services allows us to better ensure the quality of patient care and enhances control over the associated costs.
Hospital-Based Services
Our HBS Division provides hospital clients with medically-equipped helicopters and airplanes which are generally based at hospitals. Our responsibility is to operate and maintain the aircraft in accordance with Federal Aviation Regulations (FAR) Part 135 standards. Hospital clients provide medical personnel and all medical care on board the aircraft. The division operates 191 helicopters and twelve fixed wing aircraft in 32 states. Under the typical operating agreement with a hospital, we earn approximately 68% of our revenue from a fixed monthly fee and 32% from an hourly flight fee from the hospital. These fees are earned regardless of when, or if, the hospital is reimbursed for these services by its patients, their insurers, or the federal government. Both monthly and hourly fees are generally subject to annual increases based on changes in the consumer price index, hull and liability insurance premiums, or spare parts prices from aircraft manufacturers. Because the majority of the division's flight revenue is generated from fixed monthly fees, seasonal fluctuations in flight hours do not significantly impact monthly revenue in total.
Seven customers added satellite locations during 2008. Eighteen hospital contracts were due for renewal in 2008, ten of which were renewed for terms ranging from two to five years. Three other contracts were allowed to expire during 2008. Negotiations on the five remaining contracts were still in process at the end of 2008 and are expected to be concluded in the first quarter of 2009. We negotiated early termination of two of our hospital contracts, one effective in the third quarter of 2008 and one expected to be effective in the first quarter of 2009. In the fourth quarter of 2008, we reached an agreement to begin operations with two helicopters in Alaska effective in the first quarter of 2009.
We operate some of our HBS contracts under the service mark AIR LIFE®, which is generally associated within the industry with our standard of service.
Competition for the HBS Division comes primarily from four national operators: OmniFlight, Inc.; PHI, Inc.; Metro Aviation, Inc.; and Med-Trans, Inc. Operators generally compete on the basis of price, safety record, accident prevention and training, and the medical capability of the aircraft. Price is a significant element of competition because of the continued pressure on many healthcare organizations to contain costs to their consumers. We believe that our competitive strengths center on the quality of our training, maintenance, and customer service and on the medical capability of the aircraft we deploy.
Aviation Support Services
Our aviation support services group is a full-service maintenance provider, performing airframe inspection, modification, repair and refurbishment; engine repair; component and hydraulic systems repair and overhaul; and non-destructive component testing at our headquarters in metropolitan Denver, Colorado, and at the former CJ headquarters in Pittsburgh, Pennsylvania, for both CBS and HBS divisions. We are a Fleet Operator Facility for American Eurocopter Corporation (AEC), a Customer Service Facility for Bell Helicopter, Inc. (Bell) and several avionics manufacturers, and a Federal Aviation Administration (FAA) Certified Repair Station authorized to perform airframe, avionics, and engine repairs. In-house repair, maintenance, and testing capabilities provide cost savings and decrease aircraft down time by avoiding the expense and delay of having this work performed by nonaffiliated vendors. The aviation support services group also provides aircraft procurement; spare parts, fuel, and medical supplies procurement; inventory; and aircraft recordkeeping services for our flight operations and maintains the Approved Aircraft Inspection Program (AAIP) for the Part 135 operations certificate.
Products Division
Our Products Division designs, manufactures, and certifies modular medical interiors, multi-mission interiors, and other aerospace and medical transport products. These interiors and other products range from basic life support to intensive care suites to advanced search and rescue systems. With a full range of engineering, manufacturing and certification capabilities, the division has also designed and integrated aircraft communication, navigation, environmental control, structural, and electrical systems. Manufacturing capabilities include avionics, electrical, composites, machining, welding, sheet metal, and upholstery. The division also offers quality assurance and certification services pursuant to its FAA Organization Designation (ODA) authorization, Parts Manufacturer Approvals (PMA's), and ISO9001:2000 (Quality Systems) certification.
We maintain patents covering several products. These include the Litter Lift System used in the U.S. Army’s HH-60L helicopter and Medical Evacuation Vehicle (MEV), and the Articulating Patient Loading System and Modular Equipment Frame developed as part of the modular interior concept. Raw materials and components used in the manufacture of interiors and other products are widely available from several different vendors.
As of December 31, 2008, forty-eight HH60L units, 366 MEV units, and three commercial medical interiors were in process. We also have two design contracts with the U.S. Army: one for an upgraded HH-60M multi-mission interior and one for an interim medical system. Deliveries under all contracts in process as of December 31, 2008, are expected to be completed by the third quarter of 2010, and remaining revenue is estimated at $30.2 million.
The U.S. Army Multi-Year VII production contract plans for 76 HH-60M Multi-Mission Medevac units plus options for 23 additional units to be delivered by 2012, including the 48 units which we currently have under contract. The units planned under this contract are in addition to the 39 units we have already completed. There is no assurance that orders for additional units will be received in future periods.
Our competition in the aircraft interior design and manufacturing industry comes primarily from three companies based in the United States and three in Europe. Competition is based mainly on product availability, price, and product features, such as configuration and weight. With our established line of interiors for Bell and Eurocopter aircraft, we believe that we have demonstrated the ability to compete on the basis of each of these factors.
Employees
As of December 31, 2008, we had 2,647 full time and 329 part time employees, comprised of 1,006 pilots; 561 aviation machinists, airframe and power plant (A&P) engineers, and other manufacturing/maintenance positions; 746 flight nurses and paramedics; and 663 business and administrative personnel. Our pilots are IFR-rated where required by contract, and all have completed an extensive ground school and flight training program at the commencement of their employment with us, as well as local area orientation and annual training provided by us. All of our aircraft mechanics must possess FAA A&P licenses. All flight nurses and paramedics hold the appropriate state and county licenses, as well as Cardiopulmonary Resuscitation, Advanced Cardiac Life Support, and/or Pediatric Advanced Life Support certifications.
In September 2003, our pilots voted to be represented by a collective bargaining unit, and we signed a collective bargaining agreement (CBA) on March 31, 2006. The agreement is effective January 1, 2006, through April 30, 2009. Negotiations on a new CBA commenced in the fourth quarter of 2008. Other employee groups may also elect to be represented by unions in the future.
Government Regulation
We are subject to the Federal Aviation Act of 1958, as amended. All of our flight and maintenance operations are regulated and actively supervised by the U.S. Department of Transportation through the FAA. Medical interiors and other aerospace products developed by us are subject to FAA certification. Air Methods holds a Part 135 Air Carrier Certificate and a Part 145 Repair Station Certificate, which covers one master and two satellite locations, from the FAA. A Part 135 certificate requires that the voting interests of the holder of the certificate cannot be more than 25% owned by foreign persons. As of December 31, 2008, we are not aware of any foreign person who holds more than 5% of outstanding Common Stock.
The significant number of accidents experienced by the air medical services industry in 2008 has led to increased scrutiny by regulatory and legislative bodies. The National Transportation Safety Board conducted hearings regarding industry safety in February 2009, and legislative hearings may be scheduled later in the year. The FAA has proposed changes to the operations specifications for Part 135 Air Carriers which we expect to become effective during the first quarter of 2009. The proposals consist of increases to the weather minima for VFR in uncontrolled airspace operations and changes to pre-flight procedures to require more thorough route evaluation. We do not expect the changes to weather minima to have a significant impact on our operations because we have already been operating according to higher weather minima than currently required. The proposed changes to pre-flight requirements, if adopted, may increase our lift-off times in certain situations. Future legislation or regulatory changes resulting from the hearings may mandate further changes to flight and duty time, minimum equipment requirements, weather minima, or other standards which may increase the cost of our operations.
We are also subject to laws, regulations, and standards relating to corporate governance and public disclosure, including the Sarbanes-Oxley Act of 2002, Securities and Exchange Commission (SEC) regulations, and NASDAQ Market rules.
Available Information
Our internet site is www.airmethods.com. We make available free of charge, on or through the website, all annual, quarterly, and current reports, as well as any amendments to these reports, as soon as reasonably practicable after electronically filing these reports with the Securities and Exchange Commission. This reference to the website does not incorporate by reference the information contained in the website and such information should not be considered a part of this report.
Our actual operating results may differ materially from those described in forward-looking statements as a result of various factors, including but not limited to, those discussed in “Outlook for 2009” and those described below.
| · | Flight volume – Almost all CBS revenue and approximately 32% of HBS revenue is dependent upon flight volume. Approximately 23% of our costs primarily associated with flight operations incurred during the year ended December 31, 2008, also varied with the number of hours flown. Poor visibility, high winds, and heavy precipitation can affect the safe operation of aircraft and therefore result in a reduced number of flight hours due to the inability to fly during these conditions. Prolonged periods of adverse weather conditions could have an adverse impact on our operating results. Typically, the months from November through February tend to have lower flight volume due to weather conditions and other factors, resulting in lower CBS operating revenue during these months. Flight volume for CBS operations can also be affected by the distribution of calls among competitors by local government agencies and the entrance of new competitors into a market. The past several years have seen significant increases in the number of community-based units operated within the industry, which may create overcapacity in certain markets. Transport volume may also be unfavorably impacted by an overall slow-down in economic activity; a decrease in road traffic volume because of unusually high spikes in fuel prices or other factors; cost of the service; loss of confidence in certain markets because of recent, high-profile accidents within the air medical industry; or questions regarding the medical necessity for certain transports. |
| · | Collection rates – We respond to calls for air medical transport without pre-screening the creditworthiness of the patient. The CBS Division invoices patients and their insurers directly for services rendered and recognizes revenue net of provisions for contractual discounts and estimated uncompensated care. Both provisions are estimated during the period the related services are performed based on historical collection experience and any known trends or changes in reimbursement rate schedules and payer mix. The provisions are adjusted as required based on actual collections in subsequent periods. Net reimbursement per transport for CBS operations is primarily a function of price, payer mix, and timely and effective collection efforts. Both the pace of collections and the ultimate collection rate are affected by the overall health of the U.S. economy and the unemployment rate, which impact the number of indigent patients and funding for state-run programs, such as Medicaid. Medicaid reimbursement rates in many jurisdictions have remained well below the cost of providing air medical transportation. In addition, the collection rate is impacted by changes in the cost of healthcare and health insurance, as well as economic pressures on employers. As the cost of healthcare increases and businesses explore ways to contain or reduce operating costs, health insurance coverage provided by employers may be reduced or eliminated entirely, resulting in an increase in the uninsured population. A shift of 1% of our payer mix from insured accounts to either Medicaid or uninsured accounts would result in a decrease of $4.3 million to $5.0 million in operating results. Our ability to collect price increases in our standard charge structure has generally been limited to accounts covered by insurance providers. Although we have not yet experienced significant increased limitations in the amount reimbursed by insurance companies, continued price increases may cause insurance companies to limit coverage for air medical transport to amounts less than our standard rates. There is no assurance that we will be able to maintain historical collection rates after the implementation of price increases for CBS transports. |
| · | Current banking environment – We currently finance the majority of our aircraft fleet and are party to a $100 million senior credit facility. Recently several financial institutions have experienced liquidity problems and/or have been acquired by other financial institutions. Financial institutions may become unable or unwilling to fund our aircraft financing needs or to fund our borrowing requests under the senior credit facility. |
| · | Dependence on third party suppliers – We currently obtain a substantial portion of our helicopter spare parts and components from AEC and Bell and maintain supply arrangements with other parties for our engine and related dynamic components. As of December 31, 2008, AEC aircraft comprise 76% of our helicopter fleet while Bell aircraft constitute 20%. Most of the new helicopters scheduled for delivery in 2009 are AEC aircraft. Increases in the price of new aircraft have tended to outpace overall inflationary trends. In addition, increases in spare parts prices tend to be higher for aircraft which are no longer in production. Increases in our monthly and hourly flight fees billed to our HBS customers in certain cases are limited to changes in the consumer price index. As a result, an unusually high increase in the price of parts may not be fully passed on to our HBS customers. The ability to pass on price increases for CBS operations may be limited by reimbursement rates established by Medicare, Medicaid, and insurance providers and by other market considerations. Based upon the manufacturing capabilities and industry contacts of AEC, Bell, and other suppliers, we believe we will not be subject to material interruptions or delays in obtaining aircraft parts and components but do not have an alternative source of supply for AEC, Bell, and certain other aircraft parts. Failure or significant delay by these vendors in providing necessary parts could, in the absence of alternative sources of supply, have a material adverse effect on us. |
| · | Disposition of aircraft – We are dependent upon the secondary used aircraft market to dispose of older models of aircraft as part of our ongoing fleet rejuvenation efforts. In recent months, the demand for used aircraft has diminished. If we are unable to dispose of our older aircraft, our aircraft carrying costs may increase above requirements for our current operations, or we may accept lower selling prices, resulting in losses on disposition or reduced gains. The types of aircraft targeted for disposition as part of our fleet rejuvenation usually have lower carrying costs than new aircraft. We have also been able to utilize some aircraft for spare parts to support the operation of our existing fleet, rather than seeking to sell the aircraft to a third party. |
| · | Employee unionization - In September 2003, our pilots voted to be represented by a collective bargaining unit, and we signed a CBA on March 31, 2006. The agreement is effective January 1, 2006, through April 30, 2009. Negotiations on a new CBA commenced in the fourth quarter of 2008. The CBA establishes procedures for training, addressing grievances, discipline and discharge, among other matters, and defines vacation, holiday, sick, health insurance, and other employee benefits. The CBA also establishes wage scales, including adjustments for geographic locations, covering each year of the agreement. There can be no assurance that the CBA will be renewed prior to expiration, and if the CBA is renewed, there can be no assurance that the renewal terms will resemble the terms of the current CBA. Union personnel have also actively attempted to organize other employee groups in the past and these groups may elect to be represented by unions in the future. |
| · | Employee recruitment and retention - An important aspect of our operations is the ability to hire and retain employees who have advanced aviation, nursing, and other technical skills. In addition, hospital contracts typically contain minimum certification requirements for pilots and mechanics. Employees who meet these standards are in great demand and are likely to remain a limited resource in the foreseeable future. If we are unable to recruit and retain a sufficient number of these employees, the ability to maintain and grow the business could be negatively impacted. A limited supply of qualified applicants may also contribute to wage increases which outpace the rate of inflation. |
| · | Competition – Our HBS division faces significant competition from several national and regional air medical transportation providers for contracts with hospitals and other healthcare institutions. In addition to the national and regional providers, our CBS division also faces competition from smaller regional carriers and alternative air ambulance providers such as sheriff departments. Operators generally compete on the basis of price, safety record, accident prevention and training, and the medical capability of the aircraft. There can be no assurance that we will be able to continue to compete successfully for new or renewing contracts in the future. |
| · | Fuel costs – Fuel accounted for 4.0% of total operating expenses for the year ended December 31, 2008. Both the cost and availability of fuel are influenced by many economic and political factors and events occurring in oil-producing countries throughout the world, and fuel costs fluctuate widely. The price per barrel of oil has fluctuated significantly over the past several years. We cannot predict the future cost and availability of fuel or the impact of disruptions in oil supplies or refinery production from natural disasters. The unavailability of adequate fuel supplies or higher fuel prices could have an adverse effect on our cost of operations and profitability. Generally, our HBS customers pay for all fuel consumed in medical flights. However, our ability to pass on increased fuel costs for CBS operations may be limited by economic and competitive conditions and by reimbursement rates established by Medicare, Medicaid, and insurance providers. In the fourth quarter of 2008, we entered into a fuel derivative agreement for the majority of our projected fuel consumption for the year ending December 31, 2009, to protect us against increases in the cost of Gulf Coast jet fuel above $2.35 per gallon for wholesale purchases. As of December 31, 2008, the Gulf Coast jet fuel spot price was approximately $0.24 per gallon lower than it was at the date of our agreement. |
| · | Aviation industry hazards and insurance limitations – Hazards are inherent in the aviation industry and may result in loss of life and property, thereby exposing us to potentially substantial liability claims arising from the operation of aircraft. We may also be sued in connection with medical malpractice claims arising from events occurring during medical flights. Under HBS operating agreements, our customers have agreed to indemnify us against liability arising from medical malpractice claims and to maintain insurance covering such liability, but there can be no assurance that a hospital will not challenge the indemnification rights or will have sufficient assets or insurance coverage for full indemnity. In CBS operations, our personnel perform medical procedures on transported patients, which may expose us to significant direct legal exposure to medical malpractice claims. We maintain general liability aviation insurance, aviation product liability coverage, and medical malpractice insurance, and believe our level of coverage is customary in the industry and adequate to protect against claims. However, there can be no assurance that it will be sufficient to cover potential claims or that present levels of coverage will be available in the future at reasonable cost. A limited number of hull and liability insurance underwriters provide coverage for air medical operators. Insurance underwriters are required by various federal and state regulations to maintain minimum levels of reserves for known and expected claims. However, there can be no assurance that underwriters have established adequate reserves to fund existing and future claims. The number of air medical accidents in 2008 and the impact of general economic conditions on underwriters may result in increases in premiums above the rate of inflation. Approximately 50% of any increases in hull and liability insurance may be passed through to our HBS customers according to contract terms. In addition, loss of any aircraft as a result of accidents could cause adverse publicity and interruption of services to client hospitals, which could adversely affect our operating results and relationship with such hospitals. In the year ended December 31, 2008, we recorded an increase in expense of $670,000 for the self-insured portion of workers compensation premiums as a result of two fatal accidents experienced during the second quarter of 2008. |
| · | Restrictive debt covenants – Our senior credit facility contains restrictive financial and operating covenants, including restrictions on our ability to incur additional indebtedness and to engage in various corporate transactions such as mergers, acquisitions, asset sales and the payment of cash dividends. These covenants may restrict future growth through the limitation on acquisitions and may adversely impact our ability to implement our business plan. Failure to comply with the covenants defined in the agreement or to maintain the required financial ratios could result in an event of default and accelerate payment of the principal balances due under the senior credit facility. Given factors beyond our control, such as interruptions in operations from unusual weather patterns or decreases in flight volume due to overall economic conditions not included in current projections, there can be no assurance that we will be able to remain in compliance with financial covenants in the future, or that, in the event of non-compliance, we will be able to obtain waivers from the lenders, or that to obtain such waivers, we will not be required to pay lenders significant cash or equity compensation. |
| · | Governmental regulation – The air medical transportation services and products industry is subject to extensive regulation by governmental agencies, including the FAA, which impose significant compliance costs on us. In addition, reimbursement rates for air ambulance services established by governmental programs such as Medicare directly affect CBS revenue and indirectly affect HBS revenue from customers. Changes in laws or regulations or in reimbursement rates could have a material adverse impact on our cost of operations or revenue from flight operations. Periodically the FAA issues airworthiness directives covering one or more models of aircraft. Although we believe that our aircraft are currently in compliance with all FAA-issued airworthiness directives, additional airworthiness directives likely will be issued in the future and may result in additional operating costs or make a particular model of aircraft uneconomical to operate. The significant number of accidents experienced by the air medical services industry in 2008 has led to increased scrutiny by regulatory and legislative bodies. The National Transportation Safety Board conducted hearings regarding industry safety in February 2009, and legislative hearings may be scheduled later in the year. The FAA has proposed changes to the operations specifications for Part 135 Air Carriers which we expect to become effective during the first quarter of 2009. The proposals consist of increases to the weather minima for VFR in uncontrolled airspace operations and changes to pre-flight procedures to require more thorough route evaluation. We do not expect the changes to weather minima to have a significant impact on our operations because we have already been operating according to higher weather minima than currently required. The proposed changes to pre-flight requirements, if adopted, may increase our lift-off times in certain situations. Future legislation or regulatory changes resulting from the hearings may mandate further changes to flight and duty time, minimum equipment requirements, weather minima, or other standards which may increase the cost of our operations. |
| · | Internal controls – We are required by Section 404 of the Sarbanes-Oxley Act of 2002 to include management and auditor reports on internal controls as part of our annual report. Management concluded that internal control over financial reporting was effective at December 31, 2008, and our independent auditors attested to that conclusion. There can be no assurance that material weaknesses in internal controls over financial reporting will not be discovered in the future or that we and our independent auditors will be able to conclude that internal control over financial reporting is effective in the future. Although it is unclear what impact failure to comply fully with Section 404 or the discovery of a material weakness in internal controls over financial reporting would have on us, it may subject us to regulatory scrutiny and result in additional expenditures to meet the requirements, a reduced ability to obtain financing, or a loss of investor confidence in the accuracy of our financial reports. |
| · | Debt and lease obligations – We are obligated under debt facilities providing for up to approximately $151.7 million of indebtedness, of which approximately $107.9 million was outstanding (net of $13.1 million of cash) at December 31, 2008, and operating lease obligations which total $421.9 million over the remaining terms of the leases. If we fail to meet our payment obligations or otherwise default under the agreements governing indebtedness or lease obligations, the lenders under those agreements will have the right to accelerate the indebtedness and exercise other rights and remedies against us. These rights and remedies include the rights to repossess and foreclose upon the assets that serve as collateral, initiate judicial foreclosure against us, petition a court to appoint a receiver for us, and initiate involuntary bankruptcy proceedings against us. If lenders exercise their rights and remedies, our assets may not be sufficient to repay outstanding indebtedness and lease obligations, and there may be no assets remaining after payment of indebtedness and lease obligations to provide a return on common stock. |
| · | Foreign ownership – Federal law requires that United States air carriers be citizens of the United States. For a corporation to qualify as a United States citizen, the president and at least two-thirds of the directors and other managing officers of the corporation must be United States citizens and at least 75% of the voting interest of the corporation must be owned or controlled by United States citizens. If we are unable to satisfy these requirements, operating authority from the Department of Transportation may be revoked. As of December 31, 2008, we are not aware of any foreign person who holds more than 5% of outstanding Common Stock. Because we are unable to control the transfer of our stock, we are unable to assure that we can remain in compliance with these requirements in the future. |
| UNRESOLVED STAFF COMMENTS |
None.
Facilities
Our headquarters consists of approximately 113,000 square feet of office and hangar space in metropolitan Denver, Colorado, at Centennial Airport. In October 2008, we purchased the buildings, subject to an existing ground lease with the airport authority which expires in October 2044, for $7,410,000. The purchase was financed primarily by a 10-year mortgage with interest at 4.92%, monthly principal and interest payments, and a balloon payment of $2,950,000 in 2018. We also own and lease various properties for depot level maintenance, warehouse, and administration purposes. We believe that these facilities are in good condition and suitable for our present requirements.
Equipment and Parts
As of December 31, 2008, our aircraft fleet consisted of 72 Company-owned aircraft, 208 aircraft leased under operating leases, and 58 aircraft owned by HBS customers, as follows:
| Type | | CBS Division | | | HBS Division | | | Total | |
| | | | | | | | | | |
| Single-Engine Helicopters: | | | | | | | | | |
| Bell 206 | | | -- | | | | 3 | | | | 3 | |
| Bell 407 | | | -- | | | | 23 | | | | 23 | |
| Eurocopter AS 350 | | | 49 | | | | 26 | | | | 75 | |
| Eurocopter EC 130 | | | 6 | | | | 4 | | | | 10 | |
| Agusta 119 | | | -- | | | | 1 | | | | 1 | |
| Total Single-Engine | | | 55 | | | | 57 | | | | 112 | |
| | | | | | | | | | | | | |
| Twin-Engine Helicopters: | | | | | | | | | | | | |
| Bell 222 | | | 15 | | | | 8 | | | | 23 | |
| Bell 230 | | | -- | | | | 1 | | | | 1 | |
| Bell 412 | | | 3 | | | | 1 | | | | 4 | |
| Bell 430 | | | -- | | | | 12 | | | | 12 | |
| Eurocopter AS 365 | | | -- | | | | 7 | | | | 7 | |
| Eurocopter BK 117 | | | 30 | | | | 35 | | | | 65 | |
| Eurocopter BO 105 | | | 2 | | | | -- | | | | 2 | |
| Eurocopter EC 135 | | | 26 | | | | 47 | | | | 73 | |
| Eurocopter EC 145 | | | -- | | | | 13 | | | | 13 | |
| Boeing MD 902 | | | -- | | | | 1 | | | | 1 | |
| Agusta 109 | | | -- | | | | 9 | | | | 9 | |
| Total Twin-Engine | | | 76 | | | | 134 | | | | 210 | |
| Total Helicopters | | | 131 | | | | 191 | | | | 322 | |
| | | | | | | | | | | | | |
| Airplanes: | | | | | | | | | | | | |
| King Air E 90 | | | -- | | | | 3 | | | | 3 | |
| King Air B 100 | | | 2 | | | | 1 | | | | 3 | |
| King Air B 200 | | | 2 | | | | 3 | | | | 5 | |
| Pilatus PC 12 | | | -- | | | | 5 | | | | 5 | |
| Total Airplanes | | | 4 | | | | 12 | | | | 16 | |
| | | | | | | | | | | | | |
| TOTALS | | | 135 | | | | 203 | | | | 338 | |
We generally pay all insurance, taxes, and maintenance expense for each aircraft in our fleet. Because helicopters are insured at replacement cost which usually exceeds book value, we believe that helicopter accidents covered by hull and liability insurance will generally result in full reimbursement of any damages sustained. In the ordinary course of business, we may from time to time purchase and sell helicopters in order to best meet the specific needs of our operations.
We have experienced no significant difficulties in obtaining required parts for our helicopters. Repair and replacement components are purchased primarily through AEC and Bell, since AEC and Bell aircraft make up the majority of our fleet. Based upon the manufacturing capabilities and industry contacts of AEC and Bell, we believe we will not be subject to material interruptions or delays in obtaining aircraft parts and components. Any termination of production by AEC or Bell would require us to obtain spare parts from other suppliers, which are not currently in place.
None.
| SUBMISSION OF MATTERS TO A VOTE OF SECURITY HOLDERS |
No matters were submitted to a vote of security holders during the quarter ended December 31, 2008.
PART II
| MARKET FOR REGISTRANT'S COMMON EQUITY, RELATED STOCKHOLDER MATTERS, AND ISSUER PURCHASES OF EQUITY SECURITIES |
Our common stock is traded on the NASDAQ Global Select Market® under the trading symbol "AIRM." The following table shows, for the periods indicated, the high and low closing prices for our common stock. The quotations for the common stock represent prices between dealers and do not reflect adjustments for retail mark-ups, mark-downs or commissions, and may not represent actual transactions.
| Year Ended December 31, 2008 |
| | | | | | | |
| Common Stock | | High | | | Low | |
| | | | | | | |
| First Quarter | | $ | 49.44 | | | $ | 38.51 | |
| Second Quarter | | | 51.02 | | | | 25.00 | |
| Third Quarter | | | 33.90 | | | | 22.68 | |
| Fourth Quarter | | | 28.62 | | | | 14.64 | |
| Year Ended December 31, 2007 |
| | | | | | | |
| Common Stock | | High | | | Low | |
| | | | | | | |
| First Quarter | | $ | 29.11 | | | $ | 22.62 | |
| Second Quarter | | | 37.58 | | | | 24.64 | |
| Third Quarter | | | 48.68 | | | | 36.89 | |
| Fourth Quarter | | | 57.47 | | | | 44.82 | |
As of February 27, 2009, there were approximately 216 holders of record of our common stock. We estimate that we have approximately 3,600 beneficial owners of common stock.
We have not paid any cash dividends since inception and intend to retain any future earnings to finance the growth of our business rather than to pay dividends. In addition, our senior credit facility contains a covenant which restricts the payment of dividends.
During the year ended December 31, 2008, we purchased 227,917 shares of our common stock as follows:
| Period | | Total Number of Shares Purchased | | | Average Price Paid per Share | | | Total Number of Shares Purchased as Part of Publicly Announced Plans or Programs | | | Maximum Number of Shares that May Yet Be Purchased Under the Plan or Program | |
| August 29, 2008 | | | 23,500 | | | | $29.23 | | | | 23,500 | | | | 2,476,500 | |
| September 2 - 4, 2008 | | | 76,500 | | | | $29.00 | | | | 76,500 | | | | 2,400,000 | |
| November 26 - 28, 2008 | | | 49,791 | | | | $14.87 | | | | 49,791 | | | | 2,350,209 | |
| December 1 - 18, 2008 | | | 78,126 | | | | $15.45 | | | | 78,126 | | | | 2,272,083 | |
On August 7, 2008, our Board of Directors approved the repurchase of up to $10 million or 2,500,000 shares of our common stock. We publicly announced the plan on the same date. The plan as approved by the Board does not have an expiration date; however, purchases made subsequent to 2008 may be subject to restrictions by the terms of our senior credit facility.
Stock Performance Graph
The following graph compares our cumulative total stockholder return for the period from December 31, 2003 through December 31, 2008, against the Standard & Poor’s 500 Index (S&P 500) and “peer group” companies in industries similar to those of the Company. The S&P 500 is a widely used composite index reflecting the returns of five hundred publicly traded companies in a variety of industries. The Peer Group consists of all publicly traded companies in SIC Group 4522: “Non-scheduled Air Transport,” including Avantair, Inc.; Bristow Group, Inc.; Home Energy Savings Corp.; and PHI, Inc. We believe that this Peer Group is our most appropriate peer group for stock comparison purposes due to the limited number of publicly traded companies engaged in air or ground medical transport and because this Peer Group contains a number of companies with capital costs and operating constraints similar to ours. The graph shows the value at the end of each of the last five fiscal years of $100 invested in our common stock or the indices on December 31, 2003, and assumes reinvestment of dividends. Historical stock price performance is not necessarily indicative of future stock price performance.
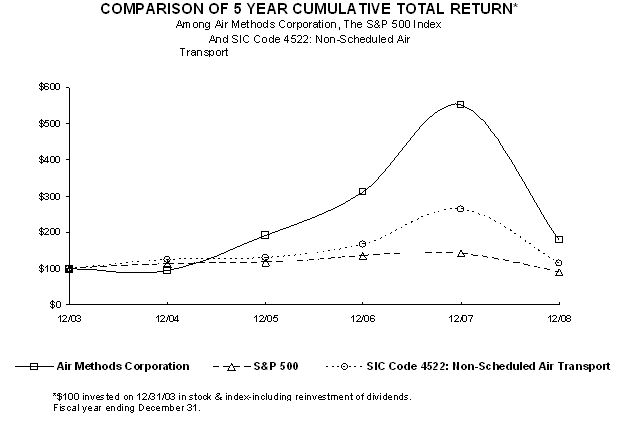
INDEXED RETURNS
| | | Base Period | | | Years Ending | |
| | | Dec-03 | | | Dec-04 | | | Dec-05 | | | Dec-06 | | | Dec-07 | | | Dec-08 | |
| AIR METHODS CORPORATION | | | 100.00 | | | | 95.77 | | | | 192.65 | | | | 310.91 | | | | 553.12 | | | | 178.06 | |
| S & P 500 | | | 100.00 | | | | 110.88 | | | | 116.33 | | | | 134.70 | | | | 142.10 | | | | 89.53 | |
| PEER GROUP | | | 100.00 | | | | 124.91 | | | | 129.29 | | | | 167.47 | | | | 264.36 | | | | 113.81 | |
The following tables present selected consolidated financial information of the Company and our subsidiaries which has been derived from our audited consolidated financial statements. This selected financial data should be read in conjunction with our consolidated financial statements and notes thereto appearing in Item 8 of this report. Revenue, expenses, and total assets as of and for the years ended December 31, 2008 and 2007, increased in part as a result of the acquisition of CJ in October 2007. See “Business – General” in Item 1 of this report.
SELECTED FINANCIAL DATA OF THE COMPANY
(Amounts in thousands except share and per share amounts)
| | | Year Ended December 31, | |
| | | 2008 | | | 2007 | | | 2006 | | | 2005 | | | 2004 | |
| Statement of Operations Data: | | | | | | | | | | | | | | | |
| Revenue | | $ | 498,802 | | | | 396,349 | | | | 319,504 | | | | 276,178 | | | | 230,211 | |
| | | | | | | | | | | | | | | | | | | | | |
| Operating expenses | | | (398,590 | ) | | | (293,424 | ) | | | (244,227 | ) | | | (211,072 | ) | | | (184,458 | ) |
| General and administrative expenses | | | (67,480 | ) | | | (53,298 | ) | | | (40,710 | ) | | | (36,971 | ) | | | (33,691 | ) |
| Other expense, net | | | (2,254 | ) | | | (4,179 | ) | | | (4,223 | ) | | | (8,110 | ) | | | (6,698 | ) |
| Income before income taxes | | $ | 30,478 | | | $ | 45,448 | | | $ | 30,344 | | | $ | 20,025 | | | $ | 5,364 | |
| Income tax expense | | | (11,209 | ) | | | (17,911 | ) | | | (13,144 | ) | | | (8,193 | ) | | | (2,121 | ) |
| | | | | | | | | | | | | | | | | | | | | |
| Income before cumulative effect of change in accounting principle | | $ | 19,269 | | | $ | 27,537 | | | $ | 17,200 | | | $ | 11,832 | | | $ | 3,243 | |
| Cumulative effect of change in method of accounting for maintenance costs, net of income taxes | | | - | | | | - | | | | - | | | | - | | | | 8,595 | |
| | | | | | | | | | | | | | | | | | | | | |
| Net income | | $ | 19,269 | | | | 27,537 | | | | 17,200 | | | | 11,832 | | | | 11,838 | |
| | | | | | | | | | | | | | | | | | | | | |
| Basic income per common share: | | | | | | | | | | | | | | | | | | | | |
| Income before cumulative effect of change in accounting principle | | $ | 1.59 | | | $ | 2.30 | | | $ | 1.46 | | | $ | 1.07 | | | $ | .30 | |
| Cumulative effect of change in method of accounting for maintenance costs, net of income taxes | | $ | - | | | $ | - | | | $ | - | | | $ | - | | | $ | .79 | |
| Net income | | $ | 1.59 | | | | 2.30 | | | | 1.46 | | | | 1.07 | | | | 1.09 | |
| | | | | | | | | | | | | | | | | | | | | |
| Diluted income per common share: | | | | | | | | | | | | | | | | | | | | |
| Income before cumulative effect of change in accounting principle | | $ | 1.54 | | | $ | 2.20 | | | $ | 1.40 | | | $ | 1.02 | | | $ | .29 | |
| Cumulative effect of change in method of accounting for maintenance costs, net of income taxes | | | - | | | $ | - | | | $ | - | | | $ | - | | | $ | .76 | |
| Net income | | $ | 1.54 | | | | 2.20 | | | | 1.40 | | | | 1.02 | | | | 1.05 | |
| | | | | | | | | | | | | | | | | | | | | |
| Weighted average number of shares of Common Stock outstanding - basic | | | 12,155,144 | | | | 11,953,871 | | | | 11,748,107 | | | | 11,058,971 | | | | 10,894,863 | |
| | | | | | | | | | | | | | | | | | | | | |
| Weighted average number of shares of Common Stock outstanding - diluted | | | 12,530,381 | | | | 12,512,077 | | | | 12,306,047 | | | | 11,654,885 | | | | 11,314,827 | |
SELECTED FINANCIAL DATA OF THE COMPANY
(Amounts in thousands)
| | | As of December 31, | |
| | | 2008 | | | 2007 | | | 2006 | | | 2005 | | | 2004 | |
| Balance Sheet Data: | | | | | | | | | | | | | | | |
| Total assets | | $ | 394,924 | | | | 369,552 | | | | 250,157 | | | | 221,532 | | | | 204,723 | |
| Long-term liabilities | | | 142,674 | | | | 125,433 | | | | 95,014 | | | | 89,649 | | | | 89,490 | |
| Stockholders' equity | | | 160,464 | | | | 142,020 | | | | 107,314 | | | | 86,211 | | | | 73,079 | |
SELECTED OPERATING DATA
| | | 2008 | | | 2007 | | | 2006 | | | 2005 | | | 2004 | |
| For year ended December 31: | | | | | | | | | | | | | | | |
| CBS patient transports | | | 42,394 | | | | 39,256 | (1) | | | 34,116 | | | | 31,841 | | | | 30,159 | |
| HBS medical missions | | | 63,577 | | | | 59,658 | (1) | | | 50,670 | | | | 49,644 | | | | 46,630 | |
| As of December 31: | | | | | | | | | | | | | | | | | | | | |
| CBS bases | | | 100 | | | | 106 | | | | 76 | | | | 69 | | | | 64 | |
| HBS bases | | | 145 | | | | 157 | | | | 90 | | | | 87 | | | | 86 | |
(1) Includes transports and missions for CJ locations from October 1, 2007 through December 31, 2007, only.
| MANAGEMENT'S DISCUSSION AND ANALYSIS OF FINANCIAL CONDITION AND RESULTS OF OPERATIONS |
The following discussion of the results of operations and financial condition should be read in conjunction with our consolidated financial statements and notes thereto included in Item 8 of this report. This report, including the information incorporated by reference, contains forward-looking statements as defined in the Private Securities Litigation Reform Act of 1995. The use of any of the words “believe,” “expect,” “anticipate,” “plan,” “estimate,” and similar expressions are intended to identify such statements. Forward-looking statements include statements concerning our possible or assumed future results; flight volume and collection rates for CBS operations; size, structure and growth of our air medical services and products markets; continuation and/or renewal of HBS contracts; acquisition of new and profitable Products Division contracts; and other matters. The actual results that we achieve may differ materially from those discussed in such forward-looking statements due to the risks and uncertainties described in the Risk Factors section of this report, in Management’s Discussion and Analysis of Financial Condition and Results of Operations, and in other sections of this report, as well as in our quarterly reports on Form 10-Q. We undertake no obligation to update any forward-looking statements.
Overview
We provide air medical transportation services throughout the United States and design, manufacture, and install medical aircraft interiors and other aerospace and medical transport products. Our divisions, or business segments, are organized according to the type of service or product provided and consist of the following:
| · | Community-Based Services (CBS) - provides air medical transportation services to the general population as an independent service. Revenue consists of flight fees billed directly to patients, their insurers, or governmental agencies, and cash flow is dependent upon collection from these individuals or entities. In 2008 the CBS Division generated 59% of our total revenue, compared to 64% in 2007 and 65% in 2006 . |
| · | Hospital-Based Services (HBS) - provides air medical transportation services to hospitals throughout the U.S. under exclusive operating agreements. Revenue consists primarily of fixed monthly fees (approximately 68% of total contract revenue) and hourly flight fees (approximately 32% of total contract revenue) billed to hospital customers. In 2008 the HBS Division generated 38% of our total revenue, compared to 33% in 2007 and 34% in 2006 . |
| · | Products Division - designs, manufactures, and installs aircraft medical interiors and other aerospace and medical transport products for domestic and international customers. In 2008 the Products Division generated 3% of our total revenue, compared to 3% in 2007 and 1% in 2006 . |
See Note 13 to the consolidated financial statements included in Item 8 of this report for operating results by segment.
We believe that the following factors have the greatest impact on our results of operations and financial condition:
| · | Flight volume. Fluctuations in flight volume have a greater impact on CBS operations than HBS operations because almost all of CBS revenue is derived from flight fees, as compared to approximately 32% of HBS revenue. By contrast, 77% of our costs primarily associated with flight operations (including salaries, aircraft ownership costs, hull insurance, and general and administrative expenses) incurred during the year ended December 31, 2008, are mainly fixed in nature. While flight volume is affected by many factors, including competition and the effectiveness of marketing and business development initiatives, the greatest single variable has historically been weather conditions. Adverse weather conditions—such as fog, high winds, or heavy precipitation—hamper our ability to operate our aircraft safely and, therefore, result in reduced flight volume. Total patient transports for CBS operations were approximately 42,400 for 2008 compared to approximately 39,300 for 2007. Patient transports for CBS bases open longer than one year (Same-Base Transports) were approximately 33,800 in 2008 compared to 37,400 in 2007. Cancellations due to unfavorable weather conditions for CBS bases open longer than one year were 1,123, or 11.6%, higher in 2008 compared to 2007. We believe that Same-Base Transports in 2008 were also negatively affected by a third-quarter spike in fuel prices which decreased road traffic volume, overall weakening economic conditions in the United States, and lost flights due to redeployment of numerous aircraft and crews to respond to Hurricanes Gustav and Ike. |
| · | Reimbursement per transport. We respond to calls for air medical transports without pre-screening the creditworthiness of the patient and are subject to collection risk on services provided to insured and uninsured patients. Medicare and Medicaid also receive contractual discounts from our standard charges for flight services. Flight revenue is recorded net of provisions for contractual discounts and estimated uncompensated care. Both provisions are estimated during the period the related services are performed based on historical collection experience and any known trends or changes in reimbursement rate schedules and payer mix. The provisions are adjusted as required based on actual collections in subsequent periods. Net reimbursement per transport for CBS operations is primarily a function of price, payer mix, and timely and effective collection efforts. Both the pace of collections and the ultimate collection rate are affected by the overall health of the U.S. economy, which impacts the number of indigent patients and funding for state-run programs, such as Medicaid. Medicaid reimbursement rates in many jurisdictions have remained well below the cost of providing air medical transportation. In addition, the collection rate is impacted by changes in the cost of healthcare and health insurance; as the cost of healthcare increases, health insurance coverage provided by employers may be reduced or eliminated entirely, resulting in an increase in the uninsured population. The average gross charge per transport increased 16.2% in the year ended December 31, 2008, compared to 2007, contributing to an increase of 5.7% in net reimbursement per transport in the year ended December 31, 2008, compared to 2007. Provisions for contractual discounts and estimated uncompensated care as a percentage of related gross billings for CBS operations are as follows: |
| | | For years ended December 31, | |
| | | 2008 | | | 2007 | | | 2006 | |
| Gross billings | | | 100 | % | | | 100 | % | | | 100 | % |
| Provision for contractual discounts | | | 35 | % | | | 32 | % | | | 29 | % |
| Provision for uncompensated care | | | 20 | % | | | 19 | % | | | 20 | % |
The increase in the total percentage of uncollectible accounts is primarily attributable to price increases. Although price increases generally increase the net reimbursement per transport from insurance payers, the amount per transport collectible from private patient payers and Medicare and Medicaid does not increase proportionately with price increases. Therefore, depending upon overall payer mix, price increases will usually result in an increase in the percentage of uncollectible accounts. Although we have not yet experienced significant increased limitations in the amount reimbursed by insurance companies, continued price increases may cause insurance companies to limit coverage for air medical transport to amounts less than our standard rates.
| · | Aircraft maintenance. Both CBS and HBS operations are directly affected by fluctuations in aircraft maintenance costs. Proper operation of the aircraft by flight crews and standardized maintenance practices can help to contain maintenance costs. Increases in spare parts prices from original equipment manufacturers (OEM’s) tend to be higher for aircraft which are no longer in production. Five models of aircraft within our fleet, representing 28% of the rotor wing fleet, are no longer in production and are, therefore, susceptible to price increases which outpace general inflationary trends. In addition, on-condition components are more likely to require replacement with age. Since January 1, 2007, we have taken delivery of 61 new aircraft for the purpose of replacing discontinued models and other older aircraft, as well as providing capacity for base expansion. Replacement models of aircraft typically have higher ownership costs than the models targeted for replacement but lower maintenance costs. Total maintenance expense for CBS and HBS operations increased 45.1% from 2007 to 2008, while total flight volume for CBS and HBS operations increased 23.4% over the same period. During 2008 we incurred costs for 138 engine overhauls, compared to 74 overhauls in 2007. The increase is primarily attributed to the timing of overhaul cycles, as well as to the acquisition of CJ. The acquisition of CJ resulted in an increase in the percentage of our fleet comprised of twin-engine aircraft, which tend to have higher maintenance costs than single-engine aircraft. Maintenance cost per hour on newer aircraft typically remains relatively constant on an annual basis. Maintenance cost per hour on older models of aircraft, however, may vary more widely on a quarterly basis depending on component overhaul and replacement and aircraft refurbishment cycles. |
| · | Competitive pressures from low-cost providers. We are recognized within the industry for our standard of service and our use of cabin-class aircraft. Many of our competitors utilize aircraft with lower ownership and operating costs and do not require a similar level of experience for aviation and medical personnel. Reimbursement rates established by Medicare, Medicaid, and most insurance providers are not contingent upon the type of aircraft used or the experience of personnel. However, we believe that higher quality standards help to differentiate our service from competitors and, therefore, lead to higher utilization. |
| · | Employee recruitment and relations. The ability to deliver quality services is partially dependent upon our ability to hire and retain employees who have advanced aviation, nursing, and other technical skills. In addition, hospital contracts typically contain minimum certification requirements for pilots and mechanics. Employees who meet these standards are in great demand and are likely to remain a limited resource in the foreseeable future. In September 2003, our pilots voted to be represented by a collective bargaining unit, and we signed a collective bargaining agreement (CBA) on March 31, 2006. The agreement is effective January 1, 2006, through April 30, 2009. Negotiations on a new CBA commenced in the fourth quarter of 2008. Other employee groups may also elect to be represented by unions in the future. |
Results of Operations
Year ended December 31, 2008 compared to 2007
We reported net income of $19,269,000 for the year ended December 31, 2008, compared to $27,537,000 for the year ended December 31, 2007. Net income for 2008 included an income tax benefit of $1,479,000 due to a change in the effective state income tax rate. Net income for 2007 included a pre-tax loss on early extinguishment of debt of $757,000 (with a tax effect of approximately $310,000) and an income tax benefit of $1,052,000 resulting from the recovery of previously expired net operating loss carryforwards. Same-Base Transports for CBS operations were 3,611, or 9.7%, lower in 2008 compared to 2007, partly because cancellations of flights due to unfavorable weather conditions for these bases increased by 1,123. Same-Base Transports were also negatively impacted by a third-quarter spike in fuel prices which decreased road traffic volume and overall weakening economic conditions in the United States. Aircraft operating expenses increased 46.5% in 2008, primarily due to the acquisition of CJ, higher maintenance costs on older models of aircraft, and higher fuel costs.
Flight Operations – Community-based Services and Hospital-based Services
Net flight revenue increased $98,807,000, or 25.6%, from $386,377,000 for the year ended December 31, 2007, to $485,184,000 for the year ended December 31, 2008. Flight revenue is generated by both CBS and HBS operations and is recorded net of provisions for contractual discounts and uncompensated care.
| · | CBS – Net flight revenue increased $42,390,000, or 16.6%, to $297,260,000 for the following reasons: |
| | · | Net revenue of $34,059,000 from CJ’s CBS operations from January 1, 2008, through September 30, 2008. |
| | · | Increase of 16.2% in average gross charge per transport for the year ended December 31, 2008, compared to 2007. Net reimbursement per transport increased approximately 5.7% over the same period. |
| | · | Incremental net revenue of $16,835,000 generated from the addition of fifteen new CBS bases during either 2008 or 2007. |
| | · | Revenue of $7,688,000 earned pursuant to a contract to support the Federal Emergency Management Agency (FEMA) in disaster recovery efforts. During the third quarter of 2008, we mobilized 25 and 15 aircraft and crews to respond to the threat posed by Hurricanes Gustav and Ike, respectively, along the Gulf Coast. During 2007, we recognized net revenue of $992,000 pursuant to the same contract. |
| | · | Closure of eight bases during either 2007 or 2008 and the conversion of another base to HBS operations, resulting in a decrease in net revenue of approximately $8,105,000. |
| | · | Decrease of approximately 9.7% in Same Base Transports in 2008 compared to 2007. Cancellations due to unfavorable weather conditions for CBS bases open longer than one year were 1,123 higher in 2008 compared to 2007. The remaining decline in Same-Base Transports is believed to be attributable to other factors, including a third-quarter spike in fuel prices which decreased road traffic volume, overall economic conditions in the United States, and lost flights due to redeployment of numerous aircraft and crews to respond to Hurricanes Gustav and Ike. |
| · | HBS – Net flight revenue increased $56,417,000, or 42.9%, to $187,924,000 for the following reasons: |
| | · | Net revenue of $47,412,000 from CJ’s HBS operations from January 1, 2008, through September 30, 2008. |
| | · | Incremental net revenue of $14,356,000 generated from the addition of three new contracts, the expansion of eight contracts, and the conversion of one base from CBS operations during 2007 or 2008. |
| | · | Cessation of service under seven contracts and the conversion of one contract to CBS operations during 2007 or 2008, resulting in a decrease in net revenue of approximately $10,211,000. |
| | · | Annual price increases in the majority of contracts based on changes in the Consumer Price Index or spare parts prices from aircraft manufacturers and the renewal of contracts at higher rates. |
| | · | Decrease of 8.7% in flight volume for all contracts excluding the CJ contracts, new contracts, contract expansions, and closed contracts discussed above. |
Flight center costs (consisting primarily of pilot, mechanic, and medical staff salaries and benefits) increased $45,972,000, or 28.1%, to $209,706,000 for the year ended December 31, 2008, compared to 2007. Changes by business segment were as follows:
| · | CBS – Flight center costs increased $24,418,000, or 23.3%, to $129,305,000 for the following reasons: |
| | · | Flight center costs of approximately $17,116,000 related to CJ’s CBS operations from January 1, 2008, through September 30, 2008. |
| | · | Increase of $9,037,000 for the addition of personnel and facilities to staff new base locations and contracts described above. |
| | · | Decrease of $4,135,000 due to the closure of base locations described above. |
| | · | Increases in salaries for merit pay raises. |
| · | HBS - Flight center costs increased $21,554,000, or 36.6%, to $80,401,000 primarily due to the following: |
| | · | Flight center costs of approximately $20,470,000 related to CJ’s HBS operations from January 1, 2008, through September 30, 2008. |
| | · | Increase of approximately $5,034,000 for the addition of personnel to staff new base locations described above. |
| | · | Decrease of approximately $4,935,000 due to the base closures described above. |
| | · | Increases in salaries for merit pay raises. |
Aircraft operating expenses increased $37,309,000, or 46.5%, for the year ended December 31, 2008, in comparison to 2007. Aircraft operating expenses consist of fuel, insurance, and maintenance costs and generally are a function of the size of the fleet, the type of aircraft flown, and the number of hours flown. The increase in costs is due to the following:
| · | Aircraft operating expenses of $24,815,000 related to CJ’s operations from January through September 2008. |
| · | Increase of $7,477,000, or 12.4%, in the cost of aircraft maintenance, excluding the effect of aircraft added as a result of the CJ acquisition and other aircraft added to the fleet during 2007 or 2008. During 2007 and 2008, we have placed 64 new aircraft into service and eliminated 27 aircraft which were older models. Maintenance costs per hour on newer aircraft have remained relatively constant on an annual basis. Maintenance costs per hour on older models of aircraft, however, may vary more widely on a quarterly basis depending on component overhaul and replacement and aircraft refurbishment cycles. During 2008 we incurred costs for 138 engine overhauls, compared to 74 overhauls in 2007. The increase is primarily attributed to the timing of overhaul cycles and the acquisition of CJ. |
| · | Decreases in flight volume for bases open longer than one year for both CBS and HBS as described above. |
| · | Increase of approximately 26.8% in the cost of aircraft fuel per hour flown for CBS operations. Total fuel costs were $18,612,000 for 2008, compared to $12,218,000 for 2007. |
| · | Increase in hull insurance rates effective July 2008. |
Aircraft rental expense increased $18,874,000, or 66.2%, for the year ended December 31, 2008, in comparison to 2007. Incremental expense for CJ aircraft under operating leases totaled approximately $11,145,000 from January 1, 2008, through September 30, 2008. Incremental rental expense incurred for fifty other leased aircraft added to our fleet during either 2007 or 2008 totaled $9,935,000. The increase for new aircraft was offset in part by selling two aircraft and refinancing eleven at lower lease rates or through debt financing during 2007 and 2008.
Medical Interiors and Products
Sales of medical interiors and products increased $3,646,000, or 36.6%, from $9,972,000 for the year ended December 31, 2007, to $13,618,000 for the year ended December 31, 2008. Significant projects in 2008 included nine modular medical interior kits for commercial customers, three of which were still in process as of December 31, 2008. As of December 31, 2008, two design contracts for the U.S. Army, 48 HH60L units, and 366 MEV units were also in process. Revenue by product line for the year ended December 31, 2008, was as follows:
| · | $5,398,000 - multi-mission interiors |
| · | $5,168,000 - modular medical interiors |
| · | $3,052,000 - other aerospace and medical transport products |
In 2007, we completed production of 27 MEV litter systems and seven modular medical interior kits for commercial customers. As of December 31, 2007, two design contracts with the U.S. Army and contracts for ten HH-60L units, fifty MEV units, and three commercial medical interiors were in process. Revenue by product line for the year ended December 31, 2007, was as follows:
| · | $3,044,000 - multi-mission interiors |
| · | $4,196,000 - modular medical interiors |
| · | $2,732,000 - other aerospace and medical transport products |
Cost of medical interiors and products increased $2,547,000, or 35.4%, for the year ended December 31, 2008, as compared to the previous year, due primarily to the change in sales volume. The average net margin earned on projects during 2008 was 17.1% compared to 17.3% in 2007. Margins earned on multi-mission interiors and other governmental contracts are generally higher than margins earned on medical interiors for commercial customers. The impact of costs incurred in 2008 for development and design work on avionics and other aircraft interior configurations for commercial customers was offset in part by higher margins earned on HH60L and MEV units during the fourth quarter.
General Expenses
Depreciation and amortization expense increased $2,672,000, or 18.5%, for the year ended December 31, 2008. Depreciation on assets acquired in the CJ transaction totaled approximately $2,461,000 from January 1, 2008, through September 30, 2008.
Gain on disposition of assets for the year ended December 31, 2008, was related primarily to the sale of eighteen aircraft which were designated for sale as part of our fleet rejuvenation efforts.
General and administrative (G&A) expenses increased $14,182,000, or 26.6%, for the year ended December 31, 2008, compared to the year ended December 31, 2007, reflecting the impact of the CJ acquisition and increases in compensation for merit pay raises. G&A expenses include executive management, accounting and finance, billing and collections, information services, human resources, aviation management, pilot training, dispatch and communications, and CBS program administration. G&A expenses were 13.5% of revenue in 2008 compared to 13.4% of revenue in 2007. We increased staffing for G&A departments over 9% in the fourth quarter of 2007 to manage the expanded operations with the acquisition of CJ and increased staffing in our Information Services department in 2008 to support scheduled systems upgrades. G&A expenses also included approximately $1,195,000 related to the consolidation of CJ’s Part 135 Air Carrier Certificate into the Air Methods certificate; the consolidation was completed during the second quarter of 2008. In addition, the first and second quarters of 2008 reflect incremental costs of staffing and maintaining our operational control center at corporate headquarters, which was established during the second quarter of 2007 to enable us to track flight plans and flight conditions for all aircraft and to communicate with our pilots en route.
Interest expense decreased $412,000, or 7.3%, for the year ended December 31, 2008, compared to 2007, primarily as a result of regularly scheduled payments of long-term debt and decreases in interest rates on our variable rate debt. The weighted average interest rate paid on variable rate debt in 2008 was over 300 basis points lower than the weighted average rate paid in 2007. During 2008 we also paid approximately $6,347,000 in balloon payments on promissory notes secured by aircraft. These decreases were offset in part by new notes and capital lease obligations of $28,352,000, primarily related to the CJ acquisition, originated during the third and fourth quarters 2007 with variable interest rates. We also entered into new notes and capital leases of approximately $24,285,000 during 2008 with a weighted average interest rate of 5.65%. The average balance outstanding against our line of credit was $18.2 million in 2008, compared to $10.8 million in 2007.
Income tax expense was $11,209,000, or 36.8% of income before taxes, in 2008 and $17,911,000, or 39.4% of income before taxes, in 2007. In 2008 the effective rate used to determine state income taxes decreased primarily due to a change in Colorado statute defining the apportionment calculation. Income tax benefit of $1,479,000 was recognized for the year ended December 31, 2008, as a result of applying the new rate to deferred tax assets and liabilities. Excluding the effect of this change, the effective tax rate for 2008 was 41.6%. In 2007 we changed certain elections related to fixed asset tax depreciation methods applied in prior years and filed amended returns for those periods. The changes resulted in the recovery of approximately $5.8 million of net operating loss carryforwards which had previously expired unused and in a decrease of $1,052,000 in deferred income tax expense for the year ended December 31, 2007. Excluding the effect of these changes, the effective tax rate for 2007 was 41.7%.
Year ended December 31, 2007 compared to 2006
We reported net income of $27,537,000 for the year ended December 31, 2007, compared to $17,200,000 for the year ended December 31, 2006. Net income for the year ended December 31, 2007, included a pre-tax loss on early extinguishment of debt of $757,000 (with a tax effect of approximately $310,000). Net income for the year ended December 31, 2006, included a litigation settlement of $1,417,000 (with a tax effect of approximately $581,000).
Flight Operations – Community-based Services and Hospital-based Services
Net flight revenue increased $72,498,000, or 23.1%, from $313,879,000 for the year ended December 31, 2006, to $386,377,000 for the year ended December 31, 2007.
| · | CBS – Net flight revenue increased $48,085,000, or 23.3%, to $254,871,000 for the following reasons: |
| | · | Net revenue of $11,052,000 from CJ’s CBS operations from the acquisition date through year-end. |
| | · | Increase of 12.5% in average gross charge per transport for the year ended December 31, 2007, compared to 2006. Net reimbursement per transport increased approximately 7.1% over the same period. |
| | · | Incremental net revenue of $30,066,000 generated from the addition of 23 new CBS bases during either 2007 or 2006, and $992,000 pursuant to a contract to support FEMA in disaster recovery efforts. During the third quarter of 2007, we mobilized thirteen aircraft to respond to the threat posed by Hurricane Dean in Texas. |
| | · | Closure of one base during the fourth quarter of 2006, the conversion of another base to HBS operations during the first quarter of 2007, and the expiration in June 2007 of our contract with the State of Mississippi to provide air medical transportation services in Gulfport, Mississippi, resulting in a decrease in net revenue of approximately $5,068,000. |
| | · | Decrease of approximately 3.1% in Same Base Transports in 2007 compared to 2006. The decrease in Same-Base Transports has been partially attributed to shifting of transports to newly-opened bases in adjacent locations. |
| · | HBS – Net flight revenue increased $24,413,000, or 22.8%, to $131,506,000 for the following reasons: |
| | · | Net revenue of $19,286,000 from CJ’s HBS operations from the acquisition date through year-end. |
| | · | Incremental net revenue of $6,292,000 generated from the addition of four new contracts, the expansion of three contracts, and the conversion of one CBS location to HBS operations during either 2007 or 2006. |
| | · | Cessation of service under three contracts and the conversion of two contracts to CBS operations during either 2007 or 2006, resulting in a decrease in net revenue of approximately $4,844,000. |
| | · | Annual price increases in the majority of contracts based on changes in the Consumer Price Index or spare parts prices from aircraft manufacturers and the renewal of contracts at higher rates. |
| | · | Flight volume for all contracts—excluding CJ and other new contracts, contract expansions, and the discontinued contracts discussed above—remained relatively unchanged. |
Flight center costs increased $29,938,000, or 22.4%, to $163,734,000 for the year ended December 31, 2007, compared to 2006. Changes by business segment were as follows:
| · | CBS – Flight center costs increased $17,745,000, or 20.4%, to $104,887,000 for the following reasons: |
| | · | Flight center costs of approximately $5,287,000 related to CJ’s CBS operations from the acquisition date through December 31, 2007. |
| | · | Increase of $13,628,000 for the addition of personnel and facilities to staff new base locations and contracts described above. |
| | · | Decrease of $1,980,000 due to the closure of base locations described above. |
| | · | Increases in salaries for merit pay raises. |
| · | HBS - Flight center costs increased $12,193,000, or 26.1%, to $58,847,000 primarily due to the following: |
| | · | Flight center costs of approximately $8,065,000 related to CJ’s HBS operations from the acquisition date through December 31, 2007. |
| | · | Increase of approximately $2,737,000 for the addition of personnel to staff new base locations described above. |
| | · | Decrease of approximately $1,711,000 due to the base closures described above. |
| | · | Increases in salaries for merit pay raises. |
Aircraft operating expenses increased $5,342,000, or 7.1%, for the year ended December 31, 2007, in comparison to 2006. The increase in costs is due to the following:
| · | Aircraft operating expenses of $7,310,000 related to CJ’s operations from the acquisition date through December 31, 2007. |
| · | Decrease of 8.4% in the cost of aircraft maintenance, excluding the effect of CJ aircraft and other new aircraft added to the fleet during the year. Annual price increases in the cost of spare parts and overhauls were offset in part by our ability to use exchange components rather than new parts in certain instances and by increased life-cycle intervals approved on certain life-limited components. Since the first quarter of 2006, we have placed 45 new helicopters into service and eliminated seventeen aircraft which were older models. Maintenance cost per hour on newer aircraft tend to remain relatively constant on an annual basis. Maintenance cost per hour on older models of aircraft, however, may vary more widely on a quarterly basis depending on component overhaul and replacement and aircraft refurbishment cycles. During 2007 we incurred costs on fewer significant maintenance events related to older models of aircraft than during 2006. |
| · | Changes in flight volume for bases open longer than one year for both CBS and HBS as described above. |
| · | Increase of approximately 17.6% in the cost of aircraft fuel per hour flown. Total fuel costs were $12,218,000 for the year ended December 31, 2007, compared to $9,461,000 for the year ended December 31, 2006. |
| · | Decrease in hull insurance rates effective July 2007 and 2006. |
Aircraft rental expense increased $6,924,000, or 32.1%, for the year ended December 31, 2007, in comparison to the year ended December 31, 2006. Expense for 76 CJ aircraft under operating leases totaled approximately $3,370,000 from the acquisition date through December 31, 2007. Incremental rental expense incurred in 2007 for 32 other leased aircraft added to our fleet during either 2007 or 2006 totaled $5,641,000. The increase for new aircraft was offset in part by selling two aircraft and refinancing thirteen at lower lease rates or through debt financing.
Medical Interiors and Products
Sales of medical interiors and products increased $4,347,000, or 77.3%, from $5,625,000 for the year ended December 31, 2006, to $9,972,000 for the year ended December 31, 2007. In 2007, we completed production of 27 MEV litter systems and seven modular medical interior kits for commercial customers. As of December 31, 2007, two design contracts with the U.S. Army and contracts for ten HH-60L units, fifty MEV units, and three commercial medical interiors were in process. Revenue by product line for the year ended December 31, 2007, was as follows:
| · | $3,044,000 - multi-mission interiors |
| · | $4,196,000 - modular medical interiors |
| · | $2,732,000 - other aerospace and medical transport products |
In 2006, we completed production of 21 MEV litter systems and eleven modular, medical interior kits for commercial customers. We also continued work on eleven HH-60L units. In the fourth quarter, we began production of 27 additional MEV units. Revenue by product line for the year ended December 31, 2006, was as follows:
| · | $2,291,000 - multi-mission interiors |
| · | $2,538,000 - modular medical interiors |
| · | $434,000 - other aerospace and medical transport products |
Cost of medical interiors and products increased $4,484,000, or 165.7%, for the year ended December 31, 2007, as compared to the previous year, due in part to the change in sales volume. The average net margin earned on projects during 2007 was 17.3% compared to 40.0% in 2006, reflecting increases in the cost of raw materials used to manufacture our aircraft interior systems and the change in product mix. Margins earned on multi-mission interiors are generally higher than margins earned on medical interiors for commercial customers. In addition, aircraft interiors completed for commercial customers during 2007 included some new types of aircraft in which we had not previously installed our modular interior, leading to higher engineering and documentation costs and lower profit margins. In order to meet schedule requirements for both the external contracts described above and the significant number of aircraft interiors manufactured and installed in our own fleet during 2007, the Products Division relied more heavily on outside contractors to supplement in-house labor than was necessary in the prior year.
General Expenses
Depreciation and amortization expense increased $1,508,000, or 11.7%, for the year ended December 31, 2007. Depreciation on assets acquired in the CJ transaction totaled approximately $792,000 from the acquisition date through December 31, 2007. The remainder of the increase is primarily the result of placing three aircraft totaling $6,013,000 into service and the purchase of new rotable equipment and aircraft interiors.
General and administrative (G&A) expenses increased $12,588,000, or 30.9%, for the year ended December 31, 2007, compared to the year ended December 31, 2006, reflecting the impact of the CJ acquisition and increases in compensation for merit pay raises. We increased staffing for G&A departments over 9% in the fourth quarter to manage the expanded operations with the acquisition of CJ, and increased staffing in our Information Services department over the course of the year to support scheduled systems upgrades. Because of the additional program administration required for CBS operations, growth in CBS operations will generally necessitate more G&A support than growth in HBS operations. In addition, G&A expenses for the year ended December 31, 2007, included stock compensation expense of $1,746,000 related to the grant of stock options, compared to $373,000 of stock compensation expense in the year ended December 31, 2006. G&A expenses were 13.4% of revenue in 2007 compared to 12.7% of revenue in 2006.
Interest expense decreased $212,000, or 3.6%, for the year ended December 31, 2007, compared to 2006, primarily as a result of regularly scheduled payments of long-term debt and decreased borrowings against our line of credit. The average balance outstanding against the line was approximately $10.8 million during 2007, compared to $14.6 million during 2006. In addition, the weighted average interest rate paid on variable rate debt decreased approximately 40 basis points from 2006 to 2007. These decreases were offset in part by new notes and capital lease obligations of $29,925,000, primarily related to the CJ acquisition, originated during 2007 with a weighted average interest rate of 7.4%.
Income tax expense was $17,911,000, or 39.4% of income before taxes, in 2007 and $13,144,000, or 43.3% of income before taxes, in 2006. In 2007 we changed certain elections related to fixed asset tax depreciation methods applied in prior years and filed amended returns for those periods. The changes resulted in the recovery of approximately $5.8 million of net operating loss carryforwards which had previously expired unused and in a decrease of $1,052,000 in deferred income tax expense for the year ended December 31, 2007. Excluding the effect of these changes, the effective tax rate for 2007 was 41.7%. For years prior to 2006, our income tax expense was determined using a federal statutory rate of 34% because we believed that our deferred tax assets and liabilities would be recovered or settled at that rate. Due to an increase in projected taxable income for the year ended December 31, 2006, and for future years, we revised our estimated tax rate to 35% in 2006. Deferred income tax expense of $525,000 was recognized for the year ended December 31, 2006, as a result of applying the new estimated rate to deferred tax assets and liabilities. The effective tax rate for 2006, excluding the effect of applying the new estimated rate against deferred tax balances, was 41.6%.
Liquidity and Capital Resources
Cash Requirements
Debt and Other Long-term Obligations
The following table outlines our contractual obligations as of December 31, 2008 (amounts in thousands):
| | | Total | | | Less than 1 year | | | 1-3 years | | | 4-5 years | | | After 5 years | |
| | | | | | | | | | | | | | | | |
| Long-term debt principal | | $ | 97,940 | | | | 14,156 | | | | 22,377 | | | | 53,992 | | | | 7,415 | |
| Interest payments (1) | | | 15,017 | | | | 4,774 | | | | 6,580 | | | | 2,484 | | | | 1,179 | |
| Total long-term debt obligations | | | 112,957 | | | | 18,930 | | | | 28,957 | | | | 56,476 | | | | 8,594 | |
| | | | | | | | | | | | | | | | | | | | | |
| Capital leases | | | 3,556 | | | | 1,482 | | | | 1,543 | | | | 531 | | | | -- | |
| Interest payments | | | 495 | | | | 250 | | | | 208 | | | | 37 | | | | -- | |
| Total capital lease obligations | | | 4,051 | | | | 1,732 | | | | 1,751 | | | | 568 | | | | -- | |
| | | | | | | | | | | | | | | | | | | | | |
| Operating leases | | | 421,929 | | | | 61,309 | | | | 116,653 | | | | 98,691 | | | | 145,276 | |
| Aircraft purchase commitments | | | 165,287 | | | | 42,881 | | | | 86,884 | | | | 35,522 | | | | -- | |
| | | | | | | | | | | | | | | | | | | | | |
| Total | | $ | $704,224 | | | | 124,852 | | | | 234,245 | | | | 191,257 | | | | 153,870 | |
| (1) | Interest payments include an estimate of variable-rate interest on our revolving credit facility and notes with principal balances of $44,645,000 as of December 31, 2008. Variable interest was estimated using the weighted average rate in effect during 2008 for each note and the average balance outstanding against the revolving credit facility during 2008. |
Balloon payments on long-term debt are due as follows:
Off-Balance Sheet Arrangements
Aircraft Purchase Commitments
In July 2004, we entered into a commitment agreement to purchase fifteen Bell 429 helicopters for approximately $55.5 million. The purchase price increases 3% per year until delivery. The agreement provides for special incentives, including a trade-in option for up to fifteen Bell 222 helicopters, with minimum guaranteed trade-in values. Deliveries were originally scheduled to begin in 2007, with a minimum of three deliveries per year. However, due to delays in the manufacturer’s processes, delivery of the first Bell 429 helicopter is currently expected in mid-2009, with the remaining units to be delivered over approximately the following three years.
During 2007 and 2006, we entered into additional purchase commitments for various models of Bell and Eurocopter helicopters. As of December 31, 2008, commitments for 31 aircraft for approximately $83.6 million are still open. Deliveries under these commitments are expected from 2009 through 2012. We also have options to enter into additional purchase commitments for future years dependent upon our aircraft requirements.
Prior to our acquisition date, CJ had entered into two commitments to purchase Eurocopter aircraft. As of December 31, 2008, commitments for 10 aircraft for approximately $20.3 million are still open, and deliveries are expected from 2009 through 2010.
We intend to use the new aircraft for base expansion opportunities as well as to replace older models of aircraft in our fleet. We plan to either sell the aircraft which are replaced, use them for spare parts, or redeploy them into the backup fleet. Typically we have financed aircraft acquired under these or similar commitments through operating lease or debt agreements. As of the first quarter of 2009, we have received financing commitments, subject to routine credit approval and aircraft inspection processes, for over 28% of the cost of aircraft to be delivered in 2009. If financing arrangements cannot be arranged or we are prevented from taking or decline to take delivery of aircraft under the commitments described above for any other reason, we may forfeit nonrefundable deposits of approximately $3.5 million. There can be no assurance that we will be able to continue to obtain aircraft financing on favorable terms.
Residual Value Guarantees
We have entered into various aircraft operating leases under which we provide residual value guarantees to the lessor. As of December 31, 2008, the undiscounted maximum amount of potential future payments under the guarantees is $15,240,000. Of this amount, $12,657,000 relates to aircraft operating leases which were assumed in the CJ acquisition. No amounts have been accrued for any estimated losses with respect to the guarantees, since it is not probable that the residual value of the aircraft will be less than the amounts stipulated in the guarantee. The assessment of whether it is probable that we will be required to make payments under the terms of the guarantee is based on current market data and our actual and expected loss experience.
Letters of Credit
In January 2005, we entered into a $1,400,000 letter of credit with an insurance underwriter in lieu of increasing cash deposits on our workers compensation insurance policy. The letter of credit may be renewed annually and reduces the available borrowing capacity under our revolving credit facility.
In April 2008, we entered into a $100,000 letter of credit with a county government in California as performance security under an exclusive operating agreement. The letter of credit may be renewed annually and reduces the available borrowing capacity under our revolving credit facility.
Sources and Uses of Cash
We had cash and cash equivalents of $13,147,000 and working capital of $115,962,000 at December 31, 2008, compared to cash and cash equivalents of $5,134,000 and working capital of $112,758,000 at December 31, 2007. Cash generated by operations totaled $52,114,000 in 2008 compared to $27,104,000 in 2007, reflecting the change in operating results described above. In addition, receivables for refundable income taxes of $20,669,000 at December 31, 2007, were either received during 2008 or offset by estimated income taxes payable for 2008 operations. We increased raw material inventory approximately $5 million in order to support the production of 366 MEV units and 48 HH60L units in process as of December 31, 2008.
Cash used for investing activities totaled $44,585,000 in 2008, compared to $41,215,000 in 2007. Equipment acquisitions in 2008 included the buyout of nineteen leased aircraft for approximately $22.3 million and the buyout of five CJ leased aircraft for approximately $6.3 million, three of which were subsequently sold during the period for net proceeds of approximately $3.5 million. These CJ aircraft had been identified for disposition upon acquisition of CJ in October 2007. We also sold fifteen other aircraft during the period for total proceeds of $12.8 million. In 2007 we paid $25 million to acquire FSS. Equipment acquisitions in 2007 included a $1.5 million aircraft, as well as medical interior and avionics installations and information systems hardware and software. We also paid approximately $1.1 million in deposits for future aircraft purchases and $1.9 million related to the purchase of certain business assets from air medical service providers in Florida and South Carolina. In 2007 we also sold two aircraft for total proceeds of approximately $1.5 million and received an insurance settlement of approximately $3.0 million for one of our helicopters totaled in an accident. In 2007 we bought out two leased aircraft for $6.5 million and subsequently sold them for a total of $5.6 million.
Financing activities generated $484,000 in 2008 compared to $15,026,000 in 2007. The primary use of cash in both 2008 and 2007 was regularly scheduled payments of long-term debt and capital lease obligations. Proceeds from new notes totaling $21.5 million in 2008 were used to finance the purchase of the corporate headquarters buildings and aircraft previously held under operating leases. We also repurchased 227,917 shares of our common stock for $4.9 million. In 2007 we used $25 million of term loan proceeds to repay $21.8 million in term loans with another lender and $25 million of additional term loan proceeds to finance the acquisition of FSS. Debt issuance costs of $706,000 were primarily associated with the new term loans.
Senior Credit Facility
Our senior credit facility consists of term loans with a balance of $44,645,000 as of December 31, 2008, and a revolving credit facility. As of December 31, 2008, we had $19,258,000 outstanding against the $50 million revolving credit facility and available capacity on the facility of $29,242,000. At December 31, 2008, pursuant to our debt covenants, we are limited to additional borrowings under the revolving credit facility of approximately $6.0 million. The amount of the limitations on additional borrowings will change based upon future operating results, asset purchases, and asset sales. The capacity available on the revolving credit facility is reduced by two outstanding letters of credit totaling $1,500,000.
Borrowings under the credit facility are secured by substantially all of our accounts receivable, inventory, equipment and general intangibles. Indebtedness under the credit facility has a first priority claim to the assets pledged to secure it. The facility matures September 1, 2012, but can be prepaid at any time without penalty.
Base Rate loans (as defined) bear interest at the greater of (i) prime or (ii) the federal funds rate plus 0.5%. The interest rate for LIBOR Rate loans (as defined) is generally the LIBOR rate plus 1.5% to 2.5%. As of December 31, 2008, the interest rate on the term loans was 3.00% and the rate on the revolving credit facility was 3.25%.
Payment obligations under the credit facility accelerate upon the occurrence of defined events of default, including the following: failure to pay principal or interest or to perform covenants under the credit facility or other indebtedness with outstanding obligations exceeding $1 million; events of insolvency or bankruptcy; failure to timely discharge judgments of $500,000 or more; failure to maintain the first priority status of liens under the credit facility; suspension of material governmental permits; a material adverse effect with respect to the Company; and a change of control in the Company.
The credit facility contains various covenants that limit, among other things, our ability to create liens, declare dividends, make loans and investments, make any material change to the nature of its business, enter into any transaction with affiliates other than on arms' length terms, enter into a merger or consolidation, or sell assets. We are required to maintain certain financial ratios as defined in the credit facility and other notes. As of December 31, 2008, we were in compliance with the covenants of the credit facility.
Outlook for 2009
The statements contained in this Outlook are based on current expectations. These statements are forward-looking, and actual results may differ materially. We undertake no obligation to update any forward-looking statements.
Community-Based Model
In the first quarter of 2009, we acquired certain business assets in Georgia from another air medical service provider, resulting in a decrease in the number of bases in the area from eleven, formerly operated by either the seller or by us, to six operated exclusively by us. In the first quarter of 2009, we opened a new base in Michigan and closed two bases, one in the Midwest and one in the southeast, due to insufficient flight volume. Absent improvement in overall economic conditions within the United States, we expect continued reductions in Same Base Transports, in comparison to 2008 levels, through the second quarter of 2009. Effective January 1, 2009, we increased prices for our CBS operations an average of approximately 5%. Based on the fuel derivative agreement we negotiated in the fourth quarter of 2008, our fuel cost for 2009 is effectively capped at $2.35 per gallon for wholesale purchases, and we expect fuel costs to decrease significantly from the levels experienced in 2008.
Hospital-Based Model
In the first quarter of 2009, we began operations under a new three-year contract, representing two aircraft, with a customer in Alaska. Contracts with eighteen hospital customers are due for renewal in 2009. Absent improvement in overall economic conditions within the United States, we expect continued reductions in flight activity for continuing hospital contracts, in comparison to 2008 levels, through the second quarter of 2009.
Products Division
As of December 31, 2008, forty-eight HH60L units, 366 MEV units, and three commercial medical interiors were in process. We also have two design contracts with the U.S. Army: one for an upgraded HH-60M multi-mission interior and one for an interim medical system. Deliveries under all contracts in process as of December 31, 2008, are expected to be completed by the third quarter of 2010, and remaining revenue is estimated at $30.2 million.
The U.S. Army Multi-Year VII production contract plans for 76 HH-60M Multi-Mission Medevac units plus options for 23 additional units to be delivered by 2012, including the 48 units which we currently have under contract. The units planned under this contract are in addition to the 39 units we have already completed. There is no assurance that orders for additional units will be received in future periods.
All Segments
There can be no assurance that we will continue to maintain flight volume or current rate of reimbursement on receivables for CBS operations, successfully expand CBS and HBS operations, renew operating agreements for our HBS operations, or generate new profitable contracts for the Products Division.
Critical Accounting Policies
Our consolidated financial statements have been prepared in accordance with accounting principles generally accepted in the United States. The preparation of these financial statements requires management to make estimates and assumptions that affect the reported amounts of assets and liabilities and the disclosure of contingent assets and liabilities at the date of the financial statements and the reported amounts of revenues and expenses during the reporting period.
On an on-going basis, management evaluates our estimates and judgments, including those related to revenue recognition, deferred income taxes, and valuation of long-lived assets and goodwill. Management bases its estimates and judgments on historical experience and on various other factors that are believed to be reasonable under the circumstances, the results of which form the basis for making judgments about the carrying values of assets and liabilities that are not readily apparent from other sources. Actual results may differ from these estimates under different assumptions or conditions. Management believes the following critical accounting policies affect its more significant judgments and estimates used in the preparation of our consolidated financial statements.
Revenue Recognition
Fixed flight fee revenue under our operating agreements with hospitals is recognized monthly over the terms of the agreements. Flight revenue relating to patient transports is recognized upon completion of the services and is recorded net of provisions for contractual discounts and estimated uncompensated care. Both provisions are estimated during the period the related services are performed based on historical collection experience and any known trends or changes in reimbursement rate schedules and payer mix. The provisions are adjusted as required based on actual collections in subsequent periods. We have from time to time experienced delays in reimbursement from third-party payers. In addition, third-party payers may disallow, in whole or in part, claims for reimbursement based on determinations that certain amounts are not reimbursable under plan coverage, determinations of medical necessity, or the need for additional information. Laws and regulations governing the Medicare and Medicaid programs are very complex and subject to interpretation. We also provide services to patients who have no insurance or other third-party payer coverage. There can be no guarantee that we will continue to experience the same collection rates that we have in the past. If actual future collections are more or less than those projected by management, adjustments to allowances for contractual discounts and uncompensated care may be required. Based on related flight revenue for the year ended December 31, 2008, a change of 100 basis points in the percentage of estimated contractual discounts and uncompensated care would have resulted in a change of approximately $6,576,000 in flight revenue.
Revenue related to fixed fee medical interior and products contracts is recorded as costs are incurred using the percentage of completion method of accounting. We estimate the percentage of completion based on costs incurred to date as a percentage of an estimate of the total costs to complete the project. Losses on contracts in process are recognized when determined. If total costs to complete a project are greater or less than estimated, the gross margin on the project may be greater or less than originally recorded under the percentage of completion method.
Deferred Income Taxes
In preparation of the consolidated financial statements, we are required to estimate income taxes in each of the jurisdictions in which we operate. This process involves estimating actual current tax exposure together with assessing temporary differences resulting from differing treatment of items, such as depreciable assets, for tax and accounting purposes. These differences result in deferred tax assets and liabilities, which are included in the consolidated balance sheets. We then assess the likelihood that deferred tax assets will be recoverable from future taxable income and record a valuation allowance for those amounts we believe are not likely to be realized. Establishing or increasing a valuation allowance in a period increases income tax expense. We consider estimated future taxable income, tax planning strategies, and the expected timing of reversals of existing temporary differences in assessing the need for a valuation allowance against deferred tax assets. In the event we were to determine that we would not be able to realize all or part of our net deferred tax assets in the future, an adjustment to the valuation allowance would be charged to income in the period such determination was made. Likewise, should we determine that we would be able to realize our deferred tax assets in the future in excess of our net recorded amount, an adjustment to the valuation allowance would increase income in the period such determination was made. The effect on deferred income tax assets and liabilities of a change in statutory tax rates applicable to the Company is also recognized in income in the period of the change.
Long-lived Assets Valuation
In accounting for long-lived assets, we make estimates about the expected useful lives, projected residual values and the potential for impairment. Estimates of useful lives and residual values of aircraft are based upon actual industry experience with the same or similar aircraft types and anticipated utilization of the aircraft. Changing market prices of new and used aircraft, government regulations and changes in our maintenance program or operations could result in changes to these estimates. Long-lived assets are evaluated for impairment whenever events or changes in circumstances indicate that the carrying amount of an asset may not be recoverable. Recoverability of long-lived assets is measured by a comparison of the carrying amount of an asset to future net cash flows expected to be generated by the asset. Our cash flow estimates are based on historical results adjusted for estimated current industry trends, the economy, and operating conditions.
Goodwill Valuation
The Company’s goodwill relates to four acquisitions and has been allocated to our community-based and hospital-based services segments. Annually, at December 31, the Company evaluates goodwill for potential impairment using a two-step test at the reporting unit level. The first step of the goodwill impairment test compares the book value of a reporting unit, including goodwill, with its fair value. If the book value of a reporting unit exceeds its fair value, we perform the second step of the impairment test to determine the amount of goodwill impairment loss to be recorded. In the second step, the implied fair value of the reporting unit’s goodwill is compared to the book value of the goodwill. The amount of impairment loss is equal to the excess of the book value of the goodwill over the implied fair value of that goodwill.
We determine the fair value of each reporting unit based upon the reporting unit’s historical operating profit and the Company’s current public trading value. Estimated future operating profit for each reporting unit is also taken into consideration when determining the reporting unit’s fair value. Considerable management judgment is necessary to evaluate the impact of economic changes and to estimate future operating profit for the reporting units. Assumptions used in our impairment evaluations, such as forecasted growth rates and patient receivable collection rates, are based on the best available market information and are consistent with our internal forecasts. Changes in these estimates or a continued decline in general economic conditions could change our conclusion regarding an impairment of goodwill and potentially result in a non-cash impairment loss in a future period.
The estimated fair values of the reporting units have historically exceeded the carrying values of the reporting units. We performed a sensitivity analysis on the Company’s public trading value and on each reporting unit’s historical and estimated future operating profits. In estimating sensitivity, either the Company’s current public trading value or the reporting unit’s operating profit would have to decrease by more than 20% before the carrying value of the reporting unit exceeded its fair value.
New Accounting Standards
In February 2007, the Financial Accounting Standards Board (FASB) issued FASB Statement No. 159, The Fair Value Option for Financial Assets and Financial Liabilities (Statement 159), which provides an option to report selected financial assets and liabilities at fair value and establishes presentation and disclosure requirements. Statement 159 permits an election to measure eligible items at fair value on an instrument-by-instrument basis and then report unrealized gains and losses for those items in earnings. Statement 159 is effective for fiscal years beginning after November 15, 2007. The implementation of Statement 159 effective January 1, 2008, did not have a material effect on our financial position or results of operations because we did not elect to measure any eligible items at fair value.
In December 2007 the FASB issued FASB Statement No. 141 (revised 2007), Business Combinations, (Statement 141R). Statement 141R establishes principles and requirements for recognizing and measuring assets acquired (including goodwill), liabilities assumed, and any noncontrolling interest acquired in a business combination. Statement 141R also provides guidance regarding information to be disclosed to enable users of the financial statements to evaluate the nature and financial effects of the business combination. Statement 141R applies prospectively to business combinations for which the acquisition date is on or after the beginning of the first annual reporting period beginning on or after December 15, 2008. We do not expect the adoption of this statement to have a material impact on our financial position or results of operations.
In April 2008 the FASB issued FASB Staff Position No. FAS 142-3, Determination of the Useful Life of Intangible Assets (FSP FAS 142-3). FSP FAS 142-3 removes the requirement under FASB Statement No. 142, Goodwill and Other Intangible Assets, to consider whether an intangible asset can be renewed without substantial cost or material modifications to the existing terms and conditions and instead requires an entity to consider its own historical experience in renewing similar arrangements. This FSP is effective for fiscal years beginning after December 15, 2008, and interim periods within those fiscal years. We do not expect the adoption of this statement to have a material impact on our financial position or results of operations.
In March 2008 the FASB issued FASB Statement No. 161 (Statement 161), Disclosures about Derivative Instruments and Hedging Activities, An Amendment of FASB No. 133. Statement 161 amends and expands the disclosure requirements of Statement 133 and requires qualitative disclosures about objectives and strategies for using derivative instruments, quantitative disclosures about fair value amounts of derivative instruments and related gains and losses, and disclosures about credit-risk-related contingent features in derivative agreements. Statement 161 is effective for fiscal years and interim periods beginning after November 15, 2008. The statement provides only for enhanced disclosures. Therefore, we do not expect the adoption of this statement to have a material impact on our financial position or results of operations.
In May 2008 the FASB issued FASB Statement No. 162 (Statement 162), Hierarchy of Generally Accepted Accounting Principles. Statement 162 identifies the sources of accounting principles and the framework for selecting the principles used in the preparation of financial statements and was effective November 15, 2008. Adoption of this statement did not have an impact on our financial position or results of operations, since this new standard codified, rather than changed, existing generally accepted accounting principles.
| QUANTITATIVE AND QUALITATIVE DISCLOSURES ABOUT MARKET RISK |
Market risk is the potential loss arising from adverse changes in market rates and prices, such as foreign currency exchange and interest rates. All of our sales and related receivables are payable in U.S. dollars. We are subject to interest rate risk on our debt obligations and notes receivable, some of which have fixed interest rates, except $19,258,000 outstanding against the line of credit and $44,645,000 in notes payable. Based on the amounts outstanding at December 31, 2008, the annual impact of a change of 100 basis points in interest rates would be approximately $639,000. Interest rates on these instruments approximate current market rates as of December 31, 2008.
Our cost of operations is also affected by changes in the price and availability of aircraft fuel. Generally, our HBS customers pay for all fuel consumed in medical flights. Based on actual CBS fuel usage for the year ended December 31, 2008, the impact on operating costs of an increase of 10% in the cost of aircraft fuel per hour flown would be approximately $1,671,000 for the year. Flight volume for CBS operations can vary due to weather conditions and other factors. Therefore, the impact of a change in fuel cost based 2008 volume is not necessarily indicative of the impact on subsequent years or quarters. In the fourth quarter of 2008, we entered into a fuel derivative agreement for the majority of our projected fuel consumption for the year ending December 31, 2009, to protect us against increases in the cost of Gulf Coast jet fuel above $2.35 per gallon for wholesale purchases. As of December 31, 2008, the Gulf Coast jet fuel spot price was approximately $0.24 per gallon lower than it was at the date of our agreement.
| FINANCIAL STATEMENTS AND SUPPLEMENTARY DATA |
See Consolidated Financial Statements attached hereto.
| CHANGES IN AND DISAGREEMENTS WITH ACCOUNTANTS ON ACCOUNTING AND FINANCIAL DISCLOSURE |
None.
Disclosure Controls and Procedures
We maintain disclosure controls and procedures that are designed to ensure that information required to be disclosed in our reports filed or submitted to the SEC under the Securities Exchange Act of 1934, as amended, is recorded, processed, summarized and reported within the time periods specified by the Commission’s rules and forms, and that information is accumulated and communicated to management, including the principal executive and financial officers (referred to in this report as the Certifying Officers), as appropriate to allow timely decisions regarding required disclosure. Management, under the supervision and with the participation of the Certifying Officers, evaluated the effectiveness of disclosure controls and procedures as of December 31, 2008, pursuant to Rule 13a-15(b) under the Exchange Act. Based on that evaluation, the Certifying Officers have concluded that, as of December 31, 2008, the Company’s disclosure controls and procedures were effective.
Changes in Internal Control over Financial Reporting
There were no significant changes in our internal control over financial reporting that occurred during the most recently completed fiscal quarter that have materially affected, or are reasonably likely to materially affect, our internal control over financial reporting.
Management’s Report on Internal Control over Financial Reporting
Management is responsible for establishing and maintaining adequate internal control over financial reporting (as defined in Rule 13a-15(f) under the Securities Exchange Act of 1934, as amended). Management assessed the effectiveness of our internal control over financial reporting as of December 31, 2008, using criteria established in Internal Control-Integrated Framework issued by the Committee of Sponsoring Organizations of the Treadway Commission (COSO).
Based on this assessment, management concluded that we maintained effective internal control over financial reporting as of December 31, 2008.
Because of its inherent limitations, internal control over financial reporting may not prevent or detect misstatements. Also, projections of any evaluation of effectiveness to future periods are subject to the risk that controls may become inadequate because of changes in conditions, or that the degree of compliance with the policies and procedures may deteriorate.
KPMG LLP, an independent registered public accounting firm, has audited the effectiveness of internal control over financial reporting as of December 31, 2008, and their report is included herein.
None.
PART III
| DIRECTORS, EXECUTIVE OFFICERS, AND CORPORATE GOVERNANCE |
The information required by this item is incorporated by reference from the Company's Proxy Statement to be filed on or prior to April 30, 2009, for the Annual Meeting of Stockholders to be held June 16, 2009.
The information required by this item is incorporated by reference from the Company's Proxy Statement to be filed on or prior to April 30, 2009, for the Annual Meeting of Stockholders to be held June 16, 2009.
| SECURITY OWNERSHIP OF CERTAIN BENEFICIAL OWNERS AND MANAGEMENT |
The information required by this item is incorporated by reference from the Company's Proxy Statement to be filed on or prior to April 30, 2009, for the Annual Meeting of Stockholders to be held June 16, 2009.
| CERTAIN RELATIONSHIPS AND RELATED TRANSACTIONS AND DIRECTOR INDEPENDENCE |
The information required by this item is incorporated by reference from the Company's Proxy Statement to be filed on or prior to April 30, 2009, for the Annual Meeting of Stockholders to be held June 16, 2009.
| PRINCIPAL ACCOUNTANT FEES AND SERVICES |
The information required by this item is incorporated by reference from the Company's Proxy Statement to be filed on or prior to April 30, 2009, for the Annual Meeting of Stockholders to be held June 16, 2009.
PART IV
| EXHIBITS AND FINANCIAL STATEMENT SCHEDULES |
| Documents filed as part of the report: |
| | | |
| 1. | | Financial Statements included in Item 8 of this report: |
| | | |
| | | Reports of Independent Registered Public Accounting Firm |
| | | Consolidated Balance Sheets, December 31, 2008 and 2007 |
| | | Consolidated Statements of Operations for the years ended December 31, 2008, 2007, and 2006 |
| | | Consolidated Statements of Stockholders' Equity for the years ended December 31, 2008, 2007, and 2006 |
| | | Consolidated Statements of Cash Flows for the years ended December 31, 2008, 2007, and 2006 |
| | | Notes to Consolidated Financial Statements |
| | | |
| 2. | | Financial Statement Schedules included in Item 8 of this report: |
| | | |
| | | Schedule II – Valuation and Qualifying Accounts for the years ended December 31, 2008, 2007, and 2006 |
| | | |
| | | All other supporting schedules have been omitted because the information required is included in the financial statements or notes thereto or have been omitted as not applicable or not required. |
| | | |
| 3. | | Exhibits: |
| Exhibit | | |
| Number | | Description of Exhibits |
| | | |
| 2.1 | | Stock Purchase Agreement dated July 31, 2007, among Air Methods Corporation, FSS Airholdings, Inc., and Fred S. Shaulis.13 |
| | | |
| 3.1 | | Certificate of Incorporation1 |
| | | |
| 3.2 | | Amendments to Certificate of Incorporation2 |
| | | |
| 3.3 | | By-Laws as Amended8 |
| | | |
| 4.1 | | Specimen Stock Certificate2 |
| | | |
| 10.1 | | 1995 Air Methods Corporation Employee Stock Option Plan4 |
| | | |
| 10.2 | | Amendment to 1995 Air Methods Corporation Employee Stock Option Plan5 |
| | | |
| 10.3 | | 2006 Equity Compensation Plan7 |
| | | |
| | Form of Restricted Stock Grant Agreement |
| | | |
| 10.5 | | Equity Compensation Plan for Nonemployee Directors, adopted March 12, 19933 |
| | | |
| 10.6 | | Employment Agreement between the Company and Aaron D. Todd, dated July 1, 20036 |
| | | |
| 10.7 | | Employment Agreement between the Company and David L. Dolstein, dated January 1, 20036 |
| 10.8 | | Employment Agreement between the Company and Company and Michael D. Allen, dated January 4, 20069 |
| | | |
| 10.9 | | Employment Agreement between the Company and Trent J. Carman, dated April 28, 20036 |
| | | |
| 10.10 | | Employment Agreement between the Company and Sharon J. Keck, dated January 1, 20036 |
| | | |
| 10.11 | | Employment Agreement between the Company and Paul Tate, dated February 22, 200814 |
| | | |
| 10.12 | | Collective Bargaining Agreement by and between Air Methods Corporation and Office and Professional Employees International Union, Local 109, from January 1, 2006, through April 30, 200910 |
| | | |
| 10.13 | | Revolving Credit, Term Loan and Security Agreement, dated as of September 17, 2007, among Air Methods Corporation, Rocky Mountain Holdings, L.L.C., Mercy Air Service, Inc. and LifeNet, Inc., KeyBank National Association, as Administrative Agent for the Lenders, Lead Arranger and Sole Book Runner, and the lending parties thereto11 |
| | | |
| 10.14 | | Amendment No. 1 to Revolving Credit, Term Loan and Security Agreement dated as of October 1, 2007 among Air Methods Corporation, Rocky Mountain Holdings, L.L.C., Mercy Air Service, Inc., LifeNet, Inc., FSS Airholdings, Inc., and CJ Systems Aviation Group, Inc., as Borrowers, KeyBank National Association, as a Lender, lead arranger, sole book runner and administrative agent, LaSalle Bank National Association, as a Lender and syndication agent, National City Bank, as a Lender and documentation agent, and the other Lenders identified therein.12 |
| | | |
| 10.15 | | Form of Guaranty Agreement between KeyBank, as Agent for the Lenders and each of (i) Special Jet Services, Inc., (ii) CJ Critical Care Transportation Systems of Kentucky, Inc., (iii) CJ Critical Care Transportation Systems of Florida, Inc., and (iv) CJ Critical Care Transportation Systems, Inc. 12 |
| | | |
| | Subsidiaries of Registrant |
| | | |
| | Consent of KPMG LLP |
| | | |
| | Chief Executive Officer Certification adopted pursuant to Section 302 of the Sarbanes-Oxley Act of 2002 |
| | | |
| | Chief Financial Officer Certification adopted pursuant to Section 302 of the Sarbanes-Oxley Act of 2002 |
| | | |
| | Certification adopted pursuant to Section 906 of the Sarbanes-Oxley Act of 2002 |
| 1 | Filed as an exhibit to the Company’s Registration Statement on Form S-1 (Registration No. 33-15007), as declared effective on August 27, 1987, and incorporated herein by reference. |
| 2 | Filed as an exhibit to the Company's Annual Report on Form 10-K for the fiscal year ended June 30, 1992, and incorporated herein by reference. |
| 3 | Filed as an exhibit to the Company's Registration Statement on Form S-8 (Registration No. 33-65370), filed with the Commission on July 1, 1993, and incorporated herein by reference. |
| 4 | Filed as an exhibit to the Company’s Quarterly Report on Form 10-Q for the quarter ended March 31, 1995, and incorporated herein by reference. |
| 5 | Filed as an exhibit to the Company’s Quarterly Report on Form 10-Q for the quarter ended June 30, 2003, and incorporated herein by reference. |
| 6 | Filed as an exhibit to the Company’s Quarterly Report on Form 10-Q for the quarter ended September 30, 2003, and incorporated herein by reference. |
| 7 | Filed as an exhibit to the Company’s Quarterly Report on Form 10-Q for the quarter ended September 30, 2006, and incorporated herein by reference. |
| 8 | Filed as an exhibit to the Company’s Current Report on Form 8-K dated June 20, 2006, and incorporated herein by reference. |
| 9 | Filed as an exhibit to the Company's Quarterly Report on Form 10-Q for the quarter ended March 31, 2006, and incorporated herein by reference. |
| 10 | Filed as an exhibit to the Company's Current Report on Form 8-K dated April 5, 2006, and incorporated herein by reference. |
| 11 | Filed as an exhibit to the Company's Current Report on Form 8-K dated September 17, 2007, and incorporated herein by reference. |
| 12 | Filed as an exhibit to the Company's Current Report on Form 8-K dated October 1, 2007, and incorporated herein by reference. |
| 13 | Filed as an exhibit to the Company's Current Report on Form 8-K dated July 31, 2007, and incorporated herein by reference. |
14 | Filed as an exhibit to the Company's Current Report on Form 8-K dated February 21, 2008, and incorporated herein by reference. |
SIGNATURES
Pursuant to the requirements of Section 13 or 15(d) of the Securities Exchange Act of 1934, the registrant has duly caused this report to be signed on its behalf by the undersigned, thereunto duly authorized.
| | | | | | AIR METHODS CORPORATION |
| | | | | | |
| | | | | | |
| Date: | | March 12, 2009 | | By: | /s/ Aaron D. Todd |
| | | | | | Aaron D. Todd |
| | | | | | Chief Executive Officer |
Pursuant to the requirements of the Securities Act of 1934, this report has been signed below by the following persons on behalf of the registrant in the capacities and on the date indicated.
| /s/ Aaron D. Todd | | Chief Executive Officer and Director | | March 12, 2009 |
| Aaron D. Todd | | | | |
| | | | | |
| /s/ Trent J. Carman | | Chief Financial Officer | | March 12, 2009 |
| Trent J. Carman | | Secretary and Treasurer | | |
| | | | | |
| /s/ Sharon J. Keck | | Chief Accounting Officer | | March 12, 2009 |
| Sharon J. Keck | | | | |
| | | | | |
| /s/ George W. Belsey | | Chairman of the Board | | March 12, 2009 |
| George W. Belsey | | | | |
| | | | | |
| /s/ Ralph J. Bernstein | | Director | | March 12, 2009 |
| Ralph J. Bernstein | | | | |
| | | | | |
| /s/ Mark D. Carleton | | Director | | March 12, 2009 |
| Mark D. Carleton | | | | |
| | | | | |
| /s/ Samuel H. Gray | | Director | | March 12, 2009 |
| Samuel H. Gray | | | | |
| | | | | |
| /s/ C. David Kikumoto | | Director | | March 12, 2009 |
| C. David Kikumoto | | | | |
| | | | | |
| /s/ Carl H. McNair, Jr. | | Director | | March 12, 2009 |
| Carl H. McNair, Jr. | | | | |
| | | | | |
| /s/ Lowell D. Miller | | Director | | March 12, 2009 |
| Lowell D. Miller, Ph.D. | | | | |
| | | | | |
| /s/ David A. Roehr | | Director | | March 12, 2009 |
| David A. Roehr | | | | |
| | | | | |
| /s/ Morad Tahbaz | | Director | | March 12, 2009 |
| Morad Tahbaz | | | | |
AIR METHODS CORPORATION
AND SUBSIDIARIES
Table of Contents
| Independent Registered Public Accounting Firm’s Reports | F-1 |
| | |
| Consolidated Financial Statements | |
| | | |
| | Consolidated Balance Sheets, | |
| | | |
| | December 31, 2008 and 2007 | F-3 |
| | | |
| | Consolidated Statements of Operations, | |
| | Years Ended December 31, 2008, 2007, and 2006 | F-5 |
| | | |
| | Consolidated Statements of Stockholders' Equity, | |
| | Years Ended December 31, 2008, 2007, and 2006 | F-6 |
| | | |
| | Consolidated Statements of Cash Flows, | |
| | Years Ended December 31, 2008, 2007, and 2006 | F-7 |
| | | |
| | Notes to Consolidated Financial Statements, | |
| | December 31, 2008 and 2007 | F-10 |
| | | |
| Schedules | |
| | | |
| | II – Valuation and Qualifying Accounts | |
| | Years Ended December 31, 2008, 2007, and 2006 | F-32 |
All other supporting schedules are omitted because they are inapplicable, not required, or the information is presented in the consolidated financial statements or notes thereto.
Report of Independent Registered Public Accounting Firm
The Board of Directors and Stockholders
Air Methods Corporation:
We have audited the accompanying consolidated balance sheets of Air Methods Corporation and subsidiaries (the Company) as of December 31, 2008 and 2007, and the related consolidated statements of operations, stockholders’ equity, and cash flows for each of the years in the three-year period ended December 31, 2008. These consolidated financial statements are the responsibility of the Company’s management. Our responsibility is to express an opinion on these consolidated financial statements based on our audits.
We conducted our audits in accordance with the standards of the Public Company Accounting Oversight Board (United States). Those standards require that we plan and perform the audit to obtain reasonable assurance about whether the financial statements are free of material misstatement. An audit includes examining, on a test basis, evidence supporting the amounts and disclosures in the financial statements. An audit also includes assessing the accounting principles used and significant estimates made by management, as well as evaluating the overall financial statement presentation. We believe that our audits provide a reasonable basis for our opinion.
In our opinion, the consolidated financial statements referred to above present fairly, in all material respects, the financial position of Air Methods Corporation and subsidiaries as of December 31, 2008 and 2007, and the results of their operations and their cash flows for each of the years in the three-year period ended December 31, 2008, in conformity with U.S. generally accepted accounting principles.
As discussed in note 1 to the accompanying consolidated financial statements, effective January 1, 2007, the Company adopted Financial Accounting Standards Board (FASB) Interpretation No. 48, Accounting for Uncertainty in Income Taxes.
We also have audited, in accordance with the standards of the Public Company Accounting Oversight Board (United States), Air Methods Corporation’s internal control over financial reporting as of December 31, 2008, based on criteria established in Internal Control – Integrated Framework issued by the Committee of Sponsoring Organizations of the Treadway Commission (COSO), and our report dated March 11, 2009 expressed an unqualified opinion on the effectiveness of the Company’s internal control over financial reporting.
KPMG LLP
Denver, Colorado
March 11, 2009
Report of Independent Registered Public Accounting Firm
The Board of Directors and Stockholders
Air Methods Corporation:
We have audited Air Methods Corporation’s internal control over financial reporting as of December 31, 2008, based on criteria established in Internal Control – Integrated Framework issued by the Committee of Sponsoring Organizations of the Treadway Commission (COSO). Air Methods Corporation’s management is responsible for maintaining effective internal control over financial reporting and for its assessment of the effectiveness of internal control over financial reporting, included in the accompanying Management’s Report on Internal Control over Financial Reporting. Our responsibility is to express an opinion on the Company’s internal control over financial reporting based on our audit.
We conducted our audit in accordance with the standards of the Public Company Accounting Oversight Board (United States). Those standards require that we plan and perform the audit to obtain reasonable assurance about whether effective internal control over financial reporting was maintained in all material respects. Our audit included obtaining an understanding of internal control over financial reporting, assessing the risk that a material weakness exists, and testing and evaluating the design and operating effectiveness of internal control based on the assessed risk. Our audit also included performing such other procedures as we considered necessary in the circumstances. We believe that our audit provides a reasonable basis for our opinion.
A company’s internal control over financial reporting is a process designed to provide reasonable assurance regarding the reliability of financial reporting and the preparation of financial statements for external purposes in accordance with generally accepted accounting principles. A company’s internal control over financial reporting includes those policies and procedures that (1) pertain to the maintenance of records that, in reasonable detail, accurately and fairly reflect the transactions and dispositions of the assets of the company; (2) provide reasonable assurance that transactions are recorded as necessary to permit preparation of financial statements in accordance with generally accepted accounting principles, and that receipts and expenditures of the company are being made only in accordance with authorizations of management and directors of the company; and (3) provide reasonable assurance regarding prevention or timely detection of unauthorized acquisition, use, or disposition of the company’s assets that could have a material effect on the financial statements.
Because of its inherent limitations, internal control over financial reporting may not prevent or detect misstatements. Also, projections of any evaluation of effectiveness to future periods are subject to the risk that controls may become inadequate because of changes in conditions, or that the degree of compliance with the policies or procedures may deteriorate.
In our opinion, Air Methods Corporation maintained, in all material respects, effective internal control over financial reporting as of December 31, 2008, based on criteria established in Internal Control – Integrated Framework issued by the Committee of Sponsoring Organizations of the Treadway Commission.
We also have audited, in accordance with the standards of the Public Company Accounting Oversight Board (United States), the consolidated balance sheets of Air Methods Corporation and subsidiaries as of December 31, 2008 and 2007, and the related consolidated statements of operations, stockholders’ equity, and cash flows for each of the years in the three-year period ended December 31, 2008, and our report dated March 11, 2009, expressed an unqualified opinion on those consolidated financial statements.
KPMG LLP
Denver, Colorado
March 11, 2009
AIR METHODS CORPORATION
AND SUBSIDIARIES
Consolidated Balance Sheets
December 31, 2008 and 2007
(Amounts in thousands, except share and per share amounts)
| | | 2008 | | | 2007 | |
| Assets | | | | | | |
| | | | | | | |
| Current assets: | | | | | | |
| Cash and cash equivalents | | $ | 13,147 | | | | 5,134 | |
| Current installments of notes receivable | | | 753 | | | | 881 | |
| Receivables: | | | | | | | | |
| Trade, net (note 5) | | | 133,467 | | | | 135,633 | |
| Refundable income taxes | | | 2,239 | | | | 20,669 | |
| Other | | | 2,487 | | | | 2,760 | |
| | | | 138,193 | | | | 159,062 | |
| | | | | | | | | |
| Inventories (note 5) | | | 20,283 | | | | 15,241 | |
| Work-in-process on medical interior and products contracts | | | 4,561 | | | | 1,395 | |
| Assets held for sale (note 5) | | | 20,712 | | | | 25,865 | |
| | | | | | | | | |
| Costs and estimated earnings in excess of billings on uncompleted contracts (note 3) | | | 5,840 | | | | 3,457 | |
| Prepaid expenses and other current assets (note 4) | | | 4,259 | | | | 3,822 | |
| | | | | | | | | |
| Total current assets | | | 207,748 | | | | 214,857 | |
| | | | | | | | | |
| Property and equipment (notes 5 and 6): | | | | | | | | |
| Land | | | 251 | | | | 251 | |
| Flight and ground support equipment | | | 206,189 | | | | 179,123 | |
| Buildings and office equipment | | | 27,196 | | | | 16,475 | |
| | | | 233,636 | | | | 195,849 | |
| Less accumulated depreciation and amortization | | | (87,469 | ) | | | (81,103 | ) |
| | | | | | | | | |
| Net property and equipment | | | 146,167 | | | | 114,746 | |
| | | | | | | | | |
| Goodwill (note 2) | | | 20,291 | | | | 20,307 | |
| Notes and other receivables, less current installments | | | 660 | | | | 1,251 | |
| Other assets, net of accumulated amortization of $2,411 and $1,959 at December 31, 2008 and 2007, respectively | | | 20,058 | | | | 18,391 | |
| | | | | | | | | |
| Total assets | | $ | 394,924 | | | | 369,552 | |
(Continued)
AIR METHODS CORPORATION
AND SUBSIDIARIES
Consolidated Balance Sheets, Continued
(Amounts in thousands, except share and per share amounts)
| | | 2008 | | | 2007 | |
| Liabilities and Stockholders' Equity | | | | | | |
| | | | | | | |
| Current liabilities: | | | | | | |
| Notes payable (note 5) | | $ | 19,520 | | | | 24,203 | |
| Current installments of long-term debt (note 5) | | | 14,156 | | | | 17,250 | |
| Current installments of obligations under capital leases (note 6) | | | 1,482 | | | | 1,100 | |
| Accounts payable | | | 13,892 | | | | 14,970 | |
| Deferred revenue | | | 6,710 | | | | 6,321 | |
| Billings in excess of costs and estimated earnings on uncompleted contracts (note 3) | | | 990 | | | | 1,621 | |
| Accrued wages and compensated absences | | | 10,422 | | | | 11,782 | |
| Accrued lease costs for assets held for sale (note 2) | | | -- | | | | 6,331 | |
| Due to third party payers | | | 3,559 | | | | 3,901 | |
| Deferred income taxes (note 10) | | | 9,340 | | | | 3,030 | |
| Other accrued liabilities | | | 11,715 | | | | 11,590 | |
| | | | | | | | | |
| Total current liabilities | | | 91,786 | | | | 102,099 | |
| | | | | | | | | |
| Long-term debt, less current installments (note 5) | | | 83,784 | | | | 75,611 | |
| Obligations under capital leases, less current installments (note 6) | | | 2,074 | | | | 1,140 | |
| Deferred income taxes (note 10) | | | 29,158 | | | | 28,159 | |
| Other liabilities | | | 27,658 | | | | 20,523 | |
| | | | | | | | | |
| Total liabilities | | | 234,460 | | | | 227,532 | |
| | | | | | | | | |
| Stockholders’ equity (notes 7 and 8): | | | | | | | | |
Preferred stock, $1 par value. Authorized 5,000,000 shares, none issued | | | -- | | | | -- | |
| Common stock, $.06 par value. Authorized 16,000,000 shares; issued 12,284,679 and 12,136,879 shares at December 31, 2008 and 2007, respectively | | | 737 | | | | 728 | |
| Additional paid-in capital | | | 80,717 | | | | 76,698 | |
| Treasury stock at cost, 227,917 shares at December 31, 2008 | | | (4,853 | ) | | | -- | |
| Retained earnings | | | 83,863 | | | | 64,594 | |
| | | | | | | | | |
| Total stockholders' equity | | | 160,464 | | | | 142,020 | |
| Commitments and contingencies (notes 5, 6, 11, and 12) | | | | | | | | |
| Total liabilities and stockholders' equity | | $ | 394,924 | | | | 369,552 | |
See accompanying notes to consolidated financial statements.
Consolidated Statements of Operations
Years Ended December 31, 2008, 2007, and 2006
(Amounts in thousands, except share and per share amounts)
| | | Year Ended December 31 | |
| | | 2008 | | | 2007 | | | 2006 | |
| Revenue: | | | | | | | | | |
| Flight revenue, net (note 9) | | $ | 485,184 | | | | 386,377 | | | | 313,879 | |
| Sales of medical interiors and products | | | 13,618 | | | | 9,972 | | | | 5,625 | |
| | | | 498,802 | | | | 396,349 | | | | 319,504 | |
| Operating expenses: | | | | | | | | | | | | |
| Flight centers | | | 209,706 | | | | 163,734 | | | | 133,796 | |
| Aircraft operations (note 4) | | | 117,523 | | | | 80,214 | | | | 74,872 | |
| Aircraft rental (note 6) | | | 47,389 | | | | 28,515 | | | | 21,591 | |
| Cost of medical interiors and products sold | | | 9,737 | | | | 7,190 | | | | 2,706 | |
| Depreciation and amortization | | | 17,090 | | | | 14,418 | | | | 12,910 | |
| Gain on disposition of assets, net | | | (2,855 | ) | | | (647 | ) | | | (231 | ) |
| Litigation settlement | | | -- | | | | -- | | | | (1,417 | ) |
| General and administrative | | | 67,480 | | | | 53,298 | | | | 40,710 | |
| | | | 466,070 | | | | 346,722 | | | | 284,937 | |
| Operating income | | | 32,732 | | | | 49,627 | | | | 34,567 | |
| Other income (expense): | | | | | | | | | | | | |
| Interest expense | | | (5,197 | ) | | | (5,609 | ) | | | (5,821 | ) |
| Loss on extinguishment of debt | | | -- | | | | (757 | ) | | | -- | |
| Other, net | | | 2,943 | | | | 2,187 | | | | 1,598 | |
| | | | | | | | | | | | | |
| Income before income taxes | | | 30,478 | | | | 45,448 | | | | 30,344 | |
| | | | | | | | | | | | | |
| Income tax expense (note 10) | | | (11,209 | ) | | | (17,911 | ) | | | (13,144 | ) |
| | | | | | | | | | | | | |
| Net income | | $ | 19,269 | | | | 27,537 | | | | 17,200 | |
| | | | | | | | | | | | | |
| Income per common share (note 7): | | | | | | | | | | | | |
| Basic | | $ | 1.59 | | | | 2.30 | | | | 1.46 | |
| Diluted | | $ | 1.54 | | | | 2.20 | | | | 1.40 | |
| | | | | | | | | | | | | |
| Weighted average number of common shares outstanding: | | | | | | | | | | | | |
| Basic | | | 12,155,144 | | | | 11,953,871 | | | | 11,748,107 | |
| Diluted | | | 12,530,381 | | | | 12,512,077 | | | | 12,306,047 | |
See accompanying notes to consolidated financial statements.
AIR METHODS CORPORATION
AND SUBSIDIARIES
Consolidated Statements of Stockholders' Equity
Years Ended December 31, 2008, 2007, and 2006
(Amounts in thousands, except share amounts)
| | | Common Stock | | | Treasury Stock | | | Additional Paid-in | | | Retained | | | Total Stock-holders’ | |
| | | Shares | | | Amount | | | Shares | | | Amount | | | Capital | | | Earnings | | | Equity | |
| | | | | | | | | | | | | | | | | | | | | | |
| Balances at January 1, 2006 | | | 11,605,590 | | | $ | 696 | | | | -- | | | $ | -- | | | | 66,219 | | | | 19,296 | | | | 86,211 | |
| | | | | | | | | | | | | | | | | | | | | | | | | | | | | |
| Issuance of common shares for options and warrants exercised | | | 269,023 | | | | 16 | | | | -- | | | | -- | | | | 2,020 | | | | -- | | | | 2,036 | |
| Tax benefit from exercise of stock options | | | -- | | | | -- | | | | -- | | | | -- | | | | 1,425 | | | | -- | | | | 1,425 | |
| Stock-based compensation (note 8) | | | -- | | | | -- | | | | -- | | | | -- | | | | 442 | | | | -- | | | | 442 | |
| Net income | | | -- | | | | -- | | | | -- | | | | -- | | | | -- | | | | 17,200 | | | | 17,200 | |
| | | | | | | | | | | | | | | | | | | | | | | | | | | | | |
| Balances at December 31, 2006 | | | 11,874,613 | | | | 712 | | | | -- | | | | -- | | | | 70,106 | | | | 36,496 | | | | 107,314 | |
| | | | | | | | | | | | | | | | | | | | | | | | | | | | | |
| Issuance of common shares for options and warrants exercised | | | 262,266 | | | | 16 | | | | -- | | | | -- | | | | 2,619 | | | | -- | | | | 2,635 | |
| Tax benefit from exercise of stock options | | | -- | | | | -- | | | | -- | | | | -- | | | | 2,139 | | | | -- | | | | 2,139 | |
| Stock-based compensation (note 8) | | | -- | | | | -- | | | | -- | | | | -- | | | | 1,834 | | | | -- | | | | 1,834 | |
| Adoption of FIN 48 (note 10) | | | -- | | | | -- | | | | -- | | | | -- | | | | -- | | | | 561 | | | | 561 | |
| Net income | | | -- | | | | -- | | | | -- | | | | -- | | | | -- | | | | 27,537 | | | | 27,537 | |
| | | | | | | | | | | | | | | | | | | | | | | | | | | | | |
| Balances at December 31, 2007 | | | 12,136,879 | | | | 728 | | | | -- | | | | -- | | | | 76,698 | | | | 64,594 | | | | 142,020 | |
| | | | | | | | | | | | | | | | | | | | | | | | | | | | | |
| Issuance of common shares for options and warrants exercised | | | 109,000 | | | | 7 | | | | -- | | | | -- | | | | 1,309 | | | | -- | | | | 1,316 | |
| Tax benefit from exercise of stock options | | | -- | | | | -- | | | | -- | | | | -- | | | | 506 | | | | -- | | | | 506 | |
| Stock-based compensation (note 8) | | | 22,500 | | | | 2 | | | | -- | | | | -- | | | | 2,204 | | | | -- | | | | 2,206 | |
| Unvested restricted stock | | | 16,300 | | | | -- | | | | -- | | | | -- | | | | -- | | | | -- | | | | -- | |
| Purchase of treasury shares | | | -- | | | | -- | | | | 227,917 | | | | (4,853 | ) | | | -- | | | | -- | | | | (4,853 | ) |
| Net income | | | -- | | | | -- | | | | -- | | | | -- | | | | -- | | | | 19,269 | | | | 19,269 | |
| | | | | | | | | | | | | | | | | | | | | | | | | | | | | |
| Balances at December 31, 2008 | | | 12,284,679 | | | $ | 737 | | | | 227,917 | | | $ | (4,853 | ) | | | 80,717 | | | | 83,863 | | | | 160,464 | |
See accompanying notes to consolidated financial statements.
Consolidated Statements of Cash Flows
Years Ended December 31, 2008, 2007, and 2006
| | | Year Ended December 31 | |
| | | 2008 | | | 2007 | | | 2006 | |
| Cash flows from operating activities: | | | | | | | | | |
| Net income | | $ | 19,269 | | | | 27,537 | | | | 17,200 | |
| Adjustments to reconcile net income to net cash provided by operating activities: | | | | | | | | | | | | |
| Depreciation and amortization expense | | | 17,090 | | | | 14,418 | | | | 12,910 | |
| Deferred income tax expense | | | 7,048 | | | | 12,754 | | | | 1,777 | |
| Stock-based compensation | | | 2,206 | | | | 1,834 | | | | 442 | |
| Tax benefit from exercise of stock options | | | (506 | ) | | | (2,139 | ) | | | (1,425 | ) |
| Loss on extinguishment of debt | | | -- | | | | 757 | | | | -- | |
| Gain on disposition of assets | | | (2,855 | ) | | | (647 | ) | | | (231 | ) |
| Unrealized loss on derivative instrument | | | 128 | | | | -- | | | | -- | |
| Changes in operating assets and liabilities, net of effects of acquisitions: | | | | | | | | | | | | |
| Decrease (increase) in receivables | | | 17,924 | | | | (22,205 | ) | | | (20,239 | ) |
| Increase in inventories | | | (5,010 | ) | | | (875 | ) | | | (1,622 | ) |
| Decrease (increase) in prepaid expenses and other current assets | | | (575 | ) | | | (212 | ) | | | 806 | |
| Decrease (increase) in work-in-process on medical interior and products contracts and costs in excess of billings | | | (5,549 | ) | | | 156 | | | | (698 | ) |
| Increase (decrease) in accounts payable, other accrued liabilities, and other liabilities | | | 3,186 | | | | (7,204 | ) | | | 1,514 | |
| Increase (decrease) in deferred revenue and billings in excess of costs | | | (242 | ) | | | 2,930 | | | | (1,587 | ) |
| Net cash provided by operating activities | | | 52,114 | | | | 27,104 | | | | 8,847 | |
| | | | | | | | | | | | | |
| | | | | | | | | | | | | |
| Cash flows from investing activities: | | | | | | | | | | | | |
| Acquisition of net assets of FSS Airholdings, Inc. (note 2) | | | -- | | | | (25,000 | ) | | | -- | |
| Acquisition of property and equipment | | | (60,783 | ) | | | (25,283 | ) | | | (13,744 | ) |
| Proceeds from disposition and sale of equipment and assets held for sale | | | 16,900 | | | | 12,530 | | | | 2,262 | |
| Increase in notes and other receivables and other assets, net | | | (702 | ) | | | (3,462 | ) | | | (315 | ) |
| | | | | | | | | | | | | |
| Net cash used by investing activities | | | (44,585 | ) | | | (41,215 | ) | | | (11,797 | ) |
(Continued)
Consolidated Statements of Cash Flows, continued
| | | Year Ended December 31 | |
| | | 2008 | | | 2007 | | | 2006 | |
| Cash flows from financing activities: | | | | | | | | | |
| Proceeds from issuance of common stock | | $ | 1,316 | | | | 2,635 | | | | 2,036 | |
| Payments for purchases of common stock | | | (4,853 | ) | | | -- | | | | -- | |
| Tax benefit from exercise of stock options | | | 506 | | | | 2,139 | | | | 1,425 | |
| Net borrowings under lines of credit | | | 2,646 | | | | 1,277 | | | | 8,480 | |
| Proceeds from long-term debt | | | 21,547 | | | | 54,373 | | | | 4,680 | |
| Payments for debt issuance costs | | | (212 | ) | | | (706 | ) | | | (138 | ) |
| Payments of long-term debt | | | (19,114 | ) | | | (43,274 | ) | | | (11,621 | ) |
| Debt retirement costs | | | -- | | | | (112 | ) | | | -- | |
| Payments of capital lease obligations | | | (1,352 | ) | | | (1,306 | ) | | | (911 | ) |
| Net cash provided by financing activities | | | 484 | | | | 15,026 | | | | 3,951 | |
| Increase in cash and cash equivalents | | | 8,013 | | | | 915 | | | | 1,001 | |
| | | | | | | | | | | | | |
| Cash and cash equivalents at beginning of year | | | 5,134 | | | | 4,219 | | | | 3,218 | |
| | | | | | | | | | | | | |
| Cash and cash equivalents at end of year | | $ | 13,147 | | | | 5,134 | | | | 4,219 | |
| | | | | | | | | | | | | |
| Interest paid in cash during the year | | $ | 5,080 | | | | 5,832 | | | | 5,375 | |
| Income taxes paid in cash during the year | | $ | 2,771 | | | | 20,109 | | | | 15,142 | |
(Continued)
AIR METHODS CORPORATION
AND SUBSIDIARIES
Consolidated Statements of Cash Flows, continued
(Amounts in thousands, except share amounts)
Non-cash investing and financing activities:
In the year ended December 31, 2008, the Company entered into capital lease obligations of $2,668 to finance the purchase of equipment.
In the year ended December 31, 2008, the Company settled notes payable of $24,203 in exchange for the aircraft securing the debt. The Company also entered into notes payable of $19,520 to finance the purchase of aircraft which are held for sale as of December 31, 2008.
In the year ended December 31, 2008, the Company made adjustments to the preliminary purchase price allocation related to the acquisition of FSS Airholdings, Inc., which decreased goodwill by $16. See Note 2 for further detail on the adjustments.
In the year ended December 31, 2007, the Company wrote off $645 in debt origination costs related to the refinancing of certain term loans and its line of credit.
In the year ended December 31, 2007, the Company entered into capital lease obligations of $552 to finance the purchase of equipment.
In the year ended December 31, 2007, the Company settled notes payable of $9,560 in exchange for the aircraft securing the debt. The Company also entered into notes payable of $24,203 to finance the purchase of aircraft which were held for sale as of December 31, 2007.
As described in note 10, effective January 1, 2007, the Company implemented FASB Interpretation No. 48 (FIN 48), Accounting for Uncertainty in Income Taxes, resulting in an increase of $561 in deferred tax assets and in the January 1, 2007, balance of retained earnings.
In the year ended December 31, 2006, the Company settled notes payable of $6,446 in exchange for the aircraft securing the debt. The Company also entered into notes payable of $9,560 to finance the purchase of aircraft which were held for sale as of December 31, 2006.
In the year ended December 31, 2006, the Company entered into a note payable of $673 to finance insurance policies and into capital lease obligations of $2,560 to finance the purchase of equipment.
See accompanying notes to consolidated financial statements.
AIR METHODS CORPORATION
AND SUBSIDIARIES
Notes to Consolidated Financial Statements
| (1) | Summary of Significant Accounting Policies |
Basis of Financial Statement Presentation and Business
Air Methods Corporation, a Delaware corporation, and its subsidiaries (Air Methods or the Company) serves as the largest provider of air medical emergency transport services and systems throughout the United States of America. The Company also designs, manufactures, and installs medical aircraft interiors and other aerospace and medical transport products for domestic and international customers. As discussed more fully in Note 2, in October 2007, the Company acquired all of the outstanding stock of FSS Airholdings, Inc. (FSS), the parent company of CJ Systems Aviation Group (CJ). FSS, Rocky Mountain Holdings, LLC (RMH), Mercy Air Service, Inc. (Mercy Air), and LifeNet, Inc. (LifeNet) operate as wholly-owned subsidiaries of Air Methods. LifeNet was formerly known as ARCH Air Medical Service, Inc. All significant intercompany balances and transactions have been eliminated in consolidation.
The preparation of financial statements in conformity with accounting principles generally accepted in the United States of America requires management to make estimates and assumptions that affect the reported amounts of assets and liabilities and disclosure of contingent assets and liabilities at the date of the financial statements and the reported amounts of revenue and expenses during the reporting period. The Company considers its critical accounting policies involving more significant judgments and estimates to be those related to revenue recognition, deferred income taxes, and valuation of long-lived assets and goodwill. Actual results could differ from those estimates.
Cash and Cash Equivalents
For purposes of the consolidated statements of cash flows, the Company considers all highly liquid instruments with original maturities of three months or less to be cash equivalents. Cash equivalents of $11,258,000 and $3,007,000 at December 31, 2008 and 2007, respectively, consist of short-term money market funds.
Trade Receivables, net
Trade receivables are presented net of allowances for contractual discounts and uncompensated care. The Company determines its allowances for contractual discounts and uncompensated care based on payer mix, payer reimbursement schedules, and historical collection experience. The allowances are reviewed monthly and adjusted periodically based on actual collections. Billings are charged off against the uncompensated care allowance when it is probable that the receivable will not be recovered. Billings in excess of actual payment are charged off against the contractual allowance when payment is received. The allowance for uncompensated care is related primarily to receivables recorded for self-pay patients. The allowances for contractual discounts and uncompensated care are as follows at December 31 (amounts in thousands):
| | | 2008 | | | 2007 | |
| | | | | | | |
| Allowance for contractual discounts | | $ | 50,631 | | | | 40,187 | |
| Allowance for uncompensated care | | | 54,118 | | | | 51,031 | |
| Total | | $ | 104,749 | | | | 91,218 | |
AIR METHODS CORPORATION
AND SUBSIDIARIES
Notes to Consolidated Financial Statements, Continued
| (1) | Summary of Significant Accounting Policies, continued |
Inventories
Inventories are comprised primarily of expendable aircraft parts which are recorded at the lower of cost (average cost) or market.
Work-in-Process on Medical Interior and Products Contracts
Work-in-process on medical interior and products contracts represents costs to manufacture and install medical equipment and modify aircraft for third parties. When the total cost to complete a project can be reasonably estimated, revenue is recorded as costs are incurred using the percentage of completion method of accounting. Losses on contracts in process are recognized when determined.
Property and Equipment
Hangars, equipment, and leasehold improvements are recorded at cost. All maintenance and repairs, including scheduled aircraft component overhauls and replacements, are expensed when incurred. Major modifications and costs incurred to place aircraft in service are capitalized. Improvements to helicopters and airplanes leased under operating leases are included in flight and ground support equipment in the accompanying financial statements. Leasehold improvements to hangar and office space are included in buildings and office equipment in the accompanying financial statements. Depreciation is computed using the straight-line method over the shorter of the useful lives of the equipment or the lease term, as follows:
| Description | | Lives | | Estimated Residual value | |
| Buildings, including hangars | | 40 years | | | 10 | % |
| Helicopters, including medical equipment | | 8 – 25 years | | | 10 - 25 | % |
| Ground support equipment and rotables | | 5 – 10 years | | | 0 - 10 | % |
| Furniture and office equipment | | 3 – 10 years | | | 0 | % |
Intangible Assets - Supplemental Type Certificates
The Company capitalizes incremental direct costs related to the application for multiple Supplemental Type Certificates (STC’s). STC’s are issued by the Federal Aviation Administration (FAA) and represent the FAA’s approval and certification of the airworthiness of an aircraft modification, such as a medical interior. A multiple STC allows the modification to be made to more than one aircraft without additional certification. STC costs are amortized using the straight-line method over the estimated useful economic life of the STC, typically five years.
Goodwill
The Company accounts for goodwill under Financial Accounting Standards Board (FASB) Statement No. 142, Accounting for Goodwill and Intangible Assets (Statement 142). Under Statement 142, goodwill and certain identifiable intangible assets are not amortized, but instead are reviewed for impairment at least annually in accordance with the provisions of the statement. In 2008, the Company recorded net adjustments of $16,000 to decrease goodwill related to the acquisition of FSS (as described more fully in Note 2) and did not recognize any losses related to impairment of existing goodwill.
AIR METHODS CORPORATION
AND SUBSIDIARIES
Notes to Consolidated Financial Statements, Continued
| (1) | Summary of Significant Accounting Policies, continued |
Derivative Instruments
The Company accounts for derivative financial instruments under FASB Statement No. 133, Accounting for Derivative Instruments and Hedging Activities (Statement 133), as amended and interpreted. Statement 133 requires the Company to measure all derivatives at fair value and to recognize them in the balance sheet as an asset or liability. Changes in fair value of derivative instruments not designated as hedging instruments are recognized in earnings in the current period. As of December 31, 2008, the Company’s one derivative instrument was not designated as a hedging instrument. Changes in the fair value of the fuel derivative instrument are reflected in fuel expense, included in aircraft operations expense, in the statement of operations.
Long-lived Assets
The Company periodically reviews long-lived assets, including intangible assets, for impairment whenever events or changes in circumstances indicate that the carrying amount of an asset may not be recoverable. Recoverability of long-lived assets is measured by a comparison of the carrying amount of an asset to future net cash flows expected to be generated by the asset. No impairment has been recognized in the accompanying consolidated financial statements.
Assets to be disposed of are reported at the lower of the carrying amount or fair value less estimated selling costs. As of December 31, 2008, assets held for sale consisted of nine aircraft, which the Company intends to sell within one year. Related debt is classified as short-term notes payable in the consolidated financial statements. Six of the aircraft are expected to be sold and leased back under operating leases. Periodically the Company identifies aircraft to be sold or used for spare parts as part of its long-term plan to phase out certain older models of aircraft and replace them with newer models.
Revenue Recognition
Fixed fee revenue under the Company's operating agreements with hospitals is recognized monthly over the terms of the agreements.
Revenue relating to emergency flights is recognized upon completion of the services and is recorded net of provisions for contractual discounts and estimated uncompensated care. Provisions for contractual discounts and estimated uncompensated care as a percentage of related gross billings are as follows:
| | | 2008 | | | 2007 | | | 2006 | |
| | | | | | | | | | |
| Gross billings | | | 100 | % | | | 100 | % | | | 100 | % |
| Provision for contractual discounts | | | 35 | % | | | 32 | % | | | 29 | % |
| Provision for uncompensated care | | | 20 | % | | | 19 | % | | | 20 | % |
AIR METHODS CORPORATION
AND SUBSIDIARIES
Notes to Consolidated Financial Statements, Continued
| (1) | Summary of Significant Accounting Policies, continued |
The Company has from time to time experienced delays in reimbursement from third-party payers. In addition, third-party payers may disallow, in whole or in part, claims for reimbursement based on determinations that certain amounts are not reimbursable under plan coverage, determinations of medical necessity, or the need for additional information. Laws and regulations governing the Medicare and Medicaid programs are very complex and subject to interpretation. The Company also provides services to patients who have no insurance or other third-party payer coverage. As a result, there is a reasonable possibility that recorded estimates will change materially in the short-term. Retroactive adjustments may change the amounts realized from third-party payers and are considered in the recognition of revenue on an estimated basis in the period the related services are rendered. Such amounts are adjusted in future periods, as adjustments become known.
Stock-based Compensation
The Company accounts for its stock-based compensation under FASB Statement No. 123R (Statement 123R), Share-Based Payment, an amendment of FASB Statement No. 123. Statement 123R requires recognition in the income statement of the grant-date fair value of stock options and other equity-based compensation issued to employees.
Income Taxes
Deferred tax assets and liabilities are recognized for future income tax consequences attributable to differences between the financial statement carrying amounts of existing assets and liabilities and their respective tax bases and operating loss and tax credit carryforwards. Deferred tax assets and liabilities are measured using enacted tax rates expected to apply to taxable income in the years in which those temporary differences are expected to be recovered or settled. The effect on deferred income tax assets and liabilities of a change in tax rates is recognized in income in the period that includes the enactment date.
Effective January 1, 2007, the Company adopted the provisions of FASB Interpretation No. 48 (FIN 48), Accounting for Uncertainty in Income Taxes. FIN 48 prescribes a recognition threshold and measurement attribute for recognition and measurement of a tax position taken or expected to be taken in a tax return. As a result of adopting FIN 48, the Company recognized an increase of $561,000 in deferred tax assets, which was accounted for as an increase to the January 1, 2007, balance of retained earnings.
Income Per Share
Basic earnings per share is computed by dividing net income by the weighted average number of common shares outstanding during the period. Diluted earnings per share is computed by dividing net income by all outstanding and potentially dilutive common shares during the period.
AIR METHODS CORPORATION
AND SUBSIDIARIES
Notes to Consolidated Financial Statements, Continued
| (1) | Summary of Significant Accounting Policies, continued |
Fair Value of Financial Instruments
The following methods and assumptions were used to estimate the fair value of each class of financial instruments:
Cash and cash equivalents, accounts receivable, notes payable, accounts payable, and accrued liabilities:
The carrying amounts approximate fair value because of the short maturity of these instruments.
Notes receivable and long-term debt:
The Company believes that the overall effective interest rates on these instruments approximate fair value in the aggregate.
New Accounting Standards
In February 2007, the Financial Accounting Standards Board (FASB) issued FASB Statement No. 159, The Fair Value Option for Financial Assets and Financial Liabilities (Statement 159), which provides an option to report selected financial assets and liabilities at fair value and establishes presentation and disclosure requirements. Statement 159 permits an election to measure eligible items at fair value on an instrument-by-instrument basis and then report unrealized gains and losses for those items in earnings. The implementation of Statement 159 effective January 1, 2008, did not have a material effect on the Company’s financial position or results of operations because the Company did not elect to measure any eligible items at fair value.
In December 2007 the FASB issued FASB Statement No. 141 (revised 2007), Business Combinations, (Statement 141R). Statement 141R establishes principles and requirements for recognizing and measuring assets acquired (including goodwill), liabilities assumed, and any noncontrolling interest acquired in a business combination. Statement 141R also provides guidance regarding information to be disclosed to enable users of the financial statements to evaluate the nature and financial effects of the business combination. Statement 141R applies prospectively to business combinations for which the acquisition date is on or after the beginning of the first annual reporting period beginning on or after December 15, 2008. The Company does not expect the adoption of this statement to have a material impact on its financial position or results of operations.
In April 2008 the FASB issued FASB Staff Position No. FAS 142-3, Determination of the Useful Life of Intangible Assets (FSP FAS 142-3). FSP FAS 142-3 removes the requirement under FASB Statement No. 142, Goodwill and Other Intangible Assets, to consider whether an intangible asset can be renewed without substantial cost or material modifications to the existing terms and conditions and instead requires an entity to consider its own historical experience in renewing similar arrangements. This FSP is effective for fiscal years beginning after December 15, 2008, and interim periods within those fiscal years. The Company does not expect the adoption of this statement to have a material impact on its financial position or results of operations.
AIR METHODS CORPORATION
AND SUBSIDIARIES
Notes to Consolidated Financial Statements, Continued
| (1) | Summary of Significant Accounting Policies, continued |
In March 2008 the FASB issued FASB Statement No. 161 (Statement 161), Disclosures about Derivative Instruments and Hedging Activities, An Amendment of FASB No. 133. Statement 161 amends and expands the disclosure requirements of Statement 133 and requires qualitative disclosures about objectives and strategies for using derivative instruments, quantitative disclosures about fair value amounts of derivative instruments and related gains and losses, and disclosures about credit-risk-related contingent features in derivative agreements. Statement 161 is effective for fiscal years and interim periods beginning after November 15, 2008. The statement provides only for enhanced disclosures. Therefore, the Company does not expect the adoption of this statement to have a material impact on its financial position or results of operations.
In May 2008 the FASB issued FASB Statement No. 162 (Statement 162), Hierarchy of Generally Accepted Accounting Principles. Statement 162 identifies the sources of accounting principles and the framework for selecting the principles used in the preparation of financial statements and was effective November 15, 2008. Adoption of this statement did not have an impact on the Company’s financial position or results of operations, since this new standard codified, rather than changed, existing generally accepted accounting principles.
| (2) | Acquisition of Subsidiary |
On October 1, 2007, the Company acquired all of the outstanding stock of FSS for total consideration of $25 million. The Company also incurred $179,000 in costs related to the transaction, primarily consisting of legal fees and payments to third party consultants. The purchase price was financed through borrowings under the Company’s Revolving Credit, Term Loan and Security Agreement with a commercial bank group. The Company assumed $11,169,000 of CJ’s long-term debt, $10,337,000 of which was paid off immediately following the acquisition. The purchase agreement further provides that any tax benefit realized by the Company from the use of certain net operating loss carryforwards generated by FSS prior to the acquisition will be paid to the former owners of FSS as additional consideration. The Company established a liability of $1,503,000 for the amounts expected to be owed under this provision. The results of FSS’s operations have been included with those of the Company since October 1, 2007.
The allocation of the purchase price was as follows (amounts in thousands):
| | | Preliminary Allocation | | | Adjustments | | | Revised Allocation | |
| Assets purchased: | | | | | | | | | |
| Receivables | | $ | 28,763 | | | | (2,945 | ) | | | 25,818 | |
| Equipment and other property | | | 14,490 | | | | (369 | ) | | | 14,121 | |
| Aircraft | | | 5,589 | | | | -- | | | | 5,589 | |
| Inventory | | | 3,547 | | | | -- | | | | 3,547 | |
| Goodwill | | | 13,722 | | | | (16 | ) | | | 13,706 | |
| Other | | | 11,243 | | | | 15 | | | | 11,258 | |
| | | | 77,354 | | | | (3,315 | ) | | | 74,039 | |
| Long-term debt | | | (11,169 | ) | | | -- | | | | (11,169 | ) |
| Other liabilities assumed | | | (41,006 | ) | | | 3,315 | | | | (37,691 | ) |
| Total liabilities assumed | | | (52,175 | ) | | | 3,315 | | | | (48,860 | ) |
| Purchase price | | $ | 25,179 | | | | -- | | | | 25,179 | |
AIR METHODS CORPORATION
AND SUBSIDIARIES
Notes to Consolidated Financial Statements, Continued
| (2) | Acquisition of Subsidiary, continued |
Adjustments to the purchase price allocation included revised estimates of the fair value of certain receivables and of liabilities related to aircraft repair costs. Revisions were based upon clarification of the payer mix comprising CBS receivables and obtaining historical collection data as of the acquisition date. In addition, the Company verified open account balances with HBS customers and open repair orders and warranty claims with aircraft parts vendors.
The Company also made revisions to the purchase price allocation based on changes to its plan for CJ aircraft targeted for disposition. At acquisition, the Company identified fourteen CJ aircraft subject to operating leases which it intended to sell within one year. One was sold during 2007. As of December 31, 2007, the liability for lease expense through the expected sales dates and the expected difference between the estimated sales prices and the lease buyouts was $6,331,000. During the year ended December 31, 2008, the liability was reduced by lease payments of $869,000. Three of the aircraft were sold during the period, and two were acquired from the leasing companies. During the third quarter of 2008, the Company determined that the remaining eight aircraft were necessary to support current operations and would not be sold within the original one-year period. The aircraft were used to support base expansions while new aircraft were still in the process of being retrofitted for service and to respond to the request from the Federal Emergency Management Agency to deploy up to 25 aircraft in response to hurricanes along the Gulf Coast during the third quarter of 2008. Based on the decision to use these aircraft in current operations, the remaining amount of lease payments reserved and the estimated loss accrued in purchase accounting totaling $3,570,000 related to these eight aircraft was reversed with a corresponding reduction in goodwill in 2008.
At the acquisition date, the Company identified administrative positions within CJ which would be eliminated or transferred from CJ’s headquarters in Pittsburgh, PA, to the Company’s headquarters in Denver, Colorado, within one year and recorded a liability of approximately $150,000 for severance and relocation as part of the purchase price allocation. The liability was settled in full during 2008.
| (3) | Costs in Excess of Billings and Billings in Excess of Costs |
As of December 31, 2008, the estimated period to complete contracts in process ranges from one to 21 months, and the Company expects to collect all related accounts receivable and costs and estimated earnings in excess of billings on uncompleted contracts within one year. The following summarizes contracts in process at December 31 (amounts in thousands):
| | | 2008 | | | 2007 | |
| | | | | | | |
| Costs incurred on uncompleted contracts | | $ | 14,749 | | | | 8,265 | |
| Estimated contribution to earnings | | | 5,210 | | | | 3,390 | |
| | | | 19,959 | | | | 11,655 | |
| Less billings to date | | | (15,109 | ) | | | (9,819 | ) |
| Costs and estimated earnings in excess of billings, net | | $ | 4,850 | | | | 1,836 | |
AIR METHODS CORPORATION
AND SUBSIDIARIES
Notes to Consolidated Financial Statements, Continued
| (4) | Derivative Instruments |
In November 2008, the Company entered into a financial derivative agreement to protect against increases in the cost of Gulf Coast jet fuel above $2.35 per gallon for wholesale purchases. The agreement is effective for fuel purchases from January 1, 2009, through December 31, 2009, for a notional quantity of 60,000 barrels of jet fuel. The premium of $365,000 paid under the agreement is included in prepaid expenses and other current assets on the Company’s balance sheet. This agreement does not qualify for hedge accounting under Statement 133, and, therefore, realized and non-cash mark to market adjustments are included in fuel expense within aircraft operations expense. Aircraft operations expense for the year ended December 31, 2008, includes a non-cash mark to market derivative loss of $128,000. This loss reduced the amount included in other current assets to $237,000. There were no cash settlements under the terms of the agreement in 2008. As of December 31, 2008, the Gulf Coast jet fuel spot price was approximately $0.24 per gallon lower than it was at the date of the agreement.
| (5) | Notes Payable and Long-term Debt |
Short-term notes payable of $19,520,000 as of December 31, 2008, consist of six notes with an aircraft manufacturer for the purchase of six aircraft. The notes are non-interest-bearing and mature in the first quarter of 2009. The six aircraft collateralizing the notes are expected to be sold and leased back under operating leases and are classified in the consolidated financial statements as assets held for sale.
AIR METHODS CORPORATION
AND SUBSIDIARIES
Notes to Consolidated Financial Statements, Continued
| (5) | Notes Payable and Long-term Debt, continued |
Long-term debt consists of the following at December 31 (amounts in thousands):
| | | 2008 | | | 2007 | |
| Term loan with monthly interest payments and quarterly installments of principal with all remaining principal due in 2012. Weighted average interest rate at December 31, 2008, is 3.00%. | | $ | 44,645 | | | | 50,000 | |
| Borrowings under revolving credit facility with monthly interest payments and all principal due in 2012. Weighted average interest rate at December 31, 2008, is 3.25%. | | | 19,258 | | | | 16,612 | |
| Note payable with interest at 6.60%, due in monthly installments of principal and interest with all remaining principal due in 2009, collateralized by aircraft | | | 1,901 | | | | 2,587 | |
| Notes payable with interest rates from 5.80% to 8.49%. Paid in full in 2008. | | | -- | | | | 6,387 | |
| Note payable with interest at LIBOR plus 2.50%. Paid in full in 2008. | | | -- | | | | 765 | |
| Note payable with interest rate at 6.46%, due in monthly installments of principal and interest with all remaining principal due in 2011, collateralized by aircraft | | | 1,367 | | | | 1,648 | |
| Note payable with interest rate at 5.60%, due in monthly installments of principal and interest with all remaining principal due in 2010, collateralized by aircraft | | | 2,026 | | | | 3,224 | |
| Notes payable with interest rates from 5.08% to 6.70%, due in monthly installments of principal and interest at various dates through 2015, collateralized by aircraft and other flight equipment | | | 10,120 | | | | 7,348 | |
| Note payable with interest rate at 6.11%, due in monthly installments of principal and interest with all remaining principal due in 2012, collateralized by aircraft | | | 2,655 | | | | 2,780 | |
| Note payable with interest rate at 6.99%, due in monthly installments of principal and interest with all remaining principal due in 2017, collateralized by aircraft | | | 1,421 | | | | 1,510 | |
| Notes payable with interest rates from 5.48% to 5.66%, due in monthly installments of principal and interest with all remaining principal due in 2013, collateralized by aircraft | | | 8,716 | | | | -- | |
| Note payable with interest rate at 4.92%, due in monthly installments of principal and interest with all remaining principal due in 2018, collateralized by real estate | | | 5,831 | | | | -- | |
| | | | 97,940 | | | | 92,861 | |
| Less current installments | | | (14,156 | ) | | | (17,250 | ) |
| | | $ | 83,784 | | | | 75,611 | |
AIR METHODS CORPORATION
AND SUBSIDIARIES
Notes to Consolidated Financial Statements, Continued
| (5) | Notes Payable and Long-term Debt, continued |
The Company’s senior credit facility consists of term loans with a balance of $44,645,000 as of December 31, 2008, and a revolving credit facility. As of December 31, 2008, the Company had $19,258,000 outstanding against the $50 million revolving credit facility and available capacity on the facility of $29,242,000. At December 31, 2008, pursuant to its debt covenants, the Company is limited to additional borrowings under the revolving credit facility of approximately $6.0 million. The amount of the limitation on additional borrowings will change based upon future operating results, asset purchases, and assets sales. The capacity available on the revolving credit facility is reduced by two outstanding letters of credit totaling $1,500,000.
Borrowings under the credit facility are secured by substantially all of the Company’s accounts receivable, inventory, equipment and general intangibles. Indebtedness under the credit facility has a first priority claim to the assets pledged to secure it. The facility matures September 1, 2012, but can be prepaid at any time without penalty.
Base Rate loans (as defined) bear interest at the greater of (i) prime or (ii) the federal funds rate plus 0.5%. The interest rate for LIBOR Rate loans (as defined) is generally the LIBOR rate plus 1.5% to 2.5%. As of December 31, 2008, the interest rate on the term loans was 3.00% and the rate on the revolving credit facility was 3.25%.
Payment obligations under the credit facility accelerate upon the occurrence of defined events of default, including the following: failure to pay principal or interest or to perform covenants under the credit facility or other indebtedness with outstanding obligations exceeding $1 million; events of insolvency or bankruptcy; failure to timely discharge judgments of $500,000 or more; failure to maintain the first priority status of liens under the credit facility; suspension of material governmental permits; a material adverse effect with respect to the Company; and a change of control in the Company.
The credit facility contains various covenants that limit, among other things, the Company’s ability to create liens, declare dividends, make loans and investments, make any material change to the nature of its business, enter into any transaction with affiliates other than on arms' length terms, enter into a merger or consolidation, or sell assets. The Company is required to maintain certain financial ratios as defined in the credit facility and other notes. As of December 31, 2008, the Company was in compliance with the covenants of the credit facility.
Aggregate maturities of long-term debt are as follows (amounts in thousands):
| Year ending December 31: | | | |
| 2009 | | $ | 14,156 | |
| 2010 | | | 11,864 | |
| 2011 | | | 10,513 | |
| 2012 | | | 46,980 | |
| 2013 | | | 7,012 | |
| Thereafter | | | 7,415 | |
| | | $ | 97,940 | |
AIR METHODS CORPORATION
AND SUBSIDIARIES
Notes to Consolidated Financial Statements, Continued
The Company leases hangar and office space under noncancelable operating leases and leases certain equipment and aircraft under noncancelable operating and capital leases. The majority of aircraft leases contain purchase options, either at the end of the lease term or at a stipulated early buyout date. As of December 31, 2008, future minimum lease payments under capital and operating leases are as follows (amounts in thousands):
| | | Capital | | | Operating | |
| | | leases | | | leases | |
| Year ending December 31: | | | | | | |
| 2009 | | $ | 1,732 | | | | 61,309 | |
| 2010 | | | 991 | | | | 59,681 | |
| 2011 | | | 760 | | | | 56,972 | |
| 2012 | | | 379 | | | | 52,151 | |
| 2013 | | | 189 | | | | 46,540 | |
| Thereafter | | | -- | | | | 145,276 | |
| | | | | | | | | |
| Total minimum lease payments | | | 4,051 | | | $ | 421,929 | |
| Less amounts representing interest | | | (495 | ) | | | | |
| Present value of minimum capital lease payments | | | 3,556 | | | | | |
| Less current installments | | | (1,482 | ) | | | | |
| | | $ | 2,074 | | | | | |
Rent expense relating to operating leases totaled $56,441,000, $34,773,000, and $26,100,000 for the years ended December 31, 2008, 2007, and 2006, respectively.
At December 31, 2008 and 2007, leased property held under capital leases included in equipment, net of accumulated depreciation, totaled $5,467,000 and $3,889,000, respectively. Amortization of leased property held under capital leases is included in depreciation expense.
During the year ended December 31, 2007, warrants with an exercise price of $5.28 were exercised for 100,000 shares of common stock. During the year ended December 31, 2006, warrants with an exercise price of $6.60 were exercised for 25,000 shares of common stock. As of December 31, 2008, the Company had no unexercised warrants outstanding.
AIR METHODS CORPORATION
AND SUBSIDIARIES
Notes to Consolidated Financial Statements, Continued
| (7) | Stockholders' Equity, continued |
The reconciliation of basic to diluted weighted average common shares outstanding is as follows for the years ended December 31:
| | | 2008 | | | 2007 | | | 2006 | |
| Weighted average number of common shares outstanding – basic | | | 12,155,144 | | | | 11,953,871 | | | | 11,748,107 | |
| Dilutive effect of: | | | | | | | | | | | | |
| Common stock options | | | 374,482 | | | | 500,077 | | | | 476,090 | |
| Common stock warrants | | | -- | | | | 58,129 | | | | 81,850 | |
| Unvested restricted stock | | | 755 | | | | -- | | | | -- | |
| Weighted average number of common shares outstanding – diluted | | | 12,530,381 | | | | 12,512,077 | | | | 12,306,047 | |
Common stock options totaling 38,500, 13,500, and 55,000 were not included in the diluted income per share calculation for the years ended December 31, 2008, 2007, and 2006, respectively, because their effect would have been anti-dilutive.
| (8) | Stock-based Compensation |
In August 2006, the Company’s shareholders approved the 2006 Equity Compensation Plan (2006 Plan) which provides for the granting of incentive stock options, non-statutory stock options (NSO’s), shares of restricted stock, stock appreciation rights and supplemental bonuses consisting of shares of common stock, cash or a combination thereof to employees, directors, and consultants. The maximum aggregate number of shares of common stock that may be made subject to awards under the 2006 Plan is 600,000. The 2006 Plan is administered by a committee of the Company’s board of directors which has discretion to set the exercise price and term of any option granted, provided that the term may not exceed ten years.
The Company also has a 1995 Stock Option Plan (1995 Plan) which provides for the granting of incentive stock options and nonqualified stock options, stock appreciation rights, and supplemental stock bonuses. Under the Plan, 3,500,000 shares of common stock are reserved for options. Generally, the options granted under the 1995 Plan have an exercise price equal to the market value on the date of grant, vest in three equal installments beginning one year from the date of grant, and expire five years from the date of grant. However, option grants to certain officers and employees in 2004 included 460,000 options which vest after five years and expire six years from the date of grant.
In February 1993, the Board of Directors adopted the Air Methods Corporation Equity Compensation Plan for Nonemployee Directors which was subsequently approved by the Company's stockholders on March 12, 1993. Under this compensation plan, 150,000 shares of common stock are reserved for issuance to non-employee directors. As of December 31, 2008, no shares have been issued under this plan.
AIR METHODS CORPORATION
AND SUBSIDIARIES
Notes to Consolidated Financial Statements, Continued
| (8) | Stock-based Compensation, continued |
Effective January 1, 2006, the Company implemented FASB Statement No. 123R (Statement 123R), Share-Based Payment, an amendment of FASB Statement No. 123, adopting the modified prospective method of implementation. Statement 123R requires recognition in the income statement of the grant-date fair value of stock options and other equity-based compensation issued to employees. Under the modified prospective method, compensation cost has been recognized in the financial statements beginning with the effective date based on the requirements of Statement 123R for all share-based payments granted after that date and based on the requirements of Statement 123 for all unvested awards granted prior to the effective date of Statement 123R.
The fair value of each option grant is estimated on the date of grant using the Black-Scholes option-pricing model. The Company uses historical option exercise data for similar employee groups, as well as the vesting period and contractual term, to estimate the expected term of options granted; the expected term represents the period of time that options granted are expected to be outstanding. Expected volatility is based on historical volatility of the Company’s stock. The risk-free rate for periods within the contractual life of the option is based on the U.S. Treasury yield curve in effect at the time of the grant. During the year ended December 31, 2008, options to purchase 27,500 shares of stock, with exercise prices ranging from $28.51 to $48.37, were granted at a weighted average fair value of $15.02. The weighted average fair value of options granted during the years ended December 31, 2007 and 2006, was $9.74 and $9.14, respectively. The following weighted average assumptions were used in valuing the grants for the years ended December 31:
| | | 2008 | | | 2007 | | | 2006 | |
| Expected term (in years) | | | 3.5 | | | | 3.5 | | | | 3.5 | |
| Expected volatility | | | 41 | % | | | 39 | % | | | 37 | % |
| Risk-free interest rate | | | 2.1 | % | | | 4.5 | % | | | 4.8 | % |
| Expected dividend yield | | | 0 | % | | | 0 | % | | | 0 | % |
The following is a summary of option activity under all stock option plans during the year ended December 31, 2008:
| | | Shares | | | Weighted Average Exercise Price | | | Weighted-Average Remaining Contractual Life (Years) | | | Aggregate Intrinsic Value (amounts in thousands) | |
| | | | | | | | | | | | | |
| Outstanding at January 1, 2008 | | | 758,233 | | | $ | 14.93 | | | | | | | |
| | | | | | | | | | | | | | | |
| Granted | | | 27,500 | | | | 46.56 | | | | | | | |
| Exercised | | | (109,000 | ) | | | 12.08 | | | | | | | |
| | | | | | | | | | | | | | | |
| Outstanding at December 31, 2008 | | | 676,733 | | | | 16.68 | | | | 2.0 | | | $ | 3,027 | |
| | | | | | | | | | | | | | | | | |
| Exercisable at December 31, 2008 | | | 184,567 | | | | 22.97 | | | | 2.8 | | | | 328 | |
The aggregate intrinsic value of options exercised during the years ended December 31, 2008, 2007, and 2006, was $2,299,000, $5,515,000, and $4,400,000, respectively.
AIR METHODS CORPORATION
AND SUBSIDIARIES
Notes to Consolidated Financial Statements, Continued
| (8) | Stock-based Compensation, continued |
In the year ended December 31, 2008, the Company issued 40,600 shares of restricted stock at a weighted average fair value of $45.96. The restricted shares were valued at the closing market price of the Company’s common stock on the date of grant, vest over a weighted average life of 2.0 years, and are subject to a restriction on the transfer of the shares for one year following the vesting date. The total fair value of shares vested during 2008 was $625,000. The following is a summary of restricted stock activity during the year ended December 31, 2008:
| | | Shares | | | Weighted Average Grant-Date Fair Value | |
| | | | | | | |
| Nonvested at January 1, 2008 | | | -- | | | | |
| | | | | | | | |
| Granted | | | 40,600 | | | $ | 45.96 | |
| Vested | | | (22,500 | ) | | | 45.77 | |
| Forfeited | | | (1,800 | ) | | | 49.10 | |
| | | | | | | | | |
| Nonvested at December 31, 2008 | | | 16,300 | | | | 45.88 | |
During the years ended December 31, 2008, 2007 and 2006, the Company recognized $2,206,000, $1,834,000, and $442,000 in stock-based compensation expense. Total unrecognized compensation cost related to unvested stock-based awards as of December 31, 2008, was $1,170,000 and is expected to be recognized over the remaining weighted average vesting term of less than one year.
The Company has operating agreements with various hospitals and hospital systems to provide services and aircraft for initial terms ranging from two to eight years. The agreements provide for revenue from monthly fixed fees and flight fees based upon the utilization of aircraft in providing emergency medical services. The fixed-fee portions of the agreements effective as of December 31, 2008, provide for the following revenue for years ending December 31 (amounts in thousands):
| 2009 | | $ | 115,885 | |
| 2010 | | | 87,576 | |
| 2011 | | | 59,159 | |
| 2012 | | | 30,913 | |
| 2013 | | | 12,620 | |
| Thereafter | | | 369 | |
| | | $ | 306,522 | |
AIR METHODS CORPORATION
AND SUBSIDIARIES
Notes to Consolidated Financial Statements, Continued
Income tax expense consists of the following for the years ended December 31 (amounts in thousands):
| | | 2008 | | | 2007 | | | 2006 | |
| Current income tax expense: | | | | | | | | | |
| Federal | | $ | (2,825 | ) | | | (4,424 | ) | | | (9,622 | ) |
| State | | | (1,336 | ) | | | (733 | ) | | | (1,745 | ) |
| | | | (4,161 | ) | | | (5,157 | ) | | | (11,367 | ) |
| | | | | | | | | | | | | |
| Deferred income tax expense: | | | | | | | | | | | | |
| Federal | | | (6,325 | ) | | | (11,160 | ) | | | (1,555 | ) |
| State | | | (723 | ) | | | (1,594 | ) | | | (222 | ) |
| | | | (7,048 | ) | | | (12,754 | ) | | | (1,777 | ) |
| Total income tax expense | | $ | (11,209 | ) | | | (17,911 | ) | | | (13,144 | ) |
In 2008 the effective rate used to determine state income taxes decreased primarily due to a change in Colorado statute defining the apportionment calculation. Income tax benefit of $1,479,000 was recognized for the year ended December 31, 2008, as a result of applying the new rate to deferred tax assets and liabilities.
In 2007 the Company changed certain elections related to fixed asset tax depreciation methods applied in prior years and filed amended returns for those periods. The changes resulted in the recovery of approximately $5.8 million of federal and state net operating loss carryforwards which had previously expired unused and in a decrease of $1,052,000 in deferred income tax expense for the year ended December 31, 2007.
For years prior to 2006, the Company’s deferred income taxes were determined using a federal statutory rate of 34% because the Company believed that the deferred tax assets and liabilities would be recovered or settled at that rate. Due to an increase in projected taxable income for the year ended December 31, 2006, and for future years, the Company revised its estimated tax rate to 35% in 2006. Deferred income tax expense of $525,000 was recognized for the year ended December 31, 2006, as a result of applying the new rate to deferred tax assets and liabilities.
Reconciliation of income taxes on income before income taxes computed at the federal statutory rate of 35% for the years ended December 31, 2008, 2007 and 2006, to income taxes as recorded is as follows (amounts in thousands):
| | | 2008 | | | 2007 | | | 2006 | |
| Tax at the federal statutory rate | | $ | (10,668 | ) | | | (15,907 | ) | | | (10,620 | ) |
| State income taxes, net of federal benefit, including adjustments based on filed state income tax returns | | | (1,590 | ) | | | (2,362 | ) | | | (1,559 | ) |
| Nondeductible expenses | | | (460 | ) | | | (628 | ) | | | (292 | ) |
| True up’s to filed returns | | | 26 | | | | (26 | ) | | | (104 | ) |
| Impact of amended returns | | | -- | | | | 1,052 | | | | -- | |
| Change in estimated tax rate | | | 1,479 | | | | -- | | | | (525 | ) |
| Other | | | 4 | | | | (40 | ) | | | (44 | ) |
| Net income tax expense | | $ | (11,209 | ) | | | (17,911 | ) | | | (13,144 | ) |
AIR METHODS CORPORATION
AND SUBSIDIARIES
Notes to Consolidated Financial Statements, Continued
| (10) | Income Taxes, continued |
For state income tax purposes, at December 31, 2008, the Company has net operating loss carryforwards of approximately $13 million, expiring at various dates through 2028. As of the acquisition date, FSS had net operating loss carryforwards for federal and state income tax purposes of approximately $3.5 million, a portion of which were used in 2008. Utilization of the FSS net operating loss carryforwards, which expire in 2027, is subject to an annual limitation under the provisions of Section 382 of the Internal Revenue Code. The FSS purchase agreement provides that any tax benefit realized by the Company from the use of certain net operating loss carryforwards generated by FSS prior to the acquisition will be paid to the former owners of FSS as additional consideration.
For the years ended December 31, 2008, 2007, and 2006, the Company recognized certain tax benefits related to stock option plans in the amount of $506,000, $2,139,000, and $1,425,000, respectively. Such benefits were recorded as a reduction of income taxes payable and an increase in additional paid-in capital.
The tax effects of temporary differences that give rise to significant portions of the deferred tax assets and liabilities at December 31 are as follows (amounts in thousands):
| | | 2008 | | | 2007 | |
| Deferred tax assets: | | | | | | |
| Net operating loss carryforwards | | $ | 1,505 | | | | 1,629 | |
| Aircraft lease accruals | | | -- | | | | 4,585 | |
| Employee compensation and benefit accruals and other | | | 8,468 | | | | 9,588 | |
| Total deferred tax assets | | | 9,973 | | | | 15,802 | |
| | | | | | | | | |
| Deferred tax liabilities: | | | | | | | | |
| Equipment and leasehold improvements, principally due to differences in bases and depreciation methods | | | (33,478 | ) | | | (33,529 | ) |
| Allowance for uncollectible accounts | | | (14,304 | ) | | | (13,066 | ) |
| Goodwill | | | (468 | ) | | | (251 | ) |
| Other | | | (221 | ) | | | (145 | ) |
| Total deferred tax liabilities | | | (48,471 | ) | | | (46,991 | ) |
| Net deferred tax liability | | $ | (38,498 | ) | | | (31,189 | ) |
Based on management’s assessment of future taxable earnings and tax-planning strategies, realization of net deferred tax assets through future taxable earnings is considered more likely than not.
Effective January 1, 2007, the Company adopted the provisions of FIN 48, Accounting for Uncertainty in Income Taxes. FIN 48 prescribes a recognition threshold and measurement attribute for recognition and measurement of a tax position taken or expected to be taken in a tax return. As a result of adopting FIN 48, the Company recognized an increase of $561,000 in deferred tax assets, which was accounted for as an increase to the January 1, 2007, balance of retained earnings. At the adoption date of January 1, 2007 and at December 31, 2008, the Company had no gross unrecognized tax benefits. It is the Company’s practice to recognize interest and penalties related to income tax matters in income tax expense. At December 31, 2008, the Company had no balance accrued for interest and penalties related to income tax. The Company does not believe that it is reasonably possible that its estimates of unrecognized tax benefits will change significantly in the next twelve months.
AIR METHODS CORPORATION
AND SUBSIDIARIES
Notes to Consolidated Financial Statements, Continued
| (10) | Income Taxes, continued |
The Company and its subsidiaries are subject to U.S. federal income tax as well as income tax of multiple state jurisdictions and are open to federal and state tax audits until the applicable statutes of limitations expire. The Company is no longer subject to U.S. federal tax examinations or state tax examinations by tax authorities for tax years before 2005. The Internal Revenue Service recently concluded its examination of the Company’s consolidated income tax return for the year ended June 30, 2004, and proposed no changes to the reported tax. The Company is currently not under examination by any federal or state taxing authority.
| (11) | Employee Benefit Plans |
The Company has a defined contribution retirement plan whereby employees may contribute any percentage of their gross pay up to the IRS maximum ($15,500 for 2008). Under the plan, the Company matches 70% of the employees' contributions up to 8% of their gross pay. On February 29, 2008, the defined contribution plan obtained with the acquisition of FSS was terminated, and the assets of the plan were merged into the Company’s defined contribution retirement plan. Company contributions to all plans totaled approximately $6,740,000, $4,800,000, and $3,572,000 for the years ended December 31, 2008, 2007, and 2006, respectively.
| (12) | Commitments, Contingencies, and Concentrations |
In January 2005, the Company entered into a $1,400,000 letter of credit with an insurance underwriter in lieu of increasing cash deposits on its workers compensation insurance policy. The letter of credit may be renewed annually and reduces the available borrowing capacity under the Company’s revolving credit facility.
In April 2008, the Company entered into a $100,000 letter of credit with a county government in California as performance security under an exclusive operating agreement. The letter of credit may be renewed annually and reduces the available borrowing capacity under the Company’s revolving credit facility.
The Company has entered into various aircraft operating leases under which it provides residual value guarantees to the lessor. As of December 31, 2008, the undiscounted maximum amount of potential future payments under the guarantees is $15,240,000. Of this amount, $12,657,000 relates to aircraft operating leases which were assumed in the FSS acquisition. No amounts have been accrued for any estimated losses with respect to the guarantees, since it is not probable that the residual value of the aircraft will be less than the amounts stipulated in the guarantee. The assessment of whether it is probable that the Company will be required to make payments under the terms of the guarantee is based on current market data and the Company’s actual and expected loss experience.
In July 2004, the Company entered into a commitment agreement to purchase fifteen Bell 429 helicopters for approximately $55.5 million. The purchase price increases 3% per year until delivery. The agreement provides for special incentives, including a trade-in option for up to fifteen Bell 222 helicopters, with minimum guaranteed trade-in values. Deliveries were originally scheduled to begin in 2007, with a minimum of three deliveries per year. However, due to delays in the manufacturer’s processes, delivery of the first Bell 429 helicopter is currently expected in mid-2009, with the remaining units to be delivered over approximately the following three years.
AIR METHODS CORPORATION
AND SUBSIDIARIES
Notes to Consolidated Financial Statements, Continued
| (12) | Commitments, Contingencies, and Concentrations, continued |
During 2007 and 2006, the Company entered into additional purchase commitments for various models of Bell and Eurocopter helicopters. As of December 31, 2008, commitments for 31 aircraft for approximately $83.6 million are still open. Deliveries under these commitments are expected from 2009 through 2012.
Prior to the acquisition date, CJ had entered into two commitments to purchase Eurocopter aircraft. As of December 31, 2008, commitments for 10 aircraft for approximately $20.3 million are still open, and deliveries are expected from 2009 through 2010.
As of December 31, 2008, the Company’s aircraft purchase commitments were as follows (amounts in thousands):
| Year ending December 31: | | | |
| 2009 | | $ | 42,881 | |
| 2010 | | | 23,476 | |
| 2011 | | | 63,408 | |
| 2012 | | | 35,522 | |
| | | $ | 165,287 | |
The Company intends to use the new aircraft for base expansion opportunities as well as to replace older models of aircraft in the fleet. The Company plans to either sell the aircraft which are replaced, use them for spare parts, or redeploy them into the backup fleet. Typically the Company has financed aircraft acquired under these or similar commitments through operating lease or debt agreements. If financing arrangements cannot be arranged or the Company is prevented from taking or declines to take delivery of aircraft under the commitments described above for any other reason, the Company may forfeit nonrefundable deposits of approximately $3.5 million.
As of December 31, 2008, American Eurocopter Corporation (AEC) aircraft comprise 76% of the Company’s helicopter fleet while aircraft made by Bell Helicopter, Inc. (Bell) constitute 20%. The Company obtains a substantial portion of its helicopter spare parts and components from AEC and Bell and maintains supply arrangements with other parties for engine and related dynamic components.
The Company’s pilots, comprising 34% of the total workforce, are represented by a collective bargaining unit. The current collective bargaining agreement (CBA) expires April 30, 2009. Negotiations on a new CBA commenced in the fourth quarter of 2008.
The Company is involved in various claims and legal actions arising in the ordinary course of business. In the opinion of management, the ultimate disposition of these matters will not have a material adverse effect on the Company’s consolidated financial position, results of operations, or liquidity.
AIR METHODS CORPORATION
AND SUBSIDIARIES
Notes to Consolidated Financial Statements, Continued
| (13) | Business Segment Information |
The Company identifies operating segments based on management responsibility and the type of services or products offered. Operating segments and their principal services or products are as follows:
| | · | Community-Based Services (CBS) - provides air medical transportation services to the general population as an independent service in 20 states. Services include aircraft operation and maintenance, medical care, dispatch and communications, and medical billing and collection. |
| | · | Hospital-Based Services (HBS) - provides air medical transportation services to hospitals in 32 states under exclusive operating agreements. Services include aircraft operation and maintenance. |
| | · | Products Division - designs, manufactures, and installs aircraft medical interiors and other aerospace and medical transport products for domestic and international customers. |
The accounting policies of the operating segments are as described in Note 1. The Company evaluates the performance of its segments based on pretax income. Intersegment sales are reflected at cost-related prices.
Summarized financial information for the Company’s operating segments is shown in the following table (amounts in thousands). Amounts in the “Corporate Activities” column represent corporate headquarters expenses and results of insignificant operations. The Company does not allocate assets between operating segments for internal reporting and performance evaluation purposes.
AIR METHODS CORPORATION
AND SUBSIDIARIES
Notes to Consolidated Financial Statements, Continued
| (13) | Business Segment Information, continued |
| | | CBS | | | HBS | | | Products Division | | | Corporate Activities | | | Intersegment Eliminations | | | Consolidated | |
| 2008 | | | | | | | | | | | | | | | | | | |
| External revenue | | $ | 297,388 | | | | 187,927 | | | | 13,487 | | | | -- | | | | -- | | | | 498,802 | |
| Intersegment revenue | | | 216 | | | | -- | | | | 23,326 | | | | -- | | | | (23,542 | ) | | | -- | |
| Total revenue | | | 297,604 | | | | 187,927 | | | | 36,813 | | | | -- | | | | (23,542 | ) | | | 498,802 | |
| | | | | | | | | | | | | | | | | | | | | | | | | |
| Operating expenses | | | (249,263 | ) | | | (172,582 | ) | | | (29,081 | ) | | | (17,067 | ) | | | 19,013 | | | | (448,980 | ) |
| Depreciation & amortization | | | (7,835 | ) | | | (7,973 | ) | | | (601 | ) | | | (681 | ) | | | -- | | | | (17,090 | ) |
| Interest expense | | | (2,360 | ) | | | (2,507 | ) | | | -- | | | | (330 | ) | | | -- | | | | (5,197 | ) |
| Other, net | | | 2,741 | | | | -- | | | | -- | | | | 202 | | | | -- | | | | 2,943 | |
| Income tax expense | | | -- | | | | -- | | | | -- | | | | (11,209 | ) | | | -- | | | | (11,209 | ) |
| Net income (loss) | | $ | 40,887 | | | | 4,865 | | | | 7,131 | | | | (29,085 | ) | | | (4,529 | ) | | | 19,269 | |
| | | | | | | | | | | | | | | | | | | | | | | | | |
| 2007 | | | | | | | | | | | | | | | | | | | | | | | | |
| External revenue | | $ | 254,946 | | | | 131,586 | | | | 9,817 | | | | -- | | | | -- | | | | 396,349 | |
| Intersegment revenue | | | 54 | | | | 473 | | | | 18,985 | | | | -- | | | | (19,512 | ) | | | -- | |
| Total revenue | | | 255,000 | | | | 132,059 | | | | 28,802 | | | | -- | | | | (19,512 | ) | | | 396,349 | |
| | | | | | | | | | | | | | | | | | | | | | | | | |
| Operating expenses | | | (196,647 | ) | | | (115,149 | ) | | | (23,270 | ) | | | (13,330 | ) | | | 16,092 | | | | (332,304 | ) |
| Depreciation & amortization | | | (7,868 | ) | | | (5,522 | ) | | | (588 | ) | | | (440 | ) | | | -- | | | | (14,418 | ) |
| Interest expense | | | (2,733 | ) | | | (2,604 | ) | | | -- | | | | (272 | ) | | | -- | | | | (5,609 | ) |
| Loss on early extinguishment of debt | | | -- | | | | -- | | | | -- | | | | (757 | ) | | | -- | | | | (757 | ) |
| Other, net | | | 2,024 | | | | -- | | | | -- | | | | 163 | | | | -- | | | | 2,187 | |
| Income tax expense | | | -- | | | | -- | | | | -- | | | | (17,911 | ) | | | -- | | | | (17,911 | ) |
| Net income (loss) | | $ | 49,776 | | | | 8,784 | | | | 4,944 | | | | (32,547 | ) | | | (3,420 | ) | | | 27,537 | |
| 2006 | | | | | | | | | | | | | | | | | | |
| External revenue | | $ | 206,827 | | | | 107,414 | | | | 5,263 | | | | -- | | | | -- | | | | 319,504 | |
| Intersegment revenue | | | -- | | | | 832 | | | | 16,813 | | | | -- | | | | (17,645 | ) | | | -- | |
| Total revenue | | | 206,827 | | | | 108,246 | | | | 22,076 | | | | -- | | | | (17,645 | ) | | | 319,504 | |
| | | | | | | | | | | | | | | | | | | | | | | | | |
| Operating expenses | | | (162,125 | ) | | | (99,608 | ) | | | (16,344 | ) | | | (9,470 | ) | | | 14,103 | | | | (273,444 | ) |
| Depreciation & amortization | | | (6,795 | ) | | | (5,354 | ) | | | (439 | ) | | | (322 | ) | | | -- | | | | (12,910 | ) |
| Litigation settlement | | | 1,417 | | | | -- | | | | -- | | | | -- | | | | -- | | | | 1,417 | |
| Interest expense | | | (3,059 | ) | | | (2,630 | ) | | | -- | | | | (132 | ) | | | -- | | | | (5,821 | ) |
| Other, net | | | 1,482 | | | | -- | | | | -- | | | | 116 | | | | -- | | | | 1,598 | |
| Income tax expense | | | -- | | | | -- | | | | -- | | | | (13,144 | ) | | | -- | | | | (13,144 | ) |
| Net income (loss) | | $ | 37,747 | | | | 654 | | | | 5,293 | | | | (22,952 | ) | | | (3,542 | ) | | | 17,200 | |
AIR METHODS CORPORATION
AND SUBSIDIARIES
Notes to Consolidated Financial Statements, Continued
| (14) | Unaudited Quarterly Financial Data |
Summarized unaudited quarterly financial data for 2008 and 2007 is as follows (amounts in thousands except per share data):
| | | Quarter | |
| | | First | | | Second | | | Third | | | Fourth | |
| 2008 | | | | | | | | | | | | |
| Revenue | | $ | 118,099 | | | | 127,959 | | | | 133,832 | | | | 118,912 | |
| Operating income | | | 4,876 | | | | 8,813 | | | | 14,546 | | | | 4,497 | |
| Income before income taxes | | | 3,952 | | | | 8,316 | | | | 14,204 | | | | 4,006 | |
| Net income | | | 2,330 | | | | 4,834 | | | | 8,369 | | | | 3,736 | |
| Basic income per common share | | | .19 | | | | .40 | | | | .69 | | | | .31 | |
| Diluted income per common share | | | .18 | | | | .38 | | | | .67 | | | | .30 | |
| | | | | | | | | | | | | | | | | |
| 2007 | | | | | | | | | | | | | | | | |
| Revenue | | $ | 81,458 | | | | 90,733 | | | | 101,549 | | | | 122,609 | |
| Operating income | | | 7,403 | | | | 14,115 | | | | 20,343 | | | | 7,766 | |
| Income before income taxes | | | 6,436 | | | | 13,288 | | | | 19,029 | | | | 6,695 | |
| Net income | | | 3,698 | | | | 7,825 | | | | 11,191 | | | | 4,823 | |
| Basic income per common share | | | .31 | | | | .66 | | | | .94 | | | | .40 | |
| Diluted income per common share | | | .30 | | | | .63 | | | | .89 | | | | .38 | |
Income per common share is computed independently for each of the quarters presented. Therefore, the sum of the quarterly income per share does not necessarily equal the total computed for the year. As described more fully in Note 2, operating results for the fourth quarter of 2007 were impacted by the acquisition of FSS on October 1, 2007.
Report of Independent Registered Public Accounting Firm
The Board of Directors and Stockholders
Air Methods Corporation:
Under date of March 11, 2009, we reported on the consolidated balance sheets of Air Methods Corporation and subsidiaries as of December 31, 2008 and 2007, and the related consolidated statements of operations, stockholders’ equity, and cash flows for each of the years in the three-year period ended December 31, 2008, which are included in the Company’s December 31, 2008 Annual Report on Form 10-K. In connection with our audits of the aforementioned consolidated financial statements, we also audited the related consolidated financial statement, Schedule II – Valuation and Qualifying Accounts. This financial statement schedule is the responsibility of the Company’s management. Our responsibility is to express an opinion on the financial statement schedule based on our audits.
In our opinion, such financial statement schedule, when considered in relation to the basic consolidated financial statements taken as a whole, presents fairly, in all material respects, the information set forth therein.
KPMG LLP
Denver, Colorado
March 11, 2009
AIR METHODS CORPORATION
AND SUBSIDIARIES
Schedule II – Valuation and Qualifying Accounts
(Amounts in thousands)
| Description | | Balance at Beginning of Period | | | Additions (a) | | | Transfers and Other (c) | | | Deductions (b) | | | Balance at End of Period | |
| | | | | | | | | | | | | | | | |
| Allowance for contractual discounts | | | | | | | | | | | | | | | |
| Year ended December 31, 2008 | | $ | 40,187 | | | | 227,383 | | | | -- | | | | (216,939 | ) | | | 50,631 | |
| Year ended December 31, 2007 | | | 33,070 | | | | 166,744 | | | | 5,172 | | | | (164,799 | ) | | | 40,187 | |
| Year ended December 31, 2006 | | | 24,700 | | | | 120,585 | | | | -- | | | | (112,215 | ) | | | 33,070 | |
| | | | | | | | | | | | | | | | | | | | | |
| Allowance for uncompensated care | | | | | | | | | | | | | | | | | | | | |
| Year ended December 31, 2008 | | $ | 51,031 | | | | 133,173 | | | | -- | | | | (130,086 | ) | | | 54,118 | |
| Year ended December 31, 2007 | | | 51,544 | | | | 99,408 | | | | 13,207 | | | | (113,128 | ) | | | 51,031 | |
| Year ended December 31, 2006 | | | 45,540 | | | | 83,917 | | | | -- | | | | (77,913 | ) | | | 51,544 | |
__________________
Notes:
| (a) | Amounts excluded from revenue. |
| (b) | Actual write-offs and charges to allowances. |
| (c) | Beginning allowance balances established against CJ receivables |
See accompanying Report of Independent Registered Public Accounting Firm.
F-32