UNITED STATES
SECURITIES AND EXCHANGE COMMISSION
WASHINGTON, D.C. 20549
FORM N-CSR
CERTIFIED SHAREHOLDER REPORT OF REGISTERED
MANAGEMENT INVESTMENT COMPANIES
Investment Company Act file number: 811-05207
ALLIANCEBERNSTEIN INCOME FUND, INC.
(Exact name of registrant as specified in charter)
1345 Avenue of the Americas, New York, New York 10105
(Address of principal executive offices) (Zip code)
Joseph J. Mantineo
AllianceBernstein L.P.
1345 Avenue of the Americas
New York, New York 10105
(Name and address of agent for service)
Registrant’s telephone number, including area code: (800) 221-5672
Date of fiscal year end: December 31, 2015
Date of reporting period: June 30, 2015
ITEM 1. REPORTS TO STOCKHOLDERS.
JUN 06.30.15
SEMI-ANNUAL REPORT
ALLIANCEBERNSTEIN INCOME FUND
(NYSE: ACG)
Investment Products Offered
|
• Are Not FDIC Insured • May Lose Value • Are Not Bank Guaranteed |
You may obtain a description of the Fund’s proxy voting policies and procedures, and information regarding how the Fund voted proxies relating to portfolio securities during the most recent 12-month period ended June 30, without charge. Simply visit AB’s website at www.abglobal.com, or go to the Securities and Exchange Commission’s (the “Commission”) website at www.sec.gov, or call AB at (800) 227-4618.
The Fund files its complete schedule of portfolio holdings with the Commission for the first and third quarters of each fiscal year on Form N-Q. The Fund’s Forms N-Q are available on the Commission’s website at www.sec.gov. The Fund’s Forms N-Q may also be reviewed and copied at the Commission’s Public Reference Room in Washington, DC; information on the operation of the Public Reference Room may be obtained by calling (800) SEC-0330.
AllianceBernstein Investments, Inc. (ABI) is the distributor of the AB family of mutual funds. ABI is a member of FINRA and is an affiliate of AllianceBernstein L.P., the Adviser of the funds.
The [A/B] logo is a service mark of AllianceBernstein and AllianceBernstein® is a registered trademark used by permission of the owner, AllianceBernstein L.P.
August 14, 2015
Semi-Annual Report
This report provides management’s discussion of fund performance for AllianceBernstein Income Fund (the “Fund”) for the semi-annual reporting period ended June 30, 2015. The Fund is a closed-end fund that trades on the New York Stock Exchange.
Investment Objectives and Policies
The investment objective of the Fund is high current income consistent with preservation of capital.
The Fund normally invests at least 80% of its net assets in income-producing securities. The Fund normally invests at least 65% of its total assets in securities issued or guaranteed by the U.S. government, its agencies or instrumentalities, and repurchase agreements pertaining to U.S. government securities. The Fund may also invest up to 35% of its assets in other fixed-income securities, including those issued by nongovernmental issuers in the U.S. and those issued by foreign governments. The Fund may invest up to 35% of its net assets in below investment-grade securities. Additionally, the Fund may utilize other investment instruments, including options, swaps, forwards and futures, and may employ leverage. For more information regarding the Fund’s risks, please see “A Word About Risk” on pages 4-5 and “Note E—Risks Involved in Investing in the Fund” of the Notes to Financial Statements on pages 64-66.
Proposed Acquisition of Assets of the Fund by AB Income Fund, a New Series of AB Bond Fund, Inc.
On August 6, 2015, the Fund announced that its Board of Directors had approved a proposed acquisition of its assets, and the assumption of its liabilities, by AB Income Fund (“Income Fund”), a newly-formed series of AB Bond Fund, Inc., an open-end registered investment company (the “Acquisition”). The Acquisition requires the approval of the Fund’s shareholders and a Special Meeting of Shareholders of the Fund (the “Special Meeting”) is scheduled to be held on February 1, 2016 to solicit the vote of shareholders on the Acquisition. The close of business on October 28, 2015 has been fixed as the record date for the Special Meeting or any adjournment or postponement thereof.
Each of the Fund and Income Fund is advised by AllianceBernstein L.P. (the “Adviser”). Income Fund will have the same investment objective as the Fund. Like the Fund, Income Fund will normally invest at least 80% of its net assets in income-producing securities. The most significant difference between the Fund and Income Fund is that while the Fund invests at least 65% of its assets in securities issued by the U.S. government, Income Fund will invest at least 65% of its assets in securities of U.S. and foreign governments. The broader investment policy of the Income Fund should provide the investment flexibility to better manage duration and credit risk. To limit the risk of this broader investment policy, the Income Fund
| | | | |
| ALLIANCEBERNSTEIN INCOME FUND • | | | 1 | |
will have an additional policy to invest at least 65% of its assets in securities denominated in U.S. dollars. Income Fund will be managed by the same portfolio managers as the Fund.
If the Acquisition is approved by the Fund’s shareholders, the Fund’s assets will be acquired, and its liabilities will be assumed, by Income Fund, and shareholders will receive Advisor Class shares of Income Fund which will have an aggregate net asset value equal to the aggregate net asset value of the shareholder’s holding in the Fund. A redemption fee of 0.75% will be imposed on redemptions of Advisor Class shares for three months after the Acquisition to defray the costs of increased redemptions expected to occur after the Acquisition. The Fund would then be de-registered as a registered investment company, dissolved, and its shares delisted from the New York Stock Exchange. If approved by the Fund’s shareholders, the Acquisition is expected to be completed in the first quarter of 2016.
Investment Results
The table on page 6 provides performance data for the Fund and its benchmark, the Barclays U.S. Aggregate Bond Index, for the six- and 12-month periods ended June 30, 2015.
The Fund outperformed its benchmark for both periods. Sector selection contributed positively for both periods, relative to the benchmark. For the six-month period, an overweight to commercial mortgage obligations and non-investment grade corporates con-
tributed to returns; during the 12-month period, an overweight to non-investment grade corporates and emerging market corporates detracted from performance. Security selection contributed for the six-month period, yet detracted for the 12-month period. Currency positioning contributed to returns for the 12-month period yet detracted for the six-month period, mainly from a long U.S. dollar position against a short Australian dollar, euro and New Zealand dollar. Yield curve positioning contributed to performance for both periods, specifically an underweight to the 20-year part of the yield curve paired with a slight overweight to the 10-year part of the curve.
The Fund utilized derivatives including Treasury futures and purchased options for hedging purposes, which added to returns for the six-month period and detracted for the 12-month period, in absolute terms; credit default swaps and interest rate swaps for hedging and investment purposes had an immaterial impact during the six-month period and detracted for the 12-month period; currency forwards for hedging and investment purposes detracted during the six-month period and added for the 12-month period; and written options for hedging purposes had an immaterial impact for the six-month period and added for the 12-month period. The Fund utilized leverage through reverse repurchase agreements at favorable rates, and was able to reinvest the proceeds into higher-yielding securities; leverage contributed positively for both periods.
| | |
| 2 | | • ALLIANCEBERNSTEIN INCOME FUND |
Market Review and Investment Strategy
Bond markets were volatile for both periods, as growth trends and monetary policies in the world’s biggest economies headed in different directions. In the fourth quarter of 2014, a sharp decline in oil prices put pressure on credit and emerging market debt, and complicated efforts to boost inflation in Europe and Japan. Oil prices stabilized later in the first quarter of 2015 but remained well below where they were in 2014. Economic fundamentals remained challenging in many emerging market countries. China’s central bank, faced with a slowing economy and volatile domestic markets, cut interest rates in June for the fourth time in several months.
Developed-market government bond yields were near multiyear lows in April. The yield on the benchmark 10-year German Bund was just slightly above zero and appeared headed for negative territory. Over the next two months, prices plunged and yields increased. In late June, they retraced some of that ground as Greece’s debt crisis worsened and the prospect of default added a new dose of volatility to financial markets.
Credit fundamentals remained generally solid, and the Fund’s Investment Management Team continues to look for opportunities in periods of volatility, while emphasizing the importance of security selection. The team cautions against the reach for yield, and remains selective in the Fund’s exposure to CCC-rated bonds. The Fund’s high yield holdings are well diversified at the country, sector and issuer levels.
Share Repurchase Program
On June 25, 2014, the Fund announced that its Board of Directors had authorized the Fund’s discretionary repurchase of up to 15% of its then outstanding shares of common stock (valued at up to approximately $306 million as of June 24, 2014 based on Fund total net assets of approximately $2.04 billion) in open market transactions over a one-year period.
Through June 25, 2015, the Fund had repurchased 27,076,089 of its shares of common stock in open market transactions (approximately 11.15% of its outstanding shares as of June 25, 2014). The share repurchase program expired on June 25, 2015.
| | | | |
| ALLIANCEBERNSTEIN INCOME FUND • | | | 3 | |
DISCLOSURES AND RISKS
AllianceBernstein Income Fund Shareholder Information
Weekly comparative net asset value (“NAV”) and market price information about the Fund is published each Saturday in Barron’s and in other newspapers in a table called “Closed End Funds”. Daily NAV and market price information, and additional information regarding the Fund, is available at www.abglobal.com and www.nyse.com. For additional shareholder information regarding this Fund, please see pages 71-72.
Benchmark Disclosure
The unmanaged Barclays U.S. Aggregate Bond Index does not reflect fees and expenses associated with the active management of a mutual fund portfolio. The Barclays U.S. Aggregate Bond Index represents the performance of securities within the U.S. investment grade fixed-rate bond market, with index components for government and corporate securities, mortgage pass-through securities, asset-backed securities, and commercial mortgage backed securities. The Index is not leveraged, whereas the Fund utilizes leverage. An investor cannot invest directly in an index, and its results are not indicative of the performance for any specific investment, including the Fund.
A Word About Risk
Until May 22, 2009, the Fund participated in a credit facility for the purpose of utilizing investment leverage. The Fund continues to utilize leverage through engaging in reverse repurchase agreements and may also utilize other techniques such as dollar rolls. In addition, the Fund may borrow money in the future through participation in credit facilities, direct bank borrowings, or otherwise. Reverse repurchase agreements involve sales by the Fund of portfolio assets concurrently with an agreement by the Fund to repurchase the same assets at a later date at a fixed price. Generally, the effect of such a transaction is that the Fund can recover all or most of the cash invested in the portfolio securities involved during the term of the reverse repurchase agreement, while it will be able to keep the interest income associated with those portfolio securities. Such transactions are only advantageous if the interest cost to the Fund of the reverse repurchase agreement transaction is less than the return on the leveraged portion of the Fund’s investment portfolio. The Fund may enter into dollar rolls in which the Fund sells securities for delivery in the current month and simultaneously contracts to repurchase substantially similar (same type and coupon) securities on a specified future date. During the roll period, the Fund forgoes principal and interest paid on the securities. The Fund is compensated by the difference between the current sales price and the lower forward price for the future purchase (often referred to as the “drop”) as well as the interest earned on the cash proceeds of the initial sale. Reverse repurchase agreements and dollar rolls are speculative techniques and are considered borrowings by the Fund.
Leverage may result in higher returns to the Fund than if the Fund were not leveraged, but may also adversely affect returns, particularly if the market is declining. The risks of leverage also include potentially a higher volatility of the NAV of the Fund’s shares, potentially more volatility in the market value of the Fund’s shares, and the relatively greater effect on the NAV of the Fund’s shares caused by favorable or adverse changes in portfolio security values or currency exchange rates. In addition, changes in the interest rate environment can increase or decrease shareholder returns. The Fund maintains asset coverage of at least 300% with respect to borrowings.
To the extent that the current interest rate on the Fund’s indebtedness approaches the net return on the leveraged portion of the Fund’s investment portfolio, then the benefit to the shareholders will be reduced. If the rate payable by the Fund on indebtedness were to exceed the net return on the same portion of the portfolio, then this would result in a lower rate of return for the shareholders. Similarly, the use of
(Disclosures, Risks and Note about Historical Performance continued on next page)
| | |
| 4 | | • ALLIANCEBERNSTEIN INCOME FUND |
Disclosures and Risks
DISCLOSURES AND RISKS
(continued from previous page)
leverage in a declining market can advance the decrease of the Fund’s NAV more so than if the Fund were not leveraged, which would likely be reflected in a greater decline in the market price for shares of the Fund than if the Fund were not leveraged. In extreme cases, if the Fund’s current investment income were not sufficient to meet interest payments on indebtedness or if the Fund failed to maintain the asset coverage required by the 1940 Act, then it could be necessary for the Fund to liquidate certain investments at a time when it may be disadvantageous to do so.
Part of the Fund’s assets will be invested in foreign securities. A significant portion of the Fund’s investments in foreign securities is in emerging markets. Since the Fund invests in foreign currency denominated securities, fluctuations in NAV may be magnified by changes in foreign exchange rates. The Fund also may seek investment opportunities by taking long or short positions in currencies through the use of currency-related derivatives, including forward currency exchange contracts, futures and options on futures, swaps and options. Foreign markets can be more volatile than the U.S. market due to increased risks of adverse issuer, political, regulatory, market or economic developments. The Fund may invest in high yield bonds or below investment-grade securities (“junk bonds”). High yield bonds involve a greater risk of default and price volatility than other bonds. While the Fund invests principally in fixed-income securities, in order to achieve its investment objectives, the Fund may at times use certain types of investment derivatives, such as options, futures, forwards and swaps. These instruments involve risks different from, and in certain cases, greater than, the risks presented by more traditional investments. These risks include the risk that the value of a derivative instrument may not correlate perfectly, or at all, with the value of the assets, reference rates or indices that they are designed to track. Other risks include: the possible absence of a liquid secondary market for a particular instrument and possible exchange-imposed price fluctuation limits, either of which may make it difficult or impossible to close out a position when desired, and the risk that the counterparty will not perform its obligation. Certain derivatives may have a leverage component and involve leverage risk. Adverse price movements in an instrument can result in a loss substantially greater than the Fund’s initial investment in that instrument (in some cases, the potential loss is unlimited).
The Fund may invest in mortgage-backed and/or other asset-backed securities, including securities backed by mortgages and assets with an international or emerging markets origination and securities backed by non-performing loans at the time of investment. Investments in mortgage-backed and other asset-backed securities are subject to certain additional risks. The value of these securities may be particularly sensitive to changes in interest rates. These risks include “extension risk”, which is the risk that, in periods of rising interest rates, issuers may delay the payment of principal, and “prepayment risk”, which is the risk that, in periods of falling interest rates, issuers may pay principal sooner than expected, exposing the Fund to a lower rate of return upon reinvestment of principal. Mortgage-backed securities offered by nongovernmental issuers and other asset-backed securities may be subject to other risks, such as higher rates of default in the mortgages or assets backing the securities or risks associated with the nature and servicing of mortgages or assets backing the securities.
An Important Note About Historical Performance
The performance on the following page represents past performance and does not guarantee future results. Current performance may be lower or higher than the performance information shown. All fees and expenses related to the operation of the Fund have been deducted. Performance assumes reinvestment of distributions and does not account for taxes.
| | | | |
| ALLIANCEBERNSTEIN INCOME FUND • | | | 5 | |
Disclosures and Risks
HISTORICAL PERFORMANCE
| | | | | | | | | | |
| | | | | | | | | | |
THE FUND VS. ITS BENCHMARK
PERIODS ENDED JUNE 30, 2015 (unaudited) | | Returns | | | |
| | 6 Months | | | 12 Months | | | |
| AllianceBernstein Income Fund (NAV) | | | 2.04% | | | | 4.40% | | | |
|
| Barclays U.S. Aggregate Bond Index | | | -0.10% | | | | 1.86% | | | |
|
| The Fund’s market price per share on June 30, 2015 was $7.44. The Fund’s NAV price per share on June 30, 2015 was $8.32. For additional Financial Highlights, please see pages 69-70. |
| | | | | | | | | | |
See Disclosures, Risks and Note about Historical Performance on pages 4-5.
| | |
| 6 | | • ALLIANCEBERNSTEIN INCOME FUND |
Historical Performance
PORTFOLIO SUMMARY
June 30, 2015 (unaudited)
PORTFOLIO STATISTICS
Net Assets ($mil): $1,796.7
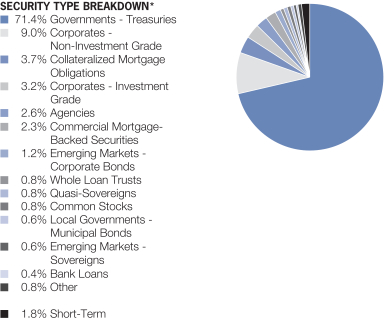
| * | | All data are as of June 30, 2015. The Fund’s security type breakdown is expressed as a percentage of total investments and may vary over time. The Fund also enters into derivative transactions, which may be used for hedging or investment purposes (see “Portfolio of Investments” section of the report for additional details). “Other” security type weightings represents 0.4% or less in the following types: Asset-Backed Securities, Governments—Sovereign Agencies, Governments—Soverign Bonds, Investment Companies, Mortgage Pass-Throughs and Preferred Stocks. |
| | | | |
| ALLIANCEBERNSTEIN INCOME FUND • | | | 7 | |
Portfolio Summary
PORTFOLIO SUMMARY
June 30, 2015 (unaudited)
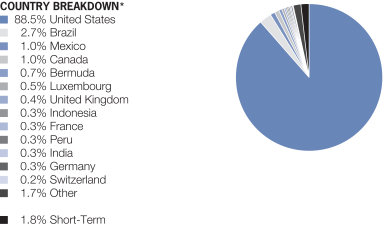
| * | | All data are as of June 30, 2015. The Fund’s country breakdown is expressed as a percentage of total investments and may vary over time. The Fund also enters into derivative transactions, which may be used for hedging or investment purposes (see “Portfolio of Investments” section of the report for additional details). “Other” country weightings represent 0.2% or less in the following countries: Australia, Barbados, Belgium, Dominican Republic, El Salvador, Guatemala, Italy, Ivory Coast, Jamaica, Morocco, Netherlands, Norway, Pakistan, South Africa, Spain, Sri Lanka, Sweden, Venezuela and Zambia. |
| | |
| 8 | | • ALLIANCEBERNSTEIN INCOME FUND |
Portfolio Summary
PORTFOLIO OF INVESTMENTS
June 30, 2015 (unaudited)
| | | | | | | | | | |
| | | | | Principal
Amount
(000) | | | U.S. $ Value | |
| |
| | | | | | | | | | |
GOVERNMENTS –
TREASURIES – 105.6% | | | | | | | | | | |
Brazil – 2.5% | | | | | | | | | | |
Brazil Notas do Tesouro Nacional
Series F
10.00%, 1/01/17-1/01/25 | | BRL | | | 148,570 | | | $ | 44,428,292 | |
| | | | | | | | | | |
| | | |
United States – 103.1% | | | | | | | | | | |
U.S. Treasury Bonds
3.125%, 8/15/44 | | U.S.$ | | | 76,388 | | | | 76,513,353 | |
5.375%, 2/15/31 | | | | | 1,961 | | | | 2,636,166 | |
6.25%, 5/15/30(a) | | | | | 250,000 | | | | 360,742,250 | |
6.375%, 8/15/27(a) | | | | | 260,000 | | | | 366,376,660 | |
6.50%, 11/15/26(a) | | | | | 183,000 | | | | 257,400,846 | |
8.00%, 11/15/21 | | | | | 27,000 | | | | 36,855,000 | |
8.75%, 8/15/20 | | | | | 39,500 | | | | 53,275,625 | |
U.S. Treasury Notes
1.125%, 3/31/20 | | | | | 13,000 | | | | 12,717,653 | |
1.25%, 1/31/20 | | | | | 33,000 | | | | 32,556,546 | |
2.125%, 8/31/20(a) | | | | | 150,000 | | | | 153,199,200 | |
2.125%, 8/15/21 | | | | | 21,000 | | | | 21,236,250 | |
2.375%, 12/31/20 | | | | | 23,080 | | | | 23,792,226 | |
3.125%, 5/15/21(a) | | | | | 95,000 | | | | 101,612,855 | |
3.50%, 5/15/20 | | | | | 27,608 | | | | 30,025,853 | |
3.625%, 2/15/21(a)(b) | | | | | 295,000 | | | | 323,647,155 | |
| | | | | | | | | | |
| | | | | | | | | 1,852,587,638 | |
| | | | | | | | | | |
Total Governments – Treasuries
(cost $1,850,691,254) | | | | | | | | | 1,897,015,930 | |
| | | | | | | | | | |
| | | | | | | | | | |
CORPORATES – NON-INVESTMENT GRADE – 13.3% | | | | | | | | | | |
Industrial – 11.0% | | | | | | | | | | |
Basic – 1.0% | | | | | | | | | | |
ArcelorMittal
7.50%, 3/01/41 | | | | | 676 | | | | 662,480 | |
7.75%, 10/15/39 | | | | | 1,846 | | | | 1,836,770 | |
Arch Coal, Inc.
7.00%, 6/15/19 | | | | | 2,100 | | | | 304,500 | |
Cliffs Natural Resources, Inc.
8.25%, 3/31/20(c) | | | | | 1,759 | | | | 1,662,255 | |
Commercial Metals Co.
7.35%, 8/15/18 | | | | | 2,644 | | | | 2,862,130 | |
Lundin Mining Corp.
7.50%, 11/01/20(c) | | | | | 1,138 | | | | 1,226,195 | |
7.875%, 11/01/22(c) | | | | | 1,500 | | | | 1,605,000 | |
Magnetation LLC/Mag Finance Corp.
11.00%, 5/15/28(c)(d) | | | | | 2,121 | | | | 890,820 | |
Novelis, Inc.
8.75%, 12/15/20 | | | | | 837 | | | | 885,127 | |
| | | | |
| ALLIANCEBERNSTEIN INCOME FUND • | | | 9 | |
Portfolio of Investments
| | | | | | | | | | |
| | | |
| | | | | Principal
Amount
(000) | | | U.S. $ Value | |
| |
| | | | | | | | | | |
Thompson Creek Metals Co., Inc.
7.375%, 6/01/18(a) | | U.S.$ | | | 4,398 | | | $ | 3,606,360 | |
TPC Group, Inc.
8.75%, 12/15/20(c) | | | | | 827 | | | | 764,975 | |
Univar, Inc.
6.75%, 7/15/23(c) | | | | | 1,666 | | | | 1,682,660 | |
| | | | | | | | | | |
| | | | | | | | | 17,989,272 | |
| | | | | | | | | | |
Capital Goods – 0.7% | | | | | | | | | | |
Apex Tool Group LLC
7.00%, 2/01/21(c) | | | | | 1,955 | | | | 1,739,950 | |
Berry Plastics Corp.
5.125%, 7/15/23 | | | | | 1,536 | | | | 1,497,600 | |
Bombardier, Inc.
4.75%, 4/15/19(c) | | | | | 3,450 | | | | 3,355,125 | |
7.50%, 3/15/25(c) | | | | | 2,438 | | | | 2,212,485 | |
Huntington Ingalls Industries, Inc.
7.125%, 3/15/21 | | | | | 690 | | | | 731,400 | |
Sealed Air Corp.
6.875%, 7/15/33(c) | | | | | 1,486 | | | | 1,500,860 | |
Summit Materials LLC/Summit Materials
Finance Corp.
10.50%, 1/31/20 | | | | | 862 | | | | 940,657 | |
| | | | | | | | | | |
| | | | | | | | | 11,978,077 | |
| | | | | | | | | | |
Communications - Media – 1.8% | | | | | | | | | | |
CCO Holdings LLC/CCO Holdings Capital Corp.
5.25%, 9/30/22 | | | | | 2,079 | | | | 2,047,815 | |
Cumulus Media Holdings, Inc.
7.75%, 5/01/19(a) | | | | | 678 | | | | 622,065 | |
DISH DBS Corp.
5.875%, 11/15/24 | | | | | 3,303 | | | | 3,172,944 | |
Hughes Satellite Systems Corp.
7.625%, 6/15/21 | | | | | 3,111 | | | | 3,422,722 | |
Intelsat Jackson Holdings SA
7.25%, 4/01/19 | | | | | 4,231 | | | | 4,294,465 | |
Nielsen Co. Luxembourg SARL (The)
5.50%, 10/01/21(c) | | | | | 3,243 | | | | 3,275,430 | |
Quebecor Media, Inc.
5.75%, 1/15/23 | | | | | 2,145 | | | | 2,139,638 | |
Time, Inc.
5.75%, 4/15/22(c) | | | | | 2,285 | | | | 2,210,738 | |
Unitymedia GmbH
6.125%, 1/15/25(c) | | | | | 2,749 | | | | 2,872,705 | |
Univision Communications, Inc.
5.125%, 5/15/23(c) | | | | | 3,295 | | | | 3,196,150 | |
UPCB Finance IV Ltd.
5.375%, 1/15/25(c) | | | | | 2,700 | | | | 2,577,150 | |
| | |
| 10 | | • ALLIANCEBERNSTEIN INCOME FUND |
Portfolio of Investments
| | | | | | | | | | |
| | | |
| | | | | Principal
Amount
(000) | | | U.S. $ Value | |
| |
| | | | | | | | | | |
Virgin Media Finance PLC
5.25%, 2/15/22 | | U.S.$ | | | 2,246 | | | $ | 2,144,930 | |
| | | | | | | | | | |
| | | | | | | | | 31,976,752 | |
| | | | | | | | | | |
Communications - Telecommunications – 0.8% | | | | | | | | | | |
Altice SA
7.75%, 5/15/22(c) | | | | | 1,342 | | | | 1,298,385 | |
Columbus International, Inc.
7.375%, 3/30/21(c) | | | | | 3,872 | | | | 4,157,560 | |
Frontier Communications Corp.
6.25%, 9/15/21 | | | | | 3,000 | | | | 2,730,000 | |
Numericable-SFR SAS
6.25%, 5/15/24(c) | | | | | 766 | | | | 753,553 | |
Sprint Corp.
7.625%, 2/15/25 | | | | | 2,635 | | | | 2,483,487 | |
Windstream Services LLC
7.50%, 4/01/23(a) | | | | | 2,000 | | | | 1,745,000 | |
7.75%, 10/01/21 | | | | | 1,070 | | | | 979,050 | |
| | | | | | | | | | |
| | | | | | | | | 14,147,035 | |
| | | | | | | | | | |
Consumer Cyclical - Automotive – 0.4% | | | | | | | | | | |
Affinia Group, Inc.
7.75%, 5/01/21 | | | | | 238 | | | | 248,710 | |
Exide Technologies
Series AI
7.00%, 4/30/25(e)(f)(g) | | | | | 2,249 | | | | 1,922,695 | |
11.00%, 4/30/20(h) | | | | | 5,143 | | | | 4,333,079 | |
| | | | | | | | | | |
| | | | | | | | | 6,504,484 | |
| | | | | | | | | | |
Consumer Cyclical - Entertainment – 0.1% | | | | | | | | | | |
AMC Entertainment, Inc.
5.75%, 6/15/25(c) | | | | | 1,692 | | | | 1,658,160 | |
| | | | | | | | | | |
| | | |
Consumer Cyclical - Other – 0.4% | | | | | | | | | | |
International Game Technology PLC
6.25%, 2/15/22(c) | | | | | 2,605 | | | | 2,487,775 | |
6.50%, 2/15/25(c) | | | | | 350 | | | | 323,750 | |
MGM Resorts International
6.625%, 12/15/21 | | | | | 744 | | | | 777,480 | |
6.75%, 10/01/20 | | | | | 1,700 | | | | 1,802,000 | |
Shea Homes LP/Shea Homes Funding Corp.
6.125%, 4/01/25(c) | | | | | 697 | | | | 702,228 | |
Taylor Morrison Communities, Inc./Monarch Communities, Inc.
5.875%, 4/15/23(c) | | | | | 2,018 | | | | 1,997,820 | |
| | | | | | | | | | |
| | | | | | | | | 8,091,053 | |
| | | | | | | | | | |
| | | | |
| ALLIANCEBERNSTEIN INCOME FUND • | | | 11 | |
Portfolio of Investments
| | | | | | | | | | |
| | | |
| | | | | Principal
Amount
(000) | | | U.S. $ Value | |
| |
| | | | | | | | | | |
Consumer Cyclical - Retailers – 0.6% | | | | | | | | | | |
American Tire Distributors, Inc.
10.25%, 3/01/22(c) | | U.S.$ | | | 3,855 | | | $ | 4,115,213 | |
Chinos Intermediate Holdings A, Inc.
7.75% (7.75% Cash or 8.50% PIK),
5/01/19(c)(g) | | | | | 1,973 | | | | 1,588,265 | |
Family Tree Escrow LLC
5.75%, 3/01/23(c) | | | | | 2,475 | | | | 2,586,375 | |
Men’s Wearhouse, Inc. (The)
7.00%, 7/01/22 | | | | | 1,870 | | | | 2,000,900 | |
| | | | | | | | | | |
| | | | | | | | | 10,290,753 | |
| | | | | | | | | | |
Consumer Non-Cyclical – 1.9% | | | | | | | | | | |
Air Medical Merger Sub Corp.
6.375%, 5/15/23(c) | | | | | 2,407 | | | | 2,262,580 | |
CHS/Community Health Systems, Inc.
6.875%, 2/01/22 | | | | | 3,286 | | | | 3,466,730 | |
ConvaTec Finance International SA
8.25% (8.25% Cash or 9.00% PIK),
1/15/19(c)(g) | | | | | 3,860 | | | | 3,792,450 | |
Endo Finance LLC/Endo Ltd./Endo Finco, Inc.
6.00%, 7/15/23(c) | | | | | 1,434 | | | | 1,466,265 | |
Holding Medi-Partenaires SAS
7.00%, 5/15/20(c) | | EUR | | | 1,750 | | | | 2,067,031 | |
Jaguar Holding Co. II/Jaguar Merger Sub, Inc.
9.50%, 12/01/19(c) | | U.S.$ | | | 2,000 | | | | 2,130,000 | |
Kinetic Concepts, Inc./KCI USA, Inc.
10.50%, 11/01/18 | | | | | 4,000 | | | | 4,270,080 | |
Mallinckrodt International Finance SA/Mallinckrodt CB LLC
5.50%, 4/15/25(c) | | | | | 653 | | | | 633,410 | |
Post Holdings, Inc.
6.00%, 12/15/22(c) | | | | | 869 | | | | 836,413 | |
7.375%, 2/15/22 | | | | | 705 | | | | 717,338 | |
PRA Holdings, Inc.
9.50%, 10/01/23(c) | | | | | 2,231 | | | | 2,493,142 | |
Smithfield Foods, Inc.
5.875%, 8/01/21(c) | | | | | 2,597 | | | | 2,681,402 | |
Spectrum Brands, Inc.
5.75%, 7/15/25(c) | | | | | 2,897 | | | | 2,940,455 | |
Sterigenics-Nordion Holdings LLC
6.50%, 5/15/23(c) | | | | | 384 | | | | 389,760 | |
Valeant Pharmaceuticals International, Inc.
5.875%, 5/15/23(c) | | | | | 1,130 | | | | 1,158,250 | |
6.125%, 4/15/25(c) | | | | | 3,277 | | | | 3,375,310 | |
| | | | | | | | | | |
| | | | | | | | | 34,680,616 | |
| | | | | | | | | | |
| | |
| 12 | | • ALLIANCEBERNSTEIN INCOME FUND |
Portfolio of Investments
| | | | | | | | | | |
| | | |
| | | | | Principal
Amount
(000) | | | U.S. $ Value | |
| |
| | | | | | | | | | |
Energy – 2.2% | | | | | | | | | | |
Antero Resources Corp.
5.375%, 11/01/21 | | U.S.$ | | | 792 | | | $ | 760,320 | |
Berry Petroleum Co. LLC
6.375%, 9/15/22 | | | | | 3,107 | | | | 2,423,460 | |
Bonanza Creek Energy, Inc.
6.75%, 4/15/21 | | | | | 640 | | | | 606,400 | |
BreitBurn Energy Partners LP/BreitBurn Finance Corp.
7.875%, 4/15/22 | | | | | 1,374 | | | | 1,140,420 | |
Denbury Resources, Inc.
4.625%, 7/15/23 | | | | | 2,591 | | | | 2,176,440 | |
5.50%, 5/01/22 | | | | | 2,257 | | | | 2,014,373 | |
Energy XXI Gulf Coast, Inc.
11.00%, 3/15/20(c) | | | | | 2,102 | | | | 1,839,250 | |
Golden Energy Offshore Services AS
8.74%, 5/28/17(e)(i) | | NOK | | | 7,624 | | | | 529,920 | |
Holly Energy Partners LP/Holly Energy Finance Corp.
6.50%, 3/01/20 | | U.S.$ | | | 2,196 | | | | 2,190,510 | |
Hornbeck Offshore Services, Inc.
5.875%, 4/01/20 | | | | | 2,737 | | | | 2,483,827 | |
Legacy Reserves LP/Legacy Reserves Finance Corp.
6.625%, 12/01/21 | | | | | 3,090 | | | | 2,502,900 | |
Northern Blizzard Resources, Inc.
7.25%, 2/01/22(c) | | | | | 1,300 | | | | 1,241,500 | |
Offshore Group Investment Ltd.
7.125%, 4/01/23 | | | | | 3,068 | | | | 1,871,480 | |
Paragon Offshore PLC
6.75%, 7/15/22(c) | | | | | 849 | | | | 280,170 | |
7.25%, 8/15/24(c) | | | | | 3,230 | | | | 1,049,750 | |
Rosetta Resources, Inc.
5.875%, 6/01/24 | | | | | 1,322 | | | | 1,424,455 | |
Sabine Pass Liquefaction LLC
5.625%, 3/01/25(c) | | | | | 2,036 | | | | 2,015,640 | |
SandRidge Energy, Inc.
7.50%, 2/15/23 | | | | | 1,259 | | | | 532,179 | |
SM Energy Co.
5.625%, 6/01/25 | | | | | 946 | | | | 936,351 | |
Southern Star Central Corp.
5.125%, 7/15/22(c) | | | | | 2,000 | | | | 2,030,000 | |
Tervita Corp.
8.00%, 11/15/18(c) | | | | | 3,547 | | | | 3,227,770 | |
Transocean, Inc.
6.50%, 11/15/20(a) | | | | | 2,700 | | | | 2,500,875 | |
7.50%, 4/15/31 | | | | | 2,200 | | | | 1,760,000 | |
| | | | |
| ALLIANCEBERNSTEIN INCOME FUND • | | | 13 | |
Portfolio of Investments
| | | | | | | | | | |
| | | |
| | | | | Principal
Amount
(000) | | | U.S. $ Value | |
| |
| | | | | | | | | | |
Whiting Petroleum Corp.
6.25%, 4/01/23(c) | | U.S.$ | | | 2,789 | | | $ | 2,795,972 | |
| | | | | | | | | | |
| | | | | | | | | 40,333,962 | |
| | | | | | | | | | |
Other Industrial – 0.2% | | | | | | | | | | |
Safway Group Holding LLC/Safway Finance Corp.
7.00%, 5/15/18(c) | | | | | 3,300 | | | | 3,373,557 | |
| | | | | | | | | | |
| | | |
Services – 0.2% | | | | | | | | | | |
Service Corp. International/US
7.50%, 4/01/27 | | | | | 3,300 | | | | 3,795,000 | |
| | | | | | | | | | |
| | | |
Technology – 0.4% | | | | | | | | | | |
Avaya, Inc.
10.50%, 3/01/21(c) | | | | | 1,196 | | | | 986,700 | |
Brightstar Corp.
9.50%, 12/01/16(c) | | | | | 1,600 | | | | 1,644,000 | |
Energizer SpinCo., Inc.
5.50%, 6/15/25(c) | | | | | 1,163 | | | | 1,148,463 | |
Infor Software Parent LLC/Infor Software Parent, Inc.
7.125% (7.125% Cash or 7.875% PIK),
5/01/21(c)(g) | | | | | 3,278 | | | | 3,286,195 | |
| | | | | | | | | | |
| | | | | | | | | 7,065,358 | |
| | | | | | | | | | |
Transportation - Services – 0.3% | | | | | | | | | | |
Hertz Corp. (The)
5.875%, 10/15/20 | | | | | 2,710 | | | | 2,743,875 | |
LBC Tank Terminals Holding Netherlands BV
6.875%, 5/15/23(c) | | | | | 1,789 | | | | 1,847,143 | |
XPO Logistics, Inc.
6.50%, 6/15/22(c) | | | | | 1,815 | | | | 1,776,431 | |
| | | | | | | | | | |
| | | | | | | | | 6,367,449 | |
| | | | | | | | | | |
| | | | | | | | | 198,251,528 | |
| | | | | | | | | | |
Financial Institutions – 1.5% | | | | | | | | | | |
Banking – 1.1% | | | | | | | | | | |
Barclays Bank PLC
6.86%, 6/15/32(c)(j) | | | | | 656 | | | | 736,360 | |
7.625%, 11/21/22 | | | | | 654 | | | | 744,775 | |
Citigroup, Inc.
5.95%, 1/30/23(j) | | | | | 2,055 | | | | 2,024,175 | |
Series P
5.95%, 5/15/25(j) | | | | | 1,850 | | | | 1,780,625 | |
Commerzbank AG
8.125%, 9/19/23(c) | | | | | 3,610 | | | | 4,210,487 | |
Credit Agricole SA
7.589%, 1/30/20(j) | | GBP | | | 1,150 | | | | 1,992,148 | |
7.875%, 1/23/24(a)(c)(j) | | U.S.$ | | | 549 | | | | 562,039 | |
| | |
| 14 | | • ALLIANCEBERNSTEIN INCOME FUND |
Portfolio of Investments
| | | | | | | | | | |
| | | |
| | | | | Principal
Amount
(000) | | | U.S. $ Value | |
| |
| | | | | | | | | | |
Credit Suisse Group AG
7.50%, 12/11/23(c)(j) | | U.S.$ | | | 2,066 | | | $ | 2,158,970 | |
Intesa Sanpaolo SpA
5.017%, 6/26/24(c) | | | | | 2,922 | | | | 2,838,852 | |
Royal Bank of Scotland PLC (The)
9.50%, 3/16/22(c) | | | | | 2,106 | | | | 2,323,211 | |
| | | | | | | | | | |
| | | | | | | | | 19,371,642 | |
| | | | | | | | | | |
Finance – 0.1% | | | | | | | | | | |
Creditcorp
12.00%, 7/15/18(c) | | | | | 2,000 | | | | 1,675,000 | |
| | | | | | | | | | |
| | | |
Insurance – 0.1% | | | | | | | | | | |
American Equity Investment Life Holding Co.
6.625%, 7/15/21 | | | | | 2,432 | | | | 2,571,840 | |
| | | | | | | | | | |
| | | |
Other Finance – 0.1% | | | | | | | | | | |
ACE Cash Express, Inc.
11.00%, 2/01/19(c) | | | | | 779 | | | | 432,345 | |
iPayment, Inc.
9.50%, 12/15/19(c) | | | | | 88 | | | | 83,668 | |
Series AI
9.50%, 12/15/19 | | | | | 1,763 | | | | 1,675,265 | |
| | | | | | | | | | |
| | | | | | | | | 2,191,278 | |
| | | | | | | | | | |
REITS – 0.1% | | | | | | | | | | |
Felcor Lodging LP
6.00%, 6/01/25(c) | | | | | 1,018 | | | | 1,033,270 | |
| | | | | | | | | | |
| | | | | | | | | 26,843,030 | |
| | | | | | | | | | |
Utility – 0.8% | | | | | | | | | | |
Electric – 0.8% | | | | | | | | | | |
Calpine Corp.
7.875%, 1/15/23(c) | | | | | 2,187 | | | | 2,361,960 | |
Dynegy, Inc.
7.375%, 11/01/22(c) | | | | | 2,895 | | | | 3,032,512 | |
7.625%, 11/01/24(c) | | | | | 1,915 | | | | 2,025,113 | |
FirstEnergy Corp.
Series C
7.375%, 11/15/31 | | | | | 1,552 | | | | 1,890,961 | |
GenOn Energy, Inc.
7.875%, 6/15/17 | | | | | 2,100 | | | | 2,126,250 | |
9.50%, 10/15/18 | | | | | 2,087 | | | | 2,128,740 | |
Talen Energy Supply LLC
4.60%, 12/15/21 | | | | | 965 | | | | 885,388 | |
| | | | | | | | | | |
| | | | | | | | | 14,450,924 | |
| | | | | | | | | | |
Total Corporates – Non-Investment Grade
(cost $250,095,053) | | | | | | | | | 239,545,482 | |
| | | | | | | | | | |
| | | | | | | | | | |
| | | | |
| ALLIANCEBERNSTEIN INCOME FUND • | | | 15 | |
Portfolio of Investments
| | | | | | | | | | |
| | | |
| | | | | Principal
Amount
(000) | | | U.S. $ Value | |
| |
| | | | | | | | | | |
COLLATERALIZED MORTGAGE OBLIGATIONS – 5.4% | | | | | | | | | | |
GSE Risk Share Floating Rate – 2.7% | | | | | | | | | | |
Federal Home Loan Mortgage Corp. Structured Agency Credit Risk Debt Notes
Series 2013-DN1, Class M2
7.337%, 7/25/23(i) | | U.S.$ | | | 3,250 | | | $ | 3,851,558 | |
Series 2013-DN2, Class M2
4.437%, 11/25/23(i) | | | | | 5,605 | | | | 5,672,247 | |
Series 2014-DN1, Class M2
2.387%, 2/25/24(i) | | | | | 4,085 | | | | 4,061,878 | |
Series 2014-DN1, Class M3
4.687%, 2/25/24(i) | | | | | 4,665 | | | | 4,785,551 | |
Series 2014-DN2, Class M3
3.787%, 4/25/24(i) | | | | | 4,565 | | | | 4,411,657 | |
Series 2014-DN3, Class M3
4.187%, 8/25/24(i) | | | | | 5,065 | | | | 5,000,242 | |
Series 2014-DN4, Class M3
4.737%, 10/25/24(i) | | | | | 700 | | | | 716,145 | |
Series 2014-HQ2, Class M3
3.937%, 9/25/24(i) | | | | | 1,010 | | | | 972,289 | |
Series 2015-DNA1, Class M3
3.487%, 10/25/27(i) | | | | | 505 | | | | 492,590 | |
Series 2015-DNA2, Class M2
2.787%, 12/25/27(i) | | | | | 5,920 | | | | 5,932,478 | |
Federal National Mortgage Association Connecticut Avenue Securities
Series 2014-C01, Class M2
4.587%, 1/25/24(i) | | | | | 1,606 | | | | 1,645,051 | |
Series 2014-C04, Class 1M2
5.087%, 11/25/24(i) | | | | | 6,100 | | | | 6,274,941 | |
Series 2015-C01, Class 1M2
4.487%, 2/25/25(i) | | | | | 4,520 | | | | 4,480,231 | |
| | | | | | | | | | |
| | | | | | | | | 48,296,858 | |
| | | | | | | | | | |
Non-Agency Fixed Rate – 1.9% | | | | | | | | | | |
Alternative Loan Trust
Series 2006-19CB, Class A24
6.00%, 8/25/36 | | | | | 164 | | | | 152,141 | |
BCAP LLC Trust
Series 2009-RR13, Class 17A3
6.082%, 4/26/37(c) | | | | | 812 | | | | 663,986 | |
BNPP Mortgage Securities LLC Trust
Series 2009-1, Class B1
6.00%, 8/27/37(c) | | | | | 1,219 | | | | 1,007,841 | |
CHL Mortgage Pass-Through Trust
Series 2007-16, Class A1
6.50%, 10/25/37 | | | | | 1,603 | | | | 1,496,507 | |
| | |
| 16 | | • ALLIANCEBERNSTEIN INCOME FUND |
Portfolio of Investments
| | | | | | | | | | |
| | | |
| | | | | Principal
Amount
(000) | | | U.S. $ Value | |
| |
| | | | | | | | | | |
Series 2007-3, Class A30
5.75%, 4/25/37 | | U.S.$ | | | 1,670 | | | $ | 1,523,881 | |
Series 2007-HY4, Class 1A1
2.554%, 9/25/47 | | | | | 896 | | | | 797,613 | |
Citigroup Mortgage Loan Trust
Series 2006-4, Class 2A1A
6.00%, 12/25/35 | | | | | 4,422 | | | | 4,089,747 | |
Series 2007-AR4, Class 1A1A
5.387%, 3/25/37 | | | | | 674 | | | | 641,112 | |
Series 2010-3, Class 2A2
7.063%, 8/25/37(c) | | | | | 739 | | | | 638,477 | |
Countrywide Alternative Loan Trust
Series 2006-19CB, Class A15
6.00%, 8/25/36 | | | | | 257 | | | | 234,640 | |
Series 2006-24CB, Class A15
5.75%, 6/25/36 | | | | | 2,409 | | | | 2,156,453 | |
Series 2006-41CB, Class 2A13
5.75%, 1/25/37 | | | | | 1,974 | | | | 1,781,857 | |
Series 2007-13, Class A2
6.00%, 6/25/47 | | | | | 2,932 | | | | 2,482,145 | |
Credit Suisse Mortgage Trust
Series 2009-8R, Class 6A2
6.00%, 1/26/38(c) | | | | | 176 | | | | 131,966 | |
Series 2010-13R, Class 1A2
5.50%, 12/26/35(c) | | | | | 67 | | | | 63,126 | |
Series 2010-9R, Class 1A5
4.00%, 8/27/37(c) | | | | | 938 | | | | 919,332 | |
CSMC Mortgage-Backed Trust
Series 2006-7, Class 3A12
6.25%, 8/25/36 | | | | | 1,682 | | | | 1,468,986 | |
First Horizon Alternative Mortgage Securities Trust
Series 2006-AA5, Class A1
2.236%, 9/25/36 | | | | | 2,319 | | | | 1,820,508 | |
Morgan Stanley Mortgage Loan Trust
Series 2005-10, Class 4A1
5.50%, 12/25/35 | | | | | 1,058 | | | | 974,053 | |
Series 2007-10XS, Class A2
6.25%, 7/25/47 | | | | | 1,242 | | | | 931,873 | |
Nomura Resecuritization Trust
Series 2010-5RA, Class 1A7
6.50%, 10/26/37(c) | | | | | 1,916 | | | | 1,640,890 | |
Wells Fargo Mortgage Backed Securities Trust
Series 2006-AR7, Class 2A1
2.733%, 5/25/36 | | | | | 2,375 | | | | 2,254,320 | |
Series 2007-AR7, Class A1
2.58%, 12/28/37 | | | | | 4,377 | | | | 4,039,238 | |
| | | | |
| ALLIANCEBERNSTEIN INCOME FUND • | | | 17 | |
Portfolio of Investments
| | | | | | | | | | |
| | | |
| | | | | Principal
Amount
(000) | | | U.S. $ Value | |
| |
| | | | | | | | | | |
Series 2007-AR8, Class A1
2.614%, 11/25/37 | | U.S.$ | | | 1,737 | | | $ | 1,521,426 | |
| | | | | | | | | | |
| | | | | | | | | 33,432,118 | |
| | | | | | | | | | |
Non-Agency Floating Rate – 0.6% | | | | | | | | | | |
First Horizon Alternative Mortgage Securities Trust
Series 2007-FA2, Class 1A10
0.437%, 4/25/37(i) | | | | | 945 | | | | 509,534 | |
Series 2007-FA2, Class 1A5
0.487%, 4/25/37(i) | | | | | 1,070 | | | | 581,062 | |
Lehman XS Trust
Series 2007-10H, Class 2AIO
6.82%, 7/25/37(i)(k) | | | | | 1,184 | | | | 308,152 | |
Residential Accredit Loans, Inc. Trust
Series 2006-QA4, Class A
0.367%, 5/25/36(i) | | | | | 3,476 | | | | 2,815,222 | |
Washington Mutual Mortgage Pass-Through Certificates Trust
Series 2007-OA1, Class A1A
0.858%, 2/25/47(i) | | | | | 4,469 | | | | 3,575,181 | |
Series 2007-OA4, Class A1A
0.918%, 4/25/47(i) | | | | | 5,283 | | | | 3,867,250 | |
| | | | | | | | | | |
| | | | | | | | | 11,656,401 | |
| | | | | | | | | | |
Agency Fixed Rate – 0.2% | | | | | | | | | | |
Federal National Mortgage Association REMICs
Series 2013-87, Class KI
3.00%, 12/25/37(k) | | | | | 14,295 | | | | 1,408,613 | |
Government National Mortgage Association
Series 2013-170, Class MI
4.50%, 11/20/43(k) | | | | | 10,251 | | | | 2,105,726 | |
| | | | | | | | | | |
| | | | | | | | | 3,514,339 | |
| | | | | | | | | | |
Total Collateralized Mortgage Obligations
(cost $95,166,925) | | | | | | | | | 96,899,716 | |
| | | | | | | | | | |
| | | | | | | | | | |
CORPORATES – INVESTMENT GRADE – 4.8% | | | | | | | | | | |
Industrial – 2.6% | | | | | | | | | | |
Basic – 0.7% | | | | | | | | | | |
Braskem Finance Ltd.
6.45%, 2/03/24 | | | | | 1,204 | | | | 1,137,780 | |
GTL Trade Finance, Inc.
5.893%, 4/29/24(c) | | | | | 2,711 | | | | 2,644,580 | |
7.25%, 4/16/44(c) | | | | | 274 | | | | 254,478 | |
Minsur SA
6.25%, 2/07/24(c) | | | | | 1,764 | | | | 1,932,944 | |
| | |
| 18 | | • ALLIANCEBERNSTEIN INCOME FUND |
Portfolio of Investments
| | | | | | | | | | |
| | | |
| | | | | Principal
Amount
(000) | | | U.S. $ Value | |
| |
| | | | | | | | | | |
Southern Copper Corp.
7.50%, 7/27/35 | | U.S.$ | | | 5,107 | | | $ | 5,719,534 | |
Teck Resources Ltd.
4.50%, 1/15/21 | | | | | 2,206 | | | | 2,117,636 | |
| | | | | | | | | | |
| | | | | | | | | 13,806,952 | |
| | | | | | | | | | |
Capital Goods – 0.4% | | | | | | | | | | |
Odebrecht Finance Ltd. | | | | | | | | | | |
4.375%, 4/25/25(c) | | | | | 6,760 | | | | 5,171,400 | |
5.25%, 6/27/29(c) | | | | | 2,103 | | | | 1,577,671 | |
| | | | | | | | | | |
| | | | | | | | | 6,749,071 | |
| | | | | | | | | | |
Communications - Telecommunications – 0.7% | | | | | | | | | | |
Qwest Corp.
6.875%, 9/15/33 | | | | | 1,500 | | | | 1,483,185 | |
Telefonica Emisiones SAU
7.045%, 6/20/36 | | | | | 5,000 | | | | 6,140,710 | |
Verizon Communications, Inc.
4.522%, 9/15/48(c) | | | | | 6,159 | | | | 5,410,786 | |
| | | | | | | | | | |
| | | | | | | | | 13,034,681 | |
| | | | | | | | | | |
Consumer Non-Cyclical – 0.3% | | | | | | | | | | |
HJ Heinz Co. | | | | | | | | | | |
2.80%, 7/02/20(c) | | | | | 2,700 | | | | 2,702,101 | |
3.50%, 7/15/22(c) | | | | | 2,294 | | | | 2,299,382 | |
Reynolds American, Inc.
5.70%, 8/15/35 | | | | | 650 | | | | 673,963 | |
| | | | | | | | | | |
| | | | | | | | | 5,675,446 | |
| | | | | | | | | | |
Energy – 0.4% | | | | | | | | | | |
Reliance Holding USA, Inc.
5.40%, 2/14/22(c) | | | | | 3,568 | | | | 3,850,307 | |
Weatherford International Ltd./Bermuda
7.00%, 3/15/38 | | | | | 2,900 | | | | 2,771,904 | |
| | | | | | | | | | |
| | | | | | | | | 6,622,211 | |
| | | | | | | | | | |
Transportation - Airlines – 0.1% | | | | | | | | | | |
Delta Air Lines Pass-Through Trust
Series 2007-1A
6.821%, 8/10/22 | | | | | 1,337 | | | | 1,533,884 | |
| | | | | | | | | | |
| | | | | | | | | 47,422,245 | |
| | | | | | | | | | |
Financial Institutions – 2.0% | | | | | | | | | | |
Banking – 0.5% | | | | | | | | | | |
Credit Suisse AG
6.50%, 8/08/23(c) | | | | | 3,900 | | | | 4,257,100 | |
HSBC Capital Funding LP/Jersey
10.176%, 6/30/30(c)(j) | | | | | 884 | | | | 1,348,100 | |
JPMorgan Chase & Co.
Series S
6.75%, 2/01/24(j) | | | | | 2,998 | | | | 3,185,375 | |
| | | | |
| ALLIANCEBERNSTEIN INCOME FUND • | | | 19 | |
Portfolio of Investments
| | | | | | | | | | |
| | | |
| | | | | Principal
Amount
(000) | | | U.S. $ Value | |
| |
| | | | | | | | | | |
Nordea Bank AB
6.125%, 9/23/24(c)(j) | | U.S.$ | | | 596 | | | $ | 587,618 | |
| | | | | | | | | | |
| | | | | | | | | 9,378,193 | |
| | | | | | | | | | |
Insurance – 1.5% | | | | | | | | | | |
AIG Life Holdings, Inc
8.125%, 3/15/46(c) | | | | | 509 | | | | 703,693 | |
American International Group, Inc.
8.175%, 5/15/58 | | | | | 2,525 | | | | 3,343,100 | |
Fairfax Financial Holdings Ltd.
8.30%, 4/15/26 | | | | | 5,000 | | | | 6,066,215 | |
Great-West Life & Annuity Insurance Capital LP II
7.153%, 5/16/46(c) | | | | | 2,707 | | | | 2,761,140 | |
Humana, Inc.
8.15%, 6/15/38 | | | | | 1,650 | | | | 2,292,543 | |
MetLife, Inc. | | | | | | | | | | |
6.40%, 12/15/36 | | | | | 3,345 | | | | 3,671,137 | |
Series C | | | | | | | | | | |
5.25%, 6/15/20(j) | | | | | 1,799 | | | | 1,783,259 | |
Pacific Life Insurance Co.
9.25%, 6/15/39(c) | | | | | 1,500 | | | | 2,240,034 | |
Transatlantic Holdings, Inc.
8.00%, 11/30/39 | | | | | 2,122 | | | | 2,746,142 | |
| | | | | | | | | | |
| | | | | | | | | 25,607,263 | |
| | | | | | | | | | |
| | | | | | | | | 34,985,456 | |
| | | | | | | | | | |
Utility – 0.2% | | | | | | | | | | |
Electric – 0.2% | | | | | | | | | | |
ComEd Financing III
6.35%, 3/15/33 | | | | | 3,462 | | | | 3,548,574 | |
| | | | | | | | | | |
| | | |
Total Corporates – Investment Grade
(cost $81,241,953) | | | | | | | | | 85,956,275 | |
| | | | | | | | | | |
| | | | | | | | | | |
AGENCIES – 3.9% | | | | | | | | | | |
Agency Debentures – 3.9% | | | | | | | | | | |
Residual Funding Corp. Principal Strip
Zero Coupon, 7/15/20 | | | | | 42,045 | | | | 38,053,079 | |
Federal Home Loan Mortgage Corp.
6.25%, 7/15/32 | | | | | 15,000 | | | | 20,844,435 | |
Federal Home Loan Banks
5.50%, 7/15/36 | | | | | 8,695 | | | | 11,249,052 | |
| | | | | | | | | | |
| | | |
Total Agencies
(cost $68,087,544) | | | | | | | | | 70,146,566 | |
| | | | | | | | | | |
| | | | | | | | | | |
| | |
| 20 | | • ALLIANCEBERNSTEIN INCOME FUND |
Portfolio of Investments
| | | | | | | | | | |
| | | |
| | | | | Principal
Amount
(000) | | | U.S. $ Value | |
| |
| | | | | | | | | | |
COMMERCIAL MORTGAGE-BACKED SECURITIES – 3.3% | | | | | | | | | | |
Non-Agency Fixed Rate CMBS – 3.1% | | | | | | | | | | |
Banc of America Commercial Mortgage Trust
Series 2007-3, Class AJ
5.749%, 6/10/49 | | U.S.$ | | | 1,517 | | | $ | 1,572,509 | |
Citigroup Commercial Mortgage Trust
Series 2013-GC17, Class D
5.261%, 11/10/46(c) | | | | | 6,525 | | | | 6,342,770 | |
Series 2014-GC21, Class D
4.997%, 5/10/47(c) | | | | | 6,052 | | | | 5,628,688 | |
Series 2014-GC23, Class D
4.658%, 7/10/47(c) | | | | | 1,323 | | | | 1,197,891 | |
Commercial Mortgage Trust
Series 2014-LC17, Class D
3.687%, 10/10/47(c) | | | | | 3,549 | | | | 2,942,844 | |
Series 2014-UBS5, Class D
3.495%, 9/10/47(c) | | | | | 1,041 | | | | 834,573 | |
Series 2015-DC1, Class D
4.499%, 2/10/48(c) | | | | | 2,730 | | | | 2,378,593 | |
CSAIL 2015-C1 Commercial Mortgage Trust
Series 2015-C2, Class D
4.354%, 6/15/57 | | | | | 4,091 | | | | 3,661,324 | |
GS Mortgage Securities Trust
Series 2013-GC13, Class D
4.206%, 7/10/46(c) | | | | | 9,440 | | | | 8,617,370 | |
LB-UBS Commercial Mortgage Trust
Series 2007-C7, Class AJ
6.455%, 9/15/45 | | | | | 1,750 | | | | 1,850,168 | |
ML-CFC Commercial Mortgage Trust
Series 2006-4, Class AJ
5.239%, 12/12/49 | | | | | 6,667 | | | | 6,744,454 | |
Morgan Stanley Bank of America Merrill Lynch Trust
Series 2014-C19, Class D
3.25%, 12/15/47(c) | | | | | 1,194 | | | | 994,492 | |
Wells Fargo Commercial Mortgage Trust
Series 2014-LC18, Class D
3.957%, 12/15/47(c) | | | | | 3,781 | | | | 3,208,858 | |
Series 2015-LC20, Class D
4.511%, 4/15/50(c) | | | | | 4,000 | | | | 3,431,924 | |
WF-RBS Commercial Mortgage Trust
Series 2012-C8, Class E
5.038%, 8/15/45(c) | | | | | 4,000 | | | | 4,021,664 | |
Series 2014-C23, Class D
4.138%, 10/15/57(c) | | | | | 2,699 | | | | 2,352,101 | |
| | | | | | | | | | |
| | | | | | | | | 55,780,223 | |
| | | | | | | | | | |
| | | | |
| ALLIANCEBERNSTEIN INCOME FUND • | | | 21 | |
Portfolio of Investments
| | | | | | | | | | |
| | | |
| | | | | Principal
Amount
(000) | | | U.S. $ Value | |
| |
| | | | | | | | | | |
Non-Agency Floating Rate CMBS – 0.2% | | | | | | | | | | |
Great Wolf Trust
Series 2015-WOLF, Class A
1.637%, 5/15/34(c)(i) | | U.S.$ | | | 4,138 | | | $ | 4,130,518 | |
Indus Eclipse PLC
Series 2007-1X, Class B
0.821%, 1/25/20(c)(i) | | GBP | | | 59 | | | | 89,096 | |
| | | | | | | | | | |
| | | | | | | | | 4,219,614 | |
| | | | | | | | | | |
Agency CMBS – 0.0% | | | | | | | | | | |
Government National Mortgage Association
Series 2006-32, Class XM
0.018%, 11/16/45(k) | | U.S.$ | | | 558 | | | | 696 | |
| | | | | |
| | | |
Total Commercial Mortgage-Backed Securities
(cost $59,671,805) | | | | | | | | | 60,000,533 | |
| | | | | |
| | | | | | | | | | |
EMERGING MARKETS – CORPORATE BONDS – 1.8% | | | | | | | | | | |
Industrial – 1.8% | | | | | | | | | | |
Basic – 0.3% | | | | | | | | | | |
Elementia SAB de CV
5.50%, 1/15/25(c) | | | | | 1,039 | | | | 1,051,987 | |
Vedanta Resources PLC
6.00%, 1/31/19(c) | | | | | 855 | | | | 827,213 | |
8.25%, 6/07/21(a)(c) | | | | | 1,943 | | | | 1,978,353 | |
9.50%, 7/18/18(c) | | | | | 610 | | | | 651,175 | |
| | | | | | | | | | |
| | | | | | | | | 4,508,728 | |
| | | | | | | | | | |
Capital Goods – 0.4% | | | | | | | | | | |
Cemex SAB de CV
7.25%, 1/15/21(c) | | | | | 2,376 | | | | 2,503,710 | |
Grupo Cementos de Chihuahua SAB de CV
8.125%, 2/08/20(c) | | | | | 1,954 | | | | 2,096,642 | |
Servicios Corporativos Javer SAPI de CV
9.875%, 4/06/21(c) | | | | | 2,185 | | | | 2,332,487 | |
| | | | | | | | | | |
| | | | | | | | | 6,932,839 | |
| | | | | | | | | | |
Communications - Telecommunications – 0.2% | | | | | | | | | | |
Comcel Trust via Comunicaciones Celulares SA
6.875%, 2/06/24(c) | | | | | 2,016 | | | | 2,121,840 | |
Digicel Ltd.
6.00%, 4/15/21(c) | | | | | 1,500 | | | | 1,446,180 | |
6.75%, 3/01/23(c) | | | | | 385 | | | | 377,416 | |
| | | | | | | | | | |
| | | | | | | | | 3,945,436 | |
| | | | | | | | | | |
| | |
| 22 | | • ALLIANCEBERNSTEIN INCOME FUND |
Portfolio of Investments
| | | | | | | | | | |
| | | |
| | | | | Principal
Amount
(000) | | | U.S. $ Value | |
| |
| | | | | | | | | | |
Consumer Cyclical - Retailers – 0.2% | | | | | | | | | | |
Office Depot de Mexico SA de CV
6.875%, 9/20/20(c) | | U.S.$ | | | 4,000 | | | $ | 4,295,000 | |
| | | | | | | | | | |
| | | |
Consumer Non-Cyclical – 0.5% | | | | | | | | | | |
Cosan Luxembourg SA
5.00%, 3/14/23(c) | | | | | 1,361 | | | | 1,258,925 | |
9.50%, 3/14/18(c) | | BRL | | | 3,117 | | | | 874,717 | |
Marfrig Holding Europe BV
8.375%, 5/09/18(c) | | U.S.$ | | | 900 | | | | 906,480 | |
Marfrig Overseas Ltd.
9.50%, 5/04/20(c) | | | | | 4,151 | | | | 4,241,077 | |
Minerva Luxembourg SA
7.75%, 1/31/23(c) | | | | | 877 | | | | 883,577 | |
Tonon Bioenergia SA
9.25%, 1/24/20(c) | | | | | 2,272 | | | | 760,461 | |
Virgolino de Oliveira Finance SA
10.50%, 1/28/18(d)(e) | | | | | 4,738 | | | | 47,380 | |
10.875%, 1/13/20(d)(e) | | | | | 750 | | | | 127,500 | |
11.75%, 2/09/22(d)(e) | | | | | 1,690 | | | | 16,900 | |
| | | | | | | | | | |
| | | | | | | | | 9,117,017 | |
| | | | | | | | | | |
Transportation - Airlines – 0.2% | | | | | | | | | | |
TAM Capital 3, Inc.
8.375%, 6/03/21(c) | | | | | 2,843 | | | | 2,956,720 | |
| | | | | | | | | | |
| | | |
Total Emerging Markets – Corporate Bonds
(cost $37,916,043) | | | | | | | | | 31,755,740 | |
| | | | | | | | | | |
| | | | | | | | | | |
WHOLE LOAN TRUSTS – 1.2% | | | | | | | | | | |
Performing Asset – 1.2% | | | | | | | | | | |
Alpha Credit Debt Fund LLC
15.00%, 1/15/18(f)(l) | | | | | 1,740 | | | | 1,739,773 | |
Cara Aircraft Leasing 28548, Inc.
8.00%, 11/26/19(f)(l) | | | | | 374 | | | | 374,412 | |
Cara Aircraft Leasing 28563, Inc.
8.00%, 6/09/19(f)(l) | | | | | 253 | | | | 252,744 | |
Cara Aircraft Leasing 28868, Inc.
8.00%, 11/26/19(f)(l) | | | | | 434 | | | | 434,353 | |
Deutsche Bank Mexico SA
8.00%, 10/31/34(f)(l) | | MXN | | | 30,052 | | | | 1,421,391 | |
Deutsche Bank Mexico SA
8.00%, 10/31/34(f)(l)(m) | | | | | 48,053 | | | | 2,272,815 | |
Ede Del Este SA (DPP)
12.00%, 3/31/16(f)(l) | | U.S.$ | | | 707 | | | | 719,320 | |
Ede Del Este SA (ITABO)
12.00%, 3/31/16(f)(l) | | | | | 684 | | | | 696,031 | |
Finalam SA de C.V.
17.25%, 8/06/19(f)(l) | | MXN | | | 15,616 | | | | 993,547 | |
| | | | |
| ALLIANCEBERNSTEIN INCOME FUND • | | | 23 | |
Portfolio of Investments
| | | | | | | | | | |
| | | |
| | | | | Principal
Amount
(000) | | | U.S. $ Value | |
| |
| | | | | | | | | | |
Recife Funding Ltd.
Zero Coupon, 11/05/29(f)(l) | | U.S.$ | | | 2,884 | | | $ | 2,859,726 | |
Sheridan Auto Loan Holdings I LLC
10.00%, 12/31/20(f)(l) | | | | | 1,369 | | | | 1,368,608 | |
Sheridan Consumer Finance Trust
10.86%, 4/01/20(f)(i)(l) | | | | | 8,611 | | | | 8,654,419 | |
| | | | | | | | | | |
| | | |
Total Whole Loan Trusts
(cost $22,449,143) | | | | | | | | | 21,787,139 | |
| | | | | | | | | | |
| | | | | | | | | | |
QUASI-SOVEREIGNS – 1.2% | | | | | | | | | | |
Quasi-Sovereign Bonds – 1.2% | | | | | | | | | | |
Indonesia – 0.4% | | | | | | | | | | |
Majapahit Holding BV
7.875%, 6/29/37(c) | | | | | 6,188 | | | | 7,131,670 | |
| | | | | | | | | | |
| | | |
Mexico – 0.5% | | | | | | | | | | |
Petroleos Mexicanos
5.625%, 1/23/46(c) | | | | | 4,710 | | | | 4,386,894 | |
6.50%, 6/02/41 | | | | | 4,900 | | | | 5,096,000 | |
| | | | | | | | | | |
| | | | | | | | | 9,482,894 | |
| | | | | | | | | | |
South Africa – 0.1% | | | | | | | | | | |
Eskom Holdings SOC Ltd.
7.125%, 2/11/25(c) | | | | | 1,070 | | | | 1,082,605 | |
| | | | | | | | | | |
| | | |
Venezuela – 0.2% | | | | | | | | | | |
Petroleos de Venezuela SA
5.25%, 4/12/17(c) | | | | | 7,500 | | | | 3,734,625 | |
| | | | | | | | | | |
| | | |
Total Quasi-Sovereigns
(cost $23,041,092) | | | | | | | | | 21,431,794 | |
| | | | | | | | | | |
| | | |
| | | | | Shares | | | | |
COMMON STOCKS – 1.2% | | | | | | | | | | |
Exide Technologies(f)(h)(n) | | | | | 45,970 | | | | 185,719 | |
Ion Media Networks, Inc. Class A(f)(l)(n) | | | | | 2,512 | | | | 969,104 | |
iPayment, Inc.(n) | | | | | 110,385 | | | | 391,867 | |
Mt Logan Re Ltd. (Preference Shares)(h)(n)(o) | | | | | 4,476 | | | | 4,556,125 | |
Mt Logan Re Ltd.(n)(o) | | | | | 15,000 | | | | 15,127,170 | |
| | | | | | | | | | |
| | | |
Total Common Stocks
(cost $20,685,633) | | | | | | | | | 21,229,985 | |
| | | | | | | | | | |
| | | | | | | | | | |
| | |
| 24 | | • ALLIANCEBERNSTEIN INCOME FUND |
Portfolio of Investments
| | | | | | | | | | |
| | | |
| | | | | Principal
Amount
(000) | | | U.S. $ Value | |
| |
| | | | | | | | | | |
LOCAL GOVERNMENTS – MUNICIPAL BONDS – 0.9% | | | | | | | | | | |
United States – 0.9% | | | | | | | | | | |
Buckeye Tobacco Settlement Financing Authority
Series 2007A-2
5.875%, 6/01/47 | | U.S.$ | | | 1,950 | | | $ | 1,506,784 | |
Iowa Tobacco Settlement Authority
Series 2005C
5.625%, 6/01/46 | | | | | 1,575 | | | | 1,353,334 | |
Michigan Tobacco Settlement Finance Authority
Series 2007A
6.00%, 6/01/48 | | | | | 5,915 | | | | 4,717,272 | |
State of Illinois
Series 2010
7.35%, 7/01/35 | | | | | 3,330 | | | | 3,686,077 | |
Texas Transportation Commission State Highway Fund
Series 2010B
5.178%, 4/01/30 | | | | | 2,560 | | | | 2,954,010 | |
Tobacco Settlement Financing Corp./VA
Series 2007B1
5.00%, 6/01/47 | | | | | 1,850 | | | | 1,287,082 | |
| | | | | | | | | | |
| | | |
Total Local Governments – Municipal Bonds
(cost $15,881,771) | | | | | | | | | 15,504,559 | |
| | | | | | | | | | |
| | | | | | | | | | |
EMERGING MARKETS –
SOVEREIGNS – 0.8% | | | | | | | | | | |
Dominican Republic – 0.1% | | | | | | | | | | |
Dominican Republic International Bond
7.45%, 4/30/44(c) | | | | | 1,873 | | | | 2,046,252 | |
| | | | | | | | | | |
| | | |
El Salvador – 0.3% | | | | | | | | | | |
El Salvador Government International Bond
7.65%, 6/15/35(c) | | | | | 5,957 | | | | 5,986,785 | |
| | | | | | | | | | |
| | | |
Ivory Coast – 0.1% | | | | | | | | | | |
Ivory Coast Government International Bond 6.375%, 3/03/28(c) | | | | | 2,440 | | | | 2,385,100 | |
| | | | | | | | | | |
| | | |
Pakistan – 0.1% | | | | | | | | | | |
Pakistan Government International Bond
7.25%, 4/15/19(c) | | | | | 1,700 | | | | 1,781,830 | |
| | | | | | | | | | |
| | | |
Sri Lanka – 0.1% | | | | | | | | | | |
Sri Lanka Government International Bond
6.00%, 1/14/19(c) | | | | | 1,236 | | | | 1,262,265 | |
| | | | | | | | | | |
| | | | |
| ALLIANCEBERNSTEIN INCOME FUND • | | | 25 | |
Portfolio of Investments
| | | | | | | | | | |
| | | |
| | | | | Principal
Amount
(000) | | | U.S. $ Value | |
| |
| | | | | | | | | | |
Zambia – 0.1% | | | | | | | | | | |
Zambia Government International Bond
8.50%, 4/14/24(c) | | U.S.$ | | | 1,553 | | | $ | 1,560,765 | |
| | | | | | | | | | |
| | | |
Total Emerging Markets – Sovereigns
(cost $13,325,180) | | | | | | | | | 15,022,997 | |
| | | | | | | | | | |
| | | | | | | | | | |
BANK LOANS – 0.6% | | | | | | | | | | |
Industrial – 0.6% | | | | | | | | | | |
Basic – 0.1% | | | | | | | | | | |
FMG Resources (August 2006) Pty Ltd. (FMG America Finance, Inc.)
3.75%, 6/30/19(i) | | | | | 924 | | | | 818,618 | |
Magnetation LLC
12.00% 11/11/15(g) | | | | | 774 | | | | 746,286 | |
| | | | | | | | | | |
| | | | | | | | | 1,564,904 | |
| | | | | | | | | | |
Communications - Media – 0.1% | | | | | | | | | | |
TWCC Holding Corp.
7.00%, 6/26/20(i) | | | | | 1,550 | | | | 1,441,500 | |
| | | | | | | | | | |
| | | |
Consumer Cyclical - Other – 0.1% | | | | | | | | | | |
New HB Acquisition LLC
6.75%, 4/09/20(i) | | | | | 1,100 | | | | 1,113,750 | |
| | | | | | | | | | |
| | | |
Consumer Non-Cyclical – 0.1% | | | | | | | | | | |
Par Pharmaceutical Companies, Inc. (Par Pharmaceutical, Inc.)
4.00%, 9/30/19(i) | | | | | 545 | | | | 544,226 | |
Pharmedium Healthcare Corp.
7.75%, 1/28/22(i) | | | | | 1,902 | | | | 1,901,604 | |
| | | | | | | | | | |
| | | | | | | | | 2,445,830 | |
| | | | | | | | | | |
Energy – 0.1% | | | | | | | | | | |
Atlas 2014 1 Ltd.
6.875%, 1/15/21 | | | | | 1,896 | | | | 1,900,540 | |
| | | | | | | | | | |
| | | |
Other Industrial – 0.1% | | | | | | | | | | |
Accudyne Industries Borrower S.C.A./Accudyne Industries LLC (fka Silver II US Holdings LLC)
4.00%, 12/13/19(i) | | | | | 1,144 | | | | 1,102,452 | |
Unifrax Holding Co.
4.50%, 11/28/18(i) | | EUR | | | 751 | | | | 838,226 | |
| | | | | | | | | | |
| | | | | | | | | 1,940,678 | |
| | | | | | | | | | |
Technology – 0.0% | | | | | | | | | | |
Avaya, Inc.
4.69%, 10/26/17(i) | | U.S.$ | | | 154 | | | | 152,876 | |
| | | | | | | | | | |
| | | |
Total Bank Loans
(cost $10,983,970) | | | | | | | | | 10,560,078 | |
| | | | | | | | | | |
| | |
| 26 | | • ALLIANCEBERNSTEIN INCOME FUND |
Portfolio of Investments
| | | | | | | | | | |
| | | |
| Company | | | | Shares | | | U.S. $ Value | |
| |
| | | | | | | | | | |
PREFERRED STOCKS – 0.5% | | | | | | | | | | |
Financial Institutions – 0.3% | | | | | | | | | | |
Banking – 0.2% | | | | | | | | | | |
US Bancorp/MN
Series F
6.50% | | | | | 180,000 | | | $ | 5,079,600 | |
| | | | | | | | | | |
| | | |
REITS – 0.1% | | | | | | | | | | |
National Retail Properties, Inc.
Series E
5.70% | | | | | 26,000 | | | | 629,720 | |
Public Storage
Series W
5.20% | | | | | 28,475 | | | | 663,183 | |
Public Storage
Series X
5.20% | | | | | 2,000 | | | | 46,840 | |
| | | | | | | | | | |
| | | | | | | | | 1,339,743 | |
| | | | | | | | | | |
| | | | | | | | | 6,419,343 | |
| | | | | | | | | | |
Industrial – 0.2% | | | | | | | | | | |
Ventas Realty LP/Ventas Capital Corp.
5.45% | | | | | 139,500 | | | | 3,363,345 | |
| | | | | | | | | | |
| | | |
Total Preferred Stocks
(cost $9,127,365) | | | | | | | | | 9,782,688 | |
| | | | | | | | | | |
| | | |
| | | | | Principal
Amount
(000) | | | | |
GOVERNMENTS – SOVEREIGN AGENCIES – 0.3% | | | | | | | | | | |
Governments - Sovereign Agencies – 0.3% | | | | | | | | | | |
OCP SA
5.625%, 4/25/24(c) | | U.S.$ | | | 1,148 | | | | 1,196,928 | |
Petrobras Global Finance BV
5.375%, 1/27/21 | | | | | 5,000 | | | | 4,809,000 | |
| | | | | | | | | | |
| | | |
Total Governments – Sovereign Agencies
(cost $6,284,155) | | | | | | | | | 6,005,928 | |
| | | | | | | | | | |
| | | |
| | | | | Shares | | | | |
INVESTMENT COMPANIES – 0.2% | | | | | | | | | | |
Funds and Investment Trusts – 0.2% | | | | | | | | | | |
OCL Opportunities Fund I(f)(l) | | | | | 16,259 | | | | 1,801,571 | |
OCL Opportunities Fund II(f)(l) | | | | | 6,916 | | | | 903,242 | |
| | | | | | | | | | |
| | | |
Total Investment Companies
(cost $2,981,056) | | | | | | | | | 2,704,813 | |
| | | | | | | | | | |
| | | | |
| ALLIANCEBERNSTEIN INCOME FUND • | | | 27 | |
Portfolio of Investments
| | | | | | | | | | |
| | | |
| | | | | Principal
Amount
(000) | | | U.S. $ Value | |
| |
| | | | | | | | | | |
ASSET-BACKED SECURITIES – 0.1% | | | | | | | | | | |
Autos - Fixed Rate – 0.1% | | | | | | | | | | |
Hertz Vehicle Financing LLC
Series 2013-1A, Class B2
2.48%, 8/25/19(c)
(cost $2,124,499) | | U.S.$ | | | 2,169 | | | $ | 2,124,804 | |
| | | | | | | | | | |
| | | | | | | | | | |
GOVERNMENTS – SOVEREIGN BONDS – 0.1% | | | | | | | | | | |
Indonesia – 0.1% | | | | | | | | | | |
Indonesia Government International Bond
8.50%, 10/12/35(c)
(cost $907,894) | | | | | 801 | | | | 1,081,350 | |
| | | | | | | | | | |
| | | | | | | | | | |
MORTGAGE PASS-THROUGHS – 0.0% | | | | | | | | | | |
Agency Fixed Rate 30-Year – 0.0% | | | | | | | | | | |
Federal National Mortgage Association
Series 1999
7.50%, 11/01/29 | | | | | 27 | | | | 32,431 | |
Series 1998
8.00%, 6/01/28 | | | | | 20 | | | | 23,578 | |
| | | | | | | | | | |
| | | |
Total Mortgage Pass-Throughs
(cost $47,926) | | | | | | | | | 56,009 | |
| | | | | | | | | | |
| | | |
| | | | | Shares | | | | |
SHORT-TERM INVESTMENTS – 2.7% | | | | | | | | | | |
Investment Companies – 2.5% | | | | | | | | | | |
AB Fixed Income Shares, Inc. – Government STIF Portfolio, 0.10%(p)(q)
(cost $43,936,524) | | | | | 43,936,524 | | | | 43,936,524 | |
| | | | | | | | | | |
| | | |
| | | | | Principal
Amount
(000) | | | | |
GOVERNMENTS – TREASURIES – 0.2% | | | | | | | | | | |
Uruguay – 0.2% | | | | | | | | | | |
Uruguay Treasury Bills
Series 0001
Zero Coupon, 8/20/15
(cost $4,116,646) | | UYU | | | 111,491 | | | | 4,052,900 | |
| | | | | | | | | | |
| | | |
Total Short-Term Investments
(cost $48,053,170) | | | | | | | | | 47,989,424 | |
| | | | | | | | | | |
| | | |
Total Investments – 147.9%
(cost $2,618,763,431) | | | | | | | | | 2,656,601,810 | |
Other assets less liabilities – (47.9)% | | | | | | | | | (859,912,321 | ) |
| | | | | | | | | | |
| | | |
Net Assets – 100.0% | | | | | | | | $ | 1,796,689,489 | |
| | | | | | | | | | |
| | |
| 28 | | • ALLIANCEBERNSTEIN INCOME FUND |
Portfolio of Investments
FUTURES (see Note C)
| | | | | | | | | | | | | | | | | | | | |
| Type | | Number of Contracts | | | Expiration Month | | | Original Value | | | Value at June 30, 2015 | | | Unrealized Appreciation/ (Depreciation) | |
Sold Contracts | | | | | | | | | | | | | | | | | | | | |
Euro-BOBL Futures | | | 212 | | | | September 2015 | | | $ | 30,630,019 | | | $ | 30,625,988 | | | $ | 4,031 | |
U.S. Long Bond (CBT) Futures | | | 2,316 | | | | September 2015 | | | | 350,103,403 | | | | 349,354,125 | | | | 749,278 | |
U.S. T-Note 5 Yr (CBT) Futures | | | 103 | | | | September 2015 | | | | 12,290,640 | | | | 12,283,555 | | | | 7,085 | |
U.S. T-Note 10 Yr (CBT) Futures | | | 3,234 | | | | September 2015 | | | | 409,298,209 | | | | 408,039,844 | | | | 1,258,365 | |
| | | | | | | | | | | | | | | | | | | | |
| | | | | | | | | | | | | | | | | | $ | 2,018,759 | |
| | | | | | | | | | | | | | | | | | | | |
FORWARD CURRENCY EXCHANGE CONTRACTS (see Note C)
| | | | | | | | | | | | | | | | |
| Counterparty | | Contracts to
Deliver
(000) | | | In Exchange
For
(000) | | | Settlement Date | | | Unrealized
Appreciation/
(Depreciation) | |
Barclays Bank PLC | | USD | 11,259 | | | IDR | 150,368,723 | | | | 7/10/15 | | | $ | (9,502 | ) |
Barclays Bank PLC | | TWD | 280,634 | | | USD | 9,047 | | | | 8/14/15 | | | | (42,267 | ) |
BNP Paribas SA | | USD | 13,852 | | | GBP | 8,887 | | | | 7/10/15 | | | | 109,981 | |
BNP Paribas SA | | USD | 9,451 | | | SGD | 12,836 | | | | 7/24/15 | | | | 76,187 | |
BNP Paribas SA | | USD | 13,750 | | | TRY | 38,553 | | | | 7/27/15 | | | | 527,509 | |
Credit Suisse International | | BRL | 147,297 | | | USD | 47,475 | | | | 7/02/15 | | | | 99,254 | |
Credit Suisse International | | TRY | 43,594 | | | USD | 15,698 | | | | 7/02/15 | | | | (562,985 | ) |
Credit Suisse International | | USD | 47,515 | | | BRL | 147,297 | | | | 7/02/15 | | | | (139,072 | ) |
Credit Suisse International | | USD | 13,884 | | | GBP | 8,887 | | | | 7/10/15 | | | | 78,040 | |
Credit Suisse International | | MXN | 282,801 | | | USD | 18,383 | | | | 7/16/15 | | | | 408,297 | |
Credit Suisse International | | BRL | 147,297 | | | USD | 46,985 | | | | 8/04/15 | | | | 154,185 | |
Deutsche Bank AG | | TRY | 38,553 | | | USD | 13,750 | | | | 7/27/15 | | | | (527,483 | ) |
Deutsche Bank AG | | USD | 17,031 | | | TRY | 45,140 | | | | 7/27/15 | | | | (313,906 | ) |
Goldman Sachs Bank USA | | BRL | 13,169 | | | USD | 4,299 | | | | 7/02/15 | | | | 63,887 | |
Goldman Sachs Bank USA | | USD | 4,244 | | | BRL | 13,169 | | | | 7/02/15 | | | | (8,873 | ) |
Goldman Sachs Bank USA | | NOK | 7,213 | | | USD | 911 | | | | 7/29/15 | | | | (8,083 | ) |
Goldman Sachs Bank USA | | TRY | 44,126 | | | USD | 16,325 | | | | 8/06/15 | | | | 29,951 | |
HSBC Bank USA | | BRL | 71,388 | | | USD | 23,161 | | | | 7/02/15 | | | | 198,947 | |
HSBC Bank USA | | USD | 8,535 | | | BRL | 27,189 | | | | 7/02/15 | | | | 210,219 | |
HSBC Bank USA | | USD | 14,246 | | | BRL | 44,200 | | | | 7/02/15 | | | | (29,783 | ) |
HSBC Bank USA | | USD | 13,714 | | | MXN | 210,583 | | | | 7/16/15 | | | | (329,505 | ) |
HSBC Bank USA | | USD | 8,268 | | | BRL | 26,261 | | | | 8/04/15 | | | | 81,421 | |
HSBC Bank USA | | NZD | 25,905 | | | USD | 17,708 | | | | 8/14/15 | | | | 218,943 | |
Royal Bank of Scotland PLC | | TRY | 25,918 | | | USD | 9,400 | | | | 7/02/15 | | | | (267,743 | ) |
Royal Bank of Scotland PLC | | USD | 9,692 | | | TRY | 25,387 | | | | 7/02/15 | | | | (222,462 | ) |
Royal Bank of Scotland PLC | | KRW | 40,401,707 | | | USD | 36,069 | | | | 8/07/15 | | | | 23,385 | |
Royal Bank of Scotland PLC | | USD | 59 | | | TWD | 1,830 | | | | 8/14/15 | | | | 279 | |
Societe Generale | | EUR | 5,885 | | | USD | 6,616 | | | | 7/30/15 | | | | 52,696 | |
Standard Chartered Bank | | CAD | 33,648 | | | USD | 27,283 | | | | 7/23/15 | | | | 350,628 | |
Standard Chartered Bank | | AUD | 35,948 | | | USD | 27,472 | | | | 8/07/15 | | | | (209,796 | ) |
State Street Bank & Trust Co. | | GBP | 19,547 | | | USD | 29,959 | | | | 7/10/15 | | | | (751,714 | ) |
State Street Bank & Trust Co. | | SGD | 12,853 | | | USD | 9,527 | | | | 7/24/15 | | | | (13,350 | ) |
UBS AG | | BRL | 117,118 | | | USD | 36,768 | | | | 7/02/15 | | | | (901,723 | ) |
UBS AG | | USD | 37,748 | | | BRL | 117,118 | | | | 7/02/15 | | | | (78,918 | ) |
| | | | | | | | | | | | | | | | |
| | | | | | | | | | | | | | $ | (1,733,356 | ) |
| | | | | | | | | | | | | | | | |
| | | | |
| ALLIANCEBERNSTEIN INCOME FUND • | | | 29 | |
Portfolio of Investments
CURRENCY OPTIONS WRITTEN (see Note C)
| | | | | | | | | | | | | | | | | | | | |
| Description | | Exercise
Price | | | Expiration
Date | | | Contracts
(000) | | | Premiums
Received | | | U.S. $ Value | |
Put – USD vs. TRY | | TRY | 3.01 | | | | 7/24/15 | | | TRY | 82,775 | | | $ | 443,575 | | | $ | (10,316 | ) |
CENTRALLY CLEARED CREDIT DEFAULT SWAPS (see Note C)
| | | | | | | | | | | | | | | | | | | | |
Clearing Broker/ (Exchange) & Referenced Obligation | | Fixed
Rate
(Pay)
Receive | | | Implied
Credit
Spread at
June 30,
2015 | | | Notional
Amount
(000) | | | Market
Value | | | Unrealized
Appreciation/
(Depreciation) | |
Sale Contracts | | | | | | | | | | | | | | | | | | | | |
Morgan Stanley & Co., LLC/(INTRCONX): | | | | | | | | | | | | | | | | | | | | |
CDX-NAHY Series 21,
5 Year Index, 12/20/18* | | | 5.00 | % | | | 2.53 | % | | $ | 12,323 | | | $ | 994,581 | | | $ | 304,250 | |
CDX-NAHY Series 24,
5 Year Index, 6/20/20* | | | 5.00 | | | | 3.53 | | | | 708 | | | | 44,922 | | | | (6,469 | ) |
CDX-NAHY Series 24,
5 Year Index, 6/20/20* | | | 5.00 | | | | 3.53 | | | | 709 | | | | 44,985 | | | | (4,545 | ) |
CDX-NAHY Series 24,
5 Year Index, 6/20/20* | | | 5.00 | | | | 3.53 | | | | 4,605 | | | | 292,278 | | | | (17,077 | ) |
CDX-NAHY Series 24,
5 Year Index, 6/20/20* | | | 5.00 | | | | 3.53 | | | | 1,632 | | | | 103,541 | | | | (8,382 | ) |
CDX-NAHY Series 24,
5 Year Index, 6/20/20* | | | 5.00 | | | | 3.53 | | | | 1,142 | | | | 72,504 | | | | (1,321 | ) |
CDX-NAHY Series 24,
5 Year Index, 6/20/20* | | | 5.00 | | | | 3.53 | | | | 1,040 | | | | 66,033 | | | | (709 | ) |
CDX-NAHY Series 24,
5 Year Index, 6/20/20* | | | 5.00 | | | | 3.53 | | | | 708 | | | | 44,922 | | | | (482 | ) |
CDX-NAHY Series 24,
5 Year Index, 6/20/20* | | | 5.00 | | | | 3.53 | | | | 708 | | | | 44,922 | | | | (958 | ) |
CDX-NAHY Series 24,
5 Year Index, 6/20/20* | | | 5.00 | | | | 3.53 | | | | 708 | | | | 44,922 | | | | (2,508 | ) |
CDX-NAHY Series 24,
5 Year Index, 6/20/20* | | | 5.00 | | | | 3.53 | | | | 708 | | | | 44,922 | | | | (3,164 | ) |
CDX-NAHY Series 24,
5 Year Index, 6/20/20* | | | 5.00 | | | | 3.53 | | | | 1,005 | | | | 63,771 | | | | (6,923 | ) |
CDX-NAHY Series 24,
5 Year Index, 6/20/20* | | | 5.00 | | | | 3.53 | | | | 709 | | | | 44,985 | | | | (4,447 | ) |
CDX-NAHY Series 24,
5 Year Index, 6/20/20* | | | 5.00 | | | | 3.53 | | | | 708 | | | | 44,922 | | | | (8,101 | ) |
CDX-NAHY Series 24,
5 Year Index, 6/20/20* | | | 5.00 | | | | 3.53 | | | | 708 | | | | 44,922 | | | | (7,335 | ) |
CDX-NAHY Series 24,
5 Year Index, 6/20/20* | | | 5.00 | | | | 3.53 | | | | 495 | | | | 31,415 | | | | (4,656 | ) |
CDX-NAHY Series 24,
5 Year Index, 6/20/20* | | | 5.00 | | | | 3.53 | | | | 708 | | | | 44,922 | | | | (6,861 | ) |
CDX-NAHY Series 24,
5 Year Index, 6/20/20* | | | 5.00 | | | | 3.53 | | | | 708 | | | | 44,922 | | | | (8,136 | ) |
CDX-NAHY Series 24,
5 Year Index, 6/20/20* | | | 5.00 | | | | 3.53 | | | | 2,683 | | | | 170,265 | | | | (2,475 | ) |
CDX-NAHY Series 24,
5 Year Index, 6/20/20* | | | 5.00 | | | | 3.53 | | | | 708 | | | | 44,922 | | | | (5,653 | ) |
CDX-NAHY Series 24,
5 Year Index, 6/20/20* | | | 5.00 | | | | 3.53 | | | | 452 | | | | 28,713 | | | | (4,178 | ) |
CDX-NAHY Series 24,
5 Year Index, 6/20/20* | | | 5.00 | | | | 3.53 | | | | 708 | | | | 44,922 | | | | (6,060 | ) |
CDX-NAHY Series 24,
5 Year Index, 6/20/20* | | | 5.00 | | | | 3.53 | | | | 746 | | | | 47,373 | | | | (6,711 | ) |
| | | | | | | | | | | | | | | | | | | | |
| | | | | | | | | | | | | | $ | 2,454,586 | | | $ | 187,099 | |
| | | | | | | | | | | | | | | | | | | | |
| | |
| 30 | | • ALLIANCEBERNSTEIN INCOME FUND |
Portfolio of Investments
CENTRALLY CLEARED INTEREST RATE SWAPS (see Note C)
| | | | | | | | | | | | | | | | |
| | | | | | | | | Rate Type | | | |
Clearing Broker/
(Exchange) | | Notional
Amount
(000) | | | Termination
Date | | | Payments
made
by the
Fund | | Payments
received
by the
Fund | | Unrealized
Appreciation/
(Depreciation) | |
Morgan Stanley & Co., LLC/(CME Group) | | CAD | 91,930 | | | | 3/10/17 | | | 0.973% | | 3 Month CDOR | | $ | (107,801 | ) |
Morgan Stanley & Co., LLC/(CME Group) | | AUD | 115,610 | | | | 3/11/17 | | | 2.140% | | 3 Month BBSW | | | 12 | |
Morgan Stanley & Co., LLC/(CME Group) | | CAD | 149,400 | | | | 6/05/17 | | | 1.504% | | 3 Month CDOR | | | (364,404 | ) |
Morgan Stanley & Co., LLC/(CME Group) | | AUD | 208,120 | | | | 6/09/17 | | | 2.200% | | 3 Month BBSW | | | (146,970 | ) |
Morgan Stanley & Co., LLC/(CME Group) | | NZD | 157,680 | | | | 6/09/17 | | | 3.368% | | 3 Month BKBM | | | (509,532 | ) |
Morgan Stanley & Co., LLC/(CME Group) | | GBP | 17,170 | | | | 6/05/20 | | | 6 Month LIBOR | | 1.651% | | | (27,514 | ) |
Morgan Stanley & Co., LLC/(CME Group) | | | 12,260 | | | | 6/05/20 | | | 6 Month LIBOR | | 1.644% | | | (25,736 | ) |
Morgan Stanley & Co., LLC/(CME Group) | | $ | 31,550 | | | | 2/05/25 | | | 1.881% | | 3 Month LIBOR | | | 1,263,880 | |
Morgan Stanley & Co., LLC/(CME Group) | | | 42,130 | | | | 2/10/25 | | | 2.034% | | 3 Month LIBOR | | | 1,110,295 | |
Morgan Stanley & Co., LLC/(CME Group) | | CAD | 11,800 | | | | 3/10/25 | | | 3 Month CDOR | | 2.019% | | | (64,912 | ) |
Morgan Stanley & Co., LLC/(CME Group) | | AUD | 18,170 | | | | 3/11/25 | | | 6 Month BBSW | | 2.973% | | | (393,975 | ) |
Morgan Stanley & Co., LLC/(CME Group) | | CAD | 19,810 | | | | 6/05/25 | | | 3 Month CDOR | | 2.281% | | | 188,802 | |
Morgan Stanley & Co., LLC/(CME Group) | | AUD | 27,550 | | | | 6/09/25 | | | 6 Month BBSW | | 3.384% | | | 82,071 | |
Morgan Stanley & Co., LLC/(CME Group) | | NZD | 18,390 | | | | 6/09/25 | | | 3 Month BKBM | | 4.068% | | | 171,864 | |
Morgan Stanley & Co., LLC/(CME Group) | | | 18,390 | | | | 6/09/25 | | | 3 Month BKBM | | 4.068% | | | 171,864 | |
Morgan Stanley & Co., LLC/(CME Group) | | $ | 8,010 | | | | 6/09/25 | | | 2.489% | | 3 Month LIBOR | | | (42,994 | ) |
Morgan Stanley & Co., LLC/(CME Group) | | | 6,010 | | | | 6/09/25 | | | 2.491% | | 3 Month LIBOR | | | (33,355 | ) |
| | | | |
| ALLIANCEBERNSTEIN INCOME FUND • | | | 31 | |
Portfolio of Investments
| | | | | | | | | | | | | | | | | | |
| | | | | | | | | Rate Type | | | | |
Clearing Broker/
(Exchange) | | Notional
Amount
(000) | | | Termination
Date | | | Payments
made
by the
Fund | | Payments
received
by the
Fund | | | Unrealized
Appreciation/
(Depreciation) | |
Morgan Stanley & Co., LLC/(CME Group) | | GBP | 2,720 | | | | 6/05/45 | | | 2.394% | | | 6 Month LIBOR | | | $ | (66,746 | ) |
Morgan Stanley & Co., LLC/(LCH Clearnet) | | | 12,000 | | | | 3/03/19 | | | 6 Month LIBOR | | | 1.921% | | | | 368,427 | |
Morgan Stanley & Co., LLC/(LCH Clearnet) | | $ | 11,850 | | | | 1/14/24 | | | 2.976% | | | 3 Month LIBOR | | | | (774,433 | ) |
Morgan Stanley & Co., LLC/(LCH Clearnet) | | | 60,150 | | | | 1/21/24 | | | 2.948% | | | 3 Month LIBOR | | | | (3,753,670 | ) |
Morgan Stanley & Co., LLC/(LCH Clearnet) | | | 11,000 | | | | 2/14/24 | | | 2.865% | | | 3 Month LIBOR | | | | (585,823 | ) |
Morgan Stanley & Co., LLC/(LCH Clearnet) | | | 47,150 | | | | 3/25/24 | | | 2.887% | | | 3 Month LIBOR | | | | (2,458,392 | ) |
Morgan Stanley & Co., LLC/(LCH Clearnet) | | | 46,860 | | | | 4/02/24 | | | 2.851% | | | 3 Month LIBOR | | | | (2,239,420 | ) |
Morgan Stanley & Co., LLC/(LCH Clearnet) | | | 40,500 | | | | 4/08/24 | | | 2.909% | | | 3 Month LIBOR | | | | (2,110,746 | ) |
| | | | | | | | | | | | | | | | | | |
| | | | | | | | | | | | | | | | $ | (10,349,208 | ) |
| | | | | | | | | | | | | | | | | | |
CREDIT DEFAULT SWAPS (see Note C)
| | | | | | | | | | | | | | | | | | | | | | | | |
Swap Counterparty & Referenced Obligation | | Fixed
Rate
(Pay)
Receive | | | Implied
Credit
Spread at
June 30,
2015 | | | Notional
Amount
(000) | | | Market
Value | | | Upfront
Premiums
Paid
(Received) | | | Unrealized
Appreciation/
(Depreciation) | |
Sale Contracts | | | | | | | | | | | | | | | | | | | | | | | | |
Credit Suisse International: | | | | | | | | | | | | | | | | | | | | | | | | |
CMBX.NA.BB.,
6.00%, 5/11/63* | | | 5.00 | % | | | 5.11 | % | | $ | 4,000 | | | $ | (22,576 | ) | | $ | 51,520 | | | $ | (74,096 | ) |
Kohl’s Corp.,
6.25%, 12/15/17, 6/20/19* | | | 1.00 | | | | 0.61 | | | | 2,148 | | | | 30,771 | | | | (23,080 | ) | | | 53,851 | |
Kohl’s Corp.,
6.25%, 12/15/17, 6/20/19* | | | 1.00 | | | | 0.61 | | | | 868 | | | | 12,439 | | | | (9,326 | ) | | | 21,765 | |
Kohl’s Corp.,
6.25%, 12/15/17, 6/20/19* | | | 1.00 | | | | 0.61 | | | | 875 | | | | 12,532 | | | | (9,400 | ) | | | 21,932 | |
Kohl’s Corp.,
6.25%, 12/15/17, 6/20/19* | | | 1.00 | | | | 0.61 | | | | 1,260 | | | | 18,047 | | | | (12,145 | ) | | | 30,192 | |
| | | | | | | | | | | | | | | | | | | | | | | | |
| | | | | | | | | | | | | | $ | 51,213 | | | $ | (2,431 | ) | | $ | 53,644 | |
| | | | | | | | | | | | | | | | | | | | | | | | |
| | |
| 32 | | • ALLIANCEBERNSTEIN INCOME FUND |
Portfolio of Investments
INTEREST RATE SWAPS (see Note C)
| | | | | | | | | | | | | | | | |
| | | | | | | | | Rate Type | | | |
Swap Counterparty | | Notional
Amount
(000) | | | Termination
Date | | | Payments
made
by the
Fund | | Payments
received
by the
Fund | | Unrealized
Appreciation/
(Depreciation) | |
Citibank | | | BRL 160,800 | | | | 1/02/17 | | | CDI | | 13.190% | | $ | (405,663 | ) |
Citibank | | | 75,000 | | | | 1/04/21 | | | 12.305% | | CDI | | | 87,020 | |
| | | | | | | | | | | | | | | | |
| | | | | | | | | | | | | | $ | (318,643 | ) |
| | | | | | | | | | | | | | | | |
REVERSE REPURCHASE AGREEMENTS (see Note C)
| | | | | | | | | | | | |
| Broker | | Interest Rate | | | Maturity | | | U.S. $
Value at
June 30, 2015 | |
Barclays Capital, Inc.† | | | (2.75 | )%* | | | — | | | $ | 2,780,057 | |
Barclays Capital, Inc.† | | | (2.00 | )%* | | | — | | | | 686,109 | |
Barclays Capital, Inc.† | | | (0.50 | )%* | | | — | | | | 2,372,959 | |
Credit Suisse Securities (USA) LLC† | | | (1.00 | )%* | | | — | | | | 1,802,192 | |
HSBC Bank USA | | | 0.23 | % | | | 7/23/15 | | | | 76,087,763 | |
HSBC Bank USA | | | 0.24 | % | | | 7/15/15 | | | | 109,480,839 | |
HSBC Bank USA | | | 0.25 | % | | | 7/01/15 | | | | 49,302,739 | |
HSBC Bank USA | | | 0.26 | % | | | 7/07/15 | | | | 20,394,601 | |
HSBC Bank USA | | | 0.28 | % | | | 8/27/15 | | | | 52,168,792 | |
HSBC Bank USA | | | 0.30 | % | | | 7/07/15 | | | | 60,717,379 | |
HSBC Bank USA | | | 0.30 | % | | | 7/16/15 | | | | 40,535,557 | |
HSBC Bank USA | | | 0.32 | % | | | 8/12/15 | | | | 35,109,991 | |
Jefferies & Co., Inc. | | | 0.23 | % | | | 7/09/15 | | | | 61,980,872 | |
Jefferies & Co., Inc. | | | 0.26 | % | | | 7/28/15 | | | | 20,209,077 | |
JPMorgan Chase Bank | | | (1.00 | )%* | | | 7/06/15 | | | | 514,375 | |
JPMorgan Chase Bank | | | 0.15 | % | | | 8/20/15 | | | | 49,385,000 | |
JPMorgan Chase Bank | | | 0.22 | % | | | 8/11/15 | | | | 75,882,518 | |
JPMorgan Chase Bank | | | 0.25 | % | | | 8/13/15 | | | | 47,790,925 | |
JPMorgan Chase Bank | | | 0.25 | % | | | 8/20/15 | | | | 200,045,968 | |
JPMorgan Chase Bank | | | 0.25 | % | | | 8/25/15 | | | | 68,332,424 | |
| | | | | | | | | | | | |
| | | | | | | | | | $ | 975,580,137 | |
| | | | | | | | | | | | |
| † | | The reverse repurchase agreement matures on demand. Interest rate resets daily and the rate shown is the rate in effect on June 30, 2015. |
| * | | Interest payment due from counterparty. |
| (a) | | Position, or a portion thereof, has been segregated to collateralize reverse repurchase agreements. |
| (b) | | Position, or a portion thereof, has been segregated to collateralize OTC derivatives outstanding. |
| (c) | | Security is exempt from registration under Rule 144A of the Securities Act of 1933. These securities are considered liquid and may be resold in transactions exempt from registration, normally to qualified institutional buyers. At June 30, 2015, the aggregate market value of these securities amounted to $286,988,545 or 16.0% of net assets. |
| | | | |
| ALLIANCEBERNSTEIN INCOME FUND • | | | 33 | |
Portfolio of Investments
| (e) | | Security is exempt from registration under Rule 144A of the Securities Act of 1933. These securities, which represent 0.15% of net assets as of June 30, 2015, are considered illiquid and restricted. |
| | | | | | | | | | | | | | | | |
| Restricted Securities | | Acquisition
Date | | | Cost | | | Market
Value | | | Percentage of
Net Assets | |
Exide Technologies Series AI
7.00%, 4/30/25 | | | 4/30/15 | | | $ | 1,905,619 | | | $ | 1,922,695 | | | | 0.11 | % |
Golden Energy Offshore Services AS
8.74%, 5/28/17 | | | 5/14/14 | | | | 1,243,934 | | | | 529,920 | | | | 0.03 | % |
Virgolino de Oliveira Finance SA
10.875%, 1/13/20 | | | 6/09/14 | | | | 745,965 | | | | 127,500 | | | | 0.01 | % |
Virgolino de Oliveira Finance SA
10.50%, 1/28/18 | | | 6/13/13 | | | | 3,510,948 | | | | 47,380 | | | | 0.00 | % |
Virgolino de Oliveira Finance SA
11.75%, 2/09/22 | | | 1/29/14 | | | | 916,308 | | | | 16,900 | | | | 0.00 | % |
| (f) | | Fair valued by the Adviser. |
| (g) | | Pay-In-Kind Payments (PIK). The issuer may pay cash interest and/or interest in additional debt securities. Rates shown are the rates in effect at June 30, 2015. |
| (h) | | Restricted and illiquid security. |
| | | | | | | | | | | | | | | | |
| Restricted Securities | | Acquisition
Date | | | Cost | | | Market
Value | | | Percentage of
Net Assets | |
Exide Technologies
11.00%, 4/30/20 | | | 4/30/14 | | | $ | 4,732,189 | | | $ | 4,333,079 | | | | 0.24 | % |
Exide Technologies | | | 4/30/14 | | | | 87,194 | | | | 185,719 | | | | 0.01 | % |
Mt. Logan Re Ltd. (Preference Shares) | | | 12/30/14 | | | | 4,476,000 | | | | 4,556,125 | | | | 0.25 | % |
| (i) | | Floating Rate Security. Stated interest rate was in effect at June 30, 2015. |
| (j) | | Securities are perpetual and, thus, do not have a predetermined maturity date. The date shown, if applicable, reflects the next call date. |
| (m) | | Variable rate coupon, rate shown as of June 30, 2015. |
| (n) | | Non-income producing security. |
| (o) | | The security is subject to a 12 month lock-up period, after which semi-annual redemptions are permitted. |
| (p) | | To obtain a copy of the fund’s financial statements, please go to the Securities and Exchange Commission’s website at www.sec.gov, or call AB at (800) 227-4618. |
| (q) | | Investment in affiliated money market mutual fund. The rate shown represents the 7-day yield as of period end. |
Currency Abbreviations:
AUD – Australian Dollar
BRL – Brazilian Real
CAD – Canadian Dollar
EUR – Euro
GBP – Great British Pound
IDR – Indonesian Rupiah
KRW – South Korean Won
MXN – Mexican Peso
NOK – Norwegian Krone
NZD – New Zealand Dollar
SGD – Singapore Dollar
TRY – Turkish Lira
TWD – New Taiwan Dollar
USD – United States Dollar
UYU – Uruguayan Peso
| | |
| 34 | | • ALLIANCEBERNSTEIN INCOME FUND |
Portfolio of Investments
Glossary:
BBSW – Bank Bill Swap Reference Rate (Australia)
BKBM – Bank Bill Benchmark (New Zealand)
CBT – Chicago Board of Trade
CDI – Brazil CETIP Interbank Deposit Rate
CDOR – Canadian Dealer Offered Rate
CDX-NAHY – North American High Yield Credit Default Swap Index
CMBS – Commercial Mortgage-Backed Securities
CMBX.NA – North American Commercial Mortgage-Backed Index
CME – Chicago Mercantile Exchange
GSE – Government-Sponsored Enterprise
INTRCONX – Inter-Continental Exchange
LCH – London Clearing House
LIBOR – London Interbank Offered Rates
REIT – Real Estate Investment Trust
REMICs – Real Estate Mortgage Investment Conduits
See notes to financial statements.
| | | | |
| ALLIANCEBERNSTEIN INCOME FUND • | | | 35 | |
Portfolio of Investments
STATEMENT OF ASSETS & LIABILITIES
June 30, 2015 (unaudited)
| | | | |
| Assets | | | | |
Investments in securities, at value | | | | |
Unaffiliated issuers (cost $2,574,826,907) | | $ | 2,612,665,286 | |
Affiliated issuers (cost $43,936,524) | | | 43,936,524 | |
Cash | | | 218,973 | |
Cash collateral due from broker | | | 16,327,810 | |
Foreign currencies, at value (cost $187,675) | | | 293,733 | |
Receivable for investment securities sold | | | 200,253,853 | |
Interest and dividends receivable | | | 29,040,872 | |
Unrealized appreciation on forward currency exchange contracts | | | 2,683,809 | |
Receivable for variation margin on exchange-traded derivatives | | | 288,595 | |
Unrealized appreciation on credit default swaps | | | 127,740 | |
Unrealized appreciation on interest rate swaps | | | 87,020 | |
Upfront premium paid on credit default swaps | | | 51,520 | |
| | | | |
Total assets | | | 2,905,975,735 | |
| | | | |
| Liabilities | | | | |
Options written, at value (premiums received $443,575) | | | 10,316 | |
Payable for reverse repurchase agreements | | | 975,580,137 | |
Payable for investment securities purchased and foreign currency transactions | | | 127,788,191 | |
Unrealized depreciation on forward currency exchange contracts | | | 4,417,165 | |
Advisory fee payable | | | 744,771 | |
Unrealized depreciation on interest rate swaps | | | 405,663 | |
Unrealized depreciation on credit default swaps | | | 74,096 | |
Upfront premium received on credit default swaps | | | 53,951 | |
Administrative fee payable | | | 13,796 | |
Dividends payable | | | 13,135 | |
Accrued expenses and other liabilities | | | 185,025 | |
| | | | |
Total liabilities | | | 1,109,286,246 | |
| | | | |
Net Assets | | $ | 1,796,689,489 | |
| | | | |
| Composition of Net Assets | | | | |
Common stock, at par | | $ | 2,158,356 | |
Additional paid-in capital | | | 1,782,459,896 | |
Undistributed net investment income | | | 5,481,956 | |
Accumulated net realized loss on investment and foreign currency transactions | | | (21,479,347 | ) |
Net unrealized appreciation on investments and foreign currency denominated assets and liabilities | | | 28,068,628 | |
| | | | |
| | $ | 1,796,689,489 | |
| | | | |
Net Asset Value Per Share—300 million shares of common stock authorized, $0.01 par value (based on 215,835,608 shares outstanding) | | $ | 8.32 | |
| | | | |
See notes to financial statements.
| | |
| 36 | | • ALLIANCEBERNSTEIN INCOME FUND |
Statement of Assets & Liabilities
STATEMENT OF OPERATIONS
Six Months Ended June 30, 2015 (unaudited)
| | | | | | | | |
| Investment Income | | | | | | | | |
Interest (net of foreign taxes withheld of $5,753) | | $ | 47,663,919 | | | | | |
Dividends | | | | | | | | |
Unaffiliated issuers | | | 408,610 | | | | | |
Affiliated issuers | | | 28,200 | | | | | |
Other income | | | 28,530 | | | $ | 48,129,259 | |
| | | | | | | | |
| Expenses | | | | | | | | |
Advisory fee (see Note B) | | | 4,478,378 | | | | | |
Custodian | | | 129,489 | | | | | |
Printing | | | 114,423 | | | | | |
Registration fees | | | 106,501 | | | | | |
Legal | | | 80,199 | | | | | |
Audit and tax | | | 65,220 | | | | | |
Transfer agency | | | 51,910 | | | | | |
Administrative | | | 31,137 | | | | | |
Directors’ fees | | | 27,869 | | | | | |
Miscellaneous | | | 59,498 | | | | | |
| | | | | | | | |
Total expenses before interest expense | | | 5,144,624 | | | | | |
Interest expense | | | 1,010,246 | | | | | |
| | | | | | | | |
Total expenses | | | | | | | 6,154,870 | |
| | | | | | | | |
Net investment income | | | | | | | 41,974,389 | |
| | | | | | | | |
| Realized and Unrealized Gain (Loss) on Investment and Foreign Currency Transactions | | | | | | | | |
Net realized gain (loss) on: | | | | | | | | |
Investment transactions | | | | | | | 43,095,545 | |
Futures | | | | | | | (6,725,032 | ) |
Options written | | | | | | | 91,514 | |
Swaps | | | | | | | 414,233 | |
Foreign currency transactions | | | | | | | 2,494,910 | |
Net change in unrealized appreciation/depreciation of: | | | | | | | | |
Investments | | | | | | | (71,298,467 | ) |
Futures | | | | | | | 19,038,618 | |
Options written | | | | | | | 389,125 | |
Swaps | | | | | | | 332,809 | |
Foreign currency denominated assets and liabilities | | | | | | | (4,425,601 | ) |
| | | | | | | | |
Net loss on investment and foreign currency transactions | | | | | | | (16,592,346 | ) |
| | | | | | | | |
Net Increase in Net Assets from Operations | | | | | | $ | 25,382,043 | |
| | | | | | | | |
See notes to financial statements.
| | | | |
| ALLIANCEBERNSTEIN INCOME FUND • | | | 37 | |
Statement of Operations
STATEMENT OF CHANGES IN NET ASSETS
| | | | | | | | |
| | | Six Months Ended
June 30, 2015
(unaudited) | | | Year Ended
December 31,
2014 | |
| Increase (Decrease) in Net Assets from Operations | | | | | | | | |
Net investment income | | $ | 41,974,389 | | | $ | 100,504,848 | |
Net realized gain (loss) on investment transactions and foreign currency transactions | | | 39,371,170 | | | | (14,555,797 | ) |
Net change in unrealized appreciation/depreciation of investments and foreign currency denominated assets and liabilities | | | (55,963,516 | ) | | | 60,564,273 | |
| | | | | | | | |
Net increase in net assets from operations | | | 25,382,043 | | | | 146,513,324 | |
| Dividends to Shareholders from | | | | | | | | |
Net investment income | | | (37,909,937 | ) | | | (107,988,728 | ) |
| Common Stock Transactions | | | | | | | | |
Repurchase of Shares (12,172,242 and 14,903,847 shares, respectively) | | | (92,499,158 | ) | | | (112,501,549 | ) |
| | | | | | | | |
Total decrease | | | (105,027,052 | ) | | | (73,976,953 | ) |
| Net Assets | | | | | | | | |
Beginning of period | | | 1,901,716,541 | | | | 1,975,693,494 | |
| | | | | | | | |
End of period (including undistributed net investment income of $5,481,956 and $1,417,504, respectively) | | $ | 1,796,689,489 | | | $ | 1,901,716,541 | |
| | | | | | | | |
See notes to financial statements.
| | |
| 38 | | • ALLIANCEBERNSTEIN INCOME FUND |
Statement of Changes in Net Assets
STATEMENT OF CASH FLOWS
For the Six Months Ended June 30, 2015 (unaudited)
| | | | | | | | |
| Cash flows from operating activities | | | | | | | | |
Net increase in net assets from operations | | | | | | $ | 25,382,043 | |
| Reconciliation of Net Increase in Net Assets from Operations to Net Increase in Cash from Operating Activities: | | | | | | | | |
Decrease in interest and dividends receivable | | $ | 5,070,424 | | | | | |
Increase in receivable for investments sold | | | (196,332,081 | ) | | | | |
Net accretion of bond discount and amortization of bond premium | | | 12,440,123 | | | | | |
Increase in payable for investments purchased | | | 124,003,594 | | | | | |
Decrease in accrued expenses | | | (458,832 | ) | | | | |
Increase in cash collateral due from broker | | | (4,234,241 | ) | | | | |
Purchases of long-term investments | | | (691,945,939 | ) | | | | |
Purchases of short-term investments | | | (755,673,882 | ) | | | | |
Proceeds from disposition of long-term investments | | | 871,319,273 | | | | | |
Proceeds from disposition of short-term investments | | | 730,623,213 | | | | | |
Proceeds from options written, net | | | 442,914 | | | | | |
Proceeds on swaps, net | | | 756,584 | | | | | |
Proceeds for exchange-traded derivatives settlements | | | 12,331,729 | | | | | |
Decrease in cash collateral due to broker | | | (377,000 | ) | | | | |
Net realized gain on investment transactions and foreign currency transactions | | | (39,371,170 | ) | | | | |
Net change in unrealized appreciation/depreciation of investments and foreign currency denominated assets and liabilities | | | 55,963,516 | | | | | |
| | | | | | | | |
Total adjustments | | | | | | | 124,558,225 | |
| | | | | | | | |
Net increase in cash from operating activities | | | | | | $ | 149,940,268 | |
| | | | | | | | |
Financing Activities: | | | | | | | | |
Repurchase of Shares | | | (95,906,044 | ) | | | | |
Cash dividends paid | | | (46,327,277 | ) | | | | |
Decrease in reverse repurchase agreements | | | (17,194,068 | ) | | | | |
| | | | | | | | |
Net decrease in cash from financing activities | | | | | | | (159,427,389 | ) |
Effect of exchange rate on cash | | | | | | | 6,897,137 | |
| | | | | | | | |
Net decrease in cash | | | | | | | (2,589,984 | ) |
Net change in cash | | | | | | | | |
Cash at beginning of period | | | | | | | 3,102,690 | |
| | | | | | | | |
Cash at end of period | | | | | | $ | 512,706 | |
| | | | | | | | |
Supplemental disclosure of cash flow information: | | | | | | | | |
Interest expense paid during the period | | $ | 1,037,835 | | | | | |
In accordance with U.S. GAAP, the Fund has included a Statement of Cash Flows as a result of its significant investments in reverse repurchase agreements throughout the period.
See notes to financial statements.
| | | | |
| ALLIANCEBERNSTEIN INCOME FUND • | | | 39 | |
Statement of Cash Flows
NOTES TO FINANCIAL STATEMENTS
June 30, 2015 (unaudited)
NOTE A
Significant Accounting Policies
AllianceBernstein Income Fund, Inc. (the “Fund”) is registered under the Investment Company Act of 1940 as a diversified, closed-end management investment company. The financial statements have been prepared in conformity with U.S. generally accepted accounting principles (“U.S. GAAP”) which require management to make certain estimates and assumptions that affect the reported amounts of assets and liabilities in the financial statements and amounts of income and expenses during the reporting period. Actual results could differ from those estimates. The Fund is an investment company under U.S. GAAP and follows the accounting and reporting guidance applicable to investment companies. The following is a summary of significant accounting policies followed by the Fund.
1. Security Valuation
Portfolio securities are valued at their current market value determined on the basis of market quotations or, if market quotations are not readily available or are deemed unreliable, at “fair value” as determined in accordance with procedures established by and under the general supervision of the Fund’s Board of Directors (the “Board”).
In general, the market values of securities which are readily available and deemed reliable are determined as follows: securities listed on a national securities exchange (other than securities listed on the NASDAQ Stock Market, Inc. (“NASDAQ”)) or on a foreign securities exchange are valued at the last sale price at the close of the exchange or foreign securities exchange. If there has been no sale on such day, the securities are valued at the last traded price from the previous day. Securities listed on more than one exchange are valued by reference to the principal exchange on which the securities are traded; securities listed only on NASDAQ are valued in accordance with the NASDAQ Official Closing Price; listed or over the counter (“OTC”) market put or call options are valued at the mid level between the current bid and ask prices. If either a current bid or current ask price is unavailable, AllianceBernstein L.P. (the “Adviser”) will have discretion to determine the best valuation (e.g. last trade price in the case of listed options); open futures are valued using the closing settlement price or, in the absence of such a price, the most recent quoted bid price. If there are no quotations available for the day of valuation, the last available closing settlement price is used; U.S. Government securities and any other debt instruments having 60 days or less remaining until maturity are generally valued at market by an independent pricing vendor, if a market price is available. If a market price is not available, the securities are valued at amortized cost. This methodology is commonly used for short term securities that have an original maturity of 60 days or less, as well as short term securities that had an original term to maturity that exceeded 60 days. In instances when amortized cost is utilized, the Valuation Committee (the “Committee”) must reasonably conclude that the utilization of amortized cost is approximately the same as the fair value of the
| | |
| 40 | | • ALLIANCEBERNSTEIN INCOME FUND |
Notes to Financial Statements
security. Such factors the Committee will consider include, but are not limited to, an impairment of the creditworthiness of the issuer or material changes in interest rates. Fixed-income securities, including mortgage-backed and asset-backed securities, may be valued on the basis of prices provided by a pricing service or at a price obtained from one or more of the major broker-dealers. In cases where broker-dealer quotes are obtained, the Adviser may establish procedures whereby changes in market yields or spreads are used to adjust, on a daily basis, a recently obtained quoted price on a security. Swaps and other derivatives are valued daily, primarily using independent pricing services, independent pricing models using market inputs, as well as third party broker-dealers or counterparties. Investment companies are valued at their net asset value each day.
Securities for which market quotations are not readily available (including restricted securities) or are deemed unreliable are valued at fair value. Factors considered in making this determination may include, but are not limited to, information obtained by contacting the issuer, analysts, analysis of the issuer’s financial statements or other available documents. In addition, the Fund may use fair value pricing for securities primarily traded in non-U.S. markets because most foreign markets close well before the Fund values its securities at 4:00 p.m., Eastern Time. The earlier close of these foreign markets gives rise to the possibility that significant events, including broad market moves, may have occurred in the interim and may materially affect the value of those securities.
2. Fair Value Measurements
In accordance with U.S. GAAP regarding fair value measurements, fair value is defined as the price that the Fund would receive to sell an asset or pay to transfer a liability in an orderly transaction between market participants at the measurement date. U.S. GAAP establishes a framework for measuring fair value, and a three-level hierarchy for fair value measurements based upon the transparency of inputs to the valuation of an asset or liability (including those valued based on their market values as described in Note A.1 above). Inputs may be observable or unobservable and refer broadly to the assumptions that market participants would use in pricing the asset or liability. Observable inputs reflect the assumptions market participants would use in pricing the asset or liability based on market data obtained from sources independent of the Fund. Unobservable inputs reflect the Fund’s own assumptions about the assumptions that market participants would use in pricing the asset or liability based on the best information available in the circumstances. Each investment is assigned a level based upon the observability of the inputs which are significant to the overall valuation. The three-tier hierarchy of inputs is summarized below.
| | • | | Level 1—quoted prices in active markets for identical investments |
| | • | | Level 2—other significant observable inputs (including quoted prices for similar investments, interest rates, prepayment speeds, credit risk, etc.) |
| | • | | Level 3—significant unobservable inputs (including the Fund’s own assumptions in determining the fair value of investments) |
| | | | |
| ALLIANCEBERNSTEIN INCOME FUND • | | | 41 | |
Notes to Financial Statements
The fair value of debt instruments, such as bonds, and over-the-counter derivatives is generally based on market price quotations, recently executed market transactions (where observable) or industry recognized modeling techniques and are generally classified as Level 2. Pricing vendor inputs to Level 2 valuations may include quoted prices for similar investments in active markets, interest rate curves, coupon rates, currency rates, yield curves, option adjusted spreads, default rates, credit spreads and other unique security features in order to estimate the relevant cash flows which are then discounted to calculate fair values. If these inputs are unobservable and significant to the fair value, these investments will be classified as Level 3. In addition, non-agency rated investments are classified as Level 3.
Where readily available market prices or relevant bid prices are not available for certain equity investments, such investments may be valued based on similar publicly traded investments, movements in relevant indices since last available prices or based upon underlying company fundamentals and comparable company data (such as multiples to earnings or other multiples to equity). Where an investment is valued using an observable input, such as another publicly traded security, the investment will be classified as Level 2. If management determines that an adjustment is appropriate based on restrictions on resale, illiquidity or uncertainty, and such adjustment is a significant component of the valuation, the investment will be classified as Level 3. An investment will also be classified as Level 3 where management uses company fundamentals and other significant inputs to determine the valuation.
Options are valued using market-based inputs to models, broker or dealer quotations, or alternative pricing sources with reasonable levels of price transparency, where such inputs and models are available. Alternatively the values may be obtained through unobservable management determined inputs and/or management’s proprietary models. Where models are used, the selection of a particular model to value an option depends upon the contractual terms of, and specific risks inherent in, the option as well as the availability of pricing information in the market. Valuation models require a variety of inputs, including contractual terms, market prices, measures of volatility and correlations of such inputs. Exchange traded options generally will be classified as Level 2. For options that do not trade on exchange but trade in liquid markets, inputs can generally be verified and model selection does not involve significant management judgment. Options are classified within Level 2 on the fair value hierarchy when all of the significant inputs can be corroborated to market evidence. Otherwise such instruments are classified as Level 3.
Valuations of mortgage-backed or other asset-backed securities, by pricing vendors, are based on both proprietary and industry recognized models and discounted cash flow techniques. Significant inputs to the valuation of these instruments are value of the collateral, the rates and timing of delinquencies, the
| | |
| 42 | | • ALLIANCEBERNSTEIN INCOME FUND |
Notes to Financial Statements
rates and timing of prepayments, and default and loss expectations, which are driven in part by housing prices for residential mortgages. Significant inputs are determined based on relative value analyses, which incorporate comparisons to instruments with similar collateral and risk profiles, including relevant indices. Mortgage and asset-backed securities for which management has collected current observable data through pricing services are generally categorized within Level 2. Those investments for which current observable data has not been provided are classified as Level 3.
Bank loan prices are provided by third party pricing services and consist of a composite of the quotes received by the vendor into a consensus price. Bank loans are classified as Level 3, as significant input used in the fair value measurement of these instruments is the market quotes that are received by the vendor and these inputs are not observable.
Other fixed income investments, including non-U.S. government and corporate debt, are generally valued using quoted market prices, if available, which are typically impacted by current interest rates, maturity dates and any perceived credit risk of the issuer. Additionally, in the absence of quoted market prices, these inputs are used by pricing vendors to derive a valuation based upon industry or proprietary models which incorporate issuer specific data with relevant yield/spread comparisons with more widely quoted bonds with similar key characteristics. Those investments for which there are observable inputs are classified as Level 2. Where the inputs are not observable, the investments are classified as Level 3.
The following table summarizes the valuation of the Fund’s investments by the above fair value hierarchy levels as of June 30, 2015:
| | | | | | | | | | | | | | | | |
Investments in
Securities: | | Level 1 | | | Level 2 | | | Level 3 | | | Total | |
Assets: | | | | | | | | | | | | | | | | |
Governments – Treasuries | | $ | – 0 | – | | $ | 1,897,015,930 | | | $ | – 0 | – | | $ | 1,897,015,930 | |
Corporates – Non-Investment Grade | | | – 0 | – | | | 232,759,788 | | | | 6,785,694 | | | | 239,545,482 | |
Collateralized Mortgage Obligations | | | – 0 | – | | | 3,514,339 | | | | 93,385,377 | | | | 96,899,716 | |
Corporates – Investment Grade | | | – 0 | – | | | 85,956,275 | | | | – 0 | – | | | 85,956,275 | |
Agencies | | | – 0 | – | | | 70,146,566 | | | | – 0 | – | | | 70,146,566 | |
Commercial Mortgage-Backed Securities | | | – 0 | – | | | 4,131,214 | | | | 55,869,319 | | | | 60,000,533 | |
Emerging Markets – Corporate Bonds | | | – 0 | – | | | 31,755,740 | | | | – 0 | – | | | 31,755,740 | |
Whole Loan Trusts | | | – 0 | – | | | – 0 | – | | | 21,787,139 | | | | 21,787,139 | |
Quasi-Sovereigns | | | – 0 | – | | | 21,431,794 | | | | – 0 | – | | | 21,431,794 | |
Common Stocks | | | – 0 | – | | | – 0 | – | | | 21,229,985 | | | | 21,229,985 | |
| | | | |
| ALLIANCEBERNSTEIN INCOME FUND • | | | 43 | |
Notes to Financial Statements
| | | | | | | | | | | | | | | | |
Investments in
Securities: | | Level 1 | | | Level 2 | | | Level 3 | | | Total | |
Local Governments – Municipal Bonds | | $ | – 0 | – | | $ | 15,504,559 | | | $ | – 0 | – | | $ | 15,504,559 | |
Emerging Markets – Sovereigns | | | – 0 | – | | | 15,022,997 | | | | – 0 | – | | | 15,022,997 | |
Bank Loans | | | – 0 | – | | | – 0 | – | | | 10,560,078 | | | | 10,560,078 | |
Preferred Stocks | | | 9,782,688 | | | | – 0 | – | | | – 0 | – | | | 9,782,688 | |
Governments – Sovereign Agencies | | | – 0 | – | | | 6,005,928 | | | | – 0 | – | | | 6,005,928 | |
Investment Companies | | | – 0 | – | | | – 0 | – | | | 2,704,813 | | | | 2,704,813 | |
Asset-Backed Securities | | | – 0 | – | | | 2,124,804 | | | | – 0 | – | | | 2,124,804 | |
Governments – Sovereign Bonds | | | – 0 | – | | | 1,081,350 | | | | – 0 | – | | | 1,081,350 | |
Mortgage Pass-Throughs | | | – 0 | – | | | 56,009 | | | | – 0 | – | | | 56,009 | |
Short-Term Investments: | | | | | | | | | | | | | | | | |
Investment Companies | | | 43,936,524 | | | | – 0 | – | | | – 0 | – | | | 43,936,524 | |
Governments – Treasuries | | | – 0 | – | | | 4,052,900 | | | | – 0 | – | | | 4,052,900 | |
| | | | | | | | | | | | | | | | |
Total Investments in Securities | | | 53,719,212 | | | | 2,390,560,193 | | | | 212,322,405 | | | | 2,656,601,810 | |
Other Financial Instruments*: | | | | | | | | | | | | | | | | |
Assets: | | | | | | | | | | | | | | | | |
Futures | | | 2,018,759 | | | | – 0 | – | | | – 0 | – | | | 2,018,759 | # |
Forward Currency Exchange Contracts | | | – 0 | – | | | 2,683,809 | | | | – 0 | – | | | 2,683,809 | |
Centrally Cleared Credit Default Swaps | | | – 0 | – | | | 304,250 | | | | – 0 | – | | | 304,250 | # |
Centrally Cleared Interest Rate Swaps | | | – 0 | – | | | 3,357,215 | | | | – 0 | – | | | 3,357,215 | # |
Credit Default Swaps | | | – 0 | – | | | 127,740 | | | | – 0 | – | | | 127,740 | |
Interest Rate Swaps | | | – 0 | – | | | 87,020 | | | | – 0 | – | | | 87,020 | |
Liabilities: | | | | | | | | | | | | | | | | |
Forward Currency Exchange Contracts | | | – 0 | – | | | (4,417,165 | ) | | | – 0 | – | | | (4,417,165 | ) |
Currency Options Written | | | – 0 | – | | | (10,316 | ) | | | – 0 | – | | | (10,316 | ) |
Centrally Cleared Credit Default Swaps | | | – 0 | – | | | (117,151 | ) | | | – 0 | – | | | (117,151 | )# |
Centrally Cleared Interest Rate Swaps | | | – 0 | – | | | (13,706,423 | ) | | | – 0 | – | | | (13,706,423 | )# |
| | |
| 44 | | • ALLIANCEBERNSTEIN INCOME FUND |
Notes to Financial Statements
| | | | | | | | | | | | | | | | |
Investments in
Securities: | | Level 1 | | | Level 2 | | | Level 3 | | | Total | |
Credit Default Swaps | | $ | – 0 | – | | $ | (74,096 | ) | | $ | – 0 | – | | $ | (74,096 | ) |
Interest Rate Swaps | | | – 0 | – | | | (405,663 | ) | | | – 0 | – | | | (405,663 | ) |
| | | | | | | | | | | | | | | | |
Total+ | | $ | 55,737,971 | | | $ | 2,378,389,413 | | | $ | 212,322,405 | | | $ | 2,646,449,789 | |
| | | | | | | | | | | | | | | | |
| * | | Other financial instruments are derivative instruments, such as futures, forwards and swaps, which are valued at the unrealized appreciation/depreciation on the instrument. Other financial instruments may also include options written which are valued at market value. |
| # | | Only variation margin receivable/payable at period end is reported within the statement of assets and liabilities. This amount reflects cumulative appreciation/(depreciation) of exchange-traded derivatives as reported in the portfolio of investments. |
| + | | There were no transfers between Level 1 and Level 2 during the reporting period. |
The Fund recognizes all transfers between levels of the fair value hierarchy assuming the financial instruments were transferred at the beginning of the reporting period.
The following is a reconciliation of investments in which significant unobservable inputs (Level 3) were used in determining fair value.
| | | | | | | | | | | | |
| | | Corporates -
Non-Investment
Grade | | | Collateralized
Mortgage
Obligations | | | Commercial
Mortgage-Backed
Securities | |
Balance as of 12/31/14 | | $ | 4,961,200 | | | $ | 87,500,657 | | | $ | 47,313,294 | |
Accrued discounts/(premiums) | | | 10,839 | | | | 146,865 | | | | 64,277 | |
Realized gain (loss) | | | 6,026 | | | | 412,879 | | | | 316,819 | |
Change in unrealized appreciation/depreciation | | | (839,144 | ) | | | 271,894 | | | | (1,152,541 | ) |
Purchases/Payups | | | 6,623,714 | | | | 17,116,328 | | | | 14,354,194 | |
Sales/Paydowns | | | (2,213,504 | ) | | | (12,063,246 | ) | | | (5,026,724 | ) |
Transfers in to Level 3 | | | – 0 | – | | | – 0 | – | | | – 0 | – |
Transfers out of Level 3 | | | (1,763,437 | ) | | | – 0 | – | | | – 0 | – |
| | | | | | | | | | | | |
Balance as of 6/30/15 | | $ | 6,785,694 | | | $ | 93,385,377 | | | $ | 55,869,319 | |
| | | | | | | | | | | | |
Net change in unrealized appreciation/depreciation from Investments held as of 6/30/15* | | $ | (809,945 | ) | | $ | 559,685 | | | $ | (891,349 | ) |
| | | | | | | | | | | | |
| | | |
| | | Whole Loan
Trusts | | | Common Stocks | | | Bank Loans | |
Balance as of 12/31/14 | | $ | 16,795,929 | | | $ | 1,258,032 | | | $ | 23,689,120 | |
Accrued discounts/(premiums) | | | 17,325 | | | | – 0 | – | | | 10,468 | |
Realized gain (loss) | | | 12,198 | | | | 278,102 | | | | (253,803 | ) |
| | | | |
| ALLIANCEBERNSTEIN INCOME FUND • | | | 45 | |
Notes to Financial Statements
| | | | | | | | | | | | |
| | | Whole Loan
Trusts | | | Common Stocks | | | Bank Loans | |
Change in unrealized appreciation/depreciation | | $ | 20,811 | | | $ | 408,759 | | | $ | 1,035,379 | |
Purchases | | | 11,277,738 | | | | 19,563,194 | | | | 2,593,594 | |
Sales | | | (6,336,862 | ) | | | (278,102 | ) | | | (16,514,680 | ) |
Transfers in to Level 3 | | | – 0 | – | | | – 0 | – | | | – 0 | – |
Transfers out of Level 3 | | | – 0 | – | | | – 0 | – | | | – 0 | – |
| | | | | | | | | | | | |
Balance as of 6/30/15 | | $ | 21,787,139 | | | $ | 21,229,985 | | | $ | 10,560,078 | |
| | | | | | | | | | | | |
Net change in unrealized appreciation/depreciation from Investments held as of 6/30/15* | | $ | 20,811 | | | $ | 682,520 | | | $ | (58,506 | ) |
| | | | | | | | | | | | |
| | | |
| | | Investment
Companies | | | Total | | | | |
Balance as of 12/31/14 | | $ | 2,409,198 | | | $ | 183,927,430 | | | | | |
Accrued discounts/(premiums) | | | – 0 | – | | | 249,774 | | | | | |
Realized gain (loss) | | | – 0 | – | | | 772,221 | | | | | |
Change in unrealized appreciation/depreciation | | | (107,407 | ) | | | (362,249 | ) | | | | |
Purchases/Payups | | | 403,022 | | | | 71,931,784 | | | | | |
Sales/Paydowns | | | – 0 | – | | | (42,433,118 | ) | | | | |
Transfers in to Level 3 | | | – 0 | – | | | – 0 | – | | | | |
Transfers out of Level 3 | | | – 0 | – | | | (1,763,437 | ) | | | | |
| | | | | | | | | | | | |
Balance as of 6/30/15 | | $ | 2,704,813 | | | $ | 212,322,405 | + | | | | |
| | | | | | | | | | | | |
Net change in unrealized appreciation/depreciation from Investments held as of 6/30/15* | | $ | (107,407 | ) | | $ | (604,191 | ) | | | | |
| | | | | | | | | | | | |
| + | | There were de minimis transfers under 1% of net assets during the reporting period. |
| * | | The unrealized appreciation/depreciation is included in net change in unrealized appreciation/depreciation on investments and other financial instruments in the accompanying statement of operations. |
The following presents information about significant unobservable inputs related to the Fund’s Level 3 investments at June 30, 2015. Securities priced by third party vendors or using prior transaction prices, which approximate fair value, are excluded from the following table.
| | | | | | | | | | |
| | | Quantitative Information about Level 3
Fair Value Measurements |
| | | Fair Value
at 6/30/15 | | | Valuation
Technique | | Unobservable Input | | Range/
Weighted
Average |
Corporates –
Non-Investment Grade | |
$ |
1,922,695 |
| |
Market
Approach | |
New Financing Net of 1st Lien and Common Stock | |
$85.50/NA |
| | |
| 46 | | • ALLIANCEBERNSTEIN INCOME FUND |
Notes to Financial Statements
| | | | | | | | | | |
| | | Quantitative Information about Level 3
Fair Value Measurements |
| | | Fair Value
at 6/30/15 | | | Valuation
Technique | | Unobservable Input | | Range/
Weighted
Average |
| | | | |
Whole Loan Trusts | | $ | 3,694,206 | | | Projected
Cash Flow | | Level Yield | | 13.45%/NA |
| | | | |
| | $ | 1,415,351 | | | Projected
Cash Flow | | Internal Rate of Return | | 7.967%/NA |
| | | | |
| | $ | 993,547 | | | Projected
Cash Flow | | Internal Rate of Return | | 15.00%/NA |
| | | | |
| | $ | 2,859,726 | | | Market
Approach | | Underlying NAV of the collateral | | $99.17/NA |
| | | | |
| | $ | 8,654,419 | | | Discounted
Cash Flow | | Level Yield | | 10.86%/NA |
| | | | |
Common Stocks | | $ | 969,104 | | | Market
Approach | | EBITDA Projection* | | $179.1
million |
| * | | Earnings Before Interest, Taxes, Depreciation and Amortization. |
The Adviser established the Committee to oversee the pricing and valuation of all securities held in the Fund. The Committee operates under pricing and valuation policies and procedures established by the Adviser and approved by the Board, including pricing policies which set forth the mechanisms and processes to be employed on a daily basis to implement these policies and procedures. In particular, the pricing policies describe how to determine market quotations for securities and other instruments. The Committee’s responsibilities include: 1) fair value and liquidity determinations (and oversight of any third parties to whom any responsibility for fair value and liquidity determinations is delegated), and 2) regular monitoring of the Adviser’s pricing and valuation policies and procedures and modification or enhancement of these policies and procedures (or recommendation of the modification of these policies and procedures) as the Committee believes appropriate.
The Committee is also responsible for monitoring the implementation of the pricing policies by the Adviser’s Pricing Group (the “Pricing Group”) and a third party which performs certain pricing functions in accordance with the pricing policies. The Pricing Group is responsible for the oversight of the third party on a day-to-day basis. The Committee and the Pricing Group perform a series of activities to provide reasonable assurance of the accuracy of prices including: 1) periodic vendor due diligence meetings, review of methodologies, new developments and processes at vendors, 2) daily comparison of security valuation versus prior day for all securities that exceeded established thresholds, and 3) daily review of unpriced, stale, and variance reports with exceptions reviewed by senior management and the Committee.
In addition, several processes outside of the pricing process are used to monitor valuation issues including: 1) performance and performance attribution reports
| | | | |
| ALLIANCEBERNSTEIN INCOME FUND • | | | 47 | |
Notes to Financial Statements
are monitored for anomalous impacts based upon benchmark performance, and 2) portfolio managers review all portfolios for performance and analytics (which are generated using the Adviser’s prices).
3. Currency Translation
Assets and liabilities denominated in foreign currencies and commitments under forward currency exchange contracts are translated into U.S. dollars at the mean of the quoted bid and ask prices of such currencies against the U.S. dollar. Purchases and sales of portfolio securities are translated into U.S. dollars at the rates of exchange prevailing when such securities were acquired or sold. Income and expenses are translated into U.S. dollars at rates of exchange prevailing when accrued.
Net realized gain or loss on foreign currency transactions represents foreign exchange gains and losses from sales and maturities of foreign fixed income investments, foreign currency exchange contracts, holding of foreign currencies, currency gains or losses realized between the trade and settlement dates on foreign investment transactions, and the difference between the amounts of dividends, interest and foreign withholding taxes recorded on the Fund’s books and the U.S. dollar equivalent amounts actually received or paid. Net unrealized currency gains and losses from valuing foreign currency denominated assets and liabilities at period end exchange rates are reflected as a component of net unrealized appreciation or depreciation of foreign currency denominated assets and liabilities.
4. Taxes
It is the Fund’s policy to meet the requirements of the Internal Revenue Code applicable to regulated investment companies and to distribute all of its investment company taxable income and net realized gains, if any, to shareholders. Therefore, no provisions for federal income or excise taxes are required. The Fund may be subject to taxes imposed by countries in which it invests. Such taxes are generally based on income and/or capital gains earned or repatriated. Taxes are accrued and applied to net investment income, net realized gains and net unrealized appreciation/depreciation as such income and/or gains are earned.
In accordance with U.S. GAAP requirements regarding accounting for uncertainties in income taxes, management has analyzed the Fund’s tax positions taken or expected to be taken on federal and state income tax returns for all open tax years (the current and the prior three tax years) and has concluded that no provision for income tax is required in the Fund’s financial statements.
5. Investment Income and Investment Transactions
Dividend income is recorded on the ex-dividend date or as soon as the Fund is informed of the dividend. Interest income is accrued daily. Investment transactions are accounted for on the date the securities are purchased or sold. Investment gains or losses are determined on the identified cost basis. The Fund amortizes premiums and accretes discounts as adjustments to interest income.
| | |
| 48 | | • ALLIANCEBERNSTEIN INCOME FUND |
Notes to Financial Statements
6. Dividends and Distributions
Dividends and distributions to shareholders, if any, are recorded on the ex-dividend date. Income dividends and capital gains distributions are determined in accordance with federal tax regulations and may differ from those determined in accordance with U.S. GAAP. To the extent these differences are permanent, such amounts are reclassified within the capital accounts based on their federal tax basis treatment; temporary differences do not require such reclassification.
7. Repurchase Agreements
It is the Fund’s policy that its custodian or designated subcustodian take control of securities as collateral under repurchase agreements and to determine on a daily basis that the value of such securities are sufficient to cover the value of the repurchase agreements. If the seller defaults and the value of the collateral declines or if bankruptcy proceedings are commenced with respect to the seller of the security, realization of collateral by the Fund may be delayed or limited.
NOTE B
Advisory Fee and Other Transactions with Affiliates
Under the terms of the investment advisory agreement, the Fund pays the Adviser a monthly advisory fee in an amount equal to the sum of 1/12th of .30 of 1% of the Fund’s average weekly net assets up to $250 million, 1/12th of .25 of 1% of the Fund’s average weekly net assets in excess of $250 million, and 4.75% of the Fund’s daily gross income (i.e., income other than gains from the sale of securities and foreign currency transactions or gains realized from options, futures and swaps, less interest on money borrowed by the Fund) accrued by the Fund during the month. However, such monthly advisory fee shall not exceed in the aggregate 1/12th of .80% of the Fund’s average weekly net assets during the month (approximately .80% on an annual basis).
Under the terms of the Shareholder Inquiry Agency Agreement with AllianceBernstein Investor Services, Inc. (“ABIS”), a wholly-owned subsidiary of the Adviser, the Fund reimburses ABIS for costs relating to servicing phone inquiries on behalf of the Fund. During the six months ended June 30, 2015, there was no reimbursement paid to ABIS.
Pursuant to the investment advisory agreement, the Fund may reimburse the Adviser for certain legal and accounting services provided to the Fund by the Adviser. For the six months ended June 30, 2015, the reimbursement for such services amounted to $31,137.
The Fund may invest in the AB Fixed-Income Shares, Inc.—Government STIF Portfolio (“Government STIF Portfolio”), an open-end management investment company managed by the Adviser. The Government STIF Portfolio is offered as a cash management option to mutual funds and other institutional accounts of the Adviser, and is not available for direct purchase by members of the public. The Government STIF Portfolio pays no investment management fees but does
| | | | |
| ALLIANCEBERNSTEIN INCOME FUND • | | | 49 | |
Notes to Financial Statements
bear its own expenses. A summary of the Fund’s transactions in shares of the Government STIF Portfolio for the six months ended June 30, 2015 is as follows:
| | | | | | | | | | | | | | | | |
Market Value December 31, 2014 (000) | | Purchases
at Cost
(000) | | | Sales
Proceeds
(000) | | | Market Value
June 30, 2015
(000) | | | Dividend
Income
(000) | |
| $ 28,409 | | $ | 735,616 | | | $ | 720,088 | | | $ | 43,937 | | | $ | 28 | |
Brokerage commissions paid on investment transactions for the six months ended June 30, 2015 amounted to $0, of which $0 and $0, respectively, was paid to Sanford C. Bernstein & Co. LLC and Sanford C. Bernstein Limited, affiliates of the Adviser.
NOTE C
Investment Transactions
Purchases and sales of investment securities (excluding short-term investments) for the six months ended June 30, 2015 were as follows:
| | | | | | | | |
| | | Purchases | | | Sales | |
Investment securities (excluding U.S. government securities) | | $ | 226,214,727 | | | $ | 215,289,710 | |
U.S. government securities | | | 465,350,337 | | | | 634,256,586 | |
The cost of investments for federal income tax purposes was substantially the same as the cost for financial reporting purposes. Accordingly, gross unrealized appreciation and unrealized depreciation (excluding futures, foreign currency, written options and swap transactions) are as follows:
| | | | |
Gross unrealized appreciation | | $ | 77,390,840 | |
Gross unrealized depreciation | | | (39,552,461 | ) |
| | | | |
Net unrealized appreciation | | $ | 37,838,379 | |
| | | | |
1. Derivative Financial Instruments
The Fund may use derivatives in an effort to earn income and enhance returns, to replace more traditional direct investments, to obtain exposure to otherwise inaccessible markets (collectively, “investment purposes”), or to hedge or adjust the risk profile of its portfolio.
The principal types of derivatives utilized by the Fund, as well as the methods in which they may be used are:
The Fund may buy or sell futures for investment purposes or for the purpose of hedging its portfolio against adverse effects of potential movements in the market. The Fund bears the market risk that arises from changes in the value of these instruments and the imperfect correlation
| | |
| 50 | | • ALLIANCEBERNSTEIN INCOME FUND |
Notes to Financial Statements
between movements in the price of the futures and movements in the price of the assets, reference rates or indices which they are designed to track. Among other things, the Fund may purchase or sell futures for foreign currencies or options thereon for non-hedging purposes as a means of making direct investment in foreign currencies, as described below under “Currency Transactions”.
At the time the Fund enters into futures, the Fund deposits and maintains as collateral an initial margin with the broker, as required by the exchange on which the transaction is effected. Such amount is shown as cash collateral due from broker on the statement of assets and liabilities. Pursuant to the contract, the Fund agrees to receive from or pay to the broker an amount of cash equal to the daily fluctuation in the value of the contract. Such receipts or payments are known as variation margin and are recorded by the Fund as unrealized gains or losses. Risks may arise from the potential inability of a counterparty to meet the terms of the contract. The credit/counterparty risk for exchange-traded futures is generally less than privately negotiated futures, since the clearinghouse, which is the issuer or counterparty to each exchange-traded future, has robust risk mitigation standards, including the requirement to provide initial and variation margin. When the contract is closed, the Fund records a realized gain or loss equal to the difference between the value of the contract at the time it was opened and the time it was closed.
Use of long futures subjects the Fund to risk of loss in excess of the amounts shown on the statement of assets and liabilities, up to the notional value of the futures. Use of short futures subjects the Fund to unlimited risk of loss. Under some circumstances, futures exchanges may establish daily limits on the amount that the price of futures can vary from the previous day’s settlement price, which could effectively prevent liquidation of unfavorable positions.
During the six months ended June 30, 2015, the Fund held futures for hedging purposes.
| | • | | Forward Currency Exchange Contracts |
The Fund may enter into forward currency exchange contracts in order to hedge its exposure to changes in foreign currency exchange rates on its foreign portfolio holdings, to hedge certain firm purchase and sale commitments denominated in foreign currencies and for non-hedging purposes as a means of making direct investments in foreign currencies, as described below under “Currency Transactions”.
A forward currency exchange contract is a commitment to purchase or sell a foreign currency at a future date at a negotiated forward rate. The gain or loss arising from the difference between the original contract and the closing of such contract would be included in net realized gain or loss on
| | | | |
| ALLIANCEBERNSTEIN INCOME FUND • | | | 51 | |
Notes to Financial Statements
foreign currency transactions. Fluctuations in the value of open forward currency exchange contracts are recorded for financial reporting purposes as unrealized appreciation and/or depreciation by the Fund. Risks may arise from the potential inability of a counterparty to meet the terms of a contract and from unanticipated movements in the value of a foreign currency relative to the U.S. dollar.
During the six months ended June 30, 2015, the Fund held forward currency exchange contracts for hedging and non-hedging purposes.
For hedging and investment purposes, the Fund may purchase and write (sell) put and call options on U.S. and foreign securities, including government securities, and foreign currencies that are traded on U.S. and foreign securities exchanges and over-the-counter markets. Among other things, the Fund may use options transactions for non-hedging purposes as a means of making direct investments in foreign currencies, as described below under “Currency Transactions” and may use options strategies involving the purchase and/or writing of various combinations of call and/or put options, for hedging and investment purposes.
The risk associated with purchasing an option is that the Fund pays a premium whether or not the option is exercised. Additionally, the Fund bears the risk of loss of the premium and change in market value should the counterparty not perform under the contract. Put and call options purchased are accounted for in the same manner as portfolio securities. The cost of securities acquired through the exercise of call options is increased by premiums paid. The proceeds from securities sold through the exercise of put options are decreased by the premiums paid.
When the Fund writes an option, the premium received by the Fund is recorded as a liability and is subsequently adjusted to the current market value of the option written. Premiums received from written options which expire unexercised are recorded by the Fund on the expiration date as realized gains from options written. The difference between the premium received and the amount paid on effecting a closing purchase transaction, including brokerage commissions, is also treated as a realized gain, or if the premium received is less than the amount paid for the closing purchase transaction, as a realized loss. If a call option is exercised, the premium received is added to the proceeds from the sale of the underlying security or currency in determining whether the Fund has realized a gain or loss. If a put option is exercised, the premium received reduces the cost basis of the security or currency purchased by the Fund. In writing an option, the Fund bears the market risk of an unfavorable change in the price of the security or currency underlying the written option. Exercise of an option written by the Fund could result in the Fund selling or buying a security or currency at a price different from the current market value.
| | |
| 52 | | • ALLIANCEBERNSTEIN INCOME FUND |
Notes to Financial Statements
During the six months ended June 30, 2015, the Fund held purchased options for hedging purposes. During the six months ended June 30, 2015, the Fund held written options for hedging purposes.
For the six months ended June 30, 2015, the Fund had the following transactions in written options:
| | | | | | | | |
| | | Number of
Contracts | | | Premiums
Received | |
Options written outstanding as of 12/31/14 | | | 2,325,000,000 | | | $ | 92,175 | |
Options written | | | 82,775,000 | | | | 443,575 | |
Options expired | | | – 0 | – | | | – 0 | – |
Options bought back | | | (2,325,000,000 | ) | | | (92,175 | ) |
Options exercised | | | – 0 | – | | | – 0 | – |
| | | | | | | | |
Options written outstanding as of 06/30/15 | | | 82,775,000 | | | $ | 443,575 | |
| | | | | | | | |
The Fund may enter into swaps to hedge its exposure to interest rates, credit risk, or currencies. The Fund may also enter into swaps for non-hedging purposes as a means of gaining market exposures, including by making direct investments in foreign currencies, as described below under “Currency Transactions”. A swap is an agreement that obligates two parties to exchange a series of cash flows at specified intervals based upon or calculated by reference to changes in specified prices or rates for a specified amount of an underlying asset. The payment flows are usually netted against each other, with the difference being paid by one party to the other. In addition, collateral may be pledged or received by the Fund in accordance with the terms of the respective swaps to provide value and recourse to the Fund or its counterparties in the event of default, bankruptcy or insolvency by one of the parties to the swap.
Risks may arise as a result of the failure of the counterparty to the swap to comply with the terms of the swap. The loss incurred by the failure of a counterparty is generally limited to the net interim payment to be received by the Fund, and/or the termination value at the end of the contract. Therefore, the Fund considers the creditworthiness of each counterparty to a swap in evaluating potential counterparty risk. This risk is mitigated by having a netting arrangement between the Fund and the counterparty and by the posting of collateral by the counterparty to the Fund to cover the Fund’s exposure to the counterparty. Additionally, risks may arise from unanticipated movements in interest rates or in the value of the underlying securities. The Fund accrues for the interim payments on swaps on a daily basis, with the net amount recorded within unrealized appreciation/depreciation of swaps on the statement of assets and liabilities, where applicable. Once the interim payments are settled in cash, the net amount is recorded as realized gain/(loss) on swaps on the statement of operations, in addition to any realized gain/(loss) recorded upon the
| | | | |
| ALLIANCEBERNSTEIN INCOME FUND • | | | 53 | |
Notes to Financial Statements
termination of swaps. Upfront premiums paid or received are recognized as cost or proceeds on the statement of assets and liabilities and are amortized on a straight line basis over the life of the contract. Amortized upfront premiums are included in net realized gain/(loss) from swaps on the statement of operations. Fluctuations in the value of swaps are recorded as a component of net change in unrealized appreciation/depreciation of swaps on the statement of operations.
Certain standardized swaps, including certain interest rate swaps and credit default swaps, are (or soon will be) subject to mandatory central clearing. Cleared swaps are transacted through futures commission merchants (“FCMs”) that are members of central clearinghouses, with the clearinghouse serving as central counterparty, similar to transactions in futures contracts. Centralized clearing will be required for additional categories of swaps on a phased-in basis based on requirements published by the Securities and Exchange Commission and Commodity Futures Trading Commission.
At the time the Fund enters into a centrally cleared swap, the Fund deposits and maintains as collateral an initial margin with the broker, as required by the clearinghouse on which the transaction is effected. Such amount is shown as cash collateral due from broker on the statement of assets and liabilities. Pursuant to the contract, the Fund agrees to receive from or pay to the broker an amount of cash equal to the daily fluctuation in the value of the contract. Such receipts or payments are known as variation margin and are recorded by the Fund as unrealized gains or losses. Risks may arise from the potential inability of a counterparty to meet the terms of the contract. The credit/counterparty risk for centrally cleared swaps is generally less than non-centrally cleared swaps, since the clearinghouse, which is the issuer or counterparty to each centrally cleared swap, has robust risk mitigation standards, including the requirement to provide initial and variation margin. When the contract is closed, the Fund records a realized gain or loss equal to the difference between the value of the contract at the time it was opened and the time it was closed.
Interest Rate Swaps:
The Fund is subject to interest rate risk exposure in the normal course of pursuing its investment objectives. Because the Fund holds fixed rate bonds, the value of these bonds may decrease if interest rates rise. To help hedge against this risk and to maintain its ability to generate income at prevailing market rates, the Fund may enter into interest rate swaps. Interest rate swaps are agreements between two parties to exchange cash flows based on a notional amount. The Fund may elect to pay a fixed rate and receive a floating rate, or, receive a fixed rate and pay a floating rate on a notional amount.
| | |
| 54 | | • ALLIANCEBERNSTEIN INCOME FUND |
Notes to Financial Statements
In addition, the Fund may also enter into interest rate swap transactions to preserve a return or spread on a particular investment or portion of its portfolio, or protecting against an increase in the price of securities the Fund anticipates purchasing at a later date. Interest rate swaps involve the exchange by a Fund with another party of their respective commitments to pay or receive interest (e.g., an exchange of floating rate payments for fixed rate payments) computed based on a contractually-based principal (or “notional”) amount. Interest rate swaps are entered into on a net basis (i.e., the two payment streams are netted out, with the Fund receiving or paying, as the case may be, only the net amount of the two payments).
During the six months ended June 30, 2015, the Fund held interest rate swaps for hedging and non-hedging purposes.
Credit Default Swaps:
The Fund may enter into credit default swaps, including to manage its exposure to the market or certain sectors of the market, to reduce its risk exposure to defaults by corporate and sovereign issuers held by the Fund, or to create exposure to corporate or sovereign issuers to which it is not otherwise exposed. The Fund may purchase credit protection (“Buy Contract”) or provide credit protection (“Sale Contract”) on the referenced obligation of the credit default swap. During the term of the swap, the Fund receives/(pays) fixed payments from/(to) the respective counterparty, calculated at the agreed upon rate applied to the notional amount. If the Fund is a buyer/(seller) of protection and a credit event occurs, as defined under the terms of the swap, the Fund will either (i) receive from the seller/(pay to the buyer) of protection an amount equal to the notional amount of the swap (the “Maximum Payout Amount”) and deliver/(take delivery of) the referenced obligation or (ii) receive/(pay) a net settlement amount in the form of cash or securities equal to the notional amount of the swap less the recovery value of the referenced obligation.
In certain circumstances Maximum Payout Amounts may be partially offset by recovery values of the respective referenced obligations, upfront premium received upon entering into the agreement, or net amounts received from settlement of buy protection credit default swaps entered into by the Fund for the same reference obligation with the same counterparty. As of June 30, 2015, the Fund did not have Buy Contracts outstanding with respect to the same referenced obligation and counterparty as certain Sale Contracts outstanding.
Credit default swaps may involve greater risks than if a Fund had invested in the referenced obligation directly. Credit default swaps are subject to general market risk, liquidity risk, counterparty risk and credit risk. If the Fund is a buyer of protection and no credit event occurs, it will lose the payments it made to its counterparty. If the Fund is a seller of protection
| | | | |
| ALLIANCEBERNSTEIN INCOME FUND • | | | 55 | |
Notes to Financial Statements
and a credit event occurs, the value of the referenced obligation received by the Fund coupled with the periodic payments previously received, may be less than the Maximum Payout Amount it pays to the buyer, resulting in a net loss to the Fund.
During the six months ended June 30, 2015, the Fund held credit default swaps for hedging and non-hedging purposes.
Implied credit spreads over U.S. Treasuries of comparable maturity utilized in determining the market value of credit default swaps on issuers as of period end are disclosed in the portfolio of investments. The implied spreads serve as an indicator of the current status of the payment/performance risk and typically reflect the likelihood of default by the issuer of the referenced obligation. The implied credit spread of a particular reference obligation also reflects the cost of buying/selling protection and may reflect upfront payments required to be made to enter into the agreement. Widening credit spreads typically represent a deterioration of the referenced obligation’s credit soundness and greater likelihood of default or other credit event occurring as defined under the terms of the agreement. A credit spread identified as “Defaulted” indicates a credit event has occurred for the referenced obligation.
The Fund typically enters into International Swaps and Derivatives Association, Inc. Master Agreements (“ISDA Master Agreement”) or similar master agreements (collectively, “Master Agreements”) with its derivative contract counterparties in order to, among other things, reduce its credit risk to counterparties. ISDA Master Agreements include provisions for general obligations, representations, collateral and events of default or termination. Under an ISDA Master Agreement, the Fund typically may offset with the counterparty certain derivative financial instrument’s payables and/or receivables with collateral held and/or posted and create one single net payment (close-out netting) in the event of default or termination.
Various Master Agreements govern the terms of certain transactions with counterparties, including transactions such as derivative transactions, repurchase and reverse repurchase agreements. These Master Agreements typically attempt to reduce the counterparty risk associated with such transactions by specifying credit protection mechanisms and providing standardization that improves legal certainty. Cross-termination provisions under Master Agreements typically provide that a default in connection with one transaction between the Fund and a counterparty gives the non-defaulting party the right to terminate any other transactions in place with the defaulting party to create one single net payment due to/due from the defaulting party. In the event of a default by a Master Agreements counterparty, the return of collateral with market value in excess of the Fund’s net liability, held by the defaulting party, may be delayed or denied.
| | |
| 56 | | • ALLIANCEBERNSTEIN INCOME FUND |
Notes to Financial Statements
The Fund’s Master Agreements may contain provisions for early termination of OTC derivative transactions in the event the net assets of the Fund decline below specific levels (“net asset contingent features”). If these levels are triggered, the Fund’s counterparty has the right to terminate such transaction and require the Fund to pay or receive a settlement amount in connection with the terminated transaction. For additional details, please refer to netting arrangements by counterparty tables below.
At June 30, 2015, the Fund had entered into the following derivatives:
| | | | | | | | | | | | |
| | | Asset Derivatives | | | Liability Derivatives | |
Derivative
Type | | Statement of
Assets and
Liabilities
Location | | Fair Value | | | Statement of
Assets and
Liabilities
Location | | Fair Value | |
Interest rate contracts | | Receivable/Payable for variation margin on exchange-traded derivatives | | $ | 5,375,974 | * | | Receivable/Payable for variation margin on exchange-traded derivatives | | $ | 13,706,423 | * |
| | | | |
Credit contracts | | Receivable/Payable for variation margin on exchange-traded derivatives | | | 304,250 | * | | Receivable/Payable for variation margin on exchange-traded derivatives | | | 117,151 | * |
| | | | |
Foreign exchange contracts | | Unrealized appreciation on forward currency exchange contracts | | | 2,683,809 | | | Unrealized depreciation on forward currency exchange contracts | | | 4,417,165 | |
| | | | |
Foreign exchange contracts | | | | | | | | Options written, at value | | | 10,316 | |
| | | | |
Interest rate contracts | | Unrealized appreciation on interest rate swaps | | | 87,020 | | | Unrealized depreciation on interest rate swaps | | | 405,663 | |
| | | | |
Credit contracts | | Unrealized appreciation on credit default swaps | | | 127,740 | | | Unrealized depreciation on credit default swaps | | | 74,096 | |
| | | | | | | | | | | | |
Total | | | | $ | 8,578,793 | | | | | $ | 18,730,814 | |
| | | | | | | | | | | | |
| * | | Only variation margin receivable/payable at period end is reported within the statement of assets and liabilities. This amount reflects cumulative appreciation/(depreciation) of exchange-traded derivatives as reported in the portfolio of investments. |
| | | | |
| ALLIANCEBERNSTEIN INCOME FUND • | | | 57 | |
Notes to Financial Statements
The effect of derivative instruments on the statement of operations for the six months ended June 30, 2015:
| | | | | | | | | | |
Derivative Type | | Location of
Gain or (Loss)
on Derivatives | | Realized Gain
or (Loss) on
Derivatives | | | Change in
Unrealized
Appreciation or
(Depreciation) | |
Interest rate contracts | | Net realized gain (loss) on futures; Net change in unrealized appreciation/depreciation of futures | | $ | (6,725,032 | ) | | $ | 19,038,618 | |
| | | |
Foreign exchange contracts | | Net realized gain (loss) on foreign currency transactions; Net change in unrealized appreciation/depreciation of foreign currency denominated assets and liabilities | | | 216,047 | | | | (4,402,227 | ) |
| | | |
Foreign exchange contracts | | Net realized gain (loss) on investment transactions; Net change in unrealized appreciation/depreciation of investments | | | 454,720 | | | | (18,853 | ) |
| | | |
Foreign exchange contracts | | Net realized gain (loss) on options written; Net change in unrealized appreciation/depreciation of options written | | | 91,514 | | | | 389,125 | |
| | | |
Interest rate contracts | | Net realized gain (loss) on swaps; Net change in unrealized appreciation/depreciation of swaps | | | (1,141,856 | ) | | | 1,300,194 | |
| | | |
Credit contracts | | Net realized gain (loss) on swaps; Net change in unrealized appreciation/depreciation of swaps | | | 1,556,089 | | | | (967,385 | ) |
| | | | | | | | | | |
Total | | | | $ | (5,548,518 | ) | | $ | 15,339,472 | |
| | | | | | | | | | |
| | |
| 58 | | • ALLIANCEBERNSTEIN INCOME FUND |
Notes to Financial Statements
The following table represents the average monthly volume of the Fund’s derivative transactions during the six months ended June 30, 2015:
| | | | |
Futures: | | | | |
Average original value of sale contracts | | $ | 843,313,118 | |
| | | | |
Forward Currency Exchange Contracts: | | | | |
Average principal amount of buy contracts | | $ | 155,819,168 | |
Average principal amount of sale contracts | | $ | 285,951,311 | |
| | | | |
Purchased Options: | | | | |
Average monthly cost | | $ | 236,525 | (a) |
| | | | |
Interest Rate Swaps: | | | | |
Average notional amount | | $ | 76,036,128 | (b) |
| | | | |
Centrally Cleared Interest Rate Swaps: | | | | |
Average notional amount | | $ | 524,495,923 | |
| | | | |
Credit Default Swaps: | | | | |
Average notional amount of buy contracts | | $ | 10,218,064 | (c) |
Average notional amount of sale contracts | | $ | 10,178,714 | |
| | | | |
Centrally Cleared Credit Default Swaps: | | | | |
Average notional amount of buy contracts | | $ | 4,506,040 | (a) |
Average notional amount of sale contracts | | $ | 37,568,556 | |
| (a) | | Positions were open for one month during the period. |
| (b) | | Positions were open for three months during the period. |
| (c) | | Positions were open for less than one month during the period. |
For financial reporting purposes, the Fund does not offset derivative assets and derivative liabilities that are subject to netting arrangements in the statement of assets and liabilities.
All derivatives held at period end were subject to netting arrangements. The following table presents the Fund’s derivative assets and liabilities by counterparty net of amounts available for offset under Master Agreements (“MA”) and net of the related collateral received/ pledged by the Fund as of June 30, 2015:
| | | | | | | | | | | | | | | | | | | | |
Counterparty | | Derivative
Assets
Subject to a
MA | | | Derivative
Available
for Offset | | | Cash
Collateral
Received | | | Security
Collateral
Received* | | | Net Amount
of Derivatives
Assets | |
Exchange-Traded Derivatives: | | | | | | | | | | | | | | | | | | | | |
Morgan Stanley & Co., LLC** | | $ | 288,595 | | | $ | – 0 | – | | $ | – 0 | – | | $ | – 0 | – | | $ | 288,595 | |
| | | | | | | | | | | | | | | | | | | | |
Total | | $ | 288,595 | | | $ | – 0 | – | | $ | – 0 | – | | $ | – 0 | – | | $ | 288,595 | |
| | | | | | | | | | | | | | | | | | | | |
| | | | |
| ALLIANCEBERNSTEIN INCOME FUND • | | | 59 | |
Notes to Financial Statements
| | | | | | | | | | | | | | | | | | | | |
Counterparty | | Derivative
Assets
Subject to a
MA | | | Derivative
Available
for Offset | | | Cash
Collateral
Received | | | Security
Collateral
Received* | | | Net Amount
of Derivatives
Assets | |
OTC Derivatives: | | | | | | | | | | | | | | | | | | | | |
BNP Paribas SA | | $ | 713,677 | | | $ | – 0 | – | | $ | – 0 | – | | $ | – 0 | – | | $ | 713,677 | |
Citibank, NA | | | 87,020 | | | | (87,020 | ) | | | – 0 | – | | | – 0 | – | | | – 0 | – |
Credit Suisse International | | | 813,565 | | | | (724,633 | ) | | | – 0 | – | | | – 0 | – | | | 88,932 | |
Goldman Sachs Bank USA | | | 93,838 | | | | (16,956 | ) | | | – 0 | – | | | – 0 | – | | | 76,882 | |
HSBC Bank USA | | | 709,530 | | | | (359,288 | ) | | | – 0 | – | | | (350,242 | ) | | | – 0 | – |
Royal Bank of Scotland PLC | | | 23,664 | | | | (23,664 | ) | | | – 0 | – | | | – 0 | – | | | – 0 | – |
Societe Generale | | | 52,696 | | | | – 0 | – | | | – 0 | – | | | – 0 | – | | | 52,696 | |
Standard Chartered Bank | | | 350,628 | | | | (209,796 | ) | | | – 0 | – | | | – 0 | – | | | 140,832 | |
| | | | | | | | | | | | | | | | | | | | |
Total | | $ | 2,844,618 | | | $ | (1,421,357 | ) | | $ | – 0 | – | | $ | (350,242 | ) | | $ | 1,073,019 | ^ |
| | | | | | | | | | | | | | | | | | | | |
| | | | | |
Counterparty | | Derivative
Liabilities
Subject to a
MA | | | Derivative
Available
for Offset | | | Cash
Collateral
Pledged | | | Security
Collateral
Pledged* | | | Net Amount
of Derivatives
Liabilities | |
OTC Derivatives: | | | | | | | | | | | | | | | | | | | | |
Barclays Bank PLC | | $ | 51,769 | | | $ | – 0 | – | | $ | – 0 | – | | $ | – 0 | – | | $ | 51,769 | |
Citibank, NA | | | 405,663 | | | | (87,020 | ) | | | – 0 | – | | | (318,643 | ) | | | – 0 | – |
Credit Suisse International | | | 724,633 | | | | (724,633 | ) | | | – 0 | – | | | – 0 | – | | | – 0 | – |
Deutsche Bank AG | | | 851,705 | | | | – 0 | – | | | – 0 | – | | | – 0 | – | | | 851,705 | |
Goldman Sachs Bank USA | | | 16,956 | | | | (16,956 | ) | | | – 0 | – | | | – 0 | – | | | – 0 | – |
HSBC Bank USA | | | 359,288 | | | | (359,288 | ) | | | – 0 | – | | | – 0 | – | | | – 0 | – |
Royal Bank of Scotland PLC | | | 490,205 | | | | (23,664 | ) | | | – 0 | – | | | – 0 | – | | | 466,541 | |
Standard Chartered Bank | | | 209,796 | | | | (209,796 | ) | | | – 0 | – | | | – 0 | – | | | – 0 | – |
State Street Bank & Trust Co. | | | 765,064 | | | | – 0 | – | | | – 0 | – | | | – 0 | – | | | 765,064 | |
UBS AG | | | 980,641 | | | | – 0 | – | | | – 0 | – | | | – 0 | – | | | 980,641 | |
| | | | | | | | | | | | | | | | | | | | |
Total | | $ | 4,855,720 | | | $ | (1,421,357 | ) | | $ | – 0 | – | | $ | (318,643 | ) | | $ | 3,115,720 | ^ |
| | | | | | | | | | | | | | | | | | | | |
| * | | The actual collateral received/pledged may be more than the amount reported due to overcollateralization. |
| ** | | Cash has been posted for initial margin requirements for exchange traded derivatives outstanding at June 30, 2015. |
| ^ | | Net amount represents the net receivable/payable that would be due from/to the counterparty in the event of default or termination. The net amount from OTC financial derivative instruments can only be netted across transactions governed under the same master agreement with the same counterparty. |
| | |
| 60 | | • ALLIANCEBERNSTEIN INCOME FUND |
Notes to Financial Statements
2. Currency Transactions
The Fund may invest in non-U.S. dollar securities on a currency hedged or unhedged basis. The Fund may seek investment opportunities by taking long or short positions in currencies through the use of currency-related derivatives, including forward currency exchange contracts, futures and options on futures, swaps, and other options. The Fund may enter into transactions for investment opportunities when it anticipates that a foreign currency will appreciate or depreciate in value but securities denominated in that currency are not held by the Fund and do not present attractive investment opportunities. Such transactions may also be used when the Adviser believes that it may be more efficient than a direct investment in a foreign currency-denominated security. The Fund may also conduct currency exchange contracts on a spot basis (i.e., for cash at the spot rate prevailing in the currency exchange market for buying or selling currencies).
3. TBA and Dollar Rolls
The Fund may invest in TBA mortgage-backed securities. A TBA, or “To Be Announced”, trade represents a contract for the purchase or sale of mortgage-backed securities to be delivered at a future agree-upon date; however, the specific mortgage pool numbers or the number of pools that will be delivered to fulfill the trade obligation or terms of the contract are unknown at the time of the trade. Mortgage pools (including fixed-rate or variable-rate mortgages) guaranteed by the Government National Mortgage Association, or GNMA, the Federal National Mortgage Association, or FNMA, or the Federal Home Loan Mortgage Corporation, or FHLMC, are subsequently allocated to the TBA transactions.
The Fund may enter into dollar rolls. Dollar rolls involve sales by the Fund of securities for delivery in the current month and the Fund’s simultaneously contracting to repurchase substantially similar (same type and coupon) securities on a specified future date. During the roll period, the Fund forgoes principal and interest paid on the securities. The Fund is compensated by the difference between the current sales price and the lower forward price for the future purchase (often referred to as the “drop”) as well as by the interest earned on the cash proceeds of the initial sale. Dollar rolls involve the risk that the market value of the securities the Fund is obligated to repurchase under the agreement may decline below the repurchase price. Dollar rolls are speculative techniques. During the six months ended June 30, 2015, the Fund had no transactions in dollar rolls.
4. Reverse Repurchase Agreements
The Fund may enter into reverse repurchase transactions (“RVP”) in accordance with the terms of a Master Repurchase Agreement (“MRA”), under which the Fund sells securities and agrees to repurchase them at a mutually agreed upon date and price. At the time the Fund enters into a reverse repurchase agreement,
| | | | |
| ALLIANCEBERNSTEIN INCOME FUND • | | | 61 | |
Notes to Financial Statements
it will establish a segregated account with the custodian containing liquid assets having a value comparable to the repurchase price. Under the MRA and other Master Agreements, the Fund is permitted to offset payables and/or receivables with collateral held and/or posted to the counterparty and create one single net payment due to or from the Fund in the event of a default. In the event of a default by a MRA counterparty, the Fund may be considered an unsecured creditor with respect to any excess collateral (collateral with a market value in excess of the repurchase price) held by and/or posted to the counterparty, and as such the return of such excess collateral may be delayed or denied. For the six months ended June 30, 2015, the average amount of reverse repurchase agreements outstanding was $1,167,360,567 and the daily weighted average interest rate was 0.16%. At June 30, 2015, the Fund had reverse repurchase agreements outstanding in the amount of $975,580,137 as reported on the statement of assets and liabilities.
The following table presents the Fund’s RVP liabilities by counterparty net of the related collateral pledged by the Fund as of June 30, 2015:
| | | | | | | | | | | | |
Counterparty | | RVP Liabilities
Subject to a MRA | | | Securities
Collateral
Pledged†* | | | Net Amount of
RVP
Liabilities | |
Barclays Capital, Inc. | | $ | 5,839,125 | | | $ | (5,466,888 | ) | | $ | 372,237 | |
Credit Suisse Securities (USA) LLC | | | 1,802,192 | | | | (1,652,292 | ) | | | 149,900 | |
HSBC Bank USA | | | 443,797,661 | | | | (443,471,391 | ) | | | 326,270 | |
JPMorgan Chase Bank | | | 441,951,210 | | | | (441,626,194 | ) | | | 325,016 | |
Jefferies & Co., Inc. | | | 82,189,949 | | | | (81,769,113 | ) | | | 420,836 | |
| | | | | | | | | | | | |
Total | | $ | 975,580,137 | | | $ | (973,985,878 | ) | | $ | 1,594,259 | |
| | | | | | | | | | | | |
| † | | Including accrued interest. |
| * | | The actual collateral received/pledged may be more than the amount reported due to overcollateralization. |
5. Loan Participations and Assignments
The Fund may invest in direct debt instruments which are interests in amounts owed to lenders or lending syndicates by corporate, governmental, or other borrowers, either in the form of participations at the time the loan is originated (“Participations”) or by buying an interest in the loan in the secondary market from a financial institution or institutional investor (“Assignments”). A loan is often administered by a bank or other financial institution (the “Lender”) that acts as agent for all holders. The agent administers the term of the loan as specified in the loan agreement. When investing in Participations, the Fund generally has no right to enforce compliance with the terms of the loan agreement with the borrower. In addition, when investing in Participations, the Fund has the right to receive payments of principal, interest and any fees to which it is entitled only from the Lender and only upon receipt of payments by the Lender from the borrower. As a result, the Fund may be subject to the credit risk of both the borrower and the Lender. When the Fund purchases Assignments from Lenders,
| | |
| 62 | | • ALLIANCEBERNSTEIN INCOME FUND |
Notes to Financial Statements
it will typically acquire direct rights against the borrower on the loan. These loans may include participations in “bridge loans”, which are loans taken out by borrowers for a short period (typically less than six months) pending arrangement of more permanent financing through, for example, the issuance of bonds, frequently high-yield bonds issued for the purpose of acquisitions. The Fund may also participate in unfunded loan commitments, which are contractual obligations for investing in future Participations, may receive a commitment fee based on the amount of the commitment. Under these arrangements, the Fund may receive a fixed rate commitment fee and, if and to the extent the borrower borrows under the facility, the Fund may receive an additional funding fee.
Unfunded loan commitments and funded loans are marked to market daily.
As of June 30, 2015, the Fund had the following unfunded loan commitments which could be extended at the option of the borrower pursuant to the respective loan agreement.
| | | | |
Borrower | | Unfunded Loan
Commitment | |
Cara Aircraft Leasing 28548, Inc.
1.00%, 11/26/19 | | $ | 155,788 | |
Sheridan Auto Loan Holdings I, LLC
1.00%, 12/31/20 | | | 39,126 | |
In addition, the Fund had the following bridge loan commitments outstanding:
| | | | | | | | |
Loan | �� | Unfunded Loan
Participation
Commitments | | | Funded | |
Rite Aid Corp | | $ | 4,454,545 | | | $ | – 0 | – |
During the six months ended June 30, 2015, the Fund received commitment fees or additional funding fees in the amount of $21,820.
NOTE D
Common Stock
During the six months ended June 30, 2015 and the year ended December 31, 2014, the Fund did not issue any shares in connection with the Fund’s dividend reinvestment plan.
On June 25, 2014, the Fund announced a share repurchase program for the Fund’s discretionary repurchase of up to 15% of its then outstanding shares of common stock (valued at up to approximately $306 million as of June 24, 2014 based on Fund total net assets of approximately $2.04 billion) in open market transactions over a one-year period. This share repurchase program is intended to benefit long-term Fund stockholders by the repurchase of Fund shares at a discount to their net asset value. Such repurchases may moderate the discount at
| | | | |
| ALLIANCEBERNSTEIN INCOME FUND • | | | 63 | |
Notes to Financial Statements
which the Fund’s shares currently trade. Repurchases will be made from time to time when they are believed to be in the best interests of the Fund. During the six months ended June 30, 2015 and the year ended December 31, 2014, the Fund repurchased 12,172,242 and 14,903,847 shares, respectively, at an average discount of 10.45% and 10.09%, respectively, from net asset value. The share repurchase program expired on June 25, 2015.
NOTE E
Risks Involved in Investing in the Fund
Interest Rate Risk and Credit Risk—Interest rate risk is the risk that changes in interest rates will affect the value of the Fund’s investments in fixed-income debt securities such as bonds or notes. Increases in interest rates may cause the value of the Fund’s investments to decline. Credit risk is the risk that the issuer or guarantor of a debt security, or the counterparty to a derivative contract, will be unable or unwilling to make timely principal and/or interest payments, or to otherwise honor its obligations. The degree of risk for a particular security may be reflected in its credit rating. Credit risk is greater for medium quality and lower-rated securities. Lower-rated debt securities and similar unrated securities (commonly known as “junk bonds”) have speculative elements or are predominantly speculative risks.
Duration Risk—Duration is the measure that relates the expected price volatility of a fixed-income security to changes in interest rates. The duration of a fixed-income security may be shorter than or equal to full maturity of a fixed-income security. Fixed-income securities with longer durations have more risk and will decrease in price as interest rates rise. For example, a fixed-income security with a duration of three years will decrease in value by approximately 3% if interest rates increase by 1%.
Liquidity Risk—Liquidity risk exists when particular investments are difficult to purchase or sell, possibly preventing the Fund from selling out of these illiquid or relatively less liquid securities at an advantageous price. Causes of liquidity risk may include low trading volume, lack of a market maker, a large position, or legal restrictions that limit or prevent a Fund from selling securities or closing derivative positions at desirable prices or opportune times. Over recent years, the capacity of dealers to make markets in fixed income securities has been outpaced by the growth in the size of the fixed income markets. Liquidity risk may be magnified in a rising interest rate environment, where the value and liquidity of fixed income securities generally go down. Derivatives and securities involving substantial market and credit risk tend to involve greater liquidity risk. Illiquid securities and relatively less liquid securities may also be difficult to value.
Mortgage-Backed and/or Other Asset-Backed Securities Risk—Investments in mortgage-backed and other asset-backed securities are subject to certain additional risks. The value of these securities may be particularly sensitive to changes
| | |
| 64 | | • ALLIANCEBERNSTEIN INCOME FUND |
Notes to Financial Statements
in interest rates. These risks include “extension risk”, which is the risk that, in periods of rising interest rates, issuers may delay the payment of principal, and “prepayment risk”, which is the risk that in periods of falling interest rates, issuers may pay principal sooner than expected, exposing the Fund to a lower rate of return upon reinvestment of principal. Mortgage-backed securities offered by non-governmental issuers and other asset-backed securities may be subject to other risks, such as higher rates of default in the mortgages or assets backing the securities or risks associated with the nature and servicing of mortgages or assets backing the securities.
Derivatives Risk—The Fund may enter into derivative transactions such as forwards, options, futures and swaps. Derivatives may be illiquid, difficult to price, and leveraged so that small changes may produce disproportionate losses for the Fund, and subject to counterparty risk to a greater degree than more traditional investments. Derivatives may result in significant losses, including losses that are far greater than the value of the derivatives reflected in the statement of assets and liabilities.
Foreign (Non-U.S.) Risk—Investments in securities of non-U.S. issuers may involve more risk than those of U.S. issuers. These securities may fluctuate more widely in price and may be less liquid due to adverse market, economic, political, regulatory or other factors. Risks relating to investments in securities of non- U.S. issuers may be heightened with respect to investments in emerging-market countries, where there may be: greater social, economic and political uncertainty and instability; more substantial governmental involvement in the economy; less governmental supervision and regulation; unavailability of currency hedging techniques; companies that are newly organized and small; differences in auditing and financial reporting standards, which may result in unavailability of material information about issuers; and less developed. Foreign investment in the securities markets of certain foreign countries is restricted or controlled to varying degrees. These restrictions or controls may at times limit or preclude investment in certain securities and may increase the costs and expenses of the Fund.
Currency Risk—Fluctuations in currency exchange rates may negatively affect the value of the Fund’s investments or reduce its returns.
Leverage Risk—When the Fund borrows money or otherwise leverages its investments, its performance may be volatile because leverage tends to exaggerate the effect of any increase or decrease in the value of the Fund’s investments. The Fund may create leverage through the use of reverse repurchase arrangements, forward currency exchange contracts, forward commitments, dollar rolls or futures or by borrowing money. The use of derivative instruments by the Fund, such as forwards, futures, options and swaps, may also result in a form of leverage. Leverage may result in higher returns to the Fund than if the Fund were not leveraged, but may also adversely affect returns, particularly if the market is declining.
| | | | |
| ALLIANCEBERNSTEIN INCOME FUND • | | | 65 | |
Notes to Financial Statements
Leverage may result in higher returns to the Fund than if the Fund were not leveraged, but may also adversely affect returns, particularly if the market is declining. The risks of leverage also include potentially a higher volatility of the NAV of the common stock, potentially more volatility in the market value of the common stock and the relatively greater effect on the NAV of the common stock caused by favorable or adverse changes in portfolio security values or currency exchange rates. In addition, changes in the interest rate environment can increase or decrease shareholder returns. The Fund maintains asset coverage of at least 300% with respect to borrowings.
To the extent that the current interest rate on the Fund’s indebtedness approaches the net return on the leveraged portion of the Fund’s investment portfolio, then the benefit to the shareholders will be reduced. If the rate on indebtedness were to exceed the net return on the same portion of the portfolio, then this would result in a lower rate of return for the shareholders. Similarly, the use of leverage in a declining market can advance the decrease of the Fund’s NAV more so than if the Fund were not leveraged, which would likely be reflected in a greater decline in the market price for shares of common stock than if the Fund were not leveraged. In extreme cases, if the Fund’s current investment income were not sufficient to meet interest payments on indebtedness or if the Fund failed to maintain the asset coverage required by the 1940 Act, then it could be necessary for the Fund to liquidate certain investments at a time when it may be disadvantageous to do so.
Indemnification Risk—In the ordinary course of business, the Fund enters into contracts that contain a variety of indemnifications. The Fund’s maximum exposure under these arrangements is unknown. However, the Fund has not had prior claims or losses pursuant to these indemnification provisions and expects the risk of loss thereunder to be remote. Therefore, the Fund has not accrued any liability in connection with these indemnification provisions.
NOTE F
Distributions to Shareholders
The tax character of distributions to be paid for the year ending December 31, 2015 will be determined at the end of the current fiscal year. The tax character of distributions paid during the fiscal years ended December 31, 2014 and December 31, 2013 were as follows:
| | | | | | | | |
| | | 2014 | | | 2013 | |
Distributions paid from: | | | | | | | | |
Ordinary income | | $ | 107,988,728 | | | $ | 103,758,100 | |
Net long-term capital gains | | | – 0 | – | | | 6,608,830 | |
| | | | | | | | |
Total taxable distributions paid | | $ | 107,988,728 | | | $ | 110,366,930 | |
| | | | | | | | |
| | |
| 66 | | • ALLIANCEBERNSTEIN INCOME FUND |
Notes to Financial Statements
As of December 31, 2014, the components of accumulated earnings/(deficit) on a tax basis were as follows:
| | | | |
Undistributed ordinary income | | $ | 3,917,534 | |
Accumulated capital and other losses | | | (77,861,332 | )(a) |
Unrealized appreciation/(depreciation) | | | 98,542,931 | (b) |
| | | | |
Total accumulated earnings/(deficit) | | $ | 24,599,133 | |
| | | | |
| (a) | | As of December 31, 2014, the Fund had a capital loss carryforward of $16,955,334 and the Fund’s cumulative deferred loss on straddles was $60,905,998. |
| (b) | | The differences between book-basis and tax-basis unrealized appreciation/(depreciation) are attributable primarily to the tax deferral of losses on wash sales, the tax treatment of swaps and partnership investments, and the realization for tax purposes of gains/losses on certain derivative instruments. |
For tax purposes, net capital losses may be carried over to offset future capital gains, if any. Funds are permitted to carry forward capital losses incurred in taxable years beginning after December 22, 2010 for an indefinite period, and such losses will retain their character as either short-term or long-term capital losses. As of December 31, 2014, the Fund had a net short-term capital loss carryforward of $16,955,334 which may be carried forward for an indefinite period.
NOTE G
Subsequent Events
On August 6, 2015, the Fund announced that its Board of Directors had approved a proposed acquisition of its assets, and the assumption of its liabilities, by AB Income Fund (“Income Fund”), a newly-formed series of AB Bond Fund, Inc., an open-end registered investment company (the “Acquisition”). The Acquisition requires the approval of the Fund’s shareholders and a Special Meeting of Shareholders of the Fund (the “Special Meeting”) is scheduled to be held on February 1, 2016 to solicit the vote of shareholders on the Acquisition. The close of business on October 28, 2015 has been fixed as the record date for the Special Meeting or any adjournment or postponement thereof.
Each of the Fund and Income Fund is advised by AllianceBernstein L.P. (the “Adviser”). Income Fund will have the same investment objective as the Fund. Like the Fund, Income Fund will normally invest at least 80% of its net assets in income-producing securities. The most significant difference between the Fund and Income Fund is that while the Fund invests at least 65% of its assets in securities issued by the U.S. government, Income Fund will invest at least 65% of its assets in securities of U.S. and foreign governments. The broader investment policy of the Income Fund should provide the investment flexibility to better manage duration and credit risk. To limit the risk of this broader investment policy, the Income Fund will have an additional policy to invest at least 65% of its assets in securities denominated in U.S. dollars. Income Fund will be managed by the same portfolio managers as the Fund.
| | | | |
| ALLIANCEBERNSTEIN INCOME FUND • | | | 67 | |
Notes to Financial Statements
If the Acquisition is approved by the Fund’s shareholders, the Fund’s assets will be acquired, and its liabilities will be assumed, by Income Fund, and shareholders will receive Advisor Class shares of Income Fund which will have an aggregate net asset value equal to the aggregate net asset value of the shareholder’s holding in the Fund. A redemption fee of 0.75% will be imposed on redemptions of Advisor Class shares for three months after the Acquisition to defray the costs of increased redemptions expected to occur after the Acquisition. The Fund would then be de-registered as a registered investment company, dissolved, and its shares delisted from the New York Stock Exchange. If approved by the Fund’s shareholders, the Acquisition is expected to be completed in the first quarter of 2016.
Management has evaluated subsequent events for possible recognition or disclosure in the financial statements through the date the financial statements are issued. Management has determined that there are no other material events that would require disclosure in the Fund’s financial statements through this date.
| | |
| 68 | | • ALLIANCEBERNSTEIN INCOME FUND |
Notes to Financial Statements
FINANCIAL HIGHLIGHTS
Selected Data For A Share Of Common Stock Outstanding Throughout Each Period
| | | | | | | | | | | | | | | | | | | | | | | | |
| | | Six Months
Ended
June 30,
2015 (unaudited) | | | Year Ended December 31, | |
| | | | 2014 | | | 2013 | | | 2012 | | | 2011 | | | 2010 | |
| | | | |
| | | | | | | | | | | | | | | | | | | | | | | | |
Net asset value, beginning of period | | | $ 8.34 | | | | $ 8.13 | | | | $ 8.89 | | | | $ 8.93 | | | | $ 8.75 | | | | $ 8.37 | |
| | | | |
Income From Investment Operations | | | | | | | | | | | | | | | | | | | | | | | | |
Net investment income(a) | | | .19 | | | | .42 | | | | .40 | | | | .40 | | | | .44 | | | | .47 | |
Net realized and unrealized gain (loss) on investment and foreign currency transactions | | | (.06 | ) | | | .19 | | | | (.71 | ) | | | .57 | | | | .31 | | | | .40 | |
Contributions from Affiliates | | | – 0 | – | | | – 0 | – | | | – 0 | – | | | .00 | (b) | | | – 0 | – | | | – 0 | – |
| | | | |
Net increase (decrease) in net asset value from operations | | | .13 | | | | .61 | | | | (.31 | ) | | | .97 | | | | .75 | | | | .87 | |
| | | | |
Less: Dividends and Distributions | | | | | | | | | | | | | | | | | | | | | | | | |
Dividends from net investment income | | | (.21 | ) | | | (.45 | ) | | | (.41 | ) | | | (.48 | ) | | | (.57 | ) | | | (.49 | ) |
Distributions from net realized gain on investment transactions | | | – 0 | – | | | – 0 | – | | | (.04 | ) | | | (.53 | ) | | | – 0 | – | | | – 0 | – |
| | | | |
Total dividends and distributions | | | (.21 | ) | | | (.45 | ) | | | (.45 | ) | | | (1.01 | ) | | | (.57 | ) | | | (.49 | ) |
| | | | |
Anti-Dilutive Effect of Share Repurchase Program | | | .06 | | | | .05 | | | | – 0 | – | | | – 0 | – | | | – 0 | – | | | – 0 | – |
| | | | |
Net asset value, end of period | | | $ 8.32 | | | | $ 8.34 | | | | $ 8.13 | | | | $ 8.89 | | | | $ 8.93 | | | | $ 8.75 | |
| | | | |
Market value, end of period | | | $ 7.44 | | | | $ 7.47 | | | | $ 7.13 | | | | $ 8.10 | | | | $ 8.07 | | | | $ 7.93 | |
| | | | |
Discount, end of period | | | (10.58 | )% | | | (10.43 | )% | | | (12.30 | )% | | | (8.89 | )% | | | (9.63 | )% | | | (9.37 | )% |
Total Return | | | | | | | | | | | | | | | | | | | | | | | | |
Total investment return
based on:(c) | | | | | | | | | | | | | | | | | | | | | | | | |
Market value | | | 1.88 | % | | | 11.28 | % | | | (6.50 | )% | | | 13.08 | % | | | 9.36 | % | | | 2.10 | % |
Net asset value | | | 2.04 | % | | | 8.96 | % | | | (2.86 | )% | | | 12.15 | % | | | 9.67 | % | | | 11.04 | %* |
Ratios/Supplemental Data | | | | | | | | | | | | | | | | | | | | | | | | |
Net assets, end of period
(000,000’s omitted) | | | $1,797 | | | | $1,902 | | | | $1,976 | | | | $2,159 | | | | $2,168 | | | | $2,126 | |
Ratio to average net assets of: | | | | | | | | | | | | | | | | | | | | | | | | |
Expenses(d) | | | .67 | %^ | | | .67 | % | | | .63 | % | | | .64 | % | | | .64 | % | | | .71 | % |
Net investment income | | | 4.55 | %^ | | | 5.02 | % | | | 4.74 | % | | | 4.34 | % | | | 5.00 | % | | | 5.40 | % |
Portfolio turnover rate. | | | 25 | % | | | 32 | % | | | 107 | % | | | 58 | % | | | 67 | % | | | 121 | % |
See footnote summary on page 70.
| | | | |
| ALLIANCEBERNSTEIN INCOME FUND • | | | 69 | |
Financial Highlights
| (a) | | Based on average shares outstanding. |
| (b) | | Amount is less than $0.005. |
| (c) | | Total investment return is calculated assuming a purchase of common stock on the opening of the first day and a sale on the closing of the last day of each period reported. Dividends and distributions, if any, are assumed for purposes of this calculation, to be reinvested at prices obtained under the Fund’s dividend reinvestment plan. Generally, total investment return based on net asset value will be higher than total investment return based on market value in periods where there is an increase in the discount or a decrease in the premium of the market value to the net asset value from the beginning to the end of such periods. Conversely, total investment return based on net asset value will be lower than total investment return based on market value in periods where there is a decrease in the discount or an increase in the premium of the market value to the net asset value from the beginning to the end of such periods. Total investment return calculated for a period of less than one year is not annualized. |
| (d) | | The expense ratios, excluding interest expense and TALF administration fee, if applicable are .56%, .61%, .57%, .55%, .58%, and .60%, respectively. These expense ratios exclude net interest expense on borrowings of .11%, .06%, .06%, .09%, .06%, and .11%, respectively. |
| * | | Includes the impact of proceeds received and credited to the Fund resulting from class action settlements, which enhanced the Fund’s performance for the year ended December 31, 2010 by 0.15%. |
See notes to financial statements.
| | |
| 70 | | • ALLIANCEBERNSTEIN INCOME FUND |
Financial Highlights
ADDITIONAL INFORMATION
(unaudited)
Dividend Reinvestment and Cash Purchase Plan
Shareholders whose shares are registered in their own names may elect to be participants in the Dividend Reinvestment and Cash Purchase Plan (the “Plan”), pursuant to which dividends and capital gain distributions to shareholders will be paid in or reinvested in additional shares of the Fund (the “Dividend Shares”). Computershare Trust Company, N.A. (the “Agent”) will act as agent for participants under the Plan. The Plan also allows you to make optional cash investments in Fund shares through the Agent. Shareholders whose shares are held in the name of a broker or nominee should contact such broker or nominee to determine whether or how they may participate in the Plan.
If the Board declares an income distribution or determines to make a capital gain distribution payable either in shares or in cash, non-participants in the Plan will receive cash and participants in the Plan will receive the equivalent in shares of common stock of the Fund valued as follows:
| | (i) | If the shares of common stock are trading at net asset value or at a premium above net asset value at the time of valuation, the Fund will issue new shares at the greater of net asset value or 95% of the then current market price. |
| | (ii) | If the shares of common stock are trading at a discount from net asset value at the time of valuation, the Plan Agent will receive the dividend or distribution in cash and apply it to the purchase of the Fund’s shares of common stock in the open market on the New York Stock Exchange or elsewhere, for the participants’ accounts. Such purchases will be made on or shortly after the payment date for such dividend or distribution and in no event more than 30 days after such date except where temporary curtailment or suspension of purchase is necessary to comply with Federal securities laws. If, before the Plan Agent has completed its purchases, the market price exceeds the net asset value of a share of common stock, the average purchase price per share paid by the Plan Agent may exceed the net asset value of the Fund’s shares of common stock, resulting in the acquisition of fewer shares than if the dividend or distribution had been paid in shares issued by the Fund. |
The Plan Agent will maintain all shareholders’ accounts in the Plan and furnish written confirmation of all transactions in the account, including information needed by shareholders for tax records. Shares in the account of each Plan participant will be held by the Plan Agent in non-certificate form in the name of the participant, and each shareholder’s proxy will include those shares purchased or received pursuant to the Plan.
There will be no charges with respect to shares issued directly by the Fund to satisfy the dividend reinvestment requirements. However, each participant will
| | | | |
| ALLIANCEBERNSTEIN INCOME FUND • | | | 71 | |
Additional Information
pay a pro-rata share of brokerage commissions incurred with respect to the Plan Agent’s open market purchases of shares.
The automatic reinvestment of dividends and distributions will not relieve participants of any income taxes that may be payable (or required to be withheld) on dividends and distributions.
Experience under the Plan may indicate that changes are desirable. Accordingly, the Fund reserves the right to amend or terminate the Plan as applied to any voluntary cash payments made and any dividend or distribution paid subsequent to written notice of the change sent to participants in the Plan at least 90 days before the record date for such dividend or distribution. The Plan may also be amended or terminated by the Plan Agent on at least 90 days written notice to participants in the Plan. All correspondence concerning the Plan should be directed to the Plan Agent at Computershare Trust Company, N.A., P.O. Box 30170, College Station, TX 77842-3170.
Proof of Share Ownership Required in Connection with Requests for Submission of Open-Ending Proposals to Annual Meetings of Stockholders Pursuant to Charter
The Fund’s charter provides that the Fund is required to submit to its stockholders a proposal to open-end the Fund if (i) the Fund’s shares trade on the NYSE at an average discount of more than 10%, determined on the basis of the discount as of the end of the last trading day in each week, during the last 12 calendar weeks of any calendar year, and (ii) during such year the Fund receives written requests from the holders of at least 10% of the Fund’s outstanding shares that such open-ending proposal be submitted to the Fund’s stockholders. Under Maryland law, requests pursuant to this charter provision must be made by persons that are stockholders of record of the Fund on the date the proposal is submitted. However, if a stockholder submits a request pursuant to the charter provision and is not a record stockholder, the Fund will accept the request provided the stockholder submits, together with its request, proof that the stockholder is the beneficial owner of shares on the date of the request. The Fund may accept as proof a written statement verifying a stockholder’s beneficial ownership from the record holder of the Fund’s shares, such as, for shares held through The Depository Trust Company (“DTC”), a DTC participant that appears as the owner of such shares on DTC’s records. To the extent beneficially owned shares are held through a brokerage firm or other intermediary that is not a DTC participant or a direct record holder of the Fund’s shares, additional documentation demonstrating the chain of ownership to a DTC participant (or to a direct record holder) will be required to establish proof of beneficial ownership. This will normally require provision of two proof of ownership statements – one from the beneficial owner’s intermediary confirming ownership, and another from the DTC participant confirming such intermediary’s ownership. A list of DTC participants can be found at http://www.dtcc.com/client-center/dtc-directories.aspx.
| | |
| 72 | | • ALLIANCEBERNSTEIN INCOME FUND |
Additional Information
RESULTS OF STOCKHOLDERS MEETING
(unaudited)
The Annual Meeting of Stockholders of AllianceBernstein Income Fund, Inc. (“the Fund”) was held on April 16, 2015. A description of the proposals and number of shares voted at the Meeting are as follows:
| 1. | To elect three Directors for a term of three years and until his successor is duly elected and qualifies. |
Class Three (term expires 2018)
| | | | |
| | | Voted
For | | Authority
Withheld |
Class Three (term expires 2018) | | | | |
| Common Shares: | | | | |
| Marshall C. Turner, Jr. | | 167,014,531 | | 34,273,711 |
| Garry L. Moody | | 167,337,078 | | 33,951,164 |
| Earl D. Weiner | | 166,837,791 | | 34,450,451 |
| 2. | A non-binding stockholder proposal: for the Board of Directors to promptly consider authorizing a self-tender offer for all outstanding common shares of the Fund at or close to net asset value, and that if more than 50% of the Fund’s outstanding common shares are tendered, that the tender offer should be cancelled and that the Board should take the steps necessary to liquidate, merge or convert the Fund to an open-end mutual fund. |
| | | | | | |
| | | Voted For | | Against | | Abstain |
| | 64,508,309 | | 58,518,105 | | 2,654,683 |
| | | | |
| ALLIANCEBERNSTEIN INCOME FUND • | | | 73 | |
Results of Stockholders Meeting
BOARD OF DIRECTORS
| | |
Marshall C. Turner, Jr.(1) , Chairman John H. Dobkin(1) Michael J. Downey(1) | | Nancy P. Jacklin(1) Robert M. Keith, President and Chief Executive Officer |
William H. Foulk, Jr.(1)
D. James Guzy(1) | | Garry L. Moody(1) Earl D. Weiner(1) |
OFFICERS
| | |
Philip L. Kirstein, Senior Vice President and Independent Compliance Officer Paul J. DeNoon(2), Vice President Gershon M. Distenfeld(2),
Vice President Michael L. Mon, Vice President Douglas J. Peebles(2), Vice President | | Matthew S. Sheridan(2), Vice President Emilie D. Wrapp, Secretary Joseph J. Mantineo, Treasurer and Chief Financial Officer Phyllis J. Clarke, Controller
Vincent S. Noto,
Chief Compliance Officer |
| | |
Administrator AllianceBernstein L.P. 1345 Avenue of the Americas New York, NY 10105 Dividend Paying Agent, Transfer Agent and Registrar Computershare Trust Company, N.A. P.O. Box 30170 College Station, TX 77842-3170 Custodian and Accounting Agent State Street Bank and Trust Company State Street Corporation CCB/5 1 Iron Street Boston, MA 02210 | | Legal Counsel Seward & Kissel LLP One Battery Park Plaza New York, NY 10004 Independent Registered Public Accounting Firm Ernst & Young LLP 5 Times Square New York, NY 10036 |
| (1) | | Member of the Audit Committee, the Governance and Nominating Committee and the Independent Directors Committee. |
| (2) | | The most significant responsibility for the day-to-day management of, and investment decisions for, the Fund’s portfolio are made by a team of investment professionals consisting of Messrs. DeNoon, Distenfeld, Peebles and Sheridan. |
| | | Notice is hereby given in accordance with Section 23(c) of the Investment Company Act of 1940 that the Fund may purchase from time to time at market prices shares of its Common Stock in the open market. |
| | | This report, including the financial statements herein, is transmitted to the shareholders of AllianceBernstein Income Fund for their information. The financial information included herein is taken from the records of the Fund. This is not a prospectus, circular or representation intended for use in the purchase of shares of the Fund or any securities mentioned in this report. |
| | | Annual Certifications—As required, on May 18, 2015, the Fund submitted to the New York Stock Exchange (“NYSE”) the annual certification of the Fund’s Chief Executive Officer certifying that he is not aware of any violations of the NYSE’s Corporate Governance listing standards. The Fund has also included the certifications of the Fund’s Chief Executive Officer and Chief Financial Officer required by Section 302 of the Sarbanes-Oxley Act of 2002 as exhibits to the Fund’s Form N-CSR filed with the Securities and Exchange Commission for the reporting period. |
| | |
| 74 | | • ALLIANCEBERNSTEIN INCOME FUND |
Board of Directors
SUMMARY OF GENERAL INFORMATION
Shareholder Information
The daily net asset value of the Fund’s shares is available from the Fund’s Transfer Agent by calling (800) 426-5523. The Fund also distributes its daily net asset value to various financial publications or independent organizations such as Lipper Inc., Morningstar, Inc. and Bloomberg.
Weekly comparative net asset value (NAV) and market price information about the Fund is published each Monday in The Wall Street Journal, each Saturday in Barron’s and other newspapers in a table called “Closed-End Funds.” Daily net asset value and market price information and additional information regarding the Fund is available at www.alliancebernstein.com and at www.nyse.com.
Dividend Reinvestment Plan
A Dividend Reinvestment Plan provides automatic reinvestment of dividends and capital gains distributions in additional Fund shares. The Plan also allows you to make optional cash investments in Fund Shares through the Plan Agent. If you wish to participate in the Plan and your shares are held in your name, simply complete and mail the enrollment form in the brochure. If your shares are held in the name of your brokerage firm, bank or other nominee, you should ask them whether or how you can participate in the Plan.
For questions concerning shareholder account information, or if you would like a brochure describing the Dividend Reinvestment Plan, please call Computershare Trust Company, N.A. at (800) 219-4218.
| | | | |
| ALLIANCEBERNSTEIN INCOME FUND • | | | 75 | |
Summary of General Information
THIS PAGE IS NOT PART OF THE SHAREHOLDER REPORT OR THE FINANCIAL STATEMENTS
AB FAMILY OF FUNDS
US EQUITY
US Core
Core Opportunities Fund
Select US Equity Portfolio
US Growth
Concentrated Growth Fund
Discovery Growth Fund
Growth Fund
Large Cap Growth Fund
Small Cap Growth Portfolio
US Value
Discovery Value Fund
Equity Income Fund
Growth & Income Fund
Small Cap Value Portfolio
Value Fund
INTERNATIONAL/ GLOBAL EQUITY
International/Global Core
Global Core Equity Portfolio
Global Equity & Covered Call Strategy Fund
Global Thematic Growth Fund
International Portfolio
Tax-Managed International Portfolio
International/Global Growth
International Growth Fund
International/Global Value
International Value Fund
FIXED INCOME
Municipal
High Income Municipal Portfolio
Intermediate California Municipal Portfolio
Intermediate Diversified Municipal Portfolio
Intermediate New York Municipal Portfolio
Municipal Bond Inflation Strategy
Tax-Aware Fixed Income Portfolio
National Portfolio
Arizona Portfolio
California Portfolio
FIXED INCOME (continued)
Massachusetts Portfolio
Michigan Portfolio
Minnesota Portfolio
New Jersey Portfolio
New York Portfolio
Ohio Portfolio
Pennsylvania Portfolio
Virginia Portfolio
Taxable
Bond Inflation Strategy
Global Bond Fund
High Income Fund
High Yield Portfolio
Intermediate Bond Portfolio
Limited Duration High Income Portfolio
Short Duration Portfolio
ALTERNATIVES
All Market Real Return Portfolio*
Credit Long/Short Portfolio
Global Real Estate Investment Fund
Long/Short Multi-Manager Fund
Market Neutral Strategy-U.S.
Multi-Manager Alternative Strategies Fund
Select US Long/Short Portfolio
Unconstrained Bond Fund
MULTI-ASSET
All Market Growth Portfolio*
All Market Income Portfolio
Emerging Markets Multi-Asset Portfolio
Global Risk Allocation Fund
Target-Date
Multi-Manager Select Retirement Allocation Fund
Multi-Manager Select 2010 Fund
Multi-Manager Select 2015 Fund
Multi-Manager Select 2020 Fund
Multi-Manager Select 2025 Fund
MULTI-ASSET (continued)
Multi-Manager Select 2030 Fund
Multi-Manager Select 2035 Fund
Multi-Manager Select 2040 Fund
Multi-Manager Select 2045 Fund
Multi-Manager Select 2050 Fund
Multi-Manager Select 2055 Fund
2000 Retirement Strategy
2005 Retirement Strategy
2010 Retirement Strategy
2015 Retirement Strategy
2020 Retirement Strategy
2025 Retirement Strategy
2030 Retirement Strategy
2035 Retirement Strategy
2040 Retirement Strategy
2045 Retirement Strategy
2050 Retirement Strategy
2055 Retirement Strategy
Wealth Strategies
Balanced Wealth Strategy
Conservative Wealth Strategy
Wealth Appreciation Strategy
Tax-Managed Balanced Wealth Strategy
Tax-Managed Conservative Wealth Strategy
Tax-Managed Wealth Appreciation Strategy
CLOSED-END FUNDS
AB Multi-Manager Alternative Fund
Alliance California Municipal Income Fund
Alliance New York Municipal Income Fund
AllianceBernstein Global High Income Fund
AllianceBernstein Income Fund
AllianceBernstein National Municipal Income Fund
We also offer Exchange Reserves, which serves as the money market fund exchange vehicle for the AB mutual funds. An investment in Exchange Reserves is not a deposit in a bank and is not insured or guaranteed by the Federal Deposit Insurance Corporation or any other government agency. Although the Fund seeks to preserve the value of your investment at $1.00 per share, it is possible to lose money by investing in the Fund.
Investors should consider the investment objectives, risks, charges and expenses of the Fund carefully before investing. For copies of our prospectus or summary prospectus, which contain this and other information, visit us online at www.abglobal.com or contact your AB representative. Please read the prospectus and/or summary prospectus carefully before investing.
* Prior to December 15, 2014, All Market Growth Portfolio was named Dynamic All Market Fund; All Market Real Return Portfolio was named Real Asset Strategy.
AB Family of Funds
| | |
| 76 | | • ALLIANCEBERNSTEIN INCOME FUND |
Privacy Policy Statement
AllianceBernstein and its affiliates (collectively “AllianceBernstein”) understand the importance of maintaining the confidentiality of their clients’ nonpublic personal information. Nonpublic personal information is personally identifiable financial information about our clients who are natural persons. To provide financial products and services to our clients, we may collect information about clients from a variety of sources, including: (1) account documentation, including applications or other forms, which may include information such as a client’s name, address, phone number, social security number, assets, income and other household information, (2) client transactions with us and others, such as account balances and transactions history, and (3) information from visitors to our websites provided through online forms, site visitorship data and online information-collecting devices known as “cookies.”
It is our policy not to disclose nonpublic personal information about our clients or former clients (collectively “clients”), except to our affiliates, or to others as permitted or required by law. From time to time, we may disclose nonpublic personal information that we collect about our clients to non-affiliated third parties, including those that perform transaction processing or servicing functions, those that provide marketing services for us or on our behalf pursuant to a joint marketing agreement or those that provide professional services to us under a professional services agreement, all of which require the third party provider to adhere to our privacy policy. We have policies and procedures to safeguard nonpublic personal information about our clients that include restricting access to nonpublic personal information and maintaining physical, electronic and procedural safeguards which comply with applicable standards.
It is also our policy to prohibit the sharing of our clients’ personal information among our affiliated group of investment, brokerage, service and insurance companies for the purpose of marketing their products or services to clients, except as permitted by law. This information includes, but is not limited to, a client’s income and account history.
We have policies and procedures to ensure that certain conditions are met before an AllianceBernstein affiliated company may use information obtained from another affiliate to solicit clients for marketing purposes.
ALLIANCEBERNSTEIN INCOME FUND
1345 Avenue of the Americas
New York, NY 10105
800.221.5672
ACMI-0152-0615 
ITEM 2. CODE OF ETHICS.
Not applicable when filing a semi-annual report to shareholders.
ITEM 3. AUDIT COMMITTEE FINANCIAL EXPERT.
Not applicable when filing a semi-annual report to shareholders.
ITEM 4. PRINCIPAL ACCOUNTANT FEES AND SERVICES.
Not applicable when filing a semi-annual report to shareholders.
ITEM 5. AUDIT COMMITTEE OF LISTED REGISTRANTS.
Not applicable when filing a semi-annual report to shareholders.
ITEM 6. SCHEDULE OF INVESTMENTS.
Please see Schedule of Investments contained in the Report to Shareholders included under Item 1 of this Form N-CSR.
ITEM 7. DISCLOSURE OF PROXY VOTING POLICIES AND PROCEDURES FOR CLOSED-END MANAGEMENT INVESTMENT COMPANIES.
Not applicable when filing a semi-annual report to shareholders.
ITEM 8. PORTFOLIO MANAGERS OF CLOSED-END MANAGEMENT INVESTMENT COMPANIES.
Not applicable when filing a semi-annual report to shareholders.
ITEM 9. PURCHASES OF EQUITY SECURITIES BY CLOSED-END MANAGEMENT INVESTMENT COMPANY AND AFFILIATED PURCHASERS.
| | | | | | | | | | | | | | | | |
| | | | | | Registrant Purchases of Equity Series* | | | | |
| | | | |
Period | | Total Number of
Shares Purchased | | | Average Price
Paid Per Share | | | Total Number of
Shares Purchased as
Part of Publicly
Announced Program | | | Maximum Number of
Shares that May Yet
Be Purchased Under
the Program | |
7/1/2014 - 7/31/2014 | | | 1,825,993 | | | $ | 7.50 | | | | 1,825,993 | | | | 34,610,762 | |
8/1/2014 - 8/31/2014 | | | 1,925,007 | | | $ | 7.51 | | | | 1,925,007 | | | | 32,685,755 | |
9/1/2014 - 9/30/2014 | | | 2,326,633 | | | $ | 7.50 | | | | 2,326,633 | | | | 30,359,122 | |
10/1/2014 - 10/31/2014 | | | 2,343,867 | | | $ | 7.54 | | | | 2,343,867 | | | | 28,015,255 | |
11/1/2014 - 11/30/2014 | | | 2,845,690 | | | $ | 7.59 | | | | 2,845,690 | | | | 25,169,565 | |
12/1/2014 - 12/31/2014 | | | 3,636,657 | | | $ | 7.52 | | | | 3,636,657 | | | | 21,532,908 | |
1/1/2015 - 1/31/2015 | | | 1,927,552 | | | $ | 7.51 | | | | 1,927,552 | | | | 19,605,356 | |
2/1/2015 - 2/28/2015 | | | 3,724,466 | | | $ | 7.49 | | | | 3,724,466 | | | | 15,880,890 | |
3/1/2015 - 3/31/2015 | | | 3,790,290 | | | $ | 7.58 | | | | 3,790,290 | | | | 12,090,600 | |
4/1/2015 - 4/30/2015 | | | 2,509,434 | | | $ | 7.75 | | | | 2,509,434 | | | | 9,581,166 | |
5/1/2015 - 5/31/2015 | | | 220,500 | | | $ | 7.79 | | | | 220,500 | | | | 9,360,666 | |
6/1/2015 - 6/30/2015 | | | 0 | | | | N/A | | | | 0 | | | | 9,360,666 | |
| | | | | | | | | | | | | | | | |
Total | | | 27,076,089 | | | $ | 7.55 | | | | 27,076,089 | | | | | |
| * | Share Repurchase Program - On June 25, 2014, the Fund announced that its Board of Directors had authorized the Fund’s discretionary repurchase of up to 15% of its then outstanding shares of common stock (valued at up to approximately $306 million as of June 24, 2014 based on Fund total net assets of approximately $2.04 billion) in open market transactions over a one-year period. |
ITEM 10. SUBMISSION OF MATTERS TO A VOTE OF SECURITY HOLDERS.
There have been no material changes to the procedures by which shareholders may recommend nominees to the Fund’s Board of Directors since the Fund last provided disclosure in response to this item.
ITEM 11. CONTROLS AND PROCEDURES.
(a) The registrant’s principal executive officer and principal financial officer have concluded that the registrant’s disclosure controls and procedures (as defined in Rule 30a-2(c) under the Investment Company Act of 1940, as amended) are effective at the reasonable assurance level based on their evaluation of these controls and procedures as of a date within 90 days of the filing date of this document.
(b) There were no changes in the registrant’s internal controls over financial reporting that occurred during the second fiscal quarter of the period that has materially affected, or is reasonably likely to materially affect, the registrant’s internal control over financial reporting.
ITEM 12. EXHIBITS.
The following exhibits are attached to this Form N-CSR:
| | |
EXHIBIT NO. | | DESCRIPTION OF EXHIBIT |
| |
| 12(b) (1) | | Certification of Principal Executive Officer Pursuant to Section 302 of the Sarbanes-Oxley Act of 2002 |
| |
| 12(b) (2) | | Certification of Principal Financial Officer Pursuant to Section 302 of the Sarbanes-Oxley Act of 2002 |
| |
| 12(c) | | Certification of Principal Executive Officer and Principal Financial Officer Pursuant to Section 906 of the Sarbanes-Oxley Act of 2002 |
SIGNATURES
Pursuant to the requirements of the Securities Exchange Act of 1934 and the Investment Company Act of 1940, the registrant has duly caused this report to be signed on its behalf by the undersigned, thereunto duly authorized.
(Registrant): AllianceBernstein Income Fund, Inc.
| | |
| By: | | /s/ Robert M. Keith |
| | Robert M. Keith |
| | President |
| |
| Date: | | August 21, 2015 |
Pursuant to the requirements of the Securities Exchange Act of 1934 and the Investment Company Act of 1940, this report has been signed below by the following persons on behalf of the registrant and in the capacities and on the dates indicated.
| | |
| By: | | /s/ Robert M. Keith |
| | Robert M. Keith |
| | President |
| |
| Date: | | August 21, 2015 |
| |
| By: | | /s/ Joseph J. Mantineo |
| | Joseph J. Mantineo |
| | Treasurer and Chief Financial Officer |
| |
| Date: | | August 21, 2015 |
