Exhibit 99.1
Alliance HealthCare Services
NASDAQ: AIQ
May 25, 2016
Disclaimer
During the course of this presentation, the Company may make projections or other forward-looking statements regarding, among other things, our business outlook, operations and strategy; service areas; competition; changes in laws and regulations and the impact of such changes on us; our estimates for future performance and operating results, including future revenues, cash flows and capital requirements. In some cases you can identify these statements by words such as “could,” “may,” “expects,” “anticipates,” “believes,” “intends,” “estimates,” or similar words. These forward-looking statements are based largely on the Company’s current expectations and are subject to a number of known or unknown risks and uncertainties (some of which are beyond the Company’s control). We urge you to review the factors discussed under the caption “Risk Factors” in the Company’s Form 10-K for the year ended December 31, 2015, filed with the Securities and Exchange Commission. In light of these risks and uncertainties, there can be no assurance that the forward-looking statements made during this presentation will in fact be realized. Except as otherwise required by applicable securities laws, we disclaim any intention or obligation to publicly update or revise forward-looking statements, whether as a result of new information, future events or otherwise.
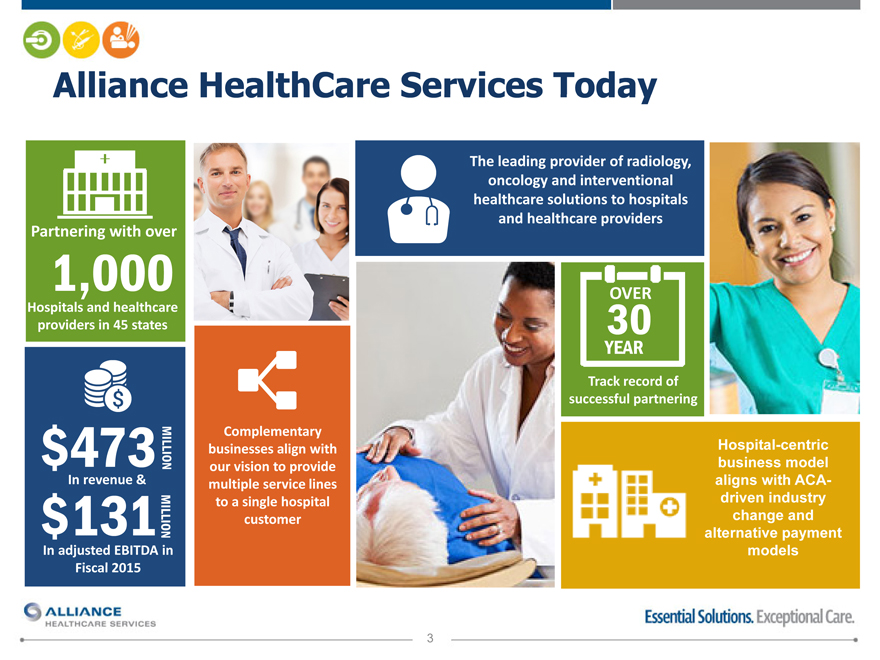
Alliance HealthCare Services Today
Partnering with over
1,000
Hospitals and healthcare providers in 45 states
$473MILLION
In revenue & $131MILLION
In adjusted EBITDA in Fiscal 2015
Complementary businesses align with our vision to provide multiple service lines to a single hospital customer
The leading provider of radiology, oncology and interventional healthcare solutions to hospitals and healthcare providers
OVER
30
YEAR
Track record of successful partnering
Hospital-centric business model aligns with ACA-driven industry change and alternative payment models
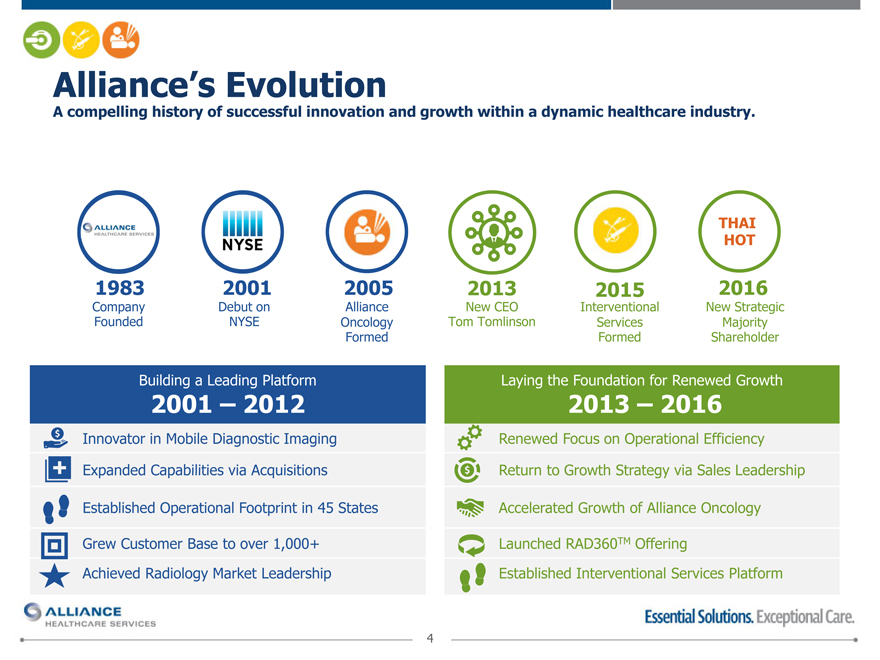
Alliance’s Evolution
A compelling history of successful innovation and growth within a dynamic healthcare industry.
THAI
HOT
1983 2001 2005 2013 2015 2016
Company Debut on Alliance New CEO Interventional New Strategic
Founded NYSE Oncology Tom Tomlinson Services Majority
Formed Formed Shareholder
Building a Leading Platform Laying the Foundation for Renewed Growth
2001 – 2012 2013 – 2016
Innovator in Mobile Diagnostic Imaging Renewed Focus on Operational Efficiency
Expanded Capabilities via Acquisitions Return to Growth Strategy via Sales Leadership
Established Operational Footprint in 45 States Accelerated Growth of Alliance Oncology
Grew Customer Base to over 1,000+ Launched RAD360TM Offering
Achieved Radiology Market Leadership Established Interventional Services Platform
Hospital Centric Business Model
Legacy of hospital partnering is aligned with healthcare industry trends.
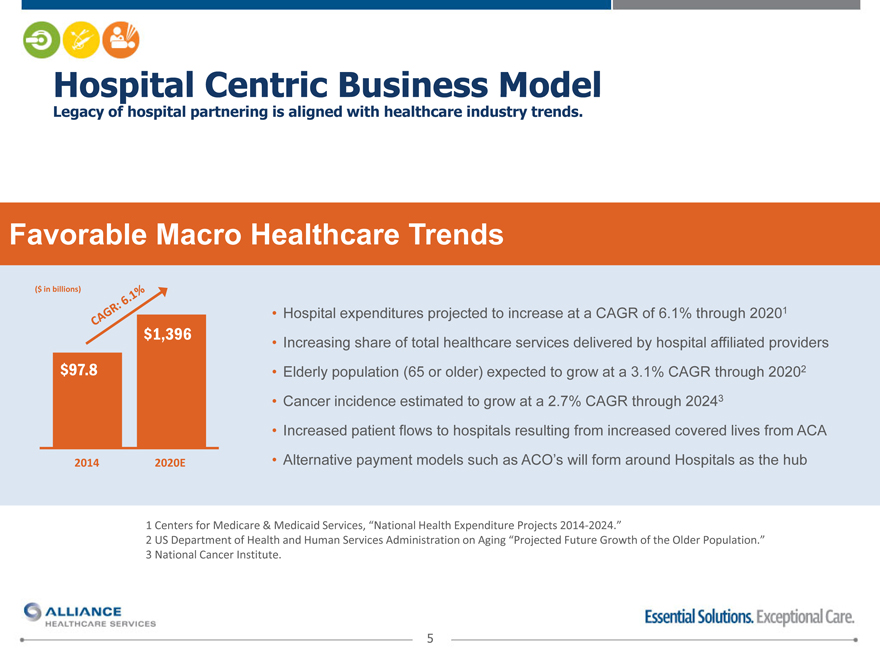
Favorable Macro Healthcare Trends
($ in billions)
Hospital expenditures projected to increase at a CAGR of 6.1% through 20201
$1,396 Increasing share of total healthcare services delivered by hospital affiliated providers
$97.8 Elderly population (65 or older) expected to grow at a 3.1% CAGR through 20202
Cancer incidence estimated to grow at a 2.7% CAGR through 20243
Increased patient flows to hospitals resulting from increased covered lives from ACA
2014 2020E Alternative payment models such as ACO’s will form around Hospitals as the hub
1 | | Centers for Medicare & Medicaid Services, “National Health Expenditure Projects 2014-2024.” |
2 US Department of Health and Human Services Administration on Aging “Projected Future Growth of the Older Population.”
3 | | National Cancer Institute. |
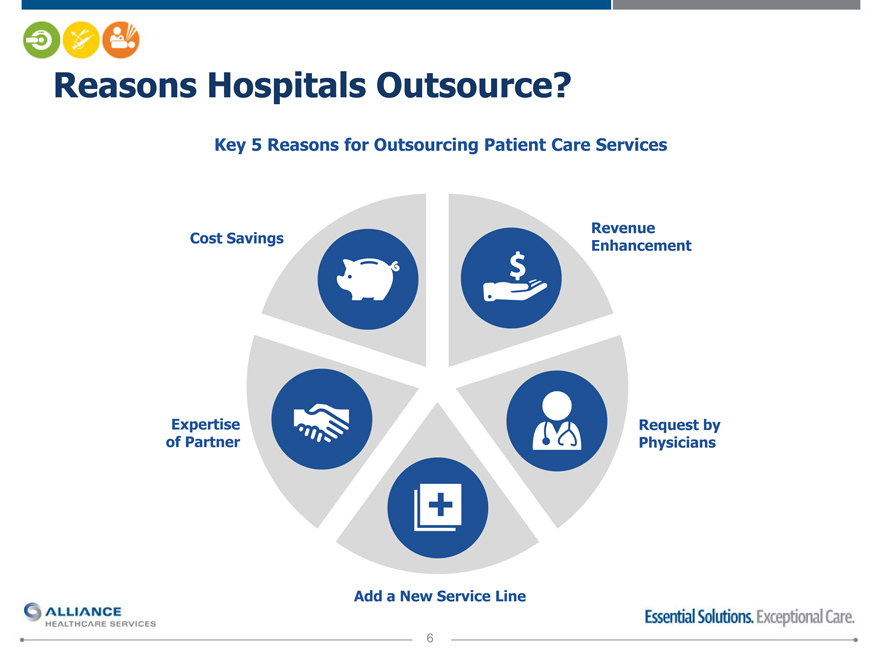
Reasons Hospitals Outsource?
Key 5 Reasons for Outsourcing Patient Care Services
Revenue
Cost Savings Enhancement
Expertise Request by
of Partner Physicians
Add a New Service Line
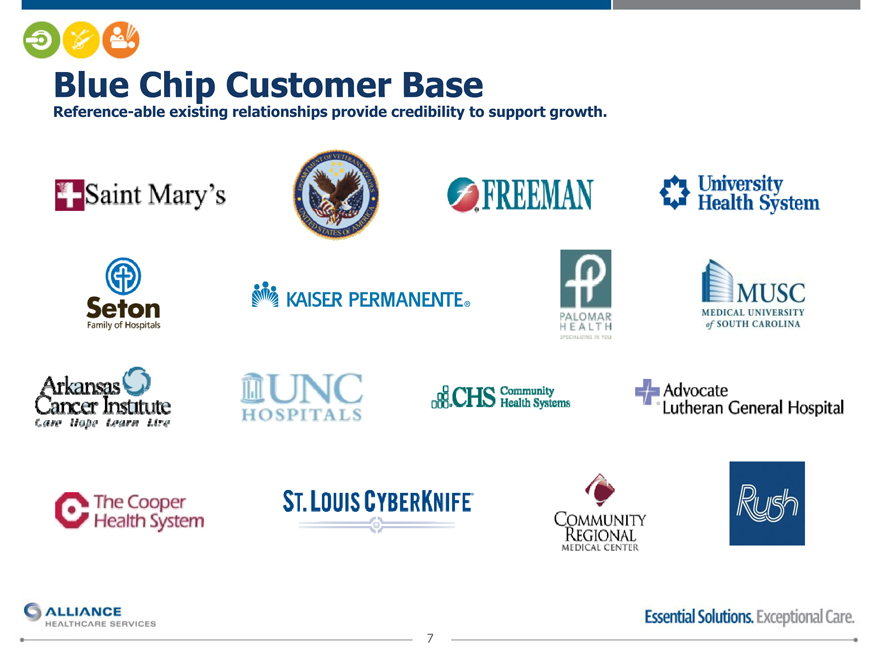
Blue Chip Customer
Base
Reference-able existing relationships provide credibility to support growth.
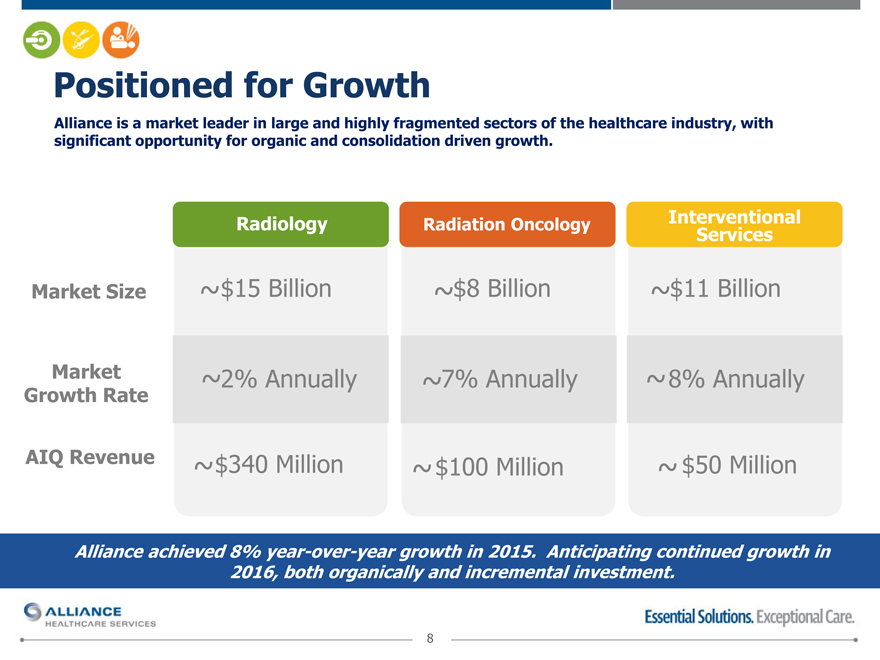
Positioned for Growth
Alliance is a market leader in large and highly fragmented sectors of the healthcare industry, with
significant opportunity for organic and consolidation driven growth.
Radiology Radiation Oncology Interventional
Services
Market Size ~$15 Billion ~$8 Billion ~$11 Billion
Market ~2% Annually ~7% Annually ~ 8% Annually
Growth Rate
AIQ Revenue ~$340 Million ~ $100 Million ~ $50 Million
Alliance achieved 8% year-over-year growth in 2015. Anticipating continued growth in
2016, both organically and incremental investment.
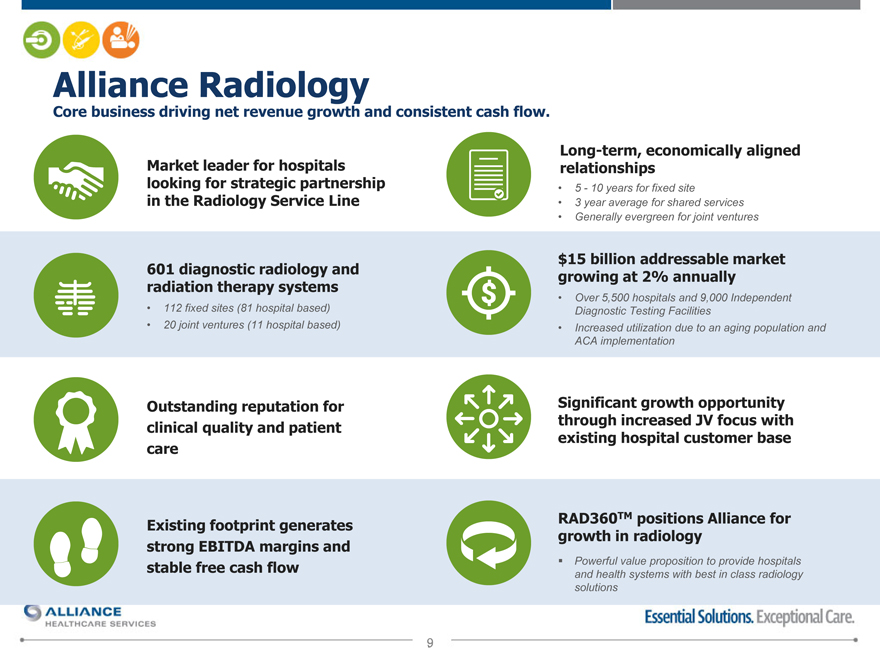
Alliance Radiology
Core business driving net revenue growth and consistent cash flow.
Long-term, economically aligned
Market leader for hospitals relationships
looking for strategic partnership 5—10 years for fixed site
in the Radiology Service Line 3 year average for shared services
Generally evergreen for joint ventures
$15 billion addressable market
601 diagnostic radiology and growing at 2% annually
radiation therapy systems
Over 5,500 hospitals and 9,000 Independent
112 fixed sites (81 hospital based) Diagnostic Testing Facilities
20 joint ventures (11 hospital based) Increased utilization due to an aging population and
ACA implementation
Outstanding reputation for Significant growth opportunity
clinical quality and patient through increased JV focus with
care existing hospital customer base
Existing footprint generates RAD360TM positions Alliance for
strong EBITDA margins and growth in radiology
stable free cash flow Powerful value proposition to provide hospitals
and health systems with best in class radiology
solutions
9
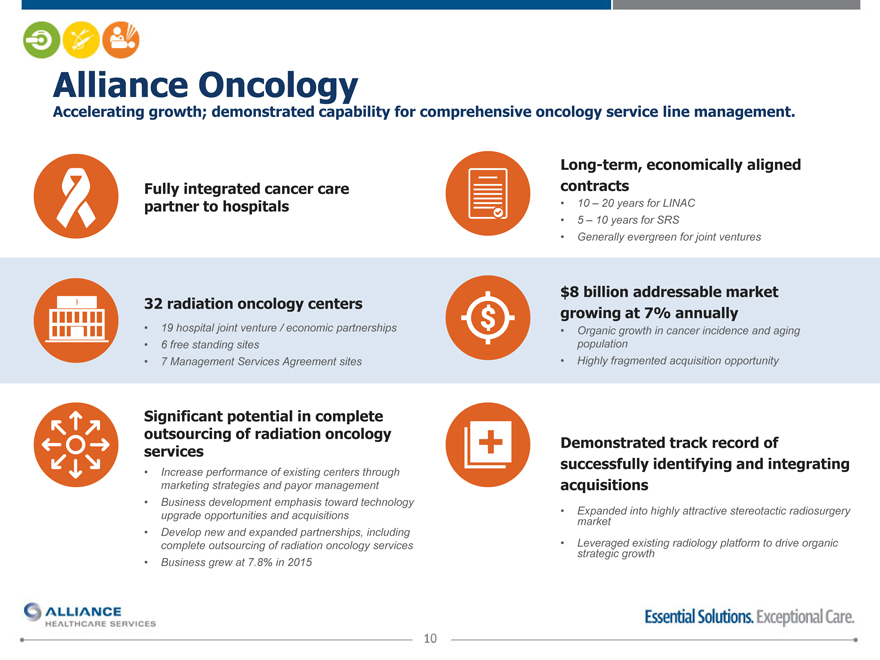
Alliance Oncology
Accelerating growth; demonstrated capability for comprehensive oncology service line management.
Long-term, economically aligned
Fully integrated cancer care contracts
partner to hospitals 10 – 20 years for LINAC
Generally evergreen for joint ventures
$8 billion addressable market
32 radiation oncology centers growing at 7% annually
19 hospital joint venture / economic partnerships Organic growth in cancer incidence and aging
6 | | free standing sites population |
7 | | Management Services Agreement sites Highly fragmented acquisition opportunity |
Significant potential in complete
outsourcing of radiation oncology
services Demonstrated track record of
Increase performance of existing centers through successfully identifying and integrating
marketing strategies and payor management acquisitions
Business development emphasis toward technology
upgrade opportunities and acquisitions Expanded into highly attractive stereotactic radiosurgery
market
Develop new and expanded partnerships, including
complete outsourcing of radiation oncology services Leveraged existing radiology platform to drive organic
strategic growth
Business grew at 7.8% in 2015
10
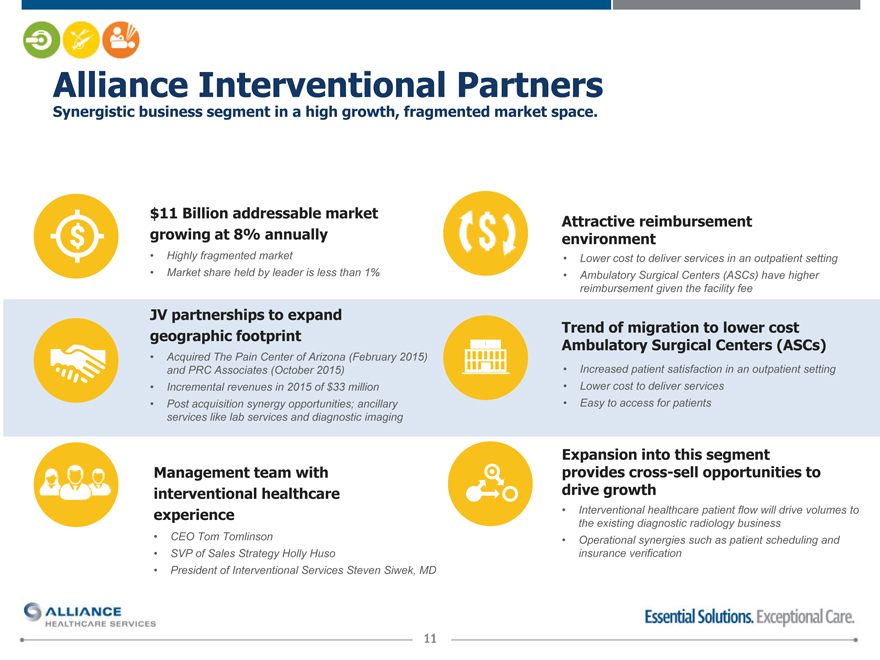
Alliance Interventional Partners
Synergistic business segment in a high growth, fragmented market space.
$11 Billion addressable market Attractive reimbursement
growing at 8% annually environment
Highly fragmented market Lower cost to deliver services in an outpatient setting
Market share held by leader is less than 1% Ambulatory Surgical Centers (ASCs) have higher
reimbursement given the facility fee
JV partnerships to expand
geographic footprint Trend of migration to lower cost
Ambulatory Surgical Centers (ASCs)
Acquired The Pain Center of Arizona (February 2015)
and PRC Associates (October 2015) Increased patient satisfaction in an outpatient setting
Incremental revenues in 2015 of $33 million Lower cost to deliver services
Post acquisition synergy opportunities; ancillary Easy to access for patients
services like lab services and diagnostic imaging
Expansion into this segment
Management team with provides cross-sell opportunities to
interventional healthcare drive growth
experience Interventional healthcare patient flow will drive volumes to
the existing diagnostic radiology business
CEO Tom Tomlinson Operational synergies such as patient scheduling and
SVP of Sales Strategy Holly Huso insurance verification
President of Interventional Services Steven Siwek, MD
11
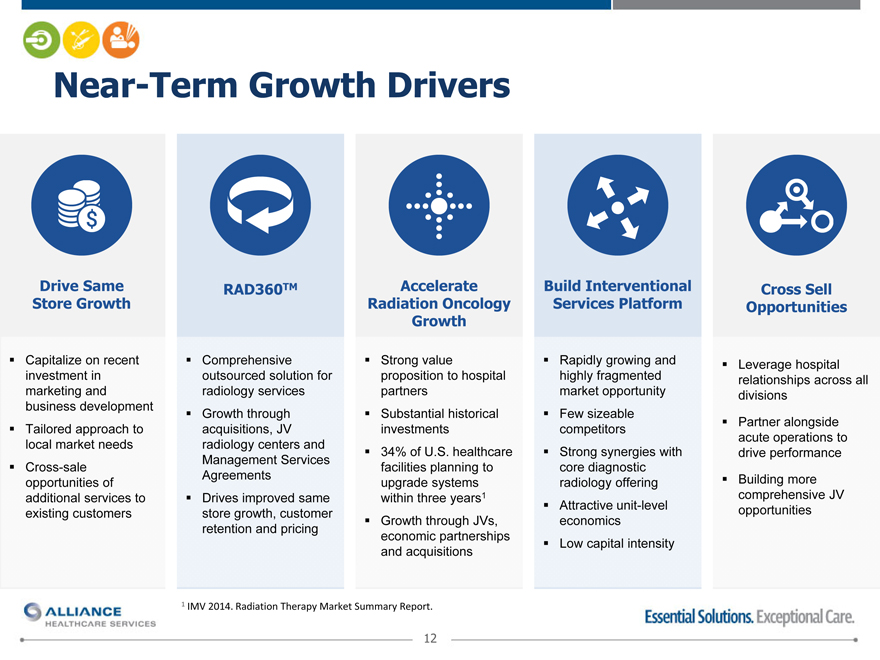
Near-Term Growth Drivers
Drive Same RAD360TM Accelerate Build Interventional Cross Sell
Store Growth Radiation Oncology Services Platform Opportunities
Growth
Capitalize on recent Comprehensive Strong value Rapidly growing and Leverage hospital
relationships across all
marketing and radiology services partners market opportunity divisions
business development Growth through Substantial historical Few sizeable
Tailored approach to acquisitions, JV investments competitors Partner alongside
local market needs radiology centers and acute operations to
Management Services 34% of U.S. healthcare Strong synergies with drive performance
Cross-sale facilities planning to core diagnostic
opportunities of Agreements upgrade systems radiology offering Building more
additional services to Drives improved same within three years1 comprehensive JV
existing customers store growth, customer Attractive unit-level opportunities
Growth through JVs, economics
retention and pricing economic partnerships Low capital intensity
and acquisitions
1 | | IMV 2014. Radiation Therapy Market Summary Report. |
12
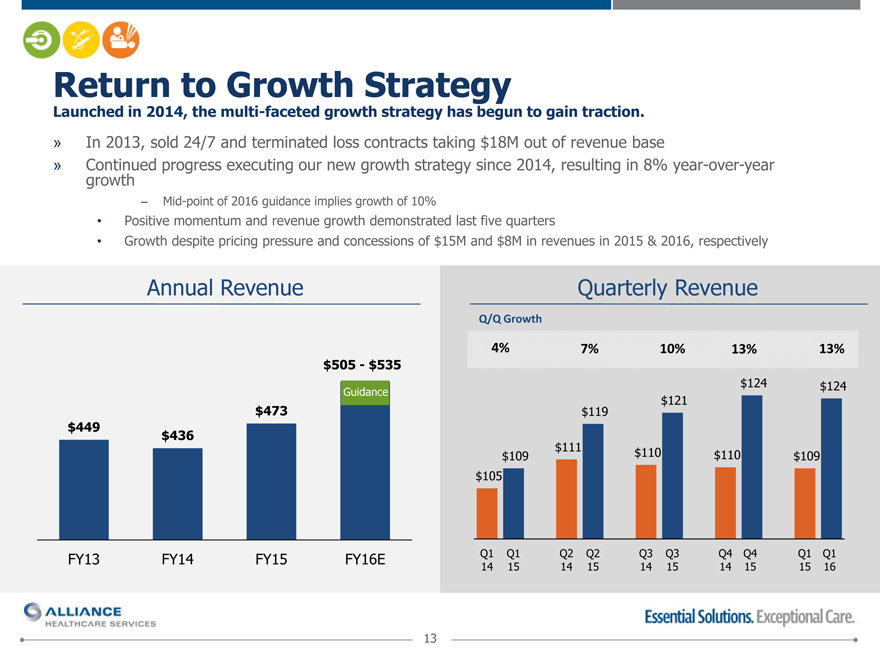
Return to Growth Strategy
Launched in 2014, the multi-faceted growth strategy has begun to gain traction.
» In 2013, sold 24/7 and terminated loss contracts taking $18M out of revenue base
» Continued progress executing our new growth strategy since 2014, resulting in 8% year-over-year
growth
– Mid-point of 2016 guidance implies growth of 10%
Positive momentum and revenue growth demonstrated last five quarters
Growth despite pricing pressure and concessions of $15M and $8M in revenues in 2015 & 2016, respectively
Annual Revenue Quarterly Revenue
Q/Q Growth
4% 7% 10% 13% 13%
$505—$535
Guidance $124 $124
$121
$473 $119
$449 $436
$109 $111 $110 $110 $109
$105
FY13 FY14 FY15 FY16E Q1 Q1 Q2 Q2 Q3 Q3 Q4 Q4 Q1 Q1
14 15 14 15 14 15 14 15 15 16
13
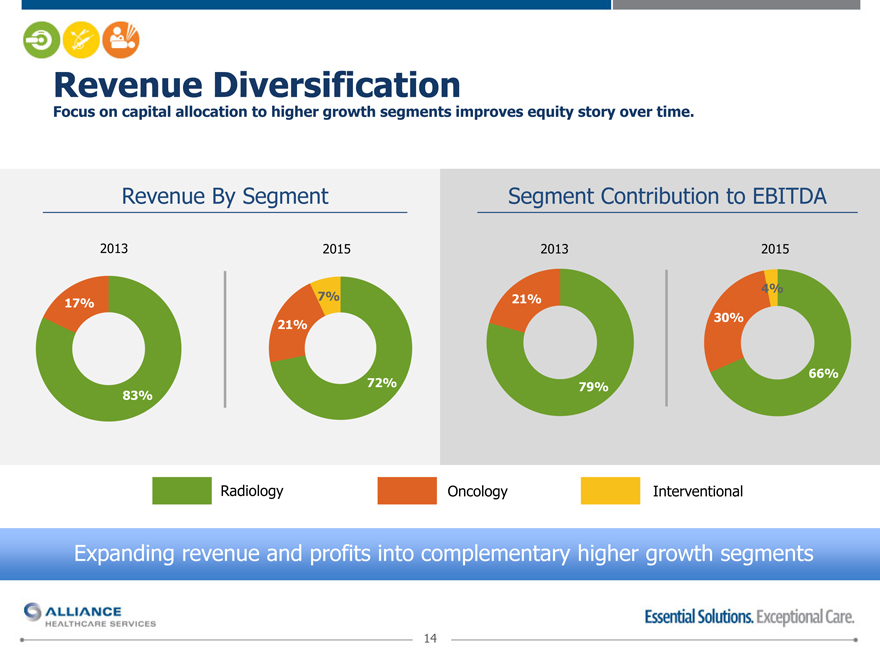
Revenue Diversification
Focus on capital allocation to higher growth segments improves equity story over time.
Revenue By Segment Segment Contribution to EBITDA
2013 2015 2013 2015
7% 4%
17% 21%
21% 30%
66%
83% 72% 79%
Radiology Oncology Interventional
14
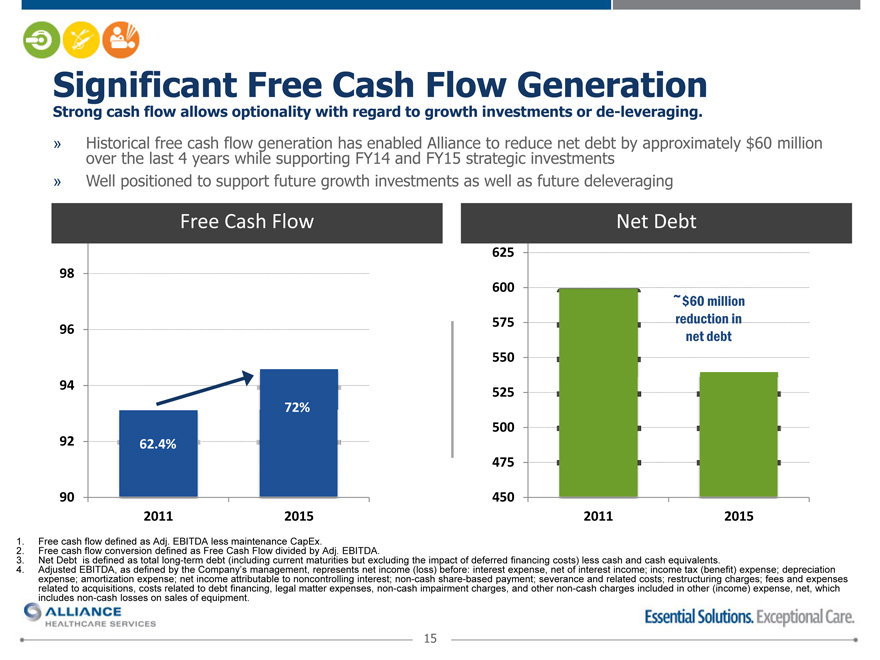
Significant Free Cash Flow Generation
Strong cash flow allows optionality with regard to growth investments or de-leveraging.
»
Historical free cash flow generation has enabled Alliance to reduce net debt by approximately $60 million
over the last 4 years while supporting FY14 and FY15 strategic investments
»
Well positioned to support future growth investments as well as future deleveraging
Free Cash Flow
Net Debt
625
98
600
~$60 million
575
reduction in
96
net debt
550
94
525
72%
500
92
62.4%
475
90
450
2011
2015
2011
2015
1. Free cash flow defined as Adj. EBITDA less maintenance CapEx.
2. Free cash flow conversion defined as Free Cash Flow divided by Adj. EBITDA.
3. Net Debt
is defined as total long-term debt (including current maturities but excluding the impact of deferred financing costs) less cash and cash equivalents.
4. Adjusted EBITDA, as defined by the Company’s management, represents net income (loss) before: interest expense, net of interest income; income tax (benefit) expense; depreciation
expense; amortization expense; net income attributable to noncontrolling interest; non-cash share-based payment; severance and related costs; restructuring charges; fees and expenses
related to acquisitions, costs related to debt financing, legal matter expenses, non-cash impairment charges, and other non-cash charges included in other (income) expense, net, which
includes non-cash losses on sales of equipment.
15
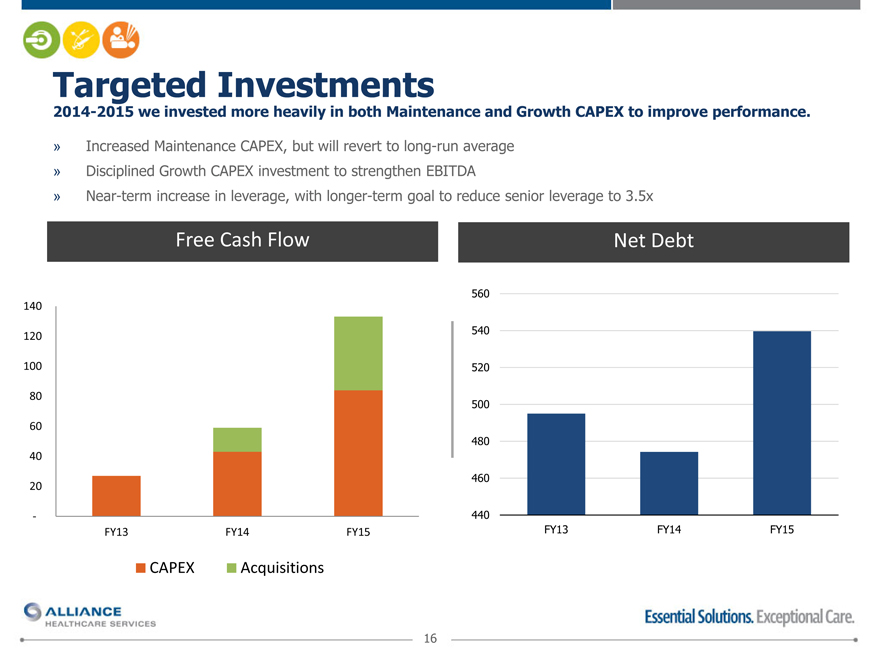
Targeted Investments
2014-2015 we invested more heavily in both Maintenance and Growth CAPEX to improve performance.
» Increased Maintenance CAPEX, but will revert to long-run average
» Disciplined Growth CAPEX investment to strengthen EBITDA
» Near-term increase in leverage, with longer-term goal to reduce senior leverage to 3.5x
Free Cash Flow Net Debt
560
140
120 540
100 520
80
500
60
480
40
460
20
- 440
FY13 FY14 FY15 FY13 FY14 FY15
CAPEX Acquisitions
16
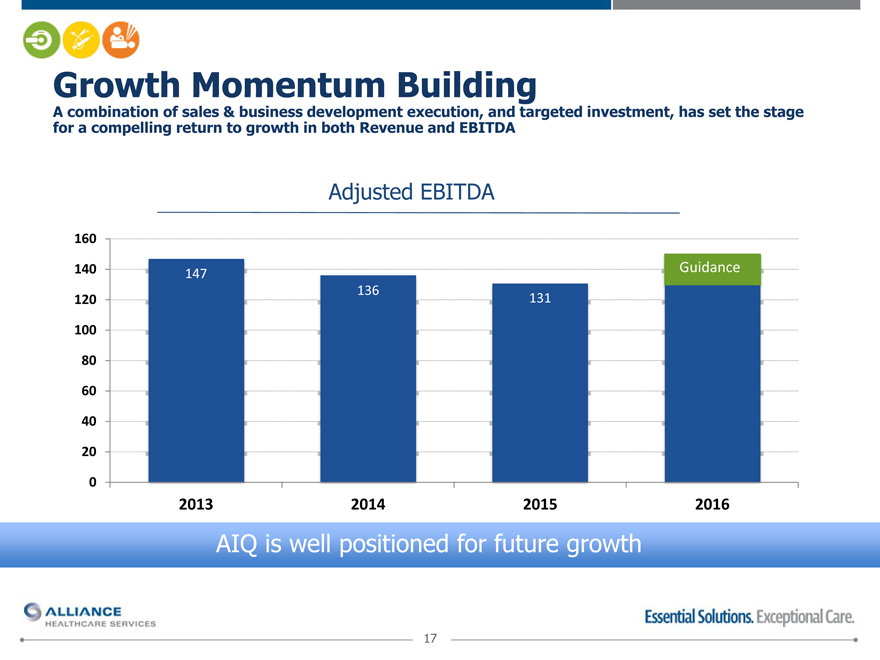
Growth Momentum Building
A combination of sales & business development execution, and targeted investment, has set the stage
for a compelling return to growth in both Revenue and EBITDA
Adjusted EBITDA
160
140 147 Guidance Guidance
136
120 131
100
80
60
40
20
0
2013 2014 2015 2016
17
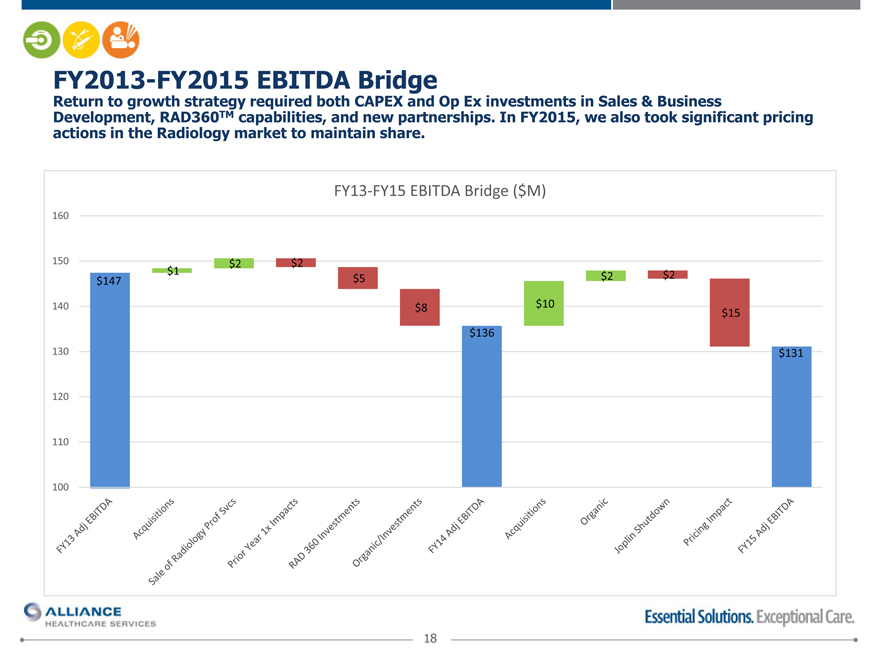
FY2013-FY2015 EBITDA Bridge
Return to growth strategy required both CAPEX and Op Ex investments in Sales & Business
Development, RAD360TM capabilities, and new partnerships. In FY2015, we also took significant pricing
actions in the Radiology market to maintain share.
FY13-FY15 EBITDA Bridge ($M)
160
150 $2 $2
$1
$147 $5 $2 $2
140 $8 $10
$15
$136
130 $131
120
110
100
18
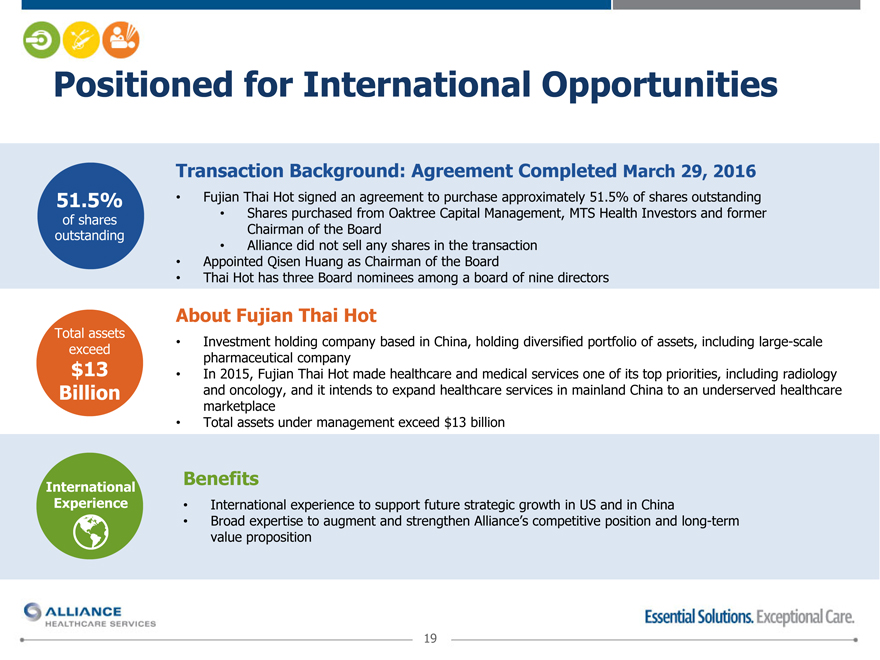
Positioned for International Opportunities
Transaction Background: Agreement Completed March 29, 2016
51.5% Fujian Thai Hot signed an agreement to purchase approximately 51.5% of shares outstanding
of shares Shares purchased from Oaktree Capital Management, MTS Health Investors and former
outstanding Chairman of the Board
Alliance did not sell any shares in the transaction
Appointed Qisen Huang as Chairman of the Board
Thai Hot has three Board nominees among a board of nine directors
About Fujian Thai Hot
Total assets
exceed Investment holding company based in China, holding diversified portfolio of assets, including large-scale
pharmaceutical company
$13 In 2015, Fujian Thai Hot made healthcare and medical services one of its top priorities, including radiology
Billion and oncology, and it intends to expand healthcare services in mainland China to an underserved healthcare
marketplace
Total assets under management exceed $13 billion
International Benefits
Experience International experience to support future strategic growth in US and in China
Broad expertise to augment and strengthen Alliance’s competitive position and long-term
value proposition
19
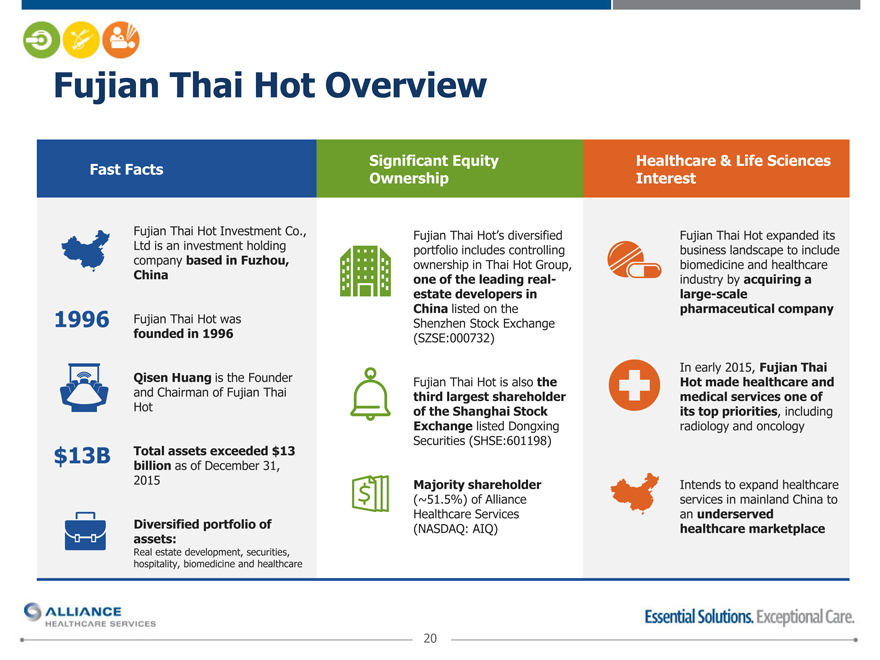
Fujian Thai Hot Overview
Significant Equity Healthcare & Life Sciences
Fast Facts Ownership Interest
Fujian Thai Hot Investment Co., Fujian Thai Hot’s diversified Fujian Thai Hot expanded its
Ltd is an investment holding portfolio includes controlling business landscape to include
company based in Fuzhou, ownership in Thai Hot Group, biomedicine and healthcare
China one of the leading real- industry by acquiring a
estate developers in large-scale
China listed on the pharmaceutical company
1996 Fujian Thai Hot was Shenzhen Stock Exchange
founded in 1996 (SZSE:000732)
In early 2015, Fujian Thai
Qisen Huang is the Founder Fujian Thai Hot is also the Hot made healthcare and
and Chairman of Fujian Thai third largest shareholder medical services one of
Hot of the Shanghai Stock its top priorities, including
Exchange listed Dongxing radiology and oncology
Securities (SHSE:601198)
$13B Total assets exceeded $13
billion as of December 31,
2015 Majority shareholder Intends to expand healthcare
(~51.5%) of Alliance services in mainland China to
Healthcare Services an underserved
Diversified portfolio of (NASDAQ: AIQ) healthcare marketplace
assets:
Real estate development, securities,
hospitality, biomedicine and healthcare
20
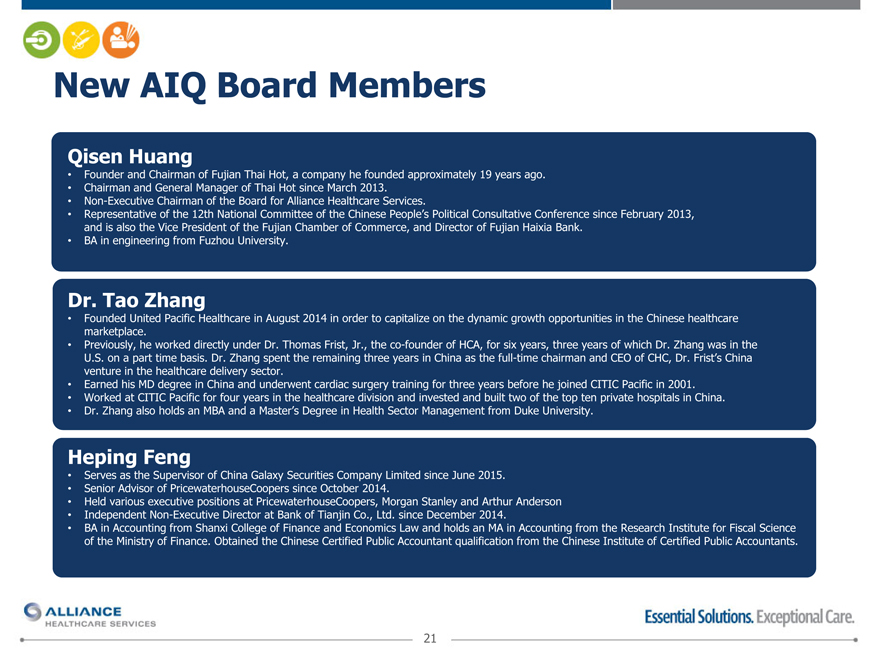
New AIQ Board Members
Qisen Huang
Founder and Chairman of Fujian Thai Hot, a company he founded approximately 19 years ago.
Chairman and General Manager of Thai Hot since March 2013.
Non-Executive Chairman of the Board for Alliance Healthcare Services.
Representative of the 12th National Committee of the Chinese People’s Political Consultative Conference since February 2013, and is also the Vice President of the Fujian Chamber of Commerce, and Director of Fujian Haixia Bank.
BA in engineering from Fuzhou University.
Dr. Tao Zhang
Founded United Pacific Healthcare in August 2014 in order to capitalize on the dynamic growth opportunities in the Chinese healthcare marketplace.
Previously, he worked directly under Dr. Thomas Frist, Jr., the co-founder of HCA, for six years, three years of which Dr. Zhang was in the U.S. on a part time basis. Dr. Zhang spent the remaining three years in China as the full-time chairman and CEO of CHC, Dr. Frist’s China venture in the healthcare delivery sector.
Earned his MD degree in China and underwent cardiac surgery training for three years before he joined CITIC Pacific in 2001.
Worked at CITIC Pacific for four years in the healthcare division and invested and built two of the top ten private hospitals in China.
Dr. Zhang also holds an MBA and a Master’s Degree in Health Sector Management from Duke University.
Heping Feng
Serves as the Supervisor of China Galaxy Securities Company Limited since June 2015.
Senior Advisor of PricewaterhouseCoopers since October 2014.
Held various executive positions at PricewaterhouseCoopers, Morgan Stanley and Arthur Anderson
Independent Non-Executive Director at Bank of Tianjin Co., Ltd. since December 2014.
BA in Accounting from Shanxi College of Finance and Economics Law and holds an MA in Accounting from the Research Institute for Fiscal Science of the Ministry of Finance. Obtained the Chinese Certified Public Accountant qualification from the Chinese Institute of Certified Public Accountants.
21
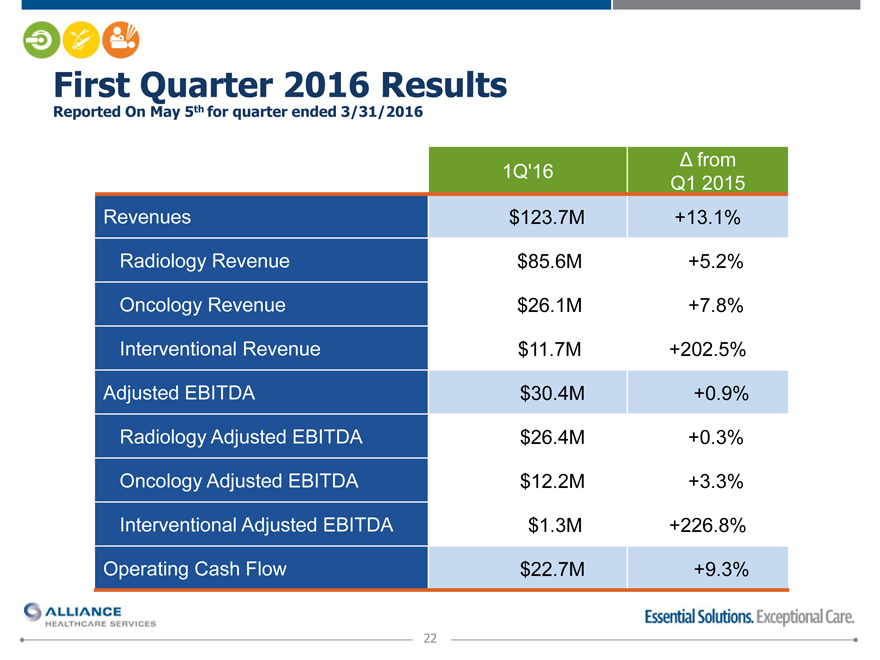
First Quarter 2016 Results
Reported On May 5th for quarter ended 3/31/2016
? from
1Q’16 Q1 2015
Revenues $123.7M +13.1%
Radiology Revenue $85.6M +5.2%
Oncology Revenue $26.1M +7.8%
Interventional Revenue $11.7M +202.5%
Adjusted EBITDA $30.4M +0.9%
Radiology Adjusted EBITDA $26.4M +0.3%
Oncology Adjusted EBITDA $12.2M +3.3%
Interventional Adjusted EBITDA $1.3M +226.8%
Operating Cash Flow $22.7M +9.3%
22
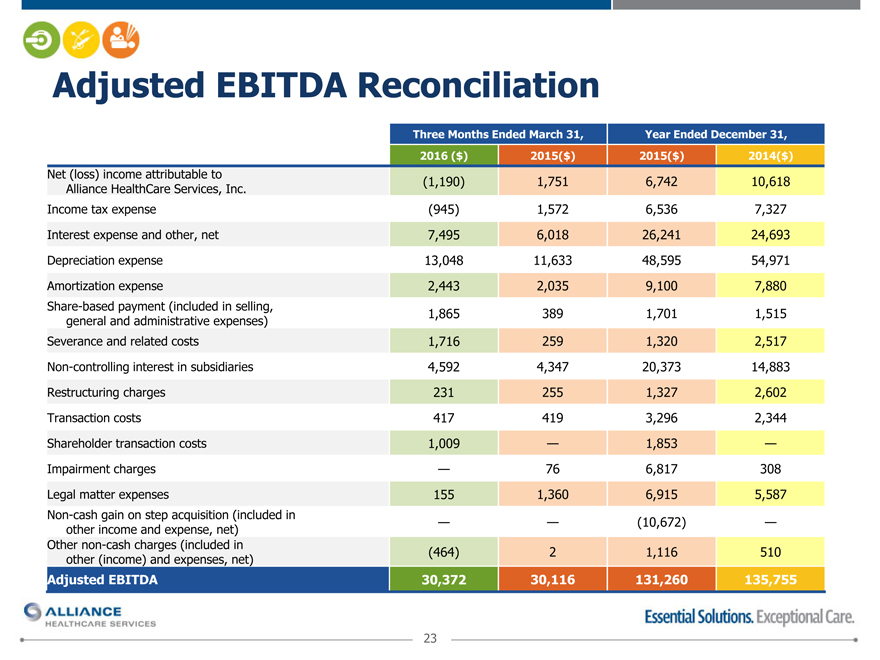
Adjusted EBITDA Reconciliation
Three Months Ended March 31, Year Ended December 31,
2016 ($) 2015($) 2015($) 2014($)
Net (loss) income attributable to
Alliance HealthCare Services, Inc. (1,190) 1,751 6,742 10,618
Income tax expense (945) 1,572 6,536 7,327
Interest expense and other, net 7,495 6,018 26,241 24,693
Depreciation expense 13,048 11,633 48,595 54,971
Amortization expense 2,443 2,035 9,100 7,880
Share-based payment (included in selling, 1,865 389 1,701 1,515
general and administrative expenses)
Severance and related costs 1,716 259 1,320 2,517
Non-controlling interest in subsidiaries 4,592 4,347 20,373 14,883
Restructuring charges 231 255 1,327 2,602
Transaction costs 417 419 3,296 2,344
Shareholder transaction costs 1,009 — 1,853 —
Impairment charges — 76 6,817 308
Legal matter expenses 155 1,360 6,915 5,587
Non-cash gain on step acquisition (included in — — (10,672) —
other income and expense, net)
Other non-cash charges (included in (464) 2 1,116 510
other (income) and expenses, net)
Adjusted EBITDA 30,372 30,116 131,260 135,755
23
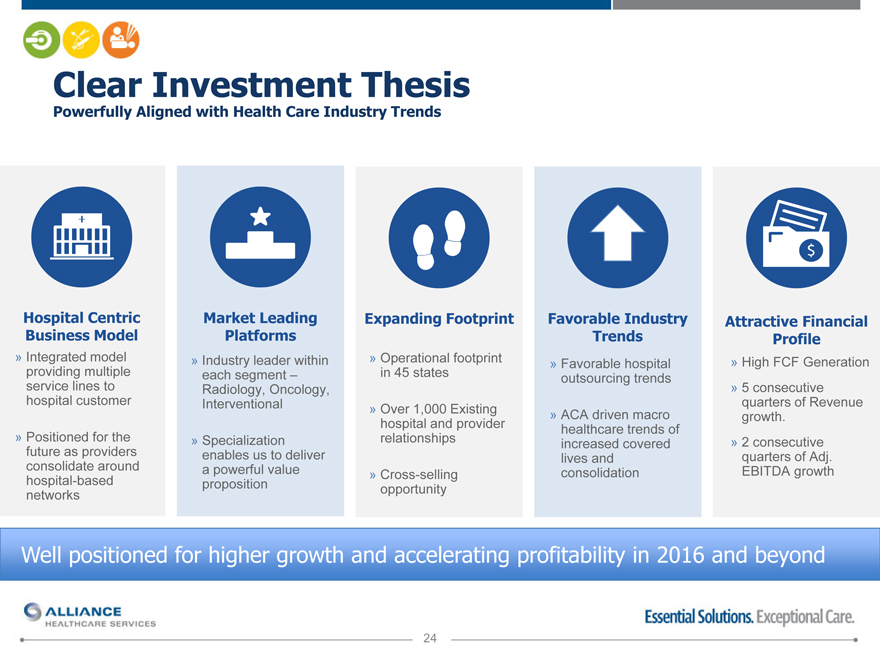
Clear Investment Thesis
Powerfully Aligned with Health Care Industry Trends
Hospital Centric Market Leading Expanding Footprint Favorable Industry Attractive Financial
Business Model Platforms Trends Profile
» Integrated model » Industry leader within » Operational footprint » Favorable hospital » High FCF Generation
providing multiple each segment – in 45 states outsourcing trends
service lines to Radiology, Oncology, » 5 consecutive
hospital customer Interventional » Over 1,000 Existing quarters of Revenue
» ACA driven macro growth.
hospital and provider healthcare trends of
» Positioned for the » Specialization relationships increased covered » 2 consecutive
future as providers enables us to deliver lives and quarters of Adj.
consolidate around a powerful value » Cross-selling consolidation EBITDA growth
hospital-based proposition opportunity
networks
24
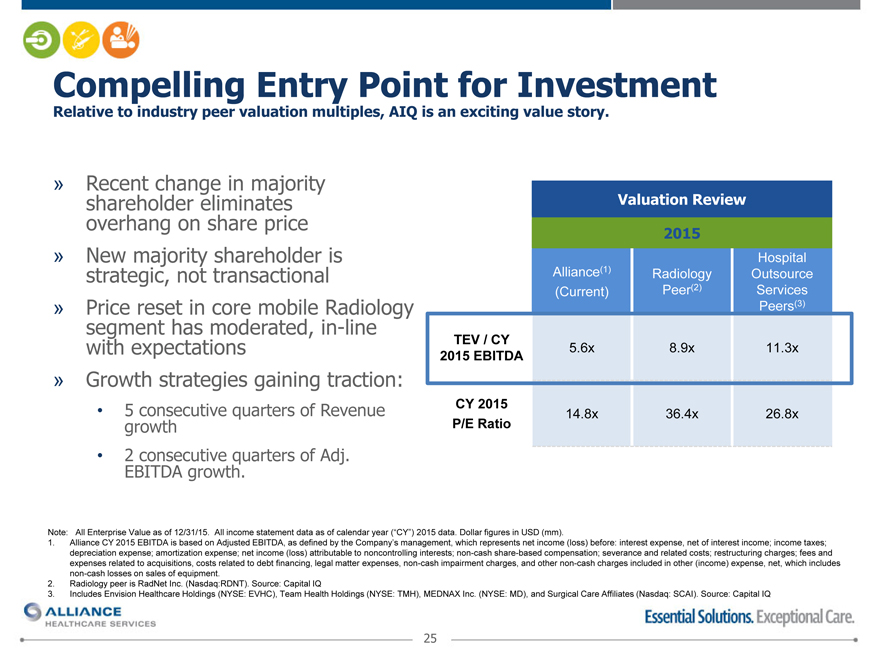
Compelling Entry Point for Investment
Relative to industry peer valuation multiples, AIQ is an exciting value story.
» Recent change in majority
shareholder eliminates Valuation Review
overhang on share price 2015
» New majority shareholder is Hospital
strategic, not transactional Alliance(1) Radiology Outsource
(Current) Peer(2) Services
» Price reset in core mobile Radiology Peers(3)
segment has moderated, in-line
with expectations TEV / CY 5.6x 8.9x 11.3x
2015 EBITDA
» Growth strategies gaining traction:
CY 2015
5 consecutive quarters of Revenue 14.8x 36.4x 26.8x
growth P/E Ratio
2 consecutive quarters of Adj.
EBITDA growth.
Note: All Enterprise Value as of 12/31/15. All income statement data as of calendar year (“CY”) 2015 data. Dollar figures in USD (mm).
1. Alliance CY 2015 EBITDA is based on Adjusted EBITDA, as defined by the Company’s management, which represents net income (loss) before: interest expense, net of interest income; income taxes;
depreciation expense; amortization expense; net income (loss) attributable to noncontrolling interests; non-cash share-based compensation; severance and related costs; restructuring charges; fees and
expenses related to acquisitions, costs related to debt financing, legal matter expenses, non-cash impairment charges, and other non-cash charges included in other (income) expense, net, which includes
non-cash losses on sales of equipment.
2. Radiology peer is RadNet Inc. (Nasdaq:RDNT). Source: Capital IQ
3. Includes Envision Healthcare Holdings (NYSE: EVHC), Team Health Holdings (NYSE: TMH), MEDNAX Inc. (NYSE: MD), and Surgical Care Affiliates (Nasdaq: SCAI). Source: Capital IQ
25
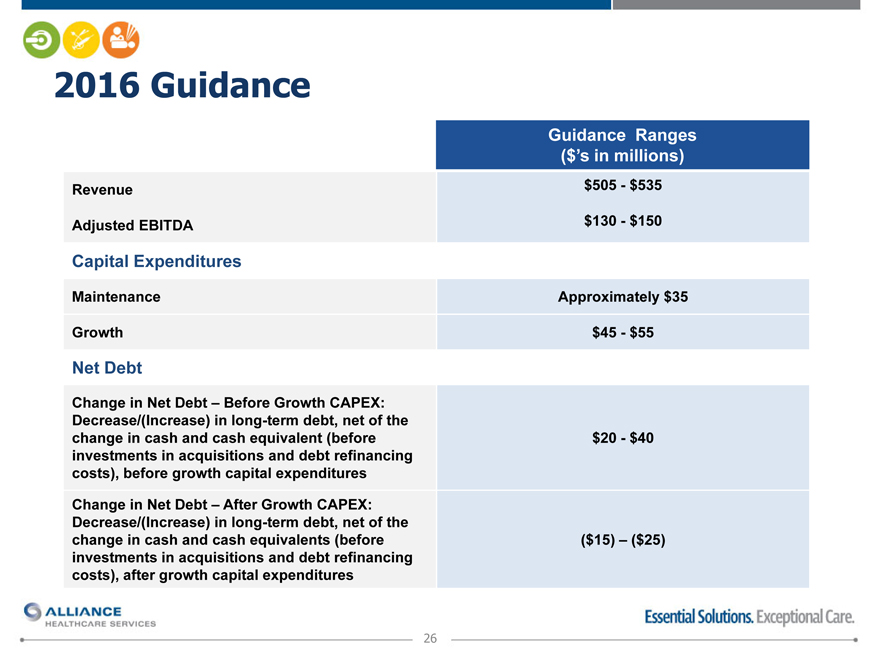
2016 Guidance
Guidance Ranges
($’s in millions)
Revenue $505—$535
Adjusted EBITDA $130—$150
Capital Expenditures
Maintenance Approximately $35
Growth $45—$55
Net Debt
Change in Net Debt – Before Growth CAPEX:
Decrease/(Increase) in long-term debt, net of the
change in cash and cash equivalent (before $20—$40
investments in acquisitions and debt refinancing
costs), before growth capital expenditures
Change in Net Debt – After Growth CAPEX:
Decrease/(Increase) in long-term debt, net of the
change in cash and cash equivalents (before ($15) – ($25)
investments in acquisitions and debt refinancing
costs), after growth capital expenditures
26
Thank You
www.alliancehealthcareservices-us.com