UNITED STATES
SECURITIES AND EXCHANGE COMMISSION
Washington, D.C. 20549
FORM 10-K
(Mark One)
| | þ | ANNUAL REPORT PURSUANT TO SECTION 13 OR 15(D) OF THE SECURITIES EXCHANGE ACT OF 1934 |
For the fiscal year ended December 31, 2009
OR
| | ¨ | TRANSITION REPORT PURSUANT TO SECTION 13 OR 15(D) OF THE SECURITIES EXCHANGE ACT OF 1934 |
Commission file number 814-00149

AMERICAN CAPITAL, LTD.
| | |
| Delaware | | 52-1451377 |
(State or Other Jurisdiction of Incorporation or Organization) | | (I.R.S. Employer Identification No.) |
2 Bethesda Metro Center
14th Floor
Bethesda, Maryland 20814
(Address of principal executive offices)
(301) 951-6122
(Registrant’s telephone number, including area code)
Securities registered pursuant to Section 12(b) of the Act:
| | |
| Title of each class | | Name of each exchange on which registered |
| Common Stock, $0.01 par value per share | | The NASDAQ Stock Market LLC |
| | (NASDAQ Global Select Market) |
Securities registered pursuant to section 12(g) of the Act: NONE
Indicate by check mark if the registrant is a well-known seasoned issuer, as defined in Rule 405 of the Securities Act. Yes ¨. No þ.
Indicate by check mark if the registrant is not required to file reports pursuant to Section 13 or 15(d) of the Act. Yes ¨. No þ.
Indicate by check mark whether the registrant (1) has filed all reports to be filed by Section 13 or 15(d) of the Securities Exchange Act of 1934 during the preceding 12 months (or for such shorter earlier period that the registrant was required to file such reports), and (2) has been subject to such filing requirements for the past 90 days. Yes þ. No ¨.
Indicate by check mark whether the registrant has submitted electronically and posted on its corporate Web site, if any, every Interactive Data File required to be submitted and posted pursuant to Rule 405 of Regulation S-T (§232.405 of this chapter) during the preceding 12 months (or for such shorter period that the registrant was required to submit and post such files). Yes ¨ No ¨
Indicate by check mark if disclosure of delinquent filers pursuant to Item 405 of Regulation S-K is not contained herein, and will not be contained, to the best of registrant’s knowledge, in definitive proxy or information statements incorporated by reference in Part III of this Form 10-K or any amendment to this Form 10-K. ¨
Indicate by check mark whether the registrant is a large accelerated filer, an accelerated filer, a non-accelerated filer, or a smaller reporting company. See definition of “large accelerated filer,” “accelerated filer” and “smaller reporting company” in Rule 12b-2 of the Act.
| | |
Large accelerated filer þ | | Accelerated filer ¨ |
Non-accelerated filer ¨ (Do not check if a smaller reporting company) | | Smaller Reporting Company ¨ |
Indicate by check mark whether the registrant is a shell company (as defined in Rule 12b-2 of the Exchange Act). Yes ¨ No. þ
As of June 30, 2009, the aggregate market value of the Registrant’s common stock held by non-affiliates of the Registrant was approximately $682 million based upon a closing price of the Registrant’s common stock of $3.21 per share as reported on The NASDAQ Global Select Market on that date. (For this computation, the registrant has excluded the market value of all shares of its common stock reported as beneficially owned by executive officers and directors of the registrant and certain other shareholders; such an exclusion shall not be deemed to constitute an admission that any such person is an “affiliate” of the registrant.)
As of February 1, 2010, there were 281,153,012 shares of the Registrant’s common stock outstanding.
DOCUMENTS INCORPORATED BY REFERENCE. The Registrant’s definitive proxy statement for the 2010 Annual Meeting of Stockholders is incorporated by reference into certain sections of Part III herein.
Certain exhibits previously filed with the Securities and Exchange Commission are incorporated by reference into Part IV of this report.
AMERICAN CAPITAL, LTD.
TABLE OF CONTENTS
2
PART I
Item 1.Business
General
American Capital, Ltd. (formerly known as American Capital Strategies, Ltd, and is referred to throughout this report as “American Capital”, “we” and “us”) is a publicly traded private equity firm and global asset manager. We invest in private equity, private debt, private real estate investments, early and late stage technology investments, special situation investments, alternative asset funds managed by us and structured finance investments. These investments constitute, in part, what are considered alternative assets. We provide investors the opportunity to participate in the private equity and alternative asset management industry through an investment in our publicly traded stock.
On August 29, 1997, we completed an initial public offering (“IPO”) and became a non-diversified closed end investment company that has elected to be regulated as a business development company (“BDC”) under the Investment Company Act of 1940, as amended (“1940 Act”). As a BDC, we primarily invest in senior debt, subordinated debt and equity in the buyouts of private companies sponsored by us, the buyouts of private companies sponsored by other private equity firms and provide capital directly to early stage and mature private and small public companies. We refer to our investments in these companies as our private finance portfolio. We also invest in structured financial product investments (“Structured Products”) including commercial mortgage backed securities (“CMBS”), commercial collateralized loan obligation (“CLO”) securities and collateralized debt obligation (“CDO”) securities and invest in alternative asset funds managed by us. We are also an alternative asset manager with $12.7 billion of capital resources under management as of December 31, 2009, including $6.0 billion of third-party assets. Our third-party alternative asset fund management services are conducted through our wholly-owned portfolio company, American Capital, LLC. Our primary business objectives are to increase our taxable income, net realized earnings and net asset value (“NAV”) by making investments with attractive current yields and/or potential for equity appreciation and realized gains.
We also operate so as to qualify to be taxed as a regulated investment company (“RIC”) as defined in Subtitle A, Chapter 1, under Subchapter M of the Internal Revenue Code of 1986, as amended (the “Code”). As a RIC, we are not subject to federal income tax on the portion of our taxable income and capital gains we distribute to our shareholders.
In addition to managing American Capital’s assets and providing management services to portfolio companies of American Capital, we, through our ownership of American Capital, LLC, also manage the following alternative asset funds: European Capital Limited (“European Capital”), American Capital Agency Corp. (“AGNC”), American Capital Equity I, LLC (“ACE I”), American Capital Equity II, LP (“ACE II”), ACAS CLO 2007-1, Ltd. (“ACAS CLO-1”) and ACAS CRE CDO 2007-1, Ltd. (“ACAS CRE CDO”).
Significant Developments in our Business in 2009
Unsecured Debt Default and Restructuring Efforts
Since December 31, 2008, we have been in breach of financial covenants under our primary unsecured debt arrangements totaling $2.4 billion as of December 31, 2009. Through the course of 2009, we have had active discussions with the creditors under these arrangements to negotiate a comprehensive restructuring of our unsecured debt. In November 2009, we reached an agreement in principle with a steering committee of the lenders under our unsecured revolving credit facility (the “Credit Facility”) with respect to the material terms of a proposed restructuring of the Credit Facility (the “Restructuring”), which also required that our other primary unsecured debt arrangements be restructured on generally similar terms. Representatives of the holders of our private unsecured notes and public unsecured notes and their advisors participated with the bank steering committee in various parts of the negotiations. We subsequently entered into a lock up agreement with all of the lenders under the Credit Facility to further our efforts to restructure all of our primary unsecured debt
3
arrangements based on the proposed Restructuring. Under the current terms of the proposed Restructuring, the loans outstanding under the Credit Facility and our private unsecured notes and public unsecured notes would be exchanged for term debt secured by a pledge of substantially all of our unencumbered assets. Key terms of the proposed Restructuring include (i) an aggregate $450 million principal payment at closing, (ii) scheduled aggregate principal amortization of $250 million in 2010, $300 million in 2011, $350 million in 2012, and $300 million in 2013 with any remaining unpaid principal due at maturity on December 31, 2013, (iii) deferral through 2013 of up to $200 million in the aggregate of annual scheduled principal amortization, which is limited to $100 million in 2010, (iv) an interest rate of the greater of 2.00% or LIBOR, plus a spread based on the aggregate outstanding principal balance of (a) 9.50% if the outstanding obligations are greater than or equal to $1.7 billion, (b) 8.50% if the outstanding obligations are less than $1.7 billion but greater than or equal to $1.4 billion, (c) 6.50% if the outstanding obligations are less than $1.4 billion but greater than or equal to $1.0 billion, or (d) 5.50% if the outstanding obligations are less than $1.0 billion, (v) an additional interest spread of 0.50% each time that certain additional principal amortizations, which are greater than the scheduled principal amortizations noted above, are not met, (vi) an additional 1.00% if we defer any portion of the scheduled principal amortization due in 2010, and (vii) the payment of fees equal to 2.00% of the aggregate principal balance at closing, and 1.00% at both December 31, 2011 and 2012.
The proposed Restructuring contemplates that there will be a voluntary amendment and restatement of the Credit Facility and an exchange of the unsecured private notes and unsecured public notes for new securities (collectively, the “Exchange Transaction”). In the event that fewer than 100% of the lenders under our Credit Facility, fewer than 100% of the holders of our private unsecured notes and holders of less than 85% of the principal amount of our public unsecured notes agree to enter the Exchange Transaction, we intend to implement the proposed Restructuring by soliciting votes for a prepackaged reorganization under Title eleven of the United States Code (the “Plan”) and commence a voluntary reorganization case under Title eleven of the United States Code (a “Restructuring Case”). We plan to commence the Exchange Transaction and solicitation of votes for the Plan simultaneously in March 2010.
The lock up agreement generally requires all of the lenders under the Credit Facility to agree to the proposed Restructuring assuming specified conditions are met. However, the lock up agreement may be terminated if various stages of the proposed Restructuring are not completed by certain dates. These deadlines were extended twice in January 2010. Currently, the lock up agreement may be terminated (i) upon consummation of the Exchange Transaction and the effective date of the Plan or a written agreement to terminate the lock up agreement, (ii) if the Exchange Transaction is not consummated in accordance with the proposed Restructuring and we have not commenced a Restructuring Case by March 15, 2010 (unless the administrative agent under the Credit Facility agrees to an extension of not later than March 31, 2010) or (iii) if we commence a Restructuring Case and (1) any material order is entered that is inconsistent with the lock up agreement or the proposed Restructuring, which is objected to by a majority of the lenders, (2) an order finding that the solicitation complying with applicable law and confirming the Plan has not been entered on or before May 15, 2010 (unless the administrative agent under the Credit Facility agrees to an extension of not later than May 31, 2010) or (3) the Plan is not consummated by May 31, 2010, or the Restructuring Case is dismissed or converted to a case under Chapter seven of Title eleven of the United States Code (the “Accelerated Case”) or a trustee or examiner shall have been appointed in the Restructuring Case. In addition, either party may terminate the lock up agreement upon a breach of material obligations by the other party. Because we have not launched the Exchange Transaction as of the date of this filing and the tender offer rules under the Securities Exchange Act of 1934, as amended, require that such offers generally remain open for 20 business days, it is likely that we will be unable to complete the Exchange Transaction by the above deadlines. We may seek an amendment to the lock up agreement to further extend the deadlines for consummating the Exchange Transaction or we may proceed with the proposed Restructuring without a lock up agreement with the lenders under the Credit Facility. We do not have a lock up agreement with our other unsecured creditors. As noted above, if the requisite lenders and noteholders do not agree to the Exchange Transaction, we intend to implement the proposed Restructuring by soliciting votes for a Plan. We expect that we will ultimately be successful in completing the proposed Restructuring.
4
Portfolio Liquidity through Realizations
As part of our overall debt restructuring efforts, we developed a plan at the beginning of 2009 to reduce the risk within our capital structure by delevering our balance sheet. To further those efforts during 2009, we evaluated each of our portfolio investments to determine if a current sale would yield attractive investment returns. As a result, we proactively exited select investments, realizing $1.1 billion of cash proceeds from exits during 2009 through the sale or repayment of debt and equity investments. We exited both performing and non-performing assets during 2009 at approximately fair value, evidenced by the realized proceeds from fully exited investments being within 1% of the prior quarter’s valuation. To the extent that any realized proceeds were not required to pay down principal balances in our asset securitizations or to fund our ongoing operations, including providing capital to our existing portfolio investments to maintain or improve those investments, we held the cash proceeds in anticipation of completing a restructuring of our debt obligations in 2010. Our cash and cash equivalents increased $626 million during the year to an ending balance of $835 million as of December 31, 2009.
Strategic Restructurings
To better align our organization and cost structure with current economic conditions, we performed strategic reviews of our business in 2009 and 2008 which resulted in the closing of several offices and the elimination of certain functions at other offices. During 2009, we recorded an aggregate restructuring charge of $25 million, including $9 million for severance and related costs associated with 72 employees and $16 million of costs related to excess facilities. During 2008, we recorded an aggregate restructuring charge of $19 million, including $10 million for severance and related costs associated with 160 employees and $9 million of costs related to excess facilities. In total, our restructuring efforts and attrition have decreased our employee headcount by more than 380 employees, or 55%, and we have reduced our number of offices by 50% since the peak in the first quarter of 2008.
Acquisition of European Capital
On November 10, 2008, American Capital and European Capital entered into an implementation agreement regarding our proposal to acquire all of the ordinary shares of European Capital held by other investors, representing 32.3% of European Capital’s outstanding ordinary shares, by means of a “scheme of arrangement” under Guernsey company law. Under the terms of the agreement, each European Capital shareholder other than us would receive 0.333 shares of our common stock for every one ordinary share that they owned of European Capital. On February 19, 2009, our shareholders approved a proposal authorizing us to sell shares of our common stock below NAV per share in certain instances, including in connection with the proposed acquisition of European Capital. On March 19, 2009, the proposed transaction was approved by a special majority of the shareholders of European Capital, not including us. The acquisition became effective as of March 26, 2009, following approval of the Royal Court of Guernsey. In connection with the transaction, we issued 11.5 million shares of our common stock with a value of $25 million as of March 26, 2009 in exchange for the outstanding European Capital ordinary shares. As of December 31, 2009, our investment in European Capital had a fair value of $269 million.
American Capital Investment Portfolio
We provide investment capital to middle market companies, which we generally consider to be companies with sales between $10 million and $750 million. We primarily invest in senior debt, subordinated debt and equity in the buyouts of private companies sponsored by us, the buyouts of private companies sponsored by other private equity firms and provide capital directly to early stage and mature private and small public companies. Currently, we will invest up to $100 million in a single middle market transaction in North America. We also invest in Structured Products and alternative asset funds managed by us. For summary financial information by geographic area, see Note 4 to our consolidated financial statements in this Annual Report on Form 10-K.
5
Since our IPO through December 31, 2009, we invested committed capital of over $5.7 billion in equity securities and over $16.8 billion in debt securities of middle market companies and also invested $1.7 billion in Structured Products. We have had 282 exits and repayments of over $13.1 billion of our originally invested committed capital, representing 54% of our total capital committed since our IPO, earning a 14% compounded annual return on these investments, including the interest, dividends, fees and net realized gains over the life of the investments. We have earned a 29% compounded annual return on the exit of our equity securities, including dividends, fees and net realized gains. Since our IPO through December 31, 2009, we have realized $1.4 billion in gross portfolio realized gains and $1.6 billion in gross portfolio realized losses resulting in $170 million in cumulative portfolio net realized losses, excluding net gains and losses attributable to interest rate swap agreements, foreign currency and taxes on net realized gains.
As of December 31, 2009, we had investments in 187 portfolio companies with an average investment size, at fair value, of $30 million, or 0.4% of total assets. As of December 31, 2009, our ten largest investments at fair value were as follows (in millions):
| | | | | |
Company | | Industry | | Fair Value |
Mirion Technologies | | Electrical Equipment | | $ | 322 |
European Capital | | Diversified Financial Services | | | 269 |
WIS Holding Company, Inc. | | Commercial Services & Supplies | | | 276 |
SMG Holdings, Inc. | | Hotels, Restaurants & Leisure | | | 236 |
Affordable Care Holding Corp. | | Health Care Providers & Services | | | 186 |
Orchard Brands Corporation | | Internet & Catalog Retail | | | 172 |
WRH, Inc. | | Life Sciences Tools & Services | | | 170 |
RDR Holdings, Inc. | | Household Durables | | | 155 |
SPL Acquisition Corp. | | Pharmaceuticals | | | 141 |
CIBT Travel Solutions, Inc | | Commercial Services & Supplies | | | 136 |
| | | | | |
Total | | | | $ | 2,063 |
| | | | | |
Business
Private Finance Investments Overview
Historically, a majority of our investment financings have been to assist in the funding of change of control management buyouts of privately held middle market companies, and we expect that trend to continue. A change of control transaction could be the result of a sale of a portfolio company by another private equity firm, a corporate divestiture, a sale of a family-owned or closely-held business, a going private transaction or an ownership transition. Our financing of a change of control management buyout could either be for a buyout sponsored by us or for a buyout sponsored by another private equity firm. As an investor in the buyouts of other private equity firms, we support other private equity sponsors with subordinated debt, senior debt and minority equity investments in order to allow them to leverage their capital base. Since our IPO, we have partnered with approximately 150 equity sponsors. We expect that in the future a majority of any investments in new portfolio companies would be to provide senior and subordinated debt to portfolio companies of other private equity firms and that equity for buyouts sponsored by us in new portfolio companies will be done through funds that we manage.
Our loans typically range from $5 million to $100 million, mature in five to ten years, and require monthly or quarterly interest payments at fixed rates or variable rates generally based on LIBOR, plus a margin. We price our debt and equity investments based on our analysis of each transaction. As of December 31, 2009, the weighted average effective interest rate on our private finance debt investments was 9.9%, which includes the impact of non-accruing loans. As of December 31, 2009, we had a fully-diluted weighted average ownership interest of 45% in our private finance portfolio companies with a total equity investment at fair value of over $1.6 billion.
6
Our private finance portfolio investments consist of loans and equity securities primarily to privately-held middle market companies. There is generally no publicly available information about these companies and a primary or secondary market for the trading of these privately issued loans and equity securities generally does not exist. These investments have been historically exited through normal repayment or a change in control transaction such as a sale or recapitalization of the portfolio company. The opportunity to be repaid or exit our investments may occur if a portfolio company repays our loans out of cash flows, refinances our loans, is sold in a change of control transaction, or sells its equity in a public offering, or if we exercise any put rights or sell our privately-held debt or equity investments in a secondary market. As a public company, we can invest with a long-term horizon compared to a limited partnership, which typically has a finite life and must sell investments in order to return capital to investors in a short time horizon.
Our ability to fund the entire capital structure is a competitive advantage in completing many middle market transactions. We often sponsor One-Stop Buyouts™ in which we provide most, if not all, of the senior debt, subordinated debt and equity financing in the transaction. We may initially fund all of the senior debt at closing and syndicate it to third-party lenders post closing. We have a loan syndications group that arranges to have all or part of the senior loans syndicated to third-party lenders. In the future, we expect that we will fund the equity for our One-Stop Buyouts™ from funds that we manage.
As a BDC, we are required by law to make significant managerial assistance available to most of our portfolio companies. Such assistance typically involves providing guidance and counsel concerning the management, operations and business objectives and policies of the portfolio company to its management and board of directors, including participating on the company’s board of directors. As of December 31, 2009, we had board seats at 78 out of 142 of our private finance and managed fund portfolio companies and had board observation rights on 22 of our remaining private finance portfolio companies. We also have an operations team, including ex-CEOs with significant turnaround and bankruptcy experience, which provides intensive operational and managerial assistance. Providing assistance to our portfolio companies serves as an opportunity for us to maximize their value.
Structured Product Investments
Our Structured Product investments are generally in non-investment grade tranches, which means that major rating agencies rate them below the top four investment-grade rating categories (i.e., “AAA” through “BBB”). Non-investment grade tranches have a higher risk of loss but are expected to provide a higher yield than investment grade securities. We may also make select investments in investment grade tranches if the expected returns meet our overall portfolio targeted returns. We invest in Structured Products with the intention of holding them until maturity. An active market for most of the non-investment grade tranches of Structured Products in which we invest generally does not exist.
Our investments in CMBS bonds are secured by diverse pools of commercial mortgage loans. We also have an investment in ACAS CRE CDO, which is a commercial real estate CDO secured by CMBS bonds. Since our IPO through December 31, 2009, we have made $1.3 billion of investments in CMBS bonds. As of December 31, 2009, our total investment in CMBS bonds and ACAS CRE CDO was $645 million at cost and $52 million at fair value, or only 1% of our total investments. Since we invested in the CMBS bonds, the overall commercial real estate market has experienced a significant decline in value. The current macroeconomic factors have resulted in a higher rate of default and likely higher future loss rate of the loan collateral compared to what we originally expected when we underwrote the investments. We do not expect to make significant new investments in CMBS in the near future.
Our investments in CLO securities are generally secured by diverse pools of commercial corporate loans and have minimal exposure to residential mortgage loans. Our investments are in 26 CLO funds managed by 19 separate portfolio managers. We also have investments in CDO securities that are generally secured by diverse pools of bonds of other securitizations including commercial loans, CMBS and residential mortgage backed
7
securities. Certain of our commercial CLO investments are in a joint venture portfolio company. Since our IPO through December 31, 2009, we have made $308 million of investments in commercial CLO and CDO securities. As of December 31, 2009, our investment in commercial CLO and CDO securities was $248 million at cost and $115 million at fair value, or only 2% of our total investments. Our investments in these securities have generally performed in accordance with our original underwriting assumptions.
Lending and Investment Decision Criteria
We review certain criteria in order to make investment decisions. The list below represents a general overview of the criteria we use in making our lending and investment decisions. Not all criteria are required to be favorable in order for us to make an investment. Add-on investments for growth, acquisitions or recapitalizations are based on the same general criteria. Add-on investments in distressed situations are based on the same general criteria, but are also evaluated on the potential to preserve prior investments.
Operating History. We generally focus on middle market companies that have been in business over ten years and have an attractive operating history, including generating positive cash flow. We generally target companies with significant market share in their products or services relative to their competitors. In addition, we consider factors such as customer concentration, performance during recessionary periods, competitive environment and ability to sustain margins. As of December 31, 2009, our current private finance portfolio companies had an average age of 32 years with 2009 average sales of $159 million and 2009 average adjusted earnings before interest, taxes, depreciation and amortization (“EBITDA”) of $32 million and an EBITDA margin of 20%.
Growth. We consider a target company’s ability to increase its cash flow. Anticipated growth is a key factor in determining the ability of the company to repay its debt and the value ascribed to any warrants and equity interests acquired by us.
Liquidation Value of Assets. Although we do not operate as an asset-based lender, liquidation value of the assets collateralizing our loans is a factor in many credit decisions. Emphasis is placed both on tangible assets such as accounts receivable, inventory, plant, property and equipment as well as intangible assets such as brand recognition, market reputation, customer lists, networks, databases and recurring revenue streams.
Experienced Management Team. We consider the quality of senior management to be extremely important to the long-term performance of most companies. Therefore, we consider it important that senior management be experienced and properly incentivized through meaningful ownership interest in the company.
Exit Strategy. Almost all of our investments consist of securities acquired directly from their issuers in private transactions. These securities are rarely traded in public markets, thus limiting their liquidity. Therefore, we consider it important that a prospective portfolio company have a number of methods by which our financing can be repaid and our equity investment sold or redeemed. These methods would typically include the sale or refinancing of the business or the ability to generate sufficient cash flow to repurchase our equity securities and repay our loans.
Structured Products Criteria.We receive extensive information from the issuer regarding the mortgage loans, commercial loans and other securities that are the underlying collateral for a CMBS, CLO or CDO pool. We underwrite the collateral securing our investment as appropriate.
8
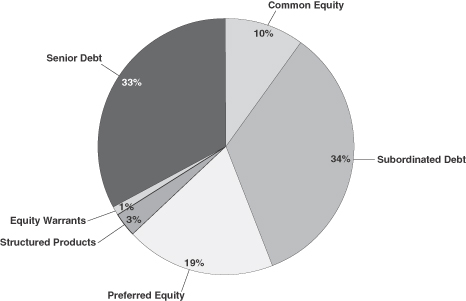
Portfolio Composition
We primarily invest in senior debt, subordinated debt, preferred and common equity and Structured Products. The composition summary of our investment portfolio as of December 31, 2009 at fair value as a percentage of total investments, excluding derivative agreements, is shown below:
We have a diversified investment portfolio and do not concentrate in any one or two industry sectors. We use the Global Industry Classification Standards for classifying the industry groupings of our portfolio companies. The following chart shows the portfolio composition by industry grouping at fair value as a percentage of total investments as of December 31, 2009. Our investments in derivative agreements, European Capital and CLO and CDO securities are excluded from the table below. Our investments in ACAS CRE CDO and CMBS are classified in the Real Estate and Real Estate Investment Trusts category.
9

Alternative Asset Management Business Overview
As of December 31, 2009, our assets under management totaled $12.5 billion, including $5.8 billion of assets under management in our alternative asset funds. Our third-party alternative asset management business is conducted through our wholly-owned portfolio company, American Capital, LLC. In general, wholly-owned subsidiaries of American Capital, LLC enter into management agreements with each of its managed alternative asset funds. The discussion of the operations of American Capital, LLC in this Annual Report on Form 10-K includes its wholly-owned consolidated subsidiaries.
American Capital, LLC had over 55 employees as of December 31, 2009, including seven investment teams with over 20 investment professionals located in three offices in Bethesda, London and Paris. We enter into service agreements with American Capital, LLC to provide asset management services. Through these agreements, we provide investment advisory and oversight services to American Capital, LLC as well as access to our employees, infrastructure, business relationships, management expertise and capital raising capabilities. We charge American Capital, LLC an asset management fee for the use of these services. American Capital, LLC generally earns base management fees based on the size of the managed alternative asset funds and may earn incentive income, or a carried interest, based on the performance of the alternative asset funds. In addition, we may invest directly into our alternative asset funds and earn investment income from our investments in those funds.
10
The following table sets forth certain information with respect to our alternative asset funds under management as of December 31, 2009.
| | | | | | | | | | | | | | |
| | | American Capital | | European Capital | | AGNC | | ACE I | | ACE II | | ACAS CLO-1 | | ACAS CRE CDO |
Fund type | | Public
Alternative
Asset Manager
& Fund | | Private Fund | | Public REIT Fund
- The NASDAQ
Global Market | | Private Fund | | Private Fund
| | Private Fund | | Private Fund |
Established | | 1986 | | 2005 | | 2008 | | 2006 | | 2007 | | 2006 | | 2007 |
Assets under management | | $6.7 Billion(1) | | $1.9 Billion(2) | | $4.6 Billion | | $0.6 Billion | | $0.2 Billion | | $0.4 Billion | | $0.0 Billion |
Investment types | | Senior &
Subordinated
Debt, Equity,
Structured
Products | | Senior & Subordinated
Debt, Equity,
Structured Products | | Agency Securities
| | Equity | | Equity | | Senior Debt | | CMBS |
Capital type | | Permanent | | Permanent | | Permanent | | Finite Life | | Finite Life | | Finite Life | | Finite Life |
| (1) | Includes our investment in third-party funds that we manage. |
| (2) | Excluded from our third-party funds under management as we own 100% of European Capital. |
European Capital invests in and sponsors management and employee buyouts, invests in private equity buyouts and provides capital directly to private and mid-sized public companies primarily in Europe. As of December 31, 2009, European Capital is a wholly-owned portfolio company of ours. American Capital, LLC receives an annual management fee equal to 2% of the weighted average monthly consolidated gross asset value of all the investments of European Capital, an incentive fee equal to 100% of the net earnings in excess of a return of 8% but less than a return of 10% and 20% of the net earnings thereafter. During 2009, the investment management agreement with European Capital was amended to reduce the annual management fee to 1.5% effective from July 1, 2009 to December 31, 2010.
AGNC is a publicly traded mortgage real estate investment trust, or REIT, that invests exclusively in residential mortgage pass-through securities and collateralized mortgage obligations on a leveraged basis. These investments consist of securities for which the principal and interest payments are guaranteed by U.S. Government-sponsored entities such as the Federal National Mortgage Association, or Fannie Mae, and the Federal Home Loan Mortgage Corporation, or Freddie Mac, or by a U.S. Government agency such as the Government National Mortgage Association, or Ginnie Mae. On May 20, 2008, AGNC successfully completed its IPO of ten million shares of common stock for proceeds, net of the underwriters’ discount and estimated expenses, of $186 million. In a private placement concurrent with the AGNC IPO, we purchased five million shares of AGNC common stock at the IPO price of $20.00 per share, for a purchase price of $100 million. AGNC’s net proceeds from the IPO and the concurrent private placement were $286 million. In July 2009, through a public secondary offering, we sold 2.5 million shares of our common stock that we purchased in the private placement. The shares are traded on The NASDAQ Global Select Market under the symbol “AGNC.” American Capital, LLC earns a base management fee of 1.25% of AGNC’s stockholders’ equity.
ACE I is a private equity fund established in 2006 with $1 billion of equity commitments from third-party investors. ACE I purchased 30% of our equity investments in 96 portfolio companies for an aggregate purchase price of $671 million. Also, ACE I co-invested with American Capital in an amount equal to 30% of equity investments made by American Capital between October 2006 and November 2007 until the $329 million remaining equity commitment was exhausted. In addition, 10%, or $100 million, of the $1 billion of equity commitments are recallable by American Capital, LLC for add-on investments with American Capital once they have been distributed to the third-party ACE I investors. As of December 31, 2009, there were $75 million of recallable distributions available for add-on investments. American Capital, LLC manages ACE I in exchange for a 2% base management fee on the net cost basis of ACE I’s assets and 10% to 30% of the net profits of ACE I, subject to certain hurdles.
ACE II is a private equity fund established in 2007 with $585 million of equity commitments from third-party investors. ACE II purchased 17% of our equity investments in 80 portfolio companies for an aggregate purchase price of $488 million.
11
The remaining $97 million commitments will be used to fund add-on investments in the 80 portfolio companies. In addition, 10%, or $59 million, of the $585 million of equity commitments are recallable by American Capital, LLC for add-on investments with American Capital once they have been distributed to the third-party ACE II investors. As of December 31, 2009, ACE II had $85 million and $59 million of unfunded equity commitments and recallable distributions outstanding, respectively. American Capital, LLC manages ACE II in exchange for a 2% base management fee on the net cost basis of ACE II’s assets and 10% to 30% of the net profits of ACE II, subject to certain hurdles.
In April 2007, ACAS CLO-1 completed a $400 million securitization that invests in broadly syndicated and middle market senior loans. We purchased 55% of the BB rated notes and 70% of the non-rated subordinated notes in ACAS CLO-1 for a total purchase price of $33 million. American Capital, LLC earns a base management fee of 0.68% of ACAS CLO-1’s assets and receives 20% of the net profits of ACAS CLO-1, subject to certain hurdles.
ACAS CRE CDO was established in 2007 as a commercial real estate collateralized debt obligation trust that holds investments in subordinated tranches of CMBS trusts. We own notes that were rated either investment grade or non-investment grade at origination and preferred shares of ACAS CRE CDO. American Capital, LLC serves as the collateral manager for ACAS CRE CDO in exchange for an annual senior management fee of 7.5 basis points and a subordinate management fee of 7.5 basis points.
Private Finance Deal Stream and Market Share
We have established an extensive referral network comprised of investment bankers, private equity firms, subordinated funds, trade organizations, commercial bankers, attorneys and business and financial brokers. We have developed an extensive proprietary database of reported middle market transactions. We have also developed an internet website that provides an efficient tool to businesses for learning about American Capital and our capabilities.
Institutional Approach to Investing
We have built an institution with a leading capability to originate, underwrite, finance, syndicate, monitor and exit investments that generate attractive returns. Our dedicated teams of investment professionals are the cornerstone of our institution. We have also created an extensive support structure that provides in-house due diligence, operational, legal and human resources support to our investment professionals and to our portfolio company, American Capital, LLC. The following are the key functional teams that execute our alternative asset management business including the internal management of American Capital and its portfolio.
Investment Teams: As of December 31, 2009, we had 25 Investment Teams with over 70 professionals located in our five offices in the United States. The Investment Teams originate, review and screen investment opportunities, conduct business, management and operations due diligence, prepare investment committee reports and models, make recommendations to the investment committee, execute investments, represent us on the boards of directors of portfolio companies, assist in monitoring and valuing of investments and manage acquisitions, divestures and exiting of investments. Our Investment Teams are organized so that each team focuses on a specific investment strategy. Our Investment Teams include:
| | • | | American Capital Buyout: A 20-person team that leads our American Capital One-Stop Buyouts™ of middle market companies including corporate divestitures, acquisitions of portfolio companies from private equity firms, acquisition of family-owned or closely held businesses, going private transactions and ownership transitions. They originate senior debt, subordinated debt and equity in American Capital controlled buyouts. |
| | • | | Sponsor Finance: A 14-person team that provides private equity sponsors with senior debt, subordinated debt and equity co-investments in support of their buyouts of middle market companies. In addition, they will also target investments directly to privately and publicly-held middle market companies. |
12
| | • | | Energy Investment: A 3-person team that leads our American Capital One-Stop Buyouts™, direct investments and sponsored finance investments in the entire chain of energy exploration, production and distribution, and services, manufacturing, power and utility services. They will also invest in alternative energy, including wind power, solar energy and biofuels. They originate senior debt, subordinated debt and equity investments. |
| | • | | Special Situations: A 5-person team that leads our American Capital One-Stop Buyouts™, direct investments and sponsored finance investments in distressed companies, companies undergoing turnarounds, bankruptcy auctions, debtor-in-possession, exit financing and other special situations in middle market companies. They originate senior debt, subordinated debt and equity investments. |
| | • | | Technology Investment: A 3-person team leads our American Capital One-Stop Buyouts™, direct investments and sponsored finance investments in early, middle and late stage technology companies. They will invest in various technology sectors including networking, software, communications, enterprise data, new media, consumer technologies and industrial technology. They originate senior debt, subordinated debt and equity investments. |
| | • | | Commercial Mortgage Asset Management: A 5-person team that invests in commercial mortgages and related assets directly or by investing in debt and equity tranches of CMBS and CRE CDOs. The team also participates in underwriting, due diligence and financing of real estate owned by our portfolio companies. |
| | • | | Collateralized Loan Obligation: A 6-person team that invests in and manages senior loan collateral for third-party investors through structured finance products such as a CLO. The team sources middle market senior loans originated through our various Investment Teams and also by purchasing rated, broadly syndicated senior debt. They also invest in non-rated tranches of CLOs and CDOs managed by other third-party fund managers. |
Operations Team: A 19-person team with expertise in manufacturing services, consumer products, financial services, energy services, supply chain management, outsourcing and technology. The Operations Team is led by a managing director and includes seasoned former presidents, CEOs (7), COOs (2), CFOs (2) and supply chain and outsourcing specialists (4). The Operations Team conducts operational due diligence on prospective portfolio companies and reports and makes recommendations to our investment committee. The team will also assist portfolio companies post close with operational improvement plans. If we have a portfolio company that is underperforming, the Operations Team will work closely with the portfolio company to improve performance by providing interim leadership at the portfolio company and to identify business actions to help improve performance. The team will provide hands-on assistance to reduce costs, systemize sales and marketing, develop and align business plans, grow the business and strengthen management talent at the portfolio company.
Investment Committee Support Team: A 5-person team that assists our investment committee (the “Investment Committee”) in establishing procedures and controls, establishing due diligence protocol and working with Investment Teams to establish due diligence plans for each prospective investment, developing standard investment committee reports and models, organizing investment committee meetings, monitoring and reporting investment committee results and tracking subsequent developments.
Financial Accounting and Compliance Team (“FACT”): A 32-person team of certified public accountants, chartered accountants and valuation and audit professionals. FACT is responsible for providing pre- and post-investment financial due diligence, portfolio monitoring and quarterly valuations of portfolio assets. FACT assists our Investment Teams in conducting extensive financial, accounting, tax and information technology due diligence of each target investment company, which includes one or more on-site visits, a review of the portfolio company’s historical and prospective financial information, and identifying and confirming pro forma financial adjustments. FACT also monitors the existing portfolio investments by gathering, inputting into an automated database, analyzing and regularly reviewing monthly financial information and other materials to assess financial performance as well as to ensure compliance with loan covenants. Also, FACT, with the assistance of our Investment Teams and subject to the oversight of senior management and the Audit and Compliance Committee, prepares a quarterly valuation of each portfolio company investment.
13
Syndications Team: A 4-person team that is responsible for arranging syndications of all or part of the senior debt of our portfolio companies either at closing or subsequent to the closing of a senior financing transaction. They perform a variety of functions relating to the marketing and completing of such transactions.
Capital Markets, Finance and Treasury Team: A 27-person team that is responsible for raising equity and debt capital, investor relations, financial budgeting and forecasting and daily liquidity and cash management. Through its debt capital raising activities, the team is responsible for structuring, selling and administering on-balance sheet term debt securitizations of debt investments, unsecured bonds and various other revolving facilities and term debt facilities for American Capital and its alternative asset funds under management. Through its equity capital raising activities, the team is responsible for structuring and selling equity for American Capital and our public and private funds. The team is also responsible for monitoring and reporting on capital market conditions and researching, developing and raising private and public capital for new third-party funds for our alternative asset management business. The team is also responsible for arranging syndications of all or part of the equity of our portfolio companies either at closing or subsequent to the closing of an equity financing transaction.
Accounting and Reporting Team: A 39-person team that is responsible for the accounting of our financial results as well as that of our managed funds, including financial reporting and communications to our shareholders, partners and regulatory bodies. Among its tasks are preparing financial statements, investment accounting, analysis of investment performance, loan servicing, billing, accounts receivable and payable, tax compliance, external audit coordination and developing and monitoring our internal controls.
Legal and Compliance Team: A 24-person team that provides legal support on corporate, capital raising and investing matters, is involved in regular reporting and special communications with our shareholder and regulatory bodies and manages the outside law firms that provide transactional, litigation and regulatory services to us. In addition, as required by the SEC, we have appointed a Chief Compliance Officer, who is responsible for administering our code of ethics and conduct and our legal compliance activities.
Internal Audit Team: A 3-person team that reports directly to the Audit and Compliance Committee of our Board of Directors. The team performs operational audits and tests our internal controls over financial reporting to assist management’s assessment of the effectiveness of our internal controls over financial reporting under the Sarbanes-Oxley Act of 2002.
Human Resources Team: An 8-person team that assists in recruiting, hiring, reviewing and establishing and administering compensation programs for our employees. In addition, the team is available to the Investment Teams and the Operations Team to assist with executive management and other human resources issues at portfolio companies.
Information Technology Team: A 20-person team that assists all departments in researching, developing, implementing and maintaining communication and technological resources for our multi-office operations including highly specialized systems for the input, processing and reporting of data.
Investment Process
Investment Sourcing and Screening: We have a multi-disciplined approach to reach diverse channels of deal sources. Our Investment Teams target a referral network comprised of investment bankers, private equity firms, subordinated funds, trade organizations, commercial bankers, attorneys and business and financial brokers. We developed and maintain a proprietary industry-wide database of reported middle market transactions, which enables us to monitor and evaluate the middle market investing environment. This database is used to help us assess whether we are penetrating our target markets and to track terms and pricing. Our financial professionals review financing memorandums and private placement memorandums sourced from this referral network in search of potential buyout or financing opportunities. Our Investment Teams undertake a preliminary evaluation
14
and analysis of potential investment opportunities to determine whether or not they meet our criteria based upon the limited information received in these early stages of the investment process. For investment opportunities that pass an initial screen, our Investment Teams prepare an initial investment thesis and analysis that is presented to an internal Investment Committee, which includes representatives of our senior officers depending on the nature of the proposed investment, for approval to proceed further.
Due Diligence:In our private finance investments, our investment professionals along with our FACT and Operations Team conduct due diligence of each target company that passes the initial screening process. This includes one or more on-site visits, a review of the target company’s historical and prospective financial information, identifying and confirming pro-forma financial adjustments, interviews with and assessments of management, employees, customers and vendors, review of the adequacy of the target company’s systems, background investigations of senior management and research on the target company’s products, services and industry. We often engage professionals such as environmental consulting firms, accounting firms, law firms, risk management companies and management consulting firms with relevant industry expertise to perform elements of the due diligence.
In our Structured Products investments, we receive information regarding the mortgage loans, commercial loans and other securities that are the underlying collateral for a CMBS, CLO or CDO pool from the issuer and we underwrite the collateral securing our investment as appropriate.
Investment Approval: Upon completion of our due diligence, our Investment Teams, FACT and Operations Team as well as any consulting firms that we have engaged, prepare and present a report containing the due diligence information for review to our Investment Committee. Our Board of Directors has delegated authority to the Investment Committee to conduct the initial review and approval of our investments. Our Investment Committee generally must approve each investment. Investments exceeding a certain size or meeting certain other criteria must also be approved by our Board of Directors. Our Investment Committee is supported by a dedicated staff that focuses on the due diligence and other research done with regard to each proposed investment.
Documentation and Negotiations: Documentation for the legal agreements for a transaction is completed either by our in-house legal team or through the retention of outside legal counsel. We maintain custody of our investment securities and the original related investment documentation in custodial accounts with qualified banks and members of national securities exchanges in accordance with applicable regulatory and financing requirements.
Investment Funding:Prior to the release of any investment funds, our treasury department prepares a summary of the investment terms, the funding amounts approved by our Investment Committee and wiring instructions. Our treasury department performs various procedures to confirm any wiring instructions. A senior executive officer must approve this summary of terms and funding amounts prior to the disbursement of the funds.
Portfolio Monitoring: In addition to the due diligence at the time of the original investment decision, we seek to preserve and enhance the performance of our portfolio companies under management through our active involvement with the portfolio companies. As a BDC, we are required by law to make significant managerial assistance available to most of our portfolio companies. This generally includes providing guidance and counsel concerning the management, operations and business objectives and policies of the portfolio company to the portfolio company’s management and board of directors, including participating on the company’s board of directors. The respective FACT and Investment Teams regularly review each portfolio company’s monthly financial statements to assess performance and trends, periodically conduct on-site financial and operational reviews and evaluate industry and economic issues that may affect the portfolio company.
Investment Exits: We regularly evaluate each investment to determine the appropriate time to exit an investment. For investments that we control, we will typically sell the portfolio company through an auction process although an exit may also occur through an initial public offering or a privately negotiated transaction.
15
With the approval of our Investment Committee, our Investment Teams will typically engage an investment bank. If an offered sales price yields the desired return, our Investment Team would recommend the sale of the company to our Investment Committee for approval. For performing investments that we do not control, the exit typically occurs when the sponsor, or other party, in control of the portfolio company decides to recapitalize or sell the business. In both instances, our debt investment is typically paid in full and any equity investment would realize a value consistent with the controlling parties. For non-performing investments that we do not control, we may determine that based on the facts and circumstances relating to the investment, to accept an amount less than what we are legally owed with any such decision requiring approval by our Investment Committee.
Portfolio Valuation
FACT, with the assistance of our Investment Teams, and subject to the oversight of senior management and the Audit and Compliance Committee, prepares a quarterly valuation of each of our portfolio company investments. Our Board of Directors approves our portfolio valuations as required by the 1940 Act. In connection with our valuation process to determine the fair value of investments, we may work with third-party consultants to obtain assistance and advice as additional support in the preparation of our internal valuation analysis for our portfolio.
Competition
We compete with hundreds of private equity and subordinated funds and other financing sources, including traditional financial services companies such as finance companies, commercial banks, investment banks and other equity and non-equity based investment funds. Some of our competitors are substantially larger and have considerably greater financial resources than we do. Competitors may have a lower cost of funds and many have access to funding sources that are not available to us. In addition, certain of our competitors may have higher risk tolerances or different risk assessments, which could allow them to consider a wider variety of investments and establish more relationships and build their market shares. There is no assurance that the competitive pressures we face will not have a material adverse effect on our business, financial condition and results of operations. In addition, as a result of this competition, we may not be able to take advantage of attractive investment opportunities from time to time and there can be no assurance that we will be able to identify and make investments that satisfy our investment objectives or that we will be able to meet our investment goals.
Corporate Information
Our executive offices are located at 2 Bethesda Metro Center, 14th Floor, Bethesda, Maryland 20814 and our telephone number is (301) 951-6122. In addition to our executive offices, we, or our portfolio company American Capital, LLC, maintain offices in New York, Chicago, Dallas, Boston, London, Paris and Hong Kong.
We make available all of our annual reports on Form 10-K, quarterly reports on Form 10-Q, current reports on Form 8-K and amendments to such reports free of charge on our internet website atwww.americancapital.com as soon as reasonably practical after such material is electronically filed with or furnished to the Securities and Exchange Commission (“SEC”). These reports are also available on the SEC’s internet website atwww.sec.gov. The public may also read and copy paper filings that we have made with the SEC at the SEC’s Public Reference Room, located at 100 F Street, NE, Washington, D.C. 20549. Information on the operation of the Public Reference Room may be obtained by calling (800) SEC-0330.
Employees
As of December 31, 2009, we employed 264 full-time employees compared to 384 and 580 full-time employees as of December 31, 2008 and 2007, respectively. We believe that we have excellent relations with our employees.
16
Business Development Company Requirements
We are a closed-end, non-diversified, management investment company that has elected to be regulated as a BDC under the 1940 Act, and, as such, are subject to regulation under that act.
Qualifying Assets
As a BDC, we may not acquire any asset other than “qualifying assets”, as defined by the 1940 Act, unless, at the time the acquisition is made, the value of our qualifying assets represent at least 70% of the value of our total assets. The principal categories of qualifying assets relevant to our business include the following:
| | • | | securities purchased in transactions not involving any public offering from: |
| | a) | an issuer that (i) is organized and has its principal place of business in the United States, (ii) is neither an investment company other than a wholly-owned small business investment company nor an entity that would be an investment company but for certain statutory exemptions, and (iii) does not have any class of securities listed on a national securities exchange with a market capitalization in excess of $250 million; or |
| | b) | an issuer that satisfies the criteria set forth in clauses (a) (i) and (ii) above but not clause (a)(iii), so long as, at the time of purchase, we own at least 50% of (i) the greatest amount of equity securities of the issuer, including securities convertible into such securities and (ii) the greatest amount of certain debt securities of such issuer, held by us at any point in time during the period when such issuer was an eligible portfolio company, except that options, warrants, and similar securities which have by their terms expired and debt securities which have been converted, or repaid or prepaid in the ordinary course of business or incident to a public offering of securities of such issuer, shall not be considered to have been held by us, and we are one of the 20 largest holders of record of such issuer’s outstanding voting securities; |
| | • | | securities of an issuer described in clauses (a)(i) and (ii) above with respect to which we control (alone or together as a part of a group), we in fact exercise a controlling influence over such issuer’s management or policies and a person affiliated with us is on the issuer’s board of directors; |
| | • | | securities received in exchange for or distributed with respect to securities described above, or pursuant to the exercise of options, warrants or rights relating to such securities; and |
| | • | | cash, cash items, government securities, or high quality debt securities maturing in one year or less from the time of investment. |
Under the 1940 Act, we may not change the nature of our business so as to cease to be, or withdraw our election as, a BDC without consent of the holders of a majority of our outstanding voting securities. Since we made our BDC election, we have not made any substantial change in our structure or in the nature of our business.
To include certain securities above as qualifying assets for the purpose of the 70% test, a BDC must either control the issuer of the securities or offer to make significant managerial assistance available to the issuer of those securities, such as providing significant guidance and counsel concerning the management, operations, or business objectives and policies of a portfolio company or making loans to a portfolio company. We make significant managerial assistance available to each of our portfolio companies.
Leverage
The 1940 Act permits us, as a BDC, to issue senior debt securities and preferred stock (collectively, “Senior Securities”) in amounts such that our asset coverage is at least 200% after each issuance of Senior Securities. Asset coverage is defined in the 1940 Act as the ratio which the value of the total assets, less all liabilities and indebtedness not represented by Senior Securities, bears to the aggregate amount of Senior Securities
17
representing indebtedness. Such indebtedness may also be incurred for the purpose of effecting share repurchases. As a result, we are exposed to the risks of leverage. Although we have no current intention to do so, we have retained the right to issue preferred stock. As permitted by the 1940 Act, we may, in addition, borrow amounts up to 5% of our total assets for temporary purposes. As of December 31, 2009, our asset coverage was 156%. Accordingly, we are generally prohibited from issuing any additional Senior Securities until our asset coverage exceeds 200%.
Under the 1940 Act, if a BDC has any senior debt securities outstanding that were publicly issued, the BDC must make provision to prohibit the declaration of any dividend (except a dividend payable in the stock of the BDC) if its asset coverage is below certain thresholds at the time of the distribution after deducting the amount of such dividend. However, we have received guidance from the staff of the SEC that notwithstanding this provision of the 1940 Act, we are able to declare and pay dividends pursuant to the revenue procedure issued by the Internal Revenue Service (“IRS”). (See Item 1. Business—Regulated Investment Company Requirements)
Issuance of Stock
We are generally not able to issue and sell our common stock at a price below our NAV per share, exclusive of any distributing commission or discount. We may, however, sell our common stock at a price below the current NAV per share of our common stock, or sell warrants options or rights to acquire our common stock at a price below the current NAV per share of our common stock if our Board of Directors determines that such a sale is in our best interests and our shareholders approve our policy and practice of making such sales. In any such case, the price at which our securities are to be issued and sold may not be less than a price that, in the determination of our Board of Directors and the underwriters on an offering, closely approximates the market value of such securities (exclusive of any distributing commission or discount).
On February 19, 2009, our shareholders approved a proposal to authorize us to sell shares of our common stock at prices below the NAV per share in one or more offerings subject to certain limitations, including the prior approval of our Board of Directors. The authorization was effective for the twelve month period that expired on February 19, 2010 and the number of shares that could be issued below the NAV per share was limited to (i) the number of shares of our common stock issued for the acquisition of the ordinary shares of European Capital and (ii) a maximum of an additional 42.8 million shares of common stock, which was 20% of the number of shares outstanding as of the record date for shareholder vote of the proposal, subject to adjustment for shares issued following the occurrence of events such as stock splits, stock dividends, distributions and recapitalizations. As a result of the shareholder distribution on August 7, 2009, which consisted of $24 million in cash and 67 million shares of common stock, the number of shares of common stock that could be issued below NAV per share was increased to approximately 55.6 million shares. On February 12, 2010, our shareholders approved an additional proposal to authorize us to sell shares of our common stock at prices below the NAV per share in one or more offerings subject to certain limitations, including the prior approval of our Board of Directors. The authorization is effective for the twelve month period expiring on February 12, 2011 and the number of shares that may be issued below NAV per share is limited to 58.3 million shares of common stock, which was 20% of the number of shares outstanding as of the record date for shareholder vote of the proposal, subject to adjustment for shares issued following the occurrence of events such as stock splits, stock dividends, distributions and recapitalizations.
Regulated Investment Company Requirements
We operate so as to qualify as a RIC under Subchapter M of the Code. If we qualify as a RIC and annually distribute to our shareholders in a timely manner at least 90% of our investment company taxable ordinary income, we will not be subject to federal income tax on the portion of our taxable ordinary income and long-term capital gains we distribute to our shareholders. Taxable income generally differs from net income as defined by accounting principles generally accepted in the United States (“GAAP”) due to temporary and permanent timing differences in the recognition of income and expenses, returns of capital and net unrealized appreciation or depreciation of investments.
18
Generally, in order to maintain our status as a RIC, we must: a) continue to qualify as a BDC; b) distribute to our shareholders in a timely manner, at least 90% of our investment company taxable ordinary income, as defined by the Code; c) derive in each taxable year at least 90% of our gross investment company income from dividends, interest, payments with respect to securities loans, gains from the sale of stock or other securities or other income derived with respect to our business of investing in such stock or securities as defined by the Code; and d) meet investment diversification requirements. The diversification requirements generally require us at the end of each quarter of the taxable year to have (i) at least 50% of the value of our assets consist of cash, cash items, government securities, securities of other regulated investment companies and other securities if such other securities of any one issuer do not represent more than 5% of our assets and 10% of the outstanding voting securities of the issuer; and (ii) no more than 25% of the value of our assets invested in the securities of one issuer (other than U.S. government securities and securities of other RICs), or of two or more issuers that are controlled by us and are engaged in the same or similar or related trades or businesses.
If we fail to satisfy the 90% distribution requirement or otherwise fail to qualify as a RIC in any taxable year, we will be subject to tax in such year on all of our taxable income, regardless of whether we make any distribution to our shareholders. In addition, in that case, all of our distributions to our shareholders will be characterized as ordinary income (to the extent of our current and accumulated earnings and profits). We have distributed and currently intend to distribute sufficient dividends to eliminate our investment company taxable income.
On January 7, 2009, the IRS issued Revenue Procedure 2009-15, which temporarily allows a RIC to distribute its own stock as a dividend for the purpose of fulfilling its distribution requirements. Pursuant to this revenue procedure, a RIC may treat a distribution of its own stock as a dividend if (i) the stock is publicly traded on an established securities market, (ii) the distribution is declared with respect to a taxable year ending on or before December 31, 2009 and (iii) each shareholder may elect to receive his entire distribution in either cash or stock of the RIC subject to a limitation on the aggregate amount of cash to be distributed to all shareholders, which must be at least 10% of the aggregate declared distribution. If too many shareholders elect to receive cash, each shareholder electing to receive cash will receive a pro rata amount of cash (with the balance of the distribution paid in stock). In no event will any shareholder electing to receive cash receive less than 10% of his or her entire distribution in cash. On December 23, 2009, the IRS issued Revenue Procedure 2010-12, which extends under similar terms the temporary guidance provided by Revenue Procedure 2009-15. This new guidance applies to distributions by a RIC of its own stock declared by December 31, 2012 with respect to RIC distribution requirements for taxable years ending on or before December 31, 2011.
In addition, with respect to each calendar year, if we distribute or have treated as having distributed (including amounts retained but designated as deemed distributed) in a timely manner 98% of our capital gain income for each one-year period ending on October 31, and distribute 98% of our investment company ordinary income for such calendar year (as well as any ordinary income not distributed in prior years), we will not be subject to the 4% nondeductible federal excise tax imposed with respect to certain undistributed income of RICs. We may elect to not distribute all of our investment company taxable income and pay the excise tax on the undistributed amount. Any such undistributed income is carried over into the next year as taxable income subject to the minimum distribution requirements for that year.
Our wholly-owned consolidated subsidiary, American Capital Financial Services, Inc. (“ACFS”), is a corporation subject to corporate level federal, state or other local income tax.
19
Investment Objectives
Our primary business objectives are to increase our taxable income, net realized earnings and NAV by investing in senior debt, subordinated debt and equity securities of private companies, early and late stage technology companies, companies in special situations, alternative asset funds managed by us and Structured Products with attractive current yields and/or potential for equity appreciation and realized gains. Our investment objectives provide that:
| | • | | We will at all times conduct our business so as to retain our status as a BDC. In order to retain that status, we may not acquire any assets (other than non-investment assets necessary and appropriate to our operations as a BDC) if after giving effect to such acquisition the value of our qualifying assets amounts to less than 70% of the value of our total assets. For a summary definition of qualifying assets, see “Business Development Company Requirements.” We believe most of the securities we will acquire (provided that we control, or through our officers or other participants in the financing transaction, make significant managerial assistance available to the issuers of these securities), as well as temporary investments, will generally be qualifying assets. Securities of public companies with a market capitalization in excess of $250 million, on the other hand, are generally not qualifying assets unless they were acquired in a distribution, in exchange for or upon the exercise of a right relating to securities that were qualifying assets. |
| | • | | We may invest up to 100% of our assets in securities acquired directly from issuers in privately-negotiated transactions. With respect to such securities, we may, for the purpose of public resale, be deemed an “underwriter” as that term is defined in the Securities Act. We may invest up to 50% of our assets to acquire securities of issuers for the purpose of acquiring control (up to 100% of the voting securities) of such issuers. We will not concentrate our investments in any particular industry or group of industries. Therefore, we will not acquire any securities (except upon the exercise of a right related to previously acquired securities) if, as a result, 25% or more of the value of our total assets consists of securities of companies in the same industry. |
| | • | | We may issue senior securities to the extent permitted by the 1940 Act for the purpose of making investments, to fund share repurchases, or for temporary or emergency purposes. As a BDC, we may issue senior securities up to an amount so that the asset coverage, as defined in the 1940 Act, is at least 200% immediately after each issuance of senior securities. |
| | • | | We generally will not (a) act as an underwriter of securities of other issuers (except to the extent that we may (i) be deemed an “underwriter” of securities purchased by us that must be registered under the Securities Act before they may be offered or sold to the public or (ii) underwrite securities to be distributed to or purchased by our shareholders in connection with offerings of securities by companies in which we are a shareholder); (b) sell securities short (except with regard to managing risks associated with publicly traded securities issued by portfolio companies); (c) purchase securities on margin (except to the extent that we may purchase securities with borrowed money); (d) write or buy put or call options (except (i) to the extent of warrants or conversion privileges in connection with our acquisition financing or other investments, and rights to require the issuers of such investments or their affiliates to repurchase them under certain circumstances, or (ii) with regard to managing risks associated with publicly traded securities issued by portfolio companies); (e) engage in the purchase or sale of commodities or commodity contracts, including futures contracts (except where necessary in working out distressed loan or investment situations); or (f) acquire more than 3% of the voting stock of, or invest more than 5% of our total assets in any securities issued by, any other investment company (as defined in the 1940 Act), except as they may be acquired as part of a merger, consolidation or acquisition of assets. With regard to that portion of our investments in securities issued by other investment companies it should be noted that such investments may subject our shareholders to additional expenses. |
The percentage restrictions set forth above, other than the restriction pertaining to the issuance of senior securities, as well as those contained elsewhere herein, apply at the time a transaction is effected, and a
20
subsequent change in a percentage resulting from market fluctuations or any cause other than an action by us will not require us to dispose of portfolio securities or to take other action to satisfy the percentage restriction.
The above investment objectives have been set by our Board of Directors and do not require shareholder consent to be changed.
Investment Advisor
We have no investment advisor and are internally managed by our executive officers under the supervision of our Board of Directors.
Item 1A. Risk Factors
You should carefully consider the risks described below and all other information contained in this annual report on Form 10-K, including our consolidated financial statements and the related notes thereto before making a decision to purchase our securities. The risks and uncertainties described below are not the only ones facing us. Additional risks and uncertainties not presently known to us, or not presently deemed material by us, may also impair our operations and performance.
If any of the following risks actually occur, our business, financial condition or results of operations could be materially adversely affected. If that happens, the trading price of our securities could decline, and you may lose all or part of your investment.
Risks Related to Our Business and Structure
Our primary unsecured creditors can or have accelerated the maturity of the amounts outstanding under our unsecured debt agreements with them due to certain financial covenant breaches by us
Our primary unsecured debt arrangements consist of the Credit Facility, privately placed unsecured notes (the “Private Unsecured Notes”) and publicly registered unsecured notes (the “Public Unsecured Notes” and collectively with the Credit Facility and Private Unsecured Notes, the “Unsecured Debt Obligations”). The Credit Facility is administered by an affiliate of Wachovia Capital Markets, LLC, and had an outstanding principal balance of $1,388 million as of December 31, 2009. The aggregate outstanding principal balance of the Private Unsecured Notes and the Public Unsecured Notes was $414 million and $550 million, respectively, as of December 31, 2009. Certain financial covenants under each of the Unsecured Debt Obligations were breached as of December 31, 2008. Under the terms of the Unsecured Debt Obligations, the respective creditors may accelerate the maturity date of the obligations outstanding under the respective agreements during the continuation of such defaults.
On August 28, 2009, the holders of the Private Unsecured Notes exercised such right, by declaring the unpaid principal amount of the notes outstanding, plus all accrued and unpaid interest and the respective make-whole interest amount for each series if applicable, immediately due and payable. However, in September 2009, we entered into forbearance agreements with all of these noteholders under which the noteholders agreed to forbear from exercising certain rights and remedies with respect to the events of default existing under their respective series. The holders of a majority in principal amount of the notes outstanding under each series may terminate the forbearance agreement for the series at any time.
In November 2009, we reached an agreement in principle with a steering committee of the lenders under the Credit Facility regarding the proposed Restructuring. Representatives of the holders of the Private Unsecured Notes and the Public Unsecured Notes and their advisors participated with the bank steering committee in certain negotiations with respect to the proposed Restructuring. We subsequently entered into a lock up agreement with all of the lenders under the Credit Facility to help further our efforts to complete the proposed Restructuring.
21
The lock up agreement generally requires all of the lenders under the Credit Facility to agree to the proposed Restructuring pursuant to the Exchange Transaction or the Plan, assuming specified conditions are met. Unless extended, the lock up agreement will terminate if the proposed Restructuring is not completed by certain dates, as described more fully herein.
Under the lock up agreement, the lenders under the Credit Facility also agreed to forbear from exercising their remedies resulting from defaults by us under the Credit Facility, until the occurrence of certain events, including the voluntary or involuntary commencement of a Restructuring Case, the acceleration of the maturity of the Public Unsecured Notes or the termination of our forbearance agreement with the holders of the Private Unsecured Notes. Unless extended, the lock up agreement may be terminated if the proposed Restructuring is not completed by certain dates, as described more fully herein. We do not have a lock up agreement with our other primary unsecured creditors, or a forbearance agreement with the holders of the Public Unsecured Notes.
If any of our primary unsecured creditors, including our lenders under the Credit Facility or the holders of the Private Unsecured Notes following the termination of their forbearance agreements, exercise their rights and remedies against us, our business, financial condition and results of operations could be materially adversely affected. For example, if any such creditors declared that all amounts outstanding under their debt arrangement with us were immediately due and payable, it is likely that our other primary unsecured creditors would also accelerate the maturity of the obligations outstanding under their debt agreements. In such case, we would probably not have sufficient funds available to repay such obligations in full or be able to obtain additional or alternative financing to repay or refinance such debt, and would likely commence a Restructuring Case.
We may not successfully restructure our Unsecured Debt Obligations
Under the terms of our agreement in principle with the lenders under the Credit Facility, both the Private Unsecured Notes and the Public Unsecured Notes must be restructured on similar terms. To consummate the proposed Restructuring through the Exchange Transaction, we need the consent of 100% of the lenders under our Credit Facility, 100% of the holders of our Private Unsecured Notes and holders of 85% of the principal amount of our Unsecured Public Notes. We have a lock up agreement with all of the lenders under the Credit Facility, which generally requires the lenders to agree to the proposed Restructuring assuming specified conditions are met. However, the lock up agreement may be terminated if various stages of the proposed Restructuring are not completed by certain dates. Because we have not launched the Exchange Transaction as of the date of this filing, it is likely that we will be unable to complete the Exchange Transaction by the specified deadline. Thus, the lock up agreement may be terminated, unless the parties agree to extend it. In addition, we also do not have a lock up agreement with the holders of our Private Unsecured Notes or our Public Unsecured Notes. In the absence of lock up agreements with holders of each of the classes of our Unsecured Debt Obligations, there can be no assurance that the requisite of holders of each of our Unsecured Debt Obligations will approve the Exchange Transaction or approve the Plan. If we are unable to successfully restructure our Unsecured Debt Obligations through the Exchange Transaction or the Plan, our primary unsecured creditors may terminate their forbearance agreements, if any, and enforce their rights and remedies as unsecured creditors against us which could have a material adverse effect on our business, financial condition and results of operations.
If we are successful in restructuring our unsecured debt agreements, the new debt arrangements could result in terms less favorable than the current proposed Restructuring
If we are successful in restructuring our Unsecured Debt Obligations, there is no assurance it will be on the terms in the current proposed Restructuring. We may have to agree to less favorable terms including interest rate, amortization and covenants. There can be no assurance that we will generate sufficient cash flow from our operations, including the sale of investments, to meet the terms of a restructured debt agreement. The failure to do so could have a material adverse effect on our business, financial condition and results of operations.
Our independent registered public accounting firm, Ernst & Young LLP, has concluded that substantial doubt exists about our ability to continue as a going concern
Our consolidated financial statements as of December 31, 2009 and 2008 and for the three years in the period ended December 31, 2009 were prepared on a “going concern” basis; however, our independent registered
22
public accounting firm concluded in its report dated March 1, 2010 regarding those consolidated financial statements, that there is substantial doubt about our ability to continue as a going concern as a result of not being in compliance with certain covenants under our Unsecured Debt Obligations and receiving event of default notices from the holders of such obligations and being below the 200% asset coverage ratio under the 1940 Act, which impacts our ability to issue new debt. Our consolidated financial statements do not include any adjustments to reflect the possible future effects on the recovery and classification of assets or the amounts and classification of liabilities that may result from the outcome of this uncertainty.
We have been impacted by a period of credit and capital markets disruption and recession
There have been traumatic developments in the financial markets worldwide over the past two years which have led to a recession in the U.S. and other countries. We have been adversely affected by these conditions. The recession and global financial crisis has limited our access to the debt and equity capital markets and resulted in significant depreciation of our investment portfolio and overleveraging of our balance sheet. The market disruption and liquidity crisis has also dramatically reduced the volume of mergers and acquisitions in the market place affecting our ability to continue to generate additional liquidity through sales of portfolio investments. Thus, we expect to continue to face significant challenges and uncertainties that could materially adversely affect our business, financial condition, and prospects.
Our business has significant capital requirements and may be adversely affected by a prolonged inability to access the capital markets or to sell assets
Our business requires a substantial amount of capital to operate. We historically have financed our operations, including the funding of new investments, through cash generated by our operating activities, the sale of investments, the sale of debt by special purpose affiliates to which we have contributed loan assets originated by us, unsecured borrowings by us and the sale of our equity. Our ability to continue to rely on such sources or other sources of capital is affected by the overleveraging of our balance sheet and the changes in the capital markets from the financial crisis. It is also affected by legal, structural and other factors. There can be no assurance that we will be able to access the funds necessary for our liquidity requirements.
The economic recession has adversely affected our business and a continuation of the adverse market and economic conditions could cause further harm to our operating results
The economic recession had a significant negative impact on the fair value of our portfolio investments evidenced by the significant net unrealized depreciation on our portfolio investments during 2008 and 2009. In addition, many of our portfolio companies are susceptible to the current economic downturn and may be unable to repay our debt investments, may be unable to be sold at a price that we could recover our investment, or even continue to operate during such periods. As a result, our non-performing assets have increased and may continue to increase and the value of our portfolio has decreased and may continue to decrease during an economic downturn. Our ability to obtain capital to invest in existing and new portfolio investments has also been impaired by the economic downturn. These results could have a material adverse effect on our business, financial condition and results of operations.
We have loans to and investments in middle market borrowers who may default on their loans or provide no return on our investments
We have invested in and made loans to privately-held, middle market businesses. There is generally no publicly available information about these businesses. Therefore, we rely on our principals, associates, analysts and consultants to investigate and monitor these businesses. The portfolio companies in which we have invested may have significant variations in operating results, may from time to time be parties to litigation, may be engaged in rapidly changing businesses with products subject to a substantial risk of obsolescence, may require substantial additional capital to support their operations, to finance expansion or to maintain their competitive position, may otherwise have a weak financial position or may be adversely affected by changes in the business cycle. Our portfolio companies may not meet net income, cash flow and other coverage tests typically imposed
23
by senior lenders. Numerous factors may affect a portfolio company’s ability to repay its loan, including the failure to meet its business plan, a downturn in its industry or negative economic conditions, such as the current recession. Deterioration in a portfolio company’s financial condition and prospects may be accompanied by deterioration in the collateral for the loan. We have also made unsecured, subordinated loans and invested in equity securities, which involve a higher degree of risk than senior loans. In certain cases, our involvement in the management of our portfolio companies may subject us to additional defenses and claims from borrowers and third parties. These conditions may make it difficult for us to obtain repayment of our investments.
Middle market businesses typically have narrower product lines and smaller market shares than large businesses. They tend to be more vulnerable to competitors’ actions and market conditions, as well as general economic downturns. In addition, these companies may face intense competition, including competition from companies with greater financial resources, more extensive development, manufacturing, marketing, and other capabilities, and a larger number of qualified managerial and technical personnel.
These businesses may also experience substantial variations in operating results. Typically, the success of a middle market business also depends on the management talents and efforts of one or two persons or a small group of persons. The death, disability or resignation of one or more of these persons could have a material adverse impact on us. In addition, middle market businesses often need substantial additional capital to expand or compete and will have borrowed money from other lenders with claims that are senior to us.
Our senior loans generally are secured by the assets of our borrowers. Our subordinated loans may or may not be secured by the assets of the borrower; however, if a subordinated loan is secured, our rights to payment and our security interest are usually subordinated to the payment rights and security interests of the senior lender. Therefore, we may be limited in our ability to enforce our rights to collect our subordinated loans and to recover any of the loan balance through a foreclosure of collateral.
There is uncertainty regarding the value of our portfolio investments
A substantial portion of our portfolio investments are not publicly traded. We value these investments based on a determination of their fair value made in good faith by our Board of Directors as required by law. Due to the uncertainty inherent in valuing investments that are not publicly traded, as set forth in our consolidated financial statements, our determinations of fair value may differ materially from the values that would exist if a ready market for these investments existed. Our determinations of the fair value of our investments have a material impact on our net earnings through the recording of unrealized appreciation or depreciation of investments as well as our assessment of income recognition. Our NAV could be materially affected if our determinations regarding the fair value of our investments are materially different from the values that would exist if a ready market existed for these securities.
We may fail to continue to qualify for our pass-through tax treatment
We operate so as to qualify to be taxed as a RIC under Subchapter M of the Code and, provided we meet certain requirements under the Code, we can generally avoid corporate level federal income taxes on income distributed to our shareholders as dividends. We would cease to qualify for this favorable pass-through tax treatment if we are unable to comply with the source of income, asset diversification or distribution requirements contained in Subchapter M of the Code, or if we cease to operate so as to qualify as a BDC under the 1940 Act. There is a risk that we will continue to sell select investments in order to delever our balance sheet over the next several years, and if so, a smaller investment portfolio may make it difficult for us to continue to meet the source of income or asset diversification requirements in order to maintain our qualification as a RIC.
If we fail to qualify to be taxed as a RIC or to distribute our income to shareholders on a current basis, we would be subject to corporate level taxes which would significantly reduce the amount of income available for distribution to our shareholders. The loss of our RIC qualification could have a material adverse effect on the total return, if any, obtainable from an investment in our common stock. See “Business—Business Development Company Requirements” and “Business—Regulated Investment Company Requirements.”
24
A change in interest rates may adversely affect our profitability
Because we have funded a portion of our investments with borrowings, our net increase in assets from operations is affected by the spread between the rate at which we have invested and the rate at which we borrowed. We have attempted to match-fund our liabilities and assets by financing floating rate assets with floating rate liabilities and fixed rate assets with fixed rate liabilities or equity. We have entered into interest rate basis swap agreements to match the interest rate basis of our assets and liabilities, thereby locking in the spread between our asset yield and the cost of our borrowings, and to fulfill our obligations under the terms of our asset securitizations. However, our derivatives are considered economic hedges that do not qualify for hedge accounting under the Statement of Financial Accounting Standards (“SFAS”) No. 133,Accounting for Derivative Instruments and Hedging Activities(“SFAS No. 133”), which is codified in Financial Accounting Standards Board (“FASB”) Accounting Standards Codification (“ASC”) Topic 815,Derivatives and Hedging (“ASC 815”).
Under our interest rate swap agreements, we generally pay a fixed rate and receive a floating interest rate based on LIBOR. We may enter into interest rate swaption agreements where, if exercised, we would receive a fixed rate and pay a floating rate based on LIBOR. We may also enter into interest rate cap agreements that would entitle us to receive an amount, if any, by which our interest payments on our variable rate debt exceed specified interest rates.
An increase or decrease in interest rates could reduce the spread between the rate at which we invest and the rate at which we borrow, and thus, adversely affect our profitability, if we have not appropriately match-funded our liabilities and assets or hedged against such event. Alternatively, our interest rate hedging activities may limit our ability to participate in the benefits of lower interest rates with respect to the hedged portfolio.
Also, the fair value of certain of our debt investments is based in part on the current market yields or interest rates of similar securities. A change in interest rates could have a significant impact on our determination of the fair value of these debt investments. In addition, a change in interest rates could also have an impact on the fair value of our interest rate swap agreements that could result in the recording of unrealized appreciation or depreciation in future periods. For example, a decline, or a flattening, of the forward interest rate yield curve will typically result in the recording of unrealized depreciation of our interest rate swap agreements.
Therefore, adverse developments resulting from changes in interest rates could have a material adverse effect on our business, financial condition and results of operations. See “Management’s Discussion And Analysis Of Financial Condition And Results Of Operations—Quantitative and Qualitative Disclosures About Market Risk” and “Financial Statements and Supplementary Data” for additional information on interest rate swap agreements.
A change in currency exchange rates may adversely affect our profitability
We have or may make investments in debt instruments that are denominated in currencies other than the U.S. dollar. In addition, we have or may make investments in the equity of portfolio companies whose functional currency is not the U.S. dollar. Our domestic portfolio companies may also transact a significant amount of business in foreign countries and therefore their profitability may be impacted by changes in foreign currency exchange rates. The functional currency of our largest portfolio company, European Capital, is the Euro. European Capital also has investments in other European currencies, including the British Pound. As a result, an adverse change in currency exchange rates may have a material adverse impact on our business, financial condition and results of operations.
We may experience fluctuations in our quarterly results
We have and could experience further fluctuations in our quarterly operating results due to a number of factors including, among others, variations in and the timing of the recognition of realized and unrealized gains or losses, the degree to which we encounter competition in our markets, the ability to sell investments at
25
attractive terms, the ability to fund and close suitable investments, the timing of the recognition of fee income from closing investment transactions and general economic conditions. As a result of these factors, results for any period should not be relied upon as being indicative of performance in future periods. See “Management’s Discussion and Analysis of Financial Condition and Results of Operations.”
We are dependent upon our key management personnel for our future success
We are dependent on the diligence and skill of our senior management and other members of management for raising capital and the selection, structuring, monitoring, restructuring/amendment and sale of our investments. Our future success depends to a significant extent on the continued service and coordination of our senior management and other members of management. Due to such factors as limitations on our ability to raise capital for new investments or the uncertainty surrounding our ability to exist as a going concern due to the default under certain of our debt obligations, it may be difficult to retain such individuals. The departure of certain executive officers or key employees could materially adversely affect our ability to implement our business strategy. We do not maintain key man life insurance on any of our officers or employees.
We operate in a highly competitive market for investment opportunities
We compete with hundreds of private equity and subordinated funds and other financing sources, including traditional financial services companies such as finance companies, commercial banks, investment banks and other equity and non-equity based investment funds. Some of our competitors are substantially larger and have considerably greater financial resources than us. Competitors may have lower cost of funds and many have access to funding sources that are not available to us. In addition, certain of our competitors may have higher risk tolerances or different risk assessments, which could allow them to consider a wider variety of investments and establish more relationships and build their market shares. There is no assurance that the competitive pressures we face will not have a material adverse effect on our business, financial condition and results of operations. In addition, as a result of this competition, we may not be able to take advantage of attractive investment opportunities from time to time and there can be no assurance that we will be able to identify and make investments that satisfy our investment objectives or that we will be able to meet our investment goals.
Changes in laws or regulations governing our operations or our failure to comply with those laws or regulations may adversely affect our business
We and our portfolio companies are subject to regulation by laws at the local, state, federal and foreign level. These laws and regulations, as well as their interpretation, may be changed from time to time. Accordingly, any change in these laws or regulations or the failure to comply with these laws or regulations could have a material adverse impact on our business. Certain of these laws and regulations pertain specifically to RICs or BDCs.
We could face losses and potential liability if intrusions, viruses or similar disruptions to our technology jeopardize our confidential information or that of users of our technology
Although we have implemented, and will continue to implement, security measures, our technology platform is and will continue to be vulnerable to intrusion, computer viruses or similar disruptive problems caused by transmission from unauthorized users. In addition, any misappropriation of proprietary information could expose us to a risk of loss or litigation.
26
Risks Related to Liquidity and Capital Resources
If we are successful in restructuring our primary unsecured debt agreements, the new agreements could place significant limitations on us
If we are successful in restructuring our Unsecured Debt Obligations on the terms of the proposed Restructuring discussed above, the new restructured debt obligations would be secured by a pledge of substantially all of our existing unencumbered assets and impose additional covenants upon us, including a limitation on our ability to enter into new debt financing, pay cash dividends and fund new investments. We will likely be required from time to time to use a portion of our excess operating cash flow and proceeds from the sale of investments to pay down outstanding balances under the proposed Restructuring. Also, certain of the proceeds received from any debt or equity capital raises could be required to pay down outstanding balances under the proposed Restructuring. As a result, our ability to utilize our excess cash flow, investment sale proceeds or capital raising proceeds for reinvestment purposes would be limited.
In addition, under the terms of the proposed Restructuring, the restructured debt obligations will have financial covenants such as maintaining a minimum ratio of operating cash flow to interest expense and a minimum ratio of pledged assets to the secured debt. There can be no assurance that we will be able to maintain any such future minimum financial covenant thresholds and a failure to do so could have a material adverse effect on our business, financial condition and results of operations.
Our existing secured borrowing arrangements impose certain limitations on us
As of December 31, 2009, we had loans outstanding under secured private term debt (“Term Debt Notes”) issued by our consolidated trusts to institutional investors. Each of these borrowing arrangements is described below. Trusts affiliated with us have issued Term Debt Notes to institutional investors with an outstanding balance of $1.8 billion as of December 31, 2009. These affiliated trusts are consolidated in our financial statements. These securities contain customary default provisions, as well as the following default provisions: a failure on our part, as the originator of the loans securing the Term Debt Notes or as the servicer of these loans, to make any payment or deposit required under related agreements within two business days after the date the payment or deposit is required to be made, or if we alter or amend our credit and collection policy in a manner that could have a material adverse effect on the holders of the Term Debt Notes or the voluntary or involuntary commencement of a case against us under Title eleven of the United States Code.
As a BDC, the 1940 Act generally limits our ability to issue Senior Securities if our asset coverage ratio does not exceed 200% after each issuance of Senior Securities.
As a BDC, the 1940 Act generally limits our ability to issue Senior Securities if our asset coverage ratio does not exceed 200% after each issuance of Senior Securities. Asset coverage ratio is defined in the 1940 Act as the ratio which the value of the total assets, less all liabilities and indebtedness not represented by Senior Securities, bears to the aggregate amount of Senior Securities representing indebtedness. As of December 31, 2009, our asset coverage ratio was 156%. Accordingly, we are prohibited from issuing any additional Senior Securities other than for the purpose of immediately repaying existing debt, until our asset coverage ratio exceeds 200%, except for temporary borrowings that are repaid within 60 days and, limited to no more than 5% of our total assets. These provisions limit our access to funding to operate our business and may have a material adverse affect on our business operations.
As a BDC, the 1940 Act generally limits our ability to issue equity below our NAV per share
Because we are subject to regulatory restrictions on the amount of debt we can issue, we are dependent on the issuance of equity as a financing source. As a BDC, we are generally not able to issue and sell our common stock at a price below our NAV per share, exclusive of any distributing commission or discount, without shareholder approval. As of December 31, 2009, our NAV per share was $8.29 per share and our closing market price was $2.44 per share. On February 12, 2010, our shareholders approved a proposal to authorize us to sell shares of our common stock at prices below our NAV per share in one or more offerings subject to certain
27
limitations, including the prior approval of our Board of Directors. The authorization is effective for a twelve month period expiring on February 12, 2011 and the number of shares that may be issued below NAV per share is limited to 58.3 million shares of common stock, which was 20% of the number of shares outstanding as of the record date for the proposal, subject to adjustment for shares issued following the occurrence of events such as stock splits, stock dividends, distributions and recapitalizations. However, even with such approval, there can be no assurances that we can issue equity when necessary. In addition, even if we were to issue equity at a price below our NAV per share, it could result in a dilution in our NAV per share, which could result in a decline in the market price of our common stock.
Out interest rate swap agreements contain covenants that place limitations on us
We enter into interest rate swap agreements to manage interest rate risk and also to fulfill our obligations under the terms of our asset securitizations. Certain of our interest rate swap agreements contain an event of default that allows the counterparty to terminate transactions outstanding under the agreement following the occurrence of a cross default on certain of our other indebtedness in amounts equal to or greater than $5 million to $15 million, as applicable. Certain of our interest rate swap agreements also contain an event of default that allows a counterparty to terminate transactions outstanding under the agreement if certain of our other indebtedness in amounts equal to or greater than $5 million or $15 million, as applicable, is accelerated. In addition, one of our interest rate swap agreements provides that, if our unsecured debt rating falls below BB- as rated by Fitch Ratings, BB- as rated by Standard & Poor’s Rating Services or Ba3 by Moody’s Investors Services, Inc., the counterparty may terminate transactions outstanding under the agreement. Certain of our interest rate swap agreements also provide that, if the Credit Facility is terminated, or the counterparty does not continue to be a lender under the Credit Facility, and we do not post collateral for our derivative obligations related to this counterparty or make arrangements for the counterparty to transfer its rights and obligations under the interest rate swap agreement within 30 days, the counterparty may terminate the transactions outstanding under the agreement.
As of December 31, 2009, we were not in compliance with the above covenants for certain of our interest rate swap agreements. While this event of default has occurred, one of our counterparties has elected to terminate its agreement with us and our remaining counterparties have not elected to terminate their agreements with us. For the agreement that was terminated, the settlement amount claimed by the counterparty is $13 million, and it was not settled as of December 31, 2009. For our other interest rate swap agreements, the settlement amount was $43 million as of December 31, 2009. If our counterparties elected to terminate their agreements with us, it could have a material adverse effect on our business, financial condition and results of operations.
The lack of liquidity of our privately-held securities may adversely affect our business
Most of our investments consist of securities acquired directly from their issuers in private transactions. Some of these securities are subject to restrictions on resale or otherwise are less liquid than public securities. The illiquidity of our investments may make it difficult for us to obtain cash equal to the value at which we record our investments if the need arises.
Risks Related to Our Investing and Financing Strategy
We have and may incur additional debt that could increase your investment risks
We or our consolidated affiliates borrow money or issue debt securities to provide us with additional funds to invest. Our lenders have fixed dollar claims on our assets or the assets of our consolidated affiliates that are senior to the claims of our shareholders and, thus, our lenders have preference over our shareholders with respect to these assets. In particular, the assets that our consolidated affiliates have pledged to lenders under the Term Debt Notes were sold or contributed to separate affiliated statutory trusts prior to such pledge. While we own a
28
beneficial interest in these trusts, these assets are the property of the respective trusts, available to satisfy the debts of the trusts, and would only become available for distribution to our shareholders to the extent specifically permitted under the agreements governing those Term Debt Notes. See “Risk Factors—Our secured borrowing arrangements impose certain limitations on us.” Additionally, under the terms of the proposed Restructuring, we would need to grant a security interest in substantially all of our other unencumbered assets to those lenders.
The following table is designed to illustrate the effect on returns to a holder of our common stock of the leverage created by our use of borrowing, at the weighted average interest rate of 5.9% for the year ended December 31, 2009, and assuming hypothetical annual returns on our portfolio of minus 15% to plus 15%. As can be seen, leverage generally increases the return to shareholders when the portfolio return is positive and decreases return when the portfolio return is negative. Actual returns may be greater or less than those appearing in the table.
| | | | | | | | | | | | | | | | | | | | | |
Assumed Return on Portfolio (Net of Expenses)(1) | | -15.0 | % | | -10.0 | % | | -5.0 | % | | — | | | 5.0 | % | | 10.0 | % | | 15.0 | % |
Corresponding Return to Common Shareholders(2) | | -29.5 | % | | -17.0 | % | | -4.4 | % | | 8.1 | % | | 20.7 | % | | 33.2 | % | | 45.7 | % |
| (1) | The assumed portfolio return is required by regulation of the SEC and is not a prediction of, and does not represent, our projected or actual performance. |
| (2) | In order to compute the “Corresponding Return to Common Shareholders,” the “Assumed Return on Portfolio” is multiplied by the total value of our assets at the beginning of the period to obtain an assumed return to us. From this amount, all interest expense accrued during the period is subtracted to determine the return available to shareholders. The return available to shareholders is then divided by the total value of our net assets as of the beginning of the period to determine the “Corresponding Return to Common Shareholders.” |
Although borrowing money for investment increases the potential for gain, it also increases the risk of a loss. A decrease in the value of our investments will have a sharper impact on our NAV if we borrow money to make investments. Our ability to pay dividends could also be adversely impacted. In addition, our ability to pay dividends or incur additional indebtedness is restricted if asset coverage is not equal to at least twice our indebtedness.
We currently have a non-investment grade corporate credit rating and we could experience further downgrades
As of December 31, 2009, our corporate credit rating was B2, B- and C by Moody’s Investor Services, Standard & Poor’s Ratings Services and Fitch Ratings, respectively, which represents a downgrade from Baa3, BBB and BBB, respectively, as of December 31, 2008. Any rating below BBB or Baa2 is considered non-investment grade. If these credit ratings were to not improve or even be further downgraded, our ability to refinance or raise additional debt, particularly at attractive rates, could be negatively impacted. Any of these occurrences could have a material effect on our business, financial condition and results of operations.
Our credit ratings may not reflect all risks of an investment in our debt securities
Our credit ratings are an assessment by major debt rating agencies of our ability to pay our obligations. Consequently, actual or expected changes in our credit ratings will likely affect the market value of our publicly issued debt securities. Our credit ratings, however, may not fully or accurately reflect all of the credit and market risks associated with our publicly issued debt securities.
29
We may have to sell our investments at prices lower than our current fair values or at prices lower than we could receive in future periods
We may need to generate liquidity in our portfolio in order to meet principal amortization payments under the terms of the proposed Restructuring of our Unsecured Debt Obligations. We may also need to generate liquidity to meet our current operating and financing costs or to fund any cash dividend to our shareholders to maintain our qualification as a RIC. In order to generate current liquidity, we may need to sell our debt and/or equity investments at prices lower than our current fair values or at prices lower than we could realize in future periods if we were to continue to hold the investments.
We may not realize gains from our equity investments
We invest in equity interests with the goal to realize gains from the disposition of the interests. These equity interests may not appreciate in value and, in fact, have depreciated in value. Accordingly, we may not be able to realize gains from our equity interests.
Failure to deploy capital effectively or obtain financing to make additional investments may reduce our return on equity
If we fail to invest new capital effectively, or obtain additional funds to grow, our return on equity may be negatively impacted, which could reduce the price of the securities that you own.
Our portfolio companies may be highly leveraged
Leverage may have important adverse consequences to our portfolio companies and to us as an investor. Portfolio companies that are leveraged may be subject to restrictive financial and operating covenants. The leverage may impair these companies’ ability to finance their future operations and capital needs. As a result, their flexibility to respond to changing business and economic conditions and to business opportunities may be limited. A leveraged company’s income and net assets will tend to increase or decrease at a greater rate than if borrowed money were not used.
Investment in non-investment grade Structured Products may be illiquid, may have a higher risk of default, and may not produce current returns
Our investments in Structured Product securities are generally non-investment grade, which means that major rating agencies rate them below the top four investment-grade rating categories (i.e., “AAA” through “BBB”), and are sometimes referred to as “junk bonds.” Non-investment grade Structured Product bonds and preferred shares tend to be less liquid, may have a higher risk of default and may be more difficult to value. Economic recessions or downturns may cause defaults or losses on collateral securities to increase. Non-investment grade securities are considered speculative, and their capacity to pay principal and interest in accordance with the terms of their issue is not certain.
Our assets include investments in Structured Products which are subordinate in right of payment to more senior securities
Our assets include subordinated CMBS, CLO and CDO securities which are the most subordinate class of securities in a structure of securities secured by a pool of loans and accordingly are the first to bear the loss upon a restructuring or liquidation of the underlying collateral and the last to receive payment of interest and principal. The economic recession has caused defaults on the underlying collateral to increase; therefore we do not expect to recover the full amount of our initial investment in such subordinated interests. Additionally, estimated fair values of these subordinated interests tend to be more sensitive to changes in economic conditions than more senior securities. As a result, such subordinated interests generally are not actively traded and may not provide holders thereof with liquid investments.
30
The trading market or market value of our publicly issued debt securities may fluctuate
Our publicly issued debt securities do not have an established trading market. There is no assurance that a trading market for our publicly issued debt securities will ever develop or be maintained if developed. Additionally, many factors may materially adversely affect the trading market for, and market value of, our publicly issued debt securities including, but not limited to, the following:
| | • | | current or future defaults under the securities; |
| | • | | the success or failure of the current restructuring efforts; |
| | • | | the time remaining to the maturity of these debt securities; |
| | • | | the outstanding principal amount of debt securities with terms identical to these debt securities; |
| | • | | the supply of debt securities trading in the secondary market, if any; |
| | • | | the redemption or repayment features, if any, of these debt securities; |
| | • | | the level, direction and volatility of market interest rates generally; and |
| | • | | market rates of interest that are higher or lower than rates borne by the debt securities. |
There may also be a limited number of buyers when an investor decides to sell its debt securities. This too may materially adversely affect the market value of the debt securities or the trading market for the debt securities.
Risks Related to Our Common Stock
There is a risk that you may not receive dividends
Since our IPO, we have distributed and currently intend to distribute more than 90% of our investment company ordinary taxable income to our shareholders in order to continue to qualify as a RIC and have distributed and currently intend to distribute sufficient dividends to eliminate our investment company taxable income and capital gains. However, due to the global financial and liquidity crisis, there can be no assurance that we will have sufficient liquidity to pay these amounts by the required dates to maintain our qualification as a RIC and to eliminate all of our investment company ordinary taxable income.
Historically, we have declared a dividend for each quarter since our IPO in 1997. However, in the fourth quarter of 2008, we revised our dividend policy to manage our capital base proactively in the volatile markets. Our Board of Directors will evaluate the declaration of our quarterly dividend after our financial results are determined each quarter, so that we may more precisely assess our taxable income, cash flow and changes in fair value to better manage our capital in the current volatile markets. In June 2009, we declared a dividend of $1.07 per share, which was paid part in cash and stock in August 2009. We have not declared any other dividends since the third quarter of 2008.
Pursuant to applicable tax regulations, we are also required to include in taxable income certain amounts that have not yet been collected in cash such as payment-in-kind interest or original issue discount accretion. Since we may be required to recognize taxable income before or without receiving cash representing such income, we may have difficulty meeting the requirement to distribute at least 90% of our investment company ordinary taxable income to continue to qualify as a RIC.
As a RIC, we could elect to retain our net long-term capital gains and pay a federal income tax on such gains on behalf of our shareholders treating them as a deemed distribution for tax purposes. In two of our last three tax years, we have elected to retain our long-term capital gains and pay the federal income tax on behalf of our shareholders instead of distributing the net long-term capital gains as a cash dividend to our shareholders.
31
There may be a risk that we will generate taxable income in future periods that is significantly lower than in prior periods or there may be a risk that we do not generate any taxable income in future periods, which could result in significantly reduced dividends, if any, in future periods as compared to historical levels. We had a net capital loss carryforward of approximately $152 million for our tax year ending September 30, 2009, which may be carried forward for up to eight years. To the extent we generate future long-term taxable capital gains, our requirement to distribute those gains as dividends will be reduced by the amount of our net capital loss carryforward. We may also realize losses on certain of our debt investments that could qualify as taxable ordinary losses under Section 166 or Section 1221 of the Code. As of December 31, 2009, our total debt investment portfolio had accumulated net unrealized depreciation of $742 million. In future periods, we could realize losses on certain of these debt investments that could qualify as taxable ordinary losses, which could significantly reduce our taxable ordinary income in future periods or could even result in us incurring a taxable ordinary loss in future periods. To the extent our taxable ordinary income is reduced from ordinary losses on the realization of our debt investments, the amount of our taxable ordinary income that we are required to distribute to our shareholders as dividends to maintain our qualification as a RIC or to eliminate our taxable income would be reduced.
We cannot assure you that we will achieve investment results or maintain a tax status that will allow any specified level of cash distributions or year-to-year increases in cash distributions.
There is a risk that you may receive our stock as dividends
Under the 1940 Act, if a BDC has any senior debt investments outstanding that were publicly issued, the BDC must make provision to prohibit the declaration of any dividend (except a dividend payable in the stock of the BDC) if its asset coverage ratio is below certain thresholds at the time of the distribution after deducting the amount of such dividend. As of December 31, 2009, our asset coverage ratio was 156%. We have received guidance from the staff of the SEC that notwithstanding this provision of the 1940 Act, we are able to declare and pay dividends pursuant to a revenue procedure issued by the IRS. On January 7, 2009, the IRS issued revenue procedure Revenue Procedure 2009-15, which temporarily allows a RIC to distribute its own stock as a dividend for the purpose of fulfilling its distribution requirements. Pursuant to this revenue procedure, we may treat a distribution of our stock as a dividend if (i) the stock is publicly traded on an established securities market, (ii) the distribution is declared with respect to a taxable year ending on or before December 31, 2009, and (iii) each shareholder may elect to receive his or her entire distribution in either cash or our stock subject to a limitation on the aggregate amount of cash to be distributed to all shareholders, which must be at least 10% of the aggregate declared distribution. If too many shareholders elect to receive cash, each shareholder electing to receive cash will receive a pro rata amount of cash (with the balance of the distribution paid in stock). In no event would any shareholder electing to receive cash receive less than 10% of his or her entire distribution in cash. On December 23, 2009, the IRS issued Revenue Procedure 2010-12, which extends under similar terms the temporary guidance provided by Revenue Procedure 2009-15. This new guidance applies to distributions by a RIC of its own stock declared by December 31, 2012 with respect to RIC distribution requirements for taxable years ending on or before December 31, 2011. Future dividends with respect to a taxable year ending on or before December 31, 2011, if any, may be paid in shares of our common stock, subject to the limitations discussed above.
Under the proposed Restructuring of our Unsecured Debt Obligations, the new credit agreement and indenture may contain a covenant that will restrict our ability, under certain circumstances, to pay cash dividends. We would be permitted to pay cash dividends only: (i) to the extent required to maintain our status as a RIC and eliminate our taxable income so long as we pay a portion of such dividends in shares of our common stock to the maximum level permitted by applicable law, or (ii) if our asset coverage is at least 200% after giving effect to such cash dividends and we are not in default under the agreements and the aggregate principal amount of the restructured debt is equal to or less than $1.4 billion.
32
Future equity financings may be on terms adverse to shareholder interests
We have issued, and may issue in the future, equity capital to help fund our operations and to make investments. As noted above, our shareholders approved a proposal at a special meeting on February 12, 2010 that extended the authority allowing us to sell shares of common stock below NAV per share subject to certain limitations. We issued shares of common stock below our NAV per share in the first quarter of 2009 in connection with our acquisition of those shares of European Capital that we did not own. If we issue any additional shares of common stock below our NAV per share, the interests of our existing shareholders may be further diluted.
The following table is designed to illustrate the dilutive effect on NAV per share if we issue additional shares of common stock below our NAV per share. The table below reflects NAV per share diluted for the issuance of 58.3 million shares of common stock, which is the maximum number of shares that we have authority from our shareholders to issue below NAV per share at hypothetical sales prices of 5%, 10%, 15%, 20%, 25% and 50% below the December 31, 2009 NAV per share of $8.29.
| | | | | | | | | | | | | | | | | | | | | | | | |
Assumed Sales price per share below NAV(1) | | | -50 | % | | | -25 | % | | | -20 | % | | | -15 | % | | | -10 | % | | | -5 | % |
Diluted NAV per share | | $ | 7.58 | | | $ | 7.94 | | | $ | 8.01 | | | $ | 8.08 | | | $ | 8.15 | | | $ | 8.22 | |
% Dilution | | | -8.6 | % | | | -4.3 | % | | | -3.4 | % | | | -2.6 | % | | | -1.7 | % | | | -0.9 | % |
| (1) | The assumed sales price per share is assumed to be net of any applicable underwriting commissions or discounts. |
If we cannot meet NASDAQ’s continued listing requirements, NASDAQ may delist our common stock, which would have an adverse impact on the liquidity and market price of our common stock.
Our common stock is currently listed on The NASDAQ Global Select Market. Under NASDAQ rules, a stock can be delisted and not allowed to trade on NASDAQ if the closing bid price of the stock over a 30 consecutive trading-day period is less than $1.00 per share. Since the beginning of the financial markets crisis, we have and continue to experience significant volatility, including substantial decreases, in the price of our common stock. For the year ended December 31, 2009, the low closing price of our common stock as reported on The NASDAQ Global Select Market was $0.58 per share and the closing price on December 31, 2009 was $2.44 per share. There is a risk that the share price of our common stock could decline further if we are unsuccessful in restructuring our Unsecured Debt Obligations that are in default or if the depressed state of the economy and credit and capital markets continue to impact our operations. There could then be a risk that the share price of our common stock could fall below the minimum listing requirement, and thus be delisted from NASDAQ. A delisting of our common stock could negatively impact us by reducing the liquidity and market price of our common stock and the number of investors willing to hold or acquire our common stock, which could negatively impact our ability to raise equity financing.
The market price of our common stock may fluctuate significantly
The market price and marketability of shares of our securities may from time to time be significantly affected by numerous factors, including many over which we have no control and that may not be directly related to us. These factors include the following:
| | • | | price and volume fluctuations in the stock market from time to time, which are often unrelated to the operating performance of particular companies; |
| | • | | failure to successfully complete the restructuring of our debt facilities; |
| | • | | significant volatility in the market price and trading volume of securities of RICs, BDCs or other companies in our sector, which is not necessarily related to the operating performance of these companies; |
| | • | | changes in regulatory policies or tax guidelines, particularly with respect to RICs or BDCs; |
33
| | • | | changes in our dividend policy and earnings or variations in operating results; |
| | • | | any shortfall in revenue or net income or any increase in losses from levels expected by securities analysts; |
| | • | | decreases in our NAV per share; |
| | • | | general economic trends and other external factors; and |
| | • | | loss of a major funding source. |
Fluctuations in the trading price of our common stock may adversely affect the liquidity of the trading market for our common stock and, in the event that we seek to raise capital through future equity financings, our ability to raise such equity capital.
Our common stock may be difficult to resell
Investors may not be able to resell shares of common stock at or above their purchase prices due to a number of factors, including:
| | • | | defaults under our primary unsecured debt arrangements; |
| | • | | actual or anticipated fluctuation in our operating results; |
| | • | | volatility in our common stock price; |
| | • | | changes in expectations as to our future financial performance or changes in financial estimates of securities analysts; and |
| | • | | departures of key personnel. |
Provisions of our Third Amended and Restated Certificate of Incorporation and Second Amended and Restated Bylaws could deter takeover attempts
Our Third Amended and Restated Certificate of Incorporation, as amended and Second Amended and Restated Bylaws and the Delaware General Corporation Law contain provisions that may have the effect of discouraging and delaying or making more difficult a change in control. The existence of these provisions may negatively impact the price of our common stock and may discourage third party bids. These provisions may reduce any premiums paid to our shareholders for shares of our common stock that they own. Furthermore, we are subject to Section 203 of the Delaware General Corporation Law. Section 203 governs business combinations with interested shareholders, and also could have the effect of delaying or preventing a change in control.
Item 1B.Unresolved Staff Comments
None.
Item 2.Properties
We do not own any real estate or other physical properties materially important to our operations. We lease office space in ten locations for terms ranging up to fifteen years.
Item 3.Legal Proceedings
Neither we, nor any of our consolidated subsidiaries, are currently subject to any material litigation nor, to our knowledge, is any material litigation threatened against us or any consolidated subsidiary, other than routine litigation and administrative proceedings arising in the ordinary course of business. Such proceedings are not expected to have a material adverse effect on the business, financial conditions, or results of our operations.
Item 4.[Reserved]
34
PART II
Item 5.Market for Registrant’s Common Equity, Related Stockholder Matters and Issuer Purchases of Equity Securities
We have distributed, and currently intend to continue to distribute in the form of dividends, a minimum of 90% of our annual taxable ordinary income to our shareholders in order to maintain our qualification as a RIC and also have distributed, or intend to distribute, sufficient dividends to eliminate our taxable income. Beginning in the fourth quarter of 2008, we revised our dividend policy to manage our capital base proactively in the current volatile markets. Under this revised dividend policy, we will retain our net long-term capital gains and treat them as “deemed distributions”, and our Board of Directors will evaluate the declaration of our quarterly dividend after our financial results are determined each quarter, so that we may more precisely assess our taxable income, cash flow and changes in fair value to better manage our capital base in the current volatile markets.
On January 7, 2009, the IRS issued Revenue Procedure 2009-15 that temporarily allows a RIC to distribute its own stock as a dividend for the purpose of fulfilling its distribution requirements. Pursuant to this revenue procedure, a RIC may treat a distribution of its own stock as a dividend if (i) the stock is publicly traded on an established securities market, (ii) the distribution is declared with respect to a taxable year ending on or before December 31, 2009 and (iii) each shareholder may elect to receive his or her entire distribution in either cash or stock of the RIC subject to a limitation on the aggregate amount of cash to be distributed to all shareholders, which must be at least 10% of the aggregate declared distribution. If too many shareholders elect to receive cash, each shareholder electing to receive cash will receive a pro rata amount of cash (with the balance of the distribution paid in stock). In no event will any shareholder electing to receive cash receive less than 10% of his or her entire distribution in cash. On December 23, 2009, the IRS issued Revenue Procedure 2010-12, which extends under similar terms the temporary guidance provided by Revenue Procedure 2009-15. This new guidance applies to distributions by a RIC of its own stock declared by December 31, 2012 with respect to RIC distribution requirements for taxable years ending on or before December 31, 2011.
Under the 1940 Act, if a BDC has any senior debt securities outstanding that were publicly issued, the BDC must make provision to prohibit the declaration of any dividend (except a dividend payable in the stock of the BDC) if its asset coverage is below certain thresholds at the time of the distribution after deducting the amount of such dividend. However, we have received guidance from the staff of the SEC that notwithstanding this provision of the 1940 Act, we are able to declare and pay dividends pursuant to the revenue procedure issued by the IRS.
On June 11, 2009, our Board of Directors declared a special dividend to our shareholders of $1.07 per share that was paid on August 7, 2009. Each shareholder could elect to receive the dividend in either cash or in shares of common stock. Because the aggregate amount of the cash elections exceeded 10% of the aggregate dividend amount, the shareholders electing to receive cash received a pro rata cash amount and the remaining portion in shares of common stock. The number of shares of common stock comprising the stock portion was determined based on the volume weighted average price of our stock on The NASDAQ Global Select Market on July 27, July 28 and July 29, 2009. In total, the distribution consisted of $24 million of cash and 67.1 million shares of common stock. Included in the distribution of 67.1 million shares of common stock were 2.9 million shares of common stock distributed to a consolidated trust for our non-qualified deferred compensation plan. The shares of common stock held by the trust are accounted for as treasury stock in the accompanying consolidated balance sheets. The exact amount of cash and common stock received by each shareholder depended on the shareholder’s election. The special dividend included our remaining 2008 taxable income and a substantial portion of our 2009 taxable income. We expect to declare a minimum amount of dividends in 2010 equal to our remaining undistributed taxable income from our 2009 tax year in order to maintain our status as a RIC and to eliminate our 2009 taxable income.
We report the estimated tax characteristics of each dividend when declared while the actual tax characteristics of dividends are reported annually to each shareholder on Form 1099-DIV. Our 2009 distributions of $1.07 per share consisted of $1.07 per share of ordinary income. For our ordinary dividends declared in 2009
35
of $1.07 per share, $0.98 per share were non-qualifying dividends and $0.09 per share were qualifying dividends. Our taxable ordinary income and taxable capital gain income comprise our investment company taxable income which differs from net income as defined by GAAP due primarily to temporary and permanent differences in interest and dividend income recognition, fee income recognition, stock-based compensation and other expense recognition, returns of capital and net unrealized appreciation or depreciation.
At the option of a holder of record of common stock, all cash distributions can be reinvested automatically under our dividend reinvestment plan (“DRIP”) in additional whole and fractional shares. Pursuant to our DRIP, a shareholder whose shares are registered in his own name may opt in to the plan and elect to reinvest all or a portion of his or her dividends in shares of our common stock by providing the required enrollment notice to the plan administrator, Computershare Investor Services. Shareholders whose shares are held in the name of a broker or the nominee of a broker may have distributions reinvested only if such service is provided by the broker or the nominee, or if the broker or the nominee permits participation in our DRIP. Shareholders whose shares are held in the name of a broker or other nominee should contact the broker or nominee for details. Shareholders that participate in the DRIP will receive the number of whole or fractional shares that can be obtained based on the price per share the plan administrator purchases the shares of common stock. Such shares will be acquired by the plan administrator through either receipt of newly issued shares or treasury shares from us or by purchase of outstanding shares of common stock on the open market. If the market price per share of our common stock on the dividend payment date equals or exceeds by at least 110% the NAV per share of our common stock as of the end of the most recently completed fiscal quarter (or as of such other time as may be determined by our Board of Directors), then our plan administrator will acquire shares of our common stock directly from us at a price equal to the greater of NAV per share or the market price on that date less a 2% discount. However, (i) if the market price per share of our common stock on the dividend payment date does not exceed 110% of the NAV per share of our common stock as of the end of the most recently completed fiscal quarter or (ii) if we advise the plan administrator that since such NAV per share was last determined we have become aware of events that indicate the possibility of a change in NAV per share as a result of which the NAV per share of the common stock on the dividend payment date might be higher than the current market price per share of our common stock, then the plan administrator will not acquire any newly issued shares from us at a discount and instead will buy shares of our common stock in the open market. You can find out more information about the DRIP by reading our Third Amended and Restated Dividend Reinvestment Plan, a copy of which is located on our internet website atwww.americancapital.com.
Our stock transfer agent, registrar and dividend reinvestment plan administrator is Computershare Investor Services. Requests for information from Computershare can be sent to Computershare Investor Services, P.O. Box 43010, Providence, RI 02940, and their telephone number is 1-800-733-5001.
For the three fiscal years ended December 31, 2009, we have not sold any equity securities that were not registered under the Securities Act.
36
Quarterly Stock Prices and Dividend Declarations
Our common stock is quoted on The NASDAQ Global Select Market under the ticker symbol “ACAS”. As of February 16, 2010, we had 934 shareholders of record. Most of the shares of our common stock are held by brokers and other institutions on behalf of shareholders. We believe that there are currently over 199,000 additional beneficial holders of our common stock. The following table sets forth the range of high and low sales prices of our common stock as reported on The NASDAQ Global Select Market and our dividends paid for the years ended December 31, 2009 and 2008. The dividends paid in the table below do not include the $0.72 per share deemed distribution of our net long-term capital gains in the fourth quarter of 2008.
| | | | | | | | | |
| | | Sales Prices | | |
| | | High | | Low | | Paid |
2009 | | | | | | | | | |
First Quarter | | $ | 7.39 | | $ | 0.58 | | $ | — |
Second Quarter | | $ | 5.56 | | $ | 1.84 | | $ | 1.07 |
Third Quarter | | $ | 3.73 | | $ | 2.08 | | $ | — |
Fourth Quarter | | $ | 3.40 | | $ | 2.31 | | $ | — |
| | | |
2008 | | | | | | | | | |
First Quarter | | $ | 37.86 | | $ | 26.15 | | $ | 1.01 |
Second Quarter | | $ | 35.84 | | $ | 23.74 | | $ | 1.03 |
Third Quarter | | $ | 28.49 | | $ | 15.83 | | $ | 1.05 |
Fourth Quarter | | $ | 27.00 | | $ | 2.77 | | $ | — |
Equity Compensation Plans
The following table summarizes information, as of December 31, 2009, relating to our equity compensation plans pursuant to which grants of options or other rights to acquire shares of our common stock may be granted from time to time. See “Item 8. Financial Statements and Supplementary Data – Notes to Consolidated Financial Statements” for a description of our equity compensation plans (shares in millions).
| | | | | | | |
Plan category | | Number of securities to
be issued upon exercise of
outstanding options | | Weighted-average
exercise price of
outstanding options | | Number of securities
remaining available for future
issuance under equity
compensation plans
(excluding securities reflected
in the first column of this
table) |
Equity compensation plans approved by security holders(1) | | 26.2 | | $ | 9.35 | | 45.4 |
Equity compensation plans not approved by security holders(1) | | — | | $ | — | | — |
| | | | | | | |
Total | | 26.2 | | $ | 9.35 | | 45.4 |
| | | | | | | |
| (1) | All of our equity compensation plans have been approved by our shareholders. |
37
Performance Graph
The performance graph below compares the total cumulative shareholder return on our common stock with the cumulative shareholder return on the equity securities of companies included in the Standard & Poor’s 500 Stock Index (“S&P 500”), BDC Peer Group, Asset Manager Peer Group and Bank Peer Group, measured as of the last trading day of each year shown. The performance graph represents past performance and should not be considered to be an indication of future performance.
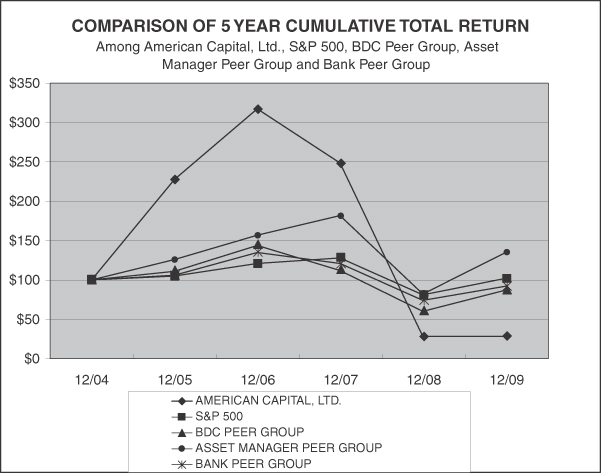
The preceding graph compares a shareholder’s cumulative total return for the last five fiscal years, assuming $100 invested at December 31, 2004, with the reinvestment of all dividends on the dates of payment without commissions, as if such amounts had been invested in: (i) our common stock; (ii) the stocks included in the S&P 500; (iii) an index of selected issuers in our BDC Peer Group, composed of Allied Capital Corporation, Apollo Investment Corporation, Ares Capital Corporation, Gladstone Capital Corporation, MCG Capital Corporation and Prospect Capital Corporation; (iv) an index of selected issuers in our Asset Manager Peer Group, composed of Affiliated Managers Group Inc., Alliance Bernstein Holding L.P., Blackrock, Inc., Brookfield Asset Management Inc., Eaton Vance Corp., Federated Investors, Inc., Franklin Resources Inc., Invesco Ltd., Janus Capital Group Inc., Legg Mason Inc., T. Rowe Price Group Inc. and Waddell & Reed Financial Inc.; and (v) an index of selected issuers in our Bank Peer Group, composed of Bank of America Corporation, Bank of New York Mellon Corporation, BB&T Corp., Citigroup Inc., Goldman Sachs Group Inc., Jefferies Group Inc., JPMorgan Chase & Co., Morgan Stanley, PNC Financial Services Group, Inc., U.S. Bancorp and Wells Fargo & Co. The
38
S&P 500 is an unmanaged, capitalization-weighted index generally representative of the U.S. market for large capitalization stocks. This information shows how our performance compares with the returns of one of the most widely used U.S. equity indexes. The S&P 500 cannot be invested in directly.
| | | | | | | | | | | | | | | | | | |
| | | Cumulative Total Return |
| | | 12/04 | | 12/05 | | 12/06 | | 12/07 | | 12/08 | | 12/09 |
AMERICAN CAPITAL, LTD. | | $ | 100 | | $ | 228 | | $ | 318 | | $ | 249 | | $ | 28 | | $ | 28 |
S&P 500 | | | 100 | | | 105 | | | 121 | | | 128 | | | 81 | | | 102 |
BDC PEER GROUP | | | 100 | | | 111 | | | 144 | | | 112 | | | 60 | | | 87 |
ASSET MANAGER PEER GROUP | | | 100 | | | 126 | | | 157 | | | 182 | | | 82 | | | 135 |
BANK PEER GROUP | | | 100 | | | 106 | | | 135 | | | 121 | | | 74 | | | 92 |
39
Item 6.Selected Financial Data
AMERICAN CAPITAL, LTD.
Consolidated Selected Financial Data
(in millions, except per share data)
The selected financial data should be read in conjunction with our consolidated financial statements and notes thereto.
| | | | | | | | | | | | | | | | | | | | |
| | | Year Ended December 31, | |
| | | 2009 | | | 2008 | | | 2007 | | | 2006 | | | 2005 | |
Total operating income(1) | | $ | 697 | | | $ | 1,051 | | | $ | 1,240 | | | $ | 860 | | | $ | 555 | |
Total operating expenses(2) | | | 582 | | | | 521 | | | | 640 | | | | 424 | | | | 228 | |
| | | | | | | | | | | | | | | | | | | | |
Operating income before income taxes | | | 115 | | | | 530 | | | | 600 | | | | 436 | | | | 327 | |
Income tax benefit (provision) | | | 20 | | | | (37 | ) | | | (6 | ) | | | (11 | ) | | | (13 | ) |
| | | | | | | | | | | | | | | | | | | | |
Net operating income | | | 135 | | | | 493 | | | | 594 | | | | 425 | | | | 314 | |
Net gain on extinguishment of debt | | | 12 | | | | — | | | | — | | | | — | | | | — | |
Net realized (loss) gain on investments | | | (825 | ) | | | 32 | | | | 214 | | | | 173 | | | | 36 | |
| | | | | | | | | | | | | | | | | | | | |
Net realized (loss) earnings | | | (678 | ) | | | 525 | | | | 808 | | | | 598 | | | | 350 | |
Net unrealized (depreciation) appreciation of investments | | | (232 | ) | | | (3,640 | ) | | | (108 | ) | | | 297 | | | | 15 | |
Cumulative effect of accounting change(2) | | | — | | | | — | | | | — | | | | 1 | | | | — | |
| | | | | | | | | | | | | | | | | | | | |
Net (decrease) increase in net assets resulting from operations | | $ | (910 | ) | | $ | (3,115 | ) | | $ | 700 | | | $ | 896 | | | $ | 365 | |
| | | | | | | | | | | | | | | | | | | | |
Per share data: | | | | | | | | | | | | | | | | | | | | |
Net operating income: | | | | | | | | | | | | | | | | | | | | |
Basic | | $ | 0.56 | | | $ | 2.42 | | | $ | 3.42 | | | $ | 3.15 | | | $ | 3.16 | |
Diluted | | $ | 0.56 | | | $ | 2.42 | | | $ | 3.36 | | | $ | 3.11 | | | $ | 3.10 | |
Net (loss) earnings: | | | | | | | | | | | | | | | | | | | | |
Basic | | $ | (3.77 | ) | | $ | (15.29 | ) | | $ | 4.03 | | | $ | 6.63 | | | $ | 3.68 | |
Diluted | | $ | (3.77 | ) | | $ | (15.29 | ) | | $ | 3.96 | | | $ | 6.55 | | | $ | 3.60 | |
Dividends declared | | $ | 1.07 | | | $ | 3.09 | | | $ | 3.72 | | | $ | 3.33 | | | $ | 3.08 | |
Balance sheet data: | | | | | | | | | | | | | | | | | | | | |
Total assets | | $ | 6,672 | | | $ | 7,910 | | | $ | 11,732 | | | $ | 8,609 | | | $ | 5,449 | |
Total debt | | $ | 4,142 | | | $ | 4,428 | | | $ | 4,824 | | | $ | 3,926 | | | $ | 2,467 | |
Total shareholders’ equity | | $ | 2,329 | | | $ | 3,155 | | | $ | 6,441 | | | $ | 4,342 | | | $ | 2,898 | |
Net asset value per share | | $ | 8.29 | | | $ | 15.41 | | | $ | 32.88 | | | $ | 29.42 | | | $ | 24.37 | |
Other data (unaudited): | | | | | | | | | | | | | | | | | | | | |
Number of portfolio companies at period end | | | 187 | | | | 223 | | | | 219 | | | | 188 | | | | 141 | |
New investments(3) | | $ | 109 | | | $ | 2,607 | | | $ | 7,928 | | | $ | 5,136 | | | $ | 3,714 | |
Realizations(4) | | $ | 1,143 | | | $ | 2,176 | | | $ | 4,537 | | | $ | 3,447 | | | $ | 1,455 | |
Net operating income return on average equity at cost(5) | | | 2.1 | % | | | 7.5 | % | | | 11.3 | % | | | 12.0 | % | | | 13.6 | % |
Net realized (loss) earnings return on average equity at cost(5) | | | (10.7 | )% | | | 8.0 | % | | | 15.3 | % | | | 16.9 | % | | | 15.2 | % |
Net (loss) earnings return on average equity at fair value(6) | | | (37.3 | )% | | | (60.0 | )% | | | 12.2 | % | | | 24.6 | % | | | 15.9 | % |
Assets under management(7) | | $ | 12,474 | | | $ | 13,387 | | | $ | 17,104 | | | $ | 11,317 | | | $ | 5,675 | |
| (1) | Prior to the second quarter of 2007, European Capital Financial Services (Guernsey) Limited (“ECFS”), the investment manager for European Capital, was a consolidated operating subsidiary. In the second quarter of 2007, ECFS was deconsolidated prospectively and is recorded at fair value on our consolidated balance sheet as part of the fair value of our portfolio investment in American Capital, LLC. |
40
| (2) | In 2006, we adopted SFAS Statement No. 123 (revised 2004),Share-Based Payment (“SFAS No. 123(R)”), which is codified in FASB ASC Topic 718,Compensation-Stock Compensation (“ASC 718”). We adopted SFAS No. 123(R) using the “modified prospective” method. Under the modified prospective method, the consolidated financial statements for prior fiscal years do not reflect any restated amounts. When recognizing compensation cost under SFAS No. 123, we elected to adjust the compensation costs for forfeitures when the unvested awards were actually forfeited. However, under SFAS 123(R), we are required to estimate forfeitures of unvested awards when recognizing compensation cost. Upon the adoption of SFAS No. 123(R) on January 1, 2006, we recorded a cumulative effect of a change in accounting principle, net of related tax effects, to adjust compensation cost for the difference in compensation costs recognized in prior periods if forfeitures had been estimated during those periods of $1 million, or $0.01 per basic and diluted share. |
| (3) | New investments include amounts as of the investment dates that are committed but unfunded. |
| (4) | Realizations represent cash proceeds received upon the exit of investments including scheduled principal amortization, debt prepayments, proceeds from loan syndications and sales, payment of accrued payment-in-kind (“PIK”) interest, dividend and accreted loan discounts and sale of equity and other securities. |
| (5) | Equity calculated before the effect of net appreciation and depreciation of investments. Average equity is calculated based on the quarterly shareholders’ equity balances. |
| (6) | Return represents net increase or decrease in net assets resulting from operations. Average equity is calculated based on the quarterly shareholders’ equity balances. |
| (7) | Assets under management include both (i) the total of American Capital’s assets and (ii) the total assets of third-party funds under management of American Capital, LLC, including any direct investment we have in those funds. |
41
| ITEM 7. | Management’s Discussion and Analysis of Financial Condition and Results of Operations |
| | (in millions, except per share data) |
Forward-Looking Statements
All statements contained herein that are not historical facts including, but not limited to, statements regarding anticipated activity are forward looking in nature and involve a number of risks and uncertainties. Actual results may differ materially. Among the factors that could cause actual results to differ materially are the following: (i) changes in the economic conditions in which we operate negatively impacting our financial resources; (ii) certain of our competitors have greater financial resources than us reducing the number of suitable investment opportunities offered to us or reducing the yield necessary to consummate the investment; (iii) there is uncertainty regarding the value of our privately held securities that require our good faith estimate of fair value, and a change in estimate could affect our net asset value; (iv) our investments in securities of privately-held companies may be illiquid which could affect our ability to realize a gain; (v) our portfolio companies could default on their loans or provide no returns on our investments which could affect our operating results; (vi) we are dependent on external financing to fund our business; (vii) our ability to retain key management personnel; (viii) a continued economic downturn or recession could further impair our portfolio companies and therefore harm our operating results; (ix) our borrowing arrangements impose certain restrictions; (x) changes in interest rates may affect our cost of capital and net operating income; (xi) we generally cannot sell Senior Securities, except to refinance existing Senior Securities, unless we maintain an asset coverage of at least 200%, which may affect returns to our shareholder; (xii) we may fail to continue to qualify for our pass-through treatment as a RIC, which could have an effect on shareholder return; (xiii) our common stock price may be volatile; (xiv) there could be substantial doubt about our ability to continue as a going concern as a result of defaults under our debt facilities; and (xv) general business and economic conditions and other risk factors described in our reports filed from time to time with the SEC. We caution readers not to place undue reliance on any such forward-looking statements, which statements are made pursuant to the Private Securities Litigation Reform Act of 1995 and, as such, speak only as of the date made.
American Capital Investing Activity
We provide investment capital to middle market companies, which we generally consider to be companies with sales between $10 million and $750 million. We invest in senior and subordinated debt in the buyouts of private companies sponsored by other private equity firms, directly to mature private and small public companies and into our current portfolio companies. We will co-invest senior and subordinated debt in One-Stop Buyouts™ sponsored by equity funds that we manage that will provide the equity portion of the investments. Currently, we will invest up to $100 million in a single middle market transaction in North America. We also invest in Structured Products and alternative asset funds managed by us. For summary financial information by geographic area, see the footnotes to our consolidated financial statements in this Annual Report on Form 10-K.
We seek to be a long-term partner with our portfolio companies. As a long-term partner, we will invest capital in a portfolio company subsequent to our initial investment if we believe that it can achieve appropriate returns for our investment. Add-on financings fund (i) strategic acquisitions by a portfolio company of either a complete business or specific lines of a business that are related to the portfolio company’s business, (ii) recapitalization of a portfolio company to raise financing on better terms, buyout one or several owners or to pay a dividend, (iii) growth of the portfolio company such as product development or plant expansions, or (iv) working capital for a portfolio company, sometimes in distressed situations, that need capital to fund operating costs, debt service, or growth in receivables or inventory.
The total value of our investment portfolio was $5.6 billion, $7.4 billion and $10.9 billion as of December 31, 2009, 2008 and 2007, respectively. Our new investments totaled $0.1 billion, $2.6 billion and $7.9 billion during the years ended December 31, 2009, 2008 and 2007, respectively. The amounts of our new investments include both funded commitments and unfunded commitments as of the investment date. During the
42
year ended December 31, 2009, we generally limited our investment originations to providing funding to our existing portfolio companies for working capital or to recapitalize or refinance their balance sheets, primarily to preserve our investments. Since our asset coverage ratio was below 200% and our net asset value per share was greater than the trading price of our common stock during the year ended December 31, 2009, regulatory restrictions limited our ability to raise debt or equity capital during the year to be able to make significant new investments. In addition, we have increased the cash balance on our balance sheet with any realization of proceeds from the exit of portfolio investments during the year ended December 31, 2009 in anticipation of restructuring our debt obligations and delevering our balance sheet instead of reinvesting the proceeds into new investments.
The type and aggregate dollar amount of our new investments during the years ended December 31, 2009, 2008 and 2007 were as follows (in millions):
| | | | | | | | | |
| | | 2009 | | 2008 | | 2007 |
Investments in managed funds | | $ | — | | $ | 775 | | $ | 474 |
Financing for private equity buyouts | | | — | | | 485 | | | 1,756 |
American Capital sponsored buyouts | | | — | | | 303 | | | 3,273 |
Direct investments | | | — | | | 192 | | | 843 |
Structured products | | | — | | | 151 | | | 602 |
Add-on financing for working capital in distressed situations | | | 81 | | | 125 | | | 99 |
Add-on financing for recapitalizations | | | 20 | | | 110 | | | 489 |
Add-on financing for growth and working capital | | | 4 | | | 368 | | | 7 |
Add-on financing for acquisitions | | | 4 | | | 98 | | | 385 |
| | | | | | | | | |
Total | | $ | 109 | | $ | 2,607 | | $ | 7,928 |
| | | | | | | | | |
We continued to produce significant liquidity in 2009 through the realizations of our portfolio investments. However, the overall reduction in realizations from 2008 and 2007 was driven primarily by reduced global M&A activity. During the years ended December 31, 2009, 2008 and 2007, we received cash proceeds from realizations and repayments of portfolio investments as follows (in millions):
| | | | | | | | | |
| | | 2009 | | 2008 | | 2007 |
Loan syndications and sales | | $ | 410 | | $ | 349 | | $ | 1,601 |
Sale of equity investments | | | 323 | | | 913 | | | 975 |
Principal prepayments | | | 316 | | | 770 | | | 1,411 |
Payment of accrued PIK interest and dividend and original issue discounts | | | 48 | | | 64 | | | 74 |
Scheduled principal amortization | | | 46 | | | 80 | | | 74 |
Sale of CMBS securities | | | — | | | — | | | 402 |
| | | | | | | | | |
Total | | $ | 1,143 | | $ | 2,176 | | $ | 4,537 |
| | | | | | | | | |
Results of Operations
The following analysis of our financial condition and results of operations should be read in conjunction with our consolidated financial statements and the notes thereto.
Our consolidated financial performance, as reflected in our consolidated statements of operations, is composed of the following three primary elements:
| | • | | The first element is “Net operating income,” which is primarily the interest, dividends and prepayment fees earned from investing in debt and equity securities and the fees we earn from portfolio company management, asset management, financing and transaction structuring activities, less our operating expenses and provision for income taxes. |
43
| | • | | The second element is “Net realized (loss) gain on investments,” which reflects the difference between the proceeds from an exit of an investment and the cost at which the investment was carried on our consolidated balance sheets and periodic interest settlements and termination receipts or payments on derivatives, foreign currency transaction gains or losses and income taxes on realized gains. |
| | • | | The third element is “Net unrealized depreciation of investments,” which is the net change in the estimated fair value of our portfolio investments and of our interest rate derivatives at the end of the period compared with their estimated fair values at the beginning of the period or their stated costs, as appropriate. In addition, our net unrealized depreciation of investments includes the foreign currency translation from converting assets and liabilities denominated in a foreign currency to the U.S. dollar. |
The consolidated operating results for the years ended December 31, 2009, 2008 and 2007 were as follows (in millions):
| | | | | | | | | | | | |
| | | 2009 | | | 2008 | | | 2007 | |
Operating income | | $ | 697 | | | $ | 1,051 | | | $ | 1,240 | |
Operating expenses | | | 582 | | | | 521 | | | | 640 | |
| | | | | | | | | | | | |
Operating income before income taxes | | | 115 | | | | 530 | | | | 600 | |
Benefit (provision) for income taxes | | | 20 | | | | (37 | ) | | | (6 | ) |
| | | | | | | | | | | | |
Net operating income | | | 135 | | | | 493 | | | | 594 | |
Net gain on extinguishment of debt | | | 12 | | | | — | | | | — | |
Net realized (loss) gain on investments | | | (825 | ) | | | 32 | | | | 214 | |
| | | | | | | | | | | | |
Net realized (loss) earnings | | | (678 | ) | | | 525 | | | | 808 | |
| | | | | | | | | | | | |
Net unrealized depreciation of investments | | | (232 | ) | | | (3,640 | ) | | | (108 | ) |
| | | | | | | | | | | | |
Net (loss) earnings | | $ | (910 | ) | | $ | (3,115 | ) | | $ | 700 | |
| | | | | | | | | | | | |
Fiscal Year 2009 Compared to Fiscal Year 2008
Operating Income
We derive the majority of our operating income by investing in senior and subordinated debt and equity of middle market companies with attractive current yields and/or potential for equity appreciation and realized gains. We also derive operating income from investing in Structured Products. Operating income consisted of the following for the years ended December 31, 2009 and 2008 (in millions):
| | | | | | |
| | | 2009 | | 2008 |
Interest income on debt and Structured Product investments | | $ | 559 | | $ | 765 |
Dividend income | | | 76 | | | 176 |
Interest income on bank deposits | | | 3 | | | 9 |
| | | | | | |
Interest and dividend income | | | 638 | | | 950 |
| | | | | | |
Fund asset management fees and reimbursements | | | 22 | | | 29 |
Portfolio company advisory and administrative fees | | | 20 | | | 21 |
Loan financing fees | | | — | | | 20 |
Other fees | | | 17 | | | 31 |
| | | | | | |
Asset management and other fee income | | | 59 | | | 101 |
| | | | | | |
Total operating income | | $ | 697 | | $ | 1,051 |
| | | | | | |
44
Interest and Dividend Income
Interest income on debt and Structured Product investments decreased by $206 million, or 27%, to $559 million for the year ended December 31, 2009 from $765 million for 2008, due to a decrease in our monthly weighted average debt and Structured Product investments and a decline in the weighted average effective interest rate. Dividend income decreased by $100 million, or 57%, to $76 million for 2009 from $176 million for 2008, primarily due to a decline in the effective dividend yield.
The following table summarizes selected data for our debt and equity investments, at cost, for the years ended December 31, 2009 and 2008 (dollars in millions):
| | | | | | | | |
| | | 2009 | | | 2008 | |
Effective interest rate on debt investments(1)(2) | | | 8.5 | % | | | 11.0 | % |
Debt investments(1)(2) | | $ | 6,537 | | | $ | 6,980 | |
Average monthly one-month LIBOR | | | 0.3 | % | | | 2.5 | % |
Average non-accrual loans at cost(3) | | $ | 915 | | | $ | 503 | |
Average non-accrual loans at fair value(3) | | $ | 250 | | | $ | 121 | |
Effective dividend yield on equity investments(1) | | | 2.1 | % | | | 4.8 | % |
Equity investments(1) | | $ | 3,675 | | | $ | 3,695 | |
Effective yield on debt and equity investments(1)(2) | | | 6.2 | % | | | 8.8 | % |
Debt and equity investments(1)(2) | | $ | 10,212 | | | $ | 10,675 | |
| (1) | Monthly weighted average. |
| (2) | Includes Structured Products. |
Our weighted average debt and Structured Product investments decreased during 2009 as we have chosen to accumulate cash on our balance sheet from any realization of proceeds from the exit of portfolio investments during the year ended December 31, 2009 in anticipation of restructuring our debt obligations and delevering our balance sheet instead of reinvesting the proceeds into new investments. The monthly weighted average effective interest rate on debt investments decreased 250 basis points to 8.5% for the year ended December 31, 2009 from 11.0% for the year ended December 31, 2008. This is primarily due to (i) a 220 basis point decrease in the average one-month LIBOR from the prior year, (ii) an increase in non-accrual loans, (iii) partially offset by an increase in the interest spreads on recent loan originations and modifications.
A portion of our debt investments, particularly our senior debt investments, accrue interest at LIBOR plus a spread. These loans either have no LIBOR floor or may have a LIBOR floor that is generally around 2.0%. As a result, as LIBOR declines, our interest income generally will decline for our loans that are based on LIBOR.
Our average quarterly non-accrual loans as a percentage of our total loans at cost increased in 2009 as compared to the prior year as the impact of the recent economic recession has negatively impacted the performance of certain of our portfolio companies. When a loan is placed on non-accrual, we record reserves on uncollected PIK interest income recorded in prior periods as a reduction of interest income in the current period. For the year ended December 31, 2009, we recorded reserves on uncollected PIK interest income recorded in prior periods of $69 million, which had an approximately 110 basis point impact on the weighted average effective interest rate for the year ended December 31, 2009.
The interest income we earn on our debt investments was generally positively impacted by loans that were originated or modified during 2008 and 2009. These recent new loans originations have been priced at generally higher spreads as compared to loans that have been repaid during this period as market spreads have increased during this period.
45
The monthly weighted average effective dividend yield on equity investments decreased 270 basis points to 2.1% for the year ended December 31, 2009 from 4.8% for the year ended December 31, 2008. This is primarily due to (i) a lower accrual of dividends on our preferred stock investments of our private finance portfolio, (ii) discontinuation of dividends from our investment in European Capital and (iii) lower dividends from our investment in American Capital, LLC.
For the year ended December 31, 2009, we recorded reserves on uncollected accrued dividend income recorded in prior periods from private finance preferred stock investments of $48 million, which are recorded as a reduction of dividend income in the current period. The reserves on accrued dividend income were recorded because we no longer expect such amounts to be collected or realized.
We recorded dividend income on our equity investment in European Capital of $51 million for the year ended December 31, 2008. We did not record any dividend income on our equity investment in European Capital for the year ended December 31, 2009.
To the extent American Capital, LLC declares dividends of its net operating income to us, such dividends would be included as dividend income. The net operating income of American Capital, LLC is comprised of the base management fees, profit sharing (called carried interest or incentive fee) and transaction fees it earns less the operating expenses it incurs for providing fund management services. For the year ended December 31, 2009, American Capital, LLC declared dividends of $4 million compared to dividends of $18 million for year ended December 31, 2008. The decrease in dividend income is attributable primarily to lower net operating income from American Capital, LLC due to lower management fee income earned from managing European Capital.
Asset Management and Other Fee Income
As of December 31, 2009, all of our third-party alternative asset fund management services are conducted through our wholly-owned portfolio company, American Capital, LLC. Fund asset management fees and reimbursements revenue for the years ended December 31, 2009 and 2008 represent fees of $22 million and $29 million, respectively, for providing advisory and administrative services to American Capital, LLC.
Our asset management and other fee income includes financial advisory services provided to our portfolio company investments and includes both management fees for providing managerial advice and analysis to our middle market portfolio companies, which can be recurring in nature, and transaction structuring and financing fees for structuring, financing and executing middle market portfolio transactions, which may not be recurring in nature.
During the year ended December 31, 2009, we did not complete any American Capital sponsored buyouts and did not provide any financing in buyouts sponsored by other private equity firms. As a result, we did not earn any loan financing, equity financing or transaction structuring fees for the year ended December 31, 2009.
Operating Expenses
Operating expenses increased $61 million, or 12%, for the year ended December 31, 2009 from 2008. Operating expenses consisted of the following for the years ended December 31, 2009 and 2008 (in millions):
| | | | | | |
| | | 2009 | | 2008 |
Interest | | $ | 256 | | $ | 220 |
Salaries, benefits and stock-based compensation | | | 215 | | | 206 |
General and administrative | | | 111 | | | 95 |
| | | | | | |
Total operating expenses | | $ | 582 | | $ | 521 |
| | | | | | |
46
Interest
Interest expense for the year ended December 31, 2009 increased $36 million, or 16%, from 2008. The increase in interest expense for the year ended December 31, 2009 was primarily attributable to an increase in interest rates for default interest and ratings downgrades and a make-whole interest payment, partially offset by a decline in LIBOR and lower weighted average borrowings. As discussed in Note 5 to our consolidated financial statements in this Annual Report on Form 10-K, we are in default under certain of our unsecured borrowing arrangements. We incurred additional interest expense of $72 million during the year ended December 31, 2009 as a result of higher interest rates due to the defaults on certain of our borrowing arrangements and rating agency downgrades. In addition, as discussed in Note 5 to our consolidated financial statements in this Annual Report on Form 10-K, we incurred interest expense of $22 million during the year ended December 31, 2009 for a make-whole interest payment associated with the acceleration of our unsecured private debt for which we subsequently entered into forbearance agreements. The $22 million make-whole interest payment was added to the outstanding principal amounts of the unsecured private notes in accordance with the forbearance agreements. The weighted average interest rate on all of our borrowings, including amortization of deferred financing costs and the make-whole interest payment accrual, for the year ended December 31, 2009 was 5.9%, compared to 4.9% for the year ended December 31, 2008. Our weighted average borrowings decreased to $4,307 million for the year ended December 31, 2009 from $4,508 million in the comparable period in 2008.
Salaries, Benefits and Stock-based Compensation
Salaries, benefits and stock-based compensation consisted of the following for the years ended December 31, 2009 and 2008 (in millions):
| | | | | | |
| | | 2009 | | 2008 |
Base salaries | | $ | 73 | | $ | 93 |
Incentive compensation | | | 34 | | | 5 |
Severance costs | | | 9 | | | 10 |
Benefits | | | 13 | | | 17 |
Stock-based compensation | | | 86 | | | 81 |
| | | | | | |
Total salaries, benefits and stock-based compensation | | $ | 215 | | $ | 206 |
| | | | | | |
Salaries, benefits and stock-based compensation for the year ended December 31, 2009 increased $9 million, or 4%, from 2008 primarily due to (i) a one-time acceleration of stock-based compensation in 2009 from a tender offer of employee stock options, (ii) an increase in incentive compensation, (iii) partially offset by a decrease in the number of employees from 2008.
In December 2009, we completed a tender offer for certain eligible outstanding employee stock options. Pursuant to the tender offer, we offered employees a cash payment for the voluntary cancellation of certain eligible outstanding employee stock options. For each tendered stock option, non-executive officer employees received a cash payment of $0.05 per eligible stock option and executive officer employees received $0.01 per eligible stock option. As a result of the tender offer, approximately $21 million was accelerated and recorded as stock-based compensation for the year ended December 31, 2009. See Note 6 to our consolidated financial statements in this Annual Report on Form 10-K.
Our incentive compensation during the year ended December 31, 2009 increased by $29 million from 2008 as a result of retention bonus accruals implemented in 2009.
To better align our organization and cost structure with current economic conditions, we undertook strategic reviews of our business in 2009 and 2008 which resulted in aggregate restructuring charges of $25 million and $19 million for the years ended December 31, 2009 and 2008, respectively. The restructuring charges included $9 million and $10 million, respectively, for severance and related costs associated with 72 and 160 employees for the years ended December 31, 2009 and 2008, respectively. The severance and related costs are included in
47
salaries, benefits and stock-based compensation in our consolidated statements of operations. As of December 31, 2009, 2008 and 2007, we had total employees of 264, 384, and 580, respectively.
General and Administrative
General and administrative expenses increased by $16 million, or 17%, from 2008. The increase is primarily due to (i) non-recurring professional fees of $18 million for the year ended December 31, 2009 from both our and our unsecured creditors’ legal and financial advisors that have been engaged in connection with our debt restructuring negotiations, (ii) $16 million in restructuring charges related to excess facilities due to office closures and employee headcount reductions for the year ended December 31, 2009 as compared to $9 million in 2008, (iii) partially offset by lower overall general and administrative expenses due to fewer employees and offices in 2009 as compared to 2008.
(Benefit) Provision for Income Taxes
As a RIC, we are subject to a nondeductible federal excise tax of 4% if we do not distribute at least 98% of our ordinary income, excluding net short-term capital gains, in any calendar year and 98% of our capital gains for each one-year period ending October 31, including any undistributed income from the prior excise tax year. For the calendar year ended December 31, 2008 and the one-year period ending October 31, 2008, we did not distribute at least 98% of our ordinary income and capital gains and accrued the 4% excise tax. For the year ended December 31, 2008, we accrued $14 million of excise tax attributable to undistributed ordinary income, which is included in our (benefit) provision for income taxes on the accompanying consolidated statements of operations. For the year ended December 31, 2009 and one-year period ending October 31, 2009 we distributed at least 98% of our ordinary income and capital gains and did not accrue excise tax. The final taxable income included in our excise tax return for the calendar year ended December 31, 2008 and the one-year period ending October 31, 2008 resulted in a lower taxable income than the estimated taxable income used to accrue the $14 million excise tax for the year ended December 31, 2008. As a result of this change in estimate, we accrued an $8 million income tax benefit for the year ended December 31, 2009 related to excise taxes, which is included in our (benefit) provision for income taxes on the accompanying consolidated statements of operations.
Our consolidated operating subsidiary, ACFS, is subject to corporate level Federal, state and local income tax. For the year ended December 31, 2009, we accrued a tax benefit of $12 million compared to a tax provision of $23 million for 2008. We use the liability method in accounting for income taxes. Deferred tax assets and liabilities are recorded for temporary differences between the carrying amount of assets and liabilities and their tax basis and are stated at tax rates expected to be in effect when taxes are actually paid or recovered. A valuation allowance is provided against deferred tax assets when it is more likely than not that some or all of the deferred tax asset will not be realized. In determining whether our deferred tax asset is realizable, we consider the forecasted future taxable income of ACFS as well as any tax planning strategies. Considering the macroeconomic environment as of December 31, 2008, we concluded that it was more likely than not that we will not realize our deferred tax asset with future taxable income of ACFS. Accordingly, we recorded a valuation allowance against our deferred tax asset in 2008. Substantially most of our $23 million tax provision for ACFS in 2008 related to our recording of a valuation allowance. As of December 31, 2009, we continued to conclude that it is more likely than not that we would not realize our deferred tax asset with future taxable income of ACFS and have recorded a full valuation allowance against our deferred tax asset. We will continue to evaluate the valuation allowance each reporting period, and if we determine that it is more likely than not that the realizable amount of the deferred tax asset exceeds the valuation allowance, we would reduce the valuation allowance.
During the year ended December 31, 2009, we recorded a tax benefit of $12 million related to ACFS. On November 6, 2009, The Worker, Homeownership, and Business Assistance Act of 2009 was enacted. As part of this legislation, the carryback period for net operating losses arising in either 2008 or 2009 was increased from two years to three, four or five years at the election of the taxpayer. As a result of this new legislation, ACFS was able to carryback its net operating loss for the tax year ended September 30, 2009 to prior years to claim a refund. This resulted in American Capital recording a tax benefit of $10 million for the year ended December 31, 2009, which is included in our (benefit) provision for income taxes on the accompanying consolidated statements of operations.
48
Net Gain on Extinguishment of Debt
In 2009, we repurchased $20 million of Class B notes issued by our indirect wholly owned consolidated subsidiary, ACAS Business Loan Trust 2007-1 for $3 million. As a result of this purchase, we recognized a $17 million gain during the year ended December 31, 2009, which is recorded in net gain on extinguishment of debt in the accompanying consolidated statements of operations.
On March 12, 2009, we terminated our $500 million secured revolving credit facility with Wachovia Capital Markets, LLC, as deal agent. All borrowings under the facility were repaid during 2008 and had not been redrawn. We terminated the facility in connection with our effort to further delever our balance sheet and to reduce our overall borrowing costs. We recorded a loss on debt extinguishment of $5 million as a result of writing off the deferred debt issuance costs during the year ended December 31, 2009, which is recorded in net gain on extinguishment of debt in the accompanying consolidated statements of operations.
Net Realized (Losses) Gains on Investments
Our net realized (loss) gain on investments for the years ended December 31, 2009 and 2008 consisted of the following individual portfolio company realized gains (losses) greater than $15 million (in millions):
| | | | | | | | |
| | | 2009 | | | 2008 | |
Axygen Holdings Corporation | | $ | 35 | | | $ | — | |
Piper Aircraft, Inc. | | | 31 | | | | — | |
Edline, LLC | | | 16 | | | | — | |
BPWest, Inc. | | | — | | | | 69 | |
Contec Holdings, Ltd | | | — | | | | 58 | |
SSH Acquisition, Inc. | | | 1 | | | | 37 | |
Pasternak Enterprises, Inc. | | | 1 | | | | 34 | |
PaR Systems, Inc. | | | — | | | | 19 | |
Exstream Holdings, Inc. | | | 2 | | | | 18 | |
PHC Acquisition, Inc. | | | 1 | | | | 16 | |
Other, net | | | 35 | | | | 44 | |
| | | | | | | | |
Total gross realized portfolio gains | | $ | 122 | | | $ | 295 | |
| | | | | | | | |
Consolidated Bedding, Inc. | | | (196 | ) | | | — | |
CMX Inc. | | | (121 | ) | | | — | |
Barton-Cotton Holding Corporation | | | (74 | ) | | | — | |
Anchor Drilling Fluids USA, Inc. | | | (55 | ) | | | — | |
ACAS CRE CDO | | | (41 | ) | | | — | |
Sale of commercial mortgage loan portfolio | | | (39 | ) | | | — | |
TestAmerica Environmental Services, LLC | | | (39 | ) | | | — | |
Halex Corporation | | | (29 | ) | | | — | |
Ranpak Acquistion Company | | | (23 | ) | | | (3 | ) |
Venus Swimwear, Inc | | | (21 | ) | | | — | |
Ford Motor Company | | | (18 | ) | | | — | |
Foamex, L.P. | | | (18 | ) | | | — | |
Small Smiles Holding Company, LLC | | | (17 | ) | | | — | |
Stein World, LLC | | | — | | | | (32 | ) |
BLI Partners, LLC | | | — | | | | (16 | ) |
Other, net | | | (147 | ) | | | (112 | ) |
| | | | | | | | |
Total gross realized portfolio losses | | $ | (838 | ) | | $ | (163 | ) |
| | | | | | | | |
Total net realized portfolio (losses) gains | | $ | (716 | ) | | $ | 132 | |
Interest rate derivative periodic interest payments, net | | | (58 | ) | | | (31 | ) |
European Capital put option agreement | | | (44 | ) | | | — | |
Interest rate derivative termination payments, net | | | (4 | ) | | | (9 | ) |
Foreign currency transactions | | | (3 | ) | | | (6 | ) |
Taxes on net realized gains | | | — | | | | (54 | ) |
| | | | | | | | |
Total net realized (losses) gains | | $ | (825 | ) | | $ | 32 | |
| | | | | | | | |
49
The following are summary descriptions of portfolio company realized gains or losses greater than $30 million.
During 2009, we received full payment of our remaining subordinated debt investment in Axygen Holdings Corporation and sold all of our equity interests for $182 million in total proceeds realizing a total gain of $35 million offset by a reversal of unrealized appreciation of $37 million.
During 2009, we received full repayment of our remaining subordinated debt investment in Piper Aircraft, Inc. and sold all of our equity interests for $31 million in total proceeds realizing a total gain of $31 million offset by a reversal of unrealized appreciation of $23 million.
During 2009, Consolidated Bedding, Inc. (“Consolidated Bedding”) sold all of its remaining assets to several purchasers for total proceeds consisting of cash, a 49% equity interest in one of the purchasers, Spring Air International, LLC, and the future collection by one of the purchasers of certain accounts receivable of Consolidated Bedding. The total fair value of the cash and non-cash proceeds received, including the present value of future payments expected to be collected, was $14 million, the proceeds of which were used to partially pay down our debt investments. Subsequently, Consolidated Bedding filed for bankruptcy protection under Chapter 7 of the United States Code. We do not expect to receive any further proceeds for our debt and equity investments in Consolidated Bedding, except the collection of the remaining $14 million of total proceeds. We deemed our remaining investments to be worthless and recognized a realized loss of $196 million offset by a reversal of unrealized depreciation of $189 million.
During 2009, we wrote off a portion of our senior debt investment in CMX Inc. We did not receive any proceeds, realizing a loss of $121 million partially offset by a reversal of unrealized depreciation of $110 million.
During 2009, Barton-Cotton, Incorporated, the wholly-owned operating subsidiary of Barton-Cotton Holding Corporation (“Barton-Cotton”), filed for bankruptcy protection under Chapter 7 of the United States Code. Although we are pursuing our claims, we do not expect to receive any proceeds for our subordinated debt or equity investments in Barton-Cotton. We deemed our investments to be worthless and recognized a realized loss of $74 million fully offset by a reversal of unrealized depreciation.
During 2009, we wrote off $55 million of our subordinated debt investment in Anchor Drilling Fluids USA, Inc. We did not receive any proceeds, realizing a loss of $55 million fully offset by a reversal of unrealized depreciation.
As a result of deterioration of certain of the commercial mortgage loan collateral securing the CMBS bonds in ACAS CRE CDO during 2009, we no longer are receiving, nor do we expect to receive, future cash flows on our non-rated preferred shares and certain of our subordinated bonds in ACAS CRE CDO. Accordingly, during 2009 we wrote off our non-rated and certain of our subordinated bond investments in ACAS CRE CDO, realizing a loss of $41 million fully offset by a reversal of unrealized depreciation.
During 2009, we sold a portfolio of commercial mortgage loans secured by Winn-Dixie supermarkets for total cash proceeds of $103 million realizing a loss of $39 million fully offset by the reversal of unrealized depreciation. The commercial mortgage loans were made to the following real estate limited liability companies that were each portfolio companies of us: FU/WD Opa Locka, LLC, ZSF/WD Fitzgerald, LLC, ZSF Hammond, LLC, ZSF/WD Jacksonville, LLC, ZSF Montgomery-31, LLC, ZSF/WD Opa Locka, LLC and ZSF/WD Orlando, LLC.
During 2009, we wrote off our subordinated debt investment in TestAmerica Environmental Services, LLC. We did not receive any proceeds, realizing a loss of $39 million fully offset by a reversal of unrealized depreciation.
50
During 2008, we received full repayment of our remaining $9 million subordinated debt investment in BPWest, Inc. and sold all of our equity interests for $75 million in proceeds realizing a total gain of $69 million offset by a reversal of unrealized appreciation of $71 million.
During 2008, we received full repayment of our remaining $88 million subordinated debt investment in Contec Holdings, Ltd. and sold all of our equity interests for $165 million in proceeds realizing a total gain of $58 million offset by a reversal of unrealized appreciation of $58 million. We provided $135 million in subordinated debt financing to the purchasers.
During 2008, we received full repayment of our remaining $32 million subordinated debt investment in SSH Acquisition, Inc. and sold all of our equity interests for $59 million in proceeds realizing a total gain of $37 million offset by a reversal of unrealized appreciation of $40 million. We provided $141 million in senior and subordinated debt financing to the purchasers.
During 2008, we received full repayment of our remaining $29 million subordinated debt investment in Pasternack Enterprises, Inc. and sold all of our equity interests for $44 million in proceeds realizing a total gain of $34 million offset by a reversal of unrealized appreciation of $35 million.
During 2008, all of the operating assets of Stein World, LLC were sold pursuant to a sale foreclosure initiated by the lenders senior to us. We did not receive any proceeds from the sale and wrote off our debt investments in 2008 realizing a loss of $32 million offset by a reversal of unrealized depreciation of $32 million.
We record the accrual of the periodic interest settlements of interest rate swaps in net unrealized appreciation (depreciation) of investments and subsequently record the amount as a realized gain (loss) on investments on the interest settlement date. We generally pay a fixed rate and receive a floating rate based on LIBOR under our interest rate swap agreements. For the years ended December 31, 2009 and 2008, we recorded a net realized loss of $58 million and $31 million, respectively, from the settlement of the periodic interest payments under our interest rate swap agreements. The unfavorable periodic interest settlements in 2009 as compared to 2008 are due primarily from the decrease in LIBOR rates in 2009 as compared to 2008.
On November 19, 2008, we entered into a put option agreement with European Capital under which European Capital could put some or all of certain investments to us at a predetermined put price. Under the terms of the agreement, the put option could be exercised at any time commencing on January 1, 2010 and expiring on December 31, 2010. In consideration for entering into the put option agreement, European Capital paid us €16 million ($20 million). The fair value of the put option liability as of December 31, 2008 was $69 million (€49 million) which is included in derivative and option agreements in our consolidated balance sheet. On March 30, 2009, we entered into a termination agreement with European Capital to terminate the put option agreement. Under the terms of the termination agreement, we settled the put option obligation by paying European Capital the fair value of the put option obligation of $65 million (€49 million). As a result, we recognized a realized loss of $44 million offset by the reversal of unrealized depreciation of $49 million in our consolidated statements of operations.
For our tax year ended September 30, 2008, we retained our $155 million of net long-term capital gains resulting in a deemed distribution of $0.72 per share of net long-term capital gains to record holders as of September 30, 2008. Pursuant to the Code, we paid on behalf of our shareholders $54 million of Federal taxes on the retained net long-term capital gains, which is included in net realized (loss) gain on investments in the accompanying consolidated statements of operations.
51
Net Unrealized Appreciation (Depreciation) of Investments
The following table itemizes the change in net unrealized appreciation (depreciation) of investments for the years ended December 31, 2009 and 2008 (in millions):
| | | | | | | | |
| | | 2009 | | | 2008 | |
Gross unrealized appreciation of private finance portfolio investments | | $ | 297 | | | $ | 192 | |
Gross unrealized depreciation of private finance portfolio investments | | | (970 | ) | | | (1,955 | ) |
| | | | | | | | |
Net unrealized depreciation of private finance portfolio investments | | | (673 | ) | | | (1,763 | ) |
Net unrealized depreciation of European Capital(1) | | | (248 | ) | | | (672 | ) |
Net unrealized appreciation of AGNC | | | 22 | | | | 1 | |
Net unrealized depreciation of American Capital, LLC(1) | | | (148 | ) | | | (300 | ) |
Net unrealized depreciation of Structured Products | | | (11 | ) | | | (606 | ) |
Reversal of prior period net unrealized depreciation (appreciation) upon realization | | | 718 | | | | (140 | ) |
| | | | | | | | |
Net unrealized depreciation of portfolio investments | | | (340 | ) | | | (3,480 | ) |
Foreign currency translation | | | 28 | | | | (41 | ) |
Derivative agreements | | | 31 | | | | (119 | ) |
Reversal of prior period net unrealized depreciation on option agreements upon realization | | | 49 | | | | — | |
| | | | | | | | |
Net unrealized depreciation of investments | | $ | (232 | ) | | $ | (3,640 | ) |
| | | | | | | | |
| (1) | Excludes foreign currency translation. |
Private Finance Portfolio
Our private finance portfolio investments consist of loans and equity securities primarily to privately-held middle market companies. There is generally no publicly available information about these companies and an active primary or secondary market for the trading of these privately issued loans and securities generally does not exist. Our investments have been historically exited through normal repayment or a change in control transaction such as a sale or recapitalization of the portfolio company.
As discussed in Note 3 to our consolidated financial statements in this Annual Report on Form 10-K, we adopted SFAS No. 157, which is codified in FASB ASC Topic 820,Fair Value Measurements and Disclosures(“ASC 820”) on January 1, 2008. As a result of the adoption of ASC 820, we were required to modify our valuation methodologies for certain of our private finance investments. Prior to the adoption of ASC 820, we generally determined the fair value of our private finance portfolio investments by using the enterprise value waterfall (“Enterprise Value Waterfall”) valuation methodology. This valuation approach results in the determination of a fair value of our investments based on a change of control in an M&A transaction or a recapitalization of the enterprise based on the value of the enterprise. However, upon the adoption of ASC 820, for investments in debt and redeemable preferred equity securities of portfolio companies for which we do not have the ability to initiate a sale of the portfolio company as of the measurement date and for which there is no active market, we are required under ASC 820 to use a hypothetical secondary market as our principal market. We determine the fair value based on the assumptions that hypothetical market participants would use to value the investment in a current hypothetical sale using the market yield (“Market Yield”) valuation methodology. As of December 31, 2009, we have recognized $241 million of cumulative net unrealized depreciation as a result of using a Market Yield valuation methodology instead of the Enterprise Value Waterfall valuation methodology. We intend to hold these private finance portfolio investments until settlement or maturity which would generally be on a change of control event such as a sale or recapitalization of the company. In general, we do not intend to exit these investments in a secondary market where the sale proceeds would be based on a market yield. Accordingly, we do not expect to realize this $241 million of cumulative net unrealized depreciation if we hold the investments to settlement or maturity and there are no significant unanticipated credit impairments. However, we may decide to sell certain of our debt investments prior to settlement or maturity in which the sale price would be based on a market yield.
52
For the year ended December 31, 2009, the $673 million of net unrealized depreciation on our private finance portfolio investments was driven primarily by portfolio company performance and credit. The declines related to portfolio company performance and credit for the year ended December 31, 2009 were driven mostly by declines in the operating results of certain of our portfolio companies due to the recent global economic recession. From a trend perspective, we experienced a significant amount of net unrealized depreciation on our private finance portfolio investments during the first half of 2009 while recognizing modest net unrealized appreciation on our private finance portfolio in the second half of 2009.
For the year ended December 31, 2008, the $1,763 million of net unrealized depreciation on our private finance portfolio included approximately $447 million of net unrealized depreciation as a result of the change in our accounting methodologies from the adoption of ASC 820. The remaining $1,316 million of net unrealized depreciation on our private finance portfolio investments during 2008 was driven primarily by a combination of declines in multiples of comparable companies and portfolio company performance and credit for certain of our portfolio companies due to the recent global economic recession, particularly in the second half of 2008.
European Capital
For the year ended December 31, 2009, we recognized unrealized depreciation of $248 million on our investment in European Capital. As of December 31, 2009, our investment in European Capital consisted of a 100% equity investment with a cost basis and fair value of $1,267 million and $243 million, respectively, as well as an unsecured revolving credit facility investment with a fair value of $26 million. In the first quarter of 2009, we acquired the remaining 32% equity interest not already owned by us.
European Capital is an investment fund that invests in and sponsors management and employee buyouts, invests in private equity buyouts and provides capital directly to private and mid-sized public companies primarily in Europe. It primarily invests in senior debt, subordinated debt and equity. European Capital’s underlying portfolio investments are recorded at fair value determined in accordance with GAAP and ASC 820. In determining the fair value of our investment in European Capital, we concluded that our wholly-owned equity investment should be less than the NAV of European Capital due to the risks associated with our ability to realize the full fair value of European Capital’s underlying assets for several reasons, including European Capital negotiating the restructuring of its credit facilities with its lenders as of the measurement date, and recent comparable transactions and public comparables, which indicate fair values at a discount to NAV. The unrealized depreciation of $248 million during the year ended December 31, 2009 is due primarily to a decrease in the NAV of European Capital primarily as a result of a decline in the fair value of its portfolio investments during the year.
The following is a summary composition of European Capital’s NAV and our equity investment’s implied discount to its NAV as of December 31, 2009 (in millions):
| | | | |
Debt investments at fair value | | € | 1,038 | |
Equity investments at fair value | | | 174 | |
Other assets and liabilities, net | | | 94 | |
Secured debt at cost | | | (569 | ) |
Unsecured debt at cost | | | (191 | ) |
Unsecured debt from American Capital at cost | | | (18 | ) |
| | | | |
Net asset value | | € | 528 | |
Exchange rate | | | 1.43 | |
| | | | |
Net asset value in dollars | | $ | 755 | |
| | | | |
Fair value of American Capital equity investment | | $ | 243 | |
| | | | |
Implied discount to NAV | | | 32.2 | % |
| | | | |
53
As of December 31, 2008, European Capital was publicly traded on the London Stock Exchange under the ticker symbol “ECAS.” The fair value of European Capital as of December 31, 2008 was based on the market quote as of December 31, 2008 plus a control premium because our Board of Directors determined that additional value above the market quote would be obtainable upon transfer of control. The unrealized depreciation of $672 million during the year ended December 31, 2008 was due primarily to a decrease in the closing market quote as of December 31, 2008.
AGNC
For the year ended December 31, 2009, we recognized unrealized appreciation of $22 million on our investment in AGNC due to an increase in the closing market quote and the elimination in the discount to the market quote for certain sales restrictions that have lapsed.
American Capital, LLC
American Capital, LLC, a wholly-owned portfolio company of American Capital, is a holding company of wholly-owned third-party fund managers. During the years ended December 31, 2009 and 2008, we recognized $148 million and $300 million, respectively, of unrealized depreciation on our investment in American Capital, LLC. The funds managed by American Capital, LLC are European Capital, AGNC, ACE I, ACE II, ACAS CLO-1 and ACAS CRE CDO. The decline in value of American Capital, LLC for the years ended December 31, 2009 and 2008 is primarily due to a decline in its projected cash flows from reduced projected management fees and carried interest for managing European Capital due in part to a decline in the fair value of European Capital’s investments.
Structured Products
American Capital has investments in Structured Products such as investment and non-investment grade tranches of CMBS, CLO and CDO securities. During the years ended December 31, 2009 and 2008, we recorded $11 million and $606 million, respectively, of net unrealized depreciation on our Structured Products investments. Our CMBS portfolio, which includes a commercial real estate CDO, experienced $51 million and $455 million of net unrealized depreciation during the years ended December 31, 2009 and 2008, respectively, and our CLO and CDO portfolios of commercial loans experienced $40 million of net unrealized appreciation during the year ended December 31, 2009 and $151 million of net unrealized depreciation during the year ended December 31, 2008.
We value our Structured Products investments using the Market Yield valuation methodology. We estimate fair value based on third-party broker quotes, sale transactions of identical or similar securities and our cash flow forecasts subject to our assumptions a market participant would use regarding the investments’ underlying collateral including, but not limited to, assumptions of default and recovery rates, reinvestment spreads and prepayment rates. Cash flow forecasts are discounted using a market participant’s market yield assumptions that are derived from multiple sources including, but not limited to, third-party broker quotes, industry research reports and transactions of securities and indices with similar structure and risk characteristics. We weight the use of third-party broker quotes, if any, in determining fair value based on our understanding of the level of actual transactions used by the broker to develop the quote and whether the quote was an indicative price or binding offer. We considered that the current market for our Structured Products investments may be considered an inactive market and that the information used by the third-party brokers to develop the quotes, if any, may generally not be based on actual transactions.
For the year ended December 31, 2008, the net unrealized depreciation of $455 million and $151 million in our CMBS and CLO/CDO portfolios, respectfully, was driven primarily by a dramatic widening of the investments spreads from origination caused by the liquidity crisis in the market as well as credit performance, particularly in our CMBS portfolio. The liquidity crisis drove investors’ expected returns higher on Structured
54
Product investments. For the year ended December 31, 2009, the net unrealized appreciation of $40 million on our CLO/CDO portfolio was mostly due to narrowing of these investment spreads from the prior year. For the year ended December 31, 2009, the net unrealized depreciation of $51 million on our CMBS portfolio is due primarily to lower projected future cash flows due to credit performance in the overall commercial real estate markets, partially offset by a narrowing of investment spreads from the prior year. Cumulatively, we have recorded net unrealized depreciation of our Structured Products investments as of December 31, 2009 of $726 million.
Foreign Currency Translation
We have a limited amount of investments in portfolio companies, including European Capital, for which the investment is denominated in a foreign currency, primarily the Euro. We also have other assets and liabilities denominated in foreign currencies. Fluctuations in exchange rates therefore impact our financial condition and results of operations, as reported in U.S. dollars. For the year ended December 31, 2009, we recorded net unrealized appreciation of $28 million primarily as a result of the Euro appreciation against the U.S. dollar compared to net unrealized depreciation of $41 million in 2008.
Derivative and Option Agreements
During the year ended December 31, 2009, we recorded $31 million of net unrealized appreciation from derivative agreements, primarily interest rate swaps, compared to net unrealized depreciation of $119 million for the prior year.
For interest rate derivative agreements, we estimate the fair value based on the estimated net present value of the future cash flows using a forward interest rate yield curve in effect as of the end of the measurement period, adjusted for nonperformance risk, if any, including an evaluation of our credit risk and our counterparty’s credit risk. A negative fair value would represent an amount we would have to pay a third-party and a positive fair value would represent an amount we would receive from a third-party to assume our obligation under an interest rate derivative agreement. The derivative agreements generally appreciate or depreciate primarily based on relative market interest rates and their remaining term to maturity as well as changes in our and our counterparty’s credit risk.
The net unrealized appreciation of $31 million for the year ended December 31, 2009 was due to net unrealized appreciation of $76 million due to an increase in the forward interest rate yield curve, partially offset by unrealized depreciation of $45 million associated with a reduction of our credit risk for non-performance during the period. Cumulatively, the fair value of our net liability for our derivative agreements as of December 31, 2009 includes an $18 million reduction in the fair value of the net liability due to the incorporation of our credit risk as a result of the impact of our default under our unsecured borrowing arrangements and credit rating downgrades.
Return on Shareholders’ Equity
The following table summarizes our returns on shareholders’ equity for the years ended December 31, 2009 and 2008:
| | | | | | |
| | | 2009 | | | 2008 | |
Net operating income return on average shareholders’ equity at cost | | 2.1 | % | | 7.5 | % |
Net realized (loss) earnings return on average shareholders’ equity at cost | | (10.7 | )% | | 8.0 | % |
Net loss return on average shareholders’ equity | | (37.3 | )% | | (60.0 | )% |
55
Fiscal Year 2008 Compared to Fiscal Year 2007
Operating Income
Operating income consisted of the following for the years ended December 31, 2008 and 2007 (in millions):
| | | | | | |
| | | 2008 | | 2007 |
Interest income on debt and Structured Product investments | | $ | 765 | | $ | 767 |
Dividend income | | | 176 | | | 222 |
Interest income on bank deposits | | | 9 | | | 10 |
| | | | | | |
Interest and dividend income | | | 950 | | | 999 |
| | | | | | |
Fund asset management fees and reimbursements | | | 29 | | | 34 |
Portfolio company advisory and administrative fees | | | 21 | | | 27 |
Loan financing fees | | | 20 | | | 55 |
Prepayment fees | | | 5 | | | 15 |
Equity financing fees | | | 4 | | | 51 |
Transaction structuring fees | | | 4 | | | 36 |
Other fees | | | 18 | | | 23 |
| | | | | | |
Asset management and other fee income | | | 101 | | | 241 |
| | | | | | |
Total operating income | | $ | 1,051 | | $ | 1,240 |
| | | | | | |
Interest and Dividend Income
Interest income on debt and Structured Product investments decreased $2 million to $765 million for the year ended December 31, 2008 from $767 million for 2007 due to a decline in the weighted average interest rate on our debt and Structured Product investments partially offset by an increase in our weighted average debt and Structured Product investments. Dividend income decreased by $46 million, or 21%, to $176 million for 2008 from $222 million for 2007, primarily due to a decline in the weighted average effective yield on our equity investments partially offset by an increase in our weighted average equity investments.
The following table summarizes selected data for our debt and equity investments, at cost, for the years ended December 31, 2008 and 2007 (dollars in millions):
| | | | | | | | |
| | | 2008 | | | 2007 | |
Effective interest rate on debt investments(1)(2) | | | 11.0 | % | | | 12.5 | % |
Debt investments(1)(2) | | $ | 6,980 | | | $ | 6,146 | |
Average monthly one-month LIBOR | | | 2.5 | % | | | 5.2 | % |
Average non-accrual loans at cost(3) | | $ | 503 | | | $ | 235 | |
Average non-accrual loans at fair value(3) | | $ | 121 | | | $ | 74 | |
Effective dividend yield on equity investments(1) | | | 4.8 | % | | | 6.5 | % |
Equity investments(1) | | $ | 3,695 | | | $ | 3,422 | |
Effective yield on debt and equity investments(1)(2) | | | 8.8 | % | | | 10.3 | % |
Debt and equity investments(1)(2) | | $ | 10,675 | | | $ | 9,568 | |
| (1) | Monthly weighted average. |
| (2) | Includes Structured Products. |
The monthly weighted average effective interest rate on debt investments decreased 150 basis points to 11.0% for the year ended December 31, 2008 from 12.5% for the year ended December 31, 2007. This is primarily due to a 270 basis point decrease in the average one-month LIBOR from the prior year resulting in
56
lower interest income on our variable rate loans. The decrease in the monthly weighted average effective interest rate is also due to an increase in non-accrual loans, partially offset by an increase in the interest spreads on new investments originated or modified in the last eighteen months.
The monthly weighted average effective dividend yield on equity investments decreased 170 basis points to 4.8% for the year ended December 31, 2008 from 6.5% for the year ended December 31, 2007. The decrease is primarily due to (i) a lower accrual of dividends on our preferred stock investments of our private finance portfolio, (ii) lower non-recurring cash dividends from our common stock investments in our private finance portfolio and (iii) lower dividend income from American Capital, LLC, partially offset by (iv) an increase in our cash dividends from our common equity investments in our alternative asset funds.
The net operating income of American Capital, LLC is comprised of the base management fees, profit sharing (called carried interest or incentive fee) and transaction fees it earns less the operating expenses it incurs for providing fund management services. For the year ended December 31, 2008, American Capital, LLC declared dividends of $18 million compared to dividends of $41 million for year ended December 31, 2007. The decrease in dividend income is attributable primarily to a decrease in American Capital, LLC’s net operating income in 2008 due mostly to lower transaction fees from lower investment volume of its private equity funds under management, mostly European Capital, and lower management fees due to a decrease in assets under management primarily attributable to higher unrealized depreciation on the asset portfolio of European Capital.
We recorded dividend income on our equity investment in European Capital of $51 million for the year ended December 31, 2008 compared to $52 million for the year ended December 31, 2007. We also recorded dividend income of $13 million on our equity investment in AGNC for the year ended December 31, 2008.
Asset Management and Other Fee Income
Fund asset management fees and reimbursements revenue for the years ended December 31, 2008 and 2007 includes fees of $29 million and $19 million, respectively, for providing advisory and administrative services to American Capital, LLC. In addition, prior to the second quarter of 2007, ECFS was a consolidated operating subsidiary that earned alternative asset management fees and expense reimbursement revenues. The alternative asset management fees and expense reimbursements revenue earned by ECFS during the year ended December 31, 2007 was $15 million. There were no alternative asset management fees and expense reimbursements revenue recorded by us related to ECFS during the year ended December 31, 2008 as it was deconsolidated in the second quarter of 2007.
Loan financing fees for the year ended December 31, 2008 decreased $35 million, or 64%, over the comparable period in 2007. The decrease in loan financing fees for the year ended December 31, 2008 was attributable to a decrease in loan originations. The loan originations during the year ended December 31, 2008 decreased by $3.3 billion as compared to the prior year. Loan fees received that are representative of additional yield are recorded as OID and accreted into interest income using the effective interest method and not included in fee income.
Equity financing fees for the year ended December 31, 2008 decreased $47 million, or 92% over the comparable period in 2007. Transaction structuring fees for the year ended December 31, 2008 decreased $32 million, or 89% over the comparable period in 2007. Equity financing fees and transaction structuring fees were significantly lower in 2008 due primarily to reduced volume of American Capital sponsored buyouts.
57
Operating Expenses
Operating expenses decreased $119 million, or 19%, for the year ended December 31, 2008 over the comparable period in 2007. Operating expenses consisted of the following for the years ended December 31, 2008 and 2007 (in millions):
| | | | | | |
| | | 2008 | | 2007 |
Interest | | $ | 220 | | $ | 287 |
Salaries, benefits and stock-based compensation | | | 206 | | | 254 |
General and administrative | | | 95 | | | 99 |
| | | | | | |
Total operating expenses | | $ | 521 | | $ | 640 |
| | | | | | |
Interest
Interest expense for the year ended December 31, 2008 decreased $67 million, or 23%, over the comparable period in 2007. The decrease in interest expense for the year ended December 31, 2008 was primarily attributable to a decrease in our weighted average interest rate due to a decline in LIBOR as well as a decrease in our weighted average borrowings. The weighted average interest rate on all of our borrowings for the years ended December 31, 2008 and 2007 was 4.9% and 6.3%, respectively. Our weighted average borrowings decreased from $4,572 million for the year ended December 31, 2007 to $4,508 million in the comparable period in 2008.
Salaries, Benefits and Stock-based Compensation
Salaries, benefits and stock-based compensation consisted of the following for the years ended December 31, 2008 and 2007 (in millions):
| | | | | | |
| | | 2008 | | 2007 |
Base salaries | | $ | 93 | | $ | 92 |
Incentive compensation | | | 5 | | | 73 |
Severance costs | | | 10 | | | — |
Benefits | | | 17 | | | 17 |
Stock-based compensation | | | 81 | | | 72 |
| | | | | | |
Total salaries, benefits and stock-based compensation | | $ | 206 | | $ | 254 |
| | | | | | |
Salaries, benefits and stock-based compensation for the year ended December 31, 2008 decreased $48 million, or 19%, over the comparable period in 2007. The decrease is primarily due to lower incentive compensation in 2008, a decrease in the number of employees and the deconsolidation of ECFS, partially offset by severance costs in 2008 and annual salary increases. Our incentive compensation during the year ended December 31, 2008 decreased by $68 million, or 93%, over the comparable period in 2007 as a result of not meeting operating performance criteria. As discussed above, we deconsolidated ECFS in the second quarter of 2007. For the fiscal year ended December 31, 2007, the total salaries, benefits and stock-based compensation of ECFS was $7 million through the date of its deconsolidation.
To better align our organization and cost structure with current economic conditions, we undertook a strategic review of our business in 2008 which resulted in an aggregate restructuring charge of $19 million, including $10 million for severance and related costs associated with 160 employees notified of termination during 2008. The severance and related costs are included in salaries, benefits and stock-based compensation and the excess facilities costs are included in general and administrative in our consolidated statements of operations. As of December 31, 2008, we had total employees of 384 compared to total employees of 580 as of December 31, 2007.
58
General and Administrative
General and administrative expenses decreased by $4 million, or 4%, over the comparable period in 2007. The decrease is primarily due to the decrease in the number of employees, lower employee recruiting costs and the deconsolidation of ECFS, partially offset by the $9 million restructuring charge related to excess facilities due to office closures and employee headcount reductions discussed above.
Provision for Income Taxes
For the calendar years ended December 31, 2008 and 2007 and the one-year periods ending October 31, 2008 and 2007, we did not distribute at least 98% of our estimated ordinary income and capital gains and accrued a 4% excise tax. For the years ended December 31, 2008 and 2007, we accrued $14 million and $7 million, respectively, of excise tax attributable to our estimated undistributed ordinary income, which is included in our (benefit) provision for income taxes on the accompanying consolidated statements of operations. For the year ended December 31, 2007, we accrued $6 million of excise tax attributable to undistributed capital gains, which is included in taxes on net realized gain on the accompanying consolidated statements of operations.
For the year ended December 31, 2008, we accrued a tax provision of $23 million compared to a tax benefit $1 million for the corresponding period in 2007 for our consolidated operating subsidiary, ACFS. ACFS operated at a net loss during the year ended December 31, 2008, however we recorded a valuation allowance against our deferred tax asset during 2008 which resulted in a provision for income taxes on our consolidated statements of operations. We use the liability method in accounting for income taxes. Deferred tax assets and liabilities are recorded for temporary differences between the carrying amount of assets and liabilities and their tax basis and are stated at tax rates expected to be in effect when taxes are actually paid or recovered. A valuation allowance is provided against deferred tax assets when it is more likely than not that some or all of the deferred tax asset will not be realized. In determining if our deferred tax asset is realizable, we consider the forecasted future taxable income of ACFS as well as any tax planning strategies. Considering the current macroeconomic environment as of December 31, 2008, we concluded that it was more likely than not that we would not realize most of our deferred tax asset with future taxable income of ACFS. Accordingly, we recorded a valuation allowance against our deferred tax asset in 2008. Substantially most of our $23 million tax provision of ACFS for the year ended December 31, 2008 related to our recording of a valuation allowance.
59
Net Realized Gains (Losses) on Investments
Our net realized gains (losses) on investments for the years ended December 31, 2008 and 2007 consisted of the following individual portfolio company realized gains (losses) greater than $15 million (in millions):
| | | | | | | | |
| | | 2008 | | | 2007 | |
BPWest, Inc. | | $ | 69 | | | $ | — | |
Contec Holdings, Ltd | | | 58 | | | | — | |
SSH Acquisition, Inc. | | | 37 | | | | — | |
Pasternak Enterprises, Inc. | | | 34 | | | | — | |
PaR Systems, Inc. | | | 19 | | | | — | |
Exstream Holdings, Inc. | | | 18 | | | | — | |
PHC Acquisition, Inc. | | | 16 | | | | — | |
Sale to American Capital Equity II, LP | | | — | | | | 78 | |
Ranpak Acquisition Company | | | — | | | | 64 | |
EAG Acquisition, LLC | | | — | | | | 50 | |
ACSAB, LLC | | | — | | | | 45 | |
SAV Holdings, Inc. | | | 1 | | | | 43 | |
The Hygenic Corporation | | | 1 | | | | 22 | |
Other, net | | | 42 | | | | 61 | |
| | | | | | | | |
Total gross realized portfolio gains | | $ | 295 | | | $ | 363 | |
| | | | | | | | |
Stein World, LLC | | | (32 | ) | | | — | |
BLI Partners, LLC | | | (16 | ) | | | — | |
Stravina Holdings, Inc. | | | — | | | | (45 | ) |
New Starcom Holdings, Inc. | | | — | | | | (43 | ) |
Sale of 22 CMBS Investments | | | — | | | | (22 | ) |
Logex Corporation | | | — | | | | (21 | ) |
Other, net | | | (115 | ) | | | (34 | ) |
| | | | | | | | |
Total gross realized portfolio losses | | $ | (163 | ) | | $ | (165 | ) |
| | | | | | | | |
Total net realized portfolio gains | | $ | 132 | | | $ | 198 | |
Interest rate derivative periodic interest (payments) receipts, net | | | (31 | ) | | | 10 | |
Interest rate derivative termination (payments) receipts, net | | | (9 | ) | | | 7 | |
Foreign currency transactions | | | (6 | ) | | | 5 | |
Taxes on net realized gains | | | (54 | ) | | | (6 | ) |
| | | | | | | | |
Total net realized gains | | $ | 32 | | | $ | 214 | |
| | | | | | | | |
See “Fiscal Year 2009 Compared to Fiscal Year 2008” for discussion on the net realized gains (losses) for the year ended December 31, 2008. The following are summary descriptions of portfolio company realized gains or losses greater than $30 million during 2007.
During 2007, we sold approximately 17% of our equity investments (other than warrants issued with debt investments) in 80 portfolio companies for an aggregate purchase price of $488 million to ACE II. ACE II is a private equity fund with $585 million of equity commitments from third-party investors. The remaining $97 million equity commitment would be used by ACE II to fund add-on investments in the 80 portfolio companies. American Capital, LLC manages ACE II in exchange for a 2% annual management fee on the cost basis of the assets of the fund and a 10% to 30% carried interest in the net profits of the fund, subject to certain hurdles. We recorded a total net realized gain of $78 million upon the sale of the $488 million of investments. In accordance with SFAS No. 140,Accounting for Transfers and Servicing of Financial Assets and Extinguishment of Liabilities, which is codified in FASB ASC Topic 860,Transfers and Servicing(“ASC 860”), we included in our sale proceeds the fair value of the management agreement associated with the $488 million of investments sold.
60
The fair value of this portion of the contract was determined to be $20 million and was treated as being contributed to American Capital, LLC and included in our cost basis in our investment in American Capital, LLC. As a result, our $78 million of net realized gain on the transaction includes $20 million of a realized gain for the value of a portion of the management agreement received as sale proceeds.
During 2007, our portfolio company Ranpak Acquisition Company (“Ranpak”) recapitalized its balance sheet that included a partial redemption of its redeemable preferred stock. As part of the recapitalization, we received $71 million in proceeds for the partial redemption of our preferred stock investment in Ranpak, including full repayment of related accrued dividends, realizing a gain of $19 million. In addition, during the fourth quarter of 2007, we received full repayment of our remaining $107 million subordinated debt investment in Ranpak and sold all of our equity interest for $119 million in proceeds realizing a total additional gain of $45 million, offset by the reversal of unrealized appreciation of $56 million.
During 2007, a newly formed holding company, EAG Limited, closed on an IPO and began trading on the London Stock Exchange. As part of the offering, we sold all our shares in our portfolio company, EAG Acquisition, LLC, for proceeds of $55 million and received full repayment of our $104 million senior and subordinated debt investment. We realized a total gain of $50 million offset by a reversal of unrealized appreciation of $26 million.
Our portfolio company ACSAB, LLC (“ACSAB”) held an investment in ASAlliances Biofuels, LLC (“ASAlliances”). During 2007, ASAlliances was sold to VeraSun Energy Corporation (“VeraSun”) (NYSE: VSE) for cash and stock consideration. ACSAB distributed to us our share of its sale proceeds, after tax, consisting of cash, stock of VeraSun and an escrow that holds additional stock of VeraSun with a total value of $73 million. The value of the VeraSun stock was $32 million and the expected proceeds of the escrow were $13 million. As part of the sale transaction, we also received full repayment of our $48 million subordinated debt investment in ASAlliances. We recorded a total realized gain on the transaction of $45 million offset by a reversal of unrealized appreciation of $55 million.
During 2007, we received full repayment of our remaining $29 million senior and subordinated debt investments in SAV Holdings, Inc. and sold all of our equity interests for $66 million in proceeds realizing a total gain of $43 million offset by a reversal of unrealized appreciation of $49 million.
During 2007, Stravina Holdings, Inc. (“Stravina”) initiated an assignment of its assets for the benefit of its creditors, which is an out of court liquidation process. We received $2 million of sale proceeds and expected to receive a minimal amount of proceeds from the liquidation of the remaining assets of Stravina. We deemed our common stock and debt investments as worthless and we wrote them off with the exception of a senior debt investment with a fair value $0.1 million that we subsequently received payments from the additional liquidation proceeds. We realized a loss of $45 million fully offset by a reversal of unrealized depreciation.
During 2007, New Starcom Holdings, Inc. sold one of its operating subsidiaries and ceased all of its other operations. We did not expect to receive any proceeds from our subordinated debt or equity investment and deemed our investments to be worthless recognizing a realized loss of $43 million fully offset by a reversal of unrealized depreciation.
For the year ended December 31, 2008, we recorded a net realized loss of $31 million compared to a net realized gain of $10 million for the year ended December 31, 2007 from the settlement of the periodic interest payments under our interest rate swap agreements. The unfavorable periodic interest settlements in 2008 as compared to 2007 are due primarily from the decrease in LIBOR rates in 2008 as compared to 2007.
61
Net Unrealized Appreciation (Depreciation) of Investments
The following table itemizes the change in net unrealized appreciation (depreciation) of investments for the years ended December 31, 2008 and 2007 (in millions):
| | | | | | | | |
| | | 2008 | | | 2007 | |
Gross unrealized appreciation of private finance portfolio investments | | $ | 192 | | | $ | 642 | |
Gross unrealized depreciation of private finance portfolio investments | | | (1,508 | ) | | | (523 | ) |
Impact of adopting ASC 820 | | | (447 | ) | | | — | |
| | | | | | | | |
Net unrealized (depreciation) appreciation of private finance portfolio investments | | | (1,763 | ) | | | 119 | |
Net unrealized depreciation of Managed funds(1) | | | (671 | ) | | | (281 | ) |
Net unrealized (depreciation) appreciation of American Capital, LLC(1) | | | (300 | ) | | | 406 | |
Net unrealized depreciation of Structured Products | | | (606 | ) | | | (203 | ) |
Reversal of prior period net unrealized appreciation upon realization | | | (140 | ) | | | (167 | ) |
| | | | | | | | |
Net unrealized depreciation of portfolio investments | | | (3,480 | ) | | | (126 | ) |
Foreign currency translation | | | (41 | ) | | | 98 | |
Derivative agreements | | | (119 | ) | | | (80 | ) |
| | | | | | | | |
Net unrealized depreciation of investments | | $ | (3,640 | ) | | $ | (108 | ) |
| | | | | | | | |
(1) Excludes foreign currency translation. | | | | | | | | |
Private Finance Portfolio
During the year ended December 31, 2008, we recorded $1,763 million of net unrealized depreciation on our private finance portfolio investments, including $447 million of net unrealized depreciation as a result of the change in our accounting methodologies from the adoption of ASC 820. The remaining $1,316 million of net unrealized depreciation on our private finance portfolio investments during 2008 was driven primarily by declines in multiples of comparable companies and reduction of historic and projected cash flows of certain portfolio companies.
Under the Market Yield valuation methodology, the net unrealized depreciation of $447 million for the year ended December 31, 2008 was driven by a significant increase in expected current market yields and interest rate spreads of similar loans or securities as well as a decline in LIBOR. For example, the Merrill Lynch 3-5 Year BB US Cash Pay High Yield Index as of December 31, 2008 increased approximately 700 basis points as compared to the prior year. This index tracks U.S. denominated debt, currently in a coupon paying period that is publicly issued in the U.S. domestic market with a remaining term to maturity greater than or equal to 3 years and less than 5 years and rated BB1 through BB3. However, we estimate that the privately-held middle market loan pricing as of December 31, 2008 has increased over 200 basis points for senior debt and over 300 basis points for subordinated debt as compared to the prior year. In addition, the one-month LIBOR as of December 31, 2008 decreased by over 400 basis points as compared to the prior year.
The remaining $1,316 million of net unrealized depreciation on our private finance portfolio was driven primarily by declines in multiples of comparable companies and reduction of historical and projected cash flows of certain portfolio companies. Under the Enterprise Value Waterfall valuation methodology, we estimate the enterprise value of the portfolio company by preparing an analysis consisting of traditional valuation methodologies including market, income and cost approaches. We weight some or all of the traditional valuation methods based on individual circumstances of the portfolio company. Three of the more significant traditional valuation methodologies used are: valuations of comparable public companies, recent sales of private and public comparable companies, and discounting the forecasted cash flows of the portfolio company. During 2008, the trading multiples of comparable public companies have declined significantly. For example, the Wilshire 5000 Index declined 37% during 2008. The Wilshire 5000 Index is a common index that measures the performance of the stocks for nearly every traded public company in the United States. Also, recent sales of private and public
62
comparable companies also reflect lower multiples. In addition, the performance of certain of our portfolio companies deteriorated during 2008 due to both global macroeconomic factors due to the economic recession as well as individual performance issues at certain portfolio companies resulting in a decline of cash flows. Of our $1,316 million of remaining net unrealized depreciation on our private finance portfolio during the year ended December 31, 2008, we estimate that approximately two-thirds was due to multiple compression and approximately one-third was due to portfolio company performance.
Managed Funds
For the year ended December 31, 2008, the net unrealized depreciation of our managed funds was $671 million, consisting primarily of $672 million of unrealized depreciation on our investment in European Capital. As of December 31, 2008, we owned a 68% controlling majority-owned interest in European Capital, a company that was publicly traded on the London Stock Exchange under the ticker symbol “ECAS”. As outlined in our accounting policy and in accordance with the 1940 Act for determining fair value, for securities of companies that are publicly traded for which we have a majority-owned interest, the value is based on the market quote on the valuation date plus a control premium if our Board of Directors determines in good faith that additional value above the market quote would be obtainable upon transfer of control. As of December 31, 2008 and 2007, European Capital’s closing market quote was €0.90 and €6.98 per share, respectively. As of December 31, 2008 and 2007, the fair value of our controlling majority-owned equity interest in European Capital was determined to be €1.15 and €7.88 per share, respectively, which was based on the closing market quote plus a control premium of 27% and 13%, respectively. The $672 million of unrealized depreciation in our investment in European Capital during the year ended December 31, 2008 was driven primarily by a decrease in the market quote from December 31, 2007 to December 31, 2008. Including the impact of foreign currency translation, our equity investment in European Capital was valued at $117 million and $839 million as of December 31, 2008 and 2007, respectively. A control premium was applied to the market quote as it was determined in good faith by our Board of Directors that additional value above the market quote would be obtainable upon the sale of our controlling interest in European Capital. The purchaser of the majority-owned controlling interest in European Capital would have the ability to realize the net asset value and take advantage of synergies and other benefits that would result from control over European Capital.
American Capital, LLC
During the year ended December 31, 2008, we recognized $300 million of unrealized depreciation on our investment in American Capital, LLC compared to $406 million of unrealized appreciation in the comparable period in 2007. This decline was primarily driven by a decrease in the trading multiples of comparable asset management companies and a decline in its projected management and incentive fees due to lower projected transaction fees and a decline in the growth rate of assets under management. The projected lower transaction fees are due to lower projected investment originations of the alternative asset funds under its management. The decline in projected assets under management of American Capital, LLC is due in part to additional unrealized depreciation as a result of changes to accounting valuation policies upon the adoption of ASC 820 by the third-party alternative asset funds managed by American Capital, LLC, primarily European Capital.
Structured Products
During the year ended December 31, 2008, we recorded $606 million of net unrealized depreciation on our Structured Products investments compared to $203 million for the comparable period in 2008. Our CMBS portfolio, which includes a commercial real estate CDO, experienced $455 million of net unrealized depreciation and our commercial CLO and CDO portfolios experienced $151 million of net unrealized depreciation during the year ended December 31, 2008.
The $606 million of net unrealized depreciation during the year ended December 31, 2008 and the accumulated net unrealized depreciation as of December 31, 2008 of $770 million was driven primarily by dramatic widening of the investments spreads caused by the liquidity crisis in the market. The liquidity crisis has
63
driven investors’ expected returns higher on Structured Products investments. In general, there is not a liquid market for our non-investment grade Structured Products investments. However, there have been a few trades of securities of similar Structured Products investments in what is considered to be an illiquid distressed market during 2008, which has had the effect of decreasing the values of the overall Structured Products market.
Foreign Currency Translation
During the year ended December 31, 2008, the foreign currency translation adjustment recorded in our consolidated statements of operations as net unrealized depreciation was $41 million, primarily as a result of the Euro depreciating against the U.S. dollar.
Derivative and Option Agreements
During the year ended December 31, 2008, we recorded $119 million of net unrealized depreciation from derivative and option agreements. We recorded $70 million of net unrealized depreciation from interest rate derivative agreements, and $49 million of net unrealized depreciation from a put option agreement. The decrease in the fair value of our interest rate derivative agreements during the year ended December 31, 2008 is primarily due to a decrease in the forward interest rate yield curve as a result of the decline in LIBOR.
As of December 31, 2008, we were party to a put option agreement with European Capital under which European Capital can put some or all of certain investments to us at a predetermined put price of €332 million (approximately $467 million as of December 31, 2008). Under the terms of the agreement, the put option may be exercised at any time commencing on January 1, 2010 and expiring on December 31, 2010. If, prior to January 1, 2010, the investments are sold to a third party for less than the predetermined put price, we would have been required to pay European Capital an amount equal to the difference between the predetermined put price and the amount received on the sale. In consideration for entering the put option, European Capital paid us a premium of €16 million ($20 million) which is included on our consolidated balance sheet as a liability. During the year ended December 31, 2008, we recorded net unrealized depreciation of $49 million on the put option agreement primarily due to a decrease in fair value of the portfolio investments of European Capital subject to the put option agreement.
Return on Shareholders’ Equity
The following table summarizes our returns on shareholders’ equity for the years ended December 31, 2008 and 2007:
| | | | | | |
| | | 2008 | | | 2007 | |
Net operating income return on average shareholders’ equity at cost | | 7.5 | % | | 11.3 | % |
Net realized earnings return on average shareholders’ equity at cost | | 8.0 | % | | 15.3 | % |
Net (loss) earnings return on average shareholders’ equity | | (60.0 | )% | | 12.2 | % |
Financial Condition, Liquidity and Capital Resources
The economic recession and crisis in the global credit markets during the past two years has adversely affected all industry sectors. We suffered significant deprecation, higher defaults and losses in many of our investments, and as a result became overlevered and defaulted on our primary unsecured arrangements. Additionally we believe that the economic recession and global financial has resulted in fewer firms interested in financing assets or businesses, tighter lending standards and reduced access to capital. The economic recession and global financial crisis has contributed to a decline in earnings and/or decline in valuation multiples for our portfolio companies and widened the investment spreads on Structured Products and certain of our private finance debt investments causing decreases in the fair value of these investments. Although we began to experience some signs of stabilization during the latter part of 2009 in the earnings and valuation multiples of our portfolio companies and in the investments spreads on our Structured Products and private finance debt investments, we may experience volatile market swings that could lead to a further decline in earnings and/or
64
decline in valuation multiples for our portfolio companies or could lead to further widening of investment spreads on Structured Products or private finance debt investments causing a further decrease in the fair value of these investments. Although we cannot predict future market conditions, we believe that our continuing ability to generate positive operating cash flows and sell existing portfolio investments will provide us with adequate liquidity to execute our current business strategy including the payment of our debt service and the minimum amount of dividends to maintain our qualification as a RIC. There is no certainty that we will generate sufficient liquidity from these realizations to meet our needs. However, to the extent that the capital markets improve, we may elect to raise new capital.
Currently, our primary sources of liquidity are our cash and cash equivalents and our portfolio investments. As of December 31, 2009, we had $835 million in cash and cash equivalents and $96 million of restricted cash and cash equivalents. Our restricted cash and cash equivalents consists primarily of collections of interest and principal payments on assets that are securitized. In accordance with the terms of the related securitized debt agreements, based on current characteristics of the securitized loan portfolios, those funds are generally used each quarter to pay interest and principal on the securitized debt and are not distributed to us or available for our general operations. During the year ended December 31, 2009, we received cash proceeds from the realizations of portfolio investments of $1.1 billion. During the year ended December 31, 2009, we principally funded our operations, including our investing activities, from (i) cash receipts from interest, dividend and fee income from our investment portfolio and (ii) cash proceeds from the realization of portfolio investments through the repayments of loan investments, the sale of loan and equity investments.
Operating and Investing Cash Flow
Historically, our investment portfolio has generated a substantial amount of operating cash flow from interest, dividends and fees. For the years ended December 31, 2009 and 2008, we generated $165 million and $383 million of cash flow from operations, respectively. One of our other sources of liquidity is our investment portfolio. For the years ended December 31, 2009 and 2008, we received net cash from investing activities totaling $819 million and $271 million, respectively. Included in our cash from investing activities were cash proceeds from the realization of portfolio investments totaling $1.1 billion and $2.2 billion for the years ended December 31, 2009 and 2008, respectively. As of December 31, 2009, we had portfolio investments totaling $5.6 billion at fair value, including $3.7 billion in debt investments, $1.7 billion in equity investments and $0.2 billion in Structured Products. Our investments are generally illiquid and no active primary or secondary market for the trading of these investments exists. We are generally repaid our investments upon a change of control event of the portfolio company such as sale or recapitalization of the portfolio company. We currently have several portfolio companies in various stages of the sale process; however, there are no assurances that we will be able to realize proceeds from our investments in the future.
Due to our deleveraging efforts during 2009, our investment portfolio at cost decreased from $10.7 billion as of December 31, 2008 to $9.2 billion as of December 31, 2009. Our private finance debt portfolio, which is the significant contributor to our operating income and our operating cash flows, also decreased from $6.2 billion at cost as of December 31, 2008 to $4.5 billion at cost as of December 31, 2009. In addition, the weighted average interest rate on our outstanding borrowings increased from 4.9% for the year ended December 31, 2008 to 5.9% for the year ended December 31, 2009. As a result of the decrease in our private finance debt portfolio and the increase in our cost of capital during 2009, our operating cash flows decreased from $383 million for the year ended December 31, 2008 to $165 million for the year ended December 31, 2009. We expect our private finance debt portfolio to continue to decrease as we continue our deleveraging efforts, and we also expect that our cost of borrowing will increase in 2010 as a result of the proposed Restructuring. Though, we believe that we will continue to generate sufficient cash flow through the receipt of interest, dividend and fee payments from our investment portfolio, as well as the disposition of select portfolio investments, to allow us to continue to service our debt, pay our operating costs and expenses, pay dividends to maintain our status as a RIC and fund capital to our current portfolio companies.
65
Debt Capital
Our debt obligations consisted of the following as of December 31, 2009 and 2008 (in millions):
| | | | | | |
| | | 2009 | | 2008 |
Unsecured revolving credit facility | | $ | 1,388 | | $ | 1,389 |
Unsecured public debt due October 2012 | | | 548 | | | 548 |
Unsecured private debt due September 2009 | | | 84 | | | 82 |
Unsecured private debt due August 2010 | | | 134 | | | 126 |
Unsecured private debt due February 2011 | | | 26 | | | 24 |
Unsecured private debt due September 2011 | | | 95 | | | 85 |
Unsecured private debt due October 2020 | | | 75 | | | 75 |
ACAS Business Loan Trust 2004-1 asset securitization | | | 170 | | | 201 |
ACAS Business Loan Trust 2005-1 asset securitization | | | 696 | | | 798 |
ACAS Business Loan Trust 2006-1 asset securitization | | | 377 | | | 427 |
ACAS Business Loan Trust 2007-1 asset securitization | | | 294 | | | 381 |
ACAS Business Loan Trust 2007-2 asset securitization | | | 255 | | | 292 |
| | | | | | |
Total | | $ | 4,142 | | $ | 4,428 |
| | | | | | |
The daily weighted average debt balance for the years ended December 31, 2009 and 2008 was $4,307 million and $4,508 million, respectively. The weighted average interest rate on all of our borrowings, including amortization of deferred financing costs and the make-whole interest payment accrual, for the years ended December 31, 2009 and 2008 was 5.9% and 4.9%, respectively.
Unsecured Revolving Credit Facility
In September 2008, we amended our Credit Facility administered by an affiliate of Wachovia Capital Markets, LLC. In connection with the amendment, the commitment size of the Credit Facility was reduced from $1,565 million to $1,409 million and was scheduled to be reduced further to $1,252 million on December 31, 2009. The maturity date was also amended from May 2012 to March 2011. Interest on borrowings under this Credit Facility is charged at either (i) the applicable index rate and the applicable percentage at such time based on our senior unsecured debt rating, or (ii) for borrowings denominated in U.S. dollars, the greater of the prime rate in effect on such day and the federal funds effective rate in effect on such day plus 0.50%, and for borrowings denominated in an alternative currency, the applicable base rate, in each case, plus the applicable percentage at such time based on our unsecured debt rating. To the extent that our unsecured debt rating decreases, the applicable spread over the applicable index rate and applicable base rate would both increase by 0.50% for each rating decrease to a maximum spread of 4.75% and 3.75%, respectively. We are also charged an unused commitment fee based on our corporate rating. To the extent that our unsecured debt rating decreases, the unused commitment fee would increase by 0.10% for each rating decrease to a maximum of 0.80%.
The agreement contains various covenants, including maintaining a minimum consolidated tangible net worth of $4.5 billion plus forty percent (40%) of any capital stock issued or debt converted after October 1, 2008, an asset coverage ratio equal to or greater than 1.55 to 1.00 and an interest coverage ratio equal to or greater than 1.75 to 1.00. The agreement also contains a cross-default provision on our consolidated debt of $25 million or more and a default triggered if we fail to maintain an unsecured debt rating equal to or greater than BB by any one rating agency and a default triggered by a change of control.
As of December 31, 2009 and 2008, we were not in compliance with the minimum consolidated tangible net worth covenant and certain other covenants for the Credit Facility. In addition, as of December 31, 2009, we were not in compliance with the ratio of adjusted earnings before interest and taxes to interest expense covenant for the Credit Facility. On March 5, 2009, the administrative agent under the Credit Facility sent a notice of such events of default to us. During the continuance of these events of default, lenders representing a majority of the
66
commitments may declare the outstanding principal and accrued interest to be due and payable immediately. Pursuant to the terms of the Credit Facility, the applicable spread on any borrowings outstanding under the Credit Facility increased by 2.00% as a result of these events of default. Also, due to the events of default, all LIBOR borrowings outstanding were automatically converted into base rate loans from index rate loans. The applicable interest rate for base rate loans is the greater of the prime rate or the federal funds rate plus 0.50%. As a result of rating agency downgrades during the first quarter of 2009, the applicable spread over the applicable base rate increased from 2.25% to 3.75% and the unused commitment fee increased from 0.50% to 0.80% as of March 2, 2009. As of December 31, 2009, the total interest rate on the Credit Facility was 9.00% for borrowings denominated in U.S. dollars.
In November 2009, we entered into a lock up agreement with lenders under the Credit Facility to further our efforts to restructure the Credit Facility and our other principal unsecured debt arrangements based on our previously announced agreement in principle with the lenders to restructure the Credit Facility. Under the current terms of the proposed Restructuring, the unsecured private notes and the unsecured public notes would have to be restructured on terms that are not more favorable to the holders of the notes than the restructured Credit Facility terms. Under the proposed Restructuring, each of the classes of our primary unsecured debt obligations would be exchanged for term debt secured by a pledge of substantially all of our unencumbered assets. Key terms of the proposed Restructuring include (i) an aggregate $450 million principal payment at closing, (ii) scheduled aggregate principal amortization of $250 million in 2010, $300 million in 2011, $350 million in 2012 and $300 million in 2013, with any remaining unpaid principal due at maturity on December 31, 2013, (iii) deferral through 2013 of up to $200 million in the aggregate of annual scheduled principal amortization, which is limited to $100 million in 2010, (iv) an interest rate of the greater of 2.00% or LIBOR, plus a spread based on the aggregate outstanding principal balance of (a) 9.50% if the outstanding obligations are greater than or equal to $1.7 billion, (b) 8.50% if the outstanding obligations are less than $1.7 billion but greater than or equal to $1.4 billion, (c) 6.50% if the outstanding obligations are less than $1.4 billion but greater than or equal to $1.0 billion, or (d) 5.50% if the outstanding obligations are less than $1.0 billion, (v) an additional interest spread of 0.50% each time that certain additional principal amortizations, which are greater than the scheduled principal amortizations noted above, are not met, (vi) an additional 1.00% if we defer any portion of the scheduled principal amortization due in 2010, and (vii) the payment of fees equal to 2.00% of the aggregate principal balance at closing, and 1.00% at both December 31, 2011 and 2012.
We intend to consummate the proposed Restructuring by entering into an Exchange Transaction. In the event that fewer than 100% of the lenders under our Credit Facility, fewer than 100% of the holders of our private unsecured notes and holders of less than 85% of the principal amount of our public unsecured notes agree to enter the Exchange Transaction, we intend to implement the transactions described in the proposed Restructuring through a solicitation of votes for the Plan and commence a Restructuring Case. We plan to commence the Exchange Transaction and solicitation of votes for the Plan simultaneously.
We and the lenders in the Credit Facility have agreed in the lock up agreement, among other things, to support the Exchange Transaction, Plan and reorganization as provided for in the proposed Restructuring, and have agreed, among other things, that neither will (i) object to the Exchange Transaction, the solicitation or confirmation of the Plan or otherwise commence any proceeding to oppose or alter the Exchange Transaction or the Plan, (ii) vote for or support any restructuring or reorganization other than contemplated in the Exchange Transaction or the Plan or (iii) take any actions to delay materially confirmation or upon consummation of the Exchange Transaction or the Plan.
In addition, we have agreed, among other things, to pay prior to commencement of any Restructuring Case, all accrued and unpaid interest at the default rate and all accrued and unpaid fees in respect of the Credit Facility. Under the lock up agreement, each lender has also agreed to participate in the Exchange Transaction, to vote its claims (“Claims”) under the facility to accept the Plan, not to change or withdraw its vote or its consent to accept the Exchange Transaction or the Plan and that it will not directly or indirectly sell, assign, pledge, hypothecate, grant an option on, or otherwise dispose of any of its Claims held as of November 20, 2009, except for transactions to entities that agree to be bound by the terms of the lock up agreement.
67
The lock up agreement also contains an agreement by the lenders to forbear from exercising remedies resulting from defaults by us under the Credit Facility, until the earlier of (i) the consummation of the Exchange Transaction or commencement of a Restructuring Case, (ii) the date on which any holder of our private unsecured notes or public unsecured notes commences litigation or an involuntary case under Title eleven of the United States Code against us, (iv) the date on which any one or more creditors of us with claims in excess of $25 million commence litigation against us or (v) any other filing of an involuntary case under Title eleven of the United States Code against us.
The lock up agreement generally requires all of the lenders under the Credit Facility to agree to the proposed Restructuring assuming specified conditions are met. However, the lock up agreement may be terminated if various stages of the proposed Restructuring are not completed by certain dates. These deadlines were extended twice in January 2010. Currently, the lock up agreement may be terminated (i) upon consummation of the Exchange Transaction and the effective date of the Plan or a written agreement to terminate the lock up agreement, (ii) if the Exchange Transaction is not consummated in accordance with the proposed Restructuring and we have not commenced a Restructuring Case by March 15, 2010 (unless the administrative agent under the Credit Facility agrees to an extension of not later than March 31, 2010) or (iii) if we commence a Restructuring Case and (1) any material order is entered that is inconsistent with the lock up agreement or the proposed Restructuring, which is objected to by a majority of the lenders, (2) an order finding that the solicitation complying with applicable law and confirming the Plan has not been entered on or before May 15, 2010 (unless the administrative agent under the Credit Facility agrees to an extension of not later than May 31, 2010) or (3) the Plan is not consummated by May 31, 2010, or the Restructuring Case is dismissed or converted to an Accelerated Case or a trustee or examiner shall have been appointed in the Restructuring Case. In addition, either party may terminate the lock up agreement upon a breach of material obligations by the other party. Because we have not launched the Exchange Transaction as of the date of this filing and the tender offer rules under the Securities Exchange Act of 1934, as amended, require that such offers generally remain open for 20 business days, it is likely that we will be unable to complete the Exchange Transaction by the above deadlines. We may seek an amendment to the lock up agreement to further extend the deadline for consummating the Exchange Transaction or we may proceed with the proposed Restructuring without a lock up agreement with the lenders under the Credit Facility. We do not have a lock up agreement with our other unsecured creditors. As noted above, if the requisite lenders and noteholders do not agree to the Exchange Transaction, we intend to implement the proposed Restructuring by soliciting votes for the Plan. We expect that we will ultimately be successful in completing the proposed Restructuring.
Unsecured Public Debt
In July 2007, we completed a public offering of $550 million of senior unsecured notes for proceeds of $547 million, net of underwriters’ discounts. The notes bore interest at an initial fixed rate of 6.85% and mature in August 2012. Interest payments are due semi-annually on February 1 and August 1 and all principal is due at maturity. At the time of the issuance, the notes were rated Baa2, BBB and BBB by Moody’s Investor Services, Standard & Poor’s Ratings Services and Fitch Ratings, respectively. If the ratings of the notes from at least two of the rating agencies are decreased to ratings set forth in the table below, the initial interest rate of 6.85% would increase from the initial interest rate by each of the percentages for the two ratings set forth below:
| | | | | | | | | | | | | |
Fitch Rating | | Interest Rate
Adjustment | | | S&P Rating | | Interest Rate
Adjustment | | | Moody’s Rating | | Interest Rate
Adjustment | |
| BB+ | | 0.25 | % | | BB+ | | 0.25 | % | | Ba1 | | 0.25 | % |
| BB | | 0.50 | % | | BB | | 0.50 | % | | Ba2 | | 0.50 | % |
| BB- | | 0.75 | % | | BB- | | 0.75 | % | | Ba3 | | 0.75 | % |
| B+ or below | | 1.00 | % | | B+ or below | | 1.00 | % | | B1 or below | | 1.00 | % |
68
If at least two of the rating agencies then subsequently increase their ratings of the notes to any of the ratings set forth above, the interest rate on the notes would decrease such that the interest rate on the notes equals the initial interest rate of 6.85% plus (if applicable) each of the percentages for the ratings set forth above. Each adjustment required by any decrease or increase in the ratings set forth above is made independent of any and all other adjustments, provided that if the ratings from three rating agencies are decreased to the ratings set forth above, then only the lowest two of the three ratings will be utilized for such adjustments. In no event shall the interest rate be reduced below 6.85% or increased above 8.85%. If at least two rating agencies cease to provide ratings for the notes, any increase or decrease necessitated by a reduction or increase in the rating by the remaining rating agency shall be twice the percentages set forth above. The notes may be redeemed by us in whole or in part, together with an interest premium, as stipulated in the note agreement. The indenture contains various covenants, including a covenant that requires us to maintain an asset coverage ratio, as defined in the 1940 Act, of at least 200%.
As a result of rating agency downgrades during the first quarter of 2009, the interest rate on these notes increased by 1.75% effective February 2, 2009 to a total rate of 8.60%. As a result of further rating agency downgrades during the third quarter of 2009, the interest rate on these notes increased by an additional 0.25% effective August 6, 2009 to a total rate of 8.85%. As we are now being charged interest at the interest rate cap of 2.00% over the original stated rate, there will be no further increase to the interest rate as a result of any future rating agency downgrades.
We were not in compliance with the asset coverage ratio covenant as of December 31, 2009 and December 31, 2008. On March 3, 2009, we received notices of an event of default from the indenture trustee and a steering committee of certain noteholders. Under the indenture for the notes, we had a 60-day period to cure the default, which commenced on the day we received the notice of default. Following the expiration of the 60-day cure period, the default matured into an event of default under the indenture. Pursuant to the terms of the notes, during the continuance of this event of default, the trustee or the holders of at least 25% of the outstanding principal amount of the notes may declare the principal and accrued interest to be due and payable immediately. The holders of more than 50% of the outstanding principal amount of the notes can rescind any acceleration if all late payments are made and any events of default are cured or waived. As of the date of this filing, the noteholders have not accelerated the amounts outstanding under the notes.
Unsecured Private Debt
In February 2006, we entered into a note purchase agreement to issue €14 million and £3 million of senior unsecured five-year notes to institutional investors in a private placement offering. The €14 million Series 2006-A Notes have a fixed interest rate of 5.177% and the £3 million Series 2006-B Notes have a fixed interest rate of 6.565%. Each series matures in February 2011. The outstanding principal balance as of December 31, 2009 includes $2 million of the $22 million make-whole interest payment discussed below.
In September 2005, we entered into a note purchase agreement to issue $75 million of senior unsecured fifteen-year notes to accredited investors in a private placement offering. The unsecured notes have a fixed interest rate of 6.923% through the interest payment date in October 2015 and bear interest at the rate of LIBOR plus 2.65% thereafter and mature in October 2020.
In August 2005, we entered into a note purchase agreement to issue an aggregate of $126 million of senior unsecured five-year notes to institutional investors in a private placement offering. The unsecured notes have a fixed interest rate of 6.14% and mature in August 2010. The outstanding principal balance as of December 31, 2009 includes $8 million of the $22 million make-whole interest payment discussed below.
In September 2004, we entered into a note purchase agreement to issue an aggregate $167 million of senior unsecured five- and seven-year notes to institutional investors in a private placement offering. The unsecured notes consist of $82 million of senior notes, Series A and $85 million of senior notes, Series B. The Series A notes have a fixed interest rate of 5.92% and matured in September 2009, however the principal balance remains
69
outstanding as of December 31, 2009. The Series B notes have a fixed interest rate of 6.46% and mature in September 2011. The outstanding principal balance of the Series A senior notes and Series B senior notes as of December 31, 2009 includes $2 million and $10 million, respectively, of the $22 million make-whole interest payment discussed below.
The note purchase agreements discussed above contain various covenants, including covenants that require us to maintain an asset coverage ratio, as defined in the 1940 Act, of at least 200%, an available debt asset coverage ratio, a minimum consolidated tangible net worth and a minimum interest coverage ratio. Each note purchase agreement also contains a cross-default provision on our consolidated debt of $15 million or more and a default triggered by a change of control. During an event of default, holders of 50% of the outstanding principal balance of each series of notes can declare all amounts due under the notes then outstanding immediately due and payable. Amounts immediately due and payable would include the outstanding principal of the notes plus (i) all accrued but unpaid interest and (ii) a make-whole interest payment, if any. The make-whole interest payment would generally be calculated as the excess of the then outstanding principal of the notes over the present value of the remaining originally scheduled principal and interest payments.
As of December 31, 2009 and 2008, we were not in compliance with certain financial covenants, including the minimum consolidated tangible net worth covenant, the available debt asset coverage ratio covenant and the asset coverage ratio covenant for each series of these notes. In addition, as of December 31, 2009, we were not in compliance with the ratio of consolidated debt to consolidated shareholders’ equity covenant for each series of these notes. On March 5, 2009, a steering committee of the noteholders sent a notice of such events of default to us. Pursuant to the terms of the notes, during the continuance of these events of default, the holders of more than 50% of the outstanding principal amount of each series of the notes can declare that all amounts outstanding under the notes for the respective series are immediately due and payable, at which time a default rate equal to the greater of 2.00% above the stated rate for each series or 2.00% over the prime rate will be applied on all overdue amounts. The holders of more than 50% of the outstanding principal amount of each series of notes could rescind any acceleration of the notes in that series if all late payments are made, any events of default are cured or waived and no judgment or decree has been entered for the payment of any monies due on the notes. On August 28, 2009, the noteholders declared the unpaid principal amount of the notes outstanding, plus all accrued and unpaid interest and the respective make-whole interest payment for each series, if any, immediately due and payable. Although we have not repaid these obligations in full, we entered into forbearance agreements with all of these noteholders, under which the noteholders agreed to forbear from exercising certain rights and remedies with respect to the events of default existing under the notes. The holders of a majority in principal amount of the notes outstanding under each series may terminate the forbearance agreement for the series at any time. In consideration for entering into the forbearance agreements, we paid all accrued and unpaid interest due on the notes as of September 1, 2009 at the default rate retroactive to March 30, 2009 and agreed to add to the outstanding principal amounts of certain of the notes a $22 million make-whole interest payment, which is included in interest expense in the accompanying consolidated statements of operations. As of December 31, 2009, the total weighted average interest rate of our unsecured private notes was 8.27%.
Securitizations
As of December 31, 2009 and 2008, we were in compliance with all of the covenants for our asset securitizations. However, for each of our asset securitizations, there was defaulted loan collateral in each trust and therefore all interest and principal collections are being applied sequentially to pay down the principal notes as discussed below.
In August 2007, we completed a $500 million asset securitization. In connection with the transaction, ACAS Business Loan Trust 2007-2 (“BLT 2007-2”), an indirect consolidated subsidiary, issued $300.5 million Class A notes, $37.5 million Class B notes and $162 million of Class C through Class F notes (collectively, the “2007-2 Notes”). The Class A notes and Class B notes were sold to institutional investors and all of the Class C through Class F notes were retained by us. The 2007-2 Notes are secured by loans originated or acquired by us and sold to our wholly-owned consolidated subsidiary, BLT 2007-2. Through February 2008, BLT 2007-2 could have also
70
generally used principal collections from the underlying loan pool to purchase additional loans to secure the 2007-2 Notes. After such time, principal payments on the 2007-2 Notes will generally be applied pro rata to each class of 2007-2 Notes outstanding until the aggregate outstanding principal balance of the loan pool is less than $250 million or the occurrence of certain other events. Payments will then be applied sequentially to the Class A notes, the Class B notes, the Class C notes, the Class D notes, the Class E notes and the Class F notes. However, if any loan collateral in the trust becomes a defaulted loan, as defined in the indenture, all interest and principal collections that would be applied to the Class E notes and Class F notes are applied sequentially to pay the principal on the Class A notes, Class B notes, Class C notes and Class D notes in an amount equal to the principal balance of the defaulted loan collateral. As of December 31, 2008 and 2009, there was defaulted loan collateral in the trust and therefore all interest and principal collections were being applied sequentially to pay down the principal of the notes as outlined above. Subject to continuing compliance with certain conditions, we will remain as servicer of the loans. The Class A notes have an interest rate of three-month LIBOR plus 40 basis points, the Class B notes have an interest rate of three-month LIBOR plus 100 basis points, the Class C notes have an interest rate of three-month LIBOR plus 125 basis points, the Class D notes have an interest rate of three-month LIBOR plus 300 basis points and the Class E and Class F notes retained by us do not have an interest rate. The 2007-2 Notes are secured by loans and assets from our portfolio companies with a principal balance of $406 million as of December 31, 2009. The 2007-2 Notes contain customary default provisions and mature in November 2019 unless redeemed or repaid prior to such date.
In April 2007, we completed a $600 million asset securitization. In connection with the transaction, ACAS Business Loan Trust 2007-1 (“BLT 2007-1”), an indirect consolidated subsidiary, issued $351 million Class A notes, $45 million Class B notes, $81 million Class C notes, $45 million Class D notes and $78 million Class E notes (collectively, the “2007-1 Notes”). The Class A notes, Class B notes, Class C notes and $15 million of the Class D notes were sold to institutional investors and $30 million of the Class D notes and all the Class E notes were retained by us. The 2007-1 Notes are secured by loans originated or acquired by us and sold to our wholly-owned consolidated subsidiary, BLT 2007-1. Through November 2007, BLT 2007-1 could have also generally used principal collections from the underlying loan pool to purchase additional loans to secure the 2007-1 Notes. After such time, principal payments on the 2007-1 Notes are generally applied pro rata to each class of 2007-1 Notes outstanding until the aggregate outstanding principal balance of the loan pool is less than $300 million or the occurrence of certain other events. Payments will then be applied sequentially to the Class A notes, the Class B notes, the Class C notes, the Class D notes and the Class E notes. However, if any loan collateral in the trust becomes a defaulted loan, as defined in the indenture, all interest and principal collections that would be applied to the Class E notes are applied sequentially to pay the principal on the Class A notes, Class B notes, Class C notes and Class D notes in an amount equal to the principal balance of the defaulted loan collateral. As of December 31, 2008 and 2009, there was defaulted loan collateral in the trust and therefore all interest and principal collections were being applied sequentially to pay down the principal of the notes as outlined above. Subject to continuing compliance with certain conditions, we will remain as servicer of the loans. The Class A notes have an interest rate of three-month LIBOR plus 14 basis points, the Class B notes have an interest rate of three-month LIBOR plus 31 basis points, the Class C notes have an interest rate of three-month LIBOR plus 85 basis points, the Class D notes have an interest rate of three-month LIBOR plus 185 basis points and the Class E notes retained by us do not have an interest rate. The 2007-1 Notes are secured by loans and assets from our portfolio companies with a principal balance of $400 million as of December 31, 2009. The 2007-1 Notes contain customary default provisions and mature in August 2019 unless redeemed or repaid prior to such date. In February 2009, we repurchased $20 million of Class B notes issued by BLT 2007-1 for $3 million. As a result of this purchase, we recognized a $17 million gain in 2009, which is recorded in net gain on debt extinguishment in the accompanying consolidated statements of operations.
In July 2006, we completed a $500 million asset securitization. In connection with the transaction, ACAS Business Loan Trust 2006-1 (“BLT 2006-1”), an indirect consolidated subsidiary, issued $291 million Class A notes, $37 million Class B notes, $73 million Class C notes, $35 million Class D notes and $64 million Class E notes (collectively, the “2006-1 Notes”). The Class A notes, Class B notes, Class C notes and Class D notes were sold to institutional investors and the Class E notes were retained by us. The 2006-1 Notes are secured by loans
71
originated or acquired by us and sold to a wholly-owned consolidated subsidiary, which in turn sold such loans to BLT 2006-1. Through August 2009, BLT 2006-1 could have also generally used principal collections from the underlying loan pool to purchase additional loans to secure the 2006-1 Notes. After such time, principal payments on the 2006-1 Notes will generally be applied pro rata to each class of 2006-1 Notes outstanding until the aggregate outstanding principal balance of the loan pool is less than $250 million or the occurrence of certain other events. Payments will then be applied sequentially to the Class A notes, the Class B notes, the Class C notes, the Class D notes and the Class E notes. However, if any loan collateral in the trust becomes a defaulted loan, as defined in the indenture, all interest and principal collections that would be applied to the Class E notes are applied sequentially to pay the principal on the Class A notes, Class B notes, Class C notes and Class D notes in an amount equal to the principal balance of the defaulted loan collateral. As of December 31, 2008 and 2009, there was defaulted loan collateral in the trust and therefore all interest and principal collections were being applied sequentially to pay down the principal of the notes as outlined above. Subject to continuing compliance with certain conditions, we will remain as servicer of the loans. The Class A notes have an interest rate of three-month LIBOR plus 23 basis points, the Class B notes have an interest rate of three-month LIBOR plus 36 basis points, the Class C notes have an interest rate of three-month LIBOR plus 65 basis points and the Class D notes have an interest rate of three-month LIBOR plus 125 basis points. The 2006-1 Notes are secured by loans and assets from our portfolio companies with a principal balance of $441 million as of December 31, 2009. The 2006-1 Notes contain customary default provisions and mature in November 2019 unless redeemed or repaid prior to such date.
In October 2005, we completed a $1,000 million asset securitization. In connection with the transaction, ACAS Business Loan Trust 2005-1 (“BLT 2005-1”), an indirect consolidated subsidiary, issued $435 million Class A-1 notes, $150 million Class A-2A notes, $50 million Class A-2B notes, $50 million Class B notes, $145 million Class C notes, $90 million Class D notes and $80 million Class E notes (collectively, the “2005-1 Notes”). The Class A-1 notes, Class A-2A notes, Class A-2B notes, Class B notes and Class C notes were issued to institutional investors and the Class D notes and Class E notes were retained by us. The 2005-1 Notes are secured by loans originated or acquired by us and sold to a wholly-owned consolidated subsidiary, which in turn sold such loans to BLT 2005-1. Through January 2009, BLT 2005-1 could have also generally used principal collections from the underlying loan pool to purchase additional loans to secure the 2005-1 Notes. After such time, principal payments on the 2005-1 Notes will be applied first to the Class A-1 notes, Class A-2A notes and Class A-2B notes, next to the Class B notes and then to the Class C notes. However, if any loan collateral in the trust becomes a defaulted loan, as defined in the indenture, all interest and principal collections that would be applied to the Class D notes and Class E notes are applied sequentially to pay the principal on the Class A notes, Class B notes and Class C notes in an amount equal to the principal balance of the defaulted loan collateral. As of December 31, 2008 and 2009, there was defaulted loan collateral in the trust and therefore all interest and principal collections were being applied sequentially to pay down the principal of the notes as outlined above. Subject to continuing compliance with certain conditions, we will remain as servicer of the loans. The Class A-1 notes have an interest rate of three-month LIBOR plus 25 basis points, the Class A-2A notes have an interest rate of three-month LIBOR plus 20 basis points, the Class A-2B notes have an interest rate of three-month LIBOR plus 35 basis points, the Class B notes have an interest rate of three-month LIBOR plus 40 basis points, and the Class C notes have an interest rate of three-month LIBOR plus 85 basis points. The 2005-1 Notes are secured by loans and assets from our portfolio companies with a principal balance of $866 million as of December 31, 2009. The 2005-1 Notes contain customary default provisions and mature in July 2019 unless redeemed or repaid prior to such date.
In December 2004, we completed a $500 million asset securitization. In connection with the transaction, ACAS Business Loan Trust 2004-1 (“BLT 2004-1”), an indirect consolidated subsidiary, issued $302 million Class A notes, $34 million Class B notes, $74 million Class C notes, $50 million Class D notes, and $40 million Class E notes (collectively, the “2004-1 Notes”). The Class A notes, Class B notes, and Class C notes were issued to institutional investors and the Class D and Class E notes were retained by us. The 2004-1 Notes are secured by loans originated or acquired by us and sold to a wholly-owned consolidated subsidiary, which in turn sold such loans to BLT 2004-1. Through January 2007, BLT 2004-1 could have also generally used principal
72
collections from the underlying loan pool to purchase additional loans to secure the 2004-1 Notes. After such time, payments are first applied to the Class A notes, then to the Class B notes and then to the Class C notes. However, if any loan collateral in the trust becomes a defaulted loan, as defined in the indenture, all interest and principal collections that would be applied to the Class D notes and Class E notes are applied sequentially to pay the principal on the Class A notes, Class B notes and Class C notes in an amount equal to the principal balance of the defaulted loan collateral. As of December 31, 2008 and 2009, there was defaulted loan collateral in the trust and therefore all interest and principal collections were being applied sequentially to pay down the principal of the notes as outlined above. Subject to continuing compliance with certain conditions, we will remain as servicer of the loans. The Class A notes have an interest rate of three-month LIBOR plus 32 basis points, the Class B notes have an interest rate of three-month LIBOR plus 50 basis points, and the Class C notes have an interest rate three-month LIBOR plus 100 basis points. The 2004-1 Notes are secured by loans and assets from our portfolio companies with a principal balance of $260 million as of December 31, 2009. The 2004-1 Notes contain customary default provisions and mature in October 2017 unless redeemed or repaid prior to such date.
Secured Revolving Credit Facility
In March 2009, we terminated our $500 million secured revolving credit facility administered by Wachovia Capital Markets, LLC. All borrowings under the facility were repaid during 2008 and had not been redrawn. We terminated the facility in connection with our effort to further delever our balance sheet and to reduce our overall borrowing costs. We did not incur any early termination fees or penalties as a result of the termination of the facility. We recorded a loss on debt extinguishment of $5 million as a result of writing off the deferred debt issuance costs, which is recorded in net gain on debt extinguishment in the accompanying consolidated statements of operations.
Interest Rate Derivatives
We use interest rate derivative financial instruments to manage interest rate risk and also to fulfill our obligations under the terms of our asset securitizations. We do not hold or issue derivative financial instruments for speculative purposes. All interest rate derivative financial instruments are recorded at fair value with changes in value reflected in net unrealized appreciation or depreciation of investments during the reporting period. The fair value of these instruments is based on the estimated net present value of the future cash flows using the forward interest rate yield curve in effect at the end of the period, adjusted for the nonperformance risk of us and our counterparties.
We have interest rate swap agreements where we generally pay a fixed rate and receive a floating rate based on LIBOR. We also have interest rate swaption agreements where, if exercised, we pay a floating rate based on LIBOR and receive a fixed rate. The fair value of our interest rate derivative agreements are identified as separate items on our consolidated balance sheets and are described in the accompanying consolidated schedules of investments.
We have interest rate swap agreements with certain of our derivative counterparties that allow the counterparty to declare an early termination event on its outstanding derivative transactions with us if an event of default on certain or all of our indebtedness in amounts that range from the greater of $5 million to $15 million, if a counterparty has accelerated certain of our indebtedness in amounts that range from the greater of $5 million to $15 million or if our unsecured debt rating falls below BB- as rated by Fitch Ratings, BB-, as rated by Standard & Poor’s Rating Services or Ba3 by Moody’s Investors Services, Inc. As of December 31, 2009, the GAAP fair value of our interest rate swap agreements with these early termination event provisions was a liability of $36 million, which is net of a $7 million credit risk adjustment based on our credit risk and our counterparty’s credit risk. Our liability in the event the counterparties should elect to terminate their outstanding interest rate swap agreements as a result of these early termination events was $43 million as of December 31, 2009.
Equity Capital
As a BDC, we are generally not able to issue and sell our common stock at a price below our NAV per share, exclusive of any distributing commission or discount, without shareholder approval. As of December 31,
73
2009, our NAV per share was $8.29 per share and our closing market price was $2.44 per share. On February 12, 2010, our shareholders approved a proposal to authorize us to sell shares of our common stock at prices below the NAV per share in one or more offerings subject to certain limitations, including the prior approval of our Board of Directors. The authorization is effective for a twelve month period expiring on February 12, 2011 and the number of shares that may be issued below NAV per share is limited to 58.3 million shares of common stock, which was 20% of the number of shares outstanding as of the record date for the shareholder vote of the proposal, subject to adjustment for shares issued following the occurrence of events such as stock splits, stock dividends, distributions and recapitalizations.
Future Distribution Requirements
If we qualify as a RIC and annually distribute to our shareholders in a timely manner at least 90% of our investment company taxable ordinary income, we will not be subject to federal income tax on the portion of our taxable ordinary income and long-term capital gains we distribute to our shareholders. As permitted by the Code, a RIC can designate dividends paid in the subsequent tax year as dividends of current year ordinary income and net long-term gains if those dividends are both declared by the extended due date of the RIC’s federal income tax return and paid to shareholders by the last day of the subsequent tax year. We have a tax fiscal year that ends on September 30. We intend to continue to distribute sufficient dividends to eliminate our taxable income. For our tax year ended September 30, 2009, we estimate that we have less than $10 million of remaining undistributed taxable ordinary income.
For any tax years ending on or before December 31, 2011, we can fulfill our distribution requirements by distributing up to 90% of our common stock as a form of payment of the declared dividend. In order to utilize this option, we must allow each shareholder to elect to receive his or her entire distribution in either cash or our stock subject to a limitation on the aggregate amount of cash to be distributed to all shareholders, which must be at least 10% of the aggregate declared distribution. If too many shareholders elect to receive cash, each shareholder electing to receive cash will receive a pro rata amount of cash (with the balance of the distribution paid in stock). In no event will any shareholder electing to receive cash receive less than 10% of his or her entire distribution in cash.
Contractual Obligations
For any of our debt obligations that we were in breach of covenants of as of December 31, 2009, the amounts outstanding are considered immediately due and payable and are classified as maturing in 2010. A summary of our contractual payment obligations as of December 31, 2009 are as follows (in millions):
| | | | | | | | | | | | | | | |
| | | Payment Due by Period |
Contractual Obligations | | Total | | Less than 1 year | | 2-3 years | | 4-5 years | | After 5 years |
Unsecured revolving credit facility | | $ | 1,388 | | $ | 1,388 | | $ | — | | $ | — | | $ | — |
Unsecured private notes | | | 414 | | | 414 | | | — | | | — | | | — |
Unsecured public notes | | | 550 | | | 550 | | | — | | | — | | | — |
Secured notes payable | | | 1,792 | | | 314 | | | 430 | | | 1,030 | | | 18 |
Interest payments on debt obligations(1) | | | 445 | | | 219 | | | 177 | | | 24 | | | 25 |
Operating leases(2) | | | 183 | | | 21 | | | 37 | | | 28 | | | 97 |
| | | | | | | | | | | | | | | |
Total | | $ | 4,772 | | $ | 2,906 | | $ | 644 | | $ | 1,082 | | $ | 140 |
| | | | | | | | | | | | | | | |
| (1) | For variable rate debt, future interest payments are based on the interest rate as of December 31, 2009. |
| (2) | Net of estimated sublease revenue. |
As of December 31, 2009, there were defaulted loan collateral in each of the trusts of our asset securitizations. As a result, all interest and principal collections from the loan collateral in the trusts are required to be applied sequentially to pay down the outstanding principal of the secured notes.
74
Off Balance Sheet Arrangements
We have non-cancelable operating leases for office space and office equipment. The leases expire over the next 14 years and contain provisions for certain annual rental escalations. However, certain of the office space subject to the non-cancelable leases have been subleased to third-party tenants and we may attempt further sublease excess office space in the future.
As of December 31, 2009, we had commitments under loan and financing agreements to fund up to $394 million to 45 portfolio companies. These commitments are primarily composed of working capital credit facilities, acquisition credit facilities and subscription agreements. The commitments are generally subject to the borrowers meeting certain criteria such as meeting covenant compliance and availability under borrowing base thresholds. The terms of the borrowings and financings subject to commitment are comparable to the terms of other debt and equity securities in our portfolio.
A summary of our loan and equity commitments as of December 31, 2009 is as follows (in millions):
| | | | | | | | | | | | | | | |
| | | | | Amount of Commitment Expiration by Period |
| | | Total | | Less than 1 year | | 1-3 years | | 4-5 years | | After 5 years |
Loan and equity commitments | | $ | 394 | | $ | 146 | | $ | 172 | | $ | 62 | | $ | 14 |
The following are summaries of commitments under loan and financing arrangements with our portfolio companies included in the amounts above that have an unfunded commitment in excess of $100 million as of December 31, 2009.
As of December 31, 2009, we have an $87 million subordinated, unsecured revolving credit facility (the “Term A Facility”) with European Capital. Borrowings under the Term A Facility bear interest at LIBOR plus 5% and 2% payable in kind. The Term A Facility has an unused commitment fee of 20 basis points and matures in February 2011. As of December 31, 2009, we also have a subordinated, unsecured revolving credit facility (the “Term B Facility”) with European Capital with a commitment equal to a standby letter of credit issued to European Capital for the benefit of The Royal Bank of Scotland, plc, the agent on European Capital’s multicurrency revolving facility. The existing standby letter of credit totals €23 million and £56 million ($122 million as of December 31, 2009). Borrowings under the Term B Facility bear interest at LIBOR plus 3.25% and 4.75% payable in kind. The Term B Facility has an unused commitment fee of 20 basis points and matures in April 2010. As of December 31, 2009, there was a $25 million outstanding balance under the Term A Facility and no outstanding balance under the Term B Facility.
Portfolio Credit Quality
We stop accruing interest on our investments when it is determined that interest is no longer collectible. Our valuation analysis serves as a critical piece of data in this determination. A significant change in the portfolio company valuation assigned by us could have an effect on the amount of our loans on non-accrual status. As of December 31, 2009, loans on non-accrual status for 37 portfolio companies had a cost basis of $811 million and had a fair value of $290 million.
75
As of December 31, 2009 and 2008, current loans, past due loans and loans on non-accrual status were as follows (in millions):
| | | | | | | | |
| | | 2009 | | | 2008 | |
Current | | $ | 3,572 | | | $ | 5,369 | |
| | | | | | | | |
0 - 30 Days Past Due | | | 38 | | | | 22 | |
31 - 60 Days Past Due | | | — | | | | — | |
61 - 90 Days Past Due | | | — | | | | — | |
Greater than 90 Days Past Due | | | 50 | | | | 27 | |
| | | | | | | | |
Total Past Due Loans at Cost | | | 88 | | | | 49 | |
Loans on Non-accrual Status at Cost | | | 811 | | | | 824 | |
| | | | | | | | |
Total Loans at Cost | | $ | 4,471 | | | $ | 6,242 | |
| | | | | | | | |
Total Loans at Fair Value | | $ | 3,729 | | | $ | 5,112 | |
| | | | | | | | |
Non-accuring Loans at Cost as a Percent of Total Loans at Cost | | | 18.1 | % | | | 13.2 | % |
| | | | | | | | |
Non-accruing Loans at Fair Value as a Percent of Total Loans at Fair Value | | | 7.8 | % | | | 2.9 | % |
| | | | | | | | |
We believe that debt service collection is probable for our loans that are past due.
During 2009, we recapitalized European Capital by exchanging a portion of our subordinated unsecured loans for ordinary shares that had a cost basis of $317 million and a fair value of $319 million. During 2009, we recapitalized eight additional portfolio companies by exchanging our loans for preferred or common equity securities that had a cost basis of $133 million and a fair value of $55 million. During 2008, we recapitalized four portfolio companies by exchanging our loans for preferred equity securities that had a cost basis of $69 million and a fair value of $3 million.
Credit Statistics
We monitor several key credit statistics that provide information about credit quality and portfolio performance. These key statistics include:
| | • | | Debt to EBITDA Ratio—the sum of all debt with equal or senior security rights to our debt investments divided by the total adjusted earnings before interest, taxes, depreciation and amortization, or EBITDA, of the most recent twelve months or, when appropriate, the forecasted twelve months. |
| | • | | Interest Coverage Ratio—EBITDA divided by the total scheduled cash interest payments required to have been made by the portfolio company during the most recent twelve-month period, or when appropriate, the forecasted twelve months. |
| | • | | Debt Service Coverage Ratio—EBITDA divided by the total scheduled principal amortization and the total scheduled cash interest payments required to have been made during the most recent twelve-month period, or when appropriate, the forecasted twelve months. |
We generally require our portfolio companies to provide annual audited and monthly or quarterly unaudited financial statements. Using these financial statements, we calculate the statistics described above. Buyout and subordinated funds typically adjust EBITDA due to the nature of change of control transactions. Such adjustments are intended to normalize and restate EBITDA to reflect the pro forma results of a company in a change of control transaction. For purposes of analyzing the financial performance of our portfolio companies, we make certain adjustments to EBITDA to reflect the pro forma results of a company consistent with a change of control transaction in addition to adjusting EBITDA for significant non-recurring, unusual or infrequent items. Adjustments to EBITDA may include anticipated cost savings resulting from a merger or restructuring, costs related to new product development, compensation to previous owners, non-recurring revenues or expenses, and other acquisition or restructuring related items.
76
We track our portfolio investments on a static pool basis, including based on the statistics described above. A static pool consists of the investments made during a given year. The static pool classification is based on the year the initial investment was made. Subsequent add-on investments are included in the static pool year of the original investment. The Pre-2001 static pool consists of the investments made from the time of our IPO through the year ended December 31, 2000. The following table contains a summary of portfolio statistics as of and for the period ended December 31, 2009:
| | | | | | | | | | | | | | | | | | | | | | | | | | | | | | | | | | | | | | | | | | | | | | | |
Portfolio Statistics (1) ($ in millions, unaudited) | | Pre-2001 | | | 2001 | | | 2002 | | | 2003 | | | 2004 | | | 2005 | | | 2006 | | | 2007 | | | 2008 | | | 2009 | | Pre-2001 - 2009
Aggregate | | | 2005 - 2009
Aggregate | |
IRR-GAAP Fair Value-All Investments(2) | | | 7.9 | % | | | 18.1 | % | | | 7.8 | % | | | 20.9 | % | | | 13.3 | % | | | 1.1 | % | | | 7.0 | % | | | -12.1 | % | | | -6.6 | % | | | — | | | 3.8 | % | | | -2.3 | % |
IRR-GAAP Fair Value- Equity Investments Only(2)(3)(4) | | | 5.8 | % | | | 46.9 | % | | | 11.4 | % | | | 28.9 | % | | | 27.5 | % | | | -11.7 | % | | | 13.5 | % | | | -18.0 | % | | | -16.9 | % | | | — | | | 1.4 | % | | | -6.8 | % |
IRR-Exited Investments(5) | | | 8.6 | % | | | 20.3 | % | | | 9.1 | % | | | 23.5 | % | | | 19.0 | % | | | 23.9 | % | | | 13.4 | % | | | -6.3 | % | | | -74.9 | % | | | — | | | 13.7 | % | | | 12.7 | % |
Original Investments and Commitments | | $ | 1,065 | | | $ | 376 | | | $ | 961 | | | $ | 1,433 | | | $ | 2,266 | | | $ | 4,561 | | | $ | 5,175 | | | $ | 7,324 | | | $ | 1,021 | | | $ | — | | $ | 24,182 | | | $ | 18,081 | |
Total Exits and Prepayments of Original Investments | | $ | 999 | | | $ | 351 | | | $ | 757 | | | $ | 1,083 | | | $ | 1,765 | | | $ | 2,086 | | | $ | 3,105 | | | $ | 2,932 | | | $ | 54 | | | $ | — | | $ | 13,132 | | | $ | 8,177 | |
Total Interest, Dividends and Fees Collected | | $ | 408 | | | $ | 148 | | | $ | 324 | | | $ | 391 | | | $ | 589 | | | $ | 930 | | | $ | 913 | | | $ | 871 | | | $ | 171 | | | $ | — | | $ | 4,745 | | | $ | 2,885 | |
Total Net Realized (Loss) Gain on Investments | | $ | (128 | ) | | $ | (4 | ) | | $ | (91 | ) | | $ | 143 | | | $ | 28 | | | $ | 292 | | | $ | 21 | | | $ | (381 | ) | | $ | (50 | ) | | $ | — | | $ | (170 | ) | | $ | (118 | ) |
Current Cost of Investments | | $ | 76 | | | $ | 23 | | | $ | 195 | | | $ | 328 | | | $ | 469 | | | $ | 2,247 | | | $ | 1,712 | | | $ | 3,312 | | | $ | 796 | | | $ | — | | $ | 9,158 | | | $ | 8,067 | |
Current Fair Value of Investments | | $ | 17 | | | $ | 3 | | | $ | 134 | | | $ | 404 | | | $ | 357 | | | $ | 1,043 | | | $ | 1,267 | | | $ | 1,767 | | | $ | 583 | | | $ | — | | $ | 5,575 | | | $ | 4,660 | |
Current Fair Value of Investments as a % of Total Investments at Fair Value | | | 0.3 | % | | | 0.1 | % | | | 2.4 | % | | | 7.2 | % | | | 6.4 | % | | | 18.7 | % | | | 22.7 | % | | | 31.7 | % | | | 10.5 | % | | | — | | | 100.0 | % | | | 83.6 | % |
Net Unrealized Appreciation/(Depreciation) | | $ | (59 | ) | | $ | (20 | ) | | $ | (61 | ) | | $ | 76 | | | $ | (112 | ) | | $ | (1,204 | ) | | $ | (445 | ) | | $ | (1,545 | ) | | $ | (213 | ) | | $ | — | | $ | (3,583 | ) | | $ | (3,407 | ) |
Non-Accruing Loans at Cost | | $ | 18 | | | $ | 14 | | | $ | 28 | | | $ | — | | | $ | 41 | | | $ | 100 | | | $ | 252 | | | $ | 349 | | | $ | 9 | | | $ | — | | $ | 811 | | | $ | 710 | |
Non-Accruing Loans at Fair Value | | $ | 16 | | | $ | 3 | | | $ | 22 | | | $ | — | | | $ | 24 | | | $ | 65 | | | $ | 78 | | | $ | 78 | | | $ | 4 | | | $ | — | | $ | 290 | | | $ | 225 | |
Equity Interest at Fair Value(3) | | $ | — | | | $ | — | | | $ | — | | | $ | 177 | | | $ | 68 | | | $ | 470 | | | $ | 413 | | | $ | 426 | | | $ | 124 | | | $ | — | | $ | 1,678 | | | $ | 1,433 | |
Debt to EBITDA(6)(7)(8) | | | 7.8 | | | | NM | | | | 8.4 | | | | 4.4 | | | | 6.4 | | | | 4.9 | | | | 5.2 | | | | 6.9 | | | | 6.8 | | | | — | | | 6.0 | | | | 6.0 | |
Interest Coverage(6)(8) | | | 1.4 | | | | NM | | | | 0.9 | | | | 2.4 | | | | 2.0 | | | | 2.2 | | | | 2.8 | | | | 2.1 | | | | 1.3 | | | | — | | | 2.2 | | | | 2.2 | |
Debt Service Coverage(6)(8) | | | 1.4 | | | | NM | | | | 0.8 | | | | 2.3 | | | | 1.5 | | | | 1.5 | | | | 2.2 | | | | 1.8 | | | | 1.2 | | | | — | | | 1.8 | | | | 1.8 | |
Average Age of Companies(8) | | | 38 yrs | | | | 45 yrs | | | | 49 yrs | | | | 41 yrs | | | | 45 yrs | | | | 28 yrs | | | | 30 yrs | | | | 30 yrs | | | | 26 yrs | | | | — | | | 32 yrs | | | | 29 yrs | |
Diluted Ownership Percentage(3) | | | 63 | % | | | 59 | % | | | 39 | % | | | 52 | % | | | 46 | % | | | 49 | % | | | 43 | % | | | 47 | % | | | 33 | % | | | — | | | 45 | % | | | 44 | % |
Average Sales(8)(9) | | $ | 45 | | | $ | 5 | | | $ | 47 | | | $ | 184 | | | $ | 94 | | | $ | 119 | | | $ | 139 | | | $ | 226 | | | $ | 99 | | | $ | — | | $ | 159 | | | $ | 166 | |
Average EBITDA(8)(10) | | $ | 3 | | | $ | — | | | $ | 8 | | | $ | 37 | | | $ | 22 | | | $ | 24 | | | $ | 37 | | | $ | 38 | | | $ | 27 | | | $ | — | | $ | 32 | | | $ | 34 | |
Average EBITDA Margin | | | 6.7 | % | | | — | | | | 17.0 | % | | | 20.1 | % | | | 23.4 | % | | | 20.2 | % | | | 26.6 | % | | | 16.8 | % | | | 27.3 | % | | | — | | | 20.1 | % | | | 20.5 | % |
Total Sales(8)(9) | | $ | 72 | | | $ | 263 | | | $ | 175 | | | $ | 1,266 | | | $ | 823 | | | $ | 1,917 | | | $ | 4,983 | | | $ | 8,379 | | | $ | 1,233 | | | $ | — | | $ | 19,111 | | | $ | 16,512 | |
Total EBITDA(8)(10) | | $ | 5 | | | $ | 4 | | | $ | 17 | | | $ | 170 | | | $ | 168 | | | $ | 313 | | | $ | 866 | | | $ | 1,579 | | | $ | 242 | | | $ | — | | $ | 3,364 | | | $ | 3,000 | |
% of Senior Loans(8)(11) | | | 83 | % | | | 11 | % | | | 58 | % | | | 61 | % | | | 42 | % | | | 49 | % | | | 38 | % | | | 60 | % | | | 27 | % | | | — | | | 49 | % | | | 48 | % |
% of Loans with Lien(8)(11) | | | 100 | % | | | 68 | % | | | 100 | % | | | 100 | % | | | 91 | % | | | 89 | % | | | 92 | % | | | 92 | % | | | 60 | % | | | — | | | 88 | % | | | 87 | % |
| (1) | Static pool classification is based on the year the initial investment was made. Subsequent add-on investments are included in the static pool year of the original investment. Investments in interest rate derivative agreements are excluded. |
| (2) | Assumes investments are exited at current GAAP fair value. |
| (3) | Excludes investments in structured products. |
| (4) | Excludes equity investments that are the result of conversions of debt and warrants received with the issuance of debt. |
| (5) | Includes exited securities of existing portfolio companies. |
| (6) | These amounts do not include investments in which we own only equity. |
| (7) | For portfolio companies with a nominal EBITDA amount, the portfolio company’s maximum debt leverage is limited to 15 times EBITDA. |
| (8) | Excludes investments in structured products, managed funds and American Capital, LLC. |
| (9) | Sales of the most recent twelve months, or when appropriate, the forecasted twelve months. |
| (10) | EBITDA of the most recent twelve months, or when appropriate, the forecasted twelve months. |
| (11) | As a percentage of our total debt investments. |
77
Impact of Inflation
We believe that inflation can influence the value of our investments through the impact it may have on interest rates, the capital markets, the valuations of business enterprises and the relationship of the valuations to underlying earnings.
Critical Accounting Policies
The discussion and analysis of our financial condition and results of operations are based on our consolidated financial statements, which have been prepared in accordance with GAAP. The preparation of these financial statements in accordance with GAAP requires us to utilize accounting policies and make certain estimates and assumptions that could affect the reported amounts of assets, liabilities, revenues, expenses and the related disclosures. We base our assumptions, estimates and judgments on historical experience, current trends and other factors that management believes to be relevant at the time the consolidated financial statements are prepared. Our significant accounting policies are more fully described in Note 3 to our consolidated financial statements in this Annual Report on Form 10-K. The SEC considers an accounting policy to be critical if it is both important to a company’s financial condition and results of operations and it requires significant judgment and estimates on the part of management in its applications.
Management believes that the following critical accounting policies are the most affected by judgments, estimates and assumptions. Management has reviewed these critical accounting policies and related disclosures with our independent auditor and the Audit and Compliance Committee of our Board of Directors. Although we believe that our judgments and estimates are appropriate and correct, actual results may differ from those estimates. See “Risk Factors” for certain matters bearing risks on our future results of operations.
Going Concern
A fundamental principle of the preparation of financial statements in accordance with GAAP is the assumption that an entity will continue in existence as a going concern, which contemplates continuity of operations and the realization of assets and settlement of liabilities occurring in the ordinary course of business. This principle is applicable to all entities except for entities in liquidation or entities for which liquidation appears imminent. In accordance with this requirement, our policy is to prepare our consolidated financial statements on a going concern basis unless we intend to liquidate or have no other alternative but to liquidate. As a result of our default of various financial covenants under our borrowing arrangements, there is substantial doubt about our ability to continue as a going concern. While we have prepared our consolidated financial statements on a going concern basis, if we are unable to successfully restructure our borrowing arrangements or we do not receive additional funding, our ability to continue as a going concern may be impacted. Therefore, we may not be able to realize our assets and settle our liabilities in the ordinary course of business. Our consolidated financial statements included in this Annual Report on Form 10-K do not reflect any adjustments that might specifically result from the outcome of this uncertainty or our debt restructuring activities.
Valuation of Investments
Our investments are carried at fair value in accordance with the 1940 Act and ASC 820. In accordance with the 1940 Act, unrestricted minority-owned publicly traded securities for which market quotations are readily available are valued at the closing market quote on the valuation date and majority-owned publicly traded securities and other privately held securities are valued as determined in good faith by our Board of Directors. For unrestricted securities of companies that are publicly traded for which we have a majority-owned interest, the value is based on the closing market quote on the valuation date plus a control premium if our Board of Directors determines in good faith that additional value above the closing market quote would be obtainable upon a sale or transfer of our controlling interest.
ASC 820 provides a framework for measuring the fair value of assets and liabilities and provides guidance regarding a fair value hierarchy, which prioritizes information used to measure fair value and the effect of fair
78
value measurements on earnings. Due to the uncertainty inherent in the valuation process, such estimates of fair value may differ significantly from the values that would have been used had a ready market for the investments existed, and the differences could be material. Additionally, changes in the market environment and other events that may occur over the life of the investments may cause the gains or losses ultimately realized on these investments to be different than the valuations currently assigned.
In April 2009, the FASB issued FASB Staff Position No. 157-4,Determining Fair Value When the Volume and Level of Activity for the Asset or Liability Have Significantly Decreased and Identifying Transactions That Are Not Orderly (“FSP FAS 157-4”), which is codified in FASB ASC 820-10-35 (“ASC 820-10-35”). FSP FAS 157-4 amended ASC 820 to provide additional guidance for estimating fair value when the volume and level of activity for the asset or liability have significantly decreased and includes guidance on identifying circumstances that indicate a transaction is not orderly. It emphasizes that even if there has been a significant decrease in the volume and level of activity for the asset or liability and regardless of the valuation technique used, the objective of a fair value measurement remains the same that the fair value is the price that would be received to sell an asset or paid to transfer a liability in an orderly transaction (that is, not a forced liquidation or distressed sale) between market participants at the measurement date under current market conditions. The guidance in ASC 820-10-35 as it relates to FSP FAS 157-4 is effective for periods ending after June 15, 2009 and is applied prospectively with early adoption permitted for periods ending after March 15, 2009. We adopted the requirements of ASC 820-10-35 as it relates to FSP FAS 157-4 during the quarter ended March 31, 2009. The adoption did not have a material impact on our consolidated financial statements.
ASC 820 defines fair value in terms of the price that would be received upon the sale of an asset or paid to transfer a liability in an orderly transaction between market participants at the measurement date under current market conditions. The price used to measure the fair value is not adjusted for transaction costs while the cost basis of our investments may include initial transaction costs. Under ASC 820, the fair value measurement also assumes that the transaction to sell an asset occurs in the principal market for the asset or, in the absence of a principal market, the most advantageous market for the asset. The principal market is the market in which the reporting entity would sell or transfer the asset with the greatest volume and level of activity for the asset. In determining the principal market for an asset or liability under ASC 820, it is assumed that the reporting entity has access to the market as of the measurement date. If no market for the asset exists or if the reporting entity does not have access to the principal market, the reporting entity should use a hypothetical market.
The market in which we would sell our private finance investments is the M&A market. Under ASC 820, we have indentified the M&A market as our principal market for portfolio companies only if we have the ability to initiate a sale of the portfolio company as of the measurement date. We determine whether we have the ability to initiate a sale of a portfolio company based on our ability to control or gain control of the board of directors of the portfolio company as of the measurement date. In evaluating if we can control or gain control of a portfolio company as of the measurement date, we include our equity securities and those securities held by entities managed by American Capital, LLC, on a fully diluted basis. For investments in portfolio companies for which we do not have the ability to control or gain control as of the measurement date and for which there is no active market, our principal market under ASC 820 is a hypothetical secondary market. The determination of the principal market used to estimate the fair value of each of our investments can have a material impact on our estimate of the fair value of our investments.
The levels of fair value inputs used to measure our investments are characterized in accordance with the fair value hierarchy established by ASC 820. Where inputs for an asset or liability fall into more than one level in the fair value hierarchy, the investment is classified in its entirety based on the lowest level input that is significant to that investment’s fair value measurement. We use judgment and consider factors specific to the investment in determining the significance of an input to a fair value measurement. The three levels of the fair value hierarchy and investments that fall into each of the levels are described below:
| | • | | Level 1: Level 1 inputs are unadjusted quoted prices in active markets that are accessible at the measurement date for identical, unrestricted assets or liabilities. We use Level 1 inputs for investments |
79
| | in publicly traded unrestricted securities for which we do not have a controlling interest. Such investments are valued at the closing price on the measurement date. |
| | • | | Level 2: Level 2 inputs are inputs other than quoted prices included within Level 1 that are observable for the asset or liability, either directly or indirectly. We did not value any of our investments using Level 2 inputs as of December 31, 2009. |
| | • | | Level 3: Level 3 inputs are unobservable and cannot be corroborated by observable market data. We use Level 3 inputs for measuring the fair value of substantially all of our investments as follows: |
| | - | For investments in portfolio companies for which we have identified the M&A market as the principal market, we estimate the fair value based on the Enterprise Value Waterfall valuation methodology. For minority equity securities in which the principal market is a hypothetical secondary market, we also estimate the fair value using the Enterprise Value Waterfall valuation methodology. Under the Enterprise Value Waterfall valuation methodology, we estimate the enterprise fair value of the portfolio company and then waterfall the enterprise value over the portfolio company’s securities in order of their preference relative to one another. To estimate the enterprise value of the portfolio company, we prepare an analysis consisting of traditional valuation methodologies including market, income and cost approaches. We weight some or all of the traditional valuation methodologies based on the individual circumstances of the portfolio company in order to conclude on our estimate of the enterprise value. The traditional valuation methodologies consist of valuation estimates based on: valuations of comparable public companies, recent sales of private and public comparable companies, discounting the forecasted cash flows of the portfolio company, estimating the liquidation or collateral value of the portfolio company’s assets, third-party valuations of the portfolio company, considering offers from third-parties to buy the company, estimating the value to potential strategic buyers and considering the value of recent investments in the equity securities of the portfolio company. To determine the enterprise value of a portfolio company, we analyze its historical and projected financial results, as well as other factors that may impact value, such as exposure to litigation, loss of significant customers or other contingencies. This financial and other information is generally obtained from our portfolio companies, and may represent unaudited, projected or pro-forma financial information. In using a valuation methodology based on comparable public companies or sales of private or public comparable companies, we have to use significant judgment in the application of discounts or premiums to the prices of comparable companies for factors such as size, marketability and relative performance. In using a valuation methodology based on the discounting of forecasted cash flows of the portfolio company, we have to use significant judgment in the development of an appropriate discount rate to be applied to the forecasted cash flows. The assumptions incorporated in the valuation methodologies used to estimate the enterprise value consists primarily of unobservable Level 3 inputs, including management assumptions based on judgment. For example, from time to time, we may have a portfolio company that has exposure to potential or actual litigation. In evaluating the impact on the valuation for such items, we are required to estimate the amount that a market participant would consider in estimating fair value. These estimates are highly subjective, based on management’s assessment of the potential outcome(s) and the related impact on the fair value of such potential outcome(s). A change in these assumptions could have a material impact on the determination of fair value. |
| | - | For debt and redeemable preferred equity investments in portfolio companies for which we have identified the hypothetical secondary market as the principal market, we determine the fair value based on the assumptions that a hypothetical market participant would use to value the investment in a current hypothetical sale using a Market Yield valuation methodology. In applying the Market Yield valuation methodology, we estimate the fair value based on such factors as third-party broker quotes and our own assumptions in the absence of market observable data including estimated remaining life, current market yield and interest rate spreads of similar loans and securities as of the measurement date. The assumptions used to estimate the fair value in a hypothetical secondary market are considered primarily Level 3 inputs. We weight third-party |
80
| | broker quotes, if any, in determining fair value based on our understanding of the level of actual transactions used by the broker to develop the quote and whether the quote was an indicative price or binding offer. In estimating the remaining life, we generally use an average life based on market data of the average life of similar loans. However, if we have information available to us that the loan is expected to be repaid in the near term, we would use an estimated life based on the expected repayment date. The average life used to estimate the fair value of our loans is generally shorter than the legal maturity of the loans as our loans have historically been prepaid prior to the maturity date. The current interest rate spreads used to estimate the fair value of our loans is based on our experience of current interest rate spreads on similar loans. A change in the unobservable inputs and assumptions that we use to estimate the fair value of our loans could have a material impact on the determination of fair value. |
| | - | We value our investments in Structured Products using the Market Yield valuation methodology. We estimate fair value based on such factors as third-party broker quotes, sales of the same or similar securities and our cash flow forecasts subject to our assumptions a market participant would use regarding the investments’ underlying collateral including, but not limited to, assumptions of default and recovery rates, reinvestment spreads and prepayment rates. Cash flow forecasts are discounted using a market participant’s market yield assumptions which are derived from multiple sources including, but not limited to, third-party broker quotes, industry research reports and transactions of securities or indices with similar structure and risk characteristics. We weight the use of third-party broker quotes, if any, in determining fair value based on our understanding of the level of actual transactions used by the broker to develop the quote and whether the quote was an indicative price or binding offer. The cash flow forecasts and market yields used to discount the cash flows incorporate a significant amount of Level 3 inputs. A change in our default and recovery rate assumptions in the cash flow forecasts or a change in the market yield assumptions could have a material impact on the determination of fair value. |
| | - | We value derivative instruments based on fair value information from both the derivative counterparty, as adjusted for nonperformance risk considerations, and third-party pricing services. We corroborate the fair value by analyzing the estimated net present value of the future cash flows using relevant market forward interest rate yield curves in effect at the end of the period as adjusted for quantitative and qualitative nonperformance risk considerations. A change in our determination of the nonperformance risk could have a material impact on the determination of fair value. |
| | - | For an investment in an investment fund that does not have a readily determinable fair value, we measure the fair value of our investment predominately based on the NAV per share of the investment fund if the NAV of the investment fund is calculated in a manner consistent with the measurement principles of ASC 946 as of our measurement date, including measurement of all or substantially all of the underlying investments of the investee in accordance with ASC 820. However, in determining the fair value of our investment, we may make adjustments to the NAV per share in certain circumstances, based on our analysis of any restrictions on redemption of our shares of our investment as of the measurement date, comparisons of price to NAV per share of comparable publicly traded funds and trades or sales of comparable of private and publicly traded funds, recent actual sales or redemptions of shares of the investment fund, expected future cash flows available to equity holders or other uncertainties surrounding our ability to realize the full NAV of the investment fund. As of December 31, 2009, we had an investment in European Capital, a wholly-owned investment fund that invests in and sponsors management and employee buyouts, invests in private equity buyouts and provides capital directly to private and mid-sized public companies primarily in Europe. It primarily invests in senior debt, subordinated debt and equity. In determining the fair value of our investment in European Capital, we concluded that our investment should be less than the NAV of European Capital due to the risks associated with our ability to realize the full fair value of European Capital’s underlying assets for several reasons, including European Capital negotiating the restructuring of its credit facilities with its lenders as |
81
| | of the measurement date, and recent comparable transactions and public comparables, which indicate fair values at a discount to NAV. The use of a discount to NAV of European Capital requires significant judgment and a change in the assumptions used to develop the discount could have a material impact on the determination of fair value. |
See Note 4 to our consolidated financial statements in this Annual Report on Form 10-K for further information regarding the classification of our investment portfolio by Levels 1, 2 and 3 as of December 31, 2009.
Interest and Dividend Income Recognition
Interest income is recorded on the accrual basis to the extent that such amounts are expected to be collected. Original issue discount (“OID”) is accreted into interest income using the effective interest method. OID initially represents the value of detachable equity warrants obtained in conjunction with the origination or purchase of loans and loan origination fees that represent yield enhancement. Dividend income is recognized on the ex-dividend date for common equity securities and on an accrual basis for preferred equity securities to the extent that such amounts are expected to be collected or realized. In determining the amount of dividend income to recognize, if any, from cash distributions on common equity securities, we will assess many factors including a portfolio company’s cumulative undistributed income and operating cash flow. Cash distributions from common equity securities received in excess of such undistributed amounts are recorded first as a reduction of our investment and then as a realized gain on investment. We stop accruing interest or dividends on our investments when it is determined that the interest or dividend is not collectible. We assess the collectability of the interest and dividends based on many factors including the portfolio company’s ability to service our loan based on current and projected cash flows as well as the current valuation of the portfolio company’s current total enterprise value. For investments with PIK interest and cumulative dividends, we base income and dividend accruals on the valuation of the PIK notes or securities received from the borrower or the redemption value of the security. If the portfolio company valuation indicates a value of the PIK notes or securities or redemption value that is not sufficient to cover the contractual interest or dividend, we will not accrue interest or dividend income on the notes or securities and will record an allowance for any accrued interest or dividend receivable as a reduction of interest or dividend income in the period we determine it is not collectible.
A change in the portfolio company valuation assigned by us could have an effect on our accrual of PIK interest income on debt investments and dividend income of preferred stock investments. Also, a change in a portfolio company’s operating performance and cash flows can impact a portfolio company’s ability to service our debt and therefore could impact our interest recognition.
Interest income on Structured Products is recognized on the effective interest method as required by Emerging Issues Task Force Issue No. 99-20, Recognition of Interest Income and Impairment on Purchased and Retained Beneficial Interests in Securitized Financial Assetswhich is codified in FASB ASC 325-40,Investments – Other, Beneficial Interests in Securitized Financial Assets(“ASC 325-40”). Under ASC 325-40, at the time of purchase, we estimate the future expected cash flows and determine the effective interest rate based on these estimated cash flows and our cost basis. Subsequent to the purchase and on a quarterly basis, these estimated cash flows are updated and a revised yield is calculated prospectively based on the current amortized cost of the investment. To the extent the current quarterly estimated cash flows decrease from the prior quarterly estimated cash flows, the revised yield is calculated prospectively based on the amortized cost basis of the investment calculated in accordance with FASB Staff Position No. FAS 115-2 and FAS 124-2,Recognition and Presentation of Other-Than-Temporary Impairments, which is codified in FASB ASC 320-10-35,Investment—Debt and Equity Securities. In estimating these cash flows, there are a number of assumptions that are subject to uncertainties and contingencies. These include the amount and timing of principal payments (including prepayments, repurchases, defaults and liquidations), the pass through or coupon rate, and interest rate fluctuations. In addition, interest payment shortfalls due to delinquencies on the underlying loans and the timing of and magnitude of projected credit losses on the loans underlying the securities have to be estimated. These
82
uncertainties and contingencies are difficult to predict and are subject to future events that may impact our estimates and interest income. As a result, actual results may differ significantly from these estimates.
Stock-based Compensation
We account for all share-based payments to employees under ASC 718. We estimate the fair value of our employee stock awards at the date of grant using certain subjective assumptions, such as expected volatility, which is based on a combination of historical and market-based implied volatility, and the expected term of the awards which is based on our historical experience of employee stock option exercises including forfeitures. Our valuation assumptions used in estimating the fair value of share-based awards may change in future periods. We recognize the fair value of awards over the vesting period or the requisite service period. In addition, we calculate our pool of excess tax benefits available within additional paid-in capital in accordance with the provisions ASC 718.
The following table reflects the weighted average fair value per option granted during the years ended December 31, 2009, 2008 and 2007, as well as the weighted average assumptions used in determining those fair values using the Black-Scholes pricing model.
| | | | | | | | | | | | |
| | | 2009 | | | 2008 | | | 2007 | |
Options granted (in millions) | | | 17.0 | | | | 6.1 | | | | 9.1 | |
Fair value on grant date | | $ | 1.41 | | | $ | 1.75 | | | $ | 4.37 | |
Expected dividend yield | | | 9.3 | % | | | 15.4 | % | | | 8.4 | % |
Expected volatility | | | 76 | % | | | 40 | % | | | 26 | % |
Estimated annual forfeiture rate | | | 6.5 | % | | | 6.3 | % | | | 6.6 | % |
Risk-free interest rate | | | 2.4 | % | | | 3.4 | % | | | 4.5 | % |
Expected life (years) | | | 6.9 | | | | 7.2 | | | | 5.4 | |
We determine our expected volatility used in the Black-Scholes option pricing model based on a combination of our historical volatility during the expected term of the option and our implied volatility based on the market prices of traded options of our stock.
Determining the appropriate fair value model and calculating the fair value of share-based payment awards require the input of subjective assumptions, including the expected life of the share-based payment awards and stock price volatility. The assumptions used in calculating the fair value of share-based payment awards represent management’s best estimates, but these estimates involve inherent uncertainties and the application of management judgment. As a result, if factors change and we use different assumptions, our equity-based compensation expense could be materially different in the future. In addition, we are required to estimate the expected forfeiture rate and recognize expense only for those shares expected to vest. If our actual forfeiture rate is materially different from our estimate, the equity-based compensation expense could be significantly different from what we have recorded in the current period.
Derivative Financial Instruments
We maintain an interest rate risk management strategy under which we use derivative financial instruments to primarily manage the adverse impact of interest rates changes on our cash flows by locking in the spread between our asset yield and the cost of our borrowings, and to fulfill our obligation under the terms of our asset securitizations. We do not hold or issue derivative financial instruments for speculative purposes. All derivative financial instruments are recorded at fair value with changes in fair value reflected in net unrealized appreciation or depreciation of investments during the reporting period. The fair value of interest rate derivative agreements is based on the estimated net present value of the future cash flows using the forward interest rate yield curve in effect at the end of the period, adjusted for non-performance risk based on our credit risk and our counterparty’s credit risk. We consider the impact of any collateral requirements, credit enhancements or netting arrangements in evaluating credit risk.
83
Our derivatives are considered economic hedges that do not qualify for hedge accounting under ASC Topic 815. We record the accrual of the periodic interest settlements of interest rate derivatives in net unrealized appreciation or depreciation of investments and subsequently record the amount as a realized gain or loss on investments on the interest settlement date.
Recent Accounting Standards
As disclosed in Note 3 to our consolidated financial statements, the FASB issued SFAS No. 166,Accounting for Transfers of Financial Assets—an amendment of FASB Statement No. 140, (“SFAS No. 166”) and Accounting Standards Update (“ASU”) No. 2009-16,Accounting for Transfers of Financial Assets, which codified SFAS No. 166 in FASB ASC Topic 860,Transfers and Servicing(“ASC 860”).The FASB also issued SFAS No. 167,Amendments to FASB Interpretation No. 46(R) (“SFAS No. 167”) and ASU No. 2009-17,Improvements to Financial Reporting by Enterprises Involved with Variable Interest Entities, which codified SFAS No. 167 in FASB ASC Topic 810,Consolidation(“ASC 810”). While the issuances of these new accounting pronouncements are expected to have a material impact on the financial statements of many companies, including many other financial services companies, we do not believe the adoption of these accounting standards will have a material impact on our consolidated financial statements. Importantly, SFAS No. 167 does not amend the ASC 810 exception that investments accounted for at fair value in accordance with the specialized accounting guidance in ASC 946 are not subject to the requirements of ASC 810. Accordingly, we do not expect our consolidation accounting policy as disclosed in Note 3 to our consolidated financial statements to be materially impacted by the above new accounting standards.
See Note 3 to our consolidated financial statements in this Annual Report on Form 10-K for further information regarding new accounting pronouncements and their potential impact on our consolidated financial statements.
Item 7A. Quantitative and Qualitative Disclosure About Market Risk
We consider our principal market risks to be the fluctuations of interest rates, foreign currency exchange rates and the valuations of our investment portfolio.
Interest Rate Risk
Because we fund a portion of our investments with borrowings, our net increase in net assets from operations is affected by the spread between the rate at which we invest and the rate at which we borrow. We attempt to match-fund our liabilities and assets by financing floating rate assets with floating rate liabilities and fixed rate assets with fixed rate liabilities or equity. We enter into interest rate basis swap agreements to match the interest rate basis of our assets and liabilities, thereby locking in the spread between our asset yield and the cost of our borrowings, and to fulfill our obligations under the terms of our asset securitizations. However, our derivatives are considered economic hedges that do not qualify for hedge accounting under FASB ASC Topic 815.
As a result of our use of interest rate swaps, as of December 31, 2009, 21% of our interest bearing assets provided fixed rate returns and approximately 79% of our interest bearing assets provided floating rate returns. Adjusted for the effect of interest rate swaps, as of December 31, 2009, we had floating rate debt investments, excluding loans on non-accrual, tied primarily to LIBOR, with a principal balance of $3,185 million and had total borrowings outstanding of $3,179 million that have a variable rate of interest based on LIBOR, the prime rate or the federal funds rate. Assuming no changes to our consolidated balance sheet as of December 31, 2009, a hypothetical increase or decrease in LIBOR, the prime rate or the federal funds rate by 100 basis points would increase or decrease our net assets resulting from operations by less than $1 million over the next twelve months compared to our 2009 net decrease in net assets resulting from operations.
84
Under our interest rate swap agreements, we generally pay a fixed rate and receive a floating interest rate based on LIBOR. We also have interest rate swaption agreements where, if exercised, we receive a fixed rate and pay a floating rate based on LIBOR. We may enter into interest rate cap agreements that would entitle us to receive an amount, if any, by which our interest payments on our variable rate debt exceeds specified interest rates. For those investments contributed to the term securitizations, the interest swap agreements enable us to lock in the spread between the asset yield on the investments and the cost of the borrowings under the term securitizations. One-month LIBOR decreased from 0.44% as of December 31, 2008 to 0.23% as of December 31, 2009 while the three-month LIBOR decreased from 1.43% as of December 31, 2008 to 0.25 % as of December 31, 2009.
A summary of our interest rate swap and swaption agreements are included in our schedule of investments in the accompanying consolidated financial statements.
Foreign Currency Risks
We have a limited amount of investments in portfolio companies, including European Capital, for which the investment is denominated in a foreign currency, primarily the Euro. We also have other assets and liabilities denominated in foreign currencies. Fluctuations in exchange rates therefore impact our financial condition and results of operations, as reported in U.S. dollars. During the year ended December 31, 2009, the foreign currency translation adjustment recorded in our consolidated statements of operations was net unrealized appreciation of $28 million, primarily as a result of the Euro depreciating against the U.S. dollar.
Portfolio Valuation
Our investments are carried at fair value in accordance with the 1940 Act and ASC 820. For a description of our accounting policy for valuation of investments, see Note 3 to our consolidated financial statements in this Annual Report on Form 10-K.
Due to the uncertainty inherent in the valuation process, such estimates of fair value may differ significantly from the values that would have been used had a ready market for the securities existed, and the differences could be material. Additionally, changes in the market environment and other events that may occur over the life of the investments may cause the gains or losses ultimately realized on these investments to be different than the valuations currently assigned. As of December 31, 2009, the fair value of 99% of our investments were estimated using Level 3 inputs determined in good faith by our Board of Directors because the investments were not publicly traded on an active market.
Item 8.Financial Statements and Supplementary Data
Our management is responsible for the preparation, integrity and objectivity of the accompanying consolidated financial statements and the related financial information. The financial statements have been prepared in conformity with accounting principles generally accepted in the United States and necessarily include certain amounts that are based on estimates and informed judgments. Our management also prepared the related financial information included in this Annual Report on Form 10-K and is responsible for its accuracy and consistency with the consolidated financial statements.
The consolidated financial statements have been audited by Ernst & Young LLP, an independent registered public accounting firm, who conducted their audit in accordance with the standards of the Public Company Accounting Oversight Board (United States) as of December 31, 2009 and 2008, and for each of the three years in the period ended December 31, 2009, and the consolidated financial highlights for each of the five years in the period ended December 31, 2009. The independent registered public accounting firm’s responsibility is to express an opinion as to the fairness with which such consolidated financial statements and financial highlights present our financial position, results of operations, changes in net assets and cash flows in accordance with accounting principles generally accepted in the United States.
85
Management’s Report on Internal Control over Financial Reporting
Our management is responsible for establishing and maintaining adequate internal control over financial reporting as defined in Rule 13a-15(f) under the Securities Exchange Act of 1934. American Capital’s internal control over financial reporting is designed to provide reasonable assurance regarding the reliability of financial reporting and the preparation of consolidated financial statements for external purposes in accordance with generally accepted accounting principles. American Capital’s internal control over financial reporting includes those policies and procedures that (i) pertain to the maintenance of records that, in reasonable detail, accurately and fairly reflect the transactions and dispositions of our assets; (ii) provide reasonable assurance that transactions are recorded as necessary to permit preparation of financial statements in accordance with generally accepted accounting principles, and that receipts and expenditures are being made only in accordance with authorizations of our management and Board of Directors; and (iii) provide reasonable assurance regarding prevention or timely detection of unauthorized acquisition, use, or disposition of our assets that could have a material effect on the consolidated financial statements.
Because of its inherent limitations, internal control over financial reporting may not prevent or detect misstatements. Also, projections of any evaluation of effectiveness to future periods are subject to the risk that controls may become inadequate because of changes in conditions, or that the degree of compliance with the policies or procedures may deteriorate.
Management assessed the effectiveness of American Capital’s internal control over financial reporting as of December 31, 2009, utilizing the criteria set forth by the Committee of Sponsoring Organizations of the Treadway Commission (COSO) in Internal Control-Integrated Framework. Based on this assessment and those criteria, management determined that American Capital’s internal control over financial reporting was effective as of December 31, 2009. The effectiveness of American Capital’s internal control over financial reporting as of December 31, 2009 has been audited by Ernst & Young LLP, American Capital’s independent registered public accounting firm, as stated in their attestation report included in this Annual Report on Form 10-K.
86
Report of Independent Registered Public Accounting Firm
The Board of Directors and Shareholders of American Capital, Ltd.
We have audited American Capital, Ltd.’s internal control over financial reporting as of December 31, 2009, based on criteria established in Internal Control—Integrated Framework issued by the Committee of Sponsoring Organizations of the Treadway Commission (the COSO criteria). American Capital, Ltd.’s management is responsible for maintaining effective internal control over financial reporting and for its assessment of the effectiveness of internal control over financial reporting included in the accompanying Management’s Report on Internal Control over Financial Reporting. Our responsibility is to express an opinion on the company’s internal control over financial reporting based on our audit.
We conducted our audit in accordance with the standards of the Public Company Accounting Oversight Board (United States). Those standards require that we plan and perform the audit to obtain reasonable assurance about whether effective internal control over financial reporting was maintained in all material respects. Our audit included obtaining an understanding of internal control over financial reporting, assessing the risk that a material weakness exists, testing and evaluating the design and operating effectiveness of internal control based on the assessed risk, and performing such other procedures as we considered necessary in the circumstances. We believe that our audit provides a reasonable basis for our opinion.
A company’s internal control over financial reporting is a process designed to provide reasonable assurance regarding the reliability of financial reporting and the preparation of financial statements for external purposes in accordance with generally accepted accounting principles. A company’s internal control over financial reporting includes those policies and procedures that (1) pertain to the maintenance of records that, in reasonable detail, accurately and fairly reflect the transactions and dispositions of the assets of the company; (2) provide reasonable assurance that transactions are recorded as necessary to permit preparation of financial statements in accordance with generally accepted accounting principles, and that receipts and expenditures of the company are being made only in accordance with authorizations of management and directors of the company; and (3) provide reasonable assurance regarding prevention or timely detection of unauthorized acquisition, use, or disposition of the company’s assets that could have a material effect on the financial statements.
Because of its inherent limitations, internal control over financial reporting may not prevent or detect misstatements. Also, projections of any evaluation of effectiveness to future periods are subject to the risk that controls may become inadequate because of changes in conditions, or that the degree of compliance with the policies or procedures may deteriorate.
In our opinion, American Capital, Ltd. maintained, in all material respects, effective internal control over financial reporting as of December 31, 2009, based on the COSO criteria.
We also have audited, in accordance with the standards of the Public Company Accounting Oversight Board (United States), the consolidated balance sheets of American Capital, Ltd., including the consolidated schedules of investments, as of December 31, 2009 and 2008, and the related consolidated statements of operations, changes in net assets, and cash flows for each of the three years in the period ended December 31, 2009, and the consolidated financial highlights for each of the five years in the period ended December 31, 2009, and our report dated March 1, 2010 expressed an unqualified opinion thereon that included an explanatory paragraph regarding American Capital, Ltd.’s ability to continue as a going concern.
/s/ Ernst & Young LLP
McLean, Virginia
March 1, 2010
87
Report of Independent Registered Public Accounting Firm
The Board of Directors and Shareholders of American Capital, Ltd.
We have audited the accompanying consolidated balance sheets of American Capital, Ltd., including the consolidated schedules of investments, as of December 31, 2009 and 2008, and the related consolidated statements of operations, changes in net assets, and cash flows for each of the three years in the period ended December 31, 2009, and the consolidated financial highlights for each of the five years in the period ended December 31, 2009. These financial statements and the financial highlights are the responsibility of the Company’s management. Our responsibility is to express an opinion on these financial statements and financial highlights based on our audits.
We conducted our audits in accordance with the standards of the Public Company Accounting Oversight Board (United States). Those standards require that we plan and perform the audit to obtain reasonable assurance about whether the financial statements and financial highlights are free of material misstatement. An audit includes examining, on a test basis, evidence supporting the amounts and disclosures in the financial statements and financial highlights. An audit also includes assessing the accounting principles used and significant estimates made by management, as well as evaluating the overall financial statement presentation. Our procedures included verification by examination or confirmation of securities held by the custodians as of December 31, 2009 or by other appropriate auditing procedures. We believe that our audits provide a reasonable basis for our opinion.
In our opinion, the financial statements and financial highlights referred to above present fairly, in all material respects, the consolidated financial position of American Capital, Ltd. at December 31, 2009 and 2008, the consolidated results of its operations, changes in its net assets and its cash flows for each of the three years in the period ended December 31, 2009, and its consolidated financial highlights for each of the five years in the period ended December 31, 2009, in conformity with U.S. generally accepted accounting principles.
The accompanying consolidated financial statements have been prepared assuming that American Capital, Ltd. will continue as a going concern. As more fully described in Note 2, the Company incurred net losses of $0.9 billion and $3.1 billion for the years ended December 31, 2009 and December 31, 2008, respectively. In addition, the Company has received default notices from certain lenders and noteholders for its non-compliance with certain covenants of its unsecured borrowing arrangements, and the Company is generally restricted from issuing any new debt because it has not met the 200% minimum asset coverage requirement under the Investment Company Act of 1940. These conditions raise substantial doubt about the Company’s ability to continue as a going concern. Management’s plans in regard to these matters are described in Note 2. The December 31, 2009 consolidated financial statements do not include any adjustments to reflect the possible future effects on the recoverability and classification of assets or the amounts and classification of liabilities that may result from the outcome of this uncertainty.
We also have audited, in accordance with the standards of the Public Company Accounting Oversight Board (United States) American Capital, Ltd.’s internal control over financial reporting as of December 31, 2009, based on criteria established in Internal Control—Integrated Framework issued by the Committee of Sponsoring Organizations of the Treadway Commission and our report dated March 1, 2010 expressed an unqualified opinion thereon.
/s/ Ernst & Young LLP
McLean, Virginia
March 1, 2010
88
AMERICAN CAPITAL, LTD.
CONSOLIDATED BALANCE SHEETS
(in millions, except per share amounts)
| | | | | | | | |
| | | December 31, | |
| | | 2009 | | | 2008 | |
Assets | | | | | | | | |
Investments at fair value (cost of $9,158 and $10,691, respectively) | | | | | | | | |
Non-Control/Non-Affiliate investments (cost of $4,839 and $5,904, respectively) | | $ | 3,036 | | | $ | 4,182 | |
Affiliate investments (cost of $251 and $405, respectively) | | | 204 | | | | 338 | |
Control investments (cost of $4,068 and $4,382, respectively) | | | 2,335 | | | | 2,898 | |
Derivative agreements (cost of $0 and $0, respectively) | | | 1 | | | | 9 | |
| | | | | | | | |
Total investments at fair value | | | 5,576 | | | | 7,427 | |
Cash and cash equivalents | | | 835 | | | | 209 | |
Restricted cash and cash equivalents | | | 96 | | | | 71 | |
Interest receivable | | | 38 | | | | 44 | |
Other | | | 127 | | | | 159 | |
| | | | | | | | |
Total assets | | $ | 6,672 | | | $ | 7,910 | |
| | | | | | | | |
Liabilities and Shareholders’ Equity | | | | | | | | |
Debt ($2,666 and $2,512 due within one year, respectively) | | $ | 4,142 | | | $ | 4,428 | |
Derivative and option agreements (cost of $0 and $(20), respectively) | | | 102 | | | | 222 | |
Other | | | 99 | | | | 105 | |
| | | | | | | | |
Total liabilities | | | 4,343 | | | | 4,755 | |
| | | | | | | | |
Commitments and contingencies | | | | | | | | |
Shareholders’ equity: | | | | | | | | |
Undesignated preferred stock, $0.01 par value, 5.0 shares authorized, 0 issued and outstanding | | | — | | | | — | |
Common stock, $0.01 par value, 1,000.0 shares authorized, 292.9 and 214.3 issued and 280.9 and 204.7 outstanding, respectively | | | 3 | | | | 2 | |
Capital in excess of par value | | | 6,735 | | | | 6,550 | |
Notes receivable from sale of common stock | | | — | | | | (5 | ) |
(Distributions in excess of) undistributed net realized earnings | | | (709 | ) | | | 76 | |
Net unrealized depreciation of investments | | | (3,700 | ) | | | (3,468 | ) |
| | | | | | | | |
Total shareholders’ equity | | | 2,329 | | | | 3,155 | |
| | | | | | | | |
Total liabilities and shareholders’ equity | | $ | 6,672 | | | $ | 7,910 | |
| | | | | | | | |
Net asset value per common share | | $ | 8.29 | | | $ | 15.41 | |
| | | | | | | | |
See accompanying notes.
89
AMERICAN CAPITAL, LTD.
CONSOLIDATED STATEMENTS OF OPERATIONS
(in millions, except per share data)
| | | | | | | | | | | | |
| | | Year Ended December 31, | |
| | | 2009 | | | 2008 | | | 2007 | |
OPERATING INCOME: | | | | | | | | | | | | |
Interest and dividend income | | | | | | | | | | | | |
Non-Control/Non-Affiliate investments | | $ | 388 | | | $ | 597 | | | $ | 599 | |
Affiliate investments | | | 47 | | | | 39 | | | | 63 | |
Control investments | | | 203 | | | | 314 | | | | 337 | |
| | | | | | | | | | | | |
Total interest and dividend income | | | 638 | | | | 950 | | | | 999 | |
| | | | | | | | | | | | |
Asset management and other fee income | | | | | | | | | | | | |
Non-Control/Non-Affiliate investments | | | 21 | | | | 35 | | | | 116 | |
Affiliate investments | | | 1 | | | | 1 | | | | 3 | |
Control investments | | | 37 | | | | 65 | | | | 122 | |
| | | | | | | | | | | | |
Total asset management and other fee income | | | 59 | | | | 101 | | | | 241 | |
| | | | | | | | | | | | |
Total operating income | | | 697 | | | | 1,051 | | | | 1,240 | |
| | | | | | | | | | | | |
OPERATING EXPENSES: | | | | | | | | | | | | |
Interest | | | 256 | | | | 220 | | | | 287 | |
Salaries, benefits and stock-based compensation | | | 215 | | | | 206 | | | | 254 | |
General and administrative | | | 111 | | | | 95 | | | | 99 | |
| | | | | | | | | | | | |
Total operating expenses | | | 582 | | | | 521 | | | | 640 | |
| | | | | | | | | | | | |
NET OPERATING INCOME BEFORE INCOME TAXES | | | 115 | | | | 530 | | | | 600 | |
Benefit (provision) for income taxes | | | 20 | | | | (37 | ) | | | (6 | ) |
| | | | | | | | | | | | |
NET OPERATING INCOME | | | 135 | | | | 493 | | | | 594 | |
| | | | | | | | | | | | |
Net gain on extinguishment of debt | | | 12 | | | | — | | | | — | |
| | | | | | | | | | | | |
Net realized (loss) gain on investments | | | | | | | | | | | | |
Non-Control/Non-Affiliate investments | | | (253 | ) | | | 37 | | | | 74 | |
Affiliate investments | | | (3 | ) | | | (22 | ) | | | 23 | |
Control investments | | | (460 | ) | | | 117 | | | | 101 | |
Taxes on net realized gain | | | — | | | | (54 | ) | | | (6 | ) |
Foreign currency transactions | | | (3 | ) | | | (6 | ) | | | 5 | |
Derivative and option agreements | | | (106 | ) | | | (40 | ) | | | 17 | |
| | | | | | | | | | | | |
Total net realized (loss) gain on investments | | | (825 | ) | | | 32 | | | | 214 | |
| | | | | | | | | | | | |
Net unrealized (depreciation) appreciation of investments | | | | | | | | | | | | |
Portfolio company investments | | | (340 | ) | | | (3,480 | ) | | | (126 | ) |
Foreign currency translation | | | 28 | | | | (41 | ) | | | 98 | |
Derivative and option agreements and other | | | 80 | | | | (119 | ) | | | (80 | ) |
| | | | | | | | | | | | |
Total net unrealized depreciation of investments | | | (232 | ) | | | (3,640 | ) | | | (108 | ) |
| | | | | | | | | | | | |
Total net (loss) gain on investments | | | (1,057 | ) | | | (3,608 | ) | | | 106 | |
| | | | | | | | | | | | |
NET (DECREASE) INCREASE IN NET ASSETS RESULTING FROM OPERATIONS (“NET (LOSS) EARNINGS”) | | $ | (910 | ) | | $ | (3,115 | ) | | $ | 700 | |
| | | | | | | | | | | | |
NET OPERATING INCOME PER COMMON SHARE: | | | | | | | | | | | | |
Basic | | $ | 0.56 | | | $ | 2.42 | | | $ | 3.42 | |
Diluted | | $ | 0.56 | | | $ | 2.42 | | | $ | 3.36 | |
NET (LOSS) EARNINGS PER COMMON SHARE: | | | | | | | | | | | | |
Basic | | $ | (3.77 | ) | | $ | (15.29 | ) | | $ | 4.03 | |
Diluted | | $ | (3.77 | ) | | $ | (15.29 | ) | | $ | 3.96 | |
WEIGHTED AVERAGE SHARES OF COMMON STOCK OUTSTANDING: | | | | | | | | | | | | |
Basic | | | 241.1 | | | | 203.7 | | | | 173.9 | |
Diluted | | | 241.1 | | | | 203.7 | | | | 176.9 | |
DIVIDENDS DECLARED PER COMMON SHARE | | $ | 1.07 | | | $ | 3.09 | | | $ | 3.72 | |
See accompanying notes.
90
AMERICAN CAPITAL, LTD.
CONSOLIDATED STATEMENTS OF CHANGES IN NET ASSETS
(in millions, except per share data)
| | | | | | | | | | | | |
| | | Year Ended December 31, | |
| | | 2009 | | | 2008 | | | 2007 | |
Operations: | | | | | | | | | | | | |
Net operating income | | $ | 135 | | | $ | 493 | | | $ | 594 | |
Net gain on extinguishment of debt | | | 12 | | | | — | | | | — | |
Net realized (loss) gain on investments | | | (825 | ) | | | 32 | | | | 214 | |
Net unrealized depreciation of investments | | | (232 | ) | | | (3,640 | ) | | | (108 | ) |
| | | | | | | | | | | | |
Net (loss) earnings | | | (910 | ) | | | (3,115 | ) | | | 700 | |
| | | | | | | | | | | | |
Shareholder distributions: | | | | | | | | | | | | |
Common stock dividends from net operating income | | | (135 | ) | | | (493 | ) | | | (594 | ) |
Common stock dividends in excess of net operating income | | | (96 | ) | | | (130 | ) | | | (61 | ) |
| | | | | | | | | | | | |
Net decrease in net assets resulting from shareholder distributions | | | (231 | ) | | | (623 | ) | | | (655 | ) |
| | | | | | | | | | | | |
Capital share transactions: | | | | | | | | | | | | |
Issuance of common stock | | | 232 | | | | 444 | | | | 2,001 | |
Issuance of common stock under stock option plans | | | — | | | | 5 | | | | 30 | |
Issuance of common stock under dividend reinvestment plan | | | — | | | | — | | | | 48 | |
Purchase of common stock held in deferred compensation trusts | | | — | | | | (71 | ) | | | (111 | ) |
Stock-based compensation | | | 86 | | | | 81 | | | | 62 | |
Other | | | (3 | ) | | | (7 | ) | | | 24 | |
| | | | | | | | | | | | |
Net increase in net assets resulting from capital share transactions | | | 315 | | | | 452 | | | | 2,054 | |
| | | | | | | | | | | | |
Total (decrease) increase in net assets | | | (826 | ) | | | (3,286 | ) | | | 2,099 | |
Net assets at beginning of period | | | 3,155 | | | | 6,441 | | | | 4,342 | |
| | | | | | | | | | | | |
Net assets at end of period | | $ | 2,329 | | | $ | 3,155 | | | $ | 6,441 | |
| | | | | | | | | | | | |
Net asset value per common share | | $ | 8.29 | | | $ | 15.41 | | | $ | 32.88 | |
| | | | | | | | | | | | |
Common shares outstanding at end of period | | | 280.9 | | | | 204.7 | | | | 195.9 | |
| | | | | | | | | | | | |
See accompanying notes.
91
AMERICAN CAPITAL, LTD.
CONSOLIDATED STATEMENTS OF CASH FLOWS
(in millions)
| | | | | | | | | | | | |
| | | Year Ended December 31, | |
| | | 2009 | | | 2008 | | | 2007 | |
Operating activities: | | | | | | | | | | | | |
Net (decrease) increase in net assets resulting from operations | | $ | (910 | ) | | $ | (3,115 | ) | | $ | 700 | |
Adjustments to reconcile net (loss) earnings to net cash provided by operating activities: | | | | | | | | | | | | |
Net unrealized depreciation of investments | | | 232 | | | | 3,640 | | | | 108 | |
Net realized loss (gain) on investments | | | 825 | | | | (32 | ) | | | (214 | ) |
Net gain on extinguishment of debt | | | (12 | ) | | | — | | | | — | |
Accrued payment-in-kind interest and dividends on investments | | | (97 | ) | | | (177 | ) | | | (207 | ) |
Accrued payment-in-kind interest for make-whole payment on debt | | | 22 | | | | — | | | | — | |
Collection of loan origination fees | | | — | | | | 15 | | | | 37 | |
Amortization of deferred finance costs, premiums and discounts | | | 13 | | | | 14 | | | | 8 | |
Depreciation of property and equipment | | | 18 | | | | 18 | | | | 8 | |
Stock-based compensation | | | 86 | | | | 81 | | | | 71 | |
(Increase) decrease in interest receivable | | | (10 | ) | | | 14 | | | | (23 | ) |
Decrease in other assets | | | 12 | | | | 41 | | | | 23 | |
Decrease in other liabilities | | | (12 | ) | | | (96 | ) | | | (4 | ) |
Other | | | (2 | ) | | | (20 | ) | | | (14 | ) |
| | | | | | | | | | | | |
Net cash provided by operating activities | | | 165 | | | | 383 | | | | 493 | |
| | | | | | | | | | | | |
Investing activities: | | | | | | | | | | | | |
Purchases of investments | | | (118 | ) | | | (1,517 | ) | | | (6,915 | ) |
Fundings on portfolio company revolving credit facility investments, net | | | (69 | ) | | | (365 | ) | | | (112 | ) |
Principal repayments | | | 362 | | | | 850 | | | | 1,887 | |
Proceeds from loan syndications and loan sales | | | 410 | | | | 349 | | | | 1,601 | |
Collection of payment-in-kind notes and dividends and accreted loan discounts | | | 48 | | | | 64 | | | | 74 | |
Proceeds from sale of equity investments | | | 323 | | | | 913 | | | | 975 | |
Interest rate derivative periodic payments, net | | | (62 | ) | | | (39 | ) | | | 18 | |
Capital expenditures for property and equipment | | | (3 | ) | | | (7 | ) | | | (35 | ) |
Termination of European Capital Limited put option agreement | | | (65 | ) | | | — | | | | — | |
Other | | | (7 | ) | | | 23 | | | | — | |
| | | | | | | | | | | | |
Net cash provided by (used in) investing activities | | | 819 | | | | 271 | | | | (2,507 | ) |
| | | | | | | | | | | | |
Financing activities: | | | | | | | | | | | | |
Payments on notes payable from asset securitizations | | | (288 | ) | | | (317 | ) | | | (90 | ) |
Proceeds from issuance of notes payable from asset securitizations | | | — | | | | — | | | | 830 | |
Draws on revolving credit facilities, net | | | — | | | | (79 | ) | | | (100 | ) |
Proceeds from unsecured debt issuance | | | — | | | | — | | | | 547 | |
Repayments of Total Return Swap facility, net | | | — | | | | — | | | | (296 | ) |
(Increase) decrease in debt service escrows | | | (25 | ) | | | 330 | | | | (168 | ) |
Issuance of common stock | | | — | | | | 449 | | | | 2,031 | |
Purchase of common stock held in deferred compensation trusts | | | — | | | | (71 | ) | | | (111 | ) |
Distributions paid | | | (24 | ) | | | (819 | ) | | | (542 | ) |
Payment of federal income tax for deemed capital gain distribution | | | — | | | | (54 | ) | | | — | |
Other | | | (21 | ) | | | (27 | ) | | | (14 | ) |
| | | | | | | | | | | | |
Net cash (used in) provided by financing activities | | | (358 | ) | | | (588 | ) | | | 2,087 | |
| | | | | | | | | | | | |
Net increase in cash and cash equivalents | | | 626 | | | | 66 | | | | 73 | |
Cash and cash equivalents at beginning of period | | | 209 | | | | 143 | | | | 77 | |
Cash eliminated with deconsolidation of European Capital Financial Services (Guernsey) Limited | | | — | | | | — | | | | (7 | ) |
| | | | | | | | | | | | |
Cash and cash equivalents at end of period | | $ | 835 | | | $ | 209 | | | $ | 143 | |
| | | | | | | | | | | | |
Supplemental Disclosures: | | | | | | | | | | | | |
Cash paid for interest | | $ | 236 | | | $ | 218 | | | $ | 260 | |
Cash paid for taxes | | $ | 9 | | | $ | 65 | | | $ | 10 | |
Non-cash investing activities: | | | | | | | | | | | | |
Stock proceeds received from sale of equity investments | | $ | — | | | $ | — | | | $ | 32 | |
Non-cash financing activities: | | | | | | | | | | | | |
Issuance of common stock in conjunction with special dividend | | $ | 207 | | | $ | — | | | $ | — | |
Issuance of common stock in conjunction with acquisition of European Capital Limited | | $ | 25 | | | $ | — | | | $ | — | |
Issuance of common stock in conjunction with dividend reinvestment plan | | $ | — | | | $ | — | | | $ | 48 | |
See accompanying notes.
92
AMERICAN CAPITAL, LTD.
CONSOLIDATED FINANCIAL HIGHLIGHTS
(in millions, except per share data)
| | | | | | | | | | | | | | | | | | | | |
| | | Year Ended December 31, | |
| | | 2009 | | | 2008 | | | 2007 | | | 2006 | | | 2005 | |
Per Share Data: | | | | | | | | | | | | | | | | | | | | |
Net asset value at beginning of the period | | $ | 15.41 | | | $ | 32.88 | | | $ | 29.42 | | | $ | 24.37 | | | $ | 21.11 | |
| | | | | | | | | | | | | | | | | | | | |
Net operating income(1) | | | 0.56 | | | | 2.42 | | | | 3.42 | | | | 3.15 | | | | 3.16 | |
Net gain on extinguishment of debt(1) | | | 0.05 | | | | — | | | | — | | | | — | | | | — | |
Net realized (loss) gain on investments(1) | | | (3.42 | ) | | | 0.16 | | | | 1.23 | | | | 1.28 | | | | 0.37 | |
Net unrealized (depreciation) appreciation on investments(1) | | | (0.96 | ) | | | (17.87 | ) | | | (0.62 | ) | | | 2.20 | | | | 0.15 | |
| | | | | | | | | | | | | | | | | | | | |
Net (decrease) increase in net assets resulting from operations(1) | | | (3.77 | ) | | | (15.29 | ) | | | 4.03 | | | | 6.63 | | | | 3.68 | |
Issuance of common stock(2) | | | (0.70 | ) | | | 0.12 | | | | 2.91 | | | | 1.96 | | | | 2.67 | |
Shareholder distributions | | | (1.07 | ) | | | (3.09 | ) | | | (3.72 | ) | | | (3.33 | ) | | | (3.08 | ) |
Other, net(3) | | | (1.58 | ) | | | 0.79 | | | | 0.24 | | | | (0.21 | ) | | | (0.01 | ) |
| | | | | | | | | | | | | | | | | | | | |
Net asset value at end of period | | $ | 8.29 | | | $ | 15.41 | | | $ | 32.88 | | | $ | 29.42 | | | $ | 24.37 | |
| | | | | | | | | | | | | | | | | | | | |
Ratio/Supplemental Data: | | | | | | | | | | | | | | | | | | | | |
Per share market value at end of period | | $ | 2.44 | | | $ | 3.24 | | | $ | 32.96 | | | $ | 46.26 | | | $ | 36.21 | |
Total investment return (loss)(4) | | | 0.34 | % | | | (88.75 | )% | | | (21.42 | )% | | | 40.00 | % | | | 18.98 | % |
Shares outstanding at end of period | | | 280.9 | | | | 204.7 | | | | 195.9 | | | | 147.6 | | | | 118.9 | |
Net assets at end of period | | $ | 2,329 | | | $ | 3,155 | | | $ | 6,441 | | | $ | 4,342 | | | $ | 2,898 | |
Average net assets(5) | | $ | 2,444 | | | $ | 5,194 | | | $ | 5,719 | | | $ | 3,643 | | | $ | 2,297 | |
Average debt outstanding(6) | | $ | 4,307 | | | $ | 4,508 | | | $ | 4,572 | | | $ | 3,021 | | | $ | 1,892 | |
Average debt outstanding per common share(1) | | $ | 17.86 | | | $ | 22.13 | | | $ | 26.30 | | | $ | 22.36 | | | $ | 19.05 | |
Ratio of operating expenses to average net assets | | | 23.82 | % | | | 10.03 | % | | | 11.19 | % | | | 11.64 | % | | | 9.93 | % |
Ratio of operating expenses, net of interest expense, to average net assets | | | 13.34 | % | | | 5.79 | % | | | 6.17 | % | | | 6.42 | % | | | 5.55 | % |
Ratio of interest expense to average net assets | | | 10.48 | % | | | 4.24 | % | | | 5.02 | % | | | 5.22 | % | | | 4.38 | % |
Ratio of net operating income to average net assets | | | 5.52 | % | | | 9.49 | % | | | 10.39 | % | | | 11.67 | % | | | 13.67 | % |
| (1) | Weighted average basic per share data. |
| (2) | For the year ended December 31, 2009, represents the issuance of common stock in conjunction with the acquisition of European Capital Limited. |
| (3) | Represents the impact of (i) the other components in the changes in net assets, including other capital transactions such as the issuance of common stock through a shareholder distribution, the purchase of common stock held in deferred compensation trusts, stock-based compensation, income tax deductions related to the exercise of stock options and distribution of stock awards in excess of GAAP expense credited to additional paid-in capital, repayments of notes receivable from the sale of common stock and the purchase of treasury stock and (ii) the different share amounts used in calculating per share data as a result of calculating certain per share data based upon the weighted average basic shares outstanding during the period and certain per share data based on the shares outstanding as of a period end or transaction date. |
| (4) | Total investment return (loss) is based on the change in the market value of our common stock taking into account dividends reinvested in accordance with the terms of our dividend reinvestment plan. |
| (5) | Based on the average of net assets as of the beginning and end of each quarterly reporting period in each period presented. |
| (6) | Based on a daily weighted average balance of debt outstanding during the period. |
See accompanying notes.
93
AMERICAN CAPITAL, LTD.
CONSOLIDATED SCHEDULE OF INVESTMENTS
December 31, 2009
(in millions, except share data)
| | | | | | | | | | | | | | | | | | | |
Company (4) | | Industry | | Investments | | Interest
Rate (5) | | Maturity
Date | | # of
shares/
units
owned | | Principal | | Cost | | Fair
Value |
NON-CONTROL / NON-AFFILIATE INVESTMENTS | | | | | | | | | | | |
Affordable Care Holding Corp. | | Health Care Providers & Services | | Subordinated Debt(7) | | 15.0% | | 11/13-11/14 | | | | $ | 66.6 | | $ | 65.9 | | $ | 66.6 |
| | | Convertible Preferred Stock | | | | | | 70,752 | | | | | | 91.0 | | | 99.4 |
| | | | Common Stock(1) | | | | | | 17,687,156 | | | | | | 17.7 | | | 19.8 |
| | | | | | | | | | | | | | | | | 174.6 | | | 185.8 |
Algoma Holding Company | | Building Products | | Subordinated Debt(7) | | 12.6% | | 4/13 | | | | | 15.2 | | | 15.1 | | | 14.9 |
American Acquisition, LLC | | Capital Markets | | Senior Debt | | 14.2% | | 12/12 | | | | | 15.7 | | | 15.4 | | | 13.5 |
AmWins Group, Inc. | | Insurance | | Senior Debt(7) | | 5.8% | | 6/14 | | | | | 18.5 | | | 18.6 | | | 12.1 |
Anchor Drilling Fluids USA, Inc. | | Energy Equipment & Services | | Senior Debt(7) | | 11.3% | | 4/13 | | | | | 7.9 | | | 7.8 | | | 6.3 |
| | | Subordinated Debt(6)(7) | | 14.7% | | 4/15 | | | | | 5.2 | | | 5.0 | | | — |
| | | | | | | | | | | | | | | | | 12.8 | | | 6.3 |
Aspect Software | | IT Services | | Senior Debt(7) | | 7.3% | | 7/12 | | | | | 20.0 | | | 19.9 | | | 16.6 |
Avanti Park Place LLC | | Real Estate | | Senior Debt | | 8.3% | | 6/10 | | | | | 5.7 | | | 5.8 | | | 5.8 |
Avalon Laboratories Holding Corp. | | Health Care Equipment & Supplies | | Senior Debt(7) | | 11.0% | | 1/14 | | | | | 17.7 | | | 17.6 | | | 17.7 |
| | | Subordinated Debt(7) | | 18.0% | | 1/15 | | | | | 22.9 | | | 21.7 | | | 20.6 |
| | | | Convertible Preferred Stock(1) | | | | | | 148,742 | | | | | | 24.3 | | | — |
| | | | Common Stock(1) | | | | | | 7,829 | | | | | | 1.3 | | | — |
| | | | | | | | | | | | | | | | | 64.9 | | | 38.3 |
BBB Industries, LLC | | Auto Components | | Senior Debt(7) | | 5.7% | | 6/14 | | | | | 21.2 | | | 21.2 | | | 15.9 |
Berry-Hill Galleries, Inc. | | Distributors | | Senior Debt | | 13.7% | | 3/10 | | | | | 7.9 | | | 7.9 | | | 7.9 |
Blue Wolf Capital Fund II, L.P. | | Capital Markets | | Limited Partnership Interest | | | | | | | | | | | | 2.5 | | | 2.5 |
CAMP Systems International, Inc. | | Air Freight & Logistics | | Senior Debt(7) | | 6.4% | | 9/14 | | | | | 30.0 | | | 29.8 | | | 20.6 |
Carestream Health, Inc. | | Health Care Equipment & Supplies | | Senior Debt(7) | | 5.5% | | 10/13 | | | | | 15.0 | | | 15.0 | | | 11.6 |
CH Holding Corp. | | Leisure Equipment & Products | | Senior Debt(6) | | 7.2% | | 5/11 | | | | | 16.2 | | | 13.0 | | | 13.7 |
| | | Redeemable Preferred Stock(1) | | | | | | 21,215 | | | | | | 42.7 | | | — |
| | | | | | | | | | | | | | | | | 55.7 | | | 13.7 |
Cinelease, Inc. | | Electronic Equipment, Instruments & Components | | Senior Debt(7) | | 7.7% | | 3/12-4/13 | | | | | 47.9 | | | 47.6 | | | 41.3 |
| | | Senior Debt(6)(7) | | 8.3% | | 4/13 | | | | | 10.4 | | | 10.4 | | | 7.1 |
| | | Common Stock(1) | | | | | | 583 | | | | | | 0.5 | | | — |
| | | | | | | | | | | | | | | | | 58.5 | | | 48.4 |
Compusearch Holdings Company, Inc. | | Software | | Subordinated Debt(7) | | 12.0% | | 7/12 | | | | | 12.6 | | | 12.5 | | | 12.6 |
| | | Convertible Preferred Stock(1) | | | | | | 23,342 | | | | | | 0.9 | | | 2.7 |
| | | | | | | | | | | | | | | | | 13.4 | | | 15.3 |
Contec LLC | | Household Durables | | Subordinated Debt(7) | | 14.0% | | 9/15-9/16 | | | | | 135.0 | | | 133.8 | | | 114.6 |
Delsey Holding(3) | | Textiles, Apparel & Luxury Goods | | Senior Debt | | 7.2% | | 2/12 | | | | | 20.5 | | | 20.5 | | | 15.0 |
DelStar, Inc. | | Building Products | | Subordinated Debt(7) | | 14.0% | | 12/12 | | | | | 19.1 | | | 19.0 | | | 19.1 |
| | | Redeemable Preferred Stock | | | | | | 26,613 | | | | | | 19.4 | | | 36.7 |
| | | | Convertible Preferred Stock(1) | | | | | | 29,569 | | | | | | 3.0 | | | — |
| | | | Common Stock Warrants(1) | | | | | | 89,020 | | | | | | 16.9 | | | — |
| | | | | | | | | | | | | | | | | 58.3 | | | 55.8 |
Direct Marketing International LLC | | Media | | Subordinated Debt(7) | | 15.2% | | 7/12 | | | | | 30.3 | | | 30.1 | | | 26.8 |
94
AMERICAN CAPITAL, LTD.
CONSOLIDATED SCHEDULE OF INVESTMENTS—(Continued)
December 31, 2009
(in millions, except share data)
| | | | | | | | | | | | | | | | |
Company (4) | | Industry | | Investments | | Interest
Rate (5) | | Maturity
Date | | # of
shares/
units
owned | | Principal | | Cost | | Fair
Value |
Dyno Holding Corp. | | Auto Components | | Senior Debt(7) | | 11.7% | | 11/13-11/15 | | | | 41.6 | | 41.3 | | 41.6 |
| | | Subordinated Debt(6)(7) | | 3.7% | | 11/16 | | | | 27.0 | | 25.6 | | 9.9 |
| | | | Convertible Preferred Stock(1) | | | | | | 389,759 | | | | 40.5 | | — |
| | | | Common Stock(1) | | | | | | 97,440 | | | | 10.1 | | — |
| | | | | | | | | | | | | | | 117.5 | | 51.5 |
Easton Bell Sports LLC | | Leisure Equipment & Products | | Redeemable Preferred Stock Common Units(1) | | | | | | 1,171
3,830,068 | | | | 1.3
0.7 | | 1.3
2.0 |
| | | | | | | | | | | | | | | 2.0 | | 3.3 |
FAMS Acquisition, Inc. | | Diversified Financial Services | | Subordinated Debt(7) Subordinated Debt(6)(7) | | 14.0%
15.5% | | 11/13
11/14 | | | | 13.1
13.6 | | 13.0
11.8 | | 13.1
3.1 |
| | | | Redeemable Preferred Stock(1) | | | | | | 919 | | | | 0.9 | | — |
| | | | Convertible Preferred Stock(1) | | | | | | 861,364 | | | | 20.9 | | — |
| | | | | | | | | | | | | | | 46.6 | | 16.2 |
FCC Holdings, LLC | | Commercial Banks | | Subordinated Debt | | 15.1% | | 12/12 | | | | 75.0 | | 74.6 | | 67.7 |
Ford Motor Company(2) | | Automobiles | | Senior Debt | | 3.4% | | 12/13 | | | | 21.2 | | 20.6 | | 18.3 |
FPI Holding Corporation | | Food Products | | Senior Debt | | 7.6% | | 11/10-5/11 | | | | 7.4 | | 7.3 | | 7.4 |
| | | | Senior Debt(6) | | 13.9% | | 5/13-6/15 | | | | 24.0 | | 23.2 | | 5.7 |
| | | | Subordinated Debt(6) | | 21.6% | | 6/15-5/16 | | | | 23.2 | | 17.3 | | — |
| | | | Redeemable Preferred Stock(1) | | | | | | 4,469 | | | | 39.1 | | — |
| | | | Convertible Preferred Stock(1) | | | | | | 21,715 | | | | 23.3 | | — |
| | | | Common Stock(1) | | | | | | 5,429 | | | | 5.8 | | — |
| | | | | | | | | | | | | | | 116.0 | | 13.1 |
Genband Inc. | | Communications Equipment | | Common Stock(1) | | | | | | 3,407,419 | | | | 14.7 | | 0.2 |
Golden Key US LLC | | Diversified Financial Services | | Commercial Paper(1) | | 5.3% | | 1/14 | | | | 7.3 | | 7.3 | | 3.9 |
HMSC Corporation | | Insurance | | Senior Debt(6)(7) | | 5.8% | | 10/14 | | | | 3.4 | | 3.4 | | 1.2 |
Hopkins Manufacturing Corporation | | Auto Components | | Subordinated Debt(7) | | 15.3% | | 7/12 | | | | 39.0 | | 38.8 | | 38.4 |
| | | | Redeemable Preferred Stock | | | | | | 2,915 | | | | 7.0 | | 6.8 |
| | | | | | | | | | | | | | | 45.8 | | 45.2 |
Infiltrator Systems, Inc. | | Building Products | | Senior Debt(7) | | 16.5% | | 10/13 | | | | 39.5 | | 39.1 | | 38.5 |
Innova Holdings, Inc. | | Software | | Senior Debt(7) | | 7.7% | | 4/13 | | | | 11.5 | | 11.4 | | 11.5 |
| | | | Subordinated Debt(7) | | 15.0% | | 3/14 | | | | 18.2 | | 18.0 | | 18.2 |
| | | | Convertible Preferred Stock | | | | | | 14,283 | | | | 23.3 | | 28.9 |
| | | | | | | | | | | | | | | 52.7 | | 58.6 |
Inovis International, Inc. | | Software | | Senior Debt(7) | | 16.0% | | 6/10 | | | | 89.2 | | 89.0 | | 89.0 |
Intergraph Corporation | | Software | | Senior Debt(7) | | 6.3% | | 12/14 | | | | 3.0 | | 3.0 | | 2.8 |
iTradeNetwork, Inc. | | IT Services | | Senior Debt(7) | | 11.5% | | 12/13 | | | | 25.0 | | 24.8 | | 25.0 |
JHCI Acquisition, Inc. | | Air Freight & Logistics | | Senior Debt(7) | | 5.7% | | 12/14 | | | | 19.0 | | 19.1 | | 12.1 |
Jones Stephens Corp.(8) | | Building Products | | Subordinated Debt(6)(7) | | 13.5% | | 9/13-9/14 | | | | 23.5 | | 22.1 | | 13.2 |
J-Pac, LLC | | Health Care Equipment & Supplies | | Senior Debt(7) | | 11.0% | | 1/14 | | | | 3.1 | | 3.0 | | 3.1 |
| | | Senior Debt(6)(7) | | 12.3% | | 1/14 | | | | 11.9 | | 11.8 | | 1.2 |
| | | | Subordinated Debt(6) | | 18.9% | | 1/14 | | | | 11.6 | | 8.7 | | — |
| | | | Common Unit Warrants(1) | | | | | | 500,000 | | | | 0.2 | | — |
| | | | | | | | | | | | | | | 23.7 | | 4.3 |
KIK Custom Products, Inc.(3) | | Household Products | | Senior Debt(6) | | 5.3% | | 12/14 | | | | 20.0 | | 20.0 | | 12.3 |
LabelCorp Holdings, Inc | | Paper & Forest Products | | Senior Debt | | 8.2% | | 8/13-8/14 | | | | 2.5 | | 2.2 | | 2.3 |
| | | | Subordinated Debt(7) | | 14.0% | | 8/15-8/16 | | | | 44.5 | | 44.2 | | 39.2 |
| | | | | | | | | | | | | | | 46.4 | | 41.5 |
95
AMERICAN CAPITAL, LTD.
CONSOLIDATED SCHEDULE OF INVESTMENTS—(Continued)
December 31, 2009
(in millions, except share data)
| | | | | | | | | | | | | | | | | |
Company (4) | | Industry | | Investments | | Interest
Rate (5) | | Maturity
Date | | # of
shares/
units
owned | | | Principal | | Cost | | Fair
Value |
LCW Holdings, LLC | | Real Estate | | Senior Debt | | 6.7% | | 10/12 | | | | | 32.2 | | 31.4 | | 30.3 |
| | | | Warrant(1) | | | | | | 12.5 | % | | | | 0.9 | | 3.5 |
| | | | | | | | | | | | | | | | 32.3 | | 33.8 |
LJVH Holdings Inc.(3) | | Beverages | | Senior Debt(7) | | 5.8% | | 1/15 | | | | | 28.5 | | 28.5 | | 21.0 |
LN Acquisition Corp. | | Machinery | | Senior Debt(7) | | 6.0% | | 1/15 | | | | | 21.5 | | 21.6 | | 14.4 |
Logex Corporation | | Road & Rail | | Subordinated Debt(6) | | 0.0% | | 3/10 | | | | | 1.1 | | 0.9 | | 1.0 |
MagnaCare Holdings, Inc. | | Health Care Providers & Services | | Subordinated Debt(7) | | 14.8% | | 1/13 | | | | | 14.3 | | 14.2 | | 14.2 |
Medical Billing Holdings, Inc. | | IT Services | | Subordinated Debt(7) | | 15.0% | | 9/13 | | | | | 11.0 | | 10.9 | | 11.0 |
| | | | Convertible Preferred Stock(1) | | | | | | 13,199,000 | | | | | 13.2 | | 10.0 |
| | | | Common Stock(1) | | | | | | 3,299,582 | | | | | 3.3 | | — |
| | | | | | | | | | | | | | | | 27.4 | | 21.0 |
Mirion Technologies | | Electrical Equipment | | Senior Debt(7) | | 5.3% | | 6/11-11/11 | | | | | 127.7 | | 127.4 | | 129.1 |
| | | | Subordinated Debt(7) | | 13.8% | | 7/11-5/12 | | | | | 52.9 | | 52.6 | | 52.9 |
| | | | Convertible Preferred Stock | | | | | | 435,724 | | | | | 54.6 | | 104.1 |
| | | | Common Stock(1) | | | | | | 24,503 | | | | | 2.8 | | 3.6 |
| | | | Common Stock Warrants(1) | | | | | | 222,156 | | | | | 18.5 | | 31.8 |
| | | | | | | | | | | | | | | | 255.9 | | 321.5 |
Mitchell International, Inc. | | IT Services | | Senior Debt(7) | | 5.6% | | 3/15 | | | | | 5.0 | | 5.0 | | 3.3 |
National Processing Company Group, Inc. | | IT Services | | Senior Debt(7) | | 10.8% | | 9/14 | | | | | 53.0 | | 52.8 | | 43.6 |
Net1 Las Colinas Manager, LLC | | Real Estate | | Senior Debt | | 7.7% | | 10/15 | | | | | 4.5 | | 4.6 | | 3.9 |
NBD Holdings Corp. | | Diversified Financial Services | | Subordinated Debt(7) | | 14.0% | | 8/13 | | | | | 46.8 | | 46.4 | | 46.8 |
| | | Convertible Preferred Stock | | | | | | 84,174 | | | | | 11.3 | | 11.3 |
| | | | Common Stock(1) | | | | | | 633,408 | | | | | 0.1 | | 1.5 |
| | | | | | | | | | | | | | | | 57.8 | | 59.6 |
Nivel Holdings, LLC | | Distributors | | Senior Debt(7) | | 10.8% | | 10/12-10/13 | | | | | 61.6 | | 61.1 | | 58.6 |
Orchard Brands Corporation | | Internet & Catalog Retail | | Senior Debt(7) | | 7.3% | | 4/13-4/14 | | | | | 174.4 | | 173.2 | | 138.8 |
| | | | Senior Debt(6) | | 10.0% | | 4/14 | | | | | 158.5 | | 118.6 | | 33.1 |
| | | | Subordinated Debt(6) | | 9.7% | | 4/14 | | | | | 66.4 | | 49.9 | | — |
| | | | | | | | | | | | | | | | 341.7 | | 171.9 |
Pan Am International Flight Academy, Inc. | | Professional Services | | Subordinated Debt(6)(7) | | 18.0% | | 7/13 | | | | | 33.4 | | 25.0 | | 14.2 |
| | | Convertible Preferred Stock(1) | | | | | | 8,234 | | | | | 8.2 | | — |
| | | | | | | | | | | | | | | | 33.2 | | 14.2 |
PaR Systems, Inc. | | Machinery | | Senior Debt | | 3.6% | | 7/13 | | | | | 4.1 | | 3.9 | | 3.4 |
Parts Holding
Coörperatief U.A(3) | | Distributors | | Membership Entitlements(1) | | | | | | 173,060 | | | | | 6.4 | | — |
Phillips & Temro Industries, Inc. | | Auto Components | | Senior Debt(7) | | 13.0% | | 12/13 | | | | | 24.1 | | 24.1 | | 24.1 |
| | | Subordinated Debt(7) | | 18.0% | | 12/13 | | | | | 18.4 | | 18.3 | | 17.0 |
| | | | | | | | | | | | | | | | 42.4 | | 41.1 |
Qioptiq S.A.R.L.(3) | | Electronic Equipment, Instruments & Components | | Subordinated Debt | | 10.0% | | 3/18 | | | | | 30.9 | | 30.7 | | 29.3 |
Ranpak Acquisition Company | | Containers & Packaging | | Senior Debt(7) | | 6.7% | | 12/13-12/14 | | | | | 20.8 | | 20.4 | | 16.9 |
96
AMERICAN CAPITAL, LTD.
CONSOLIDATED SCHEDULE OF INVESTMENTS—(Continued)
December 31, 2009
(in millions, except share data)
| | | | | | | | | | | | | | | | | | |
Company (4) | | Industry | | Investments | | Interest
Rate (5) | | | Maturity
Date | | # of
shares/
units
owned | | | Principal | | Cost | | Fair
Value |
RDR Holdings, Inc. | | Household Durables | | Subordinated Debt(7) | | 16.1% | | | 10/14-11/15 | | | | | 98.1 | | 97.4 | | 98.1 |
| | | Convertible Preferred Stock(1) | | | | | | | 1,541 | | | | | 165.6 | | 56.7 |
| | | | Common Stock(1) | | | | | | | 15,414 | | | | | 1.6 | | — |
| | | | | | | | | | | | | | | | | 264.6 | | 154.8 |
Roark - Money Mailer, LLC | | Media | | Common Membership Units(1) | | | | | | | 3.5 | % | | | | 0.9 | | — |
Scanner Holdings Corporation | | Computers & Peripherals | | Subordinated Debt(7) | | 14.0% | | | 6/14 | | | | | 19.1 | | 18.9 | | 19.1 |
| | | | Convertible Preferred Stock(1) | | | | | | | 77,640,000 | | | | | 7.8 | | 13.7 |
| | | | Common Stock(1) | | | | | | | 78,242 | | | | | 0.1 | | — |
| | | | | | | | | | | | | | | | | 26.8 | | 32.8 |
Seroyal Holdings, L.P.(3) | | Pharmaceuticals | | Redeemable Preferred Units | | | | | | | 32,462 | | | | | 0.7 | | 0.9 |
| | | Common Units(1) | | | | | | | 95,280 | | | | | 0.8 | | 1.6 |
| | | | Common Unit Warrants(1) | | | | | | | 41,661 | | | | | 0.1 | | 0.1 |
| | | | | | | | | | | | | | | | | 1.6 | | 2.6 |
Small Smiles Holding Company, LLC | | Health Care Providers & Services | | Senior Debt | | 5.3% | | | 9/12 | | | | | 12.1 | | 8.1 | | 6.1 |
| | | Subordinated Debt(6) | | 14.5% | | | 9/13 | | | | | 77.2 | | 70.6 | | — |
| | | | | | | | | | | | | | | | | 78.7 | | 6.1 |
Soil Safe Holdings, LLC | | Professional Services | | Senior Debt | | 9.6% | | | 8/13-8/14 | | | | | 40.8 | | 40.5 | | 38.4 |
| | | | Subordinated Debt(7) | | 16.3% | | | 8/15-8/17 | | | | | 62.7 | | 62.2 | | 52.6 |
| | | | | | | | | | | | | | | | | 102.7 | | 91.0 |
SPL Acquisition Corp. | | Pharmaceuticals | | Senior Debt | | 6.7% | | | 10/12-10/13 | | | | | 58.5 | | 57.9 | | 58.5 |
| | | | Subordinated Debt(7) | | 15.3% | | | 8/14-8/15 | | | | | 51.6 | | 51.1 | | 51.6 |
| | | | Convertible Preferred Stock(1) | | | | | | | 84,043 | | | | | 40.8 | | 31.1 |
| | | | | | | | | | | | | | | | | 149.8 | | 141.2 |
Swank Audio Visuals, L.L.C. | | Commercial Services & Supplies | | Senior Debt(7) | | 6.7% | | | 8/14 | | | | | 12.1 | | 12.0 | | 12.1 |
| | | Senior Debt(6)(7) | | 7.4% | | | 8/14 | | | | | 35.9 | | 35.6 | | 3.7 |
| | | | | | | | | | | | | | | | | 47.6 | | 15.8 |
Tanenbaum-Harber Co. Holdings, Inc. | | Insurance | | Redeemable Preferred Stock | | | | | | | 376 | | | | | 0.5 | | 0.5 |
TestAmerica Environmental Services, LLC | | Commercial Services & Supplies | | Senior Debt(7) | | 5.3% | | | 12/11 | | | | | 7.5 | | 7.4 | | 6.9 |
| | | Senior Debt(6)(7) | | 7.2% | | | 12/12-12/13 | | | | | 43.3 | | 37.3 | | 12.6 |
| | | | Preferred Units(1) | | | | | | | 11,659,298 | | | | | 6.9 | | — |
| | | | Preferred Unit Warrants(1) | | | | | | | 1,998,961 | | | | | 4.8 | | — |
| | | | | | | | | | | | | | | | | 56.4 | | 19.5 |
The Tensar Corporation | | Construction & Engineering | | Senior Debt(7) | | 8.2% | | | 5/13 | | | | | 82.0 | | 81.3 | | 57.0 |
| | | Subordinated Debt(6) | | 17.5% | | | 10/13 | | | | | 51.2 | | 39.9 | | 36.3 |
| | | | | | | | | | | | | | | | | 121.2 | | 93.3 |
ThreeSixty Sourcing, Inc.(3) | | Commercial Services & Supplies | | Common Stock Warrants(1) | | | | | | | 35 | | | | | 4.1 | | — |
TransFirst Holdings, Inc. | | Distributors | | Senior Debt(7) | | 7.0 | % | | 6/15 | | | | | 51.8 | | 51.4 | | 36.6 |
triVIN, Inc. | | IT Services | | Subordinated Debt(7) | | 15.0% | | | 6/14-6/15 | | | | | 20.4 | | 20.3 | | 20.4 |
| | | | Convertible Preferred Stock | | | | | | | 247,000,000 | | | | | 28.9 | | 24.4 |
| | | | Common Stock(1) | | | | | | | 6,319,923 | | | | | 6.3 | | — |
| | | | | | | | | | | | | | | | | 55.5 | | 44.8 |
Tyden Caymen Holdings Corp. | | Electronic Equipment, Instruments & Components | | Common Stock(1) | | | | | | | 3,072,494 | | | | | 3.5 | | 3.7 |
97
AMERICAN CAPITAL, LTD.
CONSOLIDATED SCHEDULE OF INVESTMENTS—(Continued)
December 31, 2009
(in millions, except share data)
| | | | | | | | | | | | | | | | | | | |
Company (4) | | Industry | | Investments | | Interest
Rate (5) | | Maturity
Date | | # of
shares/
units
owned | | Principal | | Cost | | Fair
Value |
WRH, Inc. | | Life Sciences Tools & Services | | Senior Debt(7) | | 4.0% | | 9/13-9/14 | | | | | 4.0 | | | 3.9 | | | 4.0 |
| | | Subordinated Debt(7) | | 14.6% | | 7/14-9/15 | | | | | 87.8 | | | 87.2 | | | 88.3 |
| | | | Convertible Preferred Stock(1) | | | | | | 2,008,575 | | | | | | 214.7 | | | 77.6 |
| | | | Common Stock(1) | | | | | | 502,144 | | | | | | 49.9 | | | — |
| | | | | | | | | | | | | | | | | 355.7 | | | 169.9 |
WWC Acquisitions, Inc. | | Professional Services | | Senior Debt(7) | | 7.0% | | 12/11-12/13 | | | | | 34.0 | | | 33.6 | | | 26.3 |
CMBS AND REAL ESTATE CDO INVESTMENTS | | | | | | | | | | | |
ACAS CRE CDO 2007-1, Ltd | | Real Estate | | Class C through Class K Notes(1) | | 2.7% | | 11/31 | | | | $ | 345.5 | | $ | 170.5 | | $ | 0.5 |
Banc of America Commercial Mortgage Trust 2007-1 | | Real Estate | | Commercial Mortgage Pass-Through Certificates | | 5.7% | | 2/17-2/18 | | | | | 12.4 | | | 4.8 | | | 1.3 |
CD 2007-CD4 Commercial Mortgage Trust | | Real Estate | | Commercial Mortgage Pass-Through Certificates(1) | | 5.7% | | 4/17 | | | | | 14.0 | | | 8.9 | | | — |
CD 2007-CD5 Mortgage Trust | | Real Estate | | Commercial Mortgage Pass-Through Certificates | | 6.4% | | 12/17 | | | | | 14.8 | | | 10.5 | | | 1.8 |
Citigroup Commercial Mortgage Securities Trust 2007-C6 | | Real Estate | | Commercial Mortgage Pass-Through Certificates | | 5.5% | | 7/17 | | | | | 112.5 | | | 82.9 | | | 10.9 |
COBALT CMBS Commercial Mortgage Trust 2007-C3 | | Real Estate | | Commercial Mortgage Pass-Through Certificates | | 5.2% | | 10/17 | | | | | 11.1 | | | 8.6 | | | 0.7 |
Countrywide Commercial Mortgage Trust 2007-MF1 | | Real Estate | | Commercial Mortgage Pass-Through Certificates | | 6.1% | | 11/37-11/40 | | | | | 12.8 | | | 8.7 | | | 1.0 |
Credit Suisse Commercial Mortgage Trust 2007-C3 | | Real Estate | | Commercial Mortgage Pass-Through Certificates(1) | | 5.6% | | 7/17 | | | | | 13.2 | | | 10.7 | | | — |
Credit Suisse Commercial Mortgage Trust Series 2007-C4 | | Real Estate | | Commercial Mortgage Pass-Through Certificates | | 5.8% | | 8/17 | | | | | 20.8 | | | 12.6 | | | 5.4 |
GE Commercial Mortgage Corporation, Series 2007-C1 | | Real Estate | | Commercial Mortgage Pass-Through Certificates | | 5.5% | | 12/19 | | | | | 37.0 | | | 31.2 | | | 2.6 |
GS Mortgage Securities Trust 2006-GG10 | | Real Estate | | Commercial Mortgage Pass-Through Certificates(1) | | 5.7% | | 7/17 | | | | | 63.7 | | | 52.7 | | | — |
J.P. Morgan Chase Commercial Mortgage Securities Trust 2007-LDP11 | | Real Estate | | Commercial Mortgage Pass-Through Certificates | | 5.6% | | 7/17 | | | | | 87.2 | | | 55.8 | | | 1.3 |
LB-UBS Commercial Mortgage Trust 2007-C6 | | Real Estate | | Commercial Mortgage Pass-Through Certificates | | 6.2% | | 8/17 | | | | | 36.6 | | | 22.9 | | | 4.7 |
LB-UBS Commercial Mortgage Trust 2008-C1 | | Real Estate | | Commercial Mortgage Pass-Through Certificates | | 6.1% | | 7/23-7/24 | | | | | 19.4 | | | 7.4 | | | 2.0 |
ML-CFC Commercial Mortgage Trust 2007-6 | | Real Estate | | Commercial Mortgage Pass-Through Certificates(1) | | 5.8% | | 4/17 | | | | | 9.8 | | | 3.3 | | | 0.2 |
ML-CFC Commercial Mortgage Trust 2007-8 | | Real Estate | | Commercial Mortgage Pass-Through Certificates | | 6.0% | | 8/17 | | | | | 32.8 | | | 20.0 | | | 3.6 |
98
AMERICAN CAPITAL, LTD.
CONSOLIDATED SCHEDULE OF INVESTMENTS—(Continued)
December 31, 2009
(in millions, except share data)
| | | | | | | | | | | | | | | | | | | | |
Company (4) | | Industry | | Investments | | Interest
Rate (5) | | | Maturity
Date | | # of
shares/
units
owned | | Principal | | Cost | | Fair
Value |
Wachovia Bank Commercial Mortgage Trust 2007-C31 | | Real Estate | | Commercial Mortgage Pass-Through Certificates | | 5.8 | % | | 5/17 | | | | | 20.0 | | | 11.9 | | | 2.9 |
Wachovia Bank Commercial Mortgage Trust, Series 2007-C32 | | Real Estate | | Commercial Mortgage Pass-Through Certificates | | 5.7 | % | | 10/17 | | | | | 85.1 | | | 75.2 | | | 6.7 |
Wachovia Bank Commercial Mortgage Trust, Series 2007-C34 | | Real Estate | | Commercial Mortgage Pass-Through Certificates | | 5.3 | % | | 10/17-9/24 | | | | | 70.3 | | | 43.4 | | | 6.0 |
Wachovia Bank Commercial Trust 2006-C28 | | Real Estate | | Commercial Mortgage Pass-Through Certificates | | 6.0 | % | | 11/16 | | | | | 5.0 | | | 3.1 | | | 0.4 |
CLO INVESTMENTS | | | | | | | | | | | |
ACAS CLO 2007-1, Ltd. | | Diversified Financial Services | | Secured Notes | | | | | | | | | $ | 8.5 | | $ | 8.4 | | $ | 4.0 |
| | | Subordinated Notes | | | | | | | | | | 25.9 | | | 21.5 | | | 13.4 |
| | | | | | | | | | | | | | | | | | 29.9 | | | 17.4 |
Ares IIIR/IVR CLO Ltd. | | Diversified Financial Services | | Subordinated Notes | | | | | | | | | | 20.0 | | | 18.3 | | | 7.2 |
Ares VIII CLO, Ltd. | | Diversified Financial Services | | Preference Shares | | | | | | | 6,241 | | | | | | 4.7 | | | 1.4 |
Avalon Capital Ltd.(3) | | Diversified Financial Services | | Preferred Securities | | | | | | | 13,796 | | | | | | 5.2 | | | 4.1 |
Babson CLO Ltd. 2006-II | | Diversified Financial Services | | Income Notes | | | | | | | | | | 15.0 | | | 14.4 | | | 8.8 |
BALLYROCK CLO 2006-2 LTD. | | Diversified Financial Services | | Deferrable Notes | | | | | | | | | | 2.0 | | | 1.6 | | | 1.0 |
Cent CDO 12 Limited | | Diversified Financial Services | | Income Notes | | | | | | | | | | 26.4 | | | 19.9 | | | 14.0 |
Centurion CDO 8 Limited | | Diversified Financial Services | | Subordinated Notes | | | | | | | | | | 5.0 | | | 3.1 | | | 2.2 |
Champlain CLO | | Diversified Financial Services | | Preferred Securities | | | | | | | 1,000,000 | | | | | | 0.7 | | | 0.3 |
CoLTs 2005-1 Ltd.(3) | | Diversified Financial Services | | Preference Shares(1) | | | | | | | 360 | | | | | | 6.7 | | | 2.2 |
CoLTs 2005-2 Ltd.(3) | | Diversified Financial Services | | Preference Shares | | | | | | | 34,170,000 | | | | | | 24.5 | | | 9.7 |
CREST Exeter Street Solar 2004-2 | | Diversified Financial Services | | Preferred Securities | | | | | | | 3,089,177 | | | | | | 2.9 | | | 0.9 |
Eaton Vance CDO X PLC(3) | | Diversified Financial Services | | Secured Subordinated Income Notes | | | | | | | | | | 15.0 | | | 13.9 | | | 4.7 |
Essex Park CDO Ltd. | | Diversified Financial Services | | Preferred Securities | | | | | | | 5,750,000 | | | | | | 2.1 | | | 1.8 |
Flagship CLO V | | Diversified Financial Services | | Deferrable Notes | | | | | | | | | | 1.7 | | | 1.3 | | | 0.6 |
| | | Subordinated Securities | | | | | | | 15,000 | | | | | | 12.1 | | | 7.7 |
| | | | | | | | | | | | | | | | | | 13.4 | | | 8.3 |
Galaxy III CLO, Ltd | | Diversified Financial Services | | Subordinated Notes | | | | | | | | | | 4.0 | | | 2.5 | | | 0.3 |
LightPoint CLO IV, LTD | | Diversified Financial Services | | Income Notes | | | | | | | | | | 6.7 | | | 6.8 | | | 1.5 |
99
AMERICAN CAPITAL, LTD.
CONSOLIDATED SCHEDULE OF INVESTMENTS—(Continued)
December 31, 2009
(in millions, except share data)
| | | | | | | | | | | | | | | | | | | | |
Company (4) | | Industry | | Investments | | Interest
Rate (5) | | | Maturity
Date | | # of
shares/
units
owned | | Principal | | Cost | | Fair
Value |
LightPoint CLO VII, Ltd. | | Diversified Financial Services | | Subordinated Notes | | | | | | | | | | 9.0 | | | 7.5 | | | 3.8 |
LightPoint CLO VIII, Ltd. | | Diversified Financial Services | | Deferrable Notes | | | | | | | | | | 7.0 | | | 6.4 | | | 3.7 |
Mayport CLO Ltd. | | Diversified Financial Services | | Income Notes | | | | | | | | | | 14.0 | | | 12.7 | | | 4.9 |
NYLIM Flatiron CLO 2006-1 LTD.(3) | | Diversified Financial Services | | Subordinated Securities | | | | | | | 10,000 | | | | | | 7.6 | | | 5.2 |
Octagon Investment Partners VII, Ltd. | | Diversified Financial Services | | Preferred Securities | | | | | | | 5,000,000 | | | | | | 2.0 | | | 1.3 |
Sapphire Valley CDO I, Ltd. | | Diversified Financial Services | | Subordinated Notes | | | | | | | | | | 14.0 | | | 13.8 | | | 0.8 |
Vitesse CLO, Ltd. | | Diversified Financial Services | | Preferred Securities | | | | | | | 20,000,000 | | | | | | 15.5 | | | 7.8 |
Subtotal Non-Control / Non-Affiliate Investments (55% of total investment assets and liabilities at fair value) | | | | | $ | 4,838.8 | | $ | 3,036.2 |
| | | | |
AFFILIATE INVESTMENTS | | | | | | | | | | | |
American Capital Agency Corp(2) | | Real Estate Investment Trusts | | Common Stock | | | | | | | 2,500,100 | | | | | $ | 50.0 | | $ | 66.4 |
Comfort Co., Inc. | | Household Durables | | Senior Debt(6)(7) | | 11.5% | | | 3/12-3/15 | | | | $ | 12.1 | | | 11.1 | | | 8.7 |
| | | | Common Stock(1) | | | | | | | 110,365 | | | | | | 11.8 | | | — |
| | | | | | | | | | | | | | | | | | 22.9 | | | 8.7 |
Egenera, Inc. | | Computers & Peripherals | | Subordinated Debt | | 15.0% | | | 12/10 | | | | | 3.9 | | | 3.7 | | | 2.5 |
| | | | Redeemable Preferred Stock(1) | | | | | | | 523,040 | | | | | | 0.4 | | | — |
| | | | Common Stock(1) | | | | | | | 8,046,865 | | | | | | 25.0 | | | — |
| | | | | | | | | | | | | | | | | | 29.1 | | | 2.5 |
HALT Medical, Inc. | | Health Care Equipment & Supplies | | Convertible Preferred Stock(1) | | | | | | | 5,592,367 | | | | | | 8.9 | | | 9.6 |
IEE Holding 1 S.A.(3) | | Auto Components | | Common Stock(1) | | | | | | | 250,000 | | | | | | 4.5 | | | — |
IS Holdings I, Inc. | | Software | | Senior Debt(7) | | 6.2% | | | 6/14 | | | | | 20.0 | | | 19.9 | | | 18.2 |
| | | | Redeemable Preferred Stock(1) | | | | | | | 1,297 | | | | | | 1.7 | | | 1.9 |
| | | | Common Stock(1) | | | | | | | 1,165,930 | | | | | | — | | | 6.4 |
| | | | | | | | | | | | | | | | | | 21.6 | | | 26.5 |
LTM Enterprises, Inc. | | Personal Products | | Senior Debt(6)(7) | | 17.3 | % | | 11/11 | | | | | 20.1 | | | 18.5 | | | 5.5 |
Narus, Inc. | | Internet Software & Services | | Convertible Preferred Stock(1) | | | | | | | 31,835,900 | | | | | | 9.2 | | | 6.8 |
| | | Preferred Stock Warrants(1) | | | | | | | 9,567,232 | | | | | | 0.1 | | | 2.2 |
| | | | | | | | | | | | | | | | | | 9.3 | | | 9.0 |
Primrose Holding Corporation | | Diversified Consumer Services | | Common Stock(1) | | | | | | | 4,213 | | | | | | 2.7 | | | 3.3 |
Qualitor Component Holdings, LLC | | Auto Components | | Subordinated Debt(7) Redeemable Preferred Units(1) | | 17.1% | | | 7/13 | | 3,150,000 | | | 36.2 | |
| 36.0
3.1 | |
| 36.0
— |
| | | | Common Units(1) | | | | | | | 350,000 | | | | | | 0.4 | | | — |
| | | | | | | | | | | | | | | | | | 39.5 | | | 36.0 |
Radar Detection Holdings Corp. | | Household Durables | | Senior Debt(7) Common Stock(1) | | 9.5% | | | 11/12 | | 40,688 | | | 13.0 | |
| 13.0
0.6 | |
| 10.5
1.0 |
| | | | | | | | | | | | | | | | | | 13.6 | | | 11.5 |
Roadrunner Dawes, Inc. | | Road & Rail | | Subordinated Debt(7) | | 18.5% | | | 8/12 | | | | | 20.5 | | | 20.4 | | | 20.5 |
| | | | Common Stock(1) | | | | | | | 7,000 | | | | | | 7.0 | | | 0.9 |
| | | | | | | | | | | | | | | | | | 27.4 | | | 21.4 |
100
AMERICAN CAPITAL, LTD.
CONSOLIDATED SCHEDULE OF INVESTMENTS—(Continued)
December 31, 2009
(in millions, except share data)
| | | | | | | | | | | | | | | | | | | | | |
Company (4) | | Industry | | Investments | | Interest
Rate (5) | | | Maturity
Date | | # of
shares/
units
owned | | | Principal | | Cost | | Fair
Value |
WFS Holding, Inc. | | Software | | Convertible Preferred Stock | | | | | | | 20,403,772 | | | | | | | 3.0 | | | 3.7 |
Subtotal Affiliate Investments (4% of total investments assets and liabilities at fair value) | | | | | | $ | 251.0 | | $ | 204.1 |
| | | | |
CONTROL INVESTMENTS | | | | | | | | | | | | |
ACAS Equity Holdings Corp. | | Diversified Financial Services | | Common Stock(1) | | | | | | | 589 | | | | | | $ | 14.8 | | $ | 1.4 |
ACAS Real Estate Holdings Corporation | | Real Estate | | Subordinated Debt(6) Common Stock(1) | | 15.0% | | | 5/16 | | 100 | % | | $ | 3.9 | |
| 3.5
11.5 | |
| 3.9
0.6 |
| | | | | | | | | | | | | | | | | | | 15.0 | | | 4.5 |
American Capital, LLC | | Capital Markets | | Senior Debt | | 5.7% | | | 9/12 | | | | | | 7.4 | | | 7.3 | | | 7.5 |
| | | | Common Membership interest | | | | | | | 100 | % | | | | | | 82.0 | | | 41.6 |
| | | | | | | | | | | | | | | | | | | 89.3 | | | 49.1 |
American Driveline Systems, Inc. | | Diversified Consumer Services | | Subordinated Debt(7) | | 14.0% | | | 12/14-12/15 | | | | | | 42.3 | | | 41.9 | | | 42.3 |
| | | Redeemable Preferred Stock | | | | | | | 403,357 | | | | | | | 32.1 | | | 47.8 |
| | | | Common Stock(1) | | | | | | | 128,681 | | | | | | | 10.7 | | | 1.4 |
| | | | Common Stock Warrants(1) | | | | | | | 204,663 | | | | | | | 17.3 | | | 2.2 |
| | | | | | | | | | | | | | | | | | | 102.0 | | | 93.7 |
Aptara, Inc. | | IT Services | | Senior Debt | | 11.5% | | | 2/11 | | | | | | 3.0 | | | 3.0 | | | 3.0 |
| | | | Subordinated Debt(7) | | 16.9% | | | 2/11 | | | | | | 58.0 | | | 57.8 | | | 60.0 |
| | | | Redeemable Preferred Stock(1) | | | | | | | 15,107 | | | | | | | 14.1 | | | 21.0 |
| | | | Convertible Preferred Stock(1) | | | | | | | 2,549,410 | | | | | | | 8.7 | | | — |
| | | | Preferred Stock Warrants(1) | | | | | | | 230,681 | | | | | | | 1.0 | | | — |
| | | | | | | | | | | | | | | | | | | 84.6 | | | 84.0 |
Capital.com, Inc. | | Diversified Financial Services | | Common Stock(1) | | | | | | | 8,500,100 | | | | | | | 0.9 | | | — |
CIBT Travel Solutions, Inc | | Commercial Services & Supplies | | Senior Debt(7) | | 9.5% | | | 1/13 | | | | | | 49.8 | | | 49.4 | | | 49.9 |
| | | Subordinated Debt(7) | | 15.0% | | | 1/15-1/16 | | | | | | 54.6 | | | 54.2 | | | 54.6 |
| | | | Redeemable Preferred Stock | | | | | | | 15,000 | | | | | | | 17.6 | | | 17.7 |
| | | | Convertible Preferred Stock(1) | | | | | | | 776,800 | | | | | | | 77.7 | | | 14.2 |
| | | | Common Stock(1) | | | | | | | 194,200 | | | | | | | 19.4 | | | — |
| | | | | | | | | | | | | | | | | | | 218.3 | | | 136.4 |
CMX Inc. | | Construction & Engineering | | Senior Debt(6)(7) | | 5.2 | % | | 5/12 | | | | | | 19.3 | | | 19.2 | | | 16.1 |
Contour Semiconductor, Inc. | | Semiconductors & Semiconductor Equipment | | Convertible Preferred Stock(1) | | | | | | | 11,532,842 | | | | | | | 12.4 | | | 19.6 |
Core Financial Holdings, LLC | | Diversified Financial Services | | Subordinated Debt Common Stock(1) | | 13.6% | | | 4/14-5/15 | | 57,940,360 | | | | 37.8 | |
| 37.5
54.4 | |
| 37.5
23.7 |
| | | | | | | | | | | | | | | | | | | 91.9 | | | 61.2 |
Creditcards.com, Inc. | | Internet Software & Services | | Senior Debt(7) | | 13.9% | | | 6/13-10/13 | | | | | | 79.9 | | | 79.5 | | | 79.9 |
| | | Subordinated Debt(7) | | 19.0% | | | 6/14-10/14 | | | | | | 15.5 | | | 15.4 | | | 15.5 |
| | | | Redeemable Preferred Stock(1) | | | | | | | 257,510 | | | | | | | 53.6 | | | 11.8 |
| | | | Common Stock(1) | | | | | | | 176,430,690 | | | | | | | 2.5 | | | — |
| | | | | | | | | | | | | | | | | | | 151.0 | | | 107.2 |
ECA Acquisition
holdings, Inc | | Health Care Equipment & Supplies | | Subordinated Debt(7) | | 16.5% | | | 12/14 | | | | | | 13.5 | | | 13.3 | | | 13.5 |
| | | Common Stock(1) | | | | | | | 583 | | | | | | | 11.1 | | | 12.8 |
| | | | | | | | | | | | | | | | | | | 24.4 | | | 26.3 |
101
AMERICAN CAPITAL, LTD.
CONSOLIDATED SCHEDULE OF INVESTMENTS—(Continued)
December 31, 2009
(in millions, except share data)
| | | | | | | | | | | | | | | | | |
Company (4) | | Industry | | Investments | | Interest
Rate (5) | | Maturity
Date | | # of
shares/
units
owned | | | Principal | | Cost | | Fair
Value |
eLynx Holdings, Inc. | | IT Services | | Senior Debt | | 8.7% | | 7/13 | | | | | 9.6 | | 9.6 | | 9.7 |
| | | | Subordinated Debt | | 8.5% | | 7/13 | | | | | 4.0 | | 4.0 | | 4.0 |
| | | | Subordinated Debt(6) | | 9.2% | | 7/13 | | | | | 12.1 | | 10.0 | | 4.3 |
| | | | Redeemable Preferred Stock(1) | | | | | | 21,113 | | | | | 8.9 | | — |
| | | | Convertible Preferred Stock(1) | | | | | | 7,929 | | | | | 6.0 | | — |
| | | | Common Stock(1) | | | | | | 11,261 | | | | | 1.1 | | — |
| | | | Common Stock Warrants(1) | | | | | | 1,078,792 | | | | | 13.1 | | — |
| | | | | | | | | | | | | | | | 52.7 | | 18.0 |
Endeavor Fund I, LP | | Thrifts & Mortgage Finance | | Partnership Interest | | | | | | 100 | % | | | | 18.2 | | 17.0 |
ETG Holdings, Inc. | | Containers & Packaging | | Senior Debt(6) | | 8.7% | | 5/11 | | | | | 15.6 | | 11.6 | | — |
| | | | Convertible Preferred Stock(1) | | | | | | 233,201 | | | | | 11.4 | | — |
| | | | | | | | | | | | | | | | 23.0 | | — |
European Capital Limited(3) | | Diversified Financial Services | | Subordinated Debt | | 7.3% | | 2/11 | | | | | 25.3 | | 25.0 | | 25.8 |
| | | Ordinary Shares(1) | | | | | | 431,895,528 | | | | | 1,267.3 | | 243.1 |
| | | | | | | | | | | | | | | | 1,292.3 | | 268.9 |
European Touch, LTD. II | | Leisure Equipment & Products | | Senior Debt | | 6.8% | | 8/11-1/12 | | | | | 0.4 | | 0.3 | | 0.4 |
| | | Subordinated Debt(6) | | 16.0% | | 1/11 | | | | | 18.9 | | 13.5 | | 1.8 |
| | | | Redeemable Preferred Stock(1) | | | | | | 263 | | | | | 0.3 | | — |
| | | | Common Stock(1) | | | | | | 1,688 | | | | | 0.9 | | — |
| | | | Common Stock Warrants(1) | | | | | | 7,105 | | | | | 3.7 | | — |
| | | | | | | | | | | | | | | | 18.7 | | 2.2 |
EXPL Pipeline Holdings LLC | | Oil, Gas & Consumable Fuels | | Senior Debt | | 8.0% | | 1/17 | | | | | 43.9 | | 43.6 | | 43.9 |
| | | Common Membership Units(1) | | | | | | 58,297 | | | | | 44.5 | | 12.1 |
| | | | | | | | | | | | | | 88.1 | | 56.0 |
Formed Fiber Technologies, Inc. | | Auto Components | | Common Stock(1) | | | | | | 31,250 | | | | | 8.1 | | 0.5 |
Fosbel Global Services (LUXCO) S.C.A.(3) | | Commercial Services & Supplies | | Subordinated Debt | | 17.3% | | 12/13 | | | | | 23.6 | | 23.4 | | 23.6 |
| | | Subordinated Debt(6) | | 20.0% | | 12/14 | | | | | 21.6 | | 15.1 | | 5.6 |
| | | | Redeemable Preferred Stock(1) | | | | | | 18,449,456 | | | | | 18.5 | | — |
| | | | Convertible Preferred Stock(1) | | | | | | 1,519,368 | | | | | 3.0 | | — |
| | | | Common Stock(1) | | | | | | 108,526 | | | | | 0.2 | | — |
| | | | | | | | | | | | | | | | 60.2 | | 29.2 |
Fountainhead Estate Holding Corp.(3) | | Internet Software & Services | | Senior Debt | | 4.0% | | 10/13 | | | | | 21.0 | | 21.0 | | 21.0 |
| | | Redeemable Preferred Stock | | | | | | 115,538 | | | | | 15.5 | | 15.5 |
| | | | Convertible Preferred Stock(1) | | | | | | 59,250 | | | | | 59.2 | | 16.9 |
| | | | | | | | | | | | | | | | 95.7 | | 53.4 |
FreeConference.com, Inc. | | Diversified Telecommunication Services | | Senior Debt(7) | | 6.7% | | 4/11-5/11 | | | | | 11.9 | | 11.8 | | 11.9 |
| | | Subordinated Debt | | 15.0% | | 5/12 | | | | | 10.4 | | 10.3 | | 10.4 |
| | | Redeemable Preferred Stock(1) | | | | | | 14,042,095 | | | | | 12.8 | | 4.0 |
| | | | Common Stock(1) | | | | | | 6,088,229 | | | | | 2.3 | | — |
| | | | | | | | | | | | | | | | 37.2 | | 26.3 |
Future Food, Inc. | | Food Products | | Senior Debt | | 5.2% | | 8/10 | | | | | 17.1 | | 17.1 | | 13.5 |
| | | | Common Stock(1) | | | | | | 64,917 | | | | | 13.0 | | — |
| | | | Common Stock Warrants(1) | | | | | | 6,500 | | | | | 1.3 | | — |
| | | | | | | | | | | | | | | | 31.4 | | 13.5 |
102
AMERICAN CAPITAL, LTD.
CONSOLIDATED SCHEDULE OF INVESTMENTS—(Continued)
December 31, 2009
(in millions, except share data)
| | | | | | | | | | | | | | | | | |
Company (4) | | Industry | | Investments | | Interest
Rate (5) | | Maturity
Date | | # of
shares/
units
owned | | | Principal | | Cost | | Fair
Value |
FutureLogic, Inc. | | Computers & Peripherals | | Senior Debt(7) | | 8.3% | | 10/12-10/13 | | | | | 40.0 | | 39.8 | | 40.0 |
| | | | Subordinated Debt(7) | | 18.5% | | 4/14-10/14 | | | | | 30.8 | | 30.6 | | 30.8 |
| | | | Subordinated Debt(6)(7) | | 22.5% | | 10/14 | | | | | 13.4 | | 8.8 | | 8.6 |
| | | | Redeemable Preferred Stock(1) | | | | | | 583,000 | | | | | 0.6 | | — |
| | | | Common Stock(1) | | | | | | 129,514 | | | | | 15.6 | | — |
| | | | | | | | | | | | | | | | 95.4 | | 79.4 |
FV Holdings Corporation | | Food Products | | Subordinated Debt(7) | | 14.5% | | 6/15 | | | | | 23.7 | | 23.7 | | 23.7 |
| | | | Convertible Preferred Stock(1) | | | | | | 292,000 | | | | | 14.3 | | 20.9 |
| | | | Common Stock(1) | | | | | | 125,000 | | | | | 6.1 | | 8.9 |
| | | | | | | | | | | | | | | | 44.1 | | 53.5 |
Group Montana, Inc. | | Textiles, Apparel & Luxury Goods | | Senior Debt(7) | | 10.0% | | 10/10-10/11 | | | | | 15.9 | | 15.8 | | 15.9 |
| | | Senior Debt(6)(7) | | 12.5% | | 10/11 | | | | | 5.4 | | 4.8 | | 3.7 |
| | | | Subordinated Debt(6) | | 24.5% | | 10/12 | | | | | 12.3 | | 6.8 | | — |
| | | | Convertible Preferred Stock(1) | | | | | | 4,000 | | | | | 1.0 | | — |
| | | | Common Membership Interest(1) | | | | | | 2.5 | % | | | | 0.7 | | — |
| | | | | | | | | | | | | | | | 29.1 | | 19.6 |
Halex Holdings Corp. | | Construction Materials | | Senior Debt(6) | | 7.0% | | 9/11 | | | | | 11.0 | | 9.8 | | 6.8 |
| | | | Redeemable Preferred Stock(1) | | | | | | 23,504,546 | | | | | 30.6 | | — |
| | | | | | | | | | | | | | | | 40.4 | | 6.8 |
Hartstrings Holdings Corp. | | Textiles, Apparel & Luxury Goods | | Senior Debt(6) | | 4.5% | | 12/10 | | | | | 9.3 | | 9.3 | | 6.6 |
| | | Convertible Preferred Stock(1) | | | | | | 10,196 | | | | | 2.9 | | — |
| | | | Common Stock(1) | | | | | | 14,250 | | | | | 4.8 | | — |
| | | | | | | | | | | | | | | | 17.0 | | 6.6 |
Kingway Inca Clymer Holdings, Inc. | | Building Products | | Subordinated Debt(6) | | 12.2% | | 4/12 | | | | | 2.1 | | — | | 1.1 |
| | | | Redeemable Preferred Stock(1) | | | | | | 13,709 | | | | | 9.2 | | — |
| | | | | | | | | | | | | | | | 9.2 | | 1.1 |
Lifoam Holdings, Inc. | | Leisure Equipment & Products | | Senior Debt | | 10.5% | | 12/14 | | | | | 19.1 | | 19.1 | | 19.1 |
| | | Subordinated Debt | | 8.0% | | 12/14 | | | | | 39.8 | | 39.7 | | 39.8 |
| | | | Redeemable Preferred Stock(1) | | | | | | 6,160 | | | | | 4.2 | | 7.4 |
| | | | Convertible Preferred Stock(1) | | | | | | 15,797 | | | | | 12.2 | | — |
| | | | Common Stock(1) | | | | | | 14,000 | | | | | 1.4 | | — |
| | | | Common Stock Warrants(1) | | | | | | 464,642 | | | | | 2.9 | | — |
| | | | | | | | | | | | | | | | 79.5 | | 66.3 |
LLSC Holdings Corporation | | Personal Products | | Senior Debt(7) | | 6.2% | | 8/12 | | | | | 4.5 | | 4.5 | | 4.5 |
| | | | Subordinated Debt(7) | | 12.0% | | 9/13 | | | | | 5.5 | | 5.5 | | 5.5 |
| | | | Convertible Preferred Stock(1) | | | | | | 7,496 | | | | | 8.1 | | 4.8 |
| | | | | | | | | | | | | | | | 18.1 | | 14.8 |
LVI Holdings, LLC | | Professional Services | | Senior Debt(7) | | 7.2% | | 2/10 | | | | | 2.7 | | 2.7 | | 2.7 |
| | | | Subordinated Debt(6)(7) | | 18.0% | | 2/13 | | | | | 12.1 | | 10.2 | | 11.0 |
| | | | | | | | | | | | | | | | 12.9 | | 13.7 |
Montgomery Lane, LLC | | Diversified Financial Services | | Common Membership Units(1) | | | | | | 100 | | | | | 8.6 | | 4.9 |
Montgomery Lane, LTD(3) | | Diversified Financial Services | | Common Membership Units(1) | | | | | | 50,000 | | | | | 6.9 | | 0.5 |
MW Acquisition Corporation | | Health Care Providers & Services | | Subordinated Debt(7) | | 16.2% | | 2/13-2/14 | | | | | 25.5 | | 25.3 | | 25.5 |
| | | Redeemable Preferred Stock | | | | | | 2,485 | | | | | 1.0 | | 1.0 |
| | | | Convertible Preferred Stock(1) | | | | | | 38,016 | | | | | 13.4 | | 8.5 |
| | | | | | | | | | | | | | | | 39.7 | | 35.0 |
103
AMERICAN CAPITAL, LTD.
CONSOLIDATED SCHEDULE OF INVESTMENTS—(Continued)
December 31, 2009
(in millions, except share data)
| | | | | | | | | | | | | | | | | |
Company (4) | | Industry | | Investments | | Interest
Rate (5) | | Maturity
Date | | # of
shares/
units
owned | | | Principal | | Cost | | Fair
Value |
NECCO Holdings, Inc. | | Food Products | | Senior Debt | | 13.5% | | 12/12 | | | | | 4.4 | | 4.4 | | 4.4 |
| | | | Common Stock(1) | | | | | | 760,869 | | | | | 0.1 | | — |
| | | | | | | | | | | | | | | | 4.5 | | 4.4 |
NECCO Realty Investments, LLC | | Real Estate | | Senior Debt(7) | | 14.0% | | 12/17 | | | | | 40.0 | | 39.3 | | 40.0 |
| | | | Common Membership Units(1) | | | | | | 7,000 | | | | | 4.9 | | 8.0 |
| | | | | | | | | | | | | | | | 44.2 | | 48.0 |
Paradigm Precision Holdings, LLC | | Aerospace & Defense | | Subordinated Debt | | 17.0% | | 8/14 | | | | | 57.0 | | 56.6 | | 57.0 |
| | | | Subordinated Debt(6) | | 20.0% | | 8/14-10/14 | | | | | 68.4 | | 54.1 | | 0.8 |
| | | | Common Membership Units(1) | | | | | | 478,488 | | | | | 17.5 | | — |
| | | | | | | | | | | | | | | | 128.2 | | 57.8 |
PHC Sharp Holdings, Inc. | | Commercial Services & Supplies | | Senior Debt(7) | | 5.9% | | 12/11-12/12 | | | | | 16.9 | | 16.8 | | 12.5 |
| | | Subordinated Debt(6) | | 17.0% | | 12/14 | | | | | 9.8 | | 7.3 | | — |
| | | | Common Stock(1) | | | | | | 367,881 | | | | | 4.2 | | — |
| | | | | | | | | | | | | | | | 28.3 | | 12.5 |
PHI Acquisitions, Inc. | | Internet & Catalog Retail | | Senior Debt(7) | | 12.0% | | 6/12 | | | | | 10.2 | | 10.2 | | 10.3 |
| | | | Subordinated Debt(7) | | 17.7% | | 6/13 | | | | | 24.5 | | 24.3 | | 24.6 |
| | | | Redeemable Preferred Stock | | | | | | 36,267 | | | | | 40.6 | | 52.2 |
| | | | Common Stock(1) | | | | | | 40,295 | | | | | 3.9 | | 3.0 |
| | | | Common Stock Warrants(1) | | | | | | 116,065 | | | | | 11.6 | | 8.6 |
| | | | | | | | | | | | | | | | 90.6 | | 98.7 |
Resort Funding Holdings, Inc. | | Diversified Financial Services | | Senior Debt | | 8.2% | | 4/10 | | | | | 8.8 | | 8.8 | | 7.7 |
| | | Common Stock(1) | | | | | | 583 | | | | | 20.5 | | — |
| | | | | | | | | | | | | | | | 29.3 | | 7.7 |
Sixnet Holdings, LLC | | Electronic Equipment, Instruments & Components | | Senior Debt(7) | | 11.1% | | 6/12-6/13 | | | | | 37.3 | | 37.1 | | 36.2 |
| | | Membership Units(1) | | | | | | 446 | | | | | 5.6 | | 2.6 |
| | | | | | | | | | | | | | | 42.7 | | 38.8 |
SMG Holdings, Inc. | | Hotels, Restaurants & Leisure | | Senior Debt(7) | | 3.4% | | 7/14 | | | | | 5.9 | | 5.9 | | 5.9 |
| | | Subordinated Debt(7) | | 12.5% | | 6/15 | | | | | 124.6 | | 123.8 | | 124.8 |
| | | | Convertible Preferred Stock(1) | | | | | | 1,101,673 | | | | | 124.2 | | 105.6 |
| | | | Common Stock(1) | | | | | | 275,419 | | | | | 27.5 | | — |
| | | | | | | | | | | | | | | | 281.4 | | 236.3 |
Specialty Brands of America, Inc. | | Food Products | | Subordinated Debt(7) | | 14.0% | | 5/14 | | | | | 34.8 | | 34.6 | | 34.8 |
| | | | Redeemable Preferred Stock | | | | | | 122,017 | | | | | 9.3 | | 15.0 |
| | | | Common Stock(1) | | | | | | 128,175 | | | | | 2.3 | | 12.1 |
| | | | Common Stock Warrants(1) | | | | | | 56,819 | | | | | 1.4 | | 5.3 |
| | | | | | | | | | | | | | | | 47.6 | | 67.2 |
Spring Air International, LLC | | Household Durables | | Common Membership Units(1) | | | | | | 49 | % | | | | 2.8 | | 0.5 |
UFG Member, LLC | | Food Products | | Subordinated Debt(6) | | 16.5% | | 5/15 | | | | | 36.4 | | 30.4 | | 26.9 |
| | | | Common Stock(1) | | | | | | 937 | | | | | 64.7 | | — |
| | | | | | | | | | | | | | | | 95.1 | | 26.9 |
UFG Real Estate Holdings, LLC | | Real Estate | | Common Membership(1) | | | | | | | | | | | — | | 0.9 |
Unique Fabricating Incorporated | | Auto Components | | Senior Debt | | 5.1% | | 10/10-2/11 | | | | | 1.0 | | 1.0 | | 1.0 |
| | | | Senior Debt(6) | | 10.7% | | 2/12 | | | | | 5.0 | | 4.2 | | 0.9 |
| | | | Redeemable Preferred Stock(1) | | | | | | 301,556 | | | | | 7.9 | | — |
| | | | Common Stock Warrants(1) | | | | | | 6,862 | | | | | 0.2 | | — |
| | | | | | | | | | | | | | | | 13.3 | | 1.9 |
104
AMERICAN CAPITAL, LTD.
CONSOLIDATED SCHEDULE OF INVESTMENTS—(Continued)
December 31, 2009
(in millions, except share data)
| | | | | | | | | | | | | | | | | | | |
Company (4) | | Industry | | Investments | | Interest
Rate (5) | | Maturity
Date | | # of
shares/
units
owned | | | Principal | | Cost | | Fair
Value |
Unwired Holdings, Inc. | | Household Durables | | Senior Debt | | 5.0% | | 6/10 | | | | | 1.6 | | | 1.6 | | | 1.6 |
| | | | Senior Debt(6) | | 8.5% | | 6/11 | | | | | 11.4 | | | 7.6 | | | 8.1 |
| | | | Redeemable Preferred Stock(1) | | | | | | 14,630 | | | | | | 14.6 | | | — |
| | | | Common Stock(1) | | | | | | 126,001 | | | | | | 1.3 | | | — |
| | | | | | | | | | | | | | | | | 25.1 | | | 9.7 |
VP Acquisition Holdings, Inc | | Health Care Equipment & Supplies | | Subordinated Debt(7) | | 14.5% | | 10/13-10/14 | | | | | 20.0 | | | 19.8 | | | 20.0 |
| | | Common Stock(1) | | | | | | 19,780 | | | | | | 24.7 | | | 37.4 |
| | | | | | | | | | | | | | | | | 44.5 | | | 57.4 |
Warner Power, LLC | | Electrical Equipment | | Subordinated Debt(6)(7) | | 12.6% | | 11/10 | | | | | 5.0 | | | 5.0 | | | 1.7 |
| | | | Redeemable Preferred Membership Units(1) | | | | | | 3,796,269 | | | | | | 3.0 | | | — |
| | | | Common Membership Units(1) | | | | | | 27,400 | | | | | | 1.9 | | | — |
| | | | | | | | | | | | | | | | | 9.9 | | | 1.7 |
WIS Holding Company, Inc. | | Commercial Services & Supplies | | Subordinated Debt(7) | | 14.8% | | 1/14-1/15 | | | | | 109.1 | | | 108.4 | | | 109.1 |
| | | Convertible Preferred Stock | | | | | | 703,406 | | | | | | 89.2 | | | 137.2 |
| | | | Common Stock(1) | | | | | | 175,852 | | | | | | 17.6 | | | 29.6 |
| | | | | | | | | | | | | | | | | 215.2 | | | 275.9 |
WSACS RR Holdings LLC | | Real Estate | | Common Membership Units(1) | | | | | | 3,384,615 | | | | | | 3.4 | | | — |
| | | | |
CDO/ CLO INVESTMENTS | | | | | | | | | | | |
ACAS Wachovia Investments, L.P. | | Diversified Financial Services | | Partnership Interest | | | | | | 90 | % | | | | $ | 12.0 | | $ | 2.0 |
Subtotal Control Investments (43% of total investments assets and liabilities at fair value) | | | | | | | $ | 4,068.4 | | $ | 2,335.0 |
| | | | | | | | | | | | | | | | | |
Counterparty | | Instrument | | Interest
Rate (5) | | Expiration
Date (5) | | # of
contracts | | Notional | | Cost | | Fair
Value |
| |
| DERIVATIVE AGREEMENTS | | |
Wachovia Bank, N.A. | | Balance Differential Sawp - Pay Floating/ Receive Fixed | | LIBOR/5.1% | | 8/19 | | 1 | | $ | 22.5 | | $ | — | | $ | 0.9 |
Subtotal Derivative Agreements (less than 1% of total investment assets and liabilities at fair value) | | | | | | — | | | 0.9 |
Total Investment Assets | | $ | 9,158.2 | | $ | 5,576.2 |
| DERIVATIVE AGREEMENTS | | |
BMO Financial Group | | Interest Rate Swap - Pay Fixed/ Receive Floating | | 5.4%/LIBOR | | 2/13-8/17 | | 5 | | $ | 391.4 | | $ | — | | $ | (30.2) |
Citibank, N.A. | | Interest Rate Swap - Pay Fixed/ Receive Floating | | 4.8%/LIBOR | | 4/12-11/19 | | 4 | | | 524.0 | | | — | | | (30.7) |
Wachovia Bank, N.A. | | Interest Rate Swap - Pay Fixed/ Receive Floating | | 4.9%/LIBOR | | 1/14-8/19 | | 3 | | | 323.3 | | | — | | | (25.7) |
Citibank, N.A. | | Balance Differential Sawp - Pay Fixed/ Receive Floating | | 5.2%/LIBOR | | 11/19 | | 1 | | | 30.5 | | | — | | | (2.5) |
UniCredit Group | | Interest Rate Swap - Pay Fixed/ Receive Floating | | 5.7%/LIBOR | | 7/17 | | 1 | | | 66.0 | | | — | | | (8.8) |
Fortis Financial Services LLC | | Interest Rate Swap - Pay Fixed/ Receive Floating | | 5.7%/LIBOR | | 7/17 | | 1 | | | 22.3 | | | — | | | (3.0) |
Citibank, N.A. | | Foreign Exchange Swap - Pay Euros/ Receive GBP | | | | 2/11 | | 1 | | | | | | — | | | (1.2) |
Total Investment Liabilities (2% of total investment assets and liabilities at fair value) | | $ | — | | $ | (102.1) |
| | | | | | | | | | | | | | | | |
Fund | | | | | | | | | | | | Cost | | Fair
Value |
MONEY MARKET FUNDS(9) | | | |
Fidelity Institutional Money Market Funds - Money Market Portfolio | | | | | | | | | | | | $ | 48.5 | | $ | 48.5 |
Fidelity Institutional Money Market Funds - Prime Money Market Portfolio | | | | | | | | | | | | | 47.1 | | | 47.1 |
Dreyfus Cash Advantage Fund | | | | | | | | | | | | | 47.0 | | | 47.0 |
First American Prime Obligations Fund | | | | | | | | | | | | | 45.7 | | | 45.7 |
BlackRock Liquidity Funds TempFund Portfolio | | | | | | | | | | | | | 44.9 | | | 44.9 |
Goldman Sachs Financial Square Funds - Prime Obligations Fund | | | | | | | | | | | | | 44.7 | | | 44.7 |
Federated Prime Cash Obligations Fund | | | | | | | | | | | | | 39.0 | | | 39.0 |
Goldman Sachs Financial Square Fund - Money Market Fund | | | | | | | | | | | | | 38.7 | | | 38.7 |
AIM STIT - Liquid Assets Portfolio | | | | | | | | | | | | | 37.5 | | | 37.5 |
105
AMERICAN CAPITAL, LTD.
CONSOLIDATED SCHEDULE OF INVESTMENTS—(Continued)
December 31, 2009
(in millions, except share data)
| | | | | | | | | | | | | | | | |
Fund | | | | | | | | | | | | Cost | | Fair
Value |
Dreyfus Institutional Reserves Money Fund | | | | | | | | | | | | | 37.4 | | | 37.4 |
BlackRock Cash Funds - Prime | | | | | | | | | | | | | 34.1 | | | 34.1 |
Federated Government Obligations Fund | | | | | | | | | | | | | 32.6 | | | 32.6 |
Dreyfus Government Cash Management | | | | | | | | | | | | | 31.5 | | | 31.5 |
Goldman Sachs Financial Square Funds - Government Fund | | | | | | | | | | | | | 28.3 | | | 28.3 |
AIM STIT-STIC Prime Portfolio | | | | | | | | | | | | | 25.0 | | | 25.0 |
Federated Government Obligations Fund | | | | | | | | | | | | | 25.0 | | | 25.0 |
Federated Prime Obligations Fund | | | | | | | | | | | | | 25.0 | | | 25.0 |
Federated Tax-Free Obligations Fund | | | | | | | | | | | | | 25.0 | | | 25.0 |
Federated Tax-Free Obligations Fund | | | | | | | | | | | | | 21.9 | | | 21.9 |
Fidelity Institutional Money Market Funds - Government Portfolio | | | | | | | | | | | | | 10.0 | | | 10.0 |
First American Government Obligations Fund | | | | | | | | | | | | | 5.7 | | | 5.7 |
Fidelity Institutional Money Market Funds - Government Portfolio | | | | | | | | | | | | | 0.2 | | | 0.2 |
Total Money Market Funds | | $ | 694.8 | | $ | 694.8 |
| (2) | Publicly traded company or a consolidated subsidiary of a public company. |
| (3) | International investment. |
| (4) | Certain of the securities are issued by affiliate(s) of the listed portfolio company. |
| (5) | Interest rates represent the weighted average annual stated interest rate on loans and debt securities, which are presented by the nature of indebtedness by a single issuer. The maturity dates represent the earliest and the latest maturity dates. |
| (6) | Loan is on non-accrual status and therefore considered non-income producing. |
| (7) | All or a portion of the loans are pledged as collateral under various secured financing arrangements. |
| (8) | Portfolio Company has filed for reorganization under Chapter 11 of the United States Code. |
| (9) | Included in Cash and cash equivalents on our Consolidated Balance Sheets. |
106
AMERICAN CAPITAL, LTD.
CONSOLIDATED SCHEDULE OF INVESTMENTS
December 31, 2008
(in millions, except share data)
| | | | | | | | | | | | | | | | | | | |
Company (4) | | Industry | | Investments | | Interest
Rate (5) | | Maturity
Date (5) | | # of
shares/
units
owned | | Principal | | Cost | | Fair
Value |
| | | | |
NON-CONTROL / NON-AFFILIATE INVESTMENTS | | | | | | | | | | | |
Aerus, LLC | | Household Durables | | Common Membership Warrants(1) | | | | | | 250,000 | | | | | $ | 0.2 | | $ | — |
Affordable Care Holding Corp. | | Health Care Providers & Services | | Subordinated Debt(7) | | 15.0% | | 11/13-11/14 | | | | $ | 64.6 | | | 63.8 | | | 64.6 |
| | | Convertible Preferred Stock | | | | | | 70,752 | | | | | | 83.9 | | | 83.9 |
| | | Common Stock(1) | | | | | | 17,687,156 | | | | | | 17.7 | | | 13.1 |
| | | | | | | | | | | | | | | | | 165.4 | | | 161.6 |
Algoma Holding Company | | Building Products | | Subordinated Debt(7) | | 12.3% | | 4/13 | | | | | 13.4 | | | 13.2 | | | 12.4 |
| | | | Convertible Preferred Stock(1) | | | | | | 23,319 | | | | | | — | | | 5.3 |
| | | | | | | | | | | | | | | | | 13.2 | | | 17.7 |
American Acquisition, LLC | | Capital Markets | | Senior Debt | | 12.5% | | 12/12 | | | | | 26.0 | | | 25.6 | | | 24.2 |
AmWins Group, Inc. | | Insurance | | Senior Debt(7) | | 6.5% | | 6/14 | | | | | 18.6 | | | 18.6 | | | 12.3 |
Anchor Drilling Fluids USA, Inc. | | Energy Equipment & Services | | Senior Debt(7) | | 11.3% | | 4/13 | | | | | 7.9 | | | 7.9 | | | 7.9 |
| | | Subordinated Debt(7) | | 14.5% | | 4/15 | | | | | 61.1 | | | 60.5 | | | 60.5 |
| | | | | | | | | | | | | | | | | 68.4 | | | 68.4 |
Aspect Software | | IT Services | | Senior Debt | | 9.2% | | 7/12 | | | | | 20.0 | | | 19.9 | | | 16.1 |
Autodis S.A.(3) | | Distributors | | Senior Debt(6) | | 10.3% | | 6/15 | | | | | 4.6 | | | 3.8 | | | 1.6 |
| | | | Subordinated Debt(6) | | 15.0% | | 12/15 | | | | | 3.1 | | | 2.6 | | | — |
| | | | | | | | | | | | | | | | | 6.4 | | | 1.6 |
Avalon Laboratories Holding Corp. | | Health Care Equipment & Supplies | | Senior Debt(7) | | 11.0% | | 1/14 | | | | | 17.1 | | | 17.0 | | | 17.2 |
| | | Subordinated Debt(7) | | 18.0% | | 1/15 | | | | | 21.8 | | | 21.2 | | | 17.0 |
| | | | Convertible Preferred Stock(1) | | | | | | 148,742 | | | | | | 24.3 | | | — |
| | | | Common Stock(1) | | | | | | 7,829 | | | | | | 1.3 | | | — |
| | | | | | | | | | | | | | | | | 63.8 | | | 34.2 |
Avanti Park Place LLC | | Real Estate | | Senior Debt | | 8.3% | | 6/10 | | | | | 5.9 | | | 6.0 | | | 6.0 |
Axygen Holdings Corporation | | Health Care Equipment & Supplies | | Subordinated Debt(7) | | 14.5% | | 9/14 | | | | | 61.5 | | | 60.8 | | | 61.5 |
| | | Redeemable Preferred Stock | | | | | | 205,204 | | | | | | 45.5 | | | 64.2 |
| | | | Convertible Preferred Stock | | | | | | 48,736 | | | | | | 14.2 | | | 14.2 |
| | | | Common Stock(1) | | | | | | 207,770 | | | | | | 20.9 | | | 24.2 |
| | | | | | | | | | | | | | | | | 141.4 | | | 164.1 |
BBB Industries, LLC | | Auto Components | | Senior Debt(7) | | 6.0% | | 6/14 | | | | | 21.2 | | | 21.2 | | | 15.6 |
Belloto Holdings Limited(3) | | Household Durables | | Subordinated Debt | | 12.1% | | 6/17 | | | | | 2.6 | | | 2.4 | | | 1.7 |
| | | | Subordinated Debt(6) | | 12.3% | | 6/17 | | | | | 1.3 | | | 1.2 | | | 0.1 |
| | | | PIK Note(1) | | 15.0% | | 12/17 | | | | | 10.0 | | | 8.9 | | | — |
| | | | Ordinary Shares(1) | | | | | | 32,434 | | | | | | 0.1 | | | — |
| | | | | | | | | | | | | | | | | 12.6 | | | 1.8 |
Berry-Hill Galleries, Inc. | | Distributors | | Senior Debt | | 15.4% | | 3/10 | | | | | 7.7 | | | 7.7 | | | 7.7 |
| | | | Common Stock Warrants(1) | | | | | | | | | | | | 0.1 | | | 0.1 |
| | | | | | | | | | | | | | | | | 7.8 | | | 7.8 |
Blue Wolf Capital Fund II, L.P. | | Capital Markets | | Limited Partnership Interest(1) | | | | | | | | | | | | 1.1 | | | 1.1 |
Butler Animal Health Supply, LLC | | Health Care Equipment & Supplies | | Senior Debt(7) | | 7.8% | | 7/12 | | | | | 8.0 | | | 8.0 | | | 6.9 |
CAMP Systems International, Inc. | | Air Freight & Logistics | | Senior Debt(7) | | 9.6% | | 9/14 | | | | | 30.0 | | | 29.7 | | | 22.6 |
Carestream Health, Inc. | | Health Care Equipment & Supplies | | Senior Debt(7) | | 7.4% | | 10/13 | | | | | 15.0 | | | 15.0 | | | 9.1 |
107
AMERICAN CAPITAL, LTD.
CONSOLIDATED SCHEDULE OF INVESTMENTS—(Continued)
December 31, 2008
(in millions, except share data)
| | | | | | | | | | | | | | | | |
Company (4) | | Industry | | Investments | | Interest
Rate (5) | | Maturity
Date (5) | | # of
shares/
units
owned | | Principal | | Cost | | Fair
Value |
CH Holding Corp. | | Leisure Equipment & Products | | Senior Debt(6) Redeemable Preferred Stock(1) | | 8.0% | | 5/11 | | 21,215 | | 13.1 | | 13.0
42.7 | | 5.0
— |
| | | | | | | | | | | | | | | 55.7 | | 5.0 |
Cinelease, Inc. | | Electronic Equipment, Instruments & Components | | Senior Debt(7) | | 7.8% | | 3/12-3/13 | | | | 58.2 | | 57.7 | | 45.8 |
| | | Common Stock(1) | | | | | | 583 | | | | 0.6 | | 0.7 |
| | | | | | | | | | | | | | 58.3 | | 46.5 |
CMX Inc. | | Construction & Engineering | | Senior Debt(7) | | 6.7% | | 5/11-5/12 | | | | 97.1 | | 95.9 | | 66.0 |
| | | Senior Debt(6)(7) | | 8.1% | | 5/12 | | | | 46.3 | | 46.3 | | — |
| | | | | | | | | | | | | | | 142.2 | | 66.0 |
Compusearch Holdings Company, Inc. | | Software | | Subordinated Debt(7) | | 12.0% | | 6/12 | | | | 12.6 | | 12.4 | | 12.4 |
| | | | Convertible Preferred Stock(1) | | | | | | 23,342 | | | | 0.9 | | 1.5 |
| | | | | | | | | | | | | | | 13.3 | | 13.9 |
Contec. LLC | | Household Durables | | Subordinated Debt(7) | | 14.0% | | 9/15-9/16 | | | | 135.0 | | 133.7 | | 127.2 |
Corrpro Companies, Inc. | | Construction & Engineering | | Subordinated Debt | | 12.5% | | 3/11 | | | | 13.0 | | 11.5 | | 11.6 |
| | | Redeemable Preferred Stock | | | | | | 1,165,930 | | | | 1.7 | | 1.7 |
| | | | Common Stock Warrants(1) | | | | | | 5,022,576 | | | | 3.5 | | 8.6 |
| | | | | | | | | | | | | | | 16.7 | | 21.9 |
CyrusOne Networks, LLC | | IT Services | | Senior Debt(7) | | 9.1% | | 1/14 | | | | 19.9 | | 19.8 | | 17.1 |
Delsey Holding(3) | | Textiles, Apparel & Luxury Goods | | Senior Debt | | 9.5% | | 2/12 | | | | 20.7 | | 20.7 | | 23.3 |
DelStar, Inc. | | Building Products | | Subordinated Debt(7) | | 14.0% | | 12/12 | | | | 18.7 | | 18.5 | | 18.7 |
| | | | Redeemable Preferred Stock | | | | | | 26,613 | | | | 16.7 | | 33.6 |
| | | | Convertible Preferred Stock | | | | | | 29,569 | | | | 3.4 | | 3.4 |
| | | | Common Stock Warrants(1) | | | | | | 89,020 | | | | 16.9 | | 5.0 |
| | | | | | | | | | | | | | | 55.5 | | 60.7 |
Direct Marketing International LLC | | Media | | Subordinated Debt(7) | | 15.2% | | 7/12 | | | | 29.3 | | 29.0 | | 29.0 |
Dyno Holding Corp. | | Auto Components | | Senior Debt(7) | | 9.5% | | 11/13 | | | | 41.9 | | 41.5 | | 41.9 |
| | | | Subordinated Debt(7) | | 16.0% | | 11/14 | | | | 27.4 | | 27.2 | | 27.4 |
| | | | Convertible Preferred Stock(1) | | | | | | 389,759 | | | | 40.5 | | 6.4 |
| | | | Common Stock(1) | | | | | | 97,440 | | | | 10.1 | | — |
| | | | | | | | | | | | | | | 119.3 | | 75.7 |
Easton Bell Sports LLC | | Leisure Equipment & Products | | Common Units(1) | | | | | | 1,985,748 | | | | 0.7 | | 4.2 |
Edline, LLC | | Software | | Subordinated Debt(7) | | 14.0% | | 7/13 | | | | 18.1 | | 14.4 | | 18.6 |
| | | | Membership Warrants(1) | | | | | | 6,447,500 | | | | 6.0 | | 16.0 |
| | | | | | | | | | | | | | | 20.4 | | 34.6 |
FAMS Acquisition, Inc. | | Diversified Financial Services | | Subordinated Debt(7) Convertible Preferred Stock(1) | | 14.8% | | 11/13-11/14 | | 861,364 | | 26.1 | | 25.9
20.9 | | 26.1
11.0 |
| | | | | | | | | | | | | | | 46.8 | | 37.1 |
FCC Holdings, LLC | | Commercial Banks | | Subordinated Debt | | 15.8% | | 12/12 | | | | 75.0 | | 74.4 | | 63.8 |
Foamex, L.P.(2) | | Household Durables | | Senior Debt(6) | | 8.3% | | 2/13-2/14 | | | | 23.2 | | 22.0 | | 6.2 |
Ford Motor Company(2) | | Automobiles | | Revolver Commitment | | | | 12/11 | | | | | | (6.7) | | (60.4) |
108
AMERICAN CAPITAL, LTD.
CONSOLIDATED SCHEDULE OF INVESTMENTS—(Continued)
December 31, 2008
(in millions, except share data)
| | | | | | | | | | | | | | | | |
Company (4) | | Industry | | Investments | | Interest
Rate (5) | | Maturity
Date (5) | | # of
shares/
units
owned | | Principal | | Cost | | Fair
Value |
Formed Fiber Technologies, Inc. | | Auto Components | | Subordinated Debt(6) | | 15.0% | | 8/11 | | | | 13.9 | | 11.1 | | 3.0 |
| | | | Common Stock Warrants(1) | | | | | | 122,397 | | | | 0.1 | | — |
| | | | | | | | | | | | | | | 11.2 | | 3.0 |
FPI Holding Corporation | | Food Products | | Senior Debt | | 14.7% | | 5/11-5/14 | | | | 23.4 | | 23.3 | | 23.4 |
| | | | Senior Debt(6) | | 17.3% | | 5/15 | | | | 9.1 | | 8.7 | | 5.5 |
| | | | Subordinated Debt(6) | | 21.5% | | 5/15-5/16 | | | | 18.6 | | 17.4 | | — |
| | | | Redeemable Preferred Stock(1) | | | | | | 4,469 | | | | 39.1 | | — |
| | | | Convertible Preferred Stock(1) | | | | | | 21,715 | | | | 23.3 | | — |
| | | | Common Stock(1) | | | | | | 5,429 | | | | 5.8 | | — |
| | | | | | | | | | | | | | | 117.6 | | 28.9 |
French Lick Resorts & Casino Hotels, LLC | | Hotels, Restaurants & Leisure | | Senior Debt | | 10.8% | | 4/14 | | | | 31.7 | | 25.7 | | 18.3 |
FU/WD Opa Locka, LLC | | Real Estate | | Senior Debt | | 8.0% | | 9/17-9/24 | | | | 32.5 | | 31.0 | | 27.1 |
Genband Inc. | | Communications Equipment | | Common Stock(1) | | | | | | 2,975,631 | | | | 14.7 | | 4.0 |
Golden Key US LLC | | Diversified Financial Services | | Commercial Paper(1) | | 5.3% | | 10/07 | | | | 7.3 | | 7.3 | | 4.0 |
HMSC Corporation | | Insurance | | Senior Debt(7) | | 6.0% | | 10/14 | | | | 3.5 | | 3.5 | | 2.0 |
HomeAway, Inc. | | Commercial Services & Supplies | | Redeemable Preferred Stock(1) | | | | | | 384,297 | | | | 0.7 | | 0.6 |
| | | Convertible Preferred Stock(1) | | | | | | 1,661,820 | | | | 9.7 | | 26.8 |
| | | | | | | | | | | | | | | 10.4 | | 27.4 |
Hopkins Manufacturing Corporation | | Auto Components | | Subordinated Debt(7) | | 15.3% | | 7/12 | | | | 36.9 | | 36.6 | | 35.4 |
| | | | Redeemable Preferred Stock | | | | | | 2,915 | | | | 5.9 | | 5.6 |
| | | | | | | | | | | | | | | 42.5 | | 41.0 |
III Exploration II, LP | | Oil, Gas & Consumable Fuels | | Senior Debt(7) | | 8.8% | | 4/14 | | | | 20.0 | | 20.0 | | 16.9 |
Infiltrator Systems, Inc. | | Building Products | | Senior Debt(7) | | 16.0% | | 10/13 | | | | 37.0 | | 36.6 | | 36.6 |
Innova Holdings, Inc. | | Software | | Senior Debt(7) | | 9.4% | | 3/13 | | | | 11.5 | | 11.4 | | 11.5 |
| | | | Subordinated Debt(7) | | 15.0% | | 3/14 | | | | 17.7 | | 17.5 | | 17.7 |
| | | | Convertible Preferred Stock | | | | | | 14,283 | | | | 21.6 | | 30.8 |
| | | | | | | | | | | | | | | 50.5 | | 60.0 |
Inovis International, Inc. | | Software | | Senior Debt(7) | | 8.4% | | 5/10 | | | | 88.0 | | 87.5 | | 82.6 |
Intergraph Corporation | | Software | | Senior Debt(7) | | 8.2% | | 12/14 | | | | 3.0 | | 3.0 | | 2.7 |
iTradeNetwork, Inc. | | IT Services | | Senior Debt(7) | | 11.5% | | 12/13 | | | | 25.0 | | 24.8 | | 24.3 |
JHCI Acquisition, Inc. | | Air Freight & Logistics | | Senior Debt(7) | | 6.0% | | 12/14 | | | | 19.0 | | 19.1 | | 11.7 |
Jones Stephens Corp. | | Building Products | | Subordinated Debt(7) | | 13.5% | | 9/13-9/14 | | | | 23.2 | | 22.9 | | 19.5 |
J-Pac, LLC | | Health Care Equipment & Supplies | | Senior Debt(7) | | 12.0% | | 1/14 | | | | 15.0 | | 14.8 | | 14.5 |
| | | Subordinated Debt | | 18.9% | | 1/14 | | | | 9.6 | | 9.3 | | 8.8 |
| | | | Preferred Unit Warrants(1) Common Unit Warrants(1) | | | | | | 263,158 | | | | 0.2 | | 0.1 |
| | | | | | | | | 500,000 | | | | — | | 0.1 |
| | | | | | | | | | | | | | | 24.3 | | 23.5 |
KIK Custom Products, Inc.(3) | | Household Products | | Senior Debt(6) | | 8.5% | | 11/14 | | | | 21.5 | | 21.5 | | 3.6 |
LabelCorp Holdings, Inc | | Paper & Forest Products | | Senior Debt | | 8.1% | | 8/13-8/14 | | | | 2.0 | | 1.6 | | 1.1 |
| | | | Subordinated Debt | | 14.0% | | 8/15-8/16 | | | | 60.5 | | 59.9 | | 57.0 |
| | | | | | | | | | | | | | | 61.5 | | 58.1 |
109
AMERICAN CAPITAL, LTD.
CONSOLIDATED SCHEDULE OF INVESTMENTS—(Continued)
December 31, 2008
(in millions, except share data)
| | | | | | | | | | | | | | | | |
Company (4) | | Industry | | Investments | | Interest
Rate (5) | | Maturity
Date (5) | | # of
shares/
units
owned | | Principal | | Cost | | Fair
Value |
LCW Holdings, LLC | | Real Estate | | Senior Debt | | 8.4% | | 10/12 | | | | 31.5 | | 30.5 | | 32.9 |
| | | | Warrant(1) | | | | | | 12.3% | | | | 0.9 | | 5.4 |
| | | | | | | | | | | | | | | 31.4 | | 38.3 |
LJVH Holdings Inc.(3) | | Beverages | | Senior Debt(7) | | 7.0% | | 1/15 | | | | 28.5 | | 28.6 | | 21.4 |
LN Acquisition Corp. | | Machinery | | Senior Debt(7) | | 6.8% | | 1/15 | | | | 21.5 | | 21.6 | | 15.9 |
Logex Corporation | | Road & Rail | | Subordinated Debt(6) | | 12.2% | | 3/09 | | | | 12.8 | | 9.1 | | 0.2 |
LTM Enterprises, Inc. | | Personal Products | | Senior Debt(7) | | 10.2% | | 11/11 | | | | 19.0 | | 19.0 | | 17.0 |
MagnaCare Holdings, Inc. | | Health Care Providers & Services | | Subordinated Debt(7) | | 14.8% | | 1/13 | | | | 14.0 | | 13.9 | | 13.9 |
Medical Billing Holdings, Inc. | | IT Services | | Subordinated Debt(7) | | 15.0% | | 9/13 | | | | 10.7 | | 10.5 | | 10.7 |
| | | | Convertible Preferred Stock(1) | | | | | | 13,199,000 | | | | 13.2 | | 13.7 |
| | | | Common Stock(1) | | | | | | 3,299,582 | | | | 3.3 | | — |
| | | | | | | | | | | | | | | 27.0 | | 24.4 |
MGM Holdings II, Inc. | | Media | | Senior Debt(6) | | 4.7% | | 6/11 | | | | 2.0 | | 1.7 | | 0.9 |
Mirion Technologies | | Electrical Equipment | | Senior Debt(7) | | 7.2% | | 5/10-11/11 | | | | 124.7 | | 124.2 | | 126.1 |
| | | | Subordinated Debt(7) | | 15.2% | | 9/09-5/12 | | | | 50.8 | | 50.5 | | 50.9 |
| | | | Convertible Preferred Stock | | | | | | 435,724 | | | | 48.5 | | 93.7 |
| | | | Common Stock(1) | | | | | | 24,503 | | | | 2.8 | | 3.6 |
| | | | Common Stock Warrants(1) | | | | | | 222,156 | | | | 18.6 | | 31.0 |
| | | | | | | | | | | | | | | 244.6 | | 305.3 |
Mitchell International, Inc. | | IT Services | | Senior Debt(7) | | 6.8% | | 3/15 | | | | 5.0 | | 5.0 | | 3.3 |
National Processing Company Group, Inc. | | IT Services | | Senior Debt(7) | | 10.7% | | 9/14 | | | | 53.0 | | 52.8 | | 38.8 |
NBD Holdings Corp. | | Diversified Financial Services | | Senior Subordinated Debt(7) | | 14.0% | | 8/13 | | | | 45.7 | | 45.2 | | 45.2 |
| | | Convertible Preferred Stock | | | | | | 84,174 | | | | 10.4 | | 10.4 |
| | | | Common Stock(1) | | | | | | 633,408 | | | | 0.1 | | 0.1 |
| | | | | | | | | | | | | | | 55.7 | | 55.7 |
Net1 Las Colinas Manager, LLC | | Real Estate | | Senior Debt | | 7.7% | | 10/15 | | | | 5.1 | | 5.2 | | 4.8 |
Nivel Holdings, LLC | | Distributors | | Senior Debt(7) | | 10.6% | | 10/13 | | | | 62.2 | | 61.7 | | 57.5 |
Orchard Brands Corporation | | Internet & Catalog Retail | | Senior Debt(7) | | 13.5% | | 4/13-4/14 | | | | 308.8 | | 305.9 | | 211.0 |
| | | | Subordinated Debt | | 10.0% | | 4/14 | | | | 60.2 | | 60.2 | | 32.1 |
| | | | Common Stock(1) | | | | | | 565,885 | | | | — | | 0.1 |
| | | | | | | | | | | | | | | 366.1 | | 243.2 |
Pan Am International Flight Academy, Inc. | | Professional Services | | Subordinated Debt(6)(7) | | 18.0% | | 7/13 | | | | 28.6 | | 25.2 | | 21.3 |
| | | Convertible Preferred Stock(1) | | | | | | 8,234 | | | | 8.2 | | — |
| | | | | | | | | | | | | | | 33.4 | | 21.3 |
Panavision, Inc. | | Electronic Equipment, Instruments & Components | | Senior Debt | | 6.6% | | 3/11 | | | | 2.0 | | 1.7 | | 1.1 |
PaR Systems, Inc. | | Machinery | | Senior Debt | | 4.7% | | 7/13 | | | | 4.7 | | 4.5 | | 4.5 |
Phillips & Temro Industries, Inc. | | Auto Components | | Senior Debt(7) | | 12.8% | | 12/10-12/11 | | | | 23.8 | | 23.7 | | 23.7 |
| | | | Subordinated Debt(7) | | 16.3% | | 12/12 | | | | 17.4 | | 17.4 | | 17.4 |
| | | | | | | | | | | | | | | 41.1 | | 41.1 |
Qioptiq S.A.R.L.(3) | | Electronic Equipment, Instruments & Components | | Subordinated Debt | | 10.2% | | 3/18 | | | | 29.3 | | 29.0 | | 29.0 |
Ranpak Acquisition Company | | Containers & Packaging | | Senior Debt(7) | | 8.8% | | 12/13-12/14 | | | | 142.2 | | 140.9 | | 114.0 |
110
AMERICAN CAPITAL, LTD.
CONSOLIDATED SCHEDULE OF INVESTMENTS—(Continued)
December 31, 2008
(in millions, except share data)
| | | | | | | | | | | | | | | | |
Company (4) | | Industry | | Investments | | Interest
Rate (5) | | Maturity
Date (5) | | # of
shares/
units
owned | | Principal | | Cost | | Fair
Value |
RDR Holdings, Inc. | | Household Durables | | Subordinated Debt(7) | | 15.4% | | 10/14-10/15 | | | | 216.8 | | 215.0 | | 216.8 |
| | | | Convertible Preferred Stock | | | | | | 154,142 | | | | 164.4 | | 122.9 |
| | | | Common Stock(1) | | | | | | 1,541,415 | | | | 1.5 | | — |
| | | | | | | | | | | | | | | 380.9 | | 339.7 |
Roarke - Money Mailer, LLC | | Media | | Common Membership Units(1) | | | | | | 3.5% | | | | 0.9 | | 1.3 |
Scanner Holdings Corporation | | Computers & Peripherals | | Senior Debt(7) | | 5.3% | | 5/12-5/13 | | | | 11.9 | | 11.6 | | 11.9 |
| | | | Subordinated Debt(7) | | 14.0% | | 5/14 | | | | 20.7 | | 20.5 | | 20.7 |
| | | | Convertible Preferred Stock(1) | | | | | | 77,640,000 | | | | 7.8 | | 7.4 |
| | | | Common Stock(1) | | | | | | 78,242 | | | | 0.1 | | — |
| | | | | | | | | | | | | | | 40.0 | | 40.0 |
Securus Technologies, Inc. | | Diversified Telecommunication Services | | Common Stock(1) | | | | | | 12 | | | | 0.7 | | — |
Seroyal Holdings, L.P.(3) | | Pharmaceuticals | | Redeemable Preferred Partnership Units | | | | | | 26,274 | | | | 0.5 | | 0.6 |
| | | | Partnership Units(1) | | | | | | 95,280 | | | | 0.8 | | 1.4 |
| | | | | | | | | | | | | | | 1.3 | | 2.0 |
Sleep Innovations, Inc.(9) | | Household Durables | | Senior Debt | | 11.0% | | 4/09 | | | | 2.3 | | 2.3 | | 2.3 |
| | | | Senior Debt(6) | | 7.9% | | 4/09-4/14 | | | | 30.6 | | 22.9 | | 6.8 |
| | | | | | | | | | | | | | | 25.2 | | 9.1 |
Small Smiles Holding Company, LLC | | Health Care Providers & Services | | Senior Debt | | 5.6% | | 9/12 | | | | 12.1 | | 7.0 | | 5.2 |
| | | Subordinated Debt(6)(7) | | 15.0% | | 9/13-9/14 | | | | 100.5 | | 87.9 | | — |
| | | | | | | | | | | | | | | 94.9 | | 5.2 |
Soil Safe Holdings, LLC | | Professional Services | | Senior Debt | | 9.1% | | 8/13-8/14 | | | | 52.2 | | 51.7 | | 50.0 |
| | | Subordinated Debt(7) | | 14.7% | | 8/15-8/17 | | | | 58.5 | | 57.9 | | 54.5 |
| | | | | | | | | | | | | | | 109.6 | | 104.5 |
Spectrum Brands, Inc.(2) | | Household Products | | Senior Debt(6) | | 6.6 % | | 3/13 | | | | 8.7 | | 8.3 | | 5.0 |
Supreme Corq Holdings, LLC | | Containers & Packaging | | Common Membership Warrants(1) | | | | | | 5,670 | | | | 0.4 | | — |
Swank Audio Visuals, L.L.C. | | Commercial Services & Supplies | | Senior Debt(7) | | 8.9% | | 8/14 | | | | 48.5 | | 48.1 | | 31.7 |
Tanenbaum-Harber Co. Holdings, Inc. | | Insurance | | Redeemable Preferred Stock(1) | | | | | | 376 | | | | 0.5 | | 0.5 |
| | | | Common Stock(1) | | | | | | 3,861 | | | | — | | — |
| | | | | | | | | | | | | | | 0.5 | | 0.5 |
TestAmerica Environmental Services, LLC | | Commercial Services & Supplies | | Senior Debt(7) | | 5.9% | | 12/11-12/13 | | | | 11.1 | | 10.9 | | 9.5 |
| | | Senior Debt(6)(7) | | 9.2% | | 12/13 | | | | 21.2 | | 20.9 | | — |
| | | | Subordinated Debt(6) | | 14.0% | | 12/14 | | | | 41.7 | | 39.5 | | — |
| | | | Preferred Unit(1) | | | | | | 11,659,298 | | | | 6.9 | | — |
| | | | Preferred Unit Warrants(1) | | | | | | 1,998,961 | | | | 4.8 | | — |
| | | | | | | | | | | | | | | 83.0 | | 9.5 |
The Tensar Corporation | | Construction & Engineering | | Senior Debt(7) | | 8.5% | | 5/13 | | | | 82.0 | | 81.2 | | 60.0 |
| | | Subordinated Debt | | 17.5% | | 10/13 | | | | 43.5 | | 43.2 | | 38.1 |
| | | | | | | | | | | | | | | 124.4 | | 98.1 |
ThreeSixty Sourcing, Inc.(3) | | Commercial Services & Supplies | | Common Stock Warrants(1) | | | | | | 35 | | | | 4.1 | | 1.3 |
TransFirst Holdings, Inc. | | Distributors | | Senior Debt(7) | | 7.5% | | 6/15 | | | | 50.0 | | 49.6 | | 39.3 |
111
AMERICAN CAPITAL, LTD.
CONSOLIDATED SCHEDULE OF INVESTMENTS—(Continued)
December 31, 2008
(in millions, except share data)
| | | | | | | | | | | | | | | | | | | |
Company (4) | | Industry | | Investments | | Interest
Rate (5) | | Maturity
Date (5) | | # of
shares/
units
owned | | Principal | | Cost | | Fair
Value |
triVIN, Inc. | | IT Services | | Subordinated Debt(7) | | 15.0% | | 6/14-6/15 | | | | | 19.9 | | | 19.7 | | | 19.9 |
| | | Convertible Preferred Stock(1) | | | | | | 247,000,000 | | | | | | 26.3 | | | 16.6 |
| | | | Common Stock(1) | | | | | | 6,319,923 | | | | | | 6.3 | | | — |
| | | | | | | | | | | | | | | | | 52.3 | | | 36.5 |
True Temper Sports, Inc. | | Leisure Equipment & Products | | Senior Debt | | 9.3% | | 6/11 | | | | | 2.0 | | | 1.9 | | | 1.3 |
Tyden Caymen Holdings Corp. | | Electronic Equipment, Instruments & Components | | Senior Debt(7) | | 10.5% | | 5/10-11/11 | | | | | 12.0 | | | 11.9 | | | 12.0 |
| | | Subordinated Debt(7) | | 13.8% | | 5/12 | | | | | 14.5 | | | 14.4 | | | 14.6 |
| | | Common Stock(1) | | | | | | 1,165,930 | | | | | | 1.1 | | | 2.9 |
| | | | | | | | | | | | | | | | | 27.4 | | | 29.5 |
Velocity Financial Group, Inc. | | Diversified Financial Services | | Subordinated Debt | | 15.0% | | 4/14 | | | | | 17.8 | | | 17.6 | | | 17.6 |
| | | Convertible Preferred Stock(1) | | | | | | 11,659,298 | | | | | | 20.4 | | | 8.7 |
| | | | | | | | | | | | | | | | | 38.0 | | | 26.3 |
Venus Swimwear, Inc. | | Internet & Catalog Retail | | Senior Debt | | 9.7% | | 12/11-12/12 | | | | | 21.9 | | | 21.6 | | | 17.6 |
| | | | Subordinated Debt(6) | | 20.0% | | 12/13 | | | | | 25.4 | | | 19.2 | | | 1.3 |
| | | | | | | | | | | | | | | | | 40.8 | | | 18.9 |
WRH, Inc. | | Life Sciences Tools & Services | | Senior Debt(7) | | 5.7% | | 9/13-9/14 | | | | | 4.3 | | | 4.3 | | | 4.3 |
| | | Subordinated Debt(7) | | 14.7% | | 7/14-9/14 | | | | | 81.7 | | | 81.0 | | | 81.4 |
| | | | Convertible Preferred Stock | | | | | | 2,008,575 | | | | | | 226.0 | | | 226.0 |
| | | | Common Stock(1) | | | | | | 502,144 | | | | | | 49.9 | | | 20.6 |
| | | | | | | | | | | | | | | | | 361.2 | | | 332.3 |
WWC Acquisitions, Inc. | | Professional Services | | Senior Debt(7) | | 7.2% | | 12/11-12/13 | | | | | 34.0 | | | 33.6 | | | 26.7 |
Zencon Holdings Corporation | | Internet Software & Services | | Senior Debt(7) | | 6.5% | | 5/13 | | | | | 17.2 | | | 17.1 | | | 17.2 |
| | | Subordinated Debt(7) | | 15.3% | | 5/14 | | | | | 21.0 | | | 20.8 | | | 21.0 |
| | | | Convertible Preferred Stock(1) | | | | | | 5,246,686 | | | | | | 7.5 | | | 16.5 |
| | | | | | | | | | | | | | | | | 45.4 | | | 54.7 |
ZSF/WD Fitzgerald, LLC | | Real Estate | | Senior Debt | | 8.2% | | 9/24 | | | | | 1.2 | | | 1.1 | | | 0.6 |
ZSF/WD Hammond, LLC | | Real Estate | | Senior Debt | | 8.0% | | 9/17-9/24 | | | | | 40.7 | | | 38.9 | | | 33.2 |
ZSF/WD Jacksonville, LLC | | Real Estate | | Senior Debt | | 8.1% | | 9/17-9/24 | | | | | 20.5 | | | 19.5 | | | 15.9 |
ZSF/WD Montgomery-31, LLC | | Real Estate | | Senior Debt | | 8.0% | | 9/17-9/24 | | | | | 33.8 | | | 32.2 | | | 27.9 |
ZSF/WD Opa Locka, LLC | | Real Estate | | Senior Debt | | 8.2% | | 9/24 | | | | | 0.4 | | | 0.4 | | | 0.1 |
ZSF/WD Orlando, LLC | | Real Estate | | Senior Debt | | 8.1% | | 9/17-9/24 | | | | | 20.8 | | | 19.7 | | | 16.2 |
CMBS AND REAL ESTATE CDO INVESTMENTS | | | | | | | | | | | |
ACAS CRE CDO 2007-1, Ltd. | | Real Estate | | Class C through Class N Notes Preferred Shares | | 5.7% | | 11/31 | | 417,086,293 | | $ | 345.5 | | $
| 201.1
17.7 | | $
| 13.7
4.2 |
| | | | | | | | | | | | | | | | | 218.8 | | | 17.9 |
Banc of America | | Real Estate | | Forward Purchase commitment to purchase Banc of America Commercial Mortgage Trust 2007-1, Commercial Mortgage Pass-Through Certificates ($5.8 Fair Value) | | | | 4/09 | | | | | | | | 18.2 | | | 3.7 |
CD 2007-CD4 Commercial Mortgage Trust | | Real Estate | | Commercial Mortgage Pass-Through Certificates | | 5.7% | | 4/17 | | | | | 14.1 | | | 8.8 | | | 1.3 |
112
AMERICAN CAPITAL, LTD.
CONSOLIDATED SCHEDULE OF INVESTMENTS—(Continued)
December 31, 2008
(in millions, except share data)
| | | | | | | | | | | | | | | | |
Company (4) | | Industry | | Investments | | Interest
Rate (5) | | Maturity
Date (5) | | # of
shares/
units
owned | | Principal | | Cost | | Fair
Value |
CD 2007-CD5 Mortgage Trust | | Real Estate | | Commercial Mortgage Pass-Through Certificates | | 6.2% | | 12/17 | | | | 14.8 | | 10.2 | | 2.1 |
Citigroup Commercial Mortgage Securites Trust 2007-C6 | | Real Estate | | Commercial Mortgage Pass-Through Certificates | | 5.5% | | 7/17 | | | | 152.9 | | 68.1 | | 16.4 |
COBALT CMBS Commercial Mortgage Trust 2007-C3 | | Real Estate | | Commercial Mortgage Pass-Through Certificates | | 5.2% | | 10/17 | | | | 11.1 | | 8.6 | | 0.8 |
Countrywide Commercial Mortgage Trust 2007-MF1 | | Real Estate | | Commercial Mortgage Pass-Through Certificates | | 6.1% | | 11/37-11/40 | | | | 24.0 | | 9.3 | | 1.8 |
Credit Suisse Commercial Mortgage Trust 2007-C3 | | Real Estate | | Commercial Mortgage Pass-Through Certificates | | 5.6% | | 7/17 | | | | 13.2 | | 10.6 | | 1.0 |
Credit Suisse Commercial Mortgage Trust Series 2007-C4 | | Real Estate | | Commercial Mortgage Pass-Through Certificates | | 5.8% | | 8/17 | | | | 20.8 | | 12.1 | | 4.6 |
GE Commercial Mortgage Corporation, Series 2007-C1 | | Real Estate | | Commercial Mortgage Pass-Through Certificates | | 5.5% | | 12/19 | | | | 37.0 | | 31.4 | | 3.4 |
GS Morgtage Securities Trust 2006-GG10 | | Real Estate | | Commercial Mortgage Pass-Through Certificates | | 5.7% | | 7/17 | | | | 63.7 | | 52.3 | | 4.7 |
J.P. Morgan Chase Commercial Mortgage Securities Trust 2007-LDP11 | | Real Estate | | Commercial Mortgage Pass-Through Certificates | | 5.6% | | 7/17 | | | | 142.7 | | 62.7 | | 11.7 |
J.P. Morgan Chase | | | | Forward Purchase commitment to purchase J.P. Morgan Chase Commercial Mortgage Securities Trust 2007-LDP11, Commercial Mortgage Pass-Through Certificates ($1.9 Fair Value) | | | | 1/09-5/09 | | | | | | 7.2 | | 0.8 |
J.P. Morgan Chase | | | | Forward Purchase commitment to purchase ML-CFC Commercial Mortgage Trust 2007-6, Commercial Mortgage Pass-Through Certificates ($0.9 Fair Value) | | | | 1/09 | | | | | | 2.9 | | 0.6 |
LB-UBS Commercial Mortgage Trust 2007-C6 | | Real Estate | | Commercial Mortgage Pass-Through Certificates | | 6.2% | | 8/17 | | | | 36.6 | | 22.1 | | 4.9 |
LB-UBS Commercial Mortgage Trust 2008-C1 | | Real Estate | | Commercial Mortgage Pass-Through Certificates | | 6.2% | | 7/23-7/24 | | | | 19.4 | | 7.3 | | 2.4 |
ML-CFC Commercial Mortgage Trust 2007-8 | | Real Estate | | Commercial Mortgage Pass-Through Certificates | | 6.0% | | 8/17 | | | | 32.8 | | 19.5 | | 4.4 |
Wachovia Bank Commercial Mortgage Trust 2007-C31 | | Real Estate | | Commercial Mortgage Pass-Through Certificates | | 5.8% | | 5/17 | | | | 20.0 | | 11.4 | | 2.8 |
113
AMERICAN CAPITAL, LTD.
CONSOLIDATED SCHEDULE OF INVESTMENTS—(Continued)
December 31, 2008
(in millions, except share data)
| | | | | | | | | | | | | | | | | | | |
Company (4) | | Industry | | Investments | | Interest
Rate (5) | | Maturity
Date (5) | | # of
shares/
units
owned | | Principal | | Cost | | Fair
Value |
Wachovia Bank Commercial Mortgage Trust, Series 2007-C32 | | Real Estate | | Commercial Mortgage Pass-Through Certificates | | 5.7% | | 10/17 | | | | | 161.6 | | | 76.1 | | | 13.4 |
Wachovia Bank Commercial Mortgage Trust, Series 2007-C34 | | Real Estate | | Commercial Mortgage Pass-Through Certificates | | 5.3% | | 10/17-9/24 | | | | | 96.2 | | | 43.4 | | | 8.3 |
Wachovia Bank Commercial Trust 2006-C28 | | Real Estate | | Commercial Mortgage Pass-Through Certificates | | 6.0% | | 11/16 | | | | | 5.0 | | | 3.1 | | | 0.5 |
CLO INVESTMENTS | | | | | | | | | | | |
ACAS CLO 2007-1, Ltd. | | Diversified Financial Services | | Secured Notes | | | | | | | | $ | 8.5 | | $ | 8.4 | | $ | 1.3 |
| | | Subordinated Notes | | | | | | | | | 25.9 | | | 23.0 | | | 8.2 |
| | | | | | | | | | | | | | | | | 31.4 | | | 9.5 |
Ares IIIR/IVR CLO Ltd. | | Diversified Financial Services | | Subordinated Notes | | | | | | | | | 20.0 | | | 16.8 | | | 5.1 |
Ares VIII CLO, Ltd. | | Diversified Financial Services | | Preference Shares | | | | | | 6,241 | | | | | | 4.3 | | | 1.1 |
Avalon Capital Ltd. 3 | | Diversified Financial Services | | Preferred Securities | | | | | | 13,796 | | | | | | 4.5 | | | 1.7 |
Babson CLO Ltd. 2006-II | | Diversified Financial Services | | Income Notes | | | | | | | | | 15.0 | | | 13.4 | | | 5.7 |
BALLYROCK CLO 2006-2 LTD. | | Diversified Financial Services | | Deferrable Notes | | | | | | | | | 2.5 | | | 2.1 | | | 0.5 |
Cent CDO 12 Limited | | Diversified Financial Services | | Income Notes | | | | | | | | | 26.4 | | | 22.6 | | | 8.3 |
Centurion CDO 8 Limited | | Diversified Financial Services | | Subordinated Notes | | | | | | | | | 5.0 | | | 3.1 | | | 1.4 |
Champlain CLO | | Diversified Financial Services | | Preferred Securities | | | | | | 1,000,000 | | | | | | 0.5 | | | 0.1 |
CoLTs 2005-1 Ltd.(3) | | Diversified Financial Services | | Preference Shares(1) | | | | | | 360 | | | | | | 6.7 | | | 3.0 |
CoLTs 2005-2 Ltd.(3) | | Diversified Financial Services | | Preference Shares | | | | | | 34,170,000 | | | | | | 29.3 | | | 7.8 |
CREST Exeter Street Solar 2004-2 | | Diversified Financial Services | | Preferred Securities | | | | | | 3,089,177 | | | | | | 2.7 | | | 0.3 |
Eaton Vance CDO X PLC(3) | | Diversified Financial Services | | Secured Subordinated Income Notes | | | | | | | | | 15.0 | | | 13.0 | | | 4.3 |
Essex Park CDO Ltd. | | Diversified Financial Services | | Preferred Securities | | | | | | 5,750,000 | | | | | | 1.8 | | | 1.3 |
Flagship CLO V | | Diversified Financial Services | | Deferrable Notes | | | | | | | | | 1.7 | | | 1.3 | | | 0.3 |
| | | Subordinated Securities | | | | | | 15,000 | | | | | | 13.2 | | | 4.0 |
| | | | | | | | | | | | | | | | | 14.5 | | | 4.3 |
Galaxy III CLO, Ltd | | Diversified Financial Services | | Subordinated Notes | | | | | | | | | 4.0 | | | 2.3 | | | 0.9 |
LightPoint CLO IV, LTD | | Diversified Financial Services | | Income Notes | | | | | | | | | 6.7 | | | 6.2 | | | 0.7 |
LightPoint CLO VIII, Ltd. | | Diversified Financial Services | | Deferrable Notes | | | | | | | | | 7.0 | | | 6.5 | | | 1.7 |
LightPoint CLO VII, Ltd. | | Diversified Financial Services | | Subordinated Notes | | | | | | | | | 9.0 | | | 7.6 | | | 3.2 |
114
AMERICAN CAPITAL, LTD.
CONSOLIDATED SCHEDULE OF INVESTMENTS—(Continued)
December 31, 2008
(in millions, except share data)
| | | | | | | | | | | | | | | | | | | |
Company (4) | | Industry | | Investments | | Interest
Rate (5) | | Maturity
Date (5) | | # of
shares/
units
owned | | Principal | | Cost | | Fair
Value |
Mayport CLO Ltd. | | Diversified Financial Services | | Income Notes | | | | | | | | | 14.0 | | | 12.1 | | | 4.0 |
NYLIM Flatiron CLO 2006-1 LTD.(3) | | Diversified Financial Services | | Subordinated Securities | | | | | | 10,000 | | | | | | 8.9 | | | 3.2 |
Octagon Investment Partners VII, Ltd. | | Diversified Financial Services | | Preferred Securities | | | | | | 5,000,000 | | | | | | 2.1 | | | 0.8 |
Sapphire Valley CDO I, Ltd. | | Diversified Financial Services | | Subordinated Notes | | | | | | | | | 14.0 | | | 12.4 | | | 4.8 |
Vitesse CLO, Ltd. | | Diversified Financial Services | | Preferred Securities | | | | | | 20,000,000 | | | | | | 15.2 | | | 3.8 |
Subtotal Non-Control / Non-Affiliate Investments (58% of total investment assets and liabilities at fair value) | | | | | $ | 5,904.1 | | $ | 4,182.0 |
| | | | |
AFFILIATE INVESTMENTS | | | | | | | | | | | |
Aptara, Inc. | | IT Services | | Senior Debt | | 11.5% | | 8/09 | | | | $ | 3.0 | | | $ 3.0 | | $ | 3.0 |
| | | | Subordinated Debt(7) | | 16.3% | | 8/09 | | | | | 43.5 | | | 43.3 | | | 43.3 |
| | | | Subordinated Debt(6)(7) | | 19.0% | | 8/09 | | | | | 11.8 | | | 10.0 | | | 3.7 |
| | | | Redeemable Preferred Stock(1) | | | | | | 15,107 | | | | | | 14.1 | | | — |
| | | | Convertible Preferred Stock(1) | | | | | | 2,549,410 | | | | | | 8.8 | | | — |
| | | | Preferred Stock Warrants(1) | | | | | | 230,681 | | | | | | 1.0 | | | — |
| | | | | | | | | | | | | | | | | 80.2 | | | 50.0 |
Coghead, Inc. | | Internet Software & Services | | Subordinated Debt | | 10.0% | | 4/09 | | | | | 0.1 | | | 0.1 | | | 0.1 |
| | | Convertible Preferred Stock(1) | | | | | | 5,489,656 | | | | | | 2.6 | | | 0.2 |
| | | | | | | | | | | | | | | | | 2.7 | | | 0.3 |
Creditcards.com, Inc. | | Internet Software & Services | | Senior Debt(7) | | 11.0% | | 6/13 | | | | | 140.9 | | | 140.1 | | | 136.1 |
| | | Subordinated Debt(7) | | 15.0% | | 6/14 | | | | | 28.4 | | | 28.0 | | | 26.6 |
| | | | Common Stock(1) | | | | | | 1,094,645 | | | | | | 1.6 | | | 4.2 |
| | | | | | | | | | | | | | | | | 169.7 | | | 166.9 |
Egenera, Inc. | | Computers & Peripherals | | Subordinated Debt | | 15.0% | | 12/10 | | | | | 2.8 | | | 2.4 | | | 2.4 |
| | | | Redeemable Preferred Stock(1) | | | | | | 523,040 | | | | | | 0.4 | | | 9.7 |
| | | | Common Stock(1) | | | | | | 8,046,865 | | | | | | 25.0 | | | — |
| | | | | | | | | | | | | | | | | 27.8 | | | 12.1 |
HALT Medical, Inc. | | Health Care Equipment & Supplies | | Convertible Preferred Stock(1) | | | | | | 5,053,292 | | | | | | 8.1 | | | 8.7 |
IS Holdings I, Inc. | | Software | | Senior Debt(7) | | 7.9% | | 6/14 | | | | | 20.0 | | | 19.8 | | | 15.6 |
| | | | Redeemable Preferred Stock | | | | | | 1,297 | | | | | | 1.6 | | | 1.5 |
| | | | Common Stock(1) | | | | | | 1,165,930 | | | | | | — | | | 4.6 |
| | | | | | | | | | | | | | | | | 21.4 | | | 21.7 |
Narus, Inc. | | Internet Software & Services | | Convertible Preferred Stock(1) | | | | | | 23,583,196 | | | | | | 8.4 | | | 2.1 |
| | | Preferred Stock Warrants(1) | | | | | | 5,440,881 | | | | | | — | | | — |
| | | | | | | | | | | | | | | | | 8.4 | | | 2.1 |
Primrose Holding Corporation | | Diversified Consumer Services | | Common Stock(1) | | | | | | 4,213 | | | | | | 2.7 | | | 7.4 |
Qualitor Component Holdings, LLC | | Auto Components | | Subordinated Debt(7) Redeemable Preferred Units(1) | | 17.0% | | 12/12 | | 3,150,000 | | | 35.6 | |
| 35.3
3.1 | |
| 35.9
1.1 |
| | | | Common Units(1) | | | | | | 350,000 | | | | | | 0.4 | | | — |
| | | | | | | | | | | | | | | | | 38.8 | | | 37.0 |
115
AMERICAN CAPITAL, LTD.
CONSOLIDATED SCHEDULE OF INVESTMENTS—(Continued)
December 31, 2008
(in millions, except share data)
| | | | | | | | | | | | | | | | | | | |
Company (4) | | Industry | | Investments | | Interest
Rate (5) | | Maturity
Date (5) | | # of
shares/
units
owned | | Principal | | Cost | | Fair
Value |
Radar Detection Holdings Corp. | | Household Durables | | Senior Debt(7) Common Stock(1) | | 9.4% | | 11/12 | | 40,688 | | | 13.0 | |
| 13.0
0.6 | |
| 9.5
0.6 |
| | | | | | | | | | | | | | | | | 13.6 | | | 10.1 |
Roadrunner Dawes, Inc. | | Road & Rail | | Subordinated Debt(7) | | 18.0% | | 9/12 | | | | | 19.3 | | | 19.2 | | | 19.2 |
| | | | Common Stock(1) | | | | | | 7,000 | | | | | | 7.0 | | | 0.1 |
| | | | | | | | | | | | | | | | | 26.2 | | | 19.3 |
Tymphany Corporation | | Electronic Equipment & Instruments | | Senior Debt(1) | | 0.0% | | 4/09 | | | | | 2.2 | | | 2.2 | | | — |
WFS Holding, Inc. | | Software | | Convertible Preferred Stock | | | | | | 20,403,772 | | | | | | 2.8 | | | 2.8 |
Subtotal Affiliate Investments (5% of total investment assets and liabilities at fair value) | | | | | $ | 404.6 | | $ | 338.4 |
| | | | |
CONTROL INVESTMENTS | | | | | | | | | | | |
ACAS Equity Holdings Corp. | | Diversified Financial Services | | Common Stock(1) | | | | | | 589 | | | | | $ | 14.7 | | $ | 4.3 |
ACAS Real Estate Holdings Corporation | | Real Estate | | Subordinated Debt Common Stock(1) | | 15.0% | | 5/16 | | 100%
| | $ | 0.8 | |
| 0.8
5.4 | |
| —
— |
| | | | | | | | | | | | | | | | | 6.2 | | | — |
American Capital Agency Corp.(2)(8) | | Real Estate Investment Trusts | | Common Stock | | | | | | 5,000,100 | | | | | | 100.0 | | | 101.5 |
American Capital, LLC | | Capital Markets | | Senior Debt | | 7.7% | | 9/12 | | | | | 10.6 | | | 10.4 | | | 10.6 |
| | | | Common Membership Interest | | | | | | 100% | | | | | | 58.5 | | | 164.7 |
| | | | | | | | | | | | | | | | | 68.9 | | | 175.3 |
American Driveline Systems, Inc. | | Diversified Consumer Services | | Subordinated Debt(7) | | 14.0% | | 12/14-12/15 | | | | | 41.7 | | | 41.2 | | | 41.7 |
| | | Redeemable Preferred Stock | | | | | | 403,357 | | | | | | 28.4 | | | 44.1 |
| | | | Common Stock(1) | | | | | | 128,681 | | | | | | 10.8 | | | 2.7 |
| | | | Common Stock Warrants(1) | | | | | | 204,663 | | | | | | 17.3 | | | 4.2 |
| | | | | | | | | | | | | | | | | 97.7 | | | 92.7 |
Auxi Health, Inc. | | Health Care Providers & Services | | Subordinated Debt(6) | | 5.8% | | 3/09 | | | | | 8.9 | | | 3.2 | | | 1.1 |
Barton-Cotton Holding Corporation | | Distributors | | Subordinated Debt(6) | | 14.0% | | 9/14 | | | | | 34.1 | | | 28.6 | | | — |
| | | | Redeemable Preferred Stock(1) | | | | | | 28,263 | | | | | | 15.7 | | | — |
| | | | Convertible Preferred Stock(1) | | | | | | 66,551 | | | | | | 6.7 | | | — |
| | | | Common Stock(1) | | | | | | 607 | | | | | | 0.1 | | | — |
| | | | Common Stock Warrants(1) | | | | | | 125,610 | | | | | | 12.5 | | | — |
| | | | Guarantee | | | | | | | | | | | | — | | | (10.0) |
| | | | | | | | | | | | | | | | | 63.6 | | | (10.0) |
Capital.com, Inc. | | Diversified Financial Services | | Common Stock(1) | | | | | | 8,500,100 | | | | | | 1.5 | | | 0.4 |
CIBT Travel Solutions, Inc. | | Commercial Services & Supplies | | Senior Debt | | 5.9% | | 1/13-1/14 | | | | | 74.8 | | | 74.0 | | | 74.8 |
| | | Subordinated Debt(7) | | 15.0% | | 1/10-1/16 | | | | | 43.1 | | | 42.7 | | | 43.1 |
| | | | Convertible Preferred Stock(1) | | | | | | 776,800 | | | | | | 77.7 | | | 35.2 |
| | | | Common Stock(1) | | | | | | 194,200 | | | | | | 19.4 | | | — |
| | | | | | | | | | | | | | | | | 213.8 | | | 153.1 |
Consolidated Bedding, Inc. | | Household Durables | | Senior Debt | | 11.4% | | 6/13 | | | | | 10.7 | | | 10.5 | | | 10.2 |
| | | | Senior Debt(6) | | 11.4% | | 6/13 | | | | | 113.1 | | | 103.7 | | | 23.0 |
| | | | Subordinated Debt(6) | | 21.7% | | 12/13 | | | | | 92.0 | | | 78.4 | | | — |
| | | | Convertible Preferred Stock(1) | | | | | | 16,423 | | | | | | 3.0 | | | — |
| | | | | | | | | | | | | | | | | 195.6 | | | 33.2 |
116
AMERICAN CAPITAL, LTD.
CONSOLIDATED SCHEDULE OF INVESTMENTS—(Continued)
December 31, 2008
(in millions, except share data)
| | | | | | | | | | | | | | | | |
Company (4) | | Industry | | Investments | | Interest
Rate (5) | | Maturity
Date (5) | | # of
shares/
units
owned | | Principal | | Cost | | Fair
Value |
Contour Semiconductor, Inc. | | Semiconductors & Semiconductor Equipment | | Convertible Preferred Stock(1) | | | | | | 9,738,995 | | | | 10.0 | | 10.6 |
Core Business Credit, LLC | | Diversified Financial Services | | Subordinated Debt | | 14.1% | | 5/15 | | | | 19.5 | | 19.3 | | 19.3 |
| | | Convertible Preferred Units(1) | | | | | | 155,150 | | | | 15.5 | | 16.1 |
| | | | Common Units(1) | | | | | | 38,788 | | | | 3.9 | | 3.3 |
| | | | | | | | | | | | | | | 38.7 | | 38.7 |
ECA Acquisition Holdings, Inc | | Health Care Equipment & Supplies | | Subordinated Debt(7) | | 16.5% | | 12/14 | | | | 13.0 | | 12.9 | | 13.0 |
| | | Common Stock(1) | | | | | | 583 | | | | 11.1 | | 5.1 |
| | | | | | | | | | | | | | | 24.0 | | 18.1 |
eLynx Holdings, Inc. | | IT Services | | Senior Debt(7) | | 9.8% | | 6/13 | | | | 9.6 | | 9.5 | | 9.6 |
| | | | Subordinated Debt(6)(7) | | 10.0% | | 6/13 | | | | 14.6 | | 13.4 | | 1.4 |
| | | | Redeemable Preferred Stock(1) | | | | | | 21,114 | | | | 9.0 | | — |
| | | | Convertible Preferred Stock(1) | | | | | | 7,929 | | | | 6.0 | | — |
| | | | Common Stock(1) | | | | | | 11,261 | | | | 1.1 | | — |
| | | | Common Stock Warrants(1) | | | | | | 1,078,792 | | | | 13.1 | | — |
| | | | | | | | | | | | | | | 52.1 | | 11.0 |
Endeavor Fund I, LP | | Thrifts & Mortgage Finance | | Partnership Interest | | | | | | 100% | | | | 29.7 | | 20.9 |
ETG Holdings, Inc. | | Containers & Packaging | | Senior Debt(6) | | 10.4% | | 5/11 | | | | 13.4 | | 10.8 | | 2.6 |
| | | | Subordinated Debt(6) | | 14.3% | | 5/12-5/13 | | | | 15.8 | | 10.9 | | — |
| | | | Convertible Preferred Stock(1) | | | | | | 233,201 | | | | 11.4 | | — |
| | | | | | | | | | | | | | | 33.1 | | 2.6 |
European Capital Limited(2)(3) | | Diversified Financial Services | | Subordinated Debt | | 7.5% | | 11/09-2/11 | | | | 363.6 | | 358.7 | | 363.6 |
| | | Ordinary Shares | | | | | | 72,305,938 | | | | 921.8 | | 116.9 |
| | | | | | | | | | | | | | | 1,280.5 | | 480.5 |
European Touch, LTD. II | | Leisure Equipment & Products | | Subordinated Debt | | 12.0% | | 12/10 | | | | 3.1 | | 3.1 | | 3.1 |
| | | Subordinated Debt(6) | | 18.1% | | 12/10 | | | | 20.5 | | 15.6 | | 2.2 |
| | | | Redeemable Preferred Stock(1) | | | | | | 263 | | | | 0.3 | | — |
| | | | Common Stock(1) | | | | | | 1,688 | | | | 0.9 | | — |
| | | | Common Stock Warrants(1) | | | | | | 7,105 | | | | 3.7 | | — |
| | | | | | | | | | | | | | | 23.6 | | 5.3 |
EXPL Pipeline Holdings LLC | | Oil, Gas & Consumable Fuels | | Senior Debt | | 9.6% | | 1/17 | | | | 42.3 | | 41.9 | | 42.3 |
| | | Common Membership Units(1) | | | | | | 58,297 | | | | 44.5 | | 12.0 |
| | | | | | | | | | | | | | | 86.4 | | 54.3 |
Fosbel Global Services (LUXCO) S.C.A(3) | | Commercial Services & Supplies | | Subordinated Debt(7) | | 14.0% | | 12/13 | | | | 19.6 | | 19.6 | | 19.6 |
| | | Subordinated Debt(6)(7) | | 17.0% | | 12/14 | | | | 18.6 | | 15.5 | | 15.7 |
| | | | Redeemable Preferred Stock(1) | | | | | | 18,449,456 | | | | 18.5 | | — |
| | | | Convertible Preferred Stock(1) | | | | | | 1,519,368 | | | | 3.0 | | — |
| | | | Common Stock(1) | | | | | | 108,526 | | | | 0.2 | | — |
| | | | | | | | | | | | | | | 56.8 | | 35.3 |
Fountainhead Estate Holding Corp.(3) | | Internet Software & Services | | Senior Debt Redeemable Preferred Stock(1) | | 5.7% | | 10/13 | | 115,538 | | 24.5 | | 24.5
11.6 | | 24.5
11.6 |
| | | | Convertible Preferred Stock(1) | | | | | | 59,250 | | | | 59.3 | | 2.6 |
| | | | | | | | | | | | | | | 95.4 | | 38.7 |
117
AMERICAN CAPITAL, LTD.
CONSOLIDATED SCHEDULE OF INVESTMENTS—(Continued)
December 31, 2008
(in millions, except share data)
| | | | | | | | | | | | | | | | |
Company (4) | | Industry | | Investments | | Interest
Rate (5) | | Maturity
Date (5) | | # of
shares/
units
owned | | Principal | | Cost | | Fair
Value |
FreeConferenceroom.com, Inc. | | Diversified Telecommunication Services | | Senior Debt(7) | | 8.3% | | 4/11-5/11 | | | | 14.8 | | 14.7 | | 14.9 |
| | | Subordinated Debt | | 15.0% | | 5/12 | | | | 10.1 | | 10.0 | | 10.1 |
| | | Redeemable Preferred Stock(1) | | | | | | 14,042,095 | | | | 12.8 | | 4.5 |
| | | | Common Stock(1) | | | | | | 6,088,229 | | | | 2.3 | | — |
| | | | | | | | | | | | | | | 39.8 | | 29.5 |
Future Food, Inc. | | Food Products | | Senior Debt | | 6.9% | | 7/10 | | | | 17.2 | | 17.2 | | 17.3 |
| | | | Subordinated Debt(6) | | 12.4% | | 7/11-7/12 | | | | 13.5 | | 12.5 | | 3.8 |
| | | | Common Stock(1) | | | | | | 64,917 | | | | 13.0 | | — |
| | | | Common Stock Warrants(1) | | | | | | 6,500 | | | | 1.3 | | — |
| | | | | | | | | | | | | | | 44.0 | | 21.1 |
FutureLogic, Inc. | | Computers & Peripherals | | Senior Debt(7) | | 9.7% | | 2/10-2/12 | | | | 48.2 | | 48.0 | | 48.2 |
| | | | Subordinated Debt(7) | | 15.0% | | 2/13 | | | | 32.6 | | 32.3 | | 32.6 |
| | | | Common Stock(1) | | | | | | 129,514 | | | | 15.6 | | 3.7 |
| | | | | | | | | | | | | | | 95.9 | | 84.5 |
FV Holdings Corporation | | Food Products | | Subordinated Debt(7) | | 14.5% | | 6/15 | | | | 23.1 | | 23.1 | | 23.1 |
| | | | Convertible Preferred Stock(1) | | | | | | 292,000 | | | | 14.3 | | 23.8 |
| | | | Common Stock(1) | | | | | | 125,000 | | | | 6.1 | | 10.2 |
| | | | | | | | | | | | | | | 43.5 | | 57.1 |
Group Montana, Inc. | | Textiles, Apparel & Luxury Goods | | Senior Debt(7) | | 10.4% | | 10/10-10/11 | | | | 16.1 | | 16.1 | | 16.1 |
| | | Senior Debt(6)(7) | | 12.9% | | 10/11 | | | | 5.1 | | 4.8 | | 2.1 |
| | | | Subordinated Debt(6) | | 25.0% | | 10/12 | | | | 18.8 | | 13.6 | | — |
| | | | Convertible Preferred Stock(1) | | | | | | 4,000 | | | | 1.0 | | — |
| | | | Common Membership Interest(1) | | | | | | 2.5% | | | | 0.7 | | — |
| | | | | | | | | | | | | | | 36.2 | | 18.2 |
Halex Holdings Corp. | | Construction Materials | | Senior Debt(6) | | 13.5% | | 9/11-10/13 | | | | 24.9 | | 23.4 | | 9.9 |
| | | | Subordinated Debt(6) | | 18.8% | | 8/15 | | | | 24.3 | | 15.9 | | — |
| | | | Redeemable Preferred Stock(1) | | | | | | 23,213,046 | | | | 30.2 | | — |
| | | | | | | | | | | | | | | 69.5 | | 9.9 |
Hartstrings Holdings Corp. | | Textiles, Apparel & Luxury Goods | | Senior Debt(1) | | 0.0% | | 12/10 | | | | 13.5 | | 13.5 | | 13.5 |
| | | Senior Debt(6) | | 0.0% | | 12/10 | | | | 2.9 | | 2.7 | | 0.7 |
| | | | Convertible Preferred Stock(1) | | | | | | 10,196 | | | | 3.0 | | — |
| | | | Common Stock(1) | | | | | | 14,250 | | | | 4.8 | | — |
| | | | | | | | | | | | | | | 24.0 | | 14.2 |
Imperial Supplies Holdings, Inc. | | Trading Companies and Distributors | | Subordinated Debt | | 16.0% | | 10/14 | | | | 22.1 | | 21.9 | | 21.9 |
| | | Redeemable Preferred Stock | | | | | | 19,604 | | | | 14.7 | | 21.6 |
| | | | Convertible Preferred Stock(1) | | | | | | 19,604 | | | | 20.2 | | 8.1 |
| | | | Common Stock(1) | | | | | | 442,187 | | | | 11.3 | | — |
| | | | | | | | | | | | | | | 68.1 | | 51.6 |
Kingway Inca Clymer Holdings, Inc. | | Building Products | | Subordinated Debt(6) | | 12.3% | | 4/12 | | | | 1.8 | | — | | — |
| | | | Redeemable Preferred Stock(1) | | | | | | 13,709 | | | | 9.2 | | 0.7 |
| | | | | | | | | | | | | | | 9.2 | | 0.7 |
118
AMERICAN CAPITAL, LTD.
CONSOLIDATED SCHEDULE OF INVESTMENTS—(Continued)
December 31, 2008
(in millions, except share data)
| | | | | | | | | | | | | | | | |
Company (4) | | Industry | | Investments | | Interest
Rate (5) | | Maturity
Date (5) | | # of
shares/
units
owned | | Principal | | Cost | | Fair
Value |
Lifoam Holdings, Inc. | | Leisure Equipment & Products | | Senior Debt | | 8.0% | | 6/13 | | | | 22.2 | | 22.2 | | 22.2 |
| | | Subordinated Debt | | 7.8% | | 6/13 | | | | 18.3 | | 18.3 | | 18.2 |
| | | | Subordinated Debt(6) | | 8.3% | | 6/13 | | | | 18.4 | | 15.9 | | 2.3 |
| | | | Redeemable Preferred Stock(1) | | | | | | 6,160 | | | | 4.2 | | — |
| | | | Convertible Preferred Stock(1) | | | | | | 15,797 | | | | 12.2 | | — |
| | | | Common Stock(1) | | | | | | 14,000 | | | | 1.4 | | — |
| | | | Common Stock Warrants(1) | | | | | | 434,938 | | | | 2.9 | | — |
| | | | | | | | | | | | | | | 77.1 | | 42.7 |
LLSC Holdings Corporation | | Personal Products | | Senior Debt(7) | | 7.7% | | 8/12 | | | | 5.5 | | 5.5 | | 5.5 |
| | | | Subordinated Debt(7) | | 12.0% | | 8/13 | | | | 5.5 | | 5.5 | | 5.5 |
| | | | Convertible Preferred Stock(1) | | | | | | 7,496 | | | | 8.1 | | 4.7 |
| | | | | | | | | | | | | | | 19.1 | | 15.7 |
LVI Holdings, LLC | | Professional Services | | Senior Debt(7) | | 8.9% | | 2/10 | | | | 2.4 | | 2.4 | | 2.3 |
| | | | Subordinated Debt(7) | | 18.0% | | 2/13 | | | | 11.4 | | 11.3 | | 11.4 |
| | | | | | | | | | | | | | | 13.7 | | 13.7 |
Montgomery Lane, LLC (DE LLC) | | Diversified Financial Services | | Common Membership Units(1) | | | | | | 100 | | | | 10.3 | | 6.8 |
Montgomery Lane, LTD (Cayman)(3) | | Diversified Financial Services | | Common Membership Units(1) | | | | | | 50,000 | | | | 7.2 | | 0.8 |
MW Acquisition Corporation | | Health Care Providers & Services | | Subordinated Debt(7) | | 11.3% | | 2/13-2/14 | | | | 25.0 | | 24.7 | | 25.0 |
| | | Convertible Preferred Stock(1) | | | | | | 38,016 | | | | 13.5 | | 13.9 |
| | | | Common Stock(1) | | | | | | 51,521 | | | | — | | 0.1 |
| | | | | | | | | | | | | | | 38.2 | | 39.0 |
NECCO Holdings, Inc. | | Food Products | | Senior Debt | | 13.4% | | 12/12 | | | | 4.1 | | 4.1 | | 4.1 |
| | | | Common Stock(1) | | | | | | 760,869 | | | | 0.1 | | 0.1 |
| | | | | | | | | | | | | | | 4.2 | �� | 4.2 |
NECCO Realty Investments, LLC | | Real Estate | | Senior Debt(7) | | 14.0% | | 12/17 | | | | 37.7 | | 37.0 | | 37.7 |
| | | | Common Membership Units(1) | | | | | | 7,000 | | | | 4.9 | | 9.8 |
| | | | | | | | | | | | | | | 41.9 | | 47.5 |
Oceana Media Finance, LLC | | Commercial Banks | | Common Membership Units(1) | | | | | | 145,742 | | | | 14.6 | | 11.4 |
Paradigm Precision Holdings, LLC | | Aerospace & Defense | | Senior Debt | | 6.4% | | 2/09 | | | | 19.2 | | 19.1 | | 19.1 |
| | | | Subordinated Debt | | 18.7% | | 10/13-10/14 | | | | 93.7 | | 92.8 | | 92.8 |
| | | | Common Membership Units(1) | | | | | | 478,488 | | | | 17.5 | | 6.1 |
| | | | | | | | | | | | | | | 129.4 | | 118.0 |
PHC Sharp Holdings, Inc. | | Commercial Services & Supplies | | Senior Debt(7) | | 7.7% | | 12/11-12/12 | | | | 16.0 | | 15.8 | | 16.0 |
| | | Subordinated Debt | | 17.0% | | 12/14 | | | | 8.3 | | 8.3 | | 8.3 |
| | | | Subordinated Debt(6) | | 19.0% | | 12/14 | | | | 8.4 | | 7.3 | | 0.5 |
| | | | Common Stock(1) | | | | | | 367,881 | | | | 4.2 | | — |
| | | | | | | | | | | | | | | 35.6 | | 24.8 |
PHI Acquisitions, Inc. | | Internet & Catalog Retail | | Senior Debt(7) | | 8.0% | | 6/12 | | | | 10.0 | | 9.9 | | 10.0 |
| | | | Subordinated Debt(7) | | 12.7% | | 6/13 | | | | 23.6 | | 23.4 | | 23.6 |
| | | | Redeemable Preferred Stock(1) | | | | | | 36,267 | | | | 24.6 | | 19.2 |
| | | | Common Stock(1) | | | | | | 40,295 | | | | 3.9 | | — |
| | | | Common Stock Warrants(1) | | | | | | 116,065 | | | | 11.6 | | — |
| | | | | | | | | | | | | | | 73.4 | | 52.8 |
119
AMERICAN CAPITAL, LTD.
CONSOLIDATED SCHEDULE OF INVESTMENTS—(Continued)
December 31, 2008
(in millions, except share data)
| | | | | | | | | | | | | | | | |
Company (4) | | Industry | | Investments | | Interest
Rate (5) | | Maturity
Date (5) | | # of
shares/
units
owned | | Principal | | Cost | | Fair
Value |
Piper Aircraft, Inc. | | Aerospace & Defense | | Subordinated Debt | | 8.0% | | 7/13 | | | | 0.7 | | 0.2 | | 0.7 |
| | | | Common Stock(1) | | | | | | 478,797 | | | | 0.1 | | 22.6 |
| | | | | | | | | | | | | | | 0.3 | | 23.3 |
Resort Funding Holdings, Inc. | | Diversified Financial Services | | Senior Debt | | 9.2% | | 4/10 | | | | 10.6 | | 10.6 | | 10.6 |
| | | Common Stock(1) | | | | | | 583 | | | | 20.5 | | 1.2 |
| | | | | | | | | | | | | | | 31.1 | | 11.8 |
Sixnet Holdings, LLC | | Electronic Equipment, Instruments & Components | | Senior Debt(7) | | 9.8% | | 6/12-6/13 | | | | 37.4 | | 37.0 | | 34.4 |
| | | Membership Units(1) | | | | | | 356 | | | | 4.5 | | 7.2 |
| | | | | | | | | | | | | | 41.5 | | 41.6 |
SMG Holdings, Inc. | | Hotels, Restaurants & Leisure | | Senior Debt(7) | | 6.9% | | 7/14 | | | | 5.9 | | 5.9 | | 5.9 |
| | | Subordinated Debt(7) | | 12.5% | | 6/15 | | | | 119.4 | | 118.5 | | 119.5 |
| | | | Convertible Preferred Stock | | | | | | 1,101,673 | | | | 121.5 | | 102.9 |
| | | | Common Stock(1) | | | | | | 275,419 | | | | 27.5 | | — |
| | | | | | | | | | | | | | | 273.4 | | 228.3 |
Specialty Brands of America, Inc. | | Food Products | | Subordinated Debt(7) | | 14.0% | | 5/14 | | | | 34.1 | | 33.8 | | 34.1 |
| | | | Redeemable Preferred Stock | | | | | | 122,017 | | | | 8.2 | | 13.8 |
| | | | Common Stock(1) | | | | | | 128,175 | | | | 2.3 | | 4.0 |
| | | | Common Stock Warrants(1) | | | | | | 56,819 | | | | 1.4 | | 1.8 |
| | | | | | | | | | | | | | | 45.7 | | 53.7 |
SPL Acquisition Corp. | | Pharmaceuticals | | Senior Debt | | 7.0% | | 10/12-10/13 | | | | 83.9 | | 83.0 | | 83.9 |
| | | | Subordinated Debt(7) | | 15.3% | | 8/14-8/15 | | | | 49.9 | | 49.3 | | 49.9 |
| | | | Convertible Preferred Stock | | | | | | 84,043 | | | | 48.0 | | 48.0 |
| | | | Common Stock(1) | | | | | | 84,043 | | | | — | | 10.4 |
| | | | | | | | | | | | | | | 180.3 | | 192.2 |
Stravina Holdings, Inc. | | Personal Products | | Senior Debt(6) | | 0.0% | | 4/11 | | | | 3.5 | | 3.5 | | — |
UFG Holding Corp. | | Food Products | | Subordinated Debt | | 16.5% | | 5/15 | | | | 27.9 | | 27.4 | | 27.4 |
| | | | Subordinated Debt(6) | | 20.1% | | 5/16 | | | | 35.4 | | 31.3 | | 18.7 |
| | | | Redeemable Preferred Stock(1) | | | | | | 20,602 | | | | 12.6 | | — |
| | | | Convertible Preferred Stock(1) | | | | | | 4,777 | | | | 4.6 | | — |
| | | | Common Stock(1) | | | | | | 51,504 | | | | 13.2 | | — |
| | | | Guarantee | | | | | | | | | | — | | (1.5) |
| | | | | | | | | | | | | | | 89.1 | | 44.6 |
UFG Real Estate Holdings, LLC | | Real Estate | | Common Membership(1) | | | | | | | | | | — | | 1.4 |
Unique Fabricating Incorporated | | Auto Components | | Senior Debt(7) | | 11.5% | | 2/10-2/12 | | | | 5.3 | | 5.2 | | 5.3 |
| | | | Subordinated Debt(6)(7) | | 17.0% | | 2/13 | | | | 7.7 | | 6.5 | | 0.5 |
| | | | Redeemable Preferred Stock(1) | | | | | | 292,958 | | | | 1.6 | | — |
| | | | Common Stock Warrants(1) | | | | | | 6,862 | | | | 0.2 | | — |
| | | | | | | | | | | | | | | 13.5 | | 5.8 |
Unwired Holdings, Inc. | | Household Durables | | Senior Debt | | 10.2% | | 6/10-6/11 | | | | 10.4 | | 10.3 | | 10.4 |
| | | | Subordinated Debt(6) | | 15.0% | | 6/12-6/13 | | | | 21.5 | | 14.0 | | 0.6 |
| | | | Redeemable Preferred Stock(1) | | | | | | 14,630 | | | | 14.6 | | — |
| | | | Common Stock(1) | | | | | | 126,001 | | | | 1.3 | | — |
| | | | | | | | | | | | | | | 40.2 | | 11.0 |
VP Acquisition Holdings, Inc. | | Health Care Equipment & Supplies | | Subordinated Debt(7) | | 14.5% | | 10/13-10/14 | | | | 19.5 | | 19.3 | | 19.5 |
| | | Common Stock(1) | | | | | | 19,780 | | | | 24.7 | | 45.1 |
| | | | | | | | | | | | | | | 44.0 | | 64.6 |
120
AMERICAN CAPITAL, LTD.
CONSOLIDATED SCHEDULE OF INVESTMENTS—(Continued)
December 31, 2008
(in millions, except share data)
| | | | | | | | | | | | | | | | | | |
Company (4) | | Industry | | Investments | | Interest
Rate (5) | | Maturity
Date (5) | | # of
shares/
units
owned | | Principal | | Cost | | Fair
Value |
Warner Power, LLC | | Electrical Equipment | | Subordinated Debt(7) | | 12.6% | | 10/09 | | | | 5.0 | | | 5.0 | | | 5.0 |
| | | | Redeemable Preferred Membership Units | | | | | | 3,796,269 | | | | | 4.8 | | | 5.5 |
| | | | Common Membership Units(1) | | | | | | 27,400 | | | | | 1.9 | | | 6.0 |
| | | | | | | | | | | | | | | | 11.7 | | | 16.5 |
WIS Holding Company, Inc. | | Commercial Services & Supplies | | Subordinated Debt(7) | | 14.8% | | 1/14-1/15 | | | | 103.8 | | | 103.0 | | | 103.8 |
| | | Convertible Preferred Stock | | | | | | 703,406 | | | | | 82.3 | | | 132.6 |
| | | | Common Stock(1) | | | | | | 175,852 | | | | | 17.6 | | | 30.2 |
| | | | | | | | | | | | | | | | 202.9 | | | 266.6 |
WSACS RR Holdings LLC | | Real Estate | | Common Membership Units(1) | | | | | | 3,170,176 | | | | | 3.2 | | | 3.2 |
| | | | |
CDO / CLO INVESTMENTS | | | | | | | | | | |
ACAS Wachovia Investments, L.P. | | Diversified Financial Services | | Partnership Interest | | | | | | 90% | | | | | 11.5 | | | 1.4 |
Subtotal Control Investments (40% of total investment assets and liabilities at fair value) | | | | | | $ | 4,382.3 | | $ | 2,897.8 |
| | | | | | | | | | | | | | | | | |
| | | | | | | |
Counterparty | | Instrument | | Interest
Rate (5) | | Expiration
Date (5) | | # of
contracts | | Notional | | Cost | | Fair
Value |
| |
| DERIVATIVE AGREEMENTS | | |
Citibank, N.A. | | Interest Rate Swaption - Pay Floating/ Receive Fixed | | LIBOR/4.6% | | 4/12 | | 1 | | $ | 40.0 | | $ | — | | $ | 3.1 |
Wachovia Bank, N.A. | | Interest Rate Swap - Pay Fixed/ Receive Floating | | 5.1%/LIBOR | | 8/19 | | 1 | | | 37.0 | | | — | | | 3.8 |
BMO Financial Group | | Interest Rate Swaption - Pay Floating/ Receive Fixed | | LIBOR/5.5% | | 11/12 | | 1 | | | 22.9 | | | — | | | 1.1 |
Citibank, N.A. | | Balance Differential Swap - Pay Floating/ Receive Floating | | 5.2%/LIBOR | | 11/19 | | 1 | | | 3.5 | | | — | | | 0.7 |
Subtotal Derivative Agreements (less than 1% of total investment assets and liabilities at fair value) | | | | | | — | | | 8.7 |
Total Investment Assets | | $ | 10,691.0 | | $ | 7,426.9 |
| DERIVATIVE & OPTION AGREEMENTS | | |
Citibank, N.A. | | Interest Rate Swap - Pay Fixed/ Receive Floating | | 4.8%/LIBOR | | 4/12-11/19 | | 4 | | $ | 666.9 | | $ | — | | $ | (45.9) |
BMO Financial Group | | Interest Rate Swap - Pay Fixed/ Receive Floating | | 5.4%/LIBOR | | 2/13-8/17 | | 5 | | | 479.9 | | | — | | | (43.5) |
Wachovia Bank, N.A. | | Interest Rate Swap - Pay Fixed/ Receive Floating | | 4.9%/LIBOR | | 1/14-8/19 | | 3 | | | 379.1 | | | — | | | (33.0) |
UniCredit Group | | Interest Rate Swap - Pay Fixed/ Receive Floating | | 5.7%/LIBOR | | 7/17 | | 1 | | | 66.0 | | | — | | | (10.6) |
WestLB AG | | Interest Rate Swap - Pay Fixed/ Receive Floating | | 5.8%/LIBOR | | 6/17 | | 1 | | | 55.0 | | | — | | | (8.3) |
Credit Suisse International | | Interest Rate Swap - Pay Fixed/ Receive Floating | | 5.8%/LIBOR | | 6/17 | | 1 | | | 26.1 | | | — | | | (3.9) |
Fortis Financial Services LLC | | Interest Rate Swap - Pay Fixed/ Receive Floating | | 5.7%/LIBOR | | 7/17 | | 1 | | | 22.3 | | | — | | | (5.9) |
Citibank, N.A. | | Foreign Exchange Swap - Pay Euros/ Receive GBP | | | | 2/11 | | 1 | | | | | | — | | | (1.5) |
European Capital Limited(2)(3) | | Put Option | | | | 12/10 | | | | | | | | (19.7) | | | (69.4) |
Total Investment Liabilities (3% of total investment assets and liabilities at fair value) | | $ | (19.7) | | $ | (222.0) |
| | | | | | | | | | | | | | | | |
Funds | | | | | | | | | | | | Cost | | Fair
Value |
MONEY MARKET FUNDS(10) | | | | | | | | | | | | | | | | |
First American Prime Obligations Fund | | | | | | | | | | | | $ | 15.0 | | $ | 15.0 |
BlackRock Liquidity Funds TempFund Portfolio | | | | | | | | | | | | | 15.0 | | | 15.0 |
First American Government Obligations Fund | | | | | | | | | | | | | 10.0 | | | 10.0 |
Federated Government Obligations Fund | | | | | | | | | | | | | 10.0 | | | 10.0 |
Federated Prime Cash Obligations Fund | | | | | | | | | | | | | 10.0 | | | 10.0 |
Fidelity Institutional Money Market Funds - Prime Money Market Portfolio | | | | | | | | | | | | | 10.0 | | | 10.0 |
Goldman Sachs Financial Square Fund - Money Market Fund | | | | | | | | | | | | | 10.0 | | | 10.0 |
Goldman Sachs Financial Square Funds - Government Fund | | | | | | | | | | | | | 10.0 | | | 10.0 |
Fidelity Institutional Money Market Funds - Government Portfolio | | | | | | | | | | | | | 10.0 | | | 10.0 |
AIM STIT - Liquid Assets Portfolio | | | | | | | | | | | | | 10.0 | | | 10.0 |
121
AMERICAN CAPITAL, LTD.
CONSOLIDATED SCHEDULE OF INVESTMENTS—(Continued)
December 31, 2008
(in millions, except share data)
| | | | | | | | | | | | | | | | |
Funds | | | | | | | | | | | | Cost | | Fair
Value |
Dreyfus Cash Management | | | | | | | | | | | | | 8.0 | | | 8.0 |
Dreyfus Cash Advantage Fund | | | | | | | | | | | | | 7.0 | | | 7.0 |
Federated Prime Obligations Fund | | | | | | | | | | | | | 7.0 | | | 7.0 |
Wells Fargo Advantage Prime Investment Money Market Fund | | | | | | | | | | | | | 6.0 | | | 6.0 |
Dreyfus Cash Advantage Fund | | | | | | | | | | | | | 5.0 | | | 5.0 |
Dreyfus Institutional Reserves Money Fund | | | | | | | | | | | | | 5.0 | | | 5.0 |
Dreyfus Government Cash Management | | | | | | | | | | | | | 5.0 | | | 5.0 |
AIM STIT-STIC Prime Portfolio | | | | | | | | | | | | | 5.0 | | | 5.0 |
Total Money Market Funds | | | | | | | | | | | | $ | 158.0 | | $ | 158.0 |
| (2) | Publicly traded company or a consolidated subsidiary of a public company. |
| (3) | International investment. |
| (4) | Certain of the securities are issued by affiliate(s) of the listed portfolio company. |
| (5) | Interest rates represent the weighted average annual stated interest rate on loans and debt securities, which are presented by the nature of indebtedness by a single issuer. The maturity dates represent the earliest and the latest maturity dates. |
| (6) | Loan is on non-accrual status and therefore considered non-income producing. |
| (7) | All or a portion of the loans or securities are pledged as collateral under various secured financing arrangements. |
| (8) | 2,500,100 shares with a cost of $50.0 and a fair value of $48.1 are restricted for sale until May 2009. |
| (9) | Portfolio company has filed for reorganization under Chapter 11 of the United States Code. |
| (10) | Included in Cash and cash equivalents on our Consolidated Balance Sheets. |
122
AMERICAN CAPITAL, LTD.
NOTES TO CONSOLIDATED FINANCIAL STATEMENTS
(in millions, except per share data)
Note 1. Organization
American Capital, Ltd. (formerly known as American Capital Strategies, Ltd., which is referred to throughout this report as “American Capital”, “we”, “our” and “us”) was incorporated in 1986. On August 29, 1997, we completed an initial public offering (“IPO”) and became a non-diversified closed end investment company that has elected to be regulated as a business development company (“BDC”) under the Investment Company Act of 1940, as amended (“1940 Act”). We operate so as to qualify to be taxed as a regulated investment company (“RIC”) as defined in Subtitle A, Chapter 1, under Subchapter M of the Internal Revenue Code of 1986, as amended (the “Code”). As a RIC, we are not subject to federal income tax on the portion of our taxable income and capital gains we distribute to our shareholders. As a BDC, we primarily invest in senior debt, subordinated debt and equity in the buyouts of private companies sponsored by us, the buyouts of private companies sponsored by other private equity firms and provide capital directly to early stage and mature private and small public companies. We refer to our investments in these companies as our private finance portfolio. We also invest in structured financial product investments (“Structured Products”) including commercial mortgage backed securities (“CMBS”), commercial collateralized loan obligation (“CLO”) securities and collateralized debt obligation (“CDO”) securities and invest in alternative asset funds managed by us. Our primary business objectives are to increase our taxable income, net realized earnings and net asset value (“NAV”) by making investments with attractive current yields and/or potential for equity appreciation and realized gains.
We are the sole shareholder of American Capital Financial Services, Inc. (“ACFS”). Through ACFS, we provide advisory, management and other services to our portfolio companies.
Note 2. Going Concern
A fundamental principle of the preparation of consolidated financial statements in accordance with accounting principles generally accepted in the United States is the assumption that an entity will continue in existence as a going concern, which contemplates continuity of operations and the realization of assets and settlement of liabilities occurring in the ordinary course of business. This principle is applicable to all entities except for entities in liquidation or entities for which liquidation appears imminent. In accordance with this requirement, our policy is to prepare our consolidated financial statements on a going concern basis unless we intend to liquidate or have no other alternative but to liquidate. As of December 31, 2009, we were in breach of financial covenants under certain of our borrowing arrangements. While we have prepared our consolidated financial statements on a going concern basis, if we are unable to successfully restructure these borrowing arrangements or we do not receive additional funding, our ability to continue as a going concern may be impacted. Therefore, we may not be able to realize our assets and settle our liabilities in the ordinary course of business. Our consolidated financial statements included in this Annual Report on Form 10-K do not reflect any adjustments that might specifically result from the outcome of this uncertainty or our debt restructuring activities.
During the year ended December 31, 2008, we experienced significant unrealized depreciation on our investments resulting in a significant decrease in our shareholders’ equity, or NAV, due to the economic recession and the global financial crisis which led to an unprecedented widening of investment spreads. As a result of such unrealized depreciation, we breached certain financial covenants as of December 31, 2008 under our unsecured revolving credit facility (the “Credit Facility”) and our privately and publicly issued unsecured notes. In March 2009, we received a notice of such events of default from the administrative agent under the Credit Facility and from a steering committee of the holders of our privately placed unsecured notes. The indenture trustee for our public unsecured notes and a steering committee of the public noteholders also sent us similar notices of an event of default, which default matured after a 60 day cure period. As a result, the lenders
123
AMERICAN CAPITAL, LTD.
NOTES TO CONSOLIDATED FINANCIAL STATEMENTS—(Continued)
(in millions, except per share data)
and noteholders under such unsecured debt agreements could declare all of the debt outstanding under their respective agreements to be immediately due and payable after any applicable notice periods. The holders of our private unsecured notes exercised their right to do so in August 2009. Although we have not repaid these obligations in full, we entered into forbearance agreements with all of the private noteholders in September 2009, under which the noteholders agreed to forbear from exercising certain rights and remedies with respect to the events of default that have occurred under their respective series. The holders of a majority in principal amount of the notes outstanding under each series may terminate the forbearance agreement for the series at any time (see Note 5).
As of December 31, 2009, we had an aggregate $2.4 billion outstanding under our primary unsecured debt agreements. If our creditors, following the termination of any applicable forbearance agreements, exercise their rights and remedies against us, our business, financial condition and results of operations could be materially adversely affected. For example, if any such creditors declared that all amounts outstanding under their debt arrangement with us were immediately due and payable, it is likely that our other primary unsecured creditors would also accelerate the maturity of the obligations outstanding under their debt agreements. In such case, we would probably not have sufficient funds available to repay such obligations in full or be able to obtain additional or alternative financing to repay or refinance such debt, and would likely commence a voluntary reorganization case under Title eleven of the United States Code (a “Restructuring Case”).
We did not include any adjustments to the consolidated financial statements included in this Annual Report on Form 10-K to reflect the possible future effects that may result from the uncertainty of our ability to continue as a going concern because we believe that the plans that we describe below are reasonable and appropriate to address the conditions discussed above.
Through the course of 2009, we have had active discussions with the creditors under our primary unsecured debt arrangements to negotiate a comprehensive restructuring of our unsecured debt. In November 2009, we reached an agreement in principle with a steering committee of the lenders under the Credit Facility with respect to the material terms of a proposed restructuring of the Credit Facility ( “Restructuring”), which also required that our other primary unsecured debt arrangements be restructured on generally similar terms. Representatives of the holders of our private unsecured notes and public unsecured notes and their advisors participated with the bank steering committee in various parts of the negotiations. We subsequently entered into a lock up agreement with all of the lenders under the Credit Facility to further our efforts to restructure all of our primary unsecured debt arrangements based on the proposed Restructuring. Under the current terms of the proposed Restructuring, the loans outstanding under the Credit Facility and our private unsecured notes and public unsecured notes would be exchanged for term debt secured by a pledge of substantially all of our unencumbered assets. Key terms of the proposed Restructuring include (i) an aggregate $450 million principal payment at closing, (ii) scheduled aggregate principal amortization of $250 million in 2010, $300 million in 2011, $350 million in 2012, and $300 million in 2013 with any remaining unpaid principal due at maturity on December 31, 2013, (iii) deferral through 2013 of up to $200 million in the aggregate of annual scheduled principal amortization, which is limited to $100 million in 2010, (iv) an interest rate of the greater of 2.00% or LIBOR, plus a spread based on the aggregate outstanding principal balance of (a) 9.50% if the outstanding obligations are greater than or equal to $1.7 billion, (b) 8.50% if the outstanding obligations are less than $1.7 billion but greater than or equal to $1.4 billion, (c) 6.50% if the outstanding obligations are less than $1.4 billion but greater than or equal to $1.0 billion, or (d) 5.50% if the outstanding obligations are less than $1.0 billion, (v) an additional interest spread of 0.50% each time that certain additional principal amortizations, which are greater than the scheduled principal amortizations noted above, are not met, (vi) an additional 1.00% if we defer any portion of the scheduled principal amortization due in 2010, and (vii) the payment of fees equal to 2.00% of the aggregate principal balance at closing, and 1.00% at both December 31, 2011 and 2012.
124
AMERICAN CAPITAL, LTD.
NOTES TO CONSOLIDATED FINANCIAL STATEMENTS—(Continued)
(in millions, except per share data)
The proposed Restructuring contemplates that there will be a voluntary amendment and restatement of the Credit Facility and an exchange of the unsecured private notes and unsecured public notes for new securities (collectively, the “Exchange Transaction”). In the event that fewer than 100% of the lenders under our Credit Facility, fewer than 100% of the holders of our private unsecured notes and holders of less than 85% of the principal amount of our public unsecured notes agree to enter the Exchange Transaction, we intend to implement the proposed Restructuring by soliciting votes for a prepackaged reorganization under title eleven of the United States Code (the “Plan”) and commence a Restructuring Case. We plan to commence the Exchange Transaction and solicitation of votes for the Plan simultaneously in March 2010.
The lock up agreement generally requires all of the lenders under the Credit Facility to agree to the proposed Restructuring assuming specified conditions are met. However, the lock up agreement may be terminated if various stages of the proposed Restructuring are not completed by certain dates. These deadlines were extended twice in January 2010. Currently, the lock up agreement may be terminated (i) upon consummation of the Exchange Transaction and the effective date of the Plan or a written agreement to terminate the lock up agreement, (ii) if the Exchange Transaction is not consummated in accordance with the proposed Restructuring and we have not commenced a Restructuring Case by March 15, 2010 (unless the administrative agent under the Credit Facility agrees to an extension of not later than March 31, 2010) or (iii) if we commence a Restructuring Case and (1) any material order is entered that is inconsistent with the lock up agreement or the proposed Restructuring, which is objected to by a majority of the lenders, (2) an order finding that the solicitation complying with applicable law and confirming the Plan has not been entered on or before May 15, 2010 (unless the administrative agent under the Credit Facility agrees to an extension of not later than May 31, 2010) or (3) the Plan is not consummated by May 31, 2010, or the Restructuring Case is dismissed or converted to a case under Chapter seven of Title eleven of the United States Code (the “Accelerated Case”) or a trustee or examiner shall have been appointed in the Restructuring Case. In addition, either party may terminate the lock up agreement upon a breach of material obligations by the other party. Because we have not launched the Exchange Transaction as of the date of this filing and the tender offer rules under the Securities Exchange Act of 1934, as amended, require that such offers generally remain open for 20 business days, it is likely that we will be unable to complete the Exchange Transaction by the above deadlines. We may seek an amendment to the lock up agreement to further extend the deadline for consummating the Exchange Transaction or we may proceed with the proposed Restructuring without a lock up agreement with the lenders under the Credit Facility. We do not have a lock up agreement with our other unsecured creditors. As noted above, if the requisite lenders and noteholders do not agree to the Exchange Transaction, we intend to implement the proposed Restructuring by soliciting votes for the Plan. We expect that we will ultimately be successful in completing the proposed Restructuring.
We expect that we will ultimately be successful in completing the Restructuring through the Exchange Transaction, or if we do not obtain the minimum participation necessary to effect the Exchange Transaction, then through the Plan.
We believe that we will have sufficient liquidity to continue to fund both our operations, including any increased financing costs, and any minimum scheduled principal amortizations of our debt obligations. During the year ended December 31, 2009, we generated significant liquidity from our investment portfolio having generated $1.1 billion in realized proceeds. We also had cash and cash equivalents totaling $835 million as of December 31, 2009. We have sold and expect to continue to sell select investments at attractive prices in order to generate additional liquidity so that we can delever our balance sheet. Alternatively, if we are unsuccessful in restructuring our unsecured debt obligations with our lenders and noteholders, we believe that we would be able to successfully reorganize under the Plan since our assets exceed our liabilities by $2.3 billion as of December 31, 2009 and we expect to generate positive cash flow from operating and investing activities, significantly mitigating the risk of a forced liquidation.
125
AMERICAN CAPITAL, LTD.
NOTES TO CONSOLIDATED FINANCIAL STATEMENTS—(Continued)
(in millions, except per share data)
Note 3. Summary of Significant Accounting Policies
Basis of Presentation
The accompanying consolidated financial statements have been prepared in accordance with accounting principles generally accepted in the United States (“GAAP”).
Consolidation
Under the investment company rules and regulations pursuant to Article 6 of Regulation S-X and the American Institute of Certified Public Accountants (“AICPA”) Audit and Accounting Guide for Investment Companies (the “Investment Company Guide”), codified in Financial Accounting Standards Board (“FASB”) Accounting Standards Codification (“ASC”) 946,Financial Services-Investment Companies (“ASC 946”), we are precluded from consolidating any entity other than another investment company. The Securities and Exchange Commission (“SEC”) issued guidance that the term “investment company” in this context refers to a “registered investment company.” An exception to the guidance in the Investment Company Guide occurs if the investment company has an investment in a controlled operating company that provides substantially all of its services to the investment company. Our consolidated financial statements include the accounts of a controlled operating company if all or substantially all of the services provided by the controlled operating company are provided to us or to portfolio companies in which we hold substantially all of the ownership interests. ACFS is a consolidated controlled operating company as it is considered to provide all or substantially all of its services to American Capital and its portfolio companies. If our ownership interest in a portfolio company that a consolidated controlled operating company manages or provides services to were to decrease, the controlled operating subsidiary may no longer be considered to provide substantially all of its services directly or indirectly to us and our portfolio companies, resulting in the deconsolidation of such controlled operating subsidiary at that time. In addition, if a consolidated controlled operating company were to begin providing services to third-parties, the controlled operating subsidiary may no longer be considered to provide substantially all of its services directly or indirectly to us and our portfolio companies, resulting in the deconsolidation of such controlled operating subsidiary at that time. Our investments in other nonregistered investment companies or funds are recorded as investments in the accompanying consolidated financial statements and are not consolidated.
Our consolidated financial statements had previously included the accounts of our wholly-owned entity European Capital Financial Services (Guernsey) Limited (“ECFS”) as all or substantially all of ECFS’ services were provided to European Capital Limited (“European Capital”), a controlled portfolio company in which we had a 100% ownership interest. As a result of the European Capital IPO in May 2007 (see Note 18), American Capital’s ownership interest in European Capital was diluted and ECFS was no longer considered to be providing substantially all of its services directly or indirectly to us. In the second quarter of 2007, our interest in ECFS was also contributed to American Capital, LLC, a wholly-owned portfolio company that owns alternative asset fund managers that manage various alternative asset funds, including third-party alternative asset funds. American Capital, LLC provides services to these alternative asset funds and is not considered to provide substantially all of its services directly or indirectly to us or to portfolio companies in which we hold substantially all of the ownership interests. As a result, in accordance with our consolidation policy, ECFS was deconsolidated prospectively during the second quarter of 2007 and is recorded at fair value on our consolidated balance sheets as part of the fair value of American Capital, LLC.
126
AMERICAN CAPITAL, LTD.
NOTES TO CONSOLIDATED FINANCIAL STATEMENTS—(Continued)
(in millions, except per share data)
We also have wholly-owned affiliated statutory trusts that were established to facilitate secured borrowing arrangements whereby assets were transferred to the affiliated statutory trusts and notes were sold by the trust. These transfers of assets to the trusts are treated as secured borrowing arrangements in accordance with the Statement of Financial Accounting Standards (“SFAS”) No. 140,Accounting for Transfers and Servicing of Financial Assets and Extinguishment of Liabilities, which is codified in FASB ASC Topic 860,Transfers and Servicing(“ASC 860”), and our consolidated financial statements include the accounts of our affiliated statutory trusts established for secured financing arrangements. We also have established trusts to fund deferred compensation plans for our employees. Our consolidated financial statements include the accounts of these trusts. All intercompany accounts have been eliminated in consolidation.
Investment Valuation Policy
Our investments are carried at fair value in accordance with the 1940 Act and SFAS No. 157,Fair Value Measurements (“SFAS No. 157”), which is codified in FASB ASC Topic 820,Fair Value Measurements and Disclosures (“ASC 820”). In accordance with the 1940 Act, unrestricted minority-owned publicly traded securities for which market quotations are readily available are valued at the closing market quote on the valuation date and restricted and majority-owned publicly traded securities and other privately held securities are valued as determined in good faith by our Board of Directors. For restricted securities of companies that are publicly traded, the value is based on the closing market quote on the valuation date less a discount for the restriction. For unrestricted securities of companies that are publicly traded for which we have a majority-owned interest, the value is based on the closing market quote on the valuation date plus a control premium if our Board of Directors determines in good faith that additional value above the closing market quote would be obtainable upon a sale or transfer of our controlling interest.
ASC 820 provides a framework for measuring the fair value of assets and liabilities and provides guidance regarding a fair value hierarchy, which prioritizes information used to measure fair value and the effect of fair value measurements on earnings. Due to the uncertainty inherent in the valuation process, estimates of fair value may differ significantly from the values that would have been used had a ready market for our investments existed, and the differences could be material. Additionally, changes in the market environment and other events that may occur over the life of the investments may cause the gains or losses ultimately realized on these investments to be different than the valuations currently assigned.
In April 2009, the FASB issued FASB Staff Position No. 157-4,Determining Fair Value When the Volume and Level of Activity for the Asset or Liability Have Significantly Decreased and Identifying Transactions That Are Not Orderly(“FSP FAS 157-4”), which is codified in FASB ASC 820-10-35 (“ASC 820-10-35”). FSP FAS 157-4 amended ASC 820 to provide additional guidance for estimating fair value when the volume and level of activity for the asset or liability have significantly decreased and includes guidance on identifying circumstances that indicate a transaction is not orderly. It emphasizes that even if there has been a significant decrease in the volume and level of activity for the asset or liability and regardless of the valuation technique used, the objective of a fair value measurement remains the same that the fair value is the price that would be received to sell an asset or paid to transfer a liability in an orderly transaction (that is, not a forced liquidation or distressed sale) between market participants at the measurement date under current market conditions. The guidance in ASC 820-10-35 as it relates to FSP FAS 157-4 is effective for periods ending after June 15, 2009 and is applied prospectively with early adoption permitted for periods ending after March 15, 2009. We adopted the requirements of ASC 820-10-35 as they relate to FSP FAS 157-4 during the quarter ended March 31, 2009. The adoption did not have a material impact on our consolidated financial statements.
127
AMERICAN CAPITAL, LTD.
NOTES TO CONSOLIDATED FINANCIAL STATEMENTS—(Continued)
(in millions, except per share data)
ASC 820 defines fair value in terms of the price that would be received upon the sale of an asset or paid to transfer a liability in an orderly transaction between market participants at the measurement date under current market conditions. The price used to measure the fair value is not adjusted for transaction costs while the cost basis of our investments may include initial transaction costs. Under ASC 820, the fair value measurement also assumes that the transaction to sell an asset occurs in the principal market for the asset or, in the absence of a principal market, the most advantageous market for the asset. The principal market is the market in which the reporting entity would sell or transfer the asset with the greatest volume and level of activity for the asset. In determining the principal market for an asset or liability under ASC 820, it is assumed that the reporting entity has access to the market as of the measurement date. If no market for the asset exists or if the reporting entity does not have access to the principal market, the reporting entity should use a hypothetical market.
The market in which we would sell our private finance investments is the mergers and acquisition (“M&A”) market. Under ASC 820, we have indentified the M&A market as our principal market for portfolio companies only if we have the ability to initiate a sale of the portfolio company as of the measurement date. We determine whether we have the ability to initiate a sale of a portfolio company based on our ability to control or gain control of the board of directors of the portfolio company as of the measurement date. In evaluating if we can control or gain control of a portfolio company as of the measurement date, we include our equity securities and those securities held by entities managed by American Capital, LLC, on a fully diluted basis. For investments in portfolio companies for which we do not have the ability to control or gain control as of the measurement date and for which there is no active market, our principal market under ASC 820 is a hypothetical secondary market.
Accordingly, we use the M&A market as our principal market for portfolio companies that we control or can gain control as of the measurement date, and we use a hypothetical secondary market for portfolio companies that we do not control or cannot gain control as of the measurement date. However, to the extent that an active market exists, we will consider that as our principal market. Our valuation policy considers the fact that no ready market exists for substantially all of our investments and that fair value for our investments must typically be determined using unobservable inputs.
Enterprise Value Waterfall Methodology
For investments in portfolio companies that we have identified the M&A market as the principal market, we estimate the fair value based on the enterprise value waterfall (“Enterprise Value Waterfall”) valuation methodology. For minority equity securities in which the principal market is the hypothetical secondary market, we also estimate the fair value using the Enterprise Value Waterfall valuation methodology.
Under the Enterprise Value Waterfall valuation methodology, we estimate the enterprise value of a portfolio company and then waterfall the enterprise value over the portfolio company’s securities in order of their preference relative to one another. In using the Enterprise Value Waterfall valuation methodology, we consider the in-use valuation premise under ASC 820, which assumes the loans and equity securities are sold together, which we believe is appropriate as this would provide the maximum proceeds to the seller. In applying the Enterprise Value Waterfall valuation methodology, we also consider that in a change of control transaction, our loans are generally required to be repaid at par and that a buyer cannot assume the loan.
To estimate the enterprise value of the portfolio company, we prepare an analysis consisting of traditional valuation methodologies including market, income and cost approaches. We weight some or all of the traditional valuation methodologies based on the individual circumstances of the portfolio company in order to conclude on our estimate of the enterprise value. The traditional valuation methodologies consist of valuation estimates based on: valuations of comparable public companies, recent sales of private and public comparable companies,
128
AMERICAN CAPITAL, LTD.
NOTES TO CONSOLIDATED FINANCIAL STATEMENTS—(Continued)
(in millions, except per share data)
discounting the forecasted cash flows of the portfolio company, estimating the liquidation or collateral value of the portfolio company’s assets, third-party valuations of the portfolio company, considering offers from third-parties to buy the company, estimating the value to potential strategic buyers and considering the value of recent investments in the equity securities of the portfolio company.
In valuing convertible debt, equity or other similar securities, we value our investment based on its priority in the waterfall and based on our pro rata share of the residual equity value available after deducting all outstanding debt from the estimated enterprise value. We value non-convertible debt at the face amount of the debt to the extent that the estimated enterprise value of the portfolio company exceeds the outstanding debt of the portfolio company. If the estimated enterprise value is less than the outstanding debt of the portfolio company, we reduce the value of our debt investment beginning with the junior most debt such that the enterprise value less the value of the outstanding debt is zero.
Market Yield Valuation Methodology
For debt and redeemable preferred equity investments in portfolio companies for which we are required to identify the hypothetical secondary market as the principal market, we determine the fair value based on the assumptions that hypothetical market participants would use to value the investment in a current hypothetical sale using a market yield (“Market Yield”) valuation methodology based on an exchange valuation premise under ASC 820.
For debt and redeemable preferred equity investments of our private finance portfolio for which we do not control or cannot gain control as of the measurement date, we estimate the fair value based on such factors as third-party broker quotes and our own assumptions in the absence of market observable data, including estimated remaining life, current market yield and interest rate spreads of similar loans and securities as of the measurement date. We weight the use of third-party broker quotes, if any, in determining fair value based on our understanding of the level of actual transactions used by the broker to develop the quote and whether the quote was an indicative price or binding offer. We estimate the remaining life based on market data of the average life of similar loans. However, if we have information available to us that the loan is expected to be repaid in the near term, we would use an estimated remaining life based on the expected repayment date. If there is a significant deterioration of the credit quality of a loan, we may consider other factors that a hypothetical market participant would use to estimate fair value, including the proceeds that would be received in a liquidation analysis.
We also value our investments in Structured Products using the Market Yield valuation methodology. We estimate fair value based on such factors as third-party broker quotes, sales of the same or similar securities, and our cash flow forecasts subject to assumptions a market participant would use regarding the investments’ underlying collateral including, but not limited to, assumptions of default and recovery rates, reinvestment spreads and prepayment rates. Cash flow forecasts are discounted using a market participant’s market yield assumptions that are derived from multiple sources including, but not limited to, third-party broker quotes, industry research reports and transactions of securities and indices with similar structure and risk characteristics. We weight the use of third-party broker quotes, if any, in determining fair value based on our understanding of the level of actual transactions used by the broker to develop the quote and whether the quote was an indicative price or binding offer.
Investments in Alternative Asset Investment Funds
For an investment in an investment fund that does not have a readily determinable fair value, we measure the fair value of our investment predominately based on the NAV per share of the investment fund if the NAV of the investment fund is calculated in a manner consistent with the measurement principles of ASC 946 as of our
129
AMERICAN CAPITAL, LTD.
NOTES TO CONSOLIDATED FINANCIAL STATEMENTS—(Continued)
(in millions, except per share data)
measurement date, including measurement of all or substantially all of the underlying investments of the investee in accordance with ASC 820. However, in determining the fair value of our investment, we may make adjustments to the NAV per share in certain circumstances, based on our analysis of any restrictions on redemption of our shares of our investment as of the measurement date, comparisons of price to NAV per share of comparable publicly traded funds and trades or sales of comparable private and publicly traded funds, recent actual sales or redemptions of shares of the investment fund, expected future cash flows available to equity holders or other uncertainties surrounding our ability to realize the full NAV of the investment fund.
As of December 31, 2009, we had an investment in European Capital, a wholly-owned investment fund that invests in and sponsors management and employee buyouts, invests in private equity buyouts and provides capital directly to private and mid-sized public companies primarily in Europe. It primarily invests in senior debt, subordinated debt and equity. In determining the fair value of our investment in European Capital, we concluded that our investment should be less than the NAV of European Capital due to the risks associated with our ability to realize the full fair value of European Capital’s underlying assets for several reasons, including European Capital negotiating the restructuring of its credit facilities with its lenders as of the measurement date, and recent comparable transactions and public comparables, which indicate fair values at a discount to NAV. See Note 18 for a further description of European Capital, including any unfunded commitments to European Capital.
Interest Rate Derivatives
For interest rate derivative agreements, we estimate the fair value based on the estimated net present value of the future cash flows using a forward interest rate yield curve in effect as of the end of the measurement period, adjusted for nonperformance risk, if any, including a quantitative and/or qualitative evaluation of both our credit risk and counterparty credit risk. We consider the impact of any collateral requirements, credit enhancements or netting arrangements in evaluating credit risk.
Investment Classification
As required by the 1940 Act, we classify our investments by level of control. As defined in the 1940 Act, “Control Investments” are investments in those companies that we are deemed to “Control.” “Affiliate Investments” are investments in those companies that are “Affiliated Companies” of us, as defined in the 1940 Act, other than Control Investments. “Non-Control/Non-Affiliate Investments” are those that are neither Control Investments nor Affiliate Investments. Generally, under the 1940 Act, we are deemed to control a company if we own more than 25% of the voting securities of such company or have greater than 50% representation on its board of directors. We are deemed to be an affiliate of a company in which we have invested if we own between 5% and 25% of the voting securities of such company.
Cash and Cash Equivalents
Cash and cash equivalents consist of demand deposits and highly liquid investments with original maturities of three months or less. Cash and cash equivalents are carried at cost which approximates fair value.
Restricted Cash and Cash Equivalents
Cash and cash equivalent accounts that are restricted per our credit agreements for collection of interest and principal payments on loans that are securitized and are required to be used to pay interest and principal on securitized debt are classified as restricted cash. In addition, cash accounts that are restricted as reserves per our credit agreements are classified as restricted cash. Restricted cash and cash equivalents are carried at cost which approximates fair value.
130
AMERICAN CAPITAL, LTD.
NOTES TO CONSOLIDATED FINANCIAL STATEMENTS—(Continued)
(in millions, except per share data)
Interest and Dividend Income Recognition
Interest income is recorded on the accrual basis to the extent that such amounts are expected to be collected. Original issue discount (“OID”) is accreted into interest income using the effective interest method. OID initially represents the value of detachable equity warrants obtained in conjunction with the origination or purchase of loans and loan origination fees that represent yield enhancement. Dividend income is recognized on the ex-dividend date for common equity securities and on an accrual basis for preferred equity securities to the extent that such amounts are expected to be collected or realized. In determining the amount of dividend income to recognize, if any, from cash distributions on common equity securities, we will assess many factors including a portfolio company’s cumulative undistributed income and operating cash flow. Cash distributions from common equity securities received in excess of such undistributed amounts are recorded first as a reduction of our investment and then as a realized gain on investment. We stop accruing interest or dividends on our investments when it is determined that the interest or dividend is not collectible. We assess the collectability of the interest and dividends based on many factors including the portfolio company’s ability to service our loan based on current and projected cash flows as well as the current valuation of the portfolio company’s current total enterprise value. For investments with payment-in-kind (“PIK”) interest and cumulative dividends, we base income and dividend accruals on the valuation of the PIK notes or securities received from the borrower or the redemption value of the security. If the portfolio company valuation indicates a value of the PIK notes or securities or redemption value that is not sufficient to cover the contractual interest or dividend, we will not accrue interest or dividend income on the notes or securities and will record an allowance for any accrued interest or dividend receivable as a reduction of interest or dividend income in the period we determine it is not collectible.
Interest income on Structured Products is recognized on the effective interest method as required by Emerging Issues Task Force Issue No. 99-20, Recognition of Interest Income and Impairment on Purchased and Retained Beneficial Interests in Securitized Financial Assets, which is codified in FASB ASC 325-40,Investments—Other, Beneficial Interests in Securitized Financial Assets(“ASC 325-40”). Under ASC 325-40, at the time of purchase, we estimate the future expected cash flows and determine the effective interest rate based on these estimated cash flows and our cost basis. Subsequent to the purchase and on a quarterly basis, these estimated cash flows are updated and a revised yield is calculated prospectively based on the current amortized cost of the investment. To the extent the current quarterly estimated cash flows decrease from the prior quarterly estimated cash flows, the revised yield is calculated prospectively based on the amortized cost basis of the investment calculated in accordance with FASB Staff Position No. FAS 115-2 and FAS 124-2,Recognition and Presentation of Other-Than-Temporary Impairments,which is codified in ASC 320-10-35,Investment—Debt and Equity Securities. In estimating these cash flows, there are a number of assumptions that are subject to uncertainties and contingencies. These include the amount and timing of principal payments (including prepayments, repurchases, defaults and liquidations), the pass through or coupon rate, and interest rate fluctuations. In addition, interest payment shortfalls due to delinquencies on the underlying loans and the timing of and magnitude of projected credit losses on the loans underlying the securities have to be estimated. These uncertainties and contingencies are difficult to predict and are subject to future events that may impact our estimates and interest income. As a result, actual results may differ significantly from these estimates.
Asset Management and Other Fee Income Recognition
Fees primarily include alternative asset management, portfolio company management, transaction structuring, financing and prepayment fees. Alternative asset management fees primarily represent fees for providing investment advisory and support services to our alternative asset management portfolio company. Portfolio company management fees, which are generally recurring in nature, represent amounts received for
131
AMERICAN CAPITAL, LTD.
NOTES TO CONSOLIDATED FINANCIAL STATEMENTS—(Continued)
(in millions, except per share data)
providing advice and analysis to our portfolio companies. Alternative asset management and portfolio company management fees are recognized as earned, provided that collection is probable. Transaction structuring and financing fees represent amounts received for structuring, financing and executing transactions and are generally payable only if the transaction closes and are recognized as earned when the transaction is completed. Prepayment fees are recognized as they are received.
Realized Gain or Loss and Unrealized Appreciation or Depreciation of Portfolio Investments
Realized gain or loss is recorded at the disposition of an investment and is the difference between the net proceeds from the sale and the cost basis of the investment using the specific identification method. We include the fair value of all financial assets received in our net proceeds in determining the realized gain or loss at disposition, including anticipated proceeds held in escrow at the time of sale. For an investment with a fair value of zero, we record a realized loss on the investment in the period in which we record a loss for income tax purposes.
Unrealized appreciation or depreciation reflects the difference between the Board of Directors’ valuation of the investment and the cost basis of the investment. For portfolio investments denominated in a functional currency other than the U.S. dollar, our investment is translated at the exchange rate in effect at the balance sheet date. The resulting translation adjustment is recorded as “Foreign currency translation” in our consolidated statements of operations.
Derivative Financial Instruments
We maintain an interest rate risk management strategy under which we use derivative financial instruments to primarily manage the adverse impact of interest rates changes on our cash flows by locking in the spread between our asset yield and the cost of our borrowings, and to fulfill our obligation under the terms of our asset securitizations. We do not hold or issue derivative financial instruments for speculative purposes. All derivative financial instruments are recorded at fair value with changes in fair value reflected in net unrealized appreciation or depreciation of investments during the reporting period. The fair value of interest rate derivative agreements is based on the estimated net present value of the future cash flows using the forward interest rate yield curve in effect at the end of the period, adjusted for non-performance risk based on our credit risk and our counterparty’s credit risk. We consider the impact of any collateral requirements, credit enhancements or netting arrangements in evaluating credit risk.
Our derivatives are considered economic hedges that do not qualify for hedge accounting under SFAS No. 133,Accounting for Derivative Instruments and Hedging Activities, as amended, which is codified in FASB ASC Topic 815,Derivatives and Hedging. We record the accrual of the periodic interest settlements of interest rate derivatives in net unrealized appreciation or depreciation of investments and subsequently record the amount as a realized gain or loss on investments on the interest settlement date.
Reclassifications
We have reclassified certain prior period amounts in our consolidated financial statements to conform to our current period presentation.
Distributions to Shareholders
Distributions to shareholders are recorded on the ex-dividend date.
132
AMERICAN CAPITAL, LTD.
NOTES TO CONSOLIDATED FINANCIAL STATEMENTS—(Continued)
(in millions, except per share data)
Income Taxes
We operate to qualify to be taxed as a RIC under the Code. Generally, a RIC is entitled to deduct dividends it pays to its shareholders from its income to determine taxable income. Dividends declared and paid up to one year after the current tax year can generally be carried back to the prior tax year for determining the dividends paid in such tax year. We have distributed and currently intend to distribute sufficient dividends to eliminate taxable income. We are also subject to a nondeductible federal excise tax if we do not distribute at least 98% of our investment company taxable income in any calendar year and 98% of our capital gain net income for each one-year period ending on October 31.
Our consolidated operating subsidiary, ACFS, is subject to federal, state and local income tax. We use the liability method in accounting for income taxes. Deferred tax assets and liabilities are recorded for temporary differences between the tax basis of assets and liabilities and their reported amounts in the consolidated financial statements, using statutory tax rates in effect for the year in which the differences are expected to reverse. A valuation allowance is provided against deferred tax assets when it is more likely than not that some portion or all of the deferred tax asset will not be realized.
Use of Estimates in Preparation of Financial Statements
The preparation of financial statements in conformity with GAAP requires management to make estimates and assumptions that affect the reported amounts of assets and liabilities, disclosure of contingent assets and liabilities at the date of the financial statements and revenues and expenses during the period reported. Actual results could differ from those estimates.
Property and Equipment
Property and equipment are carried at cost and depreciated using the straight-line method over the estimated useful lives of the related assets ranging from three to seven years, or the shorter of the estimated useful life or lease term for leasehold improvements.
Impairment of Long-Lived Assets
We assess the recoverability of long-lived assets for which an indicator of impairment exists, as necessary. Specifically, we determine if a long-lived asset or asset group is impaired by comparing the carrying value of these assets to their estimated undiscounted future operating cash flows. If impairment is indicated, a charge is recognized for the difference between the asset’s carrying value and fair value.
Deferred Financing Costs
Financing costs related to long-term debt obligations are deferred and amortized over the life of the debt using either the effective interest method or straight-line method.
Transfer of Financial Assets
For a transfer of financial assets to be considered a sale, the transfer must meet the sale criteria of ASC 860 under which we must surrender control over the transferred assets. The assets must be isolated from us, even in bankruptcy or other receivership; the purchaser must have the right to pledge or sell the assets transferred and we may not have an option or obligation to reacquire the assets. If the sale criteria are not met, the transfer is considered to be a secured borrowing, the assets remain on our consolidated balance sheets and the sale proceeds are recognized as a liability.
133
AMERICAN CAPITAL, LTD.
NOTES TO CONSOLIDATED FINANCIAL STATEMENTS—(Continued)
(in millions, except per share data)
The transfers of financial assets to third-party alternative asset funds managed by our wholly-owned portfolio company, American Capital, LLC, have been treated as sales by us under ASC 860. The transfer of financial assets to the affiliated statutory trusts and the related sale of notes by our trusts have been treated as secured borrowing financing arrangements by us under ASC 860.
Stock-Based Compensation
We account for all share-based payments to employees under SFAS No. 123 (revised 2004),Share-Based Payment, (“SFAS No. 123(R)”) a revision to SFAS No. 123, which is codified in FASB ASC Topic 718,Compensation—Stock Compensation (“ASC 718”). We estimate the fair value of our employee stock awards at the date of grant using certain subjective assumptions, such as expected volatility, which is based on a combination of historical and market-based implied volatility, and the expected term of the awards which is based on our historical experience of employee stock option exercises including forfeitures. Our valuation assumptions used in estimating the fair value of share-based awards may change in future periods. We recognize the fair value of awards over the vesting period or the requisite service period. In addition, we calculate our pool of excess tax benefits available within additional paid-in capital in accordance with the provisions ASC 718.
Concentration of Credit Risk
We place our cash and cash equivalents with major financial institutions and, at times, cash held in checking accounts may exceed the Federal Deposit Insurance Corporation insured limit. Our interest rate derivative agreements are with multiple large commercial financial institutions.
Operating Segments
During the fourth quarter of 2009, the Company changed its reportable segments into a single segment to reflect current business activities and organization changes. This change in reportable segments was made in the Company’s consolidated financial statements for the year ended December 31, 2009 and segment information for all prior periods presented have been restated to conform to the current presentation.
Recent Accounting Pronouncements
In May 2009, the FASB issued SFAS No. 165,Subsequent Events, which is codified in FASB ASC Topic 855,Subsequent Events (“ASC 855”). We adopted ASC 855 in the second quarter of 2009. In February 2010, the FASB issued Accounting Standards Update (“ASU”) No. 2010-09,Amendments to Certain Recognition and Disclosure Requirements (“ASU 2010-09”), which amends ASC 855. ASC 855, as amended by ASU 2010-09, establishes general standards of accounting for and disclosure of events that occur after the balance sheet date but before financial statements are issued. ASU No. 2010-09 removes the requirement for an SEC filer (as defined in ASU 2010-09) to disclose the date, in both issued and revised financial statements, through which it has evaluated subsequent events. This change alleviates potential conflicts with current SEC guidance. ASU No. 2010-09 is effective upon issuance for all entities other than conduit bond obligors. We adopted the requirements of ASU No. 2010-09 on the effective date. We do not have any material subsequent events that impact our consolidated financial statements (see Note 19).
In June 2009, the FASB issued SFAS No. 168,The FASB Accounting Standards CodificationTM and the Hierarchy of Generally Accepted Accounting Principles—a replacement of FASB Statement No. 162, which is codified in FASB ASC Topic 105,Generally Accepted Accounting Principles (“ASC 105”). ASC 105 establishes the Codification as the source of authoritative GAAP in the United States (the “GAAP hierarchy”) recognized by
134
AMERICAN CAPITAL, LTD.
NOTES TO CONSOLIDATED FINANCIAL STATEMENTS—(Continued)
(in millions, except per share data)
the FASB to be applied by nongovernmental entities. Rules and interpretive releases of the SEC under authority of federal securities laws are also sources of authoritative GAAP for SEC registrants. All of the content of ASC 105 carries the same level of authority and the GAAP hierarchy includes only two levels of GAAP, authoritative and nonauthoritative. The requirements of ASC 105 are effective for financial statements issued for interim and annual periods ending after September 15, 2009. We adopted the requirements of ASC 105 in the third quarter of 2009.
In June 2009, the FASB issued SFAS No. 166,Accounting for Transfers of Financial Assets—an amendment of FASB Statement No. 140, (“SFAS No. 166”). In December 2009, the FASB issued ASU No. 2009-16,Accounting for Transfers of Financial Assets which codified SFAS No. 166 in FASB ASC Topic 860,Transfers and Servicing(“ASC 860”).SFAS No. 166 amends the derecognition guidance in SFAS No. 140,Accounting for Transfers and Servicing of Financial Assets and Extinguishments of Liabilities, eliminates the concept of a “qualifying special-purpose entity” (“QSPE”) and requires more information about transfers of financial assets, including securitization transactions as well as a company’s continuing exposure to the risks related to transferred financial assets. The requirements of ASU No. 2009-16 are effective for financial asset transfers occurring after the beginning of an entity’s first fiscal year that begins after November 15, 2009 and early adoption is prohibited. Management has evaluated the impact on our consolidated financial statements of adopting ASU No. 2009-16 and has determined that the adoption will not have a material impact on our consolidated financial statements. However, future substantial changes to existing agreements and relationships will require a reassessment of the underlying transaction under the requirements of ASU No. 2009-16 and could result in a determination that the transaction does not qualify for sale accounting.
In June 2009, the FASB issued SFAS No. 167,Amendments to FASB Interpretation No. 46(R) (“SFAS No. 167”). In December 2009, the FASB issued ASU No. 2009-17,Improvements to Financial Reporting by Enterprises Involved with Variable Interest Entities, which codified SFAS No. 167 in FASB ASC Topic 810,Consolidation(“ASC 810”).ASC 810 amends the consolidation guidance applicable to variable interest entities. The amendments will significantly affect the overall consolidation analysis under FASB Interpretation No. 46(R),Consolidation of Variable Interest Entities—an interpretation of ARB No. 51, which is codified in ASC 810, and change the way entities account for securitizations and special purpose entities as a result of the elimination of the QSPE concept in ASU No. 2009-16. ASU No. 2009-17 does not amend the ASC 810 exception that investments accounted for at fair value in accordance with the specialized accounting guidance in ASC 946, are not subject to the requirements of ASC 810. The requirements of ASU No. 2009-17 are effective as of the beginning of the first fiscal year that begins after November 15, 2009 and early adoption is prohibited. Management has evaluated the impact on our consolidated financial statements of adopting ASU No. 2009-17 and has determined that the adoption will not have a material impact on our consolidated financial statements.
In August 2009, the FASB issued ASU No. 2009-05,Fair Value Measurements and Disclosures (Topic 820): Measuring Liabilities at Fair Value (“ASU 2009-05”), which provides guidance on measuring the fair value of liabilities under FASB ASC Topic 820, Fair Value Measurements and Disclosures (“ASC 820”). ASU 2009-05 clarifies that the unadjusted quoted price for an identical liability, when traded as an asset in an active market is a Level 1 measurement for the liability and provides guidance on the valuation techniques to estimate fair value of a liability in the absence of a Level 1 measurement. ASU 2009-05 is effective the first interim or annual reporting period after its issuance. We adopted the requirements of ASU 2009-05 in the third quarter of 2009. The adoption of ASU 2009-05 did not have a material impact on our consolidated financial statements.
In September 2009, the FASB issued ASU No. 2009-12,Fair Value Measurements and Disclosures (Topic 820): Investments in Certain Entities That Calculate Net Asset Value per Share (or Its Equivalent) (“ASU 2009- 12”), which provides guidance on measuring the fair value of certain alternative investments. ASU 2009-12
135
AMERICAN CAPITAL, LTD.
NOTES TO CONSOLIDATED FINANCIAL STATEMENTS—(Continued)
(in millions, except per share data)
amends ASC 820 to permit, as a practical expedient, a reporting entity to measure the fair value of an investment within its scope on the basis of NAV or its equivalent if the NAV or its equivalent is calculated in a manner consistent with the measurement principles of ASC 946. ASU 2009-12 also requires additional disclosures by major category for investments within its scope. ASU 2009-12 is effective for the first reporting period ending after December 15, 2009 and early adoption is permitted. We adopted the requirements of ASU 2009-12 in the fourth quarter of 2009 and its adoption did not have a material effect on our consolidated financial statements.
In January 2010, the FASB issued ASU No. 2010-01,Accounting for Distributions to Shareholders with Components of Stock and Cash(“ASU 2001-01”), which addresses the accounting for a distribution to shareholders that offers them the ability to elect to receive their entire distribution in cash or shares of equivalent value with a potential limitation on the total amount of cash that shareholders can receive in the aggregate. ASU 2010-01 clarifies that the stock portion of such a distribution is considered a share issuance reflected prospectively in earnings per share. ASU 2010-01 is effective for interim and annual periods ending after December 15, 2009 and should be applied on a prospective basis. We adopted the requirements of ASU 2010-01 in the fourth quarter of 2009 and its adoption did not have a material effect on our consolidated financial statements.
In January 2010, the FASB issued ASU No. 2010-06,Fair Value Measurements and Disclosures (“ASU 2010-06”), which amends ASC 820 and requires additional disclosure related to recurring and non-recurring fair value measurements in respect of transfers in and out of Levels 1 and 2 and activity in Level 3 fair value measurements. The update also clarifies existing disclosure requirements related to the level of disaggregation and disclosure about inputs and valuation techniques. ASU 2010-06 is effective for interim and annual periods beginning after December 15, 2009 except for disclosures related to activity in Level 3 fair value measurements which are effective for fiscal years beginning after December 15, 2010 and for interim periods within those fiscal years. Management is currently evaluating the impact on our consolidated financial statements of adopting ASU 2010-06.
Note 4. Investments
Our investments consist of loans and securities issued by public and privately-held companies, including senior debt, subordinated debt, equity warrants, preferred and common equity securities and derivative agreements. Our loans are payable in installments with final maturities ranging generally from five to ten years and many are collateralized by assets of the borrower. We also make investments that do not produce current income. These investments typically consist of equity warrants, common equity and preferred equity and are identified in the accompanying consolidated schedule of investments. We also invest in both investment grade and non-investment grade Structured Products.
We fair value our investments in accordance with GAAP as determined in good faith by our Board of Directors. When available, we base the fair value of our investments on directly observable market prices or on market data derived for comparable assets. For all other investments, inputs used to measure fair value reflect management’s best estimate of assumptions that would be used by market participants in pricing the investment in a hypothetical transaction.
The levels of fair value inputs used to measure our investments are characterized in accordance with the fair value hierarchy established by ASC 820. Where inputs for an asset or liability fall in more than one level in the fair value hierarchy, the investment is classified in its entirety based on the lowest level input that is significant to
136
AMERICAN CAPITAL, LTD.
NOTES TO CONSOLIDATED FINANCIAL STATEMENTS—(Continued)
(in millions, except per share data)
that investment’s fair value measurement. We use judgment and consider factors specific to the investment in determining the significance of an input to a fair value measurement. The three levels of the fair value hierarchy and investments that fall into each of the levels are described below:
| | • | | Level 1: Level 1 inputs are unadjusted quoted prices in active markets that are accessible at the measurement date for identical, unrestricted assets or liabilities. We use Level 1 inputs for investments in publicly traded unrestricted securities for which we do not have a controlling interest. Such investments are valued at the closing price on the measurement date. |
| | • | | Level 2: Level 2 inputs are inputs other than quoted prices included within Level 1 that are observable for the asset or liability, either directly or indirectly. We did not value any of our investments using Level 2 inputs as of December 31, 2009 |
| | • | | Level 3: Level 3 inputs are unobservable and cannot be corroborated by observable market data. We use Level 3 inputs for measuring the fair value of substantially all of our investments. See Note 3 for further information regarding the investment valuation policies used to determine the fair value of our Level 3 investments. |
The following fair value hierarchy tables set forth our assets and liabilities that are measured at fair value on a recurring basis by level as of December 31, 2009 and 2008:
| | | | | | | | | | | | | | |
| | | 2009 | |
| | Level 1 | | Level 2 | | Level 3 | | | Total | |
Senior debt | | $ | — | | $ | — | | $ | 1,817 | | | $ | 1,817 | |
Subordinated debt | | | — | | | — | | | 1,912 | | | | 1,912 | |
Preferred equity | | | — | | | — | | | 1,049 | | | | 1,049 | |
Common equity | | | 66 | | | — | | | 510 | | | | 576 | |
Structured Products | | | — | | | — | | | 167 | | | | 167 | |
Equity warrants | | | — | | | — | | | 54 | | | | 54 | |
Derivative agreements and other, net | | | — | | | — | | | (113 | ) | | | (113 | ) |
| | | | | | | | | | | | | | |
Total | | $ | 66 | | $ | — | | $ | 5,396 | | | $ | 5,462 | |
| | | | | | | | | | | | | | |
| | | | | | | | | | | | | | |
| | | 2008 | |
| | Level 1 | | Level 2 | | Level 3 | | | Total | |
Senior debt | | $ | — | | $ | — | | $ | 2,761 | | | $ | 2,761 | |
Subordinated debt | | | — | | | — | | | 2,351 | | | | 2,351 | |
Preferred equity | | | — | | | — | | | 1,344 | | | | 1,344 | |
Common equity | | | — | | | 102 | | | 601 | | | | 703 | |
Structured Products | | | — | | | — | | | 74 | | | | 74 | |
Equity warrants | | | — | | | — | | | 186 | | | | 186 | |
Derivative and option agreements and other, net | | | — | | | — | | | (214 | ) | | | (214 | ) |
| | | | | | | | | | | | | | |
Total | | $ | — | | $ | 102 | | $ | 7,103 | | | $ | 7,205 | |
| | | | | | | | | | | | | | |
137
AMERICAN CAPITAL, LTD.
NOTES TO CONSOLIDATED FINANCIAL STATEMENTS—(Continued)
(in millions, except per share data)
The following tables set forth the summary of changes in the fair value of investment assets and liabilities measured using Level 3 inputs for the years ended December 31, 2009 and 2008:
| | | | | | | | | | | | | | | | | | | | | | | | | | | |
| | | Balances,
January 1,
2009 | | | Realized
Gains
(Losses)(1) | | | Reversal of
Prior Period
(Appreciation)
Depreciation
on Realization(2) | | | Unrealized
Appreciation
(Depreciation)(2)(3) | | | Purchases,
Sales,
Issuances &
Settlements,
Net(4) | | | Transfers
In & Out
of Level 3 | | Balances,
December 31,
2009 | |
Senior debt | | $ | 2,760 | | | $ | (358 | ) | | $ | 363 | | | $ | (149 | ) | | $ | (799 | ) | | $ | — | | $ | 1,817 | |
Subordinated debt | | | 2,351 | | | | (348 | ) | | | 342 | | | | (220 | ) | | | (213 | ) | | | — | | | 1,912 | |
Preferred equity | | | 1,344 | | | | 12 | | | | (6 | ) | | | (166 | ) | | | (135 | ) | | | — | | | 1,049 | |
Common equity | | | 601 | | | | 29 | | | | (26 | ) | | | (498 | ) | | | 404 | | | | — | | | 510 | |
Structured Products | | | 186 | | | | (56 | ) | | | 55 | | | | (13 | ) | | | (5 | ) | | | — | | | 167 | |
Equity warrants | | | 74 | | | | 4 | | | | (2 | ) | | | (4 | ) | | | (18 | ) | | | — | | | 54 | |
Derivative and option agreements and other, net | | | (213 | ) | | | (106 | ) | | | 105 | | | | (25 | ) | | | 126 | | | | — | | | (113 | ) |
| | | | | | | | | | | | | | | | | | | | | | | | | | | |
Total | | $ | 7,103 | | | $ | (823 | ) | | $ | 831 | | | $ | (1,075 | ) | | $ | (640 | ) | | $ | — | | $ | 5,396 | |
| | | | | | | | | | | | | | | | | | | | | | | | | | | |
| | | | | | | | | | | | | | | | | | | | | | | | | | | | |
| | | Balances,
January 1,
2008 | | | Realized
Gains
(Losses)(1) | | | Reversal of
Prior Period
(Appreciation)
Depreciation
on Realization(2) | | | Unrealized
Appreciation
(Depreciation)(2)(3) | | | Purchases,
Sales,
Issuances &
Settlements,
Net(4) | | | Transfers
In & Out
of Level 3 | | | Balances,
December 31,
2008 | |
Senior debt | | $ | 3,555 | | | $ | (8 | ) | | $ | 13 | | | $ | (628 | ) | | $ | (172 | ) | | $ | — | | | $ | 2,760 | |
Subordinated debt | | | 2,334 | | | | (29 | ) | | | 35 | | | | (341 | ) | | | 352 | | | | — | | | | 2,351 | |
Preferred equity | | | 1,957 | | | | 65 | | | | (75 | ) | | | (396 | ) | | | (207 | ) | | | — | | | | 1,344 | |
Common equity | | | 2,205 | | | | 112 | | | | (131 | ) | | | (1,390 | ) | | | (119 | ) | | | (76 | ) | | | 601 | |
Structured Products | | | 660 | | | | (19 | ) | | | 19 | | | | (606 | ) | | | 132 | | | | — | | | | 186 | |
Equity warrants | | | 213 | | | | 9 | | | | (7 | ) | | | (48 | ) | | | (93 | ) | | | — | | | | 74 | |
Derivative and option agreements and other, net | | | (73 | ) | | | (40 | ) | | | 37 | | | | (156 | ) | | | 19 | | | | — | | | | (213 | ) |
| | | | | | | | | | | | | | | | | | | | | | | | | | | | |
Total | | $ | 10,851 | | | $ | 90 | | | $ | (109 | ) | | $ | (3,565 | ) | | $ | (88 | ) | | $ | (76 | ) | | $ | 7,103 | |
| | | | | | | | | | | | | | | | | | | | | | | | | | | | |
| (1) | Included in net realized (loss) gain on investments in the consolidated statements of operations. Excludes $54 million of taxes on net realized gains for the year ended December 31, 2008. Also excludes $2 million and $9 million in losses on realized foreign currency transactions on American Capital borrowings that are denominated in a foreign currency for the years ended December 31, 2009 and 2008, respectively. |
| (2) | Included in net unrealized (depreciation) appreciation of investments in the consolidated statements of operations. |
| (3) | Excludes $3 million of unrealized depreciation and $8 million of unrealized appreciation related to foreign currency translation for American Capital borrowings that are denominated in a foreign currency for the years ended December 31, 2009 and 2008, respectively. |
| (4) | Includes increases in the cost basis of investments resulting from new portfolio investments, PIK interest or dividends, the amortization of discounts, premiums and closing fees and the exchange of one or more existing securities for one or more new securities as well as decreases in the cost basis of investments resulting from principal repayments or sales and the exchange of one or more existing securities for one or more new securities. |
138
AMERICAN CAPITAL, LTD.
NOTES TO CONSOLIDATED FINANCIAL STATEMENTS—(Continued)
(in millions, except per share data)
As of December 31, 2009 and 2008, loans on non-accrual status had a cost basis of $811 million and $824 million, respectively, and fair value of $290 million and $150 million, respectively. As of December 31, 2009, loans with a principal balance of $52 million were greater than 90 days due, excluding loans on non-accrual status. As of December 31, 2008, loans with a principal balance of $28 million were greater than 90 days past due, excluding loans on non-accrual status.
The composition summaries of our investment portfolio, at cost and fair value as a percentage of total investments, excluding derivative and option agreements, are shown in the following tables:
| | | | | | |
| | | December 31, 2009 | | | December 31, 2008 | |
COST | | | | | | |
Subordinated debt | | 24.5 | % | | 26.5 | % |
Senior debt | | 24.3 | % | | 31.9 | % |
Common equity | | 22.2 | % | | 15.2 | % |
Preferred equity | | 18.1 | % | | 16.3 | % |
Structured Products | | 9.8 | % | | 9.0 | % |
Equity warrants | | 1.1 | % | | 1.1 | % |
| | | | | | |
| | 100.0 | % | | 100.0 | % |
| | | | | | |
FAIR VALUE | | | | | | |
Subordinated debt | | 34.3 | % | | 31.7 | % |
Senior debt | | 32.6 | % | | 37.2 | % |
Preferred equity | | 18.8 | % | | 18.1 | % |
Common equity | | 10.3 | % | | 9.5 | % |
Structured Products | | 3.0 | % | | 2.5 | % |
Equity warrants | | 1.0 | % | | 1.0 | % |
| | | | | | |
| | 100.0 | % | | 100.0 | % |
| | | | | | |
139
AMERICAN CAPITAL, LTD.
NOTES TO CONSOLIDATED FINANCIAL STATEMENTS—(Continued)
(in millions, except per share data)
We use the Global Industry Classification Standards for classifying the industry groupings of our portfolio companies. The following tables show the portfolio composition by industry grouping at cost and at fair value as a percentage of total investments. Our investments in derivative and option agreements, European Capital, CLO and CDO securities are excluded from the table below. Our investments in ACAS CRE CDO 2007-1, Ltd. and CMBS are classified in the Real Estate and Real Estate Investment Trusts category.
| | | | | | |
| | | December 31, 2009 | | | December 31, 2008 | |
COST | | | | | | |
Real Estate and Real Estate Investment Trusts | | 10.5 | % | | 11.4 | % |
Commercial Services and Supplies | | 8.9 | % | | 7.2 | % |
Household Durables | | 6.1 | % | | 9.0 | % |
Internet and Catalog Retail | | 5.7 | % | | 5.2 | % |
Life Sciences Tools and Services | | 4.7 | % | | 3.9 | % |
Food Products | | 4.4 | % | | 3.8 | % |
IT Services | | 4.2 | % | | 3.6 | % |
Health Care Providers and Services | | 4.1 | % | | 3.5 | % |
Auto Components | | 3.8 | % | | 3.1 | % |
Hotels, Restaurants and Leisure | | 3.7 | % | | 3.3 | % |
Electrical Equipment | | 3.5 | % | | 2.8 | % |
Internet Software and Services | | 3.4 | % | | 3.5 | % |
Diversified Financial Services | | 3.3 | % | | 2.6 | % |
Professional Services | | 2.5 | % | | 2.1 | % |
Software | | 2.4 | % | | 2.2 | % |
Health Care Equipment and Supplies | | 2.4 | % | | 3.6 | % |
Leisure Equipment and Products | | 2.0 | % | | 1.8 | % |
Pharmaceuticals | | 2.0 | % | | 2.0 | % |
Computers and Peripherals | | 2.0 | % | | 1.8 | % |
Building Products | | 1.9 | % | | 1.5 | % |
Construction and Engineering | | 1.8 | % | | 3.1 | % |
Electronic Equipment, Instruments and Components | | 1.8 | % | | 1.8 | % |
Aerospace and Defense | | 1.7 | % | | 1.4 | % |
Capital Markets | | 1.4 | % | | 1.0 | % |
Diversified Consumer Services | | 1.4 | % | | 1.1 | % |
Other | | 10.4 | % | | 13.7 | % |
| | | | | | |
| | 100.0 | % | | 100.0 | % |
| | | | | | |
140
AMERICAN CAPITAL, LTD.
NOTES TO CONSOLIDATED FINANCIAL STATEMENTS—(Continued)
(in millions, except per share data)
| | | | | | |
| | | December 31, 2009 | | | December 31, 2008 | |
FAIR VALUE | | | | | | |
Commercial Services and Supplies | | 10.1 | % | | 8.0 | % |
Electrical Equipment | | 6.2 | % | | 4.7 | % |
Household Durables | | 5.8 | % | | 7.8 | % |
Internet and Catalog Retail | | 5.2 | % | | 4.6 | % |
IT Services | | 4.9 | % | | 3.2 | % |
Health Care Providers and Services | | 4.6 | % | | 3.2 | % |
Hotels, Restaurants and Leisure | | 4.6 | % | | 3.6 | % |
Real Estate and Real Estate Investment Trusts | | 4.1 | % | | 6.3 | % |
Software | | 3.8 | % | | 3.2 | % |
Auto Components | | 3.7 | % | | 3.2 | % |
Food Products | | 3.4 | % | | 3.1 | % |
Life Sciences Tools and Services | | 3.3 | % | | 4.8 | % |
Internet Software and Services | | 3.3 | % | | 3.8 | % |
Diversified Financial Services | | 3.0 | % | | 2.6 | % |
Health Care Equipment and Supplies | | 2.8 | % | | 4.8 | % |
Professional Services | | 2.8 | % | | 2.5 | % |
Pharmaceuticals | | 2.8 | % | | 2.8 | % |
Building Products | | 2.4 | % | | 2.0 | % |
Electronic Equipment, Instruments and Components | | 2.3 | % | | 2.2 | % |
Computers and Peripherals | | 2.2 | % | | 2.0 | % |
Construction and Engineering | | 2.1 | % | | 2.7 | % |
Diversified Consumer Services | | 1.9 | % | | 1.5 | % |
Leisure Equipment and Products | | 1.7 | % | | 0.9 | % |
Other | | 13.0 | % | | 16.5 | % |
| | | | | | |
| | 100.0 | % | | 100.0 | % |
| | | | | | |
The following tables show the portfolio composition by geographic location at cost and at fair value as a percentage of total investments, excluding Structured Products and derivative and option agreements. The geographic composition is determined by the location of the corporate headquarters of the portfolio company.
| | | | | | |
| | | December 31, 2009 | | | December 31, 2008 | |
COST | | | | | | |
Southwest | | 21.1 | % | | 20.8 | % |
International | | 19.0 | % | | 16.1 | % |
Mid-Atlantic | | 18.4 | % | | 19.5 | % |
Northeast | | 13.5 | % | | 11.7 | % |
South-Central | | 11.6 | % | | 11.6 | % |
Southeast | | 9.7 | % | | 12.4 | % |
North-Central | | 6.3 | % | | 7.3 | % |
Northwest | | 0.4 | % | | 0.6 | % |
| | | | | | |
| | 100.0 | % | | 100.0 | % |
| | | | | | |
141
AMERICAN CAPITAL, LTD.
NOTES TO CONSOLIDATED FINANCIAL STATEMENTS—(Continued)
(in millions, except per share data)
| | | | | | |
| | | December 31, 2009 | | | December 31, 2008 | |
FAIR VALUE | | | | | | |
Southwest | | 25.3 | % | | 24.3 | % |
Mid-Atlantic | | 19.8 | % | | 21.7 | % |
Northeast | | 14.9 | % | | 12.0 | % |
South-Central | | 12.5 | % | | 13.8 | % |
Southeast | | 11.2 | % | | 10.7 | % |
International | | 8.0 | % | | 8.8 | % |
North-Central | | 7.8 | % | | 8.1 | % |
Northwest | | 0.5 | % | | 0.6 | % |
| | | | | | |
| | 100.0 | % | | 100.0 | % |
| | | | | | |
Note 5. Borrowings
Our debt obligations consisted of the following as of December 31, 2009 and 2008:
| | | | | | |
| | | 2009 | | 2008 |
Unsecured revolving credit facility | | $ | 1,388 | | $ | 1,389 |
Unsecured public debt due October 2012 | | | 548 | | | 548 |
Unsecured private debt due September 2009 | | | 84 | | | 82 |
Unsecured private debt due August 2010 | | | 134 | | | 126 |
Unsecured private debt due February 2011 | | | 26 | | | 24 |
Unsecured private debt due September 2011 | | | 95 | | | 85 |
Unsecured private debt due October 2020 | | | 75 | | | 75 |
ACAS Business Loan Trust 2004-1 asset securitization | | | 170 | | | 201 |
ACAS Business Loan Trust 2005-1 asset securitization | | | 696 | | | 798 |
ACAS Business Loan Trust 2006-1 asset securitization | | | 377 | | | 427 |
ACAS Business Loan Trust 2007-1 asset securitization | | | 294 | | | 381 |
ACAS Business Loan Trust 2007-2 asset securitization | | | 255 | | | 292 |
| | | | | | |
Total | | $ | 4,142 | | $ | 4,428 |
| | | | | | |
The daily weighted average debt balance for the years ended December 31, 2009 and 2008 was $4,307 million and $4,508 million, respectively. The weighted average interest rate on all of our borrowings, including amortization of deferred financing costs and the make-whole interest payment accrual, for the years ended December 31, 2009 and 2008 was 5.9% and 4.9%, respectively.
As of December 31, 2009 and December 31, 2008, the aggregate fair value of the above borrowings was $3,929 million and $3,172 million, respectively. The fair values of our debt obligations are determined in accordance with ASC 820, which defines fair value in terms of the price that would be paid to transfer a liability in an orderly transaction between market participants at the measurement date under current market conditions. It assumes that the liability is transferred to a market participant at the measurement date and that the nonperformance risk relating to that liability is the same before and after the transfer. Nonperformance risk refers to the risk that the obligation will not be fulfilled and affects the value at which the liability is transferred. The fair value of our debt obligations is based upon market interest rates for our own borrowings or entities with similar credit risk, adjusted for nonperformance risk, if any, based on a quantitative and/or qualitative evaluation of our credit risk.
142
AMERICAN CAPITAL, LTD.
NOTES TO CONSOLIDATED FINANCIAL STATEMENTS—(Continued)
(in millions, except per share data)
Unsecured Revolving Credit Facility
In September 2008, we amended our Credit Facility administered by an affiliate of Wachovia Capital Markets, LLC. In connection with the amendment, the commitment size of the Credit Facility was reduced from $1,565 million to $1,409 million and was scheduled to be reduced further to $1,252 million on December 31, 2009. The maturity date was also amended from May 2012 to March 2011. Interest on borrowings under this Credit Facility is charged at either (i) the applicable index rate and the applicable percentage at such time based on our senior unsecured debt rating, or (ii) for borrowings denominated in U.S. dollars, the greater of the prime rate in effect on such day and the federal funds effective rate in effect on such day plus 0.50%, and for borrowings denominated in an alternative currency, the applicable base rate, in each case, plus the applicable percentage at such time based on our unsecured debt rating. To the extent that our unsecured debt rating decreases, the applicable spread over the applicable index rate and applicable base rate would both increase by 0.50% for each rating decrease to a maximum spread of 4.75% and 3.75%, respectively. We are also charged an unused commitment fee based on our corporate rating. To the extent that our unsecured debt rating decreases, the unused commitment fee would increase by 0.10% for each rating decrease to a maximum of 0.80%.
The agreement contains various covenants, including maintaining a minimum consolidated tangible net worth of $4.5 billion plus forty percent (40%) of any capital stock issued or debt converted after October 1, 2008, an asset coverage ratio equal to or greater than 1.55 to 1.00 and an interest coverage ratio equal to or greater than 1.75 to 1.00. The agreement also contains a cross-default provision on our consolidated debt of $25 million or more and a default triggered if we fail to maintain an unsecured debt rating equal to or greater than BB by any one rating agency and a default triggered by a change of control.
As of December 31, 2009 and 2008, we were not in compliance with the minimum consolidated tangible net worth covenant and certain other covenants for the Credit Facility. In addition, as of December 31, 2009, we were not in compliance with the ratio of adjusted earnings before interest and taxes to interest expense covenant for the Credit Facility. On March 5, 2009, the administrative agent under the Credit Facility sent a notice of such events of default to us. During the continuance of these events of default, lenders representing a majority of the commitments may declare the outstanding principal and accrued interest to be due and payable immediately. Pursuant to the terms of the Credit Facility, the applicable spread on any borrowings outstanding under the Credit Facility increased by 2.00% as a result of these events of default. Also, due to the events of default, all LIBOR borrowings outstanding were automatically converted into base rate loans from index rate loans. The applicable interest rate for base rate loans is the greater of the prime rate or the federal funds rate plus 0.50%. As a result of rating agency downgrades during the first quarter of 2009, the applicable spread over the applicable base rate increased from 2.25% to 3.75% and the unused commitment fee increased from 0.50% to 0.80% as of March 2, 2009. As of December 31, 2009, the total interest rate on this Credit Facility was 9.00% for borrowings denominated in U.S. dollars.
In November 2009, we entered into a lock up agreement with lenders under the Credit Facility to further our efforts to restructure the Credit Facility and our other principal unsecured debt arrangements based on our previously announced agreement in principle with the lenders to restructure the Credit Facility. Under the current terms of the proposed Restructuring, the unsecured private notes and the unsecured public notes would have to be restructured on terms that are not more favorable to the holders of the notes than the restructured Credit Facility terms. Under the proposed Restructuring, each of the classes of our primary unsecured debt obligations would be exchanged for term debt secured by a pledge of substantially all of our unencumbered assets. Key terms of the proposed Restructuring include (i) an aggregate $450 million principal payment at closing, (ii) scheduled aggregate principal amortization of $250 million in 2010, $300 million in 2011, $350 million in 2012 and $300 million in 2013, with any remaining unpaid principal due at maturity on December 31, 2013, (iii) deferral
143
AMERICAN CAPITAL, LTD.
NOTES TO CONSOLIDATED FINANCIAL STATEMENTS—(Continued)
(in millions, except per share data)
through 2013 of up to $200 million in the aggregate of annual scheduled principal amortization, which is limited to $100 million in 2010, (iv) an interest rate of the greater of 2.00% or LIBOR, plus a spread based on the aggregate outstanding principal balance of (a) 9.50% if the outstanding obligations are greater than or equal to $1.7 billion, (b) 8.50% if the outstanding obligations are less than $1.7 billion but greater than or equal to $1.4 billion, (c) 6.50% if the outstanding obligations are less than $1.4 billion but greater than or equal to $1.0 billion, or (d) 5.50% if the outstanding obligations are less than $1.0 billion, (v) an additional interest spread of 0.50% each time that certain additional principal amortizations, which are greater than the scheduled principal amortizations noted above, are not met, (vi) an additional 1.00% if we defer any portion of the scheduled principal amortization due in 2010, and (vii) the payment of fees equal to 2.00% of the aggregate principal balance at closing, and 1.00% at both December 31, 2011 and 2012.
We intend to consummate the proposed Restructuring by entering into an Exchange Transaction. In the event that fewer than 100% of the lenders under our Credit Facility, fewer than 100% of the holders of our private unsecured notes and holders of less than 85% of the principal amount of our public unsecured notes agree to enter the Exchange Transaction, we intend to implement the transactions described in the proposed Restructuring through a solicitation of votes for the Plan and commence a Restructuring Case under Title eleven of the United States Code. We plan to commence the Exchange Transaction and solicitation of votes for the Plan simultaneously.
We and the lenders in the Credit Facility have agreed in the lock up agreement, among other things, to support the Exchange Transaction, Plan and reorganization as provided for in the proposed Restructuring, and have agreed, among other things, that neither will (i) object to the Exchange Transaction, the solicitation or confirmation of the Plan or otherwise commence any proceeding to oppose or alter the Exchange Transaction or the Plan, (ii) vote for or support any restructuring or reorganization other than contemplated in the Exchange Transaction or the Plan or (iii) take any actions to delay materially confirmation or upon consummation of the Exchange Transaction or the Plan.
In addition, we have agreed, among other things, to pay prior to commencement of any Restructuring Case, all accrued and unpaid interest at the default rate and all accrued and unpaid fees in respect of the Credit Facility. Under the lock up agreement, each lender has also agreed to participate in the Exchange Transaction, to vote its claims (“Claims”) under the facility to accept the Plan, not to change or withdraw its vote or its consent to accept the Exchange Transaction or the Plan and that it will not directly or indirectly sell, assign, pledge, hypothecate, grant an option on, or otherwise dispose of any of its Claims held as of November 20, 2009, except for transactions to entities that agree to be bound by the terms of the lock up agreement.
The lock up agreement also contains an agreement by the lenders to forbear from exercising remedies resulting from defaults by us under the Credit Facility, until the earlier of (i) the consummation of the Exchange Transaction or commencement of a Restructuring Case, (ii) the date on which any holder of our private unsecured notes or public unsecured notes commences litigation or an involuntary case under Title eleven of the United States Code against us, (iv) the date on which any one or more creditors of us with claims in excess of $25 million commence litigation against us or (v) any other filing of an involuntary case under Title eleven of the United States Code against us.
The lock up agreement generally requires all of the lenders under the Credit Facility to agree to the proposed Restructuring assuming specified conditions are met. However, the lock up agreement may be terminated if various stages of the proposed Restructuring are not completed by certain dates. These deadlines were extended twice in January 2010. Currently, the lock up agreement may be terminated (i) upon consummation of the Exchange Transaction and the effective date of the Plan or a written agreement to terminate the lock up
144
AMERICAN CAPITAL, LTD.
NOTES TO CONSOLIDATED FINANCIAL STATEMENTS—(Continued)
(in millions, except per share data)
agreement, (ii) if the Exchange Transaction is not consummated in accordance with the proposed Restructuring and we have not commenced a Restructuring Case by March 15, 2010 (unless the administrative agent under the Credit Facility agrees to an extension of not later than March 31, 2010) or (iii) if we commence a Restructuring Case and (1) any material order is entered that is inconsistent with the lock up agreement or the proposed Restructuring, which is objected to by a majority of the lenders, (2) an order finding that the solicitation complying with applicable law and confirming the Plan has not been entered on or before May 15, 2010 (unless the administrative agent under the Credit Facility agrees to an extension of not later than May 31, 2010) or (3) the Plan is not consummated by May 31, 2010, or the Restructuring Case is dismissed or converted to an Accelerated Case or a trustee or examiner shall have been appointed in the Restructuring Case. In addition, either party may terminate the lock up agreement upon a breach of material obligations by the other party. Because we have not launched the Exchange Transaction as of the date of this filing and the tender offer rules under the Securities Exchange Act of 1934, as amended, require that such offers generally remain open for 20 business days, it is likely that we will be unable to complete the Exchange Transaction by the above deadlines. We may seek an amendment to the lock up agreement to further extend the deadline for consummating the Exchange Transaction or we may proceed with the proposed Restructuring without a lock up agreement with the lenders under the Credit Facility. We do not have a lock up agreement with our other unsecured creditors. As noted above, if the requisite lenders and noteholders do not agree to the Exchange Transaction, we intend to implement the proposed Restructuring by soliciting votes for the Plan. We expect that we will ultimately be successful in completing the proposed Restructuring.
Unsecured Public Debt
In July 2007, we completed a public offering of $550 million of senior unsecured notes for proceeds of $547 million, net of underwriters’ discounts. The notes bore interest at an initial fixed rate of 6.85% and mature in August 2012. Interest payments are due semi-annually on February 1 and August 1 and all principal is due at maturity. At the time of the issuance, the notes were rated Baa2, BBB and BBB by Moody’s Investor Services, Standard & Poor’s Ratings Services and Fitch Ratings, respectively. If the ratings of the notes from at least two of the rating agencies are decreased to ratings set forth in the table below, the initial interest rate of 6.85% would increase from the initial interest rate by each of the percentages for the two ratings set forth below:
| | | | | | | | | | |
Fitch Rating | | Interest Rate
Adjustment | | S&P Rating | | Interest Rate
Adjustment | | Moody’s Rating | | Interest Rate
Adjustment |
BB+ | | 0.25% | | BB+ | | 0.25% | | Ba1 | | 0.25% |
BB | | 0.50% | | BB | | 0.50% | | Ba2 | | 0.50% |
BB- | | 0.75% | | BB- | | 0.75% | | Ba3 | | 0.75% |
B+ or below | | 1.00% | | B+ or below | | 1.00% | | B1 or below | | 1.00% |
If at least two of the rating agencies then subsequently increase their ratings of the notes to any of the ratings set forth above, the interest rate on the notes would decrease such that the interest rate on the notes equals the initial interest rate of 6.85% plus (if applicable) each of the percentages for the ratings set forth above. Each adjustment required by any decrease or increase in the ratings set forth above is made independent of any and all other adjustments, provided that if the ratings from three rating agencies are decreased to the ratings set forth above, then only the lowest two of the three ratings will be utilized for such adjustments. In no event shall the interest rate be reduced below 6.85% or increased above 8.85%. If at least two rating agencies cease to provide ratings for the notes, any increase or decrease necessitated by a reduction or increase in the rating by the remaining rating agency shall be twice the percentages set forth above. The notes may be redeemed by us in whole or in part, together with an interest premium, as stipulated in the note agreement. The indenture contains various covenants, including a covenant that requires us to maintain an asset coverage ratio, as defined in the 1940 Act, of at least 200%.
145
AMERICAN CAPITAL, LTD.
NOTES TO CONSOLIDATED FINANCIAL STATEMENTS—(Continued)
(in millions, except per share data)
As a result of rating agency downgrades during the first quarter of 2009, the interest rate on these notes increased by 1.75% effective February 2, 2009 to a total rate of 8.60%. As a result of further rating agency downgrades during the third quarter of 2009, the interest rate on these notes increased by an additional 0.25% effective August 6, 2009 to a total rate of 8.85%. As we are now being charged interest at the interest rate cap of 2.00% over the original stated rate, there will be no further increase to the interest rate as a result of any future rating agency downgrades.
We were not in compliance with the asset coverage ratio covenant as of December 31, 2009 and December 31, 2008. On March 3, 2009, we received notices of an event of default from the indenture trustee and a steering committee of certain noteholders. Under the indenture for the notes, we had a 60-day period to cure the default, which commenced on the day we received the notice of default. Following the expiration of the 60-day cure period, the default matured into an event of default under the indenture. Pursuant to the terms of the notes, during the continuance of this event of default, the trustee or the holders of at least 25% of the outstanding principal amount of the notes may declare the principal and accrued interest to be due and payable immediately. The holders of more than 50% of the outstanding principal amount of the notes can rescind any acceleration if all late payments are made and any events of default are cured or waived. As of the date of this filing, the noteholders have not accelerated the amounts outstanding under the notes.
Unsecured Private Debt
In February 2006, we entered into a note purchase agreement to issue €14 million and £3 million of senior unsecured five-year notes to institutional investors in a private placement offering. The €14 million Series 2006-A Notes have a fixed interest rate of 5.177% and the £3 million Series 2006-B Notes have a fixed interest rate of 6.565%. Each series matures in February 2011. The outstanding principal balance as of December 31, 2009 includes $2 million of the $22 million make-whole interest payment discussed below.
In September 2005, we entered into a note purchase agreement to issue $75 million of senior unsecured fifteen-year notes to accredited investors in a private placement offering. The unsecured notes have a fixed interest rate of 6.923% through the interest payment date in October 2015 and bear interest at the rate of LIBOR plus 2.65% thereafter and mature in October 2020.
In August 2005, we entered into a note purchase agreement to issue an aggregate of $126 million of senior unsecured five-year notes to institutional investors in a private placement offering. The unsecured notes have a fixed interest rate of 6.14% and mature in August 2010. The outstanding principal balance as of December 31, 2009 includes $8 million of the $22 million make-whole interest payment discussed below.
In September 2004, we entered into a note purchase agreement to issue an aggregate $167 million of senior unsecured five- and seven-year notes to institutional investors in a private placement offering. The unsecured notes consist of $82 million of senior notes, Series A and $85 million of senior notes, Series B. The Series A notes have a fixed interest rate of 5.92% and matured in September 2009, however the principal balance remains outstanding as of December 31, 2009. The Series B notes have a fixed interest rate of 6.46% and mature in September 2011. The outstanding principal balance of the Series A senior notes and Series B senior notes as of December 31, 2009 includes $2 million and $10 million, respectively, of the $22 million make-whole interest payment discussed below.
The note purchase agreements discussed above contain various covenants, including covenants that require us to maintain an asset coverage ratio, as defined in the 1940 Act, of at least 200%, an available debt asset
146
AMERICAN CAPITAL, LTD.
NOTES TO CONSOLIDATED FINANCIAL STATEMENTS—(Continued)
(in millions, except per share data)
coverage ratio, a minimum consolidated tangible net worth and a minimum interest coverage ratio. Each note purchase agreement also contains a cross-default provision on our consolidated debt of $15 million or more and a default triggered by a change of control. During an event of default, holders of 50% of the outstanding principal balance of each series of notes can declare all amounts due under the notes then outstanding immediately due and payable. Amounts immediately due and payable would include the outstanding principal of the notes, plus (i) all accrued but unpaid interest and (ii) a make-whole interest payment, if any. The make-whole interest payment would generally be calculated as the excess of the then outstanding principal of the notes over the present value of the remaining originally scheduled principal and interest payments.
As of December 31, 2009 and 2008, we were not in compliance with certain financial covenants, including the minimum consolidated tangible net worth covenant, the available debt asset coverage ratio covenant and the asset coverage ratio covenant for each series of these notes. In addition, as of December 31, 2009, we were not in compliance with the ratio of consolidated debt to consolidated shareholders’ equity covenant for each series of these notes. On March 5, 2009, a steering committee of the noteholders sent a notice of such events of default to us. Pursuant to the terms of the notes, during the continuance of these events of default, the holders of more than 50% of the outstanding principal amount of each series of the notes can declare that all amounts outstanding under the notes for the respective series are immediately due and payable, at which time a default rate equal to the greater of 2.00% above the stated rate for each series or 2.00% over the prime rate will be applied on all overdue amounts. The holders of more than 50% of the outstanding principal amount of each series of notes could rescind any acceleration of the notes in that series if all late payments are made, any events of default are cured or waived and no judgment or decree has been entered for the payment of any monies due on the notes. On August 28, 2009, the noteholders declared the unpaid principal amount of the notes outstanding, plus all accrued and unpaid interest and the respective make-whole interest payment for each series, if any, immediately due and payable. Although we have not repaid these obligations in full, we entered into forbearance agreements with all of these noteholders, under which the noteholders agreed to forbear from exercising certain rights and remedies with respect to the events of default that have occurred under the notes. The holders of a majority in principal amount of the notes outstanding under each series may terminate the forbearance agreement for the series at any time. In consideration for entering into the forbearance agreements, we paid all accrued and unpaid interest due on the notes as of September 1, 2009 at the default rate retroactive to March 30, 2009 and agreed to add to the outstanding principal amounts of certain of the notes a $22 million make-whole interest payment, which is included in interest expense in the accompanying consolidated statements of operations. As of December 31, 2009, the total weighted average interest rate of our unsecured private notes was 8.27%.
Securitizations
As of December 31, 2009 and 2008, we were in compliance with all of the covenants for our asset securitizations.
In August 2007, we completed a $500 million asset securitization. In connection with the transaction, ACAS Business Loan Trust 2007-2 (“BLT 2007-2”), an indirect consolidated subsidiary, issued $300.5 million Class A notes, $37.5 million Class B notes and $162 million of Class C through Class F notes (collectively, the “2007-2 Notes”). The Class A notes and Class B notes were sold to institutional investors and all of the Class C through Class F notes were retained by us. The 2007-2 Notes are secured by loans originated or acquired by us and sold to our wholly-owned consolidated subsidiary, BLT 2007-2. Through February 2008, BLT 2007-2 could have also generally used principal collections from the underlying loan pool to purchase additional loans to secure the 2007-2 Notes. After such time, principal payments on the 2007-2 Notes will generally be applied pro rata to each class of 2007-2 Notes outstanding until the aggregate outstanding principal balance of the loan pool is less than
147
AMERICAN CAPITAL, LTD.
NOTES TO CONSOLIDATED FINANCIAL STATEMENTS—(Continued)
(in millions, except per share data)
$250 million or the occurrence of certain other events. Payments will then be applied sequentially to the Class A notes, the Class B notes, the Class C notes, the Class D notes, the Class E notes and the Class F notes. However, if any loan collateral in the trust becomes a defaulted loan, as defined in the indenture, all interest and principal collections that would be applied to the Class E notes and Class F notes are applied sequentially to pay the principal on the Class A notes, Class B notes, Class C notes and Class D notes in an amount equal to the principal balance of the defaulted loan collateral. As of December 31, 2008 and 2009, there was defaulted loan collateral in the trust and therefore all interest and principal collections were being applied sequentially to pay down the principal of the notes as outlined above. Subject to continuing compliance with certain conditions, we will remain as servicer of the loans. The Class A notes have an interest rate of three-month LIBOR plus 40 basis points, the Class B notes have an interest rate of three-month LIBOR plus 100 basis points, the Class C notes have an interest rate of three-month LIBOR plus 125 basis points, the Class D notes have an interest rate of three-month LIBOR plus 300 basis points and the Class E and Class F notes retained by us do not have an interest rate. The 2007-2 Notes are secured by loans and assets from our portfolio companies with a principal balance of $406 million as of December 31, 2009. The 2007-2 Notes contain customary default provisions and mature in November 2019 unless redeemed or repaid prior to such date.
In April 2007, we completed a $600 million asset securitization. In connection with the transaction, ACAS Business Loan Trust 2007-1 (“BLT 2007-1”), an indirect consolidated subsidiary, issued $351 million Class A notes, $45 million Class B notes, $81 million Class C notes, $45 million Class D notes and $78 million Class E notes (collectively, the “2007-1 Notes”). The Class A notes, Class B notes, Class C notes and $15 million of the Class D notes were sold to institutional investors and $30 million of the Class D notes and all the Class E notes were retained by us. The 2007-1 Notes are secured by loans originated or acquired by us and sold to our wholly-owned consolidated subsidiary, BLT 2007-1. Through November 2007, BLT 2007-1 could have also generally used principal collections from the underlying loan pool to purchase additional loans to secure the 2007-1 Notes. After such time, principal payments on the 2007-1 Notes are generally applied pro rata to each class of 2007-1 Notes outstanding until the aggregate outstanding principal balance of the loan pool is less than $300 million or the occurrence of certain other events. Payments will then be applied sequentially to the Class A notes, the Class B notes, the Class C notes, the Class D notes and the Class E notes. However, if any loan collateral in the trust becomes a defaulted loan, as defined in the indenture, all interest and principal collections that would be applied to the Class E notes are applied sequentially to pay the principal on the Class A notes, Class B notes, Class C notes and Class D notes in an amount equal to the principal balance of the defaulted loan collateral. As of December 31, 2008 and 2009, there was defaulted loan collateral in the trust and therefore all interest and principal collections were being applied sequentially to pay down the principal of the notes as outlined above. Subject to continuing compliance with certain conditions, we will remain as servicer of the loans. The Class A notes have an interest rate of three-month LIBOR plus 14 basis points, the Class B notes have an interest rate of three-month LIBOR plus 31 basis points, the Class C notes have an interest rate of three-month LIBOR plus 85 basis points, the Class D notes have an interest rate of three-month LIBOR plus 185 basis points and the Class E notes retained by us do not have an interest rate. The 2007-1 Notes are secured by loans and assets from our portfolio companies with a principal balance of $400 million as of December 31, 2009. The 2007-1 Notes contain customary default provisions and mature in August 2019 unless redeemed or repaid prior to such date. In February 2009, we repurchased $20 million of Class B notes issued by BLT 2007-1 for $3 million. As a result of this purchase, we recognized a $17 million gain in 2009, which is recorded in net gain on debt extinguishment in the accompanying consolidated statements of operations.
In July 2006, we completed a $500 million asset securitization. In connection with the transaction, ACAS Business Loan Trust 2006-1 (“BLT 2006-1”), an indirect consolidated subsidiary, issued $291 million Class A notes, $37 million Class B notes, $73 million Class C notes, $35 million Class D notes and $64 million Class E
148
AMERICAN CAPITAL, LTD.
NOTES TO CONSOLIDATED FINANCIAL STATEMENTS—(Continued)
(in millions, except per share data)
notes (collectively, the “2006-1 Notes”). The Class A notes, Class B notes, Class C notes and Class D notes were sold to institutional investors and the Class E notes were retained by us. The 2006-1 Notes are secured by loans originated or acquired by us and sold to a wholly-owned consolidated subsidiary, which in turn sold such loans to BLT 2006-1. Through August 2009, BLT 2006-1 could have also generally used principal collections from the underlying loan pool to purchase additional loans to secure the 2006-1 Notes. After such time, principal payments on the 2006-1 Notes will generally be applied pro rata to each class of 2006-1 Notes outstanding until the aggregate outstanding principal balance of the loan pool is less than $250 million or the occurrence of certain other events. Payments will then be applied sequentially to the Class A notes, the Class B notes, the Class C notes, the Class D notes and the Class E notes. However, if any loan collateral in the trust becomes a defaulted loan, as defined in the indenture, all interest and principal collections that would be applied to the Class E notes are applied sequentially to pay the principal on the Class A notes, Class B notes, Class C notes and Class D notes in an amount equal to the principal balance of the defaulted loan collateral. As of December 31, 2008 and 2009, there was defaulted loan collateral in the trust and therefore all interest and principal collections were being applied sequentially to pay down the principal of the notes as outlined above. Subject to continuing compliance with certain conditions, we will remain as servicer of the loans. The Class A notes have an interest rate of three-month LIBOR plus 23 basis points, the Class B notes have an interest rate of three-month LIBOR plus 36 basis points, the Class C notes have an interest rate of three-month LIBOR plus 65 basis points and the Class D notes have an interest rate of three-month LIBOR plus 125 basis points. The 2006-1 Notes are secured by loans and assets from our portfolio companies with a principal balance of $441 million as of December 31, 2009. The 2006-1 Notes contain customary default provisions and mature in November 2019 unless redeemed or repaid prior to such date.
In October 2005, we completed a $1,000 million asset securitization. In connection with the transaction, ACAS Business Loan Trust 2005-1 (“BLT 2005-1”), an indirect consolidated subsidiary, issued $435 million Class A-1 notes, $150 million Class A-2A notes, $50 million Class A-2B notes, $50 million Class B notes, $145 million Class C notes, $90 million Class D notes and $80 million Class E notes (collectively, the “2005-1 Notes”). The Class A-1 notes, Class A-2A notes, Class A-2B notes, Class B notes and Class C notes were issued to institutional investors and the Class D notes and Class E notes were retained by us. The 2005-1 Notes are secured by loans originated or acquired by us and sold to a wholly-owned consolidated subsidiary, which in turn sold such loans to BLT 2005-1. Through January 2009, BLT 2005-1 could have also generally used principal collections from the underlying loan pool to purchase additional loans to secure the 2005-1 Notes. After such time, principal payments on the 2005-1 Notes will be applied first to the Class A-1 notes, Class A-2A notes and Class A-2B notes, next to the Class B notes and then to the Class C notes. However, if any loan collateral in the trust becomes a defaulted loan, as defined in the indenture, all interest and principal collections that would be applied to the Class D notes and Class E notes are applied sequentially to pay the principal on the Class A notes, Class B notes and Class C notes in an amount equal to the principal balance of the defaulted loan collateral. As of December 31, 2008 and 2009, there was defaulted loan collateral in the trust and therefore all interest and principal collections were being applied sequentially to pay down the principal of the notes as outlined above. Subject to continuing compliance with certain conditions, we will remain as servicer of the loans. The Class A-1 notes have an interest rate of three-month LIBOR plus 25 basis points, the Class A-2A notes have an interest rate of three-month LIBOR plus 20 basis points, the Class A-2B notes have an interest rate of three-month LIBOR plus 35 basis points, the Class B notes have an interest rate of three-month LIBOR plus 40 basis points, and the Class C notes have an interest rate of three-month LIBOR plus 85 basis points. The 2005-1 Notes are secured by loans and assets from our portfolio companies with a principal balance of $866 million as of December 31, 2009. The 2005-1 Notes contain customary default provisions and mature in July 2019 unless redeemed or repaid prior to such date.
149
AMERICAN CAPITAL, LTD.
NOTES TO CONSOLIDATED FINANCIAL STATEMENTS—(Continued)
(in millions, except per share data)
In December 2004, we completed a $500 million asset securitization. In connection with the transaction, ACAS Business Loan Trust 2004-1 (“BLT 2004-1”), an indirect consolidated subsidiary, issued $302 million Class A notes, $34 million Class B notes, $74 million Class C notes, $50 million Class D notes, and $40 million Class E notes (collectively, the “2004-1 Notes”). The Class A notes, Class B notes, and Class C notes were issued to institutional investors and the Class D and Class E notes were retained by us. The 2004-1 Notes are secured by loans originated or acquired by us and sold to a wholly-owned consolidated subsidiary, which in turn sold such loans to BLT 2004-1. Through January 2007, BLT 2004-1 could have also generally used principal collections from the underlying loan pool to purchase additional loans to secure the 2004-1 Notes. After such time, payments are first applied to the Class A notes, then to the Class B notes and then to the Class C notes. However, if any loan collateral in the trust becomes a defaulted loan, as defined in the indenture, all interest and principal collections that would be applied to the Class D notes and Class E notes are applied sequentially to pay the principal on the Class A notes, Class B notes and Class C notes in an amount equal to the principal balance of the defaulted loan collateral. As of December 31, 2008 and 2009, there was defaulted loan collateral in the trust and therefore all interest and principal collections were being applied sequentially to pay down the principal of the notes as outlined above. Subject to continuing compliance with certain conditions, we will remain as servicer of the loans. The Class A notes have an interest rate of three-month LIBOR plus 32 basis points, the Class B notes have an interest rate of three-month LIBOR plus 50 basis points, and the Class C notes have an interest rate three-month LIBOR plus 100 basis points. The 2004-1 Notes are secured by loans and assets from our portfolio companies with a principal balance of $260 million as of December 31, 2009. The 2004-1 Notes contain customary default provisions and mature in October 2017 unless redeemed or repaid prior to such date.
Secured Revolving Credit Facility
In March 2009, we terminated our $500 million secured revolving credit facility administered by Wachovia Capital Markets, LLC. All borrowings under the facility were repaid during 2008 and had not been redrawn. We terminated the facility in connection with our effort to further delever our balance sheet and to reduce our overall borrowing costs. We did not incur any early termination fees or penalties as a result of the termination of the facility. We recorded a loss on debt extinguishment of $5 million as a result of writing off the deferred debt issuance costs, which is recorded in net gain on debt extinguishment in the accompanying consolidated statements of operations.
Future Debt Maturities
For any of our debt obligations that we were in breach of covenants of as of December 31, 2009, the amounts outstanding are considered immediately due and payable and are classified as maturing in 2010. The maturities of our debt obligations as of December 31, 2009 were as follows:
| | | |
2010. | | $ | 2,666 |
2011 | | | 228 |
2012 | | | 202 |
2013 | | | 537 |
2014 | | | 493 |
Thereafter | | | 18 |
| | | |
Total | | $ | 4,144 |
| | | |
150
AMERICAN CAPITAL, LTD.
NOTES TO CONSOLIDATED FINANCIAL STATEMENTS—(Continued)
(in millions, except per share data)
Note 6. Stock Options
We have stock option plans which provide for the granting of options to employees and non-employee directors to purchase shares of common stock at a price of not less than the fair market value of the common stock on the date of grant. Stock options granted under these plans vest over either a three or five year period and may be exercised for a period of no more than ten years from the date of grant. Options granted under these plans may be either incentive stock options within the meaning of Section 422 of the Code or non-qualified stock options. As of December 31, 2009, there are 45.2 million shares available to be granted under these stock option plans.
In connection with our special dividend of cash and common stock in August 2009 consisting of $24 million in cash and 67 million shares of our common stock (see Note 15), the Compensation Committee of our Board of Directors adjusted our stock options that were issued and outstanding prior to June 18, 2009, the ex-dividend date for the special dividend. The stock options were adjusted by reducing the exercise price and increasing the number of shares issuable upon the exercise of each option, in accordance with the safe harbor provisions of Section 409A of the Code, such that the aggregate difference between the market price and exercise price multiplied by the number of shares issuable upon exercise was substantially the same immediately before and after the payment of the special dividend. The anti-dilution adjustment resulted in a decrease in the weighted average exercise price from $25.45 per share to $19.60 per share and an increase in the aggregate number of shares issuable upon exercise of such stock options by 10.2 million shares. Since our stock option plans permit, but do not require, anti-dilution modifications, ASC 718 requires a comparison of the fair value of each award immediately prior to and after the date of modification, based on the pertinent facts and circumstances on the modification date. The excess fair value represents incremental compensation cost to be recognized immediately for vested stock options and over the remaining vesting period for unvested stock options. This comparison resulted in an aggregate incremental compensation cost of $6 million despite the fact that the aggregate difference between the market price and exercise price multiplied by the number of shares issuable upon exercise was substantially the same immediately before and after the modification. Of the additional incremental compensation cost of $6 million, $1 million related to vested stock options that was recorded during the year ended December 31, 2009 and the remainder will be amortized over the remaining vesting period.
In December 2009, we completed a tender offer for certain eligible outstanding employee stock options. Pursuant to the tender offer, we offered employees a cash payment for the voluntary cancellation of certain eligible outstanding employee stock options. Eligible stock options subject to the tender offer were awards (i) granted prior to March 30, 2008, (ii) that had an exercise price that equaled or exceeded $16.00 per share and (iii) that were outstanding and unexercised as of the December 28, 2009. For each tendered stock option, non-executive officer employees received a cash payment of $0.05 per eligible stock option and executive officer employees received $0.01 per eligible stock option. Employees electing to participate in the tender offer were required to exchange all of their eligible stock options. As a result of the tender offer, 21.7 million eligible stock options were tendered for a total cash payment of $0.6 million. Pursuant to ASC 718, the amount of any cash to purchase an equity award is charged to equity to the extent the amount paid does not exceed the fair value of the equity award repurchased as of the repurchase date, and any unrecognized compensation cost measured at the original grant date for unvested equity awards expected to vest is accelerated and recognized immediately in earnings. Of the tendered eligible stock options that were vested or expected to vest as of the repurchase date, the fair value of the awards on the tender offer date exceeded the tender offer purchase price and therefore the cash payment of approximately $0.6 million was recorded as a reduction to shareholders’ equity. Unrecognized compensation cost of approximately $21 million, for the tendered unvested eligible stock options that were expected to vest as of the purchase date, was accelerated and recorded as compensation expense for the year ended December 31, 2009 in salaries, benefits and stock-based compensation in the accompanying
151
AMERICAN CAPITAL, LTD.
NOTES TO CONSOLIDATED FINANCIAL STATEMENTS—(Continued)
(in millions, except per share data)
consolidated statements of operations. For the tendered unvested eligible stock options that were not expected to vest as of the purchase date, the cash payment of approximately $0.1 million was recorded as compensation expense for the year ended December 31, 2009 in salaries, benefits and stock-based compensation in the accompanying consolidated statements of operations and approximately $1.4 million of unrecognized compensation costs were written off to shareholders’ equity.
Our shareholders approved non-employee director plans in 1998, 2000, 2006, 2007 and 2008, and we subsequently received orders from the SEC authorizing such plans. Options granted under the director plans are non-qualified stock options that vest over a three year period and may be exercised for a period of no more than ten years from the date of grant. As of December 31, 2009, there are 0.2 million shares available to be granted under these stock option plans.
Stock Option Activity
A summary of the activity of our stock option plans as of and for the years ended December 31, 2009 and 2008 is as follows:
| | | | | | | | | | | | |
| | | 2009 | | 2008 |
| | | Shares | | | Weighted
Average Exercise
Price | | Shares | | | Weighted
Average Exercise
Price |
Options outstanding, beginning of year | | 26.0 | | | $ | 34.91 | | 21.5 | | | $ | 37.58 |
Granted | | 17.0 | | | $ | 4.47 | | 6.1 | | | $ | 26.04 |
Exercised | | — | | | $ | — | | (0.2 | ) | | $ | 26.32 |
Cancelled and expired | | (27.0 | ) | | $ | 25.66 | | (1.4 | ) | | $ | 38.31 |
Modified | | 10.2 | | | $ | 19.60 | | — | | | $ | — |
| | | | | | | | | | | | |
Options outstanding, end of year | | 26.2 | | | $ | 9.35 | | 26.0 | | | $ | 34.91 |
| | | | | | | | | | | | |
Options exercisable, end of year | | 3.7 | | | $ | 25.44 | | 8.7 | | | $ | 34.50 |
| | | | | | | | | | | | |
Fair Value Disclosures
The following table reflects the weighted average fair value per option granted during the years ended December 31, 2009, 2008 and 2007, as well as the weighted average assumptions used in determining those fair values using a Black-Scholes pricing model.
| | | | | | | | | | | | |
| | | 2009 | | | 2008 | | | 2007 | |
Options granted (in millions) | | | 17.0 | | | | 6.1 | | | | 9.1 | |
Fair value on grant date | | $ | 1.41 | | | $ | 1.75 | | | $ | 4.37 | |
Expected dividend yield | | | 9.3 | % | | | 15.4 | % | | | 8.4 | % |
Expected volatility | | | 76 | % | | | 40 | % | | | 26 | % |
Estimated annual forfeiture rate | | | 6.5 | % | | | 6.3 | % | | | 6.6 | % |
Risk-free interest rate | | | 2.4 | % | | | 3.4 | % | | | 4.5 | % |
Expected life (years) | | | 6.9 | | | | 7.2 | | | | 5.4 | |
152
AMERICAN CAPITAL, LTD.
NOTES TO CONSOLIDATED FINANCIAL STATEMENTS—(Continued)
(in millions, except per share data)
The following table summarizes information about our stock options outstanding as of December 31, 2009:
| | | | | | | | | | | | | | |
| | | Options Outstanding | | Options Exercisable |
Range of Exercise Prices | | Outstanding | | Weighted Average
Remaining
Contractual life | | Weighted Average
Exercise Price | | Exercisable | | Weighted Average
Remaining
Contractual life | | Weighted Average
Exercise Price |
$0.94 to $15.00 | | 18.6 | | 9.3 | | $ | 3.82 | | 0.3 | | 7.4 | | $ | 6.99 |
$15.01 to $30.00 | | 6.2 | | 7.0 | | $ | 19.20 | | 2.3 | | 4.6 | | $ | 21.53 |
$30.01 to $45.00 | | 1.1 | | 5.2 | | $ | 36.62 | | 0.8 | | 4.4 | | $ | 36.36 |
$45.01 to $49.63 | | 0.3 | | 7.1 | | $ | 48.02 | | 0.3 | | 7.1 | | $ | 47.98 |
| | | | | | | | | | | | | | |
| | 26.2 | | 8.5 | | $ | 9.35 | | 3.7 | | 5.0 | | $ | 25.44 |
| | | | | | | | | | | | | | |
As of December 31, 2009, the total compensation cost related to non-vested stock option awards not yet recognized was $23 million with a weighted average period to be recognized of 2.5 years. The intrinsic value for stock options outstanding as of December 31, 2009 is $1 million. There was no intrinsic value for stock options exercisable as of December 31, 2009.
As of December 31, 2008, the total compensation cost related to non-vested stock option awards not yet recognized was $47 million with a weighted average period to be recognized of 3.2 years. There was no intrinsic value for stock options outstanding and exercisable as of December 31, 2008.
For the years ended December 31, 2009, 2008 and 2007, we recorded stock-based compensation expense attributable to our stock options of $44 million, $21 million and $25 million, respectively. For the years ended December 31, 2008 and 2007, the intrinsic value of stock options exercised was $1 million and $14 million, respectively. There were no stock options exercised during the year ended December 31, 2009.
Note 7. Deferred Compensation Plan
We have a non-qualified deferred compensation plan (the “Compensation Plan”) for the purpose of granting bonus awards to our employees. The Compensation Committee is the administrator of the Compensation Plan. The Compensation Plan is funded through a trust (the “Trust”) which is administered by a third-party trustee. The Compensation Committee determines cash bonus awards to be granted under the Compensation Plan and the terms of such awards, including vesting schedules. The cash bonus awards are invested by the Trust in our common stock by purchasing shares on the open market. Awards vest contingent on the employee’s continued employment and the achievement of performance goals, if any, as determined by the Compensation Committee. The Trust provides certain protections of its assets from events other than claims against our assets in the case of bankruptcy. The assets and liabilities of the Trust are consolidated in the accompanying consolidated financial statements. Shares of our common stock held by the Trust are accounted for as treasury stock in the accompanying consolidated balance sheets.
The Compensation Plan does not permit diversification and the cash bonus awards must be settled by the delivery of a fixed number of shares of our common stock. The awards under the Compensation Plan are accounted for as grants of unvested stock. We record stock-based compensation expense based on the fair market value of our stock on the date of grant. The compensation cost for awards with service conditions is recognized using the straight-line attribution method over the requisite service period. The compensation cost for awards with performance and service conditions is recognized using the accelerated attribution method over the requisite service period. During the years ended December 31, 2009 and 2008, we granted awards to employees totaling
153
AMERICAN CAPITAL, LTD.
NOTES TO CONSOLIDATED FINANCIAL STATEMENTS—(Continued)
(in millions, except per share data)
$4 million and $52 million, respectively. During the year ended December 31, 2009, 1.3 million forfeited shares were reallocated to plan participants to fund the 2009 awards and no cash contributions were made to acquire shares. During the year ended December 31, 2008, we contributed $44 million of cash to the Trust to acquire 3.2 million shares of our common stock on the open market and 0.4 million forfeited shares were reallocated to plan participants to fund a portion of the awards. During the years ended December 31, 2009, 2008 and 2007, we recorded stock-based compensation expense of $42 million, $60 million and $46 million, respectively, attributable to the Compensation Plan. As of December 31, 2009, the total compensation cost related to non-vested bonus awards not yet recognized was $69 million with a weighted average period to be recognized of 3.0 years. We calculated the compensation expense recognized during the years ended December 31, 2009, 2008 and 2007 using an estimated annual forfeiture rate of 6.5%, 6.3% and 6.6%, respectively.
A summary of the bonus awards under the Compensation Plan as of and for the years ended December 31, 2009 and 2008 is as follows:
| | | | | | | | | | | | |
| | | 2009 | | 2008 |
| | | Shares | | | Weighted Average
Grant Date
Fair Value | | Shares | | | Weighted Average
Grant Date
Fair Value |
Non-vested, beginning of year | | 8.0 | | | $ | 26.60 | | 5.5 | | | $ | 39.00 |
Granted | | 1.3 | | | $ | 3.10 | | 3.6 | | | $ | 14.80 |
Shares earned under dividend reinvestment plan | | 2.7 | | | $ | 3.50 | | 1.1 | | | $ | 23.90 |
Vested | | (2.7 | ) | | $ | 29.50 | | (1.7 | ) | | $ | 37.40 |
Cancelled and expired | | (1.5 | ) | | $ | 22.90 | | (0.5 | ) | | $ | 35.90 |
| | | | | | | | | | | | |
Non-vested, end of year | | 7.8 | | | $ | 14.40 | | 8.0 | | | $ | 26.60 |
| | | | | | | | | | | | |
As of December 31, 2009 and 2008, there were 2.4 million and 1.3 million shares, respectively, of our common stock in the Trust that were vested but not yet distributed to the employees.
Note 8. Employee Stock Ownership Plan
We maintain an employee stock ownership plan (“ESOP”), in which all of our employees participate and which is fully funded on a pro rata basis by us. The plan provides for participants to receive employer contributions of at least 3% of total annual employee compensation, up to certain statutory limitations. Plan participants are fully vested in the employer contributions. For the years ended December 31, 2009, 2008 and 2007, we accrued $2 million, $3 million and $2 million, respectively, in contributions to the ESOP.
We sponsor an employee stock ownership trust to act as the depository of employer contributions to the ESOP as well as to administer and manage the actual trust assets that are deposited into the ESOP.
154
AMERICAN CAPITAL, LTD.
NOTES TO CONSOLIDATED FINANCIAL STATEMENTS—(Continued)
(in millions, except per share data)
Note 9. Earnings Per Share
The following table sets forth the computation of basic and diluted earnings per share for the years ended December 31, 2009, 2008 and 2007:
| | | | | | | | | | | |
| | | 2009 | | | 2008 | | | 2007 |
Numerator for basic and diluted net operating income per share | | $ | 135 | | | $ | 493 | | | $ | 594 |
| | | | | | | | | | | |
Numerator for basic and diluted net (loss) earnings per share | | $ | (910 | ) | | $ | (3,115 | ) | | $ | 700 |
| | | | | | | | | | | |
Denominator for basic weighted average shares | | | 241.1 | | | | 203.7 | | | | 173.9 |
Employee stock options and awards | | | — | | | | — | | | | 2.7 |
Shares issuable under forward sale agreements | | | — | | | | — | | | | 0.3 |
| | | | | | | | | | | |
Denominator for diluted weighted average shares | | | 241.1 | | | | 203.7 | | | | 176.9 |
| | | | | | | | | | | |
Basic net operating income per common share | | $ | 0.56 | | | $ | 2.42 | | | $ | 3.42 |
Diluted net operating income per common share | | $ | 0.56 | | | $ | 2.42 | | | $ | 3.36 |
Basic net (loss) earnings per common share | | $ | (3.77 | ) | | $ | (15.29 | ) | | $ | 4.03 |
Diluted net (loss) earnings per common share | | $ | (3.77 | ) | | $ | (15.29 | ) | | $ | 3.96 |
In computing diluted EPS, only potential common shares that are dilutive, those that reduce earnings per share or increase loss per share, are included. The effect of stock options, unvested employee stock awards, contingently issuable shares and shares issued under forward sales agreements are not included if the result would be anti-dilutive, such as when a net loss is reported. The “control number” for determining whether including potential common shares in the diluted EPS computation would be anti-dilutive is net (loss) earnings. As a result, if there is a net (loss), diluted EPS is computed using the same number of weighted average shares as used in computing basic EPS, even if we have positive net operating income. Therefore, basic EPS and diluted EPS are computed using the same number of weighted average shares for the years ended December 31, 2009 and 2008 as we incurred a net (loss) for those periods.
During the year ended December 31, 2009, we paid a special dividend consisting of cash and common stock. Shareholders had the option to receive payment of the dividend in cash or in shares of common stock, provided that the aggregate cash payable to all shareholders was limited to an amount equal to 10% of the aggregate dividend (see Note 15). Since the aggregate amount of shareholder cash elections exceeded the 10% limitation, the shareholders electing to receive cash were distributed a pro rata cash amount and the remaining portion of the special dividend in shares of common stock. The common stock issued for the special dividend does not qualify for accounting treatment as a stock dividend as that term is defined within Accounting Research Bulletin No. 43,Restatement and Revision of Accounting Research Bulletins,which is codified in FASB ASC 505-20, Equity, Stock Dividends and Stock Splits,and therefore the number of common shares outstanding, earnings per share and NAV per share results for prior periods will not be restated.
Stock options, unvested employee stock awards and contingently issuable shares of 56.3 million, 30.5 million and 6.9 million for the years ended December 31, 2009, 2008 and 2007, respectively, were not included in the computation of diluted EPS either because the respective exercise prices are greater than the average market value of the underlying stock or their inclusion would have been anti-dilutive.
155
AMERICAN CAPITAL, LTD.
NOTES TO CONSOLIDATED FINANCIAL STATEMENTS—(Continued)
(in millions, except per share data)
Note 10. Geographic Data
The following table presents operating income and assets as of and for the years ended December 31, 2009, 2008 and 2007 by geographic location. The geographic location of a portfolio investment is determined by the location of the corporate headquarters of the portfolio company.
| | | | | | | | | |
| | | 2009 | | 2008 | | 2007 |
Operating income | | | | | | | | | |
United States | | $ | 667 | | $ | 955 | | $ | 1,169 |
International | | | 30 | | | 96 | | | 71 |
| | | | | | | | | |
Total operating income | | $ | 697 | | $ | 1,051 | | $ | 1,240 |
| | | | | | | | | |
Assets | | | | | | | | | |
United States | | $ | 6,218 | | $ | 7,271 | | $ | 10,662 |
International | | | 454 | | | 639 | | | 1,070 |
| | | | | | | | | |
Total assets | | $ | 6,672 | | $ | 7,910 | | $ | 11,732 |
| | | | | | | | | |
Note 11. Commitments
As of December 31, 2009, we had commitments under loan and financing agreements to fund up to $394 million to 45 portfolio companies, with $184 million of the commitments related to undrawn revolving credit facilities for European Capital (see Note 18). These commitments are primarily composed of working capital credit facilities, acquisition credit facilities and subscription agreements. The commitments are generally subject to the borrowers meeting certain criteria such as compliance with covenants and availability under borrowing base thresholds. The terms of the borrowings and financings subject to commitment are comparable to the terms of other loan and equity securities in our portfolio.
We have non-cancelable operating leases for office space and office equipment. The leases expire over the next fifteen years and contain provisions for certain annual rental escalations. Rent expense for operating leases for the years ended December 31, 2009, 2008 and 2007 was $15 million, $15 million and $14 million, respectively.
Future minimum lease payments under non-cancelable operating leases as of December 31, 2009, net of any related sublease revenue, were as follows:
| | | |
2010 | | $ | 21 |
2011 | | | 20 |
2012 | | | 17 |
2013 | | | 14 |
2014 | | | 14 |
Thereafter | | | 97 |
| | | |
Total | | $ | 183 |
| | | |
156
AMERICAN CAPITAL, LTD.
NOTES TO CONSOLIDATED FINANCIAL STATEMENTS—(Continued)
(in millions, except per share data)
Note 12. Restructuring Costs
To better align our organization and cost structure with current economic conditions, we conducted strategic reviews of our business in 2009 and 2008 which resulted in aggregate restructuring charges of $25 million and $19 million during the years ended December 31, 2009 and 2008, respectively. The restructuring charges for the year ended December 31, 2009 included $9 million for severance and related costs associated with 72 employees notified of termination during 2009 and $16 million of costs related to excess facilities, including $7 million of accelerated depreciation expense offset by a $3 million write-off of a deferred rent liability. The restructuring charges for the year ended December 31, 2008 included $10 million for severance and related costs associated with 160 employees notified of termination during 2008 and $9 million of net costs related to excess facilities, including $6 million of accelerated depreciation expense offset by a $2 million write-off of a deferred rent liability. The severance and related costs are included in salaries, benefits and stock-based compensation and the excess facilities costs are included in general and administrative in our consolidated statements of operations.
The liability for employee severance costs and excess facilities is included in other liabilities in the consolidated balance sheets as of December 31, 2009 and 2008. As of December 31, 2009, the liability was $20 million, comprised of $7 million of severance and related costs to be paid in 2010 and excess facility costs, net of estimated sublease revenue, of $13 million to be paid through 2016. As of December 31, 2008, the liability was $12 million, comprised of $7 million of severance and related costs paid in 2009 and excess facility costs, net of estimated sublease revenue, of $5 million to be paid through 2016.
In determining our liability related to excess facilities, we are required to estimate such factors as future vacancy rates, the time required to sublet properties and sublease rates. These estimates are reviewed quarterly based on known real estate market conditions and the credit-worthiness of subtenants, and may result in revisions to the liability. Our remaining liability of $13 million as of December 31, 2009 related to excess facilities represents gross lease commitments with agreements expiring at various dates through 2016 of approximately $38 million, net of committed and estimated sublease income of approximately $20 million and a present value factor of $5 million. We have entered into signed sublease arrangements for approximately $4 million, with the remaining $16 million based on estimated future sublease income.
The following table summarizes the restructuring accrual activity during the years ended December 31, 2009 and 2008:
| | | | | | | | | | | | |
| | | Severance | | | Excess
Facilities | | | Total | |
Balance, December 31, 2007 | | $ | — | | | $ | — | | | $ | — | |
Restructuring charges | | | 10 | | | | 5 | | | | 15 | |
Cash payments | | | (3 | ) | | | — | | | | (3 | ) |
| | | | | | | | | | | | |
Balance, December 31, 2008 | | $ | 7 | | | $ | 5 | | | $ | 12 | |
Restructuring charges | | | 9 | | | | 12 | | | | 21 | |
Cash payments | | | (9 | ) | | | (5 | ) | | | (14 | ) |
Accretion of net present value | | | — | | | | 1 | | | | 1 | |
| | | | | | | | | | | | |
Balance, December 31, 2009 | | $ | 7 | | | $ | 13 | | | $ | 20 | |
| | | | | | | | | | | | |
157
AMERICAN CAPITAL, LTD.
NOTES TO CONSOLIDATED FINANCIAL STATEMENTS—(Continued)
(in millions, except per share data)
Note 13. Shareholders’ Equity
Our common stock activity for the years ended December 31, 2009 and 2008 was as follows:
| | | | | | |
| | | 2009 | | | 2008 | |
Common stock outstanding at beginning of period | | 204.7 | | | 195.9 | |
Issuance of common stock in conjunction with acquisition of European Capital (Note 18) | | 11.5 | | | 12.7 | |
Issuance of common stock in conjunction with our special dividend (Note 15) | | 64.2 | | | — | |
Issuance of common stock under stock option plans | | — | | | 0.2 | |
Foreclosure of stock option loans | | (1.1 | ) | | — | |
Purchase of treasury stock | | — | | | (0.2 | ) |
(Distribution) purchase of common stock held in deferred compensation trusts, net | | 1.6 | | | (3.9 | ) |
| | | | | | |
Common stock outstanding at end of period | | 280.9 | | | 204.7 | |
| | | | | | |
Equity Offerings
In March 2008, we completed a public offering in which 8.7 million shares of our common stock were sold at a public offering price of $34.77 per share. Upon completion of the offering we received proceeds, net of the underwriters’ discount and other offering costs, of $302 million.
During the year ended December 31, 2008, we issued 4.0 million shares of our common stock at a price of $35.61 per share for total proceeds of $142 million pursuant to a forward sale agreement entered into in November 2007.
(Distributions in Excess of) Undistributed Net Realized Earnings
As of December 31, 2009 and 2008, our (distributions in excess of) undistributed net realized earnings determined in accordance with GAAP as reflected on our consolidated balance sheets are shown below. The amounts reflect reclassifications between distributions in excess of net realized gains and (distributions in excess of) undistributed net operating income for classification differences in how net realized gains and net operating income are recorded under GAAP and capital gains and ordinary income are recorded under tax.
| | | | | | | | |
| | | 2009 | | | 2008 | |
(Distributions in excess of) undistributed net operating income | | $ | (517 | ) | | $ | 103 | |
Distributions in excess of net realized gains | | | (192 | ) | | | (27 | ) |
| | | | | | | | |
(Distributions in excess of) undistributed net realized earnings | | $ | (709 | ) | | $ | 76 | |
| | | | | | | | |
Note 14. Interest Rate Derivatives
We enter into interest rate swap agreements to manage interest rate risk and also to fulfill our obligations under the terms of our asset securitizations. We do not hold or issue interest rate swap agreements or other derivative financial instruments for speculative purposes. All derivative financial instruments are recorded at fair value with changes in value reflected in net unrealized appreciation or depreciation of investments during the reporting period. The fair value of our interest rate swap agreements is based on the estimated net present value of the future cash flows using the forward interest rate yield curve in effect at the end of the period, adjusted for the nonperformance risk of us and our counterparties. We record the accrual of periodic interest settlements of
158
AMERICAN CAPITAL, LTD.
NOTES TO CONSOLIDATED FINANCIAL STATEMENTS—(Continued)
(in millions, except per share data)
interest rate swap agreements in net unrealized appreciation or depreciation of investments and subsequently record the amount as a net realized gain or loss on investments on the interest settlement date. Cash payments received or paid for the termination of an interest rate derivative agreement are recorded as a realized gain or loss upon termination in our consolidated statements of operations and are classified under investing activities in our consolidated statements of cash flows.
We have interest rate swap agreements where we generally pay a fixed rate and receive a floating rate based on LIBOR. We also enter into interest rate swaption agreements where, if exercised, we pay a floating rate based on LIBOR and receive a fixed rate. The fair value of our interest rate derivative agreements are identified as separate items on our consolidated balance sheets and are described in the accompanying consolidated schedules of investments.
During the year ended December 31, 2009, we recorded $31 million of net unrealized appreciation from interest rate swap agreements and a $49 million reversal of prior period net unrealized depreciation from the termination of the European Capital put option agreement (see Note 18) in the financial statement line item derivative and option agreements and other. During the years ended December 31, 2008 and 2007, we recorded $119 million and $80 million, respectively, of net unrealized depreciation from interest rate swap agreements in the financial statement line item derivative and option agreements and other in our consolidated statements of operations.
During the years ended December 31, 2009 and 2008 we recorded $59 million and $31 million, respectively, of net realized loss from interest rate swap agreements in the financial statement line item derivative and option agreements in our consolidated statements of operations for periodic interest settlements of interest rate swap agreements. During the year ended December 31, 2009, we also recorded a realized loss of $44 million from the termination of the European Capital put option agreement. During the year ended December 31, 2007 we recorded $10 million of net realized gain from interest rate swap agreements in the financial statement line item derivative and option agreements in our consolidated statements of operations for periodic interest settlements of interest rate swap agreements. During the year ended December 31, 2009, two interest rate swap agreements were terminated prior to their maturity. The transaction under one interest rate swap agreement was settled for a cash termination payment of $3 million and recorded as a net realized loss in financial statement line item derivative and option agreements in our consolidated statements of operations. The other interest rate swap agreement was not settled and was recorded as a liability with a fair value of $12 million and included in other liabilities in our consolidated balance sheets as of December 31, 2009. During the years ended December 31, 2008 and 2007, we had net cash termination payments of $9 million and net cash termination receipts of $7 million, respectively, for interest rate swap agreements and recorded as a net realized gain or loss in the financial statement line item derivative and option agreements in our consolidated statements of operations.
Periodically, an interest rate swap agreement will also be amended whereby any underlying unrealized appreciation or depreciation associated with the original interest rate swap agreement at the time of amendment will be factored into the contractual interest terms of the amended interest rate swap agreement. The contractual terms of the amended interest rate swap agreement are set such that its estimated fair value is equivalent to the estimated fair value of the original interest rate swap agreement. No realized gain or loss is recorded upon amendment when the estimated fair values of the original and amended interest rate swap agreement are substantially the same.
159
AMERICAN CAPITAL, LTD.
NOTES TO CONSOLIDATED FINANCIAL STATEMENTS—(Continued)
(in millions, except per share data)
Credit Risk-Related Contingent Features
Certain of our interest rate swap agreements contain an event of default that allows the counterparty to terminate transactions outstanding under the agreement following the occurrence of a cross default on certain of our other indebtedness in amounts equal to or greater than $5 million to $15 million, as applicable. During the year ended December 31, 2009, one counterparty had elected to terminate its interest rate swap agreement with us due to a cross default on certain of our other indebtedness, which had a fair value of $12 million. This amount had not been settled as of December 31, 2009 and is included in other liabilities in our consolidated balance sheets. Derivatives under these agreements in a liability position had a GAAP fair value liability of $29 million as of December 31, 2009. In the event that these counterparties terminated their transactions with us, the termination liability would have been $35 million as of December 31, 2009. The difference between the GAAP fair value liability and the termination liability represents an adjustment for nonperformance risk of us and our counterparties.
Certain of our interest rate swap agreements also contain an event of default that allows a counterparty to terminate transactions outstanding under the agreement if certain of our other indebtedness in amounts equal to or greater than $5 million or $15 million, as applicable, is accelerated. While this event of default has occurred, none of our counterparties have elected to terminate their transactions with us as a result of this provision as of December 31, 2009. Derivatives under these agreements in a liability position had a GAAP fair value liability of $8 million as of December 31, 2009. In the event that these counterparties terminated their transactions with us, the termination liability would have been $8 million as of December 31, 2009. During the year ended December 31, 2009, one of these agreements was terminated and settled for a cash payment of $3 million.
In addition, one of our interest rate swap agreements provides that, if our unsecured debt rating falls below BB- as rated by Fitch Ratings, BB- as rated by Standard & Poor’s Rating Services or Ba3 by Moody’s Investors Services, Inc., the counterparty may terminate transactions outstanding under the agreement. While this additional termination event has occurred, the counterparty had not elected to terminate its transactions outstanding with us as of December 31, 2009. Derivatives under these agreements in a liability position had a GAAP fair value liability of $19 million as of December 31, 2009. In the event that these counterparties terminated their transactions with us, the termination liability would have been $23 million as of December 31, 2009. The difference between the GAAP fair value liability and the termination liability represents an adjustment for nonperformance risk of us and our counterparties.
Certain of our interest rate swap agreements also provide that, if our unsecured revolving credit facility is terminated, or the counterparty does not continue to be a lender under our unsecured revolving credit facility, and we do not post collateral for our derivative obligations related to this counterparty or make arrangements for the counterparty to transfer its rights and obligations under the derivative agreement within 30 days, the counterparty may terminate the transactions outstanding under the agreement. As of December 31, 2009, this additional termination event had not occurred. Derivatives under these agreements in a liability position had a GAAP fair value liability of $1 million as of December 31, 2009. In the event that these counterparties terminated their transactions with us, the termination liability would have been $2 million as of December 31, 2009. The difference between the GAAP fair value liability and the termination liability represents an adjustment for nonperformance risk of us and our counterparties.
Note 15. Income Taxes
We operate to qualify as a RIC under Subchapter M of the Code. In order to qualify as a RIC, we must annually distribute in a timely manner to our shareholders at least 90% of our taxable ordinary income of our
160
AMERICAN CAPITAL, LTD.
NOTES TO CONSOLIDATED FINANCIAL STATEMENTS—(Continued)
(in millions, except per share data)
investment company based on our tax fiscal year. Taxable ordinary income includes net short-term capital gains but excludes net long-term capital gains. A RIC is not subject to federal income tax on the portion of its taxable ordinary income and long-term capital gains that are distributed to its shareholders, including “deemed distributions” discussed below. As permitted by the Code, a RIC can designate dividends paid in the subsequent tax year as dividends of current year taxable ordinary income and net long-term gains if those dividends are both declared by the extended due date of the RIC’s federal income tax return and paid to shareholders by the last day of the subsequent tax year. Our taxable ordinary income and net long-term capital gains comprise our taxable income for our investment company. We have distributed, or intend to distribute, sufficient dividends to eliminate taxable income. If we fail to satisfy the 90% distribution requirement or otherwise fail to qualify as a RIC in any tax year, we would be subject to income tax in such year on all of our taxable income, regardless of whether we made any distributions to our shareholders. We have a tax fiscal year that ends on September 30.
Our taxable income differs from net income as defined by GAAP due primarily to temporary and permanent differences in interest and dividend income recognition, stock-based compensation and other expense recognition and unrealized appreciation or depreciation of investments. In addition, there are classification differences between GAAP and tax as it relates to what is characterized as net operating income for GAAP compared to taxable ordinary income for tax and what is characterized as net realized gains or losses for GAAP compared to net long-term capital gains or losses for tax. These characterization differences between GAAP and tax include the characterization of realized losses for loans, interest receivable write-offs for uncollectible accounts, periodic interest settlements for interest rate swap agreements and the holding period of capital investments.
On January 7, 2009, the Internal Revenue Service (“IRS”) issued Revenue Procedure 2009-15, which temporarily allows a RIC to distribute its own stock as a dividend for the purpose of fulfilling its distribution requirements. Pursuant to this revenue procedure, a RIC may treat a distribution of its own stock as a dividend if (i) the stock is publicly traded on an established securities market, (ii) the distribution is declared with respect to a taxable year ending on or before December 31, 2009 and (iii) each shareholder may elect to receive his entire distribution in either cash or stock of the RIC subject to a limitation on the aggregate amount of cash to be distributed to all shareholders, which must be at least 10% of the aggregate declared distribution. If too many shareholders elect to receive cash, each shareholder electing to receive cash will receive a pro rata amount of cash (with the balance of the distribution paid in stock). In no event will any shareholder electing to receive cash receive less than 10% of his or her entire distribution in cash. On December 23, 2009 the IRS issued Revenue Procedure 2010-12, which extends under similar terms the temporary guidance provided by Revenue Procedure 2009-15. This new guidance applies to distributions by a RIC of its own stock declared by December 31, 2012 with respect to RIC distribution requirements for taxable years ending on or before December 31, 2011.
Under the 1940 Act, if a BDC has any senior debt securities outstanding that were publicly issued, the BDC must make provision to prohibit the declaration of any dividend (except a dividend payable in the stock of the BDC) if its asset coverage is below certain thresholds at the time of the distribution after deducting the amount of such dividend. However, we have received guidance from the staff of the SEC that notwithstanding this provision of the 1940 Act, we are able to declare and pay dividends pursuant to the revenue procedure issued by the IRS as discussed above.
On June 11, 2009, our Board of Directors declared a special dividend to our shareholders of $1.07 per share that was paid on August 7, 2009. Each shareholder could elect to receive the dividend in either cash or in shares of common stock. Because the aggregate amount of the cash elections exceeded 10% of the aggregate dividend amount, the shareholders electing to receive cash received a pro rata cash amount and the remaining portion in shares of common stock. The number of shares of common stock comprising the stock portion was determined
161
AMERICAN CAPITAL, LTD.
NOTES TO CONSOLIDATED FINANCIAL STATEMENTS—(Continued)
(in millions, except per share data)
based on the volume weighted average price of our stock on The NASDAQ Global Select Market on July 27, July 28 and July 29, 2009. In total, the distribution consisted of $24 million of cash and 67.1 million shares of common stock. Included in the distribution of 67.1 million shares of common stock were 2.9 million shares of common stock distributed to a consolidated trust for our non-qualified deferred compensation plan. The shares of common stock held by the trust are accounted for as treasury stock in the accompanying consolidated balance sheets. The exact amount of cash and common stock received by each shareholder depended on the shareholder’s election. The special dividend included our remaining 2008 taxable income and a substantial portion of our 2009 taxable income.
In addition, a RIC may elect to retain its net long-term capital gains by designating them as a “deemed distribution” to its shareholders and paying a federal tax of 35% on the net long-term capital gains for the benefit of its shareholders. Shareholders would then report their share of the retained net long-term capital gains on their income tax returns as if it had been received and report a tax credit for the tax paid on their behalf by the RIC. Shareholders then add the amount of the “deemed distribution,” net of such tax, to the basis of their shares.
We declared dividends of $231 million, $623 million and $655 million, or $1.07, $3.09 and $3.72 per share for the fiscal years ended December 31, 2009, 2008 and 2007, respectively. For income tax purposes, our distributions to shareholders for the fiscal years ended December 31, 2009 and December 31, 2007 were composed of taxable ordinary income. For income tax purposes, our distributions to shareholders for the fiscal year ended December 31, 2008 were composed of $2.39 per share of taxable ordinary income and $0.70 per share of net long-term capital gains.
For the tax years ended September 30, 2009, we incurred a net capital loss of approximately $152 million, which may be carried forward for up to eight tax years. For the tax years ended September 30, 2008 and 2007, we had net long-term capital gains of $155 million and $142 million, respectively. For the tax year ended September 30, 2008, we elected to retain such net long-term capital gains by treating them as a “deemed distribution” and paying the federal tax on behalf of our shareholders of $54 million, which is included in taxes on net realized gain on the accompanying consolidated statements of operations. For the tax year ended September 30, 2007, we elected to distribute such net long-term capital gains to our shareholders by designating a portion of our dividends as dividends of our net long-term capital gains.
As a RIC, we are also subject to a nondeductible federal excise tax of 4% if we do not distribute at least 98% of our ordinary income, excluding net short-term capital gains, in any calendar year and 98% of our capital gains for each one-year period ending October 31, including any undistributed income from the prior excise tax year. For the calendar years ended December 31, 2008 and 2007 and the one-year periods ending October 31, 2008 and 2007, we did not distribute at least 98% of our ordinary income and capital gains and paid the 4% excise tax. For the years ended December 31, 2008 and 2007, we accrued $14 million and $7 million, respectively, of excise tax expense attributable to undistributed ordinary income, which is included in our (benefit) provision for income taxes on the accompanying consolidated statements of operations. For the year ended December 31, 2007, we accrued $6 million of excise tax attributable to undistributed capital gains, which is included in taxes on net realized gain on the accompanying consolidated statements of operations. The final taxable income included in our excise tax return for the calendar year ended December 31, 2008 and one-year period ending October 31, 2008 resulted in a lower taxable income than the estimated taxable income used to accrue the $14 million excise tax for the year ended December 31, 2008. As a result of this change in estimate, we accrued an $8 million income tax benefit for the year ended December 31, 2009 related to excise taxes, which is included in our (benefit) provision for income taxes on the accompanying consolidated statements of operations. For the calendar year ended December 31, 2009 and the one-year period ending October 31, 2009, we have distributed sufficient dividends to avoid being subject to the federal excise tax.
162
AMERICAN CAPITAL, LTD.
NOTES TO CONSOLIDATED FINANCIAL STATEMENTS—(Continued)
(in millions, except per share data)
The aggregate gross unrealized appreciation of our investments over cost for federal income tax purposes was $283 million and $469 million as of December 31, 2009 and 2008, respectively. The aggregate gross unrealized depreciation of our investments under cost for federal income tax purposes was $4,348 million and $4,142 million as of December 31, 2009 and 2008, respectively. The net unrealized depreciation over cost for federal income tax purposes was $4,065 million and $3,673 million as of December 31, 2009 and 2008, respectively. The aggregate cost of securities for federal income tax purposes was $9,539 million and $10,878 million as of December 31, 2009 and 2008, respectively.
Our consolidated taxable operating subsidiary, ACFS, is subject to federal, state and local income tax. Prior to the deconsolidation of ECFS in the second quarter of 2007 (see Note 18), our tax provision included ECFS which is subject to foreign and local income tax in its respective jurisdictions.
Deferred income tax balances for our taxable operating subsidiaries reflect the impact of temporary differences between the carrying amount of assets and liabilities and their tax basis and are stated at tax rates expected to be in effect when taxes are actually paid or recovered. A valuation allowance is provided against deferred tax assets when it is more likely than not that some or all of the deferred tax asset will not be realized. In determining if our deferred tax asset is realizable, we consider the forecasted future taxable income of ACFS as well as any tax planning strategies. Considering the current macroeconomic environment as of December 31, 2008, we concluded that it was more likely than not that we would not realize our deferred tax asset with future taxable income of ACFS. Accordingly, we recorded an increase to our valuation allowance of $52 million in 2008. As of December 31, 2009, we continued to conclude that it is more likely than not that we would not realize our deferred tax asset with future taxable income of ACFS and have recorded a full valuation allowance against our deferred tax asset. We will continue to evaluate the valuation allowance each reporting period, and if we determine that it is more likely than not that the realizable amount of the deferred tax asset exceeds the valuation allowance, we would reduce the valuation allowance.
On November 6, 2009, The Worker, Homeownership, and Business Assistance Act of 2009 was enacted. As part of this legislation, the carryback period for net operating losses arising in either 2008 or 2009 was increased from two years to three, four or five years at the election of the taxpayer. As a result of this new legislation, ACFS was able to carryback its net operating loss for the tax year ended September 30, 2009 to prior years to claim a refund which resulted in American Capital recording a tax benefit of $10 million for the year ended December 31, 2009, which is included in our (benefit) provision for income taxes on the accompanying consolidated statements of operations.
The components of our deferred tax assets for our taxable operating subsidiary as of December 31, 2009 and 2008 were as follows:
| | | | | | | | |
| | | 2009 | | | 2008 | |
Deferred tax assets: | | | | | | | | |
Stock-based compensation | | $ | 23 | | | $ | 34 | |
Net operating loss carryforward | | | 4 | | | | 11 | |
Deferred rent liability | | | 8 | | | | 8 | |
Allowance for doubtful accounts | | | 3 | | | | 3 | |
Property and equipment | | | 2 | | | | 1 | |
| | | | | | | | |
Total deferred tax asset | | | 40 | | | | 57 | |
| | | | | | | | |
Valuation allowance | | | (40 | ) | | | (52 | ) |
| | | | | | | | |
Net deferred tax asset | | $ | — | | | $ | 5 | |
| | | | | | | | |
163
AMERICAN CAPITAL, LTD.
NOTES TO CONSOLIDATED FINANCIAL STATEMENTS—(Continued)
(in millions, except per share data)
For the years ended December 31, 2009, 2008 and 2007, the (benefit) provision for income taxes, including the excise tax, was comprised of the following:
| | | | | | | | | | | | |
| | | 2009 | | | 2008 | | | 2007 | |
Current tax (benefit) expense: | | | | | | | | | | | | |
Federal | | $ | (12 | ) | | $ | (1 | ) | | $ | 11 | |
State | | | — | | | | (1 | ) | | | 3 | |
Foreign | | | — | | | | — | | | | 1 | |
| | | | | | | | | | | | |
Total current tax (benefit) expense | | | (12 | ) | | | (2 | ) | | | 15 | |
| | | | | | | | | | | | |
Deferred tax provision (benefit) | | | | | | | | | | | | |
Federal | | | — | | | | 19 | | | | (20 | ) |
State | | | — | | | | 6 | | | | 4 | |
| | | | | | | | | | | | |
Total deferred tax provision (benefit) | | | — | | | | 25 | | | | (16 | ) |
| | | | | | | | | | | | |
Total (benefit) provision for income taxes of taxable operating subsidiaries | | | (12 | ) | | | 23 | | | | (1 | ) |
(Benefit) provision for excise tax | | | (8 | ) | | | 14 | | | | 7 | |
| | | | | | | | | | | | |
Total (benefit) provision for income taxes | | $ | (20 | ) | | $ | 37 | | | $ | 6 | |
| | | | | | | | | | | | |
A reconciliation between the taxes computed at the federal statutory rate and our effective tax rate for our taxable operating subsidiaries for the fiscal years ended December 31, 2009, 2008 and 2007 is as follows:
| | | | | | | | | | | | |
| | | 2009 | | | 2008 | | | 2007 | |
Federal statutory tax rate | | $ | (8 | ) | | $ | (23 | ) | | $ | (1 | ) |
State taxes, net of federal tax benefit | | | — | | | | (4 | ) | | | — | |
Change in valuation allowance | | | (2 | ) | | | 52 | | | | — | |
Other | | | (2 | ) | | | (2 | ) | | | — | |
| | | | | | | | | | | | |
Effective income tax rate | | $ | (12 | ) | | $ | 23 | | | $ | (1 | ) |
| | | | | | | | | | | | |
We adopted FASB Interpretation No. 48,Accounting for Uncertainty in Income Taxes, an interpretation of FASB Statement No. 109, which is codified in FASB ASC Topic 740,Income Taxes (“ASC 740”),on January 1, 2007. ASC 740 clarifies the accounting for income taxes by prescribing the minimum recognition threshold that an uncertain tax position is required to meet before tax benefits associated with such uncertain tax position are recognized in the consolidated financial statements. Our adoption of ASC 740 did not require a cumulative effect adjustment to the January 1, 2007 undistributed net realized earnings. We classify interest and penalties, if any, related to unrecognized tax benefits as a component of provision for income taxes.
Based on our analysis of our tax position, we concluded that we did not have any uncertain tax positions that met the recognition or measurement criteria of ASC 740. We did not have any unrecognized tax benefits as of both December 31, 2009 and 2008.
Although we file federal and state tax returns, our major tax jurisdiction is federal for American Capital and ACFS. The 2005, 2006, 2007 and 2008 federal tax years for American Capital and the 2004, 2005, 2006, 2007 and 2008 federal tax years for ACFS remain subject to examination by the IRS.
164
AMERICAN CAPITAL, LTD.
NOTES TO CONSOLIDATED FINANCIAL STATEMENTS—(Continued)
(in millions, except per share data)
Note 16. Related Party Transactions
Prior to the enactment of the Sarbanes-Oxley Act in June 2002, we provided loans to employees for the exercise of stock options under the employee stock option plans. The loans required the current payment of interest at a market rate, had varying terms not exceeding nine years and were recorded as a reduction of shareholders’ equity in the accompanying consolidated balance sheets. The loans were evidenced by full recourse notes and had to be repaid in full at the earlier of maturity or 60 days following termination of employment. The shares of our common stock that the employees purchased with the proceeds of a loan were posted as collateral. Under the terms of the loan agreements, if 95% of the outstanding loan balance was less than the aggregate value of the common stock collateral for such loan and any additional collateral, the loan maturity would be automatically accelerated and the collateral foreclosed upon. Pursuant to the loan agreements, the value of the original shares of common stock collateral was the greater of NAV per share or the average of the closing prices for the last 20 trading days. The employees could avoid acceleration under their respective loans and foreclosure by delivering additional collateral to us prior to an event of default. As of December 31, 2008, the aggregate amount of the notes receivable relating to stock option exercises was $5 million, and was included in shareholders’ equity in the accompanying consolidated balance sheets. The loans were secured by an aggregate 0.2 million shares of the common stock purchased with the proceeds from the loans.
During February 2009, an employee pledged an additional 0.9 million shares of our common stock as collateral, which was valued at the closing prices for the last 20 trading days. Due to the decline in our NAV per share as of December 31, 2008, the outstanding stock option loans became under collateralized on March 2, 2009, triggering an automatic event of default and foreclosure on the 1.1 million shares of common stock collateral in satisfaction of the loans. The shares of common stock that we received in the foreclosure are included in treasury stock and are not included in our outstanding shares of common stock. We have no further stock option loans outstanding as of December 31, 2009.
Note 17. Asset Sales
American Capital Equity II, LP
In October 2007, we entered into a purchase and sale agreement with American Capital Equity II, LP (“ACE II”) for the sale of approximately 17% of our equity investments (other than warrants associated with debt investments) in 80 portfolio companies. ACE II is a private equity fund with $585 million of equity commitments from third-party investors. The aggregate purchase price was $488 million. The remaining $97 million equity commitment would be used by ACE II to fund add-on investments in the 80 portfolio companies. As of December 31, 2009, there is $85 million of remaining equity commitments available for future add-on investments. In addition, 10%, or $58.5 million, of the $585 million of equity commitments are recallable by American Capital, LLC for add-on investments with American Capital once they have been distributed to the third-party ACE II investors. As of December 31, 2009, there were $58.5 million of recallable distributions available for add-on investments.
American Capital, LLC manages ACE II in exchange for a 2% annual management fee on the cost basis of ACE II’s investments and a 10% to 30% carried interest in the net profits of ACE II, subject to certain hurdles. To date, American Capital, LLC has not recognized any carried interest in its net operating income. We do not have a direct economic interest in ACE II and there are no arrangements that require us to provide any form of financial support to ACE II, nor have we provided any financial or other support during 2009 and 2008.
We recorded a total net realized gain of $78 million upon the sale of the $488 million of investments. In accordance with ASC 860, we included in our sale proceeds the fair value of the management agreement
165
AMERICAN CAPITAL, LTD.
NOTES TO CONSOLIDATED FINANCIAL STATEMENTS—(Continued)
(in millions, except per share data)
associated with the $488 million of investments sold. The fair value of this portion of the agreement was estimated to be $20 million and was treated as being contributed to American Capital, LLC, increasing our cost basis in our investment in American Capital, LLC. As a result, our $78 million net realized gain on the transaction includes a $20 million realized gain for the value of a portion of the management agreement obtained in connection with the sale. The proceeds were recognized in the investing section of our consolidated statement of cash flows. Limited partners of ACE II, excluding any limited partner that is our affiliate, holding a majority of the aggregate commitments may require ACE II to dispose of its investments acquired from us which could significantly impact the value of the management agreement. Subsequent changes in the fair value of the management agreement are recognized as part of the fair value of our investment in American Capital, LLC. The fair value of American Capital, LLC’s management agreement is primarily based on our estimate of future cash flows related to both the management fee and carried interest discounted at a market discount rate for comparable companies.
ACAS CRE CDO 2007-1, Ltd.
In the third quarter of 2007, we sold our investments in 121 subordinated tranches of bonds in 22 CMBS trusts to ACAS CRE CDO 2007-1, Ltd. (“ACAS CRE CDO”), a new commercial real estate collateralized debt obligation trust. Our cost basis in the CMBS bonds sold to ACAS CRE CDO was $642 million with a principal balance of $1.2 billion. Third-party investors in ACAS CRE CDO purchased AAA through A- bonds for a total purchase price of $411 million with a principal balance of $412 million. We purchased investment grade and non-investment grade notes and preferred shares of ACAS CRE CDO for a total purchase price of $215 million with a principal balance of $763 million. In accordance with ASC 860, the securities that we purchased are considered to be beneficial interests in the sold CMBS bonds that are retained by us. The beneficial interests that continue to be held by us were measured at the date of transfer by allocating the previous carrying amount of the sold CMBS bonds between the ACAS CRE CDO notes sold to third parties and the ACAS CRE CDO notes and preferred shares that we continue to hold based on their relative fair values. To the extent available, the fair values were based on the purchase price paid by third-parties. If not available, the fair values were based on a discounted cash flow analysis utilizing loss assumptions based on historical experience and a discount rate representative of a comparable yield for a similar security.
American Capital, LLC serves as the collateral manager for ACAS CRE CDO in exchange for an annual senior management fee of 7.5 basis points and a subordinate fee of 7.5 basis points. In accordance with ASC 860, the fair value of the collateral management agreement, estimated to be $2 million, was included as additional sale proceeds and treated as being contributed to American Capital, LLC increasing our cost basis in that portfolio investment. We recorded a net realized loss of $22 million in 2007 related to this transaction. The proceeds were recognized in the investing section of our consolidated statement of cash flows.
American Capital Equity I, LLC
On October 1, 2006, we entered into a purchase and sale agreement with American Capital Equity I, LLC (“ACE I”) for the sale of 30% of our equity investments (other than warrants issued with debt investments) in 96 portfolio companies to ACE I. ACE I is a private equity fund with $1 billion of equity commitments from third-party investors. The aggregate purchase price was $671 million. Also, ACE I co-invested with American Capital in an amount equal to 30% of equity investments made by American Capital between October 2006 and November 2007 until the $329 million remaining equity commitment was exhausted. In addition, 10%, or $100 million, of the $1 billion of equity commitments are recallable by American Capital, LLC for add-on investments with American Capital once they have been distributed to the third-party ACE I investors. As of December 31, 2009, there were $75 million of recallable distributions available for add-on investments.
166
AMERICAN CAPITAL, LTD.
NOTES TO CONSOLIDATED FINANCIAL STATEMENTS—(Continued)
(in millions, except per share data)
American Capital, LLC manages ACE I in exchange for a 2% annual management fee on the net cost basis of ACE I and a 10% to 30% carried interest in the net profits of ACE I, subject to certain hurdles. To date, American Capital, LLC has not recognized any carried interest in its net operating income. We do not have a direct economic interest in ACE I and there are no arrangements that require us to provide any form of financial support to ACE I, nor have we provided any financial or other support during 2009, 2008 and 2007.
We recorded a total net realized gain of $59 million upon the sale of the $671 million of investments. In accordance with ASC 860, we included in our sale proceeds the estimated fair value of the management agreement associated with the $671 million of investments sold. The fair value of this portion of the agreement was estimated to be $16 million and was treated as being contributed to American Capital, LLC and included in our cost basis in our investment in American Capital, LLC. As a result, our $59 million net realized gain on the transaction includes a $16 million realized gain for the value of a portion of the management agreement received as sale proceeds. The proceeds were recognized in the investing section of our consolidated statement of cash flows. Members of ACE I, excluding any member that is our affiliate, holding a majority of the aggregate commitments may require ACE I to dispose of its investments acquired from us which could significantly impact the value of the management agreement. Subsequent changes in the fair value of the management agreement are recognized as part of the fair value of our investment in American Capital, LLC. The fair value of American Capital, LLC’s management agreement is primarily based on our estimate of future cash flows related to both the management fee and carried interest discounted at a market discount rate for comparable companies.
Note 18. Investment in European Capital
Original Private Placement
On September 30, 2005, European Capital, a company incorporated in Guernsey, closed on a private offering of €750 million of equity commitments. We provided €521 million of the equity commitments and third-party institutional investors provided €229 million of the remaining equity commitments. European Capital invests in and sponsors management and employee buyouts, invests in private equity buyouts and provides capital directly to private and mid-sized public companies primarily in Europe. Our investment in European Capital is treated as a portfolio investment.
ECFS entered into an investment management and services agreement with European Capital. As of the date it entered into the investment and management agreement, ECFS was a directly wholly-owned entity of American Capital. Pursuant to the investment management agreement and services agreement, ECFS provided investment advisory and management services to European Capital and received a management fee equal to 1.25% of the greater of European Capital’s weighted average gross assets or €750 million. In addition, European Capital reimbursed ECFS for all costs and expenses incurred during the term of the agreement, subject to certain exclusions. In addition, ECFS received 18.75 million warrants to purchase participating preferred shares of European Capital representing 20% of European Capital’s preferred shares on a fully-diluted basis. The initial exercise price of the warrants was €10 per share, which was the same per share price that the original investors purchased their preferred shares in the initial private offering. The per share exercise price on the warrants would be reduced by dividends declared on the preferred shares.
Initial Public Offering
On May 10, 2007, European Capital closed on an IPO of 14.6 million ordinary shares at a price of €9.84 per ordinary share for gross proceeds of €144 million ($196 million). The shares were traded on the main market of the London Stock Exchange under the ticker symbol “ECAS.”
167
AMERICAN CAPITAL, LTD.
NOTES TO CONSOLIDATED FINANCIAL STATEMENTS—(Continued)
(in millions, except per share data)
Prior to the IPO, American Capital’s investment in European Capital consisted of 52.1 million participating preferred shares and warrants held by ECFS to purchase 18.75 million participating preferred shares. Immediately preceding the IPO, ECFS exercised its warrant to purchase 18.75 million participating preferred shares for an adjusted exercise price of €9.50 per share, or €178 million ($242 million), and assigned the shares to American Capital. As a result of the IPO, the warrant agreement was terminated, and ECFS will not receive any future warrants. The 18.75 million participating preferred shares received upon the assignment from ECFS and our existing 52.1 million participating preferred shares were redesignated as ordinary shares as part of the capital reorganization that took effect upon the closing of the IPO. As a result of the IPO, our ownership interest in European Capital was reduced to a 65% controlling ownership interest. Subsequent to the IPO, American Capital purchased an additional $17 million of ordinary shares in the open market increasing its ownership in European Capital to 67%.
In the second quarter of 2007, our ownership interest in ECFS was contributed to American Capital, LLC, a wholly-owned portfolio company that owns alternative asset fund managers that manage various alternative asset funds. Due to the dilution of our ownership interest in European Capital as a result of the IPO, ECFS was no longer considered to be providing substantially all of its services directly or indirectly to American Capital or its portfolio companies. Also, American Capital, LLC provides services to alternative asset funds that collectively are not substantially owned by us and therefore is not providing services directly or indirectly to us or to portfolio companies in which we hold substantially all of the ownership interests. As a result, in accordance with our consolidation policy, ECFS was deconsolidated prospectively during the second quarter of 2007 and is recorded at fair value on our consolidated balance sheets as part of the fair value of American Capital, LLC.
In addition, as part of the IPO, ECFS’ existing investment management agreement and services agreement with European Capital was terminated and ECFS and European Capital entered into a new investment management agreement to provide investment advisory and management services. Under the terms of the new investment management agreement, ECFS receives an annual management fee equal to 2% of the weighted average monthly consolidated gross asset value of all the investments of European Capital, an incentive fee equal to 100% of the net earnings in excess of a return of 8% but less than a return of 10% and 20% of the net earnings thereafter, and certain expense reimbursements not to exceed a cap of 0.25% per year of the weighted average monthly consolidated gross asset value of the all investments of European Capital. During 2009, the investment management agreement with European Capital was amended to reduce the annual management fee to 1.5% effective from July 1, 2009 to December 31, 2010.
In connection with the termination of the old management agreement, ECFS received a €10 million ($13 million) cash termination payment. In addition, prepaid management fees paid to ECFS under the old investment management agreement of €6 million ($8 million) related to prepaid cost reimbursements were accounted for by ECFS as an additional termination fee. These amounts were recorded as deferred revenue by American Capital, LLC, the parent of ECFS, and are being amortized into income by American Capital, LLC over four years, the minimum service period required by ECFS under the new investment management agreement. To the extent that American Capital, LLC declares a dividend to us of its quarterly net operating income, if any, it will include the amortization of this deferred revenue.
Acquisition of European Capital
On November 10, 2008, American Capital and European Capital entered into an implementation agreement regarding our proposal to acquire all of the ordinary shares of European Capital held by other investors, representing 32.3% of European Capital’s outstanding ordinary shares, by means of a “scheme of arrangement”
168
AMERICAN CAPITAL, LTD.
NOTES TO CONSOLIDATED FINANCIAL STATEMENTS—(Continued)
(in millions, except per share data)
under Guernsey company law. Under the terms of the agreement, each European Capital shareholder other than us would receive 0.333 shares of our common stock for every one ordinary share that they owned of European Capital. On February 19, 2009, our shareholders approved a proposal authorizing us to sell shares of our common stock below NAV per share in certain instances, including in connection with the proposed acquisition of European Capital. On March 19, 2009, the proposed transaction was approved by a special majority of the shareholders of European Capital, not including us. The acquisition became effective as of March 26, 2009, following approval of the Royal Court of Guernsey. In connection with the transaction, we issued 11.5 million shares of our common stock with a value of $25 million as of March 26, 2009 in exchange for the outstanding European Capital ordinary shares not already owned by us.
Put Option Agreement
On November 19, 2008, we entered into a put option agreement with European Capital under which European Capital could put some or all of certain investments to us at a predetermined put price. Under the terms of the agreement, the put option could be exercised at any time commencing on January 1, 2010 and expiring on December 31, 2010. In consideration for entering into the put option agreement, European Capital paid us €16 million ($20 million). The fair value of the put option liability as of December 31, 2008 was $69 million (€49 million), which is included in derivative and option agreements in our consolidated balance sheets. On March 30, 2009, we entered into a termination agreement with European Capital to terminate the put option agreement. Under the terms of the termination agreement, we settled the put option obligation by paying European Capital the fair value of the put option obligation of $65 million (€49 million). As a result, we recognized a realized loss of $44 million offset by the reversal of unrealized depreciation of $49 million in our consolidated statements of operations.
Revolving Credit Facilities
In February 2008, we provided a $400 million subordinated, unsecured revolving credit facility (the “Term A Facility”) to European Capital. Borrowings under the Term A Facility bear interest at LIBOR plus 5% and 2% payable in kind. The Term A Facility has an unused commitment fee of 20 basis points and matures in February 2011. In October 2008, we amended the loan agreement to extend an additional $250 million subordinated, unsecured revolving credit facility (the “Term B Facility”) to European Capital. Borrowings under the Term B Facility bear interest at LIBOR plus 3.25% and 4.75% payable in kind. The Term B Facility has an unused commitment fee of 20 basis points and matures in April 2010.
In June 2009, American Capital and European Capital entered into an agreement whereby the outstanding borrowings under the Term A Facility of $319 million were exchanged for 325.1 million ordinary shares of European Capital and the Term A Facility commitment amount was reduced from $400 million to $87 million. In November 2009, American Capital and European Capital entered into an amendment to the loan agreement to reduce the Term B Facility commitment of $250 million to amount equal to the existing standby letter of credit issued to European Capital for the benefit of The Royal Bank of Scotland, plc, the agent on European Capital’s multicurrency revolving facility. The existing standby letter of credit totals €23 million and £56 million ($122 million as of December 31, 2009). Any funding of a standby letter of credit by American Capital that is not reimbursed by European Capital on the disbursement date will bear interest at the rate of the respective facility. As of December 31, 2009, there was a $25 million outstanding balance under the Term A Facility and no outstanding balance under the Term B Facility.
169
AMERICAN CAPITAL, LTD.
NOTES TO CONSOLIDATED FINANCIAL STATEMENTS—(Continued)
(in millions, except per share data)
Note 19. Subsequent Events
At a special meeting of stockholders on February 12, 2010, our stockholders approved a proposal authorizing us to sell shares of our common stock in one or more offerings below the NAV per share, subject to certain limitations, including the prior approval of our Board of Directors. Our prior authorization to issue a certain number of shares of our common stock at a price below NAV per share expired on February 19, 2010. The authorization approved at the special meeting commences on February 19, 2010 and expires on February 12, 2011. The number of shares of common stock that may be issued below NAV per share is limited to a maximum of 58.3 million shares, which is 20% of the number of shares outstanding as of the record date for this year’s special meeting, subject to adjustment for shares issued following the occurrence of events such as stock splits, stock dividends, distributions and recapitalizations.
170
AMERICAN CAPITAL, LTD.
NOTES TO CONSOLIDATED FINANCIAL STATEMENTS—(Continued)
(in millions, except per share data)
Note 20. Selected Quarterly Data (Unaudited)
The following tables present our quarterly financial information for the fiscal years ended December 31, 2009 and 2008:
| | | | | | | | | | | | | | | | | | | | |
| | | Three Months Ended | | | Year Ended
December 31, 2009 | |
| | March 31, 2009 | | | June 30, 2009 | | | September 30, 2009 | | | December 31, 2009 | | |
Total operating income | | $ | 195 | | | $ | 140 | | | $ | 193 | | | $ | 169 | | | $ | 697 | |
Net operating income (“NOI”) | | $ | 64 | | | $ | 20 | | | $ | 32 | | | $ | 19 | | | $ | 135 | |
Net (decrease) increase in net assets resulting from operations | | $ | (547 | ) | | $ | (547 | ) | | $ | 77 | | | $ | 107 | | | $ | (910 | ) |
NOI per basic common share | | $ | 0.31 | | | $ | 0.09 | | | $ | 0.12 | | | $ | 0.07 | | | $ | 0.56 | |
NOI per diluted common share | | $ | 0.31 | | | $ | 0.09 | | | $ | 0.11 | | | $ | 0.07 | | | $ | 0.56 | |
Net (loss) earnings per basic common share | | $ | (2.65 | ) | | $ | (2.52 | ) | | $ | 0.30 | | | $ | 0.38 | | | $ | (3.77 | ) |
Net (loss) earnings per diluted common share | | $ | (2.65 | ) | | $ | (2.52 | ) | | $ | 0.27 | | | $ | 0.38 | | | $ | (3.77 | ) |
Weighted average basic shares outstanding | | | 206.6 | | | | 217.0 | | | | 256.5 | | | | 283.2 | | | | 241.1 | |
Weighted average diluted shares outstanding | | | 206.6 | | | | 217.0 | | | | 284.3 | | | | 284.3 | | | | 241.1 | |
| | |
| | | Three Months Ended | | | Year Ended
December 31, 2008 | |
| | March 31, 2008 | | | June 30, 2008 | | | September 30, 2008 | | | December 31, 2008 | | |
Total operating income | | $ | 292 | | | $ | 263 | | | $ | 278 | | | $ | 218 | | | $ | 1,051 | |
Net operating income | | $ | 151 | | | $ | 145 | | | $ | 153 | | | $ | 44 | | | $ | 493 | |
Net decrease in net assets resulting from operations | | $ | (813 | ) | | $ | (70 | ) | | $ | (548 | ) | | $ | (1,684 | ) | | $ | (3,115 | ) |
NOI per basic common share | | $ | 0.77 | | | $ | 0.71 | | | $ | 0.74 | | | $ | 0.21 | | | $ | 2.42 | |
NOI per diluted common share | | $ | 0.77 | | | $ | 0.71 | | | $ | 0.74 | | | $ | 0.21 | | | $ | 2.42 | |
Net loss per basic common share | | $ | (4.16 | ) | | $ | (0.34 | ) | | $ | (2.63 | ) | | $ | (8.13 | ) | | $ | (15.29 | ) |
Net loss per diluted common share | | $ | (4.16 | ) | | $ | (0.34 | ) | | $ | (2.63 | ) | | $ | (8.13 | ) | | $ | (15.29 | ) |
Weighted average basic shares outstanding | | | 195.2 | | | | 204.4 | | | | 208.1 | | | | 207.1 | | | | 203.7 | |
Weighted average diluted shares outstanding | | | 195.2 | | | | 204.4 | | | | 208.1 | | | | 207.1 | | | | 203.7 | |
171
Item 9.Changes in and Disagreements with Accountants on Accounting and Financial Disclosure
None.
Item 9A.Controls and Procedures
Evaluation of Disclosure Controls and Procedures
We maintain disclosure controls and procedures that are designed to ensure that information required to be disclosed in our Exchange Act reports is recorded, processed, summarized and reported within the time periods specified in the SEC’s rules and forms, and that such information is accumulated and communicated to our management, including our Chief Executive Officer and Chief Financial Officer, as appropriate, to allow timely decisions regarding required disclosure based on the definition of “disclosure controls and procedures” as promulgated under the SEC Act of 1934, as amended. In designing and evaluating the disclosure controls and procedures, management recognized that any controls and procedures, no matter how well designed and operated, can provide only reasonable assurance of achieving the desired control objectives, and management necessarily was required to apply its judgment in evaluating the cost-benefit relationship of possible controls and procedures.
American Capital, including our Chief Executive Officer and Chief Financial Officer, evaluated the effectiveness of the design and operation of our disclosure controls and procedures as of December 31, 2009. Based on the foregoing, our Chief Executive Officer and Chief Financial Officer concluded that our disclosure controls and procedures were effective.
Management’s Report on Internal Control over Financial Reporting
Management’s Report on Internal Control over Financial Reporting is included in “Item 8.—Financial Statements and Supplementary Data.”
Changes in Internal Control over Financial Reporting
There have been no significant changes in our internal controls over financial reporting or in other factors that could significantly affect the internal controls over financial reporting during the year ended December 31, 2009.
Item 9B.Other Information
None.
172
PART III
Item 10.Directors, Executive Officers and Corporate Governance
Information in response to this Item is incorporated herein by reference to the information provided in our Proxy Statement for our 2010 Annual Meeting of Stockholders (the “2010 Proxy Statement”) under the headings “PROPOSAL 1: ELECTION OF DIRECTORS”, “REPORT OF THE AUDIT AND COMPLIANCE COMMITTEE”, “SECTION 16(a) BENEFICIAL OWNERSHIP REPORTING COMPLIANCE” and “CODE OF ETHICS AND CONDUCT.”
Item 11.Executive Compensation
Information in response to this Item is incorporated herein by reference to the information provided in the 2010 Proxy Statement under the heading “SUMMARY COMPENSATION TABLE.”
Item 12.Security Ownership of Certain Beneficial Owners and Management and Related Stockholder Matters
Information in response to this Item is incorporated herein by reference to the information provided in the 2010 Proxy Statement under the heading “SECURITY OWNERSHIP OF MANAGEMENT AND CERTAIN BENEFICIAL OWNERS.”
Item 13.Certain Relationships and Related Transactions, and Director Independence
Information in response to this Item is incorporated herein by reference to the information provided in the 2010 Proxy Statement under the heading “CERTAIN TRANSACTIONS WITH RELATED PERSONS.”
Item 14.Principal Accounting Fees and Services
Information in response to this Item is incorporated herein by reference to the information provided in the 2010 Proxy Statement under the heading “REPORT OF AUDIT AND COMPLIANCE COMMITTEE” and “PROPOSAL 2: RATIFICATION OF APPOINTMENT OF INDEPENDENT PUBLIC ACCOUNTANTS FOR 2010.”
PART IV
Item 15.EXHIBITS AND FINANCIAL STATEMENT SCHEDULES
| | (a) | List of documents filed as part of this report: |
| | (1) | The following financial statements are filed herewith: |
| | • | Consolidated Balance Sheets as of December 31, 2009 and 2008 |
| | • | Consolidated Statements of Operations for the Fiscal Years Ended December 31, 2009, 2008 and 2007 |
| | • | Consolidated Statements of Changes in Net Assets for the Fiscal Years Ended December 31, 2009, 2008 and 2007 |
| | • | Consolidated Statements of Cash Flows for the Fiscal Years Ended December 31, 2009, 2008 and 2007 |
| | • | Consolidated Financial Highlights for the Fiscal Years Ended December 31, 2009, 2008, 2007, 2006 and 2005 |
| | • | Consolidated Schedule of Investments as of December 31, 2009 and 2008 |
173
| | (2) | The following financial statement schedules are filed herewith: |
| | • | Schedule 12-14 Investments in and Advances to Affiliates |
| | (3) | The following exhibits are filed herewith or incorporated herein by reference |
| | |
Exhibit | | Description |
| |
| *3.1. | | American Capital, Ltd. Third Amended and Restated Certificate of Incorporation, incorporated herein by reference to Exhibit 2.a of the Registration Statement on Form N-2 (File No. 333-161421), filed on August 19, 2009. |
| |
| *3.2. | | American Capital Strategies, Ltd. Second Amended and Restated Bylaws, as amended, incorporated herein by reference to Exhibit 3.2 of Form 10-Q, filed on August 11, 2008. |
| |
| *4.1. | | Instruments defining the rights of holders of securities: See Article IV of our Third Amended and Restated Certificate of Incorporation, incorporated herein by reference to Exhibit 2.d.1 of the Registration Statement on Form N-2 (File No. 333-161421), filed on August 19, 2009. |
| |
| *4.2. | | Instruments defining the rights of holders of securities: See Section I of our Second Amended and Restated Bylaws, as amended, incorporated herein by reference to Exhibit 3.2 of Form 10-Q, filed on August 11, 2008. |
| |
| *4.3. | | Indenture between American Capital, Ltd. and Wilmington Trust Company, as successor trustee, dated as of April 26, 2007, incorporated herein by reference to Exhibit 2.d.3. of the Registration Statement on Form N-2 (File No. 333-142398), filed on April 26, 2007. |
| |
| *4.4. | | Statement of Eligibility of Trustee on Form T-1, incorporated herein by reference to Exhibit 25 of the Registration Statement on Form N-2 (File No. 333-142398), filed on April 26, 2007. |
| |
| *4.5. | | Form of First Supplemental Indenture by and between American Capital, Ltd. and Wilmington Trust Company, as successor trustee, dated as of July , 2007, incorporated herein by reference to Exhibit d.4 of Post-Effective Amendment No. 1 to the Registration Statement on Form N-2 (File No. 333-142398), filed on July 18, 2007. |
| |
| *4.6. | | Form of 6.85% Senior Note due 2012, incorporated herein by reference to Exhibit 2.d.5. of Post Effective Amendment No. 1 to the Registration Statement on Form N-2 (File No. 333-142398), filed on July 18, 2007. |
| |
| *10.1. | | Third Amended and Restated Dividend Reinvestment Plan, incorporated herein by reference to Post-Effective Amendment No. 1 to the Registration Statement on Form S-3 (File No. 333-123340), filed on March 30, 2007. |
| |
| *10.2. | | Note Purchase Agreement by and among American Capital Strategies, Ltd., and the purchasers listed on Exhibit A attached thereto, dated September 1, 2004, incorporated herein by reference to Exhibit 10.12 of Form 10-Q for the quarter ended September 30, 2004 (File No. 814-00149), filed November 9, 2004, as amended by the First Amendment, dated as of March 30, 2009, to the Note Purchase Agreement dated as of September 1, 2004 between American Capital, Ltd. (f/k/a American Capital Strategies, Ltd.) and each of the Noteholders listed on the signature pages thereto, incorporated herein by reference to Exhibit 10.1 of Form 10-Q for the quarter ended March 31, 2009 (File No. 814-00149) filed May 11, 2009. |
| |
| *10.3. | | Note Purchase Agreement by and among American Capital Strategies, Ltd., and the purchasers listed on Exhibit A attached thereto, dated as of August 1, 2005, incorporated herein by reference to Exhibit 10.1 of Form 10-Q for the quarter ended June 30, 2005 (File No. 814-00149), filed August 9, 2005 as amended by the First Amendment, dated as of March 30, 2009 between American Capital, Ltd. (f/k/a American Capital Strategies, Ltd.) and each of the Noteholders listed on the signature pages thereto, incorporated herein by reference to Exhibit 10.2 of Form 10-Q for the quarter ended March 31, 2009 (File No. 814-00149) filed May 11, 2009. |
174
| | |
Exhibit | | Description |
| |
| *10.4. | | Note Purchase Agreement by and among American Capital Strategies, Ltd., Bear, Stearns & Co. Inc. and Merrill Lynch International, dated September 26, 2005, incorporated herein by reference to Exhibit 10.10 of Form 8-K (File No. 814-00149), dated September 28, 2005 as amended by the First Amendment, dated as of March 30, 2009 between American Capital, Ltd. (f/k/a American Capital Strategies, Ltd.) and each of the Noteholders listed on the signature pages thereto, incorporated herein by reference to Exhibit 10.3 of Form 10-Q for the quarter ended March 31, 2009 (File No. 814-00149) filed May 11, 2009. |
| |
| *10.5. | | Note Purchase Agreement by and among American Capital Strategies, Ltd., The Prudential Assurance Company Limited (PAC), Panther CDO III B.V. and Panther CDO I B.V., dated February 9, 2006 incorporated herein by reference to Exhibit 10.1 of Form 8-K (File No. 814-00149), dated February 15, 2006, as amended by the First Amendment, dated as of March 30, 2009 between American Capital, Ltd. (f/k/a American Capital Strategies, Ltd.) and each of the Noteholders listed on the signature pages thereto, incorporated herein by reference to Exhibit 10.4 of Form 10-Q for the quarter ended March 31, 2009 (File No. 814-00149) filed May 11, 2009. |
| |
| *10.6. | | Forbearance Agreement, dated September 3, 2009 in relation to the Note Purchase Agreement dated as of August 1, 2005 between American Capital, Ltd. and the Noteholders thereunder, incorporated herein by reference to Exhibit 10.2 of Form 10-Q for the quarter ended September 30, 2009 (File No. 814-00149), filed November 9, 2009. |
| |
| *10.7. | | Forbearance Agreement, dated September 3, 2009 in relation to the Note Purchase Agreement dated as of September 26, 2005 between American Capital, Ltd. and the Noteholders thereunder, incorporated herein by reference to Exhibit 10.3 of Form 10-Q for the quarter ended September 30, 2009 (File No. 814-00149), filed November 9, 2009. |
| |
| *10.8. | | Forbearance Agreement, dated September 3, 2009 in relation to the Note Purchase Agreement dated as of February 9, 2006 between American Capital, Ltd. and the Noteholders thereunder, incorporated herein by reference to Exhibit 10.4 of Form 10-Q for the quarter ended September 30, 2009 (File No. 814-00149), filed November 9, 2009. |
| |
| †*10.9. | | Amended and Restated Employment Agreement entered into and effective as of March 27, 2009 by and between Steven W. Burge and American Capital, Ltd. thereto incorporated herein by reference to Exhibit 10.5 of Form 10-Q for the quarter ended March 31, 2009 (File No. 814-00149), filed May 11, 2009. |
| |
| †*10.10. | | Amended and Restated Employment Agreement entered into and effective as of March 27, 2009 by and between Roland Cline and American Capital, Ltd. thereto incorporated herein by reference to Exhibit 10.6 of Form 10-Q for the quarter ended March 31, 2009 (File No. 814-00149), filed May 11, 2009. |
| |
| †*10.11. | | Amended and Restated Employment Agreement entered into and effective as of March 27, 2009 by and between John Erickson and American Capital, Ltd. thereto incorporated herein by reference to Exhibit 10.7 of Form 10-Q for the quarter ended March 31, 2009 (File No. 814-00149), filed May 11, 2009. |
| |
| †*10.12. | | Amended and Restated Employment Agreement entered into and effective as of March 27, 2009 by and between Samuel A. Flax and American Capital, Ltd. thereto incorporated herein by reference to Exhibit 10.8 of Form 10-Q for the quarter ended March 31, 2009 (File No. 814-00149), filed May 11, 2009. |
| |
| †*10.13. | | Amended and Restated Employment Agreement entered into and effective as of March 27, 2009 by and between Brian Graff and American Capital, Ltd. thereto incorporated herein by reference to Exhibit 10.9 of Form 10-Q for the quarter ended March 31, 2009 (File No. 814-00149), filed May 11, 2009. |
175
| | |
Exhibit | | Description |
| |
| †*10.14. | | Amended and Restated Employment Agreement entered into and effective as of March 27, 2009 by and between Gordon O’Brien and American Capital, Ltd. thereto incorporated herein by reference to Exhibit 10.10 of Form 10-Q for the quarter ended March 31, 2009 (File No. 814-00149), filed May 11, 2009. |
| |
| †*10.15. | | Amended and Restated Employment Agreement entered into and effective as of March 27, 2009 by and between Ira Wagner and American Capital, Ltd. thereto incorporated herein by reference to Exhibit 10.11 of Form 10-Q for the quarter ended March 31, 2009 (File No. 814-00149), filed May 11, 2009. |
| |
| †*10.16. | | Amended and Restated Employment Agreement entered into and effective as of March 27, 2009 by and between Malon Wilkus and American Capital, Ltd. thereto incorporated herein by reference to Exhibit 10.12 of Form 10-Q for the quarter ended March 31, 2009 (File No. 814-00149), filed May 11, 2009. |
| |
| †*10.17. | | Amended and Restated Employment Agreement entered into and effective as of March 27, 2009 by and between Darin Winn and American Capital, Ltd. thereto incorporated herein by reference to Exhibit 10.13 of Form 10-Q for the quarter ended March 31, 2009 (File No. 814-00149), filed May 11, 2009. |
| |
| †*10.18. | | Form of Indemnification Agreement entered into as of October 22, 2009 by and between American Capital, Ltd. and each of Malon Wilkus, Philip Harper, John Koskinen, Mary Baskin, Alvin Puryear, Kenneth Peterson, Jr., Stan Lundine, and Neil Hahl, incorporated herein by reference to Exhibit 10.1 of Form 8-K dated October 28, 2009. |
| |
| †*10.19. | | Form of American Capital Strategies, Ltd. 1997 Disinterested Director Stock Option Plan, incorporated herein by reference to Attachment I to the Definitive Proxy Statement for 1998 Annual Meeting (File No. 814-00149), filed April 15, 1998. |
| |
| †*10.20. | | Form of American Capital Strategies, Ltd. 1997 Stock Option Plan, incorporated herein by reference to Exhibit 2.i.2 of the Pre-Effective Amendment No. 1 to the Registration Statement on Form N-2 (File No. 333-29943), filed on August 12, 1997, as further amended by Amendment No. 1 incorporated herein by reference to Attachment II to the Definitive Proxy Statement for the 1998 Annual Meeting (File No. 814-00149), filed on April 15, 1998. |
| |
| †*10.21. | | Form of American Capital Strategies, Ltd., 2000 Disinterested Director Stock Option Plan, incorporated by reference to Appendix III to the Definitive Proxy Statement for the 2000 Annual Meeting (File No. 814-00149), filed on April 5, 2000. |
| |
| †*10.22. | | Form of American Capital Strategies, Ltd., 2000 Employee Stock Option Plan, incorporated herein by reference to Appendix II to the Definitive Proxy Statement for the 2000 Annual Meeting filed on April 5, 2000, as amended by Amendment No. 1 incorporated herein by reference to Exhibit II to the Definitive Proxy Statement for the 2001 Annual Meeting (File No. 814-00149), filed on April 3, 2001. |
| |
| †*10.23. | | Form of American Capital Strategies, Ltd. 2002 Employee Stock Option Plan, incorporated herein by reference to Exhibit I to the Definitive Proxy Statement for the 2002 Annual Meeting (File No. 814-00149), filed on April 12, 2002. |
| |
| †*10.24. | | Form of American Capital Strategies, Ltd. 2003 Employee Stock Option Plan, incorporated by reference to Exhibit I to the Definitive Proxy Statement for the 2003 Annual Meeting (File No. 814-00149), filed on April 10, 2003. |
| |
| †*10.25. | | Form of American Capital Strategies, Ltd. 2004 Employee Stock Option Plan, incorporated by reference herein to exhibit to the Definitive Proxy Statement for the 2004 Annual Meeting (File No. 814-00149), filed March 26, 2004. |
176
| | |
Exhibit | | Description |
| |
| †*10.26. | | Form of American Capital Strategies, Ltd. 2005 Employee Stock Option Plan, incorporated by reference to Exhibit III to the Definitive Proxy Statement for the 2004 Annual Meeting (File No. 814-00149) filed on April 26, 2005. |
| |
| †*10.27. | | Form of American Capital Strategies, Ltd. 2006 Employee Stock Option Plan, incorporated by reference to Exhibit I to the Definitive Proxy Statement for the 2006 Annual Meeting (File No. 814-00149) filed on April 11, 2006. |
| |
| †*10.28. | | Form of American Capital Strategies, Ltd. 2007 Stock Option Plan, incorporated herein by reference to Exhibit I to the Definitive Proxy Statement for the 2007 Annual Meeting (File No. 814-00149), filed March 27, 2007. |
| |
| †*10.29. | | Form of American Capital Strategies, Ltd. 2008 Stock Option Plan, incorporated herein by reference to Exhibit I to the Definitive Proxy Statement for the 2008 Annual Meeting (File No. 814-00149), filed April 4, 2008. |
| |
| †*10.30. | | Form of American Capital, Ltd. 2009 Stock Option Plan, incorporated herein by reference to Exhibit II to the Definitive Proxy Statement for the 2009 Annual Meeting (File No. 814-00149), filed April 30, 2009. |
| |
| †10.31. | | Form of Amended and Restated American Capital Performance Incentive Plan, as adopted April 1, 2009, filed herewith. |
| |
| †*10.32. | | Form of Acceptance and Election Agreement for Amended and Restated American Capital Performance Incentive Plan, incorporated by reference herein to Exhibit 2.i.12 of the Pre-Effective Amendment No. 1 to the Registration Statement on Form N-2 (File No. 333-133571), filed June 26, 2006. |
| |
| †*10.33. | | American Capital, Ltd. Disinterested Director Retention Plan, incorporated herein by reference to Exhibit 10.14 of Form 10-K for the year ended December 31, 2008 (File No. 814-00149), filed March 2, 2008. |
| |
| †10.34. | | Amended and Restated American Capital Strategies Employee Investment and Stock Ownership Plan, effective as of January 1, 2000; Amended and Restated American Capital Strategies, Ltd. 401(k) Plan, effective as of January 1, 2009, filed herewith. |
| |
| *10.35. | | Custodian Agreement between American Capital Strategies, Ltd. and PNC Bank, N.A., as successor to Riggs Bank, N.A., dated as of August 27, 1997, incorporated herein by reference to Exhibit 2.j.2 of the Pre-Effective Amendment No. 2 to the Registration statement on Form N-2 (File No. 333-29943) filed August 29, 1997. |
| |
| *10.36. | | Amended and Restated Custodian Agreement between American Capital Strategies, Ltd. and Wells Fargo Bank, National Association, dated as of February 2, 2007, incorporated herein by reference to Exhibit 2.j.2 of the Registration Statement on Form N-2 (File No. 333-142398), filed on April 26, 2007. |
| |
| *10.37. | | ACAS Transfer Agreement between American Capital Strategies, Ltd. and ACAS Business Loan LLC, 2004-1, dated as of December 2, 2004, incorporated herein by reference to Exhibit 10.3 of Form 8-K dated December 8, 2004. |
| |
| *10.38. | | Transfer and Servicing Agreement among ACAS Business Loan Trust 2004-1, ACAS Business Loan LLC, 2004-1, Wells Fargo Bank, National Association, and American Capital Strategies, Ltd. dated as of December 2, 2004, incorporated herein by reference to Exhibit 10.2 of Form 8-K dated December 8, 2004, as amended by Amendment No. 1 to Transfer and Servicing Agreement, by and among ACAS Business Loan Trust 2004-1, ACAS Business Loan LLC, 2004-1, American Capital Strategies, Ltd. and Wells Fargo Bank, National Association, dated as of September 22, 2005, incorporated by reference herein to Exhibit 10.18 of Form 10-Q for the quarter ended September 30, 2005 (File No. 814-00149), filed November 29, 2005. |
177
| | |
Exhibit | | Description |
| |
| *10.39. | | Indenture, between Wells Fargo Bank, National Association, as Indenture Trustee and ACAS Business Loan Trust 2004-1, as the Issuer, dated as of December 2, 2004, incorporated herein by reference to Exhibit 4.1 of Form 8-K dated December 8, 2004. |
| |
| *10.40. | | Purchase Agreement, by and among American Capital Strategies, Ltd., ACAS Business Loan LLC, 2004-1, ACAS Business Loan Trust 2004-1, Wachovia Capital Markets, LLC, Citigroup Global Markets Inc., J.P. Morgan Securities Inc., Harris Nesbitt Corp. and BB&T Capital Markets, a division of Scott & Stringfellow, dated as of November 22, 2004, incorporated herein by reference to Exhibit 10.1 of Form 8-K dated December 8, 2004. |
| |
| *10.41. | | Amended And Restated Trust Agreement, by and among ACAS Business Loan LLC, 2005-1, Wachovia Bank of Delaware, National Association, and American Capital Strategies, Ltd., dated as of October 4, 2005, incorporated herein by reference to Exhibit 10.23 of Form 10-Q for the quarter ended September 30, 2005 (File No. 814-00149), filed November 9, 2005. |
| |
| *10.42. | | ACAS Transfer Agreement, between American Capital Strategies, Ltd. and ACAS Business Loan LLC, 2005-1, dated as of October 4, 2005, incorporated herein by reference to Exhibit 10.27 of Form 10-Q for the quarter ended September 30, 2005 (File No. 814-00149), filed November 9, 2005. |
| |
| *10.43. | | Transfer And Servicing Agreement, by and among ACAS Business Loan Trust 2005-1, ACAS Business Loan LLC, 2005-1, American Capital Strategies, Ltd. and Wells Fargo Bank, National Association, dated as of October 4, 2005, incorporated herein by reference to Exhibit 10.28 of Form 10-Q for the quarter ended September 30, 2005 (File No. 814-00149), filed November 9, 2005. |
| |
| *10.44. | | Purchase Agreement, by and among American Capital Strategies, Ltd., ACAS Business Loan LLC, 2005-1, ACAS Business Loan Trust 2005-1, Wachovia Capital Markets, LLC, Citigroup Global Markets Inc., Banc of America Securities LLC, BB&T Capital Markets, a division of Scott & Stringfellow, Inc., Harris Nesbitt Corp., and HVB Capital Markets, Inc., dated September 29, 2005, incorporated herein by reference to Exhibit 10.29 of Form 10-Q for the quarter ended September 30, 2005 (File No. 814-00149), filed November 9, 2005. |
| |
| *10.45. | | Class A-2A Note Purchase Agreement by and among ACAS Business Loan Trust 2005-1, Wells Fargo Bank, National Association, Centauri Corporation and Wachovia Bank, National Association, dated October 4, 2005, incorporated herein by reference to Exhibit 10.30 of Form 10-Q for the quarter ended September 30, 2005 (File No. 814-00149), filed November 9, 2005. |
| |
| *10.46. | | Class A-2A Note Purchase Agreement by and among ACAS Business Loan Trust 2005-1, Wells Fargo Bank, National Association, Five Finance Corporation and Wachovia Bank, National Association, dated October 4, 2005, incorporated herein by reference to Exhibit 10.31 of Form 10-Q for the quarter ended September 30, 2005 (File No. 814-00149), filed November 9, 2005. |
| |
| *10.47. | | Class A-2A Note Purchase Agreement by and among ACAS Business Loan Trust 2005-1, Wells Fargo Bank, National Association, Dorado Corporation and Wachovia Bank, National Association, dated October 4, 2005, incorporated herein by reference to Exhibit 10.32 of Form 10-Q for the quarter ended September 30, 2005 (File No. 814-00149), filed November 9, 2005. |
| |
| *10.48. | | Indenture, by and between ACAS Business Loan Trust 2005-1, as the Issuer, and Wells Fargo Bank, National Association, as the Indenture Trustee, dated as of October 4, 2005, incorporated herein by reference to Exhibit 4.8 of Form 10-Q for the quarter ended June 30, 2005 (File No. 814-00149), filed November 9, 2005. |
| |
| *10.49. | | Amended and Restated Trust Agreement by and among ACAS Business Loan LLC, 2006-1, as the Trust Depositor, M&T Trust Company of Delaware, as the Owner Trustee, Certificate Registrar, and Paying Agent, and American Capital Strategies, Ltd., as the Servicer, dated July 28, 2006, incorporated herein by reference to Exhibit 10.2 of Form 10-Q for the quarter ended September 30, 2006 (File No. 814-00149), filed November 9, 2006. |
178
| | |
Exhibit | | Description |
| |
| *10.50. | | Purchase and Sale Agreement, dated October 1, 2006, between American Capital Strategies, Ltd. and American Capital Equity I, LLC, incorporated herein by reference to Exhibit 1.0 of Form 8-K, dated October 5, 2006. |
| |
| *10.51. | | ACAS Transfer Agreement between American Capital Strategies, Ltd., as the Originator, and ACAS Business Loan LLC, 2006-1, as the Trust Depositor, dated July 28, 2006, incorporated herein by reference to Exhibit 10.3 of Form 10-Q for the quarter ended September 30, 2006 (File No. 814-00149), filed November 9, 2006. |
| |
| *10.52. | | Transfer and Servicing Agreement by and among ACAS Business Loan Trust 2006-1, as the Issuer, ACAS Business Loan LLC, 2006-1, as the Trust Depositor, American Capital Strategies, Ltd., as the Originator and Servicer, and Wells Fargo Bank, National Association, as the Indenture Trustee and the Backup Servicer, dated July 28, 2006, incorporated herein by reference to Exhibit 10.4 of Form 10-Q for the quarter ended September 30, 2006 (File No. 814-00149), filed November 9, 2006. |
| |
| *10.53. | | Indenture, by and between ACAS Business Loan Trust 2006-1, as the Issuer, and Wells Fargo Bank, National Association, as the Indenture Trustee, dated July 28, 2006, incorporated herein by reference to Exhibit 4.5 of Form 10-Q filed on November 9, 2006. |
| |
| *10.54. | | Indenture, by and between ACAS Business Loan Trust 2007-1, as the Issuer, and Wells Fargo Bank, National Association, as the Indenture Trustee, dated April 24, 2007, incorporated herein by reference to Exhibit 4.5 of Form 10-Q for the quarter ended June 30, 2007 (File No. 814000149), filed on August 9, 2007. |
| |
| *10.55. | | Amended And Restated Trust Agreement, by and among ACAS Business Loan LLC, 2007-1, Wilmington Trust Company and American Capital Strategies, Ltd., dated as of April 24, 2007, incorporated herein by reference to Exhibit 10.23 of Form 10-Q for the quarter ended June 30, 2007 (File No. 814-00149), filed August 9, 2007. |
| |
| *10.56. | | ACAS Transfer Agreement, between American Capital Strategies, Ltd. and ACAS Business Loan LLC, 2007-1, dated as of April 24, 2007, incorporated herein by reference to Exhibit 10.2 of Form 10-Q for the quarter ended June 30, 2007 (File No. 814-00149), filed August 9, 2007. |
| |
| *10.57. | | Transfer And Servicing Agreement, by and among ACAS Business Loan Trust 2007-1, ACAS Business Loan LLC, 2007-1, American Capital Strategies, Ltd. and Wells Fargo Bank, National Association, dated as of April 24, 2007, incorporated herein by reference to Exhibit 10.3 of Form 10-Q for the quarter ended June 30, 2007 (File No. 814-00149), filed August 9, 2007. |
| |
| *10.58. | | Credit Agreement by and among American Capital Strategies, Ltd., as Borrower, Wachovia Bank, National Association, as the Administrative Agent, Swingline Lender, and Issuing Lender, and the Lenders listed therein, dated May 16, 2007, incorporated herein by reference to Exhibit 10.1 of Form 8-K dated May 22, 2007, as amended by the First Amendment to Credit Agreement and Waiver, dated December 7, 2007, incorporated herein by reference to Exhibit 2.k.8 of Pre-Effective Amendment No. 1 to the Registration Statement on Form N-2 (File No. 333-150270) filed on October 14, 2009, and by the Second Amendment to Credit Agreement, dated September 29, 2008, , incorporated herein by reference to Exhibit 10.1 of Form 8-K dated October 3, 2008. |
| |
| 10.59. | | Lock Up Agreement, dated November 20, 2009, by and among American Capital, Ltd. and the lenders under the Credit Agreement dated as of May 16, 2007, with Wachovia Bank, NA, as administrative agent, filed herewith. |
| |
| 10.60. | | First Amendment to American Capital, Ltd. Lock Up Agreement, dated January 28, 2010, by and among American Capital, Ltd. and the creditors party thereto, filed herewith. |
| |
| 12.1. | | Ratio of Earnings to Fixed Charges. |
179
| | |
Exhibit | | Description |
| |
| *14.0. | | American Capital Strategies, Ltd. Code of Ethics and Conduct, incorporated herein by reference to Exhibit 2.r of the Registration Statement on Form N-2 (File No. 333-113859), filed March 23, 2004 and American Capital Strategies, Ltd. Personal Investments Code, incorporated herein by reference to Exhibit 2.r of Pre-Effective Amendment No. 1 to Registration Statement on Form N-2 (File No. 333-125278), filed July 29, 2005. |
| |
| 21. | | Subsidiaries of the Company and jurisdiction of incorporation: |
| |
| | 1) American Capital Financial Services, Inc., a Delaware corporation |
| |
| | 2) ACAS Business Loan LLC, 2004-1, a Delaware limited liability company |
| |
| | 3) ACAS Business Loan Trust 2004-1, a Delaware statutory trust |
| |
| | 4) ACAS Business Loan LLC, 2005-1, a Delaware limited liability company |
| |
| | 5) ACAS Business Loan Trust 2005-1, a Delaware statutory trust |
| |
| | 6) ACAS Business Loan LLC, 2006-1, a Delaware limited liability company |
| |
| | 7) ACAS Business Loan Trust 2006-1, a Delaware statutory trust |
| |
| | 8) ACAS Business Loan LLC 2007-1, a Delaware limited liability company |
| |
| | 9) ACAS Business Loan Trust 2007-1, a Delaware statutory trust |
| |
| | 10) ACAS Master Business Loan LLC, a Delaware limited liability company |
| |
| | 11) ACAS Business Loan Trust 2007-2, a Delaware statutory trust |
| |
| | 12) ACAS CRE CDO 2007-1 Depositor, LLC, a Delaware limited liability company |
| |
| 23. | | Consent of Ernst & Young LLP, filed herewith. |
| |
| 24. | | Powers of Attorneys of directors and officers, filed herewith. |
| |
| 31. | | Certification of CEO and CFO Pursuant to Section 302 of the Sarbanes-Oxley Act of 2002. |
| |
| 32. | | Certification of CEO and CFO Pursuant to 18 U.S.C. Section 1350, as Adopted Pursuant to Section 906 of the Sarbanes-Oxley Act of 2002. |
| * | Fully or partly previously filed |
| † | Management contract or compensatory plan or arrangement |
| | | See the exhibits filed herewith. |
| | (c) | Additional financial statement schedules |
180
SIGNATURES
Pursuant to the requirements of Section 13 or 15(d) of the Securities Exchange Act of 1934, the registrant has duly caused this report to be signed on its behalf by the undersigned, thereunto duly authorized.
| | |
| AMERICAN CAPITAL, LTD. |
| |
| By: | | /s/ JOHN R. ERICKSON |
| | John R. Erickson |
| | Chief Financial Officer |
Date: March 1, 2010
Pursuant to the requirements of the Securities Exchange Act of 1934, this report has been signed below by the following persons on behalf of the registrant and in the capacities and on the dates indicated.
| | | | |
Name | | Title | | Date |
| | |
* Malon Wilkus | | Chairman of the Board and Chief Executive Officer (Principal Executive Officer) | | March 1, 2010 |
| | |
/s/ JOHN R. ERICKSON John R. Erickson | | Chief Financial Officer (Principal Financial and Accounting Officer) | | March 1, 2010 |
| | |
* Mary C. Baskin | | Director | | March 1, 2010 |
| | |
* Neil M. Hahl | | Director | | March 1, 2010 |
| | |
* Philip R. Harper | | Director | | March 1, 2010 |
| | |
* John A. Koskinen | | Director | | March 1, 2010 |
| | |
* Stan Lundine | | Director | | March 1, 2010 |
| | |
* Kenneth D. Peterson, Jr. | | Director | | March 1, 2010 |
| | |
* Alvin N. Puryear | | Director | | March 1, 2010 |
| | |
| |
| *By: | | /s/ JOHN R. ERICKSON |
| | John R. Erickson Attorney-in-fact |
181
Report of Independent Registered Public Accounting Firm
The Board of Directors and Shareholders of American Capital, Ltd.
We have audited the consolidated financial balance sheets of American Capital, Ltd., including the consolidated schedule of investments, as of December 31, 2009 and 2008, and the related consolidated statements of operations, changes in net assets, and cash flows for each of the three years in the period ended December 31, 2009, and the consolidated financial highlights for each of the five years in the period ended December 31, 2009, and have issued our report thereon dated March 1, 2010 (included elsewhere in the Form 10-K). Our audits also included the schedule 12-14. The schedule 12-14 is the responsibility of the Company’s management. Our responsibility is to express an opinion based on our audits.
In our opinion, the schedule 12-14 referred to above, when considered in relation to the basic financial statements taken as a whole, presents fairly in all material respects the information set forth therein. The schedule 12-14 does not include any adjustments to reflect the possible future effects on the recoverability and classification of assets or the amounts and classification of liabilities that may result from the outcome of the uncertainty regarding the Company’s ability to continue as a going concern.
/s/ Ernst & Young LLP
McLean, Virginia
March 1, 2010
182
Schedule 12-14
AMERICAN CAPITAL, LTD.
SCHEDULE OF INVESTMENTS IN AND ADVANCES TO AFFILIATES
As of and for the year ended December 31, 2009
(in millions, except share data)
| | | | | | | | | | | | | | | | | | | | | |
| | | | | Amount of Interest or
Dividends | | | | | | | | | |
Company (1) | | Investments | | Credited
to Income (2) | | Other (3) | | December 31,
2008 Value | | | Gross
Additions (4) | | Gross
Reductions (5) | | December 31,
2009 Value |
CONTROL INVESTMENTS | | | | | | | | | | | | | | | | | | | |
ACAS Equity Holdings Corp. | | Common Stock | | $ | 0.2 | | $ | — | | $ | 4.3 | | | $ | 0.4 | | $ | 3.3 | | $ | 1.4 |
ACAS Real Estate Holdings Corporation | | Subordinated Debt | | | — | | | — | | | — | | | | 3.9 | | | — | | | 3.9 |
| | Common Stock | | | — | | | — | | | — | | | | 6.1 | | | 5.5 | | | 0.6 |
| | | | | | | | | | | | | | | | | | | | | |
| | | | | | — | | | — | | | — | | | | 10.0 | | | 5.5 | | | 4.5 |
ACAS Wachovia Investments, L.P. | | Partnership Interests | | | 1.0 | | | — | | | 1.4 | | | | 11.3 | | | 10.7 | | | 2.0 |
American Capital Agency Corp.(10) | | Common Stock | | | 11.8 | | | — | | | 101.5 | | | | — | | | 101.5 | | | — |
American Capital, LLC | | Senior Debt | | | 0.7 | | | — | | | 10.6 | | | | 0.4 | | | 3.5 | | | 7.5 |
| | Common Membership Interest | | | 4.3 | | | — | | | 164.7 | | | | 26.5 | | | 149.6 | | | 41.6 |
| | | | | | | | | | | | | | | | | | | | | |
| | | | | | 5.0 | | | — | | | 175.3 | | | | 26.9 | | | 153.1 | | | 49.1 |
American Driveline Systems, Inc. | | Subordinated Debt | | | 6.0 | | | — | | | 41.7 | | | | 0.6 | | | — | | | 42.3 |
| | Redeemable Preferred Stock | | | 3.7 | | | — | | | 44.1 | | | | 3.7 | | | — | | | 47.8 |
| | Common Stock | | | — | | | — | | | 2.7 | | | | — | | | 1.3 | | | 1.4 |
| | Common Stock Warrants | | | — | | | — | | | 4.2 | | | | — | | | 2.0 | | | 2.2 |
| | | | | | | | | | | | | | | | | | | | | |
| | | | | | 9.7 | | | — | | | 92.7 | | | | 4.3 | | | 3.3 | | | 93.7 |
Aptara, Inc.(6) | | Senior Debt | | | 0.2 | | | — | | | — | | | | 3.0 | | | — | | | 3.0 |
| | Subordinated Debt | | | 4.7 | | | — | | | — | | | | 60.0 | | | — | | | 60.0 |
| | Redeeemable Preferred Stock | | | — | | | — | | | — | | | | 21.0 | | | — | | | 21.0 |
| | Convertible Preferred Stock | | | — | | | — | | | — | | | | — | | | — | | | — |
| | Preferred Stock Warrants | | | — | | | — | | | — | | | | — | | | — | | | — |
| | | | | | | | | | | | | | | | | | | | | |
| | | | | | 4.9 | | | — | | | — | | | | 84.0 | | | — | | | 84.0 |
Auxi Health, Inc. | | Subordinated Debt | | | — | | | — | | | 1.1 | | | | — | | | 1.1 | | | — |
Barton-Cotton Holding Corporation | | Subordinated Debt | | | — | | | — | | | — | | | | — | | | — | | | — |
| | Redeemable Preferred Stock | | | — | | | — | | | — | | | | — | | | — | | | — |
| | Convertible Preferred Stock | | | — | | | — | | | — | | | | — | | | — | | | — |
| | Common Stock | | | — | | | — | | | — | | | | — | | | — | | | — |
| | Common Stock Warrants | | | — | | | — | | | — | | | | — | | | — | | | — |
| | Guarantees | | | — | | | — | | | (10.0 | ) | | | 10.0 | | | — | | | — |
| | | | | | | | | | | | | | | | | | | | | |
| | | | | | — | | | — | | | (10.0 | ) | | | 10.0 | | | — | | | — |
Capital.com, Inc. | | Common Stock | | | — | | | — | | | 0.4 | | | | — | | | 0.4 | | | — |
See related notes at the end of this schedule.
183
Schedule 12-14
AMERICAN CAPITAL, LTD.
SCHEDULE OF INVESTMENTS IN AND ADVANCES TO AFFILIATES—(Continued)
As of and for the year ended December 31, 2009
(in millions, except share data)
| | | | | | | | | | | | | | |
| | | | | Amount of Interest or
Dividends | | | | | | | | |
Company (1) | | Investments | | Credited
to Income (2) | | Other (3) | | December 31,
2008 Value | | Gross
Additions (4) | | Gross
Reductions (5) | | December 31,
2009 Value |
CIBT Travel Solutions, Inc | | Senior Debt | | 4.9 | | — | | 74.8 | | 0.8 | | 25.7 | | 49.9 |
| | Subordinated Debt | | 8.2 | | — | | 43.1 | | 11.5 | | — | | 54.6 |
| | Redeemable Preferred Stock | | 2.7 | | — | | — | | 17.7 | | — | | 17.7 |
| | Convertible Preferred Stock | | — | | — | | 35.2 | | — | | 21.0 | | 14.2 |
| | Common Stock | | — | | — | | — | | — | | — | | — |
| | | | | | | | | | | | | | |
| | | | | 15.8 | | — | | 153.1 | | 30.0 | | 46.7 | | 136.4 |
CMX Inc.(7) | | Senior Debt | | 1.1 | | — | | — | | 67.6 | | 51.5 | | 16.1 |
Consolidated Bedding, Inc | | Senior Debt | | 0.6 | | — | | 33.2 | | 1.9 | | 35.1 | | — |
| | Subordinated Debt | | — | | — | | — | | 13.7 | | 13.7 | | — |
| | | | | | | | | | | | | | |
| | | | | 0.6 | | — | | 33.2 | | 15.6 | | 48.8 | | — |
Contour Semiconductor, Inc. | | Convertible Preferred Stock | | — | | — | | 10.6 | | 9.0 | | — | | 19.6 |
Core Business Credit, LLC | | Subordinated Debt | | — | | — | | 19.3 | | — | | 19.3 | | — |
| | Convertible Preferred Stock | | — | | — | | 16.1 | | — | | 16.1 | | — |
| | Common Stock | | — | | — | | 3.3 | | 0.6 | | 3.9 | | — |
| | | | | | | | | | | | | | |
| | | | | — | | — | | 38.7 | | 0.6 | | 39.3 | | — |
Core Financial Holdings, LLC | | Subordinated Debt | | 5.4 | | — | | — | | 37.5 | | — | | 37.5 |
| | Common Stock | | — | | — | | — | | 54.4 | | 30.7 | | 23.7 |
| | | | | | | | | | | | | | |
| | | | | 5.4 | | — | | — | | 91.9 | | 30.7 | | 61.2 |
Creditcards.com, Inc.(6) | | Senior Debt | | — | | — | | — | | 79.9 | | — | | 79.9 |
| | Subordinated Debt | | — | | — | | — | | 15.5 | | — | | 15.5 |
| | Redeemable Preferred Stock | | — | | — | | — | | 11.8 | | — | | 11.8 |
| | Common Stock | | — | | — | | — | | — | | — | | — |
| | | | | | | | | | | | | | |
| | | | | — | | — | | — | | 107.2 | | — | | 107.2 |
ECA Acquisition Holdings, Inc | | Subordinated Debt | | 2.2 | | — | | 13.0 | | 0.5 | | — | | 13.5 |
| | Common Stock | | — | | — | | 5.1 | | 7.7 | | — | | 12.8 |
| | | | | | | | | | | | | | |
| | | | | 2.2 | | — | | 18.1 | | 8.2 | | — | | 26.3 |
See related notes at the end of this schedule.
184
Schedule 12-14
AMERICAN CAPITAL, LTD.
SCHEDULE OF INVESTMENTS IN AND ADVANCES TO AFFILIATES—(Continued)
As of and for the year ended December 31, 2009
(in millions, except share data)
| | | | | | | | | | | | | | | |
| | | | | Amount of Interest or
Dividends | | | | | | | | |
Company (1) | | Investments | | Credited
to Income (2) | | | Other (3) | | December 31,
2008 Value | | Gross
Additions (4) | | Gross
Reductions (5) | | December 31,
2009 Value |
eLynx Holdings, Inc. | | Senior Debt | | 0.9 | | | — | | 9.6 | | 0.9 | | 0.8 | | 9.7 |
| | Subordinated Debt | | 0.5 | | | — | | 1.4 | | 6.9 | | — | | 8.3 |
| | Redeemable Preferred Stock | | — | | | — | | — | | — | | — | | — |
| | Convertible Preferred Stock | | — | | | — | | — | | — | | — | | — |
| | Common Stock | | — | | | — | | — | | — | | — | | — |
| | Common Stock Warrants | | — | | | — | | — | | — | | — | | — |
| | | | | | | | | | | | | | | |
| | | | | 1.4 | | | — | | 11.0 | | 7.8 | | 0.8 | | 18.0 |
Endeavor Fund I, LP | | Partnership Interest | | 6.4 | | | — | | 20.9 | | 6.2 | | 10.1 | | 17.0 |
ETG Holdings, Inc. | | Senior Debt | | — | �� | | — | | 2.6 | | 0.8 | | 3.4 | | — |
| | Subordinated Debt | | — | | | — | | — | | — | | — | | — |
| | Convertible Preferred Stock | | — | | | — | | — | | — | | — | | — |
| | | | | | | | | | | | | | | |
| | | | | — | | | — | | 2.6 | | 0.8 | | 3.4 | | — |
European Capital Limited | | Subordinated Debt | | 10.0 | | | — | | 363.6 | | 125.0 | | 462.8 | | 25.8 |
| | Ordinary Shares | | — | | | — | | 116.9 | | 345.5 | | 219.3 | | 243.1 |
| | | | | | | | | | | | | | | |
| | | | | 10.0 | | | — | | 480.5 | | 470.5 | | 682.1 | | 268.9 |
European Touch, LTD. II | | Senior Debt | | — | | | — | | — | | 0.4 | | — | | 0.4 |
| | Subordinated Debt | | (0.3 | ) | | — | | 5.3 | | — | | 3.5 | | 1.8 |
| | Redeemable Preferred Stock | | — | | | — | | — | | — | | — | | — |
| | Common Stock | | — | | | — | | — | | — | | — | | — |
| | Common Stock Warrants | | — | | | — | | — | | — | | — | | — |
| | | | | | | | | | | | | | | |
| | | | | (0.3 | ) | | — | | 5.3 | | 0.4 | | 3.5 | | 2.2 |
EXPL Pipeline Holdings LLC | | Senior Debt | | 3.6 | | | — | | 42.3 | | 2.9 | | 1.3 | | 43.9 |
| | Common Membership Units | | — | | | — | | 12.0 | | 0.1 | | — | | 12.1 |
| | | | | | | | | | | | | | | |
| | | | | 3.6 | | | — | | 54.3 | | 3.0 | | 1.3 | | 56.0 |
Formed Fiber Technologies, Inc.(7) | | Subordinated Debt | | — | | | — | | — | | 9.4 | | 9.4 | | — |
| | Common Stock | | — | | | — | | — | | 8.1 | | 7.6 | | 0.5 |
| | Common Stock Warrants | | — | | | — | | — | | 0.1 | | 0.1 | | — |
| | | | | | | | | | | | | | | |
| | | | | — | | | — | | — | | 17.6 | | 17.1 | | 0.5 |
Fosbel Global Services (LUXCO) S.C.A | | Subordinated Debt | | 3.4 | | | 0.6 | | 35.3 | | 4.0 | | 10.1 | | 29.2 |
| | Redeemable Preferred Stock | | — | | | — | | — | | — | | — | | — |
| | Convertible Preferred Stock | | — | | | — | | — | | — | | — | | — |
| | Common Stock | | — | | | — | | — | | — | | — | | — |
| | | | | | | | | | | | | | | |
| | | | | 3.4 | | | 0.6 | | 35.3 | | 4.0 | | 10.1 | | 29.2 |
See related notes at the end of this schedule.
185
Schedule 12-14
AMERICAN CAPITAL, LTD.
SCHEDULE OF INVESTMENTS IN AND ADVANCES TO AFFILIATES—(Continued)
As of and for the year ended December 31, 2009
(in millions, except share data)
| | | | | | | | | | | | | | |
| | | | | Amount of Interest or
Dividends | | | | | | | | |
Company (1) | | Investments | | Credited
to Income (2) | | Other (3) | | December 31,
2008 Value | | Gross
Additions (4) | | Gross
Reductions (5) | | December 31,
2009 Value |
Fountainhead Estate Holding Corp. | | Senior Debt | | 0.9 | | — | | 24.5 | | — | | 3.5 | | 21.0 |
| | Redeemable Preferred Stock | | 4.0 | | — | | 11.6 | | 3.9 | | — | | 15.5 |
| | Convertible Preferred Stock | | — | | — | | 2.6 | | 14.3 | | — | | 16.9 |
| | | | | | | | | | | | | | |
| | | | | 4.9 | | — | | 38.7 | | 18.2 | | 3.5 | | 53.4 |
FreeConferenceroom.com, Inc. | | Senior Debt | | 1.0 | | — | | 14.9 | | 0.1 | | 3.1 | | 11.9 |
| | Subordinated Debt | | 1.6 | | — | | 10.1 | | 0.3 | | — | | 10.4 |
| | Redeemable Preferred Stock | | — | | — | | 4.5 | | — | | 0.5 | | 4.0 |
| | Common Stock | | — | | — | | — | | — | | — | | — |
| | | | | | | | | | | | | | |
| | | | | 2.6 | | — | | 29.5 | | 0.4 | | 3.6 | | 26.3 |
Future Food, Inc. | | Senior Debt | | 1.0 | | — | | 17.3 | | — | | 3.8 | | 13.5 |
| | Subordinated Debt | | — | | — | | 3.8 | | — | | 3.8 | | — |
| | Common Stock | | — | | — | | — | | — | | — | | — |
| | Common Stock Warrants | | — | | — | | — | | — | | — | | — |
| | | | | | | | | | | | | | |
| | | | | 1.0 | | — | | 21.1 | | — | | 7.6 | | 13.5 |
FutureLogic, Inc. | | Senior Debt | | 3.7 | | — | | 48.2 | | 40.3 | | 48.5 | | 40.0 |
| | Subordinated Debt | | 2.6 | | 0.3 | | 32.6 | | 40.5 | | 33.7 | | 39.4 |
| | Redeemable Preferred Stock | | — | | — | | — | | 0.6 | | 0.6 | | — |
| | Common Stock | | — | | — | | 3.7 | | — | | 3.7 | | — |
| | | | | | | | | | | | | | |
| | | | | 6.3 | | 0.3 | | 84.5 | | 81.4 | | 86.5 | | 79.4 |
FV Holdings Corporation | | Subordinated Debt | | 3.4 | | — | | 23.1 | | 0.6 | | — | | 23.7 |
| | Convertible Preferred Stock | | — | | — | | 23.8 | | — | | 2.9 | | 20.9 |
| | Common Stock | | — | | — | | 10.2 | | — | | 1.3 | | 8.9 |
| | | | | | | | | | | | | | |
| | | | | 3.4 | | — | | 57.1 | | 0.6 | | 4.2 | | 53.5 |
Group Montana, Inc. | | Senior Debt | | 1.8 | | 0.1 | | 18.2 | | 3.7 | | 2.3 | | 19.6 |
| | Subordinated Debt | | — | | — | | — | | 0.1 | | 0.1 | | — |
| | Convertible Preferred Stock | | — | | — | | — | | — | | — | | — |
| | Common Membership Interest | | — | | — | | — | | — | | — | | — |
| | | | | | | | | | | | | | |
| | | | | 1.8 | | 0.1 | | 18.2 | | 3.8 | | 2.4 | | 19.6 |
Halex Holdings Corp. | | Senior Debt | | — | | — | | 9.9 | | 12.8 | | 15.9 | | 6.8 |
| | Subordinated Debt | | — | | — | | — | | — | | — | | — |
| | Redeemable Preferred Stock | | — | | — | | — | | 0.3 | | 0.3 | | — |
| | | | | | | | | | | | | | |
| | | | | — | | — | | 9.9 | | 13.1 | | 16.2 | | 6.8 |
See related notes at the end of this schedule.
186
Schedule 12-14
AMERICAN CAPITAL, LTD.
SCHEDULE OF INVESTMENTS IN AND ADVANCES TO AFFILIATES—(Continued)
As of and for the year ended December 31, 2009
(in millions, except share data)
| | | | | | | | | | | | | | | | |
| | | | | Amount of Interest or
Dividends | | | | | | | | | |
Company (1) | | Investments | | Credited
to Income (2) | | | Other (3) | | December 31,
2008 Value | | Gross
Additions (4) | | | Gross
Reductions (5) | | December 31,
2009 Value |
Hartstrings Holdings Corp. | | Senior Debt | | 0.1 | | | 0.1 | | 14.2 | | 1.6 | | | 9.2 | | 6.6 |
| | Convertible Preferred Stock | | — | | | — | | — | | — | | | — | | — |
| | Common Stock | | — | | | — | | — | | — | | | — | | — |
| | | | | | | | | | | | | | | | |
| | | | | 0.1 | | | 0.1 | | 14.2 | | 1.6 | | | 9.2 | | 6.6 |
Imperial Supplies Holdings, Inc. | | Subordinated Debt | | 2.8 | | | — | | 21.9 | | 0.7 | | | 22.6 | | — |
| | Redeemable Preferred Stock | | 1.4 | | | — | | 21.6 | | 1.4 | | | 23.0 | | — |
| | Convertible Preferred Stock | | — | | | — | | 8.1 | | 12.5 | | | 20.6 | | — |
| | Common Stock | | — | | | — | | — | | — | | | — | | — |
| | | | | | | | | | | | | | | | |
| | | | | 4.2 | | | — | | 51.6 | | 14.6 | | | 66.2 | | — |
Kingway Inca Clymer Holdings, Inc. | | Subordinated Debt | | — | | | — | | — | | 1.1 | | | — | | 1.1 |
| | Redeemable Preferred Stock | | — | | | — | | 0.7 | | — | | | 0.7 | | — |
| | | | | | | | | | | | | | | | |
| | | | | — | | | — | | 0.7 | | 1.1 | | | 0.7 | | 1.1 |
Lifoam Holdings, Inc. | | Senior Debt | | 1.9 | | | — | | 22.2 | | 9.8 | | | 12.9 | | 19.1 |
| | Subordinated Debt | | 5.4 | | | — | | 20.5 | | 19.3 | | | — | | 39.8 |
| | Redeemable Preferred Stock | | — | | | — | | — | | 7.4 | | | — | | 7.4 |
| | Convertible Preferred Stock | | — | | | — | | — | | — | | | — | | — |
| | Common Stock | | — | | | — | | — | | — | | | — | | — |
| | Common Stock Warrants | | — | | | — | | — | | — | | | — | | — |
| | | | | | | | | | | | | | | | |
| | | | | 7.3 | | | — | | 42.7 | | 36.5 | | | 12.9 | | 66.3 |
LLSC Holdings Corporation | | Senior Debt | | 0.3 | | | — | | 5.5 | | — | | | 1.0 | | 4.5 |
| | Subordinated Debt | | 0.7 | | | — | | 5.5 | | — | | | — | | 5.5 |
| | Convertible Preferred Stock | | — | | | — | | 4.7 | | 0.1 | | | — | | 4.8 |
| | | | | | | | | | | | | | | | |
| | | | | 1.0 | | | — | | 15.7 | | 0.1 | | | 1.0 | | 14.8 |
LVI Holdings, LLC | | Senior Debt | | 0.2 | | | — | | 2.3 | | 0.7 | | | 0.3 | | 2.7 |
| | Subordinated Debt | | (0.9 | ) | | — | | 11.4 | | (0.4 | ) | | — | | 11.0 |
| | | | | | | | | | | | | | | | |
| | | | | (0.7 | ) | | — | | 13.7 | | 0.3 | | | 0.3 | | 13.7 |
Montgomery Lane, LLC (DE LLC) | | Common Membership Units | | — | | | — | | 6.8 | | — | | | 1.9 | | 4.9 |
Montgomery Lane, LTD (Cayman) | | Common Membership Units | | — | | | — | | 0.8 | | — | | | 0.3 | | 0.5 |
See related notes at the end of this schedule.
187
Schedule 12-14
AMERICAN CAPITAL, LTD.
SCHEDULE OF INVESTMENTS IN AND ADVANCES TO AFFILIATES—(Continued)
As of and for the year ended December 31, 2009
(in millions, except share data)
| | | | | | | | | | | | | | | |
| | | | | Amount of Interest or
Dividends | | | | | | | | |
Company (1) | | Investments | | Credited
to Income (2) | | | Other (3) | | December 31,
2008 Value | | Gross
Additions (4) | | Gross
Reductions (5) | | December 31,
2009 Value |
MW Acquisition Corporation | | Subordinated Debt | | 4.9 | | | — | | 25.0 | | 0.5 | | — | | 25.5 |
| | Redeemable Preferred Stock | | 0.1 | | | — | | — | | 1.0 | | — | | 1.0 |
| | Convertible Preferred Stock | | — | | | — | | 13.9 | | — | | 5.4 | | 8.5 |
| | Common Stock | | — | | | — | | 0.1 | | — | | 0.1 | | — |
| | | | | | | | | | | | | | | |
| | | | | 5.0 | | | — | | 39.0 | | 1.5 | | 5.5 | | 35.0 |
NECCO Holdings, Inc. | | Senior Debt | | 0.6 | | | — | | 4.1 | | 0.3 | | — | | 4.4 |
| | Common Stock | | — | | | — | | 0.1 | | — | | 0.1 | | — |
| | | | | | | | | | | | | | | |
| | | | | 0.6 | | | — | | 4.2 | | 0.3 | | 0.1 | | 4.4 |
NECCO Realty Investments, LLC | | Senior Debt | | 5.4 | | | — | | 37.7 | | 2.3 | | — | | 40.0 |
| | Common Membership Units | | — | | | — | | 9.8 | | — | | 1.8 | | 8.0 |
| | | | | | | | | | | | | | | |
| | | | | 5.4 | | | — | | 47.5 | | 2.3 | | 1.8 | | 48.0 |
Oceana Media Finance, LLC | | Common Membership Units | | — | | | — | | 11.4 | | 3.2 | | 14.6 | | — |
Paradigm Precision Holdings, LLC | | Senior Debt | | 0.2 | | | — | | 19.1 | | 2.8 | | 21.9 | | — |
| | Subordinated Debt | | 6.0 | | | — | | 92.8 | | 18.0 | | 53.0 | | 57.8 |
| | Common Membership Units | | — | | | — | | 6.1 | | — | | 6.1 | | — |
| | | | | | | | | | | | | | | |
| | | | | 6.2 | | | — | | 118.0 | | 20.8 | | 81.0 | | 57.8 |
PHC Sharp Holdings, Inc. | | Senior Debt | | 1.0 | | | — | | 16.0 | | 1.9 | | 5.4 | | 12.5 |
| | Subordinated Debt | | (0.8 | ) | | — | | 8.8 | | — | | 8.8 | | — |
| | Common Stock | | — | | | — | | — | | — | | — | | — |
| | | | | | | | | | | | | | | |
| | | | | 0.2 | | | — | | 24.8 | | 1.9 | | 14.2 | | 12.5 |
PHI Acquisitions, Inc. | | Senior Debt | | 1.0 | | | — | | 10.0 | | 0.3 | | — | | 10.3 |
| | Subordinated Debt | | 3.7 | | | 0.1 | | 23.6 | | 1.1 | | 0.1 | | 24.6 |
| | Redeemable Preferred Stock | | 15.9 | | | — | | 19.2 | | 33.0 | | — | | 52.2 |
| | Common Stock | | — | | | — | | — | | 3.0 | | — | | 3.0 |
| | Common Stock Warrants | | — | | | — | | — | | 8.6 | | — | | 8.6 |
| | | | | | | | | | | | | | | |
| | | | | 20.6 | | | 0.1 | | 52.8 | | 46.0 | | 0.1 | | 98.7 |
Piper Aircraft, Inc. | | Subordinated Debt | | — | | | — | | 0.7 | | 0.5 | | 1.2 | | — |
| | Common Stock | | — | | | — | | 22.6 | | — | | 22.6 | | — |
| | | | | | | | | | | | | | | |
| | | | | — | | | — | | 23.3 | | 0.5 | | 23.8 | | — |
Resort Funding Holdings, Inc. | | Senior Debt | | 0.9 | | | — | | 10.6 | | 1.3 | | 4.2 | | 7.7 |
| | Common Stock | | 0.1 | | | — | | 1.2 | | — | | 1.2 | | — |
| | | | | | | | | | | | | | | |
| | | | | 1.0 | | | — | | 11.8 | | 1.3 | | 5.4 | | 7.7 |
See related notes at the end of this schedule.
188
Schedule 12-14
AMERICAN CAPITAL, LTD.
SCHEDULE OF INVESTMENTS IN AND ADVANCES TO AFFILIATES—(Continued)
As of and for the year ended December 31, 2009
(in millions, except share data)
| | | | | | | | | | | | | | | | |
| | | | | Amount of Interest or
Dividends | | | | | | | | | |
Company (1) | | Investments | | Credited
to Income (2) | | | Other (3) | | December 31,
2008 Value | | | Gross
Additions (4) | | Gross
Reductions (5) | | December 31,
2009 Value |
Sixnet, LLC | | Senior Debt | | 3.6 | | | — | | 34.4 | | | 2.9 | | 1.1 | | 36.2 |
| | Membership Units | | — | | | — | | 7.2 | | | 1.2 | | 5.8 | | 2.6 |
| | | | | | | | | | | | | | | | |
| | | | | 3.6 | | | — | | 41.6 | | | 4.1 | | 6.9 | | 38.8 |
SMG Holdings, Inc. | | Senior Debt | | 0.2 | | | — | | 5.9 | | | — | | — | | 5.9 |
| | Subordinated Debt | | 15.6 | | | — | | 119.5 | | | 5.3 | | — | | 124.8 |
| | Convertible Preferred Stock | | 2.7 | | | — | | 102.9 | | | 2.7 | | — | | 105.6 |
| | Common Stock | | — | | | — | | — | | | — | | — | | — |
| | | | | | | | | | | | | | | | |
| | | | | 18.5 | | | — | | 228.3 | | | 8.0 | | — | | 236.3 |
Specialty Brands of America, Inc. | | Subordinated Debt | | 5.0 | | | — | | 34.1 | | | 0.7 | | — | | 34.8 |
| | Redeeemable Preferred Stock | | 1.1 | | | — | | 13.8 | | | 1.2 | | — | | 15.0 |
| | Common Stock | | — | | | — | | 4.0 | | | 8.1 | | — | | 12.1 |
| | Common Stock Warrants | | — | | | — | | 1.8 | | | 3.5 | | — | | 5.3 |
| | | | | | | | | | | | | | | | |
| | | | | 6.1 | | | — | | 53.7 | | | 13.5 | | — | | 67.2 |
SPL Acquisition Corp.(8) | | Senior Debt | | — | | | — | | 83.9 | | | — | | 83.9 | | — |
| | Subordinated Debt | | — | | | — | | 49.9 | | | — | | 49.9 | | — |
| | Convertible Preferred Stock | | — | | | — | | 48.0 | | | — | | 48.0 | | — |
| | Common Stock | | — | | | — | | 10.4 | | | — | | 10.4 | | — |
| | | | | | | | | | | | | | | | |
| | | | | — | | | — | | 192.2 | | | — | | 192.2 | | — |
Spring Air International, LLC | | Common Membership Units | | — | | | — | | — | | | 5.7 | | 5.2 | | 0.5 |
Stravina Holdings, Inc. | | Senior Debt | | — | | | — | | — | | | — | | — | | — |
Tymphany Corporation | | Senior Debt | | — | | | — | | — | | | — | | — | | — |
UFG Member, LLC | | Subordinated Debt | | (0.3 | ) | | — | | 46.1 | | | 20.5 | | 39.7 | | 26.9 |
| | Redeemable Preferred Stock | | — | | | — | | — | | | 17.0 | | 17.0 | | — |
| | Convertible Preferred Stock | | — | | | — | | — | | | 4.8 | | 4.8 | | — |
| | Common Stock | | — | | | — | | — | | | 64.7 | | 64.7 | | — |
| | Guarantees | | — | | | — | | (1.5 | ) | | 1.5 | | — | | — |
| | | | | | | | | | | | | | | | |
| | | | | (0.3 | ) | | — | | 44.6 | | | 108.5 | | 126.2 | | 26.9 |
UFG Real Estate Holdings, LLC | | Common Membership | | — | | | — | | 1.4 | | | — | | 0.5 | | 0.9 |
Unique Fabricating Incorporated | | Senior Debt | | (0.1 | ) | | — | | 5.3 | | | 1.6 | | 5.0 | | 1.9 |
| | Subordinated Debt | | — | | | — | | 0.5 | | | 6.1 | | 6.6 | | — |
| | Redeemable Preferred Stock | | — | | | — | | — | | | 6.3 | | 6.3 | | — |
| | Common Stock Warrants | | — | | | — | | — | | | — | | — | | — |
| | | | | | | | | | | | | | | | |
| | | | | (0.1 | ) | | — | | 5.8 | | | 14.0 | | 17.9 | | 1.9 |
See related notes at the end of this schedule.
189
Schedule 12-14
AMERICAN CAPITAL, LTD.
SCHEDULE OF INVESTMENTS IN AND ADVANCES TO AFFILIATES—(Continued)
As of and for the year ended December 31, 2009
(in millions, except share data)
| | | | | | | | | | | | | | | | | | | | | | |
| | | | | Amount of Interest or
Dividends | | | | | | | | | |
Company (1) | | Investments | | Credited
to Income (2) | | | Other (3) | | December 31,
2008 Value | | Gross
Additions (4) | | | Gross
Reductions (5) | | December 31,
2009 Value |
Unwired Holdings, Inc. | | Senior Debt | | | (2.5 | ) | | | — | | | 10.4 | | | 0.1 | | | | 0.8 | | | 9.7 |
| | Subordinated Debt | | | (0.3 | ) | | | — | | | 0.6 | | | — | | | | 0.6 | | | — |
| | Redeemable Preferred Stock | | | — | | | | — | | | — | | | — | | | | — | | | — |
| | Common Stock | | | — | | | | — | | | — | | | — | | | | — | | | — |
| | | | | | | | | | | | | | | | | | | | | | |
| | | | | | (2.8 | ) | | | — | | | 11.0 | | | 0.1 | | | | 1.4 | | | 9.7 |
VP Acquisition Holdings, Inc. | | Subordinated Debt | | | 2.9 | | | | — | | | 19.5 | | | 0.5 | | | | — | | | 20.0 |
| | Common Stock | | | — | | | | — | | | 45.1 | | | — | | | | 7.7 | | | 37.4 |
| | | | | | | | | | | | | | | | | | | | | | |
| | | | | | 2.9 | | | | — | | | 64.6 | | | 0.5 | | | | 7.7 | | | 57.4 |
Warner Power, LLC | | Subordinated Debt | | | 0.4 | | | | — | | | 5.0 | | | — | | | | 3.3 | | | 1.7 |
| | Redeeemable Preferred Membership Units | | | (1.7 | ) | | | — | | | 5.5 | | | (1.7 | ) | | | 3.8 | | | — |
| | Common Membership Units | | | — | | | | — | | | 6.0 | | | — | | | | 6.0 | | | — |
| | | | | | | | | | | | | | | | | | | | | | |
| | | | | | (1.3 | ) | | | — | | | 16.5 | | | (1.7 | ) | | | 13.1 | | | 1.7 |
WIS Holding Company, Inc. | | Subordinated Debt | | | 16.1 | | | | — | | | 103.8 | | | 5.4 | | | | 0.1 | | | 109.1 |
| | Convertible Preferred Stock | | | 6.9 | | | | — | | | 132.6 | | | 6.9 | | | | 2.3 | | | 137.2 |
| | Common Stock | | | — | | | | — | | | 30.2 | | | — | | | | 0.6 | | | 29.6 |
| | | | | | | | | | | | | | | | | | | | | | |
| | | | | | 23.0 | | | | — | | | 266.6 | | | 12.3 | | | | 3.0 | | | 275.9 |
WSACS RR Holdings LLC | | Common Membership Units | | | — | | | | — | | | 3.2 | | | 0.2 | | | | 3.4 | | | — |
Subtotal Control Investments | | $ | 202.7 | | | $ | 1.2 | | $ | 2,886.4 | | $ | 1,402.0 | | | $ | 1,964.8 | | $ | 2,335.0 |
AFFILIATE INVESTMENTS | | | | | | | | | | | | | | | | | | | | |
Aptara, Inc.(6) | | Senior Debt | | $ | 0.2 | | | $ | — | | $ | 3.0 | | $ | — | | | $ | 3.0 | | $ | — |
| | Subordinated Debt | | | 6.7 | | | | — | | | 47.0 | | | — | | | | 47.0 | | | — |
| | Redeeemable Preferred Stock | | | — | | | | — | | | — | | | — | | | | — | | | — |
| | Convertible Preferred Stock | | | — | | | | — | | | — | | | — | | | | — | | | — |
| | Preferred Stock Warrants | | | — | | | | — | | | — | | | — | | | | — | | | — |
| | | | | | | | | | | | | | | | | | | | | | |
| | | | | | 6.9 | | | | — | | | 50.0 | | | — | | | | 50.0 | | | — |
American Capital Agency Corp.(10) | | Common Stock | | | 7.0 | | | | — | | | — | | | 116.4 | | | | 50.0 | | | 66.4 |
Coghead, Inc. | | Subordinated Debt | | | — | | | | — | | | 0.1 | | | — | | | | 0.1 | | | — |
| | Convertible Preferred Stock | | | — | | | | — | | | 0.2 | | | — | | | | 0.2 | | | — |
| | Preferred Stock Warrants | | | — | | | | — | | | — | | | — | | | | — | | | — |
| | | | | | | | | | | | | | | | | | | | | | |
| | | | | | — | | | | — | | | 0.3 | | | — | | | | 0.3 | | | — |
See related notes at the end of this schedule.
190
Schedule 12-14
AMERICAN CAPITAL, LTD.
SCHEDULE OF INVESTMENTS IN AND ADVANCES TO AFFILIATES—(Continued)
As of and for the year ended December 31, 2009
(in millions, except share data)
| | | | | | | | | | | | | | |
| | | | | Amount of Interest or
Dividends | | | | | | | | |
Company (1) | | Investments | | Credited
to Income (2) | | Other (3) | | December 31,
2008 Value | | Gross
Additions (4) | | Gross
Reductions (5) | | December 31,
2009 Value |
Comfort Co., Inc.(9) | | Senior Debt | | 0.3 | | 0.1 | | — | | 44.3 | | 35.6 | | 8.7 |
| | Common Stock | | — | | — | | — | | 11.8 | | 11.8 | | — |
| | | | | | | | | | | | | | |
| | | | | 0.3 | | 0.1 | | — | | 56.1 | | 47.4 | | 8.7 |
Creditcards.com, Inc.(6) | | Senior Debt | | 13.3 | | — | | 136.1 | | 85.8 | | 221.9 | | — |
| | Subordinated Debt | | 3.7 | | — | | 26.6 | | 17.7 | | 44.3 | | — |
| | Redeemable Preferred Stock | | 0.1 | | — | | — | | 54.7 | | 54.7 | | — |
| | Common Stock | | — | | — | | 4.2 | | 0.9 | | 5.1 | | — |
| | | | | | | | | | | | | | |
| | | | | 17.1 | | — | | 166.9 | | 159.1 | | 326.0 | | — |
Egenera, Inc. | | Subordinated Debt | | 0.7 | | — | | 2.4 | | 1.3 | | 1.2 | | 2.5 |
| | Redeemable Preferred Stock | | — | | — | | 9.7 | | — | | 9.7 | | — |
| | Common Stock | | — | | — | | — | | — | | — | | — |
| | | | | | | | | | | | | | |
| | | | | 0.7 | | — | | 12.1 | | 1.3 | | 10.9 | | 2.5 |
HALT Medical, Inc. | | Convertible Preferred Stock | | — | | — | | 8.7 | | 0.9 | | — | | 9.6 |
IEE Holding 1 S.A. | | Common Stock | | — | | — | | — | | 4.5 | | 4.5 | | — |
IS Holdings I, Inc. | | Senior Debt | | 1.3 | | — | | 15.6 | | 2.6 | | — | | 18.2 |
| | Redeemable Preferred Stock | | 0.1 | | — | | 1.5 | | 0.4 | | — | | 1.9 |
| | Common Stock | | — | | — | | 4.6 | | 1.8 | | — | | 6.4 |
| | | | | | | | | | | | | | |
| | | | | 1.4 | | — | | 21.7 | | 4.8 | | — | | 26.5 |
LTM Enterprises, Inc.(9) | | Senior Debt | | — | | 0.6 | | — | | 17.0 | | 11.5 | | 5.5 |
Narus, Inc. | | Convertible Preferred Stock | | — | | — | | 2.1 | | 4.7 | | — | | 6.8 |
| | Preferred Stock Warrants | | — | | — | | — | | 2.2 | | — | | 2.2 |
| | | | | | | | | | | | | | |
| | | | | — | | — | | 2.1 | | 6.9 | | — | | 9.0 |
Primrose Holding Corporation | | Common Stock | | — | | — | | 7.4 | | — | | 4.1 | | 3.3 |
Qualitor Component Holdings, LLC | | Subordinated Debt | | 8.2 | | — | | 35.9 | | 3.6 | | 3.5 | | 36.0 |
| | Redeemable Preferred Units | | — | | — | | 1.1 | | — | | 1.1 | | — |
| | Common Units | | — | | — | | — | | — | | — | | — |
| | | | | | | | | | | | | | |
| | | | | 8.2 | | — | | 37.0 | | 3.6 | | 4.6 | | 36.0 |
Radar Detection Holdings Corp. | | Senior Debt | | 1.4 | | — | | 9.5 | | 1.0 | | — | | 10.5 |
| | Redeemable Preferred Stock | | — | | — | | — | | 1.8 | | 1.8 | | — |
| | Common Stock | | — | | — | | 0.6 | | 0.4 | | — | | 1.0 |
| | | | | | | | | | | | | | |
| | | | | 1.4 | | — | | 10.1 | | 3.2 | | 1.8 | | 11.5 |
See related notes at the end of this schedule.
191
Schedule 12-14
AMERICAN CAPITAL, LTD.
SCHEDULE OF INVESTMENTS IN AND ADVANCES TO AFFILIATES—(Continued)
As of and for the year ended December 31, 2009
(in millions, except share data)
| | | | | | | | | | | | | | | | | | | | |
| | | | | Amount of Interest or
Dividends | | | | | | | | |
Company (1) | | Investments | | Credited
to Income (2) | | Other (3) | | December 31,
2008 Value | | Gross
Additions (4) | | Gross
Reductions (5) | | December 31,
2009 Value |
Roadrunner Dawes, Inc. | | Subordinated Debt | | | 3.6 | | | — | | | 19.2 | | | 1.3 | | | — | | | 20.5 |
| | Common Stock | | | — | | | — | | | 0.1 | | | 0.8 | | | — | | | 0.9 |
| | | | | | | | | | | | | | | | | | | | |
| | | | | | 3.6 | | | — | | | 19.3 | | | 2.1 | | | — | | | 21.4 |
WFS Holding, Inc. | | Convertible Preferred Stock | | | 0.2 | | | — | | | 2.8 | | | 0.9 | | | — | | | 3.7 |
Subtotal Affiliate Investments | | $ | 46.8 | | $ | 0.7 | | $ | 338.4 | | $ | 376.8 | | $ | 511.1 | | $ | 204.1 |
Total Control and Affiliate Investments | | $ | 249.5 | | $ | 1.9 | | $ | 3,224.8 | | $ | 1,778.8 | | $ | 2,475.9 | | $ | 2,539.1 |
| (1) | Certain of the securities are issued by affiliate(s) of the listed portfolio company. |
| (2) | Represents the total amount of interest or dividends credited to income for the portion of the year an investment was included in Control or Affiliate categories, respectively. |
| (3) | Other includes interest, dividend, or other income which was applied to the principal of the investment and therefore reduced the total investment. These reductions are also included in the Gross Reductions for the investments, as applicable. |
| (4) | Gross additions include increases in the cost basis of investments resulting from new portfolio investments, paid-in-kind interest or dividends, the amortization of discounts and closing fees and the exchange of one or more existing securities for one or more new securities. Gross additions also include net increases in unrealized appreciation or net decreases in unrealized depreciation as well as allowances for paid-in-kind interest, dividends, discounts and closing fees. |
| (5) | Gross reductions include decreases in the cost basis of investments resulting from principal repayments or sales and the exchange of one or more existing securities for one or more new securities. Gross reductions also include net increases in unrealized depreciation or net decreases in unrealized appreciation. |
| (6) | As of December, 31, 2008, the portfolio company was classified as an Affiliate Investment. As of December, 31 2009, ACAS now has a controlling interest of more than 25% of the portfolio company and is therefore classified as a Control Investment. |
| (7) | As of December 31, 2008, the portfolio company was classified as a Non-Control Investment. As of December, 31 2009, ACAS now has a controlling interest of more than 25% of the portfolio company and is therefore classified as a Control Investment. |
| (8) | As of December 31, 2008, the portfolio company was classified as a Control Investment. As of December, 31 2009, ACAS no longer has a controlling interest in the portfolio company and is therefore classified as a Non-Control Investment. |
| (9) | As of December 31, 2008, the portfolio company was classified as a Non-Control Investment. As of December, 31 2009, ACAS now has a controlling interest of more than 5% but less than 25% of the portfolio company and is therefore classified as a Affiliate Investment. |
| (10) | As of December 31, 2008, the portfolio company was classified as a Control Investment. As of December, 31 2009, ACAS now has a controlling interest of more than 5% but less than 25% of the portfolio company and is therefore classified as an Affiliate Investment. |
| ** | Information related to the amount of equity in the net profit and loss for the period for the investments listed has not been included in this schedule. This information is not considered to be meaningful due to the complex capital structures of the portfolio companies, with different classes of equity securities outstanding with different preferences in liquidation. These investments are not consolidated, nor are they accounted for under the equity method of accounting. |
192