UNITED STATES
SECURITIES AND EXCHANGE COMMISSION
Washington, D.C. 20549
FORM N-CSR
CERTIFIED SHAREHOLDER REPORT OF REGISTERED
MANAGEMENT INVESTMENT COMPANIES
Investment Company Act file number: 811-05216
ELFUN INTERNATIONAL EQUITY FUND
(Exact name of registrant as specified in charter)
One Iron Street
Boston, Massachusetts 02210
(Address of principal executive offices) (Zip code)
| (Name and Address of Agent for Service) | Copy to: | |
Sean O’Malley, Esq. Senior Vice President and General Counsel c/o SSGA Funds Management, Inc. One Iron Street Boston, Massachusetts 02210 | Timothy W. Diggins, Esq. Ropes & Gray LLP Prudential Tower 800 Boylston Street Boston, Massachusetts 02199-3600 |
Registrant’s telephone number, including area code: (617) 664-1465
Date of fiscal year end: December 31
Date of reporting period: December 31, 2022
| Item 1. | Shareholder Report. |
(a) The Report to Shareholders is attached herewith.
| Elfun Funds |
| Elfun International Equity Fund |
| Elfun Trusts |
| Elfun Diversified Fund |
| Elfun Tax-Exempt Income Fund |
| Elfun Income Fund |
| Elfun Government Money Market Fund |

| Page | |
| 1 | |
| Management's Discussion of Fund Performance, Understanding Your Fund's Expenses, Performance Summary and Schedule of Investments | |
| 2 | |
| 10 | |
| 17 | |
| 56 | |
| 67 | |
| 91 | |
| Financial Statements | |
| 98 | |
| 104 | |
| 106 | |
| 108 | |
| 111 | |
| 123 | |
| 124 |
| Notes to Performance | 1 |
| 2 | Elfun International Equity Fund |
| Sector Allocation |
| Portfolio composition as a % of Fair Value of $153,541 (in thousands) as of December 31, 2022 (a)(b) |

| Top Ten Largest Holdings | |
| as of December 31, 2022 (as a % of Fair Value) (a)(b) | |
| AstraZeneca PLC | 4.01% |
| Nestle S.A. | 3.77% |
| Novartis AG | 3.48% |
| LVMH Moet Hennessy Louis Vuitton SE | 3.42% |
| AIA Group Ltd. | 3.11% |
| ASML Holding N.V. | 3.01% |
| Roche Holding AG | 2.86% |
| Schneider Electric SE | 2.41% |
| Mitsubishi UFJ Financial Group Inc. | 2.40% |
| Safran S.A. | 2.38% |
| Average Annual Total Return for the years ended December 31, 2022 | |||||||
| (Inception date 1/1/88) | |||||||
| One Year | Five Year | Ten Year | Ending Value of a $10,000 Investment | ||||
| Elfun International Equity Fund | (16.11)% | 2.45% | 4.45% | $15,458 | |||
| MSCI EAFE Index | (14.45)% | 1.54% | 4.67% | $15,787 | |||
| (a) | Fair Value basis is inclusive of short-term investments in State Street Institutional U.S. Government Money Market Fund - Class G Shares and State Street Institutional Treasury Money Market Fund - Premier Class. |
| (b) | The securities information regarding holdings, allocations and other characteristics is presented to illustrate examples of securities that the Fund has bought and the diversity of areas in which the Fund may invest as of a particular date. It may not be representative of the Fund’s current or future investments and should not be construed as a recommendation to purchase or sell a particular security. |
| Elfun International Equity Fund | 3 |

| 4 | Elfun International Equity Fund |
| Actual Fund Return | Hypothetical 5% Return (2.5% for the period) | ||
| Beginning Account Value July 1, 2022 | $1,000.00 | $1,000.00 | |
| Ending Account value December 31, 2022 | $1,065.30 | $1,022.70 | |
| Expenses Paid During Period* | $ 2.60 | $ 2.55 |
| * | Expenses are equal to the Fund's annualized expense ratio of 0.50%** (for the period July 1, 2022 - December 31, 2022), multiplied by the average account value over the period, multiplied by 184/365 (to reflect the one-half year period). |
| ** | May differ from expense ratio disclosed in the financial highlights, which is calculated based on the entire fiscal year's data. |
| Elfun International Equity Fund | 5 |
| Number of Shares | Fair Value | |
| Common Stock - 98.4% † | ||
| Australia - 2.0% | ||
| BHP Group Ltd., Class DI | 101,026 | $ 3,123,172 |
| Brazil - 0.5% | ||
| Itau Unibanco Holding S.A. ADR | 161,785 | 762,007 |
| Canada - 0.8% | ||
| Brookfield Corp. | 41,330 | 1,298,816 |
| France - 19.0% | ||
| Air Liquide S.A. | 25,167 | 3,556,194 |
| AXA S.A. (a) | 115,036 | 3,198,828 |
| BNP Paribas S.A. | 54,000 | 3,068,876 |
| Cie de Saint-Gobain | 57,019 | 2,777,962 |
| Dassault Systemes SE | 64,306 | 2,298,780 |
| EssilorLuxottica S.A. | 16,108 | 2,908,760 |
| LVMH Moet Hennessy Louis Vuitton SE | 7,245 | 5,257,138 |
| Safran S.A. | 29,295 | 3,655,513 |
| Worldline S.A. (b)(c) | 63,309 | 2,468,204 |
| 29,190,255 | ||
| Germany - 4.7% | ||
| adidas AG | 8,703 | 1,183,883 |
| Infineon Technologies AG | 88,586 | 2,687,868 |
| SAP SE | 32,182 | 3,310,633 |
| 7,182,384 | ||
| Hong Kong - 4.8% | ||
| AIA Group Ltd. | 429,767 | 4,779,502 |
| Prudential PLC | 190,898 | 2,589,093 |
| 7,368,595 | ||
| Ireland - 1.1% | ||
| Kerry Group PLC, Class A | 19,447 | 1,748,384 |
| Japan - 21.7% | ||
| Daikin Industries Ltd. | 17,000 | 2,602,600 |
| Disco Corp. | 10,900 | 3,118,534 |
| Hoya Corp. | 23,652 | 2,277,454 |
| Kao Corp. | 56,100 | 2,234,306 |
| Komatsu Ltd. | 141,200 | 3,077,731 |
| Mitsubishi UFJ Financial Group Inc. | 545,926 | 3,678,261 |
| Murata Manufacturing Company Ltd. | 36,891 | 1,841,964 |
| Nidec Corp. | 12,973 | 672,419 |
| Number of Shares | Fair Value | |
| Recruit Holdings Company Ltd. | 87,500 | $ 2,769,999 |
| Secom Company Ltd. | 11,900 | 680,296 |
| Shimadzu Corp. | 43,157 | 1,224,927 |
| Shiseido Company Ltd. | 50,062 | 2,455,199 |
| Sony Group Corp. | 43,100 | 3,277,945 |
| Tokio Marine Holdings Inc. | 166,494 | 3,567,864 |
| 33,479,499 | ||
| Netherlands - 9.0% | ||
| ASML Holding N.V. | 8,597 | 4,622,438 |
| ING Groep N.V. | 271,635 | 3,301,408 |
| Koninklijke DSM N.V. | 23,198 | 2,829,845 |
| Universal Music Group N.V. | 130,696 | 3,139,813 |
| 13,893,504 | ||
| Norway - 1.8% | ||
| Equinor ASA | 77,309 | 2,760,868 |
| Portugal - 0.9% | ||
| Galp Energia SGPS S.A. | 102,499 | 1,379,433 |
| Singapore - 2.2% | ||
| United Overseas Bank Ltd. | 146,800 | 3,360,245 |
| Spain - 3.0% | ||
| Cellnex Telecom S.A. (b) | 72,560 | 2,394,433 |
| Industria de Diseno Textil S.A. | 83,578 | 2,216,585 |
| 4,611,018 | ||
| Sweden - 1.9% | ||
| Assa Abloy AB, Class B | 136,136 | 2,922,753 |
| Switzerland - 7.7% | ||
| Novartis AG | 59,146 | 5,343,725 |
| Roche Holding AG | 13,984 | 4,390,782 |
| Sika AG | 8,545 | 2,047,586 |
| 11,782,093 | ||
| United Kingdom - 11.1% | ||
| Ashtead Group PLC | 44,359 | 2,518,567 |
| AstraZeneca PLC | 45,617 | 6,155,620 |
| London Stock Exchange Group PLC | 39,571 | 3,396,734 |
| Rentokil Initial PLC | 476,634 | 2,912,584 |
| Spirax-Sarco Engineering PLC | 16,280 | 2,078,759 |
| 17,062,264 | ||
| 6 | Elfun International Equity Fund |
| Number of Shares | Fair Value | |
| United States - 6.2% | ||
| Nestle S.A. | 50,009 | $ 5,791,142 |
| Schneider Electric SE | 26,495 | 3,696,340 |
| 9,487,482 | ||
| Total Common Stock (Cost $124,901,407) | 151,412,772 | |
| Short-Term Investments - 1.4% | ||
| State Street Institutional Treasury Money Market Fund - Premier Class 3.79% (d)(e) | 1,192,777 | 1,192,777 |
| State Street Institutional U.S. Government Money Market Fund - Class G Shares 4.16% (d)(e) | 935,166 | 935,166 |
| Total Short-Term Investments (Cost $2,127,943) | 2,127,943 | |
| Total Investments (Cost $127,029,350) | 153,540,715 | |
| Other Assets and Liabilities, net - 0.2% | 356,036 | |
| NET ASSETS - 100.0% | $ 153,896,751 | |
| The Fund had the following short futures contracts open at December 31, 2022: |
| Description | Expiration date | Number of Contracts | Notional Amount | Value | Unrealized Appreciation (Depreciation) |
| MSCI EAFE Mini Index Futures | March 2023 | 14 | $ (1,358,558) | $ (1,364,580) | $ (6,022) |
| (a) | At December 31, 2022, all or a portion of this security was pledged to cover collateral requirements for futures. |
| Elfun International Equity Fund | 7 |
| (b) | Pursuant to Rule 144A of the Securities Act of 1933, as amended, these securities may be resold in transactions exempt from registration, normally to qualified institutional buyers. At December 31, 2022, these securities amounted to $4,862,637 or 3.16% of the net assets of the Elfun International Equity Fund. These securities have been determined to be liquid using procedures established by the Fund's Board of Trustees. |
| (c) | Non-income producing security. |
| (d) | Sponsored by SSGA Funds Management, Inc., the Fund’s investment adviser and administrator, and an affiliate of State Street Bank & Trust Co., the Fund’s sub-administrator, custodian and accounting agent. |
| (e) | Coupon amount represents effective yield. |
| † | Percentages are based on net assets as of December 31, 2022. |
| Abbreviations: |
| ADR - American Depositary Receipt |
| Investments | Level 1 | Level 2 | Level 3 | Total | |||
| Investments in Securities | |||||||
| Common Stock | $ 151,412,772 | $ — | $ — | $ 151,412,772 | |||
| Short-Term Investments | 2,127,943 | — | — | 2,127,943 | |||
| Total Investments in Securities | $ 153,540,715 | $ — | $ — | $ 153,540,715 | |||
| Other Financial Instruments | |||||||
| Short Futures Contracts - Unrealized Depreciation | $ (6,022) | $ — | $ — | $ (6,022) | |||
| Total Other Financial Instruments | $ (6,022) | $ — | $ — | $ (6,022) |
| Sector | Percentage (based on Fair Value) | ||
| Pharmaceuticals | 10.35% | ||
| Diversified Banks | 9.24% | ||
| Building Products | 5.41% | ||
| Semiconductor Equipment | 5.04% | ||
| Packaged Foods & Meats | 4.91% | ||
| Life & Health Insurance | 4.80% | ||
| Apparel, Accessories & Luxury Goods | 4.19% | ||
| Application Software | 3.66% | ||
| Healthcare Supplies | 3.37% | ||
| Specialty Chemicals | 3.17% | ||
| Personal Products | 3.06% | ||
| Electrical Components & Equipment | 2.85% | ||
| Integrated Oil & Gas | 2.70% | ||
| Aerospace & Defense | 2.38% | ||
| Property & Casualty Insurance | 2.32% | ||
| Industrial Gases | 2.32% | ||
| Financial Exchanges & Data | 2.21% | ||
| Consumer Electronics | 2.13% | ||
| Multi-Line Insurance | 2.08% | ||
| Movies & Entertainment | 2.05% | ||
| Diversified Metals & Mining | 2.03% | ||
| Construction Machinery & Heavy Trucks | 2.00% | ||
| Environmental & Facilities Services | 1.90% | ||
| Human Resource & Employment Services | 1.80% | ||
| 8 | Elfun International Equity Fund |
| Sector | Percentage (based on Fair Value) | ||
| Semiconductors | 1.75% | ||
| Trading Companies & Distributors | 1.64% | ||
| Data Processing & Outsourced Services | 1.61% | ||
| Integrated Telecommunication Services | 1.56% | ||
| Apparel Retail | 1.44% | ||
| Industrial Machinery | 1.35% | ||
| Electronic Components | 1.20% | ||
| Asset Management & Custody Banks | 0.85% | ||
| Electronic Equipment & Instruments | 0.80% | ||
| Security & Alarm Services | 0.44% | ||
| 98.61% | |||
| Short-Term Investments | |||
| Short-Term Investments | 1.39% | ||
| 100.00% | |||
| Affiliate Table |
| Number of Shares Held at 12/31/21 | Value at 12/31/21 | Cost of Purchases | Proceeds from Shares Sold | Realized Gain (Loss) | Change in Unrealized Appreciation (Depreciation) | Number of Shares Held at 12/31/22 | Value at 12/31/22 | Dividend Income | ||||||
| State Street Institutional Treasury Money Market Fund - Premier Class | 3,575,026 | $3,575,026 | $14,581,442 | $16,963,691 | $— | $— | 1,192,777 | $1,192,777 | $27,667 | |||||
| State Street Institutional U.S. Government Money Market Fund - Class G Shares | 3,338,440 | 3,338,440 | 14,560,417 | 16,963,691 | — | — | 935,166 | 935,166 | 27,053 | |||||
| TOTAL | $6,913,466 | $29,141,859 | $33,927,382 | $— | $— | $2,127,943 | $54,720 |
| Elfun International Equity Fund | 9 |
| 10 | Elfun Trusts |
| Sector Allocation |
| Portfolio composition as a % of Fair Value of $2,910,940 (in thousands) as of December 31, 2022 (a)(b) |

| Top Ten Largest Holdings | |
| as of December 31, 2022 (as a % of Fair Value) (a)(b) | |
| Microsoft Corp. | 7.14% |
| Apple Inc. | 5.27% |
| ConocoPhillips | 5.12% |
| Amazon.com Inc. | 4.09% |
| Johnson & Johnson | 3.70% |
| Alphabet Inc., Class C | 3.49% |
| UnitedHealth Group Inc. | 3.48% |
| Merck & Company Inc. | 3.13% |
| Visa Inc., Class A | 2.88% |
| Mastercard Inc., Class A | 2.86% |
| Average Annual Total Return for the years ended December 31, 2022 | |||||||
| (Inception date 5/27/35) | |||||||
| One Year | Five Year | Ten Year | Ending Value of a $10,000 Investment | ||||
| Elfun Trusts | (19.87)% | 10.28% | 12.94% | $33,752 | |||
| S&P 500® Index | (18.11)% | 9.43% | 12.56% | $32,654 | |||
| (a) | Fair Value basis is inclusive of short-term investments in State Street Institutional U.S. Government Money Market Fund - Class G Shares and State Street Institutional Treasury Money Market Fund - Premier Class. |
| (b) | The securities information regarding holdings, allocations and other characteristics is presented to illustrate examples of securities that the Fund has bought and the diversity of areas in which the Fund may invest as of a particular date. It may not be representative of the Fund’s current or future investments and should not be construed as a recommendation to purchase or sell a particular security. |
| Elfun Trusts | 11 |

| 12 | Elfun Trusts |
| Actual Fund Return | Hypothetical 5% Return (2.5% for the period) | ||
| Beginning Account Value July 1, 2022 | $1,000.00 | $1,000.00 | |
| Ending Account value December 31, 2022 | $1,014.20 | $1,024.30 | |
| Expenses Paid During Period* | $ 0.91 | $ 0.92 |
| * | Expenses are equal to the Fund's annualized expense ratio of 0.18%** (for the period July 1, 2022 - December 31, 2022), multiplied by the average account value over the period, multiplied by 184/365 (to reflect the one-half year period). |
| ** | May differ from expense ratio disclosed in the financial highlights, which is calculated based on the entire fiscal year's data. |
| Elfun Trusts | 13 |
| Number of Shares | Fair Value | |
| Common Stock - 98.6% † | ||
| Apparel Retail - 1.9% | ||
| Ross Stores Inc. | 485,100 | $ 56,305,557 |
| Application Software - 1.9% | ||
| Salesforce Inc. (a) | 422,749 | 56,052,290 |
| Biotechnology - 2.2% | ||
| BioMarin Pharmaceutical Inc. (a) | 251,691 | 26,047,501 |
| Vertex Pharmaceuticals Inc. (a) | 134,342 | 38,795,283 |
| 64,842,784 | ||
| Cable & Satellite - 1.0% | ||
| Charter Communications Inc., Class A (a) | 90,300 | 30,620,730 |
| Data Processing & Outsourced Services - 7.2% | ||
| Fidelity National Information Services Inc. | 618,549 | 41,968,550 |
| Mastercard Inc., Class A | 239,700 | 83,350,881 |
| Visa Inc., Class A | 403,300 | 83,789,608 |
| 209,109,039 | ||
| Diversified Banks - 2.4% | ||
| JPMorgan Chase & Co. | 527,921 | 70,794,206 |
| Electric Utilities - 2.9% | ||
| NextEra Energy Inc. | 994,800 | 83,165,280 |
| Environmental & Facilities Services - 1.8% | ||
| Waste Management Inc. | 333,500 | 52,319,480 |
| Financial Exchanges & Data - 2.2% | ||
| S&P Global Inc. | 188,100 | 63,002,214 |
| Healthcare Equipment - 3.4% | ||
| Boston Scientific Corp. (a) | 1,240,403 | 57,393,447 |
| IDEXX Laboratories Inc. (a) | 102,200 | 41,693,512 |
| 99,086,959 | ||
| Home Improvement Retail - 1.5% | ||
| Lowe's Companies Inc. | 220,949 | 44,021,879 |
| Hypermarkets & Super Centers - 2.1% | ||
| Costco Wholesale Corp. | 137,512 | 62,774,228 |
| Industrial Conglomerates - 2.3% | ||
| Honeywell International Inc. | 311,400 | 66,733,020 |
| Number of Shares | Fair Value | |
| Industrial Machinery - 2.2% | ||
| Parker-Hannifin Corp. | 219,500 | $ 63,874,500 |
| Interactive Media & Services - 7.3% | ||
| Alphabet Inc., Class C (a) | 1,144,000 | 101,507,120 |
| Alphabet Inc., Class A (a) | 586,000 | 51,702,780 |
| Meta Platforms Inc., Class A (a) | 494,192 | 59,471,065 |
| 212,680,965 | ||
| Internet & Direct Marketing Retail - 4.1% | ||
| Amazon.com Inc. (a) | 1,418,700 | 119,170,800 |
| Investment Banking & Brokerage - 2.4% | ||
| The Charles Schwab Corp. | 829,400 | 69,055,844 |
| Life Sciences Tools & Services - 2.1% | ||
| IQVIA Holdings Inc. (a) | 293,100 | 60,053,259 |
| Managed Healthcare - 3.5% | ||
| UnitedHealth Group Inc. | 190,956 | 101,241,052 |
| Oil & Gas Exploration & Production - 5.1% | ||
| ConocoPhillips | 1,264,000 | 149,152,000 |
| Packaged Foods & Meats - 2.1% | ||
| Mondelez International Inc., Class A | 931,883 | 62,110,002 |
| Pharmaceuticals - 6.8% | ||
| Johnson & Johnson | 609,700 | 107,703,505 |
| Merck & Company Inc. | 822,076 | 91,209,332 |
| 198,912,837 | ||
| Property & Casualty Insurance - 2.6% | ||
| Chubb Ltd. | 342,900 | 75,643,740 |
| Regional Banks - 2.1% | ||
| First Republic Bank | 509,700 | 62,127,333 |
| Semiconductor Equipment - 2.8% | ||
| Applied Materials Inc. | 651,100 | 63,404,118 |
| ASML Holding N.V. | 31,300 | 17,102,320 |
| 80,506,438 | ||
| Semiconductors - 4.9% | ||
| NVIDIA Corp. | 472,800 | 69,094,992 |
| QUALCOMM Inc. | 672,000 | 73,879,680 |
| 142,974,672 | ||
| 14 | Elfun Trusts |
| Number of Shares | Fair Value | |
| Specialized REITs - 2.4% | ||
| American Tower Corp. | 327,829 | $ 69,453,852 |
| Systems Software - 7.7% | ||
| Microsoft Corp. | 866,035 | 207,692,514 |
| ServiceNow Inc. (a) | 42,800 | 16,617,956 |
| 224,310,470 | ||
| Technology Hardware, Storage & Peripherals - 5.3% | ||
| Apple Inc. | 1,181,000 | 153,447,330 |
| Trading Companies & Distributors - 2.4% | ||
| United Rentals Inc. (a) | 193,067 | 68,619,873 |
| Total Common Stock (Cost $1,756,288,011) | 2,872,162,633 | |
| Short-Term Investments - 1.3% | ||
| State Street Institutional Treasury Money Market Fund - Premier Class 3.79% (b)(c) | 19,801,698 | 19,801,698 |
| State Street Institutional U.S. Government Money Market Fund - Class G Shares 4.16% (b)(c) | 18,975,185 | 18,975,185 |
| Total Short-Term Investments (Cost $38,776,883) | 38,776,883 | |
| Total Investments (Cost $1,795,064,894) | 2,910,939,516 | |
| Other Assets and Liabilities, net - 0.1% | 1,961,962 | |
| NET ASSETS - 100.0% | $ 2,912,901,478 | |
| (a) | Non-income producing security. |
| (b) | Sponsored by SSGA Funds Management, Inc., the Fund’s investment adviser and administrator, and an affiliate of State Street Bank & Trust Co., the Fund’s sub-administrator, custodian and accounting agent. |
| (c) | Coupon amount represents effective yield. |
| † | Percentages are based on net assets as of December 31, 2022. |
| Abbreviations: |
| REIT - Real Estate Investment Trust |
| Investments | Level 1 | Level 2 | Level 3 | Total | |||
| Investments in Securities | |||||||
| Common Stock | $ 2,872,162,633 | $ — | $ — | $ 2,872,162,633 | |||
| Short-Term Investments | 38,776,883 | — | — | 38,776,883 | |||
| Total Investments in Securities | $ 2,910,939,516 | $ — | $ — | $ 2,910,939,516 |
| Elfun Trusts | 15 |
| Affiliate Table |
| Number of Shares Held at 12/31/21 | Value at 12/31/21 | Cost of Purchases | Proceeds from Shares Sold | Realized Gain (Loss) | Change in Unrealized Appreciation (Depreciation) | Number of Shares Held at 12/31/22 | Value at 12/31/22 | Dividend Income | ||||||
| State Street Institutional Treasury Money Market Fund - Premier Class | 7,320,718 | $ 7,320,718 | $237,122,856 | $224,641,876 | $— | $— | 19,801,698 | $19,801,698 | $ 578,617 | |||||
| State Street Institutional U.S. Government Money Market Fund - Class G Shares | 6,984,701 | 6,984,701 | 236,632,360 | 224,641,876 | — | — | 18,975,185 | 18,975,185 | 637,511 | |||||
| TOTAL | $14,305,419 | $473,755,216 | $449,283,752 | $— | $— | $38,776,883 | $1,216,128 |
| 16 | Elfun Trusts |
| Elfun Diversified Fund | 17 |
| 18 | Elfun Diversified Fund |
| Elfun Diversified Fund | 19 |
| Sector Allocation |
| Portfolio composition as a % of Fair Value of $181,711 (in thousands) as of December 31, 2022 (a)(b) |

| Top Ten Largest Equity Holdings | |
| as of December 31, 2022 (as a % of Fair Value) (a)(b) | |
| Apple Inc. | 1.79% |
| Microsoft Corp. | 1.64% |
| Amazon.com Inc. | 0.69% |
| Berkshire Hathaway Inc., Class B | 0.51% |
| Alphabet Inc., Class A | 0.48% |
| UnitedHealth Group Inc. | 0.46% |
| Alphabet Inc., Class C | 0.43% |
| Johnson & Johnson | 0.42% |
| Exxon Mobil Corp. | 0.42% |
| JPMorgan Chase & Co. | 0.36% |
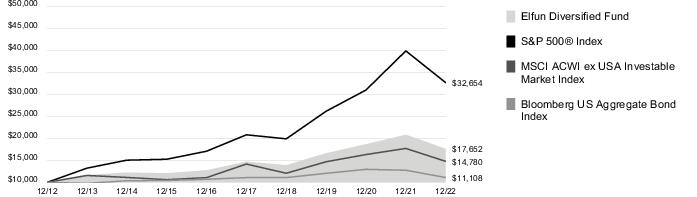
| Average Annual Total Return for the years ended December 31, 2022 | |||||||
| (Inception date 1/1/88) | |||||||
| One Year | Five Year | Ten Year | Ending Value of a $10,000 Investment | ||||
| Elfun Diversified Fund | (15.31)% | 3.68% | 5.85% | $17,652 | |||
| S&P 500® Index | (18.11)% | 9.43% | 12.56% | $32,654 | |||
| MSCI ACWI ex USA Investable Market Index | (16.58)% | 0.85% | 4.17% | $14,780 | |||
| Bloomberg U.S. Aggregate Bond Index | (13.01)% | 0.02% | 1.06% | $11,108 | |||
| (a) | The securities information regarding holdings, allocations and other characteristics is presented to illustrate examples of securities that the Fund has bought and the diversity of areas in which the Fund may invest as of a particular date. It may not be representative of the Fund’s current or future investments and should not be construed as a recommendation to purchase or sell a particular security. |
| (b) | Fair Value basis is inclusive of short-term investment in affiliated money market funds. |
| 20 | Elfun Diversified Fund |
| Elfun Diversified Fund | 21 |
| Actual Fund Return | Hypothetical 5% Return (2.5% for the period) | ||
| Beginning Account Value July 1, 2022 | $1,000.00 | $1,000.00 | |
| Ending Account value December 31, 2022 | $1,007.20 | $1,023.40 | |
| Expenses Paid During Period* | $ 1.77 | $ 1.79 |
| * | Expenses are equal to the Fund's annualized net expense ratio of 0.35%** (for the period July 1, 2022 - December 31, 2022), multiplied by the average account value over the period, multiplied by 184/365 (to reflect the one-half year period). |
| ** | May differ from expense ratio disclosed in the financial highlights, which is calculated based on the entire fiscal year's data. |
| 22 | Elfun Diversified Fund |
| Number of Shares | Fair Value | |
| Domestic Equity - 31.6% † | ||
| Common Stock - 31.6% | ||
| Advertising - 0.0%* | ||
| Omnicom Group Inc. | 341 | $ 27,815 |
| The Interpublic Group of Companies Inc. (a) | 666 | 22,185 |
| 50,000 | ||
| Aerospace & Defense - 0.6% | ||
| General Dynamics Corp. (a) | 383 | 95,026 |
| Howmet Aerospace Inc. (a) | 619 | 24,395 |
| Huntington Ingalls Industries Inc. (a) | 71 | 16,378 |
| L3Harris Technologies Inc. (a) | 327 | 68,085 |
| Lockheed Martin Corp. | 386 | 187,785 |
| Northrop Grumman Corp. | 239 | 130,401 |
| Raytheon Technologies Corp. | 2,407 | 242,914 |
| Textron Inc. | 298 | 21,098 |
| The Boeing Co. (b) | 946 | 180,204 |
| TransDigm Group Inc. | 86 | 54,150 |
| 1,020,436 | ||
| Agricultural & Farm Machinery - 0.1% | ||
| Deere & Co. | 456 | 195,515 |
| Agricultural Products - 0.1% | ||
| Archer-Daniels-Midland Co. | 903 | 83,844 |
| Air Freight & Logistics - 0.2% | ||
| CH Robinson Worldwide Inc. | 206 | 18,861 |
| Expeditors International of Washington Inc. | 272 | 28,266 |
| FedEx Corp. | 409 | 70,839 |
| United Parcel Service Inc., Class B | 1,212 | 210,694 |
| 328,660 | ||
| Airlines - 0.1% | ||
| Alaska Air Group Inc. (b) | 181 | 7,772 |
| American Airlines Group Inc. (b) | 994 | 12,644 |
| Delta Air Lines Inc. (b) | 1,100 | 36,146 |
| Southwest Airlines Co. (b) | 962 | 32,391 |
| United Airlines Holdings Inc. (b) | 536 | 20,207 |
| 109,160 | ||
| Alternative Carriers - 0.0%* | ||
| Lumen Technologies Inc. | 1,474 | 7,694 |
| Number of Shares | Fair Value | |
| Apparel Retail - 0.1% | ||
| Ross Stores Inc. | 599 | $ 69,526 |
| The TJX Companies Inc. | 1,929 | 153,548 |
| 223,074 | ||
| Apparel, Accessories & Luxury Goods - 0.0%* | ||
| Ralph Lauren Corp. | 75 | 7,925 |
| Tapestry Inc. | 436 | 16,603 |
| VF Corp. | 524 | 14,468 |
| 38,996 | ||
| Application Software - 0.7% | ||
| Adobe Inc. (b) | 773 | 260,138 |
| ANSYS Inc. (b) | 141 | 34,064 |
| Autodesk Inc. (b) | 371 | 69,329 |
| Cadence Design Systems Inc. (b) | 468 | 75,179 |
| Ceridian HCM Holding Inc. (b) | 235 | 15,075 |
| Intuit Inc. | 467 | 181,766 |
| Paycom Software Inc. (b) | 77 | 23,894 |
| PTC Inc. (b) | 183 | 21,967 |
| Roper Technologies Inc. | 181 | 78,208 |
| Salesforce Inc. (b) | 1,683 | 223,149 |
| Synopsys Inc. (b) | 261 | 83,335 |
| Tyler Technologies Inc. (b) | 66 | 21,279 |
| 1,087,383 | ||
| Asset Management & Custody Banks - 0.3% | ||
| Ameriprise Financial Inc. | 182 | 56,669 |
| BlackRock Inc. | 249 | 176,449 |
| Franklin Resources Inc. | 492 | 12,979 |
| Invesco Ltd. | 809 | 14,554 |
| Northern Trust Corp. | 336 | 29,733 |
| State Street Corp. (a)(c) | 592 | 45,921 |
| T Rowe Price Group Inc. | 376 | 41,007 |
| The Bank of New York Mellon Corp. | 1,195 | 54,396 |
| 431,708 | ||
| Auto Parts & Equipment - 0.0%* | ||
| BorgWarner Inc. | 439 | 17,670 |
| Automobile Manufacturers - 0.4% | ||
| Ford Motor Co. | 6,715 | 78,095 |
| General Motors Co. | 2,433 | 81,846 |
| Tesla Inc. (b) | 4,477 | 551,477 |
| 711,418 | ||
| Elfun Diversified Fund | 23 |
| Number of Shares | Fair Value | |
| Automotive Retail - 0.1% | ||
| Advance Auto Parts Inc. | 98 | $ 14,409 |
| AutoZone Inc. (b) | 32 | 78,918 |
| CarMax Inc. (b) | 259 | 15,770 |
| O'Reilly Automotive Inc. (b) | 104 | 87,779 |
| 196,876 | ||
| Biotechnology - 0.8% | ||
| AbbVie Inc. | 2,950 | 476,749 |
| Amgen Inc. | 895 | 235,063 |
| Biogen Inc. (b) | 248 | 68,676 |
| Gilead Sciences Inc. | 2,076 | 178,225 |
| Incyte Corp. (b) | 299 | 24,016 |
| Moderna Inc. (b) | 561 | 100,767 |
| Regeneron Pharmaceuticals Inc. (b) | 182 | 131,311 |
| Vertex Pharmaceuticals Inc. (b) | 435 | 125,619 |
| 1,340,426 | ||
| Brewers - 0.0%* | ||
| Molson Coors Beverage Co., Class B | 339 | 17,465 |
| Broadcasting - 0.0%* | ||
| Fox Corp., Class A | 497 | 15,094 |
| Fox Corp., Class B | 283 | 8,051 |
| Paramount Global, Class B | 804 | 13,572 |
| 36,717 | ||
| Building Products - 0.1% | ||
| A O Smith Corp. | 200 | 11,448 |
| Carrier Global Corp. | 1,413 | 58,286 |
| Johnson Controls International PLC | 1,185 | 75,840 |
| Masco Corp. | 373 | 17,408 |
| 162,982 | ||
| Cable & Satellite - 0.2% | ||
| Charter Communications Inc., Class A (b) | 186 | 63,073 |
| Comcast Corp., Class A | 7,125 | 249,161 |
| DISH Network Corp., Class A (b) | 432 | 6,065 |
| 318,299 | ||
| Casinos & Gaming - 0.0%* | ||
| Caesars Entertainment Inc. (b) | 382 | 15,891 |
| Las Vegas Sands Corp. (b) | 571 | 27,448 |
| Number of Shares | Fair Value | |
| MGM Resorts International | 520 | $ 17,435 |
| Wynn Resorts Ltd. (b) | 178 | 14,680 |
| 75,454 | ||
| Commodity Chemicals - 0.1% | ||
| Dow Inc. | 1,222 | 61,576 |
| LyondellBasell Industries N.V., Class A | 429 | 35,620 |
| 97,196 | ||
| Communications Equipment - 0.3% | ||
| Arista Networks Inc. (b) | 416 | 50,482 |
| Cisco Systems Inc. | 6,813 | 324,571 |
| F5 Inc. (b) | 91 | 13,060 |
| Juniper Networks Inc. | 545 | 17,418 |
| Motorola Solutions Inc. | 285 | 73,447 |
| 478,978 | ||
| Computer & Electronics Retail - 0.0%* | ||
| Best Buy Company Inc. | 346 | 27,753 |
| Construction & Engineering - 0.0%* | ||
| Quanta Services Inc. | 229 | 32,632 |
| Construction Machinery & Heavy Trucks - 0.2% | ||
| Caterpillar Inc. | 864 | 206,980 |
| Cummins Inc. | 242 | 58,634 |
| PACCAR Inc. | 596 | 58,986 |
| Westinghouse Air Brake Technologies Corp. | 299 | 29,843 |
| 354,443 | ||
| Construction Materials - 0.0%* | ||
| Martin Marietta Materials Inc. | 101 | 34,135 |
| Vulcan Materials Co. | 214 | 37,474 |
| 71,609 | ||
| Consumer Finance - 0.2% | ||
| American Express Co. | 988 | 145,977 |
| Capital One Financial Corp. | 657 | 61,075 |
| Discover Financial Services | 481 | 47,056 |
| Synchrony Financial | 803 | 26,387 |
| 280,495 | ||
| Copper - 0.1% | ||
| Freeport-McMoRan Inc. | 2,427 | 92,226 |
| 24 | Elfun Diversified Fund |
| Number of Shares | Fair Value | |
| Data Processing & Outsourced Services - 1.0% | ||
| Automatic Data Processing Inc. | 686 | $ 163,858 |
| Broadridge Financial Solutions Inc. | 186 | 24,948 |
| Fidelity National Information Services Inc. | 1,006 | 68,257 |
| Fiserv Inc. (b) | 1,047 | 105,820 |
| FleetCor Technologies Inc. (b) | 131 | 24,062 |
| Global Payments Inc. | 442 | 43,900 |
| Jack Henry & Associates Inc. | 115 | 20,189 |
| Mastercard Inc., Class A | 1,416 | 492,386 |
| Paychex Inc. | 548 | 63,327 |
| PayPal Holdings Inc. (b) | 1,884 | 134,179 |
| Visa Inc., Class A | 2,729 | 566,977 |
| 1,707,903 | ||
| Distillers & Vintners - 0.1%* | ||
| Brown-Forman Corp., Class B | 262 | 17,208 |
| Constellation Brands Inc., Class A | 275 | 63,731 |
| 80,939 | ||
| Distributors - 0.1% | ||
| Genuine Parts Co. | 232 | 40,254 |
| LKQ Corp. | 436 | 23,287 |
| Pool Corp. | 64 | 19,349 |
| 82,890 | ||
| Diversified Banks - 0.9% | ||
| Bank of America Corp. | 11,691 | 387,206 |
| Citigroup Inc. | 3,214 | 145,369 |
| JPMorgan Chase & Co. | 4,897 | 656,688 |
| U.S. Bancorp | 2,253 | 98,253 |
| Wells Fargo & Co. | 6,332 | 261,448 |
| 1,548,964 | ||
| Diversified Support Services - 0.1% | ||
| Cintas Corp. | 147 | 66,388 |
| Copart Inc. (b) | 708 | 43,110 |
| 109,498 | ||
| Drug Retail - 0.0%* | ||
| Walgreens Boots Alliance Inc. | 1,187 | 44,346 |
| Electric Utilities - 0.7% | ||
| Alliant Energy Corp. | 434 | 23,961 |
| American Electric Power Company Inc. | 877 | 83,271 |
| Number of Shares | Fair Value | |
| Constellation Energy Corp. | 574 | $ 49,485 |
| Duke Energy Corp. | 1,308 | 134,711 |
| Edison International | 643 | 40,908 |
| Entergy Corp. | 328 | 36,900 |
| Evergy Inc. | 366 | 23,033 |
| Eversource Energy | 568 | 47,621 |
| Exelon Corp. | 1,623 | 70,162 |
| FirstEnergy Corp. | 962 | 40,346 |
| NextEra Energy Inc. | 3,307 | 276,465 |
| NRG Energy Inc. | 355 | 11,296 |
| PG&E Corp. (b) | 2,600 | 42,276 |
| Pinnacle West Capital Corp. | 200 | 15,208 |
| PPL Corp. | 1,255 | 36,671 |
| The Southern Co. | 1,806 | 128,967 |
| Xcel Energy Inc. | 920 | 64,501 |
| 1,125,782 | ||
| Electrical Components & Equipment - 0.2% | ||
| AMETEK Inc. | 382 | 53,373 |
| Eaton Corporation PLC | 677 | 106,255 |
| Emerson Electric Co. | 1,007 | 96,732 |
| Generac Holdings Inc. (b) | 101 | 10,167 |
| Rockwell Automation Inc. | 193 | 49,711 |
| 316,238 | ||
| Electronic Components - 0.1% | ||
| Amphenol Corp., Class A | 1,016 | 77,358 |
| Corning Inc. | 1,240 | 39,606 |
| 116,964 | ||
| Electronic Equipment & Instruments - 0.1% | ||
| Keysight Technologies Inc. (b) | 302 | 51,663 |
| Teledyne Technologies Inc. (b) | 75 | 29,993 |
| Trimble Inc. (b) | 400 | 20,224 |
| Zebra Technologies Corp., Class A (b) | 85 | 21,795 |
| 123,675 | ||
| Environmental & Facilities Services - 0.1% | ||
| Republic Services Inc. | 346 | 44,631 |
| Rollins Inc. | 425 | 15,529 |
| Waste Management Inc. | 614 | 96,324 |
| 156,484 | ||
| Fertilizers & Agricultural Chemicals - 0.1% | ||
| CF Industries Holdings Inc. | 341 | 29,053 |
| Corteva Inc. | 1,182 | 69,478 |
| FMC Corp. | 199 | 24,835 |
| Elfun Diversified Fund | 25 |
| Number of Shares | Fair Value | |
| The Mosaic Co. | 530 | $ 23,251 |
| 146,617 | ||
| Financial Exchanges & Data - 0.4% | ||
| Cboe Global Markets Inc. | 168 | 21,079 |
| CME Group Inc. | 611 | 102,746 |
| FactSet Research Systems Inc. | 60 | 24,073 |
| Intercontinental Exchange Inc. | 951 | 97,563 |
| MarketAxess Holdings Inc. | 67 | 18,686 |
| Moody's Corp. | 270 | 75,227 |
| MSCI Inc. | 135 | 62,798 |
| Nasdaq Inc. | 564 | 34,601 |
| S&P Global Inc. | 552 | 184,887 |
| 621,660 | ||
| Food Distributors - 0.0%* | ||
| Sysco Corp. | 828 | 63,301 |
| Food Retail - 0.0%* | ||
| The Kroger Co. | 1,081 | 48,191 |
| Footwear - 0.2% | ||
| NIKE Inc., Class B | 2,113 | 247,242 |
| Gas Utilities - 0.0%* | ||
| Atmos Energy Corp. | 244 | 27,345 |
| General Merchandise Stores - 0.2% | ||
| Dollar General Corp. | 370 | 91,113 |
| Dollar Tree Inc. (b) | 341 | 48,231 |
| Target Corp. | 759 | 113,121 |
| 252,465 | ||
| Gold - 0.0%* | ||
| Newmont Corp. | 1,355 | 63,956 |
| Health Care REITs - 0.1% | ||
| Healthpeak Properties Inc. | 927 | 23,240 |
| Ventas Inc. | 718 | 32,346 |
| Welltower Inc. | 776 | 50,867 |
| 106,453 | ||
| Healthcare Distributors - 0.1% | ||
| AmerisourceBergen Corp. | 280 | 46,399 |
| Cardinal Health Inc. | 400 | 30,748 |
| Henry Schein Inc. (b) | 164 | 13,098 |
| McKesson Corp. | 233 | 87,403 |
| 177,648 | ||
| Number of Shares | Fair Value | |
| Healthcare Equipment - 0.8% | ||
| Abbott Laboratories | 2,903 | $ 318,720 |
| Baxter International Inc. | 888 | 45,261 |
| Becton Dickinson & Co. | 485 | 123,336 |
| Boston Scientific Corp. (b) | 2,399 | 111,002 |
| Dexcom Inc. (b) | 632 | 71,568 |
| Edwards Lifesciences Corp. (b) | 1,059 | 79,012 |
| Hologic Inc. (b) | 402 | 30,074 |
| IDEXX Laboratories Inc. (b) | 140 | 57,114 |
| Intuitive Surgical Inc. (b) | 585 | 155,230 |
| ResMed Inc. | 256 | 53,281 |
| STERIS PLC | 162 | 29,920 |
| Stryker Corp. | 572 | 139,848 |
| Teleflex Inc. | 72 | 17,973 |
| Zimmer Biomet Holdings Inc. | 338 | 43,095 |
| 1,275,434 | ||
| Healthcare Facilities - 0.1% | ||
| HCA Healthcare Inc. | 348 | 83,506 |
| Universal Health Services Inc., Class B | 112 | 15,780 |
| 99,286 | ||
| Healthcare Services - 0.3% | ||
| Cigna Corp. | 517 | 171,303 |
| CVS Health Corp. | 2,203 | 205,298 |
| DaVita Inc. (b) | 88 | 6,571 |
| Laboratory Corporation of America Holdings | 151 | 35,557 |
| Quest Diagnostics Inc. | 189 | 29,567 |
| 448,296 | ||
| Healthcare Supplies - 0.0%* | ||
| Align Technology Inc. (b) | 118 | 24,886 |
| DENTSPLY SIRONA Inc. | 353 | 11,240 |
| The Cooper Companies Inc. | 79 | 26,123 |
| 62,249 | ||
| Home Building - 0.1% | ||
| D.R. Horton Inc. | 509 | 45,372 |
| Lennar Corp., Class A | 409 | 37,015 |
| NVR Inc. (b) | 5 | 23,063 |
| PulteGroup Inc. | 399 | 18,166 |
| 123,616 | ||
| Home Furnishings - 0.0%* | ||
| Mohawk Industries Inc. (b) | 83 | 8,484 |
| 26 | Elfun Diversified Fund |
| Number of Shares | Fair Value | |
| Home Improvement Retail - 0.4% | ||
| Lowe's Companies Inc. | 1,031 | $ 205,416 |
| The Home Depot Inc. | 1,708 | 539,489 |
| 744,905 | ||
| Hotel & Resort REITs - 0.0%* | ||
| Host Hotels & Resorts Inc. | 1,133 | 18,185 |
| Hotels, Resorts & Cruise Lines - 0.2% | ||
| Booking Holdings Inc. (b) | 66 | 133,008 |
| Carnival Corp. (b) | 1,499 | 12,082 |
| Expedia Group Inc. (b) | 242 | 21,199 |
| Hilton Worldwide Holdings Inc. | 470 | 59,389 |
| Marriott International Inc., Class A | 439 | 65,363 |
| Norwegian Cruise Line Holdings Ltd. (b) | 648 | 7,932 |
| Royal Caribbean Cruises Ltd. (b) | 348 | 17,202 |
| 316,175 | ||
| Household Appliances - 0.0%* | ||
| Whirlpool Corp. | 93 | 13,156 |
| Household Products - 0.5% | ||
| Church & Dwight Company Inc. | 355 | 28,616 |
| Colgate-Palmolive Co. | 1,419 | 111,803 |
| Kimberly-Clark Corp. | 577 | 78,328 |
| The Clorox Co. | 197 | 27,645 |
| The Procter & Gamble Co. | 3,955 | 599,420 |
| 845,812 | ||
| Housewares & Specialties - 0.0%* | ||
| Newell Brands Inc. | 612 | 8,005 |
| Human Resource & Employment Services - 0.0%* | ||
| Robert Half International Inc. | 166 | 12,256 |
| Hypermarkets & Super Centers - 0.4% | ||
| Costco Wholesale Corp. | 736 | 335,984 |
| Walmart Inc. | 2,351 | 333,348 |
| 669,332 | ||
| Independent Power Producers & Energy Traders - 0.0%* | ||
| The AES Corp. | 1,124 | 32,326 |
| Industrial Conglomerates - 0.3% | ||
| 3M Co. | 941 | 112,845 |
| General Electric Co. | 1,795 | 150,403 |
| Number of Shares | Fair Value | |
| Honeywell International Inc. | 1,118 | $ 239,587 |
| 502,835 | ||
| Industrial Gases - 0.1% | ||
| Air Products & Chemicals Inc. | 377 | 116,214 |
| Industrial Machinery - 0.3% | ||
| Dover Corp. | 232 | 31,415 |
| Fortive Corp. | 580 | 37,265 |
| IDEX Corp. | 121 | 27,628 |
| Illinois Tool Works Inc. | 461 | 101,558 |
| Ingersoll Rand Inc. | 659 | 34,433 |
| Nordson Corp. | 94 | 22,346 |
| Otis Worldwide Corp. | 710 | 55,600 |
| Parker-Hannifin Corp. | 220 | 64,020 |
| Snap-on Inc. | 84 | 19,193 |
| Stanley Black & Decker Inc. | 263 | 19,756 |
| Xylem Inc. | 287 | 31,734 |
| 444,948 | ||
| Industrial REITs - 0.1% | ||
| Prologis Inc. | 1,564 | 176,310 |
| Insurance Brokers - 0.2% | ||
| Aon PLC, Class A | 345 | 103,548 |
| Arthur J Gallagher & Co. | 360 | 67,874 |
| Brown & Brown Inc. | 400 | 22,788 |
| Marsh & McLennan Companies Inc. | 820 | 135,694 |
| 329,904 | ||
| Integrated Oil & Gas - 0.8% | ||
| Chevron Corp. | 2,968 | 532,726 |
| Exxon Mobil Corp. | 6,878 | 758,644 |
| Occidental Petroleum Corp. | 1,205 | 75,903 |
| 1,367,273 | ||
| Integrated Telecommunication Services - 0.3% | ||
| AT&T Inc. | 11,903 | 219,134 |
| Verizon Communications Inc. | 6,950 | 273,830 |
| 492,964 | ||
| Interactive Home Entertainment - 0.1% | ||
| Activision Blizzard Inc. | 1,214 | 92,932 |
| Electronic Arts Inc. | 426 | 52,049 |
| Take-Two Interactive Software Inc. (b) | 263 | 27,386 |
| 172,367 | ||
| Elfun Diversified Fund | 27 |
| Number of Shares | Fair Value | |
| Interactive Media & Services - 1.3% | ||
| Alphabet Inc., Class C (b) | 8,843 | $ 784,639 |
| Alphabet Inc., Class A (b) | 9,978 | 880,359 |
| Match Group Inc. (b) | 446 | 18,505 |
| Meta Platforms Inc., Class A (b) | 3,750 | 451,275 |
| 2,134,778 | ||
| Internet & Direct Marketing Retail - 0.8% | ||
| Amazon.com Inc. (b) | 14,834 | 1,246,056 |
| eBay Inc. | 891 | 36,950 |
| Etsy Inc. (b) | 198 | 23,716 |
| 1,306,722 | ||
| Internet Services & Infrastructure - 0.0%* | ||
| Akamai Technologies Inc. (b) | 259 | 21,834 |
| VeriSign Inc. (b) | 155 | 31,843 |
| 53,677 | ||
| Investment Banking & Brokerage - 0.4% | ||
| Morgan Stanley | 2,151 | 182,878 |
| Raymond James Financial Inc. | 313 | 33,444 |
| The Charles Schwab Corp. | 2,490 | 207,318 |
| The Goldman Sachs Group Inc. | 561 | 192,636 |
| 616,276 | ||
| IT Consulting & Other Services - 0.2% | ||
| Cognizant Technology Solutions Corp., Class A | 844 | 48,268 |
| DXC Technology Co. (b) | 386 | 10,229 |
| EPAM Systems Inc. (b) | 94 | 30,807 |
| Gartner Inc. (b) | 133 | 44,707 |
| International Business Machines Corp. | 1,528 | 215,280 |
| 349,291 | ||
| Leisure Products - 0.0%* | ||
| Hasbro Inc. | 199 | 12,141 |
| Life & Health Insurance - 0.2% | ||
| Aflac Inc. | 965 | 69,422 |
| Globe Life Inc. | 143 | 17,239 |
| Lincoln National Corp. | 284 | 8,724 |
| MetLife Inc. | 1,081 | 78,232 |
| Principal Financial Group Inc. | 390 | 32,729 |
| Prudential Financial Inc. | 637 | 63,356 |
| 269,702 | ||
| Number of Shares | Fair Value | |
| Life Sciences Tools & Services - 0.6% | ||
| Agilent Technologies Inc. | 511 | $ 76,471 |
| Bio-Rad Laboratories Inc., Class A (b) | 34 | 14,297 |
| Bio-Techne Corp. | 276 | 22,875 |
| Charles River Laboratories International Inc. (b) | 89 | 19,393 |
| Danaher Corp. | 1,101 | 292,227 |
| Illumina Inc. (b) | 275 | 55,605 |
| IQVIA Holdings Inc. (b) | 319 | 65,360 |
| Mettler-Toledo International Inc. (b) | 38 | 54,927 |
| PerkinElmer Inc. | 203 | 28,465 |
| Thermo Fisher Scientific Inc. | 659 | 362,905 |
| Waters Corp. (b) | 99 | 33,915 |
| West Pharmaceutical Services Inc. | 116 | 27,301 |
| 1,053,741 | ||
| Managed Healthcare - 0.8% | ||
| Centene Corp. (b) | 976 | 80,042 |
| Elevance Health Inc. | 397 | 203,649 |
| Humana Inc. | 209 | 107,048 |
| Molina Healthcare Inc. (b) | 92 | 30,380 |
| UnitedHealth Group Inc. | 1,561 | 827,611 |
| 1,248,730 | ||
| Metal & Glass Containers - 0.0%* | ||
| Ball Corp. | 525 | 26,849 |
| Movies & Entertainment - 0.3% | ||
| Live Nation Entertainment Inc. (b) | 249 | 17,365 |
| Netflix Inc. (b) | 746 | 219,980 |
| The Walt Disney Co. (b) | 3,061 | 265,940 |
| Warner Bros Discovery Inc. (b) | 3,672 | 34,811 |
| 538,096 | ||
| Multi-Line Insurance - 0.1% | ||
| American International Group Inc. | 1,182 | 74,750 |
| Assurant Inc. | 90 | 11,255 |
| The Hartford Financial Services Group Inc. | 529 | 40,114 |
| 126,119 | ||
| Multi-Sector Holdings - 0.6% | ||
| Berkshire Hathaway Inc., Class B (b) | 3,010 | 929,789 |
| 28 | Elfun Diversified Fund |
| Number of Shares | Fair Value | |
| Multi-Utilities - 0.3% | ||
| Ameren Corp. | 458 | $ 40,725 |
| CenterPoint Energy Inc. | 1,040 | 31,190 |
| CMS Energy Corp. | 465 | 29,449 |
| Consolidated Edison Inc. | 577 | 54,994 |
| Dominion Energy Inc. | 1,420 | 87,074 |
| DTE Energy Co. | 344 | 40,430 |
| NiSource Inc. | 692 | 18,975 |
| Public Service Enterprise Group Inc. | 808 | 49,506 |
| Sempra Energy | 536 | 82,833 |
| WEC Energy Group Inc. | 524 | 49,130 |
| 484,306 | ||
| Office REITs - 0.0%* | ||
| Alexandria Real Estate Equities Inc. | 239 | 34,815 |
| Boston Properties Inc. | 225 | 15,205 |
| Vornado Realty Trust | 312 | 6,493 |
| 56,513 | ||
| Oil & Gas Equipment & Services - 0.1% | ||
| Baker Hughes Co. | 1,715 | 50,644 |
| Halliburton Co. | 1,563 | 61,504 |
| Schlumberger Ltd. | 2,350 | 125,631 |
| 237,779 | ||
| Oil & Gas Exploration & Production - 0.5% | ||
| APA Corp. | 521 | 24,320 |
| ConocoPhillips | 2,072 | 244,496 |
| Coterra Energy Inc. | 1,295 | 31,818 |
| Devon Energy Corp. | 1,086 | 66,800 |
| Diamondback Energy Inc. | 283 | 38,709 |
| EOG Resources Inc. | 995 | 128,873 |
| EQT Corp. | 600 | 20,298 |
| Hess Corp. | 477 | 67,648 |
| Marathon Oil Corp. | 1,099 | 29,750 |
| Pioneer Natural Resources Co. | 406 | 92,726 |
| 745,438 | ||
| Oil & Gas Refining & Marketing - 0.2% | ||
| Marathon Petroleum Corp. | 795 | 92,530 |
| Phillips 66 | 776 | 80,766 |
| Valero Energy Corp. | 632 | 80,176 |
| 253,472 | ||
| Oil & Gas Storage & Transportation - 0.1% | ||
| Kinder Morgan Inc. | 3,304 | 59,736 |
| Number of Shares | Fair Value | |
| ONEOK Inc. | 738 | $ 48,487 |
| Targa Resources Corp. | 400 | 29,400 |
| The Williams Cos. Inc. | 2,031 | 66,820 |
| 204,443 | ||
| Packaged Foods & Meats - 0.3% | ||
| Campbell Soup Co. | 313 | 17,763 |
| Conagra Brands Inc. | 826 | 31,966 |
| General Mills Inc. | 964 | 80,831 |
| Hormel Foods Corp. | 517 | 23,549 |
| Kellogg Co. | 438 | 31,203 |
| Lamb Weston Holdings Inc. | 221 | 19,749 |
| McCormick & Company Inc. | 445 | 36,886 |
| Mondelez International Inc., Class A | 2,278 | 151,829 |
| The Hershey Co. | 239 | 55,345 |
| The J M Smucker Co. | 172 | 27,255 |
| The Kraft Heinz Co. | 1,363 | 55,488 |
| Tyson Foods Inc., Class A | 507 | 31,561 |
| 563,425 | ||
| Paper Packaging - 0.1% | ||
| Avery Dennison Corp. | 132 | 23,892 |
| International Paper Co. | 644 | 22,302 |
| Packaging Corp. of America | 151 | 19,315 |
| Sealed Air Corp. | 264 | 13,168 |
| Westrock Co. | 413 | 14,521 |
| 93,198 | ||
| Personal Products - 0.1% | ||
| The Estee Lauder Companies Inc., Class A | 395 | 98,003 |
| Pharmaceuticals - 1.6% | ||
| Bristol-Myers Squibb Co. | 3,536 | 254,415 |
| Catalent Inc. (b) | 289 | 13,008 |
| Eli Lilly & Co. | 1,315 | 481,080 |
| Johnson & Johnson | 4,366 | 771,254 |
| Merck & Company Inc. | 4,172 | 462,884 |
| Organon & Co. | 387 | 10,809 |
| Pfizer Inc. | 9,339 | 478,530 |
| Viatris Inc. | 1,887 | 21,002 |
| Zoetis Inc. | 768 | 112,550 |
| 2,605,532 | ||
| Property & Casualty Insurance - 0.2% | ||
| Arch Capital Group Ltd. (b) | 600 | 37,668 |
| Cincinnati Financial Corp. | 250 | 25,597 |
| Loews Corp. | 311 | 18,141 |
| Elfun Diversified Fund | 29 |
| Number of Shares | Fair Value | |
| The Allstate Corp. | 432 | $ 58,579 |
| The Progressive Corp. | 993 | 128,802 |
| The Travelers Companies Inc. | 384 | 71,996 |
| W R Berkley Corp. | 350 | 25,400 |
| 366,183 | ||
| Publishing - 0.0%* | ||
| News Corp., Class A | 611 | 11,120 |
| News Corp., Class B | 142 | 2,619 |
| 13,739 | ||
| Railroads - 0.3% | ||
| CSX Corp. | 3,549 | 109,948 |
| Norfolk Southern Corp. | 381 | 93,886 |
| Union Pacific Corp. | 1,021 | 211,419 |
| 415,253 | ||
| Real Estate Services - 0.0%* | ||
| CBRE Group Inc., Class A (b) | 544 | 41,866 |
| Regional Banks - 0.3% | ||
| Citizens Financial Group Inc. | 801 | 31,536 |
| Comerica Inc. | 166 | 11,097 |
| Fifth Third Bancorp. | 1,124 | 36,879 |
| First Republic Bank | 325 | 39,614 |
| Huntington Bancshares Inc. | 2,334 | 32,910 |
| KeyCorp | 1,472 | 25,642 |
| M&T Bank Corp. | 282 | 40,907 |
| Regions Financial Corp. | 1,497 | 32,275 |
| Signature Bank | 99 | 11,407 |
| SVB Financial Group (b) | 108 | 24,855 |
| The PNC Financial Services Group Inc. | 665 | 105,030 |
| Truist Financial Corp. | 2,177 | 93,676 |
| Zions Bancorp NA | 252 | 12,388 |
| 498,216 | ||
| Research & Consulting Services - 0.1% | ||
| CoStar Group Inc. (b) | 700 | 54,096 |
| Equifax Inc. | 217 | 42,176 |
| Jacobs Solutions Inc. | 207 | 24,855 |
| Leidos Holdings Inc. | 223 | 23,457 |
| Verisk Analytics Inc. | 262 | 46,222 |
| 190,806 | ||
| Residential REITs - 0.1% | ||
| AvalonBay Communities Inc. | 232 | 37,473 |
| Camden Property Trust | 186 | 20,810 |
| Equity Residential | 602 | 35,518 |
| Number of Shares | Fair Value | |
| Essex Property Trust Inc. | 105 | $ 22,251 |
| Invitation Homes Inc. | 1,000 | 29,640 |
| Mid-America Apartment Communities Inc. | 186 | 29,200 |
| UDR Inc. | 517 | 20,023 |
| 194,915 | ||
| Restaurants - 0.4% | ||
| Chipotle Mexican Grill Inc. (b) | 48 | 66,599 |
| Darden Restaurants Inc. | 203 | 28,081 |
| Domino's Pizza Inc. | 63 | 21,823 |
| McDonald's Corp. | 1,220 | 321,507 |
| Starbucks Corp. | 1,943 | 192,746 |
| Yum! Brands Inc. | 488 | 62,503 |
| 693,259 | ||
| Retail REITs - 0.1% | ||
| Federal Realty Investment Trust | 139 | 14,045 |
| Kimco Realty Corp. | 1,010 | 21,392 |
| Realty Income Corp. | 1,057 | 67,045 |
| Regency Centers Corp. | 234 | 14,625 |
| Simon Property Group Inc. | 561 | 65,906 |
| 183,013 | ||
| Semiconductor Equipment - 0.2% | ||
| Applied Materials Inc. | 1,423 | 138,572 |
| Enphase Energy Inc. (b) | 232 | 61,471 |
| KLA Corp. | 242 | 91,241 |
| Lam Research Corp. | 233 | 97,930 |
| Teradyne Inc. | 261 | 22,798 |
| 412,012 | ||
| Semiconductors - 1.3% | ||
| Advanced Micro Devices Inc. (b) | 2,669 | 172,871 |
| Analog Devices Inc. | 851 | 139,590 |
| Broadcom Inc. | 680 | 380,208 |
| First Solar Inc. (b) | 200 | 29,958 |
| Intel Corp. | 6,926 | 183,054 |
| Microchip Technology Inc. | 946 | 66,457 |
| Micron Technology Inc. | 1,844 | 92,163 |
| Monolithic Power Systems Inc. | 70 | 24,753 |
| NVIDIA Corp. | 4,156 | 607,358 |
| ON Semiconductor Corp. (b) | 700 | 43,659 |
| Qorvo Inc. (b) | 156 | 14,140 |
| QUALCOMM Inc. | 1,880 | 206,687 |
| Skyworks Solutions Inc. | 263 | 23,967 |
| 30 | Elfun Diversified Fund |
| Number of Shares | Fair Value | |
| Texas Instruments Inc. | 1,509 | $ 249,317 |
| 2,234,182 | ||
| Soft Drinks - 0.6% | ||
| Keurig Dr Pepper Inc. | 1,400 | 49,924 |
| Monster Beverage Corp. (b) | 577 | 58,583 |
| PepsiCo Inc. | 2,297 | 414,976 |
| The Coca-Cola Co. | 6,482 | 412,320 |
| 935,803 | ||
| Specialized REITs - 0.4% | ||
| American Tower Corp. | 789 | 167,157 |
| Crown Castle Inc. | 737 | 99,967 |
| Digital Realty Trust Inc. | 504 | 50,536 |
| Equinix Inc. | 152 | 99,565 |
| Extra Space Storage Inc. | 222 | 32,674 |
| Iron Mountain Inc. | 505 | 25,174 |
| Public Storage | 270 | 75,651 |
| SBA Communications Corp. | 180 | 50,456 |
| VICI Properties Inc. | 1,600 | 51,840 |
| Weyerhaeuser Co. | 1,231 | 38,161 |
| 691,181 | ||
| Specialty Chemicals - 0.2% | ||
| Albemarle Corp. | 206 | 44,673 |
| Celanese Corp. | 173 | 17,688 |
| DuPont de Nemours Inc. | 840 | 57,649 |
| Eastman Chemical Co. | 205 | 16,695 |
| Ecolab Inc. | 425 | 61,863 |
| International Flavors & Fragrances Inc. | 423 | 44,347 |
| PPG Industries Inc. | 392 | 49,290 |
| The Sherwin-Williams Co. | 402 | 95,407 |
| 387,612 | ||
| Specialty Stores - 0.1% | ||
| Bath & Body Works Inc. | 387 | 16,308 |
| Tractor Supply Co. | 184 | 41,395 |
| Ulta Beauty Inc. (b) | 88 | 41,278 |
| 98,981 | ||
| Steel - 0.1% | ||
| Nucor Corp. | 418 | 55,097 |
| Steel Dynamics Inc. | 300 | 29,310 |
| 84,407 | ||
| Systems Software - 2.0% | ||
| Fortinet Inc. (b) | 1,052 | 51,432 |
| Number of Shares | Fair Value | |
| Gen Digital Inc. | 923 | $ 19,780 |
| Microsoft Corp. | 12,448 | 2,985,279 |
| Oracle Corp. | 2,571 | 210,154 |
| ServiceNow Inc. (b) | 343 | 133,177 |
| 3,399,822 | ||
| Technology Distributors - 0.0%* | ||
| CDW Corp. | 220 | 39,288 |
| Technology Hardware, Storage & Peripherals - 2.0% | ||
| Apple Inc. | 24,972 | 3,244,612 |
| Hewlett Packard Enterprise Co. | 2,063 | 32,925 |
| HP Inc. | 1,479 | 39,741 |
| NetApp Inc. | 367 | 22,042 |
| Western Digital Corp. (b) | 544 | 17,163 |
| 3,356,483 | ||
| Tobacco - 0.2% | ||
| Altria Group Inc. | 2,963 | 135,439 |
| Philip Morris International Inc. | 2,603 | 263,449 |
| 398,888 | ||
| Trading Companies & Distributors - 0.1% | ||
| Fastenal Co. | 987 | 46,705 |
| United Rentals Inc. (b) | 117 | 41,584 |
| WW Grainger Inc. | 74 | 41,162 |
| 129,451 | ||
| Trucking - 0.0%* | ||
| JB Hunt Transport Services Inc. | 133 | 23,190 |
| Old Dominion Freight Line Inc. | 151 | 42,851 |
| 66,041 | ||
| Water Utilities - 0.0%* | ||
| American Water Works Company Inc. | 301 | 45,878 |
| Wireless Telecommunication Services - 0.1% | ||
| T-Mobile US Inc. (b) | 988 | 138,320 |
| Total Common Stock (Cost $41,060,908) | 52,361,621 | |
| Elfun Diversified Fund | 31 |
| Number of Shares | Fair Value | |
| Preferred Stock - 0.0% * | ||
| Diversified Banks - 0.0%* | ||
| Wells Fargo & Co. 5.85%, (5.85% fixed rate until 09/15/23; 3.09% + 3 month USD LIBOR thereafter) (d) | 1,469 | $ 33,802 |
| Total Preferred Stock (Cost $36,725) | 33,802 | |
| Total Domestic Equity (Cost $41,097,633) | 52,395,423 | |
| Foreign Equity - 0.8% | ||
| Common Stock - 0.8% | ||
| Auto Parts & Equipment - 0.0%* | ||
| Aptiv PLC (b) | 448 | 41,722 |
| Building Products - 0.1% | ||
| Allegion PLC | 139 | 14,631 |
| Trane Technologies PLC | 389 | 65,387 |
| 80,018 | ||
| Consumer Electronics - 0.0%* | ||
| Garmin Ltd. | 243 | 22,427 |
| Electronic Manufacturing Services - 0.0%* | ||
| TE Connectivity Ltd. | 547 | 62,796 |
| Healthcare Equipment - 0.1% | ||
| Medtronic PLC | 2,251 | 174,948 |
| Industrial Gases - 0.2% | ||
| Linde PLC | 822 | 268,120 |
| Industrial Machinery - 0.0%* | ||
| Pentair PLC | 253 | 11,380 |
| Insurance Brokers - 0.0%* | ||
| Willis Towers Watson PLC | 177 | 43,291 |
| IT Consulting & Other Services - 0.2% | ||
| Accenture PLC, Class A | 1,048 | 279,648 |
| Paper Packaging - 0.0%* | ||
| Amcor PLC | 2,485 | 29,596 |
| Property & Casualty Insurance - 0.1% | ||
| Chubb Ltd. | 687 | 151,552 |
| Reinsurance - 0.0%* | ||
| Everest Re Group Ltd. | 68 | 22,526 |
| Number of Shares | Fair Value | |
| Semiconductor Equipment - 0.0%* | ||
| SolarEdge Technologies Inc. (b) | 97 | $ 27,477 |
| Semiconductors - 0.1% | ||
| NXP Semiconductors N.V. | 423 | 66,847 |
| Technology Hardware, Storage & Peripherals - 0.0%* | ||
| Seagate Technology Holdings PLC | 323 | 16,993 |
| Total Common Stock (Cost $1,053,714) | 1,299,341 | |
| Total Foreign Equity (Cost $1,053,714) | 1,299,341 | |
| Principal Amount | ||
| Bonds and Notes - 40.8% | ||
| U.S. Treasuries - 10.9% | ||
| U.S. Treasury Bonds | ||
| 1.88% 02/15/41 - 02/15/51 | $ 849,000 | 564,656 |
| 2.25% 08/15/46 | 673,000 | 478,461 |
| 2.38% 02/15/42 | 291,000 | 222,342 |
| 3.00% 08/15/48 | 1,873,600 | 1,545,720 |
| U.S. Treasury Notes | ||
| 0.25% 07/31/25 | 2,960,200 | 2,670,655 |
| 0.75% 12/31/23 - 01/31/28 | 7,944,000 | 7,076,468 |
| 1.13% 01/15/25 | 1,270,000 | 1,188,442 |
| 1.25% 11/30/26 | 280,000 | 251,213 |
| 1.50% 02/29/24 | 1,176,000 | 1,133,370 |
| 1.63% 05/15/31 | 932,000 | 784,191 |
| 1.75% 01/31/29 | 610,000 | 536,037 |
| 2.88% 05/15/32 | 1,391,000 | 1,282,328 |
| 3.00% 06/30/24 | 342,000 | 333,757 |
| 18,067,640 | ||
| Agency Mortgage Backed - 12.9% | ||
| Federal Home Loan Mortgage Corp. | ||
| 3.00% 04/01/43 - 10/01/49 | 1,384,797 | 1,245,276 |
| 4.50% 06/01/33 - 02/01/35 | 1,137 | 1,121 |
| 5.00% 07/01/35 | 7,111 | 7,160 |
| 5.50% 01/01/38 - 04/01/39 | 12,848 | 13,239 |
| 6.00% 06/01/33 - 11/01/37 | 30,435 | 31,898 |
| 6.50% 11/01/28 | 375 | 387 |
| 7.00% 12/01/29 - 08/01/36 | 8,380 | 8,872 |
| 7.50% 09/01/33 | 889 | 930 |
| 8.00% 07/01/26 - 11/01/30 | 960 | 1,005 |
| 8.50% 04/01/30 | 2,659 | 2,939 |
| 32 | Elfun Diversified Fund |
| Principal Amount | Fair Value | |
| Federal National Mortgage Assoc. | ||
| 2.50% 03/01/51 | $ 639,793 | $ 541,428 |
| 3.00% 03/01/50 | 242,362 | 215,196 |
| 3.50% 08/01/45 - 01/01/48 | 574,771 | 534,921 |
| 4.00% 01/01/41 - 01/01/50 | 540,626 | 518,373 |
| 4.50% 07/01/33 - 12/01/48 | 270,322 | 266,519 |
| 5.00% 03/01/34 - 05/01/39 | 21,142 | 21,302 |
| 5.50% 07/01/33 - 01/01/39 | 46,109 | 47,307 |
| 6.00% 02/01/29 - 05/01/41 | 164,104 | 171,545 |
| 6.50% 07/01/29 - 08/01/36 | 4,615 | 4,899 |
| 7.00% 05/01/33 - 12/01/33 | 457 | 474 |
| 7.50% 12/01/26 - 03/01/33 | 2,390 | 2,504 |
| 8.00% 06/01/24 - 12/01/30 | 1,536 | 1,544 |
| Federal National Mortgage Assoc. 1.60% + 12 month USD LIBOR | ||
| 2.97% 04/01/37 (d) | 354 | 351 |
| Federal National Mortgage Assoc. TBA | ||
| 2.00% 01/17/38 - 01/01/53 (e) | 5,085,856 | 4,165,609 |
| 2.50% 01/01/53 (e) | 1,658,790 | 1,403,011 |
| 3.00% 01/01/53 (e) | 1,000,000 | 876,846 |
| 3.50% 01/01/53 (e) | 1,500,000 | 1,361,627 |
| 4.00% 01/01/53 (e) | 2,320,592 | 2,175,267 |
| 4.50% 01/01/53 (e) | 2,051,049 | 1,974,245 |
| 5.00% 01/01/53 (e) | 2,250,000 | 2,216,437 |
| Government National Mortgage Assoc. | ||
| 3.00% 12/20/42 - 05/20/45 | 1,330,846 | 1,206,416 |
| 3.50% 08/20/48 | 229,692 | 213,998 |
| 4.00% 01/20/41 - 04/20/43 | 114,751 | 111,856 |
| 4.50% 08/15/33 - 03/20/41 | 48,106 | 47,906 |
| 5.00% 08/15/33 | 2,614 | 2,644 |
| 6.00% 07/15/33 - 04/15/34 | 3,935 | 4,126 |
| 6.50% 04/15/28 - 07/15/36 | 6,295 | 6,644 |
| 7.00% 04/15/28 - 10/15/36 | 2,430 | 2,557 |
| 7.50% 04/15/28 | 3,486 | 3,537 |
| 8.00% 05/15/30 | 126 | 130 |
| Government National Mortgage Assoc. TBA | ||
| 2.00% 01/23/53 (e) | 1,093,002 | 913,444 |
| 2.50% 01/23/53 (e) | 1,085,903 | 937,947 |
| 4.00% 01/01/53 (e) | 220,302 | 208,241 |
| 21,471,678 |
| Principal Amount | Fair Value | |
| Agency Collateralized Mortgage Obligations - 0.2% | ||
| Federal Home Loan Mortgage Corp. | ||
| 0.08% 09/25/43 (d)(f) | $ 83,579 | $ 258 |
| 2.51% 07/25/29 | 224,000 | 198,757 |
| 4.05% 09/25/28 (d) | 71,000 | 69,411 |
| Federal Home Loan Mortgage Corp. REMIC | ||
| 3.50% 11/15/30 (f) | 2,309 | 24 |
| 5.50% 06/15/33 (f) | 2,198 | 352 |
| 7.50% 07/15/27 (f) | 1,652 | 160 |
| Federal Home Loan Mortgage Corp. STRIPS | ||
| 0.00% 08/01/27 (g) | 79 | 73 |
| 8.00% 07/01/24 (f) | 75 | 4 |
| Federal National Mortgage Assoc. REMIC | ||
| 1.15% 12/25/42 (d)(f) | 17,927 | 697 |
| 5.00% 09/25/40 (f) | 5,559 | 618 |
| Federal National Mortgage Assoc. REMIC 6.00% - 1 month USD LIBOR | ||
| 1.61% 07/25/38 (d)(f) | 3,533 | 300 |
| Federal National Mortgage Assoc. REMIC 6.55% - 1 month USD LIBOR | ||
| 2.16% 11/25/41 (d)(f) | 521,598 | 61,186 |
| Federal National Mortgage Assoc. STRIPS | ||
| 4.50% 08/25/35 - 01/25/36 (f) | 4,911 | 627 |
| 5.00% 03/25/38 - 05/25/38 (f) | 3,114 | 475 |
| 5.50% 12/25/33 (f) | 1,142 | 211 |
| 6.00% 01/25/35 (f) | 3,278 | 577 |
| 7.50% 11/25/23 (f) | 264 | 5 |
| 8.00% 07/25/24 (f) | 153 | 7 |
| 333,742 | ||
| Asset Backed - 0.1% | ||
| Ford Credit Auto Owner Trust 2020-B | ||
| 0.56% 10/15/24 | 84,781 | 83,771 |
| 83,771 | ||
| Corporate Notes - 14.6% | ||
| 3M Co. | ||
| 3.13% 09/19/46 | 20,000 | 13,738 |
| 7-Eleven Inc. | ||
| 0.80% 02/10/24 (h) | 42,000 | 39,952 |
| Elfun Diversified Fund | 33 |
| Principal Amount | Fair Value | |
| 0.95% 02/10/26 (h) | $ 101,000 | $ 88,368 |
| Abbott Laboratories | ||
| 3.75% 11/30/26 | 21,000 | 20,468 |
| 4.90% 11/30/46 | 17,000 | 16,634 |
| AbbVie Inc. | ||
| 2.60% 11/21/24 | 33,000 | 31,595 |
| 2.95% 11/21/26 | 208,000 | 193,825 |
| 3.20% 05/14/26 - 11/21/29 | 74,000 | 67,574 |
| 3.75% 11/14/23 | 42,000 | 41,589 |
| 4.05% 11/21/39 | 10,000 | 8,564 |
| 4.25% 11/21/49 | 28,000 | 23,536 |
| 4.40% 11/06/42 | 12,000 | 10,420 |
| 4.63% 10/01/42 | 3,000 | 2,683 |
| 4.70% 05/14/45 | 4,000 | 3,573 |
| 4.88% 11/14/48 | 5,000 | 4,604 |
| Advance Auto Parts Inc. | ||
| 3.90% 04/15/30 | 72,000 | 63,263 |
| Advanced Micro Devices Inc. | ||
| 4.39% 06/01/52 | 45,000 | 39,793 |
| AEP Texas Inc. | ||
| 3.45% 05/15/51 | 34,000 | 24,052 |
| Aetna Inc. | ||
| 3.50% 11/15/24 | 15,000 | 14,584 |
| Aircastle Ltd. | ||
| 4.25% 06/15/26 | 17,000 | 16,005 |
| Alexandria Real Estate Equities Inc. | ||
| 1.88% 02/01/33 | 31,000 | 23,097 |
| 2.95% 03/15/34 | 28,000 | 22,796 |
| 3.55% 03/15/52 | 23,000 | 16,496 |
| 4.70% 07/01/30 | 8,000 | 7,686 |
| Ally Financial Inc. | ||
| 2.20% 11/02/28 | 32,000 | 25,033 |
| Altria Group Inc. | ||
| 3.40% 05/06/30 - 02/04/41 | 53,000 | 42,012 |
| 4.00% 02/04/61 | 6,000 | 3,910 |
| 4.25% 08/09/42 | 2,000 | 1,482 |
| 4.45% 05/06/50 | 7,000 | 4,959 |
| 4.50% 05/02/43 | 7,000 | 5,267 |
| Amazon.com Inc. | ||
| 1.50% 06/03/30 | 177,000 | 142,204 |
| 2.50% 06/03/50 | 35,000 | 22,208 |
| 2.70% 06/03/60 | 9,000 | 5,478 |
| 2.88% 05/12/41 | 22,000 | 16,429 |
| 3.15% 08/22/27 | 8,000 | 7,532 |
| 3.25% 05/12/61 | 14,000 | 9,736 |
| 4.05% 08/22/47 (d) | 7,000 | 6,052 |
| 4.25% 08/22/57 | 5,000 | 4,336 |
| Principal Amount | Fair Value | |
| Ameren Corp. | ||
| 3.65% 02/15/26 | $ 10,000 | $ 9,560 |
| American Electric Power Company Inc. | ||
| 2.30% 03/01/30 | 34,000 | 27,834 |
| 3.25% 03/01/50 | 4,000 | 2,697 |
| American International Group Inc. (5.75% fixed rate until 04/01/28; 2.87% + 3 month USD LIBOR thereafter) | ||
| 5.75% 04/01/48 (d) | 4,000 | 3,822 |
| American Tower Corp. | ||
| 1.50% 01/31/28 | 230,000 | 190,516 |
| 2.90% 01/15/30 | 11,000 | 9,319 |
| 3.80% 08/15/29 | 32,000 | 29,100 |
| American Water Capital Corp. | ||
| 2.95% 09/01/27 | 15,000 | 13,832 |
| Amgen Inc. | ||
| 2.00% 01/15/32 | 167,000 | 130,197 |
| 3.00% 01/15/52 | 12,000 | 7,713 |
| 3.15% 02/21/40 | 20,000 | 14,769 |
| 3.38% 02/21/50 | 5,000 | 3,497 |
| 4.66% 06/15/51 | 5,000 | 4,327 |
| AngloGold Ashanti Holdings PLC | ||
| 3.38% 11/01/28 | 200,000 | 175,344 |
| Anheuser-Busch Companies LLC/Anheuser-Busch InBev Worldwide Inc. | ||
| 3.65% 02/01/26 | 3,000 | 2,890 |
| 4.70% 02/01/36 | 10,000 | 9,428 |
| 4.90% 02/01/46 | 39,000 | 35,689 |
| Anheuser-Busch InBev Worldwide Inc. | ||
| 3.50% 06/01/30 | 235,000 | 213,735 |
| 4.00% 04/13/28 | 8,000 | 7,636 |
| 4.35% 06/01/40 | 14,000 | 12,372 |
| 4.38% 04/15/38 (d) | 23,000 | 20,678 |
| 4.50% 06/01/50 | 13,000 | 11,489 |
| 4.60% 04/15/48 | 18,000 | 15,845 |
| 4.75% 04/15/58 | 11,000 | 9,738 |
| 5.55% 01/23/49 | 21,000 | 20,929 |
| Aon Corp./Aon Global Holdings PLC | ||
| 2.90% 08/23/51 | 23,000 | 14,599 |
| Apollo Management Holdings LP (4.95% fixed rate until 12/17/24; 3.27% + 5 year CMT Rate thereafter) | ||
| 4.95% 01/14/50 (d)(h) | 23,000 | 19,320 |
| 34 | Elfun Diversified Fund |
| Principal Amount | Fair Value | |
| Apple Inc. | ||
| 2.20% 09/11/29 | $ 200,000 | $ 172,780 |
| 2.65% 02/08/51 | 41,000 | 27,360 |
| 2.80% 02/08/61 | 24,000 | 15,400 |
| 2.95% 09/11/49 | 9,000 | 6,427 |
| 3.35% 02/09/27 | 8,000 | 7,658 |
| 3.45% 02/09/45 | 27,000 | 21,729 |
| 3.85% 08/04/46 | 18,000 | 15,328 |
| 3.95% 08/08/52 | 20,000 | 17,079 |
| Applied Materials Inc. | ||
| 4.35% 04/01/47 | 6,000 | 5,420 |
| Aptiv PLC | ||
| 4.40% 10/01/46 | 9,000 | 6,807 |
| ArcelorMittal S.A. | ||
| 6.80% 11/29/32 | 105,000 | 104,679 |
| Archer-Daniels-Midland Co. | ||
| 2.50% 08/11/26 | 9,000 | 8,352 |
| Ares Capital Corp. | ||
| 2.88% 06/15/28 | 36,000 | 28,918 |
| 3.25% 07/15/25 | 74,000 | 68,074 |
| Arthur J Gallagher & Co. | ||
| 3.50% 05/20/51 | 28,000 | 19,611 |
| Ascension Health | ||
| 4.85% 11/15/53 | 11,000 | 10,429 |
| Astrazeneca Finance LLC | ||
| 1.75% 05/28/28 | 336,000 | 288,584 |
| AstraZeneca PLC | ||
| 3.00% 05/28/51 | 15,000 | 10,594 |
| 4.00% 01/17/29 | 8,000 | 7,690 |
| 4.38% 08/17/48 | 6,000 | 5,381 |
| AT&T Inc. | ||
| 1.70% 03/25/26 | 100,000 | 90,257 |
| 2.30% 06/01/27 | 137,000 | 122,085 |
| 2.75% 06/01/31 | 372,000 | 308,890 |
| 3.85% 06/01/60 | 127,000 | 88,650 |
| 4.35% 03/01/29 | 39,000 | 37,116 |
| 4.50% 05/15/35 | 15,000 | 13,643 |
| 4.55% 03/09/49 | 9,000 | 7,370 |
| 4.75% 05/15/46 | 7,000 | 5,973 |
| 4.85% 03/01/39 | 16,000 | 14,322 |
| Athene Holding Ltd. | ||
| 4.13% 01/12/28 | 9,000 | 8,276 |
| 6.15% 04/03/30 | 20,000 | 20,152 |
| Avangrid Inc. | ||
| 3.15% 12/01/24 (d) | 25,000 | 23,964 |
| Bain Capital Specialty Finance Inc. | ||
| 2.95% 03/10/26 (d) | 43,000 | 37,063 |
| Principal Amount | Fair Value | |
| Bank of America Corp. | ||
| 3.25% 10/21/27 (d) | $ 49,000 | $ 45,288 |
| 4.18% 11/25/27 | 24,000 | 22,795 |
| 4.25% 10/22/26 (d) | 128,000 | 123,759 |
| Bank of America Corp. (2.09% fixed rate until 06/14/28; 1.06% + SOFR thereafter) | ||
| 2.09% 06/14/29 (d) | 578,000 | 486,196 |
| Bank of America Corp. (2.97% fixed rate until 07/21/51; 1.56% + SOFR thereafter) | ||
| 2.97% 07/21/52 (d) | 44,000 | 27,762 |
| Bank of America Corp. (3.42% fixed rate until 12/20/27; 1.04% + 3 month USD LIBOR thereafter) | ||
| 3.42% 12/20/28 (d) | 42,000 | 38,095 |
| Bank of America Corp. (3.56% fixed rate until 04/23/26; 1.06% + 3 month USD LIBOR thereafter) | ||
| 3.56% 04/23/27 (d) | 22,000 | 20,614 |
| Bank of America Corp. (3.71% fixed rate until 04/24/27; 1.51% + 3 month USD LIBOR thereafter) | ||
| 3.71% 04/24/28 (d) | 29,000 | 26,875 |
| Bank of America Corp. (3.85% fixed rate until 03/08/32; 2.00% + 5 year CMT Rate thereafter) | ||
| 3.85% 03/08/37 (d) | 35,000 | 28,948 |
| Bank of America Corp. (3.95% fixed rate until 01/23/48; 1.19% + 3 month USD LIBOR thereafter) | ||
| 3.95% 01/23/49 (d) | 19,000 | 14,677 |
| Bank of America Corp. (4.24% fixed rate until 04/24/37; 1.81% + 3 month USD LIBOR thereafter) | ||
| 4.24% 04/24/38 (d) | 18,000 | 15,396 |
| Bank of America Corp. (4.27% fixed rate until 07/23/28; 1.31% + 3 month USD LIBOR thereafter) | ||
| 4.27% 07/23/29 (d) | 14,000 | 13,077 |
| Bank of America Corp. (4.30% fixed rate until 01/28/25; 2.66% + 3 month USD LIBOR thereafter) | ||
| 4.30% 12/31/99 (d) | 36,000 | 31,316 |
| Elfun Diversified Fund | 35 |
| Principal Amount | Fair Value | |
| Barclays PLC (2.65% fixed rate until 06/24/30; 1.90% + 1 year CMT Rate thereafter) | ||
| 2.65% 06/24/31 (d) | $ 200,000 | $ 156,132 |
| Barrick North America Finance LLC | ||
| 5.70% 05/30/41 | 2,000 | 2,012 |
| BAT Capital Corp. | ||
| 2.73% 03/25/31 | 22,000 | 17,158 |
| 4.39% 08/15/37 | 14,000 | 10,887 |
| 4.54% 08/15/47 | 9,000 | 6,397 |
| 4.70% 04/02/27 | 202,000 | 194,019 |
| 4.91% 04/02/30 | 12,000 | 10,998 |
| 7.75% 10/19/32 | 10,000 | 10,760 |
| BAT International Finance PLC | ||
| 1.67% 03/25/26 | 10,000 | 8,854 |
| Baxter International Inc. | ||
| 2.54% 02/01/32 | 27,000 | 21,505 |
| Baylor Scott & White Holdings | ||
| 2.84% 11/15/50 | 5,000 | 3,299 |
| Becton Dickinson & Co. | ||
| 3.70% 06/06/27 | 21,000 | 19,865 |
| 4.67% 06/06/47 | 4,000 | 3,528 |
| 4.69% 12/15/44 | 2,000 | 1,780 |
| Berkshire Hathaway Energy Co. | ||
| 3.25% 04/15/28 | 8,000 | 7,413 |
| 3.70% 07/15/30 | 64,000 | 58,588 |
| 3.80% 07/15/48 | 8,000 | 6,186 |
| 4.25% 10/15/50 | 40,000 | 33,346 |
| Berkshire Hathaway Finance Corp. | ||
| 2.85% 10/15/50 | 77,000 | 51,797 |
| 3.85% 03/15/52 | 35,000 | 28,248 |
| 4.25% 01/15/49 | 21,000 | 18,826 |
| Berry Global Inc. | ||
| 4.88% 07/15/26 (h) | 32,000 | 30,905 |
| BHP Billiton Finance USA Ltd. | ||
| 5.00% 09/30/43 | 3,000 | 2,912 |
| Biogen Inc. | ||
| 2.25% 05/01/30 | 8,000 | 6,502 |
| Block Financial LLC | ||
| 2.50% 07/15/28 | 22,000 | 18,669 |
| 3.88% 08/15/30 | 7,000 | 6,131 |
| Boardwalk Pipelines LP | ||
| 4.80% 05/03/29 | 11,000 | 10,349 |
| Boston Properties LP | ||
| 6.75% 12/01/27 | 35,000 | 36,145 |
| Principal Amount | Fair Value | |
| Boston Scientific Corp. | ||
| 4.70% 03/01/49 | $ 3,000 | $ 2,709 |
| BP Capital Markets America Inc. | ||
| 3.00% 02/24/50 | 18,000 | 12,211 |
| 3.38% 02/08/61 | 41,000 | 28,347 |
| BP Capital Markets PLC (4.38% fixed rate until 06/22/25; 4.04% + 5 year CMT Rate thereafter) | ||
| 4.38% 06/22/25 (d) | 36,000 | 34,290 |
| BP Capital Markets PLC (4.88% fixed rate until 03/22/30; 4.40% + 5 year CMT Rate thereafter) | ||
| 4.88% 12/31/99 (d) | 28,000 | 24,514 |
| Bristol-Myers Squibb Co. | ||
| 1.45% 11/13/30 | 150,000 | 118,303 |
| 2.35% 11/13/40 | 8,000 | 5,491 |
| 2.95% 03/15/32 | 25,000 | 21,810 |
| 3.20% 06/15/26 | 6,000 | 5,727 |
| 3.40% 07/26/29 | 4,000 | 3,714 |
| 3.55% 03/15/42 | 10,000 | 8,132 |
| 4.13% 06/15/39 | 10,000 | 8,915 |
| 4.25% 10/26/49 | 10,000 | 8,649 |
| 4.35% 11/15/47 | 3,000 | 2,651 |
| 4.55% 02/20/48 | 4,000 | 3,634 |
| Brixmor Operating Partnership LP | ||
| 2.25% 04/01/28 | 39,000 | 32,434 |
| 3.90% 03/15/27 | 8,000 | 7,377 |
| Broadcom Inc. | ||
| 3.19% 11/15/36 (h) | 3,000 | 2,165 |
| 3.42% 04/15/33 (h) | 14,000 | 11,238 |
| 3.47% 04/15/34 (h) | 22,000 | 17,443 |
| 4.15% 11/15/30 | 23,000 | 20,605 |
| 4.30% 11/15/32 | 10,000 | 8,828 |
| 4.93% 05/15/37 (h) | 29,000 | 25,347 |
| Brooklyn Union Gas Co. | ||
| 4.87% 08/05/32 (h) | 70,000 | 65,447 |
| Brown-Forman Corp. | ||
| 4.00% 04/15/38 | 3,000 | 2,630 |
| Brunswick Corp. | ||
| 2.40% 08/18/31 | 90,000 | 66,113 |
| Bunge Limited Finance Corp. | ||
| 3.75% 09/25/27 | 5,000 | 4,676 |
| Burlington Northern Santa Fe LLC | ||
| 4.15% 12/15/48 | 9,000 | 7,663 |
| 4.55% 09/01/44 | 16,000 | 14,525 |
| 36 | Elfun Diversified Fund |
| Principal Amount | Fair Value | |
| Cameron LNG LLC | ||
| 3.30% 01/15/35 (h) | $ 7,000 | $ 5,690 |
| Canadian Natural Resources Ltd. | ||
| 3.85% 06/01/27 | 11,000 | 10,382 |
| 4.95% 06/01/47 | 10,000 | 8,753 |
| Canadian Pacific Railway Co. | ||
| 1.75% 12/02/26 | 36,000 | 32,081 |
| 2.45% 12/02/31 | 31,000 | 25,803 |
| 3.00% 12/02/41 | 13,000 | 9,769 |
| 3.10% 12/02/51 | 13,000 | 8,859 |
| Capital One Financial Corp. | ||
| 3.75% 07/28/26 | 26,000 | 24,545 |
| Cardinal Health Inc. | ||
| 3.08% 06/15/24 | 8,000 | 7,768 |
| Carlisle Companies Inc. | ||
| 2.20% 03/01/32 | 47,000 | 35,732 |
| Carrier Global Corp. | ||
| 2.72% 02/15/30 | 78,000 | 65,734 |
| 3.58% 04/05/50 | 20,000 | 14,325 |
| Caterpillar Inc. | ||
| 3.25% 09/19/49 - 04/09/50 | 100,000 | 76,369 |
| Cenovus Energy Inc. | ||
| 2.65% 01/15/32 | 14,000 | 11,161 |
| 3.75% 02/15/52 | 17,000 | 11,989 |
| Centene Corp. | ||
| 3.00% 10/15/30 | 16,000 | 13,108 |
| 3.38% 02/15/30 | 68,000 | 57,552 |
| 4.25% 12/15/27 | 112,000 | 105,174 |
| CenterPoint Energy Inc. | ||
| 2.65% 06/01/31 | 28,000 | 23,075 |
| Charter Communications Operating LLC/Charter Communications Operating Capital | ||
| 3.50% 06/01/41 | 101,000 | 66,420 |
| 3.70% 04/01/51 | 76,000 | 46,265 |
| 4.80% 03/01/50 | 34,000 | 24,879 |
| 5.05% 03/30/29 | 25,000 | 23,507 |
| 5.75% 04/01/48 | 16,000 | 13,158 |
| Cheniere Corpus Christi Holdings LLC | ||
| 5.88% 03/31/25 | 91,000 | 91,515 |
| 7.00% 06/30/24 | 101,000 | 102,787 |
| Cheniere Energy Partners LP | ||
| 4.50% 10/01/29 | 72,000 | 64,801 |
| Chevron Corp. | ||
| 2.24% 05/11/30 | 7,000 | 5,993 |
| 3.08% 05/11/50 | 8,000 | 5,818 |
| Principal Amount | Fair Value | |
| Chevron USA Inc. | ||
| 3.85% 01/15/28 | $ 26,000 | $ 25,105 |
| 3.90% 11/15/24 | 11,000 | 10,815 |
| Choice Hotels International Inc. | ||
| 3.70% 01/15/31 | 14,000 | 11,910 |
| Chubb INA Holdings Inc. | ||
| 4.35% 11/03/45 | 8,000 | 6,943 |
| Church & Dwight Company Inc. | ||
| 2.30% 12/15/31 | 16,000 | 12,812 |
| Cigna Corp. | ||
| 2.40% 03/15/30 | 11,000 | 9,217 |
| 3.25% 04/15/25 | 11,000 | 10,595 |
| 3.40% 03/01/27 - 03/15/51 | 31,000 | 24,807 |
| 3.75% 07/15/23 | 6,000 | 5,956 |
| 3.88% 10/15/47 | 5,000 | 3,859 |
| 4.13% 11/15/25 | 21,000 | 20,535 |
| 4.38% 10/15/28 | 8,000 | 7,717 |
| 4.80% 08/15/38 | 8,000 | 7,455 |
| 4.90% 12/15/48 | 5,000 | 4,539 |
| Cintas Corp. No 2 | ||
| 4.00% 05/01/32 | 52,000 | 48,885 |
| Cisco Systems Inc. | ||
| 5.90% 02/15/39 | 8,000 | 8,636 |
| Citigroup Inc. | ||
| 4.45% 09/29/27 | 16,000 | 15,283 |
| 4.65% 07/23/48 (d) | 37,000 | 32,171 |
| Citigroup Inc. (2.56% fixed rate until 05/01/31; 1.17% + SOFR thereafter) | ||
| 2.56% 05/01/32 (d) | 191,000 | 150,817 |
| Citigroup Inc. (2.98% fixed rate until 11/05/29; 1.42% + SOFR thereafter) | ||
| 2.98% 11/05/30 (d) | 53,000 | 44,550 |
| Citigroup Inc. (3.79% fixed rate until 03/17/32; 1.94% + SOFR thereafter) | ||
| 3.79% 03/17/33 (d) | 150,000 | 128,647 |
| Citigroup Inc. (3.88% fixed rate until 01/24/38; 1.17% + 3 month USD LIBOR thereafter) | ||
| 3.88% 01/24/39 (d) | 10,000 | 8,276 |
| Citigroup Inc. (4.70% fixed rate until 01/30/25; 3.23% + SOFR thereafter) | ||
| 4.70% 12/31/99 (d) | 22,000 | 18,319 |
| CME Group Inc. | ||
| 2.65% 03/15/32 | 20,000 | 16,772 |
| Elfun Diversified Fund | 37 |
| Principal Amount | Fair Value | |
| 3.75% 06/15/28 | $ 9,000 | $ 8,676 |
| CMS Energy Corp. | ||
| 4.88% 03/01/44 | 15,000 | 13,649 |
| CNH Industrial Capital LLC | ||
| 1.95% 07/02/23 | 33,000 | 32,438 |
| Comcast Corp. | ||
| 2.65% 08/15/62 | 9,000 | 5,135 |
| 2.80% 01/15/51 | 9,000 | 5,735 |
| 2.89% 11/01/51 | 21,000 | 13,591 |
| 2.94% 11/01/56 | 19,000 | 11,917 |
| 2.99% 11/01/63 | 9,000 | 5,480 |
| 3.20% 07/15/36 | 10,000 | 8,108 |
| 3.25% 11/01/39 | 20,000 | 15,612 |
| 3.97% 11/01/47 | 33,000 | 26,475 |
| 4.15% 10/15/28 | 4,000 | 3,845 |
| CommonSpirit Health | ||
| 4.35% 11/01/42 | 24,000 | 20,174 |
| Conagra Brands Inc. | ||
| 5.30% 11/01/38 | 7,000 | 6,621 |
| 5.40% 11/01/48 | 7,000 | 6,505 |
| ConocoPhillips Co. | ||
| 4.30% 11/15/44 | 11,000 | 9,527 |
| Consolidated Edison Company of New York Inc. | ||
| 2.90% 12/01/26 | 18,000 | 16,498 |
| 3.35% 04/01/30 | 6,000 | 5,384 |
| 3.88% 06/15/47 | 8,000 | 6,188 |
| 3.95% 04/01/50 | 19,000 | 15,111 |
| Constellation Brands Inc. | ||
| 3.15% 08/01/29 | 34,000 | 29,794 |
| 3.70% 12/06/26 | 28,000 | 26,646 |
| 4.50% 05/09/47 | 9,000 | 7,584 |
| Continental Resources Inc. | ||
| 2.88% 04/01/32 (h) | 27,000 | 20,048 |
| 3.80% 06/01/24 | 146,000 | 141,959 |
| 4.50% 04/15/23 | 86,000 | 85,698 |
| Corebridge Financial Inc. | ||
| 3.90% 04/05/32 (h) | 120,000 | 105,108 |
| Corning Inc. | ||
| 4.38% 11/15/57 | 7,000 | 5,447 |
| Corporate Office Properties LP | ||
| 2.00% 01/15/29 | 33,000 | 25,404 |
| 2.25% 03/15/26 | 16,000 | 14,139 |
| 2.75% 04/15/31 | 13,000 | 9,732 |
| Crown Castle Inc. | ||
| 2.90% 03/15/27 | 60,000 | 54,617 |
| 3.30% 07/01/30 | 164,000 | 143,275 |
| 4.15% 07/01/50 | 26,000 | 20,016 |
| Principal Amount | Fair Value | |
| 5.20% 02/15/49 | $ 8,000 | $ 7,189 |
| CSL Finance PLC | ||
| 4.25% 04/27/32 (h) | 35,000 | 32,951 |
| CSX Corp. | ||
| 4.50% 03/15/49 - 08/01/54 | 26,000 | 22,351 |
| CubeSmart LP | ||
| 2.50% 02/15/32 | 36,000 | 27,568 |
| 4.38% 02/15/29 | 16,000 | 14,784 |
| Cummins Inc. | ||
| 1.50% 09/01/30 | 14,000 | 11,018 |
| 2.60% 09/01/50 | 14,000 | 8,736 |
| CVS Health Corp. | ||
| 3.00% 08/15/26 | 13,000 | 12,141 |
| 3.25% 08/15/29 | 11,000 | 9,841 |
| 3.63% 04/01/27 | 11,000 | 10,440 |
| 3.75% 04/01/30 | 10,000 | 9,075 |
| 3.88% 07/20/25 | 10,000 | 9,763 |
| 4.25% 04/01/50 | 9,000 | 7,226 |
| 4.30% 03/25/28 | 327,000 | 316,294 |
| 4.78% 03/25/38 | 15,000 | 13,744 |
| 5.00% 12/01/24 | 15,000 | 14,880 |
| 5.13% 07/20/45 | 6,000 | 5,467 |
| 5.30% 12/05/43 | 12,000 | 11,239 |
| Daimler Trucks Finance North America LLC | ||
| 2.00% 12/14/26 (h) | 150,000 | 131,790 |
| Danaher Corp. | ||
| 2.80% 12/10/51 | 48,000 | 31,935 |
| Dell International LLC/EMC Corp. | ||
| 4.00% 07/15/24 | 20,000 | 19,628 |
| 5.45% 06/15/23 | 3,000 | 3,000 |
| 6.02% 06/15/26 | 5,000 | 5,104 |
| Deutsche Bank AG (2.31% fixed rate until 11/16/26; 1.22% + SOFR thereafter) | ||
| 2.31% 11/16/27 (d) | 150,000 | 127,435 |
| Devon Energy Corp. | ||
| 5.00% 06/15/45 | 4,000 | 3,443 |
| DH Europe Finance II Sarl | ||
| 2.60% 11/15/29 | 11,000 | 9,624 |
| 3.25% 11/15/39 | 8,000 | 6,416 |
| 3.40% 11/15/49 | 5,000 | 3,775 |
| Diamondback Energy Inc. | ||
| 3.13% 03/24/31 | 19,000 | 15,748 |
| 3.25% 12/01/26 | 10,000 | 9,316 |
| 3.50% 12/01/29 | 10,000 | 8,773 |
| 4.40% 03/24/51 | 11,000 | 8,411 |
| Digital Realty Trust LP | ||
| 3.60% 07/01/29 | 24,000 | 21,454 |
| 38 | Elfun Diversified Fund |
| Principal Amount | Fair Value | |
| Discovery Communications LLC | ||
| 3.95% 03/20/28 | $ 23,000 | $ 20,411 |
| 4.95% 05/15/42 | 4,000 | 3,024 |
| 5.00% 09/20/37 | 6,000 | 4,837 |
| Dollar General Corp. | ||
| 3.50% 04/03/30 | 40,000 | 35,849 |
| 4.13% 04/03/50 | 10,000 | 8,012 |
| Dollar Tree Inc. | ||
| 4.00% 05/15/25 | 86,000 | 83,988 |
| Dominion Energy Inc. | ||
| 3.07% 08/15/24 (i) | 19,000 | 18,308 |
| 3.38% 04/01/30 | 19,000 | 16,740 |
| Dover Corp. | ||
| 2.95% 11/04/29 | 14,000 | 12,169 |
| Dow Chemical Co. | ||
| 6.30% 03/15/33 | 30,000 | 31,609 |
| DTE Energy Co. | ||
| 2.85% 10/01/26 | 24,000 | 22,116 |
| Duke Energy Carolinas LLC | ||
| 3.95% 03/15/48 | 8,000 | 6,443 |
| Duke Energy Corp. | ||
| 2.55% 06/15/31 | 28,000 | 22,850 |
| 3.30% 06/15/41 | 35,000 | 25,611 |
| 3.50% 06/15/51 | 70,000 | 49,139 |
| 3.75% 09/01/46 | 53,000 | 39,491 |
| Duke Energy Corp. (4.88% fixed rate until 09/16/24; 3.39% + 5 year CMT Rate thereafter) | ||
| 4.88% 12/31/99 (d) | 40,000 | 36,498 |
| Duke Energy Progress LLC | ||
| 4.15% 12/01/44 | 17,000 | 14,222 |
| DuPont de Nemours Inc. | ||
| 5.42% 11/15/48 | 7,000 | 6,683 |
| Duquesne Light Holdings Inc. | ||
| 3.62% 08/01/27 (h) | 16,000 | 14,251 |
| Eastman Chemical Co. | ||
| 4.65% 10/15/44 | 11,000 | 9,110 |
| Eaton Corp. | ||
| 3.10% 09/15/27 | 8,000 | 7,451 |
| Ecolab Inc. | ||
| 1.30% 01/30/31 | 14,000 | 10,681 |
| 5.25% 01/15/28 | 90,000 | 91,736 |
| Edison International | ||
| 4.95% 04/15/25 | 37,000 | 36,533 |
| 5.75% 06/15/27 | 7,000 | 7,023 |
| EI du Pont de Nemours & Co. | ||
| 2.30% 07/15/30 | 39,000 | 32,649 |
| Principal Amount | Fair Value | |
| Elevance Health Inc. | ||
| 2.88% 09/15/29 | $ 127,000 | $ 111,394 |
| 3.30% 01/15/23 | 13,000 | 12,993 |
| 3.60% 03/15/51 | 10,000 | 7,528 |
| 3.70% 09/15/49 | 9,000 | 6,875 |
| Emera US Finance LP | ||
| 2.64% 06/15/31 | 33,000 | 25,781 |
| Emerson Electric Co. | ||
| 1.80% 10/15/27 | 49,000 | 42,817 |
| 2.75% 10/15/50 | 59,000 | 38,284 |
| Empower Finance 2020 LP | ||
| 1.36% 09/17/27 (h) | 24,000 | 20,032 |
| 1.78% 03/17/31 (h) | 35,000 | 26,290 |
| Enbridge Energy Partners LP | ||
| 5.50% 09/15/40 | 4,000 | 3,744 |
| Enbridge Inc. | ||
| 1.60% 10/04/26 | 81,000 | 70,959 |
| Enbridge Inc. (5.75% fixed rate until 04/15/30; 5.31% + 5 year CMT Rate thereafter) | ||
| 5.75% 07/15/80 (d) | 52,000 | 47,001 |
| Energy Transfer LP | ||
| 4.25% 03/15/23 | 13,000 | 12,970 |
| 4.50% 04/15/24 | 23,000 | 22,681 |
| 4.95% 06/15/28 (d) | 9,000 | 8,693 |
| 5.30% 04/01/44 - 04/15/47 | 22,000 | 18,495 |
| 5.35% 05/15/45 | 21,000 | 17,898 |
| 5.75% 02/15/33 | 20,000 | 19,618 |
| 6.13% 12/15/45 | 5,000 | 4,637 |
| 6.50% 02/01/42 (d) | 9,000 | 8,892 |
| Energy Transfer LP (6.75% fixed rate until 05/15/25; 5.13% + 5 year CMT Rate thereafter) | ||
| 6.75% 12/31/99 (d) | 85,000 | 73,525 |
| Energy Transfer LP/Regency Energy Finance Corp. | ||
| 4.50% 11/01/23 | 11,000 | 10,905 |
| Enterprise Products Operating LLC | ||
| 4.25% 02/15/48 | 27,000 | 21,772 |
| Enterprise Products Operating LLC (5.25% fixed rate until 08/16/27; 3.03% + 3 month USD LIBOR thereafter) | ||
| 5.25% 08/16/77 (d) | 7,000 | 5,722 |
| EOG Resources Inc. | ||
| 4.15% 01/15/26 | 4,000 | 3,925 |
| 4.95% 04/15/50 | 8,000 | 7,652 |
| Elfun Diversified Fund | 39 |
| Principal Amount | Fair Value | |
| 5.10% 01/15/36 | $ 8,000 | $ 7,568 |
| Equinix Inc. | ||
| 1.25% 07/15/25 | 14,000 | 12,681 |
| 2.15% 07/15/30 | 19,000 | 15,150 |
| ERP Operating LP | ||
| 4.50% 07/01/44 | 9,000 | 7,650 |
| Everest Reinsurance Holdings Inc. | ||
| 3.13% 10/15/52 | 26,000 | 16,157 |
| Eversource Energy | ||
| 3.45% 01/15/50 | 14,000 | 10,239 |
| Exelon Corp. | ||
| 4.05% 04/15/30 | 20,000 | 18,627 |
| 4.45% 04/15/46 | 11,000 | 9,328 |
| 4.70% 04/15/50 | 11,000 | 9,662 |
| Extra Space Storage LP | ||
| 3.90% 04/01/29 | 15,000 | 13,465 |
| Exxon Mobil Corp. | ||
| 2.61% 10/15/30 | 61,000 | 53,255 |
| 3.45% 04/15/51 | 12,000 | 9,096 |
| FedEx Corp. | ||
| 4.10% 02/01/45 | 38,000 | 29,392 |
| Fidelity National Financial Inc. | ||
| 3.20% 09/17/51 | 23,000 | 13,437 |
| Fidelity National Information Services Inc. | ||
| 1.65% 03/01/28 | 18,000 | 14,967 |
| 3.10% 03/01/41 | 6,000 | 4,155 |
| FirstEnergy Transmission LLC | ||
| 4.55% 04/01/49 (h) | 23,000 | 18,723 |
| Fiserv Inc. | ||
| 3.50% 07/01/29 | 44,000 | 39,650 |
| 4.40% 07/01/49 | 6,000 | 4,880 |
| Florida Power & Light Co. | ||
| 2.85% 04/01/25 | 38,000 | 36,412 |
| 4.13% 02/01/42 | 11,000 | 9,527 |
| Flowers Foods Inc. | ||
| 2.40% 03/15/31 | 18,000 | 14,477 |
| Flowserve Corp. | ||
| 2.80% 01/15/32 | 24,000 | 17,934 |
| Ford Motor Co. | ||
| 4.35% 12/08/26 | 38,000 | 36,010 |
| Fox Corp. | ||
| 3.50% 04/08/30 | 30,000 | 26,530 |
| Freeport-McMoRan Inc. | ||
| 4.25% 03/01/30 | 31,000 | 28,288 |
| GA Global Funding Trust | ||
| 1.63% 01/15/26 (h) | 28,000 | 24,849 |
| Principal Amount | Fair Value | |
| General Mills Inc. | ||
| 3.00% 02/01/51 | $ 20,000 | $ 13,657 |
| General Motors Co. | ||
| 5.20% 04/01/45 | 3,000 | 2,453 |
| 5.40% 04/01/48 | 8,000 | 6,581 |
| 6.13% 10/01/25 | 70,000 | 71,362 |
| 6.80% 10/01/27 | 9,000 | 9,346 |
| General Motors Financial Company Inc. | ||
| 1.25% 01/08/26 | 138,000 | 121,657 |
| 2.35% 01/08/31 | 14,000 | 10,574 |
| 5.25% 03/01/26 | 37,000 | 36,437 |
| Genuine Parts Co. | ||
| 2.75% 02/01/32 | 19,000 | 15,287 |
| Georgia-Pacific LLC | ||
| 1.75% 09/30/25 (h) | 34,000 | 31,062 |
| 3.60% 03/01/25 (h) | 89,000 | 86,241 |
| Gilead Sciences Inc. | ||
| 2.60% 10/01/40 | 10,000 | 7,007 |
| 2.80% 10/01/50 | 15,000 | 9,707 |
| 2.95% 03/01/27 | 3,000 | 2,794 |
| 3.50% 02/01/25 | 10,000 | 9,687 |
| 3.65% 03/01/26 | 8,000 | 7,722 |
| 4.15% 03/01/47 | 9,000 | 7,451 |
| 4.75% 03/01/46 | 20,000 | 18,082 |
| GlaxoSmithKline Capital Inc. | ||
| 3.63% 05/15/25 | 17,000 | 16,608 |
| GlaxoSmithKline Capital PLC | ||
| 3.38% 06/01/29 | 14,000 | 12,917 |
| Glencore Funding LLC | ||
| 3.88% 04/27/51 (h) | 5,000 | 3,615 |
| Graphic Packaging International LLC | ||
| 1.51% 04/15/26 (h) | 33,000 | 28,820 |
| Gray Oak Pipeline LLC | ||
| 2.00% 09/15/23 (h) | 59,000 | 57,294 |
| 2.60% 10/15/25 (h) | 35,000 | 31,782 |
| Halliburton Co. | ||
| 3.80% 11/15/25 | 2,000 | 1,945 |
| 5.00% 11/15/45 | 8,000 | 7,093 |
| HCA Inc. | ||
| 3.13% 03/15/27 (h) | 50,000 | 45,482 |
| 3.50% 09/01/30 | 19,000 | 16,348 |
| 3.63% 03/15/32 (h) | 28,000 | 23,683 |
| 4.63% 03/15/52 (h) | 10,000 | 7,831 |
| 5.38% 02/01/25 | 133,000 | 132,856 |
| Health Care Service Corp. | ||
| 2.20% 06/01/30 (h) | 18,000 | 14,410 |
| 3.20% 06/01/50 (h) | 7,000 | 4,865 |
| 40 | Elfun Diversified Fund |
| Principal Amount | Fair Value | |
| Healthcare Realty Holdings LP | ||
| 2.00% 03/15/31 | $ 10,000 | $ 7,562 |
| Helmerich & Payne Inc. | ||
| 2.90% 09/29/31 | 14,000 | 11,335 |
| Hess Corp. | ||
| 5.60% 02/15/41 | 3,000 | 2,841 |
| 5.80% 04/01/47 | 2,000 | 1,916 |
| Hewlett Packard Enterprise Co. | ||
| 6.35% 10/15/45 | 3,000 | 2,999 |
| Highwoods Realty LP | ||
| 4.13% 03/15/28 (d) | 9,000 | 8,104 |
| 4.20% 04/15/29 | 23,000 | 19,902 |
| Honeywell International Inc. | ||
| 1.75% 09/01/31 | 21,000 | 16,637 |
| 2.70% 08/15/29 | 14,000 | 12,440 |
| Hormel Foods Corp. | ||
| 1.80% 06/11/30 | 36,000 | 29,354 |
| HSBC Holdings PLC (2.87% fixed rate until 11/22/31; 1.41% + SOFR thereafter) | ||
| 2.87% 11/22/32 (d) | 200,000 | 153,154 |
| Humana Inc. | ||
| 1.35% 02/03/27 | 47,000 | 40,587 |
| 2.15% 02/03/32 | 17,000 | 13,297 |
| Huntington Bancshares Inc. | ||
| 2.55% 02/04/30 | 24,000 | 19,741 |
| Huntington Ingalls Industries Inc. | ||
| 2.04% 08/16/28 | 51,000 | 42,048 |
| Huntsman International LLC | ||
| 4.50% 05/01/29 | 35,000 | 31,450 |
| Hyundai Capital America | ||
| 1.30% 01/08/26 (h) | 70,000 | 61,289 |
| Indiana Michigan Power Co. | ||
| 3.25% 05/01/51 | 15,000 | 10,263 |
| Intel Corp. | ||
| 2.00% 08/12/31 | 314,000 | 249,024 |
| 2.45% 11/15/29 | 29,000 | 24,875 |
| 2.60% 05/19/26 | 23,000 | 21,468 |
| 2.80% 08/12/41 | 27,000 | 18,817 |
| 2.88% 05/11/24 | 10,000 | 9,738 |
| 3.10% 02/15/60 | 10,000 | 6,237 |
| Intercontinental Exchange Inc. | ||
| 1.85% 09/15/32 | 8,000 | 6,019 |
| 2.65% 09/15/40 | 8,000 | 5,566 |
| International Business Machines Corp. | ||
| 2.95% 05/15/50 | 100,000 | 65,262 |
| Principal Amount | Fair Value | |
| International Paper Co. | ||
| 4.40% 08/15/47 | $ 9,000 | $ 7,409 |
| ITC Holdings Corp. | ||
| 2.95% 05/14/30 (h) | 40,000 | 33,828 |
| Jabil Inc. | ||
| 3.95% 01/12/28 | 9,000 | 8,383 |
| 4.25% 05/15/27 | 70,000 | 66,245 |
| John Deere Capital Corp. | ||
| 2.45% 01/09/30 | 156,000 | 134,491 |
| 3.90% 06/07/32 (d) | 15,000 | 13,990 |
| Johnson & Johnson | ||
| 3.63% 03/03/37 (d) | 9,000 | 8,010 |
| Johnson Controls International PLC | ||
| 4.50% 02/15/47 (d) | 4,000 | 3,315 |
| JPMorgan Chase & Co. (1.58% fixed rate until 04/22/26; 0.89% + SOFR thereafter) | ||
| 1.58% 04/22/27 (d) | 213,000 | 187,472 |
| JPMorgan Chase & Co. (2.96% fixed rate until 05/13/30; 2.52% + SOFR thereafter) | ||
| 2.96% 05/13/31 (d) | 69,000 | 56,810 |
| JPMorgan Chase & Co. (3.16% fixed rate until 04/22/41; 1.46% + SOFR thereafter) | ||
| 3.16% 04/22/42 (d) | 21,000 | 15,267 |
| JPMorgan Chase & Co. (3.88% fixed rate until 07/24/37; 1.36% + 3 month USD LIBOR thereafter) | ||
| 3.88% 07/24/38 (d) | 14,000 | 11,626 |
| JPMorgan Chase & Co. (3.90% fixed rate until 01/23/48; 1.22% + 3 month USD LIBOR thereafter) | ||
| 3.90% 01/23/49 (d) | 53,000 | 40,845 |
| JPMorgan Chase & Co. (3.96% fixed rate until 01/29/26; 1.25% + 3 month USD LIBOR thereafter) | ||
| 3.96% 01/29/27 (d) | 28,000 | 26,729 |
| JPMorgan Chase & Co. (4.01% fixed rate until 04/23/28; 1.12% + 3 month USD LIBOR thereafter) | ||
| 4.01% 04/23/29 (d) | 11,000 | 10,190 |
| Elfun Diversified Fund | 41 |
| Principal Amount | Fair Value | |
| JPMorgan Chase & Co. (4.03% fixed rate until 07/24/47; 1.46% + 3 month USD LIBOR thereafter) | ||
| 4.03% 07/24/48 (d) | $ 9,000 | $ 7,144 |
| JPMorgan Chase & Co. (4.49% fixed rate until 03/24/30; 3.79% + SOFR thereafter) | ||
| 4.49% 03/24/31 (d) | 75,000 | 70,138 |
| JPMorgan Chase & Co. (4.60% fixed rate until 02/01/25; 3.13% + SOFR thereafter) | ||
| 4.60% 12/31/99 (d) | 48,000 | 42,621 |
| Kaiser Foundation Hospitals | ||
| 3.00% 06/01/51 | 22,000 | 14,961 |
| Kansas City Southern/old | ||
| 3.50% 05/01/50 | 11,000 | 7,851 |
| Keurig Dr Pepper Inc. | ||
| 3.20% 05/01/30 | 13,000 | 11,313 |
| 3.80% 05/01/50 | 9,000 | 6,767 |
| Kinder Morgan Energy Partners LP | ||
| 4.70% 11/01/42 | 3,000 | 2,485 |
| 5.00% 03/01/43 | 8,000 | 6,849 |
| 6.38% 03/01/41 | 8,000 | 7,947 |
| Kinder Morgan Inc. | ||
| 1.75% 11/15/26 | 95,000 | 83,824 |
| 5.05% 02/15/46 | 8,000 | 6,819 |
| KLA Corp. | ||
| 3.30% 03/01/50 | 20,000 | 14,500 |
| 4.65% 11/01/24 | 5,000 | 4,991 |
| Kraft Heinz Foods Co. | ||
| 5.20% 07/15/45 | 26,000 | 23,958 |
| L3Harris Technologies Inc. | ||
| 3.85% 12/15/26 | 23,000 | 21,976 |
| Lear Corp. | ||
| 4.25% 05/15/29 | 8,000 | 7,204 |
| Leidos Inc. | ||
| 3.63% 05/15/25 | 9,000 | 8,650 |
| 4.38% 05/15/30 | 66,000 | 59,587 |
| Liberty Mutual Group Inc. | ||
| 3.95% 05/15/60 (h) | 8,000 | 5,261 |
| Life Storage LP | ||
| 2.20% 10/15/30 | 19,000 | 14,742 |
| Lincoln National Corp. | ||
| 4.35% 03/01/48 | 52,000 | 39,019 |
| Principal Amount | Fair Value | |
| Lincoln National Corp. (9.25% fixed rate until 12/01/27; 5.32% + 5 year CMT Rate thereafter) | ||
| 9.25% 12/31/99 | $ 40,000 | $ 42,303 |
| Lockheed Martin Corp. | ||
| 3.55% 01/15/26 | 4,000 | 3,885 |
| 3.80% 03/01/45 | 4,000 | 3,278 |
| 4.50% 05/15/36 | 10,000 | 9,527 |
| Lowe's Companies Inc. | ||
| 1.30% 04/15/28 | 9,000 | 7,474 |
| 1.70% 09/15/28 - 10/15/30 | 185,000 | 146,156 |
| 3.00% 10/15/50 | 9,000 | 5,771 |
| 3.70% 04/15/46 | 3,000 | 2,230 |
| 4.05% 05/03/47 | 13,000 | 10,207 |
| 5.63% 04/15/53 | 29,000 | 27,950 |
| LYB International Finance III LLC | ||
| 3.63% 04/01/51 | 20,000 | 13,405 |
| 3.80% 10/01/60 | 8,000 | 5,203 |
| Marsh & McLennan Companies Inc. | ||
| 2.90% 12/15/51 | 41,000 | 26,391 |
| Masco Corp. | ||
| 3.50% 11/15/27 | 3,000 | 2,775 |
| McCormick & Company Inc. | ||
| 1.85% 02/15/31 | 11,000 | 8,511 |
| 3.25% 11/15/25 | 130,000 | 123,254 |
| McDonald's Corp. | ||
| 3.60% 07/01/30 | 27,000 | 24,772 |
| 3.63% 09/01/49 | 9,000 | 6,850 |
| 4.88% 12/09/45 | 8,000 | 7,416 |
| Medtronic Inc. | ||
| 4.63% 03/15/45 | 4,000 | 3,719 |
| Memorial Sloan-Kettering Cancer Center | ||
| 4.13% 07/01/52 | 18,000 | 14,887 |
| Mercedes-Benz Finance North America LLC | ||
| 5.38% 11/26/25 | 150,000 | 150,916 |
| Merck & Company Inc. | ||
| 1.90% 12/10/28 | 46,000 | 39,589 |
| 2.45% 06/24/50 | 11,000 | 7,035 |
| 2.75% 02/10/25 - 12/10/51 | 48,000 | 41,445 |
| 2.90% 12/10/61 | 10,000 | 6,445 |
| 4.00% 03/07/49 | 4,000 | 3,428 |
| Meta Platforms Inc. | ||
| 3.85% 08/15/32 | 60,000 | 52,796 |
| 4.45% 08/15/52 | 60,000 | 47,679 |
| 42 | Elfun Diversified Fund |
| Principal Amount | Fair Value | |
| MetLife Inc. | ||
| 4.72% 12/15/44 | $ 11,000 | $ 9,963 |
| Microchip Technology Inc. | ||
| 2.67% 09/01/23 | 99,000 | 97,042 |
| Micron Technology Inc. | ||
| 3.37% 11/01/41 | 22,000 | 14,709 |
| 3.48% 11/01/51 | 42,000 | 26,163 |
| Microsoft Corp. | ||
| 2.40% 08/08/26 | 26,000 | 24,254 |
| 2.68% 06/01/60 | 14,000 | 9,048 |
| 2.92% 03/17/52 | 50,000 | 35,624 |
| 3.45% 08/08/36 | 4,000 | 3,550 |
| 3.50% 02/12/35 | 10,000 | 9,060 |
| Mid-America Apartments LP | ||
| 2.88% 09/15/51 | 27,000 | 17,318 |
| Molson Coors Beverage Co. | ||
| 4.20% 07/15/46 | 5,000 | 3,897 |
| Morgan Stanley | ||
| 3.63% 01/20/27 | 4,000 | 3,776 |
| 3.70% 10/23/24 | 11,000 | 10,745 |
| 4.35% 09/08/26 | 86,000 | 83,590 |
| 4.38% 01/22/47 (d) | 11,000 | 9,378 |
| Morgan Stanley (1.51% fixed rate until 07/20/26; 0.86% + SOFR thereafter) | ||
| 1.51% 07/20/27 (d) | 328,000 | 284,852 |
| Morgan Stanley (2.48% fixed rate until 09/16/31; 1.36% + SOFR thereafter) | ||
| 2.48% 09/16/36 (d) | 148,000 | 107,956 |
| Morgan Stanley (2.80% fixed rate until 01/25/51; 1.43% + SOFR thereafter) | ||
| 2.80% 01/25/52 (d) | 62,000 | 38,503 |
| Morgan Stanley (3.97% fixed rate until 07/22/37; 1.46% + 3 month USD LIBOR thereafter) | ||
| 3.97% 07/22/38 (d) | 11,000 | 9,236 |
| MPLX LP | ||
| 2.65% 08/15/30 | 16,000 | 12,981 |
| 5.20% 12/01/47 | 8,000 | 6,818 |
| Mylan Inc. | ||
| 5.20% 04/15/48 (d) | 7,000 | 5,241 |
| National Retail Properties Inc. | ||
| 4.00% 11/15/25 | 11,000 | 10,598 |
| NewMarket Corp. | ||
| 2.70% 03/18/31 | 14,000 | 11,041 |
| Newmont Corp. | ||
| 4.88% 03/15/42 | 9,000 | 8,288 |
| Principal Amount | Fair Value | |
| NextEra Energy Capital Holdings Inc. (5.65% fixed rate until 05/01/29; 3.16% + 3 month USD LIBOR thereafter) | ||
| 5.65% 05/01/79 (d) | $ 10,000 | $ 9,117 |
| NGPL PipeCo LLC | ||
| 3.25% 07/15/31 (h) | 39,000 | 31,773 |
| NIKE Inc. | ||
| 3.38% 03/27/50 | 9,000 | 7,052 |
| NiSource Inc. | ||
| 3.60% 05/01/30 | 14,000 | 12,482 |
| 3.95% 03/30/48 | 4,000 | 3,124 |
| Norfolk Southern Corp. | ||
| 3.95% 10/01/42 | 9,000 | 7,412 |
| Northern Trust Corp. | ||
| 6.13% 11/02/32 | 40,000 | 42,285 |
| NOV Inc. | ||
| 3.60% 12/01/29 | 20,000 | 17,591 |
| Novant Health Inc. | ||
| 3.32% 11/01/61 | 15,000 | 10,037 |
| Novartis Capital Corp. | ||
| 2.20% 08/14/30 | 23,000 | 19,549 |
| 3.00% 11/20/25 | 4,000 | 3,836 |
| Nutrien Ltd. | ||
| 4.90% 06/01/43 | 8,000 | 7,059 |
| NVIDIA Corp. | ||
| 2.85% 04/01/30 | 16,000 | 13,976 |
| 3.50% 04/01/50 | 9,000 | 6,811 |
| NXP BV/NXP Funding LLC/NXP USA Inc. | ||
| 3.25% 11/30/51 | 35,000 | 21,853 |
| Oklahoma Gas & Electric Co. | ||
| 3.25% 04/01/30 | 10,000 | 8,689 |
| Oncor Electric Delivery Company LLC | ||
| 3.80% 09/30/47 | 6,000 | 4,883 |
| ONEOK Inc. | ||
| 4.35% 03/15/29 | 11,000 | 10,200 |
| 6.10% 11/15/32 | 30,000 | 30,109 |
| Oracle Corp. | ||
| 1.65% 03/25/26 | 47,000 | 42,120 |
| 2.30% 03/25/28 | 10,000 | 8,672 |
| 2.40% 09/15/23 | 10,000 | 9,797 |
| 2.65% 07/15/26 | 11,000 | 10,115 |
| 2.88% 03/25/31 | 117,000 | 97,067 |
| 2.95% 04/01/30 | 30,000 | 25,608 |
| 3.60% 04/01/50 | 11,000 | 7,504 |
| 3.65% 03/25/41 | 15,000 | 11,090 |
| 3.80% 11/15/37 | 4,000 | 3,156 |
| Elfun Diversified Fund | 43 |
| Principal Amount | Fair Value | |
| 3.95% 03/25/51 | $ 8,000 | $ 5,764 |
| 4.00% 07/15/46 - 11/15/47 | 19,000 | 13,951 |
| 4.10% 03/25/61 | 19,000 | 13,267 |
| 6.15% 11/09/29 | 65,000 | 67,575 |
| 6.90% 11/09/52 | 15,000 | 16,232 |
| Otis Worldwide Corp. | ||
| 2.06% 04/05/25 | 72,000 | 67,419 |
| 2.57% 02/15/30 | 32,000 | 26,903 |
| 3.36% 02/15/50 | 59,000 | 41,364 |
| Owens Corning | ||
| 4.40% 01/30/48 | 6,000 | 4,675 |
| Pacific Gas & Electric Co. | ||
| 2.10% 08/01/27 | 10,000 | 8,562 |
| 2.50% 02/01/31 | 23,000 | 17,882 |
| 3.00% 06/15/28 | 19,000 | 16,470 |
| 3.30% 08/01/40 | 23,000 | 15,598 |
| 3.50% 08/01/50 | 9,000 | 5,665 |
| 4.30% 03/15/45 | 19,000 | 13,592 |
| PacifiCorp | ||
| 2.70% 09/15/30 | 15,000 | 12,889 |
| 2.90% 06/15/52 | 93,000 | 61,209 |
| 6.25% 10/15/37 | 14,000 | 14,878 |
| Packaging Corp. of America | ||
| 3.05% 10/01/51 | 28,000 | 17,980 |
| Paramount Global | ||
| 2.90% 01/15/27 | 7,000 | 6,284 |
| 3.70% 06/01/28 | 8,000 | 7,137 |
| 5.25% 04/01/44 | 3,000 | 2,312 |
| Parker-Hannifin Corp. | ||
| 3.25% 06/14/29 | 10,000 | 8,939 |
| 4.50% 09/15/29 | 63,000 | 60,586 |
| PartnerRe Finance B LLC (4.50% fixed rate until 04/01/30; 3.82% + 5 year CMT Rate thereafter) | ||
| 4.50% 10/01/50 (d) | 25,000 | 21,391 |
| PayPal Holdings Inc. | ||
| 2.65% 10/01/26 | 16,000 | 14,779 |
| 3.25% 06/01/50 | 9,000 | 6,189 |
| PepsiCo Inc. | ||
| 1.63% 05/01/30 | 10,000 | 8,160 |
| 2.63% 07/29/29 | 16,000 | 14,130 |
| 2.75% 10/21/51 | 42,000 | 29,319 |
| Pfizer Inc. | ||
| 2.70% 05/28/50 | 39,000 | 26,549 |
| 3.45% 03/15/29 | 7,000 | 6,595 |
| 3.60% 09/15/28 | 15,000 | 14,375 |
| 3.90% 03/15/39 | 9,000 | 7,941 |
| 4.13% 12/15/46 | 7,000 | 6,191 |
| Principal Amount | Fair Value | |
| 4.40% 05/15/44 | $ 4,000 | $ 3,715 |
| Philip Morris International Inc. | ||
| 1.50% 05/01/25 | 102,000 | 94,354 |
| 2.10% 05/01/30 | 8,000 | 6,477 |
| 3.38% 08/15/29 | 9,000 | 8,112 |
| 4.13% 03/04/43 | 4,000 | 3,163 |
| 5.63% 11/17/29 | 150,000 | 152,767 |
| Phillips 66 Co. | ||
| 2.15% 12/15/30 | 74,000 | 59,180 |
| 3.15% 12/15/29 (h) | 49,000 | 42,739 |
| 3.30% 03/15/52 | 29,000 | 20,119 |
| 3.75% 03/01/28 (h) | 9,000 | 8,302 |
| 4.68% 02/15/45 (h) | 9,000 | 7,827 |
| Pioneer Natural Resources Co. | ||
| 1.13% 01/15/26 | 57,000 | 50,795 |
| 2.15% 01/15/31 | 14,000 | 11,104 |
| Plains All American Pipeline LP/PAA Finance Corp. | ||
| 3.55% 12/15/29 | 19,000 | 16,513 |
| PPL Capital Funding Inc. | ||
| 3.10% 05/15/26 | 15,000 | 14,037 |
| Precision Castparts Corp. | ||
| 4.38% 06/15/45 | 7,000 | 6,123 |
| Prologis LP | ||
| 3.05% 03/01/50 | 6,000 | 4,047 |
| 3.25% 06/30/26 | 8,000 | 7,598 |
| Prospect Capital Corp. | ||
| 3.36% 11/15/26 | 36,000 | 30,027 |
| Prudential Financial Inc. | ||
| 3.94% 12/07/49 | 18,000 | 14,130 |
| Prudential Financial Inc. (5.70% fixed rate until 09/15/28; 2.67% + 3 month USD LIBOR thereafter) | ||
| 5.70% 09/15/48 (d) | 14,000 | 13,412 |
| Public Service Company of Colorado | ||
| 3.70% 06/15/28 | 15,000 | 14,288 |
| Public Service Electric & Gas Co. | ||
| 2.38% 05/15/23 | 39,000 | 38,635 |
| PVH Corp. | ||
| 4.63% 07/10/25 | 43,000 | 41,524 |
| QUALCOMM Inc. | ||
| 1.30% 05/20/28 | 5,000 | 4,234 |
| 4.30% 05/20/47 | 3,000 | 2,602 |
| Quanta Services Inc. | ||
| 2.35% 01/15/32 | 27,000 | 20,522 |
| 44 | Elfun Diversified Fund |
| Principal Amount | Fair Value | |
| 3.05% 10/01/41 | $ 32,000 | $ 20,961 |
| Quest Diagnostics Inc. | ||
| 2.95% 06/30/30 | 6,000 | 5,187 |
| Raytheon Technologies Corp. | ||
| 1.90% 09/01/31 | 82,000 | 64,301 |
| 2.82% 09/01/51 | 59,000 | 38,480 |
| 3.13% 05/04/27 | 49,000 | 45,664 |
| 3.50% 03/15/27 | 9,000 | 8,575 |
| 3.95% 08/16/25 | 10,000 | 9,775 |
| 4.15% 05/15/45 | 9,000 | 7,504 |
| 4.45% 11/16/38 | 8,000 | 7,272 |
| Realty Income Corp. | ||
| 2.85% 12/15/32 | 14,000 | 11,372 |
| 3.00% 01/15/27 | 5,000 | 4,630 |
| 3.25% 01/15/31 | 10,000 | 8,672 |
| Regeneron Pharmaceuticals Inc. | ||
| 1.75% 09/15/30 | 28,000 | 21,678 |
| Regions Financial Corp. | ||
| 1.80% 08/12/28 | 71,000 | 60,236 |
| Republic Services Inc. | ||
| 2.38% 03/15/33 | 50,000 | 39,790 |
| Reynolds American Inc. | ||
| 4.45% 06/12/25 | 5,000 | 4,893 |
| Rio Tinto Finance USA Ltd. | ||
| 2.75% 11/02/51 | 12,000 | 7,962 |
| Rio Tinto Finance USA PLC | ||
| 4.13% 08/21/42 | 7,000 | 6,041 |
| Rockwell Automation Inc. | ||
| 2.80% 08/15/61 | 18,000 | 10,790 |
| 4.20% 03/01/49 | 9,000 | 7,727 |
| Rogers Communications Inc. | ||
| 5.00% 03/15/44 | 3,000 | 2,555 |
| Roper Technologies Inc. | ||
| 2.95% 09/15/29 | 12,000 | 10,407 |
| Ross Stores Inc. | ||
| 4.70% 04/15/27 | 6,000 | 5,904 |
| Royalty Pharma PLC | ||
| 0.75% 09/02/23 | 15,000 | 14,536 |
| 1.20% 09/02/25 | 18,000 | 16,115 |
| 1.75% 09/02/27 | 9,000 | 7,645 |
| 2.15% 09/02/31 | 17,000 | 12,839 |
| 2.20% 09/02/30 | 8,000 | 6,251 |
| 3.30% 09/02/40 | 2,000 | 1,399 |
| RPM International Inc. | ||
| 3.75% 03/15/27 | 8,000 | 7,458 |
| Ryder System Inc. | ||
| 2.90% 12/01/26 | 50,000 | 45,525 |
| Principal Amount | Fair Value | |
| Salesforce Inc. | ||
| 1.95% 07/15/31 | $ 33,000 | $ 26,422 |
| 2.70% 07/15/41 | 28,000 | 20,008 |
| Schlumberger Holdings Corp. | ||
| 3.90% 05/17/28 (h) | 17,000 | 15,879 |
| Sealed Air Corp. | ||
| 1.57% 10/15/26 (h) | 114,000 | 98,438 |
| Selective Insurance Group Inc. | ||
| 5.38% 03/01/49 | 4,000 | 3,410 |
| Sempra Energy | ||
| 3.80% 02/01/38 | 6,000 | 4,919 |
| 4.00% 02/01/48 | 8,000 | 6,290 |
| Sempra Energy (4.13% fixed rate until 01/01/27; 2.87% + 5 year CMT Rate thereafter) | ||
| 4.13% 04/01/52 (d) | 47,000 | 37,010 |
| Shell International Finance BV | ||
| 3.13% 11/07/49 | 18,000 | 12,722 |
| 3.75% 09/12/46 | 8,000 | 6,339 |
| Shire Acquisitions Investments Ireland DAC | ||
| 2.88% 09/23/23 | 3,000 | 2,948 |
| 3.20% 09/23/26 | 4,000 | 3,760 |
| Simon Property Group LP | ||
| 3.38% 06/15/27 | 9,000 | 8,400 |
| Sonoco Products Co. | ||
| 2.85% 02/01/32 | 31,000 | 25,169 |
| Southern California Edison Co. | ||
| 4.00% 04/01/47 | 30,000 | 23,555 |
| 4.20% 03/01/29 | 23,000 | 21,880 |
| Southern Company Gas Capital Corp. | ||
| 3.95% 10/01/46 | 11,000 | 8,280 |
| 4.40% 05/30/47 | 2,000 | 1,597 |
| Southwest Airlines Co. | ||
| 2.63% 02/10/30 | 30,000 | 24,827 |
| Southwestern Electric Power Co. | ||
| 2.75% 10/01/26 | 9,000 | 8,252 |
| Spectra Energy Partners LP | ||
| 3.38% 10/15/26 | 3,000 | 2,800 |
| 4.50% 03/15/45 | 2,000 | 1,645 |
| Stanley Black & Decker Inc. | ||
| 3.00% 05/15/32 | 40,000 | 33,767 |
| Starbucks Corp. | ||
| 4.00% 11/15/28 | 8,000 | 7,623 |
| Stryker Corp. | ||
| 1.95% 06/15/30 | 34,000 | 27,667 |
| Elfun Diversified Fund | 45 |
| Principal Amount | Fair Value | |
| Suncor Energy Inc. | ||
| 4.00% 11/15/47 | $ 3,000 | $ 2,281 |
| Sysco Corp. | ||
| 3.25% 07/15/27 | 9,000 | 8,329 |
| 5.95% 04/01/30 | 4,000 | 4,148 |
| 6.60% 04/01/50 | 3,000 | 3,268 |
| Take-Two Interactive Software Inc. | ||
| 3.70% 04/14/27 | 75,000 | 70,599 |
| 4.00% 04/14/32 | 15,000 | 13,269 |
| Tampa Electric Co. | ||
| 2.40% 03/15/31 | 34,000 | 27,537 |
| 3.45% 03/15/51 | 19,000 | 13,358 |
| 4.35% 05/15/44 | 20,000 | 16,424 |
| Tapestry Inc. | ||
| 4.13% 07/15/27 | 3,000 | 2,807 |
| Targa Resources Partners LP/Targa Resources Partners Finance Corp. | ||
| 5.00% 01/15/28 | 85,000 | 81,185 |
| Target Corp. | ||
| 2.50% 04/15/26 | 9,000 | 8,431 |
| Teck Resources Ltd. | ||
| 5.40% 02/01/43 (d) | 4,000 | 3,590 |
| Telefonica Emisiones S.A. | ||
| 4.10% 03/08/27 (d) | 150,000 | 142,171 |
| Texas Instruments Inc. | ||
| 3.88% 03/15/39 (d) | 9,000 | 7,941 |
| The Allstate Corp. | ||
| 4.20% 12/15/46 | 25,000 | 20,690 |
| The Allstate Corp. (5.75% fixed rate until 08/15/23; 2.94% + 3 month USD LIBOR thereafter) | ||
| 5.75% 08/15/53 (d) | 33,000 | 31,079 |
| The Bank of New York Mellon Corp. (4.63% fixed rate until 09/20/26; 3.13% + 3 month USD LIBOR thereafter) | ||
| 4.63% 12/31/99 (d) | 57,000 | 48,612 |
| The Bank of Nova Scotia (6.57% fixed rate until 04/12/23; 2.65% + 3 month USD LIBOR thereafter) | ||
| 6.57% 12/31/99 (d) | 35,000 | 32,577 |
| The Boeing Co. | ||
| 2.20% 02/04/26 | 73,000 | 66,351 |
| 2.70% 02/01/27 | 208,000 | 187,822 |
| 2.95% 02/01/30 | 7,000 | 5,925 |
| 3.25% 03/01/28 | 8,000 | 7,161 |
| Principal Amount | Fair Value | |
| 3.55% 03/01/38 | $ 6,000 | $ 4,420 |
| 3.75% 02/01/50 (d) | 42,000 | 28,951 |
| 5.04% 05/01/27 | 52,000 | 51,457 |
| 5.15% 05/01/30 | 18,000 | 17,555 |
| 5.81% 05/01/50 | 14,000 | 13,026 |
| The Charles Schwab Corp. | ||
| 2.45% 03/03/27 | 45,000 | 41,129 |
| 2.90% 03/03/32 | 15,000 | 12,746 |
| The Charles Schwab Corp. (4.00% fixed rate until 12/01/30; 3.08% + 10 year CMT Rate thereafter) | ||
| 4.00% 12/31/99 (d) | 49,000 | 38,960 |
| The Cleveland Electric Illuminating Co. | ||
| 4.55% 11/15/30 (h) | 39,000 | 36,517 |
| The Coca-Cola Co. | ||
| 2.60% 06/01/50 | 14,000 | 9,410 |
| 2.75% 06/01/60 | 7,000 | 4,711 |
| The Dow Chemical Co. | ||
| 2.10% 11/15/30 | 25,000 | 20,101 |
| 3.60% 11/15/50 | 9,000 | 6,488 |
| 4.25% 10/01/34 | 8,000 | 7,190 |
| 5.55% 11/30/48 | 54,000 | 50,618 |
| The Estee Lauder Companies Inc. | ||
| 2.38% 12/01/29 (d) | 9,000 | 7,727 |
| The George Washington University | ||
| 4.13% 09/15/48 (d) | 15,000 | 12,550 |
| The Goldman Sachs Group Inc. | ||
| 3.85% 01/26/27 (d) | 399,000 | 379,904 |
| 4.25% 10/21/25 | 137,000 | 134,005 |
| 5.15% 05/22/45 (d) | 10,000 | 9,044 |
| The Goldman Sachs Group Inc. (1.54% fixed rate until 09/10/26; 0.82% + SOFR thereafter) | ||
| 1.54% 09/10/27 (d) | 31,000 | 26,781 |
| The Goldman Sachs Group Inc. (2.38% fixed rate until 07/21/31; 1.25% + SOFR thereafter) | ||
| 2.38% 07/21/32 (d) | 19,000 | 14,729 |
| The Goldman Sachs Group Inc. (2.91% fixed rate until 07/21/41; 1.47% + SOFR thereafter) | ||
| 2.91% 07/21/42 (d) | 15,000 | 10,227 |
| 46 | Elfun Diversified Fund |
| Principal Amount | Fair Value | |
| The Goldman Sachs Group Inc. (3.21% fixed rate until 04/22/41; 1.51% + SOFR thereafter) | ||
| 3.21% 04/22/42 (d) | $ 22,000 | $ 15,835 |
| The Goldman Sachs Group Inc. (3.44% fixed rate until 02/24/42; 1.63% + SOFR thereafter) | ||
| 3.44% 02/24/43 (d) | 37,000 | 27,265 |
| The Goldman Sachs Group Inc. (3.81% fixed rate until 04/23/28; 1.16% + 3 month USD LIBOR thereafter) | ||
| 3.81% 04/23/29 (d) | 11,000 | 10,008 |
| The Goldman Sachs Group Inc. (4.02% fixed rate until 10/31/37; 1.37% + 3 month USD LIBOR thereafter) | ||
| 4.02% 10/31/38 (d) | 8,000 | 6,561 |
| The Goldman Sachs Group Inc. (4.22% fixed rate until 05/01/28; 1.30% + 3 month USD LIBOR thereafter) | ||
| 4.22% 05/01/29 (d) | 22,000 | 20,491 |
| The Hartford Financial Services Group Inc. | ||
| 2.80% 08/19/29 | 74,000 | 63,291 |
| The Hartford Financial Services Group Inc. 2.13% + 3 month USD LIBOR | ||
| 6.73% 02/12/67 (d)(h) | 16,000 | 13,371 |
| The Home Depot Inc. | ||
| 2.70% 04/15/30 | 110,000 | 96,038 |
| 3.35% 04/15/50 | 13,000 | 9,687 |
| 3.50% 09/15/56 | 8,000 | 5,987 |
| 3.90% 12/06/28 - 06/15/47 | 16,000 | 14,457 |
| 4.50% 12/06/48 | 7,000 | 6,410 |
| 4.95% 09/15/52 | 10,000 | 9,662 |
| The Kroger Co. | ||
| 2.20% 05/01/30 | 10,000 | 8,092 |
| 4.65% 01/15/48 | 5,000 | 4,317 |
| The Northwestern Mutual Life Insurance Co. | ||
| 3.45% 03/30/51 (h) | 34,000 | 23,909 |
| The Progressive Corp. | ||
| 3.00% 03/15/32 | 57,000 | 49,505 |
| 3.70% 03/15/52 (d) | 15,000 | 11,540 |
| Principal Amount | Fair Value | |
| The Southern Co. | ||
| 3.25% 07/01/26 | $ 5,000 | $ 4,710 |
| 3.70% 04/30/30 | 42,000 | 37,942 |
| The Toronto-Dominion Bank | ||
| 3.20% 03/10/32 | 71,000 | 61,186 |
| 4.46% 06/08/32 | 35,000 | 33,272 |
| The Toronto-Dominion Bank (3.63% fixed rate until 09/15/26; 2.21% + 5 year Swap Rate thereafter) | ||
| 3.63% 09/15/31 (d) | 36,000 | 33,150 |
| The Travelers Companies Inc. | ||
| 2.55% 04/27/50 | 85,000 | 53,088 |
| The Walt Disney Co. | ||
| 2.65% 01/13/31 | 215,000 | 183,700 |
| 3.38% 11/15/26 | 2,000 | 1,891 |
| 3.60% 01/13/51 | 11,000 | 8,435 |
| 4.75% 11/15/46 | 4,000 | 3,660 |
| 6.65% 11/15/37 | 16,000 | 18,011 |
| The Williams Companies Inc. | ||
| 3.75% 06/15/27 | 2,000 | 1,885 |
| 4.85% 03/01/48 | 9,000 | 7,668 |
| 4.90% 01/15/45 | 16,000 | 13,608 |
| 5.30% 08/15/52 | 15,000 | 13,512 |
| 5.40% 03/04/44 | 3,000 | 2,737 |
| The Williams Cos. Inc. | ||
| 6.10% 10/15/52 | 15,000 | 16,155 |
| Thermo Fisher Scientific Inc. | ||
| 2.80% 10/15/41 | 17,000 | 12,528 |
| Time Warner Cable LLC | ||
| 6.55% 05/01/37 | 8,000 | 7,586 |
| T-Mobile USA Inc. | ||
| 3.75% 04/15/27 | 236,000 | 222,513 |
| 3.88% 04/15/30 | 28,000 | 25,416 |
| 4.50% 04/15/50 | 16,000 | 13,211 |
| TotalEnergies Capital International S.A. | ||
| 3.46% 02/19/29 (d) | 30,000 | 27,853 |
| Trane Technologies Luxembourg Finance S.A. | ||
| 3.55% 11/01/24 | 15,000 | 14,597 |
| 3.80% 03/21/29 | 15,000 | 13,826 |
| TransCanada PipeLines Ltd. | ||
| 4.25% 05/15/28 | 31,000 | 29,447 |
| 4.88% 01/15/26 | 8,000 | 7,960 |
| Transcanada Trust (5.63% fixed rate until 05/20/25; 3.53% + 3 month USD LIBOR thereafter) | ||
| 5.63% 05/20/75 (d) | 44,000 | 41,619 |
| Elfun Diversified Fund | 47 |
| Principal Amount | Fair Value | |
| Transcontinental Gas Pipe Line Company LLC | ||
| 4.00% 03/15/28 | $ 9,000 | $ 8,461 |
| Truist Financial Corp. (4.80% fixed rate until 09/01/24; 3.00% + 5 year CMT Rate thereafter) | ||
| 4.80% 12/31/99 (d) | 65,000 | 58,623 |
| TWDC Enterprises 18 Corp. | ||
| 4.13% 06/01/44 | 4,000 | 3,456 |
| Tyco Electronics Group S.A. | ||
| 3.13% 08/15/27 | 9,000 | 8,303 |
| Tyson Foods Inc. | ||
| 4.00% 03/01/26 | 38,000 | 36,763 |
| UDR Inc. | ||
| 2.10% 08/01/32 | 16,000 | 11,883 |
| 3.00% 08/15/31 | 9,000 | 7,512 |
| Union Pacific Corp. | ||
| 3.55% 05/20/61 | 21,000 | 15,365 |
| 3.60% 09/15/37 | 6,000 | 5,085 |
| 3.80% 04/06/71 | 11,000 | 8,121 |
| 4.10% 09/15/67 | 9,000 | 7,093 |
| UnitedHealth Group Inc. | ||
| 2.00% 05/15/30 | 250,000 | 206,910 |
| 4.20% 05/15/32 | 25,000 | 23,762 |
| 4.45% 12/15/48 | 15,000 | 13,375 |
| 4.75% 07/15/45 - 05/15/52 | 85,000 | 78,992 |
| 6.05% 02/15/63 | 10,000 | 11,011 |
| Utah Acquisition Sub Inc. | ||
| 3.95% 06/15/26 | 5,000 | 4,673 |
| Ventas Realty LP | ||
| 3.25% 10/15/26 | 18,000 | 16,653 |
| Verizon Communications Inc. | ||
| 2.10% 03/22/28 | 256,000 | 222,077 |
| 2.36% 03/15/32 | 131,000 | 103,888 |
| 2.55% 03/21/31 | 187,000 | 153,901 |
| 3.00% 03/22/27 | 52,000 | 48,354 |
| 3.40% 03/22/41 | 19,000 | 14,308 |
| 3.55% 03/22/51 | 14,000 | 10,022 |
| 3.70% 03/22/61 | 29,000 | 20,327 |
| 4.40% 11/01/34 | 48,000 | 44,130 |
| 4.86% 08/21/46 | 21,000 | 19,022 |
| Viatris Inc. | ||
| 4.00% 06/22/50 | 10,000 | 6,195 |
| Virginia Electric & Power Co. | ||
| 4.00% 11/15/46 | 15,000 | 11,878 |
| Visa Inc. | ||
| 2.70% 04/15/40 | 12,000 | 9,089 |
| Principal Amount | Fair Value | |
| Vistra Operations Company LLC | ||
| 3.55% 07/15/24 (h) | $ 55,000 | $ 52,781 |
| Viterra Finance BV | ||
| 2.00% 04/21/26 (h) | 200,000 | 172,772 |
| Vodafone Group PLC | ||
| 5.25% 05/30/48 | 4,000 | 3,552 |
| Vontier Corp. | ||
| 2.40% 04/01/28 | 42,000 | 33,155 |
| 2.95% 04/01/31 | 39,000 | 28,359 |
| Vornado Realty LP | ||
| 2.15% 06/01/26 | 48,000 | 40,662 |
| 3.50% 01/15/25 | 10,000 | 9,395 |
| Vulcan Materials Co. | ||
| 3.90% 04/01/27 | 4,000 | 3,798 |
| Walgreens Boots Alliance Inc. | ||
| 4.10% 04/15/50 | 3,000 | 2,208 |
| Walmart Inc. | ||
| 1.80% 09/22/31 | 17,000 | 13,861 |
| 2.50% 09/22/41 | 17,000 | 12,415 |
| 2.65% 09/22/51 | 8,000 | 5,479 |
| Warnermedia Holdings Inc. | ||
| 5.05% 03/15/42 (h) | 22,000 | 16,918 |
| 5.14% 03/15/52 (h) | 10,000 | 7,343 |
| 5.39% 03/15/62 (h) | 10,000 | 7,326 |
| Waste Connections Inc. | ||
| 2.20% 01/15/32 (d) | 77,000 | 61,253 |
| 2.95% 01/15/52 | 37,000 | 24,632 |
| WEC Energy Group Inc. | ||
| 3.55% 06/15/25 | 9,000 | 8,608 |
| Wells Fargo & Co. | ||
| 4.15% 01/24/29 | 31,000 | 29,126 |
| 4.75% 12/07/46 (d) | 28,000 | 23,459 |
| Wells Fargo & Co. (2.39% fixed rate until 06/02/27; 2.10% + SOFR thereafter) | ||
| 2.39% 06/02/28 (d) | 108,000 | 95,247 |
| Wells Fargo & Co. (3.07% fixed rate until 04/30/40; 2.53% + SOFR thereafter) | ||
| 3.07% 04/30/41 (d) | 36,000 | 25,736 |
| Wells Fargo & Co. (3.20% fixed rate until 06/17/26; 1.17% + 3 month USD LIBOR thereafter) | ||
| 3.20% 06/17/27 (d) | 253,000 | 234,865 |
| 48 | Elfun Diversified Fund |
| Principal Amount | Fair Value | |
| Wells Fargo & Co. (5.88% fixed rate until 06/15/25; 3.99% + 3 month USD LIBOR thereafter) | ||
| 5.88% 12/31/99 (d) | $ 71,000 | $ 68,993 |
| Westlake Corp. | ||
| 2.88% 08/15/41 | 11,000 | 7,223 |
| 3.13% 08/15/51 | 11,000 | 6,834 |
| 3.38% 08/15/61 | 10,000 | 5,902 |
| Westpac Banking Corp. (2.89% fixed rate until 02/04/25; 1.35% + 5 year CMT Rate thereafter) | ||
| 2.89% 02/04/30 (d) | 24,000 | 22,003 |
| Westpac Banking Corp. (4.11% fixed rate until 07/24/29; 2.00% + 5 year CMT Rate thereafter) | ||
| 4.11% 07/24/34 (d) | 15,000 | 12,848 |
| Weyerhaeuser Co. | ||
| 4.00% 03/09/52 | 25,000 | 18,950 |
| Willis North America Inc. | ||
| 3.88% 09/15/49 | 14,000 | 9,958 |
| Workday Inc. | ||
| 3.50% 04/01/27 | 144,000 | 134,686 |
| 3.70% 04/01/29 | 55,000 | 50,451 |
| WPP Finance 2010 | ||
| 3.75% 09/19/24 | 18,000 | 17,434 |
| Xcel Energy Inc. | ||
| 3.40% 06/01/30 | 16,000 | 14,271 |
| Yamana Gold Inc. | ||
| 2.63% 08/15/31 | 34,000 | 25,459 |
| Zoetis Inc. | ||
| 3.00% 09/12/27 | 5,000 | 4,623 |
| 3.90% 08/20/28 (d) | 9,000 | 8,556 |
| 5.60% 11/16/32 | 60,000 | 62,254 |
| 24,311,582 | ||
| Non-Agency Collateralized Mortgage Obligations - 2.0% | ||
| BANK 2017-BNK7 | ||
| 3.18% 09/15/60 | 617,000 | 561,157 |
| BANK 2018-BNK15 | ||
| 4.41% 11/15/61 (d) | 320,000 | 306,498 |
| BPR Trust 2022-OANA 1.90% + 1 month Term SOFR | ||
| 6.23% 04/15/37 (d)(h) | 117,967 | 116,163 |
| Cantor Commercial Real Estate Lending 2019-CF3 | ||
| 3.01% 01/15/53 | 139,000 | 120,029 |
| Principal Amount | Fair Value | |
| CD 2019-CD8 Mortgage Trust | ||
| 2.91% 08/15/57 | $ 246,000 | $ 212,526 |
| Citigroup Commercial Mortgage Trust 2015-GC33 | ||
| 3.78% 09/10/58 | 100,000 | 95,347 |
| Citigroup Commercial Mortgage Trust 2016-P6 | ||
| 3.72% 12/10/49 (d) | 119,583 | 112,302 |
| 4.03% 12/10/49 (d) | 78,331 | 71,607 |
| COMM 2012-CCRE3 Mortgage Trust | ||
| 3.92% 10/15/45 (h) | 100,000 | 88,827 |
| COMM 2014-CR14 Mortgage Trust | ||
| 4.53% 02/10/47 (d) | 55,000 | 53,584 |
| GS Mortgage Securities Trust 2015-GS1 | ||
| 4.42% 11/10/48 (d) | 117,000 | 93,889 |
| GS Mortgage Securities Trust 2017-GS5 | ||
| 3.67% 03/10/50 (d) | 240,062 | 224,181 |
| GS Mortgage Securities Trust 2018-GS9 | ��� | |
| 4.14% 03/10/51 (d) | 73,000 | 66,945 |
| GS Mortgage Securities Trust 2019-GC42 | ||
| 2.75% 09/01/52 | 419,000 | 358,573 |
| GS Mortgage Securities Trust 2019-GSA1 | ||
| 3.05% 11/10/52 (d) | 493,000 | 428,710 |
| JPMBB Commercial Mortgage Securities Trust 2013-C12 | ||
| 4.05% 07/15/45 (d) | 25,000 | 24,708 |
| JPMBB Commercial Mortgage Securities Trust 2015-C32 | ||
| 4.65% 11/15/48 (d) | 71,000 | 51,473 |
| MASTR Alternative Loan Trust 2003-5 | ||
| 5.00% 08/25/18 (f) | 226 | 28 |
| Morgan Stanley Bank of America Merrill Lynch Trust 2015-C21 | ||
| 0.85% 03/15/48 (d)(f) | 706,841 | 9,431 |
| Wells Fargo Commercial Mortgage Trust 2014-LC16 | ||
| 4.32% 08/15/50 | 129,943 | 109,621 |
| Wells Fargo Commercial Mortgage Trust 2015-C26 | ||
| 1.20% 02/15/48 (d)(f) | 752,804 | 14,868 |
| Elfun Diversified Fund | 49 |
| Principal Amount | Fair Value | |
| WFRBS Commercial Mortgage Trust 2013-C17 | ||
| 4.26% 12/15/46 | $ 55,000 | $ 53,977 |
| WFRBS Commercial Mortgage Trust 2014-LC14 | ||
| 4.35% 03/15/47 (d) | 123,000 | 119,055 |
| 3,293,499 | ||
| Municipal Bonds and Notes - 0.1% | ||
| American Municipal Power Inc. | ||
| 6.27% 02/15/50 | 25,000 | 26,429 |
| Board of Regents of the University of Texas System | ||
| 3.35% 08/15/47 | 25,000 | 19,226 |
| Port Authority of New York & New Jersey | ||
| 4.46% 10/01/62 | 70,000 | 60,742 |
| State of California | ||
| 4.60% 04/01/38 | 50,000 | 47,068 |
| State of Illinois | ||
| 5.10% 06/01/33 | 25,000 | 23,994 |
| 177,459 | ||
| Total Bonds and Notes (Cost $73,193,127) | 67,739,371 | |
| Number of Shares | ||
| Exchange Traded & Mutual Funds - 25.7% | ||
| State Street Global All Cap Equity ex-U.S. Index Portfolio (Cost $42,251,968) | 425,386 | 42,695,979 |
| Total Investments in Securities (Cost $157,596,442) | 164,130,114 | |
| Number of Shares | Fair Value | |
| Short-Term Investments - 10.6% | ||
| Dreyfus Treasury Obligations Cash Management Fund - Institutional Shares 3.56% | 116,548 | $ 116,548 |
| State Street Institutional Treasury Money Market Fund - Premier Class 3.79% (j)(k) | 8,599,525 | 8,599,525 |
| State Street Institutional Treasury Plus Fund - Premier Class 4.14% (j)(k) | 116,548 | 116,548 |
| State Street Institutional U.S. Government Money Market Fund - Class G Shares 4.16% (j)(k) | 8,748,612 | 8,748,612 |
| Total Short-Term Investments (Cost $17,581,233) | 17,581,233 | |
| Total Investments (Cost $175,177,675) | 181,711,347 | |
| Liabilities in Excess of Other Assets, net - (9.5)% | (15,705,403) | |
| NET ASSETS - 100.0% | $ 166,005,944 | |
| Centrally Cleared Credit Default Swaps |
| Reference Entity | Counterparty | Notional Amount (000s omitted) | Contract Annual Fixed Rate/ Payment Frequency | Termination Date | Market Value | Unamortized Upfront Payments Received (Paid) | Unrealized Appreciation (Depreciation) |
| Buy Protection | |||||||
| Markit CDX North America High Yield Index | Intercontinental Exchange | $2,515 | 5.00%/ Quarterly | 12/20/27 | $14,692 | $(99,785) | $114,477 |
| 50 | Elfun Diversified Fund |
| The Fund had the following long futures contracts open at December 31, 2022: |
| Description | Expiration Date | Number of Contracts | Notional Amount | Value | Unrealized Appreciation (Depreciation) |
| U.S. Long Bond Futures | March 2023 | 15 | $ 1,908,619 | $ 1,880,156 | $ (28,463) |
| U.S. Ultra Long-Term Treasury Bond Futures | March 2023 | 7 | 957,739 | 940,187 | (17,552) |
| 2 Yr. U.S. Treasury Notes Futures | March 2023 | 29 | 5,938,696 | 5,947,266 | 8,570 |
| S&P 500 E-mini Index Futures | March 2023 | 2 | 399,683 | 386,100 | (13,583) |
| $ (51,028) |
| The Fund had the following short futures contracts open at December 31, 2022: |
| Description | Expiration date | Number of Contracts | Notional Amount | Value | Unrealized Appreciation (Depreciation) |
| 10 Yr. U.S. Treasury Notes Futures | March 2023 | 26 | $ (2,945,009) | $ (2,919,719) | $ 25,290 |
| 10 Yr. U.S. Treasury Ultra Futures | March 2023 | 4 | (479,379) | (473,125) | 6,254 |
| 5 Yr. U.S. Treasury Notes Futures | March 2023 | 24 | (2,592,885) | (2,590,112) | 2,773 |
| $ 34,317 |
| During the fiscal year ended December 31, 2022, average notional values related to derivative contracts were as follows: | |||
| Long Futures Contracts | Short Futures Contracts | Credit Default Swap Contracts | |
| Average Notional Value | $10,732,477 | $6,142,468 | $2,285,854 |
| (a) | At December 31, 2022, all or a portion of this security was pledged to cover collateral requirements for futures. |
| (b) | Non-income producing security. |
| (c) | State Street Corp. is the parent company of State Street Bank & Trust Co., the Fund's sub-administrator, custodian and accounting agent. |
| (d) | Variable Rate Security - Interest rate shown is rate in effect at December 31, 2022. For securities based on a published reference rate and spread, the reference rate and spread are indicated in the description above. |
| (e) | Settlement is on a delayed delivery or when-issued basis with final maturity to be announced ("TBA") in the future. |
| (f) | Interest only security. These securities represent the right to receive the monthly interest payments on an underlying pool of mortgages. Payments of principal on the pool reduce the value of the "interest only" holding. |
| (g) | Principal only security. These securities represent the right to receive the monthly principal payments on an underlying pool of mortgages. No payments of interest on the pool are passed through to the "principal only" holder. |
| Elfun Diversified Fund | 51 |
| (h) | Pursuant to Rule 144A of the Securities Act of 1933, as amended, these securities may be resold in transactions exempt from registration, normally to qualified institutional buyers. At December 31, 2022, these securities amounted to $1,876,265 or 1.13% of the net assets of the Elfun Diversified Fund. These securities have been determined to be liquid using procedures established by the Fund's Board of Trustees. |
| (i) | Step coupon bond. |
| (j) | Sponsored by SSGA Funds Management, Inc., the Fund’s investment adviser and administrator, and an affiliate of State Street Bank & Trust Co., the Fund’s sub-administrator, custodian and accounting agent. |
| (k) | Coupon amount represents effective yield. |
| † | Percentages are based on net assets as of December 31, 2022. |
| * | Less than 0.05%. |
| Abbreviations: |
| CMT - Constant Maturity Treasury |
| LIBOR - London Interbank Offered Rate |
| REIT - Real Estate Investment Trust |
| REMIC - Real Estate Mortgage Investment Conduit |
| SOFR - Secured Overnight Financing Rate |
| STRIPS - Separate Trading of Registered Interest and Principal of Security |
| TBA - To Be Announced |
| Investments | Level 1 | Level 2 | Level 3 | Total | |||
| Investments in Securities | |||||||
| Domestic Equity | $ 52,395,423 | $ — | $ — | $ 52,395,423 | |||
| Foreign Equity | 1,299,341 | — | — | 1,299,341 | |||
| U.S. Treasuries | — | 18,067,640 | — | 18,067,640 | |||
| Agency Mortgage Backed | — | 21,471,678 | — | 21,471,678 | |||
| Agency Collateralized Mortgage Obligations | — | 333,742 | — | 333,742 | |||
| Asset Backed | — | 83,771 | — | 83,771 | |||
| Corporate Notes | — | 24,311,582 | — | 24,311,582 | |||
| Non-Agency Collateralized Mortgage Obligations | — | 3,293,499 | — | 3,293,499 | |||
| Municipal Bonds and Notes | — | 177,459 | — | 177,459 | |||
| Exchange Traded & Mutual Funds | 42,695,979 | — | — | 42,695,979 | |||
| Short-Term Investments | 17,581,233 | — | — | 17,581,233 | |||
| Total Investments in Securities | $ 113,971,976 | $ 67,739,371 | $ — | $ 181,711,347 | |||
| Other Financial Instruments | |||||||
| Credit Default Swap Contracts - Unrealized Appreciation | $ — | $ 114,477 | $ — | $ 114,477 | |||
| Long Futures Contracts - Unrealized Appreciation | 8,570 | — | — | 8,570 | |||
| Long Futures Contracts - Unrealized Depreciation | (59,598) | — | — | (59,598) | |||
| Short Futures Contracts - Unrealized Appreciation | 34,317 | — | — | 34,317 | |||
| Total Other Financial Instruments | $ (16,711) | $ 114,477 | $ — | $ 97,766 |
| Industry | Domestic | Foreign | Total |
| Exchange Traded Funds | 23.50% | 0.00% | 23.50% |
| Systems Software | 1.87% | 0.00% | 1.87% |
| Technology Hardware, Storage & Peripherals | 1.85% | 0.01% | 1.86% |
| Pharmaceuticals | 1.43% | 0.00% | 1.43% |
| Semiconductors | 1.23% | 0.04% | 1.27% |
| Interactive Media & Services | 1.17% | 0.00% | 1.17% |
| Data Processing & Outsourced Services | 0.94% | 0.00% | 0.94% |
| Diversified Banks | 0.87% | 0.00% | 0.87% |
| Healthcare Equipment | 0.70% | 0.10% | 0.80% |
| Integrated Oil & Gas | 0.75% | 0.00% | 0.75% |
| 52 | Elfun Diversified Fund |
| Industry | Domestic | Foreign | Total |
| Biotechnology | 0.74% | 0.00% | 0.74% |
| Internet & Direct Marketing Retail | 0.72% | 0.00% | 0.72% |
| Managed Healthcare | 0.69% | 0.00% | 0.69% |
| Electric Utilities | 0.62% | 0.00% | 0.62% |
| Application Software | 0.60% | 0.00% | 0.60% |
| Life Sciences Tools & Services | 0.58% | 0.00% | 0.58% |
| Aerospace & Defense | 0.56% | 0.00% | 0.56% |
| Soft Drinks | 0.51% | 0.00% | 0.51% |
| Multi-Sector Holdings | 0.51% | 0.00% | 0.51% |
| Household Products | 0.47% | 0.00% | 0.47% |
| Oil & Gas Exploration & Production | 0.41% | 0.00% | 0.41% |
| Home Improvement Retail | 0.41% | 0.00% | 0.41% |
| Automobile Manufacturers | 0.39% | 0.00% | 0.39% |
| Restaurants | 0.38% | 0.00% | 0.38% |
| Specialized REITs | 0.38% | 0.00% | 0.38% |
| Hypermarkets & Super Centers | 0.37% | 0.00% | 0.37% |
| IT Consulting & Other Services | 0.19% | 0.15% | 0.34% |
| Financial Exchanges & Data | 0.34% | 0.00% | 0.34% |
| Investment Banking & Brokerage | 0.34% | 0.00% | 0.34% |
| Packaged Foods & Meats | 0.31% | 0.00% | 0.31% |
| Movies & Entertainment | 0.30% | 0.00% | 0.30% |
| Property & Casualty Insurance | 0.18% | 0.10% | 0.28% |
| Industrial Conglomerates | 0.28% | 0.00% | 0.28% |
| Regional Banks | 0.27% | 0.00% | 0.27% |
| Integrated Telecommunication Services | 0.27% | 0.00% | 0.27% |
| Multi-Utilities | 0.27% | 0.00% | 0.27% |
| Communications Equipment | 0.26% | 0.00% | 0.26% |
| Industrial Machinery | 0.24% | 0.01% | 0.25% |
| Healthcare Services | 0.25% | 0.00% | 0.25% |
| Semiconductor Equipment | 0.23% | 0.02% | 0.25% |
| Asset Management & Custody Banks | 0.24% | 0.00% | 0.24% |
| Railroads | 0.23% | 0.00% | 0.23% |
| Tobacco | 0.22% | 0.00% | 0.22% |
| Specialty Chemicals | 0.21% | 0.00% | 0.21% |
| Industrial Gases | 0.06% | 0.15% | 0.21% |
| Insurance Brokers | 0.18% | 0.02% | 0.20% |
| Construction Machinery & Heavy Trucks | 0.20% | 0.00% | 0.20% |
| Air Freight & Logistics | 0.18% | 0.00% | 0.18% |
| Cable & Satellite | 0.18% | 0.00% | 0.18% |
| Electrical Components & Equipment | 0.17% | 0.00% | 0.17% |
| Hotels, Resorts & Cruise Lines | 0.17% | 0.00% | 0.17% |
| Consumer Finance | 0.15% | 0.00% | 0.15% |
| Life & Health Insurance | 0.15% | 0.00% | 0.15% |
| Oil & Gas Refining & Marketing | 0.14% | 0.00% | 0.14% |
| General Merchandise Stores | 0.14% | 0.00% | 0.14% |
| Footwear | 0.14% | 0.00% | 0.14% |
| Building Products | 0.09% | 0.04% | 0.13% |
| Oil & Gas Equipment & Services | 0.13% | 0.00% | 0.13% |
| Apparel Retail | 0.12% | 0.00% | 0.12% |
| Oil & Gas Storage & Transportation | 0.11% | 0.00% | 0.11% |
| Automotive Retail | 0.11% | 0.00% | 0.11% |
| Agricultural & Farm Machinery | 0.11% | 0.00% | 0.11% |
| Residential REITs | 0.11% | 0.00% | 0.11% |
| Research & Consulting Services | 0.11% | 0.00% | 0.11% |
| Elfun Diversified Fund | 53 |
| Industry | Domestic | Foreign | Total |
| Retail REITs | 0.10% | 0.00% | 0.10% |
| Healthcare Distributors | 0.10% | 0.00% | 0.10% |
| Industrial REITs | 0.10% | 0.00% | 0.10% |
| Interactive Home Entertainment | 0.09% | 0.00% | 0.09% |
| Environmental & Facilities Services | 0.09% | 0.00% | 0.09% |
| Fertilizers & Agricultural Chemicals | 0.08% | 0.00% | 0.08% |
| Wireless Telecommunication Services | 0.08% | 0.00% | 0.08% |
| Trading Companies & Distributors | 0.07% | 0.00% | 0.07% |
| Multi-Line Insurance | 0.07% | 0.00% | 0.07% |
| Electronic Equipment & Instruments | 0.07% | 0.00% | 0.07% |
| Home Building | 0.07% | 0.00% | 0.07% |
| Paper Packaging | 0.05% | 0.02% | 0.07% |
| Electronic Components | 0.06% | 0.00% | 0.06% |
| Diversified Support Services | 0.06% | 0.00% | 0.06% |
| Airlines | 0.06% | 0.00% | 0.06% |
| Health Care REITs | 0.06% | 0.00% | 0.06% |
| Healthcare Facilities | 0.05% | 0.00% | 0.05% |
| Specialty Stores | 0.05% | 0.00% | 0.05% |
| Personal Products | 0.05% | 0.00% | 0.05% |
| Commodity Chemicals | 0.05% | 0.00% | 0.05% |
| Copper | 0.05% | 0.00% | 0.05% |
| Steel | 0.05% | 0.00% | 0.05% |
| Agricultural Products | 0.05% | 0.00% | 0.05% |
| Distributors | 0.05% | 0.00% | 0.05% |
| Distillers & Vintners | 0.04% | 0.00% | 0.04% |
| Casinos & Gaming | 0.04% | 0.00% | 0.04% |
| Construction Materials | 0.04% | 0.00% | 0.04% |
| Trucking | 0.04% | 0.00% | 0.04% |
| Gold | 0.04% | 0.00% | 0.04% |
| Food Distributors | 0.03% | 0.00% | 0.03% |
| Electronic Manufacturing Services | 0.00% | 0.03% | 0.03% |
| Healthcare Supplies | 0.03% | 0.00% | 0.03% |
| Auto Parts & Equipment | 0.01% | 0.02% | 0.03% |
| Office REITs | 0.03% | 0.00% | 0.03% |
| Internet Services & Infrastructure | 0.03% | 0.00% | 0.03% |
| Advertising | 0.03% | 0.00% | 0.03% |
| Food Retail | 0.03% | 0.00% | 0.03% |
| Water Utilities | 0.03% | 0.00% | 0.03% |
| Drug Retail | 0.02% | 0.00% | 0.02% |
| Real Estate Services | 0.02% | 0.00% | 0.02% |
| Technology Distributors | 0.02% | 0.00% | 0.02% |
| Apparel, Accessories & Luxury Goods | 0.02% | 0.00% | 0.02% |
| Broadcasting | 0.02% | 0.00% | 0.02% |
| Construction & Engineering | 0.02% | 0.00% | 0.02% |
| Independent Power Producers & Energy Traders | 0.02% | 0.00% | 0.02% |
| Computer & Electronics Retail | 0.02% | 0.00% | 0.02% |
| Gas Utilities | 0.02% | 0.00% | 0.02% |
| Metal & Glass Containers | 0.01% | 0.00% | 0.01% |
| Reinsurance | 0.00% | 0.01% | 0.01% |
| Consumer Electronics | 0.00% | 0.01% | 0.01% |
| Hotel & Resort REITs | 0.01% | 0.00% | 0.01% |
| Brewers | 0.01% | 0.00% | 0.01% |
| Publishing | 0.01% | 0.00% | 0.01% |
| Household Appliances | 0.01% | 0.00% | 0.01% |
| 54 | Elfun Diversified Fund |
| Industry | Domestic | Foreign | Total |
| Human Resource & Employment Services | 0.01% | 0.00% | 0.01% |
| Leisure Products | 0.01% | 0.00% | 0.01% |
| Home Furnishings | 0.00% | 0.00% | 0.00%*** |
| Housewares & Specialties | 0.00% | 0.00% | 0.00%*** |
| Alternative Carriers | 0.00% | 0.00% | 0.00%*** |
| 53.04% |
| Sector | Percentage (based on Fair Value) | ||
| Corporate Notes | 13.38% | ||
| Agency Mortgage Backed | 11.82% | ||
| U.S. Treasuries | 9.94% | ||
| Non-Agency Collateralized Mortgage Obligations | 1.81% | ||
| Agency Collateralized Mortgage Obligations | 0.18% | ||
| Municipal Bonds and Notes | 0.10% | ||
| Asset Backed | 0.05% | ||
| 37.28% | |||
| Sector | Percentage (based on Fair Value) | ||
| Short-Term Investments | 9.68% | ||
| 9.68% | |||
| 100.00% | |||
| *** | Less than 0.005%. |
| Affiliate Table |
| Number of Shares Held at 12/31/21 | Value at 12/31/21 | Cost of Purchases | Proceeds from Shares Sold | Realized Gain (Loss) | Change in Unrealized Appreciation (Depreciation) | Number of Shares Held at 12/31/22 | Value at 12/31/22 | Dividend Income | ||||||
| State Street Corp. | 712 | $ 66,216 | $ 22,012 | $ 31,554 | $ (2,484) | $ (8,269) | 592 | $ 45,921 | $ 1,574 | |||||
| State Street Global All Cap Equity ex-U.S. Index Portfolio | 439,651 | 54,037,441 | 9,120,590 | 11,244,999 | 175,662 | (9,392,715) | 425,386 | 42,695,979 | 980,590 | |||||
| State Street Institutional Treasury Money Market Fund - Premier Class | 5,372,404 | 5,372,404 | 31,371,375 | 28,144,254 | — | — | 8,599,525 | 8,599,525 | 84,281 | |||||
| State Street Institutional Treasury Plus Fund - Premier Class | 2,309,897 | 2,309,897 | 7,909,544 | 10,102,893 | — | — | 116,548 | 116,548 | 50,978 | |||||
| State Street Institutional U.S. Government Money Market Fund - Class G Shares | 5,658,078 | 5,658,078 | 57,068,804 | 53,978,270 | — | — | 8,748,612 | 8,748,612 | 92,603 | |||||
| TOTAL | $67,444,036 | $105,492,325 | $103,501,970 | $173,178 | $(9,400,984) | $60,206,585 | $1,210,026 |
| Elfun Diversified Fund | 55 |
| 56 | Elfun Tax-Exempt Income Fund |
| Sector Allocation |
| Portfolio composition as a % of Fair Value of $1,041,290 (in thousands) as of December 31, 2022 (a)(b) |
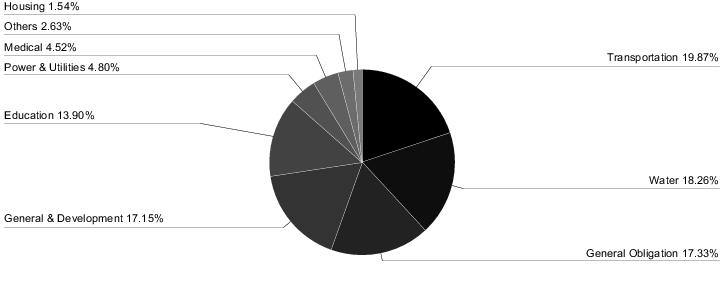
| Quality Ratings | ||
| as of December 31, 2022 as a % of Fair Value (a)(b) | ||
| Moody’s / S&P / Rating* | Percentage of Fair Value | |
| Aaa / AAA | 12.64% | |
| Aa / AA | 52.18% | |
| A / A | 26.59% | |
| Baa / BBB | 5.50% | |
| NR / Other | 3.09% | |
| 100.00% | ||
| Average Annual Total Return for the years ended December 31, 2022 | |||||||
| (Inception date 1/1/80) | |||||||
| One Year | Five Year | Ten Year | Ending Value of a $10,000 Investment | ||||
| Elfun Tax-Exempt Income Fund | (8.44)% | 1.02% | 1.86% | $12,028 | |||
| Bloomberg U.S. Municipal Bond Index | (8.53)% | 1.25% | 2.13% | $12,348 | |||
| (a) | Fair Value basis is inclusive of short-term investment in State Street Institutional Treasury Plus Fund — Premier Class. |
| (b) | The securities information regarding holdings, allocations and other characteristics is presented to illustrate examples of securities that the Fund has bought and the diversity of areas in which the Fund may invest as of a particular date. It may not be representative of the Fund’s current or future investments and should not be construed as a recommendation to purchase or sell a particular security. |
| * | Moody’s Investors Services, Inc. (“Moody’s”) and S&P Global Ratings (“S&P”) are nationally recognized statistical rating organizations. The quality ratings represent the lower of Moody’s or S&P credit ratings. When a rating from only one of the rating agencies is available, that rating is used. Securities not rated by Moody’s or S&P are categorized as not rated. Credit quality measures a bond issuer’s ability to repay interest and principal in a timely manner. Credit quality ratings assigned by a rating agency are subject to change periodically and are not absolute standard of quality. In formulating investment decisions for the Fund, SSGA Funds Management, Inc. (“SSGA FM”) develops its own analysis of the credit quality and risks associated with individual debt instruments, rather than relying exclusively on rating agency ratings. |
| Elfun Tax-Exempt Income Fund | 57 |
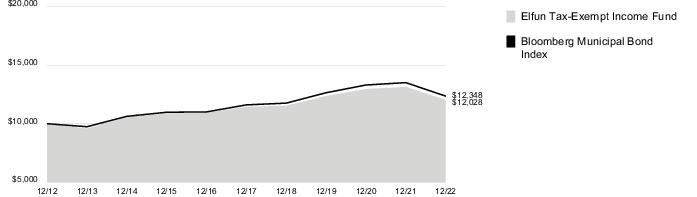
| 58 | Elfun Tax-Exempt Income Fund |
| Actual Fund Return | Hypothetical 5% Return (2.5% for the period) | ||
| Beginning Account Value July 1, 2022 | $1,000.00 | $1,000.00 | |
| Ending Account value December 31, 2022 | $1,002.40 | $1,024.10 | |
| Expenses Paid During Period* | $ 1.06 | $ 1.07 |
| * | Expenses are equal to the Fund's annualized expense ratio of 0.21%** (for the period July 1, 2022 - December 31, 2022), multiplied by the average account value over the period, multiplied by 184/365 (to reflect the one-half year period). |
| ** | May differ from expense ratio disclosed in the financial highlights, which is calculated based on the entire fiscal year's data. |
| Elfun Tax-Exempt Income Fund | 59 |
| Principal Amount | Fair Value | |
| Municipal Bonds and Notes - 97.9% † | ||
| Alaska - 0.1% | ||
| Municipality of Anchorage AK Solid Waste Services Revenue | ||
| 5.00% 11/01/35 | $ 1,230,000 | $ 1,401,984 |
| Arizona - 1.9% | ||
| Arizona State University Revenue | ||
| 5.00% 07/01/41 | 1,000,000 | 1,031,476 |
| City of Mesa AZ Utility System Revenue | ||
| 5.00% 07/01/43 | 1,500,000 | 1,616,283 |
| City of Phoenix Civic Improvement Corp. Revenue | ||
| 5.00% 07/01/42 | 1,665,000 | 1,697,773 |
| City of Phoenix Civic Improvement Corp. Revenue (NPFG Insured) | ||
| 5.50% 07/01/23 - 07/01/24 | 7,260,000 | 7,441,973 |
| Maricopa County Industrial Development Authority Revenue | ||
| 4.00% 01/01/41 | 3,000,000 | 2,883,799 |
| The University of Arizona Revenue | ||
| 5.00% 06/01/46 | 5,000,000 | 5,166,897 |
| 19,838,201 | ||
| Arkansas - 0.4% | ||
| University of Arkansas Revenue | ||
| 5.00% 11/01/46 - 11/01/47 | 3,580,000 | 3,749,444 |
| California - 8.9% | ||
| California Health Facilities Financing Authority Revenue | ||
| 5.00% 11/15/39 - 11/15/49 | 6,315,000 | 6,379,735 |
| California State Public Works Board Revenue | ||
| 5.25% 09/01/29 | 10,160,000 | 10,331,227 |
| California State University Revenue | ||
| 4.00% 11/01/45 | 5,900,000 | 5,771,048 |
| City of Los Angeles CA Wastewater System Revenue | ||
| 5.00% 06/01/48 | 10,000,000 | 10,635,480 |
| City of Los Angeles Department of Airports Revenue | ||
| 5.00% 05/15/36 | 205,000 | 215,162 |
| 5.50% 05/15/36 | 1,000,000 | 1,112,066 |
| Fresno Unified School District GO, | ||
| 4.00% 08/01/47 (a) | 5,000,000 | 5,103,212 |
| Los Angeles Department of Water & Power Revenue | ||
| 5.00% 07/01/48 | 5,500,000 | 5,823,705 |
| Mount San Antonio Community College District GO, | ||
| 4.00% 08/01/49 | 3,000,000 | 2,905,943 |
| San Francisco Bay Area Rapid Transit District GO, | ||
| 3.00% 08/01/37 | 2,440,000 | 2,158,946 |
| San Francisco City & County Airport Comm-San Francisco International Airport Revenue | ||
| 5.00% 05/01/49 | 7,000,000 | 7,384,711 |
| San Francisco Unified School District GO, | ||
| 4.00% 06/15/31 | 1,115,000 | 1,183,485 |
| State of California GO, | ||
| 4.00% 04/01/49 | 700,000 | 673,476 |
| 5.00% 02/01/31 - 08/01/46 | 14,605,000 | 15,322,499 |
| 5.00% 12/01/43 (a) | 450,000 | 458,760 |
| Principal Amount | Fair Value | |
| State of California Department of Water Resources Revenue | ||
| 5.00% 12/01/29 (a) | $ 8,120,000 | $ 8,496,344 |
| University of California Revenue | ||
| 5.00% 05/15/38 - 05/15/48 | 9,000,000 | 9,301,743 |
| 93,257,542 | ||
| Colorado - 2.0% | ||
| City & County of Denver Co. Airport System Revenue | ||
| 5.00% 11/15/28 | 500,000 | 530,831 |
| City & County of Denver Co. Dedicated Excise Tax Revenue | ||
| 4.00% 08/01/46 | 2,485,000 | 2,381,635 |
| City of Colorado Springs Co. Utilities System Revenue | ||
| 5.00% 11/15/42 - 11/15/47 | 3,000,000 | 3,191,467 |
| Colorado Health Facilities Authority Revenue | ||
| 5.00% 06/01/47 (a) | 1,750,000 | 1,908,672 |
| Regional Transportation District Revenue | ||
| 4.25% 11/01/36 | 3,405,000 | 3,684,475 |
| 5.00% 11/01/29 | 7,925,000 | 9,041,955 |
| 20,739,035 | ||
| Connecticut - 4.4% | ||
| City of Norwalk GO, | ||
| 5.00% 08/15/36 | 1,000,000 | 1,129,055 |
| Connecticut State Health & Educational Facilities Authority Revenue | ||
| 1.10% 07/01/48 | 1,000,000 | 997,292 |
| 5.00% 07/01/46 | 6,500,000 | 6,608,153 |
| South Central Connecticut Regional Water Authority Revenue | ||
| 5.00% 08/01/27 - 08/01/28 (a) | 2,195,000 | 2,221,169 |
| State of Connecticut GO, | ||
| 4.00% 08/01/33 | 1,000,000 | 1,018,398 |
| 5.00% 01/15/26 - 08/15/32 | 1,700,000 | 1,761,082 |
| State of Connecticut Special Tax Revenue | ||
| 5.00% 10/01/27 - 10/01/36 | 23,325,000 | 23,946,758 |
| State of Connecticut Clean Water Fund - State Revolving Fund Revenue | ||
| 5.00% 05/01/37 | 7,000,000 | 7,507,373 |
| State of Connecticut Special Tax Revenue | ||
| 5.00% 07/01/27 | 500,000 | 549,241 |
| 45,738,521 | ||
| Delaware - 1.3% | ||
| Delaware Transportation Authority Revenue | ||
| 3.00% 07/01/28 | 2,000,000 | 2,004,332 |
| 5.00% 09/01/31 - 06/01/55 | 8,930,000 | 9,294,011 |
| State of Delaware GO, | ||
| 3.00% 02/01/33 | 2,760,000 | 2,738,203 |
| 14,036,546 | ||
| District of Columbia - 4.2% | ||
| District of Columbia GO, | ||
| 4.00% 06/01/35 - 10/15/44 | 10,485,000 | 10,448,915 |
| 60 | Elfun Tax-Exempt Income Fund |
| Principal Amount | Fair Value | |
| 5.00% 06/01/38 | $ 3,000,000 | $ 3,056,671 |
| District of Columbia Revenue | ||
| 4.00% 05/01/45 | 1,500,000 | 1,448,443 |
| 5.00% 04/01/42 (a) | 6,250,000 | 6,835,958 |
| District of Columbia Water & Sewer Authority Revenue | ||
| 4.00% 10/01/38 | 2,185,000 | 2,187,592 |
| 5.00% 10/01/47 | 2,000,000 | 2,160,492 |
| Metropolitan Washington Airports Authority Aviation Revenue | ||
| 5.00% 10/01/25 - 10/01/47 | 2,130,000 | 2,174,077 |
| Metropolitan Washington Airports Authority Dulles Toll Road Revenue | ||
| 5.00% 10/01/44 | 5,000,000 | 5,223,313 |
| Washington Convention & Sports Authority Revenue | ||
| 5.00% 10/01/28 - 10/01/29 | 710,000 | 800,454 |
| Washington Convention & Sports Authority Tax Allocation Revenue., | ||
| 5.00% 10/01/29 | 750,000 | 850,113 |
| Washington Metropolitan Area Transit Authority Revenue | ||
| 5.00% 07/01/34 - 07/01/43 | 8,375,000 | 8,845,108 |
| 44,031,136 | ||
| Florida - 2.7% | ||
| Broward County FL Water & Sewer Utility Revenue (AGM Insured) | ||
| 4.00% 10/01/44 | 1,300,000 | 1,228,168 |
| City of Fort Lauderdale FL Water & Sewer Revenue | ||
| 4.00% 09/01/41 | 1,000,000 | 1,000,730 |
| City of Lakeland FL Department of Electric Utilities Revenue (AGM Insured) | ||
| 5.25% 10/01/29 | 825,000 | 960,368 |
| County of Broward FL Port Facilities Revenue | ||
| 4.00% 09/01/38 | 1,000,000 | 974,324 |
| 5.00% 09/01/26 | 500,000 | 531,278 |
| County of Hillsborough FL Utility Revenue | ||
| 4.00% 08/01/31 | 3,215,000 | 3,428,758 |
| County of Miami-Dade Revenue | ||
| 5.00% 04/01/42 | 1,000,000 | 1,093,473 |
| County of Miami-Dade FL Aviation Revenue | ||
| 5.00% 10/01/36 | 2,000,000 | 2,006,986 |
| County of Miami-Dade Seaport Department Revenue | ||
| 4.00% 10/01/40 | 3,000,000 | 2,820,454 |
| County of Miami-Dade Water & Sewer System Revenue | ||
| 4.00% 10/01/37 | 3,000,000 | 2,963,941 |
| 5.00% 10/01/43 | 5,000,000 | 5,217,957 |
| Martin County Health Facilities Authority Revenue | ||
| 4.00% 01/01/46 | 5,000,000 | 4,647,881 |
| State of Florida GO, | ||
| 4.00% 07/01/33 | 335,000 | 346,208 |
| 5.00% 06/01/26 | 520,000 | 561,278 |
| 27,781,804 | ||
| Principal Amount | Fair Value | |
| Georgia - 5.3% | ||
| City of Atlanta GA Airport Passenger Facility Charge Revenue | ||
| 5.00% 01/01/34 | $ 3,500,000 | $ 3,561,323 |
| City of Atlanta GA Department of Aviation Revenue | ||
| 5.00% 07/01/35 | 1,000,000 | 1,079,719 |
| City of Atlanta GA Water & Wastewater Revenue | ||
| 4.00% 11/01/38 | 1,500,000 | 1,494,874 |
| 5.00% 11/01/28 - 11/01/41 | 6,000,000 | 6,350,015 |
| 5.25% 11/01/30 (a) | 5,690,000 | 5,799,979 |
| City of Atlanta GA Water & Wastewater Revenue (AGM Insured) | ||
| 5.75% 11/01/30 | 4,500,000 | 5,455,584 |
| Development Authority of Gwinnett County Revenue | ||
| 5.00% 07/01/37 - 07/01/40 | 9,325,000 | 9,780,294 |
| Georgia Ports Authority Revenue | ||
| 5.00% 07/01/42 | 1,000,000 | 1,115,047 |
| Municipal Electric Authority of Georgia Revenue | ||
| 5.00% 01/01/35 | 5,500,000 | 5,606,613 |
| Private Colleges & Universities Authority Revenue | ||
| 4.00% 10/01/38 | 1,500,000 | 1,502,134 |
| State of Georgia GO, | ||
| 4.00% 07/01/36 - 07/01/38 | 13,795,000 | 14,182,448 |
| 55,928,030 | ||
| Hawaii - 0.5% | ||
| State of Hawaii GO, | ||
| 5.00% 01/01/36 | 4,850,000 | 5,339,702 |
| Illinois - 3.4% | ||
| Chicago O'Hare International Airport Revenue | ||
| 5.00% 01/01/38 - 01/01/48 | 9,605,000 | 9,816,947 |
| 5.25% 01/01/42 | 8,000,000 | 8,257,990 |
| Cook County Community College District No. 508 GO, | ||
| 5.13% 12/01/38 | 1,000,000 | 1,000,593 |
| Cook County High School District No 202 Evanston Township GO, | ||
| 5.00% 12/01/29 | 1,190,000 | 1,257,276 |
| Illinois State Toll Highway Authority Revenue | ||
| 5.00% 01/01/46 | 500,000 | 528,555 |
| Metropolitan Water Reclamation District of Greater Chicago GO, | ||
| 5.00% 12/01/35 | 975,000 | 1,033,977 |
| State of Illinois GO, | ||
| 4.00% 02/01/30 | 1,500,000 | 1,512,319 |
| 5.00% 03/01/25 - 10/01/30 | 10,900,000 | 11,199,083 |
| State of Illinois Sales Tax Revenue | ||
| 5.00% 06/15/28 | 500,000 | 529,471 |
| 35,136,211 | ||
| Indiana - 0.6% | ||
| Indianapolis Local Public Improvement Bond Bank Revenue | ||
| 4.00% 02/01/44 | 6,500,000 | 6,312,676 |
| Elfun Tax-Exempt Income Fund | 61 |
| Principal Amount | Fair Value | |
| Iowa - 0.2% | ||
| Cedar Rapids Community School District Infrastructure Sales Services & Use Tax Revenue | ||
| 4.00% 07/01/34 | $ 1,055,000 | $ 1,107,763 |
| State of Iowa GO, | ||
| 5.00% 06/01/29 | 360,000 | 408,661 |
| State of Iowa Board of Regents Revenue | ||
| 3.00% 09/01/30 | 1,000,000 | 1,001,458 |
| 2,517,882 | ||
| Kentucky - 1.3% | ||
| Kentucky State Property & Building Commission Revenue | ||
| 5.00% 02/01/33 - 04/01/37 | 11,705,000 | 12,357,270 |
| Louisville Water Co. Revenue | ||
| 3.00% 11/15/34 | 1,000,000 | 944,012 |
| 13,301,282 | ||
| Maine - 0.2% | ||
| Maine Health & Higher Educational Facilities Authority Revenue | ||
| 5.00% 07/01/48 | 1,990,000 | 2,093,019 |
| Maine Municipal Bond Bank Revenue | ||
| 5.00% 09/01/26 | 500,000 | 538,627 |
| 2,631,646 | ||
| Maryland - 3.2% | ||
| City of Baltimore Revenue | ||
| 4.00% 07/01/34 - 07/01/44 | 4,400,000 | 4,312,367 |
| 5.00% 07/01/35 - 07/01/46 | 15,155,000 | 15,795,100 |
| 5.00% 07/01/38 (a) | 9,375,000 | 9,572,622 |
| County of Anne Arundel GO, | ||
| 5.00% 10/01/47 | 1,000,000 | 1,059,392 |
| County of Prince George's GO, | ||
| 4.00% 07/15/31 | 1,000,000 | 1,077,307 |
| State of Maryland Department of Transportation Revenue | ||
| 4.00% 12/01/29 | 1,140,000 | 1,187,145 |
| 33,003,933 | ||
| Massachusetts - 3.4% | ||
| Commonwealth of Massachusetts GO, | ||
| 4.00% 09/01/42 - 05/01/44 | 3,005,000 | 2,906,514 |
| 5.00% 03/01/46 | 7,000,000 | 7,085,244 |
| 5.25% 09/01/43 - 01/01/44 | 17,950,000 | 19,380,488 |
| Massachusetts Bay Transportation Authority Sales Tax Revenue, Series A-1 | ||
| 4.00% 07/01/38 | 1,150,000 | 1,146,177 |
| Massachusetts Development Finance Agency Revenue | ||
| 4.00% 06/01/49 (a) | 1,000,000 | 1,077,891 |
| Massachusetts Water Resources Authority Revenue | ||
| 5.00% 08/01/32 (a) | 4,140,000 | 4,189,357 |
| 35,785,671 | ||
| Principal Amount | Fair Value | |
| Michigan - 0.8% | ||
| Michigan Finance Authority Revenue | ||
| 5.00% 11/01/31 | $ 1,395,000 | $ 1,549,162 |
| State of Michigan Revenue | ||
| 5.00% 03/15/27 | 4,415,000 | 4,808,376 |
| University of Michigan Revenue | ||
| 5.00% 04/01/46 (a) | 1,000,000 | 1,074,380 |
| Warren Consolidated Schools GO, | ||
| 5.00% 05/01/35 | 715,000 | 751,057 |
| 8,182,975 | ||
| Minnesota - 2.1% | ||
| City of Minneapolis GO, | ||
| 3.00% 12/01/34 | 1,315,000 | 1,250,465 |
| City of Rochester Revenue | ||
| 4.00% 11/15/48 | 5,330,000 | 5,087,826 |
| City of St Cloud Revenue | ||
| 5.00% 05/01/48 | 2,000,000 | 2,041,992 |
| City of St Paul MN Sales & Use Tax Revenue | ||
| 5.00% 11/01/31 | 1,400,000 | 1,447,529 |
| Cloquet Independent School District No 94 GO, | ||
| 4.00% 02/01/36 | 1,675,000 | 1,695,113 |
| Maple River Independent School District No 2135 GO, | ||
| 5.00% 02/01/28 | 750,000 | 833,056 |
| Minneapolis-St Paul Metropolitan Airports Commission Revenue | ||
| 5.00% 01/01/25 | 1,000,000 | 1,014,756 |
| State of Minnesota GO, | ||
| 3.00% 10/01/36 | 1,220,000 | 1,113,558 |
| University of Minnesota Revenue | ||
| 5.00% 09/01/39 | 4,350,000 | 4,669,416 |
| Virginia Independent School District No 706 GO, | ||
| 5.00% 02/01/30 | 2,500,000 | 2,770,406 |
| 21,924,117 | ||
| Missouri - 0.6% | ||
| City of Kansas City MO Sanitary Sewer System Revenue | ||
| 4.00% 01/01/40 | 1,725,000 | 1,686,373 |
| Health & Educational Facilities Authority of the State of Missouri Revenue | ||
| 4.00% 11/15/48 | 2,200,000 | 1,960,078 |
| Metropolitan St Louis Sewer District Revenue | ||
| 5.00% 05/01/45 (a) | 480,000 | 503,717 |
| 5.00% 05/01/45 - 05/01/46 | 2,520,000 | 2,626,328 |
| 6,776,496 | ||
| Nebraska - 0.1% | ||
| Omaha Public Power District Revenue | ||
| 5.00% 02/01/35 | 500,000 | 576,900 |
| New Hampshire - 0.1% | ||
| New Hampshire Business Finance Authority Revenue | ||
| 5.00% 08/15/27 | 250,000 | 271,385 |
| 62 | Elfun Tax-Exempt Income Fund |
| Principal Amount | Fair Value | |
| New Hampshire Municipal Bond Bank Revenue | ||
| 3.00% 02/15/32 | $ 1,000,000 | $ 976,993 |
| 1,248,378 | ||
| New Jersey - 6.4% | ||
| New Jersey Economic Development Authority Revenue | ||
| 5.00% 06/15/41 - 06/15/43 | 11,750,000 | 11,952,096 |
| 5.25% 06/15/40 (a) | 220,000 | 233,558 |
| New Jersey Educational Facilities Authority Revenue | ||
| 5.50% 09/01/30 - 09/01/33 | 14,700,000 | 15,644,273 |
| New Jersey Health Care Facilities Financing Authority Revenue (AGM Insured) | ||
| 4.13% 07/01/38 | 6,215,000 | 6,212,136 |
| New Jersey Transportation Trust Fund Authority Revenue | ||
| 5.00% 12/15/32 - 06/15/45 | 8,250,000 | 8,647,137 |
| 5.25% 06/15/32 | 500,000 | 566,147 |
| New Jersey Turnpike Authority Revenue | ||
| 4.00% 01/01/35 - 01/01/48 | 6,090,000 | 5,841,585 |
| 5.00% 01/01/28 - 01/01/45 | 16,400,000 | 16,957,672 |
| State of New Jersey GO, | ||
| 2.00% 06/01/34 | 1,000,000 | 810,725 |
| 66,865,329 | ||
| New York - 11.4% | ||
| Battery Park City Authority Revenue | ||
| 4.00% 11/01/44 | 1,590,000 | 1,556,493 |
| Build NYC Resource Corp. Revenue | ||
| 5.00% 07/01/41 | 2,000,000 | 2,004,851 |
| City of New York GO, | ||
| 5.00% 08/01/26 - 08/01/43 | 4,500,000 | 4,779,952 |
| Hudson Yards Infrastructure Corp. Revenue | ||
| 4.00% 02/15/43 - 02/15/47 | 6,830,000 | 6,263,376 |
| 5.00% 02/15/39 - 02/15/45 | 11,000,000 | 11,576,005 |
| Metropolitan Transportation Authority Revenue (AGM Insured) | ||
| 4.00% 11/15/49 | 5,000,000 | 4,476,712 |
| Metropolitan Transportation Authority Revenue | ||
| 5.00% 11/15/29 - 11/15/37 | 7,960,000 | 8,008,055 |
| 5.25% 11/15/55 | 1,000,000 | 999,933 |
| New York City Transitional Finance Authority Building Aid Revenue | ||
| 5.00% 07/15/36 | 6,000,000 | 6,452,510 |
| New York City Transitional Finance Authority Future Tax Secured Revenue | ||
| 4.00% 11/01/42 | 5,000,000 | 4,755,539 |
| 5.00% 02/01/41 - 02/01/43 | 17,500,000 | 18,101,493 |
| New York City Water & Sewer System Revenue | ||
| 5.00% 06/15/49 | 6,460,000 | 6,761,433 |
| New York Liberty Development Corp. Revenue | ||
| 3.00% 09/15/43 | 2,000,000 | 1,565,560 |
| New York State Dormitory Authority Revenue | ||
| 4.00% 08/01/38 - 03/15/47 | 7,655,000 | 7,315,033 |
| 4.25% 10/01/51 | 610,000 | 593,425 |
| 5.00% 03/15/39 - 03/15/45 | 18,500,000 | 19,534,992 |
| Principal Amount | Fair Value | |
| 5.00% 07/01/46 (a) | $ 4,000,000 | $ 4,397,486 |
| New York Transportation Development Corp. Revenue | ||
| 4.00% 07/01/35 | 2,000,000 | 1,877,306 |
| Port Authority of New York & New Jersey Revenue | ||
| 5.00% 01/15/36 - 09/01/48 | 6,760,000 | 7,128,088 |
| Utility Debt Securitization Authority Revenue | ||
| 5.00% 12/15/40 | 1,000,000 | 1,074,838 |
| 119,223,080 | ||
| North Carolina - 0.8% | ||
| County of Brunswick Revenue | ||
| 4.00% 08/01/39 | 2,235,000 | 2,262,286 |
| Greater Asheville Regional Airport Authority Revenue | ||
| 5.00% 07/01/27 | 550,000 | 583,796 |
| North Carolina Capital Facilities Finance Agency Revenue | ||
| 4.00% 10/01/44 | 2,000,000 | 2,000,082 |
| The University of North Carolina at Charlotte Revenue | ||
| 5.00% 10/01/47 | 3,545,000 | 3,719,295 |
| 8,565,459 | ||
| North Dakota - 0.0%* | ||
| City of Grand Forks Revenue | ||
| 5.00% 12/01/27 | 250,000 | 265,587 |
| Ohio - 5.7% | ||
| City of Cleveland GO, | ||
| 5.00% 12/01/29 | 1,250,000 | 1,323,534 |
| City of Columbus GO, | ||
| 5.00% 07/01/26 - 08/15/30 (a) | 13,055,000 | 13,195,096 |
| City of Toledo Water System Revenue | ||
| 5.00% 11/15/27 - 11/15/28 (a) | 2,000,000 | 2,014,754 |
| Columbus Metropolitan Library Revenue | ||
| 4.00% 12/01/30 | 995,000 | 1,076,790 |
| County of Franklin Revenue | ||
| 5.00% 12/01/47 | 1,125,000 | 1,136,443 |
| County of Summit GO, | ||
| 5.00% 12/01/43 | 1,000,000 | 1,096,802 |
| Dublin City School District GO, | ||
| 4.00% 12/01/30 | 1,010,000 | 1,079,597 |
| Northeast Ohio Regional Sewer District Revenue | ||
| 3.00% 11/15/34 | 1,385,000 | 1,287,989 |
| 4.00% 11/15/43 | 7,550,000 | 7,446,622 |
| 5.00% 11/15/38 (a) | 12,000,000 | 12,088,528 |
| Ohio Higher Educational Facility Commission Revenue | ||
| 4.00% 10/01/47 | 750,000 | 697,237 |
| Ohio Turnpike & Infrastructure Commission Revenue | ||
| 5.25% 02/15/39 | 13,250,000 | 13,283,387 |
| University of Cincinnati Revenue | ||
| 5.00% 06/01/45 | 3,500,000 | 3,632,978 |
| 59,359,757 | ||
| Elfun Tax-Exempt Income Fund | 63 |
| Principal Amount | Fair Value | |
| Oklahoma - 0.8% | ||
| City of Bixby OK GO, | ||
| 4.00% 06/01/32 | $ 1,000,000 | $ 1,086,142 |
| Oklahoma Capitol Improvement Authority Revenue | ||
| 5.00% 07/01/28 - 07/01/29 | 5,000,000 | 5,141,122 |
| Oklahoma City Zoological Trust OK Sales Tax Revenue | ||
| 4.00% 06/01/29 | 1,340,000 | 1,441,230 |
| The University of Oklahoma Revenue | ||
| 5.00% 07/01/44 | 1,000,000 | 1,005,185 |
| 8,673,679 | ||
| Oregon - 1.1% | ||
| City of Eugene OR Water Utility System Revenue | ||
| 4.00% 08/01/45 | 1,000,000 | 975,154 |
| Clackamas County School District No 7J Lake Oswego GO, | ||
| 4.00% 06/01/33 | 1,000,000 | 1,047,338 |
| Clackamas County School District No 86 Canby GO, | ||
| 4.00% 06/15/40 | 3,470,000 | 3,499,865 |
| Jackson County School District No. 5 Ashland GO, | ||
| 5.00% 06/15/31 | 880,000 | 993,604 |
| Oregon State University Revenue | ||
| 5.00% 04/01/45 | 2,000,000 | 2,062,517 |
| Port of Portland OR Airport Revenue | ||
| 5.00% 07/01/27 - 07/01/38 | 2,520,000 | 2,582,780 |
| 11,161,258 | ||
| Pennsylvania - 6.1% | ||
| Allegheny County Hospital Development Authority Revenue | ||
| 4.00% 07/15/39 | 1,500,000 | 1,414,761 |
| City of Philadelphia GO, | ||
| 5.00% 02/01/24 - 08/01/36 | 8,605,000 | 9,064,211 |
| City of Philadelphia Airport Revenue | ||
| 5.00% 07/01/28 | 1,000,000 | 1,068,978 |
| City of Philadelphia PA Airport Revenue, Series A | ||
| 4.00% 07/01/40 | 3,000,000 | 2,884,555 |
| City of Philadelphia PA Water & Wastewater Revenue | ||
| 5.00% 10/01/43 - 10/01/47 | 15,000,000 | 15,642,796 |
| City of Philadelphia PA Water & Wastewater Revenue | ||
| 4.00% 10/01/31 | 4,980,000 | 5,120,688 |
| City of Pittsburgh GO, | ||
| 5.00% 09/01/32 | 250,000 | 283,606 |
| Commonwealth of Pennsylvania GO, | ||
| 4.00% 09/15/34 | 1,475,000 | 1,497,795 |
| 5.00% 07/15/27 | 640,000 | 700,667 |
| Delaware River Joint Toll Bridge Commission Revenue | ||
| 5.00% 07/01/26 | 1,000,000 | 1,076,386 |
| Delaware River Port Authority Revenue | ||
| 5.00% 01/01/26 - 01/01/40 | 4,100,000 | 4,385,560 |
| General Authority of Southcentral Pennsylvania Revenue | ||
| 4.00% 06/01/49 | 3,015,000 | 2,786,670 |
| Middletown Area School District GO, (AGM Insured) | ||
| 4.00% 03/01/36 | 1,000,000 | 1,015,257 |
| Principal Amount | Fair Value | |
| Montgomery County Higher Education and Health Authority Revenue | ||
| 4.00% 09/01/49 | $ 3,000,000 | $ 2,599,113 |
| Pennsylvania Economic Development Financing Authority Revenue | ||
| 4.00% 11/15/42 | 5,000,000 | 4,541,096 |
| Pennsylvania Higher Educational Facilities Authority Revenue | ||
| 5.00% 05/01/41 | 1,000,000 | 1,028,760 |
| Pennsylvania Turnpike Commission Revenue | ||
| 5.00% 12/01/28 - 12/01/43 | 3,350,000 | 3,565,306 |
| Springfield School District/Delaware County GO, | ||
| 4.00% 03/01/43 | 1,000,000 | 959,321 |
| The Pennsylvania State University Revenue | ||
| 5.00% 09/01/47 | 2,000,000 | 2,099,379 |
| The School District of Philadelphia GO, | ||
| 4.00% 09/01/38 | 1,750,000 | 1,691,427 |
| 5.00% 09/01/28 | 840,000 | 917,437 |
| 64,343,769 | ||
| Rhode Island - 0.9% | ||
| Rhode Island Health and Educational Building Corp. Revenue | ||
| 4.00% 05/15/34 | 1,400,000 | 1,463,360 |
| 5.00% 09/01/43 | 5,000,000 | 5,038,555 |
| Rhode Island Health and Educational Building Corp. Revenue (BAM Insured) | ||
| 5.00% 05/15/29 | 200,000 | 225,990 |
| Rhode Island Infrastructure Bank Water Pollution Control Revolving Fund Revenue | ||
| 5.00% 10/01/28 (a) | 2,200,000 | 2,338,270 |
| 9,066,175 | ||
| South Carolina - 1.6% | ||
| Beaufort County School District GO, | ||
| 4.00% 03/01/33 | 2,200,000 | 2,338,359 |
| City of Columbia Waterworks & Sewer System Revenue Revenue | ||
| 5.00% 02/01/47 | 2,425,000 | 2,652,999 |
| South Carolina Public Service Authority Revenue | ||
| 5.00% 12/01/37 - 12/01/38 | 12,000,000 | 12,206,038 |
| 17,197,396 | ||
| Tennessee - 1.5% | ||
| City of Knoxville TN Electric System Revenue | ||
| 5.00% 07/01/40 | 2,840,000 | 3,142,773 |
| City of Memphis GO, | ||
| 4.00% 05/01/38 - 06/01/46 | 9,920,000 | 9,515,258 |
| County of Hamblen GO, | ||
| 4.00% 05/01/40 | 780,000 | 761,310 |
| Memphis-Shelby County Airport Authority Revenue | ||
| 5.00% 07/01/31 | 375,000 | 408,845 |
| 64 | Elfun Tax-Exempt Income Fund |
| Principal Amount | Fair Value | |
| Metropolitan Government of Nashville & Davidson County TN Water & Sewer Revenue | ||
| 5.00% 07/01/46 | $ 2,000,000 | $ 2,095,735 |
| 15,923,921 | ||
| Texas - 6.3% | ||
| Arlington Higher Education Finance Corp. Revenue | ||
| 5.00% 08/15/28 | 500,000 | 554,442 |
| Arlington Independent School District GO, | ||
| 4.00% 02/15/36 | 1,220,000 | 1,241,319 |
| Board of Regents of the University of Texas System Revenue | ||
| 5.00% 08/15/26 | 10,000,000 | 10,842,672 |
| City of Austin TX Airport System Revenue | ||
| 5.00% 11/15/46 | 3,000,000 | 3,052,518 |
| City of Dallas TX Waterworks & Sewer System Revenue | ||
| 5.00% 10/01/46 | 3,550,000 | 3,731,512 |
| City of Houston TX Combined Utility System Revenue | ||
| 5.00% 05/15/28 | 5,000,000 | 5,142,166 |
| City of North Richland Hills GO, | ||
| 4.00% 02/15/27 | 1,045,000 | 1,097,250 |
| Conroe Independent School District GO, | ||
| 5.00% 02/15/33 | 500,000 | 589,513 |
| Dallas Area Rapid Transit Revenue | ||
| 4.00% 12/01/38 | 1,700,000 | 1,682,376 |
| Dallas Fort Worth International Airport Revenue | ||
| 5.25% 11/01/29 | 5,000,000 | 5,099,732 |
| Dallas Independent School District GO, | ||
| 5.00% 02/15/34 | 560,000 | 625,912 |
| Del Valle Independent School District GO, | ||
| 4.00% 06/15/37 | 500,000 | 503,937 |
| Forney Independent School District GO, | ||
| 5.00% 08/15/39 | 500,000 | 559,046 |
| Grand Parkway Transportation Corp. Revenue | ||
| 5.00% 10/01/48 | 1,050,000 | 1,089,471 |
| Greater Texoma Utility Authority Revenue | ||
| 5.00% 10/01/35 | 600,000 | 671,526 |
| Hays Consolidated Independent School District GO, | ||
| 4.00% 02/15/38 | 550,000 | 550,560 |
| Klein Independent School District GO, | ||
| 5.00% 02/01/43 | 500,000 | 535,961 |
| Lower Colorado River Authority Revenue | ||
| 5.00% 05/15/44 | 2,000,000 | 2,042,501 |
| North Texas Tollway Authority Revenue | ||
| 5.00% 01/01/26 - 01/01/48 | 10,095,000 | 10,537,008 |
| Port Authority of Houston of Harris County Texas GO, | ||
| 5.00% 10/01/27 | 1,000,000 | 1,094,176 |
| State of Texas GO, | ||
| 4.00% 10/01/44 | 1,985,000 | 1,932,152 |
| Texas A&M University Revenue | ||
| 5.00% 05/15/28 | 500,000 | 557,480 |
| Texas Municipal Power Agency Revenue (AGM Insured) | ||
| 3.00% 09/01/28 | 275,000 | 271,957 |
| Principal Amount | Fair Value | |
| Texas Transportation Commission State Highway Fund Revenue | ||
| 5.00% 04/01/23 | $ 10,750,000 | $ 10,804,119 |
| Upper Trinity Regional Water District Revenue, (BAM Insured) | ||
| 5.00% 08/01/28 | 500,000 | 556,007 |
| Willis Independent School District GO, | ||
| 5.00% 02/15/32 | 500,000 | 576,444 |
| 65,941,757 | ||
| Utah - 0.9% | ||
| Central Valley Water Reclamation Facility Revenue | ||
| 3.00% 03/01/30 | 1,145,000 | 1,152,907 |
| City of Salt Lake City Public Utilities Revenue | ||
| 4.00% 02/01/45 | 1,220,000 | 1,190,348 |
| City of Salt Lake City UT Airport Revenue | ||
| 5.00% 07/01/48 | 2,000,000 | 2,039,176 |
| City of Salt Lake City UT Public Utilities Revenue | ||
| 5.00% 02/01/50 | 3,080,000 | 3,258,024 |
| The University of Utah Revenue | ||
| 5.00% 08/01/42 | 1,685,000 | 1,860,093 |
| 9,500,548 | ||
| Virginia - 3.1% | ||
| Chesapeake Bay Bridge & Tunnel District Revenue | ||
| 5.00% 07/01/51 | 2,000,000 | 1,964,958 |
| City of Richmond VA Public Utility Revenue | ||
| 4.00% 01/15/36 | 4,350,000 | 4,410,577 |
| County of Fairfax GO, | ||
| 4.00% 10/01/35 | 6,645,000 | 6,928,532 |
| County of Fairfax Sewer Revenue, Series A | ||
| 4.00% 07/15/40 | 2,245,000 | 2,302,857 |
| County of Loudoun GO, | ||
| 4.00% 12/01/37 | 2,000,000 | 2,071,052 |
| University of Virginia Revenue | ||
| 5.00% 04/01/47 | 6,000,000 | 6,370,036 |
| Virginia College Building Authority Revenue | ||
| 4.00% 09/01/35 | 1,000,000 | 1,033,137 |
| Virginia Resources Authority Revenue | ||
| 4.00% 11/01/41 | 5,585,000 | 5,625,833 |
| 5.00% 11/01/46 | 1,720,000 | 1,817,528 |
| 32,524,510 | ||
| Washington - 3.0% | ||
| City of Seattle WA Drainage & Wastewater Revenue | ||
| 4.00% 09/01/51 | 2,000,000 | 1,874,197 |
| City of Seattle WA Municipal Light & Power Revenue | ||
| 4.00% 10/01/35 - 09/01/40 | 5,590,000 | 5,637,461 |
| 5.00% 07/01/52 | 1,000,000 | 1,086,213 |
| City of Spokane GO, | ||
| 3.13% 12/01/33 | 1,260,000 | 1,207,584 |
| County of King GO, | ||
| 4.00% 12/01/34 | 2,150,000 | 2,193,271 |
| Elfun Tax-Exempt Income Fund | 65 |
| Principal Amount | Fair Value | |
| County of King WA Sewer Revenue | ||
| 5.00% 07/01/28 | $ 1,060,000 | $ 1,093,428 |
| Pierce & King Counties School District No 417 Fife GO, | ||
| 4.00% 12/01/35 | 1,450,000 | 1,497,389 |
| Port of Seattle Revenue | ||
| 5.00% 04/01/29 - 08/01/42 | 5,485,000 | 5,775,125 |
| Snohomish County Public Utility District No 1 Electric System Revenue | ||
| 5.00% 12/01/51 | 2,000,000 | 2,147,020 |
| Spokane County School District No 81 Spokane GO, | ||
| 4.00% 12/01/39 | 1,000,000 | 1,007,362 |
| State of Washington GO, | ||
| 4.00% 07/01/27 | 1,175,000 | 1,242,811 |
| 5.00% 08/01/29 - 06/01/44 | 6,105,000 | 6,603,470 |
| 31,365,331 | ||
| Wisconsin - 0.6% | ||
| State of Wisconsin GO, | ||
| 4.00% 05/01/30 - 05/01/40 | 3,975,000 | 4,010,449 |
| 5.00% 05/01/38 | 2,105,000 | 2,187,780 |
| 6,198,229 | ||
| Total Municipal Bonds and Notes (Cost $1,040,934,261) | 1,025,415,897 | |
| Short-Term Investments - 1.5% | ||
| State Street Institutional Treasury Plus Fund - Premier Class 4.15% (b)(c) (Cost $15,874,392) | 15,874,392 | 15,874,392 |
| Total Investments (Cost $1,056,808,653) | 1,041,290,289 | |
| Other Assets and Liabilities, net - 0.6% | 5,946,145 | |
| NET ASSETS - 100.0% | $ 1,047,236,434 | |
| (a) | Pre-refunded bonds are collateralized by U.S. Treasury securities, which are held in escrow by a trustee and are used to pay principal and interest on the tax-exempt issue to retire the bonds at the earliest refunding date. |
| (b) | Sponsored by SSGA Funds Management, Inc., the Fund’s investment adviser and administrator, and an affiliate of State Street Bank & Trust Co., the Fund’s sub-administrator, custodian and accounting agent. |
| (c) | Coupon amount represents effective yield. |
| † | Percentages are based on net assets as of December 31, 2022. |
| * | Less than 0.05%. |
| Abbreviations: |
| BAM - Build America Mutual Assurance Company |
| NPFG - National Public Finance Guaranty Corporation |
| Investments | Level 1 | Level 2 | Level 3 | Total | |||
| Investments in Securities | |||||||
| Municipal Bonds and Notes | $ — | $ 1,025,415,897 | $ — | $ 1,025,415,897 | |||
| Short-Term Investments | 15,874,392 | — | — | 15,874,392 | |||
| Total Investments in Securities | $ 15,874,392 | $ 1,025,415,897 | $ — | $ 1,041,290,289 |
| Affiliate Table |
| Number of Shares Held at 12/31/21 | Value at 12/31/21 | Cost of Purchases | Proceeds from Shares Sold | Realized Gain (Loss) | Change in Unrealized Appreciation (Depreciation) | Number of Shares Held at 12/31/22 | Value at 12/31/22 | Dividend Income | |
| State Street Institutional Treasury Plus Fund - Premier Class | 3,950,909 | $3,950,909 | $188,950,816 | $177,027,333 | $— | $— | 15,874,392 | $15,874,392 | $167,743 |
| 66 | Elfun Tax-Exempt Income Fund |
| Elfun Income Fund | 67 |
| Sector Allocation |
| Portfolio composition as a % of Fair Value of $189,843 (in thousands) as of December 31, 2022 (a)(b) |
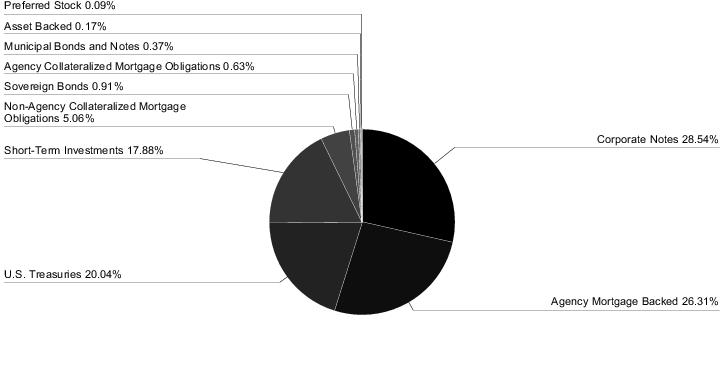
| Quality Ratings | ||
| as of December 31, 2022 as a % of Fair Value (a)(b) | ||
| Moody’s / S&P / Rating* | Percentage of Fair Value | |
| Aaa / AAA | 4.43% | |
| Aa / AA | 48.28% | |
| A / A | 6.51% | |
| Baa / BBB | 19.59% | |
| Ba / BB and lower | 1.80% | |
| NR / Other | 19.39% | |
| 100.00% | ||
| Average Annual Total Return for the years ended December 31, 2022 | |||||||
| (Inception date 12/31/84) | |||||||
| One Year | Five Year | Ten Year | Ending Value of a $10,000 Investment | ||||
| Elfun Income Fund | (13.47)% | 0.07% | 1.26% | $11,329 | |||
| Bloomberg U.S. Aggregate Bond Index | (13.01)% | 0.02% | 1.06% | $11,108 | |||
| (a) | Fair Value basis is inclusive of a short-term investment in the State Street Institutional U.S. Government Money Market Fund - Class G Shares. |
| (b) | The securities information regarding holdings, allocations and other characteristics is presented to illustrate examples of securities that the Fund has bought and the diversity of areas in which the Fund may invest as of a particular date. It may not be representative of the Fund’s current or future investments and should not be construed as a recommendation to purchase or sell a particular security. |
| * | Moody’s Investors Services, Inc. (“Moody’s”) and S&P Global Ratings (“S&P”) are nationally recognized statistical rating organizations. The quality ratings represent the lower of Moody’s or S&P credit ratings. When a rating from only one of the rating agencies is available, that rating is used. Securities not rated by Moody’s or S&P are categorized as not rated. Credit quality measures a bond issuer’s ability to repay interest and principal in a timely manner. Credit quality ratings assigned by a rating agency are subject to change periodically and are not absolute standard of quality. In formulating investment decisions for the Fund, SSGA Funds Management, Inc. (“SSGA FM”) develops its own analysis of the credit quality and risks associated with individual debt instruments, rather than relying exclusively on rating agency ratings. |
| 68 | Elfun Income Fund |
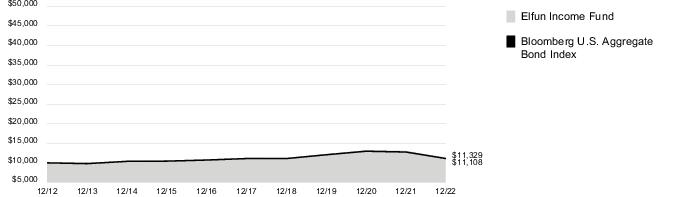
| Elfun Income Fund | 69 |
| Actual Fund Return | Hypothetical 5% Return (2.5% for the period) | ||
| Beginning Account Value July 1, 2022 | $1,000.00 | $1,000.00 | |
| Ending Account value December 31, 2022 | $ 973.40 | $1,023.60 | |
| Expenses Paid During Period* | $ 1.59 | $ 1.63 |
| * | Expenses are equal to the Fund's annualized net expense ratio of 0.32%** (for the period July 1, 2022 - December 31, 2022), multiplied by the average account value over the period, multiplied by 184/365 (to reflect the one-half year period). |
| ** | May differ from expense ratio disclosed in the financial highlights, which is calculated based on the entire fiscal year's data. |
| 70 | Elfun Income Fund |
| Principal Amount | Fair Value | |
| Bonds and Notes - 97.1% † | ||
| U.S. Treasuries - 23.7% | ||
| U.S. Treasury Bonds | ||
| 1.88%, 02/15/41 - 02/15/51 | $ 1,873,000 | $ 1,261,081 |
| 2.25%, 08/15/46 (a) | 1,518,000 | 1,079,203 |
| 2.38%, 02/15/42 | 166,000 | 126,834 |
| 3.00%, 08/15/48 (a) | 2,843,000 | 2,345,475 |
| U.S. Treasury Notes | ||
| 0.25%, 07/31/25 (a) | 5,738,400 | 5,177,113 |
| 0.75%, 12/31/23 | 6,679,000 | 6,422,015 |
| 0.75%, 01/31/28 (a) | 11,719,000 | 9,967,559 |
| 1.13%, 01/15/25 | 882,000 | 825,359 |
| 1.25%, 11/30/26 | 673,000 | 603,807 |
| 1.50%, 02/29/24 | 1,388,000 | 1,337,685 |
| 1.63%, 05/15/31 | 5,724,000 | 4,816,209 |
| 1.75%, 01/31/29 | 1,113,000 | 978,049 |
| 2.63%, 02/15/29 (a) | 1,518,000 | 1,403,676 |
| 2.88%, 05/15/32 | 546,000 | 503,344 |
| 4.25%, 10/15/25 | 1,205,000 | 1,204,247 |
| 38,051,656 | ||
| Agency Mortgage Backed - 31.2% | ||
| Federal Home Loan Mortgage Corp. | ||
| 3.00%, 04/01/43 - 10/01/49 (a) | 4,437,393 | 3,990,092 |
| 4.50%, 06/01/33 - 02/01/35 (a) | 6,286 | 6,205 |
| 5.00%, 07/01/35 (a) | 47,997 | 48,322 |
| 5.50%, 01/01/38 - 04/01/39 (a) | 79,709 | 82,138 |
| 6.00%, 06/01/33 - 11/01/37 (a) | 176,160 | 184,580 |
| 7.00%, 01/01/27 - 08/01/36 (a) | 42,308 | 44,787 |
| 7.50%, 11/01/29 - 09/01/33 (a) | 5,575 | 5,812 |
| 8.00%, 11/01/30 (a) | 1,970 | 2,065 |
| Federal National Mortgage Assoc. | ||
| 2.50%, 03/01/51 (a) | 3,198,967 | 2,707,139 |
| 3.50%, 08/01/45 - 01/01/48 (a) | 3,626,419 | 3,388,265 |
| 4.00%, 01/01/41 - 01/01/50 (a) | 1,920,793 | 1,842,633 |
| 4.50%, 07/01/33 - 12/01/48 (a) | 1,012,621 | 999,064 |
| 5.00%, 03/01/34 - 05/01/39 (a) | 105,331 | 106,187 |
| 5.50%, 12/01/32 - 01/01/39 (a) | 281,207 | 288,441 |
| 6.00%, 01/01/29 - 05/01/41 (a) | 666,923 | 697,158 |
| 6.50%, 08/01/28 - 08/01/36 (a) | 32,910 | 34,789 |
| Principal Amount | Fair Value | |
| 7.00%, 10/01/32 - 02/01/34 (a) | $ 7,264 | $ 7,540 |
| 7.50%, 12/01/26 - 03/01/33 (a) | 21,244 | 22,127 |
| 8.00%, 06/01/24 - 10/01/31 (a) | 4,141 | 4,234 |
| 8.50%, 04/01/30 (a) | 1,053 | 1,136 |
| Federal National Mortgage Assoc. 1.60% + 12 month USD LIBOR | ||
| 2.97%, 04/01/37 (a)(b) | 1,849 | 1,830 |
| Federal National Mortgage Assoc. TBA | ||
| 2.00%, 01/17/38 - 01/01/53 (c) | 13,089,788 | 10,728,583 |
| 2.50%, 01/01/53 (c) | 4,481,805 | 3,790,729 |
| 3.00%, 01/01/53 (c) | 1,121,007 | 982,951 |
| 3.50%, 01/01/53 (c) | 2,483,779 | 2,254,653 |
| 4.00%, 01/01/53 (c) | 3,505,175 | 3,285,667 |
| 4.50%, 01/01/53 (c) | 3,733,973 | 3,594,151 |
| Government National Mortgage Assoc. | ||
| 3.00%, 12/20/42 - 05/20/45 (a) | 3,767,365 | 3,416,402 |
| 3.50%, 08/20/48 (a) | 717,532 | 668,506 |
| 4.00%, 01/20/41 - 04/20/43 (a) | 618,305 | 602,709 |
| 4.50%, 08/15/33 - 03/20/41 (a) | 287,420 | 286,003 |
| 5.00%, 08/15/33 (a) | 16,367 | 16,556 |
| 6.00%, 04/15/27 - 04/15/35 (a) | 96,938 | 101,154 |
| 6.50%, 03/15/24 - 09/15/36 (a) | 34,937 | 36,542 |
| 7.00%, 11/15/27 - 10/15/36 (a) | 27,886 | 29,261 |
| 7.50%, 08/15/23 - 10/15/28 (a) | 5,568 | 5,720 |
| 8.00%, 09/15/27 - 06/15/30 (a) | 16,047 | 16,382 |
| Government National Mortgage Assoc. TBA | ||
| 2.00%, 01/23/53 | 3,004,205 | 2,510,674 |
| 2.50%, 01/23/53 | 3,010,193 | 2,600,048 |
| 4.00%, 01/01/53 (c) | 595,406 | 562,809 |
| 49,954,044 | ||
| Agency Collateralized Mortgage Obligations - 0.7% | ||
| Federal Home Loan Mortgage Corp. | ||
| 0.08%, 09/25/43 (b)(d) | 573,977 | 1,770 |
| 2.51%, 07/25/29 | 745,000 | 661,045 |
| 4.05%, 09/25/28 (b) | 300,000 | 293,286 |
| Elfun Income Fund | 71 |
| Principal Amount | Fair Value | |
| Federal Home Loan Mortgage Corp. REMIC | ||
| 3.50%, 11/15/30 (d) | $ 12,198 | $ 124 |
| 5.50%, 06/15/33 (d) | 15,629 | 2,505 |
| Federal Home Loan Mortgage Corp. STRIPS | ||
| 0.00%, 08/01/27 (e) | 286 | 265 |
| 8.00%, 02/01/23 (d)** | 3 | — |
| 8.00%, 07/01/24 (d) | 249 | 12 |
| Federal National Mortgage Assoc. REMIC | ||
| 1.15%, 12/25/42 (b)(d) | 125,490 | 4,882 |
| 5.00%, 02/25/40 - 09/25/40 (d) | 33,229 | 3,669 |
| Federal National Mortgage Assoc. REMIC 6.00% - 1 month USD LIBOR | ||
| 1.61%, 07/25/38 (b)(d) | 16,866 | 1,433 |
| Federal National Mortgage Assoc. REMIC 6.55% - 1 month USD LIBOR | ||
| 2.16%, 11/25/41 (b)(d) | 1,756,433 | 206,038 |
| Federal National Mortgage Assoc. STRIPS | ||
| 0.01%, 12/25/34 (e) | 16,894 | 13,009 |
| 4.50%, 08/25/35 - 01/25/36 (d) | 30,031 | 3,847 |
| 5.00%, 03/25/38 - 05/25/38 (d) | 18,461 | 2,817 |
| 5.50%, 12/25/33 (d) | 5,502 | 1,017 |
| 6.00%, 01/25/35 (d) | 21,787 | 3,837 |
| 7.50%, 11/25/23 (d) | 271 | 5 |
| 8.00%, 07/25/24 (d) | 509 | 23 |
| 1,199,584 | ||
| Asset Backed - 0.2% | ||
| Chase Funding Trust 2004-1 | ||
| 4.99%, 11/25/33 | 65,449 | 64,430 |
| Ford Credit Auto Owner Trust 2020-B | ||
| 0.56%, 10/15/24 | 265,045 | 261,888 |
| 326,318 | ||
| Corporate Notes - 33.8% | ||
| 3M Co. | ||
| 3.13%, 09/19/46 (a) | 19,000 | 13,051 |
| 7-Eleven Inc. | ||
| 0.95%, 02/10/26 (a)(f) | 263,000 | 230,107 |
| Abbott Laboratories | ||
| 3.75%, 11/30/26 (a) | 28,000 | 27,290 |
| 4.90%, 11/30/46 (a) | 66,000 | 64,578 |
| AbbVie Inc. | ||
| 2.60%, 11/21/24 (a) | 111,000 | 106,274 |
| Principal Amount | Fair Value | |
| 3.20%, 05/14/26 - 11/21/29 (a) | $ 148,000 | $ 135,820 |
| 4.05%, 11/21/39 (a) | 46,000 | 39,395 |
| 4.25%, 11/21/49 (a) | 93,000 | 78,173 |
| 4.40%, 11/06/42 (a) | 33,000 | 28,656 |
| 4.63%, 10/01/42 (a) | 7,000 | 6,259 |
| 4.70%, 05/14/45 (a) | 13,000 | 11,613 |
| 4.88%, 11/14/48 (a) | 10,000 | 9,208 |
| Advance Auto Parts Inc. | ||
| 3.90%, 04/15/30 (a) | 179,000 | 157,278 |
| Advanced Micro Devices Inc. | ||
| 4.39%, 06/01/52 (a) | 70,000 | 61,900 |
| AEP Texas Inc. | ||
| 3.45%, 05/15/51 (a) | 112,000 | 79,229 |
| Aetna Inc. | ||
| 3.50%, 11/15/24 (a) | 51,000 | 49,586 |
| Aircastle Ltd. | ||
| 4.25%, 06/15/26 (a) | 78,000 | 73,435 |
| Alcoa Nederland Holding BV | ||
| 5.50%, 12/15/27 (a)(f) | 203,000 | 195,595 |
| Alcon Finance Corp. | ||
| 2.60%, 05/27/30 (a)(f) | 239,000 | 202,913 |
| Alexandria Real Estate Equities Inc. | ||
| 1.88%, 02/01/33 (a) | 46,000 | 34,273 |
| 2.95%, 03/15/34 (a) | 77,000 | 62,690 |
| 3.55%, 03/15/52 (a) | 62,000 | 44,467 |
| 4.70%, 07/01/30 (a) | 20,000 | 19,215 |
| Altria Group Inc. | ||
| 3.40%, 05/06/30 - 02/04/41 (a) | 56,000 | 40,201 |
| 4.00%, 02/04/61 (a) | 20,000 | 13,035 |
| 4.25%, 08/09/42 (a) | 6,000 | 4,445 |
| 4.45%, 05/06/50 (a) | 27,000 | 19,126 |
| 4.50%, 05/02/43 (a) | 20,000 | 15,050 |
| Amazon.com Inc. | ||
| 1.50%, 06/03/30 (a) | 33,000 | 26,513 |
| 2.50%, 06/03/50 (a) | 38,000 | 24,111 |
| 2.70%, 06/03/60 (a) | 30,000 | 18,260 |
| 2.88%, 05/12/41 (a) | 67,000 | 50,034 |
| 3.15%, 08/22/27 (a) | 15,000 | 14,123 |
| 3.25%, 05/12/61 (a) | 51,000 | 35,467 |
| 4.05%, 08/22/47 (a) | 16,000 | 13,833 |
| 4.25%, 08/22/57 (a) | 10,000 | 8,673 |
| Ameren Corp. | ||
| 2.50%, 09/15/24 (a) | 159,000 | 151,917 |
| 3.65%, 02/15/26 (a) | 28,000 | 26,769 |
| American Electric Power Company Inc. | ||
| 2.30%, 03/01/30 (a) | 35,000 | 28,653 |
| 3.25%, 03/01/50 (a) | 15,000 | 10,114 |
| 72 | Elfun Income Fund |
| Principal Amount | Fair Value | |
| American International Group Inc. (5.75% fixed rate until 04/01/28; 2.87% + 3 month USD LIBOR thereafter) | ||
| 5.75%, 04/01/48 (a)(b) | $ 10,000 | $ 9,556 |
| American Tower Corp. | ||
| 1.50%, 01/31/28 (a) | 124,000 | 102,713 |
| 2.90%, 01/15/30 (a) | 45,000 | 38,123 |
| 3.70%, 10/15/49 (a) | 26,000 | 18,486 |
| 3.80%, 08/15/29 (a) | 54,000 | 49,106 |
| American Water Capital Corp. | ||
| 2.95%, 09/01/27 (a) | 35,000 | 32,276 |
| Amgen Inc. | ||
| 2.00%, 01/15/32 (a) | 77,000 | 60,031 |
| 2.45%, 02/21/30 (a) | 20,000 | 16,877 |
| 3.00%, 01/15/52 (a) | 43,000 | 27,638 |
| 3.15%, 02/21/40 (a) | 76,000 | 56,123 |
| AngloGold Ashanti Holdings PLC | ||
| 3.38%, 11/01/28 (a) | 200,000 | 175,344 |
| Anheuser-Busch Companies LLC/Anheuser-Busch InBev Worldwide Inc. | ||
| 3.65%, 02/01/26 (a) | 74,000 | 71,278 |
| 4.70%, 02/01/36 (a) | 22,000 | 20,741 |
| 4.90%, 02/01/46 (a) | 48,000 | 43,925 |
| Anheuser-Busch InBev Worldwide Inc. | ||
| 3.50%, 06/01/30 (a) | 51,000 | 46,385 |
| 4.00%, 04/13/28 (a) | 12,000 | 11,454 |
| 4.35%, 06/01/40 (a) | 50,000 | 44,185 |
| 4.38%, 04/15/38 (a) | 70,000 | 62,934 |
| 4.60%, 04/15/48 (a) | 27,000 | 23,767 |
| 4.75%, 04/15/58 (a) | 23,000 | 20,361 |
| 5.55%, 01/23/49 (a) | 50,000 | 49,832 |
| ANZ Bank New Zealand Ltd. (5.55% fixed rate until 08/11/27; 2.70% + 5 year CMT Rate thereafter) | ||
| 5.55%, 08/11/32 (b)(f) | 209,000 | 203,125 |
| Aon Corp./Aon Global Holdings PLC | ||
| 2.90%, 08/23/51 (a) | 78,000 | 49,511 |
| Apollo Management Holdings LP (4.95% fixed rate until 12/17/24; 3.27% + 5 year CMT Rate thereafter) | ||
| 4.95%, 01/14/50 (a)(b)(f) | 53,000 | 44,521 |
| Apple Inc. | ||
| 2.65%, 02/08/51 (a) | 61,000 | 40,706 |
| 2.80%, 02/08/61 (a) | 53,000 | 34,007 |
| 2.95%, 09/11/49 (a) | 30,000 | 21,422 |
| 3.35%, 02/09/27 (a) | 16,000 | 15,317 |
| 3.45%, 02/09/45 (a) | 69,000 | 55,531 |
| Principal Amount | Fair Value | |
| 3.85%, 08/04/46 (a) | $ 49,000 | $ 41,725 |
| 3.95%, 08/08/52 | 65,000 | 55,505 |
| Applied Materials Inc. | ||
| 4.35%, 04/01/47 (a) | 27,000 | 24,390 |
| Aptiv PLC | ||
| 4.40%, 10/01/46 (a) | 19,000 | 14,370 |
| ArcelorMittal S.A. | ||
| 6.80%, 11/29/32 | 260,000 | 259,204 |
| Archer-Daniels-Midland Co. | ||
| 2.50%, 08/11/26 (a) | 24,000 | 22,271 |
| Ares Capital Corp. | ||
| 2.88%, 06/15/28 (a) | 171,000 | 137,361 |
| 3.25%, 07/15/25 (a) | 352,000 | 323,812 |
| Arthur J Gallagher & Co. | ||
| 3.50%, 05/20/51 (a) | 83,000 | 58,133 |
| Ascension Health | ||
| 4.85%, 11/15/53 (a) | 59,000 | 55,938 |
| Ashtead Capital Inc. | ||
| 1.50%, 08/12/26 (a)(f) | 200,000 | 170,548 |
| Astrazeneca Finance LLC | ||
| 1.75%, 05/28/28 (a) | 109,000 | 93,618 |
| AstraZeneca PLC | ||
| 3.00%, 05/28/51 (a) | 51,000 | 36,019 |
| 4.00%, 01/17/29 (a) | 15,000 | 14,419 |
| 4.38%, 08/17/48 (a) | 7,000 | 6,278 |
| AT&T Inc. | ||
| 1.70%, 03/25/26 (a) | 292,000 | 263,550 |
| 2.30%, 06/01/27 (a) | 76,000 | 67,726 |
| 2.75%, 06/01/31 (a) | 154,000 | 127,874 |
| 3.85%, 06/01/60 (a) | 70,000 | 48,862 |
| 4.35%, 03/01/29 (a) | 55,000 | 52,342 |
| 4.50%, 05/15/35 (a) | 51,000 | 46,386 |
| 4.55%, 03/09/49 (a) | 24,000 | 19,653 |
| 4.75%, 05/15/46 (a) | 14,000 | 11,947 |
| 4.85%, 03/01/39 (a) | 41,000 | 36,701 |
| Athene Holding Ltd. | ||
| 4.13%, 01/12/28 (a) | 32,000 | 29,425 |
| 6.15%, 04/03/30 (a) | 76,000 | 76,579 |
| Avangrid Inc. | ||
| 3.15%, 12/01/24 (a) | 77,000 | 73,808 |
| Bain Capital Specialty Finance Inc. | ||
| 2.95%, 03/10/26 (a) | 112,000 | 96,537 |
| Bank of America Corp. | ||
| 3.25%, 10/21/27 (a) | 52,000 | 48,061 |
| 4.18%, 11/25/27 (a) | 95,000 | 90,230 |
| 4.25%, 10/22/26 (a) | 75,000 | 72,515 |
| Bank of America Corp. (2.09% fixed rate until 06/14/28; 1.06% + SOFR thereafter) | ||
| 2.09%, 06/14/29 (a)(b) | 156,000 | 131,223 |
| Elfun Income Fund | 73 |
| Principal Amount | Fair Value | |
| Bank of America Corp. (2.97% fixed rate until 07/21/51; 1.56% + SOFR thereafter) | ||
| 2.97%, 07/21/52 (a)(b) | $ 112,000 | $ 70,666 |
| Bank of America Corp. (3.37% fixed rate until 01/23/25; 0.81% + 3 month USD LIBOR thereafter) | ||
| 3.37%, 01/23/26 (a)(b) | 26,000 | 24,802 |
| Bank of America Corp. (3.42% fixed rate until 12/20/27; 1.04% + 3 month USD LIBOR thereafter) | ||
| 3.42%, 12/20/28 (a)(b) | 36,000 | 32,653 |
| Bank of America Corp. (3.71% fixed rate until 04/24/27; 1.51% + 3 month USD LIBOR thereafter) | ||
| 3.71%, 04/24/28 (a)(b) | 101,000 | 93,601 |
| Bank of America Corp. (3.85% fixed rate until 03/08/32; 2.00% + 5 year CMT Rate thereafter) | ||
| 3.85%, 03/08/37 (a)(b) | 102,000 | 84,364 |
| Bank of America Corp. (3.95% fixed rate until 01/23/48; 1.19% + 3 month USD LIBOR thereafter) | ||
| 3.95%, 01/23/49 (a)(b) | 61,000 | 47,121 |
| Bank of America Corp. (4.24% fixed rate until 04/24/37; 1.81% + 3 month USD LIBOR thereafter) | ||
| 4.24%, 04/24/38 (a)(b) | 49,000 | 41,913 |
| Bank of America Corp. (4.27% fixed rate until 07/23/28; 1.31% + 3 month USD LIBOR thereafter) | ||
| 4.27%, 07/23/29 (a)(b) | 13,000 | 12,143 |
| Bank of America Corp. (4.30% fixed rate until 01/28/25; 2.66% + 3 month USD LIBOR thereafter) | ||
| 4.30%, 12/31/99 (a)(b) | 103,000 | 89,600 |
| Barrick North America Finance LLC | ||
| 5.70%, 05/30/41 (a) | 7,000 | 7,040 |
| BAT Capital Corp. | ||
| 2.73%, 03/25/31 (a) | 75,000 | 58,492 |
| 4.39%, 08/15/37 (a) | 51,000 | 39,661 |
| 4.54%, 08/15/47 (a) | 20,000 | 14,216 |
| 4.70%, 04/02/27 (a) | 48,000 | 46,104 |
| 4.91%, 04/02/30 (a) | 50,000 | 45,826 |
| 7.75%, 10/19/32 | 35,000 | 37,661 |
| BAT International Finance PLC | ||
| 1.67%, 03/25/26 (a) | 48,000 | 42,499 |
| Principal Amount | Fair Value | |
| Baxter International Inc. | ||
| 2.54%, 02/01/32 (a) | $ 61,000 | $ 48,587 |
| Baylor Scott & White Holdings | ||
| 2.84%, 11/15/50 (a) | 11,000 | 7,258 |
| Becton Dickinson & Co. | ||
| 3.70%, 06/06/27 (a) | 38,000 | 35,946 |
| 4.67%, 06/06/47 (a) | 8,000 | 7,056 |
| 4.69%, 12/15/44 (a) | 5,000 | 4,449 |
| Berkshire Hathaway Energy Co. | ||
| 3.25%, 04/15/28 (a) | 15,000 | 13,899 |
| 3.70%, 07/15/30 (a) | 56,000 | 51,265 |
| 3.80%, 07/15/48 (a) | 18,000 | 13,919 |
| 4.25%, 10/15/50 (a) | 50,000 | 41,683 |
| 6.13%, 04/01/36 (a) | 8,000 | 8,404 |
| Berkshire Hathaway Finance Corp. | ||
| 2.85%, 10/15/50 (a) | 145,000 | 97,540 |
| 3.85%, 03/15/52 (a) | 103,000 | 83,130 |
| 4.25%, 01/15/49 (a) | 27,000 | 24,205 |
| Berry Global Inc. | ||
| 4.88%, 07/15/26 (a)(f) | 144,000 | 139,071 |
| BHP Billiton Finance USA Ltd. | ||
| 5.00%, 09/30/43 (a) | 10,000 | 9,707 |
| Biogen Inc. | ||
| 2.25%, 05/01/30 (a) | 21,000 | 17,068 |
| Block Financial LLC | ||
| 2.50%, 07/15/28 (a) | 72,000 | 61,099 |
| 3.88%, 08/15/30 (a) | 21,000 | 18,393 |
| Boardwalk Pipelines LP | ||
| 4.80%, 05/03/29 (a) | 49,000 | 46,099 |
| Boston Properties LP | ||
| 6.75%, 12/01/27 | 100,000 | 103,271 |
| Boston Scientific Corp. | ||
| 4.70%, 03/01/49 (a) | 6,000 | 5,418 |
| BP Capital Markets America Inc. | ||
| 3.00%, 02/24/50 (a) | 59,000 | 40,026 |
| 3.38%, 02/08/61 (a) | 84,000 | 58,077 |
| BP Capital Markets PLC (4.38% fixed rate until 06/22/25; 4.04% + 5 year CMT Rate thereafter) | ||
| 4.38%, 06/22/25 (a)(b) | 109,000 | 103,821 |
| BP Capital Markets PLC (4.88% fixed rate until 03/22/30; 4.40% + 5 year CMT Rate thereafter) | ||
| 4.88%, 12/31/99 (a)(b) | 76,000 | 66,538 |
| Bristol-Myers Squibb Co. | ||
| 1.45%, 11/13/30 (a) | 52,000 | 41,012 |
| 2.35%, 11/13/40 (a) | 26,000 | 17,846 |
| 2.95%, 03/15/32 (a) | 70,000 | 61,067 |
| 3.20%, 06/15/26 (a) | 25,000 | 23,863 |
| 74 | Elfun Income Fund |
| Principal Amount | Fair Value | |
| 3.40%, 07/26/29 (a) | $ 16,000 | $ 14,856 |
| 3.55%, 03/15/42 (a) | 30,000 | 24,396 |
| 4.13%, 06/15/39 (a) | 37,000 | 32,987 |
| 4.25%, 10/26/49 (a) | 37,000 | 32,001 |
| 4.35%, 11/15/47 (a) | 2,000 | 1,767 |
| 4.55%, 02/20/48 (a) | 8,000 | 7,267 |
| Brixmor Operating Partnership LP | ||
| 2.25%, 04/01/28 (a) | 101,000 | 83,997 |
| 3.90%, 03/15/27 (a) | 21,000 | 19,365 |
| Broadcom Inc. | ||
| 3.14%, 11/15/35 (a)(f) | 29,000 | 21,276 |
| 3.19%, 11/15/36 (a)(f) | 4,000 | 2,887 |
| 3.42%, 04/15/33 (a)(f) | 66,000 | 52,977 |
| 3.47%, 04/15/34 (a)(f) | 8,000 | 6,343 |
| 4.15%, 11/15/30 (a) | 31,000 | 27,772 |
| 4.30%, 11/15/32 (a) | 50,000 | 44,142 |
| 4.93%, 05/15/37 (a)(f) | 41,000 | 35,835 |
| Brooklyn Union Gas Co. | ||
| 4.87%, 08/05/32 (f) | 200,000 | 186,992 |
| Brown-Forman Corp. | ||
| 4.00%, 04/15/38 (a) | 8,000 | 7,012 |
| Brunswick Corp. | ||
| 2.40%, 08/18/31 (a) | 187,000 | 137,368 |
| Bunge Limited Finance Corp. | ||
| 3.75%, 09/25/27 (a) | 10,000 | 9,352 |
| Burlington Northern Santa Fe LLC | ||
| 4.15%, 12/15/48 (a) | 46,000 | 39,167 |
| 4.55%, 09/01/44 (a) | 66,000 | 59,915 |
| Cameron LNG LLC | ||
| 3.30%, 01/15/35 (a)(f) | 9,000 | 7,316 |
| Canadian Natural Resources Ltd. | ||
| 3.85%, 06/01/27 (a) | 34,000 | 32,090 |
| 4.95%, 06/01/47 (a) | 26,000 | 22,757 |
| Canadian Pacific Railway Co. | ||
| 1.75%, 12/02/26 (a) | 103,000 | 91,786 |
| 2.45%, 12/02/31 (a) | 89,000 | 74,078 |
| 3.00%, 12/02/41 (a) | 31,000 | 23,295 |
| 3.10%, 12/02/51 (a) | 31,000 | 21,127 |
| Cantor Fitzgerald LP | ||
| 4.88%, 05/01/24 (a)(f) | 176,000 | 172,656 |
| Capital One Financial Corp. | ||
| 3.75%, 07/28/26 (a) | 86,000 | 81,188 |
| Cardinal Health Inc. | ||
| 3.08%, 06/15/24 (a) | 18,000 | 17,478 |
| Carlisle Companies Inc. | ||
| 2.20%, 03/01/32 (a) | 112,000 | 85,148 |
| Carrier Global Corp. | ||
| 2.72%, 02/15/30 (a) | 48,000 | 40,452 |
| 3.58%, 04/05/50 (a) | 53,000 | 37,962 |
| Principal Amount | Fair Value | |
| Caterpillar Inc. | ||
| 3.25%, 09/19/49 - 04/09/50 (a) | $ 75,000 | $ 57,066 |
| Cenovus Energy Inc. | ||
| 2.65%, 01/15/32 (a) | 52,000 | 41,455 |
| 3.75%, 02/15/52 (a) | 59,000 | 41,610 |
| Centene Corp. | ||
| 3.00%, 10/15/30 (a) | 49,000 | 40,144 |
| 3.38%, 02/15/30 (a) | 223,000 | 188,736 |
| 4.25%, 12/15/27 (a) | 370,000 | 347,448 |
| CenterPoint Energy Inc. | ||
| 2.65%, 06/01/31 (a) | 80,000 | 65,930 |
| Charter Communications Operating LLC/Charter Communications Operating Capital | ||
| 3.50%, 06/01/41 (a) | 68,000 | 44,718 |
| 3.70%, 04/01/51 (a) | 127,000 | 77,311 |
| 4.80%, 03/01/50 (a) | 102,000 | 74,636 |
| 5.05%, 03/30/29 (a) | 25,000 | 23,507 |
| 5.75%, 04/01/48 (a) | 27,000 | 22,205 |
| Cheniere Corpus Christi Holdings LLC | ||
| 5.88%, 03/31/25 (a) | 144,000 | 144,815 |
| 7.00%, 06/30/24 (a) | 282,000 | 286,989 |
| Cheniere Energy Partners LP | ||
| 4.50%, 10/01/29 | 195,000 | 175,504 |
| Chevron Corp. | ||
| 2.24%, 05/11/30 (a) | 23,000 | 19,691 |
| 3.08%, 05/11/50 (a) | 25,000 | 18,182 |
| Chevron USA Inc. | ||
| 3.85%, 01/15/28 (a) | 92,000 | 88,832 |
| 3.90%, 11/15/24 (a) | 26,000 | 25,562 |
| Choice Hotels International Inc. | ||
| 3.70%, 01/15/31 (a) | 53,000 | 45,088 |
| Chubb INA Holdings Inc. | ||
| 4.35%, 11/03/45 (a) | 35,000 | 30,374 |
| Church & Dwight Company Inc. | ||
| 2.30%, 12/15/31 (a) | 56,000 | 44,844 |
| Cigna Corp. | ||
| 2.40%, 03/15/30 (a) | 46,000 | 38,546 |
| 3.25%, 04/15/25 (a) | 42,000 | 40,455 |
| 3.40%, 03/01/27 - 03/15/50 (a) | 44,000 | 38,087 |
| 3.75%, 07/15/23 (a) | 12,000 | 11,912 |
| 3.88%, 10/15/47 (a) | 9,000 | 6,947 |
| 4.13%, 11/15/25 (a) | 65,000 | 63,560 |
| 4.38%, 10/15/28 (a) | 17,000 | 16,399 |
| 4.80%, 08/15/38 (a) | 15,000 | 13,978 |
| 4.90%, 12/15/48 (a) | 7,000 | 6,354 |
| Cintas Corp. No 2 | ||
| 4.00%, 05/01/32 (a) | 155,000 | 145,715 |
| Elfun Income Fund | 75 |
| Principal Amount | Fair Value | |
| Cisco Systems Inc. | ||
| 5.90%, 02/15/39 (a) | $ 24,000 | $ 25,907 |
| Citigroup Inc. | ||
| 4.45%, 09/29/27 (a) | 12,000 | 11,462 |
| 4.65%, 07/23/48 (a) | 103,000 | 89,557 |
| Citigroup Inc. (2.56% fixed rate until 05/01/31; 1.17% + SOFR thereafter) | ||
| 2.56%, 05/01/32 (a)(b) | 77,000 | 60,801 |
| Citigroup Inc. (2.98% fixed rate until 11/05/29; 1.42% + SOFR thereafter) | ||
| 2.98%, 11/05/30 (a)(b) | 36,000 | 30,261 |
| Citigroup Inc. (3.88% fixed rate until 01/24/38; 1.17% + 3 month USD LIBOR thereafter) | ||
| 3.88%, 01/24/39 (a)(b) | 22,000 | 18,207 |
| Citigroup Inc. (4.70% fixed rate until 01/30/25; 3.23% + SOFR thereafter) | ||
| 4.70%, 12/31/99 (a)(b) | 94,000 | 78,273 |
| CME Group Inc. | ||
| 2.65%, 03/15/32 (a) | 55,000 | 46,124 |
| CMS Energy Corp. | ||
| 4.88%, 03/01/44 (a) | 81,000 | 73,705 |
| CNH Industrial Capital LLC | ||
| 1.95%, 07/02/23 (a) | 115,000 | 113,040 |
| Comcast Corp. | ||
| 2.65%, 08/15/62 (a) | 36,000 | 20,538 |
| 2.80%, 01/15/51 (a) | 43,000 | 27,401 |
| 2.89%, 11/01/51 (a) | 37,000 | 23,945 |
| 2.94%, 11/01/56 (a) | 54,000 | 33,870 |
| 2.99%, 11/01/63 (a) | 37,000 | 22,528 |
| 3.20%, 07/15/36 (a) | 46,000 | 37,295 |
| 3.25%, 11/01/39 (a) | 61,000 | 47,616 |
| 3.97%, 11/01/47 (a) | 55,000 | 44,125 |
| 4.15%, 10/15/28 (a) | 43,000 | 41,329 |
| CommonSpirit Health | ||
| 4.35%, 11/01/42 | 130,000 | 109,274 |
| Conagra Brands Inc. | ||
| 5.30%, 11/01/38 (a) | 19,000 | 17,972 |
| 5.40%, 11/01/48 (a) | 11,000 | 10,221 |
| ConocoPhillips Co. | ||
| 4.30%, 11/15/44 (a) | 45,000 | 38,973 |
| Consolidated Edison Company of New York Inc. | ||
| 2.90%, 12/01/26 (a) | 44,000 | 40,328 |
| 3.35%, 04/01/30 (a) | 20,000 | 17,945 |
| 3.88%, 06/15/47 (a) | 22,000 | 17,017 |
| 3.95%, 04/01/50 (a) | 18,000 | 14,316 |
| Constellation Brands Inc. | ||
| 3.15%, 08/01/29 (a) | 102,000 | 89,382 |
| 3.70%, 12/06/26 (a) | 45,000 | 42,823 |
| Principal Amount | Fair Value | |
| 4.50%, 05/09/47 (a) | $ 35,000 | $ 29,495 |
| Continental Resources Inc. | ||
| 2.88%, 04/01/32 (a)(f) | 80,000 | 59,401 |
| 3.80%, 06/01/24 (a) | 368,000 | 357,814 |
| Corebridge Financial Inc. | ||
| 3.90%, 04/05/32 (a)(f) | 240,000 | 210,216 |
| Corning Inc. | ||
| 4.38%, 11/15/57 (a) | 22,000 | 17,120 |
| Corporate Office Properties LP | ||
| 2.00%, 01/15/29 (a) | 85,000 | 65,436 |
| 2.25%, 03/15/26 (a) | 69,000 | 60,975 |
| 2.75%, 04/15/31 (a) | 42,000 | 31,440 |
| Crown Castle Inc. | ||
| 2.90%, 03/15/27 (a) | 170,000 | 154,749 |
| 3.30%, 07/01/30 (a) | 141,000 | 123,182 |
| 4.15%, 07/01/50 (a) | 30,000 | 23,096 |
| 5.20%, 02/15/49 (a) | 31,000 | 27,859 |
| CSL Finance PLC | ||
| 4.25%, 04/27/32 (a)(f) | 103,000 | 96,969 |
| CSX Corp. | ||
| 4.50%, 03/15/49 - 08/01/54 (a) | 79,000 | 68,291 |
| CubeSmart LP | ||
| 2.50%, 02/15/32 (a) | 94,000 | 71,982 |
| 4.38%, 02/15/29 (a) | 66,000 | 60,984 |
| Cummins Inc. | ||
| 1.50%, 09/01/30 (a) | 51,000 | 40,138 |
| 2.60%, 09/01/50 (a) | 51,000 | 31,822 |
| CVS Health Corp. | ||
| 3.00%, 08/15/26 (a) | 51,000 | 47,629 |
| 3.25%, 08/15/29 (a) | 40,000 | 35,786 |
| 3.63%, 04/01/27 (a) | 49,000 | 46,507 |
| 3.75%, 04/01/30 (a) | 35,000 | 31,764 |
| 3.88%, 07/20/25 (a) | 24,000 | 23,432 |
| 4.25%, 04/01/50 (a) | 23,000 | 18,467 |
| 4.30%, 03/25/28 (a) | 4,000 | 3,869 |
| 4.78%, 03/25/38 (a) | 26,000 | 23,823 |
| 5.00%, 12/01/24 (a) | 59,000 | 58,526 |
| 5.13%, 07/20/45 (a) | 27,000 | 24,602 |
| 5.30%, 12/05/43 (a) | 51,000 | 47,768 |
| Daimler Trucks Finance North America LLC | ||
| 2.00%, 12/14/26 (a)(f) | 274,000 | 240,736 |
| 2.38%, 12/14/28 (a)(f) | 155,000 | 130,566 |
| 2.50%, 12/14/31 (a)(f) | 155,000 | 120,440 |
| Danaher Corp. | ||
| 2.80%, 12/10/51 (a) | 130,000 | 86,490 |
| Dell International LLC/EMC Corp. | ||
| 4.00%, 07/15/24 (a) | 83,000 | 81,458 |
| 5.45%, 06/15/23 (a) | 11,000 | 11,001 |
| 6.02%, 06/15/26 (a) | 11,000 | 11,230 |
| 8.35%, 07/15/46 (a) | 2,000 | 2,294 |
| 76 | Elfun Income Fund |
| Principal Amount | Fair Value | |
| Deutsche Bank AG (2.31% fixed rate until 11/16/26; 1.22% + SOFR thereafter) | ||
| 2.31%, 11/16/27 (a)(b) | $ 320,000 | $ 271,862 |
| Deutsche Telekom AG | ||
| 3.63%, 01/21/50 (a)(f) | 191,000 | 137,736 |
| Devon Energy Corp. | ||
| 5.00%, 06/15/45 (a) | 15,000 | 12,910 |
| DH Europe Finance II Sarl | ||
| 2.60%, 11/15/29 (a) | 45,000 | 39,370 |
| 3.25%, 11/15/39 (a) | 24,000 | 19,249 |
| 3.40%, 11/15/49 (a) | 10,000 | 7,551 |
| Diamondback Energy Inc. | ||
| 3.13%, 03/24/31 (a) | 69,000 | 57,191 |
| 3.25%, 12/01/26 (a) | 43,000 | 40,058 |
| 3.50%, 12/01/29 (a) | 35,000 | 30,706 |
| 4.40%, 03/24/51 (a) | 25,000 | 19,117 |
| Digital Realty Trust LP | ||
| 3.60%, 07/01/29 (a) | 80,000 | 71,512 |
| Discover Bank | ||
| 2.70%, 02/06/30 (a) | 250,000 | 200,180 |
| Discovery Communications LLC | ||
| 3.95%, 03/20/28 (a) | 28,000 | 24,848 |
| 4.95%, 05/15/42 (a) | 7,000 | 5,292 |
| 5.00%, 09/20/37 (a) | 10,000 | 8,062 |
| Dollar General Corp. | ||
| 3.50%, 04/03/30 (a) | 29,000 | 25,991 |
| 4.13%, 04/03/50 (a) | 44,000 | 35,254 |
| Dollar Tree Inc. | ||
| 4.00%, 05/15/25 (a) | 51,000 | 49,807 |
| Dominion Energy Inc. | ||
| 3.07%, 08/15/24 (a)(g) | 66,000 | 63,597 |
| 3.38%, 04/01/30 (a) | 76,000 | 66,958 |
| Dover Corp. | ||
| 2.95%, 11/04/29 (a) | 51,000 | 44,329 |
| Dow Chemical Co. | ||
| 6.30%, 03/15/33 | 90,000 | 94,827 |
| DTE Energy Co. | ||
| 2.85%, 10/01/26 (a) | 22,000 | 20,273 |
| Duke Energy Carolinas LLC | ||
| 3.95%, 03/15/48 (a) | 26,000 | 20,941 |
| Duke Energy Corp. | ||
| 2.55%, 06/15/31 (a) | 114,000 | 93,033 |
| 3.30%, 06/15/41 (a) | 102,000 | 74,639 |
| 3.50%, 06/15/51 (a) | 87,000 | 61,073 |
| 3.75%, 09/01/46 (a) | 146,000 | 108,786 |
| Duke Energy Corp. (4.88% fixed rate until 09/16/24; 3.39% + 5 year CMT Rate thereafter) | ||
| 4.88%, 12/31/99 (a)(b) | 130,000 | 118,619 |
| Duke Energy Progress LLC | ||
| 4.15%, 12/01/44 (a) | 33,000 | 27,607 |
| Principal Amount | Fair Value | |
| DuPont de Nemours Inc. | ||
| 5.42%, 11/15/48 (a) | $ 10,000 | $ 9,548 |
| Duquesne Light Holdings Inc. | ||
| 3.62%, 08/01/27 (a)(f) | 64,000 | 57,003 |
| Eastman Chemical Co. | ||
| 4.65%, 10/15/44 (a) | 50,000 | 41,410 |
| Eaton Corp. | ||
| 3.10%, 09/15/27 (a) | 24,000 | 22,353 |
| Ecolab Inc. | ||
| 1.30%, 01/30/31 (a) | 51,000 | 38,909 |
| 5.25%, 01/15/28 | 244,000 | 248,707 |
| Edison International | ||
| 4.95%, 04/15/25 (a) | 121,000 | 119,473 |
| 5.75%, 06/15/27 (a) | 16,000 | 16,054 |
| EI du Pont de Nemours & Co. | ||
| 2.30%, 07/15/30 (a) | 35,000 | 29,300 |
| Electronic Arts Inc. | ||
| 1.85%, 02/15/31 (a) | 61,000 | 47,998 |
| Elevance Health Inc. | ||
| 2.88%, 09/15/29 (a) | 26,000 | 22,805 |
| 3.30%, 01/15/23 (a) | 51,000 | 50,973 |
| 3.60%, 03/15/51 (a) | 27,000 | 20,327 |
| 3.70%, 09/15/49 (a) | 26,000 | 19,861 |
| Emera US Finance LP | ||
| 2.64%, 06/15/31 (a) | 112,000 | 87,499 |
| Emerson Electric Co. | ||
| 1.80%, 10/15/27 (a) | 33,000 | 28,836 |
| 2.75%, 10/15/50 (a) | 32,000 | 20,764 |
| Empower Finance 2020 LP | ||
| 1.36%, 09/17/27 (a)(f) | 76,000 | 63,433 |
| 1.78%, 03/17/31 (a)(f) | 58,000 | 43,567 |
| Enbridge Energy Partners LP | ||
| 5.50%, 09/15/40 (a) | 6,000 | 5,615 |
| Enbridge Inc. | ||
| 1.60%, 10/04/26 (a) | 211,000 | 184,844 |
| Enbridge Inc. (5.75% fixed rate until 04/15/30; 5.31% + 5 year CMT Rate thereafter) | ||
| 5.75%, 07/15/80 (a)(b) | 129,000 | 116,598 |
| Energy Transfer LP | ||
| 4.25%, 03/15/23 (a) | 67,000 | 66,847 |
| 4.50%, 04/15/24 (a) | 46,000 | 45,362 |
| 4.95%, 06/15/28 (a) | 19,000 | 18,352 |
| 5.30%, 04/01/44 - 04/15/47 (a) | 83,000 | 69,759 |
| 5.35%, 05/15/45 (a) | 67,000 | 57,103 |
| 5.75%, 02/15/33 | 45,000 | 44,141 |
| 6.13%, 12/15/45 (a) | 8,000 | 7,418 |
| 6.50%, 02/01/42 (a) | 42,000 | 41,496 |
| Energy Transfer LP (6.75% fixed rate until 05/15/25; 5.13% + 5 year CMT Rate thereafter) | ||
| 6.75%, 12/31/99 (a)(b) | 285,000 | 246,525 |
| Elfun Income Fund | 77 |
| Principal Amount | Fair Value | |
| Energy Transfer LP/Regency Energy Finance Corp. | ||
| 4.50%, 11/01/23 (a) | $ 30,000 | $ 29,740 |
| Enterprise Products Operating LLC | ||
| 4.25%, 02/15/48 (a) | 61,000 | 49,189 |
| Enterprise Products Operating LLC (5.25% fixed rate until 08/16/27; 3.03% + 3 month USD LIBOR thereafter) | ||
| 5.25%, 08/16/77 (a)(b) | 20,000 | 16,349 |
| EOG Resources Inc. | ||
| 4.15%, 01/15/26 (a) | 5,000 | 4,907 |
| 4.95%, 04/15/50 (a) | 24,000 | 22,956 |
| 5.10%, 01/15/36 (a) | 15,000 | 14,190 |
| Equinix Inc. | ||
| 1.25%, 07/15/25 (a) | 95,000 | 86,050 |
| 2.15%, 07/15/30 (a) | 72,000 | 57,409 |
| Equinor ASA | ||
| 3.25%, 11/18/49 (a) | 50,000 | 36,521 |
| ERP Operating LP | ||
| 4.50%, 07/01/44 (a) | 21,000 | 17,851 |
| Everest Reinsurance Holdings Inc. | ||
| 3.13%, 10/15/52 (a) | 28,000 | 17,399 |
| Eversource Energy | ||
| 3.45%, 01/15/50 (a) | 49,000 | 35,837 |
| Exelon Corp. | ||
| 4.05%, 04/15/30 (a) | 76,000 | 70,782 |
| 4.45%, 04/15/46 (a) | 50,000 | 42,402 |
| 4.70%, 04/15/50 (a) | 50,000 | 43,920 |
| Extra Space Storage LP | ||
| 3.90%, 04/01/29 (a) | 45,000 | 40,395 |
| Exxon Mobil Corp. | ||
| 2.61%, 10/15/30 (a) | 80,000 | 69,842 |
| 3.45%, 04/15/51 (a) | 80,000 | 60,639 |
| FedEx Corp. | ||
| 4.10%, 02/01/45 (a) | 100,000 | 77,347 |
| Fidelity National Financial Inc. | ||
| 3.20%, 09/17/51 (a) | 78,000 | 45,569 |
| Fidelity National Information Services Inc. | ||
| 1.15%, 03/01/26 (a) | 62,000 | 54,409 |
| 1.65%, 03/01/28 (a) | 56,000 | 46,563 |
| 3.10%, 03/01/41 (a) | 11,000 | 7,618 |
| FirstEnergy Transmission LLC | ||
| 4.55%, 04/01/49 (a)(f) | 84,000 | 68,379 |
| Fiserv Inc. | ||
| 3.50%, 07/01/29 (a) | 19,000 | 17,121 |
| 4.40%, 07/01/49 (a) | 19,000 | 15,453 |
| Florida Power & Light Co. | ||
| 2.85%, 04/01/25 (a) | 132,000 | 126,482 |
| 4.13%, 02/01/42 (a) | 35,000 | 30,314 |
| Principal Amount | Fair Value | |
| Flowers Foods Inc. | ||
| 2.40%, 03/15/31 (a) | $ 58,000 | $ 46,647 |
| Flowserve Corp. | ||
| 2.80%, 01/15/32 (a) | 79,000 | 59,033 |
| Ford Motor Co. | ||
| 4.35%, 12/08/26 (a) | 54,000 | 51,172 |
| Fox Corp. | ||
| 3.50%, 04/08/30 (a) | 51,000 | 45,100 |
| Freeport-McMoRan Inc. | ||
| 4.25%, 03/01/30 (a) | 87,000 | 79,389 |
| GA Global Funding Trust | ||
| 1.63%, 01/15/26 (a)(f) | 92,000 | 81,646 |
| General Dynamics Corp. | ||
| 4.25%, 04/01/50 (a) | 35,000 | 31,163 |
| General Mills Inc. | ||
| 3.00%, 02/01/51 (a) | 32,000 | 21,851 |
| General Motors Co. | ||
| 5.20%, 04/01/45 (a) | 6,000 | 4,906 |
| 5.40%, 04/01/48 (a) | 12,000 | 9,871 |
| 6.13%, 10/01/25 (a) | 98,000 | 99,907 |
| 6.80%, 10/01/27 (a) | 38,000 | 39,460 |
| General Motors Financial Company Inc. | ||
| 1.25%, 01/08/26 (a) | 116,000 | 102,262 |
| 2.35%, 01/08/31 (a) | 49,000 | 37,009 |
| 5.25%, 03/01/26 (a) | 38,000 | 37,422 |
| Genuine Parts Co. | ||
| 2.75%, 02/01/32 (a) | 51,000 | 41,034 |
| Georgia-Pacific LLC | ||
| 1.75%, 09/30/25 (a)(f) | 131,000 | 119,680 |
| 3.60%, 03/01/25 (a)(f) | 213,000 | 206,397 |
| Gilead Sciences Inc. | ||
| 2.60%, 10/01/40 (a) | 35,000 | 24,525 |
| 2.80%, 10/01/50 (a) | 54,000 | 34,947 |
| 2.95%, 03/01/27 (a) | 6,000 | 5,588 |
| 3.50%, 02/01/25 (a) | 21,000 | 20,343 |
| 3.65%, 03/01/26 (a) | 21,000 | 20,271 |
| 4.15%, 03/01/47 (a) | 20,000 | 16,558 |
| 4.75%, 03/01/46 | 49,000 | 44,302 |
| GlaxoSmithKline Capital Inc. | ||
| 3.63%, 05/15/25 (a) | 57,000 | 55,687 |
| GlaxoSmithKline Capital PLC | ||
| 3.38%, 06/01/29 (a) | 56,000 | 51,666 |
| Glencore Funding LLC | ||
| 3.88%, 04/27/51 (f) | 63,000 | 45,551 |
| Graphic Packaging International LLC | ||
| 1.51%, 04/15/26 (a)(f) | 76,000 | 66,372 |
| Gray Oak Pipeline LLC | ||
| 2.00%, 09/15/23 (a)(f) | 180,000 | 174,796 |
| 2.60%, 10/15/25 (a)(f) | 119,000 | 108,060 |
| 78 | Elfun Income Fund |
| Principal Amount | Fair Value | |
| GSK Consumer Healthcare Capital U.S. LLC | ||
| 3.63%, 03/24/32 | $ 250,000 | $ 220,257 |
| GSK CONSUMER HEALTHCARE Co. GUAR 03/27 3.375 | ||
| 3.38%, 03/24/27 | 250,000 | 232,932 |
| Halliburton Co. | ||
| 3.80%, 11/15/25 (a) | 2,000 | 1,945 |
| 5.00%, 11/15/45 (a) | 21,000 | 18,618 |
| HCA Inc. | ||
| 3.13%, 03/15/27 (f) | 145,000 | 131,899 |
| 3.50%, 09/01/30 | 49,000 | 42,160 |
| 3.63%, 03/15/32 (f) | 77,000 | 65,129 |
| 4.63%, 03/15/52 (f) | 25,000 | 19,579 |
| 5.38%, 02/01/25 | 381,000 | 380,589 |
| Health Care Service Corp. | ||
| 2.20%, 06/01/30 (a)(f) | 71,000 | 56,838 |
| 3.20%, 06/01/50 (a)(f) | 25,000 | 17,373 |
| Healthcare Realty Holdings LP | ||
| 2.00%, 03/15/31 (a) | 38,000 | 28,735 |
| Helmerich & Payne Inc. | ||
| 2.90%, 09/29/31 | 39,000 | 31,576 |
| Hess Corp. | ||
| 5.60%, 02/15/41 | 7,000 | 6,628 |
| 5.80%, 04/01/47 (a) | 6,000 | 5,747 |
| Hewlett Packard Enterprise Co. | ||
| 6.35%, 10/15/45 (a) | 8,000 | 7,997 |
| Highwoods Realty LP | ||
| 4.13%, 03/15/28 (a) | 26,000 | 23,412 |
| 4.20%, 04/15/29 (a) | 70,000 | 60,572 |
| Honeywell International Inc. | ||
| 1.75%, 09/01/31 | 77,000 | 61,002 |
| 2.70%, 08/15/29 (a) | 3,000 | 2,666 |
| Hormel Foods Corp. | ||
| 1.80%, 06/11/30 (a) | 102,000 | 83,170 |
| HSBC Holdings PLC (2.01% fixed rate until 09/22/27; 1.73% + SOFR thereafter) | ||
| 2.01%, 09/22/28 (a)(b) | 330,000 | 275,408 |
| HSBC Holdings PLC (2.25% fixed rate until 11/22/26; 1.10% + SOFR thereafter) | ||
| 2.25%, 11/22/27 (b) | 200,000 | 173,252 |
| HSBC Holdings PLC (2.87% fixed rate until 11/22/31; 1.41% + SOFR thereafter) | ||
| 2.87%, 11/22/32 (b) | 200,000 | 153,154 |
| HSBC Holdings PLC (4.29% fixed rate until 09/12/25; 1.35% + 3 month USD LIBOR thereafter) | ||
| 4.29%, 09/12/26 (a)(b) | 423,000 | 405,868 |
| Principal Amount | Fair Value | |
| HSBC Holdings PLC (6.00% fixed rate until 05/22/27; 3.75% + 5 year US ISDA thereafter) | ||
| 6.00%, 05/22/27 (a)(b) | $ 465,000 | $ 427,465 |
| HSBC Holdings PLC (6.50% fixed rate until 03/23/28; 3.61% + 5 year US ISDA thereafter) | ||
| 6.50%, 03/23/28 (a)(b) | 205,000 | 189,078 |
| Humana Inc. | ||
| 1.35%, 02/03/27 (a) | 124,000 | 107,081 |
| 2.15%, 02/03/32 (a) | 64,000 | 50,060 |
| Huntington Bancshares Inc. | ||
| 2.55%, 02/04/30 (a) | 101,000 | 83,079 |
| Huntington Ingalls Industries Inc. | ||
| 2.04%, 08/16/28 (a) | 98,000 | 80,798 |
| Huntsman International LLC | ||
| 4.50%, 05/01/29 | 100,000 | 89,856 |
| Hyundai Capital America | ||
| 1.30%, 01/08/26 (a)(f) | 194,000 | 169,859 |
| Imperial Brands Finance PLC | ||
| 3.13%, 07/26/24 (a)(f) | 264,000 | 252,909 |
| 3.50%, 02/11/23 - 07/26/26 (a)(f) | 490,000 | 472,337 |
| Indiana Michigan Power Co. | ||
| 3.25%, 05/01/51 (a) | 51,000 | 34,893 |
| ING Groep N.V. 1.01% + SOFR | ||
| 5.33%, 04/01/27 (a)(b) | 470,000 | 452,460 |
| Ingredion Inc. | ||
| 3.90%, 06/01/50 (a) | 23,000 | 16,653 |
| Intel Corp. | ||
| 2.00%, 08/12/31 (a) | 78,000 | 61,859 |
| 2.80%, 08/12/41 (a) | 89,000 | 62,025 |
| 2.88%, 05/11/24 (a) | 10,000 | 9,738 |
| 3.10%, 02/15/60 (a) | 31,000 | 19,334 |
| Intercontinental Exchange Inc. | ||
| 2.65%, 09/15/40 (a) | 24,000 | 16,697 |
| International Business Machines Corp. | ||
| 3.45%, 02/19/26 (a) | 254,000 | 243,975 |
| 4.15%, 05/15/39 (a) | 150,000 | 129,147 |
| 4.25%, 05/15/49 (a) | 150,000 | 124,496 |
| International Paper Co. | ||
| 4.40%, 08/15/47 (a) | 35,000 | 28,812 |
| Interstate Power & Light Co. | ||
| 3.40%, 08/15/25 (a) | 185,000 | 176,355 |
| ITC Holdings Corp. | ||
| 2.95%, 05/14/30 (a)(f) | 127,000 | 107,404 |
| JAB HOLDINGS BV | ||
| 2.20%, 11/23/30 (a)(f) | 250,000 | 187,382 |
| Elfun Income Fund | 79 |
| Principal Amount | Fair Value | |
| Jabil Inc. | ||
| 4.25%, 05/15/27 (a) | $ 205,000 | $ 194,004 |
| John Deere Capital Corp. | ||
| 2.45%, 01/09/30 (a) | 127,000 | 109,489 |
| 3.90%, 06/07/32 (a) | 40,000 | 37,306 |
| Johnson & Johnson | ||
| 3.63%, 03/03/37 (a) | 22,000 | 19,579 |
| Johnson Controls International PLC | ||
| 4.50%, 02/15/47 (a) | 10,000 | 8,288 |
| JPMorgan Chase & Co. (1.58% fixed rate until 04/22/26; 0.89% + SOFR thereafter) | ||
| 1.58%, 04/22/27 (a)(b) | 142,000 | 124,981 |
| JPMorgan Chase & Co. (2.96% fixed rate until 05/13/30; 2.52% + SOFR thereafter) | ||
| 2.96%, 05/13/31 (a)(b) | 83,000 | 68,337 |
| JPMorgan Chase & Co. (3.16% fixed rate until 04/22/41; 1.46% + SOFR thereafter) | ||
| 3.16%, 04/22/42 (a)(b) | 68,000 | 49,437 |
| JPMorgan Chase & Co. (3.88% fixed rate until 07/24/37; 1.36% + 3 month USD LIBOR thereafter) | ||
| 3.88%, 07/24/38 (a)(b) | 28,000 | 23,251 |
| JPMorgan Chase & Co. (3.90% fixed rate until 01/23/48; 1.22% + 3 month USD LIBOR thereafter) | ||
| 3.90%, 01/23/49 (a)(b) | 155,000 | 119,452 |
| JPMorgan Chase & Co. (3.96% fixed rate until 01/29/26; 1.25% + 3 month USD LIBOR thereafter) | ||
| 3.96%, 01/29/27 (a)(b) | 85,000 | 81,143 |
| JPMorgan Chase & Co. (4.01% fixed rate until 04/23/28; 1.12% + 3 month USD LIBOR thereafter) | ||
| 4.01%, 04/23/29 (a)(b) | 31,000 | 28,716 |
| JPMorgan Chase & Co. (4.03% fixed rate until 07/24/47; 1.46% + 3 month USD LIBOR thereafter) | ||
| 4.03%, 07/24/48 (a)(b) | 20,000 | 15,875 |
| JPMorgan Chase & Co. (4.49% fixed rate until 03/24/30; 3.79% + SOFR thereafter) | ||
| 4.49%, 03/24/31 (a)(b) | 124,000 | 115,962 |
| Principal Amount | Fair Value | |
| JPMorgan Chase & Co. (4.60% fixed rate until 02/01/25; 3.13% + SOFR thereafter) | ||
| 4.60%, 12/31/99 (a)(b) | $ 147,000 | $ 130,526 |
| Kaiser Foundation Hospitals | ||
| 3.00%, 06/01/51 (a) | 69,000 | 46,922 |
| 3.27%, 11/01/49 (a) | 154,000 | 110,889 |
| Kansas City Southern/old | ||
| 3.50%, 05/01/50 (a) | 37,000 | 26,409 |
| Keurig Dr Pepper Inc. | ||
| 3.20%, 05/01/30 (a) | 57,000 | 49,603 |
| 3.80%, 05/01/50 (a) | 42,000 | 31,578 |
| Kinder Morgan Energy Partners LP | ||
| 4.70%, 11/01/42 (a) | 7,000 | 5,799 |
| 5.00%, 03/01/43 (a) | 21,000 | 17,978 |
| 6.38%, 03/01/41 (a) | 21,000 | 20,862 |
| Kinder Morgan Inc. | ||
| 1.75%, 11/15/26 (a) | 237,000 | 209,119 |
| 5.05%, 02/15/46 (a) | 20,000 | 17,048 |
| KLA Corp. | ||
| 3.30%, 03/01/50 (a) | 51,000 | 36,974 |
| 4.65%, 11/01/24 (a) | 21,000 | 20,964 |
| Kraft Heinz Foods Co. | ||
| 5.20%, 07/15/45 (a) | 77,000 | 70,952 |
| Kyndryl Holdings Inc. | ||
| 2.05%, 10/15/26 | 96,000 | 79,374 |
| 2.70%, 10/15/28 | 193,000 | 145,279 |
| L3Harris Technologies Inc. | ||
| 3.85%, 12/15/26 (a) | 36,000 | 34,397 |
| Lear Corp. | ||
| 4.25%, 05/15/29 (a) | 31,000 | 27,914 |
| Leidos Inc. | ||
| 2.95%, 05/15/23 (a) | 146,000 | 144,741 |
| 3.63%, 05/15/25 (a) | 40,000 | 38,443 |
| 4.38%, 05/15/30 (a) | 179,000 | 161,607 |
| Liberty Mutual Group Inc. | ||
| 3.95%, 05/15/60 (a)(f) | 22,000 | 14,469 |
| Life Storage LP | ||
| 2.20%, 10/15/30 (a) | 70,000 | 54,314 |
| Lincoln National Corp. | ||
| 4.35%, 03/01/48 (a) | 78,000 | 58,528 |
| Lincoln National Corp. (9.25% fixed rate until 12/01/27; 5.32% + 5 year CMT Rate thereafter) | ||
| 9.25%, 12/31/99 | 97,000 | 102,585 |
| Lloyds Banking Group PLC (2.44% fixed rate until 02/05/25; 1.00% + 1 year CMT Rate thereafter) | ||
| 2.44%, 02/05/26 (a)(b) | 200,000 | 185,822 |
| 80 | Elfun Income Fund |
| Principal Amount | Fair Value | |
| Lockheed Martin Corp. | ||
| 3.55%, 01/15/26 (a) | $ 10,000 | $ 9,713 |
| 4.50%, 05/15/36 (a) | 46,000 | 43,822 |
| Lowe's Companies Inc. | ||
| 1.30%, 04/15/28 (a) | 30,000 | 24,914 |
| 1.70%, 09/15/28 - 10/15/30 (a) | 104,000 | 86,063 |
| 3.00%, 10/15/50 (a) | 48,000 | 30,780 |
| 3.70%, 04/15/46 (a) | 8,000 | 5,946 |
| 4.05%, 05/03/47 (a) | 36,000 | 28,266 |
| 5.63%, 04/15/53 | 73,000 | 70,356 |
| LYB International Finance III LLC | ||
| 1.25%, 10/01/25 (a) | 35,000 | 31,288 |
| 3.63%, 04/01/51 (a) | 49,000 | 32,842 |
| 3.80%, 10/01/60 (a) | 21,000 | 13,658 |
| Marsh & McLennan Companies Inc. | ||
| 2.90%, 12/15/51 (a) | 51,000 | 32,828 |
| McCormick & Company Inc. | ||
| 1.85%, 02/15/31 (a) | 33,000 | 25,532 |
| 3.25%, 11/15/25 (a) | 363,000 | 344,164 |
| McDonald's Corp. | ||
| 3.60%, 07/01/30 (a) | 76,000 | 69,730 |
| 3.63%, 09/01/49 (a) | 16,000 | 12,178 |
| 4.88%, 12/09/45 (a) | 20,000 | 18,540 |
| Medtronic Inc. | ||
| 4.63%, 03/15/45 (a) | 6,000 | 5,578 |
| Memorial Sloan-Kettering Cancer Center | ||
| 4.13%, 07/01/52 (a) | 88,000 | 72,780 |
| Mercedes-Benz Finance North America LLC | ||
| 5.38%, 11/26/25 | 245,000 | 246,497 |
| Merck & Company Inc. | ||
| 1.90%, 12/10/28 (a) | 132,000 | 113,602 |
| 2.45%, 06/24/50 (a) | 64,000 | 40,931 |
| 2.75%, 02/10/25 - 12/10/51 (a) | 78,000 | 63,065 |
| 2.90%, 12/10/61 (a) | 21,000 | 13,534 |
| 4.00%, 03/07/49 (a) | 14,000 | 11,997 |
| Meta Platforms Inc. | ||
| 3.85%, 08/15/32 | 171,000 | 150,469 |
| 4.45%, 08/15/52 | 171,000 | 135,885 |
| MetLife Inc. | ||
| 4.72%, 12/15/44 (a) | 32,000 | 28,984 |
| Microchip Technology Inc. | ||
| 2.67%, 09/01/23 (a) | 356,000 | 348,958 |
| Micron Technology Inc. | ||
| 3.37%, 11/01/41 (a) | 64,000 | 42,790 |
| 3.48%, 11/01/51 (a) | 89,000 | 55,441 |
| Microsoft Corp. | ||
| 2.40%, 08/08/26 (a) | 35,000 | 32,650 |
| 2.68%, 06/01/60 (a) | 14,000 | 9,048 |
| Principal Amount | Fair Value | |
| 2.92%, 03/17/52 (a) | $ 95,000 | $ 67,686 |
| 3.45%, 08/08/36 (a) | 10,000 | 8,874 |
| 3.50%, 02/12/35 (a) | 29,000 | 26,275 |
| Mid-America Apartments LP | ||
| 2.88%, 09/15/51 (a) | 77,000 | 49,388 |
| Molson Coors Beverage Co. | ||
| 4.20%, 07/15/46 (a) | 14,000 | 10,911 |
| Morgan Stanley | ||
| 3.70%, 10/23/24 (a) | 22,000 | 21,489 |
| 4.35%, 09/08/26 (a) | 102,000 | 99,142 |
| 4.38%, 01/22/47 (a) | 30,000 | 25,575 |
| Morgan Stanley (1.51% fixed rate until 07/20/26; 0.86% + SOFR thereafter) | ||
| 1.51%, 07/20/27 (a)(b) | 78,000 | 67,739 |
| Morgan Stanley (2.48% fixed rate until 09/16/31; 1.36% + SOFR thereafter) | ||
| 2.48%, 09/16/36 (a)(b) | 305,000 | 222,476 |
| Morgan Stanley (2.80% fixed rate until 01/25/51; 1.43% + SOFR thereafter) | ||
| 2.80%, 01/25/52 (a)(b) | 150,000 | 93,153 |
| Morgan Stanley (3.97% fixed rate until 07/22/37; 1.46% + 3 month USD LIBOR thereafter) | ||
| 3.97%, 07/22/38 (a)(b) | 32,000 | 26,870 |
| MPLX LP | ||
| 2.65%, 08/15/30 (a) | 58,000 | 47,057 |
| 5.20%, 12/01/47 (a) | 14,000 | 11,931 |
| Mylan Inc. | ||
| 5.20%, 04/15/48 (a) | 20,000 | 14,975 |
| National Australia Bank Ltd. (3.35% fixed rate until 01/12/32; 1.70% + 5 year CMT Rate thereafter) | ||
| 3.35%, 01/12/37 (a)(b)(f) | 254,000 | 193,769 |
| National Retail Properties Inc. | ||
| 4.00%, 11/15/25 (a) | 44,000 | 42,391 |
| NewMarket Corp. | ||
| 2.70%, 03/18/31 (a) | 50,000 | 39,432 |
| Newmont Corp. | ||
| 4.88%, 03/15/42 (a) | 32,000 | 29,469 |
| NextEra Energy Capital Holdings Inc. (5.65% fixed rate until 05/01/29; 3.16% + 3 month USD LIBOR thereafter) | ||
| 5.65%, 05/01/79 (a)(b) | 45,000 | 41,025 |
| NGPL PipeCo LLC | ||
| 3.25%, 07/15/31 (a)(f) | 101,000 | 82,283 |
| NIKE Inc. | ||
| 3.38%, 03/27/50 (a) | 20,000 | 15,672 |
| Elfun Income Fund | 81 |
| Principal Amount | Fair Value | |
| NiSource Inc. | ||
| 3.60%, 05/01/30 (a) | $ 52,000 | $ 46,361 |
| 3.95%, 03/30/48 (a) | 10,000 | 7,810 |
| Norfolk Southern Corp. | ||
| 3.95%, 10/01/42 (a) | 31,000 | 25,531 |
| Northern Trust Corp. | ||
| 6.13%, 11/02/32 | 115,000 | 121,569 |
| NOV Inc. | ||
| 3.60%, 12/01/29 (a) | 76,000 | 66,847 |
| Novant Health Inc. | ||
| 3.32%, 11/01/61 (a) | 52,000 | 34,796 |
| Novartis Capital Corp. | ||
| 2.20%, 08/14/30 (a) | 76,000 | 64,597 |
| 3.00%, 11/20/25 (a) | 6,000 | 5,753 |
| Nutrien Ltd. | ||
| 4.90%, 06/01/43 (a) | 30,000 | 26,473 |
| NVIDIA Corp. | ||
| 3.50%, 04/01/50 (a) | 35,000 | 26,487 |
| NXP BV/NXP Funding LLC/NXP USA Inc. | ||
| 3.25%, 11/30/51 (a) | 100,000 | 62,438 |
| Oklahoma Gas & Electric Co. | ||
| 3.25%, 04/01/30 (a) | 43,000 | 37,362 |
| Oncor Electric Delivery Company LLC | ||
| 3.80%, 09/30/47 (a) | 10,000 | 8,139 |
| ONEOK Inc. | ||
| 4.35%, 03/15/29 (a) | 46,000 | 42,656 |
| 6.10%, 11/15/32 | 70,000 | 70,255 |
| Oracle Corp. | ||
| 2.30%, 03/25/28 (a) | 33,000 | 28,616 |
| 2.65%, 07/15/26 (a) | 49,000 | 45,056 |
| 2.88%, 03/25/31 (a) | 51,000 | 42,311 |
| 2.95%, 04/01/30 (a) | 76,000 | 64,874 |
| 3.60%, 04/01/50 (a) | 50,000 | 34,111 |
| 3.65%, 03/25/41 (a) | 54,000 | 39,923 |
| 3.80%, 11/15/37 (a) | 9,000 | 7,100 |
| 3.95%, 03/25/51 (a) | 29,000 | 20,894 |
| 4.00%, 07/15/46 - 11/15/47 (a) | 63,000 | 46,258 |
| 4.10%, 03/25/61 (a) | 65,000 | 45,388 |
| 6.15%, 11/09/29 | 170,000 | 176,735 |
| 6.90%, 11/09/52 | 45,000 | 48,696 |
| Otis Worldwide Corp. | ||
| 2.06%, 04/05/25 (a) | 89,000 | 83,337 |
| 2.57%, 02/15/30 (a) | 30,000 | 25,222 |
| 3.36%, 02/15/50 (a) | 32,000 | 22,435 |
| Pacific Gas & Electric Co. | ||
| 2.10%, 08/01/27 (a) | 43,000 | 36,818 |
| 2.50%, 02/01/31 (a) | 76,000 | 59,089 |
| 3.00%, 06/15/28 (a) | 72,000 | 62,412 |
| 3.30%, 08/01/40 (a) | 76,000 | 51,540 |
| 3.50%, 08/01/50 (a) | 30,000 | 18,883 |
| Principal Amount | Fair Value | |
| 4.30%, 03/15/45 (a) | $ 50,000 | $ 35,768 |
| PacifiCorp | ||
| 2.70%, 09/15/30 (a) | 46,000 | 39,526 |
| 2.90%, 06/15/52 (a) | 97,000 | 63,842 |
| 6.25%, 10/15/37 (a) | 2,000 | 2,125 |
| Packaging Corp. of America | ||
| 3.05%, 10/01/51 (a) | 68,000 | 43,666 |
| Paramount Global | ||
| 2.90%, 01/15/27 (a) | 21,000 | 18,851 |
| 3.70%, 06/01/28 (a) | 20,000 | 17,842 |
| 5.25%, 04/01/44 (a) | 6,000 | 4,623 |
| Parker-Hannifin Corp. | ||
| 3.25%, 06/14/29 (a) | 44,000 | 39,333 |
| 4.50%, 09/15/29 (a) | 75,000 | 72,126 |
| PartnerRe Finance B LLC (4.50% fixed rate until 04/01/30; 3.82% + 5 year CMT Rate thereafter) | ||
| 4.50%, 10/01/50 (a)(b) | 40,000 | 34,226 |
| PayPal Holdings Inc. | ||
| 2.65%, 10/01/26 (a) | 66,000 | 60,962 |
| 3.25%, 06/01/50 (a) | 35,000 | 24,068 |
| PepsiCo Inc. | ||
| 1.63%, 05/01/30 (a) | 48,000 | 39,169 |
| 2.63%, 07/29/29 (a) | 65,000 | 57,403 |
| 2.75%, 10/21/51 (a) | 117,000 | 81,674 |
| Pfizer Inc. | ||
| 2.70%, 05/28/50 (a) | 92,000 | 62,629 |
| 3.45%, 03/15/29 (a) | 19,000 | 17,900 |
| 3.60%, 09/15/28 (a) | 49,000 | 46,959 |
| 3.90%, 03/15/39 (a) | 25,000 | 22,058 |
| 4.13%, 12/15/46 (a) | 21,000 | 18,574 |
| 4.40%, 05/15/44 (a) | 7,000 | 6,502 |
| Philip Morris International Inc. | ||
| 1.50%, 05/01/25 (a) | 56,000 | 51,802 |
| 2.10%, 05/01/30 (a) | 23,000 | 18,622 |
| 3.38%, 08/15/29 (a) | 34,000 | 30,644 |
| 4.13%, 03/04/43 (a) | 18,000 | 14,232 |
| 5.63%, 11/17/29 | 220,000 | 224,059 |
| Phillips 66 Co. | ||
| 2.15%, 12/15/30 (a) | 279,000 | 223,125 |
| 3.15%, 12/15/29 (a)(f) | 137,000 | 119,494 |
| 3.30%, 03/15/52 (a) | 83,000 | 57,581 |
| 3.75%, 03/01/28 (a)(f) | 10,000 | 9,225 |
| 4.68%, 02/15/45 (a)(f) | 24,000 | 20,871 |
| Pioneer Natural Resources Co. | ||
| 1.13%, 01/15/26 (a) | 78,000 | 69,509 |
| 2.15%, 01/15/31 (a) | 44,000 | 34,897 |
| Plains All American Pipeline LP/PAA Finance Corp. | ||
| 3.55%, 12/15/29 (a) | 59,000 | 51,276 |
| 82 | Elfun Income Fund |
| Principal Amount | Fair Value | |
| PPL Capital Funding Inc. | ||
| 3.10%, 05/15/26 (a) | $ 54,000 | $ 50,533 |
| Precision Castparts Corp. | ||
| 4.38%, 06/15/45 (a) | 30,000 | 26,240 |
| Prologis LP | ||
| 3.05%, 03/01/50 | 20,000 | 13,491 |
| 3.25%, 06/30/26 | 20,000 | 18,996 |
| Prospect Capital Corp. | ||
| 3.36%, 11/15/26 (a) | 92,000 | 76,735 |
| Prudential Financial Inc. | ||
| 3.94%, 12/07/49 (a) | 52,000 | 40,821 |
| Prudential Financial Inc. (5.70% fixed rate until 09/15/28; 2.67% + 3 month USD LIBOR thereafter) | ||
| 5.70%, 09/15/48 (a)(b) | 46,000 | 44,068 |
| Public Service Company of Colorado | ||
| 3.70%, 06/15/28 (a) | 45,000 | 42,863 |
| Public Service Electric & Gas Co. | ||
| 2.38%, 05/15/23 (a) | 103,000 | 102,035 |
| PVH Corp. | ||
| 4.63%, 07/10/25 (a) | 144,000 | 139,056 |
| QUALCOMM Inc. | ||
| 1.30%, 05/20/28 (a) | 13,000 | 11,009 |
| 4.30%, 05/20/47 (a) | 7,000 | 6,070 |
| Quanta Services Inc. | ||
| 2.35%, 01/15/32 (a) | 84,000 | 63,847 |
| 3.05%, 10/01/41 (a) | 92,000 | 60,262 |
| Quest Diagnostics Inc. | ||
| 2.95%, 06/30/30 (a) | 18,000 | 15,562 |
| Raytheon Technologies Corp. | ||
| 1.90%, 09/01/31 (a) | 96,000 | 75,279 |
| 2.82%, 09/01/51 (a) | 64,000 | 41,741 |
| 3.13%, 05/04/27 (a) | 77,000 | 71,757 |
| 3.50%, 03/15/27 (a) | 25,000 | 23,819 |
| 3.95%, 08/16/25 (a) | 22,000 | 21,504 |
| 4.15%, 05/15/45 (a) | 27,000 | 22,513 |
| 4.45%, 11/16/38 (a) | 23,000 | 20,907 |
| Realty Income Corp. | ||
| 2.85%, 12/15/32 (a) | 46,000 | 37,364 |
| 3.00%, 01/15/27 (a) | 11,000 | 10,186 |
| 3.25%, 01/15/31 (a) | 48,000 | 41,628 |
| Regeneron Pharmaceuticals Inc. | ||
| 1.75%, 09/15/30 (a) | 89,000 | 68,906 |
| Regions Financial Corp. | ||
| 1.80%, 08/12/28 (a) | 195,000 | 165,438 |
| Republic Services Inc. | ||
| 2.38%, 03/15/33 (a) | 135,000 | 107,434 |
| Reynolds American Inc. | ||
| 4.45%, 06/12/25 (a) | 4,000 | 3,914 |
| Principal Amount | Fair Value | |
| Rio Tinto Finance USA Ltd. | ||
| 2.75%, 11/02/51 (a) | $ 126,000 | $ 83,604 |
| Rio Tinto Finance USA PLC | ||
| 4.13%, 08/21/42 | 18,000 | 15,533 |
| Rockwell Automation Inc. | ||
| 2.80%, 08/15/61 (a) | 26,000 | 15,586 |
| 4.20%, 03/01/49 (a) | 34,000 | 29,189 |
| Rogers Communications Inc. | ||
| 5.00%, 03/15/44 (a) | 10,000 | 8,516 |
| Roper Technologies Inc. | ||
| 2.95%, 09/15/29 (a) | 51,000 | 44,231 |
| Ross Stores Inc. | ||
| 4.70%, 04/15/27 (a) | 16,000 | 15,744 |
| Royalty Pharma PLC | ||
| 0.75%, 09/02/23 (a) | 57,000 | 55,237 |
| 1.20%, 09/02/25 (a) | 77,000 | 68,935 |
| 1.75%, 09/02/27 (a) | 37,000 | 31,428 |
| 2.15%, 09/02/31 (a) | 64,000 | 48,333 |
| 2.20%, 09/02/30 (a) | 13,000 | 10,158 |
| 3.30%, 09/02/40 (a) | 7,000 | 4,896 |
| RPM International Inc. | ||
| 3.75%, 03/15/27 (a) | 20,000 | 18,646 |
| Ryder System Inc. | ||
| 2.90%, 12/01/26 (a) | 134,000 | 122,007 |
| Salesforce Inc. | ||
| 1.95%, 07/15/31 (a) | 62,000 | 49,642 |
| 2.70%, 07/15/41 (a) | 83,000 | 59,308 |
| Santander UK Group Holdings PLC | ||
| 4.75%, 09/15/25 (a)(f) | 200,000 | 191,866 |
| Saudi Arabian Oil Co. | ||
| 3.50%, 04/16/29 (a)(f) | 254,000 | 233,190 |
| 4.38%, 04/16/49 (a)(f) | 254,000 | 218,039 |
| Schlumberger Holdings Corp. | ||
| 3.90%, 05/17/28 (a)(f) | 39,000 | 36,429 |
| Sealed Air Corp. | ||
| 1.57%, 10/15/26 (a)(f) | 352,000 | 303,948 |
| Selective Insurance Group Inc. | ||
| 5.38%, 03/01/49 (a) | 19,000 | 16,200 |
| Sempra Energy | ||
| 3.80%, 02/01/38 (a) | 10,000 | 8,199 |
| 4.00%, 02/01/48 (a) | 16,000 | 12,580 |
| Sempra Energy (4.13% fixed rate until 01/01/27; 2.87% + 5 year CMT Rate thereafter) | ||
| 4.13%, 04/01/52 (a)(b) | 122,000 | 96,069 |
| Shell International Finance BV | ||
| 3.13%, 11/07/49 (a) | 48,000 | 33,925 |
| 3.75%, 09/12/46 (a) | 16,000 | 12,678 |
| Shire Acquisitions Investments Ireland DAC | ||
| 2.88%, 09/23/23 (a) | 4,000 | 3,930 |
| 3.20%, 09/23/26 (a) | 8,000 | 7,520 |
| Elfun Income Fund | 83 |
| Principal Amount | Fair Value | |
| Simon Property Group LP | ||
| 3.38%, 06/15/27 (a) | $ 27,000 | $ 25,199 |
| Sonoco Products Co. | ||
| 2.85%, 02/01/32 (a) | 94,000 | 76,318 |
| Southern California Edison Co. | ||
| 4.00%, 04/01/47 (a) | 91,000 | 71,450 |
| 4.20%, 03/01/29 (a) | 66,000 | 62,786 |
| Southern Company Gas Capital Corp. | ||
| 3.95%, 10/01/46 (a) | 49,000 | 36,882 |
| 4.40%, 05/30/47 (a) | 7,000 | 5,590 |
| Southwest Airlines Co. | ||
| 2.63%, 02/10/30 (a) | 76,000 | 62,896 |
| Southwestern Electric Power Co. | ||
| 2.75%, 10/01/26 (a) | 32,000 | 29,341 |
| Spectra Energy Partners LP | ||
| 3.38%, 10/15/26 (a) | 8,000 | 7,467 |
| 4.50%, 03/15/45 (a) | 7,000 | 5,757 |
| Stanley Black & Decker Inc. | ||
| 3.00%, 05/15/32 (a) | 109,000 | 92,016 |
| Starbucks Corp. | ||
| 4.00%, 11/15/28 (a) | 20,000 | 19,057 |
| STERIS Irish FinCo UnLtd Co. | ||
| 2.70%, 03/15/31 (a) | 198,000 | 160,865 |
| Stryker Corp. | ||
| 1.95%, 06/15/30 (a) | 102,000 | 83,003 |
| Sumitomo Mitsui Financial Group Inc. | ||
| 4.44%, 04/02/24 (a)(f) | 466,000 | 458,316 |
| Sumitomo Mitsui Trust Bank Ltd. | ||
| 1.35%, 09/16/26 (a)(f) | 484,000 | 420,373 |
| Suncor Energy Inc. | ||
| 4.00%, 11/15/47 (a) | 8,000 | 6,081 |
| Svenska Handelsbanken AB (1.42% fixed rate until 06/11/26; 0.63% + 1 year CMT Rate thereafter) | ||
| 1.42%, 06/11/27 (a)(b)(f) | 250,000 | 219,040 |
| Sysco Corp. | ||
| 3.25%, 07/15/27 (a) | 22,000 | 20,359 |
| 5.95%, 04/01/30 (a) | 8,000 | 8,296 |
| 6.60%, 04/01/50 (a) | 11,000 | 11,982 |
| Takeda Pharmaceutical Company Ltd. | ||
| 2.05%, 03/31/30 (a) | 200,000 | 163,222 |
| 3.18%, 07/09/50 (a) | 200,000 | 136,802 |
| Take-Two Interactive Software Inc. | ||
| 3.70%, 04/14/27 (a) | 235,000 | 221,210 |
| 4.00%, 04/14/32 (a) | 50,000 | 44,230 |
| Principal Amount | Fair Value | |
| Tampa Electric Co. | ||
| 2.40%, 03/15/31 (a) | $ 95,000 | $ 76,941 |
| 3.45%, 03/15/51 (a) | 54,000 | 37,965 |
| 4.35%, 05/15/44 (a) | 64,000 | 52,557 |
| Tapestry Inc. | ||
| 4.13%, 07/15/27 (a) | 9,000 | 8,420 |
| Targa Resources Partners LP/Targa Resources Partners Finance Corp. | ||
| 5.00%, 01/15/28 (a) | 230,000 | 219,678 |
| Target Corp. | ||
| 2.50%, 04/15/26 (a) | 26,000 | 24,358 |
| Teck Resources Ltd. | ||
| 5.40%, 02/01/43 (a) | 25,000 | 22,438 |
| Texas Instruments Inc. | ||
| 3.88%, 03/15/39 (a) | 36,000 | 31,766 |
| The Allstate Corp. | ||
| 4.20%, 12/15/46 (a) | 66,000 | 54,621 |
| The Allstate Corp. (5.75% fixed rate until 08/15/23; 2.94% + 3 month USD LIBOR thereafter) | ||
| 5.75%, 08/15/53 (a)(b) | 98,000 | 92,296 |
| The Bank of New York Mellon Corp. (4.63% fixed rate until 09/20/26; 3.13% + 3 month USD LIBOR thereafter) | ||
| 4.63%, 12/31/99 (a)(b) | 50,000 | 42,643 |
| The Boeing Co. | ||
| 2.20%, 02/04/26 (a) | 145,000 | 131,793 |
| 2.70%, 02/01/27 (a) | 124,000 | 111,971 |
| 2.95%, 02/01/30 (a) | 28,000 | 23,701 |
| 3.25%, 03/01/28 (a) | 7,000 | 6,266 |
| 3.55%, 03/01/38 (a) | 6,000 | 4,420 |
| 3.75%, 02/01/50 (a) | 30,000 | 20,679 |
| 5.04%, 05/01/27 (a) | 181,000 | 179,109 |
| 5.15%, 05/01/30 (a) | 101,000 | 98,502 |
| 5.81%, 05/01/50 (a) | 62,000 | 57,685 |
| The Charles Schwab Corp. | ||
| 2.45%, 03/03/27 (a) | 80,000 | 73,118 |
| 2.90%, 03/03/32 (a) | 45,000 | 38,237 |
| The Charles Schwab Corp. (4.00% fixed rate until 12/01/30; 3.08% + 10 year CMT Rate thereafter) | ||
| 4.00%, 12/31/99 (a)(b) | 126,000 | 100,184 |
| The Cleveland Electric Illuminating Co. | ||
| 4.55%, 11/15/30 (a)(f) | 123,000 | 115,169 |
| The Clorox Co. | ||
| 1.80%, 05/15/30 (a) | 70,000 | 55,710 |
| The Coca-Cola Co. | ||
| 2.60%, 06/01/50 (a) | 51,000 | 34,279 |
| 2.75%, 06/01/60 (a) | 38,000 | 25,573 |
| 84 | Elfun Income Fund |
| Principal Amount | Fair Value | |
| The Dow Chemical Co. | ||
| 2.10%, 11/15/30 (a) | $ 37,000 | $ 29,749 |
| 3.60%, 11/15/50 (a) | 37,000 | 26,674 |
| 4.25%, 10/01/34 (a) | 23,000 | 20,671 |
| 5.55%, 11/30/48 (a) | 24,000 | 22,497 |
| The Estee Lauder Companies Inc. | ||
| 2.38%, 12/01/29 (a) | 35,000 | 30,051 |
| The George Washington University | ||
| 4.13%, 09/15/48 | 100,000 | 83,670 |
| The Goldman Sachs Group Inc. | ||
| 3.85%, 01/26/27 (a) | 219,000 | 208,519 |
| 4.25%, 10/21/25 (a) | 5,000 | 4,891 |
| 5.15%, 05/22/45 (a) | 24,000 | 21,706 |
| The Goldman Sachs Group Inc. (1.54% fixed rate until 09/10/26; 0.82% + SOFR thereafter) | ||
| 1.54%, 09/10/27 (b) | 93,000 | 80,343 |
| The Goldman Sachs Group Inc. (2.38% fixed rate until 07/21/31; 1.25% + SOFR thereafter) | ||
| 2.38%, 07/21/32 (b) | 52,000 | 40,310 |
| The Goldman Sachs Group Inc. (2.91% fixed rate until 07/21/41; 1.47% + SOFR thereafter) | ||
| 2.91%, 07/21/42 (b) | 39,000 | 26,589 |
| The Goldman Sachs Group Inc. (3.21% fixed rate until 04/22/41; 1.51% + SOFR thereafter) | ||
| 3.21%, 04/22/42 (b) | 61,000 | 43,907 |
| The Goldman Sachs Group Inc. (3.44% fixed rate until 02/24/42; 1.63% + SOFR thereafter) | ||
| 3.44%, 02/24/43 (b) | 98,000 | 72,215 |
| The Goldman Sachs Group Inc. (3.81% fixed rate until 04/23/28; 1.16% + 3 month USD LIBOR thereafter) | ||
| 3.81%, 04/23/29 (a)(b) | 24,000 | 21,835 |
| The Goldman Sachs Group Inc. (4.02% fixed rate until 10/31/37; 1.37% + 3 month USD LIBOR thereafter) | ||
| 4.02%, 10/31/38 (a)(b) | 27,000 | 22,144 |
| Principal Amount | Fair Value | |
| The Goldman Sachs Group Inc. (4.22% fixed rate until 05/01/28; 1.30% + 3 month USD LIBOR thereafter) | ||
| 4.22%, 05/01/29 (a)(b) | $ 44,000 | $ 40,982 |
| The Hartford Financial Services Group Inc. | ||
| 2.80%, 08/19/29 (a) | 108,000 | 92,371 |
| The Hartford Financial Services Group Inc. 2.13% + 3 month USD LIBOR | ||
| 6.73%, 02/12/67 (a)(b)(f) | 67,000 | 55,992 |
| The Home Depot Inc. | ||
| 2.70%, 04/15/30 (a) | 27,000 | 23,573 |
| 3.35%, 04/15/50 (a) | 50,000 | 37,260 |
| 3.50%, 09/15/56 (a) | 30,000 | 22,453 |
| 3.90%, 12/06/28 - 06/15/47 (a) | 42,000 | 37,726 |
| 4.50%, 12/06/48 (a) | 19,000 | 17,399 |
| 4.95%, 09/15/52 | 30,000 | 28,986 |
| The Kroger Co. | ||
| 2.20%, 05/01/30 (a) | 44,000 | 35,603 |
| 4.65%, 01/15/48 (a) | 14,000 | 12,088 |
| The Northwestern Mutual Life Insurance Co. | ||
| 3.45%, 03/30/51 (a)(f) | 108,000 | 75,947 |
| The Progressive Corp. | ||
| 3.00%, 03/15/32 (a) | 148,000 | 128,539 |
| 3.70%, 03/15/52 (a) | 25,000 | 19,234 |
| The Southern Co. | ||
| 3.25%, 07/01/26 (a) | 10,000 | 9,420 |
| 3.70%, 04/30/30 | 97,000 | 87,629 |
| The Toronto-Dominion Bank | ||
| 3.20%, 03/10/32 (a) | 205,000 | 176,663 |
| 4.46%, 06/08/32 (a) | 105,000 | 99,815 |
| The Toronto-Dominion Bank (3.63% fixed rate until 09/15/26; 2.21% + 5 year Swap Rate thereafter) | ||
| 3.63%, 09/15/31 (a)(b) | 38,000 | 34,991 |
| The Travelers Companies Inc. | ||
| 2.55%, 04/27/50 (a) | 81,000 | 50,589 |
| The Walt Disney Co. | ||
| 2.65%, 01/13/31 (a) | 76,000 | 64,936 |
| 3.38%, 11/15/26 (a) | 7,000 | 6,620 |
| 3.60%, 01/13/51 (a) | 48,000 | 36,807 |
| 4.75%, 11/15/46 (a) | 7,000 | 6,406 |
| 6.65%, 11/15/37 (a) | 50,000 | 56,284 |
| The Williams Companies Inc. | ||
| 3.75%, 06/15/27 (a) | 7,000 | 6,598 |
| 4.85%, 03/01/48 (a) | 22,000 | 18,744 |
| 4.90%, 01/15/45 (a) | 58,000 | 49,328 |
| 5.30%, 08/15/52 | 40,000 | 36,033 |
| 5.40%, 03/04/44 (a) | 7,000 | 6,386 |
| Elfun Income Fund | 85 |
| Principal Amount | Fair Value | |
| The Williams Cos. Inc. | ||
| 6.10%, 10/15/52 | $ 40,000 | $ 43,079 |
| Thermo Fisher Scientific Inc. | ||
| 2.80%, 10/15/41 (a) | 56,000 | 41,269 |
| Time Warner Cable LLC | ||
| 6.55%, 05/01/37 | 21,000 | 19,914 |
| T-Mobile USA Inc. | ||
| 3.50%, 04/15/25 (a) | 90,000 | 86,641 |
| 3.75%, 04/15/27 (a) | 114,000 | 107,485 |
| 3.88%, 04/15/30 (a) | 28,000 | 25,416 |
| 4.50%, 04/15/50 (a) | 22,000 | 18,165 |
| TotalEnergies Capital International S.A. | ||
| 3.46%, 02/19/29 (a) | 53,000 | 49,206 |
| Trane Technologies Luxembourg Finance S.A. | ||
| 3.55%, 11/01/24 (a) | 48,000 | 46,711 |
| 3.80%, 03/21/29 (a) | 10,000 | 9,218 |
| TransCanada PipeLines Ltd. | ||
| 4.25%, 05/15/28 (a) | 67,000 | 63,643 |
| 4.88%, 01/15/26 (a) | 14,000 | 13,929 |
| Transcanada Trust (5.63% fixed rate until 05/20/25; 3.53% + 3 month USD LIBOR thereafter) | ||
| 5.63%, 05/20/75 (a)(b) | 145,000 | 137,154 |
| Transcontinental Gas Pipe Line Company LLC | ||
| 4.00%, 03/15/28 (a) | 27,000 | 25,384 |
| Truist Financial Corp. (4.80% fixed rate until 09/01/24; 3.00% + 5 year CMT Rate thereafter) | ||
| 4.80%, 12/31/99 (a)(b) | 197,000 | 177,674 |
| TWDC Enterprises 18 Corp. | ||
| 4.13%, 06/01/44 (a) | 7,000 | 6,048 |
| Tyco Electronics Group S.A. | ||
| 3.13%, 08/15/27 (a) | 26,000 | 23,987 |
| Tyson Foods Inc. | ||
| 4.00%, 03/01/26 (a) | 123,000 | 118,995 |
| UBS Group AG (3.13% fixed rate until 08/13/29; 1.47% + 3 month USD LIBOR thereafter) | ||
| 3.13%, 08/13/30 (a)(b)(f) | 259,000 | 218,728 |
| UDR Inc. | ||
| 2.10%, 08/01/32 (a) | 64,000 | 47,532 |
| 3.00%, 08/15/31 (a) | 38,000 | 31,717 |
| UniCredit S.p.A. (2.57% fixed rate until 09/22/25; 2.30% + 1 year CMT Rate thereafter) | ||
| 2.57%, 09/22/26 (a)(b)(f) | 360,000 | 318,640 |
| Union Pacific Corp. | ||
| 3.55%, 05/20/61 (a) | 59,000 | 43,167 |
| 3.60%, 09/15/37 (a) | 10,000 | 8,475 |
| Principal Amount | Fair Value | |
| 3.80%, 04/06/71 (a) | $ 29,000 | $ 21,409 |
| 4.10%, 09/15/67 (a) | 21,000 | 16,550 |
| UnitedHealth Group Inc. | ||
| 2.00%, 05/15/30 (a) | 80,000 | 66,211 |
| 4.20%, 05/15/32 (a) | 80,000 | 76,038 |
| 4.45%, 12/15/48 (a) | 49,000 | 43,693 |
| 4.75%, 07/15/45 - 05/15/52 (a) | 88,000 | 81,753 |
| 6.05%, 02/15/63 | 30,000 | 33,035 |
| Utah Acquisition Sub Inc. | ||
| 3.95%, 06/15/26 (a) | 8,000 | 7,477 |
| Ventas Realty LP | ||
| 3.25%, 10/15/26 (a) | 36,000 | 33,306 |
| Verizon Communications Inc. | ||
| 2.10%, 03/22/28 (a) | 101,000 | 87,616 |
| 2.36%, 03/15/32 (a) | 137,000 | 108,646 |
| 2.55%, 03/21/31 (a) | 95,000 | 78,185 |
| 3.00%, 03/22/27 (a) | 180,000 | 167,378 |
| 3.40%, 03/22/41 (a) | 69,000 | 51,961 |
| 3.55%, 03/22/51 (a) | 50,000 | 35,793 |
| 3.70%, 03/22/61 (a) | 75,000 | 52,571 |
| 4.40%, 11/01/34 (a) | 52,000 | 47,807 |
| 4.86%, 08/21/46 (a) | 114,000 | 103,263 |
| Viatris Inc. | ||
| 4.00%, 06/22/50 | 24,000 | 14,867 |
| Virginia Electric & Power Co. | ||
| 4.00%, 11/15/46 (a) | 55,000 | 43,552 |
| Visa Inc. | ||
| 2.70%, 04/15/40 (a) | 51,000 | 38,628 |
| Vistra Operations Company LLC | ||
| 3.55%, 07/15/24 (a)(f) | 179,000 | 171,777 |
| Viterra Finance BV | ||
| 2.00%, 04/21/26 (a)(f) | 373,000 | 322,220 |
| Vodafone Group PLC | ||
| 5.25%, 05/30/48 (a) | 21,000 | 18,647 |
| Volkswagen Group of America Finance LLC | ||
| 1.63%, 11/24/27 (a)(f) | 232,000 | 194,511 |
| Vontier Corp. | ||
| 2.40%, 04/01/28 (a) | 133,000 | 104,992 |
| 2.95%, 04/01/31 (a) | 102,000 | 74,169 |
| Vornado Realty LP | ||
| 2.15%, 06/01/26 (a) | 120,000 | 101,654 |
| 3.50%, 01/15/25 (a) | 23,000 | 21,608 |
| Walgreens Boots Alliance Inc. | ||
| 4.10%, 04/15/50 (a) | 6,000 | 4,415 |
| Walmart Inc. | ||
| 1.80%, 09/22/31 (a) | 64,000 | 52,184 |
| 2.50%, 09/22/41 (a) | 64,000 | 46,738 |
| 2.65%, 09/22/51 (a) | 31,000 | 21,233 |
| Warnermedia Holdings Inc. | ||
| 5.05%, 03/15/42 (a)(f) | 25,000 | 19,225 |
| 86 | Elfun Income Fund |
| Principal Amount | Fair Value | |
| 5.14%, 03/15/52 (a)(f) | $ 25,000 | $ 18,357 |
| 5.39%, 03/15/62 (a)(f) | 25,000 | 18,314 |
| Waste Connections Inc. | ||
| 2.20%, 01/15/32 (a) | 89,000 | 70,799 |
| 2.95%, 01/15/52 (a) | 89,000 | 59,249 |
| WEC Energy Group Inc. | ||
| 3.55%, 06/15/25 (a) | 10,000 | 9,565 |
| Wells Fargo & Co. | ||
| 4.15%, 01/24/29 (a) | 87,000 | 81,741 |
| 4.75%, 12/07/46 (a) | 87,000 | 72,889 |
| Wells Fargo & Co. (1.65% fixed rate until 06/02/23; 1.60% + SOFR thereafter) | ||
| 1.65%, 06/02/24 (a)(b) | 96,000 | 94,474 |
| Wells Fargo & Co. (2.19% fixed rate until 04/30/25; 2.00% + SOFR thereafter) | ||
| 2.19%, 04/30/26 (a)(b) | 115,000 | 107,036 |
| Wells Fargo & Co. (2.39% fixed rate until 06/02/27; 2.10% + SOFR thereafter) | ||
| 2.39%, 06/02/28 (a)(b) | 208,000 | 183,439 |
| Wells Fargo & Co. (3.07% fixed rate until 04/30/40; 2.53% + SOFR thereafter) | ||
| 3.07%, 04/30/41 (a)(b) | 105,000 | 75,063 |
| Wells Fargo & Co. (3.20% fixed rate until 06/17/26; 1.17% + 3 month USD LIBOR thereafter) | ||
| 3.20%, 06/17/27 (a)(b) | 238,000 | 220,940 |
| Wells Fargo & Co. (5.88% fixed rate until 06/15/25; 3.99% + 3 month USD LIBOR thereafter) | ||
| 5.88%, 12/31/99 (a)(b) | 165,000 | 160,335 |
| Westlake Corp. | ||
| 2.88%, 08/15/41 (a) | 35,000 | 22,983 |
| 3.13%, 08/15/51 (a) | 40,000 | 24,850 |
| 3.38%, 08/15/61 (a) | 39,000 | 23,019 |
| Westpac Banking Corp. (2.89% fixed rate until 02/04/25; 1.35% + 5 year CMT Rate thereafter) | ||
| 2.89%, 02/04/30 (a)(b) | 80,000 | 73,343 |
| Westpac Banking Corp. (4.11% fixed rate until 07/24/29; 2.00% + 5 year CMT Rate thereafter) | ||
| 4.11%, 07/24/34 (a)(b) | 57,000 | 48,823 |
| Weyerhaeuser Co. | ||
| 4.00%, 03/09/52 (a) | 70,000 | 53,060 |
| Willis North America Inc. | ||
| 3.88%, 09/15/49 (a) | 51,000 | 36,277 |
| Workday Inc. | ||
| 3.50%, 04/01/27 (a) | 85,000 | 79,502 |
| Principal Amount | Fair Value | |
| 3.70%, 04/01/29 (a) | $ 170,000 | $ 155,941 |
| WPP Finance 2010 | ||
| 3.75%, 09/19/24 (a) | 31,000 | 30,025 |
| Xcel Energy Inc. | ||
| 3.40%, 06/01/30 (a) | 61,000 | 54,409 |
| Yamana Gold Inc. | ||
| 2.63%, 08/15/31 (a) | 102,000 | 76,378 |
| Zoetis Inc. | ||
| 3.00%, 09/12/27 (a) | 7,000 | 6,472 |
| 3.90%, 08/20/28 (a) | 27,000 | 25,669 |
| 5.60%, 11/16/32 | 160,000 | 166,010 |
| 54,182,503 | ||
| Non-Agency Collateralized Mortgage Obligations - 6.0% | ||
| BANK 2017-BNK7 | ||
| 3.18%, 09/15/60 | 2,398,000 | 2,180,963 |
| BANK 2018-BNK15 | ||
| 4.41%, 11/15/61 (b) | 1,001,000 | 958,763 |
| BPR Trust 2022-OANA 1.90% + 1 month Term SOFR | ||
| 6.23%, 04/15/37 (b)(f) | 372,398 | 366,704 |
| Cantor Commercial Real Estate Lending 2019-CF3 | ||
| 3.01%, 01/15/53 | 460,000 | 397,217 |
| CD 2019-CD8 Mortgage Trust | ||
| 2.91%, 08/15/57 | 839,000 | 724,835 |
| Citigroup Commercial Mortgage Trust 2016-P6 | ||
| 4.03%, 12/10/49 (b) | 336,823 | 307,910 |
| COMM 2012-CCRE3 Mortgage Trust | ||
| 3.92%, 10/15/45 (f) | 191,000 | 169,660 |
| COMM 2013-LC13 Mortgage Trust | ||
| 4.56%, 08/10/46 (b)(f) | 170,000 | 168,111 |
| COMM 2014-CR14 Mortgage Trust | ||
| 4.53%, 02/10/47 (b) | 240,000 | 233,821 |
| GS Mortgage Securities Trust 2015-GS1 | ||
| 4.42%, 11/10/48 (b) | 380,000 | 304,940 |
| GS Mortgage Securities Trust 2018-GS9 | ||
| 4.14%, 03/10/51 (b) | 291,000 | 266,864 |
| GS Mortgage Securities Trust 2019-GC42 | ||
| 2.75%, 09/01/52 | 1,523,000 | 1,303,359 |
| GS Mortgage Securities Trust 2019-GSA1 | ||
| 3.05%, 11/10/52 | 743,000 | 646,109 |
| Impac CMB Trust 2004-5 0.72% + 1 month USD LIBOR | ||
| 5.11%, 10/25/34 (b) | 16,737 | 16,015 |
| Elfun Income Fund | 87 |
| Principal Amount | Fair Value | |
| JPMBB Commercial Mortgage Securities Trust 2013-C12 | ||
| 4.05%, 07/15/45 (b) | $ 125,000 | $ 123,538 |
| JPMBB Commercial Mortgage Securities Trust 2015-C32 | ||
| 4.65%, 11/15/48 (b) | 250,000 | 181,242 |
| MASTR Alternative Loan Trust 2003-5 | ||
| 5.00%, 08/25/18 (d) | 1,531 | 190 |
| Morgan Stanley Bank of America Merrill Lynch Trust 2015-C21 | ||
| 0.85%, 03/15/48 (b)(d) | 3,043,098 | 40,603 |
| Wells Fargo Commercial Mortgage Trust 2014-LC16 | ||
| 4.32%, 08/15/50 | 485,082 | 409,218 |
| Wells Fargo Commercial Mortgage Trust 2015-C26 | ||
| 1.20%, 02/15/48 (b)(d) | 2,421,617 | 47,826 |
| WFRBS Commercial Mortgage Trust 2013-C17 | ||
| 4.26%, 12/15/46 | 235,000 | 230,630 |
| WFRBS Commercial Mortgage Trust 2014-LC14 | ||
| 4.35%, 03/15/47 (b) | 533,000 | 515,904 |
| 9,594,422 | ||
| Sovereign Bonds - 1.1% | ||
| Government of Chile | ||
| 2.55%, 01/27/32 (a) | 290,000 | 237,704 |
| 3.86%, 06/21/47 (a) | 200,000 | 156,444 |
| Government of Mexico | ||
| 4.75%, 03/08/44 (a) | 200,000 | 161,558 |
| Government of Panama | ||
| 3.16%, 01/23/30 (a) | 200,000 | 172,108 |
| 3.87%, 07/23/60 (a) | 200,000 | 129,410 |
| Government of Peru | ||
| 1.86%, 12/01/32 (a) | 140,000 | 102,371 |
| 2.78%, 12/01/60 (a) | 230,000 | 135,024 |
| 5.63%, 11/18/50 (a) | 105,000 | 104,184 |
| Government of Philippines | ||
| 3.95%, 01/20/40 (a) | 200,000 | 169,342 |
| Government of Qatar | ||
| 4.82%, 03/14/49 (a)(f) | 258,000 | 250,709 |
| Government of Uruguay | ||
| 5.10%, 06/18/50 (a) | 105,744 | 103,890 |
| 1,722,744 | ||
| Principal Amount | Fair Value | |
| Municipal Bonds and Notes - 0.4% | ||
| American Municipal Power Inc. | ||
| 6.27%, 02/15/50 | $ 130,000 | $ 137,432 |
| Board of Regents of the University of Texas System | ||
| 3.35%, 08/15/47 | 115,000 | 88,439 |
| Port Authority of New York & New Jersey | ||
| 4.46%, 10/01/62 | 220,000 | 190,903 |
| State of California | ||
| 4.60%, 04/01/38 | 200,000 | 188,274 |
| State of Illinois | ||
| 5.10%, 06/01/33 | 95,000 | 91,175 |
| 696,223 | ||
| Total Bonds and Notes (Cost $173,861,205) | 155,727,494 | |
| Number of Shares | ||
| Domestic Equity - 0.1% | ||
| Preferred Stock - 0.1% | ||
| Wells Fargo & Co. 5.85%, (5.85% fixed rate until 09/15/23; 3.09% + 3 month USD LIBOR thereafter) (Cost $186,475) (b) | 7,459 | 171,631 |
| Total Investments in Securities (Cost $174,047,680) | 155,899,125 | |
| Short-Term Investments - 21.2% | ||
| State Street Institutional U.S. Government Money Market Fund - Class G Shares 4.16% (h)(i) (Cost $33,943,475) | 33,943,475 | 33,943,475 |
| Total Investments (Cost $207,991,155) | 189,842,600 | |
| Liabilities in Excess of Other Assets, net - (18.4)% | (29,556,340) | |
| NET ASSETS - 100.0% | $ 160,286,260 | |
| 88 | Elfun Income Fund |
| Centrally Cleared Credit Default Swaps |
| Reference Entity | Counterparty | Notional Amount (000s omitted) | Contract Annual Fixed Rate/ Payment Frequency | Termination Date | Market Value | Unamortized Upfront Payments Received (Paid) | Unrealized Appreciation (Depreciation) |
| Buy Protection | |||||||
| Markit CDX North America High Yield Index | Intercontinental Exchange | $6,182 | 5.00%/ Quarterly | 12/20/27 | $36,109 | $(244,983) | $281,092 |
| The Fund had the following long futures contracts open at December 31, 2022: |
| Description | Expiration Date | Number of Contracts | Notional Amount | Value | Unrealized Appreciation (Depreciation) |
| U.S. Long Bond Futures | March 2023 | 18 | $ 2,276,901 | $ 2,256,188 | $ (20,713) |
| U.S. Ultra Long-Term Treasury Bond Futures | March 2023 | 18 | 2,443,057 | 2,417,625 | (25,432) |
| 2 Yr. U.S. Treasury Notes Futures | March 2023 | 82 | 16,789,136 | 16,816,406 | 27,270 |
| $ (18,875) |
| The Fund had the following short futures contracts open at December 31, 2022: |
| Description | Expiration date | Number of Contracts | Notional Amount | Value | Unrealized Appreciation (Depreciation) |
| 10 Yr. U.S. Treasury Notes Futures | March 2023 | 57 | $ (6,448,131) | $ (6,400,922) | $ 47,209 |
| 10 Yr. U.S. Treasury Ultra Futures | March 2023 | 7 | (837,334) | (827,969) | 9,366 |
| 5 Yr. U.S. Treasury Notes Futures | March 2023 | 52 | (5,621,184) | (5,612,344) | 8,840 |
| $ 65,415 |
| During the fiscal year ended December 31, 2022, average notional values related to derivative contracts were as follows: | |||
| Long Futures Contracts | Short Futures Contracts | Credit Default Swap Contracts | |
| Average Notional Value | $27,601,015 | $15,107,839 | $8,022,577 |
| (a) | At December 31, 2022, all or a portion of this security was pledged to cover collateral requirements for futures, swaps and/or TBAs. |
| (b) | Variable Rate Security - Interest rate shown is rate in effect at December 31, 2022. For securities based on a published reference rate and spread, the reference rate and spread are indicated in the description above. |
| (c) | Settlement is on a delayed delivery or when-issued basis with final maturity to be announced ("TBA") in the future. |
| Elfun Income Fund | 89 |
| (d) | Interest only security. These securities represent the right to receive the monthly interest payments on an underlying pool of mortgages. Payments of principal on the pool reduce the value of the "interest only" holding. |
| (e) | Principal only security. These securities represent the right to receive the monthly principal payments on an underlying pool of mortgages. No payments of interest on the pool are passed through to the "principal only" holder. |
| (f) | Pursuant to Rule 144A of the Securities Act of 1933, as amended, these securities may be resold in transactions exempt from registration, normally to qualified institutional buyers. At December 31, 2022, these securities amounted to $10,189,195 or 6.36% of the net assets of the Elfun Income Fund. These securities have been determined to be liquid using procedures established by the Fund's Board of Trustees. |
| (g) | Step coupon bond. |
| (h) | Sponsored by SSGA Funds Management, Inc., the Fund’s investment adviser and administrator, and an affiliate of State Street Bank & Trust Co., the Fund’s sub-administrator, custodian and accounting agent. |
| (i) | Coupon amount represents effective yield. |
| † | Percentages are based on net assets as of December 31, 2022. |
| ** | Amount is less than $0.50. |
| Abbreviations: |
| CMT - Constant Maturity Treasury |
| ISDA - International Swaps and Derivatives Association |
| LIBOR - London Interbank Offered Rate |
| REMIC - Real Estate Mortgage Investment Conduit |
| SOFR - Secured Overnight Financing Rate |
| STRIPS - Separate Trading of Registered Interest and Principal of Security |
| TBA - To Be Announced |
| Investments | Level 1 | Level 2 | Level 3 | Total | |||
| Investments in Securities | |||||||
| U.S. Treasuries | $ — | $ 38,051,656 | $ — | $ 38,051,656 | |||
| Agency Mortgage Backed | — | 49,954,044 | — | 49,954,044 | |||
| Agency Collateralized Mortgage Obligations | — | 1,199,584 | — | 1,199,584 | |||
| Asset Backed | — | 326,318 | — | 326,318 | |||
| Corporate Notes | — | 54,182,503 | — | 54,182,503 | |||
| Non-Agency Collateralized Mortgage Obligations | — | 9,594,422 | — | 9,594,422 | |||
| Sovereign Bonds | — | 1,722,744 | — | 1,722,744 | |||
| Municipal Bonds and Notes | — | 696,223 | — | 696,223 | |||
| Preferred Stock | 171,631 | — | — | 171,631 | |||
| Short-Term Investments | 33,943,475 | — | — | 33,943,475 | |||
| Total Investments in Securities | $ 34,115,106 | $ 155,727,494 | $ — | $ 189,842,600 | |||
| Other Financial Instruments | |||||||
| Credit Default Swap Contracts - Unrealized Appreciation | $ — | $ 281,092 | $ — | $ 281,092 | |||
| Long Futures Contracts - Unrealized Appreciation | 27,270 | — | — | 27,270 | |||
| Long Futures Contracts - Unrealized Depreciation | (46,145) | — | — | (46,145) | |||
| Short Futures Contracts - Unrealized Appreciation | 65,415 | — | — | 65,415 | |||
| Total Other Financial Instruments | $ 46,540 | $ 281,092 | $ — | $ 327,632 |
| Affiliate Table |
| Number of Shares Held at 12/31/21 | Value at 12/31/21 | Cost of Purchases | Proceeds from Shares Sold | Realized Gain (Loss) | Change in Unrealized Appreciation (Depreciation) | Number of Shares Held at 12/31/22 | Value at 12/31/22 | Dividend Income | |
| State Street Institutional U.S. Government Money Market Fund - Class G Shares | 25,377,841 | $25,377,841 | $87,957,011 | $79,391,377 | $— | $— | 33,943,475 | $33,943,475 | $416,866 |
| 90 | Elfun Income Fund |
| Elfun Government Money Market Fund | 91 |
| Sector Allocation |
| Portfolio composition as a % of Fair Value of $159,029 (in thousands) as of December 31, 2022 (a) |

| Average Annual Total Return for the years ended December 31, 2022 | |||||||
| (Inception date 6/13/90) | |||||||
| One Year | Five Year | Ten Year | Ending Value of a $10,000 Investment | ||||
| Elfun Government Money Market Fund | 1.45% | 1.06% | 0.61% | $10,627 | |||
| Daily-linked 90-Day T-Bill | 1.46% | 1.20% | 0.74% | $10,752 | |||
| (a) | The securities information regarding holdings, allocations and other characteristics is presented to illustrate examples of securities that the Fund has bought and the diversity of areas in which the Fund may invest as of a particular date. It may not be representative of the Fund’s current or future investments and should not be construed as a recommendation to purchase or sell a particular security. |
| 92 | Elfun Government Money Market Fund |
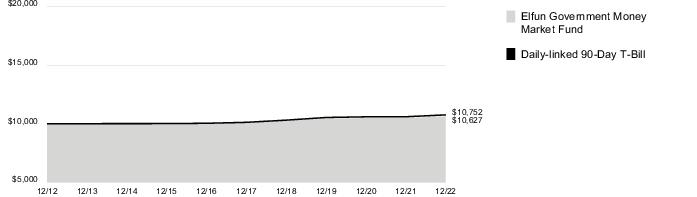
| Elfun Government Money Market Fund | 93 |
| Actual Fund Return | Hypothetical 5% Return (2.5% for the period) | ||
| Beginning Account Value July 1, 2022 | $1,000.00 | $1,000.00 | |
| Ending Account value December 31, 2022 | $1,013.20 | $1,023.80 | |
| Expenses Paid During Period* | $ 1.42 | $ 1.43 |
| * | Expenses are equal to the Fund's annualized net expense ratio of 0.28%** (for the period July 1, 2022 - December 31, 2022), multiplied by the average account value over the period, multiplied by 184/365 (to reflect the one-half year period). |
| ** | May differ from expense ratio disclosed in the financial highlights, which is calculated based on the entire fiscal year's data. |
| 94 | Elfun Government Money Market Fund |
| Principal Amount | Fair Value | |
| Short-Term Investments - 99.9% † | ||
| U.S. Treasuries - 11.9% | ||
| U.S. Treasury Bills | ||
| 2.04% 04/20/23 (a) | $ 250,000 | $ 248,529 |
| 2.18% 05/18/23 (a) | 50,000 | 49,606 |
| 2.92% 02/02/23 (a) | 500,000 | 498,816 |
| 3.00% 01/10/23 - 01/26/23 (a) | 500,000 | 499,328 |
| 3.03% 01/26/23 (a) | 200,000 | 199,624 |
| 3.17% 07/13/23 (a) | 150,000 | 147,585 |
| 3.18% 01/03/23 (a) | 500,000 | 500,000 |
| 3.20% 02/23/23 - 06/20/23 (a) | 670,000 | 666,057 |
| 3.23% 02/16/23 - 08/10/23 (a) | 400,000 | 396,966 |
| 3.27% 02/14/23 (a) | 200,000 | 199,254 |
| 3.34% 02/14/23 (a) | 200,000 | 199,239 |
| 4.10% 01/17/23 (a) | 1,000,000 | 998,437 |
| 4.20% 01/24/23 (a) | 1,470,000 | 1,466,470 |
| U.S. Treasury Notes | ||
| 0.13% 03/31/23 | 812,000 | 809,469 |
| U.S. Treasury Notes 0.02% + 3 month Treasury Money Market Yield | ||
| 4.38% 01/31/24 (b) | 60,000 | 60,023 |
| U.S. Treasury Notes 0.03% + 3 month Treasury Money Market Yield | ||
| 4.43% 04/30/23 - 07/31/23 (b) | 4,947,000 | 4,947,065 |
| U.S. Treasury Notes 0.04% + 3 month Treasury Money Market Yield | ||
| 4.43% 10/31/23 (b) | 1,575,000 | 1,575,520 |
| 4.44% 07/31/24 (b) | 1,000,000 | 999,140 |
| U.S. Treasury Notes 0.05% + 3 month Treasury Money Market Yield | ||
| 4.45% 01/31/23 (b) | 1,356,000 | 1,356,031 |
| U.S. Treasury Notes 0.08% + 3 month Treasury Money Market Yield | ||
| 4.32% 04/30/24 (b) | 3,050,000 | 3,047,243 |
| 18,864,402 | ||
| U.S. Government Agency Obligations - 24.9% | ||
| Federal Farm Credit Banks Funding Corp. | ||
| 2.10% 05/25/23 | 500,000 | 499,889 |
| Federal Farm Credit Banks Funding Corp. 0.02% + SOFR | ||
| 4.32% 06/12/23 - 08/21/23 (b) | 1,050,000 | 1,050,003 |
| Principal Amount | Fair Value | |
| Federal Farm Credit Banks Funding Corp. 0.03% + SOFR | ||
| 4.33% 01/12/23 - 06/14/23 (b) | $ 1,050,000 | $ 1,050,026 |
| Federal Farm Credit Banks Funding Corp. 0.04% + 3 month Treasury money market yield | ||
| 4.43% 05/03/23 (b) | 520,000 | 520,000 |
| Federal Farm Credit Banks Funding Corp. 0.05% + SOFR | ||
| 4.35% 05/09/24 - 06/03/24 (b) | 700,000 | 700,000 |
| Federal Farm Credit Banks Funding Corp. 0.06% + SOFR | ||
| 4.36% 05/13/24 (b) | 80,000 | 80,014 |
| Federal Home Loan Bank | ||
| 2.30% 05/18/23 (a) | 200,000 | 198,328 |
| 2.32% 05/12/23 (a) | 750,000 | 743,967 |
| 3.21% 01/26/23 (a) | 200,000 | 199,600 |
| 3.22% 07/13/23 (a) | 700,000 | 688,529 |
| Federal Home Loan Bank Discount Notes | ||
| 1.23% 02/23/23 (a) | 500,000 | 499,150 |
| 2.04% 04/20/23 (a) | 250,000 | 248,529 |
| 2.18% 05/12/23 (a) | 500,000 | 496,237 |
| 2.24% 05/18/23 (a) | 200,000 | 198,380 |
| 2.67% 01/11/23 (a) | 1,180,000 | 1,179,318 |
| 3.09% 02/01/23 (a) | 100,000 | 99,758 |
| 3.19% 06/20/23 (a) | 300,000 | 295,716 |
| 3.20% 01/26/23 (a) | 600,000 | 598,804 |
| 3.22% 07/13/23 (a) | 200,000 | 196,726 |
| 3.23% 02/28/23 (a) | 600,000 | 597,079 |
| 3.30% 08/11/23 (a) | 400,000 | 392,288 |
| 4.20% 01/25/23 (a) | 1,500,000 | 1,496,223 |
| Federal Home Loan Banks | ||
| 3.13% 08/10/23 | 1,000,000 | 1,000,000 |
| Federal Home Loan Banks 0.02% + SOFR | ||
| 4.32% 01/06/23 - 04/21/23 (b) | 6,850,000 | 6,850,000 |
| Federal Home Loan Banks 0.03% + SOFR | ||
| 4.33% 01/13/23 - 03/02/23 (b) | 3,870,000 | 3,870,000 |
| Federal Home Loan Banks 0.04% + SOFR | ||
| 4.34% 01/26/23 - 06/05/23 (b) | 6,550,000 | 6,550,000 |
| Elfun Government Money Market Fund | 95 |
| Principal Amount | Fair Value | |
| Federal Home Loan Banks 0.05% + SOFR | ||
| 4.35% 02/06/23 - 04/03/23 (b) | $ 3,000,000 | $ 3,000,000 |
| Federal Home Loan Banks 0.06% + SOFR | ||
| 4.36% 03/16/23 - 07/27/23 (b) | 2,200,000 | 2,200,000 |
| Federal Home Loan Banks 0.07% + SOFR | ||
| 4.37% 03/27/23 (b) | 1,500,000 | 1,500,000 |
| Federal Home Loan Banks 0.09% + SOFR | ||
| 4.39% 08/15/23 (b) | 2,400,000 | 2,400,000 |
| Federal Home Loan Mortgage Corp. | ||
| 0.25% 06/26/23 | 280,000 | 276,143 |
| 39,674,707 | ||
| Repurchase Agreements - 63.1% | ||
| BNP Paribas Securities Corp. U.S. Treasury Repo 4.26% dated 12/30/22, to be repurchased $300,000,000 01/03/23 | 20,000,000 | 20,000,000 |
| Citigroup Global Markets, Inc. U.S. Treasury Repo 4.27% dated 12/30/22, to be repurchased $100,000,000 on 01/03/2023, Collateralized by $48,193 U.S. Treasury Note, 0.125% to 2.625% Maturing from 08/31/2023 - 08/15/2029, Collateralized by $101,951,862 U.S. Treasury Inflation Index Note, 0.125% to 0.250% Maturing from 07/15/2029 - 01/15/2032. 01/03/23 | 15,000,000 | 15,000,000 |
| HSBC Securities USA, Inc. U.S. Treasury Repo 4.27% dated 12/30/22, to be repurchased $305,000,000 on 12/30/2022, Collateralized by $238,197,170 U.S. Treasury Bond, 2.000% to 7.625% Maturing on 02/15/2025 - 01/03/23 | 15,000,000 | 15,000,000 |
| Principal Amount | Fair Value | |
| Merrill Lynch, Pierce, Fenner & Smith, Inc. U.S. Treasury Repo 4.25% dated 12/30/22, to be repurchased $302,831,000 on 01/03/2022, Collateralized by $308,887,621 U.S. Treasury Note, 1.000% to 2.250% Maturing from 01/03/23 | $ 15,490,000 | $ 15,490,000 |
| Mitsubishi UFJ U.S. Treasury Repo 4.27% dated 12/30/22, to be repurchased $30,000,000 on 12/30/2022, Collateralized by $6,627,378 U.S. Treasury Bond, 1.250% to 4.750% Maturing from 02/15/2037 - 02/15/2052, Collateralized by $12,781,748 U.S. Government Obligation, 0.250% to 5.500% Maturing from 08/24/2023 - 09/01/2052, Collateralized by $292 U.S. Treasury Note, 3.1250% Maturing on 08/31/2027, Collateralized by $10,966,674 U.S. Treasury Inflation Index Note, 0.125% to 0.8750% Maturing from 01/15/2029 to 01/15/2030, Collateralized by $292 U.S. Treasury Note, 3.1250% Maturing on 08/31/2027, Collateralized by $223,908 U.S. Treasury Inflation Index Note, 2.500% Maturing on 01/15/2029. 01/03/23 | 30,000,000 | 30,000,000 |
| 96 | Elfun Government Money Market Fund |
| Principal Amount | Fair Value | |
| Standard Chartered U.S. Treasury Repo 4.27% dated 12/30/22, to be repurchased $5,000,000 on 01/03/2023, Collateralized by $1,055,041 U.S. Treasury Bond, 2.875% to 3.000% Maturing from 11/15/2046 - 05/15/2047, Collateralized by $56,232 U.S. Treasury Note, 0.125% to 2.875% Maturing on 07/31/2023 - 05/15/2032, Collateralized by $3,988,727 U.S. Government Obligation, 2.00% to 4.500% Maturing on 01/01/2041 - 11/01/2052. 01/03/23 | $ 5,000,000 | $ 5,000,000 |
| 100,490,000 | ||
| Total Short-Term Investments (Cost $159,029,109) | 159,029,109 | |
| Other Assets and Liabilities, net - 0.1% | 98,357 | |
| NET ASSETS - 100.0% | $ 159,127,466 |
| (a) | Coupon amount represents effective yield. |
| (b) | Variable Rate Security - Interest rate shown is rate in effect at December 31, 2022. For securities based on a published reference rate and spread, the reference rate and spread are indicated in the description above. |
| † | Percentages are based on net assets as of December 31, 2022. |
| Abbreviations: |
| SOFR - Secured Overnight Financing Rate |
| Investments | Level 1 | Level 2 | Level 3 | Total | |||
| Investments in Securities | |||||||
| U.S. Treasuries | $ — | $ 18,864,402 | $ — | $ 18,864,402 | |||
| U.S. Government Agency Obligations | — | 39,674,707 | — | 39,674,707 | |||
| Repurchase Agreements | — | 100,490,000 | — | 100,490,000 | |||
| Total Investments in Securities | $ — | $ 159,029,109 | $ — | $ 159,029,109 |
| Elfun Government Money Market Fund | 97 |
| 12/31/22 | 12/31/21 | 12/31/20 | 12/31/19 | 12/31/18 | |||||
| Inception date | 1/1/88 | ||||||||
| Net asset value, beginning of period | $ 26.73 | $ 26.53 | $ 23.69 | $ 18.51 | $ 22.68 | ||||
| Income/(loss) from investment operations: | |||||||||
| Net investment income(a) | 0.56 | 0.83 | 0.29 | 0.43 | 0.45 | ||||
| Net realized and unrealized gains/(losses) on investments | (4.86) | 1.57 | 2.86 | 5.15 | (4.16) | ||||
| Total income/(loss) from investment operations | (4.30) | 2.40 | 3.15 | 5.58 | (3.71) | ||||
| Less distributions from: | |||||||||
| Net investment income | 0.55 | 0.86 | 0.31 | 0.40 | 0.46 | ||||
| Net realized gains | 0.91 | 1.34 | — | — | — | ||||
| Total distributions | 1.46 | 2.20 | 0.31 | 0.40 | 0.46 | ||||
| Net asset value, end of period | $ 20.97 | $ 26.73 | $ 26.53 | $ 23.69 | $ 18.51 | ||||
| Total Return(b) | (16.11)% | 9.05% | 13.31% | 30.14% | (16.33)% | ||||
| Ratios/Supplemental Data: | |||||||||
| Net assets, end of period (in thousands) | $153,897 | $204,799 | $201,200 | $199,123 | $183,982 | ||||
| Ratios to average net assets: | |||||||||
| Net expenses | 0.44% | 0.37% | 0.40% | 0.38% | 0.36% | ||||
| Gross expenses | 0.44% | 0.37% | 0.40% | 0.38% | 0.36% | ||||
| Net investment income | 2.46% | 2.93% | 1.31% | 2.02% | 2.06% | ||||
| Portfolio turnover rate | 16% | 17% | 20% | 15% | 27% | ||||
| Notes to Financial Highlights | |
| (a) | Per share values have been calculated using the average shares method. |
| (b) | Total returns are historical and assume changes in share price, reinvestment of dividends and capital gains distributions and assume no sales charge. Past performance does not guarantee future results. |
| 98 | Financial Highlights |
| 12/31/22 | 12/31/21 | 12/31/20 | 12/31/19 | 12/31/18 | |||||
| Inception date | 5/27/35 | ||||||||
| Net asset value, beginning of period | $ 79.73 | $ 71.55 | $ 62.16 | $ 50.14 | $ 60.36 | ||||
| Income/(loss) from investment operations: | |||||||||
| Net investment income(a) | 0.72 | 0.72 | 0.64 | 0.71 | 0.74 | ||||
| Net realized and unrealized gains/(losses) on investments | (16.59) | 16.72 | 14.90 | 17.15 | (2.85) | ||||
| Total income/(loss) from investment operations | (15.87) | 17.44 | 15.54 | 17.86 | (2.11) | ||||
| Less distributions from: | |||||||||
| Net investment income | 0.75 | 0.74 | 0.69 | 0.67 | 0.76 | ||||
| Net realized gains | 4.53 | 8.52 | 5.46 | 5.17 | 7.35 | ||||
| Total distributions | 5.28 | 9.26 | 6.15 | 5.84 | 8.11 | ||||
| Net asset value, end of period | $ 58.58 | $ 79.73 | $ 71.55 | $ 62.16 | $ 50.14 | ||||
| Total Return(b) | (19.87)% | 24.28% | 25.07% | 35.57% | (3.39)% | ||||
| Ratios/Supplemental Data: | |||||||||
| Net assets, end of period (in thousands) | $2,912,901 | $3,965,156 | $3,419,765 | $2,979,222 | $2,427,667 | ||||
| Ratios to average net assets: | |||||||||
| Net expenses | 0.18% | 0.18% | 0.18% | 0.18% | 0.19% | ||||
| Gross expenses | 0.18% | 0.18% | 0.18% | 0.18% | 0.19% | ||||
| Net investment income | 1.03% | 0.89% | 0.99% | 1.20% | 1.17% | ||||
| Portfolio turnover rate | 29% | 26% | 25% | 17% | 18% | ||||
| Notes to Financial Highlights | |
| (a) | Per share values have been calculated using the average shares method. |
| (b) | Total returns are historical and assume changes in share price, reinvestment of dividends and capital gains distributions and do not include the effect of insurance contract charges. Past performance does not guarantee future results. |
| Financial Highlights | 99 |
| 12/31/22 | 12/31/21 | 12/31/20 | 12/31/19 | 12/31/18 | |||||
| Inception date | 1/1/88 | ||||||||
| Net asset value, beginning of period | $ 21.68 | $ 20.97 | $ 19.54 | $ 17.02 | $ 18.60 | ||||
| Income/(loss) from investment operations: | |||||||||
| Net investment income(a) | 0.35 | 0.34 | 0.37 | 0.41 | 0.42 | ||||
| Net realized and unrealized gains/(losses) on investments | (3.67) | 2.08 | 2.02 | 2.93 | (1.45) | ||||
| Total income/(loss) from investment operations | (3.32) | 2.42 | 2.39 | 3.34 | (1.03) | ||||
| Less distributions from: | |||||||||
| Net investment income | 0.42 | 0.42 | 0.38 | 0.42 | 0.43 | ||||
| Net realized gains | 0.92 | 1.29 | 0.58 | 0.40 | 0.12 | ||||
| Total distributions | 1.34 | 1.71 | 0.96 | 0.82 | 0.55 | ||||
| Net asset value, end of period | $ 17.02 | $ 21.68 | $ 20.97 | $ 19.54 | $ 17.02 | ||||
| Total Return(b) | (15.31)% | 11.56% | 12.23% | 19.58% | (5.51)% | ||||
| Ratios/Supplemental Data: | |||||||||
| Net assets, end of period (in thousands) | $166,006 | $211,716 | $205,144 | $199,011 | $181,943 | ||||
| Ratios to average net assets: | |||||||||
| Net expenses | 0.33% | 0.30% | 0.31% | 0.30% | 0.33% | ||||
| Gross expenses | 0.34% | 0.30% | 0.31% | 0.30% | 0.33% | ||||
| Net investment income | 1.83% | 1.53% | 1.88% | 2.20% | 2.26% | ||||
| Portfolio turnover rate | 49% (c) | 41% (c) | 56% (c) | 162% | 72% | ||||
| Notes to Financial Highlights | |
| (a) | Per share values have been calculated using the average shares method. |
| (b) | Total returns are historical and assume changes in share price, reinvestment of dividends and capital gains distributions and assume no sales charge. Past performance does not guarantee future results. |
| (c) | The portfolio turnover calculated for the fiscal years ended 12/31/2022, 12/31/2021 and 12/31/20 did not include To-Be-Announced transactions and, if it had, the portfolio turnover would have been 116%, 90% and 136%, respectively. |
| 100 | Financial Highlights |
| 12/31/22 | 12/31/21 | 12/31/20 | 12/31/19 | 12/31/18 | |||||
| Inception date | 1/1/80 | ||||||||
| Net asset value, beginning of period | $ 11.47 | $ 11.67 | $ 11.54 | $ 11.19 | $ 11.55 | ||||
| Income/(loss) from investment operations: | |||||||||
| Net investment income(a) | 0.31 | 0.31 | 0.37 | 0.38 | 0.46 | ||||
| Net realized and unrealized gains/(losses) on investments | (1.28) | (0.14) | 0.17 | 0.41 | (0.36) | ||||
| Total income/(loss) from investment operations | (0.97) | 0.17 | 0.54 | 0.79 | 0.10 | ||||
| Less distributions from: | |||||||||
| Net investment income | 0.37 | 0.37 | 0.41 | 0.44 | 0.46 | ||||
| Total distributions | 0.37 | 0.37 | 0.41 | 0.44 | 0.46 | ||||
| Net asset value, end of period | $ 10.13 | $ 11.47 | $ 11.67 | $ 11.54 | $ 11.19 | ||||
| Total Return(b) | (8.44)% | 1.44% | 4.77% | 7.13% | 0.90% | ||||
| Ratios/Supplemental Data: | |||||||||
| Net assets, end of period (in thousands) | $1,047,236 | $1,250,501 | $1,341,617 | $1,377,821 | $1,376,980 | ||||
| Ratios to average net assets: | |||||||||
| Net expenses | 0.21% | 0.21% | 0.21% | 0.20% | 0.21% | ||||
| Gross expenses | 0.21% | 0.21% | 0.21% | 0.20% | 0.21% | ||||
| Net investment income | 2.96% | 2.65% | 3.24% | 3.35% | 4.06% | ||||
| Portfolio turnover rate | 43% | 42% | 41% | 25% | 18% | ||||
| Notes to Financial Highlights | |
| (a) | Per share values have been calculated using the average shares method. |
| (b) | Total returns are historical and assume changes in share price, reinvestment of dividends and capital gains distributions and assume no sales charge. Past performance does not guarantee future results. |
| Financial Highlights | 101 |
| 12/31/22 | 12/31/21 | 12/31/20 | 12/31/19 | 12/31/18 | |||||
| Inception date | 12/31/84 | ||||||||
| Net asset value, beginning of period | $ 11.67 | $ 12.25 | $ 11.74 | $ 11.02 | $ 11.44 | ||||
| Income/(loss) from investment operations: | |||||||||
| Net investment income(a) | 0.25 | 0.24 | 0.29 | 0.32 | 0.32 | ||||
| Net realized and unrealized gains/(losses) on investments | (1.80) | (0.38) | 0.63 | 0.73 | (0.41) | ||||
| Total income/(loss) from investment operations | (1.55) | (0.14) | 0.92 | 1.05 | (0.09) | ||||
| Less distributions from: | |||||||||
| Net investment income | 0.27 | 0.27 | 0.34 | 0.33 | 0.33 | ||||
| Net realized gains | 0.17 | 0.17 | 0.07 | — | — | ||||
| Total distributions | 0.44 | 0.44 | 0.41 | 0.33 | 0.33 | ||||
| Net asset value, end of period | $ 9.68 | $ 11.67 | $ 12.25 | $ 11.74 | $ 11.02 | ||||
| Total Return(b) | (13.47)% | (1.19)% | 8.03% | 9.50% | (0.80)% | ||||
| Ratios/Supplemental Data: | |||||||||
| Net assets, end of period (in thousands) | $160,286 | $218,824 | $244,329 | $233,663 | $229,477 | ||||
| Ratios to average net assets: | |||||||||
| Net expenses | 0.32% | 0.29% | 0.27% | 0.29% | 0.34% | ||||
| Gross expenses | 0.32% | 0.29% | 0.27% | 0.29% | 0.34% | ||||
| Net investment income | 2.41% | 2.03% | 2.44% | 2.77% | 2.88% | ||||
| Portfolio turnover rate | 40% (c) | 71% (c) | 108% (c) | 107% | 207% | ||||
| Notes to Financial Highlights | |
| (a) | Per share values have been calculated using the average shares method. |
| (b) | Total returns are historical and assume changes in share price, reinvestment of dividends and capital gains distributions and do not include the effect of insurance contract charges. Past performance does not guarantee future results. |
| (c) | The portfolio turnover calculated for the fiscal years ended 12/31/22, 12/31/21 and 12/31/20 did not include To-Be-Announced transactions and, if it had, the portfolio turnover would have been 187%, 184% and 255%, respectively. |
| 102 | Financial Highlights |
| 12/31/22 | 12/31/21 | 12/31/20 | 12/31/19 | 12/31/18 | |||||
| Inception date | 6/13/90 | ||||||||
| Net asset value, beginning of period | $ 1.00 | $ 1.00 | $ 1.00 | $ 1.00 | $ 1.00 | ||||
| Income/(loss) from investment operations: | |||||||||
| Net investment income(a) | 0.01 | — | 0.00 (b) | 0.02 | 0.02 | ||||
| Total income from investment operations | 0.01 | — | 0.00 (b) | 0.02 | 0.02 | ||||
| Less distributions from: | |||||||||
| Net investment income | 0.01 | — | 0.00 (b) | 0.02 | 0.02 | ||||
| Net realized gains | — | — | — | — | — | ||||
| Total distributions | 0.01 | — | 0.00 (b) | 0.02 | 0.02 | ||||
| Net asset value, end of period | $ 1.00 | $ 1.00 | $ 1.00 | $ 1.00 | $ 1.00 | ||||
| Total Return(c) | 1.45% | —% | 0.32% | 1.99% | 1.55% | ||||
| Ratios/Supplemental Data: | |||||||||
| Net assets, end of period (in thousands) | $159,127 | $142,430 | $153,251 | $128,561 | $104,275 | ||||
| Ratios to average net assets: | |||||||||
| Net expenses | 0.24% | 0.09% | 0.19% | 0.26% | 0.32% | ||||
| Gross expenses | 0.27% | 0.26% | 0.25% | 0.26% | 0.32% | ||||
| Net investment income | 1.50% | —% | 0.30% | 1.96% | 1.53% | ||||
| Notes to Financial Highlights | |
| (a) | Per share values have been calculated using the average shares method. |
| (b) | Rounds to less than $0.005. |
| (c) | Total returns are historical and assume changes in share price, reinvestment of dividends and capital gains distributions and assume no sales charge. Past performance does not guarantee future results. |
| Financial Highlights | 103 |
| Elfun International Equity Fund | Elfun Trusts | ||
| Assets | |||
| Investments in securities, at fair value (cost $124,901,407; $1,756,288,011; $115,302,264; $1,040,934,261; $174,047,680 and $0, respectively) | $ 151,412,772 | $ 2,872,162,633 | |
| Investments in affiliated securities, at fair value (cost $0; $0; $42,294,178; $0; $0 and $0, respectively) | — | — | |
| Short-term investments, at fair value (cost $0; $0; $116,548; $0; $0 and $0, respectively) | — | — | |
| Investments in affiliated securities, at fair value | 2,127,943 | 38,776,883 | |
| Repurchase agreements | — | — | |
| Cash | — | — | |
| Net cash collateral on deposit with broker for future contracts | 86,942 | — | |
| Foreign currency (cost $1,738, $0, $32,020, $0, $0 and $0, respectively) | 1,739 | — | |
| Receivable for investments sold | — | — | |
| Income receivables | 894,712 | 2,670,403 | |
| Receivable for fund shares sold | 1,505 | 140,173 | |
| Income receivable from affiliated investments | 12,829 | 178,857 | |
| Receivable for accumulated variation margin on swap contracts | — | — | |
| Receivable for accumulated variation margin on futures contracts | — | — | |
| Prepaid expenses and other assets | 448 | 8,724 | |
| Total assets | 154,538,890 | 2,913,937,673 | |
| Liabilities | |||
| Distribution payable to shareholders | — | — | |
| Net cash collateral on swap contracts due to broker | — | — | |
| Payable for investments purchased | — | — | |
| Payable for fund shares redeemed | 7,505 | 324,828 | |
| Payable for accumulated variation margin on futures contracts | 5,991 | — | |
| Payable to the Adviser | 28,126 | 359,524 | |
| Payable for custody, fund accounting and sub-administration fees | 19,567 | 94,804 | |
| Accrued other expenses | 580,950 | 257,039 | |
| Total liabilities | 642,139 | 1,036,195 | |
| Net Assets | $ 153,896,751 | $ 2,912,901,478 | |
| Net Assets Consist of: | |||
| Capital paid in | $ 130,322,596 | $ 1,771,462,243 | |
| Total distributable earnings (loss) | 23,574,155 | 1,141,439,235 | |
| Net Assets | $ 153,896,751 | $ 2,912,901,478 | |
| Shares outstanding (Par value $10; $10; $10; $10; $10; and $1, respectively; unlimited shares authorized) | 7,338,205 | 49,721,764 | |
| Net asset value, offering and redemption price per share | $ 20.97 | $ 58.58 | |
| 104 | Statements of Assets and Liabilities |
| Elfun Diversified Fund | Elfun Tax-Exempt Income Fund | Elfun Income Fund | Elfun Government Money Market Fund | |||
| $ 121,299,213 | $ 1,025,415,897 | $ 155,899,125 | $ — | |||
| 42,741,900 | — | — | — | |||
| 116,548 | — | — | — | |||
| 17,464,685 | 15,874,392 | 33,943,475 | 58,539,109 | |||
| — | — | — | 100,490,000 | |||
| 536,670 | — | 431,186 | 181 | |||
| 34,390 | — | 231,320 | — | |||
| 33,814 | — | — | — | |||
| 96,238 | 7,925,457 | 9 | — | |||
| 383,633 | 14,446,024 | 929,006 | — | |||
| 985 | 23,462 | 25,789 | 237,650 | |||
| 58,068 | 48,674 | 122,929 | 319,566 | |||
| 18,884 | — | 48,130 | — | |||
| — | — | 47,102 | — | |||
| 492 | 3,055 | 506 | 429 | |||
| 182,785,520 | 1,063,736,961 | 191,678,577 | 159,586,935 | |||
| — | 983,945 | 96,061 | 56,548 | |||
| 17,667 | — | 40,384 | — | |||
| 16,505,985 | 14,798,360 | 30,872,052 | — | |||
| 101,357 | 395,344 | 259,279 | 307,996 | |||
| 16,711 | — | — | — | |||
| 22,741 | 143,163 | 19,063 | 13,986 | |||
| 18,107 | 35,216 | 12,919 | 16,247 | |||
| 97,008 | 144,499 | 92,559 | 64,692 | |||
| 16,779,576 | 16,500,527 | 31,392,317 | 459,469 | |||
| $ 166,005,944 | $ 1,047,236,434 | $ 160,286,260 | $ 159,127,466 | |||
| $ 162,245,407 | $ 1,152,692,892 | $ 191,457,561 | $ 159,127,200 | |||
| 3,760,537 | (105,456,458) | (31,171,301) | 266 | |||
| $ 166,005,944 | $ 1,047,236,434 | $ 160,286,260 | $ 159,127,466 | |||
| 9,751,048 | 103,332,462 | 16,565,843 | 159,127,181 | |||
| $ 17.02 | $ 10.13 | $ 9.68 | $ 1.00 | |||
| Statements of Assets and Liabilities | 105 |
| Elfun International Equity Fund | Elfun Trusts | ||
| Investment Income | |||
| Income | |||
| Dividend | $ 4,700,381 | $ 39,017,825 | |
| EU Reclaims | 943,627 | — | |
| Less: Taxes | (399,602) | — | |
| Interest | — | — | |
| Income from affiliated investments | 54,720 | 1,216,128 | |
| Less: Foreign taxes withheld | (468,223) | (6,292) | |
| Total income | 4,830,903 | 40,227,661 | |
| Expenses | |||
| Advisory and administration fees | 349,672 | 4,643,767 | |
| Blue Sky fees | 25,995 | 31,987 | |
| Transfer agent fees | 124,980 | 571,969 | |
| Trustees' fees | 22,020 | 40,959 | |
| Custody, fund accounting and sub-administration fees | 69,793 | 432,288 | |
| Professional fees | 130,065 | 56,771 | |
| Printing and shareholder reports | 8,364 | 66,448 | |
| Registration fees | — | 15,701 | |
| Other expenses | 6,625 | 66,713 | |
| Total expenses before waivers | 737,514 | 5,926,603 | |
| Fees waived and/or reimbursed by the adviser | — | — | |
| Net expenses | 737,514 | 5,926,603 | |
| Net investment income | $ 4,093,389 | $ 34,301,058 | |
| Net Realized and Unrealized Gain (Loss) on Investments | |||
| Realized gain (loss) on: | |||
| Unaffiliated investments | $ 1,331,638 | $ 29,082,241 | |
| Affiliated investments | — | — | |
| Futures | (61,264) | — | |
| Swap contracts | — | — | |
| Foreign currency transactions | (257,930) | — | |
| Increase (decrease) in unrealized appreciation/depreciation on: | |||
| Unaffiliated investments | (38,088,306) | (838,339,517) | |
| Affiliated investments | — | — | |
| Futures | (44,749) | — | |
| Swap contracts | — | — | |
| Foreign currency translations | (58,913) | — | |
| Net realized and unrealized gain (loss) on investments | (37,179,524) | (809,257,276) | |
| Net Increase (Decrease) in Net Assets Resulting from Operations | $ (33,086,135) | $ (774,956,218) |
| 106 | Statements of Operations |
| Elfun Diversified Fund | Elfun Tax-Exempt Income Fund | Elfun Income Fund | Elfun Government Money Market Fund | |||
| $ 1,189,914 | $ — | $ 13,280 | $ — | |||
| — | — | — | — | |||
| — | — | — | — | |||
| 1,547,329 | 34,907,098 | 4,635,792 | 2,602,026 | |||
| 1,210,026 | 167,743 | 416,866 | — | |||
| (396) | — | — | — | |||
| 3,946,873 | 35,074,841 | 5,065,938 | 2,602,026 | |||
| 309,829 | 1,772,665 | 315,979 | 149,665 | |||
| 28,195 | 36,262 | 34,113 | 34,396 | |||
| 106,418 | 235,042 | 116,030 | 80,778 | |||
| 22,091 | 27,534 | 22,351 | 21,851 | |||
| 75,814 | 160,985 | 55,763 | 57,032 | |||
| 49,332 | 48,053 | 41,598 | 29,044 | |||
| 15,064 | 29,024 | 8,532 | 26,237 | |||
| — | 805 | — | — | |||
| 5,304 | 19,025 | 6,199 | 1,944 | |||
| 612,047 | 2,329,395 | 600,565 | 400,947 | |||
| (7,108) | — | (14,684) | (43,973) | |||
| 604,939 | 2,329,395 | 585,881 | 356,974 | |||
| $ 3,341,934 | $ 32,745,446 | $ 4,480,057 | $ 2,245,052 | |||
| $ 3,107,728 | $ (38,399,737) | $ (9,502,143) | $ 211 | |||
| 173,178 | — | — | — | |||
| (335,287) | — | (1,306,777) | — | |||
| (64,622) | — | (176,099) | — | |||
| (18,967) | — | — | — | |||
| (28,954,762) | (97,949,642) | (22,757,235) | — | |||
| (9,400,984) | — | — | — | |||
| (4,980) | — | 95,663 | — | |||
| 118,746 | — | 301,705 | — | |||
| (563) | — | — | — | |||
| (35,380,513) | (136,349,379) | (33,344,886) | 211 | |||
| $ (32,038,579) | $ (103,603,933) | $ (28,864,829) | $ 2,245,263 |
| Statements of Operations | 107 |
| Elfun International Equity Fund | Elfun Trusts | ||||||
| Year Ended December 31, 2022 | Year Ended December 31, 2021 | Year Ended December 31, 2022 | Year Ended December 31, 2021 | ||||
| Increase (Decrease) in Net Assets | |||||||
| Operations: | |||||||
| Net investment income | $ 4,093,389 | $ 6,120,473 | $ 34,301,058 | $ 33,815,592 | |||
| Net realized gain (loss) on investments, futures, swap contracts and foreign currency transactions | 1,012,444 | 15,203,963 | 29,082,241 | 526,019,203 | |||
| Net increase (decrease) in unrealized appreciation/depreciation on investments, futures, swap contracts and foreign currency translations | (38,191,968) | (3,340,021) | (838,339,517) | 254,514,072 | |||
| Net increase (decrease) from operations | (33,086,135) | 17,984,415 | (774,956,218) | 814,348,867 | |||
| Distributions to shareholders: | |||||||
| Total distributions | (10,109,923) | (15,724,016) | (244,921,749) | (421,275,229) | |||
| Increase (decrease) in assets from operations and distributions | (43,196,058) | 2,260,399 | (1,019,877,967) | 393,073,638 | |||
| Share transactions: | |||||||
| Proceeds from sale of shares | 1,319,728 | 2,858,069 | 46,867,193 | 73,991,073 | |||
| Value of distributions reinvested | 8,739,289 | 13,507,831 | 199,361,109 | 344,793,733 | |||
| Cost of shares redeemed | (17,765,665) | (15,026,462) | (278,604,671) | (266,467,198) | |||
| Net increase (decrease) from share transactions | (7,706,648) | 1,339,438 | (32,376,369) | 152,317,608 | |||
| Total increase (decrease) in net assets | (50,902,706) | 3,599,837 | (1,052,254,336) | 545,391,246 | |||
| Net Assets | |||||||
| Beginning of year | 204,799,457 | 201,199,620 | 3,965,155,814 | 3,419,764,568 | |||
| End of year | $ 153,896,751 | $ 204,799,457 | $ 2,912,901,478 | $ 3,965,155,814 | |||
| Changes in Fund Shares | |||||||
| Shares sold | 57,624 | 102,485 | 682,298 | 924,232 | |||
| Issued for distributions reinvested | 414,965 | 505,533 | 3,419,573 | 4,291,874 | |||
| Shares redeemed | (796,024) | (531,166) | (4,109,858) | (3,281,753) | |||
| Net increase (decrease) in fund shares | (323,435) | 76,852 | (7,987) | 1,934,353 | |||
| 108 | Statements of Changes in Net Assets |
| Elfun Diversified Fund | Elfun Tax-Exempt Income Fund | |||||
| Year Ended December 31, 2022 | Year Ended December 31, 2021 | Year Ended December 31, 2022 | Year Ended December 31, 2021 | |||
| $ 3,341,934 | $ 3,224,928 | $ 32,745,446 | $ 34,533,678 | |||
| 2,862,030 | 14,601,462 | (38,399,737) | (312,845) | |||
| (38,242,543) | 5,260,848 | (97,949,642) | (15,370,341) | |||
| (32,038,579) | 23,087,238 | (103,603,933) | 18,850,492 | |||
| (12,253,898) | (15,754,251) | (39,613,148) | (41,209,578) | |||
| (44,292,477) | 7,332,987 | (143,217,081) | (22,359,086) | |||
| 4,806,152 | 4,772,080 | 27,813,701 | 40,093,917 | |||
| 10,857,841 | 13,873,358 | 28,329,020 | 29,155,146 | |||
| (17,081,582) | (19,406,904) | (116,189,891) | (138,005,800) | |||
| (1,417,589) | (761,466) | (60,047,170) | (68,756,737) | |||
| (45,710,066) | 6,571,521 | (203,264,251) | (91,115,823) | |||
| 211,716,010 | 205,144,489 | 1,250,500,685 | 1,341,616,508 | |||
| $ 166,005,944 | $ 211,716,010 | $ 1,047,236,434 | $ 1,250,500,685 | |||
| 245,078 | 216,554 | 2,667,177 | 3,462,715 | |||
| 637,197 | 635,917 | 2,728,399 | 2,525,649 | |||
| (896,699) | (871,621) | (11,098,604) | (11,950,926) | |||
| (14,424) | (19,150) | (5,703,028) | (5,962,562) | |||
| Statements of Changes in Net Assets | 109 |
| Elfun Income Fund | Elfun Government Money Market Fund | ||||||
| Year Ended December 31, 2022 | Year Ended December 31, 2021 | Year Ended December 31, 2022 | Year Ended December 31, 2021 | ||||
| Increase (Decrease) in Net Assets | |||||||
| Operations: | |||||||
| Net investment income | $ 4,480,057 | $ 4,752,937 | $ 2,245,052 | $ — | |||
| Net realized gain (loss) on investments, futures and swap contracts | (10,985,019) | 2,980,049 | 211 | 55 | |||
| Net increase (decrease) in unrealized appreciation/depreciation on investments, futures and swap contracts | (22,359,867) | (10,560,616) | — | — | |||
| Net increase (decrease) from operations | (28,864,829) | (2,827,630) | 2,245,263 | 55 | |||
| Distributions to shareholders: | |||||||
| Total distributions | (7,501,246) | (8,337,782) | (2,245,052) | — | |||
| Increase (decrease) in assets from operations and distributions | (36,366,075) | (11,165,412) | 211 | 55 | |||
| Share transactions: | |||||||
| Proceeds from sale of shares | 10,181,575 | 18,127,991 | 76,139,491 | 50,569,988 | |||
| Value of distributions reinvested | 6,014,489 | 6,571,744 | 2,101,565 | 422 | |||
| Cost of shares redeemed | (38,368,027) | (39,039,271) | (61,544,131) | (61,391,100) | |||
| Net increase (decrease) from share transactions | (22,171,963) | (14,339,536) | 16,696,925 | (10,820,690) | |||
| Total increase (decrease) in net assets | (58,538,038) | (25,504,948) | 16,697,136 | (10,820,635) | |||
| Net Assets | |||||||
| Beginning of year | 218,824,298 | 244,329,246 | 142,430,330 | 153,250,965 | |||
| End of year | $ 160,286,260 | $ 218,824,298 | $ 159,127,466 | $ 142,430,330 | |||
| Changes in Fund Shares | |||||||
| Shares sold | 943,220 | 1,518,468 | 76,139,492 | 50,569,987 | |||
| Issued for distributions reinvested | 598,767 | 555,624 | 2,101,565 | 422 | |||
| Shares redeemed | (3,722,118) | (3,276,520) | (61,544,131) | (61,391,100) | |||
| Net increase (decrease) in fund shares | (2,180,131) | (1,202,428) | 16,696,926 | (10,820,691) | |||
| 110 | Statements of Changes in Net Assets |
| • | Equity investments (including preferred stocks and registered investment companies that are exchange-traded funds) traded on a recognized securities exchange for which market quotations are readily available are valued at the last sale price or official closing price, as applicable, on the primary market or exchange on which they trade. Equity investments traded on a recognized exchange for which there were no sales on that day are valued at the last published sale price or at fair value. |
| • | Investments in registered investment companies (including money market funds) or other unitized pooled investment vehicles that are not traded on an exchange are valued at that day’s published net asset value (“NAV”) per share or unit. |
| • | Government and municipal fixed income securities are generally valued using quotations from independent pricing services or brokers. Certain government inflation-indexed securities may require a calculated fair valuation as the cumulative inflation is contained within the price provided by the pricing service or broker. For these securities, the inflation component of the price is “cleaned” from the pricing service or broker price utilizing the published inflation factors in order to ensure proper accrual of income. |
| • | Debt obligations (including short term investments and convertible debt securities) are valued using quotations from independent pricing services or brokers or are generally valued at the last reported evaluated prices. |
| Notes to Financial Statements | 111 |
| • | Exchange-traded futures contracts are valued at the closing settlement price on the primary market on which they are traded most extensively. Exchange-traded futures contracts traded on a recognized exchange for which there were no sales on that day are valued at the last reported sale price obtained from independent pricing services or brokers or at fair value. |
| • | Options on futures are priced at their last sale price on the principal market on which they are traded on the valuation date. If there were no sales on that day, options on futures are valued at either the last reported sale or official closing price on their primary exchange determined in accordance with the valuation policy and procedures approved by the Board. |
| • | Swap agreements are valued daily based upon prices supplied by Board approved pricing vendors or through brokers. Depending on the product and terms of the transaction, the value of agreements is determined using a series of techniques including valuation models that incorporate a number of market data factors, such as discounted cash flows, yields, curves, trades and values of the underlying reference instruments. In the event SSGA Funds Management, Inc. (the “Adviser” or “SSGA FM”) is unable to obtain an independent, third-party valuation the agreements will be fair valued. |
| • | Level 1 — Unadjusted quoted prices in active markets for an identical asset or liability; |
| • | Level 2 — Inputs other than quoted prices included within Level 1 that are observable for the asset or liability either directly or indirectly, including quoted prices for similar assets or liabilities in active markets, quoted prices for identical or similar assets or liabilities in markets that are not considered to be active, inputs other than quoted prices that are observable for the asset or liability (such as exchange rates, financing terms, interest rates, yield curves, volatilities, prepayment speeds, loss severities, credit risks and default rates) or other market-corroborated inputs; and |
| • | Level 3 — Unobservable inputs for the asset or liability, including the Committee’s assumptions used in determining the fair value of investments. |
| 112 | Notes to Financial Statements |
| Notes to Financial Statements | 113 |
| 114 | Notes to Financial Statements |
| Fund | Strategies |
| Elfun International Equity Fund | Equitization of Cash |
| Elfun Diversified Fund | Management of Interest Rate Risk and Equitization of Cash |
| Elfun Income Fund | Management of Interest Rate Risk |
| Notes to Financial Statements | 115 |
| Asset Derivatives | ||||||
| Interest Rate Risk | Foreign Exchange Risk | Credit Risk | Equity Risk | Commodity Risk | Total | |
| Elfun Diversified Fund | ||||||
| Swap Contracts | $ — | $ — | $ 18,884 | $ — | $ — | $ 18,884 |
| Elfun Income Fund | ||||||
| Futures Contracts | $ 47,102 | $ — | $ — | $ — | $ — | $ 47,102 |
| Swap Contracts | — | — | 48,130 | — | — | 48,130 |
| Liability Derivatives | ||||||
| Interest Rate Risk | Foreign Exchange Risk | Credit Risk | Equity Risk | Commodity Risk | Total | |
| Elfun International Equity Fund | ||||||
| Futures Contracts | $ — | $ — | $ — | $ 5,991 | $ — | $ 5,991 |
| Elfun Diversified Fund | ||||||
| Futures Contracts | $ — | $ — | $ — | $ 16,711 | $ — | $ 16,711 |
| Realized Gain/Loss | ||||||
| Interest Rate Risk | Foreign Exchange Risk | Credit Risk | Equity Risk | Commodity Risk | Total | |
| Elfun International Equity Fund | ||||||
| Futures Contracts | $ — | $ — | $ — | $ (61,264) | $ — | $ (61,264) |
| Elfun Diversified Fund | ||||||
| Futures Contracts | $ (259,892) | $ — | $ — | $ (75,395) | $ — | $ (335,287) |
| Swap Contracts | — | — | (64,622) | — | — | (64,622) |
| Elfun Income Fund | ||||||
| Futures Contracts | $ (1,306,777) | $ — | $ — | $ — | $ — | $ (1,306,777) |
| Swap Contracts | (176,099) | — | — | — | — | (176,099) |
| Net Change in Unrealized Appreciation (Depreciation) | ||||||
| Interest Rate Risk | Foreign Exchange Risk | Credit Risk | Equity Risk | Commodity Risk | Total | |
| Elfun International Equity Fund | ||||||
| Futures Contracts | $ — | $ — | $ — | $ (44,749) | $ — | $ (44,749) |
| 116 | Notes to Financial Statements |
| Net Change in Unrealized Appreciation (Depreciation) | ||||||
| Interest Rate Risk | Foreign Exchange Risk | Credit Risk | Equity Risk | Commodity Risk | Total | |
| Elfun Diversified Fund | ||||||
| Futures Contracts | $ 14,150 | $ — | $ — | $ (19,130) | $ — | $ (4,980) |
| Swap Contracts | — | — | 118,746 | — | — | 118,746 |
| Elfun Income Fund | ||||||
| Futures Contracts | $ 95,663 | $ — | $ — | $ — | $ — | $ 95,663 |
| Swap Contracts | — | — | 301,705 | — | — | 301,705 |
| Fund | Management Fee |
| Elfun International Equity Fund | 0.21% |
| Elfun Trusts | 0.14% |
| Elfun Diversified Fund | 0.17% |
| Elfun Tax-Exempt Income Fund | 0.16% |
| Elfun Income Fund | 0.17% |
| Elfun Government Money Market Fund | 0.10% |
| Notes to Financial Statements | 117 |
| Expiration Date | Amount |
| 12/31/2023 | $ 78,761 |
| 12/31/2024 | $233,832 |
| 12/31/2025 | $ 43,973 |
| U.S. Government Obligations | Other Securities | ||||
| Fund | Purchases | Sales | Purchases | Sales | |
| Elfun International Equity Fund | $ — | $ — | $ 26,764,787 | $ 35,308,713 | |
| Elfun Trusts | — | — | 937,148,018 | 1,203,926,035 | |
| Elfun Diversified Fund | 30,552,077 | 34,157,870 | 49,996,780 | 57,819,678 | |
| Elfun Tax-Exempt Income Fund | — | — | 470,509,472 | 535,983,071 | |
| Elfun Income Fund | 328,354,498 | 342,304,859 | 11,130,592 | 18,108,868 | |
| 118 | Notes to Financial Statements |
| Fund | Exempt Income | Ordinary Income | Long-Term Capital Gains | Total |
| Elfun International Equity Fund | $ — | $ 4,234,360 | $ 5,875,563 | $ 10,109,923 |
| Elfun Trusts | — | 41,029,943 | 203,891,806 | 244,921,749 |
| Elfun Diversified Fund | — | 4,049,986 | 8,203,912 | 12,253,898 |
| Elfun Tax-Exempt Income Fund | 39,349,026 | 264,122 | — | 39,613,148 |
| Elfun Income Fund | — | 5,213,578 | 2,287,668 | 7,501,246 |
| Elfun Government Money Market Fund | — | 2,245,052 | — | 2,245,052 |
| Fund | Exempt Income | Ordinary Income | Long-Term Capital Gains | Total |
| Elfun International Equity Fund | $ — | $ 6,139,133 | $ 9,584,883 | $ 15,724,016 |
| Elfun Trusts | — | 47,426,354 | 373,848,875 | 421,275,229 |
| Elfun Diversified Fund | — | 4,154,354 | 11,599,897 | 15,754,251 |
| Elfun Tax-Exempt Income Fund | 41,065,018 | 144,560 | — | 41,209,578 |
| Elfun Income Fund | — | 8,235,715 | 102,067 | 8,337,782 |
| Fund | Undistributed Ordinary Income | Tax Exempt Income | Capital Loss Carryforwards | Undistributed long term gain | Net Unrealized Gains (Losses) | Qualified Late-Year Losses | Total |
| Elfun International Equity Fund | $ 193,939 | $ — | $ — | $ — | $ 25,484,313 | $(2,104,097) | $ 23,574,155 |
| Elfun Trusts | 2,023,730 | — | — | 30,324,561 | 1,109,090,944 | — | 1,141,439,235 |
| Elfun Diversified Fund | 43,362 | — | — | 709,197 | 3,007,978 | — | 3,760,537 |
| Elfun Tax-Exempt Income Fund | — | 282,302 | (63,627,894) | — | (42,110,866) | — | (105,456,458) |
| Elfun Income Fund | 191,560 | — | (12,750,509) | — | (18,612,352) | — | (31,171,301) |
| Elfun Government Money Market Fund | 266 | — | — | — | — | — | 266 |
| Notes to Financial Statements | 119 |
| Fund | Non-Expiring Short Term | Non-Expiring Long Term |
| Elfun Tax-Exempt Income Fund | $39,207,699 | $24,420,195 |
| Elfun Income Fund | 5,263,034 | 7,487,475 |
| Fund | Tax Cost | Gross Unrealized Appreciation | Gross Unrealized Depreciation | Net Unrealized Appreciation (Depreciation) |
| Elfun International Equity Fund | $ 127,997,344 | $ 36,875,751 | $11,338,402 | $ 25,537,349 |
| Elfun Trusts | 1,801,848,573 | 1,175,300,505 | 66,209,562 | 1,109,090,943 |
| Elfun Diversified Fund | 178,713,927 | 11,688,584 | 8,593,398 | 3,095,186 |
| Elfun Tax-Exempt Income Fund | 1,083,401,155 | 4,932,932 | 47,043,798 | (42,110,866) |
| Elfun Income Fund | 208,782,584 | 111,715 | 18,724,067 | (18,612,352) |
| Elfun Government Money Market Fund | 159,029,109 | — | — | — |
| 120 | Notes to Financial Statements |
| Notes to Financial Statements | 121 |
| 122 | Notes to Financial Statements |

| Report of Independent Registered Public Accounting Firm | 123 |
| Amount | |
| Elfun International Equity Fund | $ 5,875,563 |
| Elfun Trusts | 203,891,806 |
| Elfun Diversified Fund | 8,203,912 |
| Elfun Income Fund | 2,287,668 |
| Amount | |
| Elfun Tax-Exempt Income Fund | $39,349,026 |
| 124 | Other Information |
| Other Information | 125 |
| Name, Address, and Year of Birth | Position(s) Held with Funds | Term of Office and Length of Time Served | Principal Occupation During Past Five Years and Relevant Experience | Number of Funds in Fund Complex Overseen by Trustee† | Other Directorships Held by Trustee During Past Five Years |
| INDEPENDENT TRUSTEES | |||||
| Michael F. Holland(1) c/o SSGA Funds Management, Inc. One Iron Street Boston, MA 02210 YOB: 1944 | Trustee and Co-Chairperson of the Board | Term: Indefinite Elected: 12/18 | Chairman, Holland & Company L.L.C. (investment adviser) (1995 – present). | 55 | Director, the Holland Series Fund, Inc.; Director, The China Fund, Inc. (1992 – 2017); Director, The Taiwan Fund, Inc. (2007 – 2017); Director, Reaves Utility Income Fund, Inc.; and Director, Blackstone/ GSO Loans (and Real Estate) Funds. |
| Patrick J. Riley c/o SSGA Funds Management, Inc. One Iron Street Boston, MA 02210 YOB: 1948 | Trustee and Co-Chairperson of the Board | Term: Indefinite Appointed: 4/16 Elected: 6/16 | Associate Justice of the Superior Court, Commonwealth of Massachusetts (2002 – May 2010); Partner, Riley, Burke & Donahue, L.L.P. (law firm) (1985 – 2002); Independent Director, State Street Global Advisors Ireland, Ltd. (investment company) (1998 – Present); Independent Director, SSGA Liquidity plc (formerly, SSGA Cash Management Fund plc) (1998 – Present); Independent Director, SSGA Fixed Income plc (January 2009 – Present); and Independent Director, SSGA Qualified Funds PLC (January 2009-2019).Fund PLC); (1998 - present), Independent Director, SSGA Fixed Income PLC; and (January 2009 – present), Independent Director, SSGA Qualified Funds PLC (January 2009-2019). | 55 | Board Director and Chairman, SPDR Europe I PLC Board (2011 – present); Board Director and Chairman, SPDR Europe II, PLC (2013 – present). |
| 126 | Other Information |
| Name, Address, and Year of Birth | Position(s) Held with Funds | Term of Office and Length of Time Served | Principal Occupation During Past Five Years and Relevant Experience | Number of Funds in Fund Complex Overseen by Trustee† | Other Directorships Held by Trustee During Past Five Years |
| INDEPENDENT TRUSTEES (continued) | |||||
| John R. Costantino c/o SSGA Funds Management, Inc. One Iron Street Boston, MA 02210 YOB: 1946 | Trustee and Chairperson of the Qualified Legal Compliance Committee | Term: Indefinite Elected: 12/18 | Senior Advisor to NGN Capital LLC (January 2020 – present); Managing General Partner, NGN Capital LLC (2006 – December 2019). | 55 | Director of Kleinfeld Bridal Corp. (January 2016 – present); Trustee of Neuroscience Research Institute (1986 – 2017); Trustee of Fordham University (1989 – 1995 and 2001 – 2007) and Trustee Emeritus (2007 – present); Trustee and Independent Chairperson of GE Funds (1993 – February 2011); Director, Muscular Dystrophy Association (2019-present); Trustee of Gregorian University Foundation (1992 – 2007); Chairman of the Board of Directors, Vivaldi Biosciences Inc. (May 2017 - present); Chairman of the Supervisory Board, Vivaldi Biosciences AG. (May 2017 - present); Trustee, Gallim Dance (December 2021 - present). |
| Donna M. Rapaccioli c/o SSGA Funds Management, Inc. One Iron Street Boston, MA 02210 YOB: 1962 | Trustee and Chairperson of the Audit Committee | Term: Indefinite Elected: 12/18 | Dean of the Gabelli School of Business (2007 – present) and Accounting Professor (1987 – present) at Fordham University. | 55 | Director- Graduate Management Admissions Council (2015 – present); Trustee of Emmanuel College (2010 – 2019). |
| Other Information | 127 |
| Name, Address, and Year of Birth | Position(s) Held with Funds | Term of Office and Length of Time Served | Principal Occupation During Past Five Years and Relevant Experience | Number of Funds in Fund Complex Overseen by Trustee† | Other Directorships Held by Trustee During Past Five Years |
| INDEPENDENT TRUSTEES (continued) | |||||
| Richard D. Shirk c/o SSGA Funds Management, Inc. One Iron Street Boston, MA 02210 YOB: 1945 | Trustee and Chairperson of the Nominating Committee Chairperson of the Governance Committee | Term: Indefinite Appointed: 7/16 Elected: 12/18 | Chairman (March 2001 - April 2002), President and Chief Executive Officer (1996 - March 2001), Cerulean Companies, Inc. (holding company) (Retired); President and Chief Executive Officer, Blue Cross Blue Shield of Georgia (health insurer, managed healthcare) (1992 - March 2001). | 55 | Chairman and Board Member (December 2008-present) and Investment Committee Member (December 2008 - present), Healthcare Georgia Foundation (private foundation); Lead Director and Board Member, Amerigroup Corp. (managed health care) (September 2002 - 2012), Board Member (1999 - 2013) Investment Committee Member (2001 - 2017), Woodruff Arts Center; Trustee, Gettysburg College (2003 - 2009); Board member, Aerocare Holdings (2003 - January 2021), Regenesis Biomedical Inc. (April 2012 - present). |
| Michael A. Jessee c/o SSGA Funds Management, Inc. One Iron Street Boston, MA 02210 YOB: 1946 | Trustee and Chairperson of the Valuation Committee | Term: Indefinite Appointed: 7/16 Elected: 12/18 | Retired; formerly, President and Chief Executive Officer of the Federal Home Loan Bank of Boston (1989 – 2009); Trustee, Randolph-Macon College (2004 – 2016). | 55 | None. |
| Margaret McLaughlin c/o SSGA Funds Management,Inc. One Iron Street Boston,MA 02210 YOB: 1967 | Trustee | Term: Indefinite Appointed: 9/22 | Consultant,Bates Group(consultants)(2021-2023) consultant,Madison Dearborn Partners (private equity)(2019-2020) General Counsel/CCO, kramer Van Krik Credit strategies L.P./Mariana Systems LLC (Investment Adviser/SaaS Technology)(2011-2019) | 55 | Director,Manning & Naiper Fund Inc(2021-2022) |
| 128 | Other Information |
| Name, Address, and Year of Birth | Position(s) Held with Funds | Term of Office and Length of Time Served | Principal Occupation During Past Five Years and Relevant Experience | Number of Funds in Fund Complex Overseen by Trustee† | Other Directorships Held by Trustee During Past Five Years |
| INDEPENDENT TRUSTEES (continued) | |||||
| George M. Pereira c/o SSGA Funds Management, Inc. One Iron Street Boston, MA 02210 YOB: 1964 | Trustee | Term: Indefinite Appointed: 9/22 | Chief Operating Officer (January 2011 – September 2020) and Chief Financial Officer (November 2004 – September 2020), Charles Schwab Investment Management. | 55 | Director, Pacific Premier Bancorp,Pacific Premier Bank(2021-present) Director, Charles Schwab Asset Management (Ireland) Ltd., & Charles Schwab Worldwide Funds plc. (2005 – 2020); Director, Rotaplast International, Inc. . (non-profit providing free medical services to children worldwide) (2012 – 2018). |
| INTERESTED TRUSTEES(2) | |||||
| Ellen M. Needham(3) SSGA Funds Management, Inc. One Iron Street Boston, MA 02210 YOB: 1967 | Trustee and President | Term: Indefinite Elected: 12/18 | Chairman, SSGA Funds Management, Inc. (March 2020 – present); President and Director, SSGA Funds Management, Inc. (2001 – present)*; Senior Managing Director, State Street Global Advisors (1992 – present)*; Manager, State Street Global Advisors Funds Distributors, LLC (May 2017 – present). | 55 | Board Director, SSGA SPDR ETFs Europe I PLC (May 2020 – present); Board Director, SSGA SPDR ETFs Europe II plc (May 2020 – present). |
| (1) | Mr. Holland retired as a Trustee of the Trust effective December 31, 2022. |
| (2) | The individual listed above is a Trustee who is an “interested person,” as defined in the 1940 Act, of the Funds (“Interested Trustee”). |
| (3) | Ms. Needham is an Interested Trustee because of her employment by SSGA FM, an affiliate of the Funds. |
| * | Served in various capacities and/or with various affiliated entities during noted time period. |
| † | For the purpose of determining the number of portfolios overseen by the Trustees, “Fund Complex” comprises registered investment companies for which SSGA FM serves as investment adviser. |
| Other Information | 129 |
| Name, Address, and Year of Birth | Position(s) Held with Funds | Term of Office and Length of Time Served | Principal Occupation During Past Five Years |
| OFFICERS | |||
| Ellen M. Needham SSGA Funds Management, Inc. One Iron Street Boston, MA 02210 YOB: 1967 | President and Trustee | Term: Indefinite served: since 7/16 | Chairman, SSGA Funds Management, Inc. (March 2020 – present); President and Director, SSGA Funds Management, Inc. (2001 – present)*; Senior Managing Director, State Street Global Advisors (1992 – present)*; Manager, State Street Global Advisors Funds Distributors, LLC (May 2017 – present). |
| Bruce S. Rosenberg SSGA Funds Management, Inc. One Iron Street Boston, MA 02210 YOB: 1961 | Treasurer | Term: Indefinite served:since 7/16 | Managing Director, State Street Global Advisors and SSGA Funds Management, Inc. (July 2015 – present); Director, Credit Suisse (April 2008 – July 2015). |
| Ann M. Carpenter SSGA Funds Management, Inc. One Iron Street Boston, MA 02210 YOB: 1966 | Vice President and Deputy Treasurer | Term: Indefinite served:since 7/16 | Chief Operating Officer, SSGA Funds Management, Inc. (April 2005 – present)*; Managing Director, State Street Global Advisors (2005 – present).* |
| Chad C. Hallett SSGA Funds Management, Inc. One Iron Street Boston, MA 02210 YOB: 1969 | Deputy Treasurer | Term: Indefinite served: since7/16 | Vice President, State Street Global Advisors and SSGA Funds Management, Inc. (November 2014 – present); Vice President. |
| Darlene Anderson-Vasquez SSGA Funds Management, Inc. One Iron Street Boston, MA 02210 YOB: 1968 | Deputy Treasurer | Term: Indefinite served:since 11/16 | Managing Director, State Street Global Advisors and SSGA Funds Management, Inc. (May 2016 – present); Senior Vice President, John Hancock Investments (September 2007 – May 2016). |
| Arthur A. Jensen SSGA Funds Management, Inc. 1600 Summer Street Stamford, CT 06905 YOB: 1966 | Deputy Treasurer | Term: Indefinite served:since 7/16 | Vice President, State Street Global Advisors and SSGA Funds Management, Inc. (July 2016 – present); |
| David K. Lancaster SSGA Funds Management, Inc. One Iron Street Boston, MA 02210 YOB: 1971 | Assistant Treasurer | Term: Indefinite served: since 11/20 | Vice President, State Street Global Advisors and SSGA Funds Management, Inc. (July 2017 – present); Assistant Vice President, State Street Bank and Trust Company (November 2011 – July 2017).* |
| 130 | Other Information |
| Name, Address, and Year of Birth | Position(s) Held with Funds | Term of Office and Length of Time Served | Principal Occupation During Past Five Years |
| OFFICERS (continued) | |||
| Ryan Hill SSGA Funds Management, Inc. One Iron Street Boston, MA 02210 YOB:1982 | Assistant Treasurer | Term: Indefinite served: since 5/22 | Vice President, State Street Global Advisors and SSGA Funds Management, Inc. (May 2017 - present); Assistant Vice President, State Street Bank and Trust Company (May 2014 - May 2017). |
| John Bettencourt SSGA Funds Management, Inc. One Iron Street Boston MA 02210 YOB:1976 | Assistant Treasurer | Term: Indefinite served: since 5/22 | Vice President, State Street Global Advisors and SSGA Funds Management, Inc.(March 2020 - present); Assistant Vice President, State Street Global Advisors (June 2007 - March 2020). |
| Brian Harris SSGA Funds Management, Inc. One Iron Street Boston, MA 02210 YOB: 1973 | Chief Compliance Officer, Anti-Money Laundering Officer and Code of Ethics Compliance Officer | Term: Indefinite served: since 7/16 | Managing Director, State Street Global Advisors and SSGA Funds Management, Inc. (June 2013 – present).* |
| Sean O’Malley SSGA Funds Management, Inc. One Iron Street Boston, MA 02210 YOB: 1969 | Chief Legal Officer | Term: Indefinite served: since 8/19 | Senior Vice President and Deputy General Counsel, State Street Global Advisors (November 2013 – present). |
| David Barr SSGA Funds Management, Inc. One Iron Street Boston, MA 02210 YOB: 1974 | Secretary | Term: Indefinite served: since 9/20 | Vice President and Senior Counsel, State Street Global Advisors (October 2019 – present); Vice President and Counsel, Eaton Vance Corp. (October 2010 – October 2019). |
| David Urman SSGA Funds Management, Inc. One Iron Street Boston, MA 02210 YOB: 1985 | Assistant Secretary | Term: Indefinite Elected: 8/19 | Vice President and Senior Counsel, State Street Global Advisors (April 2019 – present); Vice President and Counsel, State Street Global Advisors (August 2015 – April 2019); Associate, Ropes & Gray LLP (November 2012 – August 2015). |
| * | Served in various capacities and/or with various affiliated entities during noted time period. |
| Other Information | 131 |
(b) Not applicable.
| Item 2. | Code of Ethics. |
As of the end of the period covered by this report, the Elfun International Equity Fund (the “Fund,” “Fund Entity” or “Registrant”) has adopted a code of ethics, as defined in Item 2(b) of Form N-CSR, that applies to the Registrant’s principal executive officer, principal financial officer, principal accounting officer or controller, or persons performing similar functions, regardless of whether these individuals are employed by the Registrant or a third party (the “Code”). That Code comprises written standards that are reasonably designed to deter wrongdoing and to promote: (1) honest and ethical conduct, including the ethical handling of actual or apparent conflicts of interest between personal and professional relationships; (2) full, fair, accurate, timely and understandable disclosure in reports and documents that the Registrant files with, or submits to, the U.S. Securities Exchange Commission (the “SEC”) and in other public communications made by the Registrant; (3) compliance with applicable laws and governmental rules and regulations; (4) the prompt internal reporting to an appropriate person or persons identified in the Code of violations of the Code; and (5) accountability for adherence to the Code. The Code is combined with other mutual funds advised by SSGA Funds Management, Inc. (“SSGA FM” or the “Adviser”). The Registrant has not made any amendments to the Code that relates to any element of the code of ethics definition set forth in Item 2(b) of Form N-CSR during the covered period. The Registrant has not granted any waivers from any provisions of the Code during the covered period. A copy of the Code is filed as Exhibit 13(a)(1) to this Form N-CSR.
| Item 3. | Audit Committee Financial Expert. |
The Fund’s Board of Trustees (the “Board”) has determined that the Fund has the following “audit committee financial experts” as defined in Item 3(b) of Form N-CSR serving on its audit committee (the “Audit Committee”): Messrs. Richard D. Shirk, John R. Costantino and George M. Pereira and Ms. Donna M. Rapaccioli. Each of the “audit committee financial experts” is “independent” as that term is defined in Item 3(a)(2) of Form N-CSR.
An “audit committee financial expert” is not an “expert” for any purpose, including for purposes of Section 11 of the Securities Act of 1933, as amended, as a result of being designated as an “audit committee financial expert.” Further, the designation of a person as an “audit committee financial expert” does not mean that the person has any greater duties, obligations, or liability than those imposed on the person without the “audit committee financial expert” designation. Similarly, the designation of a person as an “audit committee financial expert” does not affect the duties, obligations, or liability of any other member of the Audit Committee or the Board.
| Item 4. | Principal Accountant Fees and Services. |
| (a) | Audit Fees |
For the fiscal years ended December 31, 2022 and December 31, 2021, the aggregate audit fees billed for professional services rendered by Ernst & Young LLP (“E&Y”), the Registrant’s principal accountant, for the audit of the Registrant’s annual financial statements or services normally provided by E&Y in connection with the Registrant’s statutory and regulatory filings and engagements were $34,996 and $30,683, respectively.
| (b) | Audit-Related Fees |
For the fiscal years ended December 31, 2022 and December 31, 2021, there were no fees for assurance and related services by E&Y that were reasonably related to the performance of the audit of the Registrant’s financial statements that were not reported under paragraph (a) of this Item.
| (c) | Tax Fees |
The aggregate tax fees billed for professional services rendered by E&Y for the fiscal years ended December 31, 2022 and December 31, 2021 were $2,159 and $5,398, respectively. Tax services related to the review of year-end distribution requirements for the fiscal year ended December 31, 2022 and the review of year-end distribution requirements as well as tax compliance, tax advice, and tax planning in the form of preparation of excise filings and income tax returns for the fiscal year ended December 31, 2021.
| (d) | All Other Fees |
For the fiscal years ended December 31, 2022 and December 31, 2021, there were no fees billed for professional services rendered by E&Y for products and services provided by E&Y to the Registrant, other than the services reported in paragraphs (a) through (c).
For the fiscal years ended December 31, 2022 and December 31, 2021, the aggregate fees for professional services rendered by E&Y for products and services provided by E&Y to the Adviser and any entity controlling, controlled by, or under common control with the Adviser that provides ongoing services to the Registrant that (i) relate directly to the operations and financial reporting of the Registrant and (ii) were pre-approved by the Registrant’s Audit Committee were approximately $9,327,125 and $8,904,469, respectively.
| (e)(1) | Audit Committee Pre-Approval Policies and Procedures |
The Fund’s Audit Committee Charter states the following with respect to pre-approval procedures:
The Audit Committee shall have the following duties and powers:
| • | To pre-approve engagements by a Fund Entity’s independent auditor for non-audit services to be rendered to the Fund’s investment adviser (not including any subadviser whose role is primarily portfolio management and is subcontracted with or overseen by another investment adviser), and any entity controlling, controlled by, or under common control with the investment adviser that provides ongoing services to the Fund, if the engagement relates directly to the operations and financial reporting of the Fund; |
| • | To establish, if deemed necessary or appropriate as an alternative to Audit Committee pre-approval of services to be provided by the independent auditor as required by paragraph (b) above, policies and procedures to permit such services to be pre-approved by other means, such as by action of a designated member or members of the Audit Committee, subject to the requirement that the decision of any member to whom authority is delegated to pre-approve an activity shall be presented to the full Audit Committee at its next scheduled meeting; |
Alternate Pre-Approval Procedure:
| • | The Chairperson, or a Co-Chairperson, of the Audit Committee is authorized to pre-approve any engagement involving the Fund Entity’s independent auditors to the same extent as the Audit Committee. Any pre-approval decision by the Chairperson, or a Co-Chairperson, under the foregoing authority shall be presented to the Audit Committee at its next scheduled meeting. |
| (e)(2) | Percentages of Services |
None of the services described in paragraphs (b) through (d) of this Item were performed in reliance on paragraph (c)(7)(i)(C) of Rule 2-01 of Regulation S-X during the period of time for which such rule was effective.
| (f) | Not applicable. |
| (g) | Total Fees Paid By Adviser and Certain Affiliates |
For the fiscal years ended December 31, 2022 and December 31, 2021, the aggregate non-audit fees billed by E&Y for services rendered to the Registrant and the Adviser and any entity controlling, controlled by, or under common control with the Adviser that provided ongoing services to the Registrant were approximately $38,000,000 and $38,000,000, respectively.
| (h) | E&Y notified the Fund’s Audit Committee of all non-audit services that were rendered by E&Y to the Adviser and any entity controlling, controlled by, or under common control with the Adviser that provides services to the Fund, which services were not required to be pre-approved pursuant to paragraph (c)(7)(ii) of Rule 2-01 of Regulation S-X, allowing the Fund’s Audit Committee to consider whether such services were compatible with maintaining E&Y’s independence. |
| (i) | Not applicable. |
| (j) | Not applicable. |
| Item 5. | Audit Committee of Listed Registrants. |
Not applicable to the Registrant.
| Item 6. | Investments. |
| (a) | Schedules of Investments are included as part of the report to shareholders filed under Item 1 of this Form N-CSR. |
| (b) | Not applicable to the Registrant. |
| Item 7. | Disclosure of Proxy Voting Policies and Procedures for Closed-End Management Investment Companies. |
Not applicable to the Registrant.
| Item 8. | Portfolio Managers of Closed-End Management Investment Companies. |
Not applicable to the Registrant.
| Item 9. | Purchases of Equity Securities by Closed-End Management Investment Company and Affiliated Purchasers. |
Not applicable to the Registrant.
| Item 10. | Submission of Matters to a Vote of Security Holders. |
There were no material changes to the procedures by which shareholders may recommend nominees to the Registrant’s Board of Trustees.
| Item 11. | Controls and Procedures. |
(a) The Registrant’s principal executive officer and principal financial officer have concluded that the Registrant’s disclosure controls and procedures (as defined in Rule 30a-3(c) under the Investment Company Act of 1940, as amended (the “1940 Act”)) are effective to provide reasonable assurance that information required to be disclosed by the Registrant on Form N-CSR is recorded, processed, summarized and reported as of a date within 90 days of the filing date of this report, based on their evaluation of these controls and procedures required by Rule 30a-3(b) under the 1940 Act and Rules 13a-15(b) or 15d-15(b) under the Securities Exchange Act of 1934, as amended.
(b) There were no changes in the Registrant’s internal control over financial reporting (as defined in Rule 30a-3(d) under the 1940 Act) that occurred during the period covered by this report that have materially affected, or are reasonably likely to materially affect, the Registrant’s internal control over financial reporting.
| Item 12. | Disclosure of Securities Lending Activities for Closed-End Management Investment Companies. |
(a) Not applicable to the Registrant.
(b) Not applicable to the Registrant.
| Item 13. | Exhibits. |
SIGNATURES
Pursuant to the requirements of the Securities Exchange Act of 1934 and the Investment Company Act of 1940, the Registrant has duly caused this report to be signed on its behalf by the undersigned, thereunto duly authorized.
| Registrant: | ELFUN INTERNATIONAL EQUITY FUND | |
| By: | /s/ Ellen M. Needham | |
| Ellen M. Needham | ||
| President | ||
| Date: | March 8, 2023 | |
Pursuant to the requirements of the Securities Exchange Act of 1934 and the Investment Company Act of 1940, this report has been signed below by the following persons on behalf of the Registrant and in the capacities and on the dates indicated.
| By: | /s/ Ellen M. Needham | |
| Ellen M. Needham | ||
| President (Principal Executive Officer) | ||
| Date: | March 8, 2023 | |
| By: | /s/ Bruce S. Rosenberg | |
| Bruce S. Rosenberg | ||
| Treasurer (Principal Financial and Accounting Officer) | ||
| Date: | March 8, 2023 | |