Third Quarter Fiscal 2022 Earnings SUPPLEMENTAL slides May 5, 2022 Exhibit 99.2
Safe Harbor Statement This presentation contains forward-looking statements that are subject to the safe harbors created under the Securities Act of 1933, as amended, and the Securities Exchange Act of 1934, as amended. Forward-looking statements give our current expectations and projections relating to our financial condition, results of operations, plans, objectives, future performance and business, including our expectations regarding the potential impacts on our business of the COVID-19 pandemic, and can be identified by the fact that they do not relate strictly to historical or current facts. Such forward-looking statements may include words such as “expect,” “anticipate,” “intend,” “believe,” “estimate,” “plan,” “target,” “strategy,” “continue,” “may,” “will,” “should,” variations of such words, or other words and terms of similar meaning. All forward-looking statements reflect our best judgment and are based on several factors relating to our operations and business environment, all of which are difficult to predict and many of which are beyond our control. Such factors include, but are not limited to, the risk that our business, results of operations and financial condition and prospects may be materially and adversely affected by the COVID-19 pandemic and that significant uncertainties remain related to the impact of COVID-19 on our business operations and future results, including our fourth quarter fiscal 2022 business outlook; global supply chain disruptions and component shortages that are currently affecting the semiconductor industry as a whole; the risks as identified in the “Risk Factors,” “Management’s Discussion and Analysis of Financial Condition and Results of Operations” and “Business” sections of our most recent Annual Report on Form 10-K and our most recent Quarterly Report on Form 10-Q (including that the impact of the COVID-19 pandemic may also exacerbate the risks discussed therein); and other risks as identified from time to time in our Securities and Exchange Commission reports. Forward-looking statements are based on information available to us on the date hereof, and we do not have, and expressly disclaim, any obligation to publicly release any updates or any changes in our expectations, or any change in events, conditions, or circumstances on which any forward-looking statement is based. Our actual results and the timing of certain events could differ materially from the forward-looking statements. These forward-looking statements do not reflect the potential impact of any mergers, acquisitions, or other business combinations that had not been completed as of the date of this release.
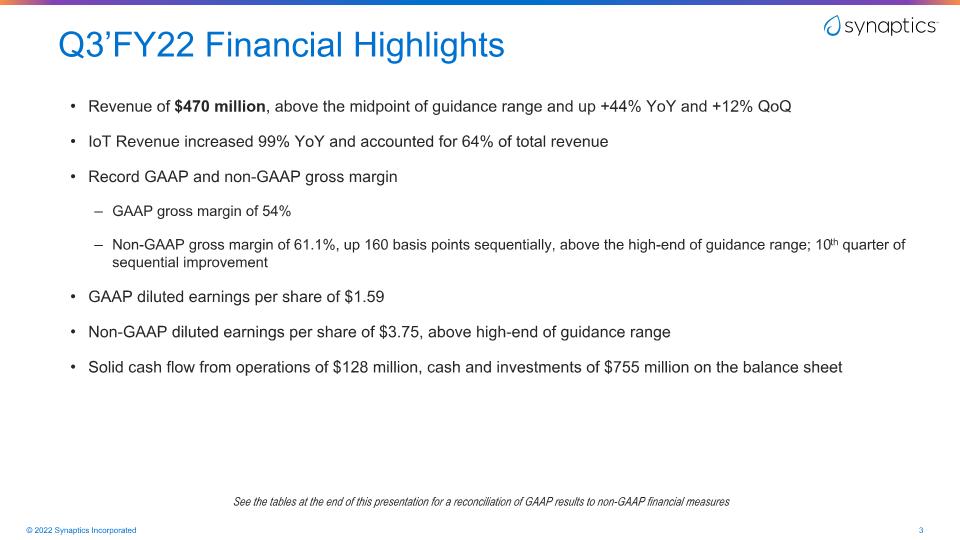
Q3’FY22 Financial Highlights Revenue of $470 million, above the midpoint of guidance range and up +44% YoY and +12% QoQ IoT Revenue increased 99% YoY and accounted for 64% of total revenue Record GAAP and non-GAAP gross margin GAAP gross margin of 54% Non-GAAP gross margin of 61.1%, up 160 basis points sequentially, above the high-end of guidance range; 10th quarter of sequential improvement GAAP diluted earnings per share of $1.59 Non-GAAP diluted earnings per share of $3.75, above high-end of guidance range Solid cash flow from operations of $128 million, cash and investments of $755 million on the balance sheet See the tables at the end of this presentation for a reconciliation of GAAP results to non-GAAP financial measures
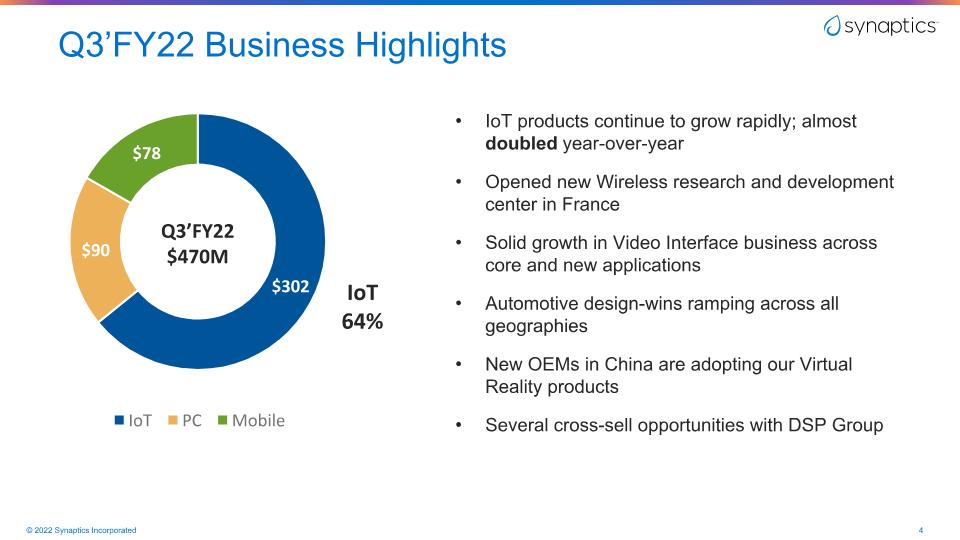
Q3’FY22 Business Highlights IoT products continue to grow rapidly; almost doubled year-over-year Opened new Wireless research and development center in France Solid growth in Video Interface business across core and new applications Automotive design-wins ramping across all geographies New OEMs in China are adopting our Virtual Reality products Several cross-sell opportunities with DSP Group IoT 64% Q3’FY22 $470M
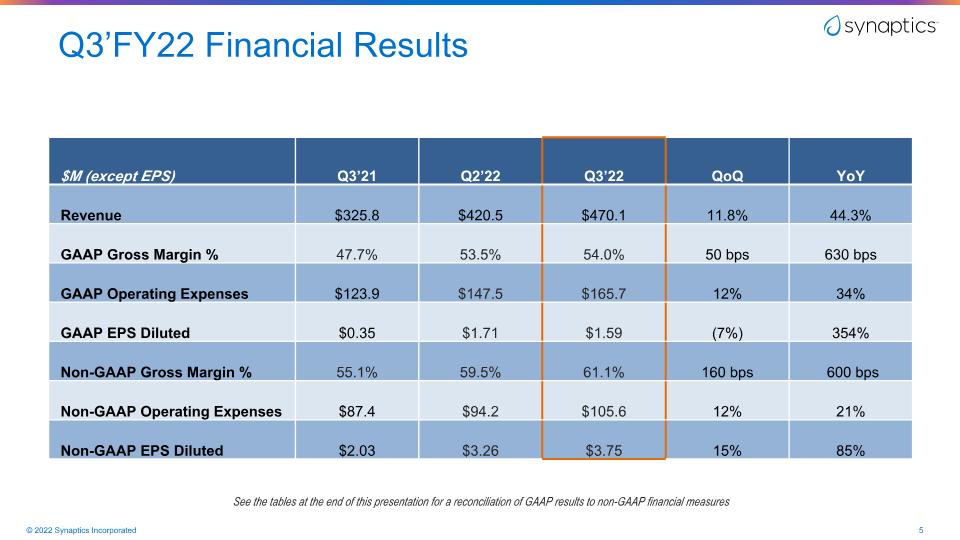
Q3’FY22 Financial Results See the tables at the end of this presentation for a reconciliation of GAAP results to non-GAAP financial measures $M (except EPS) Q1’21 Q4’21 Q1’22 QoQ YoY Revenue $328.4 $327.8 $372.7 13.7% 13.5% GAAP Gross Margin % 41.0% 52.1% 53.2% 110bps 1220bps GAAP Operating Expenses $128.5 $119.9 $137.5 15% 7% GAAP EPS ($0.08) $0.48 $0.99 106% NA Non-GAAP Gross Margin % 49.7% 57.5% 58.0% 50bps 830bps Non-GAAP Operating Expenses $87.5 $86.2 $88.4 3% 1% Non-GAAP EPS Diluted $1.85 $2.18 $2.68 23% 45% $M (except EPS) Q3’21 Q2’22 Q3’22 QoQ YoY Revenue $325.8 $420.5 $470.1 11.8% 44.3% GAAP Gross Margin % 47.7% 53.5% 54.0% 50 bps 630 bps GAAP Operating Expenses $123.9 $147.5 $165.7 12% 34% GAAP EPS Diluted $0.35 $1.71 $1.59 (7%) 354% Non-GAAP Gross Margin % 55.1% 59.5% 61.1% 160 bps 600 bps Non-GAAP Operating Expenses $87.4 $94.2 $105.6 12% 21% Non-GAAP EPS Diluted $2.03 $3.26 $3.75 15% 85%
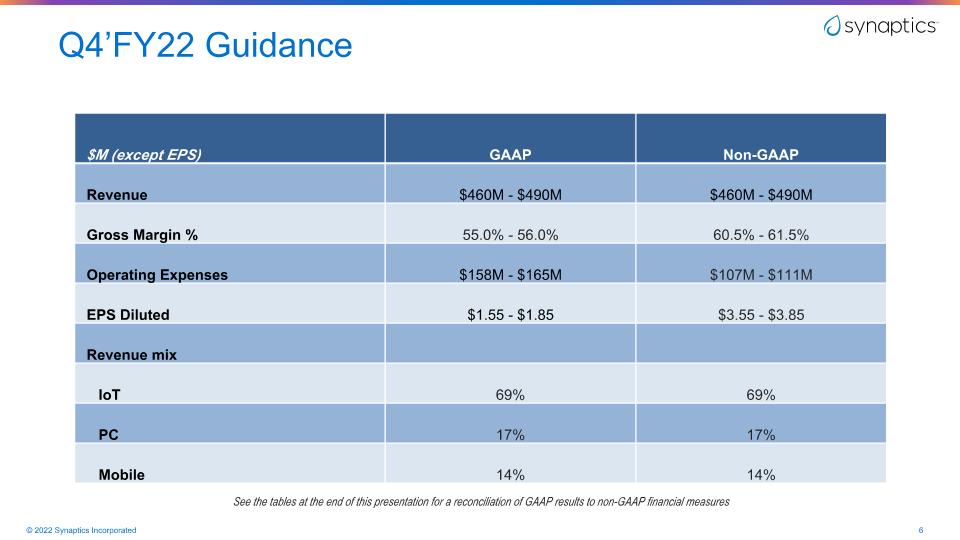
Q4’FY22 Guidance See the tables at the end of this presentation for a reconciliation of GAAP results to non-GAAP financial measures $M (except EPS) GAAP Non-GAAP Revenue $390M - $420M $390M - $420M Gross Margin % 54.0% - 55.0% 58.5% 59.5% Operating Expenses $134M - $141M $90M - $93M EPS $1.25 - $1.65 $2.90 - $3.20 Revenue mix IoT 58% 58% PC 22% 22% Mobile 20% 20% $M (except EPS) GAAP Non-GAAP Revenue $450M - $480M $450M - $480M Gross Margin % 52.5% - 53.5% 59.5% - 60.5% Operating Expenses $158M - $165M $104M - $108M EPS $1.25 - $1.55 $3.40 - $3.70 Revenue mix IoT 64% 64% PC 19% 19% Mobile 17% 17% $M (except EPS) GAAP Non-GAAP Revenue $460M - $490M $460M - $490M Gross Margin % 55.0% - 56.0% 60.5% - 61.5% Operating Expenses $158M - $165M $107M - $111M EPS Diluted $1.55 - $1.85 $3.55 - $3.85 Revenue mix IoT 69% 69% PC 17% 17% Mobile 14% 14%
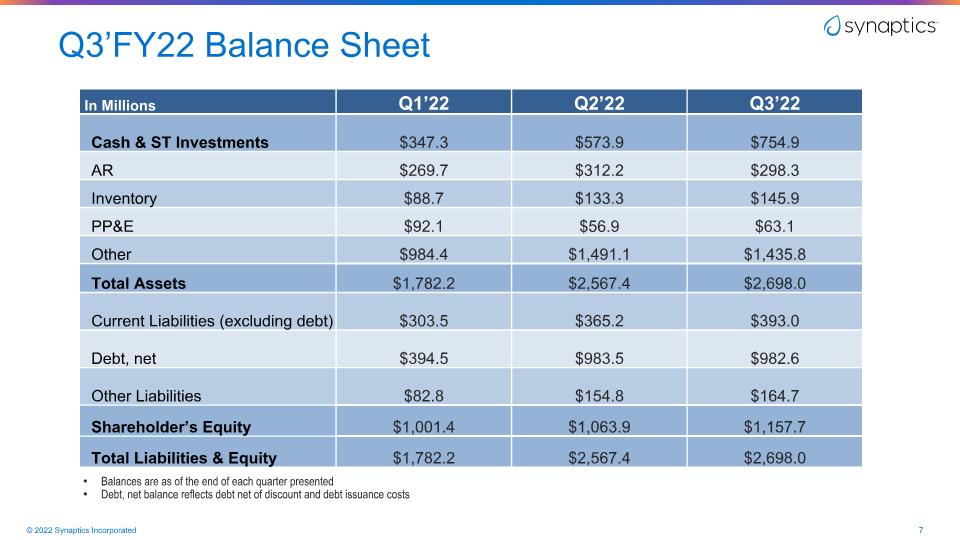
Q3’FY22 Balance Sheet Balances are as of the end of each quarter presented Debt, net balance reflects debt net of discount and debt issuance costs In Millions Q1’22 Q2’22 Q3’22 Cash & ST Investments $347.3 $573.9 $754.9 AR $269.7 $312.2 $298.3 Inventory $88.7 $133.3 $145.9 PP&E $92.1 $56.9 $63.1 Other $984.4 $1,491.1 $1,435.8 Total Assets $1,782.2 $2,567.4 $2,698.0 Current Liabilities (excluding debt) $303.5 $365.2 $393.0 Debt, net $394.5 $983.5 $982.6 Other Liabilities $82.8 $154.8 $164.7 Shareholder’s Equity $1,001.4 $1,063.9 $1,157.7 Total Liabilities & Equity $1,782.2 $2,567.4 $2,698.0
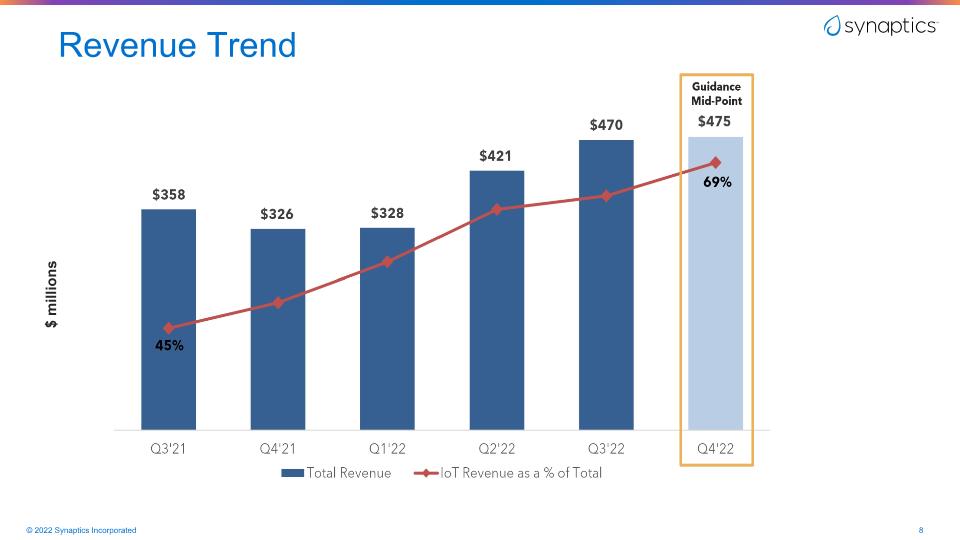
Revenue Trend $ millions
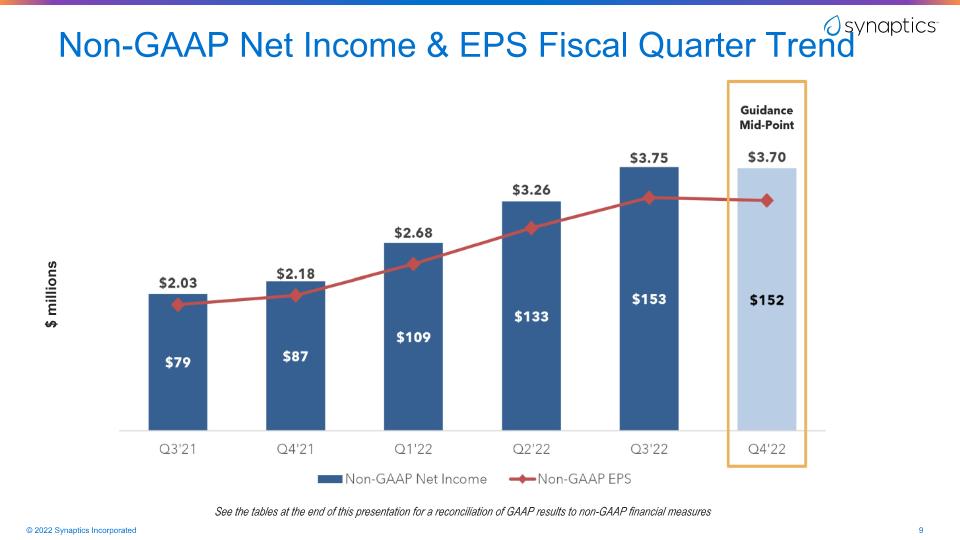
Non-GAAP Net Income & EPS Fiscal Quarter Trend See the tables at the end of this presentation for a reconciliation of GAAP results to non-GAAP financial measures $ millions

Appendix
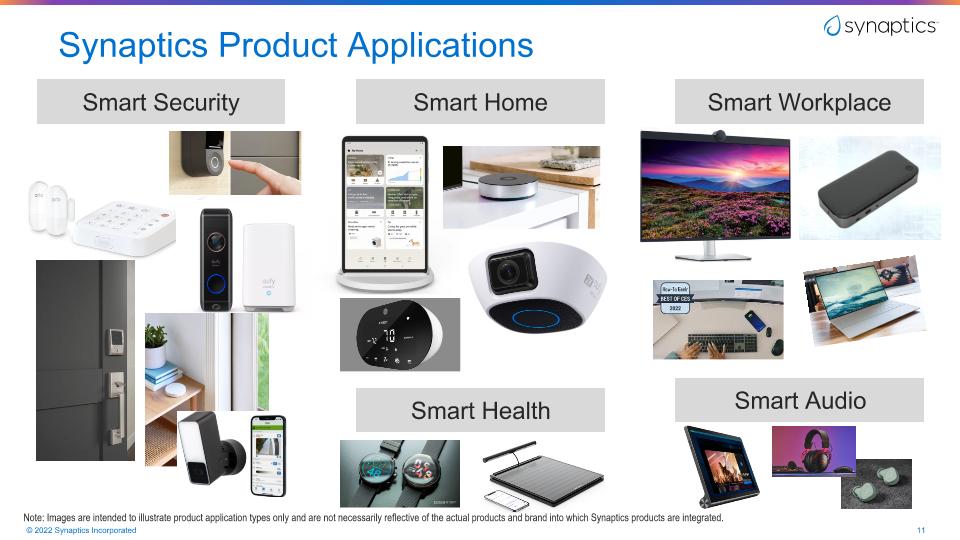
Synaptics Product Applications Smart Home Smart Workplace Smart Security Smart Health Smart Audio Note: Images are intended to illustrate product application types only and are not necessarily reflective of the actual products and brand into which Synaptics products are integrated.
Engineering Exceptional Experiences
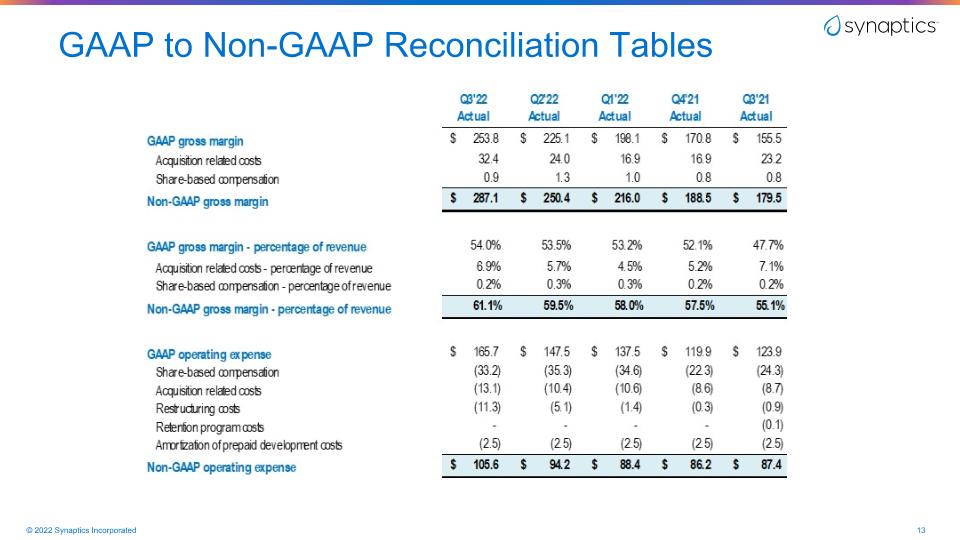
GAAP to Non-GAAP Reconciliation Tables
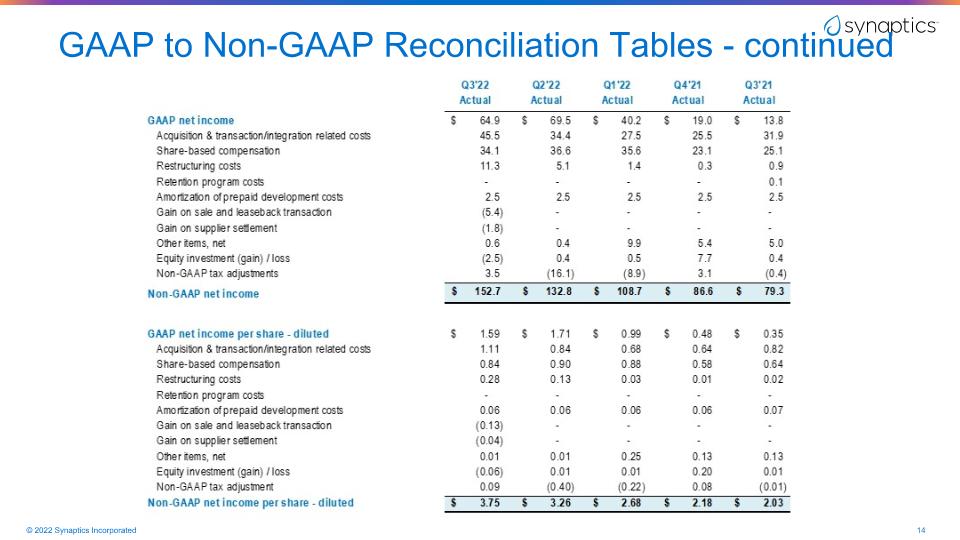
GAAP to Non-GAAP Reconciliation Tables - continued


