UNITED STATES
SECURITIES AND EXCHANGE COMMISSION
WASHINGTON, D.C. 20549
FORM N-CSR
CERTIFIED SHAREHOLDER REPORT OF REGISTERED MANAGEMENT
INVESTMENT COMPANIES
Investment Company Act file number 811-5225
Oppenheimer Quest for Value Funds
(Exact name of registrant as specified in charter)
6803 South Tucson Way, Centennial, Colorado 80112-3924
(Address of principal executive offices) (Zip code)
Robert G. Zack, Esq.
OppenheimerFunds, Inc.
Two World Financial Center, New York, New York 10281-1008
(Name and address of agent for service)
Registrant’s telephone number, including area code: (303) 768-3200
Date of fiscal year end: October 31
Date of reporting period: 04/30/2009
Item 1. Reports to Stockholders.
| April 30, 2009 Oppenheimer Management Quest Balanced Commentaries and FundSM Semiannual Report M A NAG E M E N T C O M M E N TA R I E S An Interview with Your Fund’s Managers S E M I A N N U A L REPORT Listing of Top Holdings Listing of Investments Financial Statements 1234 |
TOP HOLDINGS AND ALLOCATIONS
| | | | | |
| Top Ten Common Stock Industries | | | | |
| |
| Insurance | | | 8.0 | % |
| Oil, Gas & Consumable Fuels | | | 7.7 | |
| Health Care Providers & Services | | | 4.9 | |
| Biotechnology | | | 4.7 | |
| Communications Equipment | | | 4.4 | |
| Pharmaceuticals | | | 4.0 | |
| Capital Markets | | | 3.7 | |
| Specialty Retail | | | 3.2 | |
| Industrial Conglomerates | | | 3.2 | |
| Energy Equipment & Services | | | 3.1 | |
Portfolio holdings and allocations are subject to change. Percentages are as of April 30, 2009, and are based on net assets.
| | | | | |
| Top Ten Common Stock Holdings | | | | |
| |
| General Electric Co. | | | 3.2 | % |
| WellPoint, Inc. | | | 3.0 | |
| XTO Energy, Inc. | | | 2.8 | |
| Exxon Mobil Corp. | | | 2.7 | |
| Monsanto Co. | | | 2.6 | |
| MetLife, Inc. | | | 2.5 | |
| Morgan Stanley | | | 2.5 | |
| AFLAC, Inc. | | | 2.5 | |
| Apple, Inc. | | | 2.2 | |
| Cameco Corp. | | | 2.2 | |
Portfolio holdings and allocations are subject to change. Percentages are as of April 30, 2009, and are based on net assets.
For up-to-date Top 10 Fund Holdings, please visit www.oppenheimerfunds.com.
9 | OPPENHEIMER QUEST BALANCED FUND
TOP HOLDINGS AND ALLOCATIONS
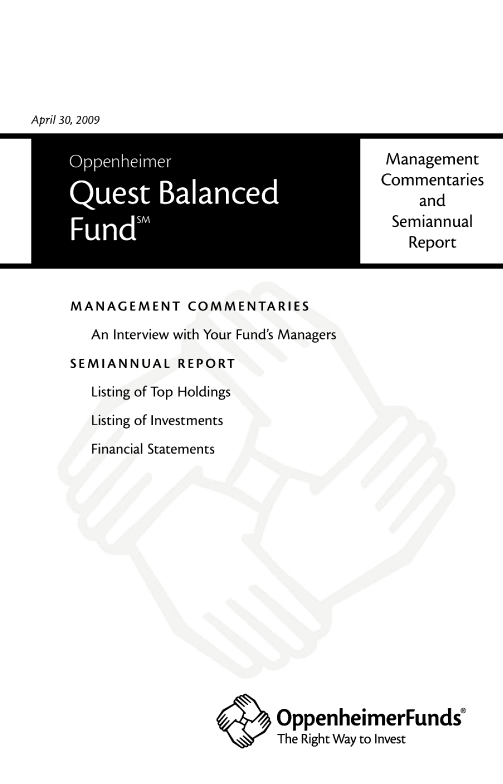
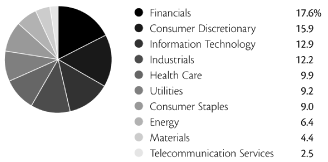
Portfolio Allocation
Portfolio holdings and allocations are subject to change. Percentages are as of April 30, 2009, and are based on the total market value of investments.
10 | OPPENHEIMER QUEST BALANCED FUND
NOTES
Total returns include changes in share price and reinvestment of dividends and capital gains distributions in a hypothetical investment for the periods shown. Cumulative total returns are not annualized. The Fund’s total returns shown do not reflect the deduction of income taxes on an individual’s investment. Taxes may reduce your actual investment returns on income or gains paid by the Fund or any gains you may realize if you sell your shares.
Investors should consider the Fund’s investment objectives, risks and other charges and expenses carefully before investing. The Fund’s prospectus contains this and other information about the Fund, and may be obtained by asking your financial advisor, calling us at 1.800.525.7048 or visiting our website at www.oppenheimerfunds.com. Read the prospectus carefully before investing.
The Fund’s investment strategy and focus can change over time. The mention of specific fund holdings does not constitute a recommendation by OppenheimerFunds, Inc.
Class A shares of the Fund were first publicly offered on 11/1/91. Unless otherwise noted, Class A returns include the current maximum initial sales charge of 5.75%.
Class B shares of the Fund were first publicly offered on 9/1/93. Unless otherwise noted, Class B returns include the applicable contingent deferred sales charges of 5% (1-year) and 2% (5-year). Because Class B shares convert to Class A shares 72 months after purchase, the 10-year return for Class B does not include any contingent deferred sales charge on redemptions and uses Class A performance for the period after conversion. Class B shares are subject to an annual 0.75% asset-based sales charge.
Class C shares of the Fund were first publicly offered on 9/1/93. Unless otherwise noted, Class C returns include the contingent deferred sales charge of 1% for the 1-year period. Class C shares are subject to an annual 0.75% asset-based sales charge.
Class N shares of the Fund were first publicly offered on 3/1/01. Class N shares are offered only through retirement plans. Unless otherwise noted, Class N returns include the contingent deferred sales charge of 1% for the 1-year period. Class N shares are subject to an annual 0.25% asset-based sales charge.
11 | OPPENHEIMER QUEST BALANCED FUND
NOTES
Class Y shares of the Fund were first publicly offered on 5/1/00. Class Y shares are offered only to certain institutional investors under a special agreement with the Distributor, and to present or former officers, directors, trustees or employees (and their eligible family members) of the Fund, the Manager, its affiliates, its parent company and the subsidiaries of its parent company, and retirement plans established for the benefit of such individuals.
An explanation of the calculation of performance is in the Fund’s Statement of Additional Information.
12 | OPPENHEIMER QUEST BALANCED FUND
FUND EXPENSES
Fund Expenses. As a shareholder of the Fund, you incur two types of costs: (1) transaction costs, which may include sales charges (loads) on purchase payments, contingent deferred sales charges on redemptions; and redemption fees (if applicable); and (2) ongoing costs, including management fees; distribution and service fees; and other Fund expenses. These examples are intended to help you understand your ongoing costs (in dollars) of investing in the Fund and to compare these costs with the ongoing costs of investing in other mutual funds.
The examples are based on an investment of $1,000.00 invested at the beginning of the period and held for the entire 6-month period ended April 30, 2009.
Actual Expenses. The first section of the table provides information about actual account values and actual expenses. You may use the information in this section for the class of shares you hold, together with the amount you invested, to estimate the expense that you paid over the period. Simply divide your account value by $1,000.00 (for example, an $8,600.00 account value divided by $1,000.00 = 8.60), then multiply the result by the number in the first section under the heading entitled “Expenses Paid During Period” to estimate the expenses you paid on your account during this period.
Hypothetical Example for Comparison Purposes. The second section of the table provides information about hypothetical account values and hypothetical expenses based on the Fund’s actual expense ratio for each class of shares, and an assumed rate of return of 5% per year for each class before expenses, which is not the actual return. The hypothetical account values and expenses may not be used to estimate the actual ending account balance or expenses you paid for the period. You may use this information to compare the ongoing costs of investing in the Fund and other funds. To do so, compare this 5% hypothetical example for the class of shares you hold with the 5% hypothetical examples that appear in the shareholder reports of the other funds.
Please note that the expenses shown in the table are meant to highlight your ongoing costs only and do not reflect any transactional costs, such as front-end or contingent deferred sales charges (loads), or a $12.00 fee imposed annually on accounts valued at less than $500.00 (subject to exceptions described in the Statement
13 | OPPENHEIMER QUEST BALANCED FUND
FUND EXPENSES Continued
of Additional Information). Therefore, the “hypothetical” section of the table is useful in comparing ongoing costs only, and will not help you determine the relative total costs of owning different funds. In addition, if these transactional costs were included, your costs would have been higher.
| | | | | | | | | | | | | |
| | | Beginning | | | Ending | | | Expenses | |
| | | Account | | | Account | | | Paid During | |
| | | Value | | | Value | | | 6 Months Ended | |
| | | November 1, 2008 | | | April 30, 2009 | | | April 30, 2009 | |
| |
Actual | | | | | | | | | | | | |
| Class A | | $ | 1,000.00 | | | $ | 1,000.40 | | | $ | 6.82 | |
| Class B | | | 1,000.00 | | | | 997.20 | | | | 10.65 | |
| Class C | | | 1,000.00 | | | | 996.70 | | | | 10.45 | |
| Class N | | | 1,000.00 | | | | 999.50 | | | | 7.86 | |
| Class Y | | | 1,000.00 | | | | 1,003.70 | | | | 4.13 | |
| | | | | | | | | | | | | |
Hypothetical
(5% return before expenses) | | | | | | | | | | | | |
| Class A | | | 1,000.00 | | | | 1,018.00 | | | | 6.88 | |
| Class B | | | 1,000.00 | | | | 1,014.18 | | | | 10.74 | |
| Class C | | | 1,000.00 | | | | 1,014.38 | | | | 10.54 | |
| Class N | | | 1,000.00 | | | | 1,016.96 | | | | 7.93 | |
| Class Y | | | 1,000.00 | | | | 1,020.68 | | | | 4.17 | |
Expenses are equal to the Fund’s annualized expense ratio for that class, multiplied by the average account value over the period, multiplied by 181/365 (to reflect the one-half year period). Those annualized expense ratios, based on the 6-month period ended April 30, 2009 are as follows:
| | | | | |
| Class | | Expense Ratios |
| |
| Class A | | | 1.37 | % |
| Class B | | | 2.14 | |
| Class C | | | 2.10 | |
| Class N | | | 1.58 | |
| Class Y | | | 0.83 | |
The expense ratios reflect reduction to custodian expenses and voluntary waivers or reimbursements of expenses by the Fund’s Manager and Transfer Agent that can be terminated at any time, without advance notice. The “Financial Highlights” tables in the Fund’s financial statements, included in this report, also show the gross expense ratios, without such waivers or reimbursements and reduction to custodian expenses, if applicable.
14 | OPPENHEIMER QUEST BALANCED FUND
STATEMENT OF INVESTMENTS April 30, 2009 / Unaudited
| | | | | | | | | |
| | | Shares | | | Value | |
| |
Common Stocks—72.8% | | | | | | | | |
Consumer Discretionary—6.0% | | | | | | | | |
Auto Components—0.9% | | | | | | | | |
Goodyear Tire & Rubber Co. (The)1,2 | | | 1,600,000 | | | $ | 17,584,000 | |
Hotels, Restaurants & Leisure—1.9% | | | | | | | | |
| International Game Technology | | | 3,300,000 | | | | 40,755,000 | |
Specialty Retail—3.2% | | | | | | | | |
Bed Bath & Beyond, Inc.1,2 | | | 1,000,000 | | | | 30,420,000 | |
| PetSmart, Inc. | | | 1,650,000 | | | | 37,752,000 | |
| | | | | | | | |
| | | | | | | | 68,172,000 | |
| | | | | | | | | |
Consumer Staples—3.0% | | | | | | | | |
Food Products—1.5% | | | | | | | | |
Dean Foods Co.2 | | | 1,500,000 | | | | 31,050,000 | |
Household Products—1.5% | | | | | | | | |
| Colgate-Palmolive Co. | | | 549,000 | | | | 32,391,000 | |
Energy—10.8% | | | | | | | | |
Energy Equipment & Services—3.1% | | | | | | | | |
| Halliburton Co. | | | 1,336,400 | | | | 27,022,008 | |
Transocean Ltd.1,2 | | | 585,300 | | | | 39,496,044 | |
| | | | | | | | |
| | | | | | | | 66,518,052 | |
| | | | | | | | | |
Oil, Gas & Consumable Fuels—7.7% | | | | | | | | |
Cameco Corp.1 | | | 2,017,000 | | | | 45,967,430 | |
Exxon Mobil Corp.1 | | | 850,000 | | | | 56,669,500 | |
| XTO Energy, Inc. | | | 1,738,400 | | | | 60,252,944 | |
| | | | | | | | |
| | | | | | | | 162,889,874 | |
| | | | | | | | | |
Financials—16.7% | | | | | | | | |
Capital Markets—3.7% | | | | | | | | |
| Goldman Sachs Group, Inc. (The) | | | 200,000 | | | | 25,700,000 | |
Morgan Stanley1 | | | 2,250,000 | | | | 53,190,000 | |
| | | | | | | | |
| | | | | | | | 78,890,000 | |
| | | | | | | | | |
Commercial Banks—1.4% | | | | | | | | |
| Wells Fargo & Co. | | | 1,500,000 | | | | 30,015,000 | |
Consumer Finance—1.9% | | | | | | | | |
Capital One Financial Corp.1 | | | 2,400,000 | | | | 40,176,000 | |
Diversified Financial Services—1.7% | | | | | | | | |
| JPMorgan Chase & Co. | | | 1,081,700 | | | | 35,696,100 | |
Insurance—8.0% | | | | | | | | |
AFLAC, Inc.1 | | | 1,800,000 | | | | 52,002,000 | |
| Hartford Financial Services Group, Inc. (The) | | | 1,843,000 | | | | 21,139,210 | |
F1 | OPPENHEIMER QUEST BALANCED FUND
STATEMENT OF INVESTMENTS Unaudited / Continued
| | | | | | | | | |
| | | Shares | | | Value | |
| |
Insurance Continued | | | | | | | | |
MetLife, Inc.1 | | | 1,795,000 | | | $ | 53,401,250 | |
| Prudential Financial, Inc. | | | 1,500,000 | | | | 43,320,000 | |
| | | | | | | | |
| | | | | | | | 169,862,460 | |
| | | | | | | | | |
Health Care—13.6% | | | | | | | | |
Biotechnology—4.7% | | | | | | | | |
Biogen Idec, Inc.2 | | | 800,000 | | | | 38,672,000 | |
Genzyme Corp. (General Division)2 | | | 350,000 | | | | 18,665,500 | |
Regeneron Pharmaceuticals, Inc.2 | | | 1,500,000 | | | | 19,890,000 | |
Theravance, Inc.1,2 | | | 1,500,000 | | | | 21,495,000 | |
| | | | | | | | |
| | | | | | | | 98,722,500 | |
| | | | | | | | | |
Health Care Providers & Services—4.9% | | | | | | | | |
Health Net, Inc.2 | | | 2,750,000 | | | | 39,710,000 | |
WellPoint, Inc.2 | | | 1,500,000 | | | | 64,140,000 | |
| | | | | | | | |
| | | | | | | | 103,850,000 | |
| | | | | | | | | |
Pharmaceuticals—4.0% | | | | | | | | |
Pfizer, Inc.1 | | | 1,600,000 | | | | 21,376,000 | |
| Roche Holding Ltd., Sponsored ADR | | | 747,300 | | | | 23,637,099 | |
Sepracor, Inc.1,2 | | | 2,850,000 | | | | 40,498,500 | |
| | | | | | | | |
| | | | | | | | 85,511,599 | |
| | | | | | | | | |
Industrials—4.3% | | | | | | | | |
Aerospace & Defense—1.1% | | | | | | | | |
| Boeing Co. | | | 550,000 | | | | 22,027,500 | |
Industrial Conglomerates—3.2% | | | | | | | | |
| General Electric Co. | | | 5,363,000 | | | | 67,841,950 | |
Information Technology—12.4% | | | | | | | | |
Communications Equipment—4.4% | | | | | | | | |
Cisco Systems, Inc.2 | | | 1,950,000 | | | | 37,674,000 | |
| Nokia Corp., Sponsored ADR | | | 1,250,000 | | | | 17,675,000 | |
| QUALCOMM, Inc. | | | 900,000 | | | | 38,088,000 | |
| | | | | | | | |
| | | | | | | | 93,437,000 | |
| | | | | | | | | |
Computers & Peripherals—2.2% | | | | | | | | |
Apple, Inc.2 | | | 375,000 | | | | 47,186,250 | |
Internet Software & Services—1.9% | | | | | | | | |
Google, Inc., Cl. A2 | | | 100,000 | | | | 39,597,000 | |
IT Services—1.9% | | | | | | | | |
Infosys Technologies Ltd., Sponsored ADR1 | | | 1,300,000 | | | | 40,053,000 | |
F2 | OPPENHEIMER QUEST BALANCED FUND
| | | | | | | | | |
| | | Shares | | | Value | |
| |
Semiconductors & Semiconductor Equipment—2.0% | | | | | | | | |
ASML Holding NV1 | | | 2,000,000 | | | $ | 42,300,000 | |
Materials—5.3% | | | | | | | | |
Chemicals—2.6% | | | | | | | | |
| Monsanto Co. | | | 660,000 | | | | 56,027,400 | |
Metals & Mining—2.7% | | | | | | | | |
Alcoa, Inc.1 | | | 4,000,000 | | | | 36,280,000 | |
Companhia Vale do Rio Doce, ADR1 | | | 1,250,000 | | | | 20,637,500 | |
| | | | | | | | |
| | | | | | | | 56,917,500 | |
| | | | | | | | | |
Telecommunication Services—0.7% | | | | | | | | |
Diversified Telecommunication Services—0.7% | | | | | | | | |
| AT&T, Inc. | | | 593,000 | | | | 15,192,660 | |
| | | | | | | | |
| | | | | | | | | |
| Total Common Stocks (Cost $1,851,236,309) | | | | | | | 1,542,663,845 | |
| | | | | | | | | |
Preferred Stocks—0.4% | | | | | | | | |
| CIT Group, Inc., 8.75% Cv., Series C (Cost $24,828,656) | | | 495,173 | | | | 7,927,720 | |
| |
| | | Principal | | | | |
| | | Amount | | | | |
| |
Asset-Backed Securities—0.7% | | | | | | | | |
| CWHEQ Home Equity Loan Trust, Home Equity Loan | | | | | | | | |
| Asset-Backed Certificates, Series 2007-S2, Cl. A3, 5.813%, 5/1/37 | | $ | 15,216,928 | | | | 4,549,787 | |
| Ford Credit Auto Owner Trust 2009-A, Auto Receivables | | | | | | | | |
| Asset-Backed Certificates, Series 2009-A, Cl. A4, 6.07%, 5/15/14 | | | 10,491,000 | | | | 10,501,216 | |
| | | | | | | | |
| | | | | | | | | |
| Total Asset-Backed Securities (Cost $16,425,104) | | | | | | | 15,051,003 | |
| | | | | | | | | |
Mortgage-Backed Obligations—10.8% | | | | | | | | |
| Federal Home Loan Mortgage Corp.: | | | | | | | | |
| 4.50%, 6/1/23-11/1/23 | | | 80,422,813 | | | | 82,655,048 | |
| 6%, 8/1/38 | | | 22,083,066 | | | | 23,077,704 | |
| Federal National Mortgage Assn., 5%, 5/1/38 | | | 55,366,414 | | | | 57,012,359 | |
| Federal National Mortgage Assn., Gtd. Real Estate | | | | | | | | |
| Mtg. Investment Conduit Pass-Through Certificates: | | | | | | | | |
Trust 2006-83, Cl. FH, 0.878%, 9/25/363 | | | 11,217,326 | | | | 11,024,668 | |
Trust 2006-93, Cl. MF, 0.838%, 10/25/363 | | | 22,779,017 | | | | 22,320,418 | |
| Government National Mortgage Assn., 5.50%, 6/1/37-6/15/38 | | | 31,513,305 | | | | 32,778,727 | |
| | | | | | | | |
| | | | | | | | | |
| Total Mortgage-Backed Obligations (Cost $219,533,099) | | | | | | | 228,868,924 | |
| | | | | | | | | |
U.S. Government Obligations—6.6% | | | | | | | | |
| Fannie Mae Nts.: | | | | | | | | |
| 1.70%, 4/29/11 | | | 7,901,000 | | | | 7,898,211 | |
2.15%, 5/4/124 | | | 7,901,000 | | | | 7,873,283 | |
| 2.75%, 3/13/14 | | | 16,160,000 | | | | 16,373,942 | |
F3 | OPPENHEIMER QUEST BALANCED FUND
STATEMENT OF INVESTMENTS Unaudited / Continued
| | | | | | | | | |
| | | Principal | | | | |
| | | Amount | | | Value | |
| |
U.S. Government Obligations Continued | | | | | | | | |
| Federal Farm Credit Bank Bonds, 2.625%, 4/17/14 | | $ | 16,506,000 | | | $ | 16,403,698 | |
Federal Home Loan Bank Bonds, 1.63%, 3/16/111 | | | 4,570,000 | | | | 4,602,657 | |
| Federal National Mortgage Assn. Sr. Unsec. Nts., 5.375%, 6/12/17 | | | 3,203,000 | | | | 3,616,161 | |
| U.S. Treasury Bonds, 7.25%, 8/15/22 | | | 19,000,000 | | | | 25,679,697 | |
U.S. Treasury Inflation Index Bonds, 1.75%, 1/15/285 | | | 25,858,000 | | | | 23,645,362 | |
| U.S. Treasury Nts.: | | | | | | | | |
1.25%, 5/15/124 | | | 30,000,000 | | | | 29,854,200 | |
| 2.25%, 2/29/16 | | | 3,238,000 | | | | 3,242,051 | |
| | | | | | | | |
| | | | | | | | | |
| Total U.S. Government Obligations (Cost $139,892,708) | | | | | | | 139,189,262 | |
| | | | | | | | | |
Non-Convertible Corporate Bonds and Notes—8.3% | | | | | | | | |
| Allied Waste North America, Inc., 6.875% Sr. Unsec. Nts., 6/1/17 | | | 6,132,000 | | | | 5,957,079 | |
| American Express Credit Corp.: | | | | | | | | |
1.838% Sr. Unsec. Nts., Series C, 5/27/103 | | | 15,414,000 | | | | 14,757,055 | |
| 5% Nts., Series B, 12/2/10 | | | 10,870,000 | | | | 10,848,086 | |
| Ameriprise Financial, Inc., 5.35% Sr. Unsec. Nts., 11/15/10 | | | 30,900,000 | | | | 30,471,448 | |
| Bank of America Corp., 5.75% Sr. Unsec. Nts., 12/1/17 | | | 25,000,000 | | | | 20,456,575 | |
Bear Stearns Cos., Inc. (The), 1.36% Sr. Unsec. Unsub. Nts., 2/1/123 | | | 15,185,000 | | | | 13,891,557 | |
| Citigroup, Inc.: | | | | | | | | |
| 4.625% Nts., 8/3/10 | | | 19,740,000 | | | | 19,190,320 | |
| 6% Nts., 2/21/12 | | | 15,050,000 | | | | 13,839,784 | |
| Goldman Sachs Group, Inc. (The): | | | | | | | | |
| 6.15% Sr. Unsec. Nts., 4/1/18 | | | 8,940,000 | | | | 8,446,584 | |
| 6.75% Unsec. Sub. Nts., 10/1/37 | | | 19,680,000 | | | | 15,056,971 | |
| Morgan Stanley: | | | | | | | | |
1.341% Sr. Unsec. Unsub. Nts., Series F, 5/7/103 | | | 9,885,000 | | | | 9,289,893 | |
| 6.625% Sr. Unsec. Nts., Series F, 4/1/18 | | | 14,765,000 | | | | 14,074,338 | |
| | | | | | | | |
| | | | | | | | | |
| Total Non-Convertible Corporate Bonds and Notes (Cost $186,831,307) | | | | | | | 176,279,690 | |
| Total Investments, at Value (excluding Investments Purchased with Cash Collateral from Securities Loaned) (Cost $2,438,747,183) | | | | | | | 2,109,980,444 | |
| |
| | | Shares | | | | |
| |
Investments Purchased with Cash Collateral from Securities Loaned—13.7%6 | | | | | | | | |
OFI Liquid Assets Fund, LLC, 0.77%7,8 (Cost $290,928,783) | | | 290,928,783 | | | | 290,928,783 | |
Total Investments, at Value (Cost $2,729,675,966) | | | 113.3 | % | | | 2,400,909,227 | |
Liabilities in Excess of Other Assets | | | (13.3 | ) | | | (282,092,531 | ) |
| | | |
| | | | | | | | | |
Net Assets | | | 100.0 | % | | $ | 2,118,816,696 | |
| | | |
F4 | OPPENHEIMER QUEST BALANCED FUND
Footnotes to Statement of Investments
| | |
| 1. | | Partial or fully-loaned security. See Note 5 of accompanying Notes. |
| |
| 2. | | Non-income producing security. |
| |
| 3. | | Represents the current interest rate for a variable or increasing rate security. |
| |
| 4. | | When-issued security or delayed delivery to be delivered and settled after April 30, 2009. See Note 1 of accompanying Notes. |
| |
| 5. | | Denotes an inflation-indexed security: coupon and principal are indexed to the consumer price index. |
| |
| 6. | | The security/securities have been segregated to satisfy the forward commitment to return the cash collateral received in securities lending transactions upon the borrower’s return of the securities loaned. See Note 5 of accompanying Notes. |
| |
| 7. | | Is or was an affiliate, as defined in the Investment Company Act of 1940, at or during the period ended April 30, 2009, by virtue of the Fund owning at least 5% of the voting securities of the issuer or as a result of the Fund and the issuer having the same investment adviser. Transactions during the period in which the issuer was an affiliate are as follows: |
| | | | | | | | | | | | | | | | | |
| | | Shares | | | Gross | | | Gross | | | Shares | |
| | | October 31, 2008 | | | Additions | | | Reductions | | | April 30, 2009 | |
| |
| OFI Liquid Assets Fund, LLC | | | 142,691,700 | | | | 978,708,463 | | | | 830,471,380 | | | | 290,928,783 | |
| | | | | | | | | |
| | | Value | | | Income | |
| |
| OFI Liquid Assets Fund, LLC | | $ | 290,928,783 | | | $ | 920,821 | a |
| | |
| a. | | Net of compensation to the securities lending agent and rebates paid to the borrowing counterparties. |
| |
| 8. | | Rate shown is the 7-day yield as of April 30, 2009. |
Valuation Inputs
Various data inputs are used in determining the value of each of the Fund’s investments as of the reporting period end. These data inputs are categorized in the following hierarchy under applicable financial accounting standards:
| | 1) | | Level 1—quoted prices in active markets for identical assets or liabilities (including securities actively traded on a securities exchange) |
| |
| | 2) | | Level 2—inputs other than quoted prices that are observable for the asset (such as quoted prices for similar assets and market corroborated inputs such as interest rates, prepayment speeds, credit risks, etc.) |
| |
| | 3) | | Level 3—unobservable inputs (including the Manager’s own judgments about assumptions that market participants would use in pricing the asset). |
The market value of the Fund’s investments was determined based on the following inputs as of April 30, 2009:
| | | | | | | | | |
| | | Investments | | | Other Financial | |
| Valuation Description | | in Securities | | | Instruments* | |
| |
| Level 1—Quoted Prices | | $ | 1,841,520,348 | | | $ | — | |
| Level 2—Other Significant Observable Inputs | | | 559,388,879 | | | | — | |
| Level 3—Significant Unobservable Inputs | | | — | | | | — | |
| | | |
| Total | | $ | 2,400,909,227 | | | $ | — | |
| | | |
* Other financial instruments include options written, currency contracts, futures, forwards and swap contracts. Currency contracts and forwards are reported at their unrealized appreciation/depreciation at measurement date, which represents the change in the contract’s value from trade date. Futures are reported at their variation margin at measurement date, which represents the amount due to/from the Fund at that date. Options written and swaps are reported at their market value at measurement date.
See the accompanying Notes for further discussion of the methods used in determining value of the Fund’s investments, and a summary of changes to the valuation techniques, if any, during the reporting period.
See accompanying Notes to Financial Statements.
F5 | OPPENHEIMER QUEST BALANCED FUND
STATEMENT OF ASSETS AND LIABILITIES Unaudited
April 30, 2009
| | | | | |
Assets | | | | |
| Investments, at value—see accompanying statement of investments: | | | | |
| Unaffiliated companies (cost $2,438,747,183) | | $ | 2,109,980,444 | |
| Affiliated companies (cost $290,928,783) | | | 290,928,783 | |
| | | | |
| | | | 2,400,909,227 | |
| Cash | | | 26,900,432 | |
| Receivables and other assets: | | | | |
| Investments sold | | | 65,839,082 | |
| Interest and dividends | | | 5,698,212 | |
| Other | | | 398,060 | |
| | | | |
| Total assets | | | 2,499,745,013 | |
| | | | | |
Liabilities | | | | |
| Return of collateral for securities loaned | | | 290,928,783 | |
| Payables and other liabilities: | | | | |
| Investments purchased (including $37,736,958 purchased on a when-issued or delayed delivery basis) | | | 82,343,501 | |
| Shares of beneficial interest redeemed | | | 5,188,123 | |
| Trustees’ compensation | | | 1,039,767 | |
| Transfer and shareholder servicing agent fees | | | 585,173 | |
| Shareholder communications | | | 477,876 | |
| Distribution and service plan fees | | | 285,282 | |
| Other | | | 79,812 | |
| | | | |
| Total liabilities | | | 380,928,317 | |
| | | | | |
Net Assets | | $ | 2,118,816,696 | |
| | | | |
| | | | | |
Composition of Net Assets | | | | |
| Par value of shares of beneficial interest | | $ | 2,019,891 | |
| Additional paid-in capital | | | 3,702,463,168 | |
| Accumulated net investment income | | | 807,699 | |
| Accumulated net realized loss on investments | | | (1,257,707,323 | ) |
| Net unrealized depreciation on investments | | | (328,766,739 | ) |
| | | | |
Net Assets | | $ | 2,118,816,696 | |
| | | | |
F6 | OPPENHEIMER QUEST BALANCED FUND
| | | | | |
Net Asset Value Per Share | | | | |
| |
| Class A Shares: | | | | |
| Net asset value and redemption price per share (based on net assets of $1,358,913,033 and 128,636,420 shares of beneficial interest outstanding) | | $ | 10.56 | |
| Maximum offering price per share (net asset value plus sales charge of 5.75% of offering price) | | $ | 11.20 | |
| |
| Class B Shares: | | | | |
| Net asset value, redemption price (excludes applicable contingent deferred sales charge) and offering price per share (based on net assets of $340,098,725 and 32,869,382 shares of beneficial interest outstanding) | | $ | 10.35 | |
| |
| Class C Shares: | | | | |
| Net asset value, redemption price (excludes applicable contingent deferred sales charge) and offering price per share (based on net assets of $322,025,535 and 31,135,583 shares of beneficial interest outstanding) | | $ | 10.34 | |
| |
| Class N Shares: | | | | |
| Net asset value, redemption price (excludes applicable contingent deferred sales charge) and offering price per share (based on net assets of $66,386,401 and 6,374,863 shares of beneficial interest outstanding) | | $ | 10.41 | |
| |
| Class Y Shares: | | | | |
| Net asset value, redemption price and offering price per share (based on net assets of $31,393,002 and 2,972,837 shares of beneficial interest outstanding) | | $ | 10.56 | |
See accompanying Notes to Financial Statements.
F7 | OPPENHEIMER QUEST BALANCED FUND
STATEMENT OF OPERATIONS Unaudited
For the Six Months Ended April 30, 2009
| | | | | |
Investment Income | | | | |
| Dividends (net of foreign withholding taxes of $448,621) | | $ | 20,655,293 | |
| Interest | | | 16,422,042 | |
| Income from investment of securities lending cash collateral, net—affiliated companies | | | 920,821 | |
| | | | |
| Total investment income | | | 37,998,156 | |
| | | | | |
Expenses | | | | |
| Management fees | | | 8,321,461 | |
| Distribution and service plan fees: | | | | |
| Class A | | | 1,707,731 | |
| Class B | | | 1,745,577 | |
| Class C | | | 1,615,284 | |
| Class N | | | 166,020 | |
| Transfer and shareholder servicing agent fees: | | | | |
| Class A | | | 2,576,598 | |
| Class B | | | 974,695 | |
| Class C | | | 574,407 | |
| Class N | | | 128,925 | |
| Class Y | | | 59,198 | |
| Shareholder communications: | | | | |
| Class A | | | 293,415 | |
| Class B | | | 119,634 | |
| Class C | | | 64,916 | |
| Class N | | | 13,167 | |
| Class Y | | | 5,801 | |
| Trustees’ compensation | | | 71,853 | |
| Custodian fees and expenses | | | 7,135 | |
| Other | | | 122,385 | |
| | | | |
| Total expenses | | | 18,568,202 | |
| Less reduction to custodian expenses | | | (3,971 | ) |
| Less waivers and reimbursements of expenses | | | (1,482,240 | ) |
| | | | |
| Net expenses | | | 17,081,991 | |
| | | | | |
Net Investment Income | | | 20,916,165 | |
| | | | | |
Realized and Unrealized Gain (Loss) | | | | |
| Net realized loss on investments from unaffiliated companies | | | (424,988,649 | ) |
| Net change in unrealized depreciation on investments | | | 382,240,836 | |
| | | | | |
Net Decrease in Net Assets Resulting from Operations | | $ | (21,831,648 | ) |
| | | | |
See accompanying Notes to Financial Statements.
F8 | OPPENHEIMER QUEST BALANCED FUND
STATEMENTS OF CHANGES IN NET ASSETS
| | | | | | | | | |
| | | Six Months | | | Year | |
| | | Ended | | | Ended | |
| | | April 30, 2009 | | | October 31, | |
| | | (Unaudited) | | | 2008 | |
| |
Operations | | | | | | | | |
| Net investment income | | $ | 20,916,165 | | | $ | 63,728,531 | |
| Net realized loss | | | (424,988,649 | ) | | | (832,760,905 | ) |
| Net change in unrealized depreciation | | | 382,240,836 | | | | (854,819,259 | ) |
| | | |
| | | | | | | | | |
| Net decrease in net assets resulting from operations | | | (21,831,648 | ) | | | (1,623,851,633 | ) |
| | | | | | | | | |
Dividends and/or Distributions to Shareholders | | | | | | | | |
| Dividends from net investment income: | | | | | | | | |
| Class A | | | (16,797,570 | ) | | | (45,931,264 | ) |
| Class B | | | (3,030,104 | ) | | | (7,436,482 | ) |
| Class C | | | (2,958,003 | ) | | | (7,000,007 | ) |
| Class N | | | (788,944 | ) | | | (2,071,501 | ) |
| Class Y | | | (821,719 | ) | | | (3,787,522 | ) |
| | | |
| | | | | | | | | |
| | | | (24,396,340 | ) | | | (66,226,776 | ) |
| | | | | | | | | |
| Distributions from net realized gain: | | | | | | | | |
| Class A | | | — | | | | (341,185,033 | ) |
| Class B | | | — | | | | (135,785,144 | ) |
| Class C | | | — | | | | (99,519,895 | ) |
| Class N | | | — | | | | (19,443,639 | ) |
| Class Y | | | — | | | | (25,395,320 | ) |
| | | |
| | | | — | | | | (621,329,031 | ) |
| | | | | | | | | |
Beneficial Interest Transactions | | | | | | | | |
| Net decrease in net assets resulting from beneficial interest transactions: | | | | | | | | |
| Class A | | | (139,499,721 | ) | | | (120,513,898 | ) |
| Class B | | | (61,179,000 | ) | | | (438,107,112 | ) |
| Class C | | | (43,886,473 | ) | | | (151,771,032 | ) |
| Class N | | | (8,632,401 | ) | | | (23,435,568 | ) |
| Class Y | | | (49,903,839 | ) | | | (52,340,651 | ) |
| | | |
| | | | | | | | | |
| | | | (303,101,434 | ) | | | (786,168,261 | ) |
| | | | | | | | | |
Net Assets | | | | | | | | |
| Total decrease | | | (349,329,422 | ) | | | (3,097,575,701 | ) |
| Beginning of period | | | 2,468,146,118 | | | | 5,565,721,819 | |
| | | |
| | | | | | | | | |
| End of period (including accumulated net investment income of $807,699 and $4,287,874, respectively) | | $ | 2,118,816,696 | | | $ | 2,468,146,118 | |
| | | |
See accompanying Notes to Financial Statements.
F9 | OPPENHEIMER QUEST BALANCED FUND
FINANCIAL HIGHLIGHTS
| | | | | | | | | | | | | | | | | | | | | | | | | |
| | | Six Months | | | | | | | | | | | | |
| | | Ended | | | | | | | | | | | | |
| | | April 30, 2009 | | | | | | | | | | | Year Ended October 31, | |
| Class A | | (Unaudited) | | | 2008 | | | 2007 | | | 2006 | | | 2005 | | | 2004 | |
| |
Per Share Operating Data | | | | | | | | | | | | | | | | | | | | | | | | |
| Net asset value, beginning of period | | $ | 10.69 | | | $ | 19.18 | | | $ | 18.82 | | | $ | 17.79 | | | $ | 17.19 | | | $ | 15.69 | |
| |
| Income (loss) from investment operations: | | | | | | | | | | | | | | | | | | | | | | | | |
| Net investment income | | | .11 | 1 | | | .27 | 1 | | | .24 | 1 | | | .21 | 1 | | | .11 | 1 | | | .07 | |
| Net realized and unrealized gain (loss) | | | (.12 | ) | | | (6.28 | ) | | | 1.05 | | | | 1.66 | | | | .49 | | | | 1.46 | |
| | | |
| Total from investment operations | | | (.01 | ) | | | (6.01 | ) | | | 1.29 | | | | 1.87 | | | | .60 | | | | 1.53 | |
| |
| | | | | | | | | | | | | | | | | | | | | | | | | |
| Dividends and/or distributions to shareholders: | | | | | | | | | | | | | | | | | | | | | | | | |
| Dividends from net investment income | | | (.12 | ) | | | (.29 | ) | | | (.25 | ) | | | (.23 | ) | | | — | | | | (.03 | ) |
| Distributions from net realized gain | | | — | | | | (2.19 | ) | | | (.68 | ) | | | (.61 | ) | | | — | | | | — | |
| | | |
| Total dividends and/or distributions to shareholders | | | (.12 | ) | | | (2.48 | ) | | | (.93 | ) | | | (.84 | ) | | | — | | | | (.03 | ) |
| |
| | | | | | | | | | | | | | | | | | | | | | | | | |
| Net asset value, end of period | | $ | 10.56 | | | $ | 10.69 | | | $ | 19.18 | | | $ | 18.82 | | | $ | 17.79 | | | $ | 17.19 | |
| | | |
| | | | | | | | | | | | | | | | | | | | | | | | | |
Total Return, at Net Asset Value2 | | | 0.04 | % | | | (35.52 | )% | | | 6.97 | % | | | 10.77 | % | | | 3.49 | % | | | 9.79 | % |
| | | | | | | | | | | | | | | | | | | | | | | | | |
Ratios/Supplemental Data | | | | | | | | | | | | | | | | | | | | | | | | |
| Net assets, end of period (in thousands) | | $ | 1,358,913 | | | $ | 1,525,472 | | | $ | 2,988,971 | | | $ | 3,058,131 | | | $ | 3,277,261 | | | $ | 3,054,761 | |
| |
| Average net assets (in thousands) | | $ | 1,360,086 | | | $ | 2,364,088 | | | $ | 3,068,226 | | | $ | 3,215,973 | | | $ | 3,285,181 | | | $ | 2,759,594 | |
| |
Ratios to average net assets:3 | | | | | | | | | | | | | | | | | | | | | | | | |
| Net investment income | | | 2.18 | % | | | 1.84 | % | | | 1.26 | % | | | 1.13 | % | | | 0.61 | % | | | 0.38 | % |
| Total expenses | | | 1.48 | % | | | 1.27 | % | | | 1.16 | % | | | 1.17 | % | | | 1.17 | % | | | 1.21 | % |
| Expenses after payments, waivers and/or reimbursements and reduction to custodian expenses | | | 1.37 | % | | | 1.26 | % | | | 1.14 | % | | | 1.17 | % | | | 1.17 | % | | | 1.21 | % |
| |
| Portfolio turnover rate | | | 77 | %4 | | | 128 | %4 | | | 112 | % | | | 63 | % | | | 89 | % | | | 106 | % |
| | |
| 1. | | Per share amounts calculated based on the average shares outstanding during the period. |
| |
| 2. | | Assumes an investment on the business day before the first day of the fiscal period, with all dividends and distributions reinvested in additional shares on the reinvestment date, and redemption at the net asset value calculated on the last business day of the fiscal period. Sales charges are not reflected in the total returns. Total returns are not annualized for periods less than one full year. Returns do not reflect the deduction of taxes that a shareholder would pay on fund distributions or the redemption of fund shares. |
| |
| 3. | | Annualized for periods less than one full year. |
| |
| 4. | | The portfolio turnover rate excludes purchase and sale transactions of To Be Announced (TBA) mortgage-related securities as follows: |
| | | | | | | | | |
| | | Purchase Transactions | | | Sale Transactions | |
| |
| Six months Ended April 30, 2009 | | $ | 255,735,717 | | | $ | 530,908,699 | |
| Year Ended October 31, 2008 | | $ | 2,211,283,531 | | | $ | 1,943,632,589 | |
See accompanying Notes to Financial Statements.
F10 | OPPENHEIMER QUEST BALANCED FUND
| | | | | | | | | | | | | | | | | | | | | | | | | |
| | | Six Months | | | | |
| | | Ended | | | | |
| | | April 30, 2009 | | | Year Ended October 31, | |
| Class B | | (Unaudited) | | | 2008 | | | 2007 | | | 2006 | | | 2005 | | | 2004 | |
| |
Per Share Operating Data | | | | | | | | | | | | | | | | | | | | | | | | |
| Net asset value, beginning of period | | $ | 10.47 | | | $ | 18.81 | | | $ | 18.46 | | | $ | 17.46 | | | $ | 17.01 | | | $ | 15.61 | |
| |
| Income (loss) from investment operations: | | | | | | | | | | | | | | | | | | | | | | | | |
| Net investment income (loss) | | | .07 | 1 | | | .15 | 1 | | | .09 | 1 | | | .06 | 1 | | | (.03 | )1 | | | (.07 | ) |
| Net realized and unrealized gain (loss) | | | (.11 | ) | | | (6.15 | ) | | | 1.03 | | | | 1.63 | | | | .48 | | | | 1.47 | |
| | | |
| Total from investment operations | | | (.04 | ) | | | (6.00 | ) | | | 1.12 | | | | 1.69 | | | | .45 | | | | 1.40 | |
| |
| Dividends and/or distributions to shareholders: | | | | | | | | | | | | | | | | | | | | | | | | |
| Dividends from net investment income | | | (.08 | ) | | | (.15 | ) | | | (.09 | ) | | | (.08 | ) | | | — | | | | — | |
| Distributions from net realized gain | | | — | | | | (2.19 | ) | | | (.68 | ) | | | (.61 | ) | | | — | | | | — | |
| | | |
| Total dividends and/or distributions to shareholders | | | (.08 | ) | | | (2.34 | ) | | | (.77 | ) | | | (.69 | ) | | | — | | | | — | |
| |
| Net asset value, end of period | | $ | 10.35 | | | $ | 10.47 | | | $ | 18.81 | | | $ | 18.46 | | | $ | 17.46 | | | $ | 17.01 | |
| | | |
| | | | | | | | | | | | | | | | | | | | | | | | | |
Total Return, at Net Asset Value2 | | | (0.28 | )% | | | (36.03 | )% | | | 6.17 | % | | | 9.90 | % | | | 2.65 | % | | | 8.97 | % |
| | | | | | | | | | | | | | | | | | | | | | | | | |
Ratios/Supplemental Data | | | | | | | | | | | | | | | | | | | | | | | | |
| Net assets, end of period (in thousands) | | $ | 340,099 | | | $ | 410,268 | | | $ | 1,294,217 | | | $ | 1,847,651 | | | $ | 2,205,679 | | | $ | 2,549,069 | |
| |
| Average net assets (in thousands) | | $ | 352,651 | | | $ | 765,095 | | | $ | 1,649,062 | | | $ | 2,014,712 | | | $ | 2,470,464 | | | $ | 2,495,872 | |
| |
Ratios to average net assets:3 | | | | | | | | | | | | | | | | | | | | | | | | |
| Net investment income (loss) | | | 1.42 | % | | | 1.04 | % | | | 0.48 | % | | | 0.35 | % | | | (0.17 | )% | | | (0.40 | )% |
| Total expenses | | | 2.42 | % | | | 2.06 | % | | | 1.94 | % | | | 1.95 | % | | | 1.96 | % | | | 2.00 | % |
| Expenses after payments, waivers and/or reimbursements and reduction to custodian expenses | | | 2.14 | % | | | 2.05 | % | | | 1.92 | % | | | 1.95 | % | | | 1.96 | % | | | 2.00 | % |
| |
| Portfolio turnover rate | | | 77 | %4 | | | 128 | %4 | | | 112 | % | | | 63 | % | | | 89 | % | | | 106 | % |
| | |
| 1. | | Per share amounts calculated based on the average shares outstanding during the period. |
| |
| 2. | | Assumes an investment on the business day before the first day of the fiscal period, with all dividends and distributions reinvested in additional shares on the reinvestment date, and redemption at the net asset value calculated on the last business day of the fiscal period. Sales charges are not reflected in the total returns. Total returns are not annualized for periods less than one full year. Returns do not reflect the deduction of taxes that a shareholder would pay on fund distributions or the redemption of fund shares. |
| |
| 3. | | Annualized for periods less than one full year. |
| |
| 4. | | The portfolio turnover rate excludes purchase and sale transactions of To Be Announced (TBA) mortgage-related securities as follows: |
| | | | | | | | | |
| | | Purchase Transactions | | | Sale Transactions | |
| |
| Six months Ended April 30, 2009 | | $ | 255,735,717 | | | $ | 530,908,699 | |
| Year Ended October 31, 2008 | | $ | 2,211,283,531 | | | $ | 1,943,632,589 | |
See accompanying Notes to Financial Statements.
F11 | OPPENHEIMER QUEST BALANCED FUND
FINANCIAL HIGHLIGHTS Continued
| | | | | | | | | | | | | | | | | | | | | | | | | |
| | | Six Months | | | | |
| | | Ended | | | | |
| | | April 30, 2009 | | | Year Ended October 31, | |
| Class C | | (Unaudited) | | | 2008 | | | 2007 | | | 2006 | | | 2005 | | | 2004 | |
| |
Per Share Operating Data | | | | | | | | | | | | | | | | | | | | | | | | |
| Net asset value, beginning of period | | $ | 10.47 | | | $ | 18.81 | | | $ | 18.48 | | | $ | 17.48 | | | $ | 17.02 | | | $ | 15.60 | |
| |
| Income (loss) from investment operations: | | | | | | | | | | | | | | | | | | | | | | | | |
| Net investment income (loss) | | | .07 | 1 | | | .16 | 1 | | | .10 | 1 | | | .07 | 1 | | | (.02 | )1 | | | (.06 | ) |
| Net realized and unrealized gain (loss) | | | (.11 | ) | | | (6.14 | ) | | | 1.02 | | | | 1.64 | | | | .48 | | | | 1.48 | |
| | | |
| Total from investment operations | | | (.04 | ) | | | (5.98 | ) | | | 1.12 | | | | 1.71 | | | | .46 | | | | 1.42 | |
| |
| Dividends and/or distributions to shareholders: | | | | | | | | | | | | | | | | | | | | | | | | |
| Dividends from net investment income | | | (.09 | ) | | | (.17 | ) | | | (.11 | ) | | | (.10 | ) | | | — | | | | — | |
| Distributions from net realized gain | | | — | | | | (2.19 | ) | | | (.68 | ) | | | (.61 | ) | | | — | | | | — | |
| | | |
| Total dividends and/or distributions to shareholders | | | (.09 | ) | | | (2.36 | ) | | | (.79 | ) | | | (.71 | ) | | | — | | | | — | |
| |
| Net asset value, end of period | | $ | 10.34 | | | $ | 10.47 | | | $ | 18.81 | | | $ | 18.48 | | | $ | 17.48 | | | $ | 17.02 | |
| | | |
| | | | | | | | | | | | | | | | | | | | | | | | | |
Total Return, at Net Asset Value2 | | | (0.33 | )% | | | (35.95 | )% | | | 6.15 | % | | | 9.97 | % | | | 2.70 | % | | | 9.10 | % |
| | | | | | | | | | | | | | | | | | | | | | | | | |
Ratios/Supplemental Data | | | | | | | | | | | | | | | | | | | | | | | | |
| Net assets, end of period (in thousands) | | $ | 322,026 | | | $ | 373,380 | | | $ | 883,839 | | | $ | 1,022,881 | | | $ | 1,191,400 | | | $ | 1,207,729 | |
| |
| Average net assets (in thousands) | | $ | 326,885 | | | $ | 621,258 | | | $ | 979,278 | | | $ | 1,122,088 | | | $ | 1,248,447 | | | $ | 1,129,522 | |
| |
Ratios to average net assets:3 | | | | | | | | | | | | | | | | | | | | | | | | |
| Net investment income (loss) | | | 1.45 | % | | | 1.10 | % | | | 0.53 | % | | | 0.41 | % | | | (0.11 | )% | | | (0.34 | )% |
| Total expenses | | | 2.19 | % | | | 2.00 | % | | | 1.89 | % | | | 1.89 | % | | | 1.89 | % | | | 1.94 | % |
| Expenses after payments, waivers and/or reimbursements and reduction to custodian expenses | | | 2.10 | % | | | 1.99 | % | | | 1.87 | % | | | 1.89 | % | | | 1.89 | % | | | 1.94 | % |
| |
| Portfolio turnover rate | | | 77 | %4 | | | 128 | %4 | | | 112 | % | | | 63 | % | | | 89 | % | | | 106 | % |
| | |
| 1. | | Per share amounts calculated based on the average shares outstanding during the period. |
| |
| 2. | | Assumes an investment on the business day before the first day of the fiscal period, with all dividends and distributions reinvested in additional shares on the reinvestment date, and redemption at the net asset value calculated on the last business day of the fiscal period. Sales charges are not reflected in the total returns. Total returns are not annualized for periods less than one full year. Returns do not reflect the deduction of taxes that a shareholder would pay on fund distributions or the redemption of fund shares. |
| |
| 3. | | Annualized for periods less than one full year. |
| |
| 4. | | The portfolio turnover rate excludes purchase and sale transactions of To Be Announced (TBA) mortgage-related securities as follows: |
| | | | | | | | | |
| | | Purchase Transactions | | | Sale Transactions | |
| |
| Six months Ended April 30, 2009 | | $ | 255,735,717 | | | $ | 530,908,699 | |
| Year Ended October 31, 2008 | | $ | 2,211,283,531 | | | $ | 1,943,632,589 | |
See accompanying Notes to Financial Statements.
F12 | OPPENHEIMER QUEST BALANCED FUND
| | | | | | | | | | | | | | | | | | | | | | | | | |
| | | Six Months | | | | |
| | | Ended | | | | |
| | | April 30, 2009 | | | Year Ended October 31, | |
| Class N | | (Unaudited) | | | 2008 | | | 2007 | | | 2006 | | | 2005 | | | 2004 | |
| |
Per Share Operating Data | | | | | | | | | | | | | | | | | | | | | | | | |
| Net asset value, beginning of period | | $ | 10.54 | | | $ | 18.94 | | | $ | 18.59 | | | $ | 17.58 | | | $ | 17.05 | | | $ | 15.58 | |
| |
| Income (loss) from investment operations: | | | | | | | | | | | | | | | | | | | | | | | | |
| Net investment income | | | .10 | 1 | | | .23 | 1 | | | .18 | 1 | | | .15 | 1 | | | .05 | 1 | | | .03 | |
| Net realized and unrealized gain (loss) | | | (.12 | ) | | | (6.20 | ) | | | 1.03 | | | | 1.64 | | | | .48 | | | | 1.45 | |
| | | |
| Total from investment operations | | | (.02 | ) | | | (5.97 | ) | | | 1.21 | | | | 1.79 | | | | .53 | | | | 1.48 | |
| |
| Dividends and/or distributions to shareholders: | | | | | | | | | | | | | | | | | | | | | | | | |
| Dividends from net investment income | | | (.11 | ) | | | (.24 | ) | | | (.18 | ) | | | (.17 | ) | | | — | | | | (.01 | ) |
| Distributions from net realized gain | | | — | | | | (2.19 | ) | | | (.68 | ) | | | (.61 | ) | | | — | | | | — | |
| | | |
| Total dividends and/or distributions to shareholders | | | (.11 | ) | | | (2.43 | ) | | | (.86 | ) | | | (.78 | ) | | | — | | | | (.01 | ) |
| |
| Net asset value, end of period | | $ | 10.41 | | | $ | 10.54 | | | $ | 18.94 | | | $ | 18.59 | | | $ | 17.58 | | | $ | 17.05 | |
| | | |
| | | | | | | | | | | | | | | | | | | | | | | | | |
Total Return, at Net Asset Value2 | | | (0.05 | )% | | | (35.69 | )% | | | 6.66 | % | | | 10.45 | % | | | 3.11 | % | | | 9.47 | % |
| | | | | | | | | | | | | | | | | | | | | | | | | |
Ratios/Supplemental Data | | | | | | | | | | | | | | | | | | | | | | | | |
| Net assets, end of period (in thousands) | | $ | 66,386 | | | $ | 76,475 | | | $ | 171,675 | | | $ | 207,130 | | | $ | 216,843 | | | $ | 207,450 | |
| |
| Average net assets (in thousands) | | $ | 67,632 | | | $ | 125,526 | | | $ | 193,216 | | | $ | 215,652 | | | $ | 219,040 | | | $ | 180,201 | |
| |
Ratios to average net assets:3 | | | | | | | | | | | | | | | | | | | | | | | | |
| Net investment income | | | 1.97 | % | | | 1.57 | % | | | 0.95 | % | | | 0.83 | % | | | 0.30 | % | | | 0.04 | % |
| Total expenses | | | 1.72 | % | | | 1.53 | % | | | 1.46 | % | | | 1.48 | % | | | 1.49 | % | | | 1.55 | % |
| Expenses after payments, waivers and/or reimbursements and reduction to custodian expenses | | | 1.58 | % | | | 1.52 | % | | | 1.44 | % | | | 1.48 | % | | | 1.49 | % | | | 1.55 | % |
| |
| Portfolio turnover rate | | | 77 | %4 | | | 128 | %4 | | | 112 | % | | | 63 | % | | | 89 | % | | | 106 | % |
| | |
| 1. | | Per share amounts calculated based on the average shares outstanding during the period. |
| |
| 2. | | Assumes an investment on the business day before the first day of the fiscal period, with all dividends and distributions reinvested in additional shares on the reinvestment date, and redemption at the net asset value calculated on the last business day of the fiscal period. Sales charges are not reflected in the total returns. Total returns are not annualized for periods less than one full year. Returns do not reflect the deduction of taxes that a shareholder would pay on fund distributions or the redemption of fund shares. |
| |
| 3. | | Annualized for periods less than one full year. |
| |
| 4. | | The portfolio turnover rate excludes purchase and sale transactions of To Be Announced (TBA) mortgage-related securities as follows: |
| | | | | | | | | |
| | | Purchase Transactions | | | Sale Transactions | |
| |
| Six months Ended April 30, 2009 | | $ | 255,735,717 | | | $ | 530,908,699 | |
| Year Ended October 31, 2008 | | $ | 2,211,283,531 | | | $ | 1,943,632,589 | |
See accompanying Notes to Financial Statements.
F13 | OPPENHEIMER QUEST BALANCED FUND
FINANCIAL HIGHLIGHTS Continued
| | | | | | | | | | | | | | | | | | | | | | | | | |
| | | Six Months | | | | |
| | | Ended | | | | |
| | | April 30, 2009 | | | Year Ended October 31, | |
| Class Y | | (Unaudited) | | | 2008 | | | 2007 | | | 2006 | | | 2005 | | | 2004 | |
| |
Per Share Operating Data | | | | | | | | | | | | | | | | | | | | | | | | |
| Net asset value, beginning of period | | $ | 10.68 | | | $ | 19.18 | | | $ | 18.82 | | | $ | 17.79 | | | $ | 17.14 | | | $ | 15.62 | |
| |
| Income (loss) from investment operations: | | | | | | | | | | | | | | | | | | | | | | | | |
| Net investment income | | | .15 | 1 | | | .31 | 1 | | | .30 | 1 | | | .26 | 1 | | | .17 | 1 | | | .12 | |
| Net realized and unrealized gain (loss) | | | (.12 | ) | | | (6.28 | ) | | | 1.04 | | | | 1.66 | | | | .48 | | | | 1.46 | |
| | | |
| Total from investment operations | | | .03 | | | | (5.97 | ) | | | 1.34 | | | | 1.92 | | | | .65 | | | | 1.58 | |
| |
| Dividends and/or distributions to shareholders: | | | | | | | | | | | | | | | | | | | | | | | | |
| Dividends from net investment income | | | (.15 | ) | | | (.34 | ) | | | (.30 | ) | | | (.28 | ) | | | — | | | | (.06 | ) |
| Distributions from net realized gain | | | — | | | | (2.19 | ) | | | (.68 | ) | | | (.61 | ) | | | — | | | | — | |
| | | |
| Total dividends and/or distributions to shareholders | | | (.15 | ) | | | (2.53 | ) | | | (.98 | ) | | | (.89 | ) | | | — | | | | (.06 | ) |
| |
| Net asset value, end of period | | $ | 10.56 | | | $ | 10.68 | | | $ | 19.18 | | | $ | 18.82 | | | $ | 17.79 | | | $ | 17.14 | |
| | | |
| | | | | | | | | | | | | | | | | | | | | | | | | |
Total Return, at Net Asset Value2 | | | 0.37 | % | | | (35.35 | )% | | | 7.29 | % | | | 11.11 | % | | | 3.79 | % | | | 10.17 | % |
| | | | | | | | | | | | | | | | | | | | | | | | | |
Ratios/Supplemental Data | | | | | | | | | | | | | | | | | | | | | | | | |
| Net assets, end of period (in thousands) | | $ | 31,393 | | | $ | 82,551 | | | $ | 227,020 | | | $ | 276,322 | | | $ | 270,335 | | | $ | 238,775 | |
| |
| Average net assets (in thousands) | | $ | 48,324 | | | $ | 165,149 | | | $ | 294,643 | | | $ | 276,812 | | | $ | 253,220 | | | $ | 216,973 | |
| |
Ratios to average net assets:3 | | | | | | | | | | | | | | | | | | | | | | | | |
| Net investment income | | | 2.88 | % | | | 2.12 | % | | | 1.56 | % | | | 1.43 | % | | | 0.93 | % | | | 0.70 | % |
| Total expenses | | | 1.07 | % | | | 0.98 | % | | | 0.86 | % | | | 0.87 | % | | | 0.85 | % | | | 0.90 | % |
| Expenses after payments, waivers and/or reimbursements and reduction to custodian expenses | | | 0.83 | % | | | 0.97 | % | | | 0.84 | % | | | 0.87 | % | | | 0.85 | % | | | 0.90 | % |
| |
| Portfolio turnover rate | | | 77 | %4 | | | 128 | %4 | | | 112 | % | | | 63 | % | | | 89 | % | | | 106 | % |
| | |
| 1. | | Per share amounts calculated based on the average shares outstanding during the period. |
| |
| 2. | | Assumes an investment on the business day before the first day of the fiscal period, with all dividends and distributions reinvested in additional shares on the reinvestment date, and redemption at the net asset value calculated on the last business day of the fiscal period. Sales charges are not reflected in the total returns. Total returns are not annualized for periods less than one full year. Returns do not reflect the deduction of taxes that a shareholder would pay on fund distributions or the redemption of fund shares. |
| |
| 3. | | Annualized for periods less than one full year. |
| |
| 4. | | The portfolio turnover rate excludes purchase and sale transactions of To Be Announced (TBA) mortgage-related securities as follows: |
| | | | | | | | | |
| | | Purchase Transactions | | | Sale Transactions | |
| |
| Six months Ended April 30, 2009 | | $ | 255,735,717 | | | $ | 530,908,699 | |
| Year Ended October 31, 2008 | | $ | 2,211,283,531 | | | $ | 1,943,632,589 | |
See accompanying Notes to Financial Statements.
F14 | OPPENHEIMER QUEST BALANCED FUND
NOTES TO FINANCIAL STATEMENTS Unaudited
1. Significant Accounting Policies
Oppenheimer Quest Balanced Fund (the “Fund”), a series of Oppenheimer Quest For Value Funds, is an open-end management investment company registered under the Investment Company Act of 1940, as amended. The Fund’s investment objective is to seek a combination of growth of capital and investment income. The Fund’s primary objective is growth of capital. The Fund’s investment adviser is OppenheimerFunds, Inc. (the “Manager”). The Manager has entered into a sub-advisory agreement with Oppenheimer Capital LLC.
The Fund offers Class A, Class B, Class C, Class N and Class Y shares. Class A shares are sold at their offering price, which is normally net asset value plus a front-end sales charge. Class B, Class C and Class N shares are sold without a front-end sales charge but may be subject to a contingent deferred sales charge (“CDSC”). Class N shares are sold only through retirement plans. Retirement plans that offer Class N shares may impose charges on those accounts. Class Y shares are sold to certain institutional investors without either a front-end sales charge or a CDSC, however, the institutional investor may impose charges on those accounts. All classes of shares have identical rights and voting privileges with respect to the Fund in general and exclusive voting rights on matters that affect that class alone. Earnings, net assets and net asset value per share may differ due to each class having its own expenses, such as transfer and shareholder servicing agent fees and shareholder communications, directly attributable to that class. Class A, B, C and N have separate distribution and/or service plans. No such plan has been adopted for Class Y shares. Class B shares will automatically convert to Class A shares 72 months after the date of purchase.
The following is a summary of significant accounting policies consistently followed by the Fund.
Securities Valuation. The Fund calculates the net asset value of its shares as of the close of the New York Stock Exchange (the “Exchange”), normally 4:00 P.M. Eastern time, on each day the Exchange is open for trading.
Effective for fiscal periods beginning after November 15, 2007, FASB Statement of Financial Accounting Standards No. 157, Fair Value Measurements, establishes a hierarchy for measuring fair value of assets and liabilities. As required by the standard, each investment asset or liability of the Fund is assigned a level at measurement date based on the significance and source of the inputs to its valuation. Quoted prices in active markets for identical securities are classified as “Level 1,” inputs other than quoted prices for an asset that are observable are classified as “Level 2” and unobservable inputs, including the Manager’s judgment about the assumptions that a market participant would use in pricing an asset or liability are classified as “Level 3.” The inputs used for valuing securities are not necessarily an indication of the risks associated with investing in those securities. A table summarizing the Fund’s investments under these levels of classification is included following the Statement of Investments.
F15 | OPPENHEIMER QUEST BALANCED FUND
NOTES TO FINANCIAL STATEMENTS Unaudited / Continued
1. Significant Accounting Policies Continued
Securities are valued using quoted market prices, when available, as supplied primarily either by portfolio pricing services approved by the Board of Trustees or dealers. These securities are typically classified within Level 1 or 2; however, they may be designated as Level 3 if the dealer or portfolio pricing service values a security through an internal model with significant unobservable market data inputs.
Securities traded on a registered U.S. securities exchange are valued based on the last sale price of the security reported on the principal exchange on which traded, prior to the time when the Fund’s assets are valued. Securities whose principal exchange is NASDAQ® are valued based on the official closing prices reported by NASDAQ prior to the time when the Fund’s assets are valued. In the absence of a sale, the security is valued at the last sale price on the prior trading day, if it is within the spread of the current day’s closing “bid” and “asked” prices, and if not, at the current day’s closing bid price. A foreign security traded on a foreign exchange is valued based on the last sale price on the principal exchange on which the security is traded, as identified by the portfolio pricing service used by the Manager, prior to the time when the Fund’s assets are valued. In the absence of a sale, the security is valued at the most recent official closing price on the principal exchange on which it is traded.
Shares of a registered investment company that are not traded on an exchange are valued at that investment company’s net asset value per share.
Corporate, government and municipal debt instruments having a remaining maturity in excess of sixty days and all mortgage-backed securities, collateralized mortgage obligations and other asset-backed securities are valued at the mean between the “bid” and “asked” prices.
“Money market-type” debt instruments with remaining maturities of sixty days or less are valued at cost adjusted by the amortization of discount or premium to maturity (amortized cost), which approximates market value. These securities are typically designated as Level 2.
In the absence of a readily available quoted market price, including for securities whose values have been materially affected by what the Manager identifies as a significant event occurring before the Fund’s assets are valued but after the close of the securities’ respective exchanges, the Manager, acting through its internal valuation committee, in good faith determines the fair valuation of that asset using consistently applied procedures under the supervision of the Board of Trustees (which reviews those fair valuations by the Manager). Those procedures include certain standardized methodologies to fair value securities. Such methodologies include, but are not limited to, pricing securities initially at cost and subsequently adjusting the value based on: changes in company specific fundamentals, changes in an appropriate securities index, or changes in the value of similar securities which may be adjusted for any discounts related to resale restrictions. When possible, such methodologies use observable market inputs such as quoted prices of similar securities, observable interest rates, currency
F16 | OPPENHEIMER QUEST BALANCED FUND
rates and yield curves. The methodologies used for valuing securities are not necessarily an indication of the risks associated with investing in those securities.
Fair valued securities may be classified as “Level 3” if the valuation primarily reflects the Manager’s own assumptions about the inputs that market participants would use in valuing such securities.
There have been no significant changes to the fair valuation methodologies during the period.
Securities on a When-Issued or Delayed Delivery Basis. The Fund may purchase securities on a “when-issued” basis, and may purchase or sell securities on a “delayed delivery” basis. “When-issued” or “delayed delivery” refers to securities whose terms and indenture are available and for which a market exists, but which are not available for immediate delivery. Delivery and payment for securities that have been purchased by the Fund on a when-issued basis normally takes place within six months and possibly as long as two years or more after the trade date. During this period, such securities do not earn interest, are subject to market fluctuation and may increase or decrease in value prior to their delivery. The purchase of securities on a when-issued basis may increase the volatility of the Fund’s net asset value to the extent the Fund executes such transactions while remaining substantially fully invested. When the Fund engages in when-issued or delayed delivery transactions, it relies on the buyer or seller, as the case may be, to complete the transaction. Their failure to do so may cause the Fund to lose the opportunity to obtain or dispose of the security at a price and yield it considers advantageous. The Fund maintains internally designated assets with a market value equal to or greater than the amount of its purchase commitments. The Fund may also sell securities that it purchased on a when-issued basis or forward commitment prior to settlement of the original purchase.
As of April 30, 2009, the Fund had purchased securities issued on a when-issued or delayed delivery basis and sold securities issued on a delayed delivery basis as follows:
| | | | | |
| | | When-Issued or | |
| | | Delayed Delivery | |
| | | Basis Transactions | |
| |
| Purchased securities | | $ | 37,736,958 | |
The Fund may enter into “forward roll” transactions with respect to mortgage-related securities. In this type of transaction, the Fund sells a mortgage-related security to a buyer and simultaneously agrees to repurchase a similar security (same type, coupon and maturity) at a later date at a set price. During the period between the sale and the repurchase, the Fund will not be entitled to receive interest and principal payments on the securities that have been sold. The Fund records the incremental difference between the forward purchase and sale of each forward roll as realized gain (loss) on investments or as fee income in the case of such transactions that have an associated fee in lieu of a difference in the forward purchase and sale price.
F17 | OPPENHEIMER QUEST BALANCED FUND
NOTES TO FINANCIAL STATEMENTS Unaudited / Continued
1. Significant Accounting Policies Continued
Forward roll transactions may be deemed to entail embedded leverage since the Fund purchases mortgage-related securities with extended settlement dates rather than paying for the securities under a normal settlement cycle. This embedded leverage increases the Fund’s market value of investments relative to its net assets which can incrementally increase the volatility of the Fund’s performance. Forward roll transactions can be replicated over multiple settlement periods.
Risks of entering into forward roll transactions include the potential inability of the counterparty to meet the terms of the agreement; the potential of the Fund to receive inferior securities at redelivery as compared to the securities sold to the counterparty; and counterparty credit risk. To assure its future payment of the purchase price, the Fund maintains internally designated assets with a market value equal to or greater than the payment obligation under the roll.
Foreign Currency Translation. The Fund’s accounting records are maintained in U.S. dollars. The values of securities denominated in foreign currencies and amounts related to the purchase and sale of foreign securities and foreign investment income are translated into U.S. dollars as of the close of the Exchange, normally 4:00 P.M. Eastern time, on each day the Exchange is open for trading. Foreign exchange rates may be valued primarily using a reliable bank, dealer or service authorized by the Board of Trustees.
Reported net realized gains and losses from foreign currency transactions arise from sales of portfolio securities, sales and maturities of short-term securities, sales of foreign currencies, exchange rate fluctuations between the trade and settlement dates on securities transactions, and the difference between the amounts of dividends, interest, and foreign withholding taxes recorded on the Fund’s books and the U.S. dollar equivalent of the amounts actually received or paid. Net unrealized appreciation and depreciation on the translation of assets and liabilities denominated in foreign currencies arise from changes in the values of assets and liabilities, including investments in securities at fiscal period end, resulting from changes in exchange rates.
The effect of changes in foreign currency exchange rates on investments is separately identified from the fluctuations arising from changes in market values of securities held and reported with all other foreign currency gains and losses in the Fund’s Statement of Operations.
Investment in OFI Liquid Assets Fund, LLC. The Fund is permitted to invest cash collateral received in connection with its securities lending activities. Pursuant to the Fund’s Securities Lending Procedures, the Fund may invest cash collateral in, among other investments, an affiliated money market fund. OFI Liquid Assets Fund, LLC (“LAF”) is a limited liability company whose investment objective is to seek current income and stability of principal. The Manager is also the investment adviser of LAF. LAF is not registered under the Investment Company Act of 1940. However, LAF does comply with the investment restrictions applicable to registered money market funds set forth in Rule 2a-7 adopted under the Investment Company Act. When applicable,
F18 | OPPENHEIMER QUEST BALANCED FUND
the Fund’s investment in LAF is included in the Statement of Investments. As a shareholder, the Fund is subject to its proportional share of LAF’s expenses, including its management fee of 0.08%.
Allocation of Income, Expenses, Gains and Losses. Income, expenses (other than those attributable to a specific class), gains and losses are allocated on a daily basis to each class of shares based upon the relative proportion of net assets represented by such class. Operating expenses directly attributable to a specific class are charged against the operations of that class.
Federal Taxes. The Fund intends to comply with provisions of the Internal Revenue Code applicable to regulated investment companies and to distribute substantially all of its investment company taxable income, including any net realized gain on investments not offset by capital loss carryforwards, if any, to shareholders. Therefore, no federal income or excise tax provision is required. The Fund files income tax returns in U.S. federal and applicable state jurisdictions. The statute of limitations on the Fund’s tax return filings generally remain open for the three preceding fiscal reporting period ends.
During the fiscal year ended October 31, 2008, the Fund did not utilize any capital loss carryforward to offset capital gains realized in that fiscal year. As of October 31, 2008, the Fund had available for federal income tax purposes unused capital loss carryforward as follows:
| | | | | |
| Expiring | | | | |
| |
| 2016 | | $ | 809,188,118 | |
As of April 30, 2009, the Fund had available for federal income tax purposes an estimated capital loss carryforward of $1,234,176,767 expiring by 2018. This estimated capital loss carryforward represents carryforward as of the end of the last fiscal year, increased for losses deferred under tax accounting rules to the current fiscal year and is increased or decreased by capital losses or gains realized in the first six months of the current fiscal year. During the six months ended April 30, 2009, it is estimated that the Fund will not utilize any capital loss carryforward to offset realized capital gains.
Net investment income (loss) and net realized gain (loss) may differ for financial statement and tax purposes. The character of dividends and distributions made during the fiscal year from net investment income or net realized gains may differ from their ultimate characterization for federal income tax purposes. Also, due to timing of dividends and distributions, the fiscal year in which amounts are distributed may differ from the fiscal year in which the income or net realized gain was recorded by the Fund.
The aggregate cost of securities and other investments and the composition of unrealized appreciation and depreciation of securities and other investments for federal income tax purposes as of April 30, 2009 are noted in the following table. The primary difference between book and tax appreciation or depreciation of securities and other investments, if
F19 | OPPENHEIMER QUEST BALANCED FUND
NOTES TO FINANCIAL STATEMENTS Unaudited / Continued
1. Significant Accounting Policies Continued
applicable, is attributable to the tax deferral of losses or tax realization of financial statement unrealized gain or loss.
| | | | | |
| Federal tax cost of securities | | $ | 2,760,465,929 | |
| | | | |
| Gross unrealized appreciation | | $ | 97,090,645 | |
| Gross unrealized depreciation | | | (456,647,347 | ) |
| | | | |
| Net unrealized depreciation | | $ | (359,556,702 | ) |
| | | | |
Trustees’ Compensation. The Fund has adopted an unfunded retirement plan (the “Plan”) for the Fund’s independent trustees. Benefits are based on years of service and fees paid to each trustee during their period of service. The Plan was frozen with respect to adding new participants effective December 31, 2007 (the “Freeze Date”) and existing Plan Participants as of the Freeze Date have each elected a distribution method with respect to their benefits under the Plan.
During the six months ended April 30, 2009, the Fund’s projected benefit obligations, payments to retired trustees and accumulated liability were as follows:
| | | | | |
| Projected Benefit Obligations Increased | | $ | 28,090 | |
| Payments Made to Retired Trustees | | | 208,149 | |
| Accumulated Liability as of April 30, 2009 | | | 915,730 | |
The Board of Trustees has adopted a compensation deferral plan for independent trustees that enables trustees to elect to defer receipt of all or a portion of the annual compensation they are entitled to receive from the Fund. For purposes of determining the amount owed to the Trustee under the plan, deferred amounts are treated as though equal dollar amounts had been invested in shares of the Fund or in other Oppenheimer funds selected by the Trustee. The Fund purchases shares of the funds selected for deferral by the Trustee in amounts equal to his or her deemed investment, resulting in a Fund asset equal to the deferred compensation liability. Such assets are included as a component of “Other” within the asset section of the Statement of Assets and Liabilities. Deferral of trustees’ fees under the plan will not affect the net assets of the Fund, and will not materially affect the Fund’s assets, liabilities or net investment income per share. Amounts will be deferred until distributed in accordance to the compensation deferral plan.
Dividends and Distributions to Shareholders. Dividends and distributions to shareholders, which are determined in accordance with income tax regulations and may differ from U.S. generally accepted accounting principles, are recorded on the ex-dividend date. Income distributions, if any, are declared and paid quarterly. Capital gain distributions, if any, are declared and paid annually. The tax character of distributions is determined as of the Fund’s fiscal year end. Therefore, a portion of the Fund’s distributions made to shareholders prior to the Fund’s fiscal year end may ultimately be categorized as a tax return of capital.
Investment Income. Dividend income is recorded on the ex-dividend date or upon ex-dividend notification in the case of certain foreign dividends where the ex-dividend
F20 | OPPENHEIMER QUEST BALANCED FUND
date may have passed. Non-cash dividends included in dividend income, if any, are recorded at the fair market value of the securities received. Interest income is recognized on an accrual basis. Discount and premium, which are included in interest income on the Statement of Operations, are amortized or accreted daily.
Custodian Fees. “Custodian fees and expenses” in the Statement of Operations may include interest expense incurred by the Fund on any cash overdrafts of its custodian account during the period. Such cash overdrafts may result from the effects of failed trades in portfolio securities and from cash outflows resulting from unanticipated shareholder redemption activity. The Fund pays interest to its custodian on such cash overdrafts, to the extent they are not offset by positive cash balances maintained by the Fund, at a rate equal to the Federal Funds Rate plus 0.50%. The “Reduction to custodian expenses” line item, if applicable, represents earnings on cash balances maintained by the Fund during the period. Such interest expense and other custodian fees may be paid with these earnings.
Security Transactions. Security transactions are recorded on the trade date. Realized gains and losses on securities sold are determined on the basis of identified cost.
Indemnifications. The Fund’s organizational documents provide current and former trustees and officers with a limited indemnification against liabilities arising in connection with the performance of their duties to the Fund. In the normal course of business, the Fund may also enter into contracts that provide general indemnifications. The Fund’s maximum exposure under these arrangements is unknown as this would be dependent on future claims that may be made against the Fund. The risk of material loss from such claims is considered remote.
Other. The preparation of financial statements in conformity with accounting principles generally accepted in the United States of America requires management to make estimates and assumptions that affect the reported amounts of assets and liabilities and disclosure of contingent assets and liabilities at the date of the financial statements and the reported amounts of increases and decreases in net assets from operations during the reporting period. Actual results could differ from those estimates.
2. Shares of Beneficial Interest
The Fund has authorized an unlimited number of $0.01 par value shares of beneficial interest of each class. Transactions in shares of beneficial interest were as follows:
| | | | | | | | | | | | | | | | | |
| | | Six Months Ended April 30, 2009 | | | Year Ended October 31, 2008 | |
| | | Shares | | | Amount | | | Shares | | | Amount | |
| |
Class A | | | | | | | | | | | | | | | | |
| Sold | | | 8,463,439 | | | $ | 84,697,385 | | | | 35,987,352 | | | $ | 558,697,460 | |
| Dividends and/or distributions reinvested | | | 1,575,645 | | | | 15,332,431 | | | | 21,790,112 | | | | 349,729,332 | |
| Redeemed | | | (24,116,622 | ) | | | (239,529,537 | ) | | | (70,926,278 | ) | | | (1,028,940,690 | ) |
| | | |
| Net decrease | | | (14,077,538 | ) | | $ | (139,499,721 | ) | | | (13,148,814 | ) | | $ | (120,513,898 | ) |
| | | |
F21 | OPPENHEIMER QUEST BALANCED FUND
NOTES TO FINANCIAL STATEMENTS Unaudited / Continued
2. Shares of Beneficial Interest Continued
| | | | | | | | | | | | | | | | | |
| | | Six Months Ended April 30, 2009 | | | Year Ended October 31, 2008 | |
| | | Shares | | | Amount | | | Shares | | | Amount | |
| |
Class B | | | | | | | | | | | | | | | | |
| Sold | | | 2,291,439 | | | $ | 22,418,125 | | | | 5,464,579 | | | $ | 80,220,239 | |
| Dividends and/or distributions reinvested | | | 260,684 | | | | 2,494,412 | | | | 7,571,664 | | | | 120,096,544 | |
| Redeemed | | | (8,871,290 | ) | | | (86,091,537 | ) | | | (42,670,144 | ) | | | (638,423,895 | ) |
| | | |
| Net decrease | | | (6,319,167 | ) | | $ | (61,179,000 | ) | | | (29,633,901 | ) | | $ | (438,107,112 | ) |
| | | |
| | | | | | | | | | | | | | | | | |
Class C | | | | | | | | | | | | | | | | |
| Sold | | | 1,448,232 | | | $ | 14,204,506 | | | | 3,583,500 | | | $ | 52,353,175 | |
| Dividends and/or distributions reinvested | | | 260,912 | | | | 2,494,055 | | | | 5,583,064 | | | | 88,374,548 | |
| Redeemed | | | (6,244,571 | ) | | | (60,585,034 | ) | | | (20,473,128 | ) | | | (292,498,755 | ) |
| | | |
| Net decrease | | | (4,535,427 | ) | | $ | (43,886,473 | ) | | | (11,306,564 | ) | | $ | (151,771,032 | ) |
| | | |
| | | | | | | | | | | | | | | | | |
Class N | | | | | | | | | | | | | | | | |
| Sold | | | 690,185 | | | $ | 6,772,679 | | | | 1,564,060 | | | $ | 22,817,704 | |
| Dividends and/or distributions reinvested | | | 77,312 | | | | 743,110 | | | | 1,282,654 | | | | 20,366,319 | |
| Redeemed | | | (1,647,845 | ) | | | (16,148,190 | ) | | | (4,656,531 | ) | | | (66,619,591 | ) |
| | | |
| Net decrease | | | (880,348 | ) | | $ | (8,632,401 | ) | | | (1,809,817 | ) | | $ | (23,435,568 | ) |
| | | |
| | | | | | | | | | | | | | | | | |
Class Y | | | | | | | | | | | | | | | | |
| Sold | | | 251,571 | | | $ | 2,478,940 | | | | 1,132,774 | | | $ | 16,934,264 | |
| Dividends and/or distributions reinvested | | | 80,219 | | | | 788,970 | | | | 1,535,880 | | | | 24,602,151 | |
| Redeemed | | | (5,085,708 | ) | | | (53,171,749 | ) | | | (6,781,222 | ) | | | (93,877,066 | ) |
| | | |
| Net decrease | | | (4,753,918 | ) | | $ | (49,903,839 | ) | | | (4,112,568 | ) | | $ | (52,340,651 | ) |
| | | |
3. Purchases and Sales of Securities
The aggregate cost of purchases and proceeds from sales of securities, other than short-term obligations and investments in LAF, for the six months ended April 30, 2009, were as follows:
| | | | | | | | | |
| | | Purchases | | | Sales | |
| |
| Investment securities | | $ | 1,090,277,812 | | | $ | 1,331,972,520 | |
| U.S. government and government agency obligations | | | 475,605,718 | | | | 341,398,491 | |
| To Be Announced (TBA) mortgage-related securities | | | 255,735,717 | | | | 530,908,699 | |
4. Fees and Other Transactions with Affiliates
Management Fees. Under the investment advisory agreement, the Fund pays the Manager a management fee based on the daily net assets of the Fund at an annual rate as shown in the following table:
F22 | OPPENHEIMER QUEST BALANCED FUND
| | | | | |
| Fee Schedule | | | | |
| |
| Up to $1.0 billion | | | 0.80 | % |
| Next $2.0 billion | | | 0.76 | |
| Next $1.0 billion | | | 0.71 | |
| Next $1.0 billion | | | 0.66 | |
| Next $1.0 billion | | | 0.60 | |
| Next $1.0 billion | | | 0.55 | |
| Next $2.0 billion | | | 0.50 | |
| Over $9.0 billion | | | 0.48 | |
Sub-Adviser Fees. The Manager retains Oppenheimer Capital LLC (the “Sub-Adviser”) to provide the day-to-day portfolio management of the Fund. Under the Sub-Advisory Agreement, the Manager, not the Fund, pays the Sub-Adviser an annual fee in monthly installments, based on the average daily net assets of the Fund. The fee is calculated as a percentage of the fee the Fund pays the Manager. The rate is 30% of the advisory fee collected by the Manager based on the net assets of the Fund. For the six months ended April 30, 2009, the Manager paid $2,355,423 to the Sub-Adviser for its services to the Fund, which shall be calculated after any investment management fee waivers (voluntary or otherwise).
Transfer Agent Fees. OppenheimerFunds Services (“OFS”), a division of the Manager, acts as the transfer and shareholder servicing agent for the Fund. The Fund pays OFS a per account fee. For the six months ended April 30, 2009, the Fund paid $3,771,590 to OFS for services to the Fund.
Additionally, Class Y shares are subject to minimum fees of $10,000 annually for assets of $10 million or more. The Class Y shares are subject to the minimum fees in the event that the per account fee does not equal or exceed the applicable minimum fees. OFS may voluntarily waive the minimum fees.
Distribution and Service Plan (12b-1) Fees. Under its General Distributor’s Agreement with the Fund, OppenheimerFunds Distributor, Inc. (the “Distributor”) acts as the Fund’s principal underwriter in the continuous public offering of the Fund’s classes of shares.
Distribution and Service Plan for Class A Shares. The Fund has adopted a Distribution and Service Plan (the “Plan”) for Class A shares. Under the Plan, the Fund pays a service fee to the Distributor of up to 0.25% of the average annual net assets of Class A shares. The Distributor currently uses all of those fees to pay dealers, brokers, banks and other financial institutions periodically for providing personal services and maintenance of accounts of their customers that hold Class A shares. Under the Plan, the Fund may also pay an asset-based sales charge to the Distributor. Beginning January 1, 2003, the Board of Trustees set the annual asset-based sales charge rate at zero. Fees incurred by the Fund under the Plan are detailed in the Statement of Operations.
Distribution and Service Plans for Class B, Class C and Class N Shares. The Fund has adopted Distribution and Service Plans (the “Plans”) for Class B, Class C and Class N shares under Rule 12b-1 of the Investment Company Act of 1940 to compensate the
F23 | OPPENHEIMER QUEST BALANCED FUND
NOTES TO FINANCIAL STATEMENTS Unaudited / Continued
4. Fees and Other Transactions with Affiliates Continued
Distributor for its services in connection with the distribution of those shares and servicing accounts. Under the Plans, the Fund pays the Distributor an annual asset-based sales charge of 0.75% on Class B and Class C shares and 0.25% on Class N shares. The Distributor also receives a service fee of 0.25% per year under each plan. If either the Class B, Class C or Class N plan is terminated by the Fund or by the shareholders of a class, the Board of Trustees and its independent trustees must determine whether the Distributor shall be entitled to payment from the Fund of all or a portion of the service fee and/or asset-based sales charge in respect to shares sold prior to the effective date of such termination. The Distributor’s aggregate uncompensated expenses under the Plans at March 31, 2009 for Class B, Class C and Class N shares were $30,351,015, $29,910,659 and $5,805,353, respectively. Fees incurred by the Fund under the Plans are detailed in the Statement of Operations.
Sales Charges. Front-end sales charges and contingent deferred sales charges (“CDSC”) do not represent expenses of the Fund. They are deducted from the proceeds of sales of Fund shares prior to investment or from redemption proceeds prior to remittance, as applicable. The sales charges retained by the Distributor from the sale of shares and the CDSC retained by the Distributor on the redemption of shares is shown in the following table for the period indicated.
| | | | | | | | | | | | | | | | | | | | | |
| | | | | | | Class A | | | Class B | | | Class C | | | Class N | |
| | | Class A | | | Contingent | | | Contingent | | | Contingent | | | Contingent | |
| | | Front-End | | | Deferred | | | Deferred | | | Deferred | | | Deferred | |
| | | Sales Charges | | | Sales Charges | | | Sales Charges | | | Sales Charges | | | Sales Charges | |
| Six Months | | Retained by | | | Retained by | | | Retained by | | | Retained by | | | Retained by | |
| Ended | | Distributor | | | Distributor | | | Distributor | | | Distributor | | | Distributor | |
| |
| April 30, 2009 | | $ | 218,436 | | | $ | 1,486 | | | $ | 422,517 | | | $ | 9,694 | | | $ | 522 | |
Waivers and Reimbursements of Expenses. Effective October 1, 2008 through September 30, 2009 (the “waiver period”), the Manager has voluntarily agreed to reduce its advisory fee rate by 0.10% of the Fund’s average daily net assets if the Fund’s trailing one-year total return performance is in the fifth quintile of the Fund’s Lipper peer group and by 0.05% of the Fund’s average daily net assets if the Fund’s trailing one-year total return performance is in the fourth quintile of the Fund’s Lipper peer group as of September 30, 2008. However, if the Fund’s trailing one-year total return performance, as measured at the end of any subsequent calendar quarter during the waiver period, improves from the fifth quintile to the fourth quintile, the advisory fee waiver for subsequent quarters during the waiver period will be reduced only by an annualized rate of 0.05% of the Fund’s average daily net assets, and if the Fund’s trailing one-year total return performance at the end of any calendar quarter during the waiver period improves to the third or higher quintile of the Fund’s Lipper peer group, the advisory fee reduction will be terminated effective the following business day. During the six months ended April 30, 2008 the Manager waived fees of $725,528. The advisory fee reduction is a voluntary undertaking and may be terminated by the Manager at any time.
F24 | OPPENHEIMER QUEST BALANCED FUND
OFS has voluntarily agreed to limit transfer and shareholder servicing agent fees for all classes to 0.35% of average annual net assets per class. This undertaking may be amended or withdrawn at any time.
During the six months ended April 30, 2009, OFS waived transfer and shareholder servicing agent fees as follows:
| | | | | |
| Class A | | $ | 291,070 | |
| Class B | | | 373,079 | |
| Class C | | | 33,334 | |
| Class N | | | 21,379 | |
| Class Y | | | 37,850 | |
5. Securities Lending
The Fund lends portfolio securities from time to time in order to earn additional income in the form of fees or interest on securities received as collateral or the investment of any cash received as collateral. The loans are secured by collateral (either securities, letters of credit, or cash) in an amount not less than 100% of the market value of the loaned securities during the period of the loan. The market value of the loaned securities is determined at the close of each business day and any additional required collateral is delivered to the Fund on the next business day. If the borrower defaults on its obligation to return the securities loaned because of insolvency or other reasons, the Fund could experience delays and cost in recovering the securities loaned or in gaining access to the collateral. The Fund continues to receive the economic benefit of interest or dividends paid on the securities loaned in the form of a substitute payment received from the borrower and recognizes the gain or loss in the fair value of the securities loaned that may occur during the term of the loan. The Fund has the right under the lending agreement to recover the securities from the borrower on demand. As of April 30, 2009, the Fund had on loan securities valued at $285,842,095. Collateral of $290,928,783 was received for the loans, all of which was received in cash and subsequently invested in approved instruments.
6. Recent Accounting Pronouncement
In March 2008, the Financial Accounting Standards Board (“FASB”) issued Statement on Financial Accounting Standards (“SFAS”) No. 161, Disclosures about Derivative Instruments and Hedging Activities. This standard requires enhanced disclosures about derivative and hedging activities, including qualitative disclosures about how and why the Fund uses derivative instruments, how these activities are accounted for, and their effect on the Fund’s financial position, financial performance and cash flows. SFAS No. 161 is effective for financial statements issued for fiscal years and interim periods beginning after November 15, 2008. At this time, management is evaluating the implications of SFAS No. 161 and its impact on the Fund’s financial statements and related disclosures.
F25 | OPPENHEIMER QUEST BALANCED FUND
NOTES TO FINANCIAL STATEMENTS Unaudited / Continued
7. Pending Litigation
During 2009, a number of complaints have been filed in federal courts against the Manager, the Distributor, and certain of the funds in the Oppenheimer family of funds (the “Defendant Funds”) advised by the Manager and distributed by the Distributor. The complaints naming the Defendant Funds also name certain officers, trustees and former trustees of the respective Defendant Funds. The plaintiffs seek class action status on behalf of purchasers of shares of the respective Defendant Fund during a particular time period. The complaints against the Defendant Funds raise claims under federal securities laws alleging that, among other things, the disclosure documents of the respective Defendant Fund contained misrepresentations and omissions, that such Defendant Fund’s investment policies were not followed, and that such Defendant Fund and the other defendants violated federal securities laws and regulations. The plaintiffs seek unspecified damages, equitable relief and an award of attorneys’ fees and litigation expenses. Additionally, a complaint has been brought in state court against the Manager, the Distributor and another subsidiary of the Manager (but not the Fund), on behalf of the Oregon College Savings Plan Trust. The complaint alleges breach of contract, breach of fiduciary duty, negligence and violation of state securities laws, and seeks compensatory damages, equitable relief and an award of attorneys’ fees and litigation expenses.
Other complaints have been filed in 2008 and 2009 in state and federal courts, by investors who made investments through an affiliate of the Manager, against the Manager and certain of its affiliates. Those complaints relate to the alleged investment fraud perpetrated by Bernard Madoff and his firm (“Madoff “) and allege a variety of claims including breach of fiduciary duty, fraud, negligent misrepresentation, unjust enrichment, and violation of federal and state securities laws and regulations, among others. They seek unspecified damages, equitable relief, and an award of attorneys’ fees and litigation expenses. None of the suits have named the Distributor, any of the Oppenheimer mutual funds or any of their independent Trustees or Directors. None of the Oppenheimer funds invested in any funds or accounts managed by Madoff.
The Manager believes that the lawsuits described above are without legal merit and intends to defend them vigorously. The Defendant Funds’ Boards of Trustees have also engaged counsel to defend the suits vigorously on behalf of those Funds, their boards and the Trustees named in those suits. The Manager believes that it is premature to render any opinion as to the likelihood of an outcome unfavorable to it and that no estimate can be made with any degree of certainty as to the amount or range of any potential loss. The Manager also believes that these suits should not impair the ability of the Manager or the Distributor to perform their respective duties to the Fund.
F26 | OPPENHEIMER QUEST BALANCED FUND
PORTFOLIO PROXY VOTING POLICIES AND PROCEDURES; UPDATES TO STATEMENTS OF INVESTMENTS Unaudited
The Fund has adopted Portfolio Proxy Voting Policies and Procedures under which the Fund votes proxies relating to securities (“portfolio proxies”) held by the Fund. A description of the Fund’s Portfolio Proxy Voting Policies and Procedures is available (i) without charge, upon request, by calling the Fund toll-free at 1.800.525.7048, (ii) on the Fund’s website at www.oppenheimerfunds.com, and (iii) on the SEC’s website at www.sec.gov. In addition, the Fund is required to file Form N-PX, with its complete proxy voting record for the 12 months ended June 30th, no later than August 31st of each year. The Fund’s voting record is available (i) without charge, upon request, by calling the Fund toll-free at 1.800.525.7048, and (ii) in the Form N-PX filing on the SEC’s website at www.sec.gov.
The Fund files its complete schedule of portfolio holdings with the SEC for the first quarter and the third quarter of each fiscal year on Form N-Q. The Fund’s Form N-Q filings are available on the SEC’s website at http://www.sec.gov. Those forms may be reviewed and copied at the SEC’s Public Reference Room in Washington, D.C. Information on the operation of the Public Reference Room may be obtained by calling 1-800-SEC-0330.
Householding—Delivery of Shareholder Documents
This is to inform you about OppenheimerFunds’ “householding” policy. If more than one member of your household maintains an account in a particular fund, OppenheimerFunds will mail only one copy of the fund’s prospectus, annual and semiannual report and privacy policy. The consolidation of these mailings, called householding, benefits your fund through reduced mailing expense, and benefits you by reducing the volume of mail you receive from OppenheimerFunds. Householding does not affect the delivery of your account statements.
Please note that we will continue to household these mailings for as long as you remain an OppenheimerFunds shareholder, unless you request otherwise. If you prefer to receive multiple copies of these materials, please call us at 1.800.CALL-OPP (225-5677). You may also notify us in writing or via email. We will begin sending you individual copies of the prospectus, reports and privacy policy within 30 days of receiving your request to stop householding.
15 | OPPENHEIMER QUEST BALANCED FUND
TOP HOLDINGS AND ALLOCATIONS
| | | | | |
Top Ten Common Stock Industries | | | | |
| |
| Software | | | 7.9 | % |
| Communications Equipment | | | 5.0 | |
| Media | | | 3.9 | |
| Internet Software & Services | | | 3.0 | |
| Chemicals | | | 1.7 | |
| Insurance | | | 1.6 | |
| Oil, Gas & Consumable Fuels | | | 1.6 | |
| Pharmaceuticals | | | 1.4 | |
| Tobacco | | | 1.4 | |
| Food Products | | | 1.3 | |
Portfolio holdings and allocations are subject to change. Percentages are as of April 30, 2009, and are based on net assets.
| | | | | |
Top Ten Common Stock Holdings | | | | |
| |
| Take-Two Interactive Software, Inc. | | | 4.2 | % |
| Research in Motion Ltd. | | | 2.6 | |
| QUALCOMM, Inc. | | | 2.4 | |
| Google, Inc., Cl. A | | | 2.1 | |
| Microsoft Corp. | | | 1.9 | |
| Exxon Mobil Corp. | | | 1.6 | |
| Nestle SA | | | 1.3 | |
| Liberty Global, Inc., Series A | | | 1.2 | |
| Everest Re Group Ltd. | | | 1.2 | |
| Lubrizol Corp. (The) | | | 1.1 | |
Portfolio holdings and allocations are subject to change. Percentages are as of April 30, 2009, and are based on net assets.
For up-to-date Top 10 Fund Holdings, please visit www.oppenheimerfunds.com.
8 | OPPENHEIMER QUEST OPPORTUNITY VALUE FUND
Portfolio Allocation
Portfolio holdings and allocations are subject to change. Percentages are as of April 30, 2009, and are based on the total market value of investments.
9 | OPPENHEIMER QUEST OPPORTUNITY VALUE FUND
NOTES
Total returns include changes in share price and reinvestment of dividends and capital gains distributions in a hypothetical investment for the periods shown. Cumulative total returns are not annualized. The Fund’s total returns shown do not reflect the deduction of income taxes on an individual’s investment. Taxes may reduce your actual investment returns on income or gains paid by the Fund or any gains you may realize if you sell your shares.
Investors should consider the Fund’s investment objectives, risks and other charges and expenses carefully before investing. The Fund’s prospectus contains this and other information about the Fund, and may be obtained by asking your financial advisor, calling us at 1.800.525.7048 or visiting our website at www.oppenheimerfunds.com. Read the prospectus carefully before investing.
The Fund’s investment strategy and focus can change over time. The mention of specific fund holdings does not constitute a recommendation by OppenheimerFunds, Inc.
Class A shares of the Fund were first publicly offered on 1/3/89. Unless otherwise noted, Class A returns include the current maximum initial sales charge of 5.75%. Class A shares are subject to a maximum annual 0.25% asset-based sales charge. There is a voluntary waiver of the Class A asset-based sales charge, as described in the Prospectus.
Class B shares of the Fund were first publicly offered on 9/1/93. Unless otherwise noted, Class B returns include the applicable contingent deferred sales charges of 5% (1-year) and 2% (5-year). Because Class B shares convert to Class A shares 72 months after purchase, the 10-year return for Class B uses Class A performance for the period after conversion. Class B shares are subject to an annual 0.75% asset-based sales charge.
Class C shares of the Fund were first publicly offered on 9/1/93. Unless otherwise noted, Class C returns include the contingent deferred sales charge of 1% for the 1-year period. Class C shares are subject to an annual 0.75% asset-based sales charge.
10 | OPPENHEIMER QUEST OPPORTUNITY VALUE FUND
Class N shares of the Fund were first publicly offered on 3/1/01. Class N shares are offered only through retirement plans. Unless otherwise noted, Class N returns include the contingent deferred sales charge of 1% for the 1-year period. Class N shares are subject to an annual 0.25% asset-based sales charge.
Class Y shares of the Fund were first publicly offered on 12/16/96. Class Y shares are offered only to certain institutional investors under a special agreement with the Distributor, and to present or former officers, directors, trustees or employees (and their eligible family members) of the Fund, the Manager, its affiliates, its parent company and the subsidiaries of its parent company, and retirement plans established for the benefit of such individuals.
An explanation of the calculation of performance is in the Fund’s Statement of Additional Information.
11 | OPPENHEIMER QUEST OPPORTUNITY VALUE FUND
FUND EXPENSES
Fund Expenses. As a shareholder of the Fund, you incur two types of costs: (1) transaction costs, which may include sales charges (loads) on purchase payments, contingent deferred sales charges on redemptions; and redemption fees (if applicable); and (2) ongoing costs, including management fees; distribution and service fees; and other Fund expenses. These examples are intended to help you understand your ongoing costs (in dollars) of investing in the Fund and to compare these costs with the ongoing costs of investing in other mutual funds.
The examples are based on an investment of $1,000.00 invested at the beginning of the period and held for the entire 6-month period ended April 30, 2009.
Actual Expenses. The first section of the table provides information about actual account values and actual expenses. You may use the information in this section for the class of shares you hold, together with the amount you invested, to estimate the expense that you paid over the period. Simply divide your account value by $1,000.00 (for example, an $8,600.00 account value divided by $1,000.00 = 8.60), then multiply the result by the number in the first section under the heading entitled “Expenses Paid During Period” to estimate the expenses you paid on your account during this period.
Hypothetical Example for Comparison Purposes. The second section of the table provides information about hypothetical account values and hypothetical expenses based on the Fund’s actual expense ratio for each class of shares, and an assumed rate of return of 5% per year for each class before expenses, which is not the actual return. The hypothetical account values and expenses may not be used to estimate the actual ending account balance or expenses you paid for the period. You may use this information to compare the ongoing costs of investing in the Fund and other funds. To do so, compare this 5% hypothetical example for the class of shares you hold with the 5% hypothetical examples that appear in the shareholder reports of the other funds.
Please note that the expenses shown in the table are meant to highlight your ongoing costs only and do not reflect any transactional costs, such as front-end or contingent deferred sales charges (loads), or a $12.00 fee imposed annually on accounts valued at less than $500.00 (subject to exceptions described in the
12 | OPPENHEIMER QUEST OPPORTUNITY VALUE FUND
Statement of Additional Information). Therefore, the “hypothetical” section of the table is useful in comparing ongoing costs only, and will not help you determine the relative total costs of owning different funds. In addition, if these transactional costs were included, your costs would have been higher.
| | | | | | | | | | | | | |
| | | Beginning | | | Ending | | | Expenses | |
| | | Account | | | Account | | | Paid During | |
| | | Value | | | Value | | | 6 Months Ended | |
| | | November 1, 2008 | | | April 30, 2009 | | | April 30, 2009 | |
| |
Actual | | | | | | | | | | | | |
| Class A | | $ | 1,000.00 | | | $ | 1,027.00 | | | $ | 7.52 | |
| Class B | | | 1,000.00 | | | | 1,022.30 | | | | 12.05 | |
| Class C | | | 1,000.00 | | | | 1,022.90 | | | | 11.40 | |
| Class N | | | 1,000.00 | | | | 1,024.80 | | | | 9.53 | |
| Class Y | | | 1,000.00 | | | | 1,028.10 | | | | 6.30 | |
| | | | | | | | | | | | | |
Hypothetical
(5% return before expenses) | | | | | | | | | | | | |
| Class A | | | 1,000.00 | | | | 1,017.41 | | | | 7.48 | |
| Class B | | | 1,000.00 | | | | 1,012.94 | | | | 12.00 | |
| Class C | | | 1,000.00 | | | | 1,013.59 | | | | 11.35 | |
| Class N | | | 1,000.00 | | | | 1,015.42 | | | | 9.49 | |
| Class Y | | | 1,000.00 | | | | 1,018.60 | | | | 6.28 | |
Expenses are equal to the Fund’s annualized expense ratio for that class, multiplied by the average account value over the period, multiplied by 181/365 (to reflect the one-half year period). Those annualized expense ratios, excluding indirect expenses from affiliated fund, based on the 6-month period ended April 30, 2009 are as follows:
| | | | | |
| Class | | Expense Ratios |
| |
| Class A | | | 1.49 | % |
| Class B | | | 2.39 | |
| Class C | | | 2.26 | |
| Class N | | | 1.89 | |
| Class Y | | | 1.25 | |
The expense ratios reflect reduction to custodian expenses and voluntary waivers or reimbursements of expenses by the Fund’s Manager and Transfer Agent that can be terminated at any time, without advance notice. The “Financial Highlights” tables in the Fund’s financial statements, included in this report, also show the gross expense ratios, without such waivers or reimbursements and reduction to custodian expenses, if applicable.
13 | OPPENHEIMER QUEST OPPORTUNITY VALUE FUND
THIS PAGE INTENTIONALLY LEFT BLANK.
14 | OPPENHEIMER QUEST OPPORTUNITY VALUE FUND
STATEMENT OF INVESTMENTS April 30, 2009 / Unaudited
| | | | | | | | | |
| | | Shares | | | Value | |
| |
Common Stocks—34.5% | | | | | | | | |
Consumer Discretionary—3.9% | | | | | | | | |
Media—3.9% | | | | | | | | |
| Cablevision Systems Corp. New York Group, Cl. A | | | 789,290 | | | $ | 13,544,216 | |
| Cinemark Holdings, Inc. | | | 13,200 | | | | 117,480 | |
| Jupiter Telecommunications Co. Ltd. | | | 15,943 | | | | 11,203,102 | |
Liberty Global, Inc., Series A1,2 | | | 1,163,678 | | | | 19,189,050 | |
Liberty Global, Inc., Series C2 | | | 767,287 | | | | 12,552,815 | |
| National CineMedia, Inc. | | | 402,941 | | | | 5,854,733 | |
| | | | | | | | |
| | | | | | | | 62,461,396 | |
| | | | | | | | | |
Consumer Staples—2.7% | | | | | | | | |
Food Products—1.3% | | | | | | | | |
Nestle SA3,4 | | | 649,310 | | | | 21,117,607 | |
Tobacco—1.4% | | | | | | | | |
| Altria Group, Inc. | | | 441,900 | | | | 7,216,227 | |
| Lorillard, Inc. | | | 231,200 | | | | 14,595,656 | |
| | | | | | | | |
| | | | | | | | 21,811,883 | |
| | | | | | | | | |
Energy—1.6% | | | | | | | | |
Oil, Gas & Consumable Fuels—1.6% | | | | | | | | |
Exxon Mobil Corp.1 | | | 386,600 | | | | 25,774,622 | |
Financials—2.9% | | | | | | | | |
Capital Markets—0.2% | | | | | | | | |
| Julius Baer Holding AG | | | 84,027 | | | | 2,755,962 | |
Diversified Financial Services—1.1% | | | | | | | | |
| JPMorgan Chase & Co. | | | 537,400 | | | | 17,734,200 | |
Insurance—1.6% | | | | | | | | |
| Assurant, Inc. | | | 301,700 | | | | 7,373,548 | |
| Everest Re Group Ltd. | | | 247,400 | | | | 18,465,936 | |
| | | | | | | | |
| | | | | | | | 25,839,484 | |
| |
Health Care—3.3% | | | | | | | | |
Biotechnology—0.5% | | | | | | | | |
Amicus Therapeutics, Inc.1,2 | | | 404,500 | | | | 3,620,275 | |
Human Genome Sciences, Inc.2 | | | 876,515 | | | | 1,919,568 | |
Orexigen Therapeutics, Inc.1,2 | | | 484,880 | | | | 1,377,059 | |
| | | | | | | | |
| | | | | | | | 6,916,902 | |
| | | | | | | | | |
Health Care Equipment & Supplies—0.5% | | | | | | | | |
| Beckman Coulter, Inc. | | | 158,700 | | | | 8,341,272 | |
Health Care Providers & Services—0.9% | | | | | | | | |
| Aetna, Inc. | | | 282,100 | | | | 6,209,021 | |
Medco Health Solutions, Inc.2 | | | 183,700 | | | | 8,000,135 | |
| | | | | | | | |
| | | | | | | | 14,209,156 | |
| | | | | | | | | |
Pharmaceuticals—1.4% | | | | | | | | |
Abbott Laboratories1 | | | 165,600 | | | | 6,930,360 | |
| Wyeth | | | 367,200 | | | | 15,569,280 | |
| | | | | | | | |
| | | | | | | | 22,499,640 | |
| | | | | | | | | |
Industrials—1.4% | | | | | | | | |
Aerospace & Defense—0.2% | | | | | | | | |
Orbital Sciences Corp.1,2 | | | 212,000 | | | | 3,277,520 | |
Machinery—0.9% | | | | | | | | |
| Joy Global, Inc. | | | 250,500 | | | | 6,387,750 | |
Navistar International Corp.2 | | | 192,600 | | | | 7,280,280 | |
| | | | | | | | |
| | | | | | | | 13,668,030 | |
| | | | | | | | | |
Trading Companies & Distributors—0.3% | | | | | | | | |
| Aircastle Ltd. | | | 715,800 | | | | 4,724,280 | |
Information Technology—16.9% | | | | | | | | |
Communications Equipment—5.0% | | | | | | | | |
| QUALCOMM, Inc. | | | 920,900 | | | | 38,972,488 | |
Research in Motion Ltd.2 | | | 600,700 | | | | 41,748,650 | |
| | | | | | | | |
| | | | | | | | 80,721,138 | |
F1 | OPPENHEIMER QUEST OPPORTUNITY VALUE FUND
STATEMENT OF INVESTMENTS Unaudited / Continued
| | | | | | | | | |
| | | Shares | | | Value | |
| |
Computers & Peripherals—1.0% | | | | | | | | |
Apple, Inc.2 | | | 122,200 | | | $ | 15,376,426 | |
Internet Software & Services—3.0% | | | | | | | | |
eBay, Inc.1,2 | | | 849,800 | | | | 13,996,206 | |
Google, Inc., Cl. A1,2 | | | 85,200 | | | | 33,736,644 | |
| | | | | | | | |
| | | | | | | | 47,732,850 | |
Software—7.9% | | | | | | | | |
Microsoft Corp.1 | | | 1,534,700 | | | | 31,093,022 | |
Novell, Inc.1,2 | | | 1,186,600 | | | | 4,461,616 | |
Synopsys, Inc.2 | | | 465,700 | | | | 10,142,946 | |
Take-Two Interactive Software, Inc.1,6 | | | 7,372,043 | | | | 66,938,150 | |
THQ, Inc.1,2,6 | | | 4,000,000 | | | | 13,680,000 | |
| | | | | | | | |
| | | | | | | | 126,315,734 | |
| | | | | | | | | |
Materials—1.7% | | | | | | | | |
Chemicals—1.7% | | | | | | | | |
Lubrizol Corp. (The)1 | | | 414,000 | | | | 17,893,080 | |
| Potash Corp. of Saskatchewan, Inc. | | | 105,800 | | | | 9,150,643 | |
| | | | | | | | |
| | | | | | | | 27,043,723 | |
| | | | | | | | | |
Utilities—0.1% | | | | | | | | |
Energy Traders—0.1% | | | | | | | | |
NRG Energy, Inc.2 | | | 110,500 | | | | 1,986,790 | |
| | | | | | | | |
Total Common Stocks
(Cost $667,901,950) | | | | | | | 550,308,615 | |
| | | | | | | | | |
Preferred Stocks—2.3% | | | | | | | | |
| Mylan, Inc., 6.50% Cv., Non-Vtg. | | | 20,100 | | | | 17,125,200 | |
| Schering-Plough Corp., 6% Cv. | | | 92,200 | | | | 19,476,328 | |
| | | | | | | | |
Total Preferred Stocks
(Cost $25,981,255) | | | | | | | 36,601,528 | |
| |
| | | Principal | | | | |
| | | Amount | | | Value | |
| |
Asset-Backed Securities—0.1% | | | | | | | | |
Babcock & Brown Air Funding Ltd., Asset-Backed Certificates, Series 2007-1A, Cl. G1, 0.76%, 10/14/335
(Cost $1,262,362) | | $ | 2,427,000 | | | $ | 1,262,040 | |
| | | | | | | | | |
Mortgage-Backed Obligations—0.1% | | | | | | | | |
| Mastr Adjustable Rate Mortgages Trust 2004-13, Mtg. | | | | | | | | |
Pass-Through Certificates, Series 2004-13, Cl. 2 A2, 4.374%, 4/1/345
(Cost $2,090,703) | | | 2,455,651 | | | | 2,046,976 | |
| | | | | | | | | |
Convertible Corporate Bonds and Notes—0.4% | | | | | | | | |
Theravance, Inc., 3% Cv. Sub. Nts., 1/15/15
(Cost $5,968,444) | | | 8,285,000 | | | | 5,840,925 | |
| |
| | | Shares | | | | | |
| |
Investment Company—63.7% | | | | | | | | |
Oppenheimer Institutional Money Market Fund, Cl. E, 0.70%6,7
(Cost $1,018,286,735) 1,018,286,735 | | | | | | | 1,018,286,735 | |
Total Investments, at Value (excluding Investments Purchased with Cash Collateral from Securities Loaned)
(Cost $1,721,491,449) | | | | | | | 1,614,346,819 | |
| Investments Purchased with Cash Collateral from Securities Loaned—1.3%8 |
OFI Liquid Assets Fund, LLC, 0.77%6,7
(Cost $21,313,600) | | | 21,313,600 | | | | 21,313,600 | |
Total Investments, at Value
(Cost $1,742,805,049) | | | 102.4 | % | | | 1,635,660,419 | |
Liabilities in Excess of Other Assets | | | (2.4 | ) | | | (38,147,427 | ) |
| | | |
Net Assets | | | 100.0 | % | | $ | 1,597,512,992 | |
| | | |
F2 | OPPENHEIMER QUEST OPPORTUNITY VALUE FUND
Footnotes to Statement of Investments
| | |
| |
| 1. | | All or a portion of the security was segregated by the Fund comprising a total segregated amount of $156,030,364, which represented 680.96% of the market value of securities sold short. See Note 1 of accompanying Notes. |
| |
| 2. | | Non-income producing security. |
| |
| 3. | | A sufficient amount of liquid assets has been designated to cover outstanding written put options. See Note 6 of accompanying Notes. |
| |
| 4. | | Partial or fully-loaned security. See Note 8 of accompanying Notes. |
| |
| 5. | | Represents the current interest rate for a variable or increasing rate security. |
| |
| 6. | | Is or was an affiliate, as defined in the Investment Company Act of 1940, at or during the period ended April 30, 2009, by virtue of the Fund owning at least 5% of the voting securities of the issuer or as a result of the Fund and the issuer having the same investment adviser. Transactions during the period in which the issuer was an affiliate are as follows: |
| | | | | | | | | | | | | | | | | |
| | | Shares | | | Gross | | | Gross | | | Shares | |
| | | October 31, 2008 | | | Additions | | | Reductions | | | April 30, 2009 | |
| |
| OFI Liquid Assets Fund, LLC | | | — | | | | 24,213,600 | | | | 2,900,000 | | | | 21,313,600 | |
| Oppenheimer Institutional Money Market Fund, Cl. E | | | 569,978,857 | | | | 705,599,579 | | | | 257,291,701 | | | | 1,018,286,735 | |
| Take-Two Interactive Software, Inc. | | | 6,780,343 | | | | 591,700 | | | | — | | | | 7,372,043 | |
| THQ, Inc. | | | 3,260,178 | | | | 739,822 | | | | — | | | | 4,000,000 | |
| | | | | | | | | |
| | | Value | | | Income | |
| |
| OFI Liquid Assets Fund, LLC | | $ | 21,313,600 | | | $ | 7,116 | a |
| Oppenheimer Institutional Money Market Fund, Cl. E | | | 1,018,286,735 | | | | 4,853,572 | |
| Take-Two Interactive Software, Inc. | | | 66,938,150 | | | | — | |
| THQ, Inc. | | | 13,680,000 | | | | — | |
| | | |
| | | $ | 1,120,218,485 | | | $ | 4,860,688 | |
| | | |
| | |
| |
| a. | | Net of compensation to the securities lending agent and rebates paid to the borrowing counterparties. |
| |
| 7. | | Rate shown is the 7-day yield as of April 30, 2009. |
| |
| 8. | | The security/securities have been segregated to satisfy the forward commitment to return the cash collateral received in securities lending transactions upon the borrower’s return of the securities loaned. See Note 8 of accompanying Notes. |
| | | | | | | | | |
| | | Shares | | | | |
| | | Sold Short | | | Value | |
| |
Common Stock Securities Sold Short—(1.4)% | | | | | | | | |
| BB&T Corp. | | | (447,700 | ) | | $ | (10,449,318 | ) |
| New York Community Bancorp, Inc. | | | (664,000 | ) | | | (7,509,840 | ) |
| Pacific Capital Bancorp | | | (32,500 | ) | | | (225,550 | ) |
| Volkswagen AG | | | (15,000 | ) | | | (4,728,687 | ) |
| | | | | | | | |
| Total Common Stock Securities Sold Short (Proceeds $23,482,807) | | | | | | $ | (22,913,395 | ) |
| | | | | | | | |
F3 | OPPENHEIMER QUEST OPPORTUNITY VALUE FUND
STATEMENT OF INVESTMENTS Unaudited / Continued
Footnotes to Statement of Investments Continued
Valuation Inputs
Various data inputs are used in determining the value of each of the Fund’s investments as of the reporting period end. These data inputs are categorized in the following hierarchy under applicable financial accounting standards:
| | 1) | | Level 1—quoted prices in active markets for identical assets or liabilities (including securities actively traded on a securities exchange) |
| |
| | 2) | | Level 2—inputs other than quoted prices that are observable for the asset (such as quoted prices for similar assets and market corroborated inputs such as interest rates, prepayment speeds, credit risks, etc.) |
| |
| | 3) | | Level 3—unobservable inputs (including the Manager’s own judgments about assumptions that market participants would use in pricing the asset). |
The market value of the Fund’s investments was determined based on the following inputs as of April 30, 2009:
| | | | | | | | | |
| | | Investments | | | Other Financial | |
| Valuation Description | | in Securities | | | Instruments* | |
| |
| Level 1—Quoted Prices | | $ | 1,583,160,581 | | | $ | (18,614,708 | ) |
| Level 2—Other Significant Observable Inputs | | | 51,237,798 | | | | (5,441,495 | ) |
| Level 3—Significant Unobservable Inputs | | | 1,262,040 | | | | — | |
| | | |
| Total | | $ | 1,635,660,419 | | | $ | (24,056,203 | ) |
| | | |
| | |
| * | | Other financial instruments include options written, currency contracts, futures, forwards, swap contracts and short positions. Currency contracts and forwards are reported at their unrealized appreciation/depreciation at measurement date, which represents the change in the contract’s value from trade date. Futures are reported at their variation margin at measurement date, which represents the amount due to/from the Fund at that date. Options written, swaps and short positions are reported at their market value at measurement date. |
See the accompanying Notes for further discussion of the methods used in determining value of the Fund’s investments, and a summary of changes to the valuation techniques, if any, during the reporting period.
Written Options as of April 30, 2009 are as follows:
| | | | | | | | | | | | | | | | | | | | | | | | | |
| | | | | | | Number of | | | Exercise | | | Expiration | | | Premiums | | | | |
| Description | | Type | | | Contracts | | | Price | | | Date | | | Received | | | Value | |
| |
| Aetna, Inc. | | Put | | | | 5,000 | | | $ | 17.50 | | | | 7/20/09 | | | $ | 1,060,427 | | | $ | (325,000 | ) |
| Electronic Arts, Inc. | | Put | | | | 3,000 | | | | 12.50 | | | | 9/21/09 | | | | 440,997 | | | | (105,000 | ) |
| | | | | | | | | | | | | | | | | | | |
| | | | | | | | | | | | | | | | | | | $ | 1,501,424 | | | $ | (430,000 | ) |
| | | | | | | | | | | | | | | | | | | |
Credit Default Swap Contracts as of April 30, 2009 are as follows:
| | | | | | | | | | | | | | | | | | | | | |
| | | | | | | | | | | Pay/ | | | | | | | |
| | | Buy | | | Notional | | | Receive | | | | | | | |
| Swap | | Credit | | | Amount | | | Fixed | | | Termination | | | | |
| Reference Entity | Counterparty | Protection | | | (000s) | | | Rate | | | Date | | | Value | |
| |
| Republic of Austria | Morgan Stanley & Co. International Ltd. | Buy | | | $ | 10,000 | | | | 2.67 | % | | | 3/20/14 | | | $ | (712,808 | ) |
See accompanying Notes to Financial Statements.
F4 | OPPENHEIMER QUEST OPPORTUNITY VALUE FUND
STATEMENT OF ASSETS AND LIABILITIES Unaudited
April 30, 2009
| | | | | |
| |
Assets | | | | |
| Investments, at value—see accompanying statement of investments: | | | | |
| Unaffiliated companies (cost $512,287,255) | | $ | 515,441,934 | |
| Affiliated companies (cost $1,230,517,794) | | | 1,120,218,485 | |
| | | | |
| | | | 1,635,660,419 | |
| Cash | | | 974,213 | |
| Receivables and other assets: | | | | |
| Shares of beneficial interest sold | | | 7,273,464 | |
| Interest and dividends | | | 2,700,207 | |
| Investments sold | | | 577,897 | |
| Other | | | 149,294 | |
| | | | |
| Total assets | | | 1,647,335,494 | |
| | | | | |
Liabilities | | | | |
| Short positions, at value (proceeds of $23,482,807)—see accompanying statement of investments | | | 22,913,395 | |
| Options written, at value (premiums received $1,501,424) | | | 430,000 | |
| Return of collateral for securities loaned | | | 21,313,600 | |
| Swaps, at value | | | 712,808 | |
| Payables and other liabilities: | | | | |
| Investments purchased | | | 1,736,919 | |
| Shares of beneficial interest redeemed | | | 1,588,825 | |
| Distribution and service plan fees | | | 308,313 | |
| Transfer and shareholder servicing agent fees | | | 301,399 | |
| Trustees’ compensation | | | 266,241 | |
| Shareholder communications | | | 191,794 | |
| Other | | | 59,208 | |
| | | | |
| Total liabilities | | | 49,822,502 | |
| | | | | |
Net Assets | | $ | 1,597,512,992 | |
| | | | |
| | | | | |
Composition of Net Assets | | | | |
| Par value of shares of beneficial interest | | $ | 706,867 | |
| Additional paid-in capital | | | 1,738,969,071 | |
| Accumulated net investment loss | | | (3,664,699 | ) |
| Accumulated net realized loss on investments and foreign currency transactions | | | (32,307,215 | ) |
| Net unrealized depreciation on investments and translation of assets and liabilities denominated in foreign currencies | | | (106,191,032 | ) |
| | | | |
| |
Net Assets | | $ | 1,597,512,992 | |
| | | | |
F5 | OPPENHEIMER QUEST OPPORTUNITY VALUE FUND
STATEMENT OF ASSETS AND LIABILITIES Unaudited / Continued
| | | | | |
Net Asset Value Per Share | | | | |
| |
| Class A Shares: | | | | |
| Net asset value and redemption price per share (based on net assets of $1,244,134,707 and 54,457,996 shares of beneficial interest outstanding) | | $ | 22.85 | |
| Maximum offering price per share (net asset value plus sales charge of 5.75% of offering price) | | $ | 24.24 | |
| |
| Class B Shares: | | | | |
| Net asset value, redemption price (excludes applicable contingent deferred sales charge) and offering price per share (based on net assets of $98,201,893 and 4,536,058 shares of beneficial interest outstanding) | | $ | 21.65 | |
| |
| Class C Shares: | | | | |
| Net asset value, redemption price (excludes applicable contingent deferred sales charge) and offering price per share (based on net assets of $194,986,553 and 9,045,733 shares of beneficial interest outstanding) | | $ | 21.56 | |
| |
| Class N Shares: | | | | |
| Net asset value, redemption price (excludes applicable contingent deferred sales charge) and offering price per share (based on net assets of $25,585,989 and 1,144,125 shares of beneficial interest outstanding) | | $ | 22.36 | |
| |
| Class Y Shares: | | | | |
| Net asset value, redemption price and offering price per share (based on net assets of $34,603,850 and 1,502,830 shares of beneficial interest outstanding) | | $ | 23.03 | |
See accompanying Notes to Financial Statements.
F6 | OPPENHEIMER QUEST OPPORTUNITY VALUE FUND
STATEMENT OF OPERATIONS Unaudited
For the Six Months Ended April 30, 2009
| | | | | |
| |
Investment Income | | | | |
| Dividends: | | | | |
| Unaffiliated companies (net of foreign withholding taxes of $42,920) | | $ | 6,237,822 | |
| Affiliated companies | | | 4,853,572 | |
| Interest | | | 436,283 | |
| Income from investment of securities lending cash collateral, net—affiliated companies | | | 7,116 | |
| | | | |
| Total investment income | | | 11,534,793 | |
| | | | | |
Expenses | | | | |
| Management fees | | | 5,701,324 | |
| Distribution and service plan fees: | | | | |
| Class A | | | 1,332,549 | |
| Class B | | | 440,029 | |
| Class C | | | 763,749 | |
| Class N | | | 49,787 | |
| Transfer and shareholder servicing agent fees: | | | | |
| Class A | | | 1,176,353 | |
| Class B | | | 178,845 | |
| Class C | | | 182,312 | |
| Class N | | | 34,355 | |
| Class Y | | | 26,672 | |
| Shareholder communications: | | | | |
| Class A | | | 165,950 | |
| Class B | | | 30,933 | |
| Class C | | | 25,523 | |
| Class N | | | 3,789 | |
| Class Y | | | 2,373 | |
| Dividends on short sales (net of foreign withholding taxes of $5,746) | | | 1,222,869 | |
| Financing expense from short sales | | | 105,553 | |
| Trustees’ compensation | | | 28,581 | |
| Custodian fees and expenses | | | 14,936 | |
| Other | | | 98,065 | |
| | | | |
| Total expenses | | | 11,584,547 | |
| Less reduction to custodian expenses | | | (1,852 | ) |
| Less waivers and reimbursements of expenses | | | (399,581 | ) |
| | | | |
| Net expenses | | | 11,183,114 | |
| | | | | |
Net Investment Income | | | 351,679 | |
F7 | OPPENHEIMER QUEST OPPORTUNITY VALUE FUND
STATEMENT OF OPERATIONS Unaudited / Continued
| | | | | |
Realized and Unrealized Gain (Loss) | | | | |
| Net realized gain (loss) on: | | | | |
| Investments from unaffiliated companies | | | (45,654,127 | ) |
| Foreign currency transactions | | | (2,778,023 | ) |
| Short positions | | | 31,362,715 | |
| Swap contracts | | | 16,391,841 | |
| | | | |
| Net realized loss | | | (677,594 | ) |
| Net change in unrealized appreciation (depreciation) on: | | | | |
| Investments | | | 44,814,147 | |
| Translation of assets and liabilities denominated in foreign currencies | | | 2,971,144 | |
| Option contracts written | | | 1,071,424 | |
| Short positions | | | 883,765 | |
| Swap contracts | | | (4,437,418 | ) |
| | | | |
| Net change in unrealized depreciation | | | 45,303,062 | |
| | | | | |
Net Increase in Net Assets Resulting from Operations | | $ | 44,977,147 | |
| | | | |
See accompanying Notes to Financial Statements.
F8 | OPPENHEIMER QUEST OPPORTUNITY VALUE FUND
STATEMENTS OF CHANGES IN NET ASSETS
| | | | | | | | | |
| | | Six Months | | | Year | |
| | | Ended | | | Ended | |
| | | April 30, 2009 | | | October 31, | |
| | | (Unaudited) | | | 2008 | |
| |
Operations | | | | | | | | |
| Net investment income | | $ | 351,679 | | | $ | 11,570,583 | |
| Net realized gain (loss) | | | (677,594 | ) | | | 55,057,961 | |
| Net change in unrealized depreciation | | | 45,303,062 | | | | (363,672,933 | ) |
| | | |
| Net increase (decrease) in net assets resulting from operations | | | 44,977,147 | | | | (297,044,389 | ) |
| | | | | | | | | |
Dividends and/or Distributions to Shareholders | | | | | | | | |
| Dividends from net investment income: | | | | | | | | |
| Class A | | | — | | | | (115,476,728 | ) |
| Class B | | | — | | | | (12,420,749 | ) |
| Class C | | | — | | | | (13,430,105 | ) |
| Class N | | | — | | | | (2,168,220 | ) |
| Class Y | | | — | | | | (1,511,547 | ) |
| | | |
| | | | — | | | | (145,007,349 | ) |
| | | | | | | | | |
| Distributions from net realized gain: | | | | | | | | |
| Class A | | | (39,815,499 | ) | | | (76,091,447 | ) |
| Class B | | | (3,517,502 | ) | | | (8,918,207 | ) |
| Class C | | | (5,850,662 | ) | | | (9,528,227 | ) |
| Class N | | | (739,009 | ) | | | (1,470,686 | ) |
| Class Y | | | (742,293 | ) | | | (980,315 | ) |
| | | |
| | | | (50,664,965 | ) | | | (96,988,882 | ) |
| | | | | | | | | |
Beneficial Interest Transactions | | | | | | | | |
| Net increase (decrease) in net assets resulting from beneficial interest transactions: | | | | | | | | |
| Class A | | | 195,408,325 | | | | 315,531,175 | |
| Class B | | | 8,716,240 | | | | (2,632,641 | ) |
| Class C | | | 56,965,866 | | | | 52,529,813 | |
| Class N | | | 7,673,770 | | | | 3,681,669 | |
| Class Y | | | 15,660,622 | | | | 10,355,880 | |
| | | |
| | | | 284,424,823 | | | | 379,465,896 | |
| | | | | | | | | |
Net Assets | | | | | | | | |
| Total increase (decrease) | | | 278,737,005 | | | | (159,574,724 | ) |
| Beginning of period | | | 1,318,775,987 | | | | 1,478,350,711 | |
| | | |
| |
| End of period (including accumulated net investment loss of $3,664,699 and $4,016,378, respectively) | | $ | 1,597,512,992 | | | $ | 1,318,775,987 | |
| | | |
See accompanying Notes to Financial Statements.
F9 | OPPENHEIMER QUEST OPPORTUNITY VALUE FUND
FINANCIAL HIGHLIGHTS
| | | | | | | | | | | | | | | | | | | | | | | | | |
| | | Six Months | | | | | | | | | | | | |
| | | Ended | | | | | | | | | | | | |
| | | April 30, 2009 | | | | | | | | | | | Year Ended October 31, | |
| Class A | | (Unaudited) | | | 2008 | | | 2007 | | | 2006 | | | 2005 | | | 2004 | |
| |
Per Share Operating Data | | | | | | | | | | | | | | | | | | | | | | | | |
| Net asset value, beginning of period | | $ | 23.15 | | | $ | 34.21 | | | $ | 30.15 | | | $ | 32.58 | | | $ | 32.41 | | | $ | 30.00 | |
| |
| Income (loss) from investment operations: | | | | | | | | | | | | | | | | | | | | | | | | |
Net investment income1 | | | .02 | | | | .26 | | | | .51 | | | | .36 | | | | .17 | | | | .07 | |
| Net realized and unrealized gain (loss) | | | .53 | | | | (5.63 | ) | | | 5.17 | | | | 1.67 | | | | 2.27 | | | | 2.41 | |
| | | |
| Total from investment operations | | | .55 | | | | (5.37 | ) | | | 5.68 | | | | 2.03 | | | | 2.44 | | | | 2.48 | |
| |
| Dividends and/or distributions to shareholders: | | | | | | | | | | | | | | | | | | | | | | | | |
| Dividends from net investment income | | | — | | | | (3.43 | ) | | | (.39 | ) | | | (.24 | ) | | | (.04 | ) | | | (.07 | ) |
| Distributions from net realized gain | | | (.85 | ) | | | (2.26 | ) | | | (1.23 | ) | | | (4.22 | ) | | | (2.23 | ) | | | — | |
| | | |
| Total dividends and/or distributions to shareholders | | | (.85 | ) | | | (5.69 | ) | | | (1.62 | ) | | | (4.46 | ) | | | (2.27 | ) | | | (.07 | ) |
| |
| Net asset value, end of period | | $ | 22.85 | | | $ | 23.15 | | | $ | 34.21 | | | $ | 30.15 | | | $ | 32.58 | | | $ | 32.41 | |
| | | |
| |
Total Return, at Net Asset Value2 | | | 2.70 | % | | | (18.62 | )% | | | 19.65 | % | | | 7.00 | % | | | 7.79 | % | | | 8.30 | % |
| | | | | | | | | | | | | | | | | | | | | | | | | |
Ratios/Supplemental Data | | | | | | | | | | | | | | | | | | | | | | | | |
| Net assets, end of period (in thousands) | | $ | 1,244,135 | | | $ | 1,052,971 | | | $ | 1,164,793 | | | $ | 1,146,503 | | | $ | 1,378,475 | | | $ | 1,459,053 | |
| |
| Average net assets (in thousands) | | $ | 1,091,659 | | | $ | 1,166,299 | | | $ | 1,142,058 | | | $ | 1,238,504 | | | $ | 1,465,797 | | | $ | 1,497,594 | |
| |
Ratios to average net assets:3 | | | | | | | | | | | | | | | | | | | | | | | | |
| Net investment income | | | 0.20 | % | | | 0.93 | % | | | 1.61 | % | | | 1.22 | % | | | 0.53 | % | | | 0.23 | % |
| Total expenses | | | 1.54 | %4 | | | 1.56 | %4 | | | 1.40 | %4 | | | 1.43 | %4 | | | 1.33 | % | | | 1.32 | % |
| Expenses after payments, waivers and/or reimbursements and reduction to custodian expenses | | | 1.49 | % | | | 1.52 | % | | | 1.37 | % | | | 1.43 | % | | | 1.28 | % | | | 1.32 | % |
| |
| Portfolio turnover rate | | | 57 | % | | | 135 | % | | | 51 | % | | | 66 | % | | | 100 | % | | | 64 | % |
| | |
| 1. | | Per share amounts calculated based on the average shares outstanding during the period. |
| |
| 2. | | Assumes an investment on the business day before the first day of the fiscal period, with all dividends and distributions reinvested in additional shares on the reinvestment date, and redemption at the net asset value calculated on the last business day of the fiscal period. Sales charges are not reflected in the total returns. Total returns are not annualized for periods less than one full year. Returns do not reflect the deduction of taxes that a shareholder would pay on fund distributions or the redemption of fund shares. |
| |
| 3. | | Annualized for periods less than one full year. |
| |
| 4. | | Total expenses including indirect expenses from affiliated fund were as follows: |
| | | | | |
| Six Months Ended April 30, 2009 | | | 1.59 | % |
| Year Ended October 31, 2008 | | | 1.60 | % |
| Year Ended October 31, 2007 | | | 1.43 | % |
| Year Ended October 31, 2006 | | | 1.43 | % |
See accompanying Notes to Financial Statements.
F10 | OPPENHEIMER QUEST OPPORTUNITY VALUE FUND
| | | | | | | | | | | | | | | | | | | | | | | | | |
| | | Six Months | | | | | | | | | | | | |
| | | Ended | | | | | | | | | | | | |
| | | April 30, 2009 | | | | | | | | | | | Year Ended October 31, | |
| Class B | | (Unaudited) | | | 2008 | | | 2007 | | | 2006 | | | 2005 | | | 2004 | |
| |
Per Share Operating Data | | | | | | | | | | | | | | | | | | | | | | | | |
| Net asset value, beginning of period | | $ | 22.08 | | | $ | 32.82 | | | $ | 28.97 | | | $ | 31.44 | | | $ | 31.55 | | | $ | 29.36 | |
| |
| Income (loss) from investment operations: | | | | | | | | | | | | | | | | | | | | | | | | |
Net investment income (loss)1 | | | (.07 | ) | | | .06 | | | | .26 | | | | .13 | | | | (.08 | ) | | | (.17 | ) |
| Net realized and unrealized gain (loss) | | | .49 | | | | (5.39 | ) | | | 4.97 | | | | 1.62 | | | | 2.20 | | | | 2.36 | |
| | | |
| Total from investment operations | | | .42 | | | | (5.33 | ) | | | 5.23 | | | | 1.75 | | | | 2.12 | | | | 2.19 | |
| |
| Dividends and/or distributions to shareholders: | | | | | | | | | | | | | | | | | | | | | | | | |
| Dividends from net investment income | | | — | | | | (3.15 | ) | | | (.15 | ) | | | — | | | | — | | | | — | |
| Distributions from net realized gain | | | (.85 | ) | | | (2.26 | ) | | | (1.23 | ) | | | (4.22 | ) | | | (2.23 | ) | | | — | |
| | | |
| Total dividends and/or distributions to shareholders | | | (.85 | ) | | | (5.41 | ) | | | (1.38 | ) | | | (4.22 | ) | | | (2.23 | ) | | | — | |
| |
| Net asset value, end of period | | $ | 21.65 | | | $ | 22.08 | | | $ | 32.82 | | | $ | 28.97 | | | $ | 31.44 | | | $ | 31.55 | |
| | | |
| | | | | | | | | | | | | | | | | | | | | | | | | |
Total Return, at Net Asset Value2 | | | 2.23 | % | | | (19.23 | )% | | | 18.74 | % | | | 6.22 | % | | | 6.94 | % | | | 7.46 | % |
| | | | | | | | | | | | | | | | | | | | | | | | | |
Ratios/Supplemental Data | | | | | | | | | | | | | | | | | | | | | | | | |
| Net assets, end of period (in thousands) | | $ | 98,202 | | | $ | 90,923 | | | $ | 136,745 | | | $ | 159,147 | | | $ | 210,856 | | | $ | 278,215 | |
| |
| Average net assets (in thousands) | | $ | 88,914 | | | $ | 113,810 | | | $ | 146,748 | | | $ | 178,815 | | | $ | 247,951 | | | $ | 342,847 | |
| |
Ratios to average net assets:3 | | | | | | | | | | | | | | | | | | | | | | | | |
| Net investment income (loss) | | | (0.70 | )% | | | 0.21 | % | | | 0.84 | % | | | 0.47 | % | | | (0.27 | )% | | | (0.54 | )% |
| Total expenses | | | 2.52 | %4 | | | 2.31 | %4 | | | 2.17 | %4 | | | 2.18 | %4 | | | 2.12 | % | | | 2.11 | % |
| Expenses after payments, waivers and/or reimbursements and reduction to custodian expenses | | | 2.39 | % | | | 2.27 | % | | | 2.14 | % | | | 2.18 | % | | | 2.07 | % | | | 2.11 | % |
| |
| Portfolio turnover rate | | | 57 | % | | | 135 | % | | | 51 | % | | | 66 | % | | | 100 | % | | | 64 | % |
| | |
| 1. | | Per share amounts calculated based on the average shares outstanding during the period. |
| |
| 2. | | Assumes an investment on the business day before the first day of the fiscal period, with all dividends and distributions reinvested in additional shares on the reinvestment date, and redemption at the net asset value calculated on the last business day of the fiscal period. Sales charges are not reflected in the total returns. Total returns are not annualized for periods less than one full year. Returns do not reflect the deduction of taxes that a shareholder would pay on fund distributions or the redemption of fund shares. |
| |
| 3. | | Annualized for periods less than one full year. |
| |
| 4. | | Total expenses including indirect expenses from affiliated fund were as follows: |
| | | | | |
| Six Months Ended April 30, 2009 | | | 2.57 | % |
| Year Ended October 31, 2008 | | | 2.35 | % |
| Year Ended October 31, 2007 | | | 2.20 | % |
| Year Ended October 31, 2006 | | | 2.18 | % |
See accompanying Notes to Financial Statements.
F11 | OPPENHEIMER QUEST OPPORTUNITY VALUE FUND
FINANCIAL HIGHLIGHTS Continued
| | | | | | | | | | | | | | | | | | | | | | | | | |
| | | Six Months | | | | | | | | | | | | |
| | | Ended | | | | | | | | | | | | |
| | | April 30, 2009 | | | | | | | | | | | Year Ended October 31, | |
| Class C | | (Unaudited) | | | 2008 | | | 2007 | | | 2006 | | | 2005 | | | 2004 | |
| |
Per Share Operating Data | | | | | | | | | | | | | | | | | | | | | | | | |
| Net asset value, beginning of period | | $ | 21.98 | | | $ | 32.73 | | | $ | 28.91 | | | $ | 31.38 | | | $ | 31.48 | | | $ | 29.29 | |
| |
| Income (loss) from investment operations: | | | | | | | | | | | | | | | | | | | | | | | | |
Net investment income (loss)1 | | | (.06 | ) | | | .04 | | | | .26 | | | | .13 | | | | (.07 | ) | | | (.16 | ) |
| Net realized and unrealized gain (loss) | | | .49 | | | | (5.35 | ) | | | 4.96 | | | | 1.62 | | | | 2.20 | | | | 2.35 | |
| | | |
| Total from investment operations | | | .43 | | | | (5.31 | ) | | | 5.22 | | | | 1.75 | | | | 2.13 | | | | 2.19 | |
| |
| Dividends and/or distributions to shareholders: | | | | | | | | | | | | | | | | | | | | | | | | |
| Dividends from net investment income | | | — | | | | (3.18 | ) | | | (.17 | ) | | | — | | | | — | | | | — | |
| Distributions from net realized gain | | | (.85 | ) | | | (2.26 | ) | | | (1.23 | ) | | | (4.22 | ) | | | (2.23 | ) | | | — | |
| | | |
| Total dividends and/or distributions to shareholders | | | (.85 | ) | | | (5.44 | ) | | | (1.40 | ) | | | (4.22 | ) | | | (2.23 | ) | | | — | |
| |
| Net asset value, end of period | | $ | 21.56 | | | $ | 21.98 | | | $ | 32.73 | | | $ | 28.91 | | | $ | 31.38 | | | $ | 31.48 | |
| | | |
| | | | | | | | | | | | | | | | | | | | | | | | | |
Total Return, at Net Asset Value2 | | | 2.29 | % | | | (19.21 | )% | | | 18.73 | % | | | 6.23 | % | | | 6.99 | % | | | 7.48 | % |
| | | | | | | | | | | | | | | | | | | | | | | | | |
Ratios/Supplemental Data | | | | | | | | | | | | | | | | | | | | | | | | |
| Net assets, end of period (in thousands) | | $ | 194,986 | | | $ | 138,331 | | | $ | 140,022 | | | $ | 141,981 | | | $ | 174,735 | | | $ | 190,426 | |
| |
| Average net assets (in thousands) | | $ | 154,946 | | | $ | 139,228 | | | $ | 139,758 | | | $ | 154,404 | | | $ | 187,520 | | | $ | 203,073 | |
| |
Ratios to average net assets:3 | | | | | | | | | | | | | | | | | | | | | | | | |
| Net investment income (loss) | | | (0.57 | )% | | | 0.15 | % | | | 0.85 | % | | | 0.47 | % | | | (0.22 | )% | | | (0.51 | )% |
| Total expenses | | | 2.31 | %4 | | | 2.32 | %4 | | | 2.16 | %4 | | | 2.18 | %4 | | | 2.08 | % | | | 2.06 | % |
| Expenses after payments, waivers and/or reimbursements and reduction to custodian expenses | | | 2.26 | % | | | 2.28 | % | | | 2.13 | % | | | 2.18 | % | | | 2.02 | % | | | 2.06 | % |
| |
| Portfolio turnover rate | | | 57 | % | | | 135 | % | | | 51 | % | | | 66 | % | | | 100 | % | | | 64 | % |
| | |
| 1. | | Per share amounts calculated based on the average shares outstanding during the period. |
| |
| 2. | | Assumes an investment on the business day before the first day of the fiscal period, with all dividends and distributions reinvested in additional shares on the reinvestment date, and redemption at the net asset value calculated on the last business day of the fiscal period. Sales charges are not reflected in the total returns. Total returns are not annualized for periods less than one full year. Returns do not reflect the deduction of taxes that a shareholder would pay on fund distributions or the redemption of fund shares. |
| |
| 3. | | Annualized for periods less than one full year. |
| |
| 4. | | Total expenses including indirect expenses from affiliated fund were as follows: |
| | | | | |
| Six Months Ended April 30, 2009 | | | 2.36 | % |
| Year Ended October 31, 2008 | | | 2.36 | % |
| Year Ended October 31, 2007 | | | 2.19 | % |
| Year Ended October 31, 2006 | | | 2.18 | % |
See accompanying Notes to Financial Statements.
F12 | OPPENHEIMER QUEST OPPORTUNITY VALUE FUND
| | | | | | | | | | | | | | | | | | | | | | | | | |
| | | Six Months | | | | | | | | | | | | |
| | | Ended | | | | | | | | | | | | |
| | | April 30, 2009 | | | | | | | | | | | Year Ended October 31, | |
| Class N | | (Unaudited) | | | 2008 | | | 2007 | | | 2006 | | | 2005 | | | 2004 | |
| |
Per Share Operating Data | | | | | | | | | | | | | | | | | | | | | | | | |
| Net asset value, beginning of period | | $ | 22.72 | | | $ | 33.68 | | | $ | 29.68 | | | $ | 32.12 | | | $ | 32.06 | | | $ | 29.72 | |
| |
| Income (loss) from investment operations: | | | | | | | | | | | | | | | | | | | | | | | | |
Net investment income (loss)1 | | | (.02 | ) | | | .17 | | | | .40 | | | | .25 | | | | .05 | | | | (.05 | ) |
| Net realized and unrealized gain (loss) | | | .51 | | | | (5.54 | ) | | | 5.10 | | | | 1.66 | | | | 2.24 | | | | 2.39 | |
| | | |
| Total from investment operations | | | .49 | | | | (5.37 | ) | | | 5.50 | | | | 1.91 | | | | 2.29 | | | | 2.34 | |
| |
| Dividends and/or distributions to shareholders: | | | | | | | | | | | | | | | | | | | | | | | | |
| Dividends from net investment income | | | — | | | | (3.33 | ) | | | (.27 | ) | | | (.13 | ) | | | — | | | | — | 2 |
| Distributions from net realized gain | | | (.85 | ) | | | (2.26 | ) | | | (1.23 | ) | | | (4.22 | ) | | | (2.23 | ) | | | — | |
| | | |
| Total dividends and/or distributions to shareholders | | | (.85 | ) | | | (5.59 | ) | | | (1.50 | ) | | | (4.35 | ) | | | (2.23 | ) | | | — | |
| |
| Net asset value, end of period | | $ | 22.36 | | | $ | 22.72 | | | $ | 33.68 | | | $ | 29.68 | | | $ | 32.12 | | | $ | 32.06 | |
| | | |
| | | | | | | | | | | | | | | | | | | | | | | | | |
Total Return, at Net Asset Value3 | | | 2.48 | % | | | (18.89 | )% | | | 19.26 | % | | | 6.64 | % | | | 7.39 | % | | | 7.89 | % |
| | | | | | | | | | | | | | | | | | | | | | | | | |
Ratios/Supplemental Data | | | | | | | | | | | | | | | | | | | | | | | | |
| Net assets, end of period (in thousands) | | $ | 25,586 | | | $ | 17,858 | | | $ | 22,007 | | | $ | 21,431 | | | $ | 25,539 | | | $ | 26,382 | |
| |
| Average net assets (in thousands) | | $ | 20,247 | | | $ | 20,349 | | | $ | 21,086 | | | $ | 24,755 | | | $ | 27,162 | | | $ | 23,702 | |
| |
Ratios to average net assets:4 | | | | | | | | | | | | | | | | | | | | | | | | |
| Net investment income (loss) | | | (0.19 | )% | | | 0.62 | % | | | 1.28 | % | | | 0.87 | % | | | 0.17 | % | | | (0.15 | )% |
| Total expenses | | | 1.94 | %5 | | | 1.90 | %5 | | | 1.73 | %5 | | | 1.77 | %5 | | | 1.69 | % | | | 1.73 | % |
| Expenses after payments, waivers and/or reimbursements and reduction to custodian expenses | | | 1.89 | % | | | 1.84 | % | | | 1.70 | % | | | 1.77 | % | | | 1.64 | % | | | 1.69 | % |
| |
| Portfolio turnover rate | | | 57 | % | | | 135 | % | | | 51 | % | | | 66 | % | | | 100 | % | | | 64 | % |
| | |
| 1. | | Per share amounts calculated based on the average shares outstanding during the period. |
| |
| 2. | | Less than $0.005 per share. |
| |
| 3. | | Assumes an investment on the business day before the first day of the fiscal period, with all dividends and distributions reinvested in additional shares on the reinvestment date, and redemption at the net asset value calculated on the last business day of the fiscal period. Sales charges are not reflected in the total returns. Total returns are not annualized for periods less than one full year. Returns do not reflect the deduction of taxes that a shareholder would pay on fund distributions or the redemption of fund shares. |
| |
| 4. | | Annualized for periods less than one full year. |
| |
| 5. | | Total expenses including indirect expenses from affiliated fund were as follows: |
| | | | | |
| Six Months Ended April 30, 2009 | | | 1.99 | % |
| Year Ended October 31, 2008 | | | 1.94 | % |
| Year Ended October 31, 2007 | | | 1.76 | % |
| Year Ended October 31, 2006 | | | 1.77 | % |
See accompanying Notes to Financial Statements.
F13 | OPPENHEIMER QUEST OPPORTUNITY VALUE FUND
FINANCIAL HIGHLIGHTS Continued
| | | | | | | | | | | | | | | | | | | | | | | | | |
| | | Six Months | | | | | | | | | | | | |
| | | Ended | | | | | | | | | | | | |
| | | April 30, 2009 | | | | | | | | | | | Year Ended October 31, | |
| Class Y | | (Unaudited) | | | 2008 | | | 2007 | | | 2006 | | | 2005 | | | 2004 | |
| |
Per Share Operating Data | | | | | | | | | | | | | | | | | | | | | | | | |
| Net asset value, beginning of period | | $ | 23.30 | | | $ | 34.39 | | | $ | 30.28 | | | $ | 32.70 | | | $ | 32.52 | | | $ | 30.11 | |
| |
| Income (loss) from investment operations: | | | | | | | | | | | | | | | | | | | | | | | | |
Net investment income1 | | | .05 | | | | .30 | | | | .56 | | | | .41 | | | | .22 | | | | .12 | |
| Net realized and unrealized gain (loss) | | | .53 | | | | (5.65 | ) | | | 5.20 | | | | 1.69 | | | | 2.28 | | | | 2.41 | |
| | | |
| Total from investment operations | | | .58 | | | | (5.35 | ) | | | 5.76 | | | | 2.10 | | | | 2.50 | | | | 2.53 | |
| |
| Dividends and/or distributions to shareholders: | | | | | | | | | | | | | | | | | | | | | | | | |
| Dividends from net investment income | | | — | | | | (3.48 | ) | | | (.42 | ) | | | (.30 | ) | | | (.09 | ) | | | (.12 | ) |
| Distributions from net realized gain | | | (.85 | ) | | | (2.26 | ) | | | (1.23 | ) | | | (4.22 | ) | | | (2.23 | ) | | | — | |
| | | |
| Total dividends and/or distributions to shareholders | | | (.85 | ) | | | (5.74 | ) | | | (1.65 | ) | | | (4.52 | ) | | | (2.32 | ) | | | (.12 | ) |
| |
| Net asset value, end of period | | $ | 23.03 | | | $ | 23.30 | | | $ | 34.39 | | | $ | 30.28 | | | $ | 32.70 | | | $ | 32.52 | |
| | | |
| | | | | | | | | | | | | | | | | | | | | | | | | |
Total Return, at Net Asset Value2 | | | 2.81 | % | | | (18.45 | )% | | | 19.85 | % | | | 7.21 | % | | | 7.98 | % | | | 8.42 | % |
| | | | | | | | | | | | | | | | | | | | | | | | | |
Ratios/Supplemental Data | | | | | | | | | | | | | | | | | | | | | | | | |
| Net assets, end of period (in thousands) | | $ | 34,604 | | | $ | 18,693 | | | $ | 14,784 | | | $ | 17,806 | | | $ | 28,100 | | | $ | 30,831 | |
| |
| Average net assets (in thousands) | | $ | 22,138 | | | $ | 17,505 | | | $ | 15,189 | | | $ | 23,687 | | | $ | 29,815 | | | $ | 30,649 | |
| |
Ratios to average net assets:3 | | | | | | | | | | | | | | | | | | | | | | | | |
| Net investment income | | | 0.44 | % | | | 1.08 | % | | | 1.77 | % | | | 1.39 | % | | | 0.69 | % | | | 0.38 | % |
| Total expenses | | | 1.30 | %4 | | | 1.35 | %4 | | | 1.25 | %4 | | | 1.24 | %4 | | | 1.17 | % | | | 1.16 | % |
| Expenses after payments, waivers and/or reimbursements and reduction to custodian expenses | | | 1.25 | % | | | 1.31 | % | | | 1.21 | % | | | 1.23 | % | | | 1.12 | % | | | 1.16 | % |
| |
| Portfolio turnover rate | | | 57 | % | | | 135 | % | | | 51 | % | | | 66 | % | | | 100 | % | | | 64 | % |
| | |
| 1. | | Per share amounts calculated based on the average shares outstanding during the period. |
| |
| 2. | | Assumes an investment on the business day before the first day of the fiscal period, with all dividends and distributions reinvested in additional shares on the reinvestment date, and redemption at the net asset value calculated on the last business day of the fiscal period. Sales charges are not reflected in the total returns. Total returns are not annualized for periods less than one full year. Returns do not reflect the deduction of taxes that a shareholder would pay on fund distributions or the redemption of fund shares. |
| |
| 3. | | Annualized for periods less than one full year. |
| |
| 4. | | Total expenses including indirect expenses from affiliated fund were as follows: |
| | | | | |
| Six Months Ended April 30, 2009 | | | 1.35 | % |
| Year Ended October 31, 2008 | | | 1.39 | % |
| Year Ended October 31, 2007 | | | 1.28 | % |
| Year Ended October 31, 2006 | | | 1.24 | % |
See accompanying Notes to Financial Statements.
F14 | OPPENHEIMER QUEST OPPORTUNITY VALUE FUND
NOTES TO FINANCIAL STATEMENTS Unaudited
1. Significant Accounting Policies
Oppenheimer Quest Opportunity Value Fund (the “Fund”), a series of Oppenheimer Quest For Value Funds, is an open-end management investment company registered under the Investment Company Act of 1940, as amended. The Fund’s investment objective is to seek growth of capital. The Fund’s investment adviser is OppenheimerFunds, Inc. (the “Manager”).
The Fund offers Class A, Class B, Class C, Class N and Class Y shares. Class A shares are sold at their offering price, which is normally net asset value plus a front-end sales charge. Class B, Class C and Class N shares are sold without a front-end sales charge but may be subject to a contingent deferred sales charge (“CDSC”). Class N shares are sold only through retirement plans. Retirement plans that offer Class N shares may impose charges on those accounts. Class Y shares are sold to certain institutional investors without either a front-end sales charge or a CDSC, however, the institutional investor may impose charges on those accounts. All classes of shares have identical rights and voting privileges with respect to the Fund in general and exclusive voting rights on matters that affect that class alone. Earnings, net assets and net asset value per share may differ due to each class having its own expenses, such as transfer and shareholder servicing agent fees and shareholder communications, directly attributable to that class. Class A, B, C and N have separate distribution and/or service plans. No such plan has been adopted for Class Y shares. Class B shares will automatically convert to Class A shares 72 months after the date of purchase.
The following is a summary of significant accounting policies consistently followed by the Fund.
Securities Valuation. The Fund calculates the net asset value of its shares as of the close of the New York Stock Exchange (the “Exchange”), normally 4:00 P.M. Eastern time, on each day the Exchange is open for trading.
Effective for fiscal periods beginning after November 15, 2007, FASB Statement of Financial Accounting Standards No. 157, Fair Value Measurements, establishes a hierarchy for measuring fair value of assets and liabilities. As required by the standard, each investment asset or liability of the Fund is assigned a level at measurement date based on the significance and source of the inputs to its valuation. Quoted prices in active markets for identical securities are classified as “Level 1,” inputs other than quoted prices for an asset that are observable are classified as “Level 2” and unobservable inputs, including the Manager’s judgment about the assumptions that a market participant would use in pricing an asset or liability are classified as “Level 3.” The inputs used for valuing securities are not necessarily an indication of the risks associated with investing in those securities. A table summarizing the Fund’s investments under these levels of classification is included following the Statement of Investments.
Securities are valued using quoted market prices, when available, as supplied primarily either by portfolio pricing services approved by the Board of Trustees or dealers. These securities are typically classified within Level 1 or 2; however, they may be designated as Level 3 if the dealer or portfolio pricing service values a security through an internal model with significant unobservable market data inputs.
F15 | OPPENHEIMER QUEST OPPORTUNITY VALUE FUND
NOTES TO FINANCIAL STATEMENTS Unaudited / Continued
1. Significant Accounting Policies Continued
Securities traded on a registered U.S. securities exchange are valued based on the last sale price of the security reported on the principal exchange on which traded, prior to the time when the Fund’s assets are valued. Securities whose principal exchange is NASDAQ® are valued based on the official closing prices reported by NASDAQ prior to the time when the Fund’s assets are valued. In the absence of a sale, the security is valued at the last sale price on the prior trading day, if it is within the spread of the current day’s closing “bid” and “asked” prices, and if not, at the current day’s closing bid price. A foreign security traded on a foreign exchange is valued based on the last sale price on the principal exchange on which the security is traded, as identified by the portfolio pricing service used by the Manager, prior to the time when the Fund’s assets are valued. In the absence of a sale, the security is valued at the most recent official closing price on the principal exchange on which it is traded.
Shares of a registered investment company that are not traded on an exchange are valued at that investment company’s net asset value per share.
Corporate, government and municipal debt instruments having a remaining maturity in excess of sixty days and all mortgage-backed securities, collateralized mortgage obligations and other asset-backed securities are valued at the mean between the “bid” and “asked” prices.
“Money market-type” debt instruments with remaining maturities of sixty days or less are valued at cost adjusted by the amortization of discount or premium to maturity (amortized cost), which approximates market value. These securities are typically designated as Level 2.
In the absence of a readily available quoted market price, including for securities whose values have been materially affected by what the Manager identifies as a significant event occurring before the Fund’s assets are valued but after the close of the securities’ respective exchanges, the Manager, acting through its internal valuation committee, in good faith determines the fair valuation of that asset using consistently applied procedures under the supervision of the Board of Trustees (which reviews those fair valuations by the Manager). Those procedures include certain standardized methodologies to fair value securities. Such methodologies include, but are not limited to, pricing securities initially at cost and subsequently adjusting the value based on: changes in company specific fundamentals, changes in an appropriate securities index, or changes in the value of similar securities which may be adjusted for any discounts related to resale restrictions. When possible, such methodologies use observable market inputs such as quoted prices of similar securities, observable interest rates, currency rates and yield curves. The methodologies used for valuing securities are not necessarily an indication of the risks associated with investing in those securities.
Fair valued securities may be classified as “Level 3” if the valuation primarily reflects the Manager’s own assumptions about the inputs that market participants would use in valuing such securities.
There have been no significant changes to the fair valuation methodologies during the period.
F16 | OPPENHEIMER QUEST OPPORTUNITY VALUE FUND
Securities Sold Short. The Fund sells securities that it does not own, and it will therefore be obligated to purchase such securities at a future date. Upon entering into a short position, the Fund is required to segregate securities at its custodian with a value equal to a certain percentage of the value of the securities that it sold short. Securities that have been segregated for this purpose are disclosed as such in the Statement of Investments. The value of the open short position is recorded as a liability, and the Fund records an unrealized gain or loss to the extent of the difference between the proceeds received and the change in value of the open short position. The Fund records a realized gain or loss when the short position is closed out. By entering into short sales, the Fund bears the market risk of increases in value of the security sold short in excess of the proceeds received. Until the security is replaced, the Fund is required to pay the lender any dividend or interest earned. Dividend expense on short sales is treated as an expense in the Statement of Operations.
Concentration of Risks. The Fund from time to time may have elements of concentration risk due to the value of certain securities held compared to the overall net investments value of the Fund. Such concentrations may subject the Fund to additional risks.
Foreign Currency Translation. The Fund’s accounting records are maintained in U.S. dollars. The values of securities denominated in foreign currencies and amounts related to the purchase and sale of foreign securities and foreign investment income are translated into U.S. dollars as of the close of the Exchange, normally 4:00 P.M. Eastern time, on each day the Exchange is open for trading. Foreign exchange rates may be valued primarily using a reliable bank, dealer or service authorized by the Board of Trustees.
Reported net realized gains and losses from foreign currency transactions arise from sales of portfolio securities, sales and maturities of short-term securities, sales of foreign currencies, exchange rate fluctuations between the trade and settlement dates on securities transactions, and the difference between the amounts of dividends, interest, and foreign withholding taxes recorded on the Fund’s books and the U.S. dollar equivalent of the amounts actually received or paid. Net unrealized appreciation and depreciation on the translation of assets and liabilities denominated in foreign currencies arise from changes in the values of assets and liabilities, including investments in securities at fiscal period end, resulting from changes in exchange rates.
The effect of changes in foreign currency exchange rates on investments is separately identified from the fluctuations arising from changes in market values of securities held and reported with all other foreign currency gains and losses in the Fund’s Statement of Operations.
Investment in Oppenheimer Institutional Money Market Fund. The Fund is permitted to invest daily available cash balances in an affiliated money market fund. The Fund may invest the available cash in Class E shares of Oppenheimer Institutional Money Market Fund (“IMMF”) to seek current income while preserving liquidity. IMMF is a registered open-end management investment company, regulated as a money market fund under
F17 | OPPENHEIMER QUEST OPPORTUNITY VALUE FUND
NOTES TO FINANCIAL STATEMENTS Unaudited / Continued
1. Significant Accounting Policies Continued
the Investment Company Act of 1940, as amended. The Manager is also the investment adviser of IMMF. When applicable, the Fund’s investment in IMMF is included in the Statement of Investments. As a shareholder, the Fund is subject to its proportional share of IMMF’s Class E expenses, including its management fee. The Manager will waive fees and/or reimburse Fund expenses in an amount equal to the indirect management fees incurred through the Fund’s investment in IMMF.
Investment in OFI Liquid Assets Fund, LLC. The Fund is permitted to invest cash collateral received in connection with its securities lending activities. Pursuant to the Fund’s Securities Lending Procedures, the Fund may invest cash collateral in, among other investments, an affiliated money market fund. OFI Liquid Assets Fund, LLC (“LAF”) is a limited liability company whose investment objective is to seek current income and stability of principal. The Manager is also the investment adviser of LAF. LAF is not registered under the Investment Company Act of 1940. However, LAF does comply with the investment restrictions applicable to registered money market funds set forth in Rule 2a-7 adopted under the Investment Company Act. When applicable, the Fund’s investment in LAF is included in the Statement of Investments. As a shareholder, the Fund is subject to its proportional share of LAF’s expenses, including its management fee of 0.08%.
Investments With Off-Balance Sheet Market Risk. The Fund enters into financial instrument transactions (such as swaps, futures, options and other derivatives) that may have off-balance sheet market risk. Off-balance sheet market risk exists when the maximum potential loss on a particular financial instrument is greater than the value of such financial instrument, as reflected in the Fund’s Statement of Assets and Liabilities.
Use of Leverage. Derivatives may have little or no initial cash investment relative to their market value exposure and therefore can produce significant gains or losses in excess of their cost. This use of embedded leverage allows the Fund to increase its market value exposure relative to its net assets and can substantially increase the volatility of the Fund’s performance.
Allocation of Income, Expenses, Gains and Losses. Income, expenses (other than those attributable to a specific class), gains and losses are allocated on a daily basis to each class of shares based upon the relative proportion of net assets represented by such class. Operating expenses directly attributable to a specific class are charged against the operations of that class.
Federal Taxes. The Fund intends to comply with provisions of the Internal Revenue Code applicable to regulated investment companies and to distribute substantially all of its investment company taxable income, including any net realized gain on investments not offset by capital loss carryforwards, if any, to shareholders. Therefore, no
F18 | OPPENHEIMER QUEST OPPORTUNITY VALUE FUND
federal income or excise tax provision is required. The Fund files income tax returns in U.S. federal and applicable state jurisdictions. The statute of limitations on the Fund’s tax return filings generally remain open for the three preceding fiscal reporting period ends.
During the fiscal year ended October 31, 2008, the Fund did not utilize any capital loss carryforward to offset capital gains realized in that fiscal year. As of October 31, 2008, the Fund had available for federal income tax purposes straddle losses of $169,405.
As of April 30, 2009, the Fund had available for federal income tax purposes an estimated capital loss carryforward of $846,999 expiring by 2018. This estimated capital loss carryforward represents carryforward as of the end of the last fiscal year, increased for losses deferred under tax accounting rules to the current fiscal year and is increased or decreased by capital losses or gains realized in the first six months of the current fiscal year. During the six months ended April 30, 2009, it is estimated that the Fund will not utilize any capital loss carryforward to offset realized capital gains.
Net investment income (loss) and net realized gain (loss) may differ for financial statement and tax purposes. The character of dividends and distributions made during the fiscal year from net investment income or net realized gains may differ from their ultimate characterization for federal income tax purposes. Also, due to timing of dividends and distributions, the fiscal year in which amounts are distributed may differ from the fiscal year in which the income or net realized gain was recorded by the Fund.
The aggregate cost of securities and other investments and the composition of unrealized appreciation and depreciation of securities and other investments for federal income tax purposes as of April 30, 2009 are noted in the following table. The primary difference between book and tax appreciation or depreciation of securities and other investments, if applicable, is attributable to the tax deferral of losses or tax realization of financial statement unrealized gain or loss.
| | | | | |
| Federal tax cost of securities | | $ | 1,747,767,187 | |
| Federal tax cost of other investments | | | (24,984,231 | ) |
| | | | |
| Total federal tax cost | | $ | 1,722,782,956 | |
| | | | |
| |
| Gross unrealized appreciation | | $ | 64,840,156 | |
| Gross unrealized depreciation | | | (176,018,896 | ) |
| | | | |
| Net unrealized depreciation | | $ | (111,178,740 | ) |
| | | | |
Trustees’ Compensation. The Fund has adopted an unfunded retirement plan (the “Plan”) for the Fund’s independent trustees. Benefits are based on years of service and fees paid to each trustee during their period of service. The Plan was frozen with respect to adding new participants effective December 31, 2007 (the “Freeze Date”) and existing Plan Participants as of the Freeze Date have each elected a distribution method with respect to their benefits under the Plan.
F19 | OPPENHEIMER QUEST OPPORTUNITY VALUE FUND
NOTES TO FINANCIAL STATEMENTS Unaudited / Continued
1. Significant Accounting Policies Continued
During the six months ended April 30, 2009, the Fund’s projected benefit obligations, payments to retired trustees and accumulated liability were as follows:
| | | | | |
| Projected Benefit Obligations Increased | | $ | 12,021 | |
| Payments Made to Retired Trustees | | | 49,312 | |
| Accumulated Liability as of April 30, 2009 | | | 222,307 | |
The Board of Trustees has adopted a compensation deferral plan for independent trustees that enables trustees to elect to defer receipt of all or a portion of the annual compensation they are entitled to receive from the Fund. For purposes of determining the amount owed to the Trustee under the plan, deferred amounts are treated as though equal dollar amounts had been invested in shares of the Fund or in other Oppenheimer funds selected by the Trustee. The Fund purchases shares of the funds selected for deferral by the Trustee in amounts equal to his or her deemed investment, resulting in a Fund asset equal to the deferred compensation liability. Such assets are included as a component of “Other” within the asset section of the Statement of Assets and Liabilities. Deferral of trustees’ fees under the plan will not affect the net assets of the Fund, and will not materially affect the Fund’s assets, liabilities or net investment income per share. Amounts will be deferred until distributed in accordance to the compensation deferral plan.
Dividends and Distributions to Shareholders. Dividends and distributions to shareholders, which are determined in accordance with income tax regulations and may differ from U.S. generally accepted accounting principles, are recorded on the ex-dividend date. Income and capital gain distributions, if any, are declared and paid annually or at other times as deemed necessary by the Manager. The tax character of distributions is determined as of the Fund’s fiscal year end. Therefore, a portion of the Fund’s distributions made to shareholders prior to the Fund’s fiscal year end may ultimately be categorized as a tax return of capital.
Investment Income. Dividend income is recorded on the ex-dividend date or upon ex-dividend notification in the case of certain foreign dividends where the ex-dividend date may have passed. Non-cash dividends included in dividend income, if any, are recorded at the fair market value of the securities received. Interest income is recognized on an accrual basis. Discount and premium, which are included in interest income on the Statement of Operations, are amortized or accreted daily.
Custodian Fees. “Custodian fees and expenses” in the Statement of Operations may include interest expense incurred by the Fund on any cash overdrafts of its custodian account during the period. Such cash overdrafts may result from the effects of failed trades in portfolio securities and from cash outflows resulting from unanticipated shareholder redemption activity. The Fund pays interest to its custodian on such cash overdrafts, to the extent they are not offset by positive cash balances maintained by the Fund, at a rate equal to the Federal Funds Rate plus 0.50%. The “Reduction to custodian expenses” line item, if applicable, represents earnings on cash balances maintained by the Fund
F20 | OPPENHEIMER QUEST OPPORTUNITY VALUE FUND
during the period. Such interest expense and other custodian fees may be paid with these earnings.
Security Transactions. Security transactions are recorded on the trade date. Realized gains and losses on securities sold are determined on the basis of identified cost.
Indemnifications. The Fund’s organizational documents provide current and former trustees and officers with a limited indemnification against liabilities arising in connection with the performance of their duties to the Fund. In the normal course of business, the Fund may also enter into contracts that provide general indemnifications. The Fund’s maximum exposure under these arrangements is unknown as this would be dependent on future claims that may be made against the Fund. The risk of material loss from such claims is considered remote.
Other. The preparation of financial statements in conformity with accounting principles generally accepted in the United States of America requires management to make estimates and assumptions that affect the reported amounts of assets and liabilities and disclosure of contingent assets and liabilities at the date of the financial statements and the reported amounts of increases and decreases in net assets from operations during the reporting period. Actual results could differ from those estimates.
2. Shares of Beneficial Interest
The Fund has authorized an unlimited number of $0.01 par value shares of beneficial interest of each class. Transactions in shares of beneficial interest were as follows:
| | | | | | | | | | | | | | | | | |
| | | Six Months Ended April 30, 2009 | | | Year Ended October 31, 2008 | |
| | | Shares | | | Amount | | | Shares | | | Amount | |
| |
Class A | | | | | | | | | | | | | | | | |
| Sold | | | 13,077,559 | | | $ | 285,499,785 | | | | 13,236,677 | | | $ | 360,999,932 | |
| Dividends and/or distributions reinvested | | | 1,781,869 | | | | 37,472,501 | | | | 6,457,412 | | | | 181,259,556 | |
| Redeemed | | | (5,881,670 | ) | | | (127,563,961 | ) | | | (8,258,900 | ) | | | (226,728,313 | ) |
| | | |
| Net increase | | | 8,977,758 | | | $ | 195,408,325 | | | | 11,435,189 | | | $ | 315,531,175 | |
| | | |
| | | | | | | | | | | | | | | | | |
Class B | | | | | | | | | | | | | | | | |
| Sold | | | 1,253,130 | | | $ | 26,031,246 | | | | 1,196,000 | | | $ | 31,273,067 | |
| Dividends and/or distributions reinvested | | | 170,973 | | | | 3,417,742 | | | | 771,963 | | | | 20,803,933 | |
| Redeemed | | | (1,005,424 | ) | | | (20,732,748 | ) | | | (2,016,479 | ) | | | (54,709,641 | ) |
| | | |
| Net increase (decrease) | | | 418,679 | | | $ | 8,716,240 | | | | (48,516 | ) | | $ | (2,632,641 | ) |
| | | |
| | | | | | | | | | | | | | | | | |
Class C | | | | | | | | | | | | | | | | |
| Sold | | | 3,516,007 | | | $ | 72,819,436 | | | | 2,646,884 | | | $ | 67,904,625 | |
| Dividends and/or distributions reinvested | | | 262,841 | | | | 5,227,901 | | | | 791,795 | | | | 21,235,946 | |
| Redeemed | | | (1,027,522 | ) | | | (21,081,471 | ) | | | (1,421,798 | ) | | | (36,610,758 | ) |
| | | |
| Net increase | | | 2,751,326 | | | $ | 56,965,866 | | | | 2,016,881 | | | $ | 52,529,813 | |
| | | |
F21 | OPPENHEIMER QUEST OPPORTUNITY VALUE FUND
NOTES TO FINANCIAL STATEMENTS Unaudited / Continued
2. Shares of Beneficial Interest Continued
| | | | | | | | | | | | | | | | | |
| | | Six Months Ended April 30, 2009 | | | Year Ended October 31, 2008 | |
| | | Shares | | | Amount | | | Shares | | | Amount | |
| |
Class N | | | | | | | | | | | | | | | | |
| Sold | | | 511,214 | | | $ | 10,955,506 | | | | 354,792 | | | $ | 9,479,421 | |
| Dividends and/or distributions reinvested | | | 35,102 | | | | 723,452 | | | | 131,039 | | | | 3,620,481 | |
| Redeemed | | | (188,098 | ) | | | (4,005,188 | ) | | | (353,318 | ) | | | (9,418,233 | ) |
| | | |
| Net increase | | | 358,218 | | | $ | 7,673,770 | | | | 132,513 | | | $ | 3,681,669 | |
| | | |
| | | | | | | | | | | | | | | | | |
Class Y | | | | | | | | | | | | | | | | |
| Sold | | | 850,008 | | | $ | 18,948,795 | | | | 486,363 | | | $ | 13,343,895 | |
| Dividends and/or distributions reinvested | | | 34,930 | | | | 739,822 | | | | 88,364 | | | | 2,491,862 | |
| Redeemed | | | (184,322 | ) | | | (4,027,995 | ) | | | (202,405 | ) | | | (5,479,877 | ) |
| | | |
| Net increase | | | 700,616 | | | $ | 15,660,622 | | | | 372,322 | | | $ | 10,355,880 | |
| | | |
3. Purchases and Sales of Securities
The aggregate cost of purchases and proceeds from sales of securities, other than short-term obligations and investments in IMMF and LAF, for the six months ended April 30, 2009, were as follows:
| | | | | | | | | |
| | | Purchases | | | Sales | |
| |
| Investment securities | | $ | 346,996,810 | | | $ | 445,762,165 | |
4. Fees and Other Transactions with Affiliates
Management Fees. Under the investment advisory agreement, the Fund pays the Manager a management fee based on the daily net assets of the Fund at an annual rate as shown in the following table:
| | | | | |
| Fee Schedule | | | | |
| |
| Up to $1.0 billion | | | 0.85 | % |
| Next $500 million | | | 0.80 | |
| Next $500 million | | | 0.75 | |
| Next $500 million | | | 0.70 | |
| Next $500 million | | | 0.65 | |
| Next $500 million | | | 0.60 | |
| Next $500 million | | | 0.55 | |
| Over $4.0 billion | | | 0.50 | |
Transfer Agent Fees. OppenheimerFunds Services (“OFS”), a division of the Manager, acts as the transfer and shareholder servicing agent for the Fund. The Fund pays OFS a per account fee. For the six months ended April 30, 2009, the Fund paid $1,489,367 to OFS for services to the Fund.
Additionally, Class Y shares are subject to minimum fees of $10,000 annually for assets of $10 million or more. The Class Y shares are subject to the minimum fees in the event that the per account fee does not equal or exceed the applicable minimum fees. OFS may voluntarily waive the minimum fees.
F22 | OPPENHEIMER QUEST OPPORTUNITY VALUE FUND
Distribution and Service Plan (12b-1) Fees. Under its General Distributor’s Agreement with the Fund, OppenheimerFunds Distributor, Inc. (the “Distributor”) acts as the Fund’s principal underwriter in the continuous public offering of the Fund’s classes of shares.
Distribution and Service Plan for Class A Shares. The Fund has adopted a Distribution and Service Plan (the “Plan”) for Class A shares. Under the Plan, the Fund pays a service fee to the Distributor of up to 0.25% of the average annual net assets of Class A shares. The Distributor currently uses all of those fees to pay dealers, brokers, banks and other financial institutions periodically for providing personal services and maintenance of accounts of their customers that hold Class A shares. Under the Plan, the Fund may also pay an asset-based sales charge to the Distributor. Beginning January 1, 2003, the Board of Trustees set the annual asset-based sales charge rate at zero. Fees incurred by the Fund under the Plan are detailed in the Statement of Operations.
Distribution and Service Plans for Class B, Class C and Class N Shares. The Fund has adopted Distribution and Service Plans (the “Plans”) for Class B, Class C and Class N shares under Rule 12b-1 of the Investment Company Act of 1940 to compensate the Distributor for its services in connection with the distribution of those shares and servicing accounts. Under the Plans, the Fund pays the Distributor an annual asset-based sales charge of 0.75% on Class B and Class C shares and 0.25% on Class N shares. The Distributor also receives a service fee of 0.25% per year under each plan. If either the Class B, Class C or Class N plan is terminated by the Fund or by the shareholders of a class, the Board of Trustees and its independent trustees must determine whether the Distributor shall be entitled to payment from the Fund of all or a portion of the service fee and/or asset-based sales charge in respect to shares sold prior to the effective date of such termination. The Distributor’s aggregate uncompensated expenses under the Plans at March 31, 2009 for Class C and Class N shares were $9,807,640 and $786,135, respectively. Fees incurred by the Fund under the Plans are detailed in the Statement of Operations.
Sales Charges. Front-end sales charges and contingent deferred sales charges (“CDSC”) do not represent expenses of the Fund. They are deducted from the proceeds of sales of Fund shares prior to investment or from redemption proceeds prior to remittance, as applicable. The sales charges retained by the Distributor from the sale of shares and the CDSC retained by the Distributor on the redemption of shares is shown in the following table for the period indicated.
| | | | | | | | | | | | | | | | | | | | | |
| | | | | | | Class A | | | Class B | | | Class C | | | Class N | |
| | | Class A | | | Contingent | | | Contingent | | | Contingent | | | Contingent | |
| | | Front-End | | | Deferred | | | Deferred | | | Deferred | | | Deferred | |
| | | Sales Charges | | | Sales Charges | | | Sales Charges | | | Sales Charges | | | Sales Charges | |
| Six Months | | Retained by | | | Retained by | | | Retained by | | | Retained by | | | Retained by | |
| Ended | | Distributor | | | Distributor | | | Distributor | | | Distributor | | | Distributor | |
| |
| April 30, 2009 | | $ | 284,963 | | | $ | 2,548 | | | $ | 81,792 | | | $ | 20,590 | | | $ | 1,314 | |
F23 | OPPENHEIMER QUEST OPPORTUNITY VALUE FUND
NOTES TO FINANCIAL STATEMENTS Unaudited / Continued
4. Fees and Other Transactions with Affiliates Continued
Waivers and Reimbursements of Expenses. OFS has voluntarily agreed to limit transfer and shareholder servicing agent fees for all classes to 0.35% of average annual net assets per class. This undertaking may be amended or withdrawn at any time.
During the six months ended April 30, 2009, OFS waived transfer and shareholder servicing agent fees as follows:
The Manager will waive fees and/or reimburse Fund expenses in an amount equal to the indirect management fees incurred through the Fund’s investment in IMMF. During the six months ended April 30, 2009, the Manager waived $364,807 for IMMF management fees.
5. Foreign Currency Exchange Contracts
The Fund may enter into foreign currency exchange contracts (“forward contracts”) for the purchase or sale of a foreign currency at a negotiated rate at a future date.
Forward contracts are reported on a schedule following the Statement of Investments. Forward contracts will be valued daily based upon the closing prices of the forward currency rates determined at the close of the Exchange as provided by a bank, dealer or pricing service. The resulting unrealized appreciation (depreciation) is reported in the Statement of Assets and Liabilities as a receivable or payable and in the Statement of Operations within the change in unrealized appreciation (depreciation). At contract close, the difference between the original cost of the contract and the value at the close date is recorded as a realized gain (loss) in the Statement of Operations.
Risks to the Fund include both market and credit risk. Market risk is the risk that the value of the forward contract will depreciate due to unfavorable changes in the exchange rates. Credit risk arises from the possibility that the counterparty will default. If the counterparty defaults, the Fund’s loss will consist of the net amount of contractual payments that the Fund has not yet received.
As of April 30, 2009, the Fund had no outstanding forward contracts.
6. Option Activity
The Fund may buy and sell put and call options, or write put and covered call options. When an option is written, the Fund receives a premium and becomes obligated to sell or purchase the underlying security at a fixed price, upon exercise of the option.
Options are valued daily based upon the last sale price on the principal exchange on which the option is traded. The difference between the premium received or paid, and market value of the option, is recorded as unrealized appreciation or depreciation. The net change in unrealized appreciation or depreciation is reported in the Statement of Operations. When an option is exercised, the cost of the security purchased or the proceeds of the security sale are adjusted by the amount of premium received or paid. Upon the expiration or closing of the option transaction, a gain or loss is reported in the Statement of Operations.
F24 | OPPENHEIMER QUEST OPPORTUNITY VALUE FUND
Securities designated to cover outstanding call or put options are noted in the Statement of Investments where applicable. Options written are reported in a schedule following the Statement of Investments and as a liability in the Statement of Assets and Liabilities.
The risk in writing a call option is that the Fund gives up the opportunity for profit if the market price of the security increases and the option is exercised. The risk in writing a put option is that the Fund may incur a loss if the market price of the security decreases and the option is exercised. The risk in buying an option is that the Fund pays a premium whether or not the option is exercised. The Fund also has the additional risk that there may be an illiquid market where the Fund is unable to close the contract.
Written option activity for the six months ended April 30, 2009 was as follows:
| | | | | | | | | |
| | | Put Options | |
| | | Number of | | | Amount of | |
| | | Contracts | | | Premiums | |
| |
| Options outstanding as of October 31, 2008 | | | — | | | $ | — | |
| Options written | | | 8,000 | | | | 1,501,424 | |
| | | |
| Options outstanding as of April 30, 2009 | | | 8,000 | | | $ | 1,501,424 | |
| | | |
7. Swap Contracts
The Fund may enter into privately negotiated agreements with a counterparty to exchange or “swap” payments at specified future intervals based on the return of an asset (such as a stock, bond or currency) or non-asset reference (such as an interest rate or index). The swap agreement will specify the “notional” amount of the asset or non-asset reference to which the contract relates. As derivative contracts, swaps typically do not have an associated cost at contract inception. At initiation, contract terms are typically set at market value such that the value of the swap is $0. If a counterparty specifies terms that would result in the contract having a value other than $0 at initiation, one counterparty will pay the other an upfront payment to equalize the contract. Subsequent changes in market value are calculated based upon changes in the performance of the asset or non-asset reference multiplied by the notional value of the contract. Contract types may include credit default, interest rate, total return, and currency swaps.
Swaps are marked to market daily using quotations primarily from pricing services, counterparties or brokers. Swap contracts are reported on a schedule following the Statement of Investments. The value of the contracts is separately disclosed on the Statement of Assets and Liabilities. The unrealized appreciation (depreciation) is comprised of the change in the valuation of the swap combined with the accrued interest due to (owed by) the Fund at termination or settlement. The net change in this amount during the period is included on the Statement of Operations. Any payment received or paid to initiate a contract is recorded as a cost of the swap in the Statement of Assets and Liabilities and as a component of unrealized gain or loss on the Statement of Operations
F25 | OPPENHEIMER QUEST OPPORTUNITY VALUE FUND
NOTES TO FINANCIAL STATEMENTS Unaudited / Continued
7. Swap Contracts Continued
until contract termination; upon contract termination, this amount is recorded as realized gain or loss on the Statement of Operations. Excluding amounts paid at contract initiation as described above, the Fund also records any periodic payments received from (paid to) the counterparty, including at termination, as realized gain (loss) on the Statement of Operations.
Risks of entering into swap contracts include credit, market and liquidity risk. Credit risk arises from the possibility that the counterparty fails to make a payment when due or otherwise defaults under the terms of the contract. If the counterparty defaults, the Fund’s loss will consist of the net amount of contractual payments that the Fund has not yet received. Market risk is the risk that the value of the contract will depreciate due to unfavorable changes in the performance of the asset or non-asset reference. Liquidity risk is the risk that the Fund may be unable to close the contract prior to its termination.
Credit Default Swap Contracts. A credit default swap is a bilateral contract that enables an investor to buy or sell protection on a debt security against a defined-issuer credit event, such as the issuer’s failure to make timely payments of interest or principal on the debt security, bankruptcy or restructuring. The Fund may enter into credit default swaps either by buying or selling protection on a single security or a basket of securities (the “reference asset”).
The buyer of protection pays a periodic fee to the seller of protection based on the notional amount of debt securities underlying the swap contract. The seller of protection agrees to compensate the buyer of protection for future potential losses as a result of a credit event on the reference asset. The contract effectively transfers the credit event risk of the reference asset from the buyer of protection to the seller of protection.
The ongoing value of the contract will fluctuate throughout the term of the contract based primarily on the credit risk of the reference asset. If the credit quality of the reference asset improves relative to the credit quality at contract initiation, the buyer of protection may have an unrealized loss greater than the anticipated periodic fee owed. This unrealized loss would be the result of current credit protection being cheaper than the cost of credit protection at contract initiation. If the buyer elects to terminate the contract prior to its maturity, and there has been no credit event, this unrealized loss will become realized. If the contract is held to maturity, and there has been no credit event, the realized loss will be equal to the periodic fee paid over the life of the contract.
If there is a credit event, the buyer of protection can exercise its rights under the contract and receive a payment from the seller of protection equal to the notional amount of the reference asset less the market value of the reference asset. Upon exercise of the contract the difference between the value of the underlying reference asset and the notional amount is recorded as realized gain (loss) and is included on the Statement of Operations.
Risks of credit default swaps include credit, market and liquidity risk. Additional risks include but are not limited to: the cost of paying for credit protection if there are no credit events or the cost of selling protection when a credit event occurs (paying the
F26 | OPPENHEIMER QUEST OPPORTUNITY VALUE FUND
notional amount to the protection buyer); and pricing transparency when assessing the value of a credit default swap.
As of April 30, 2009, the Fund has purchased credit protection through credit default swaps to decrease exposure to the credit risk of individual securities and, or, indexes.
8. Securities Lending
The Fund lends portfolio securities from time to time in order to earn additional income in the form of fees or interest on securities received as collateral or the investment of any cash received as collateral. The loans are secured by collateral (either securities, letters of credit, or cash) in an amount not less than 100% of the market value of the loaned securities during the period of the loan. The market value of the loaned securities is determined at the close of each business day and any additional required collateral is delivered to the Fund on the next business day. If the borrower defaults on its obligation to return the securities loaned because of insolvency or other reasons, the Fund could experience delays and cost in recovering the securities loaned or in gaining access to the collateral. The Fund continues to receive the economic benefit of interest or dividends paid on the securities loaned in the form of a substitute payment received from the borrower and recognizes the gain or loss in the fair value of the securities loaned that may occur during the term of the loan. The Fund has the right under the lending agreement to recover the securities from the borrower on demand. As of April 30, 2009, the Fund had on loan securities valued at $20,206,120. Collateral of $21,313,600 was received for the loans, all of which was received in cash and subsequently invested in approved instruments.
9. Recent Accounting Pronouncement
In March 2008, the Financial Accounting Standards Board (“FASB”) issued Statement on Financial Accounting Standards (“SFAS”) No. 161, Disclosures about Derivative Instruments and Hedging Activities. This standard requires enhanced disclosures about derivative and hedging activities, including qualitative disclosures about how and why the Fund uses derivative instruments, how these activities are accounted for, and their effect on the Fund’s financial position, financial performance and cash flows. SFAS No. 161 is effective for financial statements issued for fiscal years and interim periods beginning after November 15, 2008. At this time, management is evaluating the implications of SFAS No. 161 and its impact on the Fund’s financial statements and related disclosures.
10. Pending Litigation
During 2009, a number of complaints have been filed in federal courts against the Manager, the Distributor, and certain of the funds in the Oppenheimer family of funds (the “Defendant Funds”) advised by the Manager and distributed by the Distributor. The complaints naming the Defendant Funds also name certain officers, trustees and former trustees of the respective Defendant Funds. The plaintiffs seek class action status on behalf of
F27 | OPPENHEIMER QUEST OPPORTUNITY VALUE FUND
NOTES TO FINANCIAL STATEMENTS Unaudited / Continued
10. Pending Litigation Continued
purchasers of shares of the respective Defendant Fund during a particular time period. The complaints against the Defendant Funds raise claims under federal securities laws alleging that, among other things, the disclosure documents of the respective Defendant Fund contained misrepresentations and omissions, that such Defendant Fund’s investment policies were not followed, and that such Defendant Fund and the other defendants violated federal securities laws and regulations. The plaintiffs seek unspecified damages, equitable relief and an award of attorneys’ fees and litigation expenses. Additionally, a complaint has been brought in state court against the Manager, the Distributor and another subsidiary of the Manager (but not the Fund), on behalf of the Oregon College Savings Plan Trust. The complaint alleges breach of contract, breach of fiduciary duty, negligence and violation of state securities laws, and seeks compensatory damages, equitable relief and an award of attorneys’ fees and litigation expenses.
Other complaints have been filed in 2008 and 2009 in state and federal courts, by investors who made investments through an affiliate of the Manager, against the Manager and certain of its affiliates. Those complaints relate to the alleged investment fraud perpetrated by Bernard Madoff and his firm (“Madoff ”) and allege a variety of claims including breach of fiduciary duty, fraud, negligent misrepresentation, unjust enrichment, and violation of federal and state securities laws and regulations, among others. They seek unspecified damages, equitable relief, and an award of attorneys’ fees and litigation expenses. None of the suits have named the Distributor, any of the Oppenheimer mutual funds or any of their independent Trustees or Directors. None of the Oppenheimer funds invested in any funds or accounts managed by Madoff.
The Manager believes that the lawsuits described above are without legal merit and intends to defend them vigorously. The Defendant Funds’ Boards of Trustees have also engaged counsel to defend the suits vigorously on behalf of those Funds, their boards and the Trustees named in those suits. The Manager believes that it is premature to render any opinion as to the likelihood of an outcome unfavorable to it and that no estimate can be made with any degree of certainty as to the amount or range of any potential loss. The Manager also believes that these suits should not impair the ability of the Manager or the Distributor to perform their respective duties to the Fund.
F28 | OPPENHEIMER QUEST OPPORTUNITY VALUE FUND
PORTFOLIO PROXY VOTING POLICIES AND PROCEDURES; UPDATES TO STATEMENTS OF INVESTMENTS Unaudited
The Fund has adopted Portfolio Proxy Voting Policies and Procedures under which the Fund votes proxies relating to securities (“portfolio proxies”) held by the Fund. A description of the Fund’s Portfolio Proxy Voting Policies and Procedures is available (i) without charge, upon request, by calling the Fund toll-free at 1.800.525.7048, (ii) on the Fund’s website at www.oppenheimerfunds.com, and (iii) on the SEC’s website at www.sec.gov. In addition, the Fund is required to file Form N-PX, with its complete proxy voting record for the 12 months ended June 30th, no later than August 31st of each year. The Fund’s voting record is available (i) without charge, upon request, by calling the Fund toll-free at 1.800.525.7048, and (ii) in the Form N-PX filing on the SEC’s website at www.sec.gov.
The Fund files its complete schedule of portfolio holdings with the SEC for the first quarter and the third quarter of each fiscal year on Form N-Q. The Fund’s Form N-Q filings are available on the SEC’s website at http://www.sec.gov. Those forms may be reviewed and copied at the SEC’s Public Reference Room in Washington, D.C. Information on the operation of the Public Reference Room may be obtained by calling 1-800-SEC-0330.
Householding—Delivery of Shareholder Documents
This is to inform you about OppenheimerFunds’ “householding” policy. If more than one member of your household maintains an account in a particular fund, OppenheimerFunds will mail only one copy of the fund’s prospectus, annual and semiannual report and privacy policy. The consolidation of these mailings, called householding, benefits your fund through reduced mailing expense, and benefits you by reducing the volume of mail you receive from OppenheimerFunds. Householding does not affect the delivery of your account statements.
Please note that we will continue to household these mailings for as long as you remain an OppenheimerFunds shareholder, unless you request otherwise. If you prefer to receive multiple copies of these materials, please call us at 1.800.CALL-OPP (225-5677). You may also notify us in writing or via email. We will begin sending you individual copies of the prospectus, reports and privacy policy within 30 days of receiving your request to stop householding.
15 | OPPENHEIMER QUEST OPPORTUNITY VALUE FUND
Financial Statements for Oppenheimer Institutional Money Market Fund
| 18 | | Statement of Investments |
| |
| 23 | | Statement of Assets and Liabilities |
| |
| 24 | | Statement of Operations |
| |
| 25 | | Statements of Changes in Net Assets |
| |
| 26 | | Financial Highlights |
| |
| 29 | | Notes to Financial Statements |
17 | OPPENHEIMER QUEST OPPORTUNITY VALUE FUND
OPPENHEIMER INSTITUTIONAL MONEY MARKET FUND
STATEMENT OF INVESTMENTS November 30, 2008 / Unaudited
| | | | | | | | | |
| | | Principal | | | | |
| | | Amount | | | Value | |
| |
Certificates of Deposit—21.5% | | | | | | | | |
Yankee Certificates of Deposit—21.5% | | | | | | | | |
| Abbey National Treasury Services plc, Stamford, CT: | | | | | | | | |
| 3.06%, 12/12/08 | | $ | 18,500,000 | | | $ | 18,500,000 | |
| 3.06%, 12/12/08 | | | 15,000,000 | | | | 15,000,000 | |
| Bank of Nova Scotia, Houston, TX: | | | | | | | | |
3.06%, 9/2/091 | | | 50,000,000 | | | | 50,000,000 | |
3.063%, 9/4/091 | | | 50,000,000 | | | | 50,000,000 | |
3.064%, 9/8/091 | | | 50,000,000 | | | | 50,000,000 | |
3.114%, 9/8/091 | | | 100,000,000 | | | | 100,000,000 | |
| 3.20%, 12/18/08 | | | 50,000,000 | | | | 50,000,000 | |
| Barclays Bank plc, New York: | | | | | | | | |
| 1.45%, 12/22/08 | | | 100,000,000 | | | | 100,000,000 | |
| 1.60%, 12/17/08 | | | 100,000,000 | | | | 100,000,000 | |
| 1.60%, 12/18/08 | | | 50,000,000 | | | | 50,000,000 | |
| BNP Paribas, New York: | | | | | | | | |
| 1.97%, 2/12/09 | | | 50,000,000 | | | | 50,000,000 | |
| 2.16%, 2/4/09 | | | 50,000,000 | | | | 50,000,000 | |
| 2.29%, 2/10/09 | | | 36,000,000 | | | | 36,017,634 | |
| 3.10%, 2/27/09 | | | 25,000,000 | | | | 25,000,000 | |
| 3.12%, 12/16/08 | | | 50,000,000 | | | | 50,000,000 | |
| DnB NOR Bank ASA, New York, 3.07%, 12/8/08 | | | 30,000,000 | | | | 30,000,000 | |
| Lloyds TSB Bank plc: | | | | | | | | |
| 1.90%, 2/17/09 | | | 40,000,000 | | | | 39,991,331 | |
| 2.01%, 2/13/09 | | | 50,000,000 | | | | 50,000,000 | |
| 3%, 12/4/08 | | | 100,000,000 | | | | 100,000,000 | |
| 3.50%, 1/23/09 | | | 50,000,000 | | | | 50,043,705 | |
| Nordea Bank Finland plc, New York, 1.25%, 12/11/08 | | | 150,000,000 | | | | 150,000,000 | |
Royal Bank of Canada, New York, 2.706%, 8/7/091 | | | 50,000,000 | | | | 50,000,000 | |
| Societe Generale, 4%, 1/20/09 | | | 100,000,000 | | | | 100,000,000 | |
| Toronto Dominion Bank, New York: | | | | | | | | |
| 3.03%, 2/5/09 | | | 20,000,000 | | | | 20,000,000 | |
| 3.13%, 1/30/09 | | | 100,000,000 | | | | 100,000,000 | |
| | | | | | | | |
Total Certificates of Deposit
(Cost $1,484,552,670) | | | | | | | 1,484,552,670 | |
| | | | | | | | | |
Direct Bank Obligations—17.3% | | | | | | | | |
Capital One Funding Corp., Series 1996E, 2.05%, 12/1/081 | | | 5,942,000 | | | | 5,942,000 | |
| Danske Corp.: | | | | | | | | |
1%, 12/1/082 | | | 250,000,000 | | | | 250,000,000 | |
1.39%, 12/29/082 | | | 50,000,000 | | | | 49,945,944 | |
| DnB NOR Bank ASA, 2.995%, 2/9/09 | | | 50,000,000 | | | | 49,708,819 | |
| Governor & Co. of the Bank of Ireland: | | | | | | | | |
1.70%, 12/9/082 | | | 45,000,000 | | | | 44,983,000 | |
2.08%, 12/2/082 | | | 38,600,000 | | | | 38,597,770 | |
| HSBC USA, Inc.: | | | | | | | | |
| 2.81%, 12/2/08 | | | 50,000,000 | | | | 49,996,097 | |
| 2.824%, 12/5/08 | | | 75,000,000 | | | | 74,976,467 | |
| 3.06%, 12/19/08 | | | 45,000,000 | | | | 44,931,150 | |
| 3.09%, 12/12/08 | | | 100,000,000 | | | | 99,905,583 | |
| National Australia Funding (Delaware), Inc.: | | | | | | | | |
1.40%, 1/29/092 | | | 50,000,000 | | | | 49,885,278 | |
2.735%, 12/26/082 | | | 70,000,000 | | | | 69,867,049 | |
2.75%, 12/15/082 | | | 25,000,000 | | | | 24,973,264 | |
| PNC Bank NA, Nassau, 0.313%, 12/1/08 | | | 115,000,000 | | | | 115,000,000 | |
Royal Bank of Canada, 4.953%, 7/15/091 | | | 50,000,000 | | | | 50,000,000 | |
| Santander Central Hispano Finance (Delaware), Inc., 3.12%, 12/30/08 | | | 15,000,000 | | | | 14,962,300 | |
18 | OPPENHEIMER QUEST OPPORTUNITY VALUE FUND
| | | | | | | | | |
| | | Principal | | | | |
| | | Amount | | | Value | |
| |
Direct Bank Obligations Continued | | | | | | | | |
| Wells Fargo Bank NA, 0.25%, 12/1/08 | | $ | 165,000,000 | | | $ | 165,000,000 | |
| | | | | | | | |
Total Direct Bank Obligations
(Cost $1,198,674,721) | | | | | | | 1,198,674,721 | |
| | | | | | | | | |
Short-Term Notes—56.2% | | | | | | | | |
Capital Markets—2.9% | | | | | | | | |
| BNP Paribas Finance, Inc., 2.20%, 2/9/09 | | | 50,000,000 | | | | 49,786,111 | |
| Citigroup Funding, Inc.: | | | | | | | | |
| 1.48%, 12/16/08 | | | 50,000,000 | | | | 49,969,167 | |
| 2.82%, 12/10/08 | | | 100,000,000 | | | | 99,929,500 | |
| | | | | | | | |
| | | | | | | | 199,684,778 | |
| | | | | | | | | |
Commercial Banks—5.2% | | | | | | | | |
| Bank of America Corp., 0.30%, 12/1/08 | | | 190,000,000 | | | | 190,000,000 | |
| JPMorgan Chase Bank, NA, 0.50%, 12/1/08 | | | 170,000,000 | | | | 170,000,000 | |
| | | | | | | | |
| | | | | | | | 360,000,000 | |
| | | | | | | | | |
Diversified Financial Services—7.1% | | | | | | | | |
| General Electric Capital Corp.: | | | | | | | | |
| 1.90%, 2/6/09 | | | 16,000,000 | | | | 15,943,422 | |
| 3%, 1/27/09 | | | 100,000,000 | | | | 99,525,000 | |
| 3.10%, 1/23/09 | | | 100,000,000 | | | | 99,543,611 | |
| General Electric Capital Services, 1%, 12/2/08 | | | 100,000,000 | | | | 99,997,222 | |
| Prudential Funding LLC: | | | | | | | | |
1.35%, 12/15/083 | | | 25,000,000 | | | | 24,986,875 | |
2.50%, 12/3/083 | | | 50,000,000 | | | | 49,993,056 | |
3.05%, 12/1/083 | | | 100,000,000 | | | | 100,000,000 | |
| | | | | | | | |
| | | | | | | | 489,989,186 | |
| | | | | | | | | |
Insurance—2.2% | | | | | | | | |
Jackson National Life Global Funding, Series 2008-1, 2.59%, 2/10/091,4 | | | 50,000,000 | | | | 50,000,000 | |
Security Life of Denver, 2.018%, 9/8/091,3 | | | 100,000,000 | | | | 100,000,000 | |
| | | | | | | | |
| | | | | | | | 150,000,000 | |
| | | | | | | | | |
IT Services—0.3% | | | | | | | | |
IBM International Group Capital, 2.225%, 2/13/091 | | | 20,000,000 | | | | 19,988,732 | |
Leasing & Factoring—7.0% | | | | | | | | |
| American Honda Finance Corp.: | | | | | | | | |
2.319%, 8/26/091,4 | | | 50,000,000 | | | | 50,000,000 | |
2.989%, 5/5/091,4 | | | 50,000,000 | | | | 50,000,000 | |
3.026%, 9/18/091,4 | | | 50,000,000 | | | | 50,000,000 | |
4.419%, 7/8/091,4 | | | 50,000,000 | | | | 50,000,000 | |
| Toyota Motor Credit Corp.: | | | | | | | | |
| 2.10%, 2/11/09 | | | 40,000,000 | | | | 39,832,000 | |
| 2.15%, 2/9/09 | | | 50,000,000 | | | | 49,722,917 | |
| 2.50%, 2/2/09 | | | 94,100,000 | | | | 93,589,508 | |
| 2.65%, 1/26/09 | | | 100,000,000 | | | | 99,587,778 | |
| | | | | | | | |
| | | | | | | | 482,732,203 | |
| | | | | | | | | |
Municipal—0.6% | | | | | | | | |
Bloomingdale Life Time Fitness LLC Revenue Bonds, Series 2000, 2.25%, 12/1/081 | | | 7,050,000 | | | | 7,050,000 | |
Las Vegas, NV Economic Development Revenue Bonds, Keep Memory Alive Project, Series 2007B, 2.431%, 12/1/081 | | | 5,400,000 | | | | 5,400,000 | |
19 | OPPENHEIMER QUEST OPPORTUNITY VALUE FUND
OPPENHEIMER INSTITUTIONAL MONEY MARKET FUND
STATEMENT OF INVESTMENTS Unaudited / Continued
| | | | | | | | | |
| | | Principal | | | | |
| | | Amount | | | Value | |
| |
Municipal Continued | | | | | | | | |
Liberty Cnty., GA Industrial Improvement Revenue Bonds, Hugo Boss USA, Inc. Project, Series 2002, 3.50%, 12/1/081 | | $ | 3,900,000 | | | $ | 3,900,000 | |
OK University Hospitals Trust Revenue Bonds, Series B, 1.80%, 12/1/081 | | | 2,800,000 | | | | 2,800,000 | |
Private Colleges & Universities Authority Revenue Bonds, Mercer University Project, Series 2006B, 3.43%, 12/1/081 | | | 7,305,000 | | | | 7,305,000 | |
Roanoke, NC Music & Entertainment District Special Revenue Bonds, Series 2007, 1.80%, 12/1/081 | | | 9,800,000 | | | | 9,800,000 | |
Warren Cnty., KY Industrial Building Revenue Bonds, Series B2, 1.80%, 12/1/081 | | | 7,300,000 | | | | 7,300,000 | |
| | | | | | | | |
| | | | | | | | 43,555,000 | |
| | | | | | | | | |
Oil, Gas & Consumable Fuels—4.3% | | | | | | | | |
Total Capital, 0.70%, 12/1/082 | | | 300,000,000 | | | | 300,000,000 | |
Personal Products—1.4% | | | | | | | | |
| Reckitt Benckiser Treasury Services plc: | | | | | | | | |
2.19%, 2/17/092 | | | 50,000,000 | | | | 49,762,750 | |
2.27%, 2/13/092 | | | 50,000,000 | | | | 49,766,694 | |
| | | | | | | | |
| | | | | | | | 99,529,444 | |
| | | | | | | | | |
Pharmaceuticals—0.5% | | | | | | | | |
Novartis Finance Corp., 0.73%, 12/1/082 | | | 35,000,000 | | | | 35,000,000 | |
Receivables Finance—19.9% | | | | | | | | |
| Amsterdam Funding Corp.: | | | | | | | | |
3.08%, 3/5/092 | | | 50,000,000 | | | | 49,597,889 | |
3.10%, 1/6/092 | | | 76,700,000 | | | | 76,462,230 | |
4.25%, 1/8/092 | | | 88,400,000 | | | | 88,003,428 | |
| Chariot Funding LLC: | | | | | | | | |
0.60%, 12/1/084 | | | 80,000,000 | | | | 80,000,000 | |
1.40%, 1/8/094 | | | 41,178,000 | | | | 41,054,123 | |
1.40%, 1/21/094 | | | 20,000,000 | | | | 19,960,333 | |
| 2.85%, 1/27/09 | | | 51,000,000 | | | | 50,769,863 | |
Falcon Asset Securitization Co. LLC, 2.85%, 1/22/092 | | | 175,000,000 | | | | 174,279,583 | |
| Gemini Securitization Corp.: | | | | | | | | |
2.95%, 1/29/092 | | | 50,000,000 | | | | 49,758,264 | |
3%, 1/21/092 | | | 14,116,000 | | | | 14,056,007 | |
3.25%, 12/23/082 | | | 50,000,000 | | | | 49,900,694 | |
3.25%, 1/26/092 | | | 46,000,000 | | | | 45,767,444 | |
3.25%, 1/28/092 | | | 50,000,000 | | | | 49,738,194 | |
3.85%, 1/23/092 | | | 50,000,000 | | | | 49,716,597 | |
4.20%, 12/1/082 | | | 50,000,000 | | | | 50,000,000 | |
4.35%, 1/16/092 | | | 50,000,000 | | | | 49,722,083 | |
| Legacy Capital LLC: | | | | | | | | |
| 2.70%, 1/12/09 | | | 50,000,000 | | | | 49,842,500 | |
| 2.70%, 1/23/09 | | | 50,000,000 | | | | 49,801,250 | |
| Thunder Bay Funding LLC: | | | | | | | | |
1.45%, 1/20/094 | | | 65,166,000 | | | | 65,034,763 | |
3%, 1/28/094 | | | 128,059,000 | | | | 127,440,048 | |
| Windmill Funding Corp.: | | | | | | | | |
3.085%, 3/6/092 | | | 25,000,000 | | | | 24,796,476 | |
3.10%, 1/7/092 | | | 123,000,000 | | | | 122,608,108 | |
| | | | | | | | |
| | | | | | | | 1,378,309,877 | |
| | | | | | | | | |
Special Purpose Financial—4.8% | | | | | | | | |
| FCAR Owner Trust I: | | | | | | | | |
| 2.35%, 12/1/08 | | | 15,400,000 | | | | 15,400,000 | |
| 2.85%, 12/15/08 | | | 75,000,000 | | | | 74,916,875 | |
20 | OPPENHEIMER QUEST OPPORTUNITY VALUE FUND
| | | | | | | | | |
| | | Principal | | | | |
| | | Amount | | | Value | |
| |
Special Purpose Financial Continued | | | | | | | | |
| FCAR Owner Trust I: Continued | | | | | | | | |
| 2.85%, 12/17/08 | | $ | 75,000,000 | | | $ | 74,905,000 | |
| 2.85%, 12/19/08 | | | 50,000,000 | | | | 49,928,750 | |
| Ticonderoga Funding LLC: | | | | | | | | |
| 1%, 12/1/08 | | | 67,006,000 | | | | 67,006,000 | |
| 1.15%, 12/5/08 | | | 50,000,000 | | | | 49,993,611 | |
| | | | | | | | |
| | | | | | | | 332,150,236 | |
| | | | | | | | |
Total Short-Term Notes
(Cost $3,890,939,456) | | | | | | | 3,890,939,456 | |
| | | | | | | | | |
U.S. Government Agencies—1.1% | | | | | | | | |
| Federal Home Loan Bank: | | | | | | | | |
| 2.43%, 4/22/09 | | | 25,000,000 | | | | 24,760,375 | |
| 2.75%, 4/27/09 | | | 50,000,000 | | | | 49,438,542 | |
| | | | | | | | |
| | | | | | | | | |
Total U.S. Government Agencies
(Cost $74,198,917) | | | | | | | 74,198,917 | |
| | | | | | | | | |
| | | Shares | | | Value | |
| |
Investment Company—4.0% | | | | | | | | |
Dreyfus Government Cash Management— Institutional
(Cost $278,500,000) | | | 278,500,000 | | | $ | 278,500,000 | |
Total Investments, at Value
(Cost $6,926,865,764) | | | 100.1 | % | | | 6,926,865,764 | |
Liabilities in Excess of Other Assets | | | (0.1 | ) | | | (3,555,095 | ) |
| | | |
Net Assets | | | 100.0 | % | | $ | 6,923,310,669 | |
| | | |
Footnotes to Statement of Investments
Short-term notes and direct bank obligations are generally traded on a discount basis; the interest rate shown is the discount rate received by the Fund at the time of purchase. Other securities normally bear interest at the rates shown.
| | |
| 1. | | Represents the current interest rate for a variable or increasing rate security. |
| |
| 2. | | Security issued in an exempt transaction without registration under the Securities Act of 1933. Such securities amount to $1,857,188,746, or 26.83% of the Fund’s net assets, and have been determined to be liquid pursuant to guidelines adopted by the Board of Trustees. |
| |
| 3. | | Illiquid security. The aggregate value of illiquid securities as of November 30, 2008 was $274,979,931, which represents 3.97% of the Fund’s net assets. See Note 4 of accompanying Notes. |
| |
| 4. | | Represents securities sold under Rule 144A, which are exempt from registration under the Securities Act of 1933, as amended. These securities have been determined to be liquid under guidelines established by the Board of Trustees. These securities amount to $583,489,267 or 8.43% of the Fund’s net assets as of November 30, 2008. |
Valuation Inputs
Various data inputs are used in determining the value of each of the Fund’s investments as of the reporting period end. These data inputs are categorized in the following hierarchy under applicable financial accounting standards:
1) Level 1—quoted prices in active markets for identical assets or liabilities (including securities actively traded on a securities exchange)
2) Level 2—inputs other than quoted prices that are observable for the asset (such as quoted prices for similar assets and market corroborated inputs such as interest rates, prepayment speeds, credit risks, etc.)
3) Level 3—unobservable inputs (including the Manager’s own judgments about assumptions that market participants would use in pricing the asset).
21 | OPPENHEIMER QUEST OPPORTUNITY VALUE FUND
OPPENHEIMER INSTITUTIONAL MONEY MARKET FUND
STATEMENT OF INVESTMENTS Unaudited / Continued
Valuation Inputs Continued
The market value of the Fund’s investments was determined based on the following inputs as of November 30, 2008:
| | | | | | | | | |
| | | Investments in | | | Other Financial | |
| Valuation Description | | Securities | | | Instruments* | |
| |
| Level 1—Quoted Prices | | $ | 278,500,000 | | | $ | — | |
| Level 2—Other Significant Observable Inputs | | | 6,648,365,764 | | | | — | |
| Level 3—Significant Unobservable Inputs | | | — | | | | — | |
| | | |
| Total | | $ | 6,926,865,764 | | | $ | — | |
| | | |
| | |
| * | | Other financial instruments include options written, currency contracts, futures, forwards and swap contracts. Currency contracts and forwards are reported at their unrealized appreciation/depreciation at measurement date, which represents the change in the contract’s value from trade date. Futures are reported at their variation margin at measurement date, which represents the amount due to/from the Fund at that date. Options and swaps are reported at their market value at measurement date. |
See the accompanying Notes for further discussion of the methods used in determining value of the Fund’s investments, and a summary of changes to the valuation techniques, if any, during the reporting period.
See accompanying Notes to Financial Statements.
22 | OPPENHEIMER QUEST OPPORTUNITY VALUE FUND
OPPENHEIMER INSTITUTIONAL MONEY MARKET FUND
STATEMENT OF ASSETS AND LIABILITIES Unaudited
November 30, 2008
| | | | | |
| |
Assets | | | | |
| Investments, at value (cost $6,926,865,764)—see accompanying statement of investments | | $ | 6,926,865,764 | |
| Receivables and other assets: | | | | |
| Interest and dividends | | | 9,399,414 | |
| Shares of beneficial interest sold | | | 543,714 | |
| Other | | | 343,358 | |
| | | | |
| Total assets | | | 6,937,152,250 | |
| | | | | |
Liabilities | | | | |
| Bank overdraft | | | 641,657 | |
| Payables and other liabilities: | | | | |
| Dividends | | | 12,599,592 | |
| Trustees’ compensation | | | 355,114 | |
| Distribution and service plan fees | | | 160,388 | |
| Transfer and shareholder servicing agent fees | | | 6,203 | |
| Shareholder communications | | | 4,964 | |
| Other | | | 73,663 | |
| | | | |
| Total liabilities | | | 13,841,581 | |
| | | | | |
Net Assets | | $ | 6,923,310,669 | |
| | | | |
| | | | | |
Composition of Net Assets | | | | |
| Par value of shares of beneficial interest | | $ | 6,922,917 | |
| Additional paid-in capital | | | 6,915,993,672 | |
| Accumulated net investment income | | | 10 | |
| Accumulated net realized gain on investments | | | 394,070 | |
| | | | |
Net Assets | | $ | 6,923,310,669 | |
| | | | |
| | | | | |
Net Asset Value Per Share | | | | |
| |
| Class E Shares: | | | | |
| Net asset value and redemption price per share (based on net assets of $5,514,136,176 and 5,513,819,210 shares of beneficial interest outstanding) | | $ | 1.00 | |
| |
| Class L Shares: | | | | |
| Net asset value and redemption price per share (based on net assets of $1,195,627,148 and 1,195,561,507 shares of beneficial interest outstanding) | | $ | 1.00 | |
| |
| Class P Shares: | | | | |
| Net asset value and redemption price per share (based on net assets of $213,547,345 and 213,535,872 shares of beneficial interest) | | $ | 1.00 | |
See accompanying Notes to Financial Statements.
23 | OPPENHEIMER QUEST OPPORTUNITY VALUE FUND
OPPENHEIMER INSTITUTIONAL MONEY MARKET FUND
STATEMENT OF OPERATIONS Unaudited
For the Six Months Ended November 30, 2008
| | | | | |
| |
Investment Income | | | | |
| Interest | | $ | 96,941,275 | |
| Dividends | | | 2,863,075 | |
| | | | |
| Total investment income | | | 99,804,350 | |
| | | | | |
Expenses | | | | |
| Management fees | | | 3,441,364 | |
| Distribution and service plan fees—Class P | | | 173,994 | |
| Transfer and shareholder servicing agent fees: | | | | |
| Class E | | | 11,692 | |
| Class L | | | 15,015 | |
| Class P | | | 5,860 | |
| Shareholder communications: | | | | |
| Class E | | | 1,260 | |
| Class L | | | 13,230 | |
| Class P | | | 13 | |
| Insurance expense | | | 440,558 | |
| Trustees’ compensation | | | 108,094 | |
| Legal, auditing and other professional fees | | | 37,855 | |
| Custodian fees and expenses | | | 19,753 | |
| Other | | | 8,374 | |
| | | | |
| Total expenses | | | 4,277,062 | |
| Less reduction to custodian expenses | | | (135 | ) |
| Less waivers and reimbursements of expenses | | | (140,881 | ) |
| | | | |
| Net expenses | | | 4,136,046 | |
| | | | | |
Net Investment Income | | | 95,668,304 | |
| | | | | |
Net Realized Gain on Investments | | | 235,688 | |
| | | | | |
Net Increase in Net Assets Resulting from Operations | | $ | 95,903,992 | |
| | | | |
See accompanying Notes to Financial Statements.
24 | OPPENHEIMER QUEST OPPORTUNITY VALUE FUND
OPPENHEIMER INSTITUTIONAL MONEY MARKET FUND
STATEMENTS OF CHANGES IN NET ASSETS
| | | | | | | | | |
| | | Six Months | | | Year | |
| | | Ended | | | Ended | |
| | | November 30, 2008 | | | May 31, | |
| | | (Unaudited) | | | 2008 | |
| |
Operations | | | | | | | | |
| Net investment income | | $ | 95,668,304 | | | $ | 266,043,916 | |
| Net realized gain | | | 235,688 | | | | 244,737 | |
| | | |
| Net increase in net assets resulting from operations | | | 95,903,992 | | | | 266,288,653 | |
| | | | | | | | | |
Dividends and/or Distributions to Shareholders | | | | | | | | |
| Dividends from net investment income: | | | | | | | | |
| Class E | | | (76,209,303 | ) | | | (248,672,603 | ) |
| Class L | | | (17,411,863 | ) | | | (17,445,181 | ) |
| Class P | | | (2,026,959 | ) | | | (20,034 | ) |
| | | |
| | | | (95,648,125 | ) | | | (266,137,818 | ) |
| | | | | | | | | |
Beneficial Interest Transactions | | | | | | | | |
| Net increase (decrease) in net assets resulting from beneficial interest transactions: | | | | | | | | |
| Class E | | | (183,142,228 | ) | | | 1,733,750,762 | |
| Class L | | | 442,226,850 | | | | 752,833,041 | |
| Class P | | | 212,596,959 | | | | 928,913 | |
| | | |
| | | | 471,681,581 | | | | 2,487,512,716 | |
| | | | | | | | | |
Net Assets | | | | | | | | |
| Total increase | | | 471,937,448 | | | | 2,487,663,551 | |
| Beginning of period | | | 6,451,373,221 | | | | 3,963,709,670 | |
| | | |
| End of period (including accumulated net investment income (loss) of $10 and $(20,169), respectively) | | $ | 6,923,310,669 | | | $ | 6,451,373,221 | |
| | | |
See accompanying Notes to Financial Statements.
25 | OPPENHEIMER QUEST OPPORTUNITY VALUE FUND
OPPENHEIMER INSTITUTIONAL MONEY MARKET FUND
FINANCIAL HIGHLIGHTS Unaudited
| | | | | | | | | | | | | |
| | | Six Months | | | | |
| | | Ended | | | | |
| | | November 30, 2008 | | | Year Ended May 31, | |
| Class E | | (Unaudited) | | | 2008 | | | 20071 | |
| |
Per Share Operating Data | | | | | | | | | | | | |
| Net asset value, beginning of period | | $ | 1.00 | | | $ | 1.00 | | | $ | 1.00 | |
| |
Income from investment operations—net investment income and net realized gain2 | | | .01 | | | | .05 | | | | .03 | |
| |
| Dividends and/or distributions to shareholders: | | | | | | | | | | | | |
| Dividends from net investment income | | | (.01 | ) | | | (.05 | ) | | | (.03 | ) |
| |
| Net asset value, end of period | | $ | 1.00 | | | $ | 1.00 | | | $ | 1.00 | |
| | | |
| | | | | | | | | | | | | |
Total Return3 | | | 1.40 | % | | | 4.69 | % | | | 3.52 | % |
| | | | | | | | | | | | | |
Ratios/Supplemental Data | | | | | | | | | | | | |
| Net assets, end of period (in thousands) | | $ | 5,514,136 | | | $ | 5,697,092 | | | $ | 3,963,198 | |
| |
| Average net assets (in thousands) | | $ | 5,495,212 | | | $ | 5,462,546 | | | $ | 3,623,302 | |
| |
Ratios to average net assets:4 | | | | | | | | | | | | |
| Net investment income | | | 2.77 | % | | | 4.55 | % | | | 5.25 | % |
| Total expenses | | | 0.12 | %5 | | | 0.11 | % | | | 0.11 | % |
| | |
| 1. | | For the period from October 3, 2006 (commencement of operations) to May 31, 2007. |
| |
| 2. | | Per share amounts calculated based on the average shares outstanding during the period. |
| |
| 3. | | Assumes an initial investment on the business day before the first day of the fiscal period, with all dividends and distributions reinvested in additional shares on the reinvestment date, and redemption at the net asset value calculated on the last business day of the fiscal period. Total returns are not annualized for periods less than one full year. Returns do not reflect the deduction of taxes that a shareholder would pay on fund distributions or the redemption of fund shares. |
| |
| 4. | | Annualized for periods less than one full year. |
| |
| 5. | | Reduction to custodian expenses less than 0.005%. |
See accompanying Notes to Financial Statements.
26 | OPPENHEIMER QUEST OPPORTUNITY VALUE FUND
| | | | | | | | | | | | | |
| | | Six Months | | | | |
| | | Ended | | | | |
| | | November 30, 2008 | | | Year Ended May 31, | |
| Class L | | (Unaudited) | | | 2008 | | | 20071 | |
| |
Per Share Operating Data | | | | | | | | | | | | |
| Net asset value, beginning of period | | $ | 1.00 | | | $ | 1.00 | | | $ | 1.00 | |
| |
Income from investment operations—net investment income and net realized gain2 | | | .01 | | | | .05 | | | | .04 | |
| |
| Dividends and/or distributions to shareholders: | | | | | | | | | | | | |
| Dividends from net investment income | | | (.01 | ) | | | (.05 | ) | | | (.04 | ) |
| |
| Net asset value, end of period | | $ | 1.00 | | | $ | 1.00 | | | $ | 1.00 | |
| | | |
| | | | | | | | | | | | | |
Total Return3 | | | 1.40 | % | | | 4.69 | % | | | 3.61 | % |
| | | | | | | | | | | | | |
Ratios/Supplemental Data | | | | | | | | | | | | |
| Net assets, end of period (in thousands) | | $ | 1,195,627 | | | $ | 753,342 | | | $ | 502 | |
| |
| Average net assets (in thousands) | | $ | 1,247,175 | | | $ | 443,323 | | | $ | 68 | |
| |
Ratios to average net assets:4 | | | | | | | | | | | | |
| Net investment income | | | 2.79 | % | | | 3.93 | % | | | 3.62 | % |
| Total expenses | | | 0.12 | %5 | | | 0.12 | % | | | 0.08 | % |
| | |
| 1. | | For the period from October 3, 2006 (commencement of operations) to May 31, 2007. |
| |
| 2. | | Per share amounts calculated based on the average shares outstanding during the period. |
| |
| 3. | | Assumes an initial investment on the business day before the first day of the fiscal period, with all dividends and distributions reinvested in additional shares on the reinvestment date, and redemption at the net asset value calculated on the last business day of the fiscal period. Total returns are not annualized for periods less than one full year. Returns do not reflect the deduction of taxes that a shareholder would pay on fund distributions or the redemption of fund shares. |
| |
| 4. | | Annualized for periods less than one full year. |
| |
| 5. | | Reduction to custodian expenses less than 0.005%. |
See accompanying Notes to Financial Statements.
27 | OPPENHEIMER QUEST OPPORTUNITY VALUE FUND
OPPENHEIMER INSTITUTIONAL MONEY MARKET FUND
FINANCIAL HIGHLIGHTS Unaudited / Continued
| | | | | | | | | | | | | |
| | | Six Months | | | | |
| | | Ended | | | | |
| | | November 30, 2008 | | | Year Ended May 31, | |
| Class P | | (Unaudited) | | | 2008 | | | 20071 | |
| |
Per Share Operating Data | | | | | | | | | | | | |
| Net asset value, beginning of period | | $ | 1.00 | | | $ | 1.00 | | | $ | 1.00 | |
| |
Income from investment operations—net investment income and net realized gain2 | | | .01 | | | | .05 | | | | — | 3 |
| |
| Dividends and/or distributions to shareholders: | | | | | | | | | | | | |
| Dividends from net investment income | | | (.01 | ) | | | (.05 | ) | | | — | 3 |
| |
| Net asset value, end of period | | $ | 1.00 | | | $ | 1.00 | | | $ | 1.00 | |
| | | |
| | | | | | | | | | | | | |
Total Return4 | | | 1.38 | % | | | 4.68 | % | | | 0.15 | % |
| | | | | | | | | | | | | |
Ratios/Supplemental Data | | | | | | | | | | | | |
| Net assets, end of period (in thousands) | | $ | 213,548 | | | $ | 939 | | | $ | 10 | |
| |
| Average net assets (in thousands) | | $ | 143,021 | | | $ | 517 | | | $ | 10 | |
| |
Ratios to average net assets:5 | | | | | | | | | | | | |
| Net investment income | | | 2.83 | % | | | 3.78 | % | | | 4.79 | % |
| Total expenses | | | 0.37 | % | | | 2.14 | % | | | 0.10 | % |
| Expenses after payments, waivers and/or reimbursements and reduction to custodian expenses | | | 0.17 | % | | | 0.20 | % | | | 0.10 | % |
| | |
| 1. | | For the period from May 21, 2007 (inception of offering) to May 31, 2007. |
| |
| 2. | | Per share amounts calculated based on the average shares outstanding during the period. |
| |
| 3. | | Less than $0.005 per share. |
| |
| 4. | | Assumes an initial investment on the business day before the first day of the fiscal period, with all dividends and distributions reinvested in additional shares on the reinvestment date, and redemption at the net asset value calculated on the last business day of the fiscal period. Total returns are not annualized for periods less than one full year. Returns do not reflect the deduction of taxes that a shareholder would pay on fund distributions or the redemption of fund shares. |
| |
| 5. | | Annualized for periods less than one full year. |
See accompanying Notes to Financial Statements.
28 | OPPENHEIMER QUEST OPPORTUNITY VALUE FUND
OPPENHEIMER INSTITUTIONAL MONEY MARKET FUND
NOTES TO FINANCIAL STATEMENTS Unaudited
1. Significant Accounting Policies
Oppenheimer Institutional Money Market Fund (the “Fund”) is registered under the Investment Company Act of 1940, as amended, as an open-end management investment company. The Fund’s investment objective is to seek current income and stability of principal. The Fund’s investment adviser is OppenheimerFunds, Inc. (the “Manager”).
The Fund offers Class E, Class L and Class P shares. All classes of shares are sold at net asset value per share without any initial sales charge. Class E shares are only offered to other Oppenheimer Funds, the Manager and their affiliates. Class L shares are offered directly to institutional investors. Class P shares may only be sold through an investment professional. Brokers or other investment professionals that offer Class P shares may impose charges on those accounts. All classes of shares have identical rights and voting privileges with respect to the Fund in general and exclusive voting rights on matters that affect that class alone. Earnings, net assets and net asset value per share may differ due to each class having its own expenses, such as transfer and shareholder servicing agent fees and shareholder communications, directly attributable to that class.
The following is a summary of significant accounting policies consistently followed by the Fund.
Securities Valuation. Securities are valued at cost adjusted by the amortization of discount or premium to maturity (amortized cost), which approximates market value. If amortized cost is determined not to approximate market value, the fair value of the portfolio securities will be determined under procedures approved by the Fund’s Board of Trustees.
Effective for fiscal periods beginning after November 15, 2007, FASB Statement of Financial Accounting Standards No. 157, Fair Value Measurements, establishes a hierarchy for measuring fair value of assets and liabilities. As required by the standard, each investment asset or liability of the Fund is assigned a level at measurement date based on the significance and source of the inputs to its valuation. Quoted prices in active markets for identical securities are classified as “Level 1”, inputs other than quoted prices for an asset that are observable are classified as “Level 2” and unobservable inputs, including the Manager’s judgment about the assumptions that a market participant would use in pricing an asset or liability are classified as “Level 3”. The inputs used for valuing securities are not necessarily an indication of the risks associated with investing in those securities. A table summarizing the Fund’s investments under these levels of classification is included following the Statement of Investments.
“Money market-type” instruments are typically designated as Level 2.
In the absence of a readily available quoted market price, including for securities whose values have been materially affected by what the Manager identifies as a significant event occurring before the Fund’s assets are valued but after the close of the securities’ respective exchanges, the Manager, acting through its internal valuation committee, in good faith determines the fair valuation of that asset using consistently applied procedures under the supervision of the Board of Trustees (which reviews those fair valuations by the Manager). Those procedures include certain standardized methodologies to fair value securities. Such methodologies include, but are not limited to, pricing securities initially at cost and subse
29 | OPPENHEIMER QUEST OPPORTUNITY VALUE FUND
OPPENHEIMER INSTITUTIONAL MONEY MARKET FUND
NOTES TO FINANCIAL STATEMENTS Unaudited / Continued
1. Significant Accounting Policies Continued
quently adjusting the value based on: changes in company specific fundamentals, changes in an appropriate securities index, or changes in the value of similar securities which may be adjusted for any discounts related to resale restrictions. When possible, such methodologies use observable market inputs such as quoted prices of similar securities, observable interest rates, currency rates and yield curves. The methodologies used for valuing securities are not necessarily an indication of the risks associated with investing in those securities.
Fair valued securities may be classified as “Level 3” if the valuation primarily reflects the Manager’s own assumptions about the inputs that market participants would use in valuing such securities.
There have been no significant changes to the fair valuation methodologies during the period.
Allocation of Income, Expenses, Gains and Losses. Income, expenses (other than those attributable to a specific class), gains and losses are allocated on a daily basis to each class of shares based upon the relative proportion of net assets represented by such class. Operating expenses directly attributable to a specific class are charged against the operations of that class.
Federal Taxes. The Fund intends to comply with provisions of the Internal Revenue Code applicable to regulated investment companies and to distribute substantially all of its investment company taxable income, including any net realized gain on investments not offset by capital loss carryforwards, if any, to shareholders. Therefore, no federal income or excise tax provision is required. The Fund files income tax returns in U.S. federal and applicable state jurisdictions. The statute of limitations on the Fund’s tax return filings generally remain open for the three preceding fiscal reporting period ends.
Net investment income (loss) and net realized gain (loss) may differ for financial statement and tax purposes. The character of dividends and distributions made during the fiscal year from net investment income or net realized gains may differ from their ultimate characterization for federal income tax purposes. Also, due to timing of dividends and distributions, the fiscal year in which amounts are distributed may differ from the fiscal year in which the income or net realized gain was recorded by the Fund.
Trustees’ Compensation. The Fund has adopted an unfunded retirement plan (the “Plan”) for the Fund’s independent trustees. Benefits are based on years of service and fees paid to each trustee during their period of service. The Plan was frozen with respect to adding new participants effective December 31, 2006 (the “Freeze Date”) and existing Plan Participants as of the Freeze Date will continue to receive accrued benefits under the Plan. Active independent trustees as of the Freeze Date have each elected a distribution method with respect to their benefits under the Plan. During the six months ended November 30, 2008, the Fund’s projected benefit obligations, payments to retired trustees and accumulated liability were as follows:
| | | | | |
| Projected Benefit Obligations Increased | | $ | 38,060 | |
| Payments Made to Retired Trustees | | | 69 | |
| Accumulated Liability as of November 30, 2008 | | | 279,396 | |
30 | OPPENHEIMER QUEST OPPORTUNITY VALUE FUND
The Board of Trustees has adopted a compensation deferral plan for independent trustees that enables trustees to elect to defer receipt of all or a portion of the annual compensation they are entitled to receive from the Fund. For purposes of determining the amount owed to the Trustee under the plan, deferred amounts are treated as though equal dollar amounts had been invested in shares of the Fund or in other Oppenheimer funds selected by the Trustee. The Fund purchases shares of the funds selected for deferral by the Trustee in amounts equal to his or her deemed investment, resulting in a Fund asset equal to the deferred compensation liability. Such assets are included as a component of “Other” within the asset section of the Statement of Assets and Liabilities. Deferral of trustees’ fees under the plan will not affect the net assets of the Fund, and will not materially affect the Fund’s assets, liabilities or net investment income per share. Amounts will be deferred until distributed in accordance to the compensation deferral plan.
Dividends and Distributions to Shareholders. Dividends and distributions to shareholders, which are determined in accordance with income tax regulations and may differ from U.S. generally accepted accounting principles, are recorded on the ex-dividend date. Income distributions, if any, are declared daily and paid monthly. Capital gain distributions, if any, are declared and paid annually but may be paid at other times to maintain the net asset value per share at $1.00.
Investment Income. Interest income is recognized on an accrual basis. Discount and premium, which are included in interest income on the Statement of Operations, are amortized or accreted daily.
Custodian Fees. “Custodian fees and expenses” in the Statement of Operations may include interest expense incurred by the Fund on any cash overdrafts of its custodian account during the period. Such cash overdrafts may result from the effects of failed trades in portfolio securities and from cash outflows resulting from unanticipated shareholder redemption activity. The Fund pays interest to its custodian on such cash overdrafts, to the extent they are not offset by positive cash balances maintained by the Fund, at a rate equal to the Federal Funds Rate plus 0.50%. The “Reduction to custodian expenses” line item, if applicable, represents earnings on cash balances maintained by the Fund during the period. Such interest expense and other custodian fees may be paid with these earnings.
Security Transactions. Security transactions are recorded on the trade date. Realized gains and losses on securities sold are determined on the basis of identified cost.
Indemnifications. The Fund’s organizational documents provide current and former trustees and officers with a limited indemnification against liabilities arising in connection with the performance of their duties to the Fund. In the normal course of business, the Fund may also enter into contracts that provide general indemnifications. The Fund’s maximum exposure under these arrangements is unknown as this would be dependent on future claims that may be made against the Fund. The risk of material loss from such claims is considered remote.
31 | OPPENHEIMER QUEST OPPORTUNITY VALUE FUND
OPPENHEIMER INSTITUTIONAL MONEY MARKET FUND
NOTES TO FINANCIAL STATEMENTS Unaudited / Continued
1. Significant Accounting Policies Continued
Other. The preparation of financial statements in conformity with accounting principles generally accepted in the United States of America requires management to make estimates and assumptions that affect the reported amounts of assets and liabilities and disclosure of contingent assets and liabilities at the date of the financial statements and the reported amounts of increases and decreases in net assets from operations during the reporting period. Actual results could differ from those estimates.
2. Shares of Beneficial Interest
The Fund has authorized an unlimited number of $0.001 par value shares of beneficial interest of each class. Transactions in shares of beneficial interest were as follows:
| | | | | | | | | | | | | | | | | |
| | | Six Months Ended November 30, 2008 | | | Year Ended May 31, 2008 | |
| | Shares | | | Amount | | | Shares | | | Amount | |
| |
Class E | | | | | | | | | | | | | | | | |
| Sold | | | 26,553,805,780 | | | $ | 26,553,805,780 | | | | 52,370,394,439 | | | $ | 52,370,394,439 | |
| Dividends and/or distributions reinvested | | | 7,925,078 | | | | 7,925,078 | | | | 27,054,601 | | | | 27,054,601 | |
| Redeemed | | | (26,744,873,086 | ) | | | (26,744,873,086 | ) | | | (50,663,698,278 | ) | | | (50,663,698,278 | ) |
| | | |
| Net increase (decrease) | | | (183,142,228 | ) | | $ | (183,142,228 | ) | | | 1,733,750,762 | | | $ | 1,733,750,762 | |
| | | |
| | | | | | | | | | | | | | | | | |
Class L | | | | | | | | | | | | | | | | |
| Sold | | | 8,449,062,124 | | | $ | 8,449,062,124 | | | | 7,423,498,426 | | | $ | 7,423,498,426 | |
| Dividends and/or distributions reinvested | | | 16,344,088 | | | | 16,344,088 | | | | 15,204,958 | | | | 15,204,958 | |
| Redeemed | | | (8,023,179,362 | ) | | | (8,023,179,362 | ) | | | (6,685,870,343 | ) | | | (6,685,870,343 | ) |
| | | |
| Net increase | | | 442,226,850 | | | $ | 442,226,850 | | | | 752,833,041 | | | $ | 752,833,041 | |
| | | |
| | | | | | | | | | | | | | | | | |
Class P | | | | | | | | | | | | | | | | |
| Sold | | | 513,017,000 | | | $ | 513,017,000 | | | | 1,635,907 | | | $ | 1,635,907 | |
| Dividends and/or distributions reinvested | | | 146,518 | | | | 146,518 | | | | 17,517 | | | | 17,517 | |
| Redeemed | | | (300,566,559 | ) | | | (300,566,559 | ) | | | (724,511 | ) | | | (724,511 | ) |
| | | |
| Net increase | | | 212,596,959 | | | $ | 212,596,959 | | | | 928,913 | | | $ | 928,913 | |
| | | |
3. Fees and Other Transactions with Affiliates
Management Fees. Under the investment advisory agreement, the Fund pays the Manager a management fee based on the daily net assets of the Fund at an annual rate of 0.10%.
Transfer Agent Fees. OppenheimerFunds Services (“OFS”), a division of the Manager, acts as the transfer and shareholder servicing agent for the Fund. The Fund pays OFS an annual fee of $10,000 for each class of shares.
Distribution and Service Plan (12b-1) Fees. Under its General Distributor’s Agreement with the Fund, OppenheimerFunds Distributor, Inc. (the “Distributor”) acts as the Fund’s principal underwriter in the continuous public offering of the Fund’s classes of shares.
32 | OPPENHEIMER QUEST OPPORTUNITY VALUE FUND
Service Plan for Class P Shares. The Fund has adopted a Service Plan (the “Plan”) for Class P shares under Rule 12b-1 of the Investment Company Act of 1940. Under the Plan, the Fund reimburses the Distributor for a portion of its costs incurred for services provided to accounts that hold Class P shares. Reimbursement is made periodically at an annual rate of up to 0.25% of the average annual net assets of Class P shares of the Fund. The Distributor currently uses all of those fees to pay dealers, brokers, banks and other financial institutions periodically for providing personal service and maintenance of accounts of their customers that hold Class P shares. Any unreimbursed expenses the Distributor incurs with respect to Class P shares in any fiscal year cannot be recovered in subsequent periods. Fees incurred by the Fund under the Plan are detailed in the Statement of Operations.
Waivers and Reimbursements of Expenses. The Manager has agreed to waive its management fees and/or reimburse expenses such that “Expenses after waivers, payments and/or reimbursements and reduction to custodian expenses” will not exceed 0.15% for Class E and Class L shares and 0.20% for Class P shares. These undertakings are voluntary and may be amended or withdrawn at any time.
OFS has voluntarily agreed to limit transfer and shareholder servicing agent fees for all classes to 0.35% of average annual net assets per class. Effective August 1, 2008, the Transfer Agent has voluntarily undertaken to limit the Fund’s annual transfer agent fees for all classes to 0.01% of average net assets. During the six months ended November 30, 2008, OFS waived $3,757 for Class P shares. This undertaking may be amended or withdrawn at any time.
Effective October 9, 2007, the Distributor has voluntarily undertaken to waive the fees payable under the Service Plan for Class P shares so that those fees are limited to 0.05% of the average net assets for Class P shares of the Fund. During the six months ended November 30, 2008, the Distributor waived $137,124 for Class P shares. That undertaking may be amended or withdrawn at any time.
4. Illiquid Securities
As of November 30, 2008, investments in securities included issues that are illiquid. investments may be illiquid because they do not have an active trading market, making it difficult to value them or dispose of them promptly at an acceptable price. The Fund will not invest more than 10% of its net assets (determined at the time of purchase and reviewed periodically) in illiquid securities. Securities that are illiquid are marked with an applicable footnote on the Statement of Investments.
5. Temporary Guarantee Program for Money Market Funds
The Fund’s Board of Trustees has elected for the Fund to participate in the Temporary Guarantee Program for Money Market Funds (the “Program”) established by the U.S. Treasury Department. The Treasury Department has accepted the Fund’s application to participate in the Program and entered into a Guarantee Agreement with the Fund dated as of September 19, 2008. The Fund has also notified the Treasury Department of its intent to continue its participation in the Program through April 30, 2009.
33 | OPPENHEIMER QUEST OPPORTUNITY VALUE FUND
OPPENHEIMER INSTITUTIONAL MONEY MARKET FUND
NOTES TO FINANCIAL STATEMENTS Unaudited / Continued
5. Temporary Guarantee Program for Money Market Funds Continued
Under the Program, shareholders of the Fund as of the close of business on September 19, 2008 may be guaranteed against loss in the event that the Fund’s net asset value falls below $0.995. The Program applies only to shareholders of record as of the close of business on September 19, 2008. The number of shares covered by the Program will be the lesser of (a) the number of shares of the Fund owned by the shareholder on September 19, 2008 or (b) the number of shares owned by the shareholder on the date the Fund’s net asset value falls below $0.995. If the number of shares of the Fund a shareholder holds after September 19, 2008 fluctuates during the Program period due to purchases or redemptions of shares, any shares in excess of the amount held as of the close of business on September 19, 2008 will not be covered.
The Fund has paid a fee to participate in the Program’s initial term in the amount equal to 0.01% of the Fund’s net assets as of the close of business on September 19, 2008. The Fund has paid an additional fee to continue its participation in the Program through April 30, 2009 in the amount of 0.015% of the Fund’s net assets as of the close of business on September 19, 2008. Fees paid by the Fund to participate in the Program are shown as insurance expense on the Statement of Operations. Participation in any further extension of the Program would require payment of an additional fee.
6. Recent Accounting Pronouncement
In March 2008, the Financial Accounting Standards Board (“FASB”) issued Statement on Financial Accounting Standards (“SFAS”) No. 161, Disclosures about Derivative Instruments and Hedging Activities. This standard requires enhanced disclosures about derivative and hedging activities, including qualitative disclosures about how and why the Fund uses derivative instruments, how these activities are accounted for, and their effect on the Fund’s financial position, financial performance and cash flows. SFAS No. 161 is effective for financial statements issued for fiscal years and interim periods beginning after November 15, 2008. At this time, management is evaluating the implications of SFAS No. 161 and its impact on the Fund’s financial statements and related disclosures.
34 | OPPENHEIMER QUEST OPPORTUNITY VALUE FUND
TOP HOLDINGS AND ALLOCATIONS
| | | | | |
| Top Ten Common Stock Industries | | | | |
| |
| Insurance | | | 9.0 | % |
| Oil, Gas & Consumable Fuels | | | 4.5 | |
| Hotels, Restaurants & Leisure | | | 4.1 | |
| Media | | | 3.7 | |
| Health Care Providers & Services | | | 3.5 | |
| Machinery | | | 3.3 | |
| Chemicals | | | 3.2 | |
| Electric Utilities | | | 3.0 | |
| IT Services | | | 2.9 | |
| Multi-Utilities | | | 2.9 | |
Portfolio holdings and allocations are subject to change. Percentages are as of April 30, 2009, and are based on net assets.
| | | | | |
| Top Ten Common Stock Holdings | | | | |
| |
| CMS Energy Corp. | | | 2.9 | % |
| Everest Re Group Ltd. | | | 2.8 | |
| ACE Ltd. | | | 2.6 | |
| Navistar International Corp. | | | 2.5 | |
| Assurant, Inc. | | | 2.3 | |
| Tyco International Ltd. | | | 2.3 | |
| Lorillard, Inc. | | | 2.3 | |
| Lubrizol Corp. (The) | | | 2.3 | |
| Molson Coors Brewing Co., Cl. B | | | 2.2 | |
| TeleTech Holdings, Inc. | | | 1.9 | |
Portfolio holdings and allocations are subject to change. Percentages are as of April 30, 2009, and are based on net assets.
For more current Fund holdings, please visit www.oppenheimerfunds.com
11 | OPPENHEIMER SMALL- & MID- CAP VALUE FUND
TOP HOLDINGS AND ALLOCATIONS
Sector Allocation
Portfolio holdings and allocations are subject to change. Percentages are as of April 30, 2009, and are based on the total market value of common stocks.
12 | OPPENHEIMER SMALL- & MID- CAP VALUE FUND
NOTES
Total returns include changes in share price and reinvestment of dividends and capital gains distributions in a hypothetical investment for the periods shown. Cumulative total returns are not annualized. The Fund’s total returns shown do not reflect the deduction of income taxes on an individual’s investment. Taxes may reduce your actual investment returns on income or gains paid by the Fund or any gains you may realize if you sell your shares.
Investors should consider the Fund’s investment objectives, risks and other charges and expenses carefully before investing. The Fund’s prospectus contains this and other information about the Fund, and may be obtained by asking your financial advisor, calling us at 1.800.525.7048 or visiting our website at www.oppenheimerfunds.com. Read the prospectus carefully before investing.
The Fund’s investment strategy and focus can change over time. The mention of specific fund holdings does not constitute a recommendation by OppenheimerFunds, Inc.
Class A shares of the Fund were first publicly offered on 1/3/89. Unless otherwise noted, Class A returns include the current maximum initial sales charge of 5.75%. Class A shares are subject to a maximum annual 0.25% asset-based sales charge, however, the Board of Trustees has set the rate at zero.
Class B shares of the Fund were first publicly offered on 9/1/93. Unless otherwise noted, Class B returns include the applicable contingent deferred sales charges of 5% (1-year) and 2% (5-year). Because Class B shares convert to Class A shares 72 months after purchase, the 10-year return for Class B uses Class A performance for the period after conversion. Class B shares are subject to an annual 0.75% asset-based sales charge.
Class C shares of the Fund were first publicly offered on 9/1/93. Unless otherwise noted, Class C returns include the contingent deferred sales charge of 1% for the 1-year period. Class C shares are subject to an annual 0.75% asset-based sales charge.
Class N shares of the Fund were first publicly offered on 3/1/01. Class N shares are offered only through retirement plans. Unless otherwise noted, Class N returns include the contingent deferred sales charge of 1% for the 1-year period. Class N shares are subject to an annual 0.25% asset-based sales charge.
13 | OPPENHEIMER SMALL- & MID- CAP VALUE FUND
NOTES
Class Y shares of the Fund were first publicly offered on 10/24/05. Class Y shares are offered only to certain institutional investors under a special agreement with the Distributor, and to present or former officers, directors, trustees or employees (and their eligible family members) of the Fund, the Manager, its affiliates, its parent company and the subsidiaries of its parent company, and retirement plans established for the benefit of such individuals.
An explanation of the calculation of performance is in the Fund’s Statement of Additional Information.
14 | OPPENHEIMER SMALL- & MID- CAP VALUE FUND
FUND EXPENSES
Fund Expenses. As a shareholder of the Fund, you incur two types of costs: (1) transaction costs, which may include sales charges (loads) on purchase payments, contingent deferred sales charges on redemptions; and redemption fees (if applicable); and (2) ongoing costs, including management fees; distribution and service fees; and other Fund expenses. These examples are intended to help you understand your ongoing costs (in dollars) of investing in the Fund and to compare these costs with the ongoing costs of investing in other mutual funds.
The examples are based on an investment of $1,000.00 invested at the beginning of the period and held for the entire 6-month period ended April 30, 2009.
Actual Expenses. The first section of the table provides information about actual account values and actual expenses. You may use the information in this section for the class of shares you hold, together with the amount you invested, to estimate the expense that you paid over the period. Simply divide your account value by $1,000.00 (for example, an $8,600.00 account value divided by $1,000.00 = 8.60), then multiply the result by the number in the first section under the heading entitled “Expenses Paid During Period” to estimate the expenses you paid on your account during this period.
Hypothetical Example for Comparison Purposes. The second section of the table provides information about hypothetical account values and hypothetical expenses based on the Fund’s actual expense ratio for each class of shares, and an assumed rate of return of 5% per year for each class before expenses, which is not the actual return. The hypothetical account values and expenses may not be used to estimate the actual ending account balance or expenses you paid for the period. You may use this information to compare the ongoing costs of investing in the Fund and other funds. To do so, compare this 5% hypothetical example for the class of shares you hold with the 5% hypothetical examples that appear in the shareholder reports of the other funds.
Please note that the expenses shown in the table are meant to highlight your ongoing costs only and do not reflect any transactional costs, such as front-end or contingent deferred sales charges (loads), redemption fees, or a $12.00 fee imposed annually on
15 | OPPENHEIMER SMALL- & MID- CAP VALUE FUND
FUND EXPENSES Continued
accounts valued at less than $500.00 (subject to exceptions described in the Statement of Additional Information). Therefore, the “hypothetical” section of the table is useful in comparing ongoing costs only, and will not help you determine the relative total costs of owning different funds. In addition, if these transactional costs were included, your costs would have been higher.
| | | | | | | | | | | | | |
| | | Beginning | | | Ending | | | Expenses | |
| | | Account | | | Account | | | Paid During | |
| | | Value | | | Value | | | 6 Months Ended | |
| | | November 1, 2008 | | | April 30, 2009 | | | April 30, 2009 | |
| |
Actual | | | | | | | | | | | | |
| Class A | | $ | 1,000.00 | | | $ | 1,033.30 | | | $ | 6.52 | |
| Class B | | | 1,000.00 | | | | 1,029.50 | | | | 10.42 | |
| Class C | | | 1,000.00 | | | | 1,029.40 | | | | 10.32 | |
| Class N | | | 1,000.00 | | | | 1,032.20 | | | | 7.84 | |
| Class Y | | | 1,000.00 | | | | 1,035.30 | | | | 4.65 | |
| | | | | | | | | | | | | |
Hypothetical
(5% return before expenses) | | | | | | | | | | | | |
| Class A | | | 1,000.00 | | | | 1,018.40 | | | | 6.48 | |
| Class B | | | 1,000.00 | | | | 1,014.58 | | | | 10.34 | |
| Class C | | | 1,000.00 | | | | 1,014.68 | | | | 10.24 | |
| Class N | | | 1,000.00 | | | | 1,017.11 | | | | 7.78 | |
| Class Y | | | 1,000.00 | | | | 1,020.23 | | | | 4.62 | |
Expenses are equal to the Fund’s annualized expense ratio for that class, multiplied by the average account value over the period, multiplied by 181/365 (to reflect the one-half year period). Those annualized expense ratios, excluding indirect expenses from affiliated fund, based on the 6-month period ended April 30, 2009 are as follows:
| | | | | |
| Class | | Expense Ratios |
| |
| Class A | | | 1.29 | % |
| Class B | | | 2.06 | |
| Class C | | | 2.04 | |
| Class N | | | 1.55 | |
| Class Y | | | 0.92 | |
The expense ratios reflect reduction to custodian expenses and voluntary waivers or reimbursements of expenses by the Fund’s Manager and Transfer Agent that can be terminated at any time, without advance notice. The “Financial Highlights” tables in the Fund’s financial statements, included in this report, also show the gross expense ratios, without such waivers or reimbursements and reduction to custodian expenses, if applicable.
16 | OPPENHEIMER SMALL- & MID- CAP VALUE FUND
STATEMENT OF INVESTMENTS April 30, 2009 / Unaudited
| | | | | | | | | |
| | | Shares | | | Value | |
| |
Common Stocks—88.5% | | | | | | | | |
Consumer Discretionary—14.1% | | | | | | | | |
Auto Components—1.1% | | | | | | | | |
Goodyear Tire & Rubber Co. (The)1 | | | 2,000,000 | | | $ | 21,980,000 | |
Hotels, Restaurants & Leisure—4.1% | | | | | | | | |
Bally Technologies, Inc.1 | | | 250,000 | | | | 6,545,000 | |
Orient-Express Hotel Ltd., Cl. A2 | | | 3,000,000 | | | | 19,410,000 | |
Pinnacle Entertainment, Inc.1 | | | 2,000,000 | | | | 24,960,000 | |
Scientific Games Corp., Cl. A1 | | | 2,000,000 | | | | 34,980,000 | |
| | | | | | | | |
| | | | | | | | 85,895,000 | |
| | | | | | | | | |
Leisure Equipment & Products—1.3% | | | | | | | | |
| Mattel, Inc. | | | 1,800,000 | | | | 26,928,000 | |
Media—3.7% | | | | | | | | |
| Cablevision Systems Corp. New York Group, Cl. A | | | 1,800,000 | | | | 30,888,000 | |
Liberty Global, Inc., Series A1 | | | 1,200,000 | | | | 19,788,000 | |
| Time Warner Cable, Inc. | | | 800,000 | | | | 25,784,000 | |
| | | | | | | | |
| | | | | | | | 76,460,000 | |
| | | | | | | | | |
Specialty Retail—2.5% | | | | | | | | |
| Advance Auto Parts, Inc. | | | 500,000 | | | | 21,875,000 | |
Bed Bath & Beyond, Inc.1 | | | 500,000 | | | | 15,210,000 | |
Chico’s FAS, Inc.1 | | | 2,000,000 | | | | 15,280,000 | |
| | | | | | | | |
| | | | | | | | 52,365,000 | |
| | | | | | | | | |
Textiles, Apparel & Luxury Goods—1.4% | | | | | | | | |
| Phillips/Van Heusen Corp. | | | 1,000,000 | | | | 29,030,000 | |
Consumer Staples—8.0% | | | | | | | | |
Beverages—2.2% | | | | | | | | |
| Molson Coors Brewing Co., Cl. B | | | 1,200,000 | | | | 45,900,000 | |
Food & Staples Retailing—1.5% | | | | | | | | |
| Kroger Co. (The) | | | 1,500,000 | | | | 32,430,000 | |
Food Products—1.0% | | | | | | | | |
| Campbell Soup Co. | | | 800,000 | | | | 20,576,000 | |
Household Products—1.0% | | | | | | | | |
Energizer Holdings, Inc.1 | | | 350,000 | | | | 20,055,000 | |
Tobacco—2.3% | | | | | | | | |
| Lorillard, Inc. | | | 750,000 | | | | 47,347,500 | |
Energy—5.7% | | | | | | | | |
Energy Equipment & Services—1.2% | | | | | | | | |
Weatherford International Ltd.1 | | | 1,500,000 | | | | 24,945,000 | |
Oil, Gas & Consumable Fuels—4.5% | | | | | | | | |
| Cabot Oil & Gas Corp., Cl. A | | | 800,000 | | | | 24,152,000 | |
| Peabody Energy Corp. | | | 800,000 | | | | 21,112,000 | |
| Range Resources Corp. | | | 600,000 | | | | 23,982,000 | |
| Southern Union Co. | | | 1,500,000 | | | | 23,865,000 | |
| | | | | | | | |
| | | | | | | | 93,111,000 | |
| | | | | | | | | |
Financials—15.6% | | | | | | | | |
Capital Markets—1.7% | | | | | | | | |
Affiliated Managers Group, Inc.1 | | | 250,000 | | | | 14,212,500 | |
Investment Technology Group, Inc.1 | | | 900,000 | | | | 20,502,000 | |
| | | | | | | | |
| | | | | | | | 34,714,500 | |
| | | | | | | | | |
Commercial Banks—0.2% | | | | | | | | |
| KeyCorp | | | 750,000 | | | | 4,612,500 | |
Consumer Finance—1.2% | | | | | | | | |
SLM Corp.1 | | | 5,000,000 | | | | 24,150,000 | |
Diversified Financial Services—1.0% | | | | | | | | |
| Fifth Street Finance Corp. | | | 1,000,000 | | | | 7,500,000 | |
Liberty Acquisition Holdings Corp.1 | | | 1,500,000 | | | | 13,365,000 | |
| | | | | | | | |
| | | | | | | | 20,865,000 | |
F1 | OPPENHEIMER SMALL- & MID- CAP VALUE FUND
STATEMENT OF INVESTMENTS Unaudited / Continued
| | | | | | | | | |
| | | Shares | | | Value | |
| |
Insurance—9.0% | | | | | | | | |
| ACE Ltd. | | | 1,150,000 | | | $ | 53,268,000 | |
| Assurant, Inc. | | | 2,000,000 | | | | 48,880,000 | |
| Everest Re Group Ltd. | | | 775,000 | | | | 57,846,000 | |
| Fidelity National Financial, Inc., Cl. A | | | 800,000 | | | | 14,504,000 | |
| National Financial Partners Corp. | | | 1,925,000 | | | | 13,590,500 | |
| | | | | | | | |
| | | | | | | | 188,088,500 | |
| | | | | | | | | |
Real Estate Investment Trusts—1.4% | | | | | | | | |
| BioMed Realty Trust, Inc. | | | 1,000,000 | | | | 11,410,000 | |
| ProLogis | | | 2,000,000 | | | | 18,220,000 | |
| | | | | | | | |
| | | | | | | | 29,630,000 | |
| | | | | | | | | |
Thrifts & Mortgage Finance—1.1% | | | | | | | | |
| NewAlliance Bancshares, Inc. | | | 1,800,000 | | | | 23,238,000 | |
Health Care—8.7% | | | | | | | | |
Health Care Equipment & Supplies—1.8% | | | | | | | | |
Hospira, Inc.1 | | | 1,125,000 | | | | 36,978,750 | |
Health Care Providers & Services—3.5% | | | | | | | | |
| Aetna, Inc. | | | 1,650,000 | | | | 36,316,500 | |
Community Health Systems, Inc.1 | | | 600,000 | | | | 13,704,000 | |
DaVita, Inc.1 | | | 500,000 | | | | 23,185,000 | |
| | | | | | | | |
| | | | | | | | 73,205,500 | |
| | | | | | | | | |
Life Sciences Tools & Services—2.4% | | | | | | | | |
Charles River Laboratories International, Inc.1 | | | 500,000 | | | | 13,825,000 | |
Covance, Inc.1 | | | 350,000 | | | | 13,748,000 | |
Thermo Fisher Scientific, Inc.1 | | | 625,000 | | | | 21,925,000 | |
| | | | | | | | |
| | | | | | | | 49,498,000 | |
| | | | | | | | | |
Pharmaceuticals—1.0% | | | | | | | | |
| Shire Ltd., ADR | | | 600,000 | | | | 22,362,000 | |
Industrials—10.8% | | | | | | | | |
Aerospace & Defense—1.7% | | | | | | | | |
| Goodrich Corp. | | | 800,000 | | | | 35,424,000 | |
Air Freight & Logistics—1.1% | | | | | | | | |
Atlas Air Worldwide Holdings, Inc.1 | | | 900,000 | | | | 23,895,000 | |
Electrical Equipment—1.1% | | | | | | | | |
General Cable Corp.1 | | | 850,000 | | | | 23,069,000 | |
Industrial Conglomerates—2.3% | | | | | | | | |
| Tyco International Ltd. | | | 2,000,000 | | | | 47,520,000 | |
Machinery—3.3% | | | | | | | | |
| Joy Global, Inc. | | | 600,000 | | | | 15,300,000 | |
Navistar International Corp.1 | | | 1,400,000 | | | | 52,920,000 | |
| | | | | | | | |
| | | | | | | | 68,220,000 | |
| | | | | | | | | |
Trading Companies & Distributors—1.3% | | | | | | | | |
Aircastle Ltd.2 | | | 4,000,000 | | | | 26,400,000 | |
Information Technology—11.4% | | | | | | | | |
Communications Equipment—2.1% | | | | | | | | |
ADC Telecommunications, Inc.1 | | | 3,000,000 | | | | 22,080,000 | |
Juniper Networks, Inc.1 | | | 1,000,000 | | | | 21,650,000 | |
| | | | | | | | |
| | | | | | | | 43,730,000 | |
| | | | | | | | | |
Electronic Equipment & Instruments—2.3% | | | | | | | | |
Agilent Technologies, Inc.1 | | | 1,500,000 | | | | 27,390,000 | |
| Amphenol Corp., Cl. A | | | 600,000 | | | | 20,304,000 | |
| | | | | | | | |
| | | | | | | | 47,694,000 | |
| | | | | | | | | |
IT Services—2.9% | | | | | | | | |
Affiliated Computer Services, Inc., Cl. A1 | | | 425,000 | | | | 20,561,500 | |
TeleTech Holdings, Inc.1 | | | 3,000,000 | | | | 39,810,000 | |
| | | | | | | | |
| | | | | | | | 60,371,500 | |
| | | | | | | | | |
Semiconductors & Semiconductor Equipment—1.9% | | | | | | | | |
Lam Research Corp.1 | | | 400,000 | | | | 11,152,000 | |
Marvell Technology Group Ltd.1 | | | 1,200,000 | | | | 13,176,000 | |
Varian Semiconductor Equipment Associates, Inc.1 | | | 600,000 | | | | 15,354,000 | |
| | | | | | | | |
| | | | | | | | 39,682,000 | |
F2 | OPPENHEIMER SMALL- & MID- CAP VALUE FUND
| | | | | | | | | |
| | | Shares | | | Value | |
| |
Software—2.2% | | | | | | | | |
Electronic Arts, Inc.1 | | | 800,000 | | | $ | 16,280,000 | |
McAfee, Inc.1 | | | 600,000 | | | | 22,524,000 | |
THQ, Inc.1 | | | 2,250,000 | | | | 7,695,000 | |
| | | | | | | | |
| | | | | | | | 46,499,000 | |
| | | | | | | | | |
Materials—3.8% | | | | | | | | |
Chemicals—3.2% | | | | | | | | |
| FMC Corp. | | | 425,000 | | | | 20,710,250 | |
| Lubrizol Corp. (The) | | | 1,094,088 | | | | 47,286,483 | |
| | | | | | | | |
| | | | | | | | 67,996,733 | |
| | | | | | | | | |
Metals & Mining—0.6% | | | | | | | | |
| Nucor Corp. | | | 300,000 | | | | 12,207,000 | |
Telecommunication Services—2.2% | | | | | | | | |
Wireless Telecommunication Services—2.2% | | | | | | | | |
Crown Castle International Corp.1 | | | 1,000,000 | | | | 24,520,000 | |
NII Holdings, Inc.1 | | | 1,300,000 | | | | 21,008,000 | |
| | | | | | | | |
| | | | | | | | 45,528,000 | |
| | | | | | | | | |
Utilities—8.2% | | | | | | | | |
Electric Utilities—3.0% | | | | | | | | |
| Cleco Corp. | | | 1,500,000 | | | | 31,635,000 | |
| NV Energy, Inc. | | | 2,889,300 | | | | 29,615,325 | |
| | | | | | | | |
| | | | | | | | 61,250,325 | |
| | | | | | | | | |
Energy Traders—1.0% | | | | | | | | |
NRG Energy, Inc.1 | | | 1,200,000 | | | | 21,576,000 | |
Gas Utilities—1.3% | | | | | | | | |
| EQT Corp. | | | 800,000 | | | | 26,904,000 | |
Multi-Utilities—2.9% | | | | | | | | |
| CMS Energy Corp. | | | 5,000,000 | | | | 60,100,000 | |
| | | | | | | | |
| | | | | | | | | |
| Total Common Stocks (Cost $2,103,410,319) | | | | | | | 1,842,431,808 | |
| | | | | | | | | |
Investment Companies—13.6% | | | | | | | | |
| iShares Russell 2000 Value Index Fund | | | 500,000 | | | | 22,760,000 | |
| iShares Russell Midcap Value Index Fund | | | 750,000 | | | | 21,015,000 | |
Oppenheimer Institutional Money Market Fund, Cl. E, 0.70%2,3 | | | 217,906,796 | | | | 217,906,796 | |
SPDR Gold Trust1 | | | 250,000 | | | | 21,817,500 | |
| | | | | | | | |
| | | | | | | | | |
| Total Investment Companies (Cost $281,821,891) | | | | | | | 283,499,296 | |
Total Investments, at Value (Cost $2,385,232,210) | | | 102.1 | % | | | 2,125,931,104 | |
Liabilities in Excess of Other Assets | | | (2.1 | ) | | | (44,193,338 | ) |
| | | |
| |
Net Assets | | | 100.0 | % | | $ | 2,081,737,766 | |
| | | |
Footnotes to Statement of Investments
| 1. | | Non-income producing security. |
| |
| 2. | | Is or was an affiliate, as defined in the Investment Company Act of 1940, at or during the period ended April 30, 2009, by virtue of the Fund owning at least 5% of the voting securities of the issuer or as a result of the Fund and the issuer having the same investment adviser. Transactions during the period in which the issuer was an affiliate are as follows: |
| | | | | | | | | | | | | | | | | |
| | | Shares | | | Gross | | | Gross | | | Shares | |
| | | October 31, 2008 | | | Additions | | | Reductions | | | April 30, 2009 | |
| |
| Aircastle Ltd. | | | 4,500,000 | | | | — | | | | 500,000 | | | | 4,000,000 | |
Atlas Air Worldwide Holdings, Inc.a | | | 1,400,000 | | | | 201,600 | | | | 701,600 | | | | 900,000 | |
| Oppenheimer Institutional Money Market Fund, Cl. E | | | 108,333,522 | | | | 548,797,874 | | | | 439,224,600 | | | | 217,906,796 | |
| Orient-Express Hotel Ltd., Cl. A | | | — | | | | 3,098,000 | | | | 98,000 | | | | 3,000,000 | |
Pinnacle Entertainment, Inc.a | | | 3,500,000 | | | | 500,000 | | | | 2,000,000 | | | | 2,000,000 | |
F3 | OPPENHEIMER SMALL- & MID- CAP VALUE FUND
STATEMENT OF INVESTMENTS Unaudited / Continued
Footnotes to Statement of Investments Continued
| | | | | | | | | | | | | |
| | | | | | | | | | | Realized | |
| | | Value | | | Income | | | Gain (Loss) | |
| |
| Aircastle Ltd. | | $ | 26,400,000 | | | $ | 900,000 | | | $ | (4,790,831 | ) |
Atlas Air Worldwide Holdings, Inc.a | | | — | b | | | — | | | | (26,237,194 | ) |
| Oppenheimer Institutional Money Market Fund, Cl. E | | | 217,906,796 | | | | 1,028,365 | | | | — | |
| Orient-Express Hotel Ltd., Cl. A | | | 19,410,000 | | | | — | | | | 79,634 | |
Pinnacle Entertainment, Inc.a | | | — | b | | | — | | | | (39,605,759 | ) |
| | | |
| | | $ | 263,716,796 | | | $ | 1,928,365 | | | $ | (70,554,150 | ) |
| | | |
| a. | | No longer an affiliate as of April 30, 2009. |
| |
| b. | | The security is no longer an affiliate, therefore, the value has been excluded from this table. |
| 3. | | Rate shown is the 7-day yield as of April 30, 2009. |
Valuation Inputs
Various data inputs are used in determining the value of each of the Fund’s investments as of the reporting period end. These data inputs are categorized in the following hierarchy under applicable financial accounting standards:
| | 1) | | Level 1—quoted prices in active markets for identical assets or liabilities (including securities actively traded on a securities exchange) |
| |
| | 2) | | Level 2—inputs other than quoted prices that are observable for the asset (such as quoted prices for similar assets and market corroborated inputs such as interest rates, prepayment speeds, credit risks, etc.) |
| |
| | 3) | | Level 3—unobservable inputs (including the Manager’s own judgments about assumptions that market participants would use in pricing the asset). |
The market value of the Fund’s investments was determined based on the following inputs as of April 30, 2009:
| | | | | | | | | |
| | | Investments | | | Other Financial | |
| Valuation Description | | in Securities | | | Instruments* | |
| |
| Level 1—Quoted Prices | | $ | 2,125,931,104 | | | $ | — | |
| Level 2—Other Significant Observable Inputs | | | — | | | | — | |
| Level 3—Significant Unobservable Inputs | | | — | | | | — | |
| | | |
| Total | | $ | 2,125,931,104 | | | $ | — | |
| | | |
| | |
| * | | Other financial instruments include options written, currency contracts, futures, forwards and swap contracts. Currency contracts and forwards are reported at their unrealized appreciation/depreciation at measurement date, which represents the change in the contract’s value from trade date. Futures are reported at their variation margin at measurement date, which represents the amount due to/from the Fund at that date. Options written and swaps are reported at their market value at measurement date. |
See the accompanying Notes for further discussion of the methods used in determining value of the Fund’s investments, and a summary of changes to the valuation techniques, if any, during the reporting period.
See accompanying Notes to Financial Statements.
F4 | OPPENHEIMER SMALL- & MID- CAP VALUE FUND
STATEMENT OF ASSETS AND LIABILITIES Unaudited
April 30, 2009
| | | | | |
Assets | | | | |
| Investments, at value—see accompanying statement of investments: | | | | |
| Unaffiliated companies (cost $2,101,134,239) | | $ | 1,862,214,308 | |
| Affiliated companies (cost $284,097,971) | | | 263,716,796 | |
| | | | |
| |
| | | | 2,125,931,104 | |
| Cash | | | 119,469 | |
| Receivables and other assets: | | | | |
| Investments sold | | | 22,152,683 | |
| Dividends | | | 1,140,222 | |
| Shares of beneficial interest sold | | | 312,795 | |
| Other | | | 161,609 | |
| | | | |
| Total assets | | | 2,149,817,882 | |
| | | | | |
Liabilities | | | | |
| Payables and other liabilities: | | | | |
| Investments purchased | | | 61,533,549 | |
| Shares of beneficial interest redeemed | | | 4,896,624 | |
| Trustees’ compensation | | | 604,556 | |
| Transfer and shareholder servicing agent fees | | | 513,834 | |
| Shareholder communications | | | 243,426 | |
| Distribution and service plan fees | | | 241,496 | |
| Other | | | 46,631 | |
| | | | |
| Total liabilities | | | 68,080,116 | |
| | | | | |
Net Assets | | $ | 2,081,737,766 | |
| | | | |
| | | | | |
Composition of Net Assets | | | | |
| Par value of shares of beneficial interest | | $ | 1,044,817 | |
| Additional paid-in capital | | | 3,609,836,749 | |
| Accumulated net investment income | | | 1,724,622 | |
| Accumulated net realized loss on investments and foreign currency transactions | | | (1,271,567,316 | ) |
| Net unrealized depreciation on investments and translation of assets and liabilities denominated in foreign currencies | | | (259,301,106 | ) |
| | | | |
| |
Net Assets | | $ | 2,081,737,766 | |
| | | | |
F5 | OPPENHEIMER SMALL- & MID- CAP VALUE FUND
STATEMENT OF ASSETS AND LIABILITIES Unaudited / Continued
| | | | | |
Net Asset Value Per Share | | | | |
| |
| Class A Shares: | | | | |
| Net asset value and redemption price per share (based on net assets of $1,397,907,671 and 68,014,639 shares of beneficial interest outstanding) | | $ | 20.55 | |
| Maximum offering price per share (net asset value plus sales charge of 5.75% of offering price) | | $ | 21.80 | |
| |
| Class B Shares: | | | | |
| Net asset value, redemption price (excludes applicable contingent deferred sales charge) and offering price per share (based on net assets of $122,867,657 and 6,875,804 shares of beneficial interest outstanding) | | $ | 17.87 | |
| |
| Class C Shares: | | | | |
| Net asset value, redemption price (excludes applicable contingent deferred sales charge) and offering price per share (based on net assets of $283,614,824 and 15,865,857 shares of beneficial interest outstanding) | | $ | 17.88 | |
| |
| Class N Shares: | | | | |
| Net asset value, redemption price (excludes applicable contingent deferred sales charge) and offering price per share (based on net assets of $191,654,738 and 9,621,267 shares of beneficial interest outstanding) | | $ | 19.92 | |
| |
| Class Y Shares: | | | | |
| Net asset value, redemption price and offering price per share (based on net assets of $85,692,876 and 4,104,166 shares of beneficial interest outstanding) | | $ | 20.88 | |
See accompanying Notes to Financial Statements.
F6 | OPPENHEIMER SMALL- & MID- CAP VALUE FUND
STATEMENT OF OPERATIONS Unaudited
For the Six Months Ended April 30, 2009
| | | | | |
Investment Income | | | | |
| Dividends: | | | | |
| Unaffiliated companies (net of foreign withholding taxes of $60,000) | | $ | 14,089,789 | |
| Affiliated companies | | | 1,928,365 | |
| Interest | | | 17,057 | |
| | | | |
| Total investment income | | | 16,035,211 | |
| | | | | |
Expenses | | | | |
| Management fees | | | 6,324,923 | |
| Distribution and service plan fees: | | | | |
| Class A | | | 1,594,346 | |
| Class B | | | 554,281 | |
| Class C | | | 1,308,855 | |
| Class N | | | 423,974 | |
| Transfer and shareholder servicing agent fees: | | | | |
| Class A | | | 3,259,598 | |
| Class B | | | 400,898 | |
| Class C | | | 699,952 | |
| Class N | | | 658,752 | |
| Class Y | | | 85,472 | |
| Shareholder communications: | | | | |
| Class A | | | 149,890 | |
| Class B | | | 35,361 | |
| Class C | | | 37,281 | |
| Class N | | | 19,776 | |
| Class Y | | | 3,035 | |
| Trustees’ compensation | | | 69,906 | |
| Custodian fees and expenses | | | 9,260 | |
| Other | | | 115,716 | |
| | | | |
| Total expenses | | | 15,751,276 | |
| Less reduction to custodian expenses | | | (2,496 | ) |
| Less waivers and reimbursements of expenses | | | (2,144,732 | ) |
| | | | |
| Net expenses | | | 13,604,048 | |
| | | | | |
Net Investment Income | | | 2,431,163 | |
F7 | OPPENHEIMER SMALL- & MID- CAP VALUE FUND
STATEMENT OF OPERATIONS Unaudited / Continued
| | | | | |
Realized and Unrealized Gain (Loss) | | | | |
| Net realized loss on: | | | | |
| Investments: | | | | |
| Unaffiliated companies | | $ | (686,384,542 | ) |
| Affiliated companies | | | (70,554,150 | ) |
| Closing and expiration of option contracts written | | | (7,616,175 | ) |
| Foreign currency transactions | | | (6,403,361 | ) |
| | | | |
| |
| Net realized loss | | | (770,958,228 | ) |
| Net change in unrealized appreciation (depreciation) on: | | | | |
| Investments | | | 796,803,575 | |
| Translation of assets and liabilities denominated in foreign currencies | | | 7,048,909 | |
| Option contracts written | | | 5,459,970 | |
| | | | |
| Net change in unrealized depreciation | | | 809,312,454 | |
| | | | | |
Net Increase in Net Assets Resulting from Operations | | $ | 40,785,389 | |
| | | | |
See accompanying Notes to Financial Statements.
F8 | OPPENHEIMER SMALL- & MID- CAP VALUE FUND
STATEMENTS OF CHANGES IN NET ASSETS
| | | | | | | | | |
| | | Six Months | | | Year | |
| | | Ended | | | Ended | |
| | | April 30, 2009 | | | October 31, | |
| | | (Unaudited) | | | 2008 | |
| |
Operations | | | | | | | | |
| Net investment income (loss) | | $ | 2,431,163 | | | $ | (5,134,329 | ) |
| Net realized loss | | | (770,958,228 | ) | | | (490,238,830 | ) |
| Net change in unrealized depreciation | | | 809,312,454 | | | | (1,788,245,125 | ) |
| | | |
| |
| Net increase (decrease) in net assets resulting from operations | | | 40,785,389 | | | | (2,283,618,284 | ) |
| | | | | | | | | |
Dividends and/or Distributions to Shareholders | | | | | | | | |
| Distributions from net realized gain: | | | | | | | | |
| Class A | | | (713,563 | ) | | | (300,805,963 | ) |
| Class B | | | (71,904 | ) | | | (34,293,935 | ) |
| Class C | | | (174,171 | ) | | | (77,557,352 | ) |
| Class N | | | (96,466 | ) | | | (35,173,899 | ) |
| Class Y | | | (40,078 | ) | | | (8,265,179 | ) |
| | | |
| |
| | | | (1,096,182 | ) | | | (456,096,328 | ) |
| | | | | | | | | |
Beneficial Interest Transactions | | | | | | | | |
| Net increase (decrease) in net assets resulting from beneficial interest transactions: | | | | | | | | |
| Class A | | | (105,350,768 | ) | | | (205,919,474 | ) |
| Class B | | | (10,973,767 | ) | | | (55,983,402 | ) |
| Class C | | | (36,267,861 | ) | | | (72,486,028 | ) |
| Class N | | | (1,687,440 | ) | | | 13,190,840 | |
| Class Y | | | 8,843,001 | | | | 46,837,853 | |
| | | |
| |
| | | | (145,436,835 | ) | | | (274,360,211 | ) |
| | | | | | | | | |
Net Assets | | | | | | | | |
| Total decrease | | | (105,747,628 | ) | | | (3,014,074,823 | ) |
| Beginning of period | | | 2,187,485,394 | | | | 5,201,560,217 | |
| | | |
| |
| End of period (including accumulated net investment income (loss) of $1,724,622 and $(706,541), respectively) | | $ | 2,081,737,766 | | | $ | 2,187,485,394 | |
| | | |
See accompanying Notes to Financial Statements.
F9 | OPPENHEIMER SMALL- & MID- CAP VALUE FUND
FINANCIAL HIGHLIGHTS
| | | | | | | | | | | | | | | | | | | | | | | | | |
| | | Six Months | | | | | | | | | | | | | | | | |
| | | Ended | | | | | | | | | | | | | | | | |
| | | April 30, 2009 | | | | | | | | | | | | | | | Year Ended October 31, | |
| Class A | | (Unaudited) | | | 2008 | | | 2007 | | | 2006 | | | 2005 | | | 2004 | |
| |
Per Share Operating Data | | | | | | | | | | | | | | | | | | | | | | | | |
| Net asset value, beginning of period | | $ | 19.90 | | | $ | 42.78 | | | $ | 36.95 | | | $ | 33.08 | | | $ | 30.08 | | | $ | 26.11 | |
| |
| Income (loss) from investment operations: | | | | | | | | | | | | | | | | | | | | | | | | |
Net investment income (loss)1 | | | .04 | | | | .02 | | | | (.08 | ) | | | .05 | | | | (.04 | ) | | | (.17 | ) |
| Net realized and unrealized gain (loss) | | | .62 | | | | (19.19 | ) | | | 7.97 | | | | 5.69 | | | | 6.22 | | | | 5.42 | |
| | | |
| Total from investment operations | | | .66 | | | | (19.17 | ) | | | 7.89 | | | | 5.74 | | | | 6.18 | | | | 5.25 | |
| |
| Dividends and/or distributions to shareholders: | | | | | | | | | | | | | | | | | | | | | | | | |
| Distributions from net realized gain | | | (.01 | ) | | | (3.71 | ) | | | (2.06 | ) | | | (1.87 | ) | | | (3.18 | ) | | | (1.28 | ) |
| |
| |
| Net asset value, end of period | | $ | 20.55 | | | $ | 19.90 | | | $ | 42.78 | | | $ | 36.95 | | | $ | 33.08 | | | $ | 30.08 | |
| | | |
| | | | | | | | | | | | | | | | | | | | | | | | | |
Total Return, at Net Asset Value2 | | | 3.33 | % | | | (48.93 | )% | | | 22.18 | % | | | 18.04 | % | | | 21.87 | % | | | 20.90 | % |
| | | | | | | | | | | | | | | | | | | | | | | | | |
Ratios/Supplemental Data | | | | | | | | | | | | | | | | | | | | | | | | |
| Net assets, end of period (in thousands) | | $ | 1,397,908 | | | $ | 1,476,752 | | | $ | 3,530,371 | | | $ | 2,343,715 | | | $ | 1,298,204 | | | $ | 543,999 | |
| |
| Average net assets (in thousands) | | $ | 1,270,407 | | | $ | 2,688,839 | | | $ | 3,150,544 | | | $ | 1,884,099 | | | $ | 893,501 | | | $ | 436,617 | |
| |
Ratios to average net assets:3 | | | | | | | | | | | | | | | | | | | | | | | | |
| Net investment income (loss) | | | 0.42 | % | | | 0.06 | % | | | (0.19 | )% | | | 0.13 | % | | | (0.11 | )% | | | (0.61 | )% |
| Total expenses | | | 1.49 | %4 | | | 1.16 | %4 | | | 1.08 | %4 | | | 1.14 | %4 | | | 1.23 | % | | | 1.35 | % |
| Expenses after payments, waivers and/or reimbursements and reduction to custodian expenses | | | 1.29 | % | | | 1.16 | % | | | 1.08 | % | | | 1.14 | % | | | 1.23 | % | | | 1.35 | % |
| |
| Portfolio turnover rate | | | 43 | % | | | 94 | % | | | 115 | % | | | 136 | % | | | 121 | % | | | 163 | % |
| | |
| 1. | | Per share amounts calculated based on the average shares outstanding during the period. |
| |
| 2. | | Assumes an investment on the business day before the first day of the fiscal period, with all dividends and distributions reinvested in additional shares on the reinvestment date, and redemption at the net asset value calculated on the last business day of the fiscal period. Sales charges are not reflected in the total returns. Total returns are not annualized for periods less than one full year. Returns do not reflect the deduction of taxes that a shareholder would pay on fund distributions or the redemption of fund shares. |
| |
| 3. | | Annualized for periods less than one full year. |
| |
| 4. | | Total expenses including indirect expenses from affiliated fund were as follows: |
| | | | | |
| Six Months Ended April 30, 2009 | | | 1.50 | % |
| Year Ended October 31, 2008 | | | 1.16 | % |
| Year Ended October 31, 2007 | | | 1.08 | % |
| Year Ended October 31, 2006 | | | 1.14 | % |
See accompanying Notes to Financial Statements.
F10 | OPPENHEIMER SMALL- & MID- CAP VALUE FUND
| | | | | | | | | | | | | | | | | | | | | | | | | |
| | | Six Months | | | | | | | | | | | | | | | | |
| | | Ended | | | | | | | | | | | | | | | | |
| | | April 30, 2009 | | | | | | | | | | | | | | | Year Ended October 31, | |
| Class B | | (Unaudited) | | | 2008 | | | 2007 | | | 2006 | | | 2005 | | | 2004 | |
| |
Per Share Operating Data | | | | | | | | | | | | | | | | | | | | | | | | |
| Net asset value, beginning of period | | $ | 17.37 | | | $ | 38.10 | | | $ | 33.38 | | | $ | 30.29 | | | $ | 28.01 | | | $ | 24.59 | |
| |
| Income (loss) from investment operations: | | | | | | | | | | | | | | | | | | | | | | | | |
Net investment loss1 | | | (.03 | ) | | | (.22 | ) | | | (.36 | ) | | | (.22 | ) | | | (.29 | ) | | | (.37 | ) |
| Net realized and unrealized gain (loss) | | | .54 | | | | (16.80 | ) | | | 7.14 | | | | 5.18 | | | | 5.75 | | | | 5.07 | |
| | | |
| Total from investment operations | | | .51 | | | | (17.02 | ) | | | 6.78 | | | | 4.96 | | | | 5.46 | | | | 4.70 | |
| |
| Dividends and/or distributions to shareholders: | | | | | | | | | | | | | | | | | | | | | | | | |
| Distributions from net realized gain | | | (.01 | ) | | | (3.71 | ) | | | (2.06 | ) | | | (1.87 | ) | | | (3.18 | ) | | | (1.28 | ) |
| |
| |
| Net asset value, end of period | | $ | 17.87 | | | $ | 17.37 | | | $ | 38.10 | | | $ | 33.38 | | | $ | 30.29 | | | $ | 28.01 | |
| | | |
| | | | | | | | | | | | | | | | | | | | | | | | | |
Total Return, at Net Asset Value2 | | | 2.95 | % | | | (49.34 | )% | | | 21.18 | % | | | 17.08 | % | | | 20.82 | % | | | 19.91 | % |
| | | | | | | | | | | | | | | | | | | | | | | | | |
Ratios/Supplemental Data | | | | | | | | | | | | | | | | | | | | | | | | |
| Net assets, end of period (in thousands) | | $ | 122,867 | | | $ | 132,365 | | | $ | 367,688 | | | $ | 327,908 | | | $ | 272,643 | | | $ | 198,971 | |
| |
| Average net assets (in thousands) | | $ | 112,209 | | | $ | 256,533 | | | $ | 370,633 | | | $ | 307,618 | | | $ | 243,754 | | | $ | 190,251 | |
| |
Ratios to average net assets:3 | | | | | | | | | | | | | | | | | | | | | | | | |
| Net investment loss | | | (0.35 | )% | | | (0.75 | )% | | | (1.00 | )% | | | (0.71 | )% | | | (0.98 | )% | | | (1.43 | )% |
| Total expenses | | | 2.47 | %4 | | | 1.96 | %4 | | | 1.90 | %4 | | | 1.97 | %4 | | | 2.09 | % | | | 2.18 | % |
| Expenses after payments, waivers and/or reimbursements and reduction to custodian expenses | | | 2.06 | % | | | 1.96 | % | | | 1.90 | % | | | 1.97 | % | | | 2.09 | % | | | 2.18 | % |
| |
| Portfolio turnover rate | | | 43 | % | | | 94 | % | | | 115 | % | | | 136 | % | | | 121 | % | | | 163 | % |
| | |
| 1. | | Per share amounts calculated based on the average shares outstanding during the period. |
| |
| 2. | | Assumes an investment on the business day before the first day of the fiscal period, with all dividends and distributions reinvested in additional shares on the reinvestment date, and redemption at the net asset value calculated on the last business day of the fiscal period. Sales charges are not reflected in the total returns. Total returns are not annualized for periods less than one full year. Returns do not reflect the deduction of taxes that a shareholder would pay on fund distributions or the redemption of fund shares. |
| |
| 3. | | Annualized for periods less than one full year. |
| |
| 4. | | Total expenses including indirect expenses from affiliated fund were as follows: |
| | | | | |
| Six Months Ended April 30, 2009 | | | 2.48 | % |
| Year Ended October 31, 2008 | | | 1.96 | % |
| Year Ended October 31, 2007 | | | 1.90 | % |
| Year Ended October 31, 2006 | | | 1.97 | % |
See accompanying Notes to Financial Statements.
F11 | OPPENHEIMER SMALL- & MID- CAP VALUE FUND
FINANCIAL HIGHLIGHTS Continued
| | | | | | | | | | | | | | | | | | | | | | | | | |
| | | Six Months | | | | | | | | | | | | | | | | |
| | | Ended | | | | | | | | | | | | | | | | |
| | | April 30, 2009 | | | | | | | | | | | | | | | Year Ended October 31, | |
| Class C | | (Unaudited) | | | 2008 | | | 2007 | | | 2006 | | | 2005 | | | 2004 | |
| |
Per Share Operating Data | | | | | | | | | | | | | | | | | | | | | | | | |
| Net asset value, beginning of period | | $ | 17.38 | | | $ | 38.10 | | | $ | 33.36 | | | $ | 30.25 | | | $ | 27.97 | | | $ | 24.55 | |
| |
| Income (loss) from investment operations: | | | | | | | | | | | | | | | | | | | | | | | | |
Net investment loss1 | | | (.03 | ) | | | (.20 | ) | | | (.34 | ) | | | (.20 | ) | | | (.27 | ) | | | (.37 | ) |
| Net realized and unrealized gain (loss) | | | .54 | | | | (16.81 | ) | | | 7.14 | | | | 5.18 | | | | 5.73 | | | | 5.07 | |
| | | |
| Total from investment operations | | | .51 | | | | (17.01 | ) | | | 6.80 | | | | 4.98 | | | | 5.46 | | | | 4.70 | |
| |
| Dividends and/or distributions to shareholders: | | | | | | | | | | | | | | | | | | | | | | | | |
| Distributions from net realized gain | | | (.01 | ) | | | (3.71 | ) | | | (2.06 | ) | | | (1.87 | ) | | | (3.18 | ) | | | (1.28 | ) |
| |
| |
| Net asset value, end of period | | $ | 17.88 | | | $ | 17.38 | | | $ | 38.10 | | | $ | 33.36 | | | $ | 30.25 | | | $ | 27.97 | |
| | | |
| | | | | | | | | | | | | | | | | | | | | | | | | |
Total Return, at Net Asset Value2 | | | 2.94 | % | | | (49.30 | )% | | | 21.25 | % | | | 17.17 | % | | | 20.85 | % | | | 19.95 | % |
| | | | | | | | | | | | | | | | | | | | | | | | | |
Ratios/Supplemental Data | | | | | | | | | | | | | | | | | | | | | | | | |
| Net assets, end of period (in thousands) | | $ | 283,615 | | | $ | 318,189 | | | $ | 812,430 | | | $ | 542,273 | | | $ | 292,689 | | | $ | 122,329 | |
| |
| Average net assets (in thousands) | | $ | 264,677 | | | $ | 598,093 | | | $ | 725,723 | | | $ | 429,214 | | | $ | 199,650 | | | $ | 96,555 | |
| |
Ratios to average net assets:3 | | | | | | | | | | | | | | | | | | | | | | | | |
| Net investment loss | | | (0.32 | )% | | | (0.70 | )% | | | (0.95 | )% | | | (0.64 | )% | | | (0.91 | )% | | | (1.42 | )% |
| Total expenses | | | 2.25 | %4 | | | 1.91 | %4 | | | 1.84 | %4 | | | 1.92 | %4 | | | 2.03 | % | | | 2.16 | % |
| Expenses after payments, waivers and/or reimbursements and reduction to custodian expenses | | | 2.04 | % | | | 1.91 | % | | | 1.84 | % | | | 1.92 | % | | | 2.03 | % | | | 2.16 | % |
| |
| Portfolio turnover rate | | | 43 | % | | | 94 | % | | | 115 | % | | | 136 | % | | | 121 | % | | | 163 | % |
| | |
| 1. | | Per share amounts calculated based on the average shares outstanding during the period. |
| |
| 2. | | Assumes an investment on the business day before the first day of the fiscal period, with all dividends and distributions reinvested in additional shares on the reinvestment date, and redemption at the net asset value calculated on the last business day of the fiscal period. Sales charges are not reflected in the total returns. Total returns are not annualized for periods less than one full year. Returns do not reflect the deduction of taxes that a shareholder would pay on fund distributions or the redemption of fund shares. |
| |
| 3. | | Annualized for periods less than one full year. |
| |
| 4. | | Total expenses including indirect expenses from affiliated fund were as follows: |
| | | | | |
| Six Months Ended April 30, 2009 | | | 2.26 | % |
| Year Ended October 31, 2008 | | | 1.91 | % |
| Year Ended October 31, 2007 | | | 1.84 | % |
| Year Ended October 31, 2006 | | | 1.92 | % |
See accompanying Notes to Financial Statements.
F12 | OPPENHEIMER SMALL- & MID- CAP VALUE FUND
| | | | | | | | | | | | | | | | | | | | | | | | | |
| | | Six Months | | | | | | | | | | | | | | | | |
| | | Ended | | | | | | | | | | | | | | | | |
| | | April 30, 2009 | | | | | | | | | | | | | | | Year Ended October 31, | |
| Class N | | (Unaudited) | | | 2008 | | | 2007 | | | 2006 | | | 2005 | | | 2004 | |
| |
Per Share Operating Data | | | | | | | | | | | | | | | | | | | | | | | | |
| Net asset value, beginning of period | | $ | 19.31 | | | $ | 41.75 | | | $ | 36.24 | | | $ | 32.58 | | | $ | 29.77 | | | $ | 25.98 | |
| |
| Income (loss) from investment operations: | | | | | | | | | | | | | | | | | | | | | | | | |
Net investment income (loss)1 | | | .01 | | | | (.09 | ) | | | (.22 | ) | | | (.08 | ) | | | (.14 | ) | | | (.26 | ) |
| Net realized and unrealized gain (loss) | | | .61 | | | | (18.64 | ) | | | 7.79 | | | | 5.61 | | | | 6.13 | | | | 5.33 | |
| | | |
| Total from investment operations | | | .62 | | | | (18.73 | ) | | | 7.57 | | | | 5.53 | | | | 5.99 | | | | 5.07 | |
| |
| Dividends and/or distributions to shareholders: | | | | | | | | | | | | | | | | | | | | | | | | |
| Distributions from net realized gain | | | (.01 | ) | | | (3.71 | ) | | | (2.06 | ) | | | (1.87 | ) | | | (3.18 | ) | | | (1.28 | ) |
| |
| |
| Net asset value, end of period | | $ | 19.92 | | | $ | 19.31 | | | $ | 41.75 | | | $ | 36.24 | | | $ | 32.58 | | | $ | 29.77 | |
| | | |
| | | | | | | | | | | | | | | | | | | | | | | | | |
Total Return, at Net Asset Value2 | | | 3.22 | % | | | (49.10 | )% | | | 21.71 | % | | | 17.65 | % | | | 21.42 | % | | | 20.29 | % |
| | | | | | | | | | | | | | | | | | | | | | | | | |
Ratios/Supplemental Data | | | | | | | | | | | | | | | | | | | | | | | | |
| Net assets, end of period (in thousands) | | $ | 191,655 | | | $ | 187,639 | | | $ | 397,075 | | | $ | 229,340 | | | $ | 102,971 | | | $ | 36,322 | |
| |
| Average net assets (in thousands) | | $ | 171,171 | | | $ | 320,483 | | | $ | 325,526 | | | $ | 171,305 | | | $ | 68,779 | | | $ | 21,951 | |
| |
Ratios to average net assets:3 | | | | | | | | | | | | | | | | | | | | | | | | |
| Net investment income (loss) | | | 0.14 | % | | | (0.29 | )% | | | (0.55 | )% | | | (0.22 | )% | | | (0.44 | )% | | | (0.93 | )% |
| Total expenses | | | 1.99 | %4 | | | 1.56 | %4 | | | 1.45 | %4 | | | 1.50 | %4 | | | 1.57 | % | | | 1.70 | % |
| Expenses after payments, waivers and/or reimbursements and reduction to custodian expenses | | | 1.55 | % | | | 1.50 | % | | | 1.45 | % | | | 1.50 | % | | | 1.57 | % | | | 1.66 | % |
| |
| Portfolio turnover rate | | | 43 | % | | | 94 | % | | | 115 | % | | | 136 | % | | | 121 | % | | | 163 | % |
| | |
| 1. | | Per share amounts calculated based on the average shares outstanding during the period. |
| |
| 2. | | Assumes an investment on the business day before the first day of the fiscal period, with all dividends and distributions reinvested in additional shares on the reinvestment date, and redemption at the net asset value calculated on the last business day of the fiscal period. Sales charges are not reflected in the total returns. Total returns are not annualized for periods less than one full year. Returns do not reflect the deduction of taxes that a shareholder would pay on fund distributions or the redemption of fund shares. |
| |
| 3. | | Annualized for periods less than one full year. |
| |
| 4. | | Total expenses including indirect expenses from affiliated fund were as follows: |
| | | | | |
| Six Months Ended April 30, 2009 | | | 2.00 | % |
| Year Ended October 31, 2008 | | | 1.56 | % |
| Year Ended October 31, 2007 | | | 1.45 | % |
| Year Ended October 31, 2006 | | | 1.50 | % |
See accompanying Notes to Financial Statements.
F13 | OPPENHEIMER SMALL- & MID- CAP VALUE FUND
FINANCIAL HIGHLIGHTS Continued
| | | | | | | | | | | | | | | | | | | | | |
| | | Six Months | | | | | | | | | | | | |
| | | Ended | | | | | | | | | | | | |
| | | April 30, 2009 | | | | | | | | | | | Year Ended October 31, | |
| Class Y | | (Unaudited) | | | 2008 | | | 2007 | | | 2006 | | | 20051 | |
| |
Per Share Operating Data | | | | | | | | | | | | | | | | | | | | |
| Net asset value, beginning of period | | $ | 20.18 | | | $ | 43.17 | | | $ | 37.14 | | | $ | 33.08 | | | $ | 33.38 | |
| |
| Income (loss) from investment operations: | | | | | | | | | | | | | | | | | | | | |
Net investment income (loss)2 | | | .07 | | | | .14 | | | | .07 | | | | .26 | | | | — | 3 |
| Net realized and unrealized gain (loss) | | | .64 | | | | (19.42 | ) | | | 8.02 | | | | 5.67 | | | | (.30 | ) |
| | | |
| Total from investment operations | | | .71 | | | | (19.28 | ) | | | 8.09 | | | | 5.93 | | | | (.30 | ) |
| |
| Dividends and/or distributions to shareholders: | | | | | | | | | | | | | | | | | | | | |
| Distributions from net realized gain | | | (.01 | ) | | | (3.71 | ) | | | (2.06 | ) | | | (1.87 | ) | | | — | |
| |
| |
| Net asset value, end of period | | $ | 20.88 | | | $ | 20.18 | | | $ | 43.17 | | | $ | 37.14 | | | $ | 33.08 | |
| | | |
| | | | | | | | | | | | | | | | | | | | | |
Total Return, at Net Asset Value4 | | | 3.53 | % | | | (48.73 | )% | | | 22.63 | % | | | 18.64 | % | | | (0.90 | )% |
| | | | | | | | | | | | | | | | | | | | | |
Ratios/Supplemental Data | | | | | | | | | | | | | | | | | | | | |
| Net assets, end of period (in thousands) | | $ | 85,693 | | | $ | 72,540 | | | $ | 93,996 | | | $ | 35,638 | | | $ | 1 | |
| |
| Average net assets (in thousands) | | $ | 75,800 | | | $ | 93,084 | | | $ | 63,467 | | | $ | 12,164 | | | $ | 1 | |
| |
Ratios to average net assets:5 | | | | | | | | | | | | | | | | | | | | |
| Net investment income (loss) | | | 0.75 | % | | | 0.43 | % | | | 0.18 | % | | | 0.76 | % | | | (0.32 | )% |
| Total expenses | | | 0.93 | %6 | | | 0.76 | %6 | | | 0.72 | %6 | | | 0.68 | %6 | | | 0.90 | % |
| Expenses after payments, waivers and/or reimbursements and reduction to custodian expenses | | | 0.92 | % | | | 0.76 | % | | | 0.72 | % | | | 0.68 | % | | | 0.90 | % |
| |
| Portfolio turnover rate | | | 43 | % | | | 94 | % | | | 115 | % | | | 136 | % | | | 121 | % |
| | |
| 1. | | For the period from October 24, 2005 (inception of offering) to October 31, 2005. |
| |
| 2. | | Per share amounts calculated based on the average shares outstanding during the period. |
| |
| 3. | | Less than $0.005 per share. |
| |
| 4. | | Assumes an investment on the business day before the first day of the fiscal period, with all dividends and distributions reinvested in additional shares on the reinvestment date, and redemption at the net asset value calculated on the last business day of the fiscal period. Sales charges are not reflected in the total returns. Total returns are not annualized for periods less than one full year. Returns do not reflect the deduction of taxes that a shareholder would pay on fund distributions or the redemption of fund shares. |
| |
| 5. | | Annualized for periods less than one full year. |
| |
| 6. | | Total expenses including indirect expenses from affiliated fund were as follows: |
| | | | | |
| Six Months Ended April 30, 2009 | | | 0.94 | % |
| Year Ended October 31, 2008 | | | 0.76 | % |
| Year Ended October 31, 2007 | | | 0.72 | % |
| Year Ended October 31, 2006 | | | 0.68 | % |
See accompanying Notes to Financial Statements.
F14 | OPPENHEIMER SMALL- & MID- CAP VALUE FUND
NOTES TO FINANCIAL STATEMENTS Unaudited
1. Significant Accounting Policies
Oppenheimer Small- & Mid- Cap Value Fund (the “Fund”), a series of Oppenheimer Quest For Value Funds, is an open-end management investment company registered under the Investment Company Act of 1940, as amended. The Fund’s investment objective is to seek capital appreciation. The Fund’s investment adviser is OppenheimerFunds, Inc. (the “Manager”).
The Fund offers Class A, Class B, Class C, Class N and Class Y shares. Class A shares are sold at their offering price, which is normally net asset value plus a front-end sales charge. Class B, Class C and Class N shares are sold without a front-end sales charge but may be subject to a contingent deferred sales charge (“CDSC”). Class N shares are sold only through retirement plans. Retirement plans that offer Class N shares may impose charges on those accounts. Class Y shares are sold to certain institutional investors without either a front-end sales charge or a CDSC, however, the institutional investor may impose charges on those accounts. All classes of shares have identical rights and voting privileges with respect to the Fund in general and exclusive voting rights on matters that affect that class alone. Earnings, net assets and net asset value per share may differ due to each class having its own expenses, such as transfer and shareholder servicing agent fees and shareholder communications, directly attributable to that class. Class A, B, C and N have separate distribution and/or service plans. No such plan has been adopted for Class Y shares. Class B shares will automatically convert to Class A shares 72 months after the date of purchase. The Fund assesses a 2% fee on the proceeds of fund shares that are redeemed (either by selling or exchanging to another Oppenheimer fund) within 30 days of their purchase. The fee, which is retained by the Fund, is accounted for as an addition to paid-in capital. This fee was discontinued effective January 1, 2009.
The following is a summary of significant accounting policies consistently followed by the Fund.
Securities Valuation. The Fund calculates the net asset value of its shares as of the close of the New York Stock Exchange (the “Exchange”), normally 4:00 P.M. Eastern time, on each day the Exchange is open for trading.
Effective for fiscal periods beginning after November 15, 2007, FASB Statement of Financial Accounting Standards No. 157, Fair Value Measurements, establishes a hierarchy for measuring fair value of assets and liabilities. As required by the standard, each investment asset or liability of the Fund is assigned a level at measurement date based on the significance and source of the inputs to its valuation. Quoted prices in active markets for identical securities are classified as “Level 1,” inputs other than quoted prices for an asset that are observable are classified as “Level 2” and unobservable inputs, including the Manager’s judgment about the assumptions that a market participant would use in pricing an asset or liability are classified as “Level 3.” The inputs used for valuing securities are not necessarily an indication of the risks associated with investing in those securities. A table summarizing the Fund’s investments under these levels of classification is included following the Statement of Investments.
F15 | OPPENHEIMER SMALL- & MID- CAP VALUE FUND
NOTES TO FINANCIAL STATEMENTS Unaudited / Continued
1. Significant Accounting Policies Continued
Securities are valued using quoted market prices, when available, as supplied primarily either by portfolio pricing services approved by the Board of Trustees or dealers. These securities are typically classified within Level 1 or 2; however, they may be designated as Level 3 if the dealer or portfolio pricing service values a security through an internal model with significant unobservable market data inputs.
Securities traded on a registered U.S. securities exchange are valued based on the last sale price of the security reported on the principal exchange on which traded, prior to the time when the Fund’s assets are valued. Securities whose principal exchange is NASDAQ® are valued based on the official closing prices reported by NASDAQ prior to the time when the Fund’s assets are valued. In the absence of a sale, the security is valued at the last sale price on the prior trading day, if it is within the spread of the current day’s closing “bid” and “asked” prices, and if not, at the current day’s closing bid price. A foreign security traded on a foreign exchange is valued based on the last sale price on the principal exchange on which the security is traded, as identified by the portfolio pricing service used by the Manager, prior to the time when the Fund’s assets are valued. In the absence of a sale, the security is valued at the most recent official closing price on the principal exchange on which it is traded.
Shares of a registered investment company that are not traded on an exchange are valued at that investment company’s net asset value per share.
Corporate, government and municipal debt instruments having a remaining maturity in excess of sixty days and all mortgage-backed securities, collateralized mortgage obligations and other asset-backed securities are valued at the mean between the “bid” and “asked” prices.
“Money market-type” debt instruments with remaining maturities of sixty days or less are valued at cost adjusted by the amortization of discount or premium to maturity (amortized cost), which approximates market value. These securities are typically designated as Level 2.
In the absence of a readily available quoted market price, including for securities whose values have been materially affected by what the Manager identifies as a significant event occurring before the Fund’s assets are valued but after the close of the securities’ respective exchanges, the Manager, acting through its internal valuation committee, in good faith determines the fair valuation of that asset using consistently applied procedures under the supervision of the Board of Trustees (which reviews those fair valuations by the Manager). Those procedures include certain standardized methodologies to fair value securities. Such methodologies include, but are not limited to, pricing securities initially at cost and subsequently adjusting the value based on: changes in company specific fundamentals, changes in an appropriate securities index, or changes in the value of similar securities which may be adjusted for any discounts related to resale restrictions. When possible, such methodologies use observable market inputs such as quoted prices of similar securities, observable interest rates, currency rates and yield curves. The methodologies
F16 | OPPENHEIMER SMALL- & MID- CAP VALUE FUND
used for valuing securities are not necessarily an indication of the risks associated with investing in those securities.
Fair valued securities may be classified as “Level 3” if the valuation primarily reflects the Manager’s own assumptions about the inputs that market participants would use in valuing such securities.
There have been no significant changes to the fair valuation methodologies during the period.
Foreign Currency Translation. The Fund’s accounting records are maintained in U.S. dollars. The values of securities denominated in foreign currencies and amounts related to the purchase and sale of foreign securities and foreign investment income are translated into U.S. dollars as of the close of the Exchange, normally 4:00 P.M. Eastern time, on each day the Exchange is open for trading. Foreign exchange rates may be valued primarily using a reliable bank, dealer or service authorized by the Board of Trustees.
Reported net realized gains and losses from foreign currency transactions arise from sales of portfolio securities, sales and maturities of short-term securities, sales of foreign currencies, exchange rate fluctuations between the trade and settlement dates on securities transactions, and the difference between the amounts of dividends, interest, and foreign withholding taxes recorded on the Fund’s books and the U.S. dollar equivalent of the amounts actually received or paid. Net unrealized appreciation and depreciation on the translation of assets and liabilities denominated in foreign currencies arise from changes in the values of assets and liabilities, including investments in securities at fiscal period end, resulting from changes in exchange rates.
The effect of changes in foreign currency exchange rates on investments is separately identified from the fluctuations arising from changes in market values of securities held and reported with all other foreign currency gains and losses in the Fund’s Statement of Operations.
Investments in Oppenheimer Institutional Money Market Fund. The Fund is permitted to invest daily available cash balances in an affiliated money market fund. The Fund may invest the available cash in Class E shares of Oppenheimer Institutional Money Market Fund (“IMMF”) to seek current income while preserving liquidity. IMMF is a registered open-end management investment company, regulated as a money market fund under the Investment Company Act of 1940, as amended. The Manager is also the investment adviser of IMMF. When applicable, the Fund’s investment in IMMF is included in the Statement of Investments. As a shareholder, the Fund is subject to its proportional share of IMMF’s Class E expenses, including its management fee. The Manager will waive fees and/or reimburse Fund expenses in an amount equal to the indirect management fees incurred through the Fund’s investment in IMMF.
Investments With Off-Balance Sheet Market Risk. The Fund enters into financial instrument transactions (such as swaps, futures, options and other derivatives) that may have off-balance sheet market risk. Off-balance sheet market risk exists when
F17 | OPPENHEIMER SMALL- & MID- CAP VALUE FUND
NOTES TO FINANCIAL STATEMENTS Unaudited / Continued
1. Significant Accounting Policies Continued
the maximum potential loss on a particular financial instrument is greater than the value of such financial instrument, as reflected in the Fund’s Statement of Assets and Liabilities.
Use of Leverage. Derivatives may have little or no initial cash investment relative to their market value exposure and therefore can produce significant gains or losses in excess of their cost. This use of embedded leverage allows the Fund to increase its market value exposure relative to its net assets and can substantially increase the volatility of the Fund’s performance.
Allocation of Income, Expenses, Gains and Losses. Income, expenses (other than those attributable to a specific class), gains and losses are allocated on a daily basis to each class of shares based upon the relative proportion of net assets represented by such class. Operating expenses directly attributable to a specific class are charged against the operations of that class.
Federal Taxes. The Fund intends to comply with provisions of the Internal Revenue Code applicable to regulated investment companies and to distribute substantially all of its investment company taxable income, including any net realized gain on investments not offset by capital loss carryforwards, if any, to shareholders. Therefore, no federal income or excise tax provision is required. The Fund files income tax returns in U.S. federal and applicable state jurisdictions. The statute of limitations on the Fund’s tax return filings generally remain open for the three preceding fiscal reporting period ends.
During the fiscal year ended October 31, 2008, the Fund did not utilize any capital loss carryforward to offset capital gains realized in that fiscal year. As of October 31, 2008, the Fund had available for federal income tax purposes unused capital loss carryforward as follows:
| | | | | |
| Expiring | | | | |
| |
| 2016 | | $ | 460,115,322 | |
As of April 30, 2009, the Fund had available for federal income tax purposes an estimated capital loss carryforward of $1,231,073,550 expiring by 2018. This estimated capital loss carryforward represents carryforward as of the end of the last fiscal year, increased for losses deferred under tax accounting rules to the current fiscal year and is increased or decreased by capital losses or gains realized in the first six months of the current fiscal year. During the six months ended April 30, 2009, it is estimated that the Fund will not utilize any capital loss carryforward to offset realized capital gains.
Net investment income (loss) and net realized gain (loss) may differ for financial statement and tax purposes. The character of dividends and distributions made during the fiscal year from net investment income or net realized gains may differ from their ultimate characterization for federal income tax purposes. Also, due to timing of dividends and distributions, the fiscal year in which amounts are distributed may differ from the fiscal year in which the income or net realized gain was recorded by the Fund.
F18 | OPPENHEIMER SMALL- & MID- CAP VALUE FUND
The aggregate cost of securities and other investments and the composition of unrealized appreciation and depreciation of securities and other investments for federal income tax purposes as of April 30, 2009 are noted in the following table. The primary difference between book and tax appreciation or depreciation of securities and other investments, if applicable, is attributable to the tax deferral of losses or tax realization of financial statement unrealized gain or loss.
| | | | | |
| Federal tax cost of securities | | $ | 2,484,939,437 | |
| | | | |
| | | | | |
| Gross unrealized appreciation | | $ | 132,369,811 | |
| Gross unrealized depreciation | | | (491,378,144 | ) |
| | | | |
| Net unrealized depreciation | | $ | (359,008,333 | ) |
| | | | |
Trustees’ Compensation. The Fund has adopted an unfunded retirement plan (the “Plan”) for the Fund’s independent trustees. Benefits are based on years of service and fees paid to each trustee during their period of service. The Plan was frozen with respect to adding new participants effective December 31, 2007 (the “Freeze Date”) and existing Plan Participants as of the Freeze Date have each elected a distribution method with respect to their benefits under the Plan.
During the six months ended April 30, 2009, the Fund’s projected benefit obligations, payments to retired trustees and accumulated liability were as follows:
| | | | | |
| Projected Benefit Obligations Increased | | $ | 27,256 | |
| Payments Made to Retired Trustees | | | 116,903 | |
| Accumulated Liability as of April 30, 2009 | | | 525,781 | |
The Board of Trustees has adopted a compensation deferral plan for independent trustees that enables trustees to elect to defer receipt of all or a portion of the annual compensation they are entitled to receive from the Fund. For purposes of determining the amount owed to the Trustee under the plan, deferred amounts are treated as though equal dollar amounts had been invested in shares of the Fund or in other Oppenheimer funds selected by the Trustee. The Fund purchases shares of the funds selected for deferral by the Trustee in amounts equal to his or her deemed investment, resulting in a Fund asset equal to the deferred compensation liability. Such assets are included as a component of “Other” within the asset section of the Statement of Assets and Liabilities. Deferral of trustees’ fees under the plan will not affect the net assets of the Fund, and will not materially affect the Fund’s assets, liabilities or net investment income per share. Amounts will be deferred until distributed in accordance to the compensation deferral plan.
Dividends and Distributions to Shareholders. Dividends and distributions to shareholders, which are determined in accordance with income tax regulations and may differ from U.S. generally accepted accounting principles, are recorded on the ex-dividend date. Income and capital gain distributions, if any, are declared and paid annually or at other times as deemed necessary by the Manager. The tax character of distributions is determined
F19 | OPPENHEIMER SMALL- & MID- CAP VALUE FUND
NOTES TO FINANCIAL STATEMENTS Unaudited / Continued
1. Significant Accounting Policies Continued
as of the Fund’s fiscal year end. Therefore, a portion of the Fund’s distributions made to shareholders prior to the Fund’s fiscal year end may ultimately be categorized as a tax return of capital.
Investment Income. Dividend income is recorded on the ex-dividend date or upon ex-dividend notification in the case of certain foreign dividends where the ex-dividend date may have passed. Non-cash dividends included in dividend income, if any, are recorded at the fair market value of the securities received. Interest income is recognized on an accrual basis. Discount and premium, which are included in interest income on the Statement of Operations, are amortized or accreted daily.
Custodian Fees. “Custodian fees and expenses” in the Statement of Operations may include interest expense incurred by the Fund on any cash overdrafts of its custodian account during the period. Such cash overdrafts may result from the effects of failed trades in portfolio securities and from cash outflows resulting from unanticipated shareholder redemption activity. The Fund pays interest to its custodian on such cash overdrafts, to the extent they are not offset by positive cash balances maintained by the Fund, at a rate equal to the Federal Funds Rate plus 0.50%. The “Reduction to custodian expenses” line item, if applicable, represents earnings on cash balances maintained by the Fund during the period. Such interest expense and other custodian fees may be paid with these earnings.
Security Transactions. Security transactions are recorded on the trade date. Realized gains and losses on securities sold are determined on the basis of identified cost.
Indemnifications. The Fund’s organizational documents provide current and former trustees and officers with a limited indemnification against liabilities arising in connection with the performance of their duties to the Fund. In the normal course of business, the Fund may also enter into contracts that provide general indemnifications. The Fund’s maximum exposure under these arrangements is unknown as this would be dependent on future claims that may be made against the Fund. The risk of material loss from such claims is considered remote.
Other. The preparation of financial statements in conformity with accounting principles generally accepted in the United States of America requires management to make estimates and assumptions that affect the reported amounts of assets and liabilities and disclosure of contingent assets and liabilities at the date of the financial statements and the reported amounts of increases and decreases in net assets from operations during the reporting period. Actual results could differ from those estimates.
F20 | OPPENHEIMER SMALL- & MID- CAP VALUE FUND
2. Shares of Beneficial Interest
The Fund has authorized an unlimited number of $0.01 par value shares of beneficial interest of each class. Transactions in shares of beneficial interest were as follows:
| | | | | | | | | | | | | | | | | |
| | | Six Months Ended April 30, 2009 | | | Year Ended October 31, 2008 | |
| | | Shares | | | Amount | | | Shares | | | Amount | |
| |
Class A | | | | | | | | | | | | | | | | |
| Sold | | | 10,112,206 | | | $ | 180,427,700 | | | | 14,579,144 | | | $ | 480,189,852 | |
| Dividends and/or distributions reinvested | | | 37,357 | | | | 628,715 | | | | 6,926,755 | | | | 262,385,484 | |
| Redeemed | | | (16,337,721 | ) | | | (286,407,183 | )1 | | | (29,827,590 | ) | | | (948,494,810 | )2 |
| | | |
| Net decrease | | | (6,188,158 | ) | | $ | (105,350,768 | ) | | | (8,321,691 | ) | | $ | (205,919,474 | ) |
| | | |
| | | | | | | | | | | | | | | | | |
Class B | | | | | | | | | | | | | | | | |
| Sold | | | 782,641 | | | $ | 12,240,353 | | | | 947,552 | | | $ | 26,648,788 | |
| Dividends and/or distributions reinvested | | | 4,405 | | | | 64,672 | | | | 922,273 | | | | 30,711,680 | |
| Redeemed | | | (1,531,200 | ) | | | (23,278,792 | )1 | | | (3,900,257 | ) | | | (113,343,870 | )2 |
| | | |
| Net decrease | | | (744,154 | ) | | $ | (10,973,767 | ) | | | (2,030,432 | ) | | $ | (55,983,402 | ) |
| | | |
| | | | | | | | | | | | | | | | | |
Class C | | | | | | | | | | | | | | | | |
| Sold | | | 1,741,798 | | | $ | 27,010,348 | | | | 2,707,673 | | | $ | 78,229,969 | |
| Dividends and/or distributions reinvested | | | 8,666 | | | | 127,220 | | | | 1,615,748 | | | | 53,788,265 | |
| Redeemed | | | (4,197,520 | ) | | | (63,405,429 | )1 | | | (7,336,844 | ) | | | (204,504,262 | )2 |
| | | |
| Net decrease | | | (2,447,056 | ) | | $ | (36,267,861 | ) | | | (3,013,423 | ) | | $ | (72,486,028 | ) |
| | | |
| | | | | | | | | | | | | | | | | |
Class N | | | | | | | | | | | | | | | | |
| Sold | | | 2,157,719 | | | $ | 36,999,461 | | | | 3,070,051 | | | $ | 97,470,679 | |
| Dividends and/or distributions reinvested | | | 4,788 | | | | 78,185 | | | | 783,162 | | | | 28,867,366 | |
| Redeemed | | | (2,256,168 | ) | | | (38,765,086 | )1 | | | (3,647,956 | ) | | | (113,147,205 | )2 |
| | | |
| Net increase (decrease) | | | (93,661 | ) | | $ | (1,687,440 | ) | | | 205,257 | | | $ | 13,190,840 | |
| | | |
| | | | | | | | | | | | | | | | | |
Class Y | | | | | | | | | | | | | | | | |
| Sold | | | 1,515,667 | | | $ | 27,393,496 | | | | 2,584,302 | | | $ | 82,871,336 | |
| Dividends and/or distributions reinvested | | | 2,118 | | | | 36,150 | | | | 175,077 | | | | 6,700,208 | |
| Redeemed | | | (1,008,004 | ) | | | (18,586,645 | )1 | | | (1,342,519 | ) | | | (42,733,691 | )2 |
| | | |
| Net increase | | | 509,781 | | | $ | 8,843,001 | | | | 1,416,860 | | | $ | 46,837,853 | |
| | | |
| | |
| 1. | | Net of redemption fees of $13,572, $1,199, $2,828, $1,829 and $810 for Class A, Class B, Class C, Class N and Class Y, respectively. |
| |
| 2. | | Net of redemption fees of $30,623, $2,922, $6,812, $3,650 and $1,060 for Class A, Class B, Class C, Class N and Class Y, respectively. |
3. Purchases and Sales of Securities
The aggregate cost of purchases and proceeds from sales of securities, other than short-term obligations and investments in IMMF, for the six months ended April 30, 2009, were as follows:
| | | | | | | | | |
| | | Purchases | | | Sales | |
| |
| Investment securities | | $ | 778,593,405 | | | $ | 1,006,989,740 | |
F21 | OPPENHEIMER SMALL- & MID- CAP VALUE FUND
NOTES TO FINANCIAL STATEMENTS Unaudited / Continued
4. Fees and Other Transactions with Affiliates
Management Fees. Under the investment advisory agreement, the Fund pays the Manager a management fee based on the daily net assets of the Fund at an annual rate as shown in the following table:
| | | | | |
| Fee Schedule | | | | |
| |
| Up to $400 million | | | 0.80 | % |
| Next $400 million | | | 0.75 | |
| Next $1.2 billion | | | 0.60 | |
| Next $4.0 billion | | | 0.58 | |
| Over $6.0 billion | | | 0.56 | |
Transfer Agent Fees. OppenheimerFunds Services (“OFS”), a division of the Manager, acts as the transfer and shareholder servicing agent for the Fund. The Fund pays OFS a per account fee. For the six months ended April 30, 2009, the Fund paid $3,340,629 to OFS for services to the Fund.
Additionally, Class Y shares are subject to minimum fees of $10,000 annually for assets of $10 million or more. The Class Y shares are subject to the minimum fees in the event that the per account fee does not equal or exceed the applicable minimum fees. OFS may voluntarily waive the minimum fees.
Distribution and Service Plan (12b-1) Fees. Under its General Distributor’s Agreement with the Fund, OppenheimerFunds Distributor, Inc. (the “Distributor”) acts as the Fund’s principal underwriter in the continuous public offering of the Fund’s classes of shares.
Distribution and Service Plan for Class A Shares. The Fund has adopted a Distribution and Service Plan (the “Plan”) for Class A shares. Under the Plan, the Fund pays a service fee to the Distributor of up to 0.25% of the average annual net assets of Class A shares. The Distributor currently uses all of those fees to pay dealers, brokers, banks and other financial institutions periodically for providing personal services and maintenance of accounts of their customers that hold Class A shares. Under the Plan, the Fund may also pay an asset-based sales charge to the Distributor. Beginning January 1, 2003, the Board of Trustees set the annual asset-based sales charge rate at zero. Fees incurred by the Fund under the Plan are detailed in the Statement of Operations.
Distribution and Service Plans for Class B, Class C and Class N Shares. The Fund has adopted Distribution and Service Plans (the “Plans”) for Class B, Class C and Class N shares under Rule 12b-1 of the Investment Company Act of 1940 to compensate the Distributor for its services in connection with the distribution of those shares and servicing accounts. Under the Plans, the Fund pays the Distributor an annual asset-based sales charge of 0.75% on Class B and Class C shares and 0.25% on Class N shares. The Distributor also receives a service fee of 0.25% per year under each plan. If either the Class B, Class C or Class N plan is terminated by the Fund or by the shareholders of a class, the Board of Trustees and its independent trustees must determine whether the Distributor shall be entitled to payment from the Fund of all or a portion of the service fee and/or asset-based
F22 | OPPENHEIMER SMALL- & MID- CAP VALUE FUND
sales charge in respect to shares sold prior to the effective date of such termination. The Distributor’s aggregate uncompensated expenses under the Plans at March 31, 2009 for Class C and Class N shares were $7,907,364 and $3,861,527, respectively. Fees incurred by the Fund under the Plans are detailed in the Statement of Operations.
Sales Charges. Front-end sales charges and contingent deferred sales charges (“CDSC”) do not represent expenses of the Fund. They are deducted from the proceeds of sales of Fund shares prior to investment or from redemption proceeds prior to remittance, as applicable. The sales charges retained by the Distributor from the sale of shares and the CDSC retained by the Distributor on the redemption of shares is shown in the following table for the period indicated.
| | | | | | | | | | | | | | | | | | | | | |
| | | | | | | Class A | | | Class B | | | Class C | | | Class N | |
| | | Class A | | | Contingent | | | Contingent | | | Contingent | | | Contingent | |
| | | Front-End | | | Deferred | | | Deferred | | | Deferred | | | Deferred | |
| | | Sales Charges | | | Sales Charges | | | Sales Charges | | | Sales Charges | | | Sales Charges | |
| Six Months | | Retained by | | | Retained by | | | Retained by | | | Retained by | | | Retained by | |
| Ended | | Distributor | | | Distributor | | | Distributor | | | Distributor | | | Distributor | |
| |
| April 30, 2009 | | $ | 160,373 | | | $ | 2,711 | | | $ | 165,230 | | | $ | 14,684 | | | $ | 413 | |
Waivers and Reimbursements of Expenses. OFS has voluntarily agreed to limit transfer and shareholder servicing agent fees for all classes to 0.35% of average annual net assets per class. This undertaking may be amended or withdrawn at any time.
During the six months ended April 30, 2009, OFS waived transfer and shareholder servicing agent fees as follows:
| | | | | |
| Class A | | $ | 1,203,547 | |
| Class B | | | 225,898 | |
| Class C | | | 270,887 | |
| Class N | | | 365,108 | |
The Manager will waive fees and/or reimburse Fund expenses in an amount equal to the indirect management fees incurred through the Fund’s investment in IMMF. During the six months ended April 30, 2009, the Manager waived $79,292 for IMMF management fees.
5. Foreign Currency Exchange Contracts
The Fund may enter into foreign currency exchange contracts (“forward contracts”) for the purchase or sale of a foreign currency at a negotiated rate at a future date.
Forward contracts are reported on a schedule following the Statement of Investments. Forward contracts will be valued daily based upon the closing prices of the forward currency rates determined at the close of the Exchange as provided by a bank, dealer or pricing service. The resulting unrealized appreciation (depreciation) is reported in the Statement of Assets and Liabilities as a receivable or payable and in the Statement of Operations within the change in unrealized appreciation (depreciation). At contract close, the difference between the original cost of the contract and the value at the close date is recorded as a realized gain (loss) in the Statement of Operations.
F23 | OPPENHEIMER SMALL- & MID- CAP VALUE FUND
NOTES TO FINANCIAL STATEMENTS Unaudited / Continued
5. Foreign Currency Exchange Contracts Continued
Risks to the Fund include both market and credit risk. Market risk is the risk that the value of the forward contract will depreciate due to unfavorable changes in the exchange rates. Credit risk arises from the possibility that the counterparty will default. If the counterparty defaults, the Fund’s loss will consist of the net amount of contractual payments that the Fund has not yet received.
As of April 30, 2009, the Fund had no outstanding forward contracts.
6. Option Activity
The Fund may buy and sell put and call options, or write put and covered call options. When an option is written, the Fund receives a premium and becomes obligated to sell or purchase the underlying security at a fixed price, upon exercise of the option.
Options are valued daily based upon the last sale price on the principal exchange on which the option is traded. The difference between the premium received or paid, and market value of the option, is recorded as unrealized appreciation or depreciation. The net change in unrealized appreciation or depreciation is reported in the Statement of Operations. When an option is exercised, the cost of the security purchased or the proceeds of the security sale are adjusted by the amount of premium received or paid. Upon the expiration or closing of the option transaction, a gain or loss is reported in the Statement of Operations.
Securities designated to cover outstanding call or put options are noted in the Statement of Investments where applicable. Options written are reported in a schedule following the Statement of Investments and as a liability in the Statement of Assets and Liabilities.
The risk in writing a call option is that the Fund gives up the opportunity for profit if the market price of the security increases and the option is exercised. The risk in writing a put option is that the Fund may incur a loss if the market price of the security decreases and the option is exercised. The risk in buying an option is that the Fund pays a premium whether or not the option is exercised. The Fund also has the additional risk that there may be an illiquid market where the Fund is unable to close the contract.
Written option activity for the six months ended April 30, 2009 was as follows:
| | | | | | | | | |
| | | Put Options | |
| | | Number of | | | Amount of | |
| | | Contracts | | | Premiums | |
| |
| Options outstanding as of October 31, 2008 | | | 5,750 | | | $ | 2,202,250 | |
| Options closed or expired | | | (5,750 | ) | | | (2,202,250 | ) |
| | | |
| Options outstanding as of April 30, 2009 | | | — | | | $ | — | |
| | | |
F24 | OPPENHEIMER SMALL- & MID- CAP VALUE FUND
7. Recent Accounting Pronouncement
In March 2008, the Financial Accounting Standards Board (“FASB”) issued Statement on Financial Accounting Standards (“SFAS”) No. 161, Disclosures about Derivative Instruments and Hedging Activities. This standard requires enhanced disclosures about derivative and hedging activities, including qualitative disclosures about how and why the Fund uses derivative instruments, how these activities are accounted for, and their effect on the Fund’s financial position, financial performance and cash flows. SFAS No. 161 is effective for financial statements issued for fiscal years and interim periods beginning after November 15, 2008. At this time, management is evaluating the implications of SFAS No. 161 and its impact on the Fund’s financial statements and related disclosures.
8. Pending Litigation
During 2009, a number of complaints have been filed in federal courts against the Manager, the Distributor, and certain of the funds in the Oppenheimer family of funds (the “Defendant Funds”) advised by the Manager and distributed by the Distributor. The complaints naming the Defendant Funds also name certain officers, trustees and former trustees of the respective Defendant Funds. The plaintiffs seek class action status on behalf of purchasers of shares of the respective Defendant Fund during a particular time period. The complaints against the Defendant Funds raise claims under federal securities laws alleging that, among other things, the disclosure documents of the respective Defendant Fund contained misrepresentations and omissions, that such Defendant Fund’s investment policies were not followed, and that such Defendant Fund and the other defendants violated federal securities laws and regulations. The plaintiffs seek unspecified damages, equitable relief and an award of attorneys’ fees and litigation expenses. Additionally, a complaint has been brought in state court against the Manager, the Distributor and another subsidiary of the Manager (but not the Fund), on behalf of the Oregon College Savings Plan Trust. The complaint alleges breach of contract, breach of fiduciary duty, negligence and violation of state securities laws, and seeks compensatory damages, equitable relief and an award of attorneys’ fees and litigation expenses.
Other complaints have been filed in 2008 and 2009 in state and federal courts, by investors who made investments through an affiliate of the Manager, against the Manager and certain of its affiliates. Those complaints relate to the alleged investment fraud perpetrated by Bernard Madoff and his firm (“Madoff”) and allege a variety of claims including breach of fiduciary duty, fraud, negligent misrepresentation, unjust enrichment, and violation of federal and state securities laws and regulations, among others. They seek unspecified damages, equitable relief, and an award of attorneys’ fees and litigation expenses. None of the suits have named the Distributor, any of the Oppenheimer mutual funds or any of their independent Trustees or Directors. None of the Oppenheimer funds invested in any funds or accounts managed by Madoff.
The Manager believes that the lawsuits described above are without legal merit and intends to defend them vigorously. The Defendant Funds’ Boards of Trustees have also
F25 | OPPENHEIMER SMALL- & MID- CAP VALUE FUND
NOTES TO FINANCIAL STATEMENTS Unaudited / Continued
8. Pending Litigation Continued
engaged counsel to defend the suits vigorously on behalf of those Funds, their boards and the Trustees named in those suits. The Manager believes that it is premature to render any opinion as to the likelihood of an outcome unfavorable to it and that no estimate can be made with any degree of certainty as to the amount or range of any potential loss. The Manager also believes that these suits should not impair the ability of the Manager or the Distributor to perform their respective duties to the Fund.
F26 | OPPENHEIMER SMALL- & MID- CAP VALUE FUND
PORTFOLIO PROXY VOTING POLICIES AND PROCEDURES; UPDATES TO STATEMENTS OF INVESTMENTS Unaudited
The Fund has adopted Portfolio Proxy Voting Policies and Procedures under which the Fund votes proxies relating to securities (“portfolio proxies”) held by the Fund. A description of the Fund’s Portfolio Proxy Voting Policies and Procedures is available (i) without charge, upon request, by calling the Fund toll-free at 1.800.525.7048, (ii) on the Fund’s website at www.oppenheimerfunds.com, and (iii) on the SEC’s website at www.sec.gov. In addition, the Fund is required to file Form N-PX, with its complete proxy voting record for the 12 months ended June 30th, no later than August 31st of each year. The Fund’s voting record is available (i) without charge, upon request, by calling the Fund toll-free at 1.800.525.7048, and (ii) in the Form N-PX filing on the SEC’s website at www.sec.gov.
The Fund files its complete schedule of portfolio holdings with the SEC for the first quarter and the third quarter of each fiscal year on Form N-Q. The Fund’s Form N-Q filings are available on the SEC’s website at http://www.sec.gov. Those forms may be reviewed and copied at the SEC’s Public Reference Room in Washington, D.C. Information on the operation of the Public Reference Room may be obtained by calling 1-800-SEC-0330.
Householding—Delivery of Shareholder Documents
This is to inform you about OppenheimerFunds’ “householding” policy. If more than one member of your household maintains an account in a particular fund, OppenheimerFunds will mail only one copy of the fund’s prospectus, annual and semiannual report and privacy policy. The consolidation of these mailings, called householding, benefits your fund through reduced mailing expense, and benefits you by reducing the volume of mail you receive from OppenheimerFunds. Householding does not affect the delivery of your account statements.
Please note that we will continue to household these mailings for as long as you remain an OppenheimerFunds shareholder, unless you request otherwise. If you prefer to receive multiple copies of these materials, please call us at 1.800.CALL-OPP(225-5677). You may also notify us in writing or via email. We will begin sending you individual copies of the prospectus, reports and privacy policy within 30 days of receiving your request to stop householding.
17 | OPPENHEIMER SMALL- & MID- CAP VALUE FUND
Item 2. Code of Ethics.
Not applicable to semiannual reports.
Item 3. Audit Committee Financial Expert.
Not applicable to semiannual reports.
Item 4. Principal Accountant Fees and Services.
Not applicable to semiannual reports.
Item 5. Audit Committee of Listed Registrants
Not applicable.
Item 6. Schedule of Investments.
| a) | | Not applicable. |
| |
| b) | | Not applicable. |
Item 7. Disclosure of Proxy Voting Policies and Procedures for Closed-End Management Investment Companies.
Not applicable.
Item 8. Portfolio Managers of Closed-End Management Investment Companies.
Not applicable.
Item 9. Purchases of Equity Securities by Closed-End Management Investment Company and Affiliated Purchasers.
Not applicable.
Item 10. Submission of Matters to a Vote of Security Holders.
The Fund’s Audit Committee Provisions with Respect to Nominations of Directors/Trustees to the Respective Boards
| 1. | | The Fund’s Audit Committee (the “Committee”) will evaluate potential Board candidates to assess their qualifications. The Committee shall have the authority, upon approval of the Board, to retain an executive search firm to assist in this effort. The Committee may consider recommendations by business and personal contacts of current Board members and by executive search firms which the Committee may engage from time to time and may also consider shareholder recommendations. The Committee may consider the advice and recommendation of the Funds’ investment manager and its affiliates in making the selection. |
| |
| 2. | | The Committee shall screen candidates for Board membership. The Committee has not established specific qualifications that it believes must be met by a trustee nominee. In evaluating trustee nominees, the Committee considers, among other things, an individual’s background, skills, and experience; whether the individual is |
| | | an “interested person” as defined in the Investment Company Act of 1940; and whether the individual would be deemed an “audit committee financial expert” within the meaning of applicable SEC rules. The Committee also considers whether the individual’s background, skills, and experience will complement the background, skills, and experience of other nominees and will contribute to the Board. There are no differences in the manner in which the Committee evaluates nominees for trustees based on whether the nominee is recommended by a shareholder. |
| |
| 3. | | The Committee may consider nominations from shareholders for the Board at such times as the Committee meets to consider new nominees for the Board. The Committee shall have the sole discretion to determine the candidates to present to the Board and, in such cases where required, to shareholders. Recommendations for trustee nominees should, at a minimum, be accompanied by the following: |
| | • | | the name, address, and business, educational, and/or other pertinent background of the person being recommended; |
| |
| | • | | a statement concerning whether the person is an “interested person” as defined in the Investment Company Act of 1940; |
| |
| | • | | any other information that the Funds would be required to include in a proxy statement concerning the person if he or she was nominated; and |
| |
| | • | | the name and address of the person submitting the recommendation and, if that person is a shareholder, the period for which that person held Fund shares. |
| | | The recommendation also can include any additional information which the person submitting it believes would assist the Committee in evaluating the recommendation. |
| |
| 4. | | Shareholders should note that a person who owns securities issued by Massachusetts Mutual Life Insurance Company (the parent company of the Funds’ investment adviser) would be deemed an “interested person” under the Investment Company Act of 1940. In addition, certain other relationships with Massachusetts Mutual Life Insurance Company or its subsidiaries, with registered broker-dealers, or with the Funds’ outside legal counsel may cause a person to be deemed an “interested person.” |
| |
| 5. | | Before the Committee decides to nominate an individual as a trustee, Committee members and other directors customarily interview the individual in person. In addition, the individual customarily is asked to complete a detailed questionnaire which is designed to elicit information which must be disclosed under SEC and stock exchange rules and to determine whether the individual is subject to any statutory disqualification from serving as a trustee of a registered investment company. |
Item 11. Controls and Procedures.
Based on their evaluation of the registrant’s disclosure controls and procedures (as defined in rule 30a-3(c) under the Investment Company Act of 1940 (17 CFR 270.30a-3(c)) as of 04/30/2009, the registrant’s principal executive officer and principal financial officer found the registrant’s disclosure controls and procedures to provide reasonable assurances that information required to be disclosed by the registrant in the reports that it files under the Securities Exchange Act of 1934 (a) is accumulated and communicated to registrant’s management, including its principal executive officer and principal financial officer, to allow timely decisions regarding required disclosure, and (b) is recorded, processed, summarized and reported, within the time periods specified in the rules and forms adopted by the U.S. Securities and Exchange Commission.
There have been no changes in the registrant’s internal controls over financial reporting that occurred during the registrant’s second fiscal quarter of the period covered by this report that have materially affected, or are reasonably likely to materially affect, the registrant’s internal control over financial reporting.
Item 12. Exhibits.
| (a) | | (1) Not applicable to semiannual reports. |
| | (2) | | Exhibits attached hereto. |
| |
| | (3) | | Not applicable. |
| (b) | | Exhibit attached hereto. |
SIGNATURES
Pursuant to the requirements of the Securities Exchange Act of 1934 and the Investment Company Act of 1940, the registrant has duly caused this report to be signed on its behalf by the undersigned, thereunto duly authorized.
Oppenheimer Quest for Value Funds
| | | | |
| By: | /s/ John V. Murphy | |
| | John V. Murphy | |
| | Principal Executive Officer | |
Date: 06/15/2009
Pursuant to the requirements of the Securities Exchange Act of 1934 and the Investment Company Act of 1940, this report has been signed below by the following persons on behalf of the registrant and in the capacities and on the dates indicated.
| | | | |
| By: | /s/ John V. Murphy | |
| | John V. Murphy | |
| | Principal Executive Officer | |
Date: 06/15/2009
| | | | |
| By: | /s/ Brian W. Wixted | |
| | Brian W. Wixted | |
| | Principal Financial Officer | |
Date: 06/15/2009