
J.P. Morgan Healthcare Conference Simon Campion President and Chief Executive Officer January 15, 2025

Forward-Looking Statements and Associated Risks This presentation contains statements that do not directly and exclusively relate to historical facts which constitute forward-looking statements, including, statements and projections concerning, among other things, the expected timing, benefits and costs associated with the Company’s restructuring plan described in this presentation and statements and projections concerning the ability to successfully refocus the Byte business or the ability to leverage Byte assets to support other aspects of the Company’s business. The Company’s forward-looking statements represent current expectations and beliefs and involve risks and uncertainties. Actual results may differ significantly from those projected or suggested in any forward-looking statements and no assurance can be given that the results described in such forward-looking statements will be achieved. Investors are cautioned not to place undue reliance on such forward-looking statements which speak only as of the date they are made. The forward-looking statements are subject to numerous assumptions, risks and uncertainties and other factors that could cause actual results to differ materially from those described in such statements, many of which are outside of our control. The Company does not undertake any obligation to release publicly any revisions to such forward-looking statements to reflect events or circumstances occurring after the date hereof or to reflect the occurrence of unanticipated events. Any number of factors could cause the Company’s actual results to differ materially from those contemplated by any forward-looking statements, including, but not limited to, the risks associated with the following: the Company’s ability to remain profitable in a very competitive marketplace, which depends upon the Company’s ability to differentiate its products and services from those of competitors; the Company’s failure to realize assumptions and projections which may result in the need to record additional impairment charges; the effect of changes to the Company’s distribution channels for its products and the failure of significant distributors of the Company to effectively manage their inventories; increased regulation that impacts the Company’s business including Byte; the Company’s ability to control costs and failure to realize expected benefits of cost reduction and restructuring efforts and the Company’s failure to anticipate and appropriately adapt to changes or trends within the rapidly changing dental industry. Investors should carefully consider these and other relevant factors, including those risk factors in Part I, Item 1A, (“Risk Factors”) in the Company’s most recent Form 10-K, including any amendments thereto, and any updating information which may be contained in the Company’s other filings with the SEC, when reviewing any forward-looking statement. The Company notes these factors for investors as permitted under the Private Securities Litigation Reform Act of 1995. Investors should understand it is impossible to predict or identify all such factors or risks. As such, you should not consider either the foregoing lists, or the risks identified in the Company’s SEC filings, to be a complete discussion of all potential risks or uncertainties. 2 Non-GAAP Financial Measures In addition to results determined in accordance with U.S. generally accepted accounting principles (“US GAAP”) the Company provides certain measures in this presentation, described below, which are not calculated in accordance with US GAAP and therefore represent Non-GAAP measures. These Non-GAAP measures may differ from those used by other companies and should not be considered in isolation from, or as a substitute for, measures of financial performance prepared in accordance with US GAAP. These Non-GAAP measures are used by the Company to measure its performance and may differ from those used by other companies. Management believes that these Non-GAAP measures are helpful as they provide a measure of the results of operations, and are frequently used by investors and analysts to evaluate the Company’s performance exclusive of certain items that impact the comparability of results from period to period, and which may not be indicative of past or future performance of the Company. The Company does not provide forward-looking estimates on a GAAP basis as certain information is not available and cannot be reasonably estimated.
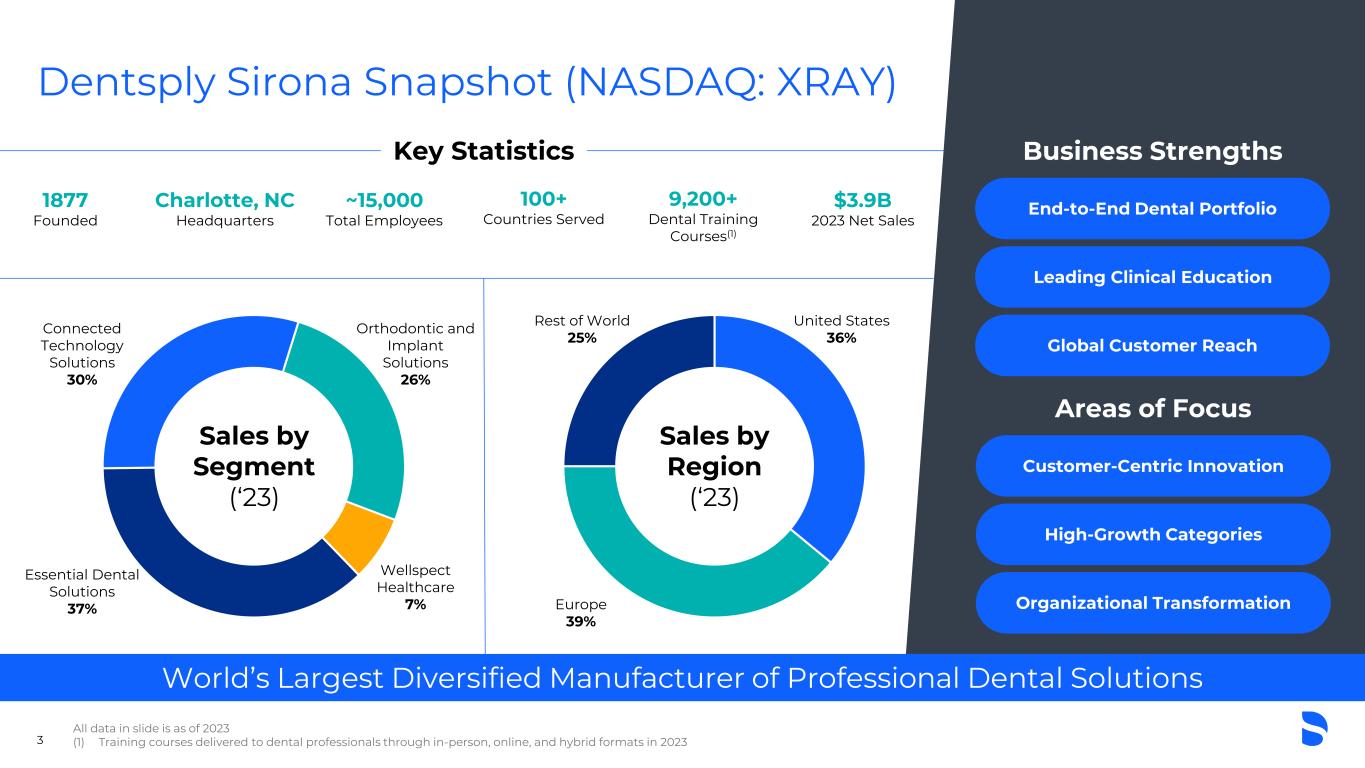
Dentsply Sirona Snapshot (NASDAQ: XRAY) World’s Largest Diversified Manufacturer of Professional Dental Solutions Essential Dental Solutions 37% Connected Technology Solutions 30% Wellspect Healthcare 7% Orthodontic and Implant Solutions 26% United States 36% Europe 39% Rest of World 25% Key Statistics 1877 Founded Charlotte, NC Headquarters ~15,000 Total Employees 100+ Countries Served $3.9B 2023 Net Sales Business Strengths End-to-End Dental Portfolio Leading Clinical Education Global Customer Reach All data in slide is as of 2023 (1) Training courses delivered to dental professionals through in-person, online, and hybrid formats in 20233 Sales by Segment (‘23) Sales by Region (‘23) 9,200+ Dental Training Courses(1) Areas of Focus Customer-Centric Innovation High-Growth Categories Organizational Transformation

Markets with Evolving Dynamics 4 ▪ Favorable demographics ▪ Integrated, connected and accessible care ▪ Shift to digital technologies ▪ GPs performing more complex procedures ▪ Increasing DSO(1) presence ▪ Value and efficiency ▪ Pressure on reimbursement Market Trends Advancing Strategies to Capture Growth and Expand Share in Key Segments Total Addressable Markets (1) DSO: Dental Support Organization
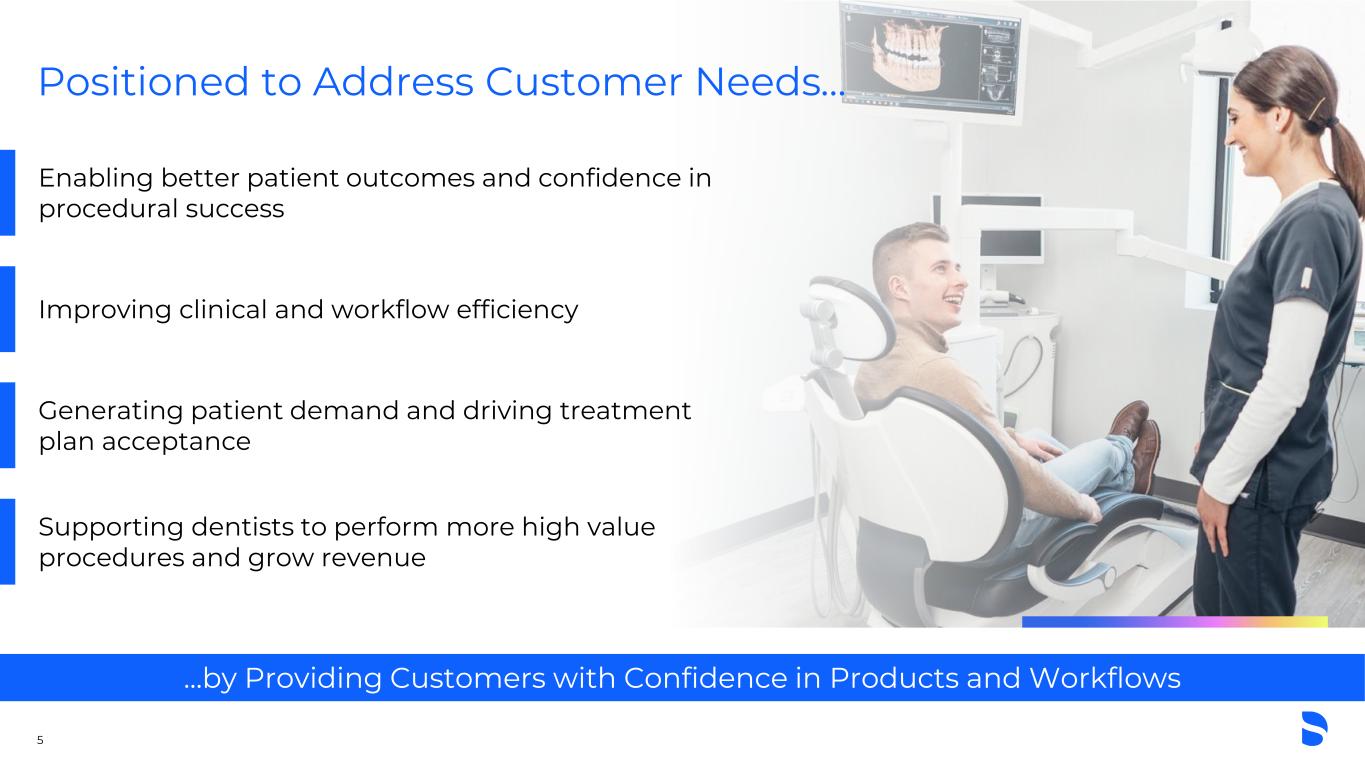
5 Enabling better patient outcomes and confidence in procedural success Improving clinical and workflow efficiency Generating patient demand and driving treatment plan acceptance Supporting dentists to perform more high value procedures and grow revenue …by Providing Customers with Confidence in Products and Workflows Positioned to Address Customer Needs…
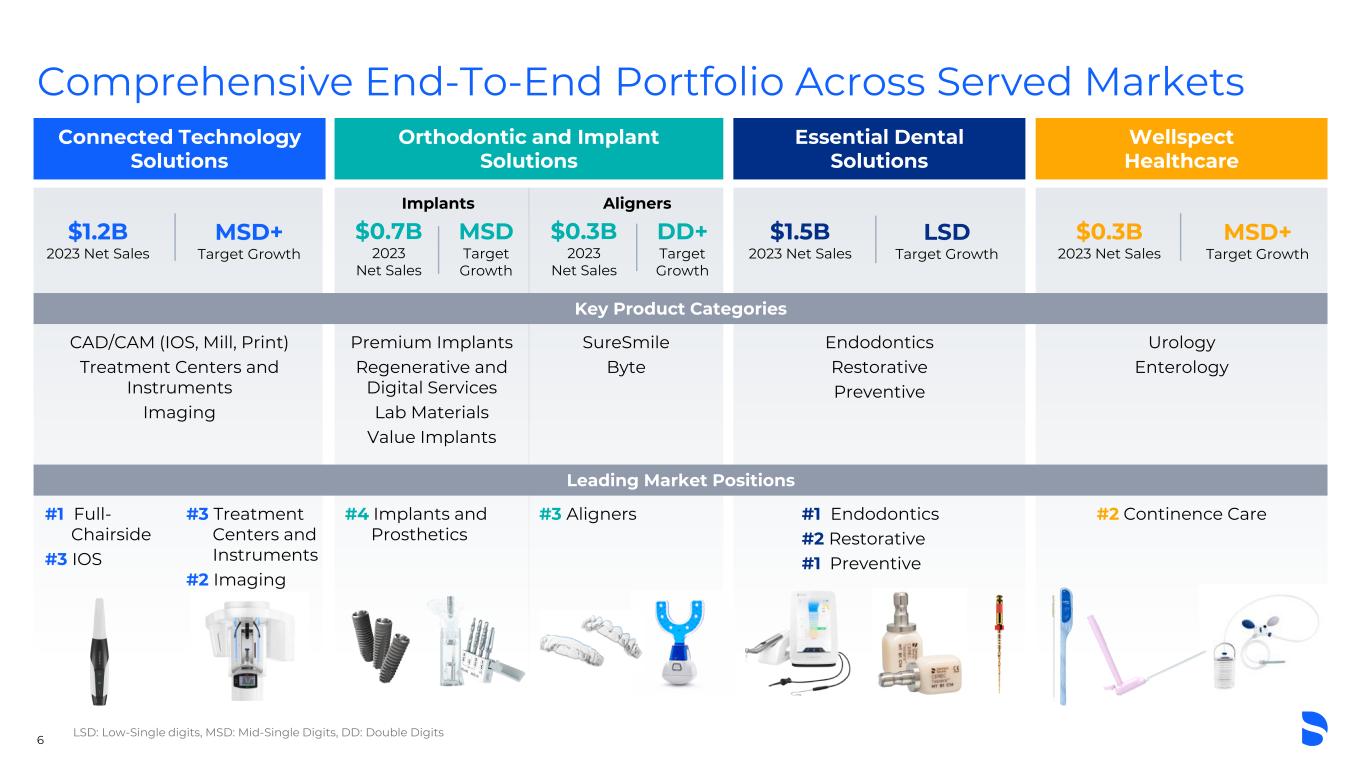
Wellspect Healthcare $0.3B 2023 Net Sales Urology Enterology MSD+ Target Growth #2 Continence Care Essential Dental Solutions $1.5B 2023 Net Sales Endodontics Restorative Preventive LSD Target Growth #1 Endodontics #2 Restorative #1 Preventive Orthodontic and Implant Solutions $0.7B 2023 Net Sales Implants $0.3B 2023 Net Sales Aligners Premium Implants Regenerative and Digital Services Lab Materials Value Implants SureSmile Byte MSD Target Growth DD+ Target Growth #4 Implants and Prosthetics #3 Aligners Connected Technology Solutions $1.2B 2023 Net Sales CAD/CAM (IOS, Mill, Print) Treatment Centers and Instruments Imaging MSD+ Target Growth #1 Full- Chairside #3 IOS #3 Treatment Centers and Instruments #2 Imaging Comprehensive End-To-End Portfolio Across Served Markets 6 Key Product Categories Leading Market Positions LSD: Low-Single digits, MSD: Mid-Single Digits, DD: Double Digits
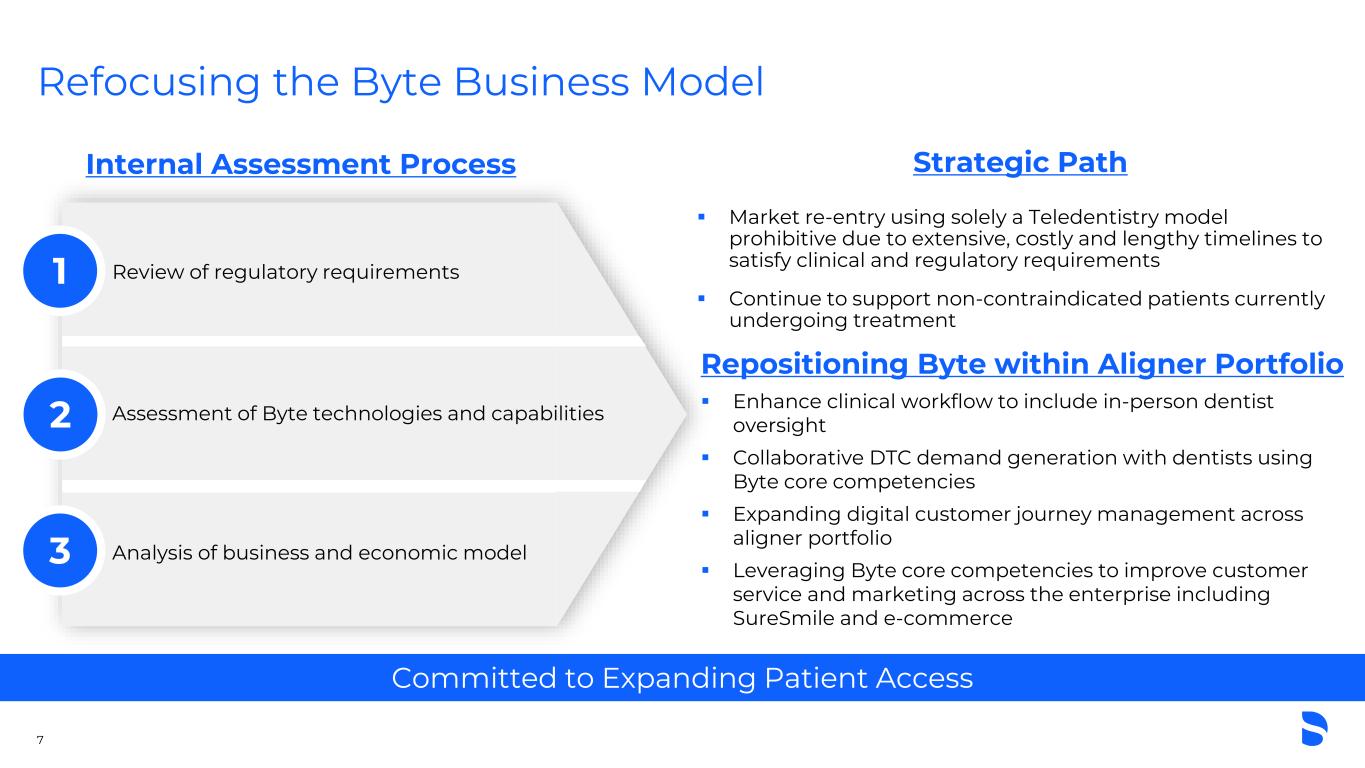
Refocusing the Byte Business Model 7 Committed to Expanding Patient Access Internal Assessment Process Strategic Path Repositioning Byte within Aligner Portfolio ▪ Enhance clinical workflow to include in-person dentist oversight ▪ Collaborative DTC demand generation with dentists using Byte core competencies ▪ Expanding digital customer journey management across aligner portfolio ▪ Leveraging Byte core competencies to improve customer service and marketing across the enterprise including SureSmile and e-commerce ▪ Market re-entry using solely a Teledentistry model prohibitive due to extensive, costly and lengthy timelines to satisfy clinical and regulatory requirements ▪ Continue to support non-contraindicated patients currently undergoing treatment 3 2 Assessment of Byte technologies and capabilities 1 Analysis of business and economic model Review of regulatory requirements

Our Strategy Transform oral health and continence care by driving product and service innovation and delivering an exceptional customer and patient experience through an engaged and diverse workforce Enabled by the DS Operating Model ONE TEAM | INNOVATION | DISCIPLINED EXECUTION 8 ACHIEVE ANNUAL GROWTH & MARGIN COMMITMENTS 1 ENHANCE & SUSTAIN PROFITABILITY 2 ACCELERATE ENTERPRISE DIGITALIZATION 3 WIN IN HIGH GROWTH CATEGORIES 4 DRIVE HIGH PERFORMANCE CULTURE 5
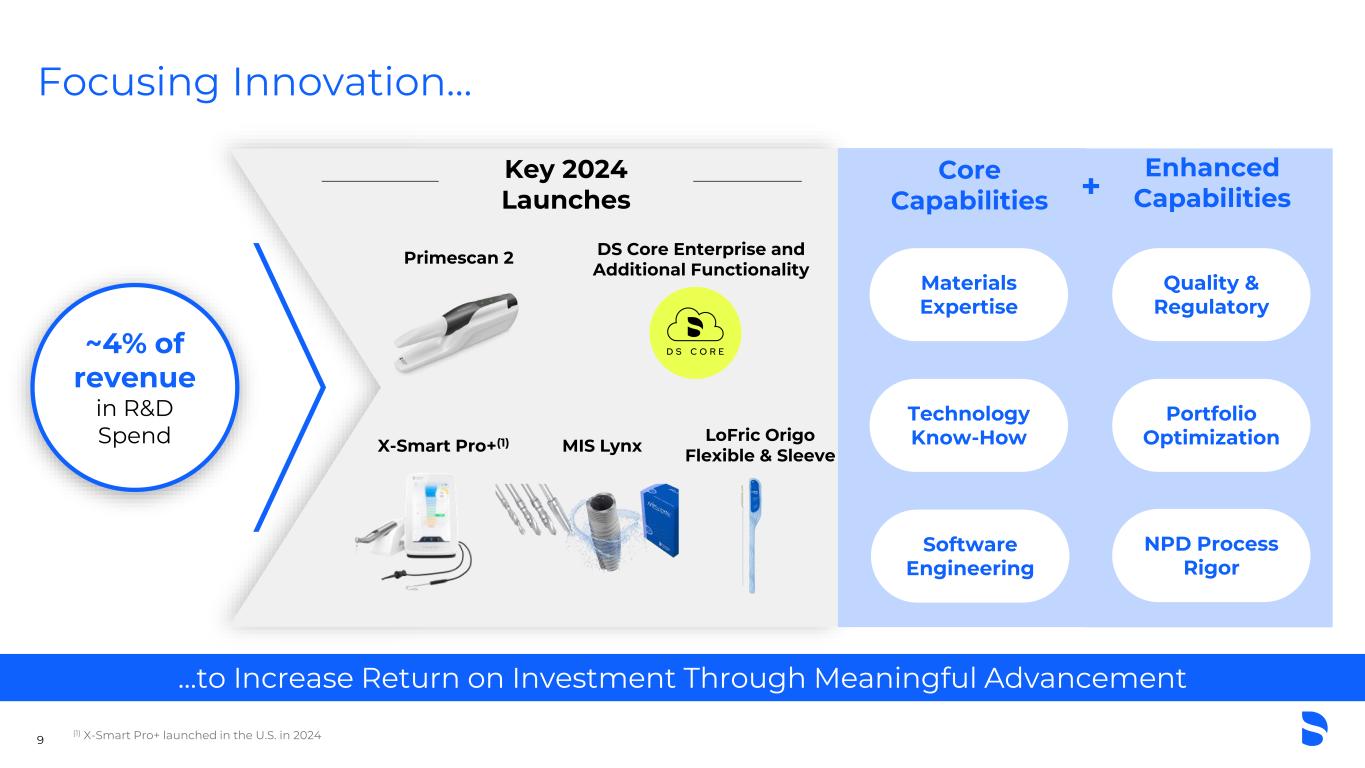
Focusing Innovation… …to Increase Return on Investment Through Meaningful Advancement ~4% of revenue in R&D Spend 9 MIS Lynx DS Core Enterprise and Additional Functionality Primescan 2 X-Smart Pro+(1) Core Capabilities Materials Expertise Technology Know-How Software Engineering Key 2024 Launches LoFric Origo Flexible & Sleeve (1) X-Smart Pro+ launched in the U.S. in 2024 Enhanced Capabilities+ NPD Process Rigor Portfolio Optimization Quality & Regulatory
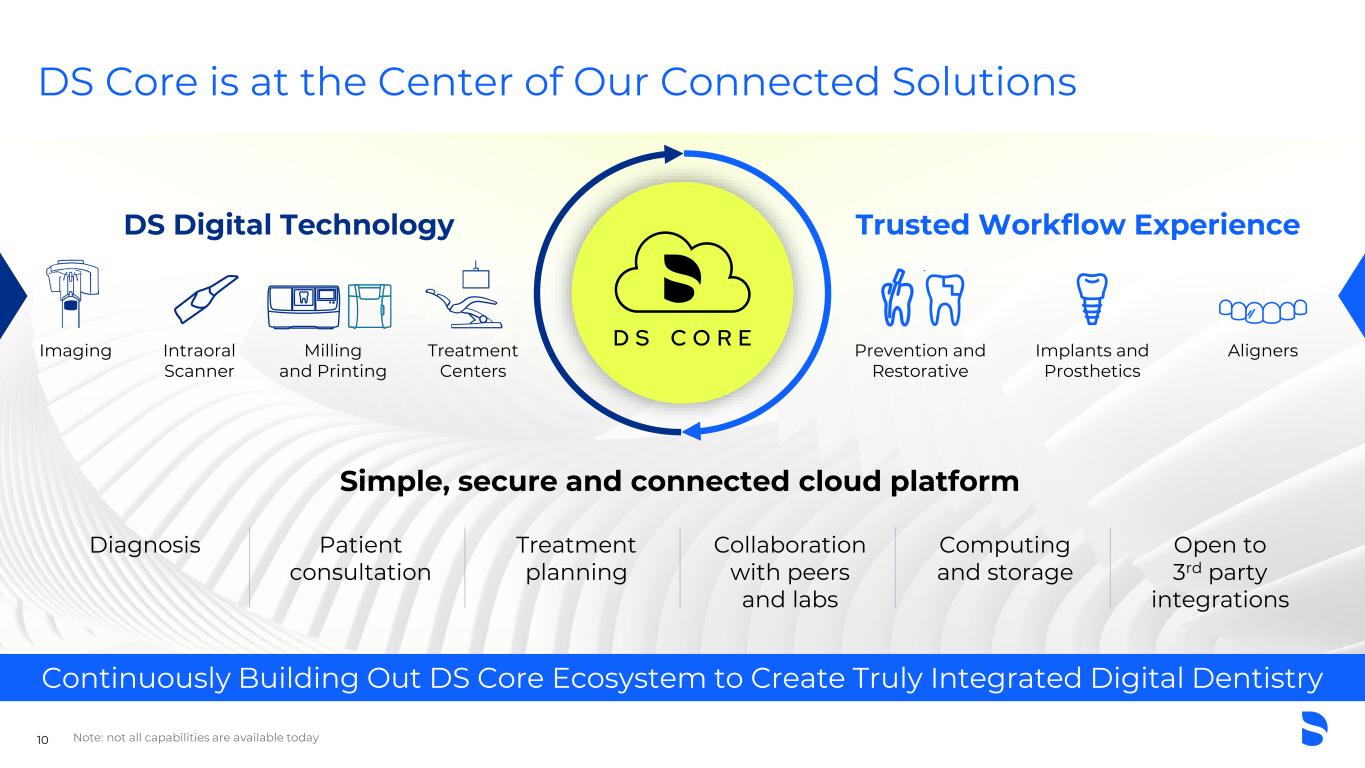
10 Continuously Building Out DS Core Ecosystem to Create Truly Integrated Digital Dentistry DS Core is at the Center of Our Connected Solutions Simple, secure and connected cloud platform Diagnosis Patient consultation Treatment planning Imaging Trusted Workflow Experience Prevention and Restorative Implants and Prosthetics Aligners Collaboration with peers and labs Computing and storage Open to 3rd party integrations Note: not all capabilities are available today Treatment Centers Milling and Printing DS Digital Technology Intraoral Scanner
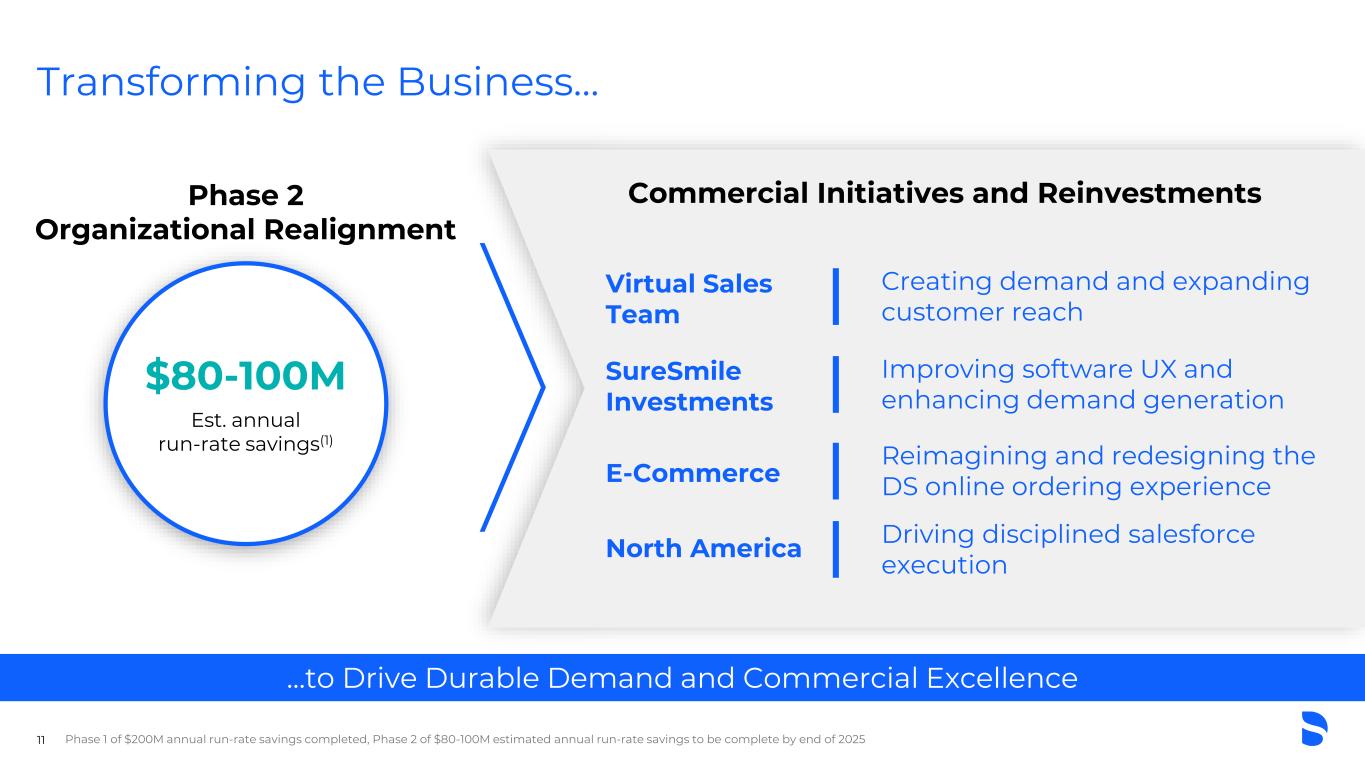
11 …to Drive Durable Demand and Commercial Excellence Commercial Initiatives and ReinvestmentsPhase 2 Organizational Realignment Transforming the Business… $80-100M Est. annual run-rate savings(1) Phase 1 of $200M annual run-rate savings completed, Phase 2 of $80-100M estimated annual run-rate savings to be complete by end of 2025 Virtual Sales Team Creating demand and expanding customer reach SureSmile Investments Improving software UX and enhancing demand generation E-Commerce Reimagining and redesigning the DS online ordering experience North America Driving disciplined salesforce execution

✓ Phase 1 restructuring completed ✓ 2 ERP deployments completed in 2024 ✓ Closed 3 manufacturing sites and 4 distribution centers • Phase 2 restructuring in process • Migrating revenue SKUs in 2025 Enabling Execution to Unlock Tomorrow’s Potential… 12 Where We Were (2023 and Prior) Where We Are (2024 – 2025) Where We Are Going (2026 – Beyond) …for Organizational Efficiency and Improved Performance • Siloed, inefficient organization • Disparate ERP system • Complex supply chain network • SKU redundancies • Inconsistent NPD process and launch cadence • Flat sales growth ✓ Improved rigor and focus on NPD ✓ 8/8 510(k) clearances in 2024 ✓ 21 product launches in 2024 • Growth focused - reinforcing commitment to improve commercial execution globally • Virtual sales team ramping and broadening customer outreach • Streamlined organization • Customer-centric, digital-forward and cohesive portfolio • ~50% reduction of Endo/Resto SKUs • 1 common ERP system • 10-15% incremental manufacturing and distribution footprint reduction • Innovation engine enabled by highly-effective NPD process • Reignited sales growth and capturing share across categories

Key Takeaways 1 2 3 4 Well-positioned with an end-to-end portfolio and clear strategy Innovation is a cornerstone of growth plans Investing for growth; shaping our organization and progressing on all initiatives 2025 is an important strategic execution year

Appendix
Non-GAAP Measures Definitions 15 Organic Sales The Company defines "organic sales" as the reported net sales adjusted for: (1) net sales from acquired businesses recorded prior to the first anniversary of the acquisition; (2) net sales attributable to disposed businesses or discontinued product lines in both the current and prior year periods; and (3) the impact of foreign currency changes, which is calculated by translating current period net sales using the comparable prior period's foreign currency exchange rates. Adjusted Operating Income and Margin Adjusted operating income is computed by excluding the following items from operating income (loss) as reported in accordance with US GAAP: (1) Business combination related costs and fair value adjustments. These adjustments include costs related to consummating and integrating acquired businesses, as well as net gains and losses related to disposed businesses. In addition, this category includes the post-acquisition roll-off of fair value adjustments recorded related to business combinations, except for amortization expense of purchased intangible assets noted below. Although the Company is regularly engaged in activities to find and act on opportunities for strategic growth and enhancement of product offerings, the costs associated with these activities may vary significantly between periods based on the timing, size and complexity of acquisitions and as such may not be indicative of past and future performance of the Company. (2) Restructuring related charges and other costs. These adjustments include costs related to the implementation of restructuring initiatives, including but not limited to, severance costs, facility closure costs, and lease and contract termination costs, as well as related professional service costs associated with these restructuring initiatives and global transformation activity. The Company is continually seeking to take actions that could enhance its efficiency; consequently, restructuring charges may recur but are subject to significant fluctuations from period to period due to the varying levels of restructuring activity, and as such may not be indicative of past and future performance of the Company. Other costs include gains and losses on the sale of property, charges related to legal settlements, executive separation costs, write-offs of inventory as a result of product rationalization, and changes in accounting principles recorded within the period. This category also includes costs related to investigations, related ongoing legal matters and associated remediation activities which primarily include legal, accounting and other professional service fees, as well as turnover and other employee-related costs. (3) Goodwill and intangible asset impairments. These adjustments include charges related to goodwill and intangible asset impairments. (4) Amortization of purchased intangible assets. This adjustment excludes the periodic amortization expense related to purchased intangible assets, which are recorded at fair value. Although these costs contribute to revenue generation and will recur in future periods, their amounts are significantly impacted by the timing and size of acquisitions, and as such may not be indicative of the future performance of the Company. (5) Fair value and credit risk adjustments. These adjustments include the non-cash mark-to-market changes in fair value associated with pension assets and obligations, and equity-method investments. Although these adjustments are recurring in nature, they are subject to significant fluctuations from period to period due to changes in the underlying assumptions and market conditions. The non-service component of pension expense is a recurring item, however it is subject to significant fluctuations from period to period due to changes in actuarial assumptions, interest rates, plan changes, settlements, curtailments, and other changes in facts and circumstances. As such, these items may not be indicative of past and future performance of the Company. Adjusted operating income margin is calculated by dividing adjusted operating income by net sales. Adjusted Gross Profit Adjusted gross profit is computed by excluding from gross profit the impact any of the above adjustments that affect either sales or cost of sales. Adjusted Net Income (Loss) Adjusted net income (loss) consists of net income (loss) as reported in accordance with US GAAP, adjusted to exclude the items identified above, as well as the related income tax impacts of those items. Additionally, net income is adjusted for other tax-related adjustments such as: discrete adjustments to valuation allowances and other uncertain tax positions, final settlement of income tax audits, discrete tax items resulting from the implementation of restructuring initiatives and the windfall or shortfall relating to exercise of employee share- based compensation, any difference between the interim and annual effective tax rate, and adjustments relating to prior periods. These adjustments are irregular in timing, and the variability in amounts may not be indicative of past and future performance of the Company and therefore are excluded for comparability purposes. Adjusted EBITDA and Margin In addition to the adjustments described above in arriving at adjusted net income, adjusted EBITDA is computed by further excluding any remaining interest expense, net, income tax expense, depreciation and amortization. Adjusted EBITDA margin is calculated by dividing adjusted EBITDA by net sales. Adjusted Earnings (Loss) Per Diluted Share Adjusted earnings (loss) (EPS) per diluted share is computed by dividing adjusted earnings (loss) attributable to Dentsply Sirona shareholders by the diluted weighted average number of common shares outstanding. Adjusted Free Cash Flow and Conversion The Company defines adjusted free cash flow as net cash provided by operating activities minus capital expenditures during the same period, and adjusted free cash flow conversion is defined as adjusted free cash flow divided by adjusted net income (loss). Management believes this Non-GAAP measure is important for use in evaluating the Company’s financial performance as it measures our ability to efficiently generate cash from our business operations relative to earnings. It should be considered in addition to, rather than as a substitute for, net income (loss) as a measure of our performance or net cash provided by operating activities as a measure of our liquidity.


