UNITED STATES
SECURITIES AND EXCHANGE COMMISSION
Washington, D.C. 20549
FORM 10-K
x ANNUAL REPORT PURSUANT TO SECTION 13 OR 15(d) OF THE SECURITIES EXCHANGE ACT OF 1934
For the fiscal year ended December 31, 2024
OR
o TRANSITION REPORT PURSUANT TO SECTION 13 OR 15(d) OF THE SECURITIES EXCHANGE ACT OF 1934
Commission File Number 0-16211
DENTSPLY SIRONA Inc.
(Exact name of registrant as specified in its charter) | | | | | |
| Delaware | 39-1434669 |
| (State or other jurisdiction of incorporation or organization) | (I.R.S. Employer Identification No.) |
| |
| 13320 Ballantyne Corporate Place, Charlotte, North Carolina | 28277-3607 |
| (Address of principal executive offices) | (Zip Code) |
Registrant’s telephone number, including area code: (844) 848-0137
Securities registered pursuant to Section 12(b) of the Act: | | | | | | | | |
| Title of each class | Trading Symbol | Name of each exchange on which registered |
| Common Stock, par value $.01 per share | XRAY | The Nasdaq Stock Market LLC |
Indicate by check mark if the registrant is a well-known seasoned issuer, as defined in Rule 405 of the Securities Act.
Yes x No o
Indicate by check mark if the registrant is not required to file reports pursuant to Section 13 or Section 15(d) of the Act.
Yes o No x
Indicate by check mark whether the registrant (1) has filed all reports required to be filed by Section 13 or 15(d) of the Securities Exchange Act of 1934 during the preceding 12 months (or for such shorter period that the registrant was required to file such reports), and (2) has been subject to such filing requirements for the past 90 days.
Yes x No o
Indicate by check mark whether the Registrant has submitted electronically every Interactive Data File required to be submitted pursuant to Rule 405 of Regulation S-T (§ 232.405 of this chapter) during the preceding 12 months (or for such shorter period that the registrant was required to submit such files).
Yes x No o
Indicate by check mark whether the registrant is a large accelerated filer, an accelerated filer, a non-accelerated filer, a smaller reporting company, or an emerging growth company. See the definitions of “large accelerated filer,” “accelerated filer,” “smaller reporting company” and “emerging growth company” in Rule 12b-2 of the Exchange Act. | | | | | | | | | | | | | | |
| Large Accelerated Filer | x | Accelerated Filer o | Non-Accelerated Filer o | Smaller Reporting Company ☐ |
Emerging Growth Company ☐ | If an emerging growth company, indicate by check mark if the registrant has elected not to use the extended transition period for complying with any new or revised financial accounting standards provided pursuant to Section 13(a) of the Exchange Act. o |
|
Indicate by check mark whether the registrant has filed a report on and attestation to its management’s assessment of the effectiveness of its internal control over financial reporting under Section 404(b) of the Sarbanes-Oxley Act (15 U.S.C.7262(b)) by the registered public accounting firm that prepared or issued its audit report. ☒
If securities are registered pursuant to Section 12(b) of the Act, indicate by check mark whether the financial statements of the registrant included in the filing reflect the correction of an error to previously issued financial statements. o
Indicate by check mark whether any of those error corrections are restatements that required a recovery analysis of incentive-based compensation received by any of the registrant’s executive officers during the relevant recovery period pursuant to §240.10D-1(b). o
Indicate by check mark whether the registrant is a shell company (as defined in Rule 12b-2 of the Act) Yes ☐ No x
The aggregate market value of the voting common stock held by non-affiliates of the registrant computed by reference to the closing price as of the last business day of the registrant’s most recently completed second quarter ended June 30, 2024, was $5,036,994,579. For purpose of this calculation only, without determining whether the following are affiliates of the registrant, the registrant has assumed that (i) its directors and executive officers are affiliates, and (ii) no party who has filed a Schedule 13D or 13G is an affiliate.
The number of shares of the registrant’s common stock outstanding as of the close of business on February 14, 2025 was 198,991,963.
DOCUMENTS INCORPORATED BY REFERENCE
Certain portions of the definitive Proxy Statement of DENTSPLY SIRONA Inc. (the “Proxy Statement”) to be used in connection with the 2025 Annual Meeting of Stockholders are incorporated by reference into Part III of this Form 10-K to the extent provided herein. Except as specifically incorporated by reference herein the Proxy Statement is not deemed to be filed as part of this Form 10-K.
| | | | | | | | | | | |
| DENTSPLY SIRONA Inc. |
| Table of Contents |
| | | |
|
| | | Page |
| | | |
| | | |
| | | |
| | | |
| | | |
| | | |
| | | |
| | | |
| | | |
| | | |
| | | |
| | | |
| | | |
| | | |
| | | |
|
| | | |
| | | |
| | | |
| | | |
| | | |
| | | |
| | | |
| | | |
| | | |
| | | |
| | | |
| | | |
| | | |
| | | |
| | | |
| | | |
| | | |
| | | |
| | | |
|
| | | |
| | | |
| | | |
| | | |
| | | |
| | | |
| | | |
| | | |
| | | |
| | | |
| | | |
|
| | | |
| | | |
| | | |
| | | |
| | | |
| | | |
PART I
FORWARD-LOOKING STATEMENTS AND ASSOCIATED RISKS
All statements included or incorporated by reference in this Form 10-K and other filings with the U.S. Securities and Exchange Commission (the “SEC”) that do not directly and exclusively relate to historical facts constitute “forward-looking statements.” These statements represent current expectations and beliefs, and no assurance can be given that the results described in such statements will be achieved. Such statements are subject to numerous assumptions, risks, uncertainties and other factors that could cause actual results to differ materially from those described in such statements, many of which are outside of our control. No assurance can be given that any expectation, belief, goal or plan set forth in any forward-looking statement can or will be achieved, and readers are cautioned not to place undue reliance on such statements which speak only as of the date they are made. We do not undertake any obligation to update or release any revisions to any forward-looking statement or to report any events or circumstances after the date of this Form 10-K or to reflect the occurrence of unanticipated events.
You should carefully consider these and other relevant factors, including those risk factors in Item 1A, “Risk Factors” of this Form 10-K and any other information included or incorporated by reference in this report, and information which may be contained in the Company’s other filings with the SEC, when reviewing any forward-looking statement. Investors should understand it is impossible to predict or identify all such factors or risks. As such, you should not consider either the foregoing lists, or the risks identified in the Company’s SEC filings, to be a complete discussion of all potential risks or uncertainties associated with an investment in the Company.
GENERAL
Unless otherwise stated herein or the context otherwise indicates, references throughout this Form 10-K to “Dentsply Sirona,” or the “Company,” “we,” “us” or “our” refer to DENTSPLY SIRONA Inc., together with its subsidiaries on a consolidated basis.
Item 1. Business
Overview
DENTSPLY SIRONA Inc. (“Dentsply Sirona” or the “Company”) is the world’s largest diversified manufacturer of professional dental products and technologies, with a 138-year history of innovation and service to the dental industry, and a vision of improving oral health and continence care globally. Dentsply Sirona develops, manufactures, and markets comprehensive solutions, including technologically advanced dental equipment supported by cloud-enabled solutions, dental products, and healthcare consumable products in urology and enterology under a strong portfolio of world-class brands. Dentsply Sirona’s innovative products provide high-quality, effective, and connected solutions to advance patient care and deliver better, safer and faster dentistry. The Company introduced the first dental electric drill approximately 133 years ago, the first dental X-ray unit approximately 100 years ago, the first hydrophilic catheter and the first dental computer-aided design/computer-aided manufacturing (“CAD/CAM”) system approximately 40 years ago, and numerous other significant innovations, including pioneering ultrasonic scaling to increase the speed, effectiveness and comfort of cleaning and revolutionizing both file and apex locater technology to make root canal procedures easier and safer. Dentsply Sirona continues to make significant investments in research and development (“R&D”), and its track record of innovative and profitable new products continues today. Dentsply Sirona’s worldwide headquarters is located in Charlotte, North Carolina and its shares of common stock are listed in the United States on Nasdaq under the symbol XRAY.
Dentsply Sirona’s headquarters and principal operations are located in the United States of America (“U.S.” or “United States”) and the Company sells products globally through its foreign subsidiaries to customers in approximately 150 countries. Dentsply Sirona has a long-established presence in the European market, particularly in Germany, Sweden, France, the United Kingdom (“UK”), Italy, and Switzerland. The Company also has a significant market presence in the Asia-Pacific region, Central and South America, the Middle East region, and Canada.
Our Company’s mission is to transform oral health and continence care with innovative products, solutions and services through an engaged workforce. We conduct our business in accordance with that goal using the following core operating principles:
•Approach customers as one: The Company has an integrated approach to customer service, direct and indirect selling, and clinical education to strengthen relationships with customers and better serve customers’ needs.
•Create innovative solutions that customers love to use: We manage a comprehensive R&D program that prioritizes strategic spending, builds the next generation of digital workflow technologies and service offerings, and results in impactful innovations that grow our business.
•Think and act with positive intent and the highest integrity: We execute our business in a way that empowers our people, respects the communities in which we do business, and establishes trust with our partners and stakeholders.
•Use size and global breadth to our advantage: We are focused on integrating our dental product portfolios to unlock operational efficiencies, and on enhancing our healthcare consumables product portfolio, with an emphasis on performance improvements in procurement, logistics, manufacturing, sales force and marketing programs, while at the same time simplifying our business on a worldwide scale. In combination, these initiatives will improve organizational efficiency and better leverage our selling, general and administrative infrastructure.
•Operate sustainably in everything we do: We take a thoughtful, proactive approach to creating a sustainable company through investments in our employees, customers, and the environment.
Principal Products and Product Categories
The professional dental industry encompasses the diagnosis, treatment and prevention of disease and ailments of the teeth, gums and supporting bone. The Company offers a broad suite of dental products which together provide digital workflows for dental practitioners to make the highest use of technological advancements throughout each stage of patient care. Dentsply Sirona’s principal dental product categories are dental technology and equipment products, dental implants, clear aligners, and dental consumable products. Additionally, the Company manufactures and sells healthcare consumable products for urological and enterological applications. As part of its dental technology and equipment solutions, the Company also offers an open, cloud-based platform for digital services, DS Core. These products and solutions are produced by the Company globally and are distributed throughout the world under some of the most well-established brand names and trademarks in these industries, including but not limited to: AH PLUS, ANKYLOS, AQUASIL ULTRA, ARTICADENT, ASTRA TECH, ATLANTIS, AXANO, AXEOS, BYTE, CALIBRA, CAULK, CAVITRON, CELTRA, CERAMCO, CERCON, CEREC, CITANEST, CONFORM FIT, DAC, DELTON, DENTSPLY, DETREY, DS CORE, DYRACT, ENERGO, ESTHET.X, FRIOS, HELIODENT, EV, INLAB, INTEGO, IPN, LOFRIC, LUCITONE, MAILLEFER, MIDWEST, MIS, NAVINA, NUPRO, OMNITAPER, ORAQIX, ORIGO, ORTHOPHOS, OSSEOSPEED, OSSIX, PALODENT, PRIME & BOND, PROFILE, PRIMEMILL, PRIMEPRINT, PRIMESCAN, PRIMESCAN CONNECT, PRIMETAPER, PROGLIDER, PROTAPER, RECIPROC, PUREVAC, SCHICK, SDR FLOW+, SIDEXIS, SIMPLANT, SINIUS, SIROLASER, SIRONA, SLIMLINE, SMARTLITE, SPECTRA ST, STYLUS, SULTAN, SURESMILE, SYMBIOS, T1, T2, T3, T4, THERMAFIL, TRIODENT, TRUBYTE, TRUNATOMY, VDW, VIPI, WAVEONE, WELLSPECT, XENO, XIOS, X SMART, XYLOCAINE and ZHERMACK.
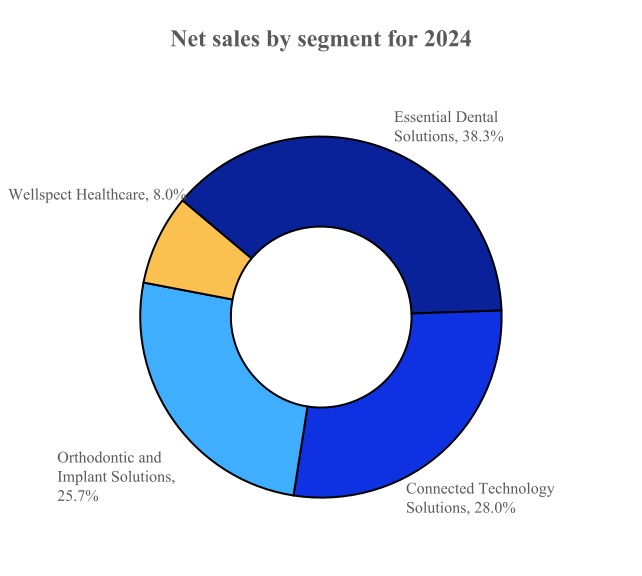
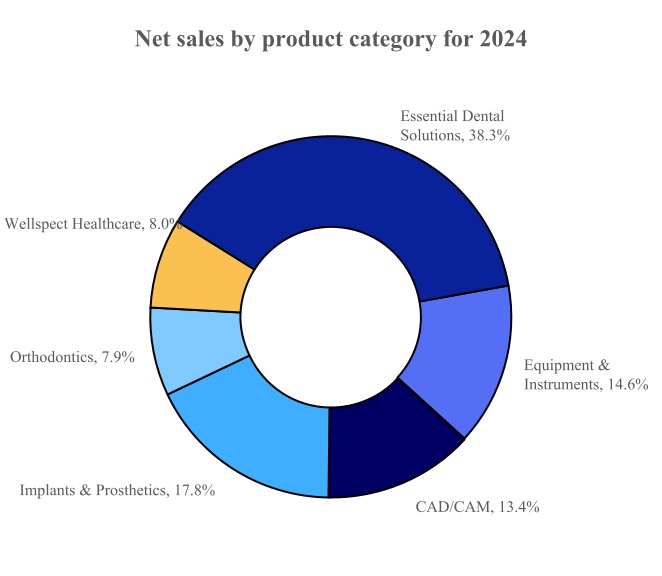
The Company conducts business through four reportable segments: (1) Connected Technology Solutions, (2) Essential Dental Solutions, (3) Orthodontic and Implant Solutions, and (4) Wellspect Healthcare. For the year ended December 31, 2024, the Company’s net sales of each reportable segments and the product categories of these reportable segments as a percent of total net sales were as follows:
Connected Technology Solutions
This segment includes the design, manufacture and sales of the Company’s dental technology and equipment products. These products include the Equipment & Instruments and CAD/CAM product categories.
Equipment & Instruments
The Equipment & Instruments product category consists of basic and high-tech dental equipment such as imaging equipment, motorized dental handpieces, treatment centers, and other instruments for dental practitioners and specialists. Imaging equipment serves as a key point of entry to the Company’s digital workflow offerings and consists of a broad range of diagnostic imaging systems for 2D or 3D, panoramic, and intraoral applications, as well as cone-beam computed tomography systems (“CBCT”). Treatment centers comprise a broad range of products from basic dental chairs to sophisticated chair-based units with integrated diagnostic, hygienic and ergonomic functionalities, as well as specialist centers used in preventive treatment and for training purposes. This product group also includes other lab equipment, such as amalgamators, mixing machines and porcelain furnaces.
CAD/CAM
Dental CAD/CAM technologies are products designed for dental professionals to support numerous digital workflows for procedures such as dental restorations through integrations with DS Core, our cloud-based platform. This product category includes intraoral scanners, 3-D printers, mills, and certain software and services, as well as a full-chairside economical restoration of esthetic ceramic dentistry offering called CEREC, which enables dentists to practice same-day or single visit dentistry.
Essential Dental Solutions
This segment includes the development, manufacture and sales of the Company’s value-added endodontic, restorative, and preventive consumable products and small equipment used by dental professionals for the treatment of patients. Offerings in this segment also include specialized treatment products including products used in the creation of dental appliances.
Essential Dental Solutions products are designed to operate in an integrated system to provide solutions for high-tech dental procedures. The endodontic products include motorized endodontic handpieces, files, sealers, irrigation needles and other tools or single-use solutions which support root canal procedures. The restorative products include dental ceramics and other materials used in prosthetic restorations including crowns and veneers.
The preventive products include small equipment products such as curing light systems, dental diagnostic systems and ultrasonic scalers and polishers, as well as other dental supplies including dental anesthetics, prophylaxis paste, dental sealants and impression materials.
Orthodontic and Implant Solutions
This segment includes the design, manufacture, and sales of the Company’s various digital implant systems and innovative dental implant products, digital dentures and dental professional-directed aligner solutions. Offerings in this segment also include application of our digital services and technology, including those provided by DS Core, our cloud-based platform.
Orthodontics
The Orthodontics product category includes SureSmile, a clear aligner solution provided through clinician offices and Byte, a direct-to-consumer clear aligner solution. The Orthodontics product category includes a High Frequency Vibration technology device known as VPro, as well as the SureSmile Simulator which uses intraoral scanners and our DS Core platform to create a 3D visualization of patient outcomes, and SureSmile aligner solutions, which include whitening kits and retainers. The aligner offerings also include software technology that enables aligner treatment planning and the seamless connectivity of a digital workflow from diagnostics through treatment delivery. Byte operations were significantly reduced after October 24, 2024 and limited to supporting patients already undergoing treatment, following a decision to voluntarily suspend sales and marketing of Byte aligners and impression kits. In January 2025, the Company subsequently announced it will no longer offer the Byte direct-to-consumer clear aligner solution to new patients, and it has decided to leverage technologies developed by Byte elsewhere in the aligners portfolio to create orthodontic demand, support a digital clinical workflow, enhance the customer experience, and improve patient monitoring.
Implants & Prosthetics
The Implants & Prosthetics product category includes technology to support the Company’s digital workflows for implant systems, a portfolio of innovative dental implant products, digital dentures, crown and bridge porcelain products, bone regenerative and restorative solutions, treatment planning software and educational programs. The Implants & Prosthetics product category is supported by key technologies including custom abutments, advanced tapered immediate load screws and regenerative bone growth factor. Offerings in this category also include dental prosthetics such as artificial teeth and precious metal dental alloys.
Wellspect Healthcare
This segment includes the design, manufacture, and sales of the Company’s innovative continence care solutions for both urinary and bowel management. Wellspect Healthcare is a leading global provider of innovative medical devices that help people suffering from urinary retention or chronic constipation. Wellspect is one of the world’s leading manufacturers of intermittent urinary catheters, with LoFric as the most known brand. To help those with chronic or severe constipation, Wellspect also offers an advanced irrigation system, Navina, which combines a high degree of user convenience, clinical effectiveness and connectivity into one smart system.
Industry Growth Drivers
The Company believes that the dental industry is attractive and will grow over the long-term based on the following factors:
•Increasing worldwide population, including a shift toward aging demographics, which will require greater dental care.
•Natural teeth are being retained longer - individuals with natural teeth are much more likely to visit a dentist than those without any natural teeth.
•Increasing demand for aesthetic dentistry and the use of clear aligners as an orthodontic treatment.
•Continued opportunities in emerging markets related to the rise in discretionary incomes making dental services an increasing priority.
•Growing preference for single visit dentistry versus historical multi-visit procedure requirements, and for higher quality of patient care in terms of comfort and ease of product use and handling.
•Increasing demand for earlier preventive care - dentistry has evolved from a profession primarily dealing with pain, infections, and tooth decay to one with increased emphasis on earlier diagnosis, preventive care, and the role oral health plays in overall health.
•Increasing opportunity for digital collaboration between General Practitioners (“GPs”), specialists, labs, and patients is creating widening demand for fully integrated solutions such as cloud-based platforms and services facilitated by GPs.
•Increasing demand for more efficiency and better workflow in the dental office, including digital tools such as diagnostic equipment enhanced through the power of 3D imaging. The rapid pace of digital technology adoption, including the digitization of clinical workflows, is becoming a category standard versus traditional manual processes.
•An accelerating trend, predominately in the United States, toward consolidation of dental practices into group affiliations, often called Dental Support Organizations (“DSOs”), which may expand access for underserved patient populations, remove administrative and capital burdens on providers, and allow more opportunities for investment in dental technology and patient care.
Similarly, we believe that the healthcare consumables market for urology and enterology products will grow over the long-term based on the following:
•Aging demographics, together with an increasing incidence of chronic diseases such as diabetes, requiring greater continence care.
•An expansion of the population covered by medical insurance and the trend toward more supportive reimbursement policies by governments and insurers encouraging the use of continence care products and related therapies.
•The growth in specialized care facilities, technical advancements pertaining to the identification and treatment of chronic renal ailments, and the increasing awareness of incontinence diseases.
Sales and Distribution
As of December 31, 2024, Dentsply Sirona employed approximately 4,600 highly trained, sales and technical staff specialized in each of our various products and solutions to provide comprehensive marketing, sales, and technical support services to meet the needs of our distributors and end-users.
The Company remains focused on its strategy of enabling dentists to utilize superior integrated workflows through our robust market offerings in all key areas of dental procedures (implants, endodontic, restorative and aligners) as well as digital infrastructure (CAD/CAM and imaging) utilized in dental practices around the globe. In 2024, the Company continued a rigorous portfolio management process to simplify and optimize our suite of product offerings, gain efficiencies through optimized product life-cycle management, and improve overall customer experience. The program, which has the potential to be expanded in future years, had an initial focus on endodontic and restorative consumable products, including a goal of achieving additional efficiency from optimizing our geographic footprint.
Dentsply Sirona distributes approximately two-thirds of its dental consumable and technology and equipment products through third-party distributors. Certain products such as endodontic instruments and materials, dental implants and orthodontic aligners and appliances are often sold directly to dental laboratories or dental professionals in some markets. Our continence care products are primarily sold to distributors of medical supplies, with the remaining sales being made directly to patients and medical providers.
For the year ended December 31, 2024, no customer accounted for 10% or more of consolidated net sales or consolidated accounts receivable.
Customers that accounted for 10% or more of net sales or accounts receivable for the years ended December 31, 2023 and 2022 were as follows:
| | | | | | | | | | | | | | | | | | | | | | | | | | | | | | | | | | | |
| | | | 2023 | | 2022 | | | |
| | | | | | % of net sales | | % of accounts receivable | | % of net sales | | % of accounts receivable | | | | | |
| | | | | | | | | | | | | | | | | |
| Henry Schein, Inc. | | | | | | 14 | % | | 11 | % | | 11 | % | | 15 | % | | | | | |
| Patterson Companies, Inc. | | | | | | N/A | | 10 | % | | N/A | | 12 | % | | | | | |
Although a significant portion of the Company’s sales are made to distributors, Dentsply Sirona focuses much of its marketing efforts on the orthodontists, dentists, dental specialists, dental hygienists, dental assistants, dental laboratories and dental schools which are the end-users of its products. As part of this end-user “pull through” marketing strategy, the Company conducts extensive marketing programs with a combined approach that also engages DSOs and distributors.
Product Development
While the Company enjoys market leadership in several of its product categories, continuous innovation and product development are critical for it to continue to grow its share in markets it serves. We continue to focus efforts on successfully launching innovative products that have a significant impact on how dental and clinical professionals treat their patients. The Company’s plans for investment in product development include maintaining a level of R&D spending that is at approximately 4% of annual net sales, with a focus on innovation in and expansion of digital workflow solutions and other platform offerings. In particular, the Company has continued to prioritize investments supporting digitally connected solutions and enhanced workflows through each stage of patient care, including software for improved collaboration and treatment planning, imaging and scanning technologies used in diagnosis, and products which are customizable and scalable.
During 2022, the Company unveiled its cloud solution, DS Core, an open platform developed in collaboration with Google Cloud that integrates digital dentistry workflows across its devices, services, and technologies. DS Core supports access of end users to case files, orders, and messages through a web browser without any software licenses. The DS Core digital platform is designed to enable simplified cloud storage, optimize diagnostic capabilities, and streamline existing workflows with laboratory partners. Innovations include: the Company’s Primeprint Solution, which provides medical-grade 3D printing; Primescan Connect, which offers a laptop-based version of Primescan; the SmartLite Pro EndoActivator which serves as a new irrigation solution for root canal procedures; and the Axano treatment center combining smart design with efficient workflows. During 2022, the Company also introduced its premium EV Implants System for providing implants that are simplified and digitally enabled and introduced SureSmile Solutions, an enhanced orthodontic offering that includes a whitening kit, retainers, and the VPro orthodontic device.
During 2023, the Company launched key digital dentistry offerings within the DS Core platform including the SureSmile Simulator and several updates to DS Core. The SureSmile Simulator creates a 3D visualization of patients’ potential new smile to be achieved in clear aligner treatment using uploads from a Primescan intraoral scanner. The DS Core Communication Canvas allows for communication with patients through images and scans along with annotations by the dentist. DS Core’s lab connectivity features enable digital collaboration between dentists and their preferred lab. Also in 2023, the Company released expanded milling and printing materials to enhance the Primeprint and Primemill Solutions and workflows for patient-specific nightguards and splints. The Company continued to expand its innovative endodontic solutions with the X-Smart Pro+ motor, the Midwest Energo series of electric handpiece instruments, and the Ossix Agile, an innovative, pericardium-based membrane for periodontic procedures.
During 2024, the Company introduced additional key offerings in digital dentistry with Primescan 2 and further updates to DS Core. Primsescan 2 is the next generation of intraoral scanners and features a cloud-native and wireless design. The new technology performs scans, which are then captured directly on the DS Core cloud platform, enabling dental professionals additional mobility when treating patients. The newly launched DS Core Enterprise provides DSOs a cloud-based platform for digital workflows to centralize management and monitoring of equipment, giving DSOs transparency over all equipment connected to DS Core across their practices. The Company also introduced the Axano Pure treatment center, which incorporates an enhanced touch display screen, allowing dental professionals to integrate DS Core directly for processing and displaying patient scans and patient communication. In 2024, the Company also expanded its implant business with the MiS Lynx implant, a new, conical connection implant technology, the PrimerTaper Guided Surgery and Atlantis for BLX and Neodent. The Company also added a multi-layer abutment block to the CEREC Zirconia offering within the restorative business and the Oryx product within the endodontic business.
Research and Development (“R&D”) investments include activities to accelerate product and clinical innovation and discipline and to develop potential improvements to the manufacturing process. These investments also support engineering efforts that incorporate customer feedback into continuous improvement for current and next-generation products, with the objective to achieve more frequent development and release cycles. The Company also undertakes pre-commercialization trials and testing of technological improvements prior to inception of the manufacturing process. As is true across its other functions, the Company regularly enhances how R&D is conducted by identifying best practices, driving efficiencies, and optimizing cost structure to enable a more effective development process with a strategic focus on innovation process discipline. We are also looking to increasingly utilize an enterprise approach to funding that employs a returns-based mindset with the goal of allocating R&D spending to those areas with the highest return. In addition to internal product development, the Company also pursues external R&D opportunities, including acquisitions, licensing, or other arrangements with third parties.
Clinical Education
In 2024, the Company continued its investments in clinical education as a key value driver to leverage its global footprint, enhance digital content, and strengthen its clinical network. As part of this objective, the Company remains committed to participation in clinical research demonstrating the efficacy of its products prior to market introduction, and in supporting the clinical education and technical training of dental professionals. Dentsply Sirona has 57 academies and education centers in 35 countries worldwide that are home to state-of-the-art training facilities which provide training both directly and through third-party content for dental professionals seeking clinical and technical continuing education. The academies offer hands-on teaching, live lectures, and on-demand webinars and courses which are taught by a diverse range of internationally recognized experts in all fields of dentistry. In 2024, we partnered in the delivery of thousands of training courses to dental professionals through in-person, online, and hybrid formats. As part of these courses, the Company trains laboratory technicians, dental hygienists, dental assistants and dentists in the proper use of its products and introduces them to the latest technological developments. Additionally, we maintain ongoing consulting and educational relationships with various dental associations and recognized worldwide opinion leaders in the dental field. Initiatives to support clinical education also include partnerships with research institutions and dental and medical schools. The Company offers education tracks at its premier DS World trade and professional education events, which hosted over 7,000 participants at six DS World events across the globe in 2024. These investments in clinical education allow us to reinforce and develop relationships with dental professionals. We also annually support the achievements of dental students conducting innovative research through our Student Competition for Advancing Dental Research and its Application Awards program.
Through our internal research centers as well as through our collaborations with external research institutions, dental and medical schools, the Company directly invests in the development of new products, the improvement of existing products, and advancements in technology. These investments include an emphasis on research in digital data sharing technology, including the incorporation of long-term artificial intelligence and machine learning. The continued development of these areas is a critical step in meeting the Company’s strategic goal to be a leader in defining the future of dentistry and preparing the next generation of dental practitioners.
Competition
The Company conducts its global operations under highly competitive market conditions. Competition in the industries for dental technology and equipment, dental consumables, orthodontics and continence care products is based primarily upon product performance, quality, safety and ease of use, as well as price, customer service, innovation and acceptance by clinicians, technicians and patients. Dentsply Sirona believes that its principal strengths include its well-established brand names, its end-to-end dental portfolio, its reputation for high quality and innovative products, its leadership in product development and manufacturing, its global sales force, the breadth of its distribution network, its commitment to customer satisfaction and the support of the Company’s products by dental and medical professionals.
The size and number of the Company’s competitors vary by product line and from region to region. There are many companies that produce some of the same types of products as those produced by the Company, but no single competitor produces the breadth of products that are produced by the Company.
Regulation
The development, manufacture, sales and distribution of the Company’s products are subject to comprehensive governmental regulation within the United States and internationally. The following sections describe some, but not all, of the significant regulations that apply to the Company. For a description of the risks related to the regulations that the Company is subject to, please refer to Item 1A, “Risk Factors,” of this Form 10-K.
The majority of the Company’s products are classified as medical devices and are subject to restrictions under domestic and foreign laws, rules, regulations, self-regulatory codes, circulars and orders, including, but not limited to, the U.S. Food, Drug, and Cosmetic Act (the “FDCA”), Council Directive 93/42/EEC on Medical Devices (“MDD”) in the European Union (“EU”), which was updated to the EU Medical Device Regulation (“MDR”), and similar international laws and regulations. The FDCA requires these products, when sold in the United States, to be safe and effective for their intended use and to comply with the regulations administered by the U.S. Food and Drug Administration (“FDA”). Certain medical device products are also regulated by comparable agencies in non-U.S. countries in which they are produced or sold.
Dental and medical devices sold by the Company in the United States are generally classified by the FDA into a category that renders them subject to the same controls that apply to all medical devices, including regulations regarding alteration,
misbranding, notification, record-keeping and good manufacturing practices. In the EU, the Company’s products are subject to the medical device laws of the various member states, which are based on a Directive of the European Commission. Such laws generally regulate the safety of the products in a similar way to the FDA regulations. The Company’s products in Europe bear the CE mark showing that such products comply with European regulations. The Company’s products classified by the EU MDD were mandated to be certified under the MDR. These regulations also applied to all medical device manufacturers who market their medical devices in the EU and all such manufacturers had to perform significant upgrades to quality systems and processes including technical documentation and subject them to certification under the EU MDR in order to continue to sell those products in the EU. Although all medical device manufacturers were required to certify their Class I products by May 2021, on March 15, 2023, the EU extended the MDR transition periods to December 31, 2027 for Class III and implantable Class IIb devices and December 31, 2028 for non-implantable Class IIb and lower risk devices and for Class I devices (each such Class as defined in the EU MDR regulations) that are a higher class under the MDR. The Company completed required certifications of its quality management systems in 2024. The Company remains focused on ensuring that all its products that are considered to be medical devices will be fully certified as required by the EU MDR dates and timelines.
Beginning in late 2022, the Chinese government launched a national program for volume-based, centralized medical device and consumables procurement with minimum quantity commitments in an attempt to negotiate lower prices from drug manufacturers and reduce the price of medical devices and other products. Under the program, the government will award contracts to the lowest bidders who are able to satisfy the quality and quantity requirements. The successful bidders will be guaranteed a sales volume for at least a year, giving the winner an opportunity to gain or increase market share. The volume guarantee is intended to make manufacturers more willing to cut their prices in order to win a bid and may also enable successful bidders to lower their distribution and commercial costs. The program, which took effect in the first half of 2023, resulted in a temporary reduction in net sales of our implants products during that period due to reduced prices, which was offset by higher volume of net sales in the second half of 2023. In 2024, the program resulted in increased volumes for implants products, particularly during the first half of the year, with a decline in the second half of the year due to current macroeconomic conditions. Although significant changes to the program were not made in 2024, China’s volume-based procurement strategy is expected to evolve further in future years, including a formal updated program policy expected in 2026, which may include expansion to new categories, new incentives for innovation, changes to the bidding process which could increase price competition, and possible implementation of stricter quality standards. It is expected that the government may also move to prioritize domestic production and the purchase of products from domestic companies in certain categories, aligning with the country’s “Made in China 2025” initiative, which may result in additional competitive pressures from the sale of implants made locally. Future expansion of the program by the Chinese government could also result in reduced margins on covered devices and products, required renegotiation of distributor arrangements, and incurrence of inventory-related charges.
The Company is also subject to domestic and foreign laws, rules, regulations, self-regulatory codes, circulars and orders regarding anti-bribery and anti-corruption, including, but not limited to, the U.S. Foreign Corrupt Practices Act (“FCPA”), the U.S. Federal Anti-Kickback Statute (“AKS”), the UK’s Bribery Act 2010 (c.23), Brazil’s Clean Company Act 2014 (Law No. 12,846) China’s National Health and Family Planning Commission (“NHFPC”) circulars No. 40 and No. 50, and similar international laws and regulations. The FCPA and similar anti-bribery and anti-corruption laws applicable in non-U.S. jurisdictions generally prohibit companies and their intermediaries from improperly offering or paying anything of value to foreign government officials for the purpose of obtaining or retaining business. Some of the Company’s customer relationships are with governmental entities and therefore may be subject to such anti-bribery laws. The AKS and similar fraud and abuse laws applicable in non-U.S. jurisdictions prohibit persons from knowingly and willfully soliciting, offering, receiving or providing remuneration, directly or indirectly, in exchange for or to induce either the referral of an individual, or the furnishing or arranging for a good or service, for which payment may be made under a health care program, such as, in the United States, Medicare or Medicaid.
The Company’s production and sales of products are further subject to regulations concerning the use of conflict minerals, various environmental regulations such as the Federal Water Pollution Control Act (the “Clean Water Act”) and others enforced by the Environmental Protection Agency (“EPA”) or equivalent state agencies, and the Patient Protection and Affordable Care Act as amended by the Health Care and Education Reconciliation Act (the “Health Care Reform Law”). In the manufacture, sale, delivery and servicing of the Company’s products internationally, the Company must also comply with various domestic and foreign import and export control and economic sanctions, laws, and regulations, including those administered by the Department of Treasury’s Office of Foreign Assets Control (“OFAC”), the Department of Commerce’s Bureau of Industry and Security (“BIS”) and similar foreign governmental agencies, which may require licenses or other authorizations for transactions relating to certain products, certain countries and regions, and/or with certain individuals and entities identified by the respective government. Despite the Company’s internal compliance program, policies and procedures may not always protect it from negligent, reckless, or criminal acts committed by its employees or agents. Violations of these requirements are punishable by criminal and civil sanctions, including substantial fines and imprisonment. The Company’s Byte aligner business in the United States is subject to various state laws, rules and policies which govern the practice of dentistry within such states, particularly based on the direct-to-consumer model that leverages teledentistry, which is no longer a model applicable to products offered to new patients as of October 24, 2024. Byte has historically contracted with an expansive nationwide network of independent licensed dentists and orthodontists for the provision of clinical services, including the oversight and control of each customer’s clinical treatment in order to comply with these regulations and to ensure that the business does not violate rules pertaining to the corporate practice of dentistry.
The Company is subject to domestic and foreign laws, rules, regulations, self-regulatory codes, circulars and orders governing data privacy and transparency, including, but not limited to, the Health Insurance Portability and Accountability Act of 1996 (“HIPAA”) as amended by the Health Information Technology for Economic and Clinical Health Act of 2009 (the “HITECH Act”), the California Consumer Privacy Act, the California Privacy Rights Act, the European General Data Protection Regulation (“GDPR”), China’s Personal Information Protection Law (“PIPL”), Brazil’s Lei Geral de Protecäo de Dados (“LPGD”), the Physician Payments Sunshine Provisions of the Patient Protection and Affordable Care Act, EU Directive 2002/58/EC (and implementing and local measures adopted thereunder), France’s Data Protection Act of 1978 (rev. 2004) and France’s Loi Bertrand, certain rules issued by Denmark’s Health and Medicines Authority, and similar international laws and regulations. Applicable privacy laws around the world restrict the use and disclosure of personal information, and mandate the adoption of standards relating to the privacy and security of individually identifiable information such as data minimization, access control, providing transparent notice of our privacy practices, and respecting data subject rights. Privacy laws also require the reporting of certain breaches of individually identifiable information. The Physician Payments Sunshine Provisions of the Patient Protection and Affordable Care Act require the Company to record all transfers of value to physicians and teaching hospitals and to report this data to the Centers for Medicare and Medicaid Services for public disclosure. Similar reporting requirements have also been enacted in several states, and an increasing number of countries worldwide either have adopted or are considering similar laws requiring transparency of interactions with health care professionals.
The Company believes it is in substantial compliance with the laws and regulations that regulate its business. There are, however, significant uncertainties involving the application of various legal requirements, the violation of which could result in, among other things, sanctions. See Item 1A, “Risk Factors,” of this Form 10-K for additional detail.
Sources and Supply of Raw Materials and Finished Goods
The Company manufactures the majority of the products that it sells. The Company sources the necessary raw materials from various suppliers, and no single supplier accounts for more than 10% of our supply requirements.
Intellectual Property
Products manufactured by Dentsply Sirona are sold primarily under its own trade names and trademarks. Dentsply Sirona also owns and maintains more than 5,000 patents throughout the world and has also licensed a number of patents owned by others.
Our policy is to protect the Company’s products and technology through patents and trademark registrations in the United States and in significant international markets. The Company monitors trademark use worldwide and promotes enforcement of its patents and trademarks in a manner that is designed to balance the cost of such protection against obtaining the greatest value for the Company. Dentsply Sirona believes its patents and trademark properties are important and contribute to the Company’s marketing position but it does not consider its overall business to be materially dependent upon any individual patent or trademark. Additional information regarding certain risks related to our intellectual property is included in Item 1A, “Risk Factors” of this Form 10-K and is incorporated herein by reference.
Human Capital
Every day, our people create innovative solutions that transform lives. Our inclusive, agile & high-performance culture equips us to build, grow, and win as one. Together, we are shaping the future and delivering value to customers and patients. As of December 31, 2024, our organization and its subsidiaries employed approximately 14,000 employees globally. Of these employees, approximately 3,000 were employed in the United States. Employees outside of the United States, particularly in Europe, may be covered by collective bargaining agreements, union contracts, worker councils or other similar programs. At Dentsply Sirona, we believe our global talent strategy enables our employees to reach their highest performance.
High-Performance Culture
We deliver a consistent, high-quality talent selection process in alignment with our desired culture. We offer Emerging Talent programs focused on attracting early-career employees through university relationships, including partnerships with Historically Black Colleges and Universities and local trade schools. These programs provide options for apprenticeships, rotational assignments, on-the-job experiences, networking, development, and executive interactions. New employees participate in our custom Enterprise Orientation module that introduces our culture and instills pride in what we do.
Our Performance Feedback Process includes performance and development goal-setting and regular reviews between the employee and manager. Every employee has access to our Own Your Journey career development pathing toolkit to explore their career aspirations. We offer access to an OnDemand learning library available in multiple languages to develop skills and capabilities through our partnership with LinkedIn Learning, and we also provide an additional eLearning training program through Cornell University. All employees globally can utilize our automated matching system for internal mentoring and coaching. To ensure employees know what development resources are available, we offer live sessions on self-development at our organization.
In 2024, we began a partnership with Prosci, the industry leader in Change Management methodology and research, to provide a consistent set of tools and processes for leading the people side of change. Our Change Management training strategy focuses on building our internal change capabilities to support our business priorities. We internally deliver courses to project teams, front-line employees, and managers.
We prioritize preparing our internal talent for available opportunities. All aspiring and existing managers have access to participate in our Manager Fundamentals course options to develop leadership skills. We utilize regular talent reviews to identify successors and high-potential employees to participate in our nomination-based Leadership Development program, delivered in partnership with Cornell University. Our executives each commit to sponsoring high potential employees to accelerate their growth and visibility.
Compensation and Benefits
As part of our total rewards strategy, we offer competitive compensation and benefit programs designed to attract, retain, and reward top talent. We are committed to providing and administering these programs in a way that treats our employees at all levels fairly and equitably. Our total rewards offerings vary by country and include an array of programs that support our employees’ financial, physical, and mental well-being, including annual performance incentive opportunities, pension and retirement savings programs, health and welfare benefits, paid time off (including for charitable actions), leave programs, flexible work schedules, and employee assistance programs.
Inclusion & Engagement
One of our greatest strengths and competitive advantages as an organization is our global diversity. To further build on this strength, we are concentrating our diversity, equity, and inclusion efforts to focus on inclusion and engagement. This shift reflects the deep significance we place on creating a workplace where every employee feels valued, heard, and empowered to contribute. By integrating inclusion and engagement more closely, we aim to enhance the experience of our employees and ensure meaningful progress toward our desired culture.
Diversity, Equity & Inclusion Council
Our Diversity, Equity & Inclusion Council is a group of diverse employees in terms of perspectives, experience, background, geography, and function within the organization dedicated to championing an environment where all employees can reach their highest performance.
Employee Resource Groups
Our Employee Resource Groups (“ERGs”) encourage an inclusive work environment, cultivate collaboration, and offer development opportunities. As of December 31, 2024, we have nine established ERGs consisting of approximately 3,800 members globally.
Training and Awareness
We offer a catalog of optional training courses aimed at strengthening our inclusive work environment. Our ongoing “Conversations of Understanding” sessions are a standout offering. Employees can choose to participate in group discussions where internal volunteers share experiences on varying topics to generate awareness.
We keep employees connected, engaged, and informed through regular town hall meetings and live video chats. These events provide multiple opportunities for our global workforce to submit questions and interact with our executive leadership team. We deploy an annual global engagement survey to all employees, share the results internally and commit to prioritizing actions and communicating progress throughout the year. We also monitor multiple stages of the employee experience through lifecycle and pulse surveys.
Employee Health & Safety Matters
The health and safety of our employees are of utmost importance to us. We have a dedicated Employee Health & Safety (“EHS”) program that provides global processes and trainings and monitors our progress against set goals. Our actions are in line with EHS frameworks and certifications such as OHSAS 1800 and ISO 45001. We also have a corporate Crisis Management Team and a newly implemented crisis response platform which prepare us to respond in a prompt and efficient manner to crisis situations which we may face on a local or global scale.
Other Factors Affecting the Business
The Company’s business is subject to quarterly fluctuations in demand due to price changes, marketing and promotional programs, management of inventory levels by distributors, and implementation of strategic initiatives which may impact sales levels in any given period. More broadly, our business is impacted by macroeconomic conditions including changes in global supply chain constraints, growth rates, interest rate variability, labor and energy costs, and geopolitical conflicts, which can impact manufacturing costs as well as demand for our products. Demand can also fluctuate based on the timing of dental trade shows where promotions are offered, major new product introductions, and variability in dental patient traffic, which can be exacerbated by seasonal or severe weather patterns, or other disruptions such as global pandemics. Some dental practices in certain countries may also delay purchasing equipment and restocking consumables until year-end due to tax planning which can impact the timing of our consolidated net sales, net income and cash flows. Sales for the industry and the Company are generally strongest in the second and fourth quarters and weaker in the first and third quarters, due to the effects of the items noted above and due to the impact of holidays and vacations, particularly throughout Europe.
Although the backlog on products is generally not material to the Company’s financial statements due in part to the Company’s efforts to maintain short lead times within its manufacturing, levels can fluctuate and affect sales in certain periods due to supply chain disruption and unavailability of required inputs.
Available Information
Dentsply Sirona maintains a primary website, www.dentsplysirona.com, and makes available free of charge through the investor section of its website the Company’s annual reports on Form 10-K, quarterly reports on Form 10-Q, current reports on Form 8-K and amendments to these reports filed or furnished pursuant to Section 13(a) or 15(d) of the Securities Exchange Act of 1934, as amended (the “Exchange Act”) as soon as reasonably practicable after such materials are filed with or furnished to the SEC. The information contained on, or that may be accessed through, the Company’s website is not incorporated by reference into, and is not a part of, this report. All filings with the Securities and Exchange Commission (“SEC”) are also available at the SEC’s website, www.sec.gov.
Item 1A. Risk Factors
Summary
The following is a summary of the significant risk factors that could materially impact our business, financial condition or future results, including risks related to our businesses, our international operations, our regulatory environments, ownership of our common stock, and other general risks:
•We rely heavily on information and technology to operate our businesses and product portfolios, and any cyber incidents could harm our operations and have a material impact on our business and financial results.
•Evolving governmental oversight of the use of personal information, cross-border data transfer restrictions and the use of emerging technologies, including AI, as well as other technology regulations, may adversely affect our business.
•We may be unable to develop innovative products and solutions to stimulate customer demand.
•Damage to our reputation or brand could negatively impact our business, financial condition or results of operations.
•Our ongoing business operations may be disrupted for a significant period of time, resulting in material operating costs and financial losses.
•We may be unable to execute key strategic initiatives due to competing priorities and strategies of our distribution partners and other factors, which may result in financial losses and operational inefficiencies.
•Our acquisitions, exiting of businesses, divestitures or strategic investments may result in financial results that are different than expected and create certain risks for our business and operations.
•We may fail to realize the expected benefits of our strategic initiatives, including executed, announced, or potential future restructuring and other business transformation efforts.
•We have recognized substantial goodwill and indefinite-lived intangible asset impairment charges and may be required to recognize additional goodwill and indefinite-lived intangible asset impairment charges in the future.
•Our failure to protect our proprietary technology could have an adverse impact on our competitive position.
•Our financial results may be adversely impacted if our products or services are found to infringe upon the intellectual property rights of others.
•Changes in our credit ratings or macroeconomic impacts on credit markets may increase our cost of capital and limit financing options.
•Our indebtedness could adversely affect our financial condition and prevent us from fulfilling our debt or contractual obligations.
•Our foreign currency hedging and cash management transactions may be ineffective or only partially mitigate the impact of exchange rate fluctuations, exposing us to unexpected volatility.
•Due to the global nature of our business, including increasing exposure to markets outside of the United States, political or economic changes or other factors could harm our business and financial performance.
•Management previously identified material weaknesses in our internal control over financial reporting, some of which resulted in errors in previously issued financial statements. These material weaknesses were all remediated as of December 31, 2023. If we experience additional material weaknesses in the future, we may be unable to accurately and timely report financial results or comply with the requirements for public companies, which could cause the price of our common stock to decline or limit our access to the capital markets.
•Lack of global standardized processes could result in control deficiencies and adversely impact management’s assertions and financial reporting.
•We may be subject to additional litigation and regulatory examinations, investigations, proceedings or court orders relating to the completed 2022 internal investigation regarding certain financial reporting matters. If any of these items are resolved adversely to us, it could harm our business, financial condition and results of operations.
•We may be unable to obtain necessary product approvals and marketing clearances.
•Changes in tax rules or interpretations of tax rules, operating structures, transfer pricing regulations, country profitability mix and regulations and tax investigations, audits, or other proceedings that we are subject to may harm our business, financial condition and results of operations, including by adversely affecting our effective tax rate.
•We voluntarily suspended the sale and marketing of our direct-to-consumer Byte aligner systems and impression kits, and subsequently determined to cease offering these aligners to new patients while repurposing Byte technologies and capabilities to support other products within our aligner portfolio. As a result, we have experienced a material impact on our results of operations, and we may be required to take additional significant impairment charges if we are unsuccessful in our efforts to reposition Byte.
•Inadequate levels of reimbursement from governmental or other third-party payors for procedures using our products may cause our revenue to decline.
•Challenges may be asserted against our products due to real or perceived quality, health or environmental issues.
•If we fail to comply with laws and regulations relating to health care fraud, we could suffer penalties or be required to make significant changes to our operations, which could adversely affect our business.
•Our business is subject to extensive, complex and changing domestic and foreign laws, rules, regulations, self-regulatory codes, directives, circulars and orders which, if not complied with, subject us to civil or criminal penalties or other liabilities.
•The market price for our common stock may continue to be volatile as a result of a number of factors, including our quarterly operating results.
•Certain provisions in our governing documents, and of Delaware law, may make it more difficult for a third party to acquire us.
•Our business may be adversely affected by changes in global economic conditions, including inflation, rising interest rates, and supply chain shortages.
•Talent gaps and failure to manage and retain top talent may impact our ability to manage our operations, execute strategic initiatives and grow our business.
•We face the inherent risk of legal actions, including litigation, product liability claims, and other regulatory or compliance matters.
•Climate change and related natural disasters could negatively impact our business and financial results.
•Expectations relating to environmental, social and governance considerations may expose us to potential liabilities, increased costs, reputational harm, and other adverse effects on our business.
Below is a full description of each of such significant risk factors.
RISKS RELATED TO OUR BUSINESSES
We rely heavily on information technology to operate our businesses and product portfolios, and any cyber incidents could harm our operations and have a material impact on our business and financial results.
We are exposed to the risk of cyber incidents, which can result from deliberate attacks or unintentional events, in the normal course of business. We use integrated information and technology systems to manage our business and deliver products and services to customers. In particular, the 2022 launch of DS Core, our cloud platform that integrates digital dentistry workflows across devices, and the 2024 launch of Primescan 2, a cloud-native intraoral scanner, have introduced new potential vulnerabilities to cyber attacks. The breadth and complexity of our information and technology systems have increased and we expect that they will continue to increase as we expand the services enabled by DS Core and further develop our ERP systems and product offerings to utilize artificial intelligence (“AI”) and analytics. As a result, we will increasingly be exposed to risks inherent in the development, integration and operation of the evolving information and technology supporting our product platforms, as well as our own internal infrastructure, including:
• security breaches, viruses, cyberattacks, ransomware or other malware or other failures, cyber incidents or malfunctions;
• disruption, impairment or failure of data centers or hardware, telecommunications facilities or other infrastructure, including due to natural disasters;
• failures during the process of upgrading or replacing software, databases or components;
• the compromise or unauthorized disclosure of sensitive, personal, proprietary or intellectual property information related to our business and customers;
• excessive costs, excessive delays or other deficiencies in systems development and deployment; and
• an unintentional event that involves a third party gaining unauthorized access to our systems or proprietary information.
We also utilize systems, applications and data storage provided and maintained by third parties, including those delivered through cloud-based solutions. Any disruptions to or deterioration of our distribution partners’ or service providers’ information and technology infrastructures could pose a threat to our operations and harm our business.
Like other large, global companies, during the normal course of business, we have experienced and expect to continue to experience cyber threats, attacks and other attempts to compromise our information systems, with such attacks and threats rapidly increasing in both sophistication and frequency. However, none, to our knowledge, have had a material adverse effect on our business, financial condition or results of operations to date. Our policies, required employee training (including that which relates to phishing prevention), procedures and technical safeguards may be insufficient to prevent or detect improper access to confidential, proprietary or sensitive data, including personal data. Cyberattacks could also cause us to incur significant costs, disrupt key business operations and divert attention of management and key information technology resources. We also face the ongoing challenge of controlling access to our information and technology infrastructure. We have experienced various cyber incidents in the past and have implemented new controls, governance, protections and procedures as a result. If we do not successfully manage these access controls, it could expose us to the risk of security breaches or disruptions. Although past cybersecurity incidents have not had a material effect on our business or operations, and although we and our service providers take efforts to ensure the integrity of our systems and anticipate, detect, avoid or mitigate such threats, we cannot provide assurances that a future cyberattack would not result in material harm to our business and results of operations. Disaster recovery plans, where in place, might not adequately protect us in the event of a system failure. Further, we currently do not have excess or standby computer processing or network capacity everywhere in the world to avoid disruption in the event of a system failure. Despite any precautions we take, damage from natural disasters, telecommunications failures, computer viruses, break-ins, human error or similar events at our computer facilities could result in interruptions in the flow of data to our servers, although we have not yet experienced such an interruption. While we have invested and continue to invest in information technology risk management and disaster recovery plans, these measures cannot fully insulate us from cyber incidents, technology disruptions or data loss and the resulting adverse effect on our operations and financial results. If our information systems are breached again, sensitive and proprietary data is compromised, surreptitiously modified, rendered inaccessible for any period of time or made public, or if we fail to make adequate or timely disclosures to affected individuals, appropriate state and federal regulatory authorities or law enforcement agencies, it could result in significant fines, penalties, court orders, sanctions and proceedings or actions against us by governmental or other regulatory authorities, customers or third parties. We may incur substantial costs and suffer other negative consequences such as liability, reputational harm and significant remediation costs and experience material harm to our business and financial results if we experience cyber incidents in the future.
AI-based platforms and tools are increasingly being used in the consumer health industries, and our use of this technology, as well as its use by our business partners, may continue to increase and could lead to the unintentional release of our confidential information, which could negatively impact us, including our ability to realize the benefits of our intellectual property. Additionally, the advancement of AI and large language models has given rise to additional vulnerabilities and potential entry points for cyber threats; threat actors may have additional tools to automate breaches or persistent attacks, evade detection, generate sophisticated phishing emails, or impersonate employees or senior management. Our use of AI in our products and processes and the use of AI by our business partners may lead to novel cybersecurity, legal and regulatory risks, which could have a material adverse effect on our operations and reputation as well as the operations of our business partners.
Additionally, we seek to maintain insurance coverage for cybersecurity risks, but such insurance has become increasingly difficult to secure and, in some cases, policies may not provide adequate coverage for possible losses. Further, as cybersecurity risks evolve, such insurance may not be available to us on commercially reasonable terms, or at all. Uninsured losses or operational losses that result from large deductible payments under commercial insurance coverage might have an adverse impact on our business operations, financial position or results of operations.
Evolving governmental oversight of the use of personal information, cross-border data transfer restrictions and the use of emerging technologies, including AI, as well as other technology regulations, may adversely affect our business.
We collect and process personally identifiable information (“PII”) and other data as part of our business processes and activities. This data is subject to an increasing number of U.S. and foreign laws and regulations, including oversight by regulatory or governmental bodies. The EU General Data Protection Regulation (“GDPR”), for example, imposes stringent data protection requirements and provides significant penalties for noncompliance. Fines for noncompliance can amount to up to €20 million or 4% of the total worldwide annual sales from the preceding financial year (whichever is higher) and may be imposed in conjunction with the exercise of the authority’s investigatory and corrective powers. The GDPR’s extraterritorial scope makes it applicable to our U.S.-based legal entities whenever our business activities process the personal data of EU residents. Privacy laws, rules and regulations are also rapidly developing in other regions, including China, Brazil and South Korea, and the United States.
In the United States, the federal Health Insurance Portability and Accountability Act of 1996, as amended, and its implementing regulations (collectively, “HIPAA”) impose certain requirements on covered entities and their business associates
to protect the privacy and security of protected health information (“PHI”) and to provide notification in the event of a breach of PHI. The U.S. Department of Health and Human Services Office for Civil Rights (“OCR”), which is responsible for enforcing HIPAA, also may enter into resolution agreements requiring the payment of civil money penalties and/or the establishment of corrective action plans to address violations of HIPAA. Pursuant to HIPAA, OCR has adopted privacy regulations to govern the use and disclosure of PHI and data security regulations that require the implementation of safeguards to protect electronic PHI.
Our Company, through its various subsidiaries, functions as both a covered entity and a business associate under HIPAA. Where necessary, we have segregated our data to ensure that PHI is handled in accordance with HIPAA requirements. We believe that we have implemented appropriate policies and procedures and security measures necessary to comply with HIPAA. However, despite our compliance efforts, we may suffer a serious breach of PHI or be subject to a cyberattack that compromises the PHI that we maintain.
Additionally, federal and state privacy and security-related laws may be more restrictive than HIPAA and could impose additional penalties. For example, the Federal Trade Commission uses its consumer protection authority to initiate enforcement actions in response to alleged privacy violations and data breaches. The California Consumer Privacy Act (“CCPA”) created additional data privacy obligations for covered companies and a private right of action with statutory damages for certain data breaches. In addition, the California Privacy Rights Act further expanded the CCPA to provide even greater rights to California consumers with respect to their data. Other states have followed California by implementing data privacy laws, including, but not limited to, Colorado, Connecticut, Utah, Virginia, and Washington. If we suffer a serious breach of personal data, we may be subject to breach notification requirements, government investigations, media inquiries, civil and criminal fines and penalties, litigation, and negative public perception, and we may be required to expend substantial financial and personnel resources. Any liability from failing to comply with applicable privacy and data protection laws could adversely affect our operations and our financial condition.
These varying laws, rules, regulations and industry standards impact our businesses to the extent we rely on the use of personal data, including PHI, and create significant compliance challenges. In addition, certain privacy and data protection laws may apply to us indirectly through our customers, manufacturers, suppliers or other third-party partners. For example, non-compliance with applicable laws or regulations by a third-party partner that is processing personal data on our behalf may be deemed to be non-compliance or a failure to conduct proper due diligence. Any inability, or perceived inability, to adequately address privacy and data protection concerns or to comply with applicable laws, regulations, policies, industry standards, contractual obligations, or other legal obligations (including at newly acquired companies) could result in additional cost and liability to us or our officers, damage our reputation, inhibit sales, and otherwise adversely affect our business.
Moreover, global regulation related to the provision of services on the Internet is increasing, as governments continue to adopt new laws and regulations addressing data privacy and the collection, processing, storage and use of personal information. Such laws and regulations are subject to new and differing interpretations and may be inconsistent among jurisdictions. These and other requirements could restrict our ability to store and process data or impact our ability to offer future digital dentistry products and services in certain locations. The costs of compliance with and other burdens imposed by these types of laws, regulations and standards may limit the adoption of our products or services or lead to significant fines, penalties or liabilities for noncompliance, any of which could harm our business.
In addition, the legal and regulatory landscape surrounding AI technologies is rapidly evolving and uncertain, especially in the areas of intellectual property, cybersecurity, and privacy and data protection. For example, there is uncertainty around the validity and enforceability of intellectual property rights related to the use, development, and deployment of AI. Compliance with new or changing laws, regulations or industry standards relating to AI may impose significant operational costs and may limit the ability of the Company and our business partners to develop, deploy or use AI technologies. Failure to appropriately respond to this evolving landscape may result in legal liability, regulatory action, or brand and reputational harm.
New and more stringent multinational, national and state technology legislation and regulations may be adopted in 2025 and beyond. We cannot predict the scope of new legislation, regulation or enforcement, the jurisdictions that may be involved, or impact. Failure to comply with technology laws and regulations could result in enforcement actions (which could include substantial penalties), private litigation and/or adverse publicity and could have a material adverse impact on our business, financial condition or results of operations.
Although we currently maintain liability insurance intended to cover cyber and certain other privacy and security breach-related claims, we cannot ensure that our insurance coverage will be adequate to cover liabilities arising out of claims asserted against us in the future if the outcomes of such claims are unfavorable to us. Liabilities in excess of our insurance coverage,
including coverage for cyber liability and certain other privacy and security breach-related claims, could have a material adverse effect on our business, financial condition, results of operations, cash flows and the trading price of our securities.
We may be unable to develop innovative products and solutions to stimulate customer demand.
The worldwide markets for dental and continence care products are highly competitive and are subject to rapid and significant technological disruption. There can be no assurance that our products will not lose their competitive advantage or become obsolete as a result of such factors, or that we will be able to generate any economic return on our investment in product development. If product demand or sales effectiveness decreases, or if our newly introduced products are not accepted by our customers, our revenue and profit could be negatively impacted. Important factors that could cause demand for our products to decrease include changes in:
•business conditions, including downturns in the dental industry, regional economies, and the overall economy;
•the level of customers’ inventories;
•evolving industry practices;
•competitive and pricing pressures, including actions taken or new products introduced by competitors;
•customer product needs and preferences and customer/patient lifecycle; and
•patient reimbursement trends which could lead to a drop in patient volumes at our customers’ dental practices.
If we fail to innovate existing technologies or develop new technologies consistent with changing consumer preferences and security requirements or fail to differentiate our products from our competition, our technology or products may become obsolete and cause us to lose market share and revenue. While we have identified the development of new technologies and products as an important part of our growth strategy, there is no assurance that new technology, products or approaches to dental treatment will not render our products obsolete, and there is no assurance that capital allocated to R&D will yield expected benefits. Additionally, the rapid pace of technological advancements may accelerate amortization faster than we anticipated or impair investments in our software technology, which could negatively impact our results.
Damage to our reputation or brand could negatively impact our business, financial condition or results of operations.
We seek to maintain our reputation, and successful promotion of our brand depends on multiple factors, including our marketing efforts and our ability to deliver a superior customer experience, develop innovative products, and differentiate our offerings from those of our competitors. Additionally, the strength of our brand relies on continued effective use of our distribution network and customer service platforms. The promotion of our brand requires us to make substantial expenditures, including continued investments in enhancing customer experience. Our brand promotion activities may not be successful in maintaining or increasing our current level of revenue. If we do not successfully position our brand and reputation as an industry leader, our business and operating results may be adversely affected.
Additionally, our brand depends on our reputation for offering high-quality solutions meeting the highest of safety standards. A serious breach of our quality assurance or quality control procedures, deterioration of our quality image, impairment of our customer or consumer relationships or failure to adequately protect the relevance of our brands may lead to litigation, customers purchasing from our competitors, other brands or private labels not manufactured by us, or regulatory enforcement action, any of which could have a material negative impact on our business, financial condition or results of operations.
Our ongoing business operations may be disrupted for a significant period of time, resulting in material operating costs and financial losses.
We operate in approximately 150 countries and our suppliers’ manufacturing facilities are located in multiple locations around the world. Potential events such as extreme weather, natural disasters, regional epidemics or global pandemics, worker strikes and social and political actions, such as trade wars, regional wars or conflicts or other events beyond our control, could impact our ongoing business operations, including due to disruptions at critical third-party vendors or the loss of critical information technology and telecommunications systems. Although we maintain multiple manufacturing facilities, a large number of the products manufactured by us are manufactured in facilities that are the sole source of such products. As there are a limited number of alternative third-party suppliers for these products, any disruption at a particular Company manufacturing facility could lead to delays and increased expenses and may damage our business and results of operations. If our incident response, disaster recovery and business continuity plans do not resolve these issues in an effective and timely manner, such events could result in an interruption in our operations and could cause material negative impacts on our business, financial condition or results of operations.
Additionally, a significant portion of our injectable anesthetic products, orthodontic products, certain dental cutting instruments, catheters, nickel titanium products and certain other products and raw materials are purchased from a limited number of suppliers and in certain cases single source suppliers pursuant to agreements that are subject to periodic renewal, some of which may also compete with us. As there are a limited number of suppliers for these products, there can be no assurance that we will be able to obtain an adequate supply of these products and raw materials in the future at acceptable prices. Any delays in delivery of or shortages in these products could interrupt and delay manufacturing of our products and result in the cancellation of orders. In addition, these suppliers could discontinue the manufacture or supply of these products to us or supply products to competitors. We may not be able to identify and integrate alternative sources of supply in a timely fashion, or at all. Any transition to alternate suppliers may result in delays in shipment, increase expenses and limit our ability to deliver products to customers.
We may be unable to execute key strategic initiatives due to competing priorities and strategies of our distribution partners and other factors, which may result in financial losses and operational inefficiencies.
We may be unable to execute our key strategic activities and investments due to operational disruptions impacting our distributors or the competing priorities of our distribution partners, which may introduce additional products that compete with our products at lower price points. If these competing products capture significant market share or result in a decrease in market prices overall, there could be negative impacts on our results of operations and financial condition.
We generate a substantial portion of our revenue through a limited number of distributors that provide important support to end-users. Together, our two largest distributors, Patterson Companies, Inc. (“Patterson”) and Henry Schein, Inc. (“Henry Schein”), accounted for approximately 13% of our annual revenue for the year ended December 31, 2024. In July 2024, we delivered a one-year notice of non-renewal to Patterson in connection with its non-exclusive distribution agreements for the distribution of dental equipment in the United States and Canada. It is anticipated that Patterson will continue to be one of our two largest distributors as a percentage of our global revenue during the one-year notice period. We intend to engage in discussions for new distribution agreements with Patterson. However, failure to successfully renegotiate the distribution agreements or secure new agreements with another distributor could have a material adverse effect on our business, operating results and financial condition. We have not incurred any charges against earnings in 2024 related to non-renewal of the distribution agreements.
Additionally, the dental market continues to be impacted by price competition, driven in part by the consolidation of dental practices, the growing significance of DSOs, innovation, and end-user price sensitivity. There can be no assurance that our distribution partners will purchase any minimum quantity of products from us or that they will continue to purchase any products at all. If Patterson or Henry Schein ceases to purchase a significant volume of products from us, or if changes in our promotional strategies and investments result in changes in our distributor relationships, it could have a material adverse effect on our results of operations and financial condition. In addition, changes in the capital structure or ownership of distributors could result in changes to our relationship, including shifts in strategies related to inventory management, customer service and servicing the installed base of Dentsply Sirona products. Changes to agreements with distributors, including expiration of existing agreements, could result in a reduction in the amount of inventory ordinarily held in the absence of contractual minimum inventory requirements.
We rely in part on our distributor and customer relationships and predictions of distributor and customer inventory levels in projecting future demand levels and financial results. These inventory levels may fluctuate, and may differ from our predictions, resulting in our projections of future results being different than expected. These changes may be influenced by
changing relationships with distributors and customers, economic conditions, and customer preference for particular products. There can be no assurance that distributors and customers will maintain levels of inventory in accordance with our predictions or past history or that the timing of customers’ inventory changes will be in accordance with our expectations. Any disruptions to our distributors’ operations or systems may result in delays in orders and shipments and may prevent our products from being timely delivered to the market.
Our acquisitions, exiting of businesses, divestitures or strategic investments may result in financial results that are different than expected and create certain risks for our business and operations.
We intend to continue utilizing acquisitions, dispositions, and strategic investments as a part of our strategy for growth and to improve financial results. We have made, and may continue to make in the future, acquisitions to enhance our business and product portfolio, which require us to invest significant resources to integrate the businesses we acquire. We also periodically evaluate our businesses and assets for potential disposition as a key part of our strategy, including the previously disclosed evaluation of strategic alternatives for our Wellspect Healthcare business. The success of each acquisition or divestiture depends in part on our ability to realize opportunities and manage risks, including challenges executing transactions, higher operating expenses, litigation, adverse effects on existing business relationships with suppliers and customers, and the potential loss of key employees, customers, distributors, vendors, and other business partners. The process of continuing to evaluate acquisitions, divestitures or strategic investments may be costly, time-consuming and complex, including requiring management to devote significant time and attention to these types of transactions that may distract our management and disrupt our ongoing business operations or relationships. We may incur significant legal, accounting and advisory fees and other expenses, some of which may be incurred regardless of whether we successfully enter into a transaction. We may not achieve expected returns and benefits in connection with acquisitions as a result of various factors, including integration challenges, such as those relating to personnel and technology, and we may not achieve financial results consistent with revenue growth expectations and cost synergies anticipated from integration activities.
After reaching an agreement for the acquisition or disposition of assets or a business, the transaction may remain subject to regulatory and governmental approvals and the satisfaction of pre-closing conditions, which may prevent us from completing a given transaction in a timely manner, or at all. Acquisitions may require us to incur debt, assume contingent liabilities and/or additional risks, or create additional expenses to consummate the transaction, any of which might adversely affect our financial results.
When we pursue the divestiture of a business, we may encounter difficulty in finding buyers or executing alternative exit strategies in a timely manner, which could delay the accomplishment of our strategic objectives. Alternatively, we may dispose of a business at a valuation or on terms that are less favorable than we had anticipated, or with the exclusion of select assets. Dispositions may also involve continued involvement in a divested business, such as through continuing equity ownership, transition service agreements, guarantees, indemnities or other financial obligations. Under these arrangements, the performance of the divested business, or other conditions outside our control, could affect our future financial results. If we are not successful in setting forth a new strategic vision for Wellspect, or if our plans are not executed in a timely fashion, this may cause reputational harm with our stockholders and the value of our securities may be adversely impacted.
We may fail to realize the expected benefits of our strategic initiatives, including executed, announced, or potential future restructuring and other business transformation efforts.
In order to improve performance and drive value creation, we implemented a restructuring plan during 2024 (the “2024 Plan”). In connection with the 2024 Plan, we anticipate a net reduction in our global workforce of approximately 2% to 4%. The proposed changes are subject to co-determination processes with employee representative groups in countries where required. Actions taken under the 2024 Plan will seek to further streamline our operations and global footprint, as well as improve alignment of our cost structure with strategic growth objectives.
In addition, we made restructuring changes during 2023 (the “2023 Plan”). The 2023 Plan plans included implementation of a new operating model with five global business units designed to align our product portfolio with our growth strategy, infrastructure optimization to support efficiency, and other initiatives aimed at delivering cost savings.
We are also in the process of implementing a new global ERP system, which will upgrade and standardize our existing information systems. Beginning in 2023 and continuing through 2024, we made capital investments in this system, which has resulted in significant costs and uses of cash that are expected to continue in the future. Implementation is expected to take several years to complete, and cost overruns or any disruptions, delays or complications could lead to higher than anticipated capital investments and related costs, distract from our core business, or result in failures to produce financial information accurately and timely and may adversely impact our financial results. The failure to either deliver the application on time or
anticipate readiness and training needs could lead to business disruptions. The quarterly timing of sales may also be impacted as distributors adjust their buying patterns and inventory levels in anticipation of potential business disruptions related to the implementation of our new ERP system. Failure or abandonment of any part of the ERP system could result in a write-off of part or all of the costs that have been capitalized on the project.
Additionally, our ability to achieve benefits from our strategic initiatives within the expected timeframe is subject to many estimates, assumptions, and other factors that we may not be able to control. We may also incur charges related to restructuring plans that are higher than anticipated, which would reduce our profitability in the periods such charges are incurred.
Due to the complexities inherent in implementing these types of cost reduction and restructuring activities, and the timing of strategic investments, we may fail to realize expected efficiencies and benefits or may experience a delay in realizing such efficiencies and benefits, and our operations and business could be disrupted. Company management may be required to divert their focus to these disruptions, and implementation may require the agreement of third parties, such as labor unions or works councils. Risks associated with these actions and other workforce management issues include delays in workforce reductions, additional unexpected costs, changes in restructuring plans that modify the number of employees affected, negative impacts on our relationship with labor unions or works councils, adverse effects on employee morale, and failure to meet operational targets due to the loss of employees, any of which may impair our ability to achieve anticipated cost reductions or may otherwise harm our business, and could have a material adverse effect on our sales growth and other results of operations, cash flows or financial condition, or competitive position.
We have recognized substantial goodwill and indefinite-lived intangible asset impairment charges and may be required to recognize additional goodwill and indefinite-lived intangible asset impairment charges in the future.
We have acquired other companies and intangible assets and may not realize all the economic benefit from those acquisitions, which could cause an impairment of goodwill or intangibles. We review amortizable intangible assets for impairment when events indicate the carrying value may not be recoverable. We test goodwill and indefinite-lived intangibles for impairment at least annually. The valuation models used to determine the fair value of goodwill or indefinite-lived intangible assets are dependent upon various assumptions and reflect management’s best estimates.
The goodwill and indefinite-lived intangible asset impairment analyses are sensitive to changes in key assumptions used, such as discount rates, revenue growth rates, perpetual revenue growth rates, operating margin percentages, and net working capital assumptions of the business as well as current market conditions affecting the dental and medical device industries. Given the uncertainty in the marketplace and other factors affecting management’s assumptions, there is a risk of future impairment charges if there is a decline in the fair value of the reporting units or indefinite-lived intangible assets as a result of, among other things, financial results lower than forecasts, adverse changes in valuation assumptions, a decline in equity valuations, increases in interest rates, or changes in the use of intangible assets. There can be no assurance that our future asset impairment testing will not result in a material charge to earnings.
In the quarter ended March 31, 2024, we identified indicators of a more likely than not impairment related to certain indefinite-lived imaging product trade names within the Connected Technology Solutions segment. The decline in fair value of these indefinite-lived trade names was driven by declines in volumes during the three months ended March 31, 2024, which was due in part to a loss in market share from competitive pricing pressures, as well as unfavorable economic conditions in certain markets. These factors contributed to a reduction in forecasted revenues in the near term. The trade names were evaluated for impairment using an income approach, specifically a relief from royalty method. As a result, we recorded an indefinite-lived intangible asset impairment charge of $6 million for the three months ended March 31, 2024.
In the quarter ended September 30, 2024, the Company identified indicators of a more likely than not impairment for two of its reporting units, Orthodontic Aligner Solutions and Implant & Prosthetic Solutions, which together comprise all of the Orthodontic and Implant Solutions segment. As a result, the Company recorded pre-tax goodwill impairment charges as of September 30, 2024 of $145 million for the Orthodontic Aligner Solutions reporting unit and $359 million for the Implant & Prosthetic Solutions reporting unit, both within the Orthodontic and Implant Solutions segment. The impairment charge related to the Orthodontic Aligner Solutions reporting unit resulted in a full write-off of the remaining goodwill balance for this reporting unit.
In the quarter ended December 31, 2024, the Company identified indicators of a more likely than not impairment for its Implant & Prosthetic Solutions reporting unit within the Orthodontic and Implant Solutions segment. The decline in fair value of this reporting unit was driven by a weaker trend in sales volumes, particularly in North America, increased competition from lower-priced alternatives impacting global markets, and adverse macroeconomic pressures impacting demand for elective
dental procedures and premium implant solutions. These factors contributed to reduced forecasted revenues, lower operating margins, and reduced expectations for future cash flows. As a result, the Company recorded a pre-tax goodwill impairment charge as of December 31, 2024 of $269 million for the Implant & Prosthetic Solutions reporting unit within the Orthodontic and Implant Solutions segment. For further information, see Note 11, Goodwill and Intangible Assets, in the Notes to Consolidated Financial Statements in Item 8 of this Form 10-K.
Additionally, in the quarter ended December 31, 2024, the Company also identified indicators of more likely than not impairments for certain indefinite-lived intangible assets including trade names and trademarks within the Connected Technology Solutions segment, and certain trade names within the Implant & Prosthetic Solutions reporting unit within the Orthodontic and Implant Solutions segment. The decline in fair value of the trade names and trademarks was driven by weakened demand for our premium equipment and implant products, competitive pricing pressures, and a sustained higher cost of capital, which are contributing to reduced forecasted revenues. As a result, the Company recorded indefinite-lived intangible asset impairment charges of $82 million and $1 million for the Connected Technology Solutions and Orthodontic and Implant Solutions segments, respectively, for the three months ended December 31, 2024. For further information, see Note 11, Goodwill and Intangible Assets, in the Notes to Consolidated Financial Statements in Item 8 of this Form 10-K.
The remaining goodwill balance of the Implant & Prosthetic Solutions reporting unit was $503 million as of December 31, 2024, and the carrying values of indefinite-lived intangible assets with impairments in the fourth quarter were $76 million and $149 million for the Implant & Prosthetic Solutions and Connected Technology Solutions reporting units, respectively, as of December 31, 2024. As the fair values of the Implant & Prosthetic Solutions reporting unit and the indefinite-lived assets within the Implant & Prosthetic Solutions and Connected Technology Solutions reporting units, respectively, continue to approximate carrying value as of December 31, 2024, any further decline in key assumptions could result in future additional impairment. At December 31, 2024, we have $337 million of indefinite-lived intangible assets and $1,597 million of goodwill recorded on our balance sheet.
Our failure to protect our proprietary technology could have an adverse impact on our competitive position.
Our financial results may be adversely impacted if third parties infringe upon our intellectual property rights or misappropriate our technologies and trademarks. To protect our rights to our intellectual property, we rely on a combination of patent and trademark law, trade secret protection, confidentiality agreements and contractual arrangements with our employees, strategic partners, and others. We cannot assure you that any of our patents, the patents we license or any patents which we receive or license in the future will provide us with a competitive advantage or afford us protection against infringement, or that the patents will not be successfully challenged or circumvented by third parties. The protective steps that we have taken may be inadequate to detect, protect against or deter misappropriation. Effective patent, trademark and trade secret protection may not be available in every country in which we will offer our products. In addition, there is a risk of employees inadvertently inputting trade secret information into AI technologies, thereby enabling third parties to access such information. Any failure to adequately protect our intellectual property rights could devalue our proprietary content and impair our ability to compete effectively. Further, defending or enforcing our intellectual property rights could result in the expenditure of significant resources.
Litigation may be necessary to assert claims against others, enforce patents owned by or licensed to us, protect our trade secrets or know-how, or determine the enforceability, scope, and validity of our proprietary rights. An adverse determination in such proceedings could subject us to significant liabilities, allow our competitors to market competitive products without obtaining a license from us, prohibit us from marketing our products or require us to seek licenses from third parties. If we cannot obtain such licenses, we may be restricted or prevented from commercializing our products. If we become involved in litigation, we may incur substantial expense, and the proceedings may divert the attention of key personnel, even if we ultimately prevail. Our success will depend in part on our ability to obtain patents for technology in our products and defend infringement on our patents by third parties that relate to our products, technologies, and processes, both in the United States and in other countries. Risks and uncertainties that we face with respect to our patents and patent applications include the following:
•pending patent applications may not result in issued patents or may take longer than we expect to result in issued patents;
•the allowed claims of any patents that are issued may not provide meaningful protection;
•other companies may challenge patents licensed or issued to us;
•disputes may arise regarding inventions and corresponding ownership rights in inventions and know-how resulting from the joint creation or use of intellectual property by us and our respective licensors; and
•other companies may design around the technologies patented by us.
Our financial results may be adversely impacted if our products or services are found to infringe upon the intellectual property rights of others.
From time to time, third parties may claim that one or more of our products or services infringe their intellectual property rights. Litigation may be necessary to defend against any such claims of infringement asserted against us. In addition, it may be necessary to participate in proceedings declared by the U.S. Patent and Trademark Office, the European Patent Office or other foreign patent offices to determine the priority of inventions, which could result in substantial costs. Acquisitions by us of products, technologies or processes that are found to infringe upon others’ intellectual property rights could further increase the risk of litigation or other proceedings and related costs.
The enforcement, defense and prosecution of intellectual property rights involve complex legal and factual questions. As a result, these proceedings are costly and time-consuming, and their outcome is uncertain.
Changes in our credit ratings or macroeconomic impacts on credit markets may increase our cost of capital and limit financing options.
We utilize short and long-term debt markets to obtain capital from time to time. Our continued access to sources of liquidity depends on multiple factors, including global economic conditions, the condition of global credit markets, the availability of sufficient amounts of financing, operating performance, and credit ratings. Macroeconomic impacts, including natural disasters, pandemics, geopolitical conditions or other catastrophic events, may result in significant disruption in the credit markets, which may adversely affect our ability to refinance existing debt or obtain additional financing to support operations or to fund new acquisitions or capital-intensive internal initiatives.
Any adverse changes in our credit ratings may result in increased borrowing costs for future long-term debt or short-term borrowing facilities which may in turn limit financing options, including access to the unsecured borrowing market. There is no guarantee that additional debt financing will be available in the future to fund obligations, or that it will be available on commercially reasonable terms, in which case we may need to seek other sources of funding.
Our indebtedness could adversely affect our financial condition and prevent us from fulfilling our debt or contractual obligations.
We now have and expect to continue to have a significant amount of debt. Our indebtedness could have important consequences to us including the following:
•making it more difficult or even impossible for us to satisfy our debt or contractual obligations;
•exposing us to the risk of increased interest rates as certain of our borrowings, including borrowings under our senior secured credit facilities, are at variable rates of interest;
•restricting us from making strategic acquisitions or causing us to make non-strategic divestitures;
•requiring us to dedicate a substantial portion of our cash flow from operations to payments on our indebtedness, which would reduce the funds available for working capital, capital expenditures, investments, acquisitions and other general corporate purposes;
•limiting our flexibility in planning for, or reacting to, changes in our business, future business opportunities and the industry in which we operate;
•placing us at a competitive disadvantage compared to any of our less leveraged competitors;
•increasing our vulnerability to a downturn in our business and both general and industry-specific adverse economic conditions; and
•limiting our ability to obtain additional financing, which could worsen if any adverse changes in our credit ratings occur.
We have debt securities outstanding of approximately $1.7 billion as of December 31, 2024. We also can incur up to $700 million of indebtedness under the multi-currency revolving credit facility (“2023 Credit Facility”), as discussed below, and may incur significantly more indebtedness in the future. Our credit facilities contain restrictive covenants, including some which require that we maintain certain ratios, that could limit our ability to engage in activities that may be in our long-term best interests. We may need to reduce the amount of our indebtedness outstanding from time to time to comply with the ratios
required by such covenants, although no assurance can be given that we will be able to do so. Our failure to comply with those covenants could result in an event of default which, if not cured or waived, could result in the acceleration of all of our debt, which could adversely affect our business, earnings and financial condition. Such failure to comply with covenants may also hurt our reputation and credibility with our stockholders and our debt holders and may compromise our future ability to finance our operations through the public equity or debt markets.
There is no guarantee that we will be able to renew or replace our existing debt agreements as they become due, including debt instruments with principal of $128 million maturing in December 2025. A failure to renew or replace such agreements and instruments would harm our overall liquidity.
Our foreign currency hedging and cash management transactions may be ineffective or only partially mitigate the impact of exchange rate fluctuations, exposing us to unexpected volatility.
Due to the global nature of our business, movements in foreign exchange rates may impact our consolidated statements of operations, consolidated balance sheets and consolidated statement of cash flows. With approximately two-thirds of our sales located outside the United States, our consolidated net sales are impacted negatively by the strengthening and positively by the weakening of the U.S. dollar as compared to certain foreign currencies. Additionally, movements in certain foreign exchange rates may impact our results of operations, financial condition, and liquidity since a number of our manufacturing and distribution operations are located outside of the United States. Although we currently use and may in the future use certain financial instruments to attempt to mitigate market fluctuations in foreign exchange rates, there can be no assurance that such measures will be effective or available.
We use foreign currency exchange forward contracts to reduce the effects of exchange rate fluctuations. Should our counterparties to such transactions or the sponsors of the exchanges through which these transactions are offered fail to honor their obligations, we would be exposed to potential losses or the inability to recover anticipated gains from these transactions.
We enter into interest rate swap agreements from time to time to manage our exposure to interest rate volatility. These swap agreements involve risks, such as the risk that counterparties may fail to honor their obligations under these arrangements. In addition, these arrangements may not be effective in reducing our exposure to changes in interest rates. If such events occur, our results of operations may be adversely affected.
Most of our cash deposited with banks is not insured and would be subject to the risk of bank failure. Our total liquidity also depends in part on the availability of funds under our 2023 Credit Facility. The failure of any bank in which we deposit our funds or that is part of our 2023 Credit Facility could reduce the amount of cash we have available.
RISKS RELATED TO OUR GLOBAL OPERATIONS
Due to the global nature of our business, including increasing exposure to markets outside of the United States, political or economic changes or other factors could harm our business and financial performance.
Approximately two-thirds of our sales are in regions outside the United States, and we anticipate that sales outside of the United States will continue to increase. Operating internationally is subject to uncertainties, including, but not limited to, those related to, the following:
•economic and political instability;
•import or export licensing requirements;
•compliance-related risks;
•trade restrictions and tariffs;
•product registration requirements;
•longer payment cycles;
•changes in regulatory requirements and tariffs, including restrictions in China on the proportion of certain medical equipment which can be imported;
•potentially adverse tax consequences; and
•trade policy changes.
Changes in or the imposition of tariffs, including the tariffs imposed or proposed by the Trump Administration in early 2025 and retaliatory tariffs imposed or proposed by other countries, could make it significantly more difficult or costly for us to export our products to other countries. In particular, these tariffs currently affect some of the components of our products we
import from China and other countries, and we may be required to raise our prices on those products due to these tariffs or share the cost of such tariffs with our customers, which could harm our operating performance. We monitor and evaluate the potential impact of the effective and proposed tariffs as well as other recent changes in foreign trade policy on our supply chain, costs, sales and profitability, and we seek to implement strategies to mitigate such impact, including reviewing sourcing options and working with our vendors and merchants to seek to minimize products coming from China and other countries, both for existing products and for new product development, and we seek to select suppliers in low cost regions where tariff issues are less challenging. These measures could also result in increased costs for goods imported into the United States, supply chain inefficiencies and decreased availability of certain materials with respect to other countries. This could require us to increase prices to our customers, which may reduce demand. If we are unable to increase prices at a sufficient level to offset tariffs, we would be required to lower our margin on products sold. We cannot predict what additional actions may ultimately be taken by the United States or other governments with respect to tariffs or trade relations, what products may be subject to such actions (including subject to United States export control restrictions), or what actions may be taken by other countries in retaliation. The adoption and expansion of trade restrictions, the occurrence of a trade war, or other governmental action related to trade policies has the potential to impact demand for our products, our costs, our customers and our suppliers, which could adversely impact our business, financial condition and results of operations.
Specifically, the Chinese government has implemented a volume-based procurement process designed to decrease prices for medical devices and other products, which has in the past resulted in, and could in the future result in, reduced margins on covered devices and products, required renegotiation of distributor arrangements, or an incurrence of inventory-related charges. For further information, see Part 1. Item 1, “Business - Regulation.” We cannot predict future impacts of the volume-based procurement program on our business, including any expansion of the program to include additional products within our portfolio.
Certain of these risks may be heightened because of changing political climates. For example, due to the invasion of Ukraine by Russia, various countries and international organizations have imposed sanctions on Russia, including its major financial institutions and certain other businesses and individuals, Belarus, the Crimea Region of Ukraine, the so-called Donetsk People’s Republic, and the so-called Luhansk People’s Republic. Russia also imposed currency control measures aimed at restricting the outflow of foreign currency and capital from Russia, imposed restrictions on transacting with non-Russian parties, banned exports of various products, and imposed other restrictions, including reducing the ability of companies to remit cash from their Russian-based operations to locations outside of Russia. Beginning in September 2024, as a result of further restrictions by European financial institutions on receiving payments from Russia, our capacity to receive intercompany payments for the delivery of our products into Russia has been partially reduced, which further limits our ability to use cash received from sales in Russia for our general purposes. The continuation of the conflict may result in additional sanctions being imposed on Russia and related individuals and entities, with Russia potentially responding in kind. The length, impact, and outcome of this ongoing military conflict is highly unpredictable and could lead to significant market and other disruptions, which, along with the spillover effect of ongoing civil, political, and economic disturbances on surrounding areas, may significantly devalue currencies we use or have other adverse impacts, including increased costs of raw materials, manufacturing or shipping delays or increases in inflation rate, cyberattacks and supply chain challenges. Export controls implemented as part of sanctions could also restrict the sale of products containing U.S.-developed software and technology into Russia.
For the year ended December 31, 2024, net sales in Russia and Ukraine were approximately 2% of our consolidated net sales, and net assets in these countries were $64 million. These net assets include $39 million of cash and cash equivalents held within Russia as of December 31, 2024, as well as inventory and trade accounts receivable. A significant escalation or expansion of economic disruption could interrupt our supply chain, broaden inflationary costs, impair our assets located in Russia, result in a loss of sales, and have a material adverse effect on our results of operations.
The terrorist attacks by Hamas militants crossing the border from Gaza to Israel in October 2023 and the subsequent military response by the Israeli government in Gaza has resulted in significant unrest within that region. During 2024, the state of Israel has also been a target of coordinated missile and drone attacks launched by the Republic of Iran and its proxies. In January 2025, a cease-fire agreement was signed between Hamas and the Israeli government; however, its potential to lead to a long-term peace deal or greater stability remains uncertain. A potential resumption of violence or the involvement of other terrorist groups or foreign powers in the region could impact our employees and operations in future periods. Additionally, in May 2024, in response to ongoing military actions, the government of Turkey implemented restrictions on the import of goods manufactured within Israel for sale in the Turkish market. Sales of our products made in Israel and sold in Turkey represent approximately 1% of our global sales of Implant & Prosthetic Solutions reporting unit, but this product category is an area of relatively high potential growth. It is not clear when these restrictions will be lifted or if other countries will institute similar restrictions.
Our operations in Israel consist of two manufacturing facilities for implant products, with one site in northern Israel and one in southern Israel, which together employ approximately 350 associates. These facilities continue to operate. We could face future production slowdowns or closures due to the impacts of the war, including having employees called to active military duty, or due to other resource constraints, such as the inability to source materials for production.
For the year ended December 31, 2024, net sales of products produced at these sites comprised approximately 3% of our consolidated net sales and 13% of the net sales attributed to our Orthodontic and Implant Solutions segment. Net assets within Israel totaled $180 million as of December 31, 2024, consisting primarily of acquired technology, property, plant and equipment, cash and inventory associated with our operations in country. Our operations in Israel have not been materially impacted by the conflict, and consequently, we have not recorded any allowance for doubtful accounts, inventory reserves, or fixed asset impairments through the year ended December 31, 2024. The Company continues to monitor developments and prepare contingency plans to limit potential disruptions.
Additionally, we sell products from across our portfolio to distributors and dental practices within Israel and its neighbors which may face reduced patient traffic and demand for our products in the near term. Net sales for products sold to our customers in Israel comprised approximately 1% of our consolidated net sales for the year ended December 31, 2024.
While Israel does not constitute a material portion of our business, a significant escalation or expansion of the conflict could result in loss of sales and market position, disrupt our supply chain, broaden inflationary costs including energy prices, and have a material adverse effect on our results of operations.
Additionally, other events, such as the outbreak of a global pandemic or other adverse public health developments could materially affect our business in a number of ways, including:
•reduced demand for our products in certain regions or our inability to timely meet our customer’s orders,
•the failure of third parties to meet their obligations to us, or significant disruptions in their ability to do so, and
•uncertainty in the global financial markets.
RISKS RELATED TO OUR INTERNAL CONTROLS
Management previously identified material weaknesses in our internal control over financial reporting, some of which resulted in errors in previously issued financial statements, which have been remediated as of December 31, 2023. If we experience additional material weaknesses in the future, we may be unable to accurately and timely report financial results or comply with the requirements for public companies, which could cause the price of our common stock to decline or limit our access to the capital markets.
A material weakness is a deficiency, or a combination of deficiencies, in internal control over financial reporting such that there is a reasonable possibility that a material misstatement of our annual or interim financial statements will not be prevented or detected on a timely basis. In 2022 and 2023, we identified material weaknesses in our internal control over financial reporting, some of which resulted in errors in previously issued financial statements. These material weaknesses were all remediated as of December 31, 2023.
Although we devote substantial resources to prevent material weaknesses from occurring, it cannot be assured that our measures will be sufficient. Accordingly, there is a reasonable possibility that a reoccurrence of the material weaknesses previously identified or the occurrence of other material weaknesses or deficiencies identified in the future could result in a
material misstatement of our financial statements, potentially causing us to fail to meet our obligations under securities laws, stock exchange listing rules, or debt instrument covenants to file periodic financial reports on a timely basis. Any material weaknesses identified in the future could adversely affect investor confidence in our financial statements, cause the price of our common stock to decline, or limit our access to the capital markets.
Lack of global standardized processes could result in control deficiencies and adversely impact management’s assertions and financial reporting.
We currently use disparate systems, including Enterprise Resource Planning (“ERP”) systems, across the organization, which may reduce our ability to obtain and analyze business data in a timely manner, increase costs for system upgrades, and pose business partner connection challenges. Non-standardized processes may lead to inaccurate, incomplete or delayed financial and management reporting, which may result in misleading or inaccurate reporting for key business decisions or noncompliance with applicable business and regulatory requirements, potentially causing penalties or fines. We continue to focus on standardizing our processes, improving our financial systems, maintaining effective internal controls and centralizing transaction management and execution to provide continued assurance with respect to our financial reports and prevent financial misstatement or fraud. In 2024, we continued implementing a new global ERP system, which will upgrade and standardize our existing information systems. However, this new system will take several years and require significant resources to implement, and may not be fully successful in providing standardization sufficient to address these risks even once completed.
RISKS RELATED TO OUR REGULATORY ENVIRONMENTS
We may be subject to additional litigation and regulatory examinations, investigations, proceedings or court orders relating to the completed 2022 internal investigation regarding certain financial reporting matters. If any of these items are resolved adversely to us, it could harm our business, financial condition and results of operations.
As a result of the previously reported material weaknesses in internal control over financial reporting which were remediated as of December 31, 2023, which partially arose from the independent investigation regarding certain financial reporting matters conducted by the Audit and Finance Committee (“AFC”) of the Company’s Board of Directors. Several securities class action lawsuits were filed against us following our announcement on May 10, 2022 of the AFC’s internal investigation. We may face additional litigation and regulatory examinations, investigations, proceedings or court orders, including additional cease and desist orders, the suspension of trading of our securities, delisting of our securities, the assessment of civil monetary penalties and other equitable remedies. Our management has devoted and may be required to further devote significant time and attention to these matters. If any of these matters are resolved against us, it could harm our reputation, business, financial condition and results of operations. Additionally, while we cannot estimate our potential exposure to these matters at this time, we have already expended a significant amount of time and resources investigating and defending against the claims underlying these matters and expect to continue to do so. Accordingly, the ongoing SEC investigation and any related litigation could distract management and entail risks and uncertainties, the outcome of which could adversely affect our results of operations and our reputation. For further information, see Note 21, Commitments and Contingencies, discussing the securities class action lawsuits, in the Notes to Consolidated Financial Statements in Item 8 of this Form 10-K.
We may be unable to obtain necessary product approvals and marketing clearances.
We must obtain certain approvals and marketing clearances from, governmental authorities, including the FDA and similar health authorities in foreign countries to market and sell select products in those countries. These agencies regulate the marketing, manufacturing, labeling, packaging, advertising, sales and distribution of medical devices. The FDA enforces additional regulations regarding the safety of X-ray emitting devices. Various U.S. states also impose manufacturing, licensing, and distribution regulations.
The FDA review process for new medical devices typically requires extended proceedings pertaining to the safety and efficacy of new products. A 510(k) application is required to market certain classes of new or modified medical devices. If specifically required by the FDA, a pre-market approval, or PMA, may be necessary. Such proceedings are potentially expensive and time consuming and may hinder a product’s entry into the marketplace. Moreover, there can be no assurance that the review or approval process for these products by the FDA or any other governmental authority will occur in a timely fashion, if at all, or that additional regulations will not be adopted or current regulations amended in a manner that will adversely affect us. The FDA also oversees the content of advertising and marketing materials relating to medical devices that received FDA clearance. Failure to comply with the FDA’s advertising guidelines may result in the imposition of penalties, enforcement actions, or import bans, and other negative consequences.
We are also subject to other federal, state, and local laws, regulations and recommendations relating to safe working conditions, and to laboratory and manufacturing practices. The extent of government regulation that might result from any future legislation or administrative action cannot be accurately predicted, and inadequate employee training may result in the failure to adhere to applicable laws, rules, and regulations.
Similar to the FDA review process, the EU review process typically requires extended proceedings on the safety and efficacy of new products. Such proceedings are potentially expensive and time consuming and may hinder a product’s entry into the marketplace.
Our products that fall into the category of Class I under the EU MDD were mandated to be certified under the EU MDR. These regulations applied to all medical device manufacturers who market their medical devices in the EU, and manufacturers were required to perform significant upgrades to quality systems and processes On March 20, 2023, the EU Commission extended the MDR transitional periods until December 31, 2027 for higher risk devices and until December 31, 2028 for other medical devices. We remain focused on ensuring that all our medical device products will be fully certified by the deadlines. Additionally, given the exit of the UK from the EU, the EU CE marking will be recognized in the UK through the earlier of the expiration of the product’s CE certificate or June 2028. After such date, the UK may impose its own differing regulatory requirements for products imported from the EU.
Failure to comply with these rules, regulations, self-regulatory codes, circulars, and orders could result in significant civil and criminal penalties and costs, including the loss of licenses and the ability to participate in federal and state health care programs, and could have a material adverse impact on our business. Also, these regulations may be interpreted in a manner that requires us to make changes in operations or incur substantial defense expenses. Even unsuccessful challenges by regulatory authorities or private regulators could result in reputational harm and the incurring of substantial costs.
Changes in tax rules or interpretations of tax rules, operating structures, transfer pricing regulations, country profitability mix and regulations and tax investigations, audits or other proceedings that we are subject to may harm our business, financial condition and results of operations, including by adversely affecting our effective tax rate.
As a company with global operations, we are subject to income and non-income-based taxes around the world. Significant judgment is required in determining our worldwide tax liabilities. Although we believe our estimates are reasonable at the time made, the actual outcome could differ materially from the amounts recorded in our financial statements. The Company has significant tax positions in a variety of countries including the United States and Germany. If the U.S. Internal Revenue Service (the “IRS”) or other tax authorities disagree with our tax positions, we could have additional tax liability, which may have a material impact on our results of operations and financial position. Our effective tax rate could be adversely affected by changes in the mix of earnings in countries with different statutory tax rates, changes in the valuation of deferred tax assets and liabilities, changes in tax laws and regulations, and changes in interpretations of tax laws.
Certain governments are considering, and may adopt, tax reform measures that could significantly increase our worldwide tax liabilities. The Organisation for Economic Co-operation and Development (“OECD”) and other government bodies have focused on the taxation of multi-national corporations, including in the area of “base erosion and profit shifting,” where payments are made from affiliates in jurisdictions with high tax rates to affiliates in jurisdictions with lower rates. Some of these proposals include a two-pillar approach to global taxation, focusing on global profit allocation and a global minimum tax rate (“Pillar Two”). On December 12, 2022, the European Union member states agreed to implement the OECD’s global corporate minimum tax rate of 15%, which became effective as of January 2024. Other countries have made, or are actively considering, changes to their tax laws to adopt certain parts of the OECD’s proposals. Due to the large scale of our global business activities, the enactment of Pillar Two legislation could increase tax uncertainty and have a material effect on the Company’s effective tax rate, financial position, results of operations, and cash flows.
The Company will continue to monitor and reflect the impact of such legislative changes in future financial statements as appropriate.
German tax authorities are currently performing a criminal investigation related to a series of intercompany loans from 2016 and 2017 (the “German Tax Investigation”). As of the date of this filing, there have been no charges against the Company or current or former employees. Potential outcomes of the German Tax Investigation involve a number of uncertainties, including those relating to the application of tax law and regulations, and there can be no assurance that the German Tax Investigation will be resolved favorably. Our management has devoted and may be required to further devote significant time
and attention to the German Tax Investigation. If the German Tax Investigation is resolved against us, it could harm our reputation, business, ability to attract talent, particularly professionals with backgrounds in international tax and tax accounting, financial condition and results of operations. Additionally, while we cannot estimate our potential exposure at this time, we have already expended a significant amount of time and resources investigating and supporting requests for information from German tax authorities, and we expect to continue to do so. Accordingly, this investigation and any related litigation could distract management and entail risks and uncertainties, the outcome of which could adversely affect our results of operations and our reputation. For further information regarding the German Tax Investigation, see Note 21, Commitments and Contingencies, in the Notes to Consolidated Financial Statements in Item 8 of this Form 10-K.
We voluntarily suspended the sale and marketing of our direct-to-consumer Byte aligner systems and impression kits, and subsequently determined to cease offering these aligners to new patients while repurposing Byte technologies and capabilities to support other products within our aligner portfolio. As a result, we have experienced a material impact on our results of operations, and we may be required to take additional significant impairment charges if we are unsuccessful in our efforts to reposition Byte.
On October 24, 2024, we announced the voluntary suspension of the sale and marketing of our direct-to-consumer Byte aligner systems and impression kits. In January 2025, we announced that Byte aligners would no longer be offered to new patients, and we now plan to utilize certain Byte resources elsewhere in the aligners portfolio to create orthodontic demand, support a digital clinical workflow, enhance the customer experience, and improve patient monitoring.
The initial suspension and subsequent decisions regarding Byte products has had a material impact on our results of operations. The sales of Byte aligner systems and impression kits represented approximately 3% of our annual revenue for the year ended December 31, 2024, and the assets related to the Byte aligner business are approximately 1% of the Company’s assets as of December 31, 2024. We also incurred charges relating to customer refunds and asset write-offs. For further information, see Note 18, Restructuring and Other Costs, in the Notes to Consolidated Financial Statements in Item 8 of this Form 10-K.
There is no guarantee that we will be successful in our endeavor to leverage Byte technologies and capabilities in a manner that is accretive to sales and profit. If we are unsuccessful in these efforts, we may be required to incur additional significant impairment charges.
In addition, although we have not accepted any new patients since October 24, 2024, we will continue to provide support for non-contraindicated Byte aligner patients currently undergoing treatment. With respect to these patients, we continue to experience regulatory uncertainties. For example, some state legislatures have passed legislation and other state legislatures have proposed legislation designed to preclude or significantly limit teledentistry, and various state legislatures are continuing to consider such legislation. Furthermore, our ability to conduct business in each state is dependent, in part, upon that state dental board’s regulation of the practice of dentistry. Some state dental boards established rules in a manner that purports to limit or restrict our Byte business, which currently focuses on the provision of Byte aligners to certain existing patients. It is possible that the laws, rules and regulations governing the practice of dentistry and orthodontics in one or more states may change or be interpreted in a manner unfavorable to our business. If adverse laws or regulations are adopted or any such claims are successful, and we were unable to adapt our business model accordingly, our current operations in such states would be disrupted, which could have a material adverse effect on our business, financial condition, and results of operations.
Inadequate levels of reimbursement from governmental or other third-party payors for procedures using our products may cause our revenue to decline.
Third-party payors, including government health administration authorities, private health care insurers and other organizations, regulate the reimbursement of fees related to certain diagnostic procedures or medical treatments. Third-party payors are increasingly challenging the price and cost-effectiveness of medical products and services. While we cannot predict what effect the policies of government entities and other third-party payors will have on future sales of our products, there can be no assurance that such policies would not cause our revenue to decline.
Challenges may be asserted against our products due to real or perceived quality, health or environmental issues.
We manufacture and sell a wide portfolio of dental and medical device products. While we endeavor to ensure that our products are safe and effective, there may be challenges from time to time regarding the quality, health or environmental impact of our products or certain raw material components. Adverse publicity about the quality or safety of our products may have an adverse effect on our brand, reputation and operating results. Legal and regulatory developments in this area may lead to litigation and/or product limitations or discontinuation.
We manufacture and sell dental filling materials that may contain bisphenol-A, commonly called BPA. BPA is found in many everyday items, such as plastic bottles, foods, detergents, and toys, and may be found in certain dental composite materials or sealants either as a by-product of other ingredients that have degraded, or as a trace material left over from the manufacture of other ingredients used in such composites or sealants. The FDA currently allows the use of BPA in dental materials, medical devices, and food packaging. Nevertheless, public reports and concerns regarding the potential hazards of BPA could contribute to a perceived safety risk for our products that contain BPA or other substances.
If we fail to comply with laws and regulations relating to health care fraud, we could suffer penalties or be required to make significant changes to our operations, which could adversely affect our business.
We are subject to federal, state, local and foreign laws, rules, regulations, self-regulatory codes, circulars, and orders relating to health care fraud (“Healthcare Fraud Laws”). Some of these laws, referred to as “false claims laws,” prohibit the submission, or causing the submission, of false or fraudulent claims for reimbursement to health care payors and programs. Other laws, referred to as “anti-kickback laws,” prohibit soliciting, offering, receiving, or paying remuneration in order to induce the referral of a patient or ordering, purchasing, leasing or arranging for or recommending ordering, purchasing or leasing, of items or services that are paid for by health care payors and programs.
The U.S. government has expressed concerns about financial relationships between suppliers and physicians and dentists. Under the reporting and disclosure obligations of the U.S. Physician Payment Sunshine Act and similar Healthcare Fraud Laws, the general public and government officials will be provided with access to detailed information with regard to payments or other transfers of value to certain practitioners (including physicians, dentists and teaching hospitals) by applicable drug and device manufacturers, including us. This information may lead to greater scrutiny, which may result in modifications to established practices and additional costs.
Failure to comply with Healthcare Fraud Laws could result in significant civil and criminal penalties and costs, including the loss of licenses and the ability to participate in governmental health care programs, and could have a material adverse impact on our business. Also, these laws may be interpreted or applied by a prosecutorial, regulatory or judicial authority in a manner that could require us to make changes in our operations or incur substantial defense and settlement expenses. Even unsuccessful challenges by regulatory authorities or private relators could result in reputational harm and the incurring of substantial costs. In addition, many of these laws are vague or indefinite and have not been interpreted by courts, and have been subject to frequent modification and varied interpretation by prosecutorial and regulatory authorities, increasing compliance risks.
We cannot predict whether changes in Healthcare Fraud Laws, or the interpretation thereof, or changes in our services or practices in response, could adversely affect our business.
Our business is subject to extensive, complex, and changing domestic and foreign laws, rules, regulations, self-regulatory codes, directives, circulars and orders which, if not complied with, subject us to civil or criminal penalties or other liabilities.
We are subject to extensive domestic and foreign laws, rules, regulations, self-regulatory codes, circulars and orders which are administered by various international, federal and state governmental authorities, including, among others, the FDA, the Office of Foreign Assets Control of the U.S. Department of the Treasury (“OFAC”), the Bureau of Industry and Security of the U.S. Department of Commerce (“BIS”), the U.S. Federal Trade Commission, the U.S. Department of Justice, the Environmental Protection Agency (“EPA”), and other similar domestic and foreign authorities. These laws, rules, regulations, self-regulatory codes, circulars and orders include, but are not limited to, the U.S. Food, Drug and Cosmetic Act, the EU MDD (and implementing and local measures adopted thereunder), the Federal Health Information Technology for Economic and Clinical Health Act (“HITECH Act”), the Federal Health Insurance Portability and Accountability Act of 1996 (“HIPAA”), France’s Data Protection Act of 1978 (rev. 2004), the U.S. Foreign Corrupt Practices Act (the “FCPA”), the U.S. Federal Anti-Kickback Statute and similar international anti-bribery and anti-corruption laws, the Physician Payments Sunshine Act, regulations concerning the supply of conflict minerals, various and increasingly fragmented environmental regulations, the Patient Protection and Affordable Care Act, as amended by the Health Care and Education Reconciliation Act (the “Health Care Reform Law”), regulations relating to trade, import and export controls and economic sanctions, and regulations relating to cybersecurity, including the EU’s Network and Information Security Directives, the EU’s Artificial Intelligence Act, and China’s Personal Information Protection Law. Such laws, rules, regulations, self-regulatory codes, circulars and orders (“Applicable Laws”) are complex and are subject to change.
The FCPA generally prohibits companies and their affiliates from making improper payment to non-U.S. officials for the purpose of obtaining or retaining business, and also includes books and records and internal accounting controls requirements. Our internal policies, procedures and Code of Ethics and Business Conduct mandate compliance with these anti-corruption laws. However, we operate in some countries known to experience corruption. Despite our training and compliance programs, we cannot provide assurance that our internal policies and procedures will always protect us from violations of such anti-corruption laws committed by our employees or affiliated entities or their respective officers, directors, employees and agents. Failure to comply with the FCPA and other laws governing the conduct of business with government entities, may subject us to criminal and civil penalties and other remedial measures, which could have a material adverse impact on our business, financial condition, results of operations and liquidity. Any ongoing investigation of potential violations of the FCPA or other anti-corruption laws by the United States or foreign authorities could harm our reputation and have an adverse impact on our business, financial condition and results of operations.
Compliance with numerous applicable existing and new Applicable Laws could require us to incur substantial regulatory compliance costs. For example, we are currently in the process of implementing enhancements to our post-market surveillance processes and reportability criteria, which has resulted in an increase in the number of regulatory reports that we have filed, including retrospective reports, for complaints regarding medical devices. There can be no assurance that governmental authorities will not raise compliance concerns or perform audits to confirm compliance with such Applicable Laws. For example, most of our products are classified as medical devices or pharmaceuticals, which are subject to extensive regulations globally, including the requirement to obtain licenses for the manufacture or distribution of such products. Failure to comply with Applicable Laws could result in a range of governmental enforcement actions, including fines or penalties, injunctions and/or criminal or other civil proceedings. Any such actions could result in higher than anticipated costs or lower than anticipated revenue and could have a material adverse effect on our reputation, business, financial condition and results of operations.
RISKS RELATED TO OWNERSHIP OF OUR COMMON STOCK
The market price for our common stock may continue to be volatile as a result of a number of factors, including our quarterly operating results.
We may experience significant fluctuations in quarterly sales and earnings due to several factors, some of which are substantially outside of our control, including but not limited to:
•general economic conditions, as well as those specific to the healthcare industry and related industries;
•changes in income tax laws and incentives that could create adverse tax consequences;
•the execution of restructuring plans;
•the complexity of our organization;
•our ability to supply products to meet customer demand;
•the timing of new product introductions by us and our competitors;
•the timing of industry trade shows;
•changes in customer inventory levels;
•developments in government or third-party payor reimbursement policies;
•changes in customer preferences and product mix;
•fluctuations in manufacturing costs;
•competitors’ sales promotions; and
•fluctuations in currency exchange rates.
As a result, we may fail to meet the expectations of investors and securities analysts, which could cause our stock price to decline.
Certain provisions in our governing documents, and of Delaware law, may make it more difficult for a third party to acquire us.
Certain provisions of our Certificate of Incorporation and By-laws and of Delaware law could have the effect of making it difficult for a third party to acquire a controlling interest in us. Such provisions include, among others, a provision allowing the Board of Directors to issue preferred stock having rights senior to those of our common stock and certain requirements which make it difficult for stockholders to amend our By-laws and prevent them from calling special meetings of stockholders. Delaware law imposes some restrictions on mergers and other business combinations between us and any “interested stockholder” with beneficial ownership of 15% or more of our outstanding common stock.
GENERAL RISKS
Our business may be adversely affected by changes in global economic conditions, including inflation, rising interest rates, and supply chain shortages.
Our business, operating results, financial condition and liquidity may be adversely affected by changes in global economic conditions, including inflation, supply chain disruptions, credit market conditions, consumer and business confidence, and other factors generally beyond our control. We expect the current global supply chain and labor market challenges and inflationary pressures will continue to negatively affect our results of operations. Specifically, the Company continues to experience higher prices and supply chain disruptions for certain raw materials, particularly electronic components, and wage inflation. Certain dental specialty products, dental equipment and related products that support discretionary dental procedures, especially elective procedures in implants and aligners, may also be especially susceptible to changes in economic conditions. Decreases in consumer discretionary spending could negatively affect our business and cause a decline in sales and financial performance.
Additionally, high interest rates have created financial market volatility, which could further negatively impact financial markets or lead to an economic downturn. These and other unfavorable economic conditions could increase our funding costs, limit our access to the capital markets or cause lenders not to extend credit to us. Tightening of credit in financial markets has adversely impacted our customers’ and suppliers’ ability to obtain financing and could result in additional impacts in the future, including a decrease in or cancellation of orders for our products and services, inability of customers to make payments, and increased risk of supplier financial distress.
The Company has sought to offset the elevated costs resulting from raw material cost inflation with annual price increases but has been only partially successful. Should the higher inflationary environment continue, we may not be able to increase the
prices of our offerings sufficiently to keep up with the rate of inflation. Any of the above factors could individually or in combination have a material adverse effect on our operating results, financial condition and liquidity.
Talent gaps and failure to manage and retain top talent may impact our ability to manage our operations, execute strategic initiatives and grow our business.
Our success is dependent on our ability to successfully manage our human capital through talent acquisition, engagement, development, and retention. To achieve our strategic initiatives, we need to attract, manage, and retain employees with the right skills, competencies, and experiences to execute our strategy and support the growth of the business. The failure to attract and retain such employees to fill key roles, or to upskill employees to fill any potential skill gaps, may adversely affect our business performance, competitive position, and future prospects. We also must retain a pipeline of team members to provide for continuity of succession for senior executive positions. To attract and retain qualified employees, we must offer competitive compensation and benefits and effectively manage employee performance and development. Leadership transitions or other senior management changes may adversely affect our ability to attract and retain talent. Our inability to attract and retain talent may negatively impact business continuity, new product launches, and innovation initiatives. Further, such organizational challenges may make it difficult to maintain our culture, resulting in employees not adhering to the desired values of the organization.
We face the inherent risk of legal actions, including litigation, product liability claims, and other regulatory or compliance matters.
We face the inherent risk of legal actions or claims, including purported securities class actions, investigations by governmental agencies, product liability claims, product recall actions, antitrust suits, customs proceedings, tax actions, commercial or contractual claims, employee benefit or discrimination lawsuits, actions based in environmental laws, and other matters. These actions or claims, regardless of their factual bases, might result in substantial costs, restrictions, or otherwise materially injure our business by harming our reputation or distracting our officers, management, and employees. The penalties imposed as a result of legal actions or claims might include fines, civil penalties, criminal penalties, injunctions, recalls, and other sanctions that may materially harm our business by reducing our ability to sell or promote our products or reducing our profits. We have insurance policies, including directors’ and officers’ insurance and product liability insurance, covering these risks in amounts that are considered adequate; however, we cannot provide assurance that the maintained coverage is sufficient to cover future claims or that the coverage will be available in adequate amounts or at a reasonable cost. Also, other types of claims asserted against us may not be covered by insurance. A successful claim brought against us in excess of available insurance, or another type of claim which is uninsured or that results in significant adverse publicity against us, could harm our business and our overall cash flows.
Additionally, we include warranties on select products against defects in materials and workmanship, which are generally for a period of one year from the date of shipment or installation plus any extended warranty period purchased by the customer. The future costs associated with providing product warranties could be material. Successful product warranty claims brought against us could reduce our profits and/or impair our financial condition and damage our reputation.
Climate change and related natural disasters could negatively impact our business and financial results.
We have sales or operations in approximately 150 countries and our suppliers’ manufacturing facilities are in many locations around the world. While we seek to mitigate our risks associated with climate events, we recognize that there are inherent climate-related risks regardless of where we conduct our businesses. Global climate change is expected to result in certain types of natural disasters occurring more frequently or with increased intensity and such climate events could disrupt the production and distribution of our products. Current or future insurance arrangements may not provide protection for costs that may arise from such events, particularly if such events are catastrophic in nature or occur in combination. Accordingly, a natural disaster impacting a significant manufacturing or distribution facility, besides potentially adversely impacting operations of key suppliers, has the potential to disrupt our and our customers’ businesses and may cause us to experience work stoppages, project delays, financial losses and additional costs to resume operations, including increased insurance costs or loss of coverage, legal liability and reputational losses. Increasing natural disasters in connection with climate change could also impact our third-party vendors, service providers or other stakeholders, including disruptions in supply chains, information technology or other necessary services for our Company.
Expectations relating to environmental, social and governance considerations may expose us to potential liabilities, increased costs, reputational harm, and other adverse effects on our business.
Many governments, regulators, investors, and other stakeholders are increasingly focused on environmental, social and governance (“ESG”) considerations relating to businesses, including climate change, pollution, greenhouse gas emissions, human and civil rights, and diversity, equity and inclusion. The increased emphasis on ESG matters has resulted in, and may continue to result in, the adoption of laws and regulations, including additional reporting requirements, leading to increased compliance costs, as well as increased scrutiny regarding our ESG activities and disclosures, which may lead to increased litigation. We make statements about our ESG goals and initiatives through our Sustainability Report, our other non-financial reports, information provided on our website, press statements and other communications. Many of the statements in those voluntary disclosures are based on hypothetical expectations, assumptions, and predictions that may or may not be representative of current or actual risks or events or forecasts of expected risks or events, including the costs associated therewith. Responding to these ESG considerations and implementing these goals and initiatives involves risks and uncertainties, may require investments, and depends in part on third-party performance or data that is outside our control which may not be independently verified. Our disclosure framework may need to be changed from time to time due to evolving standards and practices, which may result in a lack of consistent or meaningful comparative data from period to period. In addition, our interpretation of reporting frameworks or standards may differ from those of others and such frameworks or standards may change over time, either of which could revise our goals or reported progress in achieving such goals. Further, we cannot guarantee that we will achieve our ESG goals and initiatives.
Increased and varied focus and activism related to ESG may hinder our access to capital, as investors may reconsider their capital investment because of their assessment of our ESG practices. In addition, some stakeholders may disagree with our goals and initiatives. Any failure, or perceived failure, by us to achieve our goals, further our initiatives, adhere to our public statements, comply with ESG laws and regulations, or meet evolving and varied stakeholder expectations and standards could result in legal and regulatory proceedings against us and could materially adversely affect our business, reputation, results of operations, financial condition and stock price. Furthermore, in recent years, “anti-ESG” sentiment has gained momentum across the United States, with several states and the federal government having proposed or enacted anti-ESG policies, legislation or initiatives or issued related legal opinions. The Trump Administration also recently issued an executive order opposing diversity, equity and inclusion (“DEI”) initiatives in the private sector, which may draw additional attention to companies which provide products and services to the U.S. government. Such anti-ESG and anti-DEI policies, legislation, initiatives, litigation, legal opinions, and scrutiny could result in our facing additional compliance obligations, becoming the subject of investigations, enforcement actions or litigation, or sustaining reputational harm.
Legislation or regulations that potentially impose restrictions, caps, taxes, or other controls on emissions of greenhouse gases such as carbon dioxide, could adversely affect our operations and financial results. The European Union’s Corporate Sustainability Reporting Directive (“CSRD”) requires impacted companies, including multi-national companies with an EU presence, to make extensive sustainability and climate-related disclosure. The state of California has also enacted a series of environmental laws related to climate disclosures with which we are required to comply. Additionally, the SEC adopted climate-related disclosure rules, which would require the Company to make new climate-related disclosures. Subsequently, the SEC voluntarily stayed the implementation of such rules, pending the completion of judicial review by the Court of Appeals for the Eighth Circuit, and it is unclear whether and how the final rules will be implemented. Climate-related rules will increase compliance costs and could increase litigation risks related to disclosures made pursuant to the rules, either of which could materially and adversely affect our financial performance.
Item 1B. Unresolved Staff Comments
None.
Item 1C. Cybersecurity
Risk Management and Strategy
The Company maintains a comprehensive process for assessing, identifying, and managing material risks from cybersecurity threats. These include risks relating to disruption of business operations or financial reporting systems, intellectual property theft, exposure to fraud or extortion, harm to employees or customers, violation of privacy laws or other regulatory and compliance lapses, reputational risk, and inability to consistently deliver digital technologies. For more information on the Company’s risks related to cybersecurity, refer to “Risk Factors” in Item 1A of this Annual Report on Form 10-K.
Identifying and assessing cybersecurity risk is fully integrated into our overall risk management systems and processes. The Company has established a cybersecurity and information security program that includes risk assessment and mitigation through a threat intelligence-driven approach, application controls, and enhanced security with ransomware defense. We leverage the standards set by the National Institute of Standards and Technology (“NIST”) Cybersecurity Framework as well as industry best practices to measure our security posture and manage risk. Our security program under this framework utilizes policies, software, training programs and hardware solutions to protect and monitor our environment, including multi-factor authentication on all critical systems, firewalls, intrusion detection and prevention systems, vulnerability and penetration testing and identity management systems.
Our Chief Information Officer (“CIO”), who reports directly to the Chief Executive Officer, oversees the Company’s approach to managing cybersecurity and digital risk. Our CIO also regularly engages with cross-functional teams at the Company and partners with our dedicated technology risk management and privacy teams and collaborates with our internal audit department to review information technology-related internal controls as part of the overall internal controls process. Our information security strategic plan includes the development of a single detection and response team across both the corporate and product information and technology environments.
We periodically conduct risk assessments to identify threats and vulnerabilities, and then determine the likelihood and impact for each risk using a qualitative risk assessment methodology. We identify risks from various sources, including vulnerability scans, penetration tests, vendor risk assessments, product and services audits, internal compliance assessments and threat-hunting operations. We monitor our infrastructure and applications to identify evolving cyber threats, scan for vulnerabilities and mitigate risks.
With oversight from our Board of Directors, the Company has formally adopted and annually updates a Security Incident Response Plan which coordinates the activities we undertake to prepare for, detect, respond to and recover from cybersecurity incidents. These activities include processes to triage, assess the severity of, escalate, contain, investigate, and remediate incidents, as well as to comply with potentially applicable legal obligations and mitigate brand and reputational damage. Our incident response plan establishes a framework for measuring the severity of security incidents and provides for a post-market response program including protocols for coordination and communication between security response teams, designated leaders within the Company, internal and outside legal counsel, and the Audit and Finance Committee (“AFC”) of the Company’s Board of Directors in responding to any such incidents.
Our cybersecurity and information security program also includes review and assessment by external, independent third parties, with whom we periodically consult on threat assessments and security enhancements, and incident response preparedness. We share threat intelligence and collaborate with organizations across different industries to share best practices, fight cybercrime, enhance privacy, discuss new technologies, better understand the evolving regulatory environment, and advance capabilities in these areas. Additionally, the Company uses a third-party risk management program that assesses risks from vendors and suppliers. In response to these assessments, we have developed contingency plans for business continuity if our vendors are subject to a cyberattack that impacts our use of their systems.
Our Information Security team conducts annual information security awareness training for employees involved in our systems and processes that handle customer data and audits of our systems and conducts enhanced training for specialized personnel. We also conduct cyber awareness training and simulate responses to cybersecurity incidents and use the findings to improve our practices, procedures, and technologies. The Company provides security awareness education and training for all employees and consultants, conducts monthly internal “phishing” testing and mandatory training for “clickers,” and publishes periodic cybersecurity newsletters to highlight any emerging or urgent security threats.
Our business strategy, results of operations and financial condition have not been materially affected by risks from cybersecurity threats, including the impact of previous cybersecurity incidents, but we cannot provide assurance that they will not be materially affected in the future by such risks and any future material incidents. In the last three years, we have not experienced any material information security breach incidents. The Company maintains cybersecurity insurance, and as part of management oversight we regularly review our policy and levels of coverage based on current risks.
Governance
Management’s Role Managing Risk
The cybersecurity risk management processes described above are managed by our CIO who reports directly to our Chief Executive Officer. Our CIO has over 20 years of experience in matters of cybersecurity and information systems including senior roles at other global publicly traded companies in various industries. Our CIO is a member of multiple professional organizations, and holds professional certifications from leading information, compliance, and privacy organizations. His in-depth knowledge and experience are instrumental in developing and executing our cybersecurity strategies. Our CIO oversees our governance programs, tests our compliance with standards, remediates known risks, and leads our employee training program.
At the management level, our IT security team regularly monitors alerts and meets to discuss threat levels, trends and remediation, and the CIO is also continually informed about any developments in cybersecurity, including potential threats and industry techniques for risk management to address those threats. The role of the CIO includes implementation and oversight of effective processes to monitor our information systems, including the deployment of advanced security measures and regular system audits to identify potential vulnerabilities. The CIO regularly reports to senior management on our cybersecurity risks and actions taken to mitigate that risk.
Board of Directors Oversight
Our Board of Directors is committed to mitigating data privacy and cybersecurity risks and recognizes the importance of these issues as part of our risk management framework. The AFC is charged with oversight of data privacy and cybersecurity risks. Our CIO provides updates to either the AFC or to the full Board of Directors on a quarterly basis on our cybersecurity risks and actions taken to mitigate that risk. These briefings encompass a broad range of topics, including:
•current cybersecurity landscape and emerging threats;
•the status of ongoing cybersecurity initiatives and strategies;
•compliance with regulatory requirements and industry standards; and
•updates on the Company’s performance preparing for, preventing, detecting, responding to and recovering from cyber incidents.
The CIO also promptly informs and updates the Company’s Board of Directors about any information security incidents that may pose significant risk to the Company. Our guidelines require that any significant cybersecurity matters including strategic risk management decisions are escalated to the Board of Directors to ensure that they have comprehensive oversight. The AFC conducts an annual review of the Company’s cybersecurity posture and the effectiveness of its risk management strategies. As part of this review, the Company’s cybersecurity program is periodically evaluated by external experts, and the results of those reviews are reported to the Company’s Board of Directors. This review helps in identifying areas for improvement and ensuring the alignment of cybersecurity efforts with the overall risk management framework.
Item 2. Properties
The following is a listing of Dentsply Sirona’s principal manufacturing and distribution locations:
| | | | | | | | | | | | | | |
| Location | | Function | | Leased or Owned |
| | | | |
| United States: | | | | |
| Milford, Delaware (2) | | Manufacture of dental consumable products | | Owned |
| Sarasota, Florida (2) (3) | | Manufacture of orthodontic accessory products and dental consumable products | | Owned |
| Waltham, Massachusetts (3) | | Manufacture and distribution of dental implant products | | Leased |
| Long Island City, New York (1) (6) | | Manufacture of dental equipment products | | Exited |
| Lancaster, Pennsylvania (5) | | Distribution of dental consumable and dental equipment products | | Leased |
| York, Pennsylvania (1) (2) | | Manufacture and distribution of dental equipment products | | Owned |
| Johnson City, Tennessee (2) | | Manufacture and distribution of endodontic instruments and materials | | Leased |
| | | | |
| Foreign: | | | | |
| Pirassununga, Brazil (3) | | Manufacture and distribution of artificial teeth | | Owned |
| Bensheim, Germany (1) | | Manufacture and distribution of dental equipment | | Owned |
| Hanau, Germany (3) | | Manufacture and distribution of precious metal dental alloys, dental ceramics and dental implant products | | Owned |
| Konstanz, Germany (2) | | Manufacture and distribution of dental consumable products | | Owned |
| Munich, Germany (2) | | Manufacture and distribution of endodontic instruments and materials | | Owned |
| Bar Lev Industrial Park, Israel (3) | | Manufacture and distribution of dental implant products | | Owned/Leased |
| Badia Polesine, Italy (2) | | Manufacture and distribution of dental consumable products | | Owned/Leased |
| Venlo, Netherlands (5) | | Distribution of dental consumable products | | Leased |
| Mölndal, Sweden (3) (4) | | Manufacture and distribution of dental implant products and healthcare consumable products | | Owned |
| Ballaigues, Switzerland (2) | | Manufacture and distribution of endodontic instruments, plastic components and packaging material | | Owned |
| Ankara, Turkey (4) | | Manufacture and distribution of healthcare consumable products | | Owned |
| Mexicali, Mexico (3) | | Manufacture of orthodontic products | | Leased |
| San Jose Province, Costa Rica (3) | | Service provider of orthodontic products | | Leased |
(1) These properties are included in the Connected Technology Solutions segment.
(2) These properties are included in the Essential Dental Solutions segment.
(3) These properties are included in the Orthodontic and Implant Solutions segment.
(4) These properties are included in the Wellspect Healthcare segment.
(5) These properties are distribution warehouses not managed by named segments.
(6) This property was closed during the three months ended December 31, 2024.
In addition, the Company maintain sales and distribution offices at certain of our foreign and domestic manufacturing facilities, as well as at various other U.S. and international locations. Most of these sites around the world that are used exclusively for sales and distribution are leased. We conduct research and development across various locations around the world, including at our leased Innovation Center located in Charlotte, North Carolina. We also lease our worldwide headquarters located in Charlotte, North Carolina and our shared service center in Bratislava, Slovakia. We believe that our properties and facilities are well maintained and are generally suitable and adequate for the purposes for which they are used.
Item 3. Legal Proceedings
The Company is, from time to time, subject to a variety of litigation and similar proceedings incidental to our business. These legal matters primarily involve stockholder derivative suits, claims for damages arising out of the use of our products and services and claims relating to intellectual property matters including patent infringement, employment matters, tax matters, commercial disputes, competition and sales and trading practices, personal injury and insurance coverage. We may also become subject to lawsuits as a result of past or future acquisitions or as a result of liabilities retained from, or representations, warranties or indemnities provided in connection with, divested businesses. Some of these lawsuits may include claims for punitive and consequential, as well as compensatory damages. Based upon our experience, current information and applicable law, we do not believe that these proceedings and claims will have a material adverse effect on our consolidated results of operations, financial position or liquidity. However, in the event of unexpected further developments, it is possible that the ultimate resolution of these matters, or other similar matters, if unfavorable, may be materially adverse to our business, financial condition, results of operations or liquidity. For additional details, see Part II, Item 8, Note 21, Commitments and Contingencies, in the Notes to Consolidated Financial Statements of this Form 10-K, which is incorporated by reference.
Item 4. Mine Safety Disclosures
Not Applicable.
PART II
Item 5. Market for Registrant’s Common Equity, Related Stockholder Matters and Issuer Purchases of Equity Securities
The Company’s common stock is traded on the Nasdaq stock market under the symbol “XRAY.” Approximately 70,848 holders of our common stock are in “street name” or beneficial holders, whose shares are held of record by banks, brokers and other financial institutions. In addition, we estimate, based on information supplied by our transfer agent, that there are 199 holders of record of our common stock.
Stock Repurchase Program
On November 7, 2023, the Board of Directors approved an increase to the authorized share repurchase program of $1.0 billion. At December 31, 2024, the Company had authorization to repurchase $1.2 billion in shares of common stock remaining under this program. Share repurchases may be made through open market purchases, Rule 10b5-1 plans, accelerated share repurchase transactions and other structured share repurchases, privately negotiated transactions or other transactions in such amounts and at such times as we consider appropriate based upon prevailing market and business conditions and other factors.
During the three months ended December 31, 2024, the Company had no repurchases of common stock under the stock repurchase program.
For the year ended December 31, 2024, we repurchased approximately 9.4 million shares at a cost of $250 million for an average price of $26.65.
Performance Graph
The information contained in the Performance Graph section shall not be deemed to be filed as part of this Annual Report and does not constitute soliciting material and should not be deemed filed or incorporated by reference into any other filing of the Company under the Securities Act of 1933, as amended, or the Exchange Act, except to the extent we specifically incorporate the graph by reference.
The graph below compares DENTSPLY SIRONA Inc.’s cumulative 5-year total shareholder return on common stock with the cumulative total returns of the S&P 500 Index and the S&P Health Care index. The graph tracks the performance of a $100 investment in DENTSPLY SIRONA’s Inc.’s common stock and in each index (with the reinvestment of all dividends) from December 31, 2019 to December 31, 2024. The S&P 500 Index and the S&P Health Care Index are included for comparative purposes only. They do not necessarily reflect management’s opinion that such indices are an appropriate measure of the relative performance of the stock involved, and they are not intended to forecast or be indicative of possible future performance of the Company’s common stock.
| | | | | | | | | | | | | | | | | | | | | | | | | | | | | | | | | | | |
| | 12/19 | | 12/20 | | 12/21 | | 12/22 | | 12/23 | | 12/24 |
| DENTSPLY SIRONA Inc. | 100.00 | | | 93.38 | | | 100.21 | | | 58.01 | | | 65.83 | | | 36.01 | |
| S&P 500 | 100.00 | | | 118.40 | | | 152.39 | | | 124.79 | | | 157.59 | | | 197.02 | |
| S&P Health Care | 100.00 | | | 113.45 | | | 143.09 | | | 140.29 | | | 143.18 | | | 146.87 | |
Item 6. [Reserved]
Item 7. Management’s Discussion and Analysis of Financial Condition and Results of Operations
MANAGEMENT’S DISCUSSION AND ANALYSIS OF FINANCIAL CONDITION AND RESULTS OF OPERATIONS
OVERVIEW
The following Management’s Discussion and Analysis of Financial Condition and Results of Operations (“MD&A”) is intended to help the reader understand the Company’s operations and business environment. MD&A is provided as a supplement to, and should be read in conjunction with, the Consolidated Financial Statements and Notes to Consolidated Financial Statements contained in Item 8 of this Form 10-K. The following discussion includes forward-looking statements that involve certain risks and uncertainties. See Part I, Item 1, “Business - Forward-Looking Statements and Associated Risks.”
2024 Operational Summary
For the year ended December 31, 2024,
•Net sales decreased 4.3% compared to the prior year. On an organic basis (a Non-GAAP measure as defined under the heading “Key Performance Measurements” below) net sales decreased 3.5% for the year ended December 31, 2024 compared to the prior year. Net sales were negatively impacted by approximately 0.8% due to the strengthening of the U.S. dollar over the prior year period.
•Net loss was $910 million as compared to net loss of $132 million for the prior year primarily due to higher goodwill and intangible asset impairment charges of $1,014 million compared to $307 million in the prior year. Diluted loss per share was $4.48 compared to diluted loss per share of $0.62 in the prior year.
•Cash from operations was $461 million, as compared to $377 million in the prior year.
Company Profile
DENTSPLY SIRONA Inc. (“Dentsply Sirona” or the “Company”), is the world’s largest diversified manufacturer of professional dental products and technologies, with a 138-year history of innovation and service to the dental industry and a vision of improving oral health and continence care globally. Dentsply Sirona develops, manufactures, and markets comprehensive solutions, including technologically advanced dental equipment supported by cloud-enabled software solutions as well as dental products and healthcare consumable products in urology and enterology under a strong portfolio of world-class brands. Dentsply Sirona’s innovative products provide high-quality, effective, and connected solutions to advance patient care and deliver better, safer, and faster dentistry. Dentsply Sirona’s worldwide headquarters is located in Charlotte, North Carolina. The Company’s shares of common stock are listed in the United States on the Nasdaq stock market under the symbol XRAY.
BUSINESS
Segment Descriptions
A description of the products and services provided within each of the Company’s four reportable segments is provided below.
Connected Technology Solutions
This segment includes the design, manufacture, and sales of the Company’s dental technology and equipment products. These products include the Equipment & Instruments and CAD/CAM product categories. Dental CAD/CAM technologies are products designed for dental professionals to support numerous digital workflows for procedures such as dental restorations through integrations with DS Core, our cloud-based platform.
Essential Dental Solutions
This segment includes the development, manufacture, and sales of the Company’s value-added endodontic, restorative, and preventive consumable products and small equipment used by dental professionals for the treatment of patients. Offerings in this segment also include specialized treatment products including products used in the creation of dental appliances.
Orthodontic and Implant Solutions
This segment includes the design, manufacture, and sales of the Company’s various digital implant systems and innovative dental implant products, digital dentures and dental professional-directed aligner solutions. Offerings in this segment also include application of our digital services and technology, including those provided by DS Core, our cloud-based platform.
Wellspect Healthcare
This segment includes the design, manufacture, and sales of the Company’s innovative continence care solutions for both urinary and bowel management. This category consists mainly of urology catheters and other healthcare-related consumable products.
Recent Developments
As previously disclosed in the Company’s Current Report on Form 8-K filed February 11, 2025, the Company has initiated a process to evaluate strategic alternatives for its Wellspect Healthcare business. There is no deadline or definitive timetable set for completion of the strategic alternatives process or assurance that the process will result in a transaction. The Company does not intend to make further announcements regarding the review of strategic alternatives unless and until the Board of Directors approves a course of action or otherwise determines further disclosure is appropriate or necessary.
The impact of global economic conditions
Markets in several regions, particularly Europe, continue to experience varying degrees of pressures inhibiting growth and face concerns about the systemic impacts of adverse economic conditions and geopolitical events. Changes in economic conditions, supply chain constraints, higher energy costs, labor shortages, the conflict in Ukraine, and geopolitical tensions in the Middle East and Russia, have all contributed to a period of higher inflation across the industry and the regions in which the Company operates. As a result, the Company has experienced higher prices for certain raw materials, including electronic components, which have led to a negative impact on margins. We expect a continuation of inflationary pressure on the cost of both raw materials and wages into 2025, the effect of which will depend on our ability to successfully mitigate and offset the related impacts.
The challenging macroeconomic conditions have also negatively impacted demand for the Company’s products and may continue to do so in the future. Specifically, higher interest rates have put pressure on the ability and willingness of our customers to obtain financing for equipment purchases, which adversely affects volumes for these products. The higher cost of borrowing has also reduced patient demand for elective dental procedures, which affects sales of the Company’s offerings more broadly. The Company has also faced additional competitive pressure for lower-priced options for equipment and other products by dental practices, in particular for imaging products and implants. While the Company has taken steps to address competitive pressures, such as the reintroduction of its Orthophos SL 2D and 3D products, these trends may continue. While patient volumes have largely remained stable in the United States, the impact of macroeconomic declines and high interest rates has been particularly apparent in Germany, which represented 11% of the Company’s sales for the year ended December 31, 2024. Germany was in a recession for most of 2023, largely due to persistent high inflation and falling household spending. Although conditions, including inflation, marginally improved in 2024, demand for investments in new dental equipment continued to be weak, and economic forecasts by the German government project limited growth in 2025. The Company anticipates that the challenging macroeconomic and market conditions in Germany are likely to persist and negatively impact sales of equipment into next year.
In anticipation of a continued inflationary trend and potentially deteriorating macroeconomic environment, we have attempted to mitigate these pressures through the following actions, among others:
•Driving strategic procurement initiatives to leverage alternative sources of raw materials and transportation;
•Implementing cost-containment measures, as well as intensifying continuous improvement and restructuring programs in our manufacturing and distribution facilities and other areas of our business, including the most recent restructuring plan approved by the Board of Directors on July 29, 2024;
•Optimizing our customer management and implementing strategic investments in our commercial sales organization in key markets, particularly the United States; and
•Refining our focus on developing a winning portfolio with global scale to maximize market share in a competitive pricing environment.
The impact of the Israel-Hamas war
The terrorist attacks by Hamas militants crossing the border from Gaza to Israel in October 2023 and the subsequent military response by the Israeli government in Gaza has resulted in significant unrest and uncertainty within that region. During the course of 2024, the state of Israel has also been a target of coordinated missile and drone attacks launched by the Republic of Iran and by Iran’s terrorist proxy organization in Lebanon. Although a cease-fire agreement was signed between Hamas and the Israeli government in January 2025, the potential for a long-term peace deal and greater stability remains uncertain. A resumption of the violence or the involvement of other terrorist groups or foreign powers in the region could impact our employees and operations in future periods. Additionally, in May 2024, in response to ongoing military actions, the government of Turkey implemented restrictions on the import of goods manufactured within Israel for sale in the Turkish market. Sales of our products made in Israel and sold in Turkey have historically represented approximately 1% of our global sales of the Implant & Prosthetic Solutions reporting unit, but this product category is an area of relatively high potential growth. The loss of sales to Turkey in 2024 was partially offset by sales of implants produced outside of Israel. It is not clear when these restrictions will be lifted or if other countries will institute similar restrictions.
The Company’s operations in Israel consist of two manufacturing facilities for implants products, with one site in northern Israel and one site in southern Israel, which together employ approximately 350 associates. These facilities remain open and continue to operate. We may, however, decide to discontinue production at these facilities for the safety of our employees, or we could face future production slowdowns or interruptions at either location due to the impacts of the war, including personnel absences as a number of our employees have been called to active military duty, or due to other resource constraints such as the inability to source materials for production.
For the year ended December 31, 2024, net sales of products produced at these sites comprised approximately 3% of our consolidated net sales and 13% of the net sales of the Orthodontic and Implant Solutions segment. Net assets within Israel totaled $180 million as of December 31, 2024, consisting primarily of acquired technology, property, plant and equipment, cash, and inventory associated with our operations in the country. Overall, the Company’s operations in Israel have not been materially impacted by the conflict, and consequently, the Company has not recorded any allowance for doubtful accounts, inventory reserves, or fixed asset impairments for the year ended December 31, 2024 due to the conflict. The Company continues to monitor developments and prepare contingency plans to limit potential disruption to its operations in the future.
Additionally, we sell products from across our portfolio to distributors of dental products and direct to dental practices within Israel and its neighboring countries which may face reduced patient traffic and demand for our products in the near term. Net sales for products sold to our customers in Israel comprised approximately 1% of our consolidated net sales for the year ended December 31, 2024.
The impact of the war in Ukraine
In February 2022, because of the invasion of Ukraine by Russia, economic sanctions were imposed by the United States, the European Union, and certain other countries on Russian financial institutions and businesses. Due to the medical nature of our products, the current sanctions have not materially restricted our ability to continue selling many of our products to customers located in Russia. The Company also sources certain raw materials and components from Russia and Ukraine and has taken actions to minimize any adverse impacts from disrupted supply chains related to these items. The Company’s operations in Ukraine consist primarily of R&D activities, which continue from locations that focus on the safety of employees. Overall, the Company’s operations in Russia and Ukraine have not been materially impacted by the conflict, and consequently, the Company has not recorded any allowance for doubtful accounts, inventory reserves, or asset impairments for the year ended December 31, 2024 as a result of the conflict.
For the year ended December 31, 2024, net sales in Russia and Ukraine were approximately 2% of our consolidated net sales, and net assets in these countries were $64 million. These net assets include $39 million of cash and cash equivalents held within Russia as of December 31, 2024, as well as inventory and trade accounts receivable. Due to currency control measures imposed by the Russian government, which include restrictions on the ability of companies to repatriate or otherwise remit cash from their Russian-based operations to locations outside of Russia, we continue to be limited in our ability to transfer this cash balance out of Russia without incurring substantial costs. Additionally, beginning in September 2024, as a result of further restrictions by European financial institutions on receiving payments from Russia, our capacity to receive intercompany payments for the delivery of our products into Russia has been partially reduced, which further limits our ability to use cash received from sales in Russia for our general purposes. It is unclear whether the remaining financial institutions which the Company relies upon for bank transfers from Russia will ultimately be able to continue facilitating payments, or for how long.
If these restrictions on cash transfers from Russia worsen, or if we are not able to obtain long-term relief from these restrictions, we may need to take additional actions, including potential suspension of our business in Russia.
A significant escalation or expansion of the economic disruption from the conflict could interrupt our supply chain, broaden inflationary costs, impair our assets located in Russia, result in a loss of sales, and have a material adverse effect on our results of operations.
For additional discussion of associated risks, refer to Part I, Item 1A, “Risk Factors” - Risks Related to Our Global Operations.
Business Drivers
The primary drivers of organic sales (as defined below) include macroeconomic factors, global dental industry demand, innovation and new product launches by the Company, as well as continued investments in sales and marketing resources to drive demand creation, including clinical education. On a short-term basis, sudden changes in the macroeconomic environment, supply chain challenges, or changes in distributor inventory levels can and have impacted the Company’s sales. Demand can also fluctuate based on the timing of dental trade shows where promotions are offered, major new product introductions, and variability in dental patient traffic, which can be exacerbated by seasonal or severe weather patterns, or other demographic disruptions such as global pandemics.
The Company has a focus on maximizing operational excellence on a global basis. The Company has expanded the use of technology and has undertaken process improvement initiatives to enhance global efficiency. In addition, management continues to evaluate the worldwide consolidation and simplification of operations and functions to further reduce costs. While the Company continues consolidation initiatives, which can have an adverse impact on reported results in the short term, the Company expects that the continued benefits from these global efficiency efforts will improve its cost structure in the long-term. Meanwhile, the Company intends to continue pursuing opportunities to expand the Company’s product and solutions offerings, technologies, and sales and service infrastructure through partnerships. Although the professional dental market has experienced consolidation, it remains fragmented.
The Company’s business is subject to quarterly fluctuations in net sales and operating income. The timing of annual price increases, promotional activities, as well as changes in inventory levels at distributors contribute to this fluctuation. Also, the Company distributes approximately two-thirds of its dental consumable and technology and equipment products through third-party distributors whose inventory levels tend to increase in the period leading up to a price increase and decline in the period following the implementation of a price increase, although these fluctuations are mitigated by limits on purchases ahead of these increases. Changes in distributors’ inventory levels have impacted the Company’s consolidated net sales in the past and may continue to do so in the future. In addition, the Company may from time to time engage in new distributor relationships that could cause fluctuations in consolidated net sales and operating income. Distributor inventory levels may fluctuate and differ from the Company’s projections and market demand, resulting in the Company’s forecast of future results being different than expected. There can be no assurance that the Company’s distributors and customers will maintain levels of inventory or patterns of build and liquidation timing in accordance with the Company’s predictions or history. Any of these fluctuations could be material to the Company’s consolidated financial statements. For more information about the drivers of our business and related risks, see Part I, Item 1, “Business” and Part I, Item 1A, “Risk Factors.”
Restructuring Programs
On July 29, 2024, the Board of Directors of the Company approved an additional plan to restructure the Company’s business to improve operational performance and drive stockholder value creation (the “2024 Plan”). The Company expects to incur between $35 million and $50 million in non-recurring charges under the 2024 Plan. The Company anticipates that the 2024 Plan will be substantially completed by the end of 2025 and result in $80 million to $100 million in annual cost savings. For details on this plan including the nature of the non-recurring charges incurred during the year, refer to Note 18, Restructuring and Other Costs, in the Notes to Consolidated Financial Statements in Item 8 of this Form 10-K, and to the discussion under the heading “Material Trends in Capital Resources” within MD&A.
Impact of Foreign Currencies
Due to the Company’s global footprint, movements in foreign currency exchange rates may have a material impact on its reported net sales and pre-tax income. With approximately two-thirds of the Company’s net sales originating from regions
outside the United States, the Company’s net sales and results of operations are negatively impacted by the strengthening, or positively impacted by the weakening, of the U.S. dollar compared to the primary currencies in which the Company operates.
While the Company employs financial instruments to hedge some of its transactional foreign exchange exposure, these activities do not insulate it completely from those exposures, particularly from the currency exposure arising from translation of non-U.S. dollar functional currency subsidiaries. During fiscal year 2024, both net sales and gross profit were adversely impacted due to the significant strengthening of the U.S. dollar against foreign currencies. The continued strength of the U.S. dollar could continue to adversely impact the Company’s results.
Distribution Arrangements
In July 2024, the Company delivered a one-year notice of non-renewal in connection with its non-exclusive distribution agreements with Patterson Companies, Inc. (“Patterson”) for the distribution of dental equipment in the United States and Canada. It is anticipated that Patterson will continue to be one of the Company’s two largest distributors as a percentage of the Company’s global revenue during the one-year notice period. The Company intends to continue to engage in discussions for new distribution agreements with Patterson. However, failure to successfully renegotiate the distribution agreements or secure potential new agreements with another distributor could have a material adverse effect on the Company’s business, operating results and financial condition. The Company has not incurred any charges against earnings in 2024 related to non-renewal of the distribution agreements. For additional information, see Part 1, Item 1A, “Risk Factors.”
Byte Aligners Business
On October 24, 2024, the Company announced the voluntary suspension of the sale and marketing of its Byte aligner system and impression kits while the Company conducted a review of certain regulatory requirements related to these products. The Company’s decision was made in communication with the U.S. Food and Drug Administration (the “FDA”) and resulted in suspension of the shipment and processing of new and recently placed orders for Byte aligners and impression kits through the remainder of 2024. In January 2025, the Company announced plans that the Byte aligners would no longer be offered to new patients, and the Company now plans to utilize certain Byte resources elsewhere in the aligners portfolio to create orthodontic demand, support a digital clinical workflow, enhance the customer experience, and improve patient monitoring.
As a result of these developments, in the fourth quarter of 2024, the Company recorded $187 million in impairments of assets pertaining to the Byte business including a trademark, fixed assets, capitalized software and working capital. In addition to these impairments, the Company recorded an accrual for expected customer refund and other reimbursement payments stemming from the cessation of sales and business realignment, which resulted in a $35 million reduction to net sales. The suspension of sales in the fourth quarter of 2024 also resulted in a decline in aligner revenues as compared to the prior period. For additional information refer to Item 8, Note 18, Restructuring and Other Costs, in the Notes to Consolidated Financial Statements of this Form 10-K, as well as the Results of Operations discussion below.
RESULTS OF OPERATIONS
2024 Compared to 2023
Net Sales and Key Performance Measurements
The Company presents net sales comparing the current year periods to the prior year periods. In addition, the Company also presents the changes in net sales on an organic sales basis, which is a Non-GAAP measure. The Company defines “organic sales” as the reported net sales adjusted for: (1) net sales from acquired and divested businesses recorded prior to the first anniversary of the acquisition or divestiture; (2) net sales attributable to discontinued product lines in both the current and prior year periods; and (3) the impact of foreign currency changes, which is calculated by translating current period net sales using the comparable prior period’s currency exchange rates.
Our measure of organic sales may differ from those used by other companies and should not be considered in isolation from, or as a substitute for, measures of financial performance prepared in accordance with US GAAP. Organic sales is an important internal measure for the Company, and its senior management receives a monthly analysis of operating results that includes organic sales. The performance of the Company is measured on this metric along with other performance metrics.
The Company discloses changes in organic sales to allow investors to evaluate the performance of the Company’s operations exclusive of the items listed above that may impact the comparability of results from period to period and may not be indicative of past or future performance of the normal operations of the Company. The Company believes that this supplemental information is helpful in understanding underlying net sales trends.
A reconciliation of net sales to organic sales for the year ended December 31, 2024 is as follows:
| | | | | | | | | | | | | | | | | | | | | | | | | | |
| | | Year Ended December 31, |
| (in millions, except percentages) | | 2024 | | 2023 | | $ Change | | % Change |
| | | | | | | | |
| Net sales | | $ | 3,793 | | | $ | 3,965 | | | $ | (172) | | | (4.3 | %) |
| Unfavorable foreign exchange impact | | | | | | | | (0.8 | %) |
| | | | | | | | |
| | | | | | | | |
| Organic sales | | | | | | | | (3.5 | %) |
Percentages are based on actual values and may not recalculate due to rounding.
The decrease in organic sales was primarily driven by lower volumes in the Connected Technology Solutions segment across all regions, lower volumes of orthodontic and lab products within the Orthodontic and Implant Solutions segment, and lower volumes in the Essential Dental Solutions segment, primarily in the United States. These decreases were partially offset by growth in the Wellspect Healthcare segment.
Net Sales by Segment
Connected Technology Solutions
A reconciliation of net sales to organic sales for the year ended December 31, 2024 is as follows:
| | | | | | | | | | | | | | | | | | | | | | | | | | |
| | Year Ended December 31, |
| (in millions, except percentages) | | 2024 | | 2023 | | $ Change | | % Change |
| | | | | | | | |
| Net sales | | $ | 1,062 | | | $ | 1,169 | | | $ | (107) | | | (9.2 | %) |
| Unfavorable foreign exchange impact | | | | | | | | (1.0 | %) |
| | | | | | | | |
| | | | | | | | |
| Organic sales | | | | | | | | (8.2 | %) |
Percentages are based on actual values and may not recalculate due to rounding.
The decrease in organic sales was primarily due to lower volumes of imaging equipment, instruments, CAD/CAM equipment, and treatment centers across all three regions, driven in part by competitive pressures particularly from lower-cost competitors, as well as unfavorable economic conditions. The trend of lower volumes for these products is expected to continue into 2025.
Essential Dental Solutions
A reconciliation of net sales to organic sales for the year ended December 31, 2024 is as follows:
| | | | | | | | | | | | | | | | | | | | | | | | | | |
| | Year Ended December 31, |
| (in millions, except percentages) | | 2024 | | 2023 | | $ Change | | % Change |
| | | | | | | | |
| Net sales | | $ | 1,454 | | | $ | 1,468 | | | $ | (14) | | | (0.9 | %) |
| Unfavorable foreign exchange impact | | | | | | | | (0.8 | %) |
| | | | | | | | |
| | | | | | | | |
| Organic sales | | | | | | | | (0.1 | %) |
Percentages are based on actual values and may not recalculate due to rounding.
The decrease in organic sales was due to lower volumes of preventive consumable products across all three regions and lower volumes of restorative and endodontic products in the United States. The decrease was partially offset by higher volumes for endodontic products in Rest of World.
Orthodontic and Implant Solutions
A reconciliation of net sales to organic sales for the year ended December 31, 2024 is as follows:
| | | | | | | | | | | | | | | | | | | | | | | | | | |
| | Year Ended December 31, |
| (in millions, except percentages) | | 2024 | | 2023 | | $ Change | | % Change |
| | | | | | | | |
| Net sales | | $ | 973 | | | $ | 1,040 | | | $ | (67) | | | (6.5 | %) |
| Unfavorable foreign exchange impact | | | | | | | | (1.0 | %) |
| | | | | | | | |
| | | | | | | | |
| Organic sales | | | | | | | | (5.5 | %) |
Percentages are based on actual values and may not recalculate due to rounding.
The decrease in organic sales for the year was primarily driven by a decrease in volume for implants and prosthetics products across the United States and Europe, and weaker sales of aligners in the United States which were negatively impacted by the suspension of the sale and marketing of Byte aligner system and impression kits. The decrease was partially offset by increased sales of SureSmile aligners in Europe and of implants products in Rest of World.
Wellspect Healthcare
A reconciliation of net sales to organic sales for the year ended December 31, 2024 is as follows:
| | | | | | | | | | | | | | | | | | | | | | | | | | |
| | Year Ended December 31, |
| (in millions, except percentages) | | 2024 | | 2023 | | $ Change | | % Change |
| | | | | | | | |
| Net sales | | $ | 304 | | | $ | 288 | | | $ | 16 | | | 5.9 | % |
| Favorable foreign exchange impact | | | | | | | | 0.1 | % |
| | | | | | | | |
| | | | | | | | |
| Organic sales | | | | | | | | 5.8 | % |
Percentages are based on actual values and may not recalculate due to rounding.
The increase in organic sales was primarily driven by higher volumes across all regions, particularly in Europe, primarily driven by new product launches.
Net Sales by Region
United States
A reconciliation of net sales to organic sales for the year ended December 31, 2024 is as follows:
| | | | | | | | | | | | | | | | | | | | | | | | | | |
| | | Year Ended December 31, |
| (in millions, except percentages) | | 2024 | | 2023 | | $ Change | | % Change |
| | | | | | | | |
| Net sales | | $ | 1,348 | | | $ | 1,437 | | | $ | (89) | | | (6.2 | %) |
| Foreign exchange impact | | | | | | | | — | % |
| | | | | | | | |
| | | | | | | | |
| Organic sales | | | | | | | | (6.2 | %) |
Percentages are based on actual values and may not recalculate due to rounding.
The decrease in organic sales was primarily due to changes in the operation of our direct-to-consumer aligners business during the course of the year, and particularly during the fourth quarter as described above under the heading “Byte Aligners Business.” Prior to the suspension of sales of aligners and impression kits beginning in October 2024, legislative trends relating to teledentistry in certain states had already prompted us to make adjustments to the Byte business model which resulted in reductions of sales of aligners by approximately $15 million during the first nine months of 2024. The subsequent suspension of sales in October resulted in a decline in revenues relative to the prior year, and we also recorded an estimate of customer refund and other reimbursement payments stemming from these actions which resulted in an additional $35 million reduction to revenue for the year ended December 31, 2024.
In addition to the impact from Byte, the decrease in sales in the United States was also due to lower volumes for consumables products within the Essential Dental Solutions segment, lower volumes for implants and prosthetics products, and lower volumes of products within the Connected Technology Solutions segment. These decreases were partially offset by lower
customer incentives and higher volumes of Wellspect products as a result of new product launches.
Organic sales were also negatively affected by wholesale volumes for CAD/CAM products relative to the year ended December 31, 2023 due in part to timing of distributor orders. Volumes of CAD/CAM units held by distributors at December 31, 2024 decreased $8 million compared to the beginning of 2024, whereas volumes of CAD/CAM inventory held by distributors at December 31, 2023 remained consistent with the beginning of 2023. Volumes of imaging products held by distributors at December 31, 2024 decreased $7 million compared to the beginning of 2024, whereas volumes of imaging products held by distributors at December 31, 2023 increased by $1 million compared to the beginning of 2023. Distributor inventory levels for both CAD/CAM and imaging products remained low as of December 31, 2024 relative to historical averages.
Europe
A reconciliation of net sales to organic sales for the year ended December 31, 2024 is as follows:
| | | | | | | | | | | | | | | | | | | | | | | | | | |
| | | Year Ended December 31, |
| (in millions, except percentages) | | 2024 | | 2023 | | $ Change | | % Change |
| | | | | | | | |
| Net sales | | $ | 1,518 | | | $ | 1,550 | | | $ | (32) | | | (2.1 | %) |
| Favorable foreign exchange impact | | | | | | | | 0.1 | % |
| | | | | | | | |
| | | | | | | | |
| Organic sales | | | | | | | | (2.2 | %) |
Percentages are based on actual values and may not recalculate due to rounding.
The decrease in organic sales was primarily due to lower volumes of products within the Connected Technology Solutions segment and lower volumes of implants and prosthetics products within the Orthodontic and Implant Solutions segment. These decreases were partially offset by positive performance in the Wellspect Healthcare segment with new product launches, and higher volumes of SureSmile aligners in the Orthodontic and Implant Solutions segment.
Rest of World
A reconciliation of net sales to organic sales for the year ended December 31, 2024 is as follows:
| | | | | | | | | | | | | | | | | | | | | | | | | | |
| | | Year Ended December 31, |
| (in millions, except percentages) | | 2024 | | 2023 | | $ Change | | % Change |
| | | | | | | | |
| Net sales | | $ | 927 | | | $ | 978 | | | $ | (51) | | | (5.1 | %) |
| Unfavorable foreign exchange impact | | | | | | | | (3.6 | %) |
| | | | | | | | |
| | | | | | | | |
| Organic sales | | | | | | | | (1.5 | %) |
Percentages are based on actual values and may not recalculate due to rounding.
The decrease in organic sales was primarily driven by lower volumes and unfavorable pricing for Connected Technology Solutions products, particularly in Japan, which saw lower volumes due to competitive pressures. These decreases were partially offset by increased volumes for implant and endodontic products, particularly in China. The local volume-based procurement program in China resulted in increased volumes for implants products during 2024, particularly during the first half of the year, with a decline in the second half of the year due to current macroeconomic conditions.
Gross Profit | | | | | | | | | | | | | | | | | | | | | | | | | | |
| | | Year Ended December 31, |
| (in millions, except percentages) | | 2024 | | 2023 | | $ Change | | % Change |
| | | | | | | | |
| Gross profit | | $ | 1,958 | | | $ | 2,086 | | | $ | (128) | | | (6.1 | %) |
| | | | | | | | |
| Gross profit as a percentage of net sales | | 51.6 | % | | 52.6 | % | | (100) bps | | |
Percentages are based on actual values and may not recalculate due to rounding.
Gross profit declined due to lower volumes and the impact of the Byte refunds as described above, higher manufacturing and input costs, and unfavorable mix, particularly within the Connected Technology Solutions segment. These drivers were partially offset by lower customer incentives, and a decrease in warranty costs and inventory obsolescence charges.
Operating Expenses
| | | | | | | | | | | | | | | | | | | | | | | | | | |
| | | Year Ended December 31, |
| (in millions, except percentages) | | 2024 | | 2023 | | $ Change | | % Change |
| | | | | | | | |
| Selling, general, and administrative expenses | | $ | 1,605 | | | $ | 1,613 | | | $ | (8) | | | (0.4 | %) |
| Research and development expenses | | 165 | | | 184 | | | (19) | | | (10.5 | %) |
| Goodwill and intangible asset impairments | | 1,014 | | | 307 | | | 707 | | | NM |
| Restructuring costs | | 53 | | | 67 | | | (14) | | | NM |
| | | | | | | | |
| SG&A as a percentage of net sales | | 42.3 | % | | 40.7 | % | | 160 bps | | |
| R&D as a percentage of net sales | | 4.3 | % | | 4.6 | % | | (30) bps | | |
Percentages are based on actual values and may not recalculate due to rounding.
NM - Not meaningful
SG&A Expenses
SG&A expenses decreased primarily due to lower headcount costs, lower travel costs, and lower professional service costs. The decrease was also due to lower sales and advertising costs for Byte products after the suspension of sales noted above. The overall decrease in expenses was partially offset by an increase in general and administrative costs within the Orthodontic and Implant Solutions segment, primarily as a result of bad debt expense for the write-off of Byte receivables.
R&D Expenses
R&D expenses decreased compared to the prior year as the Company continues to take a disciplined approach with ongoing investments in digital workflow solutions, product development initiatives, and software development, including the clinical application suite and cloud deployment. The Company expects to continue to maintain a level of investment in R&D that is at least 4% of annual net sales.
Goodwill and Intangible Asset Impairments
Goodwill and intangible asset impairments increased compared to the prior year, due to a higher level of impairment charges, specifically related to the goodwill pertaining to the Implant & Prosthetic Solutions reporting unit, a write-off of the Byte trademark, and certain intangible assets within the Connected Technology Solutions segment. For further information, see Item 8, Note 11, Goodwill and Intangible Assets, in the Notes to Consolidated Financial Statements of this Form 10-K.
Restructuring and Other Costs
During the year ended December 31, 2024, we recorded net expense of $53 million of restructuring costs which consist primarily of charges associated with the restructuring plans announced in February 2023 and July 2024. For further information, see Item 8, Note 18, Restructuring and Other Costs, in the Notes to Consolidated Financial Statements of this Form 10-K.
Segment Adjusted Operating Income
| | | | | | | | | | | | | | | | | | | | | | | | | | |
| | Year Ended December 31, |
(in millions, except percentages) (a) | | 2024 | | 2023 | | $ Change | | % Change |
| | | | | | | | |
| Connected Technology Solutions | | $ | 70 | | | $ | 101 | | | $ | (31) | | | (30.3 | %) |
| | | | | | | | |
| Essential Dental Solutions | | 479 | | | 478 | | | 1 | | | 0.2 | % |
| | | | | | | | |
| Orthodontic and Implant Solutions | | 80 | | | 156 | | | (76) | | | (48.6 | %) |
| | | | | | | | |
| Wellspect Healthcare | | 98 | | | 87 | | | 11 | | | 12.7 | % |
Percentages are based on actual values and may not recalculate due to rounding. (a) See Note 6, Segment and Geographic Information, in the Notes to Consolidated Financial Statements in Item 8 of this Form 10-K for a reconciliation from segment adjusted operating income to consolidated US GAAP income.
Connected Technology Solutions
The decrease in segment adjusted operating income is due to the lower sales volumes noted above, unfavorable manufacturing leverage from lower volumes, and unfavorable product mix as a result of lower sales for certain higher margin CAD/CAM equipment products. These decreases were partially offset by lower headcount-related costs and product warranty and return costs.
Essential Dental Solutions
Segment adjusted operating income is flat due to favorable product mix and favorable pricing being offset primarily by the lower volumes noted above.
Orthodontic and Implant Solutions
The decrease in segment adjusted operating income is due to the impact from suspending sales of Byte clear aligners to new customers in October 2024 as previously described, the Byte refunds and inventory write-offs, and higher distribution and manufacturing costs. As noted above, operating income was also unfavorably impacted by a decline in sales for implant and prosthetics products, as well as higher general and administrative costs primarily as a result of bad debt expense for the write-off of Byte receivables, partly offset by lower sales and advertising costs for Byte products.
Wellspect Healthcare
The increase in segment adjusted operating income was driven by the increase in organic sales noted above due to new product launches, as well as margin improvements due to favorable manufacturing leverage from higher volumes.
Other Income and Expenses | | | | | | | | | | | | | | | | | | | | | | | | | | |
| | | Year Ended December 31, |
| (in millions, except percentages) | | 2024 | | 2023 | | $ Change | | % Change |
| | | | | | | | |
| Interest expense, net | | $ | 69 | | | $ | 81 | | | $ | (12) | | | (14.5 | %) |
| Other (income) expense, net | | (12) | | | 9 | | | (21) | | | NM |
| Net interest and other expense | | $ | 57 | | | $ | 90 | | | $ | (33) | | | |
Percentages are based on actual values and may not recalculate due to rounding.
NM - Not meaningful
Interest expense, net
Net interest expense for the year ended December 31, 2024 decreased as compared to the year ended December 31, 2023, driven primarily by lower short-term and other borrowings.
Other (income) expense, net
Other (income) expense, net for the year ended December 31, 2024 compared to the year ended December 31, 2023 was as follows: | | | | | | | | | | | | | | | | | | | | |
| | Year Ended December 31, |
| (in millions) | | 2024 | | 2023 | | $ Change |
| | | | | | |
| | | | | | |
Foreign exchange gains (a) | | (21) | | | (3) | | | (18) | |
| Loss from equity method investments | | — | | | 4 | | | (4) | |
| Defined benefit pension plan expenses | | 8 | | | 7 | | | 1 | |
| Other non-operating loss | | 1 | | | 1 | | | — | |
| Other (income) expense, net | | $ | (12) | | | $ | 9 | | | $ | (21) | |
(a) Foreign exchange gains include a benefit from our Swiss franc net investment hedge totaling $22 million, offset by revaluation of short-term intercompany receivables and payables of $1 million.
Income Taxes and Net Loss | | | | | | | | | | | | | | | | | | | | |
| | | Year Ended December 31, |
| (in millions, except per share data and percentages) | | 2024 | | 2023 | | $ Change |
| | | | | | |
| Benefit for income taxes | | $ | (26) | | | $ | (43) | | | $ | 17 | |
| | | | | | |
| Effective income tax rate | | 2.8 | % | | 24.8 | % | | |
| | | | | | |
| Net loss attributable to Dentsply Sirona | | $ | (910) | | | $ | (132) | | | $ | (778) | |
| | | | | | |
| Net loss per common share - diluted | | $ | (4.48) | | | $ | (0.62) | | | |
Percentages are based on actual values and may not recalculate due to rounding.
Benefit for income taxes
An income tax benefit of $26 million and $43 million was recorded for the years ended December 31, 2024 and December 31, 2023, respectively. The increase in tax benefit is primarily due to additional impairments recorded in the year ended December 31, 2024.
Further information regarding the details of income taxes is presented in Note 16, Income Taxes, in the Notes to Consolidated Financial Statements in Item 8 of this Form 10-K.
2023 Compared to 2022
Discussion of the results of operations for the year ended December 31, 2023 as compared to December 31, 2022 was included in Part II, Item 7 “Management’s Discussion and Analysis of Financial Condition and Results of Operations” in the Company’s Form 10-K for the year ended December 31, 2023, as filed with the SEC on February 29, 2024.
CRITICAL ACCOUNTING ESTIMATES
The preparation of the Company’s consolidated financial statements in conformity with US GAAP requires the Company to make estimates and assumptions about future events that affect the amounts reported in the consolidated financial statements and accompanying notes. Future events and their effects cannot be determined with absolute certainty. Therefore, the determination of estimates requires the exercise of judgment. Actual results could differ from those estimates, and such differences may be material to the consolidated financial statements. The process of determining significant estimates is fact-specific and, when determining significant estimates, management considers factors such as historical experience, current and expected economic conditions, product mix and in some cases, actuarial techniques. The Company evaluates these significant factors as facts and circumstances dictate. Some events as described below could cause results to differ significantly from those determined using estimates. The Company has identified the following accounting estimates as those which are critical to its business and results of operations.
Goodwill and Indefinite-Lived Intangible Assets
Assessment of the potential impairment of goodwill and indefinite-lived intangible assets is an integral part of the Company’s normal ongoing review of operations. Testing for potential impairment of these assets is dependent on significant assumptions and reflects management’s best estimates at a particular point in time. The dynamic economic environments in which the Company’s businesses operate and key economic and business assumptions with respect to projected selling prices, increased competition and introductions of new technologies can significantly affect the outcome of impairment tests. Estimates based on these assumptions may differ significantly from actual results. Changes in factors and assumptions used in assessing potential impairments can have a significant impact on the existence and magnitude of impairments, as well as the time at which such impairments are recognized. If there are unfavorable changes in these assumptions, particularly changes in the Company’s discount rates, revenue growth rates, and operating margins, the Company may be required to recognize impairment charges.
The determination of fair value involves uncertainties around the forecasted cash flows as it requires management to make assumptions and apply judgment to estimate future business expectations. Those future expectations relate to, among other things, distribution channel changes, impact from competition, and new product developments. The Company also considers the current and projected market and economic conditions for dental and medical device industries, both in the United States and globally, when determining its assumptions. Operating cash flow assumptions may also be impacted by assumptions regarding costs and benefits from restructuring initiatives, tax rates, foreign exchange rates, capital spending and working capital changes.
A change in any of the estimates and assumptions used in the Company’s annual goodwill impairment test as described below or unfavorable changes in the overall markets served by the Company’s reporting units, among other factors, could have a negative material impact to the fair value of the Company’s reporting units and indefinite-lived intangible assets and could result in a future impairment charge.
Goodwill
Goodwill represents the excess cost over the fair value of the identifiable net assets of business acquired and is allocated among the Company’s reporting units. Goodwill is not amortized; instead, it is tested for impairment at the reporting unit level annually at April 1 or more frequently if events or circumstances indicate that the carrying value of goodwill may be impaired, or if a decision is made to sell a business. Judgment is involved in determining if an indicator of impairment has occurred during the year. Such indicators may include a decline in expected cash flows, unanticipated competition, increased interest rates, or slower growth rates, among others. When testing goodwill for impairment, the Company may assess qualitative factors for its reporting units to determine whether it is more likely than not that the fair value of a reporting unit is less than its carrying amount including goodwill. Alternatively, the Company may bypass this qualitative assessment and perform the quantitative goodwill impairment test. It is important to note that fair values which could be realized in an actual transaction may differ from those used to evaluate the impairment of goodwill.
Goodwill is allocated among reporting units and evaluated for impairment at that level. The Company’s reporting units are either an operating segment or one level below its operating segments, as determined in accordance with US GAAP.
The quantitative evaluation of impairment involves comparing the current fair value of each reporting unit to its net book value, including goodwill. The Company uses a discounted cash flow model (“DCF model”) as its valuation technique to measure the fair value for its reporting units when testing for impairment, as management believes forecasted operating cash flows are the best indicator of such fair value. The discounted cash flow model uses ten-year forecasted cash flows plus a terminal value based on capitalizing the last period’s cash flows using a perpetual growth rate. The significant assumptions and estimates involved in the application of the DCF model to forecast operating cash flows include, but are not limited to the discount rates, revenue growth rates (including perpetual growth rates), and future operating margin percentages of the reporting unit’s business. These assumptions may vary significantly among the reporting units. Operating cash flow forecasts are based on approved business-unit operating plans for the early years and historical relationships and projections in later years. In the development of the forecasted cash flows, the Company applies revenue, gross profit, and operating expense assumptions taking into consideration historical trends as well as future expectations. The revenue growth rate assumptions were developed in consideration of future expectations which included, but were not limited to, distribution channel changes, impact from competition, and new product developments for these reporting units. Discount rates are estimated for geographic regions and applied to the reporting units located within the regions. These rates are developed based on market participant data, which include assumptions regarding the Company’s weighted-average cost of capital adjusted for the relevant risk associated with business-specific characteristics and the uncertainty related to the reporting unit’s ability to execute on the projected cash flows. As part of the annual test, the Company reconciled the aggregate fair values of its reporting units to its market capitalization, which included a reasonable control premium based on market conditions. The Company has not materially changed its methodology for goodwill impairment testing for the years presented.
Indefinite-Lived Intangible Assets
Indefinite-lived intangible assets consist of trade names, trademarks, and in-process R&D and are not subject to amortization; instead, they are tested for impairment annually at April 1 or more frequently if events or circumstances indicate that the carrying value of indefinite-lived intangible assets may be impaired or if a decision is made to discontinue or divest a business. A significant amount of judgment is involved in determining if an indicator of impairment has occurred during the year. Such indicators may include a decline in expected cash flow, unanticipated competition, increased interest rates, or slower growth rates, among others. It is important to note that fair values that could be realized in an actual transaction may differ from those used to evaluate the impairment of indefinite-lived assets.
The fair value of acquired trade names and trademarks is estimated using a relief from royalty method, which values an indefinite-lived intangible asset by estimating the royalties saved through the ownership of an asset. Under this method, an owner of an indefinite-lived intangible asset determines the arm’s length royalty that likely would have been charged if the owner had to license the asset from a third party. The royalty rate, which is based on the estimated rate applied against forecasted sales, is tax-effected and discounted at present value using a discount rate commensurate with the relative risk of achieving the cash flow attributable to the asset. Management judgment is necessary to determine key assumptions, including revenue growth rates, perpetual revenue growth rates, royalty rates, and discount rates. Other assumptions are consistent with those applied to goodwill impairment testing.
Goodwill and Indefinite-Lived Intangible Asset Impairment Results
The Company assessed the goodwill of its reporting units and its indefinite-lived intangible assets for impairment as of April 1, 2024. Based on the Company's April 1 impairment test, it was determined that the fair values of its reporting units and indefinite-lived intangible assets more likely than not exceeded their carrying values, resulting in no impairment.
In the quarter ended September 30, 2024, the Company identified indicators of a more likely than not impairment for two of its reporting units, Orthodontic Aligner Solutions and Implant & Prosthetic Solutions, which together comprise all of the Orthodontic and Implant Solutions segment. As a result, the Company recorded pre-tax goodwill impairment charges as of September 30, 2024 of $145 million for the Orthodontic Aligner Solutions reporting unit and $359 million for the Implant & Prosthetic Solutions reporting unit, both within the Orthodontic and Implant Solutions segment. The charges were recorded in Goodwill and intangible asset impairment in the Consolidated Statement of Operations. The impairment charge related to the Orthodontic Aligner Solutions reporting unit resulted in a full write-off of the remaining goodwill balance for this reporting unit.
In the quarter ended December 31, 2024, the Company identified indicators of a more likely than not impairment for its Implant & Prosthetic Solutions reporting unit within the Orthodontic and Implant Solutions segment. The decline in fair value of this reporting unit was driven by a weaker trend in sales volumes, particularly in North America, increased competition from lower-priced alternatives impacting global markets, and adverse macroeconomic pressures impacting demand for elective dental procedures and premium implant solutions. These factors contributed to reduced forecasted revenues, lower operating margins, and reduced expectations for future cash flows. The fair value of the Implant & Prosthetic Solutions reporting unit was computed using a discounted cash flow model with inputs developed using internal projections and market-based data. As a result, the Company recorded a pre-tax goodwill impairment charge as of December 31, 2024 of $269 million for the Implant & Prosthetic Solutions reporting unit within the Orthodontic and Implant Solutions segment. This charge was recorded in Goodwill and intangible asset impairment in the Consolidated Statement of Operations.
Additionally, in the quarter ended December 31, 2024, the Company also identified indicators of more likely than not impairments for certain indefinite-lived intangible assets including trade names and trademarks within the Connected Technology Solutions segment, and certain trade names within the Implant & Prosthetic Solutions reporting unit within the Orthodontic and Implant Solutions segment. The decline in fair value of the trade names and trademarks was driven by weakened demand for the Company’s premium equipment and implant products, competitive pricing pressures, and a sustained higher cost of capital, which are contributing to reduced forecasted revenues. These indefinite-lived intangible assets were evaluated for impairment using an income approach, specifically a relief from royalty methodology. As a result, the Company recorded indefinite-lived intangible asset impairment charges of $82 million and $1 million for the Connected Technology Solutions and Orthodontic and Implant Solutions segments, respectively, for the three months ended December 31, 2024. These charges were recorded in Goodwill and intangible asset impairment in the Consolidated Statements of Operations.
The remaining goodwill balance of the Implant & Prosthetic Solutions reporting unit was $503 million as of December 31, 2024, and the carrying values of indefinite-lived intangible assets with impairments in the fourth quarter were $76 million and $149 million for the Implant & Prosthetic Solutions and Connected Technology Solutions reporting units, respectively, as of December 31, 2024. As the fair values of the Implant & Prosthetic Solutions reporting unit and the indefinite-lived assets within the Implant & Prosthetic Solutions and Connected Technology Solutions reporting units, respectively, continue to approximate carrying value as of December 31, 2024, any further decline in key assumptions could result in additional impairments in future periods.
Based on quantitative and qualitative analyses performed for the other reporting units and the Company’s other indefinite-lived intangible assets, the Company believes there is no indication that the carrying value more likely than not exceeds the fair value in each case as of December 31, 2024. For the Company's reporting units that were not impaired, the Company applied a hypothetical sensitivity analysis by increasing the discount rate of these reporting units by 50 basis points. The results of this sensitivity analysis at December 31, 2024, indicate that none of the other reporting units would have been impaired.
For further information, see Note 11, Goodwill and Intangible Assets, in the Notes to Consolidated Financial Statements in Item 8 of this Form 10-K.
Income Taxes
Income taxes are determined using the liability method of accounting for income taxes. The Company’s tax expense includes U.S. and international income taxes plus the provision for U.S. taxes on undistributed earnings of international subsidiaries not considered to be permanently invested.
The Company applies a recognition threshold and measurement attribute for the financial statement recognition and measurement of a tax position taken or expected to be taken in a tax return. The Company recognizes in the consolidated financial statements the impact of a tax position if that position is more likely than not of being sustained upon examination by the taxing authorities based on the technical merits of the position.
Certain items of income and expense are not reported in tax returns and financial statements in the same year. The tax effect of such temporary differences is reported as deferred income taxes. Deferred tax assets are recognized if it is more likely than not that the assets will be realized in future years. The Company establishes a valuation allowance for deferred tax assets for which realization is not likely. At December 31, 2024, the Company has a valuation allowance of $1,503 million against the benefit of certain deferred tax assets of foreign and domestic subsidiaries.
The Company’s tax positions are subject to ongoing examinations by the tax authorities. The Company operates within multiple taxing jurisdictions throughout the world and in the normal course of business is examined by taxing authorities in those jurisdictions. Adjustments to the uncertain tax positions are recorded when taxing authority examinations are completed,
statutes of limitation are closed, changes in tax laws occur or as new information comes to light regarding the technical merits of the tax position.
LIQUIDITY AND CAPITAL RESOURCES
| | | | | | | | | | | | | | | | | | | | |
| | Year Ended December 31, |
| (in millions) | 2024 | | 2023 | | $ Change |
| | | | | | |
| Cash provided by (used in): | | | | | | |
| Operating activities | | $ | 461 | | | $ | 377 | | | $ | 84 | |
| Investing activities | | (197) | | | (89) | | | (108) | |
| Financing activities | | (302) | | | (307) | | | 5 | |
| Effect of exchange rate changes on cash and cash equivalents | | (24) | | | (12) | | | (12) | |
| Net decrease in cash and cash equivalents | | $ | (62) | | | $ | (31) | | | $ | (31) | |
| | | | | | |
Cash provided by operating activities increased compared to the prior year primarily as a result of changes in working capital, including higher collections on accounts receivable due largely to timing of customer remittances, decreased inventory levels, and timing of estimated tax payments. These increases in operating cash were offset by other changes in working capital including the timing of payments to vendors compared to the prior year. For the year ended December 31, 2024, the number of days for sales outstanding in accounts receivable decreased by 4 days to 55 days at December 31, 2024 as compared to 59 days at December 31, 2023, and the number of days of sales in inventory decreased by 2 days to 124 days at December 31, 2024 as compared to 126 days at December 31, 2023.
The cash used in investing activities increased compared to the prior year primarily due to higher capital expenditures of $31 million, lower net cash proceeds on settlement of derivatives of $38 million, and in the prior year, the Company’s sale of a minority interest investment resulted in proceeds of $13 million. For the year ended December 31, 2023, capital expenditures were $149 million, and for the year ended December 31, 2024, capital expenditures were $180 million. The Company estimates capital expenditures to be in the range of approximately $160 million to $190 million for the twelve months ending December 31, 2025 and expects these investments to include expenses for the ongoing implementation of a new global Enterprise Resource Planning (“ERP”) system, equipment upgrades, and capacity expansion to support product innovation and consolidate operations for enhanced efficiencies.
The decrease of cash used in financing activities compared to the prior year was primarily driven by an increase in net borrowings of $51 million on short-term debt compared to the prior year and a decrease in cash paid on share repurchases of $50 million compared to the prior year. The decrease of cash used in financing activities was mostly offset by an increase of $10 million in dividends paid compared to the prior year and an increase of $81 million in payments on long-term borrowings compared to the prior year. The Company’s total borrowings increased by a net $17 million during the year ended December 31, 2024.
During the year ended December 31, 2024, the Company repurchased approximately 9.4 million shares under its open market share repurchase plan for a cost of $250 million at a volume-weighted average price of $26.65. On November 7, 2023, the Board of Directors approved an increase to the authorized share repurchase program of $1.0 billion. At December 31, 2024, $1.2 billion of authorization remains available for future share repurchases. Additional share repurchases, if any, may be made through open market purchases, Rule 10b5-1 plans, accelerated share repurchases, privately negotiated transactions, or other transactions in such amounts and at such times as the Company considers appropriate based upon prevailing market and business conditions and other factors. At December 31, 2024, the Company held 65.7 million shares of treasury stock.
The Company’s ratio of total net debt to total capitalization was as follows:
| | | | | | | | | | | | | | |
| | Year Ended December 31, |
| (in millions, except percentages) | | 2024 | | 2023 |
| | | | |
| Current portion of debt | | $ | 549 | | | $ | 322 | |
| Long-term debt | | 1,586 | | | 1,796 | |
| Less: Cash and cash equivalents | | 272 | | | 334 | |
| Net debt | | $ | 1,863 | | | $ | 1,784 | |
| | | | |
| Total equity | | 1,943 | | | 3,294 | |
| Total capitalization | | $ | 3,806 | | | $ | 5,078 | |
| | | | |
| Total net debt to total capitalization ratio | | 48.9 | % | | 35.1 | % |
At December 31, 2024, the Company had $313 million of borrowings available under lines of credit, including lines available under its short-term arrangements and revolving credit facility. The Company’s borrowing capacity includes a $700 million multi-currency revolving credit facility which expires in May 2028. The Company also has access to an aggregate $700 million under a U.S. dollar commercial paper facility, which was expanded in December 2024 from its previous capacity of $500 million. The $700 million revolver serves as a back-up to the commercial paper facility, thus the total available credit under the commercial paper facility and the multi-currency revolving credit facility in the aggregate is $700 million. The Company had $410 million outstanding borrowings under the commercial paper facility at December 31, 2024 resulting in $290 million remaining available under the revolving credit and commercial paper facilities. The Company also has access to $34 million in uncommitted short-term financing under lines of credit from various financial institutions, the availability of which is reduced by other short-term borrowings. The lines of credit have no major restrictions and are provided under demand notes between the Company and the lending institutions. At December 31, 2024, the Company has $11 million outstanding under these short-term borrowing arrangements.
The Company’s revolving credit facility, term loans and senior notes contain certain covenants relating to the Company’s operations and financial condition. The most restrictive of these covenants are: (1) a ratio of total debt outstanding to total capital not to exceed 0.6, and (2) a ratio of operating income excluding depreciation and amortization to interest expense of not less than 3.0 times, in each case, as such terms are defined in the relevant agreement. Any breach of any such covenants would result in a default under the existing debt agreements that would permit the lenders to declare all borrowings under such debt agreements to be immediately due and payable and, through cross default provisions, would entitle the Company’s other lenders to accelerate their loans. At December 31, 2024, the Company was in compliance with these covenants.
The Company expects on an ongoing basis to be able to finance operating cash requirements, capital expenditures, and debt service from the current cash, cash equivalents, cash flows from operations and amounts available under its existing borrowing facilities. The Company’s credit facilities are further discussed in Note 14, Financing Arrangements, in the Consolidated Financial Statements in Part II, Item 8 of this Form 10-K.
The cash held by foreign subsidiaries for permanent reinvestment is generally used to finance the subsidiaries’ operating activities and future foreign investments. The Company has the ability to repatriate cash to the United States, which could result in an adjustment to the tax liability for foreign withholding taxes, foreign and/or U.S. state income taxes, and the impact of foreign currency movements. At December 31, 2024, management believed that sufficient liquidity was available in the United States and expects this to continue for the next twelve months. The Company has repatriated and expects to continue repatriating certain funds from its non-U.S. subsidiaries that are not needed to finance local operations. Repatriation activities both performed and contemplated to date have not resulted in, and are not expected to result in, any significant incremental tax liability to the Company.
The Company continues to review its debt portfolio and may refinance additional debt or add debt in the near-term based on strategic capital management. The Company believes there is sufficient liquidity available for the next twelve months.
Off Balance Sheet Arrangements
At December 31, 2024, the Company held $34 million of precious metals on consignment from several financial institutions. Under these consignment arrangements, the financial institutions own the precious metal, and, accordingly, the
Company does not report this consigned inventory as part of its inventory on the Consolidated Balance Sheets. These consignment agreements allow the Company to acquire the precious metal at market rates at a point in time, which is approximately the same time, and for the same price as alloys are sold to the Company’s customers. If the financial institutions would discontinue offering these consignment arrangements, and if the Company could not obtain other comparable arrangements, the Company may be required to obtain third-party financing to fund an ownership position to maintain precious metal inventory at operational levels. For additional details, see Item 7A “Quantitative and Qualitative Disclosure About Market Risk - Consignment Arrangements.”
Contractual Obligations
The Company’s scheduled contractual cash obligations at December 31, 2024 were as follows:
| | | | | | | | | | | | | | | | | | | | | | | | | | | | | | | | |
| | Within 1 Year | |
Years 2-3 | |
Years 4-5 | | Greater Than 5 Years | | Total |
| (in millions) | | | | | |
| | | | | | | | | | |
| Long-term borrowings, including finance leases | | $ | 128 | | | $ | 300 | | | $ | 227 | | | $ | 1,093 | | | $ | 1,748 | |
| Operating leases | | 52 | | | 61 | | | 28 | | | 10 | | | 151 | |
| Purchase commitments | | 194 | | | 112 | | | 40 | | | — | | | 346 | |
| Interest on long-term borrowings, net of interest rate swap agreements | | 41 | | | 73 | | | 64 | | | 17 | | | 195 | |
| Postemployment obligations | | 25 | | | 51 | | | 46 | | | 131 | | | 253 | |
| Precious metal consignment agreements | | 34 | | | — | | | — | | | — | | | 34 | |
| | | $ | 474 | | | $ | 597 | | | $ | 405 | | | $ | 1,251 | | | $ | 2,727 | |
Due to the uncertainty with respect to the timing of future cash flows associated with the Company’s unrecognized tax benefits at December 31, 2024, the Company is unable to make reasonably reliable estimates of the period of cash settlement with the respective taxing authority; therefore, $51 million of unrecognized tax benefits has been excluded from the contractual obligations table above. See Note 16, Income Taxes, in the Notes to Consolidated Financial Statements in Item 8 of this Form 10-K.
Material Trends in Capital Resources
On July 29, 2024, the Board of Directors of the Company approved an additional plan to restructure the Company’s business to improve operational performance and drive stockholder value creation (the “2024 Plan”). In connection with the 2024 Plan, the Company anticipates a net reduction in the Company’s global workforce of approximately 2% to 4%. The Company anticipates that the 2024 Plan will be substantially completed by the end of 2025 and result in $80 million to $100 million in annual cost savings. The proposed changes are subject to co-determination processes with employee representative groups in countries where required.
As of December 31, 2024, in conjunction with the 2024 Plan, the Company has incurred $28 million in restructuring charges from inception, primarily related to employee transition, severance payments and employee benefits. Actions taken under the 2024 Plan seek to further streamline the Company’s operations and global footprint, as well as improve alignment of the Company’s cost structure with its strategic growth objectives. The Company expects to incur between $35 million and $50 million in non-recurring restructuring charges under the 2024 Plan which are expected to be expensed and paid in cash by the end of 2025.
On February 14, 2023, the Board of Directors of the Company approved a plan to restructure the business through a new operating model with five global business units, optimize central functions and overall management infrastructure, and implement other efforts aimed at cost savings (the “2023 Plan”). The Company estimated a reduction in its global workforce of approximately 8% to 10% and annual cost savings of approximately $200 million pursuant to the 2023 Plan. The target for cost savings has been substantially met, with the benefits mostly offset in the short term by additional investments in sales personnel, the Company’s new global ERP system, and other transformation initiatives.
As of December 31, 2024, in conjunction with the 2023 Plan, the Company incurred $87 million in restructuring charges, from inception, primarily related to employee transition, severance payments, employee benefits, and facility closure costs, and $20 million in other non-recurring costs related to restructuring activities, which mostly consist of consulting, legal and other professional service fees. Remaining restructuring charges attributable to the 2023 Plan are not expected to be material.
The estimates of the charges and expenditures that the Company expects to incur in connection with the 2024 Plan, and the timing thereof, are subject to several assumptions, including local law requirements in various jurisdictions and co-determination aspects in countries where required. Actual amounts may differ materially from estimates. In addition, the Company may incur additional charges or cash expenditures not currently contemplated due to unanticipated events that may occur, including in connection with the implementation of the 2024 Plan. For further information, refer to Note 18, Restructuring and Other Costs, in the Notes to Consolidated Financial Statements in Item 8 of this Form 10-K.
Beginning in the second quarter of 2022, the Company’s financial results have also been impacted by the costs associated with the internal investigation conducted by the Audit and Finance Committee of the Company’s Board of Directors, along with associated litigation and an external investigation by the SEC, both of which are ongoing. For the year ended December 31, 2022, these costs totaled approximately $61 million. For the year ended December 31, 2023, these costs totaled $19 million. The costs in 2023 were offset by a $17 million gain from release of employee compensation accruals resulting from a settlement in the three months ended September 30, 2023. For the year ended December 31, 2024, these costs totaled $11 million. The Company expects that it will continue to incur such costs into 2025 pertaining to the matters described in Note 21, Commitments and Contingencies, in the Notes to Consolidated Financial Statements included in Part II, Item 8 of this Form 10-K.
NEW ACCOUNTING PRONOUNCEMENTS
Refer to Note 1, Significant Accounting Policies, in the Notes to Consolidated Financial Statements in Item 8 of this Form 10-K for a discussion of recent accounting guidance and pronouncements.
Item 7A. Quantitative and Qualitative Disclosure About Market Risk
QUANTITATIVE AND QUALITATIVE DISCLOSURE ABOUT MARKET RISK
The Company’s major market risk exposures include changing interest rates, movements in foreign currency exchange rates and potential price volatility of commodities used by the Company in its manufacturing processes. The Company’s policy is to manage risk of exposure to interest rates using a combination of fixed and floating rate debt as well as interest rate swaps. The Company employs foreign currency denominated debt and currency swaps which serve to partially offset the Company’s exposure on its net investments in subsidiaries denominated in foreign currencies. The Company’s policy generally is to hedge major foreign currency transaction exposures through foreign exchange forward contracts. These contracts are entered into with major financial institutions thereby minimizing the risk of credit loss. The Company does not hold or issue derivative financial instruments for speculative or trading purposes. The Company is subject to other foreign exchange market risk exposure in addition to the risks on its financial instruments, such as possible impacts on its pricing and production costs, which are difficult to reasonably predict, and have therefore not been included below.
Foreign Exchange Risk Management
The Company enters into derivative financial instruments to hedge the foreign exchange revaluation risk associated with recorded assets and liabilities that are denominated in a non-functional currency. The Company hedges various currencies, primarily in euros, Swedish kronor and Swiss francs. The gains and losses on these derivative transactions offset the gains and losses generated by the revaluation of the underlying non-functional currency balances.
The Company primarily uses forward foreign exchange contracts and cross currency basis swaps to hedge these risks. The Company uses a layered hedging program to hedge select anticipated foreign currency cash flows to reduce volatility in both cash flows and reported earnings of the consolidated Company. These cash flow hedges have maturities of six to 18 months and do not change the underlying long-term foreign currency exchange risk. The Company has numerous investments in foreign subsidiaries the most significant of which are denominated in euros, Swiss francs, Japanese yen and Swedish kronor. The net assets of these subsidiaries are exposed to volatility in currency exchange rates.
Currently, the Company uses both derivative and non-derivative financial instruments, including foreign currency-denominated debt held at the parent company level and foreign exchange forward contracts to hedge some of this exposure. Translation gains and losses related to the net assets of the Company’s foreign subsidiaries are offset by gains and losses in the non-derivative and derivative financial instruments designated as hedges of net investment. At December 31, 2024, a 10% weakening of the U.S. dollar against all other currencies would decrease the net fair value associated with the forward foreign exchange contracts by approximately $91 million.
Interest Rate Risk Management
The Company enters into financial instruments, including derivatives, that expose the Company to market risk related to changes in interest rates. The Company uses a combination of financial instruments, including long-term and short-term financing, variable-rate commercial paper and derivative interest rate swaps to manage the interest rate mix of our total debt portfolio and related overall cost of borrowing.
At December 31, 2024, an increase of 1% in the interest rates on the variable interest rate instruments would decrease the Company’s fair value associated with the derivative interest rate swaps by approximately $6 million.
Consignment Arrangements
The Company holds on a consignment basis, from various financial institutions, the precious metals used in the production of precious metal dental alloy products. Under these consignment arrangements, the financial institutions own the precious metal, and, accordingly, the Company does not report this inventory on consignment as part of its inventory on the Consolidated Balance Sheet. The consignment agreements allow the Company to take ownership of the metal at approximately the same time customer orders are received and to closely match the price of the metal acquired to the price charged to the customer (i.e., the price charged to the customer is largely a pass through). These agreements are cancellable by either party at the end of each consignment period, which typically run for a period of one to nine months; however, because the Company typically has access to numerous financial institutions with excess capacity, consignment needs created by cancellations can be shifted among other institutions.
As precious metal prices fluctuate, the Company evaluates the impact of the precious metal price fluctuation on its target gross margins for precious metal dental alloy products and may revise the prices customers are charged for precious metal dental alloy products accordingly. While the Company does not separately invoice customers for the precious metal content of precious metal dental alloy products, the underlying precious metal content is the primary component of the cost and sales price of the precious metal dental alloy products. For practical purposes, if the precious metal prices go up or down by a small amount, the Company will not immediately modify prices, as long as the cost of precious metals embedded in the Company’s precious metal dental alloy price closely approximates the market price of the precious metal. If there is a significant change in the price of precious metals, the Company adjusts the price for the precious metal dental alloys, maintaining its margin on the products.
At December 31, 2024, the Company had approximately 21,000 troy ounces of precious metal, primarily gold, platinum, palladium and silver on consignment for periods of less than one year with a market value of $34 million. Under the terms of the consignment agreements, the Company also makes compensatory payments to the consignor banks based on a percentage of the value of the consigned precious metals inventory. At December 31, 2024, the average annual rate charged by the consignor banks was 1.7%. These compensatory payments are considered to be a cost of the metals purchased and are recorded as part of the cost of products sold.
Item 8. Financial Statements and Supplementary Data
1.Financial Statements
The following consolidated financial statements of the Company are filed as part of this Form 10-K:
2.Financial Statement Schedule for the Years Ended December 31, 2024, 2023, and 2022.
The following financial statement schedule is filed as part of this Form 10-K and is covered by the Report of Independent Registered Public Accounting Firm | | | | | |
| Page |
Schedule II - Valuation and Qualifying Accounts for the Years Ended December 31, 2024, 2023, and 2022. | |
| |
Management’s Report on Internal Control Over Financial Reporting
The management of the Company is responsible for establishing and maintaining adequate internal control over financial reporting, as such term is defined in Rules 13a-15(f) and 15d-15(f) under the Securities Exchange Act of 1934, as amended. The Company’s internal control over financial reporting is a process designed to provide reasonable assurance regarding the reliability of financial reporting and the preparation of financial statements for external purposes in accordance with accounting principles generally accepted in the United States of America. The Company’s internal control over financial reporting includes those policies and procedures that pertain to the maintenance of records that, in reasonable detail, accurately and fairly reflect the transactions and dispositions of the assets of the Company; provide reasonable assurance that transactions are recorded as necessary to permit preparation of financial statements in accordance with generally accepted accounting principles, and that receipts and expenditures of the Company are being made only in accordance with authorizations of management and directors of the Company; and provide reasonable assurance regarding prevention or timely detection of unauthorized acquisition, use, or disposition of the Company’s assets that could have a material effect on the financial statements.
Because of its inherent limitations, internal control over financial reporting may not prevent or detect misstatements. Also, projections of any evaluation of effectiveness to future periods are subject to the risk that controls may become inadequate because of changes in conditions, or that the degree of compliance with the policies or procedures may deteriorate.
Management of the Company has assessed the effectiveness of the Company’s internal control over financial reporting as of December 31, 2024. In making its assessment, management used the criteria established in Internal Control - Integrated Framework (2013) issued by the Committee of Sponsoring Organizations of the Treadway Commission (“COSO”). Based on its assessment, management concluded that, as of December 31, 2024, the Company’s internal control over financial reporting was effective based on the criteria established in Internal Control - Integrated Framework (2013) issued by the COSO.
The effectiveness of the Company’s internal control over financial reporting as of December 31, 2024 has been audited by Deloitte & Touche LLP, an independent registered public accounting firm, as stated in their report, which appears herein.
| | | | | | | | | | |
| /s/ | Simon D. Campion | | | |
| | Simon D. Campion | | | |
| | President and Chief Executive Officer | | | |
| | | | | |
| | February 27, 2025 | | | |
Report of Independent Registered Public Accounting Firm
To the stockholders and the Board of Directors of DENTSPLY SIRONA Inc.
Opinion on the Financial Statements
We have audited the accompanying consolidated balance sheet of DENTSPLY SIRONA Inc. and subsidiaries (the “Company”) as of December 31, 2024, the related consolidated statements of operations, comprehensive loss, changes in equity, and cash flows for the year ended December 31, 2024, and the related notes and financial statement schedule listed in the index appearing under Item 8 (collectively referred to as the “financial statements”). In our opinion, the financial statements present fairly, in all material respects, the financial position of the Company as of December 31, 2024, and the results of its operations and its cash flows for the year ended December 31, 2024, in conformity with accounting principles generally accepted in the United States of America.
We have also audited, in accordance with the standards of the Public Company Accounting Oversight Board (United States) (PCAOB), the Company’s internal control over financial reporting as of December 31, 2024, based on criteria established in Internal Control — Integrated Framework (2013) issued by the Committee of Sponsoring Organizations of the Treadway Commission and our report dated February 27, 2025, expressed an unqualified opinion on the Company’s internal control over financial reporting.
Basis for Opinion
These financial statements are the responsibility of the Company’s management. Our responsibility is to express an opinion on the Company’s financial statements based on our audits. We are a public accounting firm registered with the PCAOB and are required to be independent with respect to the Company in accordance with the U.S. federal securities laws and the applicable rules and regulations of the Securities and Exchange Commission and the PCAOB.
We conducted our audits in accordance with the standards of the PCAOB. Those standards require that we plan and perform the audit to obtain reasonable assurance about whether the financial statements are free of material misstatement, whether due to error or fraud. Our audits included performing procedures to assess the risks of material misstatement of the financial statements, whether due to error or fraud, and performing procedures that respond to those risks. Such procedures included examining, on a test basis, evidence regarding the amounts and disclosures in the financial statements. Our audits also included evaluating the accounting principles used and significant estimates made by management, as well as evaluating the overall presentation of the financial statements. We believe that our audits provide a reasonable basis for our opinion.
Critical Audit Matters
The critical audit matters communicated below are matters arising from the current-period audit of the financial statements that were communicated or required to be communicated to the audit committee and that (1) relate to accounts or disclosures that are material to the financial statements and (2) involved our especially challenging, subjective, or complex judgments. The communication of critical audit matters does not alter in any way our opinion on the financial statements, taken as a whole, and we are not, by communicating the critical audit matters below, providing a separate opinion on the critical audit matters or on the accounts or disclosures to which they relate.
Goodwill — Implant and Prosthetic Solutions and Orthodontic Aligner Solutions Reporting Units — Refer to Note 11 to the financial statements
Critical Audit Matter Description
The Company’s evaluation of goodwill for impairment involves the comparison of the fair value of each reporting unit to its carrying value. The Company used the discounted cash flow model to estimate the fair value of its reporting units, which requires management to make significant estimates and assumptions related to discount rates and forecasts of future revenues and operating margins. Changes in these assumptions could have a significant impact on either the fair value, the amount of any goodwill impairment charge, or both. The goodwill balance for the Orthodontic and Implant Solutions segment is comprised of the Implant & Prosthetic Solutions (IPS) and Orthodontic Aligner Solutions (OAS) reporting units. As of the annual goodwill impairment assessment date (April 1, 2024), the fair values of the IPS and OAS reporting units exceeded their carrying values and, therefore, no impairment was recognized.
Subsequent to the annual impairment assessment date, management identified indicators of “more likely than not” impairments related to its IPS and OAS reporting units. As a result of the interim tests, management recorded goodwill impairment charges for the year ended December 31, 2024 related to the OAS and IPS reporting units.
We identified the Company’s impairment evaluations of goodwill at IPS and OAS to be a critical audit matter because of the significant judgments made by management to estimate the fair values of IPS and OAS and the sensitivity of IPS’s and OAS’s future revenues and operating margins to changes in demand. This required a high degree of auditor judgment and an increased extent of effort, including the need to involve our fair value specialists when performing audit procedures to evaluate the reasonableness of management’s estimates and assumptions related to forecasts of future revenues and operating margins, and the selection of discount rates.
How the Critical Audit Matter Was Addressed in the Audit
Our audit procedures related to the forecasts of future revenues and operating margins (“forecasts”), and the selection of discount rates for the IPS and OAS reporting units included the following, among others:
•We tested the design and operating effectiveness of controls over management’s goodwill impairment evaluation, including those over the evaluation of possible triggering events that might have occurred throughout the year and the determination of the fair values of IPS and OAS, such as controls related to management’s forecasts and selection of discount rates.
•We evaluated the reasonableness of management’s forecasts through consideration of (1) current and past performance of the reporting units, (2) consistency with external peer and industry data, (3) the impact of changes in the regulatory environment on the reporting units, and (4) consistency with management’s growth strategy and evidence obtained in other areas of the audit.
•With the assistance of our fair value specialists, we evaluated the discount rates, including testing the underlying source information and the mathematical accuracy of the calculations, and developing a range of independent estimates and comparing those to the discount rates selected by management.
Indefinite-lived Intangible Assets – Orthodontic and Implant Solutions and Connected Technology Solutions Segments — Refer to Note 11 to the financial statements
Critical Audit Matter Description
The Company’s evaluation of indefinite-lived assets for impairment involves the comparison of the fair value of each asset to its carrying value. The Company uses a relief-from-royalty methodology to estimate the fair value of its indefinite-lived trade names and trademarks, which requires management to make significant estimates and assumptions related to the discount rate, royalty rate, and forecasts of future revenues. Changes in these assumptions could have a significant impact on either the fair value, the amount of any intangible asset impairment charge, or both. Management conducted an impairment test as of the annual impairment assessment date (April 1, 2024), and also conducts an impairment test whenever events or circumstances suggest that the carrying amount of the assets may not be recoverable.
During the year ended December 31, 2024, management identified indicators of a “more likely than not” impairment of certain of its indefinite-lived trade names and trademarks within its Connected Technology Solutions (CTS) segment and within the IPS reporting unit of the Orthodontic and Implant Solutions (OIS) segment. As a result of performing impairment tests, management recorded impairment charges related to indefinite-lived intangible assets within its CTS and OIS segments.
We identified the Company’s impairment evaluation of indefinite-lived intangibles related to the CTS segment and the IPS reporting unit of the OIS segment to be a critical audit matter because of the significant judgments made by management to estimate the fair value of trade names and trademarks. This required a high degree of auditor judgment and an increased extent of effort, including the need to involve our fair value specialists, when performing audit procedures to evaluate the reasonableness of management’s estimates and assumptions related to forecasts of future revenues, and the selection of discount and royalty rates.
How the Critical Audit Matter Was Addressed in the Audit
Our audit procedures related to the forecasts of future revenues and the selection of discount and royalty rates for the trade names and trademarks within the CTS segment and the IPS reporting unit of the OIS segment included the following, among others:
•We tested the design and operating effectiveness of controls over management’s indefinite-lived asset impairment evaluation, including those over the evaluation of possible triggering events occurring throughout the year and the determination of the fair value of trade names and trademarks, such as controls related to management’s revenue forecasts and selection of the discount and royalty rates.
•We evaluated the reasonableness of management’s revenue forecasts through consideration of (1) current and past performance, (2) consistency with external peer and industry data, (3) the impact of changes in the regulatory environment, and (4) consistency with management’s growth strategy and evidence obtained in other areas of the audit.
•With the assistance of our fair value specialists, we evaluated discount and royalty rates, including testing the underlying source information and mathematical accuracy of the calculations, and developing a range of independent estimates and comparing those to the discount and royalty rates selected by management.
| | | | | |
| /s/ | Deloitte & Touche LLP |
| | |
| | Charlotte, North Carolina |
| February 27, 2025 |
We have served as the Company’s auditor since 2024.
Report of Independent Registered Public Accounting Firm
To the stockholders and the Board of Directors of DENTSPLY SIRONA Inc.
Opinion on Internal Control over Financial Reporting
We have audited the internal control over financial reporting of DENTSPLY SIRONA Inc. and subsidiaries (the “Company”) as of December 31, 2024, based on criteria established in Internal Control — Integrated Framework (2013) issued by the Committee of Sponsoring Organizations of the Treadway Commission (COSO). In our opinion, the Company maintained, in all material respects, effective internal control over financial reporting as of December 31, 2024, based on criteria established in Internal Control — Integrated Framework (2013) issued by COSO.
We have also audited, in accordance with the standards of the Public Company Accounting Oversight Board (United States) (PCAOB), the consolidated financial statements as of and for the year ended December 31, 2024, of the Company and our report dated February 27, 2025, expressed an unqualified opinion on those financial statements.
Basis for Opinion
The Company’s management is responsible for maintaining effective internal control over financial reporting and for its assessment of the effectiveness of internal control over financial reporting, included in the accompanying Management’s Report on Internal Control Over Financial Reporting. Our responsibility is to express an opinion on the Company’s internal control over financial reporting based on our audit. We are a public accounting firm registered with the PCAOB and are required to be independent with respect to the Company in accordance with the U.S. federal securities laws and the applicable rules and regulations of the Securities and Exchange Commission and the PCAOB.
We conducted our audit in accordance with the standards of the PCAOB. Those standards require that we plan and perform the audit to obtain reasonable assurance about whether effective internal control over financial reporting was maintained in all material respects. Our audit included obtaining an understanding of internal control over financial reporting, assessing the risk that a material weakness exists, testing and evaluating the design and operating effectiveness of internal control based on the assessed risk, and performing such other procedures as we considered necessary in the circumstances. We believe that our audit provides a reasonable basis for our opinion.
Definition and Limitations of Internal Control over Financial Reporting
A company’s internal control over financial reporting is a process designed to provide reasonable assurance regarding the reliability of financial reporting and the preparation of financial statements for external purposes in accordance with generally accepted accounting principles. A company’s internal control over financial reporting includes those policies and procedures that (1) pertain to the maintenance of records that, in reasonable detail, accurately and fairly reflect the transactions and dispositions of the assets of the company; (2) provide reasonable assurance that transactions are recorded as necessary to permit preparation of financial statements in accordance with generally accepted accounting principles, and that receipts and expenditures of the company are being made only in accordance with authorizations of management and directors of the company; and (3) provide reasonable assurance regarding prevention or timely detection of unauthorized acquisition, use, or disposition of the company’s assets that could have a material effect on the financial statements.
Because of its inherent limitations, internal control over financial reporting may not prevent or detect misstatements. Also, projections of any evaluation of effectiveness to future periods are subject to the risk that controls may become inadequate because of changes in conditions, or that the degree of compliance with the policies or procedures may deteriorate.
| | | | | |
| /s/ | Deloitte & Touche LLP |
| | |
| | Charlotte, North Carolina |
| February 27, 2025 |
We have served as the Company’s auditor since 2024.
Report of Independent Registered Public Accounting Firm
To the Board of Directors and Stockholders of Dentsply Sirona Inc.
Opinions on the Financial Statements and Internal Control over Financial Reporting
We have audited the consolidated balance sheet of Dentsply Sirona Inc. and its subsidiaries (the “Company”) as of December 31, 2023, and the related consolidated statements of operations, of comprehensive loss, of changes in equity and of cash flows for each of the two years in the period ended December 31, 2023, including the related notes and schedule of valuation and qualifying accounts for each of the two years in the period ended December 31, 2023 listed in the accompanying index (collectively referred to as the “consolidated financial statements”). In our opinion, the consolidated financial statements present fairly, in all material respects, the financial position of the Company as of December 31, 2023, and the results of its operations and its cash flows for each of the two years in the period ended December 31, 2023 in conformity with accounting principles generally accepted in the United States of America.
Basis for Opinions
These consolidated financial statements are the responsibility of the Company’s management. Our responsibility is to express an opinion on the Company’s consolidated financial statements based on our audits. We are a public accounting firm registered with the Public Company Accounting Oversight Board (United States) (PCAOB) and are required to be independent with respect to the Company in accordance with the U.S. federal securities laws and the applicable rules and regulations of the Securities and Exchange Commission and the PCAOB.
We conducted our audits of these consolidated financial statements in accordance with the standards of the PCAOB. Those standards require that we plan and perform the audit to obtain reasonable assurance about whether the consolidated financial statements are free of material misstatement, whether due to error or fraud.
Our audits included performing procedures to assess the risks of material misstatement of the consolidated financial statements, whether due to error or fraud, and performing procedures that respond to those risks. Such procedures included examining, on a test basis, evidence regarding the amounts and disclosures in the consolidated financial statements. Our audits also included evaluating the accounting principles used and significant estimates made by management, as well as evaluating the overall presentation of the consolidated financial statements. We believe that our audits provide a reasonable basis for our opinion.
| | | | | |
| /s/ | PricewaterhouseCoopers LLP |
| | PricewaterhouseCoopers LLP |
| | Charlotte, North Carolina |
| |
February 29, 2024, except for the change in the manner in which the Company accounts for segments discussed in Note 1 to the consolidated financial statements, as to which the date is February 27, 2025
We served as the Company’s auditor from 2000 to 2024.
DENTSPLY SIRONA INC. AND SUBSIDIARIES
CONSOLIDATED STATEMENTS OF OPERATIONS
(in millions, except per share amounts)
| | | | | | | | | | | | | | | | | |
| | Year Ended December 31, |
| | 2024 | | 2023 | | 2022 |
| | | | | |
| Net sales | $ | 3,793 | | | $ | 3,965 | | | $ | 3,922 | |
| Cost of products sold | 1,835 | | | 1,879 | | | 1,795 | |
| | | | | |
| Gross profit | 1,958 | | | 2,086 | | | 2,127 | |
| | | | | |
| Selling, general, and administrative expenses | 1,605 | | | 1,613 | | | 1,589 | |
| Research and development expenses | 165 | | | 184 | | | 174 | |
| Goodwill and intangible asset impairments | 1,014 | | | 307 | | | 1,287 | |
| Restructuring costs | 53 | | | 67 | | | 14 | |
| | | | | |
| Operating loss | (879) | | | (85) | | | (937) | |
| | | | | |
| Other income and expenses: | | | | | |
| Interest expense, net | 69 | | | 81 | | | 65 | |
| Other (income) expense, net | (12) | | | 9 | | | 53 | |
| | | | | |
| Loss before income taxes | (936) | | | (175) | | | (1,055) | |
| | | | | |
| Benefit from income taxes | (26) | | | (43) | | | (105) | |
| | | | | |
| Net loss | (910) | | | (132) | | | (950) | |
| | | | | |
| Less: Net income attributable to noncontrolling interests | — | | | — | | | — | |
| | | | | |
| | | | | |
| Net loss attributable to Dentsply Sirona | $ | (910) | | | $ | (132) | | | $ | (950) | |
| | | | | |
| Net (loss) income per common share attributable to Dentsply Sirona: | | | | | |
| Basic | $ | (4.48) | | | $ | (0.62) | | | $ | (4.41) | |
| Diluted | $ | (4.48) | | | $ | (0.62) | | | $ | (4.41) | |
| | | | | |
| Weighted average common shares outstanding: | | | | | |
| Basic | 203.2 | | | 212.0 | | | 215.5 | |
| Diluted | 203.2 | | | 212.0 | | | 215.5 | |
| | | | | |
The accompanying notes are an integral part of these consolidated financial statements.
DENTSPLY SIRONA INC. AND SUBSIDIARIES
CONSOLIDATED STATEMENTS OF COMPREHENSIVE LOSS
(in millions)
| | | | | | | | | | | | | | | | | |
| Year Ended December 31, |
| 2024 | | 2023 | | 2022 |
| | | | | |
| Net loss | $ | (910) | | | $ | (132) | | | $ | (950) | |
| | | | | |
| Other comprehensive (loss) income, net of tax: | | | | | |
| Foreign currency translation adjustments | (146) | | | 49 | | | (156) | |
| Net gain (loss) on derivative financial instruments | 40 | | | (30) | | | 29 | |
| | | | | |
| Pension liability adjustments | 12 | | | (27) | | | 91 | |
| Total other comprehensive loss | (94) | | | (8) | | | (36) | |
| | | | | |
| Total comprehensive loss | (1,004) | | | (140) | | | (986) | |
| | | | | |
| Less: Comprehensive (loss) income attributable to noncontrolling interests | — | | | — | | | — | |
| | | | | |
| Total comprehensive loss attributable to Dentsply Sirona | $ | (1,004) | | | $ | (140) | | | $ | (986) | |
The accompanying notes are an integral part of these consolidated financial statements.
DENTSPLY SIRONA INC. AND SUBSIDIARIES
CONSOLIDATED BALANCE SHEETS
(in millions, except per share amounts) | | | | | | | | | | | |
| | December 31, |
| | 2024 | | 2023 |
| | | |
| Assets | | | |
| Current Assets: | | | |
| Cash and cash equivalents | $ | 272 | | | $ | 334 | |
| Accounts and notes receivable-trade, net | 556 | | | 695 | |
| Inventories, net | 564 | | | 624 | |
| Prepaid expenses and other current assets | 354 | | | 320 | |
| Total Current Assets | 1,746 | | | 1,973 | |
| | | |
| Property, plant and equipment, net | 766 | | | 800 | |
| Operating lease right-of-use assets, net | 136 | | | 178 | |
| Identifiable intangible assets, net | 1,207 | | | 1,705 | |
| Goodwill, net | 1,597 | | | 2,438 | |
| Other noncurrent assets | 301 | | | 276 | |
| Total Assets | $ | 5,753 | | | $ | 7,370 | |
| | | |
| Liabilities and Equity | | | |
| Current Liabilities: | | | |
| Accounts payable | $ | 241 | | | $ | 305 | |
| Accrued liabilities | 754 | | | 749 | |
| Income taxes payable | 45 | | | 49 | |
| Notes payable and current portion of long-term debt | 549 | | | 322 | |
| Total Current Liabilities | 1,589 | | | 1,425 | |
| | | |
| Long-term debt | 1,586 | | | 1,796 | |
| Operating lease liabilities | 91 | | | 125 | |
| Deferred income taxes | 129 | | | 228 | |
| Other noncurrent liabilities | 415 | | | 502 | |
| Total Liabilities | 3,810 | | | 4,076 | |
| | | |
| Commitments and contingencies (Note 21) | | | |
| | | |
| Equity: | | | |
| Preferred stock, $1.00 par value; 0.25 million shares authorized; no shares issued | — | | | — | |
| Common stock, $0.01 par value; | 3 | | | 3 | |
| 400.0 million shares authorized at December 31, 2024 and 2023 | | | |
| 264.5 million shares issued at December 31, 2024 and 2023 | | | |
| 198.8 million and 207.2 million shares outstanding at December 31, 2024 and 2023, respectively | | | |
| Capital in excess of par value | 6,640 | | | 6,643 | |
| (Accumulated deficit) retained earnings | (835) | | | 205 | |
| Accumulated other comprehensive loss | (730) | | | (636) | |
| Treasury stock, at cost, 65.7 million and 57.3 million shares at December 31, 2024 and 2023, respectively | (3,136) | | | (2,922) | |
| Total Dentsply Sirona Equity | 1,942 | | | 3,293 | |
| | | |
| Noncontrolling interests | 1 | | | 1 | |
| Total Equity | 1,943 | | | 3,294 | |
| Total Liabilities and Equity | $ | 5,753 | | | $ | 7,370 | |
The accompanying notes are an integral part of these consolidated financial statements.
| | | | | | | | | | | | | | | | | | | | | | | | | | | | | | | | | | | | | | | | | | | | | | | |
| DENTSPLY SIRONA INC. AND SUBSIDIARIES |
| CONSOLIDATED STATEMENTS OF CHANGES IN EQUITY |
| (in millions, except per share amounts) | | | | | | | | | | | | | | | |
| Common Stock | | Capital in Excess of Par Value | |
(Accumulated Deficit) Retained Earnings | | Accumulated Other Comprehensive Loss | | Treasury Stock | | Total Dentsply Sirona Equity | | Noncontrolling Interests | | Total Equity |
| | | | | | | | | | | | | | | |
| Balance at December 31, 2021 | $ | 3 | | | $ | 6,606 | | | $ | 1,514 | | | $ | (592) | | | $ | (2,535) | | | $ | 4,996 | | | $ | 1 | | | $ | 4,997 | |
| Net loss | — | | | — | | | (950) | | | — | | | — | | | (950) | | | — | | | (950) | |
| Other comprehensive loss | — | | | — | | | — | | | (36) | | | — | | | (36) | | | — | | | (36) | |
| | | | | | | | | | | | | | | |
| Exercise of stock options | — | | | 1 | | | — | | | — | | | 6 | | | 7 | | | — | | | 7 | |
| Stock-based compensation expense | — | | | 59 | | | — | | | — | | | — | | | 59 | | | — | | | 59 | |
| Funding of employee stock purchase plan | — | | | 1 | | | — | | | — | | | 5 | | | 6 | | | — | | | 6 | |
| Treasury shares purchased | — | | | — | | | — | | | — | | | (150) | | | (150) | | | — | | | (150) | |
| Restricted stock unit distributions | — | | | (38) | | | — | | | — | | | 25 | | | (13) | | | — | | | (13) | |
| | | | | | | | | | | | | | | |
| Cash dividends declared ($0.50 per share) | — | | | — | | | (108) | | | — | | | — | | | (108) | | | — | | | (108) | |
| Balance at December 31, 2022 | $ | 3 | | | $ | 6,629 | | | $ | 456 | | | $ | (628) | | | $ | (2,649) | | | $ | 3,811 | | | $ | 1 | | | $ | 3,812 | |
| Net loss | — | | | — | | | (132) | | | — | | | — | | | (132) | | | — | | | (132) | |
| Other comprehensive loss | — | | | — | | | — | | | (8) | | | — | | | (8) | | | — | | | (8) | |
| | | | | | | | | | | | | | | |
| Exercise of stock options | — | | | (1) | | | — | | | — | | | 1 | | | — | | | — | | | — | |
| Stock-based compensation expense | — | | | 46 | | | — | | | — | | | — | | | 46 | | | — | | | 46 | |
| Funding of employee stock purchase plan | — | | | — | | | — | | | — | | | 6 | | | 6 | | | — | | | 6 | |
| Treasury shares purchased | — | | | — | | | — | | | — | | | (303) | | | (303) | | | — | | | (303) | |
| Restricted stock unit distributions | — | | | (32) | | | — | | | — | | | 23 | | | (9) | | | — | | | (9) | |
| Restricted stock unit dividends | — | | | 1 | | | (1) | | | — | | | — | | | — | | | — | | | — | |
| Cash dividends declared ($0.56 per share) | — | | | — | | | (118) | | | — | | | — | | | (118) | | | — | | | (118) | |
| Balance at December 31, 2023 | $ | 3 | | | $ | 6,643 | | | $ | 205 | | | $ | (636) | | | $ | (2,922) | | | $ | 3,293 | | | $ | 1 | | | $ | 3,294 | |
| Net loss | — | | | — | | | (910) | | | — | | | — | | | (910) | | | — | | | (910) | |
| Other comprehensive loss | — | | | — | | | — | | | (94) | | | — | | | (94) | | | — | | | (94) | |
| | | | | | | | | | | | | | | |
| | | | | | | | | | | | | | | |
| Stock-based compensation expense | — | | | 39 | | | — | | | — | | | — | | | 39 | | | — | | | 39 | |
| Funding of employee stock purchase plan | — | | | (2) | | | — | | | — | | | 8 | | | 6 | | | — | | | 6 | |
| Treasury shares purchased | — | | | — | | | — | | | — | | | (252) | | | (252) | | | — | | | (252) | |
| Restricted stock unit distributions | — | | | (42) | | | — | | | — | | | 30 | | | (12) | | | — | | | (12) | |
| Restricted stock unit dividends | — | | | 2 | | | (2) | | | — | | | — | | | — | | | — | | | — | |
| Cash dividends declared ($0.64 per share) | — | | | — | | | (128) | | | — | | | — | | | (128) | | | — | | | (128) | |
| Balance at December 31, 2024 | $ | 3 | | | $ | 6,640 | | | $ | (835) | | | $ | (730) | | | $ | (3,136) | | | $ | 1,942 | | | $ | 1 | | | $ | 1,943 | |
The accompanying notes are an integral part of these consolidated financial statements.
| | | | | | | | | | | | | | | | | |
| DENTSPLY SIRONA INC. AND SUBSIDIARIES | | | | | |
| CONSOLIDATED STATEMENTS OF CASH FLOWS | | | | | |
| (in millions) | Year Ended December 31, |
| | 2024 | | 2023 | | 2022 |
| | | | | |
| Cash flows from operating activities: | | | | | |
| | | | | |
| Net loss | $ | (910) | | | $ | (132) | | | $ | (950) | |
| | | | | |
| Adjustments to reconcile net loss to net cash provided by operating activities: | | | | | |
| Depreciation | 133 | | | 132 | | | 119 | |
| Amortization of intangible assets | 216 | | | 211 | | | 209 | |
| | | | | |
| | | | | |
| Goodwill impairment | 773 | | | 291 | | | 1,187 | |
| Intangible asset impairment | 241 | | | 16 | | | 100 | |
| | | | | |
| Deferred income taxes | (136) | | | (130) | | | (228) | |
| Stock-based compensation expense | 39 | | | 46 | | | 59 | |
| | | | | |
| | | | | |
| | | | | |
| Equity in earnings from unconsolidated affiliates | — | | | 4 | | | 36 | |
| | | | | |
| Other non-cash (income) expense | (9) | | | (2) | | | 60 | |
| Loss (gain) on disposal of property, plant and equipment | 19 | | | (3) | | | 3 | |
| | | | | |
| | | | | |
| | | | | |
| Changes in operating assets and liabilities: | | | | | |
| Accounts and notes receivable-trade, net | 104 | | | (58) | | | 85 | |
| Inventories, net | 17 | | | 6 | | | (141) | |
| Prepaid expenses and other current assets | 38 | | | (58) | | | (33) | |
| Other noncurrent assets | (5) | | | 4 | | | 1 | |
| Accounts payable | (30) | | | 14 | | | 30 | |
| Accrued liabilities | (39) | | | 17 | | | (6) | |
| Income taxes | 38 | | | (11) | | | (15) | |
| Other noncurrent liabilities | (28) | | | 30 | | | 1 | |
| Net cash provided by operating activities | 461 | | | 377 | | | 517 | |
| | | | | |
| Cash flows from investing activities: | | | | | |
| | | | | |
| | | | | |
| | | | | |
| Cash received on sale of non-strategic businesses or product lines | — | | | 13 | | | — | |
| | | | | |
| | | | | |
| | | | | |
| Capital expenditures | (180) | | | (149) | | | (149) | |
| | | | | |
| | | | | |
| Cash received on derivative contracts | 1 | | | 39 | | | 13 | |
| Cash paid on derivative contracts | (12) | | | — | | | — | |
| | | | | |
| | | | | |
| | | | | |
| | | | | |
| Other investing activities, net | (6) | | | 8 | | | (2) | |
| Net cash used in investing activities | (197) | | | (89) | | | (138) | |
| | | | | |
| Cash flows from financing activities: | | | | | |
| | | | | |
| | | | | |
| Proceeds from long-term borrowings | 1 | | | — | | | 6 | |
| | | | | |
| Repayments on long-term borrowings | (88) | | | (7) | | | (2) | |
| Net borrowings on short-term borrowings | 177 | | | 126 | | | (64) | |
| | | | | |
| | | | | |
| | | | | |
| | | | | |
| | | | | |
| Cash paid for treasury stock | (250) | | | (300) | | | (150) | |
| Cash dividends paid | (126) | | | (116) | | | (104) | |
| Other financing activities, net | (16) | | | (10) | | | (15) | |
| | | | | |
| Net cash used in financing activities | (302) | | | (307) | | | (329) | |
| | | | | |
| | | | | |
| Effect of exchange rate changes on cash and cash equivalents | (24) | | | (12) | | | (24) | |
| Net (decrease) increase in cash and cash equivalents | (62) | | | (31) | | | 26 | |
| Cash and cash equivalents at beginning of period | 334 | | | 365 | | | 339 | |
| Cash and cash equivalents at end of period | $ | 272 | | | $ | 334 | | | $ | 365 | |
| | | | | |
| | | | | |
| | | | | |
| | | | | |
| | | | | |
| | | | | |
| | | | | |
| | | | | |
| | | | | |
| Supplemental disclosures of cash flow information: | | | | | |
| Interest paid, net of amounts capitalized | $ | 91 | | | $ | 97 | | | $ | 70 | |
| Income taxes paid, net of refunds | 74 | | | 177 | | | 122 | |
| Non-cash investing activities: | | | | | |
| Change in accounts payable related to capital expenditures | $ | 8 | | | $ | 6 | | | $ | (6) | |
| | | | | |
The accompanying notes are an integral part of these consolidated financial statements.
DENTSPLY SIRONA INC. AND SUBSIDIARIES
NOTES TO CONSOLIDATED FINANCIAL STATEMENTS
NOTE 1 - SIGNIFICANT ACCOUNTING POLICIES
Description of Business
DENTSPLY SIRONA Inc. (“Dentsply Sirona” or the “Company”), is the world’s largest diversified manufacturer of dental products and technologies, with a 138-year history of innovation and service to the dental industry and patients worldwide. The Company’s principal product categories include dental consumable products, dental equipment, dental technologies and continence care consumable products. The Company sells its products in approximately 150 countries under some of the most well-established brand names in the industry.
Basis of Presentation
The consolidated financial statements include the results of the Company and its wholly-owned subsidiaries. All significant intercompany accounts and transactions are eliminated in consolidation. Certain prior period amounts have been reclassified to conform to current year presentation.
Use of Estimates
The preparation of financial statements in conformity with accounting principles generally accepted in the United States of America (“US GAAP”) requires management to make estimates and assumptions that affect the reported amounts of assets and liabilities and the disclosure of contingent assets and liabilities as of the date of the financial statements and the reported amounts of revenue and expense during the reporting period. Actual results could differ materially from those estimates.
Cash and Cash Equivalents
Cash and cash equivalents include deposits with banks as well as highly liquid time deposits with original maturities of ninety days or less. The balance as of December 31, 2024 includes $39 million of cash and cash equivalents located in Russia which is available for use in local operations but limited in its ability to be transferred out of the country due to control measures currently in place by the Russian government.
Accounts Receivable
The Company recognizes a receivable when it has an unconditional right to payment, which represents the amount the Company expects to collect in a transaction. Payment terms are typically 30 days in the United States but may be longer in markets outside the United States. In general, contracts containing significant financing components are not material to the Company’s financial statements.
The Company establishes an allowance for doubtful accounts based on an estimate of current expected credit losses resulting from the inability of its customers to make required payments. The allowance is determined based on a combination of factors, including the length of time that the receivable is past due, history of write-offs, and the Company’s knowledge of circumstances relating to specific customers’ ability to meet their financial obligations. The provision for doubtful accounts is included in Selling, general and administrative expenses (“SG&A”) in the Consolidated Statements of Operations. For customers on credit terms, the Company performs ongoing credit evaluation of those customers’ financial condition and generally does not require collateral from them. See Note 2, Revenue Recognition, for additional information on Accounts Receivable.
Inventories
Inventories are stated at the lower of cost and net realizable value. The cost of inventories is based upon the first-in, first-out method (“FIFO”) or average cost methods.
The Company establishes reserves for inventory estimated to be excess, obsolete or unmarketable based upon assumptions about future demand, market conditions, and expiration of products.
Valuation of Goodwill and Indefinite-Lived and Definite-Lived Intangible Assets
Goodwill
Goodwill is the excess of the purchase price over the fair value of identifiable net assets acquired and liabilities assumed in a business combination. Goodwill is not subject to amortization but is tested for impairment at the reporting unit level annually in accordance with US GAAP as of April 1 of each year, or more frequently if events or circumstances indicate that the carrying value of goodwill may be impaired. The Company performs impairment tests by comparing the fair value of each reporting unit to its carrying amount to determine if there is a potential impairment. If the carrying value of a reporting unit with goodwill exceeds its respective fair value, an impairment charge is recognized for the excess amount. Additional information related to the testing for goodwill impairment, including results of the annual test performed as of April 1, 2024 and the interim impairment assessments performed in the third and fourth quarters of 2024, is provided in Note 11, Goodwill and Intangible Assets.
Indefinite-Lived Intangible Assets
Indefinite-lived intangible assets consist primarily of trade names and trademarks and in-process research and development (“R&D”) acquired in business combinations, and these are not subject to amortization. Valuations of indefinite-lived intangible assets acquired in business combinations are based on information and assumptions available at the time of their acquisition, using income and market approaches to determine fair value. The Company conducts an impairment test in accordance with US GAAP as of April 1 of each year, or more frequently if events or circumstances indicate that the carrying value of indefinite-lived intangible assets may be impaired. Potential impairment is identified by comparing the fair value of an intangible asset to its carrying value. Additional information related to the testing for indefinite-lived intangible asset impairment, including results of the annual test performed as of April 1, 2024 and the interim impairment assessments performed in the first, third, and fourth quarters of 2024, is provided in Note 11, Goodwill and Intangible Assets.
Definite-Lived Intangible Assets
Definite-lived intangible assets primarily consist of patents, trade names, trademarks, licensing agreements, developed technology, and customer relationships. The valuation of definite-lived intangible assets acquired in business combinations is based on information and assumptions available at the time of acquisition, using income and market model approaches to determine fair value.
Identifiable definite-lived intangible assets are amortized on a basis that best reflects how their economic benefits are utilized over the life of the asset or on a straight-line basis if not materially different from actual utilization. The useful life is the period over which the asset is expected to contribute to the future cash flows of the Company. The Company uses the following useful lives for its definite-lived intangible assets:
| | | | | | | | |
| Definite-Lived Intangible Asset Type | | Useful Life |
| | |
| Patents | | Up to the date the patent expires |
| Trade names and trademarks | | Up to 20 years |
| Licensing agreements | | Up to 20 years |
| Customer relationships | | Up to 15 years |
| Developed technology | | Up to 15 years |
When the expected useful life of an intangible is not known, the Company will estimate its useful life based on similar assets or asset groups, any legal, regulatory, or contractual provision that limits the useful life, the effect of economic factors, including obsolescence, demand, competition, and the level of maintenance expenditures required to obtain the expected future economic benefit from the asset.
These assets are reviewed for impairment whenever events or circumstances suggest that the carrying amount of the asset may not be recoverable. The Company closely monitors all intangible assets, including those related to new and existing technologies, for indicators of impairment as these assets have more risk of becoming impaired. Impairment is based upon an initial evaluation of the identifiable undiscounted cash flows. If the initial evaluation identifies a potential impairment, a fair value of the asset is determined by using a discounted cash flow valuation. If impaired, the resulting charge reflects the excess of the asset’s carrying cost over its fair value.
Property, Plant and Equipment
Property, plant and equipment are stated at cost, net of accumulated depreciation. Assets acquired through acquisitions are recorded at fair value. The Company capitalizes costs incurred in the development or acquisition of software, whether for internal or external use, and expenses costs incurred in the preliminary project planning stage. Except for leasehold improvements, depreciation and amortization is computed by the straight-line method over the assets estimated useful lives:
| | | | | | | | |
| Property, Plant and Equipment Assets Type | | Useful Life |
| Buildings | 40 years |
| Machinery and Equipment | 2 to 15 years |
| Capitalized Software | 2 to 10 years |
| Leasehold Improvements | Shorter of the estimated useful life or the term of the lease |
Maintenance and repairs are expensed as incurred; replacements and major improvements are capitalized. If events or circumstances exist which suggest that the carrying amount of the asset group may not be recoverable, the identifiable undiscounted cash flows of the asset group are compared to the carrying value of the asset. If the carrying value is in excess of the identifiable undiscounted cash flows, the excess of the asset group’s carrying cost over its fair value is recorded as an impairment charge.
Leases
The Company leases real estate, automobiles and equipment under various operating and finance leases. The Company determines if an arrangement is a lease or contains a lease at inception. Operating lease right-of-use assets and liabilities are recognized at commencement date based on the present value of lease payments over the lease term. As the implicit rate is not readily determinable in most of the Company’s lease agreements, the Company uses its estimated secured incremental borrowing rate, based on the information available at commencement of the lease, to determine the present value of lease payments. Lease expense is recognized on a straight-line basis over the lease term. Leases with an initial term of 12 months or less are not recorded on the balance sheet. Any new real estate and equipment operating lease agreements with lease and non-lease components, are accounted for as a single lease component; auto leases are accounted for as separate lease components.
The Company’s leases have remaining lease terms of approximately 1 year to 9 years. Many of the Company’s real estate and equipment leases have one or more options to renew, with terms that can extend primarily from 1 year to 3 years, which are not included in the initial lease term until considered reasonably certain of renewal. The Company does not have lease agreements with residual value guarantees, sale-and-leaseback terms, or material restrictive covenants. The Company does not have any material sublease arrangements. See Note 10, Leases for additional information.
Derivative Financial Instruments
The Company employs derivative financial instruments to hedge certain anticipated transactions, firm commitments, and assets and liabilities denominated in foreign currencies. Additionally, the Company manages exposure to changes in interest rates by utilizing interest rate swaps that have the effect of converting floating rate debt to fixed rate, or vice versa. The benefit or loss from interest rate swaps is recorded in Interest expense, net in the Company’s Consolidated Statements of Operations consistent with the classification of interest expense attributable to the underlying debt.
The Company records all derivative instruments at fair value and changes in fair value are recorded each period in the consolidated statements of operations or accumulated other comprehensive income (“AOCI”). The Company classifies derivative assets and liabilities as current when the remaining term of the derivative contract is one year or less. The Company has elected to classify the cash flows from derivative instruments in the same category as the cash flows from the items being hedged. Should the Company enter into a derivative instrument that includes an other-than-insignificant financing element then all cash flows will be classified as financing activities in the Consolidated Statements of Cash Flows as required by US GAAP. See Note 19, Financial Instruments for additional information.
Pension and Other Postemployment Benefits
Some of the employees of the Company and its subsidiaries are covered by government or Company-sponsored defined benefit plans and defined contribution plans. Additionally, certain salaried employee groups in the United States are covered by postemployment healthcare plans. Projected benefit obligations and net periodic costs for Company-sponsored defined benefit and postemployment benefit plans are based on an annual actuarial valuation that includes assessment of key assumptions relating to expected return on plan assets, discount rates, employee compensation increase rates and health care cost trends. Expected return on plan assets, discount rates and health care cost trend assumptions are particularly important when determining the Company’s benefit obligations and net periodic benefit costs associated with postemployment benefits. Changes in these assumptions can impact the Company’s earnings. In determining the cost of postemployment benefits, certain assumptions are established annually to reflect market conditions and plan experience to appropriately reflect the expected costs as determined by actuaries. These assumptions include medical inflation trend rates, discount rates, employee turnover and mortality rates. The Company predominantly uses liability durations in establishing its discount rates, which are observed from indices of high-grade corporate bond yields in the respective economic regions of the plans. The expected return on plan assets is the weighted average long-term expected return based upon asset allocations and historic average returns for the markets where the assets are invested, principally in foreign locations. The Company reports the funded status of its defined benefit pension and other postemployment benefit plans on its consolidated balance sheets as a net liability or asset. See Note 17, Benefit Plans for additional information.
Accruals for Self-Insured Losses
The Company maintains insurance for certain risks, including workers’ compensation, and is self-insured for employee-related healthcare benefits. The Company accrues for the expected costs associated with these risks by considering historical claims experience, demographic factors, severity factors and other relevant information. Costs are recognized in the period the claim is incurred, and the financial statement accruals include an estimate of claims incurred but not yet reported. The Company has stop-loss coverage to limit its exposure to any significant exposure on a per claim basis.
Litigation
The Company and its subsidiaries, from time to time, are parties to lawsuits arising from operations. The Company records liabilities when a loss is probable and can be reasonably estimated. If these estimates are in the form of ranges, the Company records the liabilities at the most likely outcome within the range. If no point within the range represents a better estimate of the probable loss, then the low point in the range is accrued. The ranges established by management are based on analysis made by internal and external legal counsel who consider the best information known at the time. If the Company determines that a contingency is reasonably possible, it considers the same information to estimate the possible exposure and discloses any material potential liability. These loss contingencies are monitored regularly for a change in fact or circumstance that would require an accrual adjustment. Legal costs related to these lawsuits are expensed as incurred. For additional information on ongoing litigation see Note 21, Commitments and Contingencies.
Foreign Currency Translation
The local currency of foreign operations is generally considered to be their functional currency. In the case of operations within highly inflationary economies, which for the Company include Argentina and Turkey, the Company remeasures the financial statements of entities in those countries with the U.S. dollar as the functional currency.
Adjustments resulting from the process of translating the financial statements of entities with foreign functional currencies into U.S. dollars are included in AOCI in the Consolidated Balance Sheets. During the year ended December 31, 2024, the Company had a translation loss of $192 million and a gain on its loans designated as hedges of net investments of $46 million. During the year ended December 31, 2023, the Company had a translation gain of $78 million and a loss on its loans designated as hedges of net investments of $29 million. During the year ended December 31, 2022, the Company had a translation loss of $188 million and a gain on its loans designated as hedges of net investments of $32 million.
Foreign currency gains and losses arising from transactions denominated in a currency other than the functional currency of the entity involved are included within Other (income) expense, net in the Consolidated Statements of Operations. During the years ended December 31, 2024, 2023, and 2022, the Company had a net foreign currency gain of $21 million, gain of $3 million, and loss of $6 million, respectively.
Revenue Recognition
Revenues are derived primarily from the sale of dental equipment and dental and healthcare consumable products. Revenue is measured as the amount of consideration the Company expects to receive in exchange for transferring goods or providing services in accordance with ASC 606-10, Revenues from Contracts with Customers. Revenue is recognized when performance obligations under the terms of a contract with a customer are satisfied; this occurs with the transfer of control of products and services to the Company’s customers, which for products generally occurs when title and risk of loss transfers to the customer, and for services generally occurs as the customer receives and consumes the benefit. Sales, value-added, and other taxes collected concurrent with revenue-producing activities are excluded from revenue.
Certain contracts with the Company’s customers include promises to transfer multiple products and services to a customer. Determining whether products and services are considered distinct performance obligations that should be accounted for separately may require significant judgment. The Company generally uses an observable price, typically average selling price, to determine the stand-alone selling price for separate performance obligations. The Company determines the stand-alone selling prices based on its database of pricing and discounting practices from among the Company’s varied geographic sales locations and for specific products or services when sold separately, and the Company utilizes this data to arrive at average selling prices by product. In cases where an average selling price is not observable, the Company determines the stand-alone selling price using relevant information and applies suitable estimation methods including, but not limited to, the cost plus a margin approach. Revenue is then allocated proportionately, based on the determined stand-alone selling price, to each distinct performance obligation.
The Company exercises judgment in estimating variable consideration, which primarily includes volume discounts, sales rebates, product returns, and certain extended warranty arrangements. The Company adjusts the estimate of revenue at the earlier of when the most likely amount of consideration can be estimated, the amount expected to be received changes, or when the consideration becomes fixed. The Company estimates volume discounts by evaluating specific inputs and assumptions, including the individual customer’s historical and estimated future product purchases. Discounts are deducted from revenue at the time of sale or when the discount is offered, whichever is later. In estimating sales rebates, the Company evaluates inputs such as customer-specific trends, terms of the customers’ contracted rebate program, historical experience, and the forecasted performance of a customer and their expected level of achievement within the rebate programs. The accruals for these rebate programs are updated as actual results and updated forecasts impact the estimated achievement for customers within the rebate programs. When the Company gives customers the right to return eligible products and receive credit, returns are estimated based on an analysis of historical experience. However, returns of products, excluding warranty-related returns, are not material.
To the extent the transaction price includes variable consideration, the Company applies judgment in constraining the estimated variable consideration due to factors that may cause reversal of cumulative revenue recognized. The Company evaluates constraints based on its historical and projected experience with similar customer contracts.
For most of its products, the Company transfers control and recognizes revenue when products are shipped from the Company’s manufacturing facility or warehouse to the customer. For contracts with customers that contain destination shipping terms, revenue is not recognized until the goods are delivered to the agreed-upon destination. As such, the Company’s performance obligations related to product sales are satisfied at a point in time when customers obtain the use of, and substantially all of the benefit of, the products.
The Company recognizes revenue from support and maintenance contracts, extended warranties, and certain other contract performance obligations over time based on the period of the contracts or as the services are performed, as the customer simultaneously receives and consumes the benefits provided by the Company’s performance of the services. In general, the total amount of revenue recognized over time is not material to the Company’s financial statements.
Depending on the terms of its contracts, the Company defers the recognition of a portion of revenue on a relative stand-alone selling price basis when certain performance obligations are not yet satisfied. Consideration received from customers in advance of revenue recognition is classified as deferred revenue. For certain locations, the Company offers a loyalty points program to customers. A portion of the revenue generated in a sale is allocated to the loyalty points earned and is deferred until the loyalty points are redeemed or expire.
The Company has elected to account for shipping and handling activities as a fulfillment cost within the cost of products sold, and records shipping and handling costs collected from customers in net sales. The Company has adopted one practical expedient: relief from considering the existence of a significant financing component when the payment for the good or service is expected to be one year or less.
See Note 2, Revenue Recognition for additional information.
Cost of Products Sold
Cost of products sold represents costs directly related to the manufacture and distribution of the Company’s products, and include costs of raw materials, packaging, direct labor, overhead, shipping and handling, warehousing and the depreciation of manufacturing, warehousing and distribution facilities and amortization of intangible assets. Overhead and related expenses include salaries, wages, employee benefits, utilities, lease costs, maintenance and property taxes.
Warranties
The Company provides manufacturer’s warranties on certain equipment products. Estimated warranty costs are accrued when sales are made to customers. Estimates for warranty costs are based primarily on historical warranty claim experience. Warranty costs are included in Cost of products sold in the Consolidated Statements of Operations. The Company’s warranty expense and warranty accrual were as follows:
| | | | | | | | | | | | | | | | | | | | |
| | | December 31, |
| (in millions) | | 2024 | | 2023 | | 2022 |
| | | | | | |
| Warranty Expense | | $ | 32 | | | $ | 48 | | | $ | 27 | |
| Warranty Accrual | | 21 | | | 24 | | | 22 | |
Selling, General and Administrative Expenses
SG&A represents indirect costs associated with generating revenues and managing the operations of the Company. Such costs include advertising and marketing expenses, salaries, employee benefits, incentive compensation, travel, office expenses, lease costs, amortization of capitalized software developed for internal use, and depreciation of administrative facilities. Advertising costs are expensed as incurred.
Research and Development Costs
R&D costs, including internal labor costs, material costs, consulting expenses, and certain overhead expenses, such as facilities and information technology costs directly attributable to R&D activities, are expensed in the period in which they are incurred. Software development costs related to software to be sold, leased, or otherwise marketed that are incurred prior to the attainment of technological feasibility are considered R&D and are expensed as incurred. Once technological feasibility is established, the cost of software developed for external use is capitalized until the product is available for general release to customers. Amortization of these costs are included in Cost of products sold over the estimated life of the products.
Stock-Based Compensation
Stock-based compensation is measured at the grant date at fair value, and is recognized as an expense over the employee’s requisite service period (generally the vesting period of the equity awards). The compensation cost is only recognized for the portion of the awards that are expected to vest.
Stock options granted become exercisable as determined by the grant agreement and expire ten years after the date of grant under the Company’s stock-based compensation plans. Restricted Stock Units (“RSUs”) vest as determined by the grant agreement and are subject to a service condition, which requires grantees to remain employed by the Company during the period following the date of grant. Under the terms of the RSUs, the vesting period is referred to as the restricted period. In addition to the service condition, certain RSUs are subject to performance requirements that can vary between the first year and the final year of the RSU award. For a given RSU award which is subject to performance requirements, the number of shares which vest may be adjusted upward or downward from the target amount to reflect the achievement level. Upon the expiration of the applicable restricted period and the satisfaction of any applicable performance conditions imposed, the restrictions on RSUs will lapse, and shares of common stock will be issued for each vested RSU. Upon death, disability or qualified retirement, awards continue to vest per the remaining grant term and are pro-rated if the grant date is less than twelve months from the date of separation. Awards are expensed as compensation over their respective vesting periods or to the eligible retirement date if shorter. The Company records forfeitures on stock-based compensation as the participant terminates rather than estimating forfeitures.
Income Taxes
The Company’s income tax expense or benefit includes U.S. and international income taxes plus the provision for U.S. income taxes on undistributed earnings of international subsidiaries not considered to be permanently reinvested. Tax credits and other incentives reduce income tax expense in the year the credits are claimed. Certain items of income and expense are not reported in tax returns and financial statements in the same year. The tax effect of such temporary differences is reported as deferred income taxes. Deferred tax assets are recognized if it is more likely than not that the assets will be realized in future years. The Company establishes a valuation allowance for deferred tax assets for which realization is not likely.
The Company applies a recognition threshold and measurement attribute for the financial statement recognition and measurement of a tax position taken or expected to be taken in a tax return. The Company recognizes in the consolidated financial statements the impact of a tax position if that position is more likely than not to be sustained upon examination by taxing authorities based on the technical merits of the position.
The Company’s tax positions are subject to ongoing examinations by tax authorities. The Company operates within multiple taxing jurisdictions throughout the world and in the normal course of business is examined by taxing authorities in those jurisdictions. Adjustments to uncertain tax positions are recorded when taxing authority examinations are completed, statutes of limitation are closed, changes in tax laws occur or as new information comes to light regarding the technical merits of a given tax position.
Earnings Per Share
Basic earnings per share are calculated by dividing net earnings attributable to the Company’s stockholders by the weighted average number of shares outstanding for the period. Diluted earnings per share is calculated by dividing net earnings attributable to the Company’s stockholders by the weighted average number of shares outstanding for the period, adjusted for the effect of an assumed exercise of all dilutive options outstanding at the end of the period, unless the impact of including these options is anti-dilutive.
Investments in Unconsolidated Affiliates
Investments in non-consolidated affiliates, joint ventures, and partnerships where the Company maintains significant influence over an entity but does not have control are accounted for using the equity method. The Company records the carrying value of these investments within other noncurrent assets in the Consolidated Balance Sheets and records the Company’s proportional share of the investees’ net earnings or losses within other (income) expense. Investments in which the Company does not exercise significant influence are recorded at cost, and assessed for any other-than-temporary impairment when events or changes in circumstances indicate the carrying amount of the investment might not be recoverable.
On December 7, 2023, the Company sold its minority interest in a UK-based, privately-held provider of healthcare consumables for $13 million. Prior to the sale, the Company recorded a loss of $4 million in Other (income) expense, net due to a forfeiture of accumulated earnings on the investment for declining its option to purchase the remaining ownership interest.
The Company’s equity-method net loss for the year ended December 31, 2024 was not significant. The Company’s equity-method net losses for the years ended December 31, 2023 and 2022 were $4 million and $36 million, respectively. Loss from equity method investments for the year ended December 31, 2022 includes $36 million recorded in Other (income) expense, net in the Consolidated Statements of Operations for a write-off of the Company’s ownership position in a privately-held dental investment company following impairment of underlying investments held by the investment company and the Company’s determination that the remaining investment is not recoverable.
Noncontrolling Interests
The Company reports noncontrolling interest (“NCI”) in a subsidiary as a separate component of Equity in the Consolidated Balance Sheets. Additionally, the Company reports the portion of net loss and comprehensive loss attributed to the Company and NCI separately in the Consolidated Statements of Operations, and in the Consolidated Statements of Comprehensive Income.
Fair Value Measurement
Recurring Basis
The Company records certain financial assets and liabilities at fair value in accordance with the accounting guidance, which defines fair value as the exchange price that would be received for an asset or paid to transfer a liability (an exit price) in the principal or most advantageous market for the asset or liability in an orderly transaction between market participants on the measurement date in current markets. The accounting guidance establishes a hierarchical disclosure framework associated with the level of observable pricing utilized in measuring financial instruments at fair value. The three broad levels defined by the fair value hierarchy are as follows:
Level 1 - Quoted prices are available in active markets for identical assets or liabilities as of the reported date.
Level 2 - Pricing inputs are other than quoted prices in active markets, which are either directly or indirectly observable as of the reported date. These financial instruments include derivative instruments whose fair value have been derived using a model where inputs to the model are directly observable in the market or can be derived principally from, or corroborated by, observable market data.
Level 3 - Instruments that have little to no observable pricing as of the reported date. These financial instruments do not have two-way markets and are measured using management’s best estimate of fair value, where the inputs into the determination of fair value require significant management judgment or estimation.
The degree of judgment utilized in measuring the fair value of certain financial assets and liabilities generally correlates to the level of observable pricing. Observable pricing is impacted by a number of factors, including the type of financial instrument. Financial assets and liabilities with readily available active quoted prices or for which fair value can be measured from actively quoted prices generally will have a higher degree of pricing observability and a lesser degree of judgment utilized in measuring fair value. Conversely, financial assets and liabilities rarely traded or not quoted will generally have less, or no pricing observability and a higher degree of judgment utilized in measuring fair value.
The Company primarily applies the market approach for recurring fair value measurements and endeavors to utilize the best available information. Accordingly, the Company utilizes valuation techniques that maximize the use of observable inputs and minimize the use of unobservable inputs. Additionally, the Company considers its credit risks and its counterparties’ credit risks when determining the fair values of its financial assets and liabilities. The Company records its derivatives and contingent considerations on a recurring fair value basis.
The Company believes the carrying amounts of cash and cash equivalents, accounts receivable (net of allowance for doubtful accounts), prepaid expenses and other current assets, accounts payable, accrued liabilities, income taxes payable and notes payable approximate fair value due to the short-term nature of these instruments. See Note 20, Fair Value Measurement for additional information.
Non-Recurring Basis
When events or circumstances require an asset or liability to be measured at fair value that otherwise is generally recorded based on another valuation method, such as, net realizable value, the Company will utilize the valuation techniques described above. The Company records its business combinations and impairments on a non-recurring basis.
Recently Adopted Accounting Pronouncements
In November 2023, the FASB issued ASU No. 2023-07, “Segment Reporting (Topic 280): Improvements to Reportable Segment Disclosures,” which requires disclosure of information about significant expenses in a public company’s reportable segment results on both an interim and annual basis. Public companies are required to disclose significant expense categories and amounts for each reportable segment. Significant expense categories are derived from expenses that are regularly reported to an entity’s chief operating decision-maker (“CODM”) and included in a segment’s reported measures of profit or loss. Public entities are also required to disclose the title and position of the CODM and explain how the CODM uses the reported measures of profit or loss to assess segment performance. This standard was effective for fiscal years beginning after December 15, 2023, and interim periods within fiscal years beginning after December 15, 2024. The Company has adopted this accounting standard, and the related disclosures are included in Note 6, Segment and Geographic Information in the Notes to Consolidated Financial Statements in Item 8 of this Form 10-K.
Accounting Pronouncements Not Yet Adopted
In December 2023, the FASB issued ASU No. 2023-09, “Income Taxes (Topic 740): Improvements to Income Tax Disclosures,” which requires public entities to disclose additional income tax information, primarily related to the income tax rate reconciliation and income taxes paid on an annual basis. The amendments are intended to enhance the transparency and decision-usefulness of income tax disclosures and are effective as of January 1, 2025. Early adoption is permitted and should be applied prospectively. The Company expects this ASU to only impact the Company’s disclosures with no impacts to results of operations, financial position, or cash flows.
In November 2024, the FASB issued ASU No. 2024-03, “Income Statement—Reporting Comprehensive Income—Expense Disaggregation Disclosures (Subtopic 220-40) Disaggregation of Income Statement Expenses,” which requires disaggregated disclosure of income statement expenses for public business entities (“PBEs”). In January 2025, the FASB issued ASU No. 2025-01 “Income Statement—Reporting Comprehensive Income—Expense Disaggregation Disclosures (Subtopic 220-40),” which clarified the effective date for ASU No. 2024-03. These amendments are intended to provide more information about types of expenses in commonly presented expense captions. The amendments in this update are effective for annual periods beginning after December 15, 2026, and interim periods within fiscal years beginning after December 15, 2027, and early adoption is permitted. The Company is currently evaluating the impact on its consolidated financial statements and related disclosures.
In November 2024, the FASB issued ASU No. 2024-04, “Debt—Debt with Conversion and Other Options (Subtopic 470-20) Induced Conversions of Convertible Debt Instruments,” which amends ASC 470-202 to clarify the requirements related to accounting for the settlement of a debt instrument as an induced conversion. The amendments in this update are effective for annual periods beginning after December 15, 2025, and interim periods within those annual reporting periods, and early adoption is permitted if the entity has also adopted ASU 2020-06 “Debt—Debt with Conversion and Other Options (Subtopic 470-20) and Derivatives and Hedging-Contracts in Entity’s Own Equity (Subtopic 815-40)” for that period. The Company is currently evaluating the impact on its consolidated financial statements and related disclosures.
NOTE 2 - REVENUE RECOGNITION
Revenues are derived primarily from the sale of dental equipment and dental and healthcare consumable products. Revenues are measured as the amount of consideration the Company expects to receive in exchange for transferring goods or providing services. For a description of the products and services provided within each of the Company’s four reportable segments see Note 6, Segment and Geographic Information.
Net sales disaggregated by product category were as follows:
| | | | | | | | | | | | | | | | | | | | |
| | Year Ended December 31, |
| (in millions) | | 2024 | | 2023 | | 2022 |
| | | | | | |
| Equipment & Instruments | | $ | 553 | | | $ | 628 | | | $ | 678 | |
| CAD/CAM | | 509 | | | 541 | | | 541 | |
| Connected Technology Solutions | | $ | 1,062 | | | $ | 1,169 | | | $ | 1,219 | |
| | | | | | |
| Essential Dental Solutions | | $ | 1,454 | | | $ | 1,468 | | | $ | 1,427 | |
| | | | | | |
| Orthodontics | | $ | 299 | | | $ | 339 | | | $ | 297 | |
| Implants & Prosthetics | | 674 | | | 701 | | | 709 | |
| Orthodontic and Implant Solutions | | $ | 973 | | | $ | 1,040 | | | $ | 1,006 | |
| | | | | | |
| Wellspect Healthcare | | $ | 304 | | | $ | 288 | | | $ | 270 | |
| | | | | | |
| Total net sales | | $ | 3,793 | | | $ | 3,965 | | | $ | 3,922 | |
Net sales disaggregated by geographic region were as follows:
| | | | | | | | | | | | | | | | | | | | |
| | Year Ended December 31, |
| (in millions) | | 2024 | | 2023 | | 2022 |
| | | | | | |
| United States | | $ | 1,348 | | | $ | 1,437 | | | $ | 1,392 | |
| Europe | | 1,518 | | | 1,550 | | | 1,559 | |
| Rest of World | | 927 | | | 978 | | | 971 | |
| | | | | | |
| Total net sales | | $ | 3,793 | | | $ | 3,965 | | | $ | 3,922 | |
Contract Assets and Liabilities
The Company does not typically have contract assets in the course of its business. Contract liabilities, which represent billings in excess of revenue recognized, are primarily related to advanced billings for customer orthodontic treatments where the performance obligation has not yet been satisfied, and deferred revenue associated with loyalty points earned but not yet redeemed by customers under the Company’s loyalty point program. The Company had deferred revenue of $95 million and $49 million presented in Accrued liabilities and Other noncurrent liabilities, respectively, in the Consolidated Balance Sheets at December 31, 2024. The Company recorded deferred revenue of $91 million and $57 million presented in Accrued liabilities and Other noncurrent liabilities, respectively, in the Consolidated Balance Sheets at December 31, 2023. The Company recognized $79 million of revenue for the year ended December 31, 2024 which was previously deferred as of December 31, 2023. The amount recognized in the year ended December 31, 2024 includes a $9 million reduction in revenue for a refund reserve related to the realignment of the Byte aligner business as described in Note 18, Restructuring and Other Costs. The Company recognized $68 million of revenue for the year ended December 31, 2023 which was previously deferred as of December 31, 2022. The Company expects to recognize most of the remaining deferred revenue in net sales within the next twelve months.
Allowance for Doubtful Accounts
Accounts and notes receivable-trade, net are stated net of allowances for doubtful accounts and trade discounts, which were $14 million and $17 million at December 31, 2024 and 2023, respectively. For the years ended December 31, 2024 and 2023, changes to the allowance for doubtful accounts, including write-offs of accounts receivable that were previously reserved, were not significant. Changes to the allowance for doubtful accounts are presented in Selling, general, and administrative expenses in the Consolidated Statements of Operations.
NOTE 3 - STOCK COMPENSATION
The Company maintains the 2024 Omnibus Incentive Plan (the “Plan”), which was approved by the Company’s stockholders on May 22, 2024 (the “Effective Date”). The Company’s stockholders previously approved the 2016 Omnibus Incentive Plan (the “Prior Plan”). After the Effective Date, no new awards may be granted under the Prior Plan, although awards granted under the Prior Plan prior to the Effective Date remain outstanding and remain subject to the terms and conditions of, and continue to be governed by, the Prior Plan. Under the Plan, the Company may grant stock options, share appreciation rights, restricted shares, restricted share units, share bonuses, other share-based awards, or cash awards, collectively referred to as “Awards.” The Company’s non-qualified stock options (“NQSOs”) are granted at exercise prices that are at least equal to the closing stock price on the date of grant. Under the Plan, 14.5 million shares are initially available for Awards, less (i) one share for every one share that was subject to an option or share appreciation right granted after March 26, 2024 under the Prior Plan and (ii) 2.7 shares for every one share that was subject to an award other than an option or share appreciation right granted after March 26, 2024 under the Prior Plan (such adjusted amount, the “Share Pool”). Under the Plan, any shares that are subject to options or share appreciation rights shall be counted against the Share Pool as one share for every one share granted, and any shares that are subject to awards other than options or share appreciation rights shall be counted against the Share Pool as 2.7 shares for every one share granted. Shares granted under either the Plan or the Prior Plan which are cancelled or forfeited are added back to the count of shares available for Awards. The number of shares available for grant under the Plan at December 31, 2024 is 16 million.
The amounts of stock-based compensation expense recorded in the Company’s Consolidated Statements of Operations were as follows:
| | | | | | | | | | | | | | | | | | | | |
| | Year Ended December 31, |
| (in millions) | | 2024 | | 2023 | | 2022 |
| | | | | | |
| Cost of products sold | | $ | 3 | | | $ | 4 | | | $ | 3 | |
| Selling, general, and administrative expense | | 35 | | | 36 | | | 53 | |
| Research and development expense | | 2 | | | 4 | | | 3 | |
| Restructuring and other costs | | (1) | | | 2 | | | — | |
| Total stock-based compensation expense | | $ | 39 | | | $ | 46 | | | $ | 59 | |
| | | | | | |
| Related deferred income tax benefit | | $ | 7 | | | $ | 8 | | | $ | 7 | |
The Company uses the Black-Scholes option-pricing model to estimate the fair value of each option awarded. The average assumptions used to determine compensation cost for the Company’s NQSOs issued were as follows:
| | | | | | | | | | | | | | | | | | | | |
| | Year Ended December 31, |
| | | 2024 | | 2023 | | 2022 |
| | | | | | |
| Weighted average fair value per NQSO | | $ | 9.91 | | | $ | 12.64 | | | $ | 14.06 | |
| Expected dividend yield | | 1.92 | % | | 1.45 | % | | 1.09 | % |
| Risk-free interest rate | | 4.28 | % | | 4.27 | % | | 2.23 | % |
| Expected volatility | | 35.7 | % | | 35.8 | % | | 32.7 | % |
| Expected life (years) | | 4.26 | | 4.76 | | 5.20 |
The total intrinsic value of NQSOs exercised for the years ended December 31, 2024 and 2023 was insignificant. The total intrinsic value of options exercised for the year ended December 31, 2022 was $1 million.
The NQSO transactions for the year ended December 31, 2024 were as follows: | | | | | | | | | | | | | | | | | | | | | | | | | | | | | | | | | | | | | | | | | | | | | | | | | | | | | | | | |
| | | Outstanding | | Exercisable | | Expected to Vest |
| (in millions, except per share amounts) | | Shares | | Weighted Average Exercise Price | | Aggregate Intrinsic Value | | Shares | | Weighted Average Exercise Price | | Aggregate Intrinsic Value | | Shares | | Weighted
Average
Exercise
Price | | Aggregate
Intrinsic
Value |
| | | | | | | | | | | | | | | | | | |
| December 31, 2023 | | 2.6 | | | $ | 48.11 | | | $ | 1 | | | 1.6 | | | $ | 52.55 | | | $ | — | | | 1.0 | | | $ | 41.41 | | | $ | 1 | |
| Granted | | 0.4 | | | 33.28 | | | | | | | | | | | | | | | |
| | | | | | | | | | | | | | | | | | |
| Exercised | | — | | | 30.60 | | | | | | | | | | | | | | | |
| Cancelled | | (0.6) | | | 52.12 | | | | | | | | | | | | | | | |
| Forfeited | | (0.2) | | | 36.63 | | | | | | | | | | | | | | | |
| December 31, 2024 | | 2.2 | | | $ | 45.37 | | | $ | — | | | 1.4 | | | $ | 50.27 | | | $ | — | | | 0.8 | | | $ | 37.06 | | | $ | — | |
There were 1 million NQSOs unvested at December 31, 2024. The remaining unamortized compensation cost related to NQSOs is $6 million, which will be expensed over the weighted average remaining vesting period of the options, which is 1.5 years.
The weighted average remaining contractual term of all outstanding options, exercisable options, and options expected to vest are 5.2 years, 3.9 years and 7.4 years, respectively.
Information about NQSOs outstanding as of December 31, 2024 is provided below:
| | | | | | | | | | | | | | | | | | | | | | | | | | | | | | | | | | | | | | |
| | | | Outstanding | | Exercisable |
| | Number Outstanding at December 31, 2024 | | Weighted Average Remaining Contractual Life (in years) | | Weighted Average Exercise Price | | Number Exercisable at December 31, 2024 | | Weighted Average Exercise Price |
| Range of Exercise Prices | | | | | |
| (in millions, except per share amounts and life) | | | | | |
| | | | | | | | | | | | |
| | | | | | | | | | | | |
| | | | | | | | | | | | |
| 20.01 | | - | 30.00 | | 1.0 | | | 6.80 | | $ | 35.97 | | | 0.3 | | | $ | 36.47 | |
| 30.01 | | - | 40.00 | | 0.4 | | | 4.20 | | 47.70 | | | 0.4 | | | 47.86 | |
| 40.01 | | - | 50.00 | | 0.6 | | | 4.10 | | 55.07 | | | 0.5 | | | 55.26 | |
| 50.01 | | - | 60.00 | | 0.2 | | | 1.90 | | 62.43 | | | 0.2 | | | 62.43 | |
| | | | | | | | | | | | |
| | | | 2.2 | | | | | | | 1.4 | | | |
The unvested RSUs for the year ended December 31, 2024 were as follows: | | | | | | | | | | | | | | |
| | | Unvested Restricted Stock Units |
| | | Shares | | Weighted Average Grant Date Fair Value |
| | |
| (in millions, except per share amounts) | | |
| | | | |
| Unvested at December 31, 2023 | | 3.6 | | | $ | 42.95 | |
| Granted | | 2.4 | | | 32.10 | |
| | | | |
| Vested | | (1.1) | | | 39.48 | |
| Forfeited | | (1.0) | | | 39.35 | |
| Unvested at December 31, 2024 | | 3.9 | | | $ | 37.11 | |
The weighted average grant date fair value of RSUs granted for the years ended December 31, 2023 and 2022 were $42.95 and $39.73, respectively. The unamortized compensation cost related to RSUs is $41 million, which will be expensed over the remaining weighted average restricted period of the RSUs, which is 1.7 years.
The total fair value of shares vested for the years ended December 31, 2024, 2023 and 2022 was $46 million, $42 million and $49 million, respectively.
NOTE 4 - LOSS PER COMMON SHARE
The computations of basic and diluted loss per common share were as follows:
| | | | | | | | | | | | | | | | | | | | |
| Basic Loss Per Common Share | | Year Ended December 31, |
| (in millions, except per share amounts) | | 2024 | | 2023 | | 2022 |
| | | | | | |
| Net loss attributable to Dentsply Sirona | | $ | (910) | | | $ | (132) | | | $ | (950) | |
| | | | | | |
| Weighted average common shares outstanding | | 203.2 | | | 212.0 | | | 215.5 | |
| | | | | | |
| Basic loss per common share | | $ | (4.48) | | | $ | (0.62) | | | $ | (4.41) | |
| | | | | | |
| Diluted Loss Per Common Share | | Year Ended December 31, |
| (in millions, except per share amounts) | | 2024 | | 2023 | | 2022 |
| | | | | | |
| Net loss attributable to Dentsply Sirona | | $ | (910) | | | $ | (132) | | | $ | (950) | |
| | | | | | |
| Weighted average common shares outstanding | | 203.2 | | | 212.0 | | | 215.5 | |
| Incremental weighted average shares from assumed exercise of dilutive options from stock-based compensation awards | | — | | | — | | | — | |
| Total weighted average diluted shares outstanding | | 203.2 | | | 212.0 | | | 215.5 | |
| | | | | | |
| Diluted loss per common share | | $ | (4.48) | | | $ | (0.62) | | | $ | (4.41) | |
| | | | | | |
| Weighted average shares excluded from diluted common shares outstanding due to reported net loss | | 0.6 | | | 1.1 | | | 0.5 | |
| | | | | | |
| Weighted average shares excluded from diluted common shares outstanding due to antidilutive nature | | 3.7 | | | 3.0 | | | 3.6 | |
NOTE 5 - COMPREHENSIVE LOSS
Accumulated Other Comprehensive Income (“AOCI”) includes cumulative foreign currency translation adjustments related to consolidation of the Company’s foreign subsidiaries, fair value adjustments related to the Company’s derivative financial instruments, and actuarial gains and losses related to the Company’s pension plans. These changes are recorded in AOCI, net of tax. For the years ended December 31, 2024, 2023 and 2022, these tax adjustments were $118 million, $166 million and $100 million, respectively, primarily related to foreign currency translation adjustments.
The cumulative foreign currency translation adjustments included translation losses of $552 million and $360 million at December 31, 2024 and 2023, respectively, and included losses of $67 million and $113 million, at December 31, 2024 and 2023, respectively, on loans designated as hedges of net investments.
Changes in AOCI, net of tax, by component for the years ended December 31, 2024 and 2023 were as follows: | | | | | | | | | | | | | | | | | | | | | | | | | | | | | | | | | | |
| (in millions) | | Foreign Currency Translation Loss | | (Loss) Gain on Cash Flow Hedges | | (Loss) Gain on Net Investment and Fair Value Hedges | | | | Pension Liability (Loss) Gain | | Total |
| | | | | | | | | | | | |
| Balance, net of tax, at December 31, 2023 | | $ | (473) | | | $ | (13) | | | $ | (107) | | | | | $ | (43) | | | $ | (636) | |
| Other comprehensive (loss) income before reclassifications and tax impact | | (113) | | | — | | | 48 | | | | | 15 | | | (50) | |
| Tax benefit | | (33) | | | — | | | (11) | | | | | (4) | | | (48) | |
| Other comprehensive (loss) income, net of tax, before reclassifications | | $ | (146) | | | $ | — | | | $ | 37 | | | | | $ | 11 | | | $ | (98) | |
| Amounts reclassified from accumulated other comprehensive income, net of tax | | — | | | 3 | | | — | | | | | 1 | | | 4 | |
| Net (decrease) increase in other comprehensive income | | (146) | | | 3 | | | 37 | | | | | 12 | | | (94) | |
| | | | | | | | | | | | |
| Balance, net of tax, at December 31, 2024 | | $ | (619) | | | $ | (10) | | | $ | (70) | | | | | $ | (31) | | | $ | (730) | |
| | | | | | | | | | | | | | | | | | | | | | | | | | | | | | | | | | |
| (in millions) | | Foreign Currency Translation (Loss) Gain | | (Loss) Gain on Cash Flow Hedges | | (Loss) Gain on Net Investment and Fair Value Hedges | | | | Pension Liability (Loss) Gain | | Total |
| | | | | | | | | | | | |
| Balance, net of tax, at December 31, 2022 | | $ | (522) | | | $ | (17) | | | $ | (73) | | | | | $ | (16) | | | $ | (628) | |
| Other comprehensive (loss) income before reclassifications and tax impact | | 2 | | | — | | | (45) | | | | | (34) | | | (77) | |
| Tax expense | | 47 | | | — | | | 11 | | | | | 8 | | | 66 | |
| Other comprehensive (loss) income, net of tax, before reclassifications | | $ | 49 | | | $ | — | | | $ | (34) | | | | | $ | (26) | | | $ | (11) | |
| Amounts reclassified from accumulated other comprehensive income, net of tax | | — | | | 4 | | | — | | | | | (1) | | | 3 | |
| Net (decrease) increase in other comprehensive income | | 49 | | | 4 | | | (34) | | | | | (27) | | | (8) | |
| | | | | | | | | | | | |
| Balance, net of tax, at December 31, 2023 | | $ | (473) | | | $ | (13) | | | $ | (107) | | | | | $ | (43) | | | $ | (636) | |
Reclassification out of AOCI to the Consolidated Statements of Operations for the years ended December 31, 2024, 2023 and 2022 were as follows: | | | | | | | | | | | | | | | | | | | | | | | | | | | | | |
| | | | | | | |
| | Amounts Reclassified from AOCI | Affected Line Item in the Consolidated Statements of Operations |
| | Year Ended December 31, |
| (in millions) | | 2024 | | 2023 | | 2022 |
| | | | | | | | | |
|
| | | | | | | |
| | | | | | | | | |
| (Loss) Gain on derivative financial instruments: |
| Interest rate swaps | | $ | (3) | | | $ | (3) | | | $ | (3) | | Interest expense, net |
| Foreign exchange forward contracts | | — | | | (1) | | | 3 | | Cost of products sold |
| | | | | | | |
| | | | | | | |
| Net loss before tax | | $ | (3) | | | $ | (4) | | | $ | — | | |
| Tax impact | | — | | | — | | | — | | Benefit from income taxes |
| Net loss after tax | | $ | (3) | | | $ | (4) | | | $ | — | | | | |
| | | | | | | | | |
|
| | | | | | | |
| | | | | | | |
| | | | | | | |
| | | | | | | | | |
| Amortization of defined benefit pension and other postemployment benefit items: |
| Amortization of prior service benefits | | $ | 1 | | | $ | 1 | | | $ | 1 | | (a) |
| | | | | | | |
| Amortization of net actuarial losses | | — | | | — | | | (8) | | (a) |
| Net income (loss) before tax | | $ | 1 | | | $ | 1 | | | $ | (7) | | |
| Tax impact | | — | | | — | | | 2 | | Benefit from income taxes |
| Net income (loss) after tax | | $ | 1 | | | $ | 1 | | | $ | (5) | | |
| | | | | | | | | |
| Total reclassifications for the period | | $ | (2) | | | $ | (3) | | | $ | (5) | | | | |
| | | | | | | | | |
(a) These AOCI components are included in the computation of net periodic benefit cost for the years ended December 31, 2024, 2023 and 2022, respectively.
NOTE 6 - SEGMENT AND GEOGRAPHIC INFORMATION
The Company has four operating segments, organized primarily by product, which are also the Company’s reportable segments. These are (i) Connected Technology Solutions, (ii) Essential Dental Solutions, (iii) Orthodontic and Implant Solutions, and (iv) Wellspect Healthcare. They generally have overlapping geographical presence, customer bases, distribution channels, and regulatory oversight with the exception of Wellspect Healthcare, which has a more discrete market and regulatory environment specific to the medical device industry. These operating segments, which also form the Company’s reportable segments, are identified in accordance with how the Company’s chief operating decision maker (“CODM”) regularly reviews financial results and uses this information to evaluate the Company’s performance and allocate resources. The Company’s CODM is the Chief Executive Officer.
The CODM assesses performance of the segments based on the net sales and adjusted operating income. Segment adjusted operating income is defined as operating income before income taxes and before certain unallocated corporate costs, interest expense, net, other (income) expense, net, goodwill and intangible asset impairments, restructuring and other costs, amortization of intangible assets, other acquisition costs, and depreciation resulting from the fair value step-up of property, plant, and equipment from business combinations. Asset and other balance sheet information is not reported to the CODM.
The CODM uses both net sales and segment adjusted operating income for each segment during development of the annual operating plan and the regular forecasting process. Additionally, the CODM considers budget-to-actual variances for these measures on a quarterly basis as well as segment-specific forecasting when making decisions about the allocation of operating and capital resources to each segment.
A description of the products and services provided within each of the Company’s four reportable segments is provided below.
Connected Technology Solutions
This segment includes the design, manufacture and sales of the Company’s dental technology and equipment products. These products include the Equipment & Instruments and CAD/CAM product categories.
Equipment & Instruments
The Equipment & Instruments product category consists of basic and high-tech dental equipment such as imaging equipment, motorized dental handpieces, treatment centers, and other instruments for dental practitioners and specialists. Imaging equipment serves as a key point of entry to the Company’s digital workflow offerings and consists of a broad range of diagnostic imaging systems for 2D or 3D, panoramic, and intraoral applications, as well as cone-beam computed tomography systems (“CBCT”). Treatment centers comprise a broad range of products from basic dental chairs to sophisticated chair-based units with integrated diagnostic, hygienic and ergonomic functionalities, as well as specialist centers used in preventive treatment and for training purposes. This product group also includes other lab equipment, such as amalgamators, mixing machines and porcelain furnaces.
CAD/CAM
Dental CAD/CAM technologies are products designed for dental professionals to support numerous digital workflows for procedures such as dental restorations through integrations with DS Core, our cloud-based platform. This product category includes intraoral scanners, 3-D printers, mills, and certain software and services, as well as a full-chairside economical restoration of esthetic ceramic dentistry offering called CEREC, which enables dentists to practice same-day or single visit dentistry.
Essential Dental Solutions
This segment includes the development, manufacture and sales of the Company’s value-added endodontic, restorative, and preventive consumable products and small equipment used by dental professionals for the treatment of patients. Offerings in this segment also include specialized treatment products including products used in the creation of dental appliances.
Essential Dental Solutions products are designed to operate in an integrated system to provide solutions for high-tech dental procedures. The endodontic products include motorized endodontic handpieces, files, sealers, irrigation needles and other tools or single-use solutions which support root canal procedures. The restorative products include dental ceramics and other materials used in prosthetic restorations including crowns and veneers.
The preventive products include small equipment products such as curing light systems, dental diagnostic systems and ultrasonic scalers and polishers, as well as other dental supplies including dental anesthetics, prophylaxis paste, dental sealants and impression materials.
Orthodontic and Implant Solutions
This segment includes the design, manufacture, and sales of the Company’s various digital implant systems and innovative dental implant products, digital dentures and dental professional-directed aligner solutions. Offerings in this segment also include application of our digital services and technology, including those provided by DS Core, our cloud-based platform.
Orthodontics
The Orthodontics product category includes SureSmile, a clear aligner solution provided through clinician offices, and Byte, a direct-to-consumer clear aligner solution. The Orthodontics product category includes a High Frequency Vibration technology device known as VPro, as well as the SureSmile Simulator which uses intraoral scanners and our DS Core platform to create a 3D visualization of patient outcomes and SureSmile aligner solutions, which include whitening kits and retainers. The aligner offerings also include software technology that enables aligner treatment planning and the seamless connectivity of a digital workflow from diagnostics through treatment delivery. Byte operations were significantly reduced after October 24, 2024 and limited to supporting patients already undergoing treatment, following a decision to voluntarily suspend sales and marketing of Byte aligners and impression kits. In January 2025, the Company subsequently announced it will no longer offer the Byte direct-to-consumer clear aligner solution and has decided to leverage technologies developed by Byte elsewhere in the aligners portfolio to create orthodontic demand, support a digital clinical workflow, enhance the customer experience, and improve patient monitoring.
Implants & Prosthetics
The Implants & Prosthetics product category includes technology to support the Company’s digital workflows for implant systems, a portfolio of innovative dental implant products, digital dentures, crown and bridge porcelain products, bone regenerative and restorative solutions, treatment planning software and educational programs. The Implants & Prosthetics product category is supported by key technologies including custom abutments, advanced tapered immediate load screws and regenerative bone growth factor. Offerings in this category also include dental prosthetics such as artificial teeth and precious metal dental alloys.
Wellspect Healthcare
This segment includes the design, manufacture, and sales of the Company’s innovative continence care solutions for both urinary and bowel management. Wellspect Healthcare is a leading global provider of innovative medical devices that help people suffering from urinary retention or chronic constipation. Wellspect is one of the world’s leading manufacturers of intermittent urinary catheters, with LoFric as the most known brand. To help those with chronic or severe constipation, Wellspect also offers an advanced irrigation system, Navina, which combines a high degree of user convenience, clinical effectiveness and connectivity into one smart system.
The Company’s segment financial information was as follows:
| | | | | | | | | | | | | | | | | | | | | | | | | | | | | | | | | | | |
| | Year Ended December 31, | |
| | 2024 | |
| (in millions) | | Connected Technology Solutions | | Essential Dental Solutions | | Orthodontic and Implant Solutions | | Wellspect Healthcare | | Total | |
| | | | | | | | | | | |
| Net sales | | 1,062 | | 1,454 | | 973 | | 304 | | 3,793 | |
| | | | | | | | | | | |
Adjusted cost of products sold (a) | | 602 | | 565 | | 407 | | 117 | | | |
| | | | | | | | | | | |
| | | | | | | | | | | |
| | | | | | | | | | | |
| | | | | | | | | | | |
Adjusted selling expenses (b) | | 242 | | 313 | | 301 | | 52 | | | |
Adjusted G&A expenses (b) | | 74 | | 74 | | 133 | | 27 | | | |
| | | | | | | | | | | |
Adjusted R&D expenses (c) | | 74 | | 23 | | 52 | | 10 | | | |
| | | | | | | | | | | |
| Segment adjusted operating income | | 70 | | 479 | | 80 | | 98 | | 727 | |
| | | | | | | | | | | |
| Reconciling items (income) expense: | | | | | | | | | | | |
Unallocated corporate costs (d) | | | | | | | | | | 320 | |
| Interest expense, net | | | | | | | | | | 69 | |
| Other (income) expense, net | | | | | | | | | | (12) | |
| Goodwill and intangible asset impairments | | | | | | | | | | 1,014 | |
| Restructuring and other costs | | | | | | | | | | 53 | |
| Amortization of intangibles | | | | | | | | | | 216 | |
| Depreciation resulting from the fair value step-up of property, plant, and equipment from business combinations | | | | | | | | | | 3 | |
| Loss before income taxes | | | | | | | | | | (936) | |
| | | | | | | | | | | |
| | | | | | | | | | | |
| | | | | | | | | | | |
(a) Adjusted cost of products sold represents expenses adjusted to exclude intangible amortization expense, step-up depreciation expense, and other restructuring costs.
(b) Adjusted selling and adjusted G&A expenses represent expenses adjusted to exclude intangible amortization expense, other acquisition costs, step-up depreciation expense, and other restructuring costs.
(c) Adjusted R&D expenses represent expenses adjusted to exclude other restructuring costs.
(d) Unallocated corporate costs consist of general corporate expenses including corporate headcount costs, depreciation and amortization, unallocated professional service fees, and other operating costs which are not assigned to a specific segment.
| | | | | | | | | | | | | | | | | | | | | | | | | | | | | | | | | | | |
| | Year Ended December 31, | |
| | 2023 | |
| (in millions) | | Connected Technology Solutions | | Essential Dental Solutions | | Orthodontic and Implant Solutions | | Wellspect Healthcare | | Total | |
| | | | | | | | | | | |
| Net sales | | 1,169 | | 1,468 | | 1,040 | | 288 | | 3,965 | |
| | | | | | | | | | | |
Adjusted cost of products sold (a) | | 645 | | 560 | | 402 | | 114 | | | |
| | | | | | | | | | | |
| | | | | | | | | | | |
| | | | | | | | | | | |
| | | | | | | | | | | |
Adjusted selling expenses (b) | | 264 | | 313 | | 305 | | 51 | | | |
Adjusted G&A expenses (b) | | 77 | | 94 | | 119 | | 25 | | | |
| | | | | | | | | | | |
Adjusted R&D expenses (c) | | 82 | | 23 | | 58 | | 11 | | | |
| | | | | | | | | | | |
| Segment adjusted operating income | | 101 | | 478 | | 156 | | 87 | | 822 | |
| | | | | | | | | | | |
| Reconciling items (income) expense: | | | | | | | | | | | |
Unallocated corporate costs (d) | | | | | | | | | | 319 | |
| Interest expense, net | | | | | | | | | | 81 | |
| Other (income) expense, net | | | | | | | | | | 9 | |
| Goodwill and intangible asset impairments | | | | | | | | | | 307 | |
| Restructuring and other costs | | | | | | | | | | 67 | |
| Amortization of intangibles | | | | | | | | | | 211 | |
| Depreciation resulting from the fair value step-up of property, plant, and equipment from business combinations | | | | | | | | | | 3 | |
| Loss before income taxes | | | | | | | | | | (175) | |
| | | | | | | | | | | |
| | | | | | | | | | | |
| | | | | | | | | | | |
(a) Adjusted cost of products sold represents expenses adjusted to exclude intangible amortization expense, step-up depreciation expense, and other restructuring costs.
(b) Adjusted selling and adjusted G&A expenses represent expenses adjusted to exclude intangible amortization expense, other acquisition costs, step-up depreciation expense, and other restructuring costs.
(c) Adjusted R&D expenses represent expenses adjusted to exclude other restructuring costs.
(d) Unallocated corporate costs consist of general corporate expenses including corporate headcount costs, depreciation and amortization, unallocated professional service fees, and other operating costs which are not assigned to a specific segment.
| | | | | | | | | | | | | | | | | | | | | | | | | | | | | | | | | | | |
| | Year Ended December 31, | |
| | 2022 | |
| (in millions) | | Connected Technology Solutions | | Essential Dental Solutions | | Orthodontic and Implant Solutions | | Wellspect Healthcare | | Total | |
| | | | | | | | | | | |
| Net sales | | 1,219 | | 1,427 | | 1,006 | | 270 | | 3,922 | |
| | | | | | | | | | | |
Adjusted cost of products sold (a) | | 631 | | 540 | | 370 | | 109 | | | |
| | | | | | | | | | | |
| | | | | | | | | | | |
| | | | | | | | | | | |
| | | | | | | | | | | |
Adjusted selling expenses (b) | | 251 | | 301 | | 285 | | 48 | | | |
Adjusted G&A expenses (b) | | 80 | | 94 | | 124 | | 27 | | | |
| | | | | | | | | | | |
Adjusted R&D expenses (c) | | 96 | | 25 | | 34 | | 13 | | | |
| | | | | | | | | | | |
| Segment adjusted operating income | | 161 | | 467 | | 193 | | 73 | | 894 | |
| | | | | | | | | | | |
| Reconciling items (income) expense: | | | | | | | | | | | |
Unallocated corporate costs (d) | | | | | | | | | | 318 | |
| Interest expense, net | | | | | | | | | | 65 | |
| Other (income) expense, net | | | | | | | | | | 53 | |
| Goodwill and intangible asset impairments | | | | | | | | | | 1,287 | |
| Restructuring and other costs | | | | | | | | | | 14 | |
| Amortization of intangibles | | | | | | | | | | 209 | |
| Depreciation resulting from the fair value step-up of property, plant, and equipment from business combinations | | | | | | | | | | 3 | |
| Loss before income taxes | | | | | | | | | | (1,055) | |
| | | | | | | | | | | |
| | | | | | | | | | | |
| | | | | | | | | | | |
| | | | | | | | | | | |
(a) Adjusted cost of products sold represents expenses adjusted to exclude intangible amortization expense, step-up depreciation expense, and other restructuring costs.
(b) Adjusted selling and adjusted G&A expenses represent expenses adjusted to exclude intangible amortization expense, other acquisition costs, step-up depreciation expense, and other restructuring costs.
(c) Adjusted R&D expenses represent expenses adjusted to exclude other restructuring costs.
(d) Unallocated corporate costs consist of general corporate expenses including corporate headcount costs, depreciation and amortization, unallocated professional service fees, and other operating costs which are not assigned to a specific segment.
| | | | | | | | | | | | | | | | | | | | |
| Depreciation and Amortization | | Year Ended December 31, |
| (in millions) | | 2024 | | 2023 | | 2022 |
| | | | | | |
| Connected Technology Solutions | | $ | 175 | | | $ | 176 | | | $ | 172 | |
| Essential Dental Solutions | | 35 | | | 33 | | | 31 | |
| Orthodontic and Implant Solutions | | 98 | | | 97 | | | 90 | |
| Wellspect Healthcare | | 19 | | | 18 | | | 21 | |
All Other (a) | | 22 | | | 19 | | | 14 | |
| Total | | $ | 349 | | | $ | 343 | | | $ | 328 | |
(a) Includes unallocated corporate costs for depreciation and amortization
Geographic Information
The following tables set forth information about the Company’s significant operations by geographic areas, for the years ended December 31, 2024, 2023, and 2022. Net sales reported below represent revenues from external customers in those respective countries based on the destination of shipments.
| | | | | | | | | | | | | | | | | | | | |
| | Year Ended December 31, |
| (in millions) | | 2024 | | 2023 | | 2022 |
| | | | | | |
| Net sales | | | | | | |
| United States | | $ | 1,348 | | | $ | 1,437 | | | $ | 1,393 | |
| Germany | | 410 | | | 431 | | | 447 | |
| | | | | | |
| Other Foreign | | 2,035 | | | 2,097 | | | 2,082 | |
| Total net sales | | $ | 3,793 | | | $ | 3,965 | | | $ | 3,922 | |
Property, plant and equipment, net, represents those long-lived assets held by the operating businesses located in the respective geographic areas.
| | | | | | | | | | | | | | | | | | | | |
| | Year Ended December 31, |
| (in millions) | | 2024 | | 2023 | | 2022 |
| | | | | | |
| Property, plant, and equipment, net | | | | | | |
| United States | | $ | 210 | | | $ | 194 | | | $ | 174 | |
| Germany | | 230 | | | 260 | | | 275 | |
| Sweden | | 101 | | | 105 | | | 98 | |
| Other Foreign | | 225 | | | 241 | | | 214 | |
| Total property, plant, and equipment, net | | $ | 766 | | | $ | 800 | | | $ | 761 | |
Product and Customer Information
For information on the Company’s net sales by product category comprising each of the reportable segments, see Note 2, Revenue Recognition.
Concentration Risk
For the year ended December 31, 2024, no customer accounted for 10% or more of consolidated net sales or consolidated accounts receivable.
Customers that accounted for 10% or more of net sales or accounts receivable for the years ended December 31, 2023 and 2022 were as follows:
| | | | | | | | | | | | | | | | | | | | | | | | | | | | |
| | | | | | Year Ended December 31, |
| | | | 2023 | | 2022 |
| | | | | | % of net sales | | % of accounts receivable | | % of net sales | % of accounts receivable | |
| | | | | | | | | | | | |
| Henry Schein, Inc. | | | | | | 14 | % | | 11 | % | | 11 | % | 15 | % | |
| Patterson Companies, Inc. | | | | | | N/A | | 10 | % | | N/A | 12 | % | |
NOTE 7 - OTHER (INCOME) EXPENSE, NET
Other (income) expense, net, were as follows:
| | | | | | | | | | | | | | | | | | | | |
| | Year Ended December 31, |
| (in millions) | | 2024 | | 2023 | | 2022 |
| | | | | | |
| Foreign exchange transaction (gain) loss | | $ | (21) | | | $ | (3) | | | $ | 6 | |
| Other expense, net | | 9 | | | 12 | | | 47 | |
| Total other (income) expense, net | | $ | (12) | | | $ | 9 | | | $ | 53 | |
The Company’s equity-method net loss for the year ended December 31, 2024 was not significant. The Company’s equity-method net losses for the years ended December 31, 2023 and 2022 were $4 million and $36 million, respectively. Loss from equity method investments for the year ended December 31, 2022 includes $36 million recorded in Other (income) expense, net in the Consolidated Statements of Operations for a write-off of the Company’s ownership position in a privately-held dental investment company following impairment of underlying investments held by the investment company and the Company’s determination that the remaining investment is not recoverable.
NOTE 8 - INVENTORIES, NET
Inventories, net were as follows: | | | | | | | | | | | | | | |
| | Year Ended December 31, |
| (in millions) | | 2024 | | 2023 |
| | | | |
| Raw materials and supplies | | $ | 172 | | | $ | 185 | |
| Work-in-process | | 72 | | | 77 | |
| Finished goods | | 320 | | | 362 | |
| | | | |
| | | | |
| Inventories, net | | $ | 564 | | | $ | 624 | |
The Company’s inventory reserve was $98 million and $107 million at December 31, 2024 and 2023, respectively. Inventories are stated at the lower of cost and net realizable value.
NOTE 9 - PROPERTY, PLANT AND EQUIPMENT, NET
Property, plant and equipment, net, were as follows: | | | | | | | | | | | | | | |
| | Year Ended December 31, |
| (in millions) | | 2024 | | 2023 |
| | | | |
| Land | | $ | 46 | | | $ | 49 | |
| Buildings and improvements | | 571 | | | 568 | |
| Machinery and equipment | | 887 | | | 964 | |
| Capitalized software | | 516 | | | 446 | |
| Construction in progress | | 87 | | | 138 | |
| | | $ | 2,107 | | | $ | 2,165 | |
| Less: Accumulated depreciation and amortization | | 1,341 | | | 1,365 | |
| Property, plant and equipment, net | | $ | 766 | | | $ | 800 | |
NOTE 10 - LEASES
The net present value of finance and operating lease right-of-use assets and liabilities were as follows:
| | | | | | | | | | | | | | | | | | | | |
| | | | Year Ended December 31, |
| (in millions, except percentages) | | Location in the Consolidated Balance Sheets | | 2024 | | 2023 |
| | | | | | |
| Assets | | | | | | |
| Finance leases | | Property, plant, and equipment, net | | $ | — | | | $ | 1 | |
| Operating leases | | Operating lease right-of-use assets, net | | 136 | | | 178 | |
| Total right-of-use assets | | | | $ | 136 | | | $ | 179 | |
| | | | | | |
| Liabilities | | | | | | |
| Current liabilities | | | | | | |
| | | | | | |
| Operating leases | | Accrued liabilities | | 46 | | | 56 | |
| Noncurrent liabilities | | | | | | |
| Finance leases | | Long-term debt | | — | | | 1 | |
| Operating leases | | Operating lease liabilities | | 91 | | | 125 | |
| Total lease liabilities | | | | $ | 137 | | | $ | 182 | |
| | | | | | |
| Supplemental information: | | | | |
| Weighted-average discount rate | | | | |
| | | | | | |
| Operating leases | | | | 4.1 | % | | 3.9 | % |
| | | | | | |
| Weighted-average remaining lease term in years | | | | |
| | | | | | |
| Operating leases | | | | 4.1 | | 4.5 |
The lease costs recognized in the Consolidated Statements of Operations were as follows: | | | | | | | | | | | | | | | |
| | | Year Ended December 31, |
| (in millions) | | | 2024 | | 2023 |
| | | | | |
| | | | | |
| | | | | |
| | | | | |
| Operating lease cost | | | $ | 67 | | | $ | 67 | |
| | | | | |
| Variable lease cost | | | 16 | | | 15 | |
| Total lease cost | | | $ | 83 | | | $ | 82 | |
The contractual maturity dates of the remaining lease liabilities as of December 31, 2024 were as follows:
| | | | | | | | | | | | | | |
| (in millions) | | | | Operating Leases | | |
| | | | | | |
| 2025 | | | | $ | 52 | | | |
| 2026 | | | | 38 | | | |
| 2027 | | | | 23 | | | |
| 2028 | | | | 16 | | | |
| 2029 | | | | 12 | | | |
| 2030 and beyond | | | | 10 | | | |
| Total lease payments | | | | $ | 151 | | | |
| Less imputed interest | | | | 14 | | | |
| Present value of lease liabilities | | | | $ | 137 | | | |
The supplemental cash flow information for leases were as follows:
| | | | | | | | | | | | | | | | | | | | |
| | Year Ended December 31, |
| (in millions) | | 2024 | | 2023 | | 2022 |
| | | | | | |
| Cash paid for amounts included in the measurement of lease liabilities: | | | | | | |
| | | | | | |
| Operating cash flows paid for operating leases | | $ | 67 | | | $ | 68 | | | $ | 66 | |
| | | | | | |
| | | | | | |
| Right-of-use assets obtained in exchange for new lease liabilities (non-cash investing activity): | | | | | | |
| | | | | | |
| Operating leases | | 19 | | | 36 | | | 57 | |
NOTE 11 - GOODWILL AND INTANGIBLE ASSETS
The Company’s policy is to assess goodwill and indefinite-lived intangible assets for impairment annually as of April 1, with more frequent assessments if events or changes in circumstances indicate an asset might be impaired. Impairment charges are recorded in Goodwill and intangible asset impairment in the Consolidated Statement of Operations.
Impairment during the Three Months Ended March 31, 2024
In the three months ended March 31, 2024, the Company identified indicators of a more likely than not impairment related to certain indefinite-lived imaging product trade names within the Connected Technology Solutions segment. The decline in fair value of these indefinite-lived trade names was driven by declines in volumes during the three months ended March 31, 2024, which were due in part to a loss in market share from competitive pricing pressures, as well as unfavorable economic conditions in certain markets. These factors contributed to a reduction in forecasted revenues in the near term. The trade names were evaluated for impairment using an income approach, specifically a relief from royalty method. As a result, the Company recorded an indefinite-lived intangible asset impairment charge of $6 million for the three months ended March 31, 2024.
Impairment during the Three Months Ended September 30, 2024
The Company identified indicators of a more likely than not impairment in the three months ended September 30, 2024 for two of its reporting units, Orthodontic Aligner Solutions and Implant & Prosthetic Solutions, which together comprise all of the Orthodontic and Implant Solutions segment. As a result, the Company recorded pre-tax goodwill impairment charges as of September 30, 2024 of $145 million for the Orthodontic Aligner Solutions reporting unit and $359 million for the Implant & Prosthetic Solutions reporting unit, both within the Orthodontic and Implant Solutions segment. The impairment charge related to the Orthodontic Aligner Solutions reporting unit resulted in a full write-off of the remaining goodwill balance for this reporting unit.
Impairment during the Three Months Ended December 31, 2024
In the quarter ended December 31, 2024, the Company identified indicators of a more likely than not impairment for its Implant & Prosthetic Solutions reporting unit within the Orthodontic and Implant Solutions segment. The decline in fair value of this reporting unit was driven by a weaker trend in sales volumes, particularly in North America, increased competition from lower-priced alternatives impacting global markets, and adverse macroeconomic pressures impacting demand for elective dental procedures and premium implant solutions. These factors contributed to reduced forecasted revenues, lower operating margins, and reduced expectations for future cash flows. The fair value of the Implant & Prosthetic Solutions reporting unit was computed using a discounted cash flow model with inputs developed using both internal and market-based data. The discounted cash flow model uses ten-year forecasted cash flows plus a terminal value based on capitalizing the last period’s cash flows using a perpetual growth rate. Significant assumptions used in the discounted cash flow model included, but were not limited to, the discount rate of 12.5%, revenue growth rates (including perpetual growth rates), operating margin percentages, and net working capital changes of the reporting unit’s business. As a result, the Company recorded a pre-tax goodwill impairment charge as of December 31, 2024 of $269 million for the Implant & Prosthetic Solutions reporting unit within the Orthodontic and Implant Solutions segment.
Additionally, in the quarter ended December 31, 2024, the Company also identified indicators of more likely than not impairments for certain indefinite-lived intangible assets including trade names and trademarks within the Connected Technology Solutions segment, and certain trade names within the Implant & Prosthetic Solutions reporting unit within the Orthodontic and Implant Solutions segment. The decline in fair value of the trade names and trademarks was driven by weakened demand for the Company’s premium equipment and implant products, competitive pricing pressures, and a sustained higher cost of capital, which are contributing to reduced forecasted revenues. These indefinite-lived intangible assets were evaluated for impairment using an income approach, specifically a relief from royalty methodology. The Company’s significant assumptions in the relief from royalty method include, but are not limited to, discount rates ranging from 12.5% to 14.5%, revenue growth rates (including perpetual growth rates), and royalty rates. As a result, the Company recorded indefinite-lived intangible asset impairment charges of $82 million and $1 million for the Connected Technology Solutions and Orthodontic and Implant Solutions segments, respectively, for the three months ended December 31, 2024.
As a result of suspending sales of Byte clear aligner and impression kits during the fourth quarter, and subsequently announcing plans that the Byte aligners would no longer be offered to new patients, the Company recorded a full write-off of the Byte trademark intangible asset within the Orthodontic and Implant Solutions segment, resulting in a charge of $152 million based on a determination that the trademark will not be used in the future operating model for aligners. The Company plans to continue to use technology associated with approximately $178 million in other intangible assets acquired with the Byte
business, primarily developed technology acquired in the initial purchase of Byte, to support other product offerings and enhance customer experience elsewhere in the Company. See Note 18, Restructuring and Other Costs for additional information.
The remaining goodwill balance of the Implant & Prosthetic Solutions reporting unit was $503 million as of December 31, 2024, and the carrying values of indefinite-lived intangible assets with impairments in the fourth quarter were $76 million and $149 million for the Implant & Prosthetic Solutions and Connected Technology Solutions reporting units, respectively, as of December 31, 2024. As the fair values of the Implant & Prosthetic Solutions reporting unit and the indefinite-lived assets within the Implant & Prosthetic Solutions and Connected Technology Solutions reporting units, respectively, continue to approximate carrying value as of December 31, 2024, any further decline in key assumptions could result in additional impairments in future periods.
Based on quantitative and qualitative analyses performed for the other reporting units and the Company’s other indefinite-lived intangible assets, the Company believes there is no indication that the carrying value more likely than not exceeds the fair value in each case as of December 31, 2024. For the Company’s reporting units that were not impaired, the Company applied a hypothetical sensitivity analysis by increasing the discount rate of these reporting units by 50 basis points. The results of this sensitivity analysis at December 31, 2024 indicate that none of the other reporting units would be impaired.
There is a risk of future impairment charges if there is a decline in the fair value of the reporting units or indefinite-lived intangible assets as a result of, among other things, actual financial results that are lower than forecasts, an adverse change in valuation assumptions, a decline in equity valuations, increases in interest rates, or changes in the use of intangible assets. There can be no assurance that the Company’s future asset impairment testing will not result in a material charge to earnings.
2023 Goodwill and Indefinite-Lived Intangibles Impairment and Testing
In the quarter ended September 30, 2023, the Company identified indicators of a more likely than not impairment related to its Connected Technology Solutions reporting unit, which comprises all the Connected Technology Solutions segment. The decline in fair value for this reporting unit was driven by adverse macroeconomic factors because of weakened demand, particularly in European markets, and increased discount rates. These factors contributed to reduced forecasted revenues, lower operating margins, and reduced expectations for future cash flows in the near term, particularly in relation to demand for products which are commonly financed by end customers and are therefore adversely impacted by an environment of higher interest rates. The reporting unit was evaluated for impairment using an income approach, specifically a discounted cash flow model. As a result, the Company recorded a pre-tax goodwill impairment charge for the three months ended September 30, 2023 related to the Connected Technology Solutions reporting unit of $291 million, resulting in a full write-off of the remaining goodwill balance for the Connected Technology Solutions segment.
Additionally, in conjunction with the third quarter test in 2023, the Company conducted an impairment test on the indefinite-lived intangible assets related to the businesses within the Connected Technology Solutions reporting unit within the Connected Technology Solutions segment. The Company also identified an indicator of impairment for the indefinite-lived intangible assets within the Implant & Prosthetic Solutions reporting unit within the Orthodontic and Implant Solutions segment and determined certain trade names and trademarks were impaired. These indefinite-lived intangible assets were evaluated for impairment using an income approach, specifically a relief from royalty method. As a result, the Company recorded indefinite-lived intangible asset impairment charges of $14 million and $2 million for the Connected Technology Solutions and Orthodontic and Implant Solutions segments, respectively, for the three months ended September 30, 2023. The impairment charge was primarily driven by macroeconomic factors such as weakened demand, higher cost of capital, and cost inflation, which are contributing to reduced forecasted revenues.
2022 Goodwill and Indefinite-Lived Intangibles Impairment and Testing
In the third and fourth quarters of 2022, the Company identified indicators of a more likely than not impairment related to its former Digital Dental Group and former Equipment & Instruments reporting units within the former Technologies & Equipment segment and certain indefinite-lived intangible assets within these former reporting units as well as the former Consumables reporting unit within the former Consumables segment. The decline in fair value for these reporting units was driven by weakened global demand, higher cost of capital, unfavorable foreign currency impacts, and increased raw material, supply chain, and service costs, which contributed to reduced forecasted revenues, lower operating margins, and reduced expectations for future cash flows. The reporting unit was evaluated for impairment using an income approach, specifically a discounted cash flow model. As a result, the Company recorded a pre-tax goodwill impairment charge related to the former Digital Dental Group and former Equipment & Instruments reporting units within the former Technologies & Equipment segment of $1,100 million and $87 million, respectively, for the three months ended September 30, 2022. This charge was recorded in Goodwill and intangible asset impairment in the Consolidated Statements of Operations. The fair values of intangible assets were computed using either an income approach, specifically a relief from royalty method, or a qualitative assessment. As a result, the Company recorded impairment charges for its indefinite-lived intangible assets of $66 million and $28 million for the former Digital Dental Group and former Equipment & Instruments reporting units, respectively, within the former Technologies & Equipment segment, and a $6 million charge for the former Consumables reporting unit within the former Consumables segment, for the year ended December 31, 2022.
A reconciliation of changes in the Company’s goodwill by reportable segment were as follows:
| | | | | | | | | | | | | | | | | | | | | | | | | | | | | | | | |
| (in millions) | | Connected Technology Solutions | | Essential Dental Solutions | | Orthodontic and Implant Solutions | | Wellspect Healthcare | | Total |
| | | | | | | | | | |
| Balance at December 31, 2023 | | | | | | | | | | |
| Goodwill | | $ | 291 | | | $ | 840 | | | $ | 1,323 | | | $ | 275 | | | $ | 2,729 | |
| Accumulated impairment losses | | (291) | | | — | | | — | | | — | | | (291) | |
| Goodwill, net December 31, 2023 | | $ | — | | | $ | 840 | | | $ | 1,323 | | | $ | 275 | | | $ | 2,438 | |
| | | | | | | | | | |
| Impairment | | — | | | — | | | (773) | | | — | | | (773) | |
| Translation | | — | | | (11) | | | (47) | | | (10) | | | (68) | |
| | | | | | | | | | |
| Balance at December 31, 2024 | | | | | | | | | | |
| Goodwill | | $ | 291 | | | $ | 829 | | | $ | 1,276 | | | $ | 265 | | | $ | 2,661 | |
| Accumulated impairment losses | | (291) | | | — | | | (773) | | | — | | | (1,064) | |
| Goodwill, net at December 31, 2024 | | $ | — | | | $ | 829 | | | $ | 503 | | | $ | 265 | | | $ | 1,597 | |
|
| | | | | | | | | | |
Identifiable definite-lived and indefinite-lived intangible assets were as follows: | | | | | | | | | | | | | | | | | | | | | | | | | | | | | | | | | | | | | | |
| | Year Ended December 31, |
| | | 2024 | | 2023 |
| (in millions) | | Gross Carrying Amount | | Accumulated Amortization | | Net Carrying Amount | | Gross Carrying Amount | | Accumulated Amortization | | Net Carrying Amount |
| | | | | | | | | | | | |
| Developed technology and patents | | $ | 1,639 | | | $ | (1,079) | | | $ | 560 | | | $ | 1,697 | | | $ | (1006) | | | $ | 691 | |
| Trade names and trademarks | | 79 | | | (73) | | | 6 | | | 271 | | | (102) | | | 169 | |
| Licensing agreements | | 29 | | | (28) | | | 1 | | | 30 | | | (27) | | | 3 | |
| Customer relationships | | 1,019 | | | (716) | | | 303 | | | 1,070 | | | (680) | | | 390 | |
| Total definite-lived | | $ | 2,766 | | | $ | (1,896) | | | $ | 870 | | | $ | 3,068 | | | $ | (1,815) | | | $ | 1,253 | |
| | | | | | | | | | | | |
| Indefinite-lived trade names and trademarks | | 332 | | | — | | | 332 | | | 447 | | | — | | | 447 | |
In-process R&D (a) | | 5 | | | — | | | 5 | | | 5 | | | — | | | 5 | |
| Total indefinite-lived | | 337 | | | — | | | 337 | | | 452 | | | — | | | 452 | |
| | | | | | | | | | | | |
| Total identifiable intangible assets | | $ | 3,103 | | | $ | (1,896) | | | $ | 1,207 | | | $ | 3,520 | | | $ | (1,815) | | | $ | 1,705 | |
(a) Intangible assets acquired in a business combination that are in-process and used in R&D activities are considered indefinite-lived until the completion or abandonment of the R&D efforts. The useful life and amortization of those assets will be determined once the R&D efforts are completed.
Amortization expense for definite-lived intangible assets for the years ended December 31, 2024, 2023 and 2022 was $216 million, $211 million and $209 million, respectively. The estimated annual amortization expense related to these intangible assets for each of the five succeeding calendar years is $204 million, $132 million, $114 million, $119 million and $120 million for 2025, 2026, 2027, 2028 and 2029, respectively.
During the second quarter of 2021, the Company acquired certain developed technology rights for an initial payment of $3 million. During the fourth quarter of 2024, regulatory and commercial milestones related to the acquisition were achieved, triggering an additional payment of $7 million. As of December 31, 2024, the Company recognized a liability of $10 million for contractual future payments associated with this acquisition that were deemed probable. Both the payment and future obligation were recorded as increases to the developed technology asset for the year ended December 31, 2024.
NOTE 12 - PREPAID EXPENSES AND OTHER CURRENT ASSETS
Prepaid expenses and other current assets were as follows: | | | | | | | | | | | | | | |
| | Year Ended December 31, |
| (in millions) | | 2024 | | 2023 |
| | | | |
| Prepaid expenses | | $ | 121 | | | $ | 113 | |
| Value-added tax receivable | | 50 | | | 61 | |
| Deposits | | 30 | | | 33 | |
| Other current assets | | 153 | | | 113 | |
| Prepaid expenses and other current assets | | $ | 354 | | | $ | 320 | |
NOTE 13 - ACCRUED LIABILITIES
Accrued liabilities were as follows: | | | | | | | | | | | | | | |
| | Year Ended December 31, |
| (in millions) | | 2024 | | 2023 |
| | | | |
| Payroll, commissions, bonuses, other cash compensation and employee benefits | | $ | 125 | | | $ | 161 | |
| Sales and marketing programs | | 86 | | | 68 | |
| Reserve for distributor rebates | | 116 | | | 151 | |
| Restructuring costs | | 31 | | | 37 | |
| Accrued vacation and holidays | | 30 | | | 32 | |
| Professional and legal costs | | 105 | | | 25 | |
| Current portion of derivatives | | 12 | | | 18 | |
| General insurance | | 11 | | | 11 | |
| Warranty liabilities | | 21 | | | 24 | |
| Third-party royalties | | 5 | | | 5 | |
| Deferred income | | 95 | | | 91 | |
| Accrued interest | | 8 | | | 9 | |
| | | | |
| Accrued property taxes | | 5 | | | 6 | |
| Current operating lease liabilities | | 46 | | | 56 | |
| | | | |
| Other | | 58 | | | 55 | |
| Accrued liabilities | | $ | 754 | | | $ | 749 | |
NOTE 14 - FINANCING ARRANGEMENTS
Short-Term Debt
Short-term debt was as follows: | | | | | | | | | | | | | | | | | | | | | | | | | | |
| | Year Ended December 31, |
| | 2024 | | 2023 |
| | Principal | | Interest | | Principal | | Interest |
| (in millions except percentages) | | Balance | | Rate | | Balance | | Rate |
| | | | | | | | |
| | | | | | | | |
| Corporate commercial paper facility | | $ | 410 | | | 5.3 | % | | $ | 225 | | | 5.8 | % |
| Other short-term borrowings | | 11 | | | 4.9 | % | | 20 | | | 4.9 | % |
| Add: Current portion of long-term debt | | 128 | | | | | 77 | | | |
| | | | | | | | |
| Total short-term debt | | $ | 549 | | | | | $ | 322 | | | |
| | | | | | | | |
| Maximum month-end short-term debt outstanding during the year | | $ | 549 | | | | | $ | 399 | | | |
| Average amount of short-term debt outstanding during the year | | 344 | | | | | 284 | | | |
| Weighted-average interest rate on short-term debt at year-end | | | | 5.3 | % | | | | 5.7 | % |
Short-Term Borrowings
The Company has a five-year senior unsecured multi-currency revolving facility, for an aggregate principal amount of $700 million, that expires on May 12, 2028. The Company also has a $700 million commercial paper program. The $700 million multi-currency revolving credit facility serves as a back-up to the commercial paper facility, resulting in an aggregate of $700 million total available credit under the commercial paper facility and the multi-currency revolving credit facility. The Company had outstanding borrowings of $410 million and $225 million under the commercial paper facility at December 31, 2024 and December 31, 2023, respectively, and no outstanding borrowings under the multi-currency revolving credit facility. The Company also has access to $34 million in uncommitted short-term financing available under lines of credit from various financial institutions, which is reduced by outstanding short-term borrowings of $11 million. At December 31, 2024, the weighted-average interest rate for short-term debt was 5.3%.
At December 31, 2024, the Company had $313 million borrowings available under unused lines of credit, including lines available under its short-term arrangements and revolving credit facility.
Long-Term Debt
Long-term debt was as follows: | | | | | | | | | | | | | | | | | | | | | | | | | | |
| | Year Ended December 31, |
| | 2024 | | 2023 |
| | Principal | | Interest | | Principal | | Interest |
| (in millions except percentages) | | Balance | | Rate | | Balance | | Rate |
| | | | | | | | |
| | | | | | | | |
| Private placement notes 70 million euros due October 2024 | | $ | — | | | — | % | | $ | 77 | | | 1.0 | % |
| Private placement notes 25 million Swiss franc due December 2025 | | 28 | | | 0.9 | % | | 30 | | | 0.9 | % |
| Private placement notes 97 million euros due December 2025 | | 100 | | | 2.1 | % | | 107 | | | 2.1 | % |
| Private placement notes 26 million euros due February 2026 | | 27 | | | 2.1 | % | | 29 | | | 2.1 | % |
| Private placement notes 58 million Swiss franc due August 2026 | | 64 | | | 1.0 | % | | 69 | | | 1.0 | % |
| Private placement notes 106 million euros due August 2026 | | 110 | | | 2.3 | % | | 117 | | | 2.3 | % |
| Private placement notes 70 million euros due October 2027 | | 72 | | | 1.3 | % | | 77 | | | 1.3 | % |
| Private placement notes 8 million Swiss franc due December 2027 | | 8 | | | 1.0 | % | | 9 | | | 1.0 | % |
| Private placement notes 15 million euros due December 2027 | | 16 | | | 2.2 | % | | 17 | | | 2.2 | % |
| Private placement notes 140 million Swiss franc due August 2028 | | 154 | | | 1.2 | % | | 166 | | | 1.2 | % |
| Private placement notes 70 million euros due October 2029 | | 72 | | | 1.5 | % | | 77 | | | 1.5 | % |
| Fixed rate senior notes 750 million due June 2030 | | 750 | | | 3.3 | % | | 750 | | | 3.3 | % |
| Private placement notes 70 million euros due October 2030 | | 72 | | | 1.6 | % | | 77 | | | 1.6 | % |
| Private placement notes 45 million euros due February 2031 | | 47 | | | 2.5 | % | | 50 | | | 2.5 | % |
| Private placement notes 65 million Swiss franc due August 2031 | | 72 | | | 1.3 | % | | 77 | | | 1.3 | % |
| Private placement notes 12.6 billion Japanese yen due September 2031 | | 80 | | | 1.0 | % | | 89 | | | 1.0 | % |
| Private placement notes 70 million euros due October 2031 | | 72 | | | 1.7 | % | | 77 | | | 1.7 | % |
| Other borrowings, various currencies and rates | | 4 | | | | | 14 | | | |
Hedge accounting fair value adjustment(a) | | (28) | | | | | (28) | | | |
| | $ | 1,720 | | | | | $ | 1,881 | | | |
| Less: Current portion | | | | | | | | |
| (included in “Notes payable and current portion of long-term debt” in the Consolidated Balance Sheets) | | 128 | | | | | 77 | | | |
| Less: Long-term portion of deferred financing costs | | 6 | | | | | 8 | | | |
| Long-term portion | | $ | 1,586 | | | | | $ | 1,796 | | | |
(a) Represents the fair value of interest rate swap agreements entered into on a portion of the outstanding senior notes.
The Company’s revolving credit facility, term loans, and senior notes contain certain affirmative and negative debt covenants relating to the Company’s operations and financial condition. At December 31, 2024, the Company was in compliance with all debt covenants.
The contractual maturity dates of the Company’s long-term borrowings as of December 31, 2024 were as follows:
| | | | | | | | |
| (in millions) | | |
| 2025 | | $ | 128 | |
| 2026 | | 204 | |
| 2027 | | 96 | |
| 2028 | | 154 | |
| 2029 | | 73 | |
| 2030 and beyond | | 1,093 | |
| | | $ | 1,748 | |
Interest expense, net includes interest income of $20 million, $16 million and $11 million for the years ended December 31, 2024, 2023 and 2022, respectively. Interest income primarily relates to interest-bearing cash equivalents and customer financing for the Company’s direct-to-consumer aligner solutions.
NOTE 15 - EQUITY
On November 7, 2023, the Board of Directors approved an increase to the authorized share repurchase program of $1.0 billion. Share repurchases may be made through open market purchases, Rule 10b5-1 plans, accelerated share repurchases, privately negotiated transactions or other transactions in such amounts and at such times as the Company considers appropriate based upon prevailing market and business conditions and other factors. At December 31, 2024, the Company had authorization to repurchase $1.2 billion in shares of common stock remaining under the share repurchase program.
On March 3, 2023, the Company entered into an Accelerated Share Repurchase Agreement (“ASR Agreement”) with a financial institution to repurchase the Company’s common stock. The Company repurchased shares under the ASR Agreement as part of the share repurchase program described above. In 2023, the Company repurchased approximately 3.1 million shares, which were delivered during March 2023, at a volume-weighted average price of $38.74, representing $120 million of the total anticipated repurchase size. In April 2023, an additional 0.8 million shares were delivered upon the final settlement of the ASR Agreement, resulting in a total of 3.9 million shares repurchased under the agreement.
| | | | | | | | | | | | | | | | | | | | | | | | | | | | | |
| (in millions, except per share amounts) | | Initial Delivery | | Final Settlement |
| Agreement Date | Amount Paid | | Shares Received | Price per share | Value of Shares as a % of Contract Value | | Settlement Date | Total Shares Received | Average Price per Share |
| March 3, 2023 | $ | 150 | | | 3.1 | $ | 38.74 | | 80 | % | | April 28, 2023 | 3.9 | $ | 38.55 | |
The ASR Agreement was accounted for as an initial delivery of common shares in a treasury stock transaction on March 6, 2023 of $121 million and a forward contract indexed to the Company’s common stock for an amount of common shares that was determined on the final settlement date. The forward contract met all applicable criteria for equity classification and was not accounted for as a derivative instrument for the quarter ended March 31, 2023. Therefore, the value of the forward contract of $30 million was recorded in Capital in excess of par value at March 31, 2023. Upon final settlement in April 2023, this amount was subsequently recorded as Treasury Stock in the Consolidated Balance Sheets. The initial delivery and final settlement of common stock reduced the weighted average common shares outstanding for both basic and diluted earnings per share. The forward contract did not impact the weighted average common shares outstanding for diluted earnings per share.
For the years ended December 31, 2024, 2023 and 2022, the Company repurchased outstanding shares of common stock at a cost of $250 million, $300 million and $150 million, respectively. For the year ended December 31, 2024, the treasury stock transactions resulted in an excise tax charge of $2 million for public company stock repurchases established by the Inflation Reduction Act of 2022.
For the years ended December 31, 2024 and 2023, stock options exercised and the proceeds received at exercise were not significant. For the year ended December 31, 2022, the Company received proceeds of $6 million primarily as a result of stock options exercised in the amount of 0.1 million. It is the Company’s practice to issue shares from treasury stock when stock options are exercised and RSUs vest.
Total outstanding shares of common stock and treasury stock were as follows: | | | | | | | | | | | | | | | | | | | | |
| (in millions) | | Shares of Common Stock | | Shares of Treasury Stock | | Outstanding Shares |
| | | | | | |
| Balance at December 31, 2021 | | 264.5 | | | (47.1) | | | 217.4 | |
| | | | | | |
| Shares of treasury stock issued | | — | | | 0.9 | | | 0.9 | |
| Repurchase of common stock at an average cost of $48.22 | | — | | | (3.1) | | | (3.1) | |
| | | | | | |
| Balance at December 31, 2022 | | 264.5 | | | (49.3) | | | 215.2 | |
| | | | | | |
| Shares of treasury stock issued | | — | | | 0.8 | | | 0.8 | |
| Repurchase of common stock at an average cost of $34.20 | | — | | | (8.8) | | | (8.8) | |
| | | | | | |
| Balance at December 31, 2023 | | 264.5 | | | (57.3) | | | 207.2 | |
| Shares of treasury stock issued | | — | | | 1.0 | | | 1.0 | |
| Repurchase of common stock at an average cost of $26.65 | | — | | | (9.4) | | | (9.4) | |
| | | | | | |
| Balance at December 31, 2024 | | 264.5 | | | (65.7) | | | 198.8 | |
NOTE 16 - INCOME TAXES
The components of loss before income taxes were as follows: | | | | | | | | | | | | | | | | | | | | |
| | Year Ended December 31, |
| (in millions) | | 2024 | | 2023 | | 2022 |
| | | | | | |
| United States | | $ | (307) | | | $ | (6) | | | $ | (531) | |
| Foreign | | (629) | | | (169) | | | (524) | |
| Total loss before income taxes | | $ | (936) | | | $ | (175) | | | $ | (1,055) | |
The components of the benefit for income taxes from operations were as follows: | | | | | | | | | | | | | | | | | | | | |
| | Year Ended December 31, |
| (in millions) | | 2024 | | 2023 | | 2022 |
| | | | | | |
| Current: | | | | | | |
| U.S. federal | | $ | (6) | | | $ | 1 | | | $ | 1 | |
| U.S. state | | 1 | | | — | | | 4 | |
| Foreign | | 115 | | | 86 | | | 118 | |
| Total | | $ | 110 | | | $ | 87 | | | $ | 123 | |
| | | | | | |
| Deferred: | | | | | | |
| U.S. federal | | $ | (61) | | | $ | 4 | | | $ | (145) | |
| U.S. state | | (1) | | | (3) | | | (17) | |
| Foreign | | (74) | | | (131) | | | (66) | |
| Total | | $ | (136) | | | $ | (130) | | | $ | (228) | |
| | | | | | |
| Total benefit for income taxes | | $ | (26) | | | $ | (43) | | | $ | (105) | |
The reconciliation of the U.S. federal statutory tax rate to the effective rate were as follows: | | | | | | | | | | | | | | | | | | | | | | | | | | | | | |
| | Year Ended December 31, |
| (in millions, except percentages) | | 2024 | | 2023 | | 2022 |
| | | | | | | | | |
| Statutory U.S. federal income tax rate | | $ | (197) | | 21.0 | % | | $ | (37) | | 21.0 | % | | $ | (222) | | 21.0 | % |
| Effect of: | | | | | | | | | |
| State income taxes, net of federal benefit | | — | | — | | | (2) | | 1.4 | | | (11) | | 1.0 | |
| Federal benefit of R&D and foreign tax credits | | (7) | | 0.8 | | | (17) | | 10.0 | | | (8) | | 0.8 | |
| U.S. other permanent differences | | 3 | | (0.3) | | | 5 | | (2.7) | | | 9 | | (0.9) | |
| Tax effect of international operations | | 42 | | (4.5) | | | (65) | | 37.2 | | | (5) | | 0.5 | |
| Global Intangible Low Taxed Income (GILTI) | | 9 | | (1.0) | | | 12 | | (7.0) | | | 20 | | (1.9) | |
| Foreign Derived Intangible Income (FDII) | | — | | — | | | (9) | | 5.2 | | | (8) | | 0.8 | |
| Net effect of tax audit activity | | 23 | | (2.5) | | | (6) | | 3.2 | | | 15 | | (1.4) | |
| Tax effect of enacted statutory rate changes on Non-U.S. jurisdictions | | 3 | | (0.3) | | | 1 | | (0.4) | | | (3) | | 0.3 | |
| Federal tax on unremitted earnings of certain foreign subsidiaries | | (1) | | 0.1 | | | 2 | | (0.9) | | | 1 | | (0.1) | |
| Valuation allowance adjustments | | (13) | | 1.3 | | | 5 | | (3.2) | | | (9) | | 0.8 | |
| Tax effect of impairment of goodwill and intangibles | | 106 | | (11.3) | | | 60 | | (34.6) | | | 114 | | (10.8) | |
| Other | | 6 | | (0.5) | | | 8 | | (4.4) | | | 2 | | (0.2) | |
| | | | | | | | | |
| Effective income tax rate on operations | | $ | (26) | | 2.8 | % | | $ | (43) | | 24.8 | % | | $ | (105) | | 9.9 | % |
The tax effect of significant temporary differences giving rise to deferred tax assets and liabilities were as follows: | | | | | | | | | | | | | | | |
| | Year Ended December 31, |
| (in millions) | | 2024 | | 2023 |
| | | | | |
| Deferred tax assets | | | | | |
| Employee benefit accruals | | $ | 40 | | | $ | 55 | | |
| Inventory | | 19 | | | 15 | | |
| Miscellaneous accruals | | 50 | | | 51 | | |
| Other | | 44 | | | 44 | | |
| Lease right-of-use liability | | 39 | | | 46 | | |
| Net unrealized gains/losses included in AOCI | | — | | | 36 | | |
| Foreign tax credit and R&D carryforward | | 41 | | | 43 | | |
| Tax loss carryforwards and other tax attributes | | 1,554 | | | 948 | | |
| Total deferred tax assets | | $ | 1,787 | | | $ | 1,238 | | |
| Less: Valuation allowances | | (1,503) | | | (863) | | |
| Total deferred tax assets, net | | $ | 284 | | | $ | 375 | | |
| | | | | |
| Deferred tax liabilities | | | | | |
| Identifiable intangible assets | | $ | (110) | | | $ | (298) | | |
| Property, plant and equipment | | (28) | | | (38) | | |
| Lease right-of-use asset | | (38) | | | (46) | | |
| Net unrealized gains/losses included in AOCI | | (9) | | | — | | |
| Taxes on unremitted earnings of foreign subsidiaries | | (6) | | | (8) | | |
| Total deferred tax liabilities | | (191) | | | (390) | | |
| Net deferred tax assets (liabilities) | | $ | 93 | | | $ | (15) | | |
| | | | | |
Deferred tax assets and liabilities included in the following Consolidated Balance Sheets line items at December 31 were as follows:
| | | | | | | | | | | | | | |
| | Year Ended December 31, |
| (in millions) | | 2024 | | 2023 |
| | | | |
| Assets | | | | |
| Other noncurrent assets | | $ | 222 | | | $ | 213 | |
| Liabilities | | | | |
| Deferred income taxes | | $ | 129 | | | $ | 228 | |
The Company has $36 million of foreign tax credit carryforwards at December 31, 2024, of which $30 million will expire in 2025 and $6 million will expire at various times from 2028 through 2031.
The Company has tax loss carryforwards related to certain foreign and domestic subsidiaries of approximately $7,482 million at December 31, 2024, of which $7,214 million expires at various times through 2044 and $268 million may be carried forward indefinitely. These are reflected as deferred income tax assets at December 31, 2024, and are comprised of future tax benefits of $1,458 million and $96 million, before valuation allowances, related to tax loss carryforwards and disallowed interest carryforwards, respectively. As of December 31, 2023 the Company’s deferred tax assets included $873 million of tax loss carryforwards and $74 million of disallowed interest carryforwards. The increase in tax loss carryforwards in 2024 is primarily the result of impairment losses.
At December 31, 2024, the Company has recorded $1,395 million of valuation allowance to offset the future tax benefit of net operating losses, $29 million to offset the future tax benefit of foreign tax credits, and $79 million of valuation allowance for other deferred tax assets. The Company has recorded these valuation allowances due to the uncertainty that these assets can be realized in the future. The increase in the valuation allowance is attributable to the increase in the tax loss carryforwards generated in 2024 as there is uncertainty that these assets can be realized in the future.
The Company has recorded $6 million of withholding taxes on certain undistributed earnings of its foreign subsidiaries that the Company anticipates will be repatriated. Undistributed earnings of foreign subsidiaries and related companies that are considered to be permanently invested amounted to $348 million at December 31, 2024.
Tax Contingencies
The total amount of gross unrecognized tax benefits at December 31, 2024 is approximately $137 million, including interest, of which approximately $51 million represents the amount of unrecognized tax benefits that, if recognized, would affect the effective income tax rate. It is reasonably possible that certain amounts of unrecognized tax benefits will significantly increase or decrease within twelve months of the reporting date of the Company’s consolidated financial statements. Expiration of statutes of limitations in various jurisdictions during the next twelve months could include unrecognized tax benefits of approximately $6 million, which, if recognized, would affect the effective income tax rate.
The total amount of accrued interest and penalties were $9 million and $4 million at December 31, 2024 and 2023, respectively. The Company has consistently classified interest and penalties recognized in its consolidated financial statements as income taxes based on the accounting policy election of the Company. The Company recognized a tax expense of $5 million for the year ended December 31, 2024, and a tax benefit of $2 million in 2023 related to interest and penalties.
The increase in unrecognized tax benefits in 2024 is primarily related to transfer pricing adjustments in certain jurisdictions, offset by a decrease from foreign currency translation.
The Company is subject to U.S. federal income tax as well as income tax of multiple state and foreign jurisdictions. The significant jurisdictions include the United States and Germany. The Company has concluded all U.S. federal income tax matters for years through 2014 with the Internal Revenue Service (“IRS”). The Company is currently under IRS audit for the tax years 2015 and 2016. The Company is under audit in Germany for the tax years 2014 through 2021. For additional information on the IRS and German audits, see Note 21, Commitments and Contingencies.
The activity recorded for unrecognized tax benefits were as follows:
| | | | | | | | | | | | | | | | | | | | |
| | Year Ended December 31, |
| (in millions) | | 2024 | | 2023 | | 2022 |
| | | | | | |
| Unrecognized tax benefits at beginning of period | | $ | 132 | | | $ | 49 | | | $ | 34 | |
| Gross change for prior-period positions | | 18 | | | 1 | | | 12 | |
| Gross change for current year positions | | 1 | | | 95 | | | 4 | |
| Decrease due to settlements and payments | | (13) | | | (9) | | | — | |
| Decrease due to statute expirations | | — | | | (4) | | | — | |
| Increase due to effect of foreign currency translation | | — | | | — | | | — | |
| Decrease due to effect from foreign currency translation and other | | (10) | | | — | | | (1) | |
| | | | | | |
| Unrecognized tax benefits at end of period | | $ | 128 | | | $ | 132 | | | $ | 49 | |
NOTE 17 - BENEFIT PLANS
Defined Contribution Plans
The Company maintains both U.S. and non-U.S. employee defined contribution plans. The primary U.S. plan, the Dentsply Sirona Inc. 401(k) Savings Plan (the “Plan”), allows eligible employees to contribute a portion of their cash compensation to the Plan on a tax-deferred basis, and the Company provides a matching contribution. The Plan includes various investment funds. Each eligible participant who elects to contribute to the Plan will receive a matching contribution of 100% on the first 1% contributed and 50% on the next 5% contributed for a total maximum matching contribution of 3.5%. At its discretion, the Company may make additional non-elective cash contributions based on a percentage of compensation to participant accounts. The Company did not make any additional non-elective cash contributions in connection with 2024 compensation. In addition to the Plan, the Company also maintains various other U.S. and non-U.S. defined contribution and non-qualified deferred compensation plans. The annual expenses, net of forfeitures, of these plans were $34 million, $43 million and $41 million for the years ended December 31, 2024, 2023, and 2022, respectively.
Defined Benefit Plans
The Company maintains defined benefit pension plans for certain employees in Austria, France, Germany, Indonesia, Italy, Japan, the Netherlands, Norway, Sweden, Switzerland, Taiwan, and the United States. These plans provide benefits based upon age, years of service and remuneration. Substantially all the German and Swedish plans are unfunded book reserve plans. Most employees and retirees outside the United States are covered by government health plans.
The Company predominantly derives its discount rates by applying the specific spot rates along the yield curve to the relevant projected cash flows; or, in markets where there is an absence of a sufficiently deep corporate bond market, it uses liability durations in establishing its discount rates, which are observed from indices of high-grade corporate or government bond yield in the respective economic regions of a given plan. For the large defined benefits pension plans, the Company uses a spot rate approach for the estimation of the Service cost and Interest cost components of benefit cost by applying the specific spot rates along the yield curve to the relevant projected cash flows.
Significant changes in the retirement plan benefit obligations for the year ended December 31, 2024 include a $9 million actuarial gain primarily attributable to the increase in discount rates, the effect of which is slightly offset by a $1 million loss due to a change in the lump sum withdrawal rate for the Swiss plan. The changes also include a $4 million actuarial loss due to plan experience being different than anticipated.
Significant changes in the retirement plan benefit obligations for the year ended December 31, 2023 include a $35 million actuarial loss primarily attributable to the decrease in discount rates, the effect of which is slightly offset by the change in inflation and salary increase assumptions in some plans. The changes also include a $3 million actuarial loss due to plan experience being different than anticipated.
Defined Benefit Pension Plan Assets
The primary investment strategy is to ensure that the assets of the plans, along with anticipated future contributions, will be invested in order that the benefit entitlements of employees, pensioners and beneficiaries covered under the plan can be met when due with high probability. Pension plan assets consist mainly of common stock and fixed income investments. The target allocations for defined benefit plan assets are 30% to 65% equity securities, 30% to 65% fixed income securities, 0% to 15% real estate, and 0% to 25% in all other types of investments. Equity securities include investments in companies located both in and outside the United States. Equity securities in the defined benefit pension plans do not include Company common stock contributed directly by the Company. Fixed income securities include corporate bonds of companies from diversified industries, government bonds, mortgage notes and pledge letters. Other types of investments include investments in mutual funds, insurance contracts, hedge funds and real estate. These plan assets are not recorded in the Company’s Consolidated Balance Sheet as they are held in trust or other off-balance sheet investment vehicles.
The defined benefit pension plan assets maintained in Austria, Germany, Norway, the Netherlands, Switzerland and Taiwan all have separate investment policies but generally have an objective to achieve a long-term rate of return in excess of 2% while at the same time mitigating the impact of investment risk associated with investment categories that are expected to yield greater than average returns. In accordance with the investment policies, the plans’ assets were invested in the following investment categories: interest-bearing cash, U.S. and foreign equities, foreign fixed income securities (primarily corporate and government bonds), insurance company contracts, real estate and hedge funds.
Reconciliation of changes in the defined benefit obligations, fair value of assets and statement of funded status were as follows: | | | | | | | | | | | | | | |
| | | | | |
| | |
| | Year Ended December 31, |
| (in millions) | | 2024 | | 2023 |
| | | | |
| Change in Benefit Obligation | | | | |
| Benefit obligation at beginning of year | | $ | 511 | | | $ | 440 | |
| Service cost | | 11 | | | 10 | |
| Interest cost | | 12 | | | 14 | |
| Participant contributions | | 5 | | | 4 | |
| Actuarial (gains) losses | | (4) | | | 38 | |
| | | | |
| | | | |
| Effect of exchange rate changes | | (36) | | | 26 | |
| | | | |
| | | | |
| Benefits paid | | (21) | | | (21) | |
| Benefit obligation at end of year | | $ | 478 | | | $ | 511 | |
| | | | |
| Change in Plan Assets | | | | |
| Fair value of plan assets at beginning of year | | $ | 207 | | | $ | 182 | |
| Actual return on assets | | 16 | | | 10 | |
| | | | |
| | | | |
| Effect of exchange rate changes | | (15) | | | 17 | |
| Employer contributions | | 16 | | | 15 | |
| Participant contributions | | 5 | | | 4 | |
| Benefits paid | | (21) | | | (21) | |
| Fair value of plan assets at end of year | | $ | 208 | | | $ | 207 | |
| | | | |
| Funded status at end of year | | $ | (270) | | | $ | (304) | |
The amounts recognized in the accompanying Consolidated Balance Sheets, net of tax effects, were as follows: | | | | | | | | | | | | | | | | | | | | |
| | Location In The | | Year Ended December 31, |
| (in millions) | | Consolidated Balance Sheets | | 2024 | | 2023 |
| | | | | | |
| Other noncurrent assets | | Other noncurrent assets | | $ | 4 | | | $ | 5 | |
| Deferred tax asset | | Other noncurrent assets | | 8 | | | 11 | |
| Total assets | | | | $ | 12 | | | $ | 16 | |
| | | | | | |
| Current liabilities | | Accrued liabilities | | $ | (10) | | | $ | (11) | |
| Other noncurrent liabilities | | Other noncurrent liabilities | | (264) | | | (298) | |
| Deferred tax liability | | Deferred income taxes | | (4) | | | (2) | |
| Total liabilities | | | | $ | (278) | | | $ | (311) | |
| | | | | | |
| Accumulated other comprehensive income | | Accumulated other comprehensive loss | | 23 | | | 36 | |
| Net amount recognized | | | | $ | (243) | | | $ | (259) | |
Amounts recognized in AOCI were as follows: | | | | | | | | | | | | | | |
| | | | | |
| | | Year Ended December 31, |
| (in millions) | | 2024 | | 2023 |
| | | | |
| Net actuarial loss | | $ | 30 | | | $ | 48 | |
| Net prior service cost | | (3) | | | (3) | |
| Before tax AOCI | | $ | 27 | | | $ | 45 | |
| Less: Deferred taxes | | 4 | | | 9 | |
| Net of tax AOCI | | $ | 23 | | | $ | 36 | |
Information for pension plans with a projected or accumulated benefit obligation in excess of plan assets was as follows: | | | | | | | | | | | | | | |
| | Year Ended December 31, |
| (in millions) | | 2024 | | 2023 |
| | | | |
| Projected benefit obligation | | $ | 274 | | | $ | 323 | |
| Accumulated benefit obligation | | 263 | | | 310 | |
| Fair value of plan assets | | — | | | 15 | |
Components of net periodic benefit cost were as follows:
| | | | | | | | | | | | | | | | | | | | | | | | | | |
| | | Year Ended December 31, | | Location in the Consolidated Statements of Operations |
| (in millions) | | 2024 | | 2023 | | 2022 | |
| | | | | | | | |
| Service cost | | $ | 4 | | | $ | 4 | | | $ | 5 | | | Cost of products sold |
| Service cost | | 7 | | | 6 | | | 7 | | | Selling, general and administrative expenses |
| Interest cost | | 12 | | | 14 | | | 5 | | | Other (income) expense, net |
| Expected return on plan assets | | (5) | | | (6) | | | (4) | | | Other (income) expense, net |
| | | | | | | | |
| Amortization of prior service credit | | (1) | | | (1) | | | (1) | | | Other (income) expense, net |
| Amortization of net actuarial loss | | 2 | | | — | | | 8 | | | Other (income) expense, net |
| | | | | | | | |
| Curtailment and settlement gains | | — | | | — | | | (1) | | | Other (income) expense, net |
| | | | | | | | |
| Net periodic benefit cost | | $ | 19 | | | $ | 17 | | | $ | 19 | | | |
Other changes in plan assets and benefit obligations recognized in AOCI were as follows:
| | | | | | | | | | | | | | | | | | | | |
| | | Year Ended December 31, |
| (in millions) | | 2024 | | 2023 | | 2022 |
| | | | | | |
| Net actuarial (gains) losses | | $ | (17) | | | $ | 37 | | | $ | (125) | |
| | | | | | |
| | | | | | |
| Amortization | | (1) | | | 1 | | | (7) | |
| Total recognized in AOCI | | $ | (18) | | | $ | 38 | | | $ | (132) | |
| Total recognized in net periodic benefit cost and AOCI | | $ | 1 | | | $ | 55 | | | $ | (113) | |
Assumptions
The weighted average assumptions used to determine benefit obligations for the Company’s plans, principally in foreign locations were as follows:
| | | | | | | | | | | | | | | | | | | | |
| | Year Ended December 31, |
| | 2024 | | 2023 | | 2022 |
| | | | | | |
| Interest crediting rate | | 2.0 | % | | 2.3 | % | | 2.5 | % |
| Discount rate | | 2.5 | % | | 2.6 | % | | 3.2 | % |
| Rate of compensation increase | | 2.4 | % | | 2.5 | % | | 2.6 | % |
| | | | | | |
| | | | | | |
| | | | | | |
| | | | | | |
| | | | | | |
The weighted average assumptions used to determine net periodic benefit cost for the Company’s plans, principally in foreign locations were as follows:
| | | | | | | | | | | | | | | | | | | | |
| | Year Ended December 31, |
| | 2024 | | 2023 | | 2022 |
| | | | | | |
| Interest crediting rate | | 2.3 | % | | 2.5 | % | | 1.3 | % |
| Discount rate | | 2.6 | % | | 3.2 | % | | 1.1 | % |
| Expected return on plan assets | | 2.9 | % | | 3.2 | % | | 2.2 | % |
| Rate of compensation increase | | 2.5 | % | | 2.6 | % | | 2.6 | % |
| Measurement date | | 12/31/2024 | | 12/31/2023 | | 12/31/2022 |
To develop the assumptions for the expected long-term rate of return on assets, the Company considered the current level of expected returns on risk free investments (primarily U.S. government bonds), the historical level of the risk premium associated with the other asset classes in which the assets are invested and the expectations for future returns of each asset class. The expected return for each asset class was then weighted based on the target asset allocations to develop the assumptions for the expected long-term rate of return on assets.
Fair Value Measurements of Plan Assets
The fair values of the Company’s pension plan assets at December 31, 2024 and 2023 are presented in the table below by asset category. Approximately 83% of the total plan assets are categorized as Level 1, as the values assigned to these pension assets are based on quoted prices available in active markets. For the other category levels, a description of the valuation is provided in Note 1, Significant Accounting Policies, under the “Fair Value Measurement” heading.
| | | | | | | | | | | | | | | | | | | | | | | | | | |
| | | December 31, 2024 |
| (in millions) | | Total | | Level 1 | | Level 2 | | Level 3 |
| | | | | | | | |
| Assets Category | | | | | | | | |
| Cash and cash equivalents | | $ | 6 | | | $ | 6 | | | $ | — | | | $ | — | |
| Equity securities: | | | | | | | | |
| | | | | | | | |
| International | | 67 | | | 67 | | | — | | | — | |
| Fixed income securities: | | | | | | | | |
Fixed rate bonds (a) | | 79 | | | 79 | | | — | | | — | |
| Other types of investments: | | | | | | | | |
Mutual funds (b) | | 21 | | | 21 | | | — | | | — | |
| | | | | | | | |
| | | | | | | | |
| Insurance contracts | | 24 | | | — | | | — | | | 24 | |
| Hedge funds | | 10 | | | — | | | — | | | 10 | |
| Real estate | | 1 | | | — | | | — | | | 1 | |
| Total | | $ | 208 | | | $ | 173 | | | $ | — | | | $ | 35 | |
| | | | | | | | | | | | | | | | | | | | | | | | | | |
| | | December 31, 2023 |
| (in millions) | | Total | | Level 1 | | Level 2 | | Level 3 |
| | | | | | | | |
| Assets Category | | | | | | | | |
| Cash and cash equivalents | | $ | 7 | | | $ | 7 | | | $ | — | | | $ | — | |
| Equity securities: | | | | | | | | |
| | | | | | | | |
| International | | 63 | | | 63 | | | — | | | — | |
| Fixed income securities: | | | | | | | | |
Fixed rate bonds (a) | | 84 | | | 84 | | | — | | | — | |
| Other types of investments: | | | | | | | | |
Mutual funds (b) | | 19 | | | 19 | | | — | | | — | |
| | | | | | | | |
| | | | | | | | |
| Insurance contracts | | 26 | | | — | | | — | | | 26 | |
| Hedge funds | | 7 | | | — | | | — | | | 7 | |
| Real estate | | 1 | | | — | | | — | | | 1 | |
| Total | | $ | 207 | | | $ | 173 | | | $ | — | | | $ | 34 | |
(a) This category includes fixed income securities invested primarily in Swiss bonds, foreign bonds denominated in Swiss francs, foreign currency bonds, mortgage notes and pledged letters.
(b) This category includes mutual funds balanced between moderate income generation and moderate capital appreciation with investment allocations of approximately 50% equities and 50% fixed income investments.
A reconciliation from December 31, 2022 to December 31, 2024 for the plan assets categorized as Level 3 was as follows:
| | | | | | | | | | | | | | | | | | | | | | | | | | |
| (in millions) | | Insurance Contracts | | Hedge Funds | | Real Estate | | Total |
| | | | | | | | |
| Balance at December 31, 2022 | | $ | 24 | | | $ | 9 | | | $ | 1 | | | $ | 34 | |
| Actual return on plan assets: | | | | | | | | |
| Relating to assets still held at the reporting date | | 2 | | | — | | | — | | | 2 | |
| | | | | | | | |
| | | | | | | | |
| Purchases, sales and settlements, net | | (1) | | | (3) | | | — | | | (4) | |
| | | | | | | | |
| Effect of exchange rate changes | | 1 | | | 1 | | | — | | | 2 | |
| Balance at December 31, 2023 | | $ | 26 | | | $ | 7 | | | $ | 1 | | | $ | 34 | |
| Actual return on plan assets: | | | | | | | | |
| Relating to assets still held at the reporting date | | $ | 1 | | | $ | 1 | | | $ | — | | | $ | 2 | |
| | | | | | | | |
| | | | | | | | |
| Purchases, sales and settlements, net | | (1) | | | 3 | | | — | | | 2 | |
| | | | | | | | |
| Effect of exchange rate changes | | (2) | | | (1) | | | — | | | (3) | |
| Balance at December 31, 2024 | | $ | 24 | | | $ | 10 | | | $ | 1 | | | $ | 35 | |
Fair values for Level 3 assets are determined as follows:
Insurance Contracts: The value of the asset represents the mathematical reserve of the insurance policies and is calculated by the insurance firms using their own assumptions.
Hedge Funds: The investments are valued using the net asset value provided by the administrator of the fund, which is based on the fair value of the underlying securities.
Real Estate: Investment is stated by its appraised value.
Cash Flows
In 2025, the Company expects to make employer contributions of $17 million to its defined benefit pension plans.
Estimated Future Benefit Payments
Total benefits expected to be paid from the plans in the future are as follows: | | | | | | | | |
| (in millions) | | Pension Benefits |
| | |
| 2025 | | $ | 25 | |
| 2026 | | 25 | |
| 2027 | | 26 | |
| 2028 | | 23 | |
| 2029 | | 23 | |
| 2030-2034 | | 131 | |
NOTE 18 - RESTRUCTURING AND OTHER COSTS
Restructuring and other costs for the years ended December 31, 2024, 2023 and 2022 were recorded in the Consolidated Statements of Operations as follows:
| | | | | | | | | | | | | | | | | | | | |
| Affected Line Item in the Consolidated Statements of Operations | | Year Ended December 31, |
| (in millions) | | 2024 | | 2023 | | 2022 |
| | | | | | |
| Cost of products sold | | $ | 10 | | | $ | 4 | | | $ | — | |
| Selling, general, and administrative expenses | | 32 | | | 3 | | | — | |
| Restructuring costs | | 53 | | | 67 | | | 14 | |
| | | | | | |
| Total Restructuring and other costs | | $ | 95 | | | $ | 74 | | | $ | 14 | |
Restructuring and other costs of $95 million were recorded in the year ended December 31, 2024, which consisted primarily of employee severance benefits and other costs related to the restructuring plans approved by the Board of Directors of the Company on July 29, 2024 (the “2024 Plan”) and on February 14, 2023 (the “2023 Plan”), as well as certain asset impairments resulting from the strategic actions related to the Byte aligners business beginning in October 2024 (the “Byte Realignment”).
Restructuring Plans
With the 2024 Plan, the Company seeks to improve operational performance and drive stockholder value creation. In connection with the 2024 Plan, which is expected to be substantially completed by the end of 2025, the Company anticipates a net reduction in the Company’s global workforce of approximately 2% to 4%. The proposed changes are subject to co-determination processes with employee representative groups in countries where required. Actions taken under the 2024 Plan seek to further streamline the Company’s operations and global footprint, as well as improve alignment of the Company’s cost structure with its strategic growth objectives. As of December 31, 2024, the Company has incurred $28 million in restructuring charges under the 2024 Plan since its inception. In total, the Company expects to incur between $35 million and $50 million in non-recurring restructuring charges under the 2024 Plan, primarily related to employee transition, severance payments, and employee benefits, which are expected to be expensed and paid in cash by the end of 2025.
With the 2023 Plan, the Company sought to restructure the business through a new operating model with five global business units, optimize central functions and overall management infrastructure, and implement other efforts aimed at cost savings. The 2023 Plan’s annual cost savings target of $200 million has been substantially met, with the benefits mostly offset in the short term by additional investments in sales personnel, the Company’s new global Enterprise Resource Planning (“ERP”) system, and other transformation initiatives. As of December 31, 2024, the Company has incurred $87 million in restructuring charges under the 2023 Plan since its inception, primarily related to employee transition, severance payments, employee benefits, and facility closure costs, and $20 million in other non-recurring costs related to restructuring activities, which mostly consist of consulting, legal, and other professional service fees. Remaining restructuring charges attributable to the 2023 Plan are not expected to be material.
The estimates of the charges and expenditures that the Company expects to incur in connection with the 2024 Plan, and the timing thereof, are subject to several assumptions, including local law requirements in various jurisdictions and co-determination aspects in countries where required. Actual amounts may differ materially from estimates. In addition, the Company may incur additional charges or cash expenditures not currently contemplated due to unanticipated events that may occur, including in connection with the implementation of the 2024 Plan.
The liabilities associated with the Company’s restructuring plans are recorded in Accrued liabilities and Other noncurrent liabilities in the Consolidated Balance Sheets. Activity in the Company’s restructuring accruals at December 31, 2024 was as follows: | | | | | | | | | | | | | | | | | | | | | | | | | | |
| | Severance |
| (in millions) | | 2022 and Prior Plans | | 2023 Plans | | 2024 Plans | | Total |
| | | | | | | | |
| Balance at December 31, 2023 | | $ | 2 | | | $ | 37 | | | $ | — | | | $ | 39 | |
| Provisions and adjustments | | 1 | | | 23 | | | 30 | | | 54 | |
| Amounts applied | | (2) | | | (44) | | | (11) | | | (57) | |
| Change in estimates | | — | | | (4) | | | — | | | (4) | |
| Balance at December 31, 2024 | | $ | 1 | | | $ | 12 | | | $ | 19 | | | $ | 32 | |
| | | | | | | | | | | | | | | | | | | | | | | | | | |
| | Other Restructuring Costs |
| (in millions) | | 2022 and Prior Plans | | 2023 Plans | | 2024 Plans | | Total |
| | | | | | | | |
| Balance at December 31, 2023 | | $ | 1 | | | $ | — | | | $ | — | | | $ | 1 | |
| Provisions and adjustments | | — | | | 3 | | | — | | | 3 | |
| Amounts applied | | — | | | (3) | | | — | | | (3) | |
| | | | | | | | |
| Balance at December 31, 2024 | | $ | 1 | | | $ | — | | | $ | — | | | $ | 1 | |
The cumulative amounts for the provisions and adjustments and amounts applied for all the plans by segment were as follows: | | | | | | | | | | | | | | | | | | | | | | | | | | | | | | | | |
| (in millions) | | December 31, 2023 | | Provisions and Adjustments | | Amounts Applied | | Change in Estimates | | December 31, 2024 |
| | | | | | | | | | |
| Connected Technology Solutions | | $ | 13 | | | $ | 23 | | | $ | (25) | | | $ | (2) | | | $ | 9 | |
| Essential Dental Solutions | | 17 | | | 15 | | | (20) | | | (1) | | | 11 | |
| Orthodontic and Implant Solutions | | 9 | | | 11 | | | (11) | | | — | | | 9 | |
| Wellspect Healthcare | | 1 | | | 5 | | | (2) | | | (1) | | | 3 | |
| All Other | | — | | | 3 | | | (2) | | | — | | | 1 | |
| Total | | $ | 40 | | | $ | 57 | | | $ | (60) | | | $ | (4) | | | $ | 33 | |
The Company’s restructuring accruals at December 31, 2023 were as follows: | | | | | | | | | | | | | | | | | | | | | | | | | | |
| | Severances |
| (in millions) | | 2021 and Prior Plans | | 2022 Plans | | 2023 Plans | | Total |
| | | | | | | | |
| Balance at December 31, 2022 | | $ | 4 | | | $ | 3 | | | $ | — | | | $ | 7 | |
| Provisions and adjustments | | — | | | 2 | | | 62 | | | 64 | |
| Amounts applied | | (2) | | | (3) | | | (24) | | | (29) | |
| Change in estimates | | — | | | (2) | | | (1) | | | (3) | |
| Balance at December 31, 2023 | | $ | 2 | | | $ | — | | | $ | 37 | | | $ | 39 | |
| | | | | | | | | | | | | | | | | | | | | | | | | | |
| | Other Restructuring Costs |
| (in millions) | | 2021 and Prior Plans | | 2022 Plans | | 2023 Plans | | Total |
| | | | | | | | |
| Balance at December 31, 2022 | | $ | — | | | $ | 1 | | | $ | — | | | $ | 1 | |
| Provisions and adjustments | | 1 | | | — | | | 9 | | | 10 | |
| Amounts applied | | (1) | | | — | | | (8) | | | (9) | |
| Change in estimates | | — | | | — | | | (1) | | | (1) | |
| Balance at December 31, 2023 | | $ | — | | | $ | 1 | | | $ | — | | | $ | 1 | |
The cumulative amounts for the provisions and adjustments and amounts applied for all the plans by segment were as follows: | | | | | | | | | | | | | | | | | | | | | | | | | | | | | | | | |
| (in millions) | | December 31, 2022 | | Provisions and Adjustments | | Amounts Applied | | Change in Estimates | | December 31, 2023 |
| | | | | | | | | | |
| Connected Technology Solutions | | $ | 3 | | | $ | 18 | | | $ | (8) | | | $ | — | | | $ | 13 | |
| Essential Dental Solutions | | 4 | | | 25 | | | (10) | | | (2) | | | 17 | |
| Orthodontic and Implant Solutions | | 1 | | | 16 | | | (7) | | | (1) | | | 9 | |
| Wellspect Healthcare | | — | | | 5 | | | (3) | | | (1) | | | 1 | |
| All Other | | — | | | 10 | | | (10) | | | — | | | — | |
| Total | | $ | 8 | | | $ | 74 | | | $ | (38) | | | $ | (4) | | | $ | 40 | |
Byte Realignment
The changes to the Byte clear aligners business disclosed in Note 6, Segment and Geographic Information, have resulted in significant reductions in revenue forecasts and a triggering event in the fourth quarter of 2024 to evaluate the recoverability of assets attributable to Byte. The Company recorded long-term tangible asset charges, which include production equipment and capitalized software, as well as working capital for certain inventory and customer receivables specific to Byte. Additionally, the Company recorded a full impairment of the Byte trademark intangible asset.
In addition to these impairments, the Company recorded a full accrual for expected customer refunds and other reimbursement payments stemming from the cessation of sales, which resulted in a $35 million reduction to net sales, of which $13 million was paid during the three months ended December 31, 2024, with the remainder expected to be paid in 2025.
The impact of these charges related to the Byte Realignment was as follows:
| | | | | | | | | | | | |
| Location in the Consolidated Statements of Operations | | | | | | |
| (in millions) | | December 31, 2024 | | | | |
| | | | | | |
| Net sales | | | | | | |
| Change in refund estimate | | $ | (35) | | | | | |
| Cost of products sold | | | | | | |
| Inventory reserve | | (8) | | | | | |
| Selling, general, and administrative expenses | | | | | | |
| Intangible asset impairment - trademark | | (152) | | | | | |
| Property, plant and equipment write-off | | (17) | | | | | |
| Accounts receivable reserve and prepaid write-off | | (10) | | | | | |
| Total impact on operating loss | | $ | (222) | | | | | |
NOTE 19 - FINANCIAL INSTRUMENTS AND DERIVATIVES
Derivative Instruments and Hedging Activities
The Company’s activities expose it to a variety of market risks, which primarily include the risks related to the effects of changes in foreign currency exchange rates and interest rates. These financial exposures are monitored and managed by the Company as part of its overall risk management program. The objective of this risk management program is to reduce the volatility that these market risks may have on the Company’s operating results and cash flows. The Company employs derivative financial instruments to hedge certain anticipated transactions, firm commitments, or assets and liabilities denominated in foreign currencies. Additionally, the Company utilizes interest rate swaps to convert fixed rate debt into variable rate debt or vice versa. The Company does not hold derivative instruments for trading or speculative purposes.
The following summarizes the notional amounts of cash flow hedges, hedges of net investments, fair value hedges, and derivative instruments not designated as hedges for accounting purposes by derivative instrument type at December 31, 2024 and the notional amounts expected to mature during the next 12 months.
| | | | | | | | | | | | | | |
| | Aggregate Notional Amount | | Aggregate Notional Amount Maturing within 12 Months |
| | |
| (in millions) | | |
| | | | |
| Cash Flow Hedges | | | | |
| Foreign exchange forward contracts | | $ | — | | | $ | — | |
| | | | |
| | | | |
| Total derivative instruments designated as cash flow hedges | | $ | — | | | $ | — | |
| | | | |
| Hedges of Net Investments | | | | |
| Foreign exchange forward contracts | | $ | 827 | | | $ | 83 | |
| Cross currency basis swaps | | 276 | | | — | |
| Total derivative instruments designated as hedges of net investments | | $ | 1,103 | | | $ | 83 | |
| | | | |
| Fair Value Hedges | | | | |
| Foreign exchange forward contracts | | $ | — | | | $ | — | |
| Interest rate swaps | | 150 | | | — | |
| Total derivative instruments designated as fair value hedges | | $ | 150 | | | $ | — | |
| | | | |
| Derivative Instruments not Designated as Hedges | | | | |
| Foreign exchange forward contracts | | $ | 602 | | | $ | 602 | |
| | | | |
| Total derivative instruments not designated as hedges | | $ | 602 | | | $ | 602 | |
Cash Flow Hedges
Foreign Exchange Risk Management
The Company hedges select anticipated foreign currency cash flows to reduce volatility in both cash flows and reported earnings or losses. The Company designates certain foreign exchange forward contracts as cash flow hedges. As a result, the Company records the fair value of the contracts through AOCI based on the assessed effectiveness of the foreign exchange forward contracts. The Company measures the effectiveness of cash flow hedges of anticipated transactions on a spot-to-spot basis rather than on a forward-to-forward basis. Accordingly, the spot-to-spot change in the derivative fair value is deferred in AOCI and released and recorded in the Consolidated Statements of Operations in the same period that the hedged transaction is recorded. The time-value component of the fair value of the derivative is reported on a straight-line basis in Cost of products sold in the Consolidated Statements of Operations in the period which it is applicable. Any cash flows associated with these instruments are included in operating activities in the Consolidated Statements of Cash Flows.
These foreign exchange forward contracts generally have maturities up to 18 months, which is the period over which the Company is hedging exposures to variability of cash flows, and the counterparties to the transactions are typically large international financial institutions.
Interest Rate Risk Management
The Company enters into interest rate swap contracts to manage interest rate risk on long-term debt instruments and not for speculative purposes. Any cash flows associated with these instruments are included in operating activities in the Consolidated Statements of Cash Flows.
On May 26, 2020, the Company paid $31 million to settle the $150 million notional Treasury rate lock contract, which partially hedged the interest rate risk of the $750 million Senior Notes due June 2030. This loss is amortized over the ten-year life of the notes. As of December 31, 2024 and December 31, 2023, $16 million and $19 million, respectively, of this loss is remaining to be amortized from AOCI in future periods.
AOCI Release
Overall, the derivatives designated as cash flow hedges are considered to be highly effective for accounting purposes. At December 31, 2024, the Company expects to reclassify $3 million of deferred net losses on cash flow hedges recorded in AOCI in the Consolidated Statements of Operations during the next 12 months. For the rollforward of derivative instruments designated as cash flow hedges in AOCI, see Note 5, Comprehensive Loss.
Hedges of Net Investments in Foreign Operations
The Company has significant investments in foreign subsidiaries. The net assets of these subsidiaries are exposed to volatility in foreign currency exchange rates. The Company employs both derivative and non-derivative financial instruments to hedge a portion of these exposures. The derivative instruments consist of foreign exchange forward contracts and cross-currency basis swaps. The non-derivative instruments consist of foreign currency denominated debt held at the parent company level. Translation gains and losses related to the net assets of the foreign subsidiaries are offset by gains and losses in the aforementioned instruments, which are designated as hedges of net investments, and the intrinsic value changes in these instruments are recorded on AOCI, net of tax effects. The time-value component of the fair value of the derivative instrument is amortized on a straight-line basis in Other (income) expense, net in the Consolidated Statements of Operations in the applicable period. Any cash flows associated with these instruments are included in investing activities in the Consolidated Statements of Cash Flows, except for derivative instruments that include an other-than-insignificant financing element, for which all cash flows are classified as financing activities in the Consolidated Statements of Cash Flows.
The fair value of the foreign currency exchange forward contracts and cross-currency basis swaps is the estimated amount the Company would receive or pay at the reporting date, taking into account the effective interest rates and foreign exchange rates. The effective portion of the change in the value of these derivatives is recorded in AOCI, net of tax effects.
On July 2, 2021, the Company entered into a cross-currency basis swap of a notional amount of $300 million, which matures on June 3, 2030. The cross-currency basis swap is designated as a hedge of net investments. This contract effectively converts a portion of the $750 million bond coupon from 3.3% to 1.7%, which will result in a net reduction of Other (income) expense, net.
On May 25, 2021, the Company re-established its euro net investment hedge portfolio by entering into eight foreign exchange forward contracts, each with a notional amount of 10 million euro. The original contracts have quarterly maturity dates through March 2023 and the Company entered into additional foreign exchange contracts as individual contracts within the portfolio matured. As of December 31, 2024, the euro net investment hedge portfolio has an aggregate notional value of 160 million euro with maturity dates through December 2025.
On July 20, 2023, the Company entered into a Swiss franc foreign exchange forward contract designated as a net investment hedge. The foreign exchange forward contract had a notional amount of 600 million Swiss francs. This net investment hedge was settled in September 2023 which resulted in cash receipts totaling $32 million. The Company subsequently entered into Swiss franc foreign exchange contracts designated as net investment hedges with a total notional amount of 600 million Swiss francs. This portfolio of contracts has semi-annual maturity dates through July 2028.
Fair Value Hedges
Foreign Exchange Risk Management
The Company has intercompany loans denominated in Swedish kronor that are exposed to volatility in foreign currency exchange rates. The Company employs derivative financial instruments to hedge these exposures. The Company accounts for these designated foreign exchange forward contracts as fair value hedges. The Company measures the effectiveness of fair value hedges of anticipated transactions on a spot-to-spot basis rather than on a forward-to-forward basis. Accordingly, the spot-to-spot change in the derivative fair value will be recorded in Other (income) expense, net in the Consolidated Statements of Operations. The time-value component of the fair value of the derivative is reported on a straight-line basis in Other (income) expense, net in the Consolidated Statements of Operations in the applicable period. Any cash flows associated with these instruments are included in operating activities in the Consolidated Statements of Cash Flows.
Interest Rate Risk Management
On July 1, 2021, the Company entered into variable interest rate swaps with a notional amount of $250 million, which effectively converted a portion of the underlying fixed rate of 3.3% on the $750 million Senior Notes due June 2030 to a variable interest rate. Of the $250 million notional amount, $100 million has a term of five-years maturing on June 1, 2026 and $150 million has a term of nine years maturing on March 1, 2030.
On February 13, 2024, the Company paid $9 million to settle the variable interest rate swap with a notional amount of $100 million which was originally set to mature on June 1, 2026. This closure of the interest rate swap will result in a loss of $8 million being amortized over the remaining life of the Senior Notes due June 2030.
Derivative Instruments Not Designated as Hedges
The Company enters into derivative instruments with the intent to partially mitigate the foreign exchange revaluation risk associated with recorded assets and liabilities that are denominated in a non-functional currency. The Company primarily uses foreign exchange forward contracts to hedge these risks. The gains and losses on these derivative transactions offset the gains and losses generated by the revaluation of the underlying non-functional currency balances and are recorded in Other (income) expense, net in the Consolidated Statements of Operations. Any cash flows associated with these instruments are included in operating activities in the Consolidated Statements of Cash Flows.
Gains and losses recorded in the Company’s Consolidated Statements of Operations related to the derivative instruments not designated as hedges for the years ended December 31, 2024 and 2023 were not significant.
Derivative Instrument Activity
The effect of derivative hedging instruments on the Consolidated Statements of Operations and Consolidated Statements of Comprehensive Loss were as follows:
| | | | | | | | | | | | | | | | | | | | | | | | | | | | | | | | | | | | | | | | | | | | | | | | | | | | | | | | | | |
| | Year Ended December 31, 2024 | | | | Year Ended December 31, 2023 | | Year Ended December 31, 2022 |
| (in millions) | | Cost of products sold | | Interest expense, net | | Other (income) expense, net | | | | Cost of products sold | | Interest expense, net | | Other (income) expense, net | | Cost of products sold | | Interest expense, net | | Other (income) expense, net |
| | | | | | | | | | | | | | | | | | | | |
| Total amounts of line items presented in the Consolidated Statements of Operations in which the effects of cash flow, net investment or fair value hedges are recorded | | $ | 1,835 | | | $ | 69 | | | $ | (12) | | | | | $ | 1,879 | | | $ | 81 | | | $ | 9 | | | $ | 1,795 | | | $ | 65 | | | $ | 53 | |
| | | | | | | | | | | | | | | | | | | | |
| (Gain) loss on Cash Flow Hedges | | | | | | | | | | | | | | | | | | | | |
| Foreign exchange forward contracts | | $ | — | | | $ | — | | | $ | — | | | | | $ | 1 | | | $ | — | | | $ | — | | | $ | (3) | | | $ | — | | | $ | — | |
| Interest rate swaps | | — | | | 3 | | | — | | | | | — | | | 3 | | | — | | | — | | | 3 | | | — | |
| | | | | | | | | | | | | | | | | | | | |
| Gain on Hedges of Net Investment | | | | | | | | | | | | | | | | | | | | |
| Cross currency basis swaps | | $ | — | | | $ | — | | | $ | (5) | | | | | $ | — | | | $ | — | | | $ | (5) | | | $ | — | | | $ | — | | | $ | (5) | |
| Foreign exchange forward contracts | | — | | | — | | | (25) | | | | | — | | | — | | | (12) | | | — | | | — | | | (2) | |
| | | | | | | | | | | | | | | | | | | | |
| (Gain) loss on Fair Value Hedges: | | | | | | | | | | | | | | | | | | | | |
| Interest rate swaps | | $ | — | | | $ | 8 | | | $ | — | | | | | $ | — | | | $ | 11 | | | $ | — | | | $ | — | | | $ | 1 | | | $ | — | |
| Foreign exchange forward contracts | | — | | | — | | | — | | | | | — | | | — | | | — | | | — | | | — | | | (27) | |
| | | | | | | | | | | | | | | | | | | | |
| (Gain) loss on Derivative Instruments not Designated as Hedges | | | | | | | | | | | | | | | | | | | | |
| Foreign exchange forward contracts | | $ | — | | | $ | — | | | $ | 2 | | | | | $ | — | | | $ | — | | | $ | 8 | | | $ | — | | | $ | — | | | $ | (4) | |
| | | | | | | | | | | | | | | | | | | | |
| | | | | | | | | | | | | | | | | | | | | | | | | | | | | | | | | | | | | | | | | | | | | | |
| | Amount of Gain or (Loss) Recognized in AOCI | | | | Amount of Gain or (Loss) Reclassified from AOCI into Income |
| | Year Ended December 31, | | Consolidated Statements of Operations Location | | Year Ended December 31, |
| (in millions) | | 2024 | | 2023 | | 2022 | | | 2024 | | | | 2023 | | 2022 |
| | | | | | | | | | | | | | | | |
| Cash Flow Hedges | | | | | | | | | | | | | | | | |
| Foreign exchange forward contracts | | $ | — | | | $ | — | | | $ | (1) | | | Cost of products sold | | $ | — | | | | | $ | (1) | | | $ | 3 | |
| Interest rate swaps | | — | | | — | | | — | | | Interest expense, net | | (3) | | | | | (3) | | | (3) | |
| | | | | | | | | | | | | | | | |
| | | | | | | | | | | | | | | | |
| | | | | | | | | | | | | | | | |
| Hedges of Net Investments | | | | | | | | | | | | | | | | |
| Cross currency basis swaps | | $ | 11 | | | $ | (18) | | | $ | 30 | | | Other (income) expense, net | | $ | — | | | | | $ | — | | | $ | — | |
| Foreign exchange forward contracts | | 37 | | | (29) | | | 11 | | | Other (income) expense, net | | — | | | | | — | | | — | |
| | | | | | | | | | | | | | | | |
| | | | | | | | | | | | | | | | |
| Fair Value Hedges | | | | | | | | | | | | | | | | |
| Interest rate swaps | | $ | — | | | $ | — | | | $ | — | | | Other (income) expense, net | | $ | — | | | | | $ | — | | | $ | — | |
| Foreign exchange forward contracts | | — | | | 2 | | | (2) | | | Interest expense, net | | — | | | | | — | | | — | |
Consolidated Balance Sheets Location of Derivative Fair Values
The fair value and the location of the Company’s derivatives in the Consolidated Balance Sheets were as follows:
| | | | | | | | | | | | | | | | | | | | | | | | | | |
| | Year Ended December 31, 2024 |
| (in millions) | | Prepaid Expenses and Other Current Assets | | Other Noncurrent Assets | | | | Other Noncurrent Liabilities |
| | | | | | | | |
| Designated as Hedges: | | | | | | | | |
| Foreign exchange forward contracts | | $ | 5 | | | $ | 9 | | | $ | — | | | $ | 1 | |
| | | | | | | | |
| Interest rate swaps | | — | | | — | | | 4 | | | 17 | |
| Cross currency basis swaps | | 4 | | | 14 | | | — | | | — | |
| Total | | $ | 9 | | | $ | 23 | | | $ | 4 | | | $ | 18 | |
| | | | | | | | |
| Not Designated as Hedges: | | | | | | | | |
| Foreign exchange forward contracts | | $ | 4 | | | $ | — | | | $ | 8 | | | $ | — | |
| | | | | | | | |
| | | | | | | | |
| | | | | | | | |
| Total | | $ | 4 | | | $ | — | | | $ | 8 | | | $ | — | |
| | | | | | | | | | | | | | | | | | | | | | | | | | |
| | | Year Ended December 31, 2023 |
| (in millions) | | Prepaid Expenses and Other Current Assets | | Other Noncurrent Assets | | Accrued Liabilities | | Other Noncurrent Liabilities |
| | | | | | | | |
| Designated as Hedges: | | | | | | | | |
| Foreign exchange forward contracts | | $ | 3 | | | $ | — | | | $ | 4 | | | $ | 47 | |
| | | | | | | | |
| Interest rate swaps | | — | | | — | | | 9 | | | 19 | |
| Cross currency basis swaps | | 4 | | | 4 | | | — | | | — | |
| Total | | $ | 7 | | | $ | 4 | | | $ | 13 | | | $ | 66 | |
| | | | | | | | |
| Not Designated as Hedges: | | | | | | | | |
| Foreign exchange forward contracts | | $ | 5 | | | $ | — | | | $ | 5 | | | $ | — | |
| | | | | | | | |
| | | | | | | | |
| | | | | | | | |
| Total | | $ | 5 | | | $ | — | | | $ | 5 | | | $ | — | |
Balance Sheet Offsetting
Substantially all of the Company’s derivative contracts are subject to netting arrangements, whereby the right to offset occurs in the event of default or termination in accordance with the terms of the arrangements with the counterparty. While these contracts contain the enforceable right to offset through netting arrangements with the same counterparty, the Company elects to present them on a gross basis in the Consolidated Balance Sheets.
Offsetting of financial assets and liabilities under netting arrangements at December 31, 2024 were as follows:
| | | | | | | | | | | | | | | | | | | | | | | | | | | | | | | | | | | | | | |
| | | | | | | | Gross Amounts Not Offset in the Consolidated Balance Sheets | | |
| (in millions) | | Gross Amounts Recognized | | Gross Amounts Offset in the Consolidated Balance Sheets | | Net Amounts Presented in the Consolidated Balance Sheets | | Financial Instruments | | Cash Collateral Received/Pledged | | Net Amount |
| | | | | | | | | | | | |
| Assets | | | | | | | | | | | | |
| Foreign exchange forward contracts | | $ | 18 | | | $ | — | | | $ | 18 | | | $ | (5) | | | $ | — | | | $ | 13 | |
| | | | | | | | | | | | |
| | | | | | | | | | | | |
| Cross currency basis swaps | | 18 | | | — | | | 18 | | | (6) | | | — | | | 12 | |
| | | | | | | | | | | | |
| Total assets | | $ | 36 | | | $ | — | | | $ | 36 | | | $ | (11) | | | $ | — | | | $ | 25 | |
| | | | | | | | | | | | |
| Liabilities | | | | | | | | | | | | |
| Foreign exchange forward contracts | | $ | 9 | | | $ | — | | | $ | 9 | | | $ | (4) | | | $ | — | | | $ | 5 | |
| | | | | | | | | | | | |
| | | | | | | | | | | | |
| Interest rate swaps | | 21 | | | — | | | 21 | | | (7) | | | — | | | 14 | |
| | | | | | | | | | | | |
| Total liabilities | | $ | 30 | | | $ | — | | | $ | 30 | | | $ | (11) | | | $ | — | | | $ | 19 | |
Offsetting of financial assets and liabilities under netting arrangements at December 31, 2023 were as follows:
| | | | | | | | | | | | | | | | | | | | | | | | | | | | | | | | | | | | | | |
| | | | | | | | Gross Amounts Not Offset in the Consolidated Balance Sheets | | |
| (in millions) | | Gross Amounts Recognized | | Gross Amounts Offset in the Consolidated Balance Sheets | | Net Amounts Presented in the Consolidated Balance Sheets | | Financial Instruments | | Cash Collateral Received/Pledged | | Net Amount |
| | | | | | | | | | | | |
| Assets | | | | | | | | | | | | |
| Foreign exchange forward contracts | | $ | 8 | | | $ | — | | | $ | 8 | | | $ | (5) | | | $ | — | | | $ | 3 | |
| | | | | | | | | | | | |
| | | | | | | | | | | | |
| Cross currency basis swaps | | 8 | | | — | | | 8 | | | (4) | | | — | | | 4 | |
| Total assets | | $ | 16 | | | $ | — | | | $ | 16 | | | $ | (9) | | | $ | — | | | $ | 7 | |
| | | | | | | | | | | | |
| Liabilities | | | | | | | | | | | | |
| Foreign exchange forward contracts | | $ | 56 | | | $ | — | | | $ | 56 | | | $ | (7) | | | $ | — | | | $ | 49 | |
| Interest rate swaps | | 28 | | | — | | | 28 | | | (2) | | | — | | | 26 | |
| | | | | | | | | | | | |
| | | | | | | | | | | | |
| | | | | | | | | | | | |
| Total liabilities | | $ | 84 | | | $ | — | | | $ | 84 | | | $ | (9) | | | $ | — | | | $ | 75 | |
NOTE 20 - FAIR VALUE MEASUREMENT
The estimated fair and carrying values of the Company’s total debt were $2,037 million and $2,135 million, respectively, at December 31, 2024. At December 31, 2023, the estimated fair and carrying values were $2,018 million and $2,118 million, respectively. The fair value of long-term debt is determined by discounting future cash flows using interest rates available at December 31, 2024 to companies with similar credit ratings for issuances with similar terms and maturities. It is considered a Level 2 fair value measurement for disclosure purposes.
Assets and liabilities measured at fair value on a recurring basis
The Company’s financial assets and liabilities set forth by level within the fair value hierarchy that were accounted for at fair value on a recurring basis were as follows:
| | | | | | | | | | | | | | | | | | | | | | | | | | |
| | Year Ended December 31, 2024 |
| (in millions) | | Total | | Level 1 | | Level 2 | | Level 3 |
| | | | | | | | |
| Assets | | | | | | | | |
| | | | | | | | |
| | | | | | | | |
| | | | | | | | |
| Cross currency interest rate swaps | | $ | 18 | | | $ | — | | | $ | 18 | | | $ | — | |
| Foreign exchange forward contracts | | 18 | | | — | | | 18 | | | — | |
| | | | | | | | |
| Total assets | | $ | 36 | | | $ | — | | | $ | 36 | | | $ | — | |
| | | | | | | | |
| Liabilities | | | | | | | | |
| Interest rate swaps | | $ | 21 | | | $ | — | | | $ | 21 | | | $ | — | |
| | | | | | | | |
| | | | | | | | |
| Foreign exchange forward contracts | | 9 | | | — | | | 9 | | | — | |
| | | | | | | | |
| Contingent considerations on acquisitions | | 4 | | | — | | | — | | | 4 | |
| | | | | | | | |
| Total liabilities | | $ | 34 | | | $ | — | | | $ | 30 | | | $ | 4 | |
| | | | | | | | | | | | | | | | | | | | | | | | | | |
| | | Year Ended December 31, 2023 |
| (in millions) | | Total | | Level 1 | | Level 2 | | Level 3 |
| | | | | | | | |
| Assets | | | | | | | | |
| | | | | | | | |
| | | | | | | | |
| | | | | | | | |
| Cross currency interest rate swaps | | $ | 8 | | | $ | — | | | $ | 8 | | | $ | — | |
| Foreign exchange forward contracts | | 8 | | | — | | | 8 | | | — | |
| | | | | | | | |
| | | | | | | | |
| Total assets | | $ | 16 | | | $ | — | | | $ | 16 | | | $ | — | |
| | | | | | | | |
| Liabilities | | | | | | | | |
| Interest rate swaps | | $ | 28 | | | $ | — | | | $ | 28 | | | $ | — | |
| | | | | | | | |
| | | | | | | | |
| Foreign exchange forward contracts | | 56 | | | — | | | 56 | | | — | |
| | | | | | | | |
| Contingent considerations on acquisitions | | 4 | | | — | | | — | | | 4 | |
| | | | | | | | |
| Total liabilities | | $ | 88 | | | $ | — | | | $ | 84 | | | $ | 4 | |
Derivative valuations are based on observable inputs to the valuation model including interest rates, foreign currency exchange rates, and credit risks.
There were no transfers between fair value measurement levels during the years ended December 31, 2024 and 2023.
Assets and liabilities measured at fair value on a recurring basis using significant unobservable inputs (level 3)
The Company’s Level 3 liabilities at December 31, 2024 are related to earn-out obligations from acquisitions and licensing arrangements. The following table presents a reconciliation of the Company’s Level 3 holdings measured at fair value on a recurring basis using unobservable inputs:
| | | | | | | | | | | | |
| | | | | | | |
| (in millions) | | Level 3 | | | | |
| | | | | | |
| Balance, December 31, 2022 | | $ | 4 | | | | | |
| | | | | | |
| | | | | | |
| Payments | | — | | | | | |
| | | | | | |
| Balance, December 31, 2023 | | $ | 4 | | | | | |
| | | | | | |
| | | | | | |
| Payments | | — | | | | | |
| | | | | | |
| Balance, December 31, 2024 | | $ | 4 | | | | | |
There were no additional purchases or transfers of Level 3 financial instruments in 2024 and 2023.
NOTE 21 - COMMITMENTS AND CONTINGENCIES
Contingencies
On December 19, 2018, a putative class action was filed in the U.S. District Court for the Eastern District of New York (the “EDNY Court”) against the Company and certain individual defendants. The case was narrowed following its inception. The plaintiff’s claims which, as discussed below, have now been settled in principal, are that the Company and certain individual defendants violated U.S. securities laws by making material misrepresentations and omitting required information in the December 4, 2015 registration statement filed with the SEC in connection with the 2016 merger of Sirona Dental Systems Inc. (“Sirona”) with DENTSPLY International Inc. (the “Merger”) and that the defendants failed to disclose, among other things, that a distributor had purchased excessive inventory of legacy Sirona products. In addition, the plaintiff alleges that the defendants violated U.S. securities laws by making false and misleading statements in quarterly and annual reports and other public statements between May 6, 2016 and August 7, 2018. The plaintiff asserts claims on behalf of a putative class consisting of all purchasers of the Company's stock during the period from December 8, 2015 through August 6, 2018. The Company moved to dismiss the amended complaint on August 15, 2019. The plaintiff filed its second amended complaint on January 22, 2021, and the Company filed a motion to dismiss the second amended complaint on March 8, 2021, with briefing on the motion fully submitted on May 21, 2021. The Company’s motion to dismiss was denied in a ruling by the EDNY Court on March 29, 2023, and the Company’s answer to the second amended complaint was filed on May 12, 2023. Following additional motion practice—which remained outstanding with the EDNY Court—and discovery, the parties engaged in settlement discussions with the assistance of a mediator, and, in January 2025, reached a settlement in principal to resolve the case in full for $84 million, of which the Company expects to receive an offsetting insurance receivable of approximately $78 million while paying the rest in cash. A binding term sheet for the settlement has been signed, which is subject to negotiation and approval by the EDNY Court of a full settlement agreement. The excess of the settlement liability as of December 31, 2024 over the corresponding insurance policy receivable resulted in $6 million of legal expense which was recorded during the period.
On June 2, 2022, the Company was named as a defendant in a putative class action filed in the U.S. District Court for the Southern District of Ohio captioned City of Miami General Employees’ & Sanitation Employees’ Retirement Trust v. Casey, Jr. et al., No. 2:22-cv-02371, and on July 28, 2022, the Company was named as a defendant in a putative class action filed in the U.S. District Court for the Southern District of New York (the “SDNY Court”) captioned San Antonio Fire and Police Pension Fund v. Dentsply Sirona Inc. et al., No. 1:22-cv-06339 (together, the “Securities Litigation”). The complaints in the Securities Litigation are substantially similar and both allege that, during the period from June 9, 2021 through May 9, 2022, the Company, Mr. Donald M. Casey Jr., the Company’s former Chief Executive Officer, and Mr. Jorge Gomez, the Company’s former Chief Financial Officer, violated U.S. securities laws by, among other things, making materially false and misleading statements or omissions, including regarding the manner in which the Company recognized revenue tied to distributor rebate and incentive programs. On March 27, 2023, the Court in the Southern District of Ohio ordered the transfer of the putative class action to the SDNY Court. On June 1, 2023, the SDNY Court consolidated the two separate actions under case No. 1:22-cv-06339 and appointed as lead plaintiffs for the putative class the City of Birmingham Retirement and Relief System, the El Paso Firemen & Policemen’s Pension Fund, and the Wayne County Employees’ Retirement System (collectively, the “Lead Plaintiffs”). Lead Plaintiffs filed an amended class action complaint on July 28, 2023 (the “Amended Complaint”). In addition to asserting the same claims against the Company, Mr. Casey, and Mr. Gomez, the Amended Complaint added the Company’s former Chief Accounting Officer, Mr. Ranjit S. Chadha, as a defendant (collectively, “Defendants”). On October 10, 2023, Defendants filed a motion to dismiss the Amended Complaint. Lead Plaintiffs’ opposition to Defendants’ motion to dismiss was filed on December 8, 2023, and Defendants’ reply was filed on January 8, 2024. The motion to dismiss was granted as to Mr. Chadha and granted in part and denied in part as to the Company, Mr. Casey, and Mr. Gomez in a ruling by the SDNY Court on May 1, 2024. The Company’s answer to the Amended Complaint was filed on May 21, 2024. On November 15, 2024, Lead Plaintiffs filed a motion to certify the matter as a class action, to appoint Lead Plaintiffs as class representatives, and to appoint Robbins Geller Rudman & Dowd LLP as class counsel. Defendants’ opposition to Lead Plaintiffs’ motion was filed on December 20, 2024, and Lead Plaintiffs’ reply is due on February 28, 2025.
In addition to the Securities Litigation, as previously disclosed, the Company voluntarily contacted the SEC following the Company’s announcement on May 10, 2022 of the internal investigation by the Audit and Finance Committee of the Company’s Board of Directors. The Company continues to cooperate with the SEC regarding this matter.
Separately, on July 13, 2023, Dentsply Sirona stockholder George Presura filed a stockholder derivative suit in the Delaware Court of Chancery captioned George Presura, Derivatively on Behalf of Nominal Defendant Dentsply Sirona Inc. v. Donald M. Casey Jr. et al. and Dentsply Sirona, Inc., No. 2023-0708-NAC (the “Presura Derivative Litigation”). The complaint, filed derivatively on behalf of the Company, asserts claims against current and former members of the Company’s Board of Directors and current and former executive officers, including Messrs. Casey and Gomez. The derivative complaint in
this case contains allegations similar to those in the Securities Litigation, and it alleges that during the period from June 9, 2021 through July 13, 2023, various of the defendants breached fiduciary duties, committed corporate waste, and misappropriated information to conduct insider trading by making materially false and misleading statements or omissions regarding the Company’s recognition of revenue tied to distributor rebate and incentive programs and distributor inventory levels. On August 4, 2023, the Delaware Court of Chancery stayed the Presura Derivative Litigation until the earlier of public announcement of a settlement of the Securities Litigation or resolution of the pending motion to dismiss in the Securities Litigation.
Additionally, on March 26, 2024, Dentsply Sirona stockholder Calvin Snee filed a stockholder derivative suit in the Delaware Court of Chancery captioned Calvin Snee, derivatively on behalf of Dentsply Sirona Inc. v. Donald M. Casey Jr., et al. and Dentsply Sirona Inc, No. 2024-0308 (the “Snee Derivative Litigation”). The complaint, filed derivatively on behalf of the Company, asserts claims against current and former members of the Company’s Board of Directors and current and former executive officers, including Messrs. Casey and Gomez. The derivative complaint in this case contains allegations similar to those in the Presura Derivative Litigation and the Securities Litigation, and it alleges that beginning in 2021, various of the defendants breached fiduciary duties, misappropriated information to conduct insider trading, and were unjustly enriched by making materially false and misleading statements or omissions regarding the Company’s recognition of revenue tied to distributor rebate and incentive programs and distributor inventory levels.
On May 2, 2024, the Delaware Court of Chancery issued an order consolidating and staying the Presura Derivative Litigation and Snee Derivative Litigation.
On July 19, 2024, Dentsply Sirona stockholder Frank Manfre filed a stockholder derivative suit in the Delaware Court of Chancery captioned Frank Manfre, derivatively on behalf of nominal defendant Dentsply Sirona Inc. v. Donald M. Casey Jr. et al. and Dentsply Sirona Inc., No. 2024-0763 (the “Manfre Derivative Litigation”). The complaint asserts claims against current and former members of the Company’s Board of Directors and current and former executive officers, including Messrs. Casey and Gomez. The complaint in this case contains allegations similar to those in the Snee Derivative Litigation, the Presura Derivative Litigation, and the Securities Litigation, and it alleges that beginning in 2021, various of the defendants breached fiduciary duties, misappropriated information to conduct insider trading, and were unjustly enriched by making materially false and misleading statements or omissions regarding the Company’s recognition of revenue tied to distributor rebate and incentive programs and distributor inventory levels.
On September 19, 2024, the Delaware Court of Chancery issued an order consolidating and staying the Manfre Derivative Litigation, Presura Derivative Litigation, and Snee Derivative Litigation.
On November 26, 2024, the Company was named as a defendant in a putative class action filed in the SDNY Court captioned North Collier Fire Control and Rescue District Firefighters’ Retirement Plan v. Dentsply Sirona Inc., et al., No. 1:24-cv-09083 (the “North Collier Action”). On December 18, 2024, the Company was named as a defendant in a putative class action filed in the SDNY Court captioned Calvin v. Dentsply Sirona Inc., et al., No. 1:24-cv-09764 (the “Calvin Action”), and on December 19, 2024, the Company was named as a defendant in a putative class action filed in the SDNY Court captioned Key West Police & Fire Pension Fund v. Dentsply Sirona Inc., et al., No. 1:24-cv-09819 (the “Key West Action”). The complaints in these three cases allege that, for different alleged class periods over the period from May 6, 2021 through November 6, 2024, the Company and certain current and former officers violated U.S. securities laws by, among other things, making materially false and misleading statements or omissions, including regarding the performance of the Company’s Byte aligners business, following the Company’s acquisition of Byte LLC in December 2020. On February 21, 2025, the SDNY Court entered an order consolidating the North Collier Action, the Calvin Action, and the Key West Action under the caption In re Dentsply Sirona, Inc. Securities Litigation, No. 24-cv-9083, and appointing HANSAINVEST Hanseatische Investment-Gesellschaft mit beschränkter Haftung and City of Miami General Employees’ & Sanitation Employees’ Retirement Trust as lead plaintiffs (“Lead Plaintiffs”) and Bernstein Litowitz Berger & Grossmann LLP as lead counsel for the consolidated case. The SDNY Court ordered the Lead Plaintiffs to file an amended complaint by April 7, 2025.
On March 21, 2023, Mr. Carlo Gobbetti filed a claim in the Milan Chamber of Arbitration against Dentsply Sirona Italia S.r.l. (“DSI”), Italy, a wholly owned subsidiary of the Company, seeking a total of €28 million for the alleged failure to pay a portion of the purchase price pursuant to a Share Purchase Agreement, dated October 8, 2012 (the “SPA”), in which Sirona Dental Systems, S.r.l., which at the time of execution of the SPA was a wholly-owned subsidiary of Sirona Dental Systems, Inc., acquired all of the shares of MHT S.p.A., an Italian corporation, from Mr. Gobbetti, and various other sellers. Sirona Dental Systems S.r.l. merged into Dentsply Italia S.r.l. in 2018 (the surviving entity is now Dentsply Sirona Italia S.r.l.). Under the SPA, a portion of the purchase price equal to €7 million was required to be deposited into an escrow account (the “Escrow Account”) and released to Mr. Gobbetti and the other sellers upon the satisfaction of certain conditions, including the delivery by July 2013 of a new prototype of an MHT S.p.A. camera which had to meet certain specifications. In connection with the
closing of the share purchase transaction, the SPA was supplemented by a Facility Agreement, also dated October 8, 2012 (the “FA”), which specifically set out the mechanics of payment and release of the proceeds of the Escrow Account. The Austrian notary public, Mr. Gottfried Schachinger, acting as escrow agent, Mr. Gobbetti, and SIRONA Holdings GmbH, an affiliate of Sirona Dental Systems, Inc. which paid the €7 million into the Escrow Account, were parties to the FA. The FA is subject to Austrian law and to the jurisdiction of the Court of Salzburg in Austria.
Mr. Gobbetti claims that he is entitled to receive the €7 million outstanding balance of the purchase price under the SPA, plus €21 million for damages incurred as a consequence of the failure to make the payment. Mr. Gobbetti claims that he has a right to receive the full purchase price under the SPA even if the conditions set out in the SPA to deliver a prototype of the MHT S.p.A. camera by July 2013 were not met. On May 15, 2023, DSI filed its initial statement of defense denying that Mr. Gobbetti and the other sellers were entitled to receive the funds deposited in the Escrow Account and further disputing the allegations. Following the constitution of the arbitral tribunal, hearings were held on September 13, 2023 and January 19, 2024, to illustrate and discuss the positions of the parties. The parties also developed their arguments in several rounds of defensive briefs. The final submissions were completed on April 15, 2024 and the final hearing for discussion took place on May 8, 2024. On July 22, 2024, the arbitral tribunal rejected all of Mr. Gobbetti’s claims, ruling that the Company had met its contractual obligations under the SPA, particularly regarding the balance of the purchase price. The arbitral tribunal also dismissed Mr. Gobbetti’s claims in tort and those pertaining to the FA for lack of jurisdiction and lack of capacity for the Company to be sued. The arbitral tribunal observed that such claims should have been brought against SIRONA Holdings GmbH, which is a party to the FA but not to the SPA, before the Court of Salzburg in Austria based on the jurisdictional clause of the FA.
Mr. Gobbetti appealed the ruling of the arbitral tribunal on December 2, 2024 before the Court of Appeals of Milan, Italy (the “Court of Appeals”) arguing that the ruling is null and void. According to Mr. Gobbetti, the arbitral tribunal did not grant him appropriate defense rights under the Italian Civil Code and did not fully address the merits of his claims, despite acknowledging jurisdiction. Mr. Gobbetti asked the Court of Appeals to directly sentence DSI to pay the €7 million, plus damages of €21 million. DSI must submit its defense by March 20, 2025.
Except as noted above, no specific amounts of damages have been alleged in these lawsuits. The Company will continue to incur legal fees in connection with these pending cases, including expenses for the reimbursement of legal fees of present and former officers and directors under indemnification obligations. The expense of continuing to defend such litigation may be significant. The Company intends to defend these lawsuits vigorously, although the Company may elect to settle certain litigation matters, but there can be no assurance that the Company will be successful in any defense or that matters can be settled on terms favorable to the Company. If any of the lawsuits are decided adversely, the Company may be liable for significant damages directly or under its indemnification obligations, which could adversely affect the Company’s business, results of operations and cash flows. At this stage, the Company has accrued losses which are deemed probable, along with related insurance receivables, but the Company is unable to assess whether any incremental material loss or adverse effect is reasonably possible as a result of these lawsuits or estimate the range of any potential loss.
The Internal Revenue Service (“IRS”) is conducting an examination of the Company’s U.S. federal income tax returns for the tax years 2015 and 2016. The Company received a Notice of Proposed Adjustment in April 2023 and a Revenue Agent Report in January 2024 from the IRS examination team proposing an adjustment related to an internal reorganization completed in 2016 with respect to the integration of certain operations of Sirona Dental Systems, Inc. following its acquisition in 2016. Although the proposed adjustment does not result in any additional federal income tax liability for the internal reorganization, if sustained, the proposed adjustment would result in the Company owing additional federal income taxes on a distribution of $451 million related to a stock redemption that occurred after the internal reorganization was completed in 2016. The proposed adjustment, if sustained, would also result in a loss of foreign tax credits carried forward to later tax years. The Company believes that it accurately reported the federal income tax consequences of the internal restructuring and stock redemption in its tax returns and in April 2024, submitted an administrative protest with the IRS Independent Office of Appeals contesting the examination team’s proposed adjustments. The IRS examination team provided the Company with a rebuttal to the Company’s administrative protest during August 2024 and informed the Company that the dispute would be forwarded to the IRS Independent Office of Appeals.
The General Public Prosecutor’s Office Frankfurt am Main is investigating a series of intercompany loans implemented in 2016 and 2017 as part of the post-merger integration activities of DENTSPLY International Inc. and Sirona Dental Systems, Inc. The Company is cooperating with the investigation. The Company believes that the transactions at issue complied with all applicable German laws. No charges have been filed against the Company or any individuals.
The Company intends to vigorously defend its positions and pursue related appeals in the above-described pending matters and believes it is more likely than not that its positions will be sustained, although the Company may elect to settle certain matters. Unless otherwise disclosed herein, the Company has not accrued losses for these matters because the Company does
not believe the risk of loss is probable and cannot estimate the range of any potential loss with any reasonable degree of accuracy.
In addition to the matters disclosed above, the Company is, from time to time, subject to a variety of litigation and similar proceedings incidental to its business. These legal matters primarily involve claims for damages arising out of the use of the Company’s products and services and claims relating to intellectual property matters including patent infringement, employment matters, tax matters, commercial disputes, competition and sales and trading practices, personal injury, and insurance coverage. The Company may also become subject to lawsuits as a result of past or future acquisitions or as a result of liabilities retained from, or representations, warranties or indemnities provided in connection with, divested businesses. Some of these lawsuits may include claims for punitive and consequential, as well as compensatory, damages. Except as otherwise noted, the Company generally cannot predict what the eventual outcome of the above-described pending matters will be, what the timing of the ultimate resolution of these matters will be, or what the eventual loss, fines or penalties related to each pending matter may be. Based upon the Company’s experience, current information, and applicable law, it does not believe that these proceedings and claims will have a material adverse effect on its consolidated results of operations, financial position, or liquidity. However, in the event of unexpected further developments, it is possible that the ultimate resolution of these matters, or other similar matters, if unfavorable, may be materially adverse to the Company’s business, financial condition, results of operations, or liquidity.
While the Company maintains general, product, property, workers’ compensation, automobile, cargo, aviation, crime, fiduciary and directors’ and officers’ liability insurance up to certain limits that cover certain of these claims, this insurance may be insufficient or unavailable to cover such losses. In addition, while the Company believes it is entitled to indemnification from third parties for some of these claims, these rights may also be insufficient or unavailable to cover such losses.
Commitments
Purchase Commitments
The Company has certain non-cancelable future commitments primarily related to long-term supply contracts for key components and raw materials. At December 31, 2024, non-cancelable purchase commitments were as follows:
| | | | | | | | |
| (in millions) | | |
| | |
| | |
| 2025 | | $ | 194 | |
| 2026 | | 69 | |
| 2027 | | 43 | |
| 2028 | | 40 | |
| 2029 | | — | |
| Thereafter | | — | |
| Total | | $ | 346 | |
The table above includes commitments under the Company’s agreement with a cloud services provider supporting the Company’s digital platform which requires minimum purchases totaling $85 million through 2028.
Off-Balance Sheet Arrangements
As of December 31, 2024, the Company had no material off-balance sheet arrangements that have, or are reasonably likely to have, a current or future material effect on the Company’s consolidated financial condition, results of operations, liquidity, capital expenditures or capital resources other than certain items disclosed in the sections above.
Indemnification
In the normal course of business to facilitate sales of the Company’s products and services, the Company indemnifies certain parties, including customers, vendors, lessors, services providers, and others, with respect to certain matters, including, but not limited to, services to be provided by or for the Company, and intellectual property infringement claims made by third parties. In addition, the Company has entered into indemnification agreements with its directors and its executive officers that will require the Company, among other things, to indemnify them against certain liabilities that may arise by reason of their
status or service as directors or officers. Several of these agreements limit the time within which an indemnification claim can be made and the amount of the claim.
It is not possible to make a reasonable estimate of the maximum potential amount of indemnification under these indemnification agreements due to the unique facts and circumstances involved in each particular agreement. Additionally, the Company has a limited history of prior indemnification claims, and the payments made under such agreements have not had a material effect on the Company’s results of operations, cash flows or financial position. Except as noted in the “Contingencies” section herein, as of December 31, 2024, the Company did not have any material indemnification claims that were probable or reasonably possible. However, to the extent that valid indemnification claims arise in the future, future payments by the Company could be significant and could have a material adverse effect on the Company’s results of operations or cash flows in a particular period.
SCHEDULE II
DENTSPLY SIRONA INC. AND SUBSIDIARIES
VALUATION AND QUALIFYING ACCOUNTS
FOR THE YEARS ENDED DECEMBER 31, 2024, 2023, and 2022
| | | | | | | | | | | | | | | | | | | | | | | | | | | | | | | | | | | | | | |
| | | | | Additions | | | | | | |
| Description | | Balance at Beginning of Period | | Charged To Costs And Expenses | | Charged to Other Accounts | | Write-offs Net of Recoveries | | Translation Adjustment | | Balance at End of Period |
| | | | | | |
| (in millions) | | | | | | |
| | | | | | | | | | | | |
| Allowance for doubtful accounts: | | | | | | | | | | |
| | | | | | | | |
| For the Year Ended December 31, | | | | | | | | |
| 2022 | | $ | 13 | | | $ | 7 | | | $ | (2) | | | $ | (3) | | | $ | (1) | | | $ | 14 | |
| 2023 | | 14 | | | 6 | | | (1) | | | (3) | | | 1 | | | 17 | |
| 2024 | | 17 | | | 14 | | | (9) | | | (6) | | | (2) | | | 14 | |
| | | | | | | | | | | | |
| Inventory valuation reserve: | | | | | | | | | | |
| | | | | | | | | | | | |
| For the Year Ended December 31, | | | | | | | | |
| 2022 | | $ | 86 | | | $ | 20 | | | $ | — | | | $ | (17) | | | $ | (7) | | | $ | 82 | |
| 2023 | | 82 | | | 39 | | | — | | | (18) | | | 4 | | | 107 | |
| 2024 | | 107 | | | 26 | | | — | | | (22) | | | (13) | | | 98 | |
| | | | | | | | | | | | |
| Deferred tax asset valuation allowance: | | | | | | | | |
| | | | | | | | |
| For the Year Ended December 31, | | | | | | | | |
2022 (a) | | $ | 267 | | | $ | 3 | | | $ | 382 | | | $ | (1) | | | $ | (6) | | | $ | 645 | |
| 2023 | | 645 | | | 279 | | | 4 | | | (70) | | | 5 | | | 863 | |
| 2024 | | 863 | | | 691 | | | — | | | (39) | | | (12) | | | 1,503 | |
(a) The increase charged to other accounts represents an increase in deferred tax assets related to the re-establishment of Luxembourg net operating loss carryforwards for which a corresponding increase to the valuation allowance was also recorded, with no net impact to tax expense.
Item 9. Changes in and Disagreements with Accountants on Accounting and Financial Disclosure
None.
Item 9A. Controls and Procedures
Conclusion Regarding the Effectiveness of Disclosure Controls and Procedures
The Company’s management, with the participation of the Company’s Chief Executive Officer, who is also serving as the Company’s principal financial officer, evaluated the effectiveness of the Company’s disclosure controls and procedures (as defined in Rules 13a-15(e) and 15d-15(e) under the Securities Exchange Act of 1934, as amended) as of the end of the period covered by this report. Based on that evaluation, the Chief Executive Officer concluded that the Company’s disclosure controls and procedures as of December 31, 2024, the end of the period covered by this report, were effective to provide reasonable assurance that the information required to be disclosed by the Company in reports filed or submitted under the Securities Exchange Act of 1934, as amended, is recorded, processed, summarized and reported, within the time periods specified in the SEC’s rules and forms and that it is accumulated and communicated to management, including the Chief Executive Officer, as appropriate to allow timely decisions regarding required disclosure.
Management’s Report on Internal Control Over Financial Reporting and Report of Independent Registered Public Accounting Firm
Management’s report on the Company’s internal control over financial reporting and the report of our independent registered public accounting firm on the effectiveness of our internal control over financial reporting are included under Item 8 of this Form 10-K.
Changes in Internal Control Over Financial Reporting
The Company is implementing a new enterprise resource planning (“ERP”) system using a global platform. The implementation is underway and is expected to continue to occur in phases over the next several years. In connection with the ERP implementation, we are updating and will continue to update our internal control over financial reporting, as necessary, to accommodate modifications to our business processes and accounting procedures. In the quarter ended December 31, 2024, the Company implemented the ERP system for a legal entity in the United States. The Company has appropriately considered this change in its design of and testing for effectiveness of internal controls over financial reporting and concluded this implementation did not have an adverse effect, nor do we expect will have an adverse effect, on our internal control over financial reporting.
Except with respect to the continued implementation of the new ERP system, there have been no changes in our internal control over financial reporting during the quarter ended December 31, 2024 that have materially affected, or are reasonably likely to materially affect, our internal control over financial reporting. We will continue to evaluate any further changes in our internal control over financial reporting over the course of the implementation of the new ERP system and other related systems, which is scheduled to occur in phases over the next few years.
Item 9B. Other Information
Rule 10b5-1 Trading Plans
During the year ended December 31, 2024, none of the Company’s directors or executive officers (as defined in Rule 16a-1(f) under the Exchange Act) adopted or terminated any contract, instruction or written plan for the purchase or sale of Company securities that was intended to satisfy the affirmative defense conditions of Rule 10b5-1(c) or any “non-Rule 10b5-1 trading arrangement” as defined in Item 408(c) of Regulation S-K.
Item 9C. Disclosure Regarding Foreign Jurisdiction that Prevent Inspections
Not Applicable
PART III
Item 10. Directors, Executive Officers and Corporate Governance
The information required under this item will be included under the captions “Election of Directors” and “Corporate Governance” in our Proxy Statement for the 2025 Annual Meeting of Stockholders (the “2025 Proxy Statement”) and is incorporated herein by reference.
Code of Ethics
The Company has a Code of Ethics and Business Conduct that applies to the Chief Executive Officer, Chief Financial Officer, Chief Accounting Officer and the Board of Directors and substantially all of the Company’s management-level employees. A copy of the Code of Ethics and Business Conduct is available in the Investors section of the Company’s website at www.dentsplysirona.com. The Company intends to disclose any amendment to its Code of Ethics and Business Conduct that relates to any element enumerated in Item 406(b) of Regulation S-K, and any waiver from a provision of the Code of Ethics and Business Conduct granted to any director, principal executive officer, principal financial officer, principal accounting officer, or any of the Company’s other executive officers, in the Investors section of the Company’s website at www.dentsplysirona.com, within four business days following the date of such amendment or waiver.
Insider Trading Policy
The Company has adopted an insider trading policy governing the purchase, sale, and other dispositions of its securities by its directors, officers, employees and independent contractors. The Company believes its insider trading policy is reasonably designed to promote compliance with insider trading laws, rules and regulations, and the exchange listing standards applicable to the Company. It is the Company’s policy to comply with all applicable securities and state laws (including obtaining any required approvals by the Company’s Board of Directors or appropriate committee of the Board of Directors) when engaging in transactions in the Company’s securities.
Item 11. Executive Compensation
The information required under this item will be included under the captions “Directors’ Compensation,” “Executive Compensation” and “Compensation Committee Interlocks and Insider Participation” in our 2025 Proxy Statement and is incorporated herein by reference except as to information required pursuant to Item 402(v) of Regulation S-K relating to pay versus performance.
Item 12. Security Ownership of Certain Beneficial Owners and Management and Related Stockholder Matters
The information required under this item will be included under the caption “Principal Beneficial Owners of Shares” in our 2025 Proxy Statement and is incorporated herein by reference.
Item 13. Certain Relationships and Related Transactions and Director Independence
The information required under this item will be included under the captions “Corporate Governance” and “Certain Relationships and Related Party Transactions” in our 2025 Proxy Statement and is incorporated herein by reference.
Item 14. Principal Accountant Fees and Services
The information required under this item will be included under the caption “Ratification of Appointment of Independent Registered Public Accountants” in our 2025 Proxy Statement and is incorporated herein by reference.
PART IV
Item 15. Exhibits and Financial Statement Schedule
a.Documents filed as part of this Report
1.Financial Statements:
Management’s Report on Internal Control Over Financial Reporting
Report of Independent Registered Public Accounting Firm (PCAOB ID 34)
Consolidated Statements of Operations for the years ended December 31, 2024, 2023, and 2022
Consolidated Statements of Comprehensive Income or Loss for the years ended December 31, 2024, 2023, and 2022
Consolidated Balance Sheets as of December 31, 2024 and 2023
Consolidated Statements of Equity for the years ended December 31, 2024, 2023, and 2022
Consolidated Statements of Cash Flows for the years ended December 31, 2024, 2023, and 2022
Notes to Consolidated Financial Statements
2.Financial Statement Schedules:
The following financial statement schedule is included in this report: Schedule II - Valuation and Qualifying Accounts for the Years Ended December 31, 2024, 2023, and 2022.
All other schedules for which provision is made in the applicable accounting regulations of the Securities and Exchange Commission are not required to be included herein under the related instructions or are inapplicable and, therefore, have been omitted.
3.Exhibits
The Exhibits listed below are filed or incorporated by reference as part of the Company’s Form 10-K.
| | | | | | | | |
Exhibit Number | | Description |
| | Agreement and Plan of Merger, dated as of September 15, 2015, by and among DENTSPLY International Inc., Sirona Dental Systems, Inc. and Dawkins Merger Sub Inc. (8) |
| | Equity Purchase Agreement, dated as of December 31, 2020, by and among Dentsply Sirona Inc., Straight Smile, LLC, the members of Straight Smile, LLC and Member Representative SSB, LLC (25) |
| 3.1 | | Second Amended and Restated Certificate of Incorporation (10) |
| | Certificate of Amendment to Second Amended and Restated Certificate of Incorporation of Dentsply Sirona Inc., dated as of May 23, 2018 (14) |
| | Seventh Amended and Restated By-laws of DENTSPLY SIRONA Inc. (35) |
| 4.1 | | United States Commercial Paper Dealer Agreement dated as of March 28, 2002 between the Company and Citigroup Global Markets Inc. (formerly known as Salomon Smith Barney Inc.) (formerly Exhibit 4.1(b)) (2) |
| | First Amendment to the United States Commercial Paper Dealer Agreement dated as of March 28, 2002 between the Company and Citigroup Global Markets Inc. (formerly known as Salomon Smith Barney Inc.) (7) |
| 4.2 | | United States Commercial Paper Dealer Agreement dated as of August 18, 2011 between the Company and J.P. Morgan Securities LLC (7) |
| | First Amendment to the United States Commercial Paper Dealer Agreement dated as of August 18, 2011 between the Company and J.P. Morgan Securities LLC (7) |
| | $700 Million Credit Agreement, dated as of July 27, 2018 final maturity in July 26, 2024, by and among the Company, the subsidiary borrowers party thereto, the lenders party thereto, JPMorgan Chase Bank, N.A. as administrative agent, Citibank N.A. as Syndication Agent, and Wells Fargo Bank, N.A., Commerzbank AG, New York Branch, MUFG Bank, Ltd., Unicredit Bank AG New York Branch, and TD Bank, N.A. as co-documentation agents, and J.P. Morgan Chase Bank, N.A. and Citibank, N.A., as Joint Bookrunners and Joint Lead Arrangers (15) |
| | Description of the Registrant’s Securities (22) |
| | |
| | | | | | | | |
| Exhibit Number | | Description |
| | Form of Indenture (5) |
| | Supplemental Indenture, dated August 23, 2011 between DENTSPLY International Inc., as Issuer and Wells Fargo, National Association, as Trustee (6) |
| 4.7 | | 12.55 Billion Japanese Yen Term Loan Agreement between the Company and Bank of Tokyo dated September 22, 2014 due September 28, 2019, between the Company, The Bank of Tokyo-Mitsubishi UFJ, LTD as Sole Lead Arranger, Development Bank of Japan, Inc. as Co-Arranger, The Bank of Tokyo-Mitsubishi UFJ, LTD, as Administrative Agent (7) |
| | First Amendment to 12.55 Billion Japanese Yen Term Loan Agreement dated December 18, 2015 between the Company and Bank of Tokyo-Mitsubishi UFJ, LTD (9) |
| | United States Commercial Paper issuing and paying Agency Agreement dated as of November 4, 2014, between the Company and U.S. Bank N.A. (7) |
| | Note Purchase Agreement, dated December 11, 2015, by and among the Company, Metropolitan Life Insurance Company, Prudential Retirement Insurance and Annuity Company, C.M. Life Insurance Company, The Northwestern Mutual Life Insurance Company, The Lincoln National Life Insurance Company, Manulife Life Insurance Company, Manufacturers Life Reinsurance Limited, Nationwide Life Insurance Company, United of Omaha Life Insurance Company and the other purchasers listed in Schedule A thereto (9) |
| | Note Purchase Agreement, dated October 27, 2016, by and among the Company, Metropolitan Life Insurance Company, New York Life Insurance Company, Nationwide Life Insurance Company, The Northwestern Mutual Life Insurance Company, Massachusetts Mutual Life Insurance Company, Allianz Life Insurance Company of North America, Hartford Life and Accident Insurance Company, The Lincoln National Life Insurance Company, The Guardian Life Insurance Company of America, Great-West Life & Annuity Insurance Company, The Prudential Insurance Company of America, and the other purchasers listed in Schedule A thereto (10) |
| | Note Purchase Agreement, dated June 24, 2019, by and among the Company and Brighthouse Life Insurance Company, Metlife Insurance K.K., The Northwestern Mutual Life Insurance Company, Hartford Fire Insurance Company, and Hartford Life and Accident Insurance Company. (19) |
| | Indenture, dated as of May 26, 2020, between DENTSPLY SIRONA Inc. and Wells Fargo Bank, National Association. (23) |
| | First Supplemental Indenture, dated as of May 26, 2020, between DENTSPLY SIRONA Inc. and Wells Fargo Bank, National Association. (23) |
| | Form of 3.250% Notes due 2030 (included in Exhibit 4.13). (23) |
| | Consent Memorandum, dated August 11, 2022, by and among DENTSPLY SIRONA Inc., the Subsidiary Borrowers from time to time party thereto, the lender parties thereto and JPMorgan Chase Bank, N.A., as administrative agent. (32) |
| | Note Purchase Agreement Amendment and Consent, dated August 26, 2022, by and among DENTSPLY SIRONA Inc. and each of the holders of Notes parties thereto, with respect to that certain Note Purchase Agreement, dated December 11, 2015, by and among the Issuers and the holders of Notes set forth therein. (32) |
| | Note Purchase and Guarantee Agreement Amendment and Consent, dated August 26, 2022, by and among DENTSPLY SIRONA Inc., Sirona Dental Services GmbH and each of the holders of Notes parties thereto, with respect to that certain Note Purchase Agreement and Guarantee Agreement, dated October 27, 2016, by and among the Issuers and the holders of Notes set forth therein. (32) |
| | Note Purchase Agreement Amendment and Consent, dated August 26, 2022, by and among DENTSPLY SIRONA Inc. and each of the holders of Notes parties thereto, with respect to that certain Note Purchase Agreement, dated June 24, 2019, by and among the Issuers and the holders of Notes set forth therein. (32) |
| | Consent Memorandum, dated September 14, 2022, by and among DENTSPLY SIRONA Inc., the Subsidiary Borrowers from time to time party thereto, the lender parties thereto and JPMorgan Chase Bank, N.A., as administrative agent. (32) |
| | Consent Memorandum, dated November 4, 2022, by and among DENTSPLY SIRONA Inc., the Subsidiary Borrowers from time to time party thereto, the lender parties thereto and JPMorgan Chase Bank, N.A., as administrative agent. (32) |
| | Note Purchase Agreement Amendment No. 2 and Consent, dated November 5, 2022, by and among DENTSPLY SIRONA Inc and each of the holders of Notes parties thereto, with respect to that certain Note Purchase Agreement, dated December 11, 2015, by and among the Issuers and the holders of Notes set forth therein. (32) |
| | | | | | | | |
Exhibit Number | | Description |
| | Note Purchase and Guarantee Agreement Amendment No. 2 and Consent, dated November 5, 2022, by and among DENTSPLY SIRONA Inc, Sirona Dental Services GmbH and each of the holders of Notes parties thereto, with respect to that certain Note Purchase Agreement and Guarantee Agreement, dated October 27, 2016, by and among the Issuers and the holders of Notes set forth therein. (32) |
| | Note Purchase Agreement Amendment No. 2 and Consent, dated November 5, 2022, by and among DENTSPLY SIRONA Inc and each of the holders of Notes parties thereto, with respect to that certain Note Purchase Agreement, dated June 24, 2019, by and among the Issuers and the holders of Notes set forth therein. (32) |
| | Restricted Stock Unit Deferral Plan* (9) |
| 10.2 | | Trust Agreement for the Company’s Employee Stock Ownership Plan between the Company and T. Rowe Price Trust Company dated as of November 1, 2000 (1) |
| | Plan Recordkeeping Agreement for the Company’s Employee Stock Ownership Plan between the Company and T. Rowe Price Trust Company dated as of November 1, 2000 (1) |
| | DENTSPLY Supplemental Saving Plan Agreement dated as of December 10, 2007* (3) |
| | DENTSPLY SIRONA Inc. Directors’ Deferred Compensation Plan, as amended and restated January 1, 2019* (17) |
| | DENTSPLY SIRONA Inc. Supplemental Executive Retirement Plan, as amended and restated January 1, 2019* (17) |
| | 2010 Equity Incentive Plan, amended and restated* (9) |
| | DENTSPLY SIRONA Inc. 2016 Omnibus Incentive Plan, as amended and restated effective February 14, 2018* (13) |
| | Sirona Dental Systems, Inc. Equity Incentive Plan, as Amended* (10) |
| 10.10 | | Employment Agreement, dated February 12, 2018, between DENTSPLY SIRONA Inc. and Donald M. Casey Jr.* (11) |
| | First Amendment to Employment Agreement, dated August 3, 2018, by and between DENTSPLY SIRONA Inc. and Donald M. Casey Jr.* (17) |
| | Second Amendment dated as of March 5, 2019 to Employment Agreement by and between DENTSPLY SIRONA Inc. and Donald M. Casey, Jr.* (18) |
| 10.11 | | Form of DENTSPLY SIRONA Inc. Indemnification Agreement* (12) |
| | Form of Amended and Restated DENTSPLY SIRONA Inc. Indemnification Agreement dated as of December 15, 2021* (27) |
| | Form of Amended and Restated DENTSPLY SIRONA Inc. Indemnification Agreement dated as of December 14, 2022* (33) |
| | Form of Amended and Restated DENTSPLY SIRONA Inc. Indemnification Agreement dated as of February 27, 2024* (36) |
| | Form of Option Grant Notice Under the DENTSPLY SIRONA Inc. 2016 Omnibus Incentive Plan as amended and restated* (12) |
| | Form of Restricted Share Unit Grant Notice Under the DENTSPLY SIRONA Inc. 2016 Omnibus Incentive Plan as amended and restated* (12) |
| | Form of Performance Restricted Share Unit Grant Notice Under the DENTSPLY SIRONA Inc. 2016 Omnibus Incentive Plan as amended and restated* (12) |
| | Employee Stock Purchase Plan, dated May 23, 2018* (16) |
| 10.16 | | Non-Employee Director Compensation Policy, effective February 23, 2022* (27) |
| | Non-Employee Director Compensation Policy, effective July 27, 2023* (36) |
| | Non-Employee Director Compensation Policy, effective May 21, 2024* (38) |
| | Form of Performance Restricted Stock Unit Award Agreement* (18) |
| | Form of Restricted Share Unit Grant Notice for Directors under the DENTSPLY SIRONA Inc. 2016 Omnibus Incentive Plan as amended and restated* (20) |
| | Amended and Restated Restricted Stock Unit Deferral Plan, effective July 31, 2019* (20) |
| | Offer Letter, dated June 27, 2019, between DENTSPLY SIRONA Inc. and Jorge Gomez* (20) |
| | |
| | | | | | | | |
Exhibit Number | | Description |
| | Interim Chief Executive Officer Employment Agreement by and between DENTSPLY SIRONA Inc. and John P. Groetelaars, dated April 16, 2022 (29) |
| | Interim Chief Financial Officer Employment Agreement by and between DENTSPLY SIRONA Inc. and Barbara W. Bodem, dated April 16, 2022 (29) |
| | Dentsply Sirona Inc. Key Employee Severance Benefits Plan, dated May 25, 2022* (29) |
| | Dentsply Sirona Inc. Amended and Restated Key Employee Severance Benefits Plan, dated September 22, 2022. (32) |
| | Employment Agreement between DENTSPLY SIRONA Inc. and Simon D. Campion, entered into as of August 22, 2022. (30) |
| | First Amendment to the Interim Chief Financial Officer Employment Agreement between DENTSPLY SIRONA Inc. and Barbara W. Bodem, dated as of September 22, 2022. (31) |
| | Offer Letter between DENTSPLY SIRONA Inc. and Glenn Coleman, entered into as of September 22, 2022. (31) |
| | Credit Agreement, dated as of May 12, 2023, among DENTSPLY SIRONA Inc., JPMorgan Chase Bank, N.A., as Administrative Agent, Citibank, N.A., as Syndication Agent, Bank of America, N.A., Commerzbank AG, New York Branch, PNC Bank, National Association, TD Bank, N.A., Truist Bank and Wells Fargo Bank, National Association as Co-Documentation Agents, JPMorgan Chase Bank, N.A., and Citibank N.A., as Joint Bookrunners and Joint Leader Arrangers, and the several lenders party thereto (34) |
| | DENTSPLY SIRONA Inc. 2024 Omnibus Incentive Plan* (37) |
| | DENTSPLY SIRONA Amended and Restated Employee Stock Purchase Plan, dated April 9, 2024* (37) |
| | Form of Share-Settled Restricted Stock Unit Award Agreement (Director) under the Dentsply Sirona Inc. 2024 Omnibus Incentive Plan* (37) |
| | Form of Share-Settled Restricted Stock Unit Award Agreement under the Dentsply Sirona Inc. 2024 Omnibus Incentive Plan* (38) |
| | Form of Share-Settled Performance Restricted Stock Unit Award Agreement under the Dentsply Sirona Inc. 2024 Omnibus Incentive Plan* (38) |
| | Form of Cash-Settled Restricted Stock Unit Award Agreement under the Dentsply Sirona Inc. 2024 Omnibus Incentive Plan* (38) |
| | Form of Cash-Settled Performance Restricted Stock Unit Award Agreement under the Dentsply Sirona Inc. 2024 Omnibus Incentive Plan* (38) |
| | Form of Option Award Agreement under the DENTSPLY SIRONA Inc. 2024 Omnibus Incentive Plan* (38) |
| | Insider Trading Policy revised July 26, 2022 (36) |
| | Subsidiaries of the Company (Filed herewith) |
| | Consent of Independent Registered Public Accounting Firm - Deloitte & Touche LLP (Filed herewith) |
| | Consent of Independent Registered Public Accounting Firm - PricewaterhouseCoopers LLP (Filed herewith) |
| | Section 302 Certification Statements Chief Executive Officer (Filed herewith) |
| | |
| | Section 906 Certification Statement (Furnished herewith) |
| | Dodd-Frank Act Restatement Clawback Policy dated November 21, 2023 (36) |
| 101.INS | | Inline XBRL Instance Document (the instance document does not appear in the Interactive Data File because its XBRL tags are embedded within the Inline XBRL document) |
| 101.SCH | | XBRL Taxonomy Extension Schema Document |
| 101.CAL | | XBRL Taxonomy Extension Calculation Linkbase Document |
| 101.DEF | | XBRL Taxonomy Extension Definition Linkbase Document |
| 101.LAB | | XBRL Extension Labels Linkbase Document |
| 101.PRE | | XBRL Taxonomy Extension Presentation Linkbase Document |
| 104 | | Cover Page Interactive Data File (formatted as Inline XBRL and contained in Exhibit 101) |
*Management contract or compensatory plan.
| | | | | |
| (1) | Incorporated by reference to exhibit included in the Company’s Form 10-K for the fiscal year ended December 31, 2000, File 0-16211. |
| |
| (2) | Incorporated by reference to exhibit included in the Company’s Form 10-K for the fiscal year ended December 31, 2002, File 0-16211. |
| |
| (3) | Incorporated by reference to exhibit included in the Company’s Form 10-K for the fiscal year ended December 31, 2007, File No. 0-16211. |
| |
| | | | | |
| (4) | Incorporated by reference to exhibit included in the Company’s Form 10-K for the fiscal year ended December 31, 2008, File No. 0-16211. |
| |
| (5) | Incorporated by reference to exhibit included in the Company’s Registration Statement on Form S-3 dated August 15, 2011 (No. 333-176307). |
| |
| (6) | Incorporated by reference to exhibit included in the Company’s Form 8-K dated August 29, 2011, File no. 0-16211. |
| |
| (7) | Incorporated by reference to exhibit included in the Company’s Form 10-K for the fiscal year ended December 31, 2014, File no. 0-16211. |
| |
| (8) | Incorporated by reference to exhibit included in the Company’s Form 8-K dated September 16, 2015, File no. 0-16211. |
| |
| (9) | Incorporated by reference to exhibit included in the Company’s Form 10-K for the fiscal year ended December 31, 2015, File no. 0-16211. |
| |
| (10) | Incorporated by reference to exhibit included in the Company’s Form 10-K for the fiscal year ended December 31, 2016, File no. 0-16211. |
| |
| (11) | Incorporated by reference to exhibit included in the Company’s Form 8-K, dated January 17, 2018, File no.0-16211. |
| |
| (12) | Incorporated by reference to exhibit included in the Company’s Form 8-K, dated February 15, 2018, File no.0-16211. |
| |
| (13) | Incorporated by reference to exhibit included in the Company’s Form 10-K for the fiscal year ended December 31, 2017, File no. 0-16211. |
| |
| (14) | Incorporated by reference to exhibit included in the Company’s Form 8-K, dated May 23, 2018, File no.0-16211. |
| |
| (15) | Incorporated by reference to exhibit included in the Company’s Form 8-K, dated July 30, 2018, File no.0-16211. |
| |
| (16) | Incorporated by reference to exhibit included in the Company’s Form 10-Q for the quarterly period ended June 30, 2018, File no. 0-16211. |
| |
| (17) | Incorporated by reference to exhibit included in the Company’s Form 10-K for the fiscal year ended December 31, 2018, File no. 0-16211. |
| |
| (18) | Incorporated by reference to exhibit included in the Company’s Form 8-K, dated March 8, 2019, File no. 0-16211. |
| |
| (19) | Incorporated by reference to exhibit included in the Company’s Form 8-K, dated June 26, 2019, File no. 0-16211. |
| |
| (20) | Incorporated by reference to exhibit included in the Company’s Form 10-Q for the quarterly period ended June 30, 2019, File no. 0-16211. |
| |
| (21) | Incorporated by reference to exhibit included in the Company’s Form 10-Q for the quarterly period ended March 31, 2019, File no. 0-16211. |
| |
| (22) | Incorporated by reference to exhibit included in the Company’s Form 10-K for the fiscal year ended December 31, 2019, File no. 0-16211. |
| |
| (23) | Incorporated by reference to exhibit included in the Company’s Form 8-K, dated May 26, 2020, File no. 0-16211. |
| |
| (24) | Incorporated by reference to exhibit included in the Company’s Form 10-Q for the quarterly period ended September 30, 2020, File no. 0-16211. |
| |
| (25) | Incorporated by reference to exhibit included in the Company’s Form 8-K, dated January 4, 2021, File no. 0-16211. |
| |
| (26) | Incorporated by reference to exhibit included in the Company’s Form 10-Q for the quarterly period ended June 30, 2021, File no. 0-16211. |
| |
| (27) | Incorporated by reference to exhibit included in the Company’s Form 10-K for the fiscal year ended December 31, 2021, File no. 0-16211. |
| |
| (28) | Incorporated by reference to exhibit included in the Company’s Form 8-K, dated May 31, 2022, File no. 0-16211. |
| |
| (29) | Incorporated by reference to exhibit included in the Company’s Form 10-Q for the quarterly period ended June 30, 2022, File no. 0-16211. |
| |
| (30) | Incorporated by reference to exhibit included in the Company’s Form 8-K, dated August 25, 2022, File no. 0-16211. |
| |
| (31) | Incorporated by reference to exhibit included in the Company’s Form 8-K, dated September 22, 2022, File no. 0-16211. |
| |
| (32) | Incorporated by reference to exhibit included in the Company’s Form 10-Q for the quarterly period ended September 30, 2022, File no. 0-16211. |
| |
| (33) | Incorporated by reference to exhibit included in the Company’s Form 10-K for the fiscal year ended December 31, 2022, File no. 0-16211. |
| |
| (34) | Incorporated by reference to exhibit included in the Company’s Form 8-K, dated May 12, 2023, File no. 0-16211. |
| |
| (35) | Incorporated by reference to exhibit included in the Company’s Form 8-K, dated August 2, 2023, File no. 0-16211. |
| |
| (36) | Incorporated by reference to exhibit included in the Company’s Form 10-K for the fiscal year ended December 31, 2023, File no. 0-16211. |
| |
| (37) | Incorporated by reference to exhibit included in the Company’s Registration Statement on Form S-8 dated May 24, 2024 (No. 333-279714). |
| |
| (38) | Incorporated by reference to exhibit included in the Company’s Form 10-Q for the quarterly period ended June 30, 2024, File no. 0-16211. |
| |
Item 16. Form 10-K Summary
None.
SIGNATURES
Pursuant to the requirements of Section 13 or 15(d) of the Securities Exchange Act of 1934, the registrant has duly caused this report to be signed on its behalf by the undersigned, thereunto duly authorized.
| | | | | | | | |
| DENTSPLY SIRONA Inc. |
| | | |
| By: | /s/ | Simon D. Campion |
| | | Simon D. Campion |
| | President and |
| | | Chief Executive Officer |
| | |
| Date: | | February 27, 2025 |
Pursuant to the requirements of the Securities Exchange Act of 1934, this report has been signed below by the following persons on behalf of the registrant and in the capacities and on the dates indicated.
| | | | | | | | | | | |
| /s/ | Simon D. Campion | | February 27, 2025 |
| | Simon D. Campion | | Date |
| President and | | |
| | Chief Executive Officer and Director | | |
| | (Principal Executive Officer, Principal Financial Officer) | | |
| | | |
| | | |
| | | |
| | | |
| | | |
| /s/ | Kevin J. Czerney | | February 27, 2025 |
| Kevin J. Czerney | | Date |
| Chief Accounting Officer | | |
| (Principal Accounting Officer) | | |
| | | |
| /s/ | Gregory T. Lucier | | February 27, 2025 |
| Gregory T. Lucier | | Date |
| Chairman of the Board of Directors | | |
| | | |
| /s/ | Michael J. Barber | | February 27, 2025 |
| Michael J. Barber | | Date |
| Director | | |
| | | |
| /s/ | Willie A. Deese | | February 27, 2025 |
| | Willie A. Deese | | Date |
| | Director | | |
| | | |
| /s/ | Brian T. Gladden | | February 27, 2025 |
| Brian T. Gladden | | Date |
| Director | | |
| | | |
| | | | | | | | | | | |
| /s/ | Betsy D. Holden | | February 27, 2025 |
| Betsy D. Holden | | Date |
| Director | | |
| | | |
| /s/ | Clyde R. Hosein | | February 27, 2025 |
| Clyde R. Hosein | | Date |
| Director | | |
| | | |
| /s/ | Jonathan J. Mazelsky | | February 27, 2025 |
| Jonathan J. Mazelsky | | Date |
| Director | | |
| | | |
| /s/ | Daniel T. Scavilla | | February 27, 2025 |
| Daniel T. Scavilla | | Date |
| Director | | |
| | | |
| /s/ | Leslie F. Varon | | February 27, 2025 |
| Leslie F. Varon | | Date |
| Director | | |
| | | |
| /s/ | Janet S. Vergis | | February 27, 2025 |
| Janet S. Vergis | | Date |
| Director | | |
| | | |
| | | |
| | | |
| | | |
| | | |
| | | |
| | | |
| | | |
| | | |