Exhibit 13
Annual Report to Stockholders


| At Or For The Year Ended March 31, | ||||||||||
| 2010 | 2009 | 2008 | 2007 | 2006 | ||||||
| Balance Sheet Data | (Dollars In Thousands, Except Per Share Data) | |||||||||
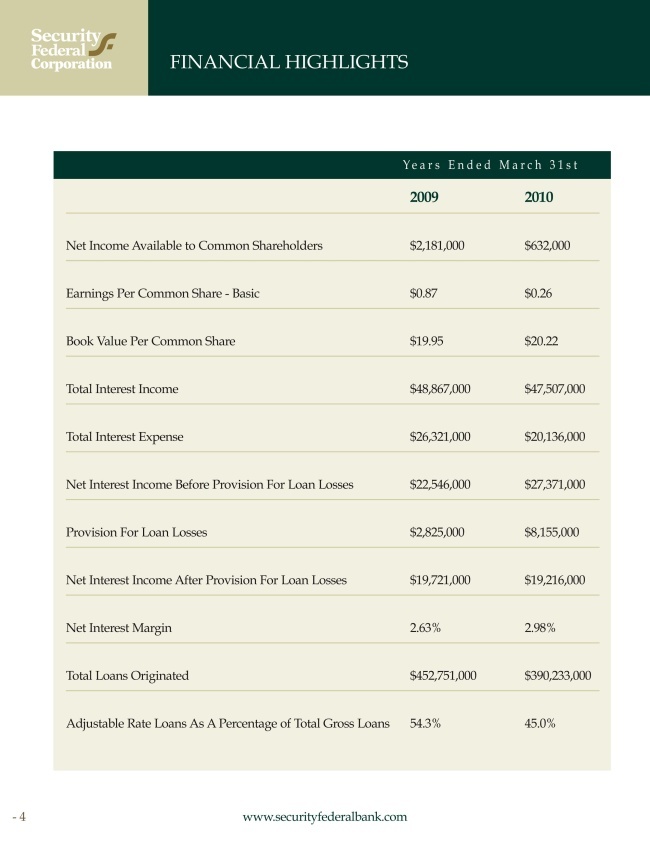
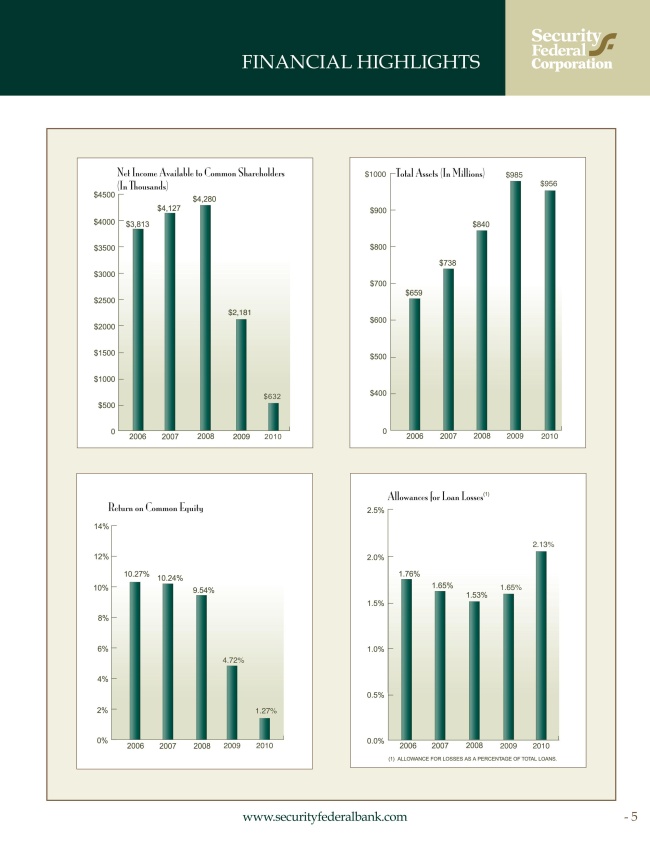
| Total Assets | $ | 956,002 | $ | 984,662 | $ | 840,030 | $ | 738,110 | $ | 658,678 |
| Cash And Cash Equivalents | 8,805 | 6,562 | 10,539 | 13,438 | 14,351 | |||||
| Investment And Mortgage-Backed Securities | 311,046 | 314,099 | 264,312 | 249,905 | 238,433 | |||||
Total Loans Receivable, Net (1) | 568,399 | 611,090 | 517,932 | 436,038 | 375,109 | |||||
| Deposits | 694,252 | 661,714 | 590,850 | 523,738 | 479,229 | |||||
| Advances From Federal Home Loan Bank | 164,004 | 218,998 | 178,234 | 153,049 | 131,363 | |||||
| Total Shareholders' Equity | 67,861 | 67,092 | 47,496 | 42,693 | 37,602 | |||||
| Income Data | ||||||||||
| Total Interest Income | 47,507 | 48,867 | 49,632 | 42,098 | 32,617 | |||||
| Total Interest Expense | 20,136 | 26,321 | 29,544 | 23,933 | 15,969 | |||||
| Net Interest Income | 27,371 | 22,546 | 20,088 | 18,165 | 16,648 | |||||
| Provision For Loan Losses | 8,155 | 2,825 | 895 | 600 | 660 | |||||
| Net Interest Income After Provision For Loan Losses | 19,216 | 19,721 | 19,193 | 17,565 | 15,988 | |||||
| Non-Interest Income | 6,071 | 4,496 | 4,489 | 3,861 | 2,630 | |||||
| General And Administrative Expense | 22,622 | 20,499 | 17,322 | 15,157 | 13,027 | |||||
| Income Taxes | 1,060 | 1,265 | 2,080 | 2,142 | 1,778 | |||||
| Net Income | 1,605 | 2,453 | 4,280 | 4,127 | 3,813 | |||||
| Preferred Stock Dividends | 900 | 252 | - | - | - | |||||
| Accretion Of Preferred Stock To Redemption Value | 73 | 20 | - | - | - | |||||
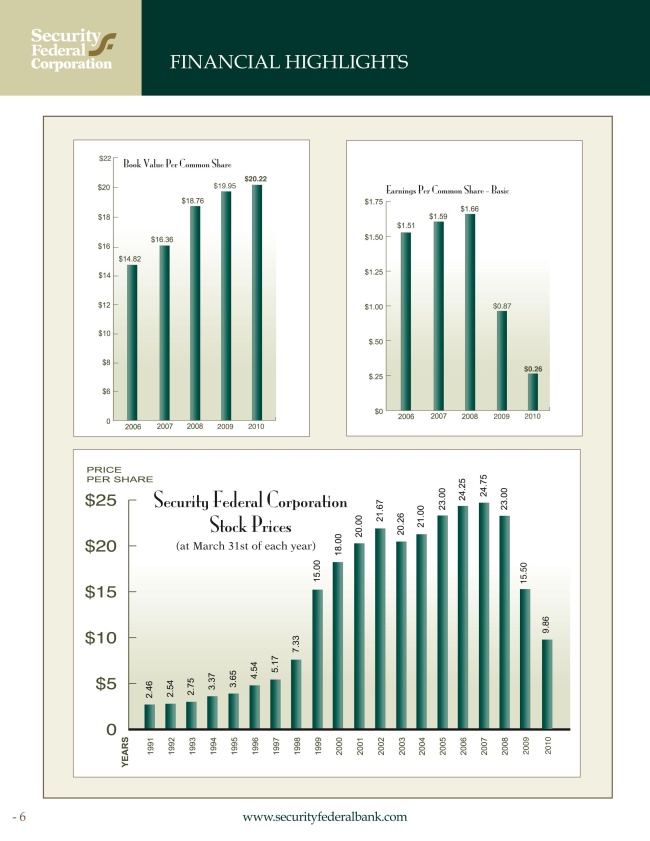
| Net Income Available to Common Shareholders | $ | 632 | $ | 2,181 | $ | 4,280 | $ | 4,127 | $ | 3,813 |
| Per Common Share Data | ||||||||||
| Net Income Per Common Share (Basic) | $ | 0.26 | $ | 0.87 | $ | 1.66 | $ | 1.59 | $ | 1.51 |
| Cash Dividends Declared | $ | 0.32 | $ | 0.32 | $ | 0.28 | $ | 0.24 | $ | 0.16 |
| Other Data | ||||||||||
| Interest Rate Spread Information: | ||||||||||
| Average During Period | 2.83% | 2.45% | 2.44% | 2.47% | 2.52% | |||||
| End Of Period | 3.21% | 2.58% | 2.14% | 2.51% | 2.59% | |||||
Net Interest Margin (Net Interest Income/Average Earning Assets) | 2.98% | 2.63% | 2.69% | 2.76% | 2.79% | |||||
Average Interest-Earning Assets To Average Interest- Bearing Liabilities | 106.64% | 105.80% | 106.30% | 108.00% | 110.25% | |||||
| Common Equity To Total Assets | 5.21% | 4.98% | 5.65% | 5.78% | 5.71% | |||||
Non-Performing Assets To Total Assets (2) | 4.39% | 1.51% | 0.81% | 0.15% | 0.20% | |||||
Return On Assets (Ratio Of Net Income To Average Total Assets) | 0.06% | 0.24% | 0.54% | 0.59% | 0.62% | |||||
Return On Common Equity (Ratio Of Net Income To Average Common Equity) | 1.27% | 4.72% | 9.54% | 10.24% | 10.27% | |||||
Common Equity To Assets Ratio (Ratio Of Average Common Equity To Average Total Assets) | 5.09% | 5.10% | 5.66% | 5.78% | 6.03% | |||||
Dividend Pay-Out Ratio On Common Shares(3) | 124.56% | 36.59% | 16.90% | 15.11% | 10.67% | |||||
| Number Of Full-Service Offices | 13 | 13 | 13 | 11 | 11 | |||||
| (1) | INCLUDES LOANS HELD FOR SALE. |
| (2) | NON-PERFORMING ASSETS CONSIST OF NON-ACCRUAL LOANS AND REPOSSESSED ASSETS. |
| (3) | RATIO OF DIVIDENDS PAID ON COMMON SHARES TO NET INCOME AVAILABLE TO COMMON SHAREHOLDERS |
7
SECURITY FEDERAL CORPORATION AND SUBSIDIARIES
Management’s Discussion and Analysis of Financial Condition and Results of Operations
General
The following discussion is presented to provide the reader with an understanding of the financial condition and the results of operations of Security Federal Corporation and its subsidiaries. The investment and other activities of the parent company, Security Federal Corporation (the “Company”), have had no significant impact on the results of operations for the periods presented in the financial statements. The information presented in the following discussion of financial results is indicative of the activities of Security Federal Bank (“Bank”), a wholly owned subsidiary of the Company. The Bank is a federally chartered stock savings bank that was founded in 1922. The Bank also has two wholly owned subsidiaries: Security Federal Insurance Inc. (“SFINS”) and Security Financial Services Corporation (“SFSC”). SFINS was formed in the fiscal year ended March 31, 2002 and began operating during the December 2001 quarter. SFINS is an insurance agency offering auto, business, health, and home insurance. SFINS has a wholly owned subsidiary, Collier Jennings Financial Corporation (“Collier Jennings”), which has three wholly owned subsidiaries Security Federal Auto Insurance, The Auto Insurance Store Inc., and Security Federal Premium Pay Plans Inc. SFSC was formed in 1975 and is currently inactive. In addition to the Bank, Security Federal Corporation has another wholly owned subsidiary, Security Federal Statutory Trust (the “Trust”), which issued and sold fixed and floating rate capital securities of the Trust. Under current accounting guidance, however, the Trust is not consolidated in the Company’s financial statements. Unless the context indicates otherwise, references to the Company shall include the Bank and its subsidiaries.
Prior to April 1, 2009, the Bank had two additional subsidiaries: Security Federal Investments, Inc. (“SFINV”) and Security Federal Trust Inc. (“SFT”). SFINV provided primarily investment brokerage services. SFT offered trust, financial planning and financial management services. On April 1, 2009, the assets and operations of SFINV and SFT were dissolved into the Bank. The services of these two entities are now offered through the trust and investment divisions of the Bank.
The principal business of the Bank is accepting deposits from the general public and originating consumer and commercial business loans as well as mortgage loans that enable borrowers to purchase or refinance one-to-four family residential real estate. The Bank also originates construction loans on single-family residences, multi-family dwellings and projects, and commercial real estate, as well as loans for the acquisition, development and construction of residential subdivisions, and commercial projects.
The Bank's net income is dependent on its interest rate spread which is the difference between the average yield earned on its loan and investment portfolios and the average rate paid on its deposits and borrowings. The Bank’s interest spread is influenced by interest rates, deposit flows, and loan demands. Levels of non-interest income and operating expense are also significant factors in earnings.
Forward-Looking Statements
This document, including information included or incorporated by reference, contents, and future filings by the Company on Form 10-K, Form 10-Q, and Form 8-K, and future oral and written statements by the Company and its management may contain forward-looking statements about the Company and its subsidiaries which we believe are within the meaning of the Private Securities Litigation Reform Act of 1995. Forward-looking statements often include the words “believes,” “expects,” “anticipates,” “estimates,” “forecasts,” “intends,” “plans,” “targets,” “potentially,” “probably,” “projects,” “outlook” or similar expressions or future or conditional verbs such as “may,” “will,” “should,” “would” and “could.” These forward-looking statements are subject to known and unknown risks, uncertainties and other factors that could cause actual results to differ materially from the results anticipated, including, but not limited to:
| · | the credit risks of lending activities, including changes in the level and trend of loan delinquencies and write-offs and changes in our allowance for loan losses and provision for loan losses that may be impacted by deterioration in the housing and commercial real estate markets; |
| · | changes in general economic conditions, either nationally or in our market areas; |
| · | changes in the levels of general interest rates, and the relative differences between short and long term interest rates, deposit interest rates, our net interest margin and funding sources; |
| · | fluctuations in the demand for loans, the number of unsold homes, land and other properties and fluctuations in real |
| · | estate values in our market areas; |
8
SECURITY FEDERAL CORPORATION AND SUBSIDIARIES
Management’s Discussion and Analysis of Financial Condition and Results of Operations
Forward-Looking Statements, Continued
| · | results of examinations of us by the Office of Thrift Supervision (the “OTS”) or the FDIC or other regulatory authorities, including the possibility that any such regulatory authority may, among other things, require us to increase our reserve for loan losses, write-down assets, change our regulatory capital position or affect our ability to borrow funds or maintain or increase deposits, which could adversely affect our liquidity and earnings; |
| · | legislative or regulatory changes that adversely affect our business including changes in regulatory policies and principles, or the interpretation of regulatory capital or other rules; |
| · | further increases in premiums for deposit insurance; |
| · | our ability to control operating costs and expenses; |
| · | the use of estimates in determining fair value of certain of our assets, which estimates may prove to be incorrect and result in significant declines in valuation; |
| · | difficulties in reducing risk associated with the loans on our balance sheet; |
| · | staffing fluctuations in response to product demand or the implementation of corporate strategies that affect our workforce and potential associated charges; |
| · | computer systems on which we depend could fail or experience a security breach; |
| · | our ability to retain key members of our senior management team; |
| · | costs and effects of litigation, including settlements and judgments; |
| · | our ability to implement our branch expansion strategy; |
| · | our ability to successfully integrate any assets, liabilities, customers, systems, and management personnel we have acquired or may in the future acquire into our operations and our ability to realize related revenue synergies and cost savings within expected time frames and any goodwill charges related thereto; |
| · | changes in premiums or claims that adversely affect our insurance segment; |
| · | increased competitive pressures among financial services companies; |
| · | changes in consumer spending, borrowing and savings habits; |
| · | the availability of resources to address changes in laws, rules, or regulations or to respond to regulatory actions; |
| · | our ability to pay dividends on our common stock; |
| · | adverse changes in the securities markets; |
| · | inability of key third-party providers to perform their obligations to us; |
| · | changes in accounting policies and practices, as may be adopted by the financial institution regulatory agencies or the Financial Accounting Standards Board, including additional guidance and interpretation on accounting issues and details of the implementation of new accounting methods; |
| · | future legislative changes in the TARP Capital Purchase Program; and |
| · | other economic, competitive, governmental, regulatory, and technological factors affecting our operations, pricing, products and services and the other risks described elsewhere in this document. |
9
SECURITY FEDERAL CORPORATION AND SUBSIDIARIES
Management’s Discussion and Analysis of Financial Condition and Results of Operations
Forward-Looking Statements, Contined
Some of these and other factors are discussed in our Annual Report on Form 10-K for the year ended March 31, 2010 under the Item 1A, “Risk Factors.” Such developments could have an adverse impact on our financial position and our results of operations.
Any forward-looking statements are based upon management’s beliefs and assumptions at the time they are made. We undertake no obligation to publicly update or revise any forward-looking statements included or incorporated by reference in this document or to update the reasons why actual results could differ from those contained in such statements, whether as a result of new information, future events or otherwise. In light of these risks, uncertainties and assumptions, the forward-looking statements discussed in this document might not occur, and you should not put undue reliance on any forward-looking statements.
Critical Accounting Policies
The Company has adopted various accounting policies which govern the application of accounting principles generally accepted in the United States in the preparation of the Company’s financial statements. The significant accounting policies of the Company are described in Note 1 of the Notes to the Consolidated Financial Statements included herein.
Certain accounting policies involve significant judgments and assumptions by management, which have a material impact on the carrying value of certain assets and liabilities; management considers these accounting policies to be critical accounting policies. The judgments and assumptions used by management are based on historical experience and other factors, which are believed to be reasonable under the circumstances. Because of the nature of the judgments and assumptions made by management, actual results could differ from these judgments and estimates, which could have a material impact on the carrying values of assets and liabilities and the results of operations of the Company.
Of these significant accounting policies, the Company considers its policies regarding the allowance for loan losses to be its most critical accounting policy because of the significant degree of management judgment involved in determining the amount of allowance for loan losses. The Company has developed policies and procedures for assessing the adequacy of the allowance for loan losses, and recognizes that this process requires a number of assumptions and estimates with respect to its loan portfolio. The Company’s assessments may be impacted in future periods by changes in economic conditions, the impact of regulatory examinations, and the discovery of information with respect to borrowers, which is not known to management at the time of the issuance of the consolidated financial statements. For a further discussion of the Company’s estimation process and methodology related to the allowance for loan losses, see the discussion under the section entitled “Comparison of the Years Ended March 31, 2010 and 2009 - Financial Condition” and “-Provision for Loan Losses” and “Comparison of the Years Ended March 31, 2009 and 2008- Financial Condition– Financial Condition” and “-Provision for Loan Losses” included herein.
Asset and Liability Management
The Bank’s program of asset and liability management seeks to limit the Bank’s vulnerability to material and prolonged increases or decreases in interest rates, or "interest rate risk." The principal determinant of the exposure of the Bank's earnings to interest rate risk is the timing difference (“gap”) between the repricing or maturity of the Bank's interest-earning assets and the repricing or maturity of its interest-bearing liabilities. If the maturities of the Bank's assets and liabilities were perfectly matched and the interest rates borne by its assets and liabilities were equally flexible and moved concurrently (neither of which is the case), the impact on net interest income of any material and prolonged changes in interest rates would be minimal.
A positive gap position generally has an adverse effect on net interest income during periods of falling interest rates. A positive one-year gap position occurs when the dollar amount of rate sensitive assets maturing or repricing within one year exceeds the dollar amount of rate sensitive liabilities maturing or repricing during that same one-year period. As a result, in a period of falling interest rates, the interest received on interest-earning assets will increase slower than the interest paid on interest-bearing liabilities, causing a decrease in net interest income. During periods of rising interest rates, the interest received on interest-earning assets will increase faster than interest paid on interest-bearing liabilities, thus increasing net interest income.
A negative gap position generally has an adverse effect on net interest income during periods of rising interest rates. A negative one-year gap position occurs when the dollar amount of rate sensitive liabilities maturing or repricing within one year exceeds the dollar amount of rate sensitive assets maturing or repricing during that same period. As a result, during periods of rising interest rates, the interest paid on interest-bearing liabilities will increase faster than interest received from interest-earning assets, thus reducing net interest income. The reverse is true in periods of declining interest rates, as discussed above, which generally results in an increase in net interest income.
10
SECURITY FEDERAL CORPORATION AND SUBSIDIARIES
Management’s Discussion and Analysis of Financial Condition and Results of Operations
Asset and Liability Management, Continued
The Bank’s Board of Directors reviews the Interest Rate Exposure Report generated for the Bank by the Office of Thrift Supervision (“OTS”). This report measures the interest rate sensitivity of the Bank’s net portfolio value (“NPV”) on a quarterly basis under different interest rate scenarios. The Bank’s sensitivity measure is well within the Bank’s policy on changes in NPV. The Bank's asset and liability policies are directed toward maximizing long-term profitability while managing acceptable interest rate risk within the Bank’s policies.
At March 31, 2010, the negative mismatch of interest-earning assets repricing or maturing within one year with interest-bearing liabilities repricing or maturing within one year was ($7.4) million or (0.8)% of total assets compared to ($9.5) million or (1.0)% at March 31, 2009. For more information on the Bank’s repricing position at March 31, 2010, see the tables on pages 11 and 12.
During the year ended March 31, 2010, the Bank originated, for investment purposes, $27.6 million in adjustable rate residential real estate loans (“ARM’s”), which are held for investment and are not sold. The Bank’s loan portfolio included $264.1 million of adjustable rate consumer loans, commercial loans, and mortgage loans or, 45.0% of total gross loans at March 31, 2010. During fiscal 2010, the Bank originated $308.7 million in consumer and commercial loans, which are usually short term in nature. The Bank's portfolio of consumer and commercial loans was $465.1 million at March 31, 2010, $494.5 million at March 31, 2009, and $400.2 million at March 31, 2008. Consumer and commercial loans combined were 79.3% of total loans at March 31, 2010, 78.8% of total loans at March 31, 2009, and 74.9% at March 31, 2008.
At March 31, 2010, the Bank held approximately $6.6 million in longer term fixed rate residential mortgage loans. These loans, which amounted to 1.2% of the total loan portfolio, had converted from ARM loans to fixed rate loans during the previous 60 months. These fixed rate loans have remaining maturities ranging from 10 to 30 years. As of March 31, 2010, the Bank no longer had any ARM loans that have conversion features to fixed rate loans. On new originations, the Bank sells virtually all of its 15 and 30 year fixed rate mortgage loans at origination. Fixed rate residential loans sold to Freddie Mac and other institutional investors, on a service-released basis totaled $67.8 million in fiscal 2010, $45.3 million in fiscal 2009, and $38.9 million in fiscal 2008. The Bank sells all its fixed rate mortgage loans on a service-release basis.
Certificates of deposit of $100,000 or more, referred to as “Jumbo Certificates,” are normally considered to be interest rate sensitive because of their relatively short maturities. At March 31, 2010, the Bank had $195.9 million outstanding in Jumbo Certificates compared to $192.8 million at March 31, 2009. Brokered deposits totaled $34.4 million at March 31, 2010 compared to $25.4 million at March 31, 2009. The majority of the Bank’s deposits are originated within the Bank’s immediate market area.
The following table sets forth the maturity schedule of certificates of deposit with balances of $100,000 or greater at March 31, 2010:
| At March 31, 2010 | ||||
| (In Thousands) | ||||
| Within 3 Months | $ | 34,335 | ||
| After 3 Months, Within 6 Months | 54,773 | |||
| After 6 Months, Within 12 Months | 54,758 | |||
| After 12 Months | 51,994 | |||
| $ | 195,860 | |||
11
SECURITY FEDERAL CORPORATION AND SUBSIDIARIES
Management’s Discussion and Analysis of Financial Condition and Results of Operations
Asset and Liability Management, Continued
The following table sets forth the Bank’s interest-bearing liabilities and interest-earning assets repricing or maturing within one year. The table on the following page presents the Bank's entire interest-bearing liabilities and interest-earning assets into repricing or maturity time periods. Both tables present adjustable rate loans in the periods they are scheduled to reprice and fixed rate loans are shown in the time frame of corresponding principal amortization schedules. Adjustable and fixed rate loans are also adjusted for the Company’s estimates of pre-payments. Mortgage-backed securities are shown at repricing dates, but also include prepayment estimates. Both tables also assume investments reprice at the earlier of maturity; the likely call date, if any, based on current interest rates; or the next scheduled interest rate change, if any. NOW accounts are assumed to have a decay rate of 20% the first year, money market accounts to have a decay rate of 65% the first year, and statement savings accounts to have a decay rate of 20% the first year. The balance, for all three products, is deemed to reprice in the one to three year category. Callable fixed rate Federal Home Loan Bank (“FHLB”) advances are included in borrowings, and are deemed to mature at the expected call date or maturity, based on the stated interest rate of the advance and current market rates. Junior subordinated debentures are shown at their repricing date or call date.
| At March 31 | ||||
| 2010 | 2009 | |||
| (Dollars In Thousands) | ||||
Loans (1) | $ | 402,832 | $ | 408,858 |
| Mortgage-Backed Securities: | ||||
| Held To Maturity | 871 | 7,200 | ||
| Available For Sale | 36,890 | 134,792 | ||
| Investment Securities: | ||||
| Held To Maturity | 3,117 | 4,965 | ||
| Available For Sale | 21,339 | 12,373 | ||
| Other Interest-Earning Assets And FHLB Stock | 12,791 | 12,791 | ||
| Total Interest Rate Sensitive Assets Repricing Within 1 Year | $ | 477,840 | $ | 580,979 |
| Deposits | $ | 439,474 | $ | 470,784 |
| FHLB Advances And Other Borrowed Money | 45,738 | 119,713 | ||
| Total Interest Rate Sensitive Liabilities Repricing Within 1 Year | $ | 485,212 | $ | 590,497 |
| Gap | $ | (7,372) | $ | (9,518) |
| Interest Rate Sensitive Assets/Interest Rate Sensitive Liabilities | 98.48% | 98.39% | ||
| Gap As A Percent Of Total Assets | (0.8)% | (1.0)% | ||
| (1) | LOANS ARE NET OF UNDISBURSED FUNDS AND LOANS IN PROCESS. |
12
SECURITY FEDERAL CORPORATION AND SUBSIDIARIES
Management’s Discussion and Analysis of Financial Condition and Results of Operations
Asset and Liability Management, Continued
The following table sets forth the interest rate sensitivity of the Bank's assets and liabilities at March 31, 2010, on the basis of the factors and assumptions set forth in the table on the previous page.
Less Than Three Months | Over 3 –12 Months | Over 1 – 3 Years | Over 3 – 5 Years | Over 5 – 10 Years | Over 10 Years | Total | ||||||||
| (Dollars In Thousands) | ||||||||||||||
| Interest-Earnings Assets | ||||||||||||||
Loans (1) | $ | 250,391 | $ | 152,441 | $ | 115,368 | $ | 52,177 | $ | 8,420 | $ | 2,060 | $ | 580,857 |
| Mortgage-Backed Securities: | ||||||||||||||
| Held To Maturity, At Cost | 147 | 724 | 2,066 | 3,012 | 3,564 | 636 | 10,149 | |||||||
Available For Sale, At Fair Value | 9,278 | 27,612 | 110,430 | 53,911 | 29,237 | 1,767 | 232,235 | |||||||
Investment Securities: (2) | ||||||||||||||
| Held To Maturity, At Cost | 1,078 | 2,039 | 2,566 | 2,020 | 774 | 159 | 8,636 | |||||||
Available For Sale, At Fair Value | 7,071 | 14,268 | 15,736 | 12,910 | 7,872 | 2,169 | 60,026 | |||||||
| FHLB Stock, At Cost | - | 12,624 | - | - | - | - | 12,624 | |||||||
| Other Interest-Earning Assets | 167 | - | - | - | - | - | 167 | |||||||
| Total Interest-Earning Assets | $ | 268,132 | $ | 209,708 | $ | 246,166 | $ | 124,030 | $ | 49,867 | $ | 6,791 | $ | 904,694 |
| Interest-Bearing Liabilities | ||||||||||||||
| Deposits: | ||||||||||||||
| Certificate Accounts | $ | 72,908 | $ | 236,405 | $ | 66,418 | $ | 16,539 | $ | - | $ | - | $ | 392,270 |
| NOW Accounts | 3,331 | 9,993 | 53,298 | - | - | - | 66,622 | |||||||
| Money Market Accounts | 27,825 | 85,213 | 60,867 | - | - | - | 173,905 | |||||||
| Statement Savings Account | 950 | 2,849 | 15,193 | - | - | - | 18,992 | |||||||
Borrowings (2) | 30,738 | 15,000 | 47,277 | 35,304 | 52,900 | 6,084 | 187,303 | |||||||
Total Interest-Bearing Liabilities | $ | 135,752 | $ | 349,460 | $ | 243,053 | $ | 51,843 | $ | 52,900 | $ | 6,084 | $ | 839,092 |
| Current Period Gap | $ | 132,380 | $ | (139,752) | $ | 3,113 | $ | 72,187 | $ | (3,033) | $ | 707 | $ | 65,602 |
| Cumulative Gap | $ | 132,380 | $ | (7,372) | $ | (4,259) | $ | 67,928 | $ | 64,895 | $ | 65,602 | $ | 65,602 |
| Cumulative Gap As A Percent Of Total Assets | 13.8% | (0.8)% | (0.5)% | 7.1% | 6.8% | 6.9% | 6.9% | ||||||||
| (1) | LOANS ARE NET OF UNDISBURSED FUNDS AND LOANS IN PROCESS. |
| (2) | CALLABLE SECURITIES AND FHLB ADVANCES ARE SHOWN AT THEIR LIKELY CALL DATES BASED ON MANAGEMENT’S ESTIMATES AT MARCH 31, 2010. |
In evaluating the Bank's exposure to interest rate risk, certain shortcomings inherent in the method of analysis presented in the foregoing tables must be considered. For example, although certain assets and liabilities may have similar maturities or periods of repricing, they may react in different degrees to changes in market interest rates. Additionally, the interest rates of certain types of assets and liabilities may fluctuate in advance of changes in market interest rates. Loan repayment rates and withdrawals of deposits will likely differ substantially from the assumed rates previously set forth in the event of significant changes in interest rates due to the option of borrowers to prepay their loans and the ability of depositors to withdraw funds prior to maturity. Further, certain assets, such as ARMs, have features that restrict changes in interest rates on a short-term basis as well as over the life of the asset.
Financial Condition
Total assets at March 31, 2010 were $956.0 million, a decrease of $28.7 million or 2.9% from $984.7 million at March 31, 2009. This decrease was primarily the result of a decrease in net loans receivable and a decrease in held to maturity securities.
13
SECURITY FEDERAL CORPORATION AND SUBSIDIARIES
Management’s Discussion and Analysis of Financial Condition and Results of Operations
Financial Condition, Continued
Total net loans receivable were $568.4 million at March 31, 2010, a decrease of $42.7 million or 7.0% from $611.1 million at March 31, 2009. Residential real estate loans held for investment decreased $8.7 million or 6.9% to $118.3 million at March 31, 2010. Typically, long term, newly originated fixed rate mortgage loans are not retained in the portfolio but are sold immediately. ARMs are typically retained in the portfolio. At March 31, 2010, the Bank held 90.5% of its residential mortgage loans in ARMs, while it had 9.5% in fixed rate mortgages. Consumer loans decreased $499,000 or 0.7% while commercial business and commercial real estate loans decreased $28.9 million or 6.8% to $396.5 million at fiscal year end March 31, 2010 from $425.4 million at March 31, 2009. Loans held for sale, which were $3.2 million at March 31, 2010, decreased $2.6 million from $5.7 million from the previous fiscal year end. The decrease in loans is the result of increased interest rates, tightened underwriting standards and a general decrease in loan demand. Total investments and mortgage-backed securities decreased $3.1 million or 1.0% to $311.0 million at March 31, 2010. Cash and cash equivalents were $8.8 million at March 31, 2010 compared to $6.6 million at March 31, 2009. Premises and equipment decreased $955,000 or 4.4% to $20.7 million in fiscal 2010 as a result of normal annual depreciation of premises and equipment. The Bank did not undergo any significant construction or renovation projects during the year ended March 31, 2010. The cash value of Bank Owned Life Insurance (“BOLI”) was $10.0 million at March 31, 2010 compared to $9.6 million at March 31, 2009 reflecting a $360,000 increase as a result of accumulated BOLI earnings. There were no additional BOLI purchases during the fiscal year ended March 31, 2010. BOLI, which earns tax-free yields, is utilized to partially offset the cost of the Company’s employee benefits programs and provide key person insurance on certain officers of the Company.
The Company’s non-performing assets increased $27.1 million to $42.0 million at March 31, 2010 from $14.9 million at March 31, 2009. The increase was primarily concentrated in non-performing commercial real estate loans which increased $17.4 million to $25.5 million at March 31, 2010 from $8.0 million at March 31, 2009. The balance in non-performing commercial real estate loans consisted of 58 loans to 29 borrowers with an average loan balance of $439,000. The following table sets forth detailed information concerning our non-performing assets for the periods indicated:
| At March 31, 2010 | At March 31, 2009 | $ Increase | % Increase | |||||||||||||||||||||
| Amount | Percent (1) | Amount | Percent (1) | (Decrease) | (Decrease) | |||||||||||||||||||
| Loans 90 days or more past due or non-accrual loans: | ||||||||||||||||||||||||
Residential real estate | $ | 4,344,060 | 0.8 | % | $ | 1,112,023 | 0.2 | % | $ | 3,232,037 | 290.6 | |||||||||||||
| Commercial business | 699,182 | 0.1 | 2,808,080 | 0.5 | (2,108,898 | ) | (75.1 | ) | ||||||||||||||||
| Commercial real estate | 25,479,420 | 4.4 | 8,044,372 | 1.3 | 17,435,048 | 216.7 | ||||||||||||||||||
| Consumer | 703,288 | 0.1 | 955,683 | 0.1 | (252,395 | ) | (26.4 | ) | ||||||||||||||||
Total non-performing loans | 31,225,950 | 5.4 | 12,920,158 | 2.1 | 18,305,792 | 141.7 | ||||||||||||||||||
| Other non-performing assets | ||||||||||||||||||||||||
Repossessed assets | 43,106 | 0.0 | 61,126 | 0.0 | (18,020 | ) | (29.5 | ) | ||||||||||||||||
Real estate owned | 10,729,944 | 1.9 | 1,924,046 | 0.3 | 8,805,898 | 457.7 | ||||||||||||||||||
Total other non-performing assets | 10,773,050 | 1.9 | 1,985,172 | 0.3 | 8,787,878 | 442.7 | ||||||||||||||||||
| Total non-performing assets | $ | 41,999,000 | 7.3 | % | $ | 14,905,330 | 2.4 | % | $ | 27,093,670 | 181.8 | % | ||||||||||||
| Total non-performing assets as a percentage of total assets | 4.4 | % | 1.5 | % | ||||||||||||||||||||
(1) Percent of gross loans receivable, net of deferred fees and loans in process and loans held for sale
A majority of the non-performing commercial real estate category, or $11.4 million consisted of 15 loans secured by commercial buildings to 12 separate borrowers. Of this amount, eight loans totaling $4.0 million were secured by buildings located in the Midlands area of South Carolina; three loans totaling $356,000 were secured by buildings located in Aiken, South Carolina; one loan for $5.5 million was secured by a building located in Charleston, South Carolina; one loan for $622,000 was secured by a building in Florida; one loan for $938,000 was secured by a building in Hardeeville, South Carolina; and one loan for $11,000 was secured by a building in North Augusta, South Carolina.
Of the remaining commercial real estate category $9.3 million was concentrated in construction loans and land acquisition and development type loans (“A&D loans”).
14
SECURITY FEDERAL CORPORATION AND SUBSIDIARIES
Management’s Discussion and Analysis of Financial Condition and Results of Operations
Financial Condition, Continued
The balance consisted of $6.3 million in A&D loans to three separate borrowers for the development of residential subdivisions in the Midlands area of South Carolina and $3.0 million in loans to 14 separate borrowers secured by builder lots or speculative houses in varying degrees of completion throughout South Carolina. The remaining loans in the commercial real estate category were secured by first mortgages on principal residences or raw land.
The Company also experienced an increase in non-performing one- to four- family real estate loans which increased $3.2 million to $4.3 million at March 31, 2010 from $1.1 million at March 31, 2009. At March 31, 2010, this balance was comprised of 16 loans with an average balance of $272,000. The increase in non-performing one- to four- family real estate loans is a result of the general deteriorating conditions in the local economy including rising unemployment rates and declining housing prices.
Repossessed assets acquired in settlement of loans increased $8.8 million to $10.8 million at March 31, 2010 from $2.0 million at March 31, 2009. The Company foreclosed on 25 real estate properties during the year ended March 31, 2010 and sold 10 properties. At March 31, 2010, the balance consisted of the following 29 real estate properties: 13 single-family residences located throughout our market area in South Carolina and Georgia; three lots within two subdivisions of Aiken, South Carolina and approximately 17 acres of land in Aiken, South Carolina; one mobile home including small acreage in Lexington County, South Carolina and five mobile homes and small acreage in Aiken, South Carolina; one commercial building in Aiken, South Carolina and two commercial buildings in Augusta, Georgia; a condominium development in Atlanta, Georgia that was originally acquired as a participation loan from another financial institution; a 55 lot subdivision development and adjacent 17 acres of land in Columbia, South Carolina; and 34.8 acres of land in Blufton, South Carolina also originally acquired as a participation loan from another financial institution. In addition to the properties listed above, the balance also included $43,000 in various other repossessed assets that were not real estate.
The Bank reviews its loan portfolio and allowance for loan losses on a monthly basis. Future additions to the Bank's allowance for loan losses are dependent on, among other things, the performance of the Bank's loan portfolio, the economy, changes in real estate values, and interest rates. There can be no assurance that additions to the allowance will not be required in future periods. The determination of the appropriate level of the allowance for loan losses inherently involves a high degree of subjectivity and requires us to make significant estimates of current credit risks and future trends, all of which may undergo material changes. Continuing deterioration in economic conditions affecting borrowers, new information regarding existing loans, identification of additional problem loans and other factors, both within and outside of our control, may require an increase in the allowance for loan losses. In addition, bank regulatory agencies periodically review our allowance for loan losses and may require an increase in the provision for possible loan losses or the recognition of further loan charge-offs, based on judgments different than those of management. In addition, if charge-offs in future periods exceed the allowance for loan losses, we will need additional provisions to increase the allowance for loan losses. Any increases in the allowance for loan losses will result in a decrease in net income and, possibly, capital, and may have a material adverse effect on our financial condition and results of operations. Management continually monitors its loan portfolio for the impact of local economic changes. The ratio of allowance for loan losses to total loans was 2.13% at March 31, 2010 compared to 1.65% at March 31, 2009. The Bank continues to practice conservative lending and past due loans are monitored closely.
The cumulative interest not accrued during the year ended March 31, 2010 relating to all non-performing loans totaled $665,000. Our strategy is to work with our borrowers to reach acceptable payment plans while protecting our interests in the existing collateral. In the event an acceptable arrangement cannot be reached, we may have to acquire these properties through foreclosure or other means and subsequently sell, develop, or liquidate them.
The balance of loans in troubled debt restructurings decreased during the year ended March 31, 2010. The Bank had five loans that were troubled debt restructurings totaling $336,000 at March 31, 2010 compared to seven loans totaling $652,000 at March 31, 2009. The five troubled debt restructurings consisted of four consumer loans secured by first mortgages on residential dwellings totaling $163,000, and one commercial loan secured by a first mortgage on land totaling $174,000. None of the troubled debt restructurings were delinquent at March 31, 2010. All troubled debt restructurings are reviewed for impairment. At March 31, 2010, the Bank held $35.3 million in impaired loans compared to $27.7 million at March 31, 2009. The Bank had specific reserves totaling $2.0 million related to $10.9 million in impaired loans at March 31, 2010 compared to $1.9 million in specific reserves related to $6.0 million in impaired loans at March 31, 2009.
In July 2006, the Company acquired Collier Jennings Financial Corporation, an insurance agency specializing in consumer automobile insurance and premium financing.
15
SECURITY FEDERAL CORPORATION AND SUBSIDIARIES
Management’s Discussion and Analysis of Financial Condition and Results of Operations
Financial Condition, Continued
The resulting goodwill and other intangibles were $1.2 million and $250,000, respectively at March 31, 2010; and $1.4 million and $353,000 at March 31, 2009, respectively. Collier Jennings is now a subsidiary of Security Federal Insurance Inc.
Deposits at the Bank increased $32.5 million or 4.9% to $694.3 million at March 31, 2010 from $661.7 million at March 31, 2009. The Bank had brokered time deposits of $34.4 million at March 31, 2010 compared to $25.4 million at March 31, 2009. Brokered time deposit were appealing because rates paid on these deposits were typically significantly lower than rates paid on time deposits obtained in the Bank’s primary market areas. Total deposits, excluding brokered time deposits, increased $23.5 million or 3.7%. Brokered time deposits were 5.0% of total deposits at March 31, 2010 and 3.8% of total deposits at March 31, 2009.
Advances from the FHLB decreased $55.5 million or 25.1% to $164.0 million at March 31, 2010 from $219.0 million a year earlier. Other borrowed money, which consists of retail repurchase agreements, term auction facility borrowings from the Federal Reserve Bank, and a line of credit with another financial institution, decreased $14.0 million or 53.7% to $12.1 million at March 31, 2010 from $26.1 million at March 31, 2009. The Company issued its first trust preferred security issuance in September 2006. Gross proceeds of the issuance were $5.2 million and are classified as junior subordinated debentures on the Consolidated Balance Sheet included in the Consolidated Financial Statements contained herein. In December 2009, the Company issued $6.1 million in convertible senior debentures. The debentures will mature on December 1, 2029 and accrue interest at the rate of 8.0% per annum until maturity or earlier redemption or repayment. The debentures are convertible into the Company’s common stock at a conversion price of $20 per share at the option of the holder at any time prior to maturity.
Total shareholders' equity was $67.9 million at March 31, 2010, an increase of $768,000 or 1.2% from $67.1 million a year earlier. The Company’s net income for the year was $1.6 million. Preferred stock dividends were $900,000 and accretion of preferred stock to its redemption value was $73,000 for the year resulting in net income available to common shareholders of $632,000. Other changes in shareholders’ equity were: proceeds from employee stock purchase plan purchases of $20,000, stock compensation expense of $33,000, and a net increase in other comprehensive income of $798,000, offset partially by $788,000 in dividends paid to common shareholders.
16
SECURITY FEDERAL CORPORATION AND SUBSIDIARIES
Management’s Discussion and Analysis of Financial Condition and Results of Operations
Results of Operations
The following table presents the dollar amount of changes in interest income and interest expense for major components of interest-earning assets and interest-bearing liabilities. The table also distinguishes between the changes related to higher or lower outstanding balances and the changes related to the volatility of interest rates. For each category of interest-earning assets and interest-bearing liabilities, information is provided on changes attributable to: (1) changes in rate (changes in rate multiplied by prior year volume); (2) changes in volume (changes in volume multiplied by prior year rate); and (3) net change (the sum of the prior columns). For purposes of this table, changes attributable to both rate and volume, which cannot be segregated, have been allocated proportionately to the change attributable to volume and the change attributable to rate.
| Fiscal Year 2010 Compared To 2009 | Fiscal Year 2009 Compared To 2008 | |||||||||||
| Volume | Rate | Net | Volume | Rate | Net | |||||||
| (In Thousands) | ||||||||||||
| Interest-Earning Assets: | ||||||||||||
Loans: (1) | ||||||||||||
| Mortgage Loans | $ | (340) | $ | (556) | $ | (896) | $ | 204 | $ | (390) | $ | (186) |
| Other Loans | 1,985 | (2,180) | (195) | 6,204 | (7,161) | (957) | ||||||
| Total Loans | 1,645 | (2,736) | (1,091) | 6,408 | (7,551) | (1,143) | ||||||
Mortgage-Backed Securities (2) | 1,239 | (1,074) | 165 | 3,538 | 87 | 3,625 | ||||||
Investments (2) | 348 | (773) | (425) | (2,481) | (716) | (3,197) | ||||||
| Other Interest-Earning Assets | (3) | (6) | (9) | 20 | (70) | (50) | ||||||
| Total Interest-Earning Assets | $ | 3,229 | $ | (4,589) | $ | (1,360) | $ | 7,485 | $ | (8,250) | $ | (765) |
| Interest-Bearing Liabilities: | ||||||||||||
| Deposits: | ||||||||||||
| Certificate Accounts | $ | 1,295 | $ | (4,883) | $ | (3,588) | $ | 2,431 | $ | (3,074) | $ | (643) |
| NOW Accounts | 16 | (132) | (116) | (8) | (532) | (540) | ||||||
| Money Market Accounts | 392 | (1,479) | (1,087) | (22) | (1,954) | (1,976) | ||||||
| Savings Accounts | 9 | (46) | (37) | (1) | (45) | (46) | ||||||
| Total Deposits | 1,712 | (6,540) | (4,828) | 2,400 | (5,605) | (3,205) | ||||||
| Borrowings | (225) | (1,132) | (1,357) | 2,150 | (2,168) | (18) | ||||||
| Total Interest-Bearing Liabilities | 1,487 | (7,672) | (6,185) | 4,550 | (7,773) | (3,223) | ||||||
| Effect On Net Income | $ | 1,742 | $ | 3,083 | $ | 4,825 | $ | 2,935 | $ | (477) | $ | 2,458 |
| (1) | INTEREST ON NON-ACCRUAL LOANS IS NOT INCLUDED IN INCOME, ALTHOUGH THEIR LOAN BALANCES ARE INCLUDED IN AVERAGE LOANS OUTSTANDING. |
| (2) | SECURITIES AVAILABLE FOR SALE ARE COMPUTED USING THEIR HISTORICAL COST. |
17
SECURITY FEDERAL CORPORATION AND SUBSIDIARIES
Management’s Discussion and Analysis of Financial Condition and Results of Operations
Results of Operations, Continued
The following table presents the total dollar amount of interest income from average interest-earning assets for the periods indicated and the resultant yields, as well as the interest expense on average interest-bearing liabilities expressed both in dollars and rates. No tax equivalent adjustments were made.
Yield/ Rate At March 31, 2010 | Averages For Fiscal Years Ended March 31, | ||||||||||||||||||
| 2010 | 2009 | 2008 | |||||||||||||||||
| Average Balance | Interest | Yield/ Rate | Average Balance | Interest | Yield/ Rate | Average Balance | Interest | Yield/ Rate | |||||||||||
| (Dollars In Thousands) | |||||||||||||||||||
| Interest-Earning Assets: | |||||||||||||||||||
| Mortgage Loans | 5.57% | $ | 121,311 | $ | 6,675 | 5.50% | $ | 127,205 | $ | 7,571 | 5.95% | $ | 123,893 | $ | 7,757 | 6.26% | |||
| Other Loans | 6.19% | 476,667 | 27,725 | 5.82% | 443,589 | 27,920 | 6.29% | 356,994 | 28,877 | 8.09% | |||||||||
Total Loans (1) | 6.06% | 597,978 | 34,400 | 5.75% | 570,794 | 35,491 | 6.22% | 480,887 | 36,634 | 7.62% | |||||||||
Mortgage-Backed Securities (2) | 4.14% | 245,173 | 10,603 | 4.32% | 217,989 | 10,438 | 4.79% | 144,041 | 6,813 | 4.73% | |||||||||
Investments (2) | 3.51% | 74,845 | 2,503 | 3.34% | 66,280 | 2,928 | 4.42% | 120,544 | 6,125 | 5.08% | |||||||||
Other Interest- Earning Assets | 0.01% | 1,261 | 1 | 0.07% | 2,378 | 10 | 0.42% | 1,619 | 60 | 3.71% | |||||||||
Total Interest-Earning Assets | 5.32% | $ | 919,257 | $ | 47,507 | 5.17% | $ | 857,441 | $ | 48,867 | 5.70% | $ | 747,091 | $ | 49,632 | 6.64% | |||
| Interest-Bearing Liabilities: | |||||||||||||||||||
| Certificate Accounts | 2.15% | $ | 383,769 | $ | 10,537 | 2.75% | $ | 349,161 | $ | 14,125 | 4.05% | $ | 295,424 | $ | 14,768 | 5.00% | |||
| NOW Accounts | 0.20% | 64,722 | 158 | 0.24% | 60,930 | 274 | 0.45% | 61,534 | 814 | 1.32% | |||||||||
Money Market Accounts | 1.28% | 161,663 | 2,429 | 1.50% | 143,110 | 3,516 | 2.46% | 143,695 | 5,492 | 3.82% | |||||||||
| Savings Accounts | 0.39% | 17,440 | 76 | 0.44% | 16,107 | 113 | 0.70% | 16,195 | 159 | 0.98% | |||||||||
Total Interest-Bearing Accounts | 1.67% | 627,594 | 13,200 | 2.10% | 569,308 | 18,028 | 3.17% | 516,848 | 21,233 | 4.11% | |||||||||
| Other Borrowings | 0.80% | 41,749 | 249 | 0.60% | 14,758 | 387 | 2.62% | 10,171 | 334 | 3.29% | |||||||||
| Jr. Subordinated Debt | 4.42% | 5,155 | 239 | 4.64% | 5,155 | 290 | 5.64% | 5,155 | 362 | 7.03% | |||||||||
| Sr. Convertible Debt | 8.00% | 2,017 | 162 | 8.03% | - | - | - | - | - | - | |||||||||
| FHLB Advances | 3.71% | 185,499 | 6,286 | 3.39% | 221,204 | 7,616 | 3.44% | 170,606 | 7,615 | 4.46% | |||||||||
Total Interest-Bearing Liabilities | 2.11% | $ | 862,014 | $ | 20,136 | 2.34% | $ | 810,425 | $ | 26,321 | 3.25% | $ | 702,780 | $ | 29,544 | 4.20% | |||
| Net Interest Income | $ | 27,371 | $ | 22,546 | $ | 20,088 | |||||||||||||
| Interest Rate Spread | 3.21% | 2.83% | 2.45% | 2.44% | |||||||||||||||
Net Yield On Earning Assets | 2.98% | 2.63% | 2.69% | ||||||||||||||||
| (1) | INTEREST ON NON-ACCRUAL LOANS IS NOT INCLUDED IN INCOME, ALTHOUGH THEIR LOAN BALANCES ARE INCLUDED IN AVERAGE LOANS OUTSTANDING. |
| (2) | SECURITIES AVAILABLE FOR SALE ARE COMPUTED USING THEIR HISTORICAL COST. |
18
SECURITY FEDERAL CORPORATION AND SUBSIDIARIES
Management’s Discussion and Analysis of Financial Condition and Results of Operations
Comparison of the Years Ended March 31, 2010 and 2009
General
The Company’s earnings available to common shareholders were $632,000 for the year ended March 31, 2010, compared to $2.2 million for the year ended March 31, 2009. The $1.5 million or 71.0% decrease in earnings was attributable primarily to the increase in the allowance for loan losses through additional charges to the provision for loan losses coupled with an increase in general and administrative expenses attributable to increased FDIC insurance premiums. These factors were offset by an increase in the Company’s net interest margin.
Net Interest Income
Net interest margin for the year ended March 31, 2010 increased 35 basis points to 2.98% up from 2.63% in the previous year. As a result, net interest income increased $4.8 million or 21.4% to $27.4 million for the year ended March 31, 2010 compared to $22.6 million for the previous year. The increase was attributable to a decrease in interest expense offset in part by a decrease in interest income. Average interest-earning assets increased $61.8 million to $919.3 million while average interest-bearing liabilities increased $51.6 million to $862.0 million. The interest rate spread was 2.83% for the year ended March 31, 2010 compared to 2.45% for the year ended March 31, 2009.
Interest income on loans decreased $1.1 million to $34.4 million during the year ended March 31, 2010 from $35.5 million during fiscal 2009. The decrease was attributable to a 47 basis point decrease in the yield earned on the Bank’s loans during fiscal 2010 offset in part by an increase in average total loans outstanding of $27.2 million. Interest income on investment securities, mortgage-backed securities, and other investments decreased $269,000 as a result of an increase in the aggregate average balance in the overall investment portfolio, including mortgage-backed securities, investments, and other interest-earning assets of $34.6 million offset by a decrease in the yield.
Interest expense on deposits decreased $4.8 million or 26.8% to $13.2 million during the year ended March 31, 2010. Average interest bearing deposits increased $58.3 million while the average cost of those deposits decreased 107 basis points during the year ended March 31, 2010. Interest expense on FHLB advances and other borrowings decreased $1.5 million or 18.4% to $6.5 million during fiscal 2010. The decrease was a result of a decrease in average FHLB advances and other borrowings outstanding during fiscal 2010 of $8.7 million while the average costs of those borrowings decreased 51 basis points to 2.88% in fiscal 2010 compared to 3.39% in fiscal 2009. Interest expense on junior subordinated debentures was $239,000 for fiscal 2010 compared to $290,000 during fiscal 2009. The average outstanding balance on these debentures remained constant at $5.2 million during both periods while the average cost decreased 100 basis points to 4.64% in fiscal 2010 compared to 5.64% in fiscal 2009. Interest expense on senior convertible debentures was $162,000 and the average balance was $2.0 million. The senior convertible debentures were issued during fiscal 2010.
Provision for Loan Losses
The Company’s provision for loan losses increased $5.3 million to $8.2 million during the year ended March 31, 2010 from $2.8 million in fiscal 2009. The increase in the provision for loan losses reflected the Company’s concern for the condition of the local and national economy coupled with an increase in non-performing assets. Non-accrual loans, which are loans delinquent 90 days or more, were $31.2 million at March 31, 2010 compared to $12.9 million at March 31, 2009. Non-performing assets, which include non-accrual loans and repossessed assets, increased $27.1 million to $42.0 million at March 31, 2010 from $14.9 million at March 31, 2009. Non-performing assets were 4.4% of total assets at March 31, 2010 and 1.5% of total assets at March 31, 2009. Net charge-offs were $6.0 million or 1.04% of gross loans in fiscal 2010 compared to $710,000 or 0.11% of gross loans in fiscal 2009. Management of the Bank continues to be concerned about current market conditions and closely monitors the loan portfolio on an on-going basis to proactively identify any potential problem loans.
The amount of the provision is determined by management’s on-going monthly analysis of the loan portfolio. Management uses multiple methods to measure the estimate of the adequacy of the allowance for loan losses. These methods incorporate the percentage of classified loans, averages of historical loan losses in each loan category and current economic trends, and the assignment of percentage targets of reserves in each loan category. The Company considers subjective factors such as changes in local and national economic conditions, industry trends, the composition and volume of the loan portfolio, credit concentrations, lending policies, and the experience and ability of the staff, management, and the Board of Directors.
19
SECURITY FEDERAL CORPORATION AND SUBSIDIARIES
Management’s Discussion and Analysis of Financial Condition and Results of Operations
Provision for Loan Losses, Continued
Management believes the allowance for loan losses is adequate based on its best estimates of the losses inherent in the loan portfolio, although there can be no guarantee as to these estimates. In addition, bank regulatory agencies may require additional provisions to the allowance for loan losses based on their judgments and estimates as part of their examination process. Because the allowance for loan losses is an estimate, there can be no guarantee that actual loan losses would not exceed the allowance for loan losses, or that additional increases in the allowance for loan losses will not be required in the future.
Non-Interest Income
Non-interest income increased $1.6 million to $6.1 million during fiscal 2010. Gain on sale of investments increased $1.1 million to $1.2 million during fiscal 2010 from $127,000 during fiscal 2009. Gain on sale of loans increased $412,000 to $1.0 million during fiscal 2010 compared to $628,000 during fiscal 2009 as a result of an increase in the origination and sale of fixed rate residential mortgage loans. Service fees on deposit accounts increased $88,000 or 7.7% to $1.2 million during fiscal 2010.
Income from insurance agency commissions was $457,000 during fiscal 2010 compared to $625,000 during fiscal 2009. Other agency income from Collier Jennings increased $138,000 to $472,000 during fiscal 2010 from $334,000 during fiscal 2009 as a result of growth and expansion of the Bank’s insurance subsidiary. Trust income increased $24,000 or 5.6% to $455,000 during fiscal 2010. Income from BOLI increased $2,000 or 0.4% to $360,000 during fiscal year 2010. Other miscellaneous income including annuity and investment brokerage commissions, Bank credit life insurance on loans, and other miscellaneous income decreased $7,000 or 0.8% to $843,000 during fiscal 2010. In 2010 SFINS incurred a $401,000 loss compared to a $281,000 loss in 2009. These losses are partially as a result of the continued integration of Collier Jennings. In addition, the Company sold the South Augusta office of its insurance subsidiary during the first quarter of the 2010 fiscal year. This resulted in the loss of premium income associated with this location when compared to the prior year.
General and Administrative Expenses
General and administrative expenses increased $2.1 million or 10.4% to $22.6 million during the year ended March 31, 2010 compared to $20.5 million during the same period one year earlier. The increase is primarily the result of an increase in FDIC insurance premiums incurred during the period. For the year ended March 31, 2010, the Company expensed $1.8 million in FDIC insurance premiums, an increase of $1.1 million or 153.8% from $724,000 for the prior year. The majority of the increase was the result of a one time special assessment and additional provisions imposed by the FDIC on all FDIC insured deposit institutions to help replenish the government’s Deposit Insurance Fund.
Compensation and employee benefits increased $166,000 or 1.4% to $11.8 million as the result of annual cost of living salary adjustments offset by a decrease in the number of employees employed by the Company. Occupancy expense increased $15,000 or 0.8% to $2.0 million. Depreciation and maintenance of equipment expense increased $151,000 or 9.3% to $1.8 million. Advertising expense decreased $138,000 or 25.4% from $542,000 to $404,000 as a result of the Company’s efforts to reduce expenses during the year.
Mandatorily redeemable financial instrument valuation expense was $63,000 for the year ended March 31, 2010 compared to $183,000 for the same period one year earlier. Based on its terms, the mandatorily redeemable financial instrument is redeemable at the greater of $26 per share or one and a half times the book value per common share of the Company which equated to $30.33 at March 31, 2010. The Company recorded a valuation expense to properly reflect the fair value of the instrument at March 31, 2010 based on the book value.
Other miscellaneous expenses, which encompasses repossessed assets expense, legal, professional, and consulting expenses, stationery and office supplies, and other expenses increased $935,000 or 28.5% during fiscal 2010. This increase is a result of fees associated with the Company’s senior convertible debt offering combined with costs required to insure compliance with increased regulation and legislation that is present in the current environment. Other expenses also include increased real estate owned expenses and increased expenses associated with loan collection and workout efforts.
Income Taxes
The provision for income taxes decreased $204,000 or 16.2% to $1.1 million during the year ended March 31, 2010 compared to $1.3 million for the year ended March 31, 2009. The effective tax rate was 39.8% for fiscal 2010 and 34.0% for fiscal 2009.
20
SECURITY FEDERAL CORPORATION AND SUBSIDIARIES
Management’s Discussion and Analysis of Financial Condition and Results of Operations
Comparison of the Years Ended March 31, 2009 and 2008
General
The Company’s earnings available to common shareholders were $2.2 million for the year ended March 31, 2009, compared to $4.3 million for the year ended March 31, 2008. The $2.1 million or 49.0% decrease in earnings was attributable primarily to compression of the net interest margin along with the Company’s decision to increase the provision for loan losses as a result of the weakening economy and increases in non-performing assets. These factors, in addition to an increase in general and administrative expenses attributable to costs associated with the Company’s recent expansion into two new market areas, were offset slightly by an increase in non-interest income.
Net Interest Income
The decline in interest rates during the year negatively impacted the Company’s net interest margin during the year ended March 31, 2009. This decrease combined with the Bank’s efforts to maintain competitive deposit rates within its primary market areas resulted in a six basis point decrease in net interest margin to 2.63% for the year ended March 31, 2009 compared to 2.69% in the previous year.
Despite the compression in the Company’s margin, net interest income increased $2.5 million or 12.2% to $22.6 million in fiscal 2009 from $20.1 million in fiscal 2008. The increase was attributable to a decrease in interest expense offset in part by a decrease in interest income. Average interest-earning assets increased $110.4 million to $857.4 million while average interest-bearing liabilities increased $107.6 million to $810.4 million. The interest rate spread was 2.45% for the year ended March 31, 2009.
Interest income on loans decreased $1.1 million to $35.5 million during the year ended March 31, 2009 from $36.6 million during fiscal 2008. The decrease was attributable to a 140 basis point decrease in the yield earned on the Bank’s loans during fiscal 2009 offset in part by an increase in average total loans outstanding of $89.9 million. Interest income on investment securities, mortgage-backed securities, and other investments increased $378,000 as a result of an increase in the aggregate average balance in the overall investment portfolio, including mortgage-backed securities, investments, and other interest-earning assets of $20.4 million offset by a decrease in the yield of 22 basis points.
Interest expense on deposits decreased $3.2 million or 15.1% to $18.0 million during the year ended March 31, 2009. Average interest bearing deposits increased $52.5 million while the average cost of those deposits decreased 94 basis points during the year. Interest expense on FHLB advances and other borrowings increased $55,000 or 0.7% to $8.0 million during fiscal 2009. The increase was a result of an increase in average FHLB advances and other borrowings outstanding during the year of $55.2 million while the average costs of those borrowings decreased 101 basis points to 3.39% in fiscal 2009 compared to 4.40% in fiscal 2008. Interest expense on junior subordinated debentures was $290,000 for fiscal 2009 compared to $362,000 during fiscal 2008. The average outstanding balance on these debentures remained constant at $5.2 million during both periods while the average cost decreased 139 basis points to 5.64% in fiscal 2009 compared to 7.03% in fiscal 2008.
Provision for Loan Losses
The Company’s provision for loan losses increased $1.9 million to $2.8 million during the year ended March 31, 2009 from $895,000 in fiscal 2008. The increase in the provision for loan losses reflected the Company’s concern for the condition of the local and national economy coupled with overall growth in its loan portfolio and an increase in non-performing assets. Non-accrual loans, which are loans delinquent 90 days or more, were $12.9 million at March 31, 2009 compared to $6.0 million at March 31, 2008. Non-performing assets, which include non-accrual loans and repossessed assets, increased $8.1 million to $14.9 million at March 31, 2009 from $6.8 million at March 31, 2008. Despite this increase, non-performing assets comprise less than 2% of total assets at March 31, 2009 and 2008. The Company also maintained relatively low and stable trends related to net charge-offs. Net charge-offs were $710,000 or 0.11% of gross loans in fiscal 2009 compared to $125,000 or 0.02% of gross loans in fiscal 2008. Management of the Bank continues to be concerned about current market conditions and closely monitors the loan portfolio on an on-going basis to proactively identify any potential problem loans.
Non-Interest Income
Non-interest income increased $7,000 to $4.5 million during fiscal 2009. Gain on sale of investments decreased $141,000 to $127,000 during fiscal 2009 from $268,000 during fiscal 2008. Gain on sale of loans increased $14,000 to $628,000 during fiscal 2009 compared to $613,000 during fiscal 2008 as a result of an increase in the origination and sale of fixed rate residential mortgage loans. Service fees on deposit accounts decreased $90,000 or 7.3% to $1.1 million during fiscal 2009.
21
SECURITY FEDERAL CORPORATION AND SUBSIDIARIES
Management’s Discussion and Analysis of Financial Condition and Results of Operations
Non-Interest Income, Continued
Income from insurance agency commissions was $625,000 during fiscal 2009 compared to $665,000 during fiscal 2008. Other agency income from Collier Jennings increased $236,000 to $334,000 during fiscal 2009 from $98,000 during fiscal 2008 as a result of growth and expansion of the Bank’s insurance subsidiary. Trust income decreased $12,000 or 2.6% to $431,000 during fiscal 2009 as a result of a decrease in the market value of the underlying trust accounts. The Bank earns trust fees as a percentage of the market value of each trust account.
Income from BOLI increased $31,000 or 9.6% to $358,000 during fiscal year 2009 as a result of an additional purchase of life insurance. Other miscellaneous income including annuity and investment brokerage commissions, Bank credit life insurance on loans, and other miscellaneous income increased $8,000 or 1.0% to $850,000 during fiscal 2009.
The Bank’s three financial subsidiaries, SFINS, SFINV, and SFT began operating in the third quarter of the fiscal year ended March 31, 2002. SFINS is an insurance agency handling property and casualty insurance and health insurance. In 2009 SFINS incurred a $281,000 loss compared to a $266,000 loss in 2008. These losses are partially as a result of the continued integration of Collier Jennings. In addition, changes in South Carolina insurance laws enacted during fiscal 2008 negatively impacted revenue in conjunction with a decrease in the commissions percentages earned from the insurance companies resulting from current market conditions and increased competition. SFINV markets mutual funds, discount brokerage, and annuities. SFT is a full-service trust company. SFINV and SFT had losses of $32,000 and $10,000, respectively, in fiscal 2009 and $18,000 and $77,000, respectively in 2008.
General and Administrative Expenses
General and administrative expenses increased $3.2 million or 18.3% to $20.5 million during the year ended March 31, 2009 compared to $17.3 million during the same period one year earlier. The largest increase was compensation and employee benefits which increased $1.4 million or 13.5% to $11.7 million. Occupancy expense increased $204,000 or 11.4% to $2.0 million. The majority of the increases in salary and employee benefits and occupancy are the result of hiring additional staff to handle the Company’s growth including expansion into the two new market areas of Richland County, South Carolina and Columbia County, Georgia. Annual cost of living salary adjustments contributed slightly to the increase in compensation and employee benefits as well. Depreciation and maintenance of equipment expense increased $280,000 or 20.7% to $1.6 million primarily as a result of the Company’s continued expansion and additional locations.
Advertising expense increased $162,000 or 42.7% from $380,000 to $542,000 as a result of the Company using more print media advertising to attract deposits specifically in its new market areas and to promote the Bank’s insurance subsidiary. FDIC insurance premiums increased $663,000 to $724,000 for fiscal 2009 from $62,000 in fiscal 2008. Previously, the Bank was benefiting from a one-time credit assessment made available by the Federal Deposit Insurance Reform Act of 2005. The credit assessment amount was applied to reduce the Bank’s quarterly deposit insurance assessments. The Bank exhausted this credit during the quarter ended June 30, 2008.
Mandatorily redeemable financial instrument valuation expense was $183,000 for the year ended March 31, 2009 compared to no expense for the same period one year earlier. Based on its terms, the mandatorily redeemable financial instrument is redeemable at the greater of $26 per share or one and a half times the book value per common share of the Company which equated to $29.35 at March 31, 2009. The Company recorded a valuation expense to properly reflect the fair value of the instrument at March 31, 2009 based on the book value.
Other miscellaneous expenses, which encompasses repossessed assets expense, legal, professional, and consulting expenses, stationery and office supplies, and other expenses increased $294,000 or 8.7% during fiscal 2009. This increase is attributable to general growth including maintaining additional employees and locations.
Income Taxes
The provision for income taxes decreased $815,000 or 39.2% to $1.3 million during the year ended March 31, 2009 compared to $2.1 million for the year ended March 31, 2008. The effective tax rate was 34.0% for fiscal 2009 and 32.7% for fiscal 2008.
22
SECURITY FEDERAL CORPORATION AND SUBSIDIARIES
Management’s Discussion and Analysis of Financial Condition and Results of Operations
Regulatory Capital
The following table reconciles the Bank's shareholders' equity to its various regulatory capital positions:
| At March 31, | ||||
| 2010 | 2009 | |||
| (In Thousands) | ||||
Bank’s Shareholders’ Equity (1) | $ | 71,729 | $ | 69,724 |
| Reduction For Goodwill And Other Intangibles | 1,449 | 1,774 | ||
| Tangible Capital | 70,280 | 67,950 | ||
| Core Capital | 70,280 | 67,950 | ||
| Supplemental Capital | 7,296 | 7,770 | ||
| Less Assets Required To Be Deducted | - | - | ||
| Total Risk-Based Capital | $ | 77,576 | $ | 75,720 |
| (1) | FOR FISCAL 2010 AND 2009, EXCLUDES UNREALIZED GAIN OF $4.6 MILLION and $3.8 MILLION RESPECTIVELY ON AVAILABLE FOR SALE SECURITIES. |
The following table compares the Bank's capital levels relative to regulatory requirements at March 31, 2010:
Amount Required | Percent Required | Actual Amount | Actual Percent | Excess Amount | Excess Percent | |||||||
| (Dollars In Thousands) | ||||||||||||
| Tangible Capital | $ | 18,993 | 2.0% | $ | 70,280 | 7.4% | $ | 51,287 | 5.4% | |||
| Tier 1 Leverage (Core) Capital | 37,987 | 4.0% | 70,280 | 7.4% | 32,293 | 3.4% | ||||||
| Tier 1 Risk-Based (Core) Capital | 23,274 | 4.0% | 70,280 | 12.1% | 47,006 | 8.1% | ||||||
| Total Risk-Based Capital | 46,548 | 8.0% | 77,576 | 13.3% | 31,028 | 5.3% | ||||||
23
SECURITY FEDERAL CORPORATION AND SUBSIDIARIES
Management’s Discussion and Analysis of Financial Condition and Results of Operations
Liquidity and Capital Resources
Liquidity refers to the ability to generate sufficient cash flows to fund current loan demand, repay maturing borrowings, fund maturing deposit withdrawals, and meet operating expenses. The Bank's primary sources of funds include loan repayments, loan sales, increased deposits, advances from the FHLB, and cash flow generated from operations. The need for funds varies among periods depending on funding needs as well as the rate of amortization and prepayment on loans. The use of FHLB and other advances varies depending on loan demand, deposit inflows, and the use of investment leverage strategies to increase net interest income.
The principal use of the Bank's funds is the origination of mortgages and other loans and the purchase of investments and mortgage-backed securities. Loan originations on loans held for investment were $336.4 million in fiscal 2010 compared to $415.3 million in fiscal 2009 and $390.9 million in fiscal 2008. The decrease in originations in fiscal 2010 was primarily the result of a decrease in commercial loan originations, which decreased $61.3 million. In fiscal 2009 and 2008 loan originations increased $38.7 million, and $28.1 million, respectively. Purchases of investments and mortgage-backed securities were $150.2 million in fiscal 2010 compared to $144.3 million in fiscal 2009 and $142.8 million in fiscal 2008. Other uses of the Bank’s funds included paying down debt including a line of credit and FHLB Advances.
Unused lines of credit on home equity loans, credit cards, and commercial loans amounted to $55.8 million at March 31, 2010. Home equity loans are made on a floating rate basis with final maturities of 10 to 15 years. Credit cards are generally made on a floating rate basis, and are renewed annually or every other year. In addition to the above commitments, the Bank has undisbursed loans-in-process of $3.2 million at March 31, 2010, which will disburse over an average of 90 days. These commitments to originate loans and future advances of lines of credit are expected to be funded from loan amortizations and prepayments, deposit inflows, maturing investments, and short-term borrowing capacity.
The following table sets forth the length of time until maturity for unused commitments to extend credit and standby letters of credit at March 31, 2010:
(In Thousands) | Within One Month | After One Through Three Months | After Three Through Twelve Months | Within One Year | One Year Or Greater | Total | ||||||||||||||||||
| Unused Lines Of Credit | $ | 2,205 | $ | 4,721 | $ | 16,667 | $ | 23,593 | $ | 32,204 | $ | 55,797 | ||||||||||||
| Standby Letters Of Credit | 20 | - | 529 | 549 | 100 | 649 | ||||||||||||||||||
| Total | $ | 2,225 | $ | 4,721 | $ | 17,196 | $ | 24,142 | $ | 32,304 | $ | 56,446 | ||||||||||||
Management believes that future liquidity can be met through the Bank's deposit base, which increased $32.5 million during fiscal 2010, and from maturing investments. In addition, at March 31, 2010 the Bank had another $124.1 million in unused borrowing capacity at the FHLB at March 31, 2010.
Historically the Bank’s cash flow from operating activities has been relatively stable. The cash flows from investing activities vary with the need to invest excess funds or utilize leverage strategies with the purchase of mortgage-backed and investment securities. The cash flows from financing activities vary depending on the need for FHLB and other advances. During the 2010 fiscal year, the Company received $6.1 million through the issuance of senior convertible debentures. See "Consolidated Statements of Cash Flows" in the Consolidated Financial Statements contained herein.
24
SECURITY FEDERAL CORPORATION AND SUBSIDIARIES
Management’s Discussion and Analysis of Financial Condition and Results of Operations
Contractual Obligations
In the normal course of business, the Company enters into contractual obligations that meet various business needs. These contractual obligations include time deposits to customers, borrowings from the FHLB of Atlanta, other borrowings, junior subordinated debentures, senior convertible debentures and lease obligations for facilities. See Notes 5, 8, 9, 10 and 12 of the Notes to the Consolidated Financial Statements included herein for additional information. The following table summarizes the Company’s long-term contractual obligations at March 31, 2010. Contractual repayments may differ from actual because some of the obligations may be subject to calls.
Less than One Year | Over One to Three Years | Over Three to Five Years | Thereafter | Total | ||||||||||||||||
| (In Thousands) | ||||||||||||||||||||
| Time deposits | $ | 309,313 | $ | 66,418 | $ | 16,539 | $ | - | $ | 392,270 | ||||||||||
| FHLB Advances | 31,100 | 44,700 | 35,304 | 52,900 | 164,004 | |||||||||||||||
| Other Borrowings | 12,060 | - | - | - | 12,060 | |||||||||||||||
| Jr. Sub. Debentures | - | - | - | 5,155 | 5,155 | |||||||||||||||
| Sr. Conv. Debentures | - | - | - | 6,084 | 6,084 | |||||||||||||||
Operating Lease Obligations | 434 | 809 | 823 | 1,888 | 3,954 | |||||||||||||||
| Total | $ | 352,907 | $ | 111,927 | $ | 52,666 | $ | 66,027 | $ | 583,527 | ||||||||||
Off-Balance Sheet Arrangements
In the normal course of business, the Company makes off-balance sheet arrangements, including credit commitments to its customers to meet their financial needs. These arrangements involve, to varying degrees, elements of credit and interest rate risk not recognized in the consolidated statement of financial condition. The Bank makes personal, commercial, and real estate lines of credit available to customers and does issue standby letters of credit.
Commitments to extend credit to customers are subject to the Bank’s normal credit policies and are essentially the same as those involved in extending loans to customers. See Note 17 of the Notes to the Consolidated Financial Statements included herein for additional information.
Impact of Inflation and Changing Prices
The Consolidated Financial Statements, related notes, and other financial information presented herein have been prepared in accordance with Generally Accepted Accounting Principles (“GAAP”) that require the measurement of financial position and operating results in terms of historical dollars without considering changes in relative purchasing power over time due to inflation. Unlike most industrial companies, substantially all of the assets and liabilities of a financial institution are monetary in nature. As a result, interest rates generally have a more significant impact on a financial institution's performance than does the effect of inflation.
25
[ELLIOTT DAVIS LLC LETTERHEAD]
REPORT OF INDEPENDENT REGISTERED PUBLIC ACCOUNTING FIRM
Shareholders and Board of Directors
Security Federal Corporation and Subsidiaries
Aiken, South Carolina
We have audited the accompanying consolidated balance sheets of Security Federal Corporation and Subsidiaries (the “Company”) as of March 31, 2010 and 2009, and the related consolidated statements of income, changes in shareholders' equity and comprehensive income and cash flows for each of the three years in the period ended March 31, 2010. These consolidated financial statements are the responsibility of the Company's management. Our responsibility is to express an opinion on these consolidated financial statements based on our audits.
We conducted our audits in accordance with the standards of the Public Company Accounting Oversight Board (United States). Those standards require that we plan and perform the audits to obtain reasonable assurance about whether the financial statements are free of material misstatement. An audit includes examining, on a test basis, evidence supporting the amounts and disclosures in the financial statements. An audit also includes assessing the accounting principles used and significant estimates made by management, as well as evaluating the overall financial statement presentation. We believe that our audits provide a reasonable basis for our opinion.
In our opinion, the consolidated financial statements referred to above present fairly, in all material respects, the financial position of Security Federal Corporation and Subsidiaries as of March 31, 2010 and 2009, and the results of their operations and their cash flows for each of the three years in the period ended March 31, 2010, in conformity with accounting principles generally accepted in the United States.

Columbia, South Carolina
June 18, 2010
26
SECURITY FEDERAL CORPORATION AND SUBSIDIARIES
Consolidated Balance Sheets
| March 31, | ||||||||
| 2010 | 2009 | |||||||
| ASSETS: | ||||||||
| Cash And Cash Equivalents | $ | 8,804,645 | $ | 6,562,394 | �� | |||
| Investment And Mortgage-Backed Securities: | ||||||||
Available For Sale: (Amortized Cost of $284,831,441 and $276,687,428 at March 31, 2010 and 2009, Respectively) | 292,261,039 | 282,832,735 | ||||||
Held To Maturity: (Fair Value of $19,854,106 and $32,492,407 at March 31, 2010 and 2009, Respectively) | 18,785,380 | 31,265,866 | ||||||
| Total Investment And Mortgage-Backed Securities | 311,046,419 | 314,098,601 | ||||||
| Loans Receivable, Net: | ||||||||
| Held For Sale | 3,161,463 | 5,711,807 | ||||||
Held For Investment: (Net of Allowance of $12,307,394 and $10,181,599 at March 31, 2010 and 2009, Respectively) | 565,237,372 | 605,378,066 | ||||||
| Total Loans Receivable, Net | 568,398,835 | 611,089,873 | ||||||
| Accrued Interest Receivable: | ||||||||
| Loans | 1,787,471 | 2,011,967 | ||||||
| Mortgage-Backed Securities | 964,380 | 1,138,911 | ||||||
| Investment Securities | 703,339 | 363,707 | ||||||
| Total Accrued Interest Receivable | 3,455,190 | 3,514,585 | ||||||
| Premises And Equipment, Net | 20,720,484 | 21,675,434 | ||||||
| Federal Home Loan Bank Stock, At Cost | 12,624,400 | 12,662,700 | ||||||
| Repossessed Assets Acquired In Settlement Of Loans | 10,773,050 | 1,985,172 | ||||||
| Bank Owned Life Insurance | 10,001,305 | 9,641,305 | ||||||
| Intangible Assets, Net | 249,500 | 352,500 | ||||||
| Goodwill | 1,199,754 | 1,421,754 | ||||||
| Other Assets | 8,728,076 | 1,657,189 | ||||||
| Total Assets | $ | 956,001,658 | $ | 984,661,507 | ||||
| LIABILITIES AND SHAREHOLDERS’ EQUITY: | ||||||||
| Liabilities: | ||||||||
| Deposit Accounts | $ | 694,252,437 | $ | 661,713,575 | ||||
| Advances From Federal Home Loan Bank | 164,003,882 | 218,998,434 | ||||||
| Other Borrowings | 12,060,470 | 26,055,966 | ||||||
| Junior Subordinated Debentures | 5,155,000 | 5,155,000 | ||||||
| Advance Payments By Borrowers For Taxes And Insurance | 327,332 | 421,461 | ||||||
| Mandatorily Redeemable Financial Instruments | 1,663,312 | 1,600,312 | ||||||
| Senior Convertible Debentures | 6,084,000 | - | ||||||
| Other Liabilities | 4,594,606 | 3,624,461 | ||||||
| Total Liabilities | 888,141,039 | 917,569,209 | ||||||
| Commitments (Notes 5 and 17) | ||||||||
| Shareholders' Equity: | ||||||||
Serial Preferred Stock, $.01 Par Value; Authorized 200,000 Shares; Issued And Outstanding, 18,000 at March 31, 2010 And March 31, 2009 | 17,692,609 | 17,620,065 | ||||||
Common Stock, $.01 Par Value; Authorized 5,000,000 Shares; Issued And Outstanding Shares, 2,662,028 And 2,461,095, Respectively, at March 31, 2010 And 2,660,528 And 2,459,595, Respectively, at March 31, 2009 | 26,055 | 26,040 | ||||||
| Warrants Issued In Conjunction With Serial Preferred Stock | 400,000 | 400,000 | ||||||
| Additional Paid-In Capital | 5,352,144 | 5,299,235 | ||||||
Treasury Stock, At Cost (200,933 Shares at March 31, 2010 And 2009, Respectively) | (4,330,712 | ) | (4,330,712 | ) | ||||
| Accumulated Other Comprehensive Income | 4,608,080 | 3,809,934 | ||||||
| Retained Earnings, Substantially Restricted | 44,112,443 | 44,267,736 | ||||||
| Total Shareholders' Equity | 67,860,619 | 67,092,298 | ||||||
| Total Liabilities And Shareholders' Equity | $ | 956,001,658 | $ | 984,661,507 | ||||
SEE ACCOMPANYING NOTES TO CONSOLIDATED FINANCIAL STATEMENTS.
27
SECURITY FEDERAL CORPORATION AND SUBSIDIARIES
Consolidated Statements of Income
| For the Years Ended March 31, | ||||||||||||
| 2010 | 2009 | 2008 | ||||||||||
| Interest Income: | ||||||||||||
| Loans | $ | 34,399,899 | $ | 35,491,100 | $ | 36,634,595 | ||||||
| Mortgage-Backed Securities | 10,603,186 | 10,437,935 | 6,812,983 | |||||||||
| Investment Securities | 2,503,005 | 2,928,145 | 6,124,662 | |||||||||
| Other | 872 | 10,095 | 60,086 | |||||||||
| Total Interest Income | 47,506,962 | 48,867,275 | 49,632,326 | |||||||||
| Interest Expense: | ||||||||||||
| NOW And Money Market Accounts | 2,586,827 | 3,789,877 | 6,306,433 | |||||||||
| Statement Savings Accounts | 76,359 | 112,982 | 158,703 | |||||||||
| Certificate Accounts | 10,537,020 | 14,124,818 | 14,768,301 | |||||||||
| FHLB Advances And Other Borrowed Money | 6,534,398 | 8,003,354 | 7,948,807 | |||||||||
| Senior Convertible Debentures | 162,240 | - | - | |||||||||
| Junior Subordinated Debentures | 239,399 | 290,488 | 362,281 | |||||||||
| Total Interest Expense | 20,136,243 | 26,321,519 | 29,544,525 | |||||||||
| Net Interest Income | 27,370,719 | 22,545,756 | 20,087,801 | |||||||||
| Provision For Loan Losses | 8,155,000 | 2,825,000 | 895,000 | |||||||||
| Net Interest Income After Provision For Loan Losses | 19,215,719 | 19,720,756 | 19,192,801 | |||||||||
| Non-Interest Income: | ||||||||||||
| Gain On Sale Of Investment Securities | 1,213,041 | 126,527 | 267,981 | |||||||||
| Gain On Sale Of Loans | 1,040,014 | 627,787 | 613,493 | |||||||||
| Service Fees On Deposit Accounts | 1,231,081 | 1,143,147 | 1,232,676 | |||||||||
| Commissions From Insurance Agency | 456,860 | 624,613 | 664,844 | |||||||||
| Other Agency Income | 472,373 | 334,215 | 98,499 | |||||||||
| Trust Income | 455,000 | 431,000 | 442,625 | |||||||||
| Bank Owned Life Insurance Income | 360,000 | 358,492 | 327,193 | |||||||||
| Other | 843,294 | 849,997 | 841,762 | |||||||||
| Total Non-Interest Income | 6,071,663 | 4,495,778 | 4,489,073 | |||||||||
| General And Administrative Expenses: | ||||||||||||
| Compensation And Employee Benefits | 11,842,024 | 11,675,548 | 10,284,937 | |||||||||
| Occupancy | 2,002,233 | 1,987,317 | 1,783,729 | |||||||||
| Advertising | 404,182 | 541,882 | 379,819 | |||||||||
| Depreciation And Maintenance Of Equipment | 1,782,497 | 1,631,627 | 1,351,289 | |||||||||
| FDIC Insurance Premiums | 1,837,877 | 724,227 | 61,508 | |||||||||
| Amortization Of Intangibles | 90,000 | 90,000 | 90,000 | |||||||||
Mandatorily Redeemable Financial Instrument Valuation Expense | 63,000 | 183,000 | - | |||||||||
| Other | 4,600,563 | 3,665,143 | 3,371,248 | |||||||||
| Total General And Administrative Expenses | 22,622,376 | 20,498,744 | 17,322,530 | |||||||||
| Income Before Income Taxes | 2,665,006 | 3,717,790 | 6,359,344 | |||||||||
| Provision For Income Taxes | 1,060,205 | 1,264,417 | 2,079,745 | |||||||||
| Net Income | 1,604,801 | 2,453,373 | 4,279,599 | |||||||||
| Preferred Stock Dividends | 900,000 | 252,500 | - | |||||||||
| Accretion Of Preferred Stock To Redemption Value | 72,544 | 20,065 | - | |||||||||
| Net Income Available To Common Shareholders | $ | 632,257 | $ | 2,180,808 | $ | 4,279,599 | ||||||
| Net Income Per Common Share (Basic) | $ | 0.26 | $ | 0.87 | $ | 1.66 | ||||||
| Net Income Per Common Share (Diluted) | $ | 0.25 | $ | 0.87 | $ | 1.65 | ||||||
| Cash Dividend Per Share On Common Stock | $ | 0.32 | $ | 0.32 | $ | 0.28 | ||||||
| Weighted Average Shares Outstanding (Basic) | 2,460,855 | 2,501,596 | 2,583,568 | |||||||||
| Weighted Average Shares Outstanding (Diluted) | 2,527,584 | 2,519,470 | 2,586,703 | |||||||||
SEE ACCOMPANYING NOTES TO CONSOLIDATED FINANCIAL STATEMENTS.
28
SECURITY FEDERAL CORPORATION AND SUBSIDIARIES
Consolidated Statements of Changes in Shareholders' Equity and Comprehensive Income
For the Years Ended March 31, 2010, 2009 and 2008
Common Stock | Additional Paid – In Capital | Treasury Stock | Accumulated Other Comprehensive Income (Loss) | Retained Earnings | Total | |||||||
| Balance At March 31, 2007 | $ | 25,814 | $ | 4,850,029 | $ | (651,220) | $ | (747,316) | $ | 39,215,901 | $ | 42,693,208 |
| Net Income | - | - | - | - | 4,279,599 | 4,279,599 | ||||||
Other Comprehensive Income, Net Of Tax: | ||||||||||||
Unrealized Holding Gains On Securities Available For Sale, Net Of Taxes | - | - | - | 3,309,388 | - | 3,309,388 | ||||||
Reclassification Adjustment For Gains Included In Net Income, Net Of Taxes | - | - | - | (166,535) | - | (166,535) | ||||||
| Comprehensive Income | - | - | - | - | - | 7,422,452 | ||||||
Purchase Of Treasury Stock At Cost, 88,009 Shares | - | - | (2,118,226) | - | - | (2,118,226) | ||||||
| Exercise Of Stock Options | 63 | 104,958 | - | - | - | 105,021 | ||||||
Employee Stock Purchase Plan Purchases | 48 | 96,581 | - | - | - | 96,629 | ||||||
| Stock Compensation Expense | - | 20,518 | - | - | - | 20,518 | ||||||
| Cash Dividends | - | - | - | - | (723,189) | (723,189) | ||||||
| Balance At March 31, 2008 | $ | 25,925 | $ | 5,072,086 | $ | (2,769,446) | $ | 2,395,537 | $ | 42,772,311 | $ | 47,496,413 |
Preferred Stock | Warrants | Common Stock | Additional Paid – In Capital | Treasury Stock | Accumulated Other Comprehensive Income | Retained Earnings | Total | ||||||||||
| Balance At March 31, 2008 | $ | - | $ | - | $ | 25,925 | $ | 5,072,086 | $ | (2,769,446) | $ | 2,395,537 | $ | 42,772,311 | $ | 47,496,413 | |
| Net Income | - | - | - | - | - | - | 2,453,373 | 2,453,373 | |||||||||
Other Comprehensive Income, Net Of Tax: | |||||||||||||||||
Unrealized Holding Gains On Securities Available For Sale, Net Of Taxes | - | - | - | - | - | 1,492,790 | - | 1,492,790 | |||||||||
Reclassification Adjustment For Gains Included In Net Income, Net Of Taxes | - | - | - | - | - | (78,393) | - | (78,393) | |||||||||
| Comprehensive Income | - | - | - | - | - | - | - | 3,867,770 | |||||||||
Purchase Of Treasury Stock At Cost, 84,098 Shares | - | - | - | - | (1,561,266) | - | - | (1,561,266) | |||||||||
| Issuance Of Preferred Stock And Related Warrants | 17,600,000 | 400,000 | - | - | - | - | - | 18,000,000 | |||||||||
| Accretion Of Preferred Stock To Redemption Value | 20,065 | - | - | - | - | - | (20,065) | - | |||||||||
| Exercise Of Stock Options | - | - | 60 | 99,960 | - | - | - | 100,020 | |||||||||
| Employee Stock Purchase Plan Purchases | - | - | 55 | 94,498 | - | - | - | 94,553 | |||||||||
| Stock Compensation Expense | - | - | - | 32,691 | - | - | - | 32,691 | |||||||||
| Cash Dividends On Preferred | - | - | - | - | - | - | (140,000) | (140,000) | |||||||||
| Cash Dividends On Common | - | - | - | - | - | - | (797,883) | (797,883) | |||||||||
| Balance At March 31, 2009 | $ | 17,620,065 | $ | 400,000 | $ | 26,040 | $ | 5,299,235 | $ | (4,330,712) | $ | 3,809,934 | $ | 44,267,736 | $ | 67,092,298 | |
(Continued)
29
SECURITY FEDERAL CORPORATION AND SUBSIDIARIES
Consolidated Statements of Changes in Shareholders' Equity and Comprehensive Income
For the Years Ended March 31, 2010, 2009 and 2008, Continued
Preferred Stock | Warrants | Common Stock | Additional Paid – In Capital | Treasury Stock | Accumulated Other Comprehensive Income | Retained Earnings | Total | ||||||||||
| Balance At March 31, 2009 | $ | 17,620,065 | $ | 400,000 | $ | 26,040 | $ | 5,299,235 | $ | (4,330,712) | $ | 3,809,934 | $ | 44,267,736 | $ | 67,092,298 | |
| Net Income | - | - | - | - | - | - | 1,604,801 | 1,604,801 | |||||||||
Other Comprehensive Income, Net Of Tax: | |||||||||||||||||
Unrealized Holding Gains On Securities Available For Sale, Net Of Taxes | - | - | - | - | - | 1,550,231 | - | 1,550,231 | |||||||||
Reclassification Adjustment For Gains Included In Net Income, Net Of Taxes | - | - | - | - | - | (752,085) | - | (752,085) | |||||||||
| Comprehensive Income | - | - | - | - | - | - | - | 2,402,947 | |||||||||
| Accretion Of Preferred Stock To Redemption Value | 72,544 | - | - | - | - | - | (72,544) | - | |||||||||
| Employee Stock Purchase Plan Purchases | - | - | 15 | 19,785 | - | - | - | 19,800 | |||||||||
| Stock Compensation Expense | - | - | - | 33,124 | - | - | - | 33,124 | |||||||||
| Cash Dividends On Preferred | - | - | - | - | - | - | (900,000) | (900,000) | |||||||||
| Cash Dividends On Common | - | - | - | - | - | - | (787,550) | (787,550) | |||||||||
| Balance At March 31, 2010 | $ | 17,692,609 | $ | 400,000 | $ | 26,055 | $ | 5,352,144 | $ | (4,330,712) | $ | 4,608,080 | $ | 44,112,443 | $ | 67,860,619 | |
SEE ACCOMPANYING NOTES TO CONSOLIDATED FINANCIAL STATEMENTS.
30
SECURITY FEDERAL CORPORATION AND SUBSIDIARIES
Consolidated Statements of Cash Flows
| For the Years Ended March 31, | ||||||||||||
| 2010 | 2009 | 2008 | ||||||||||
| CASH FLOWS FROM OPERATING ACTIVITIES: | ||||||||||||
| Net Income | $ | 1,604,801 | $ | 2,453,373 | $ | 4,279,599 | ||||||
Adjustments To Reconcile Net Income To Net Cash Provided By Operating Activities: | ||||||||||||
| Depreciation Expense | 1,577,968 | 1,491,922 | 1,098,711 | |||||||||
| Amortization Of Intangible Assets | 90,000 | 90,000 | 90,000 | |||||||||
| Stock Option Compensation Expense | 33,124 | 32,691 | 20,518 | |||||||||
| Discount Accretion And Premium Amortization | 1,914,150 | 564,876 | 236,743 | |||||||||
| Provisions For Losses On Loans | 8,155,000 | 2,825,000 | 895,000 | |||||||||
| Write Down Of Goodwill | 222,000 | - | - | |||||||||
Mandatorily Redeemable Financial Instrument Valuation Expense | 63,000 | 183,000 | - | |||||||||
| Gain On Sales Of Loans | (1,040,014 | ) | (627,787 | ) | (613,493 | ) | ||||||
| Gain On Sales Of Mortgage-Backed Securities | (619,856 | ) | - | - | ||||||||
| Gain On Sales Of Investment Securities | (593,185 | ) | (126,527 | ) | (267,981 | ) | ||||||
| (Gain) Loss On Sale Of Real Estate Owned | 103,920 | 21,940 | (14,685 | ) | ||||||||
| Write Down On Real Estate Owned | 504,580 | - | - | |||||||||
| Amortization Of Deferred Fees On Loans | (128,217 | ) | (130,099 | ) | (109,539 | ) | ||||||
| (Gain) loss On Disposition Of Premises And Equipment | (25 | ) | 61 | 10,906 | ||||||||
| Proceeds From Sale Of Loans Held For Sale | 68,819,036 | 45,900,664 | 39,115,662 | |||||||||
| Origination Of Loans Held For Sale | (65,228,678 | ) | (48,688,963 | ) | (39,268,142 | ) | ||||||
| (Increase) Decrease In Accrued Interest Receivable: | ||||||||||||
| Loans | 224,496 | (59,101 | ) | (493,673 | ) | |||||||
| Mortgage-Backed Securities | 174,531 | (316,532 | ) | (271,697 | ) | |||||||
| Investment Securities | (339,632 | ) | 401,039 | 416,893 | ||||||||
| (Decrease) Increase In Advance Payments By Borrowers | (94,129 | ) | (199,006 | ) | 134,366 | |||||||
| Increase In Prepaid FDIC Assessment | (3,987,622 | ) | - | - | ||||||||
| Other, Net | (2,946,265 | ) | (650,831 | ) | 10,762 | |||||||
| Net Cash Provided By Operating Activities | 8,508,983 | 3,165,720 | 5,269,950 | |||||||||
| CASH FLOWS FROM INVESTING ACTIVITIES: | ||||||||||||
Purchase Of Mortgage-Backed Securities Available For Sale | (80,947,679 | ) | (100,017,227 | ) | (93,232,730 | ) | ||||||
Principal Repayments On Mortgage-Backed Securities Available For Sale | 63,591,884 | 44,254,746 | 39,514,170 | |||||||||
Maturities Of Mortgage-Backed Securities Available For Sale | 1,000,000 | - | - | |||||||||
Principal Repayments On Mortgage-Backed Securities Held To Maturity | 7,486,884 | 1,526,959 | - | |||||||||
| Purchase Of Investment Securities Available For Sale | (69,209,182 | ) | (16,742,367 | ) | (49,522,853 | ) | ||||||
| Maturities Of Investment Securities Available For Sale | 18,640,344 | 25,543,010 | 41,664,531 | |||||||||
| Purchase of Investment Securities Held To Maturity | - | (27,618,762 | ) | - | ||||||||
| Maturities Of Investment Securities Held To Maturity | 4,881,502 | 14,983,444 | 44,000,000 | |||||||||
Proceeds From Sale of Investment Securities Available For Sale | 27,465,905 | 7,135,335 | 8,268,604 | |||||||||
Proceeds From Sale of Mortgage-Backed Securities Available For Sale | 30,725,706 | 2,993,520 | - | |||||||||
| Purchase Of FHLB Stock | - | (11,401,000 | ) | (10,486,300 | ) | |||||||
| Redemption Of FHLB Stock | 38,300 | 8,235,400 | 9,198,400 | |||||||||
| (Increase) Decrease In Loans Receivable | 21,540,257 | (94,155,147 | ) | (83,076,705 | ) | |||||||
| Capital Improvements To Repossessed Assets | - | 17,381 | - | |||||||||
| Proceeds From Sale Of Repossessed Assets | 1,177,276 | 460,767 | 436,370 | |||||||||
| Purchase And Improvement Of Premises And Equipment | (623,964 | ) | (1,624,687 | ) | (6,759,305 | ) | ||||||
| Proceeds From Sale of Premises and Equipment | 971 | 1,650 | 500 | |||||||||
| Increase In Bank Owned Life Insurance | - | (1,330,492 | ) | (2,527,193 | ) | |||||||
| Net Cash Provided (Used) By Investing Activities | 25,768,204 | (147,737,470 | ) | (102,522,511 | ) | |||||||
| (Continued) | ||||||||||||
31
SECURITY FEDERAL CORPORATION AND SUBSIDIARIES
Consolidated Statements of Cash Flows, Continued
| For the Years Ended March 31, | ||||||||||||
| 2010 | 2009 | 2008 | ||||||||||
| CASH FLOWS FROM FINANCING ACTIVITIES: | ||||||||||||
| Increase In Deposit Accounts | 32,538,862 | 70,863,367 | 67,112,616 | |||||||||
| Proceeds From FHLB Advances | 310,885,319 | 333,080,000 | 352,450,000 | |||||||||
| Repayment Of FHLB Advances | (365,879,871 | ) | (292,315,573 | ) | (327,265,265 | ) | ||||||
| Proceeds From Term Auction Facility Advances | 207,000,000 | - | - | |||||||||
| Repayment Of Term Auction Facility Advances | (217,000,000 | ) | - | - | ||||||||
| Proceeds (Repayments) Of Other Borrowings, Net | (3,995,496 | ) | 13,271,872 | 4,695,900 | ||||||||
| Proceeds From Issuance Of Preferred Stock | - | 18,000,000 | - | |||||||||
| Proceeds From Senior Convertible Debentures | 6,084,000 | - | - | |||||||||
| Proceeds From Employee Stock Purchase Plan Purchases | 19,800 | 94,553 | 96,629 | |||||||||
| Proceeds From Exercise Of Stock Options | - | 100,020 | 105,021 | |||||||||
| Purchase Of Treasury Stock | - | (1,561,266 | ) | (2,118,226 | ) | |||||||
| Dividends To Preferred Stock Shareholders | (900,000 | ) | (140,000 | ) | - | |||||||
| Dividends To Common Stock Shareholders | (787,550 | ) | (797,883 | ) | (723,189 | ) | ||||||
| Net Cash Provided (Used) By Financing Activities | (32,034,936 | ) | 140,595,090 | 94,353,486 | ||||||||
| Net Increase (Decrease) In Cash And Cash Equivalents | 2,242,251 | (3,976,660 | ) | (2,899,075 | ) | |||||||
| Cash And Cash Equivalents At Beginning Of Year | 6,562,394 | 10,539,054 | 13,438,129 | |||||||||
| Cash And Cash Equivalents At End Of Year | $ | 8,804,645 | $ | 6,562,394 | $ | 10,539,054 | ||||||
SUPPLEMENTAL DISCLOSURE OF CASH FLOW INFORMATION: | ||||||||||||
| Cash Paid During The Period For: | ||||||||||||
| Interest | $ | 20,326,637 | $ | 26,572,297 | $ | 29,481,506 | ||||||
| Income Taxes | $ | 3,396,162 | $ | 1,869,900 | $ | 2,403,290 | ||||||
| Supplemental Schedule Of Non Cash Transactions: | ||||||||||||
| Transfers From Loans Receivable | $ | 10,573,654 | $ | 1,718,164 | $ | 1,163,872 | ||||||
| Gains On Securities Available For Sale, Net Of Taxes | $ | 798,146 | $ | 1,414,397 | $ | 3,142,853 | ||||||
SEE ACCOMPANYING NOTES TO CONSOLIDATED FINANCIAL STATEMENTS.
32
SECURITY FEDERAL CORPORATION AND SUBSIDIARIES
Notes To Consolidated Financial Statements
| (1) | Significant Accounting Policies |
The following is a description of the more significant accounting and reporting policies used in the preparation and presentation of the accompanying consolidated financial statements. All significant intercompany transactions have been eliminated in consolidation.
| (a) | Basis of Consolidation and Nature of Operations |
The accompanying consolidated financial statements include the accounts of Security Federal Corporation (the “Company”) and its wholly owned subsidiary, Security Federal Bank (the “Bank”) and the Bank’s wholly owned subsidiaries, Security Federal Insurance, Inc. (“SFINS”) and Security Financial Services Corporation (“SFSC”). Security Federal Corporation has a wholly owned subsidiary, Security Federal Statutory Trust (the “Trust”), which issued and sold fixed and floating rate capital securities of the Trust. However, under current accounting guidance, the Trust is not consolidated in the financial statements. The Bank is primarily engaged in the business of accepting savings and demand deposits and originating mortgage loans and other loans to individuals and small businesses for various personal and commercial purposes. SFINS was formed during fiscal 2002 and began operating during the December 2001 quarter. SFINS is an insurance agency offering auto, business, health, and home insurance. SFINS has a wholly owned subsidiary, Collier Jennings Financial Corporation which has as subsidiaries Collier Jennings Inc., The Auto Insurance Store Inc., and Security Federal Premium Pay Plans Inc.
| (b) | Cash and Cash Equivalents |
For purposes of reporting cash flows, cash and cash equivalents include cash and due from banks, interest-bearing balances in other banks, and federal funds sold. Cash equivalents have original maturities of three months or less.
| (c) | Investment and Mortgage-Backed Securities |
Investment securities, including mortgage-backed securities, are classified in one of three categories: held to maturity, available for sale, or trading. Management determines the appropriate classification of debt securities at the time of purchase.
Investment securities are classified as held to maturity when the Company has the positive intent and ability to hold the securities to maturity. These securities are recorded at cost and adjusted for amortization of premiums and accretion of discounts over the estimated life of the security using a method that approximates a level yield. Prepayment assumptions on mortgage-backed securities are anticipated.
Management classifies investment securities that are not considered to be held to maturity as available for sale. This type of investment is stated at fair value with unrealized gains and losses, net of tax, reported in a separate component of shareholders' equity (“accumulated other comprehensive income (loss)”). Gains and losses from sales of investment and mortgage-backed securities available for sale are determined using the specific identification method. The Company has no trading securities.
| (d) | Loans Receivable Held for Investment |
Loans are stated at their unpaid principal balance. Interest income is computed using the simple interest method and is recorded in the period earned.
| (e) | Allowance for Loan Losses |
The Company provides for loan losses using the allowance method. Accordingly, all loan losses are charged to the related allowance, and all recoveries are credited to the allowance for loan losses. Additions to the allowance for loan losses are provided by charges to operations based on various factors which, in management's judgment, deserve current recognition in estimating possible losses. Such factors considered by management include the fair value of the underlying collateral, stated guarantees by the borrower, if applicable, the borrower's ability to repay from other economic resources, growth and composition of the loan portfolios, the relationship of the allowance for loan losses to outstanding loans, loss experience, delinquency trends, and general economic conditions. Management evaluates the carrying value of the loans periodically and the allowance is adjusted accordingly. While management uses the best information available to make evaluations, future adjustments to the allowance may be necessary if economic conditions differ substantially from the assumptions used in making these evaluations.
33
SECURITY FEDERAL CORPORATION AND SUBSIDIARIES
Notes To Consolidated Financial Statements
(1) Significant Accounting Policies, Continued
| (e) | Allowance for Loan Losses, Continued |
Allowances for loan losses are subject to periodic evaluations by various regulatory authorities and may be subject to adjustments based upon the information that is available at the time of their examinations.
The Company values impaired loans at either the loan’s fair value, or the present value of expected future cash flows, if it is probable that the Company will be unable to collect all amounts due according to the terms of the loan agreement at the present value of expected cash flows, the market price of the loan, if available, or the value of the underlying collateral. Expected cash flows are required to be discounted at the loan’s effective interest rate. When the ultimate collectibility of an impaired loan’s principal is in doubt, wholly or partially, all cash receipts are applied to principal. When this doubt does not exist, cash receipts are applied under the contractual terms of the loan agreement first to interest then to principal. Once the recorded principal balance has been reduced to zero, future cash receipts are applied to interest income to the extent that any interest has been foregone. Further cash receipts are recorded as recoveries of any amounts previously charged off.
| (f) | Loans Receivable Held for Sale |
Loans originated and intended for sale in the secondary market are carried at the lower of cost or estimated fair value in the aggregate. Net unrealized losses are provided for in a valuation allowance by charges to operations.
| (g) | Repossessed Assets Acquired in Settlement of Loans |
Repossessed assets represent real estate and other assets acquired through foreclosure or repossession and are initially recorded at the lower of cost (principal balance of the former mortgage loan less any specific valuation allowances) or estimated fair value less costs to sell. Subsequent improvements are capitalized. Costs of holding real estate, such as property taxes, insurance, general maintenance and interest expense, are expensed as a period cost. Fair values are reviewed regularly and allowances for possible losses are established when the carrying value of the asset owned exceeds the fair value less estimated costs to sell. Fair values are generally determined by reference to an outside appraisal.
| (h) | Premises and Equipment |
Premises and equipment are carried at cost, net of accumulated depreciation. Depreciation of premises and equipment is amortized on a straight-line method over the estimated useful life of the related asset. Estimated lives are seven to 40 years for buildings and improvements and generally three to 10 years for furniture, fixtures and equipment. Maintenance and repairs are charged to current expense. The cost of major renewals and improvements are capitalized.
| (i) | Intangible Assets and Goodwill |
Intangible Assets consist of the customer list and employment contracts resulting from the Company’s acquisition of Collier Jennings Financial Corporation in July 2006. The goodwill also is a result of the excess of the cost over the fair value of net assets resulting from the Collier Jennings acquisition.
Intangible assets are amortized over their estimated economic lives using methods that reflect the pattern in which the economic benefits are utilized. Goodwill is reviewed for impairment annually or whenever events or changes in circumstances indicate the carrying amount of an asset may not be recoverable.
| (j) | Income Taxes |
Deferred tax expense or benefit is recognized for the net change during the year in the deferred tax liability or asset. That amount together with income taxes currently payable is the total amount of income tax expense or benefit for the year. Deferred taxes are provided for by the differences in financial reporting bases for assets and liabilities compared with their tax bases. Generally, a current tax liability or asset is established for taxes presently payable or refundable and a deferred tax liability or asset is established for future tax items. A valuation allowance, if applicable, is established for deferred tax assets that may not be realized. Tax bad debt reserves in excess of the base year amount (established as taxable years ending March 31, 1988 or later) would create a deferred tax liability. Deferred income taxes are provided for in differences between the provision for loan losses for financial statement purposes and those allowed for income tax purposes.
34
SECURITY FEDERAL CORPORATION AND SUBSIDIARIES
Notes To Consolidated Financial Statements
(1) Significant Accounting Policies, Continued
On April 1, 2007, the Company adopted accounting guidance which prescribes a threshold and measurement attribute for the financial statement recognition and measurement of a tax position taken or expected to be taken in a tax return and also provides guidance on derecognition, classification, interest and penalties, accounting in interim periods and disclosures. There was no cumulative effect adjustment upon adoption.
There have been no gross amounts of unrecognized tax benefits or interest or penalties related to uncertain tax positions since adoption. There are no unrecognized tax benefits that would, if recognized, affect the effective tax rate. There are no positions for which it is reasonably possible that the total amounts of unrecognized tax benefits will significantly increase or decrease within the next 12 months. Years prior to March 31, 2006 are closed for federal, state and local income tax matters.
| (k) | Loan Fees and Costs Associated with Originating Loans |
Loan fees received, net of direct incremental costs of originating loans, are deferred and amortized over the contractual life of the related loan. The net fees are recognized as yield adjustments by applying the interest method. Prepayments are not anticipated.
| (l) | Interest Income |
Interest on loans is accrued and credited to income monthly based on the principal balance outstanding and the contractual rate on the loan. The Company places loans on non-accrual status when they become greater than 90 days delinquent or when, in the opinion of management, full collection of principal or interest is unlikely. The Company provides an allowance for uncollectible accrued interest on loans that are contractually 90 days delinquent for all interest accrued prior to the loan being placed on non-accrual status. The loans are returned to an accrual status when full collection of principal and interest appears likely.
| (m) | Advertising Expense |
Advertising and public relations costs are generally expensed as incurred. External costs relating to direct mailing costs are expensed in the period in which the direct mailings are sent. Advertising and public relations costs of $404,000, $542,000, and $380,000 were included in the Company’s results of operations for the years ended March 31, 2010, 2009, and 2008, respectively.
| (n) | Stock-Based Compensation |
The Company accounts for compensation costs under its stock option plans using the fair value method. This method requires the measurement of the cost of employee services received in exchange for an award of equity instruments based upon the fair value of the award on the grant date. The cost of the award is recognized in the income statement over the vesting period of the award.
(o) Earnings Per Share
Accounting guidance specifies computation and presentation requirements for both basic EPS and, for entities with complex capital structures, diluted EPS. Basic EPS is computed by dividing net income available to common shareholders by the weighted average number of common shares outstanding. Diluted EPS is similar to the computation of basic EPS except that the denominator is increased to include the number of additional common shares that would have been outstanding if the dilutive potential common shares had been issued. The dilutive effect of options and warrants outstanding is reflected in diluted earnings per share by application of the treasury stock method. The reverse treasury stock method is used to determine the dilutive effect of the mandatorily redeemable shares outstanding, which were issued by the Company in connection with the acquisition of the Collier-Jennings Companies.
Net income available to common shareholders represents consolidated net income adjusted for preferred dividends declared, accretion of discounts and amortization of premiums on preferred stock issuances and cumulative dividends related to the current dividend period that have not been declared as of period end.
35
SECURITY FEDERAL CORPORATION AND SUBSIDIARIES
Notes To Consolidated Financial Statements
(1) Significant Accounting Policies, Continued
(o) Earnings Per Share, Continued
The following tables provide a reconciliation of net income to net income available to common shareholders for the periods presented:
| For the Years Ended March 31, | ||||||||||||
| 2010 | 2009 | 2008 | ||||||||||
| Earnings available to common shareholders | ||||||||||||
| Net Income | $ | 1,604,801 | $ | 2,453,373 | $ | 4,279,599 | ||||||
| Preferred Stock Dividends | 900,000 | 252,500 | - | |||||||||
Deemed Dividends On Preferred Stock From Net Accretion of Preferred Stock | 72,544 | 20,065 | - | |||||||||
| Net Income Available To Common Shareholders | $ | 632,257 | $ | 2,180,808 | $ | 4,279,599 | ||||||
The following table shows the effect of dilutive options and warrants on the Company’s earnings per share for the periods indicated:
| For the Year Ended | ||||||||||||
| March 31, 2010 | ||||||||||||
Income | Shares | Per Share Amounts | ||||||||||
| Basic EPS | $ | 632,257 | 2,460,855 | $ | 0.26 | |||||||
| Effect of Diluted Securities: | ||||||||||||
Mandatorily Redeemable Shares | - | 66,729 | (0.01 | ) | ||||||||
| Senior Convertible Debentures | - | - | - | |||||||||
Stock Options & Warrants | - | - | - | |||||||||
| Diluted EPS | $ | 632,257 | 2,527,584 | $ | 0.25 | |||||||
| For the Year Ended | ||||||||||||||||||||||||
| March 31, 2009 | March 31, 2008 | |||||||||||||||||||||||
Income | Shares | Per Share Amounts | Income | Shares | Per Share Amounts | |||||||||||||||||||
| Basic EPS | $ | 2,180,808 | 2,501,596 | $ | 0.87 | $ | 4,279,599 | 2,583,568 | $ | 1.66 | ||||||||||||||
| Dilutive effect of: | ||||||||||||||||||||||||
Stock Options And Warrants | - | - | - | - | 3,135 | (0.01 | ) | |||||||||||||||||
Mandatorily Redeemable Shares | - | 17,874 | - | - | - | - | ||||||||||||||||||
| Diluted EPS | $ | 2,180,808 | 2,519,470 | $ | 0.87 | $ | 4,279,599 | 2,586,703 | $ | 1.65 | ||||||||||||||
The average market price used in calculating the assumed number of dilutive shares issued for the years ended March 31, 2010, 2009, and 2008 was $11.69, $19.58, and $23.90, respectively. As a result of the average stock price being greater than the exercise price of all options and warrants in the years ended March 31, 2010 and 2009, the options are not dilutive in calculating diluted earnings per share for those years.
36
SECURITY FEDERAL CORPORATION AND SUBSIDIARIES
Notes To Consolidated Financial Statements
(1) Significant Accounting Policies, Continued
| (p) | Use of Estimates |
The preparation of financial statements in conformity with Generally Accepted Accounting Principles (“GAAP”) requires management to make estimates and assumptions that affect the reported amounts of assets and liabilities and the disclosure of contingent assets and liabilities at the dates of the financial statements and the reported amounts of income and expenses during the reporting periods. Actual results could differ from those estimates.
| (q) | Recently Issued Accounting Standards |
The following is a summary of recent authoritative pronouncements that could affect accounting, reporting, and disclosure of financial information by the Company:
In January 2010, fair value guidance was amended to require disclosures for significant amounts transferred in and out of Levels 1 and 2 and the reasons for such transfers and to require that gross amounts of purchases, sales, issuances and settlements be provided in the Level 3 reconciliation. The new disclosures are effective for the Company for the quarter ended June 30, 2010.
Guidance related to subsequent events was amended in February 2010 to remove the requirement for a Securities and Exchange Commission filer to disclose the date through which subsequent events were evaluated. The amendments were effective upon issuance and had no significant impact on the Company’s financial statements.
Other accounting standards that have been issued or proposed by the Financial Accounting Standards Board (“FASB”) or other standards-setting bodies are not expected to have a material impact on the Company’s financial position, results of operations or cash flows.
(r) Risks and Uncertainties
In the normal course of its business, the Company encounters two significant types of risk: economic and regulatory. There are three main components of economic risk: interest rate risk, credit risk, and market risk. The Company is subject to interest rate risk to the degree that its interest-bearing liabilities mature or reprice at different speeds, or on different bases, than its interest-earning assets. Credit risk is the risk of default on the Company’s loan portfolio that results from borrowers’ inability or unwillingness to make contractually required payments. Market risk reflects changes in the value of collateral underlying loans receivable, the valuation of real estate held by the Company, and the valuation of loans held for sale and mortgage-backed securities available for sale. The Company is subject to the regulations of various government agencies. These regulations can and do change significantly from period to period. The Company also undergoes periodic examinations by the regulatory agencies, which may subject it to further changes with respect to asset valuations, amounts of required loss allowances, and operating restrictions, resulting form the regulators’ judgments based on information available to them at the time of their examination.
| (s) | Reclassifications |
Certain amounts in prior years’ consolidated financial statements have been reclassified to conform to current year classifications.
37
SECURITY FEDERAL CORPORATION AND SUBSIDIARIES
Notes To Consolidated Financial Statements
(2) Investment and Mortgage-Backed Securities, Available for Sale
The amortized cost, gross unrealized gains, gross unrealized losses, and fair values of investment and mortgage-backed securities available for sale are as follows:
March 31, 2010 | ||||||||||||||||
Amortized Cost | Gross Unrealized Gains | Gross Unrealized Losses | Fair value | |||||||||||||
| FHLB Securities | $ | 9,209,585 | $ | 204,066 | $ | 43,750 | $ | 9,369,901 | ||||||||
| Federal Farm Credit Securities | 4,173,462 | $ | 40,079 | $ | 4,869 | $ | 4,208,672 | |||||||||
Federal National Mortgage Association (“FNMA”) and Federal Home Loan Mortgage Corporation (“FHLMC”) Bonds | 5,993,806 | - | 30,536 | 5,963,270 | ||||||||||||
Small Business Administration (“SBA”) Bonds | 36,955,783 | 313,976 | 83,698 | 37,186,061 | ||||||||||||
| Taxable Municipal Bond | 3,192,950 | 32,976 | - | 3,225,926 | ||||||||||||
| Mortgage-Backed Securities | 225,202,917 | 7,396,067 | 363,925 | 232,235,059 | ||||||||||||
| Equity Securities | 102,938 | - | 30,788 | 72,150 | ||||||||||||
| $ | 284,831,441 | $ | 7,987,164 | $ | 557,566 | $ | 292,261,039 | |||||||||
March 31, 2009 | ||||||||||||||||
Amortized Cost | Gross Unrealized Gains | Gross Unrealized Losses | Fair value | |||||||||||||
| FHLB Securities | $ | 15,401,116 | $ | 428,886 | $ | 18,450 | $ | 15,811,552 | ||||||||
| Federal Farm Credit Securities | 14,521,626 | 121,699 | 8,855 | 14,634,470 | ||||||||||||
| FNMA Bonds | 2,000,000 | 7,810 | - | 2,007,810 | ||||||||||||
| SBA Bonds | 3,319,651 | 65,119 | 18,201 | 3,366,569 | ||||||||||||
| Taxable Municipal Bond | 1,019,781 | 26,818 | - | 1,046,599 | ||||||||||||
| Mortgage-Backed Securities | 240,322,316 | 5,718,587 | 112,668 | 245,928,235 | ||||||||||||
| Equity Securities | 102,938 | - | 65,438 | 37,500 | ||||||||||||
| $ | 276,687,428 | $ | 6,368,919 | $ | 223,612 | $ | 282,832,735 | |||||||||
FHLB securities, Federal Farm Credit securities, FNMA bonds, and FNMA and FHLMC mortgage-backed securities are issued by government-sponsored enterprises (“GSEs”). GSEs are not backed by the full faith and credit of the United States government. SBA bonds are backed by the full faith and credit of the United States government. Included in the tables above and below in mortgage-backed securities are GNMA mortgage-backed securities, which are also backed by the full faith and credit of the United States government. At March 31, 2010 and 2009, the Bank held an amortized cost and fair value of $129.1 million and $132.4 million and $107.3 million and $110.2 million, respectively in GNMA mortgage-backed securities included in mortgage-backed securities listed above. All mortgage-backed securities above are either GSEs or GNMA mortgage-backed securities. The balance does not include any private label mortgage-backed securities.
The amortized cost and fair value of investment and mortgage-backed securities available for sale at March 31, 2010 are shown below by contractual maturity. Expected maturities will differ from contractual maturities because borrowers have the right to prepay obligations with or without call or prepayment penalties.
| Amortized Cost | Fair Value | |||||||
| Less Than One Year | $ | 749,782 | $ | 769,311 | ||||
| One – Five Years | 2,909,543 | 2,956,279 | ||||||
| Five – Ten Years | 21,388,083 | 21,484,193 | ||||||
| After Ten Years | 34,581,116 | 34,816,197 | ||||||
| Mortgage-Backed Securities | 225,202,917 | 232,235,059 | ||||||
| $ | 284,831,441 | $ | 292,261,039 | |||||
38
SECURITY FEDERAL CORPORATION AND SUBSIDIARIES
Notes To Consolidated Financial Statements
(2) Investment and Mortgage-Backed Securities, Available for Sale, Continued
At March 31, 2010 and 2009, the amortized cost and fair value of investment and mortgage-backed securities available for sale pledged as collateral for certain deposit accounts, FHLB advances and other borrowings were $187.8 million and $194.2 million and $239.0 million and $245.8 million, respectively.
The Bank received approximately $58.2 million, $10.1 million and $8.3 million, respectively in proceeds from sales of available for sale securities during the years ended March 31, 2010, 2009, and 2008. As a result, the Bank recognized approximately $1.2 million in gross gains and $0 in gross losses for the year ended March 31, 2010, $149,000 in gross gains and $22,000 in gross losses for the year ended March 31, 2009 and $269,000 in gross gains and $1,000 in gross losses for the year ended March 31, 2008.
The following table shows gross unrealized losses and fair value, aggregated by investment category, and length of time that individual available for sale securities have been in a continuous unrealized loss position, at March 31, 2010.
| Less than 12 Months | 12 Months or More | Total | ||||||||||||||||||||||
Fair Value | Unrealized Losses | Fair Value | Unrealized Losses | Fair Value | Unrealized Losses | |||||||||||||||||||
| FHLB Securities | $ | 2,956,250 | $ | 43,750 | $ | - | $ | - | $ | 2,956,250 | $ | 43,750 | ||||||||||||
| Federal Farm Credit Securities | 1,037,500 | 4,869 | - | - | 1,037,500 | 4,869 | ||||||||||||||||||
| Mortgage-Backed Securities | 36,866,308 | 363,925 | - | - | 36,866,308 | 363,925 | ||||||||||||||||||
| FNMA and FHLMC Bonds | 4,963,270 | 30,536 | - | - | 4,963,270 | 30,536 | ||||||||||||||||||
| SBA Bonds | 10,464,706 | 83,698 | - | - | 10,464,706 | 83,698 | ||||||||||||||||||
| Equity Securities | - | - | 72,150 | 30,788 | 72,150 | 30,788 | ||||||||||||||||||
| $ | 56,288,034 | $ | 526,778 | $ | 72,150 | $ | 30,788 | $ | 56,360,184 | $ | 557,566 | |||||||||||||
The following table shows gross unrealized losses and fair value, aggregated by investment category, and length of time that individual available for sale securities have been in a continuous unrealized loss position, at March 31, 2009.
| Less than 12 Months | 12 Months or More | Total | ||||||||||||||||||||||
Fair Value | Unrealized Losses | Fair Value | Unrealized Losses | Fair Value | Unrealized Losses | |||||||||||||||||||
| FHLB Securities | $ | 1,980,000 | $ | 18,450 | $ | - | $ | - | $ | 1,980,000 | $ | 18,450 | ||||||||||||
| Federal Farm Credit Securities | 3,032,510 | 8,855 | - | - | 3,032,510 | 8,855 | ||||||||||||||||||
| Mortgage-Backed Securities | 23,659,916 | 109,978 | 477,716 | 2,690 | 24,137,632 | 112,668 | ||||||||||||||||||
| SBA Bonds | 1,009,060 | 18,201 | - | - | 1,009,060 | 18,201 | ||||||||||||||||||
| Equity Securities | - | - | 37,500 | 65,438 | 37,500 | 65,438 | ||||||||||||||||||
| $ | 29,681,486 | $ | 155,484 | $ | 515,216 | $ | 68,128 | $ | 30,196,702 | $ | 223,612 | |||||||||||||
Securities classified as available-for-sale are recorded at fair market value. At March 31, 2010, approximately 5.5% of the unrealized losses, or one individual security, consisted of securities in a continuous loss position for 12 months or more. At March 31, 2009, approximately 30.5% of the unrealized losses, or two individual securities, consisted of securities in a continuous loss position for 12 months or more. The Company has the ability and intent to hold these securities until such time as the value recovers or the securities mature. The Company believes, based on industry analyst reports and credit ratings, that the deterioration in value is attributable to changes in market interest rates and is not in the credit quality of the issuer and therefore, these losses are not considered other-than-temporary. The Company reviews its investment securities portfolio at least quarterly and more frequently when economic conditions warrant, assessing whether there is any indication of other-than-temporary impairment (“OTTI”). Factors considered in the review include estimated future cash flows, length of time and extent to which market value has been less than cost, the financial condition and near term prospects of the issuer, and our intent and ability to retain the security to allow for an anticipated recovery in market value.
If the review determines that there is OTTI, then an impairment loss is recognized in earnings equal to the entire difference between the investment’s cost and its fair value at the balance sheet date of the reporting period for which the assessment is made, or may recognize a portion in other comprehensive income. The fair value of investments on which OTTI is recognized then becomes the new cost basis of the investment.
39
SECURITY FEDERAL CORPORATION AND SUBSIDIARIES
Notes To Consolidated Financial Statements
(3) Investment and Mortgage-Backed Securities, Held to Maturity
The amortized cost, gross unrealized gains, gross unrealized losses, and fair values of investment and mortgage-backed securities held to maturity are as follows:
| March 31, 2010 | ||||||||||||||||
Amortized Cost | Gross Unrealized Gains | Gross Unrealized Losses | Fair Value | |||||||||||||
| FHLB Securities | $ | 4,000,000 | $ | 284,070 | $ | - | $ | 4,284,070 | ||||||||
| SBA Bonds | 4,481,515 | 262,584 | - | 4,744,099 | ||||||||||||
| Mortgage-Backed Securities | 10,148,865 | 522,072 | - | 10,670,937 | ||||||||||||
| Equity Securities | 155,000 | - | - | 155,000 | ||||||||||||
| $ | 18,785,380 | $ | 1,068,726 | $ | - | $ | 19,854,106 | |||||||||
| March 31, 2009 | ||||||||||||||||
Amortized Cost | Gross Unrealized Gains | Gross Unrealized Losses | Fair Value | |||||||||||||
| FHLB Securities | $ | 7,000,000 | $ | 371,260 | $ | 8,750 | $ | 7,362,510 | ||||||||
| Federal Farm Credit Securities | 1,000,000 | 19,060 | - | 1,019,060 | ||||||||||||
| SBA Bonds | 5,355,028 | 336,242 | - | 5,691,270 | ||||||||||||
| Mortgage-Backed Securities | 17,755,838 | 508,729 | - | 18,264,567 | ||||||||||||
| Equity Securities | 155,000 | - | - | 155,000 | ||||||||||||
| $ | 31,265,866 | $ | 1,235,291 | $ | 8,750 | $ | 32,492,407 | |||||||||
FHLB securities, FNMA and FHLMC mortgage-backed securities are issued by GSEs. GSEs are not backed by the full faith and credit of the United States government. SBA bonds are backed by the full faith and credit of the United States government. Included in the tables above and below in mortgage-backed securities are GNMA mortgage-backed securities, which are also backed by the full faith and credit of the United States government. At March 31, 2010, the Bank held an amortized cost and fair value of $5.6 million and $5.9 million, respectively in GNMA mortgage-backed securities included in mortgage-backed securities listed above. All mortgage-backed securities above are either GSEs or GNMA mortgage-backed securities. The balance does not include any private label mortgage-backed securities.
The amortized cost and fair value of investment and mortgage-backed securities held to maturity at March 31, 2010, by contractual maturity, are shown below. Expected maturities will differ from contractual maturities resulting from call features on certain investments.
| Amortized Cost | Fair Value | |||||||
| Less Than One Year | $ | 1,000,000 | $ | 1,018,130 | ||||
| One – Five Years | 4,176,146 | 4,495,353 | ||||||
| Over Five – Ten Years | - | - | ||||||
| More Than Ten Years | 3,460,369 | 3,669,686 | ||||||
| Mortgage-Backed Securities | 10,148,865 | 10,670,937 | ||||||
| $ | 18,785,380 | $ | 19,854,106 | |||||
At March 31, 2010 and 2009, the amortized cost and fair value of investment and mortgage-backed securities held to maturity pledged as collateral for certain deposit accounts, FHLB advances and other borrowings were $15.7 million and $16.6 million and $19.2 million and $19.9 million, respectively. The Company did not have any securities in an unrealized loss position at March 31, 2010. The Company had only one held to maturity security that was in an unrealized loss position at March 31, 2009. The fair value of this FHLB security was $991,250 and the unrealized loss was $8,750. The security had been in an unrealized loss position for less than 12 months. The Company’s held-to-maturity portfolio is recorded at amortized cost. The Company has the ability and intends to hold these securities to maturity. There were no sales of securities held to maturity during the years ended March 31, 2010, 2009 or 2008.
40
SECURITY FEDERAL CORPORATION AND SUBSIDIARIES
Notes To Consolidated Financial Statements
(4) Loans Receivable, Net
Loans receivable, net, at March 31 consisted of the following:
| 2010 | 2009 | |||||||
| Residential Real Estate Loans | $ | 118,256,972 | $ | 126,980,894 | ||||
| Consumer Loans | 68,526,203 | 69,025,082 | ||||||
| Commercial Business | 17,813,383 | 21,032,000 | ||||||
| Commercial Real Estate | 378,719,217 | 404,403,186 | ||||||
| Loans Held For Sale | 3,161,463 | 5,711,807 | ||||||
| 586,477,238 | 627,152,969 | |||||||
| Less: | ||||||||
| Allowance For Loan Losses | 12,307,394 | 10,181,599 | ||||||
| Loans In Process | 5,619,822 | 5,602,248 | ||||||
| Deferred Loan Fees | 151,187 | 279,249 | ||||||
| 18,078,403 | 16,063,096 | |||||||
| Total Loans Receivable, Net | $ | 568,398,835 | $ | 611,089,873 | ||||
Changes in the allowance for loan losses for the years ended March 31 are summarized as follows:
| 2010 | 2009 | 2008 | ||||||||||
| Balance At Beginning Of Year | $ | 10,181,599 | $ | 8,066,762 | $ | 7,296,791 | ||||||
| Provision For Loan Losses | 8,155,000 | 2,825,000 | 895,000 | |||||||||
| Charge Offs | (6,067,509 | ) | (745,275 | ) | (249,673 | ) | ||||||
| Recoveries | 38,304 | 35,112 | 124,644 | |||||||||
| Total Allowance For Loan Losses | $ | 12,307,394 | $ | 10,181,599 | $ | 8,066,762 | ||||||
The following table presents the loans individually evaluated and considered impaired at March 31. Impairment includes performing troubled debt restructurings.
| 2010 | 2009 | |||||||
| Total Loans Considered Impaired At Year End | $ | 35,298,754 | $ | 27,711,595 | ||||
| Impaired Loans For Which There Is A Related Specific Reserve For Loan Loss: | ||||||||
| Outstanding Loan Balance | $ | 10,885,245 | $ | 6,001,863 | ||||
| Related Specific Reserve | $ | 2,015,000 | $ | 1,854,120 | ||||
| Impaired Loans With No Related Specific Reserve | $ | 24,413,509 | $ | 21,709,732 | ||||
| Average Impaired Loans | $ | 33,633,408 | $ | 11,454,444 | ||||
| Amount Of Interest Earned During Period Of Impairment | $ | 1,063,179 | $ | 594,731 | ||||
Troubled debt restructurings included in impaired loans at March 31, 2010 and 2009 amounted to $336,000 and $652,324, respectively. Interest earned during fiscal 2010 and 2009 on these loans amounted to $105,677 and $34,031, respectively.
The following table sets forth the amount of the Company's non-accrual loans and the status of the related interest income at March 31:
| 2010 | 2009 | |||||||
| Non-Accrual Loans | $ | 31,225,950 | $ | 12,920,000 | ||||
Interest Income That Would Have Been Recognized Under Original Terms | $ | 665,000 | $ | 578,000 | ||||
Interest Recorded During The Year On Non- Accrual Loans | $ | 690,000 | $ | 240,000 | ||||
At March 31, 2010 and 2009, the Bank did not have any loans 90 days delinquent and still accruing interest.
41
SECURITY FEDERAL CORPORATION AND SUBSIDIARIES
Notes To Consolidated Financial Statements
(5) Premises and Equipment, Net
Premises and equipment, net, at March 31 are summarized as follows:
| 2010 | 2009 | |||||||
| Land | $ | 5,471,503 | $ | 5,471,503 | ||||
| Buildings And Improvements | 17,277,914 | 17,245,038 | ||||||
| Furniture And Equipment | 10,313,133 | 9,925,675 | ||||||
| Construction In Progress | 286,842 | 88,997 | ||||||
| 33,349,392 | 32,731,213 | |||||||
| Less Accumulated Depreciation | (12,628,908 | ) | (11,055,779 | ) | ||||
| Total Premises And Equipment, Net | $ | 20,720,484 | $ | 21,675,434 | ||||
Depreciation expense for the years ended March 31, 2010, 2009, and 2008 was $1.6 million, $1.5 million, and $1.1 million, respectively.
The Bank has entered into non-cancelable operating leases related to buildings and land. At March 31, 2010, future minimum payments under non-cancelable operating leases with initial or remaining terms of one year or more are as follows (by fiscal year):
| 2011 | $ | 433,613 | ||
| 2012 | 404,213 | |||
| 2013 | 404,451 | |||
| 2014 | 411,463 | |||
| 2015 | 411,463 | |||
| Thereafter | 1,888,356 | |||
| $ | 3,953,559 |
Total rental expense amounted to $434,000, $441,000, and $435,000 for the years ended March 31, 2010, 2009 and 2008, respectively. Four lease agreements with monthly expenses of $6,179, $800, $7,792, and $8,250 have multiple renewal options totaling 30, 10, 45, and 20 years, respectively.
(6) Intangible Assets and Goodwill
Intangible assets and goodwill are the result of the Collier Jennings acquisition in July 2006. Changes in intangible assets and goodwill for the years ended March 31 consisted of the following:
| 2010 | 2009 | |||||||
| Customer List | ||||||||
| Balance At Beginning Of Year | $ | 241,246 | $ | 291,246 | ||||
| Amortization | 50,000 | 50,000 | ||||||
Write Down Due To Sale of South Augusta Office Location | 13,000 | - | ||||||
| Balance At End Of Year | 178,246 | 241,246 | ||||||
| Employment Contracts | ||||||||
| Balance At Beginning Of Year | 111,254 | 151,254 | ||||||
| Amortization | 40,000 | 40,000 | ||||||
| Balance At End Of Year | 71,254 | 111,254 | ||||||
| Total Intangibles | 249,500 | 352,500 | ||||||
| Goodwill | 1,199,754 | 1,421,754 | ||||||
| Total | $ | 1,449,254 | $ | 1,774,254 | ||||
During the year ended March 31, 2010 the Company sold its South Augusta insurance office location. As part of this sale, goodwill was written down by $222,000.
42
SECURITY FEDERAL CORPORATION AND SUBSIDIARIES
Notes To Consolidated Financial Statements
(6) Intangible Assets and Goodwill, Continued
In accordance with accounting guidance, the Company evaluates its goodwill on an annual basis. The evaluations were performed as of September 30, 2009 and September 30, 2008 for fiscal years ended March 31, 2010 and March 31, 2009. At the time of the evaluations the Company determined that no impairment existed. Therefore, there was no amortization of goodwill for the years ended March 31, 2010 and 2009.
Amortization of the intangibles is scheduled to be as follows for each fiscal year as indicated:
| 2011 | $ | 90,000 | ||
| 2012 | 90,000 | |||
| 2013 | 69,500 | |||
| $ | 249,500 |
(7) FHLB Stock
Every federally insured savings institution is required to invest in FHLB stock. No readily available market exists for this stock and it has no quoted fair value. However, because redemption of this stock has historically been at par, it is carried at cost.
The Bank, as a member of the FHLB of Atlanta, is required to acquire and hold shares of capital stock in the FHLB of Atlanta in an amount equal to a membership component, which is 0.15% of total assets at December 31, 2009 and 2008 plus a transaction component which equals 4.5% of outstanding advances (borrowings) from the FHLB of Atlanta. The Bank is in compliance with this requirement with an investment in FHLB of Atlanta stock of $12.6 million and $12.7 million as of March 31, 2010 and 2009, respectively.
(8) Deposits
Deposits outstanding by type of account are summarized as follows:
| At March 31, 2010 | At March 31, 2009 | |||||||||||
| Amount | Weighted Rate | Interest Rate Range | Amount | Weighted Rate | Interest Rate Range | |||||||
| Checking Accounts | $ | 109,086,367 | 0.20% | 0.00-1.04% | $ | 104,662,377 | 0.21% | 0.00-1.24% | ||||
| Money Market Accts. | 173,904,664 | 1.28% | 0.00-1.39% | 150,513,010 | 1.88% | 0.00-2.03% | ||||||
Statement Savings Accounts | 18,991,543 | 0.39% | 0.00-0.50% | 17,187,295 | 0.54% | 0.45-0.55% | ||||||
| Total | 301,982,574 | 0.83% | 0.00-1.39% | 272,362,682 | 1.15% | 0.00-2.03% | ||||||
| Certificate Accounts: | ||||||||||||
| 0.00 – 1.99% | 118,796,507 | 21,143,194 | ||||||||||
| 2.00 – 2.99% | 255,352,355 | 112,373,285 | ||||||||||
| 3.00 – 3.99% | 4,571,860 | 76,088,180 | ||||||||||
| 4.00 – 4.99% | 8,818,487 | 173,467,216 | ||||||||||
| 5.00 – 5.99% | 4,730,654 | 6,279,018 | ||||||||||
| Total | 392,269,863 | 2.15% | 0.15-5.50% | 389,350,893 | 3.51% | 1.05-5.50% | ||||||
| Total Deposits | $ | 694,252,437 | 1.58% | 0.00-5.50% | $ | 661,713,575 | 2.54% | 0.00-5.50% | ||||
Included in the certificate accounts above at March 31, 2010 were $34.4 million in brokered deposits with a weighted average interest rate of 2.07%. Of these brokered deposits, $5.0 million mature within one year. There were $25.4 million in brokered deposits as of March 31, 2009 with a weighted average interest rate of 2.04%.
The aggregate amount of certificates of deposit with a minimum denomination of $100,000 was $195.9 million and $192.8 million at March 31, 2010 and 2009, respectively.
43
SECURITY FEDERAL CORPORATION AND SUBSIDIARIES
Notes To Consolidated Financial Statements
(8) Deposits, Continued
The amounts and scheduled maturities of all certificates of deposit at March 31 are as follows:
| March 31, | ||||||||
| 2010 | 2009 | |||||||
| Within 1 Year | $ | 309,313,273 | $ | 356,884,263 | ||||
| After 1 Year, Within 2 Years | 47,747,609 | 14,221,908 | ||||||
| After 2 Years, Within 3 Years | 18,670,608 | 10,248,417 | ||||||
| After 3 Years, Within 4 Years | 6,965,710 | 3,930,728 | ||||||
| After 4 Years, Within 5 Years | 9,572,663 | 4,065,577 | ||||||
| Thereafter | - | - | ||||||
| $ | 392,269,863 | $ | 389,350,893 | |||||
At March 31, 2010 and 2009, the Bank has $104,000 and $104,000, respectively in overdrafts that were reclassified to loans.
(9) Advances From Federal Home Loan Bank (FHLB) And Other Borrowings
Advances from the FHLB at March 31 are summarized by year of maturity and weighted average interest rate below:
| 2010 | 2009 | |||||||||||||||
| Year Ending March 31 | Amount | Weighted Rate | Amount | Weighted Rate | ||||||||||||
| 2010 | - | - | 91,080,000 | 0.94 | % | |||||||||||
| 2011 | 31,100,000 | 2.54 | % | 15,000,000 | 4.87 | % | ||||||||||
| 2012 | 34,700,000 | 3.66 | % | 24,700,000 | 4.56 | % | ||||||||||
| 2013 | 10,000,000 | 4.76 | % | 10,000,000 | 4.76 | % | ||||||||||
| 2014 | 20,000,000 | 3.84 | % | 20,000,000 | 3.84 | % | ||||||||||
| 2015 | 15,303,882 | 3.44 | % | 5,318,434 | 4.59 | % | ||||||||||
| Thereafter | 52,900,000 | 4.27 | % | 52,900,000 | 4.27 | % | ||||||||||
| $ | 164,003,882 | 3.71 | % | $ | 218,998,434 | 2.95 | % | |||||||||
These advances are secured by a blanket collateral agreement with the FHLB by pledging the Bank’s portfolio of residential first mortgage loans and investment securities with an amortized cost and fair value of $130.8 million and $136.0 million at March 31, 2010 and $176.8 million and $182.4 million at March 31, 2009, respectively. Advances are subject to prepayment penalties.
The following tables show callable FHLB advances as of the dates indicated. These advances are also included in the above table. All callable advances are callable at the option of the FHLB. If an advance is called, the Bank has the option to payoff the advance without penalty, re-borrow funds on different terms, or convert the advance to a three-month floating rate advance tied to LIBOR.
| As of March 31, 2010 | ||||||||||
| Borrow Date | Maturity Date | Amount | Int. Rate | Type | Call Dates | |||||
| 06/24/05 | 06/24/15 | 5,000,000 | 3.710% | 1 Time Call | 06/24/10 | |||||
| 11/23/05 | 11/23/15 | 5,000,000 | 3.933% | Multi-Call | 05/25/08 and quarterly thereafter | |||||
| 01/12/06 | 01/12/16 | 5,000,000 | 4.450% | 1 Time Call | 01/12/11 | |||||
| 06/02/06 | 06/02/16 | 5,000,000 | 5.160% | 1 Time Call | 06/02/11 | |||||
| 07/11/06 | 07/11/16 | 5,000,000 | 4.800% | Multi-Call | 07/11/08 and quarterly thereafter | |||||
| 11/29/06 | 11/29/16 | 5,000,000 | 4.025% | Multi-Call | 05/29/08 and quarterly thereafter | |||||
| 01/19/07 | 07/21/14 | 5,000,000 | 4.885% | 1 Time Call | 07/21/11 | |||||
| 03/09/07 | 03/09/12 | 4,700,000 | 4.286% | Multi-Call | 06/09/10 and quarterly thereafter | |||||
| 05/24/07 | 05/24/17 | 7,900,000 | 4.375% | Multi-Call | 05/27/08 and quarterly thereafter | |||||
| 07/25/07 | 07/25/17 | 5,000,000 | 4.396% | Multi-Call | 07/25/08 and quarterly thereafter | |||||
| 11/16/07 | 11/16/11 | 5,000,000 | 3.745% | Multi-Call | 11/17/08 and quarterly thereafter | |||||
| 08/28/08 | 08/28/13 | 5,000,000 | 3.113% | Multi-Call | 08/30/10 and quarterly thereafter | |||||
| 08/28/08 | 08/28/18 | 5,000,000 | 3.385% | 1 Time Call | 08/29/11 | |||||
44
SECURITY FEDERAL CORPORATION AND SUBSIDIARIES
Notes To Consolidated Financial Statements
(9) Advances From Federal Home Loan Bank (FHLB) And Other Borrowings, Continued
| As of March 31, 2009 | ||||||||||
| Borrow Date | Maturity Date | Amount | Int. Rate | Type | Call Dates | |||||
| 06/24/05 | 06/24/15 | 5,000,000 | 3.710% | 1 Time Call | 06/24/10 | |||||
| 11/10/05 | 11/10/15 | 5,000,000 | 4.400% | 1 Time Call | 11/10/09 | |||||
| 11/23/05 | 11/23/15 | 5,000,000 | 3.933% | Multi-Call | 05/25/08 and quarterly thereafter | |||||
| 11/29/05 | 11/29/13 | 5,000,000 | 4.320% | 1 Time Call | 05/29/09 | |||||
| 12/14/05 | 12/14/11 | 5,000,000 | 4.640% | 1 Time Call | 09/14/09 | |||||
| 01/12/06 | 01/12/16 | 5,000,000 | 4.450% | 1 Time Call | 01/12/11 | |||||
| 03/01/06 | 03/03/14 | 5,000,000 | 4.720% | 1 Time Call | 03/03/10 | |||||
| 06/02/06 | 06/02/16 | 5,000,000 | 5.160% | 1 Time Call | 06/02/11 | |||||
| 07/11/06 | 07/11/16 | 5,000,000 | 4.800% | Multi-Call | 07/11/08 and quarterly thereafter | |||||
| 11/29/06 | 11/29/16 | 5,000,000 | 4.025% | Multi-Call | 05/29/08 and quarterly thereafter | |||||
| 01/19/07 | 07/21/14 | 5,000,000 | 4.885% | 1 Time Call | 07/21/11 | |||||
| 03/09/07 | 03/09/12 | 4,700,000 | 4.286% | Multi-Call | 06/09/08 and quarterly thereafter | |||||
| 05/24/07 | 05/24/17 | 7,900,000 | 4.375% | Multi-Call | 05/27/08 and quarterly thereafter | |||||
| 06/29/07 | 06/29/12 | 5,000,000 | 4.945% | 1 Time Call | 06/29/09 | |||||
| 07/25/07 | 07/25/17 | 5,000,000 | 4.396% | Multi-Call | 07/25/08 and quarterly thereafter | |||||
| 11/16/07 | 11/16/11 | 5,000,000 | 3.745% | Multi-Call | 11/17/08 and quarterly thereafter | |||||
| 08/28/08 | 08/28/13 | 5,000,000 | 3.113% | Multi-Call | 08/30/10 and quarterly thereafter | |||||
| 08/28/08 | 08/28/18 | 5,000,000 | 3.385% | 1 Time Call | 08/29/11 | |||||
At March 31, 2010 and 2009, the Bank had $124.1 million and $54.0 million in additional borrowing capacity, respectively at the FHLB.
The Bank had $12.1 million and $26.1 million in other borrowings (non-FHLB advances) at March 31, 2010 and 2009, respectively. At March 31, 2010 these borrowings consist of short-term repurchase agreements with certain commercial demand deposit customers for sweep accounts. At March 31, 2009, this balance also included, short-term funds obtained though the Federal Reserve’s Term Auction Facility (“TAF”) program and the current balance on a revolving line of credit with another financial institution.
At March 31, 2010 and 2009, short-term repurchase agreements were $12.1 million and $11.3 million, respectively. The repurchase agreements typically mature within one to three days and the interest rate paid on these borrowings floats monthly with money market type rates. At March 31, 2010 and 2009 the interest rate paid on the repurchase agreements was 0.80% and 1.24%, respectively. The maximum amount outstanding at any one month end during the year ended March 31, 2010 was $12.5 million compared to $11.6 million in 2009. The Bank had pledged as collateral for these repurchase agreements investment and mortgage-backed securities with amortized costs and fair values of $20.6 million and $21.3 million at March 31, 2010 and $25.5 million and $26.0 million at March 31, 2009, respectively.
During the year ended March 31, 2010 and 2009, the Company participated in the Federal Reserve’s TAF program, an auction program designed to provide liquidity for qualifying depository institutions. Under the program, institutions place a bid for an advance from their local Federal Reserve Bank at an interest rate that is determined as the result of the auction. Borrowings under the program typically have a 28-day or 84-day maturity. At March 31, 2010, the Company had paid off all advances obtained under the program as the program had been terminated.
At March 31, 2009, the Company had two advances obtained through the TAF program totaling $10.0 million. The interest rate was 0.25% on both advances. Of the $10.0 million, $5.0 million has a 28-day term and matured on April 9, 2009 and $5.0 million has an 84-day term and matured on June 18, 2009. The Bank had pledged as collateral for these borrowings investment and mortgage-backed securities with amortized costs and fair values of $17.8 million and $17.9 million at March 31, 2009.
At March 31, 2009, the balance on the revolving line of credit was $4.8 million. The unsecured line of credit had an interest rate equal to one month LIBOR plus 2.0%. The line of credit matured on April 1, 2009.
45
SECURITY FEDERAL CORPORATION AND SUBSIDIARIES
Notes To Consolidated Financial Statements
(10) Junior Subordinated Debentures
On September 21, 2006, Security Federal Statutory Trust (the “Trust”), a wholly-owned subsidiary of the Company, issued and sold fixed and floating rate capital securities of the Trust (the “Capital Securities”), which are reported on the consolidated balance sheet as junior subordinated debentures, generating proceeds of $5.2 million. The Trust loaned these proceeds to the Company to use for general corporate purposes, primarily to provide capital to the Bank.
The Capital Securities accrue and pay distributions annually at a rate per annum equal to a blended rate of 4.42% at March 31, 2010. One-half of the Capital Securities issued in the transaction has a fixed rate of 6.88% and the remaining half has a floating rate of three-month LIBOR plus 170 basis points, which was 1.96% at March 31, 2010. The distribution rate payable on the Capital Securities is cumulative and payable quarterly in arrears. The Company has the right, subject to events of default, to defer payments of interest on the Capital Securities for a period not to exceed 20 consecutive quarterly periods, provided that no extension period may extend beyond the maturity date of December 15, 2036. The Company has no current intention to exercise its right to defer payments of interest on the Capital Securities.
The Capital Securities mature or are mandatorily redeemable upon maturity on December 15, 2036, and or upon earlier optional redemption as provided in the indenture. The Company has the right to redeem the Capital Securities in whole or in part, on or after September 15, 2011. The Company may also redeem the capital securities prior to such dates upon occurrence of specified conditions and the payment of a redemption premium.
(11) Mandatorily Redeemable Financial Instrument
On June 30, 2006, the Company recorded a $1.4 million mandatorily redeemable financial instrument as a result of the acquisition of the Collier-Jennings Companies. The shareholder of Collier-Jennings Companies received cash and was issued stock in the Company to settle the acquisition. The shares were released to the shareholder of Collier-Jennings Companies over a three-year period. The stock is mandatorily redeemable at the option of the shareholder of Collier-Jennings Companies in cumulative increments of 20% per year for a five-year period at the greater of $26 per share or one and one-half times the book value per common share of the Company’s stock which equated to $30.33 at March 31, 2010. As of March 31, 2010 the shareholder had not elected to redeem any of the shares.
The mandatorily redeemable financial instrument is carried at fair value. At March 31, 2010 and 2009, the fair value was $1.7 million and $1.6 million, respectively based on the Company’s book value per common share. The Company recorded a valuation expense of $63,000 and $183,000 during the years ended March 31, 2010 and 2009, respectively to properly reflect the fair value of the instrument.
| (12) | Senior Convertible Debentures |
Effective December 1, 2009, the Company issued $6.1 million in convertible senior debentures. The debentures will mature on December 1, 2029 and accrue interest at the rate of 8.0% per annum until maturity or earlier redemption or repayment. Interest on the debentures is payable on June 1 and December 1 of each year, commencing June 1, 2010. The debentures are convertible into the Company’s common stock at a conversion price of $20 per share at the option of the holder at any time prior to maturity.
The debentures are redeemable, in whole or in part, at the option of the Company at any time on or after December 1, 2019, at a price equal to 100% of the principal amount of the debentures to be purchased plus any accrued and unpaid interest to, but excluding, the date of redemption. The debentures will be unsecured general obligations of the Company ranking equal in right of payment to all of our present and future unsecured indebtedness that is not expressly subordinated.
46
SECURITY FEDERAL CORPORATION AND SUBSIDIARIES
Notes To Consolidated Financial Statements
(13) Income Taxes
Income tax expense is comprised of the following:
| For the Years Ended March 31, | ||||||||||||
| 2010 | 2009 | 2008 | ||||||||||
| Current: | ||||||||||||
| Federal | $ | 1,879,069 | $ | 1,613,555 | $ | 2,293,975 | ||||||
| State | 320,729 | 359,275 | 143,413 | |||||||||
| Total Current Tax Expense | 2,199,798 | 1,972,830 | 2,437,388 | |||||||||
| Deferred: | ||||||||||||
| Federal | (1,030,802 | ) | (589,881 | ) | (320,901 | ) | ||||||
| State | (108,791 | ) | (118,532 | ) | (36,742 | ) | ||||||
| Total Deferred Tax Expense | (1,139,593 | ) | (708,413 | ) | (357,643 | ) | ||||||
| Total Income Tax Expense | $ | 1,060,205 | $ | 1,264,417 | $ | 2,079,745 | ||||||
The Company's income taxes differ from those computed at the statutory federal income tax rate, as follows:
| For the Years Ended March 31, | ||||||||||||
| 2010 | 2009 | 2008 | ||||||||||
| Tax At Statutory Income Tax Rate | $ | 906,102 | $ | 1,264,049 | $ | 2,162,177 | ||||||
| State Tax And Other | 154,103 | 368 | (82,432 | ) | ||||||||
| Total Income Tax Expense | $ | 1,060,205 | $ | 1,264,417 | $ | 2,079,745 | ||||||
The tax effects of temporary differences that give rise to significant portions of the deferred tax assets and deferred tax liabilities are presented below.
| At March 31, | ||||||||
| 2010 | 2009 | |||||||
| Deferred Tax Assets: | ||||||||
| Provision For Loan Losses | $ | 4,671,808 | $ | 3,864,829 | ||||
| Other Real Estate Owned | 189,979 | - | ||||||
| Net Fees Deferred For Financial Reporting | 154,841 | 160,919 | ||||||
| Non-accrual Interest | 342,434 | 309,584 | ||||||
| Other | 490,253 | 397,952 | ||||||
| Total Gross Deferred Tax Assets | 5,849,315 | 4,733,284 | ||||||
| Deferred Tax Liabilities: | ||||||||
| FHLB Stock Basis Over Tax Basis | 126,565 | 126,565 | ||||||
| Depreciation | 588,685 | 617,694 | ||||||
| Other | 132,966 | 89,100 | ||||||
| Intangibles | 93,063 | 131,482 | ||||||
| Unrealized Gain on Securities Available for Sale | 2,831,963 | 2,357,599 | ||||||
| Total Gross Deferred Tax Liability | 3,773,242 | 3,322,440 | ||||||
| Net Deferred Tax Asset | $ | 2,076,073 | $ | 1,410,844 | ||||
No valuation allowance for deferred tax assets was required at March 31, 2010 and 2009. The realization of net deferred tax assets may be based on utilization of carrybacks to prior taxable periods, anticipation of future taxable income in certain periods, and the utilization of tax planning strategies. Management has determined that the net deferred tax asset can be supported based upon these criteria.
(14) Regulatory Matters
The Bank is subject to various regulatory capital requirements that are administered by federal banking agencies. Failure to meet minimum capital requirements can initiate certain mandatory and discretionary actions by regulators that could have a material adverse effect on the Company. Under capital adequacy guidelines and the regulatory framework for prompt corrective action, the Bank must meet specific capital guidelines that involve quantitative measures of the Bank’s assets, liabilities, and certain off-balance sheet items as calculated under regulatory accounting practices.
47
SECURITY FEDERAL CORPORATION AND SUBSIDIARIES
Notes To Consolidated Financial Statements
(14) Regulatory Matters, Continued
The Bank’s capital amounts and classifications are also subject to qualitative judgments by regulators with regard to components, risk weightings, and other factors.
As of March 31, 2010 and 2009, the Bank was categorized as “well capitalized” under the regulatory framework for prompt corrective action. To be categorized as well capitalized, the Bank had to maintain total risk-based capital, Tier 1 risk-based capital, and Tier 1 leverage ratios at 10%, 6%, and 5%, respectively. There are no conditions or events that management believes have changed the Bank’s classification.
The Bank’s regulatory capital amounts and ratios are as follows as of the dates indicated:
Actual | For Capital Adequacy | To Be Well Capitalized Under Prompt Corrective Action Provisions | |||||||||||
| Amount | Ratio | Amount | Ratio | Amount | Ratio | ||||||||
| (Dollars in Thousands) | |||||||||||||
| March 31, 2010 | |||||||||||||
Tier 1 Risk-Based Core Capital (To Risk Weighted Assets) | $ | 70,280 | 12.1% | $ | 23,274 | 4.0% | $ | 34,911 | 6.0% | ||||
Total Risk-Based Capital (To Risk Weighted Assets) | 77,576 | 13.3% | 46,548 | 8.0% | 58,185 | 10.0% | |||||||
Tier 1 Leverage (Core) Capital (To Adjusted Tangible Assets) | 70,280 | 7.4% | 37,987 | 4.0% | 47,484 | 5.0% | |||||||
Tangible Capital (To Tangible Assets) | 70,280 | 7.4% | 18,993 | 2.0% | 47,484 | 5.0% | |||||||
| March 31, 2009 | |||||||||||||
Tier 1 Risk-Based Core Capital (To Risk Weighted Assets) | $ | 67,950 | 10.9% | $ | 24,864 | 4.0% | $ | 37,296 | 6.0% | ||||
Total Risk-Based Capital (To Risk Weighted Assets) | 75,720 | 12.2% | 49,728 | 8.0% | 62,159 | 10.0% | |||||||
Tier 1 Leverage (Core) Capital (To Adjusted Tangible Assets) | 67,950 | 7.0% | 39,060 | 4.0% | 48,825 | 5.0% | |||||||
Tangible Capital (To Tangible Assets) | 67,950 | 7.0% | 19,530 | 2.0% | 48,825 | 5.0% | |||||||
The payment of dividends by the Company depends primarily on the ability of the Bank to pay dividends to the Company. The payment of dividends by the Bank to the Company is subject to substantial restrictions and would require prior notice to the Office of Thrift Supervision (“OTS”).
(15) Employee Benefit Plans
The Company is participating in a multiple employer defined contribution employee benefit plan covering substantially all employees with six months or more of service. The Company matches a portion of the employees’ contributions and the plan has a discretionary profit sharing provision. The total employer contributions were $217,000, $198,000, and $191,000 for the years ended March 31, 2010, 2009, and 2008, respectively.
The Company has an Employee Stock Purchase Plan (“ESPP”). The ESPP allows employees of the Company to purchase stock quarterly through a payroll deduction at a discount calculated as 15% of the market value with a floor equal to the Company’s book value. The ESPP, which was approved by stockholders in July 2005, became effective in January 2007. Participation is voluntary. Employees are limited to investing $25,000 or 5% of their annual salary, whichever is lower, during the year. During the year ended March 31, 2010, one employee participated in the ESPP.
Certain officers of the Company participate in a supplemental retirement plan. These benefits are not qualified under the Internal Revenue Code and they are not funded. During the years ended March 31, 2010, 2009 and 2008, the Company incurred expenses of $304,000, $287,000 and $224,000, respectively, for this plan.
48
SECURITY FEDERAL CORPORATION AND SUBSIDIARIES
Notes To Consolidated Financial Statements
(15) Employee Benefit Plans, Continued
Certain officers and directors of the Company participate in incentive and non-qualified stock option plans. Prior to the current year, the Company had three stock option plans that together authorized the Company to grant 150,000 options. In 2008, the 2008 Equity Incentive Plan was approved by stockholders and implemented by the Company with the intention of replacing the previous three option plans. No additional options are to be granted under the old plans and forfeitures under the old plans are not added to the new plan as available options, however all existing options outstanding under these plans remain in effect. The 2008 Equity Incentive Plan provides for the grant of non-qualified and incentive stock options, stock appreciation rights (“SARS”), and restricted stock awards. Under the 2008 Stock Option Plan, 50,000 shares are reserved for the issuance of stock options and stock appreciation rights in addition to 50,000 shares subject to restricted stock awards. The plan is administered by a Committee appointed by the Board of Directors. The Committee determines the specific employees, amount and type of any awards granted. At March 31, 2010 and 2009, there were 50,000 shares available for issuance under this plan.
Options under all plans are granted at exercise prices not less than the fair value of the Company’s common stock on the date of the grant. The following is a summary of the activity under the Company’s incentive and non-qualified stock option plans for the years ended March 31, 2010, 2009, and 2008:
2010 | 2009 | 2008 | ||||||
Shares | Weighted Avg. Exercise Price | Shares | Weighted Avg. Exercise Price | Shares | Weighted Avg. Exercise Price | |||
| Balance, Beginning of Year | 100,500 | $22.01 | 111,100 | $21.55 | 99,600 | $20.55 | ||
| Options Granted | - | - | 4,500 | 22.91 | 23,000 | 23.68 | ||
| Options Exercised | - | - | 6,000 | 16.67 | 6,300 | 16.67 | ||
| Options Forfeited | 9,600 | 16.67 | 9,100 | 20.32 | 5,200 | 17.40 | ||
| Balance, March 31 | 90,900 | $22.57 | 100,500 | $22.01 | 111,100 | $21.55 | ||
Total Intrinsic Value Of Options Exercised During The Year | - | $21,030 | $45,550 | |||||
Weighted-Average Fair Value Of Options Granted During The Year | - | $5.54 | $6.77 | |||||
| Options Exercisable | 50,400 | $21.93 | 60,000 | $21.09 | 74,100 | $20.60 | ||
Weighted- Average Remaining Life Of Exercisable Options | 4.4 years | 4.6 years | 5.1 years | |||||
| Options Available For Grant | 50,000 | 50,000 | 127,267 | |||||
No additional stock options vested during the years ended March 31, 2010, 2009, and 2008. The aggregate intrinsic value of the stock options outstanding and exercisable at March 31, 2010, 2009 and 2008 amounted to $0, $0 and $198,000, respectively. Total compensation expense related to stock options was $33,000 $33,000 and $21,000 for the periods ended March 31, 2010, 2009 and 2008, respectively. As of March 31, 2010, there was $211,000 of total unrecognized compensation cost related to non-vested stock options. The cost is expected to be recognized over a weighted average period of five years.
The following table summarizes the stock-based awards granted by the Company, the fair market value of each award granted as estimated on the date of grant using the Black-Scholes option-pricing model, and the weighted average assumptions used for such grants for the periods indicated:
For Awards Granted During The Year Ended March 31, | |||||||
| 2010 | 2009 | 2008 | |||||
| Awards Granted | - | 4,500 | 23,000 | ||||
| Dividend Yield | - | 1.77% | 1.28% | ||||
Weighted Average Expected Volatility | - | 17.89% | 20.42% | ||||
| Risk-free Interest Rate | - | 3.77% | 3.95% | ||||
| Expected Life | - | 9.00 | 8.50-9.00 | ||||
49
SECURITY FEDERAL CORPORATION AND SUBSIDIARIES
Notes To Consolidated Financial Statements
(15) Employee Benefit Plans, Continued
At March 31, 2010, the Company had the following options outstanding:
Grant Date | Outstanding Options | Option Price | Expiration Date | |||
| 09/01/03 | 2,400 | $24.00 | 08/31/13 | |||
| 12/01/03 | 3,000 | $23.65 | 11/30/13 | |||
| 01/01/04 | 5,500 | $24.22 | 12/31/13 | |||
| 03/08/04 | 13,000 | $21.43 | 03/08/14 | |||
| 06/07/04 | 2,000 | $24.00 | 06/07/14 | |||
| 01/01/05 | 20,500 | $20.55 | 12/31/14 | |||
| 01/01/06 | 4,000 | $23.91 | 01/01/16 | |||
| 08/24/06 | 14,000 | $23.03 | 08/24/16 | |||
| 05/24/07 | 2,000 | $24.34 | 05/24/17 | |||
| 07/09/07 | 1,000 | $24.61 | 07/09/17 | |||
| 10/01/07 | 2,000 | $24.28 | 10/01/17 | |||
| 01/01/08 | 17,000 | $23.49 | 01/01/18 | |||
| 05/19/08 | 2,500 | $22.91 | 05/19/18 | |||
| 07/01/08 | 2,000 | $22.91 | 07/01/18 |
All options granted prior to March 31, 2006 are 100% vested. Options granted after March 31, 2006 generally vest 20% per year every year beginning in the 6th year after the grant date. Those options granted after March 31, 2006 may be exercised as they vest in years six through ten, or until the end of year ten after the grant date.
(16) Bank Owned Life Insurance
The cash value of the life insurance policies are recorded as a separate line item in the accompanying balance sheets at $10.0 million, $9.6 million and $8.3 million at March 31, 2010, 2009 and 2008, respectively. The insurance provides key person life insurance on certain officers of the Company. The earnings-portion of the insurance policies grows tax deferred and helps offset the cost of the Company’s benefits programs. The Company recorded earnings of $360,000, $358,000 and $327,000 for the growth in the cash value of life insurance during the years ended March 31, 2010, 2009 and 2008, respectively.
(17) Commitments and Contingencies
In the ordinary course of business, the Company has various outstanding commitments and contingent liabilities that are not reflected in the accompanying consolidated financial statements. In addition, the Company is a defendant in certain claims and legal actions arising in the ordinary course of business. In the opinion of management, after consultation with legal counsel, the ultimate disposition of these matters is not expected to have a material adverse effect on the consolidated financial condition of the Company.
50
SECURITY FEDERAL CORPORATION AND SUBSIDIARIES
Notes To Consolidated Financial Statements
(17) Commitments and Contingencies, Continued
In conjunction with its lending activities, the Bank enters into various commitments to extend credit and issue letters of credit. Loan commitments (unfunded loans and unused lines of credit) and letters of credit are issued to accommodate the financing needs of the Bank's customers. Loan commitments are agreements by the Bank to lend at a future date, so long as there are no violations of any conditions established in the agreement. Letters of credit commit the Bank to make payments on behalf of customers when certain specified events occur.
Financial instruments where the contract amount represents the Bank's credit risk include commitments under pre-approved but unused lines of credit of $45.1 million and $64.1 million, undisbursed loans in process of $5.6 million and $5.6 million, and letters of credit of $649,000 and $1.0 million at March 31, 2010 and 2009, respectively. At March 31, 2010 and 2009, the fair value of standby letters of credit was immaterial.
These loan and letter of credit commitments are subject to the same credit policies and reviews as loans on the balance sheet. Collateral, both the amount and nature, is obtained based upon management's assessment of the credit risk. Since many of the extensions of credit are expected to expire without being drawn, the total commitment amounts do not necessarily represent future cash requirements. In addition to these loan commitments noted above, the Bank had unused credit card loan commitments of $4.6 million and $5.9 million at March 31, 2010 and 2009, respectively. Outstanding commitments on mortgage loans not yet closed amounted to $494,000 and $26,000 at March 31, 2010 and 2009, respectively. These commitments, which are funded subject to certain limitations, extend over varying periods of time with the majority being funded within 45 days. At March 31, 2010 and 2009, the Bank had outstanding commitments to sell approximately $3.2 million and $5.7 million of loans, respectively, which encompassed the Bank’s held for sale loans. The Bank also has commitments to sell mortgage loans not yet closed, on a best efforts basis. Best efforts means the Bank suffers no penalty if they are unable to deliver the loans to the potential buyers. The fair value of the Bank’s commitment to originate mortgage loans at committed interest rates and to sell such loans to permanent investors is insignificant.
(18) Related Party Transactions
Certain directors, executive officers and companies with which they are affiliated are customers of and have banking transactions with the Bank in the ordinary course of business. These loans were made on substantially the same terms, including interest rates and collateral, as those prevailing at the time for comparable arms-length transactions.
A summary of loan transactions with directors, including their affiliates, and executive officers follows:
| For the years ended March 31, | ||||||||||||
| 2010 | 2009 | 2008 | ||||||||||
| Balance, Beginning of Year | $ | 1,274,769 | $ | 1,172,101 | $ | 652,101 | ||||||
| New Loans | 65,933 | 161,819 | 1,059,347 | |||||||||
| Less Loan Payments | 880,587 | 59,151 | 539,347 | |||||||||
| Balance, End of Year | $ | 460,115 | $ | 1,274,769 | $ | 1,172,101 | ||||||
Loans to all employees, officers, and directors of the Company, in the aggregate constituted approximately 8.2% and 10.8% of the Company’s total shareholders' equity at March 31, 2010 and 2009, respectively. At March 31, 2010 and 2009, deposits from executive officers and directors of the Bank and Company and their related interests in the aggregate approximated $4.7 million and $6.9 million, respectively.
The Company leased office space from two related parties during the year. The first lease is with a company in which a director and an officer of the Company and the Bank have an ownership interest. The Company incurred expenses of $73,000, $74,000, and $70,000 for rent for the years ended March 31, 2010, 2009, and 2008, respectively related to this lease. The Company also leases office space from another officer. On this lease, the Company incurred rent expense of $41,400 per year during each of the years ended March 31, 2010, 2009 and 2008, respectively. Management is of the opinion that the transactions with respect to office rent are made on terms that are comparable to those which would be made with unaffiliated persons.
51
SECURITY FEDERAL CORPORATION AND SUBSIDIARIES
Notes To Consolidated Financial Statements
(19) Preferred Stock Issuance
On December 19, 2008, as part of the Troubled Asset Relief Capital Purchase Program (“CPP”) of the United States Department of the Treasury (“Treasury”), the Company sold to Treasury 18,000 shares of Cumulative Perpetual Preferred Stock, Series A and a warrant to purchase 137,966 shares of the Company’s common stock, par value $0.01 per share, for an aggregate purchase price of $18.0 million in cash. In accordance with GAAP, the value of the preferred stock was discounted upon issuance by the amount allocated to the warrants to reflect that the warrants were granted in exchange for the below market rate on the preferred stock. The allocation of the proceeds between the preferred stock and warrants was determined based on the relative individual fair value of the warrants compared to the relative individual fair value of the preferred stock.
The fair value of the warrants was determined using a Black-Scholes model. Key assumptions were: stock price volatility of 21.70%, a dividend yield of 3.35%, and an expected life of eight years. The fair value of the preferred shares was determined based on a discounted cash flow model using an estimated life of five years and a discount rate of 12%. Based on the resulting fair values, the preferred stock represented 97.8% of the total fair value and the warrants represented 2.2% of the total fair value. As a result, $17.6 million was allocated to preferred stock and $400,000 was allocated to the warrants.
The resulting discount on the preferred shares is being accreted through retained earnings over the five year estimated life using the effective interest method, with a corresponding increase to the carrying value of the preferred stock. For the year ended March 31, 2010, accretion of the preferred stock discount totaled $73,000 and was treated as a deemed, non-cash dividend to preferred stockholders in the computation of earnings per share.
The preferred stock requires cumulative dividends at a rate of 5% per annum for the first five years, and 9% per annum thereafter. The Company, subject to the prior regulatory approval, may redeem the Series A preferred stock at any time at its option, in whole or in part, at a redemption price of 100% of the liquidation preference amount plus any accrued and unpaid dividends. The warrant has a 10-year term and is currently exercisable with an exercise price equal to $19.57 per share of common stock. This price was based on the trailing 20-day average common stock price as of the date of Treasury approval.
The Treasury has agreed not to exercise voting power with respect to any shares of common stock issued upon exercise of the warrant that it holds.
In conjunction with participation in the CPP, the Company is subject to certain limitations. The agreement subjects the Company to certain executive compensation limitations included in the Emergency Economic Stabilization Act of 2008 and restricts the Company from increasing dividends from the last quarterly cash dividend per share ($0.08) declared on its common stock prior to December 19, 2008. These restrictions will terminate on the earlier of December 19, 2011 or the date on which the preferred stock is redeemed in whole or transferred fully by the Treasury to a third party.
(20) Stock Warrants
In conjunction with the participation in the CPP, the Company sold warrants to the U.S. Treasury to purchase 137,966 shares of the Company’s common stock. These warrants have a 10-year term and were immediately exercisable upon issuance. A summary of the status of the Company’s stock warrants and changes during the year is presented below:
| March 31, 2010 | March, 31, 2009 | |||||||||||||||
Shares | Weighted- Average Exercise Price | Shares | Weighted- Average Exercise Price | |||||||||||||
| Balance, Beginning of Year | 137,966 | $ | 19.57 | - | $ | - | ||||||||||
| Granted | - | - | 137,966 | 19.57 | ||||||||||||
| Exercised | - | - | - | - | ||||||||||||
| Forfeited | - | - | - | - | ||||||||||||
| Balance, End of Year | 137,966 | $ | 19.57 | 137,966 | $ | 19.57 | ||||||||||
There were no stock warrants outstanding at March 31, 2008.
52
SECURITY FEDERAL CORPORATION AND SUBSIDIARIES
Notes To Consolidated Financial Statements
(21) Security Federal Corporation Condensed Financial Statements (Parent Company Only)
The following is condensed financial information of Security Federal Corporation (Parent Company only). The primary asset is its investment in the Bank subsidiary and the principal source of income for the Company is equity in undistributed earnings from the Bank.
Condensed Balance Sheet Data
| At March 31, | ||||||||
| 2010 | 2009 | |||||||
| Assets: | ||||||||
| Cash | $ | 4,312,637 | $ | 4,649,464 | ||||
| Investment Securities, Available For Sale | 72,150 | 37,500 | ||||||
| Investment in Security Federal Statutory Trust | 155,000 | 155,000 | ||||||
| Property and Equipment, Net | 1,665 | 3,482 | ||||||
| Investment In Security Federal Bank | 76,357,173 | 73,577,137 | ||||||
| Accounts Receivable And Other Assets | 37,409 | 242,306 | ||||||
| Total Assets | $ | 80,936,034 | $ | 78,664,889 | ||||
| Liability And Shareholders’ Equity: | ||||||||
| Accounts Payable And Other Liabilities | $ | 173,103 | $ | 29,949 | ||||
| Other Borrowings | - | 4,787,330 | ||||||
| Junior Subordinated Debentures | 5,155,000 | 5,155,000 | ||||||
| Senior Convertible Debentures | 6,084,000 | - | ||||||
| Mandatorily Redeemable Financial Instrument | 1,663,312 | 1,600,312 | ||||||
| Shareholders’ Equity | 67,860,619 | 67,092,298 | ||||||
| Total Liabilities And Shareholders’ Equity | $ | 80,936,034 | $ | 78,664,889 | ||||
Condensed Statements of Income Data
| For the Years Ended March 31, | ||||||||||||
| 2010 | 2009 | 2008 | ||||||||||
| Income: | ||||||||||||
| Equity In Earnings Of Security Federal Bank | $ | 2,004,759 | $ | 2,852,426 | $ | 4,554,124 | ||||||
| Interest Income | 10,163 | 8,734 | 10,897 | |||||||||
| Miscellaneous Income | 7,199 | 158 | 175 | |||||||||
| Total Income | 2,022,121 | 2,861,318 | 4,565,196 | |||||||||
| Expenses: | ||||||||||||
| Interest Expense | 474,133 | 440,409 | 431,839 | |||||||||
Mandatorily Redeemable Financial Instrument Valuation Expense | 63,000 | 183,000 | - | |||||||||
| Other Expenses | 38,982 | 29,119 | 22,013 | |||||||||
| Total Expenses | 576,115 | 652,528 | 453,852 | |||||||||
| Income Before Income Taxes | 1,446,006 | 2,208,790 | 4,111,344 | |||||||||
| Income Tax Benefit | (158,795 | ) | (244,583 | ) | (168,255 | ) | ||||||
| Net Income | 1,604,801 | 2,453,373 | 4,279,599 | |||||||||
| Preferred Stock Dividends | 900,000 | 252,500 | - | |||||||||
| Accretion of Preferred Stock to Redemption Value | 72,544 | 20,065 | - | |||||||||
| Net Income Available to Common Shareholders | $ | 632,257 | $ | 2,180,808 | $ | 4,279,599 | ||||||
53
SECURITY FEDERAL CORPORATION AND SUBSIDIARIES
Notes To Consolidated Financial Statements
(21) Security Federal Corporation Condensed Financial Statements (Parent Company Only), Continued
Condensed Statements of Cash Flow Data
| For the Years Ended March 31, | ||||||
| 2010 | 2009 | 2008 | ||||
| Operating Activities: | ||||||
| Net Income | $ | 1,604,801 | $ | 2,453,373 | $ | 4,279,599 |
Adjustments To Reconcile Net Income To Net Cash Provided By (Used In) Operating Activities: | ||||||
| Equity In Earnings Of Security Federal Bank | (2,004,759) | (2,852,426) | (4,554,124) | |||
| Stock Compensation Expense | 33,124 | 32,691 | 20,518 | |||
| Mandatorily Redeemable Financial Instrument Valuation Expense | 63,000 | 183,000 | - | |||
| (Increase) Decrease In Accounts Receivable And Other Assets | 194,933 | (142,780) | 918 | |||
| Increase (Decrease) In Accounts Payable | 143,154 | (16,931) | 24,914 | |||
| Net Cash Provided By (Used In) Operating Activities | 34,253 | (343,073) | (228,175) | |||
| Investing Activities: | ||||||
| Additional Investment in Security Federal Bank | - | (13,000,000) | (2,000,000) | |||
| Net Cash Used In Investing Activities | - | (13,000,000) | (2,000,000) | |||
| Financing Activities: | ||||||
| Exercise Of Stock Options | - | 100,020 | 105,021 | |||
| Employee Stock Purchase Plan Purchases | 19,800 | 94,553 | 96,629 | |||
| Purchase Of Treasury Stock, At Cost | - | (1,561,266) | (2,118,226) | |||
| Proceeds From Issuance Of Senior Convertible Debentures | 6,084,000 | - | - | |||
| Proceeds From The Issuance Of Preferred Stock | - | 18,000,000 | - | |||
| Proceeds From (Repayments) Line of Credit | (4,787,330) | 1,787,330 | 3,000,000 | |||
| Dividends Paid To Shareholders- Preferred Stock | (900,000) | (140,000) | - | |||
| Dividends Paid To Shareholders- Common Stock | (787,550) | (797,883) | (723,189) | |||
| Net Cash Provided By (Used In) Financing Activities | (371,080) | 17,482,754 | 360,235 | |||
| Net Increase (Decrease) In Cash | (336,827) | 4,139,681 | (1,867,940) | |||
| Cash At Beginning Of Year | 4,649,464 | 509,783 | 2,377,723 | |||
| Cash At End Of Year | $ | 4,312,637 | $ | 4,649,464 | $ | 509,783 |
54
SECURITY FEDERAL CORPORATION AND SUBSIDIARIES
Notes To Consolidated Financial Statements
(22) Carrying Amounts and Fair Value of Financial Instruments
Effective April 1, 2008, the Company adopted accounting guidance which defines fair value, establishes a framework for measuring fair value and expands disclosures about fair value under generally accepted accounting principles. Topic 820 applies to reported balances that are required or permitted to be measured at fair value under existing accounting pronouncements; accordingly, the standard does not require any new fair value measurements of reported balances.
Accounting guidance emphasizes that fair value is a market-based measurement, not an entity-specific measurement. Therefore, a fair value measurement should be determined based on the assumptions that market participants would use in pricing the asset or liability. As a basis for considering market participant assumptions in fair value measurements, ASC 820 establishes a fair value hierarchy that distinguishes between market participant assumptions based on market data obtained from sources independent of the reporting entity (observable inputs that are classified within Levels 1 and 2 of the hierarchy) and the reporting entity’s own assumptions about market participant assumptions (unobservable inputs classified within Level 3 of the hierarchy).
| Level 1 | Valuation is based upon quoted prices (unadjusted) in active markets for identical assets or liabilities that the Company has the ability to access. Level 1 assets and liabilities include debt and equity securities and derivative contracts that are traded in an active exchange market, as well as U.S. Treasuries and money market funds. |
| Level 2 | Valuation is based upon quoted prices for similar assets and liabilities in active markets, as well as inputs that are observable for the asset or liability (other than quoted prices), such as interest rates, foreign exchange rates, and yield curves that are observable at commonly quoted intervals. Level 2 assets and liabilities include debt securities with quoted prices that are traded less frequently than exchange-traded instruments, mortgage-backed securities, municipal bonds, corporate debt securities and derivative contracts whose value is determined using a pricing model with inputs that are observable in the market or can be derived principally from or corroborated by observable market data. This category generally includes certain derivative contracts and impaired loans. |
| Level 3 | Valuation is generated from model-based techniques that use at least one significant assumption based on unobservable inputs for the asset or liability, which are typically based on an entity’s own assumptions, as there is little, if any, related market activity. In instances where the determination of the fair value measurement is based on inputs from different levels of the fair value hierarchy, the level in the fair value hierarchy within which the entire fair value measurement falls is based on the lowest level input that is significant to the fair value measurement in its entirety. The assessment of the significance of a particular input to the fair value measurement in its entirety requires judgment, and considers factors specific to the asset or liability. |
The following is a description of the valuation methodologies used for assets and liabilities recorded at fair value.
Investment Securities Available for Sale
Investment securities available for sale are recorded at fair value on a recurring basis. At March 31, 2010, the Company’s investment portfolio was comprised of government and agency bonds, mortgage-backed securities issued by government agencies or government sponsored enterprises, five municipals and one equity investment. The portfolio did not contain any private label mortgage-backed securities. Fair value measurement is based upon prices obtained from third party pricing services who use independent pricing models which rely on a variety of factors including reported trades, broker/dealer quotes, benchmark yields, economic and industry events and other relevant market information. As such, these securities are classified as Level 2.
55
SECURITY FEDERAL CORPORATION AND SUBSIDIARIES
Notes To Consolidated Financial Statements
(22) Carrying Amounts and Fair Value of Financial Instruments, Continued
Mortgage Loans Held for Sale
The Company originates fixed rate residential loans on a servicing released basis in the secondary market. Loans closed but not yet settled with Freddie Mac or other investors, are carried in the Company’s loans held for sale portfolio. These loans are fixed rate residential loans that have been originated in the Company’s name and have closed. Virtually all of these loans have commitments to be purchased by investors and the majority of these loans were locked in by price with the investors on the same day or shortly thereafter that the loan was locked in with the Company’s customers. Therefore, these loans present very little market risk for the Company. The Company usually delivers to, and receives funding from, the investor within 30 days. Commitments to sell these loans to the investor are considered derivative contracts and are sold to investors on a “best efforts" basis. The Company is not obligated to deliver a loan or pay a penalty if a loan is not delivered to the investor. As a result of the short-term nature of these derivative contracts, the fair value of the mortgage loans held for sale in most cases is the same as the value of the loan amount at its origination. These loans are classified as Level 2.
Impaired Loans
The Company does not record loans at fair value on a recurring basis. However, from time to time, a loan is considered impaired and an allowance for loan losses is established. Loans for which it is probable that payment of interest and principal will not be made in accordance with the contractual terms of the loan agreement are considered impaired. Once a loan is identified as individually impaired management measures impairment.
Fair value is estimated using one of the following methods: fair value of the collateral less estimated costs to sale, discounted cash flows, or market value of the loan based on similar debt. The fair value of the collateral less estimated costs to sell is the most frequently used method. Typically, the Company reviews the most recent appraisal and if it is over 24 months old will request a new third party appraisal. Depending on the particular circumstances surrounding the loan, including the location of the collateral, the date of the most recent appraisal and the value of the collateral relative to the recorded investment in the loan, management may order an independent appraisal immediately or, in some instances, may elect to perform an internal analysis. Specifically as an example, in situations where the collateral on a nonperforming commercial real estate loan is out of the Company’s primary market area, management would typically order an independent appraisal immediately, at the earlier of the date the loan becomes nonperforming or immediately following the determination that the loan is impaired. However, as a second example, on a nonperforming commercial real estate loan where management is familiar with the property and surrounding areas and where the original appraisal value far exceeds the recorded investment in the loan, management may perform an internal analysis whereby the previous appraisal value would be reviewed and adjusted for recent conditions including recent sales of similar properties in the area and any other relevant economic trends. These valuations are reviewed at a minimum on a quarterly basis.
Those impaired loans not requiring an allowance represent loans for which the fair value of the expected repayments or collateral exceed the recorded investments in such loans. At March 31, 2010, substantially all of the total impaired loans were evaluated based on the fair value of the collateral. Impaired loans where an allowance is established based on the fair value of collateral require classification in the fair value hierarchy. When the fair value of the collateral is based on an observable market price or a current appraised value, the Company records the impaired loan as nonrecurring Level 2. When an appraised value is not available or management determines the fair value of the collateral is further impaired below the appraised value and there is no observable market price, the Company records the impaired loan as nonrecurring Level 3.
As of March 31, 2010 and March 31, 2009, the recorded investment in impaired loans was $35.3 million and $27.7 million, respectively. The average recorded investment in impaired loans was $33.6 million and $11.5 million, respectively, for the years ended March 31, 2010 and 2009.
Foreclosed Assets
Foreclosed assets are adjusted to fair value upon transfer of the loans to foreclosed assets. Subsequently, foreclosed assets are carried at the lower of carrying value or fair value. Fair value is based upon independent market prices, appraised values of the collateral or management’s estimation of the value of the collateral. When the fair value of the collateral is based on an observable market price or a current appraised value, the Company records the foreclosed asset as nonrecurring Level 2.
56
SECURITY FEDERAL CORPORATION AND SUBSIDIARIES
Notes To Consolidated Financial Statements
(22) Carrying Amounts and Fair Value of Financial Instruments, Continued
When an appraised value is not available or management determines the fair value of the collateral is further impaired below the appraised value and there is no observable market price, the Company records the asset as nonrecurring Level 3.
Goodwill and Other Intangible Assets
Goodwill and identified intangible assets are subject to impairment testing. The Company’s approach to testing for impairment is to compare the business unit’s carrying value to the implied fair value based on a multiple of revenue approach. Impairment testing is performed annually as of September 30th or when events or circumstances occur indicating that goodwill of the reporting unit might be impaired. In the event the fair value is determined to be less than the carrying value, the asset is recorded at fair value as determined by the valuation model. As such, goodwill and other intangible assets subjected to nonrecurring fair value adjustments are classified as Level 3.
Mandatorily Redeemable Financial Instrument
The fair value is determined, in accordance with the underlying agreement at the instrument’s redemption value, as the number of shares issuable pursuant to the agreement at a price per share determined as the greater of a) $26 per share or b) 1.5 times the book value per share of the Company. See the section entitled “Mandatorily Redeemable Financial Instrument” of Item 2- Management’s Discussion and Analysis of Financial Condition and Results of Operations for a description of this instrument. This instrument is classified as Level 2.
Assets and liabilities measured at fair value on a recurring basis are as follows as of March 31, 2010:
Assets: | Quoted Market Price In Active Markets (Level 1) | Significant Other Observable Inputs (Level 2) | Significant Unobservable Inputs (Level 3) | |||||||||
Available-For-Sale Investment And Mortgage- Backed Securities | $ | - | $ | 292,261,039 | $ | - | ||||||
Mortgage Loans Held For Sale | - | 3,161,463 | - | |||||||||
| Total | $ | - | $ | 295,422,502 | $ | - | ||||||
| Liabilities: | ||||||||||||
Mandatorily Redeemable Financial Instrument | $ | - | $ | 1,663,312 | $ | - | ||||||
| Total | $ | - | $ | 1,663,312 | $ | - | ||||||
Assets and liabilities measured at fair value on a recurring basis are as follows as of March 31, 2009:
Assets: | Quoted Market Price In Active Markets (Level 1) | Significant Other Observable Inputs (Level 2) | Significant Unobservable Inputs (Level 3) | |||||||||
Available-For-Sale Investment And Mortgage- Backed Securities | $ | - | $ | 282,832,735 | $ | - | ||||||
Mortgage Loans Held For Sale | - | 5,711,807 | - | |||||||||
| Total | $ | - | $ | 288,544,542 | $ | - | ||||||
| Liabilities: | ||||||||||||
Mandatorily Redeemable Financial Instrument | $ | - | $ | 1,600,312 | $ | - | ||||||
| Total | $ | - | $ | 1,600,312 | $ | - | ||||||
57
SECURITY FEDERAL CORPORATION AND SUBSIDIARIES
Notes To Consolidated Financial Statements
(22) Carrying Amounts and Fair Value of Financial Instruments, Continued
The Company may be required, from time to time, to measure certain assets at fair value on a nonrecurring basis. These include assets that are measured at the lower of cost or market that were recognized at fair value below cost at the end of the period. The table below presents assets and liabilities measured at fair value on a nonrecurring basis as of March 31, 2010, aggregated by the level in the fair value hierarchy within which those measurements fall.
Assets: | Level 1 | Level 2 | Level 3 | Balance At March 31, 2010 |
| Goodwill | - | $ - | $ 1,199,754 | $ 1,199,754 |
| Intangible Assets | - | - | 249,500 | 249,500 |
Impaired Loans (1) | - | 19,735,647 | 13,548,107 | 33,283,754 |
| Foreclosed Assets | - | 10,773,050 | - | 10,773,050 |
| Total | - | $ 30,508,697 | $ 14,997,361 | 45,506,058 |
(1) Impaired loans are reported net of specific reserves of $2.0 million.
For assets and liabilities that are not presented on the balance sheet at fair value, the following methods are used to determine fair value:
Cash and cash equivalents
The carrying amount of these financial instruments approximates fair value. All mature within 90 days and do not present unanticipated credit concerns.
Loans
The fair value of loans are estimated by discounting the future cash flows using the current rates at which similar loans would be made to borrowers with similar credit ratings and for the same remaining maturities. As discount rates are based on current loan rates as well as management estimates, the fair values presented may not be indicative of the value negotiated in an actual sale.
Federal Home Loan Bank (“FHLB”) Stock
The fair value approximates the carrying value.
Deposits
The fair value of demand deposits, savings accounts, and money market accounts is the amount payable on demand at the reporting date. The fair value of fixed-maturity certificates of deposits is estimated by discounting the future cash flows using rates currently offered for deposits of similar remaining maturities.
FHLB Advances
Fair value is estimated based on discounted cash flows using current market rates for borrowings with similar terms.
TAF Borrowings and Other Borrowed Money
The carrying value of these short term borrowings approximates fair value.
Senior Convertible Debentures
The fair value is estimated by discounting the future cash flows using the current rates at which similar debenture offerings with similar terms and maturities would be issued by similar institutions. As discount rates are based on current debenture rates as well as management estimates, the fair values presented may not be indicative of the value negotiated in an actual sale.
Junior Subordinated Debentures
The carrying value approximates fair value.
58
SECURITY FEDERAL CORPORATION AND SUBSIDIARIES
Notes To Consolidated Financial Statements
(22) Carrying Amounts and Fair Value of Financial Instruments, Continued
The following table is a summary of the carrying value and estimated fair value of the Company’s financial instruments as of the periods presented in accordance with the applicable accounting guidance.
| March 31, 2010 | March 31, 2009 | |||||||
Carrying Amount | Estimated Fair Value | Carrying Amount | Estimated Fair Value | |||||
| (In Thousands) | ||||||||
| Financial Assets: | ||||||||
| Cash And Cash Equivalents | $ | 8,805 | $ | 8,805 | $ | 6,562 | $ | 6,562 |
| Investment And Mortgage-Back Securities | 311,046 | 312,115 | 314,099 | 315,325 | ||||
Loans Receivable, Net(1) | 568,399 | 578,851 | 611,090 | 623,362 | ||||
| FHLB Stock | 12,624 | 12,624 | 12,663 | 12,663 | ||||
| Financial Liabilities: | ||||||||
| Deposits: | ||||||||
| Checking, Savings, And Money Market Accounts | $ | 301,983 | $ | 301,983 | $ | 272,363 | $ | 272,363 |
| Certificate Accounts | 392,270 | 398,206 | 389,351 | 395,647 | ||||
| Advances From FHLB | 164,004 | 172,983 | 218,998 | 225,852 | ||||
| Term Auction Facility Borrowings | - | - | 10,000 | 10,000 | ||||
| Other Borrowed Money | 12,060 | 12,060 | 16,056 | 16,056 | ||||
| Senior Convertible Debentures | 6,084 | 6,084 | - | - | ||||
| Junior Subordinated Debentures | 5,155 | 5,155 | 5,155 | 5,155 | ||||
| Mandatorily Redeemable Financial Instrument | 1,663 | 1,663 | 1,600 | 1,600 | ||||
(1)Including mortgage loans held for sale
At March 31, 2010, the Bank had $56.4 million of off-balance sheet financial commitments. These commitments are to originate loans and unused consumer lines of credit and credit card lines. Because these obligations are based on current market rates, if funded, the original principal is considered to be a reasonable estimate of fair value.
Fair value estimates are made on a specific date, based on relevant market data and information about the financial instrument. These estimates do not reflect any premium or discount that could result from offering for sale the Bank’s entire holdings of a particular financial instrument. Because no active market exists for a significant portion of the Bank’s financial instruments, fair value estimates are based on judgments regarding future expected loss experience, current economic conditions, current interest rates and prepayment trends, risk characteristics of various financial instruments and other factors. These estimates are subjective in nature and involve uncertainties and matters of significant judgment and therefore cannot be determined with precision. Changes in any of these assumptions used in calculating fair value would also significantly affect the estimates. Fair value estimates are based on existing on- and off-balance sheet financial instruments without attempting to estimate the value of anticipated future business and the value of assets and liabilities that are not considered financial instruments. For example, the Bank has significant assets and liabilities that are not considered financial assets or liabilities including deposit franchise values, loan servicing portfolios, deferred tax liabilities, and premises and equipment.
In addition, the tax ramifications related to the realization of the unrealized gains and losses can have a significant effect on fair value estimates and have not been considered in any of these estimates. The Company has used management’s best estimate of fair value on the above assumptions. Thus, the fair values presented may not be the amounts, which could be realized, in an immediate sale or settlement of the instrument. In addition, any income taxes or other expenses that would be incurred in an actual sale or settlement are not taken into consideration in the fair value presented.
59
SECURITY FEDERAL CORPORATION AND SUBSIDIARIES
Notes To Consolidated Financial Statements
(23) Quarterly Financial Data (Unaudited)
Unaudited condensed financial data by quarter for fiscal year 2010 and 2009 is as follows (amounts, except per share data, in thousands):
Quarter ended | ||||||||
| 2009-2010 | June 30, 2009 | Sept. 30, 2009 | Dec. 31, 2009 | Mar. 31, 2010 | ||||
| Interest Income | $ | 12,065 | $ | 11,772 | $ | 12,245 | $ | 11,425 |
| Interest Expense | 5,736 | 5,167 | 4,733 | 4,500 | ||||
| Net Interest Income | 6,329 | 6,605 | 7,512 | 6,925 | ||||
| Provision For Loan Losses | 1,400 | 1,600 | 2,475 | 2,680 | ||||
Net Interest Income After Provision For Loan Losses | 4,929 | 5,005 | 5,037 | 4,245 | ||||
| Non-interest Income | 1,504 | 1,421 | 1,497 | 1,727 | ||||
| Non-interest Expense | 5,838 | 5,412 | 5,577 | 5,873 | ||||
| Income Before Income Tax | 595 | 1,014 | 957 | 99 | ||||
| Provision For Income taxes | 223 | 432 | 395 | 11 | ||||
| Net Income | 372 | 582 | 562 | 88 | ||||
| Preferred Stock Dividends | 225 | 225 | 225 | 225 | ||||
Accretion Of Preferred Stock To Redemption Value | 18 | 18 | 17 | 18 | ||||
| Net Income Available To Common Shareholders | $ | 129 | $ | 339 | $ | 320 | $ | (155) |
| Basic Net Income Per Common Share | $ | 0.05 | $ | 0.14 | $ | 0.13 | $ | (0.06) |
| Diluted Net Income Per Common Share | $ | 0.05 | $ | 0.13 | $ | 0.13 | $ | (0.06) |
| Basic Weighted Average Shares Outstanding | 2,460,137 | 2,461,092 | 2,461,095 | 2,461,095 | ||||
| Diluted Weighted Average Shares Outstanding | 2,503,777 | 2,521,157 | 2,543,389 | 2,544,857 | ||||
Quarter ended | ||||||||
| 2008-2009 | June 30, 2008 | Sept. 30, 2008 | Dec. 31, 2008 | Mar. 31, 2009 | ||||
| Interest Income | $ | 11,831 | $ | 12,344 | $ | 12,254 | $ | 12,438 |
| Interest Expense | 6,706 | 6,882 | 6,762 | 5,971 | ||||
| Net Interest Income | 5,125 | 5,462 | 5,492 | 6,467 | ||||
| Provision For Loan Losses | 225 | 275 | 525 | 1,800 | ||||
Net Interest Income After Provision For Loan Losses | 4,900 | 5,187 | 4,967 | 4,667 | ||||
| Non-interest Income | 1,121 | 1,061 | 1,020 | 1,294 | ||||
| Non-interest Expense | 4,822 | 5,075 | 5,245 | 5,357 | ||||
| Income Before Income Tax | 1,199 | 1,173 | 742 | 604 | ||||
| Provision For Income taxes | 397 | 388 | 253 | 227 | ||||
| Net Income | 802 | 785 | 489 | 377 | ||||
| Preferred Stock Dividends | - | - | 27 | 225 | ||||
Accretion Of Preferred Stock To Redemption Value | - | - | - | 20 | ||||
| Net Income Available To Common Shareholders | $ | 802 | $ | 785 | $ | 462 | $ | 132 |
| Basic Net Income Per Common Share | $ | 0.32 | $ | 0.31 | $ | 0.19 | $ | 0.05 |
| Diluted Net Income Per Common Share | $ | 0.32 | $ | 0.31 | $ | 0.18 | $ | 0.05 |
| Basic Weighted Average Shares Outstanding | 2,531,679 | 2,524,758 | 2,490,630 | 2,458,871 | ||||
| Diluted Weighted Average Shares Outstanding | 2,532,377 | 2,539,756 | 2,511,910 | 2,491,847 | ||||
60
SECURITY FEDERAL CORPORATION AND SUBSIDIARIES
Notes To Consolidated Financial Statements
| (24) | Subsequent Events |
Subsequent events are events or transactions that occur after the balance sheet date but before financial statements are issued. Recognized subsequent events are events or transactions that provide additional evidence about conditions that existed at the date of the balance sheet, including estimates inherent in the process of preparing financial statements. Nonrecognized subsequent events are events that provide evidence about conditions that did not exist at the date of the balance sheet but arose after that date. Management has reviewed events occurring through the date the financial statements were available to be issued and no subsequent events occurred requiring accrual or disclosure.
61
SHAREHOLDERS INFORMATION
ANNUAL MEETING
The annual meeting of shareholders will be held at 2:00 p.m., Thursday, July 15, 2010 at Newberry Hall, 117 Newberry Street Southwest, Aiken, South Carolina.
STOCK LISTING
The Company’s stock is traded on the Over-The-Counter-Bulletin Board under the symbol “SFDL.OB.” The stock began trading on the Bulletin Board in October 2003.
PRICE RANGE OF COMMON STOCK
The table below shows the range of high and low bid prices. These prices represent actual transactions and do not include retail markups, markdowns or commissions. Market makers include Sterne, Agee, and Leach, Inc., Morgan Keegan and Company, Inc., A.G. Edwards and Sons, Inc., and Monroe Securities, Inc.
| Years Ended March 31 | High | Low | ||
| 2009: | ||||
| 06-30-08 | $ | 23.05 | $ | 22.50 |
| 09-30-08 | $ | 22.85 | $ | 20.00 |
| 12-31-08 | $ | 20.00 | $ | 15.75 |
| 03-31-09 | $ | 20.00 | $ | 12.25 |
| 2010: | ||||
| 06-30-09 | $ | 15.50 | $ | 11.05 |
| 09-30-09 | $ | 13.25 | $ | 11.00 |
| 12-31-09 | $ | 13.10 | $ | 8.50 |
| 03-31-10 | $ | 11.00 | $ | 9.86 |
As of March 31, 2010, the Company had approximately 292 shareholders and 2,461,095 outstanding shares of common stock.
DIVIDENDS
The first quarterly dividend on the stock was paid to shareholders on March 15, 1991. Dividends will be paid upon the determination of the Board of Directors that such payment is consistent with the long-term interest of the Company. The factors affecting this determination include the Company’s current and projected earnings, operating results, financial condition, regulatory restrictions, future growth plans, and other relevant factors. The Company paid $0.04 per share cash dividends for each of the quarters during fiscal 2006, $0.06 per share cash dividends for each of the quarters during fiscal 2007, $0.07 per share cash dividends for each of the quarters during fiscal 2008, and $0.08 per share cash dividends for each of the quarters during fiscal 2009 and 2010.
The ability of the Company to pay dividends depends primarily on the ability of the Bank to pay dividends to the Company. The Bank may not declare or pay a cash dividend on its stock or repurchase shares of its stock if the offset thereof would be to cause its regulatory capital to be reduced below the amount required for the liquidation account or to meet applicable regulatory capital requirements. Pursuant to the OTS regulations, Tier 1 associations (associations that before and after the proposed distribution meet or exceed their fully phased-in capital requirements) may make capital distributions during any calendar year equal to 100% of net income for the year-to-date plus 50% of the amount by which the association’s total capital exceeds its fully phased-in capital requirement as measured at the beginning of the capital year. However, a Tier 1 association deemed to be in need of more than normal supervision by the OTS may be downgraded to a Tier 2 or Tier 3 association as a result of such a determination. The Bank is also required to give the OTS 30 days notice prior to the declaration of a dividend. Unlike the Bank, there is no regulatory restriction on the payment of dividends by the Company; however, it is subject to the requirements of South Carolina. South Carolina generally prohibits the Company from paying dividends if, after giving effect to a proposed dividend: (1) the Company would be unable to pay its debts as they become due in the normal course of business, or (2) the Company’s total assets would be less than its total liabilities plus the sum that would be needed to satisfy the preferential rights upon dissolution of shareholders whose preferential rights are superior to those receiving the dividend. In addition, payment of dividends by the Company is subject to certain limitations resulting from participation in the CPP. See Note 19 of the Notes to the Consolidated Financial Statements included herein for additional information.
CODE OF ETHICS
A copy of the Company’s Code of Ethics may be obtained at the Company’s internet website at www.securityfederalbank.com.
62