Teva Pharmaceutical Industries Ltd. Global Generic Medicines September 9, 2016 Exhibit 99.1
This presentation contains forward-looking statements, which are based on management’s current beliefs and expectations and involve a number of known and unknown risks and uncertainties that could cause our future results, performance or achievements to differ significantly from the results, performance or achievements expressed or implied by such forward-looking statements. Important factors that could cause or contribute to such differences include risks relating to: our ability to develop and commercialize additional pharmaceutical products; competition for our specialty products, especially Copaxone® (which faces competition from orally-administered alternatives and a generic version); our ability to integrate the acquisition of Allergan plc’s worldwide generic pharmaceuticals business (“Actavis Generics”) and to realize the anticipated benefits of such acquisition (and the timing of realizing such benefits); the fact that following the consummation of the Actavis Generics acquisition, we are dependent to a much larger extent than previously on our generic pharmaceutical business; potential restrictions on our ability to engage in additional transactions or incur additional indebtedness as a result of the substantial amount of debt incurred to finance the Actavis Generics acquisition; the fact that for a period of time following the consummation of the Actavis Generics acquisition, we will have significantly less cash on hand than previously, which could adversely affect our ability to grow; ; the possibility of material fines, penalties and other sanctions and other adverse consequences arising out of our ongoing FCPA investigations and related matters; our ability to achieve expected results from investments in our pipeline of specialty and other products; our ability to identify and successfully bid for suitable acquisition targets or licensing opportunities, or to consummate and integrate acquisitions; the extent to which any manufacturing or quality control problems damage our reputation for quality production and require costly remediation; increased government scrutiny in both the U.S. and Europe of our patent settlement agreements; our exposure to currency fluctuations and restrictions as well as credit risks; the effectiveness of our patents, confidentiality agreements and other measures to protect the intellectual property rights of our specialty medicines; the effects of reforms in healthcare regulation and pharmaceutical pricing, reimbursement and coverage; competition for our generic products, both from other pharmaceutical companies and as a result of increased governmental pricing pressures; governmental investigations into sales and marketing practices, particularly for our specialty pharmaceutical products; adverse effects of political or economic instability, major hostilities or acts of terrorism on our significant worldwide operations; interruptions in our supply chain or problems with internal or third-party information technology systems that adversely affect our complex manufacturing processes; significant disruptions of our information technology systems or breaches of our data security; competition for our specialty pharmaceutical businesses from companies with greater resources and capabilities; the impact of continuing consolidation of our distributors and customers; decreased opportunities to obtain U.S. market exclusivity for significant new generic products; potential liability in the U.S., Europe and other markets for sales of generic products prior to a final resolution of outstanding patent litigation; our potential exposure to product liability claims that are not covered by insurance; any failure to recruit or retain key personnel, or to attract additional executive and managerial talent; any failures to comply with complex Medicare and Medicaid reporting and payment obligations; significant impairment charges relating to intangible assets, goodwill and property, plant and equipment; the effects of increased leverage and our resulting reliance on access to the capital markets; potentially significant increases in tax liabilities; the effect on our overall effective tax rate of the termination or expiration of governmental programs or tax benefits, or of a change in our business; variations in patent laws that may adversely affect our ability to manufacture our products in the most efficient manner; environmental risks; and other factors that are discussed in our Annual Report on Form 20-F for the year ended December 31, 2015 and in our other filings with the U.S. Securities and Exchange Commission (the "SEC"). Forward-looking statements speak only as of the date on which they are made and we assume no obligation to update or revise any forward-looking statements or other information, whether as a result of new information, future events or otherwise. Safe Harbor Statement under the U.S. Private Securities Litigation Reform Act of 1995:
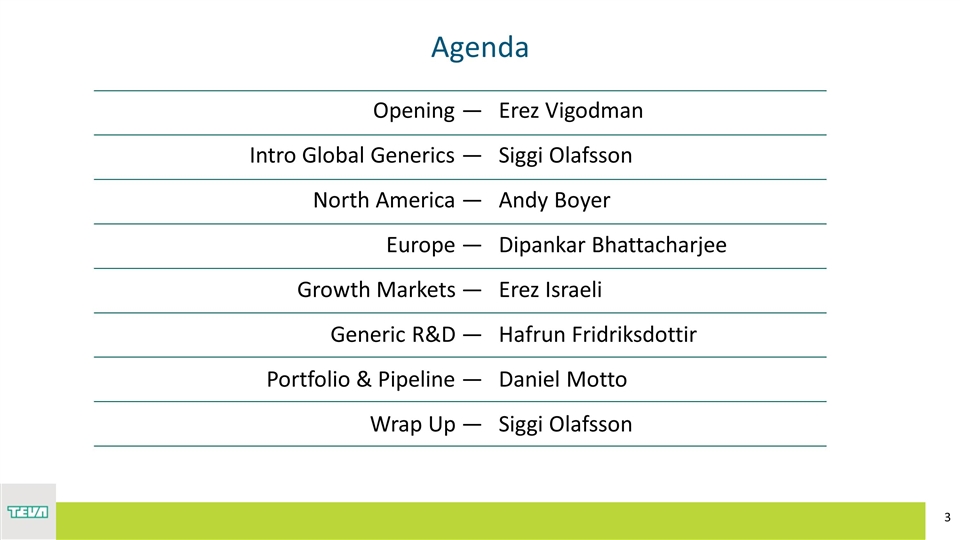
Agenda Opening — Intro Global Generics — North America — Europe — Growth Markets — Generic R&D — Portfolio & Pipeline — Wrap Up — Erez Vigodman Siggi Olafsson Andy Boyer Dipankar Bhattacharjee Erez Israeli Hafrun Fridriksdottir Daniel Motto Siggi Olafsson
EREZ VIGODMAN President & CEO Teva Pharmaceutical Industries Ltd.
SIGGI OLAFSSON Global Generic Medicines
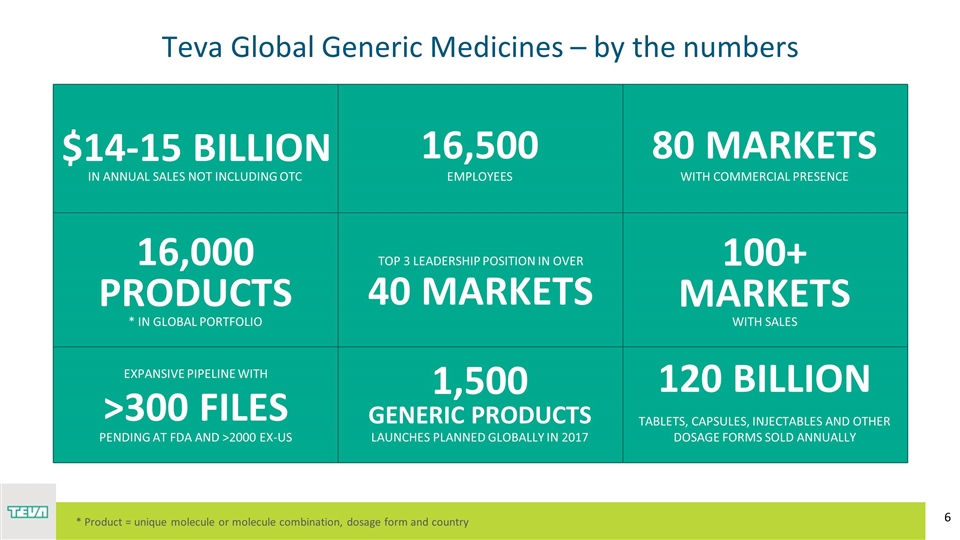
16,000 PRODUCTS * IN GLOBAL PORTFOLIO Teva Global Generic Medicines – by the numbers 16,500 TOP 3 LEADERSHIP POSITION IN OVER >300 FILES 1,500 GENERIC PRODUCTS 120 BILLION 100+ MARKETS IN ANNUAL SALES NOT INCLUDING OTC EMPLOYEES WITH COMMERCIAL PRESENCE 40 MARKETS WITH SALES EXPANSIVE PIPELINE WITH LAUNCHES PLANNED GLOBALLY IN 2017 TABLETS, CAPSULES, INJECTABLES AND OTHER DOSAGE FORMS SOLD ANNUALLY PENDING AT FDA AND >2000 EX-US 80 MARKETS * Product = unique molecule or molecule combination, dosage form and country $14-15 BILLION
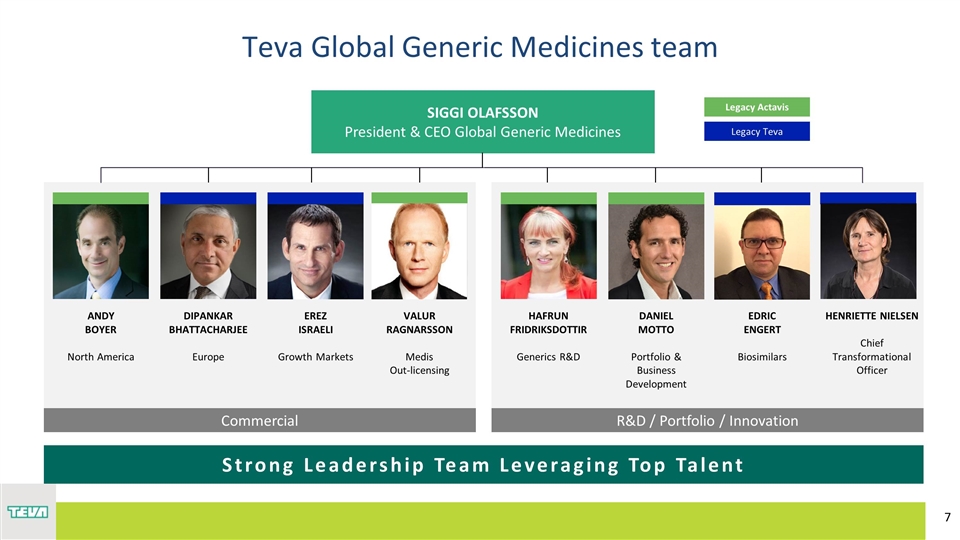
SIGGI OLAFSSON President & CEO Global Generic Medicines Strong Leadership Team Leveraging Top Talent Teva Global Generic Medicines team R: 191 G: 191 B: 191 Legacy Actavis Legacy Teva VALUR RAGNARSSON Medis Out-licensing DIPANKAR BHATTACHARJEE Europe EREZ ISRAELI Growth Markets ANDY BOYER North America HAFRUN FRIDRIKSDOTTIR Generics R&D DANIEL MOTTO Portfolio & Business Development EDRIC ENGERT Biosimilars HENRIETTE NIELSEN Chief Transformational Officer R&D / Portfolio / Innovation Commercial
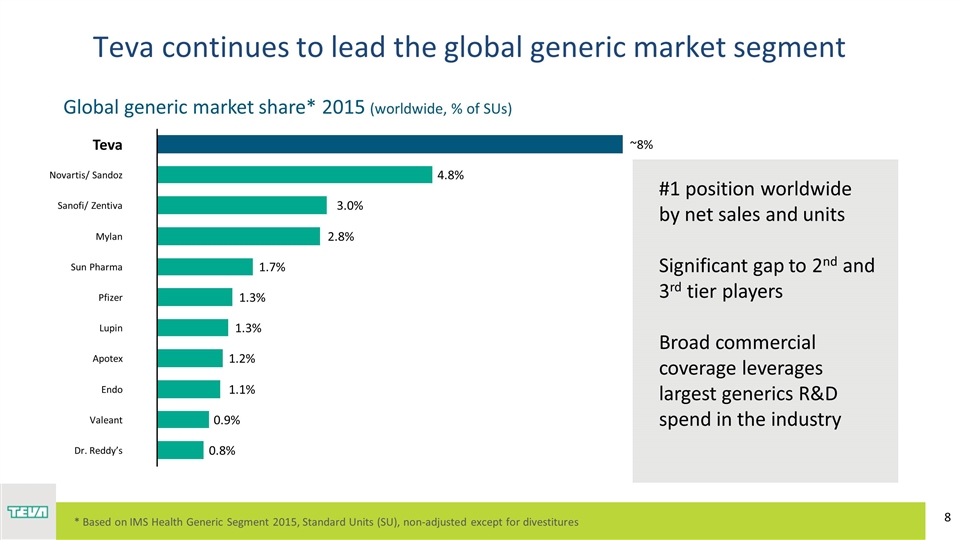
Global generic market share* 2015 (worldwide, % of SUs) ~8% Endo #1 position worldwide by net sales and units Significant gap to 2nd and 3rd tier players Broad commercial coverage leverages largest generics R&D spend in the industry Teva continues to lead the global generic market segment R: 191 G: 191 B: 191 * Based on IMS Health Generic Segment 2015, Standard Units (SU), non-adjusted except for divestitures
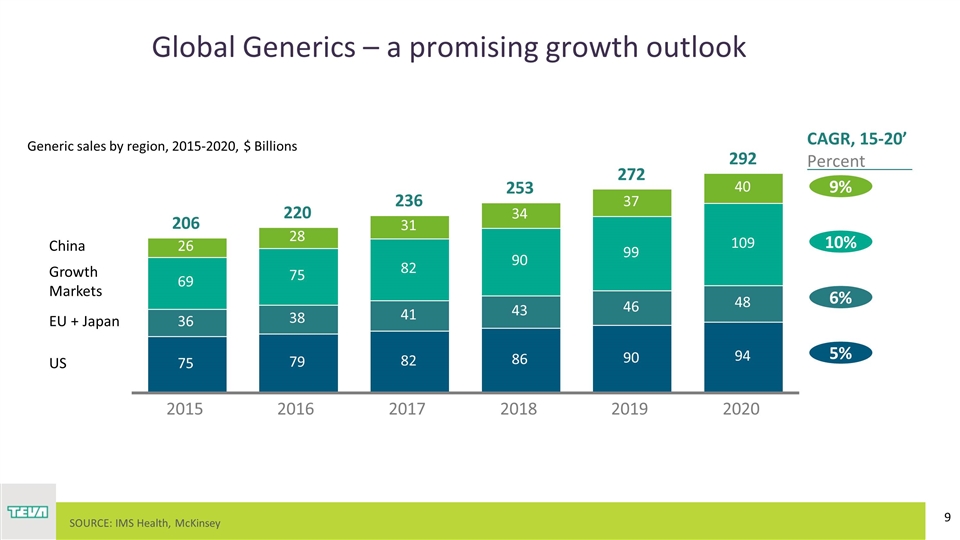
Global Generics – a promising growth outlook SOURCE: IMS Health, McKinsey Generic sales by region, 2015-2020, $ Billions CAGR, 15-20’ Percent Growth Markets 9% 10% 6% 5% 2015
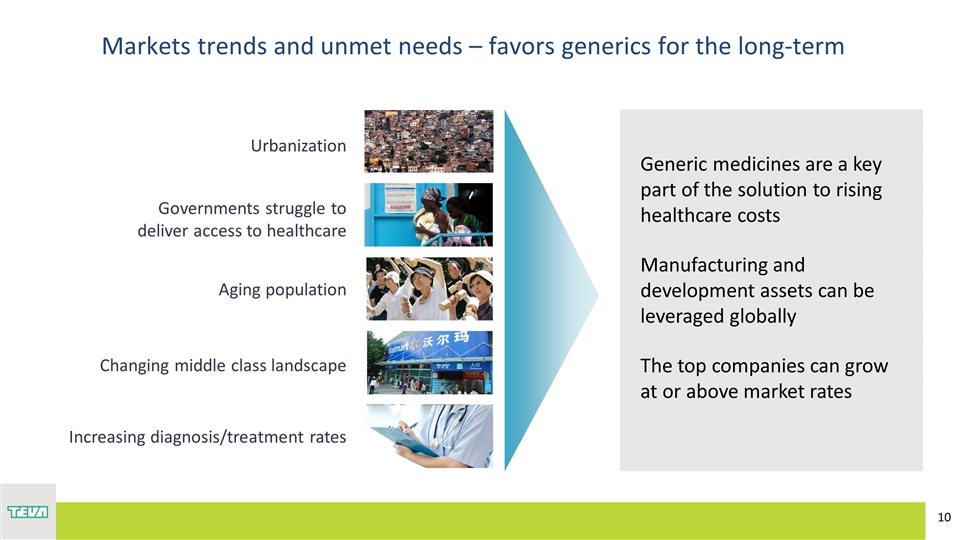
Urbanization Aging population Changing middle class landscape Governments struggle to deliver access to healthcare Markets trends and unmet needs – favors generics for the long-term Increasing diagnosis/treatment rates Generic medicines are a key part of the solution to rising healthcare costs Manufacturing and development assets can be leveraged globally The top companies can grow at or above market rates
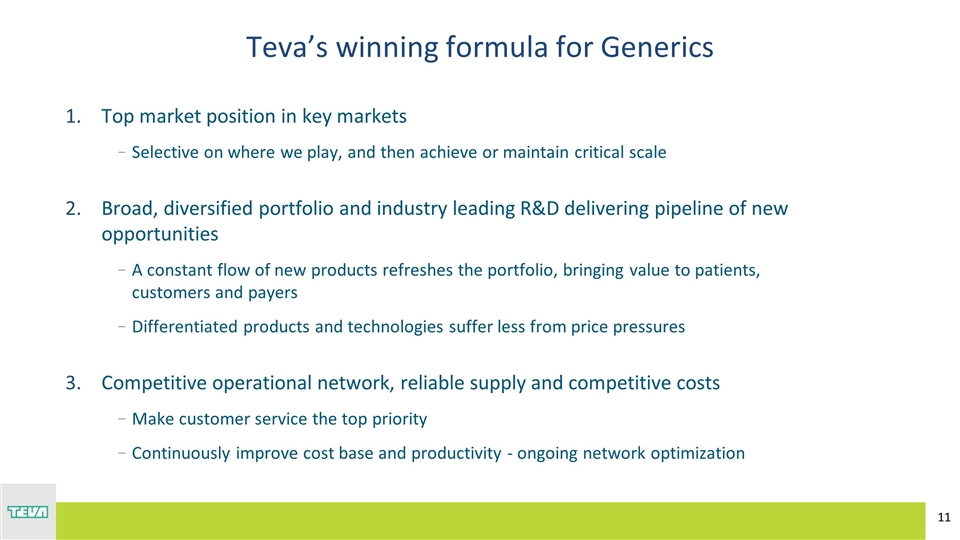
Top market position in key markets Selective on where we play, and then achieve or maintain critical scale Broad, diversified portfolio and industry leading R&D delivering pipeline of new opportunities A constant flow of new products refreshes the portfolio, bringing value to patients, customers and payers Differentiated products and technologies suffer less from price pressures Competitive operational network, reliable supply and competitive costs Make customer service the top priority Continuously improve cost base and productivity - ongoing network optimization Teva’s winning formula for Generics
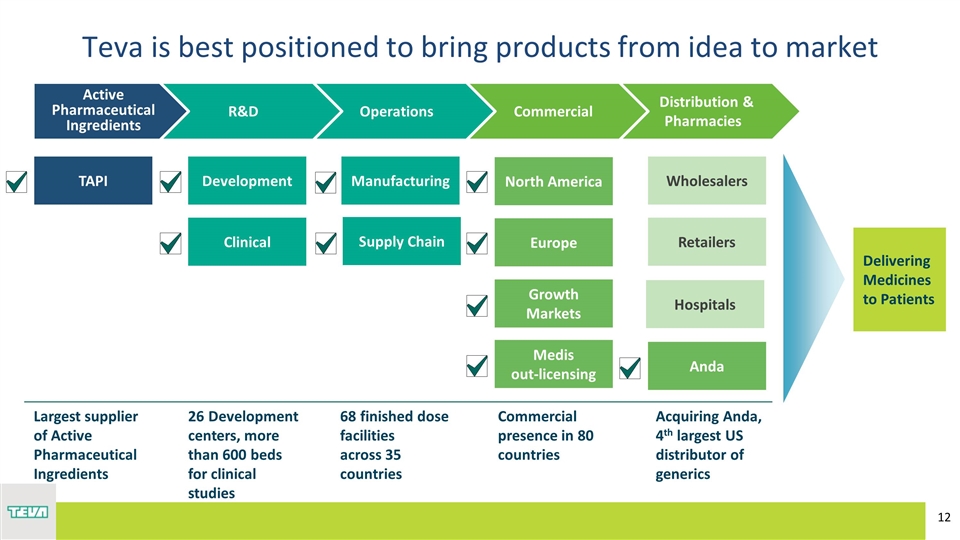
Teva is best positioned to bring products from idea to market Delivering Medicines to Patients Distribution & Pharmacies Commercial Operations R&D Active Pharmaceutical Ingredients TAPI Development Manufacturing Clinical North America Europe Growth Markets Medis out-licensing Wholesalers Retailers Anda Largest supplier of Active Pharmaceutical Ingredients 26 Development centers, more than 600 beds for clinical studies 68 finished dose facilities across 35 countries Commercial presence in 80 countries Acquiring Anda, 4th largest US distributor of generics Hospitals Supply Chain
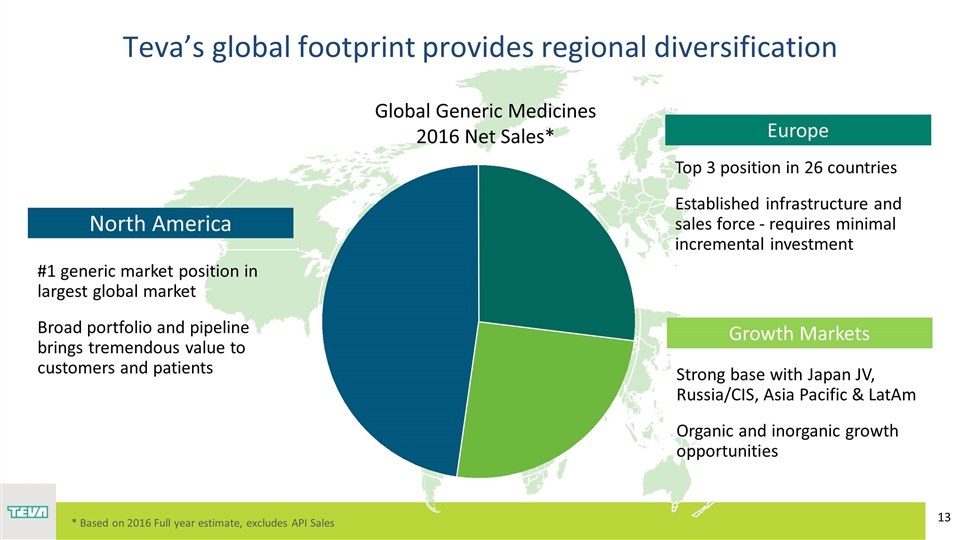
Teva’s global footprint provides regional diversification R: 191 G: 191 B: 191 Growth Markets Strong base with Japan JV, Russia/CIS, Asia Pacific & LatAm Organic and inorganic growth opportunities Top 3 position in 26 countries Established infrastructure and sales force - requires minimal incremental investment Europe #1 generic market position in largest global market Broad portfolio and pipeline brings tremendous value to customers and patients North America Global Generic Medicines 2016 Net Sales* * Based on 2016 Full year estimate, excludes API Sales
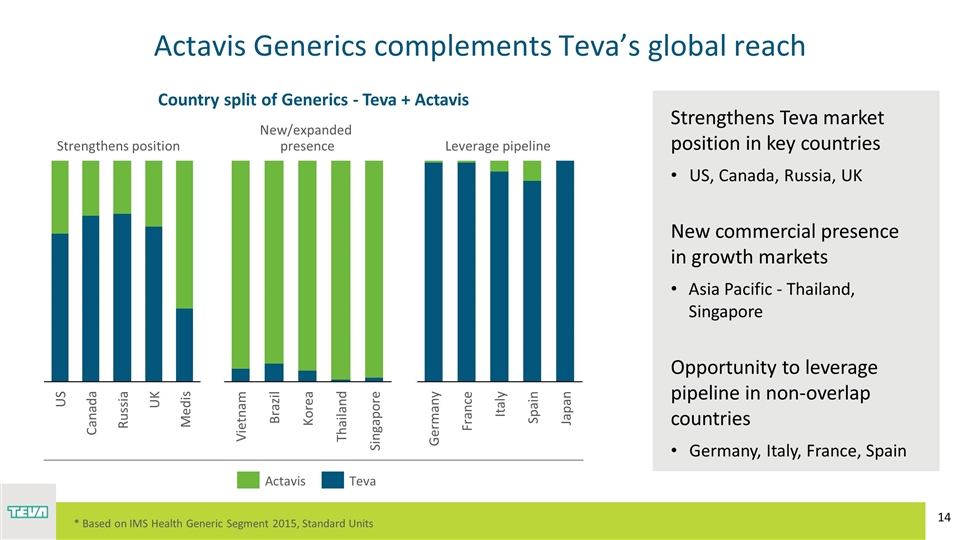
Strengthens Teva market position in key countries US, Canada, Russia, UK New commercial presence in growth markets Asia Pacific - Thailand, Singapore Opportunity to leverage pipeline in non-overlap countries Germany, Italy, France, Spain Actavis Generics complements Teva’s global reach Medis Country split of Generics - Teva + Actavis Strengthens position New/expanded presence Leverage pipeline * Based on IMS Health Generic Segment 2015, Standard Units
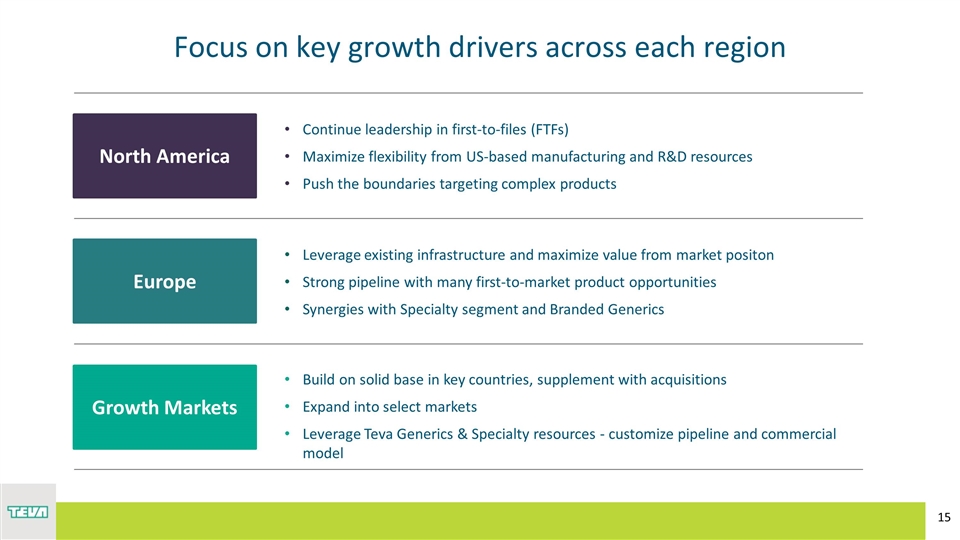
Focus on key growth drivers across each region Europe North America Growth Markets Continue leadership in first-to-files (FTFs) Maximize flexibility from US-based manufacturing and R&D resources Push the boundaries targeting complex products Leverage existing infrastructure and maximize value from market positon Strong pipeline with many first-to-market product opportunities Synergies with Specialty segment and Branded Generics Build on solid base in key countries, supplement with acquisitions Expand into select markets Leverage Teva Generics & Specialty resources - customize pipeline and commercial model
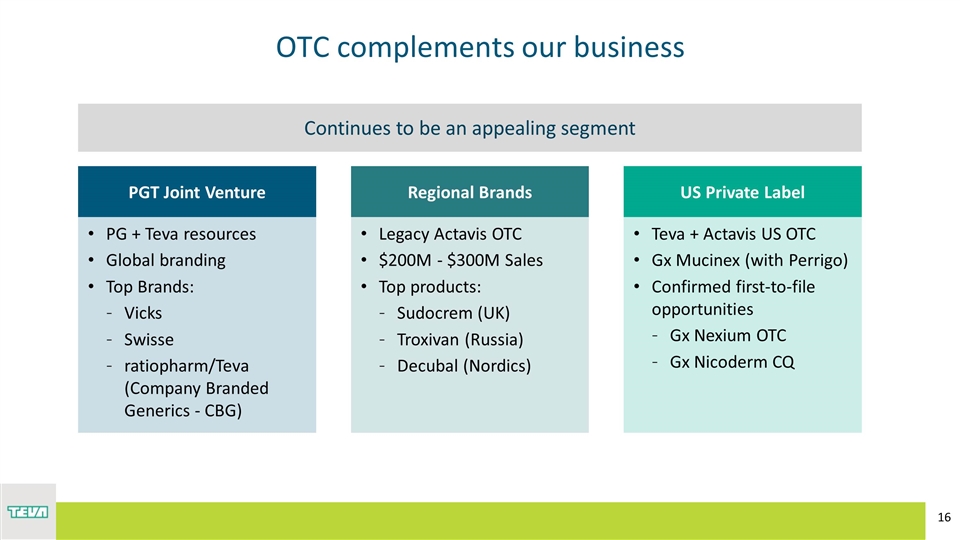
OTC complements our business PGT Joint Venture Regional Brands US Private Label PG + Teva resources Global branding Top Brands: Vicks Swisse ratiopharm/Teva (Company Branded Generics - CBG) Legacy Actavis OTC $200M - $300M Sales Top products: Sudocrem (UK) Troxivan (Russia) Decubal (Nordics) Teva + Actavis US OTC Gx Mucinex (with Perrigo) Confirmed first-to-file opportunities Gx Nexium OTC Gx Nicoderm CQ Continues to be an appealing segment
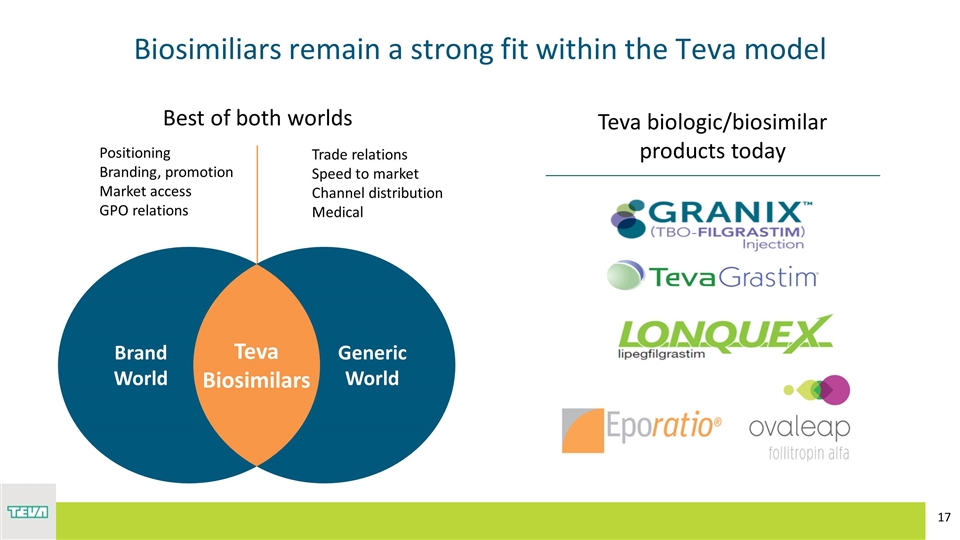
Positioning Branding, promotion Market access GPO relations Trade relations Speed to market Channel distribution Medical Best of both worlds Biosimiliars remain a strong fit within the Teva model Teva biologic/biosimilar products today Generic World Brand World Teva Biosimilars
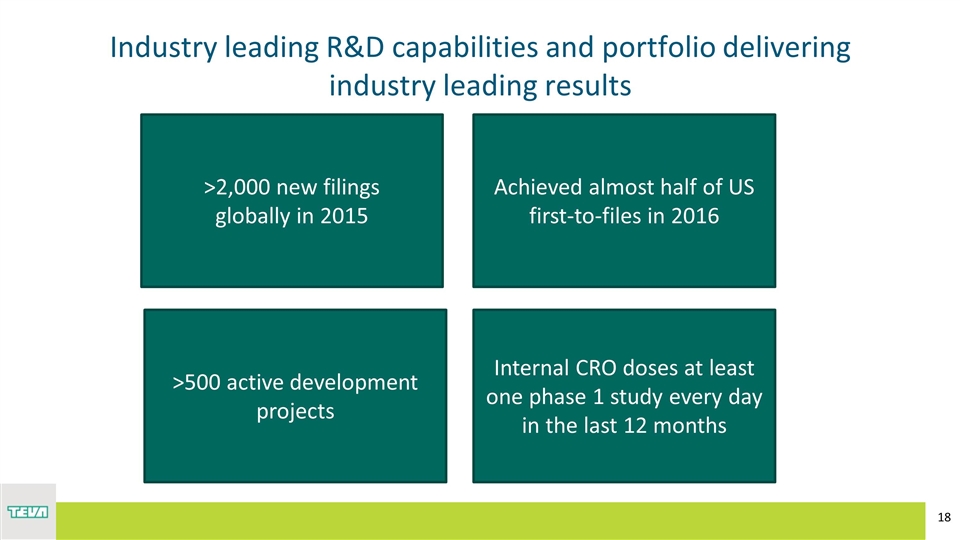
Industry leading R&D capabilities and portfolio delivering industry leading results >2,000 new filings globally in 2015 Achieved almost half of US first-to-files in 2016 >500 active development projects Internal CRO doses at least one phase 1 study every day in the last 12 months

Brazil (1, 0) Bulgaria (2, 0) Greece (1, 0) Iceland (1, 0) India (3, 3) Indonesia (1, 0) Ireland (3, 1) Italy (1, 5) Malta (2, 0) Puerto Rico (2, 1) Romania (1, 0) Serbia (1, 0) Singapore (1, 0) Thailand (1, 0) UK (2, 0) USA (14, 1) Canada (3, 0) Mexico (3, 1) Japan (3, 0) China (0, 1) Israel (5, 3) Hungary (2, 2) Netherlands (1, 0) Poland (1, 0) Czech (1, 1) Germany (2, 0) Russia (1, 0) Spain (1, 0) Croatia (1, 1) Chile (1, 0) Peru (1, 0) Venezuela (1, 0) Argentina (1, 0) Lithuania (1, 0) 68 Pharma sites 19 API sites 36 countries Plants (Pharma sites, TAPI) The largest and most competitive fully integrated manufacturing and supply chain network in the industry…
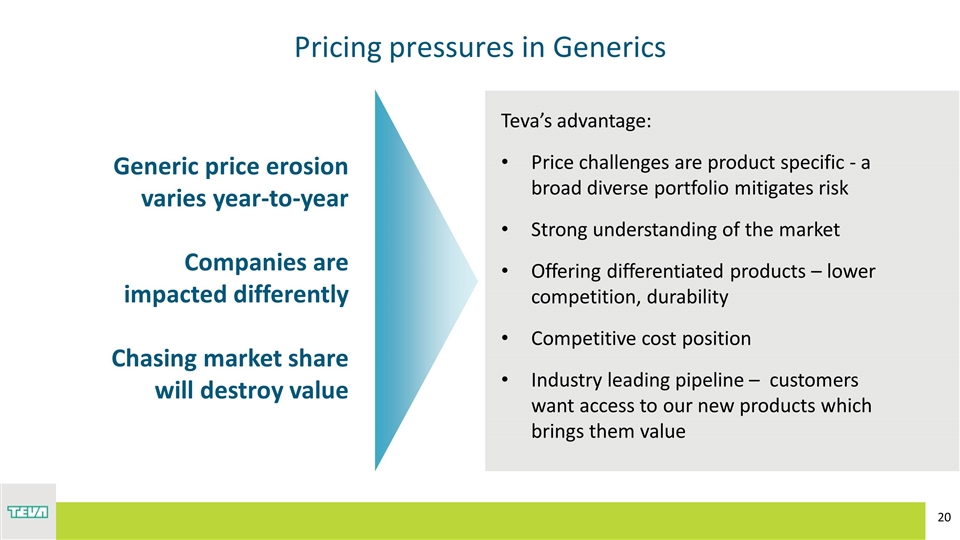
Pricing pressures in Generics Teva’s advantage: Price challenges are product specific - a broad diverse portfolio mitigates risk Strong understanding of the market Offering differentiated products – lower competition, durability Competitive cost position Industry leading pipeline – customers want access to our new products which brings them value Generic price erosion varies year-to-year Companies are impacted differently Chasing market share will destroy value
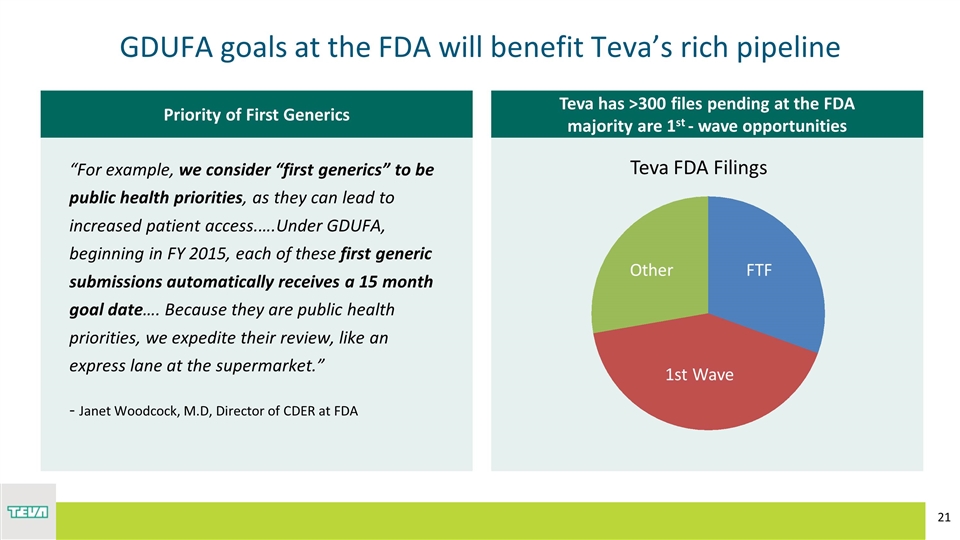
Teva has >300 files pending at the FDA majority are 1st - wave opportunities Priority of First Generics GDUFA goals at the FDA will benefit Teva’s rich pipeline “For example, we consider “first generics” to be public health priorities, as they can lead to increased patient access.….Under GDUFA, beginning in FY 2015, each of these first generic submissions automatically receives a 15 month goal date…. Because they are public health priorities, we expedite their review, like an express lane at the supermarket.” - Janet Woodcock, M.D, Director of CDER at FDA R: 0 G: 104 B: 94 R: 0 G: 170 B: 143 R: 109 G: 185 B: 61 R: 186 G: 215 B: 57 R: 64 G: 49 B: 82 R: 0 G: 88 B: 124 R: 191 G: 191 B: 191 Teva FDA Filings
ANDY BOYER North America
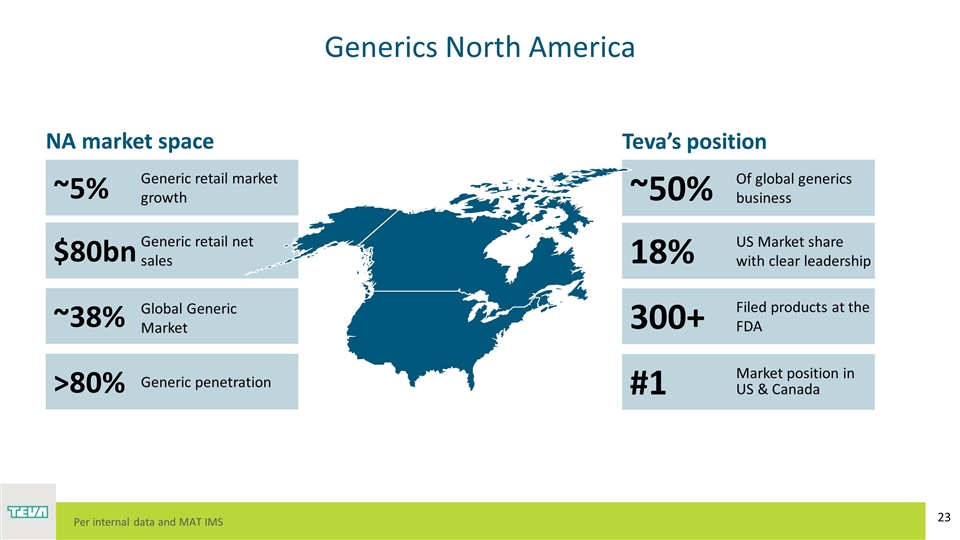
Generics North America ~5% $80bn ~38% >80% Generic retail market growth Generic retail net sales Global Generic Market Generic penetration NA market space ~50% 18% 300+ #1 Of global generics business US Market share with clear leadership Filed products at the FDA Market position in US & Canada Teva’s position Per internal data and MAT IMS
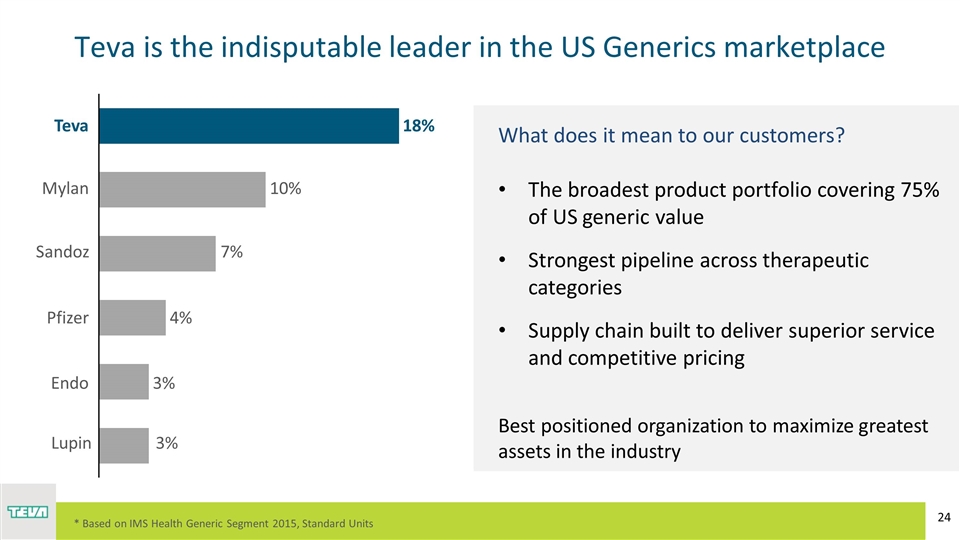
Teva is the indisputable leader in the US Generics marketplace What does it mean to our customers? The broadest product portfolio covering 75% of US generic value Strongest pipeline across therapeutic categories Supply chain built to deliver superior service and competitive pricing Best positioned organization to maximize greatest assets in the industry * Based on IMS Health Generic Segment 2015, Standard Units
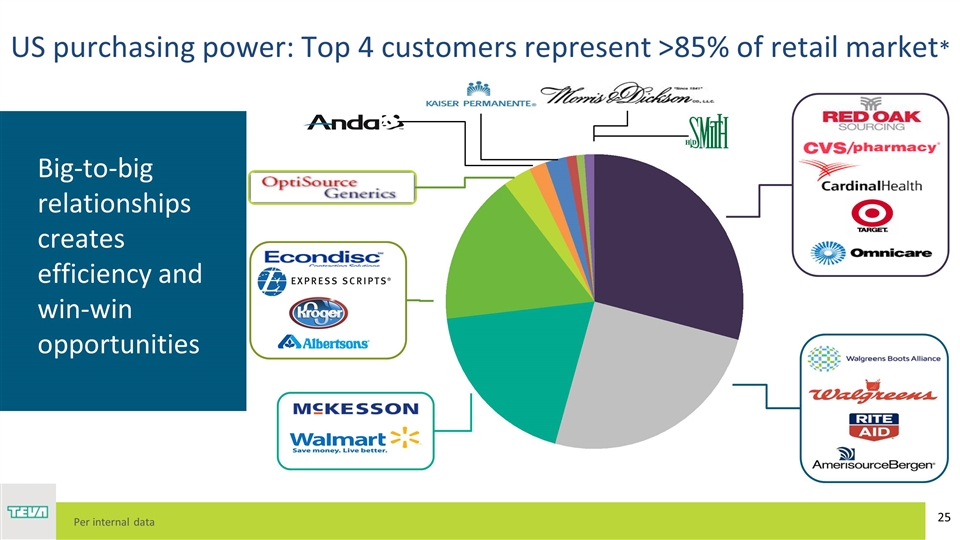
Big-to-big relationships creates efficiency and win-win opportunities US purchasing power: Top 4 customers represent >85% of retail market* Per internal data
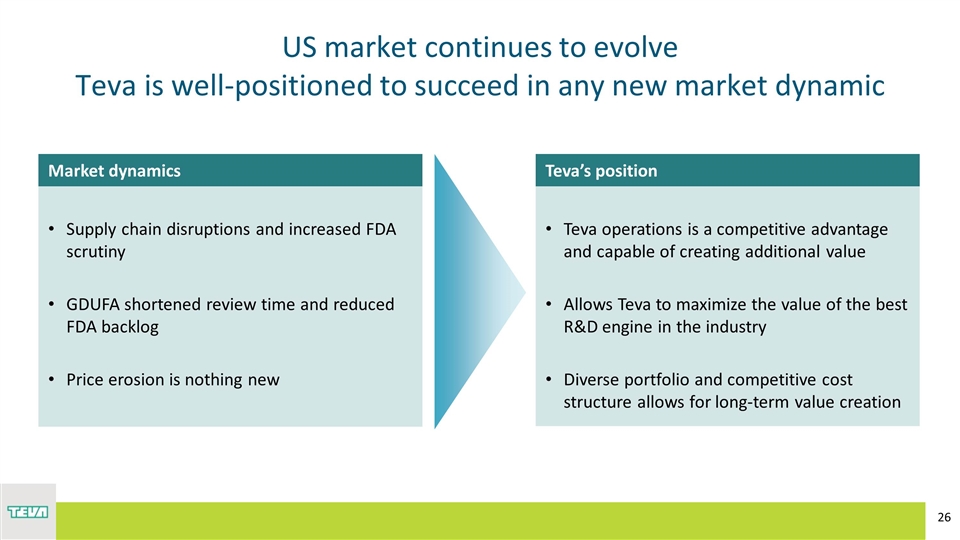
US market continues to evolve Teva is well-positioned to succeed in any new market dynamic Teva operations is a competitive advantage and capable of creating additional value Allows Teva to maximize the value of the best R&D engine in the industry Diverse portfolio and competitive cost structure allows for long-term value creation Supply chain disruptions and increased FDA scrutiny GDUFA shortened review time and reduced FDA backlog Price erosion is nothing new Market dynamics Teva’s position
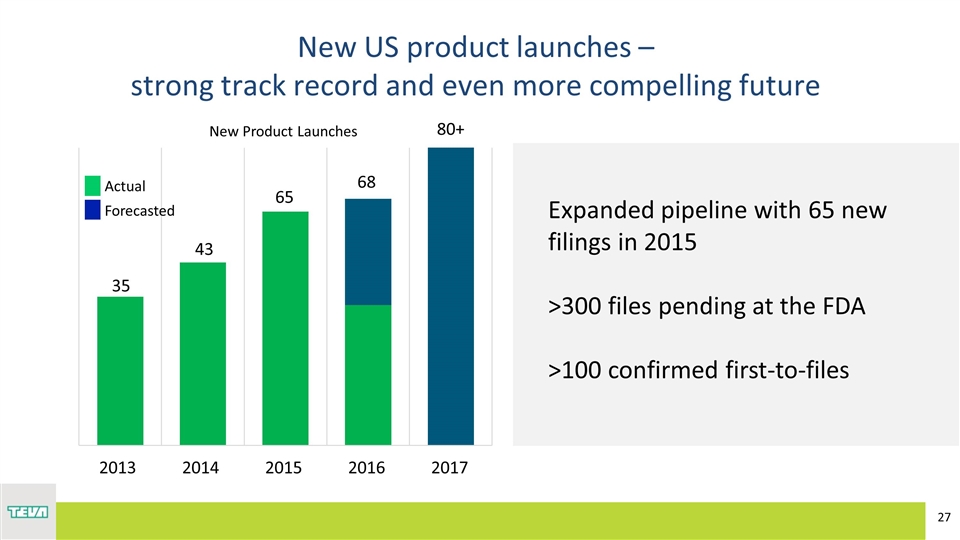
New US product launches – strong track record and even more compelling future Expanded pipeline with 65 new filings in 2015 >300 files pending at the FDA >100 confirmed first-to-files 80+ 43 35 New Product Launches Actual Forecasted

North America – looking forward Combined two leading organizations that have all the ingredients required to grow and generate value Broadest in-line portfolio with the most promising pipeline Proven track record to maximize value of new product launches Portfolio and customer relationships to create win-win partnerships globally
DIPANKAR BHATTACHARJEE Europe
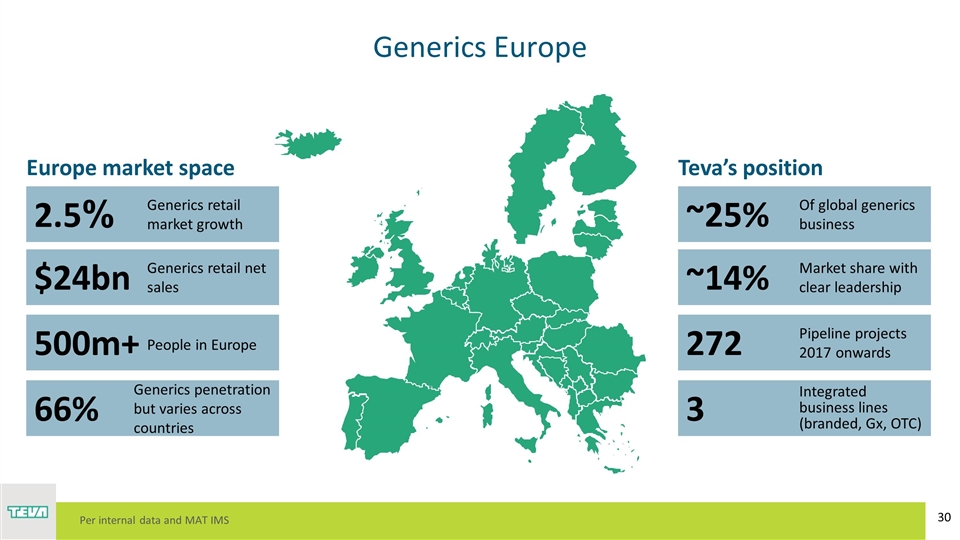
Generics Europe 2.5% $24bn 500m+ 66% ~25% ~14% 272 3 Generics retail market growth Generics retail net sales People in Europe Generics penetration but varies across countries Of global generics business Market share with clear leadership Pipeline projects 2017 onwards Integrated business lines (branded, Gx, OTC) Europe market space Teva’s position Per internal data and MAT IMS
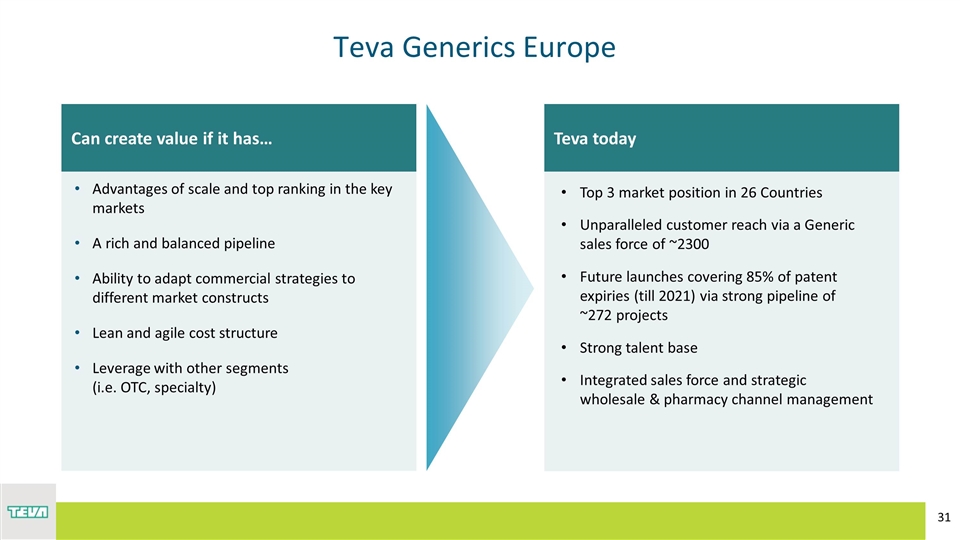
Teva Generics Europe Teva today Top 3 market position in 26 Countries Unparalleled customer reach via a Generic sales force of ~2300 Future launches covering 85% of patent expiries (till 2021) via strong pipeline of ~272 projects Strong talent base Integrated sales force and strategic wholesale & pharmacy channel management Can create value if it has… Advantages of scale and top ranking in the key markets A rich and balanced pipeline Ability to adapt commercial strategies to different market constructs Lean and agile cost structure Leverage with other segments (i.e. OTC, specialty)
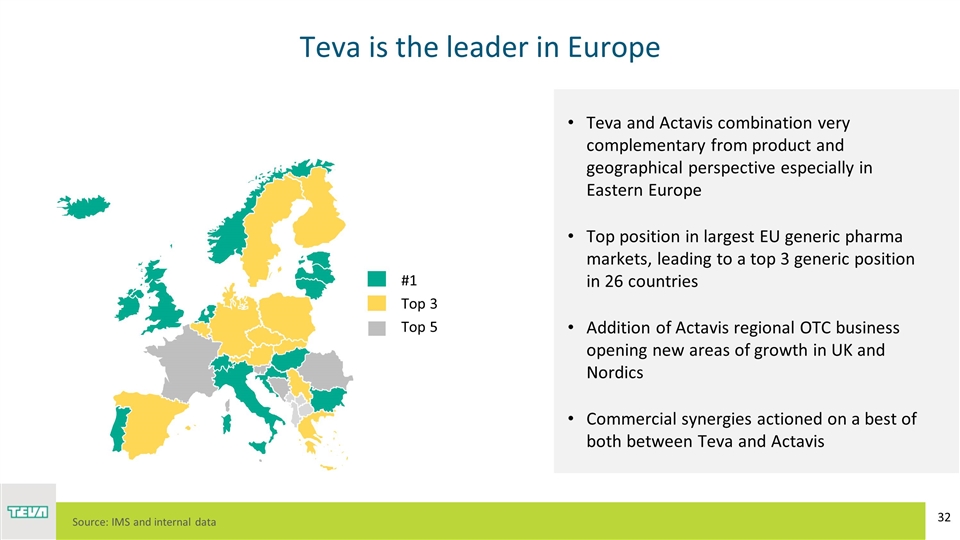
Teva is the leader in Europe Teva and Actavis combination very complementary from product and geographical perspective especially in Eastern Europe Top position in largest EU generic pharma markets, leading to a top 3 generic position in 26 countries Addition of Actavis regional OTC business opening new areas of growth in UK and Nordics Commercial synergies actioned on a best of both between Teva and Actavis Top 3 Top 5 #1 Source: IMS and internal data
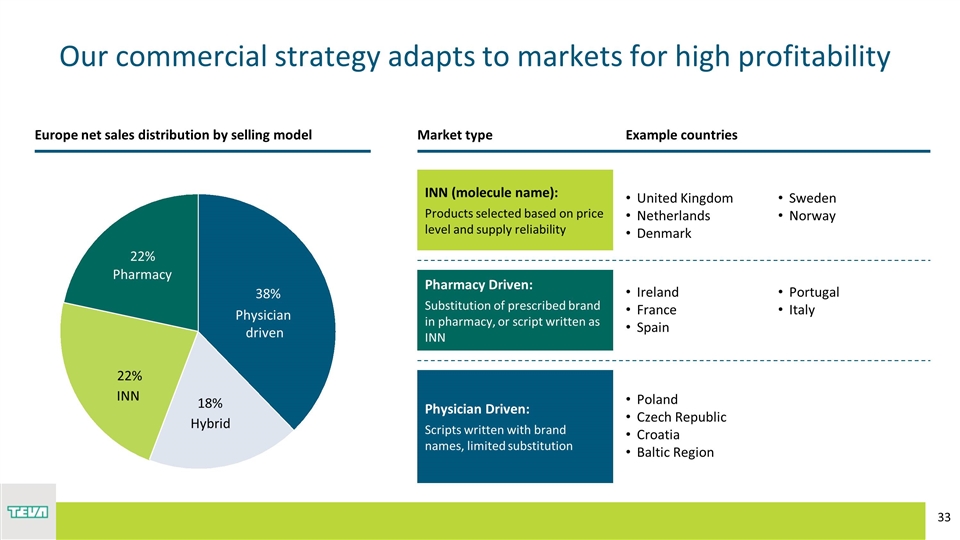
Europe net sales distribution by selling model Example countries Pharmacy Driven: Substitution of prescribed brand in pharmacy, or script written as INN Ireland France Spain Portugal Portugal Italy United Kingdom Netherlands Denmark Sweden Sweden Norway INN (molecule name): Products selected based on price level and supply reliability Physician Driven: Scripts written with brand names, limited substitution Poland Czech Republic Croatia Baltic Region Romania Bulgaria Romania Bulgaria 22% 22% Hybrid Physician driven 18% 38% Our commercial strategy adapts to markets for high profitability Market type
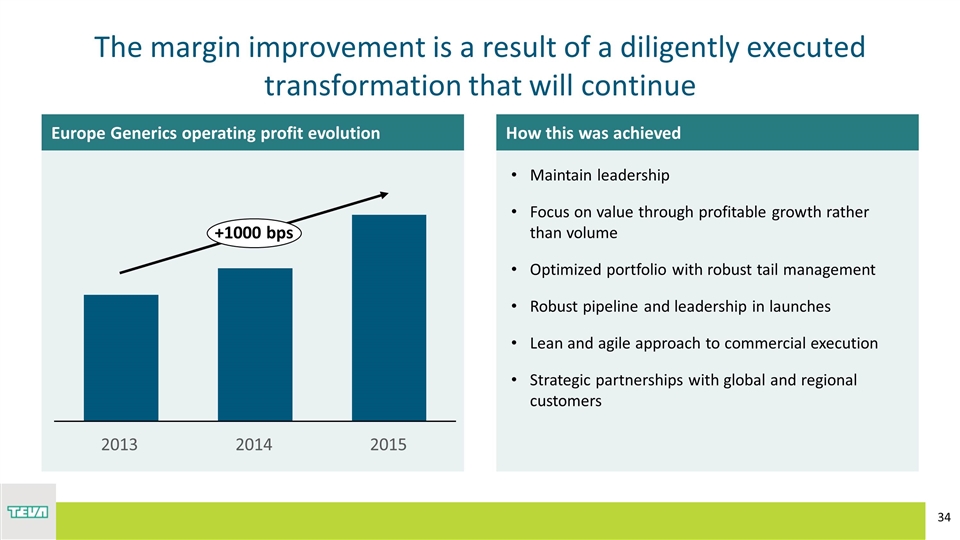
The margin improvement is a result of a diligently executed transformation that will continue Europe Generics operating profit evolution How this was achieved Maintain leadership Focus on value through profitable growth rather than volume Optimized portfolio with robust tail management Robust pipeline and leadership in launches Lean and agile approach to commercial execution Strategic partnerships with global and regional customers +1000 bps
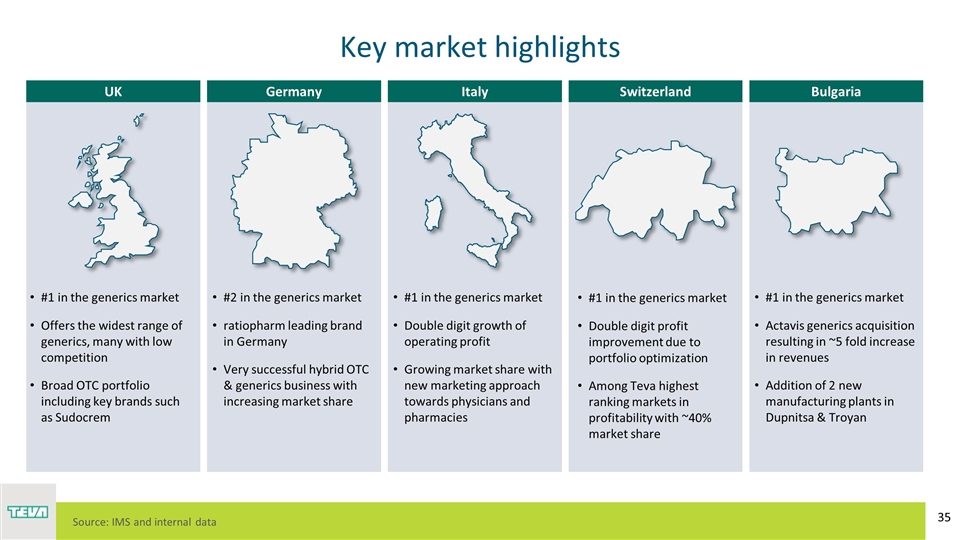
Key market highlights UK Germany Italy Switzerland Bulgaria #1 in the generics market Offers the widest range of generics, many with low competition Broad OTC portfolio including key brands such as Sudocrem #2 in the generics market ratiopharm leading brand in Germany Very successful hybrid OTC & generics business with increasing market share #1 in the generics market Double digit growth of operating profit Growing market share with new marketing approach towards physicians and pharmacies #1 in the generics market Actavis generics acquisition resulting in ~5 fold increase in revenues Addition of 2 new manufacturing plants in Dupnitsa & Troyan #1 in the generics market Double digit profit improvement due to portfolio optimization Among Teva highest ranking markets in profitability with ~40% market share Source: IMS and internal data
Generics Europe – looking forward Solidifying #1 position in Europe by increasing our share in highly profitable markets especially branded generics in Eastern Europe Executing integration plans and maximizing cost and revenue synergies Growing the Actavis brands in conjunction with existing Teva respiratory and women’s health franchises Focus on delivering the launches of the newly combined pipeline Further leverage scale and breadth of business with regional and global customers
EREZ ISRAELI Growth Markets
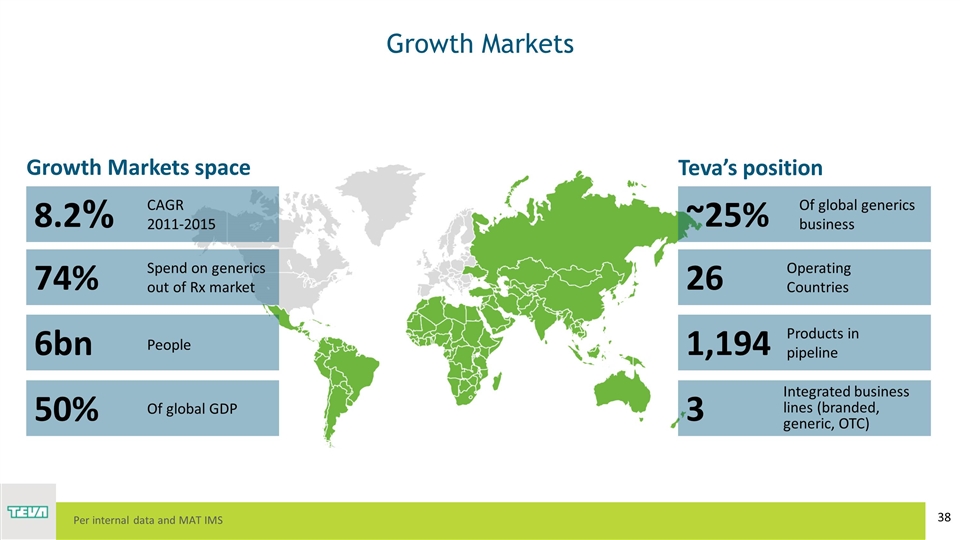
Growth Markets 8.2% 74% 6bn 50% ~25% 26 1,194 3 CAGR 2011-2015 Spend on generics out of Rx market People Of global GDP Operating Countries Products in pipeline Integrated business lines (branded, generic, OTC) Growth Markets space Teva’s position Per internal data and MAT IMS Of global generics business
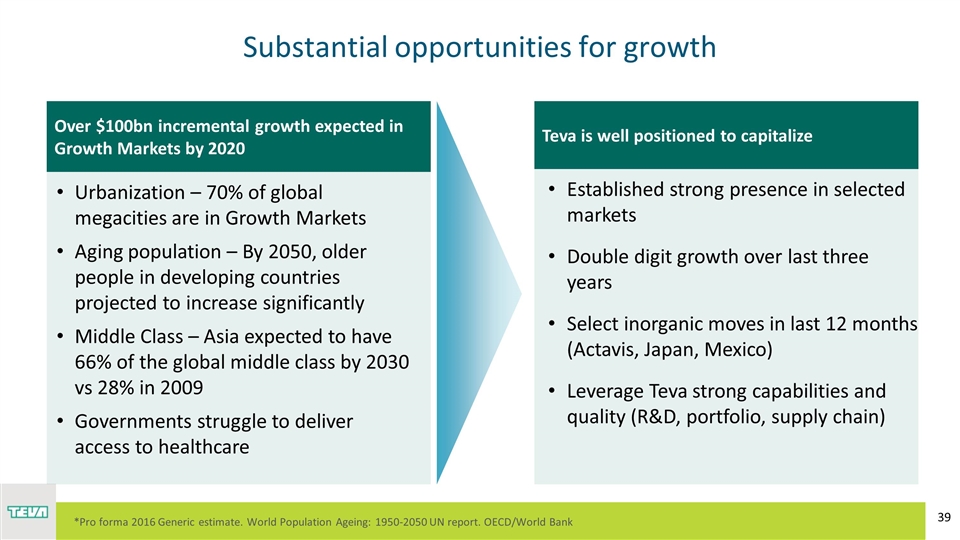
Substantial opportunities for growth Teva is well positioned to capitalize Established strong presence in selected markets Double digit growth over last three years Select inorganic moves in last 12 months (Actavis, Japan, Mexico) Leverage Teva strong capabilities and quality (R&D, portfolio, supply chain) Over $100bn incremental growth expected in Growth Markets by 2020 Urbanization – 70% of global megacities are in Growth Markets Aging population – By 2050, older people in developing countries projected to increase significantly Middle Class – Asia expected to have 66% of the global middle class by 2030 vs 28% in 2009 Governments struggle to deliver access to healthcare *Pro forma 2016 Generic estimate. World Population Ageing: 1950-2050 UN report. OECD/World Bank
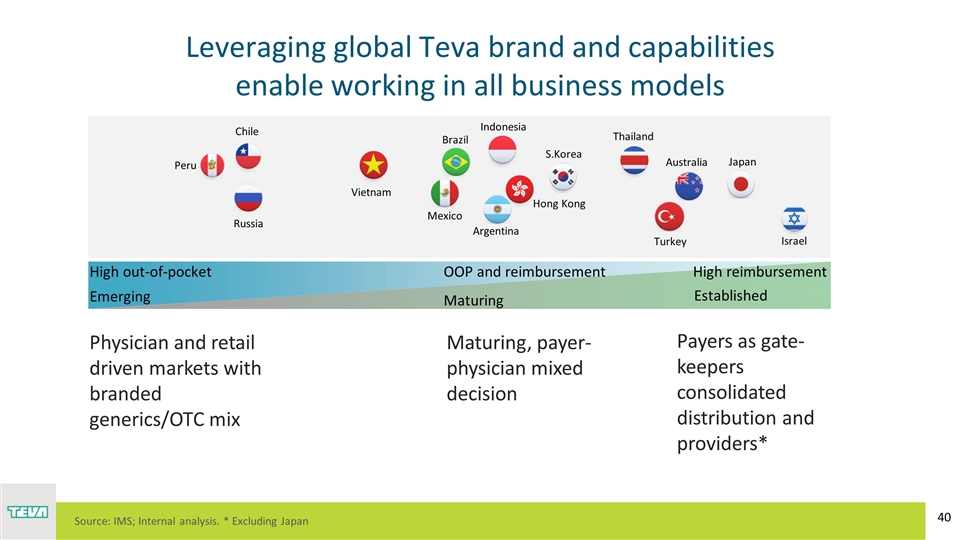
Leveraging global Teva brand and capabilities enable working in all business models Peru Chile Russia Brazil Mexico Argentina S.Korea Turkey Australia Japan Israel Thailand Indonesia Hong Kong Vietnam Physician and retail driven markets with branded generics/OTC mix Maturing, payer-physician mixed decision Payers as gate-keepers consolidated distribution and providers* Emerging Established Maturing High out-of-pocket High reimbursement OOP and reimbursement Source: IMS; Internal analysis. * Excluding Japan

Key market highlights Russia #3 in market Combined portfolio of almost 300 products and strong pipeline Significant commercial presence including 1,000 sales reps Continue to build strong Teva brand to maximize portfolio across OTC, branded genericsand Specialty Source: IMS and internal data Japan #3 in the generic space JV with Takeda established in April, brings strong brand and reputation Broad portfolio of 775 products Significant commercial presence including ~350 sales reps Excellent relations with local authorities and distributors Capitalizing on Teva scale to improve supply chain competitiveness
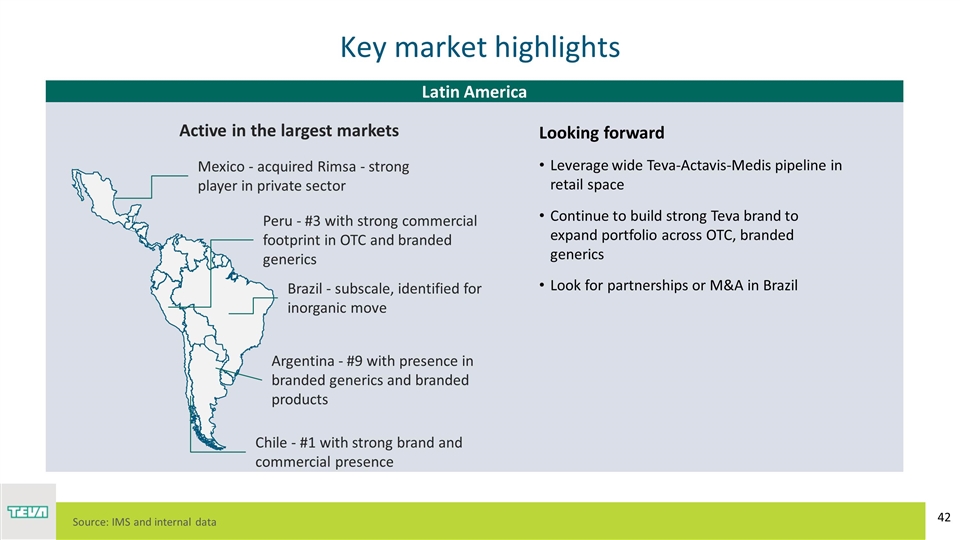
Key market highlights Latin America Source: IMS and internal data Looking forward Leverage wide Teva-Actavis-Medis pipeline in retail space Continue to build strong Teva brand to expand portfolio across OTC, branded generics Look for partnerships or M&A in Brazil Mexico - acquired Rimsa - strong player in private sector Brazil - subscale, identified for inorganic move Chile - #1 with strong brand and commercial presence Peru - #3 with strong commercial footprint in OTC and branded generics Argentina - #9 with presence in branded generics and branded products Active in the largest markets
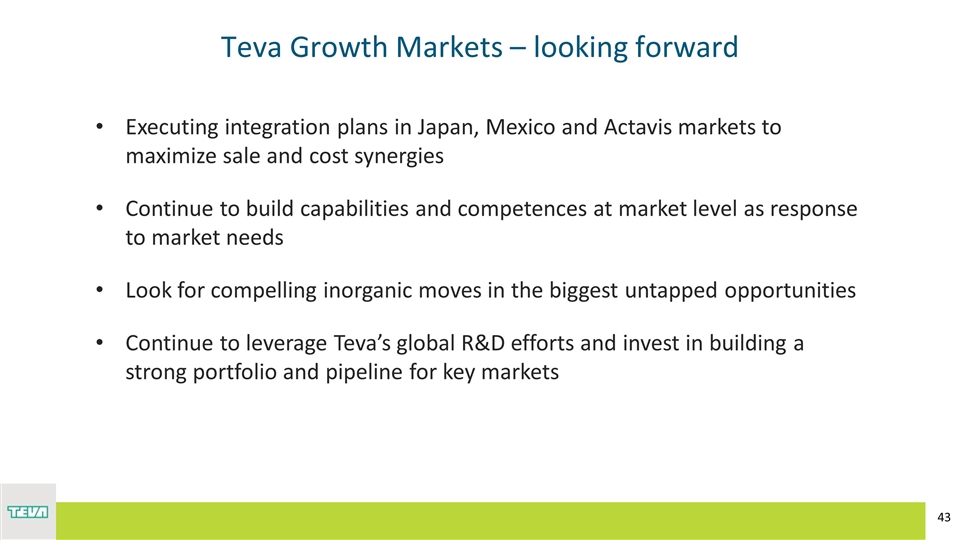
Teva Growth Markets – looking forward Executing integration plans in Japan, Mexico and Actavis markets to maximize sale and cost synergies Continue to build capabilities and competences at market level as response to market needs Look for compelling inorganic moves in the biggest untapped opportunities Continue to leverage Teva’s global R&D efforts and invest in building a strong portfolio and pipeline for key markets
HAFRUN FRIDRIKSDOTTIR Generics R&D
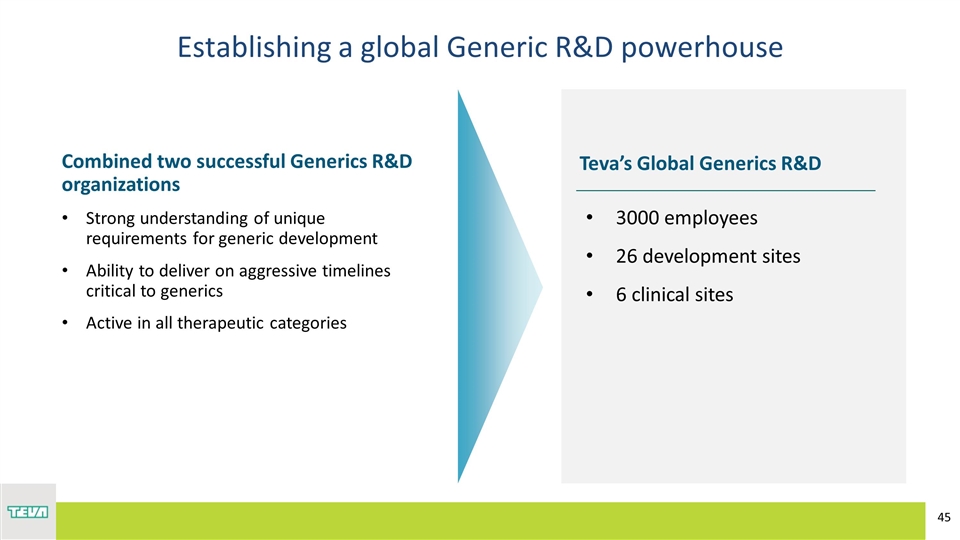
Establishing a global Generic R&D powerhouse Teva’s Global Generics R&D 3000 employees 26 development sites 6 clinical sites Combined two successful Generics R&D organizations Strong understanding of unique requirements for generic development Ability to deliver on aggressive timelines critical to generics Active in all therapeutic categories
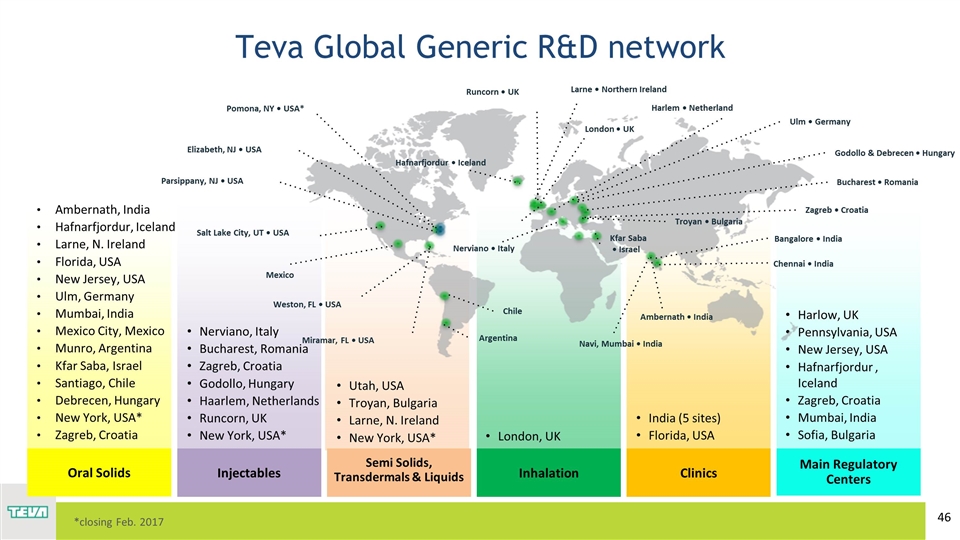
Ambernath, India Hafnarfjordur, Iceland Larne, N. Ireland Florida, USA New Jersey, USA Ulm, Germany Mumbai, India Mexico City, Mexico Munro, Argentina Kfar Saba, Israel Santiago, Chile Debrecen, Hungary New York, USA* Zagreb, Croatia Utah, USA Troyan, Bulgaria Larne, N. Ireland New York, USA* Nerviano, Italy Bucharest, Romania Zagreb, Croatia Godollo, Hungary Haarlem, Netherlands Runcorn, UK New York, USA* London, UK India (5 sites) Florida, USA Harlow, UK Pennsylvania, USA New Jersey, USA Hafnarfjordur , Iceland Zagreb, Croatia Mumbai, India Sofia, Bulgaria Teva Global Generic R&D network Oral Solids Semi Solids, Transdermals & Liquids Injectables Inhalation Clinics Main Regulatory Centers *closing Feb. 2017 Hafnarfjordur • Iceland Salt Lake City, UT • USA Weston, FL • USA Miramar, FL • USA Nerviano • Italy Bucharest • Romania Ambernath • India Bangalore • India Chennai • India Troyan • Bulgaria Navi, Mumbai • India Elizabeth, NJ • USA London • UK Larne • Northern Ireland Parsippany, NJ • USA Zagreb • Croatia Kfar Saba • Israel Pomona, NY • USA* Chile Argentina Ulm • Germany Harlem • Netherland Godollo & Debrecen • Hungary Mexico Runcorn • UK
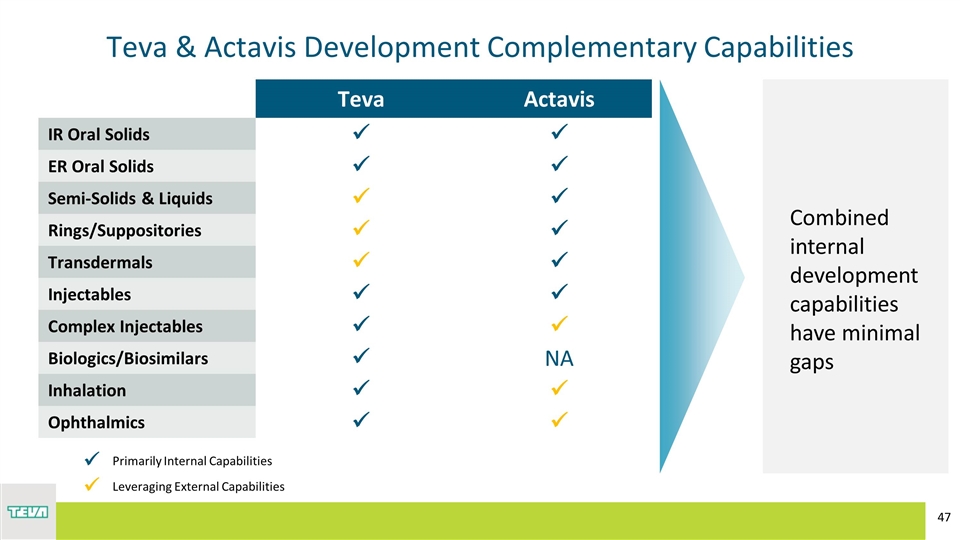
Teva & Actavis Development Complementary Capabilities Teva Actavis IR Oral Solids ü ü ER Oral Solids ü ü Semi-Solids & Liquids ü ü Rings/Suppositories ü ü Transdermals ü ü Injectables ü ü Complex Injectables ü ü Biologics/Biosimilars ü NA Inhalation ü ü Ophthalmics ü ü ü Primarily Internal Capabilities ü Leveraging External Capabilities Combined internal development capabilities have minimal gaps
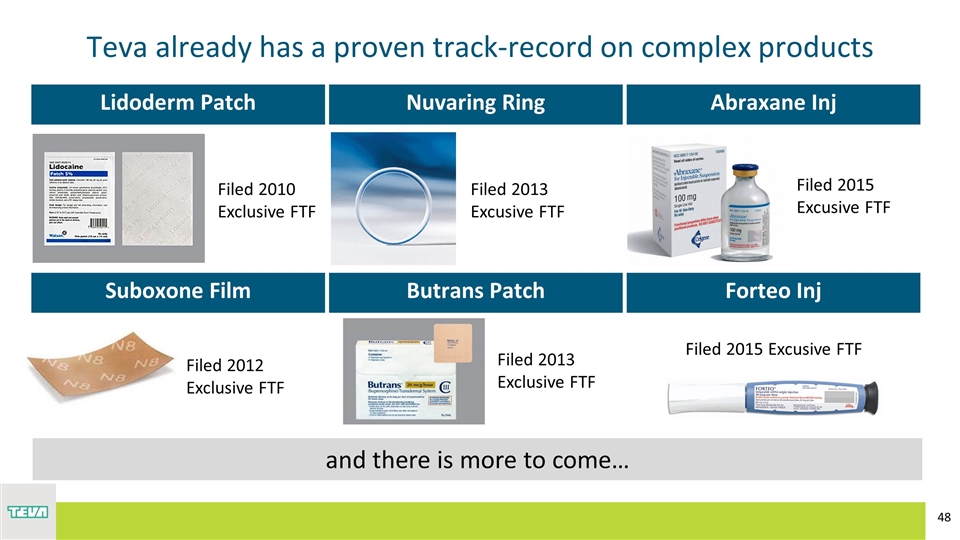
Teva already has a proven track-record on complex products Lidoderm Patch Nuvaring Ring Abraxane Inj Suboxone Film Butrans Patch Forteo Inj Filed 2010 Exclusive FTF Filed 2013 Excusive FTF Filed 2013 Exclusive FTF Filed 2012 Exclusive FTF Filed 2015 Excusive FTF Filed 2015 Excusive FTF and there is more to come…
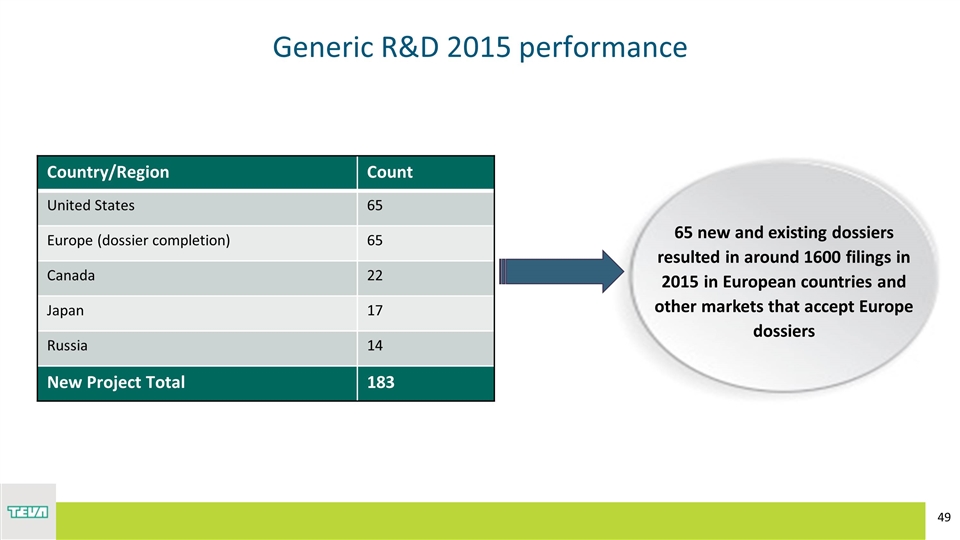
Generic R&D 2015 performance Country/Region Count United States 65 Europe (dossier completion) 65 Canada 22 Japan 17 Russia 14 New Project Total 183 65 new and existing dossiers resulted in around 1600 filings in 2015 in European countries and other markets that accept Europe dossiers
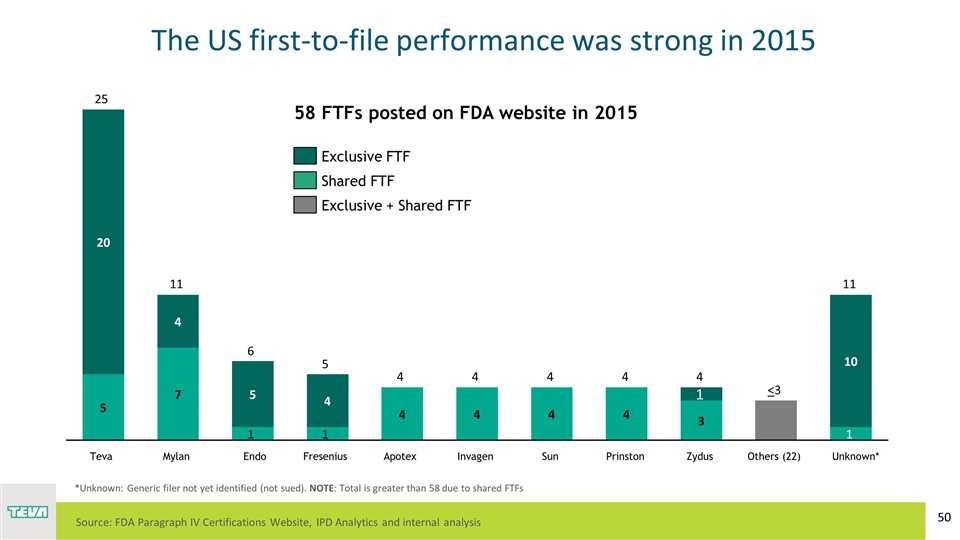
The US first-to-file performance was strong in 2015 Endo Teva Unknown* Others (22) < *Unknown: Generic filer not yet identified (not sued). NOTE: Total is greater than 58 due to shared FTFs 58 FTFs posted on FDA website in 2015 R: 64 G: 49 B: 82 Source: FDA Paragraph IV Certifications Website, IPD Analytics and internal analysis
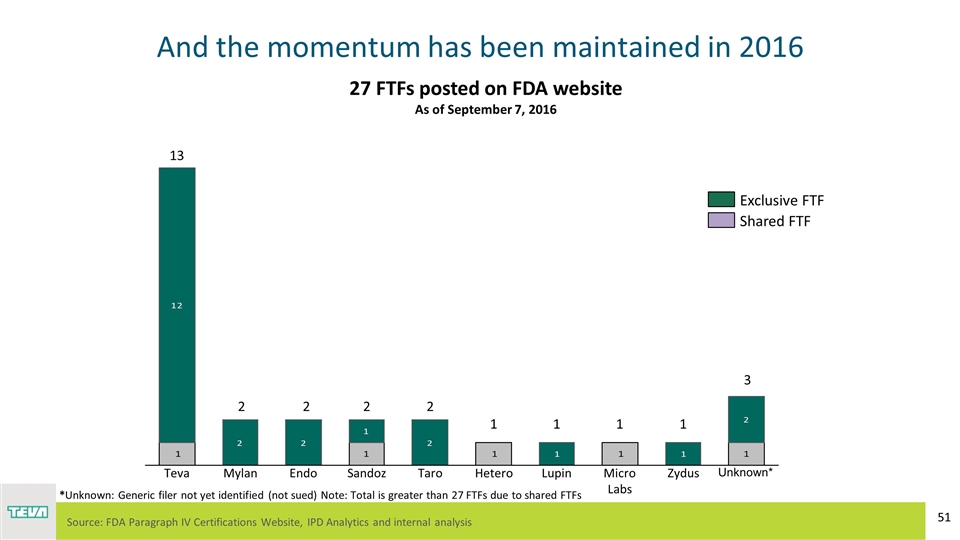
And the momentum has been maintained in 2016 Unknown* Endo Teva Source: FDA Paragraph IV Certifications Website, IPD Analytics and internal analysis *Unknown: Generic filer not yet identified (not sued) Note: Total is greater than 27 FTFs due to shared FTFs 27 FTFs posted on FDA website As of September 7, 2016
Generic R&D – looking forward Integration and optimization of the two R&D organizations Execute against continuous flow of new product opportunities Deliver on the high value products including complex products in respiratory, injectables, and other dosage forms Keep up the momentum - continue being the best of the best
DANIEL MOTTO Portfolio Management
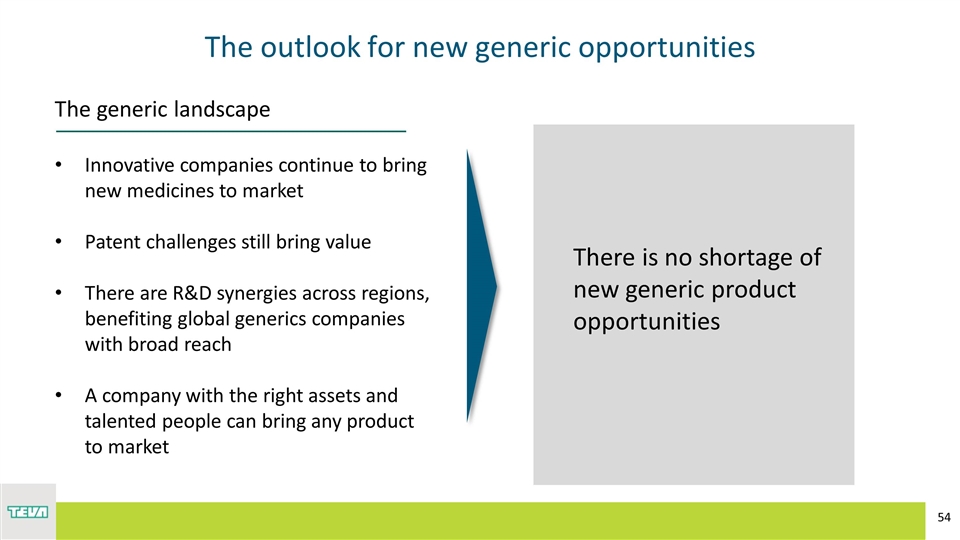
The outlook for new generic opportunities The generic landscape Innovative companies continue to bring new medicines to market Patent challenges still bring value There are R&D synergies across regions, benefiting global generics companies with broad reach A company with the right assets and talented people can bring any product to market There is no shortage of new generic product opportunities
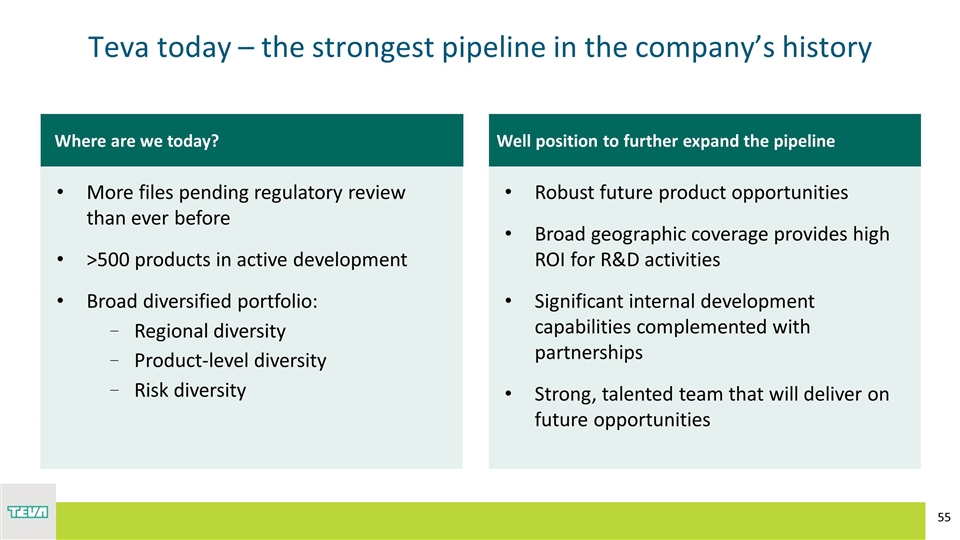
Well position to further expand the pipeline Robust future product opportunities Broad geographic coverage provides high ROI for R&D activities Significant internal development capabilities complemented with partnerships Strong, talented team that will deliver on future opportunities Where are we today? Teva today – the strongest pipeline in the company’s history More files pending regulatory review than ever before >500 products in active development Broad diversified portfolio: Regional diversity Product-level diversity Risk diversity
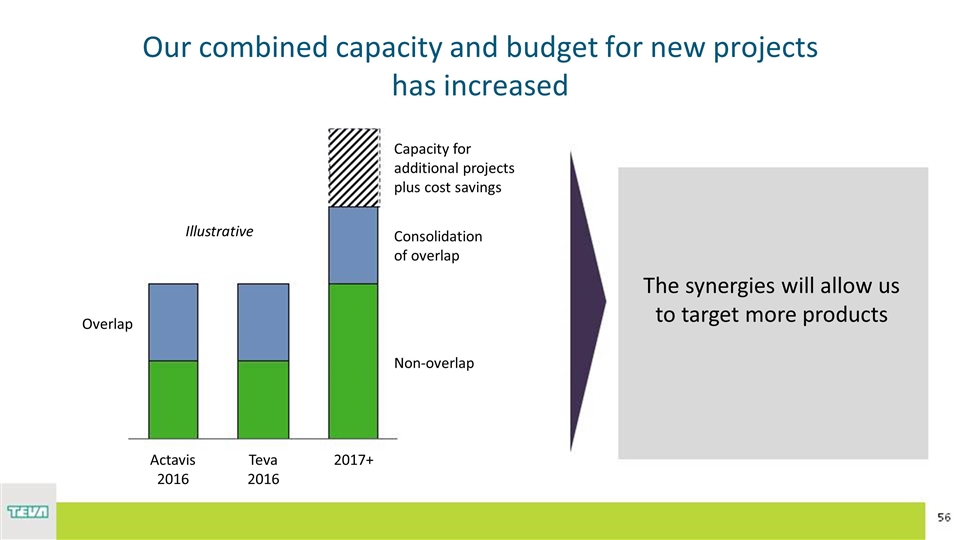
Our combined capacity and budget for new projects has increased The synergies will allow us to target more products Illustrative of overlap Capacity for additional projects plus cost savings 2017+ Teva 2016 Actavis 2016 Non-overlap
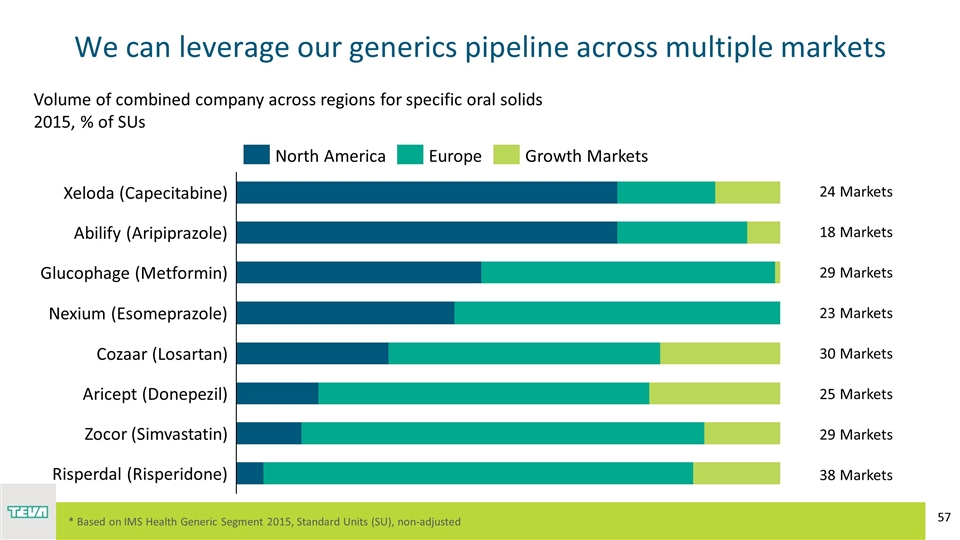
We can leverage our generics pipeline across multiple markets * Based on IMS Health Generic Segment 2015, Standard Units (SU), non-adjusted Volume of combined company across regions for specific oral solids 2015, % of SUs 24 Markets 18 Markets 29 Markets 29 Markets 23 Markets 30 Markets 25 Markets 38 Markets
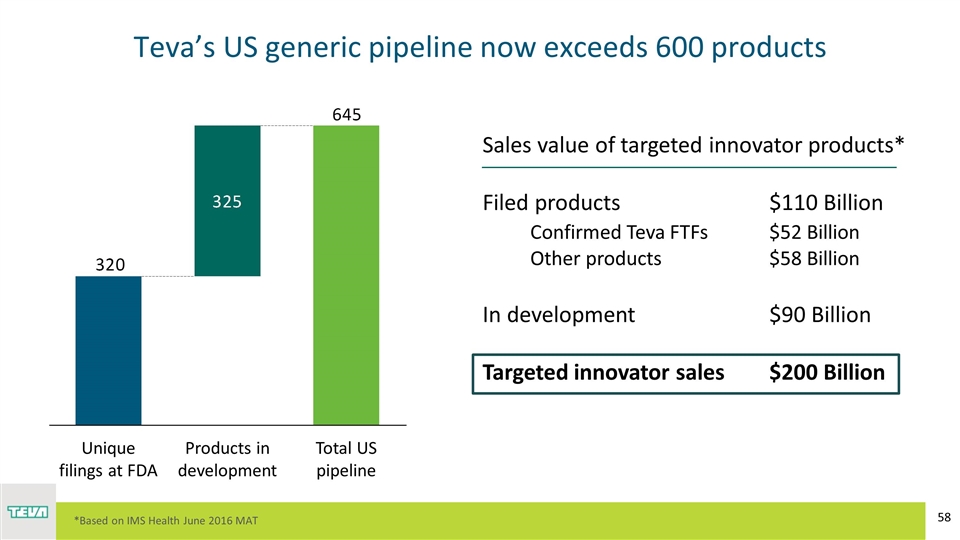
Teva’s US generic pipeline now exceeds 600 products Products in development Sales value of targeted innovator products* Filed products$110 Billion Confirmed Teva FTFs $52 Billion Other products $58 Billion In development$90 Billion Targeted innovator sales$200 Billion *Based on IMS Health June 2016 MAT
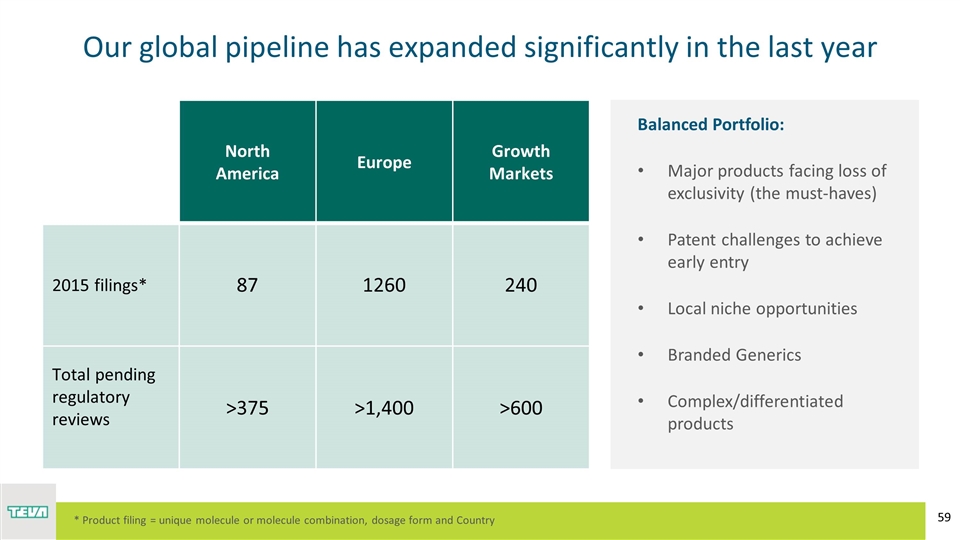
Our global pipeline has expanded significantly in the last year Balanced Portfolio: Major products facing loss of exclusivity (the must-haves) Patent challenges to achieve early entry Local niche opportunities Branded Generics Complex/differentiated products North America Europe Growth Markets 2015 filings* 87 1260 240 Total pending regulatory reviews >375 >1,400 >600 * Product filing = unique molecule or molecule combination, dosage form and Country
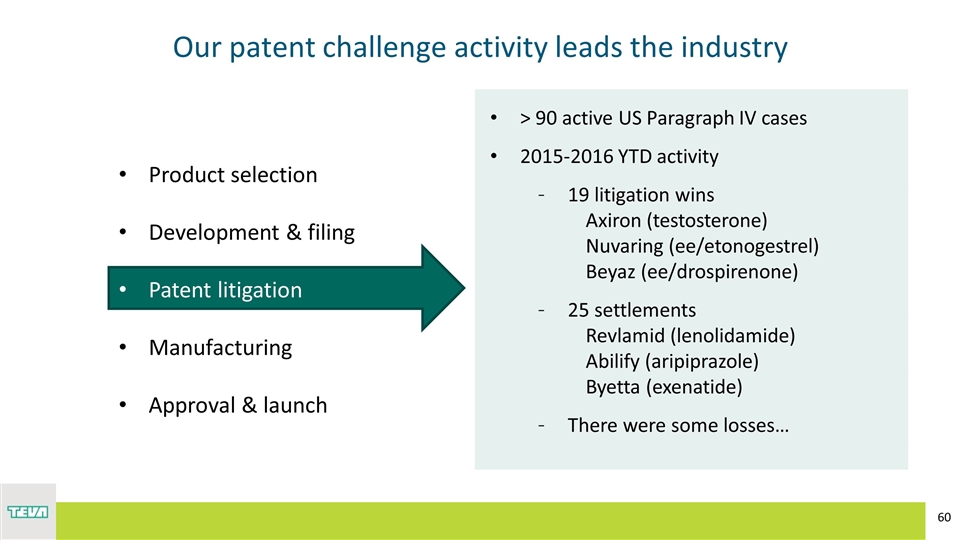
Our patent challenge activity leads the industry Product selection Development & filing Patent litigation Manufacturing Approval & launch > 90 active US Paragraph IV cases 2015-2016 YTD activity 19 litigation wins Axiron (testosterone) Nuvaring (ee/etonogestrel) Beyaz (ee/drospirenone) 25 settlements Revlamid (lenolidamide) Abilify (aripiprazole) Byetta (exenatide) There were some losses…
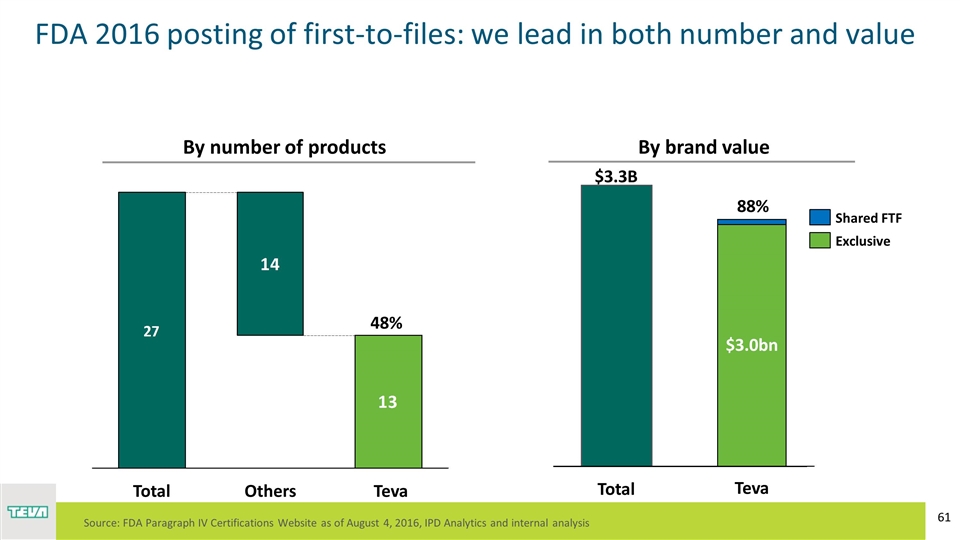
Teva 48% $2.8B By number of products By brand value Teva $3.0bn Exclusive $3.3B Source: FDA Paragraph IV Certifications Website as of August 4, 2016, IPD Analytics and internal analysis $1B 88% FDA 2016 posting of first-to-files: we lead in both number and value
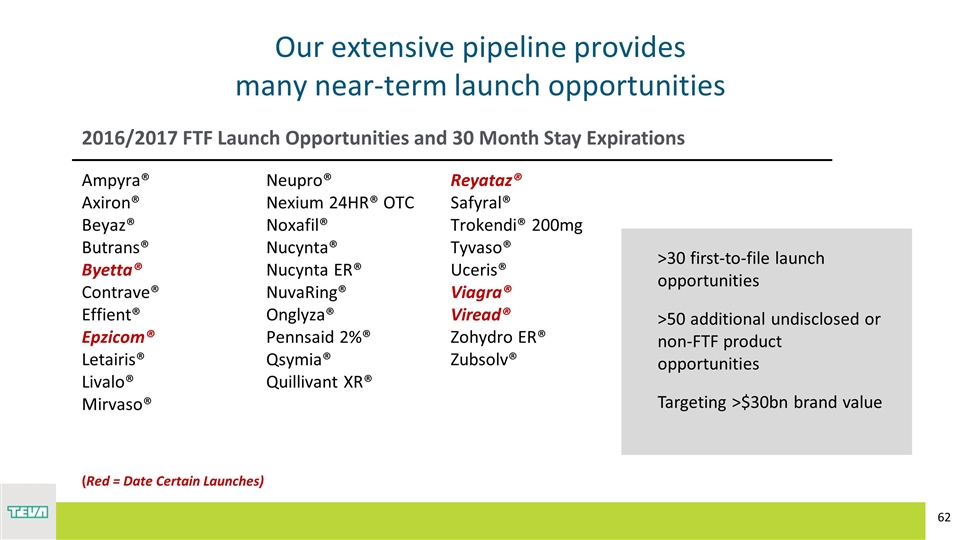
Ampyra® Axiron® Beyaz® Butrans® Byetta® Contrave® Effient® Epzicom® Letairis® Livalo® Mirvaso® Neupro® Nexium 24HR® OTC Noxafil® Nucynta® Nucynta ER® NuvaRing® Onglyza® Pennsaid 2%® Qsymia® Quillivant XR® Reyataz® Safyral® Trokendi® 200mg Tyvaso® Uceris® Viagra® Viread® Zohydro ER® Zubsolv® (Red = Date Certain Launches) 2016/2017 FTF Launch Opportunities and 30 Month Stay Expirations Our extensive pipeline provides many near-term launch opportunities >30 first-to-file launch opportunities >50 additional undisclosed or non-FTF product opportunities Targeting >$30bn brand value
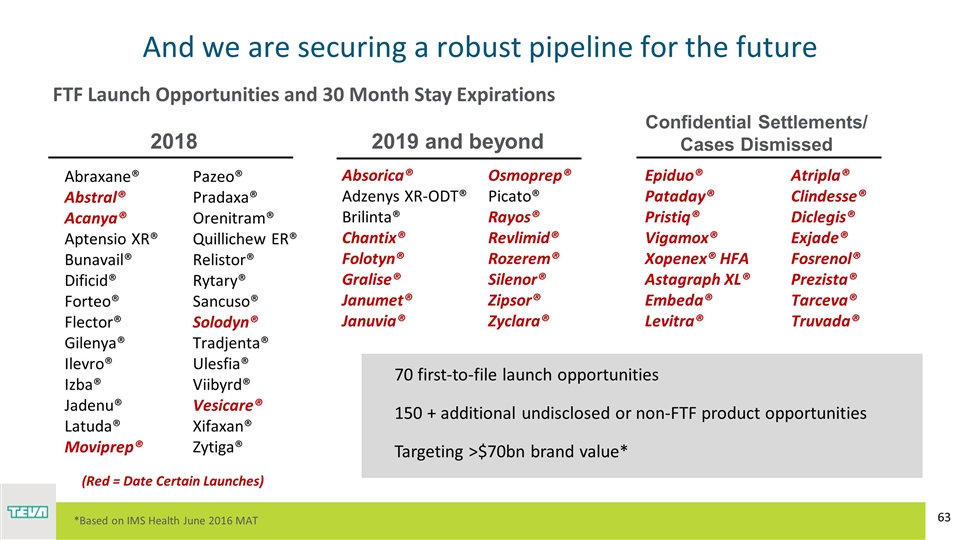
And we are securing a robust pipeline for the future Abraxane® Abstral® Acanya® Aptensio XR® Bunavail® Dificid® Forteo® Flector® Gilenya® Ilevro® Izba® Jadenu® Latuda® Moviprep® Pazeo® Pradaxa® Orenitram® Quillichew ER® Relistor® Rytary® Sancuso® Solodyn® Tradjenta® Ulesfia® Viibyrd® Vesicare® Xifaxan® Zytiga® 2018 Absorica® Adzenys XR-ODT® Brilinta® Chantix® Folotyn® Gralise® Janumet® Januvia® Osmoprep® Picato® Rayos® Revlimid® Rozerem® Silenor® Zipsor® Zyclara® 2019 and beyond FTF Launch Opportunities and 30 Month Stay Expirations 70 first-to-file launch opportunities 150 + additional undisclosed or non-FTF product opportunities Targeting >$70bn brand value* (Red = Date Certain Launches) Confidential Settlements/ Cases Dismissed Epiduo® Pataday® Pristiq® Vigamox® Xopenex® HFA Astagraph XL® Embeda® Levitra® Atripla® Clindesse® Diclegis® Exjade® Fosrenol® Prezista® Tarceva® Truvada® *Based on IMS Health June 2016 MAT
Teva portfolio & pipeline – looking forward Integration of our pipeline and in-market portfolio overlaps Proceed ahead with the most advanced development programs Switch to the most reliable, cost effective supply sources (internal & external) Ongoing new product selection and revisit past ‘no go’ decisions Greater capacity for high-cost or high-risk projects Ability to target smaller, niche opportunities Fully utilize expanded pipeline across markets Prioritization of key opportunities
SIGGI OLAFSSON Global Generic Medicines
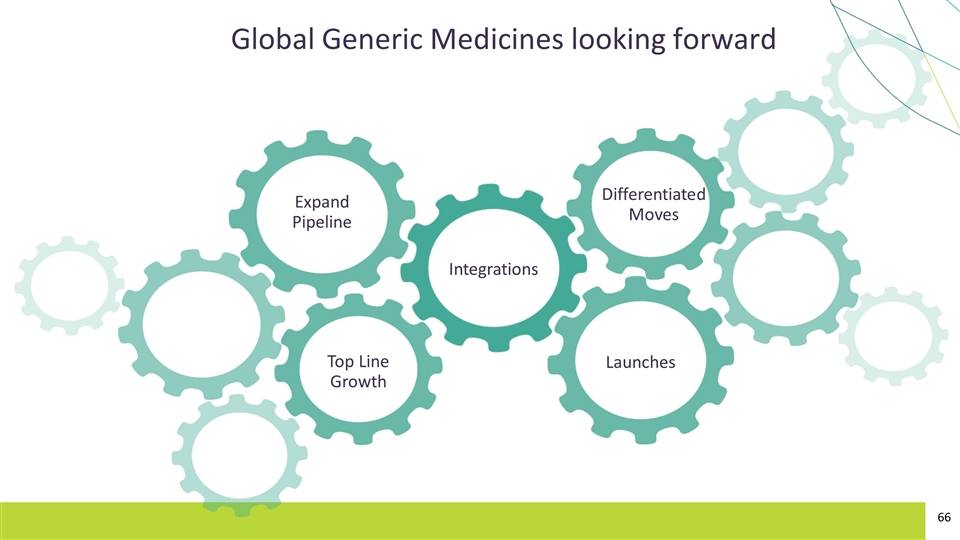
Global Generic Medicines looking forward Integrations Expand Pipeline Top Line Growth Differentiated Moves Launches


