Washington, D.C. 20549
Nuveen New York Municipal Value Fund, Inc.
Gifford R. Zimmerman
Form N-CSR is to be used by management investment companies to file reports with the Commission not later than 10 days after the transmission to stockholders of any report that is required to be transmitted to stockholders under Rule 30e-1 under the Investment Company Act of 1940 (17 CFR 270.30e-1). The Commission may use the information provided on Form N-CSR in its regulatory, disclosure review, inspection, and policymaking roles.
A registrant is required to disclose the information specified by Form N-CSR, and the Commission will make this information public. A registrant is not required to respond to the collection of information contained in Form N-CSR unless the Form displays a currently valid Office of Management and Budget ("OMB") control number. Please direct comments concerning the accuracy of the information collection burden estimate and any suggestions for reducing the burden to Secretary, Securities and Exchange Commission, 450 Fifth Street, NW, Washington, DC 20549-0609. The OMB has reviewed this collection of information under the clearance requirements of 44 U.S.C. ss. 3507.
ITEM 1. REPORTS TO STOCKHOLDERS.
Life is Complex
Nuveen makes things e-simple.
It only takes a minute to sign up for e-Reports. Once enrolled, you’ll receive an e-mail as soon as your Nuveen Fund information is ready—no more waiting for delivery by regular mail. Just click on the link within the e-mail to see the report and save it on your computer if you wish.
Free e-Reports right to your e-mail!
www.investordelivery.com
If you receive your Nuveen Fund dividends and statements from your financial advisor or brokerage account.
or
www.nuveen.com/accountaccess
If you receive your Nuveen Fund dividends and statements directly from Nuveen.

Table of Contents
| Chairman’s Letter to Shareholders | 4 |
| | |
| Portfolio Manager’s Comments | 5 |
| | |
| Fund Leverage | 8 |
| | |
| Common Share Information | 10 |
| | |
| Risk Considerations | 12 |
| | |
| Performance Overview and Holding Summaries | 13 |
| | |
| Shareholder Meeting Report | 17 |
| | |
| Portfolios of Investments | 18 |
| | |
| Statement of Assets and Liabilities | 50 |
| | |
| Statement of Operations | 51 |
| | |
| Statement of Changes in Net Assets | 52 |
| | |
| Statement of Cash Flows | 54 |
| | |
| Financial Highlights | 56 |
| | |
| Notes to Financial Statements | 61 |
| | |
| Additional Fund Information | 77 |
| | |
| Glossary of Terms Used in this Report | 78 |
| | |
| Reinvest Automatically, Easily and Conveniently | 80 |
| | |
| Annual Investment Management Agreement Approval Process | 81 |
Chairman’s Letter to Shareholders

Dear Shareholders,
Some of the key assumptions driving the markets higher at the beginning of 2017 have recently come into question. Following the collapse of the health care reform bill in the Senate, investors are concerned about President Trump’s ability to accomplish the remainder of his pro-growth fiscal agenda, including tax reform and large infrastructure projects. Economic growth projections, in turn, have been lowered and with inflation recently waning, the markets are expecting fewer rate hikes from the Federal Reserve (Fed) than the Fed itself had predicted. Yet, asset prices continued to rise.
Investors have largely looked beyond policy disappointments and focused instead on the healthy profits reported by U.S. companies during the first two quarters of 2017. U.S. growth has remained slow and steady, European growth has surprised to the upside and concern that China would decelerate too rapidly has eased, further contributing to an optimistic tone in the markets. Additionally, political risk in Europe has moderated, with the election of mainstream candidates in the Dutch and French elections earlier this year. As expected, German Chancellor Angela Merkel won a fourth term in September 2017. That election also saw a far-right party entering Parliament for the first time in almost 60 years.
The remainder of the year could bring challenges to this benign macro environment. The U.S. government voted to temporarily increase the nation’s debt limit, but the debate will resume again in December when the current extension of the debt limit expires. In addition, the need for disaster relief and recovery following Hurricanes Harvey, Irma, Maria and Nate has further muddied the outlook on the White House’s promised agenda. Markets will be watching the “Brexit” negotiations and the North American Free Trade Agreement (NAFTA) talks while assessing the implications for key trade and political partnerships. A tightening of financial conditions in China or a more aggressive-than-expected policy action from the Fed, European Central Bank or Bank of Japan could also turn into headwinds. On the geopolitical front, tensions with North Korea may continue to flare.
Market volatility readings have been remarkably low lately, but conditions can change quickly. As market conditions evolve, Nuveen remains committed to rigorously assessing opportunities and risks. If you’re concerned about how resilient your investment portfolio might be, we encourage you to talk to your financial advisor. On behalf of the other members of the Nuveen Fund Board, we look forward to continuing to earn your trust in the months and years ahead.
Sincerely,

William J. Schneider
Chairman of the Board
October 23, 2017
Portfolio Manager’s Comments
Nuveen New York Municipal Value Fund, Inc. (NNY)
Nuveen New York Municipal Value Fund 2 (NYV)
Nuveen New York Quality Municipal Income Fund (NAN)
Nuveen New York AMT-Free Quality Municipal Income Fund (NRK)
These Funds feature portfolio management by Nuveen Asset Management, LLC, an affiliate of Nuveen, LLC. Portfolio manager Scott R. Romans, PhD, discusses key investment strategies and the six-month performance of the Nuveen New York Funds. Scott assumed portfolio management responsibility for these four Funds in 2011.
What key strategies were used to manage the New York Funds during the six-month reporting period ended August 31, 2017?
The broad municipal bond market produced a positive return in this reporting period. A benign macro environment and easing concerns about the impact of the White House’s proposed tax policy on the municipal market helped credit spreads narrow and yields decline, particularly at the longer end of the yield curve. New York’s municipal bond market performed in line with the national market.
We continued to take a bottom-up approach to discovering sectors that appeared undervalued as well as individual credits that we believed had the potential to perform well over the long term. Our trading activity continued to focus on pursuing the Funds’ investment objectives. We bought JFK International Air Terminal revenue bonds, Guam credits and tobacco settlement bonds, although not all of these bonds were purchased in all four Funds. To fund these purchases, we used the proceeds from called and maturing bonds and the sale of some short-maturity credits. In addition, we traded some 4% coupon bonds for 5% coupon structures when credit spreads tightened, which helped improve the Funds’ income distribution capabilities.
As of August 31, 2017, all four of these Funds continued to use inverse floating rate securities. We employ inverse floaters for a variety of reasons, including duration management, income enhancement and total return enhancement. As part of our duration management strategies, NRK also invested in forward interest rates swaps to help reduce price volatility risk to movements in U.S. interest rates relative to the Fund’s benchmark. The swap position slightly detracted from performance, as expected in the falling interest rate environment during this reporting period.
| |
| This material is not intended to be a recommendation or investment advice, does not constitute a solicitation to buy or sell securities, and is not provided in a fiduciary capacity. The information provided does not take into account the specific objectives or circumstances of any particular investor, or suggest any specific course of action. Investment decisions should be made based on an investor’s objectives and circumstances and in consultation with his or her advisors. |
Certain statements in this report are forward-looking statements. Discussions of specific investments are for illustration only and are not intended as recommendations of individual investments. The forward-looking statements and other views expressed herein are those of the portfolio manager as of the date of this report. Actual future results or occurrences may differ significantly from those anticipated in any forward-looking statements, and the views expressed herein are subject to change at any time, due to numerous market and other factors. The Funds disclaim any obligation to update publicly or revise any forward-looking statements or views expressed herein.
For financial reporting purposes, the ratings disclosed are the highest rating given by one of the following national rating agencies: Standard & Poor’s (S&P), Moody’s Investors Service, Inc. (Moody’s) or Fitch, Inc. (Fitch). This treatment of split-rated securities may differ from that used for other purposes, such as for Fund investment policies. Credit ratings are subject to change. AAA, AA, A and BBB are investment grade ratings, while BB, B, CCC, CC, C and D are below investment grade ratings. Certain bonds backed by U.S. Government or agency securities are regarded as having an implied rating equal to the rating of such securities. Holdings designated N/R are not rated by these national rating agencies.
Bond insurance guarantees only the payment of principal and interest on the bond when due, and not the value of the bonds themselves, which will fluctuate with the bond market and the financial success of the issuer and the insurer. Insurance relates specifically to the bonds in the portfolio and not to the share prices of a Fund. No representation is made as to the insurers’ ability to meet their commitments.
Refer to the Glossary of Terms Used in this Report for further definition of the terms used within this section.
Portfolio Manager’s Comments (continued)
How did the New York Funds perform during the six-month reporting period ended August 31, 2017?
The tables in each Fund’s Performance Overview and Holding Summaries section of this report provide the Funds’ total returns for the six-month, one-year, five-year, ten-year and since inception periods ended August 31, 2017. Each Fund’s total returns at net asset value (NAV) are compared with the performance of corresponding market indexes.
For the six-month reporting period ended August 31, 2017, the total return at common share NAV for NNY, NAN and NRK exceeded the returns for both the S&P Municipal Bond New York Index and the national S&P Municipal Bond Index, while NYV’s performance trailed that of both indexes.
The factors influencing the Funds’ performance during this reporting period included yield curve and duration positioning, credit rating allocations and sector allocations. The main positive contributor to the Funds’ relative performance was their longer yield curve and duration positioning. In this reporting period, longer duration bonds outperformed those with shorter durations, and all four Funds held overweight exposures to longer duration credits and underweight exposures to shorter duration credits.
The Funds’ credit ratings allocations were also advantageous to relative performance. The Funds have continued to emphasize lower rated bonds over AAA and AA rated bonds, which was favorable to performance as lower credit quality bonds (A rated and lower) performed better than higher quality (AAA and AA rated) bonds in this reporting period.
On a sector basis, contracting credit spreads helped the Funds’ exposures to the tobacco, industrial development revenue/pollution control revenue (IDR/PCR), transportation and utilities sectors perform well in this reporting period.
In addition, the use of regulatory leverage was a factor affecting the performance of NAN and NRK. NNY and NYV do not use regulatory leverage. Leverage is discussed in more detail later in the Fund Leverage section of this report.
An Update Involving Puerto Rico
As noted in the Funds’ previous shareholder reports, we continue to monitor situations in the broader municipal market for any impact on the Funds’ holdings and performance: Puerto Rico’s ongoing debt restructuring is one such case. Puerto Rico began warning investors in 2014 the island’s debt burden might prove to be unsustainable and the Commonwealth pursued various strategies to deal with this burden.
In June 2016, President Obama signed the Puerto Rico Oversight, Management and Economic Stability Act (PROMESA) into law. The legislation established an independent Financial Oversight and Management Board charged with restructuring Puerto Rico’s financial operations and encouraging economic development. In addition to creating an oversight board, PROMESA also provides a legal framework and court-supervised debt restructuring process that enables Puerto Rico to adjust its debt obligations. In March 2017, the oversight board certified a ten-year fiscal plan projecting revenues, expenditures and a primary fiscal surplus available for debt service over the plan’s horizon. The fiscal plan was considered quite detrimental to creditors, identifying available resources to pay only about 24% of debt service due over the ten year term. In May 2017, the oversight board initiated a bankruptcy-like process for the general government, general obligation debt, the Puerto Rico Sales Tax Financing Corporation (COFINA), the Highways and Transportation Authority (HTA), and the Employee Retirement System. Officials have indicated more public corporations could follow. As of September 2017 (subsequent to the close of this reporting period), Puerto Rico has defaulted on many of its debt obligations, including General Obligation bonds.
In mid-September 2017 Puerto Rico was severely impacted by two hurricanes within the span of just two weeks. The first, Hurricane Irma, did not make direct contact, but caused widespread power outages, initially leaving one million people without power. Before power could be fully restored, Hurricane Maria, a category 4 hurricane, swept diagonally across the island causing massive destruction. Puerto Rico had not been in the direct path of a hurricane for over 85 years. The storm’s 150 mph winds, rain and flooding destroyed the island’s power infrastructure, leaving most residents without power, potable water, or cell service. Rebuilding the island’s power distribution system is expected to take months and some parts of Puerto Rico may need years to fully recover.
Although Puerto Rico’s economy is not overly reliant on tourism, the damage will likely dampen visitors for the remainder of the year, could encourage an increase in outmigration to the U.S., and will undoubtedly have a negative economic impact. Assistance from the Federal Emergency Management Agency (FEMA) will help in the short-term, but unbudgeted costs associated with storm recovery efforts will inevitably pressure government finances and liquidity in the near term, which were already stressed. Puerto Rico’s Oversight Board has said it will approve budgetary adjustments up to an amount of $1 billion to fund emergency relief efforts. Though it’s too early to accurately assess the long-term economic impact of the storms, recovering from the tragic damage caused by the hurricanes will likely prolong the restructuring process that was already underway under PROMESA.
In terms of Puerto Rico holdings, shareholders should note that, as of the end of this reporting period, NYV had no exposure to Puerto Rico debt, NAN held 0.8%, NNY held 2.9% and NRK had an allocation of 2.5%, with all of the Funds’ Puerto Rico holdings in insured bonds. The Puerto Rico credits offered higher yields, added diversification and triple exemption (i.e., exemption from most federal, state and local taxes). Puerto Rico general obligation debt is currently in default and rated Caa3/D/D by Moody’s, S&P and Fitch, respectively, with negative outlooks.
A Note About Investment Valuations
The municipal securities held by the Funds are valued by the Funds’ pricing service using a range of market-based inputs and assumptions. A different municipal pricing service might incorporate different assumptions and inputs into its valuation methodology, potentially resulting in different values for the same securities. Thus, the current net asset value of a Fund’s shares might be impacted, higher or lower, if the Fund were to use a different pricing service, or if its pricing service were to materially change its valuation methodology. On October 4, 2016, the Fund’s then-current municipal bond pricing service was acquired by the parent company of another pricing service, and the combination of the valuation methodologies used by the two organizations took place on October 16, 2017, subsequent to the close of the reporting period of this report. The change of valuation methodologies due to that combination had little or no impact on the net asset value of each Fund’s shares.
Fund Leverage
IMPACT OF THE FUNDS’ LEVERAGE STRATEGIES ON PERFORMANCE
One important factor impacting the returns of the Funds relative to their comparative benchmarks was the Funds’ use of leverage through their issuance of preferred shares and/or investments in inverse floating rate securities, which represent leveraged investments in underlying bonds. NNY and NYV do not use regulatory leverage. The Funds use leverage because our research has shown that, over time, leveraging provides opportunities for additional income, particularly in the recent market environment where short-term market rates are at or near historical lows, meaning that the short-term rates the Fund has been paying on its leveraging instruments have been much lower than the interest the Fund has been earning on its portfolio of long-term bonds that it has bought with the proceeds of that leverage. However, use of leverage also can expose the Fund to additional price volatility. When a Fund uses leverage, the Fund will experience a greater increase in its net asset value if the municipal bonds acquired through the use of leverage increase in value, but it will also experience a correspondingly larger decline in its net asset value if the bonds acquired through leverage decline in value, which will make the Fund’s net asset value more volatile, and its total return performance more variable over time. In addition, income in levered funds will typically decrease in comparison to unlevered funds when short-term interest rates increase and increase when short-term interest rates decrease. Leverage from inverse floating rate securities had a positive impact on performance for NNY and negligible impact on performance for NYV, NAN and NRK over this reporting period. Regulatory leverage had a positive impact on the performance of NAN and NRK over this reporting period.
As of August 31, 2017, the Funds’ percentages of leverage are as shown in the accompanying table.
| | | | NNY | | | NYV | | | NAN | | | NRK | |
| Effective Leverage* | | | 2.08 | % | | 0.00 | % | | 37.76 | % | | 37.08 | % |
| Regulatory Leverage* | | | 0.00 | % | | 0.00 | % | | 33.22 | % | | 36.68 | % |
| * | Effective leverage is a Fund’s effective economic leverage, and includes both regulatory leverage and the leverage effects of certain derivative and other investments in a Fund’s portfolio that increase the Fund’s investment exposure. Currently, the leverage effects of Tender Option Bond (TOB) inverse floater holdings are included in effective leverage values, in addition to any regulatory leverage. Regulatory leverage consists of preferred shares issued or borrowings of a Fund. Both of these are part of a Fund’s capital structure. A Fund, however, may from time to time borrow on a typically transient basis in connection with its day-to-day operations, primarily in connection with the need to settle portfolio trades. Such incidental borrowings are excluded from the calculation of a Fund’s effective leverage ratio. Regulatory leverage is subject to asset coverage limits set forth in the Investment Company Act of 1940. |
THE FUNDS’ REGULATORY LEVERAGE
As of August 31, 2017, the following Funds have issued and outstanding preferred shares as shown in the accompanying table. As mentioned previously, NNY and NYV do not use regulatory leverage.
| | | | Variable Rate Preferred* | | | Variable Rate
Remarketed
Preferred** | | | | |
| | | | Shares | | | Shares | | | | |
| | | | Issued at | | | Issued at | | | | |
| | | | Liquidation | | | Liquidation | | | | |
| | | | Preference | | | Preference | | | Total | |
| NAN | | $ | 147,000,000 | | $ | 89,000,000 | | $ | 236,000,000 | |
| NRK | | $ | — | | $ | 743,800,000 | | $ | 743,800,000 | |
| * | Preferred shares of the Fund featuring a floating rate dividend based on a predetermined formula or spread to an index rate. Includes the following preferred shares iMTP, VMTP, MFP-VRM and VRDP in Special Rate Mode, where applicable. See Notes to Financial Statements, Note 4 - Fund Shares, Preferred Shares for further details. |
| ** | Preferred shares of the Fund featuring floating rate dividends set by a remarketing agent via a regular remarketing. Includes the following preferred shares VRDP not in special rate mode, MFP-VRRM and MFP-VRDM, where applicable. See Notes to Financial Statements, Note 4 - Fund Shares, Preferred Shares for further details. |
Refer to Notes to Financial Statements, Note 4 – Fund Shares, Preferred Shares for further details on preferred shares and each Funds’ respective transactions.
Common Share Information
COMMON SHARE DISTRIBUTION INFORMATION
The following information regarding the Funds’ distributions is current as of August 31, 2017. Each Fund’s distribution levels may vary over time based on each Fund’s investment activity and portfolio investments value changes.
During the current reporting period, each Fund’s distributions to common shareholders were as shown in the accompanying table.
| | | | Per Common Share Amounts | |
| Monthly Distributions (Ex-Dividend Date) | | | NNY | | | NYV | | | NAN | | | NRK | |
| March 2017 | | $ | 0.0315 | | $ | 0.0500 | | $ | 0.0595 | | $ | 0.0535 | |
| April | | | 0.0315 | | | 0.0500 | | | 0.0595 | | | 0.0535 | |
| May | | | 0.0315 | | | 0.0500 | | | 0.0595 | | | 0.0535 | |
| June | | | 0.0315 | | | 0.0500 | | | 0.0595 | | | 0.0535 | |
| July | | | 0.0315 | | | 0.0500 | | | 0.0595 | | | 0.0535 | |
| August 2017 | | | 0.0315 | | | 0.0500 | | | 0.0595 | | | 0.0535 | |
| Total Distributions from Net Investment Income | | $ | 0.1890 | | $ | 0.3000 | | $ | 0.3570 | | $ | 0.3210 | |
| | | | | | | | | | | | | | |
| Yields | | | | | | | | | | | | | |
| Market Yield* | | | 3.72 | % | | 3.99 | % | | 4.98 | % | | 4.80 | % |
| Taxable-Equivalent Yield* | | | 5.54 | % | | 5.94 | % | | 7.41 | % | | 7.14 | % |
| * | Market Yield is based on the Fund’s current annualized monthly dividend divided by the Fund’s current market price as of the end of the reporting period. Taxable-Equivalent Yield represents the yield that must be earned on a fully taxable investment in order to equal the yield of the Fund on an after-tax basis. It is based on a combined federal and state income tax rate of 32.8%. When comparing a Fund to investments that generate qualified dividend income, the Taxable-Equivalent Yield would be lower. |
Each Fund in this report seeks to pay regular monthly dividends out of its net investment income at a rate that reflects its past and projected net income performance. To permit each Fund to maintain a more stable monthly dividend, the Fund may pay dividends at a rate that may be more or less than the amount of net income actually earned by the Fund during the period. If a Fund has cumulatively earned more than it has paid in dividends, it will hold the excess in reserve as undistributed net investment income (UNII) as part of the Fund’s net asset value. Conversely, if a Fund has cumulatively paid in dividends more than it has earned, the excess will constitute a negative UNII that will likewise be reflected in the Fund’s net asset value. Each Fund will, over time, pay all its net investment income as dividends to shareholders.
As of August 31, 2017, all of the Funds had positive UNII balances, based upon our best estimate, for tax purposes. NNY, NYV and NAN had positive UNII balances while NRK had a negative UNII balance for financial reporting purposes.
All monthly dividends paid by each Fund during the current reporting period were paid from net investment income. If a portion of the Fund’s monthly distributions was sourced from or comprised of elements other than net investment income, including capital gains and/or a return of capital, shareholders would have received a notice to that effect. For financial reporting purposes, the composition and per share amounts of each Fund’s dividends for the reporting period are presented in this report’s Statement of
Changes in Net Assets and Financial Highlights, respectively. For income tax purposes, distribution information for each Fund as of its most recent tax year end is presented in Note 6 — Income Tax Information within the Notes to Financial Statements of this report.
COMMON SHARE REPURCHASES
During August 2017, the Funds’ Board of Directors/Trustees reauthorized an open-market share repurchase program, allowing each Fund to repurchase an aggregate of up to approximately 10% of its outstanding shares.
As of August 31, 2017, and since the inception of the Funds’ repurchase programs, the Funds have cumulatively repurchased and retired their outstanding common shares as shown in the accompanying table.
| | | | NNY | | | NYV | | | NAN | | | NRK | |
| Common shares cumulatively repurchased and retired | | | — | | | — | | | 2,500 | | | 6,800 | |
| Common shares authorized for repurchase | | | 1,520,000 | | | 235,000 | | | 3,115,000 | | | 8,760,000 | |
During the current reporting period, the Funds did not repurchase any of their outstanding common shares.
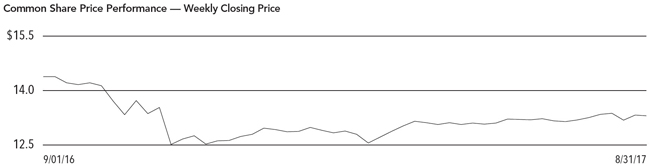
OTHER COMMON SHARE INFORMATION
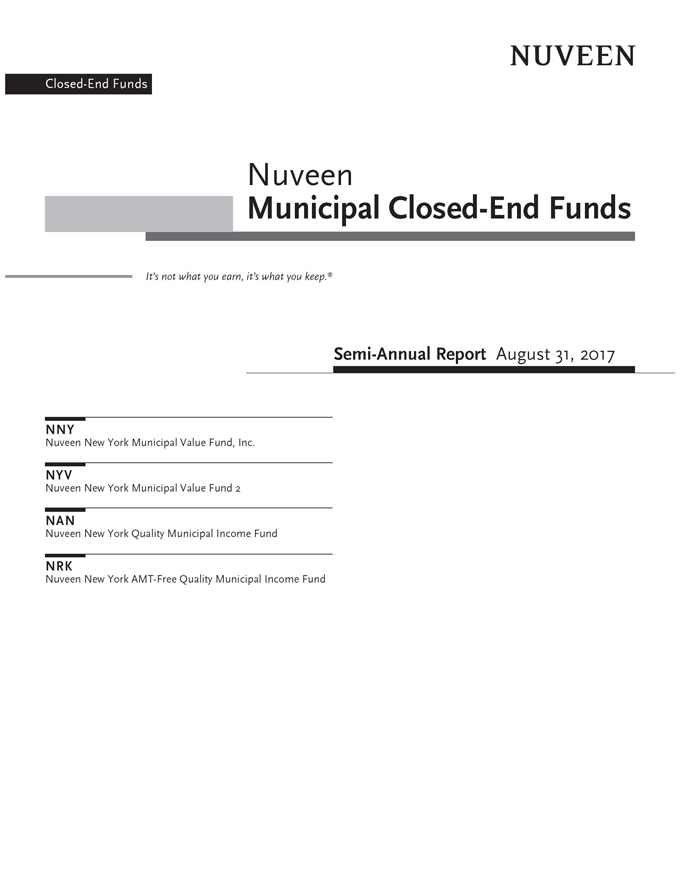
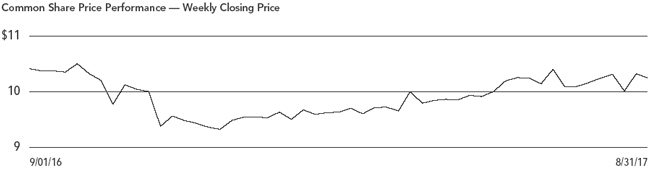
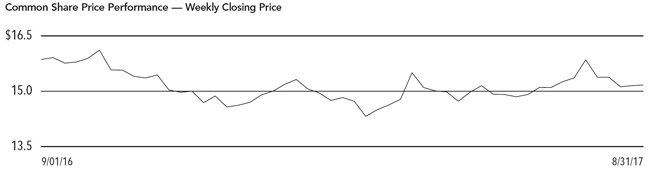
As of August 31, 2017, and during the current reporting period, the Funds’ common share prices were trading at a premium/(discount) to their common share NAVs as shown in the accompanying table.
| | | | NNY | | | NYV | | | NAN | | | NRK | |
| Common share NAV | | $ | 10.06 | | $ | 15.65 | | $ | 15.24 | | $ | 14.65 | |
| Common share price | | $ | 10.16 | | $ | 15.04 | | $ | 14.35 | | $ | 13.37 | |
| Premium/(Discount) to NAV | | | 0.99 | % | | (3.90 | )% | | (5.84 | )% | | (8.74 | )% |
| 6-month average premium/(discount) to NAV | | | 0.21 | % | | (4.63 | )% | | (7.36 | )% | | (9.16 | )% |
Risk Considerations
Fund shares are not guaranteed or endorsed by any bank or other insured depository institution, and are not federally insured by the Federal Deposit Insurance Corporation.
Nuveen New York Municipal Value Fund, Inc. (NNY)
Investing in closed-end funds involves risk; principal loss is possible. There is no guarantee the Fund’s investment objectives will be achieved. Closed-end fund shares may frequently trade at a discount or premium to their net asset value. Debt or fixed income securities such as those held by the Fund, are subject to market risk, credit risk, interest rate risk, derivatives risk, liquidity risk, and income risk. As interest rates rise, bond prices fall. State concentration makes the Fund more susceptible to local adverse economic, political, or regulatory changes affecting municipal bond issuers. These and other risk considerations such as tax risk are described in more detail on the Fund’s web page at www.nuveen.com/NNY.
Nuveen New York Municipal Value Fund 2 (NYV)
Investing in closed-end funds involves risk; principal loss is possible. There is no guarantee the Fund’s investment objectives will be achieved. Closed-end fund shares may frequently trade at a discount or premium to their net asset value. Debt or fixed income securities such as those held by the Fund, are subject to market risk, credit risk, interest rate risk, derivatives risk, liquidity risk, and income risk. As interest rates rise, bond prices fall. State concentration makes the Fund more susceptible to local adverse economic, political, or regulatory changes affecting municipal bond issuers. These and other risk considerations such as tax risk are described in more detail on the Fund’s web page at www.nuveen.com/NYV.
Nuveen New York Quality Municipal Income Fund (NAN)
Investing in closed-end funds involves risk; principal loss is possible. There is no guarantee the Fund’s investment objectives will be achieved. Closed-end fund shares may frequently trade at a discount or premium to their net asset value. Debt or fixed income securities such as those held by the Fund, are subject to market risk, credit risk, interest rate risk, derivatives risk, liquidity risk, and income risk. As interest rates rise, bond prices fall. Leverage increases return volatility and magnifies the Fund’s potential return and its risks; there is no guarantee a fund’s leverage strategy will be successful. State concentration makes the Fund more susceptible to local adverse economic, political, or regulatory changes affecting municipal bond issuers. These and other risk considerations such as inverse floater risk and tax risk are described in more detail on the Fund’s web page at www.nuveen.com/NAN.
Nuveen New York AMT-Free Quality Municipal Income Fund (NRK)
Investing in closed-end funds involves risk; principal loss is possible. There is no guarantee the Fund’s investment objectives will be achieved. Closed-end fund shares may frequently trade at a discount or premium to their net asset value. Debt or fixed income securities such as those held by the Fund, are subject to market risk, credit risk, interest rate risk, derivatives risk, liquidity risk, and income risk. As interest rates rise, bond prices fall. Leverage increases return volatility and magnifies the Fund’s potential return and its risks; there is no guarantee a fund’s leverage strategy will be successful. State concentration makes the Fund more susceptible to local adverse economic, political, or regulatory changes affecting municipal bond issuers. These and other risk considerations such as inverse floater risk and tax risk are described in more detail on the Fund’s web page at www.nuveen.com/NRK.
| NNY | |
| | Nuveen New York Municipal Value Fund, Inc. |
| | Performance Overview and Holding Summaries as of August 31, 2017 |
Refer to the Glossary of Terms Used in this Report for further definition of the terms used within this section.
Average Annual Total Returns as of August 31, 2017
| | Cumulative | | Average Annual |
| | 6-Month | | 1-Year | 5-Year | 10-Year | |
| NNY at Common Share NAV | 3.66% | | 0.49% | 3.32% | 4.60% | |
| NNY at Common Share Price | 6.75% | | 1.83% | 3.67% | 5.28% | |
| S&P Municipal Bond New York Index | 3.56% | | 0.88% | 3.30% | 4.62% | |
| S&P Municipal Bond Index | 3.51% | | 0.92% | 3.31% | 4.65% | |
Past performance is not predictive of future results. Current performance may be higher or lower than the data shown. Returns do not reflect the deduction of taxes that shareholders may have to pay on Fund distributions or upon the sale of Fund shares. Returns at NAV are net of Fund expenses, and assume reinvestment of distributions. Comparative index return information is provided for the Fund’s shares at NAV only. Indexes are not available for direct investment.
This data relates to the securities held in the Fund’s portfolio of investments as of the end of the reporting period. It should not be construed as a measure of performance for the Fund itself. Holdings are subject to change.
For financial reporting purposes, the ratings disclosed are the highest rating given by one of the following national rating agencies: Standard & Poor’s Group, Moody’s Investors Service, Inc. or Fitch, Inc. This treatment of split-rated securities may differ from that used for other purposes, such as for Fund investment policies. Credit ratings are subject to change. AAA, AA, A and BBB are investment grade ratings; BB, B, CCC, CC, C and D are below-investment grade ratings. Certain bonds backed by U.S. Government or agency securities are regarded as having an implied rating equal to the rating of such securities. Holdings designated N/R are not rated by these national rating agencies.
| Fund Allocation | |
| (% of net assets) | |
| Long-Term Municipal Bonds | 100.7% |
| Other Assets Less Liabilities | 1.4% |
| Net Assets Plus Floating Rate Obligations | 102.1% |
| Floating Rate Obligations | (2.1)% |
| Net Assets | 100% |
| Portfolio Composition | |
| (% of total investments) | |
| Transportation | 24.1% |
| Education and Civic Organizations | 19.2% |
| Tax Obligation/Limited | 16.7% |
| U.S. Guaranteed | 13.7% |
| Utilities | 8.1% |
| Water and Sewer | 4.5% |
| Other | 13.7% |
| Total | 100% |
| Portfolio Credit Quality | |
| (% of total investment exposure) | |
| AAA/U.S. Guaranteed | 27.3% |
| AA | 36.5% |
| A | 17.4% |
| BBB | 6.8% |
| BB or Lower | 8.7% |
| N/R (not rated) | 3.3% |
| Total | 100% |
| NYV | |
| | Nuveen New York Municipal Value Fund 2 |
| | Performance Overview and Holding Summaries as of August 31, 2017 |
Refer to the Glossary of Terms Used in this Report for further definition of the terms used within this section.
Average Annual Total Returns as of August 31, 2017
| | Cumulative | | Average Annual | |
| | 6-Month | | 1-Year | 5-Year | Since Inception | |
| NYV at Common Share NAV | 3.20% | | 0.11% | 3.38% | 5.51% | |
| NYV at Common Share Price | 3.17% | | (1.64)% | 3.57% | 4.67% | |
| S&P Municipal Bond New York Index | 3.56% | | 0.88% | 3.30% | 4.88% | |
| S&P Municipal Bond Index | 3.51% | | 0.92% | 3.31% | 5.10% | |
Since inception returns are from 4/28/09. Past performance is not predictive of future results. Current performance may be higher or lower than the data shown. Returns do not reflect the deduction of taxes that shareholders may have to pay on Fund distributions or upon the sale of Fund shares. Returns at NAV are net of Fund expenses, and assume reinvestment of distributions. Comparative index return information is provided for the Fund’s shares at NAV only. Indexes are not available for direct investment.
This data relates to the securities held in the Fund’s portfolio of investments as of the end of the reporting period. It should not be construed as a measure of performance for the Fund itself. Holdings are subject to change.
For financial reporting purposes, the ratings disclosed are the highest rating given by one of the following national rating agencies: Standard & Poor’s Group, Moody’s Investors Service, Inc. or Fitch, Inc. This treatment of split-rated securities may differ from that used for other purposes, such as for Fund investment policies. Credit ratings are subject to change. AAA, AA, A and BBB are investment grade ratings; BB, B, CCC, CC, C and D are below-investment grade ratings. Certain bonds backed by U.S. Government or agency securities are regarded as having an implied rating equal to the rating of such securities. Holdings designated N/R are not rated by these national rating agencies.
| Fund Allocation | |
| (% of net assets) | |
| Long-Term Municipal Bonds | 95.4% |
| Short-Term Municipal Bonds | 1.4% |
| Other Assets Less Liabilities | 3.2% |
| Net Assets | 100% |
| Portfolio Composition | |
| (% of total investments) | |
| U.S. Guaranteed | 22.0% |
| Transportation | 15.3% |
| Education and Civic Organizations | 15.2% |
| Tax Obligation/Limited | 13.2% |
| Water and Sewer | 9.6% |
| Tax Obligation/General | 7.0% |
| Other | 17.7% |
| Total | 100% |
| Portfolio Credit Quality | |
| (% of total investment exposure) | |
| AAA/U.S. Guaranteed | 36.8% |
| AA | 36.8% |
| A | 6.6% |
| BBB | 6.8% |
| BB or Lower | 8.8% |
| N/R (not rated) | 4.2% |
| Total | 100% |
| NAN | |
| | Nuveen New York Quality Municipal Income Fund |
| | Performance Overview and Holding Summaries as of August 31, 2017 |
Refer to the Glossary of Terms Used in this Report for further definition of the terms used within this section.
Average Annual Total Returns as of August 31, 2017
| | Cumulative | | Average Annual | |
| | 6-Month | | 1-Year | 5-Year | 10-Year | |
| NAN at Common Share NAV | 5.08% | | 0.16% | 4.11% | 5.81% | |
| NAN at Common Share Price | 7.05% | | (1.92)% | 3.63% | 5.86% | |
| S&P Municipal Bond New York Index | 3.56% | | 0.88% | 3.30% | 4.62% | |
| S&P Municipal Bond Index | 3.51% | | 0.92% | 3.31% | 4.65% | |
Past performance is not predictive of future results. Current performance may be higher or lower than the data shown. Returns do not reflect the deduction of taxes that shareholders may have to pay on Fund distributions or upon the sale of Fund shares. Returns at NAV are net of Fund expenses, and assume reinvestment of distributions. Comparative index return information is provided for the Fund’s shares at NAV only. Indexes are not available for direct investment.
This data relates to the securities held in the Fund’s portfolio of investments as of the end of the reporting period. It should not be construed as a measure of performance for the Fund itself. Holdings are subject to change.
For financial reporting purposes, the ratings disclosed are the highest rating given by one of the following national rating agencies: Standard & Poor’s Group, Moody’s Investors Service, Inc. or Fitch, Inc. This treatment of split-rated securities may differ from that used for other purposes, such as for Fund investment policies. Credit ratings are subject to change. AAA, AA, A and BBB are investment grade ratings; BB, B, CCC, CC, C and D are below-investment grade ratings. Certain bonds backed by U.S. Government or agency securities are regarded as having an implied rating equal to the rating of such securities. Holdings designated N/R are not rated by these national rating agencies.
| Fund Allocation | |
| (% of net assets) | |
| Long-Term Municipal Bonds | 151.9% |
| Other Assets Less Liabilities | 3.8% |
| Net Assets Plus Floating Rate Obligations, VMTP Shares, net of deferred offering costs & VRDP Shares, net of deferred offering costs | 155.7% |
| Floating Rate Obligations | (6.2)% |
| VMTP Shares, net of deferred offering costs | (31.0)% |
| VRDP Shares, net of deferred offering costs | (18.5)% |
| Net Assets | 100% |
| Portfolio Composition | |
| (% of total investments) | |
| Transportation | 18.5% |
| Education and Civic Organizations | 17.0% |
| Tax Obligation/Limited | 16.1% |
| U.S. Guaranteed | 11.7% |
| Utilities | 7.4% |
| Tax Obligation/General | 7.0% |
| Water and Sewer | 6.6% |
| Consumer Staples | 5.5% |
| Other | 10.2% |
| Total | 100% |
| Portfolio Credit Quality | |
| (% of total investment exposure) | |
| AAA/U.S. Guaranteed | 26.0% |
| AA | 37.8% |
| A | 13.8% |
| BBB | 7.0% |
| BB or Lower | 9.9% |
| N/R (not rated) | 5.5% |
| Total | 100% |
| NRK | |
| | Nuveen New York AMT-Free Quality Municipal Income Fund |
| | Performance Overview and Holding Summaries as of August 31, 2017 |
Refer to the Glossary of Terms Used in this Report for further definition of the terms used within this section.
Average Annual Total Returns as of August 31, 2017
| | Cumulative | | Average Annual | |
| | 6-Month | | 1-Year | 5-Year | 10-Year | |
| NRK at Common Share NAV | 5.41% | | (0.04)% | 4.09% | 5.29% | |
| NRK at Common Share Price | 5.94% | | (2.27)% | 2.70% | 5.09% | |
| S&P Municipal Bond New York Index | 3.56% | | 0.88% | 3.30% | 4.62% | |
| S&P Municipal Bond Index | 3.51% | | 0.92% | 3.31% | 4.65% | |
Past performance is not predictive of future results. Current performance may be higher or lower than the data shown. Returns do not reflect the deduction of taxes that shareholders may have to pay on Fund distributions or upon the sale of Fund shares. Returns at NAV are net of Fund expenses, and assume reinvestment of distributions. Comparative index return information is provided for the Fund’s shares at NAV only. Indexes averages are not available for direct investment.
This data relates to the securities held in the Fund’s portfolio of investments as of the end of the reporting period. It should not be construed as a measure of performance for the Fund itself. Holdings are subject to change.
For financial reporting purposes, the ratings disclosed are the highest rating given by one of the following national rating agencies: Standard & Poor’s Group, Moody’s Investors Service, Inc. or Fitch, Inc. This treatment of split-rated securities may differ from that used for other purposes, such as for Fund investment policies. Credit ratings are subject to change. AAA, AA, A and BBB are investment grade ratings; BB, B, CCC, CC, C and D are below-investment grade ratings. Certain bonds backed by U.S. Government or agency securities are regarded as having an implied rating equal to the rating of such securities. Holdings designated N/R are not rated by these national rating agencies.
| Fund Allocation | |
| (% of net assets) | |
| Long-Term Municipal Bonds | 155.7% |
| Short-Term Municipal Bonds | 1.8% |
| Other Assets Less Liabilities | 1.2% |
| Net Assets Plus Floating Rate Obligations, MFP Shares, net of deferred offering costs & VRDP Shares, net of deferred offering costs | 158.7% |
| Floating Rate Obligations | (1.0)% |
| MFP Shares, net of deferred offering costs | (6.2)% |
| VRDP Shares, net of deferred offering costs | (51.5)% |
| Net Assets | 100% |
| Portfolio Composition | |
| (% of total investments) | |
| Tax Obligation/Limited | 26.1% |
| Education and Civic Organizations | 18.8% |
| Transportation | 13.0% |
| Water and Sewer | 8.3% |
| U.S. Guaranteed | 7.5% |
| Utilities | 7.3% |
| Tax Obligation/General | 7.0% |
| Consumer Staples | 6.5% |
| Other | 5.5% |
| Total | 100% |
| Portfolio Credit Quality | |
| (% of total investment exposure) | |
| AAA/U.S. Guaranteed | 31.8% |
| AA | 36.3% |
| A | 16.1% |
| BBB | 5.1% |
| BB or Lower | 5.5% |
| N/R (not rated) | 5.2% |
| Total | 100% |
Shareholder Meeting Report
The annual meeting of shareholders was held in the offices of Nuveen on August 2, 2017 for NNY, NYV, NAN and NRK; at this meeting the shareholders were asked to elect Board Members.
| | | NNY | | NYV | | NAN | | NRK | |
| | | Common Shares | | Common Shares | | Common and
Preferred
shares
voting together
as a class | |
Preferred
shares
voting together
as a class | |
Common and
Preferred
shares
voting together
as a class | | Preferred
shares
voting together
as a class | |
| William C. Hunter | | | | | | | | | | | | | | | | | | | |
| For | | | — | | | — | | | — | | | 2,360 | | | — | | | 7,166 | |
| Withhold | | | — | | | — | | | — | | | — | | | — | | | — | |
| Total | | | — | | | — | | | — | | | 2,360 | | | — | | | 7,166 | |
| William J. Schneider | | | | | | | | | | | | | | | | | | | |
| For | | | — | | | — | | | — | | | 2,360 | | | — | | | 7,166 | |
| Withhold | | | — | | | — | | | — | | | — | | | — | | | — | |
| Total | | | — | | | — | | | — | | | 2,360 | | | — | | | 7,166 | |
| David J. Kundert | | | | | | | | | | | | | | | | | | | |
| For | | | 13,160,011 | | | 2,082,932 | | | 26,597,079 | | | — | | | 71,286,550 | | | — | |
| Withhold | | | 265,989 | | | 111,966 | | | 810,127 | | | — | | | 4,887,167 | | | — | |
| Total | | | 13,426,000 | | | 2,194,898 | | | 27,407,206 | | | — | | | 76,173,717 | | | — | |
| John K. Nelson | | | | | | | | | | | | | | | | | | | |
| For | | | 13,178,648 | | | 2,082,932 | | | 26,615,314 | | | — | | | 71,317,456 | | | — | |
| Withhold | | | 247,352 | | | 111,966 | | | 791,892 | | | — | | | 4,856,261 | | | — | |
| Total | | | 13,426,000 | | | 2,194,898 | | | 27,407,206 | | | — | | | 76,173,717 | | | — | |
| Terence J. Toth | | | | | | | | | | | | | | | | | | | |
| For | | | 13,178,184 | | | 2,082,932 | | | 26,620,755 | | | — | | | 71,343,660 | | | — | |
| Withhold | | | 247,816 | | | 111,966 | | | 786,451 | | | — | | | 4,830,057 | | | — | |
| Total | | | 13,426,000 | | | 2,194,898 | | | 27,407,206 | | | — | | | 76,173,717 | | | — | |
| Robert L. Young | | | | | | | | | | | | | | | | | | | |
| For | | | 13,169,007 | | | 2,144,075 | | | 26,623,364 | | | — | | | 71,489,252 | | | — | |
| Withhold | | | 256,993 | | | 50,823 | | | 783,842 | | | — | | | 4,684,465 | | | — | |
| Total | | | 13,426,000 | | | 2,194,898 | | | 27,407,206 | | | — | | | 76,173,717 | | | — | |
| NNY | | |
| | Nuveen New York Municipal Value Fund, Inc. | |
| | Portfolio of Investments | August 31, 2017 (Unaudited) |
| | Principal | | | Optional Call | | | | | |
| Amount (000) | | Description (1) | Provisions (2) | | Ratings (3) | | Value | |
| | | | LONG-TERM INVESTMENTS – 100.7% (100.0% of Total Investments) | | | | | | |
| | | | MUNICIPAL BONDS – 100.7% (100.0% of Total Investments) | | | | | | |
| | | | Consumer Staples – 3.3% (3.3% of Total Investments) | | | | | | |
| $ | 1,000 | | Erie County Tobacco Asset Securitization Corporation, New York, Tobacco Settlement Asset-Backed Bonds, Series 2005A, 5.000%, 6/01/38 | 11/17 at 100.00 | | BB | $ | 999,030 | |
| | 500 | | Nassau County Tobacco Settlement Corporation, New York, Tobacco Settlement Asset-Backed Bonds, Refunding Series 2006A-2, 5.250%, 6/01/26 | 11/17 at 100.00 | | B– | | 497,465 | |
| | 2,875 | | Nassau County Tobacco Settlement Corporation, New York, Tobacco Settlement Asset-Backed Bonds, Series 2006A-3, 5.000%, 6/01/35 | 11/17 at 100.00 | | B– | | 2,827,620 | |
| | 230 | | TSASC Inc., New York, Tobacco Asset-Backed Bonds, Series 2006, 5.000%, 6/01/48 | 6/27 at 100.00 | | N/R | | 236,056 | |
| | 500 | | TSASC Inc., New York, Tobacco Settlement Asset-Backed Bonds, Fiscal 2017 Series B, 5.000%, 6/01/25 | No Opt. Call | | BBB | | 548,365 | |
| | 5,105 | | Total Consumer Staples | | | | | 5,108,536 | |
| | | | Education and Civic Organizations – 19.4% (19.2% of Total Investments) | | | | | | |
| | 415 | | Albany Industrial Development Agency, New York, Revenue Bonds, Brighter Choice Charter Schools, Series 2007A, 5.000%, 4/01/37 | 11/17 at 100.00 | | B | | 375,069 | |
| | 750 | | Buffalo and Erie County Industrial Land Development Corporation, New York, Revenue Bonds, Enterprise Charter School Project, Series 2011A, 7.500%, 12/01/40 | 12/20 at 100.00 | | B+ | | 763,875 | |
| | 1,250 | | Build New York City Resource Corporation, New York, Revenue Bonds, City University of New York – Queens College, Q Student Residences, LLC Project, Refunding Series 2014A, 5.000%, 6/01/43 | 6/24 at 100.00 | | Aa2 | | 1,427,925 | |
| | | | Build New York City Resource Corporation, New York, Revenue Bonds, South Bronx Charter School for International Cultures and the Arts Project, Series 2013A: | | | | | | |
| | 215 | | 5.000%, 4/15/33 | 4/23 at 100.00 | | BB+ | | 217,612 | |
| | 310 | | 5.000%, 4/15/43 | 4/23 at 100.00 | | BB+ | | 310,887 | |
| | 415 | | Dormitory Authority of the State of New York, General Revenue Bonds, Saint Johns University, Series 2013A, 5.000%, 7/01/44 | 7/23 at 100.00 | | A– | | 460,974 | |
| | 1,000 | | Dormitory Authority of the State of New York, Housing Revenue Bonds, Fashion Institute of Technology, Series 2007, 5.250%, 7/01/34 – FGIC Insured | No Opt. Call | | A | | 1,253,230 | |
| | | | Dormitory Authority of the State of New York, Lease Revenue Bonds, State University Dormitory Facilities, Series 2015A: | | | | | | |
| | 235 | | 5.000%, 7/01/31 | 7/25 at 100.00 | | Aa3 | | 278,019 | |
| | 265 | | 5.000%, 7/01/33 | 7/25 at 100.00 | | Aa3 | | 311,033 | |
| | | | Dormitory Authority of the State of New York, Revenue Bonds, Icahn School of Medicine at Mount Sinai, Refunding Series 2015A: | | | | | | |
| | 1,330 | | 5.000%, 7/01/40 | 7/25 at 100.00 | | A– | | 1,499,575 | |
| | 2,180 | | 5.000%, 7/01/45 | 7/25 at 100.00 | | A– | | 2,435,474 | |
| | 1,955 | | Dormitory Authority of the State of New York, Revenue Bonds, New School University, Series 2015A, 5.000%, 7/01/45 | 7/25 at 100.00 | | A– | | 2,230,479 | |
| | 760 | | Dormitory Authority of the State of New York, Revenue Bonds, New York University, Series 2015A, 5.000%, 7/01/35 | 7/25 at 100.00 | | Aa2 | | 890,842 | |
| | 2,385 | | Dormitory Authority of the State of New York, Revenue Bonds, New York University, Series 2016A, 5.000%, 7/01/39 | 7/26 at 100.00 | | Aa2 | | 2,809,363 | |
| | 280 | | Dormitory Authority of the State of New York, Revenue Bonds, Saint Joseph’s College, Series 2010, 5.250%, 7/01/35 | 7/20 at 100.00 | | Ba1 | | 296,822 | |
| | 680 | | Dormitory Authority of the State of New York, Revenue Bonds, Vaughn College of Aeronautics & Technology, Series 2016A, 5.500%, 12/01/36 | 12/26 at 100.00 | | BB– | | 712,062 | |
| | 580 | | Glen Cove Local Economic Assistance Corporation, New York, Revenue Bonds, Garvies Point Public Improvement Project, Capital Appreciation Series 2016C, 0.000%, 1/01/55 (4) | 1/34 at 100.00 | | N/R | | 429,351 | |
| | Principal | | | Optional Call | | | | | |
| | Amount (000) | | Description (1) | Provisions (2) | | Ratings (3) | | Value | |
| | | | Education and Civic Organizations (continued) | | | | | | |
| $ | 300 | | Hempstead Town Local Development Corporation, New York, Revenue Bonds, Adelphi University Project, Series 2013, 5.000%, 9/01/43 | 9/23 at 100.00 | | A– | $ | 334,815 | |
| | | | Monroe County Industrial Development Corporation, New York, Revenue Bonds, St. John Fisher College, Series 2011: | | | | | | |
| | 1,000 | | 6.000%, 6/01/30 | 6/21 at 100.00 | | A– | | 1,127,150 | |
| | 1,000 | | 6.000%, 6/01/34 | 6/21 at 100.00 | | A– | | 1,120,310 | |
| | 3,000 | | Monroe County Industrial Development Corporation, New York, Revenue Bonds, University of Rochester Project, Series 2011B, 5.000%, 7/01/41 | 7/21 at 100.00 | | AA– | | 3,359,340 | |
| | | | New Rochelle Corporation, New York, Local Development Revenue Bonds, Iona College Project, Series 2015A: | | | | | | |
| | 25 | | 5.000%, 7/01/40 | 7/25 at 100.00 | | BBB | | 27,513 | |
| | 25 | | 5.000%, 7/01/45 | 7/25 at 100.00 | | BBB | | 27,352 | |
| | | | New York City Industrial Development Agency, New York, PILOT Revenue Bonds, Queens Baseball Stadium Project, Series 2006: | | | | | | |
| | 1,500 | | 5.000%, 1/01/39 – AMBAC Insured | 11/17 at 100.00 | | BBB | | 1,523,820 | |
| | 1,175 | | 4.750%, 1/01/42 – AMBAC Insured | 11/17 at 100.00 | | BBB | | 1,185,387 | |
| | | | New York City Industrial Development Authority, New York, PILOT Revenue Bonds, Yankee Stadium Project, Series 2006: | | | | | | |
| | 1,610 | | 4.500%, 3/01/39 – FGIC Insured | 11/17 at 100.00 | | Baa1 | | 1,613,767 | |
| | 800 | | 4.750%, 3/01/46 – NPFG Insured | 11/17 at 100.00 | | A | | 802,336 | |
| | 1,345 | | Tompkins County Development Corporation, New York, Revenue Bonds, Ithaca College, Series 2011, 5.375%, 7/01/41 – AGM Insured | 1/21 at 100.00 | | A2 | | 1,497,079 | |
| | 300 | | Troy Capital Resource Corporation, New York, Revenue Bonds, Rensselaer Polytechnic Institute, Series 2010A, 5.125%, 9/01/40 | 9/20 at 100.00 | | A3 | | 329,958 | |
| | 27,085 | | Total Education and Civic Organizations | | | | | 29,651,419 | |
| | | | Financials – 0.9% (0.9% of Total Investments) | | | | | | |
| | 1,000 | | New York Liberty Development Corporation, Revenue Bonds, Goldman Sachs Headquarters Issue, Series 2007, 5.500%, 10/01/37 | No Opt. Call | | A | | 1,328,180 | |
| | | | Health Care – 1.0% (1.0% of Total Investments) | | | | | | |
| | 350 | | Dormitory Authority of the State of New York, Highland Hospital of Rochester Revenue Bonds, Series 2010, 5.000%, 7/01/26 | 7/20 at 100.00 | | A | | 380,492 | |
| | 290 | | Livingston County Industrial Development Agency, New York, Civic Facility Revenue Bonds, Nicholas H. Noyes Hospital, Series 2005, 6.000%, 7/01/30 | 11/17 at 100.00 | | BB | | 290,073 | |
| | 250 | | Suffolk County Economic Development Corporation, New York, Revenue Bonds, Catholic Health Services of Long Island Obligated Group Project, Refunding Series 2011, 5.000%, 7/01/28 | 7/21 at 100.00 | | A– | | 275,448 | |
| | 480 | | Yonkers Industrial Development Agency, New York, Revenue Bonds, St. John’s Riverside Hospital, Series 2001A, 7.125%, 7/01/31 | 1/18 at 100.00 | | BB– | | 480,917 | |
| | 150 | | Yonkers Industrial Development Agency, New York, Revenue Bonds, St. John’s Riverside Hospital, Series 2001B, 7.125%, 7/01/31 | 11/17 at 100.00 | | BB– | | 150,287 | |
| | 1,520 | | Total Health Care | | | | | 1,577,217 | |
| | | | Housing/Multifamily – 1.7% (1.6% of Total Investments) | | | | | | |
| | 195 | | East Syracuse Housing Authority, New York, FHA-Insured Section 8 Assisted Revenue Refunding Bonds, Bennet Project, Series 2001A, 6.700%, 4/01/21 | 10/17 at 100.00 | | AA | | 195,741 | |
| | 1,000 | | New York City Housing Development Corporation, New York, Multifamily Housing Revenue Bonds, Series 2009C-1, 5.500%, 11/01/34 | 5/19 at 100.00 | | AA+ | | 1,047,860 | |
| | 1,250 | | New York City Housing Development Corporation, New York, Multifamily Housing Revenue Bonds, Series 2009M, 5.150%, 11/01/45 | 5/19 at 100.00 | | AA+ | | 1,282,238 | |
| | 2,445 | | Total Housing/Multifamily | | | | | 2,525,839 | |
| NNY | Nuveen New York Municipal Value Fund, Inc. | |
| | Portfolio of Investments (continued) | August 31, 2017 (Unaudited) |
| | Principal | | | Optional Call | | | | | |
| | Amount (000) | | Description (1) | Provisions (2) | | Ratings (3) | | Value | |
| | | | Industrials – 2.0% (2.0% of Total Investments) | | | | | | |
| $ | 425 | | Build New York City Resource Corporation, New York, Solid Waste Disposal Revenue Bonds, Pratt Paper NY, Inc. Project, Series 2014, 5.000%, 1/01/35 (Alternative Minimum Tax) | 1/25 at 100.00 | | N/R | $ | 458,766 | |
| | 2,350 | | New York Liberty Development Corporation, New York, Liberty Revenue Bonds, 3 World Trade Center Project, Class 1 Series 2014, 5.000%, 11/15/44 | 11/24 at 100.00 | | N/R | | 2,560,325 | |
| | 2,775 | | Total Industrials | | | | | 3,019,091 | |
| | | | Long-Term Care – 0.5% (0.5% of Total Investments) | | | | | | |
| | 270 | | Dormitory Authority of the State of New York, Non-State Supported Debt, Ozanam Hall of Queens Nursing Home Revenue Bonds, Series 2006, 5.000%, 11/01/31 | 11/17 at 100.00 | | A3 | | 270,284 | |
| | 170 | | New York City Industrial Development Agency, New York, Civic Facility Revenue Bonds, Special Needs Facilities Pooled Program, Series 2008A-1, 5.500%, 7/01/18 | 11/17 at 100.50 | | N/R | | 169,575 | |
| | 235 | | Suffolk County Industrial Development Agency, New York, Civic Facility Revenue Bonds, Special Needs Facilities Pooled Program, Series 2008-B1, 5.800%, 7/01/23 | 7/18 at 100.00 | | N/R | | 176,318 | |
| | 225 | | Yonkers Industrial Development Agency, New York, Civic Facilities Revenue Bonds, Special Needs Facilities Pooled Program Bonds, Series 2008-C1, 5.800%, 7/01/23 | 7/18 at 100.00 | | N/R | | 222,584 | |
| | 900 | | Total Long-Term Care | | | | | 838,761 | |
| | | | Tax Obligation/General – 4.4% (4.4% of Total Investments) | | | | | | |
| | 1,930 | | New York City, New York, General Obligation Bonds, Fiscal 2008 Series D-1, 5.125%, 12/01/25 | 12/17 at 100.00 | | AA | | 1,951,191 | |
| | 1,000 | | New York City, New York, General Obligation Bonds, Fiscal 2014 Series A-1, 5.000%, 8/01/26 | 8/23 at 100.00 | | AA | | 1,196,820 | |
| | 3,090 | | New York City, New York, General Obligation Bonds, Fiscal 2017 Series B-1, 5.000%, 12/01/41 | 12/26 at 100.00 | | AA | | 3,623,983 | |
| | 6,020 | | Total Tax Obligation/General | | | | | 6,771,994 | |
| | | | Tax Obligation/Limited – 16.8% (16.7% of Total Investments) | | | | | | |
| | | | Dormitory Authority of the State of New York, Second General Resolution Consolidated Revenue Bonds, City University System, Series 1993A: | | | | | | |
| | 220 | | 5.750%, 7/01/18 | No Opt. Call | | AA | | 228,950 | |
| | 1,400 | | 6.000%, 7/01/20 | No Opt. Call | | AA | | 1,554,098 | |
| | 2,290 | | Dormitory Authority of the State of New York, State Personal Income Tax Revenue Bonds, General Purpose Series 2012D, 5.000%, 2/15/37 | 2/22 at 100.00 | | AAA | | 2,618,226 | |
| | | | Dormitory Authority of the State of New York, State Sales Tax Revenue Bonds, Series 2015B. Group A,B&C: | | | | | | |
| | 1,000 | | 5.000%, 3/15/32 | 9/25 at 100.00 | | AAA | | 1,195,500 | |
| | 640 | | 5.000%, 3/15/35 | 9/25 at 100.00 | | AAA | | 759,962 | |
| | 2,500 | | Government of Guam, Business Privilege Tax Bonds, Refunding Series 2015D, 5.000%, 11/15/28 | 11/25 at 100.00 | | A | | 2,809,200 | |
| | 1,500 | | New York City Transitional Finance Authority, New York, Building Aid Revenue Bonds, Fiscal Series 2009-S5, 5.250%, 1/15/39 | 1/19 at 100.00 | | AA | | 1,586,760 | |
| | 3,000 | | New York City Transitional Finance Authority, New York, Building Aid Revenue Bonds, Fiscal Series 2015S-2, 5.000%, 7/15/40 | 7/25 at 100.00 | | AA | | 3,509,490 | |
| | 1,680 | | New York City Transitional Finance Authority, New York, Future Tax Secured Bonds, Subordinate Fiscal 2013 Series I, 5.000%, 5/01/38 | 5/23 at 100.00 | | AAA | | 1,928,321 | |
| | 1,225 | | New York City Transitional Finance Authority, New York, Future Tax Secured Bonds, Subordinate Fiscal 2014 Series D-1, 5.000%, 2/01/35 | 2/24 at 100.00 | | AAA | | 1,433,997 | |
| | 2,450 | | New York State Thruway Authority, Highway and Bridge Trust Fund Bonds, Series 2005B, 5.500%, 4/01/20 – AMBAC Insured (UB) (5) | No Opt. Call | | AA+ | | 2,739,468 | |
| | 600 | | New York State Urban Development Corporation, Special Project Revenue Bonds, University Facilities Grants, Series 1995, 5.875%, 1/01/21 | No Opt. Call | | AA | | 673,896 | |
| | 20,000 | | Puerto Rico Sales Tax Financing Corporation, Sales Tax Revenue Bonds, Series 2007A, 0.000%, 8/01/43 – NPFG Insured | No Opt. Call | | A | | 4,655,799 | |
| | 38,505 | | Total Tax Obligation/Limited | | | | | 25,693,667 | |
| | Principal | | | Optional Call | | | | | |
| | Amount (000) | | Description (1) | Provisions (2) | | Ratings (3) | | Value | |
| | | | Transportation – 24.2% (24.1% of Total Investments) | | | | | | |
| $ | 2,500 | | Metropolitan Transportation Authority, New York, Transportation Revenue Bonds, Refunding Series 2015D-1, 5.000%, 11/15/30 | 11/25 at 100.00 | | AA– | $ | 3,001,275 | |
| | 3,500 | | Metropolitan Transportation Authority, New York, Transportation Revenue Bonds, Series 2012E, 5.000%, 11/15/42 | 11/22 at 100.00 | | AA– | | 3,973,864 | |
| | 1,100 | | Metropolitan Transportation Authority, New York, Transportation Revenue Bonds, Series 2013E, 5.000%, 11/15/31 | 11/23 at 100.00 | | AA– | | 1,300,816 | |
| | 2,000 | | Metropolitan Transportation Authority, New York, Transportation Revenue Bonds, Series 2014B, 5.250%, 11/15/38 | 5/24 at 100.00 | | AA– | | 2,367,340 | |
| | 5,000 | | Metropolitan Transportation Authority, New York, Transportation Revenue Bonds, Series 2016C-1, 5.000%, 11/15/34 | 11/26 at 100.00 | | AA– | | 5,922,649 | |
| | 1,500 | | New York City Industrial Development Agency, New York, Civic Facility Revenue Bonds, Bronx Parking Development Company, LLC Project, Series 2007, 5.875%, 10/01/46 (6) | 10/17 at 102.00 | | N/R | | 479,490 | |
| | 660 | | New York Liberty Development Corporation, New York, Liberty Revenue Bonds, 4 World Trade Center Project, Series 2011, 5.000%, 11/15/44 | 11/21 at 100.00 | | A+ | | 737,484 | |
| | | | New York Transportation Development Corporation, New York, Special Facility Revenue Bonds, American Airlines, Inc. John F Kennedy International Airport Project, Refunding Series 2016: | | | | | | |
| | 765 | | 5.000%, 8/01/26 (Alternative Minimum Tax) | 8/21 at 100.00 | | BB– | | 822,880 | |
| | 2,020 | | 5.000%, 8/01/31 (Alternative Minimum Tax) | 8/21 at 100.00 | | BB– | | 2,161,016 | |
| | 2,630 | | New York Transportation Development Corporation, Special Facilities Bonds, LaGuardia Airport Terminal B Redevelopment Project, Series 2016A, 5.000%, 7/01/46 (Alternative Minimum Tax) | 7/24 at 100.00 | | BBB | | 2,903,099 | |
| | 5,900 | | Port Authority of New York and New Jersey, Consolidated Revenue Bonds, One Hundred Eighty-Ninth Series 2015, 5.000%, 5/01/40 | 5/25 at 100.00 | | AA– | | 6,847,184 | |
| | 1,575 | | Port Authority of New York and New Jersey, Consolidated Revenue Bonds, One Hundred Seventy Ninth Series 2013, 5.000%, 12/01/43 | 12/23 at 100.00 | | AA– | | 1,812,290 | |
| | | | Port Authority of New York and New Jersey, Special Project Bonds, JFK International Air Terminal LLC Project, Eighth Series 2010: | | | | | | |
| | 225 | | 6.500%, 12/01/28 | 11/17 at 100.00 | | Baa1 | | 228,650 | |
| | 1,160 | | 6.000%, 12/01/36 | 12/20 at 100.00 | | Baa1 | | 1,302,262 | |
| | 2,000 | | Triborough Bridge and Tunnel Authority, New York, General Purpose Revenue Bonds, Refunding Series 2016A, 5.000%, 11/15/41 | 5/26 at 100.00 | | AA– | | 2,347,900 | |
| | 780 | | Triborough Bridge and Tunnel Authority, New York, General Purpose Revenue Bonds, Refunding Subordinate Lien Series 2002E, 5.500%, 11/15/20 – NPFG Insured | No Opt. Call | | A+ | | 888,256 | |
| | 33,315 | | Total Transportation | | | | | 37,096,455 | |
| | | | U.S. Guaranteed – 13.8% (13.7% of Total Investments) (7) | | | | | | |
| | 990 | | Albany Industrial Development Agency, New York, Revenue Bonds, Saint Peter’s Hospital, Series 2008D, 5.750%, 11/15/27 (Pre-refunded 11/15/17) | 11/17 at 100.00 | | N/R (7) | | 1,000,217 | |
| | 1,350 | | Brooklyn Arena Local Development Corporation, New York, Payment in Lieu of Taxes Revenue Bonds, Barclays Center Project, Series 2009, 6.250%, 7/15/40 (Pre-refunded 1/15/20) | 1/20 at 100.00 | | AA+ (7) | | 1,521,450 | |
| | | | Dormitory Authority of the State of New York, Orange Regional Medical Center Obligated Group Revenue Bonds, Series 2008: | | | | | | |
| | 1,060 | | 6.500%, 12/01/21 (Pre-refunded 12/01/18) | 12/18 at 100.00 | | Baa3 (7) | | 1,120,091 | |
| | 565 | | 6.125%, 12/01/29 (Pre-refunded 12/01/18) | 12/18 at 100.00 | | Baa3 (7) | | 602,731 | |
| | 1,155 | | 6.250%, 12/01/37 (Pre-refunded 12/01/18) | 12/18 at 100.00 | | Baa3 (7) | | 1,234,071 | |
| | 525 | | Dormitory Authority of the State of New York, Revenue Bonds, New School University, Series 2010, 5.250%, 7/01/30 (Pre-refunded 7/01/20) | 7/20 at 100.00 | | A– (7) | | 587,171 | |
| | 2,100 | | Dormitory Authority of the State of New York, Revenue Bonds, NYU Hospitals Center, Series 2011A, 6.000%, 7/01/40 (Pre-refunded 7/01/20) | 7/20 at 100.00 | | A– (7) | | 2,392,572 | |
| | 880 | | Hempstead Town Local Development Corporation, New York, Revenue Bonds, Molloy College Project, Series 2009, 5.750%, 7/01/39 (Pre-refunded 7/01/19) | 7/19 at 100.00 | | N/R (7) | | 957,924 | |
| | 1,500 | | Metropolitan Transportation Authority, New York, Dedicated Tax Fund Bonds, Series 2009B, 5.000%, 11/15/34 (Pre-refunded 11/15/19) | 11/19 at 100.00 | | AA (7) | | 1,636,830 | |
| NNY | Nuveen New York Municipal Value Fund, Inc. | |
| | Portfolio of Investments (continued) | August 31, 2017 (Unaudited) |
| | Principal | | | Optional Call | | | | | |
| | Amount (000) | | Description (1) | Provisions (2) | | Ratings (3) | | Value | |
| | | | U.S. Guaranteed (7) (continued) | | | | | | |
| | | | Metropolitan Transportation Authority, New York, Transportation Revenue Bonds, Series 2008A: | | | | | | |
| $ | 1,365 | | 5.250%, 11/15/36 (Pre-refunded 11/15/17) | 11/17 at 100.00 | | AA– (7) | $ | 1,377,695 | |
| | 1,635 | | 5.250%, 11/15/36 (Pre-refunded 11/15/17) | 11/17 at 100.00 | | N/R (7) | | 1,650,206 | |
| | 2,830 | | New York City, New York, General Obligation Bonds, Fiscal 2008 Series D-1, 5.125%, 12/01/25 (Pre-refunded 12/01/17) | 12/17 at 100.00 | | N/R (7) | | 2,861,073 | |
| | 2,100 | | New York State Environmental Facilities Corporation, State Personal Income Tax Revenue Bonds, Series 2008A, 5.000%, 12/15/27 (Pre-refunded 12/15/17) (UB) | 12/17 at 100.00 | | AAA | | 2,126,145 | |
| | 170 | | Seneca County Industrial Development Authority, New York, Revenue Bonds, New York Chiropractic College, Series 2007, 5.000%, 10/01/27 (Pre-refunded 10/01/17) | 10/17 at 100.00 | | N/R (7) | | 170,607 | |
| | 1,830 | | Seneca Nation of Indians Capital Improvements Authority, New York, Special Obligation Bonds, Series 2007A, 5.000%, 12/01/23 (Pre-refunded 10/27/17) | 10/17 at 100.00 | | N/R (7) | | 1,833,386 | |
| | 45 | | Suffolk County Economic Development Corporation, New York, Revenue Bonds, Catholic Health Services of Long Island Obligated Group Project, Refunding Series 2011, 5.000%, 7/01/28 (Pre-refunded 7/01/21) | 7/21 at 100.00 | | N/R (7) | | 51,752 | |
| | 20,100 | | Total U.S. Guaranteed | | | | | 21,123,921 | |
| | | | Utilities – 8.2% (8.1% of Total Investments) | | | | | | |
| | 1,000 | | Chautauqua County Industrial Development Agency, New York, Exempt Facility Revenue Bonds, NRG Dunkirk Power Project, Series 2009, 5.875%, 4/01/42 | 2/20 at 100.00 | | Baa3 | | 1,046,150 | |
| | 90 | | Guam Power Authority, Revenue Bonds, Series 2012A, 5.000%, 10/01/34 | 10/22 at 100.00 | | BBB | | 95,760 | |
| | 135 | | Long Island Power Authority, New York, Electric System General Revenue Bonds, Series 2014A, 5.000%, 9/01/44 | 9/24 at 100.00 | | A– | | 154,130 | |
| | 400 | | Long Island Power Authority, New York, Electric System Revenue Bonds, Series 2011A, 5.000%, 5/01/38 | 5/21 at 100.00 | | A– | | 445,820 | |
| | 1,250 | | Long Island Power Authority, New York, Electric System Revenue Bonds, Series 2012A, 5.000%, 9/01/37 | 9/22 at 100.00 | | A– | | 1,391,675 | |
| | 2,490 | | Niagara Area Development Corporation, New York, Solid Waste Disposal Facility Revenue Refunding Bonds, Covanta Energy Project, Series 2012A, 5.250%, 11/01/42 (Alternative Minimum Tax) | 11/17 at 100.00 | | BB+ | | 2,495,254 | |
| | 400 | | Suffolk County Industrial Development Agency, New York, Revenue Bonds, Nissequogue Cogeneration Partners Facility, Series 1998, 5.500%, 1/01/23 (Alternative Minimum Tax) | 1/18 at 100.00 | | N/R | | 400,048 | |
| | | | Utility Debt Securitization Authority, New York, Restructuring Bonds, Series 2013TE: | | | | | | |
| | 4,440 | | 5.000%, 12/15/34 | 12/23 at 100.00 | | AAA | | 5,223,348 | |
| | 1,100 | | 5.000%, 12/15/41 | 12/23 at 100.00 | | AAA | | 1,282,754 | |
| | 11,305 | | Total Utilities | | | | | 12,534,939 | |
| | Principal | | | Optional Call | | | | | |
| | Amount (000) | | Description (1) | Provisions (2) | | Ratings (3) | | Value | |
| | | | Water and Sewer – 4.5% (4.5% of Total Investments) | | | | | | |
| $ | 300 | | Buffalo Municipal Water Finance Authority, New York, Water System Revenue Bonds, Refunding Series 2015A, 5.000%, 7/01/29 | 7/25 at 100.00 | | A | $ | 351,537 | |
| | | | New York State Environmental Facilities Corporation, State Clean Water and Drinking Water Revolving Funds Revenue Bonds, New York City Municipal Water Finance Authority Projects, Second Resolution Subordinated SRF Series 2015A: | | | | | | |
| | 2,100 | | 5.000%, 6/15/36 | 6/25 at 100.00 | | AAA | | 2,490,621 | |
| | 2,500 | | 5.000%, 6/15/40 | 6/25 at 100.00 | | AAA | | 2,947,500 | |
| | 1,000 | | New York State Environmental Facilities Corporation, State Revolving Funds Revenue Bonds, 2010 Master Financing Program, Series 2012B, 5.000%, 2/15/42 | 2/22 at 100.00 | | AAA | | 1,111,920 | |
| | 5,900 | | Total Water and Sewer | | | | | 6,901,578 | |
| $ | 155,975 | | Total Long-Term Investments (cost $144,824,029) | | | | | 154,171,597 | |
| | | | Floating Rate Obligations – (2.1)% | | | | | (3,255,000) | |
| | | | Other Assets Less Liabilities – 1.4% | | | | | 2,133,722 | |
| | | | Net Assets Applicable to Common Shares – 100% | | | | $ | 153,050,319 | |
| (1) | All percentages shown in the Portfolio of Investments are based on net assets applicable to common shares unless otherwise noted. |
| (2) | Optional Call Provisions: Dates (month and year) and prices of the earliest optional call or redemption. There may be other call provisions at varying prices at later dates. Certain mortgage-backed securities may be subject to periodic principal paydowns. |
| (3) | For financial reporting purposes, the ratings disclosed are the highest of Standard & Poor’s Group (“Standard & Poor’s”), Moody’s Investors Service, Inc. (“Moody’s”) or Fitch, Inc. (“Fitch”) rating. This treatment of split-rated securities may differ from that used for other purposes, such as for Fund investment policies. Ratings below BBB by Standard & Poor’s, Baa by Moody’s or BBB by Fitch are considered to be below investment grade. Holdings designated N/R are not rated by any of these national rating agencies. |
| (4) | Step-up coupon bond, a bond with a coupon that increases (“steps up”), usually at regular intervals, while the bond is outstanding. The rate shown is the coupon as of the end of the reporting period. |
| (5) | Investment, or portion of investment, has been pledged to collateralize the net payment obligations for investments in inverse floating rate transactions. |
| (6) | As of, or subsequent to, the end of the reporting period this security is non-income producing. Non-income producing, in the case of a fixed-income security, generally denotes that the issuer has (1) defaulted on the payment of principal or interest, (2) is under the protection of the Federal Bankruptcy Court or (3) the Fund’s Adviser has concluded that the issue is not likely to meet its future interest payment obligations and has ceased accruing additional income on the Fund’s records. |
| (7) | Backed by an escrow or trust containing sufficient U.S. Government or U.S. Government agency securities, which ensure the timely payment of principal and interest. Certain bonds backed by U.S. Government or agency securities are regarded as having an implied rating equal to the ratings of such securities. |
| UB | Underlying bond of an inverse floating rate trust reflected as a financing transaction. See Notes to Financial Statements, Note 3 – Portfolio Securities and Investments in Derivatives, Inverse Floating Rate Securities for more information. |
See accompanying notes to financial statements.
| NYV | | |
| | Nuveen New York Municipal Value Fund 2 | |
| | Portfolio of Investments | August 31, 2017 (Unaudited) |
| | Principal | | | Optional Call | | | | | |
| | Amount (000) | | Description (1) | Provisions (2) | | Ratings (3) | | Value | |
| | | | LONG-TERM INVESTMENTS – 95.4% (98.6% of Total Investments) | | | | | | |
| | | | MUNICIPAL BONDS – 95.4% (98.6% of Total Investments) | | | | | | |
| | | | Consumer Staples – 3.9% (4.0% of Total Investments) | | | | | | |
| $ | 1,180 | | District of Columbia Tobacco Settlement Corporation, Tobacco Settlement Asset-Backed Bonds, Series 2001, 6.500%, 5/15/33 | No Opt. Call | | Baa1 | $ | 1,327,406 | |
| | 100 | | Erie County Tobacco Asset Securitization Corporation, New York, Tobacco Settlement Asset-Backed Bonds, Series 2005A, 5.000%, 6/01/38 | 11/17 at 100.00 | | BB | | 99,903 | |
| | 1,280 | | Total Consumer Staples | | | | | 1,427,309 | |
| | | | Education and Civic Organizations – 14.7% (15.2% of Total Investments) | | | | | | |
| | 1,200 | | Albany Industrial Development Agency, New York, Revenue Bonds, Brighter Choice Charter Schools, Series 2007A, 5.000%, 4/01/37 | 11/17 at 100.00 | | B | | 1,084,536 | |
| | 210 | | Buffalo and Erie County Industrial Land Development Corporation, New York, Revenue Bonds, Enterprise Charter School Project, Series 2011A, 6.000%, 12/01/19 | No Opt. Call | | B+ | | 214,307 | |
| | | | Build New York City Resource Corporation, New York, Revenue Bonds, South Bronx Charter School for International Cultures and the Arts Project, Series 2013A: | | | | | | |
| | 50 | | 5.000%, 4/15/33 | 4/23 at 100.00 | | BB+ | | 50,608 | |
| | 75 | | 5.000%, 4/15/43 | 4/23 at 100.00 | | BB+ | | 75,215 | |
| | 100 | | Dormitory Authority of the State of New York, General Revenue Bonds, Saint Johns University, Series 2013A, 5.000%, 7/01/44 | 7/23 at 100.00 | | A– | | 111,078 | |
| | 200 | | Dormitory Authority of the State of New York, Revenue Bonds, New York University, Series 2015A, 5.000%, 7/01/35 | 7/25 at 100.00 | | Aa2 | | 234,432 | |
| | 1,000 | | Dormitory Authority of the State of New York, Revenue Bonds, Non State Supported Debt, Cornell University, Series 2010A, 5.000%, 7/01/40 | 7/20 at 100.00 | | Aa1 | | 1,104,940 | |
| | 165 | | Dormitory Authority of the State of New York, Revenue Bonds, Vaughn College of Aeronautics & Technology, Series 2016A, 5.500%, 12/01/36 | 12/26 at 100.00 | | BB– | | 172,780 | |
| | 145 | | Glen Cove Local Economic Assistance Corporation, New York, Revenue Bonds, Garvies Point Public Improvement Project, Capital Appreciation Series 2016C, 0.000%, 1/01/55 (4) | 1/34 at 100.00 | | N/R | | 107,338 | |
| | 100 | | Hempstead Town Local Development Corporation, New York, Revenue Bonds, Adelphi University Project, Series 2013, 5.000%, 9/01/38 | 9/23 at 100.00 | | A– | | 114,689 | |
| | 4,895 | | New York City Industrial Development Agency, New York, Revenue Bonds, Yankee Stadium Project PILOT, Series 2009A, 0.000%, 3/01/40 – AGC Insured | No Opt. Call | | AA | | 2,128,835 | |
| | 8,140 | | Total Education and Civic Organizations | | | | | 5,398,758 | |
| | | | Financials – 1.1% (1.1% of Total Investments) | | | | | | |
| | 300 | | New York Liberty Development Corporation, Revenue Bonds, Goldman Sachs Headquarters Issue, Series 2007, 5.500%, 10/01/37 | No Opt. Call | | A | | 398,454 | |
| | | | Health Care – 0.6% (0.6% of Total Investments) | | | | | | |
| | 50 | | Dormitory Authority of the State of New York, Highland Hospital of Rochester Revenue Bonds, Series 2010, 5.000%, 7/01/26 | 7/20 at 100.00 | | A | | 54,356 | |
| | 155 | | Yonkers Industrial Development Agency, New York, Revenue Bonds, St. John’s Riverside Hospital, Series 2001B, 7.125%, 7/01/31 | 11/17 at 100.00 | | BB– | | 155,296 | |
| | 205 | | Total Health Care | | | | | 209,652 | |
| | | | Housing/Multifamily – 4.1% (4.2% of Total Investments) | | | | | | |
| | 1,000 | | New York State Housing Finance Agency, Affordable Housing Revenue Bonds, Series 2009A, 5.250%, 11/01/41 | 5/19 at 100.00 | | Aa2 | | 1,031,380 | |
| | Principal | | | Optional Call | | | | | |
| | Amount (000) | | Description (1) | Provisions (2) | | Ratings (3) | | Value | |
| | | | Housing/Multifamily (continued) | | | | | | |
| $ | 450 | | New York State Housing Finance Agency, Affordable Housing Revenue Bonds, Series 2009B, 4.500%, 11/01/29 | 5/19 at 100.00 | | Aa2 | $ | 462,294 | |
| | 1,450 | | Total Housing/Multifamily | | | | | 1,493,674 | |
| | | | Industrials – 2.0% (2.1% of Total Investments) | | | | | | |
| | 105 | | Build New York City Resource Corporation, New York, Solid Waste Disposal Revenue Bonds, Pratt Paper NY, Inc. Project, Series 2014, 5.000%, 1/01/35 (Alternative Minimum Tax) | 1/25 at 100.00 | | N/R | | 113,342 | |
| | 580 | | New York Liberty Development Corporation, New York, Liberty Revenue Bonds, 3 World Trade Center Project, Class 1 Series 2014, 5.000%, 11/15/44 | 11/24 at 100.00 | | N/R | | 631,910 | |
| | 685 | | Total Industrials | | | | | 745,252 | |
| | | | Tax Obligation/General – 6.8% (7.0% of Total Investments) | | | | | | |
| | 1,000 | | Nassau County, New York, General Obligation Bonds, General Improvement Series 2016C, 5.000%, 4/01/35 | 4/26 at 100.00 | | A+ | | 1,157,710 | |
| | 1,150 | | New York City, New York, General Obligation Bonds, Fiscal 2017 Series B-1, 5.000%, 12/01/41 | 12/26 at 100.00 | | AA | | 1,348,732 | |
| | 2,150 | | Total Tax Obligation/General | | | | | 2,506,442 | |
| | | | Tax Obligation/Limited – 12.8% (13.2% of Total Investments) | | | | | | |
| | 1,800 | | Dormitory Authority of the State of New York, State Sales Tax Revenue Bonds, Series 2015B. Group A,B&C, 5.000%, 3/15/35 | 9/25 at 100.00 | | AAA | | 2,137,391 | |
| | 540 | | Hudson Yards Infrastructure Corporation, New York, Revenue Bonds, Second Indenture Fiscal 2017 Series A, 5.000%, 2/15/45 | 2/27 at 100.00 | | Aa3 | | 634,165 | |
| | 1,500 | | New York City Transitional Finance Authority, New York, Building Aid Revenue Bonds, Fiscal Series 2009-S5, 5.250%, 1/15/39 | 1/19 at 100.00 | | AA | | 1,586,759 | |
| | 300 | | New York City Transitional Finance Authority, New York, Future Tax Secured Bonds, Subordinate Fiscal 2014 Series D-1, 5.000%, 2/01/35 | 2/24 at 100.00 | | AAA | | 351,183 | |
| | 4,140 | | Total Tax Obligation/Limited | | | | | 4,709,498 | |
| | | | Transportation – 13.4% (13.9% of Total Investments) | | | | | | |
| | 1,000 | | Foothill/Eastern Transportation Corridor Agency, California, Toll Road Revenue Bonds, Refunding Series 2013A, 5.000%, 1/15/42 – AGM Insured | 1/24 at 100.00 | | AA | | 1,135,040 | |
| | 2,000 | | New York City Industrial Development Agency, New York, Civic Facility Revenue Bonds, Bronx Parking Development Company, LLC Project, Series 2007, 5.750%, 10/01/37 (5) | 10/17 at 102.00 | | N/R | | 639,320 | |
| | 155 | | New York Liberty Development Corporation, New York, Liberty Revenue Bonds, 4 World Trade Center Project, Series 2011, 5.000%, 11/15/44 | 11/21 at 100.00 | | A+ | | 173,197 | |
| | | | New York Transportation Development Corporation, New York, Special Facility Revenue Bonds, American Airlines, Inc. John F Kennedy International Airport Project, Refunding Series 2016: | | | | | | |
| | 220 | | 5.000%, 8/01/26 (Alternative Minimum Tax) | 8/21 at 100.00 | | BB– | | 236,645 | |
| | 420 | | 5.000%, 8/01/31 (Alternative Minimum Tax) | 8/21 at 100.00 | | BB– | | 449,320 | |
| | 645 | | New York Transportation Development Corporation, Special Facilities Bonds, LaGuardia Airport Terminal B Redevelopment Project, Series 2016A, 5.000%, 7/01/46 (Alternative Minimum Tax) | 7/24 at 100.00 | | BBB | | 711,977 | |
| | 1,050 | | Port Authority of New York and New Jersey, Consolidated Revenue Bonds, Two Hundredth Series 2017, 5.000%, 11/15/47 | 11/27 at 100.00 | | AA– | | 1,243,536 | |
| | | | Port Authority of New York and New Jersey, Special Project Bonds, JFK International Air Terminal LLC Project, Eighth Series 2010: | | | | | | |
| | 180 | | 6.500%, 12/01/28 | 11/17 at 100.00 | | Baa1 | | 182,920 | |
| | 140 | | 6.000%, 12/01/36 | 12/20 at 100.00 | | Baa1 | | 157,170 | |
| | 5,810 | | Total Transportation | | | | | 4,929,125 | |
| NYV | Nuveen New York Municipal Value Fund 2 | |
| | Portfolio of Investments (continued) | August 31, 2017 (Unaudited) |
| | Principal | | | Optional Call | | | | | |
| | Amount (000) | | Description (1) | Provisions (2) | | Ratings (3) | | Value | |
| | | | U.S. Guaranteed – 21.3% (22.0% of Total Investments) (6) | | | | | | |
| $ | 290 | | Albany Capital Resource Corporation, New York, St. Peter’s Hospital Project, Series 2011, 6.000%, 11/15/25 (Pre-refunded 11/15/20) | 11/20 at 100.00 | | N/R (6) | $ | 335,852 | |
| | | | Dormitory Authority of the State of New York, Orange Regional Medical Center Obligated Group Revenue Bonds, Series 2008: | | | | | | |
| | 285 | | 6.500%, 12/01/21 (Pre-refunded 12/01/18) | 12/18 at 100.00 | | Baa3 (6) | | 301,157 | |
| | 140 | | 6.125%, 12/01/29 (Pre-refunded 12/01/18) | 12/18 at 100.00 | | Baa3 (6) | | 149,349 | |
| | 245 | | 6.250%, 12/01/37 (Pre-refunded 12/01/18) | 12/18 at 100.00 | | Baa3 (6) | | 261,773 | |
| | 1,500 | | Dormitory Authority of the State of New York, Revenue Bonds, North Shore Long Island Jewish Obligated Group, Series 2009A, 5.500%, 5/01/37 (Pre-refunded 5/01/19) | 5/19 at 100.00 | | A (6) | | 1,614,119 | |
| | 1,200 | | Dormitory Authority of the State of New York, State Personal Income Tax Revenue Bonds, Education Series 2009A, 5.000%, 3/15/38 (Pre-refunded 3/15/19) | 3/19 at 100.00 | | AAA | | 1,276,548 | |
| | 1,200 | | Guam Government, Limited Obligation Section 30 Revenue Bonds, Series 2009A, 5.750%, 12/01/34 (Pre-refunded 12/01/19) | 12/19 at 100.00 | | BBB+ (6) | | 1,329,276 | |
| | 725 | | Illinois Finance Authority, Revenue Bonds, OSF Healthcare System, Series 2007A, 5.750%, 11/15/37 (Pre-refunded 11/15/17) | 11/17 at 100.00 | | A (6) | | 732,526 | |
| | 1,325 | | Triborough Bridge and Tunnel Authority, New York, General Purpose Revenue Bonds, Refunding Series 2008A, 5.000%, 11/15/33 (Pre-refunded 5/15/18) | 5/18 at 100.00 | | AA– (6) | | 1,364,895 | |
| | 400 | | Yonkers, New York, General Obligation Bonds, Refunding Series 2011A, 5.000%, 10/01/24 (Pre-refunded 10/01/21) – AGM Insured | 10/21 at 100.00 | | AA (6) | | 463,944 | |
| | 7,310 | | Total U.S. Guaranteed | | | | | 7,829,439 | |
| | | | Utilities – 5.4% (5.7% of Total Investments) | | | | | | |
| | 25 | | Guam Power Authority, Revenue Bonds, Series 2012A, 5.000%, 10/01/34 | 10/22 at 100.00 | | BBB | | 26,600 | |
| | 285 | | Long Island Power Authority, New York, Electric System General Revenue Bonds, Series 2014A, 5.000%, 9/01/44 | 9/24 at 100.00 | | A– | | 325,385 | |
| | 605 | | Niagara Area Development Corporation, New York, Solid Waste Disposal Facility Revenue Refunding Bonds, Covanta Energy Project, Series 2012A, 5.250%, 11/01/42 (Alternative Minimum Tax) | 11/17 at 100.00 | | BB+ | | 606,277 | |
| | 905 | | Utility Debt Securitization Authority, New York, Restructuring Bonds, Series 2013TE, 5.000%, 12/15/41 | 12/23 at 100.00 | | AAA | | 1,055,357 | |
| | 1,820 | | Total Utilities | | | | | 2,013,619 | |
| | | | Water and Sewer – 9.3% (9.6% of Total Investments) | | | | | | |
| | 900 | | New York City Municipal Water Finance Authority, New York, Water and Sewer System Revenue Bonds, Second Generation Resolution, Fiscal 2012 Series BB, 5.000%, 6/15/44 | 12/21 at 100.00 | | AA+ | | 1,012,545 | |
| | 1,000 | | New York City Municipal Water Finance Authority, New York, Water and Sewer System Second General Resolution Revenue Bonds, Fiscal 2018 Series AA, 5.000%, 6/15/38 | 6/27 at 100.00 | | AA+ | | 1,195,700 | |
| | 1,000 | | New York State Environmental Facilities Corporation, State Clean Water and Drinking Water Revolving Funds Revenue Bonds, New York City Municipal Water Finance Authority Projects-Second Resolution Bonds, Subordinated SRF Series 2017A, 5.000%, 6/15/42 | 6/27 at 100.00 | | AAA | | 1,197,600 | |
| | 2,900 | | Total Water and Sewer | | | | | 3,405,845 | |
| $ | 36,190 | | Total Long-Term Investments (cost $32,310,981) | | | | | 35,067,067 | |
| | Principal | | | Optional Call | | | | | |
| | Amount (000) | | Description (1) | Provisions (2) | | Ratings (3) | | Value | |
| | | | SHORT-TERM INVESTMENTS – 1.4% (1.4% of Total Investments) | | | | | | |
| | | | MUNICIPAL BONDS – 1.4% (1.4% of Total Investments) | | | | | | |
| | | | Transportation – 1.4% (1.4% of Total Investments) | | | | | | |
| | 210 | | Metropolitan Transportation Authority, New York, Transportation Revenue Bonds, Variable Rate Demand Obligations, Series 2015E, 0.810%, 11/15/45 (7) | 11/17 at 100.00 | | VMIG-1 | $ | 210,000 | |
| | 300 | | Metropolitan Transportation Authority, New York, Transportation Revenue Bonds, Variable Rate Demand Obligations, Series 2015E-2, 0.910%, 11/15/50 (7) | 11/17 at 100.00 | | VMIG-1 | | 300,000 | |
| $ | 510 | | Total Short-Term Investments (cost $510,000) | | | | | 510,000 | |
| | | | Total Investments (cost $32,820,981) – 96.8% | | | | | 35,577,067 | |
| | | | Other Assets Less Liabilities – 3.2% | | | | | 1,185,738 | |
| | | | Net Assets – 100% | | | | $ | 36,762,805 | |
| (1) | All percentages shown in the Portfolio of Investments are based on net assets applicable to common shares unless otherwise noted. |
| (2) | Optional Call Provisions: Dates (month and year) and prices of the earliest optional call or redemption. There may be other call provisions at varying prices at later dates. Certain mortgage-backed securities may be subject to periodic principal paydowns. |
| (3) | For financial reporting purposes, the ratings disclosed are the highest of Standard & Poor’s Group (“Standard & Poor’s”), Moody’s Investors Service, Inc. (“Moody’s”) or Fitch, Inc. (“Fitch”) rating. This treatment of split-rated securities may differ from that used for other purposes, such as for Fund investment policies. Ratings below BBB by Standard & Poor’s, Baa by Moody’s or BBB by Fitch are considered to be below investment grade. Holdings designated N/R are not rated by any of these national rating agencies. |
| (4) | Step-up coupon bond, a bond with a coupon that increases (“steps up”), usually at regular intervals, while the bond is outstanding. The rate shown is the coupon as of the end of the reporting period. |
| (5) | As of, or subsequent to, the end of the reporting period this security is non-income producing. Non-income producing, in the case of a fixed-income security, generally denotes that the issuer has (1) defaulted on the payment of principal or interest, (2) is under the protection of the Federal Bankruptcy Court or (3) the Fund’s Adviser has concluded that the issue is not likely to meet its future interest payment obligations and has ceased accruing additional income on the Fund’s records. |
| (6) | Backed by an escrow or trust containing sufficient U.S. Government or U.S. Government agency securities, which ensure the timely payment of principal and interest. Certain bonds backed by U.S. Government or agency securities are regarded as having an implied rating equal to the ratings of such securities. |
| (7) | Investment has maturity of greater than one year, but has variable rate and demand features which qualify it as a short-term investment. The rate disclosed is that in effect as of the end of the reporting period. This rate changes periodically based on market conditions or a specified market index. |
See accompanying notes to financial statements.
| NAN | | |
| | Nuveen New York Quality Municipal Income Fund | |
| | Portfolio of Investments | August 31, 2017 (Unaudited) |
| | Principal | | | Optional Call | | | | | |
| | Amount (000) | | Description (1) | Provisions (2) | | Ratings (3) | | Value | |
| | | | LONG-TERM INVESTMENTS – 151.9% (100.0% of Total Investments) | | | | | | |
| | | | MUNICIPAL BONDS – 151.9% (100.0% of Total Investments) | | | | | | |
| | | | Consumer Staples – 8.3% (5.5% of Total Investments) | | | | | | |
| | | | Erie County Tobacco Asset Securitization Corporation, New York, Tobacco Settlement Asset-Backed Bonds, Series 2005A: | | | | | | |
| $ | 12,500 | | 5.000%, 6/01/38 | 11/17 at 100.00 | | BB | $ | 12,487,874 | |
| | 3,210 | | 5.000%, 6/01/45 | 11/17 at 100.00 | | BB– | | 3,176,006 | |
| | 1,350 | | Nassau County Tobacco Settlement Corporation, New York, Tobacco Settlement Asset-Backed Bonds, Refunding Series 2006A-2, 5.250%, 6/01/26 | 11/17 at 100.00 | | B– | | 1,343,156 | |
| | 12,415 | | Nassau County Tobacco Settlement Corporation, New York, Tobacco Settlement Asset-Backed Bonds, Series 2006A-3, 5.000%, 6/01/35 | 11/17 at 100.00 | | B– | | 12,210,401 | |
| | | | TSASC Inc., New York, Tobacco Asset-Backed Bonds, Series 2006: | | | | | | |
| | 2,620 | | 5.000%, 6/01/45 | 6/27 at 100.00 | | BBB– | | 2,726,503 | |
| | 7,155 | | 5.000%, 6/01/48 | 6/27 at 100.00 | | N/R | | 7,343,391 | |
| | 39,250 | | Total Consumer Staples | | | | | 39,287,331 | |
| | | | Education and Civic Organizations – 25.8% (17.0% of Total Investments) | | | | | | |
| | 1,855 | | Albany Industrial Development Agency, New York, Revenue Bonds, Brighter Choice Charter Schools, Series 2007A, 5.000%, 4/01/37 | 11/17 at 100.00 | | B | | 1,676,512 | |
| | 3,265 | | Buffalo and Erie County Industrial Land Development Corporation, New York, Revenue Bonds, Enterprise Charter School Project, Series 2011A, 7.500%, 12/01/40 | 12/20 at 100.00 | | B+ | | 3,325,403 | |
| | | | Build New York City Resource Corporation, New York, Revenue Bonds, City University of New York – Queens College, Q Student Residences, LLC Project, Refunding Series 2014A: | | | | | | |
| | 1,025 | | 5.000%, 6/01/32 | 6/24 at 100.00 | | Aa2 | | 1,212,544 | |
| | 2,070 | | 5.000%, 6/01/43 | 6/24 at 100.00 | | Aa2 | | 2,364,644 | |
| | | | Build New York City Resource Corporation, New York, Revenue Bonds, Metropolitan College of New York, Series 2014: | | | | | | |
| | 1,405 | | 5.250%, 11/01/34 | 11/24 at 100.00 | | BB | | 1,466,230 | |
| | 1,300 | | 5.000%, 11/01/39 | 11/24 at 100.00 | | BB | | 1,325,792 | |
| | | | Build New York City Resource Corporation, New York, Revenue Bonds, South Bronx Charter School for International Cultures and the Arts Project, Series 2013A: | | | | | | |
| | 950 | | 5.000%, 4/15/33 | 4/23 at 100.00 | | BB+ | | 961,543 | |
| | 1,380 | | 5.000%, 4/15/43 | 4/23 at 100.00 | | BB+ | | 1,383,947 | |
| | 1,760 | | Dormitory Authority of the State of New York, General Revenue Bonds, Saint Johns University, Series 2013A, 5.000%, 7/01/44 | 7/23 at 100.00 | | A– | | 1,954,973 | |
| | 2,000 | | Dormitory Authority of the State of New York, Housing Revenue Bonds, Fashion Institute of Technology, Series 2007, 5.250%, 7/01/29 – FGIC Insured | No Opt. Call | | A | | 2,428,720 | |
| | 3,915 | | Dormitory Authority of the State of New York, Lease Revenue Bonds, State University Dormitory Facilities, Refunding Series 2013A, 5.000%, 7/01/27 | 7/23 at 100.00 | | Aa3 | | 4,672,748 | |
| | 3,500 | | Dormitory Authority of the State of New York, Lease Revenue Bonds, State University Dormitory Facilities, Series 2012A, 5.000%, 7/01/37 | 7/22 at 100.00 | | Aa2 | | 3,953,775 | |
| | | | Dormitory Authority of the State of New York, Lease Revenue Bonds, State University Dormitory Facilities, Series 2015A: | | | | | | |
| | 1,120 | | 5.000%, 7/01/31 | 7/25 at 100.00 | | Aa3 | | 1,325,027 | |
| | 1,245 | | 5.000%, 7/01/33 | 7/25 at 100.00 | | Aa3 | | 1,461,269 | |
| | 4,000 | | Dormitory Authority of the State of New York, Lease Revenue Bonds, State University Dormitory Facilities, Series 2017A, 5.000%, 7/01/42 | 7/27 at 100.00 | | Aa3 | | 4,721,560 | |
| | 5,090 | | Dormitory Authority of the State of New York, Revenue Bonds, Icahn School of Medicine at Mount Sinai, Refunding Series 2015A, 5.000%, 7/01/40 | 7/25 at 100.00 | | A– | | 5,738,975 | |
| | 2,100 | | Dormitory Authority of the State of New York, Revenue Bonds, Marymount Manhattan College, Series 2009, 5.250%, 7/01/29 | 7/19 at 100.00 | | Baa2 | | 2,237,886 | |
| | Principal | | | Optional Call | | | | | |
| | Amount (000) | | Description (1) | Provisions (2) | | Ratings (3) | | Value | |
| | | | Education and Civic Organizations (continued) | | | | | | |
| $ | 1,955 | | Dormitory Authority of the State of New York, Revenue Bonds, New School University, Series 2015A, 5.000%, 7/01/45 | 7/25 at 100.00 | | A– | $ | 2,230,479 | |
| | 2,120 | | Dormitory Authority of the State of New York, Revenue Bonds, New York University, Series 2001-1, 5.500%, 7/01/20 – AMBAC Insured | No Opt. Call | | Aa2 | | 2,397,275 | |
| | | | Dormitory Authority of the State of New York, Revenue Bonds, New York University, Series 2015A: | | | | | | |
| | 1,000 | | 5.000%, 7/01/34 | 7/25 at 100.00 | | Aa2 | | 1,176,040 | |
| | 2,300 | | 5.000%, 7/01/35 | 7/25 at 100.00 | | Aa2 | | 2,695,968 | |
| | | | Dormitory Authority of the State of New York, Revenue Bonds, New York University, Series 2016A: | | | | | | |
| | 5,100 | | 5.000%, 7/01/33 | 7/26 at 100.00 | | Aa2 | | 6,113,727 | |
| | 3,765 | | 5.000%, 7/01/36 | 7/26 at 100.00 | | Aa2 | | 4,464,123 | |
| | 1,055 | | 5.000%, 7/01/39 | 7/26 at 100.00 | | Aa2 | | 1,242,716 | |
| | 8,000 | | Dormitory Authority of the State of New York, Revenue Bonds, Non State Supported Debt, Cornell University, Series 2010A, 5.000%, 7/01/40 | 7/20 at 100.00 | | Aa1 | | 8,839,520 | |
| | 1,600 | | Dormitory Authority of the State of New York, Revenue Bonds, Saint Joseph’s College, Series 2010, 5.250%, 7/01/35 | 7/20 at 100.00 | | Ba1 | | 1,696,128 | |
| | 3,140 | | Dormitory Authority of the State of New York, Revenue Bonds, Vaughn College of Aeronautics & Technology, Series 2016A, 5.500%, 12/01/36 | 12/26 at 100.00 | | BB– | | 3,288,051 | |
| | 2,705 | | Glen Cove Local Economic Assistance Corporation, New York, Revenue Bonds, Garvies Point Public Improvement Project, Capital Appreciation Series 2016C, 0.000%, 1/01/55 (4) | 1/34 at 100.00 | | N/R | | 2,002,403 | |
| | 250 | | Hempstead Town Local Development Corporation, New York, Revenue Bonds, Adelphi University Project, Series 2009B, 5.250%, 2/01/39 | 2/19 at 100.00 | | A– | | 263,338 | |
| | | | Hempstead Town Local Development Corporation, New York, Revenue Bonds, Adelphi University Project, Series 2013: | | | | | | |
| | 1,005 | | 5.000%, 9/01/38 | 9/23 at 100.00 | | A– | | 1,152,624 | |
| | 265 | | 5.000%, 9/01/43 | 9/23 at 100.00 | | A– | | 295,753 | |
| | 5,000 | | Madison County Capital Resource Corporation, New York, Revenue Bonds, Colgate University Project, Refunding Series 2015A, 5.000%, 7/01/40 | 7/25 at 100.00 | | AA | | 5,837,600 | |
| | 1,260 | | Madison County Capital Resource Corporation, New York, Revenue Bonds, Colgate University Project, Series 2010A, 5.000%, 7/01/40 | 7/20 at 100.00 | | AA | | 1,379,284 | |
| | 890 | | Monroe County Industrial Development Corporation, New York, Revenue Bonds, St. John Fisher College, Series 2011, 6.000%, 6/01/30 | 6/21 at 100.00 | | A– | | 1,003,164 | |
| | | | New Rochelle Corporation, New York, Local Development Revenue Bonds, Iona College Project, Series 2015A: | | | | | | |
| | 2,945 | | 5.000%, 7/01/40 | 7/25 at 100.00 | | BBB | | 3,241,002 | |
| | 85 | | 5.000%, 7/01/45 | 7/25 at 100.00 | | BBB | | 92,995 | |
| | | | New York City Industrial Development Agency, New York, PILOT Revenue Bonds, Queens Baseball Stadium Project, Series 2006: | | | | | | |
| | 1,000 | | 5.000%, 1/01/31 – AMBAC Insured | 11/17 at 100.00 | | BBB | | 1,002,400 | |
| | 235 | | 5.000%, 1/01/36 – AMBAC Insured | 11/17 at 100.00 | | BBB | | 238,732 | |
| | 3,515 | | 5.000%, 1/01/39 – AMBAC Insured | 11/17 at 100.00 | | BBB | | 3,570,818 | |
| | 5,050 | | 4.750%, 1/01/42 – AMBAC Insured | 11/17 at 100.00 | | BBB | | 5,094,642 | |
| | 400 | | 5.000%, 1/01/46 – AMBAC Insured | 11/17 at 100.00 | | BBB | | 406,352 | |
| | | | New York City Industrial Development Authority, New York, PILOT Revenue Bonds, Yankee Stadium Project, Series 2006: | | | | | | |
| | 7,555 | | 4.500%, 3/01/39 – FGIC Insured | 11/17 at 100.00 | | Baa1 | | 7,572,679 | |
| | 2,750 | | 4.750%, 3/01/46 – NPFG Insured | 11/17 at 100.00 | | A | | 2,758,030 | |
| | 1,000 | | New York City Trust for Cultural Resources, New York, Revenue Bonds, Whitney Museum of American Art, Series 2011, 5.000%, 7/01/31 | 1/21 at 100.00 | | A | | 1,116,480 | |
| | 1,500 | | New York City Trust for Cultural Resources, New York, Revenue Bonds, Wildlife Conservation Society, Series 2013A, 5.000%, 8/01/33 | 8/23 at 100.00 | | AA– | | 1,741,725 | |
| | 1,515 | | Onondaga Civic Development Corporation, New York, Revenue Bonds, Le Moyne College Project, Series 2015, 5.000%, 7/01/40 | 7/25 at 100.00 | | Baa2 | | 1,651,032 | |
| NAN | Nuveen New York Quality Municipal Income Fund | |
| | Portfolio of Investments (continued) | August 31, 2017 (Unaudited) |
| | Principal | | | Optional Call | | | | | |
| | Amount (000) | | Description (1) | Provisions (2) | | Ratings (3) | | Value | |
| | | | Education and Civic Organizations (continued) | | | | | | |
| | | | Saint Lawrence County Industrial Development Agency Civic Development Corporation, New York, Revenue Bonds, Clarkson University Project, Series 2012A: | | | | | | |
| $ | 1,050 | | 5.250%, 9/01/33 | 3/22 at 100.00 | | A3 | $ | 1,179,308 | |
| | 1,750 | | 5.000%, 9/01/41 | 3/22 at 100.00 | | A3 | | 1,921,815 | |
| | 2,260 | | Troy Capital Resource Corporation, New York, Revenue Bonds, Rensselaer Polytechnic Institute, Series 2010A, 5.125%, 9/01/40 | 9/20 at 100.00 | | A3 | | 2,485,684 | |
| | 112,000 | | Total Education and Civic Organizations | | | | | 122,363,435 | |
| | | | Financials – 3.2% (2.1% of Total Investments) | | | | | | |
| | 4,725 | | New York Liberty Development Corporation, Revenue Bonds, Goldman Sachs Headquarters Issue, Series 2005, 5.250%, 10/01/35 | No Opt. Call | | A | | 6,054,521 | |
| | 6,885 | | New York Liberty Development Corporation, Revenue Bonds, Goldman Sachs Headquarters Issue, Series 2007, 5.500%, 10/01/37 | No Opt. Call | | A | | 9,144,519 | |
| | 11,610 | | Total Financials | | | | | 15,199,040 | |
| | | | Health Care – 4.0% (2.6% of Total Investments) | | | | | | |
| | | | Dormitory Authority of the State of New York, Highland Hospital of Rochester Revenue Bonds, Series 2010: | | | | | | |
| | 350 | | 5.000%, 7/01/26 | 7/20 at 100.00 | | A | | 380,492 | |
| | 350 | | 5.200%, 7/01/32 | 7/20 at 100.00 | | A | | 377,916 | |
| | 1,000 | | Dormitory Authority of the State of New York, Revenue Bonds, North Shore Long Island Jewish Obligated Group, Series 2011A, 5.000%, 5/01/41 | 5/21 at 100.00 | | A | | 1,096,610 | |
| | 3,700 | | Dormitory Authority of the State of New York, Revenue Bonds, North Shore Long Island Jewish Obligated Group, Series 2015A, 5.000%, 5/01/43 | 5/25 at 100.00 | | A | | 4,197,909 | |
| | 500 | | Dutchess County Local Development Corporation, New York, Revenue Bonds, Health Quest Systems Inc., Series 2010A, 5.750%, 7/01/30 | 7/20 at 100.00 | | A– | | 555,625 | |
| | 4,120 | | Dutchess County Local Development Corporation, New York, Revenue Bonds, Health Quest Systems, Inc. Project, Series 2016B, 5.000%, 7/01/32 | 7/26 at 100.00 | | A– | | 4,782,826 | |
| | 710 | | Livingston County Industrial Development Agency, New York, Civic Facility Revenue Bonds, Nicholas H. Noyes Hospital, Series 2005, 6.000%, 7/01/30 | 11/17 at 100.00 | | BB | | 710,178 | |
| | 715 | | Monroe County Industrial Development Corporation, New York, FHA Insured Mortgage Revenue Bonds, Unity Hospital of Rochester Project, Series 2010, 5.750%, 8/15/35 | 2/21 at 100.00 | | AA | | 818,775 | |
| | 2,730 | | Suffolk County Economic Development Corporation, New York, Revenue Bonds, Catholic Health Services of Long Island Obligated Group Project, Refunding Series 2011, 5.000%, 7/01/28 | 7/21 at 100.00 | | A– | | 3,007,887 | |
| | 2,175 | | Yonkers Industrial Development Agency, New York, Revenue Bonds, St. John’s Riverside Hospital, Series 2001A, 7.125%, 7/01/31 | 1/18 at 100.00 | | BB– | | 2,179,154 | |
| | 625 | | Yonkers Industrial Development Agency, New York, Revenue Bonds, St. John’s Riverside Hospital, Series 2001B, 7.125%, 7/01/31 | 7/31 at 100.00 | | BB– | | 626,194 | |
| | 16,975 | | Total Health Care | | | | | 18,733,566 | |
| | | | Housing/Multifamily – 2.4% (1.6% of Total Investments) | | | | | | |
| | 4,000 | | New York City Housing Development Corporation, New York, Multifamily Housing Revenue Bonds, Series 2009J, 4.800%, 5/01/36 | 5/19 at 100.00 | | AA+ | | 4,113,400 | |
| | 705 | | New York City Housing Development Corporation, New York, Multifamily Housing Revenue Bonds, Series 2010D-1A, 5.000%, 11/01/42 | 5/20 at 100.00 | | AA+ | | 757,100 | |
| | 2,000 | | New York State Housing Finance Agency, Affordable Housing Revenue Bonds, Series 2007B, 5.300%, 11/01/37 (Alternative Minimum Tax) | 11/17 at 100.00 | | Aa2 | | 2,005,180 | |
| | 600 | | New York State Housing Finance Agency, Affordable Housing Revenue Bonds, Series 2009B, 4.500%, 11/01/29 | 5/19 at 100.00 | | Aa2 | | 616,392 | |
| | 2,000 | | New York State Housing Finance Agency, Affordable Housing Revenue Bonds, Series 2010A, 5.000%, 11/01/42 | 5/20 at 100.00 | | Aa2 | | 2,075,140 | |
| | 1,385 | | New York State Housing Finance Agency, Affordable Housing Revenue, Series 2007A, 5.250%, 11/01/38 (Alternative Minimum Tax) | 11/17 at 100.00 | | Aa2 | | 1,388,199 | |
| | Principal | | | Optional Call | | | | | |
| | Amount (000) | | Description (1) | Provisions (2) | | Ratings (3) | | Value | |
| | | | Housing/Multifamily (continued) | | | | | | |
| $ | 530 | | New York State Housing Finance Agency, Secured Mortgage Program Multifamily Housing Revenue Bonds, Series 1999I, 6.200%, 2/15/20 (Alternative Minimum Tax) | 2/18 at 100.00 | | Aa1 | $ | 531,664 | |
| | 11,220 | | Total Housing/Multifamily | | | | | 11,487,075 | |
| | | | Housing/Single Family – 0.1% (0.1% of Total Investments) | | | | | | |
| | 645 | | Guam Housing Corporation, Mortgage-Backed Securities Program Single Family Mortgage Revenue Bonds, Series 1998A, 5.750%, 9/01/31 (Alternative Minimum Tax) | No Opt. Call | | N/R | | 677,540 | |
| | | | Industrials – 4.4% (2.9% of Total Investments) | | | | | | |
| | 1,935 | | Build New York City Resource Corporation, New York, Solid Waste Disposal Revenue Bonds, Pratt Paper NY, Inc. Project, Series 2014, 5.000%, 1/01/35 (Alternative Minimum Tax) | 1/25 at 100.00 | | N/R | | 2,088,736 | |
| | 17,145 | | New York Liberty Development Corporation, New York, Liberty Revenue Bonds, 3 World Trade Center Project, Class 1 Series 2014, 5.000%, 11/15/44 | 11/24 at 100.00 | | N/R | | 18,679,473 | |
| | 19,080 | | Total Industrials | | | | | 20,768,209 | |
| | | | Long-Term Care – 1.3% (0.9% of Total Investments) | | | | | | |
| | 1,275 | | Dormitory Authority of the State of New York, Non-State Supported Debt, Ozanam Hall of Queens Nursing Home Revenue Bonds, Series 2006, 5.000%, 11/01/31 | 11/17 at 100.00 | | A3 | | 1,276,339 | |
| | 3,130 | | East Rochester Housing Authority, New York, Senior Living Revenue Bonds, Woodland Village Project, Series 2006, 5.500%, 8/01/33 | 8/18 at 100.00 | | N/R | | 3,142,301 | |
| | | | New York City Industrial Development Agency, New York, Civic Facility Revenue Bonds, Special Needs Facilities Pooled Program, Series 2008A-1: | | | | | | |
| | 295 | | 5.500%, 7/01/18 | 11/17 at 100.00 | | N/R | | 294,263 | |
| | 1,155 | | 5.800%, 7/01/23 | 11/17 at 100.00 | | N/R | | 1,142,595 | |
| | | | Suffolk County Industrial Development Agency, New York, Civic Facility Revenue Bonds, Special Needs Facilities Pooled Program, Series 2008-B1: | | | | | | |
| | 80 | | 5.500%, 7/01/18 | 1/18 at 100.00 | | N/R | | 73,078 | |
| | 340 | | 5.800%, 7/01/23 | 1/18 at 100.00 | | N/R | | 255,099 | |
| | 170 | | Yonkers Industrial Development Agency, New York, Civic Facilities Revenue Bonds, Special Needs Facilities Pooled Program Bonds, Series 2008-C1, 5.800%, 7/01/23 | 11/17 at 100.00 | | N/R | | 168,174 | |
| | 6,445 | | Total Long-Term Care | | | | | 6,351,849 | |
| | | | Tax Obligation/General – 10.6% (7.0% of Total Investments) | | | | | | |
| | | | Nassau County, New York, General Obligation Bonds, General Improvement Series, Refunding 2016A: | | | | | | |
| | 3,630 | | 5.000%, 1/01/28 | 1/26 at 100.00 | | A+ | | 4,360,138 | |
| | 500 | | 5.000%, 1/01/38 | 1/26 at 100.00 | | A+ | | 573,625 | |
| | | | Nassau County, New York, General Obligation Bonds, General Improvement Series 2016C: | | | | | | |
| | 1,395 | | 5.000%, 4/01/35 | 4/26 at 100.00 | | A+ | | 1,615,005 | |
| | 2,000 | | 5.000%, 4/01/43 | 4/26 at 100.00 | | A+ | | 2,284,400 | |
| | | | New York City, New York, General Obligation Bonds, Fiscal 2007, Series 2007D-1: | | | | | | |
| | 4,545 | | 5.125%, 12/01/25 (UB) | 12/17 at 100.00 | | AA | | 4,594,904 | |
| | 4,060 | | 5.125%, 12/01/26 (UB) | 12/17 at 100.00 | | AA | | 4,104,498 | |
| | 400 | | New York City, New York, General Obligation Bonds, Fiscal 2009 Series E, 5.000%, 8/01/28 | 8/19 at 100.00 | | AA | | 431,196 | |
| | 1,000 | | New York City, New York, General Obligation Bonds, Fiscal 2012 Series B, 5.000%, 8/01/30 | 8/22 at 100.00 | | AA | | 1,167,440 | |
| | 980 | | New York City, New York, General Obligation Bonds, Fiscal 2012 Series I, 5.000%, 8/01/32 | 8/22 at 100.00 | | AA | | 1,135,506 | |
| | 5,000 | | New York City, New York, General Obligation Bonds, Fiscal 2014 Series A-1, 5.000%, 8/01/26 | 8/23 at 100.00 | | AA | | 5,984,100 | |
| | 8,365 | | New York City, New York, General Obligation Bonds, Fiscal 2015 Series B, 5.000%, 8/01/30 | 8/24 at 100.00 | | AA | | 9,901,818 | |
| | 410 | | New York City, New York, General Obligation Bonds, Fiscal 2017 Series B-1, 5.000%, 12/01/41 | 12/26 at 100.00 | | AA | | 480,852 | |
| | 3,775 | | New York City, New York, General Obligation Bonds, Subseries G-1 Fiscal Series 2012, 5.000%, 4/01/28 | 4/22 at 100.00 | | AA | | 4,398,215 | |
| | | | New York City, New York, General Obligation Bonds, Tender Option Bond Trust 2016-XG0082: | | | | | | |
| | 3,125 | | 15.763%, 3/01/31 (IF) (5) | 3/23 at 100.00 | | AA | | 5,189,375 | |
| | 1,525 | | 15.763%, 3/01/31 (IF) (5) | 3/23 at 100.00 | | Aa2 | | 2,532,415 | |
| NAN | Nuveen New York Quality Municipal Income Fund | |
| | Portfolio of Investments (continued) | August 31, 2017 (Unaudited) |
| | Principal | | | Optional Call | | | | | |
| | Amount (000) | | Description (1) | Provisions (2) | | Ratings (3) | | Value | |
| | | | Tax Obligation/General (continued) | | | | | | |
| | | | Rochester, New York, General Obligation Bonds, Series 1999: | | | | | | |
| $ | 720 | | 5.250%, 10/01/18 – NPFG Insured | No Opt. Call | | AA– | $ | 754,567 | |
| | 720 | | 5.250%, 10/01/19 – NPFG Insured | No Opt. Call | | AA– | | 784,570 | |
| | 42,150 | | Total Tax Obligation/General | | | | | 50,292,624 | |
| | | | Tax Obligation/Limited – 24.4% (16.1% of Total Investments) | | | | | | |
| | 980 | | Dormitory Authority of the State of New York, State Personal Income Tax Revenue Bonds, General Purpose Series 2011C, 5.000%, 3/15/41 | 3/21 at 100.00 | | AAA | | 1,093,905 | |
| | 1,000 | | Dormitory Authority of the State of New York, State Personal Income Tax Revenue Bonds, General Purpose Series 2012D, 5.000%, 2/15/33 | 2/22 at 100.00 | | AAA | | 1,150,300 | |
| | 5,000 | | Dormitory Authority of the State of New York, State Personal Income Tax Revenue Bonds, General Purpose Series 2013A, 5.000%, 2/15/43 | 2/23 at 100.00 | | AAA | | 5,671,950 | |
| | 2,080 | | Dormitory Authority of the State of New York, State Personal Income Tax Revenue Bonds, General Purpose Series 2014C, Group C, 5.000%, 3/15/44 | 3/24 at 100.00 | | AAA | | 2,409,534 | |
| | 1,000 | | Dormitory Authority of the State of New York, State Sales Tax Revenue Bonds, Series 2013A, 5.000%, 3/15/43 | 3/23 at 100.00 | | AAA | | 1,134,090 | |
| | 1,000 | | Dormitory Authority of the State of New York, State Sales Tax Revenue Bonds, Series 2015B. Group A,B&C, 5.000%, 3/15/35 | 9/25 at 100.00 | | AAA | | 1,187,440 | |
| | | | Government of Guam, Business Privilege Tax Bonds, Refunding Series 2015D: | | | | | | |
| | 3,225 | | 5.000%, 11/15/28 | 11/25 at 100.00 | | A | | 3,623,868 | |
| | 2,355 | | 5.000%, 11/15/34 | 11/25 at 100.00 | | A | | 2,569,823 | |
| | 3,750 | | Hudson Yards Infrastructure Corporation, New York, Revenue Bonds, Second Indenture Fiscal 2017 Series A, 5.000%, 2/15/45 | 2/27 at 100.00 | | Aa3 | | 4,403,925 | |
| | | | Hudson Yards Infrastructure Corporation, New York, Revenue Bonds, Senior Fiscal 2012 Series 2011A: | | | | | | |
| | 2,670 | | 5.750%, 2/15/47 | 2/21 at 100.00 | | AA– | | 3,073,998 | |
| | 2,000 | | 5.250%, 2/15/47 | 2/21 at 100.00 | | AA– | | 2,236,480 | |
| | | | Metropolitan Transportation Authority, New York, Dedicated Tax Fund Bonds, Refunding Series 2012A: | | | | | | |
| | 1,815 | | 5.000%, 11/15/27 | 11/22 at 100.00 | | AA | | 2,144,404 | |
| | 2,250 | | 5.000%, 11/15/29 | 11/22 at 100.00 | | AA | | 2,648,453 | |
| | 2,175 | | Metropolitan Transportation Authority, New York, State Service Contract Refunding Bonds, Series 2002A, 5.750%, 7/01/18 | No Opt. Call | | AA | | 2,265,698 | |
| | 1,870 | | New York City Transitional Finance Authority, New York, Building Aid Revenue Bonds, Fiscal Series 2013S-1, 5.000%, 7/15/31 | 7/22 at 100.00 | | AA | | 2,172,547 | |
| | | | New York City Transitional Finance Authority, New York, Future Tax Secured Bonds, Subordinate Fiscal 2012 Series E-1: | | | | | | |
| | 3,775 | | 5.000%, 2/01/37 | 2/22 at 100.00 | | AAA | | 4,287,343 | |
| | 3,950 | | 5.000%, 2/01/42 | 2/22 at 100.00 | | AAA | | 4,446,713 | |
| | 3,090 | | New York City Transitional Finance Authority, New York, Future Tax Secured Bonds, Subordinate Fiscal 2013 Series F-1, 5.000%, 2/01/29 | 2/23 at 100.00 | | AAA | | 3,603,713 | |
| | 7,860 | | New York City Transitional Finance Authority, New York, Future Tax Secured Bonds, Subordinate Fiscal 2013 Series I, 5.000%, 5/01/38 | 5/23 at 100.00 | | AAA | | 9,021,787 | |
| | 4,170 | | New York City Transitional Finance Authority, New York, Future Tax Secured Bonds, Subordinate Fiscal 2014 Series D-1, 5.000%, 2/01/35 | 2/24 at 100.00 | | AAA | | 4,881,444 | |
| | | | New York City Transitional Finance Authority, New York, Future Tax Secured Bonds, Subordinate Fiscal 2017 Series B-1: | | | | | | |
| | 4,960 | | 5.000%, 8/01/34 | 8/26 at 100.00 | | AAA | | 5,910,534 | |
| | 5,000 | | 5.000%, 8/01/36 | 8/26 at 100.00 | | AAA | | 5,923,200 | |
| | 2,825 | | New York City Transitional Finance Authority, New York, Future Tax Secured Revenue Bonds, Subordinate Lien Series 2011C, 5.500%, 11/01/35 | 11/20 at 100.00 | | AAA | | 3,209,454 | |
| | 2,000 | | New York City Transitional Finance Authority, New York, Future Tax Secured Revenue Bonds, Subordinate Series 2011-D1, 5.000%, 2/01/35 | 2/21 at 100.00 | | AAA | | 2,238,120 | |
| | Principal | | | Optional Call | | | | | |
| | Amount (000) | | Description (1) | Provisions (2) | | Ratings (3) | | Value | |
| | | | Tax Obligation/Limited (continued) | | | | | | |
| $ | 2,400 | | New York City Transitional Finance Authority, New York, Future Tax Secured Revenue Bonds, Tender Option Bond Trust 2015-XF0080, 11.958%, 5/01/38 (IF) | 5/19 at 100.00 | | AAA | $ | 2,867,928 | |
| | 6,000 | | New York City, New York, Educational Construction Fund, Revenue Bonds, Series 2011A, 5.750%, 4/01/41 | 4/21 at 100.00 | | AA– | | 6,865,440 | |
| | 11,300 | | New York State Thruway Authority, Highway and Bridge Trust Fund Bonds, Series 2005B, 5.500%, 4/01/20 – AMBAC Insured (UB) (5) | No Opt. Call | | AA+ | | 12,635,095 | |
| | 2,110 | | New York State Thruway Authority, State Personal Income Tax Revenue Bonds, Series 2010A, 5.000%, 3/15/29 | 9/20 at 100.00 | | AAA | | 2,360,077 | |
| | | | Puerto Rico Sales Tax Financing Corporation, Sales Tax Revenue Bonds, Series 2007A: | | | | | | |
| | 16,000 | | 0.000%, 8/01/43 – NPFG Insured | No Opt. Call | | A | | 3,724,640 | |
| | 12,500 | | 0.000%, 8/01/45 – NPFG Insured | No Opt. Call | | A | | 2,599,625 | |
| | | | Syracuse Industrial Development Authority, New York, PILOT Revenue Bonds, Carousel Center Project, Refunding Series 2016A: | | | | | | |
| | 2,000 | | 5.000%, 1/01/30 (Alternative Minimum Tax) | 1/26 at 100.00 | | A– | | 2,329,780 | |
| | 1,000 | | 5.000%, 1/01/35 (Alternative Minimum Tax) | 1/26 at 100.00 | | A– | | 1,139,340 | |
| | 124,110 | | Total Tax Obligation/Limited | | | | | 115,830,648 | |
| | | | Transportation – 28.1% (18.5% of Total Investments) | | | | | | |
| | 7,500 | | Metropolitan Transportation Authority, New York, Transportation Revenue Bonds, Refunding Series 2015D-1, 5.000%, 11/15/30 | 11/25 at 100.00 | | AA– | | 9,003,825 | |
| | | | Metropolitan Transportation Authority, New York, Transportation Revenue Bonds, Series 2010D: | | | | | | |
| | 4,000 | | 5.000%, 11/15/34 | 11/20 at 100.00 | | AA– | | 4,451,440 | |
| | 1,560 | | 5.250%, 11/15/40 | 11/20 at 100.00 | | AA– | | 1,743,565 | |
| | 6,640 | | Metropolitan Transportation Authority, New York, Transportation Revenue Bonds, Series 2012E, 5.000%, 11/15/42 | 11/22 at 100.00 | | AA– | | 7,538,990 | |
| | 2,000 | | Metropolitan Transportation Authority, New York, Transportation Revenue Bonds, Series 2013E, 5.000%, 11/15/31 | 11/23 at 100.00 | | AA– | | 2,365,120 | |
| | 5,425 | | Metropolitan Transportation Authority, New York, Transportation Revenue Bonds, Series 2015A-1, 5.000%, 11/15/45 | 5/25 at 100.00 | | AA– | | 6,250,902 | |
| | | | Metropolitan Transportation Authority, New York, Transportation Revenue Bonds, Series 2016C-1: | | | | | | |
| | 2,500 | | 5.000%, 11/15/34 | 11/26 at 100.00 | | AA– | | 2,961,325 | |
| | 12,560 | | 5.000%, 11/15/56 | 11/26 at 100.00 | | AA– | | 14,500,017 | |
| | | | New York City Industrial Development Agency, New York, Civic Facility Revenue Bonds, Bronx Parking Development Company, LLC Project, Series 2007: | | | | | | |
| | 200 | | 5.750%, 10/01/37 (6) | 10/17 at 102.00 | | N/R | | 63,932 | |
| | 5,500 | | 5.875%, 10/01/46 (6) | 10/17 at 102.00 | | N/R | | 1,758,130 | |
| | 2,850 | | New York Liberty Development Corporation, New York, Liberty Revenue Bonds, 4 World Trade Center Project, Series 2011, 5.000%, 11/15/44 | 11/21 at 100.00 | | A+ | | 3,184,590 | |
| | 1,350 | | New York State Thruway Authority, General Revenue Junior Indebtedness Obligations, Series 2016A, 5.000%, 1/01/51 | 1/26 at 100.00 | | A– | | 1,531,737 | |
| | | | New York Transportation Development Corporation, New York, Special Facility Revenue Bonds, American Airlines, Inc. John F Kennedy International Airport Project, Refunding Series 2016: | | | | | | |
| | 1,760 | | 5.000%, 8/01/26 (Alternative Minimum Tax) | 8/21 at 100.00 | | BB– | | 1,893,162 | |
| | 11,470 | | 5.000%, 8/01/31 (Alternative Minimum Tax) | 8/21 at 100.00 | | BB– | | 12,270,720 | |
| | 12,110 | | New York Transportation Development Corporation, Special Facilities Bonds, LaGuardia Airport Terminal B Redevelopment Project, Series 2016A, 5.000%, 7/01/46 (Alternative Minimum Tax) | 7/24 at 100.00 | | BBB | | 13,367,501 | |
| | | | Port Authority of New York and New Jersey, Consolidated Revenue Bonds, One Hundred Eighty-Forth Series 2014: | | | | | | |
| | 6,000 | | 5.000%, 9/01/33 | 9/24 at 100.00 | | AA– | | 7,088,700 | |
| | 4,000 | | 5.000%, 9/01/34 | 9/24 at 100.00 | | AA– | | 4,708,760 | |
| | 8,780 | | Port Authority of New York and New Jersey, Consolidated Revenue Bonds, One Hundred Eighty-Ninth Series 2015, 5.000%, 5/01/45 | 5/25 at 100.00 | | AA– | | 10,104,112 | |
| | 5,000 | | Port Authority of New York and New Jersey, Consolidated Revenue Bonds, One Hundred Sixty Sixth Series 2011, 5.000%, 1/15/41 | 1/21 at 100.00 | | AA– | | 5,572,650 | |
| NAN | Nuveen New York Quality Municipal Income Fund | |
| | Portfolio of Investments (continued) | August 31, 2017 (Unaudited) |
| | Principal | | | Optional Call | | | | | |
| | Amount (000) | | Description (1) | Provisions (2) | | Ratings (3) | | Value | |
| | | | Transportation (continued) | | | | | | |
| $ | 5,000 | | Port Authority of New York and New Jersey, Consolidated Revenue Bonds, Two Hundredth Series 2017, 5.250%, 10/15/57 | 4/27 at 100.00 | | AA– | $ | 5,947,150 | |
| | | | Port Authority of New York and New Jersey, Special Project Bonds, JFK International Air Terminal LLC Project, Eighth Series 2010: | | | | | | |
| | 1,020 | | 6.500%, 12/01/28 | 11/17 at 100.00 | | Baa1 | | 1,036,544 | |
| | 5,000 | | 6.000%, 12/01/36 | 12/20 at 100.00 | | Baa1 | | 5,613,200 | |
| | 5,000 | | Triborough Bridge and Tunnel Authority, New York, General Purpose Revenue Bonds, Refunding Series 2016A, 5.000%, 11/15/46 | 5/26 at 100.00 | | AA– | | 5,844,400 | |
| | 780 | | Triborough Bridge and Tunnel Authority, New York, General Purpose Revenue Bonds, Refunding Subordinate Lien Series 2002E, 5.500%, 11/15/20 – NPFG Insured | No Opt. Call | | A+ | | 888,256 | |
| | 3,500 | | Triborough Bridge and Tunnel Authority, New York, Subordinate Lien General Purpose Revenue Refunding Bonds, Tender Option Bond Trust 2016-XG0004, 8.451%, 11/15/33 (IF) (5) | 11/18 at 100.00 | | AA– | | 3,855,320 | |
| | 121,505 | | Total Transportation | | | | | 133,544,048 | |
| | | | U.S. Guaranteed – 17.8% (11.7% of Total Investments) (7) | | | | | | |
| | | | Brooklyn Arena Local Development Corporation, New York, Payment in Lieu of Taxes Revenue Bonds, Barclays Center Project, Series 2009: | | | | | | |
| | 2,950 | | 6.250%, 7/15/40 (Pre-refunded 1/15/20) | 1/20 at 100.00 | | AA+ (7) | | 3,324,650 | |
| | 1,000 | | 6.375%, 7/15/43 (Pre-refunded 1/15/20) | 1/20 at 100.00 | | AA+ (7) | | 1,129,930 | |
| | 400 | | Canton Capital Resource Corporation, New York, Student Housing Facility Revenue Bonds, Grasse River LLC at SUNY Canton Project Series 2010A, 5.000%, 5/01/40 (Pre-refunded 5/01/20) | 5/20 at 100.00 | | AA (7) | | 442,852 | |
| | | | Dormitory Authority of the State of New York, Orange Regional Medical Center Obligated Group Revenue Bonds, Series 2008: | | | | | | |
| | 4,665 | | 6.500%, 12/01/21 (Pre-refunded 12/01/18) | 12/18 at 100.00 | | Baa3 (7) | | 4,929,459 | |
| | 2,420 | | 6.125%, 12/01/29 (Pre-refunded 12/01/18) | 12/18 at 100.00 | | Baa3 (7) | | 2,581,608 | |
| | 4,800 | | 6.250%, 12/01/37 (Pre-refunded 12/01/18) | 12/18 at 100.00 | | Baa3 (7) | | 5,128,608 | |
| | 1,750 | | Dormitory Authority of the State of New York, Revenue Bonds, New School University, Series 2010, 5.250%, 7/01/30 (Pre-refunded 7/01/20) | 7/20 at 100.00 | | A– (7) | | 1,957,235 | |
| | 290 | | Dormitory Authority of the State of New York, Revenue Bonds, New York University, Series 2009A, 5.000%, 7/01/39 (Pre-refunded 7/01/19) | 7/19 at 100.00 | | Aa2 (7) | | 311,622 | |
| | 5,500 | | Dormitory Authority of the State of New York, Revenue Bonds, NYU Hospitals Center, Series 2011A, 6.000%, 7/01/40 (Pre-refunded 7/01/20) | 7/20 at 100.00 | | A– (7) | | 6,266,260 | |
| | 4,445 | | Hempstead Town Local Development Corporation, New York, Revenue Bonds, Molloy College Project, Series 2009, 5.750%, 7/01/39 (Pre-refunded 7/01/19) | 7/19 at 100.00 | | N/R (7) | | 4,838,605 | |
| | 4,030 | | Hudson Yards Infrastructure Corporation, New York, Revenue Bonds, Senior Fiscal 2012 Series 2011A, 5.750%, 2/15/47 (Pre-refunded 2/15/21) | 2/21 at 100.00 | | Aa3 (7) | | 4,673,349 | |
| | | | New York City, New York, General Obligation Bonds, Fiscal 2007, Series 2007D-1: | | | | | | |
| | 6,585 | | 5.125%, 12/01/25 (Pre-refunded 12/01/17) (UB) | 12/17 at 100.00 | | N/R (7) | | 6,657,303 | |
| | 5,940 | | 5.125%, 12/01/26 (Pre-refunded 12/01/17) (UB) | 12/17 at 100.00 | | N/R (7) | | 6,005,221 | |
| | 2,175 | | New York City Transitional Finance Authority, New York, Future Tax Secured Revenue Bonds, Subordinate Lien Series 2011C, 5.500%, 11/01/35 (Pre-refunded 11/01/20) | 11/20 at 100.00 | | N/R (7) | | 2,483,698 | |
| | | | New York State Environmental Facilities Corporation, State Personal Income Tax Revenue Bonds, Series 2008A: | | | | | | |
| | 2,920 | | 5.000%, 12/15/26 (Pre-refunded 12/15/17) (UB) | 12/17 at 100.00 | | AAA | | 2,956,354 | |
| | 7,020 | | 5.000%, 12/15/27 (Pre-refunded 12/15/17) (UB) | 12/17 at 100.00 | | AAA | | 7,107,399 | |
| | 5,550 | | New York State Thruway Authority, Highway and Bridge Trust Fund Bonds, Series 2007, 5.000%, 4/01/27 (Pre-refunded 10/01/17) | 10/17 at 100.00 | | AA+ (7) | | 5,570,036 | |
| | 835 | | Seneca County Industrial Development Authority, New York, Revenue Bonds, New York Chiropractic College, Series 2007, 5.000%, 10/01/27 (Pre-refunded 10/01/17) | 10/17 at 100.00 | | N/R (7) | | 837,981 | |
| | 4,975 | | Seneca Nation of Indians Capital Improvements Authority, New York, Special Obligation Bonds, Series 2007A, 5.000%, 12/01/23 (Pre-refunded 10/27/17) | 10/17 at 100.00 | | N/R (7) | | 4,984,204 | |
| | 470 | | Suffolk County Economic Development Corporation, New York, Revenue Bonds, Catholic Health Services of Long Island Obligated Group Project, Refunding Series 2011, 5.000%, 7/01/28 (Pre-refunded 7/01/21) | 7/21 at 100.00 | | N/R (7) | | 540,524 | |
| | Principal | | | Optional Call | | | | | |
| | Amount (000) | | Description (1) | Provisions (2) | | Ratings (3) | | Value | |
| | | | U.S. Guaranteed (7) (continued) | | | | | | |
| $ | 1,600 | | Triborough Bridge and Tunnel Authority, New York, General Purpose Revenue Bonds, Series 1993B, 5.000%, 1/01/20 (ETM) | No Opt. Call | | AA+ (7) | $ | 1,689,568 | |
| | 7,500 | | Triborough Bridge and Tunnel Authority, New York, General Purpose Revenue Bonds, Series 1999B, 5.500%, 1/01/30 (Pre-refunded 1/01/22) | 1/22 at 100.00 | | AA+ (7) | | 8,737,200 | |
| | 1,000 | | Yonkers Industrial Development Agency, New York, Civic Facility Revenue Bonds, Sarah Lawrence College Project, Series 2001A Remarketed, 6.000%, 6/01/41 (Pre-refunded 6/01/19) | 6/19 at 100.00 | | BBB (7) | | 1,089,620 | |
| | 78,820 | | Total U.S. Guaranteed | | | | | 84,243,286 | |
| | | | Utilities – 11.4% (7.4% of Total Investments) | | | | | | |
| | 3,500 | | Chautauqua County Industrial Development Agency, New York, Exempt Facility Revenue Bonds, NRG Dunkirk Power Project, Series 2009, 5.875%, 4/01/42 | 2/20 at 100.00 | | Baa3 | | 3,661,525 | |
| | 370 | | Guam Power Authority, Revenue Bonds, Series 2012A, 5.000%, 10/01/34 | 10/22 at 100.00 | | BBB | | 393,680 | |
| | 1,460 | | Long Island Power Authority, New York, Electric System General Revenue Bonds, Series 2014A, 5.000%, 9/01/44 | 9/24 at 100.00 | | A– | | 1,666,882 | |
| | | | Long Island Power Authority, New York, Electric System Revenue Bonds, Series 2011A: | | | | | | |
| | 1,000 | | 5.000%, 5/01/36 – AGM Insured | 5/21 at 100.00 | | AA | | 1,114,550 | |
| | 8,265 | | 5.000%, 5/01/38 | 5/21 at 100.00 | | A– | | 9,211,756 | |
| | 1,250 | | Long Island Power Authority, New York, Electric System Revenue Bonds, Series 2012A, 5.000%, 9/01/37 | 9/22 at 100.00 | | A– | | 1,391,675 | |
| | 11,760 | | Niagara Area Development Corporation, New York, Solid Waste Disposal Facility Revenue Refunding Bonds, Covanta Energy Project, Series 2012A, 5.250%, 11/01/42 (Alternative Minimum Tax) | 11/17 at 100.00 | | BB+ | | 11,784,814 | |
| | 3,300 | | Suffolk County Industrial Development Agency, New York, Revenue Bonds, Nissequogue Cogeneration Partners Facility, Series 1998, 5.500%, 1/01/23 (Alternative Minimum Tax) | 1/18 at 100.00 | | N/R | | 3,300,396 | |
| | 3,785 | | Utility Debt Securitization Authority, New York, Restructuring Bonds, Refunding Series 2015, 5.000%, 12/15/32 | 12/25 at 100.00 | | AAA | | 4,567,965 | |
| | | | Utility Debt Securitization Authority, New York, Restructuring Bonds, Series 2013TE: | | | | | | |
| | 3,800 | | 5.000%, 12/15/33 | 12/23 at 100.00 | | AAA | | 4,497,528 | |
| | 1,060 | | 5.000%, 12/15/34 | 12/23 at 100.00 | | AAA | | 1,247,016 | |
| | 8,030 | | 5.000%, 12/15/41 | 12/23 at 100.00 | | AAA | | 9,364,104 | |
| | 1,515 | | Utility Debt Securitization Authority, New York, Restructuring Bonds, Series 2016A, 5.000%, 12/15/35 | 6/26 at 100.00 | | AAA | | 1,826,726 | |
| | 49,095 | | Total Utilities | | | | | 54,028,617 | |
| | | | Water and Sewer – 10.1% (6.6% of Total Investments) | | | | | | |
| | 4,000 | | Guam Government Waterworks Authority, Water and Wastewater System Revenue Bonds, Series 2010, 5.625%, 7/01/40 | 7/20 at 100.00 | | A– | | 4,268,400 | |
| | 4,140 | | New York City Municipal Water Finance Authority, New York, Water and Sewer System Revenue Bonds, Second Generation Resolution, Fiscal 2012 Series BB, 5.000%, 6/15/44 | 12/21 at 100.00 | | AA+ | | 4,657,707 | |
| | 5,000 | | New York City Municipal Water Finance Authority, New York, Water and Sewer System Second General Resolution Revenue Bonds, Fiscal 2014 Series DD, 5.000%, 6/15/35 | 6/24 at 100.00 | | AA+ | | 5,892,050 | |
| | 10,000 | | New York City Municipal Water Finance Authority, New York, Water and Sewer System Second General Resolution Revenue Bonds, Fiscal 2018 Series AA, 5.000%, 6/15/38 | 6/27 at 100.00 | | AA+ | | 11,957,000 | |
| | 9,750 | | New York State Environmental Facilities Corporation, State Clean Water and Drinking Water Revolving Funds Revenue Bonds, New York City Municipal Water Finance Authority Projects, Second Resolution Series 2011B, 5.000%, 6/15/41 | 6/21 at 100.00 | | AAA | | 11,048,018 | |
| | 1,000 | | New York State Environmental Facilities Corporation, State Clean Water and Drinking Water Revolving Funds Revenue Bonds, New York City Municipal Water Finance Authority Projects, Second Resolution Subordinated SRF Series 2015A, 5.000%, 6/15/40 | 6/25 at 100.00 | | AAA | | 1,179,000 | |
| NAN | Nuveen New York Quality Municipal Income Fund | |
| | Portfolio of Investments (continued) | August 31, 2017 (Unaudited) |
| | Principal | | | Optional Call | | | | | |
| | Amount (000) | | Description (1) | Provisions (2) | | Ratings (3) | | Value | |
| | | | Water and Sewer (continued) | | | | | | |
| $ | 4,190 | | New York State Environmental Facilities Corporation, State Clean Water and Drinking Water Revolving Funds Revenue Bonds, New York City Municipal Water Finance Authority Projects-Second Resolution Bonds, Series 2016A, 4.000%, 6/15/46 | 6/26 at 100.00 | | AAA | $ | 4,468,048 | |
| | 3,840 | | New York State Environmental Facilities Corporation, State Revolving Funds Revenue Bonds, 2010 Master Financing Program, Series 2010C, 5.000%, 10/15/35 | 4/20 at 100.00 | | AAA | | 4,202,074 | |
| | 41,920 | | Total Water and Sewer | | | | | 47,672,297 | |
| $ | 674,825 | | Total Long-Term Investments (cost $672,230,088) | | | | | 720,479,565 | |
| | | | Floating Rate Obligations – (6.2)% | | | | | (29,570,000 | ) |
| | | | Variable Rate MuniFund Term Preferred Shares, net of deferred offering costs – (31.0)% (8) | | | | | (146,998,510 | ) |
| | | | Variable Rate Demand Preferred Shares, net of deferred offering costs – (18.5)% (9) | | | | | (87,977,807 | ) |
| | | | Other Assets Less Liabilities – 3.8% | | | | | 18,523,065 | |
| | | | Net Assets Applicable to Common Shares – 100% | | | | $ | 474,456,313 | |
| (1) | All percentages shown in the Portfolio of Investments are based on net assets applicable to common shares unless otherwise noted. |
| (2) | Optional Call Provisions: Dates (month and year) and prices of the earliest optional call or redemption. There may be other call provisions at varying prices at later dates. Certain mortgage-backed securities may be subject to periodic principal paydowns. |
| (3) | For financial reporting purposes, the ratings disclosed are the highest of Standard & Poor’s Group (“Standard & Poor’s”), Moody’s Investors Service, Inc. (“Moody’s”) or Fitch, Inc. (“Fitch”) rating. This treatment of split-rated securities may differ from that used for other purposes, such as for Fund investment policies. Ratings below BBB by Standard & Poor’s, Baa by Moody’s or BBB by Fitch are considered to be below investment grade. Holdings designated N/R are not rated by any of these national rating agencies. |
| (4) | Step-up coupon bond, a bond with a coupon that increases (“steps up”), usually at regular intervals, while the bond is outstanding. The rate shown is the coupon as of the end of the reporting period. |
| (5) | Investment, or portion of investment, has been pledged to collateralize the net payment obligations for investments in inverse floating rate transactions. |
| (6) | As of, or subsequent to, the end of the reporting period this security is non-income producing. Non-income producing, in the case of a fixed-income security, generally denotes that the issuer has (1) defaulted on the payment of principal or interest, (2) is under the protection of the Federal Bankruptcy Court or (3) the Fund’s Adviser has concluded that the issue is not likely to meet its future interest payment obligations and has ceased accruing additional income on the Fund’s records. |
| (7) | Backed by an escrow or trust containing sufficient U.S. Government or U.S. Government agency securities, which ensure the timely payment of principal and interest. Certain bonds backed by U.S. Government or agency securities are regarded as having an implied rating equal to the ratings of such securities. |
| (8) | Variable Rate MuniFund Term Preferred Shares, net of deferred offering costs as a percentage of Total Investments is 20.4%. |
| (9) | Variable Rate Demand Preferred Shares, net of deferred offering costs as a percentage of Total Investments is 12.2%. |
| ETM | Escrowed to maturity. |
| IF | Inverse floating rate security issued by a tender option bond (“TOB”) trust, the interest rate on which varies inversely with the Securities Industry Financial Markets Association (SIFMA) short-term rates, which resets weekly, or a similar short-term rate, and is reduced by the expenses related to the TOB trust. |
| UB | Underlying bond of an inverse floating rate trust reflected as a financing transaction. See Notes to Financial Statements, Note 3 – Portfolio Securities and Investments in Derivatives, Inverse Floating Rate Securities for more information. |
See accompanying notes to financial statements
| NRK | | |
| | Nuveen New York AMT-Free Quality Municipal Income Fund | |
| | Portfolio of Investments | August 31, 2017 (Unaudited) |
| | Principal | | | Optional Call | | | | | |
| | Amount (000) | | Description (1) | Provisions (2) | | Ratings (3) | | Value | |
| | | | LONG-TERM INVESTMENTS – 155.7% (98.8% of Total Investments) | | | | | | |
| | | | MUNICIPAL BONDS – 155.7% (98.8% of Total Investments) | | | | | | |
| | | | Consumer Staples – 10.2% (6.5% of Total Investments) | | | | | | |
| $ | 8,000 | | Erie County Tobacco Asset Securitization Corporation, New York, Tobacco Settlement Asset-Backed Bonds, 1st Subordinate Series 2005B, 0.000%, 6/01/47 | 11/17 at 100.00 | | N/R | $ | 1,067,840 | |
| | | | Erie County Tobacco Asset Securitization Corporation, New York, Tobacco Settlement Asset-Backed Bonds, Series 2005A: | | | | | | |
| | 27,580 | | 5.000%, 6/01/38 | 11/17 at 100.00 | | BB | | 27,553,247 | |
| | 13,500 | | 5.000%, 6/01/45 | 11/17 at 100.00 | | BB– | | 13,357,035 | |
| | 10,000 | | Erie County Tobacco Asset Securitization Corporation, New York, Tobacco Settlement Asset-Backed Bonds, Series 2005C, 0.000%, 6/01/50 | 11/17 at 100.00 | | N/R | | 917,000 | |
| | 1,310 | | Nassau County Tobacco Settlement Corporation, New York, Tobacco Settlement Asset-Backed Bonds, Refunding Series 2006A-2, 5.250%, 6/01/26 | 11/17 at 100.00 | | B– | | 1,303,358 | |
| | 26,865 | | Nassau County Tobacco Settlement Corporation, New York, Tobacco Settlement Asset-Backed Bonds, Series 2006A-3, 5.000%, 6/01/35 | 11/17 at 100.00 | | B– | | 26,422,265 | |
| | 4,680 | | New York Counties Tobacco Trust VI, New York, Tobacco Settlement Pass-Through Bonds, Turbo Term Series 2016A. Including 2016A-1, 2016A-2A and 2016A-2B, 5.000%, 6/01/51 | 6/26 at 100.00 | | N/R | | 4,831,679 | |
| | | | TSASC Inc., New York, Tobacco Asset-Backed Bonds, Series 2006: | | | | | | |
| | 4,135 | | 5.000%, 6/01/45 | 6/27 at 100.00 | | BBB– | | 4,303,088 | |
| | 49,715 | | 5.000%, 6/01/48 | 6/27 at 100.00 | | N/R | | 51,023,996 | |
| | 145,785 | | Total Consumer Staples | | | | | 130,779,508 | |
| | | | Education and Civic Organizations – 29.1% (18.5% of Total Investments) | | | | | | |
| | 3,150 | | Brooklyn Arena Local Development Corporation, New York, Payment in Lieu of Taxes Revenue Bonds, Barclays Center Project, Refunding Series 2016A, 5.000%, 7/15/42 | 1/27 at 100.00 | | BBB– | | 3,567,690 | |
| | | | Brooklyn Arena Local Development Corporation, New York, Payment in Lieu of Taxes Revenue Bonds, Barclays Center Project, Series 2009: | | | | | | |
| | 9,995 | | 0.000%, 7/15/45 | No Opt. Call | | BBB– | | 3,057,670 | |
| | 29,145 | | 0.000%, 7/15/47 | No Opt. Call | | BBB– | | 8,395,800 | |
| | | | Build New York City Resource Corporation, New York, Revenue Bonds, Bronx Charter School for Excellence, Series 2013A: | | | | | | |
| | 250 | | 5.000%, 4/01/33 | 4/23 at 100.00 | | BBB– | | 262,773 | |
| | 2,535 | | 5.500%, 4/01/43 | 4/23 at 100.00 | | BBB– | | 2,694,806 | |
| | | | Build New York City Resource Corporation, New York, Revenue Bonds, Metropolitan College of New York, Series 2014: | | | | | | |
| | 1,000 | | 5.250%, 11/01/29 | 11/24 at 100.00 | | BB | | 1,060,530 | |
| | 5,705 | | 5.250%, 11/01/34 | 11/24 at 100.00 | | BB | | 5,953,624 | |
| | 1,500 | | 5.000%, 11/01/39 | 11/24 at 100.00 | | BB | | 1,529,760 | |
| | | | Build New York City Resource Corporation, New York, Revenue Bonds, South Bronx Charter School for International Cultures and the Arts Project, Series 2013A: | | | | | | |
| | 2,690 | | 5.000%, 4/15/33 | 4/23 at 100.00 | | BB+ | | 2,722,684 | |
| | 4,090 | | 5.000%, 4/15/43 | 4/23 at 100.00 | | BB+ | | 4,101,697 | |
| | 3,655 | | Dobbs Ferry Local Development Corporation, New York, Revenue Bonds, Mercy College Project, Series 2014, 5.000%, 7/01/44 | 7/24 at 100.00 | | A | | 4,146,963 | |
| | 4,990 | | Dormitory Authority of the State of New York, General Revenue Bonds, Saint Johns University, Series 2013A, 5.000%, 7/01/44 | 7/23 at 100.00 | | A– | | 5,542,792 | |
| | 1,655 | | Dormitory Authority of the State of New York, General Revenue Bonds, Saint Johns University, Series 2015A, 5.000%, 7/01/37 | 7/25 at 100.00 | | A– | | 1,900,668 | |
| | 4,265 | | Dormitory Authority of the State of New York, Housing Revenue Bonds, Fashion Institute of Technology, Series 2007, 5.250%, 7/01/34 – FGIC Insured | No Opt. Call | | A | | 5,345,026 | |
| NRK | Nuveen New York AMT-Free Quality Municipal Income Fund |
| | Portfolio of Investments (continued) | August 31, 2017 (Unaudited) |
| | Principal | | | Optional Call | | | | | |
| | Amount (000) | | Description (1) | Provisions (2) | | Ratings (3) | | Value | |
| | | | Education and Civic Organizations (continued) | | | | | | |
| $ | 6,000 | | Dormitory Authority of the State of New York, Insured Revenue Bonds, Mount Sinai School of Medicine, Series 1994A, 5.150%, 7/01/24 – NPFG Insured | No Opt. Call | | A | $ | 7,170,960 | |
| | | | Dormitory Authority of the State of New York, Insured Revenue Bonds, Touro College and University System, Series 2014A: | | | | | | |
| | 1,685 | | 5.250%, 1/01/34 | 7/24 at 100.00 | | BBB– | | 1,858,454 | |
| | 2,185 | | 5.500%, 1/01/39 | 7/24 at 100.00 | | BBB– | | 2,430,201 | |
| | 2,820 | | 5.500%, 1/01/44 | 7/24 at 100.00 | | BBB– | | 3,125,660 | |
| | 14,585 | | Dormitory Authority of the State of New York, Lease Revenue Bonds, State University Dormitory Facilities, Refunding Series 2013A, 5.000%, 7/01/27 | 7/23 at 100.00 | | Aa3 | | 17,407,927 | |
| | 4,750 | | Dormitory Authority of the State of New York, Lease Revenue Bonds, State University Dormitory Facilities, Series 2011A, 5.000%, 7/01/41 | 7/21 at 100.00 | | Aa2 | | 5,318,955 | |
| | 3,750 | | Dormitory Authority of the State of New York, Lease Revenue Bonds, State University Dormitory Facilities, Series 2012A, 5.000%, 7/01/37 | 7/22 at 100.00 | | Aa2 | | 4,236,187 | |
| | | | Dormitory Authority of the State of New York, Lease Revenue Bonds, State University Dormitory Facilities, Series 2015A: | | | | | | |
| | 3,095 | | 5.000%, 7/01/31 | 7/25 at 100.00 | | Aa3 | | 3,661,571 | |
| | 3,465 | | 5.000%, 7/01/33 | 7/25 at 100.00 | | Aa3 | | 4,066,905 | |
| | | | Dormitory Authority of the State of New York, Lease Revenue Bonds, State University Dormitory Facilities, Series 2017A: | | | | | | |
| | 2,930 | | 5.000%, 7/01/34 | 7/27 at 100.00 | | Aa3 | | 3,519,692 | |
| | 2,000 | | 5.000%, 7/01/36 | 7/27 at 100.00 | | Aa3 | | 2,387,240 | |
| | 7,500 | | 5.000%, 7/01/37 | 7/27 at 100.00 | | Aa3 | | 8,937,900 | |
| | 2,930 | | 5.000%, 7/01/42 | 7/27 at 100.00 | | Aa3 | | 3,458,543 | |
| | | | Dormitory Authority of the State of New York, Revenue Bonds, Barnard College, Series 2007A: | | | | | | |
| | 405 | | 5.000%, 7/01/25 – NPFG Insured | 11/17 at 100.00 | | A | | 406,397 | |
| | 1,320 | | 5.000%, 7/01/37 – NPFG Insured | 11/17 at 100.00 | | A | | 1,324,369 | |
| | 6,680 | | Dormitory Authority of the State of New York, Revenue Bonds, Columbia University, Series 2011A, 5.000%, 10/01/41 | 4/21 at 100.00 | | AAA | | 7,526,957 | |
| | | | Dormitory Authority of the State of New York, Revenue Bonds, Convent of the Sacred Heart, Series 2011: | | | | | | |
| | 1,000 | | 5.625%, 11/01/35 – AGM Insured | 5/21 at 100.00 | | AA | | 1,145,460 | |
| | 5,980 | | 5.750%, 11/01/40 – AGM Insured | 5/21 at 100.00 | | AA | | 6,800,755 | |
| | 12,970 | | Dormitory Authority of the State of New York, Revenue Bonds, Icahn School of Medicine at Mount Sinai, Refunding Series 2015A, 5.000%, 7/01/40 | 7/25 at 100.00 | | A– | | 14,623,675 | |
| | 1,000 | | Dormitory Authority of the State of New York, Revenue Bonds, Marymount Manhattan College, Series 2009, 5.250%, 7/01/29 | 7/19 at 100.00 | | Baa2 | | 1,065,660 | |
| | 3,250 | | Dormitory Authority of the State of New York, Revenue Bonds, New York University, Series 1998A, 6.000%, 7/01/18 – NPFG Insured | No Opt. Call | | Aa2 | | 3,392,837 | |
| | | | Dormitory Authority of the State of New York, Revenue Bonds, New York University, Series 2001-1: | | | | | | |
| | 1,500 | | 5.500%, 7/01/24 – AMBAC Insured | No Opt. Call | | Aa2 | | 1,873,380 | |
| | 4,000 | | 5.500%, 7/01/40 – AMBAC Insured | No Opt. Call | | Aa2 | | 5,516,520 | |
| | | | Dormitory Authority of the State of New York, Revenue Bonds, New York University, Series 2015A: | | | | | | |
| | 9,000 | | 5.000%, 7/01/34 | 7/25 at 100.00 | | Aa2 | | 10,584,360 | |
| | 8,955 | | 5.000%, 7/01/45 | 7/25 at 100.00 | | Aa2 | | 10,345,443 | |
| | 10,850 | | Dormitory Authority of the State of New York, Revenue Bonds, New York University, Series 2016A, 5.000%, 7/01/32 | 7/26 at 100.00 | | Aa2 | | 13,063,942 | |
| | | | Dormitory Authority of the State of New York, Revenue Bonds, New York University, Series 2017A: | | | | | | |
| | 4,000 | | 5.000%, 7/01/38 | 7/27 at 100.00 | | Aa2 | | 4,793,560 | |
| | 5,620 | | 5.000%, 7/01/39 | 7/27 at 100.00 | | Aa2 | | 6,718,879 | |
| | 2,800 | | Dormitory Authority of the State of New York, Revenue Bonds, Non State Supported Debt, Cornell University, Series 2008C, 5.000%, 7/01/37 | 7/20 at 100.00 | | Aa1 | | 3,096,324 | |
| | Principal | | | Optional Call | | | | | |
| | Amount (000) | | Description (1) | Provisions (2) | | Ratings (3) | | Value | |
| | | | Education and Civic Organizations (continued) | | | | | | |
| | | | Dormitory Authority of the State of New York, Revenue Bonds, Non State Supported Debt, Cornell University, Series 2010A: | | | | | | |
| $ | 5,000 | | 5.000%, 7/01/35 | 7/20 at 100.00 | | Aa1 | $ | 5,538,000 | |
| | 11,560 | | 5.000%, 7/01/40 | 7/20 at 100.00 | | Aa1 | | 12,773,106 | |
| | | | Dormitory Authority of the State of New York, Revenue Bonds, Pratt Institute, Series 2015A: | | | | | | |
| | 800 | | 5.000%, 7/01/39 | 7/24 at 100.00 | | A3 | | 903,960 | |
| | 1,500 | | 5.000%, 7/01/44 | 7/24 at 100.00 | | A3 | | 1,671,300 | |
| | | | Dormitory Authority of the State of New York, Revenue Bonds, Rochester Institute of Technology, Series 2006A: | | | | | | |
| | 2,500 | | 5.250%, 7/01/20 – AMBAC Insured | No Opt. Call | | A1 | | 2,793,075 | |
| | 2,000 | | 5.250%, 7/01/21 – AMBAC Insured | No Opt. Call | | A1 | | 2,304,180 | |
| | | | Dormitory Authority of the State of New York, Revenue Bonds, Saint Joseph’s College, Series 2010: | | | | | | |
| | 1,815 | | 5.250%, 7/01/25 | 7/25 at 100.00 | | Ba1 | | 1,819,483 | |
| | 2,000 | | 5.250%, 7/01/35 | 7/20 at 100.00 | | Ba1 | | 2,120,160 | |
| | 8,925 | | Dormitory Authority of the State of New York, Revenue Bonds, Vaughn College of Aeronautics & Technology, Series 2016A, 5.500%, 12/01/36 | 12/26 at 100.00 | | BB– | | 9,345,814 | |
| | 1,000 | | Dutchess County Local Development Corporation, New York, Revenue Bonds, Marist College Project, Series 2013A, 5.000%, 7/01/39 | 7/23 at 100.00 | | A2 | | 1,106,820 | |
| | 7,695 | | Glen Cove Local Economic Assistance Corporation, New York, Revenue Bonds, Garvies Point Public Improvement Project, Capital Appreciation Series 2016C, 0.000%, 1/01/55 (4) | 1/34 at 100.00 | | N/R | | 5,696,301 | |
| | | | Hempstead Town Local Development Corporation, New York, Revenue Bonds, Adelphi University Project, Series 2013: | | | | | | |
| | 1,785 | | 5.000%, 9/01/38 | 9/23 at 100.00 | | A– | | 2,047,199 | |
| | 1,785 | | 5.000%, 9/01/43 | 9/23 at 100.00 | | A– | | 1,992,149 | |
| | 1,400 | | Monroe County Industrial Development Corporation, New York, Revenue Bonds, Saint John Fisher College, Series 2014A, 5.500%, 6/01/39 | 6/24 at 100.00 | | A– | | 1,636,586 | |
| | | | New Rochelle Corporation, New York, Local Development Revenue Bonds, Iona College Project, Series 2015A: | | | | | | |
| | 325 | | 5.000%, 7/01/40 | 7/25 at 100.00 | | BBB | | 357,666 | |
| | 350 | | 5.000%, 7/01/45 | 7/25 at 100.00 | | BBB | | 382,921 | |
| | | | New York City Industrial Development Agency, New York, Payment in Lieu of Taxes Revenue Bonds, Queens Baseball Stadium Project, Series 2009: | | | | | | |
| | 1,000 | | 6.125%, 1/01/29 – AGC Insured | 1/19 at 100.00 | | AA | | 1,069,500 | |
| | 1,000 | | 6.375%, 1/01/39 – AGC Insured | 1/19 at 100.00 | | AA | | 1,071,140 | |
| | | | New York City Industrial Development Agency, New York, PILOT Revenue Bonds, Queens Baseball Stadium Project, Series 2006: | | | | | | |
| | 6,815 | | 5.000%, 1/01/31 – AMBAC Insured | 11/17 at 100.00 | | BBB | | 6,831,356 | |
| | 5,000 | | 5.000%, 1/01/36 – AMBAC Insured | 11/17 at 100.00 | | BBB | | 5,079,400 | |
| | 1,030 | | 4.750%, 1/01/42 – AMBAC Insured | 11/17 at 100.00 | | BBB | | 1,039,105 | |
| | 14,500 | | 5.000%, 1/01/46 – AMBAC Insured | 11/17 at 100.00 | | BBB | | 14,730,260 | |
| | 4,730 | | New York City Industrial Development Agency, New York, Revenue Bonds, Yankee Stadium Project PILOT, Series 2009A, 7.000%, 3/01/49 – AGC Insured | 3/19 at 100.00 | | AA | | 5,157,355 | |
| | | | New York City Industrial Development Authority, New York, PILOT Revenue Bonds, Yankee Stadium Project, Series 2006: | | | | | | |
| | 4,280 | | 5.000%, 3/01/31 – FGIC Insured | 11/17 at 100.00 | | Baa1 | | 4,290,657 | |
| | 31,650 | | 5.000%, 3/01/36 – NPFG Insured | 11/17 at 100.00 | | A | | 32,134,245 | |
| | 20,210 | | 4.500%, 3/01/39 – FGIC Insured | 11/17 at 100.00 | | Baa1 | | 20,257,291 | |
| | 3,400 | | New York City Trust for Cultural Resources, New York, Revenue Bonds, Whitney Museum of American Art, Series 2011, 5.000%, 7/01/31 | 1/21 at 100.00 | | A | | 3,796,032 | |
| | | | Niagara Area Development Corporation, New York, Niagara University Project, Series 2012A: | | | | | | |
| | 600 | | 5.000%, 5/01/35 | 5/22 at 100.00 | | BBB+ | | 660,660 | |
| | 1,000 | | 5.000%, 5/01/42 | 5/22 at 100.00 | | BBB+ | | 1,096,040 | |
| | 1,450 | | Onondaga Civic Development Corporation, New York, Revenue Bonds, Le Moyne College Project, Series 2012, 5.000%, 7/01/42 | 7/22 at 100.00 | | Baa2 | | 1,541,901 | |
| NRK | Nuveen New York AMT-Free Quality Municipal Income Fund |
| | Portfolio of Investments (continued) | August 31, 2017 (Unaudited) |
| | Principal | | | Optional Call | | | | | |
| | Amount (000) | | Description (1) | Provisions (2) | | Ratings (3) | | Value | |
| | | | Education and Civic Organizations (continued) | | | | | | |
| $ | 1,000 | | Onondaga County Trust For Cultural Resources, New York, Revenue Bonds, Syracuse University Project, Series 2011, 5.000%, 12/01/36 | 12/21 at 100.00 | | AA– | $ | 1,135,930 | |
| | | | Tompkins County Development Corporation, New York, Revenue Bonds, Ithaca College, Series 2011: | | | | | | |
| | 1,390 | | 5.500%, 7/01/33 – AGM Insured | 1/21 at 100.00 | | A2 | | 1,554,201 | |
| | 1,000 | | 5.250%, 7/01/36 – AGM Insured | 1/21 at 100.00 | | A2 | | 1,109,050 | |
| | 4,000 | | 5.375%, 7/01/41 – AGM Insured | 1/21 at 100.00 | | A2 | | 4,452,280 | |
| | 3,700 | | Troy Capital Resource Corporation, New York, Revenue Bonds, Rensselaer Polytechnic Institute, Series 2010A, 5.125%, 9/01/40 | 9/20 at 100.00 | | A3 | | 4,069,482 | |
| | 369,845 | | Total Education and Civic Organizations | | | | | 373,705,801 | |
| | | | Financials – 1.6% (1.0% of Total Investments) | | | | | | |
| | 1,615 | | New York Liberty Development Corporation, Revenue Bonds, Goldman Sachs Headquarters Issue, Series 2005, 5.250%, 10/01/35 | No Opt. Call | | A | | 2,069,429 | |
| | 13,835 | | New York Liberty Development Corporation, Revenue Bonds, Goldman Sachs Headquarters Issue, Series 2007, 5.500%, 10/01/37 | No Opt. Call | | A | | 18,375,370 | |
| | 15,450 | | Total Financials | | | | | 20,444,799 | |
| | | | Health Care – 3.6% (2.3% of Total Investments) | | | | | | |
| | 1,250 | | Build New York City Resource Corporation, New York, Revenue Bonds, New York Methodist Hospital Project, Refunding Series 2014, 5.000%, 7/01/27 | 7/24 at 100.00 | | A3 | | 1,456,262 | |
| | 2,455 | | Dormitory Authority of the State of New York, FHA-Insured Mortgage Hospital Revenue Bonds, Hospital for Special Surgery, Series 2009, 6.250%, 8/15/34 | 8/19 at 100.00 | | AA+ | | 2,710,001 | |
| | 4,000 | | Dormitory Authority of the State of New York, Revenue Bonds, North Shore Long Island Jewish Obligated Group, Series 2011A, 5.000%, 5/01/41 | 5/21 at 100.00 | | A | | 4,386,440 | |
| | | | Dormitory Authority of the State of New York, Revenue Bonds, Orange Regional Medical Center Obligated Group, Series 2017: | | | | | | |
| | 1,000 | | 5.000%, 12/01/34 | 6/27 at 100.00 | | Baa3 | | 1,109,860 | |
| | 300 | | 5.000%, 12/01/36 | 6/27 at 100.00 | | Baa3 | | 331,146 | |
| | 900 | | Dutchess County Local Development Corporation, New York, Revenue Bonds, Health Quest Systems Inc., Series 2010A, 5.750%, 7/01/40 – AGM Insured | 7/20 at 100.00 | | A– | | 995,904 | |
| | 7,940 | | Dutchess County Local Development Corporation, New York, Revenue Bonds, Health Quest Systems, Inc. Project, Series 2016B, 5.000%, 7/01/46 | 7/26 at 100.00 | | A– | | 8,940,678 | |
| | 1,875 | | Monroe County Industrial Development Corporation, New York, FHA Insured Mortgage Revenue Bonds, Unity Hospital of Rochester Project, Series 2010, 5.750%, 8/15/35 | 2/21 at 100.00 | | AA | | 2,147,137 | |
| | 3,900 | | Monroe County Industrial Development Corporation, New York, Revenue Bonds, Rochester General Hospital Project, Series 2013A, 5.000%, 12/01/42 | 12/22 at 100.00 | | A– | | 4,254,315 | |
| | 2,800 | | Monroe County Industrial Development Corporation, New York, Revenue Bonds, Rochester General Hospital Project, Series 2017, 5.000%, 12/01/46 | 12/26 at 100.00 | | A– | | 3,157,616 | |
| | 5,585 | | Suffolk County Economic Development Corporation, New York, Revenue Bonds, Catholic Health Services of Long Island Obligated Group Project, Refunding Series 2011, 5.000%, 7/01/28 | 7/21 at 100.00 | | A– | | 6,153,497 | |
| | 565 | | Westchester County Health Care Corporation, New York, Senior Lien Revenue Bonds, Series 2010-C2, 6.125%, 11/01/37 | 11/20 at 100.00 | | BBB | | 624,235 | |
| | 2,260 | | Westchester County Local Development Corporation, New York, Revenue Bonds, Westchester Medical Center Obligated Group Project, Refunding Series 2016, 5.000%, 11/01/46 | 11/25 at 100.00 | | BBB | | 2,485,412 | |
| | 5,515 | | Yonkers Industrial Development Agency, New York, Revenue Bonds, St. John’s Riverside Hospital, Series 2001A, 7.125%, 7/01/31 | 1/18 at 100.00 | | BB– | | 5,525,534 | |
| | 1,955 | | Yonkers Industrial Development Agency, New York, Revenue Bonds, St. John’s Riverside Hospital, Series 2001B, 7.125%, 7/01/31 | 7/31 at 100.00 | | BB– | | 1,958,734 | |
| | 42,300 | | Total Health Care | | | | | 46,236,771 | |
| | | | Housing/Multifamily – 0.1% (0.1% of Total Investments) | | | | | | |
| | 1,040 | | New York City Housing Development Corporation, New York, Multifamily Housing Revenue Bonds, Series 2010D-1A, 5.000%, 11/01/42 | 5/20 at 100.00 | | AA+ | | 1,116,856 | |
| | Principal | | | Optional Call | | | | | |
| | Amount (000) | | Description (1) | Provisions (2) | | Ratings (3) | | Value | |
| | | | Housing/Multifamily (continued) | | | | | | |
| $ | 450 | | New York State Housing Finance Agency, Affordable Housing Revenue Bonds, Series 2009B, 4.500%, 11/01/29 | 5/19 at 100.00 | | Aa2 | $ | 462,294 | |
| | 40 | | New York State Housing Finance Agency, Mortgage Revenue Refunding Bonds, Housing Project, Series 1996A, 6.125%, 11/01/20 – AGM Insured | 11/17 at 100.00 | | AA | | 40,129 | |
| | 1,530 | | Total Housing/Multifamily | | | | | 1,619,279 | |
| | | | Industrials – 3.2% (2.0% of Total Investments) | | | | | | |
| | 38,030 | | New York Liberty Development Corporation, New York, Liberty Revenue Bonds, 3 World Trade Center Project, Class 1 Series 2014, 5.000%, 11/15/44 | 11/24 at 100.00 | | N/R | | 41,433,685 | |
| | | | Long-Term Care – 0.1% (0.1% of Total Investments) | | | | | | |
| | 1,225 | | Suffolk County Economic Development Corporation, New York, Revenue Bonds, Peconic Landing At Southold, Inc. Project, Refunding Series 2010, 6.000%, 12/01/40 | 12/20 at 100.00 | | BBB– | | 1,333,560 | |
| | | | Tax Obligation/General – 9.8% (6.2% of Total Investments) | | | | | | |
| | 15 | | Nassau County, New York, General Obligation Bonds, General Improvement Series 2009C, 5.000%, 10/01/29 – AGC Insured | 10/19 at 100.00 | | AA | | 16,218 | |
| | | | Nassau County, New York, General Obligation Bonds, General Improvement Series 2016B: | | | | | | |
| | 6,955 | | 5.000%, 10/01/27 | 10/26 at 100.00 | | A+ | | 8,521,405 | |
| | 4,590 | | 5.000%, 10/01/28 | 10/26 at 100.00 | | A+ | | 5,565,972 | |
| | | | Nassau County, New York, General Obligation Bonds, General Improvement Series, Refunding 2016A: | | | | | | |
| | 5,860 | | 5.000%, 1/01/31 | 1/26 at 100.00 | | A+ | | 6,883,449 | |
| | 500 | | 5.000%, 1/01/38 | 1/26 at 100.00 | | A+ | | 573,625 | |
| | 5,030 | | Nassau County, New York, General Obligation Bonds, General Improvement Series 2016C, 5.000%, 4/01/33 | 4/26 at 100.00 | | A+ | | 5,881,529 | |
| | 1,200 | | New York City, New York, General Obligation Bonds, Fiscal 2009 Series E, 5.000%, 8/01/28 | 8/19 at 100.00 | | AA | | 1,293,588 | |
| | | | New York City, New York, General Obligation Bonds, Fiscal 2012 Series A-1: | | | | | | |
| | 6,085 | | 5.000%, 10/01/31 | 10/22 at 100.00 | | AA | | 7,112,209 | |
| | 1,000 | | 5.000%, 10/01/33 | 10/22 at 100.00 | | AA | | 1,155,560 | |
| | 1,570 | | 5.000%, 10/01/34 | 10/22 at 100.00 | | AA | | 1,805,155 | |
| | 8,665 | | New York City, New York, General Obligation Bonds, Fiscal 2012 Series B, 5.000%, 8/01/30 | 8/22 at 100.00 | | AA | | 10,115,868 | |
| | | | New York City, New York, General Obligation Bonds, Fiscal 2012 Series I: | | | | | | |
| | 1,000 | | 5.000%, 8/01/30 | 8/22 at 100.00 | | AA | | 1,167,440 | |
| | 2,000 | | 5.000%, 8/01/31 | 8/22 at 100.00 | | AA | | 2,328,680 | |
| | | | New York City, New York, General Obligation Bonds, Fiscal 2013 Series F-1: | | | | | | |
| | 5,000 | | 5.000%, 3/01/29 | 3/23 at 100.00 | | AA | | 5,845,300 | |
| | 3,400 | | 5.000%, 3/01/31 | 3/23 at 100.00 | | AA | | 3,961,510 | |
| | 2,190 | | 5.000%, 3/01/32 | 3/23 at 100.00 | | AA | | 2,545,437 | |
| | 1,000 | | 5.000%, 3/01/33 | 3/23 at 100.00 | | AA | | 1,160,040 | |
| | 3,735 | | New York City, New York, General Obligation Bonds, Fiscal 2014 Series A-1, 5.000%, 8/01/26 | 8/23 at 100.00 | | AA | | 4,470,123 | |
| | 8,000 | | New York City, New York, General Obligation Bonds, Fiscal 2014 Series D-1, 5.000%, 8/01/30 | 8/23 at 100.00 | | AA | | 9,431,040 | |
| | 7,665 | | New York City, New York, General Obligation Bonds, Fiscal 2015 Series A, 5.000%, 8/01/33 | 8/24 at 100.00 | | AA | | 8,940,839 | |
| | 12,600 | | New York City, New York, General Obligation Bonds, Fiscal 2017 Series B-1, 5.000%, 12/01/41 | 12/26 at 100.00 | | AA | | 14,777,406 | |
| | 5 | | New York City, New York, General Obligation Bonds, Fiscal Series 2004E, 5.000%, 11/01/20 – AGM Insured | 11/17 at 100.00 | | AA | | 5,017 | |
| | | | New York City, New York, General Obligation Bonds, Series 2011D-I: | | | | | | |
| | 2,785 | | 5.000%, 10/01/30 | 10/21 at 100.00 | | AA | | 3,188,992 | |
| | 2,880 | | 5.000%, 10/01/34 | 10/21 at 100.00 | | AA | | 3,269,491 | |
| | 3,345 | | New York City, New York, General Obligation Bonds, Subseries G-1 Fiscal Series 2012, 5.000%, 4/01/28 | 4/22 at 100.00 | | AA | | 3,897,226 | |
| | | | Rensselaer County, New York, General Obligation Bonds, Series 1991: | | | | | | |
| | 960 | | 6.700%, 2/15/18 – AMBAC Insured | No Opt. Call | | AA | | 985,315 | |
| | 960 | | 6.700%, 2/15/19 – AMBAC Insured | No Opt. Call | | AA | | 1,041,504 | |
| | 960 | | 6.700%, 2/15/20 – AMBAC Insured | No Opt. Call | | AA | | 1,097,510 | |
| | 747 | | 6.700%, 2/15/21 – AMBAC Insured | No Opt. Call | | AA | | 896,983 | |
| NRK | Nuveen New York AMT-Free Quality Municipal Income Fund |
| | Portfolio of Investments (continued) | August 31, 2017 (Unaudited) |
| | Principal | | | Optional Call | | | | | |
| | Amount (000) | | Description (1) | Provisions (2) | | Ratings (3) | | Value | |
| | | | Tax Obligation/General (continued) | | | | | | |
| | | | Rochester, New York, General Obligation Bonds, Series 1999: | | | | | | |
| $ | 735 | | 5.250%, 10/01/20 – NPFG Insured | No Opt. Call | | AA– | $ | 829,484 | |
| | 735 | | 5.250%, 10/01/21 – NPFG Insured | No Opt. Call | | AA– | | 855,981 | |
| | 730 | | 5.250%, 10/01/22 – NPFG Insured | No Opt. Call | | AA– | | 872,978 | |
| | 730 | | 5.250%, 10/01/23 – NPFG Insured | No Opt. Call | | AA– | | 892,505 | |
| | 730 | | 5.250%, 10/01/24 – NPFG Insured | No Opt. Call | | AA– | | 892,826 | |
| | 730 | | 5.250%, 10/01/25 – NPFG Insured | No Opt. Call | | AA– | | 905,331 | |
| | 725 | | 5.250%, 10/01/26 – NPFG Insured | No Opt. Call | | AA– | | 908,178 | |
| | 1,145 | | Three Village Central School District, Brookhaven and Smithtown, Suffolk County, New York, General Obligation Bonds, Refunding Series 2005, 5.000%, 6/01/18 – FGIC Insured | No Opt. Call | | Aa2 | | 1,181,800 | |
| | 106,962 | | Total Tax Obligation/General | | | | | 125,273,514 | |
| | | | Tax Obligation/Limited – 41.2% (26.1% of Total Investments) | | | | | | |
| | 7,000 | | Dormitory Authority of the State of New York State Personal Income tax Revenue Bonds (General Purpose), Series 2017A, 5.000%, 2/15/37 | 2/27 at 100.00 | | AAA | | 8,316,280 | |
| | 360 | | Dormitory Authority of the State of New York, Insured Revenue Bonds, 853 Schools Program – Anderson School, Series 1999E, Issue 2, 5.750%, 7/01/19 – AMBAC Insured | 1/18 at 100.00 | | N/R | | 361,501 | |
| | 3,390 | | Dormitory Authority of the State of New York, Insured Revenue Bonds, Special Act School District Program, Series 1999, 5.750%, 7/01/19 – NPFG Insured | 1/18 at 100.00 | | A | | 3,403,492 | |
| | 105 | | Dormitory Authority of the State of New York, Revenue Bonds, School Districts Financing Program, Series 2009A, 5.625%, 10/01/29 – AGC Insured | 10/19 at 100.00 | | AA | | 114,758 | |
| | 1,000 | | Dormitory Authority of the State of New York, Revenue Bonds, State University Educational Facilities, Series 1993A, 5.500%, 5/15/19 – AMBAC Insured | No Opt. Call | | Aa2 | | 1,047,250 | |
| | 940 | | Dormitory Authority of the State of New York, Second General Resolution Consolidated Revenue Bonds, City University System, Series 1993A, 5.750%, 7/01/18 – AGM Insured | No Opt. Call | | AA | | 978,239 | |
| | | | Dormitory Authority of the State of New York, State Personal Income Tax Revenue Bonds, General Purpose Series 2011C: | | | | | | |
| | 995 | | 5.000%, 3/15/34 | 3/21 at 100.00 | | AAA | | 1,120,519 | |
| | 24,000 | | 5.000%, 3/15/41 | 3/21 at 100.00 | | AAA | | 26,789,520 | |
| | | | Dormitory Authority of the State of New York, State Personal Income Tax Revenue Bonds, General Purpose Series 2012D: | | | | | | |
| | 7,550 | | 5.000%, 2/15/33 | 2/22 at 100.00 | | AAA | | 8,684,765 | |
| | 10,000 | | 5.000%, 2/15/40 | 2/22 at 100.00 | | AAA | | 11,341,200 | |
| | | | Dormitory Authority of the State of New York, State Personal Income Tax Revenue Bonds, General Purpose Series 2014A: | | | | | | |
| | 5,000 | | 5.000%, 2/15/29 | 2/24 at 100.00 | | AAA | | 5,947,950 | |
| | 10,000 | | 5.000%, 2/15/30 | 2/24 at 100.00 | | AAA | | 11,877,500 | |
| | 7,000 | | Dormitory Authority of the State of New York, State Personal Income Tax Revenue Bonds, General Purpose Series 2014C, Group C, 5.000%, 3/15/44 | 3/24 at 100.00 | | AAA | | 8,109,010 | |
| | | | Dormitory Authority of the State of New York, State Personal Income Tax Revenue Bonds, General Purpose Series 2015A: | | | | | | |
| | 1,500 | | 5.000%, 3/15/31 | 3/25 at 100.00 | | AAA | | 1,781,115 | |
| | 2,500 | | 5.000%, 3/15/33 | 3/25 at 100.00 | | AAA | | 2,951,450 | |
| | 28,280 | | Dormitory Authority of the State of New York, State Sales Tax Revenue Bonds, Series 2013A, 5.000%, 3/15/43 | 3/23 at 100.00 | | AAA | | 32,072,065 | |
| | 3,000 | | Dormitory Authority of the State of New York, State Sales Tax Revenue Bonds, Series 2014A, 5.000%, 3/15/34 | 3/24 at 100.00 | | AAA | | 3,536,970 | |
| | 12,045 | | Dormitory Authority of the State of New York, State Sales Tax Revenue Bonds, Series 2015B. Group A,B&C, 5.000%, 3/15/36 | 9/25 at 100.00 | | AAA | | 14,293,079 | |
| | 1,080 | | Erie County Industrial Development Agency, New York, School Facility Revenue Bonds, Buffalo City School District, Refunding Series 2013A, 5.000%, 5/01/28 | 5/23 at 100.00 | | AA | | 1,266,430 | |
| | | | Government of Guam, Business Privilege Tax Bonds, Refunding Series 2015D: | | | | | | |
| | 5,045 | | 5.000%, 11/15/27 | 11/25 at 100.00 | | A | | 5,715,581 | |
| | 6,770 | | 5.000%, 11/15/34 | 11/25 at 100.00 | | A | | 7,387,559 | |
| | Principal | | | Optional Call | | | | | |
| | Amount (000) | | Description (1) | Provisions (2) | | Ratings (3) | | Value | |
| | | | Tax Obligation/Limited (continued) | | | | | | |
| $ | 29,200 | | Hudson Yards Infrastructure Corporation, New York, Revenue Bonds, Second Indenture Fiscal 2017 Series A, 5.000%, 2/15/42 | 2/27 at 100.00 | | Aa3 | $ | 34,397,600 | |
| | | | Hudson Yards Infrastructure Corporation, New York, Revenue Bonds, Senior Fiscal 2012 Series 2011A: | | | | | | |
| | 9,175 | | 5.750%, 2/15/47 | 2/21 at 100.00 | | AA– | | 10,563,269 | |
| | 6,000 | | 5.250%, 2/15/47 | 2/21 at 100.00 | | AA– | | 6,709,440 | |
| | 1,850 | | 5.000%, 2/15/47 – AGM Insured | 2/21 at 100.00 | | AA | | 2,049,356 | |
| | 9,000 | | Metropolitan Transportation Authority, New York, State Service Contract Bonds, Series 2002A, 5.750%, 7/01/18 – AGM Insured (UB) | No Opt. Call | | AA | | 9,375,300 | |
| | 1,000 | | Metropolitan Transportation Authority, New York, State Service Contract Refunding Bonds, Series 2002A, 5.750%, 7/01/18 – AGM Insured | No Opt. Call | | AA | | 1,041,700 | |
| | 3,675 | | Monroe County Industrial Development Agency, New York, School Facility Revenue Bonds, Rochester Schools Modernization Project, Series 2013, 5.000%, 5/01/28 | 5/23 at 100.00 | | AA | | 4,305,777 | |
| | | | New York City Transitional Finance Authority, New York, Building Aid Revenue Bonds, Fiscal Series 2015S-1: | | | | | | |
| | 5,400 | | 5.000%, 7/15/33 | 1/25 at 100.00 | | AA | | 6,303,636 | |
| | 5,360 | | 5.000%, 7/15/43 | 1/25 at 100.00 | | AA | | 6,175,095 | |
| | 11,000 | | New York City Transitional Finance Authority, New York, Building Aid Revenue Bonds, Fiscal Series 2015S-2, 5.000%, 7/15/40 | 7/25 at 100.00 | | AA | | 12,868,130 | |
| | 7,500 | | New York City Transitional Finance Authority, New York, Building Aid Revenue Bonds, Fiscal Series 2016S-1, 4.000%, 7/15/40 | 1/26 at 100.00 | | AA | | 7,982,775 | |
| | | | New York City Transitional Finance Authority, New York, Future Tax Secured Bonds, Subordinate Fiscal 2012 Series E-1: | | | | | | |
| | 6,225 | | 5.000%, 2/01/37 | 2/22 at 100.00 | | AAA | | 7,069,857 | |
| | 24,155 | | 5.000%, 2/01/42 | 2/22 at 100.00 | | AAA | | 27,192,491 | |
| | 32,500 | | New York City Transitional Finance Authority, New York, Future Tax Secured Bonds, Subordinate Fiscal 2012 Series F-1, 5.000%, 5/01/39 | 5/22 at 100.00 | | AAA | | 36,869,300 | |
| | 5,100 | | New York City Transitional Finance Authority, New York, Future Tax Secured Bonds, Subordinate Fiscal 2013 Series F-1, 5.000%, 2/01/29 | 2/23 at 100.00 | | AAA | | 5,947,875 | |
| | 13,530 | | New York City Transitional Finance Authority, New York, Future Tax Secured Bonds, Subordinate Fiscal 2014 Series D-1, 5.000%, 2/01/37 | 2/24 at 100.00 | | AAA | | 15,802,905 | |
| | | | New York City Transitional Finance Authority, New York, Future Tax Secured Bonds, Subordinate Fiscal 2015 Series B-1: | | | | | | |
| | 5,000 | | 5.000%, 8/01/33 | 8/24 at 100.00 | | AAA | | 5,928,850 | |
| | 3,960 | | 5.000%, 8/01/35 | 8/24 at 100.00 | | AAA | | 4,684,482 | |
| | 9,325 | | New York City Transitional Finance Authority, New York, Future Tax Secured Bonds, Subordinate Fiscal 2017 Series A-1, 4.000%, 5/01/42 | 5/26 at 100.00 | | AAA | | 9,958,261 | |
| | 1,375 | | New York City Transitional Finance Authority, New York, Future Tax Secured Bonds, Subordinate Fiscal 2017 Series E-1, 5.000%, 2/01/35 | 2/27 at 100.00 | | AAA | | 1,640,169 | |
| | | | New York City Transitional Finance Authority, New York, Future Tax Secured Revenue Bonds, Subordinate Lien Series 2011C: | | | | | | |
| | 5,645 | | 5.500%, 11/01/35 | 11/20 at 100.00 | | AAA | | 6,413,228 | |
| | 1,000 | | 5.000%, 11/01/39 | 11/20 at 100.00 | | AAA | | 1,116,600 | |
| | 8,490 | | New York City Transitional Finance Authority, New York, Future Tax Secured Revenue Bonds, Subordinate Series 2011-D1, 5.000%, 2/01/35 | 2/21 at 100.00 | | AAA | | 9,500,819 | |
| | | | New York City, New York, Educational Construction Fund, Revenue Bonds, Series 2011A: | | | | | | |
| | 18,575 | | 5.750%, 4/01/33 – AGM Insured | 4/21 at 100.00 | | Aa3 | | 21,394,499 | |
| | 4,000 | | 5.750%, 4/01/41 | 4/21 at 100.00 | | AA– | | 4,576,960 | |
| | 28,795 | | New York State Thruway Authority, Highway and Bridge Trust Fund Bonds, Second General, Series 2005B, 5.500%, 4/01/20 – AMBAC Insured | No Opt. Call | | AA+ | | 32,197,129 | |
| | | | New York State Thruway Authority, State Personal Income Tax Revenue Bonds, Series 2010A: | | | | | | |
| | 1,600 | | 5.000%, 3/15/29 | 9/20 at 100.00 | | AAA | | 1,789,632 | |
| | 1,945 | | 5.000%, 3/15/30 | 9/20 at 100.00 | | AAA | | 2,170,134 | |
| NRK | Nuveen New York AMT-Free Quality Municipal Income Fund |
| | Portfolio of Investments (continued) | August 31, 2017 (Unaudited) |
| | Principal | | | Optional Call | | | | | |
| | Amount (000) | | Description (1) | Provisions (2) | | Ratings (3) | | Value | |
| | | | Tax Obligation/Limited (continued) | | | | | | |
| $ | 5,450 | | New York State Urban Development Corporation, State Facilities Revenue Bonds, Series 1995, 5.700%, 4/01/20 – AGM Insured (UB) (5) | No Opt. Call | | AA | $ | 5,847,414 | |
| | 12,070 | | New York State Urban Development Corporation, State Personal Income Tax Revenue Bonds, General Purpose Series 2013C, 5.000%, 3/15/32 | 3/23 at 100.00 | | AAA | | 14,153,041 | |
| | | | Puerto Rico Sales Tax Financing Corporation, Sales Tax Revenue Bonds, Series 2007A: | | | | | | |
| | 11,000 | | 0.000%, 8/01/41 – NPFG Insured | No Opt. Call | | A | | 2,862,970 | |
| | 13,520 | | 0.000%, 8/01/42 – FGIC Insured | No Opt. Call | | A | | 3,327,813 | |
| | 10,000 | | 0.000%, 8/01/44 – NPFG Insured | No Opt. Call | | A | | 2,197,800 | |
| | 19,900 | | 0.000%, 8/01/45 – NPFG Insured | No Opt. Call | | A | | 4,138,603 | |
| | 201,690 | | 0.000%, 8/01/46 – NPFG Insured | No Opt. Call | | A | | 39,807,555 | |
| | 525 | | Suffolk County Industrial Development Agency, New York, Revenue Bonds, Hampton Bays Public Library, Series 1999A, 6.000%, 10/01/19 – NPFG Insured | 10/17 at 100.00 | | A3 | | 527,258 | |
| | 2,730 | | Suffolk County Judicial Facilities Agency, New York, Lease Revenue Bonds, H. Lee Dennison Building, Series 2013, 5.000%, 11/01/33 | 11/23 at 100.00 | | BBB+ | | 3,061,313 | |
| | 674,825 | | Total Tax Obligation/Limited | | | | | 529,045,269 | |
| | | | Transportation – 20.4% (12.9% of Total Investments) | | | | | | |
| | | | Buffalo and Fort Erie Public Bridge Authority, New York, Toll Bridge System Revenue Bonds, Series 2017: | | | | | | |
| | 2,250 | | 5.000%, 1/01/42 | 1/27 at 100.00 | | A+ | | 2,643,908 | |
| | 2,660 | | 5.000%, 1/01/47 | 1/27 at 100.00 | | A+ | | 3,111,429 | |
| | 10,000 | | Metropolitan Transportation Authority, New York, Transportation Revenue Bonds, Refunding Green Series 2016A-1, 5.000%, 11/15/46 | 5/26 at 100.00 | | AA– | | 11,530,200 | |
| | | | Metropolitan Transportation Authority, New York, Transportation Revenue Bonds, Refunding Green Series 2016B: | | | | | | |
| | 1,815 | | 4.000%, 11/15/34 | 11/26 at 100.00 | | AA– | | 1,961,507 | |
| | 4,000 | | 5.000%, 11/15/35 | 11/26 at 100.00 | | AA– | | 4,720,280 | |
| | 13,950 | | Metropolitan Transportation Authority, New York, Transportation Revenue Bonds, Refunding Series 2012F, 5.000%, 11/15/30 | 11/22 at 100.00 | | AA– | | 16,313,548 | |
| | 27,285 | | Metropolitan Transportation Authority, New York, Transportation Revenue Bonds, Series 2010D, 5.250%, 11/15/40 | 11/20 at 100.00 | | AA– | | 30,495,626 | |
| | 6,090 | | Metropolitan Transportation Authority, New York, Transportation Revenue Bonds, Series 2013B, 5.000%, 11/15/30 | 5/23 at 100.00 | | AA– | | 7,137,115 | |
| | 480 | | Metropolitan Transportation Authority, New York, Transportation Revenue Bonds, Series 2013C, 5.000%, 11/15/32 | 5/23 at 100.00 | | AA– | | 559,238 | |
| | 1,900 | | Metropolitan Transportation Authority, New York, Transportation Revenue Bonds, Series 2013D, 5.250%, 11/15/30 | 11/23 at 100.00 | | AA– | | 2,288,930 | |
| | | | Metropolitan Transportation Authority, New York, Transportation Revenue Bonds, Series 2013E: | | | | | | |
| | 14,000 | | 5.000%, 11/15/31 | 11/23 at 100.00 | | AA– | | 16,555,840 | |
| | 1,785 | | 5.000%, 11/15/32 | 11/23 at 100.00 | | AA– | | 2,103,979 | |
| | 10,000 | | 5.000%, 11/15/38 | 11/23 at 100.00 | | AA– | | 11,640,800 | |
| | 9,370 | | Metropolitan Transportation Authority, New York, Transportation Revenue Bonds, Series 2014B, 5.250%, 11/15/35 | 5/24 at 100.00 | | AA– | | 11,116,662 | |
| | 2,700 | | Metropolitan Transportation Authority, New York, Transportation Revenue Bonds, Series 2015A-1, 5.000%, 11/15/45 | 5/25 at 100.00 | | AA– | | 3,111,048 | |
| | 2,570 | | Metropolitan Transportation Authority, New York, Transportation Revenue Bonds, Series 2016C-1, 5.000%, 11/15/34 | 11/26 at 100.00 | | AA– | | 3,044,242 | |
| | 8,055 | | New York Liberty Development Corporation, New York, Liberty Revenue Bonds, 4 World Trade Center Project, Series 2011, 5.000%, 11/15/44 | 11/21 at 100.00 | | A+ | | 9,000,657 | |
| | 3,400 | | New York State Thruway Authority, General Revenue Bonds, Refunding Series 2007H, 5.000%, 1/01/25 – FGIC Insured | 1/18 at 100.00 | | A | | 3,447,294 | |
| | Principal | | | Optional Call | | | | | |
| | Amount (000) | | Description (1) | Provisions (2) | | Ratings (3) | | Value | |
| | | | Transportation (continued) | | | | | | |
| | | | New York State Thruway Authority, General Revenue Junior Indebtedness Obligations, Series 2016A: | | | | | | |
| $ | 2,000 | | 5.000%, 1/01/36 | 1/26 at 100.00 | | A– | $ | 2,316,880 | |
| | 7,500 | | 5.000%, 1/01/41 | 1/26 at 100.00 | | A– | | 8,616,300 | |
| | 1,285 | | 5.000%, 1/01/46 | 1/26 at 100.00 | | A– | | 1,468,113 | |
| | 19,230 | | 5.000%, 1/01/51 | 1/26 at 100.00 | | A– | | 21,818,743 | |
| | 5,000 | | 5.250%, 1/01/56 | 1/26 at 100.00 | | A– | | 5,859,600 | |
| | 2,350 | | 4.000%, 1/01/56 | 1/26 at 100.00 | | A– | | 2,434,013 | |
| | | | Port Authority of New York and New Jersey, Consolidated Revenue Bonds, One Hundred Eighty-Forth Series 2014: | | | | | | |
| | 2,100 | | 5.000%, 9/01/33 | 9/24 at 100.00 | | AA– | | 2,481,045 | |
| | 3,950 | | 5.000%, 9/01/34 | 9/24 at 100.00 | | AA– | | 4,649,900 | |
| | 1,000 | | 5.000%, 9/01/35 | 9/24 at 100.00 | | AA– | | 1,174,360 | |
| | 5,155 | | 5.000%, 9/01/36 | 9/24 at 100.00 | | AA– | | 6,039,289 | |
| | 9,755 | | 5.000%, 9/01/39 | 9/24 at 100.00 | | AA– | | 11,373,550 | |
| | | | Port Authority of New York and New Jersey, Consolidated Revenue Bonds, One Hundred Eighty-Ninth Series 2015: | | | | | | |
| | 3,375 | | 5.000%, 5/01/30 | 5/25 at 100.00 | | AA– | | 4,056,750 | |
| | 6,535 | | 5.000%, 5/01/31 | 5/25 at 100.00 | | AA– | | 7,809,064 | |
| | 3,595 | | 5.000%, 5/01/35 | 5/25 at 100.00 | | AA– | | 4,237,606 | |
| | 10,780 | | 5.000%, 5/01/45 | 5/25 at 100.00 | | AA– | | 12,405,732 | |
| | 9,000 | | Port Authority of New York and New Jersey, Consolidated Revenue Bonds, One Hundred Ninety-Fourth Series 2015, 5.250%, 10/15/55 | 10/25 at 100.00 | | AA– | | 10,519,650 | |
| | 2,000 | | Port Authority of New York and New Jersey, Consolidated Revenue Bonds, One Hundred Seventy Ninth Series 2013, 5.000%, 12/01/43 | 12/23 at 100.00 | | AA– | | 2,301,320 | |
| | 2,500 | | Port Authority of New York and New Jersey, Special Project Bonds, JFK International Air Terminal LLC Project, Eighth Series 2010, 6.500%, 12/01/28 | 11/17 at 100.00 | | Baa1 | | 2,540,550 | |
| | 2,000 | | Triborough Bridge and Tunnel Authority, New York, General Purpose Revenue Bonds, MTA Bridges & Tunnels, Series 2017A, 5.000%, 11/15/37 | 5/27 at 100.00 | | AA– | | 2,401,720 | |
| | 5,480 | | Triborough Bridge and Tunnel Authority, New York, General Purpose Revenue Bonds, Refunding Subordinate Lien Series 2002E, 5.500%, 11/15/20 – NPFG Insured | No Opt. Call | | A+ | | 6,240,569 | |
| | 226,900 | | Total Transportation | | | | | 261,527,057 | |
| | | | U.S. Guaranteed – 11.8% (7.5% of Total Investments) (6) | | | | | | |
| | 5,315 | | Albany Capital Resource Corporation, New York, St. Peter’s Hospital Project, Series 2011, 6.125%, 11/15/30 (Pre-refunded 11/15/20) | 11/20 at 100.00 | | N/R (6) | | 6,176,243 | |
| | 5,935 | | Albany Industrial Development Agency, New York, Revenue Bonds, Saint Peter’s Hospital, Series 2008A, 5.250%, 11/15/32 (Pre-refunded 11/15/17) | 11/17 at 100.00 | | N/R (6) | | 5,990,196 | |
| | 4,205 | | Albany Industrial Development Agency, New York, Revenue Bonds, Saint Peter’s Hospital, Series 2008D, 5.375%, 11/15/32 (Pre-refunded 11/15/17) | 11/17 at 100.00 | | N/R (6) | | 4,245,200 | |
| | 1,000 | | Albany Industrial Development Agency, New York, Revenue Bonds, Saint Peter’s Hospital, Series 2008E, 5.250%, 11/15/32 (Pre-refunded 11/15/17) | 11/17 at 100.00 | | N/R (6) | | 1,009,300 | |
| | | | Canton Capital Resource Corporation, New York, Student Housing Facility Revenue Bonds, Grasse River LLC at SUNY Canton Project Series 2010A: | | | | | | |
| | 1,000 | | 5.000%, 5/01/40 (Pre-refunded 5/01/20) | 5/20 at 100.00 | | AA (6) | | 1,107,130 | |
| | 1,000 | | 5.000%, 5/01/45 (Pre-refunded 5/01/20) – AGM Insured | 5/20 at 100.00 | | AA (6) | | 1,107,130 | |
| | 6,215 | | Dormitory Authority of the State of New York, Lease Revenue Bonds, State University Dormitory Facilities, Series 2009A, 5.000%, 7/01/39 (Pre-refunded 7/01/19) | 7/19 at 100.00 | | Aa2 (6) | | 6,687,899 | |
| | 1,000 | | Dormitory Authority of the State of New York, Master BOCES Program Lease Revenue Bonds, Nassau County Board of Cooperative Educational Services, Series 2009, 5.000%, 8/15/28 (Pre-refunded 8/15/19) – AGC Insured | 8/19 at 100.00 | | AA (6) | | 1,080,870 | |
| NRK | Nuveen New York AMT-Free Quality Municipal Income Fund |
| | Portfolio of Investments (continued) | August 31, 2017 (Unaudited) |
| | Principal | | | Optional Call | | | | | |
| | Amount (000) | | Description (1) | Provisions (2) | | Ratings (3) | | Value | |
| | | | U.S. Guaranteed (6) (continued) | | | | | | |
| | | | Dormitory Authority of the State of New York, Orange Regional Medical Center Obligated Group Revenue Bonds, Series 2008: | | | | | | |
| $ | 5,430 | | 6.500%, 12/01/21 (Pre-refunded 12/01/18) | 12/18 at 100.00 | | Baa3 (6) | $ | 5,737,827 | |
| | 6,780 | | 6.125%, 12/01/29 (Pre-refunded 12/01/18) | 12/18 at 100.00 | | Baa3 (6) | | 7,232,768 | |
| | 14,770 | | 6.250%, 12/01/37 (Pre-refunded 12/01/18) | 12/18 at 100.00 | | Baa3 (6) | | 15,781,154 | |
| | 3,000 | | Dormitory Authority of the State of New York, Revenue Bonds, Fordham University, Series 2008B, 5.000%, 7/01/38 (Pre-refunded 7/01/18) – AGC Insured | 7/18 at 100.00 | | A2 (6) | | 3,106,710 | |
| | 875 | | Dormitory Authority of the State of New York, Revenue Bonds, New School University, Series 2010, 5.250%, 7/01/30 (Pre-refunded 7/01/20) | 7/20 at 100.00 | | A– (6) | | 978,618 | |
| | | | Dormitory Authority of the State of New York, Revenue Bonds, New York University, Series 2009A: | | | | | | |
| | 10,000 | | 5.250%, 7/01/34 (Pre-refunded 7/01/19) | 7/19 at 100.00 | | Aa2 (6) | | 10,791,000 | |
| | 3,890 | | 5.000%, 7/01/39 (Pre-refunded 7/01/19) | 7/19 at 100.00 | | Aa2 (6) | | 4,180,038 | |
| | 13,500 | | Dormitory Authority of the State of New York, Revenue Bonds, New York University, Series 2009B, 5.000%, 7/01/39 (Pre-refunded 7/01/19) | 7/19 at 100.00 | | Aa2 (6) | | 14,506,560 | |
| | 895 | | Dormitory Authority of the State of New York, Revenue Bonds, School Districts Financing Program, Series 2009A, 5.625%, 10/01/29 (Pre-refunded 10/01/19) – AGC Insured | 10/19 at 100.00 | | AA (6) | | 983,542 | |
| | | | Erie County Industrial Development Agency, New York, School Facility Revenue Bonds, Buffalo City School District, Series 2008A: | | | | | | |
| | 3,540 | | 5.750%, 5/01/27 (Pre-refunded 5/01/18) – AGM Insured (UB) | 5/18 at 100.00 | | AA (6) | | 3,658,590 | |
| | 5,000 | | 5.750%, 5/01/28 (Pre-refunded 5/01/18) – AGM Insured (UB) | 5/18 at 100.00 | | AA (6) | | 5,167,500 | |
| | 10,125 | | Erie County Industrial Development Agency, New York, School Facility Revenue Bonds, Buffalo City School District Project, Series 2009A, 5.000%, 5/01/31 (Pre-refunded 5/01/19) | 5/19 at 100.00 | | AA (6) | | 10,824,030 | |
| | 13,855 | | Hudson Yards Infrastructure Corporation, New York, Revenue Bonds, Senior Fiscal 2012 Series 2011A, 5.750%, 2/15/47 (Pre-refunded 2/15/21) | 2/21 at 100.00 | | Aa3 (6) | | 16,066,812 | |
| | 3,310 | | Long Island Power Authority, New York, Electric System Revenue Bonds, Series 2008A, 5.500%, 5/01/33 (Pre-refunded 5/01/19) – BHAC Insured | 5/19 at 100.00 | | AA+ (6) | | 3,562,983 | |
| | | | Metropolitan Transportation Authority, New York, Transportation Revenue Bonds, Series 2008A: | | | | | | |
| | 4,000 | | 5.250%, 11/15/36 (Pre-refunded 11/15/17) | 11/17 at 100.00 | | AA– (6) | | 4,037,200 | |
| | 4,800 | | 5.250%, 11/15/36 (Pre-refunded 11/15/17) | 11/17 at 100.00 | | N/R (6) | | 4,844,640 | |
| | 985 | | Nassau County, New York, General Obligation Bonds, General Improvement Series 2009C, 5.000%, 10/01/29 (Pre-refunded 10/01/19) – AGC Insured | 10/19 at 100.00 | | AA (6) | | 1,069,759 | |
| | 4,355 | | New York City Transitional Finance Authority, New York, Future Tax Secured Revenue Bonds, Subordinate Lien Series 2011C, 5.500%, 11/01/35 (Pre-refunded 11/01/20) | 11/20 at 100.00 | | N/R (6) | | 4,973,105 | |
| | 955 | | Suffolk County Economic Development Corporation, New York, Revenue Bonds, Catholic Health Services of Long Island Obligated Group Project, Refunding Series 2011, 5.000%, 7/01/28 (Pre-refunded 7/01/21) | 7/21 at 100.00 | | N/R (6) | | 1,098,298 | |
| | 4,485 | | Westchester County Health Care Corporation, New York, Senior Lien Revenue Bonds, Series 2010-C2, 6.125%, 11/01/37 (Pre-refunded 11/01/20) | 11/20 at 100.00 | | N/R (6) | | 5,203,183 | |
| | 140,220 | | Total U.S. Guaranteed | | | | | 151,208,285 | |
| | | | Utilities – 11.5% (7.3% of Total Investments) | | | | | | |
| | 2,450 | | Chautauqua County Industrial Development Agency, New York, Exempt Facility Revenue Bonds, NRG Dunkirk Power Project, Series 2009, 5.875%, 4/01/42 | 2/20 at 100.00 | | Baa3 | | 2,563,068 | |
| | 3,000 | | Guam Power Authority, Revenue Bonds, Series 2010A, 5.000%, 10/01/37 – AGM Insured | 10/20 at 100.00 | | AA | | 3,287,100 | |
| | 1,045 | | Guam Power Authority, Revenue Bonds, Series 2012A, 5.000%, 10/01/34 | 10/22 at 100.00 | | BBB | | 1,111,880 | |
| | | | Long Island Power Authority, New York, Electric System General Revenue Bonds, Series 2000A: | | | | | | |
| | 8,000 | | 0.000%, 6/01/24 – AGM Insured | No Opt. Call | | AA | | 6,985,840 | |
| | 8,000 | | 0.000%, 6/01/25 – AGM Insured | No Opt. Call | | AA | | 6,752,320 | |
| | 20,000 | | 0.000%, 6/01/26 – AGM Insured | No Opt. Call | | AA | | 16,379,200 | |
| | 10,000 | | 0.000%, 6/01/27 – AGM Insured | No Opt. Call | | AA | | 7,896,200 | |
| | 15,000 | | 0.000%, 6/01/28 – AGM Insured | No Opt. Call | | AA | | 11,405,250 | |
| | 10,000 | | 0.000%, 6/01/29 – AGM Insured | No Opt. Call | | AA | | 7,275,900 | |
| | 2,590 | | Long Island Power Authority, New York, Electric System General Revenue Bonds, Series 2014A, 5.000%, 9/01/44 | 9/24 at 100.00 | | A– | | 2,957,003 | |
| | Principal | | | Optional Call | | | | | |
| | Amount (000) | | Description (1) | Provisions (2) | | Ratings (3) | | Value | |
| | | | Utilities (continued) | | | | | | |
| $ | 5,000 | | Long Island Power Authority, New York, Electric System Revenue Bonds, Series 2011A, 5.000%, 5/01/38 | 5/21 at 100.00 | | A– | $ | 5,572,750 | |
| | 6,500 | | Niagara Area Development Corporation, New York, Solid Waste Disposal Facility Revenue Refunding Bonds, Covanta Energy Project, Series 2012B, 4.000%, 11/01/24 | 11/17 at 100.00 | | BB+ | | 6,507,475 | |
| | 9,000 | | Utility Debt Securitization Authority, New York, Restructuring Bonds, Refunding Series 2015, 5.000%, 12/15/32 | 12/25 at 100.00 | | AAA | | 10,861,740 | |
| | | | Utility Debt Securitization Authority, New York, Restructuring Bonds, Series 2013TE: | | | | | | |
| | 9,500 | | 5.000%, 12/15/32 | 12/23 at 100.00 | | AAA | | 11,293,505 | |
| | 22,290 | | 5.000%, 12/15/41 | 12/23 at 100.00 | | AAA | | 25,993,261 | |
| | 7,000 | | Utility Debt Securitization Authority, New York, Restructuring Bonds, Series 2016A, 5.000%, 12/15/35 | 6/26 at 100.00 | | AAA | | 8,440,320 | |
| | | | Utility Debt Securitization Authority, New York, Restructuring Bonds, Series 2016B: | | | | | | |
| | 3,750 | | 5.000%, 12/15/33 | 6/26 at 100.00 | | AAA | | 4,551,413 | |
| | 3,575 | | 5.000%, 12/15/34 | 6/26 at 100.00 | | AAA | | 4,320,030 | |
| | 3,275 | | 5.000%, 12/15/35 | 6/26 at 100.00 | | AAA | | 3,945,982 | |
| | 149,975 | | Total Utilities | | | | | 148,100,237 | |
| | | | Water and Sewer – 13.1% (8.3% of Total Investments) | | | | | | |
| | 5,160 | | New York City Municipal Water Finance Authority, New York, Water and Sewer System Revenue Bonds, Second Generation Resolution, Fiscal 2012 Series BB, 5.000%, 6/15/44 | 12/21 at 100.00 | | AA+ | | 5,805,258 | |
| | 4,085 | | New York City Municipal Water Finance Authority, New York, Water and Sewer System Second General Resolution Revenue Bonds, Fiscal 2013 Series DD, 5.000%, 6/15/35 | 6/23 at 100.00 | | AA+ | | 4,756,492 | |
| | 10,000 | | New York City Municipal Water Finance Authority, New York, Water and Sewer System Second General Resolution Revenue Bonds, Fiscal 2014 Series DD, 5.000%, 6/15/35 | 6/24 at 100.00 | | AA+ | | 11,784,100 | |
| | 5,375 | | New York City Municipal Water Finance Authority, New York, Water and Sewer System Second General Resolution Revenue Bonds, Fiscal 2015 Series HH, 5.000%, 6/15/39 | 6/25 at 100.00 | | AA+ | | 6,291,437 | |
| | 15,000 | | New York City Municipal Water Finance Authority, New York, Water and Sewer System Second General Resolution Revenue Bonds, Fiscal 2017 Series CC-1, 5.000%, 6/15/46 | 6/26 at 100.00 | | AA+ | | 17,503,800 | |
| | 10,000 | | New York City Municipal Water Finance Authority, New York, Water and Sewer System Second General Resolution Revenue Bonds, Fiscal 2018 Series AA, 5.000%, 6/15/38 | 6/27 at 100.00 | | AA+ | | 11,957,000 | |
| | 2,580 | | New York State Environmental Facilities Corporation, State Clean Water and Drinking Water Revolving Funds Revenue Bonds, New York City Municipal Water Finance Authority Projects, Second Resolution Subordinated Series 2014A, 5.000%, 6/15/30 | 6/24 at 100.00 | | AAA | | 3,086,609 | |
| | 3,110 | | New York State Environmental Facilities Corporation, State Clean Water and Drinking Water Revolving Funds Revenue Bonds, New York City Municipal Water Finance Authority Projects, Second Resolution Subordinated SRF Series 2015A, 5.000%, 6/15/36 | 6/25 at 100.00 | | AAA | | 3,688,491 | |
| | 6,810 | | New York State Environmental Facilities Corporation, State Clean Water and Drinking Water Revolving Funds Revenue Bonds, New York City Municipal Water Finance Authority Projects-Second Resolution Bonds, Series 2016A, 5.000%, 6/15/41 | 6/26 at 100.00 | | AAA | | 8,098,316 | |
| | | | New York State Environmental Facilities Corporation, State Clean Water and Drinking Water Revolving Funds Revenue Bonds, New York City Municipal Water Finance Authority Projects-Second Resolution Bonds, Subordinated SRF Series 2017A: | | | | | | |
| | 24,465 | | 5.000%, 6/15/42 | 6/27 at 100.00 | | AAA | | 29,299,284 | |
| | 10,000 | | 5.000%, 6/15/46 | 6/27 at 100.00 | | AAA | | 11,947,500 | |
| | 22,340 | | New York State Environmental Facilities Corporation, State Revolving Funds Revenue Bonds, 2010 Master Financing Program, Green Series 2014B, 5.000%, 5/15/44 | 5/24 at 100.00 | | AAA | | 25,707,978 | |
| | 5,000 | | New York State Environmental Facilities Corporation, State Revolving Funds Revenue Bonds, 2010 Master Financing Program, Green Series 2016B, 5.000%, 8/15/41 | 8/26 at 100.00 | | AAA | | 5,962,000 | |
| | 3,845 | | New York State Environmental Facilities Corporation, State Revolving Funds Revenue Bonds, 2010 Master Financing Program, Series 2010C, 5.000%, 10/15/35 | 4/20 at 100.00 | | AAA | | 4,207,545 | |
| | 3,095 | | New York State Environmental Facilities Corporation, State Revolving Funds Revenue Bonds, 2010 Master Financing Program, Series 2012B, 5.000%, 2/15/42 | 2/22 at 100.00 | | AAA | | 3,441,392 | |
| NRK | Nuveen New York AMT-Free Quality Municipal Income Fund |
| | Portfolio of Investments (continued) | August 31, 2017 (Unaudited) |
| | Principal | | | Optional Call | | | | | |
| | Amount (000) | | Description (1) | Provisions (2) | | Ratings (3) | | Value | |
| | | | Water and Sewer (continued) | | | | | | |
| $ | 7,020 | | Suffolk County Water Authority, New York, Waterworks Revenue Bonds, Series 2015A, 5.250%, 5.250%, 6/01/36 | 6/25 at 100.00 | | AAA | $ | 8,498,763 | |
| | 2,230 | | Upper Mohawk Valley Regional Water Finance Authority, New York, Water System Revenue Bonds, Series 2000, 0.000%, 4/01/23 – AMBAC Insured | No Opt. Call | | A1 | | 2,019,689 | |
| | | | Water Authority of Western Nassau County, New York, Water System Revenue Bonds, Series 2015A: | | | | | | |
| | 1,325 | | 5.000%, 4/01/40 | 4/25 at 100.00 | | AA– | | 1,506,406 | |
| | 1,950 | | 5.000%, 4/01/45 | 4/25 at 100.00 | | AA– | | 2,205,665 | |
| | 143,390 | | Total Water and Sewer | | | | | 167,767,725 | |
| $ | 2,056,437 | | Total Long-Term Investments (cost $1,844,469,213) | | | | | 1,998,475,490 | |
| | Principal | | | Optional Call | | | | | |
| | Amount (000) | | Description (1) | Provisions (2) | | Ratings (3) | | Value | |
| | | | SHORT-TERM INVESTMENTS – 1.8% (1.2% of Total Investments) | | | | | | |
| | | | MUNICIPAL BONDS – 1.8% (1.2% of Total Investments) | | | | | | |
| | | | Education and Civic Organizations – 0.5% (0.3% of Total Investments) | | | | | | |
| $ | 6,850 | | New York City Trust for Cultural Resources, New York, Revenue Bonds, Metropolitan Museum of Art, Variable Rate Demand Obligations, Series 2006-A2, 0.940%, 10/01/36 (7) | 11/17 at 100.00 | | VMIG-1 | $ | 6,850,000 | |
| | | | Tax Obligation/General – 1.2% (0.8% of Total Investments) | | | | | | |
| | 15,000 | | New York City, New York, General Obligation Bonds, Fiscal 2017, Variable Rate Demand Obligations, Taxable Series 2016A-4, 0.910%, 8/01/44 (7) | 11/17 at 100.00 | | VMIG-1 | | 15,000,000 | |
| | | | Transportation – 0.1% (0.1% of Total Investments) | | | | | | |
| | 1,825 | | Triborough Bridge and Tunnel Authority, New York, General Purpose Revenue Bonds, Variable Rate Demand Obligations, Series 2005A, 0.900%, 11/01/35 (7) | 11/17 at 100.00 | | VMIG-1 | | 1,825,000 | |
| $ | 23,675 | | Total Short-Term Investments (cost $23,675,000) | | | | | 23,675,000 | |
| | | | Total Investments (cost $1,868,144,213) – 157.5% | | | | | 2,022,150,490 | |
| | | | Floating Rate Obligations – (1.0)% | | | | | (12,855,000 | ) |
| | | | MuniFund Preferred Shares, net of deferred offering costs – (6.2)% (8) | | | | | (79,571,015 | ) |
| | | | Variable Rate Demand Preferred Shares, net of deferred offering costs – (51.5)% (9) | | | | | (660,969,049 | ) |
| | | | Other Assets Less Liabilities – 1.2% (10) | | | | | 15,007,732 | |
| | | | Net Assets Applicable to Common Shares – 100% | | | | $ | 1,283,763,158 | |
Investments in Derivatives as of August 31, 2017
Interest Rate Swaps – OTC Uncleared
| | | | | | | Fund | | | | | | | | | | | | | | | | | | | | | | |
| | | | | | | Pay/Receive | | | | | | | | | Fixed Rate | | | | | | | | | | | | Unrealized | |
| | | | Notional | | | Floating | | | Floating | | | Fixed Rate | | | Payment | | | Effective | | | Maturity | | | | | | Appreciation | |
| Counterparty | | | Amount | | | Rate | | | Rate Index | | | (Annualized | ) | | Frequency | | | Date (11 | ) | | Date | | | Value | | | (Depreciation | ) |
| JPMorgan Chase Bank, N.A. | | $ | 31,000,000 | | | Receive | | | Weekly USD-SIFMA | | | 2.043 | % | | Quarterly | | | 5/25/18 | | | 5/25/28 | | $ | (905,825 | ) | $ | (905,825 | ) |
| (1) | All percentages shown in the Portfolio of Investments are based on net assets applicable to common shares unless otherwise noted. |
| (2) | Optional Call Provisions: Dates (month and year) and prices of the earliest optional call or redemption. There may be other call provisions at varying prices at later dates. Certain mortgage-backed securities may be subject to periodic principal paydowns. |
| (3) | For financial reporting purposes, the ratings disclosed are the highest of Standard & Poor’s Group (“Standard & Poor’s”), Moody’s Investors Service, Inc. (“Moody’s”) or Fitch, Inc. (“Fitch”) rating. This treatment of split-rated securities may differ from that used for other purposes, such as for Fund investment policies. Ratings below BBB by Standard & Poor’s, Baa by Moody’s or BBB by Fitch are considered to be below investment grade. Holdings designated N/R are not rated by any of these national rating agencies. |
| (4) | Step-up coupon bond, a bond with a coupon that increases (“steps up”), usually at regular intervals, while the bond is outstanding. The rate shown is the coupon as of the end of the reporting period. |
| (5) | Investment, or portion of investment, has been pledged to collateralize the net payment obligations for investments in inverse floating rate transactions. |
| (6) | Backed by an escrow or trust containing sufficient U.S. Government or U.S. Government agency securities, which ensure the timely payment of principal and interest. Certain bonds backed by U.S. Government or agency securities are regarded as having an implied rating equal to the ratings of such securities. |
| (7) | Investment has maturity of greater than one year, but has variable rate and demand features which qualify it as a short-term investment. The rate disclosed is that in effect as of the end of the reporting period. This rate changes periodically based on market conditions or a specified market index. |
| (8) | MuniFund Preferred Shares, net of deferred offering costs as a percentage of Total Investments is 3.9%. |
| (9) | Variable Rate Demand Preferred Shares, net of deferred offering costs as a percentage of Total Investments is 32.7%. |
| (10) | Other assets less liabilities includes the unrealized appreciation (depreciation) of certain over-the-counter derivatives (“OTC”) as presented on the Statement of Assets and Liabilities, when applicable. The unrealized appreciation (depreciation) of OTC-cleared and exchange-traded derivatives is recognized as part of the cash collateral at brokers and/or the receivable or payable for variation margin as presented on the Statement of Assets and Liabilities, when applicable. |
| (11) | Effective date represents the date on which both the Fund and counterparty commence interest payment accruals on each contract. |
| UB | Underlying bond of an inverse floating rate trust reflected as a financing transaction. See Notes to Financial Statements, Note 3 – Portfolio Securities and Investments in Derivatives, Inverse Floating Rate Securities for more information. |
| USD-SIFMA | United States Dollar-Securities-Industry and Financial Market Association. |
See accompanying notes to financial statements.
| Statement of | |
| | Assets and Liabilities | August 31, 2017 (Unaudited) |
| | | |
| | | | NNY | | | NYV | | | NAN | | | NRK | |
| Assets | | | | | | | | | | | | | |
| Long-term investments, at value (cost $144,824,029, $32,310,981, $672,230,088 and $1,844,469,213, respectively) | | $ | 154,171,597 | | $ | 35,067,067 | | $ | 720,479,565 | | $ | 1,998,475,490 | |
| Short-term investments, at value (cost approximates value) | | | — | | | 510,000 | | | — | | | 23,675,000 | |
| Cash | | | 996,172 | | | 913,778 | | | 11,493,218 | | | 5,940,030 | |
| Receivable for: | | | | | | | | | | | | | |
| Interest | | | 1,686,912 | | | 422,658 | | | 8,094,838 | | | 22,058,572 | |
| Investments sold | | | — | | | — | | | 1,341,286 | | | — | |
| Other assets | | | 4,344 | | | 3,282 | | | 146,056 | | | 749,782 | |
| Total assets | | | 156,859,025 | | | 36,916,785 | | | 741,554,963 | | | 2,050,898,874 | |
| Liabilities | | | | | | | | | | | | | |
| Floating rate obligations | | | 3,255,000 | | | — | | | 29,570,000 | | | 12,855,000 | |
| Unrealized depreciation on interest rate swaps | | | — | | | — | | | — | | | 905,825 | |
| Payable for: | | | | | | | | | | | | | |
| Dividends | | | 438,731 | | | 112,422 | | | 1,699,557 | | | 4,387,771 | |
| Interest | | | — | | | — | | | 216,352 | | | — | |
| Investments purchased | | | — | | | — | | | — | | | 6,854,215 | |
| MuniFund Preferred (“MFP”) Shares, net of deferred offering costs (liquidation preference $—, $—, $— and $80,000,000, respectively) | | | — | | | — | | | — | | | 79,571,015 | |
| Variable Rate MuniFund Term Preferred (“VMTP”) Shares, net of deferred offering costs (liquidation preference $—, $—, $147,000,000 and $—, respectively) | | | — | | | — | | | 146,998,510 | | | — | |
| Variable Rate Demand Preferred (“VRDP”) Shares, net of deferred offering costs (liquidation preference $—, $—, $89,000,000 and $663,800,000, respectively) | | | — | | | — | | | 87,977,807 | | | 660,969,049 | |
| Accrued expenses: | | | | | | | | | | | | | |
| Management fees | | | 62,401 | | | 17,460 | | | 380,483 | | | 987,450 | |
| Directors/Trustees fees | | | 704 | | | 169 | | | 69,304 | | | 277,109 | |
| Professional fees | | | 11,810 | | | 11,248 | | | 15,579 | | | 21,928 | |
| Other | | | 40,060 | | | 12,681 | | | 171,058 | | | 306,354 | |
| Total liabilities | | | 3,808,706 | | | 153,980 | | | 267,098,650 | | | 767,135,716 | |
| Net assets applicable to common shares | | $ | 153,050,319 | | $ | 36,762,805 | | $ | 474,456,313 | | $ | 1,283,763,158 | |
| Common shares outstanding | | | 15,210,648 | | | 2,349,612 | | | 31,126,546 | | | 87,618,504 | |
| Net asset value (“NAV”) per common share outstanding | | $ | 10.06 | | $ | 15.65 | | $ | 15.24 | | $ | 14.65 | |
| Net assets applicable to common shares consist of: | | | | | | | | | | | | | |
| Common shares, $0.01 par value per share | | $ | 152,106 | | $ | 23,496 | | $ | 311,265 | | $ | 876,185 | |
| Paid-in surplus | | | 145,177,706 | | | 33,599,476 | | | 439,251,193 | | | 1,178,800,198 | |
| Undistributed (Over-distribution of) net investment income | | | 438,086 | | | 227,547 | | | 48,484 | | | (1,847,710 | ) |
| Accumulated net realized gain (loss) | | | (2,065,147 | ) | | 156,200 | | | (13,404,106 | ) | | (47,165,967 | ) |
| Net unrealized appreciation (depreciation) | | | 9,347,568 | | | 2,756,086 | | | 48,249,477 | | | 153,100,452 | |
| Net assets applicable to common shares | | $ | 153,050,319 | | $ | 36,762,805 | | $ | 474,456,313 | | $ | 1,283,763,158 | |
| Authorized shares: | | | | | | | | | | | | | |
| Common | | | 250,000,000 | | | Unlimited | | | Unlimited | | | Unlimited | |
| Preferred | | | N/A | | | N/A | | | Unlimited | | | Unlimited | |
N/A – Fund is not authorized to issue preferred shares.
See accompanying notes to financial statements.
| Statement of | |
| | Operations | Six Months Ended August 31, 2017 (Unaudited) |
| | | |
| | | | NNY | | | NYV | | | NAN | | | NRK | |
| Investment Income | | $ | 3,290,329 | | $ | 779,957 | | $ | 15,533,908 | | $ | 41,045,320 | |
| Expenses | | | | | | | | | | | | | |
| Management fees | | | 370,534 | | | 103,356 | | | 2,250,919 | | | 5,855,116 | |
| Interest expense and amortization of offering costs | | | 22,569 | | | — | | | 1,973,367 | | | 3,782,176 | |
| Liquidity fees | | | — | | | — | | | 416,974 | | | 2,724,011 | |
| Remarketing fees | | | — | | | — | | | 45,489 | | | 413,942 | |
| Custodian fees | | | 12,357 | | | 3,585 | | | 33,103 | | | 90,288 | |
| Directors/Trustees fees | | | 2,515 | | | 605 | | | 11,875 | | | 34,037 | |
| Professional fees | | | 13,411 | | | 12,262 | | | 27,882 | | | 42,760 | |
| Shareholder reporting expenses | | | 12,909 | | | 5,615 | | | 24,768 | | | 50,511 | |
| Shareholder servicing agent fees | | | 10,124 | | | 92 | | | 18,752 | | | 25,995 | |
| Stock exchange listing fees | | | 3,392 | | | 4,545 | | | 4,297 | | | 12,093 | |
| Investor relations expenses | | | 7,156 | | | 2,162 | | | 27,943 | | | 77,253 | |
| Other | | | 7,800 | | | 7,739 | | | 44,605 | | | 84,786 | |
| Total expenses | | | 462,767 | | | 139,961 | | | 4,879,974 | | | 13,192,968 | |
| Net investment income (loss) | | | 2,827,562 | | | 639,996 | | | 10,653,934 | | | 27,852,352 | |
| Realized and Unrealized Gain (Loss) | | | | | | | | | | | | | |
| Net realized gain (loss) from investments | | | 15,384 | | | 403,970 | | | 607,228 | | | (2,594,763 | ) |
| Change in net unrealized appreciation (depreciation) of: | | | | | | | | | | | | | |
| Investments | | | 2,642,542 | | | 95,132 | | | 12,139,481 | | | 42,863,534 | |
| Swaps | | | — | | | — | | | — | | | (905,825 | ) |
| Net realized and unrealized gain (loss) | | | 2,657,926 | | | 499,102 | | | 12,746,709 | | | 39,362,946 | |
| Net increase (decrease) in net assets applicable to common shares from operations | | $ | 5,485,488 | | $ | 1,139,098 | | $ | 23,400,643 | | $ | 67,215,298 | |
See accompanying notes to financial statements.
| Statement of | | |
| | Changes in Net Assets | (Unaudited) |
| | | | NNY | | | NYV | |
| | | Six Months | | Five Months | | | | Six Months | | Five Months | | | |
| | | | Ended | | | Ended | | | Year Ended | | | Ended | | | Ended | | | Year Ended | |
| | | | 8/31/17 | | | 2/28/17 | | | 9/30/16 | | | 8/31/17 | | | 2/28/17 | | | 9/30/16 | |
| Operations | | | | | | | | | | | | | | | | | | | |
| Net investment income (loss) | | $ | 2,827,562 | | $ | 2,357,611 | | $ | 6,259,084 | | $ | 639,996 | | $ | 589,104 | | $ | 1,896,236 | |
| Net realized gain (loss) from investments | | | 15,384 | | | (893,972 | ) | | 273,717 | | | 403,970 | | | 236,560 | | | 75,059 | |
| Change in net unrealized appreciation (depreciation) of: | | | | | | | | | | | | | | | | | | | |
| Investments | | | 2,642,542 | | | (5,649,158 | ) | | 4,139,413 | | | 95,132 | | | (1,745,827 | ) | | 109,681 | |
| Swaps | | | — | | | — | | | — | | | — | | | — | | | — | |
| Net increase (decrease) in net assets applicable to common shares from operations | | | 5,485,488 | | | (4,185,519 | ) | | 10,672,214 | | | 1,139,098 | | | (920,163 | ) | | 2,080,976 | |
| Distributions to Common Shareholders | | | | | | | | | | | | | | | | | | | |
| From net investment income | | | (2,873,805 | ) | | (2,424,822 | ) | | (5,958,922 | ) | | (704,884 | ) | | (678,098 | ) | | (1,480,256 | ) |
| From accumulated net realized gains | | | — | | | — | | | — | | | — | | | — | | | — | |
| Decrease in net assets applicable to common shares from distributions to common shareholders | | | (2,873,805 | ) | | (2,424,822 | ) | | (5,958,922 | ) | | (704,884 | ) | | (678,098 | ) | | (1,480,256 | ) |
| Capital Share Transactions | | | | | | | | | | | | | | | | | | | |
| Net proceeds from shares issued to shareholders due to reinvestment of distributions | | | 80,230 | | | 29,719 | | | 88,520 | | | — | | | — | | | — | |
| Net increase (decrease) in net assets applicable to common shares from capital share transactions | | | 80,230 | | | 29,719 | | | 88,520 | | | — | | | — | | | — | |
| Net increase (decrease) in net assets applicable to common shares | | | 2,691,913 | | | (6,580,622 | ) | | 4,801,812 | | | 434,214 | | | (1,598,261 | ) | | 600,720 | |
| Net assets applicable to common shares at the beginning of period | | | 150,358,406 | | | 156,939,028 | | | 152,137,216 | | | 36,328,591 | | | 37,926,852 | | | 37,326,132 | |
| Net assets applicable to common shares at the end of period | | $ | 153,050,319 | | $ | 150,358,406 | | $ | 156,939,028 | | $ | 36,762,805 | | $ | 36,328,591 | | $ | 37,926,852 | |
| Undistributed (Over-distribution of) net investment income at the end of period | | $ | 438,086 | | $ | 484,329 | | $ | 858,776 | | $ | 227,547 | | $ | 292,435 | | $ | 659,024 | |
See accompanying notes to financial statements.
| | | | NAN | | | NRK | |
| | | Six Months | | Five Months | | | | Six Months | | Five Months | | | |
| | | | Ended | | | Ended | | | Year Ended | | | Ended | | | Ended | | | Year Ended | |
| | | | 8/31/17 | | | 2/28/17 | | | 9/30/16 | | | 8/31/17 | | | 2/28/17 | | | 9/30/16 | |
| Operations | | | | | | | | | | | | | | | | | | | |
| Net investment income (loss) | | $ | 10,653,934 | | $ | 9,129,122 | | $ | 23,643,728 | | $ | 27,852,352 | | $ | 23,849,097 | | $ | 60,572,350 | |
| Net realized gain (loss) from investments | | | 607,228 | | | (5,061,534 | ) | | 201,495 | | | (2,594,763 | ) | | (13,717,525 | ) | | 1,651,871 | |
| Change in net unrealized appreciation (depreciation) of: | | | | | | | | | | | | | | | | | | | |
| Investments | | | 12,139,481 | | | (23,787,429 | ) | | 17,259,101 | | | 42,863,534 | | | (70,738,688 | ) | | 70,163,041 | |
| Swaps | | | — | | | — | | | — | | | (905,825 | ) | | — | | | — | |
| Net increase (decrease) in net assets applicable to common shares from operations | | | 23,400,643 | | | (19,719,841 | ) | | 41,104,324 | | | 67,215,298 | | | (60,607,116 | ) | | 132,387,262 | |
| Distributions to Common Shareholders | | | | | | | | | | | | | | | | | | | |
| From net investment income | | | (11,112,177 | ) | | (9,384,654 | ) | | (24,583,748 | ) | | (28,125,540 | ) | | (23,788,424 | ) | | (61,245,337 | ) |
| From accumulated net realized gains | | | — | | | — | | | (90,267 | ) | | — | | | — | | | — | |
| Decrease in net assets applicable to common shares from distributions to common shareholders | | | (11,112,177 | ) | | (9,384,654 | ) | | (24,674,015 | ) | | (28,125,540 | ) | | (23,788,424 | ) | | (61,245,337 | ) |
| Capital Share Transactions | | | | | | | | | | | | | | | | | | | |
| Net proceeds from shares issued to shareholders due to reinvestment of distributions | | | — | | | — | | | — | | | — | | | — | | | — | |
| Net increase (decrease) in net assets applicable to common shares from capital share transactions | | | — | | | — | | | — | | | — | | | — | | | — | |
| Net increase (decrease) in net assets applicable to common shares | | | 12,288,466 | | | (29,104,495 | ) | | 16,430,309 | | | 39,089,758 | | | (84,395,540 | ) | | 71,141,925 | |
| Net assets applicable to common shares at the beginning of period | | | 462,167,847 | | | 491,272,342 | | | 474,842,033 | | | 1,244,673,400 | | | 1,329,068,940 | | | 1,257,927,015 | |
| Net assets applicable to common shares at the end of period | | $ | 474,456,313 | | $ | 462,167,847 | | $ | 491,272,342 | | $ | 1,283,763,158 | | $ | 1,244,673,400 | | $ | 1,329,068,940 | |
| Undistributed (Over-distribution of) net investment income at the end of period | | $ | 48,484 | | $ | 506,727 | | $ | 1,417,176 | | $ | (1,847,710 | ) | $ | (1,574,522 | ) | $ | 1,005,749 | |
See accompanying notes to financial statements.
| Statement of | | |
| | Cash Flows | Six Months Ended August 31, 2017 (Unaudited) |
| | | | NAN | | | NRK | |
| Cash Flows from Operating Activities: | | | | | | | |
| Net Increase (Decrease) in Net Assets Applicable to Common Shares from Operations | | $ | 23,400,643 | | $ | 67,215,298 | |
| Adjustments to reconcile the net increase (decrease) in net assets applicable to common shares from operations to net cash provided by (used in) operating activities: | | | | | | | |
| Purchases of investments | | | (29,587,905 | ) | | (172,510,652 | ) |
| Proceeds from sales and maturities of investments | | | 41,619,179 | | | 217,364,738 | |
| Proceeds from (Purchases of) short-term investments, net | | | — | | | (23,675,000 | ) |
| Taxes paid | | | (506 | ) | | (350 | ) |
| Amortization (Accretion) of premiums and discounts, net | | | 1,695,553 | | | 2,138,664 | |
| Amortization of deferred offering costs | | | 41,818 | | | 181,112 | |
| (Increase) Decrease in: | | | | | | | |
| Receivable for interest | | | 491,535 | | | 351,355 | |
| Receivable for investments sold | | | (1,341,286 | ) | | — | |
| Other assets | | | (16,928 | ) | | (34,118 | ) |
| Increase (Decrease) in: | | | | | | | |
| Payable for interest | | | 36,126 | | | — | |
| Payable for investments purchased | | | — | | | 6,854,215 | |
| Payable for offering costs | | | (43,255 | ) | | — | |
| Accrued management fees | | | 39,398 | | | 95,673 | |
| Accrued Directors/Trustees fees | | | 5,563 | | | 21,496 | |
| Accrued professional fees | | | (11,077 | ) | | (11,304 | ) |
| Accrued other expenses | | | 78,537 | | | 95,501 | |
| Net realized (gain) loss from investments | | | (607,228 | ) | | 2,594,763 | |
| Change in net unrealized (appreciation) depreciation of: | | | | | | | |
| Investments | | | (12,139,481 | ) | | (42,863,534 | ) |
| Swaps | | | — | | | 905,825 | |
| Net cash provided by (used in) operating activities | | | 23,660,686 | | | 58,723,682 | |
| Cash Flows from Financing Activities: | | | | | | | |
| (Payments for) iMTP Shares redeemed, at liquidation preference | | | — | | | (79,000,000 | ) |
| Proceeds from MFP Shares issued, at liquidation preference | | | — | | | 80,000,000 | |
| (Payments for) deferred offering costs | | | — | | | (432,464 | ) |
| Increase (Decrease) in: | | | | | | | |
| Cash overdraft | | | (1,072,416 | ) | | (3,751,784 | ) |
| Floating rate obligations | | | — | | | (21,470,000 | ) |
| Cash distributions paid to common shareholders | | | (11,095,052 | ) | | (28,129,404 | ) |
| Net cash provided by (used in) financing activities | | | (12,167,468 | ) | | (52,783,652 | ) |
| Net Increase (Decrease) in Cash | | | 11,493,218 | | | 5,940,030 | |
| Cash at the beginning of period | | | — | | | — | |
| Cash at the end of period | | $ | 11,493,218 | | $ | 5,940,030 | |
| | | | | | | | |
| Supplemental Disclosure of Cash Flow Information | | | NAN | | | NRK | |
| Cash paid for interest (excluding amortization of offering costs) | | $ | 1,895,422 | | $ | 3,601,064 | |
See accompanying notes to financial statements.
THIS PAGE INTENTIONALLY LEFT BLANK
| Financial | |
| | Highlights (Unaudited) |
| | |
| Selected data for a common share outstanding throughout each period: |
| | | | | | | | | | Less Distributions to | | | | |
| | | | | | | Investment Operations | | | Common Shareholders | | | Common Share | |
| | | | | | | | | | | | | | | | | | | From | | | | | | | | | | |
| | | Beginning | | | Net | | | Net | | | | | | From | | | Accumu- | | | | | | | | | | |
| | | | Common | | Investment | | | Realized/ | | | | | | Net | | | lated Net | | | | | | | | | Ending | |
| | | | Share | | | Income | | Unrealized | | | | | Investment | | | Realized | | | | | | Ending | | | Share | |
| | | | NAV | | | (Loss | ) | Gain (Loss | ) | | Total | | | Income | | | Gains | | | Total | | | NAV | | | Price | |
| NNY | | | | | | | | | | | | | | | | | | | | | | | | | | | | |
| Year Ended 2/28: | | | | | | | | | | | | | | | | | | | | | | | | | |
| 2018(d) | | $ | 9.89 | | $ | 0.19 | | $ | 0.17 | | $ | 0.36 | | $ | (0.19 | ) | $ | — | | $ | (0.19 | ) | $ | 10.06 | | $ | 10.16 | |
| 2017(e) | | | 10.33 | | | 0.16 | | | (0.44 | ) | | (0.28 | ) | | (0.16 | ) | | — | | | (0.16 | ) | | 9.89 | | | 9.70 | |
| Year Ended 9/30: | | | | | | | | | | | | | | | | | | | | | | | | | |
| 2016 | | | 10.01 | | | 0.41 | | | 0.30 | | | 0.71 | | | (0.39 | ) | | — | | | (0.39 | ) | | 10.33 | | | 10.33 | |
| 2015 | | | 10.08 | | | 0.40 | | | (0.08 | ) | | 0.32 | | | (0.39 | ) | | — | | | (0.39 | ) | | 10.01 | | | 9.71 | |
| 2014 | | | 9.65 | | | 0.41 | | | 0.41 | | | 0.82 | | | (0.39 | ) | | — | | | (0.39 | ) | | 10.08 | | | 9.71 | |
| 2013 | | | 10.41 | | | 0.40 | | | (0.75 | ) | | (0.35 | ) | | (0.39 | ) | | (0.02 | ) | | (0.41 | ) | | 9.65 | | | 8.97 | |
| 2012 | | | 9.93 | | | 0.42 | | | 0.48 | | | 0.90 | | | (0.42 | ) | | — | | | (0.42 | ) | | 10.41 | | | 10.55 | |
| | | | | | | | | | | | | | | | | | | | | | | | | | | | | |
| NYV | | | | | | | | | | | | | | | | | | | | | | | | | | | | |
| Year Ended 2/28: | | | | | | | | | | | | | | | | | | | | | | | | | |
| 2018(d) | | | 15.46 | | | 0.27 | | | 0.22 | | | 0.49 | | | (0.30 | ) | | — | | | (0.30 | ) | | 15.65 | | | 15.04 | |
| 2017(e) | | | 16.14 | | | 0.25 | | | (0.64 | ) | | (0.39 | ) | | (0.29 | ) | | — | | | (0.29 | ) | | 15.46 | | | 14.87 | |
| Year Ended 9/30: | | | | | | | | | | | | | | | | | | | | | | | | | |
| 2016 | | | 15.89 | | | 0.81 | | | 0.07 | | | 0.88 | | | (0.63 | ) | | — | | | (0.63 | ) | | 16.14 | | | 15.90 | |
| 2015 | | | 15.94 | | | 0.67 | | | (0.08 | ) | | 0.59 | | | (0.64 | ) | | — | | | (0.64 | ) | | 15.89 | | | 14.85 | |
| 2014 | | | 15.16 | | | 0.68 | | | 0.76 | | | 1.44 | | | (0.66 | ) | | — | | | (0.66 | ) | | 15.94 | | | 14.44 | |
| 2013 | | | 16.36 | | | 0.72 | | | (1.25 | ) | | (0.53 | ) | | (0.67 | ) | | — | | | (0.67 | ) | | 15.16 | | | 13.99 | |
| 2012 | | | 15.36 | | | 0.72 | | | 0.95 | | | 1.67 | | | (0.67 | ) | | — | | | (0.67 | ) | | 16.36 | | | 16.33 | |
| (a) | Total Return Based on Common share NAV is the combination of changes in common share NAV, reinvested dividend income at NAV and reinvested capital gains distributions at NAV, if any. The last dividend declared in the period, which is typically paid on the first business day of the following month, is assumed to be reinvested at the ending NAV. The actual reinvest price for the last dividend declared in the period may often be based on the Fund’s market price (and not its NAV), and therefore may be different from the price used in the calculation. Total returns are not annualized. |
| | Total Return Based on Common Share Price is the combination of changes in the market price per share and the effect of reinvested dividend income and reinvested capital gains distributions, if any, at the average price paid per share at the time of reinvestment. The last dividend declared in the period, which is typically paid on the first business day of the following month, is assumed to be reinvested at the ending market price. The actual reinvestment for the last dividend declared in the period may take place over several days, and in some instances may not be based on the market price, so the actual reinvestment price may be different from the price used in the calculation. Total returns are not annualized. |
| | | | | Common Share Supplemental Data/ | |
| | | | | Ratios Applicable to Common Shares | |
| | Common Share | | | | |
| | Total Returns | | | | | | Ratios to Average Net Assets | | | | |
| | | | | Based | | | | | | | | | | | | | |
| | Based | | | on | | | Ending | | | | | | Net | | | Portfolio | |
| | on | | | Share | | | Net | | | | | | Investment | | | Turnover | |
| | NAV | (a) | | Price | (a) | | Assets (000 | ) | | Expenses | (b) | | Income (Loss | ) | | Rate | (c) |
| | | | | | | | | | | | | | | | | | |
| | | | | | | | | | | | | | | | | | |
| | 3.66 | % | | 6.75 | % | $ | 153,050 | | | 0.61 | %* | | 3.70 | %* | | 2 | % |
| | (2.71 | ) | | (4.54 | ) | | 150,358 | | | 0.63 | * | | 3.77 | * | | 14 | |
| | | | | | | | | | | | | | | | | | |
| | 7.23 | | | 10.56 | | | 156,939 | | | 0.60 | | | 4.04 | | | 15 | |
| | 3.22 | | | 4.05 | | | 152,137 | | | 0.60 | | | 3.98 | | | 31 | |
| | 8.63 | | | 12.76 | | | 153,087 | | | 0.63 | | | 4.13 | | | 23 | |
| | (3.51 | ) | | (11.41 | ) | | 146,522 | | | 0.61 | | | 3.97 | | | 21 | |
| | 9.23 | | | 16.11 | | | 157,979 | | | 0.65 | | | 4.14 | | | 10 | |
| | | | | | | | | | | | | | | | | | |
| | | | | | | | | | | | | | | | | | |
| | 3.20 | | | 3.17 | | | 36,763 | | | 0.76 | * | | 3.48 | * | | 16 | |
| | (2.41 | ) | | (4.67 | ) | | 36,329 | | | 0.85 | * | | 3.90 | * | | 13 | |
| | | | | | | | | | | | | | | | | | |
| | 5.62 | | | 11.45 | | | 37,927 | | | 0.76 | | | 5.01 | | | 8 | |
| | 3.74 | | | 7.34 | | | 37,326 | | | 0.75 | | | 4.19 | | | 11 | |
| | 9.69 | | | 8.12 | | | 37,455 | | | 0.76 | | | 4.37 | | | 19 | |
| | (3.36 | ) | | (10.46 | ) | | 35,630 | | | 0.74 | | | 4.50 | | | 3 | |
| | 11.12 | | | 20.74 | | | 38,434 | | | 0.75 | | | 4.55 | | | 10 | |
| (b) | The expense ratios reflect, among other things, the interest expense deemed to have been paid by the Fund on the floating rate certificates issued by the special purpose trusts for the self-deposited inverse floaters held by the Fund (as described in Note 3 – Portfolio Securities and Investments in Derivatives, Inverse Floating Rate Securities), where applicable, as follows: |
| NNY | | | | |
| Year Ended 2/28: | | | | |
| 2018(d) | | | 0.03 | %* |
| 2017(e) | | | 0.03 | * |
| Year Ended 9/30: | | | | |
| 2016 | | | 0.02 | |
| 2015 | | | 0.01 | |
| 2014 | | | 0.01 | |
| 2013 | | | 0.01 | |
| 2012 | | | 0.01 | |
| NYV | | | | |
| Year Ended 2/28: | | | | |
| 2018(d) | | | — | % |
| 2017(e) | | | — | |
| Year Ended 9/30: | | | | |
| 2016 | | | — | |
| 2015 | | | — | |
| 2014 | | | — | |
| 2013 | | | — | |
| 2012 | | | — | |
| (c) | Portfolio Turnover Rate is calculated based on the lesser of long-term purchases or sales (as disclosed in Note 5 – Investment Transactions) divided by the average long-term market value during the period. |
| (d) | For the six months ended August 31, 2017. |
| (e) | For the five months ended February 28, 2017. |
| * | Annualized. |
See accompanying notes to financial statements.
Financial Highlights (Unaudited)(continued)
Selected data for a common share outstanding throughout each period:
| | | | | | | | | | Less Distributions to | | | | |
| | | | | | | Investment Operations | | | Common Shareholders | | | Common Share | |
| | | | | | | | | | | | | | | | | | | | | | | | | Discount | | | | | | | |
| | | | | | | | | | | | | | | | | | | | | | | | | per | | | | | | | |
| | | | | | | | | | | | | | | | | | | From | | | | | | Share | | | | | | | |
| | | | Beginning | | | Net | | | Net | | | | | | From | | | Accumu- | | | | | | Repur- | | | | | | | |
| | | | Common | | Investment | | | Realized/ | | | | | | Net | | | lated Net | | | | | | chased | | | | | | Ending | |
| | | | Share | | | Income | | Unrealized | | | | | Investment | | | Realized | | | | | | and | | | Ending | | | Share | |
| | | | NAV | | | (Loss | ) | Gain (Loss | ) | | Total | | | Income | | | Gains | | | Total | | | Retired | | | NAV | | | Price | |
| NAN | | | | | | | | | | | | | | | | | | | | | | | | | | | | | | | |
| Year Ended 2/28: | | | | | | | | | | | | | | | | | | | | | | | | | | | | |
| 2018(e) | | $ | 14.85 | | $ | 0.34 | | $ | 0.41 | | $ | 0.75 | | $ | (0.36 | ) | $ | — | | $ | (0.36 | ) | $ | — | | $ | 15.24 | | $ | 14.35 | |
| 2017(f) | | | 15.78 | | | 0.29 | | | (0.92 | ) | | (0.63 | ) | | (0.30 | ) | | — | | | (0.30 | ) | | — | | | 14.85 | | | 13.75 | |
| Year Ended 9/30: | | | | | | | | | | | | | | | | | | | | | | | | | | | | |
| 2016 | | | 15.26 | | | 0.76 | | | 0.55 | | | 1.31 | | | (0.79 | ) | | — | * | | (0.79 | ) | | — | | | 15.78 | | | 15.33 | |
| 2015 | | | 15.36 | | | 0.71 | | | (0.04 | ) | | 0.67 | | | (0.77 | ) | | — | | | (0.77 | ) | | — | * | | 15.26 | | | 13.42 | |
| 2014 | | | 14.33 | | | 0.67 | | | 1.12 | | | 1.79 | | | (0.76 | ) | | — | | | (0.76 | ) | | — | | | 15.36 | | | 13.33 | |
| 2013 | | | 16.13 | | | 0.70 | | | (1.71 | ) | | (1.01 | ) | | (0.76 | ) | | (0.03 | ) | | (0.79 | ) | | — | | | 14.33 | | | 12.91 | |
| 2012 | | | 15.01 | | | 0.73 | | | 1.19 | | | 1.92 | | | (0.79 | ) | | (0.01 | ) | | (0.80 | ) | | — | | | 16.13 | | | 16.00 | |
| | | | | | | | | | | | | | | | | | | | | | | | | | | | | | | | |
| NRK | | | | | | | | | | | | | | | | | | | | | | | | | | | | | | | |
| Year Ended 2/28: | | | | | | | | | | | | | | | | | | | | | | | | | | | | |
| 2018(e) | | | 14.21 | | | 0.32 | | | 0.44 | | | 0.76 | | | (0.32 | ) | | — | | | (0.32 | ) | | — | | | 14.65 | | | 13.37 | |
| 2017(f) | | | 15.17 | | | 0.27 | | | (0.96 | ) | | (0.69 | ) | | (0.27 | ) | | — | | | (0.27 | ) | | — | | | 14.21 | | | 12.93 | |
| Year Ended 9/30: | | | | | | | | | | | | | | | | | | | | | | | | | | | | |
| 2016 | | | 14.36 | | | 0.69 | | | 0.82 | | | 1.51 | | | (0.70 | ) | | — | | | (0.70 | ) | | — | | | 15.17 | | | 14.12 | |
| 2015 | | | 14.39 | | | 0.72 | | | (0.02 | ) | | 0.70 | | | (0.73 | ) | | — | | | (0.73 | ) | | — | | | 14.36 | | | 12.59 | |
| 2014 | | | 13.57 | | | 0.76 | | | 0.88 | | | 1.64 | | | (0.82 | ) | | — | | | (0.82 | ) | | — | | | 14.39 | | | 12.80 | |
| 2013 | | | 15.44 | | | 0.76 | | | (1.87 | ) | | (1.11 | ) | | (0.74 | ) | | (0.02 | ) | | (0.76 | ) | | — | | | 13.57 | | | 12.24 | |
| 2012 | | | 15.03 | | | 0.66 | | | 0.46 | | | 1.12 | | | (0.70 | ) | | (0.01 | ) | | (0.71 | ) | | — | | | 15.44 | | | 15.29 | |
| (a) | Total Return Based on Common Share NAV is the combination of changes in common share NAV, reinvested dividend income at NAV and reinvested capital gains distributions at NAV, if any. The last dividend declared in the period, which is typically paid on the first business day of the following month, is assumed to be reinvested at the ending NAV. The actual reinvest price for the last dividend declared in the period may often be based on the Fund’s market price (and not its NAV), and therefore may be different from the price used in the calculation. Total returns are not annualized. |
| | Total Return Based on Common Share Price is the combination of changes in the market price per share and the effect of reinvested dividend income and reinvested capital gains distributions, if any, at the average price paid per share at the time of reinvestment. The last dividend declared in the period, which is typically paid on the first business day of the following month, is assumed to be reinvested at the ending market price. The actual reinvestment for the last dividend declared in the period may take place over several days, and in some instances may not be based on the market price, so the actual reinvestment price may be different from the price used in the calculation. Total returns are not annualized. |
| * | Rounds to less than $0.01 per share. |
| | | | | Common Share Supplemental Data/ | |
| | | | | Ratios Applicable to Common Shares | |
| | Common Share | | | | |
| | Total Returns | | | | | | Ratios to Average Net Assets(b) | | | | |
| | | | | Based | | | | | | | | | | | | | |
| | Based | | | on | | | Ending | | | | | | Net | | | Portfolio | |
| | on | | | Share | | | Net | | | | | | Investment | | | Turnover | |
| | NAV | (a) | | Price | (a) | | Assets (000 | ) | | Expenses | (c) | | Income (Loss | ) | | Rate | (d) |
| | | | | | | | | | | | | | | | | | |
| | | | | | | | | | | | | | | | | | |
| | 5.08 | % | | 7.05 | % | $ | 474,456 | | | 2.07 | %** | | 4.52 | %** | | 4 | % |
| | (3.97 | ) | | (8.32 | ) | | 462,128 | | | 2.01 | ** | | 4.74 | ** | | 20 | |
| | | | | | | | | | | | | | | | | | |
| | 8.77 | | | 20.51 | | | 491,272 | | | 1.62 | | | 4.86 | | | 16 | |
| | 4.47 | | | 6.53 | | | 474,842 | | | 1.70 | | | 4.71 | | | 17 | |
| | 12.79 | | | 9.29 | | | 142,279 | | | 2.55 | | | 4.54 | | | 20 | |
| | (6.48 | ) | | (14.81 | ) | | 132,767 | | | 2.35 | | | 4.51 | | | 14 | |
| | 13.05 | | | 23.20 | | | 149,417 | | | 2.37 | | | 4.71 | | | 9 | |
| | | | | | | | | | | | | | | | | | |
| | | | | | | | | | | | | | | | | | |
| | 5.41 | | | 5.94 | | | 1,283,763 | | | 2.07 | ** | | 4.37 | ** | | 9 | |
| | (4.52 | ) | | (6.49 | ) | | 1,244,673 | | | 2.03 | ** | | 4.60 | ** | | 13 | |
| | | | | | | | | | | | | | | | | | |
| | 10.71 | | | 18.04 | | | 1,329,069 | | | 1.55 | | | 4.66 | | | 10 | |
| | 4.98 | | | 4.06 | | | 1,257,927 | | | 1.43 | | | 5.01 | | | 18 | |
| | 12.48 | | | 11.53 | | | 1,260,498 | | | 1.57 | | | 5.50 | | | 25 | |
| | (7.40 | ) | | (15.46 | ) | | 1,189,197 | | | 1.77 | | | 5.26 | | | 27 | |
| | 7.63 | | | 15.78 | | | 54,140 | | | 2.82 | | | 4.35 | | | 15 | |
| (b) | Net Investment Income (Loss) ratios reflect income earned and expenses incurred on assets attributable to preferred shares issued by the Fund. |
| (c) | The expense ratios reflect, among other things, all interest expense and other costs related to preferred shares (as described in Note 4 – Fund Shares, Preferred Shares) and/or the interest expense deemed to have been paid by the Fund on the floating rate certificates issued by the special purpose trusts for the self-deposited inverse floaters held by the Fund (as described in Note 3 – Portfolio Securities and Investments in Derivatives, Inverse Floating Rate Securities), where applicable, as follows: |
| NAN | | | | |
| Year Ended 2/28: | | | | |
| 2018(e) | | | 1.03 | %** |
| 2017(f) | | | 0.96 | ** |
| Year Ended 9/30: | | | | |
| 2016 | | | 0.65 | |
| 2015 | | | 0.50 | |
| 2014 | | | 1.20 | |
| 2013 | | | 1.26 | |
| 2012 | | | 1.27 | |
| NRK | | | | |
| Year Ended 2/28: | | | | |
| 2018(e) | | | 1.09 | %** |
| 2017(f) | | | 1.02 | ** |
| Year Ended 9/30: | | | | |
| 2016 | | | 0.62 | |
| 2015 | | | 0.48 | |
| 2014 | | | 0.58 | |
| 2013 | | | 0.70 | |
| 2012 | | | 1.59 | |
| (d) | Portfolio Turnover Rate is calculated based on the lesser of long-term purchases or sales (as disclosed in Note 5 – Investment Transactions) divided by the average long-term market value during the period. |
| (e) | For the six months ended August 31, 2017. |
| (f) | For the five months ended February 28, 2017. |
| ** | Annualized. |
See accompanying notes to financial statements.
Financial Highlights (Unaudited)(continued)
| | | | | | | | | | | | | | | | | | iMTP, MFP, MTP, VMTP and/or VRDP Shares | |
| | | iMTP Shares | | MFP Shares | | MTP Shares | | VMTP Shares | | VRDP Shares | | at the End | |
| | | at the End of Period | | at the End of Period | | at the End of Period(a) | | at the End of Period | | at the End of Period | | of Period | |
| | | | | | | | | | | | | | | | | | | | | | | | | | | | | | | | | | Asset | |
| | | | Aggregate | | | Asset | | | Aggregate | | | Asset | | | Aggregate | | | Asset | | | Aggregate | | | Asset | | | Aggregate | | | Asset | | | Coverage | |
| | | | Amount | | | Coverage | | | Amount | | | Coverage | | | Amount | | | Coverage | | | Amount | | | Coverage | | | Amount | | | Coverage | | | Per $1 | |
| | | | Outstanding | | | Per $5,000 | | | Outstanding | | Per $100,000 | | | Outstanding | | | Per $10 | | | Outstanding | | Per $100,000 | | | Outstanding | | | Per $100,000 | | Liquidation | |
| | | | (000 | ) | | Share | | | (000 | ) | | Share | | | (000 | ) | | Share | | | (000 | ) | | Share | | | (000 | ) | | Share | | | Preference | |
| NAN | | | | | | | | | | | | | | | | | | | | | | | | | | | | | | | | | | |
| Year Ended 2/28: | | | | | | | | | | | | | | | | | | | | | | | | | | | | | | | |
| 2018(b) | | $ | — | | $ | — | | $ | — | | $ | — | | $ | — | | $ | — | | $ | 147,000 | | $ | 301,041 | | $ | 89,000 | | $ | 301,041 | | $ | 3.01 | |
| 2017(c) | | | — | | | — | | | — | | | — | | | — | | | — | | | 147,000 | | | 295,834 | | | 89,000 | | | 295,834 | | | 2.96 | |
| Year Ended 9/30: | | | | | | | | | | | | | | | | | | | | | | | | | | | | | | | |
| 2016 | | | — | | | — | | | — | | | — | | | — | | | — | | | 147,000 | | | 308,166 | | | 89,000 | | | 308,166 | | | 3.08 | |
| 2015 | | | — | | | — | | | — | | | — | | | — | | | — | | | 94,000 | | | 359,477 | | | 89,000 | | | 359,477 | | | 3.59 | |
| 2014 | | | — | | | — | | | — | | | — | | | — | | | — | | | 56,000 | | | 354,070 | | | — | | | — | | | — | |
| 2013 | | | — | | | — | | | — | | | — | | | 55,360 | | | 33.98 | | | — | | | — | | | — | | | — | | | — | |
| 2012 | | | — | | | — | | | — | | | — | | | 55,360 | | | 36.99 | | | — | | | — | | | — | | | — | | | — | |
| | | | | | | | | | | | | | | | | | | | | | | | | | | | | | | | | | | |
| NRK | | | | | | | | | | | | | | | | | | | | | | | | | | | | | | | | | | |
| Year Ended 2/28: | | | | | | | | | | | | | | | | | | | | | | | | | | | | | | | |
| 2018(b) | | | — | | | — | | | 80,000 | | | 272,595 | | | — | | | — | | | — | | | — | | | 663,800 | | | 272,595 | | | 2.73 | |
| 2017(c) | | | 79,000 | | | 13,378 | | | — | | | — | | | — | | | — | | | — | | | — | | | 663,800 | | | 267,565 | | | 2.68 | |
| Year Ended 9/30: | | | | | | | | | | | | | | | | | | | | | | | | | | | | | | | |
| 2016 | | | 79,000 | | | 13,946 | | | — | | | — | | | — | | | — | | | — | | | — | | | 663,800 | | | 278,927 | | | 2.79 | |
| 2015 | | | 79,000 | | | 16,077 | | | — | | | — | | | — | | | — | | | — | | | — | | | 488,800 | | | 321,544 | | | 3.22 | |
| 2014 | | | 79,000 | | | 16,100 | | | — | | | — | | | — | | | — | | | — | | | — | | | 488,800 | | | 321,997 | | | 3.22 | |
| 2013 | | | — | | | — | | | — | | | — | | | 27,680 | | | 30.97 | | | 50,700 | | | 309,668 | | | 488,800 | | | 309,668 | | | 3.10 | |
| 2012 | | | — | | | — | | | — | | | — | | | 27,680 | | | 29.56 | | | — | | | — | | | — | | | — | | | — | |
| (a) | The Ending and Average Market Value Per Share for each Series of the Fund’s MTP Shares were as follows: |
| | | | 2014 | | | 2013 | | | 2012 | |
| NAN | | | | | | | | | | |
| Series 2015 (NAN PRC) | | | | | | | | | | |
| Ending Market Value per Share | | $ | — | | $ | 10.09 | | $ | 10.08 | |
| Average Market Value per Share | | | 10.04 | Ω | | 10.09 | | | 10.11 | |
| Series 2016 (NAN PRD) | | | | | | | | | | |
| Ending Market Value per Share | | | — | | | 10.02 | | | 10.09 | |
| Average Market Value per Share | | | 10.05 | Ω | | 10.10 | | | 10.11 | |
| | | | | | | | | | | |
| NRK | | | | | | | | | | |
| Series 2015 (NRK PRC) | | | | | | | | | | |
| Ending Market Value per Share | | | — | | | 10.01 | | | 10.14 | |
| Average Market Value per Share | | | 10.04 | Ω | | 10.07 | | | 10.10 | |
| (b) | For the six months ended August 31, 2017. |
| (c) | For the five months ended February 28, 2017. |
| Ω | For the period October 1, 2013 through June 13, 2014. |
See accompanying notes to financial statements.
Notes to Financial Statements (Unaudited)
1. General Information and Significant Accounting Policies
General Information
Fund Information
The funds covered in this report and their corresponding New York Stock Exchange (“NYSE”) symbols are as follows (each a “Fund” and collectively, the “Funds”):
| | • | Nuveen New York Municipal Value Fund, Inc. (NNY) |
| | • | Nuveen New York Municipal Value Fund 2 (NYV) |
| | • | Nuveen New York Quality Municipal Income Fund (NAN) |
| | • | Nuveen New York AMT-Free Quality Municipal Income Fund (NRK) |
The Funds are registered under the Investment Company Act of 1940, as amended, as diversified closed-end management investment companies. NNY was incorporated under the state laws of Minnesota on July 14, 1987. NYV, NAN and NRK were organized as Massachusetts business trusts on January 26, 2009, December 1, 1998 and April 9, 2002, respectively.
The end of the reporting period for the Funds is August 31, 2017, and the period covered by these Notes to Financial Statements is the six months ended August 31, 2017 (the “current fiscal period”).
Investment Adviser
The Funds’ investment adviser is Nuveen Fund Advisors, LLC (the “Adviser”), a subsidiary of Nuveen, LLC (“Nuveen”). Nuveen is the investment management arm of Teachers Insurance and Annuity Association of America (TIAA). The Adviser has overall responsibility for management of the Funds, oversees the management of the Funds’ portfolios, manages the Funds’ business affairs and provides certain clerical, bookkeeping and other administrative services, and, if necessary, asset allocation decisions. The Adviser has entered into sub-advisory agreements with Nuveen Asset Management, LLC (the “Sub-Adviser”), a subsidiary of the Adviser, under which the Sub-Adviser manages the investment portfolios of the Funds.
Investment Objectives and Principal Investment Strategies
Each Fund seeks to provide current income exempt from both regular federal and New York state income taxes, and in the case of NRK the alternative minimum tax (“AMT”) applicable to individuals, by investing primarily in a portfolio of municipal obligations issued by state and local government authorities within the state of New York or certain U.S. territories.
Significant Accounting Policies
Each Fund is an investment company and follows accounting and reporting guidance under Financial Accounting Standards Board (FASB) Accounting Standards Codification (ASC) Topic 946 “Financial Services – Investment Companies.” The following is a summary of significant accounting policies followed by the Funds in the preparation of their financial statements in accordance with U.S. generally accepted accounting principles (“U.S. GAAP”).
Investment Transactions
Investment transactions are recorded on a trade date basis. Realized gains and losses from investment transactions are determined on the specific identification method, which is the same basis used for federal income tax purposes. Investments purchased on a when-issued/delayed delivery basis may have extended settlement periods. Any investments so purchased are subject to market fluctuation during this period. The Funds have earmarked securities in their portfolios with a current value at least equal to the amount of the when-issued/delayed delivery purchase commitments.
As of the end of the reporting period, the Funds did not have any when-issued/delayed delivery purchase commitments.
Investment Income
Investment income, which reflects the amortization of premiums and accretion of discounts for financial reporting purposes, is recorded on an accrual basis. Investment income also reflects paydown gains and losses, if any.
Notes to Financial Statements (Unaudited) (continued)
Professional Fees
Professional fees presented on the Statement of Operations consist of legal fees incurred in the normal course of operations, audit fees, tax consulting fees and, in some cases, workout expenditures. Workout expenditures are incurred in an attempt to protect or enhance an investment or to pursue other claims or legal actions on behalf of Fund shareholders. If a refund is received for workout expenditures paid in a prior reporting period, such amounts will be recognized as “Legal fee refund” on the Statement of Operations.
Dividends and Distributions to Common Shareholders
Dividends from net investment income are, if any, declared monthly. Net realized capital gains and/or market discount from investment transactions, if any, are distributed to shareholders at least annually. Furthermore, capital gains are distributed only to the extent they exceed available capital loss carryforwards.
Distributions to common shareholders of net investment income, net realized capital gains and/or market discount, if any, are recorded on the ex-dividend date. The amount and timing of distributions are determined in accordance with federal income tax regulations, which may differ from U.S. GAAP.
Compensation
The Funds pay no compensation directly to those of its directors/trustees who are affiliated with the Adviser or to its officers, all of whom receive remuneration for their services to the Funds from the Adviser or its affiliates. The Funds’ Board of Directors/Trustees (the “Board”) has adopted a deferred compensation plan for independent directors/trustees that enables directors/trustees to elect to defer receipt of all or a portion of the annual compensation they are entitled to receive from certain Nuveen-advised funds. Under the plan, deferred amounts are treated as though equal dollar amounts had been invested in shares of select Nuveen-advised funds.
Indemnifications
Under the Funds’ organizational documents, their officers and directors/trustees are indemnified against certain liabilities arising out of the performance of their duties to the Funds. In addition, in the normal course of business, the Funds enter into contracts that provide general indemnifications to other parties. The Funds’ maximum exposure under these arrangements is unknown as this would involve future claims that may be made against the Funds that have not yet occurred. However, the Funds have not had prior claims or losses pursuant to these contracts and expect the risk of loss to be remote.
Netting Agreements
In the ordinary course of business, the Funds may enter into transactions subject to enforceable International Swaps and Derivative Association, Inc. (“ISDA”) master agreements or other similar arrangements (“netting agreements”). Generally, the right to offset in netting agreements allows each Fund to offset certain securities and derivatives with a specific counterparty, when applicable, as well as any collateral received or delivered to that counterparty based on the terms of the agreements. Generally, each Fund manages its cash collateral and securities collateral on a counterparty basis.
The Funds’ investments subject to netting agreements as of the end of the reporting period, if any, are further described in Note 3 – Portfolio Securities and Investments in Derivatives.
Use of Estimates
The preparation of financial statements in conformity with U.S. GAAP requires management to make estimates and assumptions that affect the reported amounts of assets and liabilities at the date of the financial statements and the reported amounts of increases and decreases in net assets applicable to common shares from operations during the current fiscal period. Actual results may differ from those estimates.
2. Investment Valuation and Fair Value Measurements
The fair valuation input levels as described below are for fair value measurement purposes.
Fair value is defined as the price that would be received upon selling an investment or transferring a liability in an orderly transaction to an independent buyer in the principal or most advantageous market for the investment. A three-tier hierarchy is used to maximize the use of observable market data and minimize the use of unobservable inputs and to establish classification of fair value measurements for disclosure purposes. Observable inputs reflect the assumptions market participants would use in pricing the asset or liability. Observable inputs are based on market data obtained from sources independent of the reporting entity. Unobservable inputs reflect the reporting entity’s own assumptions about the assumptions market participants would use in pricing the asset or liability. Unobservable inputs are based on the best information available in the circumstances. The following is a summary of the three-tiered hierarchy of valuation input levels.
| Level 1 – | Inputs are unadjusted and prices are determined using quoted prices in active markets for identical securities. |
| Level 2 – | Prices are determined using other significant observable inputs (including quoted prices for similar securities, interest rates, prepayment speeds, credit risk, etc.). |
| Level 3 – | Prices are determined using significant unobservable inputs (including management’s assumptions in determining the fair value of investments). |
Prices of fixed income securities are provided by an independent pricing service (“pricing service”) approved by the Board. The pricing service establishes a security’s fair value using methods that may include consideration of the following: yields or prices of investments of comparable quality, type of issue, coupon, maturity and rating, market quotes or indications of value from security dealers, evaluations of anticipated cash flows or collateral, general market conditions and other information and analysis, including the obligor’s credit characteristics considered relevant. These securities are generally classified as Level 2. In pricing certain securities, particularly less liquid and lower quality securities, the pricing service may consider information about a security, its issuer or market activity, provided by the Adviser. These securities are generally classified as Level 2 or Level 3 depending on the observability of the significant inputs.
Prices of swap contracts are also provided by a pricing service approved by the Board using the same methods as described above and are generally classified as Level 2.
Certain securities may not be able to be priced by the pre-established pricing methods as described above. Such securities may be valued by the Board and/or its appointee at fair value. These securities generally include, but are not limited to, restricted securities (securities which may not be publicly sold without registration under the Securities Act of 1933, as amended) for which a pricing service is unable to provide a market price; securities whose trading has been formally suspended; debt securities that have gone into default and for which there is no current market quotation; a security whose market price is not available from a pre-established pricing source; a security with respect to which an event has occurred that is likely to materially affect the value of the security after the market has closed but before the calculation of a Fund’s net asset value (“NAV”) (as may be the case in non-U.S. markets on which the security is primarily traded) or make it difficult or impossible to obtain a reliable market quotation; and a security whose price, as provided by the pricing service, is not deemed to reflect the security’s fair value. As a general principle, the fair value of a security would appear to be the amount that the owner might reasonably expect to receive for it in a current sale. A variety of factors may be considered in determining the fair value of such securities, which may include consideration of the following: yields or prices of investments of comparable quality, type of issue, coupon, maturity and rating, market quotes or indications of value from security dealers, evaluations of anticipated cash flows or collateral, general market conditions and other information and analysis, including the obligor’s credit characteristics considered relevant. These securities are generally classified as Level 2 or Level 3 depending on the observability of the significant inputs. Regardless of the method employed to value a particular security, all valuations are subject to review by the Board and/or its appointee.
The inputs or methodologies used for valuing securities are not an indication of the risks associated with investing in those securities. The following is a summary of each Fund’s fair value measurements as of the end of the reporting period:
| NNY | | | Level 1 | | | Level 2 | | | Level 3 | | | Total | |
| Long-Term Investments*: | | | | | | | | | | | | | |
| Municipal Bonds | | $ | — | | $ | 154,171,597 | | $ | — | | $ | 154,171,597 | |
| | | | | | | | | | | | | | |
| NYV | | | | | | | | | | | | | |
| Long-Term Investments*: | | | | | | | | | | | | | |
| Municipal Bonds | | $ | — | | $ | 35,067,067 | | $ | — | | $ | 35,067,067 | |
| Short-Term Investments: | | | | | | | | | | | | | |
| Municipal Bonds | | | — | | | 510,000 | | | — | | | 510,000 | |
| Total | | $ | — | | $ | 35,577,067 | | $ | — | | $ | 35,577,067 | |
| NAN | | | | | | | | | | | | | |
| Long-Term Investments*: | | | | | | | | | | | | | |
| Municipal Bonds | | $ | — | | $ | 720,479,565 | | $ | — | | $ | 720,479,565 | |
| | | | | | | | | | | | | | |
| NRK | | | | | | | | | | | | | |
| Long-Term Investments*: | | | | | | | | | | | | | |
| Municipal Bonds | | $ | — | | $ | 1,998,475,490 | | $ | — | | $ | 1,998,475,490 | |
| Short-Term Investments: | | | | | | | | | | | | | |
| Municipal Bonds | | | — | | | 23,675,000 | | | — | | | 23,675,000 | |
| Investment in Derivatives: | | | | | | | | | | | | | |
| Interest in Rate Swaps** | | | — | | | (905,825 | ) | | — | | | (905,825 | ) |
| Total | | $ | — | | $ | 2,021,244,665 | | $ | — | | $ | 2,021,244,665 | |
| * | Refer to the Fund’s Portfolio of Investments for industry classifications. |
| ** | Represents net unrealized appreciation (depreciation) as reported in the Fund’s Portfolio of Investments. |
Notes to Financial Statements (Unaudited) (continued)
The Board is responsible for the valuation process and has appointed the oversight of the daily valuation process to the Adviser’s Valuation Committee. The Valuation Committee, pursuant to the valuation policies and procedures adopted by the Board is responsible for making fair value determinations, evaluating the effectiveness of the Funds’ pricing policies and reporting to the Board. The Valuation Committee is aided in its efforts by the Adviser’s dedicated Securities Valuation Team, which is responsible for administering the daily valuation process and applying fair value methodologies as approved by the Valuation Committee. When determining the reliability of independent pricing services for investments owned by the Funds, the Valuation Committee, among other things, conducts due diligence reviews of the pricing services and monitors the quality of security prices received through various testing reports conducted by the Securities Valuation Team.
The Valuation Committee will consider pricing methodologies it deems relevant and appropriate when making a fair value determination, based on the facts and circumstances specific to the portfolio instrument. Fair value determinations generally will be derived as follows, using public or private market information:
| | (i) | If available, fair value determinations shall be derived by extrapolating from recent transactions or quoted prices for identical or comparable securities. |
| | | |
| | (ii) | If such information is not available, an analytical valuation methodology may be used based on other available information including, but not limited to: analyst appraisals, research reports, corporate action information, issuer financial statements and shelf registration statements. Such analytical valuation methodologies may include, but are not limited to: multiple of earnings, discount from market value of a similar freely-traded security, discounted cash flow analysis, book value or a multiple thereof, risk premium/yield analysis, yield to maturity and/or fundamental investment analysis. |
The purchase price of a portfolio instrument will be used to fair value the instrument only if no other valuation methodology is available or deemed appropriate, and it is determined that the purchase price fairly reflects the instrument’s current value.
For each portfolio security that has been fair valued pursuant to the policies adopted by the Board, the fair value price is compared against the last available and next available market quotations. The Valuation Committee reviews the results of such testing and fair valuation occurrences are reported to the Board.
3. Portfolio Securities and Investments in Derivatives
Portfolio Securities
Inverse Floating Rate Securities
Each Fund is authorized to invest in inverse floating rate securities. An inverse floating rate security is created by depositing a municipal bond (referred to as an “Underlying Bond”), typically with a fixed interest rate, into a special purpose tender option bond (“TOB”) trust (referred to as the “TOB Trust”) created by or at the direction of one or more Funds. In turn, the TOB Trust issues (a) floating rate certificates (referred to as “Floaters”), in face amounts equal to some fraction of the Underlying Bond’s par amount or market value, and (b) an inverse floating rate certificate (referred to as an “Inverse Floater”) that represents all remaining or residual interest in the TOB Trust. Floaters typically pay short-term tax-exempt interest rates to third parties who are also provided a right to tender their certificate and receive its par value, which may be paid from the proceeds of a remarketing of the Floaters, by a loan to the TOB Trust from a third party liquidity provider (“Liquidity Provider”), or by the sale of assets from the TOB Trust. The Inverse Floater is issued to a long term investor, such as one or more of the Funds. The income received by the Inverse Floater holder varies inversely with the short-term rate paid to holders of the Floaters, and in most circumstances the Inverse Floater holder bears substantially all of the Underlying Bond’s downside investment risk and also benefits disproportionately from any potential appreciation of the Underlying Bond’s value. The value of an Inverse Floater will be more volatile than that of the Underlying Bond because the interest rate is dependent on not only the fixed coupon rate of the Underlying Bond but also on the short-term interest paid on the Floaters, and because the Inverse Floater essentially bears the risk of loss (and possible gain) of the greater face value of the Underlying Bond.
The Inverse Floater held by a Fund gives the Fund the right to (a) cause the holders of the Floaters to tender their certificates at par (or slightly more than par in certain circumstances), and (b) have the trustee of the TOB Trust (the “Trustee”) transfer the Underlying Bond held by the TOB Trust to the Fund, thereby collapsing the TOB Trust.
The Fund may acquire an Inverse Floater in a transaction where it (a) transfers an Underlying Bond that it owns to a TOB Trust created by a third party or (b) transfers an Underlying Bond that it owns, or that it has purchased in a secondary market transaction for the purpose of creating an Inverse Floater, to a TOB Trust created at its direction, and in return receives the Inverse Floater of the TOB Trust (referred to as a “self-deposited Inverse Floater”). A Fund may also purchase an Inverse Floater in a secondary market transaction from a third party creator of the TOB Trust without first owning the Underlying Bond (referred to as an “externally-deposited Inverse Floater”).
An investment in a self-deposited Inverse Floater is accounted for as a “financing” transaction (i.e., a secured borrowing). For a self-deposited Inverse Floater, the Underlying Bond deposited into the TOB Trust is identified in the Fund’s Portfolio of Investments as “(UB) – Underlying bond of an inverse
floating rate trust reflected as a financing transaction,” with the Fund recognizing as liabilities, labeled “Floating rate obligations” on the Statement of Assets and Liabilities, (a) the liquidation value of Floaters issued by the TOB Trust, and (b) the amount of any borrowings by the TOB Trust from a Liquidity Provider to enable the TOB Trust to purchase outstanding Floaters in lieu of a remarketing. In addition, the Fund recognizes in “Investment Income” the entire earnings of the Underlying Bond, and recognizes (a) the interest paid to the holders of the Floaters or on the TOB Trust’s borrowings, and (b) other expenses related to remarketing, administration, trustee, liquidity and other services to a TOB Trust, as a component of “Interest expense and amortization of offering costs” on the Statement of Operations.
In contrast, an investment in an externally-deposited Inverse Floater is accounted for as a purchase of the Inverse Floater and is identified in the Fund’s Portfolio of Investments as “(IF) – Inverse floating rate investment.” For an externally-deposited Inverse Floater, a Fund’s Statement of Assets and Liabilities recognizes the Inverse Floater and not the Underlying Bond as an asset, and the Fund does not recognize the Floaters, or any related borrowings from a Liquidity Provider, as a liability. Additionally, the Fund reflects in “Investment Income” only the net amount of earnings on the Inverse Floater (net of the interest paid to the holders of the Floaters or the Liquidity Provider as lender, and the expenses of the Trust), and does not show the amount of that interest paid or the expenses of the TOB Trust as described above as interest expense on the Statement of Operations.
Fees paid upon the creation of a TOB Trust for self-deposited Inverse Floaters and externally-deposited Inverse Floaters are recognized as part of the cost basis of the Inverse Floater and are capitalized over the term of the TOB Trust.
As of the end of the reporting period, the aggregate value of Floaters issued by each Fund’s TOB Trust for self-deposited Inverse Floaters and externally-deposited Inverse Floaters was as follows:
| Floating Rate Obligations Outstanding | | | NNY | | | NYV | | | NAN | | | NRK | |
| Floating rate obligations: self-deposited Inverse Floaters | | $ | 3,255,000 | | $ | — | | $ | 29,570,000 | | $ | 12,855,000 | |
| Floating rate obligations: externally-deposited Inverse Floaters | | | — | | | — | | | 22,250,000 | | | — | |
| Total | | $ | 3,255,000 | | $ | — | | $ | 51,820,000 | | $ | 12,855,000 | |
During the current fiscal period, the average amount of Floaters (including any borrowings from a Liquidity Provider) outstanding, and the average annual interest rate and fees related to self-deposited Inverse Floaters, were as follows:
| Self-Deposited Inverse Floaters | | | NNY | | | NYV | | | NAN | | | NRK | |
| Average floating rate obligations outstanding | | $ | 3,255,000 | | $ | — | | $ | 29,570,000 | | $ | 14,834,212 | |
| Average annual interest rate and fees | | | 1.38 | % | | — | % | | 1.40 | % | | 1.35 | % |
TOB Trusts are supported by a liquidity facility provided by a Liquidity Provider pursuant to which the Liquidity Provider agrees, in the event that Floaters are (a) tendered to the Trustee for remarketing and the remarketing does not occur, or (b) subject to mandatory tender pursuant to the terms of the TOB Trust agreement, to either purchase Floaters or to provide the Trustee with an advance from a loan facility to fund the purchase of Floaters by the TOB Trust. In certain circumstances, the Liquidity Provider may otherwise elect to have the Trustee sell the Underlying Bond to retire the Floaters that were tendered and not remarketed prior to providing such a loan. In these circumstances, the Liquidity Provider remains obligated to provide a loan to the extent that the proceeds of the sale of the Underlying Bond is not sufficient to pay the purchase price of the Floaters.
The size of the commitment under the loan facility for a given TOB Trust is at least equal to the balance of that TOB Trust’s outstanding Floaters plus any accrued interest. In consideration of the loan facility, fee schedules are in place and are charged by the Liquidity Provider(s). Any loans made by the Liquidity Provider will be secured by the purchased Floaters held by the TOB Trust. Interest paid on any outstanding loan balances will be effectively borne by the Fund that owns the Inverse Floaters of the TOB Trust that has incurred the borrowing and may be at a rate that is greater than the rate that would have been paid had the Floaters been successfully remarketed.
As described above, any amounts outstanding under a liquidity facility are recognized as a component of “Floating rate obligations” on the Statement of Assets and Liabilities by the Fund holding the corresponding Inverse Floaters issued by the borrowing TOB Trust. As of the end of the reporting period, there were no loans outstanding under any such facility.
Each Fund may also enter into shortfall and forbearance agreements (sometimes referred to as a “recourse arrangement”) (TOB Trusts involving such agreements are referred to herein as “Recourse Trusts”), under which a Fund agrees to reimburse the Liquidity Provider for the Trust’s Floaters, in certain circumstances, for the amount (if any) by which the liquidation value of the Underlying Bond held by the TOB Trust may fall short of the sum of the liquidation value of the Floaters issued by the TOB Trust plus any amounts borrowed by the TOB Trust from the Liquidity Provider, plus any shortfalls in interest cash flows. Under these agreements, a Fund’s potential exposure to losses related to or on an Inverse Floater may increase beyond the value of the Inverse Floater as a Fund may potentially be liable to fulfill all amounts owed to holders of the Floaters or the Liquidity Provider. Any such shortfall amount in the aggregate is recognized as “Unrealized depreciation on Recourse Trusts” on the Statement of Assets and Liabilities.
Notes to Financial Statements (Unaudited) (continued)
As of the end of the reporting period, each Fund’s maximum exposure to the Floaters issued by Recourse Trusts for self-deposited Inverse Floaters and externally-deposited Inverse Floaters was as follows:
| Floating Rate Obligations — Recourse Trusts | | | NNY | | | NYV | | | NAN | | | NRK | |
| Maximum exposure to Recourse Trusts: self-deposited Inverse Floaters | | $ | 1,840,000 | | $ | — | | $ | 8,475,000 | | $ | 4,085,000 | |
| Maximum exposure to Recourse Trusts: externally-deposited Inverse Floaters | | | — | | | — | | | 17,450,000 | | | — | |
| Total | | $ | 1,840,000 | | $ | — | | $ | 25,925,000 | | $ | 4,085,000 | |
Zero Coupon Securities
A zero coupon security does not pay a regular interest coupon to its holders during the life of the security. Income to the holder of the security comes from accretion of the difference between the original purchase price of the security at issuance and the par value of the security at maturity and is effectively paid at maturity. The market prices of zero coupon securities generally are more volatile than the market prices of securities that pay interest periodically.
Investments in Derivatives
In addition to the inverse floating rate securities in which each Fund may invest, which are considered portfolio securities for financial reporting purposes, each Fund is authorized to invest in certain other derivative instruments such as futures, options and swap contracts. Each Fund limits its investments in futures, options on futures and swap contracts to the extent necessary for the Adviser to claim the exclusion from registration by the Commodity Futures Trading Commission as a commodity pool operator with respect to the Fund. The Funds record derivative instruments at fair value, with changes in fair value recognized on the Statement of Operations, when applicable. Even though the Funds’ investments in derivatives may represent economic hedges, they are not considered to be hedge transactions for financial reporting purposes.
Interest Rate Swap Contracts
Interest rate swap contracts involve a Fund’s agreement with the counterparty to pay or receive a fixed rate payment in exchange for the counterparty receiving or paying a variable rate payment. Forward interest rate swap contracts involve a Fund’s agreement with a counterparty to pay, in the future, a fixed or variable rate payment in exchange for the counterparty paying the Fund a variable or fixed rate payment, the accruals for which would begin at a specified date in the future (the “effective date”).
The amount of the payment obligation is based on the notional amount and the termination date of the contract. Interest rate swap contracts do not involve the delivery of securities or other underlying assets or principal. Accordingly, the risk of loss with respect to the swap counterparty on such transactions is limited to the net amount of interest payments that the Fund is to receive.
Interest rate swap contracts are valued daily. Upon entering into an interest rate swap contract (and beginning on the effective date for a forward interest rate swap contract), the Fund accrues the fixed rate payment expected to be paid or received and the variable rate payment expected to be received or paid on the interest rate swap contracts on a daily basis, and recognizes the daily change in the fair value of the Fund’s contractual rights and obligations under the contracts. For an over-the-counter (“OTC”) swap that is not cleared through a clearing house (“OTC Uncleared”), the amount recorded on these transactions is recognized on the Statement of Assets and Liabilities as a component of “Unrealized appreciation or depreciation on interest rate swaps.”
Upon the execution of an OTC swap cleared through a clearing house (“OTC Cleared”), the Fund is obligated to deposit cash or eligible securities, also known as “initial margin,” into an account at its clearing broker equal to a specified percentage of the contract amount. Cash deposited by the Fund to cover initial margin requirements on open swap contracts, if any, is recognized as a component of “Cash collateral at brokers for investments in swaps” on the Statement of Assets and Liabilities. Investments in OTC Cleared swaps obligate the Fund and the clearing broker to settle monies on a daily basis representing changes in the prior day’s “mark-to-market” of the swap contract. If the Fund has unrealized appreciation, the clearing broker will credit the Fund’s account with an amount equal to the appreciation. Conversely, if the Fund has unrealized depreciation, the clearing broker will debit the Fund’s account with an amount equal to the depreciation. These daily cash settlements are also known as “variation margin.” Variation margin for OTC Cleared swaps is recognized as a receivable and/or payable for “Variation margin on swap contracts” on the Statement of Assets and Liabilities. Upon the execution of an OTC Uncleared swap, neither the Fund nor the counterparty is required to deposit initial margin as the trades are recorded bilaterally between both parties to the swap contract, and the terms of the variation margin are subject to a predetermined threshold negotiated by the Fund and the counterparty. Variation margin for OTC Uncleared swaps is recognized as a component of “Unrealized appreciation or depreciation on interest rate swaps” as described in the preceding paragraph.
The net amount of periodic payments settled in cash are recognized as a component of “Net realized gain (loss) from swaps” on the Statement of Operations, in addition to the net realized gain or loss recorded upon the termination of the swap contract. For tax purposes, payments expected to be received or paid on the swap contracts are treated as ordinary income or expense, respectively. Changes in the value of the swap contracts during the
fiscal period are recognized as a component of “Change in net unrealized appreciation (depreciation) of swaps” on the Statement of Operations. In certain instances, payments are made or received upon entering into the swap contract to compensate for differences between the stated terms of the swap agreements and prevailing market conditions (credit spreads, currency exchange rates, interest rates, and other relevant factors). Payments received or made at the beginning of the measurement period, if any, are recognized as “Interest rate swaps premiums paid and/or received” on the Statement of Assets and Liabilities.
During the current fiscal period, NRK invested in forward interest rate swap contracts to help reduce price volatility risk movements in U.S. interest rates relative to the Fund’s benchmark.
The average notional amount of interest rate swaps contracts outstanding during the current fiscal period was as follows:
| | | | NRK | |
| Average notional amount of interest rate swap contracts outstanding* | | $ | 10,333,333 | |
| * | The average notional amount is calculated based on the outstanding notional at the beginning of the fiscal period and at the end of each fiscal quarter within the current fiscal period. |
The following table presents the fair value of all swap contracts held by the Funds as of the end of the reporting period, the location of these instruments on the Statement of Assets and Liabilities and the primary underlying risk exposure.
| | | | | Location on the Statement of Assets and Liabilities | |
| | | | | Asset Derivatives | | (Liability) Derivatives | |
| Underlying | | Derivative | | | | | | | | | | |
| Risk Exposure | | Instrument | | Location | | Value | | Location | | | Value | |
| NRK | | | | | | | | | | | | |
| Interest rate | | Swaps (OTC Uncleared) | | — | $ | — | | Unrealized depreciation | | $ | (905,825 | ) |
| | | | | | | | | on interest rate swaps | | | | |
The following table presents the swap contracts subject to netting agreements and the collateral delivered related to those swap contracts as of the end of the reporting period.
| | | | | | | | | | | | Net | | | | | | | |
| | | | | | Gross | | | Gross | | | Unrealized | | | | | | | |
| | | | | | Unrealized | | | Unrealized | | | Appreciation | | | Collateral | | | | |
| | | | | | Appreciation | | | (Depreciation | ) | | (Depreciation | ) | | Pledged | | | | |
| | | | | | on Interest | | | on Interest | | | on Interest | | | to (from | ) | | Net | |
| Fund | | Counterparty | | | Rate Swaps | * | | Rate Swaps | * | | Rate Swaps | | | Counterparty | | | Exposure | |
| NRK | | JPMorgan Chase Bank, N.A. | | $ | — | | $ | (905,825 | ) | $ | (905,825 | ) | $ | — | | $ | (905,825 | ) |
| * | Represents gross unrealized appreciation (depreciation) for the counterparty as reported in the Fund’s Portfolio of Investments. |
The following table presents the amount of net realized gain (loss) and change in net unrealized appreciation (depreciation) recognized on swap contracts on the Statement of Operations during the current fiscal period, and the primary underlying risk exposure.
| | | | | | | | | | | | | Unrealized | |
| | | | | | | | | | Net Realized | | | Appreciation | |
| | | | Underlying | | | Derivative | | | Gain (Loss) from | | | (Depreciation) of | |
| Fund | | | Risk Exposure | | | Instrument | | | Swaps | | | Swaps | |
| NRK | | | Interest rate | | | Swaps | | $ | — | | $ | (905,825 | ) |
Market and Counterparty Credit Risk
In the normal course of business each Fund may invest in financial instruments and enter into financial transactions where risk of potential loss exists due to changes in the market (market risk) or failure of the other party to the transaction to perform (counterparty credit risk). The potential loss could exceed the value of the financial assets recorded on the financial statements. Financial assets, which potentially expose each Fund to counterparty credit risk, consist principally of cash due from counterparties on forward, option and swap transactions, when applicable. The extent of each Fund’s exposure to counterparty credit risk in respect to these financial assets approximates their carrying value as recorded on the Statement of Assets and Liabilities.
Each Fund helps manage counterparty credit risk by entering into agreements only with counterparties the Adviser believes have the financial resources to honor their obligations and by having the Adviser monitor the financial stability of the counterparties. Additionally, counterparties may be required to pledge collateral daily (based on the daily valuation of the financial asset) on behalf of each Fund with a value approximately equal to the amount of any unrealized gain above a pre-determined threshold. Reciprocally, when each Fund has an unrealized loss, the Funds have instructed the custodian to pledge assets of the Funds as collateral with a value approximately equal to the amount of the unrealized loss above a pre-determined threshold. Collateral pledges are monitored and subsequently adjusted if and when the valuations fluctuate, either up or down, by at least the pre-determined threshold amount.
Notes to Financial Statements (Unaudited) (continued)
4. Fund Shares
Common Share Transactions
Transactions in common shares for the Funds during the Funds’ current and prior fiscal period, where applicable, were as follows:
| | | | NNY | |
| | | | Six | | | Five | | | | |
| | | | Months | | | Months | | | Year | |
| | | | Ended | | | Ended | | | Ended | |
| | | | 8/31/17 | | | 2/28/17 | | | 9/30/16 | |
| Common shares: | | | | | | | | | | |
| Issued to shareholders due to reinvestment of distributions | | | 8,007 | | | 2,879 | | | 8,597 | |
Preferred Shares
Institutional MuniFund Term Preferred Shares
During the current reporting period, NRK had issued and had outstanding Institutional MuniFund Term Preferred (“iMTP”) Shares, with a $5,000 liquidation preference per share. iMTP Shares are issued via private placement and are not publicly available.
On May 22, 2017, NRK redeemed all of its outstanding Series 2017 iMTP Shares. The Fund’s iMTP Shares were redeemed at their $5,000 liquidation value per share, plus dividend amounts owed, using proceeds from its issuance of MuniFund Preferred (“MFP”) Shares (as described below in MuniFund Preferred Shares).
The average liquidation preference of iMTP Shares outstanding and annualized dividend rate for the Fund during the current fiscal period were as follows:
| | | | NRK | * |
| Average liquidation preference of iMTP Shares outstanding | | $ | 79,000,000 | |
| Annualized dividend rate | | | 1.41 | % |
| * | For the period March 1, 2017 through May 22, 2017. |
iMTP Shares are subject to restrictions on transfer and may only be sold or transferred to “qualified institutional buyers.” iMTP Shares are short-term or short/intermediate-term instruments that pay a variable dividend rate tied to a short-term index, plus an additional fixed “spread” amount established at the time of issuance. The fair value of iMTP Shares is expected to be approximately their liquidation preference so long as the fixed “spread” on the iMTP Shares remains roughly in line with the “spread” being demanded by investors on instruments having similar terms in the current market environment. In present market conditions, the Fund’s Adviser has determined that the fair value of iMTP Shares is approximately their liquidation preference, but their fair value could vary if market conditions change materially. For financial reporting purposes, the liquidation preference of iMTP Shares is recorded as a liability and recognized as a component of “Institutional MuniFund Term Preferred (“iMTP”) Shares, net of deferred offering costs” on the Statement of Assets and Liabilities.
Dividends on the iMTP Shares (which are treated as interest payments for financial reporting purposes) are set weekly. Unpaid dividends on iMTP Shares are recognized as a component of “Interest payable” on the Statement of Assets and Liabilities, when applicable. Dividends accrued on iMTP Shares are recognized as a component of “Interest expense and amortization of offering costs” on the Statement of Operations.
Costs incurred by the Fund in connection with its offering of iMTP Shares were recorded as a deferred charge, which are amortized over the life of the shares and are recognized as components of “Institutional MuniFund Term Preferred (“iMTP”) Shares, net of deferred offering costs” on the Statement of Assets and Liabilities and “Interest expense and amortization of offering costs” on the Statement of Operations.
In conjunction with NRK redemption of iMTP Shares, the remaining deferred costs of $72,444, were fully expensed during the current fiscal period, as the redemptions were deemed an extinguishment of debt.
MuniFund Preferred Shares
NRK has issued and has outstanding MuniFund Preferred (“MFP”) Shares, with a $100,000 liquidation preference per share. These MFP Shares were issued via private placement and are not publically available.
The Fund is obligated to redeem its MFP Shares by the date as specified in its offering documents (“Term Redemption Date”), unless earlier redeemed by the Fund. MFP Shares are initially issued in a pre-specified mode, however, MFP Shares can be subsequently designated as an alternative mode at a later date at the discretion of the Fund. The modes within MFP Shares detail the dividend mechanics and are described as follows. At a subsequent date, the Fund may establish additional mode structures with the MFP Share.
| • | Variable Rate Remarketed Mode (“VRRM”) – Dividends for MFP Shares within this mode will be established by a remarketing agent; therefore, the market value of the MFP Shares is expected to approximate its liquidation preference. Shareholders have the ability to request a best-efforts tender of its shares upon seven days notice. If the remarketing agent is unable to identify an alternative purchaser, the shares will be retained by the shareholder requesting tender and the subsequent dividend rate will increase to its step-up dividend rate. If after one consecutive year of unsuccessful remarketing attempts, the Fund will be required to designate an alternative mode or redeem the shares. |
| | |
| | Each Fund will pay a remarketing fee on the aggregate principal amount of all MFP Shares while designated in VRRM. Payments made by the Fund to the remarketing agent are recognized as “Remarketing fees” on the Statement of Operations. |
| | |
| • | Variable Rate Mode (“VRM”) – Dividends for MFP Shares designated in this mode are based upon a short-term index plus an additional fixed “spread” amount established at the time of issuance or renewal / conversion of its mode. At the end of the period of the mode, the Fund will be required to either extend the term of the mode, designate an alternative mode or redeem the MFP Shares. |
| | |
| | The fair value of MFP Shares while in VRM are expected to approximate their liquidation preference so long as the fixed “spread” on the shares remains roughly in line with the “spread” being demanded by investors on instruments having similar terms in the current market. In current market conditions, the Adviser has determined that the fair value of the shares are approximately their liquidation preference, but their fair value could vary if market conditions change materially. |
| | |
| • | Variable Rate Demand Mode (“VRDM”) – Dividends for MFP Shares designated in this mode will be established by a remarketing agent; therefore, the market value of the MFP Shares is expected to approximate its liquidation preference. While in this mode, Shares will have an unconditional liquidity feature that enable its shareholders to require a liquidity provider, which the Fund has entered into a contractual agreement, to purchase shares in the event that the shares are not able to be successfully remarketed. In the event that shares within this mode are unable to be successfully remarketed and are purchased by the liquidity provider, the dividend rate will be the maximum rate which is designed to escalate according to a specified schedule in order to enhance the remarketing agent’s ability to successfully remarket the shares. Each Fund is required to redeem any shares that are still owned by a liquidity provider after six months of continuous, unsuccessful remarketing. |
| | |
| | Each Fund will pay a liquidity and remarketing fee on the aggregate principal amount of all MFP shares while within VRDM. Payments made by the Fund to the liquidity provider and remarketing agent are recognized as “Liquidity fees” and “Remarketing fees”, respectively, on the Statement of Operations. |
For financial reporting purposes, the liquidation preference of MFP Shares is recorded as a liability and is recognized as a component of “MuniFund Preferred (“MFP”) Shares, net of deferred offering costs” on the Statement of Assets and Liabilities. Dividends on the MFP shares are treated as interest payments for financial reporting purposes. Unpaid dividends on MFP shares are recognized as a component on “Interest payable” on the Statement of Assets and Liabilities. Dividends accrued on MFP Shares are recognized as a component of “Interest expense and amortization of offering costs” on the Statement of Operations.
Subject to certain conditions, MFP Shares may be redeemed, in whole or in part, at any time at the option of the Fund. The Fund may also be required to redeem certain MFP shares if the Fund fails to maintain certain asset coverage requirements and such failures are not cured by the applicable cure date. The redemption price per share in all circumstances is equal to the liquidation preference per share plus any accumulated but unpaid dividends.
NRK incurred offering costs of $432,464 in connection with its offering of MFP Shares, which were recorded as a deferred charge and is being amortized over the life of the shares. These offering costs are recognized as a component of “MuniFund Preferred (“MFP”) Shares, net of deferred offering costs” on the Statement of Assets and Liabilities and “Interest expense and amortization of offering costs” on the Statement of Operations.
As of the end of the reporting period, details of its MFP Shares outstanding were as follows:
| | | | | | | Shares | | | Liquidation | | | Term | | | | |
| Fund | | | Series | | | Outstanding | | | Preference | | | Redemption Date | | | Mode | |
| NRK | | | A | | | 800 | | $ | 80,000,000 | | | May 1, 2047 | | | VRRM | |
The average liquidation preference of MFP Shares outstanding and annualized dividend rate for the Fund during the current fiscal period were as follows:
| | | | NRK | * |
| Average liquidation preference of MFP Shares outstanding | | $ | 80,000,000 | |
| Annualized dividend rate | | | 1.07 | % |
| * | For the period May 12, 2017 (first issuance of shares) through August 31, 2017. |
Variable Rate MuniFund Term Preferred Shares
The following Fund has issued and has outstanding Variable Rate MuniFund Term Preferred (“VMTP”) Shares, with a $100,000 liquidation preference per share. VMTP Shares are issued via private placement and are not publicly available.
Notes to Financial Statements (Unaudited) (continued)
As of the end of the reporting period, VMTP Shares outstanding, at liquidation preference, for the Fund was as follows:
| | | | | | | Shares | | | Liquidation | |
| Fund | | | Series | | | Outstanding | | | Preference | |
| NAN | | | 2019 | | | 1,470 | | $ | 147,000,000 | |
The Fund is obligated to redeem its VMTP Shares by the date as specified in its offering document (“Term Redemption Date”), unless earlier redeemed by the Fund. VMTP Shares are subject to optional and mandatory redemption in certain circumstances. The VMTP Shares may be redeemed at the option of the Fund, subject to payment of premium for approximately one year following the date of issuance (“Premium Expiration Date”), and at the redemption price per share thereafter. The redemption price per share is equal to the sum of the liquidation preference per share plus any accumulated but unpaid dividends. The Fund may be obligated to redeem a certain amount of the VMTP Shares if the Fund fails to maintain certain asset coverage and leverage ratio requirements and such failures are not cured by the applicable cure date. The Term Redemption Date and Premium Expiration Date for the Fund’s VMTP Shares are as follows:
| | | | | | | Term | | | Premium | |
| | | | | | | Redemption | | | Expiration | |
| Fund | | | Series | | | Date | | | Date | |
| NAN | | | 2019 | | | August 1, 2019 | | | July 1, 2017 | |
The average liquidation preference of VMTP Shares outstanding and annualized dividend rate for the Fund during the current fiscal period were as follows:
| | | | NAN | |
| Average liquidation preference of VMTP Shares outstanding | | $ | 147,000,000 | |
| Annualized dividend rate | | | 1.76 | % |
VMTP Shares are subject to restrictions on transfer, generally do not trade, and market quotations are generally not available. VMTP Shares are short-term or short/intermediate-term instruments that pay a variable dividend rate tied to a short-term index, plus an additional fixed “spread” amount established at the time of issuance. The fair value of VMTP Shares is expected to be approximately their liquidation preference so long as the fixed “spread” on the VMTP Shares remains roughly in line with the “spread” being demanded by investors on instruments having similar terms in the current market environment. In present market conditions, the Fund’s Adviser has determined that fair value of VMTP Shares is approximately their liquidation preference, but their fair value could vary if market conditions change materially. For financial reporting purposes, the liquidation preference of VMTP Shares is a liability and is recognized as a component of “Variable Rate MuniFund Term Preferred (“VMTP”) Shares, net of deferred offering costs” on the Statement of Assets and Liabilities.
Dividends on the VMTP shares (which are treated as interest payments for financial reporting purposes) are set weekly. Unpaid dividends on VMTP Shares are recognized as a component of “Interest payable” on the Statement of Assets and Liabilities. Dividends accrued on VMTP Shares are recognized as a component of “Interest expense and amortization of offering costs” on the Statement of Operations.
Costs incurred in connection with the Fund’s offering of VMTP Shares were recorded as a deferred charges, which are amortized over the life of the shares and are recognized as components of “Variable Rate MuniFund Term Preferred (“VMTP”) Shares, net of deferred offering costs” on the Statement of Assets and Liabilities and “Interest expense and amortization of offering costs” on the Statement of Operations.
Variable Rate Demand Preferred Shares
The following Funds have issued and have outstanding Variable Rate Demand Preferred (“VRDP”) Shares, with a $100,000 liquidation preference per share. VRDP Shares are issued via private placement and are not publicly available.
As of the end of the reporting period, details of the Funds’ VRDP Shares outstanding were as follows:
| | | | | | | Shares | | | Liquidation | | | | |
| Fund | | | Series | | | Outstanding | | | Preference | | | Maturity | |
| NAN | | | 1 | | | 890 | | $ | 89,000,000 | | | March 1, 2040 | |
| NRK | | | | | | | | | | | | | |
| | | | 1 | | | 1,123 | | $ | 112,300,000 | | | August 1, 2040 | |
| | | | 2 | | | 1,648 | | $ | 164,800,000 | | | August 1, 2040 | |
| | | | 3 | | | 1,617 | | $ | 161,700,000 | | | December 1, 2040 | |
| | | | 4 | | | 500 | | $ | 50,000,000 | | | June 1, 2040 | |
| | | | 5 | | | 1,750 | | $ | 175,000,000 | | | June 1, 2046 | |
VRDP Shares include a liquidity feature that allows VRDP shareholders to have their shares purchased by a liquidity provider with whom each Fund has contracted in the event that the VRDP Shares are not able to be successfully remarketed. Each Fund is required to redeem any VRDP Shares that are
still owned by the liquidity provider after six months of continuous, unsuccessful remarketing. Each Fund pays an annual remarketing fee of 0.10% on the aggregate principal amount of all VRDP Shares outstanding. Each Fund’s VRDP Shares have successfully remarketed since issuance.
Dividends on the VRDP Shares (which are treated as interest payments for financial reporting purposes) are set at a rate established by a remarketing agent; therefore, the market value of the VRDP Shares is expected to approximate its liquidation preference. In the event that VRDP Shares are unable to be successfully remarketed, the dividend rate will be the maximum rate which is designed to escalate according to a specified schedule in order to enhance the remarketing agent’s ability to successfully remarket the VRDP Shares.
Subject to certain conditions, VRDP Shares may be redeemed, in whole or in part, at any time at the option of each Fund. Each Fund may also redeem certain of the VRDP Shares if the Fund fails to maintain certain asset coverage requirements and such failures are not cured by the applicable cure date. The redemption price per share is equal to the sum of the liquidation preference per share plus any accumulated but unpaid dividends.
The average liquidation preference of VRDP Shares outstanding and annualized dividend rate for each Fund during the current fiscal period were as follows:
| | | | NAN | | | NRK | |
| Average liquidation preference of VRDP Shares outstanding | | $ | 89,000,000 | | $ | 663,800,000 | |
| Annualized dividend rate | | | 0.94 | % | | 0.89 | % |
For financial reporting purposes, the liquidation preference of VRDP Shares is a liability and is recognized as a component of “Variable Rate Demand Preferred (“VRDP”) Shares, net of deferred offering costs” on the Statement of Assets and Liabilities. Unpaid dividends on VRDP Shares are recognized as a component of “Interest payable” on the Statement of Assets and Liabilities, when applicable. Dividends accrued on VRDP Shares are recognized as a component of “Interest expense and amortization of offering costs” on the Statement of Operations. Costs incurred by the Funds in connection with their offerings of VRDP Shares were recorded as a deferred charge, which are amortized over the life of the shares and are recognized as a component of “Variable Rate Demand Preferred (“VRDP”) Shares, net of deferred offering costs” on the Statement of Assets and Liabilities and “Interest expense and amortization of offerings costs” on the Statement of Operations. In addition to interest expense, each Fund also pays a per annum liquidity fee to the liquidity provider, as well as a remarketing fee, which are recognized as “Liquidity fees” and “Remarketing fees,” respectively, on the Statement of Operations.
Preferred Share Transactions
Transactions in preferred shares for the Funds during the Funds’ current and prior fiscal period, where applicable, are noted in the following tables.
Transactions in iMTP Shares for the Funds, where applicable, were as follows:
| | | | Six Months Ended | |
| | | | August 31, 2017 | |
| | | | Series | | | Shares | | | Amount | |
| NRK | | | | | | | | | | |
| iMTP Shares redeemed | | | 2017 | | | (15,800 | ) | $ | (79,000,000 | ) |
Transactions in MFP Shares for the Funds, where applicable, were as follows:
| | | | Six Months Ended | |
| | | | August 31, 2017 | |
| | | | Series | | | Shares | | | Amount | |
| NRK | | | | | | | | | | |
| MFP Shares issued | | | A | | | 800 | | $ | 80,000,000 | |
Transactions in VMTP Shares for the Funds, where applicable, were as follows:
| | | | Year Ended | |
| | | | September 30, 2016 | |
| | | | Series | | | Shares | | | Amount | |
| NAN | | | | | | | | | | |
| VMTP Shares issued | | | 2019 | | | 1,470 | | $ | 147,000,000 | |
| VMTP Shares exchanged | | | 2017 | | | (940 | ) | | (94,000,000 | ) |
| Net increase (decrease) | | | | | | 530 | | $ | 53,000,000 | |
Notes to Financial Statements (Unaudited) (continued)
Transactions in VRDP Shares for the Funds, where applicable, were as follows:
| | | | Year Ended | |
| | | | September 30, 2016 | |
| | | | Series | | | Shares | | | Amount | |
| NRK | | | | | | | | | | |
| VRDP Shares issued | | | 5 | | | 1,750 | | $ | 175,000,000 | |
5. Investment Transactions
Long-term purchases and sales (including maturities but excluding derivative transactions, where applicable) during the current fiscal period were as follows:
| | | | NNY | | | NYV | | | NAN | | | NRK | |
| Purchases | | $ | 3,593,900 | | $ | 5,670,822 | | $ | 29,587,905 | | $ | 172,510,652 | |
| Sales and maturities | | | 3,793,050 | | | 6,763,755 | | | 41,619,179 | | | 217,364,738 | |
6. Income Tax Information
Each Fund is a separate taxpayer for federal income tax purposes. Each Fund intends to distribute substantially all of its net investment income and net capital gains to shareholders and to otherwise comply with the requirements of Subchapter M of the Internal Revenue Code applicable to regulated investment companies. Therefore, no federal income tax provision is required. Furthermore, each Fund intends to satisfy conditions that will enable interest from municipal securities, which is exempt from regular federal and New York state income taxes, and in the case of NRK the AMT applicable to individuals, to retain such tax-exempt status when distributed to shareholders of the Funds. Net realized capital gains and ordinary income distributions paid by the Funds are subject to federal taxation.
For all open tax years and all major taxing jurisdictions, management of the Funds has concluded that there are no significant uncertain tax positions that would require recognition in the financial statements. Open tax years are those that are open for examination by taxing authorities (i.e., generally the last four tax year ends and the interim tax period since then). Furthermore, management of the Funds is also not aware of any tax positions for which it is reasonably possible that the total amounts of unrecognized tax benefits will significantly change in the next twelve months.
The following information is presented on an income tax basis. Differences between amounts for financial statement and federal income tax purposes are primarily due to the timing differences in recognizing taxable market discount, timing differences in recognizing certain gains and losses on investment transactions and the treatment of investments in inverse floating rate securities reflected as financing transactions, if any. To the extent that differences arise that are permanent in nature, such amounts are reclassified within the capital accounts as detailed below. Temporary differences do not require reclassification. Temporary and permanent differences do not impact the NAVs of the Funds.
The tables below present the cost and unrealized appreciation (depreciation) of each Fund’s investment portfolio, as determined on a federal income tax basis, as of August 31, 2017.
For purposes of this disclosure, derivative tax cost is generally the sum of any upfront fees or premiums exchanged and any amounts unrealized for income statement reporting but realized in income and/or capital gains for tax reporting. If a particular derivative category does not disclose any tax unrealized appreciation or depreciation, the change in value of those derivatives have generally been fully realized for tax purposes.
| | | | NNY | | | NYV | | | NAN | | | NRK | |
| Tax cost of investments | | $ | 141,290,384 | | $ | 32,619,665 | | $ | 642,181,089 | | $ | 1,853,416,783 | |
| Gross unrealized: | | | | | | | | | | | | | |
| Appreciation | | $ | 10,551,754 | | $ | 3,477,243 | | $ | 52,173,002 | | $ | 158,675,960 | |
| Depreciation | | | (926,728 | ) | | (519,841 | ) | | (3,444,576 | ) | | (2,797,261 | ) |
| Net unrealized appreciation (depreciation) of investments | | $ | 9,625,026 | | $ | 2,957,402 | | $ | 48,728,426 | | $ | 155,878,699 | |
| | | | NRK | |
| Tax cost of swap contracts | | $ | — | |
| Net unrealized appreciation (depreciation) on swap contracts | | | (905,825 | ) |
Permanent differences, primarily due to federal taxes paid, taxable market discount, nondeductible offering costs and nondeductible reorganization expenses, resulted in reclassifications among the Funds’ components of common share net assets as of February 28, 2017, the Funds’ last tax year end, as follows:
| | | | NNY | | | NYV | | | NAN | | | NRK | |
| Paid-in-surplus | | $ | — | | $ | — | | $ | (12,716 | ) | $ | (131,992 | ) |
| Undistributed (Over-distribution of) net investment income | | | (2,418 | ) | | (538 | ) | | (30,394 | ) | | (313,808 | ) |
| Accumulated net realized gain (loss) | | | 2,418 | | | 538 | | | 43,110 | | | 445,800 | |
The tax components of undistributed net tax-exempt income, net ordinary income and net long-term capital gains as of February 28, 2017, the Funds’ last tax year end, were as follows:
| | | | NNY | | | NYV | | | NAN | | | NRK | |
| Undistributed net tax-exempt income1 | | $ | 627,661 | | $ | 145,875 | | $ | 1,829,325 | | $ | 918,277 | |
| Undistributed net ordinary income2 | | | 5,222 | | | 20,570 | | | 24,395 | | | 22,068 | |
| Undistributed net long-term capital gains | | | — | | | — | | | — | | | — | |
| 1 | Undistributed net tax-exempt income (on a tax basis) has not been reduced for the dividend declared on February 1, 2017, and paid on March 1, 2017. |
| 2 | Net ordinary income consists of taxable market discount income and net short-term capital gains, if any. |
The tax character of distributions paid during the Funds’ last tax years ended February 28, 2017 and September 30, 2016, was designated for purposes of the dividends paid deduction as follows:
| 2017 | | | NNY | | | NYV | | | NAN | | | NRK | |
| Distributions from net tax-exempt income | | $ | 2,439,931 | | $ | 605,025 | | $ | 10,646,831 | | $ | 26,456,790 | |
| Distributions from net ordinary income2 | | | — | | | 78,947 | | | 62,253 | | | 1,276 | |
| Distributions from net long-term capital gains | | | — | | | — | | | — | | | — | |
| 2016 | | | NNY | | | NYV | | | NAN | | | NRK | |
| Distributions from net tax-exempt income | | $ | 5,925,222 | | $ | 1,480,256 | | $ | 26,216,708 | | $ | 64,020,915 | |
| Distributions from net ordinary income2 | | | 33,421 | | | — | | | 71,711 | | | — | |
| Distributions from net long-term capital gains | | | — | | | — | | | 89,876 | | | — | |
| 2 | Net ordinary income consists of taxable market discount income and net short-term capital gains, if any. |
As of February 28, 2017, the Funds’ last tax year end, the Funds had unused capital losses carrying forward available for federal income tax purposes to be applied against future capital gains, if any. The capital losses are not subject to expiration.
| | | | NNY | | | NYV | | | NAN3 | | | NRK | |
| Capital losses to be carried forward – not subject to expiration | | $ | 1,985,803 | | $ | 227,173 | | $ | 13,759,978 | | $ | 44,336,698 | |
| 3 | A portion of NAN’s capital loss carryforward is subject to an annual limitation under the Internal Revenue Code and related regulations. |
During the Funds’ last tax year ended February 28, 2017, NYV utilized $257,695 of its capital loss carryforward.
7. Management Fees and Other Transactions with Affiliates
Management Fees
Each Fund’s management fee compensates the Adviser for overall investment advisory and administrative services and general office facilities. The Sub-Adviser is compensated for its services to the Funds from the management fees paid to the Adviser.
Each Fund’s management fee consists of two components — a fund-level fee, based only on the amount of assets within each individual Fund, and a complex-level fee, based on the aggregate amount of all eligible fund assets managed by the Adviser and for NNY a gross interest income component. This pricing structure enables Fund shareholders to benefit from growth in the assets within their respective Fund as well as from growth in the amount of complex-wide assets managed by the Adviser.
NNY pays an annual fund-level fee, payable monthly, of 0.15% of the average daily net assets of the Fund, as well as 4.125% of the gross interest income (excluding interest on bonds underlying a “self-deposited inverse floater” trust that is attributed to the Fund over and above the net interest earned on the inverse floater itself) of the Fund.
Notes to Financial Statements (Unaudited) (continued)
The annual Fund-level fee, payable monthly, for each Fund (excluding NNY) is calculated according to the following schedules:
| | | | NYV | |
| Average Daily Net Assets* | | | Fund-Level Fee | |
| For the first $125 million | | | 0.4000 | % |
| For the next $125 million | | | 0.3875 | |
| For the next $250 million | | | 0.3750 | |
| For the next $500 million | | | 0.3625 | |
| For the next $1 billion | | | 0.3500 | |
| For the next $3 billion | | | 0.3250 | |
| For managed assets over $5 billion | | | 0.3125 | |
| | | | NAN | |
| | | | NRK | |
| Average Daily Managed Assets* | | | Fund-Level Fee | |
| For the first $125 million | | | 0.4500 | % |
| For the next $125 million | | | 0.4375 | |
| For the next $250 million | | | 0.4250 | |
| For the next $500 million | | | 0.4125 | |
| For the next $1 billion | | | 0.4000 | |
| For the next $3 billion | | | 0.3750 | |
| For managed assets over $5 billion | | | 0.3625 | |
The annual complex-level fee, payable monthly, for each Fund is calculated by multiplying the current complex-wide fee rate, determined according to the following schedule by the Fund’s daily managed assets (net assets for NNY and NYV):
| Complex-Level Managed Asset Breakpoint Level* | | | Effective Rate at Breakpoint Level | |
| $55 billion | | | 0.2000 | % |
| $56 billion | | | 0.1996 | |
| $57 billion | | | 0.1989 | |
| $60 billion | | | 0.1961 | |
| $63 billion | | | 0.1931 | |
| $66 billion | | | 0.1900 | |
| $71 billion | | | 0.1851 | |
| $76 billion | | | 0.1806 | |
| $80 billion | | | 0.1773 | |
| $91 billion | | | 0.1691 | |
| $125 billion | | | 0.1599 | |
| $200 billion | | | 0.1505 | |
| $250 billion | | | 0.1469 | |
| $300 billion | | | 0.1445 | |
| * | For the complex-level fees, managed assets include closed-end fund assets managed by the Adviser that are attributable to certain types of leverage. For these purposes, leverage includes the funds’ use of preferred stock and borrowings and certain investments in the residual interest certificates (also called inverse floating rate securities) in tender option bond (TOB) trusts, including the portion of assets held by a TOB trust that has been effectively financed by the trust’s issuance of floating rate securities, subject to an agreement by the Adviser as to certain funds to limit the amount of such assets for determining managed assets in certain circumstances. The complex-level fee is calculated based upon the aggregate daily managed assets of all Nuveen Funds that constitute “eligible assets.” Eligible assets do not include assets attributable to investments in other Nuveen Funds or assets in excess of a determined amount (originally $2 billion) added to the Nuveen fund complex in connection with the Adviser’s assumption of the management of the former First American Funds effective January 1, 2011. As of August 31, 2017, the complex-level fee for each Fund was 0.1599%. |
Other Transactions with Affiliates
Each Fund is permitted to purchase or sell securities from or to certain other funds managed by the Adviser (“inter-fund trade”) under specified conditions outlined in procedures adopted by the Board. These procedures have been designed to ensure that any inter-fund trade of securities by the Fund from or to another fund that is, or could be, considered an affiliate of the Fund under certain limited circumstances by virtue of having a common investment adviser (or affiliated investment adviser), common officer and/or common trustee complies with Rule 17a-7 of the 1940 Act. Further, as defined under these procedures, each inter-fund trade is effected at the current market price as provided by an independent pricing service. Unsettled
inter-fund trades as of the end of the reporting period are recognized as a component of “Receivable for investments sold” and/or “Payable for investments purchased” on the Statement of Assets and Liabilities, when applicable.
During the current fiscal period, the Funds did not engage in inter-fund trades pursuant to these procedures.
8. Borrowing Arrangements
Uncommitted Line of Credit
During the current fiscal period, the Funds participated in an unsecured bank line of credit (“Unsecured Credit Line”) under which outstanding balances would bear interest at a variable rate. Although the Funds participated in the Unsecured Credit Line, they did not have any outstanding balances during the current fiscal period.
The Unsecured Credit Line was not renewed after its scheduled termination date on July 27, 2017.
Committed Line of Credit
The Funds, along with certain other funds managed by the Adviser (“Participating Funds”), have established a 364-day, approximately $3 billion standby credit facility with a group of lenders, under which the Participating Funds may borrow for various purposes other than leveraging for investment purposes. A large portion of this facility’s capacity (and its associated costs as described below) is currently dedicated for use by a small number of Participating Funds, which does not include any of the Funds covered by the shareholder report. The remaining capacity under the facility (and the corresponding portion of the facility’s annual costs) is separately dedicated to most of the other open-end funds in the Nuveen fund family, along with a number of Nuveen closed-end funds, including all of the Funds covered by this shareholder report. The credit facility expires in July 2018 unless extended or renewed.
The credit facility has the following terms: a fee of 0.15% per annum on unused commitment amounts, and interest at a rate equal to the higher of (a) one-month LIBOR (London Inter-Bank Offered Rate) plus 1.25% per annum or (b) the Fed Funds rate plus 1.25% per annum on amounts borrowed. Participating Funds paid administration, legal and arrangement fees, which are recognized as a component of “Other expenses” on the Statement of Operations, and along with commitment fees, have been allocated among such Participating Funds based upon the relative proportions of the facility’s aggregate capacity reserved for them and other factors deemed relevant by the Adviser and the Board of each Participating Fund.
During the current fiscal period, the following Funds utilized this facility. The Funds’ maximum outstanding balance during the utilization period was as follows:
| | | | NAN | | | NRK | |
| Maximum Outstanding Balance | | $ | 7,000,000 | | $ | 14,000,000 | |
During the current fiscal period, and during each Fund’s utilization period, the average daily balance outstanding and average annual interest rate on the Borrowings were as follows:
| | | | NAN | | | NRK | |
| Average daily balance outstanding | | $ | 5,000,000 | | $ | 9,800,000 | |
| Average annual interest rate | | | 2.27 | % | | 2.43 | % |
Borrowings outstanding as of the end of the reporting period are recognized as “Borrowings” on the Statement of Assets and Liabilities. None of the other Funds utilized this facility during the current fiscal period.
Inter-Fund Borrowing and Lending
The Securities and Exchange Commission (“SEC”) has granted an exemptive order permitting registered open-end and closed-end Nuveen funds to participate in an inter-fund lending facility whereby the Nuveen funds may directly lend to and borrow money from each other for temporary purposes (e.g., to satisfy redemption requests or when a sale of securities “fails,” resulting in an unanticipated cash shortfall) (the “Inter-Fund Program”). The closed-end Nuveen funds, including the Funds covered by this shareholder report, will participate only as lenders, and not as borrowers, in the Inter-Fund Program because such closed-end funds rarely, if ever, need to borrow cash to meet redemptions. The Inter-Fund Program is subject to a number of conditions, including, among other things, the requirements that (1) no fund may borrow or lend money through the Inter-Fund Program unless it receives a more favorable interest rate than is typically available from a bank or other financial institution for a comparable transaction; (2) no fund may borrow on an unsecured basis through the Inter-Fund Program unless the fund’s outstanding borrowings from all sources immediately after the inter-fund borrowing total 10% or less of its total assets; provided that if the borrowing fund has a secured borrowing outstanding from any other lender, including but not limited to another fund, the inter-fund loan must be secured on at least an equal priority basis with at least an equivalent percentage of collateral to loan value; (3) if a fund’s total outstanding borrowings immediately after an inter-fund borrowing would be greater than 10% of its total assets, the fund may borrow through the inter-fund loan on a secured basis only; (4) no fund may lend money if the loan would cause its aggregate outstanding loans through the Inter-Fund Program to exceed 15% of its net assets at the time of the loan; (5) a fund’s inter-fund loans to any one fund shall not exceed 5% of the lending fund’s net assets; (6) the duration of inter-fund loans will be limited to the time required to receive payment for securities sold, but in no event more than seven days; and (7) each inter-fund loan may be called on one business day’s notice by a lending fund and may be repaid on
Notes to Financial Statements (Unaudited) (continued)
any day by a borrowing fund. In addition, a Nuveen fund may participate in the Inter-Fund Program only if and to the extent that such participation is consistent with the fund’s investment objective and investment policies. The Board is responsible for overseeing the Inter-Fund Program.
The limitations detailed above and the other conditions of the SEC exemptive order permitting the Inter-Fund Program are designed to minimize the risks associated with Inter-Fund Program for both the lending fund and the borrowing fund. However, no borrowing or lending activity is without risk. When a fund borrows money from another fund, there is a risk that the loan could be called on one day’s notice or not renewed, in which case the fund may have to borrow from a bank at a higher rate or take other actions to payoff such loan if an inter-fund loan is not available from another fund. Any delay in repayment to a lending fund could result in a lost investment opportunity or additional borrowing costs.
During May 2017, the Board approved the Nuveen funds participation in the Inter-Fund Program. During the current reporting period, none of the Funds have entered into any inter-fund loan activity.
9. New Accounting Pronouncements
Accounting Standards Update (“ASU”) 2017-08 (“ASU 2017-08”) Premium Amortization on Purchased Callable Debt Securities
During March 2017, the Financial Accounting Standards Board (“FASB”) issued ASU 2017-08, which shortens the premium amortization period for purchased non-contingently callable debt securities. ASU 2017-08 specifies that the premium amortization period ends at the earliest call date, for purchased non-contingently callable debt securities. ASU 2017-08 is effective for fiscal years, and interim periods within those fiscal years, beginning after December 15, 2018. Management is currently evaluating the implications of ASU 2017-08, if any.
| Additional Fund Information |
| | |
| Board of Directors/Trustees | | | | | | | | | | |
| Margo Cook* | | Jack B. Evans | | William C. Hunter | | David J. Kundert | | Albin F. Moschner | | John K. Nelson |
| William J. Schneider | | Judith M. Stockdale | | Carole E. Stone | | Terence J. Toth | | Margaret L. Wolff | | Robert C. Young |
| | | | | | | | | | | |
| * Interested Board Member. | | | | | | | | |
| | | | | | | | | | | �� |
| Fund Manager | | Custodian | | Legal Counsel | | Independent Registered | | Transfer Agent and |
| Nuveen Fund Advisors, LLC | | State Street Bank | | Chapman and Cutler LLP | | Public Accounting Firm | | Shareholder Services |
| 333 West Wacker Drive | | & Trust Company | | Chicago, IL 60603 | | KPMG LLP | | Computershare Trust |
| Chicago, IL 60606 | | One Lincoln Street | | | | 200 East Randolph Drive | | Company, N.A. |
| | | Boston, MA 02111 | | | | Chicago, IL 60601 | | 250 Royall Street |
| | | | | | | | | Canton, MA 02021 |
| | | | | | | | | (800) 257-8787 |
| | | | | | | | | |
Quarterly Form N-Q Portfolio of Investments Information
Each Fund is required to file its complete schedule of portfolio holdings with the Securities and Exchange Commission (SEC) for the first and third quarters of each fiscal year on Form N-Q. You may obtain this information directly from the SEC. Visit the SEC on-line at http://www.sec.gov or in person at the SEC’s Public Reference Room in Washington, D.C. Call the SEC toll-free at (800) SEC-0330 for room hours and operation.
Nuveen Funds’ Proxy Voting Information
You may obtain (i) information regarding how each fund voted proxies relating to portfolio securities held during the most recent twelve-month period ended June 30, without charge, upon request, by calling Nuveen toll-free at (800) 257-8787 or on Nuveen’s website at www.nuveen.com and (ii) a description of the policies and procedures that each fund used to determine how to vote proxies relating to portfolio securities without charge, upon request, by calling Nuveen toll free at (800) 257-8787. You may also obtain this information directly from the SEC. Visit the SEC on-line at http://www.sec.gov.
CEO Certification Disclosure
Each Fund’s Chief Executive Officer (CEO) has submitted to the New York Stock Exchange (NYSE) the annual CEO certification as required by Section 303A.12(a) of the NYSE Listed Company Manual. Each Fund has filed with the SEC the certification of its CEO and Chief Financial Officer required by Section 302 of the Sarbanes-Oxley Act.
Common Share Repurchases
Each Fund intends to repurchase, through its open-market share repurchase program, shares of its own common stock at such times and in such amounts as is deemed advisable. During the period covered by this report, each Fund repurchased shares of its common stock as shown in the accompanying table. Any future repurchases will be reported to shareholders in the next annual or semi-annual report.
| | | | NNY | | | NYV | | | NAN | | | NRK | |
| Common shares repurchased | | | — | | | — | | | — | | | — | |
FINRA BrokerCheck
The Financial Industry Regulatory Authority (FINRA) provides information regarding the disciplinary history of FINRA member firms and associated investment professionals. This information as well as an investor brochure describing FINRA BrokerCheck is available to the public by calling the FINRA BrokerCheck Hotline number at (800) 289-9999 or by visiting www.FINRA.org.
| Glossary of Terms Used in this Report (Unaudited) |
| ■ | Auction Rate Bond: An auction rate bond is a security whose interest payments are adjusted periodically through an auction process, which process typically also serves as a means for buying and selling the bond. Auctions that fail to attract enough buyers for all the shares offered for sale are deemed to have “failed,” with current holders receiving a formula-based interest rate until the next scheduled auction. |
| | |
| ■ | Average Annual Total Return: This is a commonly used method to express an investment’s performance over a particular, usually multi-year time period. It expresses the return that would have been necessary each year to equal the investment’s actual cumulative performance (including change in NAV or market price and reinvested dividends and capital gains distributions, if any) over the time period being considered. |
| | |
| ■ | Duration: Duration is a measure of the expected period over which a bond’s principal and interest will be paid, and consequently is a measure of the sensitivity of a bond’s or bond fund’s value to changes when market interest rates change. Generally, the longer a bond’s or fund’s duration, the more the price of the bond or fund will change as interest rates change. |
| | |
| ■ | Effective Leverage: Effective leverage is a fund’s effective economic leverage, and includes both regulatory leverage (see leverage) and the leverage effects of certain derivative investments in the fund’s portfolio. Currently, the leverage effects of Tender Option Bond (TOB) inverse floater holdings are included in effective leverage values, in addition to any regulatory leverage. |
| | |
| ■ | Inverse Floating Rate Securities: Inverse floating rate securities, also known as inverse floaters or tender option bonds (TOBs), are created by depositing a municipal bond, typically with a fixed interest rate, into a special purpose trust. This trust, in turn, (a) issues floating rate certificates typically paying short-term tax-exempt interest rates to third parties in amounts equal to some fraction of the deposited bond’s par amount or market value, and (b) issues an inverse floating rate certificate (sometimes referred to as an “inverse floater”) to an investor (such as a Fund) interested in gaining investment exposure to a long-term municipal bond. The income received by the holder of the inverse floater varies inversely with the short-term rate paid to the floating rate certificates’ holders, and in most circumstances the holder of the inverse floater bears substantially all of the underlying bond’s downside investment risk. The holder of the inverse floater typically also benefits disproportionately from any potential appreciation of the underlying bond’s value. Hence, an inverse floater essentially represents an investment in the underlying bond on a leveraged basis. |
| | |
| ■ | Leverage: Leverage is created whenever a fund has investment exposure (both reward and/or risk) equivalent to more than 100% of the investment capital. |
| | |
| ■ | Net Asset Value (NAV) Per Share: A fund’s Net Assets is equal to its total assets (securities, cash, accrued earnings and receivables) less its total liabilities. NAV per share is equal to the fund’s Net Assets divided by its number of shares outstanding. |
| | |
| ■ | Pre-Refunding: Pre-Refunding, also known as advanced refundings or refinancings, is a procedure used by state and local governments to refinance municipal bonds to lower interest expenses. The issuer sells new bonds with a lower yield and uses the proceeds to buy U.S. Treasury securities, the interest from which is used to make payments on the higher-yielding bonds. Because of this collateral, pre-refunding generally raises a bond’s credit rating and thus its value. |
| | |
| ■ | Regulatory Leverage: Regulatory Leverage consists of preferred shares issued by or borrowings of a fund. Both of these are part of a fund’s capital structure. Regulatory leverage is subject to asset coverage limits set in the Investment Company Act of 1940. |
| ■ | S&P Municipal Bond Index: An unleveraged, market value-weighted index designed to measure the performance of the tax-exempt, investment-grade U.S. municipal bond market. Index returns assume reinvestment of distributions but do not reflect any applicable sales charges or management fees. |
| | |
| ■ | S&P Municipal Bond New York Index: An unleveraged, market value-weighted index designed to measure the performance of the tax-exempt, investment-grade New York municipal bond market. Index returns assume reinvestment of distributions but do not reflect any applicable sales charges or management fees. |
| | |
| ■ | Total Investment Exposure: Total investment exposure is a fund’s assets managed by the Adviser that are attributable to financial leverage. For these purposes, financial leverage includes a fund’s use of preferred stock and borrowings and investments in the residual interest certificates (also called inverse floating rate securities) in tender option bond (TOB) trusts, including the portion of assets held by a TOB trust that has been effectively financed by the trust’s issuance of floating rate securities. |
| | |
| ■ | Zero Coupon Bond: A zero coupon bond does not pay a regular interest coupon to its holders during the life of the bond. Income to the holder of the bond comes from accretion of the difference between the original purchase price of the bond at issuance and the par value of the bond at maturity and is effectively paid at maturity. The market prices of zero coupon bonds generally are more volatile than the market prices of bonds that pay interest periodically. |
Reinvest Automatically, Easily and Conveniently
Nuveen makes reinvesting easy. A phone call is all it takes to set up your reinvestment account.
| |
| Nuveen Closed-End Funds Automatic Reinvestment Plan |
Nuveen Closed-End Fund allows you to conveniently reinvest distributions in additional Fund shares. By choosing to reinvest, you’ll be able to invest money regularly and automatically, and watch your investment grow through the power of compounding. Just like distributions in cash, there may be times when income or capital gains taxes may be payable on distributions that are reinvested. It is important to note that an automatic reinvestment plan does not ensure a profit, nor does it protect you against loss in a declining market.
Easy and convenient
To make recordkeeping easy and convenient, each month you’ll receive a statement showing your total distributions, the date of investment, the shares acquired and the price per share, and the total number of shares you own.
How shares are purchased
The shares you acquire by reinvesting will either be purchased on the open market or newly issued by the Fund. If the shares are trading at or above net asset value at the time of valuation, the Fund will issue new shares at the greater of the net asset value or 95% of the then-current market price. If the shares are trading at less than net as - set value, shares for your account will be purchased on the open market. If the Plan Agent begins purchasing Fund shares on the open market while shares are trading below net asset value, but the Fund’s shares subsequently trade at or above their net asset value before the Plan Agent is able to complete its purchases, the Plan Agent may cease open-market purchases and may invest the uninvested portion of the distribution in newly-issued Fund shares at a price equal to the greater of the shares’ net asset value or 95% of the shares’ market value on the last business day immediately prior to the purchase date. Distributions received to purchase shares in the open market will normally be invested shortly after the distribution payment date. No interest will be paid on distributions awaiting reinvestment. Because the market price of the shares may increase before purchases are completed, the average purchase price per share may exceed the market price at the time of valuation, resulting in the acquisition of fewer shares than if the distribution had been paid in shares issued by the Fund. A pro rata portion of any applicable brokerage commissions on open market purchases will be paid by Plan participants. These commissions usually will be lower than those charged on individual transactions.
Flexible
You may change your distribution option or withdraw from the Plan at any time, should your needs or situation change. You can reinvest whether your shares are registered in your name, or in the name of a brokerage firm, bank, or other nominee. Ask your investment advisor if his or her firm will participate on your behalf. Participants whose shares are registered in the name of one firm may not be able to transfer the shares to another firm and continue to participate in the Plan. The Fund reserves the right to amend or terminate the Plan at any time. Although the Fund reserves the right to amend the Plan to include a service charge payable by the participants, there is no direct service charge to participants in the Plan at this time.
Call today to start reinvesting distributions
For more information on the Nuveen Automatic Reinvestment Plan or to enroll in or withdraw from the Plan, speak with your financial advisor or call us at (800) 257-8787.
Annual Investment Management Agreement Approval Process (Unaudited)
The Board of Directors or Trustees (each, a “Board,” and each Director or Trustee, a “Board Member”) of each Fund, including the Board Members who are not parties to the applicable advisory or sub-advisory agreements or “interested persons” of any such parties (the “Independent Board Members”), oversees the management of its respective Fund, including the performance of Nuveen Fund Advisors, LLC, the Funds’ investment adviser (the “Adviser”), and Nuveen Asset Management, LLC, the Funds’ sub-adviser (the “Sub-Adviser”). As required by applicable law, after the initial term of the respective Fund following commencement of its operations, the Board is required to consider annually whether to renew the Fund’s management agreement with the Adviser (the “Investment Management Agreement”) and its sub-advisory agreement with the Sub-Adviser (the “Sub-Advisory Agreement” and, together with the Investment Management Agreement, the “Advisory Agreements”). Accordingly, the Board met in person on April 11-12, 2017 (the “April Meeting”) and May 23-25, 2017 (the “May Meeting”) to consider the approval of each Advisory Agreement that was up for renewal for an additional one-year period.
The Board considered its review of the Advisory Agreements as an ongoing process encompassing the information received and the deliberations the Board and its committees have had throughout the year. The Board met regularly during the year and received materials and discussed topics that were relevant to the annual consideration of the renewal of the Advisory Agreements, including, among other things, overall market performance and developments; fund investment performance; investment team review; valuation of securities; compliance, regulatory and risk management matters; and other developments. The Board had also established several standing committees, including the Open-end Fund Committee and Closed-end Fund Committee, which met regularly throughout the year to permit the Board Members to delve deeper into the topics particularly relevant to the respective product line. The Board further continued its practice of seeking to meet periodically with the Sub-Adviser and its investment team. The accumulated information, knowledge, and experience the Board Members had gained during their tenure on the Board governing the Funds and working with the Fund Advisers (as defined below) were taken into account in their review of the Advisory Agreements.
In addition to the materials received by the Board or its committees throughout the year, the Board reviewed extensive additional materials prepared specifically for its annual review of the Advisory Agreements in response to a request by independent legal counsel on behalf of the Independent Board Members. The materials addressed a variety of topics, including, but not limited to, a description of the services provided by the Adviser and Sub-Adviser (the Adviser and the Sub-Adviser are each a “Fund Adviser”); an analysis of fund performance including comparative industry data and a detailed focus on any performance outliers; an analysis of the Sub-Adviser; an analysis of the fees and expense ratios of the Nuveen funds in absolute terms and in comparison to the fees and expenses of peers with a focus on any expense outliers; an assessment of shareholder services for the Nuveen funds and of the performance of certain service providers; a review of initiatives instituted or continued during the past year; a review of premium/discount trends and leverage management for the closed-end funds as well as information regarding the profitability of the Fund Advisers, the compensation of portfolio managers, and compliance and risk matters. The materials provided in connection with the annual review included information compiled and prepared by Broadridge Financial Solutions, Inc. (“Broadridge” or “Lipper”), an independent provider of investment company data, comparing, in relevant part, each Fund’s fees and expenses with those of a comparable universe of funds (the “Peer Universe”), as selected by Broadridge (the “Broadridge Report”). The Independent Board Members also received a memorandum from independent legal counsel outlining their fiduciary duties and legal standards in reviewing the Advisory Agreements.
As part of its annual review, the Board met at the April Meeting to review the investment performance of the Funds and to consider the Adviser’s analysis of the Sub-Adviser evaluating, among other things, the Sub-Adviser’s assets under management, investment team, performance, organizational stability, and investment approach. During the review, the Independent Board Members
Annual Investment Management Agreement Approval Process (Unaudited) (continued)
requested and received additional information from management. At the May Meeting, the Board, including the Independent Board Members, continued its review and ultimately approved the continuation of the Advisory Agreements for an additional year. Throughout the year and throughout their review of the Advisory Agreements, the Independent Board Members were assisted by independent legal counsel and met with counsel separately without management present. In deciding to renew the Advisory Agreements, the Independent Board Members did not identify a particular factor as determinative, but rather the decision reflected the comprehensive consideration of all the information presented, and each Board Member may have attributed different weights to the various factors and information considered in connection with the approval process. The following summarizes the principal factors, but not all the factors, the Board considered in its review of the Advisory Agreements and its conclusions.
A. Nature, Extent and Quality of Services
In evaluating the renewal of the Advisory Agreements, the Independent Board Members received and considered information regarding the nature, extent and quality of the applicable Fund Adviser’s services provided to the respective Fund and the resulting performance of each Fund. The Board recognized the myriad of services the Adviser and its affiliates provided to manage and operate the Nuveen funds, including (a) product management (such as managing distributions, positioning the product in the marketplace, maintaining and enhancing shareholder communications and reporting to the Board); (b) investment oversight, risk management and securities valuation (such as overseeing the sub-advisers and other service providers, analyzing investment performance and risks, overseeing risk management and disclosure, executing the daily valuation of securities, and analyzing trade execution); (c) fund administration (such as helping to prepare fund tax returns and complete other tax compliance matters and helping to prepare regulatory filings and shareholder reports); (d) fund board administration (such as preparing board materials and organizing and providing assistance for board meetings); (e) compliance (such as helping to devise and maintain the Nuveen funds’ compliance program and test for adherence); (f) legal support (such as helping to prepare registration statements and proxy statements, interpreting regulations and policies and overseeing fund activities); (g) with respect to certain closed-end funds, providing leverage, capital and distribution management services; and (h) with respect to certain open-end funds with portfolios that have a leverage component, providing such leverage management services.
The Board further noted the Adviser’s continued dedication to investing in its business to enhance the quality and breadth of the services provided to the Funds. The Board recognized the Adviser’s investment in staffing over recent years to support the services provided to the Nuveen funds in key areas, including in investment services, product management, retail distribution and information technology, closed-end funds and structured products, as well as in fund administration, operations and risk management. The Board further noted the Adviser’s continued commitment to enhancing its compliance program by, among other things, restructuring the compliance organization, developing a unified compliance program, adding compliance staff, and developing and/or revising policies and procedures as well as building further infrastructure to address new regulatory requirements or guidance and the growth of the complex. The Board also considered the enhancements to Nuveen’s cybersecurity capabilities, systems and processes to value securities, stress test reporting and risk and control self-assessments.
In addition, the Independent Board Members considered information highlighting the various initiatives that the Adviser had implemented or continued over recent years to benefit the open-end fund and closed-end fund product lines and/or particular Nuveen funds. The Board noted the Adviser’s continued efforts to rationalize the open-end fund and closed-end fund product lines through, among other things, mergers, liquidations and repositionings in seeking to provide enhanced shareholder value over the years through increased efficiency, reduced costs, improved performance and revised investment approaches that are more relevant to current shareholder needs. With respect to closed-end Nuveen funds, such initiatives included (a) an increased level of leverage management activities in 2016 and 2017 resulting from the rollover of existing facilities, the negotiation of improved terms and pricing to reduce leverage costs, the innovation of new leverage structures, the rebalancing of leverage of various funds as a result of mergers or new investment mandates, and the restructuring of tender option bonds to be compliant with new regulatory requirements; (b) an increased level of capital management activities (i.e., the management of the issuance and repurchase of shares of certain closed-end funds) during 2016 as a result of market demand as well as an implementation of a cross department review
system for shares trading at certain discount levels; (c) continued refinements to a database to permit further analysis of the closed-end fund marketplace and shareholder base; (d) the development of enhanced secondary market board reporting and commentary; (e) the reconfiguration of the framework for determining and maintaining closed-end fund benchmarks to permit more consistency across the complex; and (f) the development of product innovations for new closed-end offerings, including target term funds. The Board also recognized the Adviser’s continued commitment to supporting the closed-end product line through its award winning investor relations support program through which Nuveen seeks to educate investors and financial advisers regarding closed-end funds.
With respect to municipal funds, the Independent Board Members also appreciated, in particular, the astute portfolio management of the municipal funds with respect to the Puerto Rico debt crisis.
In its review, the Board recognized that initiatives that attracted assets to the Nuveen family of funds generally benefited the Nuveen funds in the complex as fixed costs would be spread over a larger asset base and, as described below, through the complex-wide fee arrangement which generally provides that the management fees of the Nuveen funds (subject to limited exceptions) are reduced as asset levels in the complex reach certain breakpoints in the fee schedule.
Similarly, the Board considered the sub-advisory services provided by the Sub-Adviser to the Funds. The Sub-Adviser generally provided portfolio advisory services for the Funds. The Board reviewed the Adviser’s analysis of the Sub-Adviser which evaluated, among other things, the investment team and any changes thereto, the stability and history of the organization, the assets under management, the investment approach and the performance of the Nuveen funds it sub-advises. The Board noted that the Adviser recommended the renewal of the Sub-Advisory Agreements.
Based on its review, the Board determined, in the exercise of its reasonable business judgment, that it was satisfied with the nature, extent and quality of services provided to the respective Funds under each applicable Advisory Agreement.
B. The Investment Performance of the Funds and Fund Advisers
As part of its evaluation of the services provided by the Fund Advisers, the Board reviewed Fund performance over the quarter, one-, three- and five-year periods ending December 31, 2016 as well as performance data for the first quarter of 2017 ending March 31, 2017. The Board reviewed performance on an absolute basis and in comparison to the performance of peer funds (the “Performance Peer Group”) and recognized and/or customized benchmarks (i.e., generally benchmarks derived from multiple recognized benchmarks). For closed-end funds, the Board (or the Closed-end Fund Committee) also reviewed, among other things, the premium or discount to net asset value of the Nuveen closed-end funds as of a specified date and over various periods as well as in comparison to the premium/discount average in their respective Lipper peer category. The Independent Board Members continued to recognize the importance of secondary market trading for the shares of the closed-end funds and the evaluation of the premium and discount levels was a continuing priority for them. The review and analysis of performance information during the annual review of Advisory Agreements incorporated the discussions and performance information the Board Members have had at each of their quarterly meetings throughout the year.
In evaluating performance data, the Independent Board Members recognized some of the limitations of such data and the difficulty in establishing appropriate peer groups and benchmarks for certain of the Nuveen funds. They recognized that each fund operates pursuant to its own investment objective(s), parameters and restrictions which may differ from that of the Performance Peer Group or benchmark. Certain funds may also utilize leverage which may provide benefits or risks to their portfolio compared to an unlev-ered benchmark. The Independent Board Members had noted that management had classified the Performance Peer Groups as low, medium and high in relevancy to the applicable fund as a result of these differences or other factors. The Independent Board Members recognized that the variations between the Performance Peer Group or benchmark and the applicable Fund will lead to differing performance results and may limit the value of the comparative performance data in assessing the particular Fund’s performance.
Annual Investment Management Agreement Approval Process (Unaudited) (continued)
In addition, the Independent Board Members recognized that the performance data is a snapshot in time, in this case as of the end of the 2016 calendar year or end of the first quarter of 2017. A different period may generate significantly different results and longer term performance can be adversely affected by even one period of significant underperformance. Further, a shareholder’s experience in a Fund depends on his or her own holding period which may differ from that reviewed by the Independent Board Members.
In their review of performance, the Independent Board Members focused, in particular, on the Adviser’s analysis of Nuveen funds determined to be underperforming performance outliers and the factors contributing to the respective fund’s performance and any efforts to address performance concerns. With respect to any Nuveen funds for which the Board has identified performance issues, the Board monitors such funds closely until performance improves, discusses with the Adviser the reasons for such results, considers any steps necessary or appropriate to address such issues, and reviews the results of any efforts undertaken. The Board, however, acknowledged that shareholders chose to invest or remain invested in a fund knowing that the Adviser and applicable sub-adviser manage the fund, knowing the fund’s investment strategy and seeking exposure to that strategy (even if the strategy was “out of favor” in the marketplace) and knowing the fund’s fee structure.
In reviewing the performance of the Nuveen municipal funds, the Board recognized the challenged and volatile conditions of the municipal market in the fourth quarter of 2016 which impacted the performance of many of the municipal funds. The Board further considered that the municipal market had generally rebounded in the first quarter of 2017. In reviewing the performance of the municipal funds, the Board considered the impact of the market conditions.
For Nuveen New York Municipal Value Fund, Inc. (the “Municipal Value Fund”), the Board noted that although the Fund ranked in its Performance Peer Group in the fourth quartile for the longer three- and five-year periods, the Fund ranked in the first quartile in the one-year period. The Fund also outperformed its benchmark in the one-, three- and five-year periods. The Board was satisfied with the Fund’s performance.
For Nuveen New York Municipal Value Fund 2 (the “Municipal Value Fund 2”), the Board noted that although the Fund ranked in its Performance Peer Group in the fourth quartile in the three-year period, the Fund ranked in the second quartile in the one-year period and third quartile in the five-year period. Although the Fund underperformed its benchmark in the one-year period, the Fund outperformed its benchmark in the three- and five-year periods. The Board was satisfied with the Fund’s overall performance.
For Nuveen New York Quality Municipal Income Fund (the “Quality Fund”), the Board noted that the Fund ranked in its Performance Peer Group in the third quartile for the one-, three- and five-year periods. Although the Fund underperformed its benchmark in the one-year period, the Fund outperformed its benchmark in the three- and five-year periods. In reviewing performance, the Board recognized that the Fund generally utilized less leverage than the majority of peers in the Performance Peer Group which detracted from peer relative performance. The Fund also ranked in the first quartile of its Performance Peer Group and outperformed its benchmark for the first quarter of 2017. The Board was satisfied with the Adviser’s explanation of performance and with the Fund’s overall performance.
For Nuveen New York AMT-Free Quality Municipal Income Fund (the “AMT-Free Quality Fund”), the Board noted that although the Fund ranked in the Performance Peer Group in the fourth quartile in the five-year period, the Fund ranked in the first quartile in the one-year period and third quartile in the three-year period. The Fund also outperformed its benchmark in the one-, three- and five-year periods. The Board was satisfied with the Fund’s overall performance.
| C. | Fees, Expenses and Profitability |
| | |
| | 1. Fees and Expenses |
| | The Board evaluated the management fees and other fees and expenses of each Fund. The Board reviewed and considered, among other things, the gross and net management fees paid by the Funds. The Board further considered the net total expense ratio of each Fund (expressed as a percentage of average net assets) as the expense ratio is most reflective of the investors’ net experience in a Fund as it directly reflected the costs of investing in the respective Fund. |
| | |
| | In addition, the Board reviewed the Broadridge Report comparing, in relevant part, each Fund’s gross and net advisory fees and net total expense ratio with those of a Peer Universe. The Independent Board Members also reviewed the methodology regarding the construction of the applicable Peer Universe by Broadridge. In reviewing the comparative data, the Board was aware that various factors may limit some of the usefulness of the data, such as differences in size of the peers; the composition of the Peer Universe; changes each year of funds comprising the Peer Universe; levels of expense reimbursements and fee waivers; and differences in the type and use of leverage. Nevertheless, in reviewing a fund’s fees and expenses compared to the fees and expenses of its peers (excluding leverage costs and leveraged assets), the Board generally considered a fund’s expenses and fees to be higher if they were over 10 basis points higher, slightly higher if they were 6 to 10 basis points higher, in line if they were within approximately 5 basis points higher than the peer average and below if they were below the peer average of the Peer Universe. The Board noted that the substantial majority of the Nuveen funds had a net expense ratio that was near or below their respective peer average. |
| | |
| | The Independent Board Members noted that (a) the Quality Fund had a net management fee in line with its peer average and a net expense ratio below its peer average and (b) the Municipal Value Fund, the Municipal Value Fund 2 and the AMT-Free Quality Fund each had a net management fee and net expense ratio below its respective peer averages. |
| | |
| | In their evaluation of the management fee schedule, the Independent Board Members also reviewed the fund-level and complex-wide breakpoint schedules, as described in further detail below. With respect to closed-end funds, the Board considered the effects of leverage on fees and expenses, including the calculation of management fees for funds with tender option bonds. |
| | |
| | Based on their review of the information provided, the Board determined that each Fund’s management fees (as applicable) to a Fund Adviser were reasonable in light of the nature, extent and quality of services provided to the Fund. |
| | |
| | 2. Comparisons with the Fees of Other Clients |
| | The Board also reviewed information regarding the respective Fund Adviser’s fee rates for providing advisory services to other types of clients. For the Adviser and/or the Sub-Adviser, such other clients may include municipal separately managed accounts and passively managed exchange-traded funds (“ETFs”) sub-advised by the Sub-Adviser but that are offered by another fund complex. |
| | |
| | The Board recognized that each Fund had an affiliated sub-adviser. In reviewing the fee rates assessed to other clients, with respect to affiliated sub-advisers, the Board reviewed, among other things, the range of fees and average fee rates assessed for managed accounts. |
| | |
| | The Board recognized the inherent differences between the Nuveen funds and the other types of clients. The Board considered information regarding these various differences which included, among other things, the services required, average account sizes, types of investors targeted, legal structure and operations, and applicable laws and regulations. The Independent Board Members recognized that the foregoing variations resulted in different economics among the product structures and culminated in varying management fees among the types of clients and the Nuveen funds. In general, the Board noted that higher fee levels reflected higher levels of service provided by the Fund Adviser, increased investment management complexity, greater product management requirements and higher levels of business risk or some combination of the foregoing. The Board |
Annual Investment Management Agreement Approval Process (Unaudited) (continued)
| | recognized the breadth of services the Adviser provided to support the Nuveen funds as summarized above and noted that many of such administrative services may not be required to the same extent or at all for the institutional clients or other clients. The Board further recognized the passive management of ETFs compared to the active management required of other Nuveen funds would contribute to differing fee levels. |
| | |
| | The Independent Board Members noted that the sub-advisory fees paid by the Adviser to the Sub-Adviser, however, were generally for portfolio management services. With respect to affiliated sub-advisers, the Board noted such sub-advisory fees were more comparable to the fees of retail wrap accounts and other external sub-advisory mandates. |
| | |
| | Given the inherent differences in the various products, particularly the extensive services provided to the Funds, the Board concluded that such facts justify the different levels of fees. |
| | |
| | 3. Profitability of Fund Advisers |
| | In conjunction with their review of fees, the Independent Board Members also considered Nuveen’s level of profitability for its advisory services to the Nuveen funds for the calendar years 2016 and 2015. In considering profitability, the Independent Board Members considered the level of profitability realized by Nuveen before the imposition of any distribution and marketing expenses incurred by the firm from its own resources. In evaluating the profitability, the Independent Board Members evaluated the analysis employed in developing the profitability figures, including the assumptions and methodology employed in allocating expenses. The Independent Board Members recognized the inherent limitations to any cost allocation methodology as different and reasonable approaches may be used and yet yield differing results. The Independent Board Members further reviewed an analysis of the history of the profitability methodology used explaining any changes to the methodology over the years. The Board has appointed two Independent Board Members, who along with independent legal counsel, helped to review and discuss the methodology employed to develop the profitability analysis each year and any proposed changes thereto and to keep the Board apprised of such changes during the year. |
| | |
| | In their review, the Independent Board Members evaluated, among other things, Nuveen’s adjusted operating margins, the gross and net revenue margins (pre-tax and after-tax) for advisory activities for the Nuveen funds, and the revenues, expenses, and net income (pre-tax and after-tax) of Nuveen for each of the last two calendar years. The Independent Board Members also reviewed an analysis of the key drivers behind the changes in revenues and expenses that impacted profitability in 2016 versus 2015. The Board, however, observed that Nuveen’s operating margins for its advisory activities in 2016 were similar to that of 2015. |
| | |
| | In addition to reviewing Nuveen’s profitability in absolute terms, the Independent Board Members also reviewed the adjusted total company margins of other advisory firms that had publicly available information and comparable assets under management (based on asset size and asset composition). The Independent Board Members, however, noted that the usefulness of the comparative data may be limited as the other firms may have a different business mix and their profitability data may be affected by numerous other factors such as the types of funds managed, the cost allocation methodology used, and their capital structure. Nevertheless, the Board noted that Nuveen’s adjusted operating margins appeared comparable to the adjusted margins of the peers. |
| | |
| | Further, the Adviser is a subsidiary of Nuveen, LLC, the investment management arm of Teachers Insurance and Annuity Association of America (“TIAA”). To have a fuller picture of the financial condition and strength of the TIAA complex, together with Nuveen, the Board reviewed a balance sheet for TIAA reflecting its assets, liabilities and capital and contingency reserves for the 2016 and 2015 calendar years. |
| | |
| | In addition to the Adviser’s profitability, the Independent Board Members also considered the profitability of the Sub-Adviser from its relationship with the Nuveen funds. The Independent Board Members reviewed the Sub-Adviser’s revenues, expenses and revenue margins (pre- and post-tax) for its advisory activities for the calendar year ended December 31, 2016. The |
| | Independent Board Members also reviewed a profitability analysis reflecting the revenues, expenses and revenue margin (pre-and post-tax) by asset type for the Sub-Adviser for the calendar year ending December 31, 2016. |
| | |
| | In evaluating the reasonableness of the compensation, the Independent Board Members also considered other amounts paid to a Fund Adviser for its services to the Funds as well as indirect benefits (such as soft dollar arrangements), if any, the Fund Adviser and its affiliates received or were expected to receive that were directly attributable to the management of a Fund. See Section E below for additional information on indirect benefits a Fund Adviser may receive as a result of its relationship with the Funds. |
| | |
| | Based on a consideration of all the information provided, the Board noted that Nuveen’s and the Sub-Adviser’s level of profitability was acceptable and not unreasonable in light of the services provided. |
D. Economies of Scale and Whether Fee Levels Reflect These Economies of Scale
When evaluating the level of the advisory fees, the Independent Board Members considered whether there will be any economies of scale that may be realized by the Fund Adviser as a Fund grows and the extent to which these economies were shared with the Funds and shareholders. The Board recognized that economies of scale are difficult to measure with precision; however, the Board considered that there were several ways the Fund Adviser may share the benefits of economies of scale with the Nuveen funds, including through breakpoints in the management fee schedule reducing the fee rates as asset levels grow, fee waivers and/or expense limitation agreements and the Adviser’s investment in its business which can enhance the services provided to the Nuveen funds. With respect to the fee structure, the Independent Board Members have recognized that economies of scale may be realized when a particular fund grows, but also when the total size of the fund complex grows (even if the assets of a particular fund in the complex have not changed or have decreased). Accordingly, subject to certain exceptions, the funds in the Nuveen complex pay a management fee to the Adviser which is generally comprised of a fund-level component and complex-level component, each of which has a breakpoint schedule. Subject to certain exceptions, the fund-level fee component declines as the assets of the particular fund grow and the complex-level fee component declines when eligible assets of all the funds (except for Nuveen ETFs which are subject to a unitary fee) in the Nuveen complex combined grow. In addition, with respect to closed-end funds, the Independent Board Members noted that, although such funds may from time-to-time make additional share offerings, the growth of their assets would occur primarily through the appreciation of such funds’ investment portfolios.
The Independent Board Members reviewed the breakpoint and complex-wide schedules and any savings achieved from fee reductions as a result of the fund-level and complex-level breakpoints for the 2016 calendar year. In addition, the Independent Board Members recognized the Adviser’s ongoing investment in its business to expand or enhance the services provided to the benefit of all of the Nuveen funds.
Based on their review, the Board concluded that the current fee structure was acceptable and reflected economies of scale to be shared with shareholders when assets under management increase.
E. Indirect Benefits
The Independent Board Members received and considered information regarding other benefits the respective Fund Adviser or its affiliates may receive as a result of their relationship with the Nuveen funds, including compensation paid to affiliates of a Fund Adviser for services rendered to the funds and research services received by a Fund Adviser from broker-dealers that execute fund trades. The Independent Board Members noted that affiliates of the Adviser may receive compensation for serving as a co-manager for initial public offerings of new Nuveen closed-end funds and as underwriter on shelf offerings for certain existing funds. The Independent Board Members considered the compensation paid for such services in 2016.
In addition to the above, the Independent Board Members considered that the Funds’ portfolio transactions are allocated by the Sub-Adviser and the Sub-Adviser may benefit from research received from broker-dealers that execute Fund portfolio transactions.
Annual Investment Management Agreement Approval Process (Unaudited) (continued)
The Board noted, however, that with respect to transactions in fixed income securities, such securities generally trade on a principal basis and do not generate soft dollar credits. Although the Board recognized the Sub-Adviser may benefit from a soft dollar arrangement if it does not have to pay for this research out of its own assets, the Board also recognized that the research may benefit the Funds to the extent it enhances the ability of the Sub-Adviser to manage the Funds.
Based on their review, the Board concluded that any indirect benefits received by a Fund Adviser as a result of its relationship with the Funds were reasonable and within acceptable parameters.
F. Other Considerations
The Board Members did not identify any single factor discussed previously as all-important or controlling. The Board Members, including the Independent Board Members, concluded that the terms of each Advisory Agreement were fair and reasonable, that the respective Fund Adviser’s fees were reasonable in light of the services provided to each Fund and that the Advisory Agreements be renewed.
Notes
Notes
Notes
Nuveen:
Serving Investors for Generations
| |
| Since 1898, financial advisors and their clients have relied on Nuveen to provide dependable investment solutions through continued adherence to proven, long-term investing principles. Today, we offer a range of high quality solutions designed to be integral components of a well-diversified core portfolio. |
| |
| |
| Focused on meeting investor needs. |
| |
| Nuveen is the investment management arm of TIAA. We have grown into one of the world’s premier global asset managers, with specialist knowledge across all major asset classes and particular strength in solutions that provide income for investors and that draw on our expertise in alternatives and responsible investing. Nuveen is driven not only by the independent investment processes across the firm, but also the insights, risk management, analytics and other tools and resources that a truly world-class platform provides. As a global asset manager, our mission is to work in partnership with our clients to create solutions which help them secure their financial future. |
| |
| |
| Find out how we can help you. |
| |
| To learn more about how the products and services of Nuveen may be able to help you meet your financial goals, talk to your financial advisor, or call us at (800) 257-8787. Please read the information provided carefully before you invest. Investors should consider the investment objective and policies, risk considerations, charges and expenses of any investment carefully. Where applicable, be sure to obtain a prospectus, which contains this and other relevant information. To obtain a prospectus, please contact your securities representative or Nuveen, 333 W. Wacker Dr., Chicago, IL 60606. Please read the prospectus carefully before you invest or send money. |
| |
| Learn more about Nuveen Funds at: www.nuveen.com/cef |
| | |
| Nuveen Securities, LLC, member FINRA and SIPC | 333 West Wacker Drive Chicago, IL 60606 | www.nuveen.com |  |
ESA-C-0817D 281408-INV-B-10/18
ITEM 2. CODE OF ETHICS.
Not applicable to this filing.
ITEM 3. AUDIT COMMITTEE FINANCIAL EXPERT.
Not applicable to this filing.
ITEM 4. PRINCIPAL ACCOUNTANT FEES AND SERVICES.
Not applicable to this filing.
ITEM 5. AUDIT COMMITTEE OF LISTED REGISTRANTS.
Not applicable to this filing.
ITEM 6. SCHEDULE OF INVESTMENTS.
(a) See Portfolio of Investments in Item 1.
(b) Not applicable.
ITEM 7. DISCLOSURE OF PROXY VOTING POLICIES AND PROCEDURES FOR CLOSED-END MANAGEMENT INVESTMENT COMPANIES.
Not applicable to this filing.
ITEM 8. PORTFOLIO MANAGERS OF CLOSED-END MANAGEMENT INVESTMENT COMPANIES.
Not applicable to this filing.
ITEM 9. PURCHASES OF EQUITY SECURITIES BY CLOSED-END MANAGEMENT INVESTMENT COMPANY AND AFFILIATED PURCHASERS.
Not applicable.
ITEM 10. SUBMISSION OF MATTERS TO A VOTE OF SECURITY HOLDERS.
There have been no material changes to the procedures by which shareholders may recommend nominees to the registrant's Board implemented after the registrant last provided disclosure in response to this Item.
ITEM 11. CONTROLS AND PROCEDURES.
ITEM 12. EXHIBITS.
File the exhibits listed below as part of this Form.
Pursuant to the requirements of the Securities Exchange Act of 1934 and the Investment Company Act of 1940, the registrant has duly caused this report to be signed on its behalf by the undersigned, thereunto duly authorized.
Gifford R. Zimmerman
Pursuant to the requirements of the Securities Exchange Act of 1934 and the Investment Company Act of 1940, this report has been signed below by the following persons on behalf of the registrant and in the capacities and on the dates indicated.
Cedric H. Antosiewicz
Stephen D. Foy