
PROVIDENT BANKSHARES
C O R P O R A T I O N
Sandler O’Neill & Partners, L.P.
Financial Services Conference
November 13, 2003
Filed by Provident Bankshares Corporation
Pursuant to Rule 425 under the Securities Act of 1933
and deemed filed pursuant to Rule 14a-12
of the Securities Exchange Act of 1934
Subject Company: Southern Financial Bancorp, Inc.
Commission File No. 0-22836
The following is the presentation of Provident Bankshares Corporation at the Sandler O’Neill & Partners, L.P. Financial Services Conference hosted on November 13, 2003:

Provident Bankshares Corporation and Southern Financial Bancorp, Inc. will be filing a joint proxy statement/prospectus and other relevant documents concerning the merger with the
United States Securities and Exchange Commission (the "SEC").
WE URGE INVESTORS TO READ THE JOINT PROXY STATEMENT/PROSPECTUS AND ANY OTHER RELEVANT DOCUMENTS TO BE FILED WITH THE SEC, BECAUSE THEY
CONTAIN IMPORTANT INFORMATION.
Investors will be able to obtain these documents free of charge at the SEC's web site (www.sec.gov). In addition, documents filed with the SEC by Provident Bankshares Corporation will be
available free of charge from the Investor Relations Department at Provident Bankshares Corporation, 114 East Lexington Street, Baltimore, Maryland 21202. Documents filed with the
SEC by Southern Financial Bancorp, Inc. will be available free of charge from the Investor Relations Department at Southern Financial Bancorp, Inc., 37 East Main Street, Warrenton,
Virginia 20186.
The directors, executive officers, and certain other members of management of Provident Bankshares Corporation and Southern Financial Bancorp, Inc. may be soliciting proxies in favor of
the merger from the companies' respective shareholders. For information about these directors, executive officers, and members of management, shareholders are asked to refer to the most
recent proxy statements issued by the respective companies, which are available on their web sites and at the addresses provided in the preceding paragraph.
FORWARD-LOOKING STATEMENTS AND ASSOCIATED RISK FACTORS
This release, and the associated conference call, web cast, other written materials, and statements management may make, may contain certain forward-looking statements regarding the
Company's prospective performance and strategies within the meaning of Section 27A of the Securities Act of 1933, as amended, and Section 21E of the Securities Exchange Act of 1934, as
amended. The Company intends such forward-looking statements to be covered by the safe harbor provisions for forward-looking statements contained in the Private Securities Litigation
Reform Act of 1995, and is including this statement for purposes of said safe harbor provisions.
Forward-looking statements, which are based on certain assumptions and describe future plans, strategies, and expectations of the Company, are generally identified by use of the words
"plan," "believe," "expect," "intend," "anticipate," "estimate," "project," or other similar expressions. The Company's ability to predict results or the actual effects of its plans and strategies
is inherently uncertain. Accordingly, actual results may differ materially from anticipated results.
The following factors, among others, could cause the actual results of the merger to differ materially from the expectations stated in this release and the associated conference call and web
cast: the ability of the companies to obtain the required shareholder or regulatory approvals of the merger; the ability of the companies to consummate the merger; the ability of Southern
Financial to timely complete its acquisition of Essex Bancorp, Inc.; the ability to successfully integrate the companies following the merger; a materially adverse change in the financial
condition of either company; the ability to fully realize the expected cost savings and revenues; and the ability to realize the expected cost savings and revenues on a timely basis.
Other factors that could cause the actual results of the merger to differ materially from current expectations include a change in economic conditions; changes in interest rates, deposit
flows, loan demand, real estate values, and competition; changes in accounting principles, policies, or guidelines; changes in legislation and regulation; and other economic, competitive,
governmental, regulatory, geopolitical, and technological factors affecting the companies' operations, pricing, and services.
The Company undertakes no obligation to update these forward-looking statements to reflect events or circumstances that occur after the date on which such statements were made.
###

HISTORY
THE PROVIDENT DISTINCTION
KEY STRATEGIES
SOUTHERN FINANCIAL
MERGER
AGENDA
PROVIDENT BANKSHARES
C O R P O R A T I O N

HISTORY
1886 - Founded
1987 - Converted to Commercial Bank
1993 - Totally Free Checking/In-Store
Branches
1997 - CSB Acquisition
2003 - Strategic Merger with SFFB announced
November 3
PROVIDENT BANKSHARES
C O R P O R A T I O N

THE PROVIDENT
DISTINCTION

UNIQUE BY WHAT WE ARE
$5 Billion in Assets
“Right size bank” to know and serve our primary region
Access to Executive Management
Targeted to specific customers
“Middle America” Consumer customer
Small Business and Middle Market
Sophisticated niche businesses (RE & Marine)
Value-oriented products and delivery
Convenient access
Depth and breadth of products and services
PROVIDENT BANKSHARES
C O R P O R A T I O N

KEY STRATEGIES
Build market share and expand branch network
in Washington Metro
Grow commercial banking market share in the
Baltimore-Washington corridor
Grow core banking business
Improve financial fundamentals
PROVIDENT BANKSHARES
C O R P O R A T I O N

GROW MARKET SHARE AND
EXPAND IN
WASHINGTON METRO
PROVIDENT BANKSHARES
C O R P O R A T I O N
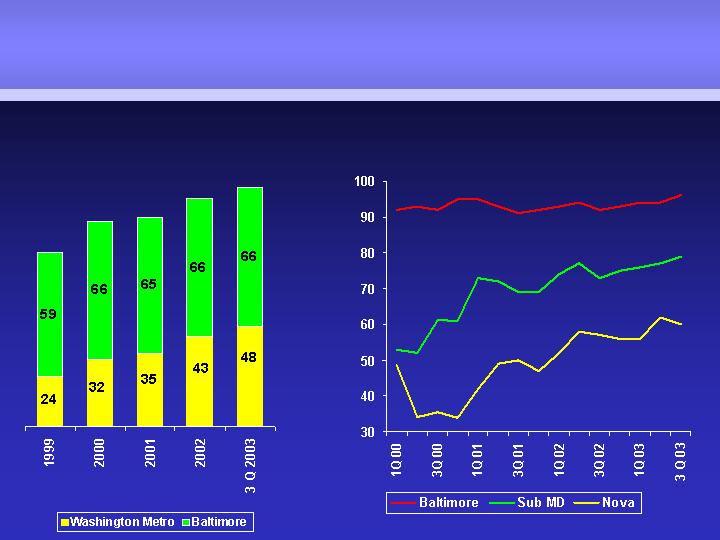
GROW MARKET SHARE AND EXPAND
IN WASHINGTON METRO
TOTAL AWARENESS
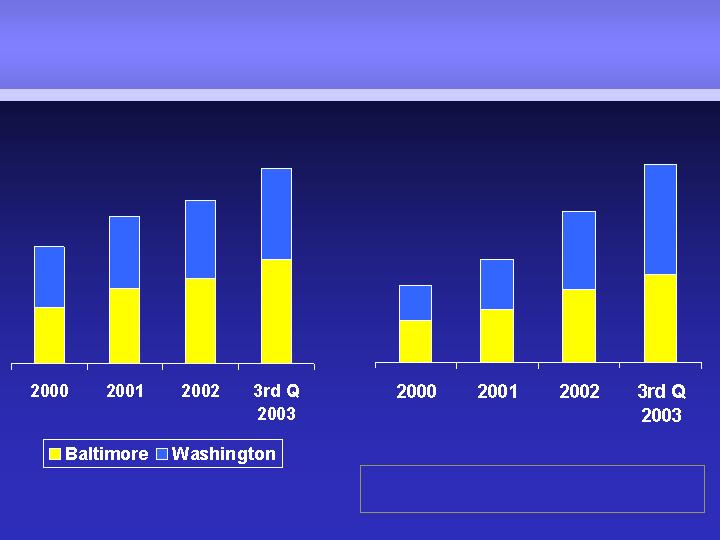
BRANCH NETWORK
CHECKING BALANCE GROWTH
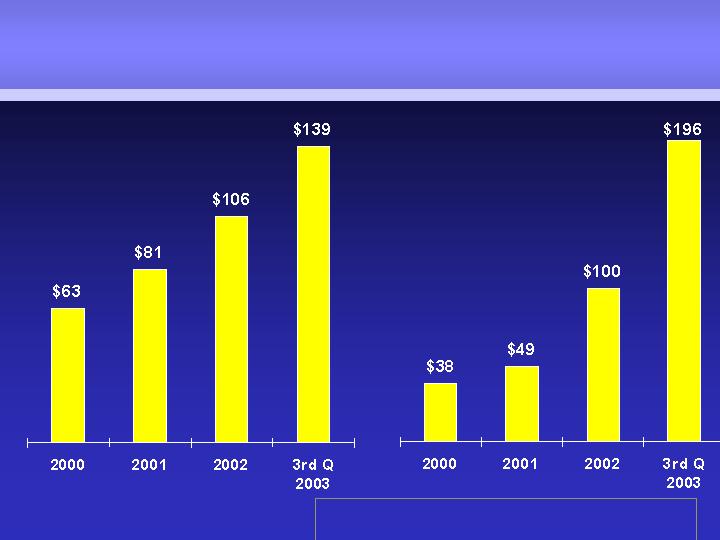
WASHINGTON METRO
CONSUMER
COMMERCIAL
Average Balances - Millions
CAGR Consumer 2000-2002 29.44%
CAGR Commercial 2000-2002 61.36%

GROW COMMERCIAL BANKING
MARKET SHARE IN THE
BALTIMORE-WASHINGTON
CORRIDOR
PROVIDENT BANKSHARES
C O R P O R A T I O N
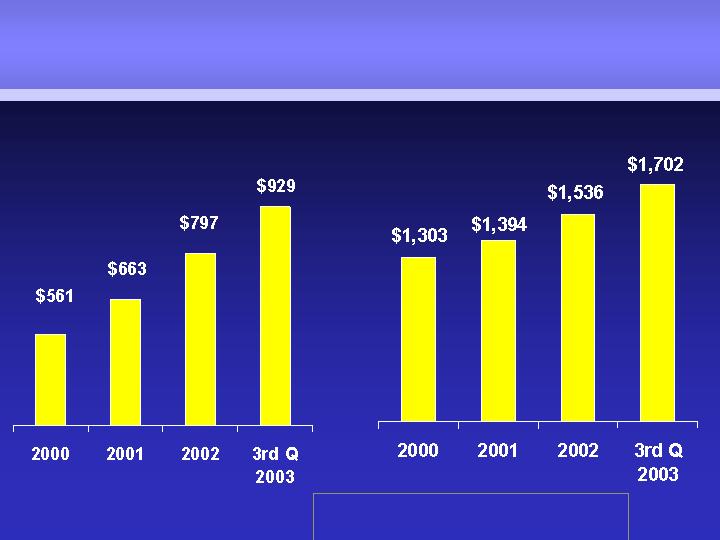
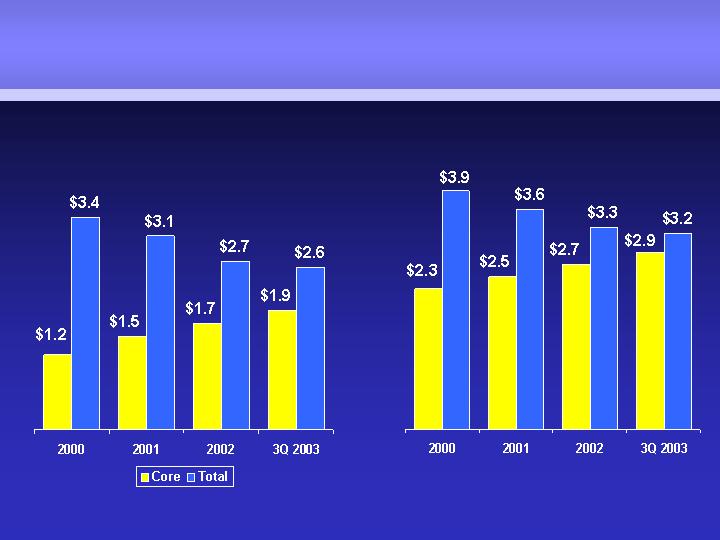
CORE COMMERCIAL LOAN AND
DEPOSIT/REPO GROWTH
Average Balances ($ millions)
$670
$791
$856
$985
LOANS
$346
$426
$579
$727
DEPOSIT/REPO
CAGR Loans 2000-2002 13.04%
CAGR Dep/Repo 2000-2002 29.37%

GROW CORE
BANKING BUSINESS
PROVIDENT BANKSHARES
C O R P O R A T I O N

DEFINITIONS
Core Loans
Originated by Provident; participations in our defined
market area
Core Consumer includes home equity loans and
lines, marine, other installment loans
Core Commercial includes real estate, commercial
loans and lines and leases
Non-Core Loans
Purchased loans; participations outside our defined
market area; discontinued product lines
Core Deposits
All deposits except brokered deposits
CORE CONSUMER LOAN AND
DEPOSIT GROWTH
Average Balances ($ millions)
LOANS
DEPOSITS
(excluding CD/IRA’s)
CAGR 2000-2002 Loans 19.15%
CAGR 2000-2002 Deposits 8.57%
GROW CORE BANKING
Average Balances ( $ Billions)
CORE LOANS VS
TOTAL LOANS
CORE DEPOSITS VS
TOTAL DEPOSITS
CAGR Total Loans 2000-2002 (11.47%)
CAGR Core Loans 2000-2002 15.88%
CAGR Total Deposits 2000-2002 (8.06%)
CAGR Core Deposits 2000-2002 7.53%

STRATEGIC MERGER
Southern
Financial
Bank

SOUTHERN FINANCIAL
BANCORP, INC
Founded in 1986
Headquartered in Warrenton, Virginia
$1.5 Billion Assets*
33 Branches*
Middle Market and Small Business focus;
Leading SBA lender
*Upon completion of Essex acquisition

TRANSACTION STRENGTHS
Strategic Fit
Cultural Compatibility
Financial Opportunity

STRATEGIC FIT
Continues Provident’s market
share expansion in the high
growth markets of Northern
Virginia

VIRGINIA:
STRONG BANKING MARKET
Population:
7.4 million
(12th largest state)
Projected Population Growth:
6.5% (14th highest growth rate in the nation)
(‘03-’08)
Median Household Income:
$51,923 (13th highest in the nation and 10% above the national average)
Median Household Income Growth:
14.4% (11th highest growth rate in the nation)
(‘03-’08)
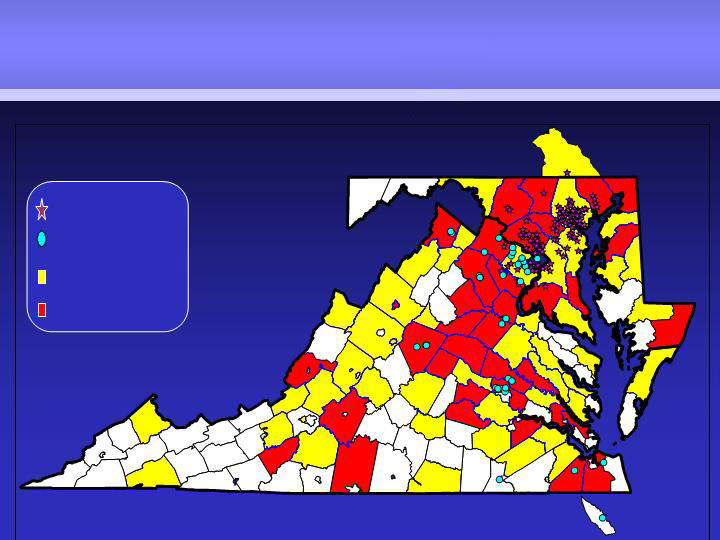
PRO FORMA FRANCHISE
County Demographics
PBKS Branches
SFFB Branches*
4 - 8% Projected
Growth
+8% Projected
Growth
Branches located in Maryland and
Virginia’s best markets
* Southern Financial Bancorp, Inc. is pro forma for the pending
acquisition of Essex Bancorp

STRATEGIC FIT
Adds significant competitive
advantage for business banking
companies with a powerful
integrated suite of online
banking services
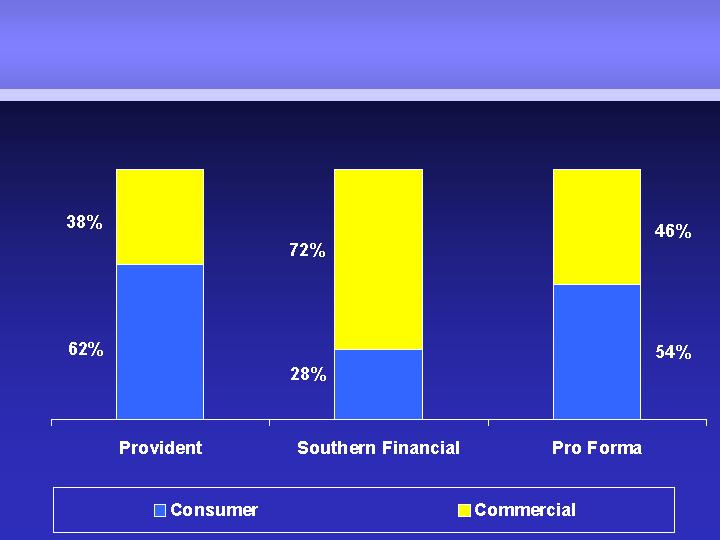
Pro Forma Financial Impact
Loan Mix
$2.6 Billion
$0.6 Billion
$3.2 Billion
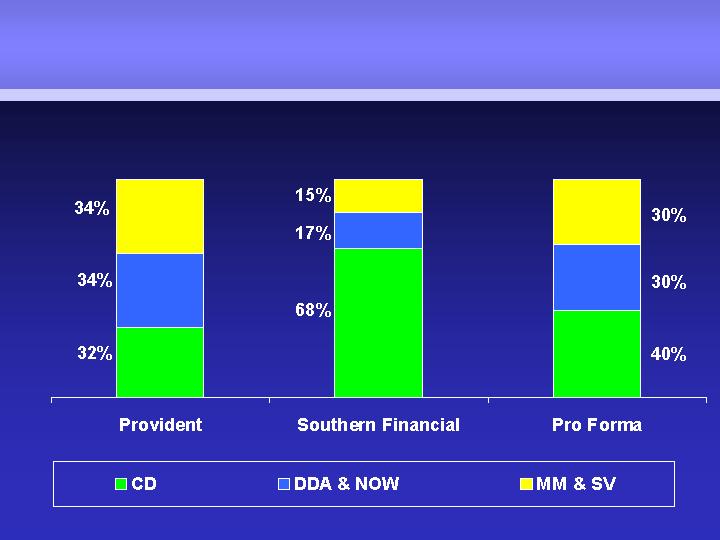
Pro Forma Financial Impact
Deposit Mix
$3.3 Billion
$0.9 Billion
$4.2 Billion

CULTURAL COMPATABILITY
Customer oriented
Employee focused
Community supporter
Excellent credit quality

FINANCIAL OPPORTUNITY
Accretive to GAAP and cash EPS in first full
year of combined operations
Identified, achievable cost savings
Combined loan composition well-balanced
Significant potential for retail loan and
deposit growth

DEAL STRUCTURE
Shares Issued: 8,065,000
Seller Ownership: 29.9%
Goodwill: $261 Million
Cost Savings: 24.6%

DEAL STRUCTURE
Price / LTM Reported EPS:
Premium to Market:
Price / Estimated EPS:
Price / Book Value:
Price / Tangible Book Value:
19.4%
22.9x
19.0x
2.72x
3.40x
37.3%
20.4x
19.0x
2.88x
3.04x
PBKS/ SFFB
Mid-Atlantic Comps
(2)
(1)
Source: SNL Financial, Company Filings, Press Releases & KBW
Comparable Transactions include bank transactions greater than $50 million since 1/1/2002
(1) Includes selling companies headquartered in MD, NC, NJ, PA, SC or VA
(2) Southern Financial Bancorp, Inc. is pro forma for the pending acquisition of Essex Bancorp

PRO FORMA RESULTS
At Closing
At First Year
Assets
$6.7 Billion
$6.7 Billion
Deposits
$4.5 Billion
$4.9 Billion
Core Loans
$2.6 Billion
$2.9 Billion
Tangible Capital
5.19%
6.23%
Leverage Ratio
7.34%
8.39%

Provident
Transaction Integration Experience
Three prior acquisitions
At the time of acquisition, First Citizens Financial
represented 25% of Provident assets; Southern Financial
Bancorp represents 29% of Provident assets today
Company
Employees
Accounts
First Citizens Financial
188
56,400
Southern Financial Bancorp
216
47,414
Provident has more than sufficient systems capacity to
accommodate Southern Financial’s customers
(1) Southern Financial Bancorp, Inc. is pro forma for the pending acquisition of Essex Bancorp

IMPROVE FINANCIAL
FUNDAMENTALS
PROVIDENT BANKSHARES
C O R P O R A T I O N
BACK TO PROVIDENT….
IMPROVE FINANCIAL
FUNDAMENTALS
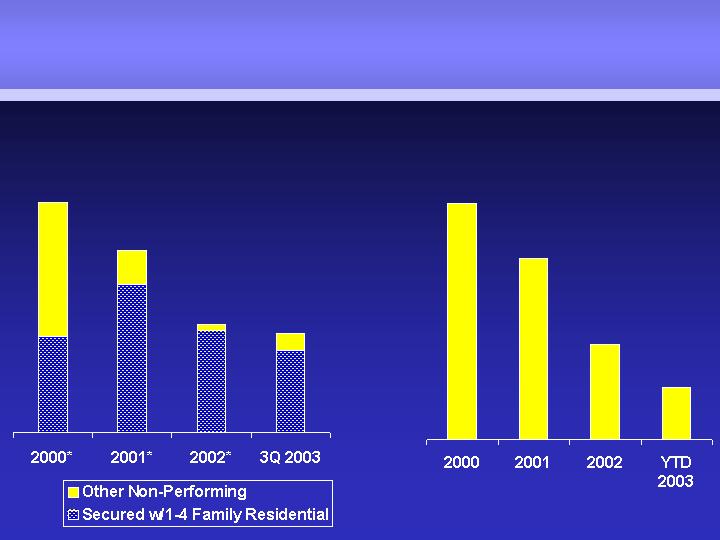
NET CHARGE OFFS
NON PERFORMING LOANS
(Period End)
0.81%
$27.4
0.68%
$21.0
0.41%
$11.0
0.32%
$6.1
% of loans; $Millions
1.01%
$33.8
1.04%
$28.8
0.83%
$21.1
0.75%
$20.3
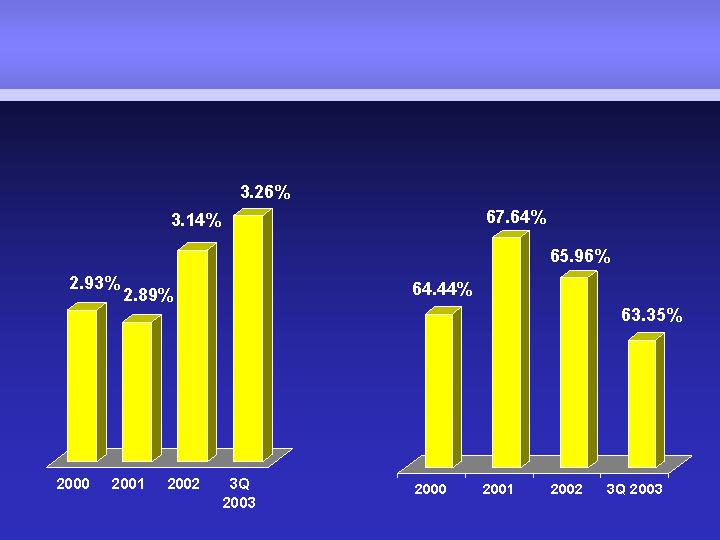
IMPROVE FINANCIAL
FUNDAMENTALS
NET INTEREST MARGIN
EFFICIENCY RATIO
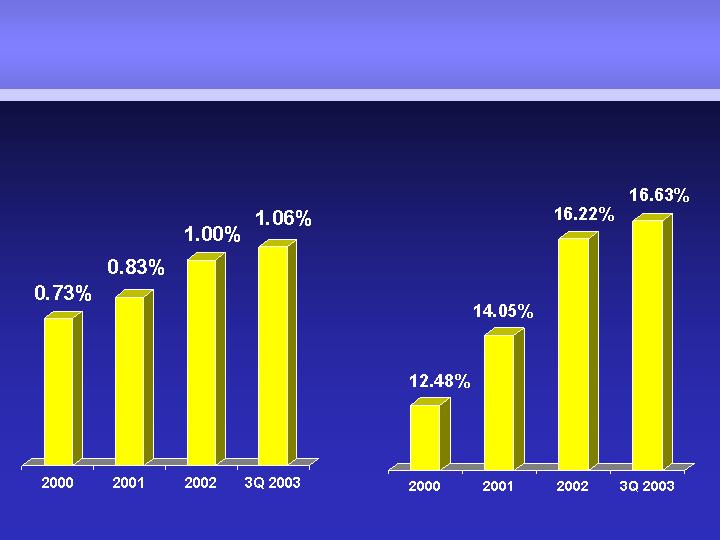
IMPROVE FINANCIAL
FUNDAMENTALS
00-02 Compound Annual Growth Rate 17%
RETURN ON AVERAGE
ASSETS
RETURN ON AVERAGE
COMMON EQUITY

PROVIDENT BANKSHARES
CORPORATION
(www.provbank.com)
Contact:
Media: Lillian Kilroy: (410) 277-2833
Investment Community: Josie Porterfield: (410) 277-
2889
PROVIDENT BANKSHARES
C O R P O R A T I O N