
PROVIDENT BANKSHARES C O R P O R A T I O N
August 2005

FORWARD-LOOKING STATEMENTS AND RISK FACTORS
This presentation, as well as other written communications made from time to time by Provident Bankshares Corporation and its subsidiaries (the “Corporation”) (including, without limitation, the Corporation’s 2004 Annual Report to Stockholders) and oral communications made from time to time by authorized officers of the Corporation, may contain statements relating to the future results of the Corporation (including certain projections and business trends) that are considered “forward-looking statements” as defined in the Private Securities Litigation Reform Act of 1995 (the “PSLRA”). Such forward-looking statements may be identified by the use of such words as “believe,” “expect,” “anticipate,” “should,” “planned,” “estimated,” “intend” and “potential.” Examples of forward-looking statements include, but are not limited to, possible or assumed estimates with respect to the financial condition, expected or anticipated revenue, and results of operations and business of the Corporation, including earnings growth determined using U.S. generally accepted accounting principles (“GAAP”); revenue growth in retail banking, lending and other areas; origination volume in the Corporation’s consumer, commercial and other lending businesses; asset quality and levels of non-performing assets; current and future capital management programs; non-interest income levels, including fees from services and product sales; tangible capital generation; market share; expense levels; and other business operations and strategies. For these statements, the Corporation claims the protection of the safe harbor for forward-looking statements contained in the PSLRA.
The Corporation cautions you that a number of important factors could cause actual results to differ materially from those currently anticipated in any forward-looking statement. Such factors include, but are not limited to: the factors identified in the Corporation’s Form 10-K for the fiscal year ended December 31, 2004 under the headings “Forward-Looking Statements” and “Risk Factors,” prevailing economic conditions, either nationally or locally in some or all areas in which the Corporation conducts business or conditions in the securities markets or the banking industry; changes in interest rates, deposit flows, loan demand, real estate values and competition, which can materially affect, among other things, consumer banking revenues, revenues from sales on non-deposit investment products, origination levels in the Corporation’s lending businesses and the level of defaults, losses and prepayments on loans made by the Corporation, whether held in portfolio or sold in the secondary markets; changes in the quality or composition of the loan or investment portfolios; the Corporation’s ability to successfully integrate any assets, liabilities, customers, systems and management personnel the Corporation may acquire into its operations and its ability to realize related revenue synergies and cost savings within expected time frames; the Corporation’s timely development of new and competitive products or services in a changing environment, and the acceptance of such products or services by customers; operational issues and/or capital spending necessitated by the potential need to adapt to industry changes in information technology systems, on which it is highly dependent; changes in accounting principles, policies, and guidelines; changes in any applicable law, rule, regulation or practice with respect to tax or legal issues; risks and uncertainties related to mergers and related integration and restructuring activities; and other economic, competitive, governmental, regulatory and technological factors affecting the Corporation’s operations, pricing, products and services. Readers are cautioned not to place undue reliance on these forward-looking statements which are made as of the date of this presentation, and, except as may be required by applicable law or regulation, the Corporation assumes no obligation to update the forward-looking statements or to update the reasons why actual results could differ from those projected in the forward-looking statements.
2

AGENDA
COMPANY BACKGROUND
MARKET DISTINCTION
KEY STRATEGIES FINANCIAL PERFORMANCE
3
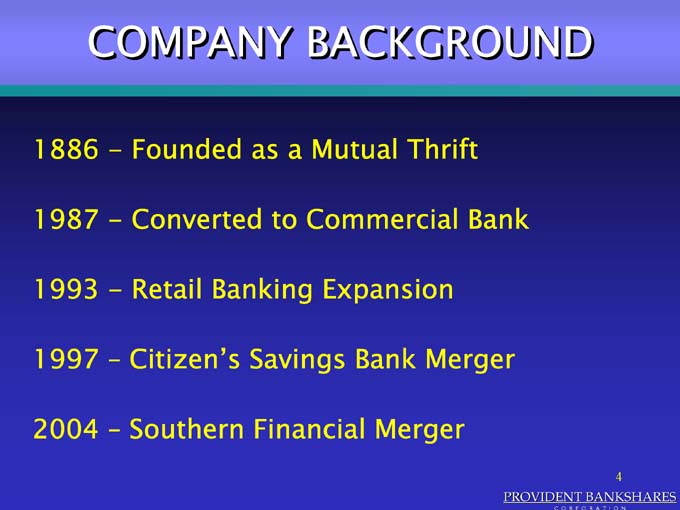
COMPANY BACKGROUND
1886—Founded as a Mutual Thrift 1987—Converted to Commercial Bank 1993—Retail Banking Expansion 1997 – Citizen’s Savings Bank Merger
2004 – Southern Financial Merger
4
PROVIDENT BANKSHARES
C O R P O R A T I O N
RETAIL EXPANSION STRATEGY
1993
Broaden Base of Consumer Deposits
High Performance Checking In-Store Branch Network
5
PROVIDENT BANKSHARES
C O R P O R A T I O N

RETAIL CHECKING GROWTH
(in 000’s)
$250,000 $200,000 $150,000 $100,000 $50,000 $0
4 Year CAGR Average Balances 26%
Base Year
1992 1993 1994 1995 1996
200 150 100 50 0
$84,000 $106,000 $144,000 $173,200 $208,700
Retail Checking Average Balances Retail Checking Accounts on Hand
6

STRATEGIC ALLIANCES
1997
Expansion into VA/Washington Metro Area
Merger with First Citizens Financial Corporation Partnership with Shoppers Food
7
PROVIDENT BANKSHARES
C O R P O R A T I O N

STRATEGIC MERGER
2004
Merger with Southern Financial Bancorp, Inc.
Add 30 Branches to the Virginia Network Compliment Commercial and Small Business
8
PROVIDENT BANKSHARES
C O R P O R A T I O N
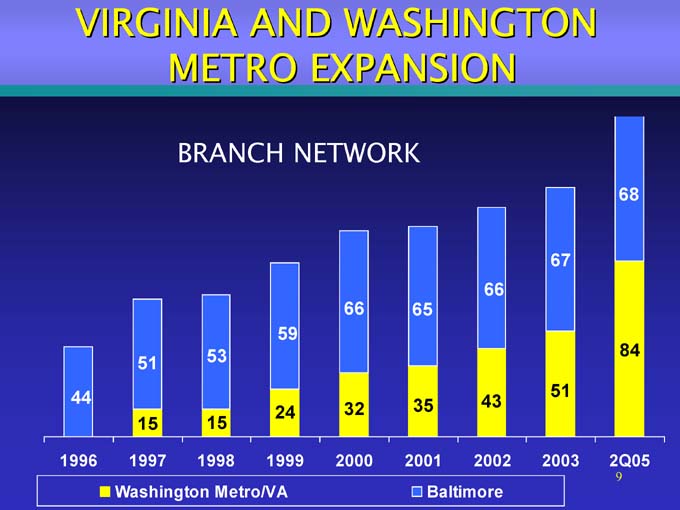
VIRGINIA AND WASHINGTON
METRO EXPANSION
BRANCH NETWORK
68
67 66
66 65 59
53 84 51
44 51
32 35 43 24
15 15
1996 1997 1998 1999 2000 2001 2002 2003 2Q05
Washington Metro/VA Baltimore
9

VIRGINIA AND WASHINGTON
METRO EXPANSION
TOTAL AWARENESS
100 90 80 70 60 50 40 30
4Q97 4Q98 4Q99 1Q 00 1Q 01 1Q 02 1Q 03 1Q04 1Q05 2Q05
Baltimore Sub MD Northern VA Richmond
10
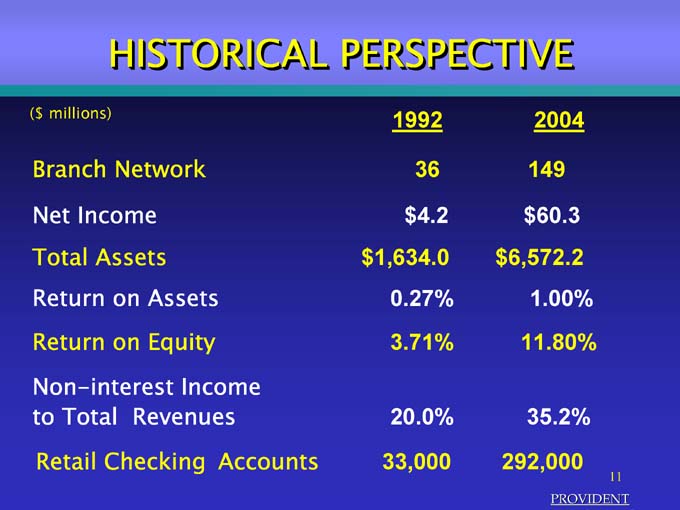
HISTORICAL PERSPECTIVE
($ millions)
Branch Network Net Income Total Assets Return on Assets Return on Equity Non-interest Income to Total Revenues Retail Checking Accounts
1992
36 $4.2 $1,634.0 0.27% 3.71%
20.0% 33,000
2004
149 $60.3 $6,572.2 1.00% 11.80%
35.2% 292,000
PROVIDENT BANKSHARES
C O R P O R A T I O N
11

MARKET DISTINCTION
Footprint in growth markets ofMaryland, Virginia and DC Metro
12
PROVIDENT BANKSHARES
C O R P O R A T I O N
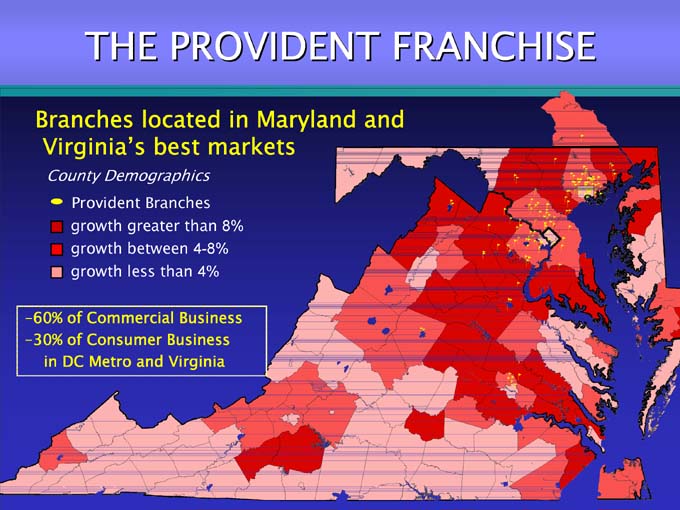
THE PROVIDENT FRANCHISE
Branmches located in Maryland and Virginia’s best markets
County Demographics
Provident Branches
growth greater than 8%
growth between 4-8%
growth less than 4%
-60% of Commercial Business
-30% of Consumer Business in DC Metro and Virginia
13
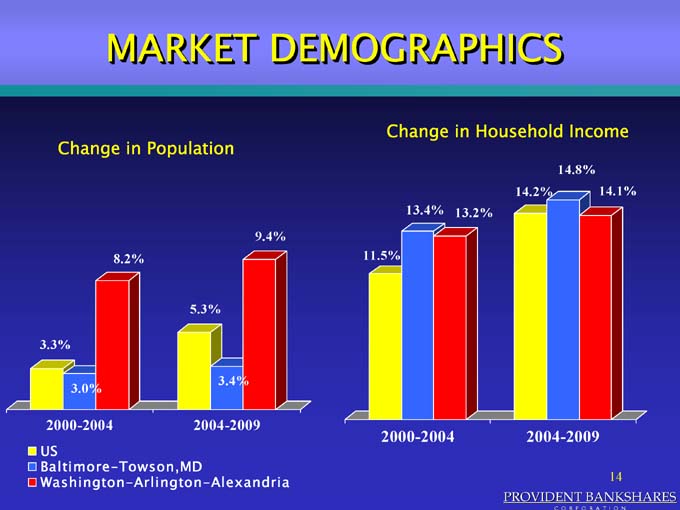
MARKET DEMOGRAPHICS
Change in Population
Change in Household Income
3.3% 8.2% 3.0% 5.3% 3.4% 9.4%
11.5% 13.4% 13.2% 14.2% 14.8% 14.1%
2000-2004 2004-2009
2000-2004 2004-2009
US
Baltimore–Towson,MD
Washington–Arlington–Alexandria
14
PROVIDENT BANKSHARES
C O R P O R A T I O N

KEY STRATEGIES
Maximize Provident’s Position as the “Right Size” Bank in the Marketplace Grow and Deepen Consumer and Small Business Relationships in Maryland and Virginia Grow and Deepen Commercial and Real Estate Relationships in Maryland and Virginia Move from a Product Driven Organization to a Customer Relationship Focused Sales Culture Create a High Performance Culture that Focuses on Employee Development and Retention Improve Financial Fundamentals 15
PROVIDENT BANKSHARES
C O R P O R A T I O N
THE “RIGHT SIZE” BANK
“We will continue to provide the products and services of our largest competitors, while delivering the level of service found in only the best community banks.”
16
PROVIDENT BANKSHARES
C O R P O R A T I O N

GROW AND DEEPEN CONSUMER AND SMALL BUSINESS
RELATIONSHIPS IN MARYLAND AND VIRGINIA
17
PROVIDENT BANKSHARES
C O R P O R A T I O N
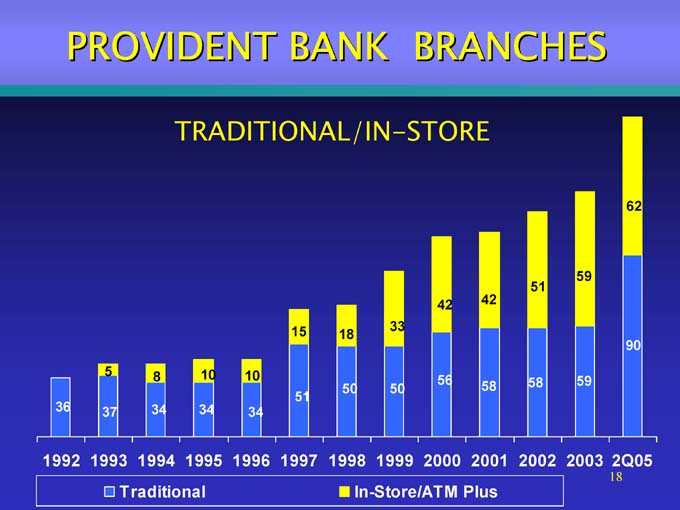
PROVIDENT BANK BRANCHES
TRADITIONAL/IN-STORE
62
59 51
42 42
15 33 18
90
5 8 10 10
56 58 58 59
50 50 51
36 37 34 34 34
1992 1993 1994 1995 1996 1997 1998 1999 2000 2001 2002 2003 2Q05
Traditional In-Store/ATM Plus
18
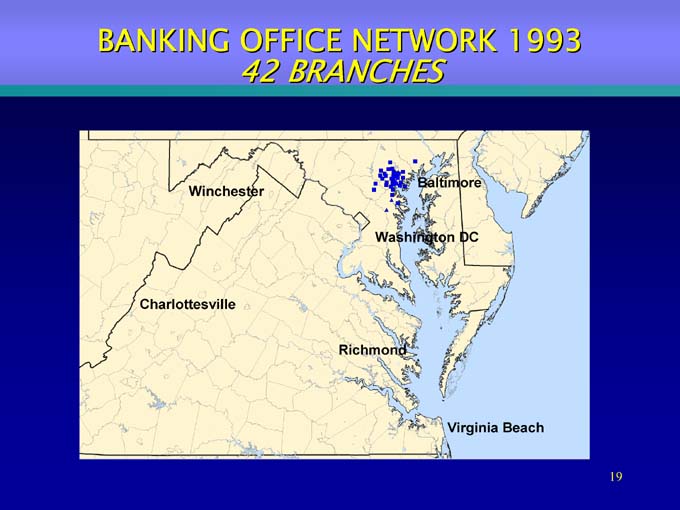
BANKING OFFICE NETWORK 1993 42 BRANCHES
19
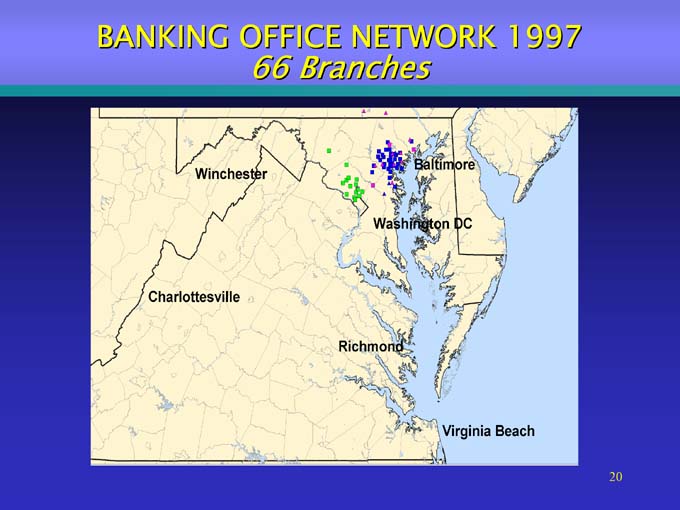
BANKING OFFICE NETWORK 1997 66 Branches
20
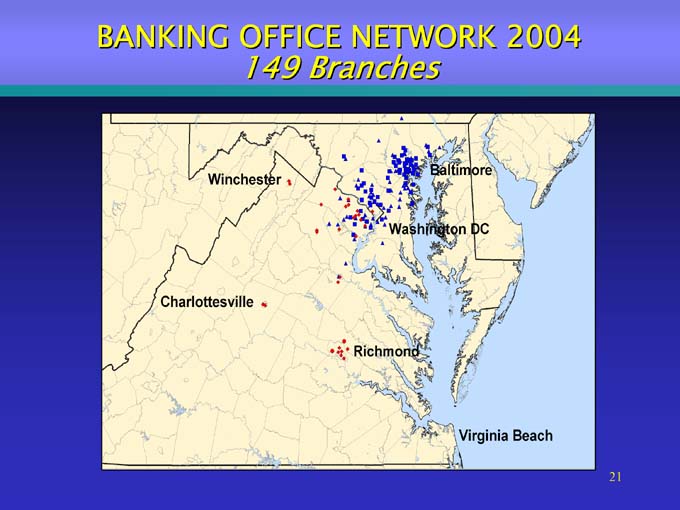
BANKING OFFICE NETWORK 2004 149 Branches
21
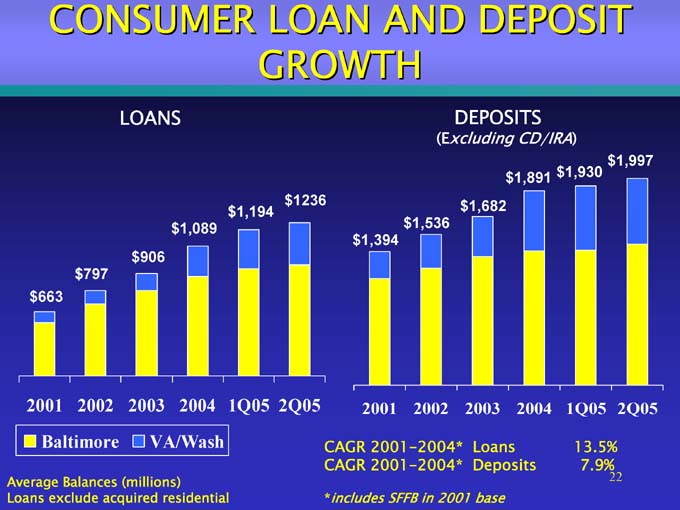
CONSUMER LOAN AND DEPOSIT
GROWTH
LOANS DEPOSITS
(Excluding CD/IRA)
$1,997 $1,891 $1,930 $1236 $1,682 $1,194 $1,089 $1,536 $1,394 $906 $797 $663
2001 2002 2003 2004 1Q05 2Q05 2001 2002 2003 2004 1Q05 2Q05
Baltimore VA/Wash CAGR 2001-2004* Loans 13.5% CAGR 2001-2004* Deposits 7.9%
Average Balances (millions)
Loans exclude acquired residential *includes SFFB in 2001 base
22
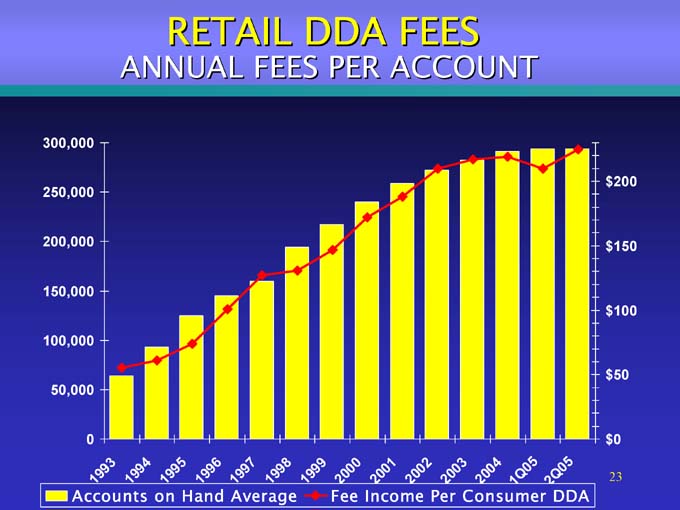
RETAIL DDA FEES
ANNUAL FEES PER ACCOUNT
300,000 250,000 200,000 150,000 100,000 50,000 0
$200 $150 $100 $50 $0
19 93
1994 1995
19 96
1997
1998
1999 2000
2001
2002
2003
2004
1Q05
2Q05
Accounts on Hand Average Fee Income Per Consumer DDA
23
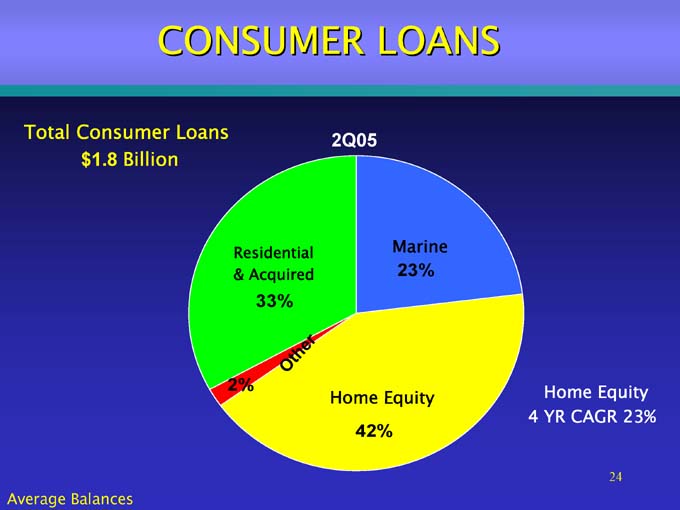
CONSUMER LOANS
Total Consumer Loans $1.8 Billion
2Q05
Residential & Acquired
33%
Marine
23%
2%
Other
Home Equity 42%
Home Equity 4 YR CAGR 23%
Average Balances
24
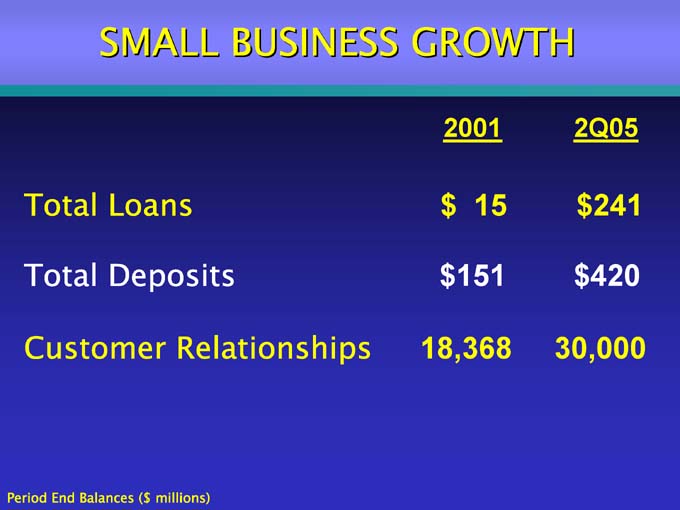
SMALL BUSINESS GROWTH
Total Loans Total Deposits
Customer Relationships
2001
$15 $151 18,368
2Q05
$241 $420 30,000
Period End Balances ($ millions)
25

GROW AND DEEPEN COMMERCIAL AND REAL ESTATE
RELATIONSIONSHIPS IN MARYLAND AND VIRGINIA
26
PROVIDENT BANKSHARES
C O R P O R A T I O N
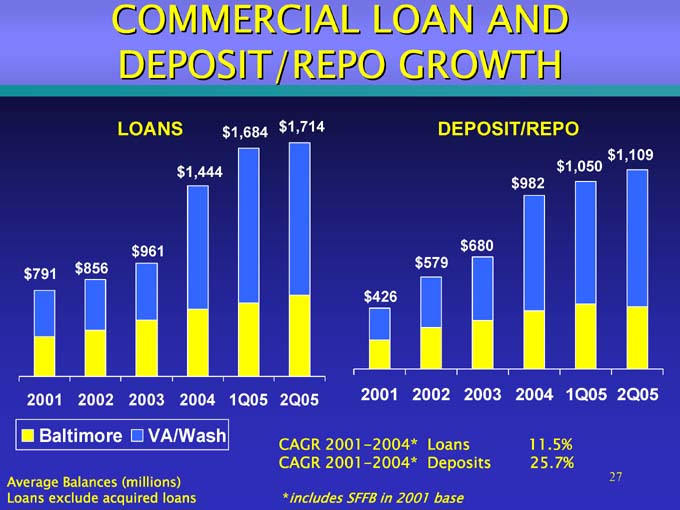
COMMERCIAL LOAN AND DEPOSIT/REPO GROWTH
LOANS
DEPOSIT/REPO
$96 1 $791 $856
$1,444
$1,684 $1,714
$680 $579
$426
$1,109 $1,050 $982
2001 2002 2003 2004 1Q05 2Q05
2001 2002 2003 2004 1Q05 2Q05
Baltimore VA/Wash
CAGR 2001-2004* Loans 11.5% CAGR 2001-2004* Deposits 25.7%
Average Balances (millions) Loans exclude acquired loans
*includes SFFB in 2001 base
27
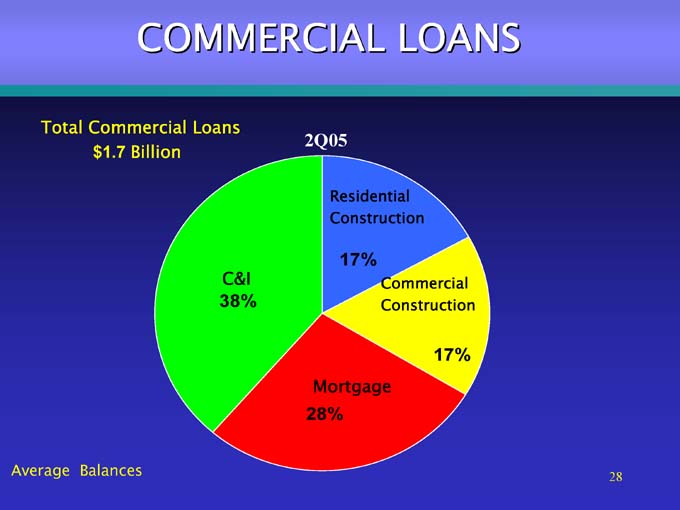
COMMERCIAL LOANS
Total Commercial Loans $1.7 Billion
2Q05
C&I
38%
Residential Construction
17%
Commercial Construction
17%
Mortgage
28%
Average Balances
28

IMPROVE FINANCIAL
FUNDAMENTALS
29
PROVIDENT BANKSHARES
C O R P O R A T I O N

IMPROVED FUNDAMENTALS
Transformed Balance Sheet
Higher Absolute Earnings
Improved Earnings Quality
30
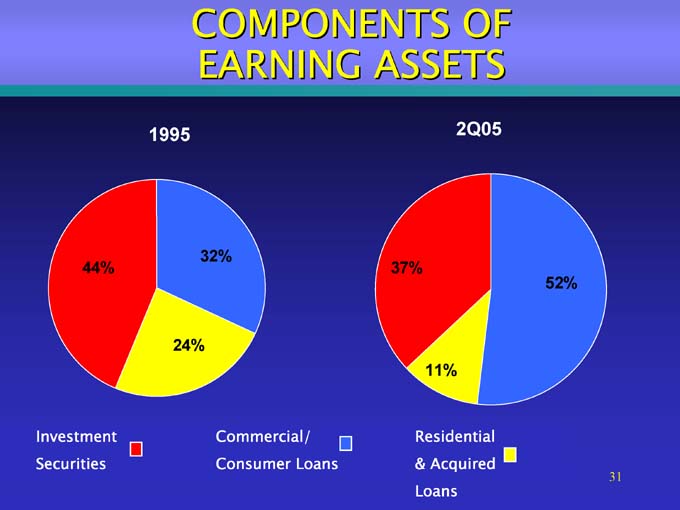
COMPONENTS OF EARNING ASSETS
1995
2Q05
44% 32% 24% 37% 52% 11%
Investment Securities
Commercial/ Consumer Loans
Residential & Acquired Loans
31
INTEREST RATE RISK
Asset Sensitivity Low Equity Duration Floating Rate Investments
32
PROVIDENT BANKSHARES
C O R P O R A T I O N
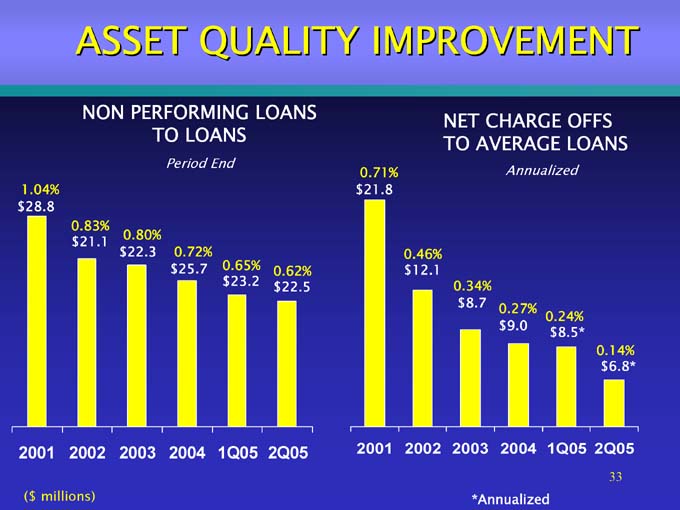
ASSET QUALITY IMPROVEMENT
NON PERFORMING LOANS
TO LOANS
NET CHARGE OFFS TO AVERAGE LOANS
Period End
Annualized
1.04% $28.8
0.83% $21.1 0.80% $22.3 0.72% $25.7 0.65% $23.2 $0.62% 22.5
0.71% $21.8 0.46% $12.1 0.34% $8.7 0.27% 0.24% $9.0 $8.5* 0.14% $6.8*
2001 2002 2003 2004 1Q05 2Q05
($ millions)
*Annualized
33
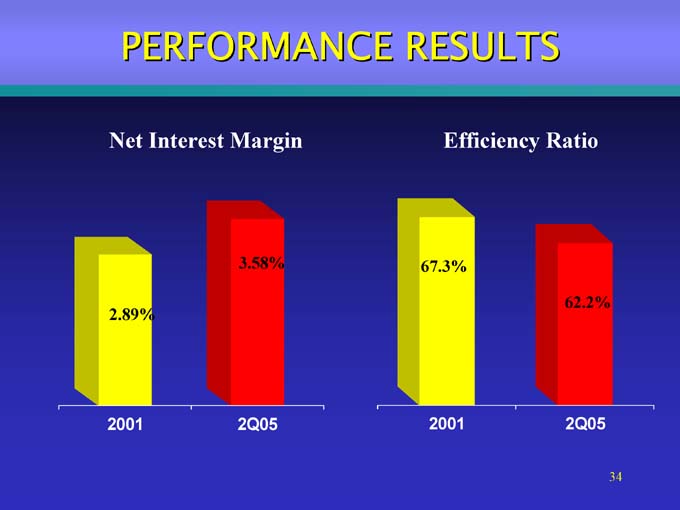
PERFORMANCE RESULTS
Net Interest Margin
Efficiency Ratio
3.58% 67.3%
62.2%
2.89%
2001 2Q05 2001 2Q05
34
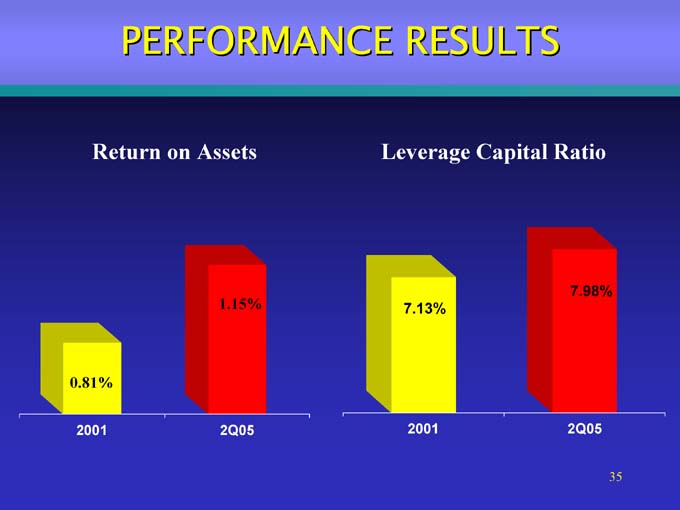
PERFORMANCE RESULTS
Return on Assets Leverage Capital Ratio
7.98%
1.15% 7.13%
0.81%
2001 2Q05 2001 2Q05
35
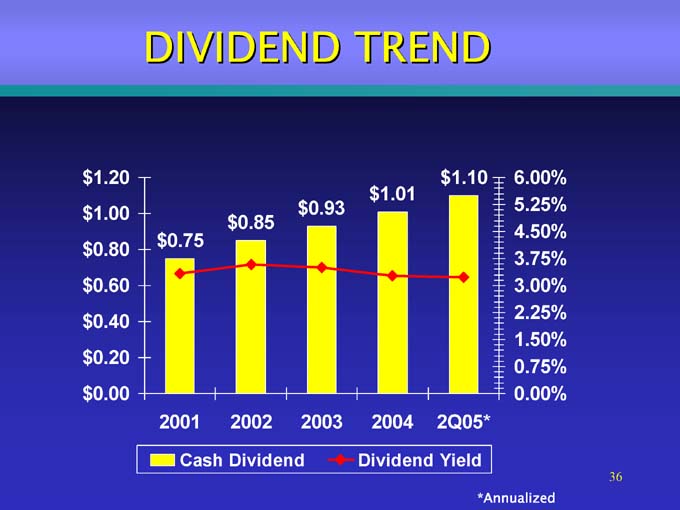
DIVIDEND TREND
$1.20 $1.00 $0.80 $0.60 $0.40 $0.20 $0.00
$1.10 $1.01 $0.93 $0.85 $0.75
6.00% 5.25% 4.50% 3.75% 3.00% 2.25% 1.50% 0.75% 0.00%
2001 2002 2003 2004 2Q05*
Cash Dividend Dividend Yield
*Annualized
36
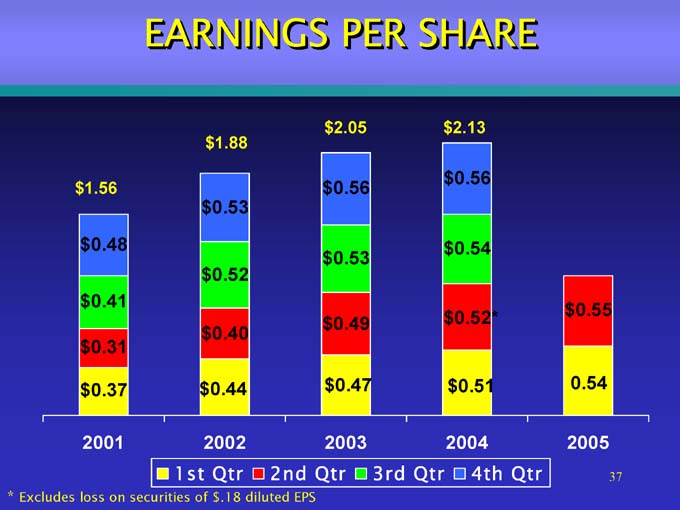
EARNINGS PER SHARE
$1.56
$0.48
$0.41 $0.31 $0.37
2001
$1.88 $0.53 $0.52 $0.40 $0.44 2002
$2.05 $0.56 $0.53 $0.49 $0.47 2003
$2.13 $0.56 $0.54 $0.52* $0.51 2004
$0.55 0.54 2005
1st Qtr 2nd Qtr 3rd Qtr 4th Qtr
* Excludes loss on securities of $.18 diluted EPS
37

EQUITY SUMMARY TOTAL RETURN COMPARISON
30.71% 91.91% 29.41% 51.81% 41.14% 53.93% 4.79% 12.81%
Since 12/31/00 Since 12/31/01 Since 12/31/02 Since 12/31/03
SNL Bank PBKS
Through 3/31/05
38
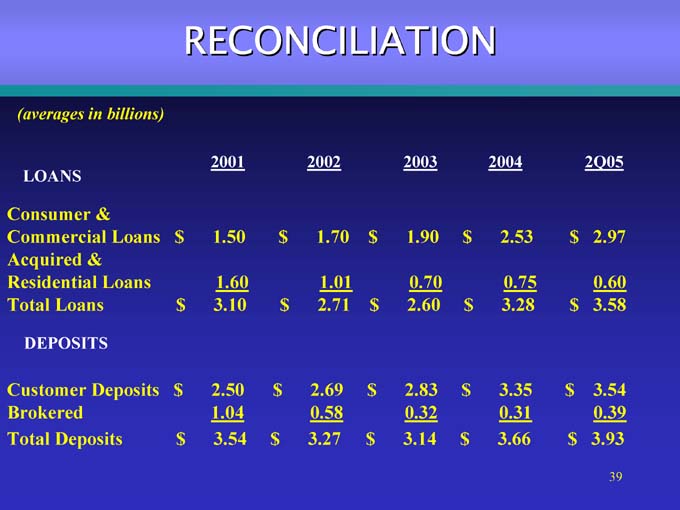
RECONCILIATION
(averages in billions)
2001 2002 2003 2004 2Q05
LOANS
Consumer &
Commercial Loans $1.50 $1.70 $1.90 $2.53 $2.97
Acquired &
Residential Loans 1.60 1.01 0.70 0.75 0.60
Total Loans $3.10 $2.71 $2.60 $3.28 $3.58
DEPOSITS
Customer Deposits $2.50 $2.69 $2.83 $3.35 $3.54
Brokered 1.04 0.58 0.32 0.31 0.39
Total Deposits $3.54 $3.27 $3.14 $3.66 $3.93
39

PROVIDENT BANKSHARES
C O R P O R A T I O N
www.provbank.com
Contact
Media: Lillian Kilroy (410) 277-2833
Investment Community: Melissa Kelly (410) 277-2080
40
PROVIDENT BANKSHARES
C O R P O R A T I O N