Exhibit 99.1

PROVIDENT BANKSHARES
CORPORATION

FORWARD-LOOKING STATEMENTS AND RISK FACTORS
This presentation, as well as other written communications made from time to time by Provident Bankshares Corporation and its subsidiaries (the “Corporation”) (including, without limitation, the Corporation’s 2004 Annual Report to Stockholders) and oral communications made from time to time by authorized officers of the Corporation, may contain statements relating to the future results of the Corporation (including certain projections and business trends) that are considered “forward-looking statements” as defined in the Private Securities Litigation Reform Act of 1995 (the “PSLRA”). Such forward-looking statements may be identified by the use of such words as “believe,” “expect,” “anticipate,” “should,” “planned,” “estimated,” “intend” and “potential.” Examples of forward-looking statements include, but are not limited to, possible or assumed estimates with respect to the financial condition, expected or anticipated revenue, and results of operations and business of the Corporation, including earnings growth determined using U.S. generally accepted accounting principles (“GAAP”); revenue growth in retail banking, lending and other areas; origination volume in the Corporation’s consumer, commercial and other lending businesses; asset quality and levels of non-performing assets; current and future capital management programs; non-interest income levels, including fees from services and product sales; tangible capital generation; market share; expense levels; and other business operations and strategies. For these statements, the Corporation claims the protection of the safe harbor for forward-looking statements contained in the PSLRA.
The Corporation cautions you that a number of important factors could cause actual results to differ materially from those currently anticipated in any forward-looking statement. Such factors include, but are not limited to: the factors identified in the Corporation’s Form 10-K for the fiscal year ended December 31, 2004 under the headings “Forward-Looking Statements” and “Risk Factors,” prevailing economic conditions, either nationally or locally in some or all areas in which the Corporation conducts business or conditions in the securities markets or the banking industry; changes in interest rates, deposit flows, loan demand, real estate values and competition, which can materially affect, among other things, consumer banking revenues, revenues from sales on non-deposit investment products, origination levels in the Corporation’s lending businesses and the level of defaults, losses and prepayments on loans made by the Corporation, whether held in portfolio or sold in the secondary markets; changes in the quality or composition of the loan or investment portfolios; the Corporation’s ability to successfully integrate any assets, liabilities, customers, systems and management personnel the Corporation may acquire into its operations and its ability to realize related revenue synergies and cost savings within expected time frames; the Corporation’s timely development of new and competitive products or services in a changing environment, and the acceptance of such products or services by customers; operational issues and/or capital spending necessitated by the potential need to adapt to industry changes in information technology systems, on which it is highly dependent; changes in accounting principles, policies, and guidelines; changes in any applicable law, rule, regulation or practice with respect to tax or legal issues; risks and uncertainties related to mergers and related integration and restructuring activities; and other economic, competitive, governmental, regulatory and technological factors affecting the Corporation’s operations, pricing, products and services. Readers are cautioned not to place undue reliance on these forward-looking statements which are made as of the date of this presentation, and, except as may be required by applicable law or regulation, the Corporation assumes no obligation to update the forward-looking statements or to update the reasons why actual results could differ from those projected in the forward-looking statements.

ANALYST / INVESTOR DAY
PRESENTATION
September 9, 2005

Welcome
Gary N. Geisel
Chairman and Chief Executive Officer
Introduction
Provident Bank History
1886 Founded as a Mutual Thrift
1987 Converted to Commercial Bank
1993 Retail Banking Expansion
1997 Citizen’s Savings Bank Merger
2004 Southern Financial Merger
Introduction
Provident Bank Mission
Provident Bank’s mission is to exceed customer expectations by delivering superior service, products and banking convenience. Every employee’s commitment to serve our customers in this fashion will establish Provident Bank as the primary bank of choice of individuals, families, small businesses and mid-sized companies throughout our chosen markets.
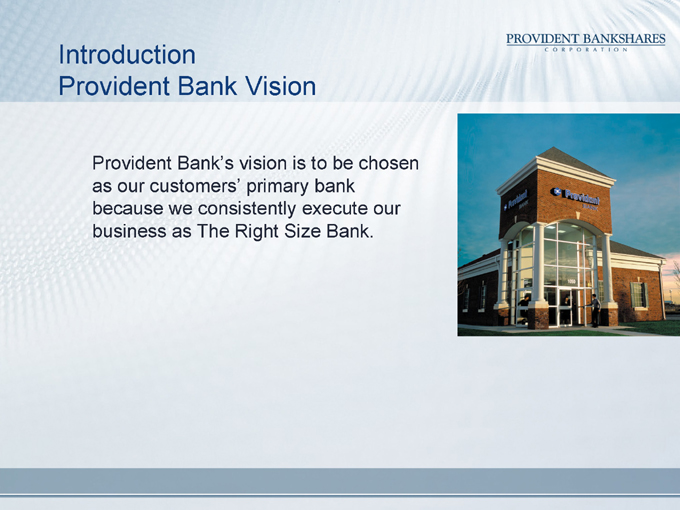
Introduction
Provident Bank Vision
Provident Bank’s vision is to be chosen as our customers’ primary bank because we consistently execute our business as The Right Size Bank.
Introduction
Provident Bank Core Values
Integrity
Excellence
Caring
Partnership
Results Driven
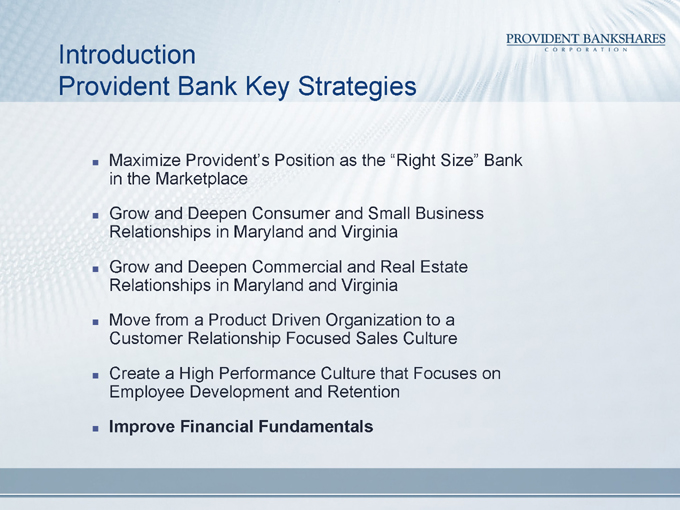
Introduction
Provident Bank Key Strategies
Maximize Provident’s Position as the “Right Size” Bank in the Marketplace
Grow and Deepen Consumer and Small Business Relationships in Maryland and Virginia
Grow and Deepen Commercial and Real Estate Relationships in Maryland and Virginia
Move from a Product Driven Organization to a Customer Relationship Focused Sales Culture
Create a High Performance Culture that Focuses on Employee Development and Retention
Improve Financial Fundamentals
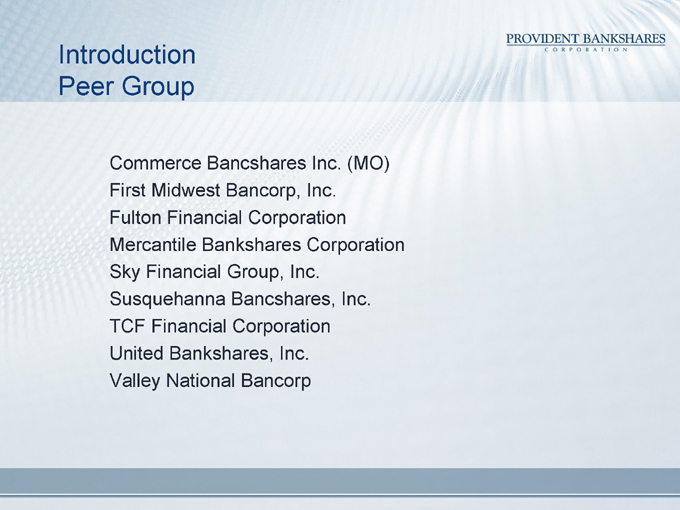
Introduction Peer Group
Commerce Bancshares Inc. (MO)
First Midwest Bancorp, Inc.
Fulton Financial Corporation
Mercantile Bankshares Corporation
Sky Financial Group, Inc.
Susquehanna Bancshares, Inc.
TCF Financial Corporation
United Bankshares, Inc.
Valley National Bancorp
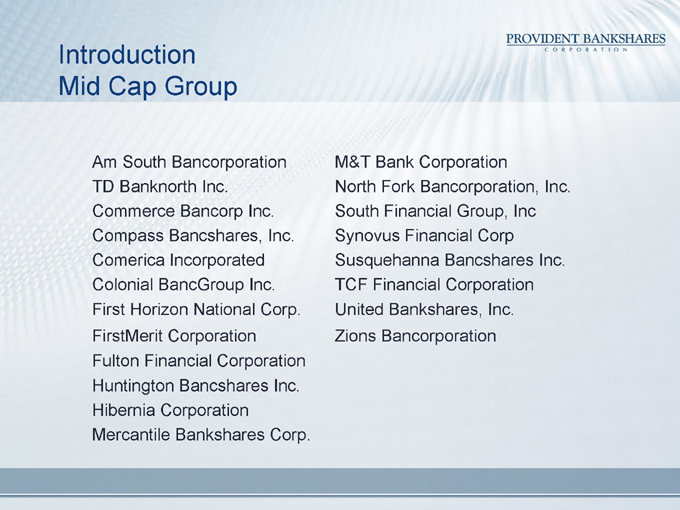
Introduction Mid Cap Group
Am South Bancorporation
TD Banknorth Inc.
Commerce Bancorp Inc.
Compass Bancshares, Inc.
Comerica Incorporated
Colonial BancGroup Inc.
First Horizon National Corp.
FirstMerit Corporation
Fulton Financial Corporation
Huntington Bancshares Inc.
Hibernia Corporation
Mercantile Bankshares Corp.
M&T Bank Corporation
North Fork Bancorporation, Inc.
South Financial Group, Inc
Synovus Financial Corp
Susquehanna Bancshares Inc.
TCF Financial Corporation
United Bankshares, Inc.
Zions Bancorporation
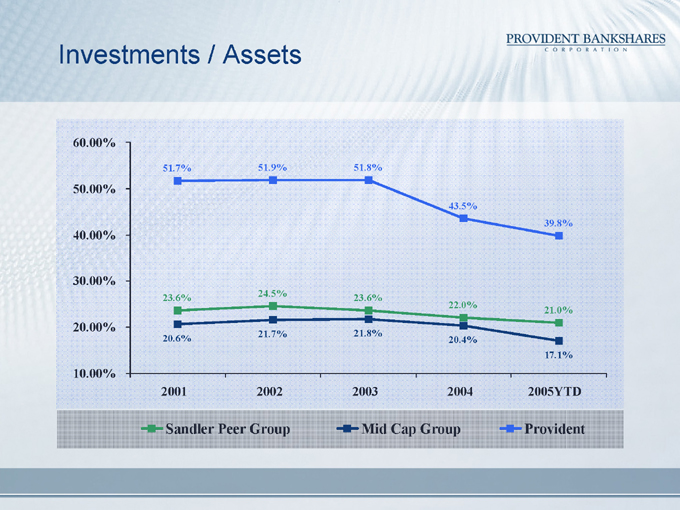
Investments / Assets
60.00% 50.00% 40.00% 30.00% 20.00% 10.00%
2001 2002 2003 2004 2005YTD
51.7%
51.9%
51.8%
43.5%
39.8%
23.6%
24.5%
23.6%
22.0%
21.0%
20.6%
21.7%
21.8%
20.4%
17.1%
Sandler Peer Group
Mid Cap Group
Provident
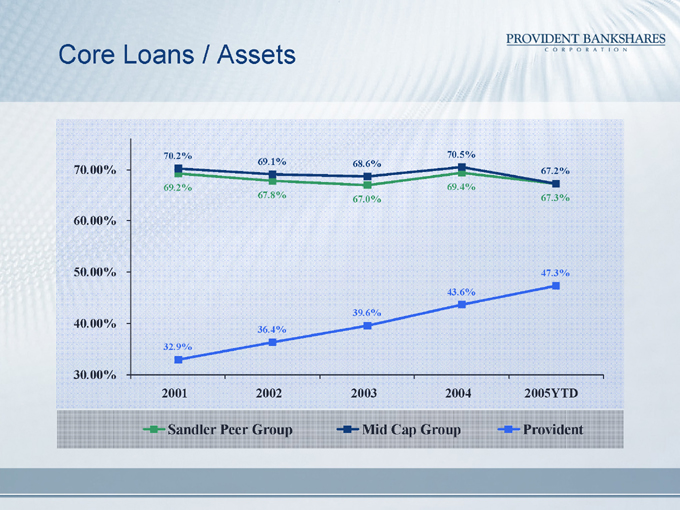
Core Loans / Assets
70.00% 60.00% 50.00% 40.00% 30.00%
2001 2002 2003 2004 2005YTD
70.2%
69.1%
68.6%
70.5%
67.2%
69.2%
67.8%
67.0%
69.4%
67.3%
32.9%
36.4%
39.6%
43.6%
47.3%
Sandler Peer Group
Mid Cap Group
Provident
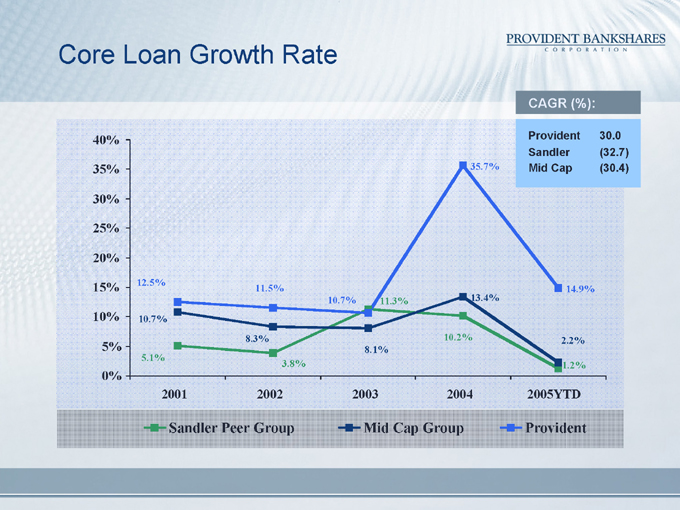
Core Loan Growth Rate
40% 35% 30% 25% 20% 15% 10% 5% 0%
2001 2002 2003 2004 2005YTD
12.5%
11.5%
10.7%
35.7%
14.9%
10.7%
8.3%
8.1%
13.4%
2.2%
5.1%
3.8%
11.3%
10.2%
1.2%
Sandler Peer Group
Mid Cap Group
Provident
CAGR (%):
Provident 30.0 Sandler (32.7) Mid Cap (30.4)
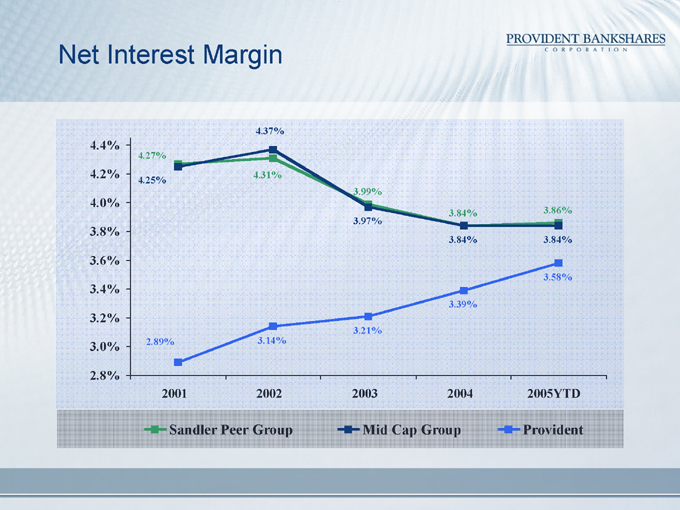
Net Interest Margin
4.4% 4.2% 4.0% 3.8% 3.6% 3.4% 3.2% 3.0% 2.8%
2001 2002 2003 2004 2005YTD
4.27%
4.25%
2.89%
4.37%
4.31%
3.14%
3.99%
3.97%
3.21%
3.84%
3.84%
3.39%
3.86%
3.84%
3.58%
Sandler Peer Group
Mid Cap Group
Provident
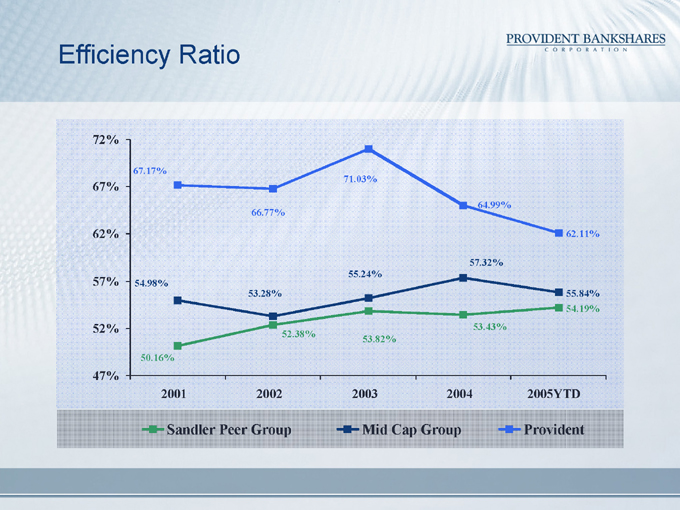
Efficiency Ratio
72% 67% 62% 57% 52% 47%
2001 2002 2003 2004 2005YTD
67.17%
54.98%
50.16%
66.77%
53.28%
52.38%
71.03%
55.24%
53.82%
64.99%
57.32%
53.43%
62.11%
55.84%
54.19%
Sandler Peer Group
Mid Cap Group
Provident
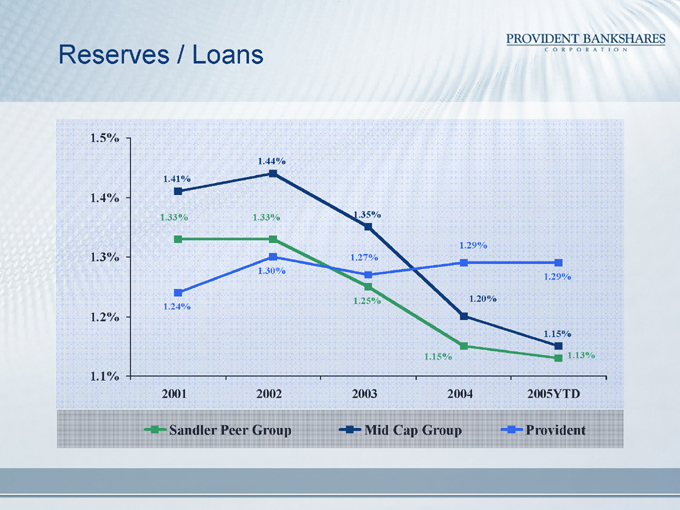
Reserves / Loans
1.5% 1.4% 1.3% 1.2% 1.1%
2001 2002 2003 2004 2005YTD
1.41%
1.33%
1.24%
1.44%
1.33%
1.30%
1.35%
1.27%
1.25%
1.29%
1.20%
1.15%
1.29%
1.15%
1.13%
Sandler Peer Group
Mid Cap Group
Provident
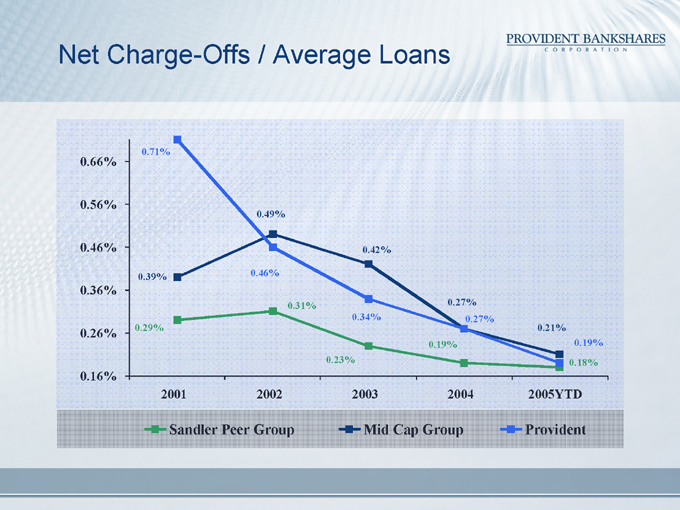
Net Charge-Offs / Average Loans
0.66% 0.56% 0.46% 0.36% 0.26% 0.16%
2001 2002 2003 2004 2005YTD
0.71%
0.39%
0.29%
0.49%
0.46%
0.31%
0.23%
0.42%
0.34%
0.19%
0.27%
0.27%
0.21%
0.19%
0.18%
Sandler Peer Group
Mid Cap Group
Provident
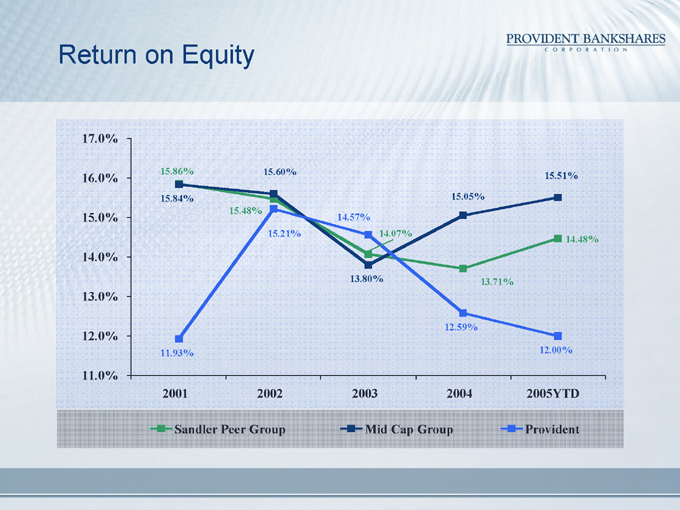
Return on Equity
17.0% 16.0% 15.0% 14.0% 13.0% 12.0% 11.0%
2001 2002 2003 2004 2005YTD
15.86%
15.84%
11.93%
15.60%
15.48%
15.21%
14.57%
14.07%
13.80%
15.05%
13.71%
12.59%
15.51%
14.48%
12.00%
Sandler Peer Group
Mid Cap Group
Provident
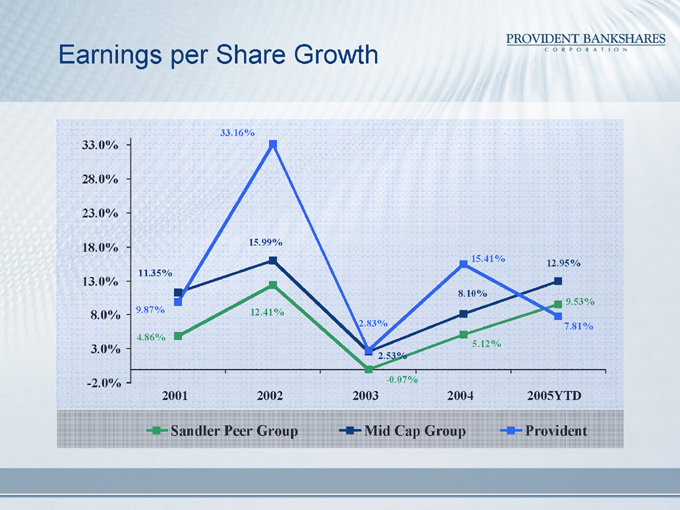
Earnings per Share Growth
33.0% 28.0% 23.0% 18.0% 13.0% 8.0% 3.0% -2.0%
2001 2002 2003 2004 2005YTD
11.35%
9.87%
4.86%
33.16%
15.99%
12.41%
2.83%
2.53%
-0.07%
15.41%
8.10%
5.12%
12.95%
9.53%
7.81%
Sandler Peer Group
Mid Cap Group
Provident
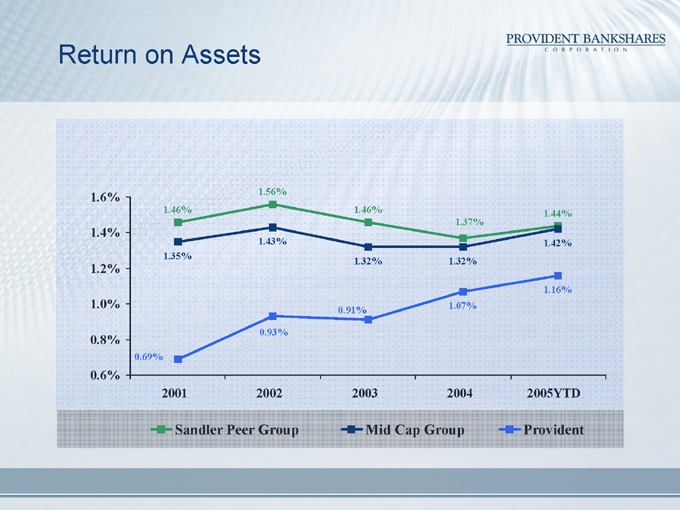
Return on Assets
1.6% 1.4% 1.2% 1.0% 0.8% 0.6%
2001 2002 2003 2004 2005YTD
1.46%
1.35%
0.69%
1.56%
1.43%
0.93%
1.46%
1.32%
0.91%
1.37%
1.32%
1.07%
1.44%
1.42%
1.16%
Sandler Peer Group
Mid Cap Group
Provident
PROGRAM OVERVIEW
Kevin Byrnes
President and Chief Operating Officer
CONVENIENT BANKING
Ann Clair
Managing Director, Sales Management

Convenient Banking
Banking Channels
In Store Banking
Products
Future Opportunities
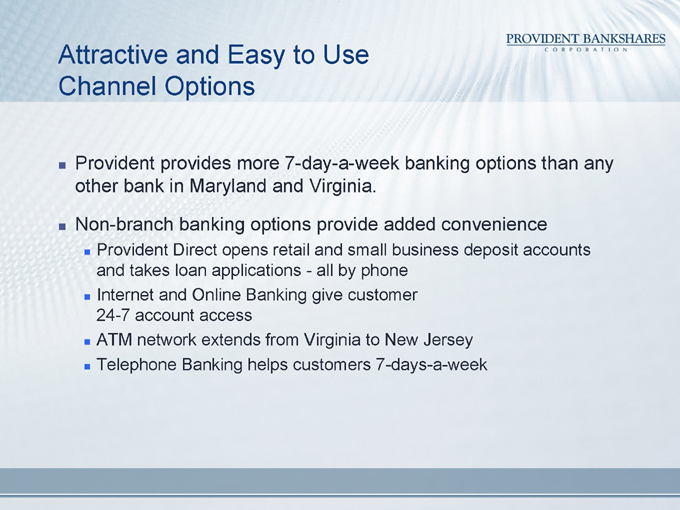
Attractive and Easy to Use Channel Options
Provident provides more 7-day-a-week banking options than any other bank in Maryland and Virginia.
Non-branch banking options provide added convenience
Provident Direct opens retail and small business deposit accounts and takes loan applications—all by phone
Internet and Online Banking give customer 24-7 account access
ATM network extends from Virginia to New Jersey
Telephone Banking helps customers 7-days-a-week
In Store Network Why We Are Successful
We have the right store Partners
Our Program supports success
We hire and train the right People
EDLP Product line
We Have the Right Store Partners
Store partnerships primarily with Superfresh, Shoppers Food Warehouse, Wal-Mart and BJ’s Wholesale Club
Target similar customer segments
Employ complementary pricing methods
Select stores where we will be successful
Our Program Supports Success
Independent In-store network structure
Value In-store branch contribution
Capitalize on 65,000 sq. ft. In-store lobbies
Market to 15,000 customers who visit our stores each week
Provide attractive variable compensation
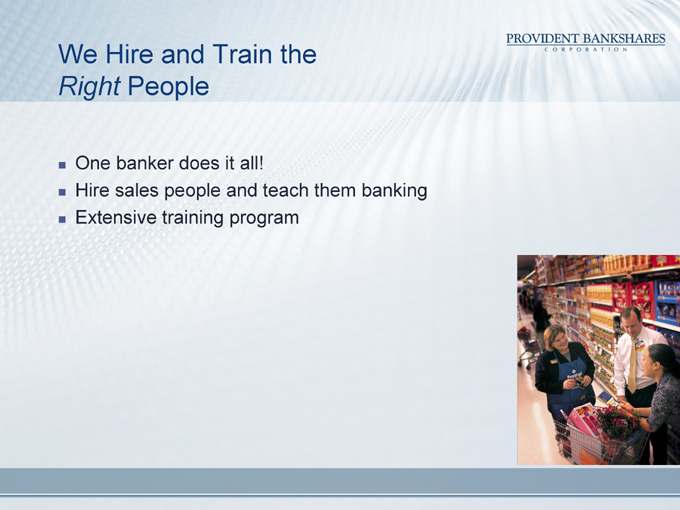
We Hire and Train the
Right People
One banker does it all!
Hire sales people and teach them banking
Extensive training program
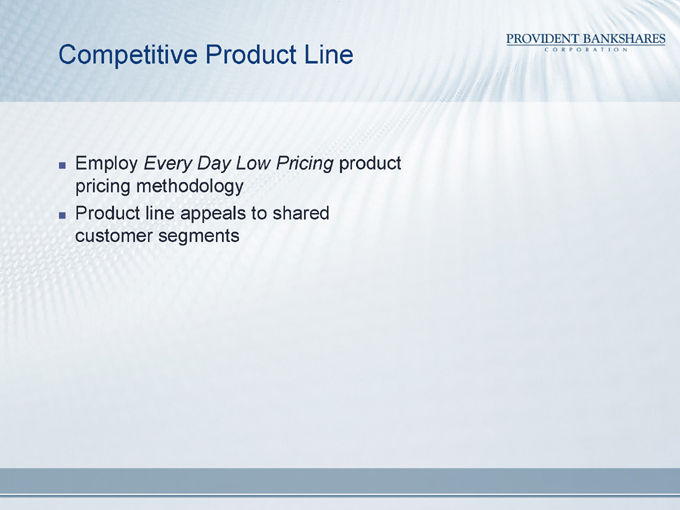
Competitive Product Line
Employ Every Day Low Pricing product pricing methodology
Product line appeals to shared customer segments
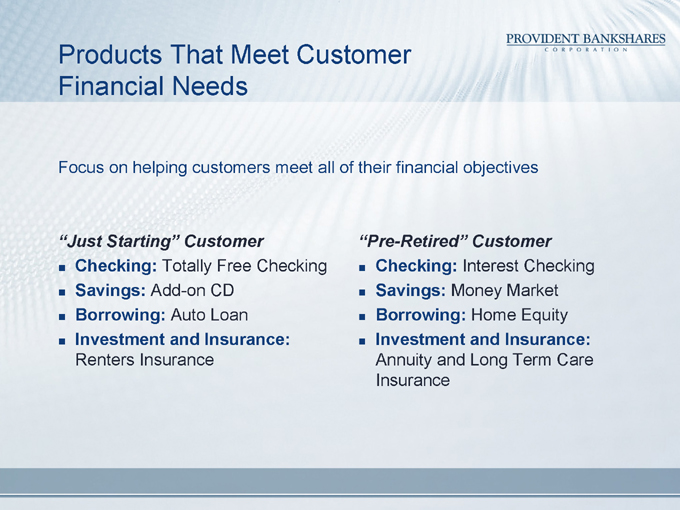
Products That Meet Customer Financial Needs
Focus on helping customers meet all of their financial objectives
“Just Starting” Customer
Checking: Totally Free Checking
Savings: Add-on CD
Borrowing: Auto Loan
Investment and Insurance: Renters Insurance
“Pre-Retired” Customer
Checking: Interest Checking
Savings: Money Market
Borrowing: Home Equity
Investment and Insurance: Annuity and Long Term Care Insurance
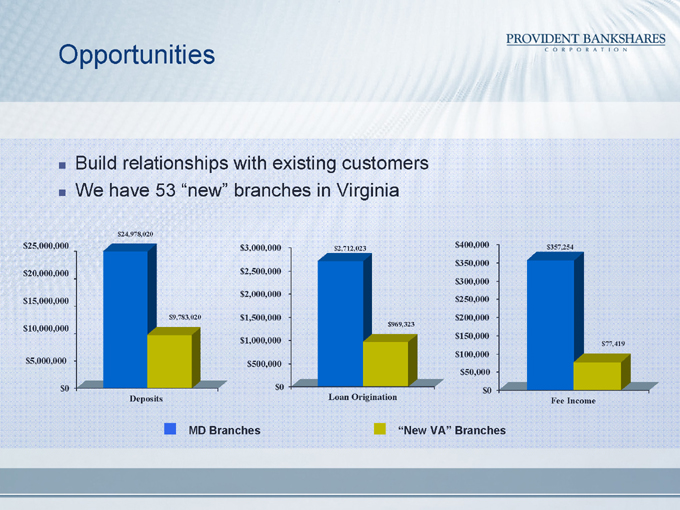
Opportunities
Build relationships with existing customers
We have 53 “new” branches in Virginia
$25,000,000 $20,000,000 $15,000,000 $10,000,000 $5,000,000 $0 $24,978,020 $9,783,020
Deposits $3,000,000 $2,500,000 $2,000,000 $1,500,000 $1,000,000 $500,000 $0 $2,712,023 $969,323
Loan Origination $400,000 $350,000 $300,000 $250,000 $200,000 $150,000 $100,000 $50,000 $0 $357,254 $77,419
Fee Income
MD Branches
“New VA” Branches
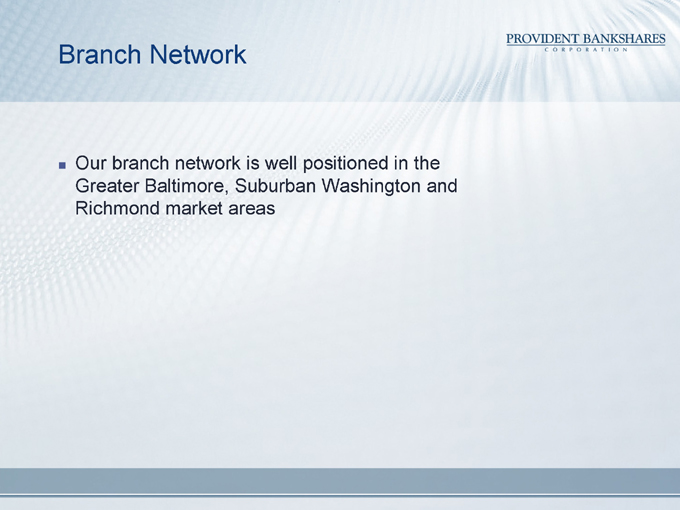
Branch Network
Our branch network is well positioned in the Greater Baltimore, Suburban Washington and Richmond market areas

CONSUMER LENDING
Eric Dawes
Managing Director, Consumer Lending Division
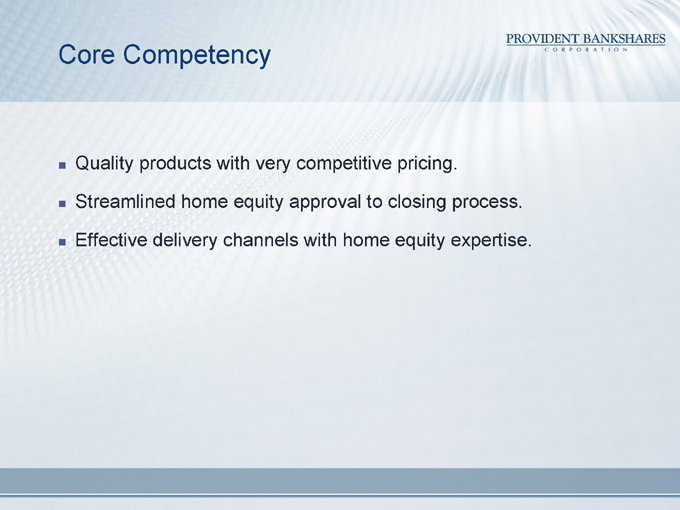
Core Competency
Quality products with very competitive pricing.
Streamlined home equity approval to closing process.
Effective delivery channels with home equity expertise.
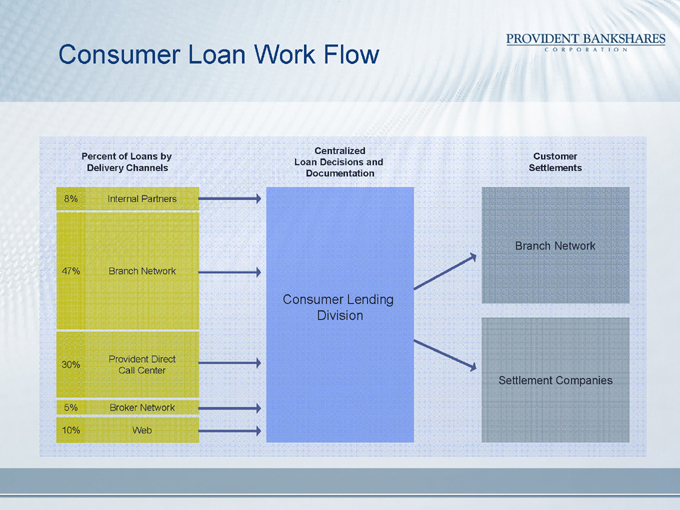
Consumer Loan Work Flow
Percent of Loans by Delivery Channels
8% Internal Partners
47% Branch Network
Provident Direct
30%
Call Center
5% Broker Network
10% Web
Centralized Loan Decisions and Documentation
Consumer Lending Division
Customer Settlements
Branch Network
Settlement Companies
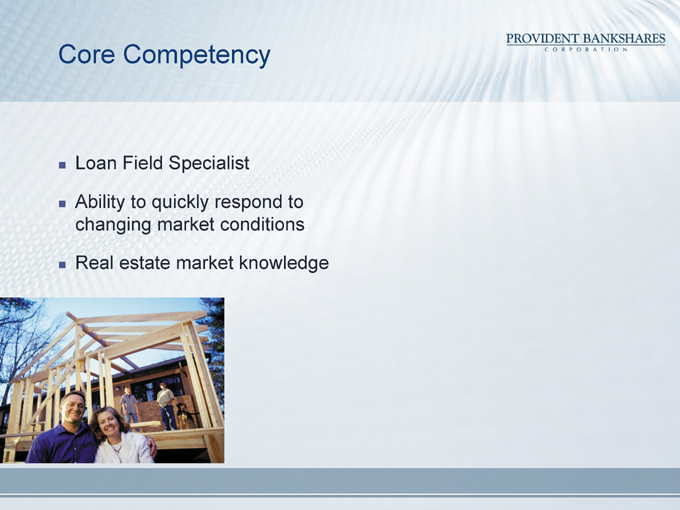
Core Competency
Loan Field Specialist
Ability to quickly respond to changing market conditions
Real estate market knowledge
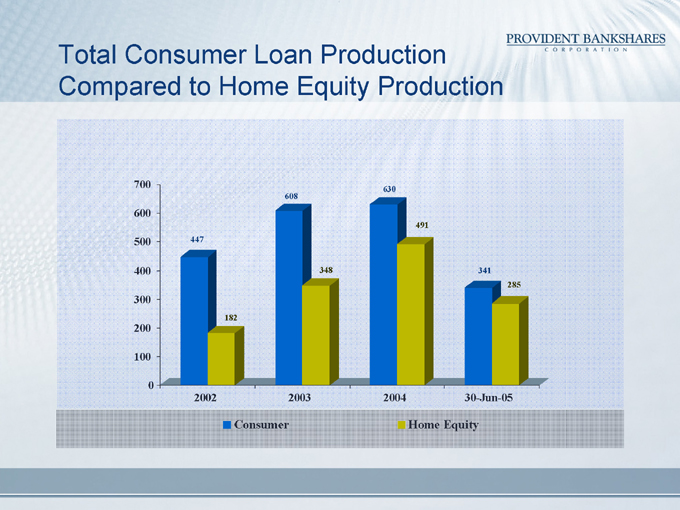
Total Consumer Loan Production Compared to Home Equity Production
700 600 500 400 300 200 100 0
2002 2003 2004 30-Jun-05
447
182
608
348
630
491
341
285
Consumer
Home Equity
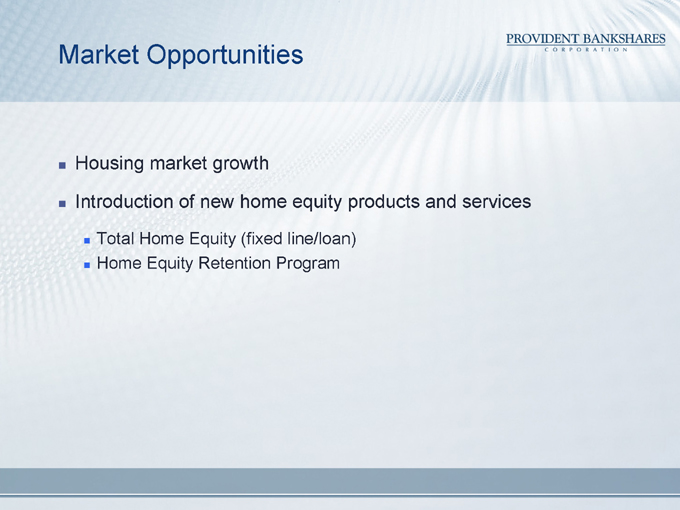
Market Opportunities
Housing market growth
Introduction of new home equity products and services
Total Home Equity (fixed line/loan) Home Equity Retention Program
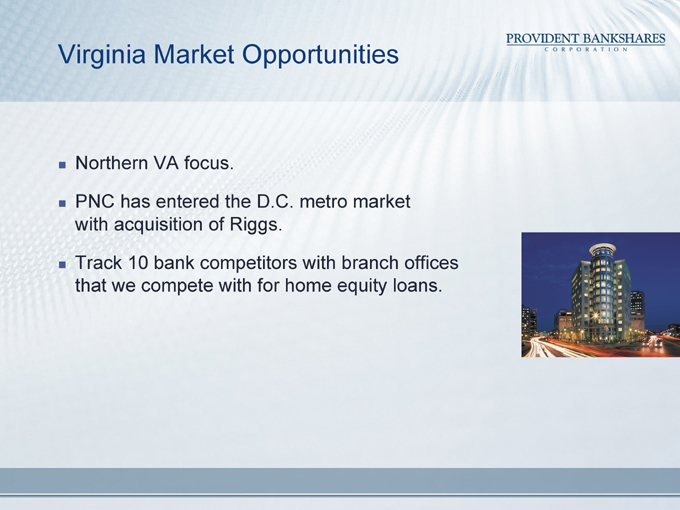
Virginia Market Opportunities
Northern VA focus.
PNC has entered the D.C. metro market with acquisition of Riggs.
Track 10 bank competitors with branch offices that we compete with for home equity loans.
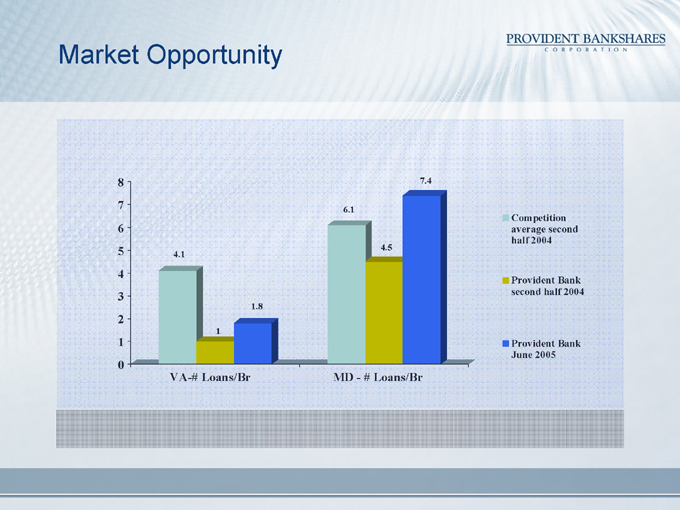
Market Opportunity
8 7 6 5 4 3 2 1 0
4.1
1
1.8
VA-# Loans/Br
6.1
4.5
7.4
MD - # Loans/Br
Competition average second half 2004
Provident Bank second half 2004
Provident Bank June 2005
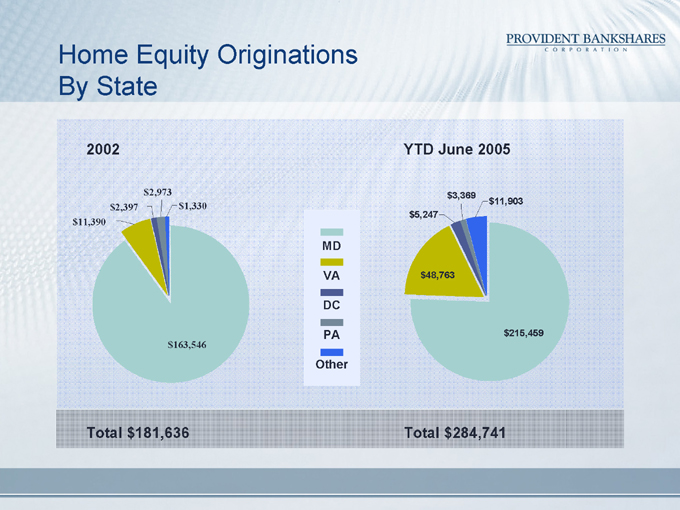
Home Equity Originations By State
2002 $11,390 $2,397 $2,973 $1,330 $163,546
MD
VA
DC
PA
Other
YTD June 2005 $5,247 $3,369 $11,903 $48,763 $215,459
Total $181,636
Total $284,741
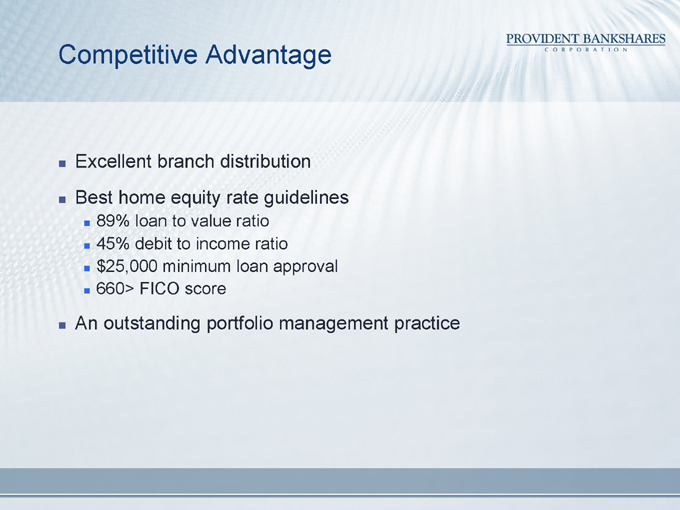
Competitive Advantage
Excellent branch distribution Best home equity rate guidelines
89% loan to value ratio
45% debit to income ratio
$25,000 minimum loan approval
660> FICO score
An outstanding portfolio management practice
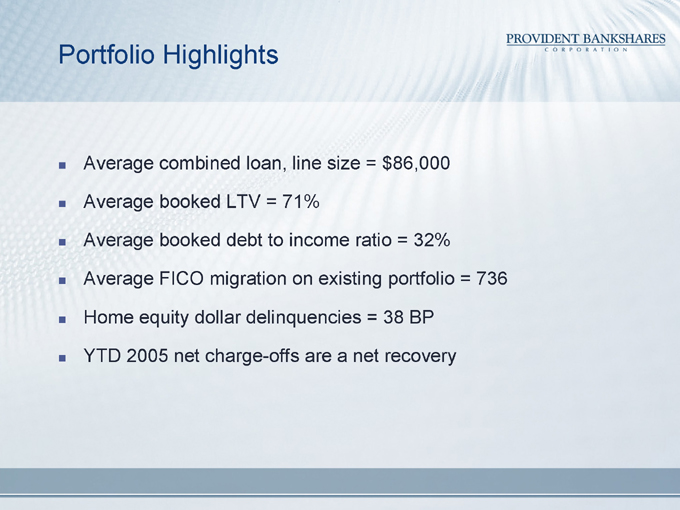
Portfolio Highlights
Average combined loan, line size = $86,000
Average booked LTV = 71%
Average booked debt to income ratio = 32%
Average FICO migration on existing portfolio = 736
Home equity dollar delinquencies = 38 BP
YTD 2005 net charge-offs are a net recovery
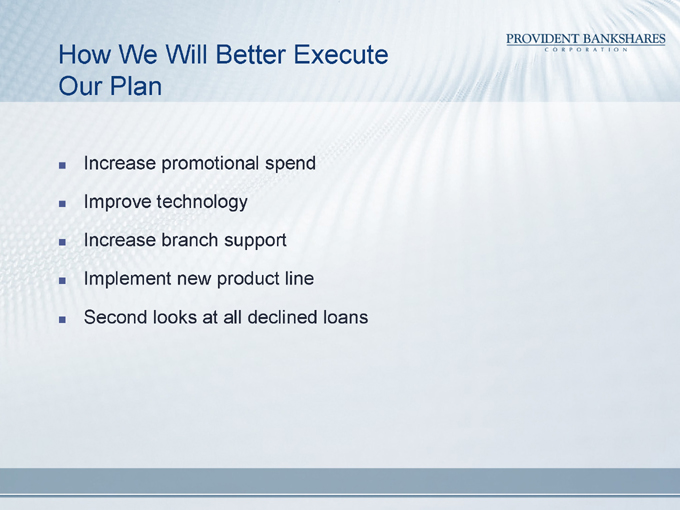
How We Will Better Execute Our Plan
Increase promotional spend
Improve technology
Increase branch support
Implement new product line
Second looks at all declined loans

CASH MANAGEMENT
John Goedeke
Senior Vice President / Division Head Commercial Services Division

Cash Management
History
Product offerings
Outsourcing
Cash Management
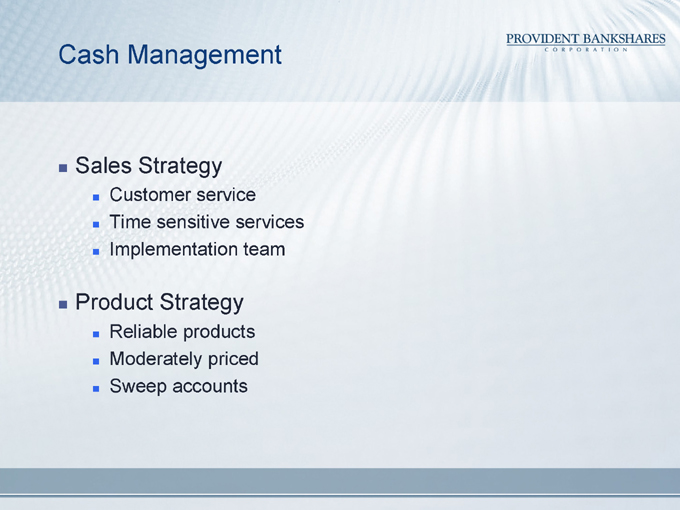
Sales Strategy
Customer service
Time sensitive services
Implementation team
Product Strategy
Reliable products
Moderately priced
Sweep accounts
Cash Management
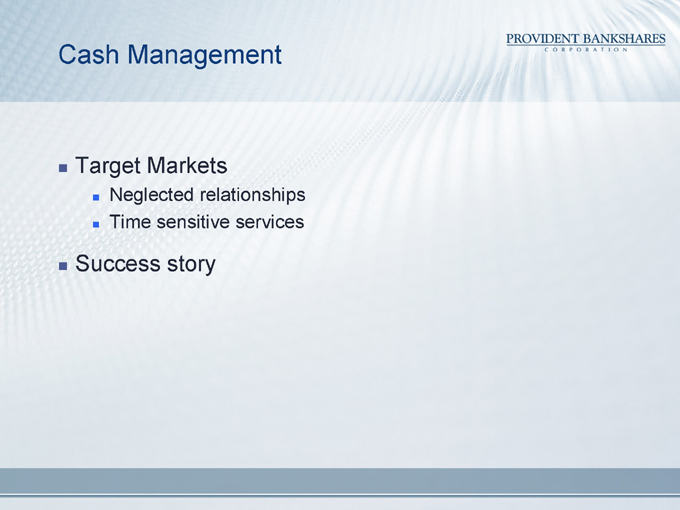
Target Markets
Neglected relationships
Time sensitive services
Success story
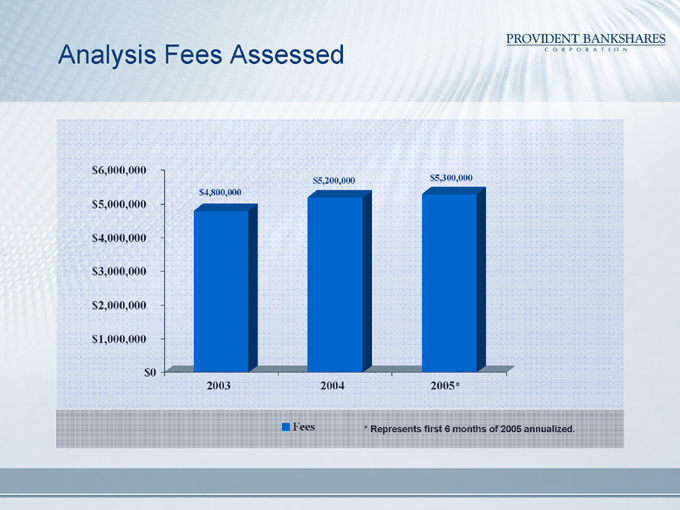
Analysis Fees Assessed
$6,000,000 $5,000,000 $4,000,000 $3,000,000 $2,000,000 $1,000,000 $0
2003 2004 2005* $4,800,000 $5,200,000 $5,300,000
Fees
* Represents first 6 months of 2005 annualized.
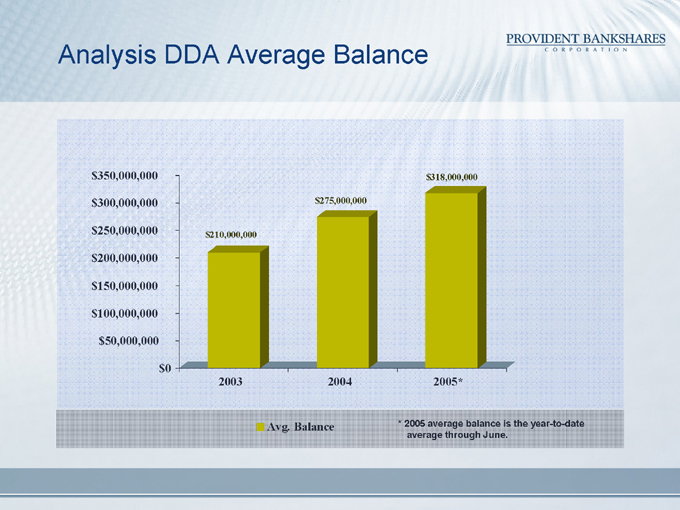
Analysis DDA Average Balance
$350,000,000 $300,000,000 $250,000,000 $200,000,000 $150,000,000 $100,000,000 $50,000,000 $0
2003 2004 2005* $210,000,000 $275,000,000 $318,000,000
Avg. Balance
* 2005 average balance is the year-to-date average through June.
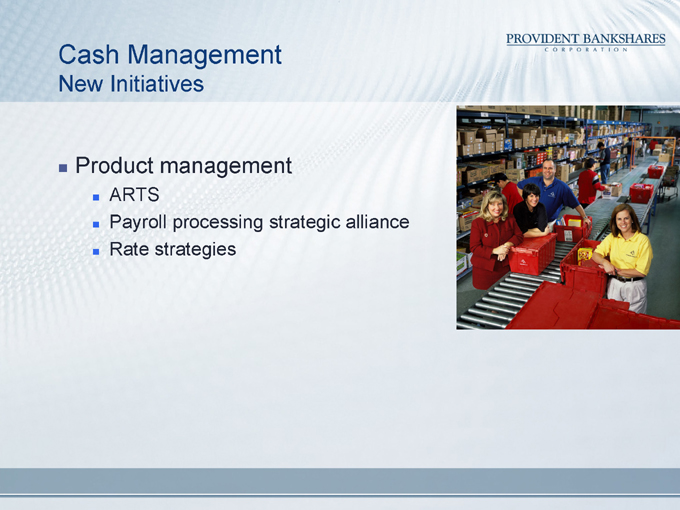
Cash Management
New Initiatives
Product management
ARTS
Payroll processing strategic alliance
Rate strategies
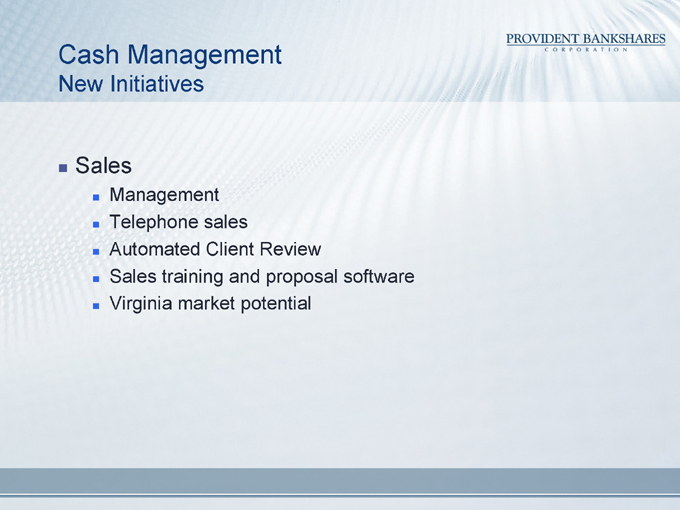
Cash Management
New Initiatives
Sales
Management
Telephone sales
Automated Client Review
Sales training and proposal software
Virginia market potential

DEVELOPMENT OF REAL ESTATE
LENDING INTO NEW MARKETS
Cecilia Hodges
Managing Director
George Decker
Senior Vice President
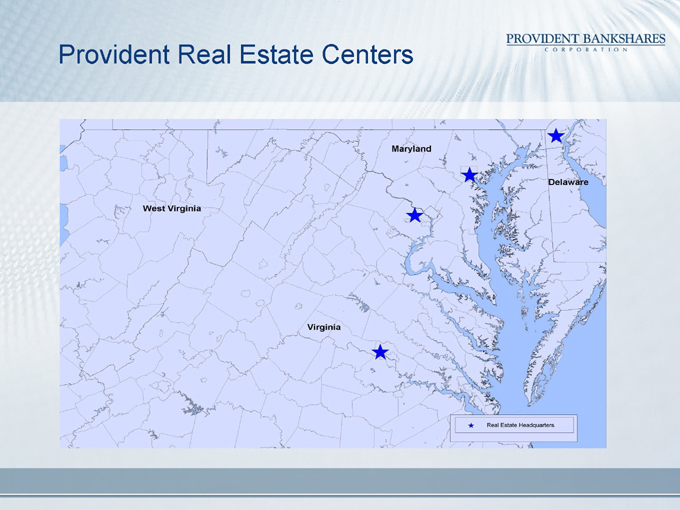
Provident Real Estate Centers
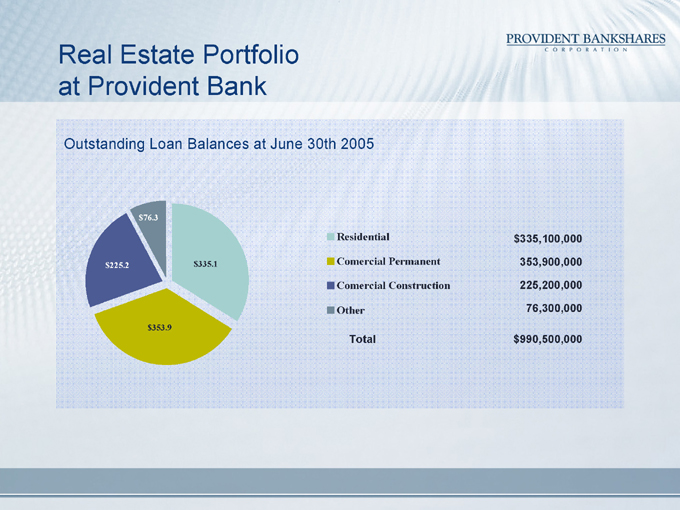
Real Estate Portfolio at Provident Bank
Outstanding Loan Balances at June 30th 2005 $225.2 $76.3 $335.1 $353.9
Residential $ 335,100,000
Comercial Permanent 353,900,000
Comercial Construction 225,200,000
Other 76,300,000
Total $ 990,500,000
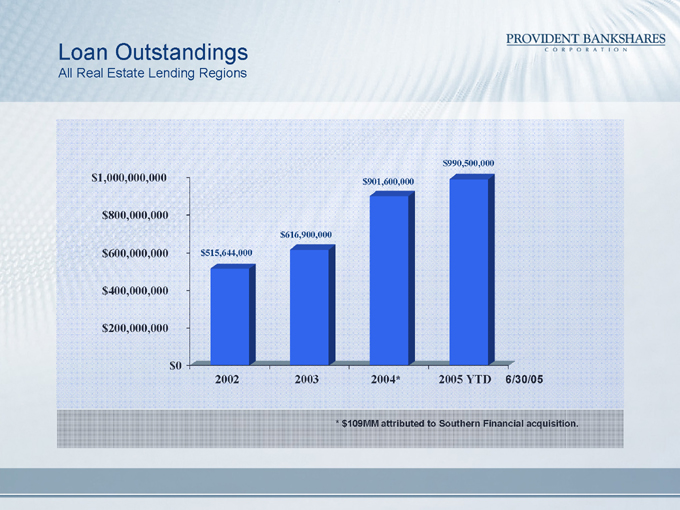
Loan Outstandings
All Real Estate Lending Regions $1,000,000,000 $800,000,000 $600,000,000 $400,000,000 $200,000,000 $0
2002 2003 2004* 2005 YTD 6/30/05 $515,644,000 $616,900,000 $901,600,000 $990,500,000
* $ 109MM attributed to Southern Financial acquisition.
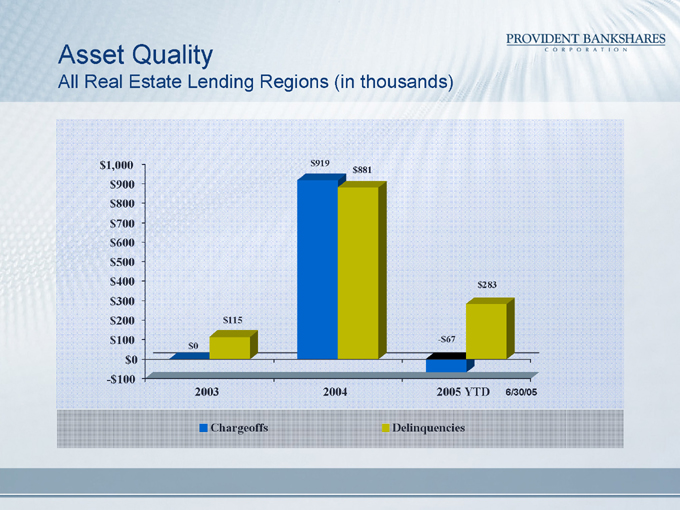
Asset Quality
All Real Estate Lending Regions (in thousands) $1,000 $900 $800 $700 $600 $500 $400 $300 $200 $100 $0
-$100
2003 2004 2005 YTD 6/30/05 $0 $115 $919 $881
-$67 $283
Chargeoffs
Delinquencies
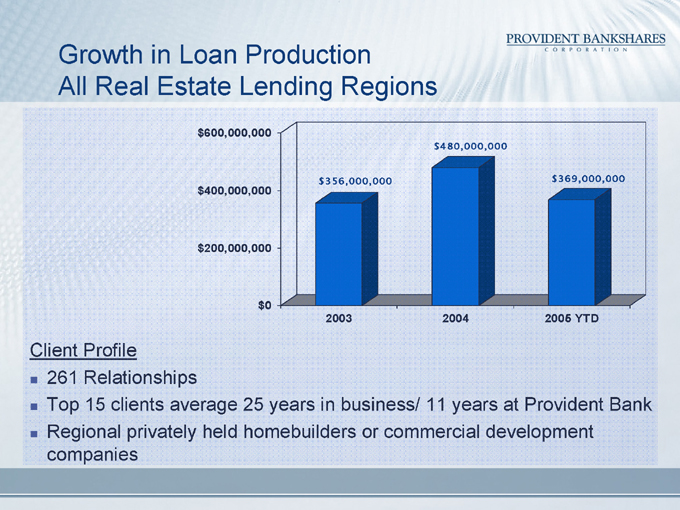
Growth in Loan Production All Real Estate Lending Regions $600,000,000 $400,000,000 $200,000,000 $0
2003 2004 2005 YTD $356,000,000 $480,000,000 $369,000,000
Client Profile
261 Relationships
Top 15 clients average 25 years in business/ 11 years at Provident Bank
Regional privately held homebuilders or commercial development companies
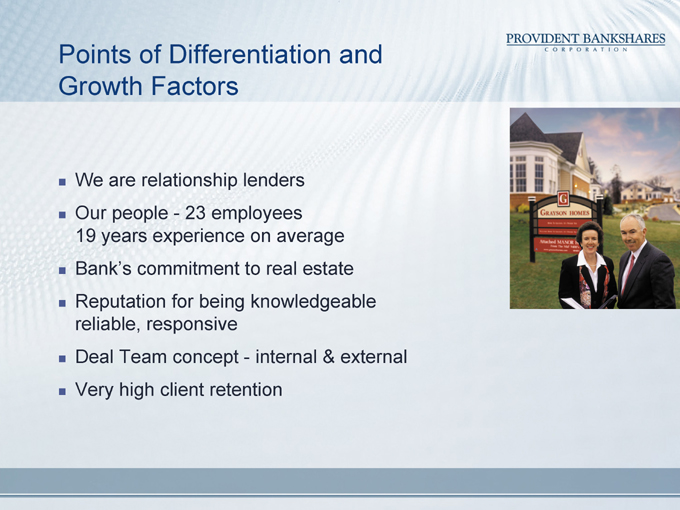
Points of Differentiation and Growth Factors
We are relationship lenders
Our people - 23 employees 19 years experience on average
Bank’s commitment to real estate
Reputation for being knowledgeable reliable, responsive
Deal Team concept - internal & external
Very high client retention
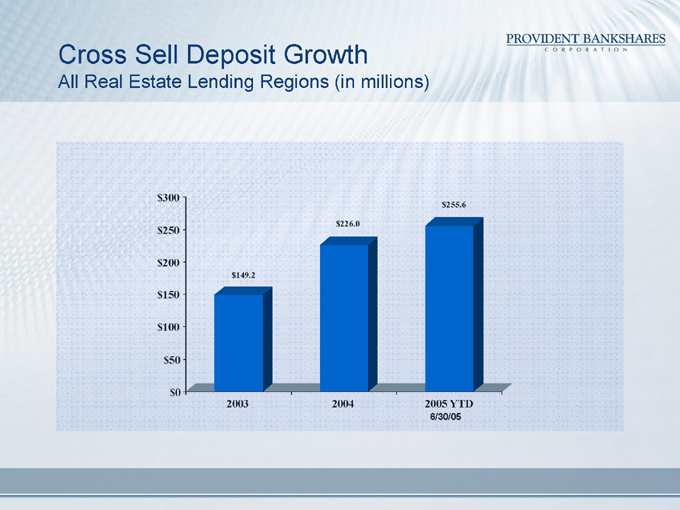
Cross Sell Deposit Growth
All Real Estate Lending Regions (in millions) $300 $250 $200 $150 $100 $50 $0
2003 2004 2005 YTD
6/30/05 $149.2 $226.0 $255.6

Virginia
Opportunities for Expansion
Additional opportunities in Washington Metro/DC Market
Central Virginia
Custom Homebuilder
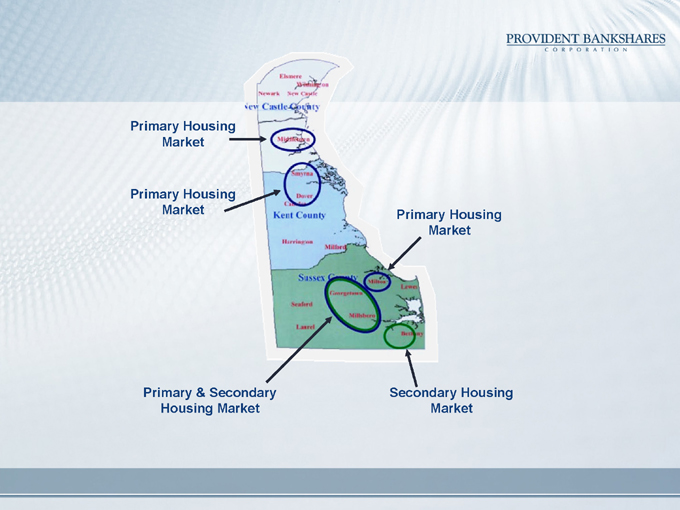
Primary Housing Market
Primary Housing Market
Primary & Secondary Housing Market
Secondary Housing Market
Primary Housing Market
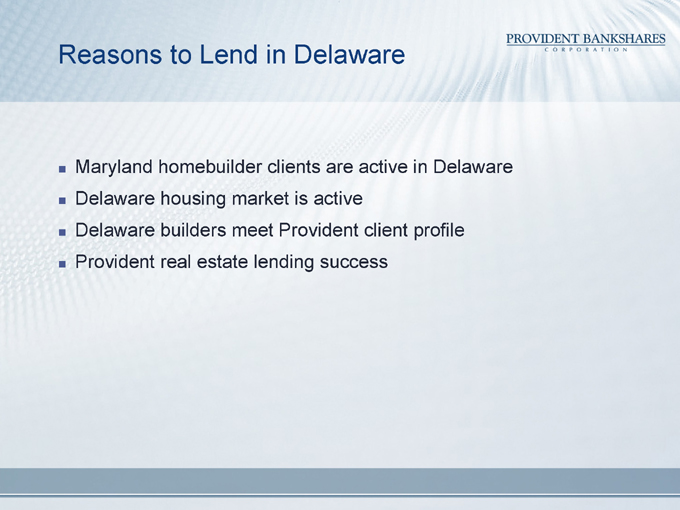
Reasons to Lend in Delaware
Maryland homebuilder clients are active in Delaware
Delaware housing market is active
Delaware builders meet Provident client profile
Provident real estate lending success

Expected Results of Lending in Delaware
Ongoing/expansion source of real estate loans
Opportunity to increase loans with Maryland builders
Opportunity to bring new clients to Provident

RELATIONSHIP SALES CULTURE
John King
Group Manager Consumer Banking

Relationship Sales Culture
Why the change?
What is it?
Where are we?
Relationship Sales Culture
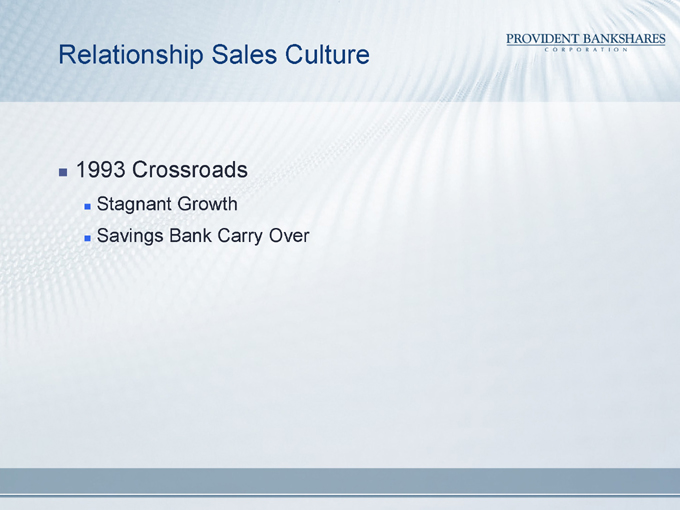
1993 Crossroads
Stagnant Growth
Savings Bank Carry Over
Relationship Sales Culture
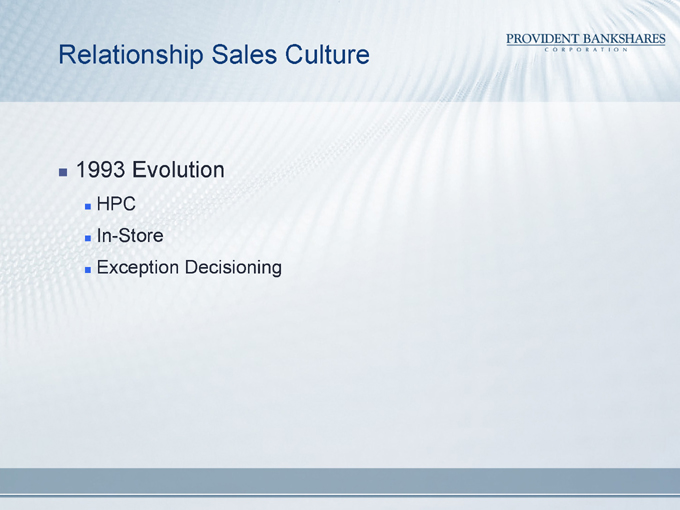
1993 Evolution
HPC
In-Store
Exception Decisioning
Relationship Sales Culture
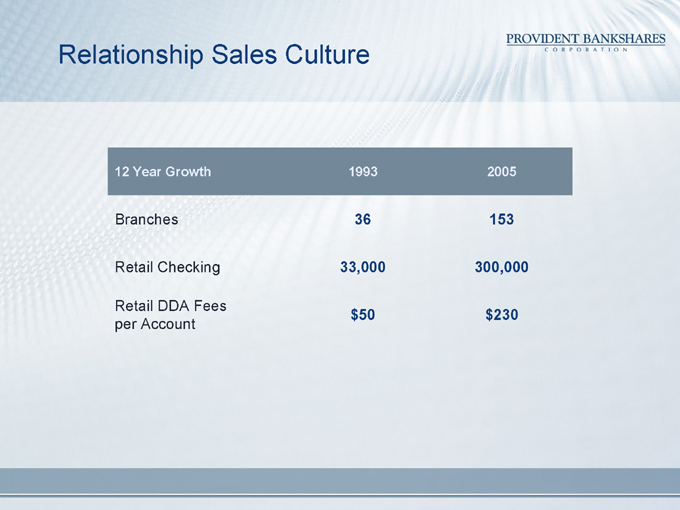
12 Year Growth 1993 2005
Branches 36 153
Retail Checking 33,000 300,000
Retail DDA Fees
$50 $230
per Account
Relationship Sales Culture
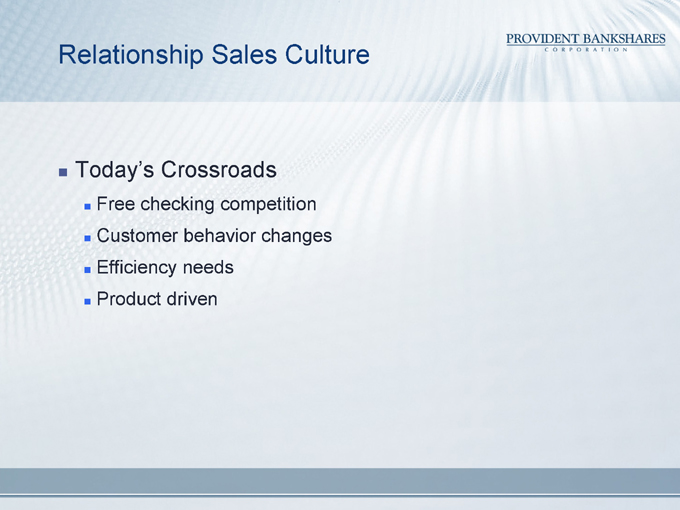
Today’s Crossroads
Free checking competition
Customer behavior changes
Efficiency needs
Product driven
Relationship Sales Culture
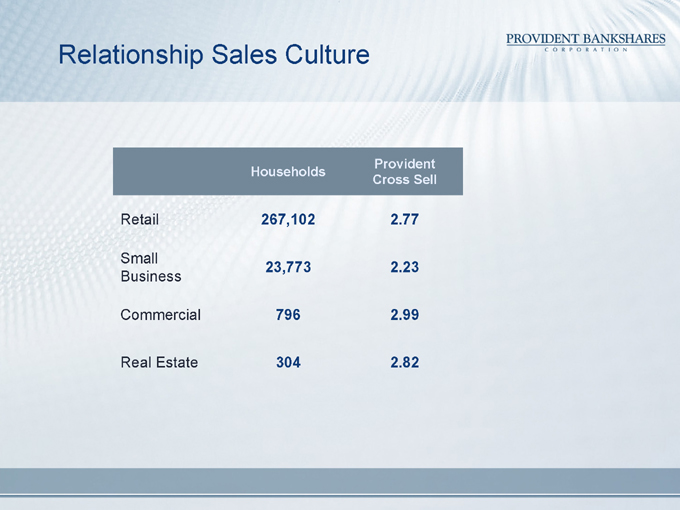
Households Provident Cross Sell
Retail 267,102 2.77
Small Business 23,773 2.23
Commercial 796 2.99
Real Estate 304 2.82
Relationship Sales Culture
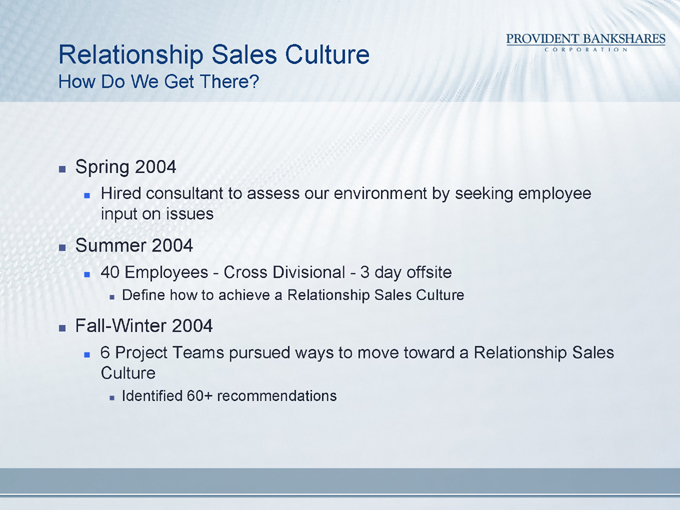
How Do We Get There?
Spring 2004
Hired consultant to assess our environment by seeking employee input on issues
Summer 2004
40 Employees - Cross Divisional - 3 day offsite
Define how to achieve a Relationship Sales Culture
Fall-Winter 2004
6 Project Teams pursued ways to move toward a Relationship Sales Culture
Identified 60+ recommendations
Relationship Sales Culture
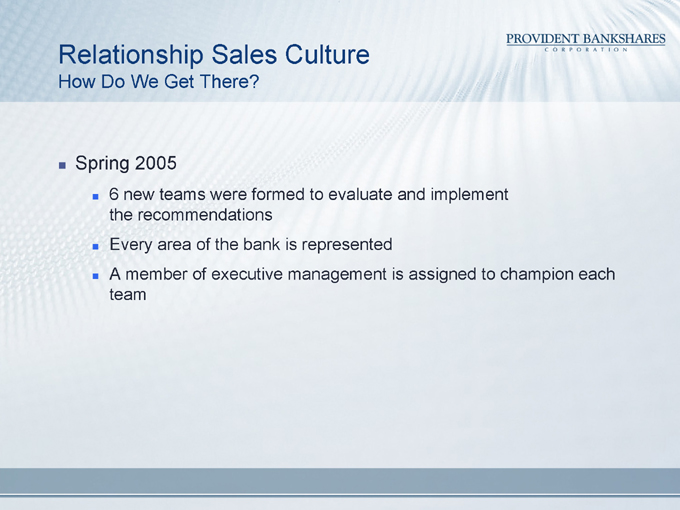
How Do We Get There?
Spring 2005
6 new teams were formed to evaluate and implement the recommendations
Every area of the bank is represented
A member of executive management is assigned to champion each team
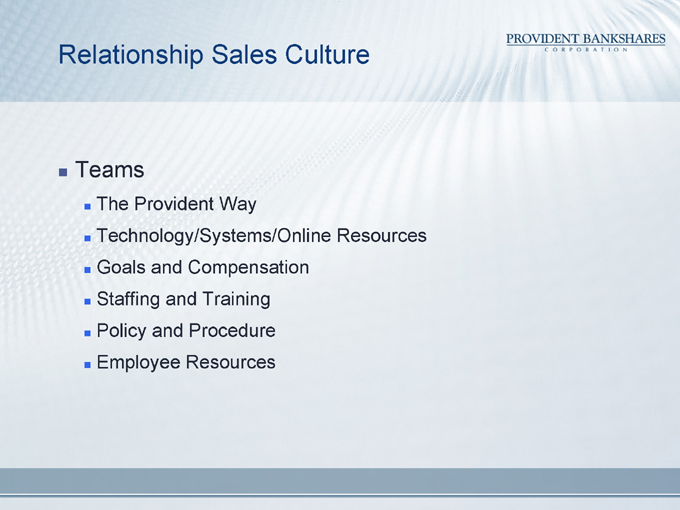
Relationship Sales Culture
Teams
The Provident Way
Technology/Systems/Online Resources
Goals and Compensation
Staffing and Training
Policy and Procedure
Employee Resources
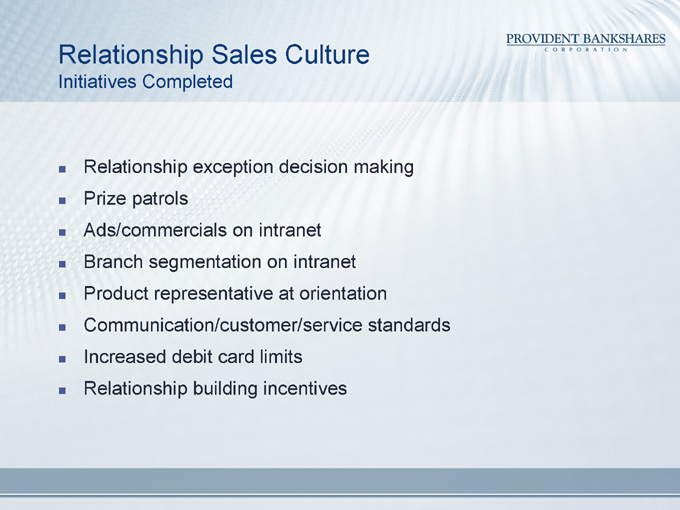
Relationship Sales Culture
Initiatives Completed
Relationship exception decision making
Prize patrols
Ads/commercials on intranet
Branch segmentation on intranet
Product representative at orientation
Communication/customer/service standards
Increased debit card limits
Relationship building incentives
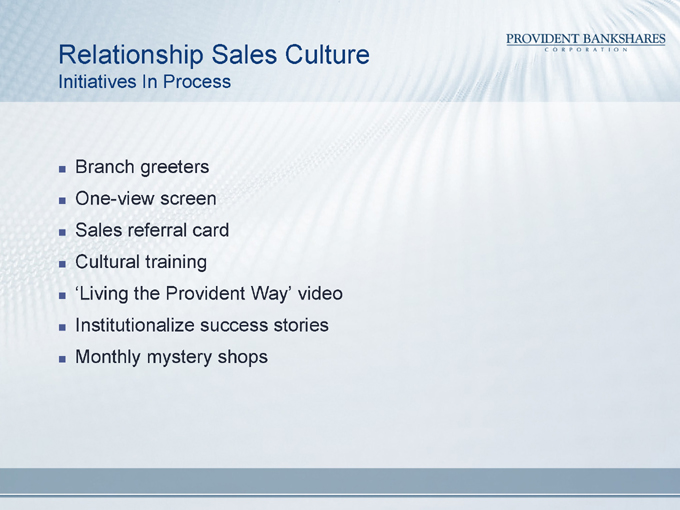
Relationship Sales Culture
Initiatives In Process
Branch greeters
One-view screen
Sales referral card
Cultural training
‘Living the Provident Way’ video
Institutionalize success stories
Monthly mystery shops
Relationship Sales Culture
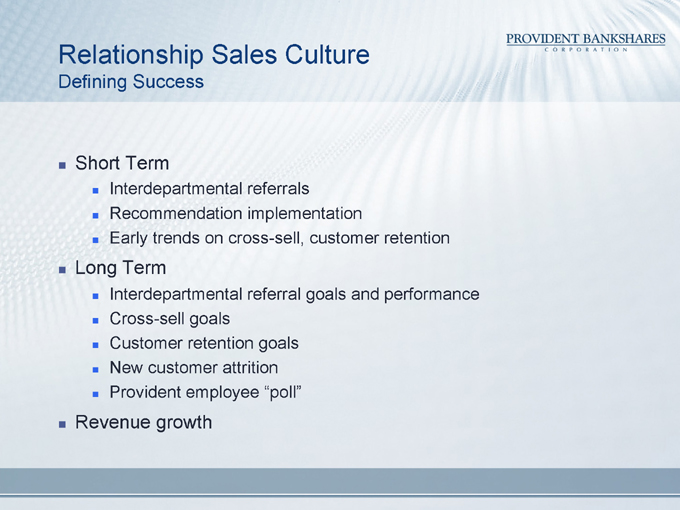
Defining Success
Short Term
Interdepartmental referrals
Recommendation implementation
Early trends on cross-sell, customer retention
Long Term
Interdepartmental referral goals and performance
Cross-sell goals
Customer retention goals
New customer attrition
Provident employee “poll”
Revenue growth

Relationship Sales Culture
Success Story
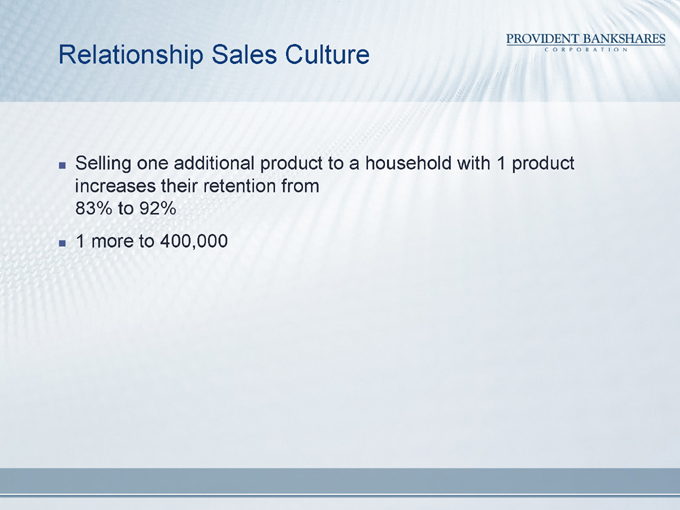
Relationship Sales Culture
Selling one additional product to a household with 1 product increases their retention from 83% to 92%
1 more to 400,000

SMALL BUSINESS
Rich Hunt
SVP / Division Head, Small Business
Jim Prusak
SVP, Consumer Banking Division
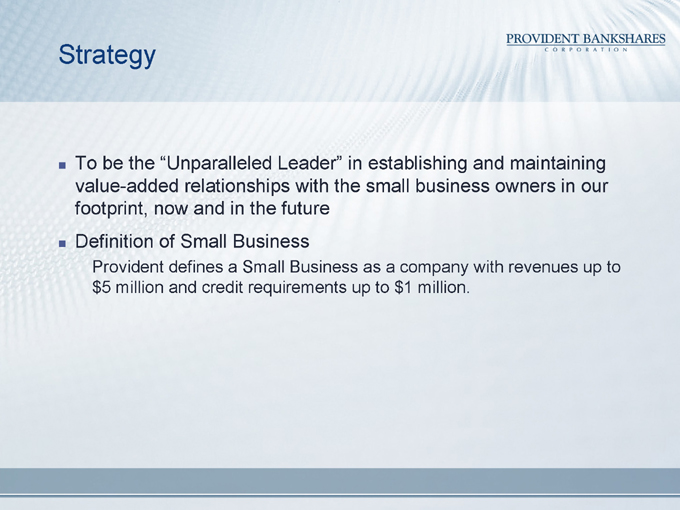
Strategy
To be the “Unparalleled Leader” in establishing and maintaining value-added relationships with the small business owners in our footprint, now and in the future
Definition of Small Business
Provident defines a Small Business as a company with revenues up to $5 million and credit requirements up to $1 million.
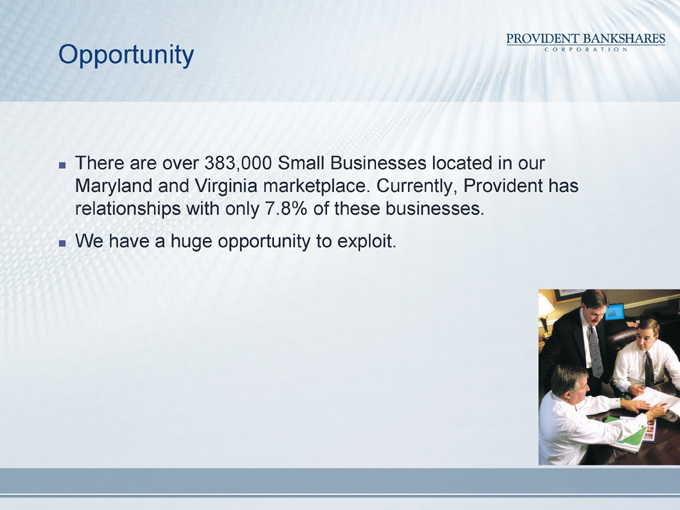
Opportunity
There are over 383,000 Small Businesses located in our Maryland and Virginia marketplace. Currently, Provident has relationships with only 7.8% of these businesses.
We have a huge opportunity to exploit.
Challenges
Focusing on cross sell, not just being a lender
Increased competition
Establishing effective partnerships both internally and externally
Centralized support and continued product enhancement
Effective delivery channels
Sales Philosophy
A business loan is not enough. Our sales force will go after the company’s entire banking relationship: business, owner and employees.
Developing relationships through persistent cross-selling is our standard for excellence.
Delivery Channels
How it all fits together
Relationship Managers
Commercial Branch Managers
Small Business Financial Consultants (Provident Direct Call Center Team)
Branch Managers
Right Size Bank - Providing the small business customer with choices

Partnerships
Small Business Division H/R TRAINING
COLLECTIONS
MARKETING
CREDIT
CASH MANAGEMENT
CONSUMER
LENDING
COMMUNITY
BANKING
Branches
PIC
COURT SQUARE LEASING
COMMERCIAL
MIDDLE MARKET
COMMERCIAL
BRANCHES
PROVIDENT
DIRECT
LEGEND
SMALL BUSINESS SUPPORT
SMALL BUSINESS PARTNER
Branch Banking’s Small
Business Focus… Why are we having one
30,000 Small Business Customers
Importance of deepening these relationships:
The average small business customer life span with a bank is 7 years.
Increase customer loyalty by focusing on life cycle of business owner (it’s not just about commercial).
Capitalize on our branch network to deliver small business products to customer.

Small Business Focus
Commercial Branches
12 Commercial Branches in the Network
What is a Commercial Manager?
What is a Commercial Branch?
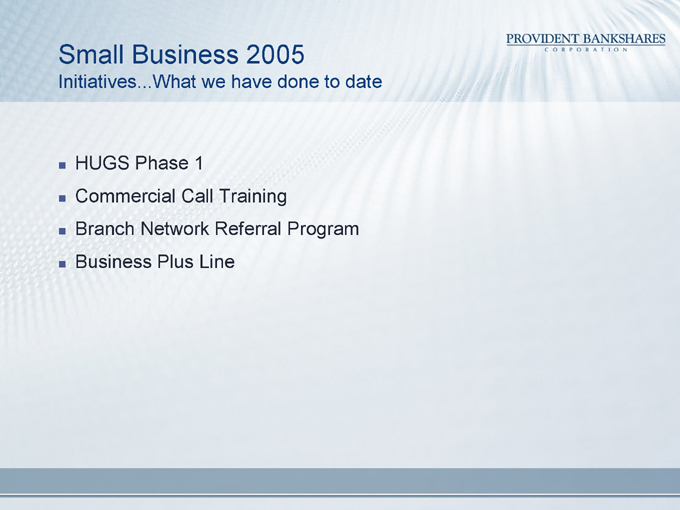
Small Business 2005
InitiativesWhat we have done to date
HUGS Phase 1
Commercial Call Training
Branch Network Referral Program
Business Plus Line
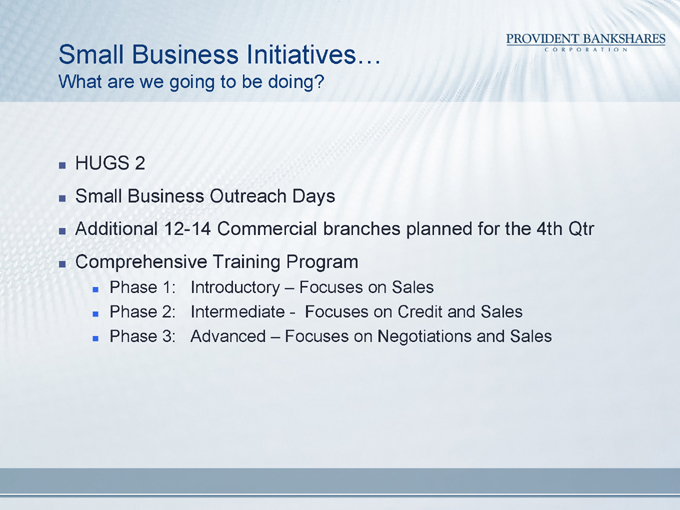
Small Business Initiatives…
What are we going to be doing?
HUGS 2
Small Business Outreach Days
Additional 12-14 Commercial branches planned for the 4th Qtr
Comprehensive Training Program
Phase 1: Introductory – Focuses on Sales
Phase 2: Intermediate - Focuses on Credit and Sales
Phase 3: Advanced – Focuses on Negotiations and Sales
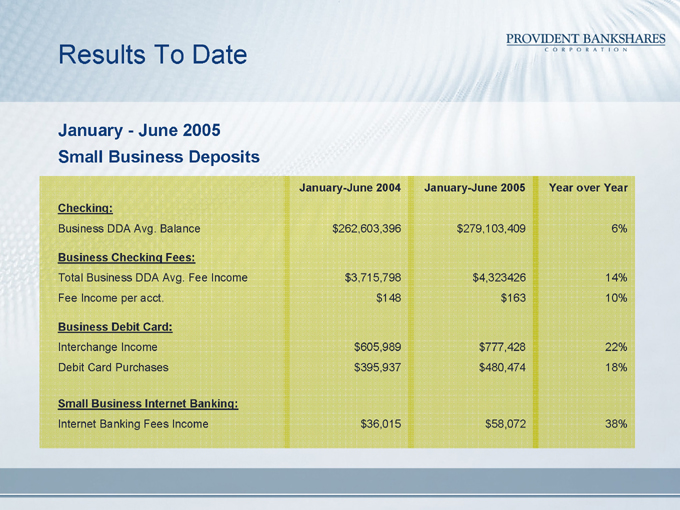
Results To Date
January - June 2005 Small Business Deposits
January-June 2004 January-June 2005 Year over Year
Checking:
Business DDA Avg. Balance $262,603,396 $279,103,409 6%
Business Checking Fees:
Total Business DDA Avg. Fee Income $3,715,798 $4,323426 14%
Fee Income per acct. $148 $163 10%
Business Debit Card:
Interchange Income $605,989 $777,428 22%
Debit Card Purchases $395,937 $480,474 18%
Small Business Internet Banking:
Internet Banking Fees Income $36,015 $58,072 38%
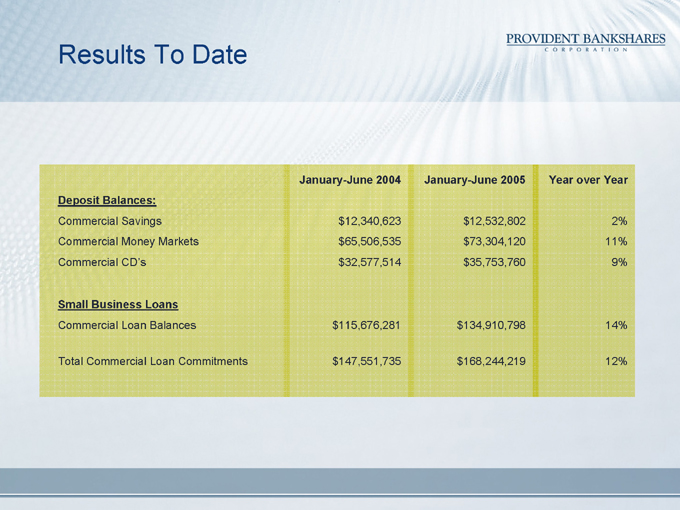
Results To Date
January-June 2004 January-June 2005 Year over Year
Deposit Balances:
Commercial Savings $12,340,623 $12,532,802 2%
Commercial Money Markets $65,506,535 $73,304,120 11%
Commercial CD’s $32,577,514 $35,753,760 9%
Small Business Loans
Commercial Loan Balances $115,676,281 $134,910,798 14%
Total Commercial Loan Commitments $147,551,735 $168,244,219 12%

NEW PRODUCTS/SERVICES AND
ADVERTISING STRATEGIES
Lillian Suffolk Kilroy
Chief Marketing Officer & Managing Director, Consumer Products
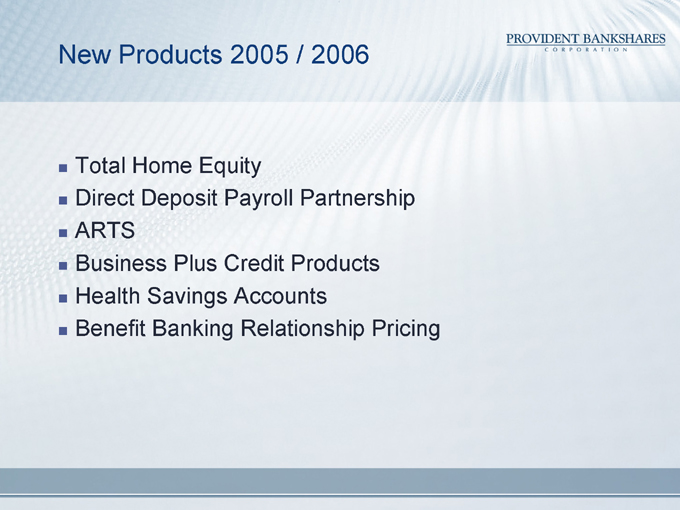
New Products 2005 / 2006
Total Home Equity
Direct Deposit Payroll Partnership
ARTS
Business Plus Credit Products
Health Savings Accounts
Benefit Banking Relationship Pricing

Health Savings Accounts
Product Definition
H.S.A. Accounts
Individually owned tax-favored account
Funds pay for current medical expenses
Provident H.S.A.
Interest checking, competitive rates and online access
Debit card access for purchases and ATM
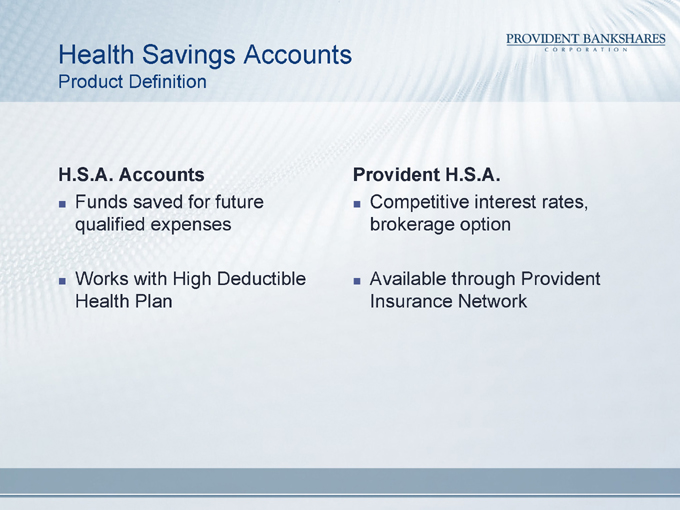
Health Savings Accounts
Product Definition
H.S.A. Accounts
Provident H.S.A.
Funds saved for future qualified expenses
Works with High Deductible Health Plan
Competitive interest rates, brokerage option
Available through Provident Insurance Network
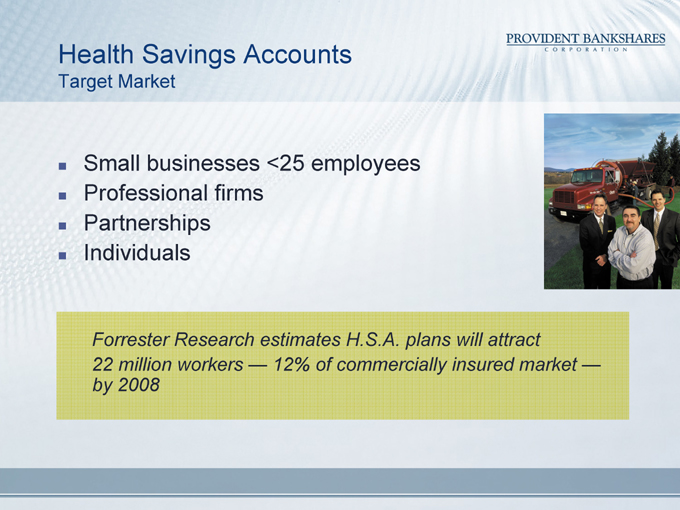
Health Savings Accounts
Target Market
Small businesses <25 employees
Professional firms
Partnerships
Individuals
Forrester Research estimates H.S.A. plans will attract 22 million workers — 12% of commercially insured market — by 2008
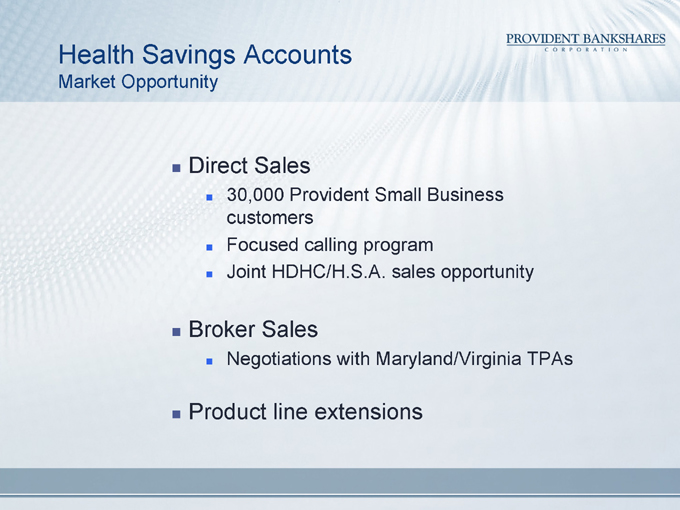
Health Savings Accounts
Market Opportunity
Direct Sales
30,000 Provident Small Business customers
Focused calling program
Joint HDHC/H.S.A. sales opportunity
Broker Sales
Negotiations with Maryland/Virginia TPAs
Product line extensions
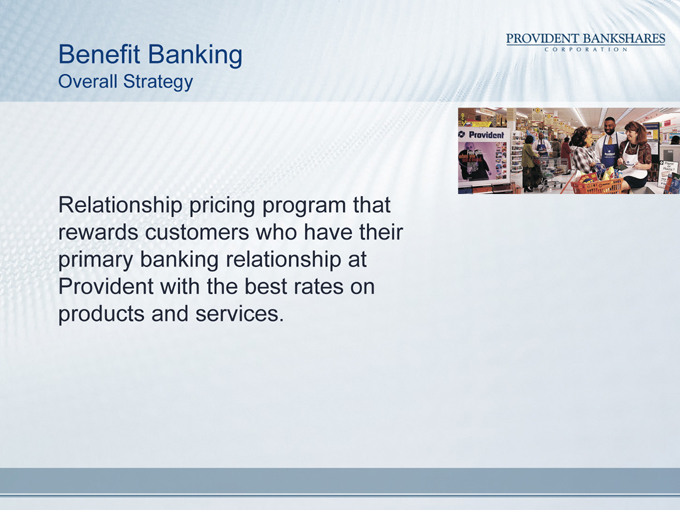
Benefit Banking
Overall Strategy
Relationship pricing program that rewards customers who have their primary banking relationship at Provident with the best rates on products and services.
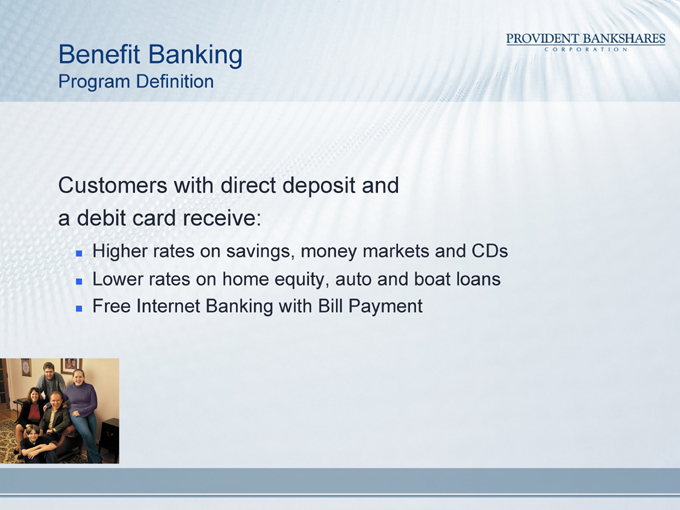
Benefit Banking
Program Definition
Customers with direct deposit and a debit card receive:
Higher rates on savings, money markets and CDs
Lower rates on home equity, auto and boat loans
Free Internet Banking with Bill Payment
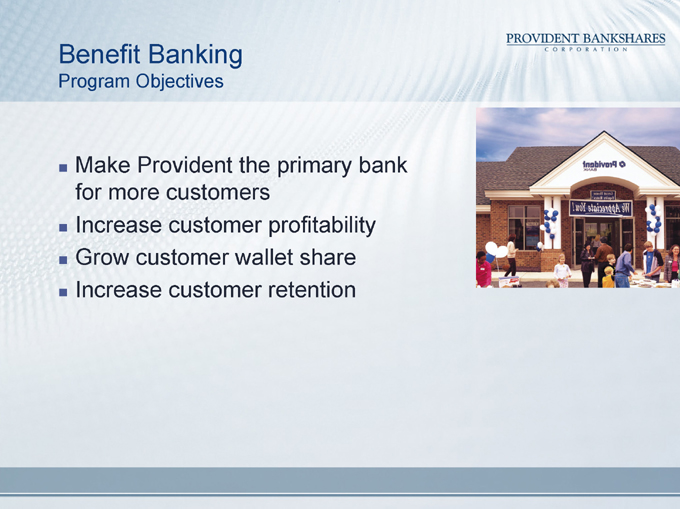
Benefit Banking
Program Objectives
Make Provident the primary bank for more customers
Increase customer profitability
Grow customer wallet share
Increase customer retention
Benefit Banking
Financials Benefits
A customer with checking, direct deposit and an active debit card contributes $282 per year
94,000 current customers qualify for Benefit Banking
Active promotional programs for acquisition, cross sell and retention in 2006

Provident Bank
Just the Right Size for You
Brand Position
Conveniently deliver the product/service depth and breath of big banks
With personal attention, market expertise and attention to detail provided by only the best community banks
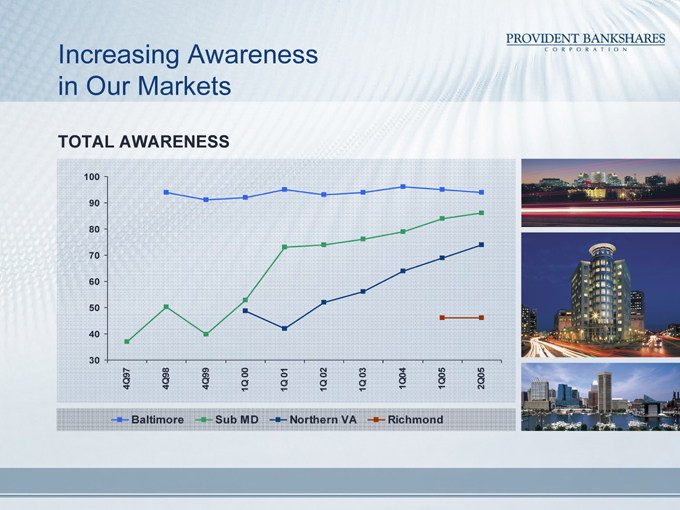
Increasing Awareness in Our Markets
TOTAL AWARENESS
100 90 80 70 60 50 40 30
4Q97 4Q98 4Q99 1Q 00 1Q 01 1Q 02 1Q 03 1Q04 1Q05 2Q05
Baltimore
Sub MD
Northern VA
Richmond
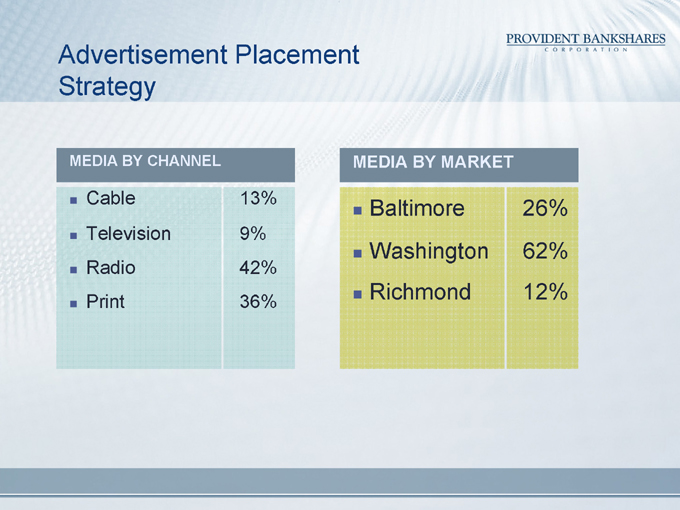
Advertisement Placement Strategy
MEDIA BY CHANNEL
MEDIA BY MARKET
Cable 13%
Television 9%
Radio 42%
Print 36%
Baltimore 26%
Washington 62%
Richmond 12%
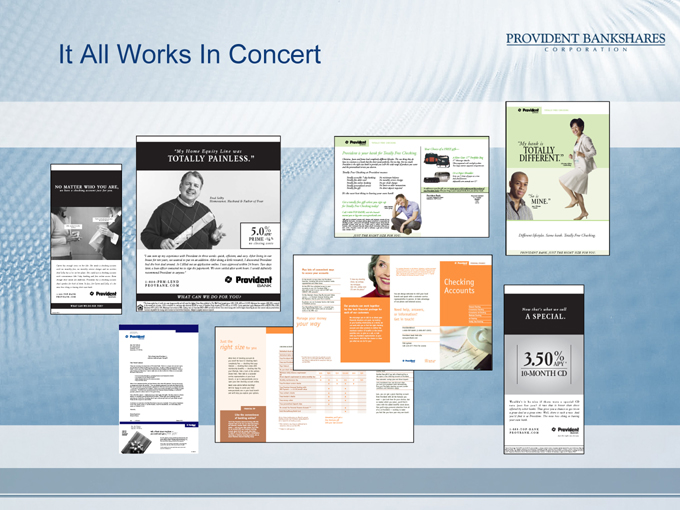
It All Works In Concert

PROVIDENT BANKSHARES CORPORATION
www.provbank.com
Contact
Media: Lillian Kilroy (410) 277-2833
Investment Community: Melissa Kelly (410) 277-2080