Exhibit 99.2

PROVIDENT BANKSHARES CORPORATION
November 2006

FORWARD-LOOKING STATEMENTS AND RISK FACTORS
This presentation contains “forward-looking statements” as that term is defined in the Private Securities Litigation Reform Act of 1995. These statements involve risks and uncertainties, which may cause results to differ materially from those set forth in the statements. The forward-looking statements may include statements regarding business strategies, intended results and future performance. Forward-looking statements are preceded by such terms as “expects,” “believes,” “anticipates,” “intends,” and similar expressions. No forward-looking statement can be guaranteed, and actual results may differ materially from those projected. The Company undertakes no obligation to publicly update any forward-looking statement, whether as a result of new information, future events, or otherwise. Forward-looking statements in this presentation should be evaluated together with the uncertainties that affect the Company’s business, particularly those mentioned under the headings “Forward-looking Statements” and “Item 1A. Risk Factors” in the Company’s Form 10-K for the year ended December 31, 2005, and in its reports on Form 10-Q and Form 8-K, which the Company incorporates by reference.
In the event that any non-GAAP financial information is described in any communication, including this presentation, please refer to the supplemental financial tables included on our website for the GAAP reconciliation of this information.

Agenda
Introduction Regional Overview Key Strategies Financial Performance

Introduction
Headquartered in Baltimore, Maryland
Total assets of $6.4 billion (as of 9/30/06)
Serves individuals, families, small businesses and larger companies in Greater Baltimore, Greater Washington and Central Virginia
Over 2,000 employees

Introduction
Provident Bank History
1886 Founded as a Mutual Thrift 1987 Converted to Commercial Bank 1993 Retail Banking Expansion 1997 Citizen’s Savings Bank Merger 2004 Southern Financial Merger
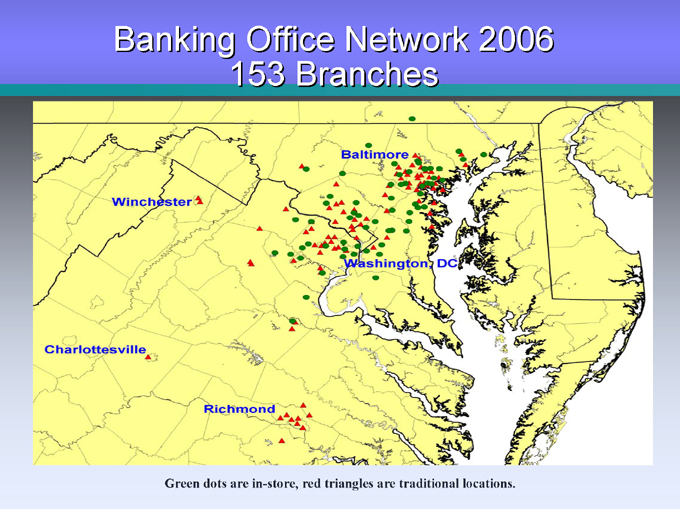
Banking Office Network 2006 153 Branches
Winchester
Baltimore
Richmond
Charlotteville
Washington DC
Green dots are in-store, red triangles are traditional locations.

Regional Overview
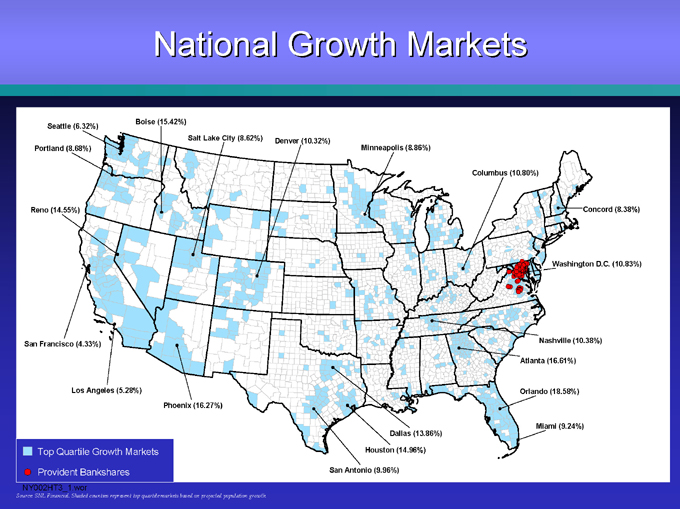
National Growth Markets
Seattle (6.32%)
Portland (8.68%)
Reno (14.55%)
San Francisco (4.33%)
Los Angeles (5.28%)
Phoenix (16.27%)
Boise (15.42%)
Salt Lake City (8.62%) Denver (10.32%)
Minneapolis (8.86%)
Columbus (10.80%)
Concord (8.38%)
Washington D.C. (10.83%)
Nashville (10.38%)
Atlanta (16.61%)
Orlando (18.58%)
Miami (9.24%)
Dallas (13.86%)
Houston (14.96%)
San Antonio (9.96%)
Top Quartile Growth Markets
Provident Bankshares
NY002HT3_1.wor
Source: SNL Financial. Shaded counties represent top quartile markets based on projected population growth.
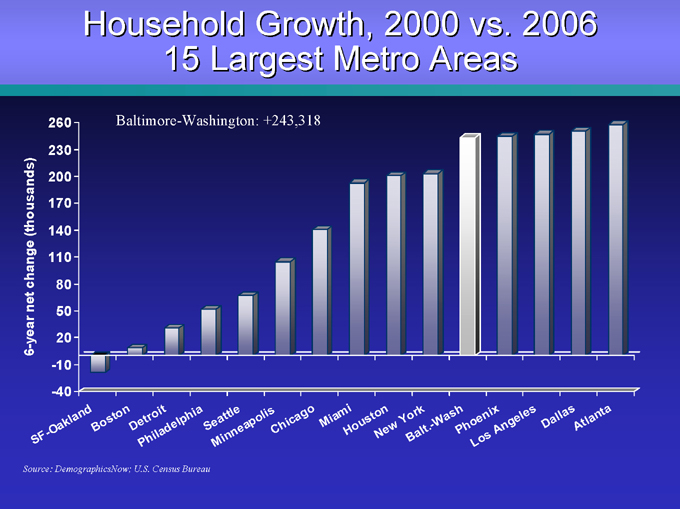
Household Growth, 2000 vs. 2006 15 Largest Metro Areas
Baltimore-Washington: +243,318
260 230 200 170 140 110 80 50 20 -10 -40
SF-Oakland
Boston
Detroit
Philadelphia
Seattle
Minneapolis
Chicago
Miami
Houston
New York
Balt.-Wash
Phoenix
Los Angeles
Dallas
Atlanta
Baltimore-Washington: +243,318
6-year net change (thousands)
Source: DemographicsNow; U.S. Census Bureau
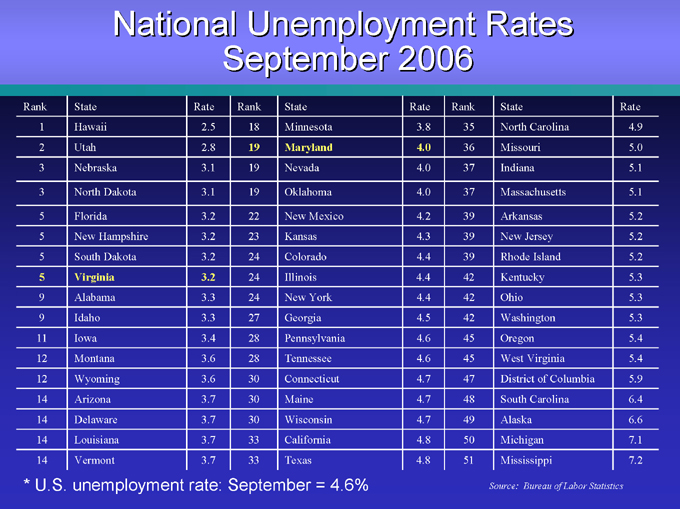
National Unemployment Rates September 2006
Rank State Rate Rank State Rate Rank State Rate
1 | | Hawaii 2.5 18 Minnesota 3.8 35 North Carolina 4.9 |
2 | | Utah 2.8 19 Maryland 4.0 36 Missouri 5.0 |
3 | | Nebraska 3.1 19 Nevada 4.0 37 Indiana 5.1 |
3 | | North Dakota 3.1 19 Oklahoma 4.0 37 Massachusetts 5.1 |
5 | | Florida 3.2 22 New Mexico 4.2 39 Arkansas 5.2 |
5 | | New Hampshire 3.2 23 Kansas 4.3 39 New Jersey 5.2 |
5 | | South Dakota 3.2 24 Colorado 4.4 39 Rhode Island 5.2 |
5 | | Virginia 3.2 24 Illinois 4.4 42 Kentucky 5.3 |
9 Alabama 3.3 24 New York 4.4 42 Ohio 5.3
9 Idaho 3.3 27 Georgia 4.5 42 Washington 5.3
11 Iowa 3.4 28 Pennsylvania 4.6 45 Oregon 5.4
12 Montana 3.6 28 Tennessee 4.6 45 West Virginia 5.4
12 Wyoming 3.6 30 Connecticut 4.7 47 District of Columbia 5.9
14 Arizona 3.7 30 Maine 4.7 48 South Carolina 6.4
14 Delaware 3.7 30 Wisconsin 4.7 49 Alaska 6.6
14 Louisiana 3.7 33 California 4.8 50 Michigan 7.1
14 Vermont 3.7 33 Texas 4.8 51 Mississippi 7.2
* | | U.S. unemployment rate: September = 4.6% |
Source: Bureau of Labor Statistics
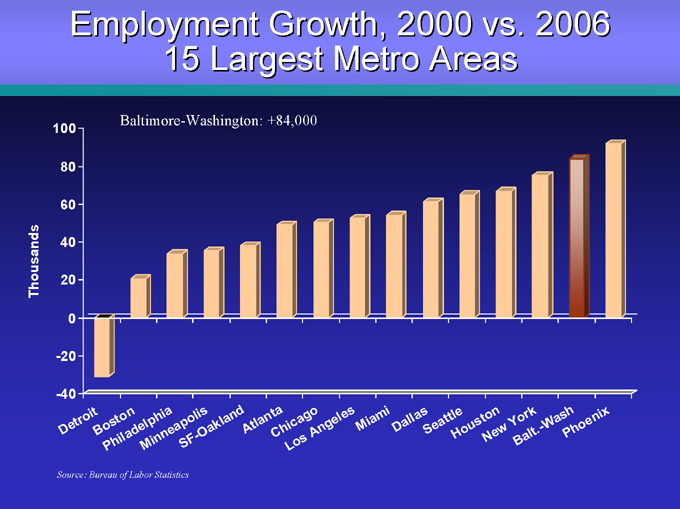
Employment Growth, 2000 vs. 2006 15 Largest Metro Areas
Baltimore-Washington: +84,000
100 80 60 40 20 0 -20 -40
Detroit
Boston
Philadelphia
Minneapolis
SF-Oakland
Atlanta
Chicago
Los Angeles Miami Dallas Seattle Houston New York Balt.-Wash Phoenix
Thousands
Source: Bureau of Labor Statistics
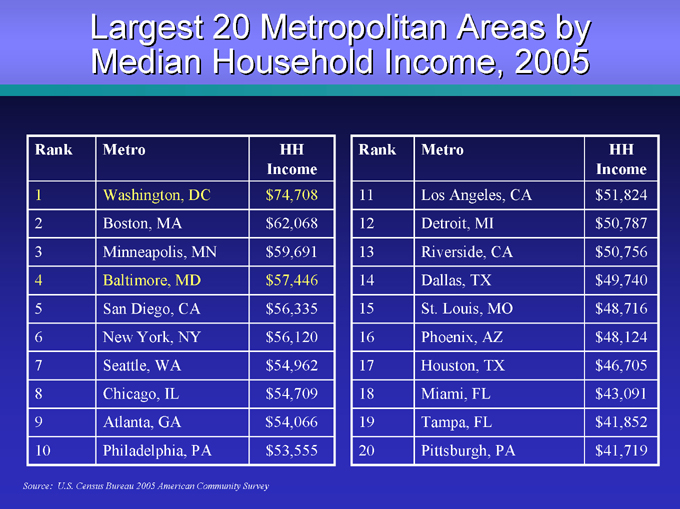
Largest 20 Metropolitan Areas by Median Household Income, 2005
Rank Metro HH
Income
1 | | Washington, DC $ 74,708 |
3 | | Minneapolis, MN $ 59,691 |
9 Atlanta, GA $ 54,066
10 Philadelphia, PA $ 53,555
Rank Metro HH
Income
11 Los Angeles, CA $ 51,824
12 Detroit, MI $ 50,787
13 Riverside, CA $ 50,756
14 Dallas, TX $ 49,740
15 St. Louis, MO $ 48,716
16 Phoenix, AZ $ 48,124
17 Houston, TX $ 46,705
18 Miami, FL $ 43,091
19 Tampa, FL $ 41,852
20 Pittsburgh, PA $ 41,719
Source: U.S. Census Bureau 2005 American Community Survey
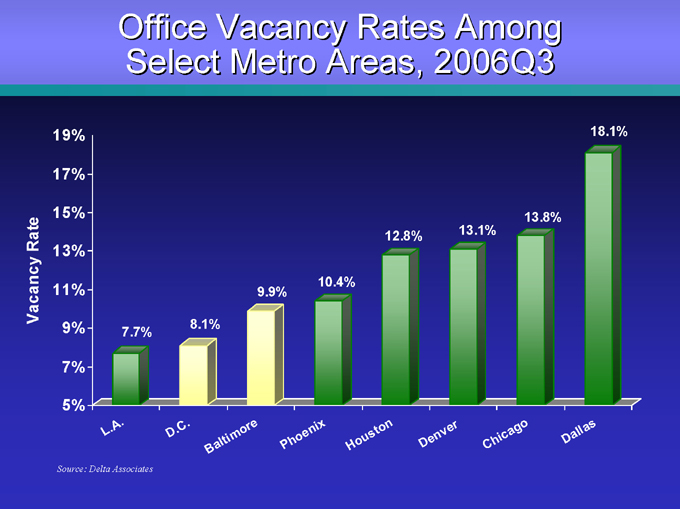
Office Vacancy Rates Among Select Metro Areas, 2006Q3
18.1%
13.8%
12.8% 13.1%
10.4% 9.9%
8.1% 7.7%
19% 17% 15% 13% 11% 9% 7% 5%
Vacancy Rate
Source: Delta Associates
L.A.D.C.BaltimorePhoenixHoustonDenverChicagoDallas
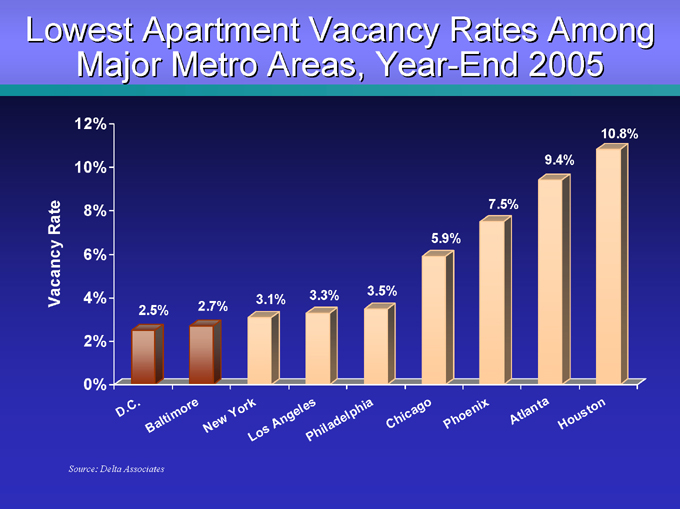
Lowest Apartment Vacancy Rates Among Major Metro Areas, Year-End 2005
12% 10% 8%
6% 4% 2% 0%
Vacancy Rate
10.8% 9.4%
7.5%
5.9%
3.3% 3.5% 3.1% 2.5% 2.7%
D.C.
Baltimore
New York Los Angeles Philadelphia Chicago Phoenix Atlanta Houston
Source: Delta Associates

Department of Defense Operations Relocating to the Region
Aberdeen Proving Ground Fort Meade Fort Detrick National Naval Medical Center
All told, 40,000 – 60,000 jobs expected
Source: U.S. Department of Defense

Introduction Provident Bank Mission
Provident Bank’s mission is to exceed customer expectations by delivering superior service, products and banking convenience. Every employee’s commitment to serve our customers in this fashion will establish Provident Bank as the primary bank of choice of individuals, families, small businesses and mid-sized companies throughout our chosen markets.

Introduction Provident Bank Core Values
Integrity Excellence Caring Partnership Results Driven

Strategic Priorities
Maximize Provident’s position as the ‘right size’ bank
Consistently execute a high performance, customer relationship focused sales culture
Sustain a culture that attracts and retains employees who provide the differentiating ‘Provident Way’ customer experience
Profitably grow and deepen customer relationships in all four key market segments: commercial, commercial real estate, small business and consumer
Expand delivery (branch and non-branch) within the footprint
Improve financial fundamentals

Provident Bank Positioning Strategy
We will continue to provide the products and services of our largest competitors, while delivering the level of service found in only the best community banks.

Strategic Priorities
Consistently execute a high performance customer relationship focused sales culture

Customer Relationship Strategy
Provident Bank’s vision is to be chosen as our customers’ primary bank because we consistently execute our business as The Right Size Bank.

Customer Relationship Strategy
Executing our Vision
Acquire Enhance Retain
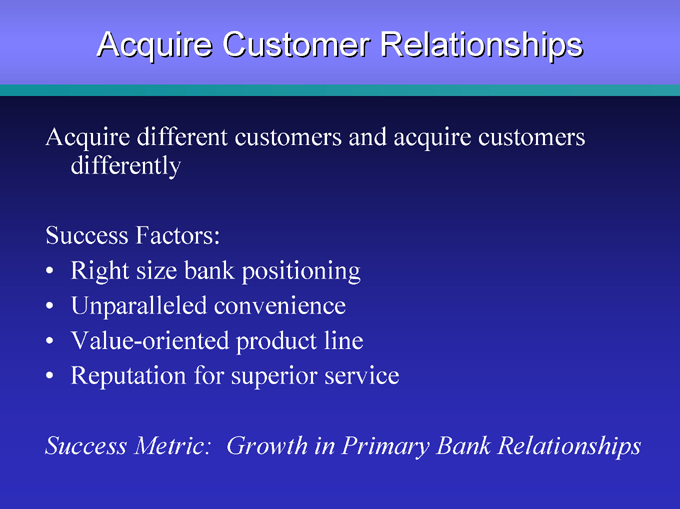
Acquire Customer Relationships
Acquire different customers and acquire customers differently
Success Factors:
Right size bank positioning Unparalleled convenience Value-oriented product line Reputation for superior service
Success Metric: Growth in Primary Bank Relationships
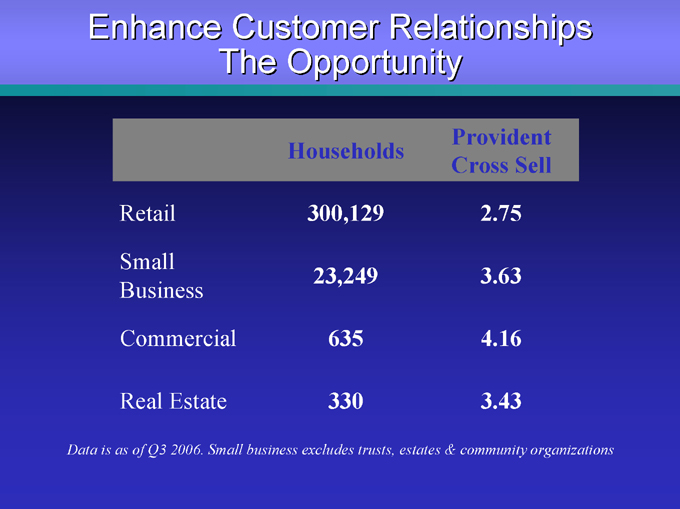
Enhance Customer Relationships The Opportunity
Households
Provident Cross Sell
Retail 300,129 2.75
Small Business
23,249 3.63
Commercial 635 4.16
Real Estate 330 3.43
Data is as of Q3 2006. Small business excludes trusts, estates & community organizations

Enhance Customer Relationships
Leverage customer segmentation methodology Build a relationship sales culture Roll-out sales and leadership training Achieve CSBI relationship
Success Metric: 1 More to 400,000

Retain Customer Relationships
One additional product to a household with one product increases their retention from 83% to 92%
Utilize on-boarding program for all customers Survey customers’ satisfaction quarterly Build specific retention plans based on customer segmentation data
Success Metric: Level of Customer Engagement

Strategic Priorities
Sustain a culture that attracts and retains employees who provide the differentiating ‘Provident Way’ customer experience
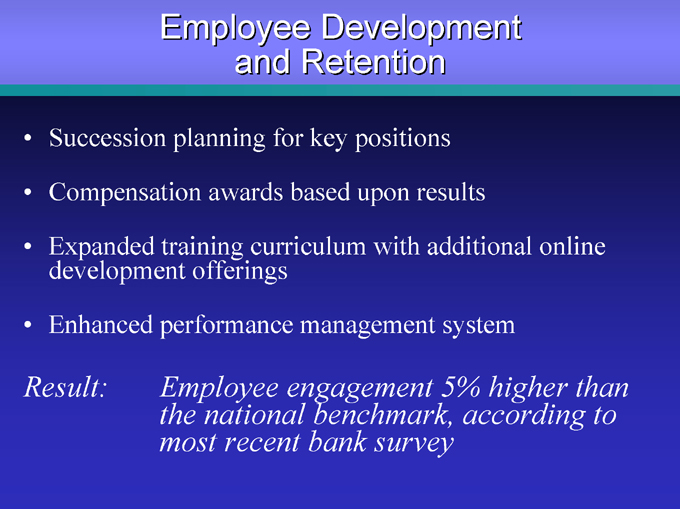
Employee Development and Retention
Succession planning for key positions
Compensation awards based upon results
Expanded training curriculum with additional online development offerings
Enhanced performance management system
Result:
Employee engagement 5% higher than the national benchmark, according to most recent bank survey

Strategic Priorities
Profitably grow and deepen customer relationships in all four key market segments:
commercial real estate small business consumer
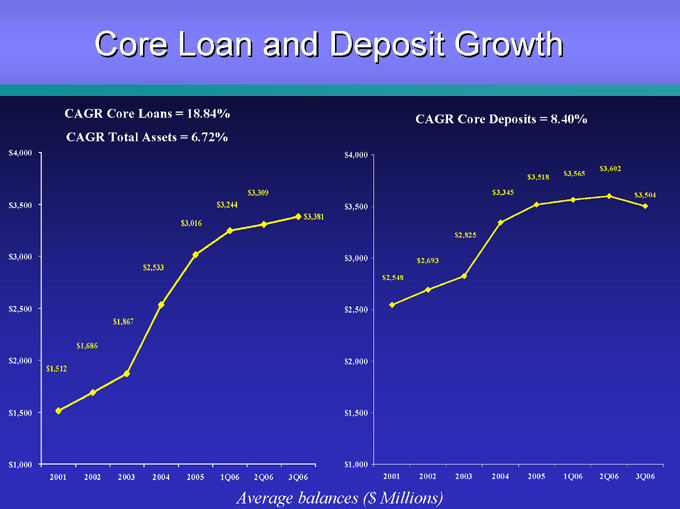
Core Loan and Deposit Growth
CAGR Core Loans = 18.84% CAGR Total Assets = 6.72% $4,000 $3,500 $3,000 $2,500 $2,000 $1,500 $1,000 $3,309 $3,244 $3,381 $3,016
$2,533
$1,867 $1,686 $1,512
2001 2002 2003 2004 2005 1Q06 2Q06 3Q06
CAGR Core Deposits = 8.40% $4,000 $3,500 $3,000 $2,500 $2,000 $1,500 $1,000 $3,602 $3,565 $3,518 $3,345 $3,504
$2,825
$2,693
$2,548
2001 2002 2003 2004 2005 1Q06 2Q06 3Q06
Average balances ($ Millions)
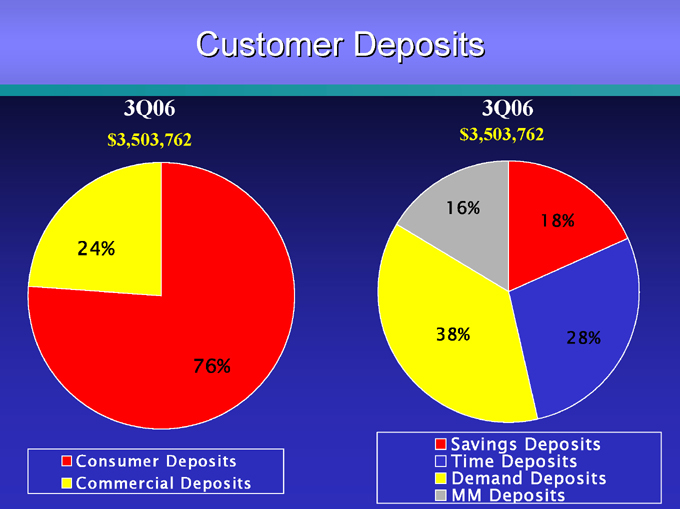
Customer Deposits
3Q06
$3,503,762
24%
76%
Consumer Deposits Commercial Deposits
3Q06
$3,503,762
16%
38%
18%
28%
Savings Deposits Time Deposits Demand Deposits MM Deposits
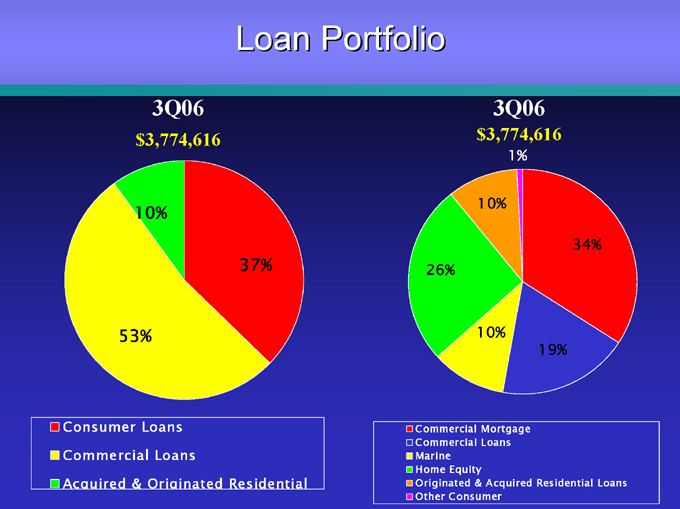
Loan Portfolio
3Q06
$3,774,616
10%
37%
53%
Consumer Loans Commercial Loans
Acquired & Originated Residential
3Q06
$3,774,616
1%
10%
34%
19%
10%
26%
Commercial Mortgage Commercial Loans Marine Home Equity
Originated & Acquired Residential Loans Other Consumer

Strategic Priorities
Expand delivery via de novo branches and select acquisitions within the footprint
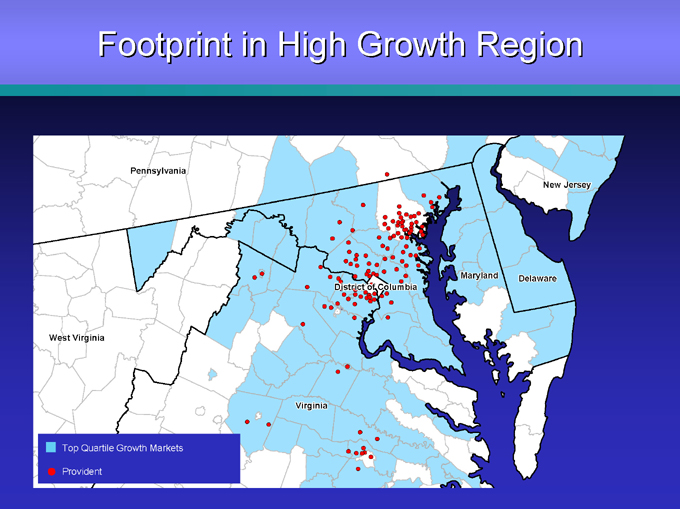
Footprint in High Growth Region
Pennsylvania
West Virginia
Virginia
District of Columbia
Maryland Delaware
New Jersey
Top Quartile Growth Markets
Provident
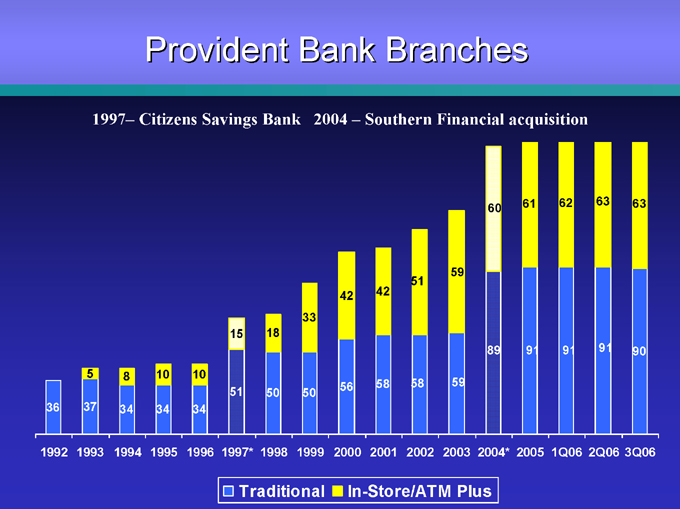
Provident Bank Branches
1997– Citizens Savings Bank 2004 – Southern Financial acquisition
61 62 63 63 60
59 51
42 42 33
15 18
89 91 91 91 90
56 58 58 59
51 50 50
36 37 34 34 34
1992 1993 1994 1995 1996 1997* 1998 1999 2000 2001 2002 2003 2004* 2005 1Q06 2Q06 3Q06
Traditional
In-Store/ATM Plus
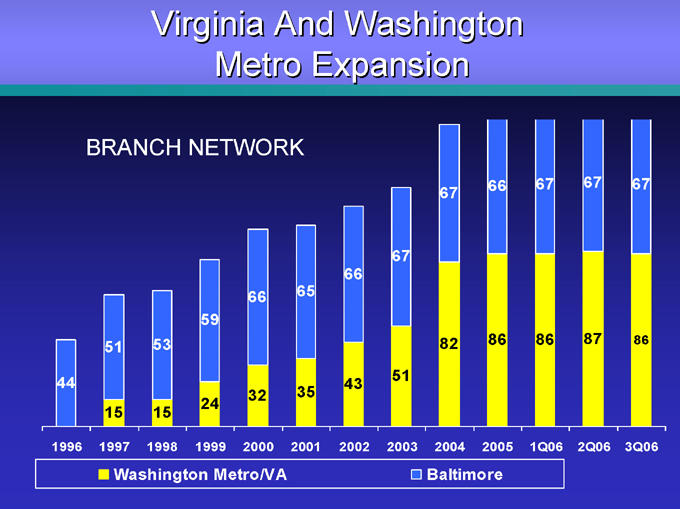
Virginia And Washington Metro Expansion
BRANCH NETWORK
66 67 67 67 67
67 66
66 65 59
53 82 86 86 87 86 51 51
44 43
32 35 24
15 15
1996 1997 1998 1999 2000 2001 2002 2003 2004 2005 1Q06 2Q06 3Q06
Washington Metro/VA
Baltimore
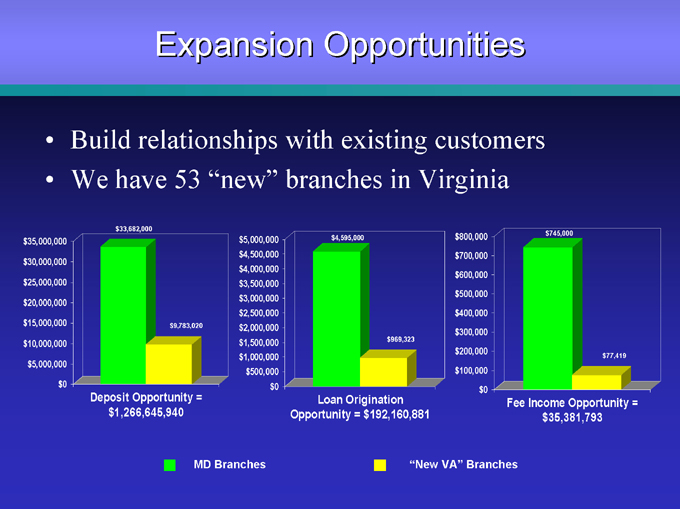
Expansion Opportunities
Build relationships with existing customers We have 53 “new” branches in Virginia $33,682,000 $35,000,000 $30,000,000 $25,000,000 $20,000,000 $15,000,000 $10,000,000 $5,000,000 $0
Deposit Opportunity = $1,266,645,940 $9,783,020 $4,595,000
$969,323 $5,000,000 $4,500,000 $4,000,000 $3,500,000 $3,000,000 $2,500,000 $2,000,000 $1,500,000 $1,000,000 $500,000 $0
Loan Origination Opportunity = $192,160,881 $745,000
$77,419 $800,000 $700,000 $600,000 $500,000 $400,000 $300,000 $200,000 $100,000 $0
Fee Income Opportunity = $35,381,793
MD Branches
“New VA” Branches

Strategic Priorities Improve Financial Fundamentals
I. Continued transformation of the balance sheet II. Strong growth in core loans and deposits III. Solid fee income growth IV. Improved asset quality
V. Higher capital levels
VI. Growth in earnings with improved quality of earnings
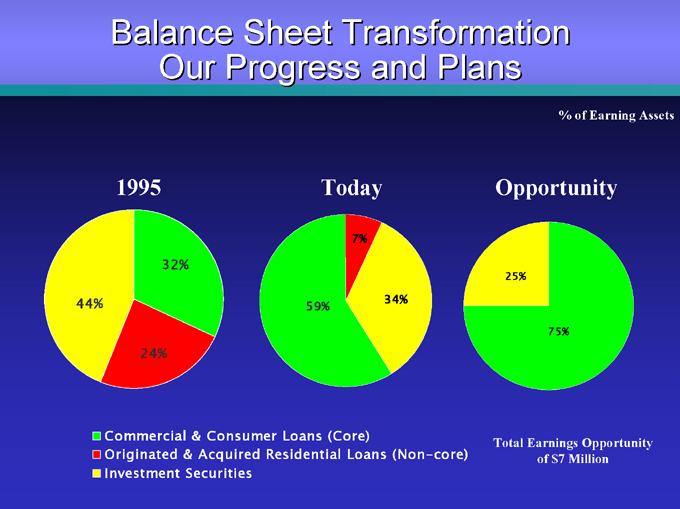
Balance Sheet Transformation Our Progress and Plans
% of Earning Assets
1995
32%
24%
44%
Today
7%
34%
59%
Opportunity
25%
75%
Commercial & Consumer Loans (Core)
Originated & Acquired Residential Loans (Non-core) Investment Securities
Total Earnings Opportunity of $7 Million
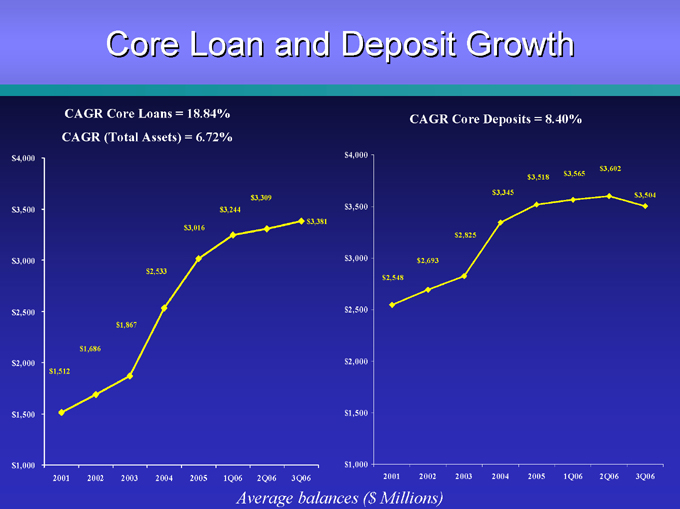
Core Loan and Deposit Growth
CAGR Core Loans = 18.84% CAGR (Total Assets) = 6.72% $4,000 $3,500 $3,000 $2,500 $2,000 $1,500 $1,000 $3,309 $3,244 $3,381 $3,016
$2,533
$1,867 $1,686 $1,512
2001 2002 2003 2004 2005 1Q06 2Q06 3Q06
CAGR Core Deposits = 8.40% $4,000 $3,500 $3,000 $2,500 $2,000 $1,500 $1,000 $3,602 $3,565 $3,518 $3,345 $3,504
$2,825
$2,693
$2,548
2001 2002 2003 2004 2005 1Q06 2Q06 3Q06
Average balances ($ Millions)
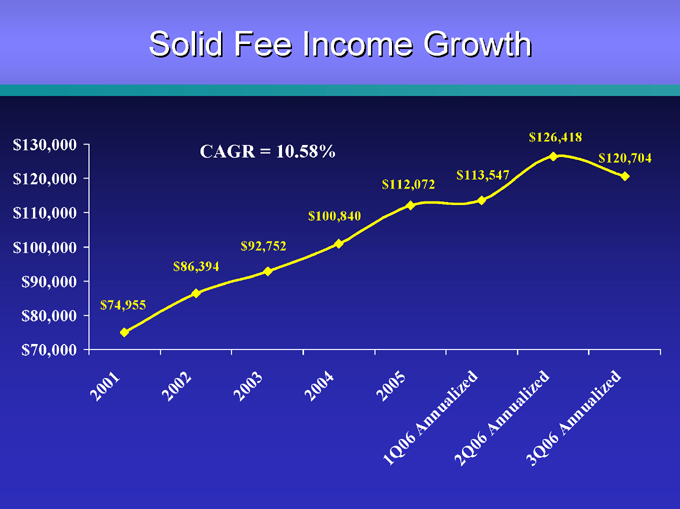
Solid Fee Income Growth
CAGR = 10.58% $130,000 $120,000 $110,000
$100,000 $90,000 $80,000 $70,000 $74,955 $86,394 $92,752 $100,840 $112,072 $113,547 $126,418 $120,704
2001 2002 2003 2004
2005
1Q06 Annualized2Q06 Annualized3Q06 Annualized
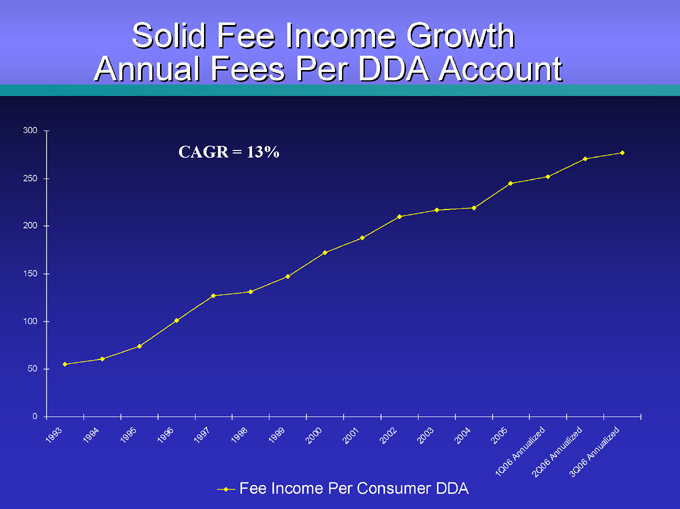
Solid Fee Income Growth Annual Fees Per DDA Account
CAGR = 13%
300 250 200 150 100 50 0
Fee Income Per Consumer DDA
19931994199519961997199819992000200120022003
2004
2005
1Q06 Annualized2Q06 Annualized3Q06 Annualized
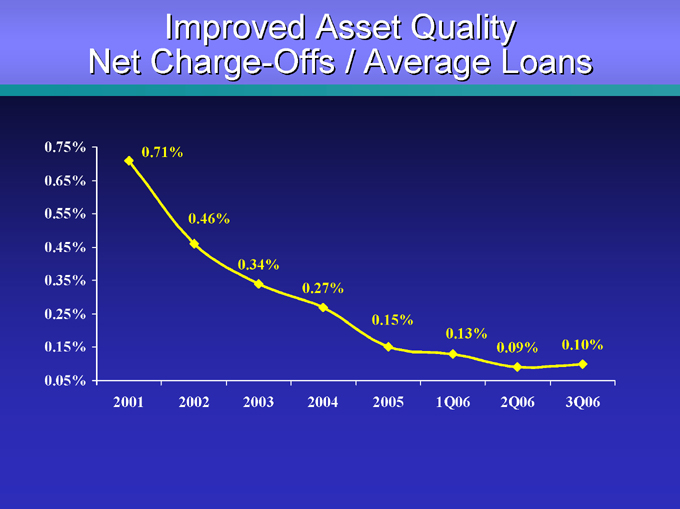
Improved Asset Quality Net Charge-Offs / Average Loans
0.71%
0.46%
0.34%
0.27%
0.15%
0.13%
0.09% 0.10%
0.75% 0.65% 0.55% 0.45% 0.35% 0.25% 0.15% 0.05%
2001 2002 2003 2004 2005 1Q06 2Q06 3Q06
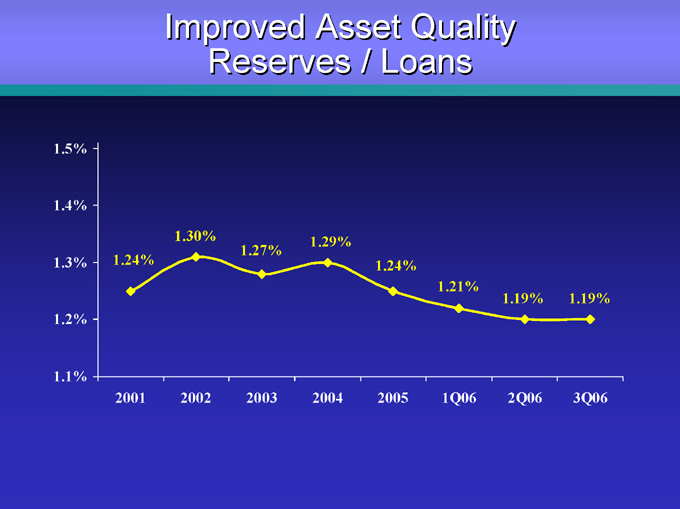
Improved Asset Quality Reserves / Loans
1.5% 1.4% 1.3% 1.2% 1.1%
1.30% 1.29% 1.27%
1.24% 1.24%
1.21%
1.19% 1.19%
2001 2002 2003 2004 2005 1Q06 2Q06 3Q06
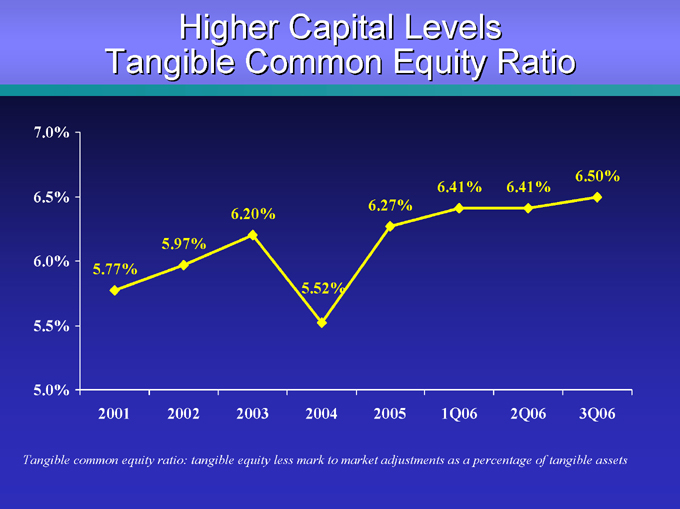
Higher Capital Levels Tangible Common Equity Ratio
6.50% 6.41% 6.41% 6.27% 6.20% 5.97% 5.77% 5.52%
7.0% 6.5% 6.0% 5.5% 5.0%
2001 2002 2003 2004 2005 1Q06 2Q06 3Q06
Tangible common equity ratio: tangible equity less mark to market adjustments as a percentage of tangible assets
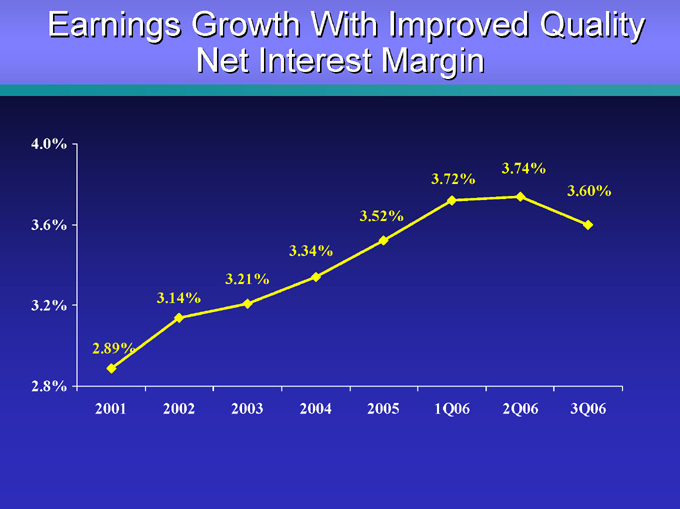
Earnings Growth With Improved Quality Net Interest Margin
3.74% 3.72%
3.60% 3.52%
3.34% 3.21% 3.14%
2.89%
4.0% 3.6% 3.2% 2.8%
2001 2002 2003 2004 2005 1Q06 2Q06 3Q06
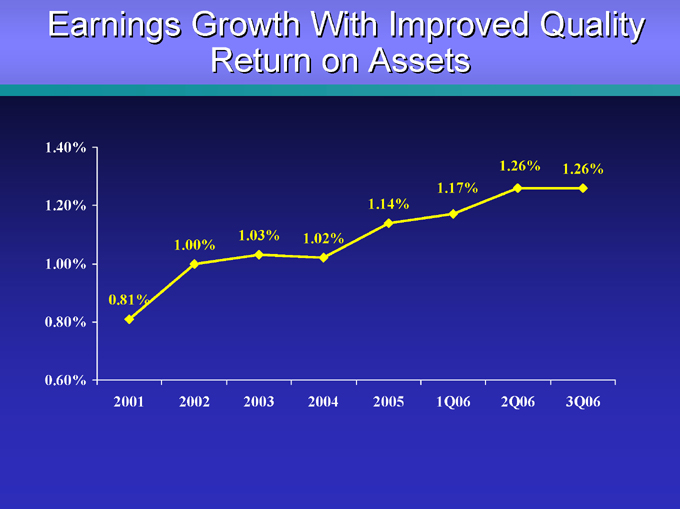
Earnings Growth With Improved Quality Return on Assets
1.26% 1.26% 1.17% 1.14%
1.03% 1.02% 1.00%
0.81%
1.40% 1.20% 1.00% 0.80% 0.60%
2001 2002 2003 2004 2005 1Q06 2Q06 3Q06
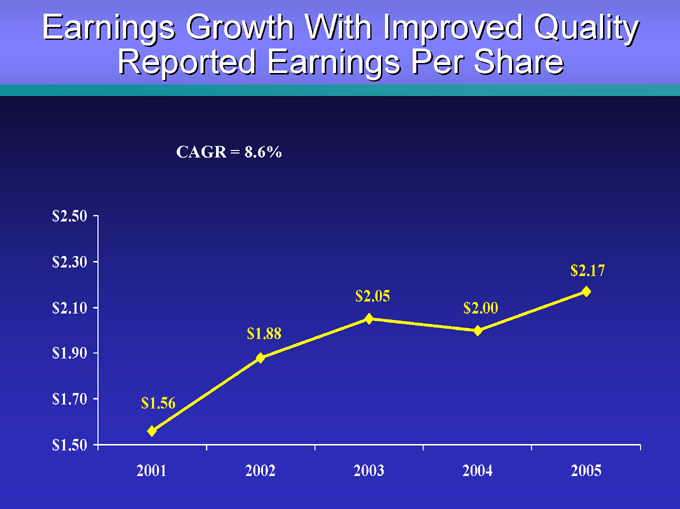
Earnings Growth With Improved Quality Reported Earnings Per Share
CAGR = 8.6% $2.50 $2.30 $2.10 $1.90 $1.70 $1.50 $2.17 $2.05 $2.00 $1.88
$1.56
2001 2002 2003 2004 2005

PROVIDENT BANKSHARES
CORPORATION
www.provbank.com
Contact
Media: Lillian Kilroy (410) 277-2833
Investment Community: Melissa Kelly (410) 277-2080