UNITED STATES
SECURITIES AND EXCHANGE COMMISSION
Washington, D.C. 20549
FORM N-CSR
CERTIFIED SHAREHOLDER REPORT OF REGISTERED
MANAGEMENT INVESTMENT COMPANIES
Investment Company Act file number 811-05251
Fidelity Concord Street Trust
(Exact name of registrant as specified in charter)
245 Summer St., Boston, Massachusetts 02210
(Address of principal executive offices) (Zip code)
Margaret Carey, Secretary
245 Summer St.
Boston, Massachusetts 02210
(Name and address of agent for service)
Registrant's telephone number, including area code:
617-563-7000
| |
Date of fiscal year end: | April 30 |
|
|
Date of reporting period: | April 30, 2024 |
Item 1.
Reports to Stockholders
Fidelity® Series Small Cap Core Fund
Annual Report
April 30, 2024
Contents
To view a fund's proxy voting guidelines and proxy voting record for the 12-month period ended June 30, visit http://www.fidelity.com/proxyvotingresults or visit the Securities and Exchange Commission's (SEC) web site at http://www.sec.gov.
You may also call 1-800-544-8544 to request a free copy of the proxy voting guidelines.
Standard & Poor's, S&P and S&P 500 are registered service marks of The McGraw-Hill Companies, Inc. and have been licensed for use by Fidelity Distributors Corporation.
Other third-party marks appearing herein are the property of their respective owners.
All other marks appearing herein are registered or unregistered trademarks or service marks of FMR LLC or an affiliated company. © 2024 FMR LLC. All rights reserved.
This report and the financial statements contained herein are submitted for the general information of the shareholders of the Fund. This report is not authorized for distribution to prospective investors in the Fund unless preceded or accompanied by an effective prospectus.
A fund files its complete schedule of portfolio holdings with the SEC for the first and third quarters of each fiscal year on Form N-PORT. Forms N-PORT are available on the SEC's web site at http://www.sec.gov. A fund's Forms N-PORT may be reviewed and copied at the SEC's Public Reference Room in Washington, DC. Information regarding the operation of the SEC's Public Reference Room may be obtained by calling 1-800-SEC-0330.
For a complete list of a fund's portfolio holdings, view the most recent holdings listing, semiannual report, or annual report on Fidelity's web site at http://www.fidelity.com, http://www.institutional.fidelity.com, or http://www.401k.com, as applicable.
NOT FDIC INSURED •MAY LOSE VALUE •NO BANK GUARANTEE
Neither the Fund nor Fidelity Distributors Corporation is a bank.
Average annual total return reflects the change in the value of an investment, assuming reinvestment of distributions from dividend income and capital gains (the profits earned upon the sale of securities that have grown in value, if any) and assuming a constant rate of performance each year. The hypothetical investment and the average annual total returns do not reflect the deduction of taxes that a shareholder would pay on fund distributions or the redemption of fund shares. During periods of reimbursement by Fidelity, a fund's total return will be greater than it would be had the reimbursement not occurred. How a fund did yesterday is no guarantee of how it will do tomorrow.
| Average Annual Total Returns |
| | | | |
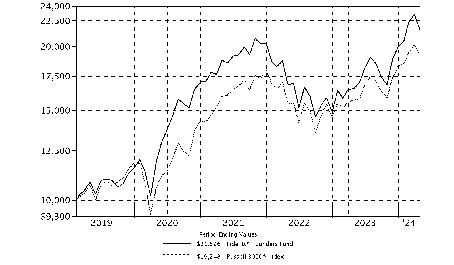
Periods ended April 30, 2024 | Past 1 year | Life of Fund A |
| Fidelity® Series Small Cap Core Fund | 14.81% | 8.49% |
A From November 4, 2022
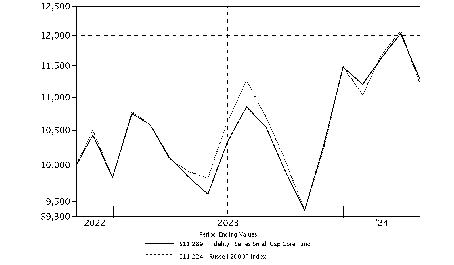
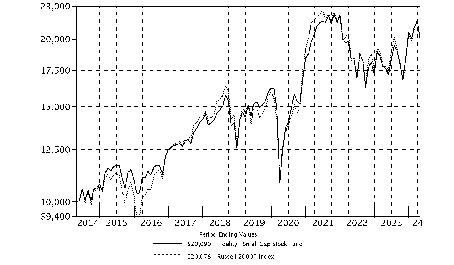
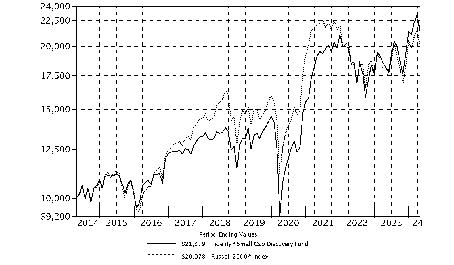
| $10,000 Over Life of Fund |
| |
Let's say hypothetically that $10,000 was invested in Fidelity® Series Small Cap Core Fund, on November 4, 2022, when the fund started. The chart shows how the value of your investment would have changed, and also shows how the Russell 2000® Index performed over the same period. |
|
|
Market Recap:
U.S. equities gained 22.66% for the 12 months ending April 30, 2024, according to the S&P 500® index, driven by resilient corporate profits, a frenzy over generative artificial intelligence and the Federal Reserve's likely pivot to cutting interest rates later this year. Amid this favorable backdrop for higher-risk assets, the S&P 500® continued its late-2023 momentum and ended March at its all-time high before snapping a five-month uptrend in April (-4.08%). Growth stocks led the broad rally, mostly driven by a narrow set of firms in the communication services (+41%) and information technology (+37%) sectors, largely due to excitement for AI. In particular, semiconductor-related stocks (+104%) were a standout. Following the Fed's November 1 meeting, when the central bank hinted it might be done raising rates, the S&P 500® reversed a three-month decline and gained 14.09% in the final two months of 2023 and 10.56% the first quarter. Risk assets were further aided on March 20, when the central bank held steady its benchmark federal funds rate and affirmed its projection to cut in 2024. The index then slipped in April, as inflation remained stickier than expected, spurring doubts of a soft economic landing. For the full 12 months, the financials, industrials and consumer discretionary sectors each gained about 24%. In sharp contrast, real estate and the defensive-oriented utilities sector each roughly broke even. Other notable "laggards" included consumer staples (+3%) and health care (+7%).
Comments from Co-Managers Drew Gellert and Ethan Hugo:
For the fiscal year ending April 30, 2024, the fund gained 14.81%, versus 13.32% for the benchmark Russell 2000 Index. Relative to the benchmark, security selection was the primary contributor, especially within consumer staples. Stock selection in financials, primarily within the banks industry, also helped. Security selection in information technology and materials also boosted the fund's relative performance. The top individual relative contributor was an overweight in Onto Innovation (+133%). Onto Innovation was among our biggest holdings. This period we increased our investment in Onto Innovation. The second-largest relative contributor was our non-benchmark stake in TechnipFMC (+87%). TechnipFMC was among the largest holdings at period end. This period we increased our stake in TechnipFMC. A non-benchmark stake in Natera gained 77% and notably helped. This period we increased our position in Natera. In contrast, the biggest detractor from performance versus the benchmark was stock picking in consumer discretionary. Also hurting our result were stock picks in real estate and utilities. The biggest individual relative detractor was an underweight in Super Micro Computer (+715%). This was an investment we established this period. A second notable relative detractor was an overweight in Shoals Technologies (-60%). This period we increased our stake in Shoals Technologies. A non-benchmark stake in WNS returned -54% and notably hurt. Notable changes in positioning include decreased exposure to consumer staples and a higher allocation to information technology.
Note to shareholders:
On June 30, 2023, Drew Gellert assumed co-management responsibilities for the fund.
The views expressed above reflect those of the portfolio manager(s) only through the end of the period as stated on the cover of this report and do not necessarily represent the views of Fidelity or any other person in the Fidelity organization. Any such views are subject to change at any time based upon market or other conditions and Fidelity disclaims any responsibility to update such views. These views may not be relied on as investment advice and, because investment decisions for a Fidelity fund are based on numerous factors, may not be relied on as an indication of trading intent on behalf of any Fidelity fund.
Top Holdings (% of Fund's net assets) |
| |
| Chord Energy Corp. | 1.1 | |
| Onto Innovation, Inc. | 1.0 | |
| Wintrust Financial Corp. | 1.0 | |
| ATI, Inc. | 1.0 | |
| FirstCash Holdings, Inc. | 1.0 | |
| TechnipFMC PLC | 0.9 | |
| Cadence Bank | 0.9 | |
| Cactus, Inc. | 0.9 | |
| Applied Industrial Technologies, Inc. | 0.9 | |
| Varonis Systems, Inc. | 0.9 | |
| | 9.6 | |
| |
| Market Sectors (% of Fund's net assets) |
| |
| Industrials | 17.4 | |
| Financials | 17.1 | |
| Health Care | 14.9 | |
| Information Technology | 14.2 | |
| Consumer Discretionary | 10.5 | |
| Energy | 7.3 | |
| Real Estate | 5.5 | |
| Materials | 4.9 | |
| Consumer Staples | 2.9 | |
| Communication Services | 2.1 | |
| Utilities | 2.1 | |
| |
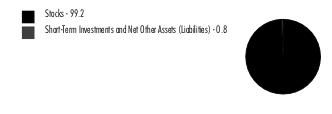
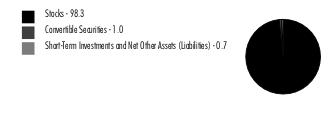
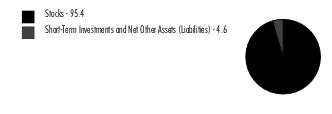
Asset Allocation (% of Fund's net assets) |
|
|
Showing Percentage of Net Assets
| Common Stocks - 98.9% |
| | | Shares | Value ($) |
| COMMUNICATION SERVICES - 2.1% | | | |
| Diversified Telecommunication Services - 0.4% | | | |
| Cogent Communications Group, Inc. | | 29,573 | 1,897,995 |
| Entertainment - 0.2% | | | |
| IMAX Corp. (a) | | 63,416 | 1,015,290 |
| Interactive Media & Services - 1.2% | | | |
| IAC, Inc. (a) | | 29,638 | 1,409,583 |
| QuinStreet, Inc. (a) | | 145,305 | 2,628,567 |
| Ziff Davis, Inc. (a) | | 35,676 | 1,787,724 |
| | | | 5,825,874 |
| Wireless Telecommunication Services - 0.3% | | | |
| Gogo, Inc. (a) | | 123,755 | 1,121,220 |
TOTAL COMMUNICATION SERVICES | | | 9,860,379 |
| CONSUMER DISCRETIONARY - 10.5% | | | |
| Automobile Components - 1.2% | | | |
| Adient PLC (a) | | 43,566 | 1,301,316 |
| Gentherm, Inc. (a) | | 22,830 | 1,154,513 |
| LCI Industries | | 21,750 | 2,261,565 |
| Patrick Industries, Inc. | | 6,992 | 730,594 |
| | | | 5,447,988 |
| Broadline Retail - 0.3% | | | |
| Global-e Online Ltd. (a) | | 40,882 | 1,370,773 |
| Diversified Consumer Services - 2.1% | | | |
| Adtalem Global Education, Inc. (a) | | 16,790 | 833,120 |
| European Wax Center, Inc. (a)(b) | | 113,861 | 1,339,005 |
| Grand Canyon Education, Inc. (a) | | 26,695 | 3,470,884 |
| Laureate Education, Inc. Class A | | 156,032 | 2,262,464 |
| OneSpaWorld Holdings Ltd. (a) | | 178,424 | 2,269,553 |
| | | | 10,175,026 |
| Hotels, Restaurants & Leisure - 1.2% | | | |
| Aramark | | 82,645 | 2,604,144 |
| Bowlero Corp. Class A (b) | | 104,894 | 1,232,505 |
| Noodles & Co. (a) | | 12,741 | 19,239 |
| Red Rock Resorts, Inc. | | 32,562 | 1,729,693 |
| | | | 5,585,581 |
| Household Durables - 1.6% | | | |
| Cavco Industries, Inc. (a) | | 8,356 | 3,043,339 |
| LGI Homes, Inc. (a) | | 17,416 | 1,566,221 |
| SharkNinja, Inc. | | 47,123 | 3,029,066 |
| | | | 7,638,626 |
| Leisure Products - 0.6% | | | |
| Brunswick Corp. | | 33,864 | 2,730,793 |
| Specialty Retail - 3.5% | | | |
| Academy Sports & Outdoors, Inc. | | 46,083 | 2,686,639 |
| Advance Auto Parts, Inc. | | 23,107 | 1,686,349 |
| America's Car Mart, Inc. (a) | | 25,206 | 1,442,791 |
| Boot Barn Holdings, Inc. (a) | | 22,249 | 2,368,851 |
| Camping World Holdings, Inc. (b) | | 90,718 | 1,838,854 |
| Dick's Sporting Goods, Inc. | | 13,398 | 2,692,194 |
| Murphy U.S.A., Inc. | | 6,473 | 2,678,657 |
| Victoria's Secret & Co. (a) | | 64,334 | 1,133,565 |
| | | | 16,527,900 |
| Textiles, Apparel & Luxury Goods - 0.0% | | | |
| Rocky Brands, Inc. | | 5,564 | 143,384 |
TOTAL CONSUMER DISCRETIONARY | | | 49,620,071 |
| CONSUMER STAPLES - 2.9% | | | |
| Beverages - 0.5% | | | |
| Primo Water Corp. | | 112,089 | 2,115,119 |
| Consumer Staples Distribution & Retail - 1.3% | | | |
| Performance Food Group Co. (a) | | 36,520 | 2,478,978 |
| Sprouts Farmers Market LLC (a) | | 55,804 | 3,684,738 |
| | | | 6,163,716 |
| Food Products - 0.6% | | | |
| SunOpta, Inc. (a) | | 116,769 | 764,837 |
| The Simply Good Foods Co. (a) | | 62,001 | 2,259,936 |
| | | | 3,024,773 |
| Household Products - 0.5% | | | |
| Spectrum Brands Holdings, Inc. (b) | | 27,243 | 2,230,384 |
TOTAL CONSUMER STAPLES | | | 13,533,992 |
| ENERGY - 7.3% | | | |
| Energy Equipment & Services - 3.2% | | | |
| Cactus, Inc. | | 88,920 | 4,413,989 |
| Liberty Oilfield Services, Inc. Class A | | 170,762 | 3,756,764 |
| Oceaneering International, Inc. (a) | | 120,609 | 2,763,152 |
| TechnipFMC PLC | | 175,618 | 4,499,333 |
| | | | 15,433,238 |
| Oil, Gas & Consumable Fuels - 4.1% | | | |
| California Resources Corp. | | 36,458 | 1,927,170 |
| Chord Energy Corp. | | 28,987 | 5,130,112 |
| Civitas Resources, Inc. | | 40,787 | 2,935,033 |
| Golar LNG Ltd. | | 75,807 | 1,858,788 |
| National Energy Services Reunited Corp. (a) | | 175,356 | 1,736,024 |
| Northern Oil & Gas, Inc. | | 64,319 | 2,623,572 |
| Range Resources Corp. | | 51,294 | 1,841,968 |
| Sitio Royalties Corp. | | 15,821 | 367,680 |
| Uranium Energy Corp. (a)(b) | | 142,584 | 962,442 |
| | | | 19,382,789 |
TOTAL ENERGY | | | 34,816,027 |
| FINANCIALS - 17.1% | | | |
| Banks - 9.2% | | | |
| Associated Banc-Corp. | | 72,309 | 1,523,551 |
| BOK Financial Corp. | | 18,424 | 1,634,762 |
| Byline Bancorp, Inc. | | 81,620 | 1,768,705 |
| Cadence Bank | | 160,950 | 4,453,487 |
| Camden National Corp. | | 5,323 | 166,184 |
| ConnectOne Bancorp, Inc. | | 34,157 | 611,752 |
| Eastern Bankshares, Inc. | | 227,373 | 2,855,805 |
| First Foundation, Inc. | | 4,339 | 23,778 |
| First Interstate Bancsystem, Inc. | | 135,996 | 3,631,093 |
| FNB Corp., Pennsylvania | | 227,946 | 3,040,800 |
| Fulton Financial Corp. | | 19,700 | 326,035 |
| Glacier Bancorp, Inc. | | 54,058 | 1,955,818 |
| Independent Bank Corp. | | 82,734 | 2,052,631 |
| Independent Bank Group, Inc. | | 39,623 | 1,475,561 |
| International Bancshares Corp. | | 23,299 | 1,296,589 |
| Pinnacle Financial Partners, Inc. | | 27,093 | 2,078,033 |
| Popular, Inc. | | 1,263 | 107,342 |
| United Community Bank, Inc. | | 117,903 | 2,974,693 |
| Univest Corp. of Pennsylvania | | 13,737 | 286,691 |
| Webster Financial Corp. | | 82,602 | 3,620,446 |
| Western Alliance Bancorp. | | 58,104 | 3,302,050 |
| Wintrust Financial Corp. | | 47,956 | 4,634,468 |
| | | | 43,820,274 |
| Capital Markets - 3.3% | | | |
| Patria Investments Ltd. | | 103,234 | 1,383,336 |
| Perella Weinberg Partners Class A | | 283,001 | 4,222,375 |
| Piper Jaffray Companies | | 16,541 | 3,238,562 |
| PJT Partners, Inc. (b) | | 19,895 | 1,879,879 |
| StepStone Group, Inc. Class A | | 63,032 | 2,273,564 |
| Stifel Financial Corp. | | 35,370 | 2,826,770 |
| | | | 15,824,486 |
| Consumer Finance - 1.0% | | | |
| FirstCash Holdings, Inc. | | 40,265 | 4,549,140 |
| NerdWallet, Inc. (a) | | 2,289 | 28,773 |
| | | | 4,577,913 |
| Financial Services - 2.1% | | | |
| Essent Group Ltd. | | 60,801 | 3,220,629 |
| Federal Agricultural Mortgage Corp. Class C (non-vtg.) | | 5,569 | 1,036,558 |
| Flywire Corp. (a) | | 86,826 | 1,779,933 |
| NMI Holdings, Inc. (a) | | 88,238 | 2,723,025 |
| Walker & Dunlop, Inc. | | 13,110 | 1,201,269 |
| | | | 9,961,414 |
| Insurance - 1.5% | | | |
| Selective Insurance Group, Inc. | | 17,617 | 1,790,768 |
| The Baldwin Insurance Group, Inc. (a) | | 106,973 | 2,849,761 |
| White Mountains Insurance Group Ltd. (b) | | 1,285 | 2,284,910 |
| | | | 6,925,439 |
TOTAL FINANCIALS | | | 81,109,526 |
| HEALTH CARE - 14.9% | | | |
| Biotechnology - 7.3% | | | |
| Apogee Therapeutics, Inc. | | 5,333 | 268,250 |
| Arcellx, Inc. (a) | | 37,925 | 1,897,009 |
| Autolus Therapeutics PLC ADR (a) | | 228,679 | 841,539 |
| Blueprint Medicines Corp. (a) | | 40,691 | 3,716,716 |
| Celldex Therapeutics, Inc. (a) | | 67,719 | 2,534,045 |
| Crinetics Pharmaceuticals, Inc. (a) | | 57,449 | 2,517,415 |
| Cytokinetics, Inc. (a) | | 44,333 | 2,718,500 |
| Day One Biopharmaceuticals, Inc. (a) | | 112,310 | 1,920,501 |
| Insmed, Inc. (a) | | 31,637 | 782,067 |
| Janux Therapeutics, Inc. (a) | | 10,437 | 594,909 |
| Keros Therapeutics, Inc. (a) | | 38,231 | 2,155,846 |
| Madrigal Pharmaceuticals, Inc. (a)(b) | | 10,069 | 2,054,277 |
| Moonlake Immunotherapeutics (a) | | 27,619 | 1,129,893 |
| Natera, Inc. (a) | | 23,271 | 2,161,410 |
| PTC Therapeutics, Inc. (a) | | 39,395 | 1,266,549 |
| Repligen Corp. (a) | | 8,438 | 1,385,520 |
| Spyre Therapeutics, Inc. (a) | | 5,908 | 195,141 |
| Vaxcyte, Inc. (a) | | 32,356 | 1,959,156 |
| Viking Therapeutics, Inc. (a) | | 4,467 | 355,484 |
| Viridian Therapeutics, Inc. (a) | | 90,436 | 1,199,181 |
| Xenon Pharmaceuticals, Inc. (a) | | 50,032 | 2,033,801 |
| Zentalis Pharmaceuticals, Inc. (a) | | 98,373 | 1,088,005 |
| | | | 34,775,214 |
| Health Care Equipment & Supplies - 3.6% | | | |
| Axonics, Inc. (a) | | 1,029 | 68,501 |
| Glaukos Corp. (a) | | 33,842 | 3,248,832 |
| Inspire Medical Systems, Inc. (a) | | 11,877 | 2,870,196 |
| iRhythm Technologies, Inc. (a) | | 24,686 | 2,705,092 |
| Masimo Corp. (a) | | 19,725 | 2,651,237 |
| Merit Medical Systems, Inc. (a) | | 46,283 | 3,429,570 |
| TransMedics Group, Inc. (a) | | 19,279 | 1,814,732 |
| ViewRay, Inc. (a) | | 34,227 | 0 |
| | | | 16,788,160 |
| Health Care Providers & Services - 2.1% | | | |
| Acadia Healthcare Co., Inc. (a) | | 37,687 | 2,786,577 |
| LifeStance Health Group, Inc. (a) | | 237,732 | 1,469,184 |
| Surgery Partners, Inc. (a) | | 86,401 | 2,155,705 |
| The Ensign Group, Inc. | | 30,661 | 3,629,036 |
| | | | 10,040,502 |
| Health Care Technology - 0.2% | | | |
| Phreesia, Inc. (a) | | 32,666 | 677,493 |
| Pharmaceuticals - 1.7% | | | |
| Arvinas Holding Co. LLC (a) | | 75,264 | 2,391,137 |
| Axsome Therapeutics, Inc. (a)(b) | | 35,183 | 2,595,098 |
| Enliven Therapeutics, Inc. (a) | | 60,361 | 1,049,678 |
| Structure Therapeutics, Inc. ADR (a) | | 20,285 | 800,040 |
| Verona Pharma PLC ADR (a) | | 84,791 | 1,310,021 |
| | | | 8,145,974 |
TOTAL HEALTH CARE | | | 70,427,343 |
| INDUSTRIALS - 17.4% | | | |
| Aerospace & Defense - 2.0% | | | |
| AerSale Corp. (a) | | 137,367 | 979,427 |
| Cadre Holdings, Inc. | | 79,862 | 2,663,398 |
| Kratos Defense & Security Solutions, Inc. (a) | | 136,583 | 2,433,909 |
| Spirit AeroSystems Holdings, Inc. Class A (a) | | 63,071 | 2,018,272 |
| V2X, Inc. (a) | | 29,628 | 1,439,328 |
| | | | 9,534,334 |
| Building Products - 1.6% | | | |
| AAON, Inc. | | 24,517 | 2,306,805 |
| AZZ, Inc. | | 18,858 | 1,350,799 |
| Tecnoglass, Inc. | | 22,669 | 1,259,263 |
| UFP Industries, Inc. | | 24,911 | 2,807,470 |
| | | | 7,724,337 |
| Commercial Services & Supplies - 1.6% | | | |
| ACV Auctions, Inc. Class A (a) | | 109,019 | 1,902,382 |
| Brady Corp. Class A | | 9,260 | 546,340 |
| The Brink's Co. | | 47,724 | 4,173,941 |
| VSE Corp. | | 11,835 | 923,958 |
| | | | 7,546,621 |
| Construction & Engineering - 3.1% | | | |
| Bowman Consulting Group Ltd. (a) | | 60,548 | 1,967,205 |
| Centuri Holdings, Inc. | | 47,430 | 1,173,893 |
| Comfort Systems U.S.A., Inc. | | 10,223 | 3,163,098 |
| Construction Partners, Inc. Class A (a) | | 41,397 | 2,137,741 |
| EMCOR Group, Inc. | | 4,040 | 1,442,967 |
| IES Holdings, Inc. (a) | | 15,332 | 2,071,660 |
| Sterling Construction Co., Inc. (a) | | 27,415 | 2,785,364 |
| | | | 14,741,928 |
| Electrical Equipment - 1.5% | | | |
| Atkore, Inc. | | 14,187 | 2,486,981 |
| Fluence Energy, Inc. (a) | | 51,697 | 922,274 |
| Nextracker, Inc. Class A (a) | | 56,030 | 2,397,524 |
| Shoals Technologies Group, Inc. (a) | | 167,531 | 1,415,637 |
| | | | 7,222,416 |
| Machinery - 2.0% | | | |
| Crane Co. | | 22,969 | 3,215,890 |
| Federal Signal Corp. | | 10,566 | 859,016 |
| Hillenbrand, Inc. | | 48,615 | 2,319,908 |
| Terex Corp. | | 55,288 | 3,098,892 |
| | | | 9,493,706 |
| Professional Services - 3.8% | | | |
| ASGN, Inc. (a) | | 40,473 | 3,903,621 |
| Concentrix Corp. | | 16,432 | 898,337 |
| CRA International, Inc. | | 26,883 | 3,900,454 |
| ICF International, Inc. | | 22,868 | 3,299,624 |
| Maximus, Inc. | | 26,265 | 2,108,554 |
| TrueBlue, Inc. (a) | | 82,139 | 855,888 |
| Verra Mobility Corp. (a) | | 69,440 | 1,637,395 |
| WNS Holdings Ltd. | | 35,998 | 1,508,676 |
| | | | 18,112,549 |
| Trading Companies & Distributors - 1.8% | | | |
| Applied Industrial Technologies, Inc. | | 23,595 | 4,323,784 |
| FTAI Aviation Ltd. | | 55,317 | 3,883,807 |
| | | | 8,207,591 |
TOTAL INDUSTRIALS | | | 82,583,482 |
| INFORMATION TECHNOLOGY - 14.2% | | | |
| Communications Equipment - 0.5% | | | |
| Ciena Corp. (a) | | 29,234 | 1,351,488 |
| Lumentum Holdings, Inc. (a) | | 21,408 | 936,814 |
| | | | 2,288,302 |
| Electronic Equipment, Instruments & Components - 1.9% | | | |
| Advanced Energy Industries, Inc. | | 22,651 | 2,170,872 |
| Belden, Inc. | | 22,570 | 1,834,264 |
| Crane NXT Co. | | 39,982 | 2,431,305 |
| Napco Security Technologies, Inc. | | 66,147 | 2,692,183 |
| | | | 9,128,624 |
| IT Services - 0.3% | | | |
| Perficient, Inc. (a) | | 34,613 | 1,635,810 |
| Semiconductors & Semiconductor Equipment - 6.1% | | | |
| Allegro MicroSystems LLC (a) | | 69,580 | 2,065,830 |
| Cirrus Logic, Inc. (a) | | 23,037 | 2,040,387 |
| Diodes, Inc. (a) | | 26,320 | 1,921,623 |
| Ichor Holdings Ltd. (a) | | 62,432 | 2,421,113 |
| Impinj, Inc. (a) | | 2,341 | 373,109 |
| MACOM Technology Solutions Holdings, Inc. (a) | | 31,333 | 3,194,399 |
| MKS Instruments, Inc. | | 13,368 | 1,590,525 |
| Nova Ltd. (a) | | 15,093 | 2,564,301 |
| Onto Innovation, Inc. (a) | | 25,974 | 4,817,917 |
| Silicon Motion Tech Corp. sponsored ADR | | 20,033 | 1,478,636 |
| SMART Global Holdings, Inc. (a) | | 102,571 | 1,873,972 |
| Synaptics, Inc. (a) | | 30,824 | 2,772,927 |
| Ultra Clean Holdings, Inc. (a) | | 43,458 | 1,817,848 |
| | | | 28,932,587 |
| Software - 4.5% | | | |
| BlackLine, Inc. (a) | | 45,119 | 2,619,158 |
| Five9, Inc. (a) | | 23,777 | 1,368,842 |
| MicroStrategy, Inc. Class A (a) | | 2,020 | 2,151,361 |
| PROS Holdings, Inc. (a) | | 58,049 | 1,901,105 |
| Rapid7, Inc. (a) | | 60,129 | 2,693,779 |
| Telos Corp. (a) | | 27,878 | 95,900 |
| Tenable Holdings, Inc. (a) | | 90,931 | 4,089,167 |
| Varonis Systems, Inc. (a) | | 97,514 | 4,266,238 |
| Workiva, Inc. (a) | | 28,086 | 2,213,177 |
| | | | 21,398,727 |
| Technology Hardware, Storage & Peripherals - 0.9% | | | |
| Super Micro Computer, Inc. (a) | | 4,667 | 4,008,020 |
TOTAL INFORMATION TECHNOLOGY | | | 67,392,070 |
| MATERIALS - 4.9% | | | |
| Chemicals - 1.7% | | | |
| Element Solutions, Inc. | | 93,043 | 2,152,085 |
| Olin Corp. | | 23,154 | 1,210,491 |
| Quaker Houghton | | 14,305 | 2,668,312 |
| The Chemours Co. LLC | | 68,813 | 1,840,748 |
| Tronox Holdings PLC | | 13,472 | 228,889 |
| | | | 8,100,525 |
| Construction Materials - 0.7% | | | |
| Eagle Materials, Inc. | | 12,987 | 3,255,971 |
| Containers & Packaging - 0.9% | | | |
| Graphic Packaging Holding Co. | | 94,001 | 2,429,926 |
| O-I Glass, Inc. (a) | | 130,932 | 1,958,743 |
| | | | 4,388,669 |
| Metals & Mining - 1.6% | | | |
| ATI, Inc. (a) | | 76,829 | 4,586,691 |
| Commercial Metals Co. | | 21,290 | 1,144,125 |
| Constellium NV (a) | | 100,951 | 1,987,725 |
| | | | 7,718,541 |
TOTAL MATERIALS | | | 23,463,706 |
| REAL ESTATE - 5.5% | | | |
| Equity Real Estate Investment Trusts (REITs) - 4.4% | | | |
| Apple Hospitality (REIT), Inc. | | 127,756 | 1,885,679 |
| Armada Hoffler Properties, Inc. | | 152,721 | 1,606,625 |
| Douglas Emmett, Inc. | | 155,755 | 2,135,401 |
| Four Corners Property Trust, Inc. | | 98,475 | 2,309,239 |
| LXP Industrial Trust (REIT) | | 317,053 | 2,647,393 |
| Outfront Media, Inc. | | 104,464 | 1,656,799 |
| Plymouth Industrial REIT, Inc. | | 113,495 | 2,369,776 |
| Postal Realty Trust, Inc. | | 76,087 | 1,053,805 |
| RLJ Lodging Trust | | 114,833 | 1,263,163 |
| Ryman Hospitality Properties, Inc. | | 13,518 | 1,425,879 |
| Urban Edge Properties | | 147,562 | 2,468,712 |
| | | | 20,822,471 |
| Real Estate Management & Development - 1.1% | | | |
| Cushman & Wakefield PLC (a) | | 325,683 | 3,142,841 |
| Jones Lang LaSalle, Inc. (a) | | 12,344 | 2,230,561 |
| | | | 5,373,402 |
TOTAL REAL ESTATE | | | 26,195,873 |
| UTILITIES - 2.1% | | | |
| Electric Utilities - 0.9% | | | |
| Allete, Inc. | | 48,525 | 2,873,651 |
| IDACORP, Inc. | | 14,169 | 1,342,938 |
| | | | 4,216,589 |
| Gas Utilities - 1.2% | | | |
| Brookfield Infrastructure Corp. A Shares | | 81,165 | 2,473,098 |
| New Jersey Resources Corp. | | 45,024 | 1,967,099 |
| Southwest Gas Holdings, Inc. | | 15,869 | 1,184,145 |
| | | | 5,624,342 |
TOTAL UTILITIES | | | 9,840,931 |
| TOTAL COMMON STOCKS (Cost $473,241,696) | | | 468,843,400 |
| | | | |
| Money Market Funds - 3.7% |
| | | Shares | Value ($) |
| Fidelity Cash Central Fund 5.39% (c) | | 6,371,331 | 6,372,606 |
| Fidelity Securities Lending Cash Central Fund 5.39% (c)(d) | | 11,091,141 | 11,092,250 |
| TOTAL MONEY MARKET FUNDS (Cost $17,464,856) | | | 17,464,856 |
| | | | |
| Equity Funds - 0.3% |
| | | Shares | Value ($) |
| Small Blend Funds - 0.3% | | | |
iShares Russell 2000 Index ETF (b) (Cost $1,514,889) | | 7,635 | 1,495,697 |
| | | | |
| TOTAL INVESTMENT IN SECURITIES - 102.9% (Cost $492,221,441) | 487,803,953 |
NET OTHER ASSETS (LIABILITIES) - (2.9)% | (13,589,323) |
| NET ASSETS - 100.0% | 474,214,630 |
| | |
Security Type Abbreviations
Legend
| (b) | Security or a portion of the security is on loan at period end. |
| (c) | Affiliated fund that is generally available only to investment companies and other accounts managed by Fidelity Investments. The rate quoted is the annualized seven-day yield of the fund at period end. A complete unaudited listing of the fund's holdings as of its most recent quarter end is available upon request. In addition, each Fidelity Central Fund's financial statements, which are not covered by the Fund's Report of Independent Registered Public Accounting Firm, are available on the SEC's website or upon request. |
| (d) | Investment made with cash collateral received from securities on loan. |
Affiliated Central Funds
Fiscal year to date information regarding the Fund's investments in Fidelity Central Funds, including the ownership percentage, is presented below.
| Affiliate | Value, beginning of period ($) | Purchases ($) | Sales Proceeds ($) | Dividend Income ($) | Realized Gain (loss) ($) | Change in Unrealized appreciation (depreciation) ($) | Value, end of period ($) | % ownership, end of period |
| Fidelity Cash Central Fund 5.39% | 37,469 | 494,367,176 | 488,031,896 | 166,267 | (143) | - | 6,372,606 | 0.0% |
| Fidelity Securities Lending Cash Central Fund 5.39% | - | 45,737,459 | 34,645,209 | 22,100 | - | - | 11,092,250 | 0.0% |
| Total | 37,469 | 540,104,635 | 522,677,105 | 188,367 | (143) | - | 17,464,856 | |
| | | | | | | | | |
Amounts in the dividend income column in the above table include any capital gain distributions from underlying funds, which are presented in the corresponding line item in the Statement of Operations, if applicable.
Amounts in the dividend income column for Fidelity Securities Lending Cash Central Fund represents the income earned on investing cash collateral, less rebates paid to borrowers and any lending agent fees associated with the loan, plus any premium payments received for lending certain types of securities.
Amounts included in the purchases and sales proceeds columns may include in-kind transactions, if applicable.
Investment Valuation
The following is a summary of the inputs used, as of April 30, 2024, involving the Fund's assets and liabilities carried at fair value. The inputs or methodology used for valuing securities may not be an indication of the risk associated with investing in those securities. For more information on valuation inputs, and their aggregation into the levels used below, please refer to the Investment Valuation section in the accompanying Notes to Financial Statements.
| Valuation Inputs at Reporting Date: |
| Description | Total ($) | Level 1 ($) | Level 2 ($) | Level 3 ($) |
Investments in Securities: | | | | |
|
| Equities: | | | | |
Communication Services | 9,860,379 | 9,860,379 | - | - |
Consumer Discretionary | 49,620,071 | 49,620,071 | - | - |
Consumer Staples | 13,533,992 | 13,533,992 | - | - |
Energy | 34,816,027 | 34,816,027 | - | - |
Financials | 81,109,526 | 81,109,526 | - | - |
Health Care | 70,427,343 | 70,427,343 | - | - |
Industrials | 82,583,482 | 82,583,482 | - | - |
Information Technology | 67,392,070 | 67,392,070 | - | - |
Materials | 23,463,706 | 23,463,706 | - | - |
Real Estate | 26,195,873 | 26,195,873 | - | - |
Utilities | 9,840,931 | 9,840,931 | - | - |
|
| Money Market Funds | 17,464,856 | 17,464,856 | - | - |
|
| Equity Funds | 1,495,697 | 1,495,697 | - | - |
| Total Investments in Securities: | 487,803,953 | 487,803,953 | - | - |
| Statement of Assets and Liabilities |
| | | | April 30, 2024 |
| | | | | |
| Assets | | | | |
| Investment in securities, at value (including securities loaned of $10,747,827) - See accompanying schedule: | | | | |
Unaffiliated issuers (cost $474,756,585) | $ | 470,339,097 | | |
Fidelity Central Funds (cost $17,464,856) | | 17,464,856 | | |
| | | | | |
| | | | | |
| Total Investment in Securities (cost $492,221,441) | | | $ | 487,803,953 |
| Cash | | | | 1,351 |
| Receivable for investments sold | | | | 630,715 |
| Receivable for fund shares sold | | | | 5,842,614 |
| Dividends receivable | | | | 15,191 |
| Distributions receivable from Fidelity Central Funds | | | | 37,152 |
| Receivable from investment adviser for expense reductions | | | | 4,179 |
Total assets | | | | 494,335,155 |
| Liabilities | | | | |
| Payable for investments purchased | $ | 3,697,273 | | |
| Payable for fund shares redeemed | | 5,316,868 | | |
| Other payables and accrued expenses | | 14,134 | | |
| Collateral on securities loaned | | 11,092,250 | | |
| Total liabilities | | | | 20,120,525 |
| Net Assets | | | $ | 474,214,630 |
| Net Assets consist of: | | | | |
| Paid in capital | | | $ | 477,877,862 |
| Total accumulated earnings (loss) | | | | (3,663,232) |
| Net Assets | | | $ | 474,214,630 |
Net Asset Value, offering price and redemption price per share ($474,214,630 ÷ 42,856,728 shares) | | | $ | 11.07 |
| Statement of Operations |
| | | | Year ended April 30, 2024 |
| Investment Income | | | | |
| Dividends | | | $ | 1,379,704 |
| Income from Fidelity Central Funds (including $22,100 from security lending) | | | | 188,367 |
| Total income | | | | 1,568,071 |
| Expenses | | | | |
| Custodian fees and expenses | $ | 19,816 | | |
| Independent trustees' fees and expenses | | 300 | | |
| Total expenses before reductions | | 20,116 | | |
| Expense reductions | | (16,881) | | |
| Total expenses after reductions | | | | 3,235 |
| Net Investment income (loss) | | | | 1,564,836 |
| Realized and Unrealized Gain (Loss) | | | | |
| Net realized gain (loss) on: | | | | |
| Investment Securities: | | | | |
| Unaffiliated issuers | | (260,252) | | |
| Fidelity Central Funds | | (143) | | |
| Total net realized gain (loss) | | | | (260,395) |
| Change in net unrealized appreciation (depreciation) on investment securities | | | | (4,419,968) |
| Net gain (loss) | | | | (4,680,363) |
| Net increase (decrease) in net assets resulting from operations | | | $ | (3,115,527) |
| Statement of Changes in Net Assets |
| |
| | Year ended April 30, 2024 | | For the period November 4, 2022 (commencement of operations) through April 30, 2023 |
| Increase (Decrease) in Net Assets | | | | |
| Operations | | | | |
| Net investment income (loss) | $ | 1,564,836 | $ | 16,966 |
| Net realized gain (loss) | | (260,395) | | (18,234) |
| Change in net unrealized appreciation (depreciation) | | (4,419,968) | | 2,480 |
| Net increase (decrease) in net assets resulting from operations | | (3,115,527) | | 1,212 |
| Distributions to shareholders | | (526,397) | | (3,300) |
| | | | | |
| Share transactions | | | | |
| Proceeds from sales of shares | | 471,978,517 | | 29,788,496 |
| Reinvestment of distributions | | 526,397 | | 3,300 |
| Cost of shares redeemed | | (24,438,068) | | - |
| | | | | |
Net increase (decrease) in net assets resulting from share transactions | | 448,066,846 | | 29,791,796 |
| Total increase (decrease) in net assets | | 444,424,922 | | 29,789,708 |
| | | | | |
| Net Assets | | | | |
| Beginning of period | | 29,789,708 | | - |
| End of period | $ | 474,214,630 | $ | 29,789,708 |
| | | | | |
| Other Information | | | | |
| Shares | | | | |
| Sold | | 41,963,237 | | 3,040,580 |
| Issued in reinvestment of distributions | | 50,432 | | 334 |
| Redeemed | | (2,197,855) | | - |
| Net increase (decrease) | | 39,815,814 | | 3,040,914 |
| | | | | |
Financial Highlights
Fidelity® Series Small Cap Core Fund |
| |
| Years ended April 30, | | 2024 | | 2023 A |
Selected Per-Share Data | | | | |
| Net asset value, beginning of period | $ | 9.80 | $ | 10.00 |
| Income from Investment Operations | | | | |
Net investment income (loss) B,C | | .14 | | .05 |
| Net realized and unrealized gain (loss) | | 1.30 D | | (.22) |
| Total from investment operations | | 1.44 | | (.17) |
| Distributions from net investment income | | (.12) | | (.03) |
| Distributions from net realized gain | | (.05) | | - |
| Total distributions | | (.17) | | (.03) |
| Net asset value, end of period | $ | 11.07 | $ | 9.80 |
Total Return E,F | | | | (1.67)% |
Ratios to Average Net Assets C,G,H | | | | |
| Expenses before reductions | | .02% | | .20% I |
| Expenses net of fee waivers, if any | | | | -% I,J |
| Expenses net of all reductions | | -% J | | -% I,J |
| Net investment income (loss) | | 1.30% | | 1.12% I |
| Supplemental Data | | | | |
| Net assets, end of period (000 omitted) | $ | 474,215 | $ | 29,790 |
Portfolio turnover rate K | | | | 12% L |
AFor the period November 4, 2022 (commencement of operations) through April 30, 2023.
BCalculated based on average shares outstanding during the period.
CNet investment income (loss) is affected by the timing of the declaration of dividends by any underlying mutual funds or exchange-traded funds (ETFs). Net investment income (loss) of any mutual funds or ETFs is not included in the Fund's net investment income (loss) ratio.
DThe amount shown for a share outstanding does not correspond with the aggregate net gain (loss) on investments for the period due to the timing of sales and repurchases of shares in relation to fluctuating market values of the investments of the Fund.
ETotal returns for periods of less than one year are not annualized.
FTotal returns would have been lower if certain expenses had not been reduced during the applicable periods shown.
GFees and expenses of any underlying mutual funds or exchange-traded funds (ETFs) are not included in the Fund's expense ratio. The Fund indirectly bears its proportionate share of these expenses. For additional expense information related to investments in Fidelity Central Funds, please refer to the "Investments in Fidelity Central Funds" note found in the Notes to Financial Statements section of the most recent Annual or Semi-Annual report.
HExpense ratios reflect operating expenses of the class. Expenses before reductions do not reflect amounts reimbursed, waived, or reduced through arrangements with the investment adviser, brokerage services, or other offset arrangements, if applicable, and do not represent the amount paid by the class during periods when reimbursements, waivers or reductions occur.
IAnnualized.
JAmount represents less than .005%.
KAmount does not include the portfolio activity of any underlying mutual funds or exchange-traded funds (ETFs).
LAmount not annualized.
For the period ended April 30, 2024
1. Organization.
Fidelity Series Small Cap Core Fund (the Fund) is a fund of Fidelity Concord Street Trust (the Trust) and is authorized to issue an unlimited number of shares. Shares are offered only to certain other Fidelity funds, Fidelity managed 529 plans, and Fidelity managed collective investment trusts. The Trust is registered under the Investment Company Act of 1940, as amended (the 1940 Act), as an open-end management investment company organized as a Massachusetts business trust.
2. Investments in Fidelity Central Funds.
Funds may invest in Fidelity Central Funds, which are open-end investment companies generally available only to other investment companies and accounts managed by the investment adviser and its affiliates. The Schedule of Investments lists any Fidelity Central Funds held as an investment as of period end, but does not include the underlying holdings of each Fidelity Central Fund. An investing fund indirectly bears its proportionate share of the expenses of the underlying Fidelity Central Funds.
Based on its investment objective, each Fidelity Central Fund may invest or participate in various investment vehicles or strategies that are similar to those of the investing fund. These strategies are consistent with the investment objectives of the investing fund and may involve certain economic risks which may cause a decline in value of each of the Fidelity Central Funds and thus a decline in the value of the investing fund.
| Fidelity Central Fund | Investment Manager | Investment Objective | Investment Practices | Expense RatioA |
| Fidelity Money Market Central Funds | Fidelity Management & Research Company LLC (FMR) | Each fund seeks to obtain a high level of current income consistent with the preservation of capital and liquidity. | Short-term Investments | Less than .005% |
A Expenses expressed as a percentage of average net assets and are as of each underlying Central Fund's most recent annual or semi-annual shareholder report.
A complete unaudited list of holdings for each Fidelity Central Fund is available upon request or at the Securities and Exchange Commission website at www.sec.gov. In addition, the financial statements of the Fidelity Central Funds which contain the significant accounting policies (including investment valuation policies) of those funds, and are not covered by the Report of Independent Registered Public Accounting Firm, are available on the Securities and Exchange Commission website or upon request.
3. Significant Accounting Policies.
The Fund is an investment company and applies the accounting and reporting guidance of the Financial Accounting Standards Board (FASB) Accounting Standards Codification Topic 946 Financial Services - Investment Companies. The financial statements have been prepared in conformity with accounting principles generally accepted in the United States of America (GAAP), which require management to make certain estimates and assumptions at the date of the financial statements. Actual results could differ from those estimates. Subsequent events, if any, through the date that the financial statements were issued have been evaluated in the preparation of the financial statements. The Fund's Schedule of Investments lists any underlying mutual funds or exchange-traded funds (ETFs) but does not include the underlying holdings of these funds. The following summarizes the significant accounting policies of the Fund:
Investment Valuation. Investments are valued as of 4:00 p.m. Eastern time on the last calendar day of the period. The Board of Trustees (the Board) has designated the Fund's investment adviser as the valuation designee responsible for the fair valuation function and performing fair value determinations as needed. The investment adviser has established a Fair Value Committee (the Committee) to carry out the day-to-day fair valuation responsibilities and has adopted policies and procedures to govern the fair valuation process and the activities of the Committee. In accordance with these fair valuation policies and procedures, which have been approved by the Board, the Fund attempts to obtain prices from one or more third party pricing services or brokers to value its investments. When current market prices, quotations or currency exchange rates are not readily available or reliable, investments will be fair valued in good faith by the Committee, in accordance with the policies and procedures. Factors used in determining fair value vary by investment type and may include market or investment specific events, transaction data, estimated cash flows, and market observations of comparable investments. The frequency that the fair valuation procedures are used cannot be predicted and they may be utilized to a significant extent. The Committee manages the Fund's fair valuation practices and maintains the fair valuation policies and procedures. The Fund's investment adviser reports to the Board information regarding the fair valuation process and related material matters.
The Fund categorizes the inputs to valuation techniques used to value its investments into a disclosure hierarchy consisting of three levels as shown below:
Level 1 - unadjusted quoted prices in active markets for identical investments
Level 2 - other significant observable inputs (including quoted prices for similar investments, interest rates, prepayment speeds, etc.)
Level 3 - unobservable inputs (including the Fund's own assumptions based on the best information available)
Valuation techniques used to value the Fund's investments by major category are as follows:
Equity securities, including restricted securities, for which market quotations are readily available, are valued at the last reported sale price or official closing price as reported by a third party pricing service on the primary market or exchange on which they are traded and are categorized as Level 1 in the hierarchy. In the event there were no sales during the day or closing prices are not available, securities are valued at the last quoted bid price or may be valued using the last available price and are generally categorized as Level 2 in the hierarchy. For foreign equity securities, when market or security specific events arise, comparisons to the valuation of American Depositary Receipts (ADRs), futures contracts, Exchange-Traded Funds (ETFs) and certain indexes as well as quoted prices for similar securities may be used and would be categorized as Level 2 in the hierarchy. For equity securities, including restricted securities, where observable inputs are limited, assumptions about market activity and risk are used and these securities may be categorized as Level 3 in the hierarchy. Exchange-Traded Funds (ETFs) and Exchange-Traded Notes (ETNs) are valued at their last sale price or official closing price as reported by a third party pricing service on the primary market or exchange on which they are traded and are categorized as Level 1 in the hierarchy. In the event there were no sales during the day but the exchange reports a closing bid level, ETFs and ETNs are valued at the closing bid and would be categorized as Level 1 in the hierarchy. In the event there was no closing bid, ETFs and ETNs may be valued by another method that the Board believes reflects fair value in accordance with the Board's fair value pricing policies and may be categorized as Level 2 in the hierarchy.
Investments in open-end mutual funds, including the Fidelity Central Funds, are valued at their closing net asset value (NAV) each business day and are categorized as Level 1 in the hierarchy.
Changes in valuation techniques may result in transfers in or out of an assigned level within the disclosure hierarchy. The aggregate value of investments by input level as of April 30, 2024 is included at the end of the Fund's Schedule of Investments.
Investment Transactions and Income. For financial reporting purposes, the Fund's investment holdings and NAV include trades executed through the end of the last business day of the period. The NAV per share for processing shareholder transactions is calculated as of the close of business of the New York Stock Exchange (NYSE), normally 4:00 p.m. Eastern time and includes trades executed through the end of the prior business day. Gains and losses on securities sold are determined on the basis of identified cost. Commissions paid to certain brokers with whom the investment adviser, or its affiliates, places trades on behalf of a fund include an amount in addition to trade execution, which may be rebated back to a fund. Any such rebates are included in net realized gain (loss) on investments in the Statement of Operations. Dividend income is recorded on the ex-dividend date, except for certain dividends from foreign securities where the ex-dividend date may have passed, which are recorded as soon as the Fund is informed of the ex-dividend date. Non-cash dividends included in dividend income, if any, are recorded at the fair market value of the securities received. Income and capital gain distributions from Fidelity Central Funds, if any, are recorded on the ex-dividend date. Certain distributions received by the Fund represent a return of capital or capital gain. The Fund determines the components of these distributions subsequent to the ex-dividend date, based upon receipt of tax filings or other correspondence relating to the underlying investment. These distributions are recorded as a reduction of cost of investments and/or as a realized gain.
Expenses. Expenses directly attributable to a fund are charged to that fund. Expenses attributable to more than one fund are allocated among the respective funds on the basis of relative net assets or other appropriate methods. Expenses included in the accompanying financial statements reflect the expenses of that fund and do not include any expenses associated with any underlying mutual funds or exchange-traded funds. Although not included in a fund's expenses, a fund indirectly bears its proportionate share of these expenses through the net asset value of each underlying mutual fund or exchange-traded fund. Expense estimates are accrued in the period to which they relate and adjustments are made when actual amounts are known.
Income Tax Information and Distributions to Shareholders. Each year, the Fund intends to qualify as a regulated investment company under Subchapter M of the Internal Revenue Code, including distributing substantially all of its taxable income and realized gains. As a result, no provision for U.S. Federal income taxes is required. As of April 30, 2024, the Fund did not have any unrecognized tax benefits in the financial statements; nor is the Fund aware of any tax positions for which it is reasonably possible that the total amounts of unrecognized tax benefits will significantly change in the next twelve months. The Fund files a U.S. federal tax return, in addition to state and local tax returns as required. The Fund's federal income tax returns are subject to examination by the Internal Revenue Service (IRS) for a period of three fiscal years after they are filed. State and local tax returns may be subject to examination for an additional fiscal year depending on the jurisdiction.
Distributions are declared and recorded on the ex-dividend date. Income and capital gain distributions are determined in accordance with income tax regulations, which may differ from GAAP. In addition, the Fund claimed a portion of the payment made to redeeming shareholders as a distribution for income tax purposes.
Capital accounts within the financial statements are adjusted for permanent book-tax differences. These adjustments have no impact on net assets or the results of operations. Capital accounts are not adjusted for temporary book-tax differences which will reverse in a subsequent period.
Book-tax differences are primarily due to passive foreign investment companies (PFIC) and losses deferred due to wash sales.
As of period end, the cost and unrealized appreciation (depreciation) in securities, and derivatives if applicable, for federal income tax purposes were as follows:
| Gross unrealized appreciation | $24,355,697 |
| Gross unrealized depreciation | (30,399,032) |
| Net unrealized appreciation (depreciation) | $(6,043,335) |
| Tax Cost | $493,847,288 |
The tax-based components of distributable earnings as of period end were as follows:
| Undistributed ordinary income | $2,257,618 |
| Undistributed long-term capital gain | $122,485 |
| Net unrealized appreciation (depreciation) on securities and other investments | $(6,043,335) |
The tax character of distributions paid was as follows:
| | April 30, 2024 | | 2023A |
| Ordinary Income | $526,397 | | $ 3,300 |
A For the period November 4, 2022 (commencement of operations) through April 30, 2023.
4. Purchases and Sales of Investments.
Purchases and sales of securities, other than short-term securities and in-kind transactions, as applicable, are noted in the table below.
| | Purchases ($) | Sales ($) |
| Fidelity Series Small Cap Core Fund | 569,635,992 | 122,687,361 |
5. Fees and Other Transactions with Affiliates.
Management Fee. Fidelity Management & Research Company LLC (the investment adviser) and its affiliates provide the Fund with investment management related services for which the Fund does not pay a management fee. Under the management contract, the investment adviser or an affiliate pays all ordinary operating expenses of the Fund, except custody fees, fees and expenses of the independent Trustees, and certain miscellaneous expenses such as proxy and shareholder meeting expenses.
Brokerage Commissions. A portion of portfolio transactions were placed with brokerage firms which are affiliates of the investment adviser. Brokerage commissions are included in net realized gain (loss) and change in net unrealized appreciation (depreciation) in the Statement of Operations. The commissions paid to these affiliated firms were as follows:
| | Amount ($) |
| Fidelity Series Small Cap Core Fund | 8,507 |
Interfund Trades. Funds may purchase from or sell securities to other Fidelity Funds under procedures adopted by the Board. The procedures have been designed to ensure these interfund trades are executed in accordance with Rule 17a-7 of the 1940 Act. Any interfund trades are included within the respective purchases and sales amounts shown in the Purchases and Sales of Investments note. Interfund trades during the period are noted in the table below.
| | Purchases ($) | Sales ($) | Realized Gain (Loss)($) |
| Fidelity Series Small Cap Core Fund | 48,821,973 | 4,288,975 | 180,406 |
Sub-Advisory Arrangements. Effective March 1, 2024, the Fund's sub-advisory agreements with FMR Investment Management (UK) Limited, Fidelity Management & Research (Hong Kong) Limited, and Fidelity Management & Research (Japan) Limited were amended to provide that the investment adviser pays each sub-adviser monthly fees equal to 110% of the sub-adviser's costs for providing sub-advisory services.
6. Committed Line of Credit.
Certain Funds participate with other funds managed by the investment adviser or an affiliate in a $4.25 billion credit facility (the "line of credit") to be utilized for temporary or emergency purposes to fund shareholder redemptions or for other short-term liquidity purposes. The commitment fees on the pro-rata portion of the line of credit are borne by the investment adviser. During the period, there were no borrowings on this line of credit.
7. Security Lending.
Funds lend portfolio securities from time to time in order to earn additional income. Lending agents are used, including National Financial Services (NFS), an affiliate of the investment adviser. Pursuant to a securities lending agreement, NFS will receive a fee, which is capped at 9.9% of a fund's daily lending revenue, for its services as lending agent. A fund may lend securities to certain qualified borrowers, including NFS. On the settlement date of the loan, a fund receives collateral (in the form of U.S. Treasury obligations, letters of credit and/or cash) against the loaned securities and maintains collateral in an amount not less than 100% of the market value of the loaned securities during the period of the loan. The market value of the loaned securities is determined at the close of business of a fund and any additional required collateral is delivered to a fund on the next business day. A fund or borrower may terminate the loan at any time, and if the borrower defaults on its obligation to return the securities loaned because of insolvency or other reasons, a fund may apply collateral received from the borrower against the obligation. A fund may experience delays and costs in recovering the securities loaned. Any cash collateral received is invested in the Fidelity Securities Lending Cash Central Fund. Any loaned securities are identified as such in the Schedule of Investments, and the value of loaned securities and cash collateral at period end, as applicable, are presented in the Statement of Assets and Liabilities. Security lending income represents the income earned on investing cash collateral, less rebates paid to borrowers and any lending agent fees associated with the loan, plus any premium payments received for lending certain types of securities. Security lending income is presented in the Statement of Operations as a component of income from Fidelity Central Funds. Affiliated security lending activity, if any, was as follows:
| | Total Security Lending Fees Paid to NFS ($) | Security Lending Income From Securities Loaned to NFS ($) | Value of Securities Loaned to NFS at Period End ($) |
| Fidelity Series Small Cap Core Fund | 2,414 | - | - |
8. Expense Reductions.
The investment adviser contractually agreed to reimburse the Fund to the extent annual operating expenses exceeded .003% of average net assets. This reimbursement will remain in place through August 31, 2027. Some expenses, for example the compensation of the independent Trustees, and certain other expenses such as interest expense, are excluded from this reimbursement. During the period this reimbursement reduced the Fund's expenses by $16,246.
Through arrangements with the Fund's custodian, credits realized as a result of certain uninvested cash balances were used to reduce the Fund's expenses by $635.
9. Other.
A fund's organizational documents provide former and current trustees and officers with a limited indemnification against liabilities arising in connection with the performance of their duties to the fund. In the normal course of business, a fund may also enter into contracts that provide general indemnifications. A fund's maximum exposure under these arrangements is unknown as this would be dependent on future claims that may be made against a fund. The risk of material loss from such claims is considered remote.
At the end of the period, mutual funds and accounts managed by the investment adviser or its affiliates were the owners of record of all of the outstanding shares of the Fund.
10. Risk and Uncertainties.
Many factors affect a fund's performance. Developments that disrupt global economies and financial markets, such as pandemics, epidemics, outbreaks of infectious diseases, war, terrorism, and environmental disasters, may significantly affect a fund's investment performance. The effects of these developments to a fund will be impacted by the types of securities in which a fund invests, the financial condition, industry, economic sector, and geographic location of an issuer, and a fund's level of investment in the securities of that issuer. Significant concentrations in security types, issuers, industries, sectors, and geographic locations may magnify the factors that affect a fund's performance.
To the Board of Trustees of Fidelity Concord Street Trust and the Shareholders of Fidelity Series Small Cap Core Fund:
Opinion on the Financial Statements and Financial Highlights
We have audited the accompanying statement of assets and liabilities of Fidelity Series Small Cap Core Fund (the "Fund"), a fund of Fidelity Concord Street Trust, including the schedule of investments, as of April 30, 2024, the related statement of operations for the year then ended, the statement of changes in net assets and the financial highlights for the year then ended and for the period from November 4, 2022 (commencement of operations) through April 30, 2023, and the related notes. In our opinion, the financial statements and financial highlights present fairly, in all material respects, the financial position of the Fund as of April 30, 2024, the results of its operations for the year then ended, and the changes in its net assets and the financial highlights for the year then ended and for the period from November 4, 2022 (commencement of operations) through April 30, 2023, in conformity with accounting principles generally accepted in the United States of America.
Basis for Opinion
These financial statements and financial highlights are the responsibility of the Fund's management. Our responsibility is to express an opinion on the Fund's financial statements and financial highlights based on our audits. We are a public accounting firm registered with the Public Company Accounting Oversight Board (United States) (PCAOB) and are required to be independent with respect to the Fund in accordance with the U.S. federal securities laws and the applicable rules and regulations of the Securities and Exchange Commission and the PCAOB.
We conducted our audits in accordance with the standards of the PCAOB. Those standards require that we plan and perform the audit to obtain reasonable assurance about whether the financial statements and financial highlights are free of material misstatement, whether due to error or fraud. The Fund is not required to have, nor were we engaged to perform, an audit of its internal control over financial reporting. As part of our audits, we are required to obtain an understanding of internal control over financial reporting but not for the purpose of expressing an opinion on the effectiveness of the Fund's internal control over financial reporting. Accordingly, we express no such opinion.
Our audits included performing procedures to assess the risks of material misstatement of the financial statements and financial highlights, whether due to error or fraud, and performing procedures that respond to those risks. Such procedures included examining, on a test basis, evidence regarding the amounts and disclosures in the financial statements and financial highlights. Our audits also included evaluating the accounting principles used and significant estimates made by management, as well as evaluating the overall presentation of the financial statements and financial highlights. Our procedures included confirmation of securities owned as of April 30, 2024, by correspondence with the custodian and brokers; when replies were not received from brokers, we performed other auditing procedures. We believe that our audits provide a reasonable basis for our opinion.
/s/ Deloitte & Touche LLP
Boston, Massachusetts
June 14, 2024
We have served as the auditor of one or more of the Fidelity investment companies since 1999.
The Trustees, Members of the Advisory Board (if any), and officers of the trust and fund, as applicable, are listed below. The Board of Trustees governs the fund and is responsible for protecting the interests of shareholders. The Trustees are experienced executives who meet periodically throughout the year to oversee the fund's activities, review contractual arrangements with companies that provide services to the fund, oversee management of the risks associated with such activities and contractual arrangements, and review the fund's performance. Except for Jonathan Chiel, each of the Trustees oversees 323 funds. Mr. Chiel oversees 192 funds.
The Trustees hold office without limit in time except that (a) any Trustee may resign; (b) any Trustee may be removed by written instrument, signed by at least two-thirds of the number of Trustees prior to such removal; (c) any Trustee who requests to be retired or who has become incapacitated by illness or injury may be retired by written instrument signed by a majority of the other Trustees; and (d) any Trustee may be removed at any special meeting of shareholders by a two-thirds vote of the outstanding voting securities of the trust. Each Trustee who is not an interested person (as defined in the 1940 Act) of the trust and the fund is referred to herein as an Independent Trustee. Each Independent Trustee shall retire not later than the last day of the calendar year in which his or her 75th birthday occurs. The Independent Trustees may waive this mandatory retirement age policy with respect to individual Trustees. Officers and Advisory Board Members hold office without limit in time, except that any officer or Advisory Board Member may resign or may be removed by a vote of a majority of the Trustees at any regular meeting or any special meeting of the Trustees. Except as indicated, each individual has held the office shown or other offices in the same company for the past five years.
The fund's Statement of Additional Information (SAI) includes more information about the Trustees. To request a free copy, call Fidelity at 1-800-544-8544.
Experience, Skills, Attributes, and Qualifications of the Trustees. The Governance and Nominating Committee has adopted a statement of policy that describes the experience, qualifications, attributes, and skills that are necessary and desirable for potential Independent Trustee candidates (Statement of Policy). The Board believes that each Trustee satisfied at the time he or she was initially elected or appointed a Trustee, and continues to satisfy, the standards contemplated by the Statement of Policy. The Governance and Nominating Committee also engages professional search firms to help identify potential Independent Trustee candidates who have the experience, qualifications, attributes, and skills consistent with the Statement of Policy. From time to time, additional criteria based on the composition and skills of the current Independent Trustees, as well as experience or skills that may be appropriate in light of future changes to board composition, business conditions, and regulatory or other developments, have also been considered by the professional search firms and the Governance and Nominating Committee. In addition, the Board takes into account the Trustees' commitment and participation in Board and committee meetings, as well as their leadership of standing and ad hoc committees throughout their tenure.
In determining that a particular Trustee was and continues to be qualified to serve as a Trustee, the Board has considered a variety of criteria, none of which, in isolation, was controlling. The Board believes that, collectively, the Trustees have balanced and diverse experience, qualifications, attributes, and skills, which allow the Board to operate effectively in governing the fund and protecting the interests of shareholders. Information about the specific experience, skills, attributes, and qualifications of each Trustee, which in each case led to the Board's conclusion that the Trustee should serve (or continue to serve) as a trustee of the fund, is provided below.
Board Structure and Oversight Function. Robert A. Lawrence is an interested person and currently serves as Chair. The Trustees have determined that an interested Chair is appropriate and benefits shareholders because an interested Chair has a personal and professional stake in the quality and continuity of services provided to the fund. Independent Trustees exercise their informed business judgment to appoint an individual of their choosing to serve as Chair, regardless of whether the Trustee happens to be independent or a member of management. The Independent Trustees have determined that they can act independently and effectively without having an Independent Trustee serve as Chair and that a key structural component for assuring that they are in a position to do so is for the Independent Trustees to constitute a substantial majority for the Board. The Independent Trustees also regularly meet in executive session. David M. Thomas serves as Lead Independent Trustee and as such (i) acts as a liaison between the Independent Trustees and management with respect to matters important to the Independent Trustees and (ii) with management prepares agendas for Board meetings.
Fidelity® funds are overseen by different Boards of Trustees. The fund's Board oversees Fidelity's high income and certain equity funds, and other Boards oversee Fidelity's alternative investment, investment-grade bond, money market, asset allocation, and other equity funds. The asset allocation funds may invest in Fidelity® funds overseen by the fund's Board. The use of separate Boards, each with its own committee structure, allows the Trustees of each group of Fidelity® funds to focus on the unique issues of the funds they oversee, including common research, investment, and operational issues. On occasion, the separate Boards establish joint committees to address issues of overlapping consequences for the Fidelity® funds overseen by each Board.
The Trustees operate using a system of committees to facilitate the timely and efficient consideration of all matters of importance to the Trustees, the fund, and fund shareholders and to facilitate compliance with legal and regulatory requirements and oversight of the fund's activities and associated risks. The Board, acting through its committees, has charged FMR and its affiliates with (i) identifying events or circumstances the occurrence of which could have demonstrably adverse effects on the fund's business and/or reputation; (ii) implementing processes and controls to lessen the possibility that such events or circumstances occur or to mitigate the effects of such events or circumstances if they do occur; and (iii) creating and maintaining a system designed to evaluate continuously business and market conditions in order to facilitate the identification and implementation processes described in (i) and (ii) above. Because the day-to-day operations and activities of the fund are carried out by or through FMR, its affiliates, and other service providers, the fund's exposure to risks is mitigated but not eliminated by the processes overseen by the Trustees. While each of the Board's committees has responsibility for overseeing different aspects of the fund's activities, oversight is exercised primarily through the Operations, Audit, and Compliance Committees. Appropriate personnel, including but not limited to the fund's Chief Compliance Officer (CCO), FMR's internal auditor, the independent accountants, the fund's Treasurer and portfolio management personnel, make periodic reports to the Board's committees, as appropriate, including an annual review of Fidelity's risk management program for the Fidelity® funds. The responsibilities of each standing committee, including their oversight responsibilities, are described further under "Standing Committees of the Trustees."
Interested Trustees*:
Correspondence intended for a Trustee who is an interested person may be sent to Fidelity Investments, 245 Summer Street, Boston, Massachusetts 02210.
Name, Year of Birth; Principal Occupations and Other Relevant Experience+
Jonathan Chiel (1957)
Year of Election or Appointment: 2016
Trustee
Mr. Chiel also serves as Trustee of other Fidelity® funds. Mr. Chiel is Senior Counsel at Fidelity Investments (diversified financial services company, 2024-present). Previously, Mr. Chiel served as General Counsel (2012-2024) and Head of Legal, Risk and Compliance (2022-2024) for Fidelity Investments; Executive Vice President and General Counsel for FMR LLC (diversified financial services company, 2012-2024); Director and President of OH Company LLC (holding company, 2018-2024); General Counsel (2004-2012) and Senior Vice President and Deputy General Counsel (2000-2004) for John Hancock Financial Services; a partner with Choate, Hall & Stewart (law firm, 1996-2000); and an Assistant United States Attorney for the United States Attorney's Office of the District of Massachusetts (1986-1995), including Chief of the Criminal Division (1993-1995). Mr. Chiel is a director on the boards of the Harvard Law School Center on the Legal Profession and the U.S. Chamber Litigation Center.
Bettina Doulton (1964)
Year of Election or Appointment: 2021
Trustee
Ms. Doulton also serves as Trustee of other Fidelity® funds. Prior to her retirement, Ms. Doulton served in a variety of positions at Fidelity Investments, including as a managing director of research (2006-2007), portfolio manager to certain Fidelity® funds (1993-2005), equity analyst and portfolio assistant (1990-1993), and research assistant (1987-1990). Ms. Doulton currently owns and operates Cellardoor Winery. Previously, Ms. Doulton served as a member of the Board of Brown Capital Management, LLC (2014-2018).
Robert A. Lawrence (1952)
Year of Election or Appointment: 2020
Trustee
Chair of the Board of Trustees
Mr. Lawrence also serves as Trustee of other funds. Previously, Mr. Lawrence served as a Trustee and Member of the Advisory Board of certain funds. Prior to his retirement in 2008, Mr. Lawrence served as Vice President of certain Fidelity® funds (2006-2008), Senior Vice President, Head of High Income Division of Fidelity Management & Research Company (investment adviser firm, 2006-2008), and President of Fidelity Strategic Investments (investment adviser firm, 2002-2005).
* Determined to be an "Interested Trustee" by virtue of, among other things, his or her affiliation with the trust or various entities under common control with FMR.
+ The information includes the Trustee's principal occupation during the last five years and other information relating to the experience, attributes, and skills relevant to the Trustee's qualifications to serve as a Trustee, which led to the conclusion that the Trustee should serve as a Trustee for the fund.
Independent Trustees:
Correspondence intended for an Independent Trustee may be sent to Fidelity Investments, P.O. Box 55235, Boston, Massachusetts 02205-5235.
Name, Year of Birth; Principal Occupations and Other Relevant Experience+
Thomas P. Bostick (1956)
Year of Election or Appointment: 2021
Trustee
Lieutenant General Bostick also serves as Trustee of other Fidelity® funds. Prior to his retirement, General Bostick (United States Army, Retired) held a variety of positions within the U.S. Army, including Chief of Engineers and Commanding General, U.S. Army Corps of Engineers (2012-2016) and Deputy Chief of Staff and Director of Human Resources, U.S. Army (2009-2012). General Bostick currently serves as a member of the Board and Finance and Governance & Sustainability Committees of CSX Corporation (transportation, 2020-present) and a member of the Board and Corporate Governance and Nominating Committee of Perma-Fix Environmental Services, Inc. (nuclear waste management, 2020-present). General Bostick serves as Chief Executive Officer of Bostick Global Strategies, LLC (consulting, 2016-present), as a member of the Board of HireVue, Inc. (video interview and assessment, 2020-present), as a member of the Board of Allonnia (biotechnology and engineering solutions, 2022-present), on the Advisory Board of Hilco Redevelopment Partners (a real estate investment and redevelopment company, 2021-present), and on the Advisory Board of Solugen, Inc. (specialty bio-based chemicals manufacturer, 2022-present). Previously, General Bostick served as a Member of the Advisory Board of certain Fidelity® funds (2021), President, Intrexon Bioengineering (2018-2020) and Chief Operating Officer (2017-2020) and Senior Vice President of the Environment Sector (2016-2017) of Intrexon Corporation (biopharmaceutical company).
Donald F. Donahue (1950)
Year of Election or Appointment: 2018
Trustee
Mr. Donahue also serves as Trustee of other Fidelity® funds. Mr. Donahue serves as President and Chief Executive Officer of Miranda Partners, LLC (risk consulting for the financial services industry, 2012-present). Previously, Mr. Donahue served as Chief Executive Officer (2006-2012), Chief Operating Officer (2003-2006) and Managing Director, Customer Marketing and Development (1999-2003) of The Depository Trust & Clearing Corporation (financial markets infrastructure). Mr. Donahue currently serves as a member (2007-present) and Co-Chairman (2016-present) of the Board of United Way of New York. Mr. Donahue previously served as a member of the Advisory Board of certain Fidelity® funds (2015-2018) and as a member of the Board of The Leadership Academy (previously NYC Leadership Academy) (2012-2022).
Vicki L. Fuller (1957)
Year of Election or Appointment: 2020
Trustee
Ms. Fuller also serves as Trustee of other Fidelity® funds. Previously, Ms. Fuller served as a member of the Advisory Board of certain Fidelity® funds (2018-2020), Chief Investment Officer of the New York State Common Retirement Fund (2012-2018) and held a variety of positions at AllianceBernstein L.P. (global asset management, 1985-2012), including Managing Director (2006-2012) and Senior Vice President and Senior Portfolio Manager (2001-2006). Ms. Fuller currently serves as a member of the Board, Audit Committee, Compensation Committee and Nominating and Governance Committee of two Blackstone business development companies (2020-present), as a member of the Board of Treliant, LLC (consulting, 2019-present), as a member of the Board of Ariel Alternatives, LLC (private equity, 2022-present) and as a member of the Board and Chair of the Audit Committee of Gusto, Inc. (software, 2021-present). In addition, Ms. Fuller currently serves as a member of the Executive Board of New York University's Stern School of Business. Ms. Fuller previously served as a member of the Board of Roosevelt University (2019-2024) and member of the Board, Audit Committee and Nominating and Governance Committee of The Williams Companies, Inc. (natural gas infrastructure, 2018-2021).
Patricia L. Kampling (1959)
Year of Election or Appointment: 2020
Trustee
Ms. Kampling also serves as Trustee of other Fidelity® funds. Prior to her retirement, Ms. Kampling served as Chairman of the Board and Chief Executive Officer (2012-2019), President and Chief Operating Officer (2011-2012) and Executive Vice President and Chief Financial Officer (2010-2011) of Alliant Energy Corporation. Ms. Kampling currently serves as a member of the Board, Audit Committee and Governance, Compensation and Nominating Committee of Xcel Energy Inc. (utilities company, 2020-present) and as a member of the Board, Audit, Finance and Risk Committee and Safety, Environmental, Technology and Operations Committee and Chair of the Executive Development and Compensation Committee of American Water Works Company, Inc. (utilities company, 2019-present). In addition, Ms. Kampling currently serves as a member of the Board of the Nature Conservancy, Wisconsin Chapter (2019-present). Previously, Ms. Kampling served as a Member of the Advisory Board of certain Fidelity® funds (2020), a member of the Board, Compensation Committee and Executive Committee and Chair of the Audit Committee of Briggs & Stratton Corporation (manufacturing, 2011-2021), a member of the Board of Interstate Power and Light Company (2012-2019) and Wisconsin Power and Light Company (2012-2019) (each a subsidiary of Alliant Energy Corporation) and as a member of the Board and Workforce Development Committee of the Business Roundtable (2018-2019).
Thomas A. Kennedy (1955)
Year of Election or Appointment: 2021
Trustee
Mr. Kennedy also serves as Trustee of other Fidelity® funds. Previously, Mr. Kennedy served as a Member of the Advisory Board of certain Fidelity® funds (2020) and held a variety of positions at Raytheon Company (aerospace and defense, 1983-2020), including Chairman and Chief Executive Officer (2014-2020) and Executive Vice President and Chief Operating Officer (2013-2014). Mr. Kennedy served as Executive Chairman of the Board of Directors of Raytheon Technologies Corporation (aerospace and defense, 2020-2021). Mr. Kennedy serves as a Director of the Board of Directors of Textron Inc. (aerospace and defense, 2023-present).
Oscar Munoz (1959)
Year of Election or Appointment: 2021
Trustee
Mr. Munoz also serves as Trustee of other Fidelity® funds. Prior to his retirement, Mr. Munoz served as Executive Chairman (2020-2021), Chief Executive Officer (2015-2020), President (2015-2016) and a member of the Board (2010-2021) of United Airlines Holdings, Inc. Mr. Munoz currently serves as a member of the Board of CBRE Group, Inc. (commercial real estate, 2020-present), a member of the Board of Univision Communications, Inc. (Hispanic media, 2020-present), a member of the Board of Archer Aviation Inc. (2021-present), a member of the Defense Business Board of the United States Department of Defense (2021-present) and a member of the Board of Salesforce.com, Inc. (cloud-based software, 2022-present). Previously, Mr. Munoz served as a Member of the Advisory Board of certain Fidelity® funds (2021).
David M. Thomas (1949)
Year of Election or Appointment: 2008
Trustee
Lead Independent Trustee
Mr. Thomas also serves as Trustee of other Fidelity® funds. Previously, Mr. Thomas served as Executive Chairman (2005-2006) and Chairman and Chief Executive Officer (2000-2005) of IMS Health, Inc. (pharmaceutical and healthcare information solutions) and as a member of the Board of Fortune Brands Home and Security (home and security products, 2004-2023). Mr. Thomas currently serves as Director (2013-present) and Non-Executive Chairman of the Board (2022-present) of Interpublic Group of Companies, Inc. (marketing communication).
Susan Tomasky (1953)
Year of Election or Appointment: 2020
Trustee
Ms. Tomasky also serves as Trustee of other Fidelity® funds. Prior to her retirement, Ms. Tomasky served in various executive officer positions at American Electric Power Company, Inc. (1998-2011), including most recently as President of AEP Transmission (2007-2011). Ms. Tomasky currently serves as a member of the Board and Sustainability Committee and as Chair of the Audit Committee of Marathon Petroleum Corporation (2018-present) and as a member of the Board, Executive Committee, Corporate Governance Committee and Organization and Compensation Committee and as Lead Director of the Board of Public Service Enterprise Group, Inc. (utilities company, 2012-present) and as a member of the Board of its subsidiary company, Public Service Electric and Gas Co. (2021-present). In addition, Ms. Tomasky currently serves as a member (2009-present) and President (2020-present) of the Board of the Royal Shakespeare Company - America (2009-present) and as a member and Vice Chair of the Board of Kenyon College (2016-present). Previously, Ms. Tomasky served as a Member of the Advisory Board of certain Fidelity® funds (2020), as a member of the Board of the Columbus Association for the Performing Arts (2011-2023), as a member of the Board of the Columbus Regional Airport Authority (2007-2020), as a member of the Board (2011-2018) and Lead Independent Director (2015-2018) of Andeavor Corporation (previously Tesoro Corporation) (independent oil refiner and marketer) and as a member of the Board of Summit Midstream Partners LP (energy, 2012-2018).
Michael E. Wiley (1950)
Year of Election or Appointment: 2020
Trustee
Mr. Wiley also serves as Trustee of other Fidelity® funds. Previously, Mr. Wiley served as a member of the Advisory Board of certain Fidelity® funds (2018-2020), Chairman, President and CEO of Baker Hughes, Inc. (oilfield services, 2000-2004). Mr. Wiley also previously served as a member of the Board of Andeavor Corporation (independent oil refiner and marketer, 2005-2018), a member of the Board of Andeavor Logistics LP (natural resources logistics, 2015-2018) and a member of the Board of High Point Resources (exploration and production, 2005-2020).
+ The information includes the Trustee's principal occupation during the last five years and other information relating to the experience, attributes, and skills relevant to the Trustee's qualifications to serve as a Trustee, which led to the conclusion that the Trustee should serve as a Trustee for the fund.
Advisory Board Members and Officers:
Correspondence intended for a Member of the Advisory Board (if any) may be sent to Fidelity Investments, P.O. Box 55235, Boston, Massachusetts 02205-5235. Correspondence intended for an officer or Peter S. Lynch may be sent to Fidelity Investments, 245 Summer Street, Boston, Massachusetts 02210.
Name, Year of Birth; Principal Occupations+
Vijay C. Advani (1960)
Year of Election or Appointment: 2023
Member of the Advisory Board
Mr. Advani also serves as Trustee or Member of the Advisory Board of other funds. Previously, Mr. Advani served as Executive Chairman (2020-2022), Chief Executive Officer (2017-2020) and Chief Operating Officer (2016-2017) of Nuveen (global investment manager). He also served in various capacities at Franklin Resources (global investment manager), including Co-President (2015-2016), Executive Vice President, Global Advisory Services (2008-2015), Head of Global Retail Distribution (2005-2008), Executive Managing Director, International Retail Development (2002-2005), Managing Director, Product Developments, Sales & Marketing, Asia, Eastern Europe and Africa (2000-2002) and President, Templeton Asset Management India (1995-2000). Mr. Advani also served as Senior Investment Officer of International Finance Corporation (private equity and venture capital arm of The World Bank, 1984-1995). Mr. Advani is Chairman Emeritus of the U.S. India Business Council (2018-present), a Director of The Global Impact Investing Network (2019-present), a Director of LOK Capital (Mauritius) (2022-present), a member of the Advisory Council of LOK Capital (2022-present), a Senior Advisor of Neuberger Berman (2021-present), a Senior Advisor of Seviora Holdings Pte. Ltd (Temasek-Singapore) (2021-present), a Director of Seviora Capital (Singapore) (2021-present) and an Advisor of EQUIAM (2021-present). Mr. Advani formerly served as a member of the Board of BowX Acquisition Corp. (special purpose acquisition company, 2020-2021), a member of the Board of Intellecap (advisory arm of The Aavishkaar Group, 2018-2020), a member of the Board of Nuveen Investments, Inc. (2017-2020) and a member of the Board of Docusign (software, 2016-2019).
Peter S. Lynch (1944)
Year of Election or Appointment: 2003
Member of the Advisory Board
Mr. Lynch also serves as a Member of the Advisory Board of other Fidelity® funds. Mr. Lynch is Vice Chairman and a Director of Fidelity Management & Research Company LLC (investment adviser firm). In addition, Mr. Lynch serves as a Trustee of Boston College and as the Chairman of the Inner-City Scholarship Fund. Previously, Mr. Lynch served as Vice Chairman and a Director of FMR Co., Inc. (investment adviser firm) and on the Special Olympics International Board of Directors (1997-2006).
Karen B. Peetz (1955)
Year of Election or Appointment: 2023
Member of the Advisory Board
Ms. Peetz also serves as a Member of the Advisory Board of other funds. Previously, Ms. Peetz served as Chief Administration Officer (2020-2023) of Citigroup Inc. (a diversified financial service company). She also served in various capacities at Bank of New York Mellon Corporation, including President (2013-2016), Vice Chairman, Senior Executive Vice President and Chief Executive Officer of Financial Markets & Treasury Services (2010-2013), Senior Executive Vice President and Chief Executive Officer of Global Corporate Trust (2003-2008), Senior Vice President and Division Manager of Global Payments & Trade Services (2002-2003) and Senior Vice President and Division Manager of Domestic Corporate Trust (1998-2002). Ms. Peetz also served in various capacities at Chase Manhattan Corporation (1982-1998), including Senior Vice President and Manager of Corporate Trust International Business (1996-1998), Managing Director and Manager of Corporate Trust Services (1994-1996) and Managing Director and Group Manager of Financial Institution Sales (1990-1993). Ms. Peetz currently serves as Chair of Amherst Holdings Advisory Council (2018-present), Trustee of Johns Hopkins University (2016-present), Chair of the Carey Business School Advisory Council, Member of the Johns Hopkins Medicine Board and Finance Committee and Chair of the Lyme and Tick Related Disease Institute Advisory Council. Ms. Peetz previously served as a member of the Board of Guardian Life Insurance Company of America (2019-2023), a member of the Board of Trane Technologies (2018-2022), a member of the Board of Wells Fargo Corp. (2017-2019), a member of the Board of SunCoke Energy Inc. (2012-2016), a member of the Board of Private Export Funding Corporation (2010-2016) and as a Trustee of Penn State University (2010-2014) and the United Way of New York City (2008-2010).
Heather Bonner (1977)
Year of Election or Appointment: 2023
Assistant Treasurer
Ms. Bonner also serves as an officer of other funds. Ms. Bonner is a Senior Vice President (2022-present) and is an employee of Fidelity Investments (2022-present). Ms. Bonner serves as Senior Vice President, Vice President, Treasurer, or Director of certain Fidelity entities. Prior to joining Fidelity, Ms. Bonner served as Managing Director at AQR Capital Management (2013-2022) and was the Treasurer and Principal Financial Officer of the AQR Funds (2013-2022).
Craig S. Brown (1977)
Year of Election or Appointment: 2022
Deputy Treasurer
Mr. Brown also serves as an officer of other funds. Mr. Brown is a Vice President (2015-present) and is an employee of Fidelity Investments. Mr. Brown serves as Assistant Treasurer of FIMM, LLC (2021-present). Previously, Mr. Brown served as Assistant Treasurer of certain Fidelity® funds (2019-2022).
John J. Burke III (1964)
Year of Election or Appointment: 2018
Chief Financial Officer
Mr. Burke also serves as Chief Financial Officer of other funds. Mr. Burke is Head of Fidelity Fund and Investment Operations (2018-present) and is an employee of Fidelity Investments. Mr. Burke serves as President, Executive Vice President, or Director of certain Fidelity entities. Previously Mr. Burke served as head of Asset Management Investment Operations (2012-2018).
Margaret Carey (1973)
Year of Election or Appointment: 2023
Secretary and Chief Legal Officer (CLO)
Ms. Carey also serves as an officer of other funds and as CLO of certain Fidelity entities. Ms. Carey is a Senior Vice President, Deputy General Counsel (2019-present) and is an employee of Fidelity Investments.
William C. Coffey (1969)
Year of Election or Appointment: 2019
Assistant Secretary
Mr. Coffey also serves as Assistant Secretary of other funds. Mr. Coffey is a Senior Vice President, Deputy General Counsel (2010-present) and is an employee of Fidelity Investments. Previously, Mr. Coffey served as Secretary and CLO of certain funds (2018-2019); CLO, Secretary, or Senior Vice President of certain Fidelity entities and Assistant Secretary of certain funds (2009-2018).
Timothy M. Cohen (1969)
Year of Election or Appointment: 2018
Vice President
Mr. Cohen also serves as Vice President of other funds. Mr. Cohen is Co-Head of Equity (2018-present) and is an employee of Fidelity Investments. Mr. Cohen serves as President or Director of certain Fidelity entities. Previously, Mr. Cohen served as Executive Vice President of Fidelity SelectCo, LLC (2019) and Head of Global Equity Research (2016-2018).
Jonathan Davis (1968)
Year of Election or Appointment: 2010
Assistant Treasurer
Mr. Davis also serves as an officer of other funds. Mr. Davis is a Vice President (2006-present) and is an employee of Fidelity Investments. Mr. Davis serves as Assistant Treasurer or Director of certain Fidelity entities.
Laura M. Del Prato (1964)
Year of Election or Appointment: 2018
Assistant Treasurer
Ms. Del Prato also serves as an officer of other funds. Ms. Del Prato is a Senior Vice President (2017-present) and is an employee of Fidelity Investments. Ms. Del Prato serves as Senior Vice President, Vice President, Assistant Treasurer, or Director of certain Fidelity entities. Previously, Ms. Del Prato served as President and Treasurer of The North Carolina Capital Management Trust: Cash Portfolio and Term Portfolio (2018-2020).
Colm A. Hogan (1973)
Year of Election or Appointment: 2020
Assistant Treasurer
Mr. Hogan also serves as an officer of other funds. Mr. Hogan is a Vice President (2016-present) and is an employee of Fidelity Investments. Mr. Hogan serves as Assistant Treasurer of certain Fidelity entities. Previously, Mr. Hogan served as Deputy Treasurer of certain Fidelity® funds (2016-2020) and Assistant Treasurer of certain Fidelity® funds (2016-2018).
Pamela R. Holding (1964)
Year of Election or Appointment: 2018
Vice President
Ms. Holding also serves as Vice President of other funds. Ms. Holding is Co-Head of Equity (2018-present) and is an employee of Fidelity Investments. Previously, Ms. Holding served as Executive Vice President of Fidelity SelectCo, LLC (2019) and as Chief Investment Officer of Fidelity Institutional Asset Management (2013-2018).
Chris Maher (1972)
Year of Election or Appointment: 2020
Deputy Treasurer
Mr. Maher also serves as an officer of other funds. Mr. Maher is a Vice President (2008-present) and is an employee of Fidelity Investments. Mr. Maher serves as Assistant Treasurer of certain Fidelity entities. Previously, Mr. Maher served as Assistant Treasurer of certain funds (2013-2020).
Jason P. Pogorelec (1975)
Year of Election or Appointment: 2020
Chief Compliance Officer
Mr. Pogorelec also serves as Chief Compliance Officer of other funds. Mr. Pogorelec is a Senior Vice President of Asset Management Compliance (2020-present) and is an employee of Fidelity Investments. Mr. Pogorelec serves as Compliance Officer of Fidelity Management & Research Company LLC (investment adviser firm, 2023-present) and Ballyrock Investment Advisors LLC (2023-present). Previously, Mr. Pogorelec served as a Vice President, Associate General Counsel for Fidelity Investments (2010-2020) and Assistant Secretary of certain Fidelity® funds (2015-2020).
Brett Segaloff (1972)
Year of Election or Appointment: 2021
Anti-Money Laundering (AML) Officer
Mr. Segaloff also serves as AML Officer of other funds. Mr. Segaloff is a Vice President (2022-present) and is an employee of Fidelity Investments. Mr. Segaloff serves as Anti Money Laundering Compliance Officer or Anti Money Laundering/Bank Secrecy Act Compliance Officer of certain Fidelity entities.
Stacie M. Smith (1974)
Year of Election or Appointment: 2016
President and Treasurer
Ms. Smith also serves as an officer of other funds. Ms. Smith is a Senior Vice President (2016-present) and is an employee of Fidelity Investments. Ms. Smith serves as Assistant Treasurer of certain Fidelity entities and has served in other fund officer roles.
Jim Wegmann (1979)
Year of Election or Appointment: 2019
Assistant Treasurer
Mr. Wegmann also serves as an officer of other funds. Mr. Wegmann is a Vice President (2016-present) and is an employee of Fidelity Investments. Mr. Wegmann serves as Assistant Treasurer of FIMM, LLC (2021-present). Previously, Mr. Wegmann served as Assistant Treasurer of certain Fidelity® funds (2019-2021).
+ The information includes principal occupation during the last five years.
As a shareholder, you incur two types of costs: (1) transaction costs, which may include sales charges (loads) on purchase payments or redemption proceeds, as applicable and (2) ongoing costs, which generally include management fees, distribution and/or service (12b-1) fees and other Fund expenses. This Example is intended to help you understand your ongoing costs (in dollars) of investing in a fund and to compare these costs with the ongoing costs of investing in other mutual funds.
| The Example is based on an investment of $1,000 invested at the beginning of the period and held for the entire period (November 1, 2023 to April 30, 2024). |
Actual Expenses
The first line of the accompanying table provides information about actual account values and actual expenses. You may use the information in this line, together with the amount you invested, to estimate the expenses that you paid over the period. Simply divide your account value by $1,000.00 (for example, an $8,600 account value divided by $1,000.00 = 8.6), then multiply the result by the number in the first line for a class/Fund under the heading entitled "Expenses Paid During Period" to estimate the expenses you paid on your account during this period. If any fund is a shareholder of any underlying mutual funds or exchange-traded funds (ETFs) (the Underlying Funds), such fund indirectly bears its proportional share of the expenses of the Underlying Funds in addition to the direct expenses incurred presented in the table. These fees and expenses are not included in the annualized expense ratio used to calculate the expense estimate in the table below.
Hypothetical Example for Comparison Purposes
The second line of the accompanying table provides information about hypothetical account values and hypothetical expenses based on the actual expense ratio and an assumed rate of return of 5% per year before expenses, which is not the actual return. The hypothetical account values and expenses may not be used to estimate the actual ending account balance or expenses you paid for the period. You may use this information to compare the ongoing costs of investing in the Fund and other funds. To do so, compare this 5% hypothetical example with the 5% hypothetical examples that appear in the shareholder reports of the other funds. If any fund is a shareholder of any Underlying Funds, such fund indirectly bears its proportional share of the expenses of the Underlying Funds in addition to the direct expenses as presented in the table. These fees and expenses are not included in the annualized expense ratio used to calculate the expense estimate in the table below.
Please note that the expenses shown in the table are meant to highlight your ongoing costs only and do not reflect any transaction costs. Therefore, the second line of the table is useful in comparing ongoing costs only, and will not help you determine the relative total costs of owning different funds. In addition, if these transactional costs were included, your costs would have been higher.
| | | | | Annualized Expense Ratio- A | | Beginning Account Value November 1, 2023 | | Ending Account Value April 30, 2024 | | Expenses Paid During Period- C November 1, 2023 to April 30, 2024 |
| | | | | | | | | | |
| Fidelity® Series Small Cap Core Fund | | | | -%-D | | | | | | |
| Actual | | | | | | $ 1,000 | | $ 1,203.90 | | $-E |
Hypothetical-B | | | | | | $ 1,000 | | $ 1,024.86 | | $-E |
| |
A Annualized expense ratio reflects expenses net of applicable fee waivers.
B 5% return per year before expenses
C Expenses are equal to the annualized expense ratio, multiplied by the average account value over the period, multiplied by 182/ 366 (to reflect the one-half year period). The fees and expenses of any Underlying Funds are not included in each annualized expense ratio.
D Amount represents less than .005%.
E Amount represents less than $.005.
The dividend and capital gains distributions for the fund(s) are available on Fidelity.com or Institutional.Fidelity.com.
The fund hereby designates as a capital gain dividend with respect to the taxable year ended April 30,2024 $122,485, or, if subsequently determined to be different, the net capital gain of such year.
The fund designates $20,063 of distributions paid during the fiscal year ended 2024 as qualifying to be taxed as section 163(j) interest dividends.
The fund designates 56%, and 40% of the dividends distributed in June and December, respectively during the fiscal year as qualifying for the dividends-received deduction for corporate shareholders.
The fund designates 59.04%, and 44.96% of the dividends distributed in June and December, respectively during the fiscal year as amounts which may be taken into account as a dividend for the purposes of the maximum rate under section 1(h)(11) of the Internal Revenue Code.
The fund designates 24.93%, and 15.38% of the dividends distributed in June and December, respectively during the fiscal year as a section 199A dividend.
The fund will notify shareholders in January 2025 of amounts for use in preparing 2024 income tax returns.
Board Approval of Investment Advisory Contracts
Fidelity Series Small Cap Core Fund
At its January 2024 meeting, the Board of Trustees, including the Independent Trustees (together, the Board), approved amended and restated sub-advisory agreements (the Sub-Advisory Contracts) for the fund, including the fund's sub-advisory agreements with FMR Investment Management (UK) Limited (FMR UK), Fidelity Management & Research (Hong Kong) Limited (FMR H.K.), and Fidelity Management & Research (Japan) Limited (FMR Japan). The Sub-Advisory Contracts will be effective March 1, 2024. The Board will consider the annual renewal of the fund's Sub-Advisory Contracts in May 2024, following its review of additional materials provided by FMR.
The Board considered the Sub-Advisory Contracts, which simplified the calculation of the fees paid by FMR to the sub-advisers under the agreements. The Board noted that the agreements with FMR UK, FMR H.K., and FMR Japan were amended to provide that FMR will compensate each sub-adviser at a fee rate equal to 110% of the sub-adviser's costs incurred in providing services under the agreement. The Board considered that, under the Sub-Advisory Contracts, FMR, and not the fund, will continue to pay the sub-advisory fees to each applicable sub-adviser, and that the management fee paid by the fund under the management contract with FMR will remain unchanged.
The Board further considered that the approval of the fund's Sub-Advisory Contracts will not result in any changes in the investment process or strategies employed in the management of the fund's assets or the day-to-day management of the fund or the persons primarily responsible for such management. Further, the Board considered that the Sub-Advisory Contracts would not change the obligations and services of FMR and its affiliates on behalf of the fund, and, in particular, there would be no change in the nature and level of services provided to the fund by FMR and its affiliates.
In connection with its consideration of future renewals of the fund's advisory contracts, the Board will consider: (i) the nature, extent and quality of services provided to the funds, including shareholder and administrative services and investment performance; (ii) the competitiveness of the management fee and total expenses for the fund; (iii) the costs of the services and profitability, including the revenues earned and the expenses incurred in conducting the business of developing, marketing, distributing, managing, administering, and servicing the fund and its shareholders, to the extent applicable; and (iv) whether there have been economies of scale in respect of the Fidelity funds, whether the Fidelity funds (including the fund) have appropriately benefited from any such economies of scale, and whether there is the potential for realization of any further economies.
Based on its evaluation of all of the conclusions noted above, and after considering all factors it believed relevant, the Board concluded that the fund's management fee structure is fair and reasonable, and that the fund's Sub-Advisory Contracts should be approved.
The Securities and Exchange Commission adopted Rule 22e-4 under the Investment Company Act of 1940 (the Liquidity Rule) to promote effective liquidity risk management throughout the open-end investment company industry, thereby reducing the risk that funds will be unable to meet their redemption obligations and mitigating dilution of the interests of fund shareholders.
The Fund has adopted and implemented a liquidity risk management program (the Program) reasonably designed to assess and manage the Fund's liquidity risk and to comply with the requirements of the Liquidity Rule. The Fund's Board of Trustees (the Board) has designated the Fund's investment adviser as administrator of the Program. The Fidelity advisers have established a Liquidity Risk Management Committee (the LRM Committee) to manage the Program for each of the Fidelity Funds. The LRM Committee monitors the adequacy and effectiveness of implementation of the Program and on a periodic basis assesses each Fund's liquidity risk based on a variety of factors including (1) the Fund's investment strategy, (2) portfolio liquidity and cash flow projections during normal and reasonably foreseeable stressed conditions, (3) shareholder redemptions, (4) borrowings and other funding sources and (5) certain factors specific to ETFs including the effect of the Fund's prices and spreads, market participants, and basket compositions on the overall liquidity of the Fund's portfolio, as applicable.
In accordance with the Program, each of the Fund's portfolio investments is classified into one of four defined liquidity categories based on a determination of a reasonable expectation for how long it would take to convert the investment to cash (or sell or dispose of the investment) without significantly changing its market value.
- Highly liquid investments - cash or convertible to cash within three business days or less
- Moderately liquid investments - convertible to cash in three to seven calendar days
- Less liquid investments - can be sold or disposed of, but not settled, within seven calendar days
- Illiquid investments - cannot be sold or disposed of within seven calendar days
Liquidity classification determinations take into account a variety of factors including various market, trading and investment-specific considerations, as well as market depth, and generally utilize analysis from a third-party liquidity metrics service.
The Liquidity Rule places a 15% limit on a fund's illiquid investments and requires funds that do not primarily hold assets that are highly liquid investments to determine and maintain a minimum percentage of the fund's net assets to be invested in highly liquid investments (highly liquid investment minimum or HLIM). The Program includes provisions reasonably designed to comply with the 15% limit on illiquid investments and for determining, periodically reviewing and complying with the HLIM requirement as applicable.
At a recent meeting of the Fund's Board of Trustees, the LRM Committee provided a written report to the Board pertaining to the operation, adequacy, and effectiveness of the Program for the period December 1, 2022 through November 30, 2023. The report concluded that the Program is operating effectively and is reasonably designed to assess and manage the Fund's liquidity risk.
1.9906191.101
SCC-ANN-0624
Fidelity® Large Cap Stock Fund
Annual Report
April 30, 2024
Contents
To view a fund's proxy voting guidelines and proxy voting record for the 12-month period ended June 30, visit http://www.fidelity.com/proxyvotingresults or visit the Securities and Exchange Commission's (SEC) web site at http://www.sec.gov.
You may also call 1-800-544-8544 to request a free copy of the proxy voting guidelines.
Standard & Poor's, S&P and S&P 500 are registered service marks of The McGraw-Hill Companies, Inc. and have been licensed for use by Fidelity Distributors Corporation.
Other third-party marks appearing herein are the property of their respective owners.
All other marks appearing herein are registered or unregistered trademarks or service marks of FMR LLC or an affiliated company. © 2024 FMR LLC. All rights reserved.
This report and the financial statements contained herein are submitted for the general information of the shareholders of the Fund. This report is not authorized for distribution to prospective investors in the Fund unless preceded or accompanied by an effective prospectus.
A fund files its complete schedule of portfolio holdings with the SEC for the first and third quarters of each fiscal year on Form N-PORT. Forms N-PORT are available on the SEC's web site at http://www.sec.gov. A fund's Forms N-PORT may be reviewed and copied at the SEC's Public Reference Room in Washington, DC. Information regarding the operation of the SEC's Public Reference Room may be obtained by calling 1-800-SEC-0330.
For a complete list of a fund's portfolio holdings, view the most recent holdings listing, semiannual report, or annual report on Fidelity's web site at http://www.fidelity.com, http://www.institutional.fidelity.com, or http://www.401k.com, as applicable.
NOT FDIC INSURED •MAY LOSE VALUE •NO BANK GUARANTEE
Neither the Fund nor Fidelity Distributors Corporation is a bank.
Average annual total return reflects the change in the value of an investment, assuming reinvestment of distributions from dividend income and capital gains (the profits earned upon the sale of securities that have grown in value, if any) and assuming a constant rate of performance each year. The hypothetical investment and the average annual total returns do not reflect the deduction of taxes that a shareholder would pay on fund distributions or the redemption of fund shares. During periods of reimbursement by Fidelity, a fund's total return will be greater than it would be had the reimbursement not occurred. How a fund did yesterday is no guarantee of how it will do tomorrow.
| Average Annual Total Returns |
| | | | |
Periods ended April 30, 2024 | Past 1 year | Past 5 years | Past 10 years |
| Fidelity® Large Cap Stock Fund | 24.07% | 13.55% | 11.40% |
| $10,000 Over 10 Years |
| |
Let's say hypothetically that $10,000 was invested in Fidelity® Large Cap Stock Fund on April 30, 2014. The chart shows how the value of your investment would have changed, and also shows how the S&P 500® Index performed over the same period. |
|
|
Market Recap:
U.S. equities gained 22.66% for the 12 months ending April 30, 2024, according to the S&P 500® index, driven by resilient corporate profits, a frenzy over generative artificial intelligence and the Federal Reserve's likely pivot to cutting interest rates later this year. Amid this favorable backdrop for higher-risk assets, the S&P 500® continued its late-2023 momentum and ended March at its all-time high before snapping a five-month uptrend in April (-4.08%). Growth stocks led the broad rally, mostly driven by a narrow set of firms in the communication services (+41%) and information technology (+37%) sectors, largely due to excitement for AI. In particular, semiconductor-related stocks (+104%) were a standout. Following the Fed's November 1 meeting, when the central bank hinted it might be done raising rates, the S&P 500® reversed a three-month decline and gained 14.09% in the final two months of 2023 and 10.56% the first quarter. Risk assets were further aided on March 20, when the central bank held steady its benchmark federal funds rate and affirmed its projection to cut in 2024. The index then slipped in April, as inflation remained stickier than expected, spurring doubts of a soft economic landing. For the full 12 months, the financials, industrials and consumer discretionary sectors each gained about 24%. In sharp contrast, real estate and the defensive-oriented utilities sector each roughly broke even. Other notable "laggards" included consumer staples (+3%) and health care (+7%).
Comments from Portfolio Manager Matt Fruhan:
For the fiscal year, the fund gained 24.07%, versus 22.66% for the benchmark S&P 500® index. Relative to the benchmark, security selection was the primary contributor, especially within the industrials sector, where stock picking in capital goods helped most. Stock selection in financials also helped. Stock picking in health care, primarily within the health care equipment & services industry, also boosted relative performance. The top individual relative contributor by a wide margin was an overweight in General Electric (+106%). General Electric was one of our largest holdings. The second-largest relative contributor was an overweight in Wells Fargo (+54%). Wells Fargo was among the fund's biggest holdings. Another notable relative contributor was a non-benchmark stake in Vertiv Holdings (+518%). In contrast, the biggest detractor from performance versus the benchmark was an underweight in information technology, primarily within the semiconductors & semiconductor equipment industry. Security selection and an overweight in energy also hampered the fund's result, as did stock picking in communication services. The largest individual relative detractor was an underweight in Nvidia (+211%). Nvidia was among the biggest holdings at period end, as we notably increased our position the past 12 months. A second notable relative detractor was an overweight in Exxon Mobil (+4%). Exxon Mobil was among our largest holdings. An underweight in Amazon.com (+66%) also hurt. This period we decreased our investment in Amazon.com. Notable changes in positioning include increased exposure to information technology and a lower allocation to energy.
The views expressed above reflect those of the portfolio manager(s) only through the end of the period as stated on the cover of this report and do not necessarily represent the views of Fidelity or any other person in the Fidelity organization. Any such views are subject to change at any time based upon market or other conditions and Fidelity disclaims any responsibility to update such views. These views may not be relied on as investment advice and, because investment decisions for a Fidelity fund are based on numerous factors, may not be relied on as an indication of trading intent on behalf of any Fidelity fund.
Top Holdings (% of Fund's net assets) |
| |
| Microsoft Corp. | 6.9 | |
| Exxon Mobil Corp. | 5.9 | |
| General Electric Co. | 5.7 | |
| Wells Fargo & Co. | 5.6 | |
| NVIDIA Corp. | 3.5 | |
| Meta Platforms, Inc. Class A | 2.6 | |
| Bank of America Corp. | 2.6 | |
| Apple, Inc. | 2.4 | |
| The Boeing Co. | 2.4 | |
| Alphabet, Inc. Class A | 2.0 | |
| | 39.6 | |
| |
| Market Sectors (% of Fund's net assets) |
| |
| Information Technology | 19.9 | |
| Industrials | 16.4 | |
| Financials | 16.3 | |
| Health Care | 11.5 | |
| Communication Services | 9.9 | |
| Energy | 9.6 | |
| Consumer Staples | 5.1 | |
| Consumer Discretionary | 3.2 | |
| Materials | 2.2 | |
| Utilities | 1.1 | |
| Real Estate | 0.8 | |
| |
Asset Allocation (% of Fund's net assets) |
|
|
Showing Percentage of Net Assets
| Common Stocks - 95.8% |
| | | Shares | Value ($) (000s) |
| COMMUNICATION SERVICES - 9.9% | | | |
| Diversified Telecommunication Services - 0.2% | | | |
| Cellnex Telecom SA (a) | | 204,852 | 6,771 |
| Entertainment - 0.9% | | | |
| The Walt Disney Co. | | 170,729 | 18,968 |
| Universal Music Group NV | | 639,563 | 18,906 |
| | | | 37,874 |
| Interactive Media & Services - 7.0% | | | |
| Alphabet, Inc.: | | | |
| Class A | | 527,980 | 85,945 |
| Class C | | 464,241 | 76,433 |
| Match Group, Inc. (b) | | 285,540 | 8,800 |
| Meta Platforms, Inc. Class A | | 250,179 | 107,620 |
| Reddit, Inc. Class B (f) | | 3,600 | 160 |
| Snap, Inc. Class A (b) | | 1,035,824 | 15,589 |
| | | | 294,547 |
| Media - 1.8% | | | |
| Charter Communications, Inc. Class A (b) | | 5,699 | 1,459 |
| Comcast Corp. Class A | | 1,633,190 | 62,241 |
| Interpublic Group of Companies, Inc. | | 407,484 | 12,404 |
| | | | 76,104 |
TOTAL COMMUNICATION SERVICES | | | 415,296 |
| CONSUMER DISCRETIONARY - 3.2% | | | |
| Automobiles - 0.1% | | | |
| Rivian Automotive, Inc. (b) | | 249,600 | 2,221 |
| Broadline Retail - 0.1% | | | |
| Amazon.com, Inc. (b) | | 27,244 | 4,768 |
| Hotels, Restaurants & Leisure - 1.6% | | | |
| Booking Holdings, Inc. | | 12,501 | 43,154 |
| Expedia Group, Inc. (b) | | 56,540 | 7,612 |
| Marriott International, Inc. Class A | | 51,828 | 12,238 |
| Starbucks Corp. | | 60,583 | 5,361 |
| | | | 68,365 |
| Household Durables - 0.3% | | | |
| Mohawk Industries, Inc. (b) | | 67,828 | 7,822 |
| Sony Group Corp. sponsored ADR (c) | | 40,763 | 3,366 |
| Whirlpool Corp. | | 34,274 | 3,251 |
| | | | 14,439 |
| Specialty Retail - 1.0% | | | |
| JD Sports Fashion PLC | | 3,044,500 | 4,398 |
| Lowe's Companies, Inc. | | 141,110 | 32,172 |
| RH (b) | | 16,500 | 4,076 |
| | | | 40,646 |
| Textiles, Apparel & Luxury Goods - 0.1% | | | |
| Compagnie Financiere Richemont SA Series A | | 10,300 | 1,424 |
| NIKE, Inc. Class B | | 25,790 | 2,379 |
| | | | 3,803 |
TOTAL CONSUMER DISCRETIONARY | | | 134,242 |
| CONSUMER STAPLES - 5.1% | | | |
| Beverages - 1.8% | | | |
| Diageo PLC sponsored ADR | | 88,259 | 12,194 |
| Keurig Dr. Pepper, Inc. | | 954,499 | 32,167 |
| Pernod Ricard SA | | 5,600 | 849 |
| The Coca-Cola Co. | | 494,358 | 30,536 |
| | | | 75,746 |
| Consumer Staples Distribution & Retail - 1.5% | | | |
| Performance Food Group Co. (b) | | 110,914 | 7,529 |
| Sysco Corp. | | 245,092 | 18,215 |
| Target Corp. | | 79,392 | 12,781 |
| U.S. Foods Holding Corp. (b) | | 137,365 | 6,903 |
| Walmart, Inc. | | 260,871 | 15,483 |
| | | | 60,911 |
| Personal Care Products - 1.4% | | | |
| Estee Lauder Companies, Inc. Class A | | 67,100 | 9,844 |
| Haleon PLC ADR (c) | | 3,236,737 | 27,609 |
| Kenvue, Inc. | | 1,221,316 | 22,985 |
| | | | 60,438 |
| Tobacco - 0.4% | | | |
| Altria Group, Inc. | | 279,361 | 12,239 |
| Philip Morris International, Inc. | | 29,900 | 2,839 |
| | | | 15,078 |
TOTAL CONSUMER STAPLES | | | 212,173 |
| ENERGY - 9.6% | | | |
| Energy Equipment & Services - 0.1% | | | |
| Tidewater, Inc. (b) | | 55,200 | 5,070 |
| Oil, Gas & Consumable Fuels - 9.5% | | | |
| Cameco Corp. | | 34,000 | 1,551 |
| Exxon Mobil Corp. | | 2,106,478 | 249,133 |
| Galp Energia SGPS SA Class B | | 161,400 | 3,479 |
| Imperial Oil Ltd. | | 730,888 | 50,251 |
| Kosmos Energy Ltd. (b) | | 2,574,318 | 14,596 |
| MEG Energy Corp. (b) | | 578,000 | 13,146 |
| Pioneer Natural Resources Co. | | 94,300 | 25,397 |
| Shell PLC ADR | | 562,300 | 40,294 |
| | | | 397,847 |
TOTAL ENERGY | | | 402,917 |
| FINANCIALS - 16.3% | | | |
| Banks - 11.3% | | | |
| Bank of America Corp. | | 2,905,595 | 107,536 |
| JPMorgan Chase & Co. | | 242,358 | 46,470 |
| M&T Bank Corp. | | 106,984 | 15,447 |
| PNC Financial Services Group, Inc. | | 259,105 | 39,710 |
| U.S. Bancorp | | 703,694 | 28,591 |
| Wells Fargo & Co. | | 3,962,598 | 235,061 |
| | | | 472,815 |
| Capital Markets - 2.0% | | | |
| 3i Group PLC | | 46,900 | 1,676 |
| Charles Schwab Corp. | | 33,598 | 2,485 |
| CME Group, Inc. | | 3,999 | 838 |
| KKR & Co. LP | | 310,378 | 28,887 |
| Moody's Corp. | | 8,900 | 3,296 |
| Morgan Stanley | | 115,962 | 10,534 |
| MSCI, Inc. | | 2,700 | 1,258 |
| Northern Trust Corp. | | 374,178 | 30,829 |
| Raymond James Financial, Inc. | | 33,533 | 4,091 |
| | | | 83,894 |
| Financial Services - 2.6% | | | |
| Acacia Research Corp. (b) | | 24,000 | 117 |
| Edenred SA | | 190,091 | 9,019 |
| Fidelity National Information Services, Inc. | | 107,099 | 7,274 |
| Global Payments, Inc. | | 27,650 | 3,395 |
| MasterCard, Inc. Class A | | 31,713 | 14,309 |
| PayPal Holdings, Inc. (b) | | 87,144 | 5,919 |
| Visa, Inc. Class A | | 256,948 | 69,019 |
| | | | 109,052 |
| Insurance - 0.4% | | | |
| Arthur J. Gallagher & Co. | | 31,100 | 7,299 |
| Chubb Ltd. | | 32,106 | 7,983 |
| | | | 15,282 |
TOTAL FINANCIALS | | | 681,043 |
| HEALTH CARE - 11.5% | | | |
| Biotechnology - 0.4% | | | |
| Alnylam Pharmaceuticals, Inc. (b) | | 38,546 | 5,549 |
| Argenx SE ADR (b) | | 5,390 | 2,024 |
| Insmed, Inc. (b) | | 179,022 | 4,425 |
| Vaxcyte, Inc. (b) | | 93,485 | 5,661 |
| | | | 17,659 |
| Health Care Equipment & Supplies - 2.0% | | | |
| Abbott Laboratories | | 73,265 | 7,764 |
| Becton, Dickinson & Co. | | 33,384 | 7,832 |
| Boston Scientific Corp. (b) | | 872,829 | 62,730 |
| Koninklijke Philips Electronics NV (depository receipt) (NY Reg.) | | 164,846 | 4,377 |
| Solventum Corp. | | 43,588 | 2,834 |
| | | | 85,537 |
| Health Care Providers & Services - 5.0% | | | |
| Cardinal Health, Inc. | | 211,568 | 21,800 |
| Cigna Group | | 151,069 | 53,938 |
| CVS Health Corp. | | 155,807 | 10,550 |
| Guardant Health, Inc. (b) | | 63,633 | 1,145 |
| Humana, Inc. | | 60,265 | 18,205 |
| McKesson Corp. | | 71,543 | 38,434 |
| UnitedHealth Group, Inc. | | 136,433 | 65,993 |
| | | | 210,065 |
| Life Sciences Tools & Services - 0.4% | | | |
| Danaher Corp. | | 62,734 | 15,471 |
| Thermo Fisher Scientific, Inc. | | 2,800 | 1,592 |
| | | | 17,063 |
| Pharmaceuticals - 3.7% | | | |
| Bristol-Myers Squibb Co. | | 777,606 | 34,168 |
| Eli Lilly & Co. | | 43,497 | 33,976 |
| Galderma Group AG | | 59,900 | 4,464 |
| GSK PLC sponsored ADR | | 666,701 | 27,628 |
| Johnson & Johnson | | 157,780 | 22,813 |
| UCB SA | | 224,400 | 29,827 |
| | | | 152,876 |
TOTAL HEALTH CARE | | | 483,200 |
| INDUSTRIALS - 16.2% | | | |
| Aerospace & Defense - 9.9% | | | |
| Airbus Group NV | | 110,687 | 18,214 |
| Bombardier, Inc. Class B (sub. vtg.) (b) | | 117,400 | 5,349 |
| General Dynamics Corp. | | 47,492 | 13,634 |
| General Electric Co. | | 1,474,071 | 238,534 |
| Huntington Ingalls Industries, Inc. | | 34,722 | 9,616 |
| Loar Holdings, Inc. (c) | | 4,200 | 220 |
| Rolls-Royce Holdings PLC (b) | | 607,500 | 3,115 |
| Safran SA | | 17,127 | 3,714 |
| Spirit AeroSystems Holdings, Inc. Class A (b) | | 565,800 | 18,106 |
| Textron, Inc. | | 37,896 | 3,206 |
| The Boeing Co. (b) | | 591,833 | 99,333 |
| | | | 413,041 |
| Air Freight & Logistics - 1.5% | | | |
| FedEx Corp. | | 64,176 | 16,800 |
| United Parcel Service, Inc. Class B | | 315,087 | 46,469 |
| | | | 63,269 |
| Commercial Services & Supplies - 0.2% | | | |
| ACV Auctions, Inc. Class A (b) | | 263,149 | 4,592 |
| GFL Environmental, Inc. | | 89,000 | 2,840 |
| Veralto Corp. | | 21,144 | 1,981 |
| | | | 9,413 |
| Construction & Engineering - 0.0% | | | |
| Centuri Holdings, Inc. | | 2,700 | 67 |
| Electrical Equipment - 3.2% | | | |
| Acuity Brands, Inc. | | 44,358 | 11,014 |
| GE Vernova LLC | | 410,692 | 63,127 |
| Hubbell, Inc. Class B | | 34,345 | 12,726 |
| Regal Rexnord Corp. | | 70,575 | 11,389 |
| Vertiv Holdings Co. | | 391,845 | 36,442 |
| | | | 134,698 |
| Ground Transportation - 0.3% | | | |
| Knight-Swift Transportation Holdings, Inc. Class A | | 250,219 | 11,568 |
| Machinery - 0.8% | | | |
| Allison Transmission Holdings, Inc. | | 18,089 | 1,330 |
| Chart Industries, Inc. (b)(c) | | 36,595 | 5,272 |
| Cummins, Inc. | | 21,743 | 6,142 |
| Fortive Corp. | | 93,620 | 7,047 |
| Nordson Corp. | | 5,500 | 1,420 |
| Otis Worldwide Corp. | | 60,460 | 5,514 |
| Stanley Black & Decker, Inc. | | 35,217 | 3,219 |
| Westinghouse Air Brake Tech Co. | | 24,672 | 3,974 |
| | | | 33,918 |
| Passenger Airlines - 0.1% | | | |
| Copa Holdings SA Class A | | 3,071 | 293 |
| Ryanair Holdings PLC sponsored ADR | | 30,711 | 4,183 |
| | | | 4,476 |
| Professional Services - 0.1% | | | |
| Equifax, Inc. | | 13,765 | 3,031 |
| Paycom Software, Inc. | | 8,600 | 1,617 |
| | | | 4,648 |
| Trading Companies & Distributors - 0.1% | | | |
| Beijer Ref AB (B Shares) (c) | | 133,602 | 1,921 |
| Watsco, Inc. | | 7,000 | 3,134 |
| | | | 5,055 |
TOTAL INDUSTRIALS | | | 680,153 |
| INFORMATION TECHNOLOGY - 19.9% | | | |
| IT Services - 0.3% | | | |
| EPAM Systems, Inc. (b) | | 8,700 | 2,047 |
| IBM Corp. | | 37,495 | 6,232 |
| Snowflake, Inc. (b) | | 4,594 | 713 |
| Twilio, Inc. Class A (b) | | 75,913 | 4,546 |
| | | | 13,538 |
| Semiconductors & Semiconductor Equipment - 6.4% | | | |
| Analog Devices, Inc. | | 38,785 | 7,781 |
| Applied Materials, Inc. | | 71,446 | 14,193 |
| BE Semiconductor Industries NV | | 1,230 | 165 |
| Broadcom, Inc. | | 21,200 | 27,566 |
| Lam Research Corp. | | 13,066 | 11,686 |
| Marvell Technology, Inc. | | 393,428 | 25,931 |
| NVIDIA Corp. | | 170,984 | 147,734 |
| Qualcomm, Inc. | | 76,424 | 12,675 |
| Taiwan Semiconductor Manufacturing Co. Ltd. sponsored ADR | | 112,984 | 15,517 |
| Teradyne, Inc. | | 47,400 | 5,514 |
| | | | 268,762 |
| Software - 10.7% | | | |
| Adobe, Inc. (b) | | 68,047 | 31,494 |
| Autodesk, Inc. (b) | | 53,320 | 11,349 |
| DoubleVerify Holdings, Inc. (b) | | 46,951 | 1,376 |
| Elastic NV (b) | | 80,618 | 8,241 |
| Intuit, Inc. | | 19,596 | 12,260 |
| Microsoft Corp. | | 742,893 | 289,222 |
| Oracle Corp. | | 346,800 | 39,449 |
| PTC, Inc. (b) | | 27,310 | 4,846 |
| Sage Group PLC | | 274,000 | 3,992 |
| Salesforce, Inc. | | 14,866 | 3,998 |
| SAP SE sponsored ADR | | 210,178 | 38,086 |
| Workday, Inc. Class A (b) | | 10,571 | 2,587 |
| | | | 446,900 |
| Technology Hardware, Storage & Peripherals - 2.5% | | | |
| Apple, Inc. | | 589,718 | 100,447 |
| Samsung Electronics Co. Ltd. | | 72,120 | 3,998 |
| | | | 104,445 |
TOTAL INFORMATION TECHNOLOGY | | | 833,645 |
| MATERIALS - 2.2% | | | |
| Chemicals - 0.3% | | | |
| Air Products & Chemicals, Inc. | | 45,100 | 10,659 |
| DuPont de Nemours, Inc. | | 843 | 61 |
| Sherwin-Williams Co. | | 5,799 | 1,737 |
| | | | 12,457 |
| Metals & Mining - 1.9% | | | |
| First Quantum Minerals Ltd. | | 2,843,166 | 36,101 |
| Freeport-McMoRan, Inc. | | 597,535 | 29,841 |
| Ivanhoe Mines Ltd. (b) | | 958,200 | 12,988 |
| | | | 78,930 |
TOTAL MATERIALS | | | 91,387 |
| REAL ESTATE - 0.8% | | | |
| Equity Real Estate Investment Trusts (REITs) - 0.8% | | | |
| American Tower Corp. | | 61,947 | 10,628 |
| Crown Castle, Inc. | | 156,793 | 14,704 |
| Equinix, Inc. | | 1,121 | 797 |
| Simon Property Group, Inc. | | 62,109 | 8,728 |
| | | | 34,857 |
| UTILITIES - 1.1% | | | |
| Electric Utilities - 1.1% | | | |
| Duke Energy Corp. | | 28,300 | 2,781 |
| Edison International | | 36,100 | 2,565 |
| Entergy Corp. | | 26,415 | 2,818 |
| Southern Co. | | 485,886 | 35,713 |
| | | | 43,877 |
| TOTAL COMMON STOCKS (Cost $2,528,700) | | | 4,012,790 |
| | | | |
| Nonconvertible Preferred Stocks - 0.2% |
| | | Shares | Value ($) (000s) |
| INDUSTRIALS - 0.2% | | | |
| Aerospace & Defense - 0.2% | | | |
Embraer SA sponsored ADR (b) (Cost $3,954) | | 333,390 | 8,518 |
| | | | |
| Money Market Funds - 4.3% |
| | | Shares | Value ($) (000s) |
| Fidelity Cash Central Fund 5.39% (d) | | 169,085,334 | 169,119 |
| Fidelity Securities Lending Cash Central Fund 5.39% (d)(e) | | 12,931,231 | 12,933 |
| TOTAL MONEY MARKET FUNDS (Cost $182,052) | | | 182,052 |
| | | | |
| TOTAL INVESTMENT IN SECURITIES - 100.3% (Cost $2,714,706) | 4,203,360 |
NET OTHER ASSETS (LIABILITIES) - (0.3)% | (13,513) |
| NET ASSETS - 100.0% | 4,189,847 |
| | |
Any values shown as $0 in the Schedule of Investments may reflect amounts less than $500.
Legend
| (a) | Security exempt from registration under Rule 144A of the Securities Act of 1933. These securities may be resold in transactions exempt from registration, normally to qualified institutional buyers. At the end of the period, the value of these securities amounted to $6,771,000 or 0.2% of net assets. |
| (c) | Security or a portion of the security is on loan at period end. |
| (d) | Affiliated fund that is generally available only to investment companies and other accounts managed by Fidelity Investments. The rate quoted is the annualized seven-day yield of the fund at period end. A complete unaudited listing of the fund's holdings as of its most recent quarter end is available upon request. In addition, each Fidelity Central Fund's financial statements, which are not covered by the Fund's Report of Independent Registered Public Accounting Firm, are available on the SEC's website or upon request. |
| (e) | Investment made with cash collateral received from securities on loan. |
| (f) | Equity security is subject to lock-up or market standoff agreement. Fair value is based on the unadjusted market price of the equivalent equity security. As of period end, the total fair value of unadjusted equity securities subject to contractual sale restrictions is $160 and all restrictions are set to expire on or before September 30, 2024. Under normal market conditions, there are no circumstances that could cause the restrictions to lapse. |
Affiliated Central Funds
Fiscal year to date information regarding the Fund's investments in Fidelity Central Funds, including the ownership percentage, is presented below.
| Affiliate (Amounts in thousands) | Value, beginning of period ($) | Purchases ($) | Sales Proceeds ($) | Dividend Income ($) | Realized Gain (loss) ($) | Change in Unrealized appreciation (depreciation) ($) | Value, end of period ($) | % ownership, end of period |
| Fidelity Cash Central Fund 5.39% | 126,781 | 555,966 | 513,628 | 6,901 | - | - | 169,119 | 0.3% |
| Fidelity Securities Lending Cash Central Fund 5.39% | 21,437 | 312,555 | 321,059 | 254 | - | - | 12,933 | 0.0% |
| Total | 148,218 | 868,521 | 834,687 | 7,155 | - | - | 182,052 | |
| | | | | | | | | |
Amounts in the dividend income column in the above table include any capital gain distributions from underlying funds, which are presented in the corresponding line item in the Statement of Operations, if applicable.
Amounts in the dividend income column for Fidelity Securities Lending Cash Central Fund represents the income earned on investing cash collateral, less rebates paid to borrowers and any lending agent fees associated with the loan, plus any premium payments received for lending certain types of securities.
Amounts included in the purchases and sales proceeds columns may include in-kind transactions, if applicable.
Investment Valuation
The following is a summary of the inputs used, as of April 30, 2024, involving the Fund's assets and liabilities carried at fair value. The inputs or methodology used for valuing securities may not be an indication of the risk associated with investing in those securities. For more information on valuation inputs, and their aggregation into the levels used below, please refer to the Investment Valuation section in the accompanying Notes to Financial Statements.
| Valuation Inputs at Reporting Date: |
Description (Amounts in thousands) | Total ($) | Level 1 ($) | Level 2 ($) | Level 3 ($) |
Investments in Securities: | | | | |
|
| Equities: | | | | |
Communication Services | 415,296 | 408,525 | 6,771 | - |
Consumer Discretionary | 134,242 | 132,818 | 1,424 | - |
Consumer Staples | 212,173 | 212,173 | - | - |
Energy | 402,917 | 402,917 | - | - |
Financials | 681,043 | 679,367 | 1,676 | - |
Health Care | 483,200 | 483,200 | - | - |
Industrials | 688,671 | 663,628 | 25,043 | - |
Information Technology | 833,645 | 829,647 | 3,998 | - |
Materials | 91,387 | 91,387 | - | - |
Real Estate | 34,857 | 34,857 | - | - |
Utilities | 43,877 | 43,877 | - | - |
|
| Money Market Funds | 182,052 | 182,052 | - | - |
| Total Investments in Securities: | 4,203,360 | 4,164,448 | 38,912 | - |
| Statement of Assets and Liabilities |
| Amounts in thousands (except per-share amount) | | | | April 30, 2024 |
| | | | | |
| Assets | | | | |
| Investment in securities, at value (including securities loaned of $12,454) - See accompanying schedule: | | | | |
Unaffiliated issuers (cost $2,532,654) | $ | 4,021,308 | | |
Fidelity Central Funds (cost $182,052) | | 182,052 | | |
| | | | | |
| | | | | |
| Total Investment in Securities (cost $2,714,706) | | | $ | 4,203,360 |
| Foreign currency held at value (cost $5) | | | | 5 |
| Receivable for investments sold | | | | 18,294 |
| Receivable for fund shares sold | | | | 3,021 |
| Dividends receivable | | | | 2,665 |
| Distributions receivable from Fidelity Central Funds | | | | 720 |
| Prepaid expenses | | | | 1 |
Total assets | | | | 4,228,066 |
| Liabilities | | | | |
| Payable for investments purchased | $ | 21,413 | | |
| Payable for fund shares redeemed | | 1,132 | | |
| Accrued management fee | | 2,597 | | |
| Other payables and accrued expenses | | 142 | | |
| Collateral on securities loaned | | 12,935 | | |
| Total liabilities | | | | 38,219 |
| Net Assets | | | $ | 4,189,847 |
| Net Assets consist of: | | | | |
| Paid in capital | | | $ | 2,589,622 |
| Total accumulated earnings (loss) | | | | 1,600,225 |
| Net Assets | | | $ | 4,189,847 |
Net Asset Value, offering price and redemption price per share ($4,189,847 ÷ 84,826 shares) | | | $ | 49.39 |
| Statement of Operations |
| Amounts in thousands | | | | Year ended April 30, 2024 |
| Investment Income | | | | |
| Dividends | | | $ | 55,662 |
| Income from Fidelity Central Funds (including $254 from security lending) | | | | 7,155 |
| Total income | | | | 62,817 |
| Expenses | | | | |
| Management fee | | | | |
| Basic fee | $ | 18,392 | | |
| Performance adjustment | | 5,023 | | |
| Transfer agent fees | | 3,837 | | |
| Accounting fees | | 693 | | |
| Custodian fees and expenses | | 88 | | |
| Independent trustees' fees and expenses | | 16 | | |
| Registration fees | | 85 | | |
| Audit | | 60 | | |
| Legal | | 6 | | |
| Miscellaneous | | 15 | | |
| Total expenses before reductions | | 28,215 | | |
| Expense reductions | | (272) | | |
| Total expenses after reductions | | | | 27,943 |
| Net Investment income (loss) | | | | 34,874 |
| Realized and Unrealized Gain (Loss) | | | | |
| Net realized gain (loss) on: | | | | |
| Investment Securities: | | | | |
| Unaffiliated issuers | | 163,520 | | |
| Foreign currency transactions | | (8) | | |
| Total net realized gain (loss) | | | | 163,512 |
| Change in net unrealized appreciation (depreciation) on: | | | | |
| Investment Securities: | | | | |
| Unaffiliated issuers | | 541,589 | | |
| Assets and liabilities in foreign currencies | | (15) | | |
| Total change in net unrealized appreciation (depreciation) | | | | 541,574 |
| Net gain (loss) | | | | 705,086 |
| Net increase (decrease) in net assets resulting from operations | | | $ | 739,960 |
| Statement of Changes in Net Assets |
| |
| Amount in thousands | | Year ended April 30, 2024 | | Year ended April 30, 2023 |
| Increase (Decrease) in Net Assets | | | | |
| Operations | | | | |
| Net investment income (loss) | $ | 34,874 | $ | 35,800 |
| Net realized gain (loss) | | 163,512 | | 20,894 |
| Change in net unrealized appreciation (depreciation) | | 541,574 | | 169,949 |
| Net increase (decrease) in net assets resulting from operations | | 739,960 | | 226,643 |
| Distributions to shareholders | | (94,232) | | (83,013) |
| | | | | |
| Share transactions | | | | |
| Proceeds from sales of shares | | 978,358 | | 710,784 |
| Reinvestment of distributions | | 68,651 | | 62,219 |
| Cost of shares redeemed | | (528,137) | | (760,670) |
| | | | | |
Net increase (decrease) in net assets resulting from share transactions | | 518,872 | | 12,333 |
| Total increase (decrease) in net assets | | 1,164,600 | | 155,963 |
| | | | | |
| Net Assets | | | | |
| Beginning of period | | 3,025,247 | | 2,869,284 |
| End of period | $ | 4,189,847 | $ | 3,025,247 |
| | | | | |
| Other Information | | | | |
| Shares | | | | |
| Sold | | 21,440 | | 19,028 |
| Issued in reinvestment of distributions | | 1,560 | | 1,672 |
| Redeemed | | (12,017) | | (20,438) |
| Net increase (decrease) | | 10,983 | | 262 |
| | | | | |
Financial Highlights
Fidelity® Large Cap Stock Fund |
| |
| Years ended April 30, | | 2024 | | 2023 | | 2022 | | 2021 | | 2020 |
Selected Per-Share Data | | | | | | | | | | |
| Net asset value, beginning of period | $ | 40.97 | $ | 39.00 | $ | 41.09 | $ | 27.80 | $ | 32.11 |
| Income from Investment Operations | | | | | | | | | | |
Net investment income (loss) A,B | | .46 | | .49 | | .75 C | | .57 | | .63 |
| Net realized and unrealized gain (loss) | | 9.24 | | 2.64 | | (.86) | | 14.10 | | (3.12) |
| Total from investment operations | | 9.70 | | 3.13 | | (.11) | | 14.67 | | (2.49) |
| Distributions from net investment income | | (.48) | | (.48) | | (.77) | | (.65) | | (.62) |
| Distributions from net realized gain | | (.79) | | (.68) | | (1.21) | | (.73) | | (1.20) |
| Total distributions | | (1.28) D | | (1.16) | | (1.98) | | (1.38) | | (1.82) |
| Net asset value, end of period | $ | 49.39 | $ | 40.97 | $ | 39.00 | $ | 41.09 | $ | 27.80 |
Total Return E | | | | 8.33% | | (.46)% | | 54.08% | | (8.41)% |
Ratios to Average Net Assets B,F,G | | | | | | | | | | |
| Expenses before reductions | | .84% | | .76% | | .54% | | .48% | | .47% |
| Expenses net of fee waivers, if any | | | | .76% | | .53% | | .48% | | .47% |
| Expenses net of all reductions | | .83% | | .76% | | .53% | | .48% | | .47% |
| Net investment income (loss) | | 1.04% | | 1.29% | | 1.80% C | | 1.73% | | 2.05% |
| Supplemental Data | | | | | | | | | | |
| Net assets, end of period (in millions) | $ | 4,190 | $ | 3,025 | $ | 2,869 | $ | 2,969 | $ | 2,173 |
Portfolio turnover rate H | | | | 8% I | | 15% I | | 18% | | 32% I |
ACalculated based on average shares outstanding during the period.
BNet investment income (loss) is affected by the timing of the declaration of dividends by any underlying mutual funds or exchange-traded funds (ETFs). Net investment income (loss) of any mutual funds or ETFs is not included in the Fund's net investment income (loss) ratio.
CNet investment income per share reflects one or more large, non-recurring dividend(s) which amounted to $.24 per share. Excluding such non-recurring dividend(s), the ratio of net investment income (loss) to average net assets would have been 1.24%.
DTotal distributions per share do not sum due to rounding.
ETotal returns would have been lower if certain expenses had not been reduced during the applicable periods shown.
FFees and expenses of any underlying mutual funds or exchange-traded funds (ETFs) are not included in the Fund's expense ratio. The Fund indirectly bears its proportionate share of these expenses. For additional expense information related to investments in Fidelity Central Funds, please refer to the "Investments in Fidelity Central Funds" note found in the Notes to Financial Statements section of the most recent Annual or Semi-Annual report.
GExpense ratios reflect operating expenses of the class. Expenses before reductions do not reflect amounts reimbursed, waived, or reduced through arrangements with the investment adviser, brokerage services, or other offset arrangements, if applicable, and do not represent the amount paid by the class during periods when reimbursements, waivers or reductions occur.
HAmount does not include the portfolio activity of any underlying mutual funds or exchange-traded funds (ETFs).
IPortfolio turnover rate excludes securities received or delivered in-kind.
For the period ended April 30, 2024
(Amounts in thousands except percentages)
1. Organization.
Fidelity Large Cap Stock Fund (the Fund) is a fund of Fidelity Concord Street Trust (the Trust) and is authorized to issue an unlimited number of shares. Share transactions on the Statement of Changes in Net Assets may contain exchanges between affiliated funds. The Trust is registered under the Investment Company Act of 1940, as amended (the 1940 Act), as an open-end management investment company organized as a Massachusetts business trust.
2. Investments in Fidelity Central Funds.
Funds may invest in Fidelity Central Funds, which are open-end investment companies generally available only to other investment companies and accounts managed by the investment adviser and its affiliates. The Schedule of Investments lists any Fidelity Central Funds held as an investment as of period end, but does not include the underlying holdings of each Fidelity Central Fund. An investing fund indirectly bears its proportionate share of the expenses of the underlying Fidelity Central Funds.
Based on its investment objective, each Fidelity Central Fund may invest or participate in various investment vehicles or strategies that are similar to those of the investing fund. These strategies are consistent with the investment objectives of the investing fund and may involve certain economic risks which may cause a decline in value of each of the Fidelity Central Funds and thus a decline in the value of the investing fund.
| Fidelity Central Fund | Investment Manager | Investment Objective | Investment Practices | Expense RatioA |
| Fidelity Money Market Central Funds | Fidelity Management & Research Company LLC (FMR) | Each fund seeks to obtain a high level of current income consistent with the preservation of capital and liquidity. | Short-term Investments | Less than .005% |
A Expenses expressed as a percentage of average net assets and are as of each underlying Central Fund's most recent annual or semi-annual shareholder report.
A complete unaudited list of holdings for each Fidelity Central Fund is available upon request or at the Securities and Exchange Commission website at www.sec.gov. In addition, the financial statements of the Fidelity Central Funds which contain the significant accounting policies (including investment valuation policies) of those funds, and are not covered by the Report of Independent Registered Public Accounting Firm, are available on the Securities and Exchange Commission website or upon request.
3. Significant Accounting Policies.
The Fund is an investment company and applies the accounting and reporting guidance of the Financial Accounting Standards Board (FASB) Accounting Standards Codification Topic 946 Financial Services - Investment Companies. The financial statements have been prepared in conformity with accounting principles generally accepted in the United States of America (GAAP), which require management to make certain estimates and assumptions at the date of the financial statements. Actual results could differ from those estimates. Subsequent events, if any, through the date that the financial statements were issued have been evaluated in the preparation of the financial statements. The Fund's Schedule of Investments lists any underlying mutual funds or exchange-traded funds (ETFs) but does not include the underlying holdings of these funds. The following summarizes the significant accounting policies of the Fund:
Investment Valuation. Investments are valued as of 4:00 p.m. Eastern time on the last calendar day of the period. The Board of Trustees (the Board) has designated the Fund's investment adviser as the valuation designee responsible for the fair valuation function and performing fair value determinations as needed. The investment adviser has established a Fair Value Committee (the Committee) to carry out the day-to-day fair valuation responsibilities and has adopted policies and procedures to govern the fair valuation process and the activities of the Committee. In accordance with these fair valuation policies and procedures, which have been approved by the Board, the Fund attempts to obtain prices from one or more third party pricing services or brokers to value its investments. When current market prices, quotations or currency exchange rates are not readily available or reliable, investments will be fair valued in good faith by the Committee, in accordance with the policies and procedures. Factors used in determining fair value vary by investment type and may include market or investment specific events, transaction data, estimated cash flows, and market observations of comparable investments. The frequency that the fair valuation procedures are used cannot be predicted and they may be utilized to a significant extent. The Committee manages the Fund's fair valuation practices and maintains the fair valuation policies and procedures. The Fund's investment adviser reports to the Board information regarding the fair valuation process and related material matters.
The Fund categorizes the inputs to valuation techniques used to value its investments into a disclosure hierarchy consisting of three levels as shown below:
Level 1 - unadjusted quoted prices in active markets for identical investments
Level 2 - other significant observable inputs (including quoted prices for similar investments, interest rates, prepayment speeds, etc.)
Level 3 - unobservable inputs (including the Fund's own assumptions based on the best information available)
Valuation techniques used to value the Fund's investments by major category are as follows:
Equity securities, including restricted securities, for which market quotations are readily available, are valued at the last reported sale price or official closing price as reported by a third party pricing service on the primary market or exchange on which they are traded and are categorized as Level 1 in the hierarchy. In the event there were no sales during the day or closing prices are not available, securities are valued at the last quoted bid price or may be valued using the last available price and are generally categorized as Level 2 in the hierarchy. For foreign equity securities, when market or security specific events arise, comparisons to the valuation of American Depositary Receipts (ADRs), futures contracts, Exchange-Traded Funds (ETFs) and certain indexes as well as quoted prices for similar securities may be used and would be categorized as Level 2 in the hierarchy. For equity securities, including restricted securities, where observable inputs are limited, assumptions about market activity and risk are used and these securities may be categorized as Level 3 in the hierarchy.
Investments in open-end mutual funds, including the Fidelity Central Funds, are valued at their closing net asset value (NAV) each business day and are categorized as Level 1 in the hierarchy.
Changes in valuation techniques may result in transfers in or out of an assigned level within the disclosure hierarchy. The aggregate value of investments by input level as of April 30, 2024 is included at the end of the Fund's Schedule of Investments.
Foreign Currency. Certain Funds may use foreign currency contracts to facilitate transactions in foreign-denominated securities. Gains and losses from these transactions may arise from changes in the value of the foreign currency or if the counterparties do not perform under the contracts' terms.
Foreign-denominated assets, including investment securities, and liabilities are translated into U.S. dollars at the exchange rates at period end. Purchases and sales of investment securities, income and dividends received, and expenses denominated in foreign currencies are translated into U.S. dollars at the exchange rate in effect on the transaction date.
The effects of exchange rate fluctuations on investments are included with the net realized and unrealized gain (loss) on investment securities. Other foreign currency transactions resulting in realized and unrealized gain (loss) are disclosed separately.
Investment Transactions and Income. For financial reporting purposes, the Fund's investment holdings and NAV include trades executed through the end of the last business day of the period. The NAV per share for processing shareholder transactions is calculated as of the close of business of the New York Stock Exchange (NYSE), normally 4:00 p.m. Eastern time and includes trades executed through the end of the prior business day. Gains and losses on securities sold are determined on the basis of identified cost and include proceeds received from litigation. Commissions paid to certain brokers with whom the investment adviser, or its affiliates, places trades on behalf of a fund include an amount in addition to trade execution, which may be rebated back to a fund. Any such rebates are included in net realized gain (loss) on investments in the Statement of Operations. Dividend income is recorded on the ex-dividend date, except for certain dividends from foreign securities where the ex-dividend date may have passed, which are recorded as soon as the Fund is informed of the ex-dividend date. Non-cash dividends included in dividend income, if any, are recorded at the fair market value of the securities received. Income and capital gain distributions from Fidelity Central Funds, if any, are recorded on the ex-dividend date. Certain distributions received by the Fund represent a return of capital or capital gain. The Fund determines the components of these distributions subsequent to the ex-dividend date, based upon receipt of tax filings or other correspondence relating to the underlying investment. These distributions are recorded as a reduction of cost of investments and/or as a realized gain. Interest income is accrued as earned and includes coupon interest and amortization of premium and accretion of discount on debt securities as applicable. Investment income is recorded net of foreign taxes withheld where recovery of such taxes is uncertain. Funds may file withholding tax reclaims in certain jurisdictions to recover a portion of amounts previously withheld. Any withholding tax reclaims income is included in the Statement of Operations in dividends. Any receivables for withholding tax reclaims are included in the Statement of Assets and Liabilities in dividends receivable.
Expenses. Expenses directly attributable to a fund are charged to that fund. Expenses attributable to more than one fund are allocated among the respective funds on the basis of relative net assets or other appropriate methods. Expenses included in the accompanying financial statements reflect the expenses of that fund and do not include any expenses associated with any underlying mutual funds or exchange-traded funds. Although not included in a fund's expenses, a fund indirectly bears its proportionate share of these expenses through the net asset value of each underlying mutual fund or exchange-traded fund. Expense estimates are accrued in the period to which they relate and adjustments are made when actual amounts are known.
Income Tax Information and Distributions to Shareholders. Each year, the Fund intends to qualify as a regulated investment company under Subchapter M of the Internal Revenue Code, including distributing substantially all of its taxable income and realized gains. As a result, no provision for U.S. Federal income taxes is required. As of April 30, 2024, the Fund did not have any unrecognized tax benefits in the financial statements; nor is the Fund aware of any tax positions for which it is reasonably possible that the total amounts of unrecognized tax benefits will significantly change in the next twelve months. The Fund files a U.S. federal tax return, in addition to state and local tax returns as required. The Fund's federal income tax returns are subject to examination by the Internal Revenue Service (IRS) for a period of three fiscal years after they are filed. State and local tax returns may be subject to examination for an additional fiscal year depending on the jurisdiction. Foreign taxes are provided for based on the Fund's understanding of the tax rules and rates that exist in the foreign markets in which it invests.
Distributions are declared and recorded on the ex-dividend date. Income and capital gain distributions are determined in accordance with income tax regulations, which may differ from GAAP. In addition, the Fund claimed a portion of the payment made to redeeming shareholders as a distribution for income tax purposes.
Capital accounts within the financial statements are adjusted for permanent book-tax differences. These adjustments have no impact on net assets or the results of operations. Capital accounts are not adjusted for temporary book-tax differences which will reverse in a subsequent period.
Book-tax differences are primarily due to foreign currency transactions, passive foreign investment companies (PFIC) and losses deferred due to wash sales.
As of period end, the cost and unrealized appreciation (depreciation) in securities, and derivatives if applicable, for federal income tax purposes were as follows:
| Gross unrealized appreciation | $1,585,610 |
| Gross unrealized depreciation | (101,200) |
| Net unrealized appreciation (depreciation) | $1,484,410 |
| Tax Cost | $2,718,950 |
The tax-based components of distributable earnings as of period end were as follows:
| Undistributed ordinary income | $11,449 |
| Undistributed long-term capital gain | $104,569 |
| Net unrealized appreciation (depreciation) on securities and other investments | $1,484,207 |
The tax character of distributions paid was as follows:
| | April 30, 2024 | April 30, 2023 |
| Ordinary Income | $35,590 | $34,532 |
| Long-term Capital Gains | 58,642 | 48,481 |
| Total | $94,232 | $83,013 |
Restricted Securities (including Private Placements). Funds may invest in securities that are subject to legal or contractual restrictions on resale. These securities generally may be resold in transactions exempt from registration or to the public if the securities are registered. Disposal of these securities may involve time-consuming negotiations and expense, and prompt sale at an acceptable price may be difficult. Information regarding restricted securities held at period end is included at the end of the Schedule of Investments, if applicable.
4. Purchases and Sales of Investments.
Purchases and sales of securities, other than short-term securities and in-kind transactions, as applicable, are noted in the table below.
| | Purchases ($) | Sales ($) |
| Fidelity Large Cap Stock Fund | 964,084 | 539,389 |
Prior Fiscal Year Unaffiliated Redemptions In-Kind. Shares that were redeemed in-kind for investments, including accrued interest and cash, if any, are shown in the table below; along with realized gain or loss on investments delivered through in-kind redemptions. The amount of the in-kind redemptions is included in share transactions in the accompanying Statement of Changes in Net Assets. There was no gain or loss for federal income tax purposes.
| | Shares | Total net realized gain or loss ($) | Total Proceeds ($) |
| Fidelity Large Cap Stock Fund | 194 | 3,730 | 7,555 |
5. Fees and Other Transactions with Affiliates.
Management Fee. Fidelity Management & Research Company LLC (the investment adviser) and its affiliates provide the Fund with investment management related services for which the Fund pays a monthly management fee.
Effective March 1, 2024, the Fund's management contract was amended to incorporate administrative services previously covered under separate services agreements (Transfer Agent and Accounting agreements). Any reference to "class" in this note shall mean "the Fund" as the Fund currently offers only one class of shares. The amended contract incorporates a basic fee rate that may vary by class (subject to a performance adjustment). The investment adviser or an affiliate pays certain expenses of managing and operating the Fund out of each class's management fee. Each class of the Fund pays a management fee to the investment adviser. The management fee is calculated and paid to the investment adviser every month. The management fee is determined by calculating a basic fee and then applying a performance adjustment. When determining a class's basic fee, a mandate rate is calculated based on the monthly average net assets of a group of funds advised by FMR within a designated asset class. A discount rate is subtracted from the mandate rate once the Fund's monthly average net assets reach a certain level. The mandate rate and discount rate may vary by class. The annual basic fee rate for a class of shares of the Fund is the lesser of (1) the class's mandate rate reduced by the class's discount rate (if applicable) or (2) the amount set forth in the following table.
| | Maximum Management Fee Rate % |
| Fidelity Large Cap Stock Fund | .66 |
One-twelfth of the basic fee rate for a class is applied to the average net assets of the class for the month, giving a dollar amount which is the basic fee for the class for that month. A different management fee rate may be applicable to each class of the Fund. The difference between classes is the result of separate arrangements for class-level services and/or waivers of certain expenses. It is not the result of any difference in advisory or custodial fees or other expenses related to the management of the Fund's assets, which do not vary by class. For the portion of the reporting period on or after March 1, 2024, the total annualized management fee rates were as follows:
| | Total Management Fee Rate % |
| Fidelity Large Cap Stock Fund | .63 |
Prior to March 1, 2024, the management fee was the sum of an individual fund fee rate that was based on an annual rate of .30% of the Fund's average net assets and an annualized group fee rate that averaged .22% during the period. The group fee rate was based upon the monthly average net assets of a group of registered investment companies with which the investment adviser has management contracts. The group fee rate decreased as assets under management increased and increased as assets under management decreased. For the portion of the reporting period prior to March 1, 2024, the total annualized management fee rate was .52%.
The performance adjustment rate is calculated monthly by comparing over the performance period the Fund's performance to that of the performance adjustment index listed below.
| | Performance Adjustment Index |
| Fidelity Large Cap Stock Fund | S&P 500 Index |
For the purposes of calculating the performance adjustment for the Fund, the Fund's investment performance is based on the performance of the Fund. To the extent that other classes of the Fund have higher expenses, this could result in those classes bearing a larger positive performance adjustment and smaller negative performance adjustment than would be the case if each class's own performance were considered. The performance period is the most recent 36 month period. The maximum annualized performance adjustment rate is ± .20% of the Fund's average net assets over the performance period. The performance adjustment rate is divided by twelve and multiplied by the Fund's average net assets over the performance period, and the resulting dollar amount is proportionately added to or subtracted from a class's basic fee. For the entire reporting period, the total annual performance adjustment was .15%.
Effective March 1, 2024, the Fund's sub-advisory agreements with FMR Investment Management (UK) Limited, Fidelity Management & Research (Hong Kong) Limited, and Fidelity Management & Research (Japan) Limited were amended to provide that the investment adviser pays each sub-adviser monthly fees equal to 110% of the sub-adviser's costs for providing sub-advisory services.
Transfer Agent Fees. Fidelity Investments Institutional Operations Company LLC (FIIOC), an affiliate of the investment adviser, is the Fund's transfer, dividend disbursing and shareholder servicing agent. Effective March 1, 2024, each Fund's management contract was amended to incorporate transfer agent services and associated fees previously covered under a separate services agreement. FIIOC pays for typesetting, printing and mailing of shareholder reports, except proxy statements.
During November 2023, the Board approved a change in the transfer agent fees effective December 1, 2023 to a fixed annual rate of average net assets of .1413%.
Prior to December 1, 2023, FIIOC received account fees and asset-based fees that varied according to account size and type of account.
For the portion of the reporting period prior to March 1, 2024, the fees were equivalent to the annualized rate of .14% of average net assets.
Accounting Fees. Fidelity Service Company, Inc. (FSC), an affiliate of the investment adviser, maintains the Fund's accounting records. Effective March 1, 2024, the Fund's management contract was amended to incorporate accounting services and associated fees previously covered under a separate services agreement.
During November 2023, the Board approved a change in the accounting fees effective December 1, 2023 to a fixed annual rate of average net assets as follows:
| | % of Average Net Assets |
| Fidelity Large Cap Stock Fund | .0257 |
Prior to December 1, 2023, the accounting fee was based on the level of average net assets for each month. For the portion of the reporting period prior to March 1, 2024, the fees were equivalent to the following annualized rates:
| | % of Average Net Assets |
| Fidelity Large Cap Stock Fund | .03 |
Brokerage Commissions. A portion of portfolio transactions were placed with brokerage firms which are affiliates of the investment adviser. Brokerage commissions are included in net realized gain (loss) and change in net unrealized appreciation (depreciation) in the Statement of Operations. The commissions paid to these affiliated firms were as follows:
| | Amount ($) |
| Fidelity Large Cap Stock Fund | 10 |
Interfund Trades. Funds may purchase from or sell securities to other Fidelity Funds under procedures adopted by the Board. The procedures have been designed to ensure these interfund trades are executed in accordance with Rule 17a-7 of the 1940 Act. Any interfund trades are included within the respective purchases and sales amounts shown in the Purchases and Sales of Investments note. Interfund trades during the period are noted in the table below.
| | Purchases ($) | Sales ($) | Realized Gain (Loss)($) |
| Fidelity Large Cap Stock Fund | 67,334 | 17,024 | 4,713 |
6. Committed Line of Credit.
Certain Funds participate with other funds managed by the investment adviser or an affiliate in a $4.25 billion credit facility (the "line of credit") to be utilized for temporary or emergency purposes to fund shareholder redemptions or for other short-term liquidity purposes. The participating funds have agreed to pay commitment fees on their pro-rata portion of the line of credit, which are reflected in Miscellaneous expenses on the Statement of Operations, and are listed below. During the period, there were no borrowings on this line of credit.
| | Amount ($) |
| Fidelity Large Cap Stock Fund | 6 |
7. Security Lending.
Funds lend portfolio securities from time to time in order to earn additional income. Lending agents are used, including National Financial Services (NFS), an affiliate of the investment adviser. Pursuant to a securities lending agreement, NFS will receive a fee, which is capped at 9.9% of a fund's daily lending revenue, for its services as lending agent. A fund may lend securities to certain qualified borrowers, including NFS. On the settlement date of the loan, a fund receives collateral (in the form of U.S. Treasury obligations, letters of credit and/or cash) against the loaned securities and maintains collateral in an amount not less than 100% of the market value of the loaned securities during the period of the loan. The market value of the loaned securities is determined at the close of business of a fund and any additional required collateral is delivered to a fund on the next business day. A fund or borrower may terminate the loan at any time, and if the borrower defaults on its obligation to return the securities loaned because of insolvency or other reasons, a fund may apply collateral received from the borrower against the obligation. A fund may experience delays and costs in recovering the securities loaned. Any cash collateral received is invested in the Fidelity Securities Lending Cash Central Fund. Any loaned securities are identified as such in the Schedule of Investments, and the value of loaned securities and cash collateral at period end, as applicable, are presented in the Statement of Assets and Liabilities. Security lending income represents the income earned on investing cash collateral, less rebates paid to borrowers and any lending agent fees associated with the loan, plus any premium payments received for lending certain types of securities. Security lending income is presented in the Statement of Operations as a component of income from Fidelity Central Funds. Affiliated security lending activity, if any, was as follows:
| | Total Security Lending Fees Paid to NFS ($) | Security Lending Income From Securities Loaned to NFS ($) | Value of Securities Loaned to NFS at Period End ($) |
| Fidelity Large Cap Stock Fund | 26 | - | - |
8. Expense Reductions.
During the period the investment adviser or an affiliate reimbursed and/or waived a portion of operating expenses in the amount of $272.
9. Other.
A fund's organizational documents provide former and current trustees and officers with a limited indemnification against liabilities arising in connection with the performance of their duties to the fund. In the normal course of business, a fund may also enter into contracts that provide general indemnifications. A fund's maximum exposure under these arrangements is unknown as this would be dependent on future claims that may be made against a fund. The risk of material loss from such claims is considered remote.
10. Risk and Uncertainties.
Many factors affect a fund's performance. Developments that disrupt global economies and financial markets, such as pandemics, epidemics, outbreaks of infectious diseases, war, terrorism, and environmental disasters, may significantly affect a fund's investment performance. The effects of these developments to a fund will be impacted by the types of securities in which a fund invests, the financial condition, industry, economic sector, and geographic location of an issuer, and a fund's level of investment in the securities of that issuer. Significant concentrations in security types, issuers, industries, sectors, and geographic locations may magnify the factors that affect a fund's performance.
To the Board of Trustees of Fidelity Concord Street Trust and the Shareholders of Fidelity Large Cap Stock Fund:
Opinion on the Financial Statements and Financial Highlights
We have audited the accompanying statement of assets and liabilities of Fidelity Large Cap Stock Fund (the "Fund"), a fund of Fidelity Concord Street Trust, including the schedule of investments, as of April 30, 2024, the related statement of operations for the year then ended, the statement of changes in net assets for each of the two years in the period then ended, the financial highlights for each of the five years in the period then ended, and the related notes. In our opinion, the financial statements and financial highlights present fairly, in all material respects, the financial position of the Fund as of April 30, 2024, and the results of its operations for the year then ended, the changes in its net assets for each of the two years in the period then ended, and the financial highlights for each of the five years in the period then ended in conformity with accounting principles generally accepted in the United States of America.
Basis for Opinion
These financial statements and financial highlights are the responsibility of the Fund's management. Our responsibility is to express an opinion on the Fund's financial statements and financial highlights based on our audits. We are a public accounting firm registered with the Public Company Accounting Oversight Board (United States) (PCAOB) and are required to be independent with respect to the Fund in accordance with the U.S. federal securities laws and the applicable rules and regulations of the Securities and Exchange Commission and the PCAOB.
We conducted our audits in accordance with the standards of the PCAOB. Those standards require that we plan and perform the audit to obtain reasonable assurance about whether the financial statements and financial highlights are free of material misstatement, whether due to error or fraud. The Fund is not required to have, nor were we engaged to perform, an audit of its internal control over financial reporting. As part of our audits, we are required to obtain an understanding of internal control over financial reporting but not for the purpose of expressing an opinion on the effectiveness of the Fund's internal control over financial reporting. Accordingly, we express no such opinion.
Our audits included performing procedures to assess the risks of material misstatement of the financial statements and financial highlights, whether due to error or fraud, and performing procedures that respond to those risks. Such procedures included examining, on a test basis, evidence regarding the amounts and disclosures in the financial statements and financial highlights. Our audits also included evaluating the accounting principles used and significant estimates made by management, as well as evaluating the overall presentation of the financial statements and financial highlights. Our procedures included confirmation of securities owned as of April 30, 2024, by correspondence with the custodian and brokers; when replies were not received from brokers, we performed other auditing procedures. We believe that our audits provide a reasonable basis for our opinion.
/s/ Deloitte & Touche LLP
Boston, Massachusetts
June 13, 2024
We have served as the auditor of one or more of the Fidelity investment companies since 1999.
The Trustees, Members of the Advisory Board (if any), and officers of the trust and fund, as applicable, are listed below. The Board of Trustees governs the fund and is responsible for protecting the interests of shareholders. The Trustees are experienced executives who meet periodically throughout the year to oversee the fund's activities, review contractual arrangements with companies that provide services to the fund, oversee management of the risks associated with such activities and contractual arrangements, and review the fund's performance. Except for Jonathan Chiel, each of the Trustees oversees 323 funds. Mr. Chiel oversees 192 funds.
The Trustees hold office without limit in time except that (a) any Trustee may resign; (b) any Trustee may be removed by written instrument, signed by at least two-thirds of the number of Trustees prior to such removal; (c) any Trustee who requests to be retired or who has become incapacitated by illness or injury may be retired by written instrument signed by a majority of the other Trustees; and (d) any Trustee may be removed at any special meeting of shareholders by a two-thirds vote of the outstanding voting securities of the trust. Each Trustee who is not an interested person (as defined in the 1940 Act) of the trust and the fund is referred to herein as an Independent Trustee. Each Independent Trustee shall retire not later than the last day of the calendar year in which his or her 75th birthday occurs. The Independent Trustees may waive this mandatory retirement age policy with respect to individual Trustees. Officers and Advisory Board Members hold office without limit in time, except that any officer or Advisory Board Member may resign or may be removed by a vote of a majority of the Trustees at any regular meeting or any special meeting of the Trustees. Except as indicated, each individual has held the office shown or other offices in the same company for the past five years.
The fund's Statement of Additional Information (SAI) includes more information about the Trustees. To request a free copy, call Fidelity at 1-800-544-8544.
Experience, Skills, Attributes, and Qualifications of the Trustees. The Governance and Nominating Committee has adopted a statement of policy that describes the experience, qualifications, attributes, and skills that are necessary and desirable for potential Independent Trustee candidates (Statement of Policy). The Board believes that each Trustee satisfied at the time he or she was initially elected or appointed a Trustee, and continues to satisfy, the standards contemplated by the Statement of Policy. The Governance and Nominating Committee also engages professional search firms to help identify potential Independent Trustee candidates who have the experience, qualifications, attributes, and skills consistent with the Statement of Policy. From time to time, additional criteria based on the composition and skills of the current Independent Trustees, as well as experience or skills that may be appropriate in light of future changes to board composition, business conditions, and regulatory or other developments, have also been considered by the professional search firms and the Governance and Nominating Committee. In addition, the Board takes into account the Trustees' commitment and participation in Board and committee meetings, as well as their leadership of standing and ad hoc committees throughout their tenure.
In determining that a particular Trustee was and continues to be qualified to serve as a Trustee, the Board has considered a variety of criteria, none of which, in isolation, was controlling. The Board believes that, collectively, the Trustees have balanced and diverse experience, qualifications, attributes, and skills, which allow the Board to operate effectively in governing the fund and protecting the interests of shareholders. Information about the specific experience, skills, attributes, and qualifications of each Trustee, which in each case led to the Board's conclusion that the Trustee should serve (or continue to serve) as a trustee of the fund, is provided below.
Board Structure and Oversight Function. Robert A. Lawrence is an interested person and currently serves as Chair. The Trustees have determined that an interested Chair is appropriate and benefits shareholders because an interested Chair has a personal and professional stake in the quality and continuity of services provided to the fund. Independent Trustees exercise their informed business judgment to appoint an individual of their choosing to serve as Chair, regardless of whether the Trustee happens to be independent or a member of management. The Independent Trustees have determined that they can act independently and effectively without having an Independent Trustee serve as Chair and that a key structural component for assuring that they are in a position to do so is for the Independent Trustees to constitute a substantial majority for the Board. The Independent Trustees also regularly meet in executive session. David M. Thomas serves as Lead Independent Trustee and as such (i) acts as a liaison between the Independent Trustees and management with respect to matters important to the Independent Trustees and (ii) with management prepares agendas for Board meetings.
Fidelity® funds are overseen by different Boards of Trustees. The fund's Board oversees Fidelity's high income and certain equity funds, and other Boards oversee Fidelity's alternative investment, investment-grade bond, money market, asset allocation, and other equity funds. The asset allocation funds may invest in Fidelity® funds overseen by the fund's Board. The use of separate Boards, each with its own committee structure, allows the Trustees of each group of Fidelity® funds to focus on the unique issues of the funds they oversee, including common research, investment, and operational issues. On occasion, the separate Boards establish joint committees to address issues of overlapping consequences for the Fidelity® funds overseen by each Board.
The Trustees operate using a system of committees to facilitate the timely and efficient consideration of all matters of importance to the Trustees, the fund, and fund shareholders and to facilitate compliance with legal and regulatory requirements and oversight of the fund's activities and associated risks. The Board, acting through its committees, has charged FMR and its affiliates with (i) identifying events or circumstances the occurrence of which could have demonstrably adverse effects on the fund's business and/or reputation; (ii) implementing processes and controls to lessen the possibility that such events or circumstances occur or to mitigate the effects of such events or circumstances if they do occur; and (iii) creating and maintaining a system designed to evaluate continuously business and market conditions in order to facilitate the identification and implementation processes described in (i) and (ii) above. Because the day-to-day operations and activities of the fund are carried out by or through FMR, its affiliates, and other service providers, the fund's exposure to risks is mitigated but not eliminated by the processes overseen by the Trustees. While each of the Board's committees has responsibility for overseeing different aspects of the fund's activities, oversight is exercised primarily through the Operations, Audit, and Compliance Committees. Appropriate personnel, including but not limited to the fund's Chief Compliance Officer (CCO), FMR's internal auditor, the independent accountants, the fund's Treasurer and portfolio management personnel, make periodic reports to the Board's committees, as appropriate, including an annual review of Fidelity's risk management program for the Fidelity® funds. The responsibilities of each standing committee, including their oversight responsibilities, are described further under "Standing Committees of the Trustees."
Interested Trustees*:
Correspondence intended for a Trustee who is an interested person may be sent to Fidelity Investments, 245 Summer Street, Boston, Massachusetts 02210.
Name, Year of Birth; Principal Occupations and Other Relevant Experience+
Jonathan Chiel (1957)
Year of Election or Appointment: 2016
Trustee
Mr. Chiel also serves as Trustee of other Fidelity® funds. Mr. Chiel is Senior Counsel at Fidelity Investments (diversified financial services company, 2024-present). Previously, Mr. Chiel served as General Counsel (2012-2024) and Head of Legal, Risk and Compliance (2022-2024) for Fidelity Investments; Executive Vice President and General Counsel for FMR LLC (diversified financial services company, 2012-2024); Director and President of OH Company LLC (holding company, 2018-2024); General Counsel (2004-2012) and Senior Vice President and Deputy General Counsel (2000-2004) for John Hancock Financial Services; a partner with Choate, Hall & Stewart (law firm, 1996-2000); and an Assistant United States Attorney for the United States Attorney's Office of the District of Massachusetts (1986-1995), including Chief of the Criminal Division (1993-1995). Mr. Chiel is a director on the boards of the Harvard Law School Center on the Legal Profession and the U.S. Chamber Litigation Center.
Bettina Doulton (1964)
Year of Election or Appointment: 2021
Trustee
Ms. Doulton also serves as Trustee of other Fidelity® funds. Prior to her retirement, Ms. Doulton served in a variety of positions at Fidelity Investments, including as a managing director of research (2006-2007), portfolio manager to certain Fidelity® funds (1993-2005), equity analyst and portfolio assistant (1990-1993), and research assistant (1987-1990). Ms. Doulton currently owns and operates Cellardoor Winery. Previously, Ms. Doulton served as a member of the Board of Brown Capital Management, LLC (2014-2018).
Robert A. Lawrence (1952)
Year of Election or Appointment: 2020
Trustee
Chair of the Board of Trustees
Mr. Lawrence also serves as Trustee of other funds. Previously, Mr. Lawrence served as a Trustee and Member of the Advisory Board of certain funds. Prior to his retirement in 2008, Mr. Lawrence served as Vice President of certain Fidelity® funds (2006-2008), Senior Vice President, Head of High Income Division of Fidelity Management & Research Company (investment adviser firm, 2006-2008), and President of Fidelity Strategic Investments (investment adviser firm, 2002-2005).
* Determined to be an "Interested Trustee" by virtue of, among other things, his or her affiliation with the trust or various entities under common control with FMR.
+ The information includes the Trustee's principal occupation during the last five years and other information relating to the experience, attributes, and skills relevant to the Trustee's qualifications to serve as a Trustee, which led to the conclusion that the Trustee should serve as a Trustee for the fund.
Independent Trustees:
Correspondence intended for an Independent Trustee may be sent to Fidelity Investments, P.O. Box 55235, Boston, Massachusetts 02205-5235.
Name, Year of Birth; Principal Occupations and Other Relevant Experience+
Thomas P. Bostick (1956)
Year of Election or Appointment: 2021
Trustee
Lieutenant General Bostick also serves as Trustee of other Fidelity® funds. Prior to his retirement, General Bostick (United States Army, Retired) held a variety of positions within the U.S. Army, including Chief of Engineers and Commanding General, U.S. Army Corps of Engineers (2012-2016) and Deputy Chief of Staff and Director of Human Resources, U.S. Army (2009-2012). General Bostick currently serves as a member of the Board and Finance and Governance & Sustainability Committees of CSX Corporation (transportation, 2020-present) and a member of the Board and Corporate Governance and Nominating Committee of Perma-Fix Environmental Services, Inc. (nuclear waste management, 2020-present). General Bostick serves as Chief Executive Officer of Bostick Global Strategies, LLC (consulting, 2016-present), as a member of the Board of HireVue, Inc. (video interview and assessment, 2020-present), as a member of the Board of Allonnia (biotechnology and engineering solutions, 2022-present), on the Advisory Board of Hilco Redevelopment Partners (a real estate investment and redevelopment company, 2021-present), and on the Advisory Board of Solugen, Inc. (specialty bio-based chemicals manufacturer, 2022-present). Previously, General Bostick served as a Member of the Advisory Board of certain Fidelity® funds (2021), President, Intrexon Bioengineering (2018-2020) and Chief Operating Officer (2017-2020) and Senior Vice President of the Environment Sector (2016-2017) of Intrexon Corporation (biopharmaceutical company).
Donald F. Donahue (1950)
Year of Election or Appointment: 2018
Trustee
Mr. Donahue also serves as Trustee of other Fidelity® funds. Mr. Donahue serves as President and Chief Executive Officer of Miranda Partners, LLC (risk consulting for the financial services industry, 2012-present). Previously, Mr. Donahue served as Chief Executive Officer (2006-2012), Chief Operating Officer (2003-2006) and Managing Director, Customer Marketing and Development (1999-2003) of The Depository Trust & Clearing Corporation (financial markets infrastructure). Mr. Donahue currently serves as a member (2007-present) and Co-Chairman (2016-present) of the Board of United Way of New York. Mr. Donahue previously served as a member of the Advisory Board of certain Fidelity® funds (2015-2018) and as a member of the Board of The Leadership Academy (previously NYC Leadership Academy) (2012-2022).
Vicki L. Fuller (1957)
Year of Election or Appointment: 2020
Trustee
Ms. Fuller also serves as Trustee of other Fidelity® funds. Previously, Ms. Fuller served as a member of the Advisory Board of certain Fidelity® funds (2018-2020), Chief Investment Officer of the New York State Common Retirement Fund (2012-2018) and held a variety of positions at AllianceBernstein L.P. (global asset management, 1985-2012), including Managing Director (2006-2012) and Senior Vice President and Senior Portfolio Manager (2001-2006). Ms. Fuller currently serves as a member of the Board, Audit Committee, Compensation Committee and Nominating and Governance Committee of two Blackstone business development companies (2020-present), as a member of the Board of Treliant, LLC (consulting, 2019-present), as a member of the Board of Ariel Alternatives, LLC (private equity, 2022-present) and as a member of the Board and Chair of the Audit Committee of Gusto, Inc. (software, 2021-present). In addition, Ms. Fuller currently serves as a member of the Executive Board of New York University's Stern School of Business. Ms. Fuller previously served as a member of the Board of Roosevelt University (2019-2024) and member of the Board, Audit Committee and Nominating and Governance Committee of The Williams Companies, Inc. (natural gas infrastructure, 2018-2021).
Patricia L. Kampling (1959)
Year of Election or Appointment: 2020
Trustee
Ms. Kampling also serves as Trustee of other Fidelity® funds. Prior to her retirement, Ms. Kampling served as Chairman of the Board and Chief Executive Officer (2012-2019), President and Chief Operating Officer (2011-2012) and Executive Vice President and Chief Financial Officer (2010-2011) of Alliant Energy Corporation. Ms. Kampling currently serves as a member of the Board, Audit Committee and Governance, Compensation and Nominating Committee of Xcel Energy Inc. (utilities company, 2020-present) and as a member of the Board, Audit, Finance and Risk Committee and Safety, Environmental, Technology and Operations Committee and Chair of the Executive Development and Compensation Committee of American Water Works Company, Inc. (utilities company, 2019-present). In addition, Ms. Kampling currently serves as a member of the Board of the Nature Conservancy, Wisconsin Chapter (2019-present). Previously, Ms. Kampling served as a Member of the Advisory Board of certain Fidelity® funds (2020), a member of the Board, Compensation Committee and Executive Committee and Chair of the Audit Committee of Briggs & Stratton Corporation (manufacturing, 2011-2021), a member of the Board of Interstate Power and Light Company (2012-2019) and Wisconsin Power and Light Company (2012-2019) (each a subsidiary of Alliant Energy Corporation) and as a member of the Board and Workforce Development Committee of the Business Roundtable (2018-2019).
Thomas A. Kennedy (1955)
Year of Election or Appointment: 2021
Trustee
Mr. Kennedy also serves as Trustee of other Fidelity® funds. Previously, Mr. Kennedy served as a Member of the Advisory Board of certain Fidelity® funds (2020) and held a variety of positions at Raytheon Company (aerospace and defense, 1983-2020), including Chairman and Chief Executive Officer (2014-2020) and Executive Vice President and Chief Operating Officer (2013-2014). Mr. Kennedy served as Executive Chairman of the Board of Directors of Raytheon Technologies Corporation (aerospace and defense, 2020-2021). Mr. Kennedy serves as a Director of the Board of Directors of Textron Inc. (aerospace and defense, 2023-present).
Oscar Munoz (1959)
Year of Election or Appointment: 2021
Trustee
Mr. Munoz also serves as Trustee of other Fidelity® funds. Prior to his retirement, Mr. Munoz served as Executive Chairman (2020-2021), Chief Executive Officer (2015-2020), President (2015-2016) and a member of the Board (2010-2021) of United Airlines Holdings, Inc. Mr. Munoz currently serves as a member of the Board of CBRE Group, Inc. (commercial real estate, 2020-present), a member of the Board of Univision Communications, Inc. (Hispanic media, 2020-present), a member of the Board of Archer Aviation Inc. (2021-present), a member of the Defense Business Board of the United States Department of Defense (2021-present) and a member of the Board of Salesforce.com, Inc. (cloud-based software, 2022-present). Previously, Mr. Munoz served as a Member of the Advisory Board of certain Fidelity® funds (2021).
David M. Thomas (1949)
Year of Election or Appointment: 2008
Trustee
Lead Independent Trustee
Mr. Thomas also serves as Trustee of other Fidelity® funds. Previously, Mr. Thomas served as Executive Chairman (2005-2006) and Chairman and Chief Executive Officer (2000-2005) of IMS Health, Inc. (pharmaceutical and healthcare information solutions) and as a member of the Board of Fortune Brands Home and Security (home and security products, 2004-2023). Mr. Thomas currently serves as Director (2013-present) and Non-Executive Chairman of the Board (2022-present) of Interpublic Group of Companies, Inc. (marketing communication).
Susan Tomasky (1953)
Year of Election or Appointment: 2020
Trustee
Ms. Tomasky also serves as Trustee of other Fidelity® funds. Prior to her retirement, Ms. Tomasky served in various executive officer positions at American Electric Power Company, Inc. (1998-2011), including most recently as President of AEP Transmission (2007-2011). Ms. Tomasky currently serves as a member of the Board and Sustainability Committee and as Chair of the Audit Committee of Marathon Petroleum Corporation (2018-present) and as a member of the Board, Executive Committee, Corporate Governance Committee and Organization and Compensation Committee and as Lead Director of the Board of Public Service Enterprise Group, Inc. (utilities company, 2012-present) and as a member of the Board of its subsidiary company, Public Service Electric and Gas Co. (2021-present). In addition, Ms. Tomasky currently serves as a member (2009-present) and President (2020-present) of the Board of the Royal Shakespeare Company - America (2009-present) and as a member and Vice Chair of the Board of Kenyon College (2016-present). Previously, Ms. Tomasky served as a Member of the Advisory Board of certain Fidelity® funds (2020), as a member of the Board of the Columbus Association for the Performing Arts (2011-2023), as a member of the Board of the Columbus Regional Airport Authority (2007-2020), as a member of the Board (2011-2018) and Lead Independent Director (2015-2018) of Andeavor Corporation (previously Tesoro Corporation) (independent oil refiner and marketer) and as a member of the Board of Summit Midstream Partners LP (energy, 2012-2018).
Michael E. Wiley (1950)
Year of Election or Appointment: 2020
Trustee
Mr. Wiley also serves as Trustee of other Fidelity® funds. Previously, Mr. Wiley served as a member of the Advisory Board of certain Fidelity® funds (2018-2020), Chairman, President and CEO of Baker Hughes, Inc. (oilfield services, 2000-2004). Mr. Wiley also previously served as a member of the Board of Andeavor Corporation (independent oil refiner and marketer, 2005-2018), a member of the Board of Andeavor Logistics LP (natural resources logistics, 2015-2018) and a member of the Board of High Point Resources (exploration and production, 2005-2020).
+ The information includes the Trustee's principal occupation during the last five years and other information relating to the experience, attributes, and skills relevant to the Trustee's qualifications to serve as a Trustee, which led to the conclusion that the Trustee should serve as a Trustee for the fund.
Advisory Board Members and Officers:
Correspondence intended for a Member of the Advisory Board (if any) may be sent to Fidelity Investments, P.O. Box 55235, Boston, Massachusetts 02205-5235. Correspondence intended for an officer or Peter S. Lynch may be sent to Fidelity Investments, 245 Summer Street, Boston, Massachusetts 02210.
Name, Year of Birth; Principal Occupations+
Vijay C. Advani (1960)
Year of Election or Appointment: 2023
Member of the Advisory Board
Mr. Advani also serves as Trustee or Member of the Advisory Board of other funds. Previously, Mr. Advani served as Executive Chairman (2020-2022), Chief Executive Officer (2017-2020) and Chief Operating Officer (2016-2017) of Nuveen (global investment manager). He also served in various capacities at Franklin Resources (global investment manager), including Co-President (2015-2016), Executive Vice President, Global Advisory Services (2008-2015), Head of Global Retail Distribution (2005-2008), Executive Managing Director, International Retail Development (2002-2005), Managing Director, Product Developments, Sales & Marketing, Asia, Eastern Europe and Africa (2000-2002) and President, Templeton Asset Management India (1995-2000). Mr. Advani also served as Senior Investment Officer of International Finance Corporation (private equity and venture capital arm of The World Bank, 1984-1995). Mr. Advani is Chairman Emeritus of the U.S. India Business Council (2018-present), a Director of The Global Impact Investing Network (2019-present), a Director of LOK Capital (Mauritius) (2022-present), a member of the Advisory Council of LOK Capital (2022-present), a Senior Advisor of Neuberger Berman (2021-present), a Senior Advisor of Seviora Holdings Pte. Ltd (Temasek-Singapore) (2021-present), a Director of Seviora Capital (Singapore) (2021-present) and an Advisor of EQUIAM (2021-present). Mr. Advani formerly served as a member of the Board of BowX Acquisition Corp. (special purpose acquisition company, 2020-2021), a member of the Board of Intellecap (advisory arm of The Aavishkaar Group, 2018-2020), a member of the Board of Nuveen Investments, Inc. (2017-2020) and a member of the Board of Docusign (software, 2016-2019).
Peter S. Lynch (1944)
Year of Election or Appointment: 2003
Member of the Advisory Board
Mr. Lynch also serves as a Member of the Advisory Board of other Fidelity® funds. Mr. Lynch is Vice Chairman and a Director of Fidelity Management & Research Company LLC (investment adviser firm). In addition, Mr. Lynch serves as a Trustee of Boston College and as the Chairman of the Inner-City Scholarship Fund. Previously, Mr. Lynch served as Vice Chairman and a Director of FMR Co., Inc. (investment adviser firm) and on the Special Olympics International Board of Directors (1997-2006).
Karen B. Peetz (1955)
Year of Election or Appointment: 2023
Member of the Advisory Board
Ms. Peetz also serves as a Member of the Advisory Board of other funds. Previously, Ms. Peetz served as Chief Administration Officer (2020-2023) of Citigroup Inc. (a diversified financial service company). She also served in various capacities at Bank of New York Mellon Corporation, including President (2013-2016), Vice Chairman, Senior Executive Vice President and Chief Executive Officer of Financial Markets & Treasury Services (2010-2013), Senior Executive Vice President and Chief Executive Officer of Global Corporate Trust (2003-2008), Senior Vice President and Division Manager of Global Payments & Trade Services (2002-2003) and Senior Vice President and Division Manager of Domestic Corporate Trust (1998-2002). Ms. Peetz also served in various capacities at Chase Manhattan Corporation (1982-1998), including Senior Vice President and Manager of Corporate Trust International Business (1996-1998), Managing Director and Manager of Corporate Trust Services (1994-1996) and Managing Director and Group Manager of Financial Institution Sales (1990-1993). Ms. Peetz currently serves as Chair of Amherst Holdings Advisory Council (2018-present), Trustee of Johns Hopkins University (2016-present), Chair of the Carey Business School Advisory Council, Member of the Johns Hopkins Medicine Board and Finance Committee and Chair of the Lyme and Tick Related Disease Institute Advisory Council. Ms. Peetz previously served as a member of the Board of Guardian Life Insurance Company of America (2019-2023), a member of the Board of Trane Technologies (2018-2022), a member of the Board of Wells Fargo Corp. (2017-2019), a member of the Board of SunCoke Energy Inc. (2012-2016), a member of the Board of Private Export Funding Corporation (2010-2016) and as a Trustee of Penn State University (2010-2014) and the United Way of New York City (2008-2010).
Heather Bonner (1977)
Year of Election or Appointment: 2023
Assistant Treasurer
Ms. Bonner also serves as an officer of other funds. Ms. Bonner is a Senior Vice President (2022-present) and is an employee of Fidelity Investments (2022-present). Ms. Bonner serves as Senior Vice President, Vice President, Treasurer, or Director of certain Fidelity entities. Prior to joining Fidelity, Ms. Bonner served as Managing Director at AQR Capital Management (2013-2022) and was the Treasurer and Principal Financial Officer of the AQR Funds (2013-2022).
Craig S. Brown (1977)
Year of Election or Appointment: 2022
Deputy Treasurer
Mr. Brown also serves as an officer of other funds. Mr. Brown is a Vice President (2015-present) and is an employee of Fidelity Investments. Mr. Brown serves as Assistant Treasurer of FIMM, LLC (2021-present). Previously, Mr. Brown served as Assistant Treasurer of certain Fidelity® funds (2019-2022).
John J. Burke III (1964)
Year of Election or Appointment: 2018
Chief Financial Officer
Mr. Burke also serves as Chief Financial Officer of other funds. Mr. Burke is Head of Fidelity Fund and Investment Operations (2018-present) and is an employee of Fidelity Investments. Mr. Burke serves as President, Executive Vice President, or Director of certain Fidelity entities. Previously Mr. Burke served as head of Asset Management Investment Operations (2012-2018).
Margaret Carey (1973)
Year of Election or Appointment: 2023
Secretary and Chief Legal Officer (CLO)
Ms. Carey also serves as an officer of other funds and as CLO of certain Fidelity entities. Ms. Carey is a Senior Vice President, Deputy General Counsel (2019-present) and is an employee of Fidelity Investments.
William C. Coffey (1969)
Year of Election or Appointment: 2019
Assistant Secretary
Mr. Coffey also serves as Assistant Secretary of other funds. Mr. Coffey is a Senior Vice President, Deputy General Counsel (2010-present) and is an employee of Fidelity Investments. Previously, Mr. Coffey served as Secretary and CLO of certain funds (2018-2019); CLO, Secretary, or Senior Vice President of certain Fidelity entities and Assistant Secretary of certain funds (2009-2018).
Timothy M. Cohen (1969)
Year of Election or Appointment: 2018
Vice President
Mr. Cohen also serves as Vice President of other funds. Mr. Cohen is Co-Head of Equity (2018-present) and is an employee of Fidelity Investments. Mr. Cohen serves as President or Director of certain Fidelity entities. Previously, Mr. Cohen served as Executive Vice President of Fidelity SelectCo, LLC (2019) and Head of Global Equity Research (2016-2018).
Jonathan Davis (1968)
Year of Election or Appointment: 2010
Assistant Treasurer
Mr. Davis also serves as an officer of other funds. Mr. Davis is a Vice President (2006-present) and is an employee of Fidelity Investments. Mr. Davis serves as Assistant Treasurer or Director of certain Fidelity entities.
Laura M. Del Prato (1964)
Year of Election or Appointment: 2018
Assistant Treasurer
Ms. Del Prato also serves as an officer of other funds. Ms. Del Prato is a Senior Vice President (2017-present) and is an employee of Fidelity Investments. Ms. Del Prato serves as Senior Vice President, Vice President, Assistant Treasurer, or Director of certain Fidelity entities. Previously, Ms. Del Prato served as President and Treasurer of The North Carolina Capital Management Trust: Cash Portfolio and Term Portfolio (2018-2020).
Colm A. Hogan (1973)
Year of Election or Appointment: 2020
Assistant Treasurer
Mr. Hogan also serves as an officer of other funds. Mr. Hogan is a Vice President (2016-present) and is an employee of Fidelity Investments. Mr. Hogan serves as Assistant Treasurer of certain Fidelity entities. Previously, Mr. Hogan served as Deputy Treasurer of certain Fidelity® funds (2016-2020) and Assistant Treasurer of certain Fidelity® funds (2016-2018).
Pamela R. Holding (1964)
Year of Election or Appointment: 2018
Vice President
Ms. Holding also serves as Vice President of other funds. Ms. Holding is Co-Head of Equity (2018-present) and is an employee of Fidelity Investments. Previously, Ms. Holding served as Executive Vice President of Fidelity SelectCo, LLC (2019) and as Chief Investment Officer of Fidelity Institutional Asset Management (2013-2018).
Chris Maher (1972)
Year of Election or Appointment: 2020
Deputy Treasurer
Mr. Maher also serves as an officer of other funds. Mr. Maher is a Vice President (2008-present) and is an employee of Fidelity Investments. Mr. Maher serves as Assistant Treasurer of certain Fidelity entities. Previously, Mr. Maher served as Assistant Treasurer of certain funds (2013-2020).
Jason P. Pogorelec (1975)
Year of Election or Appointment: 2020
Chief Compliance Officer
Mr. Pogorelec also serves as Chief Compliance Officer of other funds. Mr. Pogorelec is a Senior Vice President of Asset Management Compliance (2020-present) and is an employee of Fidelity Investments. Mr. Pogorelec serves as Compliance Officer of Fidelity Management & Research Company LLC (investment adviser firm, 2023-present) and Ballyrock Investment Advisors LLC (2023-present). Previously, Mr. Pogorelec served as a Vice President, Associate General Counsel for Fidelity Investments (2010-2020) and Assistant Secretary of certain Fidelity® funds (2015-2020).
Brett Segaloff (1972)
Year of Election or Appointment: 2021
Anti-Money Laundering (AML) Officer
Mr. Segaloff also serves as AML Officer of other funds. Mr. Segaloff is a Vice President (2022-present) and is an employee of Fidelity Investments. Mr. Segaloff serves as Anti Money Laundering Compliance Officer or Anti Money Laundering/Bank Secrecy Act Compliance Officer of certain Fidelity entities.
Stacie M. Smith (1974)
Year of Election or Appointment: 2016
President and Treasurer
Ms. Smith also serves as an officer of other funds. Ms. Smith is a Senior Vice President (2016-present) and is an employee of Fidelity Investments. Ms. Smith serves as Assistant Treasurer of certain Fidelity entities and has served in other fund officer roles.
Jim Wegmann (1979)
Year of Election or Appointment: 2019
Assistant Treasurer
Mr. Wegmann also serves as an officer of other funds. Mr. Wegmann is a Vice President (2016-present) and is an employee of Fidelity Investments. Mr. Wegmann serves as Assistant Treasurer of FIMM, LLC (2021-present). Previously, Mr. Wegmann served as Assistant Treasurer of certain Fidelity® funds (2019-2021).
+ The information includes principal occupation during the last five years.
As a shareholder, you incur two types of costs: (1) transaction costs, which may include sales charges (loads) on purchase payments or redemption proceeds, as applicable and (2) ongoing costs, which generally include management fees, distribution and/or service (12b-1) fees and other Fund expenses. This Example is intended to help you understand your ongoing costs (in dollars) of investing in a fund and to compare these costs with the ongoing costs of investing in other mutual funds.
| The Example is based on an investment of $1,000 invested at the beginning of the period and held for the entire period (November 1, 2023 to April 30, 2024). |
Actual Expenses
The first line of the accompanying table provides information about actual account values and actual expenses. You may use the information in this line, together with the amount you invested, to estimate the expenses that you paid over the period. Simply divide your account value by $1,000.00 (for example, an $8,600 account value divided by $1,000.00 = 8.6), then multiply the result by the number in the first line for a class/Fund under the heading entitled "Expenses Paid During Period" to estimate the expenses you paid on your account during this period. If any fund is a shareholder of any underlying mutual funds or exchange-traded funds (ETFs) (the Underlying Funds), such fund indirectly bears its proportional share of the expenses of the Underlying Funds in addition to the direct expenses incurred presented in the table. These fees and expenses are not included in the annualized expense ratio used to calculate the expense estimate in the table below.
Hypothetical Example for Comparison Purposes
The second line of the accompanying table provides information about hypothetical account values and hypothetical expenses based on the actual expense ratio and an assumed rate of return of 5% per year before expenses, which is not the actual return. The hypothetical account values and expenses may not be used to estimate the actual ending account balance or expenses you paid for the period. You may use this information to compare the ongoing costs of investing in the Fund and other funds. To do so, compare this 5% hypothetical example with the 5% hypothetical examples that appear in the shareholder reports of the other funds. If any fund is a shareholder of any Underlying Funds, such fund indirectly bears its proportional share of the expenses of the Underlying Funds in addition to the direct expenses as presented in the table. These fees and expenses are not included in the annualized expense ratio used to calculate the expense estimate in the table below.
Please note that the expenses shown in the table are meant to highlight your ongoing costs only and do not reflect any transaction costs. Therefore, the second line of the table is useful in comparing ongoing costs only, and will not help you determine the relative total costs of owning different funds. In addition, if these transactional costs were included, your costs would have been higher.
| | | | | Annualized Expense Ratio- A | | Beginning Account Value November 1, 2023 | | Ending Account Value April 30, 2024 | | Expenses Paid During Period- C November 1, 2023 to April 30, 2024 |
| | | | | | | | | | |
| Fidelity® Large Cap Stock Fund | | | | .79% | | | | | | |
| Actual | | | | | | $ 1,000 | | $ 1,241.30 | | $ 4.40 |
Hypothetical-B | | | | | | $ 1,000 | | $ 1,020.93 | | $ 3.97 |
| |
A Annualized expense ratio reflects expenses net of applicable fee waivers.
B 5% return per year before expenses
C Expenses are equal to the annualized expense ratio, multiplied by the average account value over the period, multiplied by 182/ 366 (to reflect the one-half year period). The fees and expenses of any Underlying Funds are not included in each annualized expense ratio.
The dividend and capital gains distributions for the fund(s) are available on Fidelity.com or Institutional.Fidelity.com.
The fund hereby designates as a capital gain dividend with respect to the taxable year ended April 30, 2024, $161,858,327 or, if subsequently determined to be different, the net capital gain of such year.
The fund designates 100% of the dividends distributed during the fiscal year as qualifying for the dividends-received deduction for corporate shareholders.
The fund designates 100% of the dividends distributed during the fiscal year as amounts which may be taken into account as a dividend for the purposes of the maximum rate under section 1(h)(11) of the Internal Revenue Code.
The fund will notify shareholders in January 2025 of amounts for use in preparing 2024 income tax returns.
Board Approval of Investment Advisory Contracts
Fidelity Large Cap Stock Fund
At its January 2024 meeting, the Board of Trustees, including the Independent Trustees (together, the Board), approved an amended and restated management contract with Fidelity Management & Research Company LLC (FMR) (the Management Contract), and amended and restated sub-advisory agreements (the Sub-Advisory Contracts, and together with the Management Contract, the Advisory Contracts) for the fund, including the fund's sub-advisory agreements with FMR Investment Management (UK) Limited (FMR UK), Fidelity Management & Research (Hong Kong) Limited (FMR H.K.), and Fidelity Management & Research (Japan) Limited (FMR Japan). The Advisory Contracts will be effective March 1, 2024. The Board will consider the annual renewal of the fund's Advisory Contracts in May 2024, following its review of additional materials provided by FMR.
Management Contract. The Board approved the Management Contract, which implements a new fee structure combining the management fee, transfer agent fee (TA Fee), and pricing and bookkeeping fee (P&B Fee) of the fund into a single fee based on tiered schedules and subject to a maximum rate (the Unified Fee). In exchange for the Unified Fee, the fund will receive investment advisory, management, administrative, transfer agent, pricing and bookkeeping services under a single agreement - the Management Contract.
In its consideration of the Management Contract over several meetings, the Board received, reviewed and discussed a comprehensive set of analyses regarding the Unified Fee including (i) the legal framework, (ii) design goals for the Unified Fee, (iii) calculation methodology for the Unified Fee and illustrative examples, (iv) annual and cumulative projected impacts under various scenarios, both in the aggregate and at the fund/class level, (v) explanations of schedules, rate levers and maximum rates and (vi) shareholder benefits and projected savings.
The Board considered that the maximum Unified Fee for the fund would be no higher than the sum of (i) the lowest contractual management fee rate under the fund's existing management contract, which is the individual fund fee rate, if any, plus the lowest contractual marginal group fee rate and (ii) the TA and P&B Fee rates, which are fixed fee rates since December 1, 2023 (together, the Unified Fee Cap). The Board noted that Fidelity has represented that, as a result of this Unified Fee Cap, the Unified Fee would be no greater than the fee rates previously authorized to be charged to the fund for the same services. The Board noted that certain expenses such as performance adjustments, third-party expenses, and certain other miscellaneous expenses would be outside the scope of the Unified Fee and the calculation of such fees would not change as a result of the Unified Fee.
The Board considered Fidelity's representations that implementation of the Unified Fee, which includes the Unified Fee Cap, would cause all funds subject to the Unified Fee, including the fund, to experience an immediate reduction on contractual fee rates for services provided under the current management contracts. The Board considered that some funds would not experience lower net total fees as a result of existing fee caps. The Board further considered that, in addition to the contractual fee savings, the Unified Fee offers funds and their shareholders greater protection from future rate increases for services previously offered under separate agreements that are now covered by the Management Contract because such rate increases would require shareholder approval.
Sub-Advisory Contracts. In connection with the Unified Fee changes, the Board considered the Sub-Advisory Contracts, which simplified the calculation of the fees paid by FMR to the sub-advisers under the agreements. The Board noted that the agreements with FMR UK, FMR H.K., and FMR Japan were amended to provide that FMR will compensate each sub-adviser at a fee rate equal to 110% of the sub-adviser's costs incurred in providing services under the agreement. The Board considered that, under the Sub-Advisory Contracts, FMR, and not the fund, will continue to pay the sub-advisory fees to each applicable sub-adviser.
The Board further considered that the approval of the fund's Advisory Contracts will not result in any changes in the investment process or strategies employed in the management of the fund's assets or the day-to-day management of the fund or the persons primarily responsible for such management. Further, the Board considered that the Management Contract would not change the obligations and services of FMR and its affiliates on behalf of the fund, and, in particular, there would be no change in the nature and level of advisory, management, administration, transfer agent, and pricing and bookkeeping services provided to the fund by FMR, its affiliates, and each applicable sub-adviser.
In connection with its consideration of future renewals of the fund's Advisory Contracts, the Board will consider: (i) the nature, extent and quality of services provided to the funds, including shareholder and administrative services and investment performance; (ii) the competitiveness of the management fee and total expenses for the fund; (iii) the costs of the services and profitability, including the revenues earned and the expenses incurred in conducting the business of developing, marketing, distributing, managing, administering, and servicing the fund and its shareholders, to the extent applicable; and (iv) whether there have been economies of scale in respect of the Fidelity funds, whether the Fidelity funds (including the fund) have appropriately benefited from any such economies of scale, and whether there is the potential for realization of any further economies.
Based on its evaluation of all of the conclusions and representations noted above, and after considering all factors it believed relevant, the Board concluded that the fund's management fee structure is fair and reasonable, and that the fund's Advisory Contracts should be approved.
The Securities and Exchange Commission adopted Rule 22e-4 under the Investment Company Act of 1940 (the Liquidity Rule) to promote effective liquidity risk management throughout the open-end investment company industry, thereby reducing the risk that funds will be unable to meet their redemption obligations and mitigating dilution of the interests of fund shareholders.
The Fund has adopted and implemented a liquidity risk management program (the Program) reasonably designed to assess and manage the Fund's liquidity risk and to comply with the requirements of the Liquidity Rule. The Fund's Board of Trustees (the Board) has designated the Fund's investment adviser as administrator of the Program. The Fidelity advisers have established a Liquidity Risk Management Committee (the LRM Committee) to manage the Program for each of the Fidelity Funds. The LRM Committee monitors the adequacy and effectiveness of implementation of the Program and on a periodic basis assesses each Fund's liquidity risk based on a variety of factors including (1) the Fund's investment strategy, (2) portfolio liquidity and cash flow projections during normal and reasonably foreseeable stressed conditions, (3) shareholder redemptions, (4) borrowings and other funding sources and (5) certain factors specific to ETFs including the effect of the Fund's prices and spreads, market participants, and basket compositions on the overall liquidity of the Fund's portfolio, as applicable.
In accordance with the Program, each of the Fund's portfolio investments is classified into one of four defined liquidity categories based on a determination of a reasonable expectation for how long it would take to convert the investment to cash (or sell or dispose of the investment) without significantly changing its market value.
- Highly liquid investments - cash or convertible to cash within three business days or less
- Moderately liquid investments - convertible to cash in three to seven calendar days
- Less liquid investments - can be sold or disposed of, but not settled, within seven calendar days
- Illiquid investments - cannot be sold or disposed of within seven calendar days
Liquidity classification determinations take into account a variety of factors including various market, trading and investment-specific considerations, as well as market depth, and generally utilize analysis from a third-party liquidity metrics service.
The Liquidity Rule places a 15% limit on a fund's illiquid investments and requires funds that do not primarily hold assets that are highly liquid investments to determine and maintain a minimum percentage of the fund's net assets to be invested in highly liquid investments (highly liquid investment minimum or HLIM). The Program includes provisions reasonably designed to comply with the 15% limit on illiquid investments and for determining, periodically reviewing and complying with the HLIM requirement as applicable.
At a recent meeting of the Fund's Board of Trustees, the LRM Committee provided a written report to the Board pertaining to the operation, adequacy, and effectiveness of the Program for the period December 1, 2022 through November 30, 2023. The report concluded that the Program is operating effectively and is reasonably designed to assess and manage the Fund's liquidity risk.
1.703546.126
LCS-ANN-0624
Fidelity® Mid-Cap Stock Fund
Annual Report
April 30, 2024
Contents
To view a fund's proxy voting guidelines and proxy voting record for the 12-month period ended June 30, visit http://www.fidelity.com/proxyvotingresults or visit the Securities and Exchange Commission's (SEC) web site at http://www.sec.gov.
You may also call 1-800-544-8544 if you're an individual investing directly with Fidelity, call 1-800-835-5092 if you're a plan sponsor or participant with Fidelity as your recordkeeper or call 1-877-208-0098 on institutional accounts or if you're an advisor or invest through one to request a free copy of the proxy voting guidelines.
Standard & Poor's, S&P and S&P 500 are registered service marks of The McGraw-Hill Companies, Inc. and have been licensed for use by Fidelity Distributors Corporation.
Other third-party marks appearing herein are the property of their respective owners.
All other marks appearing herein are registered or unregistered trademarks or service marks of FMR LLC or an affiliated company. © 2024 FMR LLC. All rights reserved.
This report and the financial statements contained herein are submitted for the general information of the shareholders of the Fund. This report is not authorized for distribution to prospective investors in the Fund unless preceded or accompanied by an effective prospectus.
A fund files its complete schedule of portfolio holdings with the SEC for the first and third quarters of each fiscal year on Form N-PORT. Forms N-PORT are available on the SEC's web site at http://www.sec.gov. A fund's Forms N-PORT may be reviewed and copied at the SEC's Public Reference Room in Washington, DC. Information regarding the operation of the SEC's Public Reference Room may be obtained by calling 1-800-SEC-0330.
For a complete list of a fund's portfolio holdings, view the most recent holdings listing, semiannual report, or annual report on Fidelity's web site at http://www.fidelity.com, http://www.institutional.fidelity.com, or http://www.401k.com, as applicable.
NOT FDIC INSURED •MAY LOSE VALUE •NO BANK GUARANTEE
Neither the Fund nor Fidelity Distributors Corporation is a bank.
Average annual total return reflects the change in the value of an investment, assuming reinvestment of distributions from dividend income and capital gains (the profits earned upon the sale of securities that have grown in value, if any) and assuming a constant rate of performance each year. The hypothetical investment and the average annual total returns do not reflect the deduction of taxes that a shareholder would pay on fund distributions or the redemption of fund shares. During periods of reimbursement by Fidelity, a fund's total return will be greater than it would be had the reimbursement not occurred. How a fund did yesterday is no guarantee of how it will do tomorrow.
| Average Annual Total Returns |
| | | | |
Periods ended April 30, 2024 | Past 1 year | Past 5 years | Past 10 years |
| Fidelity® Mid-Cap Stock Fund | 12.37% | 10.65% | 9.59% |
| Class K | 12.46% | 10.76% | 9.70% |
| $10,000 Over 10 Years |
| |
Let's say hypothetically that $10,000 was invested in Fidelity® Mid-Cap Stock Fund, a class of the fund, on April 30, 2014. The chart shows how the value of your investment would have changed, and also shows how the S&P MidCap 400® Index performed over the same period. |
|
|
Market Recap:
U.S. equities gained 22.66% for the 12 months ending April 30, 2024, according to the S&P 500® index, driven by resilient corporate profits, a frenzy over generative artificial intelligence and the Federal Reserve's likely pivot to cutting interest rates later this year. Amid this favorable backdrop for higher-risk assets, the S&P 500® continued its late-2023 momentum and ended March at its all-time high before snapping a five-month uptrend in April (-4.08%). Growth stocks led the broad rally, mostly driven by a narrow set of firms in the communication services (+41%) and information technology (+37%) sectors, largely due to excitement for AI. In particular, semiconductor-related stocks (+104%) were a standout. Following the Fed's November 1 meeting, when the central bank hinted it might be done raising rates, the S&P 500® reversed a three-month decline and gained 14.09% in the final two months of 2023 and 10.56% the first quarter. Risk assets were further aided on March 20, when the central bank held steady its benchmark federal funds rate and affirmed its projection to cut in 2024. The index then slipped in April, as inflation remained stickier than expected, spurring doubts of a soft economic landing. For the full 12 months, the financials, industrials and consumer discretionary sectors each gained about 24%. In sharp contrast, real estate and the defensive-oriented utilities sector each roughly broke even. Other notable "laggards" included consumer staples (+3%) and health care (+7%).
Comments from Portfolio Manager Nicola Stafford:
For the fiscal year ending April 30, 2024, the fund's share classes gained about 12%, versus 16.82% for the benchmark S&P MidCap 400 Index. Relative to the benchmark, security selection was the primary detractor, especially within energy. Stock selection in consumer discretionary also hurt. Stock picks and an underweight in information technology, primarily within the technology hardware & equipment industry, also hampered the fund's relative result. Also detracting was stock picking in materials. Not owning Super Micro Computer, a benchmark component that gained 914%, was the fund's biggest individual relative detractor. A second notable relative detractor was our non-benchmark stake in WNS (-54%). A non-benchmark stake in O-I Glass returned roughly -33% and notably hurt. We reduced the position. In contrast, the biggest contributor to performance versus the benchmark was an overweight in energy. Stock picks in communication services and utilities also boosted the fund's relative performance. The top individual relative contributor was our non-benchmark stake in Vertiv Holdings (+368%). This was an investment we established this period. The second-largest relative contributor was an overweight in Vistra (+225%). Vistra was among the fund's biggest holdings at period end. Another notable relative contributor was our non-benchmark stake in Fabrinet (+83%), and we reduced out stake. Notable changes in positioning include increased exposure to information technology and a lower allocation to energy.
The views expressed above reflect those of the portfolio manager(s) only through the end of the period as stated on the cover of this report and do not necessarily represent the views of Fidelity or any other person in the Fidelity organization. Any such views are subject to change at any time based upon market or other conditions and Fidelity disclaims any responsibility to update such views. These views may not be relied on as investment advice and, because investment decisions for a Fidelity fund are based on numerous factors, may not be relied on as an indication of trading intent on behalf of any Fidelity fund.
Top Holdings (% of Fund's net assets) |
| |
| Space Exploration Technologies Corp. Class A | 1.9 | |
| Imperial Oil Ltd. | 1.6 | |
| Vistra Corp. | 1.6 | |
| Arch Capital Group Ltd. | 1.5 | |
| American Financial Group, Inc. | 1.4 | |
| Regal Rexnord Corp. | 1.3 | |
| AECOM | 1.3 | |
| Molina Healthcare, Inc. | 1.3 | |
| Cheniere Energy, Inc. | 1.3 | |
| Performance Food Group Co. | 1.2 | |
| | 14.4 | |
| |
| Market Sectors (% of Fund's net assets) |
| |
| Industrials | 25.2 | |
| Financials | 15.6 | |
| Consumer Discretionary | 11.3 | |
| Information Technology | 8.4 | |
| Health Care | 7.9 | |
| Materials | 7.4 | |
| Energy | 6.8 | |
| Consumer Staples | 4.9 | |
| Utilities | 4.8 | |
| Real Estate | 4.6 | |
| Communication Services | 2.4 | |
| |
Asset Allocation (% of Fund's net assets) |
|
|
Showing Percentage of Net Assets
| Common Stocks - 98.3% |
| | | Shares | Value ($) (000s) |
| COMMUNICATION SERVICES - 2.4% | | | |
| Entertainment - 2.0% | | | |
| Endeavor Group Holdings, Inc. | | 1,172,373 | 30,962 |
| Liberty Media Corp. Liberty Formula One Class A | | 312,879 | 19,483 |
| TKO Group Holdings, Inc. | | 695,463 | 65,839 |
| Warner Music Group Corp. Class A | | 883,617 | 29,159 |
| | | | 145,443 |
| Media - 0.4% | | | |
| Interpublic Group of Companies, Inc. | | 900,641 | 27,416 |
TOTAL COMMUNICATION SERVICES | | | 172,859 |
| CONSUMER DISCRETIONARY - 11.3% | | | |
| Automobile Components - 0.5% | | | |
| Aptiv PLC (a) | | 552,618 | 39,236 |
| Distributors - 0.4% | | | |
| LKQ Corp. | | 680,266 | 29,340 |
| Diversified Consumer Services - 0.7% | | | |
| H&R Block, Inc. | | 1,079,578 | 50,988 |
| Hotels, Restaurants & Leisure - 3.8% | | | |
| Aramark | | 1,717,910 | 54,131 |
| Caesars Entertainment, Inc. (a) | | 572,168 | 20,495 |
| Churchill Downs, Inc. | | 561,337 | 72,412 |
| Domino's Pizza, Inc. | | 106,248 | 56,234 |
| Flutter Entertainment PLC (a) | | 128,648 | 23,992 |
| Wyndham Hotels & Resorts, Inc. | | 650,902 | 47,848 |
| | | | 275,112 |
| Household Durables - 1.2% | | | |
| D.R. Horton, Inc. | | 214,078 | 30,504 |
| Mohawk Industries, Inc. (a) | | 162,645 | 18,756 |
| NVR, Inc. (a) | | 5,240 | 38,980 |
| | | | 88,240 |
| Leisure Products - 0.5% | | | |
| Brunswick Corp. | | 427,207 | 34,450 |
| Specialty Retail - 1.2% | | | |
| Burlington Stores, Inc. (a) | | 306,504 | 55,152 |
| Foot Locker, Inc. | | 568,841 | 11,860 |
| JD Sports Fashion PLC | | 13,063,236 | 18,870 |
| | | | 85,882 |
| Textiles, Apparel & Luxury Goods - 3.0% | | | |
| Bolt Threads, Inc. (b)(c) | | 239,558 | 333 |
| Brunello Cucinelli SpA | | 790,283 | 81,050 |
| PVH Corp. | | 733,042 | 79,755 |
| Tapestry, Inc. | | 1,411,555 | 56,349 |
| | | | 217,487 |
TOTAL CONSUMER DISCRETIONARY | | | 820,735 |
| CONSUMER STAPLES - 4.8% | | | |
| Beverages - 0.9% | | | |
| Boston Beer Co., Inc. Class A (a) | | 80,114 | 22,305 |
| Keurig Dr. Pepper, Inc. | | 1,222,430 | 41,196 |
| | | | 63,501 |
| Consumer Staples Distribution & Retail - 2.4% | | | |
| BJ's Wholesale Club Holdings, Inc. (a) | | 826,294 | 61,708 |
| Maplebear, Inc. (NASDAQ) | | 659,434 | 22,506 |
| Performance Food Group Co. (a) | | 1,320,315 | 89,623 |
| | | | 173,837 |
| Food Products - 1.1% | | | |
| Bowery Farming, Inc. warrants (a)(b)(c) | | 252,678 | 222 |
| Bunge Global SA | | 252,660 | 25,711 |
| Lamb Weston Holdings, Inc. | | 312,461 | 26,040 |
| Nomad Foods Ltd. | | 1,737,978 | 31,388 |
| | | | 83,361 |
| Household Products - 0.4% | | | |
| Energizer Holdings, Inc. | | 901,300 | 25,885 |
TOTAL CONSUMER STAPLES | | | 346,584 |
| ENERGY - 6.8% | | | |
| Energy Equipment & Services - 1.0% | | | |
| Expro Group Holdings NV (a) | | 1,841,233 | 34,542 |
| NOV, Inc. | | 1,979,403 | 36,599 |
| | | | 71,141 |
| Oil, Gas & Consumable Fuels - 5.8% | | | |
| Cameco Corp. (d) | | 355,920 | 16,241 |
| Canadian Natural Resources Ltd. | | 957,376 | 72,548 |
| Cheniere Energy, Inc. | | 584,636 | 92,267 |
| Energy Transfer LP | | 3,306,546 | 52,012 |
| Imperial Oil Ltd. (d) | | 1,657,977 | 113,992 |
| Parkland Corp. | | 311,500 | 9,596 |
| Range Resources Corp. | | 1,836,653 | 65,954 |
| | | | 422,610 |
TOTAL ENERGY | | | 493,751 |
| FINANCIALS - 15.6% | | | |
| Banks - 5.4% | | | |
| BOK Financial Corp. | | 430,537 | 38,202 |
| First Horizon National Corp. | | 4,661,175 | 69,545 |
| Huntington Bancshares, Inc. | | 3,699,627 | 49,834 |
| M&T Bank Corp. | | 438,995 | 63,386 |
| PNC Financial Services Group, Inc. | | 330,262 | 50,616 |
| U.S. Bancorp | | 1,075,839 | 43,711 |
| Wintrust Financial Corp. | | 759,872 | 73,434 |
| | | | 388,728 |
| Capital Markets - 1.5% | | | |
| Cboe Global Markets, Inc. | | 183,568 | 33,253 |
| Lazard, Inc. Class A | | 724,927 | 27,910 |
| Raymond James Financial, Inc. | | 366,007 | 44,653 |
| | | | 105,816 |
| Financial Services - 2.2% | | | |
| Flywire Corp. (a) | | 771,597 | 15,818 |
| Radian Group, Inc. | | 2,294,228 | 68,529 |
| Shift4 Payments, Inc. (a)(d) | | 205,923 | 11,915 |
| WEX, Inc. (a) | | 296,931 | 62,730 |
| | | | 158,992 |
| Insurance - 6.5% | | | |
| American Financial Group, Inc. | | 765,852 | 97,838 |
| Arch Capital Group Ltd. (a) | | 1,187,470 | 111,076 |
| Beazley PLC | | 3,924,991 | 32,517 |
| First American Financial Corp. | | 1,200,206 | 64,295 |
| Hartford Financial Services Group, Inc. | | 702,691 | 68,084 |
| Hiscox Ltd. | | 2,612,611 | 40,154 |
| Stewart Information Services Corp. | | 241,481 | 14,974 |
| The Travelers Companies, Inc. | | 214,587 | 45,527 |
| | | | 474,465 |
TOTAL FINANCIALS | | | 1,128,001 |
| HEALTH CARE - 7.5% | | | |
| Biotechnology - 0.7% | | | |
| Repligen Corp. (a) | | 321,305 | 52,758 |
| Health Care Equipment & Supplies - 2.0% | | | |
| Dentsply Sirona, Inc. | | 643,244 | 19,304 |
| Hologic, Inc. (a) | | 807,018 | 61,148 |
| Inspire Medical Systems, Inc. (a) | | 84,779 | 20,488 |
| Masimo Corp. (a) | | 342,297 | 46,008 |
| | | | 146,948 |
| Health Care Providers & Services - 2.5% | | | |
| Centene Corp. (a) | | 779,172 | 56,926 |
| Henry Schein, Inc. (a) | | 411,964 | 28,541 |
| Molina Healthcare, Inc. (a) | | 271,881 | 93,010 |
| | | | 178,477 |
| Health Care Technology - 0.3% | | | |
| Evolent Health, Inc. Class A (a) | | 687,126 | 19,061 |
| Life Sciences Tools & Services - 0.8% | | | |
| Charles River Laboratories International, Inc. (a) | | 163,706 | 37,489 |
| Sartorius Stedim Biotech | | 89,132 | 19,310 |
| | | | 56,799 |
| Pharmaceuticals - 1.2% | | | |
| Elanco Animal Health, Inc. (a) | | 718,887 | 9,461 |
| Recordati SpA | | 618,251 | 33,023 |
| UCB SA | | 361,649 | 48,070 |
| | | | 90,554 |
TOTAL HEALTH CARE | | | 544,597 |
| INDUSTRIALS - 24.7% | | | |
| Aerospace & Defense - 4.3% | | | |
| BWX Technologies, Inc. | | 630,209 | 60,355 |
| Huntington Ingalls Industries, Inc. | | 167,808 | 46,471 |
| Space Exploration Technologies Corp.: | | | |
| Class A (a)(b)(c) | | 1,396,290 | 135,439 |
| Class C (a)(b)(c) | | 20,340 | 1,973 |
| Woodward, Inc. | | 407,142 | 66,104 |
| | | | 310,342 |
| Air Freight & Logistics - 0.4% | | | |
| GXO Logistics, Inc. (a) | | 566,456 | 28,130 |
| Building Products - 1.7% | | | |
| Hayward Holdings, Inc. (a) | | 1,319,667 | 17,921 |
| Johnson Controls International PLC | | 772,307 | 50,254 |
| Owens Corning | | 312,259 | 52,525 |
| | | | 120,700 |
| Commercial Services & Supplies - 1.0% | | | |
| GFL Environmental, Inc. | | 2,301,035 | 73,428 |
| Construction & Engineering - 2.9% | | | |
| AECOM | | 1,026,099 | 94,771 |
| Comfort Systems U.S.A., Inc. | | 59,651 | 18,457 |
| EMCOR Group, Inc. | | 146,596 | 52,360 |
| Willscot Mobile Mini Holdings (a) | | 1,151,035 | 42,542 |
| | | | 208,130 |
| Electrical Equipment - 4.1% | | | |
| Acuity Brands, Inc. | | 308,383 | 76,571 |
| Generac Holdings, Inc. (a) | | 296,514 | 40,314 |
| Nextracker, Inc. Class A (a) | | 497,641 | 21,294 |
| Regal Rexnord Corp. | | 590,117 | 95,227 |
| Vertiv Holdings Co. | | 697,906 | 64,905 |
| | | | 298,311 |
| Ground Transportation - 0.8% | | | |
| Knight-Swift Transportation Holdings, Inc. Class A | | 1,277,595 | 59,063 |
| Machinery - 5.1% | | | |
| Allison Transmission Holdings, Inc. | | 786,585 | 57,853 |
| Atmus Filtration Technologies, Inc. | | 488,957 | 14,811 |
| Chart Industries, Inc. (a)(d) | | 586,092 | 84,432 |
| Crane Co. | | 431,467 | 60,410 |
| Donaldson Co., Inc. | | 1,131,505 | 81,695 |
| Energy Recovery, Inc. (a) | | 584,299 | 8,706 |
| Fortive Corp. | | 787,052 | 59,241 |
| | | | 367,148 |
| Professional Services - 3.1% | | | |
| Leidos Holdings, Inc. | | 412,932 | 57,901 |
| Science Applications International Corp. | | 430,848 | 55,450 |
| TransUnion | | 865,274 | 63,165 |
| WNS Holdings Ltd. | | 1,109,582 | 46,503 |
| | | | 223,019 |
| Trading Companies & Distributors - 1.3% | | | |
| Beacon Roofing Supply, Inc. (a) | | 333,958 | 32,905 |
| Watsco, Inc. | | 74,439 | 33,328 |
| WESCO International, Inc. | | 194,932 | 29,776 |
| | | | 96,009 |
TOTAL INDUSTRIALS | | | 1,784,280 |
| INFORMATION TECHNOLOGY - 8.4% | | | |
| Communications Equipment - 1.1% | | | |
| Ciena Corp. (a) | | 1,189,642 | 54,997 |
| Lumentum Holdings, Inc. (a) | | 546,782 | 23,927 |
| | | | 78,924 |
| Electronic Equipment, Instruments & Components - 3.2% | | | |
| Coherent Corp. (a) | | 617,478 | 33,733 |
| Crane NXT Co. | | 848,400 | 51,591 |
| Fabrinet (a) | | 247,999 | 42,921 |
| Flex Ltd. (a) | | 2,068,439 | 59,261 |
| Vontier Corp. | | 1,104,086 | 44,859 |
| | | | 232,365 |
| IT Services - 1.2% | | | |
| Amdocs Ltd. | | 558,456 | 46,905 |
| MongoDB, Inc. Class A (a) | | 119,195 | 43,528 |
| | | | 90,433 |
| Semiconductors & Semiconductor Equipment - 1.8% | | | |
| Allegro MicroSystems LLC (a) | | 1,135,950 | 33,726 |
| Lattice Semiconductor Corp. (a) | | 636,705 | 43,678 |
| MKS Instruments, Inc. | | 322,968 | 38,427 |
| ON Semiconductor Corp. (a) | | 189,672 | 13,307 |
| | | | 129,138 |
| Software - 1.1% | | | |
| Dynatrace, Inc. (a) | | 1,388,027 | 62,892 |
| Gen Digital, Inc. | | 853,374 | 17,187 |
| | | | 80,079 |
TOTAL INFORMATION TECHNOLOGY | | | 610,939 |
| MATERIALS - 7.4% | | | |
| Chemicals - 2.8% | | | |
| Cabot Corp. | | 633,150 | 57,762 |
| Celanese Corp. Class A | | 208,129 | 31,971 |
| CF Industries Holdings, Inc. | | 473,384 | 37,383 |
| Nutrien Ltd. | | 426,370 | 22,482 |
| Westlake Corp. | | 343,936 | 50,682 |
| | | | 200,280 |
| Containers & Packaging - 2.5% | | | |
| Avery Dennison Corp. | | 182,911 | 39,743 |
| Crown Holdings, Inc. | | 724,743 | 59,480 |
| Graphic Packaging Holding Co. | | 1,133,763 | 29,308 |
| O-I Glass, Inc. (a) | | 3,409,089 | 51,000 |
| | | | 179,531 |
| Metals & Mining - 2.1% | | | |
| Commercial Metals Co. | | 1,236,565 | 66,453 |
| Franco-Nevada Corp. | | 288,406 | 34,718 |
| Freeport-McMoRan, Inc. | | 1,103,448 | 55,106 |
| | | | 156,277 |
TOTAL MATERIALS | | | 536,088 |
| REAL ESTATE - 4.6% | | | |
| Equity Real Estate Investment Trusts (REITs) - 3.9% | | | |
| CubeSmart | | 1,178,526 | 47,660 |
| Essex Property Trust, Inc. | | 90,935 | 22,393 |
| Gaming & Leisure Properties | | 1,156,913 | 49,435 |
| Omega Healthcare Investors, Inc. | | 1,116,827 | 33,963 |
| Realty Income Corp. | | 1,339,477 | 71,716 |
| Ventas, Inc. | | 812,091 | 35,959 |
| Welltower, Inc. | | 227,659 | 21,691 |
| | | | 282,817 |
| Real Estate Management & Development - 0.7% | | | |
| Jones Lang LaSalle, Inc. (a) | | 270,347 | 48,852 |
TOTAL REAL ESTATE | | | 331,669 |
| UTILITIES - 4.8% | | | |
| Electric Utilities - 1.5% | | | |
| Alliant Energy Corp. | | 690,136 | 34,369 |
| FirstEnergy Corp. | | 952,020 | 36,500 |
| IDACORP, Inc. | | 394,361 | 37,378 |
| | | | 108,247 |
| Independent Power and Renewable Electricity Producers - 1.9% | | | |
| The AES Corp. | | 1,342,818 | 24,036 |
| Vistra Corp. | | 1,471,318 | 111,585 |
| | | | 135,621 |
| Multi-Utilities - 0.7% | | | |
| NiSource, Inc. | | 1,898,354 | 52,888 |
| Water Utilities - 0.7% | | | |
| Essential Utilities, Inc. | | 1,343,838 | 49,158 |
TOTAL UTILITIES | | | 345,914 |
| TOTAL COMMON STOCKS (Cost $5,160,314) | | | 7,115,417 |
| | | | |
| Convertible Preferred Stocks - 1.0% |
| | | Shares | Value ($) (000s) |
| CONSUMER STAPLES - 0.1% | | | |
| Food Products - 0.1% | | | |
| Bowery Farming, Inc.: | | | |
| Series C1 (a)(b)(c) | | 466,468 | 2,901 |
| Series D1 (b)(c) | | 252,678 | 998 |
| | | | 3,899 |
| HEALTH CARE - 0.4% | | | |
| Biotechnology - 0.4% | | | |
| National Resilience, Inc. Series B (a)(b)(c) | | 711,831 | 31,997 |
| INDUSTRIALS - 0.5% | | | |
| Aerospace & Defense - 0.3% | | | |
| Space Exploration Technologies Corp. Series H (a)(b)(c) | | 18,837 | 18,272 |
| Construction & Engineering - 0.2% | | | |
| Beta Technologies, Inc. Series B, 6.00% (a)(b)(c) | | 145,591 | 18,195 |
TOTAL INDUSTRIALS | | | 36,467 |
| TOTAL CONVERTIBLE PREFERRED STOCKS (Cost $57,779) | | | 72,363 |
| | | | |
| Money Market Funds - 2.5% |
| | | Shares | Value ($) (000s) |
| Fidelity Cash Central Fund 5.39% (e) | | 54,458,581 | 54,469 |
| Fidelity Securities Lending Cash Central Fund 5.39% (e)(f) | | 125,047,555 | 125,060 |
| TOTAL MONEY MARKET FUNDS (Cost $179,527) | | | 179,529 |
| | | | |
| TOTAL INVESTMENT IN SECURITIES - 101.8% (Cost $5,397,620) | 7,367,309 |
NET OTHER ASSETS (LIABILITIES) - (1.8)% | (127,411) |
| NET ASSETS - 100.0% | 7,239,898 |
| | |
Any values shown as $0 in the Schedule of Investments may reflect amounts less than $500.
Legend
| (b) | Restricted securities (including private placements) - Investment in securities not registered under the Securities Act of 1933 (excluding 144A issues). At the end of the period, the value of restricted securities (excluding 144A issues) amounted to $210,330,000 or 2.9% of net assets. |
| (d) | Security or a portion of the security is on loan at period end. |
| (e) | Affiliated fund that is generally available only to investment companies and other accounts managed by Fidelity Investments. The rate quoted is the annualized seven-day yield of the fund at period end. A complete unaudited listing of the fund's holdings as of its most recent quarter end is available upon request. In addition, each Fidelity Central Fund's financial statements, which are not covered by the Fund's Report of Independent Registered Public Accounting Firm, are available on the SEC's website or upon request. |
| (f) | Investment made with cash collateral received from securities on loan. |
| Additional information on each restricted holding is as follows: |
| Security | Acquisition Date | Acquisition Cost ($) (000s) |
| Beta Technologies, Inc. Series B, 6.00% | 4/04/22 | 15,021 |
| | | |
| Bolt Threads, Inc. | 12/13/17 - 9/02/21 | 40,889 |
| | | |
| Bowery Farming, Inc. Series C1 | 5/18/21 | 28,104 |
| | | |
| Bowery Farming, Inc. Series D1 | 10/25/23 | 2,387 |
| | | |
| Bowery Farming, Inc. warrants | 10/25/23 | 0 |
| | | |
| National Resilience, Inc. Series B | 12/01/20 | 9,724 |
| | | |
| Space Exploration Technologies Corp. Class A | 4/08/16 - 9/11/17 | 14,283 |
| | | |
| Space Exploration Technologies Corp. Class C | 9/11/17 | 275 |
| | | |
| Space Exploration Technologies Corp. Series H | 8/04/17 | 2,543 |
| | | |
Affiliated Central Funds
Fiscal year to date information regarding the Fund's investments in Fidelity Central Funds, including the ownership percentage, is presented below.
| Affiliate (Amounts in thousands) | Value, beginning of period ($) | Purchases ($) | Sales Proceeds ($) | Dividend Income ($) | Realized Gain (loss) ($) | Change in Unrealized appreciation (depreciation) ($) | Value, end of period ($) | % ownership, end of period |
| Fidelity Cash Central Fund 5.39% | 194,205 | 1,003,190 | 1,142,926 | 3,953 | 1 | (1) | 54,469 | 0.1% |
| Fidelity Securities Lending Cash Central Fund 5.39% | 139,889 | 1,771,115 | 1,785,944 | 377 | - | - | 125,060 | 0.5% |
| Total | 334,094 | 2,774,305 | 2,928,870 | 4,330 | 1 | (1) | 179,529 | |
| | | | | | | | | |
Amounts in the dividend income column in the above table include any capital gain distributions from underlying funds, which are presented in the corresponding line item in the Statement of Operations, if applicable.
Amounts in the dividend income column for Fidelity Securities Lending Cash Central Fund represents the income earned on investing cash collateral, less rebates paid to borrowers and any lending agent fees associated with the loan, plus any premium payments received for lending certain types of securities.
Amounts included in the purchases and sales proceeds columns may include in-kind transactions, if applicable.
Investment Valuation
The following is a summary of the inputs used, as of April 30, 2024, involving the Fund's assets and liabilities carried at fair value. The inputs or methodology used for valuing securities may not be an indication of the risk associated with investing in those securities. For more information on valuation inputs, and their aggregation into the levels used below, please refer to the Investment Valuation section in the accompanying Notes to Financial Statements.
| Valuation Inputs at Reporting Date: |
Description (Amounts in thousands) | Total ($) | Level 1 ($) | Level 2 ($) | Level 3 ($) |
Investments in Securities: | | | | |
|
| Equities: | | | | |
Communication Services | 172,859 | 172,859 | - | - |
Consumer Discretionary | 820,735 | 820,402 | - | 333 |
Consumer Staples | 350,483 | 346,362 | - | 4,121 |
Energy | 493,751 | 493,751 | - | - |
Financials | 1,128,001 | 1,128,001 | - | - |
Health Care | 576,594 | 544,597 | - | 31,997 |
Industrials | 1,820,747 | 1,646,868 | - | 173,879 |
Information Technology | 610,939 | 610,939 | - | - |
Materials | 536,088 | 536,088 | - | - |
Real Estate | 331,669 | 331,669 | - | - |
Utilities | 345,914 | 345,914 | - | - |
|
| Money Market Funds | 179,529 | 179,529 | - | - |
| Total Investments in Securities: | 7,367,309 | 7,156,979 | - | 210,330 |
The following is a reconciliation of Investments in Securities for which Level 3 inputs were used in determining value:
| (Amounts in thousands) | |
| Investments in Securities: | |
| Industrials | | | |
| Beginning Balance | $ | 134,304 | |
| Net Realized Gain (Loss) on Investment Securities | | - | |
| Net Unrealized Gain (Loss) on Investment Securities | | 39,575 | |
| Cost of Purchases | | - | |
| Proceeds of Sales | | - | |
| Amortization/Accretion | | - | |
| Transfers into Level 3 | | - | |
| Transfers out of Level 3 | | - | |
| Ending Balance | $ | 173,879 | |
| The change in unrealized gain (loss) for the period attributable to Level 3 securities held at April 30, 2024 | $ | 39,575 | |
| Other Investments in Securities | | | |
| Beginning Balance | $ | 49,121 | |
| Net Realized Gain (Loss) on Investment Securities | | - | |
| Net Unrealized Gain (Loss) on Investment Securities | | (15,057) | |
| Cost of Purchases | | 2,387 | |
| Proceeds of Sales | | - | |
| Amortization/Accretion | | - | |
| Transfers into Level 3 | | - | |
| Transfers out of Level 3 | | - | |
| Ending Balance | $ | 36,451 | |
| The change in unrealized gain (loss) for the period attributable to Level 3 securities held at April 30, 2024 | $ | (15,057) | |
| The information used in the above reconciliation represents fiscal year to date activity for any Investments in Securities identified as using Level 3 inputs at either the beginning or the end of the current fiscal period. Cost of purchases and proceeds of sales may include securities received and/or delivered through in-kind transactions, corporate actions or exchanges. Transfers into Level 3 were attributable to a lack of observable market data resulting from decreases in market activity, decreases in liquidity, security restructurings or corporate actions. Transfers out of Level 3 were attributable to observable market data becoming available for those securities. Transfers in or out of Level 3 represent the beginning value of any Security or Instrument where a change in the pricing level occurred from the beginning to the end of the period. Realized and unrealized gains (losses) disclosed in the reconciliation are included in Net Gain (Loss) on the Fund's Statement of Operations. | |
| Statement of Assets and Liabilities |
| Amounts in thousands (except per-share amounts) | | | | April 30, 2024 |
| | | | | |
| Assets | | | | |
| Investment in securities, at value (including securities loaned of $116,717) - See accompanying schedule: | | | | |
Unaffiliated issuers (cost $5,218,093) | $ | 7,187,780 | | |
Fidelity Central Funds (cost $179,527) | | 179,529 | | |
| | | | | |
| | | | | |
| Total Investment in Securities (cost $5,397,620) | | | $ | 7,367,309 |
| Cash | | | | 188 |
| Foreign currency held at value (cost $367) | | | | 367 |
| Receivable for investments sold | | | | 1,004 |
| Receivable for fund shares sold | | | | 2,504 |
| Dividends receivable | | | | 4,587 |
| Distributions receivable from Fidelity Central Funds | | | | 228 |
| Prepaid expenses | | | | 3 |
| Other receivables | | | | 367 |
Total assets | | | | 7,376,557 |
| Liabilities | | | | |
| Payable for investments purchased | $ | 5,138 | | |
| Payable for fund shares redeemed | | 1,513 | | |
| Accrued management fee | | 4,401 | | |
| Other payables and accrued expenses | | 568 | | |
| Collateral on securities loaned | | 125,039 | | |
| Total liabilities | | | | 136,659 |
| Net Assets | | | $ | 7,239,898 |
| Net Assets consist of: | | | | |
| Paid in capital | | | $ | 4,881,680 |
| Total accumulated earnings (loss) | | | | 2,358,218 |
| Net Assets | | | $ | 7,239,898 |
| | | | | |
| Net Asset Value and Maximum Offering Price | | | | |
| Mid-Cap Stock : | | | | |
Net Asset Value, offering price and redemption price per share ($6,431,942 ÷ 154,409 shares) | | | $ | 41.66 |
| Class K : | | | | |
Net Asset Value, offering price and redemption price per share ($807,956 ÷ 19,370 shares) | | | $ | 41.71 |
| Statement of Operations |
| Amounts in thousands | | | | Year ended April 30, 2024 |
| Investment Income | | | | |
| Dividends | | | $ | 115,627 |
| Income from Fidelity Central Funds (including $377 from security lending) | | | | 4,330 |
| Total income | | | | 119,957 |
| Expenses | | | | |
| Management fee | | | | |
| Basic fee | $ | 39,284 | | |
| Performance adjustment | | 10,945 | | |
| Transfer agent fees | | 7,576 | | |
| Accounting fees | | 870 | | |
| Custodian fees and expenses | | 88 | | |
| Independent trustees' fees and expenses | | 37 | | |
| Registration fees | | 123 | | |
| Audit | | 76 | | |
| Legal | | 9 | | |
| Interest | | 198 | | |
| Miscellaneous | | 34 | | |
| Total expenses before reductions | | 59,240 | | |
| Expense reductions | | (612) | | |
| Total expenses after reductions | | | | 58,628 |
| Net Investment income (loss) | | | | 61,329 |
| Realized and Unrealized Gain (Loss) | | | | |
| Net realized gain (loss) on: | | | | |
| Investment Securities: | | | | |
| Unaffiliated issuers | | 549,753 | | |
| Redemptions in-kind | | 51,953 | | |
| Fidelity Central Funds | | 1 | | |
| Foreign currency transactions | | (81) | | |
| Total net realized gain (loss) | | | | 601,626 |
| Change in net unrealized appreciation (depreciation) on: | | | | |
| Investment Securities: | | | | |
| Unaffiliated issuers | | 180,438 | | |
| Fidelity Central Funds | | (1) | | |
| Assets and liabilities in foreign currencies | | (14) | | |
| Total change in net unrealized appreciation (depreciation) | | | | 180,423 |
| Net gain (loss) | | | | 782,049 |
| Net increase (decrease) in net assets resulting from operations | | | $ | 843,378 |
| Statement of Changes in Net Assets |
| |
| Amount in thousands | | Year ended April 30, 2024 | | Year ended April 30, 2023 |
| Increase (Decrease) in Net Assets | | | | |
| Operations | | | | |
| Net investment income (loss) | $ | 61,329 | $ | 90,863 |
| Net realized gain (loss) | | 601,626 | | 50,838 |
| Change in net unrealized appreciation (depreciation) | | 180,423 | | (50,985) |
| Net increase (decrease) in net assets resulting from operations | | 843,378 | | 90,716 |
| Distributions to shareholders | | (191,238) | | (385,728) |
| | | | | |
| Share transactions - net increase (decrease) | | (1,279,615) | | 787,613 |
| Total increase (decrease) in net assets | | (627,475) | | 492,601 |
| | | | | |
| Net Assets | | | | |
| Beginning of period | | 7,867,373 | | 7,374,772 |
| End of period | $ | 7,239,898 | $ | 7,867,373 |
| | | | | |
| | | | | |
Financial Highlights
Fidelity® Mid-Cap Stock Fund |
| |
| Years ended April 30, | | 2024 | | 2023 | | 2022 | | 2021 | | 2020 |
Selected Per-Share Data | | | | | | | | | | |
| Net asset value, beginning of period | $ | 38.06 | $ | 39.74 | $ | 44.52 | $ | 28.96 | $ | 35.31 |
| Income from Investment Operations | | | | | | | | | | |
Net investment income (loss) A,B | | .33 | | .45 | | .44 | | .35 | | .31 |
| Net realized and unrealized gain (loss) | | 4.32 | | (.09) | | .18 | | 17.71 | | (4.29) |
| Total from investment operations | | 4.65 | | .36 | | .62 | | 18.06 | | (3.98) |
| Distributions from net investment income | | (.37) | | (.27) | | (.48) | | (.39) C | | (.35) |
| Distributions from net realized gain | | (.68) | | (1.77) | | (4.91) | | (2.10) C | | (2.02) |
| Total distributions | | (1.05) | | (2.04) | | (5.40) D | | (2.50) D | | (2.37) |
| Net asset value, end of period | $ | 41.66 | $ | 38.06 | $ | 39.74 | $ | 44.52 | $ | 28.96 |
Total Return E | | | | 1.06% | | 1.17% | | 64.86% | | (12.42)% |
Ratios to Average Net Assets B,F,G | | | | | | | | | | |
| Expenses before reductions | | .83% | | .85% | | .79% | | .77% | | .86% |
| Expenses net of fee waivers, if any | | | | .84% | | .79% | | .77% | | .86% |
| Expenses net of all reductions | | .82% | | .84% | | .79% | | .76% | | .86% |
| Net investment income (loss) | | .83% | | 1.18% | | 1.05% | | .97% | | .90% |
| Supplemental Data | | | | | | | | | | |
| Net assets, end of period (in millions) | $ | 6,432 | $ | 6,854 | $ | 6,034 | $ | 6,020 | $ | 4,125 |
Portfolio turnover rate H | | | | 19% I | | 17% I | | 30% I | | 36% I |
ACalculated based on average shares outstanding during the period.
BNet investment income (loss) is affected by the timing of the declaration of dividends by any underlying mutual funds or exchange-traded funds (ETFs). Net investment income (loss) of any mutual funds or ETFs is not included in the Fund's net investment income (loss) ratio.
CThe amount shown reflects reclassifications related to book to tax differences that were made in the year shown.
DTotal distributions per share do not sum due to rounding.
ETotal returns would have been lower if certain expenses had not been reduced during the applicable periods shown.
FFees and expenses of any underlying mutual funds or exchange-traded funds (ETFs) are not included in the Fund's expense ratio. The Fund indirectly bears its proportionate share of these expenses. For additional expense information related to investments in Fidelity Central Funds, please refer to the "Investments in Fidelity Central Funds" note found in the Notes to Financial Statements section of the most recent Annual or Semi-Annual report.
GExpense ratios reflect operating expenses of the class. Expenses before reductions do not reflect amounts reimbursed, waived, or reduced through arrangements with the investment adviser, brokerage services, or other offset arrangements, if applicable, and do not represent the amount paid by the class during periods when reimbursements, waivers or reductions occur.
HAmount does not include the portfolio activity of any underlying mutual funds or exchange-traded funds (ETFs).
IPortfolio turnover rate excludes securities received or delivered in-kind.
Fidelity® Mid-Cap Stock Fund Class K |
| |
| Years ended April 30, | | 2024 | | 2023 | | 2022 | | 2021 | | 2020 |
Selected Per-Share Data | | | | | | | | | | |
| Net asset value, beginning of period | $ | 38.11 | $ | 39.77 | $ | 44.55 | $ | 28.98 | $ | 35.32 |
| Income from Investment Operations | | | | | | | | | | |
Net investment income (loss) A,B | | .37 | | .48 | | .48 | | .38 | | .34 |
| Net realized and unrealized gain (loss) | | 4.32 | | (.08) | | .17 | | 17.72 | | (4.27) |
| Total from investment operations | | 4.69 | | .40 | | .65 | | 18.10 | | (3.93) |
| Distributions from net investment income | | (.41) | | (.29) | | (.51) | | (.43) C | | (.39) |
| Distributions from net realized gain | | (.68) | | (1.77) | | (4.93) | | (2.10) C | | (2.02) |
| Total distributions | | (1.09) | | (2.06) | | (5.43) D | | (2.53) | | (2.41) |
| Net asset value, end of period | $ | 41.71 | $ | 38.11 | $ | 39.77 | $ | 44.55 | $ | 28.98 |
Total Return E | | | | 1.16% | | 1.26% | | 65.01% | | (12.30)% |
Ratios to Average Net Assets B,F,G | | | | | | | | | | |
| Expenses before reductions | | .73% | | .75% | | .70% | | .67% | | .76% |
| Expenses net of fee waivers, if any | | | | .75% | | .70% | | .67% | | .76% |
| Expenses net of all reductions | | .72% | | .75% | | .70% | | .66% | | .76% |
| Net investment income (loss) | | .93% | | 1.28% | | 1.13% | | 1.07% | | 1.00% |
| Supplemental Data | | | | | | | | | | |
| Net assets, end of period (in millions) | $ | 808 | $ | 1,013 | $ | 1,341 | $ | 1,962 | $ | 1,496 |
Portfolio turnover rate H | | | | 19% I | | 17% I | | 30% I | | 36% I |
ACalculated based on average shares outstanding during the period.
BNet investment income (loss) is affected by the timing of the declaration of dividends by any underlying mutual funds or exchange-traded funds (ETFs). Net investment income (loss) of any mutual funds or ETFs is not included in the Fund's net investment income (loss) ratio.
CThe amount shown reflects reclassifications related to book to tax differences that were made in the year shown.
DTotal distributions per share do not sum due to rounding.
ETotal returns would have been lower if certain expenses had not been reduced during the applicable periods shown.
FFees and expenses of any underlying mutual funds or exchange-traded funds (ETFs) are not included in the Fund's expense ratio. The Fund indirectly bears its proportionate share of these expenses. For additional expense information related to investments in Fidelity Central Funds, please refer to the "Investments in Fidelity Central Funds" note found in the Notes to Financial Statements section of the most recent Annual or Semi-Annual report.
GExpense ratios reflect operating expenses of the class. Expenses before reductions do not reflect amounts reimbursed, waived, or reduced through arrangements with the investment adviser, brokerage services, or other offset arrangements, if applicable, and do not represent the amount paid by the class during periods when reimbursements, waivers or reductions occur.
HAmount does not include the portfolio activity of any underlying mutual funds or exchange-traded funds (ETFs).
IPortfolio turnover rate excludes securities received or delivered in-kind.
For the period ended April 30, 2024
(Amounts in thousands except percentages)
1. Organization.
Fidelity Mid-Cap Stock Fund (the Fund) is a fund of Fidelity Concord Street Trust (the Trust) and is authorized to issue an unlimited number of shares. The Trust is registered under the Investment Company Act of 1940, as amended (the 1940 Act), as an open-end management investment company organized as a Massachusetts business trust. The Fund offers Mid-Cap Stock and Class K shares, each of which has equal rights as to assets and voting privileges. Each class has exclusive voting rights with respect to matters that affect that class.
2. Investments in Fidelity Central Funds.
Funds may invest in Fidelity Central Funds, which are open-end investment companies generally available only to other investment companies and accounts managed by the investment adviser and its affiliates. The Schedule of Investments lists any Fidelity Central Funds held as an investment as of period end, but does not include the underlying holdings of each Fidelity Central Fund. An investing fund indirectly bears its proportionate share of the expenses of the underlying Fidelity Central Funds.
Based on its investment objective, each Fidelity Central Fund may invest or participate in various investment vehicles or strategies that are similar to those of the investing fund. These strategies are consistent with the investment objectives of the investing fund and may involve certain economic risks which may cause a decline in value of each of the Fidelity Central Funds and thus a decline in the value of the investing fund.
| Fidelity Central Fund | Investment Manager | Investment Objective | Investment Practices | Expense RatioA |
| Fidelity Money Market Central Funds | Fidelity Management & Research Company LLC (FMR) | Each fund seeks to obtain a high level of current income consistent with the preservation of capital and liquidity. | Short-term Investments | Less than .005% |
A Expenses expressed as a percentage of average net assets and are as of each underlying Central Fund's most recent annual or semi-annual shareholder report.
A complete unaudited list of holdings for each Fidelity Central Fund is available upon request or at the Securities and Exchange Commission website at www.sec.gov. In addition, the financial statements of the Fidelity Central Funds which contain the significant accounting policies (including investment valuation policies) of those funds, and are not covered by the Report of Independent Registered Public Accounting Firm, are available on the Securities and Exchange Commission website or upon request.
3. Significant Accounting Policies.
The Fund is an investment company and applies the accounting and reporting guidance of the Financial Accounting Standards Board (FASB) Accounting Standards Codification Topic 946 Financial Services - Investment Companies. The financial statements have been prepared in conformity with accounting principles generally accepted in the United States of America (GAAP), which require management to make certain estimates and assumptions at the date of the financial statements. Actual results could differ from those estimates. Subsequent events, if any, through the date that the financial statements were issued have been evaluated in the preparation of the financial statements. The Fund's Schedule of Investments lists any underlying mutual funds or exchange-traded funds (ETFs) but does not include the underlying holdings of these funds. The following summarizes the significant accounting policies of the Fund:
Investment Valuation. Investments are valued as of 4:00 p.m. Eastern time on the last calendar day of the period. The Board of Trustees (the Board) has designated the Fund's investment adviser as the valuation designee responsible for the fair valuation function and performing fair value determinations as needed. The investment adviser has established a Fair Value Committee (the Committee) to carry out the day-to-day fair valuation responsibilities and has adopted policies and procedures to govern the fair valuation process and the activities of the Committee. In accordance with these fair valuation policies and procedures, which have been approved by the Board, the Fund attempts to obtain prices from one or more third party pricing services or brokers to value its investments. When current market prices, quotations or currency exchange rates are not readily available or reliable, investments will be fair valued in good faith by the Committee, in accordance with the policies and procedures. Factors used in determining fair value vary by investment type and may include market or investment specific events, transaction data, estimated cash flows, and market observations of comparable investments. The frequency that the fair valuation procedures are used cannot be predicted and they may be utilized to a significant extent. The Committee manages the Fund's fair valuation practices and maintains the fair valuation policies and procedures. The Fund's investment adviser reports to the Board information regarding the fair valuation process and related material matters.
The Fund categorizes the inputs to valuation techniques used to value its investments into a disclosure hierarchy consisting of three levels as shown below:
Level 1 - unadjusted quoted prices in active markets for identical investments
Level 2 - other significant observable inputs (including quoted prices for similar investments, interest rates, prepayment speeds, etc.)
Level 3 - unobservable inputs (including the Fund's own assumptions based on the best information available)
Valuation techniques used to value the Fund's investments by major category are as follows:
Equity securities, including restricted securities, for which market quotations are readily available, are valued at the last reported sale price or official closing price as reported by a third party pricing service on the primary market or exchange on which they are traded and are categorized as Level 1 in the hierarchy. In the event there were no sales during the day or closing prices are not available, securities are valued at the last quoted bid price or may be valued using the last available price and are generally categorized as Level 2 in the hierarchy. For foreign equity securities, when market or security specific events arise, comparisons to the valuation of American Depositary Receipts (ADRs), futures contracts, Exchange-Traded Funds (ETFs) and certain indexes as well as quoted prices for similar securities may be used and would be categorized as Level 2 in the hierarchy. For equity securities, including restricted securities, where observable inputs are limited, assumptions about market activity and risk are used and these securities may be categorized as Level 3 in the hierarchy. Securities, including private placements or other restricted securities, for which observable inputs are not available are valued using alternate valuation approaches, including the market approach, the income approach and cost approach, and are categorized as Level 3 in the hierarchy. The market approach considers factors including the price of recent investments in the same or a similar security or financial metrics of comparable securities. The income approach considers factors including expected future cash flows, security specific risks and corresponding discount rates. The cost approach considers factors including the value of the security's underlying assets and liabilities.
Investments in open-end mutual funds, including the Fidelity Central Funds, are valued at their closing net asset value (NAV) each business day and are categorized as Level 1 in the hierarchy.
The following provides information on Level 3 securities held by the Fund that were valued at period end based on unobservable inputs. These amounts exclude valuations provided by a broker.
| Asset Type | Fair Value | Valuation Technique(s) | Unobservable Input | Amount or Range/Weighted Average | Impact to Valuation from an Increase in InputA |
| Equities | $210,330 | Market comparable | Enterprise value/Revenue multiple (EV/R) | 5.0 - 12.0 / 10.7 | Increase |
| | | | Enterprise value/EBITDA multiple (EV/EBITDA) | 16.9 | Increase |
| | | Market approach | Transaction price | $60.73 | Increase |
| | | | Discount rate | 25.0% | Decrease |
| | | Recovery value | Recovery value | $0.00 | Increase |
| | | Black scholes | Discount rate | 4.9% | Increase |
| | | | Term | 0.2 - 2.0 / 1.9 | Increase |
| | | | Volatility | 80.0% - 100.0% / 98.5% | Increase |
| | | | Discount for lack of marketability (DLOM) | 8.9% | Decrease |
A Represents the directional change in the fair value of the Level 3 investments that could have resulted from an increase in the corresponding input as of period end. A decrease to the unobservable input would have had the opposite effect. Significant changes in these inputs may have resulted in a significantly higher or lower fair value measurement at period end.
Changes in valuation techniques may result in transfers in or out of an assigned level within the disclosure hierarchy. The aggregate value of investments by input level as of April 30, 2024, as well as a roll forward of Level 3 investments, is included at the end of the Fund's Schedule of Investments.
Foreign Currency. Certain Funds may use foreign currency contracts to facilitate transactions in foreign-denominated securities. Gains and losses from these transactions may arise from changes in the value of the foreign currency or if the counterparties do not perform under the contracts' terms.
Foreign-denominated assets, including investment securities, and liabilities are translated into U.S. dollars at the exchange rates at period end. Purchases and sales of investment securities, income and dividends received, and expenses denominated in foreign currencies are translated into U.S. dollars at the exchange rate in effect on the transaction date.
The effects of exchange rate fluctuations on investments are included with the net realized and unrealized gain (loss) on investment securities. Other foreign currency transactions resulting in realized and unrealized gain (loss) are disclosed separately.
Investment Transactions and Income. For financial reporting purposes, the Fund's investment holdings and NAV include trades executed through the end of the last business day of the period. The NAV per share for processing shareholder transactions is calculated as of the close of business of the New York Stock Exchange (NYSE), normally 4:00 p.m. Eastern time and includes trades executed through the end of the prior business day. Gains and losses on securities sold are determined on the basis of identified cost and include proceeds received from litigation. Commissions paid to certain brokers with whom the investment adviser, or its affiliates, places trades on behalf of a fund include an amount in addition to trade execution, which may be rebated back to a fund. Any such rebates are included in net realized gain (loss) on investments in the Statement of Operations. Dividend income is recorded on the ex-dividend date, except for certain dividends from foreign securities where the ex-dividend date may have passed, which are recorded as soon as the Fund is informed of the ex-dividend date. Non-cash dividends included in dividend income, if any, are recorded at the fair market value of the securities received. Income and capital gain distributions from Fidelity Central Funds, if any, are recorded on the ex-dividend date. Certain distributions received by the Fund represent a return of capital or capital gain. The Fund determines the components of these distributions subsequent to the ex-dividend date, based upon receipt of tax filings or other correspondence relating to the underlying investment. These distributions are recorded as a reduction of cost of investments and/or as a realized gain. Investment income is recorded net of foreign taxes withheld where recovery of such taxes is uncertain. Funds may file withholding tax reclaims in certain jurisdictions to recover a portion of amounts previously withheld. Any withholding tax reclaims income is included in the Statement of Operations in dividends. Any receivables for withholding tax reclaims are included in the Statement of Assets and Liabilities in dividends receivable.
Class Allocations and Expenses. Investment income, realized and unrealized capital gains and losses, common expenses of a fund, and certain fund-level expense reductions, if any, are allocated daily on a pro-rata basis to each class based on the relative net assets of each class to the total net assets of a fund. Each class differs with respect to transfer agent and distribution and service plan fees incurred, as applicable. Certain expense reductions may also differ by class, if applicable. For the reporting period, the allocated portion of income and expenses to each class as a percent of its average net assets may vary due to the timing of recording these transactions in relation to fluctuating net assets of the classes. Expenses directly attributable to a fund are charged to that fund. Expenses attributable to more than one fund are allocated among the respective funds on the basis of relative net assets or other appropriate methods. Expenses included in the accompanying financial statements reflect the expenses of that fund and do not include any expenses associated with any underlying mutual funds or exchange-traded funds (ETFs). Although not included in a fund's expenses, a fund indirectly bears its proportionate share of these expenses through the net asset value of each underlying mutual fund or exchange-traded fund (ETF). Expense estimates are accrued in the period to which they relate and adjustments are made when actual amounts are known.
Deferred Trustee Compensation. Under a Deferred Compensation Plan (the Plan) for certain Funds, certain independent Trustees have elected to defer receipt of a portion of their annual compensation. Deferred amounts are invested in affiliated mutual funds, are marked-to-market and remain in a fund until distributed in accordance with the Plan. The investment of deferred amounts and the offsetting payable to the Trustees presented below are included in the accompanying Statement of Assets and Liabilities in other receivables and other payables and accrued expenses, as applicable.
| Fidelity Mid-Cap Stock Fund | $366 |
Income Tax Information and Distributions to Shareholders. Each year, the Fund intends to qualify as a regulated investment company under Subchapter M of the Internal Revenue Code, including distributing substantially all of its taxable income and realized gains. As a result, no provision for U.S. Federal income taxes is required. As of April 30, 2024, the Fund did not have any unrecognized tax benefits in the financial statements; nor is the Fund aware of any tax positions for which it is reasonably possible that the total amounts of unrecognized tax benefits will significantly change in the next twelve months. The Fund files a U.S. federal tax return, in addition to state and local tax returns as required. The Fund's federal income tax returns are subject to examination by the Internal Revenue Service (IRS) for a period of three fiscal years after they are filed. State and local tax returns may be subject to examination for an additional fiscal year depending on the jurisdiction. Foreign taxes are provided for based on the Fund's understanding of the tax rules and rates that exist in the foreign markets in which it invests.
Distributions are declared and recorded on the ex-dividend date. Income and capital gain distributions are declared separately for each class. Income and capital gain distributions are determined in accordance with income tax regulations, which may differ from GAAP. In addition, the Fund claimed a portion of the payment made to redeeming shareholders as a distribution for income tax purposes.
Capital accounts within the financial statements are adjusted for permanent book-tax differences. These adjustments have no impact on net assets or the results of operations. Capital accounts are not adjusted for temporary book-tax differences which will reverse in a subsequent period.
Book-tax differences are primarily due to foreign currency transactions, passive foreign investment companies (PFIC), redemptions in-kind, partnerships and losses deferred due to wash sales.
As of period end, the cost and unrealized appreciation (depreciation) in securities, and derivatives if applicable, for federal income tax purposes were as follows:
| Gross unrealized appreciation | $2,241,613 |
| Gross unrealized depreciation | (261,670) |
| Net unrealized appreciation (depreciation) | $1,979,943 |
| Tax Cost | $5,387,366 |
The tax-based components of distributable earnings as of period end were as follows:
| Undistributed ordinary income | $15,919 |
| Undistributed long-term capital gain | $368,632 |
| Net unrealized appreciation (depreciation) on securities and other investments | $1,973,666 |
The tax character of distributions paid was as follows:
| | April 30, 2024 | April 30, 2023 |
| Ordinary Income | $70,001 | $57,478 |
| Long-term Capital Gains | 121,237 | 328,250 |
| Total | $191,238 | $385,728 |
Restricted Securities (including Private Placements). Funds may invest in securities that are subject to legal or contractual restrictions on resale. These securities generally may be resold in transactions exempt from registration or to the public if the securities are registered. Disposal of these securities may involve time-consuming negotiations and expense, and prompt sale at an acceptable price may be difficult. Information regarding restricted securities held at period end is included at the end of the Schedule of Investments, if applicable.
4. Purchases and Sales of Investments.
Purchases and sales of securities, other than short-term securities and in-kind transactions, as applicable, are noted in the table below.
| | Purchases ($) | Sales ($) |
| Fidelity Mid-Cap Stock Fund | 1,921,822 | 3,039,538 |
Unaffiliated Redemptions In-Kind. Shares that were redeemed in-kind for investments, including accrued interest and cash, if any, are shown in the table below. The net realized gain or loss on investments delivered through in-kind redemptions is included in the "Net realized gain (loss) on: Redemptions in-kind" line in the accompanying Statement of Operations. The amount of the in-kind redemptions is included in share transactions in the accompanying Statement of Changes in Net Assets. There was no gain or loss for federal income tax purposes.
| | Shares | Total net realized gain or loss ($) | Total Proceeds ($) |
| Fidelity Mid-Cap Stock Fund | 3,712 | 51,953 | 148,354 |
Prior Fiscal Year Unaffiliated Redemptions In-Kind. Shares that were redeemed in-kind for investments, including accrued interest and cash, if any, are shown in the table below; along with realized gain or loss on investments delivered through in-kind redemptions. The amount of the in-kind redemptions is included in share transactions in the accompanying Statement of Changes in Net Assets. There was no gain or loss for federal income tax purposes.
| | Shares | Total net realized gain or loss ($) | Total Proceeds ($) |
| Fidelity Mid-Cap Stock Fund | 6,467 | 76,622 | 237,758 |
5. Fees and Other Transactions with Affiliates.
Management Fee. Fidelity Management & Research Company LLC (the investment adviser) and its affiliates provide the Fund with investment management related services for which the Fund pays a monthly management fee.
Effective March 1, 2024, the Fund's management contract was amended to incorporate administrative services previously covered under separate services agreements (Transfer Agent and Accounting agreements). The amended contract incorporates a basic fee rate that may vary by class (subject to a performance adjustment). The investment adviser or an affiliate pays certain expenses of managing and operating the Fund out of each class's management fee. Each class of the Fund pays a management fee to the investment adviser. The management fee is calculated and paid to the investment adviser every month. The management fee is determined by calculating a basic fee and then applying a performance adjustment. When determining a class's basic fee, a mandate rate is calculated based on the monthly average net assets of a group of funds advised by FMR within a designated asset class. A discount rate is subtracted from the mandate rate once the Fund's monthly average net assets reach a certain level. The mandate rate and discount rate may vary by class. The annual basic fee rate for a class of shares of the Fund is the lesser of (1) the class's mandate rate reduced by the class's discount rate (if applicable) or (2) the amount set forth in the following table.
| | Maximum Management Fee Rate % |
| Mid-Cap Stock | .64 |
| Class K | .55 |
One-twelfth of the basic fee rate for a class is applied to the average net assets of the class for the month, giving a dollar amount which is the basic fee for the class for that month. A different management fee rate may be applicable to each class of the Fund. The difference between classes is the result of separate arrangements for class-level services and/or waivers of certain expenses. It is not the result of any difference in advisory or custodial fees or other expenses related to the management of the Fund's assets, which do not vary by class. For the portion of the reporting period on or after March 1, 2024, the total annualized management fee rates were as follows:
| | Total Management Fee Rate % |
| Mid-Cap Stock | .63 |
| Class K | .55 |
Prior to March 1, 2024, the management fee was the sum of an individual fund fee rate that was based on an annual rate of .30% of the Fund's average net assets and an annualized group fee rate that averaged .22% during the period. The group fee rate was based upon the monthly average net assets of a group of registered investment companies with which the investment adviser has management contracts. The group fee rate decreased as assets under management increased and increased as assets under management decreased. For the portion of the reporting period prior to March 1, 2024, the total annualized management fee rate was .52%.
The performance adjustment rate is calculated monthly by comparing over the performance period the Fund's performance to that of the performance adjustment index listed below.
| | Performance Adjustment Index |
| Fidelity Mid-Cap Stock Fund | S&P MidCap 400 Index |
For the purposes of calculating the performance adjustment for the Fund, the Fund's investment performance is based on the performance of Mid-Cap Stock. To the extent that other classes of the Fund have higher expenses, this could result in those classes bearing a larger positive performance adjustment and smaller negative performance adjustment than would be the case if each class's own performance were considered. The performance period is the most recent 36 month period. The maximum annualized performance adjustment rate is ± .20% of the Fund's average net assets over the performance period. The performance adjustment rate is divided by twelve and multiplied by the Fund's average net assets over the performance period, and the resulting dollar amount is proportionately added to or subtracted from a class's basic fee. For the entire reporting period, the total annual performance adjustment was .15%.
Effective March 1, 2024, the Fund's sub-advisory agreements with FMR Investment Management (UK) Limited, Fidelity Management & Research (Hong Kong) Limited, and Fidelity Management & Research (Japan) Limited were amended to provide that the investment adviser pays each sub-adviser monthly fees equal to 110% of the sub-adviser's costs for providing sub-advisory services.
Transfer Agent Fees. Fidelity Investments Institutional Operations Company LLC (FIIOC), an affiliate of the investment adviser, is the transfer, dividend disbursing and shareholder servicing agent for each class of the Fund. Effective March 1, 2024, the Fund's management contract was amended to incorporate transfer agent services and associated fees previously covered under a separate services agreement. FIIOC pays for typesetting, printing and mailing of shareholder reports, except proxy statements.
During November 2023, the Board approved a change in the transfer agent fees effective December 1, 2023 to a fixed annual rate of class-level average net assets as follows:
| | % of Class-Level Average Net Assets |
| Mid-Cap Stock | .1370 |
Prior to December 1, 2023, FIIOC received account fees and asset-based fees that varied according to the account size and type of account of the shareholders of the respective classes of the Fund, except for Class K. FIIOC received an asset-based fee of Class K's average net assets. For the portion of the reporting period prior to March 1, 2024, the fees were equivalent to the following annualized rates:
| | Amount ($) | % of Class-Level Average Net Assets |
| Mid-Cap Stock | 7,246 | .14 |
| Class K | 330 | .04 |
| | 7,576 | |
Accounting Fees. Fidelity Service Company, Inc. (FSC), an affiliate of the investment adviser, maintains the Fund's accounting records. Effective March 1, 2024, the Fund's management contract was amended to incorporate accounting services and associated fees previously covered under a separate services agreement.
During November 2023, the Board approved a change in the accounting fees effective December 1, 2023 to a fixed annual rate of average net assets as follows:
| | % of Average Net Assets |
| Fidelity Mid-Cap Stock Fund | .0142 |
Prior to December 1, 2023, the accounting fee was based on the level of average net assets for each month. For the portion of the reporting period prior to March 1, 2024, the fees were equivalent to the following annualized rates:
| | % of Average Net Assets |
| Fidelity Mid-Cap Stock Fund | .01 |
Brokerage Commissions. A portion of portfolio transactions were placed with brokerage firms which are affiliates of the investment adviser. Brokerage commissions are included in net realized gain (loss) and change in net unrealized appreciation (depreciation) in the Statement of Operations. The commissions paid to these affiliated firms were as follows:
| | Amount ($) |
| Fidelity Mid-Cap Stock Fund | 43 |
Interfund Lending Program. Pursuant to an Exemptive Order issued by the Securities and Exchange Commission (the SEC), the Fund, along with other registered investment companies having management contracts with Fidelity Management & Research Company LLC (FMR), or other affiliated entities of FMR, may participate in an interfund lending program. This program provides an alternative credit facility allowing the Fund to borrow from, or lend money to, other participating affiliated funds. At period end, there were no interfund loans outstanding. Activity in this program during the period for which loans were outstanding was as follows:
| | Borrower or Lender | Average Loan Balance ($) | Weighted Average Interest Rate | Interest Expense ($) |
| Fidelity Mid-Cap Stock Fund | Borrower | 42,944 | 5.35% | 198 |
Interfund Trades. Funds may purchase from or sell securities to other Fidelity Funds under procedures adopted by the Board. The procedures have been designed to ensure these interfund trades are executed in accordance with Rule 17a-7 of the 1940 Act. Any interfund trades are included within the respective purchases and sales amounts shown in the Purchases and Sales of Investments note. Interfund trades during the period are noted in the table below.
| | Purchases ($) | Sales ($) | Realized Gain (Loss)($) |
| Fidelity Mid-Cap Stock Fund | 71,452 | 90,755 | (20,380) |
6. Committed Line of Credit.
Certain Funds participate with other funds managed by the investment adviser or an affiliate in a $4.25 billion credit facility (the "line of credit") to be utilized for temporary or emergency purposes to fund shareholder redemptions or for other short-term liquidity purposes. The participating funds have agreed to pay commitment fees on their pro-rata portion of the line of credit, which are reflected in Miscellaneous expenses on the Statement of Operations, and are listed below. During the period, there were no borrowings on this line of credit.
| | Amount ($) |
| Fidelity Mid-Cap Stock Fund | 13 |
7. Security Lending.
Funds lend portfolio securities from time to time in order to earn additional income. Lending agents are used, including National Financial Services (NFS), an affiliate of the investment adviser. Pursuant to a securities lending agreement, NFS will receive a fee, which is capped at 9.9% of a fund's daily lending revenue, for its services as lending agent. A fund may lend securities to certain qualified borrowers, including NFS. On the settlement date of the loan, a fund receives collateral (in the form of U.S. Treasury obligations, letters of credit and/or cash) against the loaned securities and maintains collateral in an amount not less than 100% of the market value of the loaned securities during the period of the loan. The market value of the loaned securities is determined at the close of business of a fund and any additional required collateral is delivered to a fund on the next business day. A fund or borrower may terminate the loan at any time, and if the borrower defaults on its obligation to return the securities loaned because of insolvency or other reasons, a fund may apply collateral received from the borrower against the obligation. A fund may experience delays and costs in recovering the securities loaned. Any cash collateral received is invested in the Fidelity Securities Lending Cash Central Fund. Any loaned securities are identified as such in the Schedule of Investments, and the value of loaned securities and cash collateral at period end, as applicable, are presented in the Statement of Assets and Liabilities. Security lending income represents the income earned on investing cash collateral, less rebates paid to borrowers and any lending agent fees associated with the loan, plus any premium payments received for lending certain types of securities. Security lending income is presented in the Statement of Operations as a component of income from Fidelity Central Funds. Affiliated security lending activity, if any, was as follows:
| | Total Security Lending Fees Paid to NFS ($) | Security Lending Income From Securities Loaned to NFS ($) | Value of Securities Loaned to NFS at Period End ($) |
| Fidelity Mid-Cap Stock Fund | 41 | -A | - |
A Amount represent less than five hundred dollars.
8. Expense Reductions.
Through arrangements with the Fund's custodian, credits realized as a result of certain uninvested cash balances were used to reduce the Fund's expenses. During the period, custodian credits reduced the Fund's expenses by $9.
In addition, during the period the investment adviser or an affiliate reimbursed and/or waived a portion of fund-level operating expenses in the amount of $603.
9. Distributions to Shareholders.
Distributions to shareholders of each class were as follows:
| | Year ended April 30, 2024 | Year ended April 30, 2023 |
| Fidelity Mid-Cap Stock Fund | | |
| Distributions to shareholders | | |
| Mid-Cap Stock | $166,009 | $316,842 |
| Class K | 25,229 | 68,886 |
Total | $191,238 | $385,728 |
10. Share Transactions.
Share transactions for each class were as follows and may contain in-kind transactions, automatic conversions between classes or exchanges between affiliated funds:
| | Shares | Shares | Dollars | Dollars |
| | Year ended April 30, 2024 | Year ended April 30, 2023 | Year ended April 30, 2024 | Year ended April 30, 2023 |
| Fidelity Mid-Cap Stock Fund | | | | |
| Mid-Cap Stock | | | | |
| Shares sold | 16,640 | 48,049 | $655,840 | $1,804,277 |
| Reinvestment of distributions | 3,833 | 7,943 | 152,080 | 295,347 |
| Shares redeemed | (46,166) | (27,728) | (1,799,020) | (1,047,495) |
| Net increase (decrease) | (25,693) | 28,264 | $(991,100) | $1,052,129 |
| Class K | | | | |
| Shares sold | 3,401 | 6,538 | $133,438 | $247,592 |
| Reinvestment of distributions | 635 | 1,851 | 25,225 | 68,886 |
| Shares redeemed | (11,262) | (15,508) | (447,178) | (580,994) |
| Net increase (decrease) | (7,226) | (7,119) | $(288,515) | $(264,516) |
11. Other.
A fund's organizational documents provide former and current trustees and officers with a limited indemnification against liabilities arising in connection with the performance of their duties to the fund. In the normal course of business, a fund may also enter into contracts that provide general indemnifications. A fund's maximum exposure under these arrangements is unknown as this would be dependent on future claims that may be made against a fund. The risk of material loss from such claims is considered remote.
12. Risk and Uncertainties.
Many factors affect a fund's performance. Developments that disrupt global economies and financial markets, such as pandemics, epidemics, outbreaks of infectious diseases, war, terrorism, and environmental disasters, may significantly affect a fund's investment performance. The effects of these developments to a fund will be impacted by the types of securities in which a fund invests, the financial condition, industry, economic sector, and geographic location of an issuer, and a fund's level of investment in the securities of that issuer. Significant concentrations in security types, issuers, industries, sectors, and geographic locations may magnify the factors that affect a fund's performance.
To the Board of Trustees of Fidelity Concord Street Trust and the Shareholders of Fidelity Mid-Cap Stock Fund:
Opinion on the Financial Statements and Financial Highlights
We have audited the accompanying statement of assets and liabilities of Fidelity Mid-Cap Stock Fund (the "Fund"), a fund of Fidelity Concord Street Trust, including the schedule of investments, as of April 30, 2024, the related statement of operations for the year then ended, the statement of changes in net assets for each of the two years in the period then ended, the financial highlights for each of the five years in the period then ended, and the related notes. In our opinion, the financial statements and financial highlights present fairly, in all material respects, the financial position of the Fund as of April 30, 2024, and the results of its operations for the year then ended, the changes in its net assets for each of the two years in the period then ended, and the financial highlights for each of the five years in the period then ended in conformity with accounting principles generally accepted in the United States of America.
Basis for Opinion
These financial statements and financial highlights are the responsibility of the Fund's management. Our responsibility is to express an opinion on the Fund's financial statements and financial highlights based on our audits. We are a public accounting firm registered with the Public Company Accounting Oversight Board (United States) (PCAOB) and are required to be independent with respect to the Fund in accordance with the U.S. federal securities laws and the applicable rules and regulations of the Securities and Exchange Commission and the PCAOB.
We conducted our audits in accordance with the standards of the PCAOB. Those standards require that we plan and perform the audit to obtain reasonable assurance about whether the financial statements and financial highlights are free of material misstatement, whether due to error or fraud. The Fund is not required to have, nor were we engaged to perform, an audit of its internal control over financial reporting. As part of our audits, we are required to obtain an understanding of internal control over financial reporting but not for the purpose of expressing an opinion on the effectiveness of the Fund's internal control over financial reporting. Accordingly, we express no such opinion.
Our audits included performing procedures to assess the risks of material misstatement of the financial statements and financial highlights, whether due to error or fraud, and performing procedures that respond to those risks. Such procedures included examining, on a test basis, evidence regarding the amounts and disclosures in the financial statements and financial highlights. Our audits also included evaluating the accounting principles used and significant estimates made by management, as well as evaluating the overall presentation of the financial statements and financial highlights. Our procedures included confirmation of securities owned as of April 30, 2024, by correspondence with the custodian and brokers; when replies were not received from brokers, we performed other auditing procedures. We believe that our audits provide a reasonable basis for our opinion.
/s/ Deloitte & Touche LLP
Boston, Massachusetts
June 14, 2024
We have served as the auditor of one or more of the Fidelity investment companies since 1999.
The Trustees, Members of the Advisory Board (if any), and officers of the trust and fund, as applicable, are listed below. The Board of Trustees governs the fund and is responsible for protecting the interests of shareholders. The Trustees are experienced executives who meet periodically throughout the year to oversee the fund's activities, review contractual arrangements with companies that provide services to the fund, oversee management of the risks associated with such activities and contractual arrangements, and review the fund's performance. Except for Jonathan Chiel, each of the Trustees oversees 323 funds. Mr. Chiel oversees 192 funds.
The Trustees hold office without limit in time except that (a) any Trustee may resign; (b) any Trustee may be removed by written instrument, signed by at least two-thirds of the number of Trustees prior to such removal; (c) any Trustee who requests to be retired or who has become incapacitated by illness or injury may be retired by written instrument signed by a majority of the other Trustees; and (d) any Trustee may be removed at any special meeting of shareholders by a two-thirds vote of the outstanding voting securities of the trust. Each Trustee who is not an interested person (as defined in the 1940 Act) of the trust and the fund is referred to herein as an Independent Trustee. Each Independent Trustee shall retire not later than the last day of the calendar year in which his or her 75th birthday occurs. The Independent Trustees may waive this mandatory retirement age policy with respect to individual Trustees. Officers and Advisory Board Members hold office without limit in time, except that any officer or Advisory Board Member may resign or may be removed by a vote of a majority of the Trustees at any regular meeting or any special meeting of the Trustees. Except as indicated, each individual has held the office shown or other offices in the same company for the past five years.
The fund's Statement of Additional Information (SAI) includes more information about the Trustees. To request a free copy, call Fidelity at 1-800-544-8544 if you're an individual investing directly with Fidelity, call 1-800-835-5092 if you're a plan sponsor or participant with Fidelity as your recordkeeper or call 1-877-208-0098 on institutional accounts or if you're an advisor or invest through one.
Experience, Skills, Attributes, and Qualifications of the Trustees. The Governance and Nominating Committee has adopted a statement of policy that describes the experience, qualifications, attributes, and skills that are necessary and desirable for potential Independent Trustee candidates (Statement of Policy). The Board believes that each Trustee satisfied at the time he or she was initially elected or appointed a Trustee, and continues to satisfy, the standards contemplated by the Statement of Policy. The Governance and Nominating Committee also engages professional search firms to help identify potential Independent Trustee candidates who have the experience, qualifications, attributes, and skills consistent with the Statement of Policy. From time to time, additional criteria based on the composition and skills of the current Independent Trustees, as well as experience or skills that may be appropriate in light of future changes to board composition, business conditions, and regulatory or other developments, have also been considered by the professional search firms and the Governance and Nominating Committee. In addition, the Board takes into account the Trustees' commitment and participation in Board and committee meetings, as well as their leadership of standing and ad hoc committees throughout their tenure.
In determining that a particular Trustee was and continues to be qualified to serve as a Trustee, the Board has considered a variety of criteria, none of which, in isolation, was controlling. The Board believes that, collectively, the Trustees have balanced and diverse experience, qualifications, attributes, and skills, which allow the Board to operate effectively in governing the fund and protecting the interests of shareholders. Information about the specific experience, skills, attributes, and qualifications of each Trustee, which in each case led to the Board's conclusion that the Trustee should serve (or continue to serve) as a trustee of the fund, is provided below.
Board Structure and Oversight Function. Robert A. Lawrence is an interested person and currently serves as Chair. The Trustees have determined that an interested Chair is appropriate and benefits shareholders because an interested Chair has a personal and professional stake in the quality and continuity of services provided to the fund. Independent Trustees exercise their informed business judgment to appoint an individual of their choosing to serve as Chair, regardless of whether the Trustee happens to be independent or a member of management. The Independent Trustees have determined that they can act independently and effectively without having an Independent Trustee serve as Chair and that a key structural component for assuring that they are in a position to do so is for the Independent Trustees to constitute a substantial majority for the Board. The Independent Trustees also regularly meet in executive session. David M. Thomas serves as Lead Independent Trustee and as such (i) acts as a liaison between the Independent Trustees and management with respect to matters important to the Independent Trustees and (ii) with management prepares agendas for Board meetings.
Fidelity® funds are overseen by different Boards of Trustees. The fund's Board oversees Fidelity's high income and certain equity funds, and other Boards oversee Fidelity's alternative investment, investment-grade bond, money market, asset allocation, and other equity funds. The asset allocation funds may invest in Fidelity® funds overseen by the fund's Board. The use of separate Boards, each with its own committee structure, allows the Trustees of each group of Fidelity® funds to focus on the unique issues of the funds they oversee, including common research, investment, and operational issues. On occasion, the separate Boards establish joint committees to address issues of overlapping consequences for the Fidelity® funds overseen by each Board.
The Trustees operate using a system of committees to facilitate the timely and efficient consideration of all matters of importance to the Trustees, the fund, and fund shareholders and to facilitate compliance with legal and regulatory requirements and oversight of the fund's activities and associated risks. The Board, acting through its committees, has charged FMR and its affiliates with (i) identifying events or circumstances the occurrence of which could have demonstrably adverse effects on the fund's business and/or reputation; (ii) implementing processes and controls to lessen the possibility that such events or circumstances occur or to mitigate the effects of such events or circumstances if they do occur; and (iii) creating and maintaining a system designed to evaluate continuously business and market conditions in order to facilitate the identification and implementation processes described in (i) and (ii) above. Because the day-to-day operations and activities of the fund are carried out by or through FMR, its affiliates, and other service providers, the fund's exposure to risks is mitigated but not eliminated by the processes overseen by the Trustees. While each of the Board's committees has responsibility for overseeing different aspects of the fund's activities, oversight is exercised primarily through the Operations, Audit, and Compliance Committees. Appropriate personnel, including but not limited to the fund's Chief Compliance Officer (CCO), FMR's internal auditor, the independent accountants, the fund's Treasurer and portfolio management personnel, make periodic reports to the Board's committees, as appropriate, including an annual review of Fidelity's risk management program for the Fidelity® funds. The responsibilities of each standing committee, including their oversight responsibilities, are described further under "Standing Committees of the Trustees."
Interested Trustees*:
Correspondence intended for a Trustee who is an interested person may be sent to Fidelity Investments, 245 Summer Street, Boston, Massachusetts 02210.
Name, Year of Birth; Principal Occupations and Other Relevant Experience+
Jonathan Chiel (1957)
Year of Election or Appointment: 2016
Trustee
Mr. Chiel also serves as Trustee of other Fidelity® funds. Mr. Chiel is Senior Counsel at Fidelity Investments (diversified financial services company, 2024-present). Previously, Mr. Chiel served as General Counsel (2012-2024) and Head of Legal, Risk and Compliance (2022-2024) for Fidelity Investments; Executive Vice President and General Counsel for FMR LLC (diversified financial services company, 2012-2024); Director and President of OH Company LLC (holding company, 2018-2024); General Counsel (2004-2012) and Senior Vice President and Deputy General Counsel (2000-2004) for John Hancock Financial Services; a partner with Choate, Hall & Stewart (law firm, 1996-2000); and an Assistant United States Attorney for the United States Attorney's Office of the District of Massachusetts (1986-1995), including Chief of the Criminal Division (1993-1995). Mr. Chiel is a director on the boards of the Harvard Law School Center on the Legal Profession and the U.S. Chamber Litigation Center.
Bettina Doulton (1964)
Year of Election or Appointment: 2021
Trustee
Ms. Doulton also serves as Trustee of other Fidelity® funds. Prior to her retirement, Ms. Doulton served in a variety of positions at Fidelity Investments, including as a managing director of research (2006-2007), portfolio manager to certain Fidelity® funds (1993-2005), equity analyst and portfolio assistant (1990-1993), and research assistant (1987-1990). Ms. Doulton currently owns and operates Cellardoor Winery. Previously, Ms. Doulton served as a member of the Board of Brown Capital Management, LLC (2014-2018).
Robert A. Lawrence (1952)
Year of Election or Appointment: 2020
Trustee
Chair of the Board of Trustees
Mr. Lawrence also serves as Trustee of other funds. Previously, Mr. Lawrence served as a Trustee and Member of the Advisory Board of certain funds. Prior to his retirement in 2008, Mr. Lawrence served as Vice President of certain Fidelity® funds (2006-2008), Senior Vice President, Head of High Income Division of Fidelity Management & Research Company (investment adviser firm, 2006-2008), and President of Fidelity Strategic Investments (investment adviser firm, 2002-2005).
* Determined to be an "Interested Trustee" by virtue of, among other things, his or her affiliation with the trust or various entities under common control with FMR.
+ The information includes the Trustee's principal occupation during the last five years and other information relating to the experience, attributes, and skills relevant to the Trustee's qualifications to serve as a Trustee, which led to the conclusion that the Trustee should serve as a Trustee for the fund.
Independent Trustees:
Correspondence intended for an Independent Trustee may be sent to Fidelity Investments, P.O. Box 55235, Boston, Massachusetts 02205-5235.
Name, Year of Birth; Principal Occupations and Other Relevant Experience+
Thomas P. Bostick (1956)
Year of Election or Appointment: 2021
Trustee
Lieutenant General Bostick also serves as Trustee of other Fidelity® funds. Prior to his retirement, General Bostick (United States Army, Retired) held a variety of positions within the U.S. Army, including Chief of Engineers and Commanding General, U.S. Army Corps of Engineers (2012-2016) and Deputy Chief of Staff and Director of Human Resources, U.S. Army (2009-2012). General Bostick currently serves as a member of the Board and Finance and Governance & Sustainability Committees of CSX Corporation (transportation, 2020-present) and a member of the Board and Corporate Governance and Nominating Committee of Perma-Fix Environmental Services, Inc. (nuclear waste management, 2020-present). General Bostick serves as Chief Executive Officer of Bostick Global Strategies, LLC (consulting, 2016-present), as a member of the Board of HireVue, Inc. (video interview and assessment, 2020-present), as a member of the Board of Allonnia (biotechnology and engineering solutions, 2022-present), on the Advisory Board of Hilco Redevelopment Partners (a real estate investment and redevelopment company, 2021-present), and on the Advisory Board of Solugen, Inc. (specialty bio-based chemicals manufacturer, 2022-present). Previously, General Bostick served as a Member of the Advisory Board of certain Fidelity® funds (2021), President, Intrexon Bioengineering (2018-2020) and Chief Operating Officer (2017-2020) and Senior Vice President of the Environment Sector (2016-2017) of Intrexon Corporation (biopharmaceutical company).
Donald F. Donahue (1950)
Year of Election or Appointment: 2018
Trustee
Mr. Donahue also serves as Trustee of other Fidelity® funds. Mr. Donahue serves as President and Chief Executive Officer of Miranda Partners, LLC (risk consulting for the financial services industry, 2012-present). Previously, Mr. Donahue served as Chief Executive Officer (2006-2012), Chief Operating Officer (2003-2006) and Managing Director, Customer Marketing and Development (1999-2003) of The Depository Trust & Clearing Corporation (financial markets infrastructure). Mr. Donahue currently serves as a member (2007-present) and Co-Chairman (2016-present) of the Board of United Way of New York. Mr. Donahue previously served as a member of the Advisory Board of certain Fidelity® funds (2015-2018) and as a member of the Board of The Leadership Academy (previously NYC Leadership Academy) (2012-2022).
Vicki L. Fuller (1957)
Year of Election or Appointment: 2020
Trustee
Ms. Fuller also serves as Trustee of other Fidelity® funds. Previously, Ms. Fuller served as a member of the Advisory Board of certain Fidelity® funds (2018-2020), Chief Investment Officer of the New York State Common Retirement Fund (2012-2018) and held a variety of positions at AllianceBernstein L.P. (global asset management, 1985-2012), including Managing Director (2006-2012) and Senior Vice President and Senior Portfolio Manager (2001-2006). Ms. Fuller currently serves as a member of the Board, Audit Committee, Compensation Committee and Nominating and Governance Committee of two Blackstone business development companies (2020-present), as a member of the Board of Treliant, LLC (consulting, 2019-present), as a member of the Board of Ariel Alternatives, LLC (private equity, 2022-present) and as a member of the Board and Chair of the Audit Committee of Gusto, Inc. (software, 2021-present). In addition, Ms. Fuller currently serves as a member of the Executive Board of New York University's Stern School of Business. Ms. Fuller previously served as a member of the Board of Roosevelt University (2019-2024) and member of the Board, Audit Committee and Nominating and Governance Committee of The Williams Companies, Inc. (natural gas infrastructure, 2018-2021).
Patricia L. Kampling (1959)
Year of Election or Appointment: 2020
Trustee
Ms. Kampling also serves as Trustee of other Fidelity® funds. Prior to her retirement, Ms. Kampling served as Chairman of the Board and Chief Executive Officer (2012-2019), President and Chief Operating Officer (2011-2012) and Executive Vice President and Chief Financial Officer (2010-2011) of Alliant Energy Corporation. Ms. Kampling currently serves as a member of the Board, Audit Committee and Governance, Compensation and Nominating Committee of Xcel Energy Inc. (utilities company, 2020-present) and as a member of the Board, Audit, Finance and Risk Committee and Safety, Environmental, Technology and Operations Committee and Chair of the Executive Development and Compensation Committee of American Water Works Company, Inc. (utilities company, 2019-present). In addition, Ms. Kampling currently serves as a member of the Board of the Nature Conservancy, Wisconsin Chapter (2019-present). Previously, Ms. Kampling served as a Member of the Advisory Board of certain Fidelity® funds (2020), a member of the Board, Compensation Committee and Executive Committee and Chair of the Audit Committee of Briggs & Stratton Corporation (manufacturing, 2011-2021), a member of the Board of Interstate Power and Light Company (2012-2019) and Wisconsin Power and Light Company (2012-2019) (each a subsidiary of Alliant Energy Corporation) and as a member of the Board and Workforce Development Committee of the Business Roundtable (2018-2019).
Thomas A. Kennedy (1955)
Year of Election or Appointment: 2021
Trustee
Mr. Kennedy also serves as Trustee of other Fidelity® funds. Previously, Mr. Kennedy served as a Member of the Advisory Board of certain Fidelity® funds (2020) and held a variety of positions at Raytheon Company (aerospace and defense, 1983-2020), including Chairman and Chief Executive Officer (2014-2020) and Executive Vice President and Chief Operating Officer (2013-2014). Mr. Kennedy served as Executive Chairman of the Board of Directors of Raytheon Technologies Corporation (aerospace and defense, 2020-2021). Mr. Kennedy serves as a Director of the Board of Directors of Textron Inc. (aerospace and defense, 2023-present).
Oscar Munoz (1959)
Year of Election or Appointment: 2021
Trustee
Mr. Munoz also serves as Trustee of other Fidelity® funds. Prior to his retirement, Mr. Munoz served as Executive Chairman (2020-2021), Chief Executive Officer (2015-2020), President (2015-2016) and a member of the Board (2010-2021) of United Airlines Holdings, Inc. Mr. Munoz currently serves as a member of the Board of CBRE Group, Inc. (commercial real estate, 2020-present), a member of the Board of Univision Communications, Inc. (Hispanic media, 2020-present), a member of the Board of Archer Aviation Inc. (2021-present), a member of the Defense Business Board of the United States Department of Defense (2021-present) and a member of the Board of Salesforce.com, Inc. (cloud-based software, 2022-present). Previously, Mr. Munoz served as a Member of the Advisory Board of certain Fidelity® funds (2021).
David M. Thomas (1949)
Year of Election or Appointment: 2008
Trustee
Lead Independent Trustee
Mr. Thomas also serves as Trustee of other Fidelity® funds. Previously, Mr. Thomas served as Executive Chairman (2005-2006) and Chairman and Chief Executive Officer (2000-2005) of IMS Health, Inc. (pharmaceutical and healthcare information solutions) and as a member of the Board of Fortune Brands Home and Security (home and security products, 2004-2023). Mr. Thomas currently serves as Director (2013-present) and Non-Executive Chairman of the Board (2022-present) of Interpublic Group of Companies, Inc. (marketing communication).
Susan Tomasky (1953)
Year of Election or Appointment: 2020
Trustee
Ms. Tomasky also serves as Trustee of other Fidelity® funds. Prior to her retirement, Ms. Tomasky served in various executive officer positions at American Electric Power Company, Inc. (1998-2011), including most recently as President of AEP Transmission (2007-2011). Ms. Tomasky currently serves as a member of the Board and Sustainability Committee and as Chair of the Audit Committee of Marathon Petroleum Corporation (2018-present) and as a member of the Board, Executive Committee, Corporate Governance Committee and Organization and Compensation Committee and as Lead Director of the Board of Public Service Enterprise Group, Inc. (utilities company, 2012-present) and as a member of the Board of its subsidiary company, Public Service Electric and Gas Co. (2021-present). In addition, Ms. Tomasky currently serves as a member (2009-present) and President (2020-present) of the Board of the Royal Shakespeare Company - America (2009-present) and as a member and Vice Chair of the Board of Kenyon College (2016-present). Previously, Ms. Tomasky served as a Member of the Advisory Board of certain Fidelity® funds (2020), as a member of the Board of the Columbus Association for the Performing Arts (2011-2023), as a member of the Board of the Columbus Regional Airport Authority (2007-2020), as a member of the Board (2011-2018) and Lead Independent Director (2015-2018) of Andeavor Corporation (previously Tesoro Corporation) (independent oil refiner and marketer) and as a member of the Board of Summit Midstream Partners LP (energy, 2012-2018).
Michael E. Wiley (1950)
Year of Election or Appointment: 2020
Trustee
Mr. Wiley also serves as Trustee of other Fidelity® funds. Previously, Mr. Wiley served as a member of the Advisory Board of certain Fidelity® funds (2018-2020), Chairman, President and CEO of Baker Hughes, Inc. (oilfield services, 2000-2004). Mr. Wiley also previously served as a member of the Board of Andeavor Corporation (independent oil refiner and marketer, 2005-2018), a member of the Board of Andeavor Logistics LP (natural resources logistics, 2015-2018) and a member of the Board of High Point Resources (exploration and production, 2005-2020).
+ The information includes the Trustee's principal occupation during the last five years and other information relating to the experience, attributes, and skills relevant to the Trustee's qualifications to serve as a Trustee, which led to the conclusion that the Trustee should serve as a Trustee for the fund.
Advisory Board Members and Officers:
Correspondence intended for a Member of the Advisory Board (if any) may be sent to Fidelity Investments, P.O. Box 55235, Boston, Massachusetts 02205-5235. Correspondence intended for an officer or Peter S. Lynch may be sent to Fidelity Investments, 245 Summer Street, Boston, Massachusetts 02210.
Name, Year of Birth; Principal Occupations+
Vijay C. Advani (1960)
Year of Election or Appointment: 2023
Member of the Advisory Board
Mr. Advani also serves as Trustee or Member of the Advisory Board of other funds. Previously, Mr. Advani served as Executive Chairman (2020-2022), Chief Executive Officer (2017-2020) and Chief Operating Officer (2016-2017) of Nuveen (global investment manager). He also served in various capacities at Franklin Resources (global investment manager), including Co-President (2015-2016), Executive Vice President, Global Advisory Services (2008-2015), Head of Global Retail Distribution (2005-2008), Executive Managing Director, International Retail Development (2002-2005), Managing Director, Product Developments, Sales & Marketing, Asia, Eastern Europe and Africa (2000-2002) and President, Templeton Asset Management India (1995-2000). Mr. Advani also served as Senior Investment Officer of International Finance Corporation (private equity and venture capital arm of The World Bank, 1984-1995). Mr. Advani is Chairman Emeritus of the U.S. India Business Council (2018-present), a Director of The Global Impact Investing Network (2019-present), a Director of LOK Capital (Mauritius) (2022-present), a member of the Advisory Council of LOK Capital (2022-present), a Senior Advisor of Neuberger Berman (2021-present), a Senior Advisor of Seviora Holdings Pte. Ltd (Temasek-Singapore) (2021-present), a Director of Seviora Capital (Singapore) (2021-present) and an Advisor of EQUIAM (2021-present). Mr. Advani formerly served as a member of the Board of BowX Acquisition Corp. (special purpose acquisition company, 2020-2021), a member of the Board of Intellecap (advisory arm of The Aavishkaar Group, 2018-2020), a member of the Board of Nuveen Investments, Inc. (2017-2020) and a member of the Board of Docusign (software, 2016-2019).
Peter S. Lynch (1944)
Year of Election or Appointment: 2003
Member of the Advisory Board
Mr. Lynch also serves as a Member of the Advisory Board of other Fidelity® funds. Mr. Lynch is Vice Chairman and a Director of Fidelity Management & Research Company LLC (investment adviser firm). In addition, Mr. Lynch serves as a Trustee of Boston College and as the Chairman of the Inner-City Scholarship Fund. Previously, Mr. Lynch served as Vice Chairman and a Director of FMR Co., Inc. (investment adviser firm) and on the Special Olympics International Board of Directors (1997-2006).
Karen B. Peetz (1955)
Year of Election or Appointment: 2023
Member of the Advisory Board
Ms. Peetz also serves as a Member of the Advisory Board of other funds. Previously, Ms. Peetz served as Chief Administration Officer (2020-2023) of Citigroup Inc. (a diversified financial service company). She also served in various capacities at Bank of New York Mellon Corporation, including President (2013-2016), Vice Chairman, Senior Executive Vice President and Chief Executive Officer of Financial Markets & Treasury Services (2010-2013), Senior Executive Vice President and Chief Executive Officer of Global Corporate Trust (2003-2008), Senior Vice President and Division Manager of Global Payments & Trade Services (2002-2003) and Senior Vice President and Division Manager of Domestic Corporate Trust (1998-2002). Ms. Peetz also served in various capacities at Chase Manhattan Corporation (1982-1998), including Senior Vice President and Manager of Corporate Trust International Business (1996-1998), Managing Director and Manager of Corporate Trust Services (1994-1996) and Managing Director and Group Manager of Financial Institution Sales (1990-1993). Ms. Peetz currently serves as Chair of Amherst Holdings Advisory Council (2018-present), Trustee of Johns Hopkins University (2016-present), Chair of the Carey Business School Advisory Council, Member of the Johns Hopkins Medicine Board and Finance Committee and Chair of the Lyme and Tick Related Disease Institute Advisory Council. Ms. Peetz previously served as a member of the Board of Guardian Life Insurance Company of America (2019-2023), a member of the Board of Trane Technologies (2018-2022), a member of the Board of Wells Fargo Corp. (2017-2019), a member of the Board of SunCoke Energy Inc. (2012-2016), a member of the Board of Private Export Funding Corporation (2010-2016) and as a Trustee of Penn State University (2010-2014) and the United Way of New York City (2008-2010).
Heather Bonner (1977)
Year of Election or Appointment: 2023
Assistant Treasurer
Ms. Bonner also serves as an officer of other funds. Ms. Bonner is a Senior Vice President (2022-present) and is an employee of Fidelity Investments (2022-present). Ms. Bonner serves as Senior Vice President, Vice President, Treasurer, or Director of certain Fidelity entities. Prior to joining Fidelity, Ms. Bonner served as Managing Director at AQR Capital Management (2013-2022) and was the Treasurer and Principal Financial Officer of the AQR Funds (2013-2022).
Craig S. Brown (1977)
Year of Election or Appointment: 2022
Deputy Treasurer
Mr. Brown also serves as an officer of other funds. Mr. Brown is a Vice President (2015-present) and is an employee of Fidelity Investments. Mr. Brown serves as Assistant Treasurer of FIMM, LLC (2021-present). Previously, Mr. Brown served as Assistant Treasurer of certain Fidelity® funds (2019-2022).
John J. Burke III (1964)
Year of Election or Appointment: 2018
Chief Financial Officer
Mr. Burke also serves as Chief Financial Officer of other funds. Mr. Burke is Head of Fidelity Fund and Investment Operations (2018-present) and is an employee of Fidelity Investments. Mr. Burke serves as President, Executive Vice President, or Director of certain Fidelity entities. Previously Mr. Burke served as head of Asset Management Investment Operations (2012-2018).
Margaret Carey (1973)
Year of Election or Appointment: 2023
Secretary and Chief Legal Officer (CLO)
Ms. Carey also serves as an officer of other funds and as CLO of certain Fidelity entities. Ms. Carey is a Senior Vice President, Deputy General Counsel (2019-present) and is an employee of Fidelity Investments.
William C. Coffey (1969)
Year of Election or Appointment: 2019
Assistant Secretary
Mr. Coffey also serves as Assistant Secretary of other funds. Mr. Coffey is a Senior Vice President, Deputy General Counsel (2010-present) and is an employee of Fidelity Investments. Previously, Mr. Coffey served as Secretary and CLO of certain funds (2018-2019); CLO, Secretary, or Senior Vice President of certain Fidelity entities and Assistant Secretary of certain funds (2009-2018).
Timothy M. Cohen (1969)
Year of Election or Appointment: 2018
Vice President
Mr. Cohen also serves as Vice President of other funds. Mr. Cohen is Co-Head of Equity (2018-present) and is an employee of Fidelity Investments. Mr. Cohen serves as President or Director of certain Fidelity entities. Previously, Mr. Cohen served as Executive Vice President of Fidelity SelectCo, LLC (2019) and Head of Global Equity Research (2016-2018).
Jonathan Davis (1968)
Year of Election or Appointment: 2010
Assistant Treasurer
Mr. Davis also serves as an officer of other funds. Mr. Davis is a Vice President (2006-present) and is an employee of Fidelity Investments. Mr. Davis serves as Assistant Treasurer or Director of certain Fidelity entities.
Laura M. Del Prato (1964)
Year of Election or Appointment: 2018
Assistant Treasurer
Ms. Del Prato also serves as an officer of other funds. Ms. Del Prato is a Senior Vice President (2017-present) and is an employee of Fidelity Investments. Ms. Del Prato serves as Senior Vice President, Vice President, Assistant Treasurer, or Director of certain Fidelity entities. Previously, Ms. Del Prato served as President and Treasurer of The North Carolina Capital Management Trust: Cash Portfolio and Term Portfolio (2018-2020).
Colm A. Hogan (1973)
Year of Election or Appointment: 2020
Assistant Treasurer
Mr. Hogan also serves as an officer of other funds. Mr. Hogan is a Vice President (2016-present) and is an employee of Fidelity Investments. Mr. Hogan serves as Assistant Treasurer of certain Fidelity entities. Previously, Mr. Hogan served as Deputy Treasurer of certain Fidelity® funds (2016-2020) and Assistant Treasurer of certain Fidelity® funds (2016-2018).
Pamela R. Holding (1964)
Year of Election or Appointment: 2018
Vice President
Ms. Holding also serves as Vice President of other funds. Ms. Holding is Co-Head of Equity (2018-present) and is an employee of Fidelity Investments. Previously, Ms. Holding served as Executive Vice President of Fidelity SelectCo, LLC (2019) and as Chief Investment Officer of Fidelity Institutional Asset Management (2013-2018).
Chris Maher (1972)
Year of Election or Appointment: 2020
Deputy Treasurer
Mr. Maher also serves as an officer of other funds. Mr. Maher is a Vice President (2008-present) and is an employee of Fidelity Investments. Mr. Maher serves as Assistant Treasurer of certain Fidelity entities. Previously, Mr. Maher served as Assistant Treasurer of certain funds (2013-2020).
Jason P. Pogorelec (1975)
Year of Election or Appointment: 2020
Chief Compliance Officer
Mr. Pogorelec also serves as Chief Compliance Officer of other funds. Mr. Pogorelec is a Senior Vice President of Asset Management Compliance (2020-present) and is an employee of Fidelity Investments. Mr. Pogorelec serves as Compliance Officer of Fidelity Management & Research Company LLC (investment adviser firm, 2023-present) and Ballyrock Investment Advisors LLC (2023-present). Previously, Mr. Pogorelec served as a Vice President, Associate General Counsel for Fidelity Investments (2010-2020) and Assistant Secretary of certain Fidelity® funds (2015-2020).
Brett Segaloff (1972)
Year of Election or Appointment: 2021
Anti-Money Laundering (AML) Officer
Mr. Segaloff also serves as AML Officer of other funds. Mr. Segaloff is a Vice President (2022-present) and is an employee of Fidelity Investments. Mr. Segaloff serves as Anti Money Laundering Compliance Officer or Anti Money Laundering/Bank Secrecy Act Compliance Officer of certain Fidelity entities.
Stacie M. Smith (1974)
Year of Election or Appointment: 2016
President and Treasurer
Ms. Smith also serves as an officer of other funds. Ms. Smith is a Senior Vice President (2016-present) and is an employee of Fidelity Investments. Ms. Smith serves as Assistant Treasurer of certain Fidelity entities and has served in other fund officer roles.
Jim Wegmann (1979)
Year of Election or Appointment: 2019
Assistant Treasurer
Mr. Wegmann also serves as an officer of other funds. Mr. Wegmann is a Vice President (2016-present) and is an employee of Fidelity Investments. Mr. Wegmann serves as Assistant Treasurer of FIMM, LLC (2021-present). Previously, Mr. Wegmann served as Assistant Treasurer of certain Fidelity® funds (2019-2021).
+ The information includes principal occupation during the last five years.
As a shareholder, you incur two types of costs: (1) transaction costs, which may include sales charges (loads) on purchase payments or redemption proceeds, as applicable and (2) ongoing costs, which generally include management fees, distribution and/or service (12b-1) fees and other Fund expenses. This Example is intended to help you understand your ongoing costs (in dollars) of investing in a fund and to compare these costs with the ongoing costs of investing in other mutual funds.
| The Example is based on an investment of $1,000 invested at the beginning of the period and held for the entire period (November 1, 2023 to April 30, 2024). |
Actual Expenses
The first line of the accompanying table provides information about actual account values and actual expenses. You may use the information in this line, together with the amount you invested, to estimate the expenses that you paid over the period. Simply divide your account value by $1,000.00 (for example, an $8,600 account value divided by $1,000.00 = 8.6), then multiply the result by the number in the first line for a class/Fund under the heading entitled "Expenses Paid During Period" to estimate the expenses you paid on your account during this period. If any fund is a shareholder of any underlying mutual funds or exchange-traded funds (ETFs) (the Underlying Funds), such fund indirectly bears its proportional share of the expenses of the Underlying Funds in addition to the direct expenses incurred presented in the table. These fees and expenses are not included in the annualized expense ratio used to calculate the expense estimate in the table below.
Hypothetical Example for Comparison Purposes
The second line of the accompanying table provides information about hypothetical account values and hypothetical expenses based on the actual expense ratio and an assumed rate of return of 5% per year before expenses, which is not the actual return. The hypothetical account values and expenses may not be used to estimate the actual ending account balance or expenses you paid for the period. You may use this information to compare the ongoing costs of investing in the Fund and other funds. To do so, compare this 5% hypothetical example with the 5% hypothetical examples that appear in the shareholder reports of the other funds. If any fund is a shareholder of any Underlying Funds, such fund indirectly bears its proportional share of the expenses of the Underlying Funds in addition to the direct expenses as presented in the table. These fees and expenses are not included in the annualized expense ratio used to calculate the expense estimate in the table below.
Please note that the expenses shown in the table are meant to highlight your ongoing costs only and do not reflect any transaction costs. Therefore, the second line of the table is useful in comparing ongoing costs only, and will not help you determine the relative total costs of owning different funds. In addition, if these transactional costs were included, your costs would have been higher.
| | | | | Annualized Expense Ratio- A | | Beginning Account Value November 1, 2023 | | Ending Account Value April 30, 2024 | | Expenses Paid During Period- C November 1, 2023 to April 30, 2024 |
| Fidelity® Mid-Cap Stock Fund | | | | | | | | | | |
| Fidelity® Mid-Cap Stock Fund | | | | .81% | | | | | | |
| Actual | | | | | | $ 1,000 | | $ 1,185.20 | | $ 4.40 |
Hypothetical-B | | | | | | $ 1,000 | | $ 1,020.84 | | $ 4.07 |
| Class K | | | | .70% | | | | | | |
| Actual | | | | | | $ 1,000 | | $ 1,185.70 | | $ 3.80 |
Hypothetical-B | | | | | | $ 1,000 | | $ 1,021.38 | | $ 3.52 |
| |
A Annualized expense ratio reflects expenses net of applicable fee waivers.
B 5% return per year before expenses
C Expenses are equal to the annualized expense ratio, multiplied by the average account value over the period, multiplied by 182/ 366 (to reflect the one-half year period). The fees and expenses of any Underlying Funds are not included in each annualized expense ratio.
The dividend and capital gains distributions for the fund(s) are available on Fidelity.com or Institutional.Fidelity.com.
The fund hereby designates as a capital gain dividend with respect to the taxable year ended April 30, 2024, $531,440,099, or, if subsequently determined to be different, the net capital gain of such year.
Mid-Cap Stock and Class K designate 100% of the dividends distributed during the fiscal year as qualifying for the dividends-received deduction for corporate shareholders.
Mid-Cap Stock and Class K designate 100% of the dividends distributed during the fiscal year as amounts which may be taken into account as a dividend for purposes of the maximum rate under section 1(h)(11) of the Internal Revenue Code.
The fund will notify shareholders in January 2025 of amounts for use in preparing 2024 income tax returns.
Board Approval of Investment Advisory Contracts
Fidelity Mid-Cap Stock Fund
At its January 2024 meeting, the Board of Trustees, including the Independent Trustees (together, the Board), approved an amended and restated management contract with Fidelity Management & Research Company LLC (FMR) (the Management Contract), and amended and restated sub-advisory agreements (the Sub-Advisory Contracts, and together with the Management Contract, the Advisory Contracts) for the fund, including the fund's sub-advisory agreements with FMR Investment Management (UK) Limited (FMR UK), Fidelity Management & Research (Hong Kong) Limited (FMR H.K.), and Fidelity Management & Research (Japan) Limited (FMR Japan). The Advisory Contracts will be effective March 1, 2024. The Board will consider the annual renewal of the fund's Advisory Contracts in May 2024, following its review of additional materials provided by FMR.
Management Contract. The Board approved the Management Contract, which implements a new fee structure combining the management fee, transfer agent fee (TA Fee), and pricing and bookkeeping fee (P&B Fee) of the fund and each class into a single class-level fee based on tiered schedules and subject to a maximum class-level rate (the Unified Fee). In exchange for the Unified Fee, the fund will receive investment advisory, management, administrative, transfer agent, pricing and bookkeeping services under a single agreement - the Management Contract.
In its consideration of the Management Contract over several meetings, the Board received, reviewed and discussed a comprehensive set of analyses regarding the Unified Fee including (i) the legal framework, (ii) design goals for the Unified Fee, (iii) calculation methodology for the Unified Fee and illustrative examples, (iv) annual and cumulative projected impacts under various scenarios, both in the aggregate and at the fund/class level, (v) explanations of schedules, rate levers and maximum rates and (vi) shareholder benefits and projected savings.
The Board considered that the maximum Unified Fee for each class of the fund would be no higher than the sum of (i) the lowest contractual management fee rate under the fund's existing management contract, which is the individual fund fee rate, if any, plus the lowest contractual marginal group fee rate and (ii) the TA and P&B Fee rates, which are fixed fee rates since December 1, 2023 (together, the Unified Fee Cap). The Board noted that Fidelity has represented that, as a result of this Unified Fee Cap, the Unified Fee would be no greater than the fee rates previously authorized to be charged to the fund for the same services. The Board noted that certain expenses such as performance adjustments, third-party expenses, and certain other miscellaneous expenses would be outside the scope of the Unified Fee and the calculation of such fees would not change as a result of the Unified Fee. The Board considered that, under the Management Contract, a different management fee rate will be applicable to each class of the fund. The Board noted that Fidelity has represented that the difference in expenses between classes is based on differences in class-specific expenses and not due to any difference in advisory or third-party custodial fees or other expenses related to the management of the fund's assets.
The Board considered Fidelity's representations that implementation of the Unified Fee, which includes the Unified Fee Cap, would cause all funds subject to the Unified Fee, including the fund, to experience an immediate reduction on contractual fee rates for services provided under the current management contracts. The Board considered that some funds would not experience lower net total fees as a result of existing fee caps. The Board further considered that, in addition to the contractual fee savings, the Unified Fee offers funds and their shareholders greater protection from future rate increases for services previously offered under separate agreements that are now covered by the Management Contract because such rate increases would require shareholder approval.
Sub-Advisory Contracts. In connection with the Unified Fee changes, the Board considered the Sub-Advisory Contracts, which simplified the calculation of the fees paid by FMR to the sub-advisers under the agreements. The Board noted that the agreements with FMR UK, FMR H.K., and FMR Japan were amended to provide that FMR will compensate each sub-adviser at a fee rate equal to 110% of the sub-adviser's costs incurred in providing services under the agreement. The Board considered that, under the Sub-Advisory Contracts, FMR, and not the fund, will continue to pay the sub-advisory fees to each applicable sub-adviser.
The Board further considered that the approval of the fund's Advisory Contracts will not result in any changes in the investment process or strategies employed in the management of the fund's assets or the day-to-day management of the fund or the persons primarily responsible for such management. Further, the Board considered that the Management Contract would not change the obligations and services of FMR and its affiliates on behalf of the fund, and, in particular, there would be no change in the nature and level of advisory, management, administration, transfer agent, and pricing and bookkeeping services provided to the fund by FMR, its affiliates, and each applicable sub-adviser.
In connection with its consideration of future renewals of the fund's Advisory Contracts, the Board will consider: (i) the nature, extent and quality of services provided to the funds, including shareholder and administrative services and investment performance; (ii) the competitiveness of the management fee and total expenses for the fund; (iii) the costs of the services and profitability, including the revenues earned and the expenses incurred in conducting the business of developing, marketing, distributing, managing, administering, and servicing the fund and its shareholders, to the extent applicable; and (iv) whether there have been economies of scale in respect of the Fidelity funds, whether the Fidelity funds (including the fund) have appropriately benefited from any such economies of scale, and whether there is the potential for realization of any further economies.
Based on its evaluation of all of the conclusions and representations noted above, and after considering all factors it believed relevant, the Board concluded that the fund's management fee structure is fair and reasonable, and that the fund's Advisory Contracts should be approved.
The Securities and Exchange Commission adopted Rule 22e-4 under the Investment Company Act of 1940 (the Liquidity Rule) to promote effective liquidity risk management throughout the open-end investment company industry, thereby reducing the risk that funds will be unable to meet their redemption obligations and mitigating dilution of the interests of fund shareholders.
The Fund has adopted and implemented a liquidity risk management program (the Program) reasonably designed to assess and manage the Fund's liquidity risk and to comply with the requirements of the Liquidity Rule. The Fund's Board of Trustees (the Board) has designated the Fund's investment adviser as administrator of the Program. The Fidelity advisers have established a Liquidity Risk Management Committee (the LRM Committee) to manage the Program for each of the Fidelity Funds. The LRM Committee monitors the adequacy and effectiveness of implementation of the Program and on a periodic basis assesses each Fund's liquidity risk based on a variety of factors including (1) the Fund's investment strategy, (2) portfolio liquidity and cash flow projections during normal and reasonably foreseeable stressed conditions, (3) shareholder redemptions, (4) borrowings and other funding sources and (5) certain factors specific to ETFs including the effect of the Fund's prices and spreads, market participants, and basket compositions on the overall liquidity of the Fund's portfolio, as applicable.
In accordance with the Program, each of the Fund's portfolio investments is classified into one of four defined liquidity categories based on a determination of a reasonable expectation for how long it would take to convert the investment to cash (or sell or dispose of the investment) without significantly changing its market value.
- Highly liquid investments - cash or convertible to cash within three business days or less
- Moderately liquid investments - convertible to cash in three to seven calendar days
- Less liquid investments - can be sold or disposed of, but not settled, within seven calendar days
- Illiquid investments - cannot be sold or disposed of within seven calendar days
Liquidity classification determinations take into account a variety of factors including various market, trading and investment-specific considerations, as well as market depth, and generally utilize analysis from a third-party liquidity metrics service.
The Liquidity Rule places a 15% limit on a fund's illiquid investments and requires funds that do not primarily hold assets that are highly liquid investments to determine and maintain a minimum percentage of the fund's net assets to be invested in highly liquid investments (highly liquid investment minimum or HLIM). The Program includes provisions reasonably designed to comply with the 15% limit on illiquid investments and for determining, periodically reviewing and complying with the HLIM requirement as applicable.
At a recent meeting of the Fund's Board of Trustees, the LRM Committee provided a written report to the Board pertaining to the operation, adequacy, and effectiveness of the Program for the period December 1, 2022 through November 30, 2023. The report concluded that the Program is operating effectively and is reasonably designed to assess and manage the Fund's liquidity risk.
1.703594.126
MCS-ANN-0624
Fidelity® Founders Fund
Annual Report
April 30, 2024
Includes Fidelity and Fidelity Advisor share classes
Contents
To view a fund's proxy voting guidelines and proxy voting record for the 12-month period ended June 30, visit http://www.fidelity.com/proxyvotingresults or visit the Securities and Exchange Commission's (SEC) web site at http://www.sec.gov.
You may also call 1-800-544-8544 if you're an individual investing directly with Fidelity, call 1-800-835-5092 if you're a plan sponsor or participant with Fidelity as your recordkeeper or call 1-877-208-0098 on institutional accounts or if you're an advisor or invest through one to request a free copy of the proxy voting guidelines.
Standard & Poor's, S&P and S&P 500 are registered service marks of The McGraw-Hill Companies, Inc. and have been licensed for use by Fidelity Distributors Corporation.
Other third-party marks appearing herein are the property of their respective owners.
All other marks appearing herein are registered or unregistered trademarks or service marks of FMR LLC or an affiliated company. © 2024 FMR LLC. All rights reserved.
This report and the financial statements contained herein are submitted for the general information of the shareholders of the Fund. This report is not authorized for distribution to prospective investors in the Fund unless preceded or accompanied by an effective prospectus.
A fund files its complete schedule of portfolio holdings with the SEC for the first and third quarters of each fiscal year on Form N-PORT. Forms N-PORT are available on the SEC's web site at http://www.sec.gov. A fund's Forms N-PORT may be reviewed and copied at the SEC's Public Reference Room in Washington, DC. Information regarding the operation of the SEC's Public Reference Room may be obtained by calling 1-800-SEC-0330.
For a complete list of a fund's portfolio holdings, view the most recent holdings listing, semiannual report, or annual report on Fidelity's web site at http://www.fidelity.com, http://www.institutional.fidelity.com, or http://www.401k.com, as applicable.
NOT FDIC INSURED •MAY LOSE VALUE •NO BANK GUARANTEE
Neither the Fund nor Fidelity Distributors Corporation is a bank.
Average annual total return reflects the change in the value of an investment, assuming reinvestment of distributions from dividend income and capital gains (the profits earned upon the sale of securities that have grown in value, if any) and assuming a constant rate of performance each year. The hypothetical investment and the average annual total returns do not reflect the deduction of taxes that a shareholder would pay on fund distributions or the redemption of fund shares. During periods of reimbursement by Fidelity, a fund's total return will be greater than it would be had the reimbursement not occurred. How a fund did yesterday is no guarantee of how it will do tomorrow.
| Average Annual Total Returns |
| | | | |
Periods ended April 30, 2024 | Past 1 year | Past 5 years | Life of Fund A |
Class A (incl. 5.75% sales charge) | 22.64% | 13.12% | 14.34% |
Class M (incl. 3.50% sales charge) | 25.25% | 13.37% | 14.57% |
Class C (incl. contingent deferred sales charge) | 28.07% | 13.58% | 14.76% |
| Fidelity® Founders Fund | 30.42% | 14.74% | 15.92% |
| Class I | 30.48% | 14.78% | 15.96% |
| Class Z | 30.66% | 14.92% | 16.10% |
A From February 14, 2019
Class C shares' contingent deferred sales charges included in the past one year, past five years and life of fund total return figures are 1%, 0% and 0%, respectively.
| $10,000 Over Life of Fund |
| |
Let's say hypothetically that $10,000 was invested in Fidelity® Founders Fund, a class of the fund, on February 14, 2019, when the fund started. The chart shows how the value of your investment would have changed, and also shows how the Russell 3000® Index performed over the same period. |
|
|
Market Recap:
U.S. equities gained 22.66% for the 12 months ending April 30, 2024, according to the S&P 500® index, driven by resilient corporate profits, a frenzy over generative artificial intelligence and the Federal Reserve's likely pivot to cutting interest rates later this year. Amid this favorable backdrop for higher-risk assets, the S&P 500® continued its late-2023 momentum and ended March at its all-time high before snapping a five-month uptrend in April (-4.08%). Growth stocks led the broad rally, mostly driven by a narrow set of firms in the communication services (+41%) and information technology (+37%) sectors, largely due to excitement for AI. In particular, semiconductor-related stocks (+104%) were a standout. Following the Fed's November 1 meeting, when the central bank hinted it might be done raising rates, the S&P 500® reversed a three-month decline and gained 14.09% in the final two months of 2023 and 10.56% the first quarter. Risk assets were further aided on March 20, when the central bank held steady its benchmark federal funds rate and affirmed its projection to cut in 2024. The index then slipped in April, as inflation remained stickier than expected, spurring doubts of a soft economic landing. For the full 12 months, the financials, industrials, and consumer discretionary sectors each gained about 24%. In sharp contrast, real estate, and the defensive-oriented utilities sector each roughly broke even. Other notable "laggards" included consumer staples (+3%) and health care (+7%).
Comments from Portfolio Manager Daniel Kelley:
For the fiscal year ending April 30, 2024, the fund's share classes (excluding sales charges, if applicable) gained about 29% to 31%, versus 22.30% for the benchmark Russell 3000® Index. Stock picking in information technology was the biggest contributor to performance versus the benchmark. Security selection and an overweight in communication services plus investment choices in industrials, primarily within the transportation industry, also materially aided relative performance. An overweight in Nvidia (+212%), the fund's largest holding as of period end, was the top individual relative contributor. Overweights in Uber Technologies (+112%) and Meta Platforms (+79%) also notably bolstered the fund's performance versus the benchmark. Meta Platforms and Uber Technologies were among our largest holdings. In contrast, stock picking and an underweight in materials as well as security selection in health care detracted from relative performance. The largest individual relative detractor was our non-benchmark stake in Barrick Gold (-19%), which was not held at period end. Avoiding both Eli Lilly, a benchmark component that gained 99% this period, and Broadcom, a benchmark component that returned about 112%, also hampered relative performance. Notable changes in positioning this period include decreased exposure to materials and health care and higher allocations to financials and information technology.
The views expressed above reflect those of the portfolio manager(s) only through the end of the period as stated on the cover of this report and do not necessarily represent the views of Fidelity or any other person in the Fidelity organization. Any such views are subject to change at any time based upon market or other conditions and Fidelity disclaims any responsibility to update such views. These views may not be relied on as investment advice and, because investment decisions for a Fidelity fund are based on numerous factors, may not be relied on as an indication of trading intent on behalf of any Fidelity fund.
Top Holdings (% of Fund's net assets) |
| |
| NVIDIA Corp. | 7.7 | |
| Microsoft Corp. | 7.4 | |
| Meta Platforms, Inc. Class A | 5.0 | |
| Amazon.com, Inc. | 4.9 | |
| Alphabet, Inc. Class C | 4.6 | |
| Apollo Global Management, Inc. | 2.4 | |
| Marriott International, Inc. Class A | 2.4 | |
| Uber Technologies, Inc. | 2.4 | |
| Netflix, Inc. | 2.3 | |
| BlackRock, Inc. Class A | 2.0 | |
| | 41.1 | |
| |
| Market Sectors (% of Fund's net assets) |
| |
| Information Technology | 31.7 | |
| Consumer Discretionary | 16.2 | |
| Financials | 14.4 | |
| Communication Services | 13.2 | |
| Health Care | 7.2 | |
| Industrials | 7.0 | |
| Energy | 3.9 | |
| Real Estate | 2.3 | |
| Consumer Staples | 1.1 | |
| Materials | 0.2 | |
| |
Asset Allocation (% of Fund's net assets) |
|
|
Showing Percentage of Net Assets
| Common Stocks - 96.9% |
| | | Shares | Value ($) |
| COMMUNICATION SERVICES - 13.1% | | | |
| Entertainment - 2.9% | | | |
| Netflix, Inc. (a) | | 5,709 | 3,143,604 |
| Spotify Technology SA (a) | | 2,990 | 838,516 |
| | | | 3,982,120 |
| Interactive Media & Services - 9.6% | | | |
| Alphabet, Inc. Class C | | 37,636 | 6,196,391 |
| Meta Platforms, Inc. Class A | | 15,887 | 6,834,111 |
| Reddit, Inc. Class B (h) | | 200 | 8,888 |
| VerticalScope Holdings, Inc. (a) | | 7,292 | 41,528 |
| | | | 13,080,918 |
| Media - 0.6% | | | |
| The Trade Desk, Inc. (a) | | 8,738 | 723,943 |
TOTAL COMMUNICATION SERVICES | | | 17,786,981 |
| CONSUMER DISCRETIONARY - 16.2% | | | |
| Automobiles - 0.4% | | | |
| Tesla, Inc. (a) | | 2,863 | 524,731 |
| Broadline Retail - 4.9% | | | |
| Amazon.com, Inc. (a) | | 38,290 | 6,700,750 |
| Hotels, Restaurants & Leisure - 5.4% | | | |
| Airbnb, Inc. Class A (a) | | 15,162 | 2,404,238 |
| Cava Group, Inc. | | 300 | 21,582 |
| Draftkings Holdings, Inc. (a) | | 31,963 | 1,328,382 |
| Dutch Bros, Inc. (a) | | 300 | 8,448 |
| Marriott International, Inc. Class A | | 13,564 | 3,202,867 |
| Monarch Casino & Resort, Inc. | | 724 | 49,065 |
| Penn Entertainment, Inc. (a) | | 3,300 | 54,582 |
| Red Rock Resorts, Inc. | | 1,003 | 53,279 |
| Trip.com Group Ltd. ADR (a) | | 4,676 | 225,664 |
| | | | 7,348,107 |
| Household Durables - 0.7% | | | |
| D.R. Horton, Inc. | | 5,800 | 826,442 |
| Garmin Ltd. | | 756 | 109,219 |
| | | | 935,661 |
| Specialty Retail - 1.4% | | | |
| Aritzia, Inc. (a) | | 22,857 | 591,743 |
| Auto1 Group SE (a)(b) | | 16,871 | 86,063 |
| Industria de Diseno Textil SA (c) | | 20,650 | 944,315 |
| Revolve Group, Inc. (a)(c) | | 7,900 | 157,289 |
| thredUP, Inc. (a)(c) | | 400 | 640 |
| Wayfair LLC Class A (a) | | 2,097 | 105,165 |
| | | | 1,885,215 |
| Textiles, Apparel & Luxury Goods - 3.4% | | | |
| Brunello Cucinelli SpA | | 4,884 | 500,893 |
| Canva, Inc. Class A (d)(e) | | 100 | 106,666 |
| LVMH Moet Hennessy Louis Vuitton SE | | 829 | 680,971 |
| Moncler SpA | | 9,992 | 683,741 |
| On Holding AG (a) | | 300 | 9,525 |
| Prada SpA | | 117,710 | 959,962 |
| Ralph Lauren Corp. | | 10,742 | 1,757,821 |
| | | | 4,699,579 |
TOTAL CONSUMER DISCRETIONARY | | | 22,094,043 |
| CONSUMER STAPLES - 1.1% | | | |
| Beverages - 1.1% | | | |
| Monster Beverage Corp. (a) | | 26,863 | 1,435,827 |
| ENERGY - 3.9% | | | |
| Energy Equipment & Services - 0.4% | | | |
| Cactus, Inc. | | 10,264 | 509,505 |
| Oil, Gas & Consumable Fuels - 3.5% | | | |
| Devon Energy Corp. | | 2,256 | 115,462 |
| Hess Corp. | | 12,688 | 1,998,233 |
| Reliance Industries Ltd. | | 15,134 | 531,117 |
| Tourmaline Oil Corp. | | 42,569 | 2,080,443 |
| | | | 4,725,255 |
TOTAL ENERGY | | | 5,234,760 |
| FINANCIALS - 14.4% | | | |
| Banks - 0.5% | | | |
| Pinnacle Financial Partners, Inc. | | 5,665 | 434,506 |
| Starling Bank Ltd. Series D (a)(d)(e) | | 44,800 | 168,499 |
| | | | 603,005 |
| Capital Markets - 8.7% | | | |
| Antin Infrastructure Partners SA | | 962 | 12,320 |
| Ares Management Corp. | | 18,277 | 2,432,486 |
| BlackRock, Inc. Class A | | 3,579 | 2,700,857 |
| Blue Owl Capital, Inc. Class A | | 108,187 | 2,043,652 |
| Carlyle Group LP | | 16,454 | 737,139 |
| Coinbase Global, Inc. (a) | | 5,255 | 1,071,652 |
| EQT AB | | 2,811 | 77,108 |
| Intercontinental Exchange, Inc. | | 5,260 | 677,278 |
| KKR & Co. LP | | 14,114 | 1,313,590 |
| Morningstar, Inc. | | 1,122 | 317,133 |
| XP, Inc. Class A | | 20,373 | 417,035 |
| | | | 11,800,250 |
| Consumer Finance - 0.6% | | | |
| Capital One Financial Corp. | | 5,756 | 825,583 |
| NerdWallet, Inc. (a) | | 400 | 5,028 |
| | | | 830,611 |
| Financial Services - 4.3% | | | |
| Apollo Global Management, Inc. | | 29,694 | 3,218,236 |
| Berkshire Hathaway, Inc. Class B (a) | | 3,815 | 1,513,525 |
| Block, Inc. Class A (a) | | 10,520 | 767,960 |
| Corpay, Inc. (a) | | 1,167 | 352,597 |
| Jio Financial Services Ltd. | | 10,760 | 48,440 |
| Remitly Global, Inc. (a) | | 200 | 3,566 |
| | | | 5,904,324 |
| Insurance - 0.3% | | | |
| Arthur J. Gallagher & Co. | | 1,903 | 446,615 |
TOTAL FINANCIALS | | | 19,584,805 |
| HEALTH CARE - 7.2% | | | |
| Biotechnology - 2.9% | | | |
| Blueprint Medicines Corp. (a) | | 872 | 79,648 |
| Celldex Therapeutics, Inc. (a) | | 13,072 | 489,154 |
| Moderna, Inc. (a) | | 7,390 | 815,191 |
| Prelude Therapeutics, Inc. (a) | | 300 | 1,131 |
| Regeneron Pharmaceuticals, Inc. (a) | | 2,758 | 2,456,440 |
| TG Therapeutics, Inc. (a) | | 9,875 | 134,893 |
| | | | 3,976,457 |
| Health Care Equipment & Supplies - 1.2% | | | |
| Glaukos Corp. (a) | | 3,400 | 326,400 |
| Inspire Medical Systems, Inc. (a) | | 1,936 | 467,854 |
| Masimo Corp. (a) | | 2,477 | 332,934 |
| Penumbra, Inc. (a) | | 2,536 | 498,248 |
| TransMedics Group, Inc. (a) | | 481 | 45,277 |
| | | | 1,670,713 |
| Health Care Providers & Services - 0.9% | | | |
| Guardant Health, Inc. (a) | | 2,678 | 48,204 |
| LifeStance Health Group, Inc. (a) | | 37,998 | 234,828 |
| The Joint Corp. (a) | | 1,173 | 14,006 |
| UnitedHealth Group, Inc. | | 1,941 | 938,862 |
| | | | 1,235,900 |
| Health Care Technology - 0.5% | | | |
| Doximity, Inc. (a) | | 1,932 | 46,928 |
| Veeva Systems, Inc. Class A (a) | | 2,850 | 565,896 |
| | | | 612,824 |
| Life Sciences Tools & Services - 1.7% | | | |
| Bruker Corp. | | 6,050 | 471,961 |
| Danaher Corp. | | 7,442 | 1,835,346 |
| Stevanato Group SpA (c) | | 1,249 | 35,022 |
| | | | 2,342,329 |
TOTAL HEALTH CARE | | | 9,838,223 |
| INDUSTRIALS - 7.0% | | | |
| Aerospace & Defense - 0.6% | | | |
| HEICO Corp. Class A | | 4,938 | 818,967 |
| Building Products - 0.1% | | | |
| Tecnoglass, Inc. | | 3,335 | 185,259 |
| Commercial Services & Supplies - 2.0% | | | |
| Cintas Corp. | | 2,388 | 1,572,116 |
| GFL Environmental, Inc. | | 17,222 | 549,382 |
| Veralto Corp. | | 1,307 | 122,440 |
| Waste Connections, Inc. (United States) | | 3,149 | 510,421 |
| | | | 2,754,359 |
| Construction & Engineering - 0.1% | | | |
| Bowman Consulting Group Ltd. (a) | | 3,700 | 120,213 |
| Electrical Equipment - 0.7% | | | |
| Nextracker, Inc. Class A (a) | | 23,794 | 1,018,145 |
| Ground Transportation - 2.4% | | | |
| Uber Technologies, Inc. (a) | | 48,208 | 3,194,744 |
| Professional Services - 1.1% | | | |
| TDCX, Inc. ADR (a) | | 300 | 2,148 |
| Thomson Reuters Corp. | | 9,830 | 1,484,729 |
| | | | 1,486,877 |
TOTAL INDUSTRIALS | | | 9,578,564 |
| INFORMATION TECHNOLOGY - 31.5% | | | |
| Communications Equipment - 0.5% | | | |
| Arista Networks, Inc. (a) | | 2,495 | 640,117 |
| Electronic Equipment, Instruments & Components - 0.0% | | | |
| Vontier Corp. | | 1,083 | 44,002 |
| IT Services - 4.2% | | | |
| CGI, Inc. Class A (sub. vtg.) (a) | | 890 | 90,180 |
| Cloudflare, Inc. (a) | | 8,157 | 712,922 |
| Globant SA (a) | | 4,659 | 832,051 |
| MongoDB, Inc. Class A (a) | | 3,535 | 1,290,911 |
| Shopify, Inc. Class A (a) | | 34,371 | 2,412,844 |
| Snowflake, Inc. (a) | | 1,990 | 308,848 |
| | | | 5,647,756 |
| Semiconductors & Semiconductor Equipment - 9.1% | | | |
| Analog Devices, Inc. | | 6,195 | 1,242,779 |
| Astera Labs, Inc. | | 300 | 25,428 |
| Monolithic Power Systems, Inc. | | 950 | 635,864 |
| NVIDIA Corp. | | 12,200 | 10,541,042 |
| | | | 12,445,113 |
| Software - 17.4% | | | |
| Adobe, Inc. (a) | | 2,365 | 1,094,593 |
| BlackLine, Inc. (a) | | 6,903 | 400,719 |
| CoreWeave, Inc. (d)(e) | | 160 | 62,434 |
| Dynatrace, Inc. (a) | | 16,580 | 751,240 |
| Intuit, Inc. | | 2,282 | 1,427,665 |
| Microsoft Corp. | | 25,870 | 10,071,967 |
| MicroStrategy, Inc. Class A (a)(c) | | 1,986 | 2,115,150 |
| nCino, Inc. (a) | | 84 | 2,449 |
| Oracle Corp. | | 13,430 | 1,527,663 |
| Palantir Technologies, Inc. (a) | | 33,866 | 744,036 |
| Salesforce, Inc. | | 4,924 | 1,324,261 |
| Samsara, Inc. (a) | | 800 | 27,944 |
| Synopsys, Inc. (a) | | 2,789 | 1,479,816 |
| Tenable Holdings, Inc. (a) | | 6,527 | 293,519 |
| UiPath, Inc. Class A (a) | | 38,473 | 729,833 |
| Varonis Systems, Inc. (a) | | 5,638 | 246,663 |
| Workday, Inc. Class A (a) | | 3,464 | 847,745 |
| Zoom Video Communications, Inc. Class A (a) | | 4,000 | 244,400 |
| Zscaler, Inc. (a) | | 1,553 | 268,576 |
| | | | 23,660,673 |
| Technology Hardware, Storage & Peripherals - 0.3% | | | |
| Dell Technologies, Inc. | | 3,400 | 423,776 |
TOTAL INFORMATION TECHNOLOGY | | | 42,861,437 |
| MATERIALS - 0.2% | | | |
| Metals & Mining - 0.2% | | | |
| Alamos Gold, Inc. | | 18,313 | 269,377 |
| REAL ESTATE - 2.3% | | | |
| Equity Real Estate Investment Trusts (REITs) - 1.8% | | | |
| Equity Residential (SBI) | | 15,947 | 1,026,987 |
| Public Storage | | 5,686 | 1,475,233 |
| | | | 2,502,220 |
| Real Estate Management & Development - 0.5% | | | |
| Zillow Group, Inc. Class C (a) | | 14,957 | 636,719 |
TOTAL REAL ESTATE | | | 3,138,939 |
| TOTAL COMMON STOCKS (Cost $91,091,337) | | | 131,822,956 |
| | | | |
| Convertible Preferred Stocks - 0.3% |
| | | Shares | Value ($) |
| COMMUNICATION SERVICES - 0.1% | | | |
| Interactive Media & Services - 0.1% | | | |
| ByteDance Ltd. Series E1 (a)(d)(e) | | 638 | 147,040 |
| CONSUMER DISCRETIONARY - 0.0% | | | |
| Textiles, Apparel & Luxury Goods - 0.0% | | | |
| Canva, Inc.: | | | |
| Series A (d)(e) | | 17 | 18,133 |
| Series A2 (d)(e) | | 3 | 3,200 |
| | | | 21,333 |
| INFORMATION TECHNOLOGY - 0.2% | | | |
| IT Services - 0.1% | | | |
| Yanka Industries, Inc.: | | | |
| Series E (a)(d)(e) | | 2,484 | 11,600 |
| Series F (a)(d)(e) | | 12,743 | 75,184 |
| | | | 86,784 |
| Software - 0.1% | | | |
| Evozyne, Inc. Series A (a)(d)(e) | | 1,000 | 16,050 |
| Moloco, Inc. Series A (d)(e) | | 3,703 | 165,228 |
| | | | 181,278 |
TOTAL INFORMATION TECHNOLOGY | | | 268,062 |
| TOTAL CONVERTIBLE PREFERRED STOCKS (Cost $772,102) | | | 436,435 |
| | | | |
| Money Market Funds - 5.7% |
| | | Shares | Value ($) |
| Fidelity Cash Central Fund 5.39% (f) | | 4,185,669 | 4,186,506 |
| Fidelity Securities Lending Cash Central Fund 5.39% (f)(g) | | 3,514,162 | 3,514,513 |
| TOTAL MONEY MARKET FUNDS (Cost $7,701,019) | | | 7,701,019 |
| | | | |
| TOTAL INVESTMENT IN SECURITIES - 102.9% (Cost $99,564,458) | 139,960,410 |
NET OTHER ASSETS (LIABILITIES) - (2.9)% | (3,947,483) |
| NET ASSETS - 100.0% | 136,012,927 |
| | |
Legend
| (b) | Security exempt from registration under Rule 144A of the Securities Act of 1933. These securities may be resold in transactions exempt from registration, normally to qualified institutional buyers. At the end of the period, the value of these securities amounted to $86,063 or 0.1% of net assets. |
| (c) | Security or a portion of the security is on loan at period end. |
| (d) | Restricted securities (including private placements) - Investment in securities not registered under the Securities Act of 1933 (excluding 144A issues). At the end of the period, the value of restricted securities (excluding 144A issues) amounted to $774,034 or 0.6% of net assets. |
| (f) | Affiliated fund that is generally available only to investment companies and other accounts managed by Fidelity Investments. The rate quoted is the annualized seven-day yield of the fund at period end. A complete unaudited listing of the fund's holdings as of its most recent quarter end is available upon request. In addition, each Fidelity Central Fund's financial statements, which are not covered by the Fund's Report of Independent Registered Public Accounting Firm, are available on the SEC's website or upon request. |
| (g) | Investment made with cash collateral received from securities on loan. |
| (h) | Equity security is subject to lock-up or market standoff agreement. Fair value is based on the unadjusted market price of the equivalent equity security. As of period end, the total fair value of unadjusted equity securities subject to contractual sale restrictions is $8,888 and all restrictions are set to expire on or before September 30, 2024. Under normal market conditions, there are no circumstances that could cause the restrictions to lapse. |
| Additional information on each restricted holding is as follows: |
| Security | Acquisition Date | Acquisition Cost ($) |
| ByteDance Ltd. Series E1 | 11/18/20 | 69,908 |
| | | |
| Canva, Inc. Class A | 3/18/24 | 106,666 |
| | | |
| Canva, Inc. Series A | 9/22/23 | 18,133 |
| | | |
| Canva, Inc. Series A2 | 9/22/23 | 3,200 |
| | | |
| CoreWeave, Inc. | 11/29/23 | 49,578 |
| | | |
| Evozyne, Inc. Series A | 4/09/21 | 22,470 |
| | | |
| Moloco, Inc. Series A | 6/26/23 | 222,180 |
| | | |
| Starling Bank Ltd. Series D | 6/18/21 - 4/05/22 | 85,152 |
| | | |
| Yanka Industries, Inc. Series E | 5/15/20 | 30,005 |
| | | |
| Yanka Industries, Inc. Series F | 4/08/21 | 406,206 |
| | | |
Affiliated Central Funds
Fiscal year to date information regarding the Fund's investments in Fidelity Central Funds, including the ownership percentage, is presented below.
| Affiliate | Value, beginning of period ($) | Purchases ($) | Sales Proceeds ($) | Dividend Income ($) | Realized Gain (loss) ($) | Change in Unrealized appreciation (depreciation) ($) | Value, end of period ($) | % ownership, end of period |
| Fidelity Cash Central Fund 5.39% | 2,147,926 | 30,337,318 | 28,298,738 | 130,772 | - | - | 4,186,506 | 0.0% |
| Fidelity Securities Lending Cash Central Fund 5.39% | 320,400 | 20,858,793 | 17,664,680 | 7,881 | - | - | 3,514,513 | 0.0% |
| Total | 2,468,326 | 51,196,111 | 45,963,418 | 138,653 | - | - | 7,701,019 | |
| | | | | | | | | |
Amounts in the dividend income column in the above table include any capital gain distributions from underlying funds, which are presented in the corresponding line item in the Statement of Operations, if applicable.
Amounts in the dividend income column for Fidelity Securities Lending Cash Central Fund represents the income earned on investing cash collateral, less rebates paid to borrowers and any lending agent fees associated with the loan, plus any premium payments received for lending certain types of securities.
Amounts included in the purchases and sales proceeds columns may include in-kind transactions, if applicable.
Investment Valuation
The following is a summary of the inputs used, as of April 30, 2024, involving the Fund's assets and liabilities carried at fair value. The inputs or methodology used for valuing securities may not be an indication of the risk associated with investing in those securities. For more information on valuation inputs, and their aggregation into the levels used below, please refer to the Investment Valuation section in the accompanying Notes to Financial Statements.
| Valuation Inputs at Reporting Date: |
| Description | Total ($) | Level 1 ($) | Level 2 ($) | Level 3 ($) |
Investments in Securities: | | | | |
|
| Equities: | | | | |
Communication Services | 17,934,021 | 17,786,981 | - | 147,040 |
Consumer Discretionary | 22,115,376 | 20,346,444 | 1,640,933 | 127,999 |
Consumer Staples | 1,435,827 | 1,435,827 | - | - |
Energy | 5,234,760 | 4,703,643 | 531,117 | - |
Financials | 19,584,805 | 19,367,866 | 48,440 | 168,499 |
Health Care | 9,838,223 | 9,838,223 | - | - |
Industrials | 9,578,564 | 9,578,564 | - | - |
Information Technology | 43,129,499 | 42,799,003 | - | 330,496 |
Materials | 269,377 | 269,377 | - | - |
Real Estate | 3,138,939 | 3,138,939 | - | - |
|
| Money Market Funds | 7,701,019 | 7,701,019 | - | - |
| Total Investments in Securities: | 139,960,410 | 136,965,886 | 2,220,490 | 774,034 |
| Statement of Assets and Liabilities |
| | | | April 30, 2024 |
| | | | | |
| Assets | | | | |
| Investment in securities, at value (including securities loaned of $2,966,990) - See accompanying schedule: | | | | |
Unaffiliated issuers (cost $91,863,439) | $ | 132,259,391 | | |
Fidelity Central Funds (cost $7,701,019) | | 7,701,019 | | |
| | | | | |
| | | | | |
| Total Investment in Securities (cost $99,564,458) | | | $ | 139,960,410 |
| Cash | | | | 118 |
| Receivable for fund shares sold | | | | 229,135 |
| Dividends receivable | | | | 31,560 |
| Distributions receivable from Fidelity Central Funds | | | | 18,221 |
| Prepaid expenses | | | | 34 |
Total assets | | | | 140,239,478 |
| Liabilities | | | | |
| Payable for investments purchased | $ | 499,588 | | |
| Payable for fund shares redeemed | | 78,316 | | |
| Accrued management fee | | 74,644 | | |
| Distribution and service plan fees payable | | 13,549 | | |
| Other payables and accrued expenses | | 45,941 | | |
| Collateral on securities loaned | | 3,514,513 | | |
| Total liabilities | | | | 4,226,551 |
| Net Assets | | | $ | 136,012,927 |
| Net Assets consist of: | | | | |
| Paid in capital | | | $ | 97,341,824 |
| Total accumulated earnings (loss) | | | | 38,671,103 |
| Net Assets | | | $ | 136,012,927 |
| | | | | |
| Net Asset Value and Maximum Offering Price | | | | |
| Class A : | | | | |
Net Asset Value and redemption price per share ($22,455,869 ÷ 1,145,402 shares)(a) | | | $ | 19.61 |
| Maximum offering price per share (100/94.25 of $19.61) | | | $ | 20.81 |
| Class M : | | | | |
Net Asset Value and redemption price per share ($14,328,005 ÷ 737,252 shares)(a) | | | $ | 19.43 |
| Maximum offering price per share (100/96.50 of $19.43) | | | $ | 20.13 |
| Class C : | | | | |
Net Asset Value and offering price per share ($3,084,674 ÷ 161,895 shares)(a) | | | $ | 19.05 |
| Fidelity Founders Fund : | | | | |
Net Asset Value, offering price and redemption price per share ($84,557,284 ÷ 4,280,403 shares) | | | $ | 19.75 |
| Class I : | | | | |
Net Asset Value, offering price and redemption price per share ($4,791,913 ÷ 242,613 shares) | | | $ | 19.75 |
| Class Z : | | | | |
Net Asset Value, offering price and redemption price per share ($6,795,182 ÷ 342,650 shares) | | | $ | 19.83 |
(a)Redemption price per share is equal to net asset value less any applicable contingent deferred sales charge. |
| Statement of Operations |
| | | | Year ended April 30, 2024 |
| Investment Income | | | | |
| Dividends | | | $ | 819,119 |
| Income from Fidelity Central Funds (including $7,881 from security lending) | | | | 138,653 |
| Total income | | | | 957,772 |
| Expenses | | | | |
| Management fee | | | | |
| Basic fee | $ | 628,426 | | |
| Performance adjustment | | (96,764) | | |
| Transfer agent fees | | 179,381 | | |
| Distribution and service plan fees | | 127,300 | | |
| Accounting fees | | 31,837 | | |
| Custodian fees and expenses | | 7,491 | | |
| Independent trustees' fees and expenses | | 536 | | |
| Registration fees | | 90,133 | | |
| Audit | | 47,934 | | |
| Legal | | 1,767 | | |
| Miscellaneous | | 402 | | |
| Total expenses before reductions | | 1,018,443 | | |
| Expense reductions | | (9,639) | | |
| Total expenses after reductions | | | | 1,008,804 |
| Net Investment income (loss) | | | | (51,032) |
| Realized and Unrealized Gain (Loss) | | | | |
| Net realized gain (loss) on: | | | | |
| Investment Securities: | | | | |
| Unaffiliated issuers | | 2,533,749 | | |
| Foreign currency transactions | | (2,668) | | |
| Total net realized gain (loss) | | | | 2,531,081 |
| Change in net unrealized appreciation (depreciation) on: | | | | |
| Investment Securities: | | | | |
| Unaffiliated issuers (net of increase in deferred foreign taxes of $10,975) | | 25,992,425 | | |
| Assets and liabilities in foreign currencies | | (109) | | |
| Total change in net unrealized appreciation (depreciation) | | | | 25,992,316 |
| Net gain (loss) | | | | 28,523,397 |
| Net increase (decrease) in net assets resulting from operations | | | $ | 28,472,365 |
| Statement of Changes in Net Assets |
| |
| | Year ended April 30, 2024 | | Year ended April 30, 2023 |
| Increase (Decrease) in Net Assets | | | | |
| Operations | | | | |
| Net investment income (loss) | $ | (51,032) | $ | 623,204 |
| Net realized gain (loss) | | 2,531,081 | | (3,924,115) |
| Change in net unrealized appreciation (depreciation) | | 25,992,316 | | (384,550) |
| Net increase (decrease) in net assets resulting from operations | | 28,472,365 | | (3,685,461) |
| Distributions to shareholders | | (98,999) | | (2,274,733) |
| | | | | |
| Share transactions - net increase (decrease) | | 14,124,777 | | (11,151,975) |
| Total increase (decrease) in net assets | | 42,498,143 | | (17,112,169) |
| | | | | |
| Net Assets | | | | |
| Beginning of period | | 93,514,784 | | 110,626,953 |
| End of period | $ | 136,012,927 | $ | 93,514,784 |
| | | | | |
| | | | | |
Financial Highlights
Fidelity Advisor® Founders Fund Class A |
| |
| Years ended April 30, | | 2024 | | 2023 | | 2022 | | 2021 | | 2020 |
Selected Per-Share Data | | | | | | | | | | |
| Net asset value, beginning of period | $ | 15.07 | $ | 15.71 | $ | 18.71 | $ | 11.85 | $ | 10.85 |
| Income from Investment Operations | | | | | | | | | | |
Net investment income (loss) A,B | | (.04) | | .07 | | - C,D | | (.14) | | (.05) E |
| Net realized and unrealized gain (loss) | | 4.58 | | (.38) | | (1.88) | | 7.00 | | 1.05 |
| Total from investment operations | | 4.54 | | (.31) | | (1.88) | | 6.86 | | 1.00 |
| Distributions from net investment income | | - | | (.07) | | (.02) | | - | | - D |
| Distributions from net realized gain | | - | | (.26) | | (1.11) | | - | | - |
| Total distributions | | - | | (.33) | | (1.12) F | | - | | - D |
| Net asset value, end of period | $ | 19.61 | $ | 15.07 | $ | 15.71 | $ | 18.71 | $ | 11.85 |
Total Return G,H | | | | (1.90)% | | (10.74)% | | 57.89% | | 9.25% |
Ratios to Average Net Assets B,I,J | | | | | | | | | | |
| Expenses before reductions | | 1.06% | | 1.24% | | 1.17% | | 1.25% | | 2.05% |
| Expenses net of fee waivers, if any | | | | 1.15% | | 1.15% | | 1.25% | | 1.25% |
| Expenses net of all reductions | | 1.05% | | 1.15% | | 1.15% | | 1.24% | | 1.25% |
| Net investment income (loss) | | (.21)% | | .49% | | -% C,K | | (.83)% | | (.47)% E |
| Supplemental Data | | | | | | | | | | |
| Net assets, end of period (000 omitted) | $ | 22,456 | $ | 13,884 | $ | 11,013 | $ | 11,606 | $ | 1,310 |
Portfolio turnover rate L | | | | 51% | | 47% | | 57% | | 82% |
ACalculated based on average shares outstanding during the period.
BNet investment income (loss) is affected by the timing of the declaration of dividends by any underlying mutual funds or exchange-traded funds (ETFs). Net investment income (loss) of any mutual funds or ETFs is not included in the Fund's net investment income (loss) ratio.
CNet investment income per share reflects one or more large, non-recurring dividend(s) which amounted to $.03 per share. Excluding such non-recurring dividend(s), the ratio of net investment income (loss) to average net assets would have been (.19)%.
DAmount represents less than $.005 per share.
ENet investment income per share reflects one or more large, non-recurring dividend(s) which amounted to $.03 per share. Excluding such non-recurring dividend(s), the ratio of net investment income (loss) to average net assets would have been (.70)%.
FTotal distributions per share do not sum due to rounding.
GTotal returns would have been lower if certain expenses had not been reduced during the applicable periods shown.
HTotal returns do not include the effect of the sales charges.
IFees and expenses of any underlying mutual funds or exchange-traded funds (ETFs) are not included in the Fund's expense ratio. The Fund indirectly bears its proportionate share of these expenses. For additional expense information related to investments in Fidelity Central Funds, please refer to the "Investments in Fidelity Central Funds" note found in the Notes to Financial Statements section of the most recent Annual or Semi-Annual report.
JExpense ratios reflect operating expenses of the class. Expenses before reductions do not reflect amounts reimbursed, waived, or reduced through arrangements with the investment adviser, brokerage services, or other offset arrangements, if applicable, and do not represent the amount paid by the class during periods when reimbursements, waivers or reductions occur.
KAmount represents less than .005%.
LAmount does not include the portfolio activity of any underlying mutual funds or exchange-traded funds (ETFs).
Fidelity Advisor® Founders Fund Class M |
| |
| Years ended April 30, | | 2024 | | 2023 | | 2022 | | 2021 | | 2020 |
Selected Per-Share Data | | | | | | | | | | |
| Net asset value, beginning of period | $ | 14.97 | $ | 15.62 | $ | 18.62 | $ | 11.82 | $ | 10.85 |
| Income from Investment Operations | | | | | | | | | | |
Net investment income (loss) A,B | | (.08) | | .03 | | (.04) C | | (.17) | | (.08) D |
| Net realized and unrealized gain (loss) | | 4.54 | | (.38) | | (1.87) | | 6.97 | | 1.05 |
| Total from investment operations | | 4.46 | | (.35) | | (1.91) | | 6.80 | | .97 |
| Distributions from net investment income | | - | | (.04) | | - | | - | | - |
| Distributions from net realized gain | | - | | (.26) | | (1.09) | | - | | - |
| Total distributions | | - | | (.30) | | (1.09) | | - | | - |
| Net asset value, end of period | $ | 19.43 | $ | 14.97 | $ | 15.62 | $ | 18.62 | $ | 11.82 |
Total Return E,F | | | | (2.20)% | | (10.93)% | | 57.53% | | 8.94% |
Ratios to Average Net Assets B,G,H | | | | | | | | | | |
| Expenses before reductions | | 1.29% | | 1.44% | | 1.39% | | 1.46% | | 2.14% |
| Expenses net of fee waivers, if any | | | | 1.40% | | 1.38% | | 1.46% | | 1.50% |
| Expenses net of all reductions | | 1.28% | | 1.40% | | 1.38% | | 1.45% | | 1.50% |
| Net investment income (loss) | | (.44)% | | .24% | | (.24)% C | | (1.04)% | | (.72)% D |
| Supplemental Data | | | | | | | | | | |
| Net assets, end of period (000 omitted) | $ | 14,328 | $ | 8,354 | $ | 8,562 | $ | 7,357 | $ | 695 |
Portfolio turnover rate I | | | | 51% | | 47% | | 57% | | 82% |
ACalculated based on average shares outstanding during the period.
BNet investment income (loss) is affected by the timing of the declaration of dividends by any underlying mutual funds or exchange-traded funds (ETFs). Net investment income (loss) of any mutual funds or ETFs is not included in the Fund's net investment income (loss) ratio.
CNet investment income per share reflects one or more large, non-recurring dividend(s) which amounted to $.03 per share. Excluding such non-recurring dividend(s), the ratio of net investment income (loss) to average net assets would have been (.42)%.
DNet investment income per share reflects one or more large, non-recurring dividend(s) which amounted to $.03 per share. Excluding such non-recurring dividend(s), the ratio of net investment income (loss) to average net assets would have been (.95)%.
ETotal returns do not include the effect of the sales charges.
FTotal returns would have been lower if certain expenses had not been reduced during the applicable periods shown.
GFees and expenses of any underlying mutual funds or exchange-traded funds (ETFs) are not included in the Fund's expense ratio. The Fund indirectly bears its proportionate share of these expenses. For additional expense information related to investments in Fidelity Central Funds, please refer to the "Investments in Fidelity Central Funds" note found in the Notes to Financial Statements section of the most recent Annual or Semi-Annual report.
HExpense ratios reflect operating expenses of the class. Expenses before reductions do not reflect amounts reimbursed, waived, or reduced through arrangements with the investment adviser, brokerage services, or other offset arrangements, if applicable, and do not represent the amount paid by the class during periods when reimbursements, waivers or reductions occur.
IAmount does not include the portfolio activity of any underlying mutual funds or exchange-traded funds (ETFs).
Fidelity Advisor® Founders Fund Class C |
| |
| Years ended April 30, | | 2024 | | 2023 | | 2022 | | 2021 | | 2020 |
Selected Per-Share Data | | | | | | | | | | |
| Net asset value, beginning of period | $ | 14.76 | $ | 15.43 | $ | 18.41 | $ | 11.75 | $ | 10.84 |
| Income from Investment Operations | | | | | | | | | | |
Net investment income (loss) A,B | | (.17) | | (.04) | | (.14) C | | (.26) | | (.13) D |
| Net realized and unrealized gain (loss) | | 4.46 | | (.37) | | (1.84) | | 6.92 | | 1.04 |
| Total from investment operations | | 4.29 | | (.41) | | (1.98) | | 6.66 | | .91 |
| Distributions from net realized gain | | - | | (.26) | | (1.00) | | - | | - |
| Total distributions | | - | | (.26) | | (1.00) | | - | | - |
| Net asset value, end of period | $ | 19.05 | $ | 14.76 | $ | 15.43 | $ | 18.41 | $ | 11.75 |
Total Return E,F | | | | (2.67)% | | (11.40)% | | 56.68% | | 8.39% |
Ratios to Average Net Assets B,G,H | | | | | | | | | | |
| Expenses before reductions | | 1.83% | | 2.01% | | 1.99% | | 2.04% | | 2.64% |
| Expenses net of fee waivers, if any | | | | 1.90% | | 1.91% | | 2.00% | | 2.00% |
| Expenses net of all reductions | | 1.82% | | 1.90% | | 1.91% | | 1.99% | | 2.00% |
| Net investment income (loss) | | (.98)% | | (.26)% | | (.76)% C | | (1.58)% | | (1.22)% D |
| Supplemental Data | | | | | | | | | | |
| Net assets, end of period (000 omitted) | $ | 3,085 | $ | 1,613 | $ | 1,717 | $ | 2,035 | $ | 335 |
Portfolio turnover rate I | | | | 51% | | 47% | | 57% | | 82% |
ACalculated based on average shares outstanding during the period.
BNet investment income (loss) is affected by the timing of the declaration of dividends by any underlying mutual funds or exchange-traded funds (ETFs). Net investment income (loss) of any mutual funds or ETFs is not included in the Fund's net investment income (loss) ratio.
CNet investment income per share reflects one or more large, non-recurring dividend(s) which amounted to $.03 per share. Excluding such non-recurring dividend(s), the ratio of net investment income (loss) to average net assets would have been (.95)%.
DNet investment income per share reflects one or more large, non-recurring dividend(s) which amounted to $.03 per share. Excluding such non-recurring dividend(s), the ratio of net investment income (loss) to average net assets would have been (1.45)%.
ETotal returns would have been lower if certain expenses had not been reduced during the applicable periods shown.
FTotal returns do not include the effect of the contingent deferred sales charge.
GFees and expenses of any underlying mutual funds or exchange-traded funds (ETFs) are not included in the Fund's expense ratio. The Fund indirectly bears its proportionate share of these expenses. For additional expense information related to investments in Fidelity Central Funds, please refer to the "Investments in Fidelity Central Funds" note found in the Notes to Financial Statements section of the most recent Annual or Semi-Annual report.
HExpense ratios reflect operating expenses of the class. Expenses before reductions do not reflect amounts reimbursed, waived, or reduced through arrangements with the investment adviser, brokerage services, or other offset arrangements, if applicable, and do not represent the amount paid by the class during periods when reimbursements, waivers or reductions occur.
IAmount does not include the portfolio activity of any underlying mutual funds or exchange-traded funds (ETFs).
| Years ended April 30, | | 2024 | | 2023 | | 2022 | | 2021 | | 2020 |
Selected Per-Share Data | | | | | | | | | | |
| Net asset value, beginning of period | $ | 15.16 | $ | 15.79 | $ | 18.80 | $ | 11.88 | $ | 10.86 |
| Income from Investment Operations | | | | | | | | | | |
Net investment income (loss) A,B | | .01 | | .11 | | .05 C | | (.09) | | (.02) D |
| Net realized and unrealized gain (loss) | | 4.60 | | (.39) | | (1.89) | | 7.01 | | 1.05 |
| Total from investment operations | | 4.61 | | (.28) | | (1.84) | | 6.92 | | 1.03 |
| Distributions from net investment income | | (.02) | | (.09) | | (.04) | | - | | (.01) |
| Distributions from net realized gain | | - | | (.26) | | (1.13) | | - | | - |
| Total distributions | | (.02) | | (.35) | | (1.17) | | - | | (.01) |
| Net asset value, end of period | $ | 19.75 | $ | 15.16 | $ | 15.79 | $ | 18.80 | $ | 11.88 |
Total Return E | | | | (1.69)% | | (10.48)% | | 58.25% | | 9.49% |
Ratios to Average Net Assets B,F,G | | | | | | | | | | |
| Expenses before reductions | | .80% | | .98% | | .90% | | .97% | | 1.70% |
| Expenses net of fee waivers, if any | | | | .90% | | .90% | | .97% | | 1.00% |
| Expenses net of all reductions | | .79% | | .90% | | .90% | | .97% | | 1.00% |
| Net investment income (loss) | | .06% | | .74% | | .25% C | | (.56)% | | (.22)% D |
| Supplemental Data | | | | | | | | | | |
| Net assets, end of period (000 omitted) | $ | 84,557 | $ | 62,601 | $ | 69,885 | $ | 96,052 | $ | 22,724 |
Portfolio turnover rate H | | | | 51% | | 47% | | 57% | | 82% |
ACalculated based on average shares outstanding during the period.
BNet investment income (loss) is affected by the timing of the declaration of dividends by any underlying mutual funds or exchange-traded funds (ETFs). Net investment income (loss) of any mutual funds or ETFs is not included in the Fund's net investment income (loss) ratio.
CNet investment income per share reflects one or more large, non-recurring dividend(s) which amounted to $.03 per share. Excluding such non-recurring dividend(s), the ratio of net investment income (loss) to average net assets would have been .06%.
DNet investment income per share reflects one or more large, non-recurring dividend(s) which amounted to $.03 per share. Excluding such non-recurring dividend(s), the ratio of net investment income (loss) to average net assets would have been (.45)%.
ETotal returns would have been lower if certain expenses had not been reduced during the applicable periods shown.
FFees and expenses of any underlying mutual funds or exchange-traded funds (ETFs) are not included in the Fund's expense ratio. The Fund indirectly bears its proportionate share of these expenses. For additional expense information related to investments in Fidelity Central Funds, please refer to the "Investments in Fidelity Central Funds" note found in the Notes to Financial Statements section of the most recent Annual or Semi-Annual report.
GExpense ratios reflect operating expenses of the class. Expenses before reductions do not reflect amounts reimbursed, waived, or reduced through arrangements with the investment adviser, brokerage services, or other offset arrangements, if applicable, and do not represent the amount paid by the class during periods when reimbursements, waivers or reductions occur.
HAmount does not include the portfolio activity of any underlying mutual funds or exchange-traded funds (ETFs).
Fidelity Advisor® Founders Fund Class I |
| |
| Years ended April 30, | | 2024 | | 2023 | | 2022 | | 2021 | | 2020 |
Selected Per-Share Data | | | | | | | | | | |
| Net asset value, beginning of period | $ | 15.16 | $ | 15.79 | $ | 18.81 | $ | 11.88 | $ | 10.86 |
| Income from Investment Operations | | | | | | | | | | |
Net investment income (loss) A,B | | .02 | | .11 | | .06 C | | (.08) | | (.02) D |
| Net realized and unrealized gain (loss) | | 4.60 | | (.39) | | (1.89) | | 7.01 | | 1.05 |
| Total from investment operations | | 4.62 | | (.28) | | (1.83) | | 6.93 | | 1.03 |
| Distributions from net investment income | | (.03) | | (.10) | | (.05) | | - | | (.01) |
| Distributions from net realized gain | | - | | (.26) | | (1.14) | | - | | - |
| Total distributions | | (.03) | | (.35) E | | (1.19) | | - | | (.01) |
| Net asset value, end of period | $ | 19.75 | $ | 15.16 | $ | 15.79 | $ | 18.81 | $ | 11.88 |
Total Return F | | | | (1.64)% | | (10.45)% | | 58.33% | | 9.49% |
Ratios to Average Net Assets B,G,H | | | | | | | | | | |
| Expenses before reductions | | .74% | | .88% | | .85% | | .93% | | 1.63% |
| Expenses net of fee waivers, if any | | | | .88% | | .85% | | .93% | | 1.00% |
| Expenses net of all reductions | | .73% | | .88% | | .85% | | .92% | | 1.00% |
| Net investment income (loss) | | .12% | | .76% | | .30% C | | (.51)% | | (.22)% D |
| Supplemental Data | | | | | | | | | | |
| Net assets, end of period (000 omitted) | $ | 4,792 | $ | 2,899 | $ | 1,263 | $ | 1,449 | $ | 467 |
Portfolio turnover rate I | | | | 51% | | 47% | | 57% | | 82% |
ACalculated based on average shares outstanding during the period.
BNet investment income (loss) is affected by the timing of the declaration of dividends by any underlying mutual funds or exchange-traded funds (ETFs). Net investment income (loss) of any mutual funds or ETFs is not included in the Fund's net investment income (loss) ratio.
CNet investment income per share reflects one or more large, non-recurring dividend(s) which amounted to $.03 per share. Excluding such non-recurring dividend(s), the ratio of net investment income (loss) to average net assets would have been .12%.
DNet investment income per share reflects one or more large, non-recurring dividend(s) which amounted to $.03 per share. Excluding such non-recurring dividend(s), the ratio of net investment income (loss) to average net assets would have been (.45)%.
ETotal distributions per share do not sum due to rounding.
FTotal returns would have been lower if certain expenses had not been reduced during the applicable periods shown.
GFees and expenses of any underlying mutual funds or exchange-traded funds (ETFs) are not included in the Fund's expense ratio. The Fund indirectly bears its proportionate share of these expenses. For additional expense information related to investments in Fidelity Central Funds, please refer to the "Investments in Fidelity Central Funds" note found in the Notes to Financial Statements section of the most recent Annual or Semi-Annual report.
HExpense ratios reflect operating expenses of the class. Expenses before reductions do not reflect amounts reimbursed, waived, or reduced through arrangements with the investment adviser, brokerage services, or other offset arrangements, if applicable, and do not represent the amount paid by the class during periods when reimbursements, waivers or reductions occur.
IAmount does not include the portfolio activity of any underlying mutual funds or exchange-traded funds (ETFs).
Fidelity Advisor® Founders Fund Class Z |
| |
| Years ended April 30, | | 2024 | | 2023 | | 2022 | | 2021 | | 2020 |
Selected Per-Share Data | | | | | | | | | | |
| Net asset value, beginning of period | $ | 15.21 | $ | 15.83 | $ | 18.86 | $ | 11.90 | $ | 10.86 |
| Income from Investment Operations | | | | | | | | | | |
Net investment income (loss) A,B | | .04 | | .13 | | .07 C | | (.07) | | (.01) D |
| Net realized and unrealized gain (loss) | | 4.62 | | (.39) | | (1.89) | | 7.03 | | 1.06 |
| Total from investment operations | | 4.66 | | (.26) | | (1.82) | | 6.96 | | 1.05 |
| Distributions from net investment income | | (.04) | | (.10) | | (.06) | | - | | (.01) |
| Distributions from net realized gain | | - | | (.26) | | (1.15) | | - | | - |
| Total distributions | | (.04) | | (.36) | | (1.21) | | - | | (.01) |
| Net asset value, end of period | $ | 19.83 | $ | 15.21 | $ | 15.83 | $ | 18.86 | $ | 11.90 |
Total Return E | | | | (1.55)% | | (10.37)% | | 58.49% | | 9.67% |
Ratios to Average Net Assets B,F,G | | | | | | | | | | |
| Expenses before reductions | | .63% | | .78% | | .76% | | .83% | | 1.51% |
| Expenses net of fee waivers, if any | | | | .75% | | .75% | | .83% | | .85% |
| Expenses net of all reductions | | .63% | | .75% | | .75% | | .82% | | .85% |
| Net investment income (loss) | | .22% | | .89% | | .40% C | | (.41)% | | (.07)% D |
| Supplemental Data | | | | | | | | | | |
| Net assets, end of period (000 omitted) | $ | 6,795 | $ | 4,165 | $ | 18,186 | $ | 21,966 | $ | 6,839 |
Portfolio turnover rate H | | | | 51% | | 47% | | 57% | | 82% |
ACalculated based on average shares outstanding during the period.
BNet investment income (loss) is affected by the timing of the declaration of dividends by any underlying mutual funds or exchange-traded funds (ETFs). Net investment income (loss) of any mutual funds or ETFs is not included in the Fund's net investment income (loss) ratio.
CNet investment income per share reflects one or more large, non-recurring dividend(s) which amounted to $.03 per share. Excluding such non-recurring dividend(s), the ratio of net investment income (loss) to average net assets would have been .22%.
DNet investment income per share reflects one or more large, non-recurring dividend(s) which amounted to $.03 per share. Excluding such non-recurring dividend(s), the ratio of net investment income (loss) to average net assets would have been (.30)%.
ETotal returns would have been lower if certain expenses had not been reduced during the applicable periods shown.
FFees and expenses of any underlying mutual funds or exchange-traded funds (ETFs) are not included in the Fund's expense ratio. The Fund indirectly bears its proportionate share of these expenses. For additional expense information related to investments in Fidelity Central Funds, please refer to the "Investments in Fidelity Central Funds" note found in the Notes to Financial Statements section of the most recent Annual or Semi-Annual report.
GExpense ratios reflect operating expenses of the class. Expenses before reductions do not reflect amounts reimbursed, waived, or reduced through arrangements with the investment adviser, brokerage services, or other offset arrangements, if applicable, and do not represent the amount paid by the class during periods when reimbursements, waivers or reductions occur.
HAmount does not include the portfolio activity of any underlying mutual funds or exchange-traded funds (ETFs).
For the period ended April 30, 2024
1. Organization.
Fidelity Founders Fund (the Fund) is a fund of Fidelity Concord Street Trust (the Trust) and is authorized to issue an unlimited number of shares. The Trust is registered under the Investment Company Act of 1940, as amended (the 1940 Act), as an open-end management investment company organized as a Massachusetts business trust. The Fund offers Class A, Class M, Class C, Fidelity Founders Fund, Class I and Class Z shares, each of which has equal rights as to assets and voting privileges. Class A, Class M, Class C, Class I and Class Z are Fidelity Advisor classes. Each class has exclusive voting rights with respect to matters that affect that class. Class C shares will automatically convert to Class A shares after a holding period of eight years from the initial date of purchase, with certain exceptions.
2. Investments in Fidelity Central Funds.
Funds may invest in Fidelity Central Funds, which are open-end investment companies generally available only to other investment companies and accounts managed by the investment adviser and its affiliates. The Schedule of Investments lists any Fidelity Central Funds held as an investment as of period end, but does not include the underlying holdings of each Fidelity Central Fund. An investing fund indirectly bears its proportionate share of the expenses of the underlying Fidelity Central Funds.
Based on its investment objective, each Fidelity Central Fund may invest or participate in various investment vehicles or strategies that are similar to those of the investing fund. These strategies are consistent with the investment objectives of the investing fund and may involve certain economic risks which may cause a decline in value of each of the Fidelity Central Funds and thus a decline in the value of the investing fund.
| Fidelity Central Fund | Investment Manager | Investment Objective | Investment Practices | Expense RatioA |
| Fidelity Money Market Central Funds | Fidelity Management & Research Company LLC (FMR) | Each fund seeks to obtain a high level of current income consistent with the preservation of capital and liquidity. | Short-term Investments | Less than .005% |
A Expenses expressed as a percentage of average net assets and are as of each underlying Central Fund's most recent annual or semi-annual shareholder report.
A complete unaudited list of holdings for each Fidelity Central Fund is available upon request or at the Securities and Exchange Commission website at www.sec.gov. In addition, the financial statements of the Fidelity Central Funds which contain the significant accounting policies (including investment valuation policies) of those funds, and are not covered by the Report of Independent Registered Public Accounting Firm, are available on the Securities and Exchange Commission website or upon request.
3. Significant Accounting Policies.
The Fund is an investment company and applies the accounting and reporting guidance of the Financial Accounting Standards Board (FASB) Accounting Standards Codification Topic 946 Financial Services - Investment Companies. The financial statements have been prepared in conformity with accounting principles generally accepted in the United States of America (GAAP), which require management to make certain estimates and assumptions at the date of the financial statements. Actual results could differ from those estimates. Subsequent events, if any, through the date that the financial statements were issued have been evaluated in the preparation of the financial statements. The Fund's Schedule of Investments lists any underlying mutual funds or ETFs but does not include the underlying holdings of these funds. The following summarizes the significant accounting policies of the Fund:
Investment Valuation. Investments are valued as of 4:00 p.m. Eastern time on the last calendar day of the period. The Board of Trustees (the Board) has designated the Fund's investment adviser as the valuation designee responsible for the fair valuation function and performing fair value determinations as needed. The investment adviser has established a Fair Value Committee (the Committee) to carry out the day-to-day fair valuation responsibilities and has adopted policies and procedures to govern the fair valuation process and the activities of the Committee. In accordance with these fair valuation policies and procedures, which have been approved by the Board, the Fund attempts to obtain prices from one or more third party pricing services or brokers to value its investments. When current market prices, quotations or currency exchange rates are not readily available or reliable, investments will be fair valued in good faith by the Committee, in accordance with the policies and procedures. Factors used in determining fair value vary by investment type and may include market or investment specific events, transaction data, estimated cash flows, and market observations of comparable investments. The frequency that the fair valuation procedures are used cannot be predicted and they may be utilized to a significant extent. The Committee manages the Fund's fair valuation practices and maintains the fair valuation policies and procedures. The Fund's investment adviser reports to the Board information regarding the fair valuation process and related material matters.
The Fund categorizes the inputs to valuation techniques used to value its investments into a disclosure hierarchy consisting of three levels as shown below:
Level 1 - unadjusted quoted prices in active markets for identical investments
Level 2 - other significant observable inputs (including quoted prices for similar investments, interest rates, prepayment speeds, etc.)
Level 3 - unobservable inputs (including the Fund's own assumptions based on the best information available)
Valuation techniques used to value the Fund's investments by major category are as follows:
Equity securities, including restricted securities, for which market quotations are readily available, are valued at the last reported sale price or official closing price as reported by a third party pricing service on the primary market or exchange on which they are traded and are categorized as Level 1 in the hierarchy. In the event there were no sales during the day or closing prices are not available, securities are valued at the last quoted bid price or may be valued using the last available price and are generally categorized as Level 2 in the hierarchy. For foreign equity securities, when market or security specific events arise, comparisons to the valuation of American Depositary Receipts (ADRs), futures contracts, ETFs and certain indexes as well as quoted prices for similar securities may be used and would be categorized as Level 2 in the hierarchy. For equity securities, including restricted securities, where observable inputs are limited, assumptions about market activity and risk are used and these securities may be categorized as Level 3 in the hierarchy.
Investments in open-end mutual funds, including the Fidelity Central Funds, are valued at their closing net asset value (NAV) each business day and are categorized as Level 1 in the hierarchy.
Changes in valuation techniques may result in transfers in or out of an assigned level within the disclosure hierarchy. The aggregate value of investments by input level as of April 30, 2024 is included at the end of the Fund's Schedule of Investments.
Foreign Currency. Certain Funds may use foreign currency contracts to facilitate transactions in foreign-denominated securities. Gains and losses from these transactions may arise from changes in the value of the foreign currency or if the counterparties do not perform under the contracts' terms.
Foreign-denominated assets, including investment securities, and liabilities are translated into U.S. dollars at the exchange rates at period end. Purchases and sales of investment securities, income and dividends received, and expenses denominated in foreign currencies are translated into U.S. dollars at the exchange rate in effect on the transaction date.
The effects of exchange rate fluctuations on investments are included with the net realized and unrealized gain (loss) on investment securities. Other foreign currency transactions resulting in realized and unrealized gain (loss) are disclosed separately.
Investment Transactions and Income. For financial reporting purposes, the Fund's investment holdings and NAV include trades executed through the end of the last business day of the period. The NAV per share for processing shareholder transactions is calculated as of the close of business of the New York Stock Exchange (NYSE), normally 4:00 p.m. Eastern time and includes trades executed through the end of the prior business day. Gains and losses on securities sold are determined on the basis of identified cost and include proceeds received from litigation. Commissions paid to certain brokers with whom the investment adviser, or its affiliates, places trades on behalf of a fund include an amount in addition to trade execution, which may be rebated back to a fund. Any such rebates are included in net realized gain (loss) on investments in the Statement of Operations. Dividend income is recorded on the ex-dividend date, except for certain dividends from foreign securities where the ex-dividend date may have passed, which are recorded as soon as the Fund is informed of the ex-dividend date. Non-cash dividends included in dividend income, if any, are recorded at the fair market value of the securities received. Income and capital gain distributions from Fidelity Central Funds, if any, are recorded on the ex-dividend date. Certain distributions received by the Fund represent a return of capital or capital gain. The Fund determines the components of these distributions subsequent to the ex-dividend date, based upon receipt of tax filings or other correspondence relating to the underlying investment. These distributions are recorded as a reduction of cost of investments and/or as a realized gain. Investment income is recorded net of foreign taxes withheld where recovery of such taxes is uncertain. Funds may file withholding tax reclaims in certain jurisdictions to recover a portion of amounts previously withheld. Any withholding tax reclaims income is included in the Statement of Operations in dividends. Any receivables for withholding tax reclaims are included in the Statement of Assets and Liabilities in dividends receivable.
Class Allocations and Expenses. Investment income, realized and unrealized capital gains and losses, common expenses of a fund, and certain fund-level expense reductions, if any, are allocated daily on a pro-rata basis to each class based on the relative net assets of each class to the total net assets of a fund. Each class differs with respect to transfer agent and distribution and service plan fees incurred, as applicable. Certain expense reductions may also differ by class, if applicable. For the reporting period, the allocated portion of income and expenses to each class as a percent of its average net assets may vary due to the timing of recording these transactions in relation to fluctuating net assets of the classes. Expenses directly attributable to a fund are charged to that fund. Expenses attributable to more than one fund are allocated among the respective funds on the basis of relative net assets or other appropriate methods. Expenses included in the accompanying financial statements reflect the expenses of that fund and do not include any expenses associated with any underlying mutual funds or exchange-traded funds (ETFs). Although not included in a fund's expenses, a fund indirectly bears its proportionate share of these expenses through the net asset value of each underlying mutual fund or exchange-traded fund (ETF). Expense estimates are accrued in the period to which they relate and adjustments are made when actual amounts are known.
Income Tax Information and Distributions to Shareholders. Each year, the Fund intends to qualify as a regulated investment company under Subchapter M of the Internal Revenue Code, including distributing substantially all of its taxable income and realized gains. As a result, no provision for U.S. Federal income taxes is required. As of April 30, 2024, the Fund did not have any unrecognized tax benefits in the financial statements; nor is the Fund aware of any tax positions for which it is reasonably possible that the total amounts of unrecognized tax benefits will significantly change in the next twelve months. The Fund files a U.S. federal tax return, in addition to state and local tax returns as required. The Fund's federal income tax returns are subject to examination by the Internal Revenue Service (IRS) for a period of three fiscal years after they are filed. State and local tax returns may be subject to examination for an additional fiscal year depending on the jurisdiction. Foreign taxes are provided for based on the Fund's understanding of the tax rules and rates that exist in the foreign markets in which it invests. The Fund is subject to a tax imposed on capital gains by certain countries in which it invests. An estimated deferred tax liability for net unrealized appreciation on the applicable securities is included in Other payables and accrued expenses on the Statement of Assets & Liabilities.
Distributions are declared and recorded on the ex-dividend date. Income and capital gain distributions are declared separately for each class. Income and capital gain distributions are determined in accordance with income tax regulations, which may differ from GAAP.
Capital accounts within the financial statements are adjusted for permanent book-tax differences. These adjustments have no impact on net assets or the results of operations. Capital accounts are not adjusted for temporary book-tax differences which will reverse in a subsequent period.
Book-tax differences are primarily due to foreign currency transactions, passive foreign investment companies (PFIC), capital loss carryforwards and losses deferred due to wash sales and excise tax regulations.
As of period end, the cost and unrealized appreciation (depreciation) in securities, and derivatives if applicable, for federal income tax purposes were as follows:
| Gross unrealized appreciation | $44,580,856 |
| Gross unrealized depreciation | (5,185,439) |
| Net unrealized appreciation (depreciation) | $39,395,417 |
| Tax Cost | $100,564,993 |
The tax-based components of distributable earnings as of period end were as follows:
| Capital loss carryforward | $(564,216) |
| Net unrealized appreciation (depreciation) on securities and other investments | $39,395,278 |
The Fund intends to elect to defer to its next fiscal year $148,984 of ordinary losses recognized during the period January 1, 2024 to April 30, 2024.
Capital loss carryforwards are only available to offset future capital gains of the Fund to the extent provided by regulations and may be limited. The capital loss carryforward information presented below, including any applicable limitation, is estimated as of fiscal period end and is subject to adjustment.
| Short-term | $(564,216) |
| Total capital loss carryforward | $(564,216) |
The tax character of distributions paid was as follows:
| | April 30, 2024 | April 30, 2023 |
| Ordinary Income | $98,999 | $509,253 |
| Long-term Capital Gains | - | 1,765,480 |
| Total | $98,999 | $2,274,733 |
Restricted Securities (including Private Placements). Funds may invest in securities that are subject to legal or contractual restrictions on resale. These securities generally may be resold in transactions exempt from registration or to the public if the securities are registered. Disposal of these securities may involve time-consuming negotiations and expense, and prompt sale at an acceptable price may be difficult. Information regarding restricted securities held at period end is included at the end of the Schedule of Investments, if applicable.
4. Purchases and Sales of Investments.
Purchases and sales of securities, other than short-term securities and in-kind transactions, as applicable, are noted in the table below.
| | Purchases ($) | Sales ($) |
| Fidelity Founders Fund | 47,783,078 | 34,750,470 |
5. Fees and Other Transactions with Affiliates.
Management Fee. Fidelity Management & Research Company LLC (the investment adviser) and its affiliates provide the Fund with investment management related services for which the Fund pays a monthly management fee.
Effective March 1, 2024, the Fund's management contract was amended to incorporate administrative services previously covered under separate services agreements (Transfer Agent and Accounting agreements). The amended contract incorporates a basic fee rate that may vary by class (subject to a performance adjustment). The investment adviser or an affiliate pays certain expenses of managing and operating the Fund out of each class's management fee. Each class of the Fund pays a management fee to the investment adviser. The management fee is calculated and paid to the investment adviser every month. The management fee is determined by calculating a basic fee and then applying a performance adjustment. When determining a class's basic fee, a mandate rate is calculated based on the monthly average net assets of a group of funds advised by FMR within a designated asset class. A discount rate is subtracted from the mandate rate once the Fund's monthly average net assets reach a certain level. The mandate rate and discount rate may vary by class. The annual basic fee rate for a class of shares of the Fund is the lesser of (1) the class's mandate rate reduced by the class's discount rate (if applicable) or (2) the amount set forth in the following table.
| | Maximum Management Fee Rate % |
| Class A | .72 |
| Class M | .71 |
| Class C | .72 |
| Fidelity Founders Fund | .72 |
| Class I | .65 |
| Class Z | .56 |
One-twelfth of the basic fee rate for a class is applied to the average net assets of the class for the month, giving a dollar amount which is the basic fee for the class for that month. A different management fee rate may be applicable to each class of the Fund. The difference between classes is the result of separate arrangements for class-level services and/or waivers of certain expenses. It is not the result of any difference in advisory or custodial fees or other expenses related to the management of the Fund's assets, which do not vary by class. For the portion of the reporting period on or after March 1, 2024, the total annualized management fee rates were as follows:
| | Total Management Fee Rate % |
| Class A | .72 |
| Class M | .71 |
| Class C | .72 |
| Fidelity Founders Fund | .68 |
| Class I | .65 |
| Class Z | .56 |
Prior to March 1, 2024, the management fee was the sum of an individual fund fee rate that was based on an annual rate of .30% of the Fund's average net assets and an annualized group fee rate that averaged .22% during the period. The group fee rate was based upon the monthly average net assets of a group of registered investment companies with which the investment adviser has management contracts. The group fee rate decreased as assets under management increased and increased as assets under management decreased. For the portion of the reporting period prior to March 1, 2024, the total annualized management fee rate was .52%.
The performance adjustment rate is calculated monthly by comparing over the performance period the Fund's performance to that of the performance adjustment index listed below.
| | Performance Adjustment Index |
| Fidelity Founders Fund | Russell 3000 Index |
For the purposes of calculating the performance adjustment for the Fund, the Fund's investment performance is based on the performance of Fidelity Founders Fund. To the extent that other classes of the Fund have higher expenses, this could result in those classes bearing a larger positive performance adjustment and smaller negative performance adjustment than would be the case if each class's own performance were considered. The performance period is the most recent 36 month period. The maximum annualized performance adjustment rate is .10% of the Fund's average net assets over the performance period. The performance adjustment rate is divided by twelve and multiplied by the Fund's average net assets over the performance period, and the resulting dollar amount is proportionately added to or subtracted from a class's basic fee. For the entire reporting period, the total annual performance adjustment was (.09)%.
Effective March 1, 2024, the Fund's sub-advisory agreements with FMR Investment Management (UK) Limited, Fidelity Management & Research (Hong Kong) Limited, and Fidelity Management & Research (Japan) Limited were amended to provide that the investment adviser pays each sub-adviser monthly fees equal to 110% of the sub-adviser's costs for providing sub-advisory services.
Distribution and Service Plan Fees. In accordance with Rule 12b-1 of the 1940 Act, the Fund has adopted separate Distribution and Service Plans for each class of shares. Certain classes pay Fidelity Distributors Company LLC (FDC), an affiliate of the investment adviser, separate Distribution and Service Fees, each of which is based on an annual percentage of each class' average net assets. In addition, FDC may pay financial intermediaries for selling shares of the Fund and providing shareholder support services. For the period, the Distribution and Service Fee rates, total fees and amounts retained by FDC were as follows:
| | Distribution Fee | Service Fee | Total Fees ($) | Retained by FDC ($) |
| Class A | - % | .25% | 45,073 | 3,005 |
| Class M | .25% | .25% | 57,438 | - |
| Class C | .75% | .25% | 24,789 | 3,767 |
| | | | 127,300 | 6,772 |
Sales Load. FDC may receive a front-end sales charge of up to 5.75% for selling Class A shares and 3.50% for selling Class M shares, some of which is paid to financial intermediaries for selling shares of the Fund. Depending on the holding period, FDC may receive contingent deferred sales charges levied on Class A, Class M and Class C redemptions. The deferred sales charges are 1.00% for Class C shares, 1.00% for certain purchases of Class A shares and .25% for certain purchases of Class M shares.
For the period, sales charge amounts retained by FDC were as follows:
| | Retained by FDC ($) |
| Class A | 14,430 |
| Class M | 1,701 |
Class CA | 87 |
| | 16,218 |
A When Class C shares are initially sold, FDC pays commissions from its own resources to financial intermediaries through which the sales are made.
Transfer Agent Fees. Fidelity Investments Institutional Operations Company LLC (FIIOC), an affiliate of the investment adviser, is the transfer, dividend disbursing and shareholder servicing agent for each class of the Fund. Effective March 1, 2024, the Fund's management contract was amended to incorporate transfer agent services and associated fees previously covered under a separate services agreement. FIIOC pays for typesetting, printing and mailing of shareholder reports, except proxy statements.
During November 2023, the Board approved a change in the transfer agent fees effective December 1, 2023 to a fixed annual rate of class-level average net assets as follows:
| | % of Class-Level Average Net Assets |
| Class A | .2000 |
| Class M | .1886 |
| Class C | .2000 |
| Fidelity Founders Fund | .2000 |
| Class I | .1341 |
Prior to December 1, 2023, FIIOC received account fees and asset-based fees that varied according to the account size and type of account of the shareholders of the respective classes of the Fund, except for Class Z. FIIOC received an asset-based fee of Class Z's average net assets. For the portion of the reporting period prior to March 1, 2024, the fees were equivalent to the following annualized rates:
| | Amount ($) | % of Class-Level Average Net Assets |
| Class A | 30,188 | .21 |
| Class M | 17,138 | .19 |
| Class C | 4,572 | .24 |
| Fidelity Founders Fund | 120,952 | .21 |
| Class I | 4,532 | .14 |
| Class Z | 1,999 | .04 |
| | 179,381 | |
Accounting Fees. Fidelity Service Company, Inc. (FSC), an affiliate of the investment adviser, maintains the Fund's accounting records. Effective March 1, 2024, the Fund's management contract was amended to incorporate accounting services and associated fees previously covered under a separate services agreement.
During November 2023, the Board approved a change in the accounting fees effective December 1, 2023 to a fixed annual rate of average net assets as follows:
| | % of Average Net Assets |
| Fidelity Founders Fund | .0353 |
Prior to December 1, 2023, the accounting fee was based on the level of average net assets for each month. For the portion of the reporting period prior to March 1, 2024, the fees were equivalent to the following annualized rates:
| | % of Average Net Assets |
| Fidelity Founders Fund | .04 |
Brokerage Commissions. A portion of portfolio transactions were placed with brokerage firms which are affiliates of the investment adviser. Brokerage commissions are included in net realized gain (loss) and change in net unrealized appreciation (depreciation) in the Statement of Operations. The commissions paid to these affiliated firms were as follows:
| | Amount ($) |
| Fidelity Founders Fund | 954 |
Interfund Trades. Funds may purchase from or sell securities to other Fidelity Funds under procedures adopted by the Board. The procedures have been designed to ensure these interfund trades are executed in accordance with Rule 17a-7 of the 1940 Act. Any interfund trades are included within the respective purchases and sales amounts shown in the Purchases and Sales of Investments note. Interfund trades during the period are noted in the table below.
| | Purchases ($) | Sales ($) | Realized Gain (Loss)($) |
| Fidelity Founders Fund | 1,675,703 | 2,024,980 | 302,398 |
6. Committed Line of Credit.
Certain Funds participate with other funds managed by the investment adviser or an affiliate in a $4.25 billion credit facility (the "line of credit") to be utilized for temporary or emergency purposes to fund shareholder redemptions or for other short-term liquidity purposes. The participating funds have agreed to pay commitment fees on their pro-rata portion of the line of credit, which are reflected in Miscellaneous expenses on the Statement of Operations, and are listed below. During the period, there were no borrowings on this line of credit.
| | Amount ($) |
| Fidelity Founders Fund | 194 |
7. Security Lending.
Funds lend portfolio securities from time to time in order to earn additional income. Lending agents are used, including National Financial Services (NFS), an affiliate of the investment adviser. Pursuant to a securities lending agreement, NFS will receive a fee, which is capped at 9.9% of a fund's daily lending revenue, for its services as lending agent. A fund may lend securities to certain qualified borrowers, including NFS. On the settlement date of the loan, a fund receives collateral (in the form of U.S. Treasury obligations, letters of credit and/or cash) against the loaned securities and maintains collateral in an amount not less than 100% of the market value of the loaned securities during the period of the loan. The market value of the loaned securities is determined at the close of business of a fund and any additional required collateral is delivered to a fund on the next business day. A fund or borrower may terminate the loan at any time, and if the borrower defaults on its obligation to return the securities loaned because of insolvency or other reasons, a fund may apply collateral received from the borrower against the obligation. A fund may experience delays and costs in recovering the securities loaned. Any cash collateral received is invested in the Fidelity Securities Lending Cash Central Fund. Any loaned securities are identified as such in the Schedule of Investments, and the value of loaned securities and cash collateral at period end, as applicable, are presented in the Statement of Assets and Liabilities. Security lending income represents the income earned on investing cash collateral, less rebates paid to borrowers and any lending agent fees associated with the loan, plus any premium payments received for lending certain types of securities. Security lending income is presented in the Statement of Operations as a component of income from Fidelity Central Funds. Affiliated security lending activity, if any, was as follows:
| | Total Security Lending Fees Paid to NFS ($) | Security Lending Income From Securities Loaned to NFS ($) | Value of Securities Loaned to NFS at Period End ($) |
| Fidelity Founders Fund | 827 | 3 | - |
8. Expense Reductions.
Through arrangements with the Fund's custodian, credits realized as a result of certain uninvested cash balances were used to reduce the Fund's expenses. During the period, custodian credits reduced the Fund's expenses by $448.
In addition, during the period the investment adviser or an affiliate reimbursed and/or waived a portion of fund-level operating expenses in the amount of $9,191.
9. Distributions to Shareholders.
Distributions to shareholders of each class were as follows:
| | Year ended April 30, 2024 | Year ended April 30, 2023 |
| Fidelity Founders Fund | | |
| Distributions to shareholders | | |
| Class A | $ - | $235,249 |
| Class M | - | 166,118 |
| Class C | - | 28,666 |
| Fidelity Founders Fund | 78,648 | 1,504,822 |
| Class I | 6,222 | 34,844 |
| Class Z | 14,129 | 305,034 |
Total | $98,999 | $2,274,733 |
10. Share Transactions.
Share transactions for each class were as follows and may contain in-kind transactions, automatic conversions between classes or exchanges between affiliated funds:
| | Shares | Shares | Dollars | Dollars |
| | Year ended April 30, 2024 | Year ended April 30, 2023 | Year ended April 30, 2024 | Year ended April 30, 2023 |
| Fidelity Founders Fund | | | | |
| Class A | | | | |
| Shares sold | 357,562 | 327,212 | $6,328,363 | $4,701,902 |
| Reinvestment of distributions | - | 16,132 | - | 234,268 |
| Shares redeemed | (133,442) | (123,004) | (2,302,213) | (1,780,393) |
| Net increase (decrease) | 224,120 | 220,340 | $4,026,150 | $3,155,777 |
| Class M | | | | |
| Shares sold | 221,304 | 148,983 | $3,818,142 | $2,165,205 |
| Reinvestment of distributions | - | 11,220 | - | 163,460 |
| Shares redeemed | (41,973) | (150,485) | (723,828) | (2,119,047) |
| Net increase (decrease) | 179,331 | 9,718 | $3,094,314 | $209,618 |
| Class C | | | | |
| Shares sold | 80,325 | 42,163 | $1,343,892 | $600,290 |
| Reinvestment of distributions | - | 1,956 | - | 28,488 |
| Shares redeemed | (27,722) | (46,117) | (486,933) | (640,847) |
| Net increase (decrease) | 52,603 | (1,998) | $856,959 | $(12,069) |
| Fidelity Founders Fund | | | | |
| Shares sold | 1,292,892 | 822,803 | $24,261,828 | $11,999,078 |
| Reinvestment of distributions | 4,059 | 96,400 | 73,069 | 1,407,429 |
| Shares redeemed | (1,145,208) | (1,216,913) | (20,197,581) | (17,564,962) |
| Net increase (decrease) | 151,743 | (297,710) | $4,137,316 | $(4,158,455) |
| Class I | | | | |
| Shares sold | 150,025 | 154,835 | $2,648,431 | $2,270,763 |
| Reinvestment of distributions | 346 | 2,412 | 6,222 | 34,844 |
| Shares redeemed | (99,004) | (46,030) | (1,764,775) | (659,817) |
| Net increase (decrease) | 51,367 | 111,217 | $889,878 | $1,645,790 |
| Class Z | | | | |
| Shares sold | 120,849 | 64,002 | $2,052,346 | $959,742 |
| Reinvestment of distributions | 755 | 19,927 | 13,644 | 295,980 |
| Shares redeemed | (52,719) | (958,761) | (945,830) | (13,248,358) |
| Net increase (decrease) | 68,885 | (874,832) | $1,120,160 | $(11,992,636) |
11. Other.
A fund's organizational documents provide former and current trustees and officers with a limited indemnification against liabilities arising in connection with the performance of their duties to the fund. In the normal course of business, a fund may also enter into contracts that provide general indemnifications. A fund's maximum exposure under these arrangements is unknown as this would be dependent on future claims that may be made against a fund. The risk of material loss from such claims is considered remote.
12. Risk and Uncertainties.
Many factors affect a fund's performance. Developments that disrupt global economies and financial markets, such as pandemics, epidemics, outbreaks of infectious diseases, war, terrorism, and environmental disasters, may significantly affect a fund's investment performance. The effects of these developments to a fund will be impacted by the types of securities in which a fund invests, the financial condition, industry, economic sector, and geographic location of an issuer, and a fund's level of investment in the securities of that issuer. Significant concentrations in security types, issuers, industries, sectors, and geographic locations may magnify the factors that affect a fund's performance.
To the Board of Trustees of Fidelity Concord Street Trust and Shareholders of Fidelity Founders Fund
Opinion on the Financial Statements
We have audited the accompanying statement of assets and liabilities, including the schedule of investments, of Fidelity Founders Fund (one of the funds constituting Fidelity Concord Street Trust, referred to hereafter as the "Fund") as of April 30, 2024, the related statement of operations for the year ended April 30, 2024, the statement of changes in net assets for each of the two years in the period ended April 30, 2024, including the related notes, and the financial highlights for each of the five years in the period ended April 30, 2024 (collectively referred to as the "financial statements"). In our opinion, the financial statements present fairly, in all material respects, the financial position of the Fund as of April 30, 2024, the results of its operations for the year then ended, the changes in its net assets for each of the two years in the period ended April 30, 2024 and the financial highlights for each of the five years in the period ended April 30, 2024 in conformity with accounting principles generally accepted in the United States of America.
Basis for Opinion
These financial statements are the responsibility of the Fund's management. Our responsibility is to express an opinion on the Fund's financial statements based on our audits. We are a public accounting firm registered with the Public Company Accounting Oversight Board (United States) (PCAOB) and are required to be independent with respect to the Fund in accordance with the U.S. federal securities laws and the applicable rules and regulations of the Securities and Exchange Commission and the PCAOB.
We conducted our audits of these financial statements in accordance with the standards of the PCAOB. Those standards require that we plan and perform the audit to obtain reasonable assurance about whether the financial statements are free of material misstatement, whether due to error or fraud.
Our audits included performing procedures to assess the risks of material misstatement of the financial statements, whether due to error or fraud, and performing procedures that respond to those risks. Such procedures included examining, on a test basis, evidence regarding the amounts and disclosures in the financial statements. Our audits also included evaluating the accounting principles used and significant estimates made by management, as well as evaluating the overall presentation of the financial statements. Our procedures included confirmation of securities owned as of April 30, 2024 by correspondence with the custodian, issuers of privately offered securities and brokers; when replies were not received from brokers, we performed other auditing procedures. We believe that our audits provide a reasonable basis for our opinion.
/s/ PricewaterhouseCoopers LLP
Boston, Massachusetts
June 13, 2024
We have served as the auditor of one or more investment companies in the Fidelity group of funds since 1932.
The Trustees, Members of the Advisory Board (if any), and officers of the trust and fund, as applicable, are listed below. The Board of Trustees governs the fund and is responsible for protecting the interests of shareholders. The Trustees are experienced executives who meet periodically throughout the year to oversee the fund's activities, review contractual arrangements with companies that provide services to the fund, oversee management of the risks associated with such activities and contractual arrangements, and review the fund's performance. Except for Jonathan Chiel, each of the Trustees oversees 323 funds. Mr. Chiel oversees 192 funds.
The Trustees hold office without limit in time except that (a) any Trustee may resign; (b) any Trustee may be removed by written instrument, signed by at least two-thirds of the number of Trustees prior to such removal; (c) any Trustee who requests to be retired or who has become incapacitated by illness or injury may be retired by written instrument signed by a majority of the other Trustees; and (d) any Trustee may be removed at any special meeting of shareholders by a two-thirds vote of the outstanding voting securities of the trust. Each Trustee who is not an interested person (as defined in the 1940 Act) of the trust and the fund is referred to herein as an Independent Trustee. Each Independent Trustee shall retire not later than the last day of the calendar year in which his or her 75th birthday occurs. The Independent Trustees may waive this mandatory retirement age policy with respect to individual Trustees. Officers and Advisory Board Members hold office without limit in time, except that any officer or Advisory Board Member may resign or may be removed by a vote of a majority of the Trustees at any regular meeting or any special meeting of the Trustees. Except as indicated, each individual has held the office shown or other offices in the same company for the past five years.
The fund's Statement of Additional Information (SAI) includes more information about the Trustees. To request a free copy, call Fidelity at 1-800-544-8544 if you're an individual investing directly with Fidelity, call 1-800-835-5092 if you're a plan sponsor or participant with Fidelity as your recordkeeper or call 1-877-208-0098 on institutional accounts or if you're an advisor or invest through one.
Experience, Skills, Attributes, and Qualifications of the Trustees. The Governance and Nominating Committee has adopted a statement of policy that describes the experience, qualifications, attributes, and skills that are necessary and desirable for potential Independent Trustee candidates (Statement of Policy). The Board believes that each Trustee satisfied at the time he or she was initially elected or appointed a Trustee, and continues to satisfy, the standards contemplated by the Statement of Policy. The Governance and Nominating Committee also engages professional search firms to help identify potential Independent Trustee candidates who have the experience, qualifications, attributes, and skills consistent with the Statement of Policy. From time to time, additional criteria based on the composition and skills of the current Independent Trustees, as well as experience or skills that may be appropriate in light of future changes to board composition, business conditions, and regulatory or other developments, have also been considered by the professional search firms and the Governance and Nominating Committee. In addition, the Board takes into account the Trustees' commitment and participation in Board and committee meetings, as well as their leadership of standing and ad hoc committees throughout their tenure.
In determining that a particular Trustee was and continues to be qualified to serve as a Trustee, the Board has considered a variety of criteria, none of which, in isolation, was controlling. The Board believes that, collectively, the Trustees have balanced and diverse experience, qualifications, attributes, and skills, which allow the Board to operate effectively in governing the fund and protecting the interests of shareholders. Information about the specific experience, skills, attributes, and qualifications of each Trustee, which in each case led to the Board's conclusion that the Trustee should serve (or continue to serve) as a trustee of the fund, is provided below.
Board Structure and Oversight Function. Robert A. Lawrence is an interested person and currently serves as Chair. The Trustees have determined that an interested Chair is appropriate and benefits shareholders because an interested Chair has a personal and professional stake in the quality and continuity of services provided to the fund. Independent Trustees exercise their informed business judgment to appoint an individual of their choosing to serve as Chair, regardless of whether the Trustee happens to be independent or a member of management. The Independent Trustees have determined that they can act independently and effectively without having an Independent Trustee serve as Chair and that a key structural component for assuring that they are in a position to do so is for the Independent Trustees to constitute a substantial majority for the Board. The Independent Trustees also regularly meet in executive session. David M. Thomas serves as Lead Independent Trustee and as such (i) acts as a liaison between the Independent Trustees and management with respect to matters important to the Independent Trustees and (ii) with management prepares agendas for Board meetings.
Fidelity® funds are overseen by different Boards of Trustees. The fund's Board oversees Fidelity's high income and certain equity funds, and other Boards oversee Fidelity's alternative investment, investment-grade bond, money market, asset allocation, and other equity funds. The asset allocation funds may invest in Fidelity® funds overseen by the fund's Board. The use of separate Boards, each with its own committee structure, allows the Trustees of each group of Fidelity® funds to focus on the unique issues of the funds they oversee, including common research, investment, and operational issues. On occasion, the separate Boards establish joint committees to address issues of overlapping consequences for the Fidelity® funds overseen by each Board.
The Trustees operate using a system of committees to facilitate the timely and efficient consideration of all matters of importance to the Trustees, the fund, and fund shareholders and to facilitate compliance with legal and regulatory requirements and oversight of the fund's activities and associated risks. The Board, acting through its committees, has charged FMR and its affiliates with (i) identifying events or circumstances the occurrence of which could have demonstrably adverse effects on the fund's business and/or reputation; (ii) implementing processes and controls to lessen the possibility that such events or circumstances occur or to mitigate the effects of such events or circumstances if they do occur; and (iii) creating and maintaining a system designed to evaluate continuously business and market conditions in order to facilitate the identification and implementation processes described in (i) and (ii) above. Because the day-to-day operations and activities of the fund are carried out by or through FMR, its affiliates, and other service providers, the fund's exposure to risks is mitigated but not eliminated by the processes overseen by the Trustees. While each of the Board's committees has responsibility for overseeing different aspects of the fund's activities, oversight is exercised primarily through the Operations, Audit, and Compliance Committees. Appropriate personnel, including but not limited to the fund's Chief Compliance Officer (CCO), FMR's internal auditor, the independent accountants, the fund's Treasurer and portfolio management personnel, make periodic reports to the Board's committees, as appropriate, including an annual review of Fidelity's risk management program for the Fidelity® funds. The responsibilities of each standing committee, including their oversight responsibilities, are described further under "Standing Committees of the Trustees."
Interested Trustees*:
Correspondence intended for a Trustee who is an interested person may be sent to Fidelity Investments, 245 Summer Street, Boston, Massachusetts 02210.
Name, Year of Birth; Principal Occupations and Other Relevant Experience+
Jonathan Chiel (1957)
Year of Election or Appointment: 2016
Trustee
Mr. Chiel also serves as Trustee of other Fidelity® funds. Mr. Chiel is Senior Counsel at Fidelity Investments (diversified financial services company, 2024-present). Previously, Mr. Chiel served as General Counsel (2012-2024) and Head of Legal, Risk and Compliance (2022-2024) for Fidelity Investments; Executive Vice President and General Counsel for FMR LLC (diversified financial services company, 2012-2024); Director and President of OH Company LLC (holding company, 2018-2024); General Counsel (2004-2012) and Senior Vice President and Deputy General Counsel (2000-2004) for John Hancock Financial Services; a partner with Choate, Hall & Stewart (law firm, 1996-2000); and an Assistant United States Attorney for the United States Attorney's Office of the District of Massachusetts (1986-1995), including Chief of the Criminal Division (1993-1995). Mr. Chiel is a director on the boards of the Harvard Law School Center on the Legal Profession and the U.S. Chamber Litigation Center.
Bettina Doulton (1964)
Year of Election or Appointment: 2021
Trustee
Ms. Doulton also serves as Trustee of other Fidelity® funds. Prior to her retirement, Ms. Doulton served in a variety of positions at Fidelity Investments, including as a managing director of research (2006-2007), portfolio manager to certain Fidelity® funds (1993-2005), equity analyst and portfolio assistant (1990-1993), and research assistant (1987-1990). Ms. Doulton currently owns and operates Cellardoor Winery. Previously, Ms. Doulton served as a member of the Board of Brown Capital Management, LLC (2014-2018).
Robert A. Lawrence (1952)
Year of Election or Appointment: 2020
Trustee
Chair of the Board of Trustees
Mr. Lawrence also serves as Trustee of other funds. Previously, Mr. Lawrence served as a Trustee and Member of the Advisory Board of certain funds. Prior to his retirement in 2008, Mr. Lawrence served as Vice President of certain Fidelity® funds (2006-2008), Senior Vice President, Head of High Income Division of Fidelity Management & Research Company (investment adviser firm, 2006-2008), and President of Fidelity Strategic Investments (investment adviser firm, 2002-2005).
* Determined to be an "Interested Trustee" by virtue of, among other things, his or her affiliation with the trust or various entities under common control with FMR.
+ The information includes the Trustee's principal occupation during the last five years and other information relating to the experience, attributes, and skills relevant to the Trustee's qualifications to serve as a Trustee, which led to the conclusion that the Trustee should serve as a Trustee for the fund.
Independent Trustees:
Correspondence intended for an Independent Trustee may be sent to Fidelity Investments, P.O. Box 55235, Boston, Massachusetts 02205-5235.
Name, Year of Birth; Principal Occupations and Other Relevant Experience+
Thomas P. Bostick (1956)
Year of Election or Appointment: 2021
Trustee
Lieutenant General Bostick also serves as Trustee of other Fidelity® funds. Prior to his retirement, General Bostick (United States Army, Retired) held a variety of positions within the U.S. Army, including Chief of Engineers and Commanding General, U.S. Army Corps of Engineers (2012-2016) and Deputy Chief of Staff and Director of Human Resources, U.S. Army (2009-2012). General Bostick currently serves as a member of the Board and Finance and Governance & Sustainability Committees of CSX Corporation (transportation, 2020-present) and a member of the Board and Corporate Governance and Nominating Committee of Perma-Fix Environmental Services, Inc. (nuclear waste management, 2020-present). General Bostick serves as Chief Executive Officer of Bostick Global Strategies, LLC (consulting, 2016-present), as a member of the Board of HireVue, Inc. (video interview and assessment, 2020-present), as a member of the Board of Allonnia (biotechnology and engineering solutions, 2022-present), on the Advisory Board of Hilco Redevelopment Partners (a real estate investment and redevelopment company, 2021-present), and on the Advisory Board of Solugen, Inc. (specialty bio-based chemicals manufacturer, 2022-present). Previously, General Bostick served as a Member of the Advisory Board of certain Fidelity® funds (2021), President, Intrexon Bioengineering (2018-2020) and Chief Operating Officer (2017-2020) and Senior Vice President of the Environment Sector (2016-2017) of Intrexon Corporation (biopharmaceutical company).
Donald F. Donahue (1950)
Year of Election or Appointment: 2018
Trustee
Mr. Donahue also serves as Trustee of other Fidelity® funds. Mr. Donahue serves as President and Chief Executive Officer of Miranda Partners, LLC (risk consulting for the financial services industry, 2012-present). Previously, Mr. Donahue served as Chief Executive Officer (2006-2012), Chief Operating Officer (2003-2006) and Managing Director, Customer Marketing and Development (1999-2003) of The Depository Trust & Clearing Corporation (financial markets infrastructure). Mr. Donahue currently serves as a member (2007-present) and Co-Chairman (2016-present) of the Board of United Way of New York. Mr. Donahue previously served as a member of the Advisory Board of certain Fidelity® funds (2015-2018) and as a member of the Board of The Leadership Academy (previously NYC Leadership Academy) (2012-2022).
Vicki L. Fuller (1957)
Year of Election or Appointment: 2020
Trustee
Ms. Fuller also serves as Trustee of other Fidelity® funds. Previously, Ms. Fuller served as a member of the Advisory Board of certain Fidelity® funds (2018-2020), Chief Investment Officer of the New York State Common Retirement Fund (2012-2018) and held a variety of positions at AllianceBernstein L.P. (global asset management, 1985-2012), including Managing Director (2006-2012) and Senior Vice President and Senior Portfolio Manager (2001-2006). Ms. Fuller currently serves as a member of the Board, Audit Committee, Compensation Committee and Nominating and Governance Committee of two Blackstone business development companies (2020-present), as a member of the Board of Treliant, LLC (consulting, 2019-present), as a member of the Board of Ariel Alternatives, LLC (private equity, 2022-present) and as a member of the Board and Chair of the Audit Committee of Gusto, Inc. (software, 2021-present). In addition, Ms. Fuller currently serves as a member of the Executive Board of New York University's Stern School of Business. Ms. Fuller previously served as a member of the Board of Roosevelt University (2019-2024) and member of the Board, Audit Committee and Nominating and Governance Committee of The Williams Companies, Inc. (natural gas infrastructure, 2018-2021).
Patricia L. Kampling (1959)
Year of Election or Appointment: 2020
Trustee
Ms. Kampling also serves as Trustee of other Fidelity® funds. Prior to her retirement, Ms. Kampling served as Chairman of the Board and Chief Executive Officer (2012-2019), President and Chief Operating Officer (2011-2012) and Executive Vice President and Chief Financial Officer (2010-2011) of Alliant Energy Corporation. Ms. Kampling currently serves as a member of the Board, Audit Committee and Governance, Compensation and Nominating Committee of Xcel Energy Inc. (utilities company, 2020-present) and as a member of the Board, Audit, Finance and Risk Committee and Safety, Environmental, Technology and Operations Committee and Chair of the Executive Development and Compensation Committee of American Water Works Company, Inc. (utilities company, 2019-present). In addition, Ms. Kampling currently serves as a member of the Board of the Nature Conservancy, Wisconsin Chapter (2019-present). Previously, Ms. Kampling served as a Member of the Advisory Board of certain Fidelity® funds (2020), a member of the Board, Compensation Committee and Executive Committee and Chair of the Audit Committee of Briggs & Stratton Corporation (manufacturing, 2011-2021), a member of the Board of Interstate Power and Light Company (2012-2019) and Wisconsin Power and Light Company (2012-2019) (each a subsidiary of Alliant Energy Corporation) and as a member of the Board and Workforce Development Committee of the Business Roundtable (2018-2019).
Thomas A. Kennedy (1955)
Year of Election or Appointment: 2021
Trustee
Mr. Kennedy also serves as Trustee of other Fidelity® funds. Previously, Mr. Kennedy served as a Member of the Advisory Board of certain Fidelity® funds (2020) and held a variety of positions at Raytheon Company (aerospace and defense, 1983-2020), including Chairman and Chief Executive Officer (2014-2020) and Executive Vice President and Chief Operating Officer (2013-2014). Mr. Kennedy served as Executive Chairman of the Board of Directors of Raytheon Technologies Corporation (aerospace and defense, 2020-2021). Mr. Kennedy serves as a Director of the Board of Directors of Textron Inc. (aerospace and defense, 2023-present).
Oscar Munoz (1959)
Year of Election or Appointment: 2021
Trustee
Mr. Munoz also serves as Trustee of other Fidelity® funds. Prior to his retirement, Mr. Munoz served as Executive Chairman (2020-2021), Chief Executive Officer (2015-2020), President (2015-2016) and a member of the Board (2010-2021) of United Airlines Holdings, Inc. Mr. Munoz currently serves as a member of the Board of CBRE Group, Inc. (commercial real estate, 2020-present), a member of the Board of Univision Communications, Inc. (Hispanic media, 2020-present), a member of the Board of Archer Aviation Inc. (2021-present), a member of the Defense Business Board of the United States Department of Defense (2021-present) and a member of the Board of Salesforce.com, Inc. (cloud-based software, 2022-present). Previously, Mr. Munoz served as a Member of the Advisory Board of certain Fidelity® funds (2021).
David M. Thomas (1949)
Year of Election or Appointment: 2008
Trustee
Lead Independent Trustee
Mr. Thomas also serves as Trustee of other Fidelity® funds. Previously, Mr. Thomas served as Executive Chairman (2005-2006) and Chairman and Chief Executive Officer (2000-2005) of IMS Health, Inc. (pharmaceutical and healthcare information solutions) and as a member of the Board of Fortune Brands Home and Security (home and security products, 2004-2023). Mr. Thomas currently serves as Director (2013-present) and Non-Executive Chairman of the Board (2022-present) of Interpublic Group of Companies, Inc. (marketing communication).
Susan Tomasky (1953)
Year of Election or Appointment: 2020
Trustee
Ms. Tomasky also serves as Trustee of other Fidelity® funds. Prior to her retirement, Ms. Tomasky served in various executive officer positions at American Electric Power Company, Inc. (1998-2011), including most recently as President of AEP Transmission (2007-2011). Ms. Tomasky currently serves as a member of the Board and Sustainability Committee and as Chair of the Audit Committee of Marathon Petroleum Corporation (2018-present) and as a member of the Board, Executive Committee, Corporate Governance Committee and Organization and Compensation Committee and as Lead Director of the Board of Public Service Enterprise Group, Inc. (utilities company, 2012-present) and as a member of the Board of its subsidiary company, Public Service Electric and Gas Co. (2021-present). In addition, Ms. Tomasky currently serves as a member (2009-present) and President (2020-present) of the Board of the Royal Shakespeare Company - America (2009-present) and as a member and Vice Chair of the Board of Kenyon College (2016-present). Previously, Ms. Tomasky served as a Member of the Advisory Board of certain Fidelity® funds (2020), as a member of the Board of the Columbus Association for the Performing Arts (2011-2023), as a member of the Board of the Columbus Regional Airport Authority (2007-2020), as a member of the Board (2011-2018) and Lead Independent Director (2015-2018) of Andeavor Corporation (previously Tesoro Corporation) (independent oil refiner and marketer) and as a member of the Board of Summit Midstream Partners LP (energy, 2012-2018).
Michael E. Wiley (1950)
Year of Election or Appointment: 2020
Trustee
Mr. Wiley also serves as Trustee of other Fidelity® funds. Previously, Mr. Wiley served as a member of the Advisory Board of certain Fidelity® funds (2018-2020), Chairman, President and CEO of Baker Hughes, Inc. (oilfield services, 2000-2004). Mr. Wiley also previously served as a member of the Board of Andeavor Corporation (independent oil refiner and marketer, 2005-2018), a member of the Board of Andeavor Logistics LP (natural resources logistics, 2015-2018) and a member of the Board of High Point Resources (exploration and production, 2005-2020).
+ The information includes the Trustee's principal occupation during the last five years and other information relating to the experience, attributes, and skills relevant to the Trustee's qualifications to serve as a Trustee, which led to the conclusion that the Trustee should serve as a Trustee for the fund.
Advisory Board Members and Officers:
Correspondence intended for a Member of the Advisory Board (if any) may be sent to Fidelity Investments, P.O. Box 55235, Boston, Massachusetts 02205-5235. Correspondence intended for an officer or Peter S. Lynch may be sent to Fidelity Investments, 245 Summer Street, Boston, Massachusetts 02210.
Name, Year of Birth; Principal Occupations+
Vijay C. Advani (1960)
Year of Election or Appointment: 2023
Member of the Advisory Board
Mr. Advani also serves as Trustee or Member of the Advisory Board of other funds. Previously, Mr. Advani served as Executive Chairman (2020-2022), Chief Executive Officer (2017-2020) and Chief Operating Officer (2016-2017) of Nuveen (global investment manager). He also served in various capacities at Franklin Resources (global investment manager), including Co-President (2015-2016), Executive Vice President, Global Advisory Services (2008-2015), Head of Global Retail Distribution (2005-2008), Executive Managing Director, International Retail Development (2002-2005), Managing Director, Product Developments, Sales & Marketing, Asia, Eastern Europe and Africa (2000-2002) and President, Templeton Asset Management India (1995-2000). Mr. Advani also served as Senior Investment Officer of International Finance Corporation (private equity and venture capital arm of The World Bank, 1984-1995). Mr. Advani is Chairman Emeritus of the U.S. India Business Council (2018-present), a Director of The Global Impact Investing Network (2019-present), a Director of LOK Capital (Mauritius) (2022-present), a member of the Advisory Council of LOK Capital (2022-present), a Senior Advisor of Neuberger Berman (2021-present), a Senior Advisor of Seviora Holdings Pte. Ltd (Temasek-Singapore) (2021-present), a Director of Seviora Capital (Singapore) (2021-present) and an Advisor of EQUIAM (2021-present). Mr. Advani formerly served as a member of the Board of BowX Acquisition Corp. (special purpose acquisition company, 2020-2021), a member of the Board of Intellecap (advisory arm of The Aavishkaar Group, 2018-2020), a member of the Board of Nuveen Investments, Inc. (2017-2020) and a member of the Board of Docusign (software, 2016-2019).
Peter S. Lynch (1944)
Year of Election or Appointment: 2003
Member of the Advisory Board
Mr. Lynch also serves as a Member of the Advisory Board of other Fidelity® funds. Mr. Lynch is Vice Chairman and a Director of Fidelity Management & Research Company LLC (investment adviser firm). In addition, Mr. Lynch serves as a Trustee of Boston College and as the Chairman of the Inner-City Scholarship Fund. Previously, Mr. Lynch served as Vice Chairman and a Director of FMR Co., Inc. (investment adviser firm) and on the Special Olympics International Board of Directors (1997-2006).
Karen B. Peetz (1955)
Year of Election or Appointment: 2023
Member of the Advisory Board
Ms. Peetz also serves as a Member of the Advisory Board of other funds. Previously, Ms. Peetz served as Chief Administration Officer (2020-2023) of Citigroup Inc. (a diversified financial service company). She also served in various capacities at Bank of New York Mellon Corporation, including President (2013-2016), Vice Chairman, Senior Executive Vice President and Chief Executive Officer of Financial Markets & Treasury Services (2010-2013), Senior Executive Vice President and Chief Executive Officer of Global Corporate Trust (2003-2008), Senior Vice President and Division Manager of Global Payments & Trade Services (2002-2003) and Senior Vice President and Division Manager of Domestic Corporate Trust (1998-2002). Ms. Peetz also served in various capacities at Chase Manhattan Corporation (1982-1998), including Senior Vice President and Manager of Corporate Trust International Business (1996-1998), Managing Director and Manager of Corporate Trust Services (1994-1996) and Managing Director and Group Manager of Financial Institution Sales (1990-1993). Ms. Peetz currently serves as Chair of Amherst Holdings Advisory Council (2018-present), Trustee of Johns Hopkins University (2016-present), Chair of the Carey Business School Advisory Council, Member of the Johns Hopkins Medicine Board and Finance Committee and Chair of the Lyme and Tick Related Disease Institute Advisory Council. Ms. Peetz previously served as a member of the Board of Guardian Life Insurance Company of America (2019-2023), a member of the Board of Trane Technologies (2018-2022), a member of the Board of Wells Fargo Corp. (2017-2019), a member of the Board of SunCoke Energy Inc. (2012-2016), a member of the Board of Private Export Funding Corporation (2010-2016) and as a Trustee of Penn State University (2010-2014) and the United Way of New York City (2008-2010).
Heather Bonner (1977)
Year of Election or Appointment: 2023
Assistant Treasurer
Ms. Bonner also serves as an officer of other funds. Ms. Bonner is a Senior Vice President (2022-present) and is an employee of Fidelity Investments (2022-present). Ms. Bonner serves as Senior Vice President, Vice President, Treasurer, or Director of certain Fidelity entities. Prior to joining Fidelity, Ms. Bonner served as Managing Director at AQR Capital Management (2013-2022) and was the Treasurer and Principal Financial Officer of the AQR Funds (2013-2022).
Craig S. Brown (1977)
Year of Election or Appointment: 2022
Deputy Treasurer
Mr. Brown also serves as an officer of other funds. Mr. Brown is a Vice President (2015-present) and is an employee of Fidelity Investments. Mr. Brown serves as Assistant Treasurer of FIMM, LLC (2021-present). Previously, Mr. Brown served as Assistant Treasurer of certain Fidelity® funds (2019-2022).
John J. Burke III (1964)
Year of Election or Appointment: 2018
Chief Financial Officer
Mr. Burke also serves as Chief Financial Officer of other funds. Mr. Burke is Head of Fidelity Fund and Investment Operations (2018-present) and is an employee of Fidelity Investments. Mr. Burke serves as President, Executive Vice President, or Director of certain Fidelity entities. Previously Mr. Burke served as head of Asset Management Investment Operations (2012-2018).
Margaret Carey (1973)
Year of Election or Appointment: 2023
Secretary and Chief Legal Officer (CLO)
Ms. Carey also serves as an officer of other funds and as CLO of certain Fidelity entities. Ms. Carey is a Senior Vice President, Deputy General Counsel (2019-present) and is an employee of Fidelity Investments.
William C. Coffey (1969)
Year of Election or Appointment: 2019
Assistant Secretary
Mr. Coffey also serves as Assistant Secretary of other funds. Mr. Coffey is a Senior Vice President, Deputy General Counsel (2010-present) and is an employee of Fidelity Investments. Previously, Mr. Coffey served as Secretary and CLO of certain funds (2018-2019); CLO, Secretary, or Senior Vice President of certain Fidelity entities and Assistant Secretary of certain funds (2009-2018).
Timothy M. Cohen (1969)
Year of Election or Appointment: 2018
Vice President
Mr. Cohen also serves as Vice President of other funds. Mr. Cohen is Co-Head of Equity (2018-present) and is an employee of Fidelity Investments. Mr. Cohen serves as President or Director of certain Fidelity entities. Previously, Mr. Cohen served as Executive Vice President of Fidelity SelectCo, LLC (2019) and Head of Global Equity Research (2016-2018).
Jonathan Davis (1968)
Year of Election or Appointment: 2010
Assistant Treasurer
Mr. Davis also serves as an officer of other funds. Mr. Davis is a Vice President (2006-present) and is an employee of Fidelity Investments. Mr. Davis serves as Assistant Treasurer or Director of certain Fidelity entities.
Laura M. Del Prato (1964)
Year of Election or Appointment: 2018
Assistant Treasurer
Ms. Del Prato also serves as an officer of other funds. Ms. Del Prato is a Senior Vice President (2017-present) and is an employee of Fidelity Investments. Ms. Del Prato serves as Senior Vice President, Vice President, Assistant Treasurer, or Director of certain Fidelity entities. Previously, Ms. Del Prato served as President and Treasurer of The North Carolina Capital Management Trust: Cash Portfolio and Term Portfolio (2018-2020).
Colm A. Hogan (1973)
Year of Election or Appointment: 2020
Assistant Treasurer
Mr. Hogan also serves as an officer of other funds. Mr. Hogan is a Vice President (2016-present) and is an employee of Fidelity Investments. Mr. Hogan serves as Assistant Treasurer of certain Fidelity entities. Previously, Mr. Hogan served as Deputy Treasurer of certain Fidelity® funds (2016-2020) and Assistant Treasurer of certain Fidelity® funds (2016-2018).
Pamela R. Holding (1964)
Year of Election or Appointment: 2018
Vice President
Ms. Holding also serves as Vice President of other funds. Ms. Holding is Co-Head of Equity (2018-present) and is an employee of Fidelity Investments. Previously, Ms. Holding served as Executive Vice President of Fidelity SelectCo, LLC (2019) and as Chief Investment Officer of Fidelity Institutional Asset Management (2013-2018).
Chris Maher (1972)
Year of Election or Appointment: 2020
Deputy Treasurer
Mr. Maher also serves as an officer of other funds. Mr. Maher is a Vice President (2008-present) and is an employee of Fidelity Investments. Mr. Maher serves as Assistant Treasurer of certain Fidelity entities. Previously, Mr. Maher served as Assistant Treasurer of certain funds (2013-2020).
Jason P. Pogorelec (1975)
Year of Election or Appointment: 2020
Chief Compliance Officer
Mr. Pogorelec also serves as Chief Compliance Officer of other funds. Mr. Pogorelec is a Senior Vice President of Asset Management Compliance (2020-present) and is an employee of Fidelity Investments. Mr. Pogorelec serves as Compliance Officer of Fidelity Management & Research Company LLC (investment adviser firm, 2023-present) and Ballyrock Investment Advisors LLC (2023-present). Previously, Mr. Pogorelec served as a Vice President, Associate General Counsel for Fidelity Investments (2010-2020) and Assistant Secretary of certain Fidelity® funds (2015-2020).
Brett Segaloff (1972)
Year of Election or Appointment: 2021
Anti-Money Laundering (AML) Officer
Mr. Segaloff also serves as AML Officer of other funds. Mr. Segaloff is a Vice President (2022-present) and is an employee of Fidelity Investments. Mr. Segaloff serves as Anti Money Laundering Compliance Officer or Anti Money Laundering/Bank Secrecy Act Compliance Officer of certain Fidelity entities.
Stacie M. Smith (1974)
Year of Election or Appointment: 2016
President and Treasurer
Ms. Smith also serves as an officer of other funds. Ms. Smith is a Senior Vice President (2016-present) and is an employee of Fidelity Investments. Ms. Smith serves as Assistant Treasurer of certain Fidelity entities and has served in other fund officer roles.
Jim Wegmann (1979)
Year of Election or Appointment: 2019
Assistant Treasurer
Mr. Wegmann also serves as an officer of other funds. Mr. Wegmann is a Vice President (2016-present) and is an employee of Fidelity Investments. Mr. Wegmann serves as Assistant Treasurer of FIMM, LLC (2021-present). Previously, Mr. Wegmann served as Assistant Treasurer of certain Fidelity® funds (2019-2021).
+ The information includes principal occupation during the last five years.
As a shareholder, you incur two types of costs: (1) transaction costs, which may include sales charges (loads) on purchase payments or redemption proceeds, as applicable and (2) ongoing costs, which generally include management fees, distribution and/or service (12b-1) fees and other Fund expenses. This Example is intended to help you understand your ongoing costs (in dollars) of investing in a fund and to compare these costs with the ongoing costs of investing in other mutual funds.
| The Example is based on an investment of $1,000 invested at the beginning of the period and held for the entire period (November 1, 2023 to April 30, 2024). |
Actual Expenses
The first line of the accompanying table provides information about actual account values and actual expenses. You may use the information in this line, together with the amount you invested, to estimate the expenses that you paid over the period. Simply divide your account value by $1,000.00 (for example, an $8,600 account value divided by $1,000.00 = 8.6), then multiply the result by the number in the first line for a class/Fund under the heading entitled "Expenses Paid During Period" to estimate the expenses you paid on your account during this period. If any fund is a shareholder of any underlying mutual funds or exchange-traded funds (ETFs) (the Underlying Funds), such fund indirectly bears its proportional share of the expenses of the Underlying Funds in addition to the direct expenses incurred presented in the table. These fees and expenses are not included in the annualized expense ratio used to calculate the expense estimate in the table below.
Hypothetical Example for Comparison Purposes
The second line of the accompanying table provides information about hypothetical account values and hypothetical expenses based on the actual expense ratio and an assumed rate of return of 5% per year before expenses, which is not the actual return. The hypothetical account values and expenses may not be used to estimate the actual ending account balance or expenses you paid for the period. You may use this information to compare the ongoing costs of investing in the Fund and other funds. To do so, compare this 5% hypothetical example with the 5% hypothetical examples that appear in the shareholder reports of the other funds. If any fund is a shareholder of any Underlying Funds, such fund indirectly bears its proportional share of the expenses of the Underlying Funds in addition to the direct expenses as presented in the table. These fees and expenses are not included in the annualized expense ratio used to calculate the expense estimate in the table below.
Please note that the expenses shown in the table are meant to highlight your ongoing costs only and do not reflect any transaction costs. Therefore, the second line of the table is useful in comparing ongoing costs only, and will not help you determine the relative total costs of owning different funds. In addition, if these transactional costs were included, your costs would have been higher.
| | | | | Annualized Expense Ratio- A | | Beginning Account Value November 1, 2023 | | Ending Account Value April 30, 2024 | | Expenses Paid During Period- C November 1, 2023 to April 30, 2024 |
| Fidelity® Founders Fund | | | | | | | | | | |
Class A ** | | | | 1.08% | | | | | | |
| Actual | | | | | | $ 1,000 | | $ 1,280.90 | | $ 6.12 |
Hypothetical-B | | | | | | $ 1,000 | | $ 1,019.49 | | $ 5.42 |
| Class M | | | | 1.31% | | | | | | |
| Actual | | | | | | $ 1,000 | | $ 1,279.10 | | $ 7.42 |
Hypothetical-B | | | | | | $ 1,000 | | $ 1,018.35 | | $ 6.57 |
| Class C | | | | 1.83% | | | | | | |
| Actual | | | | | | $ 1,000 | | $ 1,276.00 | | $ 10.36 |
Hypothetical-B | | | | | | $ 1,000 | | $ 1,015.76 | | $ 9.17 |
Fidelity® Founders Fund ** | | | | .81% | | | | | | |
| Actual | | | | | | $ 1,000 | | $ 1,282.20 | | $ 4.60 |
Hypothetical-B | | | | | | $ 1,000 | | $ 1,020.84 | | $ 4.07 |
Class I ** | | | | .75% | | | | | | |
| Actual | | | | | | $ 1,000 | | $ 1,282.80 | | $ 4.26 |
Hypothetical-B | | | | | | $ 1,000 | | $ 1,021.13 | | $ 3.77 |
Class Z ** | | | | .65% | | | | | | |
| Actual | | | | | | $ 1,000 | | $ 1,283.00 | | $ 3.69 |
Hypothetical-B | | | | | | $ 1,000 | | $ 1,021.63 | | $ 3.27 |
| |
A Annualized expense ratio reflects expenses net of applicable fee waivers.
B 5% return per year before expenses
C Expenses are equal to the annualized expense ratio, multiplied by the average account value over the period, multiplied by 182/ 366 (to reflect the one-half year period). The fees and expenses of any Underlying Funds are not included in each annualized expense ratio.
** If fees and changes to the expense contract and/or expense cap, effective March 1, 2024, had been in effect during the entire current period, the restated annualized expense ratio and the expenses paid in the actual and hypothetical examples above would have been as shown in table below:
| | | | | Annualized Expense Ratio- A | | Expenses Paid |
| Fidelity® Founders Fund | | | | | | |
| Class A | | | | 1.01% | | |
| Actual | | | | | | $ 5.73 |
Hypothetical- B | | | | | | $ 5.07 |
| Fidelity® Founders Fund | | | | .71% | | |
| Actual | | | | | | $ 4.03 |
Hypothetical- B | | | | | | $ 3.57 |
| Class I | | | | .69% | | |
| Actual | | | | | | $ 3.92 |
Hypothetical- B | | | | | | $ 3.47 |
| Class Z | | | | .60% | | |
| Actual | | | | | | $ 3.41 |
Hypothetical- B | | | | | | $ 3.02 |
| | | | | | | |
| A Annualized expense ratio reflects expenses net of applicable fee waivers. | | | | | | |
| B 5% return per year before expenses | | | | | | |
The dividend and capital gains distributions for the fund(s) are available on Fidelity.com or Institutional.Fidelity.com.
Retail Class, Class I and Class Z designate 100% of the dividends distributed in December during the fiscal year as qualifying for the dividends-received deduction for corporate shareholders.
Retail Class, Class I and Class Z designate 100% of the dividends distributed in December during the fiscal year as amounts which may be taken into account as a dividend for purposes of the maximum rate under section 1(h)(11) of the Internal Revenue Code.
The fund will notify shareholders in January 2025 of amounts for use in preparing 2024 income tax returns.
Board Approval of Investment Advisory Contracts
Fidelity Founders Fund
At its January 2024 meeting, the Board of Trustees, including the Independent Trustees (together, the Board), approved an amended and restated management contract with Fidelity Management & Research Company LLC (FMR) (the Management Contract), and amended and restated sub-advisory agreements (the Sub-Advisory Contracts, and together with the Management Contract, the Advisory Contracts) for the fund, including the fund's sub-advisory agreements with FMR Investment Management (UK) Limited (FMR UK), Fidelity Management & Research (Hong Kong) Limited (FMR H.K.), and Fidelity Management & Research (Japan) Limited (FMR Japan). The Advisory Contracts will be effective March 1, 2024. The Board will consider the annual renewal of the fund's Advisory Contracts in May 2024, following its review of additional materials provided by FMR.
Management Contract. The Board approved the Management Contract, which implements a new fee structure combining the management fee, transfer agent fee (TA Fee), and pricing and bookkeeping fee (P&B Fee) of the fund and each class into a single class-level fee based on tiered schedules and subject to a maximum class-level rate (the Unified Fee). In exchange for the Unified Fee, the fund will receive investment advisory, management, administrative, transfer agent, pricing and bookkeeping services under a single agreement - the Management Contract.
In its consideration of the Management Contract over several meetings, the Board received, reviewed and discussed a comprehensive set of analyses regarding the Unified Fee including (i) the legal framework, (ii) design goals for the Unified Fee, (iii) calculation methodology for the Unified Fee and illustrative examples, (iv) annual and cumulative projected impacts under various scenarios, both in the aggregate and at the fund/class level, (v) explanations of schedules, rate levers and maximum rates and (vi) shareholder benefits and projected savings.
The Board considered that the maximum Unified Fee for each class of the fund would be no higher than the sum of (i) the lowest contractual management fee rate under the fund's existing management contract, which is the individual fund fee rate, if any, plus the lowest contractual marginal group fee rate and (ii) the TA and P&B Fee rates, which are fixed fee rates since December 1, 2023 (together, the Unified Fee Cap). The Board noted that Fidelity has represented that, as a result of this Unified Fee Cap, the Unified Fee would be no greater than the fee rates previously authorized to be charged to the fund for the same services. The Board noted that certain expenses such as performance adjustments, third-party expenses, Rule 12b-1 fees, and certain other miscellaneous expenses would be outside the scope of the Unified Fee and the calculation of such fees would not change as a result of the Unified Fee. The Board considered that, under the Management Contract, a different management fee rate will be applicable to each class of the fund. The Board noted that Fidelity has represented that the difference in expenses between classes is based on differences in class-specific expenses and not due to any difference in advisory or third-party custodial fees or other expenses related to the management of the fund's assets.
The Board considered Fidelity's representations that implementation of the Unified Fee, which includes the Unified Fee Cap, would cause all funds subject to the Unified Fee, including the fund, to experience an immediate reduction on contractual fee rates for services provided under the current management contracts. The Board considered that some funds would not experience lower net total fees as a result of existing fee caps. The Board further considered that, in addition to the contractual fee savings, the Unified Fee offers funds and their shareholders greater protection from future rate increases for services previously offered under separate agreements that are now covered by the Management Contract because such rate increases would require shareholder approval.
Sub-Advisory Contracts. In connection with the Unified Fee changes, the Board considered the Sub-Advisory Contracts, which simplified the calculation of the fees paid by FMR to the sub-advisers under the agreements. The Board noted that the agreements with FMR UK, FMR H.K., and FMR Japan were amended to provide that FMR will compensate each sub-adviser at a fee rate equal to 110% of the sub-adviser's costs incurred in providing services under the agreement. The Board considered that, under the Sub-Advisory Contracts, FMR, and not the fund, will continue to pay the sub-advisory fees to each applicable sub-adviser.
The Board further considered that the approval of the fund's Advisory Contracts will not result in any changes in the investment process or strategies employed in the management of the fund's assets or the day-to-day management of the fund or the persons primarily responsible for such management. Further, the Board considered that the Management Contract would not change the obligations and services of FMR and its affiliates on behalf of the fund, and, in particular, there would be no change in the nature and level of advisory, management, administration, transfer agent, and pricing and bookkeeping services provided to the fund by FMR, its affiliates, and each applicable sub-adviser.
In connection with its consideration of future renewals of the fund's Advisory Contracts, the Board will consider: (i) the nature, extent and quality of services provided to the funds, including shareholder and administrative services and investment performance; (ii) the competitiveness of the management fee and total expenses for the fund; (iii) the costs of the services and profitability, including the revenues earned and the expenses incurred in conducting the business of developing, marketing, distributing, managing, administering, and servicing the fund and its shareholders, to the extent applicable; and (iv) whether there have been economies of scale in respect of the Fidelity funds, whether the Fidelity funds (including the fund) have appropriately benefited from any such economies of scale, and whether there is the potential for realization of any further economies.
Based on its evaluation of all of the conclusions and representations noted above, and after considering all factors it believed relevant, the Board concluded that the fund's management fee structure is fair and reasonable, and that the fund's Advisory Contracts should be approved.
The Securities and Exchange Commission adopted Rule 22e-4 under the Investment Company Act of 1940 (the Liquidity Rule) to promote effective liquidity risk management throughout the open-end investment company industry, thereby reducing the risk that funds will be unable to meet their redemption obligations and mitigating dilution of the interests of fund shareholders.
The Fund has adopted and implemented a liquidity risk management program (the Program) reasonably designed to assess and manage the Fund's liquidity risk and to comply with the requirements of the Liquidity Rule. The Fund's Board of Trustees (the Board) has designated the Fund's investment adviser as administrator of the Program. The Fidelity advisers have established a Liquidity Risk Management Committee (the LRM Committee) to manage the Program for each of the Fidelity Funds. The LRM Committee monitors the adequacy and effectiveness of implementation of the Program and on a periodic basis assesses each Fund's liquidity risk based on a variety of factors including (1) the Fund's investment strategy, (2) portfolio liquidity and cash flow projections during normal and reasonably foreseeable stressed conditions, (3) shareholder redemptions, (4) borrowings and other funding sources and (5) certain factors specific to ETFs including the effect of the Fund's prices and spreads, market participants, and basket compositions on the overall liquidity of the Fund's portfolio, as applicable.
In accordance with the Program, each of the Fund's portfolio investments is classified into one of four defined liquidity categories based on a determination of a reasonable expectation for how long it would take to convert the investment to cash (or sell or dispose of the investment) without significantly changing its market value.
- Highly liquid investments - cash or convertible to cash within three business days or less
- Moderately liquid investments - convertible to cash in three to seven calendar days
- Less liquid investments - can be sold or disposed of, but not settled, within seven calendar days
- Illiquid investments - cannot be sold or disposed of within seven calendar days
Liquidity classification determinations take into account a variety of factors including various market, trading and investment-specific considerations, as well as market depth, and generally utilize analysis from a third-party liquidity metrics service.
The Liquidity Rule places a 15% limit on a fund's illiquid investments and requires funds that do not primarily hold assets that are highly liquid investments to determine and maintain a minimum percentage of the fund's net assets to be invested in highly liquid investments (highly liquid investment minimum or HLIM). The Program includes provisions reasonably designed to comply with the 15% limit on illiquid investments and for determining, periodically reviewing and complying with the HLIM requirement as applicable.
At a recent meeting of the Fund's Board of Trustees, the LRM Committee provided a written report to the Board pertaining to the operation, adequacy, and effectiveness of the Program for the period December 1, 2022 through November 30, 2023. The report concluded that the Program is operating effectively and is reasonably designed to assess and manage the Fund's liquidity risk.
1.9892518.105
RFFF-ANN-0624
Fidelity® Series Small Cap Discovery Fund
Annual Report
April 30, 2024
Contents
To view a fund's proxy voting guidelines and proxy voting record for the 12-month period ended June 30, visit http://www.fidelity.com/proxyvotingresults or visit the Securities and Exchange Commission's (SEC) web site at http://www.sec.gov.
You may also call 1-800-544-8544 to request a free copy of the proxy voting guidelines.
Standard & Poor's, S&P and S&P 500 are registered service marks of The McGraw-Hill Companies, Inc. and have been licensed for use by Fidelity Distributors Corporation.
Other third-party marks appearing herein are the property of their respective owners.
All other marks appearing herein are registered or unregistered trademarks or service marks of FMR LLC or an affiliated company. © 2024 FMR LLC. All rights reserved.
This report and the financial statements contained herein are submitted for the general information of the shareholders of the Fund. This report is not authorized for distribution to prospective investors in the Fund unless preceded or accompanied by an effective prospectus.
A fund files its complete schedule of portfolio holdings with the SEC for the first and third quarters of each fiscal year on Form N-PORT. Forms N-PORT are available on the SEC's web site at http://www.sec.gov. A fund's Forms N-PORT may be reviewed and copied at the SEC's Public Reference Room in Washington, DC. Information regarding the operation of the SEC's Public Reference Room may be obtained by calling 1-800-SEC-0330.
For a complete list of a fund's portfolio holdings, view the most recent holdings listing, semiannual report, or annual report on Fidelity's web site at http://www.fidelity.com, http://www.institutional.fidelity.com, or http://www.401k.com, as applicable.
NOT FDIC INSURED •MAY LOSE VALUE •NO BANK GUARANTEE
Neither the Fund nor Fidelity Distributors Corporation is a bank.
Average annual total return reflects the change in the value of an investment, assuming reinvestment of distributions from dividend income and capital gains (the profits earned upon the sale of securities that have grown in value, if any) and assuming a constant rate of performance each year. The hypothetical investment and the average annual total returns do not reflect the deduction of taxes that a shareholder would pay on fund distributions or the redemption of fund shares. During periods of reimbursement by Fidelity, a fund's total return will be greater than it would be had the reimbursement not occurred. How a fund did yesterday is no guarantee of how it will do tomorrow.
| Average Annual Total Returns |
| | | | |
Periods ended April 30, 2024 | Past 1 year | Past 5 years | Past 10 years |
| Fidelity® Series Small Cap Discovery Fund | 18.22% | 10.29% | 8.89% |
| $10,000 Over 10 Years |
| |
Let's say hypothetically that $10,000 was invested in Fidelity® Series Small Cap Discovery Fund on April 30, 2014. The chart shows how the value of your investment would have changed, and also shows how the Russell 2000® Index performed over the same period. |
|
|
Market Recap:
U.S. equities gained 22.66% for the 12 months ending April 30, 2024, according to the S&P 500® index, driven by resilient corporate profits, a frenzy over generative artificial intelligence and the Federal Reserve's likely pivot to cutting interest rates later this year. Amid this favorable backdrop for higher-risk assets, the S&P 500® continued its late-2023 momentum and ended March at its all-time high before snapping a five-month uptrend in April (-4.08%). Growth stocks led the broad rally, mostly driven by a narrow set of firms in the communication services (+41%) and information technology (+37%) sectors, largely due to excitement for AI. In particular, semiconductor-related stocks (+104%) were a standout. Following the Fed's November 1 meeting, when the central bank hinted it might be done raising rates, the S&P 500® reversed a three-month decline and gained 14.09% in the final two months of 2023 and 10.56% the first quarter. Risk assets were further aided on March 20, when the central bank held steady its benchmark federal funds rate and affirmed its projection to cut in 2024. The index then slipped in April, as inflation remained stickier than expected, spurring doubts of a soft economic landing. For the full 12 months, the financials, industrials and consumer discretionary sectors each gained about 24%. In sharp contrast, real estate and the defensive-oriented utilities sector each roughly broke even. Other notable "laggards" included consumer staples (+3%) and health care (+7%).
Comments from Portfolio Manager Forrest St. Clair:
For the fiscal year ending April 30, 2024, the fund gained 18.22%, versus 13.32% for the benchmark Russell 2000 Index. The biggest contributor to performance versus the benchmark was security selection in the industrials sector, particularly within the transportation and capital goods industries. An underweight in health care also notably helped. Further bolstering the portfolio's relative result were picks among consumer discretionary and information technology stocks, primarily within the automobiles & components and technology hardware & equipment categories, respectively. The top individual relative contributor was a non-benchmark stake in XPO (+146%), where we decreased the fund's exposure this period. An overweight in Beacon Roofing Supply (+64%), one of the portfolio biggest holdings this period, was another plus. Outsized exposure to Insight Enterprises (+51%), the fund's largest holding the past 12 months, proved advantageous as well. In contrast, the biggest detractor from performance versus the benchmark was security selection in energy, followed by stock picks in health care and utilities. On an individual basis, avoiding Super Micro Computer, a benchmark component that gained roughly 715%, was the portfolio's foremost relative detractor. A non-benchmark stake in Concentrix (-42%) further pressured relative performance, as did the fund's out-of-benchmark exposure to Genpact (-30%), a stock we increased our exposure to in this period. Notable changes in positioning include decreased exposure to the real estate sector and a higher allocation to information technology firms.
Note to shareholders:
After 17 years at Fidelity, Derek Janssen retired from the firm on December 31, 2023, at which time Forrest St. Clair assumed sole management responsibilities for the fund.
The views expressed above reflect those of the portfolio manager(s) only through the end of the period as stated on the cover of this report and do not necessarily represent the views of Fidelity or any other person in the Fidelity organization. Any such views are subject to change at any time based upon market or other conditions and Fidelity disclaims any responsibility to update such views. These views may not be relied on as investment advice and, because investment decisions for a Fidelity fund are based on numerous factors, may not be relied on as an indication of trading intent on behalf of any Fidelity fund.
Top Holdings (% of Fund's net assets) |
| |
| Insight Enterprises, Inc. | 3.6 | |
| Performance Food Group Co. | 2.9 | |
| Beacon Roofing Supply, Inc. | 2.8 | |
| Genpact Ltd. | 2.5 | |
| Maximus, Inc. | 2.5 | |
| Olin Corp. | 2.5 | |
| Ciena Corp. | 2.4 | |
| Owens & Minor, Inc. | 2.4 | |
| Patrick Industries, Inc. | 2.4 | |
| First American Financial Corp. | 2.4 | |
| | 26.4 | |
| |
| Market Sectors (% of Fund's net assets) |
| |
| Industrials | 25.3 | |
| Consumer Discretionary | 15.1 | |
| Information Technology | 14.8 | |
| Financials | 13.5 | |
| Energy | 8.2 | |
| Materials | 7.0 | |
| Consumer Staples | 5.1 | |
| Health Care | 4.9 | |
| Utilities | 1.4 | |
| Communication Services | 0.1 | |
| |
Asset Allocation (% of Fund's net assets) |
|
|
Showing Percentage of Net Assets
| Common Stocks - 95.4% |
| | | Shares | Value ($) |
| COMMUNICATION SERVICES - 0.1% | | | |
| Interactive Media & Services - 0.1% | | | |
| Ziff Davis, Inc. (a) | | 24,450 | 1,225,190 |
| CONSUMER DISCRETIONARY - 15.1% | | | |
| Automobile Components - 4.1% | | | |
| Adient PLC (a) | | 496,000 | 14,815,520 |
| Lear Corp. | | 55,900 | 7,036,133 |
| Patrick Industries, Inc. (b) | | 284,166 | 29,692,505 |
| | | | 51,544,158 |
| Diversified Consumer Services - 2.1% | | | |
| Adtalem Global Education, Inc. (a) | | 86,600 | 4,297,092 |
| Laureate Education, Inc. Class A | | 1,495,373 | 21,682,909 |
| | | | 25,980,001 |
| Household Durables - 0.9% | | | |
| Helen of Troy Ltd. (a)(b) | | 121,800 | 11,292,078 |
| Leisure Products - 1.0% | | | |
| Brunswick Corp. | | 152,900 | 12,329,856 |
| Specialty Retail - 5.3% | | | |
| Academy Sports & Outdoors, Inc. | | 189,000 | 11,018,700 |
| Advance Auto Parts, Inc. | | 82,100 | 5,991,658 |
| America's Car Mart, Inc. (a)(b) | | 131,235 | 7,511,891 |
| American Eagle Outfitters, Inc. | | 216,388 | 5,249,573 |
| Boot Barn Holdings, Inc. (a) | | 29,000 | 3,087,630 |
| Caleres, Inc. (b) | | 106,900 | 3,937,127 |
| Murphy U.S.A., Inc. | | 53,200 | 22,015,224 |
| Upbound Group, Inc. | | 233,539 | 7,242,044 |
| | | | 66,053,847 |
| Textiles, Apparel & Luxury Goods - 1.7% | | | |
| Crocs, Inc. (a) | | 165,700 | 20,608,109 |
| Wolverine World Wide, Inc. | | 119,337 | 1,281,679 |
| | | | 21,889,788 |
TOTAL CONSUMER DISCRETIONARY | | | 189,089,728 |
| CONSUMER STAPLES - 5.1% | | | |
| Beverages - 1.6% | | | |
| Coca-Cola Consolidated, Inc. | | 18,660 | 15,413,160 |
| MGP Ingredients, Inc. (b) | | 61,338 | 4,811,353 |
| | | | 20,224,513 |
| Consumer Staples Distribution & Retail - 2.9% | | | |
| Performance Food Group Co. (a) | | 527,400 | 35,799,912 |
| Sprouts Farmers Market LLC (a) | | 8,537 | 563,698 |
| | | | 36,363,610 |
| Food Products - 0.6% | | | |
| Lamb Weston Holdings, Inc. (b) | | 52,000 | 4,333,680 |
| The Simply Good Foods Co. (a) | | 81,700 | 2,977,965 |
| | | | 7,311,645 |
TOTAL CONSUMER STAPLES | | | 63,899,768 |
| ENERGY - 8.2% | | | |
| Energy Equipment & Services - 3.6% | | | |
| Cactus, Inc. | | 182,500 | 9,059,300 |
| Mattr Corp. Class A (a) | | 2,229,715 | 26,416,774 |
| Total Energy Services, Inc. | | 1,295,130 | 9,106,787 |
| | | | 44,582,861 |
| Oil, Gas & Consumable Fuels - 4.6% | | | |
| Civitas Resources, Inc. | | 218,600 | 15,730,456 |
| Parkland Corp. | | 500,000 | 15,403,334 |
| Sitio Royalties Corp. (b) | | 1,133,000 | 26,330,920 |
| | | | 57,464,710 |
TOTAL ENERGY | | | 102,047,571 |
| FINANCIALS - 13.5% | | | |
| Banks - 2.3% | | | |
| Cadence Bank | | 550,257 | 15,225,611 |
| Fulton Financial Corp. | | 50,700 | 839,085 |
| Webster Financial Corp. | | 298,700 | 13,092,021 |
| | | | 29,156,717 |
| Capital Markets - 0.6% | | | |
| Virtus Investment Partners, Inc. | | 33,500 | 7,347,220 |
| Consumer Finance - 2.1% | | | |
| FirstCash Holdings, Inc. | | 235,598 | 26,617,862 |
| Financial Services - 1.6% | | | |
| EVERTEC, Inc. (b) | | 305,600 | 11,469,168 |
| WEX, Inc. (a) | | 37,700 | 7,964,502 |
| | | | 19,433,670 |
| Insurance - 6.9% | | | |
| Assurant, Inc. | | 62,600 | 10,917,440 |
| Enstar Group Ltd. (a) | | 87,022 | 25,268,578 |
| First American Financial Corp. | | 552,500 | 29,597,425 |
| Primerica, Inc. | | 94,700 | 20,063,142 |
| | | | 85,846,585 |
TOTAL FINANCIALS | | | 168,402,054 |
| HEALTH CARE - 4.9% | | | |
| Biotechnology - 1.0% | | | |
| Blueprint Medicines Corp. (a) | | 14,500 | 1,324,430 |
| Celldex Therapeutics, Inc. (a) | | 124,900 | 4,673,758 |
| Keros Therapeutics, Inc. (a) | | 50,000 | 2,819,500 |
| Vaxcyte, Inc. (a) | | 51,610 | 3,124,986 |
| | | | 11,942,674 |
| Health Care Equipment & Supplies - 0.7% | | | |
| Dentsply Sirona, Inc. | | 223,500 | 6,707,235 |
| Utah Medical Products, Inc. | | 24,619 | 1,629,778 |
| | | | 8,337,013 |
| Health Care Providers & Services - 3.0% | | | |
| AMN Healthcare Services, Inc. (a) | | 125,700 | 7,539,486 |
| Owens & Minor, Inc. (a) | | 1,205,182 | 29,816,203 |
| Pennant Group, Inc. (a) | | 26,500 | 554,115 |
| The Ensign Group, Inc. | | 700 | 82,852 |
| | | | 37,992,656 |
| Pharmaceuticals - 0.2% | | | |
| Arvinas Holding Co. LLC (a)(b) | | 86,000 | 2,732,220 |
TOTAL HEALTH CARE | | | 61,004,563 |
| INDUSTRIALS - 25.3% | | | |
| Aerospace & Defense - 0.9% | | | |
| Loar Holdings, Inc. | | 1,200 | 62,784 |
| V2X, Inc. (a) | | 218,291 | 10,604,577 |
| | | | 10,667,361 |
| Building Products - 2.8% | | | |
| Armstrong World Industries, Inc. | | 79,157 | 9,093,556 |
| AZZ, Inc. | | 132,700 | 9,505,301 |
| Tecnoglass, Inc. (b) | | 186,600 | 10,365,630 |
| UFP Industries, Inc. | | 58,300 | 6,570,410 |
| | | | 35,534,897 |
| Commercial Services & Supplies - 2.3% | | | |
| Brady Corp. Class A | | 17,100 | 1,008,900 |
| The Brink's Co. | | 299,582 | 26,201,442 |
| Vestis Corp. | | 72,100 | 1,328,082 |
| | | | 28,538,424 |
| Construction & Engineering - 1.1% | | | |
| Centuri Holdings, Inc. | | 2,700 | 66,825 |
| EMCOR Group, Inc. | | 30,500 | 10,893,685 |
| IES Holdings, Inc. (a) | | 18,600 | 2,513,232 |
| | | | 13,473,742 |
| Electrical Equipment - 0.9% | | | |
| Atkore, Inc. | | 64,600 | 11,324,380 |
| Ground Transportation - 3.1% | | | |
| ArcBest Corp. | | 21,458 | 2,379,907 |
| TFI International, Inc. | | 193,100 | 25,158,999 |
| TFI International, Inc. (Canada) | | 50,600 | 6,589,596 |
| Universal Logistics Holdings, Inc. | | 14,800 | 661,264 |
| XPO, Inc. (a) | | 35,836 | 3,850,937 |
| | | | 38,640,703 |
| Machinery - 0.3% | | | |
| Gates Industrial Corp. PLC (a) | | 185,500 | 3,268,510 |
| Timken Co. | | 7,600 | 678,072 |
| | | | 3,946,582 |
| Professional Services - 9.9% | | | |
| ASGN, Inc. (a) | | 296,198 | 28,568,297 |
| Concentrix Corp. (b) | | 304,700 | 16,657,949 |
| Genpact Ltd. | | 1,027,500 | 31,585,350 |
| Kforce, Inc. (b) | | 256,803 | 15,860,153 |
| Maximus, Inc. | | 388,897 | 31,220,651 |
| WNS Holdings Ltd. | | 6,968 | 292,029 |
| | | | 124,184,429 |
| Trading Companies & Distributors - 4.0% | | | |
| Beacon Roofing Supply, Inc. (a) | | 351,200 | 34,603,736 |
| Core & Main, Inc. (a) | | 219,600 | 12,400,812 |
| DXP Enterprises, Inc. (a) | | 26,724 | 1,303,062 |
| GMS, Inc. (a) | | 19,900 | 1,841,148 |
| | | | 50,148,758 |
TOTAL INDUSTRIALS | | | 316,459,276 |
| INFORMATION TECHNOLOGY - 14.8% | | | |
| Communications Equipment - 3.7% | | | |
| Ciena Corp. (a) | | 654,400 | 30,252,912 |
| Lumentum Holdings, Inc. (a) | | 362,700 | 15,871,752 |
| | | | 46,124,664 |
| Electronic Equipment, Instruments & Components - 5.3% | | | |
| Belden, Inc. | | 57,800 | 4,697,406 |
| ePlus, Inc. (a) | | 105,300 | 8,095,464 |
| Insight Enterprises, Inc. (a) | | 244,500 | 44,638,364 |
| TD SYNNEX Corp. | | 75,700 | 8,920,488 |
| Vishay Precision Group, Inc. (a) | | 22,311 | 736,263 |
| | | | 67,087,985 |
| IT Services - 0.4% | | | |
| Perficient, Inc. (a) | | 98,000 | 4,631,480 |
| Semiconductors & Semiconductor Equipment - 2.6% | | | |
| Diodes, Inc. (a) | | 114,202 | 8,337,888 |
| Ichor Holdings Ltd. (a)(b) | | 502,375 | 19,482,103 |
| SMART Global Holdings, Inc. (a) | | 257,089 | 4,697,016 |
| | | | 32,517,007 |
| Software - 2.8% | | | |
| Five9, Inc. (a) | | 113,800 | 6,551,466 |
| Rapid7, Inc. (a) | | 294,815 | 13,207,712 |
| Tenable Holdings, Inc. (a) | | 337,200 | 15,163,884 |
| | | | 34,923,062 |
TOTAL INFORMATION TECHNOLOGY | | | 185,284,198 |
| MATERIALS - 7.0% | | | |
| Chemicals - 3.8% | | | |
| FMC Corp. | | 134,100 | 7,913,241 |
| Hawkins, Inc. | | 6,256 | 474,017 |
| Olin Corp. | | 592,800 | 30,991,584 |
| The Chemours Co. LLC | | 337,635 | 9,031,736 |
| | | | 48,410,578 |
| Containers & Packaging - 2.6% | | | |
| Crown Holdings, Inc. | | 97,900 | 8,034,653 |
| Graphic Packaging Holding Co. | | 935,200 | 24,174,920 |
| | | | 32,209,573 |
| Metals & Mining - 0.6% | | | |
| ATI, Inc. (a) | | 127,500 | 7,611,750 |
TOTAL MATERIALS | | | 88,231,901 |
| UTILITIES - 1.4% | | | |
| Gas Utilities - 1.4% | | | |
| Brookfield Infrastructure Corp. A Shares (b) | | 558,400 | 17,014,448 |
| TOTAL COMMON STOCKS (Cost $976,007,658) | | | 1,192,658,697 |
| | | | |
| Money Market Funds - 6.5% |
| | | Shares | Value ($) |
| Fidelity Cash Central Fund 5.39% (c) | | 23,530,944 | 23,535,650 |
| Fidelity Securities Lending Cash Central Fund 5.39% (c)(d) | | 57,589,573 | 57,595,332 |
| TOTAL MONEY MARKET FUNDS (Cost $81,130,982) | | | 81,130,982 |
| | | | |
| TOTAL INVESTMENT IN SECURITIES - 101.9% (Cost $1,057,138,640) | 1,273,789,679 |
NET OTHER ASSETS (LIABILITIES) - (1.9)% | (24,015,322) |
| NET ASSETS - 100.0% | 1,249,774,357 |
| | |
Legend
| (b) | Security or a portion of the security is on loan at period end. |
| (c) | Affiliated fund that is generally available only to investment companies and other accounts managed by Fidelity Investments. The rate quoted is the annualized seven-day yield of the fund at period end. A complete unaudited listing of the fund's holdings as of its most recent quarter end is available upon request. In addition, each Fidelity Central Fund's financial statements, which are not covered by the Fund's Report of Independent Registered Public Accounting Firm, are available on the SEC's website or upon request. |
| (d) | Investment made with cash collateral received from securities on loan. |
Affiliated Central Funds
Fiscal year to date information regarding the Fund's investments in Fidelity Central Funds, including the ownership percentage, is presented below.
| Affiliate | Value, beginning of period ($) | Purchases ($) | Sales Proceeds ($) | Dividend Income ($) | Realized Gain (loss) ($) | Change in Unrealized appreciation (depreciation) ($) | Value, end of period ($) | % ownership, end of period |
| Fidelity Cash Central Fund 5.39% | 30,296,753 | 410,434,448 | 417,195,468 | 2,144,112 | (83) | - | 23,535,650 | 0.0% |
| Fidelity Securities Lending Cash Central Fund 5.39% | 70,453,469 | 537,695,530 | 550,553,667 | 90,897 | - | - | 57,595,332 | 0.2% |
| Total | 100,750,222 | 948,129,978 | 967,749,135 | 2,235,009 | (83) | - | 81,130,982 | |
| | | | | | | | | |
Amounts in the dividend income column in the above table include any capital gain distributions from underlying funds, which are presented in the corresponding line item in the Statement of Operations, if applicable.
Amounts in the dividend income column for Fidelity Securities Lending Cash Central Fund represents the income earned on investing cash collateral, less rebates paid to borrowers and any lending agent fees associated with the loan, plus any premium payments received for lending certain types of securities.
Amounts included in the purchases and sales proceeds columns may include in-kind transactions, if applicable.
Investment Valuation
The following is a summary of the inputs used, as of April 30, 2024, involving the Fund's assets and liabilities carried at fair value. The inputs or methodology used for valuing securities may not be an indication of the risk associated with investing in those securities. For more information on valuation inputs, and their aggregation into the levels used below, please refer to the Investment Valuation section in the accompanying Notes to Financial Statements.
| Valuation Inputs at Reporting Date: |
| Description | Total ($) | Level 1 ($) | Level 2 ($) | Level 3 ($) |
Investments in Securities: | | | | |
|
| Equities: | | | | |
Communication Services | 1,225,190 | 1,225,190 | - | - |
Consumer Discretionary | 189,089,728 | 189,089,728 | - | - |
Consumer Staples | 63,899,768 | 63,899,768 | - | - |
Energy | 102,047,571 | 102,047,571 | - | - |
Financials | 168,402,054 | 168,402,054 | - | - |
Health Care | 61,004,563 | 61,004,563 | - | - |
Industrials | 316,459,276 | 316,459,276 | - | - |
Information Technology | 185,284,198 | 185,284,198 | - | - |
Materials | 88,231,901 | 88,231,901 | - | - |
Utilities | 17,014,448 | 17,014,448 | - | - |
|
| Money Market Funds | 81,130,982 | 81,130,982 | - | - |
| Total Investments in Securities: | 1,273,789,679 | 1,273,789,679 | - | - |
| Statement of Assets and Liabilities |
| | | | April 30, 2024 |
| | | | | |
| Assets | | | | |
| Investment in securities, at value (including securities loaned of $55,082,315) - See accompanying schedule: | | | | |
Unaffiliated issuers (cost $976,007,658) | $ | 1,192,658,697 | | |
Fidelity Central Funds (cost $81,130,982) | | 81,130,982 | | |
| | | | | |
| | | | | |
| Total Investment in Securities (cost $1,057,138,640) | | | $ | 1,273,789,679 |
| Foreign currency held at value (cost $1) | | | | 1 |
| Receivable for investments sold | | | | 2,340,729 |
| Receivable for fund shares sold | | | | 35,724,359 |
| Dividends receivable | | | | 756,307 |
| Distributions receivable from Fidelity Central Funds | | | | 136,301 |
Total assets | | | | 1,312,747,376 |
| Liabilities | | | | |
| Payable to custodian bank | $ | 3,000 | | |
| Payable for investments purchased | | 5,356,980 | | |
| Payable for fund shares redeemed | | 15,060 | | |
| Other payables and accrued expenses | | 7,616 | | |
| Collateral on securities loaned | | 57,590,363 | | |
| Total liabilities | | | | 62,973,019 |
| Net Assets | | | $ | 1,249,774,357 |
| Net Assets consist of: | | | | |
| Paid in capital | | | $ | 956,896,272 |
| Total accumulated earnings (loss) | | | | 292,878,085 |
| Net Assets | | | $ | 1,249,774,357 |
Net Asset Value, offering price and redemption price per share ($1,249,774,357 ÷ 106,546,652 shares) | | | $ | 11.73 |
| Statement of Operations |
| | | | Year ended April 30, 2024 |
| Investment Income | | | | |
| Dividends | | | $ | 13,186,200 |
| Income from Fidelity Central Funds (including $90,897 from security lending) | | | | 2,235,009 |
| Total income | | | | 15,421,209 |
| Expenses | | | | |
| Custodian fees and expenses | $ | 23,393 | | |
| Independent trustees' fees and expenses | | 5,838 | | |
| Total expenses before reductions | | 29,231 | | |
| Expense reductions | | (1,411) | | |
| Total expenses after reductions | | | | 27,820 |
| Net Investment income (loss) | | | | 15,393,389 |
| Realized and Unrealized Gain (Loss) | | | | |
| Net realized gain (loss) on: | | | | |
| Investment Securities: | | | | |
| Unaffiliated issuers | | 101,326,399 | | |
| Fidelity Central Funds | | (83) | | |
| Foreign currency transactions | | 977 | | |
| Total net realized gain (loss) | | | | 101,327,293 |
| Change in net unrealized appreciation (depreciation) on: | | | | |
| Investment Securities: | | | | |
| Unaffiliated issuers | | 90,019,271 | | |
| Assets and liabilities in foreign currencies | | (6,452) | | |
| Total change in net unrealized appreciation (depreciation) | | | | 90,012,819 |
| Net gain (loss) | | | | 191,340,112 |
| Net increase (decrease) in net assets resulting from operations | | | $ | 206,733,501 |
| Statement of Changes in Net Assets |
| |
| | Year ended April 30, 2024 | | Year ended April 30, 2023 |
| Increase (Decrease) in Net Assets | | | | |
| Operations | | | | |
| Net investment income (loss) | $ | 15,393,389 | $ | 15,428,501 |
| Net realized gain (loss) | | 101,327,293 | | 55,652,940 |
| Change in net unrealized appreciation (depreciation) | | 90,012,819 | | (82,903,683) |
| Net increase (decrease) in net assets resulting from operations | | 206,733,501 | | (11,822,242) |
| Distributions to shareholders | | (36,352,612) | | (216,852,104) |
| | | | | |
| Share transactions | | | | |
| Proceeds from sales of shares | | 210,055,809 | | 146,433,073 |
| Reinvestment of distributions | | 36,352,612 | | 216,852,104 |
| Cost of shares redeemed | | (316,218,152) | | (280,746,366) |
| | | | | |
Net increase (decrease) in net assets resulting from share transactions | | (69,809,731) | | 82,538,811 |
| Total increase (decrease) in net assets | | 100,571,158 | | (146,135,535) |
| | | | | |
| Net Assets | | | | |
| Beginning of period | | 1,149,203,199 | | 1,295,338,734 |
| End of period | $ | 1,249,774,357 | $ | 1,149,203,199 |
| | | | | |
| Other Information | | | | |
| Shares | | | | |
| Sold | | 18,967,947 | | 14,162,287 |
| Issued in reinvestment of distributions | | 3,323,219 | | 21,076,097 |
| Redeemed | | (28,130,153) | | (26,578,442) |
| Net increase (decrease) | | (5,838,987) | | 8,659,942 |
| | | | | |
Financial Highlights
Fidelity® Series Small Cap Discovery Fund |
| |
| Years ended April 30, | | 2024 | | 2023 | | 2022 | | 2021 | | 2020 |
Selected Per-Share Data | | | | | | | | | | |
| Net asset value, beginning of period | $ | 10.23 | $ | 12.49 | $ | 15.20 | $ | 8.73 | $ | 11.70 |
| Income from Investment Operations | | | | | | | | | | |
Net investment income (loss) A,B | | .14 | | .14 | | .14 | | .12 | | .15 |
| Net realized and unrealized gain (loss) | | 1.70 | | (.34) | | (.33) | | 6.68 | | (2.35) |
| Total from investment operations | | 1.84 | | (.20) | | (.19) | | 6.80 | | (2.20) |
| Distributions from net investment income | | (.13) | | (.15) | | (.14) | | (.12) | | (.16) |
| Distributions from net realized gain | | (.21) | | (1.92) | | (2.38) | | (.21) | | (.61) |
| Total distributions | | (.34) | | (2.06) C | | (2.52) | | (.33) | | (.77) |
| Net asset value, end of period | $ | 11.73 | $ | 10.23 | $ | 12.49 | $ | 15.20 | $ | 8.73 |
Total Return D | | | | (1.01)% | | (2.37)% | | 78.91% | | (20.16)% |
Ratios to Average Net Assets B,E,F | | | | | | | | | | |
Expenses before reductions G | | -% | | -% | | -% | | -% | | -% |
Expenses net of fee waivers, if any G | | | | -% | | -% | | -% | | -% |
Expenses net of all reductions G | | -% | | -% | | -% | | -% | | -% |
| Net investment income (loss) | | 1.30% | | 1.31% | | 1.01% | | 1.03% | | 1.38% |
| Supplemental Data | | | | | | | | | | |
| Net assets, end of period (000 omitted) | $ | 1,249,774 | $ | 1,149,203 | $ | 1,295,339 | $ | 1,510,555 | $ | 1,152,206 |
Portfolio turnover rate H | | | | 31% | | 25% | | 28% | | 51% |
ACalculated based on average shares outstanding during the period.
BNet investment income (loss) is affected by the timing of the declaration of dividends by any underlying mutual funds or exchange-traded funds (ETFs). Net investment income (loss) of any mutual funds or ETFs is not included in the Fund's net investment income (loss) ratio.
CTotal distributions per share do not sum due to rounding.
DTotal returns would have been lower if certain expenses had not been reduced during the applicable periods shown.
EFees and expenses of any underlying mutual funds or exchange-traded funds (ETFs) are not included in the Fund's expense ratio. The Fund indirectly bears its proportionate share of these expenses. For additional expense information related to investments in Fidelity Central Funds, please refer to the "Investments in Fidelity Central Funds" note found in the Notes to Financial Statements section of the most recent Annual or Semi-Annual report.
FExpense ratios reflect operating expenses of the class. Expenses before reductions do not reflect amounts reimbursed, waived, or reduced through arrangements with the investment adviser, brokerage services, or other offset arrangements, if applicable, and do not represent the amount paid by the class during periods when reimbursements, waivers or reductions occur.
GAmount represents less than .005%.
HAmount does not include the portfolio activity of any underlying mutual funds or exchange-traded funds (ETFs).
For the period ended April 30, 2024
1. Organization.
Fidelity Series Small Cap Discovery Fund (the Fund) is a fund of Fidelity Concord Street Trust (the Trust) and is authorized to issue an unlimited number of shares. Shares are offered only to certain other Fidelity funds, Fidelity managed 529 plans, and Fidelity managed collective investment trusts. The Trust is registered under the Investment Company Act of 1940, as amended (the 1940 Act), as an open-end management investment company organized as a Massachusetts business trust.
2. Investments in Fidelity Central Funds.
Funds may invest in Fidelity Central Funds, which are open-end investment companies generally available only to other investment companies and accounts managed by the investment adviser and its affiliates. The Schedule of Investments lists any Fidelity Central Funds held as an investment as of period end, but does not include the underlying holdings of each Fidelity Central Fund. An investing fund indirectly bears its proportionate share of the expenses of the underlying Fidelity Central Funds.
Based on its investment objective, each Fidelity Central Fund may invest or participate in various investment vehicles or strategies that are similar to those of the investing fund. These strategies are consistent with the investment objectives of the investing fund and may involve certain economic risks which may cause a decline in value of each of the Fidelity Central Funds and thus a decline in the value of the investing fund.
| Fidelity Central Fund | Investment Manager | Investment Objective | Investment Practices | Expense RatioA |
| Fidelity Money Market Central Funds | Fidelity Management & Research Company LLC (FMR) | Each fund seeks to obtain a high level of current income consistent with the preservation of capital and liquidity. | Short-term Investments | Less than .005% |
A Expenses expressed as a percentage of average net assets and are as of each underlying Central Fund's most recent annual or semi-annual shareholder report.
A complete unaudited list of holdings for each Fidelity Central Fund is available upon request or at the Securities and Exchange Commission website at www.sec.gov. In addition, the financial statements of the Fidelity Central Funds which contain the significant accounting policies (including investment valuation policies) of those funds, and are not covered by the Report of Independent Registered Public Accounting Firm, are available on the Securities and Exchange Commission website or upon request.
3. Significant Accounting Policies.
The Fund is an investment company and applies the accounting and reporting guidance of the Financial Accounting Standards Board (FASB) Accounting Standards Codification Topic 946 Financial Services - Investment Companies. The financial statements have been prepared in conformity with accounting principles generally accepted in the United States of America (GAAP), which require management to make certain estimates and assumptions at the date of the financial statements. Actual results could differ from those estimates. Subsequent events, if any, through the date that the financial statements were issued have been evaluated in the preparation of the financial statements. The Fund's Schedule of Investments lists any underlying mutual funds or exchange-traded funds (ETFs) but does not include the underlying holdings of these funds. The following summarizes the significant accounting policies of the Fund:
Investment Valuation. Investments are valued as of 4:00 p.m. Eastern time on the last calendar day of the period. The Board of Trustees (the Board) has designated the Fund's investment adviser as the valuation designee responsible for the fair valuation function and performing fair value determinations as needed. The investment adviser has established a Fair Value Committee (the Committee) to carry out the day-to-day fair valuation responsibilities and has adopted policies and procedures to govern the fair valuation process and the activities of the Committee. In accordance with these fair valuation policies and procedures, which have been approved by the Board, the Fund attempts to obtain prices from one or more third party pricing services or brokers to value its investments. When current market prices, quotations or currency exchange rates are not readily available or reliable, investments will be fair valued in good faith by the Committee, in accordance with the policies and procedures. Factors used in determining fair value vary by investment type and may include market or investment specific events, transaction data, estimated cash flows, and market observations of comparable investments. The frequency that the fair valuation procedures are used cannot be predicted and they may be utilized to a significant extent. The Committee manages the Fund's fair valuation practices and maintains the fair valuation policies and procedures. The Fund's investment adviser reports to the Board information regarding the fair valuation process and related material matters.
The Fund categorizes the inputs to valuation techniques used to value its investments into a disclosure hierarchy consisting of three levels as shown below:
Level 1 - unadjusted quoted prices in active markets for identical investments
Level 2 - other significant observable inputs (including quoted prices for similar investments, interest rates, prepayment speeds, etc.)
Level 3 - unobservable inputs (including the Fund's own assumptions based on the best information available)
Valuation techniques used to value the Fund's investments by major category are as follows:
Equity securities, including restricted securities, for which market quotations are readily available, are valued at the last reported sale price or official closing price as reported by a third party pricing service on the primary market or exchange on which they are traded and are categorized as Level 1 in the hierarchy. In the event there were no sales during the day or closing prices are not available, securities are valued at the last quoted bid price or may be valued using the last available price and are generally categorized as Level 2 in the hierarchy. For foreign equity securities, when market or security specific events arise, comparisons to the valuation of American Depositary Receipts (ADRs), futures contracts, Exchange-Traded Funds (ETFs) and certain indexes as well as quoted prices for similar securities may be used and would be categorized as Level 2 in the hierarchy. For equity securities, including restricted securities, where observable inputs are limited, assumptions about market activity and risk are used and these securities may be categorized as Level 3 in the hierarchy.
Investments in open-end mutual funds, including the Fidelity Central Funds, are valued at their closing net asset value (NAV) each business day and are categorized as Level 1 in the hierarchy.
Changes in valuation techniques may result in transfers in or out of an assigned level within the disclosure hierarchy. The aggregate value of investments by input level as of April 30, 2024 is included at the end of the Fund's Schedule of Investments.
Foreign Currency. Certain Funds may use foreign currency contracts to facilitate transactions in foreign-denominated securities. Gains and losses from these transactions may arise from changes in the value of the foreign currency or if the counterparties do not perform under the contracts' terms.
Foreign-denominated assets, including investment securities, and liabilities are translated into U.S. dollars at the exchange rates at period end. Purchases and sales of investment securities, income and dividends received, and expenses denominated in foreign currencies are translated into U.S. dollars at the exchange rate in effect on the transaction date.
The effects of exchange rate fluctuations on investments are included with the net realized and unrealized gain (loss) on investment securities. Other foreign currency transactions resulting in realized and unrealized gain (loss) are disclosed separately.
Investment Transactions and Income. For financial reporting purposes, the Fund's investment holdings and NAV include trades executed through the end of the last business day of the period. The NAV per share for processing shareholder transactions is calculated as of the close of business of the New York Stock Exchange (NYSE), normally 4:00 p.m. Eastern time and includes trades executed through the end of the prior business day. Gains and losses on securities sold are determined on the basis of identified cost and include proceeds received from litigation. Commissions paid to certain brokers with whom the investment adviser, or its affiliates, places trades on behalf of a fund include an amount in addition to trade execution, which may be rebated back to a fund. Any such rebates are included in net realized gain (loss) on investments in the Statement of Operations. Dividend income is recorded on the ex-dividend date, except for certain dividends from foreign securities where the ex-dividend date may have passed, which are recorded as soon as the Fund is informed of the ex-dividend date. Non-cash dividends included in dividend income, if any, are recorded at the fair market value of the securities received. Income and capital gain distributions from Fidelity Central Funds, if any, are recorded on the ex-dividend date. Certain distributions received by the Fund represent a return of capital or capital gain. The Fund determines the components of these distributions subsequent to the ex-dividend date, based upon receipt of tax filings or other correspondence relating to the underlying investment. These distributions are recorded as a reduction of cost of investments and/or as a realized gain. Investment income is recorded net of foreign taxes withheld where recovery of such taxes is uncertain. Funds may file withholding tax reclaims in certain jurisdictions to recover a portion of amounts previously withheld. Any withholding tax reclaims income is included in the Statement of Operations in dividends. Any receivables for withholding tax reclaims are included in the Statement of Assets and Liabilities in dividends receivable.
Expenses. Expenses directly attributable to a fund are charged to that fund. Expenses attributable to more than one fund are allocated among the respective funds on the basis of relative net assets or other appropriate methods. Expenses included in the accompanying financial statements reflect the expenses of that fund and do not include any expenses associated with any underlying mutual funds or exchange-traded funds. Although not included in a fund's expenses, a fund indirectly bears its proportionate share of these expenses through the net asset value of each underlying mutual fund or exchange-traded fund. Expense estimates are accrued in the period to which they relate and adjustments are made when actual amounts are known.
Income Tax Information and Distributions to Shareholders. Each year, the Fund intends to qualify as a regulated investment company under Subchapter M of the Internal Revenue Code, including distributing substantially all of its taxable income and realized gains. As a result, no provision for U.S. Federal income taxes is required. As of April 30, 2024, the Fund did not have any unrecognized tax benefits in the financial statements; nor is the Fund aware of any tax positions for which it is reasonably possible that the total amounts of unrecognized tax benefits will significantly change in the next twelve months. The Fund files a U.S. federal tax return, in addition to state and local tax returns as required. The Fund's federal income tax returns are subject to examination by the Internal Revenue Service (IRS) for a period of three fiscal years after they are filed. State and local tax returns may be subject to examination for an additional fiscal year depending on the jurisdiction. Foreign taxes are provided for based on the Fund's understanding of the tax rules and rates that exist in the foreign markets in which it invests.
Distributions are declared and recorded on the ex-dividend date. Income and capital gain distributions are determined in accordance with income tax regulations, which may differ from GAAP. In addition, the Fund claimed a portion of the payment made to redeeming shareholders as a distribution for income tax purposes.
Capital accounts within the financial statements are adjusted for permanent book-tax differences. These adjustments have no impact on net assets or the results of operations. Capital accounts are not adjusted for temporary book-tax differences which will reverse in a subsequent period.
Book-tax differences are primarily due to foreign currency transactions, passive foreign investment companies (PFIC) and losses deferred due to wash sales and excise tax regulations.
As of period end, the cost and unrealized appreciation (depreciation) in securities, and derivatives if applicable, for federal income tax purposes were as follows:
| Gross unrealized appreciation | $294,325,128 |
| Gross unrealized depreciation | (78,654,852) |
| Net unrealized appreciation (depreciation) | $215,670,276 |
| Tax Cost | $1,058,119,403 |
The tax-based components of distributable earnings as of period end were as follows:
| Undistributed ordinary income | $42,557,957 |
| Undistributed long-term capital gain | $34,676,184 |
| Net unrealized appreciation (depreciation) on securities and other investments | $215,643,945 |
The tax character of distributions paid was as follows:
| | April 30, 2024 | April 30, 2023 |
| Ordinary Income | $13,766,701 | $ 15,554,144 |
| Long-term Capital Gains | 22,585,911 | 201,297,960 |
| Total | $36,352,612 | $ 216,852,104 |
4. Purchases and Sales of Investments.
Purchases and sales of securities, other than short-term securities and in-kind transactions, as applicable, are noted in the table below.
| | Purchases ($) | Sales ($) |
| Fidelity Series Small Cap Discovery Fund | 568,017,756 | 656,960,065 |
5. Fees and Other Transactions with Affiliates.
Management Fee. Fidelity Management & Research Company LLC (the investment adviser) and its affiliates provide the Fund with investment management related services for which the Fund does not pay a management fee. Under the management contract, the investment adviser or an affiliate pays all ordinary operating expenses of the Fund, except custody fees, fees and expenses of the independent Trustees, and certain miscellaneous expenses such as proxy and shareholder meeting expenses.
Brokerage Commissions. A portion of portfolio transactions were placed with brokerage firms which are affiliates of the investment adviser. Brokerage commissions are included in net realized gain (loss) and change in net unrealized appreciation (depreciation) in the Statement of Operations. The commissions paid to these affiliated firms were as follows:
| | Amount ($) |
| Fidelity Series Small Cap Discovery Fund | 9,996 |
Interfund Trades. Funds may purchase from or sell securities to other Fidelity Funds under procedures adopted by the Board. The procedures have been designed to ensure these interfund trades are executed in accordance with Rule 17a-7 of the 1940 Act. Any interfund trades are included within the respective purchases and sales amounts shown in the Purchases and Sales of Investments note. Interfund trades during the period are noted in the table below.
| | Purchases ($) | Sales ($) | Realized Gain (Loss)($) |
| Fidelity Series Small Cap Discovery Fund | 27,321,573 | 21,651,019 | 4,438,572 |
Sub-Advisory Arrangements. Effective March 1, 2024, each Fund's sub-advisory agreements with Fidelity Management & Research (Hong Kong) Limited and Fidelity Management & Research (Japan) Limited were amended to provide that the investment adviser pays each sub-adviser monthly fees equal to 110% of the sub-adviser's costs for providing sub-advisory services.
6. Committed Line of Credit.
Certain Funds participate with other funds managed by the investment adviser or an affiliate in a $4.25 billion credit facility (the "line of credit") to be utilized for temporary or emergency purposes to fund shareholder redemptions or for other short-term liquidity purposes. The commitment fees on the pro-rata portion of the line of credit are borne by the investment adviser. During the period, there were no borrowings on this line of credit.
7. Security Lending.
Funds lend portfolio securities from time to time in order to earn additional income. Lending agents are used, including National Financial Services (NFS), an affiliate of the investment adviser. Pursuant to a securities lending agreement, NFS will receive a fee, which is capped at 9.9% of a fund's daily lending revenue, for its services as lending agent. A fund may lend securities to certain qualified borrowers, including NFS. On the settlement date of the loan, a fund receives collateral (in the form of U.S. Treasury obligations, letters of credit and/or cash) against the loaned securities and maintains collateral in an amount not less than 100% of the market value of the loaned securities during the period of the loan. The market value of the loaned securities is determined at the close of business of a fund and any additional required collateral is delivered to a fund on the next business day. A fund or borrower may terminate the loan at any time, and if the borrower defaults on its obligation to return the securities loaned because of insolvency or other reasons, a fund may apply collateral received from the borrower against the obligation. A fund may experience delays and costs in recovering the securities loaned. Any cash collateral received is invested in the Fidelity Securities Lending Cash Central Fund. Any loaned securities are identified as such in the Schedule of Investments, and the value of loaned securities and cash collateral at period end, as applicable, are presented in the Statement of Assets and Liabilities. Security lending income represents the income earned on investing cash collateral, less rebates paid to borrowers and any lending agent fees associated with the loan, plus any premium payments received for lending certain types of securities. Security lending income is presented in the Statement of Operations as a component of income from Fidelity Central Funds. Affiliated security lending activity, if any, was as follows:
| | Total Security Lending Fees Paid to NFS ($) | Security Lending Income From Securities Loaned to NFS ($) | Value of Securities Loaned to NFS at Period End ($) |
| Fidelity Series Small Cap Discovery Fund | 9,658 | 10 | - |
8. Expense Reductions.
Through arrangements with the Fund's custodian, credits realized as a result of certain uninvested cash balances were used to reduce the Fund's expenses by $1,411.
9. Other.
A fund's organizational documents provide former and current trustees and officers with a limited indemnification against liabilities arising in connection with the performance of their duties to the fund. In the normal course of business, a fund may also enter into contracts that provide general indemnifications. A fund's maximum exposure under these arrangements is unknown as this would be dependent on future claims that may be made against a fund. The risk of material loss from such claims is considered remote.
At the end of the period, mutual funds and accounts managed by the investment adviser or its affiliates were the owners of record of all of the outstanding shares of the Fund.
10. Risk and Uncertainties.
Many factors affect a fund's performance. Developments that disrupt global economies and financial markets, such as pandemics, epidemics, outbreaks of infectious diseases, war, terrorism, and environmental disasters, may significantly affect a fund's investment performance. The effects of these developments to a fund will be impacted by the types of securities in which a fund invests, the financial condition, industry, economic sector, and geographic location of an issuer, and a fund's level of investment in the securities of that issuer. Significant concentrations in security types, issuers, industries, sectors, and geographic locations may magnify the factors that affect a fund's performance.
To the Board of Trustees of Fidelity Concord Street Trust and the Shareholders of Fidelity Series Small Cap Discovery Fund:
Opinion on the Financial Statements and Financial Highlights
We have audited the accompanying statement of assets and liabilities of Fidelity Series Small Cap Discovery Fund (the "Fund"), a fund of Fidelity Concord Street Trust, including the schedule of investments, as of April 30, 2024, the related statement of operations for the year then ended, the statement of changes in net assets for each of the two years in the period then ended, the financial highlights for each of the five years in the period then ended, and the related notes. In our opinion, the financial statements and financial highlights present fairly, in all material respects, the financial position of the Fund as of April 30, 2024, and the results of its operations for the year then ended, the changes in its net assets for each of the two years in the period then ended, and the financial highlights for each of the five years in the period then ended in conformity with accounting principles generally accepted in the United States of America.
Basis for Opinion
These financial statements and financial highlights are the responsibility of the Fund's management. Our responsibility is to express an opinion on the Fund's financial statements and financial highlights based on our audits. We are a public accounting firm registered with the Public Company Accounting Oversight Board (United States) (PCAOB) and are required to be independent with respect to the Fund in accordance with the U.S. federal securities laws and the applicable rules and regulations of the Securities and Exchange Commission and the PCAOB.
We conducted our audits in accordance with the standards of the PCAOB. Those standards require that we plan and perform the audit to obtain reasonable assurance about whether the financial statements and financial highlights are free of material misstatement, whether due to error or fraud. The Fund is not required to have, nor were we engaged to perform, an audit of its internal control over financial reporting. As part of our audits, we are required to obtain an understanding of internal control over financial reporting but not for the purpose of expressing an opinion on the effectiveness of the Fund's internal control over financial reporting. Accordingly, we express no such opinion.
Our audits included performing procedures to assess the risks of material misstatement of the financial statements and financial highlights, whether due to error or fraud, and performing procedures that respond to those risks. Such procedures included examining, on a test basis, evidence regarding the amounts and disclosures in the financial statements and financial highlights. Our audits also included evaluating the accounting principles used and significant estimates made by management, as well as evaluating the overall presentation of the financial statements and financial highlights. Our procedures included confirmation of securities owned as of April 30, 2024, by correspondence with the custodian and brokers; when replies were not received from brokers, we performed other auditing procedures. We believe that our audits provide a reasonable basis for our opinion.
/s/ Deloitte & Touche LLP
Boston, Massachusetts
June 14, 2024
We have served as the auditor of one or more of the Fidelity investment companies since 1999.
The Trustees, Members of the Advisory Board (if any), and officers of the trust and fund, as applicable, are listed below. The Board of Trustees governs the fund and is responsible for protecting the interests of shareholders. The Trustees are experienced executives who meet periodically throughout the year to oversee the fund's activities, review contractual arrangements with companies that provide services to the fund, oversee management of the risks associated with such activities and contractual arrangements, and review the fund's performance. Except for Jonathan Chiel, each of the Trustees oversees 323 funds. Mr. Chiel oversees 192 funds.
The Trustees hold office without limit in time except that (a) any Trustee may resign; (b) any Trustee may be removed by written instrument, signed by at least two-thirds of the number of Trustees prior to such removal; (c) any Trustee who requests to be retired or who has become incapacitated by illness or injury may be retired by written instrument signed by a majority of the other Trustees; and (d) any Trustee may be removed at any special meeting of shareholders by a two-thirds vote of the outstanding voting securities of the trust. Each Trustee who is not an interested person (as defined in the 1940 Act) of the trust and the fund is referred to herein as an Independent Trustee. Each Independent Trustee shall retire not later than the last day of the calendar year in which his or her 75th birthday occurs. The Independent Trustees may waive this mandatory retirement age policy with respect to individual Trustees. Officers and Advisory Board Members hold office without limit in time, except that any officer or Advisory Board Member may resign or may be removed by a vote of a majority of the Trustees at any regular meeting or any special meeting of the Trustees. Except as indicated, each individual has held the office shown or other offices in the same company for the past five years.
The fund's Statement of Additional Information (SAI) includes more information about the Trustees. To request a free copy, call Fidelity at 1-800-544-8544.
Experience, Skills, Attributes, and Qualifications of the Trustees. The Governance and Nominating Committee has adopted a statement of policy that describes the experience, qualifications, attributes, and skills that are necessary and desirable for potential Independent Trustee candidates (Statement of Policy). The Board believes that each Trustee satisfied at the time he or she was initially elected or appointed a Trustee, and continues to satisfy, the standards contemplated by the Statement of Policy. The Governance and Nominating Committee also engages professional search firms to help identify potential Independent Trustee candidates who have the experience, qualifications, attributes, and skills consistent with the Statement of Policy. From time to time, additional criteria based on the composition and skills of the current Independent Trustees, as well as experience or skills that may be appropriate in light of future changes to board composition, business conditions, and regulatory or other developments, have also been considered by the professional search firms and the Governance and Nominating Committee. In addition, the Board takes into account the Trustees' commitment and participation in Board and committee meetings, as well as their leadership of standing and ad hoc committees throughout their tenure.
In determining that a particular Trustee was and continues to be qualified to serve as a Trustee, the Board has considered a variety of criteria, none of which, in isolation, was controlling. The Board believes that, collectively, the Trustees have balanced and diverse experience, qualifications, attributes, and skills, which allow the Board to operate effectively in governing the fund and protecting the interests of shareholders. Information about the specific experience, skills, attributes, and qualifications of each Trustee, which in each case led to the Board's conclusion that the Trustee should serve (or continue to serve) as a trustee of the fund, is provided below.
Board Structure and Oversight Function. Robert A. Lawrence is an interested person and currently serves as Chair. The Trustees have determined that an interested Chair is appropriate and benefits shareholders because an interested Chair has a personal and professional stake in the quality and continuity of services provided to the fund. Independent Trustees exercise their informed business judgment to appoint an individual of their choosing to serve as Chair, regardless of whether the Trustee happens to be independent or a member of management. The Independent Trustees have determined that they can act independently and effectively without having an Independent Trustee serve as Chair and that a key structural component for assuring that they are in a position to do so is for the Independent Trustees to constitute a substantial majority for the Board. The Independent Trustees also regularly meet in executive session. David M. Thomas serves as Lead Independent Trustee and as such (i) acts as a liaison between the Independent Trustees and management with respect to matters important to the Independent Trustees and (ii) with management prepares agendas for Board meetings.
Fidelity® funds are overseen by different Boards of Trustees. The fund's Board oversees Fidelity's high income and certain equity funds, and other Boards oversee Fidelity's alternative investment, investment-grade bond, money market, asset allocation, and other equity funds. The asset allocation funds may invest in Fidelity® funds overseen by the fund's Board. The use of separate Boards, each with its own committee structure, allows the Trustees of each group of Fidelity® funds to focus on the unique issues of the funds they oversee, including common research, investment, and operational issues. On occasion, the separate Boards establish joint committees to address issues of overlapping consequences for the Fidelity® funds overseen by each Board.
The Trustees operate using a system of committees to facilitate the timely and efficient consideration of all matters of importance to the Trustees, the fund, and fund shareholders and to facilitate compliance with legal and regulatory requirements and oversight of the fund's activities and associated risks. The Board, acting through its committees, has charged FMR and its affiliates with (i) identifying events or circumstances the occurrence of which could have demonstrably adverse effects on the fund's business and/or reputation; (ii) implementing processes and controls to lessen the possibility that such events or circumstances occur or to mitigate the effects of such events or circumstances if they do occur; and (iii) creating and maintaining a system designed to evaluate continuously business and market conditions in order to facilitate the identification and implementation processes described in (i) and (ii) above. Because the day-to-day operations and activities of the fund are carried out by or through FMR, its affiliates, and other service providers, the fund's exposure to risks is mitigated but not eliminated by the processes overseen by the Trustees. While each of the Board's committees has responsibility for overseeing different aspects of the fund's activities, oversight is exercised primarily through the Operations, Audit, and Compliance Committees. Appropriate personnel, including but not limited to the fund's Chief Compliance Officer (CCO), FMR's internal auditor, the independent accountants, the fund's Treasurer and portfolio management personnel, make periodic reports to the Board's committees, as appropriate, including an annual review of Fidelity's risk management program for the Fidelity® funds. The responsibilities of each standing committee, including their oversight responsibilities, are described further under "Standing Committees of the Trustees."
Interested Trustees*:
Correspondence intended for a Trustee who is an interested person may be sent to Fidelity Investments, 245 Summer Street, Boston, Massachusetts 02210.
Name, Year of Birth; Principal Occupations and Other Relevant Experience+
Jonathan Chiel (1957)
Year of Election or Appointment: 2016
Trustee
Mr. Chiel also serves as Trustee of other Fidelity® funds. Mr. Chiel is Senior Counsel at Fidelity Investments (diversified financial services company, 2024-present). Previously, Mr. Chiel served as General Counsel (2012-2024) and Head of Legal, Risk and Compliance (2022-2024) for Fidelity Investments; Executive Vice President and General Counsel for FMR LLC (diversified financial services company, 2012-2024); Director and President of OH Company LLC (holding company, 2018-2024); General Counsel (2004-2012) and Senior Vice President and Deputy General Counsel (2000-2004) for John Hancock Financial Services; a partner with Choate, Hall & Stewart (law firm, 1996-2000); and an Assistant United States Attorney for the United States Attorney's Office of the District of Massachusetts (1986-1995), including Chief of the Criminal Division (1993-1995). Mr. Chiel is a director on the boards of the Harvard Law School Center on the Legal Profession and the U.S. Chamber Litigation Center.
Bettina Doulton (1964)
Year of Election or Appointment: 2021
Trustee
Ms. Doulton also serves as Trustee of other Fidelity® funds. Prior to her retirement, Ms. Doulton served in a variety of positions at Fidelity Investments, including as a managing director of research (2006-2007), portfolio manager to certain Fidelity® funds (1993-2005), equity analyst and portfolio assistant (1990-1993), and research assistant (1987-1990). Ms. Doulton currently owns and operates Cellardoor Winery. Previously, Ms. Doulton served as a member of the Board of Brown Capital Management, LLC (2014-2018).
Robert A. Lawrence (1952)
Year of Election or Appointment: 2020
Trustee
Chair of the Board of Trustees
Mr. Lawrence also serves as Trustee of other funds. Previously, Mr. Lawrence served as a Trustee and Member of the Advisory Board of certain funds. Prior to his retirement in 2008, Mr. Lawrence served as Vice President of certain Fidelity® funds (2006-2008), Senior Vice President, Head of High Income Division of Fidelity Management & Research Company (investment adviser firm, 2006-2008), and President of Fidelity Strategic Investments (investment adviser firm, 2002-2005).
* Determined to be an "Interested Trustee" by virtue of, among other things, his or her affiliation with the trust or various entities under common control with FMR.
+ The information includes the Trustee's principal occupation during the last five years and other information relating to the experience, attributes, and skills relevant to the Trustee's qualifications to serve as a Trustee, which led to the conclusion that the Trustee should serve as a Trustee for the fund.
Independent Trustees:
Correspondence intended for an Independent Trustee may be sent to Fidelity Investments, P.O. Box 55235, Boston, Massachusetts 02205-5235.
Name, Year of Birth; Principal Occupations and Other Relevant Experience+
Thomas P. Bostick (1956)
Year of Election or Appointment: 2021
Trustee
Lieutenant General Bostick also serves as Trustee of other Fidelity® funds. Prior to his retirement, General Bostick (United States Army, Retired) held a variety of positions within the U.S. Army, including Chief of Engineers and Commanding General, U.S. Army Corps of Engineers (2012-2016) and Deputy Chief of Staff and Director of Human Resources, U.S. Army (2009-2012). General Bostick currently serves as a member of the Board and Finance and Governance & Sustainability Committees of CSX Corporation (transportation, 2020-present) and a member of the Board and Corporate Governance and Nominating Committee of Perma-Fix Environmental Services, Inc. (nuclear waste management, 2020-present). General Bostick serves as Chief Executive Officer of Bostick Global Strategies, LLC (consulting, 2016-present), as a member of the Board of HireVue, Inc. (video interview and assessment, 2020-present), as a member of the Board of Allonnia (biotechnology and engineering solutions, 2022-present), on the Advisory Board of Hilco Redevelopment Partners (a real estate investment and redevelopment company, 2021-present), and on the Advisory Board of Solugen, Inc. (specialty bio-based chemicals manufacturer, 2022-present). Previously, General Bostick served as a Member of the Advisory Board of certain Fidelity® funds (2021), President, Intrexon Bioengineering (2018-2020) and Chief Operating Officer (2017-2020) and Senior Vice President of the Environment Sector (2016-2017) of Intrexon Corporation (biopharmaceutical company).
Donald F. Donahue (1950)
Year of Election or Appointment: 2018
Trustee
Mr. Donahue also serves as Trustee of other Fidelity® funds. Mr. Donahue serves as President and Chief Executive Officer of Miranda Partners, LLC (risk consulting for the financial services industry, 2012-present). Previously, Mr. Donahue served as Chief Executive Officer (2006-2012), Chief Operating Officer (2003-2006) and Managing Director, Customer Marketing and Development (1999-2003) of The Depository Trust & Clearing Corporation (financial markets infrastructure). Mr. Donahue currently serves as a member (2007-present) and Co-Chairman (2016-present) of the Board of United Way of New York. Mr. Donahue previously served as a member of the Advisory Board of certain Fidelity® funds (2015-2018) and as a member of the Board of The Leadership Academy (previously NYC Leadership Academy) (2012-2022).
Vicki L. Fuller (1957)
Year of Election or Appointment: 2020
Trustee
Ms. Fuller also serves as Trustee of other Fidelity® funds. Previously, Ms. Fuller served as a member of the Advisory Board of certain Fidelity® funds (2018-2020), Chief Investment Officer of the New York State Common Retirement Fund (2012-2018) and held a variety of positions at AllianceBernstein L.P. (global asset management, 1985-2012), including Managing Director (2006-2012) and Senior Vice President and Senior Portfolio Manager (2001-2006). Ms. Fuller currently serves as a member of the Board, Audit Committee, Compensation Committee and Nominating and Governance Committee of two Blackstone business development companies (2020-present), as a member of the Board of Treliant, LLC (consulting, 2019-present), as a member of the Board of Ariel Alternatives, LLC (private equity, 2022-present) and as a member of the Board and Chair of the Audit Committee of Gusto, Inc. (software, 2021-present). In addition, Ms. Fuller currently serves as a member of the Executive Board of New York University's Stern School of Business. Ms. Fuller previously served as a member of the Board of Roosevelt University (2019-2024) and member of the Board, Audit Committee and Nominating and Governance Committee of The Williams Companies, Inc. (natural gas infrastructure, 2018-2021).
Patricia L. Kampling (1959)
Year of Election or Appointment: 2020
Trustee
Ms. Kampling also serves as Trustee of other Fidelity® funds. Prior to her retirement, Ms. Kampling served as Chairman of the Board and Chief Executive Officer (2012-2019), President and Chief Operating Officer (2011-2012) and Executive Vice President and Chief Financial Officer (2010-2011) of Alliant Energy Corporation. Ms. Kampling currently serves as a member of the Board, Audit Committee and Governance, Compensation and Nominating Committee of Xcel Energy Inc. (utilities company, 2020-present) and as a member of the Board, Audit, Finance and Risk Committee and Safety, Environmental, Technology and Operations Committee and Chair of the Executive Development and Compensation Committee of American Water Works Company, Inc. (utilities company, 2019-present). In addition, Ms. Kampling currently serves as a member of the Board of the Nature Conservancy, Wisconsin Chapter (2019-present). Previously, Ms. Kampling served as a Member of the Advisory Board of certain Fidelity® funds (2020), a member of the Board, Compensation Committee and Executive Committee and Chair of the Audit Committee of Briggs & Stratton Corporation (manufacturing, 2011-2021), a member of the Board of Interstate Power and Light Company (2012-2019) and Wisconsin Power and Light Company (2012-2019) (each a subsidiary of Alliant Energy Corporation) and as a member of the Board and Workforce Development Committee of the Business Roundtable (2018-2019).
Thomas A. Kennedy (1955)
Year of Election or Appointment: 2021
Trustee
Mr. Kennedy also serves as Trustee of other Fidelity® funds. Previously, Mr. Kennedy served as a Member of the Advisory Board of certain Fidelity® funds (2020) and held a variety of positions at Raytheon Company (aerospace and defense, 1983-2020), including Chairman and Chief Executive Officer (2014-2020) and Executive Vice President and Chief Operating Officer (2013-2014). Mr. Kennedy served as Executive Chairman of the Board of Directors of Raytheon Technologies Corporation (aerospace and defense, 2020-2021). Mr. Kennedy serves as a Director of the Board of Directors of Textron Inc. (aerospace and defense, 2023-present).
Oscar Munoz (1959)
Year of Election or Appointment: 2021
Trustee
Mr. Munoz also serves as Trustee of other Fidelity® funds. Prior to his retirement, Mr. Munoz served as Executive Chairman (2020-2021), Chief Executive Officer (2015-2020), President (2015-2016) and a member of the Board (2010-2021) of United Airlines Holdings, Inc. Mr. Munoz currently serves as a member of the Board of CBRE Group, Inc. (commercial real estate, 2020-present), a member of the Board of Univision Communications, Inc. (Hispanic media, 2020-present), a member of the Board of Archer Aviation Inc. (2021-present), a member of the Defense Business Board of the United States Department of Defense (2021-present) and a member of the Board of Salesforce.com, Inc. (cloud-based software, 2022-present). Previously, Mr. Munoz served as a Member of the Advisory Board of certain Fidelity® funds (2021).
David M. Thomas (1949)
Year of Election or Appointment: 2008
Trustee
Lead Independent Trustee
Mr. Thomas also serves as Trustee of other Fidelity® funds. Previously, Mr. Thomas served as Executive Chairman (2005-2006) and Chairman and Chief Executive Officer (2000-2005) of IMS Health, Inc. (pharmaceutical and healthcare information solutions) and as a member of the Board of Fortune Brands Home and Security (home and security products, 2004-2023). Mr. Thomas currently serves as Director (2013-present) and Non-Executive Chairman of the Board (2022-present) of Interpublic Group of Companies, Inc. (marketing communication).
Susan Tomasky (1953)
Year of Election or Appointment: 2020
Trustee
Ms. Tomasky also serves as Trustee of other Fidelity® funds. Prior to her retirement, Ms. Tomasky served in various executive officer positions at American Electric Power Company, Inc. (1998-2011), including most recently as President of AEP Transmission (2007-2011). Ms. Tomasky currently serves as a member of the Board and Sustainability Committee and as Chair of the Audit Committee of Marathon Petroleum Corporation (2018-present) and as a member of the Board, Executive Committee, Corporate Governance Committee and Organization and Compensation Committee and as Lead Director of the Board of Public Service Enterprise Group, Inc. (utilities company, 2012-present) and as a member of the Board of its subsidiary company, Public Service Electric and Gas Co. (2021-present). In addition, Ms. Tomasky currently serves as a member (2009-present) and President (2020-present) of the Board of the Royal Shakespeare Company - America (2009-present) and as a member and Vice Chair of the Board of Kenyon College (2016-present). Previously, Ms. Tomasky served as a Member of the Advisory Board of certain Fidelity® funds (2020), as a member of the Board of the Columbus Association for the Performing Arts (2011-2023), as a member of the Board of the Columbus Regional Airport Authority (2007-2020), as a member of the Board (2011-2018) and Lead Independent Director (2015-2018) of Andeavor Corporation (previously Tesoro Corporation) (independent oil refiner and marketer) and as a member of the Board of Summit Midstream Partners LP (energy, 2012-2018).
Michael E. Wiley (1950)
Year of Election or Appointment: 2020
Trustee
Mr. Wiley also serves as Trustee of other Fidelity® funds. Previously, Mr. Wiley served as a member of the Advisory Board of certain Fidelity® funds (2018-2020), Chairman, President and CEO of Baker Hughes, Inc. (oilfield services, 2000-2004). Mr. Wiley also previously served as a member of the Board of Andeavor Corporation (independent oil refiner and marketer, 2005-2018), a member of the Board of Andeavor Logistics LP (natural resources logistics, 2015-2018) and a member of the Board of High Point Resources (exploration and production, 2005-2020).
+ The information includes the Trustee's principal occupation during the last five years and other information relating to the experience, attributes, and skills relevant to the Trustee's qualifications to serve as a Trustee, which led to the conclusion that the Trustee should serve as a Trustee for the fund.
Advisory Board Members and Officers:
Correspondence intended for a Member of the Advisory Board (if any) may be sent to Fidelity Investments, P.O. Box 55235, Boston, Massachusetts 02205-5235. Correspondence intended for an officer or Peter S. Lynch may be sent to Fidelity Investments, 245 Summer Street, Boston, Massachusetts 02210.
Name, Year of Birth; Principal Occupations+
Vijay C. Advani (1960)
Year of Election or Appointment: 2023
Member of the Advisory Board
Mr. Advani also serves as Trustee or Member of the Advisory Board of other funds. Previously, Mr. Advani served as Executive Chairman (2020-2022), Chief Executive Officer (2017-2020) and Chief Operating Officer (2016-2017) of Nuveen (global investment manager). He also served in various capacities at Franklin Resources (global investment manager), including Co-President (2015-2016), Executive Vice President, Global Advisory Services (2008-2015), Head of Global Retail Distribution (2005-2008), Executive Managing Director, International Retail Development (2002-2005), Managing Director, Product Developments, Sales & Marketing, Asia, Eastern Europe and Africa (2000-2002) and President, Templeton Asset Management India (1995-2000). Mr. Advani also served as Senior Investment Officer of International Finance Corporation (private equity and venture capital arm of The World Bank, 1984-1995). Mr. Advani is Chairman Emeritus of the U.S. India Business Council (2018-present), a Director of The Global Impact Investing Network (2019-present), a Director of LOK Capital (Mauritius) (2022-present), a member of the Advisory Council of LOK Capital (2022-present), a Senior Advisor of Neuberger Berman (2021-present), a Senior Advisor of Seviora Holdings Pte. Ltd (Temasek-Singapore) (2021-present), a Director of Seviora Capital (Singapore) (2021-present) and an Advisor of EQUIAM (2021-present). Mr. Advani formerly served as a member of the Board of BowX Acquisition Corp. (special purpose acquisition company, 2020-2021), a member of the Board of Intellecap (advisory arm of The Aavishkaar Group, 2018-2020), a member of the Board of Nuveen Investments, Inc. (2017-2020) and a member of the Board of Docusign (software, 2016-2019).
Peter S. Lynch (1944)
Year of Election or Appointment: 2003
Member of the Advisory Board
Mr. Lynch also serves as a Member of the Advisory Board of other Fidelity® funds. Mr. Lynch is Vice Chairman and a Director of Fidelity Management & Research Company LLC (investment adviser firm). In addition, Mr. Lynch serves as a Trustee of Boston College and as the Chairman of the Inner-City Scholarship Fund. Previously, Mr. Lynch served as Vice Chairman and a Director of FMR Co., Inc. (investment adviser firm) and on the Special Olympics International Board of Directors (1997-2006).
Karen B. Peetz (1955)
Year of Election or Appointment: 2023
Member of the Advisory Board
Ms. Peetz also serves as a Member of the Advisory Board of other funds. Previously, Ms. Peetz served as Chief Administration Officer (2020-2023) of Citigroup Inc. (a diversified financial service company). She also served in various capacities at Bank of New York Mellon Corporation, including President (2013-2016), Vice Chairman, Senior Executive Vice President and Chief Executive Officer of Financial Markets & Treasury Services (2010-2013), Senior Executive Vice President and Chief Executive Officer of Global Corporate Trust (2003-2008), Senior Vice President and Division Manager of Global Payments & Trade Services (2002-2003) and Senior Vice President and Division Manager of Domestic Corporate Trust (1998-2002). Ms. Peetz also served in various capacities at Chase Manhattan Corporation (1982-1998), including Senior Vice President and Manager of Corporate Trust International Business (1996-1998), Managing Director and Manager of Corporate Trust Services (1994-1996) and Managing Director and Group Manager of Financial Institution Sales (1990-1993). Ms. Peetz currently serves as Chair of Amherst Holdings Advisory Council (2018-present), Trustee of Johns Hopkins University (2016-present), Chair of the Carey Business School Advisory Council, Member of the Johns Hopkins Medicine Board and Finance Committee and Chair of the Lyme and Tick Related Disease Institute Advisory Council. Ms. Peetz previously served as a member of the Board of Guardian Life Insurance Company of America (2019-2023), a member of the Board of Trane Technologies (2018-2022), a member of the Board of Wells Fargo Corp. (2017-2019), a member of the Board of SunCoke Energy Inc. (2012-2016), a member of the Board of Private Export Funding Corporation (2010-2016) and as a Trustee of Penn State University (2010-2014) and the United Way of New York City (2008-2010).
Heather Bonner (1977)
Year of Election or Appointment: 2023
Assistant Treasurer
Ms. Bonner also serves as an officer of other funds. Ms. Bonner is a Senior Vice President (2022-present) and is an employee of Fidelity Investments (2022-present). Ms. Bonner serves as Senior Vice President, Vice President, Treasurer, or Director of certain Fidelity entities. Prior to joining Fidelity, Ms. Bonner served as Managing Director at AQR Capital Management (2013-2022) and was the Treasurer and Principal Financial Officer of the AQR Funds (2013-2022).
Craig S. Brown (1977)
Year of Election or Appointment: 2022
Deputy Treasurer
Mr. Brown also serves as an officer of other funds. Mr. Brown is a Vice President (2015-present) and is an employee of Fidelity Investments. Mr. Brown serves as Assistant Treasurer of FIMM, LLC (2021-present). Previously, Mr. Brown served as Assistant Treasurer of certain Fidelity® funds (2019-2022).
John J. Burke III (1964)
Year of Election or Appointment: 2018
Chief Financial Officer
Mr. Burke also serves as Chief Financial Officer of other funds. Mr. Burke is Head of Fidelity Fund and Investment Operations (2018-present) and is an employee of Fidelity Investments. Mr. Burke serves as President, Executive Vice President, or Director of certain Fidelity entities. Previously Mr. Burke served as head of Asset Management Investment Operations (2012-2018).
Margaret Carey (1973)
Year of Election or Appointment: 2023
Secretary and Chief Legal Officer (CLO)
Ms. Carey also serves as an officer of other funds and as CLO of certain Fidelity entities. Ms. Carey is a Senior Vice President, Deputy General Counsel (2019-present) and is an employee of Fidelity Investments.
William C. Coffey (1969)
Year of Election or Appointment: 2019
Assistant Secretary
Mr. Coffey also serves as Assistant Secretary of other funds. Mr. Coffey is a Senior Vice President, Deputy General Counsel (2010-present) and is an employee of Fidelity Investments. Previously, Mr. Coffey served as Secretary and CLO of certain funds (2018-2019); CLO, Secretary, or Senior Vice President of certain Fidelity entities and Assistant Secretary of certain funds (2009-2018).
Timothy M. Cohen (1969)
Year of Election or Appointment: 2018
Vice President
Mr. Cohen also serves as Vice President of other funds. Mr. Cohen is Co-Head of Equity (2018-present) and is an employee of Fidelity Investments. Mr. Cohen serves as President or Director of certain Fidelity entities. Previously, Mr. Cohen served as Executive Vice President of Fidelity SelectCo, LLC (2019) and Head of Global Equity Research (2016-2018).
Jonathan Davis (1968)
Year of Election or Appointment: 2010
Assistant Treasurer
Mr. Davis also serves as an officer of other funds. Mr. Davis is a Vice President (2006-present) and is an employee of Fidelity Investments. Mr. Davis serves as Assistant Treasurer or Director of certain Fidelity entities.
Laura M. Del Prato (1964)
Year of Election or Appointment: 2018
Assistant Treasurer
Ms. Del Prato also serves as an officer of other funds. Ms. Del Prato is a Senior Vice President (2017-present) and is an employee of Fidelity Investments. Ms. Del Prato serves as Senior Vice President, Vice President, Assistant Treasurer, or Director of certain Fidelity entities. Previously, Ms. Del Prato served as President and Treasurer of The North Carolina Capital Management Trust: Cash Portfolio and Term Portfolio (2018-2020).
Colm A. Hogan (1973)
Year of Election or Appointment: 2020
Assistant Treasurer
Mr. Hogan also serves as an officer of other funds. Mr. Hogan is a Vice President (2016-present) and is an employee of Fidelity Investments. Mr. Hogan serves as Assistant Treasurer of certain Fidelity entities. Previously, Mr. Hogan served as Deputy Treasurer of certain Fidelity® funds (2016-2020) and Assistant Treasurer of certain Fidelity® funds (2016-2018).
Pamela R. Holding (1964)
Year of Election or Appointment: 2018
Vice President
Ms. Holding also serves as Vice President of other funds. Ms. Holding is Co-Head of Equity (2018-present) and is an employee of Fidelity Investments. Previously, Ms. Holding served as Executive Vice President of Fidelity SelectCo, LLC (2019) and as Chief Investment Officer of Fidelity Institutional Asset Management (2013-2018).
Chris Maher (1972)
Year of Election or Appointment: 2020
Deputy Treasurer
Mr. Maher also serves as an officer of other funds. Mr. Maher is a Vice President (2008-present) and is an employee of Fidelity Investments. Mr. Maher serves as Assistant Treasurer of certain Fidelity entities. Previously, Mr. Maher served as Assistant Treasurer of certain funds (2013-2020).
Jason P. Pogorelec (1975)
Year of Election or Appointment: 2020
Chief Compliance Officer
Mr. Pogorelec also serves as Chief Compliance Officer of other funds. Mr. Pogorelec is a Senior Vice President of Asset Management Compliance (2020-present) and is an employee of Fidelity Investments. Mr. Pogorelec serves as Compliance Officer of Fidelity Management & Research Company LLC (investment adviser firm, 2023-present) and Ballyrock Investment Advisors LLC (2023-present). Previously, Mr. Pogorelec served as a Vice President, Associate General Counsel for Fidelity Investments (2010-2020) and Assistant Secretary of certain Fidelity® funds (2015-2020).
Brett Segaloff (1972)
Year of Election or Appointment: 2021
Anti-Money Laundering (AML) Officer
Mr. Segaloff also serves as AML Officer of other funds. Mr. Segaloff is a Vice President (2022-present) and is an employee of Fidelity Investments. Mr. Segaloff serves as Anti Money Laundering Compliance Officer or Anti Money Laundering/Bank Secrecy Act Compliance Officer of certain Fidelity entities.
Stacie M. Smith (1974)
Year of Election or Appointment: 2016
President and Treasurer
Ms. Smith also serves as an officer of other funds. Ms. Smith is a Senior Vice President (2016-present) and is an employee of Fidelity Investments. Ms. Smith serves as Assistant Treasurer of certain Fidelity entities and has served in other fund officer roles.
Jim Wegmann (1979)
Year of Election or Appointment: 2019
Assistant Treasurer
Mr. Wegmann also serves as an officer of other funds. Mr. Wegmann is a Vice President (2016-present) and is an employee of Fidelity Investments. Mr. Wegmann serves as Assistant Treasurer of FIMM, LLC (2021-present). Previously, Mr. Wegmann served as Assistant Treasurer of certain Fidelity® funds (2019-2021).
+ The information includes principal occupation during the last five years.
As a shareholder, you incur two types of costs: (1) transaction costs, which may include sales charges (loads) on purchase payments or redemption proceeds, as applicable and (2) ongoing costs, which generally include management fees, distribution and/or service (12b-1) fees and other Fund expenses. This Example is intended to help you understand your ongoing costs (in dollars) of investing in a fund and to compare these costs with the ongoing costs of investing in other mutual funds.
| The Example is based on an investment of $1,000 invested at the beginning of the period and held for the entire period (November 1, 2023 to April 30, 2024). |
Actual Expenses
The first line of the accompanying table provides information about actual account values and actual expenses. You may use the information in this line, together with the amount you invested, to estimate the expenses that you paid over the period. Simply divide your account value by $1,000.00 (for example, an $8,600 account value divided by $1,000.00 = 8.6), then multiply the result by the number in the first line for a class/Fund under the heading entitled "Expenses Paid During Period" to estimate the expenses you paid on your account during this period. If any fund is a shareholder of any underlying mutual funds or exchange-traded funds (ETFs) (the Underlying Funds), such fund indirectly bears its proportional share of the expenses of the Underlying Funds in addition to the direct expenses incurred presented in the table. These fees and expenses are not included in the annualized expense ratio used to calculate the expense estimate in the table below.
Hypothetical Example for Comparison Purposes
The second line of the accompanying table provides information about hypothetical account values and hypothetical expenses based on the actual expense ratio and an assumed rate of return of 5% per year before expenses, which is not the actual return. The hypothetical account values and expenses may not be used to estimate the actual ending account balance or expenses you paid for the period. You may use this information to compare the ongoing costs of investing in the Fund and other funds. To do so, compare this 5% hypothetical example with the 5% hypothetical examples that appear in the shareholder reports of the other funds. If any fund is a shareholder of any Underlying Funds, such fund indirectly bears its proportional share of the expenses of the Underlying Funds in addition to the direct expenses as presented in the table. These fees and expenses are not included in the annualized expense ratio used to calculate the expense estimate in the table below.
Please note that the expenses shown in the table are meant to highlight your ongoing costs only and do not reflect any transaction costs. Therefore, the second line of the table is useful in comparing ongoing costs only, and will not help you determine the relative total costs of owning different funds. In addition, if these transactional costs were included, your costs would have been higher.
| | | | | Annualized Expense Ratio- A | | Beginning Account Value November 1, 2023 | | Ending Account Value April 30, 2024 | | Expenses Paid During Period- C November 1, 2023 to April 30, 2024 |
| | | | | | | | | | |
| Fidelity® Series Small Cap Discovery Fund | | | | -%-D | | | | | | |
| Actual | | | | | | $ 1,000 | | $ 1,209.20 | | $-E |
Hypothetical-B | | | | | | $ 1,000 | | $ 1,024.86 | | $-E |
| |
A Annualized expense ratio reflects expenses net of applicable fee waivers.
B 5% return per year before expenses
C Expenses are equal to the annualized expense ratio, multiplied by the average account value over the period, multiplied by 182/ 366 (to reflect the one-half year period). The fees and expenses of any Underlying Funds are not included in each annualized expense ratio.
D Amount represents less than .005%.
E Amount represents less than $.005.
The dividend and capital gains distributions for the fund(s) are available on Fidelity.com or Institutional.Fidelity.com.
The fund hereby designates as a capital gain dividend with respect to the taxable year ended April 30, 2024, $57,262,094, or, if subsequently determined to be different, the net capital gain of such year.
The fund designates $ $1,873,975 of distributions paid during the fiscal year ended 2024 as qualifying to be taxed as section 163(j) interest dividends.
The fund designates 90%, and 59% of the dividends distributed in June and December, respectively during the fiscal year as qualifying for the dividends-received deduction for corporate shareholders.
The fund designates 98.63%, and 78.41% of the dividends distributed in June and December, respectively during the fiscal year as amounts which may be taken into account as a dividend for the purposes of the maximum rate under section 1(h)(11) of the Internal Revenue Code.
The fund designates 0.05% and 0.69% of the dividends distributed in June and December, respectively during the fiscal year as a section 199A dividend.
The fund will notify shareholders in January 2025 of amounts for use in preparing 2024 income tax returns.
Board Approval of Investment Advisory Contracts
Fidelity Series Small Cap Discovery Fund
At its January 2024 meeting, the Board of Trustees, including the Independent Trustees (together, the Board), approved amended and restated sub-advisory agreements (the Sub-Advisory Contracts) for the fund, including the fund's sub-advisory agreements with Fidelity Management & Research (Hong Kong) Limited (FMR H.K.) and Fidelity Management & Research (Japan) Limited (FMR Japan). The Sub-Advisory Contracts will be effective March 1, 2024. The Board will consider the annual renewal of the fund's Sub-Advisory Contracts in May 2024, following its review of additional materials provided by FMR.
The Board considered the Sub-Advisory Contracts, which simplified the calculation of the fees paid by FMR to the sub-advisers under the agreements. The Board noted that the agreements with FMR H.K. and FMR Japan were amended to provide that FMR will compensate each sub-adviser at a fee rate equal to 110% of the sub-adviser's costs incurred in providing services under the agreement. The Board considered that, under the Sub-Advisory Contracts, FMR, and not the fund, will continue to pay the sub-advisory fees to each applicable sub-adviser, and that the management fee paid by the fund under the management contract with FMR will remain unchanged.
The Board further considered that the approval of the fund's Sub-Advisory Contracts will not result in any changes in the investment process or strategies employed in the management of the fund's assets or the day-to-day management of the fund or the persons primarily responsible for such management. Further, the Board considered that the Sub-Advisory Contracts would not change the obligations and services of FMR and its affiliates on behalf of the fund, and, in particular, there would be no change in the nature and level of services provided to the fund by FMR and its affiliates.
In connection with its consideration of future renewals of the fund's advisory contracts, the Board will consider: (i) the nature, extent and quality of services provided to the funds, including shareholder and administrative services and investment performance; (ii) the competitiveness of the management fee and total expenses for the fund; (iii) the costs of the services and profitability, including the revenues earned and the expenses incurred in conducting the business of developing, marketing, distributing, managing, administering, and servicing the fund and its shareholders, to the extent applicable; and (iv) whether there have been economies of scale in respect of the Fidelity funds, whether the Fidelity funds (including the fund) have appropriately benefited from any such economies of scale, and whether there is the potential for realization of any further economies.
Based on its evaluation of all of the conclusions noted above, and after considering all factors it believed relevant, the Board concluded that the fund's management fee structure is fair and reasonable, and that the fund's Sub-Advisory Contracts should be approved.
The Securities and Exchange Commission adopted Rule 22e-4 under the Investment Company Act of 1940 (the Liquidity Rule) to promote effective liquidity risk management throughout the open-end investment company industry, thereby reducing the risk that funds will be unable to meet their redemption obligations and mitigating dilution of the interests of fund shareholders.
The Fund has adopted and implemented a liquidity risk management program (the Program) reasonably designed to assess and manage the Fund's liquidity risk and to comply with the requirements of the Liquidity Rule. The Fund's Board of Trustees (the Board) has designated the Fund's investment adviser as administrator of the Program. The Fidelity advisers have established a Liquidity Risk Management Committee (the LRM Committee) to manage the Program for each of the Fidelity Funds. The LRM Committee monitors the adequacy and effectiveness of implementation of the Program and on a periodic basis assesses each Fund's liquidity risk based on a variety of factors including (1) the Fund's investment strategy, (2) portfolio liquidity and cash flow projections during normal and reasonably foreseeable stressed conditions, (3) shareholder redemptions, (4) borrowings and other funding sources and (5) certain factors specific to ETFs including the effect of the Fund's prices and spreads, market participants, and basket compositions on the overall liquidity of the Fund's portfolio, as applicable.
In accordance with the Program, each of the Fund's portfolio investments is classified into one of four defined liquidity categories based on a determination of a reasonable expectation for how long it would take to convert the investment to cash (or sell or dispose of the investment) without significantly changing its market value.
- Highly liquid investments - cash or convertible to cash within three business days or less
- Moderately liquid investments - convertible to cash in three to seven calendar days
- Less liquid investments - can be sold or disposed of, but not settled, within seven calendar days
- Illiquid investments - cannot be sold or disposed of within seven calendar days
Liquidity classification determinations take into account a variety of factors including various market, trading and investment-specific considerations, as well as market depth, and generally utilize analysis from a third-party liquidity metrics service.
The Liquidity Rule places a 15% limit on a fund's illiquid investments and requires funds that do not primarily hold assets that are highly liquid investments to determine and maintain a minimum percentage of the fund's net assets to be invested in highly liquid investments (highly liquid investment minimum or HLIM). The Program includes provisions reasonably designed to comply with the 15% limit on illiquid investments and for determining, periodically reviewing and complying with the HLIM requirement as applicable.
At a recent meeting of the Fund's Board of Trustees, the LRM Committee provided a written report to the Board pertaining to the operation, adequacy, and effectiveness of the Program for the period December 1, 2022 through November 30, 2023. The report concluded that the Program is operating effectively and is reasonably designed to assess and manage the Fund's liquidity risk.
1.968029.110
XS4-ANN-0624
Fidelity® Small Cap Stock K6 Fund
Annual Report
April 30, 2024
Contents
To view a fund's proxy voting guidelines and proxy voting record for the 12-month period ended June 30, visit http://www.fidelity.com/proxyvotingresults or visit the Securities and Exchange Commission's (SEC) web site at http://www.sec.gov.
You may also call 1-800-835-5092 to request a free copy of the proxy voting guidelines.
Standard & Poor's, S&P and S&P 500 are registered service marks of The McGraw-Hill Companies, Inc. and have been licensed for use by Fidelity Distributors Corporation.
Other third-party marks appearing herein are the property of their respective owners.
All other marks appearing herein are registered or unregistered trademarks or service marks of FMR LLC or an affiliated company. © 2024 FMR LLC. All rights reserved.
This report and the financial statements contained herein are submitted for the general information of the shareholders of the Fund. This report is not authorized for distribution to prospective investors in the Fund unless preceded or accompanied by an effective prospectus.
A fund files its complete schedule of portfolio holdings with the SEC for the first and third quarters of each fiscal year on Form N-PORT. Forms N-PORT are available on the SEC's web site at http://www.sec.gov. A fund's Forms N-PORT may be reviewed and copied at the SEC's Public Reference Room in Washington, DC. Information regarding the operation of the SEC's Public Reference Room may be obtained by calling 1-800-SEC-0330.
For a complete list of a fund's portfolio holdings, view the most recent holdings listing, semiannual report, or annual report on Fidelity's web site at http://www.fidelity.com, http://www.institutional.fidelity.com, or http://www.401k.com, as applicable.
NOT FDIC INSURED •MAY LOSE VALUE •NO BANK GUARANTEE
Neither the Fund nor Fidelity Distributors Corporation is a bank.
Average annual total return reflects the change in the value of an investment, assuming reinvestment of distributions from dividend income and capital gains (the profits earned upon the sale of securities that have grown in value, if any) and assuming a constant rate of performance each year. The hypothetical investment and the average annual total returns do not reflect the deduction of taxes that a shareholder would pay on fund distributions or the redemption of fund shares. During periods of reimbursement by Fidelity, a fund's total return will be greater than it would be had the reimbursement not occurred. How a fund did yesterday is no guarantee of how it will do tomorrow.
| Average Annual Total Returns |
| | | | |
Periods ended April 30, 2024 | Past 1 year | Past 5 years | Life of Fund A |
| Fidelity® Small Cap Stock K6 Fund | 13.94% | 6.60% | 7.23% |
A From May 25, 2017
| $10,000 Over Life of Fund |
| |
Let's say hypothetically that $10,000 was invested in Fidelity® Small Cap Stock K6 Fund, on May 25, 2017, when the fund started. The chart shows how the value of your investment would have changed, and also shows how the Russell 2000® Index performed over the same period. |
|
|
Market Recap:
U.S. equities gained 22.66% for the 12 months ending April 30, 2024, according to the S&P 500® index, driven by resilient corporate profits, a frenzy over generative artificial intelligence and the Federal Reserve's likely pivot to cutting interest rates later this year. Amid this favorable backdrop for higher-risk assets, the S&P 500® continued its late-2023 momentum and ended March at its all-time high before snapping a five-month uptrend in April (-4.08%). Growth stocks led the broad rally, mostly driven by a narrow set of firms in the communication services (+41%) and information technology (+37%) sectors, largely due to excitement for AI. In particular, semiconductor-related stocks (+104%) were a standout. Following the Fed's November 1 meeting, when the central bank hinted it might be done raising rates, the S&P 500® reversed a three-month decline and gained 14.09% in the final two months of 2023 and 10.56% the first quarter. Risk assets were further aided on March 20, when the central bank held steady its benchmark federal funds rate and affirmed its projection to cut in 2024. The index then slipped in April, as inflation remained stickier than expected, spurring doubts of a soft economic landing. For the full 12 months, the financials, industrials and consumer discretionary sectors each gained about 24%. In sharp contrast, real estate and the defensive-oriented utilities sector each roughly broke even. Other notable "laggards" included consumer staples (+3%) and health care (+7%).
Comments from Portfolio Manager Marc Grow:
For the fiscal year ending April 30, 2024, the fund gained 13.94%, versus 13.32% for the benchmark Russell 2000 Index. Relative to the benchmark, sector positioning was the primary contributor, led by an underweight in health care. Security selection and smaller-than-benchmark exposure to materials stocks also helped. An underweight in utilities was another plus, as were investment choices and an overweight in industrials, primarily within the capital goods industry. The fund's non-benchmark stake in Vertiv Holdings gained 253% and was the top individual relative contributor though the stock was no longer held at period end. An out-of-benchmark holding in XPO (+131%) - a position we established this period - added value as well. Another notable relative contributor was the portfolio's outsized exposure to Murphy USA (+51%), one of our biggest holdings this period. In contrast, the most sizable detractors from performance versus the benchmark were stock picks and an underweight in information technology, especially among technology hardware & equipment companies. Security selection and comparatively light exposure to the energy sector also was problematic in terms of the fund's relative result. Subpar investment choices and an overweight in consumer discretionary, primarily within the consumer durables & apparel industry, hurt as well. Lastly, the portfolio's cash position was a notable drag on performance. Avoiding Super Micro Computer, an index component that gained approximately 715%, detracted most from the fund's relative return. A non-benchmark stake in Concentrix returned roughly -42% and was the second-largest relative detractor, although it was among the fund's biggest holdings this period. Outsized exposure to LGI Homes (-24%) also proved detrimental to performance. However, the stock was among the portfolio's larger holdings the past 12 months, despite a reduction in exposure to the firm. Notable changes in positioning include an increased allocation to materials stocks and a smaller stake in the real estate sector.
The views expressed above reflect those of the portfolio manager(s) only through the end of the period as stated on the cover of this report and do not necessarily represent the views of Fidelity or any other person in the Fidelity organization. Any such views are subject to change at any time based upon market or other conditions and Fidelity disclaims any responsibility to update such views. These views may not be relied on as investment advice and, because investment decisions for a Fidelity fund are based on numerous factors, may not be relied on as an indication of trading intent on behalf of any Fidelity fund.
Top Holdings (% of Fund's net assets) |
| |
| Grand Canyon Education, Inc. | 2.9 | |
| Murphy U.S.A., Inc. | 2.7 | |
| Performance Food Group Co. | 2.6 | |
| Ciena Corp. | 2.3 | |
| FirstCash Holdings, Inc. | 2.3 | |
| Insight Enterprises, Inc. | 1.9 | |
| Maximus, Inc. | 1.6 | |
| Lumentum Holdings, Inc. | 1.6 | |
| First American Financial Corp. | 1.6 | |
| Brookfield Infrastructure Corp. A Shares | 1.5 | |
| | 21.0 | |
| |
| Market Sectors (% of Fund's net assets) |
| |
| Industrials | 17.6 | |
| Financials | 15.5 | |
| Information Technology | 15.5 | |
| Consumer Discretionary | 13.6 | |
| Health Care | 12.4 | |
| Consumer Staples | 6.5 | |
| Energy | 6.3 | |
| Materials | 6.2 | |
| Utilities | 2.6 | |
| Communication Services | 1.6 | |
| Real Estate | 1.2 | |
| |
Asset Allocation (% of Fund's net assets) |
|
|
Showing Percentage of Net Assets
| Common Stocks - 99.0% |
| | | Shares | Value ($) |
| COMMUNICATION SERVICES - 1.6% | | | |
| Diversified Telecommunication Services - 0.0% | | | |
| GCI Liberty, Inc. Class A (Escrow) (a)(f) | | 6,792 | 0 |
| Media - 1.6% | | | |
| TechTarget, Inc. (b) | | 11,125 | 305,938 |
| Thryv Holdings, Inc. (b) | | 27,150 | 624,722 |
| | | | 930,660 |
TOTAL COMMUNICATION SERVICES | | | 930,660 |
| CONSUMER DISCRETIONARY - 13.6% | | | |
| Automobile Components - 0.6% | | | |
| Patrick Industries, Inc. | | 3,256 | 340,219 |
| Diversified Consumer Services - 4.3% | | | |
| Grand Canyon Education, Inc. (b) | | 13,156 | 1,710,544 |
| Laureate Education, Inc. Class A | | 58,044 | 841,638 |
| | | | 2,552,182 |
| Household Durables - 2.2% | | | |
| Cavco Industries, Inc. (b) | | 1,029 | 374,772 |
| Helen of Troy Ltd. (b) | | 2,826 | 261,998 |
| LGI Homes, Inc. (b) | | 4,583 | 412,149 |
| SharkNinja, Inc. | | 3,328 | 213,924 |
| | | | 1,262,843 |
| Leisure Products - 1.7% | | | |
| Brunswick Corp. | | 6,423 | 517,951 |
| Clarus Corp. | | 28,511 | 180,475 |
| Games Workshop Group PLC | | 1,400 | 173,363 |
| YETI Holdings, Inc. (b) | | 3,211 | 114,697 |
| | | | 986,486 |
| Specialty Retail - 3.6% | | | |
| America's Car Mart, Inc. (b) | | 4,630 | 265,021 |
| Boot Barn Holdings, Inc. (b) | | 2,501 | 266,281 |
| Murphy U.S.A., Inc. | | 3,896 | 1,612,243 |
| | | | 2,143,545 |
| Textiles, Apparel & Luxury Goods - 1.2% | | | |
| Crocs, Inc. (b) | | 4,400 | 547,228 |
| Wolverine World Wide, Inc. | | 14,655 | 157,395 |
| | | | 704,623 |
TOTAL CONSUMER DISCRETIONARY | | | 7,989,898 |
| CONSUMER STAPLES - 6.5% | | | |
| Beverages - 2.1% | | | |
| Boston Beer Co., Inc. Class A (b) | | 1,297 | 361,098 |
| Coca-Cola Consolidated, Inc. | | 978 | 807,828 |
| MGP Ingredients, Inc. | | 526 | 41,259 |
| | | | 1,210,185 |
| Consumer Staples Distribution & Retail - 2.6% | | | |
| Performance Food Group Co. (b) | | 22,978 | 1,559,747 |
| Food Products - 1.8% | | | |
| Lassonde Industries, Inc. Class A (sub. vtg.) | | 2,921 | 305,584 |
| Nomad Foods Ltd. | | 43,266 | 781,384 |
| | | | 1,086,968 |
TOTAL CONSUMER STAPLES | | | 3,856,900 |
| ENERGY - 6.3% | | | |
| Energy Equipment & Services - 3.1% | | | |
| Cactus, Inc. | | 17,289 | 858,226 |
| TechnipFMC PLC | | 30,754 | 787,917 |
| Tidewater, Inc. (b) | | 1,892 | 173,780 |
| | | | 1,819,923 |
| Oil, Gas & Consumable Fuels - 3.2% | | | |
| Antero Resources Corp. (b) | | 13,428 | 456,686 |
| Northern Oil & Gas, Inc. | | 14,346 | 585,173 |
| Sitio Royalties Corp. | | 35,766 | 831,202 |
| | | | 1,873,061 |
TOTAL ENERGY | | | 3,692,984 |
| FINANCIALS - 15.5% | | | |
| Banks - 4.6% | | | |
| Cadence Bank | | 12,524 | 346,539 |
| ConnectOne Bancorp, Inc. | | 24,703 | 442,431 |
| Glacier Bancorp, Inc. | | 8,916 | 322,581 |
| Independent Bank Group, Inc. | | 17,370 | 646,859 |
| Metropolitan Bank Holding Corp. (b) | | 12,548 | 498,156 |
| Synovus Financial Corp. | | 12,754 | 456,466 |
| | | | 2,713,032 |
| Capital Markets - 2.3% | | | |
| P10, Inc. | | 54,606 | 387,703 |
| Piper Jaffray Companies | | 2,736 | 535,681 |
| StoneX Group, Inc. (b) | | 5,738 | 416,579 |
| | | | 1,339,963 |
| Consumer Finance - 2.8% | | | |
| Encore Capital Group, Inc. (b) | | 7,981 | 327,939 |
| FirstCash Holdings, Inc. | | 11,781 | 1,331,017 |
| | | | 1,658,956 |
| Insurance - 5.8% | | | |
| First American Financial Corp. | | 17,105 | 916,315 |
| Primerica, Inc. | | 3,928 | 832,186 |
| Selective Insurance Group, Inc. | | 8,095 | 822,857 |
| The Baldwin Insurance Group, Inc. (b) | | 31,771 | 846,379 |
| | | | 3,417,737 |
TOTAL FINANCIALS | | | 9,129,688 |
| HEALTH CARE - 12.4% | | | |
| Biotechnology - 4.4% | | | |
| Allogene Therapeutics, Inc. (b) | | 17,200 | 47,472 |
| ALX Oncology Holdings, Inc. (b) | | 10,147 | 172,702 |
| Annexon, Inc. (b) | | 12,967 | 59,000 |
| Arcellx, Inc. (b) | | 2,038 | 101,941 |
| Celldex Therapeutics, Inc. (b) | | 3,613 | 135,198 |
| Crinetics Pharmaceuticals, Inc. (b) | | 3,463 | 151,749 |
| Cytokinetics, Inc. (b) | | 3,778 | 231,667 |
| Insmed, Inc. (b) | | 3,400 | 84,048 |
| Keros Therapeutics, Inc. (b) | | 2,753 | 155,242 |
| Madrigal Pharmaceuticals, Inc. (b)(c) | | 712 | 145,262 |
| ORIC Pharmaceuticals, Inc. (b)(c) | | 4,896 | 43,232 |
| Revolution Medicines, Inc. (b) | | 3,372 | 125,708 |
| Scholar Rock Holding Corp. (b) | | 5,322 | 78,074 |
| Spyre Therapeutics, Inc. (b) | | 3,200 | 105,696 |
| Tyra Biosciences, Inc. (b) | | 2,483 | 42,459 |
| Vaxcyte, Inc. (b) | | 4,177 | 252,917 |
| Viking Therapeutics, Inc. (b) | | 5,266 | 419,068 |
| Viridian Therapeutics, Inc. (b) | | 6,200 | 82,212 |
| Xenon Pharmaceuticals, Inc. (b) | | 2,045 | 83,129 |
| Zentalis Pharmaceuticals, Inc. (b) | | 7,986 | 88,325 |
| | | | 2,605,101 |
| Health Care Equipment & Supplies - 2.1% | | | |
| Dentsply Sirona, Inc. | | 9,684 | 290,617 |
| Neogen Corp. (b)(c) | | 27,854 | 343,440 |
| TransMedics Group, Inc. (b) | | 6,469 | 608,927 |
| | | | 1,242,984 |
| Health Care Providers & Services - 4.5% | | | |
| Acadia Healthcare Co., Inc. (b) | | 3,046 | 225,221 |
| AdaptHealth Corp. (b) | | 39,044 | 384,583 |
| AMN Healthcare Services, Inc. (b) | | 7,647 | 458,667 |
| Chemed Corp. | | 1,113 | 632,184 |
| Owens & Minor, Inc. (b) | | 27,584 | 682,428 |
| PACS Group, Inc. | | 6,000 | 149,820 |
| Privia Health Group, Inc. (b) | | 4,097 | 75,385 |
| | | | 2,608,288 |
| Health Care Technology - 0.3% | | | |
| Evolent Health, Inc. Class A (b) | | 6,048 | 167,772 |
| Life Sciences Tools & Services - 0.6% | | | |
| Bio-Rad Laboratories, Inc. Class A (b) | | 546 | 147,284 |
| Maravai LifeSciences Holdings, Inc. (b) | | 25,377 | 208,091 |
| | | | 355,375 |
| Pharmaceuticals - 0.5% | | | |
| Edgewise Therapeutics, Inc. (b) | | 2,477 | 44,437 |
| Enliven Therapeutics, Inc. (b) | | 5,810 | 101,036 |
| Intra-Cellular Therapies, Inc. (b) | | 2,225 | 159,777 |
| | | | 305,250 |
TOTAL HEALTH CARE | | | 7,284,770 |
| INDUSTRIALS - 17.6% | | | |
| Aerospace & Defense - 2.0% | | | |
| Cadre Holdings, Inc. | | 5,225 | 174,254 |
| Leonardo DRS, Inc. (b) | | 36,646 | 788,622 |
| Loar Holdings, Inc. | | 200 | 10,464 |
| Spirit AeroSystems Holdings, Inc. Class A (b) | | 7,328 | 234,496 |
| | | | 1,207,836 |
| Building Products - 2.3% | | | |
| CSW Industrials, Inc. | | 924 | 219,561 |
| Hayward Holdings, Inc. (b) | | 43,222 | 586,955 |
| Janus International Group, Inc. (b) | | 25,048 | 360,942 |
| Tecnoglass, Inc. | | 3,900 | 216,645 |
| | | | 1,384,103 |
| Construction & Engineering - 2.9% | | | |
| Bowman Consulting Group Ltd. (b) | | 5,788 | 188,052 |
| Centuri Holdings, Inc. | | 8,600 | 212,850 |
| IES Holdings, Inc. (b) | | 804 | 108,636 |
| Sterling Construction Co., Inc. (b) | | 4,719 | 479,450 |
| Willscot Mobile Mini Holdings (b) | | 19,123 | 706,786 |
| | | | 1,695,774 |
| Electrical Equipment - 1.6% | | | |
| Atkore, Inc. | | 1,303 | 228,416 |
| Generac Holdings, Inc. (b) | | 3,457 | 470,014 |
| Nextracker, Inc. Class A (b) | | 5,297 | 226,659 |
| | | | 925,089 |
| Ground Transportation - 0.6% | | | |
| ArcBest Corp. | | 2,000 | 221,820 |
| XPO, Inc. (b) | | 967 | 103,914 |
| | | | 325,734 |
| Machinery - 0.3% | | | |
| Beijer Alma AB (B Shares) | | 9,009 | 171,672 |
| Professional Services - 5.8% | | | |
| Concentrix Corp. | | 12,694 | 693,981 |
| ExlService Holdings, Inc. (b) | | 16,820 | 487,780 |
| Genpact Ltd. | | 7,700 | 236,698 |
| ICF International, Inc. | | 2,414 | 348,316 |
| Kforce, Inc. | | 9,263 | 572,083 |
| Maximus, Inc. | | 11,956 | 959,828 |
| UL Solutions, Inc. Class A | | 2,700 | 94,770 |
| | | | 3,393,456 |
| Trading Companies & Distributors - 2.1% | | | |
| Alligo AB (B Shares) | | 4,483 | 52,720 |
| Applied Industrial Technologies, Inc. | | 3,211 | 588,416 |
| GMS, Inc. (b) | | 6,567 | 607,579 |
| | | | 1,248,715 |
TOTAL INDUSTRIALS | | | 10,352,379 |
| INFORMATION TECHNOLOGY - 15.5% | | | |
| Communications Equipment - 3.9% | | | |
| Ciena Corp. (b) | | 28,978 | 1,339,653 |
| Lumentum Holdings, Inc. (b) | | 21,228 | 928,937 |
| | | | 2,268,590 |
| Electronic Equipment, Instruments & Components - 2.5% | | | |
| ePlus, Inc. (b) | | 2,018 | 155,144 |
| Fabrinet (b) | | 1,100 | 190,377 |
| Insight Enterprises, Inc. (b) | | 6,060 | 1,106,374 |
| | | | 1,451,895 |
| IT Services - 0.7% | | | |
| Endava PLC ADR (b) | | 3,968 | 115,072 |
| Perficient, Inc. (b) | | 6,600 | 311,916 |
| | | | 426,988 |
| Semiconductors & Semiconductor Equipment - 4.5% | | | |
| Allegro MicroSystems LLC (b) | | 10,391 | 308,509 |
| Alpha & Omega Semiconductor Ltd. (b) | | 7,800 | 170,586 |
| Diodes, Inc. (b) | | 6,637 | 484,567 |
| MKS Instruments, Inc. | | 3,624 | 431,184 |
| Nova Ltd. (b) | | 1,800 | 305,820 |
| Silicon Motion Tech Corp. sponsored ADR | | 8,752 | 645,985 |
| SMART Global Holdings, Inc. (b) | | 18,055 | 329,865 |
| | | | 2,676,516 |
| Software - 3.9% | | | |
| BlackLine, Inc. (b) | | 6,469 | 375,525 |
| Five9, Inc. (b) | | 6,112 | 351,868 |
| Intapp, Inc. (b) | | 11,717 | 362,290 |
| Rapid7, Inc. (b) | | 9,348 | 418,790 |
| Tenable Holdings, Inc. (b) | | 8,599 | 386,697 |
| Varonis Systems, Inc. (b) | | 9,178 | 401,538 |
| | | | 2,296,708 |
TOTAL INFORMATION TECHNOLOGY | | | 9,120,697 |
| MATERIALS - 6.2% | | | |
| Chemicals - 4.3% | | | |
| Cabot Corp. | | 4,840 | 441,553 |
| FMC Corp. | | 7,736 | 456,501 |
| Hawkins, Inc. | | 3,246 | 245,949 |
| Olin Corp. | | 15,705 | 821,057 |
| Tronox Holdings PLC | | 32,444 | 551,224 |
| | | | 2,516,284 |
| Construction Materials - 1.0% | | | |
| Eagle Materials, Inc. | | 2,326 | 583,151 |
| Containers & Packaging - 0.9% | | | |
| Graphic Packaging Holding Co. | | 21,292 | 550,398 |
TOTAL MATERIALS | | | 3,649,833 |
| REAL ESTATE - 1.2% | | | |
| Equity Real Estate Investment Trusts (REITs) - 1.2% | | | |
| Ryman Hospitality Properties, Inc. | | 2,984 | 314,752 |
| Terreno Realty Corp. | | 6,855 | 372,569 |
| | | | 687,321 |
| UTILITIES - 2.6% | | | |
| Gas Utilities - 2.6% | | | |
| Brookfield Infrastructure Corp. A Shares | | 28,937 | 881,710 |
| Southwest Gas Holdings, Inc. | | 8,869 | 661,805 |
| | | | 1,543,515 |
| TOTAL COMMON STOCKS (Cost $52,338,617) | | | 58,238,645 |
| | | | |
| Money Market Funds - 0.9% |
| | | Shares | Value ($) |
| Fidelity Cash Central Fund 5.39% (d) | | 278,920 | 278,975 |
| Fidelity Securities Lending Cash Central Fund 5.39% (d)(e) | | 260,813 | 260,839 |
| TOTAL MONEY MARKET FUNDS (Cost $539,814) | | | 539,814 |
| | | | |
| TOTAL INVESTMENT IN SECURITIES - 99.9% (Cost $52,878,431) | 58,778,459 |
NET OTHER ASSETS (LIABILITIES) - 0.1% | 70,826 |
| NET ASSETS - 100.0% | 58,849,285 |
| | |
Legend
| (c) | Security or a portion of the security is on loan at period end. |
| (d) | Affiliated fund that is generally available only to investment companies and other accounts managed by Fidelity Investments. The rate quoted is the annualized seven-day yield of the fund at period end. A complete unaudited listing of the fund's holdings as of its most recent quarter end is available upon request. In addition, each Fidelity Central Fund's financial statements, which are not covered by the Fund's Report of Independent Registered Public Accounting Firm, are available on the SEC's website or upon request. |
| (e) | Investment made with cash collateral received from securities on loan. |
| (f) | Restricted securities (including private placements) - Investment in securities not registered under the Securities Act of 1933 (excluding 144A issues). At the end of the period, the value of restricted securities (excluding 144A issues) amounted to $0 or 0.0% of net assets. |
| Additional information on each restricted holding is as follows: |
| Security | Acquisition Date | Acquisition Cost ($) |
| GCI Liberty, Inc. Class A (Escrow) | 5/23/23 | 0 |
| | | |
Affiliated Central Funds
Fiscal year to date information regarding the Fund's investments in Fidelity Central Funds, including the ownership percentage, is presented below.
| Affiliate | Value, beginning of period ($) | Purchases ($) | Sales Proceeds ($) | Dividend Income ($) | Realized Gain (loss) ($) | Change in Unrealized appreciation (depreciation) ($) | Value, end of period ($) | % ownership, end of period |
| Fidelity Cash Central Fund 5.39% | 849,900 | 19,971,379 | 20,542,319 | 26,154 | 15 | - | 278,975 | 0.0% |
| Fidelity Securities Lending Cash Central Fund 5.39% | 4,328,689 | 12,584,483 | 16,652,333 | 1,642 | - | - | 260,839 | 0.0% |
| Total | 5,178,589 | 32,555,862 | 37,194,652 | 27,796 | 15 | - | 539,814 | |
| | | | | | | | | |
Amounts in the dividend income column in the above table include any capital gain distributions from underlying funds, which are presented in the corresponding line item in the Statement of Operations, if applicable.
Amounts in the dividend income column for Fidelity Securities Lending Cash Central Fund represents the income earned on investing cash collateral, less rebates paid to borrowers and any lending agent fees associated with the loan, plus any premium payments received for lending certain types of securities.
Amounts included in the purchases and sales proceeds columns may include in-kind transactions, if applicable.
Investment Valuation
The following is a summary of the inputs used, as of April 30, 2024, involving the Fund's assets and liabilities carried at fair value. The inputs or methodology used for valuing securities may not be an indication of the risk associated with investing in those securities. For more information on valuation inputs, and their aggregation into the levels used below, please refer to the Investment Valuation section in the accompanying Notes to Financial Statements.
| Valuation Inputs at Reporting Date: |
| Description | Total ($) | Level 1 ($) | Level 2 ($) | Level 3 ($) |
Investments in Securities: | | | | |
|
| Equities: | | | | |
Communication Services | 930,660 | 930,660 | - | - |
Consumer Discretionary | 7,989,898 | 7,989,898 | - | - |
Consumer Staples | 3,856,900 | 3,856,900 | - | - |
Energy | 3,692,984 | 3,692,984 | - | - |
Financials | 9,129,688 | 9,129,688 | - | - |
Health Care | 7,284,770 | 7,284,770 | - | - |
Industrials | 10,352,379 | 10,352,379 | - | - |
Information Technology | 9,120,697 | 9,120,697 | - | - |
Materials | 3,649,833 | 3,649,833 | - | - |
Real Estate | 687,321 | 687,321 | - | - |
Utilities | 1,543,515 | 1,543,515 | - | - |
|
| Money Market Funds | 539,814 | 539,814 | - | - |
| Total Investments in Securities: | 58,778,459 | 58,778,459 | - | - |
| Statement of Assets and Liabilities |
| | | | April 30, 2024 |
| | | | | |
| Assets | | | | |
| Investment in securities, at value (including securities loaned of $254,203) - See accompanying schedule: | | | | |
Unaffiliated issuers (cost $52,338,617) | $ | 58,238,645 | | |
Fidelity Central Funds (cost $539,814) | | 539,814 | | |
| | | | | |
| | | | | |
| Total Investment in Securities (cost $52,878,431) | | | $ | 58,778,459 |
| Cash | | | | 44,672 |
| Foreign currency held at value (cost $1) | | | | 1 |
| Receivable for investments sold | | | | 283,168 |
| Receivable for fund shares sold | | | | 489,451 |
| Dividends receivable | | | | 16,264 |
| Distributions receivable from Fidelity Central Funds | | | | 1,627 |
Total assets | | | | 59,613,642 |
| Liabilities | | | | |
| Payable for investments purchased | $ | 366,506 | | |
| Payable for fund shares redeemed | | 107,114 | | |
| Accrued management fee | | 30,087 | | |
| Collateral on securities loaned | | 260,650 | | |
| Total liabilities | | | | 764,357 |
| Net Assets | | | $ | 58,849,285 |
| Net Assets consist of: | | | | |
| Paid in capital | | | $ | 52,439,097 |
| Total accumulated earnings (loss) | | | | 6,410,188 |
| Net Assets | | | $ | 58,849,285 |
Net Asset Value, offering price and redemption price per share ($58,849,285 ÷ 5,307,839 shares) | | | $ | 11.09 |
| Statement of Operations |
| | | | Year ended April 30, 2024 |
| Investment Income | | | | |
| Dividends | | | $ | 515,772 |
| Income from Fidelity Central Funds (including $1,642 from security lending) | | | | 27,796 |
| Total income | | | | 543,568 |
| Expenses | | | | |
| Management fee | $ | 356,542 | | |
| Independent trustees' fees and expenses | | 299 | | |
| Legal | | 259 | | |
| Total expenses before reductions | | 357,100 | | |
| Expense reductions | | (243) | | |
| Total expenses after reductions | | | | 356,857 |
| Net Investment income (loss) | | | | 186,711 |
| Realized and Unrealized Gain (Loss) | | | | |
| Net realized gain (loss) on: | | | | |
| Investment Securities: | | | | |
| Unaffiliated issuers | | 4,179,475 | | |
| Fidelity Central Funds | | 15 | | |
| Foreign currency transactions | | (334) | | |
| Total net realized gain (loss) | | | | 4,179,156 |
| Change in net unrealized appreciation (depreciation) on: | | | | |
| Investment Securities: | | | | |
| Unaffiliated issuers | | 3,539,502 | | |
| Assets and liabilities in foreign currencies | | (357) | | |
| Total change in net unrealized appreciation (depreciation) | | | | 3,539,145 |
| Net gain (loss) | | | | 7,718,301 |
| Net increase (decrease) in net assets resulting from operations | | | $ | 7,905,012 |
| Statement of Changes in Net Assets |
| |
| | Year ended April 30, 2024 | | Year ended April 30, 2023 |
| Increase (Decrease) in Net Assets | | | | |
| Operations | | | | |
| Net investment income (loss) | $ | 186,711 | $ | 93,965 |
| Net realized gain (loss) | | 4,179,156 | | 7,390 |
| Change in net unrealized appreciation (depreciation) | | 3,539,145 | | (1,428,049) |
| Net increase (decrease) in net assets resulting from operations | | 7,905,012 | | (1,326,694) |
| Distributions to shareholders | | (101,525) | | (4,797,169) |
| | | | | |
| Share transactions | | | | |
| Proceeds from sales of shares | | 9,880,273 | | 19,624,087 |
| Reinvestment of distributions | | 101,525 | | 4,797,169 |
| Cost of shares redeemed | | (23,193,209) | | (11,212,740) |
| | | | | |
Net increase (decrease) in net assets resulting from share transactions | | (13,211,411) | | 13,208,516 |
| Total increase (decrease) in net assets | | (5,407,924) | | 7,084,653 |
| | | | | |
| Net Assets | | | | |
| Beginning of period | | 64,257,209 | | 57,172,556 |
| End of period | $ | 58,849,285 | $ | 64,257,209 |
| | | | | |
| Other Information | | | | |
| Shares | | | | |
| Sold | | 924,996 | | 2,032,499 |
| Issued in reinvestment of distributions | | 9,830 | | 493,536 |
| Redeemed | | (2,216,408) | | (1,162,566) |
| Net increase (decrease) | | (1,281,582) | | 1,363,469 |
| | | | | |
Financial Highlights
Fidelity® Small Cap Stock K6 Fund |
| |
| Years ended April 30, | | 2024 | | 2023 | | 2022 | | 2021 | | 2020 |
Selected Per-Share Data | | | | | | | | | | |
| Net asset value, beginning of period | $ | 9.75 | $ | 10.94 | $ | 15.61 | $ | 9.24 | $ | 11.16 |
| Income from Investment Operations | | | | | | | | | | |
Net investment income (loss) A,B | | .03 | | .02 | | .05 | | .03 | | .06 |
| Net realized and unrealized gain (loss) | | 1.33 | | (.28) | | (1.54) | | 6.38 | | (1.88) |
| Total from investment operations | | 1.36 | | (.26) | | (1.49) | | 6.41 | | (1.82) |
| Distributions from net investment income | | (.02) | | - | | (.06) | | (.04) | | (.10) |
| Distributions from net realized gain | | - | | (.93) | | (3.13) | | - | | - |
| Total distributions | | (.02) | | (.93) | | (3.18) C | | (.04) | | (.10) |
| Net asset value, end of period | $ | 11.09 | $ | 9.75 | $ | 10.94 | $ | 15.61 | $ | 9.24 |
Total Return D | | | | (2.39)% | | (12.54)% | | 69.44% | | (16.50)% |
Ratios to Average Net Assets B,E,F | | | | | | | | | | |
| Expenses before reductions | | .60% | | .60% | | .60% | | .60% | | .60% |
| Expenses net of fee waivers, if any | | | | .60% | | .60% | | .60% | | .60% |
| Expenses net of all reductions | | .60% | | .60% | | .60% | | .56% | | .60% |
| Net investment income (loss) | | .31% | | .16% | | .35% | | .27% | | .58% |
| Supplemental Data | | | | | | | | | | |
| Net assets, end of period (000 omitted) | $ | 58,849 | $ | 64,257 | $ | 57,173 | $ | 75,872 | $ | 72,029 |
Portfolio turnover rate G | | | | 78% H | | 148% H | | 136% H | | 73% H |
ACalculated based on average shares outstanding during the period.
BNet investment income (loss) is affected by the timing of the declaration of dividends by any underlying mutual funds or exchange-traded funds (ETFs). Net investment income (loss) of any mutual funds or ETFs is not included in the Fund's net investment income (loss) ratio.
CTotal distributions per share do not sum due to rounding.
DTotal returns would have been lower if certain expenses had not been reduced during the applicable periods shown.
EFees and expenses of any underlying mutual funds or exchange-traded funds (ETFs) are not included in the Fund's expense ratio. The Fund indirectly bears its proportionate share of these expenses. For additional expense information related to investments in Fidelity Central Funds, please refer to the "Investments in Fidelity Central Funds" note found in the Notes to Financial Statements section of the most recent Annual or Semi-Annual report.
FExpense ratios reflect operating expenses of the class. Expenses before reductions do not reflect amounts reimbursed, waived, or reduced through arrangements with the investment adviser, brokerage services, or other offset arrangements, if applicable, and do not represent the amount paid by the class during periods when reimbursements, waivers or reductions occur.
GAmount does not include the portfolio activity of any underlying mutual funds or exchange-traded funds (ETFs).
HPortfolio turnover rate excludes securities received or delivered in-kind.
For the period ended April 30, 2024
1. Organization.
Fidelity Small Cap Stock K6 Fund (the Fund) is a fund of Fidelity Concord Street Trust (the Trust) and is authorized to issue an unlimited number of shares. Share transactions on the Statement of Changes in Net Assets may contain exchanges between affiliated funds. The Trust is registered under the Investment Company Act of 1940, as amended (the 1940 Act), as an open-end management investment company organized as a Massachusetts business trust. Shares generally are available only to employer-sponsored retirement plans that are recordkept by Fidelity, or to certain employer-sponsored retirement plans that are not recordkept by Fidelity.
2. Investments in Fidelity Central Funds.
Funds may invest in Fidelity Central Funds, which are open-end investment companies generally available only to other investment companies and accounts managed by the investment adviser and its affiliates. The Schedule of Investments lists any Fidelity Central Funds held as an investment as of period end, but does not include the underlying holdings of each Fidelity Central Fund. An investing fund indirectly bears its proportionate share of the expenses of the underlying Fidelity Central Funds.
Based on its investment objective, each Fidelity Central Fund may invest or participate in various investment vehicles or strategies that are similar to those of the investing fund. These strategies are consistent with the investment objectives of the investing fund and may involve certain economic risks which may cause a decline in value of each of the Fidelity Central Funds and thus a decline in the value of the investing fund.
| Fidelity Central Fund | Investment Manager | Investment Objective | Investment Practices | Expense RatioA |
| Fidelity Money Market Central Funds | Fidelity Management & Research Company LLC (FMR) | Each fund seeks to obtain a high level of current income consistent with the preservation of capital and liquidity. | Short-term Investments | Less than .005% |
A Expenses expressed as a percentage of average net assets and are as of each underlying Central Fund's most recent annual or semi-annual shareholder report.
A complete unaudited list of holdings for each Fidelity Central Fund is available upon request or at the Securities and Exchange Commission website at www.sec.gov. In addition, the financial statements of the Fidelity Central Funds which contain the significant accounting policies (including investment valuation policies) of those funds, and are not covered by the Report of Independent Registered Public Accounting Firm, are available on the Securities and Exchange Commission website or upon request.
3. Significant Accounting Policies.
The Fund is an investment company and applies the accounting and reporting guidance of the Financial Accounting Standards Board (FASB) Accounting Standards Codification Topic 946 Financial Services - Investment Companies. The financial statements have been prepared in conformity with accounting principles generally accepted in the United States of America (GAAP), which require management to make certain estimates and assumptions at the date of the financial statements. Actual results could differ from those estimates. Subsequent events, if any, through the date that the financial statements were issued have been evaluated in the preparation of the financial statements. The Fund's Schedule of Investments lists any underlying mutual funds or exchange-traded funds (ETFs) but does not include the underlying holdings of these funds. The following summarizes the significant accounting policies of the Fund:
Investment Valuation. Investments are valued as of 4:00 p.m. Eastern time on the last calendar day of the period. The Board of Trustees (the Board) has designated the Fund's investment adviser as the valuation designee responsible for the fair valuation function and performing fair value determinations as needed. The investment adviser has established a Fair Value Committee (the Committee) to carry out the day-to-day fair valuation responsibilities and has adopted policies and procedures to govern the fair valuation process and the activities of the Committee. In accordance with these fair valuation policies and procedures, which have been approved by the Board, the Fund attempts to obtain prices from one or more third party pricing services or brokers to value its investments. When current market prices, quotations or currency exchange rates are not readily available or reliable, investments will be fair valued in good faith by the Committee, in accordance with the policies and procedures. Factors used in determining fair value vary by investment type and may include market or investment specific events, transaction data, estimated cash flows, and market observations of comparable investments. The frequency that the fair valuation procedures are used cannot be predicted and they may be utilized to a significant extent. The Committee manages the Fund's fair valuation practices and maintains the fair valuation policies and procedures. The Fund's investment adviser reports to the Board information regarding the fair valuation process and related material matters.
The Fund categorizes the inputs to valuation techniques used to value its investments into a disclosure hierarchy consisting of three levels as shown below:
Level 1 - unadjusted quoted prices in active markets for identical investments
Level 2 - other significant observable inputs (including quoted prices for similar investments, interest rates, prepayment speeds, etc.)
Level 3 - unobservable inputs (including the Fund's own assumptions based on the best information available)
Valuation techniques used to value the Fund's investments by major category are as follows:
Equity securities, including restricted securities, for which market quotations are readily available, are valued at the last reported sale price or official closing price as reported by a third party pricing service on the primary market or exchange on which they are traded and are categorized as Level 1 in the hierarchy. In the event there were no sales during the day or closing prices are not available, securities are valued at the last quoted bid price or may be valued using the last available price and are generally categorized as Level 2 in the hierarchy. For foreign equity securities, when market or security specific events arise, comparisons to the valuation of American Depositary Receipts (ADRs), futures contracts, Exchange-Traded Funds (ETFs) and certain indexes as well as quoted prices for similar securities may be used and would be categorized as Level 2 in the hierarchy. For equity securities, including restricted securities, where observable inputs are limited, assumptions about market activity and risk are used and these securities may be categorized as Level 3 in the hierarchy.
Investments in open-end mutual funds, including the Fidelity Central Funds, are valued at their closing net asset value (NAV) each business day and are categorized as Level 1 in the hierarchy.
Changes in valuation techniques may result in transfers in or out of an assigned level within the disclosure hierarchy. The aggregate value of investments by input level as of April 30, 2024 is included at the end of the Fund's Schedule of Investments.
Foreign Currency. Certain Funds may use foreign currency contracts to facilitate transactions in foreign-denominated securities. Gains and losses from these transactions may arise from changes in the value of the foreign currency or if the counterparties do not perform under the contracts' terms.
Foreign-denominated assets, including investment securities, and liabilities are translated into U.S. dollars at the exchange rates at period end. Purchases and sales of investment securities, income and dividends received, and expenses denominated in foreign currencies are translated into U.S. dollars at the exchange rate in effect on the transaction date.
The effects of exchange rate fluctuations on investments are included with the net realized and unrealized gain (loss) on investment securities. Other foreign currency transactions resulting in realized and unrealized gain (loss) are disclosed separately.
Investment Transactions and Income. For financial reporting purposes, the Fund's investment holdings and NAV include trades executed through the end of the last business day of the period. The NAV per share for processing shareholder transactions is calculated as of the close of business of the New York Stock Exchange (NYSE), normally 4:00 p.m. Eastern time and includes trades executed through the end of the prior business day. Gains and losses on securities sold are determined on the basis of identified cost and include proceeds received from litigation. Commissions paid to certain brokers with whom the investment adviser, or its affiliates, places trades on behalf of a fund include an amount in addition to trade execution, which may be rebated back to a fund. Any such rebates are included in net realized gain (loss) on investments in the Statement of Operations. Dividend income is recorded on the ex-dividend date, except for certain dividends from foreign securities where the ex-dividend date may have passed, which are recorded as soon as the Fund is informed of the ex-dividend date. Non-cash dividends included in dividend income, if any, are recorded at the fair market value of the securities received. Income and capital gain distributions from Fidelity Central Funds, if any, are recorded on the ex-dividend date. Certain distributions received by the Fund represent a return of capital or capital gain. The Fund determines the components of these distributions subsequent to the ex-dividend date, based upon receipt of tax filings or other correspondence relating to the underlying investment. These distributions are recorded as a reduction of cost of investments and/or as a realized gain. Investment income is recorded net of foreign taxes withheld where recovery of such taxes is uncertain. Funds may file withholding tax reclaims in certain jurisdictions to recover a portion of amounts previously withheld. Any withholding tax reclaims income is included in the Statement of Operations in dividends. Any receivables for withholding tax reclaims are included in the Statement of Assets and Liabilities in dividends receivable.
Expenses. Expenses directly attributable to a fund are charged to that fund. Expenses attributable to more than one fund are allocated among the respective funds on the basis of relative net assets or other appropriate methods. Expenses included in the accompanying financial statements reflect the expenses of that fund and do not include any expenses associated with any underlying mutual funds or exchange-traded funds. Although not included in a fund's expenses, a fund indirectly bears its proportionate share of these expenses through the net asset value of each underlying mutual fund or exchange-traded fund. Expense estimates are accrued in the period to which they relate and adjustments are made when actual amounts are known.
Income Tax Information and Distributions to Shareholders. Each year, the Fund intends to qualify as a regulated investment company under Subchapter M of the Internal Revenue Code, including distributing substantially all of its taxable income and realized gains. As a result, no provision for U.S. Federal income taxes is required. As of April 30, 2024, the Fund did not have any unrecognized tax benefits in the financial statements; nor is the Fund aware of any tax positions for which it is reasonably possible that the total amounts of unrecognized tax benefits will significantly change in the next twelve months. The Fund files a U.S. federal tax return, in addition to state and local tax returns as required. The Fund's federal income tax returns are subject to examination by the Internal Revenue Service (IRS) for a period of three fiscal years after they are filed. State and local tax returns may be subject to examination for an additional fiscal year depending on the jurisdiction. Foreign taxes are provided for based on the Fund's understanding of the tax rules and rates that exist in the foreign markets in which it invests.
Distributions are declared and recorded on the ex-dividend date. Income and capital gain distributions are determined in accordance with income tax regulations, which may differ from GAAP.
Capital accounts within the financial statements are adjusted for permanent book-tax differences. These adjustments have no impact on net assets or the results of operations. Capital accounts are not adjusted for temporary book-tax differences which will reverse in a subsequent period.
Book-tax differences are primarily due to foreign currency transactions, passive foreign investment companies (PFIC), capital loss carryforwards and losses deferred due to wash sales.
As of period end, the cost and unrealized appreciation (depreciation) in securities, and derivatives if applicable, for federal income tax purposes were as follows:
| Gross unrealized appreciation | $9,357,571 |
| Gross unrealized depreciation | (4,042,499) |
| Net unrealized appreciation (depreciation) | $5,315,072 |
| Tax Cost | $53,463,387 |
The tax-based components of distributable earnings as of period end were as follows:
| Undistributed ordinary income | $143,301 |
| Undistributed long-term capital gain | $952,731 |
| Net unrealized appreciation (depreciation) on securities and other investments | $5,314,154 |
The tax character of distributions paid was as follows:
| | April 30, 2024 | April 30, 2023 |
| Ordinary Income | $101,525 | $- |
| Long-term Capital Gains | - | $4,797,169 |
| Total | $101,525 | $4,797,169 |
4. Purchases and Sales of Investments.
Purchases and sales of securities, other than short-term securities and in-kind transactions, as applicable, are noted in the table below.
| | Purchases ($) | Sales ($) |
| Fidelity Small Cap Stock K6 Fund | 57,265,311 | 70,669,545 |
Prior Year Unaffiliated Exchanges In-Kind. Shares that were exchanged for investments, including accrued interest and cash, if any, are shown in the table below. The amount of in-kind exchanges is included in share transactions in the accompanying Statement of Changes in Net Assets.
| | Shares | Total Proceeds ($) |
| Fidelity Small Cap Stock K6 Fund | 281,051 | 2,609,414 |
5. Fees and Other Transactions with Affiliates.
Management Fee. Fidelity Management & Research Company LLC (the investment adviser) and its affiliates provide the Fund with investment management related services for which the Fund pays a monthly management fee that is based on an annual rate of .60% of average net assets. Under the management contract, the investment adviser or an affiliate pays all other expenses of the Fund, excluding fees and expenses of the independent Trustees, and certain miscellaneous expenses such as proxy and shareholder meeting expenses.
Brokerage Commissions. A portion of portfolio transactions were placed with brokerage firms which are affiliates of the investment adviser. Brokerage commissions are included in net realized gain (loss) and change in net unrealized appreciation (depreciation) in the Statement of Operations. The commissions paid to these affiliated firms were as follows:
| | Amount ($) |
| Fidelity Small Cap Stock K6 Fund | 1,661 |
Interfund Trades. Funds may purchase from or sell securities to other Fidelity Funds under procedures adopted by the Board. The procedures have been designed to ensure these interfund trades are executed in accordance with Rule 17a-7 of the 1940 Act. Any interfund trades are included within the respective purchases and sales amounts shown in the Purchases and Sales of Investments note. Interfund trades during the period are noted in the table below.
| | Purchases ($) | Sales ($) | Realized Gain (Loss)($) |
| Fidelity Small Cap Stock K6 Fund | 2,153,056 | 3,282,391 | 151,437 |
Sub-Advisory Arrangements. Effective March 1, 2024, the Fund's sub-advisory agreements with FMR Investment Management (UK) Limited, Fidelity Management & Research (Hong Kong) Limited, and Fidelity Management & Research (Japan) Limited were amended to provide that the investment adviser pays each sub-adviser monthly fees equal to 110% of the sub-adviser's costs for providing sub-advisory services.
6. Committed Line of Credit.
Certain Funds participate with other funds managed by the investment adviser or an affiliate in a $4.25 billion credit facility (the "line of credit") to be utilized for temporary or emergency purposes to fund shareholder redemptions or for other short-term liquidity purposes. The commitment fees on the pro-rata portion of the line of credit are borne by the investment adviser. During the period, there were no borrowings on this line of credit.
7. Security Lending.
Funds lend portfolio securities from time to time in order to earn additional income. Lending agents are used, including National Financial Services (NFS), an affiliate of the investment adviser. Pursuant to a securities lending agreement, NFS will receive a fee, which is capped at 9.9% of a fund's daily lending revenue, for its services as lending agent. A fund may lend securities to certain qualified borrowers, including NFS. On the settlement date of the loan, a fund receives collateral (in the form of U.S. Treasury obligations, letters of credit and/or cash) against the loaned securities and maintains collateral in an amount not less than 100% of the market value of the loaned securities during the period of the loan. The market value of the loaned securities is determined at the close of business of a fund and any additional required collateral is delivered to a fund on the next business day. A fund or borrower may terminate the loan at any time, and if the borrower defaults on its obligation to return the securities loaned because of insolvency or other reasons, a fund may apply collateral received from the borrower against the obligation. A fund may experience delays and costs in recovering the securities loaned. Any cash collateral received is invested in the Fidelity Securities Lending Cash Central Fund. Any loaned securities are identified as such in the Schedule of Investments, and the value of loaned securities and cash collateral at period end, as applicable, are presented in the Statement of Assets and Liabilities. Security lending income represents the income earned on investing cash collateral, less rebates paid to borrowers and any lending agent fees associated with the loan, plus any premium payments received for lending certain types of securities. Security lending income is presented in the Statement of Operations as a component of income from Fidelity Central Funds. Affiliated security lending activity, if any, was as follows:
| | Total Security Lending Fees Paid to NFS ($) | Security Lending Income From Securities Loaned to NFS ($) | Value of Securities Loaned to NFS at Period End ($) |
| Fidelity Small Cap Stock K6 Fund | 141 | 9 | - |
8. Expense Reductions.
Through arrangements with the Fund's custodian, credits realized as a result of certain uninvested cash balances were used to reduce the Fund's expenses by $243.
9. Other.
A fund's organizational documents provide former and current trustees and officers with a limited indemnification against liabilities arising in connection with the performance of their duties to the fund. In the normal course of business, a fund may also enter into contracts that provide general indemnifications. A fund's maximum exposure under these arrangements is unknown as this would be dependent on future claims that may be made against a fund. The risk of material loss from such claims is considered remote.
10. Risk and Uncertainties.
Many factors affect a fund's performance. Developments that disrupt global economies and financial markets, such as pandemics, epidemics, outbreaks of infectious diseases, war, terrorism, and environmental disasters, may significantly affect a fund's investment performance. The effects of these developments to a fund will be impacted by the types of securities in which a fund invests, the financial condition, industry, economic sector, and geographic location of an issuer, and a fund's level of investment in the securities of that issuer. Significant concentrations in security types, issuers, industries, sectors, and geographic locations may magnify the factors that affect a fund's performance.
To the Board of Trustees of Fidelity Concord Street Trust and the Shareholders of Fidelity Small Cap Stock K6 Fund:
Opinion on the Financial Statements and Financial Highlights
We have audited the accompanying statement of assets and liabilities of Fidelity Small Cap Stock K6 Fund (the "Fund"), a fund of Fidelity Concord Street Trust, including the schedule of investments, as of April 30, 2024, the related statement of operations for the year then ended, the statement of changes in net assets for each of the two years in the period then ended, the financial highlights for each of the five years in the period then ended, and the related notes. In our opinion, the financial statements and financial highlights present fairly, in all material respects, the financial position of the Fund as of April 30, 2024, and the results of its operations for the year then ended, the changes in its net assets for each of the two years in the period then ended, and the financial highlights for each of the five years in the period then ended in conformity with accounting principles generally accepted in the United States of America.
Basis for Opinion
These financial statements and financial highlights are the responsibility of the Fund's management. Our responsibility is to express an opinion on the Fund's financial statements and financial highlights based on our audits. We are a public accounting firm registered with the Public Company Accounting Oversight Board (United States) (PCAOB) and are required to be independent with respect to the Fund in accordance with the U.S. federal securities laws and the applicable rules and regulations of the Securities and Exchange Commission and the PCAOB.
We conducted our audits in accordance with the standards of the PCAOB. Those standards require that we plan and perform the audit to obtain reasonable assurance about whether the financial statements and financial highlights are free of material misstatement, whether due to error or fraud. The Fund is not required to have, nor were we engaged to perform, an audit of its internal control over financial reporting. As part of our audits, we are required to obtain an understanding of internal control over financial reporting but not for the purpose of expressing an opinion on the effectiveness of the Fund's internal control over financial reporting. Accordingly, we express no such opinion.
Our audits included performing procedures to assess the risks of material misstatement of the financial statements and financial highlights, whether due to error or fraud, and performing procedures that respond to those risks. Such procedures included examining, on a test basis, evidence regarding the amounts and disclosures in the financial statements and financial highlights. Our audits also included evaluating the accounting principles used and significant estimates made by management, as well as evaluating the overall presentation of the financial statements and financial highlights. Our procedures included confirmation of securities owned as of April 30, 2024, by correspondence with the custodian and brokers; when replies were not received from brokers, we performed other auditing procedures. We believe that our audits provide a reasonable basis for our opinion.
/s/ Deloitte & Touche LLP
Boston, Massachusetts
June 12, 2024
We have served as the auditor of one or more of the Fidelity investment companies since 1999.
The Trustees, Members of the Advisory Board (if any), and officers of the trust and fund, as applicable, are listed below. The Board of Trustees governs the fund and is responsible for protecting the interests of shareholders. The Trustees are experienced executives who meet periodically throughout the year to oversee the fund's activities, review contractual arrangements with companies that provide services to the fund, oversee management of the risks associated with such activities and contractual arrangements, and review the fund's performance. Except for Jonathan Chiel, each of the Trustees oversees 323 funds. Mr. Chiel oversees 192 funds.
The Trustees hold office without limit in time except that (a) any Trustee may resign; (b) any Trustee may be removed by written instrument, signed by at least two-thirds of the number of Trustees prior to such removal; (c) any Trustee who requests to be retired or who has become incapacitated by illness or injury may be retired by written instrument signed by a majority of the other Trustees; and (d) any Trustee may be removed at any special meeting of shareholders by a two-thirds vote of the outstanding voting securities of the trust. Each Trustee who is not an interested person (as defined in the 1940 Act) of the trust and the fund is referred to herein as an Independent Trustee. Each Independent Trustee shall retire not later than the last day of the calendar year in which his or her 75th birthday occurs. The Independent Trustees may waive this mandatory retirement age policy with respect to individual Trustees. Officers and Advisory Board Members hold office without limit in time, except that any officer or Advisory Board Member may resign or may be removed by a vote of a majority of the Trustees at any regular meeting or any special meeting of the Trustees. Except as indicated, each individual has held the office shown or other offices in the same company for the past five years.
The fund's Statement of Additional Information (SAI) includes more information about the Trustees. To request a free copy, call Fidelity at 1-800-835-5092.
Experience, Skills, Attributes, and Qualifications of the Trustees. The Governance and Nominating Committee has adopted a statement of policy that describes the experience, qualifications, attributes, and skills that are necessary and desirable for potential Independent Trustee candidates (Statement of Policy). The Board believes that each Trustee satisfied at the time he or she was initially elected or appointed a Trustee, and continues to satisfy, the standards contemplated by the Statement of Policy. The Governance and Nominating Committee also engages professional search firms to help identify potential Independent Trustee candidates who have the experience, qualifications, attributes, and skills consistent with the Statement of Policy. From time to time, additional criteria based on the composition and skills of the current Independent Trustees, as well as experience or skills that may be appropriate in light of future changes to board composition, business conditions, and regulatory or other developments, have also been considered by the professional search firms and the Governance and Nominating Committee. In addition, the Board takes into account the Trustees' commitment and participation in Board and committee meetings, as well as their leadership of standing and ad hoc committees throughout their tenure.
In determining that a particular Trustee was and continues to be qualified to serve as a Trustee, the Board has considered a variety of criteria, none of which, in isolation, was controlling. The Board believes that, collectively, the Trustees have balanced and diverse experience, qualifications, attributes, and skills, which allow the Board to operate effectively in governing the fund and protecting the interests of shareholders. Information about the specific experience, skills, attributes, and qualifications of each Trustee, which in each case led to the Board's conclusion that the Trustee should serve (or continue to serve) as a trustee of the fund, is provided below.
Board Structure and Oversight Function. Robert A. Lawrence is an interested person and currently serves as Chair. The Trustees have determined that an interested Chair is appropriate and benefits shareholders because an interested Chair has a personal and professional stake in the quality and continuity of services provided to the fund. Independent Trustees exercise their informed business judgment to appoint an individual of their choosing to serve as Chair, regardless of whether the Trustee happens to be independent or a member of management. The Independent Trustees have determined that they can act independently and effectively without having an Independent Trustee serve as Chair and that a key structural component for assuring that they are in a position to do so is for the Independent Trustees to constitute a substantial majority for the Board. The Independent Trustees also regularly meet in executive session. David M. Thomas serves as Lead Independent Trustee and as such (i) acts as a liaison between the Independent Trustees and management with respect to matters important to the Independent Trustees and (ii) with management prepares agendas for Board meetings.
Fidelity® funds are overseen by different Boards of Trustees. The fund's Board oversees Fidelity's high income and certain equity funds, and other Boards oversee Fidelity's alternative investment, investment-grade bond, money market, asset allocation, and other equity funds. The asset allocation funds may invest in Fidelity® funds overseen by the fund's Board. The use of separate Boards, each with its own committee structure, allows the Trustees of each group of Fidelity® funds to focus on the unique issues of the funds they oversee, including common research, investment, and operational issues. On occasion, the separate Boards establish joint committees to address issues of overlapping consequences for the Fidelity® funds overseen by each Board.
The Trustees operate using a system of committees to facilitate the timely and efficient consideration of all matters of importance to the Trustees, the fund, and fund shareholders and to facilitate compliance with legal and regulatory requirements and oversight of the fund's activities and associated risks. The Board, acting through its committees, has charged FMR and its affiliates with (i) identifying events or circumstances the occurrence of which could have demonstrably adverse effects on the fund's business and/or reputation; (ii) implementing processes and controls to lessen the possibility that such events or circumstances occur or to mitigate the effects of such events or circumstances if they do occur; and (iii) creating and maintaining a system designed to evaluate continuously business and market conditions in order to facilitate the identification and implementation processes described in (i) and (ii) above. Because the day-to-day operations and activities of the fund are carried out by or through FMR, its affiliates, and other service providers, the fund's exposure to risks is mitigated but not eliminated by the processes overseen by the Trustees. While each of the Board's committees has responsibility for overseeing different aspects of the fund's activities, oversight is exercised primarily through the Operations, Audit, and Compliance Committees. Appropriate personnel, including but not limited to the fund's Chief Compliance Officer (CCO), FMR's internal auditor, the independent accountants, the fund's Treasurer and portfolio management personnel, make periodic reports to the Board's committees, as appropriate, including an annual review of Fidelity's risk management program for the Fidelity® funds. The responsibilities of each standing committee, including their oversight responsibilities, are described further under "Standing Committees of the Trustees."
Interested Trustees*:
Correspondence intended for a Trustee who is an interested person may be sent to Fidelity Investments, 245 Summer Street, Boston, Massachusetts 02210.
Name, Year of Birth; Principal Occupations and Other Relevant Experience+
Jonathan Chiel (1957)
Year of Election or Appointment: 2016
Trustee
Mr. Chiel also serves as Trustee of other Fidelity® funds. Mr. Chiel is Senior Counsel at Fidelity Investments (diversified financial services company, 2024-present). Previously, Mr. Chiel served as General Counsel (2012-2024) and Head of Legal, Risk and Compliance (2022-2024) for Fidelity Investments; Executive Vice President and General Counsel for FMR LLC (diversified financial services company, 2012-2024); Director and President of OH Company LLC (holding company, 2018-2024); General Counsel (2004-2012) and Senior Vice President and Deputy General Counsel (2000-2004) for John Hancock Financial Services; a partner with Choate, Hall & Stewart (law firm, 1996-2000); and an Assistant United States Attorney for the United States Attorney's Office of the District of Massachusetts (1986-1995), including Chief of the Criminal Division (1993-1995). Mr. Chiel is a director on the boards of the Harvard Law School Center on the Legal Profession and the U.S. Chamber Litigation Center.
Bettina Doulton (1964)
Year of Election or Appointment: 2021
Trustee
Ms. Doulton also serves as Trustee of other Fidelity® funds. Prior to her retirement, Ms. Doulton served in a variety of positions at Fidelity Investments, including as a managing director of research (2006-2007), portfolio manager to certain Fidelity® funds (1993-2005), equity analyst and portfolio assistant (1990-1993), and research assistant (1987-1990). Ms. Doulton currently owns and operates Cellardoor Winery. Previously, Ms. Doulton served as a member of the Board of Brown Capital Management, LLC (2014-2018).
Robert A. Lawrence (1952)
Year of Election or Appointment: 2020
Trustee
Chair of the Board of Trustees
Mr. Lawrence also serves as Trustee of other funds. Previously, Mr. Lawrence served as a Trustee and Member of the Advisory Board of certain funds. Prior to his retirement in 2008, Mr. Lawrence served as Vice President of certain Fidelity® funds (2006-2008), Senior Vice President, Head of High Income Division of Fidelity Management & Research Company (investment adviser firm, 2006-2008), and President of Fidelity Strategic Investments (investment adviser firm, 2002-2005).
* Determined to be an "Interested Trustee" by virtue of, among other things, his or her affiliation with the trust or various entities under common control with FMR.
+ The information includes the Trustee's principal occupation during the last five years and other information relating to the experience, attributes, and skills relevant to the Trustee's qualifications to serve as a Trustee, which led to the conclusion that the Trustee should serve as a Trustee for the fund.
Independent Trustees:
Correspondence intended for an Independent Trustee may be sent to Fidelity Investments, P.O. Box 55235, Boston, Massachusetts 02205-5235.
Name, Year of Birth; Principal Occupations and Other Relevant Experience+
Thomas P. Bostick (1956)
Year of Election or Appointment: 2021
Trustee
Lieutenant General Bostick also serves as Trustee of other Fidelity® funds. Prior to his retirement, General Bostick (United States Army, Retired) held a variety of positions within the U.S. Army, including Chief of Engineers and Commanding General, U.S. Army Corps of Engineers (2012-2016) and Deputy Chief of Staff and Director of Human Resources, U.S. Army (2009-2012). General Bostick currently serves as a member of the Board and Finance and Governance & Sustainability Committees of CSX Corporation (transportation, 2020-present) and a member of the Board and Corporate Governance and Nominating Committee of Perma-Fix Environmental Services, Inc. (nuclear waste management, 2020-present). General Bostick serves as Chief Executive Officer of Bostick Global Strategies, LLC (consulting, 2016-present), as a member of the Board of HireVue, Inc. (video interview and assessment, 2020-present), as a member of the Board of Allonnia (biotechnology and engineering solutions, 2022-present), on the Advisory Board of Hilco Redevelopment Partners (a real estate investment and redevelopment company, 2021-present), and on the Advisory Board of Solugen, Inc. (specialty bio-based chemicals manufacturer, 2022-present). Previously, General Bostick served as a Member of the Advisory Board of certain Fidelity® funds (2021), President, Intrexon Bioengineering (2018-2020) and Chief Operating Officer (2017-2020) and Senior Vice President of the Environment Sector (2016-2017) of Intrexon Corporation (biopharmaceutical company).
Donald F. Donahue (1950)
Year of Election or Appointment: 2018
Trustee
Mr. Donahue also serves as Trustee of other Fidelity® funds. Mr. Donahue serves as President and Chief Executive Officer of Miranda Partners, LLC (risk consulting for the financial services industry, 2012-present). Previously, Mr. Donahue served as Chief Executive Officer (2006-2012), Chief Operating Officer (2003-2006) and Managing Director, Customer Marketing and Development (1999-2003) of The Depository Trust & Clearing Corporation (financial markets infrastructure). Mr. Donahue currently serves as a member (2007-present) and Co-Chairman (2016-present) of the Board of United Way of New York. Mr. Donahue previously served as a member of the Advisory Board of certain Fidelity® funds (2015-2018) and as a member of the Board of The Leadership Academy (previously NYC Leadership Academy) (2012-2022).
Vicki L. Fuller (1957)
Year of Election or Appointment: 2020
Trustee
Ms. Fuller also serves as Trustee of other Fidelity® funds. Previously, Ms. Fuller served as a member of the Advisory Board of certain Fidelity® funds (2018-2020), Chief Investment Officer of the New York State Common Retirement Fund (2012-2018) and held a variety of positions at AllianceBernstein L.P. (global asset management, 1985-2012), including Managing Director (2006-2012) and Senior Vice President and Senior Portfolio Manager (2001-2006). Ms. Fuller currently serves as a member of the Board, Audit Committee, Compensation Committee and Nominating and Governance Committee of two Blackstone business development companies (2020-present), as a member of the Board of Treliant, LLC (consulting, 2019-present), as a member of the Board of Ariel Alternatives, LLC (private equity, 2022-present) and as a member of the Board and Chair of the Audit Committee of Gusto, Inc. (software, 2021-present). In addition, Ms. Fuller currently serves as a member of the Executive Board of New York University's Stern School of Business. Ms. Fuller previously served as a member of the Board of Roosevelt University (2019-2024) and member of the Board, Audit Committee and Nominating and Governance Committee of The Williams Companies, Inc. (natural gas infrastructure, 2018-2021).
Patricia L. Kampling (1959)
Year of Election or Appointment: 2020
Trustee
Ms. Kampling also serves as Trustee of other Fidelity® funds. Prior to her retirement, Ms. Kampling served as Chairman of the Board and Chief Executive Officer (2012-2019), President and Chief Operating Officer (2011-2012) and Executive Vice President and Chief Financial Officer (2010-2011) of Alliant Energy Corporation. Ms. Kampling currently serves as a member of the Board, Audit Committee and Governance, Compensation and Nominating Committee of Xcel Energy Inc. (utilities company, 2020-present) and as a member of the Board, Audit, Finance and Risk Committee and Safety, Environmental, Technology and Operations Committee and Chair of the Executive Development and Compensation Committee of American Water Works Company, Inc. (utilities company, 2019-present). In addition, Ms. Kampling currently serves as a member of the Board of the Nature Conservancy, Wisconsin Chapter (2019-present). Previously, Ms. Kampling served as a Member of the Advisory Board of certain Fidelity® funds (2020), a member of the Board, Compensation Committee and Executive Committee and Chair of the Audit Committee of Briggs & Stratton Corporation (manufacturing, 2011-2021), a member of the Board of Interstate Power and Light Company (2012-2019) and Wisconsin Power and Light Company (2012-2019) (each a subsidiary of Alliant Energy Corporation) and as a member of the Board and Workforce Development Committee of the Business Roundtable (2018-2019).
Thomas A. Kennedy (1955)
Year of Election or Appointment: 2021
Trustee
Mr. Kennedy also serves as Trustee of other Fidelity® funds. Previously, Mr. Kennedy served as a Member of the Advisory Board of certain Fidelity® funds (2020) and held a variety of positions at Raytheon Company (aerospace and defense, 1983-2020), including Chairman and Chief Executive Officer (2014-2020) and Executive Vice President and Chief Operating Officer (2013-2014). Mr. Kennedy served as Executive Chairman of the Board of Directors of Raytheon Technologies Corporation (aerospace and defense, 2020-2021). Mr. Kennedy serves as a Director of the Board of Directors of Textron Inc. (aerospace and defense, 2023-present).
Oscar Munoz (1959)
Year of Election or Appointment: 2021
Trustee
Mr. Munoz also serves as Trustee of other Fidelity® funds. Prior to his retirement, Mr. Munoz served as Executive Chairman (2020-2021), Chief Executive Officer (2015-2020), President (2015-2016) and a member of the Board (2010-2021) of United Airlines Holdings, Inc. Mr. Munoz currently serves as a member of the Board of CBRE Group, Inc. (commercial real estate, 2020-present), a member of the Board of Univision Communications, Inc. (Hispanic media, 2020-present), a member of the Board of Archer Aviation Inc. (2021-present), a member of the Defense Business Board of the United States Department of Defense (2021-present) and a member of the Board of Salesforce.com, Inc. (cloud-based software, 2022-present). Previously, Mr. Munoz served as a Member of the Advisory Board of certain Fidelity® funds (2021).
David M. Thomas (1949)
Year of Election or Appointment: 2008
Trustee
Lead Independent Trustee
Mr. Thomas also serves as Trustee of other Fidelity® funds. Previously, Mr. Thomas served as Executive Chairman (2005-2006) and Chairman and Chief Executive Officer (2000-2005) of IMS Health, Inc. (pharmaceutical and healthcare information solutions) and as a member of the Board of Fortune Brands Home and Security (home and security products, 2004-2023). Mr. Thomas currently serves as Director (2013-present) and Non-Executive Chairman of the Board (2022-present) of Interpublic Group of Companies, Inc. (marketing communication).
Susan Tomasky (1953)
Year of Election or Appointment: 2020
Trustee
Ms. Tomasky also serves as Trustee of other Fidelity® funds. Prior to her retirement, Ms. Tomasky served in various executive officer positions at American Electric Power Company, Inc. (1998-2011), including most recently as President of AEP Transmission (2007-2011). Ms. Tomasky currently serves as a member of the Board and Sustainability Committee and as Chair of the Audit Committee of Marathon Petroleum Corporation (2018-present) and as a member of the Board, Executive Committee, Corporate Governance Committee and Organization and Compensation Committee and as Lead Director of the Board of Public Service Enterprise Group, Inc. (utilities company, 2012-present) and as a member of the Board of its subsidiary company, Public Service Electric and Gas Co. (2021-present). In addition, Ms. Tomasky currently serves as a member (2009-present) and President (2020-present) of the Board of the Royal Shakespeare Company - America (2009-present) and as a member and Vice Chair of the Board of Kenyon College (2016-present). Previously, Ms. Tomasky served as a Member of the Advisory Board of certain Fidelity® funds (2020), as a member of the Board of the Columbus Association for the Performing Arts (2011-2023), as a member of the Board of the Columbus Regional Airport Authority (2007-2020), as a member of the Board (2011-2018) and Lead Independent Director (2015-2018) of Andeavor Corporation (previously Tesoro Corporation) (independent oil refiner and marketer) and as a member of the Board of Summit Midstream Partners LP (energy, 2012-2018).
Michael E. Wiley (1950)
Year of Election or Appointment: 2020
Trustee
Mr. Wiley also serves as Trustee of other Fidelity® funds. Previously, Mr. Wiley served as a member of the Advisory Board of certain Fidelity® funds (2018-2020), Chairman, President and CEO of Baker Hughes, Inc. (oilfield services, 2000-2004). Mr. Wiley also previously served as a member of the Board of Andeavor Corporation (independent oil refiner and marketer, 2005-2018), a member of the Board of Andeavor Logistics LP (natural resources logistics, 2015-2018) and a member of the Board of High Point Resources (exploration and production, 2005-2020).
+ The information includes the Trustee's principal occupation during the last five years and other information relating to the experience, attributes, and skills relevant to the Trustee's qualifications to serve as a Trustee, which led to the conclusion that the Trustee should serve as a Trustee for the fund.
Advisory Board Members and Officers:
Correspondence intended for a Member of the Advisory Board (if any) may be sent to Fidelity Investments, P.O. Box 55235, Boston, Massachusetts 02205-5235. Correspondence intended for an officer or Peter S. Lynch may be sent to Fidelity Investments, 245 Summer Street, Boston, Massachusetts 02210.
Name, Year of Birth; Principal Occupations+
Vijay C. Advani (1960)
Year of Election or Appointment: 2023
Member of the Advisory Board
Mr. Advani also serves as Trustee or Member of the Advisory Board of other funds. Previously, Mr. Advani served as Executive Chairman (2020-2022), Chief Executive Officer (2017-2020) and Chief Operating Officer (2016-2017) of Nuveen (global investment manager). He also served in various capacities at Franklin Resources (global investment manager), including Co-President (2015-2016), Executive Vice President, Global Advisory Services (2008-2015), Head of Global Retail Distribution (2005-2008), Executive Managing Director, International Retail Development (2002-2005), Managing Director, Product Developments, Sales & Marketing, Asia, Eastern Europe and Africa (2000-2002) and President, Templeton Asset Management India (1995-2000). Mr. Advani also served as Senior Investment Officer of International Finance Corporation (private equity and venture capital arm of The World Bank, 1984-1995). Mr. Advani is Chairman Emeritus of the U.S. India Business Council (2018-present), a Director of The Global Impact Investing Network (2019-present), a Director of LOK Capital (Mauritius) (2022-present), a member of the Advisory Council of LOK Capital (2022-present), a Senior Advisor of Neuberger Berman (2021-present), a Senior Advisor of Seviora Holdings Pte. Ltd (Temasek-Singapore) (2021-present), a Director of Seviora Capital (Singapore) (2021-present) and an Advisor of EQUIAM (2021-present). Mr. Advani formerly served as a member of the Board of BowX Acquisition Corp. (special purpose acquisition company, 2020-2021), a member of the Board of Intellecap (advisory arm of The Aavishkaar Group, 2018-2020), a member of the Board of Nuveen Investments, Inc. (2017-2020) and a member of the Board of Docusign (software, 2016-2019).
Peter S. Lynch (1944)
Year of Election or Appointment: 2003
Member of the Advisory Board
Mr. Lynch also serves as a Member of the Advisory Board of other Fidelity® funds. Mr. Lynch is Vice Chairman and a Director of Fidelity Management & Research Company LLC (investment adviser firm). In addition, Mr. Lynch serves as a Trustee of Boston College and as the Chairman of the Inner-City Scholarship Fund. Previously, Mr. Lynch served as Vice Chairman and a Director of FMR Co., Inc. (investment adviser firm) and on the Special Olympics International Board of Directors (1997-2006).
Karen B. Peetz (1955)
Year of Election or Appointment: 2023
Member of the Advisory Board
Ms. Peetz also serves as a Member of the Advisory Board of other funds. Previously, Ms. Peetz served as Chief Administration Officer (2020-2023) of Citigroup Inc. (a diversified financial service company). She also served in various capacities at Bank of New York Mellon Corporation, including President (2013-2016), Vice Chairman, Senior Executive Vice President and Chief Executive Officer of Financial Markets & Treasury Services (2010-2013), Senior Executive Vice President and Chief Executive Officer of Global Corporate Trust (2003-2008), Senior Vice President and Division Manager of Global Payments & Trade Services (2002-2003) and Senior Vice President and Division Manager of Domestic Corporate Trust (1998-2002). Ms. Peetz also served in various capacities at Chase Manhattan Corporation (1982-1998), including Senior Vice President and Manager of Corporate Trust International Business (1996-1998), Managing Director and Manager of Corporate Trust Services (1994-1996) and Managing Director and Group Manager of Financial Institution Sales (1990-1993). Ms. Peetz currently serves as Chair of Amherst Holdings Advisory Council (2018-present), Trustee of Johns Hopkins University (2016-present), Chair of the Carey Business School Advisory Council, Member of the Johns Hopkins Medicine Board and Finance Committee and Chair of the Lyme and Tick Related Disease Institute Advisory Council. Ms. Peetz previously served as a member of the Board of Guardian Life Insurance Company of America (2019-2023), a member of the Board of Trane Technologies (2018-2022), a member of the Board of Wells Fargo Corp. (2017-2019), a member of the Board of SunCoke Energy Inc. (2012-2016), a member of the Board of Private Export Funding Corporation (2010-2016) and as a Trustee of Penn State University (2010-2014) and the United Way of New York City (2008-2010).
Heather Bonner (1977)
Year of Election or Appointment: 2023
Assistant Treasurer
Ms. Bonner also serves as an officer of other funds. Ms. Bonner is a Senior Vice President (2022-present) and is an employee of Fidelity Investments (2022-present). Ms. Bonner serves as Senior Vice President, Vice President, Treasurer, or Director of certain Fidelity entities. Prior to joining Fidelity, Ms. Bonner served as Managing Director at AQR Capital Management (2013-2022) and was the Treasurer and Principal Financial Officer of the AQR Funds (2013-2022).
Craig S. Brown (1977)
Year of Election or Appointment: 2022
Deputy Treasurer
Mr. Brown also serves as an officer of other funds. Mr. Brown is a Vice President (2015-present) and is an employee of Fidelity Investments. Mr. Brown serves as Assistant Treasurer of FIMM, LLC (2021-present). Previously, Mr. Brown served as Assistant Treasurer of certain Fidelity® funds (2019-2022).
John J. Burke III (1964)
Year of Election or Appointment: 2018
Chief Financial Officer
Mr. Burke also serves as Chief Financial Officer of other funds. Mr. Burke is Head of Fidelity Fund and Investment Operations (2018-present) and is an employee of Fidelity Investments. Mr. Burke serves as President, Executive Vice President, or Director of certain Fidelity entities. Previously Mr. Burke served as head of Asset Management Investment Operations (2012-2018).
Margaret Carey (1973)
Year of Election or Appointment: 2023
Secretary and Chief Legal Officer (CLO)
Ms. Carey also serves as an officer of other funds and as CLO of certain Fidelity entities. Ms. Carey is a Senior Vice President, Deputy General Counsel (2019-present) and is an employee of Fidelity Investments.
William C. Coffey (1969)
Year of Election or Appointment: 2019
Assistant Secretary
Mr. Coffey also serves as Assistant Secretary of other funds. Mr. Coffey is a Senior Vice President, Deputy General Counsel (2010-present) and is an employee of Fidelity Investments. Previously, Mr. Coffey served as Secretary and CLO of certain funds (2018-2019); CLO, Secretary, or Senior Vice President of certain Fidelity entities and Assistant Secretary of certain funds (2009-2018).
Timothy M. Cohen (1969)
Year of Election or Appointment: 2018
Vice President
Mr. Cohen also serves as Vice President of other funds. Mr. Cohen is Co-Head of Equity (2018-present) and is an employee of Fidelity Investments. Mr. Cohen serves as President or Director of certain Fidelity entities. Previously, Mr. Cohen served as Executive Vice President of Fidelity SelectCo, LLC (2019) and Head of Global Equity Research (2016-2018).
Jonathan Davis (1968)
Year of Election or Appointment: 2010
Assistant Treasurer
Mr. Davis also serves as an officer of other funds. Mr. Davis is a Vice President (2006-present) and is an employee of Fidelity Investments. Mr. Davis serves as Assistant Treasurer or Director of certain Fidelity entities.
Laura M. Del Prato (1964)
Year of Election or Appointment: 2018
Assistant Treasurer
Ms. Del Prato also serves as an officer of other funds. Ms. Del Prato is a Senior Vice President (2017-present) and is an employee of Fidelity Investments. Ms. Del Prato serves as Senior Vice President, Vice President, Assistant Treasurer, or Director of certain Fidelity entities. Previously, Ms. Del Prato served as President and Treasurer of The North Carolina Capital Management Trust: Cash Portfolio and Term Portfolio (2018-2020).
Colm A. Hogan (1973)
Year of Election or Appointment: 2020
Assistant Treasurer
Mr. Hogan also serves as an officer of other funds. Mr. Hogan is a Vice President (2016-present) and is an employee of Fidelity Investments. Mr. Hogan serves as Assistant Treasurer of certain Fidelity entities. Previously, Mr. Hogan served as Deputy Treasurer of certain Fidelity® funds (2016-2020) and Assistant Treasurer of certain Fidelity® funds (2016-2018).
Pamela R. Holding (1964)
Year of Election or Appointment: 2018
Vice President
Ms. Holding also serves as Vice President of other funds. Ms. Holding is Co-Head of Equity (2018-present) and is an employee of Fidelity Investments. Previously, Ms. Holding served as Executive Vice President of Fidelity SelectCo, LLC (2019) and as Chief Investment Officer of Fidelity Institutional Asset Management (2013-2018).
Chris Maher (1972)
Year of Election or Appointment: 2020
Deputy Treasurer
Mr. Maher also serves as an officer of other funds. Mr. Maher is a Vice President (2008-present) and is an employee of Fidelity Investments. Mr. Maher serves as Assistant Treasurer of certain Fidelity entities. Previously, Mr. Maher served as Assistant Treasurer of certain funds (2013-2020).
Jason P. Pogorelec (1975)
Year of Election or Appointment: 2020
Chief Compliance Officer
Mr. Pogorelec also serves as Chief Compliance Officer of other funds. Mr. Pogorelec is a Senior Vice President of Asset Management Compliance (2020-present) and is an employee of Fidelity Investments. Mr. Pogorelec serves as Compliance Officer of Fidelity Management & Research Company LLC (investment adviser firm, 2023-present) and Ballyrock Investment Advisors LLC (2023-present). Previously, Mr. Pogorelec served as a Vice President, Associate General Counsel for Fidelity Investments (2010-2020) and Assistant Secretary of certain Fidelity® funds (2015-2020).
Brett Segaloff (1972)
Year of Election or Appointment: 2021
Anti-Money Laundering (AML) Officer
Mr. Segaloff also serves as AML Officer of other funds. Mr. Segaloff is a Vice President (2022-present) and is an employee of Fidelity Investments. Mr. Segaloff serves as Anti Money Laundering Compliance Officer or Anti Money Laundering/Bank Secrecy Act Compliance Officer of certain Fidelity entities.
Stacie M. Smith (1974)
Year of Election or Appointment: 2016
President and Treasurer
Ms. Smith also serves as an officer of other funds. Ms. Smith is a Senior Vice President (2016-present) and is an employee of Fidelity Investments. Ms. Smith serves as Assistant Treasurer of certain Fidelity entities and has served in other fund officer roles.
Jim Wegmann (1979)
Year of Election or Appointment: 2019
Assistant Treasurer
Mr. Wegmann also serves as an officer of other funds. Mr. Wegmann is a Vice President (2016-present) and is an employee of Fidelity Investments. Mr. Wegmann serves as Assistant Treasurer of FIMM, LLC (2021-present). Previously, Mr. Wegmann served as Assistant Treasurer of certain Fidelity® funds (2019-2021).
+ The information includes principal occupation during the last five years.
As a shareholder, you incur two types of costs: (1) transaction costs, which may include sales charges (loads) on purchase payments or redemption proceeds, as applicable and (2) ongoing costs, which generally include management fees, distribution and/or service (12b-1) fees and other Fund expenses. This Example is intended to help you understand your ongoing costs (in dollars) of investing in a fund and to compare these costs with the ongoing costs of investing in other mutual funds.
| The Example is based on an investment of $1,000 invested at the beginning of the period and held for the entire period (November 1, 2023 to April 30, 2024). |
Actual Expenses
The first line of the accompanying table provides information about actual account values and actual expenses. You may use the information in this line, together with the amount you invested, to estimate the expenses that you paid over the period. Simply divide your account value by $1,000.00 (for example, an $8,600 account value divided by $1,000.00 = 8.6), then multiply the result by the number in the first line for a class/Fund under the heading entitled "Expenses Paid During Period" to estimate the expenses you paid on your account during this period. If any fund is a shareholder of any underlying mutual funds or exchange-traded funds (ETFs) (the Underlying Funds), such fund indirectly bears its proportional share of the expenses of the Underlying Funds in addition to the direct expenses incurred presented in the table. These fees and expenses are not included in the annualized expense ratio used to calculate the expense estimate in the table below.
Hypothetical Example for Comparison Purposes
The second line of the accompanying table provides information about hypothetical account values and hypothetical expenses based on the actual expense ratio and an assumed rate of return of 5% per year before expenses, which is not the actual return. The hypothetical account values and expenses may not be used to estimate the actual ending account balance or expenses you paid for the period. You may use this information to compare the ongoing costs of investing in the Fund and other funds. To do so, compare this 5% hypothetical example with the 5% hypothetical examples that appear in the shareholder reports of the other funds. If any fund is a shareholder of any Underlying Funds, such fund indirectly bears its proportional share of the expenses of the Underlying Funds in addition to the direct expenses as presented in the table. These fees and expenses are not included in the annualized expense ratio used to calculate the expense estimate in the table below.
Please note that the expenses shown in the table are meant to highlight your ongoing costs only and do not reflect any transaction costs. Therefore, the second line of the table is useful in comparing ongoing costs only, and will not help you determine the relative total costs of owning different funds. In addition, if these transactional costs were included, your costs would have been higher.
| | | | | Annualized Expense Ratio- A | | Beginning Account Value November 1, 2023 | | Ending Account Value April 30, 2024 | | Expenses Paid During Period- C November 1, 2023 to April 30, 2024 |
| | | | | | | | | | |
| Fidelity® Small Cap Stock K6 Fund | | | | .60% | | | | | | |
| Actual | | | | | | $ 1,000 | | $ 1,194.10 | | $ 3.27 |
Hypothetical-B | | | | | | $ 1,000 | | $ 1,021.88 | | $ 3.02 |
| |
A Annualized expense ratio reflects expenses net of applicable fee waivers.
B 5% return per year before expenses
C Expenses are equal to the annualized expense ratio, multiplied by the average account value over the period, multiplied by 182/ 366 (to reflect the one-half year period). The fees and expenses of any Underlying Funds are not included in each annualized expense ratio.
The dividend and capital gains distributions for the fund(s) are available on Fidelity.com or Institutional.Fidelity.com.
The fund hereby designates as a capital gain dividend with respect to the taxable year ended April 30, 2024, $952,731, or, if subsequently determined to be different, the net capital gain of such year.
The fund designates 100% of the dividends distributed during the fiscal year as qualifying for the dividends-received deduction for corporate shareholders.
The fund designates 100% of the dividends distributed during the fiscal year as amounts which may be taken into account as a dividend for the purposes of the maximum rate under section 1(h)(11) of the Internal Revenue Code.
The fund will notify shareholders in January 2025 of amounts for use in preparing 2024 income tax returns.
Board Approval of Investment Advisory Contracts
Fidelity Small Cap Stock K6 Fund
At its January 2024 meeting, the Board of Trustees, including the Independent Trustees (together, the Board), approved amended and restated sub-advisory agreements (the Sub-Advisory Contracts) for the fund, including the fund's sub-advisory agreements with FMR Investment Management (UK) Limited (FMR UK), Fidelity Management & Research (Hong Kong) Limited (FMR H.K.), and Fidelity Management & Research (Japan) Limited (FMR Japan). The Sub-Advisory Contracts will be effective March 1, 2024. The Board will consider the annual renewal of the fund's Sub-Advisory Contracts in May 2024, following its review of additional materials provided by FMR.
The Board considered the Sub-Advisory Contracts, which simplified the calculation of the fees paid by FMR to the sub-advisers under the agreements. The Board noted that the agreements with FMR UK, FMR H.K., and FMR Japan were amended to provide that FMR will compensate each sub-adviser at a fee rate equal to 110% of the sub-adviser's costs incurred in providing services under the agreement. The Board considered that, under the Sub-Advisory Contracts, FMR, and not the fund, will continue to pay the sub-advisory fees to each applicable sub-adviser, and that the management fee paid by the fund under the management contract with FMR will remain unchanged.
The Board further considered that the approval of the fund's Sub-Advisory Contracts will not result in any changes in the investment process or strategies employed in the management of the fund's assets or the day-to-day management of the fund or the persons primarily responsible for such management. Further, the Board considered that the Sub-Advisory Contracts would not change the obligations and services of FMR and its affiliates on behalf of the fund, and, in particular, there would be no change in the nature and level of services provided to the fund by FMR and its affiliates.
In connection with its consideration of future renewals of the fund's advisory contracts, the Board will consider: (i) the nature, extent and quality of services provided to the funds, including shareholder and administrative services and investment performance; (ii) the competitiveness of the management fee and total expenses for the fund; (iii) the costs of the services and profitability, including the revenues earned and the expenses incurred in conducting the business of developing, marketing, distributing, managing, administering, and servicing the fund and its shareholders, to the extent applicable; and (iv) whether there have been economies of scale in respect of the Fidelity funds, whether the Fidelity funds (including the fund) have appropriately benefited from any such economies of scale, and whether there is the potential for realization of any further economies.
Based on its evaluation of all of the conclusions noted above, and after considering all factors it believed relevant, the Board concluded that the fund's management fee structure is fair and reasonable, and that the fund's Sub-Advisory Contracts should be approved.
The Securities and Exchange Commission adopted Rule 22e-4 under the Investment Company Act of 1940 (the Liquidity Rule) to promote effective liquidity risk management throughout the open-end investment company industry, thereby reducing the risk that funds will be unable to meet their redemption obligations and mitigating dilution of the interests of fund shareholders.
The Fund has adopted and implemented a liquidity risk management program (the Program) reasonably designed to assess and manage the Fund's liquidity risk and to comply with the requirements of the Liquidity Rule. The Fund's Board of Trustees (the Board) has designated the Fund's investment adviser as administrator of the Program. The Fidelity advisers have established a Liquidity Risk Management Committee (the LRM Committee) to manage the Program for each of the Fidelity Funds. The LRM Committee monitors the adequacy and effectiveness of implementation of the Program and on a periodic basis assesses each Fund's liquidity risk based on a variety of factors including (1) the Fund's investment strategy, (2) portfolio liquidity and cash flow projections during normal and reasonably foreseeable stressed conditions, (3) shareholder redemptions, (4) borrowings and other funding sources and (5) certain factors specific to ETFs including the effect of the Fund's prices and spreads, market participants, and basket compositions on the overall liquidity of the Fund's portfolio, as applicable.
In accordance with the Program, each of the Fund's portfolio investments is classified into one of four defined liquidity categories based on a determination of a reasonable expectation for how long it would take to convert the investment to cash (or sell or dispose of the investment) without significantly changing its market value.
- Highly liquid investments - cash or convertible to cash within three business days or less
- Moderately liquid investments - convertible to cash in three to seven calendar days
- Less liquid investments - can be sold or disposed of, but not settled, within seven calendar days
- Illiquid investments - cannot be sold or disposed of within seven calendar days
Liquidity classification determinations take into account a variety of factors including various market, trading and investment-specific considerations, as well as market depth, and generally utilize analysis from a third-party liquidity metrics service.
The Liquidity Rule places a 15% limit on a fund's illiquid investments and requires funds that do not primarily hold assets that are highly liquid investments to determine and maintain a minimum percentage of the fund's net assets to be invested in highly liquid investments (highly liquid investment minimum or HLIM). The Program includes provisions reasonably designed to comply with the 15% limit on illiquid investments and for determining, periodically reviewing and complying with the HLIM requirement as applicable.
At a recent meeting of the Fund's Board of Trustees, the LRM Committee provided a written report to the Board pertaining to the operation, adequacy, and effectiveness of the Program for the period December 1, 2022 through November 30, 2023. The report concluded that the Program is operating effectively and is reasonably designed to assess and manage the Fund's liquidity risk.
1.9883975.106
SLCXK6-ANN-0624
Fidelity® Small Cap Stock Fund
Annual Report
April 30, 2024
Contents
To view a fund's proxy voting guidelines and proxy voting record for the 12-month period ended June 30, visit http://www.fidelity.com/proxyvotingresults or visit the Securities and Exchange Commission's (SEC) web site at http://www.sec.gov.
You may also call 1-800-544-8544 to request a free copy of the proxy voting guidelines.
Standard & Poor's, S&P and S&P 500 are registered service marks of The McGraw-Hill Companies, Inc. and have been licensed for use by Fidelity Distributors Corporation.
Other third-party marks appearing herein are the property of their respective owners.
All other marks appearing herein are registered or unregistered trademarks or service marks of FMR LLC or an affiliated company. © 2024 FMR LLC. All rights reserved.
This report and the financial statements contained herein are submitted for the general information of the shareholders of the Fund. This report is not authorized for distribution to prospective investors in the Fund unless preceded or accompanied by an effective prospectus.
A fund files its complete schedule of portfolio holdings with the SEC for the first and third quarters of each fiscal year on Form N-PORT. Forms N-PORT are available on the SEC's web site at http://www.sec.gov. A fund's Forms N-PORT may be reviewed and copied at the SEC's Public Reference Room in Washington, DC. Information regarding the operation of the SEC's Public Reference Room may be obtained by calling 1-800-SEC-0330.
For a complete list of a fund's portfolio holdings, view the most recent holdings listing, semiannual report, or annual report on Fidelity's web site at http://www.fidelity.com, http://www.institutional.fidelity.com, or http://www.401k.com, as applicable.
NOT FDIC INSURED •MAY LOSE VALUE •NO BANK GUARANTEE
Neither the Fund nor Fidelity Distributors Corporation is a bank.
Average annual total return reflects the change in the value of an investment, assuming reinvestment of distributions from dividend income and capital gains (the profits earned upon the sale of securities that have grown in value, if any) and assuming a constant rate of performance each year. The hypothetical investment and the average annual total returns do not reflect the deduction of taxes that a shareholder would pay on fund distributions or the redemption of fund shares. During periods of reimbursement by Fidelity, a fund's total return will be greater than it would be had the reimbursement not occurred. How a fund did yesterday is no guarantee of how it will do tomorrow.
| Average Annual Total Returns |
| | | | |
Periods ended April 30, 2024 | Past 1 year | Past 5 years | Past 10 years |
| Fidelity® Small Cap Stock Fund | 13.71% | 5.89% | 7.23% |
| $10,000 Over 10 Years |
| |
Let's say hypothetically that $10,000 was invested in Fidelity® Small Cap Stock Fund on April 30, 2014. The chart shows how the value of your investment would have changed, and also shows how the Russell 2000® Index performed over the same period. |
|
|
Market Recap:
U.S. equities gained 22.66% for the 12 months ending April 30, 2024, according to the S&P 500® index, driven by resilient corporate profits, a frenzy over generative artificial intelligence and the Federal Reserve's likely pivot to cutting interest rates later this year. Amid this favorable backdrop for higher-risk assets, the S&P 500® continued its late-2023 momentum and ended March at its all-time high before snapping a five-month uptrend in April (-4.08%). Growth stocks led the broad rally, mostly driven by a narrow set of firms in the communication services (+41%) and information technology (+37%) sectors, largely due to excitement for AI. In particular, semiconductor-related stocks (+104%) were a standout. Following the Fed's November 1 meeting, when the central bank hinted it might be done raising rates, the S&P 500® reversed a three-month decline and gained 14.09% in the final two months of 2023 and 10.56% the first quarter. Risk assets were further aided on March 20, when the central bank held steady its benchmark federal funds rate and affirmed its projection to cut in 2024. The index then slipped in April, as inflation remained stickier than expected, spurring doubts of a soft economic landing. For the full 12 months, the financials, industrials and consumer discretionary sectors each gained about 24%. In sharp contrast, real estate and the defensive-oriented utilities sector each roughly broke even. Other notable "laggards" included consumer staples (+3%) and health care (+7%).
Comments from Portfolio Manager Marc Grow:
For the fiscal year ending April 30, 2024, the fund gained 13.71%, versus 13.32% for the benchmark Russell 2000 Index. Relative to the benchmark, security selection and an underweight in health care, primarily within the pharmaceuticals, biotechnology & life sciences industry, led the way. Stock picks and smaller-than-benchmark exposure to materials stocks also helped. An underweight in utilities was another plus. The fund's non-benchmark stake in Vertiv Holdings gained 257% and was the top individual relative contributor, though the stock was no longer held at period end. An out-of-benchmark holding in XPO (+130%) - a position we established this period - added value as well. Another notable relative contributor was the portfolio's outsized exposure to Murphy USA (+51%), one of our biggest holdings this period. In contrast, the largest detractors from performance versus the benchmark were security selection and comparatively light exposure to energy stocks. Investment choices and an underweight in information technology, especially among technology hardware & equipment companies, hurt as well. Subpar picks, coupled with an overweight in consumer discretionary, primarily within the consumer durables & apparel industry, further detracted. Lastly, the portfolio's cash position was a drag on performance. Avoiding Super Micro Computer, an index component that gained approximately 715%, detracted most from the fund's relative return. A non-benchmark stake in Concentrix returned roughly -43% and was the second-largest relative detractor, although it was among the fund's biggest holdings this period. Outsized exposure to LGI Homes (-24%) also proved detrimental to performance. The stock was among the portfolio's larger holdings the past 12 months, even as we decreased exposure to the firm. Notable changes in positioning include an increased allocation to materials stocks and a reduced stake in the real estate sector.
The views expressed above reflect those of the portfolio manager(s) only through the end of the period as stated on the cover of this report and do not necessarily represent the views of Fidelity or any other person in the Fidelity organization. Any such views are subject to change at any time based upon market or other conditions and Fidelity disclaims any responsibility to update such views. These views may not be relied on as investment advice and, because investment decisions for a Fidelity fund are based on numerous factors, may not be relied on as an indication of trading intent on behalf of any Fidelity fund.
Top Holdings (% of Fund's net assets) |
| |
| Grand Canyon Education, Inc. | 3.0 | |
| Murphy U.S.A., Inc. | 2.8 | |
| Performance Food Group Co. | 2.7 | |
| Ciena Corp. | 2.3 | |
| FirstCash Holdings, Inc. | 2.3 | |
| Insight Enterprises, Inc. | 1.9 | |
| Maximus, Inc. | 1.6 | |
| Lumentum Holdings, Inc. | 1.6 | |
| Brookfield Infrastructure Corp. A Shares | 1.5 | |
| First American Financial Corp. | 1.5 | |
| | 21.2 | |
| |
| Market Sectors (% of Fund's net assets) |
| |
| Industrials | 17.9 | |
| Information Technology | 15.6 | |
| Financials | 15.6 | |
| Consumer Discretionary | 13.7 | |
| Health Care | 12.4 | |
| Consumer Staples | 6.7 | |
| Energy | 6.4 | |
| Materials | 6.3 | |
| Utilities | 2.7 | |
| Communication Services | 1.6 | |
| Real Estate | 1.2 | |
| |
Asset Allocation (% of Fund's net assets) |
|
Short-Term Investments and Net Other Assets (Liabilities) - (0.1)% |
|
Showing Percentage of Net Assets
| Common Stocks - 100.1% |
| | | Shares | Value ($) (000s) |
| COMMUNICATION SERVICES - 1.6% | | | |
| Diversified Telecommunication Services - 0.0% | | | |
| GCI Liberty, Inc. Class A (Escrow) (a) | | 112,550 | 0 |
| Media - 1.6% | | | |
| TechTarget, Inc. (b) | | 212,833 | 5,853 |
| Thryv Holdings, Inc. (b) | | 495,441 | 11,400 |
| | | | 17,253 |
TOTAL COMMUNICATION SERVICES | | | 17,253 |
| CONSUMER DISCRETIONARY - 13.7% | | | |
| Automobile Components - 0.5% | | | |
| Patrick Industries, Inc. | | 57,926 | 6,053 |
| Diversified Consumer Services - 4.4% | | | |
| Grand Canyon Education, Inc. (b) | | 251,913 | 32,750 |
| Laureate Education, Inc. Class A | | 1,102,100 | 15,980 |
| | | | 48,730 |
| Household Durables - 2.2% | | | |
| Cavco Industries, Inc. (b) | | 19,949 | 7,266 |
| Helen of Troy Ltd. (b) | | 51,337 | 4,759 |
| LGI Homes, Inc. (b) | | 86,875 | 7,813 |
| SharkNinja, Inc. | | 63,300 | 4,069 |
| | | | 23,907 |
| Leisure Products - 1.7% | | | |
| Brunswick Corp. | | 124,500 | 10,040 |
| Clarus Corp. (c) | | 537,600 | 3,403 |
| Games Workshop Group PLC | | 25,900 | 3,207 |
| YETI Holdings, Inc. (b) | | 59,579 | 2,128 |
| | | | 18,778 |
| Specialty Retail - 3.7% | | | |
| America's Car Mart, Inc. (b) | | 83,808 | 4,797 |
| Boot Barn Holdings, Inc. (b) | | 47,000 | 5,004 |
| Murphy U.S.A., Inc. | | 74,420 | 30,796 |
| | | | 40,597 |
| Textiles, Apparel & Luxury Goods - 1.2% | | | |
| Crocs, Inc. (b) | | 84,300 | 10,484 |
| Wolverine World Wide, Inc. | | 280,592 | 3,014 |
| | | | 13,498 |
TOTAL CONSUMER DISCRETIONARY | | | 151,563 |
| CONSUMER STAPLES - 6.7% | | | |
| Beverages - 2.1% | | | |
| Boston Beer Co., Inc. Class A (b) | | 24,974 | 6,953 |
| Coca-Cola Consolidated, Inc. | | 18,701 | 15,447 |
| MGP Ingredients, Inc. | | 9,735 | 764 |
| | | | 23,164 |
| Consumer Staples Distribution & Retail - 2.7% | | | |
| Performance Food Group Co. (b) | | 436,883 | 29,656 |
| Food Products - 1.9% | | | |
| Lassonde Industries, Inc. Class A (sub. vtg.) | | 52,984 | 5,543 |
| Nomad Foods Ltd. | | 904,822 | 16,341 |
| | | | 21,884 |
TOTAL CONSUMER STAPLES | | | 74,704 |
| ENERGY - 6.4% | | | |
| Energy Equipment & Services - 3.2% | | | |
| Cactus, Inc. | | 328,300 | 16,297 |
| TechnipFMC PLC | | 585,600 | 15,003 |
| Tidewater, Inc. (b) | | 36,100 | 3,316 |
| | | | 34,616 |
| Oil, Gas & Consumable Fuels - 3.2% | | | |
| Antero Resources Corp. (b) | | 263,618 | 8,966 |
| Northern Oil & Gas, Inc. (c) | | 275,104 | 11,221 |
| Sitio Royalties Corp. | | 666,491 | 15,489 |
| | | | 35,676 |
TOTAL ENERGY | | | 70,292 |
| FINANCIALS - 15.6% | | | |
| Banks - 4.7% | | | |
| Cadence Bank | | 241,713 | 6,688 |
| ConnectOne Bancorp, Inc. | | 456,198 | 8,171 |
| Glacier Bancorp, Inc. | | 168,400 | 6,093 |
| Independent Bank Group, Inc. | | 327,391 | 12,192 |
| Metropolitan Bank Holding Corp. (b) | | 272,911 | 10,835 |
| Synovus Financial Corp. | | 243,200 | 8,704 |
| | | | 52,683 |
| Capital Markets - 2.3% | | | |
| P10, Inc. (c) | | 1,051,600 | 7,466 |
| Piper Jaffray Companies | | 51,900 | 10,162 |
| StoneX Group, Inc. (b) | | 110,397 | 8,015 |
| | | | 25,643 |
| Consumer Finance - 2.9% | | | |
| Encore Capital Group, Inc. (b)(c) | | 155,243 | 6,379 |
| FirstCash Holdings, Inc. | | 223,600 | 25,262 |
| NerdWallet, Inc. (b) | | 3,492 | 44 |
| | | | 31,685 |
| Insurance - 5.7% | | | |
| First American Financial Corp. | | 310,864 | 16,653 |
| Primerica, Inc. | | 70,201 | 14,873 |
| Selective Insurance Group, Inc. | | 153,688 | 15,622 |
| The Baldwin Insurance Group, Inc. (b) | | 585,200 | 15,590 |
| | | | 62,738 |
TOTAL FINANCIALS | | | 172,749 |
| HEALTH CARE - 12.4% | | | |
| Biotechnology - 4.5% | | | |
| Allogene Therapeutics, Inc. (b) | | 355,900 | 982 |
| ALX Oncology Holdings, Inc. (b) | | 197,725 | 3,365 |
| Annexon, Inc. (b) | | 243,403 | 1,107 |
| Arcellx, Inc. (b) | | 37,400 | 1,871 |
| Celldex Therapeutics, Inc. (b) | | 69,344 | 2,595 |
| Crinetics Pharmaceuticals, Inc. (b) | | 63,600 | 2,787 |
| Cytokinetics, Inc. (b) | | 71,125 | 4,361 |
| Insmed, Inc. (b) | | 64,200 | 1,587 |
| Keros Therapeutics, Inc. (b) | | 51,742 | 2,918 |
| Madrigal Pharmaceuticals, Inc. (b)(c) | | 13,400 | 2,734 |
| ORIC Pharmaceuticals, Inc. (b)(c) | | 85,000 | 751 |
| Revolution Medicines, Inc. (b) | | 66,300 | 2,472 |
| Scholar Rock Holding Corp. (b) | | 93,900 | 1,378 |
| Spyre Therapeutics, Inc. (b) | | 60,300 | 1,992 |
| Tyra Biosciences, Inc. (b) | | 54,900 | 939 |
| Vaxcyte, Inc. (b) | | 76,935 | 4,658 |
| Viking Therapeutics, Inc. (b) | | 98,500 | 7,839 |
| Viridian Therapeutics, Inc. (b) | | 117,200 | 1,554 |
| Xenon Pharmaceuticals, Inc. (b) | | 41,005 | 1,667 |
| Zentalis Pharmaceuticals, Inc. (b) | | 155,242 | 1,717 |
| | | | 49,274 |
| Health Care Equipment & Supplies - 2.1% | | | |
| Dentsply Sirona, Inc. | | 188,300 | 5,651 |
| Neogen Corp. (b) | | 529,785 | 6,532 |
| TransMedics Group, Inc. (b) | | 116,971 | 11,010 |
| | | | 23,193 |
| Health Care Providers & Services - 4.4% | | | |
| Acadia Healthcare Co., Inc. (b) | | 58,400 | 4,318 |
| AdaptHealth Corp. (b) | | 750,604 | 7,393 |
| AMN Healthcare Services, Inc. (b) | | 147,000 | 8,817 |
| Chemed Corp. | | 21,263 | 12,077 |
| Owens & Minor, Inc. (b) | | 504,773 | 12,488 |
| PACS Group, Inc. | | 112,500 | 2,809 |
| Privia Health Group, Inc. (b) | | 73,700 | 1,356 |
| | | | 49,258 |
| Health Care Technology - 0.3% | | | |
| Evolent Health, Inc. Class A (b) | | 112,421 | 3,119 |
| Life Sciences Tools & Services - 0.6% | | | |
| Bio-Rad Laboratories, Inc. Class A (b) | | 10,400 | 2,805 |
| Maravai LifeSciences Holdings, Inc. (b) | | 481,100 | 3,945 |
| | | | 6,750 |
| Pharmaceuticals - 0.5% | | | |
| Edgewise Therapeutics, Inc. (b) | | 53,412 | 958 |
| Enliven Therapeutics, Inc. (b) | | 98,200 | 1,708 |
| Intra-Cellular Therapies, Inc. (b) | | 42,644 | 3,062 |
| | | | 5,728 |
TOTAL HEALTH CARE | | | 137,322 |
| INDUSTRIALS - 17.9% | | | |
| Aerospace & Defense - 2.1% | | | |
| Cadre Holdings, Inc. | | 99,858 | 3,330 |
| Leonardo DRS, Inc. (b) | | 696,746 | 14,994 |
| Loar Holdings, Inc. (c) | | 1,100 | 58 |
| Spirit AeroSystems Holdings, Inc. Class A (b) | | 139,900 | 4,477 |
| | | | 22,859 |
| Building Products - 2.4% | | | |
| CSW Industrials, Inc. | | 18,099 | 4,301 |
| Hayward Holdings, Inc. (b) | | 821,467 | 11,156 |
| Janus International Group, Inc. (b) | | 472,600 | 6,810 |
| Tecnoglass, Inc. | | 73,800 | 4,100 |
| | | | 26,367 |
| Construction & Engineering - 2.9% | | | |
| Bowman Consulting Group Ltd. (b) | | 113,501 | 3,688 |
| Centuri Holdings, Inc. | | 159,500 | 3,948 |
| IES Holdings, Inc. (b) | | 14,414 | 1,948 |
| Sterling Construction Co., Inc. (b) | | 89,147 | 9,057 |
| Willscot Mobile Mini Holdings (b) | | 364,159 | 13,459 |
| | | | 32,100 |
| Electrical Equipment - 1.6% | | | |
| Atkore, Inc. | | 25,383 | 4,450 |
| Generac Holdings, Inc. (b) | | 65,600 | 8,919 |
| Nextracker, Inc. Class A (b) | | 103,600 | 4,433 |
| | | | 17,802 |
| Ground Transportation - 0.6% | | | |
| ArcBest Corp. | | 37,800 | 4,192 |
| XPO, Inc. (b) | | 26,300 | 2,826 |
| | | | 7,018 |
| Machinery - 0.3% | | | |
| Beijer Alma AB (B Shares) | | 170,897 | 3,257 |
| Professional Services - 5.8% | | | |
| Concentrix Corp. | | 241,825 | 13,221 |
| ExlService Holdings, Inc. (b) | | 319,387 | 9,262 |
| Genpact Ltd. | | 145,500 | 4,473 |
| ICF International, Inc. | | 46,700 | 6,738 |
| Kforce, Inc. | | 176,373 | 10,893 |
| Maximus, Inc. | | 228,697 | 18,360 |
| UL Solutions, Inc. Class A | | 50,900 | 1,787 |
| | | | 64,734 |
| Trading Companies & Distributors - 2.2% | | | |
| Alligo AB (B Shares) | | 88,820 | 1,045 |
| Applied Industrial Technologies, Inc. | | 61,200 | 11,215 |
| GMS, Inc. (b) | | 125,100 | 11,574 |
| | | | 23,834 |
TOTAL INDUSTRIALS | | | 197,971 |
| INFORMATION TECHNOLOGY - 15.6% | | | |
| Communications Equipment - 3.9% | | | |
| Ciena Corp. (b) | | 551,600 | 25,500 |
| Lumentum Holdings, Inc. (b) | | 396,600 | 17,355 |
| | | | 42,855 |
| Electronic Equipment, Instruments & Components - 2.5% | | | |
| ePlus, Inc. (b) | | 39,824 | 3,062 |
| Fabrinet (b) | | 22,100 | 3,825 |
| Insight Enterprises, Inc. (b) | | 116,206 | 21,216 |
| | | | 28,103 |
| IT Services - 0.8% | | | |
| Endava PLC ADR (b) | | 79,900 | 2,317 |
| Perficient, Inc. (b) | | 126,400 | 5,974 |
| | | | 8,291 |
| Semiconductors & Semiconductor Equipment - 4.5% | | | |
| Allegro MicroSystems LLC (b) | | 199,800 | 5,932 |
| Alpha & Omega Semiconductor Ltd. (b) | | 146,700 | 3,208 |
| Diodes, Inc. (b) | | 127,802 | 9,331 |
| MKS Instruments, Inc. | | 69,500 | 8,269 |
| Nova Ltd. (b) | | 33,400 | 5,675 |
| Silicon Motion Tech Corp. sponsored ADR | | 166,054 | 12,256 |
| SMART Global Holdings, Inc. (b) | | 306,500 | 5,600 |
| | | | 50,271 |
| Software - 3.9% | | | |
| BlackLine, Inc. (b) | | 121,800 | 7,070 |
| Five9, Inc. (b) | | 116,061 | 6,682 |
| Intapp, Inc. (b) | | 221,708 | 6,855 |
| Rapid7, Inc. (b) | | 177,500 | 7,952 |
| Tenable Holdings, Inc. (b) | | 164,600 | 7,402 |
| Varonis Systems, Inc. (b) | | 175,900 | 7,696 |
| | | | 43,657 |
TOTAL INFORMATION TECHNOLOGY | | | 173,177 |
| MATERIALS - 6.3% | | | |
| Chemicals - 4.4% | | | |
| Cabot Corp. | | 90,983 | 8,300 |
| FMC Corp. | | 149,500 | 8,822 |
| Hawkins, Inc. | | 63,309 | 4,797 |
| Olin Corp. | | 298,400 | 15,600 |
| Tronox Holdings PLC | | 656,243 | 11,150 |
| | | | 48,669 |
| Construction Materials - 1.0% | | | |
| Eagle Materials, Inc. | | 44,300 | 11,106 |
| Containers & Packaging - 0.9% | | | |
| Graphic Packaging Holding Co. | | 406,300 | 10,503 |
TOTAL MATERIALS | | | 70,278 |
| REAL ESTATE - 1.2% | | | |
| Equity Real Estate Investment Trusts (REITs) - 1.2% | | | |
| Ryman Hospitality Properties, Inc. | | 56,300 | 5,939 |
| Terreno Realty Corp. | | 132,864 | 7,221 |
| | | | 13,160 |
| UTILITIES - 2.7% | | | |
| Gas Utilities - 2.7% | | | |
| Brookfield Infrastructure Corp. A Shares | | 549,026 | 16,729 |
| Southwest Gas Holdings, Inc. | | 170,100 | 12,693 |
| | | | 29,422 |
| TOTAL COMMON STOCKS (Cost $1,011,661) | | | 1,107,891 |
| | | | |
| Money Market Funds - 1.0% |
| | | Shares | Value ($) (000s) |
| Fidelity Cash Central Fund 5.39% (d) | | 2,754,921 | 2,755 |
| Fidelity Securities Lending Cash Central Fund 5.39% (d)(e) | | 8,633,144 | 8,634 |
| TOTAL MONEY MARKET FUNDS (Cost $11,389) | | | 11,389 |
| | | | |
| TOTAL INVESTMENT IN SECURITIES - 101.1% (Cost $1,023,050) | 1,119,280 |
NET OTHER ASSETS (LIABILITIES) - (1.1)% | (11,944) |
| NET ASSETS - 100.0% | 1,107,336 |
| | |
Any values shown as $0 in the Schedule of Investments may reflect amounts less than $500.
Legend
| (c) | Security or a portion of the security is on loan at period end. |
| (d) | Affiliated fund that is generally available only to investment companies and other accounts managed by Fidelity Investments. The rate quoted is the annualized seven-day yield of the fund at period end. A complete unaudited listing of the fund's holdings as of its most recent quarter end is available upon request. In addition, each Fidelity Central Fund's financial statements, which are not covered by the Fund's Report of Independent Registered Public Accounting Firm, are available on the SEC's website or upon request. |
| (e) | Investment made with cash collateral received from securities on loan. |
| Additional information on each restricted holding is as follows: |
| Security | Acquisition Date | Acquisition Cost ($) (000s) |
| GCI Liberty, Inc. Class A (Escrow) | 5/23/23 | 0 |
| | | |
Affiliated Central Funds
Fiscal year to date information regarding the Fund's investments in Fidelity Central Funds, including the ownership percentage, is presented below.
| Affiliate (Amounts in thousands) | Value, beginning of period ($) | Purchases ($) | Sales Proceeds ($) | Dividend Income ($) | Realized Gain (loss) ($) | Change in Unrealized appreciation (depreciation) ($) | Value, end of period ($) | % ownership, end of period |
| Fidelity Cash Central Fund 5.39% | 20,249 | 256,024 | 273,518 | 438 | - | - | 2,755 | 0.0% |
| Fidelity Securities Lending Cash Central Fund 5.39% | 54,265 | 335,867 | 381,498 | 40 | - | - | 8,634 | 0.0% |
| Total | 74,514 | 591,891 | 655,016 | 478 | - | - | 11,389 | |
| | | | | | | | | |
Amounts in the dividend income column in the above table include any capital gain distributions from underlying funds, which are presented in the corresponding line item in the Statement of Operations, if applicable.
Amounts in the dividend income column for Fidelity Securities Lending Cash Central Fund represents the income earned on investing cash collateral, less rebates paid to borrowers and any lending agent fees associated with the loan, plus any premium payments received for lending certain types of securities.
Amounts included in the purchases and sales proceeds columns may include in-kind transactions, if applicable.
Investment Valuation
The following is a summary of the inputs used, as of April 30, 2024, involving the Fund's assets and liabilities carried at fair value. The inputs or methodology used for valuing securities may not be an indication of the risk associated with investing in those securities. For more information on valuation inputs, and their aggregation into the levels used below, please refer to the Investment Valuation section in the accompanying Notes to Financial Statements.
| Valuation Inputs at Reporting Date: |
Description (Amounts in thousands) | Total ($) | Level 1 ($) | Level 2 ($) | Level 3 ($) |
Investments in Securities: | | | | |
|
| Equities: | | | | |
Communication Services | 17,253 | 17,253 | - | - |
Consumer Discretionary | 151,563 | 151,563 | - | - |
Consumer Staples | 74,704 | 74,704 | - | - |
Energy | 70,292 | 70,292 | - | - |
Financials | 172,749 | 172,749 | - | - |
Health Care | 137,322 | 137,322 | - | - |
Industrials | 197,971 | 197,971 | - | - |
Information Technology | 173,177 | 173,177 | - | - |
Materials | 70,278 | 70,278 | - | - |
Real Estate | 13,160 | 13,160 | - | - |
Utilities | 29,422 | 29,422 | - | - |
|
| Money Market Funds | 11,389 | 11,389 | - | - |
| Total Investments in Securities: | 1,119,280 | 1,119,280 | - | - |
| Statement of Assets and Liabilities |
| Amounts in thousands (except per-share amount) | | | | April 30, 2024 |
| | | | | |
| Assets | | | | |
| Investment in securities, at value (including securities loaned of $8,317) - See accompanying schedule: | | | | |
Unaffiliated issuers (cost $1,011,661) | $ | 1,107,891 | | |
Fidelity Central Funds (cost $11,389) | | 11,389 | | |
| | | | | |
| | | | | |
| Total Investment in Securities (cost $1,023,050) | | | $ | 1,119,280 |
| Receivable for investments sold | | | | 5,324 |
| Receivable for fund shares sold | | | | 64 |
| Dividends receivable | | | | 312 |
| Distributions receivable from Fidelity Central Funds | | | | 31 |
Total assets | | | | 1,125,011 |
| Liabilities | | | | |
| Payable for investments purchased | $ | 6,824 | | |
| Payable for fund shares redeemed | | 1,288 | | |
| Accrued management fee | | 874 | | |
| Other payables and accrued expenses | | 60 | | |
| Collateral on securities loaned | | 8,629 | | |
| Total liabilities | | | | 17,675 |
| Net Assets | | | $ | 1,107,336 |
| Net Assets consist of: | | | | |
| Paid in capital | | | $ | 1,021,906 |
| Total accumulated earnings (loss) | | | | 85,430 |
| Net Assets | | | $ | 1,107,336 |
Net Asset Value, offering price and redemption price per share ($1,107,336 ÷ 65,976 shares) | | | $ | 16.78 |
| Statement of Operations |
| Amounts in thousands | | | | Year ended April 30, 2024 |
| Investment Income | | | | |
| Dividends | | | $ | 9,935 |
| Income from Fidelity Central Funds (including $40 from security lending) | | | | 478 |
| Total income | | | | 10,413 |
| Expenses | | | | |
| Management fee | | | | |
| Basic fee | $ | 8,028 | | |
| Performance adjustment | | 107 | | |
| Transfer agent fees | | 1,456 | | |
| Accounting fees | | 276 | | |
| Custodian fees and expenses | | 27 | | |
| Independent trustees' fees and expenses | | 6 | | |
| Registration fees | | 26 | | |
| Audit | | 60 | | |
| Legal | | 9 | | |
| Interest | | 3 | | |
| Miscellaneous | | 6 | | |
| Total expenses before reductions | | 10,004 | | |
| Expense reductions | | (97) | | |
| Total expenses after reductions | | | | 9,907 |
| Net Investment income (loss) | | | | 506 |
| Realized and Unrealized Gain (Loss) | | | | |
| Net realized gain (loss) on: | | | | |
| Investment Securities: | | | | |
| Unaffiliated issuers | | 83,518 | | |
| Foreign currency transactions | | (7) | | |
| Total net realized gain (loss) | | | | 83,511 |
| Change in net unrealized appreciation (depreciation) on: | | | | |
| Investment Securities: | | | | |
| Unaffiliated issuers | | 63,847 | | |
| Assets and liabilities in foreign currencies | | (5) | | |
| Total change in net unrealized appreciation (depreciation) | | | | 63,842 |
| Net gain (loss) | | | | 147,353 |
| Net increase (decrease) in net assets resulting from operations | | | $ | 147,859 |
| Statement of Changes in Net Assets |
| |
| Amount in thousands | | Year ended April 30, 2024 | | Year ended April 30, 2023 |
| Increase (Decrease) in Net Assets | | | | |
| Operations | | | | |
| Net investment income (loss) | $ | 506 | $ | (267) |
| Net realized gain (loss) | | 83,511 | | (5,714) |
| Change in net unrealized appreciation (depreciation) | | 63,842 | | (41,253) |
| Net increase (decrease) in net assets resulting from operations | | 147,859 | | (47,234) |
| Distributions to shareholders | | (211) | | (85,845) |
| | | | | |
| Share transactions | | | | |
| Proceeds from sales of shares | | 52,723 | | 139,727 |
| Reinvestment of distributions | | 202 | | 82,717 |
| Cost of shares redeemed | | (261,683) | | (178,581) |
| | | | | |
Net increase (decrease) in net assets resulting from share transactions | | (208,758) | | 43,863 |
| Total increase (decrease) in net assets | | (61,110) | | (89,216) |
| | | | | |
| Net Assets | | | | |
| Beginning of period | | 1,168,446 | | 1,257,662 |
| End of period | $ | 1,107,336 | $ | 1,168,446 |
| | | | | |
| Other Information | | | | |
| Shares | | | | |
| Sold | | 3,283 | | 9,124 |
| Issued in reinvestment of distributions | | 13 | | 5,578 |
| Redeemed | | (16,503) | | (12,013) |
| Net increase (decrease) | | (13,207) | | 2,689 |
| | | | | |
Financial Highlights
Fidelity® Small Cap Stock Fund |
| |
| Years ended April 30, | | 2024 | | 2023 | | 2022 | | 2021 | | 2020 |
Selected Per-Share Data | | | | | | | | | | |
| Net asset value, beginning of period | $ | 14.76 | $ | 16.44 | $ | 23.58 | $ | 14.00 | $ | 16.89 |
| Income from Investment Operations | | | | | | | | | | |
Net investment income (loss) A,B | | .01 | | - C | | .02 | | (.01) | | .05 |
| Net realized and unrealized gain (loss) | | 2.01 | | (.54) | | (2.57) | | 9.59 | | (2.88) |
| Total from investment operations | | 2.02 | | (.54) | | (2.55) | | 9.58 | | (2.83) |
| Distributions from net investment income | | - C | | - | | (.05) | | - | | (.06) |
| Distributions from net realized gain | | - | | (1.14) | | (4.54) | | - | | - |
| Total distributions | | - C | | (1.14) | | (4.59) | | - | | (.06) |
| Net asset value, end of period | $ | 16.78 | $ | 14.76 | $ | 16.44 | $ | 23.58 | $ | 14.00 |
Total Return D | | | | (3.33)% | | (13.53)% | | 68.43% | | (16.85)% |
Ratios to Average Net Assets B,E,F | | | | | | | | | | |
| Expenses before reductions | | .87% | | .77% | | .90% | | .88% | | .91% |
| Expenses net of fee waivers, if any | | | | .77% | | .89% | | .88% | | .91% |
| Expenses net of all reductions | | .86% | | .77% | | .89% | | .86% | | .90% |
| Net investment income (loss) | | .04% | | (.02)% | | .10% | | (.05)% | | .27% |
| Supplemental Data | | | | | | | | | | |
| Net assets, end of period (in millions) | $ | 1,107 | $ | 1,168 | $ | 1,258 | $ | 1,609 | $ | 1,097 |
Portfolio turnover rate G | | | | 74% H | | 135% H | | 123% H | | 65% H |
ACalculated based on average shares outstanding during the period.
BNet investment income (loss) is affected by the timing of the declaration of dividends by any underlying mutual funds or exchange-traded funds (ETFs). Net investment income (loss) of any mutual funds or ETFs is not included in the Fund's net investment income (loss) ratio.
CAmount represents less than $.005 per share.
DTotal returns would have been lower if certain expenses had not been reduced during the applicable periods shown.
EFees and expenses of any underlying mutual funds or exchange-traded funds (ETFs) are not included in the Fund's expense ratio. The Fund indirectly bears its proportionate share of these expenses. For additional expense information related to investments in Fidelity Central Funds, please refer to the "Investments in Fidelity Central Funds" note found in the Notes to Financial Statements section of the most recent Annual or Semi-Annual report.
FExpense ratios reflect operating expenses of the class. Expenses before reductions do not reflect amounts reimbursed, waived, or reduced through arrangements with the investment adviser, brokerage services, or other offset arrangements, if applicable, and do not represent the amount paid by the class during periods when reimbursements, waivers or reductions occur.
GAmount does not include the portfolio activity of any underlying mutual funds or exchange-traded funds (ETFs).
HPortfolio turnover rate excludes securities received or delivered in-kind.
For the period ended April 30, 2024
(Amounts in thousands except percentages)
1. Organization.
Fidelity Small Cap Stock Fund (the Fund) is a fund of Fidelity Concord Street Trust (the Trust) and is authorized to issue an unlimited number of shares. Share transactions on the Statement of Changes in Net Assets may contain exchanges between affiliated funds. The Trust is registered under the Investment Company Act of 1940, as amended (the 1940 Act), as an open-end management investment company organized as a Massachusetts business trust.
2. Investments in Fidelity Central Funds.
Funds may invest in Fidelity Central Funds, which are open-end investment companies generally available only to other investment companies and accounts managed by the investment adviser and its affiliates. The Schedule of Investments lists any Fidelity Central Funds held as an investment as of period end, but does not include the underlying holdings of each Fidelity Central Fund. An investing fund indirectly bears its proportionate share of the expenses of the underlying Fidelity Central Funds.
Based on its investment objective, each Fidelity Central Fund may invest or participate in various investment vehicles or strategies that are similar to those of the investing fund. These strategies are consistent with the investment objectives of the investing fund and may involve certain economic risks which may cause a decline in value of each of the Fidelity Central Funds and thus a decline in the value of the investing fund.
| Fidelity Central Fund | Investment Manager | Investment Objective | Investment Practices | Expense RatioA |
| Fidelity Money Market Central Funds | Fidelity Management & Research Company LLC (FMR) | Each fund seeks to obtain a high level of current income consistent with the preservation of capital and liquidity. | Short-term Investments | Less than .005% |
A Expenses expressed as a percentage of average net assets and are as of each underlying Central Fund's most recent annual or semi-annual shareholder report.
A complete unaudited list of holdings for each Fidelity Central Fund is available upon request or at the Securities and Exchange Commission website at www.sec.gov. In addition, the financial statements of the Fidelity Central Funds which contain the significant accounting policies (including investment valuation policies) of those funds, and are not covered by the Report of Independent Registered Public Accounting Firm, are available on the Securities and Exchange Commission website or upon request.
3. Significant Accounting Policies.
The Fund is an investment company and applies the accounting and reporting guidance of the Financial Accounting Standards Board (FASB) Accounting Standards Codification Topic 946 Financial Services - Investment Companies. The financial statements have been prepared in conformity with accounting principles generally accepted in the United States of America (GAAP), which require management to make certain estimates and assumptions at the date of the financial statements. Actual results could differ from those estimates. Subsequent events, if any, through the date that the financial statements were issued have been evaluated in the preparation of the financial statements. The Fund's Schedule of Investments lists any underlying mutual funds or exchange-traded funds (ETFs) but does not include the underlying holdings of these funds. The following summarizes the significant accounting policies of the Fund:
Investment Valuation. Investments are valued as of 4:00 p.m. Eastern time on the last calendar day of the period. The Board of Trustees (the Board) has designated the Fund's investment adviser as the valuation designee responsible for the fair valuation function and performing fair value determinations as needed. The investment adviser has established a Fair Value Committee (the Committee) to carry out the day-to-day fair valuation responsibilities and has adopted policies and procedures to govern the fair valuation process and the activities of the Committee. In accordance with these fair valuation policies and procedures, which have been approved by the Board, the Fund attempts to obtain prices from one or more third party pricing services or brokers to value its investments. When current market prices, quotations or currency exchange rates are not readily available or reliable, investments will be fair valued in good faith by the Committee, in accordance with the policies and procedures. Factors used in determining fair value vary by investment type and may include market or investment specific events, transaction data, estimated cash flows, and market observations of comparable investments. The frequency that the fair valuation procedures are used cannot be predicted and they may be utilized to a significant extent. The Committee manages the Fund's fair valuation practices and maintains the fair valuation policies and procedures. The Fund's investment adviser reports to the Board information regarding the fair valuation process and related material matters.
The Fund categorizes the inputs to valuation techniques used to value its investments into a disclosure hierarchy consisting of three levels as shown below:
Level 1 - unadjusted quoted prices in active markets for identical investments
Level 2 - other significant observable inputs (including quoted prices for similar investments, interest rates, prepayment speeds, etc.)
Level 3 - unobservable inputs (including the Fund's own assumptions based on the best information available)
Valuation techniques used to value the Fund's investments by major category are as follows:
Equity securities, including restricted securities, for which market quotations are readily available, are valued at the last reported sale price or official closing price as reported by a third party pricing service on the primary market or exchange on which they are traded and are categorized as Level 1 in the hierarchy. In the event there were no sales during the day or closing prices are not available, securities are valued at the last quoted bid price or may be valued using the last available price and are generally categorized as Level 2 in the hierarchy. For foreign equity securities, when market or security specific events arise, comparisons to the valuation of American Depositary Receipts (ADRs), futures contracts, Exchange-Traded Funds (ETFs) and certain indexes as well as quoted prices for similar securities may be used and would be categorized as Level 2 in the hierarchy. For equity securities, including restricted securities, where observable inputs are limited, assumptions about market activity and risk are used and these securities may be categorized as Level 3 in the hierarchy.
Investments in open-end mutual funds, including the Fidelity Central Funds, are valued at their closing net asset value (NAV) each business day and are categorized as Level 1 in the hierarchy.
Changes in valuation techniques may result in transfers in or out of an assigned level within the disclosure hierarchy. The aggregate value of investments by input level as of April 30, 2024 is included at the end of the Fund's Schedule of Investments.
Foreign Currency. Certain Funds may use foreign currency contracts to facilitate transactions in foreign-denominated securities. Gains and losses from these transactions may arise from changes in the value of the foreign currency or if the counterparties do not perform under the contracts' terms.
Foreign-denominated assets, including investment securities, and liabilities are translated into U.S. dollars at the exchange rates at period end. Purchases and sales of investment securities, income and dividends received, and expenses denominated in foreign currencies are translated into U.S. dollars at the exchange rate in effect on the transaction date.
The effects of exchange rate fluctuations on investments are included with the net realized and unrealized gain (loss) on investment securities. Other foreign currency transactions resulting in realized and unrealized gain (loss) are disclosed separately.
Investment Transactions and Income. For financial reporting purposes, the Fund's investment holdings and NAV include trades executed through the end of the last business day of the period. The NAV per share for processing shareholder transactions is calculated as of the close of business of the New York Stock Exchange (NYSE), normally 4:00 p.m. Eastern time and includes trades executed through the end of the prior business day. Gains and losses on securities sold are determined on the basis of identified cost and include proceeds received from litigation. Commissions paid to certain brokers with whom the investment adviser, or its affiliates, places trades on behalf of a fund include an amount in addition to trade execution, which may be rebated back to a fund. Any such rebates are included in net realized gain (loss) on investments in the Statement of Operations. Dividend income is recorded on the ex-dividend date, except for certain dividends from foreign securities where the ex-dividend date may have passed, which are recorded as soon as the Fund is informed of the ex-dividend date. Non-cash dividends included in dividend income, if any, are recorded at the fair market value of the securities received. Income and capital gain distributions from Fidelity Central Funds, if any, are recorded on the ex-dividend date. Certain distributions received by the Fund represent a return of capital or capital gain. The Fund determines the components of these distributions subsequent to the ex-dividend date, based upon receipt of tax filings or other correspondence relating to the underlying investment. These distributions are recorded as a reduction of cost of investments and/or as a realized gain. Investment income is recorded net of foreign taxes withheld where recovery of such taxes is uncertain. Funds may file withholding tax reclaims in certain jurisdictions to recover a portion of amounts previously withheld. Any withholding tax reclaims income is included in the Statement of Operations in dividends. Any receivables for withholding tax reclaims are included in the Statement of Assets and Liabilities in dividends receivable.
Expenses. Expenses directly attributable to a fund are charged to that fund. Expenses attributable to more than one fund are allocated among the respective funds on the basis of relative net assets or other appropriate methods. Expenses included in the accompanying financial statements reflect the expenses of that fund and do not include any expenses associated with any underlying mutual funds or exchange-traded funds. Although not included in a fund's expenses, a fund indirectly bears its proportionate share of these expenses through the net asset value of each underlying mutual fund or exchange-traded fund. Expense estimates are accrued in the period to which they relate and adjustments are made when actual amounts are known.
Income Tax Information and Distributions to Shareholders. Each year, the Fund intends to qualify as a regulated investment company under Subchapter M of the Internal Revenue Code, including distributing substantially all of its taxable income and realized gains. As a result, no provision for U.S. Federal income taxes is required. As of April 30, 2024, the Fund did not have any unrecognized tax benefits in the financial statements; nor is the Fund aware of any tax positions for which it is reasonably possible that the total amounts of unrecognized tax benefits will significantly change in the next twelve months. The Fund files a U.S. federal tax return, in addition to state and local tax returns as required. The Fund's federal income tax returns are subject to examination by the Internal Revenue Service (IRS) for a period of three fiscal years after they are filed. State and local tax returns may be subject to examination for an additional fiscal year depending on the jurisdiction. Foreign taxes are provided for based on the Fund's understanding of the tax rules and rates that exist in the foreign markets in which it invests.
Distributions are declared and recorded on the ex-dividend date. Income and capital gain distributions are determined in accordance with income tax regulations, which may differ from GAAP.
Capital accounts within the financial statements are adjusted for permanent book-tax differences. These adjustments have no impact on net assets or the results of operations. Capital accounts are not adjusted for temporary book-tax differences which will reverse in a subsequent period.
Book-tax differences are primarily due to foreign currency transactions, passive foreign investment companies (PFIC), capital loss carryforwards and losses deferred due to wash sales and excise tax regulations.
As of period end, the cost and unrealized appreciation (depreciation) in securities, and derivatives if applicable, for federal income tax purposes were as follows:
| Gross unrealized appreciation | $176,654 |
| Gross unrealized depreciation | (86,824) |
| Net unrealized appreciation (depreciation) | $89,830 |
| Tax Cost | $1,029,450 |
The tax-based components of distributable earnings as of period end were as follows:
| Capital loss carryforward | $(3,749) |
| Net unrealized appreciation (depreciation) on securities and other investments | $89,812 |
Capital loss carryforwards are only available to offset future capital gains of the Fund to the extent provided by regulations and may be limited. The capital loss carryforward information presented below, including any applicable limitation, is estimated as of fiscal period end and is subject to adjustment.
The Fund intends to elect to defer to its next fiscal year $634 of ordinary losses recognized during the period January 1, 2024 to April 30,2024.
The tax character of distributions paid was as follows:
| | April 30, 2024 | April 30, 2023 |
| Ordinary Income | $211 | $- |
| Long-term Capital Gains | - | 85,845 |
| Total | $211 | $85,845 |
Restricted Securities (including Private Placements). Funds may invest in securities that are subject to legal or contractual restrictions on resale. These securities generally may be resold in transactions exempt from registration or to the public if the securities are registered. Disposal of these securities may involve time-consuming negotiations and expense, and prompt sale at an acceptable price may be difficult. Information regarding restricted securities held at period end is included at the end of the Schedule of Investments, if applicable.
4. Purchases and Sales of Investments.
Purchases and sales of securities, other than short-term securities and in-kind transactions, as applicable, are noted in the table below.
| | Purchases ($) | Sales ($) |
| Fidelity Small Cap Stock Fund | 893,247 | 1,091,548 |
Prior Fiscal Year Unaffiliated Redemptions In-Kind. Shares that were redeemed in-kind for investments, including accrued interest and cash, if any, are shown in the table below; along with realized gain or loss on investments delivered through in-kind redemptions. The amount of the in-kind redemptions is included in share transactions in the accompanying Statement of Changes in Net Assets. There was no gain or loss for federal income tax purposes.
| | Shares | Total net realized gain or loss ($) | Total Proceeds ($) |
| Fidelity Small Cap Stock Fund | 185 | 401 | 2,609 |
5. Fees and Other Transactions with Affiliates.
Management Fee. Fidelity Management & Research Company LLC (the investment adviser) and its affiliates provide the Fund with investment management related services for which the Fund pays a monthly management fee.
Effective March 1, 2024, the Fund's management contract was amended to incorporate administrative services previously covered under separate services agreements (Transfer Agent and Accounting agreements). Any reference to "class" in this note shall mean "the Fund" as the Fund currently offers only one class of shares. The amended contract incorporates a basic fee rate that may vary by class (subject to a performance adjustment). The investment adviser or an affiliate pays certain expenses of managing and operating the Fund out of each class's management fee. Each class of the Fund pays a management fee to the investment adviser. The management fee is calculated and paid to the investment adviser every month. The management fee is determined by calculating a basic fee and then applying a performance adjustment. When determining a class's basic fee, a mandate rate is calculated based on the monthly average net assets of a group of funds advised by FMR within a designated asset class. A discount rate is subtracted from the mandate rate once the Fund's monthly average net assets reach a certain level. The mandate rate and discount rate may vary by class. The annual basic fee rate for a class of shares of the Fund is the lesser of (1) the class's mandate rate reduced by the class's discount rate (if applicable) or (2) the amount set forth in the following table.
| | Maximum Management Fee Rate % |
| Fidelity Small Cap Stock Fund | .82 |
One-twelfth of the basic fee rate for a class is applied to the average net assets of the class for the month, giving a dollar amount which is the basic fee for the class for that month. A different management fee rate may be applicable to each class of the Fund. The difference between classes is the result of separate arrangements for class-level services and/or waivers of certain expenses. It is not the result of any difference in advisory or custodial fees or other expenses related to the management of the Fund's assets, which do not vary by class. For the portion of the reporting period on or after March 1, 2024, the total annualized management fee rates were as follows:
| | Total Management Fee Rate % |
| Fidelity Small Cap Stock Fund | .82 |
Prior to March 1, 2024, the management fee was the sum of an individual fund fee rate that was based on an annual rate of .45% of the Fund's average net assets and an annualized group fee rate that averaged .22% during the period. The group fee rate was based upon the monthly average net assets of a group of registered investment companies with which the investment adviser has management contracts. The group fee rate decreased as assets under management increased and increased as assets under management decreased. For the portion of the reporting period prior to March 1, 2024, the total annualized management fee rate was .67%.
The performance adjustment rate is calculated monthly by comparing over the performance period the Fund's performance to that of the performance adjustment index listed below.
| | Performance Adjustment Index |
| Fidelity Small Cap Stock Fund | Russell 2000 Index |
For the purposes of calculating the performance adjustment for the Fund, the Fund's investment performance is based on the performance of the Fund. To the extent that other classes of the Fund have higher expenses, this could result in those classes bearing a larger positive performance adjustment and smaller negative performance adjustment than would be the case if each class's own performance were considered. The performance period is the most recent 36 month period. The maximum annualized performance adjustment rate is ± .20% of the Fund's average net assets over the performance period. The performance adjustment rate is divided by twelve and multiplied by the Fund's average net assets over the performance period, and the resulting dollar amount is proportionately added to or subtracted from a class's basic fee. For the entire reporting period, the total annual performance adjustment was .01%.
Effective March 1, 2024, the Fund's sub-advisory agreements with FMR Investment Management (UK) Limited, Fidelity Management & Research (Hong Kong) Limited, and Fidelity Management & Research (Japan) Limited were amended to provide that the investment adviser pays each sub-adviser monthly fees equal to 110% of the sub-adviser's costs for providing sub-advisory services.
Transfer Agent Fees. Fidelity Investments Institutional Operations Company LLC (FIIOC), an affiliate of the investment adviser, is the Fund's transfer, dividend disbursing and shareholder servicing agent. Effective March 1, 2024, each Fund's management contract was amended to incorporate transfer agent services and associated fees previously covered under a separate services agreement. FIIOC pays for typesetting, printing and mailing of shareholder reports, except proxy statements.
During November 2023, the Board approved a change in the transfer agent fees effective December 1, 2023 to a fixed annual rate of average net assets of .1497%.
Prior to December 1, 2023, FIIOC received account fees and asset-based fees that varied according to account size and type of account.
For the portion of the reporting period prior to March 1, 2024, the fees were equivalent to the annualized rate of .15% of average net assets.
Accounting Fees. Fidelity Service Company, Inc. (FSC), an affiliate of the investment adviser, maintains the Fund's accounting records. Effective March 1, 2024, the Fund's management contract was amended to incorporate accounting services and associated fees previously covered under a separate services agreement.
During November 2023, the Board approved a change in the accounting fees effective December 1, 2023 to a fixed annual rate of average net assets as follows:
| | % of Average Net Assets |
| Fidelity Small Cap Stock Fund | .0286 |
Prior to December 1, 2023, the accounting fee was based on the level of average net assets for each month. For the portion of the reporting period prior to March 1, 2024, the fees were equivalent to the following annualized rates:
| | % of Average Net Assets |
| Fidelity Small Cap Stock Fund | .03 |
Brokerage Commissions. A portion of portfolio transactions were placed with brokerage firms which are affiliates of the investment adviser. Brokerage commissions are included in net realized gain (loss) and change in net unrealized appreciation (depreciation) in the Statement of Operations. The commissions paid to these affiliated firms were as follows:
| | Amount ($) |
| Fidelity Small Cap Stock Fund | 29 |
Interfund Lending Program. Pursuant to an Exemptive Order issued by the Securities and Exchange Commission (the SEC), the Fund, along with other registered investment companies having management contracts with Fidelity Management & Research Company LLC (FMR), or other affiliated entities of FMR, may participate in an interfund lending program. This program provides an alternative credit facility allowing the Fund to borrow from, or lend money to, other participating affiliated funds. At period end, there were no interfund loans outstanding. Activity in this program during the period for which loans were outstanding was as follows:
| | Borrower or Lender | Average Loan Balance ($) | Weighted Average Interest Rate | Interest Expense ($) |
| Fidelity Small Cap Stock Fund | Borrower | 7,458 | 5.57% | 3 |
Interfund Trades. Funds may purchase from or sell securities to other Fidelity Funds under procedures adopted by the Board. The procedures have been designed to ensure these interfund trades are executed in accordance with Rule 17a-7 of the 1940 Act. Any interfund trades are included within the respective purchases and sales amounts shown in the Purchases and Sales of Investments note. Interfund trades during the period are noted in the table below.
| | Purchases ($) | Sales ($) | Realized Gain (Loss)($) |
| Fidelity Small Cap Stock Fund | 38,974 | 58,525 | 2,926 |
6. Committed Line of Credit.
Certain Funds participate with other funds managed by the investment adviser or an affiliate in a $4.25 billion credit facility (the "line of credit") to be utilized for temporary or emergency purposes to fund shareholder redemptions or for other short-term liquidity purposes. The participating funds have agreed to pay commitment fees on their pro-rata portion of the line of credit, which are reflected in Miscellaneous expenses on the Statement of Operations, and are listed below. During the period, there were no borrowings on this line of credit.
| | Amount ($) |
| Fidelity Small Cap Stock Fund | 2 |
7. Security Lending.
Funds lend portfolio securities from time to time in order to earn additional income. Lending agents are used, including National Financial Services (NFS), an affiliate of the investment adviser. Pursuant to a securities lending agreement, NFS will receive a fee, which is capped at 9.9% of a fund's daily lending revenue, for its services as lending agent. A fund may lend securities to certain qualified borrowers, including NFS. On the settlement date of the loan, a fund receives collateral (in the form of U.S. Treasury obligations, letters of credit and/or cash) against the loaned securities and maintains collateral in an amount not less than 100% of the market value of the loaned securities during the period of the loan. The market value of the loaned securities is determined at the close of business of a fund and any additional required collateral is delivered to a fund on the next business day. A fund or borrower may terminate the loan at any time, and if the borrower defaults on its obligation to return the securities loaned because of insolvency or other reasons, a fund may apply collateral received from the borrower against the obligation. A fund may experience delays and costs in recovering the securities loaned. Any cash collateral received is invested in the Fidelity Securities Lending Cash Central Fund. Any loaned securities are identified as such in the Schedule of Investments, and the value of loaned securities and cash collateral at period end, as applicable, are presented in the Statement of Assets and Liabilities. Security lending income represents the income earned on investing cash collateral, less rebates paid to borrowers and any lending agent fees associated with the loan, plus any premium payments received for lending certain types of securities. Security lending income is presented in the Statement of Operations as a component of income from Fidelity Central Funds. Affiliated security lending activity, if any, was as follows:
| | Total Security Lending Fees Paid to NFS ($) | Security Lending Income From Securities Loaned to NFS ($) | Value of Securities Loaned to NFS at Period End ($) |
| Fidelity Small Cap Stock Fund | 4 | -A | - |
| | | | |
A Amount represent less than five hundred dollars.
8. Expense Reductions.
Through arrangements with the Fund's custodian, credits realized as a result of certain uninvested cash balances were used to reduce the Fund's expenses by $2.
In addition, during the period the investment adviser or an affiliate reimbursed and/or waived a portion of operating expenses in the amount of $95.
9. Other.
A fund's organizational documents provide former and current trustees and officers with a limited indemnification against liabilities arising in connection with the performance of their duties to the fund. In the normal course of business, a fund may also enter into contracts that provide general indemnifications. A fund's maximum exposure under these arrangements is unknown as this would be dependent on future claims that may be made against a fund. The risk of material loss from such claims is considered remote.
10. Risk and Uncertainties.
Many factors affect a fund's performance. Developments that disrupt global economies and financial markets, such as pandemics, epidemics, outbreaks of infectious diseases, war, terrorism, and environmental disasters, may significantly affect a fund's investment performance. The effects of these developments to a fund will be impacted by the types of securities in which a fund invests, the financial condition, industry, economic sector, and geographic location of an issuer, and a fund's level of investment in the securities of that issuer. Significant concentrations in security types, issuers, industries, sectors, and geographic locations may magnify the factors that affect a fund's performance.
To the Board of Trustees of Fidelity Concord Street Trust and the Shareholders of Fidelity Small Cap Stock Fund:
Opinion on the Financial Statements and Financial Highlights
We have audited the accompanying statement of assets and liabilities of Fidelity Small Cap Stock Fund (the "Fund"), a fund of Fidelity Concord Street Trust, including the schedule of investments, as of April 30, 2024, the related statement of operations for the year then ended, the statement of changes in net assets for each of the two years in the period then ended, the financial highlights for each of the five years in the period then ended, and the related notes. In our opinion, the financial statements and financial highlights present fairly, in all material respects, the financial position of the Fund as of April 30, 2024, and the results of its operations for the year then ended, the changes in its net assets for each of the two years in the period then ended, and the financial highlights for each of the five years in the period then ended in conformity with accounting principles generally accepted in the United States of America.
Basis for Opinion
These financial statements and financial highlights are the responsibility of the Fund's management. Our responsibility is to express an opinion on the Fund's financial statements and financial highlights based on our audits. We are a public accounting firm registered with the Public Company Accounting Oversight Board (United States) (PCAOB) and are required to be independent with respect to the Fund in accordance with the U.S. federal securities laws and the applicable rules and regulations of the Securities and Exchange Commission and the PCAOB.
We conducted our audits in accordance with the standards of the PCAOB. Those standards require that we plan and perform the audit to obtain reasonable assurance about whether the financial statements and financial highlights are free of material misstatement, whether due to error or fraud. The Fund is not required to have, nor were we engaged to perform, an audit of its internal control over financial reporting. As part of our audits, we are required to obtain an understanding of internal control over financial reporting but not for the purpose of expressing an opinion on the effectiveness of the Fund's internal control over financial reporting. Accordingly, we express no such opinion.
Our audits included performing procedures to assess the risks of material misstatement of the financial statements and financial highlights, whether due to error or fraud, and performing procedures that respond to those risks. Such procedures included examining, on a test basis, evidence regarding the amounts and disclosures in the financial statements and financial highlights. Our audits also included evaluating the accounting principles used and significant estimates made by management, as well as evaluating the overall presentation of the financial statements and financial highlights. Our procedures included confirmation of securities owned as of April 30, 2024, by correspondence with the custodian and brokers; when replies were not received from brokers, we performed other auditing procedures. We believe that our audits provide a reasonable basis for our opinion.
/s/ Deloitte & Touche LLP
Boston, Massachusetts
June 13, 2024
We have served as the auditor of one or more of the Fidelity investment companies since 1999.
The Trustees, Members of the Advisory Board (if any), and officers of the trust and fund, as applicable, are listed below. The Board of Trustees governs the fund and is responsible for protecting the interests of shareholders. The Trustees are experienced executives who meet periodically throughout the year to oversee the fund's activities, review contractual arrangements with companies that provide services to the fund, oversee management of the risks associated with such activities and contractual arrangements, and review the fund's performance. Except for Jonathan Chiel, each of the Trustees oversees 323 funds. Mr. Chiel oversees 192 funds.
The Trustees hold office without limit in time except that (a) any Trustee may resign; (b) any Trustee may be removed by written instrument, signed by at least two-thirds of the number of Trustees prior to such removal; (c) any Trustee who requests to be retired or who has become incapacitated by illness or injury may be retired by written instrument signed by a majority of the other Trustees; and (d) any Trustee may be removed at any special meeting of shareholders by a two-thirds vote of the outstanding voting securities of the trust. Each Trustee who is not an interested person (as defined in the 1940 Act) of the trust and the fund is referred to herein as an Independent Trustee. Each Independent Trustee shall retire not later than the last day of the calendar year in which his or her 75th birthday occurs. The Independent Trustees may waive this mandatory retirement age policy with respect to individual Trustees. Officers and Advisory Board Members hold office without limit in time, except that any officer or Advisory Board Member may resign or may be removed by a vote of a majority of the Trustees at any regular meeting or any special meeting of the Trustees. Except as indicated, each individual has held the office shown or other offices in the same company for the past five years.
The fund's Statement of Additional Information (SAI) includes more information about the Trustees. To request a free copy, call Fidelity at 1-800-544-8544.
Experience, Skills, Attributes, and Qualifications of the Trustees. The Governance and Nominating Committee has adopted a statement of policy that describes the experience, qualifications, attributes, and skills that are necessary and desirable for potential Independent Trustee candidates (Statement of Policy). The Board believes that each Trustee satisfied at the time he or she was initially elected or appointed a Trustee, and continues to satisfy, the standards contemplated by the Statement of Policy. The Governance and Nominating Committee also engages professional search firms to help identify potential Independent Trustee candidates who have the experience, qualifications, attributes, and skills consistent with the Statement of Policy. From time to time, additional criteria based on the composition and skills of the current Independent Trustees, as well as experience or skills that may be appropriate in light of future changes to board composition, business conditions, and regulatory or other developments, have also been considered by the professional search firms and the Governance and Nominating Committee. In addition, the Board takes into account the Trustees' commitment and participation in Board and committee meetings, as well as their leadership of standing and ad hoc committees throughout their tenure.
In determining that a particular Trustee was and continues to be qualified to serve as a Trustee, the Board has considered a variety of criteria, none of which, in isolation, was controlling. The Board believes that, collectively, the Trustees have balanced and diverse experience, qualifications, attributes, and skills, which allow the Board to operate effectively in governing the fund and protecting the interests of shareholders. Information about the specific experience, skills, attributes, and qualifications of each Trustee, which in each case led to the Board's conclusion that the Trustee should serve (or continue to serve) as a trustee of the fund, is provided below.
Board Structure and Oversight Function. Robert A. Lawrence is an interested person and currently serves as Chair. The Trustees have determined that an interested Chair is appropriate and benefits shareholders because an interested Chair has a personal and professional stake in the quality and continuity of services provided to the fund. Independent Trustees exercise their informed business judgment to appoint an individual of their choosing to serve as Chair, regardless of whether the Trustee happens to be independent or a member of management. The Independent Trustees have determined that they can act independently and effectively without having an Independent Trustee serve as Chair and that a key structural component for assuring that they are in a position to do so is for the Independent Trustees to constitute a substantial majority for the Board. The Independent Trustees also regularly meet in executive session. David M. Thomas serves as Lead Independent Trustee and as such (i) acts as a liaison between the Independent Trustees and management with respect to matters important to the Independent Trustees and (ii) with management prepares agendas for Board meetings.
Fidelity® funds are overseen by different Boards of Trustees. The fund's Board oversees Fidelity's high income and certain equity funds, and other Boards oversee Fidelity's alternative investment, investment-grade bond, money market, asset allocation, and other equity funds. The asset allocation funds may invest in Fidelity® funds overseen by the fund's Board. The use of separate Boards, each with its own committee structure, allows the Trustees of each group of Fidelity® funds to focus on the unique issues of the funds they oversee, including common research, investment, and operational issues. On occasion, the separate Boards establish joint committees to address issues of overlapping consequences for the Fidelity® funds overseen by each Board.
The Trustees operate using a system of committees to facilitate the timely and efficient consideration of all matters of importance to the Trustees, the fund, and fund shareholders and to facilitate compliance with legal and regulatory requirements and oversight of the fund's activities and associated risks. The Board, acting through its committees, has charged FMR and its affiliates with (i) identifying events or circumstances the occurrence of which could have demonstrably adverse effects on the fund's business and/or reputation; (ii) implementing processes and controls to lessen the possibility that such events or circumstances occur or to mitigate the effects of such events or circumstances if they do occur; and (iii) creating and maintaining a system designed to evaluate continuously business and market conditions in order to facilitate the identification and implementation processes described in (i) and (ii) above. Because the day-to-day operations and activities of the fund are carried out by or through FMR, its affiliates, and other service providers, the fund's exposure to risks is mitigated but not eliminated by the processes overseen by the Trustees. While each of the Board's committees has responsibility for overseeing different aspects of the fund's activities, oversight is exercised primarily through the Operations, Audit, and Compliance Committees. Appropriate personnel, including but not limited to the fund's Chief Compliance Officer (CCO), FMR's internal auditor, the independent accountants, the fund's Treasurer and portfolio management personnel, make periodic reports to the Board's committees, as appropriate, including an annual review of Fidelity's risk management program for the Fidelity® funds. The responsibilities of each standing committee, including their oversight responsibilities, are described further under "Standing Committees of the Trustees."
Interested Trustees*:
Correspondence intended for a Trustee who is an interested person may be sent to Fidelity Investments, 245 Summer Street, Boston, Massachusetts 02210.
Name, Year of Birth; Principal Occupations and Other Relevant Experience+
Jonathan Chiel (1957)
Year of Election or Appointment: 2016
Trustee
Mr. Chiel also serves as Trustee of other Fidelity® funds. Mr. Chiel is Senior Counsel at Fidelity Investments (diversified financial services company, 2024-present). Previously, Mr. Chiel served as General Counsel (2012-2024) and Head of Legal, Risk and Compliance (2022-2024) for Fidelity Investments; Executive Vice President and General Counsel for FMR LLC (diversified financial services company, 2012-2024); Director and President of OH Company LLC (holding company, 2018-2024); General Counsel (2004-2012) and Senior Vice President and Deputy General Counsel (2000-2004) for John Hancock Financial Services; a partner with Choate, Hall & Stewart (law firm, 1996-2000); and an Assistant United States Attorney for the United States Attorney's Office of the District of Massachusetts (1986-1995), including Chief of the Criminal Division (1993-1995). Mr. Chiel is a director on the boards of the Harvard Law School Center on the Legal Profession and the U.S. Chamber Litigation Center.
Bettina Doulton (1964)
Year of Election or Appointment: 2021
Trustee
Ms. Doulton also serves as Trustee of other Fidelity® funds. Prior to her retirement, Ms. Doulton served in a variety of positions at Fidelity Investments, including as a managing director of research (2006-2007), portfolio manager to certain Fidelity® funds (1993-2005), equity analyst and portfolio assistant (1990-1993), and research assistant (1987-1990). Ms. Doulton currently owns and operates Cellardoor Winery. Previously, Ms. Doulton served as a member of the Board of Brown Capital Management, LLC (2014-2018).
Robert A. Lawrence (1952)
Year of Election or Appointment: 2020
Trustee
Chair of the Board of Trustees
Mr. Lawrence also serves as Trustee of other funds. Previously, Mr. Lawrence served as a Trustee and Member of the Advisory Board of certain funds. Prior to his retirement in 2008, Mr. Lawrence served as Vice President of certain Fidelity® funds (2006-2008), Senior Vice President, Head of High Income Division of Fidelity Management & Research Company (investment adviser firm, 2006-2008), and President of Fidelity Strategic Investments (investment adviser firm, 2002-2005).
* Determined to be an "Interested Trustee" by virtue of, among other things, his or her affiliation with the trust or various entities under common control with FMR.
+ The information includes the Trustee's principal occupation during the last five years and other information relating to the experience, attributes, and skills relevant to the Trustee's qualifications to serve as a Trustee, which led to the conclusion that the Trustee should serve as a Trustee for the fund.
Independent Trustees:
Correspondence intended for an Independent Trustee may be sent to Fidelity Investments, P.O. Box 55235, Boston, Massachusetts 02205-5235.
Name, Year of Birth; Principal Occupations and Other Relevant Experience+
Thomas P. Bostick (1956)
Year of Election or Appointment: 2021
Trustee
Lieutenant General Bostick also serves as Trustee of other Fidelity® funds. Prior to his retirement, General Bostick (United States Army, Retired) held a variety of positions within the U.S. Army, including Chief of Engineers and Commanding General, U.S. Army Corps of Engineers (2012-2016) and Deputy Chief of Staff and Director of Human Resources, U.S. Army (2009-2012). General Bostick currently serves as a member of the Board and Finance and Governance & Sustainability Committees of CSX Corporation (transportation, 2020-present) and a member of the Board and Corporate Governance and Nominating Committee of Perma-Fix Environmental Services, Inc. (nuclear waste management, 2020-present). General Bostick serves as Chief Executive Officer of Bostick Global Strategies, LLC (consulting, 2016-present), as a member of the Board of HireVue, Inc. (video interview and assessment, 2020-present), as a member of the Board of Allonnia (biotechnology and engineering solutions, 2022-present), on the Advisory Board of Hilco Redevelopment Partners (a real estate investment and redevelopment company, 2021-present), and on the Advisory Board of Solugen, Inc. (specialty bio-based chemicals manufacturer, 2022-present). Previously, General Bostick served as a Member of the Advisory Board of certain Fidelity® funds (2021), President, Intrexon Bioengineering (2018-2020) and Chief Operating Officer (2017-2020) and Senior Vice President of the Environment Sector (2016-2017) of Intrexon Corporation (biopharmaceutical company).
Donald F. Donahue (1950)
Year of Election or Appointment: 2018
Trustee
Mr. Donahue also serves as Trustee of other Fidelity® funds. Mr. Donahue serves as President and Chief Executive Officer of Miranda Partners, LLC (risk consulting for the financial services industry, 2012-present). Previously, Mr. Donahue served as Chief Executive Officer (2006-2012), Chief Operating Officer (2003-2006) and Managing Director, Customer Marketing and Development (1999-2003) of The Depository Trust & Clearing Corporation (financial markets infrastructure). Mr. Donahue currently serves as a member (2007-present) and Co-Chairman (2016-present) of the Board of United Way of New York. Mr. Donahue previously served as a member of the Advisory Board of certain Fidelity® funds (2015-2018) and as a member of the Board of The Leadership Academy (previously NYC Leadership Academy) (2012-2022).
Vicki L. Fuller (1957)
Year of Election or Appointment: 2020
Trustee
Ms. Fuller also serves as Trustee of other Fidelity® funds. Previously, Ms. Fuller served as a member of the Advisory Board of certain Fidelity® funds (2018-2020), Chief Investment Officer of the New York State Common Retirement Fund (2012-2018) and held a variety of positions at AllianceBernstein L.P. (global asset management, 1985-2012), including Managing Director (2006-2012) and Senior Vice President and Senior Portfolio Manager (2001-2006). Ms. Fuller currently serves as a member of the Board, Audit Committee, Compensation Committee and Nominating and Governance Committee of two Blackstone business development companies (2020-present), as a member of the Board of Treliant, LLC (consulting, 2019-present), as a member of the Board of Ariel Alternatives, LLC (private equity, 2022-present) and as a member of the Board and Chair of the Audit Committee of Gusto, Inc. (software, 2021-present). In addition, Ms. Fuller currently serves as a member of the Executive Board of New York University's Stern School of Business. Ms. Fuller previously served as a member of the Board of Roosevelt University (2019-2024) and member of the Board, Audit Committee and Nominating and Governance Committee of The Williams Companies, Inc. (natural gas infrastructure, 2018-2021).
Patricia L. Kampling (1959)
Year of Election or Appointment: 2020
Trustee
Ms. Kampling also serves as Trustee of other Fidelity® funds. Prior to her retirement, Ms. Kampling served as Chairman of the Board and Chief Executive Officer (2012-2019), President and Chief Operating Officer (2011-2012) and Executive Vice President and Chief Financial Officer (2010-2011) of Alliant Energy Corporation. Ms. Kampling currently serves as a member of the Board, Audit Committee and Governance, Compensation and Nominating Committee of Xcel Energy Inc. (utilities company, 2020-present) and as a member of the Board, Audit, Finance and Risk Committee and Safety, Environmental, Technology and Operations Committee and Chair of the Executive Development and Compensation Committee of American Water Works Company, Inc. (utilities company, 2019-present). In addition, Ms. Kampling currently serves as a member of the Board of the Nature Conservancy, Wisconsin Chapter (2019-present). Previously, Ms. Kampling served as a Member of the Advisory Board of certain Fidelity® funds (2020), a member of the Board, Compensation Committee and Executive Committee and Chair of the Audit Committee of Briggs & Stratton Corporation (manufacturing, 2011-2021), a member of the Board of Interstate Power and Light Company (2012-2019) and Wisconsin Power and Light Company (2012-2019) (each a subsidiary of Alliant Energy Corporation) and as a member of the Board and Workforce Development Committee of the Business Roundtable (2018-2019).
Thomas A. Kennedy (1955)
Year of Election or Appointment: 2021
Trustee
Mr. Kennedy also serves as Trustee of other Fidelity® funds. Previously, Mr. Kennedy served as a Member of the Advisory Board of certain Fidelity® funds (2020) and held a variety of positions at Raytheon Company (aerospace and defense, 1983-2020), including Chairman and Chief Executive Officer (2014-2020) and Executive Vice President and Chief Operating Officer (2013-2014). Mr. Kennedy served as Executive Chairman of the Board of Directors of Raytheon Technologies Corporation (aerospace and defense, 2020-2021). Mr. Kennedy serves as a Director of the Board of Directors of Textron Inc. (aerospace and defense, 2023-present).
Oscar Munoz (1959)
Year of Election or Appointment: 2021
Trustee
Mr. Munoz also serves as Trustee of other Fidelity® funds. Prior to his retirement, Mr. Munoz served as Executive Chairman (2020-2021), Chief Executive Officer (2015-2020), President (2015-2016) and a member of the Board (2010-2021) of United Airlines Holdings, Inc. Mr. Munoz currently serves as a member of the Board of CBRE Group, Inc. (commercial real estate, 2020-present), a member of the Board of Univision Communications, Inc. (Hispanic media, 2020-present), a member of the Board of Archer Aviation Inc. (2021-present), a member of the Defense Business Board of the United States Department of Defense (2021-present) and a member of the Board of Salesforce.com, Inc. (cloud-based software, 2022-present). Previously, Mr. Munoz served as a Member of the Advisory Board of certain Fidelity® funds (2021).
David M. Thomas (1949)
Year of Election or Appointment: 2008
Trustee
Lead Independent Trustee
Mr. Thomas also serves as Trustee of other Fidelity® funds. Previously, Mr. Thomas served as Executive Chairman (2005-2006) and Chairman and Chief Executive Officer (2000-2005) of IMS Health, Inc. (pharmaceutical and healthcare information solutions) and as a member of the Board of Fortune Brands Home and Security (home and security products, 2004-2023). Mr. Thomas currently serves as Director (2013-present) and Non-Executive Chairman of the Board (2022-present) of Interpublic Group of Companies, Inc. (marketing communication).
Susan Tomasky (1953)
Year of Election or Appointment: 2020
Trustee
Ms. Tomasky also serves as Trustee of other Fidelity® funds. Prior to her retirement, Ms. Tomasky served in various executive officer positions at American Electric Power Company, Inc. (1998-2011), including most recently as President of AEP Transmission (2007-2011). Ms. Tomasky currently serves as a member of the Board and Sustainability Committee and as Chair of the Audit Committee of Marathon Petroleum Corporation (2018-present) and as a member of the Board, Executive Committee, Corporate Governance Committee and Organization and Compensation Committee and as Lead Director of the Board of Public Service Enterprise Group, Inc. (utilities company, 2012-present) and as a member of the Board of its subsidiary company, Public Service Electric and Gas Co. (2021-present). In addition, Ms. Tomasky currently serves as a member (2009-present) and President (2020-present) of the Board of the Royal Shakespeare Company - America (2009-present) and as a member and Vice Chair of the Board of Kenyon College (2016-present). Previously, Ms. Tomasky served as a Member of the Advisory Board of certain Fidelity® funds (2020), as a member of the Board of the Columbus Association for the Performing Arts (2011-2023), as a member of the Board of the Columbus Regional Airport Authority (2007-2020), as a member of the Board (2011-2018) and Lead Independent Director (2015-2018) of Andeavor Corporation (previously Tesoro Corporation) (independent oil refiner and marketer) and as a member of the Board of Summit Midstream Partners LP (energy, 2012-2018).
Michael E. Wiley (1950)
Year of Election or Appointment: 2020
Trustee
Mr. Wiley also serves as Trustee of other Fidelity® funds. Previously, Mr. Wiley served as a member of the Advisory Board of certain Fidelity® funds (2018-2020), Chairman, President and CEO of Baker Hughes, Inc. (oilfield services, 2000-2004). Mr. Wiley also previously served as a member of the Board of Andeavor Corporation (independent oil refiner and marketer, 2005-2018), a member of the Board of Andeavor Logistics LP (natural resources logistics, 2015-2018) and a member of the Board of High Point Resources (exploration and production, 2005-2020).
+ The information includes the Trustee's principal occupation during the last five years and other information relating to the experience, attributes, and skills relevant to the Trustee's qualifications to serve as a Trustee, which led to the conclusion that the Trustee should serve as a Trustee for the fund.
Advisory Board Members and Officers:
Correspondence intended for a Member of the Advisory Board (if any) may be sent to Fidelity Investments, P.O. Box 55235, Boston, Massachusetts 02205-5235. Correspondence intended for an officer or Peter S. Lynch may be sent to Fidelity Investments, 245 Summer Street, Boston, Massachusetts 02210.
Name, Year of Birth; Principal Occupations+
Vijay C. Advani (1960)
Year of Election or Appointment: 2023
Member of the Advisory Board
Mr. Advani also serves as Trustee or Member of the Advisory Board of other funds. Previously, Mr. Advani served as Executive Chairman (2020-2022), Chief Executive Officer (2017-2020) and Chief Operating Officer (2016-2017) of Nuveen (global investment manager). He also served in various capacities at Franklin Resources (global investment manager), including Co-President (2015-2016), Executive Vice President, Global Advisory Services (2008-2015), Head of Global Retail Distribution (2005-2008), Executive Managing Director, International Retail Development (2002-2005), Managing Director, Product Developments, Sales & Marketing, Asia, Eastern Europe and Africa (2000-2002) and President, Templeton Asset Management India (1995-2000). Mr. Advani also served as Senior Investment Officer of International Finance Corporation (private equity and venture capital arm of The World Bank, 1984-1995). Mr. Advani is Chairman Emeritus of the U.S. India Business Council (2018-present), a Director of The Global Impact Investing Network (2019-present), a Director of LOK Capital (Mauritius) (2022-present), a member of the Advisory Council of LOK Capital (2022-present), a Senior Advisor of Neuberger Berman (2021-present), a Senior Advisor of Seviora Holdings Pte. Ltd (Temasek-Singapore) (2021-present), a Director of Seviora Capital (Singapore) (2021-present) and an Advisor of EQUIAM (2021-present). Mr. Advani formerly served as a member of the Board of BowX Acquisition Corp. (special purpose acquisition company, 2020-2021), a member of the Board of Intellecap (advisory arm of The Aavishkaar Group, 2018-2020), a member of the Board of Nuveen Investments, Inc. (2017-2020) and a member of the Board of Docusign (software, 2016-2019).
Peter S. Lynch (1944)
Year of Election or Appointment: 2003
Member of the Advisory Board
Mr. Lynch also serves as a Member of the Advisory Board of other Fidelity® funds. Mr. Lynch is Vice Chairman and a Director of Fidelity Management & Research Company LLC (investment adviser firm). In addition, Mr. Lynch serves as a Trustee of Boston College and as the Chairman of the Inner-City Scholarship Fund. Previously, Mr. Lynch served as Vice Chairman and a Director of FMR Co., Inc. (investment adviser firm) and on the Special Olympics International Board of Directors (1997-2006).
Karen B. Peetz (1955)
Year of Election or Appointment: 2023
Member of the Advisory Board
Ms. Peetz also serves as a Member of the Advisory Board of other funds. Previously, Ms. Peetz served as Chief Administration Officer (2020-2023) of Citigroup Inc. (a diversified financial service company). She also served in various capacities at Bank of New York Mellon Corporation, including President (2013-2016), Vice Chairman, Senior Executive Vice President and Chief Executive Officer of Financial Markets & Treasury Services (2010-2013), Senior Executive Vice President and Chief Executive Officer of Global Corporate Trust (2003-2008), Senior Vice President and Division Manager of Global Payments & Trade Services (2002-2003) and Senior Vice President and Division Manager of Domestic Corporate Trust (1998-2002). Ms. Peetz also served in various capacities at Chase Manhattan Corporation (1982-1998), including Senior Vice President and Manager of Corporate Trust International Business (1996-1998), Managing Director and Manager of Corporate Trust Services (1994-1996) and Managing Director and Group Manager of Financial Institution Sales (1990-1993). Ms. Peetz currently serves as Chair of Amherst Holdings Advisory Council (2018-present), Trustee of Johns Hopkins University (2016-present), Chair of the Carey Business School Advisory Council, Member of the Johns Hopkins Medicine Board and Finance Committee and Chair of the Lyme and Tick Related Disease Institute Advisory Council. Ms. Peetz previously served as a member of the Board of Guardian Life Insurance Company of America (2019-2023), a member of the Board of Trane Technologies (2018-2022), a member of the Board of Wells Fargo Corp. (2017-2019), a member of the Board of SunCoke Energy Inc. (2012-2016), a member of the Board of Private Export Funding Corporation (2010-2016) and as a Trustee of Penn State University (2010-2014) and the United Way of New York City (2008-2010).
Heather Bonner (1977)
Year of Election or Appointment: 2023
Assistant Treasurer
Ms. Bonner also serves as an officer of other funds. Ms. Bonner is a Senior Vice President (2022-present) and is an employee of Fidelity Investments (2022-present). Ms. Bonner serves as Senior Vice President, Vice President, Treasurer, or Director of certain Fidelity entities. Prior to joining Fidelity, Ms. Bonner served as Managing Director at AQR Capital Management (2013-2022) and was the Treasurer and Principal Financial Officer of the AQR Funds (2013-2022).
Craig S. Brown (1977)
Year of Election or Appointment: 2022
Deputy Treasurer
Mr. Brown also serves as an officer of other funds. Mr. Brown is a Vice President (2015-present) and is an employee of Fidelity Investments. Mr. Brown serves as Assistant Treasurer of FIMM, LLC (2021-present). Previously, Mr. Brown served as Assistant Treasurer of certain Fidelity® funds (2019-2022).
John J. Burke III (1964)
Year of Election or Appointment: 2018
Chief Financial Officer
Mr. Burke also serves as Chief Financial Officer of other funds. Mr. Burke is Head of Fidelity Fund and Investment Operations (2018-present) and is an employee of Fidelity Investments. Mr. Burke serves as President, Executive Vice President, or Director of certain Fidelity entities. Previously Mr. Burke served as head of Asset Management Investment Operations (2012-2018).
Margaret Carey (1973)
Year of Election or Appointment: 2023
Secretary and Chief Legal Officer (CLO)
Ms. Carey also serves as an officer of other funds and as CLO of certain Fidelity entities. Ms. Carey is a Senior Vice President, Deputy General Counsel (2019-present) and is an employee of Fidelity Investments.
William C. Coffey (1969)
Year of Election or Appointment: 2019
Assistant Secretary
Mr. Coffey also serves as Assistant Secretary of other funds. Mr. Coffey is a Senior Vice President, Deputy General Counsel (2010-present) and is an employee of Fidelity Investments. Previously, Mr. Coffey served as Secretary and CLO of certain funds (2018-2019); CLO, Secretary, or Senior Vice President of certain Fidelity entities and Assistant Secretary of certain funds (2009-2018).
Timothy M. Cohen (1969)
Year of Election or Appointment: 2018
Vice President
Mr. Cohen also serves as Vice President of other funds. Mr. Cohen is Co-Head of Equity (2018-present) and is an employee of Fidelity Investments. Mr. Cohen serves as President or Director of certain Fidelity entities. Previously, Mr. Cohen served as Executive Vice President of Fidelity SelectCo, LLC (2019) and Head of Global Equity Research (2016-2018).
Jonathan Davis (1968)
Year of Election or Appointment: 2010
Assistant Treasurer
Mr. Davis also serves as an officer of other funds. Mr. Davis is a Vice President (2006-present) and is an employee of Fidelity Investments. Mr. Davis serves as Assistant Treasurer or Director of certain Fidelity entities.
Laura M. Del Prato (1964)
Year of Election or Appointment: 2018
Assistant Treasurer
Ms. Del Prato also serves as an officer of other funds. Ms. Del Prato is a Senior Vice President (2017-present) and is an employee of Fidelity Investments. Ms. Del Prato serves as Senior Vice President, Vice President, Assistant Treasurer, or Director of certain Fidelity entities. Previously, Ms. Del Prato served as President and Treasurer of The North Carolina Capital Management Trust: Cash Portfolio and Term Portfolio (2018-2020).
Colm A. Hogan (1973)
Year of Election or Appointment: 2020
Assistant Treasurer
Mr. Hogan also serves as an officer of other funds. Mr. Hogan is a Vice President (2016-present) and is an employee of Fidelity Investments. Mr. Hogan serves as Assistant Treasurer of certain Fidelity entities. Previously, Mr. Hogan served as Deputy Treasurer of certain Fidelity® funds (2016-2020) and Assistant Treasurer of certain Fidelity® funds (2016-2018).
Pamela R. Holding (1964)
Year of Election or Appointment: 2018
Vice President
Ms. Holding also serves as Vice President of other funds. Ms. Holding is Co-Head of Equity (2018-present) and is an employee of Fidelity Investments. Previously, Ms. Holding served as Executive Vice President of Fidelity SelectCo, LLC (2019) and as Chief Investment Officer of Fidelity Institutional Asset Management (2013-2018).
Chris Maher (1972)
Year of Election or Appointment: 2020
Deputy Treasurer
Mr. Maher also serves as an officer of other funds. Mr. Maher is a Vice President (2008-present) and is an employee of Fidelity Investments. Mr. Maher serves as Assistant Treasurer of certain Fidelity entities. Previously, Mr. Maher served as Assistant Treasurer of certain funds (2013-2020).
Jason P. Pogorelec (1975)
Year of Election or Appointment: 2020
Chief Compliance Officer
Mr. Pogorelec also serves as Chief Compliance Officer of other funds. Mr. Pogorelec is a Senior Vice President of Asset Management Compliance (2020-present) and is an employee of Fidelity Investments. Mr. Pogorelec serves as Compliance Officer of Fidelity Management & Research Company LLC (investment adviser firm, 2023-present) and Ballyrock Investment Advisors LLC (2023-present). Previously, Mr. Pogorelec served as a Vice President, Associate General Counsel for Fidelity Investments (2010-2020) and Assistant Secretary of certain Fidelity® funds (2015-2020).
Brett Segaloff (1972)
Year of Election or Appointment: 2021
Anti-Money Laundering (AML) Officer
Mr. Segaloff also serves as AML Officer of other funds. Mr. Segaloff is a Vice President (2022-present) and is an employee of Fidelity Investments. Mr. Segaloff serves as Anti Money Laundering Compliance Officer or Anti Money Laundering/Bank Secrecy Act Compliance Officer of certain Fidelity entities.
Stacie M. Smith (1974)
Year of Election or Appointment: 2016
President and Treasurer
Ms. Smith also serves as an officer of other funds. Ms. Smith is a Senior Vice President (2016-present) and is an employee of Fidelity Investments. Ms. Smith serves as Assistant Treasurer of certain Fidelity entities and has served in other fund officer roles.
Jim Wegmann (1979)
Year of Election or Appointment: 2019
Assistant Treasurer
Mr. Wegmann also serves as an officer of other funds. Mr. Wegmann is a Vice President (2016-present) and is an employee of Fidelity Investments. Mr. Wegmann serves as Assistant Treasurer of FIMM, LLC (2021-present). Previously, Mr. Wegmann served as Assistant Treasurer of certain Fidelity® funds (2019-2021).
+ The information includes principal occupation during the last five years.
As a shareholder, you incur two types of costs: (1) transaction costs, which may include sales charges (loads) on purchase payments or redemption proceeds, as applicable and (2) ongoing costs, which generally include management fees, distribution and/or service (12b-1) fees and other Fund expenses. This Example is intended to help you understand your ongoing costs (in dollars) of investing in a fund and to compare these costs with the ongoing costs of investing in other mutual funds.
| The Example is based on an investment of $1,000 invested at the beginning of the period and held for the entire period (November 1, 2023 to April 30, 2024). |
Actual Expenses
The first line of the accompanying table provides information about actual account values and actual expenses. You may use the information in this line, together with the amount you invested, to estimate the expenses that you paid over the period. Simply divide your account value by $1,000.00 (for example, an $8,600 account value divided by $1,000.00 = 8.6), then multiply the result by the number in the first line for a class/Fund under the heading entitled "Expenses Paid During Period" to estimate the expenses you paid on your account during this period. If any fund is a shareholder of any underlying mutual funds or exchange-traded funds (ETFs) (the Underlying Funds), such fund indirectly bears its proportional share of the expenses of the Underlying Funds in addition to the direct expenses incurred presented in the table. These fees and expenses are not included in the annualized expense ratio used to calculate the expense estimate in the table below.
Hypothetical Example for Comparison Purposes
The second line of the accompanying table provides information about hypothetical account values and hypothetical expenses based on the actual expense ratio and an assumed rate of return of 5% per year before expenses, which is not the actual return. The hypothetical account values and expenses may not be used to estimate the actual ending account balance or expenses you paid for the period. You may use this information to compare the ongoing costs of investing in the Fund and other funds. To do so, compare this 5% hypothetical example with the 5% hypothetical examples that appear in the shareholder reports of the other funds. If any fund is a shareholder of any Underlying Funds, such fund indirectly bears its proportional share of the expenses of the Underlying Funds in addition to the direct expenses as presented in the table. These fees and expenses are not included in the annualized expense ratio used to calculate the expense estimate in the table below.
Please note that the expenses shown in the table are meant to highlight your ongoing costs only and do not reflect any transaction costs. Therefore, the second line of the table is useful in comparing ongoing costs only, and will not help you determine the relative total costs of owning different funds. In addition, if these transactional costs were included, your costs would have been higher.
| | | | | Annualized Expense Ratio- A | | Beginning Account Value November 1, 2023 | | Ending Account Value April 30, 2024 | | Expenses Paid During Period- C November 1, 2023 to April 30, 2024 |
| | | | | | | | | | |
Fidelity® Small Cap Stock Fund ** | | | | 1.00% | | | | | | |
| Actual | | | | | | $ 1,000 | | $ 1,191.10 | | $ 5.45 |
Hypothetical-B | | | | | | $ 1,000 | | $ 1,019.89 | | $ 5.02 |
| |
A Annualized expense ratio reflects expenses net of applicable fee waivers.
B 5% return per year before expenses
C Expenses are equal to the annualized expense ratio, multiplied by the average account value over the period, multiplied by 182/ 366 (to reflect the one-half year period). The fees and expenses of any Underlying Funds are not included in each annualized expense ratio.
** If fees and changes to the expense contract and/or expense cap, effective March 1, 2024, had been in effect during the entire current period, the restated annualized expense ratio and the expenses paid in the actual and hypothetical examples above would have been as shown in table below:
| | | | | Annualized Expense Ratio- A | | Expenses Paid |
| | | | | | |
| Fidelity® Small Cap Stock Fund | | | | .83% | | |
| Actual | | | | | | $ 4.52 |
Hypothetical- B | | | | | | $ 4.17 |
| | | | | | | |
| A Annualized expense ratio reflects expenses net of applicable fee waivers. | | | | | | |
| B 5% return per year before expenses | | | | | | |
The dividend and capital gains distributions for the fund(s) are available on Fidelity.com or Institutional.Fidelity.com.
The fund designates 100% of the dividends distributed during the fiscal year as qualifying for the dividends-received deduction for corporate shareholders.
The fund designates 100% of the dividends distributed during the fiscal year as amounts which may be taken into account as a dividend for the purposes of the maximum rate under section 1(h)(11) of the Internal Revenue Code.
The fund will notify shareholders in January 2025 of amounts for use in preparing 2024 income tax returns.
Board Approval of Investment Advisory Contracts
Fidelity Small Cap Stock Fund
At its January 2024 meeting, the Board of Trustees, including the Independent Trustees (together, the Board), approved an amended and restated management contract with Fidelity Management & Research Company LLC (FMR) (the Management Contract), and amended and restated sub-advisory agreements (the Sub-Advisory Contracts, and together with the Management Contract, the Advisory Contracts) for the fund, including the fund's sub-advisory agreements with FMR Investment Management (UK) Limited (FMR UK), Fidelity Management & Research (Hong Kong) Limited (FMR H.K.), and Fidelity Management & Research (Japan) Limited (FMR Japan). The Advisory Contracts will be effective March 1, 2024. The Board will consider the annual renewal of the fund's Advisory Contracts in May 2024, following its review of additional materials provided by FMR.
Management Contract. The Board approved the Management Contract, which implements a new fee structure combining the management fee, transfer agent fee (TA Fee), and pricing and bookkeeping fee (P&B Fee) of the fund into a single fee based on tiered schedules and subject to a maximum rate (the Unified Fee). In exchange for the Unified Fee, the fund will receive investment advisory, management, administrative, transfer agent, pricing and bookkeeping services under a single agreement - the Management Contract.
In its consideration of the Management Contract over several meetings, the Board received, reviewed and discussed a comprehensive set of analyses regarding the Unified Fee including (i) the legal framework, (ii) design goals for the Unified Fee, (iii) calculation methodology for the Unified Fee and illustrative examples, (iv) annual and cumulative projected impacts under various scenarios, both in the aggregate and at the fund/class level, (v) explanations of schedules, rate levers and maximum rates and (vi) shareholder benefits and projected savings.
The Board considered that the maximum Unified Fee for the fund would be no higher than the sum of (i) the lowest contractual management fee rate under the fund's existing management contract, which is the individual fund fee rate, if any, plus the lowest contractual marginal group fee rate and (ii) the TA and P&B Fee rates, which are fixed fee rates since December 1, 2023 (together, the Unified Fee Cap). The Board noted that Fidelity has represented that, as a result of this Unified Fee Cap, the Unified Fee would be no greater than the fee rates previously authorized to be charged to the fund for the same services. The Board noted that certain expenses such as performance adjustments, third-party expenses, and certain other miscellaneous expenses would be outside the scope of the Unified Fee and the calculation of such fees would not change as a result of the Unified Fee.
The Board considered Fidelity's representations that implementation of the Unified Fee, which includes the Unified Fee Cap, would cause all funds subject to the Unified Fee, including the fund, to experience an immediate reduction on contractual fee rates for services provided under the current management contracts. The Board considered that some funds would not experience lower net total fees as a result of existing fee caps. The Board further considered that, in addition to the contractual fee savings, the Unified Fee offers funds and their shareholders greater protection from future rate increases for services previously offered under separate agreements that are now covered by the Management Contract because such rate increases would require shareholder approval.
Sub-Advisory Contracts. In connection with the Unified Fee changes, the Board considered the Sub-Advisory Contracts, which simplified the calculation of the fees paid by FMR to the sub-advisers under the agreements. The Board noted that the agreements with FMR UK, FMR H.K., and FMR Japan were amended to provide that FMR will compensate each sub-adviser at a fee rate equal to 110% of the sub-adviser's costs incurred in providing services under the agreement. The Board considered that, under the Sub-Advisory Contracts, FMR, and not the fund, will continue to pay the sub-advisory fees to each applicable sub-adviser.
The Board further considered that the approval of the fund's Advisory Contracts will not result in any changes in the investment process or strategies employed in the management of the fund's assets or the day-to-day management of the fund or the persons primarily responsible for such management. Further, the Board considered that the Management Contract would not change the obligations and services of FMR and its affiliates on behalf of the fund, and, in particular, there would be no change in the nature and level of advisory, management, administration, transfer agent, and pricing and bookkeeping services provided to the fund by FMR, its affiliates, and each applicable sub-adviser.
In connection with its consideration of future renewals of the fund's Advisory Contracts, the Board will consider: (i) the nature, extent and quality of services provided to the funds, including shareholder and administrative services and investment performance; (ii) the competitiveness of the management fee and total expenses for the fund; (iii) the costs of the services and profitability, including the revenues earned and the expenses incurred in conducting the business of developing, marketing, distributing, managing, administering, and servicing the fund and its shareholders, to the extent applicable; and (iv) whether there have been economies of scale in respect of the Fidelity funds, whether the Fidelity funds (including the fund) have appropriately benefited from any such economies of scale, and whether there is the potential for realization of any further economies.
Based on its evaluation of all of the conclusions and representations noted above, and after considering all factors it believed relevant, the Board concluded that the fund's management fee structure is fair and reasonable, and that the fund's Advisory Contracts should be approved.
The Securities and Exchange Commission adopted Rule 22e-4 under the Investment Company Act of 1940 (the Liquidity Rule) to promote effective liquidity risk management throughout the open-end investment company industry, thereby reducing the risk that funds will be unable to meet their redemption obligations and mitigating dilution of the interests of fund shareholders.
The Fund has adopted and implemented a liquidity risk management program (the Program) reasonably designed to assess and manage the Fund's liquidity risk and to comply with the requirements of the Liquidity Rule. The Fund's Board of Trustees (the Board) has designated the Fund's investment adviser as administrator of the Program. The Fidelity advisers have established a Liquidity Risk Management Committee (the LRM Committee) to manage the Program for each of the Fidelity Funds. The LRM Committee monitors the adequacy and effectiveness of implementation of the Program and on a periodic basis assesses each Fund's liquidity risk based on a variety of factors including (1) the Fund's investment strategy, (2) portfolio liquidity and cash flow projections during normal and reasonably foreseeable stressed conditions, (3) shareholder redemptions, (4) borrowings and other funding sources and (5) certain factors specific to ETFs including the effect of the Fund's prices and spreads, market participants, and basket compositions on the overall liquidity of the Fund's portfolio, as applicable.
In accordance with the Program, each of the Fund's portfolio investments is classified into one of four defined liquidity categories based on a determination of a reasonable expectation for how long it would take to convert the investment to cash (or sell or dispose of the investment) without significantly changing its market value.
- Highly liquid investments - cash or convertible to cash within three business days or less
- Moderately liquid investments - convertible to cash in three to seven calendar days
- Less liquid investments - can be sold or disposed of, but not settled, within seven calendar days
- Illiquid investments - cannot be sold or disposed of within seven calendar days
Liquidity classification determinations take into account a variety of factors including various market, trading and investment-specific considerations, as well as market depth, and generally utilize analysis from a third-party liquidity metrics service.
The Liquidity Rule places a 15% limit on a fund's illiquid investments and requires funds that do not primarily hold assets that are highly liquid investments to determine and maintain a minimum percentage of the fund's net assets to be invested in highly liquid investments (highly liquid investment minimum or HLIM). The Program includes provisions reasonably designed to comply with the 15% limit on illiquid investments and for determining, periodically reviewing and complying with the HLIM requirement as applicable.
At a recent meeting of the Fund's Board of Trustees, the LRM Committee provided a written report to the Board pertaining to the operation, adequacy, and effectiveness of the Program for the period December 1, 2022 through November 30, 2023. The report concluded that the Program is operating effectively and is reasonably designed to assess and manage the Fund's liquidity risk.
1.703590.126
SLCX-ANN-0624
Fidelity® Large Cap Stock K6 Fund
Annual Report
April 30, 2024
Contents
To view a fund's proxy voting guidelines and proxy voting record for the 12-month period ended June 30, visit http://www.fidelity.com/proxyvotingresults or visit the Securities and Exchange Commission's (SEC) web site at http://www.sec.gov.
You may also call 1-800-835-5092 to request a free copy of the proxy voting guidelines.
Standard & Poor's, S&P and S&P 500 are registered service marks of The McGraw-Hill Companies, Inc. and have been licensed for use by Fidelity Distributors Corporation.
Other third-party marks appearing herein are the property of their respective owners.
All other marks appearing herein are registered or unregistered trademarks or service marks of FMR LLC or an affiliated company. © 2024 FMR LLC. All rights reserved.
This report and the financial statements contained herein are submitted for the general information of the shareholders of the Fund. This report is not authorized for distribution to prospective investors in the Fund unless preceded or accompanied by an effective prospectus.
A fund files its complete schedule of portfolio holdings with the SEC for the first and third quarters of each fiscal year on Form N-PORT. Forms N-PORT are available on the SEC's web site at http://www.sec.gov. A fund's Forms N-PORT may be reviewed and copied at the SEC's Public Reference Room in Washington, DC. Information regarding the operation of the SEC's Public Reference Room may be obtained by calling 1-800-SEC-0330.
For a complete list of a fund's portfolio holdings, view the most recent holdings listing, semiannual report, or annual report on Fidelity's web site at http://www.fidelity.com, http://www.institutional.fidelity.com, or http://www.401k.com, as applicable.
NOT FDIC INSURED •MAY LOSE VALUE •NO BANK GUARANTEE
Neither the Fund nor Fidelity Distributors Corporation is a bank.
Average annual total return reflects the change in the value of an investment, assuming reinvestment of distributions from dividend income and capital gains (the profits earned upon the sale of securities that have grown in value, if any) and assuming a constant rate of performance each year. The hypothetical investment and the average annual total returns do not reflect the deduction of taxes that a shareholder would pay on fund distributions or the redemption of fund shares. During periods of reimbursement by Fidelity, a fund's total return will be greater than it would be had the reimbursement not occurred. How a fund did yesterday is no guarantee of how it will do tomorrow.
| Average Annual Total Returns |
| | | | |
Periods ended April 30, 2024 | Past 1 year | Past 5 years | Life of Fund A |
| Fidelity® Large Cap Stock K6 Fund | 24.71% | 14.21% | 13.23% |
A From May 25, 2017
| $10,000 Over Life of Fund |
| |
Let's say hypothetically that $10,000 was invested in Fidelity® Large Cap Stock K6 Fund, on May 25, 2017, when the fund started. The chart shows how the value of your investment would have changed, and also shows how the S&P 500® Index performed over the same period. |
|
|
Market Recap:
U.S. equities gained 22.66% for the 12 months ending April 30, 2024, according to the S&P 500® index, driven by resilient corporate profits, a frenzy over generative artificial intelligence and the Federal Reserve's likely pivot to cutting interest rates later this year. Amid this favorable backdrop for higher-risk assets, the S&P 500® continued its late-2023 momentum and ended March at its all-time high before snapping a five-month uptrend in April (-4.08%). Growth stocks led the broad rally, mostly driven by a narrow set of firms in the communication services (+41%) and information technology (+37%) sectors, largely due to excitement for AI. In particular, semiconductor-related stocks (+104%) were a standout. Following the Fed's November 1 meeting, when the central bank hinted it might be done raising rates, the S&P 500® reversed a three-month decline and gained 14.09% in the final two months of 2023 and 10.56% the first quarter. Risk assets were further aided on March 20, when the central bank held steady its benchmark federal funds rate and affirmed its projection to cut in 2024. The index then slipped in April, as inflation remained stickier than expected, spurring doubts of a soft economic landing. For the full 12 months, the financials, industrials and consumer discretionary sectors each gained about 24%. In sharp contrast, real estate and the defensive-oriented utilities sector each roughly broke even. Other notable "laggards" included consumer staples (+3%) and health care (+7%).
Comments from Portfolio Manager Matt Fruhan:
For the fiscal year, the fund gained 24.71%, versus 22.66% for the benchmark S&P 500® index. Relative to the benchmark, security selection was the primary contributor, led by industrials, where our picks in capital goods helped most. Stock selection in financials also helped. Stock picking in health care, primarily within the health care equipment & services industry, also boosted relative performance. The top individual relative contributor by a wide margin was an overweight in General Electric (+106%). General Electric was among the fund's biggest holdings. The second-largest relative contributor was an overweight in Wells Fargo (+54%). Wells Fargo was one of the fund's largest holdings. A non-benchmark stake in Vertiv Holdings gained 516% and notably helped. This period we decreased our position in Vertiv Holdings. In contrast, the biggest detractor from performance versus the benchmark was an underweight in information technology, primarily within the semiconductors & semiconductor equipment industry. Stock selection and an overweight in energy also hampered the fund's result, as did security selection in communication services. Lastly, the fund's position in cash detracted. The biggest individual relative detractor was an underweight in Nvidia (+211%). Nvidia was among the largest holdings at period end, as we notably increased our position the past 12 months. A second notable relative detractor was an overweight in Exxon Mobil (+4%). Exxon Mobil was among our biggest holdings. An underweight in Amazon.com (+66%) also hurt. Notable changes in positioning include increased exposure to information technology and a lower allocation to energy.
The views expressed above reflect those of the portfolio manager(s) only through the end of the period as stated on the cover of this report and do not necessarily represent the views of Fidelity or any other person in the Fidelity organization. Any such views are subject to change at any time based upon market or other conditions and Fidelity disclaims any responsibility to update such views. These views may not be relied on as investment advice and, because investment decisions for a Fidelity fund are based on numerous factors, may not be relied on as an indication of trading intent on behalf of any Fidelity fund.
Top Holdings (% of Fund's net assets) |
| |
| Microsoft Corp. | 6.9 | |
| Exxon Mobil Corp. | 5.8 | |
| General Electric Co. | 5.7 | |
| Wells Fargo & Co. | 5.6 | |
| NVIDIA Corp. | 3.5 | |
| Meta Platforms, Inc. Class A | 2.6 | |
| Bank of America Corp. | 2.6 | |
| Apple, Inc. | 2.4 | |
| The Boeing Co. | 2.4 | |
| Alphabet, Inc. Class A | 2.2 | |
| | 39.7 | |
| |
| Market Sectors (% of Fund's net assets) |
| |
| Information Technology | 19.8 | |
| Industrials | 16.5 | |
| Financials | 16.1 | |
| Health Care | 11.2 | |
| Energy | 10.0 | |
| Communication Services | 10.0 | |
| Consumer Staples | 4.9 | |
| Consumer Discretionary | 3.1 | |
| Materials | 2.1 | |
| Utilities | 1.0 | |
| Real Estate | 0.8 | |
| |
Asset Allocation (% of Fund's net assets) |
|
|
Showing Percentage of Net Assets
| Common Stocks - 95.3% |
| | | Shares | Value ($) |
| COMMUNICATION SERVICES - 10.0% | | | |
| Diversified Telecommunication Services - 0.2% | | | |
| Cellnex Telecom SA (a) | | 2,301 | 76,059 |
| Entertainment - 0.8% | | | |
| The Walt Disney Co. | | 1,844 | 204,868 |
| Universal Music Group NV | | 6,450 | 190,671 |
| | | | 395,539 |
| Interactive Media & Services - 7.3% | | | |
| Alphabet, Inc.: | | | |
| Class A | | 6,538 | 1,064,256 |
| Class C | | 5,519 | 908,648 |
| Match Group, Inc. (b) | | 4,475 | 137,920 |
| Meta Platforms, Inc. Class A | | 3,045 | 1,309,868 |
| Reddit, Inc. Class B (d) | | 200 | 8,888 |
| Snap, Inc. Class A (b) | | 12,210 | 183,761 |
| | | | 3,613,341 |
| Media - 1.7% | | | |
| Charter Communications, Inc. Class A (b) | | 61 | 15,612 |
| Comcast Corp. Class A | | 18,926 | 721,270 |
| Interpublic Group of Companies, Inc. | | 4,319 | 131,470 |
| | | | 868,352 |
TOTAL COMMUNICATION SERVICES | | | 4,953,291 |
| CONSUMER DISCRETIONARY - 3.1% | | | |
| Automobiles - 0.1% | | | |
| Rivian Automotive, Inc. (b) | | 2,900 | 25,810 |
| Broadline Retail - 0.1% | | | |
| Amazon.com, Inc. (b) | | 342 | 59,850 |
| Hotels, Restaurants & Leisure - 1.6% | | | |
| Booking Holdings, Inc. | | 144 | 497,092 |
| Expedia Group, Inc. (b) | | 626 | 84,278 |
| Marriott International, Inc. Class A | | 563 | 132,941 |
| Starbucks Corp. | | 662 | 58,580 |
| | | | 772,891 |
| Household Durables - 0.3% | | | |
| Mohawk Industries, Inc. (b) | | 671 | 77,380 |
| Sony Group Corp. sponsored ADR | | 454 | 37,487 |
| Whirlpool Corp. | | 374 | 35,478 |
| | | | 150,345 |
| Specialty Retail - 0.9% | | | |
| JD Sports Fashion PLC | | 34,300 | 49,546 |
| Lowe's Companies, Inc. | | 1,622 | 369,800 |
| RH (b) | | 215 | 53,116 |
| | | | 472,462 |
| Textiles, Apparel & Luxury Goods - 0.1% | | | |
| Compagnie Financiere Richemont SA Series A | | 120 | 16,587 |
| NIKE, Inc. Class B | | 362 | 33,398 |
| | | | 49,985 |
TOTAL CONSUMER DISCRETIONARY | | | 1,531,343 |
| CONSUMER STAPLES - 4.9% | | | |
| Beverages - 1.7% | | | |
| Diageo PLC sponsored ADR | | 1,028 | 142,028 |
| Keurig Dr. Pepper, Inc. | | 10,807 | 364,196 |
| Pernod Ricard SA | | 100 | 15,154 |
| The Coca-Cola Co. | | 5,574 | 344,306 |
| | | | 865,684 |
| Consumer Staples Distribution & Retail - 1.4% | | | |
| Performance Food Group Co. (b) | | 1,198 | 81,320 |
| Sysco Corp. | | 2,477 | 184,091 |
| Target Corp. | | 949 | 152,770 |
| U.S. Foods Holding Corp. (b) | | 1,439 | 72,310 |
| Walmart, Inc. | | 3,249 | 192,828 |
| | | | 683,319 |
| Personal Care Products - 1.4% | | | |
| Estee Lauder Companies, Inc. Class A | | 780 | 114,434 |
| Haleon PLC ADR | | 37,988 | 324,038 |
| Kenvue, Inc. | | 13,691 | 257,665 |
| | | | 696,137 |
| Tobacco - 0.4% | | | |
| Altria Group, Inc. | | 3,273 | 143,390 |
| Philip Morris International, Inc. | | 310 | 29,431 |
| | | | 172,821 |
TOTAL CONSUMER STAPLES | | | 2,417,961 |
| ENERGY - 10.0% | | | |
| Energy Equipment & Services - 0.2% | | | |
| Tidewater, Inc. (b) | | 800 | 73,480 |
| Oil, Gas & Consumable Fuels - 9.8% | | | |
| Cameco Corp. | | 100 | 4,563 |
| Exxon Mobil Corp. | | 24,574 | 2,906,367 |
| Galp Energia SGPS SA Class B | | 1,900 | 40,959 |
| Imperial Oil Ltd. | | 8,904 | 612,184 |
| Kosmos Energy Ltd. (b) | | 44,036 | 249,684 |
| MEG Energy Corp. (b) | | 6,400 | 145,559 |
| Pioneer Natural Resources Co. | | 1,650 | 444,378 |
| Shell PLC ADR | | 6,700 | 480,122 |
| | | | 4,883,816 |
TOTAL ENERGY | | | 4,957,296 |
| FINANCIALS - 16.1% | | | |
| Banks - 11.2% | | | |
| Bank of America Corp. | | 34,629 | 1,281,619 |
| JPMorgan Chase & Co. | | 2,397 | 459,601 |
| M&T Bank Corp. | | 1,527 | 220,484 |
| PNC Financial Services Group, Inc. | | 3,080 | 472,041 |
| U.S. Bancorp | | 8,317 | 337,920 |
| Wells Fargo & Co. | | 47,074 | 2,792,430 |
| | | | 5,564,095 |
| Capital Markets - 2.0% | | | |
| 3i Group PLC | | 500 | 17,864 |
| Charles Schwab Corp. | | 502 | 37,123 |
| CME Group, Inc. | | 51 | 10,692 |
| KKR & Co. LP | | 3,143 | 292,519 |
| Moody's Corp. | | 175 | 64,808 |
| Morgan Stanley | | 1,355 | 123,088 |
| MSCI, Inc. | | 30 | 13,974 |
| Northern Trust Corp. | | 4,597 | 378,747 |
| Raymond James Financial, Inc. | | 505 | 61,610 |
| | | | 1,000,425 |
| Financial Services - 2.4% | | | |
| Edenred SA | | 2,004 | 95,085 |
| Fidelity National Information Services, Inc. | | 1,299 | 88,228 |
| Global Payments, Inc. | | 265 | 32,534 |
| MasterCard, Inc. Class A | | 348 | 157,018 |
| PayPal Holdings, Inc. (b) | | 852 | 57,868 |
| Visa, Inc. Class A | | 2,931 | 787,296 |
| | | | 1,218,029 |
| Insurance - 0.5% | | | |
| Arthur J. Gallagher & Co. | | 445 | 104,437 |
| Chubb Ltd. | | 555 | 137,995 |
| | | | 242,432 |
TOTAL FINANCIALS | | | 8,024,981 |
| HEALTH CARE - 11.2% | | | |
| Biotechnology - 0.5% | | | |
| Alnylam Pharmaceuticals, Inc. (b) | | 399 | 57,436 |
| Argenx SE ADR (b) | | 90 | 33,795 |
| Insmed, Inc. (b) | | 2,228 | 55,076 |
| Vaxcyte, Inc. (b) | | 1,471 | 89,069 |
| | | | 235,376 |
| Health Care Equipment & Supplies - 1.9% | | | |
| Abbott Laboratories | | 570 | 60,403 |
| Becton, Dickinson & Co. | | 330 | 77,418 |
| Boston Scientific Corp. (b) | | 9,731 | 699,367 |
| Koninklijke Philips Electronics NV (depository receipt) (NY Reg.) | | 1,540 | 40,887 |
| Solventum Corp. | | 718 | 46,677 |
| | | | 924,752 |
| Health Care Providers & Services - 5.0% | | | |
| Cardinal Health, Inc. | | 2,334 | 240,495 |
| Cigna Group | | 1,785 | 637,316 |
| CVS Health Corp. | | 1,848 | 125,128 |
| Guardant Health, Inc. (b) | | 1,042 | 18,756 |
| Humana, Inc. | | 715 | 215,994 |
| McKesson Corp. | | 849 | 456,091 |
| UnitedHealth Group, Inc. | | 1,625 | 786,013 |
| | | | 2,479,793 |
| Life Sciences Tools & Services - 0.4% | | | |
| Danaher Corp. | | 814 | 200,749 |
| Thermo Fisher Scientific, Inc. | | 35 | 19,905 |
| | | | 220,654 |
| Pharmaceuticals - 3.4% | | | |
| Bristol-Myers Squibb Co. | | 8,350 | 366,899 |
| Eli Lilly & Co. | | 525 | 410,078 |
| Galderma Group AG | | 700 | 52,162 |
| GSK PLC sponsored ADR | | 8,075 | 334,628 |
| Johnson & Johnson | | 1,561 | 225,705 |
| UCB SA | | 2,300 | 305,715 |
| | | | 1,695,187 |
TOTAL HEALTH CARE | | | 5,555,762 |
| INDUSTRIALS - 16.3% | | | |
| Aerospace & Defense - 10.0% | | | |
| Airbus Group NV | | 1,272 | 209,317 |
| Bombardier, Inc. Class B (sub. vtg.) (b) | | 1,900 | 86,564 |
| General Dynamics Corp. | | 561 | 161,057 |
| General Electric Co. | | 17,676 | 2,860,330 |
| Huntington Ingalls Industries, Inc. | | 418 | 115,757 |
| Loar Holdings, Inc. | | 200 | 10,464 |
| Rolls-Royce Holdings PLC (b) | | 7,400 | 37,947 |
| Safran SA | | 224 | 48,570 |
| Spirit AeroSystems Holdings, Inc. Class A (b) | | 7,600 | 243,200 |
| Textron, Inc. | | 406 | 34,344 |
| The Boeing Co. (b) | | 6,984 | 1,172,195 |
| | | | 4,979,745 |
| Air Freight & Logistics - 1.5% | | | |
| FedEx Corp. | | 677 | 177,225 |
| United Parcel Service, Inc. Class B | | 3,795 | 559,687 |
| | | | 736,912 |
| Commercial Services & Supplies - 0.2% | | | |
| ACV Auctions, Inc. Class A (b) | | 2,722 | 47,499 |
| GFL Environmental, Inc. | | 1,100 | 35,102 |
| Veralto Corp. | | 339 | 31,758 |
| | | | 114,359 |
| Construction & Engineering - 0.0% | | | |
| Centuri Holdings, Inc. | | 200 | 4,950 |
| Electrical Equipment - 3.2% | | | |
| Acuity Brands, Inc. | | 534 | 132,592 |
| GE Vernova LLC | | 4,915 | 755,485 |
| Hubbell, Inc. Class B | | 360 | 133,387 |
| Regal Rexnord Corp. | | 780 | 125,869 |
| Vertiv Holdings Co. | | 4,835 | 449,655 |
| | | | 1,596,988 |
| Ground Transportation - 0.3% | | | |
| Knight-Swift Transportation Holdings, Inc. Class A | | 3,039 | 140,493 |
| Machinery - 0.8% | | | |
| Allison Transmission Holdings, Inc. | | 600 | 44,130 |
| Chart Industries, Inc. (b) | | 440 | 63,386 |
| Cummins, Inc. | | 216 | 61,018 |
| Fortive Corp. | | 1,026 | 77,227 |
| Nordson Corp. | | 35 | 9,037 |
| Otis Worldwide Corp. | | 594 | 54,173 |
| Stanley Black & Decker, Inc. | | 394 | 36,012 |
| Westinghouse Air Brake Tech Co. | | 451 | 72,647 |
| | | | 417,630 |
| Passenger Airlines - 0.1% | | | |
| Ryanair Holdings PLC sponsored ADR | | 295 | 40,179 |
| Professional Services - 0.1% | | | |
| Equifax, Inc. | | 129 | 28,405 |
| Paycom Software, Inc. | | 95 | 17,858 |
| | | | 46,263 |
| Trading Companies & Distributors - 0.1% | | | |
| Beijer Ref AB (B Shares) | | 1,365 | 19,626 |
| Watsco, Inc. | | 70 | 31,340 |
| | | | 50,966 |
TOTAL INDUSTRIALS | | | 8,128,485 |
| INFORMATION TECHNOLOGY - 19.8% | | | |
| IT Services - 0.3% | | | |
| EPAM Systems, Inc. (b) | | 125 | 29,408 |
| IBM Corp. | | 349 | 58,004 |
| Snowflake, Inc. (b) | | 71 | 11,019 |
| Twilio, Inc. Class A (b) | | 874 | 52,335 |
| | | | 150,766 |
| Semiconductors & Semiconductor Equipment - 6.5% | | | |
| Analog Devices, Inc. | | 367 | 73,624 |
| Applied Materials, Inc. | | 684 | 135,877 |
| BE Semiconductor Industries NV | | 100 | 13,393 |
| Broadcom, Inc. | | 298 | 387,480 |
| Lam Research Corp. | | 133 | 118,957 |
| Marvell Technology, Inc. | | 5,082 | 334,955 |
| NVIDIA Corp. | | 2,024 | 1,748,776 |
| Qualcomm, Inc. | | 942 | 156,231 |
| Taiwan Semiconductor Manufacturing Co. Ltd. sponsored ADR | | 1,366 | 187,606 |
| Teradyne, Inc. | | 500 | 58,160 |
| | | | 3,215,059 |
| Software - 10.5% | | | |
| Adobe, Inc. (b) | | 806 | 373,041 |
| Autodesk, Inc. (b) | | 699 | 148,782 |
| DoubleVerify Holdings, Inc. (b) | | 496 | 14,533 |
| Elastic NV (b) | | 1,024 | 104,673 |
| Intuit, Inc. | | 201 | 125,750 |
| Microsoft Corp. | | 8,877 | 3,456,079 |
| Oracle Corp. | | 4,065 | 462,394 |
| PTC, Inc. (b) | | 290 | 51,458 |
| Sage Group PLC | | 3,300 | 48,080 |
| Salesforce, Inc. | | 144 | 38,727 |
| SAP SE sponsored ADR | | 2,179 | 394,857 |
| Workday, Inc. Class A (b) | | 98 | 23,984 |
| | | | 5,242,358 |
| Technology Hardware, Storage & Peripherals - 2.5% | | | |
| Apple, Inc. | | 7,068 | 1,203,892 |
| Samsung Electronics Co. Ltd. | | 687 | 38,081 |
| | | | 1,241,973 |
TOTAL INFORMATION TECHNOLOGY | | | 9,850,156 |
| MATERIALS - 2.1% | | | |
| Chemicals - 0.2% | | | |
| Air Products & Chemicals, Inc. | | 355 | 83,901 |
| Sherwin-Williams Co. | | 56 | 16,778 |
| | | | 100,679 |
| Metals & Mining - 1.9% | | | |
| First Quantum Minerals Ltd. | | 33,172 | 421,201 |
| Freeport-McMoRan, Inc. | | 7,437 | 371,404 |
| Ivanhoe Mines Ltd. (b) | | 11,300 | 153,167 |
| | | | 945,772 |
TOTAL MATERIALS | | | 1,046,451 |
| REAL ESTATE - 0.8% | | | |
| Equity Real Estate Investment Trusts (REITs) - 0.8% | | | |
| American Tower Corp. | | 730 | 125,239 |
| Crown Castle, Inc. | | 1,986 | 186,247 |
| Equinix, Inc. | | 13 | 9,244 |
| Simon Property Group, Inc. | | 714 | 100,338 |
| | | | 421,068 |
| UTILITIES - 1.0% | | | |
| Electric Utilities - 1.0% | | | |
| Duke Energy Corp. | | 200 | 19,652 |
| Edison International | | 400 | 28,424 |
| Entergy Corp. | | 279 | 29,761 |
| Southern Co. | | 5,997 | 440,780 |
| | | | 518,617 |
| TOTAL COMMON STOCKS (Cost $30,529,813) | | | 47,405,411 |
| | | | |
| Nonconvertible Preferred Stocks - 0.2% |
| | | Shares | Value ($) |
| INDUSTRIALS - 0.2% | | | |
| Aerospace & Defense - 0.2% | | | |
Embraer SA sponsored ADR (b) (Cost $43,535) | | 3,670 | 93,769 |
| | | | |
| Money Market Funds - 4.6% |
| | | Shares | Value ($) |
Fidelity Cash Central Fund 5.39% (c) (Cost $2,266,355) | | 2,265,902 | 2,266,355 |
| | | | |
| TOTAL INVESTMENT IN SECURITIES - 100.1% (Cost $32,839,703) | 49,765,535 |
NET OTHER ASSETS (LIABILITIES) - (0.1)% | (34,664) |
| NET ASSETS - 100.0% | 49,730,871 |
| | |
Legend
| (a) | Security exempt from registration under Rule 144A of the Securities Act of 1933. These securities may be resold in transactions exempt from registration, normally to qualified institutional buyers. At the end of the period, the value of these securities amounted to $76,059 or 0.2% of net assets. |
| (c) | Affiliated fund that is generally available only to investment companies and other accounts managed by Fidelity Investments. The rate quoted is the annualized seven-day yield of the fund at period end. A complete unaudited listing of the fund's holdings as of its most recent quarter end is available upon request. In addition, each Fidelity Central Fund's financial statements, which are not covered by the Fund's Report of Independent Registered Public Accounting Firm, are available on the SEC's website or upon request. |
| (d) | Equity security is subject to lock-up or market standoff agreement. Fair value is based on the unadjusted market price of the equivalent equity security. As of period end, the total fair value of unadjusted equity securities subject to contractual sale restrictions is $8,888 and all restrictions are set to expire on or before September 30, 2024. Under normal market conditions, there are no circumstances that could cause the restrictions to lapse. |
Affiliated Central Funds
Fiscal year to date information regarding the Fund's investments in Fidelity Central Funds, including the ownership percentage, is presented below.
| Affiliate | Value, beginning of period ($) | Purchases ($) | Sales Proceeds ($) | Dividend Income ($) | Realized Gain (loss) ($) | Change in Unrealized appreciation (depreciation) ($) | Value, end of period ($) | % ownership, end of period |
| Fidelity Cash Central Fund 5.39% | 2,238,481 | 9,547,752 | 9,519,856 | 128,607 | (22) | - | 2,266,355 | 0.0% |
| Fidelity Securities Lending Cash Central Fund 5.39% | 276,625 | 183,775 | 460,400 | 1,324 | - | - | - | 0.0% |
| Total | 2,515,106 | 9,731,527 | 9,980,256 | 129,931 | (22) | - | 2,266,355 | |
| | | | | | | | | |
Amounts in the dividend income column in the above table include any capital gain distributions from underlying funds, which are presented in the corresponding line item in the Statement of Operations, if applicable.
Amounts in the dividend income column for Fidelity Securities Lending Cash Central Fund represents the income earned on investing cash collateral, less rebates paid to borrowers and any lending agent fees associated with the loan, plus any premium payments received for lending certain types of securities.
Amounts included in the purchases and sales proceeds columns may include in-kind transactions, if applicable.
Investment Valuation
The following is a summary of the inputs used, as of April 30, 2024, involving the Fund's assets and liabilities carried at fair value. The inputs or methodology used for valuing securities may not be an indication of the risk associated with investing in those securities. For more information on valuation inputs, and their aggregation into the levels used below, please refer to the Investment Valuation section in the accompanying Notes to Financial Statements.
| Valuation Inputs at Reporting Date: |
| Description | Total ($) | Level 1 ($) | Level 2 ($) | Level 3 ($) |
Investments in Securities: | | | | |
|
| Equities: | | | | |
Communication Services | 4,953,291 | 4,877,232 | 76,059 | - |
Consumer Discretionary | 1,531,343 | 1,514,756 | 16,587 | - |
Consumer Staples | 2,417,961 | 2,417,961 | - | - |
Energy | 4,957,296 | 4,957,296 | - | - |
Financials | 8,024,981 | 8,007,117 | 17,864 | - |
Health Care | 5,555,762 | 5,555,762 | - | - |
Industrials | 8,222,254 | 7,926,420 | 295,834 | - |
Information Technology | 9,850,156 | 9,812,075 | 38,081 | - |
Materials | 1,046,451 | 1,046,451 | - | - |
Real Estate | 421,068 | 421,068 | - | - |
Utilities | 518,617 | 518,617 | - | - |
|
| Money Market Funds | 2,266,355 | 2,266,355 | - | - |
| Total Investments in Securities: | 49,765,535 | 49,321,110 | 444,425 | - |
| Statement of Assets and Liabilities |
| | | | April 30, 2024 |
| | | | | |
| Assets | | | | |
| Investment in securities, at value - See accompanying schedule: | | | | |
Unaffiliated issuers (cost $30,573,348) | $ | 47,499,180 | | |
Fidelity Central Funds (cost $2,266,355) | | 2,266,355 | | |
| | | | | |
| | | | | |
| Total Investment in Securities (cost $32,839,703) | | | $ | 49,765,535 |
| Cash | | | | 42,988 |
| Foreign currency held at value (cost $2,404) | | | | 2,404 |
| Receivable for investments sold | | | | 120,390 |
| Receivable for forward foreign currency contracts | | | | 22,551 |
| Receivable for fund shares sold | | | | 40,808 |
| Dividends receivable | | | | 27,589 |
| Distributions receivable from Fidelity Central Funds | | | | 12,303 |
Total assets | | | | 50,034,568 |
| Liabilities | | | | |
| Payable for investments purchased | $ | 254,663 | | |
| Payable for forward foreign currency contracts | | 22,600 | | |
| Payable for fund shares redeemed | | 7,772 | | |
| Accrued management fee | | 18,662 | | |
| Total liabilities | | | | 303,697 |
| Net Assets | | | $ | 49,730,871 |
| Net Assets consist of: | | | | |
| Paid in capital | | | $ | 31,725,436 |
| Total accumulated earnings (loss) | | | | 18,005,435 |
| Net Assets | | | $ | 49,730,871 |
Net Asset Value, offering price and redemption price per share ($49,730,871 ÷ 3,539,791 shares) | | | $ | 14.05 |
| Statement of Operations |
| | | | Year ended April 30, 2024 |
| Investment Income | | | | |
| Dividends | | | $ | 637,896 |
| Income from Fidelity Central Funds (including $1,324 from security lending) | | | | 129,931 |
| Total income | | | | 767,827 |
| Expenses | | | | |
| Management fee | $ | 180,517 | | |
| Independent trustees' fees and expenses | | 189 | | |
| Total expenses before reductions | | 180,706 | | |
| Expense reductions | | (348) | | |
| Total expenses after reductions | | | | 180,358 |
| Net Investment income (loss) | | | | 587,469 |
| Realized and Unrealized Gain (Loss) | | | | |
| Net realized gain (loss) on: | | | | |
| Investment Securities: | | | | |
| Unaffiliated issuers | | 1,658,185 | | |
| Fidelity Central Funds | | (22) | | |
| Foreign currency transactions | | (171) | | |
| Total net realized gain (loss) | | | | 1,657,992 |
| Change in net unrealized appreciation (depreciation) on: | | | | |
| Investment Securities: | | | | |
| Unaffiliated issuers | | 6,837,194 | | |
| Assets and liabilities in foreign currencies | | (32) | | |
| Total change in net unrealized appreciation (depreciation) | | | | 6,837,162 |
| Net gain (loss) | | | | 8,495,154 |
| Net increase (decrease) in net assets resulting from operations | | | $ | 9,082,623 |
| Statement of Changes in Net Assets |
| |
| | Year ended April 30, 2024 | | Year ended April 30, 2023 |
| Increase (Decrease) in Net Assets | | | | |
| Operations | | | | |
| Net investment income (loss) | $ | 587,469 | $ | 643,358 |
| Net realized gain (loss) | | 1,657,992 | | 2,022,536 |
| Change in net unrealized appreciation (depreciation) | | 6,837,162 | | (2,401,297) |
| Net increase (decrease) in net assets resulting from operations | | 9,082,623 | | 264,597 |
| Distributions to shareholders | | (1,218,756) | | (12,370,579) |
| | | | | |
| Share transactions | | | | |
| Proceeds from sales of shares | | 14,299,667 | | 24,577,557 |
| Reinvestment of distributions | | 1,218,756 | | 12,370,579 |
| Cost of shares redeemed | | (7,137,752) | | (36,450,472) |
| | | | | |
Net increase (decrease) in net assets resulting from share transactions | | 8,380,671 | | 497,664 |
| Total increase (decrease) in net assets | | 16,244,538 | | (11,608,318) |
| | | | | |
| Net Assets | | | | |
| Beginning of period | | 33,486,333 | | 45,094,651 |
| End of period | $ | 49,730,871 | $ | 33,486,333 |
| | | | | |
| Other Information | | | | |
| Shares | | | | |
| Sold | | 1,126,371 | | 1,974,639 |
| Issued in reinvestment of distributions | | 99,040 | | 1,106,300 |
| Redeemed | | (563,723) | | (3,346,634) |
| Net increase (decrease) | | 661,688 | | (265,695) |
| | | | | |
Financial Highlights
Fidelity® Large Cap Stock K6 Fund |
| |
| Years ended April 30, | | 2024 | | 2023 | | 2022 | | 2021 | | 2020 |
Selected Per-Share Data | | | | | | | | | | |
| Net asset value, beginning of period | $ | 11.63 | $ | 14.34 | $ | 15.41 | $ | 10.37 | $ | 11.61 |
| Income from Investment Operations | | | | | | | | | | |
Net investment income (loss) A,B | | .18 | | .19 | | .30 C | | .22 | | .23 |
| Net realized and unrealized gain (loss) | | 2.63 | | .92 D | | (.36) | | 5.27 | | (1.15) |
| Total from investment operations | | 2.81 | | 1.11 | | (.06) | | 5.49 | | (.92) |
| Distributions from net investment income | | (.16) | | (.28) | | (.30) | | (.25) | | (.24) |
| Distributions from net realized gain | | (.23) | | (3.54) | | (.71) | | (.20) | | (.08) |
| Total distributions | | (.39) | | (3.82) | | (1.01) | | (.45) | | (.32) |
| Net asset value, end of period | $ | 14.05 | $ | 11.63 | $ | 14.34 | $ | 15.41 | $ | 10.37 |
Total Return E | | | | 11.14% | | (.72)% | | 54.03% | | (8.32)% |
Ratios to Average Net Assets B,F,G | | | | | | | | | | |
| Expenses before reductions | | .45% | | .45% | | .45% | | .45% | | .45% |
| Expenses net of fee waivers, if any | | | | .45% | | .45% | | .45% | | .45% |
| Expenses net of all reductions | | .45% | | .45% | | .45% | | .45% | | .45% |
| Net investment income (loss) | | 1.47% | | 1.65% | | 1.95% C | | 1.80% | | 2.05% |
| Supplemental Data | | | | | | | | | | |
| Net assets, end of period (000 omitted) | $ | 49,731 | $ | 33,486 | $ | 45,095 | $ | 72,208 | $ | 70,742 |
Portfolio turnover rate H | | | | 27% I | | 18% I | | 19% I | | 30% I |
ACalculated based on average shares outstanding during the period.
BNet investment income (loss) is affected by the timing of the declaration of dividends by any underlying mutual funds or exchange-traded funds (ETFs). Net investment income (loss) of any mutual funds or ETFs is not included in the Fund's net investment income (loss) ratio.
CNet investment income per share reflects one or more large, non-recurring dividend(s) which amounted to $.10 per share. Excluding such non-recurring dividend(s), the ratio of net investment income (loss) to average net assets would have been 1.30%.
DThe amount shown for a share outstanding does not correspond with the aggregate net gain (loss) on investments for the period due to the timing of sales and repurchases of shares in relation to fluctuating market values of the investments of the Fund.
ETotal returns would have been lower if certain expenses had not been reduced during the applicable periods shown.
FFees and expenses of any underlying mutual funds or exchange-traded funds (ETFs) are not included in the Fund's expense ratio. The Fund indirectly bears its proportionate share of these expenses. For additional expense information related to investments in Fidelity Central Funds, please refer to the "Investments in Fidelity Central Funds" note found in the Notes to Financial Statements section of the most recent Annual or Semi-Annual report.
GExpense ratios reflect operating expenses of the class. Expenses before reductions do not reflect amounts reimbursed, waived, or reduced through arrangements with the investment adviser, brokerage services, or other offset arrangements, if applicable, and do not represent the amount paid by the class during periods when reimbursements, waivers or reductions occur.
HAmount does not include the portfolio activity of any underlying mutual funds or exchange-traded funds (ETFs).
IPortfolio turnover rate excludes securities received or delivered in-kind.
For the period ended April 30, 2024
1. Organization.
Fidelity Large Cap Stock K6 Fund (the Fund) is a fund of Fidelity Concord Street Trust (the Trust) and is authorized to issue an unlimited number of shares. Share transactions on the Statement of Changes in Net Assets may contain exchanges between affiliated funds. The Trust is registered under the Investment Company Act of 1940, as amended (the 1940 Act), as an open-end management investment company organized as a Massachusetts business trust. Shares generally are available only to employer-sponsored retirement plans that are recordkept by Fidelity, or to certain employer-sponsored retirement plans that are not recordkept by Fidelity.
2. Investments in Fidelity Central Funds.
Funds may invest in Fidelity Central Funds, which are open-end investment companies generally available only to other investment companies and accounts managed by the investment adviser and its affiliates. The Schedule of Investments lists any Fidelity Central Funds held as an investment as of period end, but does not include the underlying holdings of each Fidelity Central Fund. An investing fund indirectly bears its proportionate share of the expenses of the underlying Fidelity Central Funds.
Based on its investment objective, each Fidelity Central Fund may invest or participate in various investment vehicles or strategies that are similar to those of the investing fund. These strategies are consistent with the investment objectives of the investing fund and may involve certain economic risks which may cause a decline in value of each of the Fidelity Central Funds and thus a decline in the value of the investing fund.
| Fidelity Central Fund | Investment Manager | Investment Objective | Investment Practices | Expense RatioA |
| Fidelity Money Market Central Funds | Fidelity Management & Research Company LLC (FMR) | Each fund seeks to obtain a high level of current income consistent with the preservation of capital and liquidity. | Short-term Investments | Less than .005% |
A Expenses expressed as a percentage of average net assets and are as of each underlying Central Fund's most recent annual or semi-annual shareholder report.
A complete unaudited list of holdings for each Fidelity Central Fund is available upon request or at the Securities and Exchange Commission website at www.sec.gov. In addition, the financial statements of the Fidelity Central Funds which contain the significant accounting policies (including investment valuation policies) of those funds, and are not covered by the Report of Independent Registered Public Accounting Firm, are available on the Securities and Exchange Commission website or upon request.
3. Significant Accounting Policies.
The Fund is an investment company and applies the accounting and reporting guidance of the Financial Accounting Standards Board (FASB) Accounting Standards Codification Topic 946 Financial Services - Investment Companies. The financial statements have been prepared in conformity with accounting principles generally accepted in the United States of America (GAAP), which require management to make certain estimates and assumptions at the date of the financial statements. Actual results could differ from those estimates. Subsequent events, if any, through the date that the financial statements were issued have been evaluated in the preparation of the financial statements. The Fund's Schedule of Investments lists any underlying mutual funds or exchange-traded funds (ETFs) but does not include the underlying holdings of these funds. The following summarizes the significant accounting policies of the Fund:
Investment Valuation. Investments are valued as of 4:00 p.m. Eastern time on the last calendar day of the period. The Board of Trustees (the Board) has designated the Fund's investment adviser as the valuation designee responsible for the fair valuation function and performing fair value determinations as needed. The investment adviser has established a Fair Value Committee (the Committee) to carry out the day-to-day fair valuation responsibilities and has adopted policies and procedures to govern the fair valuation process and the activities of the Committee. In accordance with these fair valuation policies and procedures, which have been approved by the Board, the Fund attempts to obtain prices from one or more third party pricing services or brokers to value its investments. When current market prices, quotations or currency exchange rates are not readily available or reliable, investments will be fair valued in good faith by the Committee, in accordance with the policies and procedures. Factors used in determining fair value vary by investment type and may include market or investment specific events, transaction data, estimated cash flows, and market observations of comparable investments. The frequency that the fair valuation procedures are used cannot be predicted and they may be utilized to a significant extent. The Committee manages the Fund's fair valuation practices and maintains the fair valuation policies and procedures. The Fund's investment adviser reports to the Board information regarding the fair valuation process and related material matters.
The Fund categorizes the inputs to valuation techniques used to value its investments into a disclosure hierarchy consisting of three levels as shown below:
Level 1 - unadjusted quoted prices in active markets for identical investments
Level 2 - other significant observable inputs (including quoted prices for similar investments, interest rates, prepayment speeds, etc.)
Level 3 - unobservable inputs (including the Fund's own assumptions based on the best information available)
Valuation techniques used to value the Fund's investments by major category are as follows:
Equity securities, including restricted securities, for which market quotations are readily available, are valued at the last reported sale price or official closing price as reported by a third party pricing service on the primary market or exchange on which they are traded and are categorized as Level 1 in the hierarchy. In the event there were no sales during the day or closing prices are not available, securities are valued at the last quoted bid price or may be valued using the last available price and are generally categorized as Level 2 in the hierarchy. For foreign equity securities, when market or security specific events arise, comparisons to the valuation of American Depositary Receipts (ADRs), futures contracts, Exchange-Traded Funds (ETFs) and certain indexes as well as quoted prices for similar securities may be used and would be categorized as Level 2 in the hierarchy. For equity securities, including restricted securities, where observable inputs are limited, assumptions about market activity and risk are used and these securities may be categorized as Level 3 in the hierarchy.
Investments in open-end mutual funds ,including the Fidelity Central Funds, are valued at their closing net asset value (NAV) each business day and are categorized as Level 1 in the hierarchy.
Changes in valuation techniques may result in transfers in or out of an assigned level within the disclosure hierarchy. The aggregate value of investments by input level as of April 30, 2024, is included at the end of the Fund's Schedule of Investments.
Foreign Currency. Certain Funds may use foreign currency contracts to facilitate transactions in foreign-denominated securities. Gains and losses from these transactions may arise from changes in the value of the foreign currency or if the counterparties do not perform under the contracts' terms.
Foreign-denominated assets, including investment securities, and liabilities are translated into U.S. dollars at the exchange rates at period end. Purchases and sales of investment securities, income and dividends received, and expenses denominated in foreign currencies are translated into U.S. dollars at the exchange rate in effect on the transaction date.
The effects of exchange rate fluctuations on investments are included with the net realized and unrealized gain (loss) on investment securities. Other foreign currency transactions resulting in realized and unrealized gain (loss) are disclosed separately.
Investment Transactions and Income. For financial reporting purposes, the Fund's investment holdings and NAV include trades executed through the end of the last business day of the period. The NAV per share for processing shareholder transactions is calculated as of the close of business of the New York Stock Exchange (NYSE), normally 4:00 p.m. Eastern time and includes trades executed through the end of the prior business day. Gains and losses on securities sold are determined on the basis of identified cost and include proceeds received from litigation. Commissions paid to certain brokers with whom the investment adviser, or its affiliates, places trades on behalf of a fund include an amount in addition to trade execution, which may be rebated back to a fund. Any such rebates are included in net realized gain (loss) on investments in the Statement of Operations. Dividend income is recorded on the ex-dividend date, except for certain dividends from foreign securities where the ex-dividend date may have passed, which are recorded as soon as the Fund is informed of the ex-dividend date. Non-cash dividends included in dividend income, if any, are recorded at the fair market value of the securities received. Income and capital gain distributions from Fidelity Central Funds, if any, are recorded on the ex-dividend date. Certain distributions received by the Fund represent a return of capital or capital gain. The Fund determines the components of these distributions subsequent to the ex-dividend date, based upon receipt of tax filings or other correspondence relating to the underlying investment. These distributions are recorded as a reduction of cost of investments and/or as a realized gain. Investment income is recorded net of foreign taxes withheld where recovery of such taxes is uncertain. Funds may file withholding tax reclaims in certain jurisdictions to recover a portion of amounts previously withheld. Any withholding tax reclaims income is included in the Statement of Operations in dividends. Any receivables for withholding tax reclaims are included in the Statement of Assets and Liabilities in dividends receivable.
Expenses. Expenses directly attributable to a fund are charged to that fund. Expenses attributable to more than one fund are allocated among the respective funds on the basis of relative net assets or other appropriate methods. Expenses included in the accompanying financial statements reflect the expenses of that fund and do not include any expenses associated with any underlying mutual funds or exchange-traded funds. Although not included in a fund's expenses, a fund indirectly bears its proportionate share of these expenses through the net asset value of each underlying mutual fund or exchange-traded fund. Expense estimates are accrued in the period to which they relate and adjustments are made when actual amounts are known.
Income Tax Information and Distributions to Shareholders. Each year, the Fund intends to qualify as a regulated investment company under Subchapter M of the Internal Revenue Code, including distributing substantially all of its taxable income and realized gains. As a result, no provision for U.S. Federal income taxes is required. As of April 30, 2024, the Fund did not have any unrecognized tax benefits in the financial statements; nor is the Fund aware of any tax positions for which it is reasonably possible that the total amounts of unrecognized tax benefits will significantly change in the next twelve months. The Fund files a U.S. federal tax return, in addition to state and local tax returns as required. The Fund's federal income tax returns are subject to examination by the Internal Revenue Service (IRS) for a period of three fiscal years after they are filed. State and local tax returns may be subject to examination for an additional fiscal year depending on the jurisdiction. Foreign taxes are provided for based on the Fund's understanding of the tax rules and rates that exist in the foreign markets in which it invests.
Distributions are declared and recorded on the ex-dividend date. Income and capital gain distributions are determined in accordance with income tax regulations, which may differ from GAAP.
Capital accounts within the financial statements are adjusted for permanent book-tax differences. These adjustments have no impact on net assets or the results of operations. Capital accounts are not adjusted for temporary book-tax differences which will reverse in a subsequent period.
Book-tax differences are primarily due to foreign currency transactions, passive foreign investment companies (PFIC) and losses deferred due to wash sales.
As of period end, the cost and unrealized appreciation (depreciation) in securities, and derivatives if applicable, for federal income tax purposes were as follows:
| Gross unrealized appreciation | $17,530,764 |
| Gross unrealized depreciation | (968,577) |
| Net unrealized appreciation (depreciation) | $16,562,187 |
| Tax Cost | $33,203,348 |
The tax-based components of distributable earnings as of period end were as follows:
| Undistributed ordinary income | $292,792 |
| Undistributed long-term capital gain | $1,150,584 |
| Net unrealized appreciation (depreciation) on securities and other investments | $16,562,059 |
The tax character of distributions paid was as follows:
| | April 30, 2024 | April 30, 2023 |
| Ordinary Income | $499,855 | $ 864,682 |
| Long-term Capital Gains | 718,901 | 11,505,897 |
| Total | $1,218,756 | $ 12,370,579 |
| | | |
Restricted Securities (including Private Placements). Funds may invest in securities that are subject to legal or contractual restrictions on resale. These securities generally may be resold in transactions exempt from registration or to the public if the securities are registered. Disposal of these securities may involve time-consuming negotiations and expense, and prompt sale at an acceptable price may be difficult. Information regarding restricted securities held at period end is included at the end of the Schedule of Investments, if applicable.
4. Purchases and Sales of Investments.
Purchases and sales of securities, other than short-term securities and in-kind transactions, as applicable, are noted in the table below.
| | Purchases ($) | Sales ($) |
| Fidelity Large Cap Stock K6 Fund | 12,947,921 | 5,102,123 |
Prior Year Unaffiliated Exchanges In-Kind. Shares that were exchanged for investments, including accrued interest and cash, if any, are shown in the table below. The amount of in-kind exchanges is included in share transactions in the accompanying Statement of Changes in Net Assets.
| | Shares | Total Proceeds ($) | |
| Fidelity Large Cap Stock K6 Fund | 554,943 | 7,554,605 | |
5. Fees and Other Transactions with Affiliates.
Management Fee. Fidelity Management & Research Company LLC (the investment adviser) and its affiliates provide the Fund with investment management related services for which the Fund pays a monthly management fee that is based on an annual rate of .45% of average net assets. Under the management contract, the investment adviser or an affiliate pays all other expenses of the Fund, excluding fees and expenses of the independent Trustees, and certain miscellaneous expenses such as proxy and shareholder meeting expenses.
Brokerage Commissions. A portion of portfolio transactions were placed with brokerage firms which are affiliates of the investment adviser. Brokerage commissions are included in net realized gain (loss) and change in net unrealized appreciation (depreciation) in the Statement of Operations. The commissions paid to these affiliated firms were as follows:
| | Amount ($) |
| Fidelity Large Cap Stock K6 Fund | 373 |
Interfund Trades. Funds may purchase from or sell securities to other Fidelity Funds under procedures adopted by the Board. The procedures have been designed to ensure these interfund trades are executed in accordance with Rule 17a-7 of the 1940 Act. Any interfund trades are included within the respective purchases and sales amounts shown in the Purchases and Sales of Investments note. Interfund trades during the period are noted in the table below.
| | Purchases ($) | Sales ($) | Realized Gain (Loss)($) |
| Fidelity Large Cap Stock K6 Fund | 960,081 | 182,406 | 52,465 |
Sub-Advisory Arrangements. Effective March 1, 2024, the Fund's sub-advisory agreements with FMR Investment Management (UK) Limited, Fidelity Management & Research (Hong Kong) Limited, and Fidelity Management & Research (Japan) Limited were amended to provide that the investment adviser pays each sub-adviser monthly fees equal to 110% of the sub-adviser's costs for providing sub-advisory services.
6. Committed Line of Credit.
Certain Funds participate with other funds managed by the investment adviser or an affiliate in a $4.25 billion credit facility (the "line of credit") to be utilized for temporary or emergency purposes to fund shareholder redemptions or for other short-term liquidity purposes. The commitment fees on the pro-rata portion of the line of credit are borne by the investment adviser. During the period, there were no borrowings on this line of credit.
7. Security Lending.
Funds lend portfolio securities from time to time in order to earn additional income. Lending agents are used, including National Financial Services (NFS), an affiliate of the investment adviser. Pursuant to a securities lending agreement, NFS will receive a fee, which is capped at 9.9% of a fund's daily lending revenue, for its services as lending agent. A fund may lend securities to certain qualified borrowers, including NFS. On the settlement date of the loan, a fund receives collateral (in the form of U.S. Treasury obligations, letters of credit and/or cash) against the loaned securities and maintains collateral in an amount not less than 100% of the market value of the loaned securities during the period of the loan. The market value of the loaned securities is determined at the close of business of a fund and any additional required collateral is delivered to a fund on the next business day. A fund or borrower may terminate the loan at any time, and if the borrower defaults on its obligation to return the securities loaned because of insolvency or other reasons, a fund may apply collateral received from the borrower against the obligation. A fund may experience delays and costs in recovering the securities loaned. Any cash collateral received is invested in the Fidelity Securities Lending Cash Central Fund. Any loaned securities are identified as such in the Schedule of Investments, and the value of loaned securities and cash collateral at period end, as applicable, are presented in the Statement of Assets and Liabilities. Security lending income represents the income earned on investing cash collateral, less rebates paid to borrowers and any lending agent fees associated with the loan, plus any premium payments received for lending certain types of securities. Security lending income is presented in the Statement of Operations as a component of income from Fidelity Central Funds. Affiliated security lending activity, if any, was as follows:
| | Total Security Lending Fees Paid to NFS ($) | Security Lending Income From Securities Loaned to NFS ($) | Value of Securities Loaned to NFS at Period End ($) |
| Fidelity Large Cap Stock K6 Fund | 131 | - | - |
8. Expense Reductions.
Through arrangements with the Fund's custodian, credits realized as a result of certain uninvested cash balances were used to reduce the Fund's expenses by $348.
9. Other.
A fund's organizational documents provide former and current trustees and officers with a limited indemnification against liabilities arising in connection with the performance of their duties to the fund. In the normal course of business, a fund may also enter into contracts that provide general indemnifications. A fund's maximum exposure under these arrangements is unknown as this would be dependent on future claims that may be made against a fund. The risk of material loss from such claims is considered remote.
10. Risk and Uncertainties.
Many factors affect a fund's performance. Developments that disrupt global economies and financial markets, such as pandemics, epidemics, outbreaks of infectious diseases, war, terrorism, and environmental disasters, may significantly affect a fund's investment performance. The effects of these developments to a fund will be impacted by the types of securities in which a fund invests, the financial condition, industry, economic sector, and geographic location of an issuer, and a fund's level of investment in the securities of that issuer. Significant concentrations in security types, issuers, industries, sectors, and geographic locations may magnify the factors that affect a fund's performance.
To the Board of Trustees of Fidelity Concord Street Trust and the Shareholders of Fidelity Large Cap Stock K6 Fund:
Opinion on the Financial Statements and Financial Highlights
We have audited the accompanying statement of assets and liabilities of Fidelity Large Cap Stock K6 Fund (the "Fund"), a fund of Fidelity Concord Street Trust, including the schedule of investments, as of April 30, 2024, the related statement of operations for the year then ended, the statement of changes in net assets for each of the two years in the period then ended, the financial highlights for each of the five years in the period then ended, and the related notes. In our opinion, the financial statements and financial highlights present fairly, in all material respects, the financial position of the Fund as of April 30, 2024, and the results of its operations for the year then ended, the changes in its net assets for each of the two years in the period then ended, and the financial highlights for each of the five years in the period then ended in conformity with accounting principles generally accepted in the United States of America.
Basis for Opinion
These financial statements and financial highlights are the responsibility of the Fund's management. Our responsibility is to express an opinion on the Fund's financial statements and financial highlights based on our audits. We are a public accounting firm registered with the Public Company Accounting Oversight Board (United States) (PCAOB) and are required to be independent with respect to the Fund in accordance with the U.S. federal securities laws and the applicable rules and regulations of the Securities and Exchange Commission and the PCAOB.
We conducted our audits in accordance with the standards of the PCAOB. Those standards require that we plan and perform the audit to obtain reasonable assurance about whether the financial statements and financial highlights are free of material misstatement, whether due to error or fraud. The Fund is not required to have, nor were we engaged to perform, an audit of its internal control over financial reporting. As part of our audits, we are required to obtain an understanding of internal control over financial reporting but not for the purpose of expressing an opinion on the effectiveness of the Fund's internal control over financial reporting. Accordingly, we express no such opinion.
Our audits included performing procedures to assess the risks of material misstatement of the financial statements and financial highlights, whether due to error or fraud, and performing procedures that respond to those risks. Such procedures included examining, on a test basis, evidence regarding the amounts and disclosures in the financial statements and financial highlights. Our audits also included evaluating the accounting principles used and significant estimates made by management, as well as evaluating the overall presentation of the financial statements and financial highlights. Our procedures included confirmation of securities owned as of April 30, 2024, by correspondence with the custodian and brokers; when replies were not received from brokers, we performed other auditing procedures. We believe that our audits provide a reasonable basis for our opinion.
/s/ Deloitte & Touche LLP
Boston, Massachusetts
June 14, 2024
We have served as the auditor of one or more of the Fidelity investment companies since 1999.
The Trustees, Members of the Advisory Board (if any), and officers of the trust and fund, as applicable, are listed below. The Board of Trustees governs the fund and is responsible for protecting the interests of shareholders. The Trustees are experienced executives who meet periodically throughout the year to oversee the fund's activities, review contractual arrangements with companies that provide services to the fund, oversee management of the risks associated with such activities and contractual arrangements, and review the fund's performance. Except for Jonathan Chiel, each of the Trustees oversees 323 funds. Mr. Chiel oversees 192 funds.
The Trustees hold office without limit in time except that (a) any Trustee may resign; (b) any Trustee may be removed by written instrument, signed by at least two-thirds of the number of Trustees prior to such removal; (c) any Trustee who requests to be retired or who has become incapacitated by illness or injury may be retired by written instrument signed by a majority of the other Trustees; and (d) any Trustee may be removed at any special meeting of shareholders by a two-thirds vote of the outstanding voting securities of the trust. Each Trustee who is not an interested person (as defined in the 1940 Act) of the trust and the fund is referred to herein as an Independent Trustee. Each Independent Trustee shall retire not later than the last day of the calendar year in which his or her 75th birthday occurs. The Independent Trustees may waive this mandatory retirement age policy with respect to individual Trustees. Officers and Advisory Board Members hold office without limit in time, except that any officer or Advisory Board Member may resign or may be removed by a vote of a majority of the Trustees at any regular meeting or any special meeting of the Trustees. Except as indicated, each individual has held the office shown or other offices in the same company for the past five years.
The fund's Statement of Additional Information (SAI) includes more information about the Trustees. To request a free copy, call Fidelity at 1-800-835-5092.
Experience, Skills, Attributes, and Qualifications of the Trustees. The Governance and Nominating Committee has adopted a statement of policy that describes the experience, qualifications, attributes, and skills that are necessary and desirable for potential Independent Trustee candidates (Statement of Policy). The Board believes that each Trustee satisfied at the time he or she was initially elected or appointed a Trustee, and continues to satisfy, the standards contemplated by the Statement of Policy. The Governance and Nominating Committee also engages professional search firms to help identify potential Independent Trustee candidates who have the experience, qualifications, attributes, and skills consistent with the Statement of Policy. From time to time, additional criteria based on the composition and skills of the current Independent Trustees, as well as experience or skills that may be appropriate in light of future changes to board composition, business conditions, and regulatory or other developments, have also been considered by the professional search firms and the Governance and Nominating Committee. In addition, the Board takes into account the Trustees' commitment and participation in Board and committee meetings, as well as their leadership of standing and ad hoc committees throughout their tenure.
In determining that a particular Trustee was and continues to be qualified to serve as a Trustee, the Board has considered a variety of criteria, none of which, in isolation, was controlling. The Board believes that, collectively, the Trustees have balanced and diverse experience, qualifications, attributes, and skills, which allow the Board to operate effectively in governing the fund and protecting the interests of shareholders. Information about the specific experience, skills, attributes, and qualifications of each Trustee, which in each case led to the Board's conclusion that the Trustee should serve (or continue to serve) as a trustee of the fund, is provided below.
Board Structure and Oversight Function. Robert A. Lawrence is an interested person and currently serves as Chair. The Trustees have determined that an interested Chair is appropriate and benefits shareholders because an interested Chair has a personal and professional stake in the quality and continuity of services provided to the fund. Independent Trustees exercise their informed business judgment to appoint an individual of their choosing to serve as Chair, regardless of whether the Trustee happens to be independent or a member of management. The Independent Trustees have determined that they can act independently and effectively without having an Independent Trustee serve as Chair and that a key structural component for assuring that they are in a position to do so is for the Independent Trustees to constitute a substantial majority for the Board. The Independent Trustees also regularly meet in executive session. David M. Thomas serves as Lead Independent Trustee and as such (i) acts as a liaison between the Independent Trustees and management with respect to matters important to the Independent Trustees and (ii) with management prepares agendas for Board meetings.
Fidelity® funds are overseen by different Boards of Trustees. The fund's Board oversees Fidelity's high income and certain equity funds, and other Boards oversee Fidelity's alternative investment, investment-grade bond, money market, asset allocation, and other equity funds. The asset allocation funds may invest in Fidelity® funds overseen by the fund's Board. The use of separate Boards, each with its own committee structure, allows the Trustees of each group of Fidelity® funds to focus on the unique issues of the funds they oversee, including common research, investment, and operational issues. On occasion, the separate Boards establish joint committees to address issues of overlapping consequences for the Fidelity® funds overseen by each Board.
The Trustees operate using a system of committees to facilitate the timely and efficient consideration of all matters of importance to the Trustees, the fund, and fund shareholders and to facilitate compliance with legal and regulatory requirements and oversight of the fund's activities and associated risks. The Board, acting through its committees, has charged FMR and its affiliates with (i) identifying events or circumstances the occurrence of which could have demonstrably adverse effects on the fund's business and/or reputation; (ii) implementing processes and controls to lessen the possibility that such events or circumstances occur or to mitigate the effects of such events or circumstances if they do occur; and (iii) creating and maintaining a system designed to evaluate continuously business and market conditions in order to facilitate the identification and implementation processes described in (i) and (ii) above. Because the day-to-day operations and activities of the fund are carried out by or through FMR, its affiliates, and other service providers, the fund's exposure to risks is mitigated but not eliminated by the processes overseen by the Trustees. While each of the Board's committees has responsibility for overseeing different aspects of the fund's activities, oversight is exercised primarily through the Operations, Audit, and Compliance Committees. Appropriate personnel, including but not limited to the fund's Chief Compliance Officer (CCO), FMR's internal auditor, the independent accountants, the fund's Treasurer and portfolio management personnel, make periodic reports to the Board's committees, as appropriate, including an annual review of Fidelity's risk management program for the Fidelity® funds. The responsibilities of each standing committee, including their oversight responsibilities, are described further under "Standing Committees of the Trustees."
Interested Trustees*:
Correspondence intended for a Trustee who is an interested person may be sent to Fidelity Investments, 245 Summer Street, Boston, Massachusetts 02210.
Name, Year of Birth; Principal Occupations and Other Relevant Experience+
Jonathan Chiel (1957)
Year of Election or Appointment: 2016
Trustee
Mr. Chiel also serves as Trustee of other Fidelity® funds. Mr. Chiel is Senior Counsel at Fidelity Investments (diversified financial services company, 2024-present). Previously, Mr. Chiel served as General Counsel (2012-2024) and Head of Legal, Risk and Compliance (2022-2024) for Fidelity Investments; Executive Vice President and General Counsel for FMR LLC (diversified financial services company, 2012-2024); Director and President of OH Company LLC (holding company, 2018-2024); General Counsel (2004-2012) and Senior Vice President and Deputy General Counsel (2000-2004) for John Hancock Financial Services; a partner with Choate, Hall & Stewart (law firm, 1996-2000); and an Assistant United States Attorney for the United States Attorney's Office of the District of Massachusetts (1986-1995), including Chief of the Criminal Division (1993-1995). Mr. Chiel is a director on the boards of the Harvard Law School Center on the Legal Profession and the U.S. Chamber Litigation Center.
Bettina Doulton (1964)
Year of Election or Appointment: 2021
Trustee
Ms. Doulton also serves as Trustee of other Fidelity® funds. Prior to her retirement, Ms. Doulton served in a variety of positions at Fidelity Investments, including as a managing director of research (2006-2007), portfolio manager to certain Fidelity® funds (1993-2005), equity analyst and portfolio assistant (1990-1993), and research assistant (1987-1990). Ms. Doulton currently owns and operates Cellardoor Winery. Previously, Ms. Doulton served as a member of the Board of Brown Capital Management, LLC (2014-2018).
Robert A. Lawrence (1952)
Year of Election or Appointment: 2020
Trustee
Chair of the Board of Trustees
Mr. Lawrence also serves as Trustee of other funds. Previously, Mr. Lawrence served as a Trustee and Member of the Advisory Board of certain funds. Prior to his retirement in 2008, Mr. Lawrence served as Vice President of certain Fidelity® funds (2006-2008), Senior Vice President, Head of High Income Division of Fidelity Management & Research Company (investment adviser firm, 2006-2008), and President of Fidelity Strategic Investments (investment adviser firm, 2002-2005).
* Determined to be an "Interested Trustee" by virtue of, among other things, his or her affiliation with the trust or various entities under common control with FMR.
+ The information includes the Trustee's principal occupation during the last five years and other information relating to the experience, attributes, and skills relevant to the Trustee's qualifications to serve as a Trustee, which led to the conclusion that the Trustee should serve as a Trustee for the fund.
Independent Trustees:
Correspondence intended for an Independent Trustee may be sent to Fidelity Investments, P.O. Box 55235, Boston, Massachusetts 02205-5235.
Name, Year of Birth; Principal Occupations and Other Relevant Experience+
Thomas P. Bostick (1956)
Year of Election or Appointment: 2021
Trustee
Lieutenant General Bostick also serves as Trustee of other Fidelity® funds. Prior to his retirement, General Bostick (United States Army, Retired) held a variety of positions within the U.S. Army, including Chief of Engineers and Commanding General, U.S. Army Corps of Engineers (2012-2016) and Deputy Chief of Staff and Director of Human Resources, U.S. Army (2009-2012). General Bostick currently serves as a member of the Board and Finance and Governance & Sustainability Committees of CSX Corporation (transportation, 2020-present) and a member of the Board and Corporate Governance and Nominating Committee of Perma-Fix Environmental Services, Inc. (nuclear waste management, 2020-present). General Bostick serves as Chief Executive Officer of Bostick Global Strategies, LLC (consulting, 2016-present), as a member of the Board of HireVue, Inc. (video interview and assessment, 2020-present), as a member of the Board of Allonnia (biotechnology and engineering solutions, 2022-present), on the Advisory Board of Hilco Redevelopment Partners (a real estate investment and redevelopment company, 2021-present), and on the Advisory Board of Solugen, Inc. (specialty bio-based chemicals manufacturer, 2022-present). Previously, General Bostick served as a Member of the Advisory Board of certain Fidelity® funds (2021), President, Intrexon Bioengineering (2018-2020) and Chief Operating Officer (2017-2020) and Senior Vice President of the Environment Sector (2016-2017) of Intrexon Corporation (biopharmaceutical company).
Donald F. Donahue (1950)
Year of Election or Appointment: 2018
Trustee
Mr. Donahue also serves as Trustee of other Fidelity® funds. Mr. Donahue serves as President and Chief Executive Officer of Miranda Partners, LLC (risk consulting for the financial services industry, 2012-present). Previously, Mr. Donahue served as Chief Executive Officer (2006-2012), Chief Operating Officer (2003-2006) and Managing Director, Customer Marketing and Development (1999-2003) of The Depository Trust & Clearing Corporation (financial markets infrastructure). Mr. Donahue currently serves as a member (2007-present) and Co-Chairman (2016-present) of the Board of United Way of New York. Mr. Donahue previously served as a member of the Advisory Board of certain Fidelity® funds (2015-2018) and as a member of the Board of The Leadership Academy (previously NYC Leadership Academy) (2012-2022).
Vicki L. Fuller (1957)
Year of Election or Appointment: 2020
Trustee
Ms. Fuller also serves as Trustee of other Fidelity® funds. Previously, Ms. Fuller served as a member of the Advisory Board of certain Fidelity® funds (2018-2020), Chief Investment Officer of the New York State Common Retirement Fund (2012-2018) and held a variety of positions at AllianceBernstein L.P. (global asset management, 1985-2012), including Managing Director (2006-2012) and Senior Vice President and Senior Portfolio Manager (2001-2006). Ms. Fuller currently serves as a member of the Board, Audit Committee, Compensation Committee and Nominating and Governance Committee of two Blackstone business development companies (2020-present), as a member of the Board of Treliant, LLC (consulting, 2019-present), as a member of the Board of Ariel Alternatives, LLC (private equity, 2022-present) and as a member of the Board and Chair of the Audit Committee of Gusto, Inc. (software, 2021-present). In addition, Ms. Fuller currently serves as a member of the Executive Board of New York University's Stern School of Business. Ms. Fuller previously served as a member of the Board of Roosevelt University (2019-2024) and member of the Board, Audit Committee and Nominating and Governance Committee of The Williams Companies, Inc. (natural gas infrastructure, 2018-2021).
Patricia L. Kampling (1959)
Year of Election or Appointment: 2020
Trustee
Ms. Kampling also serves as Trustee of other Fidelity® funds. Prior to her retirement, Ms. Kampling served as Chairman of the Board and Chief Executive Officer (2012-2019), President and Chief Operating Officer (2011-2012) and Executive Vice President and Chief Financial Officer (2010-2011) of Alliant Energy Corporation. Ms. Kampling currently serves as a member of the Board, Audit Committee and Governance, Compensation and Nominating Committee of Xcel Energy Inc. (utilities company, 2020-present) and as a member of the Board, Audit, Finance and Risk Committee and Safety, Environmental, Technology and Operations Committee and Chair of the Executive Development and Compensation Committee of American Water Works Company, Inc. (utilities company, 2019-present). In addition, Ms. Kampling currently serves as a member of the Board of the Nature Conservancy, Wisconsin Chapter (2019-present). Previously, Ms. Kampling served as a Member of the Advisory Board of certain Fidelity® funds (2020), a member of the Board, Compensation Committee and Executive Committee and Chair of the Audit Committee of Briggs & Stratton Corporation (manufacturing, 2011-2021), a member of the Board of Interstate Power and Light Company (2012-2019) and Wisconsin Power and Light Company (2012-2019) (each a subsidiary of Alliant Energy Corporation) and as a member of the Board and Workforce Development Committee of the Business Roundtable (2018-2019).
Thomas A. Kennedy (1955)
Year of Election or Appointment: 2021
Trustee
Mr. Kennedy also serves as Trustee of other Fidelity® funds. Previously, Mr. Kennedy served as a Member of the Advisory Board of certain Fidelity® funds (2020) and held a variety of positions at Raytheon Company (aerospace and defense, 1983-2020), including Chairman and Chief Executive Officer (2014-2020) and Executive Vice President and Chief Operating Officer (2013-2014). Mr. Kennedy served as Executive Chairman of the Board of Directors of Raytheon Technologies Corporation (aerospace and defense, 2020-2021). Mr. Kennedy serves as a Director of the Board of Directors of Textron Inc. (aerospace and defense, 2023-present).
Oscar Munoz (1959)
Year of Election or Appointment: 2021
Trustee
Mr. Munoz also serves as Trustee of other Fidelity® funds. Prior to his retirement, Mr. Munoz served as Executive Chairman (2020-2021), Chief Executive Officer (2015-2020), President (2015-2016) and a member of the Board (2010-2021) of United Airlines Holdings, Inc. Mr. Munoz currently serves as a member of the Board of CBRE Group, Inc. (commercial real estate, 2020-present), a member of the Board of Univision Communications, Inc. (Hispanic media, 2020-present), a member of the Board of Archer Aviation Inc. (2021-present), a member of the Defense Business Board of the United States Department of Defense (2021-present) and a member of the Board of Salesforce.com, Inc. (cloud-based software, 2022-present). Previously, Mr. Munoz served as a Member of the Advisory Board of certain Fidelity® funds (2021).
David M. Thomas (1949)
Year of Election or Appointment: 2008
Trustee
Lead Independent Trustee
Mr. Thomas also serves as Trustee of other Fidelity® funds. Previously, Mr. Thomas served as Executive Chairman (2005-2006) and Chairman and Chief Executive Officer (2000-2005) of IMS Health, Inc. (pharmaceutical and healthcare information solutions) and as a member of the Board of Fortune Brands Home and Security (home and security products, 2004-2023). Mr. Thomas currently serves as Director (2013-present) and Non-Executive Chairman of the Board (2022-present) of Interpublic Group of Companies, Inc. (marketing communication).
Susan Tomasky (1953)
Year of Election or Appointment: 2020
Trustee
Ms. Tomasky also serves as Trustee of other Fidelity® funds. Prior to her retirement, Ms. Tomasky served in various executive officer positions at American Electric Power Company, Inc. (1998-2011), including most recently as President of AEP Transmission (2007-2011). Ms. Tomasky currently serves as a member of the Board and Sustainability Committee and as Chair of the Audit Committee of Marathon Petroleum Corporation (2018-present) and as a member of the Board, Executive Committee, Corporate Governance Committee and Organization and Compensation Committee and as Lead Director of the Board of Public Service Enterprise Group, Inc. (utilities company, 2012-present) and as a member of the Board of its subsidiary company, Public Service Electric and Gas Co. (2021-present). In addition, Ms. Tomasky currently serves as a member (2009-present) and President (2020-present) of the Board of the Royal Shakespeare Company - America (2009-present) and as a member and Vice Chair of the Board of Kenyon College (2016-present). Previously, Ms. Tomasky served as a Member of the Advisory Board of certain Fidelity® funds (2020), as a member of the Board of the Columbus Association for the Performing Arts (2011-2023), as a member of the Board of the Columbus Regional Airport Authority (2007-2020), as a member of the Board (2011-2018) and Lead Independent Director (2015-2018) of Andeavor Corporation (previously Tesoro Corporation) (independent oil refiner and marketer) and as a member of the Board of Summit Midstream Partners LP (energy, 2012-2018).
Michael E. Wiley (1950)
Year of Election or Appointment: 2020
Trustee
Mr. Wiley also serves as Trustee of other Fidelity® funds. Previously, Mr. Wiley served as a member of the Advisory Board of certain Fidelity® funds (2018-2020), Chairman, President and CEO of Baker Hughes, Inc. (oilfield services, 2000-2004). Mr. Wiley also previously served as a member of the Board of Andeavor Corporation (independent oil refiner and marketer, 2005-2018), a member of the Board of Andeavor Logistics LP (natural resources logistics, 2015-2018) and a member of the Board of High Point Resources (exploration and production, 2005-2020).
+ The information includes the Trustee's principal occupation during the last five years and other information relating to the experience, attributes, and skills relevant to the Trustee's qualifications to serve as a Trustee, which led to the conclusion that the Trustee should serve as a Trustee for the fund.
Advisory Board Members and Officers:
Correspondence intended for a Member of the Advisory Board (if any) may be sent to Fidelity Investments, P.O. Box 55235, Boston, Massachusetts 02205-5235. Correspondence intended for an officer or Peter S. Lynch may be sent to Fidelity Investments, 245 Summer Street, Boston, Massachusetts 02210.
Name, Year of Birth; Principal Occupations+
Vijay C. Advani (1960)
Year of Election or Appointment: 2023
Member of the Advisory Board
Mr. Advani also serves as Trustee or Member of the Advisory Board of other funds. Previously, Mr. Advani served as Executive Chairman (2020-2022), Chief Executive Officer (2017-2020) and Chief Operating Officer (2016-2017) of Nuveen (global investment manager). He also served in various capacities at Franklin Resources (global investment manager), including Co-President (2015-2016), Executive Vice President, Global Advisory Services (2008-2015), Head of Global Retail Distribution (2005-2008), Executive Managing Director, International Retail Development (2002-2005), Managing Director, Product Developments, Sales & Marketing, Asia, Eastern Europe and Africa (2000-2002) and President, Templeton Asset Management India (1995-2000). Mr. Advani also served as Senior Investment Officer of International Finance Corporation (private equity and venture capital arm of The World Bank, 1984-1995). Mr. Advani is Chairman Emeritus of the U.S. India Business Council (2018-present), a Director of The Global Impact Investing Network (2019-present), a Director of LOK Capital (Mauritius) (2022-present), a member of the Advisory Council of LOK Capital (2022-present), a Senior Advisor of Neuberger Berman (2021-present), a Senior Advisor of Seviora Holdings Pte. Ltd (Temasek-Singapore) (2021-present), a Director of Seviora Capital (Singapore) (2021-present) and an Advisor of EQUIAM (2021-present). Mr. Advani formerly served as a member of the Board of BowX Acquisition Corp. (special purpose acquisition company, 2020-2021), a member of the Board of Intellecap (advisory arm of The Aavishkaar Group, 2018-2020), a member of the Board of Nuveen Investments, Inc. (2017-2020) and a member of the Board of Docusign (software, 2016-2019).
Peter S. Lynch (1944)
Year of Election or Appointment: 2003
Member of the Advisory Board
Mr. Lynch also serves as a Member of the Advisory Board of other Fidelity® funds. Mr. Lynch is Vice Chairman and a Director of Fidelity Management & Research Company LLC (investment adviser firm). In addition, Mr. Lynch serves as a Trustee of Boston College and as the Chairman of the Inner-City Scholarship Fund. Previously, Mr. Lynch served as Vice Chairman and a Director of FMR Co., Inc. (investment adviser firm) and on the Special Olympics International Board of Directors (1997-2006).
Karen B. Peetz (1955)
Year of Election or Appointment: 2023
Member of the Advisory Board
Ms. Peetz also serves as a Member of the Advisory Board of other funds. Previously, Ms. Peetz served as Chief Administration Officer (2020-2023) of Citigroup Inc. (a diversified financial service company). She also served in various capacities at Bank of New York Mellon Corporation, including President (2013-2016), Vice Chairman, Senior Executive Vice President and Chief Executive Officer of Financial Markets & Treasury Services (2010-2013), Senior Executive Vice President and Chief Executive Officer of Global Corporate Trust (2003-2008), Senior Vice President and Division Manager of Global Payments & Trade Services (2002-2003) and Senior Vice President and Division Manager of Domestic Corporate Trust (1998-2002). Ms. Peetz also served in various capacities at Chase Manhattan Corporation (1982-1998), including Senior Vice President and Manager of Corporate Trust International Business (1996-1998), Managing Director and Manager of Corporate Trust Services (1994-1996) and Managing Director and Group Manager of Financial Institution Sales (1990-1993). Ms. Peetz currently serves as Chair of Amherst Holdings Advisory Council (2018-present), Trustee of Johns Hopkins University (2016-present), Chair of the Carey Business School Advisory Council, Member of the Johns Hopkins Medicine Board and Finance Committee and Chair of the Lyme and Tick Related Disease Institute Advisory Council. Ms. Peetz previously served as a member of the Board of Guardian Life Insurance Company of America (2019-2023), a member of the Board of Trane Technologies (2018-2022), a member of the Board of Wells Fargo Corp. (2017-2019), a member of the Board of SunCoke Energy Inc. (2012-2016), a member of the Board of Private Export Funding Corporation (2010-2016) and as a Trustee of Penn State University (2010-2014) and the United Way of New York City (2008-2010).
Heather Bonner (1977)
Year of Election or Appointment: 2023
Assistant Treasurer
Ms. Bonner also serves as an officer of other funds. Ms. Bonner is a Senior Vice President (2022-present) and is an employee of Fidelity Investments (2022-present). Ms. Bonner serves as Senior Vice President, Vice President, Treasurer, or Director of certain Fidelity entities. Prior to joining Fidelity, Ms. Bonner served as Managing Director at AQR Capital Management (2013-2022) and was the Treasurer and Principal Financial Officer of the AQR Funds (2013-2022).
Craig S. Brown (1977)
Year of Election or Appointment: 2022
Deputy Treasurer
Mr. Brown also serves as an officer of other funds. Mr. Brown is a Vice President (2015-present) and is an employee of Fidelity Investments. Mr. Brown serves as Assistant Treasurer of FIMM, LLC (2021-present). Previously, Mr. Brown served as Assistant Treasurer of certain Fidelity® funds (2019-2022).
John J. Burke III (1964)
Year of Election or Appointment: 2018
Chief Financial Officer
Mr. Burke also serves as Chief Financial Officer of other funds. Mr. Burke is Head of Fidelity Fund and Investment Operations (2018-present) and is an employee of Fidelity Investments. Mr. Burke serves as President, Executive Vice President, or Director of certain Fidelity entities. Previously Mr. Burke served as head of Asset Management Investment Operations (2012-2018).
Margaret Carey (1973)
Year of Election or Appointment: 2023
Secretary and Chief Legal Officer (CLO)
Ms. Carey also serves as an officer of other funds and as CLO of certain Fidelity entities. Ms. Carey is a Senior Vice President, Deputy General Counsel (2019-present) and is an employee of Fidelity Investments.
William C. Coffey (1969)
Year of Election or Appointment: 2019
Assistant Secretary
Mr. Coffey also serves as Assistant Secretary of other funds. Mr. Coffey is a Senior Vice President, Deputy General Counsel (2010-present) and is an employee of Fidelity Investments. Previously, Mr. Coffey served as Secretary and CLO of certain funds (2018-2019); CLO, Secretary, or Senior Vice President of certain Fidelity entities and Assistant Secretary of certain funds (2009-2018).
Timothy M. Cohen (1969)
Year of Election or Appointment: 2018
Vice President
Mr. Cohen also serves as Vice President of other funds. Mr. Cohen is Co-Head of Equity (2018-present) and is an employee of Fidelity Investments. Mr. Cohen serves as President or Director of certain Fidelity entities. Previously, Mr. Cohen served as Executive Vice President of Fidelity SelectCo, LLC (2019) and Head of Global Equity Research (2016-2018).
Jonathan Davis (1968)
Year of Election or Appointment: 2010
Assistant Treasurer
Mr. Davis also serves as an officer of other funds. Mr. Davis is a Vice President (2006-present) and is an employee of Fidelity Investments. Mr. Davis serves as Assistant Treasurer or Director of certain Fidelity entities.
Laura M. Del Prato (1964)
Year of Election or Appointment: 2018
Assistant Treasurer
Ms. Del Prato also serves as an officer of other funds. Ms. Del Prato is a Senior Vice President (2017-present) and is an employee of Fidelity Investments. Ms. Del Prato serves as Senior Vice President, Vice President, Assistant Treasurer, or Director of certain Fidelity entities. Previously, Ms. Del Prato served as President and Treasurer of The North Carolina Capital Management Trust: Cash Portfolio and Term Portfolio (2018-2020).
Colm A. Hogan (1973)
Year of Election or Appointment: 2020
Assistant Treasurer
Mr. Hogan also serves as an officer of other funds. Mr. Hogan is a Vice President (2016-present) and is an employee of Fidelity Investments. Mr. Hogan serves as Assistant Treasurer of certain Fidelity entities. Previously, Mr. Hogan served as Deputy Treasurer of certain Fidelity® funds (2016-2020) and Assistant Treasurer of certain Fidelity® funds (2016-2018).
Pamela R. Holding (1964)
Year of Election or Appointment: 2018
Vice President
Ms. Holding also serves as Vice President of other funds. Ms. Holding is Co-Head of Equity (2018-present) and is an employee of Fidelity Investments. Previously, Ms. Holding served as Executive Vice President of Fidelity SelectCo, LLC (2019) and as Chief Investment Officer of Fidelity Institutional Asset Management (2013-2018).
Chris Maher (1972)
Year of Election or Appointment: 2020
Deputy Treasurer
Mr. Maher also serves as an officer of other funds. Mr. Maher is a Vice President (2008-present) and is an employee of Fidelity Investments. Mr. Maher serves as Assistant Treasurer of certain Fidelity entities. Previously, Mr. Maher served as Assistant Treasurer of certain funds (2013-2020).
Jason P. Pogorelec (1975)
Year of Election or Appointment: 2020
Chief Compliance Officer
Mr. Pogorelec also serves as Chief Compliance Officer of other funds. Mr. Pogorelec is a Senior Vice President of Asset Management Compliance (2020-present) and is an employee of Fidelity Investments. Mr. Pogorelec serves as Compliance Officer of Fidelity Management & Research Company LLC (investment adviser firm, 2023-present) and Ballyrock Investment Advisors LLC (2023-present). Previously, Mr. Pogorelec served as a Vice President, Associate General Counsel for Fidelity Investments (2010-2020) and Assistant Secretary of certain Fidelity® funds (2015-2020).
Brett Segaloff (1972)
Year of Election or Appointment: 2021
Anti-Money Laundering (AML) Officer
Mr. Segaloff also serves as AML Officer of other funds. Mr. Segaloff is a Vice President (2022-present) and is an employee of Fidelity Investments. Mr. Segaloff serves as Anti Money Laundering Compliance Officer or Anti Money Laundering/Bank Secrecy Act Compliance Officer of certain Fidelity entities.
Stacie M. Smith (1974)
Year of Election or Appointment: 2016
President and Treasurer
Ms. Smith also serves as an officer of other funds. Ms. Smith is a Senior Vice President (2016-present) and is an employee of Fidelity Investments. Ms. Smith serves as Assistant Treasurer of certain Fidelity entities and has served in other fund officer roles.
Jim Wegmann (1979)
Year of Election or Appointment: 2019
Assistant Treasurer
Mr. Wegmann also serves as an officer of other funds. Mr. Wegmann is a Vice President (2016-present) and is an employee of Fidelity Investments. Mr. Wegmann serves as Assistant Treasurer of FIMM, LLC (2021-present). Previously, Mr. Wegmann served as Assistant Treasurer of certain Fidelity® funds (2019-2021).
+ The information includes principal occupation during the last five years.
As a shareholder, you incur two types of costs: (1) transaction costs, which may include sales charges (loads) on purchase payments or redemption proceeds, as applicable and (2) ongoing costs, which generally include management fees, distribution and/or service (12b-1) fees and other Fund expenses. This Example is intended to help you understand your ongoing costs (in dollars) of investing in a fund and to compare these costs with the ongoing costs of investing in other mutual funds.
| The Example is based on an investment of $1,000 invested at the beginning of the period and held for the entire period (November 1, 2023 to April 30, 2024). |
Actual Expenses
The first line of the accompanying table provides information about actual account values and actual expenses. You may use the information in this line, together with the amount you invested, to estimate the expenses that you paid over the period. Simply divide your account value by $1,000.00 (for example, an $8,600 account value divided by $1,000.00 = 8.6), then multiply the result by the number in the first line for a class/Fund under the heading entitled "Expenses Paid During Period" to estimate the expenses you paid on your account during this period. If any fund is a shareholder of any underlying mutual funds or exchange-traded funds (ETFs) (the Underlying Funds), such fund indirectly bears its proportional share of the expenses of the Underlying Funds in addition to the direct expenses incurred presented in the table. These fees and expenses are not included in the annualized expense ratio used to calculate the expense estimate in the table below.
Hypothetical Example for Comparison Purposes
The second line of the accompanying table provides information about hypothetical account values and hypothetical expenses based on the actual expense ratio and an assumed rate of return of 5% per year before expenses, which is not the actual return. The hypothetical account values and expenses may not be used to estimate the actual ending account balance or expenses you paid for the period. You may use this information to compare the ongoing costs of investing in the Fund and other funds. To do so, compare this 5% hypothetical example with the 5% hypothetical examples that appear in the shareholder reports of the other funds. If any fund is a shareholder of any Underlying Funds, such fund indirectly bears its proportional share of the expenses of the Underlying Funds in addition to the direct expenses as presented in the table. These fees and expenses are not included in the annualized expense ratio used to calculate the expense estimate in the table below.
Please note that the expenses shown in the table are meant to highlight your ongoing costs only and do not reflect any transaction costs. Therefore, the second line of the table is useful in comparing ongoing costs only, and will not help you determine the relative total costs of owning different funds. In addition, if these transactional costs were included, your costs would have been higher.
| | | | | Annualized Expense Ratio- A | | Beginning Account Value November 1, 2023 | | Ending Account Value April 30, 2024 | | Expenses Paid During Period- C November 1, 2023 to April 30, 2024 |
| | | | | | | | | | |
| Fidelity® Large Cap Stock K6 Fund | | | | .45% | | | | | | |
| Actual | | | | | | $ 1,000 | | $ 1,238.80 | | $ 2.50 |
Hypothetical-B | | | | | | $ 1,000 | | $ 1,022.63 | | $ 2.26 |
| |
A Annualized expense ratio reflects expenses net of applicable fee waivers.
B 5% return per year before expenses
C Expenses are equal to the annualized expense ratio, multiplied by the average account value over the period, multiplied by 182/ 366 (to reflect the one-half year period). The fees and expenses of any Underlying Funds are not included in each annualized expense ratio.
The dividend and capital gains distributions for the fund(s) are available on Fidelity.com or Institutional.Fidelity.com.
The fund hereby designates as a capital gain dividend with respect to the taxable year ended April 30, 2024, $1,569,200, or, if subsequently determined to be different, the net capital gain of such year.
The fund designates $81,560 of distributions paid during the fiscal year ended 2024 as qualifying to be taxed as section 163(j) interest dividends.
The fund designates 81% and 100% of the dividends distributed in June and December, respectively during the fiscal year as qualifying for the dividends-received deduction for corporate shareholders.
The fund designates 100% of the dividends distributed during the fiscal year as amounts which may be taken into account as a dividend for the purposes of the maximum rate under section 1(h)(11) of the Internal Revenue Code.
The fund will notify shareholders in January 2025 of amounts for use in preparing 2024 income tax returns.
Board Approval of Investment Advisory Contracts
Fidelity Large Cap Stock K6 Fund
At its January 2024 meeting, the Board of Trustees, including the Independent Trustees (together, the Board), approved amended and restated sub-advisory agreements (the Sub-Advisory Contracts) for the fund, including the fund's sub-advisory agreements with FMR Investment Management (UK) Limited (FMR UK), Fidelity Management & Research (Hong Kong) Limited (FMR H.K.), and Fidelity Management & Research (Japan) Limited (FMR Japan). The Sub-Advisory Contracts will be effective March 1, 2024. The Board will consider the annual renewal of the fund's Sub-Advisory Contracts in May 2024, following its review of additional materials provided by FMR.
The Board considered the Sub-Advisory Contracts, which simplified the calculation of the fees paid by FMR to the sub-advisers under the agreements. The Board noted that the agreements with FMR UK, FMR H.K., and FMR Japan were amended to provide that FMR will compensate each sub-adviser at a fee rate equal to 110% of the sub-adviser's costs incurred in providing services under the agreement. The Board considered that, under the Sub-Advisory Contracts, FMR, and not the fund, will continue to pay the sub-advisory fees to each applicable sub-adviser, and that the management fee paid by the fund under the management contract with FMR will remain unchanged.
The Board further considered that the approval of the fund's Sub-Advisory Contracts will not result in any changes in the investment process or strategies employed in the management of the fund's assets or the day-to-day management of the fund or the persons primarily responsible for such management. Further, the Board considered that the Sub-Advisory Contracts would not change the obligations and services of FMR and its affiliates on behalf of the fund, and, in particular, there would be no change in the nature and level of services provided to the fund by FMR and its affiliates.
In connection with its consideration of future renewals of the fund's advisory contracts, the Board will consider: (i) the nature, extent and quality of services provided to the funds, including shareholder and administrative services and investment performance; (ii) the competitiveness of the management fee and total expenses for the fund; (iii) the costs of the services and profitability, including the revenues earned and the expenses incurred in conducting the business of developing, marketing, distributing, managing, administering, and servicing the fund and its shareholders, to the extent applicable; and (iv) whether there have been economies of scale in respect of the Fidelity funds, whether the Fidelity funds (including the fund) have appropriately benefited from any such economies of scale, and whether there is the potential for realization of any further economies.
Based on its evaluation of all of the conclusions noted above, and after considering all factors it believed relevant, the Board concluded that the fund's management fee structure is fair and reasonable, and that the fund's Sub-Advisory Contracts should be approved.
The Securities and Exchange Commission adopted Rule 22e-4 under the Investment Company Act of 1940 (the Liquidity Rule) to promote effective liquidity risk management throughout the open-end investment company industry, thereby reducing the risk that funds will be unable to meet their redemption obligations and mitigating dilution of the interests of fund shareholders.
The Fund has adopted and implemented a liquidity risk management program (the Program) reasonably designed to assess and manage the Fund's liquidity risk and to comply with the requirements of the Liquidity Rule. The Fund's Board of Trustees (the Board) has designated the Fund's investment adviser as administrator of the Program. The Fidelity advisers have established a Liquidity Risk Management Committee (the LRM Committee) to manage the Program for each of the Fidelity Funds. The LRM Committee monitors the adequacy and effectiveness of implementation of the Program and on a periodic basis assesses each Fund's liquidity risk based on a variety of factors including (1) the Fund's investment strategy, (2) portfolio liquidity and cash flow projections during normal and reasonably foreseeable stressed conditions, (3) shareholder redemptions, (4) borrowings and other funding sources and (5) certain factors specific to ETFs including the effect of the Fund's prices and spreads, market participants, and basket compositions on the overall liquidity of the Fund's portfolio, as applicable.
In accordance with the Program, each of the Fund's portfolio investments is classified into one of four defined liquidity categories based on a determination of a reasonable expectation for how long it would take to convert the investment to cash (or sell or dispose of the investment) without significantly changing its market value.
- Highly liquid investments - cash or convertible to cash within three business days or less
- Moderately liquid investments - convertible to cash in three to seven calendar days
- Less liquid investments - can be sold or disposed of, but not settled, within seven calendar days
- Illiquid investments - cannot be sold or disposed of within seven calendar days
Liquidity classification determinations take into account a variety of factors including various market, trading and investment-specific considerations, as well as market depth, and generally utilize analysis from a third-party liquidity metrics service.
The Liquidity Rule places a 15% limit on a fund's illiquid investments and requires funds that do not primarily hold assets that are highly liquid investments to determine and maintain a minimum percentage of the fund's net assets to be invested in highly liquid investments (highly liquid investment minimum or HLIM). The Program includes provisions reasonably designed to comply with the 15% limit on illiquid investments and for determining, periodically reviewing and complying with the HLIM requirement as applicable.
At a recent meeting of the Fund's Board of Trustees, the LRM Committee provided a written report to the Board pertaining to the operation, adequacy, and effectiveness of the Program for the period December 1, 2022 through November 30, 2023. The report concluded that the Program is operating effectively and is reasonably designed to assess and manage the Fund's liquidity risk.
1.9883971.106
LCSK6-ANN-0624
Fidelity® Mid-Cap Stock K6 Fund
Annual Report
April 30, 2024
Contents
To view a fund's proxy voting guidelines and proxy voting record for the 12-month period ended June 30, visit http://www.fidelity.com/proxyvotingresults or visit the Securities and Exchange Commission's (SEC) web site at http://www.sec.gov.
You may also call 1-800-835-5092 to request a free copy of the proxy voting guidelines.
Standard & Poor's, S&P and S&P 500 are registered service marks of The McGraw-Hill Companies, Inc. and have been licensed for use by Fidelity Distributors Corporation.
Other third-party marks appearing herein are the property of their respective owners.
All other marks appearing herein are registered or unregistered trademarks or service marks of FMR LLC or an affiliated company. © 2024 FMR LLC. All rights reserved.
This report and the financial statements contained herein are submitted for the general information of the shareholders of the Fund. This report is not authorized for distribution to prospective investors in the Fund unless preceded or accompanied by an effective prospectus.
A fund files its complete schedule of portfolio holdings with the SEC for the first and third quarters of each fiscal year on Form N-PORT. Forms N-PORT are available on the SEC's web site at http://www.sec.gov. A fund's Forms N-PORT may be reviewed and copied at the SEC's Public Reference Room in Washington, DC. Information regarding the operation of the SEC's Public Reference Room may be obtained by calling 1-800-SEC-0330.
For a complete list of a fund's portfolio holdings, view the most recent holdings listing, semiannual report, or annual report on Fidelity's web site at http://www.fidelity.com, http://www.institutional.fidelity.com, or http://www.401k.com, as applicable.
NOT FDIC INSURED •MAY LOSE VALUE •NO BANK GUARANTEE
Neither the Fund nor Fidelity Distributors Corporation is a bank.
Average annual total return reflects the change in the value of an investment, assuming reinvestment of distributions from dividend income and capital gains (the profits earned upon the sale of securities that have grown in value, if any) and assuming a constant rate of performance each year. The hypothetical investment and the average annual total returns do not reflect the deduction of taxes that a shareholder would pay on fund distributions or the redemption of fund shares. During periods of reimbursement by Fidelity, a fund's total return will be greater than it would be had the reimbursement not occurred. How a fund did yesterday is no guarantee of how it will do tomorrow.
| Average Annual Total Returns |
| | | | |
Periods ended April 30, 2024 | Past 1 year | Life of Fund A |
| Fidelity® Mid-Cap Stock K6 Fund | 12.70% | 11.04% |
A From June 13, 2019
| $10,000 Over Life of Fund |
| |
Let's say hypothetically that $10,000 was invested in Fidelity® Mid-Cap Stock K6 Fund, on June 13, 2019, when the fund started. The chart shows how the value of your investment would have changed, and also shows how the S&P MidCap 400® Index performed over the same period. |
|
|
Market Recap:
U.S. equities gained 22.66% for the 12 months ending April 30, 2024, according to the S&P 500® index, driven by resilient corporate profits, a frenzy over generative artificial intelligence and the Federal Reserve's likely pivot to cutting interest rates later this year. Amid this favorable backdrop for higher-risk assets, the S&P 500® continued its late-2023 momentum and ended March at its all-time high before snapping a five-month uptrend in April (-4.08%). Growth stocks led the broad rally, mostly driven by a narrow set of firms in the communication services (+41%) and information technology (+37%) sectors, largely due to excitement for AI. In particular, semiconductor-related stocks (+104%) were a standout. Following the Fed's November 1 meeting, when the central bank hinted it might be done raising rates, the S&P 500® reversed a three-month decline and gained 14.09% in the final two months of 2023 and 10.56% the first quarter. Risk assets were further aided on March 20, when the central bank held steady its benchmark federal funds rate and affirmed its projection to cut in 2024. The index then slipped in April, as inflation remained stickier than expected, spurring doubts of a soft economic landing. For the full 12 months, the financials, industrials and consumer discretionary sectors each gained about 24%. In sharp contrast, real estate and the defensive-oriented utilities sector each roughly broke even. Other notable "laggards" included consumer staples (+3%) and health care (+7%).
Comments from Portfolio Manager Nicola Stafford:
For the fiscal year ending April 30, 2024, the fund gained 12.70%, versus 16.82% for the benchmark S&P MidCap 400 Index. Relative to the benchmark, security selection was the primary detractor, especially within energy. Security selection in consumer discretionary also hurt. Stock picks and an underweight in information technology, primarily within the technology hardware & equipment industry, also hampered the fund's result. Also detracting from our result was stock picking in materials. Not owning Super Micro Computer, a benchmark component that gained 914%, was the fund's biggest individual relative detractor. A non-benchmark stake in WNS returned roughly -53% and was a second notable relative detractor. Another notable relative detractor was our non-benchmark stake in O-I Glass (-33%). In contrast, the biggest contributor to performance versus the benchmark was an overweight in energy. Stock selection in communication services and utilities also boosted the fund's relative performance. The top individual relative contributor was our non-benchmark stake in Vertiv Holdings (+369%). This was an investment we established this period. A second notable relative contributor was an overweight in Vistra (+225%). Vistra was among the biggest holdings at period end. A non-benchmark stake in Fabrinet gained 83% and notably helped. We reduced the position. Notable changes in positioning by sector include increased exposure to information technology and a lower allocation to energy.
The views expressed above reflect those of the portfolio manager(s) only through the end of the period as stated on the cover of this report and do not necessarily represent the views of Fidelity or any other person in the Fidelity organization. Any such views are subject to change at any time based upon market or other conditions and Fidelity disclaims any responsibility to update such views. These views may not be relied on as investment advice and, because investment decisions for a Fidelity fund are based on numerous factors, may not be relied on as an indication of trading intent on behalf of any Fidelity fund.
Top Holdings (% of Fund's net assets) |
| |
| Imperial Oil Ltd. | 1.6 | |
| Vistra Corp. | 1.6 | |
| Arch Capital Group Ltd. | 1.6 | |
| American Financial Group, Inc. | 1.4 | |
| Regal Rexnord Corp. | 1.4 | |
| AECOM | 1.3 | |
| Molina Healthcare, Inc. | 1.3 | |
| Cheniere Energy, Inc. | 1.3 | |
| Performance Food Group Co. | 1.3 | |
| Chart Industries, Inc. | 1.2 | |
| | 14.0 | |
| |
| Market Sectors (% of Fund's net assets) |
| |
| Industrials | 23.7 | |
| Financials | 16.0 | |
| Consumer Discretionary | 11.6 | |
| Information Technology | 8.6 | |
| Health Care | 7.8 | |
| Materials | 7.6 | |
| Energy | 7.0 | |
| Consumer Staples | 5.0 | |
| Utilities | 4.9 | |
| Real Estate | 4.8 | |
| Communication Services | 2.5 | |
| |
Asset Allocation (% of Fund's net assets) |
|
|
Geographic Diversification (% of Fund's net assets) |
|
* Includes Short-Term investments and Net Other Assets (Liabilities). Percentages are adjusted for the effect of derivatives, if applicable. |
| |
Showing Percentage of Net Assets
| Common Stocks - 99.2% |
| | | Shares | Value ($) |
| COMMUNICATION SERVICES - 2.5% | | | |
| Entertainment - 2.1% | | | |
| Endeavor Group Holdings, Inc. | | 151,127 | 3,991,264 |
| Liberty Media Corp. Liberty Formula One Class A | | 43,121 | 2,685,145 |
| TKO Group Holdings, Inc. | | 94,000 | 8,898,980 |
| Warner Music Group Corp. Class A | | 116,888 | 3,857,304 |
| | | | 19,432,693 |
| Media - 0.4% | | | |
| Interpublic Group of Companies, Inc. | | 122,955 | 3,742,750 |
TOTAL COMMUNICATION SERVICES | | | 23,175,443 |
| CONSUMER DISCRETIONARY - 11.6% | | | |
| Automobile Components - 0.6% | | | |
| Aptiv PLC (a) | | 74,238 | 5,270,898 |
| Distributors - 0.4% | | | |
| LKQ Corp. | | 90,800 | 3,916,204 |
| Diversified Consumer Services - 0.7% | | | |
| H&R Block, Inc. | | 140,670 | 6,643,844 |
| Hotels, Restaurants & Leisure - 3.9% | | | |
| Aramark | | 228,802 | 7,209,551 |
| Caesars Entertainment, Inc. (a) | | 74,173 | 2,656,877 |
| Churchill Downs, Inc. | | 74,369 | 9,593,601 |
| Domino's Pizza, Inc. | | 14,173 | 7,501,344 |
| Flutter Entertainment PLC (a) | | 17,500 | 3,263,668 |
| Wyndham Hotels & Resorts, Inc. | | 86,742 | 6,376,404 |
| | | | 36,601,445 |
| Household Durables - 1.2% | | | |
| D.R. Horton, Inc. | | 29,107 | 4,147,456 |
| Mohawk Industries, Inc. (a) | | 21,994 | 2,536,348 |
| NVR, Inc. (a) | | 685 | 5,095,612 |
| | | | 11,779,416 |
| Leisure Products - 0.5% | | | |
| Brunswick Corp. | | 56,500 | 4,556,160 |
| Specialty Retail - 1.2% | | | |
| Burlington Stores, Inc. (a) | | 40,633 | 7,311,502 |
| Foot Locker, Inc. | | 77,409 | 1,613,978 |
| JD Sports Fashion PLC | | 1,771,700 | 2,559,185 |
| | | | 11,484,665 |
| Textiles, Apparel & Luxury Goods - 3.1% | | | |
| Brunello Cucinelli SpA | | 106,233 | 10,895,036 |
| PVH Corp. | | 96,622 | 10,512,474 |
| Tapestry, Inc. | | 187,221 | 7,473,862 |
| | | | 28,881,372 |
TOTAL CONSUMER DISCRETIONARY | | | 109,134,004 |
| CONSUMER STAPLES - 5.0% | | | |
| Beverages - 0.9% | | | |
| Boston Beer Co., Inc. Class A (a) | | 11,010 | 3,065,294 |
| Keurig Dr. Pepper, Inc. | | 164,670 | 5,549,379 |
| | | | 8,614,673 |
| Consumer Staples Distribution & Retail - 2.5% | | | |
| BJ's Wholesale Club Holdings, Inc. (a) | | 109,589 | 8,184,107 |
| Maplebear, Inc. (NASDAQ) | | 88,300 | 3,013,679 |
| Performance Food Group Co. (a) | | 175,658 | 11,923,665 |
| | | | 23,121,451 |
| Food Products - 1.2% | | | |
| Bowery Farming, Inc. warrants (a)(b)(c) | | 10,540 | 9,275 |
| Bunge Global SA | | 34,524 | 3,513,162 |
| Lamb Weston Holdings, Inc. | | 41,762 | 3,480,445 |
| Nomad Foods Ltd. | | 233,652 | 4,219,755 |
| | | | 11,222,637 |
| Household Products - 0.4% | | | |
| Energizer Holdings, Inc. | | 123,321 | 3,541,779 |
TOTAL CONSUMER STAPLES | | | 46,500,540 |
| ENERGY - 7.0% | | | |
| Energy Equipment & Services - 1.0% | | | |
| Expro Group Holdings NV (a) | | 238,681 | 4,477,656 |
| NOV, Inc. | | 268,686 | 4,968,004 |
| | | | 9,445,660 |
| Oil, Gas & Consumable Fuels - 6.0% | | | |
| Cameco Corp. (d) | | 48,800 | 2,226,744 |
| Canadian Natural Resources Ltd. | | 127,181 | 9,637,542 |
| Cheniere Energy, Inc. | | 78,589 | 12,402,916 |
| Energy Transfer LP | | 448,139 | 7,049,226 |
| Imperial Oil Ltd. | | 221,266 | 15,212,895 |
| Parkland Corp. | | 40,400 | 1,244,589 |
| Range Resources Corp. | | 243,695 | 8,751,087 |
| | | | 56,524,999 |
TOTAL ENERGY | | | 65,970,659 |
| FINANCIALS - 16.0% | | | |
| Banks - 5.5% | | | |
| BOK Financial Corp. | | 57,511 | 5,102,951 |
| First Horizon National Corp. | | 617,753 | 9,216,875 |
| Huntington Bancshares, Inc. | | 493,703 | 6,650,179 |
| M&T Bank Corp. | | 58,409 | 8,433,676 |
| PNC Financial Services Group, Inc. | | 44,113 | 6,760,758 |
| U.S. Bancorp | | 145,092 | 5,895,088 |
| Wintrust Financial Corp. | | 101,784 | 9,836,406 |
| | | | 51,895,933 |
| Capital Markets - 1.5% | | | |
| Cboe Global Markets, Inc. | | 24,896 | 4,509,910 |
| Lazard, Inc. Class A | | 96,021 | 3,696,809 |
| Raymond James Financial, Inc. | | 49,047 | 5,983,734 |
| | | | 14,190,453 |
| Financial Services - 2.3% | | | |
| Flywire Corp. (a) | | 100,900 | 2,068,450 |
| Radian Group, Inc. | | 304,881 | 9,106,795 |
| Shift4 Payments, Inc. (a)(d) | | 28,194 | 1,631,305 |
| WEX, Inc. (a) | | 39,578 | 8,361,248 |
| | | | 21,167,798 |
| Insurance - 6.7% | | | |
| American Financial Group, Inc. | | 102,281 | 13,066,398 |
| Arch Capital Group Ltd. (a) | | 158,638 | 14,838,999 |
| Beazley PLC | | 531,470 | 4,402,972 |
| First American Financial Corp. | | 157,679 | 8,446,864 |
| Hartford Financial Services Group, Inc. | | 93,093 | 9,019,781 |
| Hiscox Ltd. | | 351,787 | 5,406,778 |
| Stewart Information Services Corp. | | 33,200 | 2,058,732 |
| The Travelers Companies, Inc. | | 28,718 | 6,092,811 |
| | | | 63,333,335 |
TOTAL FINANCIALS | | | 150,587,519 |
| HEALTH CARE - 7.7% | | | |
| Biotechnology - 0.7% | | | |
| Repligen Corp. (a) | | 42,852 | 7,036,298 |
| Health Care Equipment & Supplies - 2.1% | | | |
| Dentsply Sirona, Inc. | | 83,600 | 2,508,836 |
| Hologic, Inc. (a) | | 107,118 | 8,116,331 |
| Inspire Medical Systems, Inc. (a) | | 11,542 | 2,789,240 |
| Masimo Corp. (a) | | 45,774 | 6,152,483 |
| | | | 19,566,890 |
| Health Care Providers & Services - 2.6% | | | |
| Centene Corp. (a) | | 104,317 | 7,621,400 |
| Henry Schein, Inc. (a) | | 56,105 | 3,886,954 |
| Molina Healthcare, Inc. (a) | | 36,545 | 12,502,045 |
| | | | 24,010,399 |
| Health Care Technology - 0.3% | | | |
| Evolent Health, Inc. Class A (a) | | 94,500 | 2,621,430 |
| Life Sciences Tools & Services - 0.8% | | | |
| Charles River Laboratories International, Inc. (a) | | 22,022 | 5,043,038 |
| Sartorius Stedim Biotech | | 11,543 | 2,500,694 |
| | | | 7,543,732 |
| Pharmaceuticals - 1.2% | | | |
| Elanco Animal Health, Inc. (a) | | 90,600 | 1,192,296 |
| Recordati SpA | | 73,703 | 3,936,725 |
| UCB SA | | 48,600 | 6,459,900 |
| | | | 11,588,921 |
TOTAL HEALTH CARE | | | 72,367,670 |
| INDUSTRIALS - 23.5% | | | |
| Aerospace & Defense - 2.5% | | | |
| BWX Technologies, Inc. | | 83,697 | 8,015,662 |
| Huntington Ingalls Industries, Inc. | | 22,630 | 6,266,926 |
| Woodward, Inc. | | 54,080 | 8,780,429 |
| | | | 23,063,017 |
| Air Freight & Logistics - 0.4% | | | |
| GXO Logistics, Inc. (a) | | 77,232 | 3,835,341 |
| Building Products - 1.7% | | | |
| Hayward Holdings, Inc. (a) | | 173,722 | 2,359,145 |
| Johnson Controls International PLC | | 103,249 | 6,718,412 |
| Owens Corning | | 42,067 | 7,076,090 |
| | | | 16,153,647 |
| Commercial Services & Supplies - 1.0% | | | |
| GFL Environmental, Inc. | | 309,496 | 9,876,264 |
| Construction & Engineering - 3.0% | | | |
| AECOM | | 136,450 | 12,602,522 |
| Comfort Systems U.S.A., Inc. | | 8,200 | 2,537,162 |
| EMCOR Group, Inc. | | 19,700 | 7,036,249 |
| Willscot Mobile Mini Holdings (a) | | 153,814 | 5,684,965 |
| | | | 27,860,898 |
| Electrical Equipment - 4.3% | | | |
| Acuity Brands, Inc. | | 41,608 | 10,331,266 |
| Generac Holdings, Inc. (a) | | 40,294 | 5,478,372 |
| Nextracker, Inc. Class A (a) | | 64,754 | 2,770,824 |
| Regal Rexnord Corp. | | 78,900 | 12,732,093 |
| Vertiv Holdings Co. | | 93,608 | 8,705,544 |
| | | | 40,018,099 |
| Ground Transportation - 0.8% | | | |
| Knight-Swift Transportation Holdings, Inc. Class A | | 172,821 | 7,989,515 |
| Machinery - 5.2% | | | |
| Allison Transmission Holdings, Inc. | | 104,856 | 7,712,159 |
| Atmus Filtration Technologies, Inc. | | 67,700 | 2,050,633 |
| Chart Industries, Inc. (a)(d) | | 78,678 | 11,334,353 |
| Crane Co. | | 57,512 | 8,052,255 |
| Donaldson Co., Inc. | | 151,883 | 10,965,953 |
| Energy Recovery, Inc. (a) | | 83,256 | 1,240,514 |
| Fortive Corp. | | 104,330 | 7,852,919 |
| | | | 49,208,786 |
| Professional Services - 3.2% | | | |
| Leidos Holdings, Inc. | | 55,130 | 7,730,329 |
| Science Applications International Corp. | | 57,453 | 7,394,201 |
| TransUnion | | 114,770 | 8,378,210 |
| WNS Holdings Ltd. | | 149,267 | 6,255,780 |
| | | | 29,758,520 |
| Trading Companies & Distributors - 1.4% | | | |
| Beacon Roofing Supply, Inc. (a) | | 45,623 | 4,495,234 |
| Watsco, Inc. | | 10,000 | 4,477,200 |
| WESCO International, Inc. | | 26,000 | 3,971,500 |
| | | | 12,943,934 |
TOTAL INDUSTRIALS | | | 220,708,021 |
| INFORMATION TECHNOLOGY - 8.6% | | | |
| Communications Equipment - 1.1% | | | |
| Ciena Corp. (a) | | 160,700 | 7,429,161 |
| Lumentum Holdings, Inc. (a) | | 72,898 | 3,190,016 |
| | | | 10,619,177 |
| Electronic Equipment, Instruments & Components - 3.2% | | | |
| Coherent Corp. (a) | | 80,852 | 4,416,945 |
| Crane NXT Co. | | 113,182 | 6,882,597 |
| Fabrinet (a) | | 32,830 | 5,681,888 |
| Flex Ltd. (a) | | 251,387 | 7,202,238 |
| Vontier Corp. | | 147,300 | 5,984,799 |
| | | | 30,168,467 |
| IT Services - 1.3% | | | |
| Amdocs Ltd. | | 75,301 | 6,324,531 |
| MongoDB, Inc. Class A (a) | | 16,058 | 5,864,060 |
| | | | 12,188,591 |
| Semiconductors & Semiconductor Equipment - 1.9% | | | |
| Allegro MicroSystems LLC (a) | | 153,500 | 4,557,415 |
| Lattice Semiconductor Corp. (a) | | 84,300 | 5,782,980 |
| MKS Instruments, Inc. | | 43,600 | 5,187,528 |
| ON Semiconductor Corp. (a) | | 25,800 | 1,810,128 |
| | | | 17,338,051 |
| Software - 1.1% | | | |
| Dynatrace, Inc. (a) | | 183,937 | 8,334,185 |
| Gen Digital, Inc. | | 115,500 | 2,326,170 |
| | | | 10,660,355 |
TOTAL INFORMATION TECHNOLOGY | | | 80,974,641 |
| MATERIALS - 7.6% | | | |
| Chemicals - 2.9% | | | |
| Cabot Corp. | | 84,078 | 7,670,436 |
| Celanese Corp. Class A | | 28,410 | 4,364,060 |
| CF Industries Holdings, Inc. | | 63,867 | 5,043,577 |
| Nutrien Ltd. | | 56,818 | 2,995,982 |
| Westlake Corp. | | 45,886 | 6,761,761 |
| | | | 26,835,816 |
| Containers & Packaging - 2.5% | | | |
| Avery Dennison Corp. | | 24,611 | 5,347,478 |
| Crown Holdings, Inc. | | 96,200 | 7,895,134 |
| Graphic Packaging Holding Co. | | 150,700 | 3,895,595 |
| O-I Glass, Inc. (a) | | 454,039 | 6,792,423 |
| | | | 23,930,630 |
| Metals & Mining - 2.2% | | | |
| Commercial Metals Co. | | 163,802 | 8,802,719 |
| Franco-Nevada Corp. | | 38,987 | 4,693,223 |
| Freeport-McMoRan, Inc. | | 146,846 | 7,333,489 |
| | | | 20,829,431 |
TOTAL MATERIALS | | | 71,595,877 |
| REAL ESTATE - 4.8% | | | |
| Equity Real Estate Investment Trusts (REITs) - 4.1% | | | |
| CubeSmart | | 156,500 | 6,328,860 |
| Essex Property Trust, Inc. | | 12,465 | 3,069,506 |
| Gaming & Leisure Properties | | 154,377 | 6,596,529 |
| Omega Healthcare Investors, Inc. | | 151,080 | 4,594,343 |
| Realty Income Corp. | | 180,842 | 9,682,281 |
| Ventas, Inc. | | 109,217 | 4,836,129 |
| Welltower, Inc. | | 30,484 | 2,904,516 |
| | | | 38,012,164 |
| Real Estate Management & Development - 0.7% | | | |
| Jones Lang LaSalle, Inc. (a) | | 36,260 | 6,552,182 |
TOTAL REAL ESTATE | | | 44,564,346 |
| UTILITIES - 4.9% | | | |
| Electric Utilities - 1.6% | | | |
| Alliant Energy Corp. | | 91,565 | 4,559,937 |
| FirstEnergy Corp. | | 128,515 | 4,927,265 |
| IDACORP, Inc. | | 53,531 | 5,073,668 |
| | | | 14,560,870 |
| Independent Power and Renewable Electricity Producers - 1.9% | | | |
| The AES Corp. | | 182,058 | 3,258,838 |
| Vistra Corp. | | 196,535 | 14,905,214 |
| | | | 18,164,052 |
| Multi-Utilities - 0.7% | | | |
| NiSource, Inc. | | 252,686 | 7,039,832 |
| Water Utilities - 0.7% | | | |
| Essential Utilities, Inc. | | 181,600 | 6,642,928 |
TOTAL UTILITIES | | | 46,407,682 |
| TOTAL COMMON STOCKS (Cost $780,414,774) | | | 931,986,402 |
| | | | |
| Convertible Preferred Stocks - 0.3% |
| | | Shares | Value ($) |
| CONSUMER STAPLES - 0.0% | | | |
| Food Products - 0.0% | | | |
| Bowery Farming, Inc.: | | | |
| Series C1 (a)(b)(c) | | 19,457 | 121,023 |
| Series D1 (b)(c) | | 10,540 | 41,633 |
| | | | 162,656 |
| HEALTH CARE - 0.1% | | | |
| Biotechnology - 0.1% | | | |
| National Resilience, Inc. Series B (a)(b)(c) | | 15,539 | 698,478 |
| INDUSTRIALS - 0.2% | | | |
| Construction & Engineering - 0.2% | | | |
| Beta Technologies, Inc. Series B, 6.00% (a)(b)(c) | | 11,901 | 1,487,268 |
| TOTAL CONVERTIBLE PREFERRED STOCKS (Cost $2,711,945) | | | 2,348,402 |
| | | | |
| Money Market Funds - 2.1% |
| | | Shares | Value ($) |
| Fidelity Cash Central Fund 5.39% (e) | | 6,730,488 | 6,731,834 |
| Fidelity Securities Lending Cash Central Fund 5.39% (e)(f) | | 13,095,470 | 13,096,780 |
| TOTAL MONEY MARKET FUNDS (Cost $19,828,614) | | | 19,828,614 |
| | | | |
| TOTAL INVESTMENT IN SECURITIES - 101.6% (Cost $802,955,333) | 954,163,418 |
NET OTHER ASSETS (LIABILITIES) - (1.6)% | (14,784,475) |
| NET ASSETS - 100.0% | 939,378,943 |
| | |
Legend
| (b) | Restricted securities (including private placements) - Investment in securities not registered under the Securities Act of 1933 (excluding 144A issues). At the end of the period, the value of restricted securities (excluding 144A issues) amounted to $2,357,677 or 0.3% of net assets. |
| (d) | Security or a portion of the security is on loan at period end. |
| (e) | Affiliated fund that is generally available only to investment companies and other accounts managed by Fidelity Investments. The rate quoted is the annualized seven-day yield of the fund at period end. A complete unaudited listing of the fund's holdings as of its most recent quarter end is available upon request. In addition, each Fidelity Central Fund's financial statements, which are not covered by the Fund's Report of Independent Registered Public Accounting Firm, are available on the SEC's website or upon request. |
| (f) | Investment made with cash collateral received from securities on loan. |
| Additional information on each restricted holding is as follows: |
| Security | Acquisition Date | Acquisition Cost ($) |
| Beta Technologies, Inc. Series B, 6.00% | 4/04/22 | 1,227,826 |
| | | |
| Bowery Farming, Inc. Series C1 | 5/18/21 | 1,172,271 |
| | | |
| Bowery Farming, Inc. Series D1 | 10/25/23 | 99,585 |
| | | |
| Bowery Farming, Inc. warrants | 10/25/23 | 0 |
| | | |
| National Resilience, Inc. Series B | 12/01/20 | 212,263 |
| | | |
Affiliated Central Funds
Fiscal year to date information regarding the Fund's investments in Fidelity Central Funds, including the ownership percentage, is presented below.
| Affiliate | Value, beginning of period ($) | Purchases ($) | Sales Proceeds ($) | Dividend Income ($) | Realized Gain (loss) ($) | Change in Unrealized appreciation (depreciation) ($) | Value, end of period ($) | % ownership, end of period |
| Fidelity Cash Central Fund 5.39% | 19,537,899 | 226,619,559 | 239,424,693 | 536,955 | (931) | - | 6,731,834 | 0.0% |
| Fidelity Securities Lending Cash Central Fund 5.39% | 23,296,425 | 151,140,378 | 161,340,023 | 68,659 | - | - | 13,096,780 | 0.0% |
| Total | 42,834,324 | 377,759,937 | 400,764,716 | 605,614 | (931) | - | 19,828,614 | |
| | | | | | | | | |
Amounts in the dividend income column in the above table include any capital gain distributions from underlying funds, which are presented in the corresponding line item in the Statement of Operations, if applicable.
Amounts in the dividend income column for Fidelity Securities Lending Cash Central Fund represents the income earned on investing cash collateral, less rebates paid to borrowers and any lending agent fees associated with the loan, plus any premium payments received for lending certain types of securities.
Amounts included in the purchases and sales proceeds columns may include in-kind transactions, if applicable.
Investment Valuation
The following is a summary of the inputs used, as of April 30, 2024, involving the Fund's assets and liabilities carried at fair value. The inputs or methodology used for valuing securities may not be an indication of the risk associated with investing in those securities. For more information on valuation inputs, and their aggregation into the levels used below, please refer to the Investment Valuation section in the accompanying Notes to Financial Statements.
| Valuation Inputs at Reporting Date: |
| Description | Total ($) | Level 1 ($) | Level 2 ($) | Level 3 ($) |
Investments in Securities: | | | | |
|
| Equities: | | | | |
Communication Services | 23,175,443 | 23,175,443 | - | - |
Consumer Discretionary | 109,134,004 | 109,134,004 | - | - |
Consumer Staples | 46,663,196 | 46,491,265 | - | 171,931 |
Energy | 65,970,659 | 65,970,659 | - | - |
Financials | 150,587,519 | 150,587,519 | - | - |
Health Care | 73,066,148 | 72,367,670 | - | 698,478 |
Industrials | 222,195,289 | 220,708,021 | - | 1,487,268 |
Information Technology | 80,974,641 | 80,974,641 | - | - |
Materials | 71,595,877 | 71,595,877 | - | - |
Real Estate | 44,564,346 | 44,564,346 | - | - |
Utilities | 46,407,682 | 46,407,682 | - | - |
|
| Money Market Funds | 19,828,614 | 19,828,614 | - | - |
| Total Investments in Securities: | 954,163,418 | 951,805,741 | - | 2,357,677 |
| Statement of Assets and Liabilities |
| | | | April 30, 2024 |
| | | | | |
| Assets | | | | |
| Investment in securities, at value (including securities loaned of $12,332,749) - See accompanying schedule: | | | | |
Unaffiliated issuers (cost $783,126,719) | $ | 934,334,804 | | |
Fidelity Central Funds (cost $19,828,614) | | 19,828,614 | | |
| | | | | |
| | | | | |
| Total Investment in Securities (cost $802,955,333) | | | $ | 954,163,418 |
| Cash | | | | 8,391 |
| Foreign currency held at value (cost $49,396) | | | | 49,407 |
| Receivable for investments sold | | | | 132,424 |
| Receivable for fund shares sold | | | | 112,913 |
| Dividends receivable | | | | 584,752 |
| Distributions receivable from Fidelity Central Funds | | | | 40,693 |
| Other receivables | | | | 981 |
Total assets | | | | 955,092,979 |
| Liabilities | | | | |
| Payable for investments purchased | $ | 668,232 | | |
| Payable for fund shares redeemed | | 1,592,568 | | |
| Accrued management fee | | 356,890 | | |
| Collateral on securities loaned | | 13,096,346 | | |
| Total liabilities | | | | 15,714,036 |
| Net Assets | | | $ | 939,378,943 |
| Net Assets consist of: | | | | |
| Paid in capital | | | $ | 801,456,403 |
| Total accumulated earnings (loss) | | | | 137,922,540 |
| Net Assets | | | $ | 939,378,943 |
Net Asset Value, offering price and redemption price per share ($939,378,943 ÷ 62,312,102 shares) | | | $ | 15.08 |
| Statement of Operations |
| | | | Year ended April 30, 2024 |
| Investment Income | | | | |
| Dividends | | | $ | 14,381,814 |
| Interest | | | | 349 |
| Income from Fidelity Central Funds (including $68,659 from security lending) | | | | 605,614 |
| Total income | | | | 14,987,777 |
| Expenses | | | | |
| Management fee | $ | 3,980,655 | | |
| Independent trustees' fees and expenses | | 4,320 | | |
| Interest | | 9,424 | | |
| Total expenses before reductions | | 3,994,399 | | |
| Expense reductions | | (3,421) | | |
| Total expenses after reductions | | | | 3,990,978 |
| Net Investment income (loss) | | | | 10,996,799 |
| Realized and Unrealized Gain (Loss) | | | | |
| Net realized gain (loss) on: | | | | |
| Investment Securities: | | | | |
| Unaffiliated issuers | | 17,383,696 | | |
| Fidelity Central Funds | | (931) | | |
| Foreign currency transactions | | (11,099) | | |
| Total net realized gain (loss) | | | | 17,371,666 |
| Change in net unrealized appreciation (depreciation) on: | | | | |
| Investment Securities: | | | | |
| Unaffiliated issuers | | 81,373,817 | | |
| Assets and liabilities in foreign currencies | | (1,494) | | |
| Total change in net unrealized appreciation (depreciation) | | | | 81,372,323 |
| Net gain (loss) | | | | 98,743,989 |
| Net increase (decrease) in net assets resulting from operations | | | $ | 109,740,788 |
| Statement of Changes in Net Assets |
| |
| | Year ended April 30, 2024 | | Year ended April 30, 2023 |
| Increase (Decrease) in Net Assets | | | | |
| Operations | | | | |
| Net investment income (loss) | $ | 10,996,799 | $ | 9,879,796 |
| Net realized gain (loss) | | 17,371,666 | | (15,737,132) |
| Change in net unrealized appreciation (depreciation) | | 81,372,323 | | 25,488,593 |
| Net increase (decrease) in net assets resulting from operations | | 109,740,788 | | 19,631,257 |
| Distributions to shareholders | | (9,307,425) | | (16,927,430) |
| | | | | |
| Share transactions | | | | |
| Proceeds from sales of shares | | 260,593,698 | | 410,750,484 |
| Reinvestment of distributions | | 9,307,425 | | 16,927,430 |
| Cost of shares redeemed | | (253,923,755) | | (183,950,405) |
| | | | | |
Net increase (decrease) in net assets resulting from share transactions | | 15,977,368 | | 243,727,509 |
| Total increase (decrease) in net assets | | 116,410,731 | | 246,431,336 |
| | | | | |
| Net Assets | | | | |
| Beginning of period | | 822,968,212 | | 576,536,876 |
| End of period | $ | 939,378,943 | $ | 822,968,212 |
| | | | | |
| Other Information | | | | |
| Shares | | | | |
| Sold | | 18,703,595 | | 31,165,672 |
| Issued in reinvestment of distributions | | 663,948 | | 1,289,203 |
| Redeemed | | (17,920,946) | | (13,767,167) |
| Net increase (decrease) | | 1,446,597 | | 18,687,708 |
| | | | | |
Financial Highlights
Fidelity® Mid-Cap Stock K6 Fund |
| |
| Years ended April 30, | | 2024 | | 2023 | | 2022 | | 2021 | | 2020 A |
Selected Per-Share Data | | | | | | | | | | |
| Net asset value, beginning of period | $ | 13.52 | $ | 13.67 | $ | 14.13 | $ | 8.78 | $ | 10.00 |
| Income from Investment Operations | | | | | | | | | | |
Net investment income (loss) B,C | | .18 | | .21 | | .19 | | .15 | | .11 |
| Net realized and unrealized gain (loss) | | 1.53 | | .03 | | (.07) | | 5.37 | | (1.27) |
| Total from investment operations | | 1.71 | | .24 | | .12 | | 5.52 | | (1.16) |
| Distributions from net investment income | | (.15) | | (.17) | | (.13) | | (.17) | | (.06) |
| Distributions from net realized gain | | - | | (.21) | | (.45) | | - | | - |
| Total distributions | | (.15) | | (.39) D | | (.58) | | (.17) | | (.06) |
| Net asset value, end of period | $ | 15.08 | $ | 13.52 | $ | 13.67 | $ | 14.13 | $ | 8.78 |
Total Return E,F | | | | 1.82% | | .78% | | 63.39% | | (11.74)% |
Ratios to Average Net Assets C,G,H | | | | | | | | | | |
| Expenses before reductions | | .45% | | .45% | | .45% | | .45% | | .45% I |
| Expenses net of fee waivers, if any | | | | .45% | | .45% | | .45% | | .45% I |
| Expenses net of all reductions | | .45% | | .45% | | .45% | | .44% | | .45% I |
| Net investment income (loss) | | 1.24% | | 1.58% | | 1.35% | | 1.35% | | 1.29% I |
| Supplemental Data | | | | | | | | | | |
| Net assets, end of period (000 omitted) | $ | 939,379 | $ | 822,968 | $ | 576,537 | $ | 319,924 | $ | 108,435 |
Portfolio turnover rate J | | | | 34% K | | 40% K | | 61% K | | 52% I,K |
AFor the period June 13, 2019 (commencement of operations) through April 30, 2020.
BCalculated based on average shares outstanding during the period.
CNet investment income (loss) is affected by the timing of the declaration of dividends by any underlying mutual funds or exchange-traded funds (ETFs). Net investment income (loss) of any mutual funds or ETFs is not included in the Fund's net investment income (loss) ratio.
DTotal distributions per share do not sum due to rounding.
ETotal returns for periods of less than one year are not annualized.
FTotal returns would have been lower if certain expenses had not been reduced during the applicable periods shown.
GFees and expenses of any underlying mutual funds or exchange-traded funds (ETFs) are not included in the Fund's expense ratio. The Fund indirectly bears its proportionate share of these expenses. For additional expense information related to investments in Fidelity Central Funds, please refer to the "Investments in Fidelity Central Funds" note found in the Notes to Financial Statements section of the most recent Annual or Semi-Annual report.
HExpense ratios reflect operating expenses of the class. Expenses before reductions do not reflect amounts reimbursed, waived, or reduced through arrangements with the investment adviser, brokerage services, or other offset arrangements, if applicable, and do not represent the amount paid by the class during periods when reimbursements, waivers or reductions occur.
IAnnualized.
JAmount does not include the portfolio activity of any underlying mutual funds or exchange-traded funds (ETFs).
KPortfolio turnover rate excludes securities received or delivered in-kind.
For the period ended April 30, 2024
1. Organization.
Fidelity Mid-Cap Stock K6 Fund (the Fund) is a fund of Fidelity Concord Street Trust (the Trust) and is authorized to issue an unlimited number of shares. Share transactions on the Statement of Changes in Net Assets may contain exchanges between affiliated funds. The Trust is registered under the Investment Company Act of 1940, as amended (the 1940 Act), as an open-end management investment company organized as a Massachusetts business trust. Shares generally are available only to employer-sponsored retirement plans that are recordkept by Fidelity, or to certain employer-sponsored retirement plans that are not recordkept by Fidelity.
2. Investments in Fidelity Central Funds.
Funds may invest in Fidelity Central Funds, which are open-end investment companies generally available only to other investment companies and accounts managed by the investment adviser and its affiliates. The Schedule of Investments lists any Fidelity Central Funds held as an investment as of period end, but does not include the underlying holdings of each Fidelity Central Fund. An investing fund indirectly bears its proportionate share of the expenses of the underlying Fidelity Central Funds.
Based on its investment objective, each Fidelity Central Fund may invest or participate in various investment vehicles or strategies that are similar to those of the investing fund. These strategies are consistent with the investment objectives of the investing fund and may involve certain economic risks which may cause a decline in value of each of the Fidelity Central Funds and thus a decline in the value of the investing fund.
| Fidelity Central Fund | Investment Manager | Investment Objective | Investment Practices | Expense RatioA |
| Fidelity Money Market Central Funds | Fidelity Management & Research Company LLC (FMR) | Each fund seeks to obtain a high level of current income consistent with the preservation of capital and liquidity. | Short-term Investments | Less than .005% |
A Expenses expressed as a percentage of average net assets and are as of each underlying Central Fund's most recent annual or semi-annual shareholder report.
A complete unaudited list of holdings for each Fidelity Central Fund is available upon request or at the Securities and Exchange Commission website at www.sec.gov. In addition, the financial statements of the Fidelity Central Funds which contain the significant accounting policies (including investment valuation policies) of those funds, and are not covered by the Report of Independent Registered Public Accounting Firm, are available on the Securities and Exchange Commission website or upon request.
3. Significant Accounting Policies.
The Fund is an investment company and applies the accounting and reporting guidance of the Financial Accounting Standards Board (FASB) Accounting Standards Codification Topic 946 Financial Services - Investment Companies. The financial statements have been prepared in conformity with accounting principles generally accepted in the United States of America (GAAP), which require management to make certain estimates and assumptions at the date of the financial statements. Actual results could differ from those estimates. Subsequent events, if any, through the date that the financial statements were issued have been evaluated in the preparation of the financial statements. The Fund's Schedule of Investments lists any underlying mutual funds or exchange-traded funds (ETFs) but does not include the underlying holdings of these funds. The following summarizes the significant accounting policies of the Fund:
Investment Valuation. Investments are valued as of 4:00 p.m. Eastern time on the last calendar day of the period. The Board of Trustees (the Board) has designated the Fund's investment adviser as the valuation designee responsible for the fair valuation function and performing fair value determinations as needed. The investment adviser has established a Fair Value Committee (the Committee) to carry out the day-to-day fair valuation responsibilities and has adopted policies and procedures to govern the fair valuation process and the activities of the Committee. In accordance with these fair valuation policies and procedures, which have been approved by the Board, the Fund attempts to obtain prices from one or more third party pricing services or brokers to value its investments. When current market prices, quotations or currency exchange rates are not readily available or reliable, investments will be fair valued in good faith by the Committee, in accordance with the policies and procedures. Factors used in determining fair value vary by investment type and may include market or investment specific events, transaction data, estimated cash flows, and market observations of comparable investments. The frequency that the fair valuation procedures are used cannot be predicted and they may be utilized to a significant extent. The Committee manages the Fund's fair valuation practices and maintains the fair valuation policies and procedures. The Fund's investment adviser reports to the Board information regarding the fair valuation process and related material matters.
The Fund categorizes the inputs to valuation techniques used to value its investments into a disclosure hierarchy consisting of three levels as shown below:
Level 1 - unadjusted quoted prices in active markets for identical investments
Level 2 - other significant observable inputs (including quoted prices for similar investments, interest rates, prepayment speeds, etc.)
Level 3 - unobservable inputs (including the Fund's own assumptions based on the best information available)
Valuation techniques used to value the Fund's investments by major category are as follows:
Equity securities, including restricted securities, for which market quotations are readily available, are valued at the last reported sale price or official closing price as reported by a third party pricing service on the primary market or exchange on which they are traded and are categorized as Level 1 in the hierarchy. In the event there were no sales during the day or closing prices are not available, securities are valued at the last quoted bid price or may be valued using the last available price and are generally categorized as Level 2 in the hierarchy. For foreign equity securities, when market or security specific events arise, comparisons to the valuation of American Depositary Receipts (ADRs), futures contracts, Exchange-Traded Funds (ETFs) and certain indexes as well as quoted prices for similar securities may be used and would be categorized as Level 2 in the hierarchy. For equity securities, including restricted securities, where observable inputs are limited, assumptions about market activity and risk are used and these securities may be categorized as Level 3 in the hierarchy.
Investments in open-end mutual funds, including the Fidelity Central Funds, are valued at their closing net asset value (NAV) each business day and are categorized as Level 1 in the hierarchy.
Changes in valuation techniques may result in transfers in or out of an assigned level within the disclosure hierarchy. The aggregate value of investments by input level as of April 30, 2024 is included at the end of the Fund's Schedule of Investments.
Foreign Currency. Certain Funds may use foreign currency contracts to facilitate transactions in foreign-denominated securities. Gains and losses from these transactions may arise from changes in the value of the foreign currency or if the counterparties do not perform under the contracts' terms.
Foreign-denominated assets, including investment securities, and liabilities are translated into U.S. dollars at the exchange rates at period end. Purchases and sales of investment securities, income and dividends received, and expenses denominated in foreign currencies are translated into U.S. dollars at the exchange rate in effect on the transaction date.
The effects of exchange rate fluctuations on investments are included with the net realized and unrealized gain (loss) on investment securities. Other foreign currency transactions resulting in realized and unrealized gain (loss) are disclosed separately.
Investment Transactions and Income. For financial reporting purposes, the Fund's investment holdings and NAV include trades executed through the end of the last business day of the period. The NAV per share for processing shareholder transactions is calculated as of the close of business of the New York Stock Exchange (NYSE), normally 4:00 p.m. Eastern time and includes trades executed through the end of the prior business day. Gains and losses on securities sold are determined on the basis of identified cost and include proceeds received from litigation. Commissions paid to certain brokers with whom the investment adviser, or its affiliates, places trades on behalf of a fund include an amount in addition to trade execution, which may be rebated back to a fund. Any such rebates are included in net realized gain (loss) on investments in the Statement of Operations. Dividend income is recorded on the ex-dividend date, except for certain dividends from foreign securities where the ex-dividend date may have passed, which are recorded as soon as the Fund is informed of the ex-dividend date. Non-cash dividends included in dividend income, if any, are recorded at the fair market value of the securities received. Income and capital gain distributions from Fidelity Central Funds, if any, are recorded on the ex-dividend date. Certain distributions received by the Fund represent a return of capital or capital gain. The Fund determines the components of these distributions subsequent to the ex-dividend date, based upon receipt of tax filings or other correspondence relating to the underlying investment. These distributions are recorded as a reduction of cost of investments and/or as a realized gain. Interest income is accrued as earned and includes coupon interest and amortization of premium and accretion of discount on debt securities as applicable. Investment income is recorded net of foreign taxes withheld where recovery of such taxes is uncertain. Funds may file withholding tax reclaims in certain jurisdictions to recover a portion of amounts previously withheld. Any withholding tax reclaims income is included in the Statement of Operations in dividends. Any receivables for withholding tax reclaims are included in the Statement of Assets and Liabilities in dividends receivable.
Expenses. Expenses directly attributable to a fund are charged to that fund. Expenses attributable to more than one fund are allocated among the respective funds on the basis of relative net assets or other appropriate methods. Expenses included in the accompanying financial statements reflect the expenses of that fund and do not include any expenses associated with any underlying mutual funds or exchange-traded funds. Although not included in a fund's expenses, a fund indirectly bears its proportionate share of these expenses through the net asset value of each underlying mutual fund or exchange-traded fund. Expense estimates are accrued in the period to which they relate and adjustments are made when actual amounts are known.
Income Tax Information and Distributions to Shareholders. Each year, the Fund intends to qualify as a regulated investment company under Subchapter M of the Internal Revenue Code, including distributing substantially all of its taxable income and realized gains. As a result, no provision for U.S. Federal income taxes is required. As of April 30, 2024, the Fund did not have any unrecognized tax benefits in the financial statements; nor is the Fund aware of any tax positions for which it is reasonably possible that the total amounts of unrecognized tax benefits will significantly change in the next twelve months. The Fund files a U.S. federal tax return, in addition to state and local tax returns as required. The Fund's federal income tax returns are subject to examination by the Internal Revenue Service (IRS) for a period of three fiscal years after they are filed. State and local tax returns may be subject to examination for an additional fiscal year depending on the jurisdiction. Foreign taxes are provided for based on the Fund's understanding of the tax rules and rates that exist in the foreign markets in which it invests.
Distributions are declared and recorded on the ex-dividend date. Income and capital gain distributions are determined in accordance with income tax regulations, which may differ from GAAP.
Capital accounts within the financial statements are adjusted for permanent book-tax differences. These adjustments have no impact on net assets or the results of operations. Capital accounts are not adjusted for temporary book-tax differences which will reverse in a subsequent period.
Book-tax differences are primarily due to foreign currency transactions, passive foreign investment companies (PFIC), partnerships, capital loss carryforwards and losses deferred due to wash sales.
As of period end, the cost and unrealized appreciation (depreciation) in securities, and derivatives if applicable, for federal income tax purposes were as follows:
| Gross unrealized appreciation | $181,801,064 |
| Gross unrealized depreciation | (34,305,075) |
| Net unrealized appreciation (depreciation) | $147,495,989 |
| Tax Cost | $806,667,429 |
The tax-based components of distributable earnings as of period end were as follows:
| Undistributed ordinary income | $5,596,648 |
| Capital loss carryforward | $(14,779,572) |
| Net unrealized appreciation (depreciation) on securities and other investments | $147,105,463 |
Capital loss carryforwards are only available to offset future capital gains of the Fund to the extent provided by regulations and may be limited. The capital loss carryforward information presented below, including any applicable limitation, is estimated as of fiscal period end and is subject to adjustment.
Short-term | $(14,779,572) |
| Total capital loss carryforward | $(14,779,572) |
The tax character of distributions paid was as follows:
| | April 30, 2024 | April 30, 2023 |
| Ordinary Income | $9,307,425 | $ 7,865,886 |
| Long-term Capital Gains | - | 9,061,544 |
| Total | $9,307,425 | $ 16,927,430 |
Restricted Securities (including Private Placements). Funds may invest in securities that are subject to legal or contractual restrictions on resale. These securities generally may be resold in transactions exempt from registration or to the public if the securities are registered. Disposal of these securities may involve time-consuming negotiations and expense, and prompt sale at an acceptable price may be difficult. Information regarding restricted securities held at period end is included at the end of the Schedule of Investments, if applicable.
4. Purchases and Sales of Investments.
Purchases and sales of securities, other than short-term securities and in-kind transactions, as applicable, are noted in the table below.
| | Purchases ($) | Sales ($) |
| Fidelity Mid-Cap Stock K6 Fund | 441,547,698 | 469,364,518 |
Unaffiliated Exchanges In-Kind. Shares that were exchanged for investments, including accrued interest and cash, if any, are shown in the table below. The amount of in-kind exchanges is included in share transactions in the accompanying Statement of Changes in Net Assets.
| | Shares | Total Proceeds ($) | |
| Fidelity Mid-Cap Stock K6 Fund | 4,708,453 | 61,987,359 | |
Prior Fiscal Year Unaffiliated Redemptions In-Kind. Shares that were redeemed in-kind for investments, including accrued interest and cash, if any, are shown in the table below; along with realized gain or loss on investments delivered through in-kind redemptions. The amount of the in-kind redemptions is included in share transactions in the accompanying Statement of Changes in Net Assets. There was no gain or loss for federal income tax purposes.
| | Shares | Total net realized gain or loss ($) | Total Proceeds ($) | |
| Fidelity Mid-Cap Stock K6 Fund | 4,189,666 | 16,581,447 | 56,686,184 | |
Prior Year Unaffiliated Exchanges In-Kind. Shares that were exchanged for investments, including accrued interest and cash, if any, are shown in the table below. The amount of in-kind exchanges is included in share transactions in the accompanying Statement of Changes in Net Assets.
| | Shares | Total Proceeds ($) | |
| Fidelity Mid-Cap Stock K6 Fund | 18,276,381 | 237,757,517 | |
| | | | |
5. Fees and Other Transactions with Affiliates.
Management Fee. Fidelity Management & Research Company LLC (the investment adviser) and its affiliates provide the Fund with investment management related services for which the Fund pays a monthly management fee that is based on an annual rate of .45% of average net assets. Under the management contract, the investment adviser or an affiliate pays all other expenses of the Fund, excluding fees and expenses of the independent Trustees, and certain miscellaneous expenses such as proxy and shareholder meeting expenses.
Brokerage Commissions. A portion of portfolio transactions were placed with brokerage firms which are affiliates of the investment adviser. Brokerage commissions are included in net realized gain (loss) and change in net unrealized appreciation (depreciation) in the Statement of Operations. The commissions paid to these affiliated firms were as follows:
| | Amount ($) |
| Fidelity Mid-Cap Stock K6 Fund | 7,098 |
Interfund Lending Program. Pursuant to an Exemptive Order issued by the Securities and Exchange Commission (the SEC), the Fund, along with other registered investment companies having management contracts with Fidelity Management & Research Company LLC (FMR), or other affiliated entities of FMR, may participate in an interfund lending program. This program provides an alternative credit facility allowing the Fund to borrow from, or lend money to, other participating affiliated funds. Activity in this program during the period for which loans were outstanding was as follows:
| | Borrower or Lender | Average Loan Balance ($) | Weighted Average Interest Rate | Interest Expense ($) |
| Fidelity Mid-Cap Stock K6 Fund | Borrower | 15,197,250 | 5.58% | 9,424 |
Interfund Trades. Funds may purchase from or sell securities to other Fidelity Funds under procedures adopted by the Board. The procedures have been designed to ensure these interfund trades are executed in accordance with Rule 17a-7 of the 1940 Act. Any interfund trades are included within the respective purchases and sales amounts shown in the Purchases and Sales of Investments note. Interfund trades during the period are noted in the table below.
| | Purchases ($) | Sales ($) | Realized Gain (Loss)($) |
| Fidelity Mid-Cap Stock K6 Fund | 19,879,388 | 17,249,201 | (2,087,699) |
Sub-Advisory Arrangements. Effective March 1, 2024, the Fund's sub-advisory agreements with FMR Investment Management (UK) Limited, Fidelity Management & Research (Hong Kong) Limited, and Fidelity Management & Research (Japan) Limited were amended to provide that the investment adviser pays each sub-adviser monthly fees equal to 110% of the sub-adviser's costs for providing sub-advisory services.
6. Committed Line of Credit.
Certain Funds participate with other funds managed by the investment adviser or an affiliate in a $4.25 billion credit facility (the "line of credit") to be utilized for temporary or emergency purposes to fund shareholder redemptions or for other short-term liquidity purposes. The commitment fees on the pro-rata portion of the line of credit are borne by the investment adviser. During the period, there were no borrowings on this line of credit.
7. Security Lending.
Funds lend portfolio securities from time to time in order to earn additional income. Lending agents are used, including National Financial Services (NFS), an affiliate of the investment adviser. Pursuant to a securities lending agreement, NFS will receive a fee, which is capped at 9.9% of a fund's daily lending revenue, for its services as lending agent. A fund may lend securities to certain qualified borrowers, including NFS. On the settlement date of the loan, a fund receives collateral (in the form of U.S. Treasury obligations, letters of credit and/or cash) against the loaned securities and maintains collateral in an amount not less than 100% of the market value of the loaned securities during the period of the loan. The market value of the loaned securities is determined at the close of business of a fund and any additional required collateral is delivered to a fund on the next business day. A fund or borrower may terminate the loan at any time, and if the borrower defaults on its obligation to return the securities loaned because of insolvency or other reasons, a fund may apply collateral received from the borrower against the obligation. A fund may experience delays and costs in recovering the securities loaned. Any cash collateral received is invested in the Fidelity Securities Lending Cash Central Fund. Any loaned securities are identified as such in the Schedule of Investments, and the value of loaned securities and cash collateral at period end, as applicable, are presented in the Statement of Assets and Liabilities. Security lending income represents the income earned on investing cash collateral, less rebates paid to borrowers and any lending agent fees associated with the loan, plus any premium payments received for lending certain types of securities. Security lending income is presented in the Statement of Operations as a component of income from Fidelity Central Funds. Affiliated security lending activity, if any, was as follows:
| | Total Security Lending Fees Paid to NFS ($) | Security Lending Income From Securities Loaned to NFS ($) | Value of Securities Loaned to NFS at Period End ($) |
| Fidelity Mid-Cap Stock K6 Fund | 7,407 | 1 | - |
8. Expense Reductions.
Through arrangements with the Fund's custodian, credits realized as a result of certain uninvested cash balances were used to reduce the Fund's expenses by $3,421.
9. Other.
A fund's organizational documents provide former and current trustees and officers with a limited indemnification against liabilities arising in connection with the performance of their duties to the fund. In the normal course of business, a fund may also enter into contracts that provide general indemnifications. A fund's maximum exposure under these arrangements is unknown as this would be dependent on future claims that may be made against a fund. The risk of material loss from such claims is considered remote.
10. Risk and Uncertainties.
Many factors affect a fund's performance. Developments that disrupt global economies and financial markets, such as pandemics, epidemics, outbreaks of infectious diseases, war, terrorism, and environmental disasters, may significantly affect a fund's investment performance. The effects of these developments to a fund will be impacted by the types of securities in which a fund invests, the financial condition, industry, economic sector, and geographic location of an issuer, and a fund's level of investment in the securities of that issuer. Significant concentrations in security types, issuers, industries, sectors, and geographic locations may magnify the factors that affect a fund's performance.
To the Board of Trustees of Fidelity Concord Street Trust and Shareholders of Fidelity Mid-Cap Stock K6 Fund
Opinion on the Financial Statements
We have audited the accompanying statement of assets and liabilities, including the schedule of investments, of Fidelity Mid-Cap Stock K6 Fund (one of the funds constituting Fidelity Concord Street Trust, referred to hereafter as the "Fund") as of April 30, 2024, the related statement of operations for the year ended April 30, 2024, the statement of changes in net assets for each of the two years in the period ended April 30, 2024, including the related notes, and the financial highlights for each of the four years in the period ended April 30, 2024 and for the period June 13, 2019 (commencement of operations) through April 30, 2020 (collectively referred to as the "financial statements"). In our opinion, the financial statements present fairly, in all material respects, the financial position of the Fund as of April 30, 2024, the results of its operations for the year then ended, the changes in its net assets for each of the two years in the period ended April 30, 2024 and the financial highlights for each of the four years in the period ended April 30, 2024 and for the period June 13, 2019 (commencement of operations) through April 30, 2020 in conformity with accounting principles generally accepted in the United States of America.
Basis for Opinion
These financial statements are the responsibility of the Fund's management. Our responsibility is to express an opinion on the Fund's financial statements based on our audits. We are a public accounting firm registered with the Public Company Accounting Oversight Board (United States) (PCAOB) and are required to be independent with respect to the Fund in accordance with the U.S. federal securities laws and the applicable rules and regulations of the Securities and Exchange Commission and the PCAOB.
We conducted our audits of these financial statements in accordance with the standards of the PCAOB. Those standards require that we plan and perform the audit to obtain reasonable assurance about whether the financial statements are free of material misstatement, whether due to error or fraud.
Our audits included performing procedures to assess the risks of material misstatement of the financial statements, whether due to error or fraud, and performing procedures that respond to those risks. Such procedures included examining, on a test basis, evidence regarding the amounts and disclosures in the financial statements. Our audits also included evaluating the accounting principles used and significant estimates made by management, as well as evaluating the overall presentation of the financial statements. Our procedures included confirmation of securities owned as of April 30, 2024 by correspondence with the custodian, issuers of privately offered securities and brokers; when replies were not received from brokers, we performed other auditing procedures. We believe that our audits provide a reasonable basis for our opinion.
/s/ PricewaterhouseCoopers LLP
Boston, Massachusetts
June 14, 2024
We have served as the auditor of one or more investment companies in the Fidelity group of funds since 1932.
The Trustees, Members of the Advisory Board (if any), and officers of the trust and fund, as applicable, are listed below. The Board of Trustees governs the fund and is responsible for protecting the interests of shareholders. The Trustees are experienced executives who meet periodically throughout the year to oversee the fund's activities, review contractual arrangements with companies that provide services to the fund, oversee management of the risks associated with such activities and contractual arrangements, and review the fund's performance. Except for Jonathan Chiel, each of the Trustees oversees 323 funds. Mr. Chiel oversees 192 funds.
The Trustees hold office without limit in time except that (a) any Trustee may resign; (b) any Trustee may be removed by written instrument, signed by at least two-thirds of the number of Trustees prior to such removal; (c) any Trustee who requests to be retired or who has become incapacitated by illness or injury may be retired by written instrument signed by a majority of the other Trustees; and (d) any Trustee may be removed at any special meeting of shareholders by a two-thirds vote of the outstanding voting securities of the trust. Each Trustee who is not an interested person (as defined in the 1940 Act) of the trust and the fund is referred to herein as an Independent Trustee. Each Independent Trustee shall retire not later than the last day of the calendar year in which his or her 75th birthday occurs. The Independent Trustees may waive this mandatory retirement age policy with respect to individual Trustees. Officers and Advisory Board Members hold office without limit in time, except that any officer or Advisory Board Member may resign or may be removed by a vote of a majority of the Trustees at any regular meeting or any special meeting of the Trustees. Except as indicated, each individual has held the office shown or other offices in the same company for the past five years.
The fund's Statement of Additional Information (SAI) includes more information about the Trustees. To request a free copy, call Fidelity at 1-800-835-5092.
Experience, Skills, Attributes, and Qualifications of the Trustees. The Governance and Nominating Committee has adopted a statement of policy that describes the experience, qualifications, attributes, and skills that are necessary and desirable for potential Independent Trustee candidates (Statement of Policy). The Board believes that each Trustee satisfied at the time he or she was initially elected or appointed a Trustee, and continues to satisfy, the standards contemplated by the Statement of Policy. The Governance and Nominating Committee also engages professional search firms to help identify potential Independent Trustee candidates who have the experience, qualifications, attributes, and skills consistent with the Statement of Policy. From time to time, additional criteria based on the composition and skills of the current Independent Trustees, as well as experience or skills that may be appropriate in light of future changes to board composition, business conditions, and regulatory or other developments, have also been considered by the professional search firms and the Governance and Nominating Committee. In addition, the Board takes into account the Trustees' commitment and participation in Board and committee meetings, as well as their leadership of standing and ad hoc committees throughout their tenure.
In determining that a particular Trustee was and continues to be qualified to serve as a Trustee, the Board has considered a variety of criteria, none of which, in isolation, was controlling. The Board believes that, collectively, the Trustees have balanced and diverse experience, qualifications, attributes, and skills, which allow the Board to operate effectively in governing the fund and protecting the interests of shareholders. Information about the specific experience, skills, attributes, and qualifications of each Trustee, which in each case led to the Board's conclusion that the Trustee should serve (or continue to serve) as a trustee of the fund, is provided below.
Board Structure and Oversight Function. Robert A. Lawrence is an interested person and currently serves as Chair. The Trustees have determined that an interested Chair is appropriate and benefits shareholders because an interested Chair has a personal and professional stake in the quality and continuity of services provided to the fund. Independent Trustees exercise their informed business judgment to appoint an individual of their choosing to serve as Chair, regardless of whether the Trustee happens to be independent or a member of management. The Independent Trustees have determined that they can act independently and effectively without having an Independent Trustee serve as Chair and that a key structural component for assuring that they are in a position to do so is for the Independent Trustees to constitute a substantial majority for the Board. The Independent Trustees also regularly meet in executive session. David M. Thomas serves as Lead Independent Trustee and as such (i) acts as a liaison between the Independent Trustees and management with respect to matters important to the Independent Trustees and (ii) with management prepares agendas for Board meetings.
Fidelity® funds are overseen by different Boards of Trustees. The fund's Board oversees Fidelity's high income and certain equity funds, and other Boards oversee Fidelity's alternative investment, investment-grade bond, money market, asset allocation, and other equity funds. The asset allocation funds may invest in Fidelity® funds overseen by the fund's Board. The use of separate Boards, each with its own committee structure, allows the Trustees of each group of Fidelity® funds to focus on the unique issues of the funds they oversee, including common research, investment, and operational issues. On occasion, the separate Boards establish joint committees to address issues of overlapping consequences for the Fidelity® funds overseen by each Board.
The Trustees operate using a system of committees to facilitate the timely and efficient consideration of all matters of importance to the Trustees, the fund, and fund shareholders and to facilitate compliance with legal and regulatory requirements and oversight of the fund's activities and associated risks. The Board, acting through its committees, has charged FMR and its affiliates with (i) identifying events or circumstances the occurrence of which could have demonstrably adverse effects on the fund's business and/or reputation; (ii) implementing processes and controls to lessen the possibility that such events or circumstances occur or to mitigate the effects of such events or circumstances if they do occur; and (iii) creating and maintaining a system designed to evaluate continuously business and market conditions in order to facilitate the identification and implementation processes described in (i) and (ii) above. Because the day-to-day operations and activities of the fund are carried out by or through FMR, its affiliates, and other service providers, the fund's exposure to risks is mitigated but not eliminated by the processes overseen by the Trustees. While each of the Board's committees has responsibility for overseeing different aspects of the fund's activities, oversight is exercised primarily through the Operations, Audit, and Compliance Committees. Appropriate personnel, including but not limited to the fund's Chief Compliance Officer (CCO), FMR's internal auditor, the independent accountants, the fund's Treasurer and portfolio management personnel, make periodic reports to the Board's committees, as appropriate, including an annual review of Fidelity's risk management program for the Fidelity® funds. The responsibilities of each standing committee, including their oversight responsibilities, are described further under "Standing Committees of the Trustees."
Interested Trustees*:
Correspondence intended for a Trustee who is an interested person may be sent to Fidelity Investments, 245 Summer Street, Boston, Massachusetts 02210.
Name, Year of Birth; Principal Occupations and Other Relevant Experience+
Jonathan Chiel (1957)
Year of Election or Appointment: 2016
Trustee
Mr. Chiel also serves as Trustee of other Fidelity® funds. Mr. Chiel is Senior Counsel at Fidelity Investments (diversified financial services company, 2024-present). Previously, Mr. Chiel served as General Counsel (2012-2024) and Head of Legal, Risk and Compliance (2022-2024) for Fidelity Investments; Executive Vice President and General Counsel for FMR LLC (diversified financial services company, 2012-2024); Director and President of OH Company LLC (holding company, 2018-2024); General Counsel (2004-2012) and Senior Vice President and Deputy General Counsel (2000-2004) for John Hancock Financial Services; a partner with Choate, Hall & Stewart (law firm, 1996-2000); and an Assistant United States Attorney for the United States Attorney's Office of the District of Massachusetts (1986-1995), including Chief of the Criminal Division (1993-1995). Mr. Chiel is a director on the boards of the Harvard Law School Center on the Legal Profession and the U.S. Chamber Litigation Center.
Bettina Doulton (1964)
Year of Election or Appointment: 2021
Trustee
Ms. Doulton also serves as Trustee of other Fidelity® funds. Prior to her retirement, Ms. Doulton served in a variety of positions at Fidelity Investments, including as a managing director of research (2006-2007), portfolio manager to certain Fidelity® funds (1993-2005), equity analyst and portfolio assistant (1990-1993), and research assistant (1987-1990). Ms. Doulton currently owns and operates Cellardoor Winery. Previously, Ms. Doulton served as a member of the Board of Brown Capital Management, LLC (2014-2018).
Robert A. Lawrence (1952)
Year of Election or Appointment: 2020
Trustee
Chair of the Board of Trustees
Mr. Lawrence also serves as Trustee of other funds. Previously, Mr. Lawrence served as a Trustee and Member of the Advisory Board of certain funds. Prior to his retirement in 2008, Mr. Lawrence served as Vice President of certain Fidelity® funds (2006-2008), Senior Vice President, Head of High Income Division of Fidelity Management & Research Company (investment adviser firm, 2006-2008), and President of Fidelity Strategic Investments (investment adviser firm, 2002-2005).
* Determined to be an "Interested Trustee" by virtue of, among other things, his or her affiliation with the trust or various entities under common control with FMR.
+ The information includes the Trustee's principal occupation during the last five years and other information relating to the experience, attributes, and skills relevant to the Trustee's qualifications to serve as a Trustee, which led to the conclusion that the Trustee should serve as a Trustee for the fund.
Independent Trustees:
Correspondence intended for an Independent Trustee may be sent to Fidelity Investments, P.O. Box 55235, Boston, Massachusetts 02205-5235.
Name, Year of Birth; Principal Occupations and Other Relevant Experience+
Thomas P. Bostick (1956)
Year of Election or Appointment: 2021
Trustee
Lieutenant General Bostick also serves as Trustee of other Fidelity® funds. Prior to his retirement, General Bostick (United States Army, Retired) held a variety of positions within the U.S. Army, including Chief of Engineers and Commanding General, U.S. Army Corps of Engineers (2012-2016) and Deputy Chief of Staff and Director of Human Resources, U.S. Army (2009-2012). General Bostick currently serves as a member of the Board and Finance and Governance & Sustainability Committees of CSX Corporation (transportation, 2020-present) and a member of the Board and Corporate Governance and Nominating Committee of Perma-Fix Environmental Services, Inc. (nuclear waste management, 2020-present). General Bostick serves as Chief Executive Officer of Bostick Global Strategies, LLC (consulting, 2016-present), as a member of the Board of HireVue, Inc. (video interview and assessment, 2020-present), as a member of the Board of Allonnia (biotechnology and engineering solutions, 2022-present), on the Advisory Board of Hilco Redevelopment Partners (a real estate investment and redevelopment company, 2021-present), and on the Advisory Board of Solugen, Inc. (specialty bio-based chemicals manufacturer, 2022-present). Previously, General Bostick served as a Member of the Advisory Board of certain Fidelity® funds (2021), President, Intrexon Bioengineering (2018-2020) and Chief Operating Officer (2017-2020) and Senior Vice President of the Environment Sector (2016-2017) of Intrexon Corporation (biopharmaceutical company).
Donald F. Donahue (1950)
Year of Election or Appointment: 2018
Trustee
Mr. Donahue also serves as Trustee of other Fidelity® funds. Mr. Donahue serves as President and Chief Executive Officer of Miranda Partners, LLC (risk consulting for the financial services industry, 2012-present). Previously, Mr. Donahue served as Chief Executive Officer (2006-2012), Chief Operating Officer (2003-2006) and Managing Director, Customer Marketing and Development (1999-2003) of The Depository Trust & Clearing Corporation (financial markets infrastructure). Mr. Donahue currently serves as a member (2007-present) and Co-Chairman (2016-present) of the Board of United Way of New York. Mr. Donahue previously served as a member of the Advisory Board of certain Fidelity® funds (2015-2018) and as a member of the Board of The Leadership Academy (previously NYC Leadership Academy) (2012-2022).
Vicki L. Fuller (1957)
Year of Election or Appointment: 2020
Trustee
Ms. Fuller also serves as Trustee of other Fidelity® funds. Previously, Ms. Fuller served as a member of the Advisory Board of certain Fidelity® funds (2018-2020), Chief Investment Officer of the New York State Common Retirement Fund (2012-2018) and held a variety of positions at AllianceBernstein L.P. (global asset management, 1985-2012), including Managing Director (2006-2012) and Senior Vice President and Senior Portfolio Manager (2001-2006). Ms. Fuller currently serves as a member of the Board, Audit Committee, Compensation Committee and Nominating and Governance Committee of two Blackstone business development companies (2020-present), as a member of the Board of Treliant, LLC (consulting, 2019-present), as a member of the Board of Ariel Alternatives, LLC (private equity, 2022-present) and as a member of the Board and Chair of the Audit Committee of Gusto, Inc. (software, 2021-present). In addition, Ms. Fuller currently serves as a member of the Executive Board of New York University's Stern School of Business. Ms. Fuller previously served as a member of the Board of Roosevelt University (2019-2024) and member of the Board, Audit Committee and Nominating and Governance Committee of The Williams Companies, Inc. (natural gas infrastructure, 2018-2021).
Patricia L. Kampling (1959)
Year of Election or Appointment: 2020
Trustee
Ms. Kampling also serves as Trustee of other Fidelity® funds. Prior to her retirement, Ms. Kampling served as Chairman of the Board and Chief Executive Officer (2012-2019), President and Chief Operating Officer (2011-2012) and Executive Vice President and Chief Financial Officer (2010-2011) of Alliant Energy Corporation. Ms. Kampling currently serves as a member of the Board, Audit Committee and Governance, Compensation and Nominating Committee of Xcel Energy Inc. (utilities company, 2020-present) and as a member of the Board, Audit, Finance and Risk Committee and Safety, Environmental, Technology and Operations Committee and Chair of the Executive Development and Compensation Committee of American Water Works Company, Inc. (utilities company, 2019-present). In addition, Ms. Kampling currently serves as a member of the Board of the Nature Conservancy, Wisconsin Chapter (2019-present). Previously, Ms. Kampling served as a Member of the Advisory Board of certain Fidelity® funds (2020), a member of the Board, Compensation Committee and Executive Committee and Chair of the Audit Committee of Briggs & Stratton Corporation (manufacturing, 2011-2021), a member of the Board of Interstate Power and Light Company (2012-2019) and Wisconsin Power and Light Company (2012-2019) (each a subsidiary of Alliant Energy Corporation) and as a member of the Board and Workforce Development Committee of the Business Roundtable (2018-2019).
Thomas A. Kennedy (1955)
Year of Election or Appointment: 2021
Trustee
Mr. Kennedy also serves as Trustee of other Fidelity® funds. Previously, Mr. Kennedy served as a Member of the Advisory Board of certain Fidelity® funds (2020) and held a variety of positions at Raytheon Company (aerospace and defense, 1983-2020), including Chairman and Chief Executive Officer (2014-2020) and Executive Vice President and Chief Operating Officer (2013-2014). Mr. Kennedy served as Executive Chairman of the Board of Directors of Raytheon Technologies Corporation (aerospace and defense, 2020-2021). Mr. Kennedy serves as a Director of the Board of Directors of Textron Inc. (aerospace and defense, 2023-present).
Oscar Munoz (1959)
Year of Election or Appointment: 2021
Trustee
Mr. Munoz also serves as Trustee of other Fidelity® funds. Prior to his retirement, Mr. Munoz served as Executive Chairman (2020-2021), Chief Executive Officer (2015-2020), President (2015-2016) and a member of the Board (2010-2021) of United Airlines Holdings, Inc. Mr. Munoz currently serves as a member of the Board of CBRE Group, Inc. (commercial real estate, 2020-present), a member of the Board of Univision Communications, Inc. (Hispanic media, 2020-present), a member of the Board of Archer Aviation Inc. (2021-present), a member of the Defense Business Board of the United States Department of Defense (2021-present) and a member of the Board of Salesforce.com, Inc. (cloud-based software, 2022-present). Previously, Mr. Munoz served as a Member of the Advisory Board of certain Fidelity® funds (2021).
David M. Thomas (1949)
Year of Election or Appointment: 2008
Trustee
Lead Independent Trustee
Mr. Thomas also serves as Trustee of other Fidelity® funds. Previously, Mr. Thomas served as Executive Chairman (2005-2006) and Chairman and Chief Executive Officer (2000-2005) of IMS Health, Inc. (pharmaceutical and healthcare information solutions) and as a member of the Board of Fortune Brands Home and Security (home and security products, 2004-2023). Mr. Thomas currently serves as Director (2013-present) and Non-Executive Chairman of the Board (2022-present) of Interpublic Group of Companies, Inc. (marketing communication).
Susan Tomasky (1953)
Year of Election or Appointment: 2020
Trustee
Ms. Tomasky also serves as Trustee of other Fidelity® funds. Prior to her retirement, Ms. Tomasky served in various executive officer positions at American Electric Power Company, Inc. (1998-2011), including most recently as President of AEP Transmission (2007-2011). Ms. Tomasky currently serves as a member of the Board and Sustainability Committee and as Chair of the Audit Committee of Marathon Petroleum Corporation (2018-present) and as a member of the Board, Executive Committee, Corporate Governance Committee and Organization and Compensation Committee and as Lead Director of the Board of Public Service Enterprise Group, Inc. (utilities company, 2012-present) and as a member of the Board of its subsidiary company, Public Service Electric and Gas Co. (2021-present). In addition, Ms. Tomasky currently serves as a member (2009-present) and President (2020-present) of the Board of the Royal Shakespeare Company - America (2009-present) and as a member and Vice Chair of the Board of Kenyon College (2016-present). Previously, Ms. Tomasky served as a Member of the Advisory Board of certain Fidelity® funds (2020), as a member of the Board of the Columbus Association for the Performing Arts (2011-2023), as a member of the Board of the Columbus Regional Airport Authority (2007-2020), as a member of the Board (2011-2018) and Lead Independent Director (2015-2018) of Andeavor Corporation (previously Tesoro Corporation) (independent oil refiner and marketer) and as a member of the Board of Summit Midstream Partners LP (energy, 2012-2018).
Michael E. Wiley (1950)
Year of Election or Appointment: 2020
Trustee
Mr. Wiley also serves as Trustee of other Fidelity® funds. Previously, Mr. Wiley served as a member of the Advisory Board of certain Fidelity® funds (2018-2020), Chairman, President and CEO of Baker Hughes, Inc. (oilfield services, 2000-2004). Mr. Wiley also previously served as a member of the Board of Andeavor Corporation (independent oil refiner and marketer, 2005-2018), a member of the Board of Andeavor Logistics LP (natural resources logistics, 2015-2018) and a member of the Board of High Point Resources (exploration and production, 2005-2020).
+ The information includes the Trustee's principal occupation during the last five years and other information relating to the experience, attributes, and skills relevant to the Trustee's qualifications to serve as a Trustee, which led to the conclusion that the Trustee should serve as a Trustee for the fund.
Advisory Board Members and Officers:
Correspondence intended for a Member of the Advisory Board (if any) may be sent to Fidelity Investments, P.O. Box 55235, Boston, Massachusetts 02205-5235. Correspondence intended for an officer or Peter S. Lynch may be sent to Fidelity Investments, 245 Summer Street, Boston, Massachusetts 02210.
Name, Year of Birth; Principal Occupations+
Vijay C. Advani (1960)
Year of Election or Appointment: 2023
Member of the Advisory Board
Mr. Advani also serves as Trustee or Member of the Advisory Board of other funds. Previously, Mr. Advani served as Executive Chairman (2020-2022), Chief Executive Officer (2017-2020) and Chief Operating Officer (2016-2017) of Nuveen (global investment manager). He also served in various capacities at Franklin Resources (global investment manager), including Co-President (2015-2016), Executive Vice President, Global Advisory Services (2008-2015), Head of Global Retail Distribution (2005-2008), Executive Managing Director, International Retail Development (2002-2005), Managing Director, Product Developments, Sales & Marketing, Asia, Eastern Europe and Africa (2000-2002) and President, Templeton Asset Management India (1995-2000). Mr. Advani also served as Senior Investment Officer of International Finance Corporation (private equity and venture capital arm of The World Bank, 1984-1995). Mr. Advani is Chairman Emeritus of the U.S. India Business Council (2018-present), a Director of The Global Impact Investing Network (2019-present), a Director of LOK Capital (Mauritius) (2022-present), a member of the Advisory Council of LOK Capital (2022-present), a Senior Advisor of Neuberger Berman (2021-present), a Senior Advisor of Seviora Holdings Pte. Ltd (Temasek-Singapore) (2021-present), a Director of Seviora Capital (Singapore) (2021-present) and an Advisor of EQUIAM (2021-present). Mr. Advani formerly served as a member of the Board of BowX Acquisition Corp. (special purpose acquisition company, 2020-2021), a member of the Board of Intellecap (advisory arm of The Aavishkaar Group, 2018-2020), a member of the Board of Nuveen Investments, Inc. (2017-2020) and a member of the Board of Docusign (software, 2016-2019).
Peter S. Lynch (1944)
Year of Election or Appointment: 2003
Member of the Advisory Board
Mr. Lynch also serves as a Member of the Advisory Board of other Fidelity® funds. Mr. Lynch is Vice Chairman and a Director of Fidelity Management & Research Company LLC (investment adviser firm). In addition, Mr. Lynch serves as a Trustee of Boston College and as the Chairman of the Inner-City Scholarship Fund. Previously, Mr. Lynch served as Vice Chairman and a Director of FMR Co., Inc. (investment adviser firm) and on the Special Olympics International Board of Directors (1997-2006).
Karen B. Peetz (1955)
Year of Election or Appointment: 2023
Member of the Advisory Board
Ms. Peetz also serves as a Member of the Advisory Board of other funds. Previously, Ms. Peetz served as Chief Administration Officer (2020-2023) of Citigroup Inc. (a diversified financial service company). She also served in various capacities at Bank of New York Mellon Corporation, including President (2013-2016), Vice Chairman, Senior Executive Vice President and Chief Executive Officer of Financial Markets & Treasury Services (2010-2013), Senior Executive Vice President and Chief Executive Officer of Global Corporate Trust (2003-2008), Senior Vice President and Division Manager of Global Payments & Trade Services (2002-2003) and Senior Vice President and Division Manager of Domestic Corporate Trust (1998-2002). Ms. Peetz also served in various capacities at Chase Manhattan Corporation (1982-1998), including Senior Vice President and Manager of Corporate Trust International Business (1996-1998), Managing Director and Manager of Corporate Trust Services (1994-1996) and Managing Director and Group Manager of Financial Institution Sales (1990-1993). Ms. Peetz currently serves as Chair of Amherst Holdings Advisory Council (2018-present), Trustee of Johns Hopkins University (2016-present), Chair of the Carey Business School Advisory Council, Member of the Johns Hopkins Medicine Board and Finance Committee and Chair of the Lyme and Tick Related Disease Institute Advisory Council. Ms. Peetz previously served as a member of the Board of Guardian Life Insurance Company of America (2019-2023), a member of the Board of Trane Technologies (2018-2022), a member of the Board of Wells Fargo Corp. (2017-2019), a member of the Board of SunCoke Energy Inc. (2012-2016), a member of the Board of Private Export Funding Corporation (2010-2016) and as a Trustee of Penn State University (2010-2014) and the United Way of New York City (2008-2010).
Heather Bonner (1977)
Year of Election or Appointment: 2023
Assistant Treasurer
Ms. Bonner also serves as an officer of other funds. Ms. Bonner is a Senior Vice President (2022-present) and is an employee of Fidelity Investments (2022-present). Ms. Bonner serves as Senior Vice President, Vice President, Treasurer, or Director of certain Fidelity entities. Prior to joining Fidelity, Ms. Bonner served as Managing Director at AQR Capital Management (2013-2022) and was the Treasurer and Principal Financial Officer of the AQR Funds (2013-2022).
Craig S. Brown (1977)
Year of Election or Appointment: 2022
Deputy Treasurer
Mr. Brown also serves as an officer of other funds. Mr. Brown is a Vice President (2015-present) and is an employee of Fidelity Investments. Mr. Brown serves as Assistant Treasurer of FIMM, LLC (2021-present). Previously, Mr. Brown served as Assistant Treasurer of certain Fidelity® funds (2019-2022).
John J. Burke III (1964)
Year of Election or Appointment: 2018
Chief Financial Officer
Mr. Burke also serves as Chief Financial Officer of other funds. Mr. Burke is Head of Fidelity Fund and Investment Operations (2018-present) and is an employee of Fidelity Investments. Mr. Burke serves as President, Executive Vice President, or Director of certain Fidelity entities. Previously Mr. Burke served as head of Asset Management Investment Operations (2012-2018).
Margaret Carey (1973)
Year of Election or Appointment: 2023
Secretary and Chief Legal Officer (CLO)
Ms. Carey also serves as an officer of other funds and as CLO of certain Fidelity entities. Ms. Carey is a Senior Vice President, Deputy General Counsel (2019-present) and is an employee of Fidelity Investments.
William C. Coffey (1969)
Year of Election or Appointment: 2019
Assistant Secretary
Mr. Coffey also serves as Assistant Secretary of other funds. Mr. Coffey is a Senior Vice President, Deputy General Counsel (2010-present) and is an employee of Fidelity Investments. Previously, Mr. Coffey served as Secretary and CLO of certain funds (2018-2019); CLO, Secretary, or Senior Vice President of certain Fidelity entities and Assistant Secretary of certain funds (2009-2018).
Timothy M. Cohen (1969)
Year of Election or Appointment: 2018
Vice President
Mr. Cohen also serves as Vice President of other funds. Mr. Cohen is Co-Head of Equity (2018-present) and is an employee of Fidelity Investments. Mr. Cohen serves as President or Director of certain Fidelity entities. Previously, Mr. Cohen served as Executive Vice President of Fidelity SelectCo, LLC (2019) and Head of Global Equity Research (2016-2018).
Jonathan Davis (1968)
Year of Election or Appointment: 2010
Assistant Treasurer
Mr. Davis also serves as an officer of other funds. Mr. Davis is a Vice President (2006-present) and is an employee of Fidelity Investments. Mr. Davis serves as Assistant Treasurer or Director of certain Fidelity entities.
Laura M. Del Prato (1964)
Year of Election or Appointment: 2018
Assistant Treasurer
Ms. Del Prato also serves as an officer of other funds. Ms. Del Prato is a Senior Vice President (2017-present) and is an employee of Fidelity Investments. Ms. Del Prato serves as Senior Vice President, Vice President, Assistant Treasurer, or Director of certain Fidelity entities. Previously, Ms. Del Prato served as President and Treasurer of The North Carolina Capital Management Trust: Cash Portfolio and Term Portfolio (2018-2020).
Colm A. Hogan (1973)
Year of Election or Appointment: 2020
Assistant Treasurer
Mr. Hogan also serves as an officer of other funds. Mr. Hogan is a Vice President (2016-present) and is an employee of Fidelity Investments. Mr. Hogan serves as Assistant Treasurer of certain Fidelity entities. Previously, Mr. Hogan served as Deputy Treasurer of certain Fidelity® funds (2016-2020) and Assistant Treasurer of certain Fidelity® funds (2016-2018).
Pamela R. Holding (1964)
Year of Election or Appointment: 2018
Vice President
Ms. Holding also serves as Vice President of other funds. Ms. Holding is Co-Head of Equity (2018-present) and is an employee of Fidelity Investments. Previously, Ms. Holding served as Executive Vice President of Fidelity SelectCo, LLC (2019) and as Chief Investment Officer of Fidelity Institutional Asset Management (2013-2018).
Chris Maher (1972)
Year of Election or Appointment: 2020
Deputy Treasurer
Mr. Maher also serves as an officer of other funds. Mr. Maher is a Vice President (2008-present) and is an employee of Fidelity Investments. Mr. Maher serves as Assistant Treasurer of certain Fidelity entities. Previously, Mr. Maher served as Assistant Treasurer of certain funds (2013-2020).
Jason P. Pogorelec (1975)
Year of Election or Appointment: 2020
Chief Compliance Officer
Mr. Pogorelec also serves as Chief Compliance Officer of other funds. Mr. Pogorelec is a Senior Vice President of Asset Management Compliance (2020-present) and is an employee of Fidelity Investments. Mr. Pogorelec serves as Compliance Officer of Fidelity Management & Research Company LLC (investment adviser firm, 2023-present) and Ballyrock Investment Advisors LLC (2023-present). Previously, Mr. Pogorelec served as a Vice President, Associate General Counsel for Fidelity Investments (2010-2020) and Assistant Secretary of certain Fidelity® funds (2015-2020).
Brett Segaloff (1972)
Year of Election or Appointment: 2021
Anti-Money Laundering (AML) Officer
Mr. Segaloff also serves as AML Officer of other funds. Mr. Segaloff is a Vice President (2022-present) and is an employee of Fidelity Investments. Mr. Segaloff serves as Anti Money Laundering Compliance Officer or Anti Money Laundering/Bank Secrecy Act Compliance Officer of certain Fidelity entities.
Stacie M. Smith (1974)
Year of Election or Appointment: 2016
President and Treasurer
Ms. Smith also serves as an officer of other funds. Ms. Smith is a Senior Vice President (2016-present) and is an employee of Fidelity Investments. Ms. Smith serves as Assistant Treasurer of certain Fidelity entities and has served in other fund officer roles.
Jim Wegmann (1979)
Year of Election or Appointment: 2019
Assistant Treasurer
Mr. Wegmann also serves as an officer of other funds. Mr. Wegmann is a Vice President (2016-present) and is an employee of Fidelity Investments. Mr. Wegmann serves as Assistant Treasurer of FIMM, LLC (2021-present). Previously, Mr. Wegmann served as Assistant Treasurer of certain Fidelity® funds (2019-2021).
+ The information includes principal occupation during the last five years.
As a shareholder, you incur two types of costs: (1) transaction costs, which may include sales charges (loads) on purchase payments or redemption proceeds, as applicable and (2) ongoing costs, which generally include management fees, distribution and/or service (12b-1) fees and other Fund expenses. This Example is intended to help you understand your ongoing costs (in dollars) of investing in a fund and to compare these costs with the ongoing costs of investing in other mutual funds.
| The Example is based on an investment of $1,000 invested at the beginning of the period and held for the entire period (November 1, 2023 to April 30, 2024). |
Actual Expenses
The first line of the accompanying table provides information about actual account values and actual expenses. You may use the information in this line, together with the amount you invested, to estimate the expenses that you paid over the period. Simply divide your account value by $1,000.00 (for example, an $8,600 account value divided by $1,000.00 = 8.6), then multiply the result by the number in the first line for a class/Fund under the heading entitled "Expenses Paid During Period" to estimate the expenses you paid on your account during this period. If any fund is a shareholder of any underlying mutual funds or exchange-traded funds (ETFs) (the Underlying Funds), such fund indirectly bears its proportional share of the expenses of the Underlying Funds in addition to the direct expenses incurred presented in the table. These fees and expenses are not included in the annualized expense ratio used to calculate the expense estimate in the table below.
Hypothetical Example for Comparison Purposes
The second line of the accompanying table provides information about hypothetical account values and hypothetical expenses based on the actual expense ratio and an assumed rate of return of 5% per year before expenses, which is not the actual return. The hypothetical account values and expenses may not be used to estimate the actual ending account balance or expenses you paid for the period. You may use this information to compare the ongoing costs of investing in the Fund and other funds. To do so, compare this 5% hypothetical example with the 5% hypothetical examples that appear in the shareholder reports of the other funds. If any fund is a shareholder of any Underlying Funds, such fund indirectly bears its proportional share of the expenses of the Underlying Funds in addition to the direct expenses as presented in the table. These fees and expenses are not included in the annualized expense ratio used to calculate the expense estimate in the table below.
Please note that the expenses shown in the table are meant to highlight your ongoing costs only and do not reflect any transaction costs. Therefore, the second line of the table is useful in comparing ongoing costs only, and will not help you determine the relative total costs of owning different funds. In addition, if these transactional costs were included, your costs would have been higher.
| | | | | Annualized Expense Ratio- A | | Beginning Account Value November 1, 2023 | | Ending Account Value April 30, 2024 | | Expenses Paid During Period- C November 1, 2023 to April 30, 2024 |
| | | | | | | | | | |
| Fidelity® Mid-Cap Stock K6 Fund | | | | .45% | | | | | | |
| Actual | | | | | | $ 1,000 | | $ 1,190.00 | | $ 2.45 |
Hypothetical-B | | | | | | $ 1,000 | | $ 1,022.63 | | $ 2.26 |
| |
A Annualized expense ratio reflects expenses net of applicable fee waivers.
B 5% return per year before expenses
C Expenses are equal to the annualized expense ratio, multiplied by the average account value over the period, multiplied by 182/ 366 (to reflect the one-half year period). The fees and expenses of any Underlying Funds are not included in each annualized expense ratio.
The dividend and capital gains distributions for the fund(s) are available on Fidelity.com or Institutional.Fidelity.com.
The fund designates $545,366 of distributions paid during the fiscal year ended 2024 as qualifying to be taxed as section 163(j) interest dividends.
The fund designates 58% and 100% of the dividends distributed in June and December, respectively during the fiscal year as qualifying for the dividends-received deduction for corporate shareholders.
The fund designates 81.72%, and 100% of the dividends distributed in June and December, respectively during the fiscal year as amounts which may be taken into account as a dividend for the purposes of the maximum rate under section 1(h)(11) of the Internal Revenue Code.
The fund designates 18.29% and 0.00% of the dividends distributed in June and December, respectively during the fiscal year as a section 199A dividend.
The fund will notify shareholders in January 2025 of amounts for use in preparing 2024 income tax returns.
Board Approval of Investment Advisory Contracts
Fidelity Mid Cap Stock K6 Fund
At its January 2024 meeting, the Board of Trustees, including the Independent Trustees (together, the Board), approved amended and restated sub-advisory agreements (the Sub-Advisory Contracts) for the fund, including the fund's sub-advisory agreements with FMR Investment Management (UK) Limited (FMR UK), Fidelity Management & Research (Hong Kong) Limited (FMR H.K.), and Fidelity Management & Research (Japan) Limited (FMR Japan). The Sub-Advisory Contracts will be effective March 1, 2024. The Board will consider the annual renewal of the fund's Sub-Advisory Contracts in May 2024, following its review of additional materials provided by FMR.
The Board considered the Sub-Advisory Contracts, which simplified the calculation of the fees paid by FMR to the sub-advisers under the agreements. The Board noted that the agreements with FMR UK, FMR H.K., and FMR Japan were amended to provide that FMR will compensate each sub-adviser at a fee rate equal to 110% of the sub-adviser's costs incurred in providing services under the agreement. The Board considered that, under the Sub-Advisory Contracts, FMR, and not the fund, will continue to pay the sub-advisory fees to each applicable sub-adviser, and that the management fee paid by the fund under the management contract with FMR will remain unchanged.
The Board further considered that the approval of the fund's Sub-Advisory Contracts will not result in any changes in the investment process or strategies employed in the management of the fund's assets or the day-to-day management of the fund or the persons primarily responsible for such management. Further, the Board considered that the Sub-Advisory Contracts would not change the obligations and services of FMR and its affiliates on behalf of the fund, and, in particular, there would be no change in the nature and level of services provided to the fund by FMR and its affiliates.
In connection with its consideration of future renewals of the fund's advisory contracts, the Board will consider: (i) the nature, extent and quality of services provided to the funds, including shareholder and administrative services and investment performance; (ii) the competitiveness of the management fee and total expenses for the fund; (iii) the costs of the services and profitability, including the revenues earned and the expenses incurred in conducting the business of developing, marketing, distributing, managing, administering, and servicing the fund and its shareholders, to the extent applicable; and (iv) whether there have been economies of scale in respect of the Fidelity funds, whether the Fidelity funds (including the fund) have appropriately benefited from any such economies of scale, and whether there is the potential for realization of any further economies.
Based on its evaluation of all of the conclusions noted above, and after considering all factors it believed relevant, the Board concluded that the fund's management fee structure is fair and reasonable, and that the fund's Sub-Advisory Contracts should be approved.
The Securities and Exchange Commission adopted Rule 22e-4 under the Investment Company Act of 1940 (the Liquidity Rule) to promote effective liquidity risk management throughout the open-end investment company industry, thereby reducing the risk that funds will be unable to meet their redemption obligations and mitigating dilution of the interests of fund shareholders.
The Fund has adopted and implemented a liquidity risk management program (the Program) reasonably designed to assess and manage the Fund's liquidity risk and to comply with the requirements of the Liquidity Rule. The Fund's Board of Trustees (the Board) has designated the Fund's investment adviser as administrator of the Program. The Fidelity advisers have established a Liquidity Risk Management Committee (the LRM Committee) to manage the Program for each of the Fidelity Funds. The LRM Committee monitors the adequacy and effectiveness of implementation of the Program and on a periodic basis assesses each Fund's liquidity risk based on a variety of factors including (1) the Fund's investment strategy, (2) portfolio liquidity and cash flow projections during normal and reasonably foreseeable stressed conditions, (3) shareholder redemptions, (4) borrowings and other funding sources and (5) certain factors specific to ETFs including the effect of the Fund's prices and spreads, market participants, and basket compositions on the overall liquidity of the Fund's portfolio, as applicable.
In accordance with the Program, each of the Fund's portfolio investments is classified into one of four defined liquidity categories based on a determination of a reasonable expectation for how long it would take to convert the investment to cash (or sell or dispose of the investment) without significantly changing its market value.
- Highly liquid investments - cash or convertible to cash within three business days or less
- Moderately liquid investments - convertible to cash in three to seven calendar days
- Less liquid investments - can be sold or disposed of, but not settled, within seven calendar days
- Illiquid investments - cannot be sold or disposed of within seven calendar days
Liquidity classification determinations take into account a variety of factors including various market, trading and investment-specific considerations, as well as market depth, and generally utilize analysis from a third-party liquidity metrics service.
The Liquidity Rule places a 15% limit on a fund's illiquid investments and requires funds that do not primarily hold assets that are highly liquid investments to determine and maintain a minimum percentage of the fund's net assets to be invested in highly liquid investments (highly liquid investment minimum or HLIM). The Program includes provisions reasonably designed to comply with the 15% limit on illiquid investments and for determining, periodically reviewing and complying with the HLIM requirement as applicable.
At a recent meeting of the Fund's Board of Trustees, the LRM Committee provided a written report to the Board pertaining to the operation, adequacy, and effectiveness of the Program for the period December 1, 2022 through November 30, 2023. The report concluded that the Program is operating effectively and is reasonably designed to assess and manage the Fund's liquidity risk.
1.9893890.104
MCS-K6-ANN-0624
Fidelity® Small Cap Discovery Fund
Annual Report
April 30, 2024
Contents
To view a fund's proxy voting guidelines and proxy voting record for the 12-month period ended June 30, visit http://www.fidelity.com/proxyvotingresults or visit the Securities and Exchange Commission's (SEC) web site at http://www.sec.gov.
You may also call 1-800-544-8544 to request a free copy of the proxy voting guidelines.
Standard & Poor's, S&P and S&P 500 are registered service marks of The McGraw-Hill Companies, Inc. and have been licensed for use by Fidelity Distributors Corporation.
Other third-party marks appearing herein are the property of their respective owners.
All other marks appearing herein are registered or unregistered trademarks or service marks of FMR LLC or an affiliated company. © 2024 FMR LLC. All rights reserved.
This report and the financial statements contained herein are submitted for the general information of the shareholders of the Fund. This report is not authorized for distribution to prospective investors in the Fund unless preceded or accompanied by an effective prospectus.
A fund files its complete schedule of portfolio holdings with the SEC for the first and third quarters of each fiscal year on Form N-PORT. Forms N-PORT are available on the SEC's web site at http://www.sec.gov. A fund's Forms N-PORT may be reviewed and copied at the SEC's Public Reference Room in Washington, DC. Information regarding the operation of the SEC's Public Reference Room may be obtained by calling 1-800-SEC-0330.
For a complete list of a fund's portfolio holdings, view the most recent holdings listing, semiannual report, or annual report on Fidelity's web site at http://www.fidelity.com, http://www.institutional.fidelity.com, or http://www.401k.com, as applicable.
NOT FDIC INSURED •MAY LOSE VALUE •NO BANK GUARANTEE
Neither the Fund nor Fidelity Distributors Corporation is a bank.
Average annual total return reflects the change in the value of an investment, assuming reinvestment of distributions from dividend income and capital gains (the profits earned upon the sale of securities that have grown in value, if any) and assuming a constant rate of performance each year. The hypothetical investment and the average annual total returns do not reflect the deduction of taxes that a shareholder would pay on fund distributions or the redemption of fund shares. During periods of reimbursement by Fidelity, a fund's total return will be greater than it would be had the reimbursement not occurred. How a fund did yesterday is no guarantee of how it will do tomorrow.
| Average Annual Total Returns |
| | | | |
Periods ended April 30, 2024 | Past 1 year | Past 5 years | Past 10 years |
| Fidelity® Small Cap Discovery Fund | 17.57% | 9.22% | 7.89% |
| $10,000 Over 10 Years |
| |
Let's say hypothetically that $10,000 was invested in Fidelity® Small Cap Discovery Fund on April 30, 2014. The chart shows how the value of your investment would have changed, and also shows how the Russell 2000® Index performed over the same period. |
|
|
Market Recap:
U.S. equities gained 22.66% for the 12 months ending April 30, 2024, according to the S&P 500® index, driven by resilient corporate profits, a frenzy over generative artificial intelligence and the Federal Reserve's likely pivot to cutting interest rates later this year. Amid this favorable backdrop for higher-risk assets, the S&P 500® continued its late-2023 momentum and ended March at its all-time high before snapping a five-month uptrend in April (-4.08%). Growth stocks led the broad rally, mostly driven by a narrow set of firms in the communication services (+41%) and information technology (+37%) sectors, largely due to excitement for AI. In particular, semiconductor-related stocks (+104%) were a standout. Following the Fed's November 1 meeting, when the central bank hinted it might be done raising rates, the S&P 500® reversed a three-month decline and gained 14.09% in the final two months of 2023 and 10.56% the first quarter. Risk assets were further aided on March 20, when the central bank held steady its benchmark federal funds rate and affirmed its projection to cut in 2024. The index then slipped in April, as inflation remained stickier than expected, spurring doubts of a soft economic landing. For the full 12 months, the financials, industrials and consumer discretionary sectors each gained about 24%. In sharp contrast, real estate and the defensive-oriented utilities sector each roughly broke even. Other notable "laggards" included consumer staples (+3%) and health care (+7%).
Comments from Portfolio Manager Forrest St. Clair:
For the fiscal year ending April 30, 2024, the fund gained 17.57%, versus 13.32% for the benchmark Russell 2000 Index. The biggest contributor to performance versus the benchmark was security selection in the industrials sector, particularly within the transportation and capital goods industries. An underweight in health care also notably helped. Further bolstering the portfolio's relative result were picks among consumer discretionary stocks, primarily within the automobiles & components industry. The top individual relative contributor was a non-benchmark stake in XPO (+145%), in which we decreased the fund's exposure this period. An overweight in Insight Enterprises (+51%), the fund's largest holding the past 12 months, was another plus. Outsized exposure to Patrick Industries (+56%), one of the portfolio's biggest holdings, proved advantageous as well. In contrast, the biggest detractor from performance versus the benchmark was security selection in energy, followed by stock picks in health care and financials. On an individual basis, avoiding Super Micro Computer, a benchmark component that gained roughly 715%, was the fund's foremost relative detractor. A non-benchmark stake in Concentrix (-42%) further pressured relative performance, as did the portfolio's out-of-benchmark exposure to Envista Holdings (-40%), a stock that was no longer held at period end. Notable changes in positioning include decreased exposure to the real estate sector and a higher allocation to energy firms.
Note to shareholders:
After 17 years at Fidelity, Derek Janssen retired from the firm on December 31, 2023, at which time Forrest St. Clair assumed sole management responsibilities for the fund.
The views expressed above reflect those of the portfolio manager(s) only through the end of the period as stated on the cover of this report and do not necessarily represent the views of Fidelity or any other person in the Fidelity organization. Any such views are subject to change at any time based upon market or other conditions and Fidelity disclaims any responsibility to update such views. These views may not be relied on as investment advice and, because investment decisions for a Fidelity fund are based on numerous factors, may not be relied on as an indication of trading intent on behalf of any Fidelity fund.
Top Holdings (% of Fund's net assets) |
| |
| Insight Enterprises, Inc. | 3.8 | |
| Performance Food Group Co. | 2.8 | |
| Beacon Roofing Supply, Inc. | 2.7 | |
| Patrick Industries, Inc. | 2.7 | |
| First American Financial Corp. | 2.6 | |
| Genpact Ltd. | 2.6 | |
| Olin Corp. | 2.6 | |
| Maximus, Inc. | 2.6 | |
| Ciena Corp. | 2.5 | |
| Mattr Corp. Class A | 2.5 | |
| | 27.4 | |
| |
| Market Sectors (% of Fund's net assets) |
| |
| Industrials | 25.2 | |
| Consumer Discretionary | 15.3 | |
| Information Technology | 15.0 | |
| Financials | 13.8 | |
| Energy | 8.1 | |
| Materials | 7.2 | |
| Consumer Staples | 5.0 | |
| Health Care | 4.9 | |
| Utilities | 1.4 | |
| Communication Services | 0.1 | |
| |
Asset Allocation (% of Fund's net assets) |
|
|
Showing Percentage of Net Assets
| Common Stocks - 96.0% |
| | | Shares | Value ($) |
| COMMUNICATION SERVICES - 0.1% | | | |
| Interactive Media & Services - 0.1% | | | |
| Ziff Davis, Inc. (a) | | 48,216 | 2,416,104 |
| CONSUMER DISCRETIONARY - 15.3% | | | |
| Automobile Components - 4.2% | | | |
| Adient PLC (a) | | 851,600 | 25,437,292 |
| Lear Corp. | | 111,600 | 14,047,092 |
| Patrick Industries, Inc. | | 664,433 | 69,426,604 |
| | | | 108,910,988 |
| Diversified Consumer Services - 2.1% | | | |
| Adtalem Global Education, Inc. (a) | | 184,800 | 9,169,776 |
| Laureate Education, Inc. Class A | | 3,186,603 | 46,205,744 |
| | | | 55,375,520 |
| Household Durables - 0.9% | | | |
| Helen of Troy Ltd. (a) | | 247,200 | 22,917,912 |
| Leisure Products - 0.9% | | | |
| Brunswick Corp. | | 309,564 | 24,963,241 |
| Specialty Retail - 5.4% | | | |
| Academy Sports & Outdoors, Inc. | | 407,200 | 23,739,760 |
| Advance Auto Parts, Inc. | | 176,100 | 12,851,778 |
| America's Car Mart, Inc. (a) | | 266,362 | 15,246,561 |
| American Eagle Outfitters, Inc. | | 463,497 | 11,244,437 |
| Boot Barn Holdings, Inc. (a) | | 62,218 | 6,624,350 |
| Caleres, Inc. | | 230,900 | 8,504,047 |
| Murphy U.S.A., Inc. | | 118,600 | 49,079,052 |
| Upbound Group, Inc. | | 473,873 | 14,694,802 |
| | | | 141,984,787 |
| Textiles, Apparel & Luxury Goods - 1.8% | | | |
| Crocs, Inc. (a) | | 352,400 | 43,827,988 |
| Wolverine World Wide, Inc. | | 290,836 | 3,123,579 |
| | | | 46,951,567 |
TOTAL CONSUMER DISCRETIONARY | | | 401,104,015 |
| CONSUMER STAPLES - 5.0% | | | |
| Beverages - 1.6% | | | |
| Coca-Cola Consolidated, Inc. Consolidated | | 36,913 | 30,490,138 |
| MGP Ingredients, Inc. | | 129,385 | 10,148,959 |
| | | | 40,639,097 |
| Consumer Staples Distribution & Retail - 2.8% | | | |
| Performance Food Group Co. (a) | | 1,070,000 | 72,631,600 |
| Sprouts Farmers Market LLC (a) | | 18,489 | 1,220,829 |
| | | | 73,852,429 |
| Food Products - 0.6% | | | |
| Lamb Weston Holdings, Inc. | | 112,100 | 9,342,414 |
| The Simply Good Foods Co. (a) | | 175,100 | 6,382,395 |
| | | | 15,724,809 |
TOTAL CONSUMER STAPLES | | | 130,216,335 |
| ENERGY - 8.1% | | | |
| Energy Equipment & Services - 3.2% | | | |
| Cactus, Inc. | | 391,500 | 19,434,060 |
| Mattr Corp. Class A (a)(b) | | 5,396,090 | 63,930,722 |
| | | | 83,364,782 |
| Oil, Gas & Consumable Fuels - 4.9% | | | |
| Civitas Resources, Inc. | | 468,500 | 33,713,260 |
| Parkland Corp. | | 1,241,800 | 38,255,721 |
| Sitio Royalties Corp. (c) | | 2,371,000 | 55,102,040 |
| | | | 127,071,021 |
TOTAL ENERGY | | | 210,435,803 |
| FINANCIALS - 13.8% | | | |
| Banks - 2.4% | | | |
| Cadence Bank | | 1,173,796 | 32,478,935 |
| Fulton Financial Corp. | | 109,100 | 1,805,605 |
| Webster Financial Corp. | | 638,400 | 27,981,072 |
| | | | 62,265,612 |
| Capital Markets - 0.6% | | | |
| Virtus Investment Partners, Inc. | | 76,800 | 16,843,776 |
| Consumer Finance - 2.2% | | | |
| FirstCash Holdings, Inc. | | 506,300 | 57,201,774 |
| Financial Services - 1.5% | | | |
| EVERTEC, Inc. | | 635,013 | 23,832,038 |
| WEX, Inc. (a) | | 76,500 | 16,161,390 |
| | | | 39,993,428 |
| Insurance - 7.1% | | | |
| Assurant, Inc. | | 128,740 | 22,452,256 |
| Enstar Group Ltd. (a) | | 176,587 | 51,275,567 |
| First American Financial Corp. | | 1,268,500 | 67,953,545 |
| Primerica, Inc. | | 204,147 | 43,250,583 |
| | | | 184,931,951 |
TOTAL FINANCIALS | | | 361,236,541 |
| HEALTH CARE - 4.9% | | | |
| Biotechnology - 1.0% | | | |
| Blueprint Medicines Corp. (a) | | 29,100 | 2,657,994 |
| Celldex Therapeutics, Inc. (a) | | 266,700 | 9,979,914 |
| Keros Therapeutics, Inc. (a) | | 100,000 | 5,639,000 |
| Vaxcyte, Inc. (a) | | 124,100 | 7,514,255 |
| | | | 25,791,163 |
| Health Care Equipment & Supplies - 0.7% | | | |
| Dentsply Sirona, Inc. | | 479,000 | 14,374,790 |
| Utah Medical Products, Inc. | | 50,000 | 3,310,000 |
| | | | 17,684,790 |
| Health Care Providers & Services - 3.0% | | | |
| AMN Healthcare Services, Inc. (a) | | 266,313 | 15,973,454 |
| Owens & Minor, Inc. (a) | | 2,457,759 | 60,804,958 |
| Pennant Group, Inc. (a) | | 52,800 | 1,104,048 |
| The Ensign Group, Inc. | | 1,276 | 151,027 |
| | | | 78,033,487 |
| Pharmaceuticals - 0.2% | | | |
| Arvinas Holding Co. LLC (a) | | 206,400 | 6,557,328 |
TOTAL HEALTH CARE | | | 128,066,768 |
| INDUSTRIALS - 25.2% | | | |
| Aerospace & Defense - 0.8% | | | |
| Loar Holdings, Inc. | | 2,700 | 141,264 |
| V2X, Inc. (a) | | 463,374 | 22,510,709 |
| | | | 22,651,973 |
| Building Products - 2.9% | | | |
| Armstrong World Industries, Inc. | | 169,469 | 19,468,599 |
| AZZ, Inc. | | 269,211 | 19,283,584 |
| Tecnoglass, Inc. (c) | | 400,036 | 22,222,000 |
| UFP Industries, Inc. | | 124,200 | 13,997,340 |
| | | | 74,971,523 |
| Commercial Services & Supplies - 2.2% | | | |
| Brady Corp. Class A | | 30,469 | 1,797,671 |
| The Brink's Co. | | 607,319 | 53,116,120 |
| Vestis Corp. | | 154,400 | 2,844,048 |
| | | | 57,757,839 |
| Construction & Engineering - 1.1% | | | |
| Centuri Holdings, Inc. | | 5,800 | 143,550 |
| EMCOR Group, Inc. | | 65,326 | 23,332,487 |
| IES Holdings, Inc. (a) | | 39,900 | 5,391,288 |
| | | | 28,867,325 |
| Electrical Equipment - 0.9% | | | |
| Atkore, Inc. | | 131,000 | 22,964,300 |
| Ground Transportation - 3.1% | | | |
| ArcBest Corp. | | 45,469 | 5,042,967 |
| TFI International, Inc. | | 391,800 | 51,047,622 |
| TFI International, Inc. (Canada) | | 116,000 | 15,106,585 |
| Universal Logistics Holdings, Inc. | | 31,400 | 1,402,952 |
| XPO, Inc. (a) | | 76,868 | 8,260,235 |
| | | | 80,860,361 |
| Machinery - 0.3% | | | |
| Gates Industrial Corp. PLC (a) | | 392,900 | 6,922,898 |
| Timken Co. | | 16,200 | 1,445,364 |
| | | | 8,368,262 |
| Professional Services - 10.0% | | | |
| ASGN, Inc. (a) | | 605,000 | 58,352,250 |
| Concentrix Corp. (c) | | 655,400 | 35,830,718 |
| Genpact Ltd. | | 2,202,700 | 67,710,998 |
| Kforce, Inc. | | 521,000 | 32,176,960 |
| Maximus, Inc. | | 830,884 | 66,703,368 |
| WNS Holdings Ltd. | | 13,464 | 564,276 |
| | | | 261,338,570 |
| Trading Companies & Distributors - 3.9% | | | |
| Beacon Roofing Supply, Inc. (a) | | 712,500 | 70,202,625 |
| Core & Main, Inc. (a) | | 445,600 | 25,163,032 |
| DXP Enterprises, Inc. (a) | | 55,185 | 2,690,821 |
| GMS, Inc. (a) | | 42,900 | 3,969,108 |
| | | | 102,025,586 |
TOTAL INDUSTRIALS | | | 659,805,739 |
| INFORMATION TECHNOLOGY - 15.0% | | | |
| Communications Equipment - 3.7% | | | |
| Ciena Corp. (a) | | 1,410,700 | 65,216,661 |
| Lumentum Holdings, Inc. (a) | | 712,006 | 31,157,383 |
| | | | 96,374,044 |
| Electronic Equipment, Instruments & Components - 5.6% | | | |
| Belden, Inc. | | 124,000 | 10,077,480 |
| ePlus, Inc. (a) | | 213,600 | 16,421,568 |
| Insight Enterprises, Inc. (a) | | 546,482 | 99,771,216 |
| TD SYNNEX Corp. | | 153,500 | 18,088,440 |
| Vishay Precision Group, Inc. (a) | | 44,934 | 1,482,822 |
| | | | 145,841,526 |
| IT Services - 0.4% | | | |
| Perficient, Inc. (a) | | 210,800 | 9,962,408 |
| Semiconductors & Semiconductor Equipment - 2.6% | | | |
| Diodes, Inc. (a) | | 226,481 | 16,535,378 |
| Ichor Holdings Ltd. (a) | | 1,072,361 | 41,586,160 |
| SMART Global Holdings, Inc. (a) | | 521,242 | 9,523,091 |
| | | | 67,644,629 |
| Software - 2.7% | | | |
| Five9, Inc. (a) | | 242,800 | 13,977,996 |
| Rapid7, Inc. (a) | | 598,225 | 26,800,480 |
| Tenable Holdings, Inc. (a) | | 684,100 | 30,763,977 |
| | | | 71,542,453 |
TOTAL INFORMATION TECHNOLOGY | | | 391,365,060 |
| MATERIALS - 7.2% | | | |
| Chemicals - 4.0% | | | |
| FMC Corp. | | 287,300 | 16,953,573 |
| Hawkins, Inc. | | 13,117 | 993,875 |
| Olin Corp. | | 1,276,100 | 66,714,508 |
| The Chemours Co. LLC | | 727,100 | 19,449,925 |
| | | | 104,111,881 |
| Containers & Packaging - 2.6% | | | |
| Crown Holdings, Inc. | | 210,000 | 17,234,700 |
| Graphic Packaging Holding Co. | | 1,995,800 | 51,591,430 |
| | | | 68,826,130 |
| Metals & Mining - 0.6% | | | |
| ATI, Inc. (a) | | 274,700 | 16,399,590 |
TOTAL MATERIALS | | | 189,337,601 |
| UTILITIES - 1.4% | | | |
| Gas Utilities - 1.4% | | | |
| Brookfield Infrastructure Corp. A Shares (c) | | 1,185,100 | 36,109,997 |
| TOTAL COMMON STOCKS (Cost $2,080,523,424) | | | 2,510,093,963 |
| | | | |
| Money Market Funds - 5.8% |
| | | Shares | Value ($) |
| Fidelity Cash Central Fund 5.39% (d) | | 111,786,862 | 111,809,220 |
| Fidelity Securities Lending Cash Central Fund 5.39% (d)(e) | | 39,718,726 | 39,722,698 |
| TOTAL MONEY MARKET FUNDS (Cost $151,531,918) | | | 151,531,918 |
| | | | |
| TOTAL INVESTMENT IN SECURITIES - 101.8% (Cost $2,232,055,342) | 2,661,625,881 |
NET OTHER ASSETS (LIABILITIES) - (1.8)% | (46,404,663) |
| NET ASSETS - 100.0% | 2,615,221,218 |
| | |
Legend
| (c) | Security or a portion of the security is on loan at period end. |
| (d) | Affiliated fund that is generally available only to investment companies and other accounts managed by Fidelity Investments. The rate quoted is the annualized seven-day yield of the fund at period end. A complete unaudited listing of the fund's holdings as of its most recent quarter end is available upon request. In addition, each Fidelity Central Fund's financial statements, which are not covered by the Fund's Report of Independent Registered Public Accounting Firm, are available on the SEC's website or upon request. |
| (e) | Investment made with cash collateral received from securities on loan. |
Affiliated Central Funds
Fiscal year to date information regarding the Fund's investments in Fidelity Central Funds, including the ownership percentage, is presented below.
| Affiliate | Value, beginning of period ($) | Purchases ($) | Sales Proceeds ($) | Dividend Income ($) | Realized Gain (loss) ($) | Change in Unrealized appreciation (depreciation) ($) | Value, end of period ($) | % ownership, end of period |
| Fidelity Cash Central Fund 5.39% | 136,491,806 | 728,375,998 | 753,058,535 | 3,627,127 | (49) | - | 111,809,220 | 0.2% |
| Fidelity Securities Lending Cash Central Fund 5.39% | 201,076,847 | 581,207,175 | 742,561,324 | 101,758 | - | - | 39,722,698 | 0.1% |
| Total | 337,568,653 | 1,309,583,173 | 1,495,619,859 | 3,728,885 | (49) | - | 151,531,918 | |
| | | | | | | | | |
Amounts in the dividend income column in the above table include any capital gain distributions from underlying funds, which are presented in the corresponding line item in the Statement of Operations, if applicable.
Amounts in the dividend income column for Fidelity Securities Lending Cash Central Fund represents the income earned on investing cash collateral, less rebates paid to borrowers and any lending agent fees associated with the loan, plus any premium payments received for lending certain types of securities.
Amounts included in the purchases and sales proceeds columns may include in-kind transactions, if applicable.
Other Affiliated Issuers
An affiliated company is a company in which the Fund has ownership of at least 5% of the voting securities. Fiscal year to date transactions with companies which are or were affiliates are presented in the table below. Certain corporate actions, such as mergers, are excluded from the amounts in this table if applicable. A dash in the Value end of period ($) column means either the issuer is no longer held at period end, or the issuer is held at period end but is no longer an affiliate.
| Affiliate | Value, beginning of period ($) | Purchases ($) | Sales Proceeds ($) | Dividend Income ($) | Realized Gain (loss) ($) | Change in Unrealized appreciation (depreciation) ($) | Value, end of period ($) |
| America's Car Mart, Inc. | 25,636,371 | - | 5,068,080 | - | (1,226,065) | (4,095,665) | - |
| Ichor Holdings Ltd. | 47,345,000 | - | 24,493,507 | - | (3,585,212) | 22,319,879 | - |
| Mattr Corp. Class A | 33,281,323 | - | 1,904,051 | - | (1,715,002) | 17,229,464 | 63,930,722 |
| Total | 106,262,694 | - | 31,465,638 | - | (6,526,279) | 35,453,678 | 63,930,722 |
Amounts included in the purchases and sales proceeds columns may include in-kind transactions, if applicable.
Investment Valuation
The following is a summary of the inputs used, as of April 30, 2024, involving the Fund's assets and liabilities carried at fair value. The inputs or methodology used for valuing securities may not be an indication of the risk associated with investing in those securities. For more information on valuation inputs, and their aggregation into the levels used below, please refer to the Investment Valuation section in the accompanying Notes to Financial Statements.
| Valuation Inputs at Reporting Date: |
| Description | Total ($) | Level 1 ($) | Level 2 ($) | Level 3 ($) |
Investments in Securities: | | | | |
|
| Equities: | | | | |
Communication Services | 2,416,104 | 2,416,104 | - | - |
Consumer Discretionary | 401,104,015 | 401,104,015 | - | - |
Consumer Staples | 130,216,335 | 130,216,335 | - | - |
Energy | 210,435,803 | 210,435,803 | - | - |
Financials | 361,236,541 | 361,236,541 | - | - |
Health Care | 128,066,768 | 128,066,768 | - | - |
Industrials | 659,805,739 | 659,805,739 | - | - |
Information Technology | 391,365,060 | 391,365,060 | - | - |
Materials | 189,337,601 | 189,337,601 | - | - |
Utilities | 36,109,997 | 36,109,997 | - | - |
|
| Money Market Funds | 151,531,918 | 151,531,918 | - | - |
| Total Investments in Securities: | 2,661,625,881 | 2,661,625,881 | - | - |
| Statement of Assets and Liabilities |
| | | | April 30, 2024 |
| | | | | |
| Assets | | | | |
| Investment in securities, at value (including securities loaned of $37,864,061) - See accompanying schedule: | | | | |
Unaffiliated issuers (cost $2,010,134,480) | $ | 2,446,163,241 | | |
Fidelity Central Funds (cost $151,531,918) | | 151,531,918 | | |
Other affiliated issuers (cost $70,388,944) | | 63,930,722 | | |
| | | | | |
| | | | | |
| Total Investment in Securities (cost $2,232,055,342) | | | $ | 2,661,625,881 |
| Foreign currency held at value (cost $2) | | | | 2 |
| Receivable for investments sold | | | | 5,100,159 |
| Receivable for fund shares sold | | | | 1,511,311 |
| Dividends receivable | | | | 472,245 |
| Reclaims receivable | | | | 1,311,840 |
| Distributions receivable from Fidelity Central Funds | | | | 558,958 |
| Prepaid expenses | | | | 908 |
Total assets | | | | 2,670,581,304 |
| Liabilities | | | | |
| Payable for investments purchased | $ | 11,868,553 | | |
| Payable for fund shares redeemed | | 1,463,720 | | |
| Accrued management fee | | 2,255,636 | | |
| Other payables and accrued expenses | | 52,877 | | |
| Collateral on securities loaned | | 39,719,300 | | |
| Total liabilities | | | | 55,360,086 |
| Net Assets | | | $ | 2,615,221,218 |
| Net Assets consist of: | | | | |
| Paid in capital | | | $ | 1,999,820,632 |
| Total accumulated earnings (loss) | | | | 615,400,586 |
| Net Assets | | | $ | 2,615,221,218 |
Net Asset Value, offering price and redemption price per share ($2,615,221,218 ÷ 98,251,988 shares) | | | $ | 26.62 |
| Statement of Operations |
| | | | Year ended April 30, 2024 |
| Investment Income | | | | |
| Dividends | | | $ | 28,597,738 |
| Income from Fidelity Central Funds (including $101,758 from security lending) | | | | 3,728,885 |
| Total income | | | | 32,326,623 |
| Expenses | | | | |
| Management fee | | | | |
| Basic fee | $ | 17,758,191 | | |
| Performance adjustment | | 5,900,110 | | |
| Transfer agent fees | | 3,836,702 | | |
| Accounting fees | | 552,944 | | |
| Custodian fees and expenses | | 36,408 | | |
| Independent trustees' fees and expenses | | 12,866 | | |
| Registration fees | | 70,603 | | |
| Audit | | 56,000 | | |
| Legal | | 1,888 | | |
| Miscellaneous | | 12,315 | | |
| Total expenses before reductions | | 28,238,027 | | |
| Expense reductions | | (210,575) | | |
| Total expenses after reductions | | | | 28,027,452 |
| Net Investment income (loss) | | | | 4,299,171 |
| Realized and Unrealized Gain (Loss) | | | | |
| Net realized gain (loss) on: | | | | |
| Investment Securities: | | | | |
| Unaffiliated issuers | | 301,673,568 | | |
| Fidelity Central Funds | | (49) | | |
| Other affiliated issuers | | (6,526,279) | | |
| Foreign currency transactions | | (7,231) | | |
| Total net realized gain (loss) | | | | 295,140,009 |
| Change in net unrealized appreciation (depreciation) on: | | | | |
| Investment Securities: | | | | |
| Unaffiliated issuers | | 68,092,229 | | |
| Affiliated issuers | | 35,453,678 | | |
| Assets and liabilities in foreign currencies | | (20,881) | | |
| Total change in net unrealized appreciation (depreciation) | | | | 103,525,026 |
| Net gain (loss) | | | | 398,665,035 |
| Net increase (decrease) in net assets resulting from operations | | | $ | 402,964,206 |
| Statement of Changes in Net Assets |
| |
| | Year ended April 30, 2024 | | Year ended April 30, 2023 |
| Increase (Decrease) in Net Assets | | | | |
| Operations | | | | |
| Net investment income (loss) | $ | 4,299,171 | $ | 7,230,666 |
| Net realized gain (loss) | | 295,140,009 | | 114,843,344 |
| Change in net unrealized appreciation (depreciation) | | 103,525,026 | | (196,594,050) |
| Net increase (decrease) in net assets resulting from operations | | 402,964,206 | | (74,520,040) |
| Distributions to shareholders | | (115,324,597) | | (312,093,346) |
| | | | | |
| Share transactions | | | | |
| Proceeds from sales of shares | | 503,047,090 | | 297,164,963 |
| Reinvestment of distributions | | 107,900,583 | | 290,979,010 |
| Cost of shares redeemed | | (1,040,709,877) | | (667,601,847) |
| | | | | |
Net increase (decrease) in net assets resulting from share transactions | | (429,762,204) | | (79,457,874) |
| Total increase (decrease) in net assets | | (142,122,595) | | (466,071,260) |
| | | | | |
| Net Assets | | | | |
| Beginning of period | | 2,757,343,813 | | 3,223,415,073 |
| End of period | $ | 2,615,221,218 | $ | 2,757,343,813 |
| | | | | |
| Other Information | | | | |
| Shares | | | | |
| Sold | | 19,402,492 | | 12,445,624 |
| Issued in reinvestment of distributions | | 4,239,591 | | 12,400,315 |
| Redeemed | | (41,747,091) | | (28,175,480) |
| Net increase (decrease) | | (18,105,008) | | (3,329,541) |
| | | | | |
Financial Highlights
Fidelity® Small Cap Discovery Fund |
| |
| Years ended April 30, | | 2024 | | 2023 | | 2022 | | 2021 | | 2020 |
Selected Per-Share Data | | | | | | | | | | |
| Net asset value, beginning of period | $ | 23.70 | $ | 26.93 | $ | 29.55 | $ | 17.11 | $ | 23.60 |
| Income from Investment Operations | | | | | | | | | | |
Net investment income (loss) A,B | | .04 | | .06 | | - C | | .08 | | .18 |
| Net realized and unrealized gain (loss) | | 4.06 | | (.64) | | (.74) | | 13.03 | | (4.94) |
| Total from investment operations | | 4.10 | | (.58) | | (.74) | | 13.11 | | (4.76) |
| Distributions from net investment income | | (.03) | | (.04) | | (.03) | | (.07) D | | (.19) |
| Distributions from net realized gain | | (1.15) | | (2.61) | | (1.85) | | (.60) D | | (1.54) |
| Total distributions | | (1.18) | | (2.65) | | (1.88) | | (.67) | | (1.73) |
| Net asset value, end of period | $ | 26.62 | $ | 23.70 | $ | 26.93 | $ | 29.55 | $ | 17.11 |
Total Return E | | | | (1.82)% | | (2.94)% | | 77.54% | | (21.89)% |
Ratios to Average Net Assets B,F,G | | | | | | | | | | |
| Expenses before reductions | | 1.10% | | 1.03% | | .98% | | .62% | | .61% |
| Expenses net of fee waivers, if any | | | | 1.02% | | .97% | | .62% | | .61% |
| Expenses net of all reductions | | 1.09% | | 1.02% | | .97% | | .61% | | .61% |
| Net investment income (loss) | | .17% | | .25% | | .01% | | .33% | | .81% |
| Supplemental Data | | | | | | | | | | |
| Net assets, end of period (000 omitted) | $ | 2,615,221 | $ | 2,757,344 | $ | 3,223,415 | $ | 3,170,589 | $ | 1,880,740 |
Portfolio turnover rate H | | | | 27% | | 26% | | 33% | | 52% |
ACalculated based on average shares outstanding during the period.
BNet investment income (loss) is affected by the timing of the declaration of dividends by any underlying mutual funds or exchange-traded funds (ETFs). Net investment income (loss) of any mutual funds or ETFs is not included in the Fund's net investment income (loss) ratio.
CAmount represents less than $.005 per share.
DThe amount shown reflects reclassifications related to book to tax differences that were made in the year shown.
ETotal returns would have been lower if certain expenses had not been reduced during the applicable periods shown.
FFees and expenses of any underlying mutual funds or exchange-traded funds (ETFs) are not included in the Fund's expense ratio. The Fund indirectly bears its proportionate share of these expenses. For additional expense information related to investments in Fidelity Central Funds, please refer to the "Investments in Fidelity Central Funds" note found in the Notes to Financial Statements section of the most recent Annual or Semi-Annual report.
GExpense ratios reflect operating expenses of the class. Expenses before reductions do not reflect amounts reimbursed, waived, or reduced through arrangements with the investment adviser, brokerage services, or other offset arrangements, if applicable, and do not represent the amount paid by the class during periods when reimbursements, waivers or reductions occur.
HAmount does not include the portfolio activity of any underlying mutual funds or exchange-traded funds (ETFs).
For the period ended April 30, 2024
1. Organization.
Fidelity Small Cap Discovery Fund (the Fund) is a fund of Fidelity Concord Street Trust (the Trust) and is authorized to issue an unlimited number of shares. Share transactions on the Statement of Changes in Net Assets may contain exchanges between affiliated funds. The Trust is registered under the Investment Company Act of 1940, as amended (the 1940 Act), as an open-end management investment company organized as a Massachusetts business trust.
2. Investments in Fidelity Central Funds.
Funds may invest in Fidelity Central Funds, which are open-end investment companies generally available only to other investment companies and accounts managed by the investment adviser and its affiliates. The Schedule of Investments lists any Fidelity Central Funds held as an investment as of period end, but does not include the underlying holdings of each Fidelity Central Fund. An investing fund indirectly bears its proportionate share of the expenses of the underlying Fidelity Central Funds.
Based on its investment objective, each Fidelity Central Fund may invest or participate in various investment vehicles or strategies that are similar to those of the investing fund. These strategies are consistent with the investment objectives of the investing fund and may involve certain economic risks which may cause a decline in value of each of the Fidelity Central Funds and thus a decline in the value of the investing fund.
| Fidelity Central Fund | Investment Manager | Investment Objective | Investment Practices | Expense RatioA |
| Fidelity Money Market Central Funds | Fidelity Management & Research Company LLC (FMR) | Each fund seeks to obtain a high level of current income consistent with the preservation of capital and liquidity. | Short-term Investments | Less than .005% |
A Expenses expressed as a percentage of average net assets and are as of each underlying Central Fund's most recent annual or semi-annual shareholder report.
A complete unaudited list of holdings for each Fidelity Central Fund is available upon request or at the Securities and Exchange Commission website at www.sec.gov. In addition, the financial statements of the Fidelity Central Funds which contain the significant accounting policies (including investment valuation policies) of those funds, and are not covered by the Report of Independent Registered Public Accounting Firm, are available on the Securities and Exchange Commission website or upon request.
3. Significant Accounting Policies.
The Fund is an investment company and applies the accounting and reporting guidance of the Financial Accounting Standards Board (FASB) Accounting Standards Codification Topic 946 Financial Services - Investment Companies. The financial statements have been prepared in conformity with accounting principles generally accepted in the United States of America (GAAP), which require management to make certain estimates and assumptions at the date of the financial statements. Actual results could differ from those estimates. Subsequent events, if any, through the date that the financial statements were issued have been evaluated in the preparation of the financial statements. The Fund's Schedule of Investments lists any underlying mutual funds or exchange-traded funds (ETFs) but does not include the underlying holdings of these funds. The following summarizes the significant accounting policies of the Fund:
Investment Valuation. Investments are valued as of 4:00 p.m. Eastern time on the last calendar day of the period. The Board of Trustees (the Board) has designated the Fund's investment adviser as the valuation designee responsible for the fair valuation function and performing fair value determinations as needed. The investment adviser has established a Fair Value Committee (the Committee) to carry out the day-to-day fair valuation responsibilities and has adopted policies and procedures to govern the fair valuation process and the activities of the Committee. In accordance with these fair valuation policies and procedures, which have been approved by the Board, the Fund attempts to obtain prices from one or more third party pricing services or brokers to value its investments. When current market prices, quotations or currency exchange rates are not readily available or reliable, investments will be fair valued in good faith by the Committee, in accordance with the policies and procedures. Factors used in determining fair value vary by investment type and may include market or investment specific events, transaction data, estimated cash flows, and market observations of comparable investments. The frequency that the fair valuation procedures are used cannot be predicted and they may be utilized to a significant extent. The Committee manages the Fund's fair valuation practices and maintains the fair valuation policies and procedures. The Fund's investment adviser reports to the Board information regarding the fair valuation process and related material matters.
The Fund categorizes the inputs to valuation techniques used to value its investments into a disclosure hierarchy consisting of three levels as shown below:
Level 1 - unadjusted quoted prices in active markets for identical investments
Level 2 - other significant observable inputs (including quoted prices for similar investments, interest rates, prepayment speeds, etc.)
Level 3 - unobservable inputs (including the Fund's own assumptions based on the best information available)
Valuation techniques used to value the Fund's investments by major category are as follows:
Equity securities, including restricted securities, for which market quotations are readily available, are valued at the last reported sale price or official closing price as reported by a third party pricing service on the primary market or exchange on which they are traded and are categorized as Level 1 in the hierarchy. In the event there were no sales during the day or closing prices are not available, securities are valued at the last quoted bid price or may be valued using the last available price and are generally categorized as Level 2 in the hierarchy. For foreign equity securities, when market or security specific events arise, comparisons to the valuation of American Depositary Receipts (ADRs), futures contracts, Exchange-Traded Funds (ETFs) and certain indexes as well as quoted prices for similar securities may be used and would be categorized as Level 2 in the hierarchy. For equity securities, including restricted securities, where observable inputs are limited, assumptions about market activity and risk are used and these securities may be categorized as Level 3 in the hierarchy.
Investments in open-end mutual funds, including the Fidelity Central Funds, are valued at their closing net asset value (NAV) each business day and are categorized as Level 1 in the hierarchy.
Changes in valuation techniques may result in transfers in or out of an assigned level within the disclosure hierarchy. The aggregate value of investments by input level as of April 30, 2024 is included at the end of the Fund's Schedule of Investments.
Foreign Currency. Certain Funds may use foreign currency contracts to facilitate transactions in foreign-denominated securities. Gains and losses from these transactions may arise from changes in the value of the foreign currency or if the counterparties do not perform under the contracts' terms.
Foreign-denominated assets, including investment securities, and liabilities are translated into U.S. dollars at the exchange rates at period end. Purchases and sales of investment securities, income and dividends received, and expenses denominated in foreign currencies are translated into U.S. dollars at the exchange rate in effect on the transaction date.
The effects of exchange rate fluctuations on investments are included with the net realized and unrealized gain (loss) on investment securities. Other foreign currency transactions resulting in realized and unrealized gain (loss) are disclosed separately.
Investment Transactions and Income. For financial reporting purposes, the Fund's investment holdings and NAV include trades executed through the end of the last business day of the period. The NAV per share for processing shareholder transactions is calculated as of the close of business of the New York Stock Exchange (NYSE), normally 4:00 p.m. Eastern time and includes trades executed through the end of the prior business day. Gains and losses on securities sold are determined on the basis of identified cost and include proceeds received from litigation. Commissions paid to certain brokers with whom the investment adviser, or its affiliates, places trades on behalf of a fund include an amount in addition to trade execution, which may be rebated back to a fund. Any such rebates are included in net realized gain (loss) on investments in the Statement of Operations. Dividend income is recorded on the ex-dividend date, except for certain dividends from foreign securities where the ex-dividend date may have passed, which are recorded as soon as the Fund is informed of the ex-dividend date. Non-cash dividends included in dividend income, if any, are recorded at the fair market value of the securities received. Income and capital gain distributions from Fidelity Central Funds, if any, are recorded on the ex-dividend date. Certain distributions received by the Fund represent a return of capital or capital gain. The Fund determines the components of these distributions subsequent to the ex-dividend date, based upon receipt of tax filings or other correspondence relating to the underlying investment. These distributions are recorded as a reduction of cost of investments and/or as a realized gain. Interest income is accrued as earned and includes coupon interest and amortization of premium and accretion of discount on debt securities as applicable. Investment income is recorded net of foreign taxes withheld where recovery of such taxes is uncertain. Funds may file withholding tax reclaims in certain jurisdictions to recover a portion of amounts previously withheld. Any withholding tax reclaims income is included in the Statement of Operations in dividends. Any receivables for withholding tax reclaims are included in the Statement of Assets and Liabilities in reclaims receivable.
Expenses. Expenses directly attributable to a fund are charged to that fund. Expenses attributable to more than one fund are allocated among the respective funds on the basis of relative net assets or other appropriate methods. Expenses included in the accompanying financial statements reflect the expenses of that fund and do not include any expenses associated with any underlying mutual funds or exchange-traded funds. Although not included in a fund's expenses, a fund indirectly bears its proportionate share of these expenses through the net asset value of each underlying mutual fund or exchange-traded fund. Expense estimates are accrued in the period to which they relate and adjustments are made when actual amounts are known.
Income Tax Information and Distributions to Shareholders. Each year, the Fund intends to qualify as a regulated investment company under Subchapter M of the Internal Revenue Code, including distributing substantially all of its taxable income and realized gains. As a result, no provision for U.S. Federal income taxes is required. As of April 30, 2024, the Fund did not have any unrecognized tax benefits in the financial statements; nor is the Fund aware of any tax positions for which it is reasonably possible that the total amounts of unrecognized tax benefits will significantly change in the next twelve months. The Fund files a U.S. federal tax return, in addition to state and local tax returns as required. The Fund's federal income tax returns are subject to examination by the Internal Revenue Service (IRS) for a period of three fiscal years after they are filed. State and local tax returns may be subject to examination for an additional fiscal year depending on the jurisdiction. Foreign taxes are provided for based on the Fund's understanding of the tax rules and rates that exist in the foreign markets in which it invests.
Distributions are declared and recorded on the ex-dividend date. Income and capital gain distributions are determined in accordance with income tax regulations, which may differ from GAAP. In addition, the Fund claimed a portion of the payment made to redeeming shareholders as a distribution for income tax purposes.
Capital accounts within the financial statements are adjusted for permanent book-tax differences. These adjustments have no impact on net assets or the results of operations. Capital accounts are not adjusted for temporary book-tax differences which will reverse in a subsequent period.
Book-tax differences are primarily due to foreign currency transactions, passive foreign investment companies (PFIC), and losses deferred due to wash sales and excise tax regulations.
As of period end, the cost and unrealized appreciation (depreciation) in securities, and derivatives if applicable, for federal income tax purposes were as follows:
| Gross unrealized appreciation | $611,608,492 |
| Gross unrealized depreciation | (183,508,349) |
| Net unrealized appreciation (depreciation) | $428,100,143 |
| Tax Cost | $2,233,525,738 |
The tax-based components of distributable earnings as of period end were as follows:
| Undistributed ordinary income | $74,175,456 |
| Undistributed long-term capital gain | $113,185,778 |
| Net unrealized appreciation (depreciation) on securities and other investments | $428,039,355 |
The tax character of distributions paid was as follows:
| | April 30, 2024 | April 30, 2023 |
| Ordinary Income | $2,717,572 | $ 23,734,991 |
| Long-term Capital Gains | 112,607,025 | 288,358,355 |
| Total | $115,324,597 | $ 312,093,346 |
4. Purchases and Sales of Investments.
Purchases and sales of securities, other than short-term securities and in-kind transactions, as applicable, are noted in the table below.
| | Purchases ($) | Sales ($) |
| Fidelity Small Cap Discovery Fund | 1,114,714,657 | 1,615,364,512 |
5. Fees and Other Transactions with Affiliates.
Management Fee. Fidelity Management & Research Company LLC (the investment adviser) and its affiliates provide the Fund with investment management related services for which the Fund pays a monthly management fee.
Effective March 1, 2024, the Fund's management contract was amended to incorporate administrative services previously covered under separate services agreements (Transfer Agent and Accounting agreements). Any reference to "class" in this note shall mean "the Fund" as the Fund currently offers only one class of shares. The amended contract incorporates a basic fee rate that may vary by class (subject to a performance adjustment). The investment adviser or an affiliate pays certain expenses of managing and operating the Fund out of each class's management fee. Each class of the Fund pays a management fee to the investment adviser. The management fee is calculated and paid to the investment adviser every month. The management fee is determined by calculating a basic fee and then applying a performance adjustment. When determining a class's basic fee, a mandate rate is calculated based on the monthly average net assets of a group of funds advised by FMR within a designated asset class. A discount rate is subtracted from the mandate rate once the Fund's monthly average net assets reach a certain level. The mandate rate and discount rate may vary by class. The annual basic fee rate for a class of shares of the Fund is the lesser of (1) the class's mandate rate reduced by the class's discount rate (if applicable) or (2) the amount set forth in the following table.
| | Maximum Management Fee Rate % |
| Fidelity Small Cap Discovery Fund | .84 |
One-twelfth of the basic fee rate for a class is applied to the average net assets of the class for the month, giving a dollar amount which is the basic fee for the class for that month. A different management fee rate may be applicable to each class of the Fund. The difference between classes is the result of separate arrangements for class-level services and/or waivers of certain expenses. It is not the result of any difference in advisory or custodial fees or other expenses related to the management of the Fund's assets, which do not vary by class. For the portion of the reporting period on or after March 1, 2024, the total annualized management fee rates were as follows:
| | Total Management Fee Rate % |
| Fidelity Small Cap Discovery Fund | .79 |
Prior to March 1, 2024, the management fee was the sum of an individual fund fee rate that was based on an annual rate of .45% of the Fund's average net assets and an annualized group fee rate that averaged .22% during the period. The group fee rate was based upon the monthly average net assets of a group of registered investment companies with which the investment adviser has management contracts. The group fee rate decreased as assets under management increased and increased as assets under management decreased. For the portion of the reporting period prior to March 1, 2024, the total annualized management fee rate was .67%.
The performance adjustment rate is calculated monthly by comparing over the performance period the Fund's performance to that of the performance adjustment index listed below.
| | Performance Adjustment Index |
| Fidelity Small Cap Discovery Fund | Russell 2000 Index |
For the purposes of calculating the performance adjustment for the Fund, the Fund's investment performance is based on the performance of The Fund. To the extent that other classes of the Fund have higher expenses, this could result in those classes bearing a larger positive performance adjustment and smaller negative performance adjustment than would be the case if each class's own performance were considered. The performance period is the most recent 36 month period. The maximum annualized performance adjustment rate is ±.20% of the Fund's average net assets over the performance period. The performance adjustment rate is divided by twelve and multiplied by the Fund's average net assets over the performance period, and the resulting dollar amount is proportionately added to or subtracted from a class's basic fee. For the entire reporting period, the total annual performance adjustment was .23%.
Effective March 1, 2024, the Fund's sub-advisory agreements with FMR Investment Management (UK) Limited, Fidelity Management & Research (Hong Kong) Limited, and Fidelity Management & Research (Japan) Limited were amended to provide that the investment adviser pays each sub-adviser monthly fees equal to 110% of the sub-adviser's costs for providing sub-advisory services.
Transfer Agent Fees. Fidelity Investments Institutional Operations Company LLC (FIIOC), an affiliate of the investment adviser, is the Fund's transfer, dividend disbursing and shareholder servicing agent. Effective March 1, 2024, each Fund's management contract was amended to incorporate transfer agent services and associated fees previously covered under a separate services agreement. FIIOC pays for typesetting, printing and mailing of shareholder reports, except proxy statements.
During November 2023, the Board approved a change in the transfer agent fees effective December 1, 2023 to a fixed annual rate of average net assets of 0.1744%.
Prior to December 1, 2023, FIIOC received account fees and asset-based fees that varied according to account size and type of account.
For the portion of the reporting period prior to March 1, 2024, the fees were equivalent to the annualized rate of .18% of average net assets.
Accounting Fees. Fidelity Service Company, Inc. (FSC), an affiliate of the investment adviser, maintains the Fund's accounting records. Effective March 1, 2024, the Fund's management contract was amended to incorporate accounting services and associated fees previously covered under a separate services agreement.
During November 2023, the Board approved a change in the accounting fees effective December 1, 2023 to a fixed annual rate of average net assets as follows:
| | % of Average Net Assets |
| Fidelity Small Cap Discovery Fund | .0261 |
Prior to December 1, 2023, the accounting fee was based on the level of average net assets for each month. For the portion of the reporting period prior to March 1, 2024, the fees were equivalent to the following annualized rates:
| | % of Average Net Assets |
| Fidelity Small Cap Discovery Fund | .03 |
Brokerage Commissions. A portion of portfolio transactions were placed with brokerage firms which are affiliates of the investment adviser. Brokerage commissions are included in net realized gain (loss) and change in net unrealized appreciation (depreciation) in the Statement of Operations. The commissions paid to these affiliated firms were as follows:
| | Amount ($) |
| Fidelity Small Cap Discovery Fund | 22,482 |
Interfund Trades. Funds may purchase from or sell securities to other Fidelity Funds under procedures adopted by the Board. The procedures have been designed to ensure these interfund trades are executed in accordance with Rule 17a-7 of the 1940 Act. Any interfund trades are included within the respective purchases and sales amounts shown in the Purchases and Sales of Investments note. Interfund trades during the period are noted in the table below.
| | Purchases ($) | Sales ($) | Realized Gain (Loss)($) |
| Fidelity Small Cap Discovery Fund | 56,352,457 | 77,183,057 | 19,667,691 |
6. Committed Line of Credit.
Certain Funds participate with other funds managed by the investment adviser or an affiliate in a $4.25 billion credit facility (the "line of credit") to be utilized for temporary or emergency purposes to fund shareholder redemptions or for other short-term liquidity purposes. The participating funds have agreed to pay commitment fees on their pro-rata portion of the line of credit, which are reflected in Miscellaneous expenses on the Statement of Operations, and are listed below. During the period, there were no borrowings on this line of credit.
| | Amount ($) |
| Fidelity Small Cap Discovery Fund | 4,513 |
7. Security Lending.
Funds lend portfolio securities from time to time in order to earn additional income. Lending agents are used, including National Financial Services (NFS), an affiliate of the investment adviser. Pursuant to a securities lending agreement, NFS will receive a fee, which is capped at 9.9% of a fund's daily lending revenue, for its services as lending agent. A fund may lend securities to certain qualified borrowers, including NFS. On the settlement date of the loan, a fund receives collateral (in the form of U.S. Treasury obligations, letters of credit and/or cash) against the loaned securities and maintains collateral in an amount not less than 100% of the market value of the loaned securities during the period of the loan. The market value of the loaned securities is determined at the close of business of a fund and any additional required collateral is delivered to a fund on the next business day. A fund or borrower may terminate the loan at any time, and if the borrower defaults on its obligation to return the securities loaned because of insolvency or other reasons, a fund may apply collateral received from the borrower against the obligation. A fund may experience delays and costs in recovering the securities loaned. Any cash collateral received is invested in the Fidelity Securities Lending Cash Central Fund. Any loaned securities are identified as such in the Schedule of Investments, and the value of loaned securities and cash collateral at period end, as applicable, are presented in the Statement of Assets and Liabilities. Security lending income represents the income earned on investing cash collateral, less rebates paid to borrowers and any lending agent fees associated with the loan, plus any premium payments received for lending certain types of securities. Security lending income is presented in the Statement of Operations as a component of income from Fidelity Central Funds. Affiliated security lending activity, if any, was as follows:
| | Total Security Lending Fees Paid to NFS ($) | Security Lending Income From Securities Loaned to NFS ($) | Value of Securities Loaned to NFS at Period End ($) |
| Fidelity Small Cap Discovery Fund | 10,659 | - | - |
8. Expense Reductions.
During the period the investment adviser or an affiliate reimbursed and/or waived a portion of operating expenses in the amount of $210,575.
9. Other.
A fund's organizational documents provide former and current trustees and officers with a limited indemnification against liabilities arising in connection with the performance of their duties to the fund. In the normal course of business, a fund may also enter into contracts that provide general indemnifications. A fund's maximum exposure under these arrangements is unknown as this would be dependent on future claims that may be made against a fund. The risk of material loss from such claims is considered remote.
10. Risk and Uncertainties.
Many factors affect a fund's performance. Developments that disrupt global economies and financial markets, such as pandemics, epidemics, outbreaks of infectious diseases, war, terrorism, and environmental disasters, may significantly affect a fund's investment performance. The effects of these developments to a fund will be impacted by the types of securities in which a fund invests, the financial condition, industry, economic sector, and geographic location of an issuer, and a fund's level of investment in the securities of that issuer. Significant concentrations in security types, issuers, industries, sectors, and geographic locations may magnify the factors that affect a fund's performance.
To the Board of Trustees of Fidelity Concord Street Trust and the Shareholders of Fidelity Small Cap Discovery Fund:
Opinion on the Financial Statements and Financial Highlights
We have audited the accompanying statement of assets and liabilities of Fidelity Small Cap Discovery Fund (the "Fund"), a fund of Fidelity Concord Street Trust, including the schedule of investments, as of April 30, 2024, the related statement of operations for the year then ended, the statement of changes in net assets for each of the two years in the period then ended, the financial highlights for each of the five years in the period then ended, and the related notes. In our opinion, the financial statements and financial highlights present fairly, in all material respects, the financial position of the Fund as of April 30, 2024, and the results of its operations for the year then ended, the changes in its net assets for each of the two years in the period then ended, and the financial highlights for each of the five years in the period then ended in conformity with accounting principles generally accepted in the United States of America.
Basis for Opinion
These financial statements and financial highlights are the responsibility of the Fund's management. Our responsibility is to express an opinion on the Fund's financial statements and financial highlights based on our audits. We are a public accounting firm registered with the Public Company Accounting Oversight Board (United States) (PCAOB) and are required to be independent with respect to the Fund in accordance with the U.S. federal securities laws and the applicable rules and regulations of the Securities and Exchange Commission and the PCAOB.
We conducted our audits in accordance with the standards of the PCAOB. Those standards require that we plan and perform the audit to obtain reasonable assurance about whether the financial statements and financial highlights are free of material misstatement, whether due to error or fraud. The Fund is not required to have, nor were we engaged to perform, an audit of its internal control over financial reporting. As part of our audits, we are required to obtain an understanding of internal control over financial reporting but not for the purpose of expressing an opinion on the effectiveness of the Fund's internal control over financial reporting. Accordingly, we express no such opinion.
Our audits included performing procedures to assess the risks of material misstatement of the financial statements and financial highlights, whether due to error or fraud, and performing procedures that respond to those risks. Such procedures included examining, on a test basis, evidence regarding the amounts and disclosures in the financial statements and financial highlights. Our audits also included evaluating the accounting principles used and significant estimates made by management, as well as evaluating the overall presentation of the financial statements and financial highlights. Our procedures included confirmation of securities owned as of April 30, 2024, by correspondence with the custodian and brokers; when replies were not received from brokers, we performed other auditing procedures. We believe that our audits provide a reasonable basis for our opinion.
/s/ Deloitte & Touche LLP
Boston, Massachusetts
June 12, 2024
We have served as the auditor of one or more of the Fidelity investment companies since 1999.
The Trustees, Members of the Advisory Board (if any), and officers of the trust and fund, as applicable, are listed below. The Board of Trustees governs the fund and is responsible for protecting the interests of shareholders. The Trustees are experienced executives who meet periodically throughout the year to oversee the fund's activities, review contractual arrangements with companies that provide services to the fund, oversee management of the risks associated with such activities and contractual arrangements, and review the fund's performance. Except for Jonathan Chiel, each of the Trustees oversees 323 funds. Mr. Chiel oversees 192 funds.
The Trustees hold office without limit in time except that (a) any Trustee may resign; (b) any Trustee may be removed by written instrument, signed by at least two-thirds of the number of Trustees prior to such removal; (c) any Trustee who requests to be retired or who has become incapacitated by illness or injury may be retired by written instrument signed by a majority of the other Trustees; and (d) any Trustee may be removed at any special meeting of shareholders by a two-thirds vote of the outstanding voting securities of the trust. Each Trustee who is not an interested person (as defined in the 1940 Act) of the trust and the fund is referred to herein as an Independent Trustee. Each Independent Trustee shall retire not later than the last day of the calendar year in which his or her 75th birthday occurs. The Independent Trustees may waive this mandatory retirement age policy with respect to individual Trustees. Officers and Advisory Board Members hold office without limit in time, except that any officer or Advisory Board Member may resign or may be removed by a vote of a majority of the Trustees at any regular meeting or any special meeting of the Trustees. Except as indicated, each individual has held the office shown or other offices in the same company for the past five years.
The fund's Statement of Additional Information (SAI) includes more information about the Trustees. To request a free copy, call Fidelity at 1-800-544-8544.
Experience, Skills, Attributes, and Qualifications of the Trustees. The Governance and Nominating Committee has adopted a statement of policy that describes the experience, qualifications, attributes, and skills that are necessary and desirable for potential Independent Trustee candidates (Statement of Policy). The Board believes that each Trustee satisfied at the time he or she was initially elected or appointed a Trustee, and continues to satisfy, the standards contemplated by the Statement of Policy. The Governance and Nominating Committee also engages professional search firms to help identify potential Independent Trustee candidates who have the experience, qualifications, attributes, and skills consistent with the Statement of Policy. From time to time, additional criteria based on the composition and skills of the current Independent Trustees, as well as experience or skills that may be appropriate in light of future changes to board composition, business conditions, and regulatory or other developments, have also been considered by the professional search firms and the Governance and Nominating Committee. In addition, the Board takes into account the Trustees' commitment and participation in Board and committee meetings, as well as their leadership of standing and ad hoc committees throughout their tenure.
In determining that a particular Trustee was and continues to be qualified to serve as a Trustee, the Board has considered a variety of criteria, none of which, in isolation, was controlling. The Board believes that, collectively, the Trustees have balanced and diverse experience, qualifications, attributes, and skills, which allow the Board to operate effectively in governing the fund and protecting the interests of shareholders. Information about the specific experience, skills, attributes, and qualifications of each Trustee, which in each case led to the Board's conclusion that the Trustee should serve (or continue to serve) as a trustee of the fund, is provided below.
Board Structure and Oversight Function. Robert A. Lawrence is an interested person and currently serves as Chair. The Trustees have determined that an interested Chair is appropriate and benefits shareholders because an interested Chair has a personal and professional stake in the quality and continuity of services provided to the fund. Independent Trustees exercise their informed business judgment to appoint an individual of their choosing to serve as Chair, regardless of whether the Trustee happens to be independent or a member of management. The Independent Trustees have determined that they can act independently and effectively without having an Independent Trustee serve as Chair and that a key structural component for assuring that they are in a position to do so is for the Independent Trustees to constitute a substantial majority for the Board. The Independent Trustees also regularly meet in executive session. David M. Thomas serves as Lead Independent Trustee and as such (i) acts as a liaison between the Independent Trustees and management with respect to matters important to the Independent Trustees and (ii) with management prepares agendas for Board meetings.
Fidelity® funds are overseen by different Boards of Trustees. The fund's Board oversees Fidelity's high income and certain equity funds, and other Boards oversee Fidelity's alternative investment, investment-grade bond, money market, asset allocation, and other equity funds. The asset allocation funds may invest in Fidelity® funds overseen by the fund's Board. The use of separate Boards, each with its own committee structure, allows the Trustees of each group of Fidelity® funds to focus on the unique issues of the funds they oversee, including common research, investment, and operational issues. On occasion, the separate Boards establish joint committees to address issues of overlapping consequences for the Fidelity® funds overseen by each Board.
The Trustees operate using a system of committees to facilitate the timely and efficient consideration of all matters of importance to the Trustees, the fund, and fund shareholders and to facilitate compliance with legal and regulatory requirements and oversight of the fund's activities and associated risks. The Board, acting through its committees, has charged FMR and its affiliates with (i) identifying events or circumstances the occurrence of which could have demonstrably adverse effects on the fund's business and/or reputation; (ii) implementing processes and controls to lessen the possibility that such events or circumstances occur or to mitigate the effects of such events or circumstances if they do occur; and (iii) creating and maintaining a system designed to evaluate continuously business and market conditions in order to facilitate the identification and implementation processes described in (i) and (ii) above. Because the day-to-day operations and activities of the fund are carried out by or through FMR, its affiliates, and other service providers, the fund's exposure to risks is mitigated but not eliminated by the processes overseen by the Trustees. While each of the Board's committees has responsibility for overseeing different aspects of the fund's activities, oversight is exercised primarily through the Operations, Audit, and Compliance Committees. Appropriate personnel, including but not limited to the fund's Chief Compliance Officer (CCO), FMR's internal auditor, the independent accountants, the fund's Treasurer and portfolio management personnel, make periodic reports to the Board's committees, as appropriate, including an annual review of Fidelity's risk management program for the Fidelity® funds. The responsibilities of each standing committee, including their oversight responsibilities, are described further under "Standing Committees of the Trustees."
Interested Trustees*:
Correspondence intended for a Trustee who is an interested person may be sent to Fidelity Investments, 245 Summer Street, Boston, Massachusetts 02210.
Name, Year of Birth; Principal Occupations and Other Relevant Experience+
Jonathan Chiel (1957)
Year of Election or Appointment: 2016
Trustee
Mr. Chiel also serves as Trustee of other Fidelity® funds. Mr. Chiel is Senior Counsel at Fidelity Investments (diversified financial services company, 2024-present). Previously, Mr. Chiel served as General Counsel (2012-2024) and Head of Legal, Risk and Compliance (2022-2024) for Fidelity Investments; Executive Vice President and General Counsel for FMR LLC (diversified financial services company, 2012-2024); Director and President of OH Company LLC (holding company, 2018-2024); General Counsel (2004-2012) and Senior Vice President and Deputy General Counsel (2000-2004) for John Hancock Financial Services; a partner with Choate, Hall & Stewart (law firm, 1996-2000); and an Assistant United States Attorney for the United States Attorney's Office of the District of Massachusetts (1986-1995), including Chief of the Criminal Division (1993-1995). Mr. Chiel is a director on the boards of the Harvard Law School Center on the Legal Profession and the U.S. Chamber Litigation Center.
Bettina Doulton (1964)
Year of Election or Appointment: 2021
Trustee
Ms. Doulton also serves as Trustee of other Fidelity® funds. Prior to her retirement, Ms. Doulton served in a variety of positions at Fidelity Investments, including as a managing director of research (2006-2007), portfolio manager to certain Fidelity® funds (1993-2005), equity analyst and portfolio assistant (1990-1993), and research assistant (1987-1990). Ms. Doulton currently owns and operates Cellardoor Winery. Previously, Ms. Doulton served as a member of the Board of Brown Capital Management, LLC (2014-2018).
Robert A. Lawrence (1952)
Year of Election or Appointment: 2020
Trustee
Chair of the Board of Trustees
Mr. Lawrence also serves as Trustee of other funds. Previously, Mr. Lawrence served as a Trustee and Member of the Advisory Board of certain funds. Prior to his retirement in 2008, Mr. Lawrence served as Vice President of certain Fidelity® funds (2006-2008), Senior Vice President, Head of High Income Division of Fidelity Management & Research Company (investment adviser firm, 2006-2008), and President of Fidelity Strategic Investments (investment adviser firm, 2002-2005).
* Determined to be an "Interested Trustee" by virtue of, among other things, his or her affiliation with the trust or various entities under common control with FMR.
+ The information includes the Trustee's principal occupation during the last five years and other information relating to the experience, attributes, and skills relevant to the Trustee's qualifications to serve as a Trustee, which led to the conclusion that the Trustee should serve as a Trustee for the fund.
Independent Trustees:
Correspondence intended for an Independent Trustee may be sent to Fidelity Investments, P.O. Box 55235, Boston, Massachusetts 02205-5235.
Name, Year of Birth; Principal Occupations and Other Relevant Experience+
Thomas P. Bostick (1956)
Year of Election or Appointment: 2021
Trustee
Lieutenant General Bostick also serves as Trustee of other Fidelity® funds. Prior to his retirement, General Bostick (United States Army, Retired) held a variety of positions within the U.S. Army, including Chief of Engineers and Commanding General, U.S. Army Corps of Engineers (2012-2016) and Deputy Chief of Staff and Director of Human Resources, U.S. Army (2009-2012). General Bostick currently serves as a member of the Board and Finance and Governance & Sustainability Committees of CSX Corporation (transportation, 2020-present) and a member of the Board and Corporate Governance and Nominating Committee of Perma-Fix Environmental Services, Inc. (nuclear waste management, 2020-present). General Bostick serves as Chief Executive Officer of Bostick Global Strategies, LLC (consulting, 2016-present), as a member of the Board of HireVue, Inc. (video interview and assessment, 2020-present), as a member of the Board of Allonnia (biotechnology and engineering solutions, 2022-present), on the Advisory Board of Hilco Redevelopment Partners (a real estate investment and redevelopment company, 2021-present), and on the Advisory Board of Solugen, Inc. (specialty bio-based chemicals manufacturer, 2022-present). Previously, General Bostick served as a Member of the Advisory Board of certain Fidelity® funds (2021), President, Intrexon Bioengineering (2018-2020) and Chief Operating Officer (2017-2020) and Senior Vice President of the Environment Sector (2016-2017) of Intrexon Corporation (biopharmaceutical company).
Donald F. Donahue (1950)
Year of Election or Appointment: 2018
Trustee
Mr. Donahue also serves as Trustee of other Fidelity® funds. Mr. Donahue serves as President and Chief Executive Officer of Miranda Partners, LLC (risk consulting for the financial services industry, 2012-present). Previously, Mr. Donahue served as Chief Executive Officer (2006-2012), Chief Operating Officer (2003-2006) and Managing Director, Customer Marketing and Development (1999-2003) of The Depository Trust & Clearing Corporation (financial markets infrastructure). Mr. Donahue currently serves as a member (2007-present) and Co-Chairman (2016-present) of the Board of United Way of New York. Mr. Donahue previously served as a member of the Advisory Board of certain Fidelity® funds (2015-2018) and as a member of the Board of The Leadership Academy (previously NYC Leadership Academy) (2012-2022).
Vicki L. Fuller (1957)
Year of Election or Appointment: 2020
Trustee
Ms. Fuller also serves as Trustee of other Fidelity® funds. Previously, Ms. Fuller served as a member of the Advisory Board of certain Fidelity® funds (2018-2020), Chief Investment Officer of the New York State Common Retirement Fund (2012-2018) and held a variety of positions at AllianceBernstein L.P. (global asset management, 1985-2012), including Managing Director (2006-2012) and Senior Vice President and Senior Portfolio Manager (2001-2006). Ms. Fuller currently serves as a member of the Board, Audit Committee, Compensation Committee and Nominating and Governance Committee of two Blackstone business development companies (2020-present), as a member of the Board of Treliant, LLC (consulting, 2019-present), as a member of the Board of Ariel Alternatives, LLC (private equity, 2022-present) and as a member of the Board and Chair of the Audit Committee of Gusto, Inc. (software, 2021-present). In addition, Ms. Fuller currently serves as a member of the Executive Board of New York University's Stern School of Business. Ms. Fuller previously served as a member of the Board of Roosevelt University (2019-2024) and member of the Board, Audit Committee and Nominating and Governance Committee of The Williams Companies, Inc. (natural gas infrastructure, 2018-2021).
Patricia L. Kampling (1959)
Year of Election or Appointment: 2020
Trustee
Ms. Kampling also serves as Trustee of other Fidelity® funds. Prior to her retirement, Ms. Kampling served as Chairman of the Board and Chief Executive Officer (2012-2019), President and Chief Operating Officer (2011-2012) and Executive Vice President and Chief Financial Officer (2010-2011) of Alliant Energy Corporation. Ms. Kampling currently serves as a member of the Board, Audit Committee and Governance, Compensation and Nominating Committee of Xcel Energy Inc. (utilities company, 2020-present) and as a member of the Board, Audit, Finance and Risk Committee and Safety, Environmental, Technology and Operations Committee and Chair of the Executive Development and Compensation Committee of American Water Works Company, Inc. (utilities company, 2019-present). In addition, Ms. Kampling currently serves as a member of the Board of the Nature Conservancy, Wisconsin Chapter (2019-present). Previously, Ms. Kampling served as a Member of the Advisory Board of certain Fidelity® funds (2020), a member of the Board, Compensation Committee and Executive Committee and Chair of the Audit Committee of Briggs & Stratton Corporation (manufacturing, 2011-2021), a member of the Board of Interstate Power and Light Company (2012-2019) and Wisconsin Power and Light Company (2012-2019) (each a subsidiary of Alliant Energy Corporation) and as a member of the Board and Workforce Development Committee of the Business Roundtable (2018-2019).
Thomas A. Kennedy (1955)
Year of Election or Appointment: 2021
Trustee
Mr. Kennedy also serves as Trustee of other Fidelity® funds. Previously, Mr. Kennedy served as a Member of the Advisory Board of certain Fidelity® funds (2020) and held a variety of positions at Raytheon Company (aerospace and defense, 1983-2020), including Chairman and Chief Executive Officer (2014-2020) and Executive Vice President and Chief Operating Officer (2013-2014). Mr. Kennedy served as Executive Chairman of the Board of Directors of Raytheon Technologies Corporation (aerospace and defense, 2020-2021). Mr. Kennedy serves as a Director of the Board of Directors of Textron Inc. (aerospace and defense, 2023-present).
Oscar Munoz (1959)
Year of Election or Appointment: 2021
Trustee
Mr. Munoz also serves as Trustee of other Fidelity® funds. Prior to his retirement, Mr. Munoz served as Executive Chairman (2020-2021), Chief Executive Officer (2015-2020), President (2015-2016) and a member of the Board (2010-2021) of United Airlines Holdings, Inc. Mr. Munoz currently serves as a member of the Board of CBRE Group, Inc. (commercial real estate, 2020-present), a member of the Board of Univision Communications, Inc. (Hispanic media, 2020-present), a member of the Board of Archer Aviation Inc. (2021-present), a member of the Defense Business Board of the United States Department of Defense (2021-present) and a member of the Board of Salesforce.com, Inc. (cloud-based software, 2022-present). Previously, Mr. Munoz served as a Member of the Advisory Board of certain Fidelity® funds (2021).
David M. Thomas (1949)
Year of Election or Appointment: 2008
Trustee
Lead Independent Trustee
Mr. Thomas also serves as Trustee of other Fidelity® funds. Previously, Mr. Thomas served as Executive Chairman (2005-2006) and Chairman and Chief Executive Officer (2000-2005) of IMS Health, Inc. (pharmaceutical and healthcare information solutions) and as a member of the Board of Fortune Brands Home and Security (home and security products, 2004-2023). Mr. Thomas currently serves as Director (2013-present) and Non-Executive Chairman of the Board (2022-present) of Interpublic Group of Companies, Inc. (marketing communication).
Susan Tomasky (1953)
Year of Election or Appointment: 2020
Trustee
Ms. Tomasky also serves as Trustee of other Fidelity® funds. Prior to her retirement, Ms. Tomasky served in various executive officer positions at American Electric Power Company, Inc. (1998-2011), including most recently as President of AEP Transmission (2007-2011). Ms. Tomasky currently serves as a member of the Board and Sustainability Committee and as Chair of the Audit Committee of Marathon Petroleum Corporation (2018-present) and as a member of the Board, Executive Committee, Corporate Governance Committee and Organization and Compensation Committee and as Lead Director of the Board of Public Service Enterprise Group, Inc. (utilities company, 2012-present) and as a member of the Board of its subsidiary company, Public Service Electric and Gas Co. (2021-present). In addition, Ms. Tomasky currently serves as a member (2009-present) and President (2020-present) of the Board of the Royal Shakespeare Company - America (2009-present) and as a member and Vice Chair of the Board of Kenyon College (2016-present). Previously, Ms. Tomasky served as a Member of the Advisory Board of certain Fidelity® funds (2020), as a member of the Board of the Columbus Association for the Performing Arts (2011-2023), as a member of the Board of the Columbus Regional Airport Authority (2007-2020), as a member of the Board (2011-2018) and Lead Independent Director (2015-2018) of Andeavor Corporation (previously Tesoro Corporation) (independent oil refiner and marketer) and as a member of the Board of Summit Midstream Partners LP (energy, 2012-2018).
Michael E. Wiley (1950)
Year of Election or Appointment: 2020
Trustee
Mr. Wiley also serves as Trustee of other Fidelity® funds. Previously, Mr. Wiley served as a member of the Advisory Board of certain Fidelity® funds (2018-2020), Chairman, President and CEO of Baker Hughes, Inc. (oilfield services, 2000-2004). Mr. Wiley also previously served as a member of the Board of Andeavor Corporation (independent oil refiner and marketer, 2005-2018), a member of the Board of Andeavor Logistics LP (natural resources logistics, 2015-2018) and a member of the Board of High Point Resources (exploration and production, 2005-2020).
+ The information includes the Trustee's principal occupation during the last five years and other information relating to the experience, attributes, and skills relevant to the Trustee's qualifications to serve as a Trustee, which led to the conclusion that the Trustee should serve as a Trustee for the fund.
Advisory Board Members and Officers:
Correspondence intended for a Member of the Advisory Board (if any) may be sent to Fidelity Investments, P.O. Box 55235, Boston, Massachusetts 02205-5235. Correspondence intended for an officer or Peter S. Lynch may be sent to Fidelity Investments, 245 Summer Street, Boston, Massachusetts 02210.
Name, Year of Birth; Principal Occupations+
Vijay C. Advani (1960)
Year of Election or Appointment: 2023
Member of the Advisory Board
Mr. Advani also serves as Trustee or Member of the Advisory Board of other funds. Previously, Mr. Advani served as Executive Chairman (2020-2022), Chief Executive Officer (2017-2020) and Chief Operating Officer (2016-2017) of Nuveen (global investment manager). He also served in various capacities at Franklin Resources (global investment manager), including Co-President (2015-2016), Executive Vice President, Global Advisory Services (2008-2015), Head of Global Retail Distribution (2005-2008), Executive Managing Director, International Retail Development (2002-2005), Managing Director, Product Developments, Sales & Marketing, Asia, Eastern Europe and Africa (2000-2002) and President, Templeton Asset Management India (1995-2000). Mr. Advani also served as Senior Investment Officer of International Finance Corporation (private equity and venture capital arm of The World Bank, 1984-1995). Mr. Advani is Chairman Emeritus of the U.S. India Business Council (2018-present), a Director of The Global Impact Investing Network (2019-present), a Director of LOK Capital (Mauritius) (2022-present), a member of the Advisory Council of LOK Capital (2022-present), a Senior Advisor of Neuberger Berman (2021-present), a Senior Advisor of Seviora Holdings Pte. Ltd (Temasek-Singapore) (2021-present), a Director of Seviora Capital (Singapore) (2021-present) and an Advisor of EQUIAM (2021-present). Mr. Advani formerly served as a member of the Board of BowX Acquisition Corp. (special purpose acquisition company, 2020-2021), a member of the Board of Intellecap (advisory arm of The Aavishkaar Group, 2018-2020), a member of the Board of Nuveen Investments, Inc. (2017-2020) and a member of the Board of Docusign (software, 2016-2019).
Peter S. Lynch (1944)
Year of Election or Appointment: 2003
Member of the Advisory Board
Mr. Lynch also serves as a Member of the Advisory Board of other Fidelity® funds. Mr. Lynch is Vice Chairman and a Director of Fidelity Management & Research Company LLC (investment adviser firm). In addition, Mr. Lynch serves as a Trustee of Boston College and as the Chairman of the Inner-City Scholarship Fund. Previously, Mr. Lynch served as Vice Chairman and a Director of FMR Co., Inc. (investment adviser firm) and on the Special Olympics International Board of Directors (1997-2006).
Karen B. Peetz (1955)
Year of Election or Appointment: 2023
Member of the Advisory Board
Ms. Peetz also serves as a Member of the Advisory Board of other funds. Previously, Ms. Peetz served as Chief Administration Officer (2020-2023) of Citigroup Inc. (a diversified financial service company). She also served in various capacities at Bank of New York Mellon Corporation, including President (2013-2016), Vice Chairman, Senior Executive Vice President and Chief Executive Officer of Financial Markets & Treasury Services (2010-2013), Senior Executive Vice President and Chief Executive Officer of Global Corporate Trust (2003-2008), Senior Vice President and Division Manager of Global Payments & Trade Services (2002-2003) and Senior Vice President and Division Manager of Domestic Corporate Trust (1998-2002). Ms. Peetz also served in various capacities at Chase Manhattan Corporation (1982-1998), including Senior Vice President and Manager of Corporate Trust International Business (1996-1998), Managing Director and Manager of Corporate Trust Services (1994-1996) and Managing Director and Group Manager of Financial Institution Sales (1990-1993). Ms. Peetz currently serves as Chair of Amherst Holdings Advisory Council (2018-present), Trustee of Johns Hopkins University (2016-present), Chair of the Carey Business School Advisory Council, Member of the Johns Hopkins Medicine Board and Finance Committee and Chair of the Lyme and Tick Related Disease Institute Advisory Council. Ms. Peetz previously served as a member of the Board of Guardian Life Insurance Company of America (2019-2023), a member of the Board of Trane Technologies (2018-2022), a member of the Board of Wells Fargo Corp. (2017-2019), a member of the Board of SunCoke Energy Inc. (2012-2016), a member of the Board of Private Export Funding Corporation (2010-2016) and as a Trustee of Penn State University (2010-2014) and the United Way of New York City (2008-2010).
Heather Bonner (1977)
Year of Election or Appointment: 2023
Assistant Treasurer
Ms. Bonner also serves as an officer of other funds. Ms. Bonner is a Senior Vice President (2022-present) and is an employee of Fidelity Investments (2022-present). Ms. Bonner serves as Senior Vice President, Vice President, Treasurer, or Director of certain Fidelity entities. Prior to joining Fidelity, Ms. Bonner served as Managing Director at AQR Capital Management (2013-2022) and was the Treasurer and Principal Financial Officer of the AQR Funds (2013-2022).
Craig S. Brown (1977)
Year of Election or Appointment: 2022
Deputy Treasurer
Mr. Brown also serves as an officer of other funds. Mr. Brown is a Vice President (2015-present) and is an employee of Fidelity Investments. Mr. Brown serves as Assistant Treasurer of FIMM, LLC (2021-present). Previously, Mr. Brown served as Assistant Treasurer of certain Fidelity® funds (2019-2022).
John J. Burke III (1964)
Year of Election or Appointment: 2018
Chief Financial Officer
Mr. Burke also serves as Chief Financial Officer of other funds. Mr. Burke is Head of Fidelity Fund and Investment Operations (2018-present) and is an employee of Fidelity Investments. Mr. Burke serves as President, Executive Vice President, or Director of certain Fidelity entities. Previously Mr. Burke served as head of Asset Management Investment Operations (2012-2018).
Margaret Carey (1973)
Year of Election or Appointment: 2023
Secretary and Chief Legal Officer (CLO)
Ms. Carey also serves as an officer of other funds and as CLO of certain Fidelity entities. Ms. Carey is a Senior Vice President, Deputy General Counsel (2019-present) and is an employee of Fidelity Investments.
William C. Coffey (1969)
Year of Election or Appointment: 2019
Assistant Secretary
Mr. Coffey also serves as Assistant Secretary of other funds. Mr. Coffey is a Senior Vice President, Deputy General Counsel (2010-present) and is an employee of Fidelity Investments. Previously, Mr. Coffey served as Secretary and CLO of certain funds (2018-2019); CLO, Secretary, or Senior Vice President of certain Fidelity entities and Assistant Secretary of certain funds (2009-2018).
Timothy M. Cohen (1969)
Year of Election or Appointment: 2018
Vice President
Mr. Cohen also serves as Vice President of other funds. Mr. Cohen is Co-Head of Equity (2018-present) and is an employee of Fidelity Investments. Mr. Cohen serves as President or Director of certain Fidelity entities. Previously, Mr. Cohen served as Executive Vice President of Fidelity SelectCo, LLC (2019) and Head of Global Equity Research (2016-2018).
Jonathan Davis (1968)
Year of Election or Appointment: 2010
Assistant Treasurer
Mr. Davis also serves as an officer of other funds. Mr. Davis is a Vice President (2006-present) and is an employee of Fidelity Investments. Mr. Davis serves as Assistant Treasurer or Director of certain Fidelity entities.
Laura M. Del Prato (1964)
Year of Election or Appointment: 2018
Assistant Treasurer
Ms. Del Prato also serves as an officer of other funds. Ms. Del Prato is a Senior Vice President (2017-present) and is an employee of Fidelity Investments. Ms. Del Prato serves as Senior Vice President, Vice President, Assistant Treasurer, or Director of certain Fidelity entities. Previously, Ms. Del Prato served as President and Treasurer of The North Carolina Capital Management Trust: Cash Portfolio and Term Portfolio (2018-2020).
Colm A. Hogan (1973)
Year of Election or Appointment: 2020
Assistant Treasurer
Mr. Hogan also serves as an officer of other funds. Mr. Hogan is a Vice President (2016-present) and is an employee of Fidelity Investments. Mr. Hogan serves as Assistant Treasurer of certain Fidelity entities. Previously, Mr. Hogan served as Deputy Treasurer of certain Fidelity® funds (2016-2020) and Assistant Treasurer of certain Fidelity® funds (2016-2018).
Pamela R. Holding (1964)
Year of Election or Appointment: 2018
Vice President
Ms. Holding also serves as Vice President of other funds. Ms. Holding is Co-Head of Equity (2018-present) and is an employee of Fidelity Investments. Previously, Ms. Holding served as Executive Vice President of Fidelity SelectCo, LLC (2019) and as Chief Investment Officer of Fidelity Institutional Asset Management (2013-2018).
Chris Maher (1972)
Year of Election or Appointment: 2020
Deputy Treasurer
Mr. Maher also serves as an officer of other funds. Mr. Maher is a Vice President (2008-present) and is an employee of Fidelity Investments. Mr. Maher serves as Assistant Treasurer of certain Fidelity entities. Previously, Mr. Maher served as Assistant Treasurer of certain funds (2013-2020).
Jason P. Pogorelec (1975)
Year of Election or Appointment: 2020
Chief Compliance Officer
Mr. Pogorelec also serves as Chief Compliance Officer of other funds. Mr. Pogorelec is a Senior Vice President of Asset Management Compliance (2020-present) and is an employee of Fidelity Investments. Mr. Pogorelec serves as Compliance Officer of Fidelity Management & Research Company LLC (investment adviser firm, 2023-present) and Ballyrock Investment Advisors LLC (2023-present). Previously, Mr. Pogorelec served as a Vice President, Associate General Counsel for Fidelity Investments (2010-2020) and Assistant Secretary of certain Fidelity® funds (2015-2020).
Brett Segaloff (1972)
Year of Election or Appointment: 2021
Anti-Money Laundering (AML) Officer
Mr. Segaloff also serves as AML Officer of other funds. Mr. Segaloff is a Vice President (2022-present) and is an employee of Fidelity Investments. Mr. Segaloff serves as Anti Money Laundering Compliance Officer or Anti Money Laundering/Bank Secrecy Act Compliance Officer of certain Fidelity entities.
Stacie M. Smith (1974)
Year of Election or Appointment: 2016
President and Treasurer
Ms. Smith also serves as an officer of other funds. Ms. Smith is a Senior Vice President (2016-present) and is an employee of Fidelity Investments. Ms. Smith serves as Assistant Treasurer of certain Fidelity entities and has served in other fund officer roles.
Jim Wegmann (1979)
Year of Election or Appointment: 2019
Assistant Treasurer
Mr. Wegmann also serves as an officer of other funds. Mr. Wegmann is a Vice President (2016-present) and is an employee of Fidelity Investments. Mr. Wegmann serves as Assistant Treasurer of FIMM, LLC (2021-present). Previously, Mr. Wegmann served as Assistant Treasurer of certain Fidelity® funds (2019-2021).
+ The information includes principal occupation during the last five years.
As a shareholder, you incur two types of costs: (1) transaction costs, which may include sales charges (loads) on purchase payments or redemption proceeds, as applicable and (2) ongoing costs, which generally include management fees, distribution and/or service (12b-1) fees and other Fund expenses. This Example is intended to help you understand your ongoing costs (in dollars) of investing in a fund and to compare these costs with the ongoing costs of investing in other mutual funds.
| The Example is based on an investment of $1,000 invested at the beginning of the period and held for the entire period (November 1, 2023 to April 30, 2024). |
Actual Expenses
The first line of the accompanying table provides information about actual account values and actual expenses. You may use the information in this line, together with the amount you invested, to estimate the expenses that you paid over the period. Simply divide your account value by $1,000.00 (for example, an $8,600 account value divided by $1,000.00 = 8.6), then multiply the result by the number in the first line for a class/Fund under the heading entitled "Expenses Paid During Period" to estimate the expenses you paid on your account during this period. If any fund is a shareholder of any underlying mutual funds or exchange-traded funds (ETFs) (the Underlying Funds), such fund indirectly bears its proportional share of the expenses of the Underlying Funds in addition to the direct expenses incurred presented in the table. These fees and expenses are not included in the annualized expense ratio used to calculate the expense estimate in the table below.
Hypothetical Example for Comparison Purposes
The second line of the accompanying table provides information about hypothetical account values and hypothetical expenses based on the actual expense ratio and an assumed rate of return of 5% per year before expenses, which is not the actual return. The hypothetical account values and expenses may not be used to estimate the actual ending account balance or expenses you paid for the period. You may use this information to compare the ongoing costs of investing in the Fund and other funds. To do so, compare this 5% hypothetical example with the 5% hypothetical examples that appear in the shareholder reports of the other funds. If any fund is a shareholder of any Underlying Funds, such fund indirectly bears its proportional share of the expenses of the Underlying Funds in addition to the direct expenses as presented in the table. These fees and expenses are not included in the annualized expense ratio used to calculate the expense estimate in the table below.
Please note that the expenses shown in the table are meant to highlight your ongoing costs only and do not reflect any transaction costs. Therefore, the second line of the table is useful in comparing ongoing costs only, and will not help you determine the relative total costs of owning different funds. In addition, if these transactional costs were included, your costs would have been higher.
| | | | | Annualized Expense Ratio- A | | Beginning Account Value November 1, 2023 | | Ending Account Value April 30, 2024 | | Expenses Paid During Period- C November 1, 2023 to April 30, 2024 |
| | | | | | | | | | |
| Fidelity® Small Cap Discovery Fund | | | | 1.07% | | | | | | |
| Actual | | | | | | $ 1,000 | | $ 1,213.90 | | $ 5.89 |
Hypothetical-B | | | | | | $ 1,000 | | $ 1,019.54 | | $ 5.37 |
| |
A Annualized expense ratio reflects expenses net of applicable fee waivers.
B 5% return per year before expenses
C Expenses are equal to the annualized expense ratio, multiplied by the average account value over the period, multiplied by 182/ 366 (to reflect the one-half year period). The fees and expenses of any Underlying Funds are not included in each annualized expense ratio.
The dividend and capital gains distributions for the fund(s) are available on Fidelity.com or Institutional.Fidelity.com.
The fund hereby designates as a capital gain dividend with respect to the taxable year ended April 30, 2024, $193,139,277, or, if subsequently determined to be different, the net capital gain of such year.
The fund designates 100% of the dividends distributed during the fiscal year as qualifying for the dividends-received deduction for corporate shareholders.
The fund designates 100% of the dividends distributed during the fiscal year as amounts which may be taken into account as a dividend for the purposes of the maximum rate under section 1(h)(11) of the Internal Revenue Code.
The fund will notify shareholders in January 2025 of amounts for use in preparing 2024 income tax returns.
Board Approval of Investment Advisory Contracts
Fidelity Small Cap Discovery Fund
At its January 2024 meeting, the Board of Trustees, including the Independent Trustees (together, the Board), approved an amended and restated management contract with Fidelity Management & Research Company LLC (FMR) (the Management Contract), and amended and restated sub-advisory agreements (the Sub-Advisory Contracts, and together with the Management Contract, the Advisory Contracts) for the fund, including the fund's sub-advisory agreements with FMR Investment Management (UK) Limited (FMR UK), Fidelity Management & Research (Hong Kong) Limited (FMR H.K.), and Fidelity Management & Research (Japan) Limited (FMR Japan). The Advisory Contracts will be effective March 1, 2024. The Board will consider the annual renewal of the fund's Advisory Contracts in May 2024, following its review of additional materials provided by FMR.
Management Contract. The Board approved the Management Contract, which implements a new fee structure combining the management fee, transfer agent fee (TA Fee), and pricing and bookkeeping fee (P&B Fee) of the fund into a single fee based on tiered schedules and subject to a maximum rate (the Unified Fee). In exchange for the Unified Fee, the fund will receive investment advisory, management, administrative, transfer agent, pricing and bookkeeping services under a single agreement - the Management Contract.
In its consideration of the Management Contract over several meetings, the Board received, reviewed and discussed a comprehensive set of analyses regarding the Unified Fee including (i) the legal framework, (ii) design goals for the Unified Fee, (iii) calculation methodology for the Unified Fee and illustrative examples, (iv) annual and cumulative projected impacts under various scenarios, both in the aggregate and at the fund/class level, (v) explanations of schedules, rate levers and maximum rates and (vi) shareholder benefits and projected savings.
The Board considered that the maximum Unified Fee for the fund would be no higher than the sum of (i) the lowest contractual management fee rate under the fund's existing management contract, which is the individual fund fee rate, if any, plus the lowest contractual marginal group fee rate and (ii) the TA and P&B Fee rates, which are fixed fee rates since December 1, 2023 (together, the Unified Fee Cap). The Board noted that Fidelity has represented that, as a result of this Unified Fee Cap, the Unified Fee would be no greater than the fee rates previously authorized to be charged to the fund for the same services. The Board noted that certain expenses such as performance adjustments, third-party expenses, and certain other miscellaneous expenses would be outside the scope of the Unified Fee and the calculation of such fees would not change as a result of the Unified Fee.
The Board considered Fidelity's representations that implementation of the Unified Fee, which includes the Unified Fee Cap, would cause all funds subject to the Unified Fee, including the fund, to experience an immediate reduction on contractual fee rates for services provided under the current management contracts. The Board considered that some funds would not experience lower net total fees as a result of existing fee caps. The Board further considered that, in addition to the contractual fee savings, the Unified Fee offers funds and their shareholders greater protection from future rate increases for services previously offered under separate agreements that are now covered by the Management Contract because such rate increases would require shareholder approval.
Sub-Advisory Contracts. In connection with the Unified Fee changes, the Board considered the Sub-Advisory Contracts, which simplified the calculation of the fees paid by FMR to the sub-advisers under the agreements. The Board noted that the agreements with FMR UK, FMR H.K., and FMR Japan were amended to provide that FMR will compensate each sub-adviser at a fee rate equal to 110% of the sub-adviser's costs incurred in providing services under the agreement. The Board considered that, under the Sub-Advisory Contracts, FMR, and not the fund, will continue to pay the sub-advisory fees to each applicable sub-adviser.
The Board further considered that the approval of the fund's Advisory Contracts will not result in any changes in the investment process or strategies employed in the management of the fund's assets or the day-to-day management of the fund or the persons primarily responsible for such management. Further, the Board considered that the Management Contract would not change the obligations and services of FMR and its affiliates on behalf of the fund, and, in particular, there would be no change in the nature and level of advisory, management, administration, transfer agent, and pricing and bookkeeping services provided to the fund by FMR, its affiliates, and each applicable sub-adviser.
In connection with its consideration of future renewals of the fund's Advisory Contracts, the Board will consider: (i) the nature, extent and quality of services provided to the funds, including shareholder and administrative services and investment performance; (ii) the competitiveness of the management fee and total expenses for the fund; (iii) the costs of the services and profitability, including the revenues earned and the expenses incurred in conducting the business of developing, marketing, distributing, managing, administering, and servicing the fund and its shareholders, to the extent applicable; and (iv) whether there have been economies of scale in respect of the Fidelity funds, whether the Fidelity funds (including the fund) have appropriately benefited from any such economies of scale, and whether there is the potential for realization of any further economies.
Based on its evaluation of all of the conclusions and representations noted above, and after considering all factors it believed relevant, the Board concluded that the fund's management fee structure is fair and reasonable, and that the fund's Advisory Contracts should be approved.
The Securities and Exchange Commission adopted Rule 22e-4 under the Investment Company Act of 1940 (the Liquidity Rule) to promote effective liquidity risk management throughout the open-end investment company industry, thereby reducing the risk that funds will be unable to meet their redemption obligations and mitigating dilution of the interests of fund shareholders.
The Fund has adopted and implemented a liquidity risk management program (the Program) reasonably designed to assess and manage the Fund's liquidity risk and to comply with the requirements of the Liquidity Rule. The Fund's Board of Trustees (the Board) has designated the Fund's investment adviser as administrator of the Program. The Fidelity advisers have established a Liquidity Risk Management Committee (the LRM Committee) to manage the Program for each of the Fidelity Funds. The LRM Committee monitors the adequacy and effectiveness of implementation of the Program and on a periodic basis assesses each Fund's liquidity risk based on a variety of factors including (1) the Fund's investment strategy, (2) portfolio liquidity and cash flow projections during normal and reasonably foreseeable stressed conditions, (3) shareholder redemptions, (4) borrowings and other funding sources and (5) certain factors specific to ETFs including the effect of the Fund's prices and spreads, market participants, and basket compositions on the overall liquidity of the Fund's portfolio, as applicable.
In accordance with the Program, each of the Fund's portfolio investments is classified into one of four defined liquidity categories based on a determination of a reasonable expectation for how long it would take to convert the investment to cash (or sell or dispose of the investment) without significantly changing its market value.
- Highly liquid investments - cash or convertible to cash within three business days or less
- Moderately liquid investments - convertible to cash in three to seven calendar days
- Less liquid investments - can be sold or disposed of, but not settled, within seven calendar days
- Illiquid investments - cannot be sold or disposed of within seven calendar days
Liquidity classification determinations take into account a variety of factors including various market, trading and investment-specific considerations, as well as market depth, and generally utilize analysis from a third-party liquidity metrics service.
The Liquidity Rule places a 15% limit on a fund's illiquid investments and requires funds that do not primarily hold assets that are highly liquid investments to determine and maintain a minimum percentage of the fund's net assets to be invested in highly liquid investments (highly liquid investment minimum or HLIM). The Program includes provisions reasonably designed to comply with the 15% limit on illiquid investments and for determining, periodically reviewing and complying with the HLIM requirement as applicable.
At a recent meeting of the Fund's Board of Trustees, the LRM Committee provided a written report to the Board pertaining to the operation, adequacy, and effectiveness of the Program for the period December 1, 2022 through November 30, 2023. The report concluded that the Program is operating effectively and is reasonably designed to assess and manage the Fund's liquidity risk.
1.757239.123
SMR-ANN-0624
Item 2.
Code of Ethics
As of the end of the period, April 30, 2024, Fidelity Concord Street Trust (the trust) has adopted a code of ethics, as defined in Item 2 of Form N-CSR, that applies to its President and Treasurer and its Chief Financial Officer. A copy of the code of ethics is filed as an exhibit to this Form N-CSR.
Item 3.
Audit Committee Financial Expert
The Board of Trustees of the trust has determined that Donald F. Donahue is an audit committee financial expert, as defined in Item 3 of Form N-CSR. Mr. Donahue is independent for purposes of Item 3 of Form N-CSR.
Item 4.
Principal Accountant Fees and Services
Fees and Services
The following table presents fees billed by Deloitte & Touche LLP, the member firms of Deloitte Touche Tohmatsu, and their respective affiliates (collectively, “Deloitte Entities”) in each of the last two fiscal years for services rendered to Fidelity Large Cap Stock Fund, Fidelity Large Cap Stock K6 Fund, Fidelity Mid-Cap Stock Fund, Fidelity Series Small Cap Core Fund, Fidelity Series Small Cap Discovery Fund, Fidelity Small Cap Discovery Fund, Fidelity Small Cap Stock Fund, and Fidelity Small Cap Stock K6 Fund (the “Funds”):
Services Billed by Deloitte Entities
April 30, 2024 FeesA
| | | | |
| Audit Fees | Audit-Related Fees | Tax Fees | All Other Fees |
Fidelity Large Cap Stock Fund | $42,900 | $- | $7,600 | $1,000 |
Fidelity Large Cap Stock K6 Fund | $42,300 | $- | $7,400 | $1,000 |
Fidelity Mid-Cap Stock Fund | $48,900 | $- | $9,600 | $1,200 |
Fidelity Series Small Cap Core Fund | $40,000 | $- | $7,900 | $900 |
Fidelity Series Small Cap Discovery Fund | $39,500 | $- | $7,400 | $1,000 |
Fidelity Small Cap Discovery Fund | $41,500 | $- | $7,400 | $1,100 |
Fidelity Small Cap Stock Fund | $44,500 | $- | $7,600 | $1,100 |
Fidelity Small Cap Stock K6 Fund | $43,200 | $- | $8,000 | $1,100 |
| | | | |
| Audit Fees | Audit-Related Fees | Tax Fees | All Other Fees |
Fidelity Large Cap Stock Fund | $43,900 | $- | $9,400 | $1,000 |
Fidelity Large Cap Stock K6 Fund | $43,600 | $- | $7,900 | $1,000 |
Fidelity Mid-Cap Stock Fund | $71,800 | $- | $9,600 | $1,100 |
Fidelity Series Small Cap Core Fund | $34,800 | $- | $7,700 | $400 |
Fidelity Series Small Cap Discovery Fund | $39,600 | $- | $7,400 | $1,000 |
Fidelity Small Cap Discovery Fund | $41,600 | $- | $7,400 | $1,000 |
Fidelity Small Cap Stock Fund | $44,900 | $- | $9,400 | $1,000 |
Fidelity Small Cap Stock K6 Fund | $45,000 | $- | $8,000 | $1,000 |
A Amounts may reflect rounding.
B Fidelity Series Small Cap Core Fund commenced operations on November 4, 2022.
The following table presents fees billed by PricewaterhouseCoopers LLP (“PwC”) in each of the last two fiscal years for services rendered to Fidelity Founders Fund and Fidelity Mid-Cap Stock K6 Fund (the “Funds”):
Services Billed by PwC
April 30, 2024 FeesA
| | | | |
| Audit Fees | Audit-Related Fees | Tax Fees | All Other Fees |
Fidelity Founders Fund | $29,600 | $2,800 | $6,800 | $900 |
Fidelity Mid-Cap Stock K6 Fund | $57,200 | $3,600 | $9,100 | $1,200 |
| | | | |
| Audit Fees | Audit-Related Fees | Tax Fees | All Other Fees |
Fidelity Founders Fund | $29,700 | $2,600 | $6,800 | $900 |
Fidelity Mid-Cap Stock K6 Fund | $59,000 | $3,400 | $7,700 | $1,200 |
A Amounts may reflect rounding.
The following table(s) present(s) fees billed by Deloitte Entities and PwC that were required to be approved by the Audit Committee for services that relate directly to the operations and financial reporting of the Fund(s) and that are rendered on behalf of Fidelity Management & Research Company LLC ("FMR") and entities controlling, controlled by, or under common control with FMR (not including any sub-adviser whose role is primarily portfolio management and is subcontracted with or overseen by another investment adviser) that provide ongoing services to the Fund(s) (“Fund Service Providers”):
Services Billed by Deloitte Entities
| | |
| April 30, 2024A | April 30, 2023A,B |
Audit-Related Fees | $75,000 | $80,000 |
Tax Fees | $- | $- |
All Other Fees | $935,000 | $- |
A Amounts may reflect rounding.
B May include amounts billed prior to the Fidelity Series Small Cap Core Fund’s commencement of operations.
Services Billed by PwC
| | |
| April 30, 2024A | April 30, 2023A |
Audit-Related Fees | $9,367,800 | $8,604,200 |
Tax Fees | $61,000 | $1,000 |
All Other Fees | $- | $- |
A Amounts may reflect rounding.
“Audit-Related Fees” represent fees billed for assurance and related services that are reasonably related to the performance of the fund audit or the review of the fund's financial statements and that are not reported under Audit Fees.
“Tax Fees” represent fees billed for tax compliance, tax advice or tax planning that relate directly to the operations and financial reporting of the fund.
“All Other Fees” represent fees billed for services provided to the fund or Fund Service Provider, a significant portion of which are assurance related, that relate directly to the operations and financial reporting of the fund, excluding those services that are reported under Audit Fees, Audit-Related Fees or Tax Fees.
Assurance services must be performed by an independent public accountant.
* * *
The aggregate non-audit fees billed by Deloitte Entities and PwC for services rendered to the Fund(s), FMR (not including any sub-adviser whose role is primarily portfolio management and is subcontracted with or overseen by another investment adviser), and any Fund Service Provider for each of the last two fiscal years of the Fund(s) are as follows:
| | |
Billed By | April 30, 2024A | April 30, 2023A,B |
Deloitte Entities | $5,105,800 | $2,122,300 |
PwC | $14,937,900 | $14,280,400 |
A Amounts may reflect rounding.
B May include amounts billed prior to the Fidelity Series Small Cap Core Fund’s commencement of operations.
The trust's Audit Committee has considered non-audit services that were not pre-approved that were provided by Deloitte Entities and PwC to Fund Service Providers to be compatible with maintaining the independence of Deloitte Entities and PwC in its(their) audit of the Fund(s), taking into account representations from Deloitte Entities and PwC, in accordance with Public Company Accounting Oversight Board rules, regarding its independence from the Fund(s) and its(their) related entities and FMR’s review of the appropriateness and permissibility under applicable law of such non-audit services prior to their provision to the Fund(s) Service Providers.
Audit Committee Pre-Approval Policies and Procedures
The trust’s Audit Committee must pre-approve all audit and non-audit services provided by a fund’s independent registered public accounting firm relating to the operations or financial reporting of the fund. Prior to the commencement of any audit or non-audit
services to a fund, the Audit Committee reviews the services to determine whether they are appropriate and permissible under applicable law.
The Audit Committee has adopted policies and procedures to, among other purposes, provide a framework for the Committee’s consideration of non-audit services by the audit firms that audit the Fidelity funds. The policies and procedures require that any non-audit service provided by a fund audit firm to a Fidelity fund and any non-audit service provided by a fund auditor to a Fund Service Provider that relates directly to the operations and financial reporting of a Fidelity fund (“Covered Service”) are subject to approval by the Audit Committee before such service is provided.
All Covered Services must be approved in advance of provision of the service either: (i) by formal resolution of the Audit Committee, or (ii) by oral or written approval of the service by the Chair of the Audit Committee (or if the Chair is unavailable, such other member of the Audit Committee as may be designated by the Chair to act in the Chair’s absence). The approval contemplated by (ii) above is permitted where the Treasurer determines that action on such an engagement is necessary before the next meeting of the Audit Committee.
Non-audit services provided by a fund audit firm to a Fund Service Provider that do not relate directly to the operations and financial reporting of a Fidelity fund are reported to the Audit Committee periodically.
Non-Audit Services Approved Pursuant to Rule 2-01(c)(7)(i)(C) and (ii) of Regulation S-X (“De Minimis Exception”)
There were no non-audit services approved or required to be approved by the Audit Committee pursuant to the De Minimis Exception during the Fund’s(s’) last two fiscal years relating to services provided to (i) the Fund(s) or (ii) any Fund Service Provider that relate directly to the operations and financial reporting of the Fund(s).
The Registrant has not retained, for the preparation of the audit report on the financial statements included in the Form N-CSR, a registered public accounting firm that has a branch or office that is located in a foreign jurisdiction and that the Public Company Accounting Oversight Board (the “PCAOB”) has determined that the PCAOB is unable to inspect or investigate completely because of a position taken by an authority in the foreign jurisdiction.
The Registrant is not a “foreign issuer,” as defined in 17 CFR 240.3b-4.
Item 5.
Audit Committee of Listed Registrants
Not applicable.
Item 6.
Investments
(a)
Not applicable.
(b)
Not applicable.
Item 7.
Disclosure of Proxy Voting Policies and Procedures for Closed-End Management Investment Companies
Not applicable.
Item 8.
Portfolio Managers of Closed-End Management Investment Companies
Not applicable.
Item 9.
Purchase of Equity Securities by Closed-End Management Investment Company and Affiliated Purchasers
Not applicable.
Item 10.
Submission of Matters to a Vote of Security Holders
There were no material changes to the procedures by which shareholders may recommend nominees to the trust’s Board of Trustees.
Item 11.
Controls and Procedures
(a)(i) The President and Treasurer and the Chief Financial Officer have concluded that the trust’s disclosure controls and procedures (as defined in Rule 30a-3(c) under the Investment Company Act) provide reasonable assurances that material information relating to the trust is made known to them by the appropriate persons, based on their evaluation of these controls and procedures as of a date within 90 days of the filing date of this report.
(a)(ii) There was no change in the trust’s internal control over financial reporting (as defined in Rule 30a-3(d) under the Investment Company Act) that occurred during the period covered by this report that has materially affected, or is reasonably likely to materially affect, the trust’s internal control over financial reporting.
Item 12.
Disclosure of Securities Lending Activities for Closed-End Management
Investment Companies
Not applicable.
Item 18.
Recovery of Erroneously Awarded Compensation
(a)
Not applicable.
(b)
Not applicable.
Item 19.
Exhibits
SIGNATURES
Pursuant to the requirements of the Securities Exchange Act of 1934 and the Investment Company Act of 1940, the registrant has duly caused this report to be signed on its behalf by the undersigned, thereunto duly authorized.
Fidelity Concord Street Trust
| |
By: | /s/Stacie M. Smith |
| Stacie M. Smith |
| President and Treasurer (Principal Executive Officer) |
|
|
Date: | June 21, 2024 |
Pursuant to the requirements of the Securities Exchange Act of 1934 and the Investment Company Act of 1940, this report has been signed below by the following persons on behalf of the registrant and in the capacities and on the dates indicated.
| |
By: | /s/Stacie M. Smith |
| Stacie M. Smith |
| President and Treasurer (Principal Executive Officer) |
|
|
Date: | June 21, 2024 |
| |
By: | /s/John J. Burke III |
| John J. Burke III |
| Chief Financial Officer (Principal Financial Officer) |
|
|
Date: | June 21, 2024 |