UNITED STATES
SECURITIES AND EXCHANGE COMMISSION
Washington, D.C. 20549
FORM N-CSR
CERTIFIED SHAREHOLDER REPORT OF REGISTERED
MANAGEMENT INVESTMENT COMPANIES
Investment Company Act file number 811-5251
Fidelity Concord Street Trust
(Exact name of registrant as specified in charter)
245 Summer St., Boston, MA 02210
(Address of principal executive offices) (Zip code)
Marc Bryant, Secretary
245 Summer St.
Boston, Massachusetts 02210
(Name and address of agent for service)
Registrant's telephone number, including area code:
617-563-7000
Date of fiscal year end: | February 28 |
Date of reporting period: | August 31, 2017 |
Item 1.
Reports to Stockholders
Fidelity Flex℠ Funds Fidelity Flex℠ 500 Index Fund Semi-Annual Report August 31, 2017 |
 |
Contents
Board Approval of Investment Advisory Contracts and Management Fees |
To view a fund's proxy voting guidelines and proxy voting record for the 12-month period ended June 30, visit http://www.fidelity.com/proxyvotingresults or visit the Securities and Exchange Commission's (SEC) web site at http://www.sec.gov.
You may also call 1-800-835-5092 to request a free copy of the proxy voting guidelines.
Standard & Poor's, S&P and S&P 500 are registered service marks of The McGraw-Hill Companies, Inc. and have been licensed for use by Fidelity Distributors Corporation.
Other third-party marks appearing herein are the property of their respective owners.
All other marks appearing herein are registered or unregistered trademarks or service marks of FMR LLC or an affiliated company. © 2017 FMR LLC. All rights reserved.
This report and the financial statements contained herein are submitted for the general information of the shareholders of the Fund. This report is not authorized for distribution to prospective investors in the Fund unless preceded or accompanied by an effective prospectus.
A fund files its complete schedule of portfolio holdings with the SEC for the first and third quarters of each fiscal year on Form N-Q. Forms N-Q are available on the SEC’s web site at http://www.sec.gov. A fund's Forms N-Q may be reviewed and copied at the SEC’s Public Reference Room in Washington, DC. Information regarding the operation of the SEC's Public Reference Room may be obtained by calling 1-800-SEC-0330.
For a complete list of a fund's portfolio holdings, view the most recent holdings listing, semiannual report, or annual report on Fidelity's web site at http://www.fidelity.com, http://www.institutional.fidelity.com, or http://www.401k.com, as applicable.
NOT FDIC INSURED •MAY LOSE VALUE •NO BANK GUARANTEE
Neither the Fund nor Fidelity Distributors Corporation is a bank.
Investment Summary (Unaudited)
Top Ten Stocks as of August 31, 2017
| % of fund's net assets | |
| Apple, Inc. | 3.9 |
| Microsoft Corp. | 2.6 |
| Facebook, Inc. Class A | 1.9 |
| Amazon.com, Inc. | 1.8 |
| Johnson & Johnson | 1.6 |
| Berkshire Hathaway, Inc. Class B | 1.6 |
| JPMorgan Chase & Co. | 1.5 |
| Exxon Mobil Corp. | 1.5 |
| Alphabet, Inc. Class A | 1.3 |
| Alphabet, Inc. Class C | 1.3 |
| 19.0 |
Top Market Sectors as of August 31, 2017
| % of fund's net assets | |
| Information Technology | 22.9 |
| Health Care | 14.3 |
| Financials | 13.9 |
| Consumer Discretionary | 11.8 |
| Industrials | 9.9 |
| Consumer Staples | 8.3 |
| Energy | 5.5 |
| Utilities | 3.2 |
| Real Estate | 3.0 |
| Materials | 2.8 |
Asset Allocation (% of fund's net assets)
| As of August 31, 2017* | ||
| Stocks and Equity Futures | 99.8% | |
| Short-Term Investments and Net Other Assets (Liabilities) | 0.2% | |

* Foreign investments - 4.3%
Investments August 31, 2017 (Unaudited)
Showing Percentage of Net Assets
| Common Stocks - 97.7% | |||
| Shares | Value | ||
| CONSUMER DISCRETIONARY - 11.8% | |||
| Auto Components - 0.2% | |||
| BorgWarner, Inc. | 55 | $2,553 | |
| Delphi Automotive PLC | 74 | 7,134 | |
| The Goodyear Tire & Rubber Co. | 71 | 2,151 | |
| 11,838 | |||
| Automobiles - 0.5% | |||
| Ford Motor Co. | 1,017 | 11,218 | |
| General Motors Co. | 381 | 13,922 | |
| Harley-Davidson, Inc. | 49 | 2,303 | |
| 27,443 | |||
| Distributors - 0.1% | |||
| Genuine Parts Co. | 40 | 3,313 | |
| LKQ Corp. (a) | 86 | 2,980 | |
| 6,293 | |||
| Diversified Consumer Services - 0.0% | |||
| H&R Block, Inc. | 59 | 1,578 | |
| Hotels, Restaurants & Leisure - 1.8% | |||
| Carnival Corp. | 116 | 8,060 | |
| Chipotle Mexican Grill, Inc. (a) | 8 | 2,534 | |
| Darden Restaurants, Inc. | 35 | 2,873 | |
| Hilton, Inc. | 56 | 3,602 | |
| Marriott International, Inc. Class A | 86 | 8,908 | |
| McDonald's Corp. | 226 | 36,153 | |
| MGM Mirage, Inc. | 134 | 4,417 | |
| Royal Caribbean Cruises Ltd. | 47 | 5,850 | |
| Starbucks Corp. | 401 | 21,999 | |
| Wyndham Worldwide Corp. | 29 | 2,891 | |
| Wynn Resorts Ltd. | 22 | 3,058 | |
| Yum! Brands, Inc. | 91 | 6,991 | |
| 107,336 | |||
| Household Durables - 0.4% | |||
| D.R. Horton, Inc. | 94 | 3,398 | |
| Garmin Ltd. | 30 | 1,545 | |
| Leggett & Platt, Inc. | 35 | 1,609 | |
| Lennar Corp. Class A | 56 | 2,899 | |
| Mohawk Industries, Inc. (a) | 18 | 4,556 | |
| Newell Brands, Inc. | 134 | 6,470 | |
| PulteGroup, Inc. | 80 | 2,066 | |
| Whirlpool Corp. | 20 | 3,432 | |
| 25,975 | |||
| Internet & Direct Marketing Retail - 2.7% | |||
| Amazon.com, Inc. (a) | 109 | 106,885 | |
| Expedia, Inc. | 34 | 5,044 | |
| Netflix, Inc. (a) | 120 | 20,965 | |
| Priceline Group, Inc. (a) | 13 | 24,077 | |
| TripAdvisor, Inc. (a) | 30 | 1,282 | |
| 158,253 | |||
| Leisure Products - 0.1% | |||
| Hasbro, Inc. | 31 | 3,046 | |
| Mattel, Inc. | 98 | 1,590 | |
| 4,636 | |||
| Media - 3.0% | |||
| CBS Corp. Class B | 102 | 6,534 | |
| Charter Communications, Inc. Class A (a) | 60 | 23,912 | |
| Comcast Corp. Class A | 1,297 | 52,671 | |
| Discovery Communications, Inc.: | |||
| Class A (a) | 44 | 977 | |
| Class C (non-vtg.) (a) | 55 | 1,156 | |
| DISH Network Corp. Class A (a) | 63 | 3,609 | |
| Interpublic Group of Companies, Inc. | 110 | 2,215 | |
| News Corp.: | |||
| Class A | 115 | 1,538 | |
| Class B | 27 | 370 | |
| Omnicom Group, Inc. | 64 | 4,632 | |
| Scripps Networks Interactive, Inc. Class A | 27 | 2,313 | |
| The Walt Disney Co. | 397 | 40,176 | |
| Time Warner, Inc. | 215 | 21,737 | |
| Twenty-First Century Fox, Inc.: | |||
| Class A | 299 | 8,249 | |
| Class B | 130 | 3,523 | |
| Viacom, Inc. Class B (non-vtg.) | 97 | 2,774 | |
| 176,386 | |||
| Multiline Retail - 0.4% | |||
| Dollar General Corp. | 69 | 5,007 | |
| Dollar Tree, Inc. (a) | 65 | 5,177 | |
| Kohl's Corp. | 48 | 1,909 | |
| Macy's, Inc. | 87 | 1,807 | |
| Nordstrom, Inc. | 32 | 1,428 | |
| Target Corp. | 153 | 8,343 | |
| 23,671 | |||
| Specialty Retail - 2.0% | |||
| Advance Auto Parts, Inc. | 20 | 1,958 | |
| AutoZone, Inc. (a) | 8 | 4,228 | |
| Best Buy Co., Inc. | 73 | 3,961 | |
| CarMax, Inc. (a) | 51 | 3,425 | |
| Foot Locker, Inc. | 37 | 1,304 | |
| Gap, Inc. | 63 | 1,488 | |
| Home Depot, Inc. | 326 | 48,858 | |
| L Brands, Inc. | 67 | 2,427 | |
| Lowe's Companies, Inc. | 238 | 17,586 | |
| O'Reilly Automotive, Inc. (a) | 25 | 4,903 | |
| Ross Stores, Inc. | 107 | 6,254 | |
| Signet Jewelers Ltd. | 19 | 1,198 | |
| Staples, Inc. | 186 | 1,900 | |
| Tiffany & Co., Inc. | 30 | 2,742 | |
| TJX Companies, Inc. | 180 | 13,014 | |
| Tractor Supply Co. | 34 | 2,023 | |
| Ulta Beauty, Inc. | 16 | 3,536 | |
| 120,805 | |||
| Textiles, Apparel & Luxury Goods - 0.6% | |||
| Coach, Inc. | 78 | 3,253 | |
| Hanesbrands, Inc. | 101 | 2,450 | |
| Michael Kors Holdings Ltd. (a) | 45 | 1,900 | |
| NIKE, Inc. Class B | 368 | 19,434 | |
| PVH Corp. | 21 | 2,644 | |
| Ralph Lauren Corp. | 15 | 1,318 | |
| Under Armour, Inc.: | |||
| Class A (sub. vtg.) (a) | 42 | 678 | |
| Class C (non-vtg.) (a) | 63 | 951 | |
| VF Corp. | 88 | 5,533 | |
| 38,161 | |||
| TOTAL CONSUMER DISCRETIONARY | 702,375 | ||
| CONSUMER STAPLES - 8.3% | |||
| Beverages - 2.0% | |||
| Brown-Forman Corp. Class B (non-vtg.) | 49 | 2,599 | |
| Constellation Brands, Inc. Class A (sub. vtg.) | 48 | 9,605 | |
| Dr. Pepper Snapple Group, Inc. | 51 | 4,644 | |
| Molson Coors Brewing Co. Class B | 51 | 4,577 | |
| Monster Beverage Corp. (a) | 112 | 6,252 | |
| PepsiCo, Inc. | 393 | 45,482 | |
| The Coca-Cola Co. | 1,060 | 48,283 | |
| 121,442 | |||
| Food & Staples Retailing - 1.8% | |||
| Costco Wholesale Corp. | 121 | 18,966 | |
| CVS Health Corp. | 283 | 21,887 | |
| Kroger Co. | 253 | 5,533 | |
| Sysco Corp. | 136 | 7,163 | |
| Wal-Mart Stores, Inc. | 410 | 32,009 | |
| Walgreens Boots Alliance, Inc. | 236 | 19,234 | |
| 104,792 | |||
| Food Products - 1.2% | |||
| Archer Daniels Midland Co. | 158 | 6,529 | |
| Campbell Soup Co. | 53 | 2,449 | |
| ConAgra Foods, Inc. | 111 | 3,603 | |
| General Mills, Inc. | 158 | 8,415 | |
| Hormel Foods Corp. | 76 | 2,336 | |
| Kellogg Co. | 69 | 4,517 | |
| McCormick & Co., Inc. (non-vtg.) | 32 | 3,044 | |
| Mondelez International, Inc. | 420 | 17,077 | |
| The Hershey Co. | 38 | 3,987 | |
| The J.M. Smucker Co. | 28 | 2,933 | |
| The Kraft Heinz Co. | 165 | 13,324 | |
| Tyson Foods, Inc. Class A | 80 | 5,064 | |
| 73,278 | |||
| Household Products - 1.7% | |||
| Church & Dwight Co., Inc. | 69 | 3,462 | |
| Clorox Co. | 35 | 4,849 | |
| Colgate-Palmolive Co. | 244 | 17,480 | |
| Kimberly-Clark Corp. | 98 | 12,082 | |
| Procter & Gamble Co. | 706 | 65,143 | |
| 103,016 | |||
| Personal Products - 0.2% | |||
| Coty, Inc. Class A | 131 | 2,172 | |
| Estee Lauder Companies, Inc. Class A | 62 | 6,633 | |
| 8,805 | |||
| Tobacco - 1.4% | |||
| Altria Group, Inc. | 536 | 33,982 | |
| Philip Morris International, Inc. | 427 | 49,929 | |
| 83,911 | |||
| TOTAL CONSUMER STAPLES | 495,244 | ||
| ENERGY - 5.5% | |||
| Energy Equipment & Services - 0.7% | |||
| Baker Hughes, a GE Co. Class A | 117 | 3,966 | |
| Halliburton Co. | 231 | 9,002 | |
| Helmerich & Payne, Inc. | 31 | 1,313 | |
| National Oilwell Varco, Inc. | 104 | 3,190 | |
| Schlumberger Ltd. | 385 | 24,451 | |
| TechnipFMC PLC | 128 | 3,306 | |
| 45,228 | |||
| Oil, Gas & Consumable Fuels - 4.8% | |||
| Anadarko Petroleum Corp. | 155 | 6,344 | |
| Andeavor | 42 | 4,206 | |
| Apache Corp. | 105 | 4,078 | |
| Cabot Oil & Gas Corp. | 128 | 3,270 | |
| Chesapeake Energy Corp. (a) | 219 | 797 | |
| Chevron Corp. | 521 | 56,070 | |
| Cimarex Energy Co. | 27 | 2,692 | |
| Concho Resources, Inc. (a) | 41 | 4,550 | |
| ConocoPhillips Co. | 343 | 14,975 | |
| Devon Energy Corp. | 144 | 4,522 | |
| EOG Resources, Inc. | 161 | 13,683 | |
| EQT Corp. | 48 | 2,992 | |
| Exxon Mobil Corp. | 1,166 | 89,001 | |
| Hess Corp. | 75 | 2,918 | |
| Kinder Morgan, Inc. | 532 | 10,284 | |
| Marathon Oil Corp. | 235 | 2,613 | |
| Marathon Petroleum Corp. | 144 | 7,553 | |
| Newfield Exploration Co. (a) | 52 | 1,359 | |
| Noble Energy, Inc. | 125 | 2,971 | |
| Occidental Petroleum Corp. | 205 | 12,239 | |
| ONEOK, Inc. | 105 | 5,687 | |
| Phillips 66 Co. | 121 | 10,141 | |
| Pioneer Natural Resources Co. | 47 | 6,094 | |
| Range Resources Corp. | 53 | 920 | |
| The Williams Companies, Inc. | 229 | 6,808 | |
| Valero Energy Corp. | 124 | 8,444 | |
| 285,211 | |||
| TOTAL ENERGY | 330,439 | ||
| FINANCIALS - 13.9% | |||
| Banks - 6.1% | |||
| Bank of America Corp. | 2,733 | 65,291 | |
| BB&T Corp. | 223 | 10,278 | |
| Citigroup, Inc. | 763 | 51,907 | |
| Citizens Financial Group, Inc. | 139 | 4,605 | |
| Comerica, Inc. | 48 | 3,276 | |
| Fifth Third Bancorp | 206 | 5,383 | |
| Huntington Bancshares, Inc. | 296 | 3,727 | |
| JPMorgan Chase & Co. | 980 | 89,072 | |
| KeyCorp | 301 | 5,180 | |
| M&T Bank Corp. | 42 | 6,210 | |
| Peoples United Financial, Inc. | 38 | 635 | |
| PNC Financial Services Group, Inc. | 134 | 16,805 | |
| Regions Financial Corp. | 330 | 4,656 | |
| SunTrust Banks, Inc. | 132 | 7,273 | |
| U.S. Bancorp | 437 | 22,396 | |
| Wells Fargo & Co. | 1,239 | 63,276 | |
| Zions Bancorporation | 53 | 2,314 | |
| 362,284 | |||
| Capital Markets - 2.9% | |||
| Affiliated Managers Group, Inc. | 16 | 2,827 | |
| Ameriprise Financial, Inc. | 42 | 5,817 | |
| Bank of New York Mellon Corp. | 288 | 15,057 | |
| BlackRock, Inc. Class A | 33 | 13,827 | |
| Brighthouse Financial, Inc. | 26 | 1,484 | |
| CBOE Holdings, Inc. | 26 | 2,623 | |
| Charles Schwab Corp. | 338 | 13,486 | |
| CME Group, Inc. | 94 | 11,825 | |
| E*TRADE Financial Corp. (a) | 76 | 3,117 | |
| Franklin Resources, Inc. | 95 | 4,107 | |
| Goldman Sachs Group, Inc. | 99 | 22,150 | |
| IntercontinentalExchange, Inc. | 164 | 10,606 | |
| Invesco Ltd. | 112 | 3,671 | |
| Moody's Corp. | 46 | 6,165 | |
| Morgan Stanley | 395 | 17,973 | |
| Northern Trust Corp. | 60 | 5,310 | |
| Raymond James Financial, Inc. | 36 | 2,820 | |
| S&P Global, Inc. | 72 | 11,112 | |
| State Street Corp. | 98 | 9,064 | |
| T. Rowe Price Group, Inc. | 67 | 5,652 | |
| The NASDAQ OMX Group, Inc. | 32 | 2,412 | |
| 171,105 | |||
| Consumer Finance - 0.7% | |||
| American Express Co. | 209 | 17,995 | |
| Capital One Financial Corp. | 134 | 10,668 | |
| Discover Financial Services | 104 | 6,131 | |
| Navient Corp. | 79 | 1,043 | |
| Synchrony Financial | 213 | 6,558 | |
| 42,395 | |||
| Diversified Financial Services - 1.6% | |||
| Berkshire Hathaway, Inc. Class B (a) | 525 | 95,109 | |
| Leucadia National Corp. | 90 | 2,131 | |
| 97,240 | |||
| Insurance - 2.6% | |||
| AFLAC, Inc. | 110 | 9,081 | |
| Allstate Corp. | 101 | 9,141 | |
| American International Group, Inc. | 244 | 14,757 | |
| Aon PLC | 73 | 10,159 | |
| Arthur J. Gallagher & Co. | 50 | 2,895 | |
| Assurant, Inc. | 16 | 1,515 | |
| Chubb Ltd. | 127 | 17,960 | |
| Cincinnati Financial Corp. | 41 | 3,150 | |
| Everest Re Group Ltd. | 12 | 3,030 | |
| Hartford Financial Services Group, Inc. | 102 | 5,515 | |
| Lincoln National Corp. | 62 | 4,207 | |
| Loews Corp. | 75 | 3,494 | |
| Marsh & McLennan Companies, Inc. | 143 | 11,165 | |
| MetLife, Inc. | 300 | 14,049 | |
| Principal Financial Group, Inc. | 74 | 4,626 | |
| Progressive Corp. | 162 | 7,530 | |
| Prudential Financial, Inc. | 119 | 12,148 | |
| The Travelers Companies, Inc. | 77 | 9,331 | |
| Torchmark Corp. | 29 | 2,232 | |
| Unum Group | 63 | 3,035 | |
| Willis Group Holdings PLC | 35 | 5,196 | |
| XL Group Ltd. | 72 | 2,949 | |
| 157,165 | |||
| TOTAL FINANCIALS | 830,189 | ||
| HEALTH CARE - 14.3% | |||
| Biotechnology - 3.1% | |||
| AbbVie, Inc. | 442 | 33,283 | |
| Alexion Pharmaceuticals, Inc. (a) | 62 | 8,829 | |
| Amgen, Inc. | 204 | 36,265 | |
| Biogen, Inc. (a) | 59 | 18,677 | |
| Celgene Corp. (a) | 209 | 29,036 | |
| Gilead Sciences, Inc. | 362 | 30,303 | |
| Incyte Corp. (a) | 47 | 6,458 | |
| Regeneron Pharmaceuticals, Inc. (a) | 21 | 10,435 | |
| Vertex Pharmaceuticals, Inc. (a) | 69 | 11,077 | |
| 184,363 | |||
| Health Care Equipment & Supplies - 2.8% | |||
| Abbott Laboratories | 481 | 24,502 | |
| Align Technology, Inc. (a) | 21 | 3,712 | |
| Baxter International, Inc. | 135 | 8,375 | |
| Becton, Dickinson & Co. | 63 | 12,565 | |
| Boston Scientific Corp. (a) | 379 | 10,441 | |
| C.R. Bard, Inc. | 20 | 6,416 | |
| Danaher Corp. | 170 | 14,181 | |
| Dentsply Sirona, Inc. | 63 | 3,564 | |
| Edwards Lifesciences Corp. (a) | 58 | 6,592 | |
| Hologic, Inc. (a) | 77 | 2,972 | |
| IDEXX Laboratories, Inc. (a) | 24 | 3,730 | |
| Intuitive Surgical, Inc. (a) | 10 | 10,047 | |
| Medtronic PLC | 379 | 30,555 | |
| ResMed, Inc. | 39 | 3,026 | |
| Stryker Corp. | 80 | 11,310 | |
| The Cooper Companies, Inc. | 14 | 3,512 | |
| Varian Medical Systems, Inc. (a) | 26 | 2,763 | |
| Zimmer Biomet Holdings, Inc. | 56 | 6,399 | |
| 164,662 | |||
| Health Care Providers & Services - 2.7% | |||
| Aetna, Inc. | 92 | 14,508 | |
| AmerisourceBergen Corp. | 46 | 3,692 | |
| Anthem, Inc. | 73 | 14,311 | |
| Cardinal Health, Inc. | 87 | 5,869 | |
| Centene Corp. (a) | 48 | 4,265 | |
| Cigna Corp. | 71 | 12,926 | |
| DaVita HealthCare Partners, Inc. (a) | 44 | 2,577 | |
| Envision Healthcare Corp. | 34 | 1,782 | |
| Express Scripts Holding Co. (a) | 164 | 10,302 | |
| HCA Holdings, Inc. (a) | 79 | 6,214 | |
| Henry Schein, Inc. (a) | 22 | 3,821 | |
| Humana, Inc. | 40 | 10,305 | |
| Laboratory Corp. of America Holdings (a) | 28 | 4,392 | |
| McKesson Corp. | 58 | 8,660 | |
| Patterson Companies, Inc. | 25 | 963 | |
| Quest Diagnostics, Inc. | 38 | 4,117 | |
| UnitedHealth Group, Inc. | 267 | 53,106 | |
| Universal Health Services, Inc. Class B | 25 | 2,703 | |
| 164,513 | |||
| Health Care Technology - 0.1% | |||
| Cerner Corp. (a) | 82 | 5,558 | |
| Life Sciences Tools & Services - 0.8% | |||
| Agilent Technologies, Inc. | 89 | 5,760 | |
| Illumina, Inc. (a) | 40 | 8,178 | |
| Mettler-Toledo International, Inc. (a) | 7 | 4,236 | |
| PerkinElmer, Inc. | 31 | 2,077 | |
| Quintiles Transnational Holdings, Inc. (a) | 38 | 3,649 | |
| Thermo Fisher Scientific, Inc. | 108 | 20,211 | |
| Waters Corp. (a) | 22 | 4,037 | |
| 48,148 | |||
| Pharmaceuticals - 4.8% | |||
| Allergan PLC | 93 | 21,342 | |
| Bristol-Myers Squibb Co. | 457 | 27,639 | |
| Eli Lilly & Co. | 269 | 21,867 | |
| Johnson & Johnson | 741 | 98,086 | |
| Merck & Co., Inc. | 749 | 47,831 | |
| Mylan N.V. (a) | 128 | 4,029 | |
| Perrigo Co. PLC | 40 | 3,158 | |
| Pfizer, Inc. | 1,632 | 55,357 | |
| Zoetis, Inc. Class A | 136 | 8,527 | |
| 287,836 | |||
| TOTAL HEALTH CARE | 855,080 | ||
| INDUSTRIALS - 9.9% | |||
| Aerospace & Defense - 2.4% | |||
| Arconic, Inc. | 122 | 3,107 | |
| General Dynamics Corp. | 79 | 15,907 | |
| L3 Technologies, Inc. | 21 | 3,811 | |
| Lockheed Martin Corp. | 69 | 21,072 | |
| Northrop Grumman Corp. | 46 | 12,522 | |
| Raytheon Co. | 81 | 14,743 | |
| Rockwell Collins, Inc. | 45 | 5,897 | |
| Textron, Inc. | 74 | 3,633 | |
| The Boeing Co. | 155 | 37,147 | |
| TransDigm Group, Inc. | 14 | 3,649 | |
| United Technologies Corp. | 204 | 24,423 | |
| 145,911 | |||
| Air Freight & Logistics - 0.7% | |||
| C.H. Robinson Worldwide, Inc. | 39 | 2,755 | |
| Expeditors International of Washington, Inc. | 50 | 2,805 | |
| FedEx Corp. | 68 | 14,578 | |
| United Parcel Service, Inc. Class B | 191 | 21,843 | |
| 41,981 | |||
| Airlines - 0.5% | |||
| Alaska Air Group, Inc. | 34 | 2,538 | |
| American Airlines Group, Inc. | 136 | 6,085 | |
| Delta Air Lines, Inc. | 196 | 9,249 | |
| Southwest Airlines Co. | 167 | 8,707 | |
| United Continental Holdings, Inc. (a) | 78 | 4,833 | |
| 31,412 | |||
| Building Products - 0.4% | |||
| A.O. Smith Corp. | 42 | 2,339 | |
| Allegion PLC | 27 | 2,125 | |
| Fortune Brands Home & Security, Inc. | 42 | 2,626 | |
| Johnson Controls International PLC | 260 | 10,293 | |
| Masco Corp. | 88 | 3,236 | |
| 20,619 | |||
| Commercial Services & Supplies - 0.3% | |||
| Cintas Corp. | 24 | 3,240 | |
| Republic Services, Inc. | 62 | 4,045 | |
| Stericycle, Inc. (a) | 24 | 1,725 | |
| Waste Management, Inc. | 103 | 7,942 | |
| 16,952 | |||
| Construction & Engineering - 0.1% | |||
| Fluor Corp. | 40 | 1,543 | |
| Jacobs Engineering Group, Inc. | 31 | 1,689 | |
| Quanta Services, Inc. (a) | 39 | 1,401 | |
| 4,633 | |||
| Electrical Equipment - 0.6% | |||
| Acuity Brands, Inc. | 12 | 2,121 | |
| AMETEK, Inc. | 63 | 3,985 | |
| Eaton Corp. PLC | 124 | 8,898 | |
| Emerson Electric Co. | 178 | 10,509 | |
| Fortive Corp. | 83 | 5,393 | |
| Rockwell Automation, Inc. | 36 | 5,906 | |
| 36,812 | |||
| Industrial Conglomerates - 2.1% | |||
| 3M Co. | 164 | 33,508 | |
| General Electric Co. | 2,390 | 58,675 | |
| Honeywell International, Inc. | 211 | 29,175 | |
| Roper Technologies, Inc. | 28 | 6,458 | |
| 127,816 | |||
| Machinery - 1.4% | |||
| Caterpillar, Inc. | 163 | 19,151 | |
| Cummins, Inc. | 43 | 6,853 | |
| Deere & Co. | 82 | 9,506 | |
| Dover Corp. | 43 | 3,650 | |
| Flowserve Corp. | 38 | 1,493 | |
| Illinois Tool Works, Inc. | 86 | 11,826 | |
| Ingersoll-Rand PLC | 71 | 6,063 | |
| PACCAR, Inc. | 97 | 6,434 | |
| Parker Hannifin Corp. | 37 | 5,953 | |
| Pentair PLC | 46 | 2,854 | |
| Snap-On, Inc. | 16 | 2,361 | |
| Stanley Black & Decker, Inc. | 42 | 6,048 | |
| Xylem, Inc. | 50 | 3,104 | |
| 85,296 | |||
| Professional Services - 0.3% | |||
| Equifax, Inc. | 33 | 4,702 | |
| IHS Markit Ltd. (a) | 87 | 4,075 | |
| Nielsen Holdings PLC | 93 | 3,613 | |
| Robert Half International, Inc. | 37 | 1,676 | |
| Verisk Analytics, Inc. (a) | 42 | 3,404 | |
| 17,470 | |||
| Road & Rail - 0.9% | |||
| CSX Corp. | 256 | 12,851 | |
| J.B. Hunt Transport Services, Inc. | 24 | 2,373 | |
| Kansas City Southern | 30 | 3,103 | |
| Norfolk Southern Corp. | 80 | 9,642 | |
| Union Pacific Corp. | 224 | 23,587 | |
| 51,556 | |||
| Trading Companies & Distributors - 0.2% | |||
| Fastenal Co. | 80 | 3,414 | |
| United Rentals, Inc. (a) | 23 | 2,715 | |
| W.W. Grainger, Inc. | 15 | 2,439 | |
| 8,568 | |||
| TOTAL INDUSTRIALS | 589,026 | ||
| INFORMATION TECHNOLOGY - 22.9% | |||
| Communications Equipment - 0.9% | |||
| Cisco Systems, Inc. | 1,387 | 44,675 | |
| F5 Networks, Inc. (a) | 18 | 2,149 | |
| Harris Corp. | 34 | 4,179 | |
| Juniper Networks, Inc. | 105 | 2,912 | |
| Motorola Solutions, Inc. | 45 | 3,965 | |
| 57,880 | |||
| Electronic Equipment & Components - 0.4% | |||
| Amphenol Corp. Class A | 84 | 6,799 | |
| Corning, Inc. | 255 | 7,334 | |
| FLIR Systems, Inc. | 36 | 1,368 | |
| TE Connectivity Ltd. | 98 | 7,801 | |
| 23,302 | |||
| Internet Software & Services - 4.7% | |||
| Akamai Technologies, Inc. (a) | 48 | 2,263 | |
| Alphabet, Inc.: | |||
| Class A (a) | 82 | 78,330 | |
| Class C (a) | 82 | 77,025 | |
| eBay, Inc. (a) | 278 | 10,044 | |
| Facebook, Inc. Class A (a) | 650 | 111,781 | |
| VeriSign, Inc. (a) | 25 | 2,594 | |
| 282,037 | |||
| IT Services - 3.9% | |||
| Accenture PLC Class A | 172 | 22,491 | |
| Alliance Data Systems Corp. | 16 | 3,608 | |
| Automatic Data Processing, Inc. | 124 | 13,202 | |
| Cognizant Technology Solutions Corp. Class A | 163 | 11,536 | |
| CSRA, Inc. | 38 | 1,197 | |
| DXC Technology Co. | 79 | 6,715 | |
| Fidelity National Information Services, Inc. | 91 | 8,456 | |
| Fiserv, Inc. (a) | 59 | 7,299 | |
| Gartner, Inc. (a) | 25 | 3,015 | |
| Global Payments, Inc. | 42 | 4,011 | |
| IBM Corp. | 237 | 33,898 | |
| MasterCard, Inc. Class A | 260 | 34,658 | |
| Paychex, Inc. | 88 | 5,019 | |
| PayPal Holdings, Inc. (a) | 310 | 19,121 | |
| The Western Union Co. | 131 | 2,479 | |
| Total System Services, Inc. | 45 | 3,110 | |
| Visa, Inc. Class A | 504 | 52,174 | |
| 231,989 | |||
| Semiconductors & Semiconductor Equipment - 3.5% | |||
| Advanced Micro Devices, Inc. (a) | 215 | 2,795 | |
| Analog Devices, Inc. | 102 | 8,534 | |
| Applied Materials, Inc. | 298 | 13,446 | |
| Broadcom Ltd. | 111 | 27,980 | |
| Intel Corp. | 1,306 | 45,801 | |
| KLA-Tencor Corp. | 43 | 4,029 | |
| Lam Research Corp. | 45 | 7,469 | |
| Microchip Technology, Inc. | 63 | 5,468 | |
| Micron Technology, Inc. (a) | 288 | 9,207 | |
| NVIDIA Corp. | 165 | 27,958 | |
| Qorvo, Inc. (a) | 35 | 2,563 | |
| Qualcomm, Inc. | 409 | 21,378 | |
| Skyworks Solutions, Inc. | 51 | 5,373 | |
| Texas Instruments, Inc. | 263 | 21,782 | |
| Xilinx, Inc. | 68 | 4,492 | |
| 208,275 | |||
| Software - 5.0% | |||
| Activision Blizzard, Inc. | 192 | 12,588 | |
| Adobe Systems, Inc. (a) | 137 | 21,257 | |
| ANSYS, Inc. (a) | 24 | 3,092 | |
| Autodesk, Inc. (a) | 54 | 6,181 | |
| CA Technologies, Inc. | 87 | 2,887 | |
| Citrix Systems, Inc. (a) | 42 | 3,285 | |
| Electronic Arts, Inc. (a) | 86 | 10,449 | |
| Intuit, Inc. | 67 | 9,477 | |
| Microsoft Corp. | 2,122 | 158,662 | |
| Oracle Corp. | 833 | 41,925 | |
| Red Hat, Inc. (a) | 49 | 5,268 | |
| Salesforce.com, Inc. (a) | 178 | 16,997 | |
| Symantec Corp. | 168 | 5,037 | |
| Synopsys, Inc. (a) | 41 | 3,297 | |
| 300,402 | |||
| Technology Hardware, Storage & Peripherals - 4.5% | |||
| Apple, Inc. | 1,435 | 235,331 | |
| Hewlett Packard Enterprise Co. | 461 | 8,326 | |
| HP, Inc. | 467 | 8,910 | |
| NetApp, Inc. | 75 | 2,900 | |
| Seagate Technology LLC | 83 | 2,617 | |
| Western Digital Corp. | 81 | 7,150 | |
| Xerox Corp. | 61 | 1,968 | |
| 267,202 | |||
| TOTAL INFORMATION TECHNOLOGY | 1,371,087 | ||
| MATERIALS - 2.8% | |||
| Chemicals - 2.1% | |||
| Air Products & Chemicals, Inc. | 60 | 8,722 | |
| Albemarle Corp. U.S. | 31 | 3,604 | |
| CF Industries Holdings, Inc. | 66 | 1,913 | |
| Eastman Chemical Co. | 40 | 3,448 | |
| Ecolab, Inc. | 69 | 9,198 | |
| FMC Corp. | 37 | 3,190 | |
| International Flavors & Fragrances, Inc. | 22 | 3,011 | |
| LyondellBasell Industries NV Class A | 91 | 8,244 | |
| Monsanto Co. | 121 | 14,181 | |
| PPG Industries, Inc. | 71 | 7,407 | |
| Praxair, Inc. | 78 | 10,260 | |
| Sherwin-Williams Co. | 21 | 7,125 | |
| The Dow Chemical Co. | 618 | 41,190 | |
| The Mosaic Co. | 99 | 1,978 | |
| 123,471 | |||
| Construction Materials - 0.1% | |||
| Martin Marietta Materials, Inc. | 16 | 3,392 | |
| Vulcan Materials Co. | 35 | 4,244 | |
| 7,636 | |||
| Containers & Packaging - 0.3% | |||
| Avery Dennison Corp. | 25 | 2,357 | |
| Ball Corp. | 96 | 3,839 | |
| International Paper Co. | 114 | 6,141 | |
| Packaging Corp. of America | 26 | 2,923 | |
| Sealed Air Corp. | 55 | 2,441 | |
| WestRock Co. | 69 | 3,927 | |
| 21,628 | |||
| Metals & Mining - 0.3% | |||
| Freeport-McMoRan, Inc. (a) | 369 | 5,454 | |
| Newmont Mining Corp. | 147 | 5,636 | |
| Nucor Corp. | 88 | 4,850 | |
| 15,940 | |||
| TOTAL MATERIALS | 168,675 | ||
| REAL ESTATE - 3.0% | |||
| Equity Real Estate Investment Trusts (REITs) - 2.9% | |||
| Alexandria Real Estate Equities, Inc. | 25 | 3,033 | |
| American Tower Corp. | 115 | 17,026 | |
| Apartment Investment & Management Co. Class A | 41 | 1,859 | |
| AvalonBay Communities, Inc. | 38 | 7,134 | |
| Boston Properties, Inc. | 42 | 5,065 | |
| Crown Castle International Corp. | 111 | 12,037 | |
| Digital Realty Trust, Inc. | 44 | 5,207 | |
| Duke Realty Corp. | 98 | 2,913 | |
| Equinix, Inc. | 22 | 10,305 | |
| Equity Residential (SBI) | 101 | 6,782 | |
| Essex Property Trust, Inc. | 18 | 4,787 | |
| Extra Space Storage, Inc. | 35 | 2,717 | |
| Federal Realty Investment Trust (SBI) | 20 | 2,539 | |
| General Growth Properties, Inc. | 161 | 3,341 | |
| HCP, Inc. | 129 | 3,845 | |
| Host Hotels & Resorts, Inc. | 204 | 3,696 | |
| Iron Mountain, Inc. | 68 | 2,681 | |
| Kimco Realty Corp. | 119 | 2,335 | |
| Mid-America Apartment Communities, Inc. | 31 | 3,300 | |
| Prologis, Inc. | 150 | 9,504 | |
| Public Storage | 41 | 8,419 | |
| Realty Income Corp. | 67 | 3,857 | |
| Regency Centers Corp. | 40 | 2,573 | |
| SBA Communications Corp. Class A (a) | 33 | 5,067 | |
| Simon Property Group, Inc. | 86 | 13,489 | |
| SL Green Realty Corp. | 29 | 2,795 | |
| The Macerich Co. | 34 | 1,794 | |
| UDR, Inc. | 74 | 2,873 | |
| Ventas, Inc. | 98 | 6,707 | |
| Vornado Realty Trust | 47 | 3,501 | |
| Welltower, Inc. | 101 | 7,395 | |
| Weyerhaeuser Co. | 208 | 6,783 | |
| 175,359 | |||
| Real Estate Management & Development - 0.1% | |||
| CBRE Group, Inc. (a) | 83 | 2,995 | |
| TOTAL REAL ESTATE | 178,354 | ||
| TELECOMMUNICATION SERVICES - 2.1% | |||
| Diversified Telecommunication Services - 2.1% | |||
| AT&T, Inc. | 1,692 | 63,382 | |
| CenturyLink, Inc. | 151 | 2,978 | |
| Level 3 Communications, Inc. (a) | 81 | 4,409 | |
| Verizon Communications, Inc. | 1,123 | 53,870 | |
| 124,639 | |||
| UTILITIES - 3.2% | |||
| Electric Utilities - 2.0% | |||
| Alliant Energy Corp. | 60 | 2,564 | |
| American Electric Power Co., Inc. | 134 | 9,866 | |
| Duke Energy Corp. | 193 | 16,849 | |
| Edison International | 93 | 7,457 | |
| Entergy Corp. | 49 | 3,879 | |
| Eversource Energy | 86 | 5,418 | |
| Exelon Corp. | 257 | 9,733 | |
| FirstEnergy Corp. | 122 | 3,975 | |
| NextEra Energy, Inc. | 130 | 19,566 | |
| PG&E Corp. | 141 | 9,924 | |
| Pinnacle West Capital Corp. | 27 | 2,429 | |
| PPL Corp. | 187 | 7,338 | |
| Southern Co. | 275 | 13,272 | |
| Xcel Energy, Inc. | 136 | 6,732 | |
| 119,002 | |||
| Independent Power and Renewable Electricity Producers - 0.1% | |||
| NRG Energy, Inc. | 89 | 2,217 | |
| The AES Corp. | 186 | 2,053 | |
| 4,270 | |||
| Multi-Utilities - 1.0% | |||
| Ameren Corp. | 67 | 4,019 | |
| CenterPoint Energy, Inc. | 119 | 3,525 | |
| CMS Energy Corp. | 76 | 3,689 | |
| Consolidated Edison, Inc. | 84 | 7,079 | |
| Dominion Resources, Inc. | 175 | 13,785 | |
| DTE Energy Co. | 49 | 5,504 | |
| NiSource, Inc. | 90 | 2,418 | |
| Public Service Enterprise Group, Inc. | 140 | 6,558 | |
| SCANA Corp. | 39 | 2,355 | |
| Sempra Energy | 69 | 8,137 | |
| WEC Energy Group, Inc. | 86 | 5,609 | |
| 62,678 | |||
| Water Utilities - 0.1% | |||
| American Water Works Co., Inc. | 49 | 3,964 | |
| TOTAL UTILITIES | 189,914 | ||
| TOTAL COMMON STOCKS | |||
| (Cost $5,788,707) | 5,835,022 | ||
| Money Market Funds - 2.1% | |||
| Fidelity Cash Central Fund, 1.11% (b) | |||
| (Cost $126,777) | 126,752 | 126,777 | |
| TOTAL INVESTMENT IN SECURITIES - 99.8% | |||
| (Cost $5,915,484) | 5,961,799 | ||
| NET OTHER ASSETS (LIABILITIES) - 0.2% | 14,392 | ||
| NET ASSETS - 100% | $5,976,191 |
| Futures Contracts | |||||
| Number of contracts | Expiration Date | Notional amount | Value | Unrealized Appreciation/(Depreciation) | |
| Purchased | |||||
| Equity Index Contracts | |||||
| CME E-mini S&P 500 Index Contracts (United States) | 1 | Sept. 2017 | $123,505 | $1,628 | $1,628 |
The notional amount of futures purchased as a percentage of Net Assets is 2.1%
Legend
(a) Non-income producing
(b) Affiliated fund that is generally available only to investment companies and other accounts managed by Fidelity Investments. The rate quoted is the annualized seven-day yield of the fund at period end. A complete unaudited listing of the fund's holdings as of its most recent quarter end is available upon request. In addition, each Fidelity Central Fund's financial statements are available on the SEC's website or upon request.
Affiliated Central Funds
Information regarding fiscal year to date income earned by the Fund from investments in Fidelity Central Funds is as follows:
| Fund | Income earned |
| Fidelity Cash Central Fund | $415 |
| Total | $415 |
Investment Valuation
All investments are categorized as Level 1 under the Fair Value Hierarchy. The inputs or methodology used for valuing securities may not be an indication of the risk associated with investing in those securities. For more information on valuation inputs please refer to the Investment Valuation section in the accompanying Notes to Financial Statements.
Value of Derivative Instruments
The following table is a summary of the Fund's value of derivative instruments by primary risk exposure as of August 31, 2017. For additional information on derivative instruments, please refer to the Derivative Instruments section in the accompanying Notes to Financial Statements.
| Primary Risk Exposure / Derivative Type | Value | |
| Asset | Liability | |
| Equity Risk | ||
| Futures Contracts(a) | $1,628 | $0 |
| Total Equity Risk | 1,628 | 0 |
| Total Value of Derivatives | $1,628 | $0 |
(a) Reflects gross cumulative appreciation (depreciation) on futures contracts as presented in the Schedule of Investments. Only the period and receivable or payable for daily variation margin and net unrealized appreciation (depreciation) are presented in the Statements of Assets and Liabilities..
See accompanying notes which are an integral part of the financial statements.
Financial Statements
Statement of Assets and Liabilities
| August 31, 2017 (Unaudited) | ||
| Assets | ||
| Investment in securities, at value — See accompanying schedule: Unaffiliated issuers (cost $5,788,707) | $5,835,022 | |
| Fidelity Central Funds (cost $126,777) | 126,777 | |
| Total Investment in Securities (cost $5,915,484) | $5,961,799 | |
| Segregated cash with brokers for derivative instruments | 4,200 | |
| Cash | 1,410 | |
| Receivable for investments sold | 20,144 | |
| Receivable for fund shares sold | 607 | |
| Dividends receivable | 12,690 | |
| Distributions receivable from Fidelity Central Funds | 153 | |
| Receivable for daily variation margin on futures contracts | 715 | |
| Total assets | 6,001,718 | |
| Liabilities | ||
| Payable for investments purchased | $25,527 | |
| Total liabilities | 25,527 | |
| Net Assets | $5,976,191 | |
| Net Assets consist of: | ||
| Paid in capital | $5,912,967 | |
| Undistributed net investment income | 17,935 | |
| Accumulated undistributed net realized gain (loss) on investments | (2,654) | |
| Net unrealized appreciation (depreciation) on investments | 47,943 | |
| Net Assets, for 567,321 shares outstanding | $5,976,191 | |
| Net Asset Value, offering price and redemption price per share ($5,976,191 ÷ 567,321 shares) | $10.53 |
See accompanying notes which are an integral part of the financial statements.
Statement of Operations
| For the period March 9, 2017 (commencement of operations) to August 31, 2017 (Unaudited) | ||
| Investment Income | ||
| Dividends | $19,930 | |
| Income from Fidelity Central Funds | 415 | |
| Total income | 20,345 | |
| Expenses | ||
| Independent trustees' fees and expenses | $1 | |
| Total expenses | 1 | |
| Net investment income (loss) | 20,344 | |
| Realized and Unrealized Gain (Loss) | ||
| Net realized gain (loss) on: | ||
| Investment securities: | ||
| Unaffiliated issuers | (2,654) | |
| Total net realized gain (loss) | (2,654) | |
| Change in net unrealized appreciation (depreciation) on: | ||
| Investment securities: | ||
| Unaffiliated issuers | 46,315 | |
| Futures contracts | 1,628 | |
| Total change in net unrealized appreciation (depreciation) | 47,943 | |
| Net gain (loss) | 45,289 | |
| Net increase (decrease) in net assets resulting from operations | $65,633 |
See accompanying notes which are an integral part of the financial statements.
Statement of Changes in Net Assets
| For the period March 9, 2017 (commencement of operations) to August 31, 2017 (Unaudited) | |
| Increase (Decrease) in Net Assets | |
| Operations | |
| Net investment income (loss) | $20,344 |
| Net realized gain (loss) | (2,654) |
| Change in net unrealized appreciation (depreciation) | 47,943 |
| Net increase (decrease) in net assets resulting from operations | 65,633 |
| Distributions to shareholders from net investment income | (2,409) |
| Share transactions | |
| Proceeds from sales of shares | 6,205,075 |
| Reinvestment of distributions | 2,409 |
| Cost of shares redeemed | (294,517) |
| Net increase (decrease) in net assets resulting from share transactions | 5,912,967 |
| Total increase (decrease) in net assets | 5,976,191 |
| Net Assets | |
| Beginning of period | – |
| End of period | $5,976,191 |
| Other Information | |
| Undistributed net investment income end of period | $17,935 |
| Shares | |
| Sold | 595,386 |
| Issued in reinvestment of distributions | 234 |
| Redeemed | (28,299) |
| Net increase (decrease) | 567,321 |
See accompanying notes which are an integral part of the financial statements.
Financial Highlights — Fidelity Flex 500 Index Fund
| Six months ended (Unaudited) August 31, | |
| 2017 A | |
| Selected Per–Share Data | |
| Net asset value, beginning of period | $10.00 |
| Income from Investment Operations | |
| Net investment income (loss)B | .12 |
| Net realized and unrealized gain (loss) | .43 |
| Total from investment operations | .55 |
| Distributions from net investment income | (.02) |
| Total distributions | (.02) |
| Net asset value, end of period | $10.53 |
| Total ReturnC | 5.46% |
| Ratios to Average Net AssetsD,E | |
| Expenses before reductions | - %F,G |
| Expenses net of fee waivers, if any | - %F,G |
| Expenses net of all reductions | - %F,G |
| Net investment income (loss) | 2.42%F |
| Supplemental Data | |
| Net assets, end of period (000 omitted) | $5,976 |
| Portfolio turnover rateH | 12%I |
A For the period March 9, 2017 (commencement of operations) to August 31, 2017.
B Calculated based on average shares outstanding during the period.
C Total returns for periods of less than one year are not annualized.
D Fees and expenses of any underlying Fidelity Central Funds are not included in the Fund's expense ratio. The Fund indirectly bears its proportionate share of the expenses of any underlying Fidelity Central Funds.
E Expense ratios reflect operating expenses of the Fund. Expenses before reductions do not reflect amounts reimbursed by the investment adviser or reductions from expense offset arrangements and do not represent the amount paid by the Fund during periods when reimbursements or reductions occur. Expense ratios before reductions for start-up periods may not be representative of longer term operating periods. Expenses net of fee waivers reflect expenses after reimbursement by the investment adviser but prior to reductions from expense offset arrangements. Expenses net of all reductions represent the net expenses paid by the Fund.
F Annualized
G Amount represents less than .005%.
H Amount does not include the portfolio activity of any underlying Fidelity Central Funds.
I Amount not annualized.
See accompanying notes which are an integral part of the financial statements.
Notes to Financial Statements (Unaudited)
For the period ended August 31, 2017
1. Organization.
Fidelity Flex 500 Index Fund (the Fund) is a fund of Fidelity Concord Street Trust (the Trust) and is authorized to issue an unlimited number of shares. Share transactions on the Statement of Changes in Net Assets may contain exchanges between affiliated funds. The Trust is registered under the Investment Company Act of 1940, as amended (the 1940 Act), as an open-end management investment company organized as a Massachusetts business trust. The Fund is available only to certain fee-based accounts offered by Fidelity.
2. Investments in Fidelity Central Funds.
The Fund invests in Fidelity Central Funds, which are open-end investment companies generally available only to other investment companies and accounts managed by the investment adviser and its affiliates. The Fund's Schedule of Investments lists each of the Fidelity Central Funds held as of period end, if any, as an investment of the Fund, but does not include the underlying holdings of each Fidelity Central Fund. As an Investing Fund, the Fund indirectly bears its proportionate share of the expenses of the underlying Fidelity Central Funds.
The Money Market Central Funds seek preservation of capital and current income and are managed by Fidelity Investments Money Management, Inc. (FIMM), an affiliate of the investment adviser. Annualized expenses of the Money Market Central Funds as of their most recent shareholder report date are less than .005%.
A complete unaudited list of holdings for each Fidelity Central Fund is available upon request or at the Securities and Exchange Commission (the SEC) website at www.sec.gov. In addition, the financial statements of the Fidelity Central Funds are available on the SEC website or upon request.
3. Significant Accounting Policies.
The Fund is an investment company and applies the accounting and reporting guidance of the Financial Accounting Standards Board (FASB) Accounting Standards Codification Topic 946 Financial Services – Investments Companies. The financial statements have been prepared in conformity with accounting principles generally accepted in the United States of America (GAAP), which require management to make certain estimates and assumptions at the date of the financial statements. Actual results could differ from those estimates. Subsequent events, if any, through the date that the financial statements were issued have been evaluated in the preparation of the financial statements. The following summarizes the significant accounting policies of the Fund:
Investment Valuation. Investments are valued as of 4:00 p.m. Eastern time on the last calendar day of the period. The Board of Trustees (the Board) has delegated the day to day responsibility for the valuation of the Fund's investments to the Fair Value Committee (the Committee) established by the Fund's investment adviser. In accordance with valuation policies and procedures approved by the Board, the Fund attempts to obtain prices from one or more third party pricing vendors or brokers to value its investments. When current market prices, quotations or currency exchange rates are not readily available or reliable, investments will be fair valued in good faith by the Committee, in accordance with procedures adopted by the Board. Factors used in determining fair value vary by investment type and may include market or investment specific events. The frequency with which these procedures are used cannot be predicted and they may be utilized to a significant extent. The Committee oversees the Fund's valuation policies and procedures and reports to the Board on the Committee's activities and fair value determinations. The Board monitors the appropriateness of the procedures used in valuing the Fund's investments and ratifies the fair value determinations of the Committee.
The Fund categorizes the inputs to valuation techniques used to value its investments into a disclosure hierarchy consisting of three levels as shown below:
- Level 1 – quoted prices in active markets for identical investments
- Level 2 – other significant observable inputs (including quoted prices for similar investments, interest rates, prepayment speeds, etc.)
- Level 3 – unobservable inputs (including the Fund's own assumptions based on the best information available)
Valuation techniques used to value the Fund's investments by major category are as follows:
Equity securities, including restricted securities, for which market quotations are readily available, are valued at the last reported sale price or official closing price as reported by a third party pricing vendor on the primary market or exchange on which they are traded and are categorized as Level 1 in the hierarchy. In the event there were no sales during the day or closing prices are not available, securities are valued at the last quoted bid price or may be valued using the last available price and are generally categorized as Level 2 in the hierarchy. For foreign equity securities, when market or security specific events arise, comparisons to the valuation of American Depositary Receipts (ADRs), futures contracts, Exchange-Traded Funds (ETFs) and certain indexes as well as quoted prices for similar securities may be used and would be categorized as Level 2 in the hierarchy. Utilizing these techniques may result in transfers between Level 1 and Level 2. For equity securities, including restricted securities, where observable inputs are limited, assumptions about market activity and risk are used and these securities may be categorized as Level 3 in the hierarchy.
Futures contracts are valued at the settlement price established each day by the board of trade or exchange on which they are traded and are categorized as Level 1 in the hierarchy. Investments in open-end mutual funds, including the Fidelity Central Funds, are valued at their closing net asset value (NAV) each business day and are categorized as Level 1 in the hierarchy.
Changes in valuation techniques may result in transfers in or out of an assigned level within the disclosure hierarchy.
Investment Transactions and Income. For financial reporting purposes, the Fund's investment holdings and NAV include trades executed through the end of the last business day of the period. The NAV per share for processing shareholder transactions is calculated as of the close of business of the New York Stock Exchange (NYSE), normally 4:00 p.m. Eastern time and includes trades executed through the end of the prior business day. Gains and losses on securities sold are determined on the basis of identified cost. Dividend income is recorded on the ex-dividend date, except for certain dividends from foreign securities where the ex-dividend date may have passed, which are recorded as soon as the Fund is informed of the ex-dividend date. Non-cash dividends included in dividend income, if any, are recorded at the fair market value of the securities received. Income and capital gain distributions from Fidelity Central Funds, if any, are recorded on the ex-dividend date. Certain distributions received by the Fund represent a return of capital or capital gain. The Fund determines the components of these distributions subsequent to the ex-dividend date, based upon receipt of tax filings or other correspondence relating to the underlying investment. These distributions are recorded as a reduction of cost of investments and/or as a realized gain.
Expenses. Expenses directly attributable to a fund are charged to that fund. Expenses attributable to more than one fund are allocated among the respective funds on the basis of relative net assets or other appropriate methods. Expense estimates are accrued in the period to which they relate and adjustments are made when actual amounts are known.
Income Tax Information and Distributions to Shareholders. Each year, the Fund intends to qualify as a regulated investment company under Subchapter M of the Internal Revenue Code, including distributing substantially all of its taxable income and realized gains. As a result, no provision for U.S. Federal income taxes is required. The Fund files a U.S. federal tax return, in addition to state and local tax returns as required. The Fund's federal income tax returns are subject to examination by the Internal Revenue Service (IRS) for a period of three fiscal years after they are filed. State and local tax returns may be subject to examination for an additional fiscal year depending on the jurisdiction.
Distributions are declared and recorded on the ex-dividend date. Income and capital gain distributions are determined in accordance with income tax regulations, which may differ from GAAP.
Capital accounts within the financial statements are adjusted for permanent book-tax differences. These adjustments have no impact on net assets or the results of operations. Capital accounts are not adjusted for temporary book-tax differences which will reverse in a subsequent period.
As of period end, the cost and unrealized appreciation (depreciation) in securities, and derivatives if applicable, for federal income tax purposes were as follows:
| Gross unrealized appreciation | $170,789 |
| Gross unrealized depreciation | (127,277) |
| Net unrealized appreciation (depreciation) | $43,512 |
| Tax cost | $5,919,915 |
4. Derivative Instruments.
Risk Exposures and the Use of Derivative Instruments. The Fund's investment objective allows the Fund to enter into various types of derivative contracts, including futures contracts. Derivatives are investments whose value is primarily derived from underlying assets, indices or reference rates and may be transacted on an exchange or over-the-counter (OTC). Derivatives may involve a future commitment to buy or sell a specified asset based on specified terms, to exchange future cash flows at periodic intervals based on a notional principal amount, or for one party to make one or more payments upon the occurrence of specified events in exchange for periodic payments from the other party.
The Fund used derivatives to increase returns and to manage exposure to certain risks as defined below. The success of any strategy involving derivatives depends on analysis of numerous economic factors, and if the strategies for investment do not work as intended, the Fund may not achieve its objectives.
The Fund's use of derivatives increased or decreased its exposure to the following risk:
| Equity Risk | Equity risk relates to the fluctuations in the value of financial instruments as a result of changes in market prices (other than those arising from interest rate risk or foreign exchange risk), whether caused by factors specific to an individual investment, its issuer, or all factors affecting all instruments traded in a market or market segment. |
The Fund is also exposed to additional risks from investing in derivatives, such as liquidity risk and counterparty credit risk. Liquidity risk is the risk that the Fund will be unable to close out the derivative in the open market in a timely manner. Counterparty credit risk is the risk that the counterparty will not be able to fulfill its obligation to the Fund. Counterparty credit risk related to exchange-traded futures contracts may be mitigated by the protection provided by the exchange on which they trade.
Investing in derivatives may involve greater risks than investing in the underlying assets directly and, to varying degrees, may involve risk of loss in excess of any initial investment and collateral received and amounts recognized in the Statement of Assets and Liabilities. In addition, there may be the risk that the change in value of the derivative contract does not correspond to the change in value of the underlying instrument.
Futures Contracts. A futures contract is an agreement between two parties to buy or sell a specified underlying instrument for a fixed price at a specified future date. The Fund used futures contracts to manage its exposure to the stock market.
Upon entering into a futures contract, a fund is required to deposit either cash or securities (initial margin) with a clearing broker in an amount equal to a certain percentage of the face value of the contract. Futures contracts are marked-to-market daily and subsequent daily payments (variation margin) are made or received by a fund depending on the daily fluctuations in the value of the futures contracts and are recorded as unrealized appreciation or (depreciation). This receivable and/or payable, if any, is included in daily variation margin on futures contracts in the Statement of Assets and Liabilities. Realized gain or (loss) is recorded upon the expiration or closing of a futures contract.
Any open futures contracts at period end are presented in the Schedule of Investments under the caption "Futures Contracts". The underlying face amount at value reflects each contract's exposure to the underlying instrument or index at period end and is representative of volume of activity during the period. Cash deposited to meet initial margin requirements is presented as segregated cash with brokers for derivative instruments in the Statement of Assets and Liabilities.
During the period the Fund recognized net realized gain (loss) of $0 and a change in net unrealized appreciation (depreciation) of $1,628 related to its investment in futures contracts. These amounts are included in the Statement of Operations.
5. Purchases and Sales of Investments.
Purchases and sales of securities, other than short-term securities, aggregated $6,031,628 and $235,661, respectively.
6. Fees and Other Transactions with Affiliates.
Management Fee. Fidelity Management & Research Company (the investment adviser) and its affiliates provide the Fund with investment management related services and the Fund does not pay any fees for these services. Under the management contract, the investment adviser or an affiliate pays all other expenses of the Fund, excluding fees and expenses of the independent Trustees, and certain miscellaneous expenses such as proxy and shareholder meeting expenses.
Sub-Adviser. Geode Capital Management, LLC (Geode), serves as sub-adviser for the Fund. Geode provides discretionary investment advisory services to the Fund and is paid by the investment adviser for providing these services.
Interfund Trades. The Fund may purchase from or sell securities to other Fidelity Funds under procedures adopted by the Board. The procedures have been designed to ensure these interfund trades are executed in accordance with Rule 17a-7 of the 1940 Act. Interfund trades are included within the respective purchases and sales amounts shown in the Purchases and Sales of Investments note.
7. Committed Line of Credit.
The Fund participates with other funds managed by the investment adviser or an affiliate in a $4.25 billion credit facility (the "line of credit") to be utilized for temporary or emergency purposes to fund shareholder redemptions or for other short-term liquidity purposes. The Fund has agreed to pay commitment fees on its pro-rata portion of the line of credit, which amounted to less than $1. During the period, the Fund did not borrow on this line of credit.
8. Other.
The Fund's organizational documents provide former and current trustees and officers with a limited indemnification against liabilities arising in connection with the performance of their duties to the Fund. In the normal course of business, the Fund may also enter into contracts that provide general indemnifications. The Fund's maximum exposure under these arrangements is unknown as this would be dependent on future claims that may be made against the Fund. The risk of material loss from such claims is considered remote.
Shareholder Expense Example
As a shareholder of the Fund, you incur two types of costs: (1) transaction costs and (2) ongoing costs, including other Fund expenses. This Example is intended to help you understand your ongoing costs (in dollars) of investing in the Fund and to compare these costs with the ongoing costs of investing in other mutual funds.
The actual expense Example is based on an investment of $1,000 invested at the beginning of the period and held for the entire period (March 9, 2017 to August 31, 2017). The hypothetical expense Example is based on an investment of $1,000 invested for the one-half year period (March 1, 2017 to August 31, 2017).
Actual Expenses
The first line of the accompanying table provides information about actual account values and actual expenses. You may use the information in this line, together with the amount you invested, to estimate the expenses that you paid over the period. Simply divide your account value by $1,000.00 (for example, an $8,600 account value divided by $1,000.00 = 8.6), then multiply the result by the number in the first line under the heading entitled "Expenses Paid During Period" to estimate the expenses you paid on your account during this period. In addition, the Fund, as a shareholder in the underlying Fidelity Central Funds, will indirectly bear its pro-rata share of the fees and expenses incurred by the underlying Fidelity Central Funds. These fees and expenses are not included in the Fund's annualized expense ratio used to calculate the expense estimate in the table below.
Hypothetical Example for Comparison Purposes
The second line of the accompanying table provides information about hypothetical account values and hypothetical expenses based on the Fund's actual expense ratio and an assumed rate of return of 5% per year before expenses, which is not the Fund's actual return. The hypothetical account values and expenses may not be used to estimate the actual ending account balance or expenses you paid for the period. You may use this information to compare the ongoing costs of investing in the Fund and other funds. To do so, compare this 5% hypothetical example with the 5% hypothetical examples that appear in the shareholder reports of the other funds. In addition, the Fund, as a shareholder in the underlying Fidelity Central Funds, will indirectly bear its pro-rata share of the fees and expenses incurred by the underlying Fidelity Central Funds. These fees and expenses are not included in the Fund's annualized expense ratio used to calculate the expense estimate in the table below.
Please note that the expenses shown in the table are meant to highlight your ongoing costs only and do not reflect any transaction costs. Therefore, the second line of the table is useful in comparing ongoing costs only, and will not help you determine the relative total costs of owning different funds.
| Annualized Expense Ratio-A | Beginning Account Value | Ending Account Value August 31, 2017 | Expenses Paid During Period | |
| Actual | - %-B | $1,000.00 | $1,054.60 | $--C |
| Hypothetical-D | $1,000.00 | $1,025.21 | $--E |
A Annualized expense ratio reflects expenses net of applicable fee waivers.
B Amounts represent less than .005%.
C Actual expenses are equal to the Fund's annualized expense ratio, multiplied by the average account value over the period, multiplied by 176/365 (to reflect the period March 9, 2017 to August 31, 2017).
D 5% return per year before expenses
E Hypothetical expenses are equal to the Fund's annualized expense ratio, multiplied by the average account value over the period, multiplied by 184/365 (to reflect the one-half year period).
Board Approval of Investment Advisory Contracts and Management Fees
Fidelity Flex 500 Index Fund
On January 18, 2017, the Board of Trustees, including the Independent Trustees (together, the Board), voted to approve the management contract with Fidelity Management & Research Company (FMR) and the sub-advisory agreements (together, the Advisory Contracts) for the fund, including the fund's sub-advisory agreement with Geode Capital Management, LLC (Geode). The Board, assisted by the advice of fund counsel and Independent Trustees' counsel, considered a broad range of information.
Nature, Extent, and Quality of Services Provided. The Board considered staffing as it relates to the fund, including the backgrounds of investment personnel of Fidelity and Geode, and also considered the fund's investment objective, strategies, and related investment philosophy. The Board considered the structure of the investment personnel compensation programs and whether the structures provide appropriate incentives to act in the best interests of the fund.Resources Dedicated to Investment Management and Support Services. The Board and the Fund Oversight and Research Committees reviewed the general qualifications and capabilities of Fidelity's and Geode's investment staffs, including their size, education, experience, and resources, as well as Fidelity's approach to recruiting, training, managing, and compensating investment personnel. The Board noted that Fidelity has continued to increase the resources devoted to non-U.S. offices, including expansion of Fidelity's global investment organization. Additionally, in its deliberations, the Board considered Fidelity's and Geode's trading, risk management, compliance, and technology and operations capabilities and resources, which are integral parts of the investment management process.Shareholder and Administrative Services. The Board considered the nature, extent, quality, and cost of advisory, administrative, and shareholder services to be performed by FMR, the sub-advisers (together with FMR, the Investment Advisers), and their affiliates under the Advisory Contracts and under separate agreements covering transfer agency, pricing and bookkeeping, and securities lending services for the fund. The Board also considered the nature and extent of the supervision of third party service providers, principally custodians, subcustodians, and pricing vendors.The Board noted that the growth of fund assets over time across the complex allows Fidelity to reinvest in the development of services designed to enhance the value or convenience of the Fidelity funds as investment vehicles. These services include 24-hour access to account information and market information through telephone representatives and over the Internet, investor education materials and asset allocation tools, and the expanded availability of Fidelity Investor Centers.Investment Performance. The fund is a new fund and therefore had no historical performance for the Board to review at the time it approved the fund's Advisory Contracts.Based on its review, the Board concluded that the nature, extent, and quality of services to be provided to the fund under the Advisory Contracts should benefit the shareholders of the fund.Competitiveness of Management Fee and Total Expense Ratio. The Board noted that the fund is available exclusively to retirement plans offered through certain Fidelity fee-based programs. The Board considered that while the fund does not pay a management fee, FMR is indirectly compensated for its services out of the program fee. The Board noted that FMR pays all operating expenses, with certain limited exceptions, on behalf of the fund. Based on its review, the Board concluded that the fund's management fee and projected total expense ratio were reasonable in light of the services that the fund and its shareholders will receive and the other factors considered.Costs of the Services and Profitability. The fund is a new fund and therefore no revenue, cost, or profitability data was available for the Board to review in respect of the fund at the time it approved the Advisory Contracts. In connection with its future renewal of the fund's Advisory Contracts, the Board will consider the revenues earned and the expenses incurred by Fidelity in conducting the business of developing, marketing, distributing, managing, administering and servicing the fund and servicing the fund's shareholders.Economies of Scale. The Board will consider economies of scale when there is operating experience to permit assessment thereof. It noted, however, that because the fund pays no advisory fees and FMR bears most expenses of the fund, economies of scale cannot be realized by the fund.Based on its evaluation of all of the conclusions noted above, and after considering all factors it believed relevant, the Board concluded that the advisory and sub-advisory fee structures are fair and reasonable, and that the fund's Advisory Contracts should be approved.Board Approval of Investment Advisory Contracts
Fidelity Flex 500 Index FundAt its July 2017 meeting, the Board of Trustees, including the Independent Trustees (together, the Board), voted to approve an amended and restated sub-advisory agreement with Geode Capital Management, LLC for the fund to decrease the sub-advisory fees paid to the sub-adviser (Amended Contract). The Board, assisted by the advice of fund counsel and Independent Trustees' counsel, considered a broad range of information.The Board noted that it previously received and considered materials relating to the nature, extent and quality of services provided by FMR and the sub-adviser to the fund, including the resources dedicated to investment management and support services, shareholder and administrative services, and the benefits to shareholders of investment in a large fund family. At its January 2017 meeting, the Board concluded that the nature, extent and quality of the services provided to the fund under the existing management and sub-advisory agreements should benefit the fund's shareholders. The Board noted that approval of the Amended Contract would not change the fund's portfolio manager, the investment processes, the level or nature of services provided, the resources and personnel allocated or trading and compliance operations.The Board noted that the fund is available through a new bundled fee offering for plans that are recordkept by Fidelity Investments. The Board considered that, while the fund does not pay a management fee, FMR is indirectly compensated for its services out of the program fee and the sub-adviser receives compensation from FMR. The Board noted at its January 2017 meeting that FMR pays all operating expenses, with certain limited exceptions, on behalf of the fund. Because the Board was approving an arrangement with the sub-adviser under which the fund will not bear any additional management fees or expenses and under which the fund's portfolio manager would not change, it did not consider the fund's investment performance, competitiveness of management fee and total expenses, costs of services and profitability, or economies of scale to be significant factors in its decision.In connection with its future renewal of the fund's management contract and sub-advisory agreements, the Board will consider: (i) the nature, extent, and quality of services provided to the fund, including shareholder and administrative services and investment performance; (ii) the competitiveness of the fund's management fee and total expenses; (iii) the costs of the services and profitability, including the revenues earned and the expenses incurred by Fidelity in conducting the business of developing, marketing, distributing, managing, administering, and servicing the fund and its shareholders; and (iv) whether there have been economies of scale in respect of the management of the Fidelity funds, whether the Fidelity funds (including the fund) have appropriately benefited from any such economies of scale, and whether there is potential for realization of any further economies.Based on its evaluation of all of the conclusions noted above, and after considering all material factors, the Board ultimately concluded that the fund's Amended Contract is fair and reasonable, and that the fund's Amended Contract should be approved.
![]()
Corporate Headquarters
245 Summer St.
Boston, MA 02210
www.fidelity.com
Z5I-SANN-1017
1.9881570.100
Fidelity® Total Market Index Fund Fidelity® Extended Market Index Fund Fidelity® International Index Fund Semi-Annual Report August 31, 2017 |
|
Contents
Fidelity® Total Market Index Fund | |
Fidelity® Extended Market Index Fund | |
Fidelity® International Index Fund | |
Board Approval of Investment Advisory Contracts and Management Fees |
To view a fund's proxy voting guidelines and proxy voting record for the 12-month period ended June 30, visit http://www.fidelity.com/proxyvotingresults or visit the Securities and Exchange Commission's (SEC) web site at http://www.sec.gov.
You may also call 1-800-544-8544 to request a free copy of the proxy voting guidelines.
The funds or securities referred to herein are not sponsored, endorsed, or promoted by MSCI, and MSCI bears no liability with respect to any such funds or securities or any index on which such funds or securities are based. The prospectus contains a more detailed description of the limited relationship MSCI has with Fidelity and any related funds.
Standard & Poor's, S&P and S&P 500 are registered service marks of The McGraw-Hill Companies, Inc. and have been licensed for use by Fidelity Distributors Corporation.
Other third-party marks appearing herein are the property of their respective owners.
All other marks appearing herein are registered or unregistered trademarks or service marks of FMR LLC or an affiliated company. © 2017 FMR LLC. All rights reserved.
This report and the financial statements contained herein are submitted for the general information of the shareholders of the Funds. This report is not authorized for distribution to prospective investors in the Funds unless preceded or accompanied by an effective prospectus.
A fund files its complete schedule of portfolio holdings with the SEC for the first and third quarters of each fiscal year on Form N-Q. Forms N-Q are available on the SEC’s web site at http://www.sec.gov. A fund's Forms N-Q may be reviewed and copied at the SEC’s Public Reference Room in Washington, DC. Information regarding the operation of the SEC's Public Reference Room may be obtained by calling 1-800-SEC-0330.
For a complete list of a fund's portfolio holdings, view the most recent holdings listing, semiannual report, or annual report on Fidelity's web site at http://www.fidelity.com, http://www.institutional.fidelity.com, or http://www.401k.com, as applicable.
NOT FDIC INSURED •MAY LOSE VALUE •NO BANK GUARANTEE
Neither the Funds nor Fidelity Distributors Corporation is a bank.
Fidelity® Total Market Index Fund
Investment Summary (Unaudited)
Top Ten Stocks as of August 31, 2017
| % of fund's net assets | % of fund's net assets 6 months ago | |
| Apple, Inc. | 3.3 | 2.9 |
| Microsoft Corp. | 2.3 | 2.0 |
| Facebook, Inc. Class A | 1.6 | 1.3 |
| Amazon.com, Inc. | 1.5 | 1.3 |
| Johnson & Johnson | 1.4 | 1.4 |
| Berkshire Hathaway, Inc. Class B | 1.4 | 1.3 |
| Exxon Mobil Corp. | 1.3 | 1.4 |
| JPMorgan Chase & Co. | 1.3 | 1.3 |
| Alphabet, Inc. Class A | 1.1 | 1.0 |
| Alphabet, Inc. Class C | 1.1 | 1.0 |
| 16.3 |
Top Market Sectors as of August 31, 2017
| % of fund's net assets | % of fund's net assets 6 months ago | |
| Information Technology | 22.5 | 20.6 |
| Financials | 14.6 | 15.3 |
| Health Care | 14.1 | 13.3 |
| Consumer Discretionary | 12.4 | 12.4 |
| Industrials | 10.6 | 10.7 |
| Consumer Staples | 7.5 | 8.3 |
| Energy | 5.3 | 6.2 |
| Real Estate | 4.1 | 4.0 |
| Materials | 3.3 | 3.3 |
| Utilities | 3.3 | 3.2 |
Fidelity® Total Market Index Fund
Investments August 31, 2017 (Unaudited)
Showing Percentage of Net Assets
| Common Stocks - 99.6% | |||
| Shares | Value | ||
| CONSUMER DISCRETIONARY - 12.4% | |||
| Auto Components - 0.4% | |||
| Adient PLC | 159,281 | $11,257,981 | |
| American Axle & Manufacturing Holdings, Inc. (a) | 148,067 | 2,163,259 | |
| Autoliv, Inc. (b) | 151,190 | 16,422,258 | |
| BorgWarner, Inc. | 350,359 | 16,260,161 | |
| Clean Diesel Technologies, Inc. (a)(b) | 8,475 | 18,052 | |
| Cooper Tire & Rubber Co. | 91,978 | 3,090,461 | |
| Cooper-Standard Holding, Inc. (a) | 32,523 | 3,271,163 | |
| Dana Holding Corp. | 235,295 | 5,663,551 | |
| Delphi Automotive PLC | 456,707 | 44,026,555 | |
| Dorman Products, Inc. (a) | 55,243 | 3,669,240 | |
| Fox Factory Holding Corp. (a) | 56,459 | 2,258,360 | |
| Gentex Corp. | 483,427 | 8,832,211 | |
| Gentherm, Inc. (a) | 58,309 | 1,816,325 | |
| Hertz Global Holdings, Inc. (a)(b) | 124,860 | 2,714,456 | |
| Horizon Global Corp. (a)(b) | 41,718 | 717,550 | |
| LCI Industries | 43,682 | 4,315,782 | |
| Lear Corp. | 119,894 | 17,928,949 | |
| Modine Manufacturing Co. (a) | 88,001 | 1,421,216 | |
| Motorcar Parts of America, Inc. (a) | 32,435 | 852,067 | |
| Shiloh Industries, Inc. (a) | 23,634 | 207,034 | |
| Standard Motor Products, Inc. | 32,576 | 1,436,602 | |
| Stoneridge, Inc. (a) | 43,907 | 727,100 | |
| Strattec Security Corp. | 4,334 | 136,088 | |
| Superior Industries International, Inc. | 39,790 | 582,924 | |
| Sypris Solutions, Inc. (a) | 16,848 | 27,631 | |
| Tenneco, Inc. | 96,642 | 5,237,996 | |
| The Goodyear Tire & Rubber Co. | 424,185 | 12,852,806 | |
| Tower International, Inc. | 31,785 | 713,573 | |
| UQM Technologies, Inc. (a) | 38,648 | 34,783 | |
| Visteon Corp. (a) | 57,388 | 6,624,871 | |
| VOXX International Corp. (a)(b) | 39,260 | 318,006 | |
| Workhorse Group, Inc. (a)(b) | 43,808 | 147,633 | |
| 175,746,644 | |||
| Automobiles - 0.6% | |||
| Ford Motor Co. | 6,679,951 | 73,679,860 | |
| General Motors Co. | 2,352,167 | 85,948,182 | |
| Harley-Davidson, Inc. (b) | 295,888 | 13,909,695 | |
| REV Group, Inc. (b) | 22,528 | 567,480 | |
| Tesla, Inc. (a)(b) | 217,184 | 77,295,786 | |
| Thor Industries, Inc. | 80,273 | 8,720,859 | |
| Winnebago Industries, Inc. (b) | 45,507 | 1,645,078 | |
| 261,766,940 | |||
| Distributors - 0.1% | |||
| Core-Mark Holding Co., Inc. | 75,278 | 2,037,023 | |
| Educational Development Corp. (b) | 2,866 | 30,236 | |
| Genuine Parts Co. | 248,224 | 20,560,394 | |
| LKQ Corp. (a) | 538,255 | 18,650,536 | |
| Pool Corp. | 71,179 | 7,095,835 | |
| Weyco Group, Inc. | 5,169 | 142,406 | |
| 48,516,430 | |||
| Diversified Consumer Services - 0.2% | |||
| American Public Education, Inc. (a) | 24,607 | 453,999 | |
| Ascent Capital Group, Inc. (a) | 16,905 | 167,867 | |
| Bridgepoint Education, Inc. (a) | 27,580 | 243,531 | |
| Bright Horizons Family Solutions, Inc. (a) | 83,097 | 6,641,943 | |
| Cambium Learning Group, Inc. (a) | 12,514 | 73,332 | |
| Capella Education Co. | 20,930 | 1,409,636 | |
| Career Education Corp. (a) | 109,234 | 1,049,739 | |
| Carriage Services, Inc. | 24,048 | 588,936 | |
| Chegg, Inc. (a)(b) | 135,548 | 1,923,426 | |
| Collectors Universe, Inc. | 6,416 | 154,176 | |
| DeVry, Inc. | 101,372 | 3,466,922 | |
| Graham Holdings Co. | 8,772 | 5,150,918 | |
| Grand Canyon Education, Inc. (a) | 82,727 | 6,787,750 | |
| H&R Block, Inc. | 348,246 | 9,312,098 | |
| Houghton Mifflin Harcourt Co. (a) | 170,821 | 1,742,374 | |
| K12, Inc. (a) | 59,099 | 1,059,054 | |
| Laureate Education, Inc. Class A | 104,594 | 1,531,256 | |
| Liberty Tax, Inc. | 8,571 | 115,280 | |
| Lincoln Educational Services Corp. (a) | 15,671 | 43,879 | |
| National American University Holdings, Inc. | 5,378 | 11,616 | |
| Regis Corp. (a) | 52,945 | 703,110 | |
| Service Corp. International | 317,953 | 11,236,459 | |
| ServiceMaster Global Holdings, Inc. (a) | 236,280 | 11,133,514 | |
| Sotheby's Class A (Ltd. vtg.) (a)(b) | 77,436 | 3,474,553 | |
| Strayer Education, Inc. | 17,939 | 1,435,299 | |
| Universal Technical Institute, Inc. (a) | 29,419 | 104,143 | |
| Weight Watchers International, Inc. (a) | 50,480 | 2,362,969 | |
| 72,377,779 | |||
| Hotels, Restaurants & Leisure - 2.1% | |||
| ARAMARK Holdings Corp. | 423,578 | 17,235,389 | |
| Belmond Ltd. Class A (a) | 147,743 | 1,883,723 | |
| Biglari Holdings, Inc. (a) | 2,475 | 736,956 | |
| BJ's Restaurants, Inc. (a) | 35,904 | 1,080,710 | |
| Bloomin' Brands, Inc. | 181,456 | 3,086,567 | |
| Bob Evans Farms, Inc. | 36,126 | 2,484,746 | |
| Bojangles', Inc. (a)(b) | 24,608 | 328,517 | |
| Boyd Gaming Corp. | 147,259 | 3,893,528 | |
| Bravo Brio Restaurant Group, Inc. (a) | 12,451 | 34,240 | |
| Brinker International, Inc. | 77,201 | 2,410,215 | |
| Buffalo Wild Wings, Inc. (a) | 29,848 | 3,066,882 | |
| Caesars Entertainment Corp. (a)(b) | 91,365 | 1,059,834 | |
| Carnival Corp. | 714,595 | 49,650,061 | |
| Carrols Restaurant Group, Inc. (a) | 61,598 | 671,418 | |
| Century Casinos, Inc. (a) | 28,742 | 196,883 | |
| Chipotle Mexican Grill, Inc. (a)(b) | 49,526 | 15,685,379 | |
| Choice Hotels International, Inc. | 66,238 | 4,110,068 | |
| Churchill Downs, Inc. | 21,995 | 4,297,823 | |
| Chuy's Holdings, Inc. (a)(b) | 26,361 | 495,587 | |
| ClubCorp Holdings, Inc. | 105,707 | 1,797,019 | |
| Cracker Barrel Old Country Store, Inc. (b) | 40,400 | 6,005,864 | |
| Darden Restaurants, Inc. | 211,433 | 17,356,535 | |
| Dave & Buster's Entertainment, Inc. (a) | 61,208 | 3,578,220 | |
| Del Frisco's Restaurant Group, Inc. (a) | 37,615 | 526,610 | |
| Del Taco Restaurants, Inc. (a)(b) | 75,328 | 1,060,618 | |
| Denny's Corp. (a) | 117,334 | 1,403,315 | |
| DineEquity, Inc. | 27,200 | 1,081,200 | |
| Domino's Pizza, Inc. | 81,781 | 14,905,405 | |
| Dover Downs Gaming & Entertainment, Inc. (a) | 1,508 | 1,493 | |
| Dover Motorsports, Inc. | 9,993 | 20,985 | |
| Drive Shack, Inc. | 86,128 | 232,546 | |
| Dunkin' Brands Group, Inc. | 155,091 | 7,996,492 | |
| El Pollo Loco Holdings, Inc. (a)(b) | 42,298 | 480,082 | |
| Eldorado Resorts, Inc. (a)(b) | 69,377 | 1,595,671 | |
| Empire Resorts, Inc. (a)(b) | 4,022 | 93,914 | |
| Extended Stay America, Inc. unit | 338,299 | 6,627,277 | |
| Famous Dave's of America, Inc. (a)(b) | 7,623 | 33,160 | |
| Fiesta Restaurant Group, Inc. (a)(b) | 50,677 | 881,780 | |
| Fogo de Chao, Inc. (a) | 21,909 | 277,149 | |
| Golden Entertainment, Inc. (a) | 12,680 | 288,090 | |
| Good Times Restaurants, Inc. (a) | 7,939 | 22,229 | |
| Habit Restaurants, Inc. Class A (a)(b) | 36,946 | 480,298 | |
| Hilton Grand Vacations, Inc. | 107,778 | 3,906,953 | |
| Hilton, Inc. | 350,021 | 22,516,851 | |
| Hyatt Hotels Corp. Class A (a) | 85,165 | 5,068,169 | |
| ILG, Inc. | 190,126 | 5,019,326 | |
| International Speedway Corp. Class A | 44,736 | 1,594,838 | |
| J. Alexanders Holdings, Inc. (a) | 20,559 | 203,534 | |
| Jack in the Box, Inc. | 50,437 | 4,721,912 | |
| Jamba, Inc. (a)(b) | 19,136 | 188,298 | |
| Kona Grill, Inc. (a)(b) | 8,466 | 25,398 | |
| La Quinta Holdings, Inc. (a) | 128,968 | 2,037,694 | |
| Las Vegas Sands Corp. | 629,877 | 39,184,648 | |
| Lindblad Expeditions Holdings (a) | 22,275 | 247,698 | |
| Luby's, Inc. (a) | 14,614 | 38,727 | |
| Marcus Corp. | 30,096 | 749,390 | |
| Marriott International, Inc. Class A | 529,166 | 54,811,014 | |
| Marriott Vacations Worldwide Corp. (b) | 42,588 | 4,955,540 | |
| McDonald's Corp. | 1,396,519 | 223,401,144 | |
| MGM Mirage, Inc. | 840,509 | 27,703,177 | |
| Monarch Casino & Resort, Inc. (a) | 16,794 | 597,363 | |
| Nathan's Famous, Inc. (a) | 3,561 | 208,497 | |
| Noodles & Co. (a)(b) | 28,579 | 110,029 | |
| Norwegian Cruise Line Holdings Ltd. (a) | 304,314 | 18,094,510 | |
| Papa John's International, Inc. (b) | 42,981 | 3,214,549 | |
| Papa Murphy's Holdings, Inc. (a)(b) | 22,690 | 115,946 | |
| Park Hotels & Resorts, Inc. | 268,171 | 7,157,484 | |
| Penn National Gaming, Inc. (a) | 158,816 | 3,524,127 | |
| Pinnacle Entertainment, Inc. (a) | 94,638 | 1,845,441 | |
| Planet Fitness, Inc. | 118,106 | 2,996,349 | |
| Playa Hotels & Resorts NV | 140,860 | 1,460,718 | |
| Potbelly Corp. (a) | 30,614 | 367,368 | |
| Rave Restaurant Group, Inc. (a)(b) | 9,079 | 13,165 | |
| Rave Restaurant Group, Inc. rights (b) | 9,079 | 152 | |
| RCI Hospitality Holdings, Inc. | 15,482 | 360,731 | |
| Red Lion Hotels Corp. (a) | 6,989 | 48,923 | |
| Red Robin Gourmet Burgers, Inc. (a)(b) | 21,139 | 1,204,923 | |
| Red Rock Resorts, Inc. | 72,993 | 1,649,642 | |
| Royal Caribbean Cruises Ltd. | 285,089 | 35,482,177 | |
| Ruby Tuesday, Inc. (a) | 88,086 | 189,385 | |
| Ruth's Hospitality Group, Inc. | 42,076 | 822,586 | |
| Scientific Games Corp. Class A (a)(b) | 89,331 | 3,144,451 | |
| SeaWorld Entertainment, Inc. (b) | 103,555 | 1,344,144 | |
| Shake Shack, Inc. Class A (a)(b) | 35,538 | 1,098,835 | |
| Six Flags Entertainment Corp. | 140,263 | 7,654,152 | |
| Sonic Corp. (b) | 74,649 | 1,747,533 | |
| Speedway Motorsports, Inc. | 23,497 | 488,973 | |
| Starbucks Corp. | 2,484,039 | 136,274,380 | |
| Texas Roadhouse, Inc. Class A | 113,067 | 5,365,029 | |
| The Cheesecake Factory, Inc. (b) | 75,769 | 3,139,110 | |
| Town Sports International Holdings, Inc. (a) | 13,107 | 77,331 | |
| U.S. Foods Holding Corp. (a) | 221,001 | 6,066,477 | |
| Vail Resorts, Inc. | 67,071 | 15,288,834 | |
| Wendy's Co. | 328,867 | 4,906,696 | |
| Wingstop, Inc. | 55,195 | 1,788,870 | |
| Wyndham Worldwide Corp. | 177,047 | 17,648,045 | |
| Wynn Resorts Ltd. (b) | 138,056 | 19,188,403 | |
| Yum! Brands, Inc. | 570,420 | 43,819,664 | |
| Zoe's Kitchen, Inc. (a)(b) | 27,188 | 349,910 | |
| 924,383,691 | |||
| Household Durables - 0.6% | |||
| AV Homes, Inc. (a)(b) | 12,051 | 186,188 | |
| Bassett Furniture Industries, Inc. | 15,479 | 554,922 | |
| Beazer Homes U.S.A., Inc. (a) | 65,476 | 976,247 | |
| CalAtlantic Group, Inc. | 137,770 | 4,787,508 | |
| Cavco Industries, Inc. (a) | 13,938 | 1,875,358 | |
| Century Communities, Inc. (a) | 33,155 | 747,645 | |
| Comstock Holding Companies, Inc. (a) | 1,496 | 2,902 | |
| CSS Industries, Inc. | 16,118 | 431,640 | |
| D.R. Horton, Inc. | 588,321 | 21,267,804 | |
| Dixie Group, Inc. (a) | 11,105 | 45,531 | |
| Emerson Radio Corp. (a) | 23,724 | 26,096 | |
| Ethan Allen Interiors, Inc. (b) | 53,577 | 1,567,127 | |
| Flexsteel Industries, Inc. | 9,186 | 417,963 | |
| Garmin Ltd. (b) | 197,296 | 10,160,744 | |
| GoPro, Inc. Class A (a)(b) | 162,726 | 1,498,706 | |
| Green Brick Partners, Inc. (a) | 37,398 | 353,411 | |
| Helen of Troy Ltd. (a) | 44,560 | 4,023,768 | |
| Hooker Furniture Corp. | 17,507 | 704,657 | |
| Hovnanian Enterprises, Inc. Class A (a) | 177,163 | 322,437 | |
| Installed Building Products, Inc. (a) | 34,760 | 2,005,652 | |
| iRobot Corp. (a)(b) | 46,436 | 4,430,923 | |
| KB Home (b) | 179,193 | 3,834,730 | |
| Koss Corp. (a) | 2,669 | 3,817 | |
| La-Z-Boy, Inc. | 79,546 | 1,897,172 | |
| Leggett & Platt, Inc. | 221,974 | 10,204,145 | |
| Lennar Corp. Class A | 361,788 | 18,726,147 | |
| LGI Homes, Inc. (a)(b) | 30,018 | 1,276,966 | |
| Libbey, Inc. | 30,735 | 251,105 | |
| Lifetime Brands, Inc. | 14,046 | 244,400 | |
| M.D.C. Holdings, Inc. | 74,685 | 2,333,906 | |
| M/I Homes, Inc. (b) | 40,257 | 990,322 | |
| Meritage Homes Corp. (a) | 64,418 | 2,621,813 | |
| Mohawk Industries, Inc. (a) | 107,436 | 27,194,200 | |
| NACCO Industries, Inc. Class A | 7,854 | 569,415 | |
| New Home Co. LLC (a) | 17,775 | 183,438 | |
| Newell Brands, Inc. | 823,827 | 39,774,368 | |
| Nova LifeStyle, Inc. (a)(b) | 26,136 | 31,886 | |
| NVR, Inc. (a) | 5,916 | 16,096,549 | |
| PICO Holdings, Inc. (a) | 33,668 | 547,105 | |
| PulteGroup, Inc. | 477,718 | 12,334,679 | |
| Skyline Corp. (a) | 21,741 | 259,370 | |
| Stanley Furniture Co., Inc. | 5,699 | 6,383 | |
| Taylor Morrison Home Corp. (a) | 166,089 | 3,358,320 | |
| Tempur Sealy International, Inc. (a)(b) | 77,783 | 4,814,768 | |
| Toll Brothers, Inc. | 253,725 | 9,885,126 | |
| TopBuild Corp. (a) | 72,015 | 4,274,090 | |
| TRI Pointe Homes, Inc. (a)(b) | 267,734 | 3,410,931 | |
| Tupperware Brands Corp. | 86,145 | 4,985,211 | |
| Turtle Beach Corp. (a)(b) | 6,672 | 4,670 | |
| Universal Electronics, Inc. (a) | 25,010 | 1,464,336 | |
| Vuzix Corp. (a)(b) | 22,003 | 127,617 | |
| Whirlpool Corp. | 126,716 | 21,747,000 | |
| William Lyon Homes, Inc. (a)(b) | 35,265 | 846,007 | |
| Zagg, Inc. (a) | 38,365 | 483,399 | |
| 251,170,620 | |||
| Internet & Direct Marketing Retail - 2.4% | |||
| 1-800-FLOWERS.com, Inc. Class A (a) | 52,658 | 473,922 | |
| Amazon.com, Inc. (a) | 679,412 | 666,231,407 | |
| Duluth Holdings, Inc. (a)(b) | 12,299 | 240,937 | |
| Etsy, Inc. (a)(b) | 161,975 | 2,651,531 | |
| EVINE Live, Inc. (a) | 71,405 | 71,048 | |
| Expedia, Inc. | 205,735 | 30,522,845 | |
| FTD Companies, Inc. (a) | 25,393 | 340,012 | |
| Gaia, Inc. Class A (a) | 12,609 | 140,590 | |
| Groupon, Inc. (a)(b) | 645,768 | 2,867,210 | |
| HSN, Inc. | 58,131 | 2,133,408 | |
| Lands' End, Inc. (a)(b) | 26,352 | 320,177 | |
| Liberty Expedia Holdings, Inc. | 99,495 | 5,441,382 | |
| Liberty Interactive Corp. QVC Group: | |||
| (Venture Group) Series A (a) | 144,556 | 8,898,867 | |
| Series A (a) | 751,358 | 16,620,039 | |
| Liberty TripAdvisor Holdings, Inc. (a) | 119,998 | 1,601,973 | |
| Netflix, Inc. (a) | 737,411 | 128,833,076 | |
| NutriSystem, Inc. | 50,522 | 2,743,345 | |
| Overstock.com, Inc. (a)(b) | 24,847 | 545,392 | |
| PetMed Express, Inc. (b) | 32,292 | 1,171,231 | |
| Priceline Group, Inc. (a) | 83,939 | 155,461,743 | |
| Shutterfly, Inc. (a) | 54,203 | 2,470,573 | |
| TripAdvisor, Inc. (a)(b) | 187,324 | 8,004,355 | |
| U.S. Auto Parts Network, Inc. (a) | 5,048 | 14,740 | |
| Wayfair LLC Class A (a)(b) | 53,340 | 3,787,673 | |
| 1,041,587,476 | |||
| Leisure Products - 0.1% | |||
| American Outdoor Brands Corp. (a)(b) | 96,497 | 1,574,831 | |
| Brunswick Corp. | 157,212 | 8,250,486 | |
| Callaway Golf Co. | 178,654 | 2,490,437 | |
| Clarus Corp. (a) | 32,583 | 236,227 | |
| Escalade, Inc. | 7,022 | 84,615 | |
| Hasbro, Inc. | 191,773 | 18,841,697 | |
| JAKKS Pacific, Inc. (a)(b) | 19,661 | 67,830 | |
| Johnson Outdoors, Inc. Class A | 8,158 | 520,480 | |
| Malibu Boats, Inc. Class A (a) | 36,393 | 981,519 | |
| Marine Products Corp. | 11,741 | 182,925 | |
| Mattel, Inc. (b) | 607,515 | 9,853,893 | |
| MCBC Holdings, Inc. (a) | 21,350 | 365,939 | |
| Nautilus, Inc. (a) | 46,907 | 766,929 | |
| Polaris Industries, Inc. (b) | 100,575 | 9,376,607 | |
| Sturm, Ruger & Co., Inc. (b) | 33,314 | 1,525,781 | |
| Summer Infant, Inc. (a) | 32,605 | 66,514 | |
| Vista Outdoor, Inc. (a)(b) | 94,769 | 1,942,765 | |
| 57,129,475 | |||
| Media - 3.0% | |||
| A.H. Belo Corp. Class A | 22,177 | 110,885 | |
| AMC Entertainment Holdings, Inc. Class A (b) | 98,115 | 1,314,741 | |
| AMC Networks, Inc. Class A (a) | 101,098 | 6,144,736 | |
| Ballantyne of Omaha, Inc. (a) | 17,964 | 113,173 | |
| Cable One, Inc. | 8,311 | 6,305,888 | |
| CBS Corp. Class B | 648,125 | 41,518,888 | |
| Central European Media Enterprises Ltd. Class A (a)(b) | 116,862 | 484,977 | |
| Charter Communications, Inc. Class A (a) | 368,979 | 147,052,891 | |
| Cinedigm Corp. (a)(b) | 5,614 | 8,477 | |
| Cinemark Holdings, Inc. | 176,432 | 5,873,421 | |
| Clear Channel Outdoor Holding, Inc. Class A (a) | 57,659 | 221,987 | |
| Comcast Corp. Class A | 8,100,248 | 328,951,071 | |
| Cumulus Media, Inc. Class A (a)(b) | 17,877 | 6,972 | |
| Daily Journal Corp. (a) | 644 | 135,176 | |
| Discovery Communications, Inc.: | |||
| Class A (a)(b) | 247,368 | 5,494,043 | |
| Class C (non-vtg.) (a) | 376,024 | 7,900,264 | |
| DISH Network Corp. Class A (a) | 387,018 | 22,172,261 | |
| E.W. Scripps Co. Class A (a)(b) | 104,171 | 1,862,577 | |
| Emmis Communications Corp. Class A (a) | 1,993 | 5,281 | |
| Entercom Communications Corp. Class A (b) | 42,593 | 438,708 | |
| Entravision Communication Corp. Class A | 112,796 | 626,018 | |
| Gannett Co., Inc. | 225,017 | 1,910,394 | |
| Global Eagle Entertainment, Inc. (a)(b) | 84,431 | 260,892 | |
| Gray Television, Inc. (a) | 109,585 | 1,567,066 | |
| Harte-Hanks, Inc. (a) | 45,482 | 40,856 | |
| Hemisphere Media Group, Inc. (a)(b) | 10,964 | 141,984 | |
| Insignia Systems, Inc. | 5,038 | 5,290 | |
| Interpublic Group of Companies, Inc. | 672,240 | 13,538,914 | |
| John Wiley & Sons, Inc. Class A | 79,959 | 4,313,788 | |
| Lee Enterprises, Inc. (a)(b) | 58,988 | 123,875 | |
| Liberty Broadband Corp.: | |||
| Class A (a) | 36,926 | 3,745,404 | |
| Class C (a) | 130,665 | 13,266,417 | |
| Liberty Global PLC: | |||
| Class A (a) | 432,377 | 14,700,818 | |
| Class C (a) | 1,083,957 | 35,803,100 | |
| LiLAC Class A (a)(b) | 77,452 | 2,014,527 | |
| LiLAC Class C (a) | 214,602 | 5,534,586 | |
| Liberty Media Corp.: | |||
| Liberty Braves Class A (a) | 14,273 | 348,404 | |
| Liberty Braves Class C (a) | 68,302 | 1,671,350 | |
| Liberty Formula One Group Series C (a)(b) | 232,999 | 9,156,861 | |
| Liberty Media Class A (a)(b) | 28,511 | 1,081,422 | |
| Liberty SiriusXM Series A(a) | 131,422 | 5,874,563 | |
| Liberty SiriusXM Series C (a) | 317,236 | 14,151,898 | |
| Lions Gate Entertainment Corp.: | |||
| Class A (b) | 84,440 | 2,510,401 | |
| Class B (b) | 201,823 | 5,665,172 | |
| Live Nation Entertainment, Inc. (a) | 224,734 | 8,980,371 | |
| Loral Space & Communications Ltd. (a) | 20,272 | 920,349 | |
| Meredith Corp. | 62,660 | 3,405,571 | |
| MSG Network, Inc. Class A (a) | 103,460 | 2,219,217 | |
| National CineMedia, Inc. | 108,730 | 588,229 | |
| New Media Investment Group, Inc. | 89,861 | 1,239,183 | |
| News Corp.: | |||
| Class A | 717,388 | 9,591,478 | |
| Class B | 130,013 | 1,781,178 | |
| Nexstar Broadcasting Group, Inc. Class A (b) | 74,709 | 4,497,482 | |
| Omnicom Group, Inc. (b) | 395,017 | 28,591,330 | |
| Reading International, Inc. Class A (a) | 17,900 | 282,104 | |
| Regal Entertainment Group Class A | 191,111 | 2,822,709 | |
| RLJ Entertainment, Inc. (a) | 5,726 | 17,980 | |
| Saga Communications, Inc. Class A | 3,882 | 158,580 | |
| Salem Communications Corp. Class A | 10,842 | 65,594 | |
| Scholastic Corp. | 44,904 | 1,770,565 | |
| Scripps Networks Interactive, Inc. Class A | 162,026 | 13,877,527 | |
| Sinclair Broadcast Group, Inc. Class A | 119,056 | 3,601,444 | |
| Sirius XM Holdings, Inc. (b) | 2,845,102 | 16,359,337 | |
| Tegna, Inc. | 350,960 | 4,429,115 | |
| The Madison Square Garden Co. (a) | 25,883 | 5,500,396 | |
| The McClatchy Co. Class A (a) | 6,072 | 44,204 | |
| The New York Times Co. Class A | 207,571 | 3,871,199 | |
| The Walt Disney Co. | 2,487,987 | 251,784,284 | |
| Time Warner, Inc. | 1,326,649 | 134,124,214 | |
| Time, Inc. | 173,717 | 2,284,379 | |
| Townsquare Media, Inc. (a) | 1,285 | 12,824 | |
| Tribune Media Co. Class A | 123,479 | 4,947,804 | |
| tronc, Inc. (a) | 51,781 | 751,342 | |
| Twenty-First Century Fox, Inc.: | |||
| Class A | 1,810,082 | 49,940,162 | |
| Class B | 830,892 | 22,517,173 | |
| Urban One, Inc. Class D (non-vtg.) (a) | 32,336 | 56,588 | |
| Viacom, Inc. Class B (non-vtg.) | 632,315 | 18,084,209 | |
| World Wrestling Entertainment, Inc. Class A | 69,670 | 1,518,806 | |
| 1,314,807,344 | |||
| Multiline Retail - 0.3% | |||
| Big Lots, Inc. (b) | 72,215 | 3,437,434 | |
| Dillard's, Inc. Class A (b) | 40,152 | 2,441,242 | |
| Dollar General Corp. | 429,076 | 31,133,755 | |
| Dollar Tree, Inc. (a) | 405,144 | 32,265,668 | |
| Fred's, Inc. Class A (b) | 52,965 | 313,553 | |
| JC Penney Corp., Inc. (a)(b) | 535,524 | 2,072,478 | |
| Kohl's Corp. | 300,366 | 11,948,559 | |
| Macy's, Inc. | 517,789 | 10,754,478 | |
| Nordstrom, Inc. (b) | 185,779 | 8,289,459 | |
| Ollie's Bargain Outlet Holdings, Inc. (a)(b) | 79,892 | 3,343,480 | |
| Sears Holdings Corp. (a)(b) | 98,150 | 805,812 | |
| Target Corp. | 944,954 | 51,528,342 | |
| The Bon-Ton Stores, Inc. (a)(b) | 19,775 | 13,052 | |
| Tuesday Morning Corp. (a)(b) | 61,992 | 139,482 | |
| 158,486,794 | |||
| Specialty Retail - 2.0% | |||
| Aaron's, Inc. Class A | 106,680 | 4,722,724 | |
| Abercrombie & Fitch Co. Class A | 133,398 | 1,699,491 | |
| Advance Auto Parts, Inc. | 124,902 | 12,227,906 | |
| America's Car Mart, Inc. (a)(b) | 10,422 | 400,205 | |
| American Eagle Outfitters, Inc. | 303,607 | 3,628,104 | |
| Armstrong Flooring, Inc. (a) | 37,094 | 553,442 | |
| Asbury Automotive Group, Inc. (a) | 40,476 | 2,179,633 | |
| Ascena Retail Group, Inc. (a)(b) | 266,405 | 543,466 | |
| AutoNation, Inc. (a)(b) | 112,063 | 5,084,298 | |
| AutoZone, Inc. (a) | 48,090 | 25,412,680 | |
| Barnes & Noble Education, Inc. (a) | 60,796 | 314,923 | |
| Barnes & Noble, Inc. | 82,041 | 635,818 | |
| bebe stores, Inc. (a)(b) | 6,695 | 36,956 | |
| Bed Bath & Beyond, Inc. | 241,299 | 6,657,439 | |
| Best Buy Co., Inc. | 452,794 | 24,568,602 | |
| Big 5 Sporting Goods Corp. | 23,104 | 176,746 | |
| Boot Barn Holdings, Inc. (a)(b) | 24,133 | 195,477 | |
| Build-A-Bear Workshop, Inc. (a) | 15,205 | 139,886 | |
| Burlington Stores, Inc. (a) | 117,818 | 10,265,482 | |
| Cabela's, Inc. Class A (a) | 89,589 | 4,810,929 | |
| Caleres, Inc. | 81,369 | 2,195,336 | |
| CarMax, Inc. (a)(b) | 313,461 | 21,048,906 | |
| Cars.com, Inc. (b) | 116,986 | 3,025,258 | |
| Chico's FAS, Inc. | 231,778 | 1,780,055 | |
| Christopher & Banks Corp. (a) | 57,707 | 74,442 | |
| Citi Trends, Inc. | 19,731 | 357,723 | |
| Conn's, Inc. (a)(b) | 39,904 | 692,334 | |
| Destination Maternity Corp. (a) | 22,235 | 26,682 | |
| Destination XL Group, Inc. (a)(b) | 51,406 | 95,101 | |
| Dick's Sporting Goods, Inc. | 145,373 | 3,832,032 | |
| DSW, Inc. Class A (b) | 144,844 | 2,683,959 | |
| Express, Inc. (a) | 127,643 | 813,086 | |
| Finish Line, Inc. Class A (b) | 63,867 | 532,012 | |
| Five Below, Inc. (a)(b) | 100,983 | 4,803,761 | |
| Floor & Decor Holdings, Inc. Class A | 44,505 | 1,599,510 | |
| Foot Locker, Inc. | 223,548 | 7,875,596 | |
| Francesca's Holdings Corp. (a) | 57,702 | 418,917 | |
| GameStop Corp. Class A | 164,497 | 3,043,195 | |
| Gap, Inc. (b) | 381,256 | 9,005,267 | |
| Genesco, Inc. (a) | 32,141 | 679,782 | |
| GNC Holdings, Inc. Class A (b) | 120,441 | 999,660 | |
| Group 1 Automotive, Inc. | 30,918 | 1,855,698 | |
| Guess?, Inc. | 102,345 | 1,594,535 | |
| Haverty Furniture Companies, Inc. | 30,217 | 708,589 | |
| Hibbett Sports, Inc. (a)(b) | 34,547 | 424,928 | |
| Home Depot, Inc. | 2,049,223 | 307,117,051 | |
| Kirkland's, Inc. (a) | 21,240 | 244,897 | |
| L Brands, Inc. (b) | 421,006 | 15,248,837 | |
| Lithia Motors, Inc. Class A (sub. vtg.) (b) | 38,999 | 4,211,892 | |
| Lowe's Companies, Inc. | 1,466,570 | 108,364,857 | |
| Lumber Liquidators Holdings, Inc. (a)(b) | 49,362 | 1,852,556 | |
| MarineMax, Inc. (a) | 36,815 | 594,562 | |
| Michaels Companies, Inc. (a)(b) | 197,854 | 4,441,822 | |
| Monro, Inc. (b) | 59,370 | 2,831,949 | |
| Murphy U.S.A., Inc. (a)(b) | 58,955 | 3,800,239 | |
| New York & Co., Inc. (a) | 34,393 | 66,378 | |
| O'Reilly Automotive, Inc. (a) | 154,690 | 30,339,350 | |
| Office Depot, Inc. | 882,988 | 3,788,019 | |
| Party City Holdco, Inc. (a)(b) | 50,325 | 702,034 | |
| Penske Automotive Group, Inc. | 71,056 | 3,009,932 | |
| Perfumania Holdings, Inc. (a) | 876 | 1,594 | |
| Pier 1 Imports, Inc. | 163,568 | 685,350 | |
| Rent-A-Center, Inc. (b) | 93,716 | 1,133,964 | |
| RH (a)(b) | 55,177 | 2,581,732 | |
| Ross Stores, Inc. | 676,887 | 39,564,045 | |
| Sally Beauty Holdings, Inc. (a)(b) | 228,422 | 4,246,365 | |
| Sears Hometown & Outlet Stores, Inc. (a)(b) | 10,000 | 17,500 | |
| Select Comfort Corp. (a)(b) | 68,724 | 2,029,420 | |
| Shoe Carnival, Inc. | 21,330 | 428,733 | |
| Signet Jewelers Ltd. (b) | 116,151 | 7,325,644 | |
| Sonic Automotive, Inc. Class A (sub. vtg.) | 40,396 | 731,168 | |
| Sportsman's Warehouse Holdings, Inc. (a)(b) | 48,606 | 201,715 | |
| Stage Stores, Inc. (b) | 38,699 | 70,432 | |
| Staples, Inc. | 1,145,552 | 11,701,814 | |
| Stein Mart, Inc. (b) | 40,412 | 50,515 | |
| Tailored Brands, Inc. (b) | 76,887 | 908,804 | |
| The Buckle, Inc. (b) | 40,527 | 573,457 | |
| The Cato Corp. Class A (sub. vtg.) | 36,544 | 480,919 | |
| The Children's Place Retail Stores, Inc. | 29,482 | 3,129,514 | |
| The Container Store Group, Inc. (a)(b) | 22,029 | 89,438 | |
| Tiffany & Co., Inc. | 181,968 | 16,631,875 | |
| Tile Shop Holdings, Inc. | 56,926 | 856,736 | |
| Tilly's, Inc. | 14,113 | 155,384 | |
| TJX Companies, Inc. | 1,102,027 | 79,676,552 | |
| Tractor Supply Co. (b) | 226,801 | 13,496,928 | |
| Trans World Entertainment Corp. (a) | 2,977 | 4,614 | |
| Ulta Beauty, Inc. | 99,561 | 22,003,977 | |
| Urban Outfitters, Inc. (a)(b) | 143,484 | 2,932,813 | |
| Vitamin Shoppe, Inc. (a)(b) | 45,231 | 241,986 | |
| West Marine, Inc. | 26,644 | 345,573 | |
| Williams-Sonoma, Inc. (b) | 139,872 | 6,434,112 | |
| Winmark Corp. | 3,184 | 419,810 | |
| Zumiez, Inc. (a)(b) | 31,066 | 386,772 | |
| 880,574,201 | |||
| Textiles, Apparel & Luxury Goods - 0.6% | |||
| Carter's, Inc. | 82,628 | 7,164,674 | |
| Cherokee, Inc. (a) | 20,319 | 93,467 | |
| Coach, Inc. | 480,314 | 20,029,094 | |
| Columbia Sportswear Co. | 46,822 | 2,682,432 | |
| Crocs, Inc. (a) | 126,644 | 1,130,931 | |
| Culp, Inc. | 12,256 | 355,424 | |
| Deckers Outdoor Corp. (a) | 55,355 | 3,537,185 | |
| Delta Apparel, Inc. (a) | 4,312 | 84,601 | |
| Differential Brands Group, Inc. (a) | 1,083 | 1,787 | |
| Emerald Expositions Events, Inc. (b) | 58,843 | 1,279,247 | |
| Fossil Group, Inc. (a)(b) | 73,701 | 610,981 | |
| G-III Apparel Group Ltd. (a)(b) | 69,854 | 1,920,985 | |
| Hanesbrands, Inc. (b) | 627,279 | 15,217,789 | |
| Iconix Brand Group, Inc. (a)(b) | 101,691 | 568,453 | |
| J.Jill, Inc. | 24,557 | 238,448 | |
| Lakeland Industries, Inc. (a) | 6,813 | 96,063 | |
| lululemon athletica, Inc. (a) | 180,400 | 10,382,020 | |
| Michael Kors Holdings Ltd. (a) | 277,238 | 11,704,988 | |
| Movado Group, Inc. | 39,217 | 1,088,272 | |
| NIKE, Inc. Class B | 2,276,900 | 120,243,089 | |
| Oxford Industries, Inc. | 25,955 | 1,500,459 | |
| Perry Ellis International, Inc. (a) | 15,961 | 348,429 | |
| PVH Corp. | 132,712 | 16,707,114 | |
| Ralph Lauren Corp. | 91,187 | 8,014,425 | |
| Rocky Brands, Inc. | 8,326 | 107,405 | |
| Sequential Brands Group, Inc. (a)(b) | 82,806 | 252,558 | |
| Skechers U.S.A., Inc. Class A (sub. vtg.) (a) | 228,771 | 6,046,418 | |
| Steven Madden Ltd. (a) | 86,611 | 3,672,306 | |
| Superior Uniform Group, Inc. | 11,974 | 263,667 | |
| Under Armour, Inc.: | |||
| Class A (sub. vtg.) (a)(b) | 312,447 | 5,046,019 | |
| Class C (non-vtg.) (a)(b) | 313,320 | 4,731,132 | |
| Unifi, Inc. (a) | 22,047 | 685,221 | |
| Vera Bradley, Inc. (a) | 29,957 | 270,811 | |
| VF Corp. | 554,884 | 34,885,557 | |
| Vince Holding Corp. (a)(b) | 26,763 | 12,204 | |
| Wolverine World Wide, Inc. | 170,818 | 4,492,513 | |
| 285,466,168 | |||
| TOTAL CONSUMER DISCRETIONARY | 5,472,013,562 | ||
| CONSUMER STAPLES - 7.5% | |||
| Beverages - 1.7% | |||
| Boston Beer Co., Inc. Class A (a)(b) | 14,791 | 2,203,859 | |
| Brown-Forman Corp.: | |||
| Class A | 46,010 | 2,559,076 | |
| Class B (non-vtg.) | 362,686 | 19,236,865 | |
| Castle Brands, Inc. (a)(b) | 173,742 | 246,714 | |
| Coca-Cola Bottling Co. Consolidated | 7,832 | 1,672,837 | |
| Constellation Brands, Inc. Class A (sub. vtg.) | 292,803 | 58,589,880 | |
| Craft Brew Alliance, Inc. (a)(b) | 14,306 | 248,924 | |
| Dr. Pepper Snapple Group, Inc. | 315,830 | 28,756,322 | |
| MGP Ingredients, Inc. (b) | 19,078 | 1,072,756 | |
| Molson Coors Brewing Co. Class B | 313,413 | 28,128,817 | |
| Monster Beverage Corp. (a) | 699,904 | 39,068,641 | |
| National Beverage Corp. (b) | 22,740 | 2,642,615 | |
| New Age Beverages Corp. | 33,316 | 140,927 | |
| PepsiCo, Inc. | 2,449,315 | 283,459,225 | |
| Primo Water Corp. (a)(b) | 33,980 | 372,081 | |
| REED'S, Inc. (a)(b) | 1,830 | 4,209 | |
| The Coca-Cola Co. | 6,586,084 | 299,996,126 | |
| 768,399,874 | |||
| Food & Staples Retailing - 1.6% | |||
| Andersons, Inc. | 47,014 | 1,497,396 | |
| Casey's General Stores, Inc. (b) | 65,556 | 6,910,914 | |
| Chefs' Warehouse Holdings (a)(b) | 34,201 | 589,967 | |
| Costco Wholesale Corp. | 750,932 | 117,701,082 | |
| CVS Health Corp. | 1,751,876 | 135,490,090 | |
| Ingles Markets, Inc. Class A | 21,439 | 470,586 | |
| Kroger Co. | 1,557,377 | 34,059,835 | |
| Natural Grocers by Vitamin Cottage, Inc. (a)(b) | 12,082 | 67,901 | |
| Performance Food Group Co. (a) | 157,320 | 4,373,496 | |
| PriceSmart, Inc. | 38,992 | 3,168,100 | |
| Rite Aid Corp. (a)(b) | 1,799,849 | 4,355,635 | |
| Smart & Final Stores, Inc. (a)(b) | 46,551 | 328,185 | |
| SpartanNash Co. | 61,272 | 1,509,742 | |
| Sprouts Farmers Market LLC (a) | 217,629 | 4,339,522 | |
| SUPERVALU, Inc. (a) | 107,946 | 2,157,841 | |
| Sysco Corp. | 846,395 | 44,579,625 | |
| United Natural Foods, Inc. (a)(b) | 87,309 | 3,033,988 | |
| Village Super Market, Inc. Class A | 8,594 | 198,779 | |
| Wal-Mart Stores, Inc. | 2,527,879 | 197,351,514 | |
| Walgreens Boots Alliance, Inc. | 1,462,141 | 119,164,492 | |
| Weis Markets, Inc. | 29,625 | 1,309,721 | |
| Welbilt, Inc. (a)(b) | 274,877 | 5,470,052 | |
| 688,128,463 | |||
| Food Products - 1.3% | |||
| Alico, Inc. | 4,002 | 128,064 | |
| Amplify Snack Brands, Inc. (a)(b) | 47,704 | 343,946 | |
| Archer Daniels Midland Co. | 974,171 | 40,252,746 | |
| B&G Foods, Inc. Class A (b) | 116,520 | 3,553,860 | |
| Blue Buffalo Pet Products, Inc. (a)(b) | 164,852 | 4,246,588 | |
| Bunge Ltd. | 243,028 | 18,137,180 | |
| Cal-Maine Foods, Inc. (a)(b) | 58,088 | 2,117,308 | |
| Calavo Growers, Inc. (b) | 26,199 | 1,759,263 | |
| Campbell Soup Co. | 330,429 | 15,265,820 | |
| Coffee Holding Co., Inc. (a) | 3,401 | 12,958 | |
| ConAgra Foods, Inc. | 702,119 | 22,790,783 | |
| Darling International, Inc. (a) | 281,119 | 4,891,471 | |
| Dean Foods Co. | 156,497 | 1,721,467 | |
| Farmer Brothers Co. (a) | 27,261 | 887,346 | |
| Flowers Foods, Inc. | 308,740 | 5,362,814 | |
| Fresh Del Monte Produce, Inc. | 55,694 | 2,617,061 | |
| Freshpet, Inc. (a)(b) | 33,847 | 536,475 | |
| General Mills, Inc. (b) | 975,500 | 51,955,130 | |
| Hormel Foods Corp. (b) | 467,102 | 14,358,715 | |
| Hostess Brands, Inc. Class A (a)(b) | 143,616 | 1,915,837 | |
| Ingredion, Inc. | 123,585 | 15,302,295 | |
| Inventure Foods, Inc. (a)(b) | 20,016 | 68,655 | |
| J&J Snack Foods Corp. | 25,667 | 3,272,286 | |
| John B. Sanfilippo & Son, Inc. (b) | 17,222 | 1,068,797 | |
| Kellogg Co. | 425,266 | 27,837,912 | |
| Lamb Weston Holdings, Inc. | 239,740 | 10,903,375 | |
| Lancaster Colony Corp. | 32,520 | 3,787,604 | |
| Landec Corp. (a) | 35,757 | 464,841 | |
| Lifeway Foods, Inc. (a) | 1,962 | 17,069 | |
| Limoneira Co. | 13,723 | 307,395 | |
| McCormick & Co., Inc. (non-vtg.) | 192,200 | 18,283,986 | |
| Mondelez International, Inc. | 2,599,304 | 105,687,701 | |
| Omega Protein Corp. | 32,056 | 506,485 | |
| Pilgrim's Pride Corp. (a)(b) | 94,260 | 2,775,957 | |
| Pinnacle Foods, Inc. | 202,857 | 12,031,449 | |
| Post Holdings, Inc. (a) | 113,903 | 9,696,562 | |
| Sanderson Farms, Inc. (b) | 34,070 | 5,026,006 | |
| Seaboard Corp. | 460 | 1,976,008 | |
| Seneca Foods Corp. Class A (a) | 9,032 | 269,154 | |
| Snyders-Lance, Inc. | 142,680 | 5,067,994 | |
| The Hain Celestial Group, Inc. (a) | 175,026 | 7,039,546 | |
| The Hershey Co. | 243,763 | 25,575,614 | |
| The J.M. Smucker Co. | 195,769 | 20,508,760 | |
| The Kraft Heinz Co. | 1,023,514 | 82,648,756 | |
| Tootsie Roll Industries, Inc. (b) | 47,006 | 1,755,674 | |
| TreeHouse Foods, Inc. (a)(b) | 96,338 | 6,453,683 | |
| Tyson Foods, Inc. Class A | 497,168 | 31,470,734 | |
| 592,659,130 | |||
| Household Products - 1.5% | |||
| Central Garden & Pet Co. Class A (non-vtg.) (a) | 79,976 | 2,726,382 | |
| Church & Dwight Co., Inc. | 437,941 | 21,971,500 | |
| Clorox Co. | 220,454 | 30,539,493 | |
| Colgate-Palmolive Co. | 1,512,806 | 108,377,422 | |
| Energizer Holdings, Inc. | 99,799 | 4,406,126 | |
| HRG Group, Inc. (a) | 243,938 | 3,851,781 | |
| Kimberly-Clark Corp. | 606,754 | 74,806,701 | |
| Oil-Dri Corp. of America | 2,105 | 85,674 | |
| Orchids Paper Products Co. (b) | 12,438 | 126,868 | |
| Procter & Gamble Co. | 4,376,206 | 403,792,528 | |
| Spectrum Brands Holdings, Inc. (b) | 41,932 | 4,610,843 | |
| WD-40 Co. | 25,080 | 2,732,466 | |
| 658,027,784 | |||
| Personal Products - 0.2% | |||
| Avon Products, Inc. (a) | 750,697 | 1,869,236 | |
| Coty, Inc. Class A | 800,297 | 13,268,924 | |
| Cyanotech Corp. (a) | 2,300 | 10,810 | |
| Edgewell Personal Care Co. (a) | 95,191 | 7,228,805 | |
| elf Beauty, Inc. (b) | 35,801 | 740,723 | |
| Estee Lauder Companies, Inc. Class A | 380,597 | 40,720,073 | |
| Herbalife Ltd. (a)(b) | 121,381 | 8,376,503 | |
| Inter Parfums, Inc. | 29,691 | 1,171,310 | |
| LifeVantage Corp. (a) | 19,206 | 79,897 | |
| Mannatech, Inc. | 599 | 9,015 | |
| MediFast, Inc. | 40,989 | 2,320,797 | |
| Natural Health Trends Corp. | 11,452 | 231,101 | |
| Nature's Sunshine Products, Inc. | 6,985 | 73,692 | |
| Nu Skin Enterprises, Inc. Class A | 84,187 | 5,121,095 | |
| Revlon, Inc. (a)(b) | 25,388 | 429,057 | |
| The Female Health Co. (a) | 11,731 | 18,887 | |
| USANA Health Sciences, Inc. (a) | 20,348 | 1,204,602 | |
| 82,874,527 | |||
| Tobacco - 1.2% | |||
| 22nd Century Group, Inc. (a)(b) | 98,310 | 216,282 | |
| Alliance One International, Inc. (a) | 8,945 | 93,028 | |
| Altria Group, Inc. | 3,307,146 | 209,673,056 | |
| Philip Morris International, Inc. | 2,662,623 | 311,340,507 | |
| Universal Corp. | 43,930 | 2,512,796 | |
| Vector Group Ltd. (b) | 180,167 | 3,891,607 | |
| 527,727,276 | |||
| TOTAL CONSUMER STAPLES | 3,317,817,054 | ||
| ENERGY - 5.3% | |||
| Energy Equipment & Services - 0.8% | |||
| Archrock, Inc. | 117,660 | 1,200,132 | |
| Aspen Aerogels, Inc. (a) | 9,858 | 40,319 | |
| Atwood Oceanics, Inc. (a)(b) | 121,695 | 799,536 | |
| Baker Hughes, a GE Co. Class A | 724,941 | 24,575,500 | |
| Basic Energy Services, Inc. (a) | 42,877 | 610,568 | |
| Bristow Group, Inc. (b) | 47,191 | 388,854 | |
| C&J Energy Services, Inc. | 129,736 | 3,277,131 | |
| Carbo Ceramics, Inc. (a)(b) | 36,697 | 240,732 | |
| Core Laboratories NV (b) | 76,525 | 6,747,975 | |
| Dawson Geophysical Co. (a) | 19,081 | 79,759 | |
| Diamond Offshore Drilling, Inc. (a)(b) | 99,661 | 1,132,149 | |
| Dril-Quip, Inc. (a)(b) | 70,873 | 2,661,281 | |
| ENGlobal Corp. (a) | 5,637 | 7,272 | |
| Ensco PLC Class A (b) | 494,916 | 2,103,393 | |
| Era Group, Inc. (a) | 30,759 | 270,987 | |
| Exterran Corp. (a) | 59,232 | 1,643,096 | |
| Fairmount Santrol Holidings, Inc. (a)(b) | 254,086 | 777,503 | |
| Forum Energy Technologies, Inc. (a)(b) | 122,886 | 1,425,478 | |
| Frank's International NV (b) | 90,617 | 569,075 | |
| Geospace Technologies Corp. (a)(b) | 25,924 | 391,193 | |
| Gulf Island Fabrication, Inc. | 17,861 | 200,043 | |
| Halliburton Co. | 1,482,857 | 57,786,937 | |
| Helix Energy Solutions Group, Inc. (a) | 241,675 | 1,515,302 | |
| Helmerich & Payne, Inc. (b) | 179,550 | 7,602,147 | |
| Hornbeck Offshore Services, Inc. (a)(b) | 41,835 | 115,883 | |
| Independence Contract Drilling, Inc. (a) | 45,769 | 147,376 | |
| ION Geophysical Corp. (a)(b) | 10,360 | 76,146 | |
| Mammoth Energy Services, Inc. (b) | 11,194 | 154,253 | |
| Matrix Service Co. (a) | 47,813 | 566,584 | |
| McDermott International, Inc. (a) | 460,303 | 2,826,260 | |
| Mitcham Industries, Inc. (a) | 23,287 | 87,326 | |
| Nabors Industries Ltd. | 457,542 | 2,996,900 | |
| National Oilwell Varco, Inc. | 640,133 | 19,632,879 | |
| Natural Gas Services Group, Inc. (a) | 21,602 | 509,807 | |
| NCS Multistage Holdings, Inc. | 41,493 | 819,902 | |
| Newpark Resources, Inc. (a) | 153,002 | 1,231,666 | |
| Noble Corp. (b) | 421,660 | 1,374,612 | |
| Oceaneering International, Inc. | 170,909 | 3,853,998 | |
| Oil States International, Inc. (a) | 89,813 | 1,953,433 | |
| Parker Drilling Co. (a) | 180,331 | 198,364 | |
| Patterson-UTI Energy, Inc. | 274,325 | 4,380,970 | |
| PHI, Inc. (non-vtg.) (a) | 18,377 | 201,963 | |
| Pioneer Energy Services Corp. (a) | 120,721 | 205,226 | |
| Profire Energy, Inc. (a) | 14,213 | 21,462 | |
| RigNet, Inc. (a) | 15,376 | 246,016 | |
| Rowan Companies PLC (a)(b) | 205,609 | 2,004,688 | |
| RPC, Inc. (b) | 95,956 | 1,862,506 | |
| Schlumberger Ltd. | 2,382,237 | 151,295,872 | |
| SEACOR Holdings, Inc. (a)(b) | 30,397 | 1,166,333 | |
| Smart Sand, Inc. | 41,295 | 246,531 | |
| Solaris Oilfield Infrastructure, Inc. Class A | 17,397 | 246,342 | |
| Superior Energy Services, Inc. (a)(b) | 268,168 | 2,209,704 | |
| Synthesis Energy Systems, Inc. (a)(b) | 138,081 | 56,254 | |
| TechnipFMC PLC | 812,785 | 20,994,237 | |
| Tesco Corp. (a) | 127,576 | 561,334 | |
| TETRA Technologies, Inc. (a) | 186,418 | 384,021 | |
| Transocean Ltd. (United States) (a)(b) | 642,424 | 5,242,180 | |
| U.S. Silica Holdings, Inc. | 125,689 | 3,419,998 | |
| Unit Corp. (a) | 95,665 | 1,522,987 | |
| Weatherford International PLC (b) | 1,680,088 | 6,434,737 | |
| Willbros Group, Inc. (a) | 69,552 | 153,014 | |
| 355,448,126 | |||
| Oil, Gas & Consumable Fuels - 4.5% | |||
| Abraxas Petroleum Corp. (a) | 241,078 | 409,833 | |
| Adams Resources & Energy, Inc. | 2,090 | 72,460 | |
| Aemetis, Inc. (a) | 10,055 | 8,678 | |
| Amyris, Inc. (a)(b) | 3,925 | 9,695 | |
| Anadarko Petroleum Corp. | 953,300 | 39,018,569 | |
| Andeavor | 257,277 | 25,766,292 | |
| Antero Resources Corp. (a)(b) | 254,152 | 5,004,253 | |
| Apache Corp. (b) | 667,324 | 25,918,864 | |
| Approach Resources, Inc. (a)(b) | 60,041 | 166,914 | |
| Arch Coal, Inc. | 42,349 | 3,382,415 | |
| Ardmore Shipping Corp. (b) | 44,385 | 359,519 | |
| Barnwell Industries, Inc. (a) | 2,847 | 5,125 | |
| Bill Barrett Corp. (a)(b) | 120,934 | 361,593 | |
| Bonanza Creek Energy, Inc. | 3,794 | 98,606 | |
| Bonanza Creek Energy, Inc. (c) | 47,310 | 0 | |
| Cabot Oil & Gas Corp. | 796,005 | 20,337,928 | |
| California Resources Corp. (a)(b) | 64,079 | 499,816 | |
| Callon Petroleum Co. (a)(b) | 334,854 | 3,469,087 | |
| Camber Energy, Inc. (a)(b) | 376 | 73 | |
| Carrizo Oil & Gas, Inc. (a)(b) | 129,850 | 1,745,184 | |
| Centennial Resource Development, Inc. Class A (b) | 257,479 | 4,451,812 | |
| Cheniere Energy, Inc. (a) | 408,060 | 17,460,887 | |
| Chesapeake Energy Corp. (a)(b) | 1,267,641 | 4,614,213 | |
| Chevron Corp. | 3,246,859 | 349,426,966 | |
| Cimarex Energy Co. | 163,321 | 16,281,470 | |
| Clean Energy Fuels Corp. (a)(b) | 207,470 | 493,779 | |
| Cloud Peak Energy, Inc. (a) | 152,269 | 478,125 | |
| Cobalt International Energy, Inc. (a)(b) | 37,473 | 70,449 | |
| Comstock Resources, Inc. (a)(b) | 24,083 | 154,613 | |
| Concho Resources, Inc. (a) | 252,785 | 28,051,551 | |
| ConocoPhillips Co. | 2,125,019 | 92,778,330 | |
| CONSOL Energy, Inc. | 300,644 | 4,374,370 | |
| Contango Oil & Gas Co. (a) | 51,306 | 235,495 | |
| Continental Resources, Inc. (a)(b) | 146,908 | 4,983,119 | |
| CVR Energy, Inc. (b) | 23,933 | 512,645 | |
| Delek U.S. Holdings, Inc. | 119,223 | 2,947,193 | |
| Denbury Resources, Inc. (a)(b) | 635,481 | 673,610 | |
| Devon Energy Corp. | 895,520 | 28,119,328 | |
| Diamondback Energy, Inc. (a) | 166,969 | 15,159,116 | |
| Earthstone Energy, Inc. (a)(b) | 10,660 | 102,229 | |
| Eclipse Resources Corp. (a) | 169,538 | 395,024 | |
| Energen Corp. (a) | 161,072 | 8,259,772 | |
| Energy XXI Gulf Coast, Inc. (b) | 77,532 | 810,209 | |
| EOG Resources, Inc. | 987,307 | 83,911,222 | |
| EP Energy Corp. (a)(b) | 91,298 | 268,416 | |
| EQT Corp. (b) | 294,556 | 18,362,621 | |
| Evolution Petroleum Corp. | 53,534 | 372,061 | |
| EXCO Resources, Inc. (a)(b) | 21,120 | 37,805 | |
| Extraction Oil & Gas, Inc. (b) | 65,143 | 855,979 | |
| Exxon Mobil Corp. | 7,260,245 | 554,174,501 | |
| Gastar Exploration, Inc. (a)(b) | 285,601 | 168,562 | |
| Gener8 Maritime, Inc. (a)(b) | 186,799 | 840,596 | |
| Gevo, Inc. (a)(b) | 7,805 | 5,073 | |
| Green Plains, Inc. (b) | 65,482 | 1,214,691 | |
| Gulfport Energy Corp. (a) | 275,383 | 3,450,549 | |
| Halcon Resources Corp. (a)(b) | 43,182 | 267,297 | |
| Hallador Energy Co. | 29,822 | 172,968 | |
| Hess Corp. | 463,865 | 18,044,349 | |
| HollyFrontier Corp. | 300,302 | 9,402,456 | |
| Houston American Energy Corp. (a)(b) | 36,485 | 17,878 | |
| International Seaways, Inc. | 72,136 | 1,330,188 | |
| Isramco, Inc. (a) | 123 | 13,850 | |
| Jagged Peak Energy, Inc. (b) | 69,960 | 896,188 | |
| Jones Energy, Inc. (b) | 91,542 | 90,627 | |
| Kinder Morgan, Inc. | 3,278,366 | 63,370,815 | |
| Kosmos Energy Ltd. (a)(b) | 380,364 | 2,677,763 | |
| Laredo Petroleum, Inc. (a)(b) | 240,236 | 2,983,731 | |
| Lilis Energy, Inc. (a)(b) | 19,185 | 70,217 | |
| Lonestar Resources U.S., Inc. (a) | 18,853 | 61,461 | |
| Marathon Oil Corp. | 1,454,381 | 16,172,717 | |
| Marathon Petroleum Corp. | 886,982 | 46,522,206 | |
| Matador Resources Co. (a)(b) | 153,132 | 3,610,853 | |
| Murphy Oil Corp. (b) | 270,006 | 6,118,336 | |
| Newfield Exploration Co. (a) | 346,789 | 9,061,597 | |
| Noble Energy, Inc. | 783,196 | 18,616,569 | |
| Northern Oil & Gas, Inc. (a)(b) | 93,777 | 79,710 | |
| Oasis Petroleum, Inc. (a)(b) | 395,968 | 2,890,566 | |
| Occidental Petroleum Corp. | 1,319,327 | 78,763,822 | |
| ONEOK, Inc. | 645,368 | 34,953,131 | |
| Overseas Shipholding Group, Inc. (a) | 80,103 | 181,033 | |
| Pacific Ethanol, Inc. (a) | 51,285 | 256,425 | |
| Panhandle Royalty Co. Class A | 32,305 | 681,636 | |
| Par Pacific Holdings, Inc. (a)(b) | 53,028 | 944,429 | |
| Parsley Energy, Inc. Class A (a) | 385,750 | 9,663,038 | |
| PBF Energy, Inc. Class A (b) | 185,150 | 4,384,352 | |
| PDC Energy, Inc. (a) | 95,525 | 3,756,998 | |
| Peabody Energy Corp. | 204,690 | 5,936,010 | |
| Penn Virginia Corp. (b) | 9,594 | 369,369 | |
| Petroquest Energy, Inc. (a) | 17,737 | 31,749 | |
| Phillips 66 Co. | 754,225 | 63,211,597 | |
| Pioneer Natural Resources Co. | 290,835 | 37,706,758 | |
| QEP Resources, Inc. (a) | 417,391 | 3,151,302 | |
| Range Resources Corp. (b) | 313,387 | 5,440,398 | |
| Renewable Energy Group, Inc. (a)(b) | 62,544 | 756,782 | |
| Resolute Energy Corp. (a)(b) | 30,507 | 901,482 | |
| Rex American Resources Corp. (a) | 9,008 | 780,273 | |
| Rex Energy Corp. (a)(b) | 6,338 | 14,514 | |
| Rice Energy, Inc. (a) | 273,274 | 7,476,777 | |
| Ring Energy, Inc. (a) | 84,537 | 1,007,681 | |
| RSP Permian, Inc. (a) | 181,533 | 5,696,506 | |
| Sanchez Energy Corp. (a)(b) | 110,256 | 482,921 | |
| SandRidge Energy, Inc. (a) | 37,708 | 649,332 | |
| SemGroup Corp. Class A (b) | 87,119 | 2,238,958 | |
| SilverBow Resources, Inc. (a)(b) | 9,186 | 198,785 | |
| SM Energy Co. | 163,665 | 2,186,564 | |
| Southwestern Energy Co. (a) | 872,953 | 4,757,594 | |
| Src Energy, Inc. (a)(b) | 344,278 | 2,716,353 | |
| Stone Energy Corp. (b) | 44,486 | 1,076,561 | |
| Syntroleum Corp. (a)(b)(c) | 15,037 | 0 | |
| Targa Resources Corp. | 367,453 | 16,377,380 | |
| Teekay Corp. (b) | 95,089 | 876,721 | |
| Tellurian, Inc. (a)(b) | 82,724 | 764,370 | |
| Tengasco, Inc. (a) | 1,261 | 832 | |
| The Williams Companies, Inc. | 1,418,085 | 42,159,667 | |
| Torchlight Energy Resources, Inc. (a)(b) | 48,218 | 65,576 | |
| TransAtlantic Petroleum Ltd. (a) | 18,382 | 13,787 | |
| U.S. Energy Corp. (a) | 2,263 | 1,720 | |
| Uranium Energy Corp. (a)(b) | 246,510 | 325,393 | |
| VAALCO Energy, Inc. (a) | 68,248 | 49,650 | |
| Valero Energy Corp. | 765,807 | 52,151,457 | |
| Vertex Energy, Inc. (a)(b) | 17,824 | 14,259 | |
| W&T Offshore, Inc. (a)(b) | 37,319 | 71,279 | |
| Warrior Metropolitan Coal, Inc. | 102,882 | 2,807,650 | |
| Westmoreland Coal Co. (a) | 31,012 | 72,258 | |
| Westwater Resources, Inc. (a)(b) | 2,190 | 2,978 | |
| Whiting Petroleum Corp. (a)(b) | 451,901 | 2,019,997 | |
| WildHorse Resource Development Corp. (b) | 44,975 | 490,677 | |
| World Fuel Services Corp. | 116,948 | 4,039,384 | |
| WPX Energy, Inc. (a) | 680,691 | 6,800,103 | |
| Zion Oil & Gas, Inc. (a)(b) | 91,553 | 305,787 | |
| 1,983,387,682 | |||
| TOTAL ENERGY | 2,338,835,808 | ||
| FINANCIALS - 14.6% | |||
| Banks - 6.3% | |||
| 1st Source Corp. | 33,223 | 1,550,517 | |
| Access National Corp. | 21,459 | 551,067 | |
| ACNB Corp. | 3,789 | 99,082 | |
| Allegiance Bancshares, Inc. (a) | 20,938 | 712,939 | |
| American National Bankshares, Inc. | 2,748 | 100,302 | |
| Ameris Bancorp | 68,985 | 3,038,789 | |
| Ames National Corp. | 2,652 | 71,869 | |
| Arrow Financial Corp. | 16,949 | 547,453 | |
| Associated Banc-Corp. | 269,062 | 5,892,458 | |
| Atlantic Capital Bancshares, Inc. (a) | 27,339 | 490,735 | |
| Banc of California, Inc. (b) | 80,001 | 1,484,019 | |
| BancFirst Corp. | 35,422 | 1,785,269 | |
| Bancorp, Inc., Delaware (a) | 84,963 | 666,960 | |
| BancorpSouth, Inc. | 133,469 | 3,877,274 | |
| Bank of America Corp. | 17,019,398 | 406,593,418 | |
| Bank of Commerce Holdings (b) | 29,023 | 306,193 | |
| Bank of Hawaii Corp. | 74,301 | 5,805,137 | |
| Bank of Marin Bancorp | 8,356 | 546,900 | |
| Bank of the Ozarks, Inc. | 201,654 | 8,663,056 | |
| BankUnited, Inc. | 186,241 | 6,198,100 | |
| Banner Corp. | 51,093 | 2,816,246 | |
| Bar Harbor Bankshares | 27,763 | 729,056 | |
| BB&T Corp. | 1,389,355 | 64,035,372 | |
| BCB Bancorp, Inc. | 11,980 | 170,116 | |
| Berkshire Hills Bancorp, Inc. | 64,958 | 2,195,580 | |
| Blue Hills Bancorp, Inc. | 49,471 | 925,108 | |
| BOK Financial Corp. (b) | 49,801 | 4,007,984 | |
| Boston Private Financial Holdings, Inc. | 148,661 | 2,185,317 | |
| Bridge Bancorp, Inc. | 53,457 | 1,651,821 | |
| Brookline Bancorp, Inc., Delaware | 125,282 | 1,797,797 | |
| Bryn Mawr Bank Corp. | 27,092 | 1,109,417 | |
| C & F Financial Corp. | 1,992 | 93,325 | |
| Camden National Corp. | 25,093 | 978,627 | |
| Capital Bank Financial Corp. Series A | 55,839 | 2,099,546 | |
| Capital City Bank Group, Inc. | 7,146 | 147,851 | |
| Carolina Financial Corp. | 15,721 | 534,986 | |
| Cathay General Bancorp | 122,996 | 4,338,069 | |
| Centerstate Banks of Florida, Inc. | 102,610 | 2,510,867 | |
| Central Pacific Financial Corp. | 46,756 | 1,355,924 | |
| Central Valley Community Bancorp | 4,570 | 89,892 | |
| Century Bancorp, Inc. Class A (non-vtg.) | 686 | 45,825 | |
| Chemical Financial Corp. | 128,787 | 5,848,218 | |
| CIT Group, Inc. | 249,047 | 11,169,758 | |
| Citigroup, Inc. | 4,717,068 | 320,902,136 | |
| Citizens & Northern Corp. | 8,777 | 196,956 | |
| Citizens Financial Group, Inc. | 870,236 | 28,830,919 | |
| City Holding Co. | 25,184 | 1,594,903 | |
| Civista Bancshares, Inc. (b) | 10,636 | 214,954 | |
| CNB Financial Corp., Pennsylvania | 22,243 | 537,391 | |
| CoBiz, Inc. | 52,226 | 890,453 | |
| Columbia Banking Systems, Inc. | 99,994 | 3,716,777 | |
| Comerica, Inc. | 292,599 | 19,969,882 | |
| Commerce Bancshares, Inc. | 166,131 | 9,135,544 | |
| Commerce Union Bancshares, Inc. | 8,584 | 205,930 | |
| Community Bank System, Inc. | 95,374 | 4,907,946 | |
| Community Bankers Trust Corp. (a) | 24,176 | 203,078 | |
| Community Financial Corp. | 3,879 | 135,765 | |
| Community Trust Bancorp, Inc. | 30,823 | 1,311,519 | |
| ConnectOne Bancorp, Inc. | 44,434 | 1,013,095 | |
| CU Bancorp (a) | 27,578 | 983,156 | |
| Cullen/Frost Bankers, Inc. | 95,722 | 8,059,792 | |
| Customers Bancorp, Inc. (a) | 47,427 | 1,336,493 | |
| CVB Financial Corp. | 169,790 | 3,514,653 | |
| Eagle Bancorp, Inc. (a) | 51,420 | 3,198,324 | |
| East West Bancorp, Inc. | 249,361 | 13,807,119 | |
| Enterprise Bancorp, Inc. | 15,551 | 497,476 | |
| Enterprise Financial Services Corp. | 35,692 | 1,363,434 | |
| Equity Bancshares, Inc. (a) | 6,273 | 214,223 | |
| Evans Bancorp, Inc. (b) | 6,302 | 260,273 | |
| Farmers Capital Bank Corp. | 12,316 | 461,234 | |
| Farmers National Banc Corp. | 66,489 | 910,899 | |
| FCB Financial Holdings, Inc. Class A (a) | 80,361 | 3,503,740 | |
| Fidelity Southern Corp. | 33,831 | 739,546 | |
| Fifth Third Bancorp | 1,290,331 | 33,716,349 | |
| Financial Institutions, Inc. | 20,978 | 570,602 | |
| First Bancorp, North Carolina | 37,328 | 1,154,928 | |
| First Bancorp, Puerto Rico (a) | 301,460 | 1,712,293 | |
| First Bancshares, Inc. | 3,982 | 112,292 | |
| First Busey Corp. | 69,369 | 2,001,296 | |
| First Business Finance Services, Inc. | 3,936 | 83,876 | |
| First Citizen Bancshares, Inc. | 15,636 | 5,324,214 | |
| First Commonwealth Financial Corp. | 162,059 | 2,043,564 | |
| First Community Bancshares, Inc. | 14,260 | 367,052 | |
| First Connecticut Bancorp, Inc. | 13,599 | 336,575 | |
| First Financial Bancorp, Ohio | 103,444 | 2,477,484 | |
| First Financial Bankshares, Inc. (b) | 118,200 | 4,733,910 | |
| First Financial Corp., Indiana | 17,277 | 749,822 | |
| First Financial Northwest, Inc. | 2,197 | 35,152 | |
| First Foundation, Inc. (a) | 39,781 | 674,288 | |
| First Hawaiian, Inc. | 99,118 | 2,685,107 | |
| First Horizon National Corp. | 415,890 | 7,157,467 | |
| First Internet Bancorp | 6,364 | 202,375 | |
| First Interstate Bancsystem, Inc. | 47,490 | 1,671,648 | |
| First Merchants Corp. | 71,357 | 2,802,189 | |
| First Mid-Illinois Bancshares, Inc. | 15,730 | 545,516 | |
| First Midwest Bancorp, Inc., Delaware | 157,154 | 3,312,806 | |
| First Northwest Bancorp (a) | 5,375 | 85,248 | |
| First of Long Island Corp. | 37,824 | 1,011,792 | |
| First Republic Bank | 272,217 | 26,418,660 | |
| First South Bancorp, Inc., Virginia | 13,282 | 231,372 | |
| First United Corp. (a) | 3,395 | 53,471 | |
| Flushing Financial Corp. | 47,044 | 1,286,183 | |
| FNB Corp., Pennsylvania | 535,314 | 6,793,135 | |
| Franklin Financial Network, Inc. (a) | 20,997 | 686,602 | |
| Fulton Financial Corp. | 320,846 | 5,598,763 | |
| German American Bancorp, Inc. | 33,825 | 1,100,666 | |
| Glacier Bancorp, Inc. | 124,637 | 4,139,195 | |
| Great Southern Bancorp, Inc. | 16,765 | 834,897 | |
| Great Western Bancorp, Inc. | 100,598 | 3,613,480 | |
| Green Bancorp, Inc. (a) | 40,300 | 808,015 | |
| Guaranty Bancorp | 32,104 | 828,283 | |
| Hancock Holding Co. | 152,688 | 6,710,638 | |
| Hanmi Financial Corp. | 52,514 | 1,402,124 | |
| HarborOne Bancorp, Inc. (a) | 44,762 | 769,459 | |
| Heartland Financial U.S.A., Inc. | 40,533 | 1,844,252 | |
| Heritage Commerce Corp. | 59,915 | 802,861 | |
| Heritage Financial Corp., Washington | 51,567 | 1,348,477 | |
| Hilltop Holdings, Inc. | 136,474 | 3,230,340 | |
| Home Bancshares, Inc. | 211,108 | 4,920,927 | |
| HomeTrust Bancshares, Inc. (a) | 28,372 | 658,230 | |
| Hope Bancorp, Inc. | 216,598 | 3,495,892 | |
| Horizon Bancorp Industries | 29,396 | 769,293 | |
| Howard Bancorp, Inc. (a)(b) | 9,598 | 189,561 | |
| Huntington Bancshares, Inc. | 1,891,662 | 23,816,025 | |
| IBERIABANK Corp. | 90,251 | 6,913,227 | |
| Independent Bank Corp. | 29,867 | 609,287 | |
| Independent Bank Corp., Massachusetts (b) | 46,109 | 3,195,354 | |
| Independent Bank Group, Inc. | 22,475 | 1,250,734 | |
| International Bancshares Corp. | 106,256 | 3,819,903 | |
| Investar Holding Corp. | 8,384 | 184,448 | |
| Investors Bancorp, Inc. | 516,646 | 6,762,896 | |
| JPMorgan Chase & Co. | 6,088,307 | 553,366,223 | |
| KeyCorp | 1,887,018 | 32,475,580 | |
| Lakeland Bancorp, Inc. | 71,024 | 1,313,944 | |
| Lakeland Financial Corp. | 43,110 | 1,873,561 | |
| LegacyTexas Financial Group, Inc. | 83,607 | 3,009,016 | |
| Live Oak Bancshares, Inc. (b) | 47,360 | 1,058,496 | |
| M&T Bank Corp. | 267,858 | 39,605,484 | |
| Macatawa Bank Corp. | 22,839 | 218,569 | |
| MainSource Financial Group, Inc. | 34,621 | 1,133,145 | |
| MB Financial, Inc. | 124,722 | 4,960,194 | |
| MBT Financial Corp. | 19,637 | 199,316 | |
| Mercantile Bank Corp. | 25,655 | 779,655 | |
| Midland States Bancorp, Inc. | 9,812 | 299,658 | |
| Midsouth Bancorp, Inc. | 23,289 | 275,975 | |
| MidWestOne Financial Group, Inc. | 12,572 | 413,367 | |
| MutualFirst Financial, Inc. | 20,181 | 710,371 | |
| National Bank Holdings Corp. | 47,060 | 1,514,391 | |
| National Bankshares, Inc. (b) | 5,803 | 228,638 | |
| National Commerce Corp. (a) | 16,217 | 644,626 | |
| NBT Bancorp, Inc. | 92,219 | 3,027,550 | |
| Nicolet Bankshares, Inc. (a) | 8,651 | 472,777 | |
| Northeast Bancorp | 4,761 | 102,838 | |
| Northrim Bancorp, Inc. | 6,518 | 194,562 | |
| Norwood Financial Corp. (b) | 5,067 | 223,151 | |
| OFG Bancorp | 71,939 | 625,869 | |
| Ohio Valley Banc Corp. | 3,608 | 118,703 | |
| Old Line Bancshares, Inc. | 8,031 | 220,853 | |
| Old National Bancorp, Indiana | 272,863 | 4,461,310 | |
| Old Point Financial Corp. | 1,881 | 57,822 | |
| Old Second Bancorp, Inc. | 36,720 | 420,444 | |
| Opus Bank | 31,202 | 698,925 | |
| Orrstown Financial Services, Inc. | 5,669 | 138,607 | |
| Pacific Continental Corp. | 35,872 | 851,960 | |
| Pacific Mercantile Bancorp (a) | 10,321 | 87,729 | |
| Pacific Premier Bancorp, Inc. (a) | 51,645 | 1,828,233 | |
| PacWest Bancorp | 207,277 | 9,358,557 | |
| Park National Corp. | 25,668 | 2,479,272 | |
| Park Sterling Corp. | 83,541 | 949,861 | |
| PCSB Financial Corp. (b) | 61,717 | 1,044,252 | |
| Peapack-Gladstone Financial Corp. | 23,917 | 728,751 | |
| Penns Woods Bancorp, Inc. | 3,854 | 165,375 | |
| People's Utah Bancorp | 31,031 | 848,698 | |
| Peoples Bancorp of North Carolina | 3,856 | 117,145 | |
| Peoples Bancorp, Inc. | 27,844 | 864,835 | |
| Peoples Financial Corp., Mississippi (a) | 2,667 | 36,005 | |
| Peoples Financial Services Corp. | 12,111 | 503,212 | |
| Peoples United Financial, Inc. | 574,176 | 9,588,739 | |
| Pinnacle Financial Partners, Inc. | 128,020 | 7,962,844 | |
| PNC Financial Services Group, Inc. | 831,194 | 104,240,040 | |
| Popular, Inc. | 183,067 | 7,306,204 | |
| Preferred Bank, Los Angeles | 21,681 | 1,166,438 | |
| Premier Financial Bancorp, Inc. | 4,507 | 85,182 | |
| Prosperity Bancshares, Inc. | 109,880 | 6,565,330 | |
| QCR Holdings, Inc. | 31,102 | 1,359,157 | |
| Regions Financial Corp. | 2,020,677 | 28,511,752 | |
| Renasant Corp. | 83,390 | 3,321,424 | |
| Republic Bancorp, Inc., Kentucky Class A | 18,205 | 647,734 | |
| Republic First Bancorp, Inc. (a)(b) | 116,122 | 981,231 | |
| Royal Bancshares of Pennsylvania, Inc. Class A (a) | 5,400 | 22,086 | |
| S&T Bancorp, Inc. | 72,150 | 2,593,071 | |
| Sandy Spring Bancorp, Inc. | 42,176 | 1,626,728 | |
| Seacoast Banking Corp., Florida (a) | 63,108 | 1,443,280 | |
| ServisFirst Bancshares, Inc. | 88,788 | 3,028,559 | |
| Shore Bancshares, Inc. | 6,745 | 111,225 | |
| Sierra Bancorp | 11,641 | 294,634 | |
| Signature Bank (a) | 92,531 | 11,875,429 | |
| Simmons First National Corp. Class A | 56,478 | 2,948,152 | |
| SmartFinancial, Inc. (a) | 7,194 | 166,109 | |
| South State Corp. | 41,590 | 3,420,778 | |
| Southern First Bancshares, Inc. (a) | 4,963 | 175,442 | |
| Southern National Bancorp of Virginia, Inc. | 38,866 | 651,006 | |
| Southside Bancshares, Inc. | 47,031 | 1,536,503 | |
| Southwest Bancorp, Inc., Oklahoma | 34,097 | 860,949 | |
| State Bank Financial Corp. | 60,571 | 1,627,543 | |
| Sterling Bancorp | 235,339 | 5,283,361 | |
| Stock Yards Bancorp, Inc. | 30,796 | 1,071,701 | |
| Stonegate Bank | 27,534 | 1,327,414 | |
| Summit Financial Group, Inc. (b) | 7,690 | 168,334 | |
| Sun Bancorp, Inc. | 15,520 | 362,392 | |
| Sunshine Bancorp, Inc. (a)(b) | 3,140 | 67,824 | |
| SunTrust Banks, Inc. | 838,051 | 46,176,610 | |
| SVB Financial Group (a) | 90,200 | 15,274,468 | |
| Synovus Financial Corp. | 230,632 | 9,714,220 | |
| TCF Financial Corp. | 303,183 | 4,708,432 | |
| Texas Capital Bancshares, Inc. (a) | 86,508 | 6,423,219 | |
| The First Bancorp, Inc. | 17,759 | 462,267 | |
| Tompkins Financial Corp. | 22,580 | 1,714,274 | |
| TowneBank | 102,762 | 3,154,793 | |
| Trico Bancshares | 37,499 | 1,334,214 | |
| TriState Capital Holdings, Inc. (a) | 37,306 | 779,695 | |
| Triumph Bancorp, Inc. (a) | 26,498 | 747,244 | |
| Trustmark Corp. | 125,196 | 3,708,306 | |
| Two River Bancorp (b) | 3,500 | 63,770 | |
| U.S. Bancorp | 2,722,911 | 139,549,189 | |
| UMB Financial Corp. | 85,559 | 5,742,720 | |
| Umpqua Holdings Corp. | 368,620 | 6,450,850 | |
| Union Bankshares Corp. | 76,873 | 2,408,431 | |
| Union Bankshares, Inc. (b) | 1,824 | 78,706 | |
| United Bankshares, Inc., West Virginia (b) | 191,327 | 6,419,021 | |
| United Community Bank, Inc. | 111,127 | 2,901,526 | |
| United Security Bancshares, California | 5,985 | 55,361 | |
| Unity Bancorp, Inc. | 5,913 | 102,591 | |
| Univest Corp. of Pennsylvania | 42,518 | 1,239,400 | |
| Valley National Bancorp | 592,760 | 6,632,984 | |
| Veritex Holdings, Inc. (a) | 20,567 | 543,174 | |
| Washington Trust Bancorp, Inc. | 24,464 | 1,253,780 | |
| WashingtonFirst Bankshares, Inc. | 14,852 | 503,037 | |
| Webster Financial Corp. | 163,732 | 7,643,010 | |
| Wells Fargo & Co. | 7,714,368 | 393,972,774 | |
| WesBanco, Inc. | 73,993 | 2,810,254 | |
| West Bancorp., Inc. | 59,222 | 1,299,923 | |
| Westamerica Bancorp. | 50,684 | 2,612,760 | |
| Western Alliance Bancorp. (a) | 158,029 | 7,621,739 | |
| Wintrust Financial Corp. | 92,607 | 6,742,716 | |
| Xenith Bankshares, Inc. (a) | 13,287 | 380,673 | |
| Zions Bancorporation | 354,085 | 15,459,351 | |
| 2,786,881,926 | |||
| Capital Markets - 2.8% | |||
| Affiliated Managers Group, Inc. | 94,956 | 16,777,776 | |
| Ameriprise Financial, Inc. | 258,160 | 35,757,742 | |
| Arlington Asset Investment Corp. (b) | 39,851 | 514,875 | |
| Artisan Partners Asset Management, Inc. | 74,438 | 2,285,247 | |
| Ashford, Inc. (a) | 1,254 | 77,309 | |
| Associated Capital Group, Inc. | 6,083 | 208,951 | |
| B. Riley Financial, Inc. | 24,014 | 393,830 | |
| Bank of New York Mellon Corp. | 1,776,247 | 92,862,193 | |
| BGC Partners, Inc. Class A | 395,046 | 5,131,648 | |
| BlackRock, Inc. Class A | 207,191 | 86,815,101 | |
| Brighthouse Financial, Inc. | 167,673 | 9,569,098 | |
| CBOE Holdings, Inc. | 156,195 | 15,758,514 | |
| Charles Schwab Corp. | 2,081,741 | 83,061,466 | |
| CME Group, Inc. | 583,090 | 73,352,722 | |
| Cohen & Steers, Inc. | 39,455 | 1,492,977 | |
| Cowen Group, Inc. Class A (a)(b) | 42,436 | 689,585 | |
| Diamond Hill Investment Group, Inc. | 4,801 | 942,580 | |
| E*TRADE Financial Corp. (a) | 466,118 | 19,115,499 | |
| Eaton Vance Corp. (non-vtg.) | 189,531 | 9,017,885 | |
| Evercore, Inc. Class A | 86,895 | 6,556,228 | |
| FactSet Research Systems, Inc. | 68,243 | 10,726,435 | |
| Federated Investors, Inc. Class B (non-vtg.) (b) | 166,109 | 4,536,437 | |
| Financial Engines, Inc. (b) | 110,645 | 3,656,817 | |
| Franklin Resources, Inc. | 580,185 | 25,081,398 | |
| Gain Capital Holdings, Inc. | 33,946 | 213,860 | |
| GAMCO Investors, Inc. Class A | 6,083 | 179,266 | |
| Global Brokerage, Inc. Class A (a)(b) | 5,137 | 6,421 | |
| Goldman Sachs Group, Inc. | 625,751 | 140,005,529 | |
| Great Elm Capital Group, Inc. (a) | 8,360 | 27,588 | |
| Greenhill & Co., Inc. (b) | 46,751 | 703,603 | |
| Hamilton Lane, Inc. Class A | 48,843 | 1,144,880 | |
| Houlihan Lokey | 40,223 | 1,450,039 | |
| Institutional Financial Markets, Inc. | 6,881 | 7,844 | |
| Interactive Brokers Group, Inc. | 119,445 | 5,008,329 | |
| IntercontinentalExchange, Inc. | 1,016,421 | 65,731,946 | |
| INTL FCStone, Inc. (a) | 23,975 | 850,873 | |
| Invesco Ltd. | 685,472 | 22,469,772 | |
| Investment Technology Group, Inc. | 55,680 | 1,118,611 | |
| Janus Henderson Group PLC | 310,163 | 10,719,233 | |
| Ladenburg Thalmann Financial Services, Inc. | 146,974 | 377,723 | |
| Lazard Ltd. Class A | 222,637 | 9,548,901 | |
| Legg Mason, Inc. | 154,159 | 5,887,332 | |
| LPL Financial | 136,938 | 6,414,176 | |
| Manning & Napier, Inc. Class A | 21,800 | 77,390 | |
| MarketAxess Holdings, Inc. | 63,986 | 12,346,099 | |
| Moelis & Co. Class A | 54,806 | 2,159,356 | |
| Moody's Corp. | 288,845 | 38,713,895 | |
| Morgan Stanley | 2,432,356 | 110,672,198 | |
| Morningstar, Inc. | 35,957 | 2,973,644 | |
| MSCI, Inc. | 154,816 | 17,743,462 | |
| Northern Trust Corp. | 367,395 | 32,514,458 | |
| Oppenheimer Holdings, Inc. Class A (non-vtg.) | 13,547 | 220,139 | |
| Piper Jaffray Companies | 20,940 | 1,161,123 | |
| PJT Partners, Inc. | 43,421 | 1,678,656 | |
| Pzena Investment Management, Inc. | 4,972 | 49,223 | |
| Raymond James Financial, Inc. | 214,854 | 16,827,365 | |
| S&P Global, Inc. | 441,125 | 68,078,821 | |
| Safeguard Scientifics, Inc. (a)(b) | 26,745 | 326,289 | |
| SEI Investments Co. | 229,425 | 13,412,186 | |
| Silvercrest Asset Management Group Class A | 6,008 | 73,598 | |
| State Street Corp. | 603,058 | 55,776,834 | |
| Stifel Financial Corp. | 118,002 | 5,634,596 | |
| T. Rowe Price Group, Inc. | 411,469 | 34,711,525 | |
| TD Ameritrade Holding Corp. | 412,225 | 17,857,587 | |
| The NASDAQ OMX Group, Inc. | 201,312 | 15,174,899 | |
| TheStreet.com, Inc. (a) | 3,696 | 3,142 | |
| U.S. Global Investments, Inc. Class A | 7,637 | 10,157 | |
| Vector Capital Corp. rights (a)(c) | 4,280 | 0 | |
| Virtu Financial, Inc. Class A (b) | 77,143 | 1,384,717 | |
| Virtus Investment Partners, Inc. (b) | 10,135 | 1,074,310 | |
| Waddell & Reed Financial, Inc. Class A (b) | 156,809 | 2,918,215 | |
| Westwood Holdings Group, Inc. | 10,927 | 667,968 | |
| WisdomTree Investments, Inc. (b) | 190,333 | 1,745,354 | |
| 1,232,235,445 | |||
| Consumer Finance - 0.7% | |||
| Ally Financial, Inc. | 799,706 | 18,073,356 | |
| American Express Co. | 1,284,959 | 110,634,970 | |
| Asta Funding, Inc. (a) | 4,468 | 35,967 | |
| Atlanticus Holdings Corp. (a) | 35,598 | 87,215 | |
| Capital One Financial Corp. | 824,624 | 65,648,317 | |
| Consumer Portfolio Services, Inc. (a) | 11,930 | 46,885 | |
| Credit Acceptance Corp. (a)(b) | 19,841 | 5,402,704 | |
| Discover Financial Services | 653,137 | 38,502,426 | |
| Elevate Credit, Inc. | 13,402 | 84,835 | |
| Encore Capital Group, Inc. (a)(b) | 44,570 | 1,798,400 | |
| Enova International, Inc. (a) | 32,960 | 392,224 | |
| EZCORP, Inc. (non-vtg.) Class A (a)(b) | 86,606 | 783,784 | |
| First Cash Financial Services, Inc. | 90,535 | 5,314,405 | |
| Green Dot Corp. Class A (a) | 74,413 | 3,585,218 | |
| Imperial Holdings, Inc. warrants 4/11/19 (a) | 1,880 | 0 | |
| LendingClub Corp. (a)(b) | 543,864 | 3,366,518 | |
| Navient Corp. | 480,094 | 6,337,241 | |
| Nelnet, Inc. Class A | 36,382 | 1,725,598 | |
| Nicholas Financial, Inc. (a) | 5,705 | 49,120 | |
| OneMain Holdings, Inc. (a) | 91,372 | 2,500,852 | |
| PRA Group, Inc. (a)(b) | 79,585 | 2,300,007 | |
| Regional Management Corp. (a) | 12,187 | 267,505 | |
| Santander Consumer U.S.A. Holdings, Inc. (a) | 199,933 | 2,855,043 | |
| SLM Corp. (a) | 719,307 | 7,315,352 | |
| Synchrony Financial | 1,327,462 | 40,872,555 | |
| World Acceptance Corp. (a)(b) | 10,919 | 816,960 | |
| 318,797,457 | |||
| Diversified Financial Services - 1.4% | |||
| Acushnet Holdings Corp. | 49,208 | 808,980 | |
| Alteryx, Inc. (b) | 16,777 | 395,769 | |
| At Home Group, Inc. | 11,583 | 283,784 | |
| Berkshire Hathaway, Inc. Class B (a) | 3,252,453 | 589,214,385 | |
| Camping World Holdings, Inc. (b) | 32,678 | 1,200,917 | |
| Cotiviti Holdings, Inc. (a) | 64,469 | 2,303,477 | |
| Donnelley Financial Solutions, Inc. | 58,021 | 1,242,230 | |
| FB Financial Corp. (b) | 19,661 | 683,220 | |
| Leucadia National Corp. | 564,714 | 13,372,428 | |
| Marlin Business Services Corp. | 13,319 | 347,626 | |
| NewStar Financial, Inc. | 27,065 | 290,137 | |
| On Deck Capital, Inc. (a)(b) | 61,562 | 297,344 | |
| Quantenna Communications, Inc. (b) | 16,406 | 304,823 | |
| Ra Pharmaceuticals, Inc. | 9,916 | 148,839 | |
| Sachem Capital Corp. | 200 | 930 | |
| Senseonics Holdings, Inc. (a)(b) | 40,982 | 125,815 | |
| Tiptree, Inc. | 33,155 | 212,192 | |
| Varex Imaging Corp. (b) | 60,332 | 1,841,936 | |
| Voya Financial, Inc. | 328,653 | 12,564,404 | |
| 625,639,236 | |||
| Insurance - 2.9% | |||
| AFLAC, Inc. | 676,740 | 55,864,887 | |
| Alleghany Corp. (a) | 26,648 | 14,996,695 | |
| Allstate Corp. | 619,177 | 56,035,519 | |
| AMBAC Financial Group, Inc. (a) | 77,952 | 1,417,947 | |
| American Equity Investment Life Holding Co. | 151,614 | 4,208,805 | |
| American Financial Group, Inc. | 124,528 | 12,678,196 | |
| American International Group, Inc. | 1,500,016 | 90,720,968 | |
| American National Insurance Co. | 20,619 | 2,385,824 | |
| Amerisafe, Inc. | 34,393 | 1,850,343 | |
| AmTrust Financial Services, Inc. (b) | 184,814 | 2,291,694 | |
| Aon PLC | 448,420 | 62,402,127 | |
| Arch Capital Group Ltd. (a) | 219,343 | 21,350,848 | |
| Argo Group International Holdings, Ltd. | 52,927 | 3,186,205 | |
| Arthur J. Gallagher & Co. | 303,378 | 17,565,586 | |
| Aspen Insurance Holdings Ltd. | 111,432 | 5,036,726 | |
| Assurant, Inc. | 94,584 | 8,956,159 | |
| Assured Guaranty Ltd. | 219,846 | 9,352,249 | |
| Athene Holding Ltd. | 86,087 | 4,606,515 | |
| Atlas Financial Holdings, Inc. (a) | 9,356 | 157,649 | |
| Axis Capital Holdings Ltd. | 153,356 | 9,238,165 | |
| Baldwin & Lyons, Inc. Class B | 11,829 | 259,055 | |
| Brown & Brown, Inc. | 204,333 | 9,186,812 | |
| Chubb Ltd. | 798,902 | 112,980,721 | |
| Cincinnati Financial Corp. | 261,500 | 20,093,660 | |
| Citizens, Inc. Class A (a)(b) | 62,312 | 469,209 | |
| CNA Financial Corp. | 65,156 | 3,196,553 | |
| CNO Financial Group, Inc. | 290,469 | 6,491,982 | |
| Crawford & Co. Class B | 31,537 | 312,847 | |
| Donegal Group, Inc. Class A | 8,008 | 122,763 | |
| eHealth, Inc. (a) | 26,343 | 639,608 | |
| EMC Insurance Group | 8,724 | 243,225 | |
| Employers Holdings, Inc. | 50,084 | 2,111,041 | |
| Enstar Group Ltd. (a) | 18,704 | 3,882,015 | |
| Erie Indemnity Co. Class A | 39,674 | 4,792,222 | |
| Everest Re Group Ltd. | 70,880 | 17,895,782 | |
| FBL Financial Group, Inc. Class A | 16,450 | 1,118,600 | |
| Federated National Holding Co. | 19,431 | 301,958 | |
| Fidelity & Guaranty Life (b) | 29,774 | 930,438 | |
| First Acceptance Corp. (a) | 4,055 | 4,542 | |
| First American Financial Corp. | 189,648 | 9,304,131 | |
| FNF Group | 485,332 | 23,412,416 | |
| FNFV Group (a) | 119,032 | 2,005,689 | |
| Genworth Financial, Inc. Class A (a) | 831,470 | 2,851,942 | |
| Global Indemnity Ltd. | 13,709 | 554,118 | |
| Greenlight Capital Re, Ltd. (a) | 42,022 | 934,990 | |
| Hallmark Financial Services, Inc. (a) | 10,337 | 105,954 | |
| Hanover Insurance Group, Inc. | 70,993 | 6,970,093 | |
| Hartford Financial Services Group, Inc. | 624,209 | 33,750,981 | |
| HCI Group, Inc. | 13,167 | 513,381 | |
| Health Insurance Innovations, Inc. (a) | 14,064 | 473,254 | |
| Heritage Insurance Holdings, Inc. | 60,181 | 684,860 | |
| Horace Mann Educators Corp. | 65,267 | 2,294,135 | |
| Independence Holding Co. | 16,014 | 347,504 | |
| Infinity Property & Casualty Corp. | 17,608 | 1,557,428 | |
| Investors Title Co. | 1,086 | 190,995 | |
| James River Group Holdings Ltd. | 33,994 | 1,355,681 | |
| Kemper Corp. | 85,524 | 4,096,600 | |
| Kingstone Companies, Inc. | 9,045 | 136,127 | |
| Kinsale Capital Group, Inc. | 33,893 | 1,282,850 | |
| Lincoln National Corp. | 381,053 | 25,858,257 | |
| Loews Corp. | 473,959 | 22,077,010 | |
| Maiden Holdings Ltd. | 125,108 | 907,033 | |
| Markel Corp. (a) | 24,343 | 25,608,593 | |
| Marsh & McLennan Companies, Inc. | 882,937 | 68,939,721 | |
| MBIA, Inc. (a)(b) | 228,577 | 2,299,485 | |
| Mercury General Corp. | 66,212 | 3,805,204 | |
| MetLife, Inc. | 1,844,404 | 86,373,439 | |
| National General Holdings Corp. | 106,900 | 1,835,473 | |
| National Western Life Group, Inc. | 3,602 | 1,204,545 | |
| Navigators Group, Inc. | 37,597 | 2,097,913 | |
| NI Holdings, Inc. | 11,972 | 197,658 | |
| Old Republic International Corp. | 417,839 | 7,976,547 | |
| OneBeacon Insurance Group Ltd. | 45,014 | 820,155 | |
| Patriot National, Inc. (b) | 7,857 | 11,786 | |
| Primerica, Inc. | 75,461 | 5,776,540 | |
| Principal Financial Group, Inc. | 451,193 | 28,208,586 | |
| ProAssurance Corp. | 95,168 | 5,067,696 | |
| Progressive Corp. | 987,900 | 45,917,592 | |
| Prudential Financial, Inc. | 741,461 | 75,688,339 | |
| Reinsurance Group of America, Inc. | 107,870 | 14,503,122 | |
| RenaissanceRe Holdings Ltd. | 73,938 | 10,289,212 | |
| RLI Corp. | 67,585 | 3,617,149 | |
| Safety Insurance Group, Inc. | 21,926 | 1,565,516 | |
| Selective Insurance Group, Inc. | 101,970 | 5,139,288 | |
| State Auto Financial Corp. | 23,497 | 581,316 | |
| State National Companies, Inc. | 40,781 | 847,021 | |
| Stewart Information Services Corp. | 39,769 | 1,434,866 | |
| The Travelers Companies, Inc. | 475,109 | 57,573,709 | |
| Third Point Reinsurance Ltd. (a) | 92,317 | 1,297,054 | |
| Torchmark Corp. | 180,107 | 13,862,836 | |
| Trupanion, Inc. (a)(b) | 25,585 | 559,800 | |
| United Fire Group, Inc. | 36,055 | 1,516,473 | |
| United Insurance Holdings Corp. | 29,576 | 465,526 | |
| Universal Insurance Holdings, Inc. (b) | 52,834 | 1,133,289 | |
| Unum Group | 384,330 | 18,517,019 | |
| Validus Holdings Ltd. | 133,201 | 6,680,030 | |
| W.R. Berkley Corp. | 176,033 | 11,730,839 | |
| White Mountains Insurance Group Ltd. | 8,265 | 7,199,394 | |
| Willis Group Holdings PLC | 216,037 | 32,075,013 | |
| WMI Holdings Corp. (a) | 391,046 | 488,808 | |
| XL Group Ltd. | 452,595 | 18,538,291 | |
| 1,282,446,412 | |||
| Mortgage Real Estate Investment Trusts - 0.3% | |||
| AG Mortgage Investment Trust, Inc. | 28,740 | 553,820 | |
| AGNC Investment Corp. | 599,467 | 12,912,519 | |
| American Capital Mortgage Investment Corp. | 77,847 | 1,494,662 | |
| Annaly Capital Management, Inc. | 1,841,289 | 23,016,113 | |
| Anworth Mortgage Asset Corp. | 251,516 | 1,524,187 | |
| Apollo Commercial Real Estate Finance, Inc. | 157,668 | 2,852,214 | |
| Arbor Realty Trust, Inc. | 80,640 | 661,248 | |
| Ares Commercial Real Estate Corp. | 39,618 | 522,561 | |
| Armour Residential REIT, Inc. (b) | 61,211 | 1,616,583 | |
| Blackstone Mortgage Trust, Inc. (b) | 164,134 | 5,145,601 | |
| Capstead Mortgage Corp. | 155,839 | 1,506,963 | |
| Cherry Hill Mortgage Investment Corp. | 12,023 | 222,185 | |
| Chimera Investment Corp. | 306,209 | 5,839,406 | |
| CIM Commercial Trust Corp. (b) | 6,057 | 94,792 | |
| CYS Investments, Inc. | 246,028 | 2,162,586 | |
| Dynex Capital, Inc. | 68,104 | 486,944 | |
| Ellington Residential Mortgage REIT | 15,540 | 227,350 | |
| Five Oaks Investment Corp. (b) | 6,106 | 25,401 | |
| Great Ajax Corp. | 14,698 | 208,418 | |
| Hannon Armstrong Sustainable Infrastructure Capital, Inc. | 84,233 | 1,954,206 | |
| Invesco Mortgage Capital, Inc. | 180,605 | 3,066,673 | |
| KKR Real Estate Finance Trust, Inc. | 46,076 | 956,999 | |
| Ladder Capital Corp. Class A | 130,256 | 1,787,112 | |
| MFA Financial, Inc. | 654,424 | 5,745,843 | |
| New Residential Investment Corp. | 514,969 | 8,486,689 | |
| New York Mortgage Trust, Inc. (b) | 176,500 | 1,104,890 | |
| Orchid Island Capital, Inc. | 73,768 | 713,337 | |
| Owens Realty Mortgage, Inc. | 54,252 | 941,272 | |
| PennyMac Mortgage Investment Trust | 106,166 | 1,835,610 | |
| Redwood Trust, Inc. | 130,122 | 2,170,435 | |
| Resource Capital Corp. | 40,594 | 420,148 | |
| Starwood Property Trust, Inc. | 462,583 | 10,273,968 | |
| Two Harbors Investment Corp. | 567,052 | 5,800,942 | |
| Western Asset Mortgage Capital Corp. (b) | 72,828 | 765,422 | |
| ZAIS Financial Corp. | 6,000 | 91,500 | |
| 107,188,599 | |||
| Real Estate Management & Development - 0.0% | |||
| The RMR Group, Inc. | 10,073 | 520,270 | |
| Thrifts & Mortgage Finance - 0.2% | |||
| ASB Bancorp, Inc. (a) | 1,992 | 88,345 | |
| Astoria Financial Corp. | 151,919 | 2,976,093 | |
| Bank Mutual Corp. | 56,001 | 512,409 | |
| BankFinancial Corp. | 19,300 | 309,572 | |
| Bear State Financial, Inc. | 13,571 | 139,510 | |
| Beneficial Bancorp, Inc. | 178,014 | 2,661,309 | |
| BofI Holding, Inc. (a)(b) | 104,951 | 2,782,251 | |
| BSB Bancorp, Inc. (a) | 6,958 | 198,303 | |
| Capitol Federal Financial, Inc. | 255,033 | 3,499,053 | |
| Charter Financial Corp. | 26,857 | 436,695 | |
| Clifton Bancorp, Inc. | 32,703 | 515,072 | |
| Dime Community Bancshares, Inc. | 51,879 | 983,107 | |
| Entegra Financial Corp. (a)(b) | 3,030 | 70,296 | |
| ESSA Bancorp, Inc. | 4,298 | 64,900 | |
| Essent Group Ltd. (a) | 146,912 | 5,741,321 | |
| Farmer Mac Class C (non-vtg.) | 17,857 | 1,216,419 | |
| First Defiance Financial Corp. | 13,178 | 645,195 | |
| Flagstar Bancorp, Inc. (a) | 37,206 | 1,221,101 | |
| Hingham Institution for Savings | 2,103 | 386,973 | |
| Home Bancorp, Inc. | 3,114 | 125,743 | |
| HomeStreet, Inc. (a) | 54,010 | 1,363,753 | |
| Impac Mortgage Holdings, Inc. (a)(b) | 22,924 | 304,201 | |
| Kearny Financial Corp. | 157,909 | 2,234,412 | |
| Lendingtree, Inc. (a)(b) | 12,573 | 2,903,734 | |
| Malvern Bancorp, Inc. (a) | 6,089 | 144,918 | |
| Meridian Bancorp, Inc. Maryland | 112,706 | 1,983,626 | |
| Meta Financial Group, Inc. | 16,728 | 1,175,978 | |
| MGIC Investment Corp. (a) | 616,542 | 7,059,406 | |
| Nationstar Mortgage Holdings, Inc. (a)(b) | 63,329 | 1,090,525 | |
| New York Community Bancorp, Inc. | 878,574 | 10,586,817 | |
| NMI Holdings, Inc. (a) | 95,441 | 1,035,535 | |
| Northfield Bancorp, Inc. | 77,835 | 1,253,922 | |
| Northwest Bancshares, Inc. | 177,568 | 2,739,874 | |
| OceanFirst Financial Corp. | 60,020 | 1,498,099 | |
| Ocwen Financial Corp. (a)(b) | 179,422 | 525,706 | |
| Oritani Financial Corp. | 122,108 | 1,959,833 | |
| PennyMac Financial Services, Inc. (a) | 35,269 | 599,573 | |
| PHH Corp. (a) | 94,843 | 1,346,771 | |
| Poage Bankshares, Inc. | 2,365 | 43,161 | |
| Provident Financial Holdings, Inc. | 3,066 | 58,070 | |
| Provident Financial Services, Inc. | 124,224 | 3,086,966 | |
| Radian Group, Inc. | 389,840 | 6,822,200 | |
| Riverview Bancorp, Inc. | 6,875 | 55,206 | |
| Security National Financial Corp. Class A | 11,754 | 69,349 | |
| SI Financial Group, Inc. | 3,746 | 54,692 | |
| Southern Missouri Bancorp, Inc. | 5,377 | 174,537 | |
| Territorial Bancorp, Inc. | 13,244 | 400,366 | |
| TFS Financial Corp. | 159,329 | 2,450,480 | |
| Timberland Bancorp, Inc. | 5,034 | 139,492 | |
| Trustco Bank Corp., New York | 140,018 | 1,106,142 | |
| United Community Financial Corp. | 43,226 | 392,924 | |
| United Financial Bancorp, Inc. New | 84,987 | 1,471,975 | |
| Walker & Dunlop, Inc. (a) | 49,313 | 2,376,393 | |
| Walter Investment Management Corp. (a)(b) | 49,597 | 21,416 | |
| Washington Federal, Inc. | 157,606 | 4,925,188 | |
| Waterstone Financial, Inc. | 41,772 | 737,276 | |
| Westbury Bancorp, Inc. (a) | 4,860 | 97,929 | |
| Westfield Financial, Inc. | 33,310 | 331,435 | |
| WSFS Financial Corp. | 46,100 | 2,060,670 | |
| 91,256,217 | |||
| TOTAL FINANCIALS | 6,444,965,562 | ||
| HEALTH CARE - 14.1% | |||
| Biotechnology - 3.4% | |||
| AbbVie, Inc. | 2,726,854 | 205,332,106 | |
| Abeona Therapeutics, Inc. (a)(b) | 62,198 | 817,904 | |
| ACADIA Pharmaceuticals, Inc. (a)(b) | 164,038 | 5,841,393 | |
| Acceleron Pharma, Inc. (a)(b) | 65,396 | 2,534,749 | |
| Achaogen, Inc. (a)(b) | 54,118 | 1,014,171 | |
| Achillion Pharmaceuticals, Inc. (a) | 199,588 | 1,019,895 | |
| Acorda Therapeutics, Inc. (a)(b) | 83,616 | 1,739,213 | |
| Actinium Pharmaceuticals, Inc. (a)(b) | 38,656 | 23,580 | |
| Adamas Pharmaceuticals, Inc. (a)(b) | 24,337 | 509,617 | |
| Aduro Biotech, Inc. (a)(b) | 43,288 | 525,949 | |
| Advaxis, Inc. (a)(b) | 48,573 | 330,782 | |
| Adverum Biotechnologies, Inc. (a) | 12,370 | 34,018 | |
| Aevi Genomic Medicine, Inc. (a) | 41,669 | 52,920 | |
| Agenus, Inc. (a)(b) | 138,167 | 509,836 | |
| Agios Pharmaceuticals, Inc. (a)(b) | 72,800 | 4,605,328 | |
| Aimmune Therapeutics, Inc. (a)(b) | 39,537 | 850,046 | |
| Akebia Therapeutics, Inc. (a) | 89,194 | 1,493,108 | |
| Albireo Pharma, Inc. (a) | 5,786 | 143,146 | |
| Alder Biopharmaceuticals, Inc. (a) | 88,675 | 869,015 | |
| Alexion Pharmaceuticals, Inc. (a) | 385,294 | 54,869,719 | |
| Alkermes PLC (a)(b) | 263,559 | 13,383,526 | |
| Alnylam Pharmaceuticals, Inc. (a)(b) | 138,114 | 11,840,513 | |
| Alpine Immune Sciences, Inc. (a) | 12,084 | 105,735 | |
| AMAG Pharmaceuticals, Inc. (a)(b) | 54,744 | 914,225 | |
| Amgen, Inc. | 1,262,784 | 224,485,112 | |
| Amicus Therapeutics, Inc. (a)(b) | 274,496 | 3,826,474 | |
| AnaptysBio, Inc. | 8,529 | 238,556 | |
| Anavex Life Sciences Corp. (a)(b) | 58,538 | 259,909 | |
| Anthera Pharmaceuticals, Inc. (a)(b) | 7,268 | 11,629 | |
| Applied Genetic Technologies Corp. (a) | 14,097 | 64,846 | |
| Aptevo Therapeutics, Inc. (a) | 19,070 | 25,363 | |
| AquaBounty Technologies, Inc. (a)(b) | 1,372 | 9,906 | |
| Aquinox Pharmaceuticals, Inc. (a)(b) | 27,880 | 407,327 | |
| Ardelyx, Inc. (a) | 32,056 | 165,088 | |
| Arena Pharmaceuticals, Inc. (a) | 64,716 | 1,500,117 | |
| Argos Therapeutics, Inc. (a)(b) | 19,777 | 3,942 | |
| ArQule, Inc. (a) | 65,290 | 71,166 | |
| Array BioPharma, Inc. (a)(b) | 301,593 | 2,919,420 | |
| Arrowhead Pharmaceuticals, Inc. (a)(b) | 223,439 | 625,629 | |
| Asterias Biotherapeutics, Inc. (a)(b) | 24,436 | 84,304 | |
| Atara Biotherapeutics, Inc. (a)(b) | 38,054 | 599,351 | |
| Athersys, Inc. (a)(b) | 185,212 | 324,121 | |
| aTyr Pharma, Inc. (a) | 6,529 | 19,913 | |
| Audentes Therapeutics, Inc. (a) | 34,208 | 718,026 | |
| AVEO Pharmaceuticals, Inc. (a)(b) | 164,980 | 560,932 | |
| Aviragen Therapeutics, Inc. (a) | 46,093 | 28,946 | |
| Bellicum Pharmaceuticals, Inc. (a)(b) | 35,938 | 389,209 | |
| Biocept, Inc. (a)(b) | 7,092 | 8,652 | |
| BioCryst Pharmaceuticals, Inc. (a)(b) | 125,510 | 640,101 | |
| Biogen, Inc. (a) | 364,324 | 115,330,405 | |
| Biohaven Pharmaceutical Holding Co. Ltd. (b) | 57,394 | 2,051,836 | |
| BioMarin Pharmaceutical, Inc. (a) | 315,079 | 28,416,975 | |
| Biospecifics Technologies Corp. (a) | 7,257 | 342,168 | |
| Biostage, Inc. (a)(b) | 3,080 | 960 | |
| BioTime, Inc. (a)(b) | 346,441 | 1,015,072 | |
| Bioverativ, Inc. | 185,633 | 10,523,535 | |
| bluebird bio, Inc. (a)(b) | 75,907 | 9,476,989 | |
| Blueprint Medicines Corp. (a) | 59,036 | 3,200,932 | |
| BrainStorm Cell Therpeutic, Inc. (a)(b) | 15,396 | 65,587 | |
| Calithera Biosciences, Inc. (a) | 45,690 | 749,316 | |
| Cancer Genetics, Inc. (a)(b) | 9,725 | 33,065 | |
| Cara Therapeutics, Inc. (a)(b) | 41,713 | 597,747 | |
| Cascadian Therapeutics, Inc. (a)(b) | 49,541 | 179,338 | |
| CASI Pharmaceuticals, Inc. (a) | 289 | 278 | |
| Catalyst Biosciences, Inc. (a) | 180 | 603 | |
| Catalyst Pharmaceutical Partners, Inc. (a) | 93,518 | 257,175 | |
| Cel-Sci Corp. (a)(b) | 3,253 | 5,920 | |
| Celgene Corp. (a) | 1,338,817 | 186,001,846 | |
| Celldex Therapeutics, Inc. (a)(b) | 215,095 | 529,134 | |
| Cellular Biomedicine Group, Inc. (a)(b) | 8,068 | 79,470 | |
| Celsion Corp. (a) | 762 | 1,021 | |
| ChemoCentryx, Inc. (a) | 36,062 | 250,270 | |
| Chiasma, Inc. (a)(b) | 8,745 | 19,239 | |
| Chimerix, Inc. (a) | 63,824 | 303,802 | |
| Cidara Therapeutics, Inc. (a) | 2,782 | 19,196 | |
| Cleveland Biolabs, Inc. (a)(b) | 1,776 | 4,795 | |
| Clovis Oncology, Inc. (a)(b) | 83,622 | 6,361,126 | |
| Coherus BioSciences, Inc. (a)(b) | 71,178 | 1,028,522 | |
| Conatus Pharmaceuticals, Inc. (a)(b) | 36,543 | 209,757 | |
| Concert Pharmaceuticals, Inc. (a) | 25,754 | 391,976 | |
| Corbus Pharmaceuticals Holdings, Inc. (a)(b) | 46,114 | 357,384 | |
| Corvus Pharmaceuticals, Inc. (a)(b) | 10,405 | 168,249 | |
| CTI BioPharma Corp. (a)(b) | 19,153 | 62,247 | |
| Curis, Inc. (a) | 179,000 | 365,160 | |
| Cyclacel Pharmaceuticals, Inc. | 960 | 1,613 | |
| Cytokinetics, Inc. (a)(b) | 76,663 | 1,138,446 | |
| CytomX Therapeutics, Inc. (a) | 55,930 | 966,470 | |
| Cytori Therapeutics, Inc. (a)(b) | 10,777 | 3,880 | |
| CytRx Corp. (a)(b) | 243,861 | 129,490 | |
| Dicerna Pharmaceuticals, Inc. (a)(b) | 22,350 | 78,002 | |
| Dimension Therapeutics, Inc. (a) | 31,436 | 106,882 | |
| Dyax Corp. rights 12/31/19 (a)(c) | 200,675 | 662,228 | |
| Dynavax Technologies Corp. (a)(b) | 88,051 | 1,580,515 | |
| Eagle Pharmaceuticals, Inc. (a)(b) | 14,894 | 812,617 | |
| Edge Therapeutics, Inc. (a)(b) | 50,398 | 531,699 | |
| Editas Medicine, Inc. (a)(b) | 42,479 | 896,732 | |
| Eiger Biopharmaceuticals, Inc. (a) | 1,065 | 9,851 | |
| Eleven Biotherapeutics, Inc. (a)(b) | 6,105 | 6,593 | |
| Emergent BioSolutions, Inc. (a)(b) | 56,205 | 2,098,133 | |
| Enanta Pharmaceuticals, Inc. (a)(b) | 25,666 | 1,100,045 | |
| Epizyme, Inc. (a)(b) | 64,306 | 1,115,709 | |
| Esperion Therapeutics, Inc. (a)(b) | 35,029 | 1,731,133 | |
| Exact Sciences Corp. (a)(b) | 200,706 | 8,407,574 | |
| Exelixis, Inc. (a) | 390,440 | 11,416,466 | |
| Fate Therapeutics, Inc. (a)(b) | 23,219 | 87,768 | |
| Fibrocell Science, Inc. (a) | 12,960 | 34,733 | |
| FibroGen, Inc. (a) | 112,539 | 5,424,380 | |
| Five Prime Therapeutics, Inc. (a) | 46,353 | 1,572,294 | |
| Flexion Therapeutics, Inc. (a)(b) | 39,546 | 1,016,332 | |
| Fortress Biotech, Inc. (a)(b) | 43,908 | 208,563 | |
| Foundation Medicine, Inc. (a)(b) | 24,382 | 982,595 | |
| Galectin Therapeutics, Inc. (a)(b) | 56,076 | 96,451 | |
| Galena Biopharma, Inc. (a)(b) | 12,770 | 4,597 | |
| Genocea Biosciences, Inc. (a)(b) | 32,032 | 155,996 | |
| Genomic Health, Inc. (a) | 30,953 | 981,210 | |
| GenVec, Inc. rights (c) | 814 | 0 | |
| Geron Corp. (a)(b) | 277,780 | 602,783 | |
| Gilead Sciences, Inc. | 2,245,188 | 187,944,687 | |
| Global Blood Therapeutics, Inc. (a)(b) | 55,511 | 1,687,534 | |
| GlycoMimetics, Inc. (a)(b) | 35,771 | 436,406 | |
| GTx, Inc. (a)(b) | 1,962 | 12,930 | |
| Halozyme Therapeutics, Inc. (a)(b) | 222,904 | 2,899,981 | |
| Heat Biologics, Inc. (a) | 3,136 | 1,756 | |
| Hemispherx Biopharma, Inc. (a) | 10,898 | 3,956 | |
| Heron Therapeutics, Inc. (a)(b) | 88,956 | 1,467,774 | |
| iBio, Inc. (a) | 40,361 | 11,939 | |
| Idera Pharmaceuticals, Inc. (a)(b) | 159,215 | 315,246 | |
| Ignyta, Inc. (a)(b) | 75,502 | 868,273 | |
| Immune Design Corp. (a)(b) | 22,465 | 243,745 | |
| Immune Pharmaceuticals, Inc. (a)(b) | 7,141 | 8,284 | |
| ImmunoCellular Therapeutics Ltd. (a) | 1,048 | 290 | |
| ImmunoGen, Inc. (a)(b) | 155,417 | 1,299,286 | |
| Immunomedics, Inc. (a)(b) | 167,994 | 2,123,444 | |
| Incyte Corp. (a) | 290,297 | 39,889,711 | |
| Infinity Pharmaceuticals, Inc. (a) | 64,535 | 61,437 | |
| Inotek Pharmaceuticals Corp. (a)(b) | 20,127 | 20,530 | |
| Inovio Pharmaceuticals, Inc. (a)(b) | 153,711 | 913,043 | |
| Insmed, Inc. (a) | 93,412 | 1,160,177 | |
| Insys Therapeutics, Inc. (a)(b) | 45,156 | 412,726 | |
| Intellia Therapeutics, Inc. (a)(b) | 14,395 | 302,727 | |
| Intercept Pharmaceuticals, Inc. (a)(b) | 29,766 | 3,471,013 | |
| Intrexon Corp. (a)(b) | 110,181 | 2,173,871 | |
| Invitae Corp. (a) | 60,878 | 597,822 | |
| Ionis Pharmaceuticals, Inc. (a)(b) | 209,776 | 11,248,189 | |
| Iovance Biotherapeutics, Inc. (a) | 86,775 | 498,956 | |
| Ironwood Pharmaceuticals, Inc. Class A (a)(b) | 221,795 | 3,537,630 | |
| IsoRay, Inc. (a) | 57,047 | 30,235 | |
| Jounce Therapeutics, Inc. | 10,322 | 175,371 | |
| Juno Therapeutics, Inc. (a)(b) | 132,147 | 5,453,707 | |
| Kalvista Pharmaceuticals, Inc. (a) | 508 | 3,358 | |
| Karyopharm Therapeutics, Inc. (a) | 46,345 | 473,646 | |
| Keryx Biopharmaceuticals, Inc. (a)(b) | 176,242 | 1,270,705 | |
| Kindred Biosciences, Inc. (a) | 41,075 | 312,170 | |
| Kite Pharma, Inc. (a)(b) | 85,521 | 15,221,883 | |
| Kura Oncology, Inc. (a) | 20,397 | 146,858 | |
| La Jolla Pharmaceutical Co. (a)(b) | 28,865 | 985,740 | |
| Lexicon Pharmaceuticals, Inc. (a)(b) | 68,906 | 1,043,237 | |
| Ligand Pharmaceuticals, Inc. Class B (a)(b) | 36,373 | 4,687,389 | |
| Loxo Oncology, Inc. (a)(b) | 32,076 | 2,675,138 | |
| Macrogenics, Inc. (a)(b) | 52,348 | 989,901 | |
| Madrigal Pharmaceuticals, Inc. (a)(b) | 6,525 | 111,447 | |
| MannKind Corp. (a)(b) | 80,635 | 166,914 | |
| Matinas BioPharma Holdings, Inc. (b) | 91,988 | 117,745 | |
| MediciNova, Inc. (a) | 31,401 | 170,193 | |
| MEI Pharma, Inc. (a) | 62,189 | 164,179 | |
| Merrimack Pharmaceuticals, Inc. (b) | 222,876 | 303,111 | |
| MiMedx Group, Inc. (a)(b) | 170,113 | 2,767,739 | |
| Minerva Neurosciences, Inc. (a)(b) | 51,124 | 309,300 | |
| Mirati Therapeutics, Inc. (a)(b) | 22,963 | 124,000 | |
| Molecular Templates, Inc. (a)(b) | 11,026 | 63,510 | |
| Momenta Pharmaceuticals, Inc. (a) | 120,689 | 2,033,610 | |
| Myriad Genetics, Inc. (a)(b) | 115,012 | 3,506,716 | |
| NanoViricides, Inc. (a)(b) | 32,620 | 44,363 | |
| NantKwest, Inc. (a)(b) | 76,001 | 473,486 | |
| Natera, Inc. (a)(b) | 66,582 | 822,288 | |
| Navidea Biopharmaceuticals, Inc. (a)(b) | 148,549 | 58,305 | |
| Neothetics, Inc. (a)(b) | 10,095 | 3,474 | |
| Neuralstem, Inc. (a)(b) | 8,195 | 9,752 | |
| Neurocrine Biosciences, Inc. (a)(b) | 154,025 | 8,717,815 | |
| NewLink Genetics Corp. (a)(b) | 41,496 | 336,948 | |
| Novavax, Inc. (a)(b) | 436,535 | 458,362 | |
| Ohr Pharmaceutical, Inc. (a)(b) | 32,314 | 24,727 | |
| OncoCyte Corp. (a)(b) | 3,324 | 18,781 | |
| OncoGenex Pharmaceuticals, Inc. (a)(b) | 960 | 3,370 | |
| OncoGenex Pharmaceuticals, Inc. rights (c) | 10,565 | 0 | |
| OncoMed Pharmaceuticals, Inc. (a) | 27,577 | 137,058 | |
| Onconova Therapeutics, Inc. (a) | 624 | 1,011 | |
| Opexa Therapeutics, Inc. (a)(b) | 715 | 613 | |
| Ophthotech Corp. (a) | 50,366 | 156,135 | |
| Opko Health, Inc. (a)(b) | 617,855 | 3,954,272 | |
| Oragenics, Inc. (a) | 9,973 | 3,191 | |
| Organovo Holdings, Inc. (a)(b) | 337,362 | 701,713 | |
| Otonomy, Inc. (a) | 38,289 | 137,840 | |
| OvaScience, Inc. (a)(b) | 60,110 | 84,154 | |
| Palatin Technologies, Inc. (a) | 204,858 | 88,089 | |
| PDL BioPharma, Inc. (a)(b) | 309,517 | 965,693 | |
| Peregrine Pharmaceuticals, Inc. (a) | 55,462 | 171,932 | |
| Pfenex, Inc. (a) | 21,045 | 75,972 | |
| PharmAthene, Inc. | 5,138 | 12,948 | |
| Portola Pharmaceuticals, Inc. (a) | 95,806 | 6,078,891 | |
| Progenics Pharmaceuticals, Inc. (a)(b) | 118,604 | 798,205 | |
| Protagonist Therapeutics, Inc. (b) | 52,263 | 853,455 | |
| Proteon Therapeutics, Inc. (a)(b) | 5,515 | 7,170 | |
| Proteostasis Therapeutics, Inc. (a)(b) | 15,177 | 32,934 | |
| Prothena Corp. PLC (a)(b) | 67,107 | 4,123,054 | |
| PTC Therapeutics, Inc. (a)(b) | 53,763 | 1,115,582 | |
| Puma Biotechnology, Inc. (a)(b) | 47,911 | 4,431,768 | |
| Radius Health, Inc. (a)(b) | 63,620 | 2,394,021 | |
| Recro Pharma, Inc. (a)(b) | 20,797 | 156,601 | |
| Regeneron Pharmaceuticals, Inc. (a) | 129,960 | 64,577,124 | |
| REGENXBIO, Inc. (a) | 45,270 | 1,029,893 | |
| Regulus Therapeutics, Inc. (a)(b) | 85,834 | 85,834 | |
| Repligen Corp. (a)(b) | 69,352 | 3,028,602 | |
| Retrophin, Inc. (a)(b) | 55,340 | 1,350,296 | |
| Rexahn Pharmaceuticals, Inc. (a)(b) | 42,298 | 101,938 | |
| Rigel Pharmaceuticals, Inc. (a) | 204,250 | 520,838 | |
| Sage Therapeutics, Inc. (a)(b) | 54,004 | 4,441,829 | |
| Sangamo Therapeutics, Inc. (a)(b) | 153,345 | 2,047,156 | |
| Sarepta Therapeutics, Inc. (a)(b) | 98,863 | 3,983,190 | |
| Savara, Inc. (a)(b) | 2,094 | 10,994 | |
| Seattle Genetics, Inc. (a)(b) | 163,698 | 8,599,056 | |
| Selecta Biosciences, Inc. (a) | 4,963 | 88,590 | |
| Seres Therapeutics, Inc. (a)(b) | 32,924 | 461,924 | |
| Sorrento Therapeutics, Inc. (a)(b) | 134,335 | 241,803 | |
| Spark Therapeutics, Inc. (a)(b) | 52,137 | 4,292,439 | |
| Spectrum Pharmaceuticals, Inc. (a)(b) | 121,770 | 1,188,475 | |
| Spring Bank Pharmaceuticals, Inc. (a) | 9,145 | 133,151 | |
| Stemline Therapeutics, Inc. (a)(b) | 29,702 | 268,803 | |
| Sunesis Pharmaceuticals, Inc. (a)(b) | 5,440 | 11,859 | |
| Syndax Pharmaceuticals, Inc. (a)(b) | 33,111 | 384,088 | |
| Synergy Pharmaceuticals, Inc. (a)(b) | 387,288 | 1,154,118 | |
| Synthetic Biologics, Inc. (a)(b) | 84,770 | 64,425 | |
| Syros Pharmaceuticals, Inc. (a)(b) | 16,253 | 318,071 | |
| T2 Biosystems, Inc. (a) | 14,700 | 61,593 | |
| Tenax Therapeutics, Inc. (a)(b) | 1,373 | 467 | |
| TESARO, Inc. (a)(b) | 58,508 | 7,555,723 | |
| TG Therapeutics, Inc. (a)(b) | 86,621 | 1,100,087 | |
| Tocagen, Inc. (b) | 8,584 | 119,403 | |
| TONIX Pharmaceuticals Holding (a)(b) | 1,717 | 6,473 | |
| TRACON Pharmaceuticals, Inc. (a)(b) | 4,111 | 10,278 | |
| Trevena, Inc. (a)(b) | 130,021 | 312,050 | |
| Trovagene, Inc. (a)(b) | 33,847 | 22,339 | |
| Ultragenyx Pharmaceutical, Inc. (a)(b) | 65,524 | 3,738,799 | |
| United Therapeutics Corp. (a)(b) | 76,764 | 10,040,731 | |
| Vanda Pharmaceuticals, Inc. (a) | 83,623 | 1,438,316 | |
| Veracyte, Inc. (a) | 15,721 | 128,755 | |
| Verastem, Inc. (a) | 47,048 | 183,487 | |
| Vericel Corp. (a)(b) | 28,746 | 123,608 | |
| Versartis, Inc. (a) | 37,706 | 716,414 | |
| Vertex Pharmaceuticals, Inc. (a) | 425,706 | 68,342,841 | |
| Vical, Inc. (a) | 6,566 | 15,496 | |
| Vital Therapies, Inc. (a) | 26,714 | 80,142 | |
| Voyager Therapeutics, Inc. (a) | 6,634 | 63,952 | |
| Xbiotech, Inc. (a)(b) | 36,998 | 189,430 | |
| Xencor, Inc. (a)(b) | 60,989 | 1,318,582 | |
| XOMA Corp. (a)(b) | 4,980 | 55,228 | |
| Zafgen, Inc. (a) | 24,672 | 89,066 | |
| ZIOPHARM Oncology, Inc. (a)(b) | 222,939 | 1,424,580 | |
| 1,499,608,882 | |||
| Health Care Equipment & Supplies - 2.8% | |||
| Abaxis, Inc. | 36,438 | 1,684,164 | |
| Abbott Laboratories | 2,965,736 | 151,074,592 | |
| Abiomed, Inc. (a) | 70,588 | 10,644,670 | |
| Accuray, Inc. (a)(b) | 142,393 | 590,931 | |
| Alere, Inc. (a) | 147,553 | 7,297,971 | |
| Align Technology, Inc. (a) | 129,953 | 22,967,893 | |
| Alliqua Biomedical, Inc. (a)(b) | 4,397 | 1,452 | |
| Alphatec Holdings, Inc. (a)(b) | 3,066 | 6,193 | |
| Amedica Corp. (a)(b) | 69,010 | 22,704 | |
| Analogic Corp. | 19,536 | 1,397,801 | |
| Angiodynamics, Inc. (a) | 51,608 | 878,884 | |
| Anika Therapeutics, Inc. (a)(b) | 26,869 | 1,442,865 | |
| Antares Pharma, Inc. (a)(b) | 242,616 | 730,274 | |
| Apollo Endosurgery, Inc. (a) | 102 | 422 | |
| Atricure, Inc. (a)(b) | 47,294 | 1,060,804 | |
| Atrion Corp. | 2,291 | 1,425,346 | |
| Avinger, Inc. (a)(b) | 31,221 | 9,366 | |
| AxoGen, Inc. (a) | 41,462 | 729,731 | |
| Baxter International, Inc. | 832,536 | 51,650,533 | |
| Becton, Dickinson & Co. | 388,521 | 77,486,628 | |
| Bellerophon Therapeutics, Inc. (a)(b) | 16,556 | 18,212 | |
| BioLase Technology, Inc. (a)(b) | 31,172 | 15,873 | |
| Boston Scientific Corp. (a) | 2,353,090 | 64,827,630 | |
| Bovie Medical Corp. (a) | 10,849 | 25,821 | |
| C.R. Bard, Inc. | 123,487 | 39,615,864 | |
| Cantel Medical Corp. | 62,489 | 5,077,231 | |
| Cardiovascular Systems, Inc. (a) | 58,185 | 1,708,893 | |
| Cerus Corp. (a)(b) | 223,482 | 525,183 | |
| Cesca Therapeutics, Inc. (a) | 793 | 2,696 | |
| Cogentix Medical, Inc. (a) | 1,160 | 2,668 | |
| ConforMis, Inc. (a)(b) | 87,736 | 324,623 | |
| CONMED Corp. | 42,831 | 2,124,418 | |
| Corindus Vascular Robotics, Inc. (a)(b) | 178,714 | 341,344 | |
| Cryolife, Inc. (a) | 44,979 | 935,563 | |
| CryoPort, Inc. (a) | 21,868 | 167,946 | |
| Cutera, Inc. (a) | 22,484 | 835,281 | |
| CytoSorbents Corp. (a)(b) | 24,969 | 128,590 | |
| Danaher Corp. | 1,044,709 | 87,149,625 | |
| Dare Bioscience, Inc. (a)(b) | 2,822 | 9,397 | |
| Delcath Systems, Inc. (a)(b) | 724,984 | 80,183 | |
| Dentsply Sirona, Inc. | 392,936 | 22,228,390 | |
| DexCom, Inc. (a)(b) | 148,457 | 11,076,377 | |
| Dextera Surgical, Inc. (a)(b) | 2,377 | 849 | |
| Edwards Lifesciences Corp. (a) | 358,419 | 40,737,904 | |
| Ekso Bionics Holdings, Inc. (a)(b) | 18,398 | 23,181 | |
| Endologix, Inc. (a)(b) | 127,100 | 537,633 | |
| Entellus Medical, Inc. (a)(b) | 19,089 | 337,875 | |
| EnteroMedics, Inc. (a)(b) | 13,109 | 24,776 | |
| Exactech, Inc. (a) | 12,870 | 393,179 | |
| Fonar Corp. (a) | 7,275 | 215,340 | |
| Genmark Diagnostics, Inc. (a) | 85,964 | 837,289 | |
| Glaukos Corp. (a)(b) | 17,206 | 649,527 | |
| Globus Medical, Inc. (a) | 121,778 | 3,681,349 | |
| Haemonetics Corp. (a) | 91,218 | 3,924,198 | |
| Halyard Health, Inc. (a)(b) | 83,663 | 3,789,097 | |
| Heska Corp. (a) | 12,153 | 1,236,203 | |
| Hill-Rom Holdings, Inc. | 104,665 | 8,055,018 | |
| Hologic, Inc. (a) | 475,499 | 18,354,261 | |
| ICU Medical, Inc. (a) | 25,020 | 4,362,237 | |
| IDEXX Laboratories, Inc. (a) | 149,372 | 23,216,890 | |
| Inogen, Inc. (a) | 30,117 | 2,885,209 | |
| Insulet Corp. (a) | 96,745 | 5,617,015 | |
| Integer Holdings Corp. (a) | 45,898 | 2,109,013 | |
| Integra LifeSciences Holdings Corp. (a) | 106,721 | 5,441,704 | |
| Intuitive Surgical, Inc. (a) | 63,201 | 63,496,149 | |
| Invacare Corp. (b) | 57,619 | 777,857 | |
| InVivo Therapeutics Holdings Corp. (a)(b) | 46,249 | 53,186 | |
| Invuity, Inc. (a) | 16,779 | 134,232 | |
| IRadimed Corp. (a)(b) | 3,077 | 31,078 | |
| iRhythm Technologies, Inc. (b) | 20,421 | 974,899 | |
| Iridex Corp. (a) | 4,871 | 43,352 | |
| K2M Group Holdings, Inc. (a) | 62,592 | 1,463,401 | |
| Kewaunee Scientific Corp. | 1,376 | 35,432 | |
| Lantheus Holdings, Inc. (a) | 45,045 | 788,288 | |
| LeMaitre Vascular, Inc. | 20,554 | 748,166 | |
| LivaNova PLC (a)(b) | 75,176 | 4,704,514 | |
| Masimo Corp. (a) | 77,531 | 6,542,066 | |
| Medtronic PLC | 2,345,978 | 189,132,746 | |
| Meridian Bioscience, Inc. | 73,595 | 1,022,971 | |
| Merit Medical Systems, Inc. (a) | 93,532 | 3,862,872 | |
| Microbot Medical, Inc. (a)(b) | 7,285 | 7,504 | |
| Misonix, Inc. (a) | 7,938 | 77,792 | |
| Natus Medical, Inc. (a) | 56,909 | 1,912,142 | |
| Neogen Corp. (a) | 67,196 | 4,629,804 | |
| Nevro Corp. (a)(b) | 40,235 | 3,467,452 | |
| NuVasive, Inc. (a)(b) | 83,449 | 5,213,894 | |
| Nuvectra Corp. (a) | 13,499 | 145,654 | |
| NxStage Medical, Inc. (a) | 98,730 | 2,764,440 | |
| OraSure Technologies, Inc. (a) | 97,410 | 1,988,138 | |
| Orthofix International NV (a) | 32,172 | 1,583,184 | |
| Penumbra, Inc. (a)(b) | 54,930 | 4,723,980 | |
| Pulse Biosciences, Inc. (a)(b) | 10,423 | 208,773 | |
| Quidel Corp. (a) | 49,569 | 1,731,941 | |
| ResMed, Inc. (b) | 241,759 | 18,755,663 | |
| Retractable Technologies, Inc. (a) | 5,248 | 3,338 | |
| Rockwell Medical Technologies, Inc. (a)(b) | 83,284 | 526,355 | |
| Roka Bioscience, Inc. (a) | 10,160 | 9,917 | |
| RTI Biologics, Inc. (a) | 100,701 | 453,155 | |
| Seaspine Holdings Corp. (a) | 11,601 | 131,091 | |
| Second Sight Medical Products, Inc. (a)(b) | 20,882 | 23,597 | |
| Sientra, Inc. (a)(b) | 27,954 | 320,353 | |
| Skyline Medical, Inc. (a)(b) | 19,298 | 27,017 | |
| Staar Surgical Co. (a)(b) | 39,188 | 468,297 | |
| Steris PLC | 151,004 | 13,161,509 | |
| STRATA Skin Sciences, Inc. (a) | 803 | 1,502 | |
| Stryker Corp. | 531,872 | 75,190,745 | |
| SurModics, Inc. (a) | 19,525 | 507,650 | |
| Synergetics U.S.A., Inc. (a)(c) | 19,727 | 0 | |
| Tactile Systems Technology, Inc. (a)(b) | 22,275 | 732,402 | |
| Tandem Diabetes Care, Inc. (a)(b) | 25,765 | 21,643 | |
| TearLab Corp. (a)(b) | 1,739 | 2,348 | |
| Teleflex, Inc. | 77,066 | 16,318,726 | |
| The Cooper Companies, Inc. | 83,062 | 20,834,441 | |
| TransEnterix, Inc. (a)(b) | 90,218 | 77,587 | |
| Utah Medical Products, Inc. | 13,511 | 974,819 | |
| Varian Medical Systems, Inc. (a)(b) | 159,232 | 16,918,400 | |
| Vermillion, Inc. (a)(b) | 12,449 | 15,810 | |
| ViewRay, Inc. (a)(b) | 55,513 | 291,998 | |
| Viveve Medical, Inc. (a)(b) | 22,359 | 126,776 | |
| West Pharmaceutical Services, Inc. | 126,597 | 11,019,003 | |
| Wright Medical Group NV (a)(b) | 185,020 | 5,476,592 | |
| Zimmer Biomet Holdings, Inc. | 342,629 | 39,152,216 | |
| Zosano Pharma Corp. (a)(b) | 34,865 | 29,287 | |
| 1,218,592,923 | |||
| Health Care Providers & Services - 2.6% | |||
| AAC Holdings, Inc. (a)(b) | 12,779 | 118,717 | |
| Acadia Healthcare Co., Inc. (a)(b) | 128,691 | 6,040,756 | |
| Aceto Corp. | 47,837 | 507,551 | |
| Addus HomeCare Corp. (a) | 10,897 | 371,043 | |
| Aetna, Inc. | 564,977 | 89,096,873 | |
| Almost Family, Inc. (a) | 19,278 | 938,839 | |
| Amedisys, Inc. (a) | 47,206 | 2,466,041 | |
| American Renal Associates Holdings, Inc. (a)(b) | 16,913 | 242,363 | |
| AmerisourceBergen Corp. | 281,803 | 22,614,691 | |
| AMN Healthcare Services, Inc. (a)(b) | 87,493 | 3,267,864 | |
| Anthem, Inc. | 452,049 | 88,619,686 | |
| BioScrip, Inc. (a)(b) | 230,699 | 699,018 | |
| BioTelemetry, Inc. (a) | 51,243 | 1,903,677 | |
| Brookdale Senior Living, Inc. (a) | 326,054 | 3,955,035 | |
| Caladrius Biosciences, Inc. (a)(b) | 9,530 | 38,215 | |
| Capital Senior Living Corp. (a)(b) | 37,012 | 460,059 | |
| Cardinal Health, Inc. | 540,009 | 36,429,007 | |
| Centene Corp. (a) | 297,424 | 26,426,122 | |
| Chemed Corp. | 28,374 | 5,597,906 | |
| Cigna Corp. | 437,196 | 79,595,904 | |
| Civitas Solutions, Inc. (a) | 27,734 | 529,719 | |
| Community Health Systems, Inc. (a)(b) | 198,155 | 1,513,904 | |
| Corvel Corp. (a) | 17,696 | 918,422 | |
| Cross Country Healthcare, Inc. (a) | 55,702 | 689,591 | |
| DaVita HealthCare Partners, Inc. (a) | 263,576 | 15,435,011 | |
| Diplomat Pharmacy, Inc. (a)(b) | 79,924 | 1,338,727 | |
| Envision Healthcare Corp. | 199,964 | 10,480,113 | |
| Express Scripts Holding Co. (a) | 1,013,621 | 63,675,671 | |
| Five Star Sr Living, Inc. (a) | 70,113 | 113,934 | |
| Genesis HealthCare, Inc. Class A (a)(b) | 27,157 | 28,243 | |
| HCA Holdings, Inc. (a) | 489,951 | 38,539,546 | |
| HealthEquity, Inc. (a) | 76,252 | 3,261,298 | |
| HealthSouth Corp. | 168,846 | 7,724,705 | |
| Henry Schein, Inc. (a) | 146,456 | 25,436,478 | |
| Humana, Inc. | 247,696 | 63,811,444 | |
| Interpace Diagnostics Group, Inc. (a) | 136 | 178 | |
| Kindred Healthcare, Inc. | 151,684 | 1,228,640 | |
| Laboratory Corp. of America Holdings (a) | 175,793 | 27,576,648 | |
| Landauer, Inc. | 14,935 | 926,717 | |
| LHC Group, Inc. (a) | 27,965 | 1,824,716 | |
| LifePoint Hospitals, Inc. (a) | 65,814 | 3,813,921 | |
| Magellan Health Services, Inc. (a) | 40,373 | 3,266,176 | |
| McKesson Corp. | 363,256 | 54,237,753 | |
| MEDNAX, Inc. (a) | 163,523 | 7,334,007 | |
| Molina Healthcare, Inc. (a)(b) | 72,754 | 4,656,256 | |
| National Healthcare Corp. | 18,256 | 1,138,079 | |
| National Research Corp. Class A | 11,334 | 366,088 | |
| Owens & Minor, Inc. | 118,083 | 3,299,239 | |
| Patterson Companies, Inc. (b) | 134,760 | 5,188,260 | |
| PharMerica Corp. (a) | 50,899 | 1,496,431 | |
| Premier, Inc. (a) | 101,239 | 3,391,507 | |
| Providence Service Corp. (a) | 20,443 | 1,059,561 | |
| Psychemedics Corp. | 2,724 | 57,585 | |
| Quest Diagnostics, Inc. | 231,764 | 25,111,629 | |
| Quorum Health Corp. (a) | 41,687 | 182,589 | |
| R1 RCM, Inc. (a) | 178,635 | 589,496 | |
| RadNet, Inc. (a) | 43,227 | 443,077 | |
| Select Medical Holdings Corp. (a)(b) | 195,741 | 3,640,783 | |
| Sharps Compliance Corp. (a) | 12,687 | 62,801 | |
| Surgery Partners, Inc. (a) | 43,549 | 424,603 | |
| Teladoc, Inc. (a)(b) | 60,964 | 2,045,342 | |
| Tenet Healthcare Corp. (a)(b) | 137,153 | 2,354,917 | |
| The Ensign Group, Inc. | 78,310 | 1,608,487 | |
| Tivity Health, Inc.(a)(b) | 52,424 | 2,055,021 | |
| Triple-S Management Corp. (a)(b) | 37,106 | 916,889 | |
| U.S. Physical Therapy, Inc. | 18,467 | 1,106,173 | |
| UnitedHealth Group, Inc. | 1,650,119 | 328,208,669 | |
| Universal Health Services, Inc. Class B | 153,265 | 16,572,544 | |
| VCA, Inc. (a) | 141,830 | 13,184,517 | |
| Wellcare Health Plans, Inc. (a) | 75,649 | 13,214,367 | |
| 1,135,469,839 | |||
| Health Care Technology - 0.2% | |||
| Allscripts Healthcare Solutions, Inc. (a) | 329,763 | 4,333,086 | |
| athenahealth, Inc. (a)(b) | 66,612 | 9,387,629 | |
| Castlight Health, Inc. Class B (a)(b) | 69,240 | 270,036 | |
| Cerner Corp. (a) | 507,173 | 34,376,186 | |
| Computer Programs & Systems, Inc. (b) | 21,937 | 660,304 | |
| Connecture, Inc. (a) | 7,971 | 5,341 | |
| Evolent Health, Inc. (a)(b) | 108,849 | 1,817,778 | |
| HealthStream, Inc. (a)(b) | 41,650 | 978,359 | |
| HMS Holdings Corp. (a) | 140,319 | 2,486,453 | |
| iCAD, Inc. (a) | 14,864 | 58,861 | |
| Inovalon Holdings, Inc. Class A (a)(b) | 119,481 | 1,618,968 | |
| Medidata Solutions, Inc. (a) | 94,000 | 7,046,240 | |
| Omnicell, Inc. (a) | 60,052 | 3,080,668 | |
| Quality Systems, Inc. (a) | 73,135 | 1,151,876 | |
| Simulations Plus, Inc. | 6,008 | 87,116 | |
| Tabula Rasa HealthCare, Inc. | 5,543 | 125,992 | |
| Veeva Systems, Inc. Class A (a) | 198,680 | 11,821,460 | |
| Vocera Communications, Inc. (a) | 48,079 | 1,339,000 | |
| 80,645,353 | |||
| Life Sciences Tools & Services - 0.8% | |||
| Accelerate Diagnostics, Inc. (a)(b) | 47,182 | 1,085,186 | |
| Agilent Technologies, Inc. | 553,206 | 35,803,492 | |
| Albany Molecular Research, Inc. (a) | 40,643 | 883,579 | |
| Bio-Rad Laboratories, Inc. Class A (a) | 35,877 | 7,814,728 | |
| Bio-Techne Corp. | 69,291 | 8,576,840 | |
| Bruker Corp. | 188,235 | 5,475,756 | |
| Cambrex Corp. (a) | 66,661 | 3,473,038 | |
| Charles River Laboratories International, Inc. (a) | 77,816 | 8,466,381 | |
| ChromaDex, Inc. (a)(b) | 56,591 | 190,146 | |
| Enzo Biochem, Inc. (a) | 66,443 | 747,484 | |
| Fluidigm Corp. (a)(b) | 38,600 | 176,402 | |
| Harvard Bioscience, Inc. (a) | 18,919 | 58,649 | |
| Illumina, Inc. (a) | 250,734 | 51,265,074 | |
| INC Research Holdings, Inc. Class A (a)(b) | 91,734 | 5,384,786 | |
| Luminex Corp. | 66,508 | 1,285,600 | |
| Medpace Holdings, Inc. (b) | 21,051 | 687,105 | |
| Mettler-Toledo International, Inc. (a) | 43,558 | 26,356,510 | |
| Nanostring Technologies, Inc. (a) | 24,217 | 374,153 | |
| NeoGenomics, Inc. (a)(b) | 77,966 | 788,236 | |
| Pacific Biosciences of California, Inc. (a)(b) | 161,679 | 800,311 | |
| PAREXEL International Corp. (a) | 86,781 | 7,627,182 | |
| PerkinElmer, Inc. | 184,639 | 12,368,967 | |
| PRA Health Sciences, Inc. (a) | 84,500 | 6,540,300 | |
| pSivida Corp. (a)(b) | 25,265 | 30,571 | |
| Quintiles Transnational Holdings, Inc. (a) | 232,389 | 22,316,316 | |
| Thermo Fisher Scientific, Inc. | 667,814 | 124,974,712 | |
| VWR Corp. (a) | 150,777 | 4,978,657 | |
| Waters Corp. (a) | 136,882 | 25,115,109 | |
| 363,645,270 | |||
| Pharmaceuticals - 4.3% | |||
| AcelRx Pharmaceuticals, Inc. (a)(b) | 65,025 | 214,583 | |
| Aclaris Therapeutics, Inc. (a) | 40,572 | 1,052,032 | |
| Adamis Pharmaceuticals Corp. (a)(b) | 36,542 | 199,154 | |
| Aerie Pharmaceuticals, Inc. (a)(b) | 59,316 | 3,401,773 | |
| Agile Therapeutics, Inc. (a)(b) | 87,068 | 299,514 | |
| Akorn, Inc. (a) | 148,175 | 4,874,958 | |
| Alimera Sciences, Inc. (a) | 22,049 | 30,648 | |
| Allergan PLC | 574,331 | 131,797,478 | |
| Amphastar Pharmaceuticals, Inc. (a) | 63,932 | 1,023,551 | |
| Ampio Pharmaceuticals, Inc. (a)(b) | 59,082 | 31,467 | |
| ANI Pharmaceuticals, Inc. (a) | 10,919 | 524,112 | |
| ANI Pharmaceuticals, Inc. rights (a)(c) | 21,445 | 0 | |
| Apricus Biosciences, Inc. (a)(b) | 5,725 | 9,332 | |
| Aratana Therapeutics, Inc. (a)(b) | 38,612 | 220,475 | |
| Assembly Biosciences, Inc. (a) | 23,295 | 631,527 | |
| AstraZeneca PLC rights (a)(c) | 7,692 | 0 | |
| Avexis, Inc. (a)(b) | 38,150 | 3,561,303 | |
| Axsome Therapeutics, Inc. (a) | 21,511 | 109,706 | |
| Bio Path Holdings, Inc. (a)(b) | 166,645 | 45,827 | |
| Biodelivery Sciences International, Inc. (a)(b) | 170,623 | 528,931 | |
| BioPharmX Corp. (a)(b) | 64,864 | 19,848 | |
| Bristol-Myers Squibb Co. | 2,825,699 | 170,898,276 | |
| Catalent, Inc. (a) | 212,086 | 8,757,031 | |
| Cempra, Inc. (a)(b) | 81,591 | 248,853 | |
| Clearside Biomedical, Inc. (a)(b) | 19,198 | 134,194 | |
| Collegium Pharmaceutical, Inc. (a)(b) | 32,296 | 324,252 | |
| ContraVir Pharmaceuticals, Inc. (a)(b) | 80,626 | 38,322 | |
| Corcept Therapeutics, Inc. (a)(b) | 156,567 | 2,609,972 | |
| Corium International, Inc. (a)(b) | 42,043 | 359,468 | |
| CorMedix, Inc. (a)(b) | 48,587 | 24,051 | |
| Cumberland Pharmaceuticals, Inc. (a) | 7,158 | 50,178 | |
| CymaBay Therapeutics, Inc. (a) | 67,284 | 419,852 | |
| DepoMed, Inc. (a)(b) | 97,171 | 590,800 | |
| Dermira, Inc. (a)(b) | 70,654 | 1,666,728 | |
| Durect Corp. (a) | 198,076 | 314,941 | |
| Egalet Corp. (a) | 12,340 | 14,931 | |
| Eli Lilly & Co. | 1,666,890 | 135,501,488 | |
| Endo International PLC (a)(b) | 329,369 | 2,895,154 | |
| Endocyte, Inc. (a)(b) | 47,373 | 64,427 | |
| Flex Pharma, Inc. (a) | 10,224 | 40,180 | |
| Gemphire Therapeutics, Inc. (b) | 6,333 | 61,050 | |
| Horizon Pharma PLC (a)(b) | 272,914 | 3,733,464 | |
| Impax Laboratories, Inc. (a)(b) | 130,689 | 2,829,417 | |
| Imprimis Pharmaceuticals, Inc. (a)(b) | 10,757 | 19,685 | |
| Innoviva, Inc. (a)(b) | 134,795 | 1,892,522 | |
| Intersect ENT, Inc. (a) | 61,422 | 1,897,940 | |
| Intra-Cellular Therapies, Inc. (a)(b) | 67,457 | 1,244,582 | |
| Jazz Pharmaceuticals PLC (a) | 102,757 | 15,347,786 | |
| Johnson & Johnson | 4,615,739 | 610,985,371 | |
| Juniper Pharmaceuticals, Inc. (a) | 11,831 | 55,014 | |
| KemPharm, Inc. (a)(b) | 5,081 | 15,497 | |
| Lannett Co., Inc. (a)(b) | 44,883 | 787,697 | |
| Lipocine, Inc. (a)(b) | 20,645 | 78,038 | |
| Mallinckrodt PLC (a) | 172,938 | 7,104,293 | |
| Marinus Pharmaceuticals, Inc. (a) | 9,220 | 28,213 | |
| Merck & Co., Inc. | 4,685,121 | 299,191,827 | |
| Mylan N.V. (a) | 791,862 | 24,927,816 | |
| MyoKardia, Inc. (a) | 35,984 | 1,559,906 | |
| Nektar Therapeutics (a) | 273,203 | 5,745,459 | |
| Neos Therapeutics, Inc. (a)(b) | 19,225 | 160,529 | |
| Novan, Inc. (b) | 7,147 | 36,092 | |
| Novus Therapeutics, Inc. (a)(b) | 606 | 2,400 | |
| Ocera Therapeutics, Inc. (a)(b) | 10,720 | 9,970 | |
| Ocular Therapeutix, Inc. (a)(b) | 28,848 | 180,588 | |
| Omeros Corp. (a)(b) | 69,139 | 1,415,275 | |
| Orexigen Therapeutics, Inc. (a)(b) | 16,675 | 37,852 | |
| Pacira Pharmaceuticals, Inc. (a) | 70,346 | 2,680,183 | |
| Pain Therapeutics, Inc. (a) | 4,934 | 15,838 | |
| Paratek Pharmaceuticals, Inc. (a)(b) | 35,978 | 1,014,580 | |
| Pernix Therapeutics Holdings, Inc. (a)(b) | 4,109 | 12,327 | |
| Perrigo Co. PLC | 246,025 | 19,426,134 | |
| Pfizer, Inc. | 10,232,789 | 347,096,203 | |
| Phibro Animal Health Corp. Class A | 37,189 | 1,320,210 | |
| Plx Pharma PLC/New (a) | 290 | 1,827 | |
| Prestige Brands Holdings, Inc. (a) | 93,229 | 4,727,643 | |
| Reata Pharmaceuticals, Inc. (a) | 15,332 | 463,793 | |
| Repros Therapeutics, Inc. (a) | 24,715 | 7,311 | |
| Revance Therapeutics, Inc. (a)(b) | 37,609 | 923,301 | |
| SciClone Pharmaceuticals, Inc. (a) | 95,019 | 1,045,209 | |
| SCYNEXIS, Inc. (a)(b) | 16,272 | 31,242 | |
| Sucampo Pharmaceuticals, Inc. Class A (a)(b) | 39,776 | 467,368 | |
| Supernus Pharmaceuticals, Inc. (a)(b) | 84,621 | 3,875,642 | |
| Teligent, Inc. (a)(b) | 140,525 | 971,028 | |
| Tetraphase Pharmaceuticals, Inc. (a) | 74,420 | 519,452 | |
| The Medicines Company (a)(b) | 125,813 | 4,616,079 | |
| TherapeuticsMD, Inc. (a)(b) | 280,301 | 1,681,806 | |
| Theravance Biopharma, Inc. (a)(b) | 67,445 | 2,203,428 | |
| Titan Pharmaceuticals, Inc. (a)(b) | 11,285 | 16,928 | |
| VIVUS, Inc. (a)(b) | 157,068 | 139,885 | |
| WAVE Life Sciences (a)(b) | 28,404 | 667,494 | |
| Zoetis, Inc. Class A | 844,331 | 52,939,554 | |
| Zogenix, Inc. (a)(b) | 41,404 | 490,637 | |
| Zynerba Pharmaceuticals, Inc. (a)(b) | 23,422 | 148,730 | |
| 1,900,381,432 | |||
| TOTAL HEALTH CARE | 6,198,343,699 | ||
| INDUSTRIALS - 10.6% | |||
| Aerospace & Defense - 2.4% | |||
| AAR Corp. | 51,954 | 1,873,461 | |
| Aerojet Rocketdyne Holdings, Inc. (a) | 129,248 | 3,829,618 | |
| AeroVironment, Inc. (a)(b) | 33,858 | 1,659,719 | |
| Arconic, Inc. | 746,482 | 19,012,897 | |
| Arotech Corp. (a)(b) | 32,173 | 106,171 | |
| Astronics Corp. (a) | 34,623 | 910,239 | |
| Astronics Corp. Class B | 3,221 | 84,390 | |
| Astrotech Corp. (a) | 8,707 | 6,356 | |
| Axon Enterprise, Inc. (a)(b) | 93,306 | 2,025,673 | |
| BWX Technologies, Inc. | 171,125 | 9,363,960 | |
| CPI Aerostructures, Inc. (a) | 3,805 | 33,104 | |
| Cubic Corp. | 40,394 | 1,734,922 | |
| Curtiss-Wright Corp. | 91,404 | 8,849,735 | |
| DigitalGlobe, Inc. (a) | 105,249 | 3,620,566 | |
| Ducommun, Inc. (a) | 15,643 | 430,183 | |
| Engility Holdings, Inc. (a) | 28,046 | 871,389 | |
| Esterline Technologies Corp. (a) | 49,383 | 4,217,308 | |
| General Dynamics Corp. | 484,645 | 97,583,271 | |
| HEICO Corp. (b) | 55,920 | 4,796,258 | |
| HEICO Corp. Class A | 63,535 | 4,615,818 | |
| Hexcel Corp. | 159,521 | 8,577,444 | |
| Huntington Ingalls Industries, Inc. | 78,560 | 16,808,698 | |
| Innovative Solutions & Support, Inc. (a) | 21,878 | 75,479 | |
| KEYW Holding Corp. (a)(b) | 74,131 | 530,037 | |
| KLX, Inc. (a) | 87,459 | 4,192,784 | |
| Kratos Defense & Security Solutions, Inc. (a)(b) | 149,910 | 2,005,796 | |
| L3 Technologies, Inc. | 133,944 | 24,308,157 | |
| Lockheed Martin Corp. | 426,404 | 130,219,518 | |
| Mercury Systems, Inc. (a) | 82,892 | 3,999,539 | |
| Micronet Enertec Technologies, Inc. (a) | 3,018 | 2,423 | |
| Moog, Inc. Class A (a) | 52,323 | 4,016,313 | |
| National Presto Industries, Inc. (b) | 7,356 | 732,658 | |
| Northrop Grumman Corp. | 301,621 | 82,104,252 | |
| Orbital ATK, Inc. | 102,816 | 11,472,209 | |
| Raytheon Co. | 497,629 | 90,573,454 | |
| Rockwell Collins, Inc. | 276,208 | 36,197,058 | |
| SIFCO Industries, Inc. (a) | 891 | 4,901 | |
| Sparton Corp. (a) | 13,384 | 310,107 | |
| Spirit AeroSystems Holdings, Inc. Class A | 205,388 | 15,301,406 | |
| Teledyne Technologies, Inc. (a) | 61,440 | 9,219,686 | |
| Textron, Inc. | 452,435 | 22,210,034 | |
| The Boeing Co. | 960,373 | 230,162,993 | |
| TransDigm Group, Inc. | 84,738 | 22,087,807 | |
| Triumph Group, Inc. | 96,901 | 2,548,496 | |
| United Technologies Corp. | 1,276,596 | 152,834,073 | |
| Vectrus, Inc. (a) | 17,822 | 509,353 | |
| Wesco Aircraft Holdings, Inc. (a) | 94,440 | 793,296 | |
| 1,037,423,009 | |||
| Air Freight & Logistics - 0.6% | |||
| Air Transport Services Group, Inc. (a) | 108,399 | 2,488,841 | |
| Atlas Air Worldwide Holdings, Inc. (a) | 45,740 | 3,055,432 | |
| C.H. Robinson Worldwide, Inc. | 243,163 | 17,174,603 | |
| Echo Global Logistics, Inc. (a)(b) | 48,848 | 742,490 | |
| Expeditors International of Washington, Inc. | 312,542 | 17,533,606 | |
| FedEx Corp. | 419,000 | 89,825,220 | |
| Forward Air Corp. | 54,775 | 2,846,657 | |
| Hub Group, Inc. Class A (a) | 55,422 | 2,130,976 | |
| Radiant Logistics, Inc. (a) | 54,959 | 277,543 | |
| United Parcel Service, Inc. Class B | 1,179,920 | 134,935,651 | |
| XPO Logistics, Inc. (a)(b) | 147,648 | 9,036,058 | |
| 280,047,077 | |||
| Airlines - 0.5% | |||
| Alaska Air Group, Inc. | 212,539 | 15,868,162 | |
| Allegiant Travel Co. (b) | 23,703 | 2,796,954 | |
| American Airlines Group, Inc. | 840,913 | 37,622,448 | |
| Delta Air Lines, Inc. | 1,254,555 | 59,202,450 | |
| Hawaiian Holdings, Inc. (a) | 89,875 | 3,851,144 | |
| JetBlue Airways Corp. (a) | 563,310 | 11,159,171 | |
| SkyWest, Inc. | 97,566 | 3,385,540 | |
| Southwest Airlines Co. | 1,032,776 | 53,848,941 | |
| Spirit Airlines, Inc. (a) | 120,068 | 4,088,315 | |
| United Continental Holdings, Inc. (a) | 481,496 | 29,833,492 | |
| 221,656,617 | |||
| Building Products - 0.5% | |||
| A.O. Smith Corp. | 253,397 | 14,111,679 | |
| AAON, Inc. | 75,766 | 2,469,972 | |
| Advanced Drain Systems, Inc. Del | 62,250 | 1,210,763 | |
| Allegion PLC | 162,633 | 12,800,843 | |
| American Woodmark Corp. (a) | 24,566 | 2,034,065 | |
| Apogee Enterprises, Inc. | 47,950 | 2,095,415 | |
| Armstrong World Industries, Inc. (a) | 81,275 | 3,860,563 | |
| Builders FirstSource, Inc. (a) | 179,848 | 2,927,925 | |
| Continental Building Products, Inc. (a) | 69,835 | 1,700,482 | |
| CSW Industrials, Inc. (a) | 25,190 | 1,054,202 | |
| Fortune Brands Home & Security, Inc. | 256,876 | 16,062,456 | |
| GCP Applied Technologies, Inc. (a) | 121,060 | 3,419,945 | |
| Gibraltar Industries, Inc. (a) | 56,316 | 1,647,243 | |
| GMS, Inc. (a) | 46,973 | 1,511,591 | |
| Griffon Corp. | 59,127 | 1,096,806 | |
| Insteel Industries, Inc. | 29,073 | 728,860 | |
| Jeld-Wen Holding, Inc. | 63,204 | 1,928,986 | |
| Johnson Controls International PLC | 1,604,213 | 63,510,793 | |
| Lennox International, Inc. (b) | 64,752 | 10,731,349 | |
| Masco Corp. | 540,799 | 19,885,179 | |
| Masonite International Corp. (a) | 51,336 | 3,249,569 | |
| NCI Building Systems, Inc. (a) | 58,589 | 984,295 | |
| Owens Corning | 191,219 | 14,175,064 | |
| Patrick Industries, Inc. (a) | 27,897 | 2,064,378 | |
| PGT, Inc. (a) | 80,695 | 1,065,174 | |
| Ply Gem Holdings, Inc. (a) | 36,381 | 565,725 | |
| Quanex Building Products Corp. | 55,487 | 1,087,545 | |
| Simpson Manufacturing Co. Ltd. | 63,559 | 2,782,613 | |
| Tecogen, Inc. New (a) | 2,274 | 6,822 | |
| Trex Co., Inc. (a) | 51,288 | 3,897,888 | |
| Universal Forest Products, Inc. | 36,181 | 3,155,345 | |
| USG Corp. (a)(b) | 145,958 | 4,378,740 | |
| 202,202,275 | |||
| Commercial Services & Supplies - 0.5% | |||
| ABM Industries, Inc. | 102,806 | 4,567,671 | |
| ACCO Brands Corp. (a) | 198,147 | 2,169,710 | |
| ADS Waste Holdings, Inc. | 88,843 | 2,118,017 | |
| Aqua Metals, Inc. (a)(b) | 20,623 | 152,816 | |
| ARC Document Solutions, Inc. (a) | 46,203 | 163,097 | |
| Brady Corp. Class A | 89,558 | 2,986,759 | |
| Casella Waste Systems, Inc. Class A (a) | 64,851 | 1,090,145 | |
| CECO Environmental Corp. | 40,679 | 303,872 | |
| Cenveo, Inc. (a)(b) | 13,016 | 49,200 | |
| Cintas Corp. | 149,849 | 20,231,113 | |
| Clean Harbors, Inc. (a) | 97,820 | 5,291,084 | |
| Copart, Inc. (a) | 345,568 | 11,296,618 | |
| Covanta Holding Corp. (b) | 226,728 | 3,253,547 | |
| Deluxe Corp. | 77,034 | 5,342,308 | |
| Ennis, Inc. | 34,279 | 654,729 | |
| Essendant, Inc. | 58,461 | 693,347 | |
| Fuel Tech, Inc. (a) | 51,934 | 46,896 | |
| Healthcare Services Group, Inc. | 122,906 | 6,292,787 | |
| Heritage-Crystal Clean, Inc. (a) | 21,763 | 424,379 | |
| Herman Miller, Inc. | 110,582 | 3,721,084 | |
| HNI Corp. | 80,621 | 2,954,760 | |
| Hudson Technologies, Inc. (a)(b) | 56,393 | 501,898 | |
| Industrial Services of America, Inc. (a)(b) | 1,620 | 3,159 | |
| InnerWorkings, Inc. (a) | 57,411 | 601,093 | |
| Interface, Inc. | 108,800 | 2,067,200 | |
| Intersections, Inc. (a)(b) | 12,865 | 45,156 | |
| KAR Auction Services, Inc. | 230,024 | 10,371,782 | |
| Kimball International, Inc. Class B | 52,574 | 891,655 | |
| Knoll, Inc. | 81,039 | 1,462,754 | |
| LSC Communications, Inc. | 57,687 | 929,338 | |
| Matthews International Corp. Class A | 55,558 | 3,347,370 | |
| McGrath RentCorp. | 37,522 | 1,514,763 | |
| Mobile Mini, Inc. | 73,292 | 2,217,083 | |
| Msa Safety, Inc. | 56,016 | 4,081,326 | |
| Multi-Color Corp. | 21,263 | 1,696,787 | |
| NL Industries, Inc. (a) | 6,707 | 50,638 | |
| Odyssey Marine Exploration, Inc. (a)(b) | 5,346 | 19,834 | |
| Performant Financial Corp. (a) | 31,038 | 54,627 | |
| Perma-Fix Environmental Services, Inc. (a) | 6,937 | 24,626 | |
| Pitney Bowes, Inc. | 320,489 | 4,118,284 | |
| Quad/Graphics, Inc. | 51,478 | 981,171 | |
| Quest Resource Holding Corp. (a)(b) | 2,977 | 4,108 | |
| R.R. Donnelley & Sons Co. | 111,816 | 1,032,062 | |
| Republic Services, Inc. | 404,127 | 26,365,245 | |
| Rollins, Inc. (b) | 163,488 | 7,260,502 | |
| SP Plus Corp. (a) | 38,199 | 1,409,543 | |
| Steelcase, Inc. Class A | 153,375 | 2,024,550 | |
| Stericycle, Inc. (a) | 146,361 | 10,521,892 | |
| Team, Inc. (a)(b) | 59,115 | 730,070 | |
| Tetra Tech, Inc. | 99,334 | 4,231,628 | |
| The Brink's Co. | 75,766 | 5,943,843 | |
| U.S. Ecology, Inc. | 34,516 | 1,774,122 | |
| UniFirst Corp. | 28,960 | 4,158,656 | |
| Viad Corp. | 33,828 | 1,858,849 | |
| Virco Manufacturing Co. (a) | 2,682 | 13,946 | |
| VSE Corp. | 10,794 | 562,907 | |
| Waste Management, Inc. | 702,694 | 54,184,734 | |
| West Corp. | 87,503 | 2,044,945 | |
| 232,906,085 | |||
| Construction & Engineering - 0.2% | |||
| AECOM (a) | 274,003 | 9,179,101 | |
| Aegion Corp. (a) | 54,146 | 1,173,344 | |
| Ameresco, Inc. Class A (a) | 38,199 | 276,943 | |
| Argan, Inc. | 22,803 | 1,444,570 | |
| Chicago Bridge & Iron Co. NV (b) | 165,022 | 2,036,371 | |
| Comfort Systems U.S.A., Inc. | 69,706 | 2,373,489 | |
| Dycom Industries, Inc. (a)(b) | 52,510 | 4,236,507 | |
| EMCOR Group, Inc. | 106,586 | 7,038,939 | |
| Fluor Corp. | 233,020 | 8,987,581 | |
| Goldfield Corp. | 41,171 | 183,211 | |
| Granite Construction, Inc. (b) | 70,943 | 3,918,182 | |
| Great Lakes Dredge & Dock Corp. (a) | 77,922 | 315,584 | |
| HC2 Holdings, Inc. (a) | 49,076 | 223,787 | |
| Ies Holdings, Inc. (a) | 16,326 | 269,379 | |
| Jacobs Engineering Group, Inc. | 212,899 | 11,600,867 | |
| KBR, Inc. | 238,105 | 3,873,968 | |
| Keane Group, Inc. (b) | 49,477 | 640,727 | |
| Layne Christensen Co. (a)(b) | 24,456 | 262,657 | |
| MasTec, Inc. (a) | 112,881 | 4,605,545 | |
| MYR Group, Inc. (a) | 33,116 | 854,724 | |
| Northwest Pipe Co. (a)(b) | 12,188 | 223,528 | |
| NV5 Holdings, Inc. (a) | 11,806 | 569,640 | |
| Orion Group Holdings, Inc. (a) | 33,745 | 203,820 | |
| Primoris Services Corp. | 70,710 | 2,023,013 | |
| Quanta Services, Inc. (a) | 267,735 | 9,619,719 | |
| Sterling Construction Co., Inc. (a) | 41,743 | 491,733 | |
| Tutor Perini Corp. (a) | 72,569 | 1,897,679 | |
| Valmont Industries, Inc. | 38,333 | 5,502,702 | |
| 84,027,310 | |||
| Electrical Equipment - 0.6% | |||
| Acuity Brands, Inc. (b) | 75,177 | 13,290,542 | |
| Allied Motion Technologies, Inc. | 10,236 | 258,868 | |
| American Superconductor Corp. (a)(b) | 20,903 | 81,104 | |
| AMETEK, Inc. | 394,980 | 24,982,485 | |
| AZZ, Inc. | 45,717 | 2,235,561 | |
| Babcock & Wilcox Enterprises, Inc. (a) | 92,914 | 209,986 | |
| Broadwind Energy, Inc. (a) | 15,938 | 54,508 | |
| Capstone Turbine Corp. (a)(b) | 40,707 | 26,093 | |
| Eaton Corp. PLC | 763,510 | 54,789,478 | |
| Emerson Electric Co. | 1,105,773 | 65,284,838 | |
| Encore Wire Corp. | 34,550 | 1,482,195 | |
| Energous Corp. (a)(b) | 25,329 | 240,372 | |
| Energy Focus, Inc. (a)(b) | 8,003 | 14,325 | |
| EnerSys | 77,507 | 4,968,199 | |
| Enphase Energy, Inc. (a)(b) | 30,890 | 28,419 | |
| EnSync, Inc. (a)(b) | 32,445 | 12,654 | |
| Espey Manufacturing & Electronics Corp. | 2,015 | 45,620 | |
| Fortive Corp. | 514,592 | 33,433,042 | |
| FuelCell Energy, Inc. (a)(b) | 48,863 | 75,249 | |
| Generac Holdings, Inc. (a)(b) | 118,381 | 4,780,225 | |
| General Cable Corp. | 78,815 | 1,335,914 | |
| Hubbell, Inc. Class B | 92,812 | 10,468,265 | |
| Ideal Power, Inc. (a)(b) | 38,104 | 92,593 | |
| LSI Industries, Inc. | 35,290 | 200,800 | |
| Ocean Power Technologies, Inc. (a)(b) | 1,104 | 1,347 | |
| Orion Energy Systems, Inc. (a) | 20,733 | 19,105 | |
| Plug Power, Inc. (a)(b) | 485,070 | 1,038,050 | |
| Powell Industries, Inc. | 13,455 | 383,064 | |
| Preformed Line Products Co. | 1,961 | 102,462 | |
| Real Goods Solar, Inc. (a) | 1 | 1 | |
| Regal Beloit Corp. | 80,384 | 6,060,954 | |
| Revolution Lighting Technologies, Inc. (a)(b) | 7,326 | 54,286 | |
| Rockwell Automation, Inc. | 219,516 | 36,013,795 | |
| Sensata Technologies Holding BV (a)(b) | 292,485 | 13,062,380 | |
| Sunrun, Inc. (a)(b) | 104,524 | 700,311 | |
| Sunworks, Inc. (a)(b) | 12,722 | 19,465 | |
| Thermon Group Holdings, Inc. (a)(b) | 52,027 | 859,486 | |
| TPI Composites, Inc. (a) | 37,115 | 754,919 | |
| Ultralife Corp. (a) | 13,410 | 87,165 | |
| Vicor Corp. (a) | 18,023 | 350,547 | |
| Vivint Solar, Inc. (a)(b) | 34,907 | 165,808 | |
| 278,064,480 | |||
| Industrial Conglomerates - 1.9% | |||
| 3M Co. | 1,023,713 | 209,165,040 | |
| Carlisle Companies, Inc. | 111,464 | 10,554,526 | |
| General Electric Co. | 14,915,787 | 366,182,571 | |
| Honeywell International, Inc. | 1,302,893 | 180,151,015 | |
| ITT, Inc. | 140,185 | 5,657,867 | |
| Raven Industries, Inc. | 60,171 | 1,684,788 | |
| Roper Technologies, Inc. | 172,938 | 39,889,879 | |
| 813,285,686 | |||
| Machinery - 1.8% | |||
| Actuant Corp. Class A (b) | 105,914 | 2,547,232 | |
| AGCO Corp. | 111,076 | 7,603,152 | |
| Alamo Group, Inc. | 17,898 | 1,642,320 | |
| Albany International Corp. Class A | 47,080 | 2,523,488 | |
| Allison Transmission Holdings, Inc. | 274,756 | 9,542,276 | |
| Altra Industrial Motion Corp. | 46,822 | 2,156,153 | |
| American Railcar Industries, Inc. | 11,797 | 424,692 | |
| ARC Group Worldwide, Inc. (a) | 1,450 | 3,553 | |
| Astec Industries, Inc. | 38,170 | 1,896,286 | |
| Barnes Group, Inc. | 79,881 | 4,994,160 | |
| Blue Bird Corp. (a) | 4,122 | 75,020 | |
| Briggs & Stratton Corp. | 75,012 | 1,570,751 | |
| Caterpillar, Inc. | 1,011,242 | 118,810,823 | |
| Chart Industries, Inc. (a) | 59,494 | 2,007,328 | |
| CIRCOR International, Inc. | 26,680 | 1,281,174 | |
| Colfax Corp. (a) | 167,182 | 6,667,218 | |
| Columbus McKinnon Corp. (NY Shares) | 35,569 | 1,174,844 | |
| Commercial Vehicle Group, Inc. (a) | 77,079 | 457,849 | |
| Crane Co. | 92,238 | 6,846,827 | |
| Cummins, Inc. | 263,695 | 42,027,709 | |
| Deere & Co. | 504,280 | 58,461,180 | |
| Dmc Global, Inc. | 17,783 | 230,290 | |
| Donaldson Co., Inc. | 227,086 | 10,729,814 | |
| Douglas Dynamics, Inc. | 38,692 | 1,350,351 | |
| Dover Corp. | 262,682 | 22,296,448 | |
| Eastern Co. | 5,588 | 146,126 | |
| Energy Recovery, Inc. (a)(b) | 61,650 | 400,725 | |
| EnPro Industries, Inc. | 33,499 | 2,360,675 | |
| ESCO Technologies, Inc. | 41,567 | 2,263,323 | |
| ExOne Co. (a)(b) | 13,829 | 111,877 | |
| Federal Signal Corp. | 91,334 | 1,707,032 | |
| Flowserve Corp. | 226,246 | 8,886,943 | |
| Franklin Electric Co., Inc. | 62,330 | 2,402,822 | |
| FreightCar America, Inc. | 19,411 | 352,504 | |
| Gardner Denver Holdings, Inc. (b) | 127,416 | 2,993,002 | |
| Gencor Industries, Inc. (a) | 2,773 | 42,704 | |
| Global Brass & Copper Holdings, Inc. | 34,001 | 1,014,930 | |
| Gorman-Rupp Co. | 28,251 | 859,960 | |
| Graco, Inc. | 95,451 | 11,025,545 | |
| Graham Corp. | 12,124 | 242,844 | |
| Greenbrier Companies, Inc. (b) | 47,653 | 2,044,314 | |
| Hardinge, Inc. | 14,874 | 203,625 | |
| Harsco Corp. (a) | 144,208 | 2,465,957 | |
| Hillenbrand, Inc. | 107,808 | 3,854,136 | |
| Hurco Companies, Inc. | 6,325 | 222,324 | |
| Hyster-Yale Materials Handling Class A | 17,565 | 1,250,277 | |
| IDEX Corp. | 131,232 | 15,430,259 | |
| Illinois Tool Works, Inc. | 529,610 | 72,826,671 | |
| Ingersoll-Rand PLC | 433,238 | 36,994,193 | |
| Jason Industries, Inc. (a) | 13,118 | 16,266 | |
| John Bean Technologies Corp. | 55,934 | 4,961,346 | |
| Kadant, Inc. | 18,429 | 1,600,559 | |
| Kennametal, Inc. | 136,498 | 4,777,430 | |
| L.B. Foster Co. Class A | 13,680 | 261,288 | |
| Lincoln Electric Holdings, Inc. | 100,440 | 8,722,210 | |
| Lindsay Corp. (b) | 16,477 | 1,426,414 | |
| Lydall, Inc. (a) | 28,864 | 1,356,608 | |
| Manitex International, Inc. (a) | 11,053 | 101,467 | |
| Manitowoc Co., Inc. (a)(b) | 250,611 | 2,062,529 | |
| Meritor, Inc. (a) | 154,933 | 3,076,969 | |
| Middleby Corp. (a) | 99,566 | 12,117,182 | |
| Milacron Holdings Corp. (a) | 88,730 | 1,415,244 | |
| Miller Industries, Inc. | 16,197 | 406,545 | |
| Mueller Industries, Inc. | 98,286 | 2,931,871 | |
| Mueller Water Products, Inc. Class A | 293,253 | 3,516,103 | |
| Navistar International Corp. New (a)(b) | 114,244 | 3,902,575 | |
| NN, Inc. | 43,595 | 1,111,673 | |
| Nordson Corp. | 91,551 | 10,006,524 | |
| Omega Flex, Inc. | 5,880 | 340,981 | |
| Oshkosh Corp. | 126,887 | 9,465,770 | |
| PACCAR, Inc. | 598,876 | 39,723,445 | |
| Park-Ohio Holdings Corp. | 13,382 | 533,273 | |
| Parker Hannifin Corp. | 224,266 | 36,082,157 | |
| Pentair PLC | 293,393 | 18,205,036 | |
| ProPetro Holding Corp. (b) | 100,689 | 1,158,930 | |
| Proto Labs, Inc. (a)(b) | 43,461 | 3,120,500 | |
| RBC Bearings, Inc. (a) | 41,703 | 4,598,590 | |
| Rexnord Corp. (a) | 169,317 | 4,043,290 | |
| Snap-On, Inc. (b) | 97,697 | 14,417,146 | |
| Spartan Motors, Inc. | 44,931 | 413,365 | |
| SPX Corp. (a) | 68,191 | 1,643,403 | |
| SPX Flow, Inc. (a) | 72,709 | 2,433,570 | |
| Standex International Corp. | 20,721 | 1,977,819 | |
| Stanley Black & Decker, Inc. | 263,099 | 37,886,256 | |
| Sun Hydraulics Corp. | 42,205 | 2,022,042 | |
| Supreme Industries, Inc. Class A | 19,310 | 404,351 | |
| Tennant Co. | 30,833 | 1,879,271 | |
| Terex Corp. | 170,082 | 6,556,661 | |
| The L.S. Starrett Co. Class A | 4,836 | 35,303 | |
| Timken Co. | 116,166 | 5,210,045 | |
| Titan International, Inc. | 99,148 | 850,690 | |
| Toro Co. | 182,747 | 11,271,835 | |
| TriMas Corp. (a) | 72,524 | 1,755,081 | |
| Trinity Industries, Inc. | 263,641 | 7,603,406 | |
| Twin Disc, Inc. (a)(b) | 8,286 | 143,845 | |
| Wabash National Corp. (b) | 105,115 | 2,209,517 | |
| WABCO Holdings, Inc. (a) | 85,901 | 12,337,102 | |
| Wabtec Corp. | 148,338 | 10,468,213 | |
| Watts Water Technologies, Inc. Class A | 51,551 | 3,180,697 | |
| Woodward, Inc. | 92,622 | 6,502,991 | |
| Xerium Technologies, Inc. (a) | 10,544 | 63,791 | |
| Xylem, Inc. | 308,987 | 19,178,823 | |
| 808,911,704 | |||
| Marine - 0.0% | |||
| Genco Shipping & Trading Ltd. (a)(b) | 10,301 | 143,287 | |
| Kirby Corp. (a)(b) | 89,632 | 5,610,963 | |
| Matson, Inc. | 69,658 | 1,797,176 | |
| 7,551,426 | |||
| Professional Services - 0.4% | |||
| Acacia Research Corp. (a) | 73,187 | 237,858 | |
| Advisory Board Co. (a) | 68,427 | 3,643,738 | |
| Barrett Business Services, Inc. | 8,858 | 456,896 | |
| BG Staffing, Inc. (b) | 5,516 | 89,194 | |
| CBIZ, Inc. (a) | 94,868 | 1,437,250 | |
| CDI Corp. (a) | 12,621 | 103,492 | |
| Cogint, Inc. (a)(b) | 74,077 | 362,977 | |
| CRA International, Inc. | 15,589 | 585,055 | |
| Dun & Bradstreet Corp. | 69,069 | 7,697,049 | |
| Equifax, Inc. | 205,395 | 29,262,626 | |
| Exponent, Inc. | 49,089 | 3,342,961 | |
| Franklin Covey Co. (a) | 19,900 | 374,120 | |
| FTI Consulting, Inc. (a) | 78,630 | 2,666,343 | |
| GP Strategies Corp. (a) | 22,618 | 646,875 | |
| Heidrick & Struggles International, Inc. | 29,141 | 531,823 | |
| Hill International, Inc. (a) | 55,142 | 261,925 | |
| Hudson Global, Inc. (a) | 13,947 | 20,502 | |
| Huron Consulting Group, Inc. (a) | 39,007 | 1,179,962 | |
| ICF International, Inc. (a) | 34,131 | 1,639,995 | |
| IHS Markit Ltd. (a) | 539,528 | 25,271,492 | |
| Insperity, Inc. | 32,267 | 2,591,040 | |
| Kelly Services, Inc. Class A (non-vtg.) | 51,237 | 1,108,256 | |
| Kforce, Inc. | 36,597 | 658,746 | |
| Korn/Ferry International | 104,534 | 3,483,073 | |
| Manpower, Inc. | 113,986 | 12,710,579 | |
| Marathon Patent Group, Inc. (a)(b) | 8,838 | 3,871 | |
| Mastech Digital, Inc. (a) | 373 | 3,394 | |
| MISTRAS Group, Inc. (a) | 29,557 | 558,923 | |
| Navigant Consulting, Inc. (a) | 75,747 | 1,161,202 | |
| Nielsen Holdings PLC | 596,445 | 23,171,888 | |
| On Assignment, Inc. (a) | 80,032 | 3,817,526 | |
| Pendrell Corp. (a) | 15,028 | 101,890 | |
| RCM Technologies, Inc. (a) | 9,908 | 53,404 | |
| Resources Connection, Inc. | 51,824 | 660,756 | |
| Robert Half International, Inc. | 211,379 | 9,575,469 | |
| RPX Corp. (a) | 97,220 | 1,269,693 | |
| TransUnion Holding Co., Inc. (a) | 255,382 | 12,222,583 | |
| TriNet Group, Inc. (a) | 66,298 | 2,368,828 | |
| TrueBlue, Inc. (a) | 75,110 | 1,536,000 | |
| Verisk Analytics, Inc. (a) | 260,972 | 21,151,781 | |
| Volt Information Sciences, Inc. (a) | 6,248 | 19,994 | |
| WageWorks, Inc. (a) | 80,292 | 4,733,213 | |
| Willdan Group, Inc. (a) | 10,974 | 340,304 | |
| 183,114,546 | |||
| Road & Rail - 0.9% | |||
| AMERCO | 10,691 | 3,989,988 | |
| ArcBest Corp. | 43,696 | 1,297,771 | |
| Avis Budget Group, Inc. (a)(b) | 143,156 | 5,186,542 | |
| Celadon Group, Inc. (b) | 62,978 | 314,890 | |
| Covenant Transport Group, Inc. Class A (a) | 19,818 | 475,830 | |
| CSX Corp. | 1,571,799 | 78,904,310 | |
| Daseke, Inc. (a)(b) | 34,697 | 454,531 | |
| Genesee & Wyoming, Inc. Class A (a) | 108,225 | 7,419,906 | |
| Heartland Express, Inc. (b) | 91,092 | 2,019,510 | |
| J.B. Hunt Transport Services, Inc. | 147,712 | 14,607,240 | |
| Kansas City Southern | 182,352 | 18,860,667 | |
| Knight Transportation, Inc. (b) | 113,018 | 4,413,353 | |
| Landstar System, Inc. | 76,087 | 7,102,721 | |
| Marten Transport Ltd. | 73,518 | 1,260,834 | |
| Norfolk Southern Corp. | 494,111 | 59,550,258 | |
| Old Dominion Freight Lines, Inc. | 117,920 | 11,780,208 | |
| P.A.M. Transportation Services, Inc. (a) | 3,193 | 63,094 | |
| Patriot Transportation Holding, Inc. (a) | 1,280 | 24,717 | |
| Roadrunner Transportation Systems, Inc. (a) | 43,638 | 325,976 | |
| Ryder System, Inc. | 90,251 | 7,003,478 | |
| Saia, Inc. (a) | 39,382 | 2,227,052 | |
| Schneider National, Inc. Class B (b) | 73,442 | 1,634,085 | |
| Swift Transporation Co. (a)(b) | 138,111 | 3,874,014 | |
| U.S.A. Truck, Inc. (a) | 7,889 | 87,962 | |
| Union Pacific Corp. | 1,382,528 | 145,580,198 | |
| Universal Logistics Holdings, Inc. | 12,296 | 204,114 | |
| Werner Enterprises, Inc. (b) | 69,717 | 2,307,633 | |
| YRC Worldwide, Inc. (a) | 47,961 | 642,198 | |
| 381,613,080 | |||
| Trading Companies & Distributors - 0.3% | |||
| AeroCentury Corp. (a) | 688 | 8,669 | |
| Air Lease Corp. Class A | 168,551 | 6,849,913 | |
| Aircastle Ltd. | 96,241 | 2,157,723 | |
| Applied Industrial Technologies, Inc. | 64,348 | 3,667,836 | |
| Beacon Roofing Supply, Inc. (a) | 111,136 | 5,234,506 | |
| BlueLinx Corp. (a) | 2,338 | 22,819 | |
| BMC Stock Holdings, Inc. (a) | 96,728 | 1,963,578 | |
| CAI International, Inc. (a) | 29,270 | 907,077 | |
| DXP Enterprises, Inc. (a) | 22,844 | 618,844 | |
| Fastenal Co. (b) | 510,029 | 21,762,937 | |
| GATX Corp. (b) | 67,450 | 4,086,121 | |
| H&E Equipment Services, Inc. | 49,244 | 1,159,204 | |
| HD Supply Holdings, Inc. (a) | 339,883 | 11,318,104 | |
| Herc Holdings, Inc. (a)(b) | 42,814 | 1,807,607 | |
| Houston Wire & Cable Co. | 15,647 | 89,970 | |
| Huttig Building Products, Inc. (a) | 22,831 | 130,137 | |
| Kaman Corp. | 42,373 | 2,077,972 | |
| Lawson Products, Inc. (a) | 6,300 | 150,255 | |
| MRC Global, Inc. (a) | 173,407 | 2,734,628 | |
| MSC Industrial Direct Co., Inc. Class A | 88,439 | 6,091,678 | |
| Neff Corp. (a) | 8,761 | 218,587 | |
| Nexeo Solutions, Inc. (a) | 103,751 | 743,895 | |
| Now, Inc. (a) | 176,983 | 2,063,622 | |
| Rush Enterprises, Inc. Class A (a) | 64,888 | 2,659,759 | |
| SiteOne Landscape Supply, Inc. (a)(b) | 67,882 | 3,410,392 | |
| Textainer Group Holdings Ltd. (b) | 42,716 | 758,209 | |
| Titan Machinery, Inc. (a) | 24,582 | 317,108 | |
| Triton International Ltd. | 53,680 | 1,981,866 | |
| United Rentals, Inc. (a) | 143,088 | 16,892,969 | |
| Univar, Inc. (a) | 178,396 | 5,032,551 | |
| Veritiv Corp. (a) | 19,444 | 544,432 | |
| W.W. Grainger, Inc. (b) | 90,821 | 14,764,770 | |
| Watsco, Inc. | 53,435 | 7,874,182 | |
| WESCO International, Inc. (a) | 73,100 | 3,687,895 | |
| Willis Lease Finance Corp. (a) | 2,668 | 63,498 | |
| 133,853,313 | |||
| Transportation Infrastructure - 0.0% | |||
| Macquarie Infrastructure Co. LLC | 130,429 | 9,714,352 | |
| SEACOR Marine Holdings, Inc. (b) | 30,560 | 391,474 | |
| 10,105,826 | |||
| TOTAL INDUSTRIALS | 4,674,762,434 | ||
| INFORMATION TECHNOLOGY - 22.5% | |||
| Communications Equipment - 1.1% | |||
| ADTRAN, Inc. | 74,924 | 1,655,820 | |
| Aerohive Networks, Inc. (a) | 130,171 | 449,090 | |
| Applied Optoelectronics, Inc. (a)(b) | 29,272 | 1,730,561 | |
| Arista Networks, Inc. (a)(b) | 74,208 | 13,071,739 | |
| Arris International PLC (a) | 323,592 | 9,015,273 | |
| Aviat Networks, Inc. (a) | 5,550 | 85,914 | |
| Black Box Corp. | 16,753 | 50,259 | |
| Blonder Tongue Laboratories, Inc. (a) | 3,352 | 1,445 | |
| Brocade Communications Systems, Inc. | 716,208 | 8,866,655 | |
| CalAmp Corp. (a) | 63,415 | 1,175,714 | |
| Calix Networks, Inc. (a) | 55,272 | 270,833 | |
| Carvana Co. Class A (b) | 26,177 | 467,259 | |
| Ciena Corp. (a)(b) | 238,403 | 5,151,889 | |
| Cisco Systems, Inc. | 8,562,233 | 275,789,525 | |
| Clearfield, Inc. (a)(b) | 16,017 | 195,407 | |
| CommScope Holding Co., Inc. (a) | 326,580 | 10,796,735 | |
| Communications Systems, Inc. | 4,311 | 15,563 | |
| Comtech Telecommunications Corp. | 38,555 | 754,521 | |
| Dasan Zhone Solutions, Inc. (a) | 1,172 | 7,688 | |
| Digi International, Inc. (a) | 37,099 | 341,311 | |
| EchoStar Holding Corp. Class A (a) | 85,828 | 5,175,428 | |
| EMCORE Corp. (a) | 50,451 | 459,104 | |
| Extreme Networks, Inc. (a) | 245,320 | 2,804,008 | |
| F5 Networks, Inc. (a) | 110,573 | 13,200,205 | |
| Finisar Corp. (a) | 193,129 | 4,664,065 | |
| Harmonic, Inc. (a)(b) | 134,269 | 436,374 | |
| Harris Corp. | 209,532 | 25,751,483 | |
| Infinera Corp. (a)(b) | 259,331 | 2,193,940 | |
| InterDigital, Inc. | 59,150 | 4,220,353 | |
| Juniper Networks, Inc. | 647,360 | 17,951,293 | |
| KVH Industries, Inc. (a) | 23,641 | 278,964 | |
| Lantronix, Inc. (a) | 71 | 150 | |
| Lumentum Holdings, Inc. (a)(b) | 94,599 | 5,377,953 | |
| Motorola Solutions, Inc. | 275,488 | 24,276,003 | |
| NETGEAR, Inc. (a) | 57,212 | 2,746,176 | |
| NetScout Systems, Inc. (a) | 150,999 | 4,945,217 | |
| Network-1 Security Solutions, Inc. | 21,477 | 81,613 | |
| Oclaro, Inc. (a)(b) | 207,242 | 1,742,905 | |
| Optical Cable Corp. (a) | 564 | 1,382 | |
| Palo Alto Networks, Inc. (a) | 156,219 | 20,728,699 | |
| Parkervision, Inc. (a)(b) | 10,028 | 19,254 | |
| PC-Tel, Inc. | 11,999 | 77,754 | |
| Plantronics, Inc. | 53,885 | 2,297,118 | |
| Relm Wireless Corp. | 9,436 | 36,800 | |
| Resonant, Inc. (a)(b) | 2,385 | 10,852 | |
| ShoreTel, Inc. (a) | 114,759 | 854,955 | |
| Sonus Networks, Inc. (a) | 82,074 | 567,131 | |
| Tessco Technologies, Inc. | 7,287 | 95,460 | |
| Ubiquiti Networks, Inc. (a)(b) | 44,626 | 2,659,263 | |
| ViaSat, Inc. (a)(b) | 93,287 | 5,933,986 | |
| Viavi Solutions, Inc. (a) | 389,051 | 3,906,072 | |
| Westell Technologies, Inc. Class A (a) | 18,994 | 54,513 | |
| 483,441,674 | |||
| Electronic Equipment & Components - 1.0% | |||
| Amphenol Corp. Class A | 523,273 | 42,353,717 | |
| Anixter International, Inc. (a) | 51,288 | 3,785,054 | |
| Applied DNA Sciences, Inc. (a)(b) | 18,968 | 39,264 | |
| Arrow Electronics, Inc. (a) | 174,121 | 13,830,431 | |
| Avnet, Inc. | 219,819 | 8,478,419 | |
| AVX Corp. | 141,087 | 2,461,968 | |
| Badger Meter, Inc. | 74,053 | 3,399,033 | |
| Bel Fuse, Inc. Class B (non-vtg.) | 12,097 | 308,474 | |
| Belden, Inc. | 76,472 | 5,893,697 | |
| Benchmark Electronics, Inc. (a) | 73,834 | 2,399,605 | |
| Cardtronics PLC (a) | 76,739 | 1,993,679 | |
| CDW Corp. | 262,789 | 16,666,078 | |
| ClearSign Combustion Corp. (a)(b) | 7,019 | 21,408 | |
| Cognex Corp. | 154,691 | 16,856,678 | |
| Coherent, Inc. (a) | 41,706 | 9,730,844 | |
| Control4 Corp. (a) | 35,202 | 871,602 | |
| Corning, Inc. | 1,571,612 | 45,199,561 | |
| CTS Corp. | 48,442 | 1,089,945 | |
| CUI Global, Inc. (a)(b) | 26,608 | 102,973 | |
| Daktronics, Inc. | 49,334 | 475,086 | |
| Dell Technologies, Inc. | 232,199 | 17,398,671 | |
| Dolby Laboratories, Inc. Class A | 101,632 | 5,128,351 | |
| Echelon Corp. (a) | 3,219 | 14,904 | |
| Electro Scientific Industries, Inc. (a) | 113,580 | 1,399,306 | |
| eMagin Corp. (a) | 5,084 | 10,931 | |
| ePlus, Inc. (a) | 21,340 | 1,786,158 | |
| Fabrinet (a) | 63,037 | 2,448,357 | |
| FARO Technologies, Inc. (a) | 24,409 | 840,890 | |
| Fitbit, Inc. (a)(b) | 275,332 | 1,660,252 | |
| FLIR Systems, Inc. | 235,820 | 8,961,160 | |
| Frequency Electronics, Inc. (a) | 2,550 | 20,349 | |
| Giga-Tronics, Inc. (a) | 2,579 | 1,554 | |
| I. D. Systems Inc. (a) | 6,071 | 38,490 | |
| Identiv, Inc. (a) | 10,618 | 52,134 | |
| IEC Electronics Corp. (a) | 86 | 356 | |
| II-VI, Inc. (a) | 95,705 | 3,431,024 | |
| Insight Enterprises, Inc. (a) | 62,606 | 2,509,248 | |
| Intellicheck, Inc. (a)(b) | 545 | 1,417 | |
| IPG Photonics Corp. (a) | 63,918 | 11,236,145 | |
| Iteris, Inc. (a)(b) | 32,677 | 209,786 | |
| Itron, Inc. (a) | 55,882 | 4,057,033 | |
| Jabil, Inc. | 305,429 | 9,575,199 | |
| KEMET Corp. (a) | 73,106 | 1,747,964 | |
| KEY Tronic Corp. (a) | 6,483 | 46,094 | |
| Keysight Technologies, Inc. (a) | 331,556 | 13,547,378 | |
| Kimball Electronics, Inc. (a) | 30,376 | 578,663 | |
| Knowles Corp. (a)(b) | 178,238 | 2,614,751 | |
| LightPath Technologies, Inc. Class A (a) | 376 | 981 | |
| Littelfuse, Inc. | 39,308 | 7,317,577 | |
| LRAD Corp. (a) | 56,581 | 96,754 | |
| Luna Innovations, Inc. (a) | 1,444 | 2,180 | |
| Maxwell Technologies, Inc. (a) | 38,769 | 215,943 | |
| Mesa Laboratories, Inc. | 4,836 | 660,453 | |
| Methode Electronics, Inc. Class A | 56,055 | 2,292,650 | |
| MicroVision, Inc. (a)(b) | 117,860 | 279,328 | |
| MTS Systems Corp. (b) | 29,288 | 1,417,539 | |
| National Instruments Corp. | 178,144 | 7,195,236 | |
| Neonode, Inc. (a)(b) | 33,197 | 41,828 | |
| NetList, Inc. (a)(b) | 104,599 | 73,219 | |
| Novanta, Inc. (a) | 69,461 | 2,715,925 | |
| OSI Systems, Inc. (a) | 28,365 | 2,355,997 | |
| Park Electrochemical Corp. | 28,127 | 510,786 | |
| PC Connection, Inc. | 26,383 | 673,030 | |
| PC Mall, Inc. (a)(b) | 8,716 | 114,615 | |
| Perceptron, Inc. (a) | 13,154 | 101,417 | |
| Plexus Corp. (a) | 72,969 | 3,800,226 | |
| RadiSys Corp. (a) | 34,231 | 53,743 | |
| Research Frontiers, Inc. (a)(b) | 16,855 | 19,889 | |
| RF Industries Ltd. | 5,778 | 10,400 | |
| Richardson Electronics Ltd. | 23,707 | 132,759 | |
| Rogers Corp. (a) | 31,193 | 3,697,930 | |
| Sanmina Corp. (a) | 138,110 | 5,172,220 | |
| ScanSource, Inc. (a) | 36,663 | 1,439,023 | |
| SYNNEX Corp. | 50,673 | 6,060,998 | |
| Systemax, Inc. | 23,392 | 571,700 | |
| TE Connectivity Ltd. | 603,729 | 48,056,828 | |
| Tech Data Corp. (a) | 55,538 | 6,125,286 | |
| Trimble, Inc. (a) | 431,914 | 16,706,434 | |
| TTM Technologies, Inc. (a)(b) | 135,794 | 1,933,707 | |
| Uni-Pixel, Inc. (a)(b) | 49,445 | 5,444 | |
| Universal Display Corp. | 75,720 | 9,624,012 | |
| VeriFone Systems, Inc. (a) | 198,885 | 3,931,956 | |
| Vishay Intertechnology, Inc. | 233,503 | 4,133,003 | |
| Vishay Precision Group, Inc. (a) | 9,596 | 209,673 | |
| Wayside Technology Group, Inc. | 1,232 | 18,850 | |
| Wireless Telecom Group, Inc. (a) | 11,200 | 16,464 | |
| Zebra Technologies Corp. Class A (a) | 89,788 | 9,256,245 | |
| 412,316,329 | |||
| Internet Software & Services - 4.4% | |||
| 2U, Inc. (a)(b) | 68,060 | 3,409,806 | |
| Actua Corp. (a)(b) | 58,635 | 750,528 | |
| Akamai Technologies, Inc. (a) | 294,471 | 13,884,308 | |
| Alarm.com Holdings, Inc. (a)(b) | 24,291 | 1,091,152 | |
| Alphabet, Inc.: | |||
| Class A (a) | 508,559 | 485,795,899 | |
| Class C (a) | 512,009 | 480,945,414 | |
| Amber Road, Inc. (a) | 55,819 | 449,901 | |
| Angie's List, Inc. (a)(b) | 57,858 | 703,553 | |
| AppFolio, Inc. (a) | 18,857 | 808,965 | |
| Apptio, Inc. Class A | 10,079 | 179,406 | |
| Autobytel, Inc. (a) | 9,434 | 68,491 | |
| Bankrate, Inc. (a) | 83,183 | 1,152,085 | |
| Bazaarvoice, Inc. (a) | 201,642 | 957,800 | |
| Benefitfocus, Inc. (a) | 24,805 | 765,234 | |
| BlackLine, Inc. (b) | 26,716 | 824,723 | |
| Blucora, Inc. (a) | 67,133 | 1,530,632 | |
| Box, Inc. Class A (a) | 112,627 | 2,209,742 | |
| Brightcove, Inc. (a) | 59,246 | 417,684 | |
| BroadVision, Inc. (a) | 490 | 1,936 | |
| Carbonite, Inc. (a)(b) | 40,379 | 807,580 | |
| Care.com, Inc. (a) | 25,585 | 383,007 | |
| ChannelAdvisor Corp. (a) | 32,537 | 377,429 | |
| Cloudera, Inc. (b) | 72,946 | 1,415,152 | |
| CommerceHub, Inc.: | |||
| Series A (a) | 21,320 | 472,664 | |
| Series C (a) | 54,178 | 1,150,199 | |
| Cornerstone OnDemand, Inc. (a) | 79,186 | 2,769,926 | |
| CoStar Group, Inc. (a) | 54,807 | 15,708,782 | |
| Coupa Software, Inc. | 54,059 | 1,646,637 | |
| Determine, Inc. (a) | 552 | 1,110 | |
| DHI Group, Inc. (a) | 141,360 | 275,652 | |
| eBay, Inc. (a) | 1,720,569 | 62,164,158 | |
| eGain Communications Corp. (a) | 8,558 | 14,549 | |
| Endurance International Group Holdings, Inc. (a) | 119,063 | 916,785 | |
| Envestnet, Inc. (a) | 69,312 | 3,080,918 | |
| Facebook, Inc. Class A (a) | 4,046,445 | 695,867,147 | |
| Five9, Inc. (a) | 81,974 | 1,762,441 | |
| GlowPoint, Inc. (a) | 18,770 | 5,068 | |
| GoDaddy, Inc. (a)(b) | 96,243 | 4,313,611 | |
| Gogo, Inc. (a)(b) | 109,584 | 1,535,272 | |
| GrubHub, Inc. (a)(b) | 145,837 | 8,325,834 | |
| GTT Communications, Inc. (a) | 50,744 | 1,611,122 | |
| Hortonworks, Inc. (a) | 69,183 | 1,175,419 | |
| IAC/InterActiveCorp (a) | 125,109 | 14,201,123 | |
| Instructure, Inc. (a) | 8,268 | 244,733 | |
| Internap Network Services Corp. (a)(b) | 99,683 | 445,583 | |
| Inuvo, Inc. (a) | 9,640 | 9,833 | |
| iPass, Inc. (a) | 33,662 | 18,851 | |
| j2 Global, Inc. (b) | 83,229 | 6,265,479 | |
| Leaf Group Ltd. (a) | 19,244 | 136,632 | |
| Limelight Networks, Inc. (a) | 85,727 | 307,760 | |
| Liquidity Services, Inc. (a) | 37,923 | 216,161 | |
| LivePerson, Inc. (a) | 99,233 | 1,329,722 | |
| LogMeIn, Inc. | 88,256 | 10,096,486 | |
| Marchex, Inc. Class B (a) | 28,685 | 88,637 | |
| Marin Software, Inc. (a) | 9,976 | 11,472 | |
| Match Group, Inc. (a)(b) | 78,674 | 1,711,160 | |
| MaxPoint Interactive, Inc. (a) | 1,466 | 20,099 | |
| MeetMe, Inc. (a)(b) | 113,904 | 446,504 | |
| MINDBODY, Inc. (a)(b) | 51,352 | 1,214,475 | |
| MuleSoft, Inc. Class A (b) | 52,013 | 1,133,883 | |
| New Relic, Inc. (a) | 60,180 | 2,882,622 | |
| NIC, Inc. | 110,917 | 1,813,493 | |
| NumereX Corp. Class A (a) | 13,747 | 53,476 | |
| Nutanix, Inc. Class A (b) | 87,220 | 1,918,840 | |
| Okta, Inc. (b) | 46,160 | 1,245,858 | |
| Ominto, Inc. (a)(b) | 11,014 | 35,796 | |
| Pandora Media, Inc. (a)(b) | 408,712 | 3,453,616 | |
| Q2 Holdings, Inc. (a) | 48,710 | 1,977,626 | |
| QuinStreet, Inc. (a) | 38,666 | 206,863 | |
| Qumu Corp. (a) | 6,017 | 16,908 | |
| Quotient Technology, Inc. (a)(b) | 132,658 | 1,989,870 | |
| Reis, Inc. | 8,134 | 139,091 | |
| Rocket Fuel, Inc. (a)(b) | 59,472 | 154,032 | |
| SecureWorks Corp. (a)(b) | 18,872 | 193,061 | |
| Shutterstock, Inc. (a)(b) | 29,764 | 999,475 | |
| Spark Networks, Inc. (a)(b) | 16,620 | 20,775 | |
| SPS Commerce, Inc. (a) | 30,117 | 1,834,728 | |
| Stamps.com, Inc. (a)(b) | 27,053 | 5,173,886 | |
| Support.com, Inc. (a) | 39,218 | 92,554 | |
| Synacor, Inc. (a)(b) | 20,037 | 46,085 | |
| TechTarget, Inc. (a) | 23,593 | 234,514 | |
| The Trade Desk, Inc. (b) | 37,435 | 1,982,932 | |
| Travelzoo, Inc. (a) | 5,383 | 43,871 | |
| Tremor Video, Inc. (a) | 17,986 | 63,311 | |
| TrueCar, Inc. (a)(b) | 124,192 | 2,105,054 | |
| Twilio, Inc. Class A (a)(b) | 42,402 | 1,241,531 | |
| Twitter, Inc. (a) | 1,064,350 | 17,998,159 | |
| VeriSign, Inc. (a)(b) | 147,930 | 15,347,738 | |
| Web.com Group, Inc. (a)(b) | 88,964 | 2,250,789 | |
| WebMD Health Corp. (a)(b) | 69,214 | 4,598,578 | |
| XO Group, Inc. (a) | 81,695 | 1,521,161 | |
| Yelp, Inc. (a)(b) | 104,237 | 4,440,496 | |
| Yext, Inc. (b) | 22,445 | 292,009 | |
| YuMe, Inc. | 101,833 | 497,963 | |
| Zillow Group, Inc.: | |||
| Class A (a) | 72,361 | 2,888,651 | |
| Class C (a)(b) | 192,635 | 7,632,199 | |
| 1,927,013,925 | |||
| IT Services - 3.8% | |||
| Accenture PLC Class A | 1,060,760 | 138,704,978 | |
| Acxiom Corp. (a) | 136,727 | 3,184,372 | |
| Alliance Data Systems Corp. | 94,701 | 21,355,076 | |
| Amdocs Ltd. | 273,648 | 17,729,654 | |
| Automatic Data Processing, Inc. | 763,935 | 81,336,159 | |
| Black Knight Financial Services, Inc. Class A (a)(b) | 45,984 | 1,958,918 | |
| Blackhawk Network Holdings, Inc. (a) | 93,800 | 4,202,240 | |
| Booz Allen Hamilton Holding Corp. Class A | 251,437 | 8,576,516 | |
| Broadridge Financial Solutions, Inc. | 205,695 | 16,070,950 | |
| CACI International, Inc. Class A (a) | 43,520 | 5,648,896 | |
| Cartesian, Inc. (a) | 206 | 102 | |
| Cass Information Systems, Inc. | 15,060 | 921,973 | |
| Cognizant Technology Solutions Corp. Class A | 1,007,698 | 71,314,787 | |
| Computer Task Group, Inc. | 11,646 | 61,724 | |
| Conduent, Inc. | 300,582 | 4,962,609 | |
| Convergys Corp. | 164,874 | 3,874,539 | |
| CoreLogic, Inc. (a) | 146,089 | 6,861,800 | |
| CSG Systems International, Inc. | 60,961 | 2,359,800 | |
| CSP, Inc. | 3,696 | 37,367 | |
| CSRA, Inc. | 246,056 | 7,753,225 | |
| DST Systems, Inc. | 112,242 | 5,761,382 | |
| DXC Technology Co. | 482,546 | 41,016,410 | |
| Edgewater Technology, Inc. (a) | 2,875 | 18,400 | |
| EPAM Systems, Inc. (a) | 77,553 | 6,307,385 | |
| Euronet Worldwide, Inc. (a) | 88,098 | 8,657,390 | |
| Everi Holdings, Inc. (a) | 99,354 | 766,019 | |
| EVERTEC, Inc. | 105,730 | 1,945,432 | |
| ExlService Holdings, Inc. (a) | 59,903 | 3,371,341 | |
| Fidelity National Information Services, Inc. | 560,193 | 52,053,134 | |
| First Data Corp. Class A (a) | 335,780 | 6,181,710 | |
| Fiserv, Inc. (a) | 363,868 | 45,014,110 | |
| FleetCor Technologies, Inc. (a) | 157,293 | 22,614,015 | |
| Forrester Research, Inc. | 17,100 | 696,825 | |
| Gartner, Inc. (a) | 154,792 | 18,666,367 | |
| Genpact Ltd. | 232,461 | 6,613,515 | |
| Global Payments, Inc. | 258,559 | 24,689,799 | |
| Hackett Group, Inc. | 39,872 | 544,652 | |
| IBM Corp. | 1,465,294 | 209,581,001 | |
| Information Services Group, Inc. (a) | 18,000 | 67,500 | |
| Innodata, Inc. (a) | 14,010 | 21,716 | |
| Jack Henry & Associates, Inc. | 139,152 | 14,342,397 | |
| Leidos Holdings, Inc. | 242,832 | 14,161,962 | |
| ManTech International Corp. Class A | 47,385 | 1,905,825 | |
| MasterCard, Inc. Class A | 1,606,433 | 214,137,519 | |
| Mattersight Corp. (a)(b) | 9,437 | 22,177 | |
| Maximus, Inc. | 109,431 | 6,651,216 | |
| ModusLink Global Solutions, Inc. (a)(b) | 31,030 | 49,648 | |
| MoneyGram International, Inc. (a) | 66,937 | 1,054,927 | |
| Paychex, Inc. | 545,609 | 31,116,081 | |
| PayPal Holdings, Inc. (a) | 1,912,306 | 117,951,034 | |
| Perficient, Inc. (a) | 51,600 | 944,280 | |
| PFSweb, Inc. (a) | 22,457 | 176,961 | |
| Planet Payment, Inc. (a) | 40,113 | 158,847 | |
| Presidio, Inc. (b) | 95,619 | 1,330,060 | |
| PRG-Schultz International, Inc. (a) | 36,569 | 246,841 | |
| Sabre Corp. (b) | 349,079 | 6,437,017 | |
| Science Applications International Corp. | 74,228 | 5,483,965 | |
| ServiceSource International, Inc. (a) | 93,929 | 330,630 | |
| Square, Inc. (a) | 45,912 | 1,198,762 | |
| StarTek, Inc. (a) | 15,709 | 186,937 | |
| Sykes Enterprises, Inc. (a) | 68,849 | 1,835,514 | |
| Syntel, Inc. (b) | 56,060 | 1,012,444 | |
| Teletech Holdings, Inc. | 29,721 | 1,179,924 | |
| Teradata Corp. (a)(b) | 220,606 | 7,041,744 | |
| The Western Union Co. | 833,977 | 15,778,845 | |
| Total System Services, Inc. | 282,084 | 19,497,646 | |
| Travelport Worldwide Ltd. | 241,707 | 3,659,444 | |
| Unisys Corp. (a)(b) | 68,286 | 529,217 | |
| Vantiv, Inc. (a) | 274,434 | 19,399,739 | |
| Virtusa Corp. (a) | 48,896 | 1,775,903 | |
| Visa, Inc. Class A | 3,160,024 | 327,125,684 | |
| WEX, Inc. (a) | 68,406 | 7,465,831 | |
| WidePoint Corp. (a) | 71,654 | 38,693 | |
| 1,675,731,502 | |||
| Semiconductors & Semiconductor Equipment - 3.4% | |||
| Acacia Communications, Inc. (a)(b) | 24,135 | 1,178,512 | |
| Advanced Energy Industries, Inc. (a) | 70,933 | 5,216,413 | |
| Advanced Micro Devices, Inc. (a)(b) | 1,322,156 | 17,188,028 | |
| AEHR Test Systems (a) | 18,931 | 63,608 | |
| Alpha & Omega Semiconductor Ltd. (a) | 32,383 | 514,242 | |
| Amkor Technology, Inc. (a) | 223,902 | 1,965,860 | |
| Amtech Systems, Inc. (a) | 13,719 | 151,595 | |
| Analog Devices, Inc. | 632,839 | 52,949,639 | |
| Applied Materials, Inc. | 1,825,017 | 82,344,767 | |
| Axcelis Technologies, Inc. (a) | 45,794 | 957,095 | |
| AXT, Inc. (a)(b) | 68,422 | 533,692 | |
| Broadcom Ltd. | 687,438 | 173,282,497 | |
| Brooks Automation, Inc. | 126,012 | 3,285,133 | |
| Cabot Microelectronics Corp. | 44,714 | 3,202,417 | |
| Cavium, Inc. (a) | 113,279 | 7,171,693 | |
| Ceva, Inc. (a) | 37,331 | 1,513,772 | |
| Cirrus Logic, Inc. (a) | 109,205 | 6,331,706 | |
| Cohu, Inc. | 83,996 | 1,575,765 | |
| Cree, Inc. (a)(b) | 179,530 | 4,367,965 | |
| CVD Equipment Corp. (a)(b) | 24,298 | 267,278 | |
| CyberOptics Corp. (a)(b) | 9,251 | 140,153 | |
| Cypress Semiconductor Corp. (b) | 556,739 | 7,621,757 | |
| Diodes, Inc. (a) | 66,747 | 1,878,261 | |
| DSP Group, Inc. (a) | 64,723 | 770,204 | |
| Entegris, Inc. (a) | 244,281 | 6,216,951 | |
| Experi Corp. | 89,409 | 2,436,395 | |
| First Solar, Inc. (a)(b) | 134,619 | 6,321,708 | |
| FormFactor, Inc. (a) | 123,711 | 1,868,036 | |
| GSI Technology, Inc. (a) | 18,344 | 121,804 | |
| Ichor Holdings Ltd. | 29,846 | 682,876 | |
| Impinj, Inc. (a)(b) | 14,583 | 557,654 | |
| Inphi Corp. (a)(b) | 64,122 | 2,455,231 | |
| Integrated Device Technology, Inc. (a) | 224,546 | 5,548,532 | |
| Intel Corp. | 8,073,812 | 283,148,587 | |
| Intermolecular, Inc. (a) | 6,975 | 5,999 | |
| Intest Corp. (a) | 2,175 | 16,421 | |
| IXYS Corp. (a) | 67,452 | 1,551,396 | |
| KLA-Tencor Corp. | 267,440 | 25,056,454 | |
| Kopin Corp. (a)(b) | 88,411 | 355,412 | |
| Kulicke & Soffa Industries, Inc. (a) | 125,107 | 2,380,786 | |
| Lam Research Corp. | 272,876 | 45,291,958 | |
| Lattice Semiconductor Corp. (a) | 220,983 | 1,248,554 | |
| M/A-COM Technology Solutions Holdings, Inc. (a)(b) | 62,646 | 2,852,899 | |
| Marvell Technology Group Ltd. | 752,545 | 13,478,081 | |
| Maxim Integrated Products, Inc. | 484,561 | 22,609,616 | |
| MaxLinear, Inc. Class A (a) | 86,669 | 1,872,050 | |
| Microchip Technology, Inc. (b) | 388,920 | 33,758,256 | |
| Micron Technology, Inc. (a) | 1,773,384 | 56,695,086 | |
| Microsemi Corp. (a) | 202,154 | 10,184,519 | |
| MKS Instruments, Inc. | 93,742 | 7,719,654 | |
| Monolithic Power Systems, Inc. | 69,641 | 7,056,026 | |
| MoSys, Inc. (a)(b) | 6,042 | 5,861 | |
| Nanometrics, Inc. (a) | 38,377 | 989,743 | |
| NeoPhotonics Corp. (a)(b) | 44,702 | 261,507 | |
| NVE Corp. | 7,985 | 605,582 | |
| NVIDIA Corp. | 1,018,180 | 172,520,419 | |
| ON Semiconductor Corp. (a) | 717,972 | 12,262,962 | |
| PDF Solutions, Inc. (a)(b) | 47,788 | 725,900 | |
| Photronics, Inc. (a) | 101,617 | 802,774 | |
| Pixelworks, Inc. (a)(b) | 22,798 | 109,430 | |
| Power Integrations, Inc. | 52,203 | 3,802,989 | |
| Qorvo, Inc. (a)(b) | 214,691 | 15,719,675 | |
| Qualcomm, Inc. | 2,530,781 | 132,283,923 | |
| QuickLogic Corp. (a)(b) | 142,208 | 190,559 | |
| Rambus, Inc. (a) | 201,505 | 2,613,520 | |
| Rubicon Technology, Inc. (a)(b) | 2,504 | 20,508 | |
| Rudolph Technologies, Inc. (a) | 69,669 | 1,546,652 | |
| Semtech Corp. (a) | 111,258 | 4,183,301 | |
| Sevcon, Inc. (a) | 2,938 | 64,577 | |
| Sigma Designs, Inc. (a) | 51,095 | 319,344 | |
| Silicon Laboratories, Inc. (a) | 73,360 | 5,568,024 | |
| Skyworks Solutions, Inc. | 316,117 | 33,306,087 | |
| SolarEdge Technologies, Inc. (a) | 54,440 | 1,456,270 | |
| SunPower Corp. (a)(b) | 97,783 | 864,402 | |
| Synaptics, Inc. (a)(b) | 56,125 | 2,333,116 | |
| Teradyne, Inc. | 339,570 | 12,092,088 | |
| Texas Instruments, Inc. | 1,696,527 | 140,506,366 | |
| Ultra Clean Holdings, Inc. (a) | 60,588 | 1,397,765 | |
| Veeco Instruments, Inc. (a) | 86,705 | 1,638,725 | |
| Versum Materials, Inc. | 188,451 | 6,959,495 | |
| Xcerra Corp. (a) | 98,441 | 966,691 | |
| Xilinx, Inc. | 430,246 | 28,422,051 | |
| 1,500,503,299 | |||
| Software - 5.0% | |||
| 8x8, Inc. (a) | 162,409 | 2,298,087 | |
| A10 Networks, Inc. (a) | 73,118 | 478,923 | |
| ACI Worldwide, Inc. (a) | 200,153 | 4,555,482 | |
| Activision Blizzard, Inc. | 1,183,120 | 77,565,347 | |
| Adobe Systems, Inc. (a) | 841,242 | 130,527,109 | |
| Agilysys, Inc. (a) | 38,149 | 392,553 | |
| American Software, Inc. Class A | 55,166 | 607,378 | |
| ANSYS, Inc. (a) | 144,955 | 18,673,103 | |
| Aspen Technology, Inc. (a) | 131,521 | 8,318,703 | |
| Asure Software, Inc. (a)(b) | 8,721 | 100,989 | |
| Autodesk, Inc. (a) | 329,727 | 37,740,552 | |
| Barracuda Networks, Inc. (a) | 58,271 | 1,410,741 | |
| Blackbaud, Inc. | 80,900 | 6,828,769 | |
| Bottomline Technologies, Inc. (a) | 62,280 | 1,887,707 | |
| BroadSoft, Inc. (a)(b) | 53,585 | 2,655,137 | |
| BSQUARE Corp. (a) | 11,182 | 55,910 | |
| CA Technologies, Inc. | 535,355 | 17,763,079 | |
| Cadence Design Systems, Inc. (a) | 470,063 | 18,468,775 | |
| Callidus Software, Inc. (a) | 115,529 | 2,974,872 | |
| CDK Global, Inc. | 250,362 | 16,148,349 | |
| Citrix Systems, Inc. (a) | 260,051 | 20,338,589 | |
| CommVault Systems, Inc. (a) | 75,089 | 4,584,183 | |
| Datawatch Corp. (a) | 9,730 | 100,219 | |
| Digimarc Corp. (a)(b) | 18,523 | 572,361 | |
| Digital Turbine, Inc. (a)(b) | 41,910 | 48,616 | |
| Document Security Systems, Inc. (a) | 4,956 | 3,271 | |
| Ebix, Inc. | 35,461 | 2,046,100 | |
| Electronic Arts, Inc. (a) | 528,943 | 64,266,575 | |
| Ellie Mae, Inc. (a) | 59,098 | 4,903,952 | |
| Everbridge, Inc. | 29,747 | 689,238 | |
| Evolving Systems, Inc. (a) | 4,973 | 23,622 | |
| Exa Corp. (a) | 15,758 | 226,127 | |
| Fair Isaac Corp. | 53,660 | 7,553,182 | |
| FalconStor Software, Inc. (a)(b) | 37,427 | 13,474 | |
| FireEye, Inc. (a)(b) | 276,277 | 4,080,611 | |
| Form Holdings Corp. (a)(b) | 9,862 | 12,032 | |
| Fortinet, Inc. (a) | 253,763 | 9,693,747 | |
| Gigamon, Inc. (a) | 53,853 | 2,312,986 | |
| Glu Mobile, Inc. (a)(b) | 173,754 | 632,465 | |
| GSE Systems, Inc. (a) | 388 | 1,086 | |
| Guidance Software, Inc. (a) | 26,710 | 189,107 | |
| Guidewire Software, Inc. (a) | 129,374 | 9,794,906 | |
| HubSpot, Inc. (a)(b) | 54,014 | 3,961,927 | |
| Imperva, Inc. (a) | 51,764 | 2,311,263 | |
| Inseego Corp. (b) | 35,452 | 49,987 | |
| Intuit, Inc. | 414,561 | 58,639,653 | |
| Manhattan Associates, Inc. (a) | 127,067 | 5,343,167 | |
| Microsoft Corp. | 13,229,954 | 989,203,661 | |
| MicroStrategy, Inc. Class A (a) | 16,727 | 2,157,783 | |
| Mitek Systems, Inc. (a) | 45,058 | 457,339 | |
| MobileIron, Inc. (a) | 70,668 | 268,538 | |
| Model N, Inc. (a) | 64,636 | 875,818 | |
| Monotype Imaging Holdings, Inc. | 66,977 | 1,222,330 | |
| NetSol Technologies, Inc. (a) | 10,165 | 45,743 | |
| Nuance Communications, Inc. (a) | 427,719 | 6,873,444 | |
| Oracle Corp. | 5,148,287 | 259,113,285 | |
| Parametric Technology Corp. (a) | 196,550 | 11,006,800 | |
| Park City Group, Inc. (a)(b) | 18,083 | 227,846 | |
| Paycom Software, Inc. (a)(b) | 65,084 | 4,855,917 | |
| Paylocity Holding Corp. (a) | 39,896 | 1,960,489 | |
| Pegasystems, Inc. | 63,152 | 3,634,398 | |
| Polarityte, Inc. (a)(b) | 5,861 | 170,496 | |
| Progress Software Corp. | 78,882 | 2,648,858 | |
| Proofpoint, Inc. (a)(b) | 71,790 | 6,587,450 | |
| PROS Holdings, Inc. (a) | 40,708 | 1,072,249 | |
| QAD, Inc.: | |||
| Class A | 10,065 | 339,191 | |
| Class B | 4,298 | 115,960 | |
| Qualys, Inc. (a) | 50,519 | 2,399,653 | |
| Rapid7, Inc. (a) | 27,175 | 458,171 | |
| RealNetworks, Inc. (a) | 28,670 | 114,393 | |
| RealPage, Inc. (a) | 95,369 | 4,110,404 | |
| Red Hat, Inc. (a) | 303,397 | 32,615,178 | |
| RingCentral, Inc. (a) | 109,308 | 4,629,194 | |
| Rosetta Stone, Inc. (a) | 22,826 | 209,999 | |
| Salesforce.com, Inc. (a) | 1,141,898 | 109,039,840 | |
| SeaChange International, Inc. (a) | 36,866 | 96,220 | |
| ServiceNow, Inc. (a) | 298,950 | 34,735,001 | |
| Silver Spring Networks, Inc. (a)(b) | 66,256 | 838,801 | |
| SITO Mobile Ltd. (a)(b) | 17,979 | 76,950 | |
| Smith Micro Software, Inc. (a) | 10,363 | 11,296 | |
| Sonic Foundry, Inc. (a) | 155 | 529 | |
| Splunk, Inc. (a)(b) | 236,248 | 15,849,878 | |
| SS&C Technologies Holdings, Inc. | 293,141 | 11,347,488 | |
| Symantec Corp. | 1,047,401 | 31,401,082 | |
| Synchronoss Technologies, Inc. (a) | 70,331 | 1,180,857 | |
| Synopsys, Inc. (a) | 254,413 | 20,459,893 | |
| Tableau Software, Inc. (a)(b) | 103,158 | 7,476,892 | |
| Take-Two Interactive Software, Inc. (a) | 184,465 | 18,038,832 | |
| TeleNav, Inc. (a) | 46,856 | 304,564 | |
| The Rubicon Project, Inc. (a) | 59,339 | 223,115 | |
| TiVo Corp. | 211,366 | 3,867,998 | |
| Tyler Technologies, Inc. (a) | 58,649 | 10,134,547 | |
| Ultimate Software Group, Inc. (a)(b) | 52,907 | 10,629,016 | |
| Upland Software, Inc. (a) | 13,813 | 317,699 | |
| Varonis Systems, Inc. (a) | 31,174 | 1,209,551 | |
| Vasco Data Security International, Inc. (a) | 48,861 | 613,206 | |
| Verint Systems, Inc. (a) | 104,276 | 4,139,757 | |
| VirnetX Holding Corp. (a)(b) | 93,723 | 374,892 | |
| VMware, Inc. Class A (a)(b) | 121,491 | 13,133,177 | |
| Workday, Inc. Class A (a)(b) | 222,931 | 24,453,301 | |
| Workiva, Inc. (a) | 31,679 | 639,916 | |
| Zedge, Inc. (a) | 14,921 | 26,858 | |
| Zendesk, Inc. (a) | 130,945 | 3,587,893 | |
| Zix Corp. (a) | 69,803 | 370,654 | |
| Zynga, Inc. (a) | 1,392,357 | 5,221,339 | |
| 2,219,019,640 | |||
| Technology Hardware, Storage & Peripherals - 3.8% | |||
| 3D Systems Corp. (a)(b) | 180,858 | 2,271,576 | |
| Apple, Inc. | 8,935,155 | 1,465,365,349 | |
| Astro-Med, Inc. | 4,606 | 62,642 | |
| Avid Technology, Inc. (a)(b) | 38,570 | 170,094 | |
| Concurrent Computer Corp. | 6,675 | 42,186 | |
| CPI Card Group (b) | 22,281 | 21,396 | |
| Cray, Inc. (a) | 76,017 | 1,432,920 | |
| Diebold Nixdorf, Inc. | 123,985 | 2,535,493 | |
| Eastman Kodak Co. (a)(b) | 64,018 | 496,140 | |
| Electronics for Imaging, Inc. (a)(b) | 82,143 | 2,921,005 | |
| Everspin Technologies, Inc. (b) | 9,978 | 162,641 | |
| Hewlett Packard Enterprise Co. | 2,841,574 | 51,318,826 | |
| HP, Inc. | 2,885,248 | 55,050,532 | |
| Immersion Corp. (a)(b) | 59,681 | 436,865 | |
| Intevac, Inc. (a) | 29,097 | 264,783 | |
| NCR Corp. (a) | 216,399 | 7,905,055 | |
| NetApp, Inc. | 460,042 | 17,785,224 | |
| Pure Storage, Inc. Class A (a)(b) | 153,259 | 2,282,027 | |
| Quantum Corp. (a)(b) | 41,835 | 230,511 | |
| Seagate Technology LLC (b) | 503,012 | 15,859,968 | |
| Super Micro Computer, Inc. (a)(b) | 65,674 | 1,748,570 | |
| Transact Technologies, Inc. | 3,411 | 33,257 | |
| U.S.A. Technologies, Inc. (a)(b) | 68,908 | 375,549 | |
| Western Digital Corp. | 496,255 | 43,804,429 | |
| Xerox Corp. | 371,484 | 11,987,789 | |
| Xplore Technologies Corp. (a) | 2,067 | 6,552 | |
| 1,684,571,379 | |||
| TOTAL INFORMATION TECHNOLOGY | 9,902,597,748 | ||
| MATERIALS - 3.3% | |||
| Chemicals - 2.2% | |||
| A. Schulman, Inc. | 45,099 | 1,371,010 | |
| Advanced Emissions Solutions, Inc. (b) | 57,241 | 594,162 | |
| AdvanSix, Inc. | 52,136 | 1,664,702 | |
| AgroFresh Solutions, Inc. (a)(b) | 38,931 | 277,189 | |
| Air Products & Chemicals, Inc. | 375,812 | 54,631,790 | |
| Albemarle Corp. U.S. | 190,401 | 22,136,020 | |
| American Vanguard Corp. | 44,829 | 907,787 | |
| Ashland Global Holdings, Inc. | 107,479 | 6,669,072 | |
| Axalta Coating Systems (a) | 374,838 | 11,065,218 | |
| Balchem Corp. | 53,639 | 4,020,779 | |
| BioAmber, Inc. (a)(b) | 17,794 | 7,776 | |
| Cabot Corp. | 106,306 | 5,600,200 | |
| Calgon Carbon Corp. | 83,129 | 1,014,174 | |
| Celanese Corp. Class A | 237,507 | 23,042,929 | |
| CF Industries Holdings, Inc. | 394,832 | 11,446,180 | |
| Chase Corp. | 19,479 | 1,821,287 | |
| Codexis, Inc. (a) | 42,409 | 235,370 | |
| Core Molding Technologies, Inc. | 10,858 | 223,349 | |
| Eastman Chemical Co. | 259,233 | 22,345,885 | |
| Ecolab, Inc. | 447,379 | 59,635,621 | |
| Ferro Corp. (a) | 133,620 | 2,574,857 | |
| Flotek Industries, Inc. (a)(b) | 98,612 | 510,810 | |
| FMC Corp. | 228,847 | 19,731,188 | |
| FutureFuel Corp. | 37,844 | 510,137 | |
| H.B. Fuller Co. | 88,055 | 4,419,480 | |
| Hawkins, Inc. | 13,930 | 496,605 | |
| Huntsman Corp. | 335,090 | 8,903,341 | |
| Ingevity Corp. (a) | 71,031 | 4,472,822 | |
| Innophos Holdings, Inc. | 32,175 | 1,469,111 | |
| Innospec, Inc. | 41,822 | 2,321,121 | |
| International Flavors & Fragrances, Inc. | 134,797 | 18,446,969 | |
| Intrepid Potash, Inc. (a)(b) | 199,844 | 741,421 | |
| KMG Chemicals, Inc. | 10,303 | 494,750 | |
| Koppers Holdings, Inc. (a) | 34,144 | 1,338,445 | |
| Kraton Performance Polymers, Inc. (a) | 55,754 | 1,830,404 | |
| Kronos Worldwide, Inc. | 34,238 | 716,601 | |
| LSB Industries, Inc. (a)(b) | 28,693 | 175,027 | |
| LyondellBasell Industries NV Class A | 566,829 | 51,349,039 | |
| Marrone Bio Innovations, Inc. (a)(b) | 15,737 | 18,727 | |
| Minerals Technologies, Inc. | 58,663 | 3,754,432 | |
| Monsanto Co. | 754,490 | 88,426,228 | |
| NewMarket Corp. | 16,721 | 6,997,906 | |
| Olin Corp. | 276,573 | 8,913,948 | |
| OMNOVA Solutions, Inc. (a) | 52,644 | 458,003 | |
| Platform Specialty Products Corp. (a)(b) | 374,823 | 4,377,933 | |
| PolyOne Corp. | 144,671 | 5,228,410 | |
| PPG Industries, Inc. | 437,630 | 45,653,562 | |
| Praxair, Inc. | 486,123 | 63,944,619 | |
| Quaker Chemical Corp. | 22,939 | 3,193,568 | |
| Rayonier Advanced Materials, Inc. | 82,695 | 1,134,575 | |
| RPM International, Inc. | 226,844 | 11,108,551 | |
| Senomyx, Inc. (a) | 66,138 | 40,020 | |
| Sensient Technologies Corp. | 86,306 | 6,226,978 | |
| Sherwin-Williams Co. | 137,857 | 46,770,744 | |
| Stepan Co. | 34,404 | 2,661,493 | |
| The Chemours Co. LLC | 310,949 | 15,258,267 | |
| The Dow Chemical Co. | 3,839,123 | 255,877,548 | |
| The Mosaic Co. | 596,228 | 11,912,635 | |
| The Scotts Miracle-Gro Co. Class A | 77,671 | 7,424,571 | |
| Trecora Resources (a) | 28,770 | 349,556 | |
| Tredegar Corp. | 71,882 | 1,171,677 | |
| Trinseo SA | 75,141 | 5,026,933 | |
| Tronox Ltd. Class A | 110,795 | 2,292,349 | |
| Valhi, Inc. | 35,553 | 77,506 | |
| Valvoline, Inc. | 351,998 | 7,494,037 | |
| W.R. Grace & Co. | 111,862 | 7,995,896 | |
| Westlake Chemical Corp. | 64,435 | 4,955,696 | |
| Yield10 Bioscience, Inc. (a)(b) | 693 | 1,864 | |
| 967,960,860 | |||
| Construction Materials - 0.1% | |||
| Eagle Materials, Inc. | 85,683 | 8,332,672 | |
| Forterra, Inc. (b) | 32,917 | 109,284 | |
| Foundation Building Materials, Inc. | 21,184 | 276,663 | |
| Martin Marietta Materials, Inc. | 109,383 | 23,188,102 | |
| Summit Materials, Inc. | 172,319 | 5,090,303 | |
| U.S. Concrete, Inc. (a)(b) | 26,762 | 2,142,298 | |
| United States Lime & Minerals, Inc. | 2,200 | 175,890 | |
| Vulcan Materials Co. | 223,084 | 27,051,166 | |
| 66,366,378 | |||
| Containers & Packaging - 0.5% | |||
| Aptargroup, Inc. | 119,670 | 10,005,609 | |
| Avery Dennison Corp. | 149,434 | 14,085,649 | |
| Ball Corp. | 589,483 | 23,573,425 | |
| Bemis Co., Inc. | 156,089 | 6,650,952 | |
| Berry Global Group, Inc. (a) | 220,167 | 12,382,192 | |
| Crown Holdings, Inc. (a) | 233,058 | 13,757,414 | |
| Graphic Packaging Holding Co. | 529,162 | 6,905,564 | |
| Greif, Inc. Class A | 63,236 | 3,822,616 | |
| International Paper Co. | 704,583 | 37,955,886 | |
| Myers Industries, Inc. | 29,894 | 562,007 | |
| Owens-Illinois, Inc. (a) | 264,706 | 6,522,356 | |
| Packaging Corp. of America | 160,703 | 18,064,624 | |
| Sealed Air Corp. | 328,644 | 14,585,221 | |
| Silgan Holdings, Inc. | 135,972 | 4,091,397 | |
| Sonoco Products Co. | 183,166 | 8,839,591 | |
| UFP Technologies, Inc. (a) | 14,187 | 377,374 | |
| WestRock Co. | 427,751 | 24,343,309 | |
| 206,525,186 | |||
| Metals & Mining - 0.4% | |||
| AK Steel Holding Corp. (a)(b) | 525,512 | 2,942,867 | |
| Alcoa Corp. | 248,002 | 10,882,328 | |
| Allegheny Technologies, Inc. (b) | 174,474 | 3,634,293 | |
| Ampco-Pittsburgh Corp. | 10,414 | 160,376 | |
| Atkore International Group, Inc. (a) | 35,003 | 583,150 | |
| Carpenter Technology Corp. | 80,027 | 3,243,494 | |
| Century Aluminum Co. (a)(b) | 86,859 | 1,695,488 | |
| Cliffs Natural Resources, Inc. (a)(b) | 454,481 | 3,799,461 | |
| Coeur d'Alene Mines Corp. (a) | 297,840 | 2,606,100 | |
| Commercial Metals Co. | 192,032 | 3,627,484 | |
| Compass Minerals International, Inc. | 56,608 | 3,781,414 | |
| Comstock Mining, Inc. (a) | 56,723 | 10,545 | |
| Freeport-McMoRan, Inc. (a) | 2,260,613 | 33,411,860 | |
| Friedman Industries | 2,001 | 11,346 | |
| General Moly, Inc. (a) | 60,513 | 26,414 | |
| Gold Resource Corp. | 109,163 | 435,560 | |
| Golden Minerals Co. (a)(b) | 71,014 | 38,561 | |
| Handy & Harman Ltd. (a) | 5,646 | 184,624 | |
| Haynes International, Inc. | 18,364 | 561,020 | |
| Hecla Mining Co. | 683,190 | 3,607,243 | |
| Kaiser Aluminum Corp. | 27,980 | 2,695,034 | |
| Materion Corp. | 30,858 | 1,178,776 | |
| McEwen Mining, Inc. (b) | 403,016 | 1,035,751 | |
| Newmont Mining Corp. | 915,669 | 35,106,749 | |
| Nucor Corp. | 538,845 | 29,695,748 | |
| Olympic Steel, Inc. | 12,703 | 231,830 | |
| Paramount Gold Nevada Corp. (a) | 7,958 | 12,176 | |
| Pershing Gold Corp. (a)(b) | 31,696 | 96,039 | |
| Real Industries, Inc. (a)(b) | 30,069 | 51,117 | |
| Reliance Steel & Aluminum Co. | 131,422 | 9,517,581 | |
| Royal Gold, Inc. | 110,834 | 10,338,596 | |
| Ryerson Holding Corp. (a) | 30,039 | 258,335 | |
| Schnitzer Steel Industries, Inc. Class A | 47,241 | 1,270,783 | |
| Solitario Exploration & Royalty Corp. (a) | 18,115 | 12,681 | |
| Steel Dynamics, Inc. | 413,913 | 14,259,303 | |
| SunCoke Energy, Inc. (a) | 99,267 | 925,168 | |
| Synalloy Corp. (a) | 8,615 | 97,780 | |
| TimkenSteel Corp. (a)(b) | 69,807 | 1,035,238 | |
| U.S. Antimony Corp. (a) | 24,962 | 7,988 | |
| U.S. Gold Corp. (a) | 46 | 111 | |
| United States Steel Corp. (b) | 307,753 | 8,189,307 | |
| Universal Stainless & Alloy Products, Inc. (a) | 6,659 | 120,728 | |
| Worthington Industries, Inc. | 71,924 | 3,593,323 | |
| 194,973,770 | |||
| Paper & Forest Products - 0.1% | |||
| Boise Cascade Co. (a) | 63,767 | 1,913,010 | |
| Clearwater Paper Corp. (a) | 29,564 | 1,374,726 | |
| Deltic Timber Corp. | 17,765 | 1,386,381 | |
| Domtar Corp. | 128,751 | 5,206,690 | |
| Kapstone Paper & Packaging Corp. | 150,928 | 3,376,259 | |
| Louisiana-Pacific Corp. (a) | 261,592 | 6,665,364 | |
| Mercer International, Inc. (SBI) | 60,804 | 671,884 | |
| Neenah Paper, Inc. | 27,129 | 2,095,715 | |
| P.H. Glatfelter Co. | 69,408 | 1,202,147 | |
| Rentech, Inc. (a) | 27,522 | 7,321 | |
| Resolute Forest Products (a) | 146,819 | 726,754 | |
| Schweitzer-Mauduit International, Inc. | 48,432 | 1,837,026 | |
| Verso Corp. (b) | 59,171 | 314,790 | |
| 26,778,067 | |||
| TOTAL MATERIALS | 1,462,604,261 | ||
| REAL ESTATE - 4.1% | |||
| Equity Real Estate Investment Trusts (REITs) - 4.0% | |||
| Acadia Realty Trust (SBI) | 161,267 | 4,626,750 | |
| Agree Realty Corp. | 50,269 | 2,519,482 | |
| Alexanders, Inc. | 6,076 | 2,543,960 | |
| Alexandria Real Estate Equities, Inc. | 159,183 | 19,310,490 | |
| Altisource Residential Corp. Class B | 86,977 | 1,053,291 | |
| American Assets Trust, Inc. | 89,595 | 3,639,349 | |
| American Campus Communities, Inc. | 225,191 | 10,716,840 | |
| American Homes 4 Rent Class A | 382,812 | 8,483,114 | |
| American Tower Corp. | 728,593 | 107,868,194 | |
| Apartment Investment & Management Co. Class A | 262,560 | 11,901,845 | |
| Apple Hospitality (REIT), Inc. | 276,107 | 5,019,625 | |
| Armada Hoffler Properties, Inc. | 73,011 | 976,157 | |
| Ashford Hospitality Prime, Inc. | 47,533 | 457,267 | |
| Ashford Hospitality Trust, Inc. | 123,613 | 767,637 | |
| AvalonBay Communities, Inc. | 234,204 | 43,967,117 | |
| Bluerock Residential Growth (REIT), Inc. | 90,320 | 914,942 | |
| Boston Properties, Inc. | 262,495 | 31,656,897 | |
| Brandywine Realty Trust (SBI) | 276,702 | 4,753,740 | |
| Brixmor Property Group, Inc. | 452,816 | 8,476,716 | |
| BRT Realty Trust (a) | 189,164 | 1,471,696 | |
| Camden Property Trust (SBI) | 145,586 | 13,027,035 | |
| CareTrust (REIT), Inc. | 113,682 | 2,192,926 | |
| CatchMark Timber Trust, Inc. | 100,692 | 1,160,979 | |
| CBL & Associates Properties, Inc. (b) | 283,674 | 2,269,392 | |
| Cedar Realty Trust, Inc. | 134,023 | 675,476 | |
| Chatham Lodging Trust | 57,137 | 1,158,738 | |
| Chesapeake Lodging Trust | 98,722 | 2,526,296 | |
| City Office REIT, Inc. | 67,579 | 864,335 | |
| Clipper Realty, Inc. (b) | 6,962 | 77,696 | |
| Colony NorthStar, Inc. (b) | 925,392 | 12,131,889 | |
| Columbia Property Trust, Inc. | 198,850 | 4,175,850 | |
| Communications Sales & Leasing, Inc. | 267,108 | 5,144,500 | |
| Community Healthcare Trust, Inc. | 41,798 | 1,110,155 | |
| Condor Hospitality Trust, Inc. | 108 | 1,130 | |
| CorEnergy Infrastructure Trust, Inc. (b) | 14,135 | 461,225 | |
| CoreSite Realty Corp. | 56,759 | 6,740,699 | |
| Corporate Office Properties Trust (SBI) | 181,324 | 6,048,969 | |
| Corrections Corp. of America | 203,536 | 5,454,765 | |
| Cousins Properties, Inc. | 673,063 | 6,293,139 | |
| Crown Castle International Corp. | 687,025 | 74,500,991 | |
| CubeSmart | 296,680 | 7,313,162 | |
| CyrusOne, Inc. | 130,176 | 8,204,993 | |
| DCT Industrial Trust, Inc. | 161,523 | 9,424,867 | |
| DDR Corp. | 536,213 | 5,190,542 | |
| DiamondRock Hospitality Co. | 332,744 | 3,656,857 | |
| Digital Realty Trust, Inc. | 272,874 | 32,291,909 | |
| Douglas Emmett, Inc. | 264,925 | 10,321,478 | |
| Duke Realty Corp. | 603,073 | 17,923,330 | |
| DuPont Fabros Technology, Inc. | 130,007 | 8,367,251 | |
| Easterly Government Properties, Inc. (b) | 30,760 | 617,046 | |
| EastGroup Properties, Inc. | 54,382 | 4,832,385 | |
| Education Realty Trust, Inc. | 129,203 | 4,992,404 | |
| Empire State Realty Trust, Inc. | 218,080 | 4,437,928 | |
| EPR Properties | 106,196 | 7,397,613 | |
| Equinix, Inc. | 132,832 | 62,219,837 | |
| Equity Commonwealth (a) | 213,360 | 6,601,358 | |
| Equity Lifestyle Properties, Inc. | 141,492 | 12,614,012 | |
| Equity Residential (SBI) | 620,908 | 41,693,972 | |
| Essex Property Trust, Inc. | 111,421 | 29,634,643 | |
| Extra Space Storage, Inc. (b) | 213,703 | 16,589,764 | |
| Farmland Partners, Inc. (b) | 105,443 | 934,225 | |
| Federal Realty Investment Trust (SBI) | 126,706 | 16,082,793 | |
| FelCor Lodging Trust, Inc. | 200,216 | 1,461,577 | |
| First Industrial Realty Trust, Inc. | 184,151 | 5,704,998 | |
| First Potomac Realty Trust | 85,240 | 948,721 | |
| Forest City Realty Trust, Inc. Class A | 359,272 | 8,608,157 | |
| Four Corners Property Trust, Inc. | 103,212 | 2,622,617 | |
| Franklin Street Properties Corp. | 176,797 | 1,762,666 | |
| Gaming & Leisure Properties | 346,079 | 13,562,836 | |
| General Growth Properties, Inc. | 1,017,602 | 21,115,242 | |
| Getty Realty Corp. | 48,238 | 1,329,439 | |
| Gladstone Commercial Corp. | 76,606 | 1,639,368 | |
| Gladstone Land Corp. | 8,000 | 111,360 | |
| Global Net Lease, Inc. | 83,478 | 1,808,133 | |
| Government Properties Income Trust | 163,137 | 3,026,191 | |
| Gramercy Property Trust | 249,250 | 7,592,155 | |
| HCP, Inc. | 798,555 | 23,804,925 | |
| Healthcare Realty Trust, Inc. | 211,777 | 7,047,939 | |
| Healthcare Trust of America, Inc. | 317,837 | 9,875,196 | |
| Hersha Hospitality Trust | 71,283 | 1,321,587 | |
| Highwoods Properties, Inc. (SBI) | 169,915 | 8,874,660 | |
| Hospitality Properties Trust (SBI) | 292,755 | 8,009,777 | |
| Host Hotels & Resorts, Inc. | 1,241,687 | 22,499,368 | |
| Hudson Pacific Properties, Inc. | 249,715 | 8,240,595 | |
| Independence Realty Trust, Inc. | 102,753 | 1,057,328 | |
| InfraReit, Inc. | 82,809 | 1,862,374 | |
| Investors Real Estate Trust | 202,786 | 1,273,496 | |
| Invitation Homes, Inc. (b) | 138,858 | 3,213,174 | |
| Iron Mountain, Inc. | 427,140 | 16,837,859 | |
| iStar Financial, Inc. (a)(b) | 102,599 | 1,191,174 | |
| JBG SMITH Properties | 143,795 | 4,706,410 | |
| Jernigan Capital, Inc. (b) | 21,201 | 412,147 | |
| Kilroy Realty Corp. | 169,012 | 11,700,701 | |
| Kimco Realty Corp. | 718,168 | 14,090,456 | |
| Kite Realty Group Trust | 145,444 | 2,926,333 | |
| Lamar Advertising Co. Class A (b) | 144,792 | 9,637,356 | |
| LaSalle Hotel Properties (SBI) | 187,702 | 5,326,983 | |
| Lexington Corporate Properties Trust | 345,008 | 3,401,779 | |
| Liberty Property Trust (SBI) | 243,797 | 10,385,752 | |
| Life Storage, Inc. | 80,608 | 5,931,943 | |
| LTC Properties, Inc. | 62,032 | 3,016,616 | |
| Mack-Cali Realty Corp. | 154,097 | 3,527,280 | |
| MedEquities Realty Trust, Inc. | 56,982 | 653,584 | |
| Medical Properties Trust, Inc. | 636,344 | 8,374,287 | |
| Mid-America Apartment Communities, Inc. | 193,973 | 20,650,366 | |
| Monmouth Real Estate Investment Corp. Class A | 107,747 | 1,750,889 | |
| Monogram Residential Trust, Inc. | 273,079 | 3,276,948 | |
| National Health Investors, Inc. | 85,662 | 6,868,379 | |
| National Retail Properties, Inc. (b) | 250,989 | 10,498,870 | |
| National Storage Affiliates Trust | 66,569 | 1,485,820 | |
| New Senior Investment Group, Inc. | 149,321 | 1,378,233 | |
| NexPoint Residential Trust, Inc. | 32,020 | 746,066 | |
| NorthStar Realty Europe Corp. | 77,758 | 966,532 | |
| Omega Healthcare Investors, Inc. (b) | 333,230 | 10,620,040 | |
| One Liberty Properties, Inc. | 42,541 | 1,021,409 | |
| Outfront Media, Inc. | 245,927 | 5,410,394 | |
| Paramount Group, Inc. | 304,533 | 4,805,531 | |
| Parkway, Inc. | 79,308 | 1,820,912 | |
| Pebblebrook Hotel Trust (b) | 119,218 | 4,004,533 | |
| Pennsylvania Real Estate Investment Trust (SBI) | 105,464 | 1,057,804 | |
| Physicians Realty Trust | 319,999 | 5,993,581 | |
| Piedmont Office Realty Trust, Inc. Class A | 250,343 | 5,069,446 | |
| Potlatch Corp. | 63,794 | 3,049,353 | |
| Power (REIT) (a) | 718 | 4,574 | |
| Preferred Apartment Communities, Inc. Class A | 51,100 | 929,509 | |
| Prologis, Inc. | 903,235 | 57,228,970 | |
| PS Business Parks, Inc. | 31,822 | 4,299,470 | |
| Public Storage | 254,518 | 52,262,726 | |
| QTS Realty Trust, Inc. Class A | 76,420 | 4,140,436 | |
| Quality Care Properties, Inc. | 156,460 | 2,146,631 | |
| RAIT Financial Trust | 116,629 | 96,476 | |
| Ramco-Gershenson Properties Trust (SBI) | 128,503 | 1,689,814 | |
| Rayonier, Inc. | 230,983 | 6,700,817 | |
| Realty Income Corp. | 483,151 | 27,810,172 | |
| Regency Centers Corp. | 251,354 | 16,167,089 | |
| Retail Opportunity Investments Corp. | 189,056 | 3,750,871 | |
| Retail Properties America, Inc. | 409,657 | 5,460,728 | |
| Rexford Industrial Realty, Inc. | 121,774 | 3,659,309 | |
| RLJ Lodging Trust | 206,953 | 4,176,312 | |
| Ryman Hospitality Properties, Inc. | 91,162 | 5,416,846 | |
| Sabra Health Care REIT, Inc. (b) | 277,620 | 6,065,997 | |
| Saul Centers, Inc. | 23,905 | 1,448,643 | |
| SBA Communications Corp. Class A (a) | 208,263 | 31,978,784 | |
| Select Income REIT | 130,864 | 3,037,353 | |
| Senior Housing Properties Trust (SBI) | 396,382 | 7,816,653 | |
| Seritage Growth Properties (b) | 43,689 | 2,099,693 | |
| Simon Property Group, Inc. | 532,951 | 83,593,364 | |
| SL Green Realty Corp. | 183,660 | 17,701,151 | |
| Sotherly Hotels, Inc. | 2,721 | 16,489 | |
| Spirit Realty Capital, Inc. | 831,107 | 7,230,631 | |
| Stag Industrial, Inc. | 147,627 | 4,132,080 | |
| Starwood Waypoint Homes | 210,697 | 7,844,249 | |
| Store Capital Corp. | 322,243 | 8,178,527 | |
| Summit Hotel Properties, Inc. | 229,907 | 3,411,820 | |
| Sun Communities, Inc. | 118,372 | 10,690,175 | |
| Sunstone Hotel Investors, Inc. | 363,918 | 5,749,904 | |
| Tanger Factory Outlet Centers, Inc. (b) | 158,086 | 3,699,212 | |
| Taubman Centers, Inc. | 102,172 | 5,337,465 | |
| Terreno Realty Corp. | 83,145 | 3,014,006 | |
| The GEO Group, Inc. | 214,441 | 5,927,149 | |
| The Macerich Co. | 198,583 | 10,479,225 | |
| TIER REIT, Inc. | 108,647 | 2,000,191 | |
| UDR, Inc. | 456,019 | 17,702,658 | |
| UMH Properties, Inc. | 79,886 | 1,263,797 | |
| Universal Health Realty Income Trust (SBI) | 38,916 | 2,946,330 | |
| Urban Edge Properties | 187,255 | 4,709,463 | |
| Urstadt Biddle Properties, Inc. Class A | 92,798 | 1,919,063 | |
| Ventas, Inc. | 605,415 | 41,434,603 | |
| VEREIT, Inc. | 1,684,858 | 14,220,202 | |
| Vornado Realty Trust | 287,590 | 21,422,579 | |
| Washington REIT (SBI) | 128,414 | 4,219,684 | |
| Weingarten Realty Investors (SBI) | 198,541 | 6,361,254 | |
| Welltower, Inc. | 629,721 | 46,108,172 | |
| Weyerhaeuser Co. | 1,290,302 | 42,076,748 | |
| Wheeler REIT, Inc. (b) | 6,770 | 70,950 | |
| Whitestone REIT Class B | 105,336 | 1,320,913 | |
| WP Carey, Inc. | 185,070 | 12,742,070 | |
| WP Glimcher, Inc. | 352,285 | 2,941,580 | |
| Xenia Hotels & Resorts, Inc. | 170,955 | 3,412,262 | |
| 1,741,719,147 | |||
| Real Estate Management & Development - 0.1% | |||
| Alexander & Baldwin, Inc. | 76,237 | 3,308,686 | |
| Altisource Portfolio Solutions SA (a)(b) | 18,423 | 419,676 | |
| CBRE Group, Inc. (a) | 502,108 | 18,116,057 | |
| Consolidated-Tomoka Land Co. (b) | 6,987 | 387,080 | |
| Forestar Group, Inc. (a) | 61,936 | 1,065,299 | |
| FRP Holdings, Inc. (a) | 3,842 | 168,664 | |
| HFF, Inc. | 59,609 | 2,272,891 | |
| Howard Hughes Corp. (a) | 64,397 | 7,556,988 | |
| Jones Lang LaSalle, Inc. | 79,229 | 9,658,807 | |
| Kennedy-Wilson Holdings, Inc. (b) | 159,048 | 3,069,626 | |
| Marcus & Millichap, Inc. (a) | 19,559 | 514,988 | |
| Maui Land & Pineapple, Inc. (a) | 31,310 | 403,899 | |
| RE/MAX Holdings, Inc. | 27,266 | 1,670,043 | |
| Realogy Holdings Corp. | 241,978 | 8,203,054 | |
| Stratus Properties, Inc. | 12,801 | 378,910 | |
| Tejon Ranch Co. (a) | 21,096 | 421,498 | |
| The St. Joe Co. (a)(b) | 125,813 | 2,371,575 | |
| Transcontinental Realty Investors, Inc. (a)(b) | 20,697 | 440,432 | |
| Trinity Place Holdings, Inc. (a)(b) | 7,019 | 48,501 | |
| 60,476,674 | |||
| TOTAL REAL ESTATE | 1,802,195,821 | ||
| TELECOMMUNICATION SERVICES - 1.9% | |||
| Diversified Telecommunication Services - 1.8% | |||
| Alaska Communication Systems Group, Inc. (a) | 135,810 | 298,782 | |
| AT&T, Inc. | 10,533,465 | 394,583,599 | |
| Atlantic Tele-Network, Inc. | 20,159 | 1,221,031 | |
| CenturyLink, Inc. (b) | 939,434 | 18,525,638 | |
| Cincinnati Bell, Inc. (a) | 75,163 | 1,582,181 | |
| Cogent Communications Group, Inc. | 79,491 | 3,704,281 | |
| Consolidated Communications Holdings, Inc. (b) | 126,066 | 2,325,918 | |
| Frontier Communications Corp. (b) | 131,607 | 1,772,746 | |
| General Communications, Inc. Class A (a) | 45,133 | 1,946,586 | |
| Globalstar, Inc. (a)(b) | 552,886 | 1,061,541 | |
| Hawaiian Telcom Holdco, Inc. (a) | 18,678 | 568,185 | |
| IDT Corp. Class B | 44,765 | 658,493 | |
| Intelsat SA (a)(b) | 61,651 | 237,973 | |
| Iridium Communications, Inc. (a)(b) | 166,538 | 1,848,572 | |
| Level 3 Communications, Inc. (a) | 495,033 | 26,944,646 | |
| Lumos Networks Corp. (a) | 41,227 | 741,261 | |
| Ooma, Inc. (a) | 37,459 | 367,098 | |
| ORBCOMM, Inc. (a) | 100,896 | 1,115,910 | |
| Pareteum Corp. (a)(b) | 2,527 | 2,325 | |
| PDVWireless, Inc. (a) | 18,833 | 550,865 | |
| Straight Path Communications, Inc. Class B (a) | 14,258 | 2,545,196 | |
| Verizon Communications, Inc. | 6,992,211 | 335,416,362 | |
| Vonage Holdings Corp. (a) | 343,700 | 2,852,710 | |
| Windstream Holdings, Inc. (b) | 322,467 | 667,507 | |
| Zayo Group Holdings, Inc. (a) | 163,519 | 5,587,444 | |
| 807,126,850 | |||
| Wireless Telecommunication Services - 0.1% | |||
| Airgain, Inc. (b) | 9,732 | 106,857 | |
| Boingo Wireless, Inc. (a) | 75,566 | 1,555,904 | |
| NII Holdings, Inc. (a)(b) | 134,717 | 89,452 | |
| Shenandoah Telecommunications Co. | 75,836 | 2,733,888 | |
| Spok Holdings, Inc. | 43,148 | 722,729 | |
| Sprint Corp. (a)(b) | 1,082,920 | 8,934,090 | |
| T-Mobile U.S., Inc. (a) | 493,731 | 31,949,333 | |
| Telephone & Data Systems, Inc. | 160,373 | 4,700,533 | |
| U.S. Cellular Corp. (a) | 27,310 | 1,056,351 | |
| 51,849,137 | |||
| TOTAL TELECOMMUNICATION SERVICES | 858,975,987 | ||
| UTILITIES - 3.3% | |||
| Electric Utilities - 1.9% | |||
| Allete, Inc. | 89,687 | 6,935,496 | |
| Alliant Energy Corp. | 389,728 | 16,656,975 | |
| American Electric Power Co., Inc. | 834,358 | 61,433,780 | |
| Duke Energy Corp. | 1,199,150 | 104,685,795 | |
| Edison International | 554,634 | 44,470,554 | |
| El Paso Electric Co. | 80,794 | 4,488,107 | |
| Entergy Corp. | 309,998 | 24,542,542 | |
| Eversource Energy | 543,825 | 34,260,975 | |
| Exelon Corp. | 1,590,124 | 60,217,996 | |
| FirstEnergy Corp. | 753,599 | 24,552,255 | |
| Genie Energy Ltd. Class B | 24,074 | 148,055 | |
| Great Plains Energy, Inc. | 385,148 | 11,820,192 | |
| Hawaiian Electric Industries, Inc. | 219,652 | 7,340,770 | |
| IDACORP, Inc. | 95,061 | 8,458,528 | |
| MGE Energy, Inc. | 60,635 | 3,856,386 | |
| NextEra Energy, Inc. | 798,761 | 120,221,518 | |
| OGE Energy Corp. | 341,406 | 12,195,022 | |
| Otter Tail Corp. | 81,371 | 3,401,308 | |
| PG&E Corp. | 871,977 | 61,369,741 | |
| Pinnacle West Capital Corp. | 178,279 | 16,039,762 | |
| PNM Resources, Inc. | 139,589 | 5,918,574 | |
| Portland General Electric Co. | 147,815 | 7,022,691 | |
| PPL Corp. | 1,161,753 | 45,587,188 | |
| Southern Co. | 1,702,371 | 82,156,424 | |
| Spark Energy, Inc. Class A, (b) | 24,582 | 389,625 | |
| Vistra Energy Corp. | 545,395 | 9,653,492 | |
| Westar Energy, Inc. | 246,415 | 12,643,554 | |
| Xcel Energy, Inc. | 847,854 | 41,968,773 | |
| 832,436,078 | |||
| Gas Utilities - 0.2% | |||
| Atmos Energy Corp. | 177,568 | 15,633,087 | |
| Chesapeake Utilities Corp. | 27,662 | 2,197,746 | |
| Delta Natural Gas Co., Inc. | 3,078 | 94,310 | |
| National Fuel Gas Co. | 143,599 | 8,325,870 | |
| New Jersey Resources Corp. | 144,194 | 6,294,068 | |
| Northwest Natural Gas Co. | 56,327 | 3,734,480 | |
| ONE Gas, Inc. | 93,649 | 7,046,151 | |
| RGC Resources, Inc. | 6,537 | 180,094 | |
| South Jersey Industries, Inc. | 141,912 | 5,091,803 | |
| Southwest Gas Holdings, Inc. | 78,682 | 6,256,793 | |
| Spire, Inc. | 80,546 | 6,161,769 | |
| UGI Corp. | 292,531 | 14,453,957 | |
| WGL Holdings, Inc. | 90,512 | 7,626,541 | |
| 83,096,669 | |||
| Independent Power and Renewable Electricity Producers - 0.1% | |||
| Calpine Corp. (a) | 640,548 | 9,416,056 | |
| Dynegy, Inc. (a)(b) | 219,293 | 2,065,740 | |
| NRG Energy, Inc. | 543,641 | 13,542,097 | |
| NRG Yield, Inc.: | |||
| Class A | 44,523 | 809,873 | |
| Class C | 119,926 | 2,218,631 | |
| Ormat Technologies, Inc. | 63,023 | 3,620,041 | |
| Pattern Energy Group, Inc. (b) | 114,646 | 2,879,908 | |
| TerraForm Global, Inc. (a) | 98,063 | 495,218 | |
| Terraform Power, Inc. (a)(b) | 129,794 | 1,811,924 | |
| The AES Corp. | 1,082,881 | 11,955,006 | |
| U.S. Geothermal, Inc. (a) | 27,201 | 105,812 | |
| 48,920,306 | |||
| Multi-Utilities - 1.0% | |||
| Ameren Corp. | 427,084 | 25,620,769 | |
| Avangrid, Inc. | 122,071 | 5,959,506 | |
| Avista Corp. | 128,677 | 6,613,998 | |
| Black Hills Corp. (b) | 88,586 | 6,234,683 | |
| CenterPoint Energy, Inc. | 722,368 | 21,396,540 | |
| CMS Energy Corp. | 453,550 | 22,015,317 | |
| Consolidated Edison, Inc. | 513,131 | 43,241,549 | |
| Dominion Resources, Inc. | 1,074,271 | 84,620,327 | |
| DTE Energy Co. | 298,717 | 33,551,893 | |
| MDU Resources Group, Inc. | 335,493 | 9,071,731 | |
| NiSource, Inc. | 533,707 | 14,340,707 | |
| NorthWestern Energy Corp. | 78,122 | 4,712,319 | |
| Public Service Enterprise Group, Inc. | 861,594 | 40,357,063 | |
| SCANA Corp. | 249,382 | 15,057,685 | |
| Sempra Energy | 426,502 | 50,297,381 | |
| Unitil Corp. | 55,250 | 2,754,765 | |
| Vectren Corp. | 147,188 | 9,657,005 | |
| WEC Energy Group, Inc. | 529,641 | 34,543,186 | |
| 430,046,424 | |||
| Water Utilities - 0.1% | |||
| American States Water Co. | 59,968 | 2,956,422 | |
| American Water Works Co., Inc. | 287,864 | 23,288,198 | |
| Aqua America, Inc. | 319,867 | 10,683,558 | |
| AquaVenture Holdings Ltd. (b) | 15,365 | 232,933 | |
| Artesian Resources Corp. Class A | 60,277 | 2,235,674 | |
| Cadiz, Inc. (a)(b) | 33,186 | 404,869 | |
| California Water Service Group | 83,616 | 3,131,419 | |
| Connecticut Water Service, Inc. | 31,367 | 1,701,346 | |
| Middlesex Water Co. | 39,650 | 1,505,907 | |
| Pure Cycle Corp. (a) | 17,116 | 124,091 | |
| Select Energy Services, Inc. Class A | 15,108 | 213,023 | |
| SJW Corp. | 29,404 | 1,631,922 | |
| York Water Co. | 40,150 | 1,320,935 | |
| 49,430,297 | |||
| TOTAL UTILITIES | 1,443,929,774 | ||
| TOTAL COMMON STOCKS | |||
| (Cost $28,561,652,721) | 43,917,041,710 | ||
| Principal Amount | Value | ||
| U.S. Treasury Obligations - 0.0% | |||
| U.S. Treasury Bills, yield at date of purchase 0.87% to 1.18% 10/12/17 to 6/21/18 (d) | |||
| (Cost $14,942,485) | 15,000,000 | 14,939,958 | |
| Shares | Value | ||
| Money Market Funds - 4.2% | |||
| Fidelity Cash Central Fund, 1.11% (e) | 97,784,424 | $97,803,981 | |
| Fidelity Securities Lending Cash Central Fund 1.11% (e)(f) | 1,746,259,739 | 1,746,434,365 | |
| TOTAL MONEY MARKET FUNDS | |||
| (Cost $1,844,088,941) | 1,844,238,346 | ||
| TOTAL INVESTMENT IN SECURITIES - 103.8% | |||
| (Cost $30,420,684,147) | 45,776,220,014 | ||
| NET OTHER ASSETS (LIABILITIES) - (3.8)% | (1,675,770,670) | ||
| NET ASSETS - 100% | $44,100,449,344 |
| Futures Contracts | |||||
| Number of contracts | Expiration Date | Notional amount | Value | Unrealized Appreciation/(Depreciation) | |
| Purchased | |||||
| Equity Index Contracts | |||||
| CME E-mini S&P 500 Index Contracts (United States) | 1,259 | Sept. 2017 | $155,492,795 | $2,585,847 | $2,585,847 |
| CME E-mini S&P MidCap 400 Index Contracts (United States) | 65 | Sept. 2017 | 11,247,600 | 43,037 | 43,037 |
| ICE Russell 2000 Mini Contracts (United States) | 324 | Sept. 2017 | 22,751,280 | 218,878 | 218,878 |
| TOTAL FUTURES CONTRACTS | $2,847,762 |
The notional amount of futures purchased as a percentage of Net Assets is 0.4%
Legend
(a) Non-income producing
(b) Security or a portion of the security is on loan at period end.
(c) Level 3 instrument
(d) Security or a portion of the security was pledged to cover margin requirements for futures contracts. At period end, the value of securities pledged amounted to $6,588,331.
(e) Affiliated fund that is generally available only to investment companies and other accounts managed by Fidelity Investments. The rate quoted is the annualized seven-day yield of the fund at period end. A complete unaudited listing of the fund's holdings as of its most recent quarter end is available upon request. In addition, each Fidelity Central Fund's financial statements are available on the SEC's website or upon request.
(f) Investment made with cash collateral received from securities on loan.
Affiliated Central Funds
Information regarding fiscal year to date income earned by the Fund from investments in Fidelity Central Funds is as follows:
| Fund | Income earned |
| Fidelity Cash Central Fund | $826,367 |
| Fidelity Securities Lending Cash Central Fund | 5,377,449 |
| Total | $6,203,816 |
Investment Valuation
The following is a summary of the inputs used, as of August 31, 2017, involving the Fund's assets and liabilities carried at fair value. The inputs or methodology used for valuing securities may not be an indication of the risk associated with investing in those securities. For more information on valuation inputs, and their aggregation into the levels used below, please refer to the Investment Valuation section in the accompanying Notes to Financial Statements.
| Valuation Inputs at Reporting Date: | ||||
| Description | Total | Level 1 | Level 2 | Level 3 |
| Investments in Securities: | ||||
| Equities: | ||||
| Consumer Discretionary | $5,472,013,562 | $5,472,013,410 | $152 | $-- |
| Consumer Staples | 3,317,817,054 | 3,317,817,054 | -- | -- |
| Energy | 2,338,835,808 | 2,338,835,808 | -- | -- |
| Financials | 6,444,965,562 | 6,444,965,562 | -- | -- |
| Health Care | 6,198,343,699 | 6,197,681,471 | -- | 662,228 |
| Industrials | 4,674,762,434 | 4,674,762,434 | -- | -- |
| Information Technology | 9,902,597,748 | 9,902,597,748 | -- | -- |
| Materials | 1,462,604,261 | 1,462,604,261 | -- | -- |
| Real Estate | 1,802,195,821 | 1,802,195,821 | -- | -- |
| Telecommunication Services | 858,975,987 | 858,975,987 | -- | -- |
| Utilities | 1,443,929,774 | 1,443,929,774 | -- | -- |
| U.S. Government and Government Agency Obligations | 14,939,958 | -- | 14,939,958 | -- |
| Money Market Funds | 1,844,238,346 | 1,844,238,346 | -- | -- |
| Total Investments in Securities: | $45,776,220,014 | $45,760,617,676 | $14,940,110 | $662,228 |
| Derivative Instruments: | ||||
| Assets | ||||
| Futures Contracts | $2,847,762 | $2,847,762 | $-- | $-- |
| Total Assets | $2,847,762 | $2,847,762 | $-- | $-- |
| Total Derivative Instruments: | $2,847,762 | $2,847,762 | $-- | $-- |
Value of Derivative Instruments
The following table is a summary of the Fund's value of derivative instruments by primary risk exposure as of August 31, 2017. For additional information on derivative instruments, please refer to the Derivative Instruments section in the accompanying Notes to Financial Statements.
| Primary Risk Exposure / Derivative Type | Value | |
| Asset | Liability | |
| Equity Risk | ||
| Futures Contracts(a) | $2,847,762 | $0 |
| Total Equity Risk | 2,847,762 | 0 |
| Total Value of Derivatives | $2,847,762 | $0 |
(a) Reflects gross cumulative appreciation (depreciation) on futures contracts as presented in the Schedule of Investments. In the Statement of Assets and Liabilities, the period end daily variation margin is included in receivable or payable for daily variation margin on futures contracts, and the net cumulative appreciation (depreciation) is included in net unrealized appreciation (depreciation).
See accompanying notes which are an integral part of the financial statements.
Fidelity® Total Market Index Fund
Financial Statements
Statement of Assets and Liabilities
| August 31, 2017 (Unaudited) | ||
| Assets | ||
| Investment in securities, at value (including securities loaned of $1,719,278,042) — See accompanying schedule: Unaffiliated issuers (cost $28,576,595,206) | $43,931,981,668 | |
| Fidelity Central Funds (cost $1,844,088,941) | 1,844,238,346 | |
| Total Investment in Securities (cost $30,420,684,147) | $45,776,220,014 | |
| Receivable for investments sold | 124,426,439 | |
| Receivable for fund shares sold | 31,442,111 | |
| Dividends receivable | 86,493,059 | |
| Distributions receivable from Fidelity Central Funds | 1,090,571 | |
| Receivable for daily variation margin on futures contracts | 1,147,585 | |
| Other receivables | 676,982 | |
| Total assets | 46,021,496,761 | |
| Liabilities | ||
| Payable to custodian bank | $14,627 | |
| Payable for investments purchased | 147,632,521 | |
| Payable for fund shares redeemed | 25,476,811 | |
| Accrued management fee | 545,915 | |
| Other affiliated payables | 493,026 | |
| Other payables and accrued expenses | 671,569 | |
| Collateral on securities loaned | 1,746,212,948 | |
| Total liabilities | 1,921,047,417 | |
| Net Assets | $44,100,449,344 | |
| Net Assets consist of: | ||
| Paid in capital | $28,256,968,018 | |
| Undistributed net investment income | 417,925,088 | |
| Accumulated undistributed net realized gain (loss) on investments and foreign currency transactions | 67,172,247 | |
| Net unrealized appreciation (depreciation) on investments and assets and liabilities in foreign currencies | 15,358,383,991 | |
| Net Assets | $44,100,449,344 | |
| Investor Class: | ||
| Net Asset Value, offering price and redemption price per share ($751,125,831 ÷ 10,513,531 shares) | $71.44 | |
| Premium Class: | ||
| Net Asset Value, offering price and redemption price per share ($24,990,875,649 ÷ 349,738,361 shares) | $71.46 | |
| Institutional Class: | ||
| Net Asset Value, offering price and redemption price per share ($2,618,871,459 ÷ 36,654,262 shares) | $71.45 | |
| Institutional Premium Class: | ||
| Net Asset Value, offering price and redemption price per share ($5,083,793,066 ÷ 71,156,396 shares) | $71.45 | |
| Class F: | ||
| Net Asset Value, offering price and redemption price per share ($10,655,783,339 ÷ 149,103,358 shares) | $71.47 |
See accompanying notes which are an integral part of the financial statements.
Statement of Operations
| Six months ended August 31, 2017 (Unaudited) | ||
| Investment Income | ||
| Dividends | $419,790,336 | |
| Interest | 56,514 | |
| Income from Fidelity Central Funds (including $5,377,449 from security lending) | 6,203,816 | |
| Total income | 426,050,666 | |
| Expenses | ||
| Management fee | $3,165,702 | |
| Transfer agent fees | 3,936,066 | |
| Independent trustees' fees and expenses | 84,553 | |
| Legal | 9,817 | |
| Miscellaneous | 65,808 | |
| Total expenses before reductions | 7,261,946 | |
| Expense reductions | (7,598) | 7,254,348 |
| Net investment income (loss) | 418,796,318 | |
| Realized and Unrealized Gain (Loss) | ||
| Net realized gain (loss) on: | ||
| Investment securities: | ||
| Unaffiliated issuers | 208,983,651 | |
| Fidelity Central Funds | 11,823 | |
| Foreign currency transactions | 156 | |
| Futures contracts | 16,055,775 | |
| Total net realized gain (loss) | 225,051,405 | |
| Change in net unrealized appreciation (depreciation) on: | ||
| Investment securities: | ||
| Unaffiliated issuers | 1,526,646,005 | |
| Fidelity Central Funds | (149,405) | |
| Assets and liabilities in foreign currencies | 362 | |
| Futures contracts | (6,800,984) | |
| Total change in net unrealized appreciation (depreciation) | 1,519,695,978 | |
| Net gain (loss) | 1,744,747,383 | |
| Net increase (decrease) in net assets resulting from operations | $2,163,543,701 |
See accompanying notes which are an integral part of the financial statements.
Statement of Changes in Net Assets
| Six months ended August 31, 2017 (Unaudited) | Year ended February 28, 2017 | |
| Increase (Decrease) in Net Assets | ||
| Operations | ||
| Net investment income (loss) | $418,796,318 | $693,855,123 |
| Net realized gain (loss) | 225,051,405 | 214,952,729 |
| Change in net unrealized appreciation (depreciation) | 1,519,695,978 | 7,091,127,790 |
| Net increase (decrease) in net assets resulting from operations | 2,163,543,701 | 7,999,935,642 |
| Distributions to shareholders from net investment income | (114,777,247) | (649,892,693) |
| Distributions to shareholders from net realized gain | (62,350,888) | (218,645,122) |
| Total distributions | (177,128,135) | (868,537,815) |
| Share transactions - net increase (decrease) | 2,023,366,572 | 3,500,265,848 |
| Redemption fees | – | 257,287 |
| Total increase (decrease) in net assets | 4,009,782,138 | 10,631,920,962 |
| Net Assets | ||
| Beginning of period | 40,090,667,206 | 29,458,746,244 |
| End of period | $44,100,449,344 | $40,090,667,206 |
| Other Information | ||
| Undistributed net investment income end of period | $417,925,088 | $113,906,017 |
See accompanying notes which are an integral part of the financial statements.
Financial Highlights — Fidelity Total Market Index Fund Investor Class
| Six months ended (Unaudited) August 31, | Years ended February 28, | |||||
| 2017 | 2017 | 2016A | 2015 | 2014 | 2013 | |
| Selected Per–Share Data | ||||||
| Net asset value, beginning of period | $68.20 | $55.32 | $61.58 | $54.91 | $44.05 | $39.55 |
| Income from Investment Operations | ||||||
| Net investment income (loss)B | .67 | 1.20 | 1.13 | 1.10 | .92 | .87 |
| Net realized and unrealized gain (loss) | 2.86 | 13.20 | (5.97) | 6.51 | 10.74 | 4.40 |
| Total from investment operations | 3.53 | 14.40 | (4.84) | 7.61 | 11.66 | 5.27 |
| Distributions from net investment income | (.18) | (1.13) | (1.11) | (.94) | (.80) | (.77) |
| Distributions from net realized gain | (.10) | (.39) | (.31) | – | – | – |
| Total distributions | (.29)C | (1.52) | (1.42) | (.94) | (.80) | (.77) |
| Redemption fees added to paid in capitalB | – | –D | –D | –D | –D | –D |
| Net asset value, end of period | $71.44 | $68.20 | $55.32 | $61.58 | $54.91 | $44.05 |
| Total ReturnE,F | 5.19% | 26.22% | (7.96)% | 13.94% | 26.62% | 13.50% |
| Ratios to Average Net AssetsG,H | ||||||
| Expenses before reductions | .09%I | .09% | .10% | .10% | .10% | .10% |
| Expenses net of fee waivers, if any | .09%I | .09% | .10% | .10% | .10% | .10% |
| Expenses net of all reductions | .09%I | .09% | .10% | .10% | .10% | .10% |
| Net investment income (loss) | 1.93%I | 1.96% | 1.90% | 1.91% | 1.85% | 2.15% |
| Supplemental Data | ||||||
| Net assets, end of period (000 omitted) | $751,126 | $736,989 | $1,932,568 | $1,943,259 | $1,694,212 | $1,305,435 |
| Portfolio turnover rateJ | 3%I | 4% | 3% | 2% | 2% | 3% |
A For the year ended February 29.
B Calculated based on average shares outstanding during the period.
C Total distributions of $.29 per share is comprised of distributions from net investment income of $.181 and distributions from net realized gain of $.104 per share.
D Amount represents less than $.005 per share.
E Total returns for periods of less than one year are not annualized.
F Total returns would have been lower if certain expenses had not been reduced during the applicable periods shown.
G Fees and expenses of any underlying Fidelity Central Funds are not included in the Fund's expense ratio. The Fund indirectly bears its proportionate share of the expenses of any underlying Fidelity Central Funds.
H Expense ratios reflect operating expenses of the class. Expenses before reductions do not reflect amounts reimbursed by the investment adviser or reductions from expense offset arrangements and do not represent the amount paid by the class during periods when reimbursements or reductions occur. Expenses net of fee waivers reflect expenses after reimbursement by the investment adviser but prior to reductions from expense offset arrangements. Expenses net of all reductions represent the net expenses paid by the class.
I Annualized
J Amount does not include the portfolio activity of any underlying Fidelity Central Funds.
See accompanying notes which are an integral part of the financial statements.
Financial Highlights — Fidelity Total Market Index Fund Premium Class
| Six months ended (Unaudited) August 31, | Years ended February 28, | |||||
| 2017 | 2017 | 2016A | 2015 | 2014 | 2013 | |
| Selected Per–Share Data | ||||||
| Net asset value, beginning of period | $68.20 | $55.32 | $61.59 | $54.91 | $44.06 | $39.56 |
| Income from Investment Operations | ||||||
| Net investment income (loss)B | .69 | 1.25 | 1.16 | 1.13 | .94 | .89 |
| Net realized and unrealized gain (loss) | 2.86 | 13.18 | (5.98) | 6.52 | 10.73 | 4.39 |
| Total from investment operations | 3.55 | 14.43 | (4.82) | 7.65 | 11.67 | 5.28 |
| Distributions from net investment income | (.19) | (1.16) | (1.14) | (.97) | (.82) | (.78) |
| Distributions from net realized gain | (.10) | (.39) | (.31) | – | – | – |
| Total distributions | (.29) | (1.55) | (1.45) | (.97) | (.82) | (.78) |
| Redemption fees added to paid in capitalB | – | –C | –C | –C | –C | –C |
| Net asset value, end of period | $71.46 | $68.20 | $55.32 | $61.59 | $54.91 | $44.06 |
| Total ReturnD,E | 5.24% | 26.28% | (7.92)% | 14.02% | 26.65% | 13.53% |
| Ratios to Average Net AssetsF,G | ||||||
| Expenses before reductions | .04%H | .05% | .07% | .07% | .07% | .07% |
| Expenses net of fee waivers, if any | .04%H | .05% | .05% | .05% | .06% | .07% |
| Expenses net of all reductions | .04%H | .05% | .05% | .05% | .06% | .07% |
| Net investment income (loss) | 1.97%H | 2.00% | 1.95% | 1.96% | 1.89% | 2.18% |
| Supplemental Data | ||||||
| Net assets, end of period (000 omitted) | $24,990,876 | $23,288,507 | $18,866,595 | $18,860,117 | $14,943,835 | $10,262,592 |
| Portfolio turnover rateI | 3%H | 4% | 3% | 2% | 2% | 3% |
A For the year ended February 29.
B Calculated based on average shares outstanding during the period.
C Amount represents less than $.005 per share.
D Total returns for periods of less than one year are not annualized.
E Total returns would have been lower if certain expenses had not been reduced during the applicable periods shown.
F Fees and expenses of any underlying Fidelity Central Funds are not included in the Fund's expense ratio. The Fund indirectly bears its proportionate share of the expenses of any underlying Fidelity Central Funds.
G Expense ratios reflect operating expenses of the class. Expenses before reductions do not reflect amounts reimbursed by the investment adviser or reductions from expense offset arrangements and do not represent the amount paid by the class during periods when reimbursements or reductions occur. Expenses net of fee waivers reflect expenses after reimbursement by the investment adviser but prior to reductions from expense offset arrangements. Expenses net of all reductions represent the net expenses paid by the class.
H Annualized
I Amount does not include the portfolio activity of any underlying Fidelity Central Funds.
See accompanying notes which are an integral part of the financial statements.
Financial Highlights — Fidelity Total Market Index Fund Institutional Class
| Six months ended (Unaudited) August 31, | Years ended February 28, | |||||
| 2017 | 2017 | 2016A | 2015 | 2014 | 2013 | |
| Selected Per–Share Data | ||||||
| Net asset value, beginning of period | $68.19 | $55.31 | $61.58 | $54.91 | $44.05 | $39.55 |
| Income from Investment Operations | ||||||
| Net investment income (loss)B | .69 | 1.26 | 1.17 | 1.13 | .94 | .89 |
| Net realized and unrealized gain (loss) | 2.87 | 13.18 | (5.98) | 6.52 | 10.75 | 4.40 |
| Total from investment operations | 3.56 | 14.44 | (4.81) | 7.65 | 11.69 | 5.29 |
| Distributions from net investment income | (.19) | (1.16) | (1.15) | (.98) | (.83) | (.79) |
| Distributions from net realized gain | (.10) | (.39) | (.31) | – | – | – |
| Total distributions | (.30)C | (1.56)D | (1.46) | (.98) | (.83) | (.79) |
| Redemption fees added to paid in capitalB | – | –E | –E | –E | –E | –E |
| Net asset value, end of period | $71.45 | $68.19 | $55.31 | $61.58 | $54.91 | $44.05 |
| Total ReturnF,G | 5.24% | 26.30% | (7.92)% | 14.01% | 26.69% | 13.55% |
| Ratios to Average Net AssetsH,I | ||||||
| Expenses before reductions | .03%J | .05% | .07% | .07% | .07% | .07% |
| Expenses net of fee waivers, if any | .03%J | .04% | .04% | .04% | .05% | .06% |
| Expenses net of all reductions | .03%J | .04% | .04% | .04% | .05% | .06% |
| Net investment income (loss) | 1.98%J | 2.01% | 1.96% | 1.97% | 1.90% | 2.19% |
| Supplemental Data | ||||||
| Net assets, end of period (000 omitted) | $2,618,871 | $2,345,441 | $1,199,719 | $1,307,281 | $1,254,047 | $876,155 |
| Portfolio turnover rateK | 3%J | 4% | 3% | 2% | 2% | 3% |
A For the year ended February 29.
B Calculated based on average shares outstanding during the period.
C Total distributions of $.30 per share is comprised of distributions from net investment income of $.191 and distributions from net realized gain of $.104 per share.
D Total distributions of $1.56 per share is comprised of distributions from net investment income of $1.162 and distributions from net realized gain of $.393 per share.
E Amount represents less than $.005 per share.
F Total returns for periods of less than one year are not annualized.
G Total returns would have been lower if certain expenses had not been reduced during the applicable periods shown.
H Fees and expenses of any underlying Fidelity Central Funds are not included in the Fund's expense ratio. The Fund indirectly bears its proportionate share of the expenses of any underlying Fidelity Central Funds.
I Expense ratios reflect operating expenses of the class. Expenses before reductions do not reflect amounts reimbursed by the investment adviser or reductions from expense offset arrangements and do not represent the amount paid by the class during periods when reimbursements or reductions occur. Expenses net of fee waivers reflect expenses after reimbursement by the investment adviser but prior to reductions from expense offset arrangements. Expenses net of all reductions represent the net expenses paid by the class.
J Annualized
K Amount does not include the portfolio activity of any underlying Fidelity Central Funds.
See accompanying notes which are an integral part of the financial statements.
Financial Highlights — Fidelity Total Market Index Fund Institutional Premium Class
| Six months ended (Unaudited) August 31, | Years ended February 28, | |||||
| 2017 | 2017 | 2016A | 2015 | 2014 | 2013 | |
| Selected Per–Share Data | ||||||
| Net asset value, beginning of period | $68.19 | $55.31 | $61.58 | $54.90 | $44.05 | $39.55 |
| Income from Investment Operations | ||||||
| Net investment income (loss)B | .70 | 1.28 | 1.17 | 1.14 | .95 | .90 |
| Net realized and unrealized gain (loss) | 2.86 | 13.17 | (5.98) | 6.52 | 10.73 | 4.39 |
| Total from investment operations | 3.56 | 14.45 | (4.81) | 7.66 | 11.68 | 5.29 |
| Distributions from net investment income | (.20) | (1.17) | (1.15) | (.98) | (.83) | (.79) |
| Distributions from net realized gain | (.10) | (.39) | (.31) | – | – | – |
| Total distributions | (.30) | (1.57)C | (1.46) | (.98) | (.83) | (.79) |
| Redemption fees added to paid in capitalB | – | –D | –D | –D | –D | –D |
| Net asset value, end of period | $71.45 | $68.19 | $55.31 | $61.58 | $54.90 | $44.05 |
| Total ReturnE,F | 5.25% | 26.32% | (7.91)% | 14.04% | 26.67% | 13.57% |
| Ratios to Average Net AssetsG,H | ||||||
| Expenses before reductions | .02%I | .02% | .05% | .04% | .06% | .06% |
| Expenses net of fee waivers, if any | .02%I | .02% | .04% | .04% | .05% | .05% |
| Expenses net of all reductions | .02%I | .02% | .04% | .04% | .05% | .05% |
| Net investment income (loss) | 2.00%I | 2.02% | 1.97% | 1.97% | 1.90% | 2.20% |
| Supplemental Data | ||||||
| Net assets, end of period (000 omitted) | $5,083,793 | $4,684,669 | $800,304 | $1,022,585 | $740,877 | $546,329 |
| Portfolio turnover rateJ | 3%I | 4% | 3% | 2% | 2% | 3% |
A For the year ended February 29.
B Calculated based on average shares outstanding during the period.
C Total distributions of $1.57. per share is comprised of distributions from net investment income of $1.173 and distributions from net realized gain of $.393 per share.
D Amount represents less than $.005 per share.
E Total returns for periods of less than one year are not annualized.
F Total returns would have been lower if certain expenses had not been reduced during the applicable periods shown.
G Fees and expenses of any underlying Fidelity Central Funds are not included in the Fund's expense ratio. The Fund indirectly bears its proportionate share of the expenses of any underlying Fidelity Central Funds.
H Expense ratios reflect operating expenses of the class. Expenses before reductions do not reflect amounts reimbursed by the investment adviser or reductions from expense offset arrangements and do not represent the amount paid by the class during periods when reimbursements or reductions occur. Expenses net of fee waivers reflect expenses after reimbursement by the investment adviser but prior to reductions from expense offset arrangements. Expenses net of all reductions represent the net expenses paid by the class.
I Annualized
J Amount does not include the portfolio activity of any underlying Fidelity Central Funds.
See accompanying notes which are an integral part of the financial statements.
Financial Highlights — Fidelity Total Market Index Fund Class F
| Six months ended (Unaudited) August 31, | Years ended February 28, | |||||
| 2017 | 2017 | 2016A | 2015 | 2014 | 2013 | |
| Selected Per–Share Data | ||||||
| Net asset value, beginning of period | $68.21 | $55.32 | $61.59 | $54.92 | $44.06 | $39.56 |
| Income from Investment Operations | ||||||
| Net investment income (loss)B | .70 | 1.26 | 1.17 | 1.14 | .95 | .90 |
| Net realized and unrealized gain (loss) | 2.86 | 13.20 | (5.98) | 6.51 | 10.74 | 4.39 |
| Total from investment operations | 3.56 | 14.46 | (4.81) | 7.65 | 11.69 | 5.29 |
| Distributions from net investment income | (.20) | (1.17) | (1.15) | (.98) | (.83) | (.79) |
| Distributions from net realized gain | (.10) | (.39) | (.31) | – | – | – |
| Total distributions | (.30) | (1.57)C | (1.46) | (.98) | (.83) | (.79) |
| Redemption fees added to paid in capitalB | – | –D | –D | –D | –D | –D |
| Net asset value, end of period | $71.47 | $68.21 | $55.32 | $61.59 | $54.92 | $44.06 |
| Total ReturnE,F | 5.24% | 26.33% | (7.91)% | 14.01% | 26.69% | 13.55% |
| Ratios to Average Net AssetsG,H | ||||||
| Expenses before reductions | .02%I | .02% | .04% | .04% | .05% | .05% |
| Expenses net of fee waivers, if any | .02%I | .02% | .04% | .04% | .05% | .05% |
| Expenses net of all reductions | .02%I | .02% | .04% | .04% | .05% | .05% |
| Net investment income (loss) | 2.00%I | 2.02% | 1.97% | 1.97% | 1.90% | 2.20% |
| Supplemental Data | ||||||
| Net assets, end of period (000 omitted) | $10,655,783 | $9,035,061 | $6,659,560 | $6,368,808 | $5,088,489 | $2,833,198 |
| Portfolio turnover rateJ | 3%I | 4% | 3% | 2% | 2% | 3% |
A For the year ended February 29.
B Calculated based on average shares outstanding during the period.
C Total distributions of $1.57 per share is comprised of distributions from net investment income of $1.173 and distributions from net realized gain of $.393 per share.
D Amount represents less than $.005 per share.
E Total returns for periods of less than one year are not annualized.
F Total returns would have been lower if certain expenses had not been reduced during the applicable periods shown.
G Fees and expenses of any underlying Fidelity Central Funds are not included in the Fund's expense ratio. The Fund indirectly bears its proportionate share of the expenses of any underlying Fidelity Central Funds.
H Expense ratios reflect operating expenses of the class. Expenses before reductions do not reflect amounts reimbursed by the investment adviser or reductions from expense offset arrangements and do not represent the amount paid by the class during periods when reimbursements or reductions occur. Expenses net of fee waivers reflect expenses after reimbursement by the investment adviser but prior to reductions from expense offset arrangements. Expenses net of all reductions represent the net expenses paid by the class.
I Annualized
J Amount does not include the portfolio activity of any underlying Fidelity Central Funds.
See accompanying notes which are an integral part of the financial statements.
Fidelity® Extended Market Index Fund
Investment Summary (Unaudited)
Top Ten Stocks as of August 31, 2017
| % of fund's net assets | % of fund's net assets 6 months ago | |
| Tesla, Inc. | 1.0 | 0.7 |
| Las Vegas Sands Corp. | 0.5 | 0.4 |
| Liberty Global PLC Class C | 0.5 | 0.5 |
| ServiceNow, Inc. | 0.4 | 0.3 |
| T-Mobile U.S., Inc. | 0.4 | 0.4 |
| BioMarin Pharmaceutical, Inc. | 0.4 | 0.4 |
| First Republic Bank | 0.3 | 0.3 |
| Markel Corp. | 0.3 | 0.3 |
| Workday, Inc. Class A | 0.3 | 0.2 |
| Celanese Corp. Class A | 0.3 | 0.3 |
| 4.4 |
Top Market Sectors as of August 31, 2017
| % of fund's net assets | % of fund's net assets 6 months ago | |
| Information Technology | 18.0 | 17.1 |
| Financials | 16.8 | 17.6 |
| Consumer Discretionary | 14.3 | 14.0 |
| Industrials | 13.2 | 13.2 |
| Health Care | 11.5 | 10.3 |
| Real Estate | 9.0 | 9.3 |
| Materials | 5.3 | 5.6 |
| Energy | 3.7 | 4.2 |
| Utilities | 3.4 | 3.0 |
| Consumer Staples | 3.1 | 3.4 |
Fidelity® Extended Market Index Fund
Investments August 31, 2017 (Unaudited)
Showing Percentage of Net Assets
| Common Stocks - 99.4% | |||
| Shares | Value | ||
| CONSUMER DISCRETIONARY - 14.3% | |||
| Auto Components - 1.3% | |||
| Adient PLC (a) | 415,327 | $29,355,312 | |
| American Axle & Manufacturing Holdings, Inc. (a)(b) | 361,716 | 5,284,671 | |
| Autoliv, Inc. (a) | 390,972 | 42,467,379 | |
| Clean Diesel Technologies, Inc. (a)(b) | 23,558 | 50,179 | |
| Cooper Tire & Rubber Co. | 229,720 | 7,718,592 | |
| Cooper-Standard Holding, Inc. (b) | 81,211 | 8,168,202 | |
| Dana Holding Corp. | 630,727 | 15,181,599 | |
| Dorman Products, Inc. (a)(b) | 133,826 | 8,888,723 | |
| Fox Factory Holding Corp. (b) | 151,917 | 6,076,680 | |
| Gentex Corp. (a) | 1,292,449 | 23,613,043 | |
| Gentherm, Inc. (a)(b) | 162,500 | 5,061,875 | |
| Hertz Global Holdings, Inc. (a)(b) | 315,419 | 6,857,209 | |
| Horizon Global Corp. (a)(b) | 106,337 | 1,828,996 | |
| LCI Industries (a) | 109,508 | 10,819,390 | |
| Lear Corp. | 302,955 | 45,303,891 | |
| Modine Manufacturing Co. (b) | 218,308 | 3,525,674 | |
| Motorcar Parts of America, Inc. (a)(b) | 89,786 | 2,358,678 | |
| Shiloh Industries, Inc. (b) | 47,028 | 411,965 | |
| Standard Motor Products, Inc. | 91,465 | 4,033,607 | |
| Stoneridge, Inc. (b) | 118,638 | 1,964,645 | |
| Strattec Security Corp. | 16,381 | 514,363 | |
| Superior Industries International, Inc. | 103,889 | 1,521,974 | |
| Sypris Solutions, Inc. (b) | 33,998 | 55,757 | |
| Tenneco, Inc. | 242,021 | 13,117,538 | |
| Tower International, Inc. | 98,181 | 2,204,163 | |
| Unique Fabricating, Inc. | 9,604 | 70,589 | |
| UQM Technologies, Inc. (a)(b) | 137,888 | 124,099 | |
| Visteon Corp. (a)(b) | 143,483 | 16,563,678 | |
| VOXX International Corp. (a)(b) | 83,482 | 676,204 | |
| Workhorse Group, Inc. (a)(b) | 97,973 | 330,169 | |
| 264,148,844 | |||
| Automobiles - 1.1% | |||
| REV Group, Inc. (a) | 54,597 | 1,375,298 | |
| Tesla, Inc. (a)(b) | 560,262 | 199,397,154 | |
| Thor Industries, Inc. (a) | 211,698 | 22,998,871 | |
| Winnebago Industries, Inc. (a) | 117,184 | 4,236,202 | |
| 228,007,525 | |||
| Distributors - 0.1% | |||
| Core-Mark Holding Co., Inc. | 203,246 | 5,499,837 | |
| Educational Development Corp. (a) | 16,502 | 174,096 | |
| Pool Corp. | 184,742 | 18,416,930 | |
| Weyco Group, Inc. | 21,447 | 590,865 | |
| 24,681,728 | |||
| Diversified Consumer Services - 0.8% | |||
| American Public Education, Inc. (b) | 68,815 | 1,269,637 | |
| Ascent Capital Group, Inc. (b) | 47,464 | 471,318 | |
| Bridgepoint Education, Inc. (b) | 97,961 | 864,996 | |
| Bright Horizons Family Solutions, Inc. (b) | 221,472 | 17,702,257 | |
| Cambium Learning Group, Inc. (b) | 48,546 | 284,480 | |
| Capella Education Co. | 52,862 | 3,560,256 | |
| Career Education Corp. (b) | 286,747 | 2,755,639 | |
| Carriage Services, Inc. | 65,607 | 1,606,715 | |
| Chegg, Inc. (a)(b) | 349,784 | 4,963,435 | |
| Collectors Universe, Inc. | 21,093 | 506,865 | |
| DeVry, Inc. (a) | 251,371 | 8,596,888 | |
| Graham Holdings Co. | 20,435 | 11,999,432 | |
| Grand Canyon Education, Inc. (b) | 214,591 | 17,607,192 | |
| Houghton Mifflin Harcourt Co. (b) | 463,566 | 4,728,373 | |
| K12, Inc. (b) | 154,850 | 2,774,912 | |
| Laureate Education, Inc. Class A | 166,957 | 2,444,250 | |
| Liberty Tax, Inc. | 35,449 | 476,789 | |
| Lincoln Educational Services Corp. (b) | 84,172 | 235,682 | |
| National American University Holdings, Inc. | 23,237 | 50,192 | |
| Regis Corp. (a)(b) | 160,027 | 2,125,159 | |
| Service Corp. International | 828,622 | 29,283,501 | |
| ServiceMaster Global Holdings, Inc. (b) | 594,775 | 28,025,798 | |
| Sotheby's Class A (Ltd. vtg.) (a)(b) | 205,416 | 9,217,016 | |
| Strayer Education, Inc. | 46,164 | 3,693,582 | |
| Universal Technical Institute, Inc. (b) | 87,539 | 309,888 | |
| Weight Watchers International, Inc. (a)(b) | 122,175 | 5,719,012 | |
| 161,273,264 | |||
| Hotels, Restaurants & Leisure - 3.4% | |||
| ARAMARK Holdings Corp. (a) | 1,074,112 | 43,705,617 | |
| Ark Restaurants Corp. | 8,457 | 194,511 | |
| Belmond Ltd. Class A (a)(b) | 384,579 | 4,903,382 | |
| Biglari Holdings, Inc. (b) | 4,573 | 1,361,656 | |
| BJ's Restaurants, Inc. (a)(b) | 88,226 | 2,655,603 | |
| Bloomin' Brands, Inc. (a) | 459,073 | 7,808,832 | |
| Bob Evans Farms, Inc. | 88,961 | 6,118,738 | |
| Bojangles', Inc. (a)(b) | 82,760 | 1,104,846 | |
| Boyd Gaming Corp. | 373,563 | 9,877,006 | |
| Bravo Brio Restaurant Group, Inc. (b) | 63,389 | 174,320 | |
| Brinker International, Inc. | 218,671 | 6,826,909 | |
| Buffalo Wild Wings, Inc. (a)(b) | 71,413 | 7,337,686 | |
| Caesars Entertainment Corp. (a)(b) | 251,223 | 2,914,187 | |
| Carrols Restaurant Group, Inc. (b) | 153,011 | 1,667,820 | |
| Century Casinos, Inc. (b) | 84,324 | 577,619 | |
| Chanticleer Holdings, Inc. (a)(b) | 9,214 | 20,824 | |
| Choice Hotels International, Inc. | 163,521 | 10,146,478 | |
| Churchill Downs, Inc. | 56,961 | 11,130,179 | |
| Chuy's Holdings, Inc. (a)(b) | 82,228 | 1,545,886 | |
| ClubCorp Holdings, Inc. | 285,558 | 4,854,486 | |
| Cracker Barrel Old Country Store, Inc. (a) | 105,563 | 15,692,996 | |
| Dave & Buster's Entertainment, Inc. (b) | 170,599 | 9,973,218 | |
| Del Frisco's Restaurant Group, Inc. (b) | 105,058 | 1,470,812 | |
| Del Taco Restaurants, Inc. (a)(b) | 140,561 | 1,979,099 | |
| Denny's Corp. (b) | 339,423 | 4,059,499 | |
| DineEquity, Inc. (a) | 75,057 | 2,983,516 | |
| Diversified Restaurant Holdings, Inc. (b) | 54,865 | 108,084 | |
| Domino's Pizza, Inc. | 210,545 | 38,373,932 | |
| Dover Downs Gaming & Entertainment, Inc. (b) | 28,631 | 28,345 | |
| Dover Motorsports, Inc. | 22,686 | 47,641 | |
| Drive Shack, Inc. (a) | 278,628 | 752,296 | |
| Dunkin' Brands Group, Inc. | 404,552 | 20,858,701 | |
| El Pollo Loco Holdings, Inc. (a)(b) | 97,361 | 1,105,047 | |
| Eldorado Resorts, Inc. (a)(b) | 179,218 | 4,122,014 | |
| Empire Resorts, Inc. (a)(b) | 9,364 | 218,649 | |
| Extended Stay America, Inc. unit | 892,623 | 17,486,485 | |
| Famous Dave's of America, Inc. (a)(b) | 21,114 | 91,846 | |
| Fiesta Restaurant Group, Inc. (a)(b) | 118,712 | 2,065,589 | |
| Flanigans Enterprises, Inc. | 1,120 | 28,728 | |
| Fogo de Chao, Inc. (b) | 44,064 | 557,410 | |
| Full House Resorts, Inc. (b) | 24,413 | 61,277 | |
| Gaming Partners International Corp. | 1,584 | 16,711 | |
| Golden Entertainment, Inc. (b) | 38,650 | 878,128 | |
| Good Times Restaurants, Inc. (b) | 41,006 | 114,817 | |
| Habit Restaurants, Inc. Class A (a)(b) | 85,475 | 1,111,175 | |
| Hilton Grand Vacations, Inc. | 291,660 | 10,572,675 | |
| Hyatt Hotels Corp. Class A (b) | 209,713 | 12,480,021 | |
| ILG, Inc. | 469,206 | 12,387,038 | |
| International Speedway Corp. Class A | 111,755 | 3,984,066 | |
| J. Alexanders Holdings, Inc. (b) | 59,031 | 584,407 | |
| Jack in the Box, Inc. | 134,174 | 12,561,370 | |
| Jamba, Inc. (a)(b) | 61,744 | 607,561 | |
| Kona Grill, Inc. (a)(b) | 43,155 | 129,465 | |
| La Quinta Holdings, Inc. (b) | 357,487 | 5,648,295 | |
| Las Vegas Sands Corp. | 1,611,777 | 100,268,647 | |
| Lindblad Expeditions Holdings (b) | 93,954 | 1,044,768 | |
| Luby's, Inc. (b) | 54,955 | 145,631 | |
| Marcus Corp. | 82,737 | 2,060,151 | |
| Marriott Vacations Worldwide Corp. (a) | 108,946 | 12,676,957 | |
| Monarch Casino & Resort, Inc. (b) | 52,952 | 1,883,503 | |
| Nathan's Famous, Inc. (b) | 14,327 | 838,846 | |
| Noodles & Co. (a)(b) | 86,399 | 332,636 | |
| Norwegian Cruise Line Holdings Ltd. (b) | 782,398 | 46,521,385 | |
| Papa John's International, Inc. (a) | 117,281 | 8,771,446 | |
| Papa Murphy's Holdings, Inc. (a)(b) | 43,281 | 221,166 | |
| Park Hotels & Resorts, Inc. | 622,485 | 16,614,125 | |
| Peak Resorts, Inc. | 18,903 | 91,680 | |
| Penn National Gaming, Inc. (a)(b) | 372,134 | 8,257,653 | |
| Pinnacle Entertainment, Inc. (a)(b) | 259,117 | 5,052,782 | |
| Planet Fitness, Inc. (a) | 321,777 | 8,163,482 | |
| Playa Hotels & Resorts NV | 214,907 | 2,228,586 | |
| Potbelly Corp. (b) | 111,393 | 1,336,716 | |
| Rave Restaurant Group, Inc. (a)(b) | 27,514 | 39,895 | |
| Rave Restaurant Group, Inc. rights | 27,514 | 461 | |
| RCI Hospitality Holdings, Inc. | 40,834 | 951,432 | |
| Red Lion Hotels Corp. (b) | 96,281 | 673,967 | |
| Red Robin Gourmet Burgers, Inc. (a)(b) | 59,222 | 3,375,654 | |
| Red Rock Resorts, Inc. (a) | 181,693 | 4,106,262 | |
| Ruby Tuesday, Inc. (a)(b) | 276,837 | 595,200 | |
| Ruth's Hospitality Group, Inc. | 146,679 | 2,867,574 | |
| Scientific Games Corp. Class A (a)(b) | 229,308 | 8,071,642 | |
| SeaWorld Entertainment, Inc. (a) | 290,191 | 3,766,679 | |
| Shake Shack, Inc. Class A (a)(b) | 79,162 | 2,447,689 | |
| Six Flags Entertainment Corp. | 356,741 | 19,467,356 | |
| Sonic Corp. (a) | 197,876 | 4,632,277 | |
| Speedway Motorsports, Inc. | 53,351 | 1,110,234 | |
| Texas Roadhouse, Inc. Class A (a) | 288,713 | 13,699,432 | |
| The Cheesecake Factory, Inc. (a) | 203,008 | 8,410,621 | |
| The ONE Group Hospitality, Inc. (b) | 65 | 103 | |
| Town Sports International Holdings, Inc. (b) | 75,993 | 448,359 | |
| U.S. Foods Holding Corp. (a)(b) | 590,944 | 16,221,413 | |
| Vail Resorts, Inc. | 176,916 | 40,328,002 | |
| Wendy's Co. | 845,883 | 12,620,574 | |
| Wingstop, Inc. | 134,080 | 4,345,533 | |
| Zoe's Kitchen, Inc. (a)(b) | 85,967 | 1,106,395 | |
| 673,864,412 | |||
| Household Durables - 1.2% | |||
| AV Homes, Inc. (a)(b) | 49,463 | 764,203 | |
| Bassett Furniture Industries, Inc. | 45,391 | 1,627,267 | |
| Beazer Homes U.S.A., Inc. (b) | 147,094 | 2,193,172 | |
| CalAtlantic Group, Inc. | 335,797 | 11,668,946 | |
| Cavco Industries, Inc. (b) | 38,060 | 5,120,973 | |
| Century Communities, Inc. (b) | 96,185 | 2,168,972 | |
| Comstock Holding Companies, Inc. (b) | 5,354 | 10,387 | |
| CSS Industries, Inc. | 33,658 | 901,361 | |
| Dixie Group, Inc. (b) | 53,047 | 217,493 | |
| Emerson Radio Corp. (b) | 24,397 | 26,837 | |
| Ethan Allen Interiors, Inc. (a) | 110,848 | 3,242,304 | |
| Flexsteel Industries, Inc. | 28,089 | 1,278,050 | |
| GoPro, Inc. Class A (a)(b) | 436,274 | 4,018,084 | |
| Green Brick Partners, Inc. (b) | 103,995 | 982,753 | |
| Helen of Troy Ltd. (b) | 120,394 | 10,871,578 | |
| Hooker Furniture Corp. | 52,315 | 2,105,679 | |
| Hovnanian Enterprises, Inc. Class A (a)(b) | 504,242 | 917,720 | |
| Installed Building Products, Inc. (a)(b) | 87,541 | 5,051,116 | |
| iRobot Corp. (a)(b) | 121,600 | 11,603,072 | |
| KB Home (a) | 365,917 | 7,830,624 | |
| Koss Corp. (b) | 1,389 | 1,986 | |
| La-Z-Boy, Inc. | 214,088 | 5,105,999 | |
| LGI Homes, Inc. (a)(b) | 75,233 | 3,200,412 | |
| Libbey, Inc. | 91,140 | 744,614 | |
| Lifetime Brands, Inc. | 49,962 | 869,339 | |
| Live Ventures, Inc. (a)(b) | 13,691 | 142,934 | |
| M.D.C. Holdings, Inc. (a) | 186,008 | 5,812,750 | |
| M/I Homes, Inc. (a) | 105,916 | 2,605,534 | |
| Meritage Homes Corp. (a)(b) | 173,856 | 7,075,939 | |
| NACCO Industries, Inc. Class A | 20,539 | 1,489,078 | |
| New Home Co. LLC (b) | 57,074 | 589,004 | |
| Nova LifeStyle, Inc. (a)(b) | 96,346 | 117,542 | |
| NVR, Inc. (b) | 15,400 | 41,901,090 | |
| PICO Holdings, Inc. (b) | 106,751 | 1,734,704 | |
| Skyline Corp. (b) | 30,617 | 365,261 | |
| Stanley Furniture Co., Inc. | 37,789 | 42,324 | |
| Taylor Morrison Home Corp. (a)(b) | 316,611 | 6,401,874 | |
| Tempur Sealy International, Inc. (a)(b) | 208,981 | 12,935,924 | |
| Toll Brothers, Inc. | 648,053 | 25,248,145 | |
| TopBuild Corp. (b) | 162,219 | 9,627,698 | |
| TRI Pointe Homes, Inc. (a)(b) | 738,525 | 9,408,809 | |
| Tupperware Brands Corp. | 222,339 | 12,866,758 | |
| Turtle Beach Corp. (a)(b) | 43,489 | 30,442 | |
| Universal Electronics, Inc. (b) | 65,853 | 3,855,693 | |
| Vuzix Corp. (a)(b) | 70,636 | 409,689 | |
| William Lyon Homes, Inc. (a)(b) | 111,071 | 2,664,593 | |
| Zagg, Inc. (b) | 120,643 | 1,520,102 | |
| 229,368,828 | |||
| Internet & Direct Marketing Retail - 0.7% | |||
| 1-800-FLOWERS.com, Inc. Class A (b) | 131,286 | 1,181,574 | |
| CafePress, Inc. (b) | 18,875 | 40,015 | |
| Duluth Holdings, Inc. (a)(b) | 36,141 | 708,002 | |
| Etsy, Inc. (a)(b) | 428,850 | 7,020,275 | |
| EVINE Live, Inc. (b) | 206,333 | 205,301 | |
| FTD Companies, Inc. (b) | 73,961 | 990,338 | |
| Gaia, Inc. Class A (b) | 64,695 | 721,349 | |
| Groupon, Inc. (a)(b) | 1,706,591 | 7,577,264 | |
| HSN, Inc. | 139,421 | 5,116,751 | |
| JRJR Networks (b) | 44,389 | 26,190 | |
| Lands' End, Inc. (a)(b) | 66,814 | 811,790 | |
| Liberty Expedia Holdings, Inc. | 237,560 | 12,992,156 | |
| Liberty Interactive Corp. QVC Group: | |||
| (Venture Group) Series A (a)(b) | 357,061 | 21,980,675 | |
| Series A (a)(b) | 1,764,149 | 39,022,976 | |
| Liberty TripAdvisor Holdings, Inc. (b) | 317,071 | 4,232,898 | |
| NutriSystem, Inc. | 134,203 | 7,287,223 | |
| Overstock.com, Inc. (a)(b) | 74,996 | 1,646,162 | |
| PetMed Express, Inc. (a) | 87,890 | 3,187,770 | |
| Shutterfly, Inc. (a)(b) | 152,525 | 6,952,090 | |
| U.S. Auto Parts Network, Inc. (b) | 62,757 | 183,250 | |
| Wayfair LLC Class A (a)(b) | 139,452 | 9,902,487 | |
| 131,786,536 | |||
| Leisure Products - 0.4% | |||
| American Outdoor Brands Corp. (a)(b) | 252,912 | 4,127,524 | |
| Brunswick Corp. | 396,224 | 20,793,836 | |
| Callaway Golf Co. | 417,114 | 5,814,569 | |
| Clarus Corp. (b) | 93,828 | 680,253 | |
| Escalade, Inc. | 33,614 | 405,049 | |
| JAKKS Pacific, Inc. (a)(b) | 79,564 | 274,496 | |
| Johnson Outdoors, Inc. Class A | 25,505 | 1,627,219 | |
| Malibu Boats, Inc. Class A (a)(b) | 91,166 | 2,458,747 | |
| Marine Products Corp. | 25,214 | 392,834 | |
| MCBC Holdings, Inc. (b) | 72,487 | 1,242,427 | |
| Nautilus, Inc. (b) | 142,013 | 2,321,913 | |
| Polaris Industries, Inc. (a) | 257,551 | 24,011,480 | |
| Sturm, Ruger & Co., Inc. (a) | 80,609 | 3,691,892 | |
| Summer Infant, Inc. (b) | 37,416 | 76,329 | |
| Vista Outdoor, Inc. (a)(b) | 251,298 | 5,151,609 | |
| 73,070,177 | |||
| Media - 2.8% | |||
| A.H. Belo Corp. Class A | 70,842 | 354,210 | |
| AMC Entertainment Holdings, Inc. Class A (a) | 233,263 | 3,125,724 | |
| AMC Networks, Inc. Class A (a)(b) | 229,829 | 13,969,007 | |
| Ballantyne of Omaha, Inc. (b) | 47,765 | 300,920 | |
| Beasley Broadcast Group, Inc. Class A | 8,569 | 85,262 | |
| Cable One, Inc. | 20,878 | 15,840,974 | |
| Central European Media Enterprises Ltd. Class A (a)(b) | 338,460 | 1,404,609 | |
| Cinedigm Corp. (a)(b) | 23,731 | 35,834 | |
| Cinemark Holdings, Inc. | 473,543 | 15,764,246 | |
| Clear Channel Outdoor Holding, Inc. Class A (a)(b) | 153,163 | 589,678 | |
| Cumulus Media, Inc. Class A (a)(b) | 76,888 | 29,986 | |
| Daily Journal Corp. (a)(b) | 4,313 | 905,299 | |
| E.W. Scripps Co. Class A (a)(b) | 249,395 | 4,459,183 | |
| Emmis Communications Corp. Class A (b) | 24,761 | 65,617 | |
| Entercom Communications Corp. Class A (a) | 120,536 | 1,241,521 | |
| Entravision Communication Corp. Class A | 286,902 | 1,592,306 | |
| Gannett Co., Inc. | 490,323 | 4,162,842 | |
| Global Eagle Entertainment, Inc. (a)(b) | 223,324 | 690,071 | |
| Gray Television, Inc. (a)(b) | 300,702 | 4,300,039 | |
| Harte-Hanks, Inc. (b) | 205,404 | 184,514 | |
| Hemisphere Media Group, Inc. (a)(b) | 52,967 | 685,923 | |
| Insignia Systems, Inc. | 22,896 | 24,041 | |
| John Wiley & Sons, Inc. Class A | 203,117 | 10,958,162 | |
| Lee Enterprises, Inc. (a)(b) | 197,525 | 414,803 | |
| Liberty Broadband Corp.: | |||
| Class A (b) | 106,720 | 10,824,610 | |
| Class C (b) | 305,673 | 31,034,980 | |
| Liberty Global PLC: | |||
| Class A (b) | 1,034,512 | 35,173,408 | |
| Class C (b) | 2,851,073 | 94,170,941 | |
| LiLAC Class A (a)(b) | 230,476 | 5,994,691 | |
| LiLAC Class C (a)(b) | 537,090 | 13,851,551 | |
| Liberty Media Corp.: | |||
| Liberty Braves Class A (b) | 47,693 | 1,164,186 | |
| Liberty Braves Class C (b) | 135,237 | 3,309,249 | |
| Liberty Formula One Group Series C (a)(b) | 562,233 | 22,095,757 | |
| Liberty Media Class A (a)(b) | 112,685 | 4,274,142 | |
| Liberty SiriusXM Series A (b) | 450,124 | 20,120,543 | |
| Liberty SiriusXM Series C (b) | 715,187 | 31,904,492 | |
| Lions Gate Entertainment Corp.: | |||
| Class A (a) | 200,958 | 5,974,481 | |
| Class B (a) | 506,700 | 14,223,069 | |
| Live Nation Entertainment, Inc. (a)(b) | 590,348 | 23,590,306 | |
| Loral Space & Communications Ltd. (a)(b) | 56,686 | 2,573,544 | |
| Meredith Corp. | 165,628 | 9,001,882 | |
| MSG Network, Inc. Class A (a)(b) | 287,087 | 6,158,016 | |
| National CineMedia, Inc. | 289,834 | 1,568,002 | |
| New Media Investment Group, Inc. | 243,842 | 3,362,581 | |
| Nexstar Broadcasting Group, Inc. Class A (a) | 196,033 | 11,801,187 | |
| NTN Communications, Inc. (a)(b) | 21,179 | 154,607 | |
| Reading International, Inc. Class A (b) | 68,862 | 1,085,265 | |
| Regal Entertainment Group Class A | 483,323 | 7,138,681 | |
| RLJ Entertainment, Inc. (b) | 85,916 | 269,776 | |
| Saga Communications, Inc. Class A | 17,390 | 710,382 | |
| Salem Communications Corp. Class A | 38,916 | 235,442 | |
| Scholastic Corp. | 121,686 | 4,798,079 | |
| Sinclair Broadcast Group, Inc. Class A | 327,708 | 9,913,167 | |
| Sirius XM Holdings, Inc. (a) | 7,363,922 | 42,342,552 | |
| SPAR Group, Inc. (b) | 211,168 | 221,726 | |
| Tegna, Inc. | 954,663 | 12,047,847 | |
| The Madison Square Garden Co. (b) | 62,580 | 13,298,876 | |
| The McClatchy Co. Class A (a)(b) | 20,839 | 151,708 | |
| The New York Times Co. Class A (a) | 535,564 | 9,988,269 | |
| Time, Inc. | 431,065 | 5,668,505 | |
| Townsquare Media, Inc. (b) | 40,471 | 403,901 | |
| Tribune Media Co. Class A | 321,979 | 12,901,699 | |
| tronc, Inc. (b) | 102,477 | 1,486,941 | |
| Urban One, Inc. Class D (non-vtg.) (b) | 114,506 | 200,386 | |
| World Wrestling Entertainment, Inc. Class A | 178,244 | 3,885,719 | |
| 560,259,917 | |||
| Multiline Retail - 0.2% | |||
| Big Lots, Inc. (a) | 204,194 | 9,719,634 | |
| Dillard's, Inc. Class A (a) | 99,840 | 6,070,272 | |
| Fred's, Inc. Class A (a) | 148,273 | 877,776 | |
| JC Penney Corp., Inc. (a)(b) | 1,335,725 | 5,169,256 | |
| Ollie's Bargain Outlet Holdings, Inc. (a)(b) | 207,746 | 8,694,170 | |
| Sears Holdings Corp. (a)(b) | 214,478 | 1,760,864 | |
| The Bon-Ton Stores, Inc. (a)(b) | 46,249 | 30,524 | |
| Tuesday Morning Corp. (a)(b) | 195,077 | 438,923 | |
| 32,761,419 | |||
| Specialty Retail - 1.7% | |||
| Aaron's, Inc. Class A | 281,323 | 12,454,169 | |
| Abercrombie & Fitch Co. Class A | 288,053 | 3,669,795 | |
| America's Car Mart, Inc. (a)(b) | 32,877 | 1,262,477 | |
| American Eagle Outfitters, Inc. (a) | 719,120 | 8,593,484 | |
| Appliance Recycling Centers of America, Inc. (b) | 2,967 | 4,065 | |
| Armstrong Flooring, Inc. (b) | 109,555 | 1,634,561 | |
| Asbury Automotive Group, Inc. (a)(b) | 87,283 | 4,700,190 | |
| Ascena Retail Group, Inc. (a)(b) | 736,486 | 1,502,431 | |
| AutoNation, Inc. (a)(b) | 285,000 | 12,930,450 | |
| Barnes & Noble Education, Inc. (a)(b) | 156,009 | 808,127 | |
| Barnes & Noble, Inc. (a) | 244,408 | 1,894,162 | |
| bebe stores, Inc. (a)(b) | 12,304 | 67,918 | |
| Bed Bath & Beyond, Inc. | 621,375 | 17,143,736 | |
| Big 5 Sporting Goods Corp. | 77,948 | 596,302 | |
| Boot Barn Holdings, Inc. (a)(b) | 56,501 | 457,658 | |
| Build-A-Bear Workshop, Inc. (b) | 62,129 | 571,587 | |
| Burlington Stores, Inc. (a)(b) | 304,704 | 26,548,860 | |
| Cabela's, Inc. Class A (b) | 226,029 | 12,137,757 | |
| Caleres, Inc. | 202,318 | 5,458,540 | |
| Cars.com, Inc. (a) | 310,000 | 8,016,600 | |
| Chico's FAS, Inc. | 580,288 | 4,456,612 | |
| Christopher & Banks Corp. (a)(b) | 142,357 | 183,641 | |
| Citi Trends, Inc. | 69,557 | 1,261,068 | |
| Conn's, Inc. (a)(b) | 103,172 | 1,790,034 | |
| Destination Maternity Corp. (b) | 47,814 | 57,377 | |
| Destination XL Group, Inc. (a)(b) | 165,015 | 305,278 | |
| DGSE Companies, Inc. (a)(b) | 6,929 | 9,216 | |
| Dick's Sporting Goods, Inc. | 382,225 | 10,075,451 | |
| DSW, Inc. Class A (a) | 313,027 | 5,800,390 | |
| Express, Inc. (a)(b) | 375,573 | 2,392,400 | |
| Finish Line, Inc. Class A (a) | 173,876 | 1,448,387 | |
| Five Below, Inc. (a)(b) | 243,633 | 11,589,622 | |
| Floor & Decor Holdings, Inc. Class A | 89,209 | 3,206,171 | |
| Francesca's Holdings Corp. (b) | 164,101 | 1,191,373 | |
| GameStop Corp. Class A (a) | 436,723 | 8,079,376 | |
| Genesco, Inc. (a)(b) | 88,725 | 1,876,534 | |
| GNC Holdings, Inc. Class A (a) | 311,587 | 2,586,172 | |
| Group 1 Automotive, Inc. | 93,406 | 5,606,228 | |
| Guess?, Inc. | 272,830 | 4,250,691 | |
| Haverty Furniture Companies, Inc. | 84,810 | 1,988,795 | |
| Hibbett Sports, Inc. (a)(b) | 113,850 | 1,400,355 | |
| Kirkland's, Inc. (b) | 64,776 | 746,867 | |
| Lithia Motors, Inc. Class A (sub. vtg.) (a) | 104,049 | 11,237,292 | |
| Lumber Liquidators Holdings, Inc. (a)(b) | 125,749 | 4,719,360 | |
| MarineMax, Inc. (a)(b) | 110,011 | 1,776,678 | |
| Michaels Companies, Inc. (a)(b) | 481,990 | 10,820,676 | |
| Monro, Inc. (a) | 145,692 | 6,949,508 | |
| Murphy U.S.A., Inc. (a)(b) | 156,605 | 10,094,758 | |
| New York & Co., Inc. (a)(b) | 123,907 | 239,141 | |
| Office Depot, Inc. | 2,251,861 | 9,660,484 | |
| Party City Holdco, Inc. (a)(b) | 108,856 | 1,518,541 | |
| Penske Automotive Group, Inc. (a) | 166,277 | 7,043,494 | |
| Perfumania Holdings, Inc. (a)(b) | 10,679 | 19,436 | |
| Pier 1 Imports, Inc. (a) | 336,151 | 1,408,473 | |
| Rent-A-Center, Inc. (a) | 229,748 | 2,779,951 | |
| RH (a)(b) | 87,612 | 4,099,365 | |
| Sally Beauty Holdings, Inc. (a)(b) | 635,949 | 11,822,292 | |
| Sears Hometown & Outlet Stores, Inc. (a)(b) | 48,309 | 84,541 | |
| Select Comfort Corp. (a)(b) | 185,514 | 5,478,228 | |
| Shoe Carnival, Inc. | 61,077 | 1,227,648 | |
| Sonic Automotive, Inc. Class A (sub. vtg.) | 124,006 | 2,244,509 | |
| Sportsman's Warehouse Holdings, Inc. (a)(b) | 125,349 | 520,198 | |
| Stage Stores, Inc. (a) | 128,267 | 233,446 | |
| Stein Mart, Inc. (a) | 120,516 | 150,645 | |
| Tailored Brands, Inc. (a) | 222,120 | 2,625,458 | |
| Tandy Leather Factory, Inc. (b) | 3,074 | 25,361 | |
| The Buckle, Inc. (a) | 134,493 | 1,903,076 | |
| The Cato Corp. Class A (sub. vtg.) | 111,693 | 1,469,880 | |
| The Children's Place Retail Stores, Inc. | 77,364 | 8,212,189 | |
| The Container Store Group, Inc. (a)(b) | 75,281 | 305,641 | |
| Tile Shop Holdings, Inc. (a) | 146,904 | 2,210,905 | |
| Tilly's, Inc. | 54,153 | 596,225 | |
| Trans World Entertainment Corp. (b) | 29,120 | 45,136 | |
| Urban Outfitters, Inc. (a)(b) | 390,214 | 7,975,974 | |
| Vitamin Shoppe, Inc. (a)(b) | 110,328 | 590,255 | |
| West Marine, Inc. | 82,712 | 1,072,775 | |
| Williams-Sonoma, Inc. (a) | 354,940 | 16,327,240 | |
| Winmark Corp. | 8,782 | 1,157,907 | |
| Zumiez, Inc. (a)(b) | 83,973 | 1,045,464 | |
| 330,447,057 | |||
| Textiles, Apparel & Luxury Goods - 0.6% | |||
| Carter's, Inc. | 214,862 | 18,630,684 | |
| Charles & Colvard Ltd. (b) | 45,090 | 40,130 | |
| Cherokee, Inc. (b) | 51,314 | 236,044 | |
| Columbia Sportswear Co. | 123,057 | 7,049,936 | |
| Crocs, Inc. (b) | 338,182 | 3,019,965 | |
| Crown Crafts, Inc. | 2,227 | 14,810 | |
| Culp, Inc. | 41,594 | 1,206,226 | |
| Deckers Outdoor Corp. (a)(b) | 145,090 | 9,271,251 | |
| Delta Apparel, Inc. (b) | 25,490 | 500,114 | |
| Differential Brands Group, Inc. (b) | 22,419 | 36,991 | |
| Emerald Expositions Events, Inc. (a) | 82,412 | 1,791,637 | |
| Forward Industries, Inc. (NY Shares) (a)(b) | 18,823 | 20,894 | |
| Fossil Group, Inc. (a)(b) | 171,326 | 1,420,293 | |
| G-III Apparel Group Ltd. (a)(b) | 199,717 | 5,492,218 | |
| Iconix Brand Group, Inc. (a)(b) | 274,433 | 1,534,080 | |
| J.Jill, Inc. (a) | 85,367 | 828,914 | |
| Lakeland Industries, Inc. (b) | 24,535 | 345,944 | |
| lululemon athletica, Inc. (a)(b) | 472,460 | 27,190,073 | |
| Movado Group, Inc. (a) | 67,327 | 1,868,324 | |
| Naked Brand Group, Inc. (a)(b) | 34,817 | 48,396 | |
| Oxford Industries, Inc. | 65,064 | 3,761,350 | |
| Perry Ellis International, Inc. (b) | 55,257 | 1,206,260 | |
| Rocky Brands, Inc. | 27,150 | 350,235 | |
| Sequential Brands Group, Inc. (a)(b) | 184,989 | 564,216 | |
| Skechers U.S.A., Inc. Class A (sub. vtg.) (b) | 597,488 | 15,791,608 | |
| Steven Madden Ltd. (b) | 243,792 | 10,336,781 | |
| Superior Uniform Group, Inc. | 30,551 | 672,733 | |
| Unifi, Inc. (b) | 63,053 | 1,959,687 | |
| Vera Bradley, Inc. (b) | 96,199 | 869,639 | |
| Vince Holding Corp. (a)(b) | 105,062 | 47,908 | |
| Wolverine World Wide, Inc. (a) | 437,927 | 11,517,480 | |
| 127,624,821 | |||
| TOTAL CONSUMER DISCRETIONARY | 2,837,294,528 | ||
| CONSUMER STAPLES - 3.1% | |||
| Beverages - 0.1% | |||
| Boston Beer Co., Inc. Class A (a)(b) | 41,723 | 6,216,727 | |
| Castle Brands, Inc. (a)(b) | 356,392 | 506,077 | |
| Coca-Cola Bottling Co. Consolidated | 20,918 | 4,467,876 | |
| Craft Brew Alliance, Inc. (a)(b) | 39,325 | 684,255 | |
| Crystal Rock Holdings, Inc. (b) | 4,384 | 3,346 | |
| MGP Ingredients, Inc. (a) | 57,126 | 3,212,195 | |
| National Beverage Corp. (a) | 51,760 | 6,015,030 | |
| New Age Beverages Corp. (a) | 91,718 | 387,967 | |
| Primo Water Corp. (a)(b) | 117,562 | 1,287,304 | |
| REED'S, Inc. (a)(b) | 71,901 | 165,372 | |
| 22,946,149 | |||
| Food & Staples Retailing - 0.5% | |||
| Andersons, Inc. | 121,250 | 3,861,813 | |
| Casey's General Stores, Inc. (a) | 177,673 | 18,730,288 | |
| Chefs' Warehouse Holdings (a)(b) | 84,128 | 1,451,208 | |
| Ingles Markets, Inc. Class A | 63,051 | 1,383,969 | |
| Natural Grocers by Vitamin Cottage, Inc. (a)(b) | 42,822 | 240,660 | |
| Performance Food Group Co. (a)(b) | 374,106 | 10,400,147 | |
| PriceSmart, Inc. (a) | 101,308 | 8,231,275 | |
| Rite Aid Corp. (a)(b) | 4,669,312 | 11,299,735 | |
| Smart & Final Stores, Inc. (a)(b) | 132,210 | 932,081 | |
| SpartanNash Co. | 166,314 | 4,097,977 | |
| Sprouts Farmers Market LLC (a)(b) | 572,540 | 11,416,448 | |
| SUPERVALU, Inc. (b) | 168,596 | 3,370,234 | |
| United Natural Foods, Inc. (a)(b) | 221,930 | 7,712,068 | |
| Village Super Market, Inc. Class A | 36,569 | 845,841 | |
| Weis Markets, Inc. | 76,401 | 3,377,688 | |
| Welbilt, Inc. (a)(b) | 619,869 | 12,335,393 | |
| 99,686,825 | |||
| Food Products - 1.8% | |||
| Alico, Inc. | 12,666 | 405,312 | |
| Amplify Snack Brands, Inc. (a)(b) | 150,310 | 1,083,735 | |
| Arcadia Biosciences, Inc. (a)(b) | 26,228 | 10,753 | |
| B&G Foods, Inc. Class A (a) | 298,213 | 9,095,497 | |
| Blue Buffalo Pet Products, Inc. (a)(b) | 411,859 | 10,609,488 | |
| Bunge Ltd. | 618,883 | 46,187,238 | |
| Cal-Maine Foods, Inc. (a)(b) | 130,643 | 4,761,937 | |
| Calavo Growers, Inc. (a) | 68,245 | 4,582,652 | |
| Coffee Holding Co., Inc. (a)(b) | 18,940 | 72,161 | |
| Darling International, Inc. (b) | 719,937 | 12,526,904 | |
| Dean Foods Co. | 392,749 | 4,320,239 | |
| Farmer Brothers Co. (b) | 40,539 | 1,319,544 | |
| Flowers Foods, Inc. | 840,298 | 14,595,976 | |
| Fresh Del Monte Produce, Inc. | 143,001 | 6,719,617 | |
| Freshpet, Inc. (a)(b) | 92,564 | 1,467,139 | |
| Hostess Brands, Inc. Class A (a)(b) | 387,414 | 5,168,103 | |
| Ingredion, Inc. | 313,871 | 38,863,507 | |
| Inventure Foods, Inc. (a)(b) | 76,402 | 262,059 | |
| J&J Snack Foods Corp. | 69,066 | 8,805,224 | |
| John B. Sanfilippo & Son, Inc. (a) | 39,021 | 2,421,643 | |
| Lamb Weston Holdings, Inc. | 610,493 | 27,765,222 | |
| Lancaster Colony Corp. | 85,473 | 9,955,040 | |
| Landec Corp. (b) | 116,866 | 1,519,258 | |
| Lifeway Foods, Inc. (b) | 27,446 | 238,780 | |
| Limoneira Co. | 47,312 | 1,059,789 | |
| Omega Protein Corp. | 96,626 | 1,526,691 | |
| Pilgrim's Pride Corp. (a)(b) | 254,353 | 7,490,696 | |
| Pinnacle Foods, Inc. | 519,350 | 30,802,649 | |
| Post Holdings, Inc. (a)(b) | 289,377 | 24,634,664 | |
| RiceBran Technologies (b) | 15,640 | 16,578 | |
| Rocky Mountain Chocolate Factory, Inc. | 3,001 | 35,142 | |
| S&W Seed Co. (a)(b) | 38,997 | 128,690 | |
| Sanderson Farms, Inc. (a) | 87,851 | 12,959,780 | |
| Seaboard Corp. | 1,198 | 5,146,213 | |
| Seneca Foods Corp. Class A (b) | 30,121 | 897,606 | |
| Snyders-Lance, Inc. (a) | 382,787 | 13,596,594 | |
| The Hain Celestial Group, Inc. (b) | 455,320 | 18,312,970 | |
| Tootsie Roll Industries, Inc. (a) | 89,305 | 3,335,542 | |
| TreeHouse Foods, Inc. (a)(b) | 250,906 | 16,808,193 | |
| 349,508,825 | |||
| Household Products - 0.2% | |||
| Central Garden & Pet Co. Class A (non-vtg.) (b) | 203,188 | 6,926,679 | |
| Energizer Holdings, Inc. (a) | 275,587 | 12,167,166 | |
| HRG Group, Inc. (a)(b) | 611,179 | 9,650,516 | |
| Ocean Bio-Chem, Inc. | 26,292 | 114,107 | |
| Oil-Dri Corp. of America | 22,679 | 923,035 | |
| Orchids Paper Products Co. (a) | 40,696 | 415,099 | |
| Spectrum Brands Holdings, Inc. (a) | 105,465 | 11,596,931 | |
| WD-40 Co. (a) | 63,004 | 6,864,286 | |
| 48,657,819 | |||
| Personal Products - 0.4% | |||
| Avon Products, Inc. (b) | 1,906,557 | 4,747,327 | |
| CCA Industries, Inc. (b) | 3,083 | 10,945 | |
| Cyanotech Corp. (b) | 3,808 | 17,898 | |
| Edgewell Personal Care Co. (a)(b) | 255,772 | 19,423,326 | |
| elf Beauty, Inc. (a) | 86,380 | 1,787,202 | |
| Herbalife Ltd. (a)(b) | 307,483 | 21,219,402 | |
| Inter Parfums, Inc. | 80,161 | 3,162,351 | |
| LifeVantage Corp. (a)(b) | 58,439 | 243,106 | |
| Mannatech, Inc. | 4,519 | 68,011 | |
| MediFast, Inc. | 51,562 | 2,919,440 | |
| MYOS Corp. (a)(b) | 849 | 1,061 | |
| Natural Alternatives International, Inc. (b) | 20,104 | 221,144 | |
| Natural Health Trends Corp. | 30,893 | 623,421 | |
| Nature's Sunshine Products, Inc. | 31,943 | 336,999 | |
| Nu Skin Enterprises, Inc. Class A | 218,397 | 13,285,090 | |
| Reliv International, Inc. (b) | 1,527 | 11,758 | |
| Revlon, Inc. (a)(b) | 56,452 | 954,039 | |
| The Female Health Co. (b) | 72,631 | 116,936 | |
| United-Guardian, Inc. | 6,016 | 102,272 | |
| USANA Health Sciences, Inc. (a)(b) | 50,330 | 2,979,536 | |
| 72,231,264 | |||
| Tobacco - 0.1% | |||
| 22nd Century Group, Inc. (a)(b) | 345,348 | 759,766 | |
| Alliance One International, Inc. (b) | 33,481 | 348,202 | |
| Turning Point Brands, Inc. (b) | 29,381 | 505,353 | |
| Universal Corp. | 111,115 | 6,355,778 | |
| Vector Group Ltd. (a) | 446,014 | 9,633,902 | |
| 17,603,001 | |||
| TOTAL CONSUMER STAPLES | 610,633,883 | ||
| ENERGY - 3.7% | |||
| Energy Equipment & Services - 1.0% | |||
| Archrock, Inc. | 301,614 | 3,076,463 | |
| Aspen Aerogels, Inc. (b) | 85,012 | 347,699 | |
| Atwood Oceanics, Inc. (a)(b) | 321,131 | 2,109,831 | |
| Basic Energy Services, Inc. (b) | 100,658 | 1,433,370 | |
| Bristow Group, Inc. (a) | 142,536 | 1,174,497 | |
| C&J Energy Services, Inc. (a) | 281,497 | 7,110,614 | |
| Carbo Ceramics, Inc. (a)(b) | 90,902 | 596,317 | |
| Core Laboratories NV (a) | 194,145 | 17,119,706 | |
| Dawson Geophysical Co. (b) | 84,323 | 352,470 | |
| Diamond Offshore Drilling, Inc. (a)(b) | 274,267 | 3,115,673 | |
| Dril-Quip, Inc. (a)(b) | 165,265 | 6,205,701 | |
| EcoStim Energy Solutions, Inc. (a)(b) | 45,860 | 60,077 | |
| ENGlobal Corp. (b) | 49,530 | 63,894 | |
| Ensco PLC Class A (a) | 1,312,309 | 5,577,313 | |
| Enservco Corp. (a)(b) | 77,749 | 37,024 | |
| Era Group, Inc. (b) | 75,717 | 667,067 | |
| Exterran Corp. (b) | 137,290 | 3,808,425 | |
| Fairmount Santrol Holidings, Inc. (a)(b) | 640,322 | 1,959,385 | |
| Forum Energy Technologies, Inc. (a)(b) | 311,762 | 3,616,439 | |
| Frank's International NV (a) | 226,789 | 1,424,235 | |
| Geospace Technologies Corp. (a)(b) | 53,804 | 811,902 | |
| Gulf Island Fabrication, Inc. | 51,115 | 572,488 | |
| Helix Energy Solutions Group, Inc. (b) | 603,189 | 3,781,995 | |
| Hornbeck Offshore Services, Inc. (a)(b) | 148,293 | 410,772 | |
| Independence Contract Drilling, Inc. (b) | 127,230 | 409,681 | |
| ION Geophysical Corp. (a)(b) | 31,686 | 232,892 | |
| Mammoth Energy Services, Inc. (a) | 59,263 | 816,644 | |
| Matrix Service Co. (b) | 116,892 | 1,385,170 | |
| McDermott International, Inc. (a)(b) | 1,235,190 | 7,584,067 | |
| Mitcham Industries, Inc. (b) | 40,926 | 153,473 | |
| Nabors Industries Ltd. | 1,284,767 | 8,415,224 | |
| Natural Gas Services Group, Inc. (b) | 52,753 | 1,244,971 | |
| NCS Multistage Holdings, Inc. | 47,450 | 937,612 | |
| Newpark Resources, Inc. (a)(b) | 403,139 | 3,245,269 | |
| Noble Corp. (a) | 1,084,172 | 3,534,401 | |
| Oceaneering International, Inc. (a) | 426,515 | 9,617,913 | |
| Oil States International, Inc. (a)(b) | 226,051 | 4,916,609 | |
| Parker Drilling Co. (a)(b) | 571,982 | 629,180 | |
| Patterson-UTI Energy, Inc. | 742,721 | 11,861,254 | |
| PHI, Inc. (non-vtg.) (b) | 46,438 | 510,354 | |
| Pioneer Energy Services Corp. (b) | 318,662 | 541,725 | |
| Profire Energy, Inc. (b) | 83,066 | 125,430 | |
| RigNet, Inc. (b) | 52,479 | 839,664 | |
| Rowan Companies PLC (a)(b) | 586,816 | 5,721,456 | |
| RPC, Inc. (a) | 264,838 | 5,140,506 | |
| SAExploration Holdings, Inc.: | |||
| warrants 7/27/21 (c) | 42 | 1 | |
| warrants 7/27/21 (c) | 42 | 2 | |
| SEACOR Holdings, Inc. (a)(b) | 70,418 | 2,701,939 | |
| Smart Sand, Inc. (a) | 101,936 | 608,558 | |
| Solaris Oilfield Infrastructure, Inc. Class A | 70,674 | 1,000,744 | |
| Superior Energy Services, Inc. (a)(b) | 660,904 | 5,445,849 | |
| Synthesis Energy Systems, Inc. (a)(b) | 247,060 | 100,652 | |
| Tesco Corp. (b) | 196,597 | 865,027 | |
| TETRA Technologies, Inc. (b) | 540,634 | 1,113,706 | |
| Transocean Ltd. (United States) (a)(b) | 1,742,456 | 14,218,441 | |
| U.S. Silica Holdings, Inc. | 322,967 | 8,787,932 | |
| Unit Corp. (a)(b) | 236,049 | 3,757,900 | |
| Weatherford International PLC (a) | 4,387,855 | 16,805,485 | |
| Willbros Group, Inc. (b) | 173,199 | 381,038 | |
| 189,084,126 | |||
| Oil, Gas & Consumable Fuels - 2.7% | |||
| Abraxas Petroleum Corp. (b) | 679,559 | 1,155,250 | |
| Adams Resources & Energy, Inc. | 9,909 | 343,545 | |
| Aemetis, Inc. (a)(b) | 44,295 | 38,231 | |
| Amyris, Inc. (a)(b) | 25,665 | 63,393 | |
| Antero Resources Corp. (a)(b) | 643,512 | 12,670,751 | |
| Approach Resources, Inc. (a)(b) | 211,859 | 588,968 | |
| Arch Coal, Inc. | 108,752 | 8,686,022 | |
| Ardmore Shipping Corp. (a) | 128,732 | 1,042,729 | |
| Barnwell Industries, Inc. (b) | 11,298 | 20,336 | |
| Bill Barrett Corp. (a)(b) | 346,422 | 1,035,802 | |
| Bonanza Creek Energy, Inc. | 9,121 | 237,055 | |
| Bonanza Creek Energy, Inc. (d) | 166,099 | 2 | |
| California Resources Corp. (a)(b) | 172,583 | 1,346,147 | |
| Callon Petroleum Co. (a)(b) | 902,491 | 9,349,807 | |
| Carrizo Oil & Gas, Inc. (a)(b) | 334,669 | 4,497,951 | |
| Centennial Resource Development, Inc. Class A (a) | 544,343 | 9,411,690 | |
| Centrus Energy Corp. Class A (a)(b) | 22,164 | 83,780 | |
| Cheniere Energy, Inc. (a)(b) | 1,052,608 | 45,041,096 | |
| Clean Energy Fuels Corp. (a)(b) | 457,470 | 1,088,779 | |
| Cloud Peak Energy, Inc. (a)(b) | 350,207 | 1,099,650 | |
| Cobalt International Energy, Inc. (a)(b) | 109,951 | 206,708 | |
| Comstock Resources, Inc. (a)(b) | 59,844 | 384,198 | |
| CONSOL Energy, Inc. | 790,515 | 11,501,993 | |
| Contango Oil & Gas Co. (a)(b) | 88,353 | 405,540 | |
| Continental Resources, Inc. (a)(b) | 391,200 | 13,269,504 | |
| CVR Energy, Inc. (a) | 67,664 | 1,449,363 | |
| Delek U.S. Holdings, Inc. | 324,339 | 8,017,660 | |
| Denbury Resources, Inc. (a)(b) | 1,713,341 | 1,816,141 | |
| Diamondback Energy, Inc. (b) | 430,889 | 39,120,412 | |
| Earthstone Energy, Inc. (a)(b) | 37,892 | 363,384 | |
| Eclipse Resources Corp. (b) | 384,060 | 894,860 | |
| Energen Corp. (b) | 425,353 | 21,812,102 | |
| Energy XXI Gulf Coast, Inc. (a) | 141,118 | 1,474,683 | |
| EP Energy Corp. (a)(b) | 194,327 | 571,321 | |
| Evolution Petroleum Corp. | 131,930 | 916,914 | |
| EXCO Resources, Inc. (a)(b) | 48,051 | 86,011 | |
| Extraction Oil & Gas, Inc. (a) | 178,876 | 2,350,431 | |
| FieldPoint Petroleum Corp. (b) | 9,981 | 3,314 | |
| Gastar Exploration, Inc. (a)(b) | 765,403 | 451,741 | |
| Gener8 Maritime, Inc. (a)(b) | 367,090 | 1,651,905 | |
| Gevo, Inc. (a)(b) | 25,651 | 16,673 | |
| Green Plains, Inc. (a) | 167,214 | 3,101,820 | |
| Gulfport Energy Corp. (b) | 697,873 | 8,744,349 | |
| Halcon Resources Corp. (a)(b) | 129,266 | 800,157 | |
| Hallador Energy Co. (a) | 78,379 | 454,598 | |
| HollyFrontier Corp. (a) | 781,490 | 24,468,452 | |
| Houston American Energy Corp. (a)(b) | 98,796 | 48,410 | |
| International Seaways, Inc. | 134,191 | 2,474,482 | |
| Isramco, Inc. (a)(b) | 3,497 | 393,762 | |
| Jagged Peak Energy, Inc. (a) | 152,260 | 1,950,451 | |
| Jones Energy, Inc. (a) | 301,130 | 298,119 | |
| Kosmos Energy Ltd. (a)(b) | 1,024,087 | 7,209,572 | |
| Laredo Petroleum, Inc. (a)(b) | 622,734 | 7,734,356 | |
| Lilis Energy, Inc. (a)(b) | 116,379 | 425,947 | |
| Lonestar Resources U.S., Inc. (b) | 83,150 | 271,069 | |
| Matador Resources Co. (a)(b) | 416,404 | 9,818,806 | |
| Mexco Energy Corp. (b) | 2,119 | 9,345 | |
| Murphy Oil Corp. (a) | 717,888 | 16,267,342 | |
| Northern Oil & Gas, Inc. (a)(b) | 216,184 | 183,756 | |
| Oasis Petroleum, Inc. (a)(b) | 1,064,131 | 7,768,156 | |
| Overseas Shipholding Group, Inc. (b) | 203,430 | 459,752 | |
| Pacific Ethanol, Inc. (b) | 157,778 | 788,890 | |
| Panhandle Royalty Co. Class A | 65,031 | 1,372,154 | |
| Par Pacific Holdings, Inc. (a)(b) | 146,529 | 2,609,681 | |
| Parsley Energy, Inc. Class A (b) | 1,000,939 | 25,073,522 | |
| PBF Energy, Inc. Class A (a) | 489,298 | 11,586,577 | |
| PDC Energy, Inc. (a)(b) | 251,056 | 9,874,032 | |
| Peabody Energy Corp. (a) | 433,861 | 12,581,969 | |
| Pedevco Corp. (a)(b) | 6,185 | 4,094 | |
| Penn Virginia Corp. (a) | 30,000 | 1,155,000 | |
| Petroquest Energy, Inc. (b) | 55,392 | 99,152 | |
| PrimeEnergy Corp. (b) | 4,530 | 199,320 | |
| QEP Resources, Inc. (a)(b) | 1,089,505 | 8,225,763 | |
| Ramaco Resources, Inc. (a) | 23,661 | 183,846 | |
| Renewable Energy Group, Inc. (a)(b) | 153,384 | 1,855,946 | |
| Resolute Energy Corp. (a)(b) | 84,842 | 2,507,081 | |
| Rex American Resources Corp. (b) | 26,148 | 2,264,940 | |
| Rex Energy Corp. (a)(b) | 38,463 | 88,080 | |
| Rice Energy, Inc. (b) | 715,932 | 19,587,900 | |
| Ring Energy, Inc. (b) | 208,423 | 2,484,402 | |
| RSP Permian, Inc. (a)(b) | 478,288 | 15,008,677 | |
| Sanchez Energy Corp. (a)(b) | 307,135 | 1,345,251 | |
| SandRidge Energy, Inc. (a)(b) | 95,557 | 1,645,492 | |
| SemGroup Corp. Class A (a) | 235,573 | 6,054,226 | |
| SilverBow Resources, Inc. (a)(b) | 23,761 | 514,188 | |
| SM Energy Co. (a) | 443,376 | 5,923,503 | |
| Southwestern Energy Co. (b) | 2,298,895 | 12,528,978 | |
| Src Energy, Inc. (b) | 892,580 | 7,042,456 | |
| Stone Energy Corp. (a) | 92,375 | 2,235,475 | |
| Syntroleum Corp. (a)(b)(d) | 21,880 | 0 | |
| Targa Resources Corp. | 954,087 | 42,523,658 | |
| Teekay Corp. (a) | 243,861 | 2,248,398 | |
| Tellurian, Inc. (a)(b) | 201,608 | 1,862,858 | |
| Tengasco, Inc. (a)(b) | 73,015 | 48,190 | |
| Torchlight Energy Resources, Inc. (a)(b) | 200,782 | 273,064 | |
| TransAtlantic Petroleum Ltd. (b) | 79,564 | 59,673 | |
| U.S. Energy Corp. (a)(b) | 16,587 | 12,608 | |
| Uranium Energy Corp. (a)(b) | 640,353 | 845,266 | |
| VAALCO Energy, Inc. (b) | 208,727 | 151,849 | |
| Vertex Energy, Inc. (a)(b) | 54,529 | 43,623 | |
| W&T Offshore, Inc. (a)(b) | 172,461 | 329,401 | |
| Warrior Metropolitan Coal, Inc. (a) | 83,389 | 2,275,686 | |
| Westmoreland Coal Co. (a)(b) | 73,444 | 171,125 | |
| Westwater Resources, Inc. (a)(b) | 151,823 | 206,479 | |
| Whiting Petroleum Corp. (a)(b) | 1,205,956 | 5,390,623 | |
| WildHorse Resource Development Corp. (a) | 130,932 | 1,428,468 | |
| World Fuel Services Corp. | 302,651 | 10,453,566 | |
| WPX Energy, Inc. (b) | 1,772,698 | 17,709,253 | |
| Yuma Energy, Inc. (a)(b) | 5,304 | 6,153 | |
| Zion Oil & Gas, Inc. (a)(b) | 201,994 | 674,660 | |
| 539,003,739 | |||
| TOTAL ENERGY | 728,087,865 | ||
| FINANCIALS - 16.8% | |||
| Banks - 6.9% | |||
| 1st Constitution Bancorp | 42,103 | 724,172 | |
| 1st Source Corp. | 82,536 | 3,851,955 | |
| Access National Corp. (a) | 63,466 | 1,629,807 | |
| ACNB Corp. | 17,139 | 448,185 | |
| Allegiance Bancshares, Inc. (a)(b) | 49,520 | 1,686,156 | |
| American National Bankshares, Inc. | 28,161 | 1,027,877 | |
| American River Bankshares | 8,231 | 108,732 | |
| Ameris Bancorp | 168,643 | 7,428,724 | |
| AmeriServ Financial, Inc. | 14,728 | 57,439 | |
| Ames National Corp. (a) | 27,281 | 739,315 | |
| Anchor Bancorp (b) | 8,039 | 201,377 | |
| Arrow Financial Corp. | 50,020 | 1,615,646 | |
| Associated Banc-Corp. | 677,617 | 14,839,812 | |
| Atlantic Capital Bancshares, Inc. (b) | 74,953 | 1,345,406 | |
| Auburn National Bancorp., Inc. | 3,534 | 126,341 | |
| Banc of California, Inc. (a) | 218,168 | 4,047,016 | |
| BancFirst Corp. | 75,734 | 3,816,994 | |
| Bancorp, Inc., Delaware (b) | 253,910 | 1,993,194 | |
| BancorpSouth, Inc. | 364,939 | 10,601,478 | |
| Bank of Commerce Holdings (a) | 98,321 | 1,037,287 | |
| Bank of Hawaii Corp. | 190,452 | 14,880,015 | |
| Bank of Marin Bancorp | 24,262 | 1,587,948 | |
| Bank of South Carolina Corp. | 10,268 | 185,337 | |
| Bank of the Ozarks, Inc. (a) | 538,139 | 23,118,451 | |
| BankUnited, Inc. | 489,886 | 16,303,406 | |
| Bankwell Financial Group, Inc. | 40,974 | 1,389,019 | |
| Banner Corp. | 127,685 | 7,037,997 | |
| Bar Harbor Bankshares | 62,421 | 1,639,175 | |
| BCB Bancorp, Inc. (a) | 55,365 | 786,183 | |
| Berkshire Hills Bancorp, Inc. | 161,342 | 5,453,360 | |
| Blue Hills Bancorp, Inc. (a) | 123,079 | 2,301,577 | |
| BOK Financial Corp. (a) | 95,691 | 7,701,212 | |
| Boston Private Financial Holdings, Inc. | 373,066 | 5,484,070 | |
| Bridge Bancorp, Inc. | 80,834 | 2,497,771 | |
| Brookline Bancorp, Inc., Delaware | 346,551 | 4,973,007 | |
| Bryn Mawr Bank Corp. (a) | 81,577 | 3,340,578 | |
| C & F Financial Corp. | 11,407 | 534,418 | |
| California First National Bancorp | 1,545 | 24,952 | |
| Camden National Corp. | 73,144 | 2,852,616 | |
| Capital Bank Financial Corp. Series A | 119,506 | 4,493,426 | |
| Capital City Bank Group, Inc. | 48,944 | 1,012,651 | |
| Capstar Financial Holdings, Inc. (a) | 10,727 | 186,006 | |
| Carolina Financial Corp. | 55,435 | 1,886,453 | |
| Cathay General Bancorp | 324,330 | 11,439,119 | |
| CB Financial Services, Inc. | 34,610 | 939,662 | |
| Centerstate Banks of Florida, Inc. | 276,150 | 6,757,391 | |
| Central Pacific Financial Corp. | 137,108 | 3,976,132 | |
| Central Valley Community Bancorp | 34,644 | 681,447 | |
| Century Bancorp, Inc. Class A (non-vtg.) | 8,372 | 559,250 | |
| Chemical Financial Corp. | 313,725 | 14,246,252 | |
| Chemung Financial Corp. (a) | 14,797 | 597,651 | |
| CIT Group, Inc. (a) | 592,137 | 26,557,344 | |
| Citizens & Northern Corp. | 49,346 | 1,107,324 | |
| Citizens Holding Co. | 12,650 | 295,378 | |
| City Holding Co. | 75,888 | 4,805,987 | |
| Civista Bancshares, Inc. (a) | 34,892 | 705,167 | |
| CNB Financial Corp., Pennsylvania | 61,173 | 1,477,940 | |
| CoBiz, Inc. | 222,257 | 3,789,482 | |
| Codorus Valley Bancorp, Inc. | 33,275 | 833,539 | |
| Colony Bankcorp, Inc. | 4,518 | 60,089 | |
| Columbia Banking Systems, Inc. (a) | 254,513 | 9,460,248 | |
| Commerce Bancshares, Inc. | 385,313 | 21,188,362 | |
| Commerce Union Bancshares, Inc. (a) | 23,562 | 565,252 | |
| Community Bank System, Inc. (a) | 217,028 | 11,168,261 | |
| Community Bankers Trust Corp. (a)(b) | 171,891 | 1,443,884 | |
| Community Financial Corp. (a) | 16,726 | 585,410 | |
| Community Trust Bancorp, Inc. | 84,178 | 3,581,774 | |
| ConnectOne Bancorp, Inc. | 128,046 | 2,919,449 | |
| County Bancorp, Inc. | 25,129 | 753,367 | |
| CU Bancorp (b) | 78,920 | 2,813,498 | |
| Cullen/Frost Bankers, Inc. | 251,960 | 21,215,032 | |
| Customers Bancorp, Inc. (b) | 124,000 | 3,494,320 | |
| CVB Financial Corp. (a) | 441,582 | 9,140,747 | |
| DNB Financial Corp. | 4,951 | 161,155 | |
| Eagle Bancorp, Inc. (b) | 134,184 | 8,346,245 | |
| East West Bancorp, Inc. | 632,265 | 35,008,513 | |
| Enterprise Bancorp, Inc. | 37,217 | 1,190,572 | |
| Enterprise Financial Services Corp. | 105,839 | 4,043,050 | |
| Equity Bancshares, Inc. (b) | 21,834 | 745,631 | |
| Evans Bancorp, Inc. (a) | 17,239 | 711,971 | |
| Farmers Capital Bank Corp. | 34,947 | 1,308,765 | |
| Farmers National Banc Corp. | 109,961 | 1,506,466 | |
| FCB Financial Holdings, Inc. Class A (a)(b) | 190,229 | 8,293,984 | |
| Fidelity Southern Corp. | 97,915 | 2,140,422 | |
| Financial Institutions, Inc. | 63,631 | 1,730,763 | |
| First Bancorp, North Carolina | 107,671 | 3,331,341 | |
| First Bancorp, Puerto Rico (b) | 809,686 | 4,599,016 | |
| First Bancshares, Inc. (a) | 28,134 | 793,379 | |
| First Bank Hamilton New Jersey | 51,342 | 616,104 | |
| First Busey Corp. | 190,257 | 5,488,914 | |
| First Business Finance Services, Inc. | 37,553 | 800,254 | |
| First Citizen Bancshares, Inc. | 39,444 | 13,431,076 | |
| First Commonwealth Financial Corp. | 394,538 | 4,975,124 | |
| First Community Bancshares, Inc. | 65,716 | 1,691,530 | |
| First Community Corp. | 50,202 | 1,059,262 | |
| First Connecticut Bancorp, Inc. | 63,853 | 1,580,362 | |
| First Financial Bancorp, Ohio | 288,325 | 6,905,384 | |
| First Financial Bankshares, Inc. (a) | 290,331 | 11,627,757 | |
| First Financial Corp., Indiana | 56,581 | 2,455,615 | |
| First Financial Northwest, Inc. | 38,725 | 619,600 | |
| First Foundation, Inc. (b) | 120,044 | 2,034,746 | |
| First Hawaiian, Inc. | 221,378 | 5,997,130 | |
| First Horizon National Corp. | 1,034,454 | 17,802,953 | |
| First Internet Bancorp | 24,292 | 772,486 | |
| First Interstate Bancsystem, Inc. | 125,482 | 4,416,966 | |
| First Merchants Corp. | 189,960 | 7,459,729 | |
| First Mid-Illinois Bancshares, Inc. | 30,682 | 1,064,052 | |
| First Midwest Bancorp, Inc., Delaware | 356,411 | 7,513,144 | |
| First Northwest Bancorp (b) | 29,480 | 467,553 | |
| First of Long Island Corp. | 95,119 | 2,544,433 | |
| First Republic Bank | 673,295 | 65,343,280 | |
| First South Bancorp, Inc., Virginia | 39,689 | 691,382 | |
| First United Corp. (b) | 16,427 | 258,725 | |
| Flushing Financial Corp. | 128,655 | 3,517,428 | |
| FNB Corp., Pennsylvania | 1,411,846 | 17,916,326 | |
| Franklin Financial Network, Inc. (b) | 55,816 | 1,825,183 | |
| Fulton Financial Corp. | 763,857 | 13,329,305 | |
| German American Bancorp, Inc. | 91,374 | 2,973,310 | |
| Glacier Bancorp, Inc. (a) | 342,242 | 11,365,857 | |
| Glen Burnie Bancorp | 18,661 | 196,127 | |
| Great Southern Bancorp, Inc. | 44,239 | 2,203,102 | |
| Great Western Bancorp, Inc. | 265,155 | 9,524,368 | |
| Green Bancorp, Inc. (b) | 96,487 | 1,934,564 | |
| Guaranty Bancorp | 81,387 | 2,099,785 | |
| Guaranty Bancshares, Inc. Texas | 6,893 | 208,444 | |
| Hancock Holding Co. | 379,714 | 16,688,430 | |
| Hanmi Financial Corp. | 139,169 | 3,715,812 | |
| HarborOne Bancorp, Inc. (b) | 139,543 | 2,398,744 | |
| Hawthorn Bancshares, Inc. | 48,188 | 970,988 | |
| Heartland Financial U.S.A., Inc. | 111,545 | 5,075,298 | |
| Heritage Commerce Corp. | 144,223 | 1,932,588 | |
| Heritage Financial Corp., Washington | 134,310 | 3,512,207 | |
| Hilltop Holdings, Inc. | 360,056 | 8,522,526 | |
| Home Bancshares, Inc. (a) | 553,439 | 12,900,663 | |
| HomeTrust Bancshares, Inc. (b) | 82,069 | 1,904,001 | |
| Hope Bancorp, Inc. | 575,341 | 9,286,004 | |
| Horizon Bancorp Industries | 89,615 | 2,345,225 | |
| Howard Bancorp, Inc. (a)(b) | 32,517 | 642,211 | |
| IBERIABANK Corp. | 220,149 | 16,863,413 | |
| Independent Bank Corp. | 96,933 | 1,977,433 | |
| Independent Bank Corp., Massachusetts (a) | 121,955 | 8,451,482 | |
| Independent Bank Group, Inc. | 55,312 | 3,078,113 | |
| International Bancshares Corp. | 260,048 | 9,348,726 | |
| Investar Holding Corp. | 29,136 | 640,992 | |
| Investors Bancorp, Inc. | 1,364,718 | 17,864,159 | |
| Lakeland Bancorp, Inc. | 184,477 | 3,412,825 | |
| Lakeland Financial Corp. | 114,291 | 4,967,087 | |
| Landmark Bancorp, Inc. | 38 | 1,112 | |
| LCNB Corp. | 38,996 | 719,476 | |
| LegacyTexas Financial Group, Inc. | 185,316 | 6,669,523 | |
| Live Oak Bancshares, Inc. (a) | 117,643 | 2,629,321 | |
| Macatawa Bank Corp. | 91,347 | 874,191 | |
| MainSource Financial Group, Inc. | 119,416 | 3,908,486 | |
| MB Financial, Inc. | 313,695 | 12,475,650 | |
| MBT Financial Corp. | 69,241 | 702,796 | |
| Mercantile Bank Corp. | 67,865 | 2,062,417 | |
| Mid Penn Bancorp, Inc. | 28,255 | 836,348 | |
| Middlefield Banc Corp. (a) | 24,755 | 1,112,737 | |
| Midland States Bancorp, Inc. | 36,485 | 1,114,252 | |
| Midsouth Bancorp, Inc. | 59,250 | 702,113 | |
| MidWestOne Financial Group, Inc. | 36,136 | 1,188,152 | |
| MutualFirst Financial, Inc. | 16,479 | 580,061 | |
| National Bank Holdings Corp. | 120,099 | 3,864,786 | |
| National Bankshares, Inc. (a) | 27,586 | 1,086,888 | |
| National Commerce Corp. (b) | 43,733 | 1,738,387 | |
| NBT Bancorp, Inc. | 212,914 | 6,989,967 | |
| Nicolet Bankshares, Inc. (b) | 27,108 | 1,481,452 | |
| Northeast Bancorp | 47,101 | 1,017,382 | |
| Northrim Bancorp, Inc. | 32,754 | 977,707 | |
| Norwood Financial Corp. (a) | 17,432 | 767,705 | |
| OFG Bancorp (a) | 196,849 | 1,712,586 | |
| Ohio Valley Banc Corp. (a) | 14,494 | 476,853 | |
| Old Line Bancshares, Inc. | 23,282 | 640,255 | |
| Old National Bancorp, Indiana | 617,544 | 10,096,844 | |
| Old Point Financial Corp. | 8,603 | 264,456 | |
| Old Second Bancorp, Inc. | 127,732 | 1,462,531 | |
| Opus Bank | 75,669 | 1,694,986 | |
| Orrstown Financial Services, Inc. | 28,866 | 705,774 | |
| Pacific Continental Corp. | 89,523 | 2,126,171 | |
| Pacific Mercantile Bancorp (b) | 76,145 | 647,233 | |
| Pacific Premier Bancorp, Inc. (b) | 150,823 | 5,339,134 | |
| PacWest Bancorp | 532,317 | 24,034,113 | |
| Park National Corp. | 59,483 | 5,745,463 | |
| Park Sterling Corp. | 235,316 | 2,675,543 | |
| Parke Bancorp, Inc. (a) | 9,617 | 187,051 | |
| Patriot National Bancorp, Inc. | 1,402 | 23,413 | |
| PCSB Financial Corp. (a) | 71,701 | 1,213,181 | |
| Peapack-Gladstone Financial Corp. | 67,127 | 2,045,360 | |
| Penns Woods Bancorp, Inc. | 18,934 | 812,458 | |
| People's Utah Bancorp | 68,752 | 1,880,367 | |
| Peoples Bancorp of North Carolina (a) | 28,481 | 865,253 | |
| Peoples Bancorp, Inc. | 86,252 | 2,678,987 | |
| Peoples Financial Corp., Mississippi (b) | 7,232 | 97,632 | |
| Peoples Financial Services Corp. | 28,276 | 1,174,868 | |
| Pinnacle Financial Partners, Inc. | 321,651 | 20,006,692 | |
| Popular, Inc. | 447,330 | 17,852,940 | |
| Porter Bancorp, Inc. (b) | 747 | 8,299 | |
| Preferred Bank, Los Angeles | 57,012 | 3,067,246 | |
| Premier Financial Bancorp, Inc. | 21,201 | 400,699 | |
| Prosperity Bancshares, Inc. | 302,610 | 18,080,948 | |
| QCR Holdings, Inc. | 57,990 | 2,534,163 | |
| Renasant Corp. (a) | 194,858 | 7,761,194 | |
| Republic Bancorp, Inc., Kentucky Class A | 38,600 | 1,373,388 | |
| Republic First Bancorp, Inc. (a)(b) | 238,609 | 2,016,246 | |
| Royal Bancshares of Pennsylvania, Inc. Class A (b) | 13,408 | 54,839 | |
| S&T Bancorp, Inc. | 157,543 | 5,662,095 | |
| Sandy Spring Bancorp, Inc. | 113,430 | 4,374,995 | |
| SB Financial Group, Inc. | 532 | 8,783 | |
| Seacoast Banking Corp., Florida (b) | 179,262 | 4,099,722 | |
| Select Bancorp, Inc. New (b) | 98 | 1,144 | |
| ServisFirst Bancshares, Inc. (a) | 200,763 | 6,848,026 | |
| Shore Bancshares, Inc. | 42,320 | 697,857 | |
| Sierra Bancorp | 45,562 | 1,153,174 | |
| Signature Bank (b) | 237,314 | 30,456,879 | |
| Simmons First National Corp. Class A (a) | 133,602 | 6,974,024 | |
| SmartFinancial, Inc. (a)(b) | 29,546 | 682,217 | |
| South State Corp. | 109,889 | 9,038,370 | |
| Southern First Bancshares, Inc. (b) | 41,478 | 1,466,247 | |
| Southern National Bancorp of Virginia, Inc. | 84,680 | 1,418,390 | |
| Southside Bancshares, Inc. | 125,401 | 4,096,851 | |
| Southwest Bancorp, Inc., Oklahoma | 82,567 | 2,084,817 | |
| State Bank Financial Corp. | 163,053 | 4,381,234 | |
| Sterling Bancorp (a) | 608,039 | 13,650,476 | |
| Stock Yards Bancorp, Inc. | 114,773 | 3,994,100 | |
| Stonegate Bank | 66,942 | 3,227,274 | |
| Summit Financial Group, Inc. (a) | 28,736 | 629,031 | |
| Sun Bancorp, Inc. | 52,032 | 1,214,947 | |
| Sunshine Bancorp, Inc. (a)(b) | 22,894 | 494,510 | |
| Sussex Bancorp (a) | 1,371 | 32,630 | |
| SVB Financial Group (b) | 230,334 | 39,004,760 | |
| Synovus Financial Corp. | 529,490 | 22,302,119 | |
| TCF Financial Corp. | 787,248 | 12,225,961 | |
| Texas Capital Bancshares, Inc. (a)(b) | 215,943 | 16,033,768 | |
| The First Bancorp, Inc. | 40,384 | 1,051,196 | |
| Tompkins Financial Corp. (a) | 56,854 | 4,316,356 | |
| TowneBank (a) | 258,979 | 7,950,655 | |
| Trico Bancshares | 98,612 | 3,508,615 | |
| TriState Capital Holdings, Inc. (b) | 98,771 | 2,064,314 | |
| Triumph Bancorp, Inc. (b) | 78,615 | 2,216,943 | |
| Trustmark Corp. | 296,262 | 8,775,280 | |
| Two River Bancorp (a) | 43,275 | 788,471 | |
| UMB Financial Corp. (a) | 200,120 | 13,432,054 | |
| Umpqua Holdings Corp. | 987,453 | 17,280,428 | |
| Union Bankshares Corp. (a) | 202,037 | 6,329,819 | |
| Union Bankshares, Inc. (a) | 26,240 | 1,132,256 | |
| United Bancorp, Inc. | 41,665 | 495,814 | |
| United Bankshares, Inc., West Virginia (a) | 460,054 | 15,434,812 | |
| United Community Bank, Inc. | 313,340 | 8,181,307 | |
| United Security Bancshares, Inc. | 8,545 | 96,559 | |
| United Security Bancshares, California | 21,338 | 197,377 | |
| Unity Bancorp, Inc. | 57,145 | 991,466 | |
| Univest Corp. of Pennsylvania | 120,426 | 3,510,418 | |
| Valley National Bancorp | 1,183,756 | 13,246,230 | |
| Veritex Holdings, Inc. (a)(b) | 71,960 | 1,900,464 | |
| Village Bank & Trust Financial Corp. (b) | 8,883 | 271,376 | |
| Washington Trust Bancorp, Inc. | 63,697 | 3,264,471 | |
| WashingtonFirst Bankshares, Inc. | 40,114 | 1,358,661 | |
| Webster Financial Corp. | 407,516 | 19,022,847 | |
| WesBanco, Inc. | 179,643 | 6,822,841 | |
| West Bancorp., Inc. | 62,916 | 1,381,006 | |
| Westamerica Bancorp. (a) | 117,356 | 6,049,702 | |
| Western Alliance Bancorp. (b) | 415,273 | 20,028,617 | |
| Wintrust Financial Corp. | 242,225 | 17,636,402 | |
| Xenith Bankshares, Inc. (b) | 35,243 | 1,009,712 | |
| 1,360,535,804 | |||
| Capital Markets - 2.2% | |||
| Arlington Asset Investment Corp. (a) | 114,310 | 1,476,885 | |
| Artisan Partners Asset Management, Inc. | 207,245 | 6,362,422 | |
| Ashford, Inc. (b) | 4,486 | 276,562 | |
| Associated Capital Group, Inc. | 20,662 | 709,740 | |
| B. Riley Financial, Inc. | 77,782 | 1,275,625 | |
| BGC Partners, Inc. Class A | 969,436 | 12,592,974 | |
| Cohen & Steers, Inc. | 93,396 | 3,534,105 | |
| Cowen Group, Inc. Class A (a)(b) | 119,709 | 1,945,271 | |
| Diamond Hill Investment Group, Inc. (a) | 13,288 | 2,608,833 | |
| Eaton Vance Corp. (non-vtg.) | 501,551 | 23,863,797 | |
| Evercore, Inc. Class A | 182,141 | 13,742,538 | |
| FactSet Research Systems, Inc. | 172,980 | 27,188,996 | |
| Federated Investors, Inc. Class B (non-vtg.) (a) | 401,131 | 10,954,888 | |
| Fifth Street Asset Management, Inc. Class A (a) | 29,106 | 119,335 | |
| Financial Engines, Inc. (a) | 276,738 | 9,146,191 | |
| Gain Capital Holdings, Inc. | 115,932 | 730,372 | |
| GAMCO Investors, Inc. Class A | 17,907 | 527,719 | |
| Global Brokerage, Inc. Class A (a)(b) | 23,887 | 29,859 | |
| Great Elm Capital Group, Inc. (b) | 27,036 | 89,219 | |
| Greenhill & Co., Inc. (a) | 121,210 | 1,824,211 | |
| Hamilton Lane, Inc. Class A (a) | 59,581 | 1,396,579 | |
| Hennessy Advisors, Inc. | 9,352 | 138,223 | |
| Houlihan Lokey | 112,015 | 4,038,141 | |
| Institutional Financial Markets, Inc. | 16,813 | 19,167 | |
| Interactive Brokers Group, Inc. | 314,893 | 13,203,463 | |
| INTL FCStone, Inc. (b) | 64,346 | 2,283,640 | |
| Investment Technology Group, Inc. | 132,967 | 2,671,307 | |
| Janus Henderson Group PLC (a) | 801,528 | 27,700,808 | |
| Ladenburg Thalmann Financial Services, Inc. | 402,412 | 1,034,199 | |
| Lazard Ltd. Class A | 570,797 | 24,481,483 | |
| Legg Mason, Inc. | 376,000 | 14,359,440 | |
| LPL Financial | 352,936 | 16,531,522 | |
| Manning & Napier, Inc. Class A | 54,262 | 192,630 | |
| MarketAxess Holdings, Inc. | 165,985 | 32,026,806 | |
| Medley Management, Inc. (a) | 32,708 | 202,790 | |
| Moelis & Co. Class A | 139,192 | 5,484,165 | |
| Morningstar, Inc. | 86,170 | 7,126,259 | |
| MSCI, Inc. | 400,887 | 45,945,659 | |
| National Holdings Corp. (b) | 3,483 | 9,091 | |
| National Holdings Corp. warrants 1/18/22 | 3,483 | 1,898 | |
| Oppenheimer Holdings, Inc. Class A (non-vtg.) | 40,209 | 653,396 | |
| Paragon Commercial Corp. (b) | 5,375 | 278,694 | |
| Piper Jaffray Companies | 64,129 | 3,555,953 | |
| PJT Partners, Inc. | 73,261 | 2,832,270 | |
| Pzena Investment Management, Inc. | 58,015 | 574,349 | |
| Safeguard Scientifics, Inc. (a)(b) | 85,673 | 1,045,211 | |
| SEI Investments Co. | 587,931 | 34,370,446 | |
| Silvercrest Asset Management Group Class A | 17,895 | 219,214 | |
| Stifel Financial Corp. | 307,295 | 14,673,336 | |
| TD Ameritrade Holding Corp. | 1,071,588 | 46,421,192 | |
| TheStreet.com, Inc. (b) | 85,257 | 72,468 | |
| U.S. Global Investments, Inc. Class A | 36,632 | 48,721 | |
| Value Line, Inc. | 13,155 | 210,085 | |
| Vector Capital Corp. rights (b)(d) | 49,572 | 1 | |
| Virtu Financial, Inc. Class A (a) | 190,073 | 3,411,810 | |
| Virtus Investment Partners, Inc. (a) | 29,444 | 3,121,064 | |
| Waddell & Reed Financial, Inc. Class A (a) | 368,027 | 6,848,982 | |
| Westwood Holdings Group, Inc. | 31,636 | 1,933,909 | |
| WisdomTree Investments, Inc. (a) | 492,911 | 4,519,994 | |
| Zais Group Holdings, Inc. (a)(b) | 22,211 | 41,090 | |
| 442,678,997 | |||
| Consumer Finance - 0.8% | |||
| Ally Financial, Inc. | 2,040,124 | 46,106,802 | |
| Asta Funding, Inc. (a)(b) | 38,423 | 309,305 | |
| Atlanticus Holdings Corp. (b) | 33,601 | 82,322 | |
| Consumer Portfolio Services, Inc. (b) | 87,449 | 343,675 | |
| Credit Acceptance Corp. (a)(b) | 53,276 | 14,507,055 | |
| Elevate Credit, Inc. (a) | 77,759 | 492,214 | |
| Encore Capital Group, Inc. (a)(b) | 104,445 | 4,214,356 | |
| Enova International, Inc. (a)(b) | 106,637 | 1,268,980 | |
| EZCORP, Inc. (non-vtg.) Class A (a)(b) | 207,953 | 1,881,975 | |
| First Cash Financial Services, Inc. | 214,308 | 12,579,880 | |
| Green Dot Corp. Class A (b) | 196,552 | 9,469,875 | |
| Imperial Holdings, Inc. warrants 4/11/19 (b) | 3,852 | 0 | |
| LendingClub Corp. (a)(b) | 1,483,428 | 9,182,419 | |
| Nelnet, Inc. Class A | 84,547 | 4,010,064 | |
| Nicholas Financial, Inc. (b) | 73,640 | 634,040 | |
| OneMain Holdings, Inc. (a)(b) | 231,191 | 6,327,698 | |
| PRA Group, Inc. (a)(b) | 202,706 | 5,858,203 | |
| Regional Management Corp. (b) | 42,651 | 936,189 | |
| Santander Consumer U.S.A. Holdings, Inc. (b) | 489,438 | 6,989,175 | |
| SLM Corp. (b) | 1,930,689 | 19,635,107 | |
| World Acceptance Corp. (a)(b) | 25,904 | 1,938,137 | |
| 146,767,471 | |||
| Diversified Financial Services - 0.3% | |||
| A-Mark Precious Metals, Inc. | 15,543 | 266,407 | |
| Acushnet Holdings Corp. (a) | 96,112 | 1,580,081 | |
| Alteryx, Inc. (a) | 45,290 | 1,068,391 | |
| At Home Group, Inc. (a) | 46,573 | 1,141,039 | |
| Camping World Holdings, Inc. (a) | 90,236 | 3,316,173 | |
| Catskill Litigation Trust (b)(d) | 1,036 | 0 | |
| Cotiviti Holdings, Inc. (a)(b) | 165,909 | 5,927,929 | |
| Donnelley Financial Solutions, Inc. | 142,998 | 3,061,587 | |
| FB Financial Corp. (a) | 55,658 | 1,934,116 | |
| Marlin Business Services Corp. | 36,382 | 949,570 | |
| NCP Litigation Trust (b)(d) | 200 | 0 | |
| NewStar Financial, Inc. | 83,480 | 894,906 | |
| On Deck Capital, Inc. (a)(b) | 192,982 | 932,103 | |
| Quantenna Communications, Inc. (a) | 32,196 | 598,202 | |
| Ra Pharmaceuticals, Inc. | 33,809 | 507,473 | |
| Senseonics Holdings, Inc. (a)(b) | 144,591 | 443,894 | |
| Tiptree, Inc. | 128,445 | 822,048 | |
| Varex Imaging Corp. (a) | 162,547 | 4,962,560 | |
| Voya Financial, Inc. | 818,279 | 31,282,806 | |
| 59,689,285 | |||
| Insurance - 4.0% | |||
| 1347 Property Insurance Holdings, Inc. (a)(b) | 6,993 | 52,448 | |
| Alleghany Corp. (b) | 68,441 | 38,516,542 | |
| AMBAC Financial Group, Inc. (b) | 200,573 | 3,648,423 | |
| American Equity Investment Life Holding Co. (a) | 387,822 | 10,765,939 | |
| American Financial Group, Inc. | 320,127 | 32,592,130 | |
| American National Insurance Co. | 40,063 | 4,635,690 | |
| Amerisafe, Inc. | 82,809 | 4,455,124 | |
| AmTrust Financial Services, Inc. (a) | 469,157 | 5,817,547 | |
| Arch Capital Group Ltd. (b) | 566,925 | 55,184,480 | |
| Argo Group International Holdings, Ltd. | 134,581 | 8,101,776 | |
| Aspen Insurance Holdings Ltd. | 263,854 | 11,926,201 | |
| Assured Guaranty Ltd. | 533,794 | 22,707,597 | |
| Athene Holding Ltd. | 225,513 | 12,067,201 | |
| Atlas Financial Holdings, Inc. (b) | 42,675 | 719,074 | |
| Axis Capital Holdings Ltd. | 374,665 | 22,569,820 | |
| Baldwin & Lyons, Inc. Class B | 42,752 | 936,269 | |
| Blue Capital Reinsurance Holdings Ltd. | 23,939 | 450,053 | |
| Brown & Brown, Inc. | 506,538 | 22,773,948 | |
| Citizens, Inc. Class A (a)(b) | 184,834 | 1,391,800 | |
| CNA Financial Corp. | 123,338 | 6,050,962 | |
| CNO Financial Group, Inc. | 755,655 | 16,888,889 | |
| Conifer Holdings, Inc. (b) | 13,396 | 86,404 | |
| Crawford & Co. Class B | 86,860 | 861,651 | |
| Donegal Group, Inc. Class A | 119,498 | 1,831,904 | |
| eHealth, Inc. (b) | 78,217 | 1,899,109 | |
| EMC Insurance Group | 32,192 | 897,513 | |
| Employers Holdings, Inc. | 143,996 | 6,069,431 | |
| Enstar Group Ltd. (a)(b) | 48,866 | 10,142,138 | |
| Erie Indemnity Co. Class A | 88,842 | 10,731,225 | |
| FBL Financial Group, Inc. Class A | 43,350 | 2,947,800 | |
| Federated National Holding Co. | 50,478 | 784,428 | |
| Fidelity & Guaranty Life (a) | 51,288 | 1,602,750 | |
| First Acceptance Corp. (b) | 24,679 | 27,640 | |
| First American Financial Corp. | 484,867 | 23,787,575 | |
| FNF Group | 1,200,506 | 57,912,409 | |
| FNFV Group (b) | 291,196 | 4,906,653 | |
| Genworth Financial, Inc. Class A (b) | 2,224,677 | 7,630,642 | |
| Global Indemnity Ltd. | 37,631 | 1,521,045 | |
| Greenlight Capital Re, Ltd. (b) | 129,165 | 2,873,921 | |
| Hallmark Financial Services, Inc. (b) | 49,582 | 508,216 | |
| Hanover Insurance Group, Inc. | 189,091 | 18,564,954 | |
| HCI Group, Inc. | 36,061 | 1,406,018 | |
| Health Insurance Innovations, Inc. (a)(b) | 27,165 | 914,102 | |
| Heritage Insurance Holdings, Inc. | 108,895 | 1,239,225 | |
| Horace Mann Educators Corp. | 178,779 | 6,284,082 | |
| Independence Holding Co. | 94,596 | 2,052,733 | |
| Infinity Property & Casualty Corp. | 47,591 | 4,209,424 | |
| Investors Title Co. | 5,515 | 969,923 | |
| James River Group Holdings Ltd. | 95,401 | 3,804,592 | |
| Kemper Corp. | 217,544 | 10,420,358 | |
| Kingstone Companies, Inc. | 39,207 | 590,065 | |
| Kinsale Capital Group, Inc. | 81,546 | 3,086,516 | |
| Maiden Holdings Ltd. (a) | 316,619 | 2,295,488 | |
| Markel Corp. (b) | 61,648 | 64,853,080 | |
| MBIA, Inc. (a)(b) | 566,957 | 5,703,587 | |
| Mercury General Corp. | 167,105 | 9,603,524 | |
| National General Holdings Corp. | 271,086 | 4,654,547 | |
| National Western Life Group, Inc. | 9,867 | 3,299,623 | |
| Navigators Group, Inc. | 101,022 | 5,637,028 | |
| NI Holdings, Inc. (a) | 45,692 | 754,375 | |
| Old Republic International Corp. | 1,099,149 | 20,982,754 | |
| OneBeacon Insurance Group Ltd. | 104,662 | 1,906,942 | |
| Patriot National, Inc. (a) | 41,971 | 62,957 | |
| Primerica, Inc. | 203,248 | 15,558,634 | |
| ProAssurance Corp. | 239,584 | 12,757,848 | |
| Reinsurance Group of America, Inc. | 281,871 | 37,897,556 | |
| RenaissanceRe Holdings Ltd. | 176,360 | 24,542,258 | |
| RLI Corp. | 167,632 | 8,971,665 | |
| Safety Insurance Group, Inc. | 66,718 | 4,763,665 | |
| Selective Insurance Group, Inc. | 258,572 | 13,032,029 | |
| State Auto Financial Corp. | 68,353 | 1,691,053 | |
| State National Companies, Inc. | 135,068 | 2,805,362 | |
| Stewart Information Services Corp. (a) | 103,105 | 3,720,028 | |
| Third Point Reinsurance Ltd. (a)(b) | 255,705 | 3,592,655 | |
| Trupanion, Inc. (a)(b) | 68,165 | 1,491,450 | |
| United Fire Group, Inc. | 93,258 | 3,922,431 | |
| United Insurance Holdings Corp. | 78,431 | 1,234,504 | |
| Universal Insurance Holdings, Inc. (a) | 143,216 | 3,071,983 | |
| Validus Holdings Ltd. | 347,186 | 17,411,378 | |
| W.R. Berkley Corp. | 427,107 | 28,462,410 | |
| White Mountains Insurance Group Ltd. | 20,241 | 17,631,328 | |
| WMI Holdings Corp. (b) | 870,756 | 1,088,445 | |
| 796,216,946 | |||
| Mortgage Real Estate Investment Trusts - 1.4% | |||
| AG Mortgage Investment Trust, Inc. | 128,388 | 2,474,037 | |
| AGNC Investment Corp. | 1,549,591 | 33,378,190 | |
| American Capital Mortgage Investment Corp. | 216,830 | 4,163,136 | |
| Annaly Capital Management, Inc. | 4,727,742 | 59,096,775 | |
| Anworth Mortgage Asset Corp. | 522,696 | 3,167,538 | |
| Apollo Commercial Real Estate Finance, Inc. | 408,851 | 7,396,115 | |
| Arbor Realty Trust, Inc. | 227,213 | 1,863,147 | |
| Ares Commercial Real Estate Corp. | 140,575 | 1,854,184 | |
| Armour Residential REIT, Inc. (a) | 182,039 | 4,807,650 | |
| Blackstone Mortgage Trust, Inc. (a) | 411,032 | 12,885,853 | |
| Capstead Mortgage Corp. | 453,763 | 4,387,888 | |
| Cherry Hill Mortgage Investment Corp. | 46,903 | 866,767 | |
| Chimera Investment Corp. | 797,417 | 15,206,742 | |
| CIM Commercial Trust Corp. | 63,757 | 997,797 | |
| CYS Investments, Inc. | 708,349 | 6,226,388 | |
| Dynex Capital, Inc. | 259,773 | 1,857,377 | |
| Ellington Residential Mortgage REIT | 40,648 | 594,680 | |
| Five Oaks Investment Corp. (a) | 77,659 | 323,061 | |
| Great Ajax Corp. | 64,550 | 915,319 | |
| Hannon Armstrong Sustainable Infrastructure Capital, Inc. (a) | 215,560 | 5,000,992 | |
| Invesco Mortgage Capital, Inc. | 486,582 | 8,262,162 | |
| KKR Real Estate Finance Trust, Inc. (a) | 54,773 | 1,137,635 | |
| Ladder Capital Corp. Class A | 379,158 | 5,202,048 | |
| MFA Financial, Inc. | 1,728,465 | 15,175,923 | |
| New Residential Investment Corp. | 1,361,840 | 22,443,123 | |
| New York Mortgage Trust, Inc. (a) | 504,041 | 3,155,297 | |
| Orchid Island Capital, Inc. (a) | 181,831 | 1,758,306 | |
| Owens Realty Mortgage, Inc. | 37,687 | 653,869 | |
| PennyMac Mortgage Investment Trust | 295,936 | 5,116,733 | |
| Redwood Trust, Inc. | 353,007 | 5,888,157 | |
| Resource Capital Corp. | 146,355 | 1,514,774 | |
| Starwood Property Trust, Inc. | 1,138,958 | 25,296,257 | |
| Two Harbors Investment Corp. | 1,517,727 | 15,526,347 | |
| Western Asset Mortgage Capital Corp. (a) | 191,198 | 2,009,491 | |
| ZAIS Financial Corp. (a) | 43,166 | 658,282 | |
| 281,262,040 | |||
| Real Estate Management & Development - 0.0% | |||
| The RMR Group, Inc. | 33,925 | 1,752,226 | |
| Thrifts & Mortgage Finance - 1.2% | |||
| ASB Bancorp, Inc. (a)(b) | 33,389 | 1,480,802 | |
| Astoria Financial Corp. | 425,857 | 8,342,539 | |
| Atlantic Coast Financial Corp. (b) | 8,654 | 72,261 | |
| Bank Mutual Corp. | 187,600 | 1,716,540 | |
| BankFinancial Corp. | 75,843 | 1,216,522 | |
| Bear State Financial, Inc. | 45,612 | 468,891 | |
| Beneficial Bancorp, Inc. | 357,084 | 5,338,406 | |
| BofI Holding, Inc. (a)(b) | 254,547 | 6,748,041 | |
| BSB Bancorp, Inc. (b) | 29,828 | 850,098 | |
| Capitol Federal Financial, Inc. | 583,580 | 8,006,718 | |
| Charter Financial Corp. | 65,398 | 1,063,371 | |
| Citizens Community Bancorp, Inc. | 15,634 | 212,622 | |
| Clifton Bancorp, Inc. (a) | 102,761 | 1,618,486 | |
| Dime Community Bancshares, Inc. | 152,632 | 2,892,376 | |
| Elmira Savings Bank | 185 | 3,765 | |
| Entegra Financial Corp. (a)(b) | 77,977 | 1,809,066 | |
| ESSA Bancorp, Inc. | 32,482 | 490,478 | |
| Essent Group Ltd. (b) | 364,284 | 14,236,219 | |
| Farmer Mac Class C (non-vtg.) | 44,156 | 3,007,907 | |
| First Capital, Inc. | 12,982 | 416,722 | |
| First Defiance Financial Corp. | 41,293 | 2,021,705 | |
| Flagstar Bancorp, Inc. (b) | 95,859 | 3,146,092 | |
| Greene County Bancorp, Inc. (a) | 2,032 | 47,447 | |
| Hamilton Bancorp, Inc. (b) | 69 | 980 | |
| Hingham Institution for Savings | 8,459 | 1,556,541 | |
| HMN Financial, Inc. (b) | 3,871 | 68,710 | |
| Home Bancorp, Inc. | 16,971 | 685,289 | |
| Home Federal Bancorp, Inc. | 31 | 806 | |
| HomeStreet, Inc. (a)(b) | 121,978 | 3,079,945 | |
| HopFed Bancorp, Inc. | 18,100 | 253,400 | |
| Impac Mortgage Holdings, Inc. (a)(b) | 65,855 | 873,896 | |
| Kearny Financial Corp. | 415,174 | 5,874,712 | |
| Lendingtree, Inc. (a)(b) | 32,192 | 7,434,742 | |
| Malvern Bancorp, Inc. (b) | 64,070 | 1,524,866 | |
| Meridian Bancorp, Inc. Maryland | 235,823 | 4,150,485 | |
| Meta Financial Group, Inc. | 40,463 | 2,844,549 | |
| MGIC Investment Corp. (b) | 1,644,961 | 18,834,803 | |
| Nationstar Mortgage Holdings, Inc. (a)(b) | 148,405 | 2,555,534 | |
| New York Community Bancorp, Inc. (a) | 2,154,746 | 25,964,689 | |
| NMI Holdings, Inc. (b) | 243,001 | 2,636,561 | |
| Northfield Bancorp, Inc. | 220,790 | 3,556,927 | |
| Northwest Bancshares, Inc. (a) | 450,358 | 6,949,024 | |
| OceanFirst Financial Corp. (a) | 135,646 | 3,385,724 | |
| Ocwen Financial Corp. (a)(b) | 453,944 | 1,330,056 | |
| Oritani Financial Corp. | 189,634 | 3,043,626 | |
| PB Bancorp, Inc. | 7,070 | 72,468 | |
| PennyMac Financial Services, Inc. (b) | 84,716 | 1,440,172 | |
| PHH Corp. (b) | 240,647 | 3,417,187 | |
| Poage Bankshares, Inc. | 6,654 | 121,436 | |
| Provident Bancorp, Inc. (b) | 84,161 | 1,716,884 | |
| Provident Financial Holdings, Inc. | 21,795 | 412,797 | |
| Provident Financial Services, Inc. | 266,158 | 6,614,026 | |
| Prudential Bancorp, Inc. (a) | 82,322 | 1,518,841 | |
| Radian Group, Inc. (a) | 961,592 | 16,827,860 | |
| Riverview Bancorp, Inc. | 146,681 | 1,177,848 | |
| Security National Financial Corp. Class A | 38,708 | 228,377 | |
| SI Financial Group, Inc. | 23,177 | 338,384 | |
| Southern Missouri Bancorp, Inc. | 20,482 | 664,846 | |
| Territorial Bancorp, Inc. | 30,643 | 926,338 | |
| TFS Financial Corp. | 269,004 | 4,137,282 | |
| Timberland Bancorp, Inc. (a) | 27,057 | 749,749 | |
| Trustco Bank Corp., New York | 425,565 | 3,361,964 | |
| United Community Bancorp, Inc. | 1,461 | 27,540 | |
| United Community Financial Corp. | 251,020 | 2,281,772 | |
| United Financial Bancorp, Inc. New | 220,063 | 3,811,491 | |
| Walker & Dunlop, Inc. (b) | 129,353 | 6,233,521 | |
| Walter Investment Management Corp. (a)(b) | 163,591 | 70,639 | |
| Washington Federal, Inc. | 382,695 | 11,959,219 | |
| Waterstone Financial, Inc. | 133,580 | 2,357,687 | |
| Westbury Bancorp, Inc. (b) | 15,948 | 321,352 | |
| Westfield Financial, Inc. | 126,385 | 1,257,531 | |
| WSFS Financial Corp. | 122,998 | 5,498,011 | |
| 239,358,161 | |||
| TOTAL FINANCIALS | 3,328,260,930 | ||
| HEALTH CARE - 11.5% | |||
| Biotechnology - 4.6% | |||
| Abeona Therapeutics, Inc. (a)(b) | 112,297 | 1,476,706 | |
| ACADIA Pharmaceuticals, Inc. (a)(b) | 437,926 | 15,594,545 | |
| Acceleron Pharma, Inc. (a)(b) | 140,916 | 5,461,904 | |
| Achaogen, Inc. (a)(b) | 136,730 | 2,562,320 | |
| Achillion Pharmaceuticals, Inc. (a)(b) | 536,785 | 2,742,971 | |
| Acorda Therapeutics, Inc. (a)(b) | 203,958 | 4,242,326 | |
| Actinium Pharmaceuticals, Inc. (a)(b) | 152,593 | 93,082 | |
| Adamas Pharmaceuticals, Inc. (a)(b) | 61,583 | 1,289,548 | |
| ADMA Biologics, Inc. (a)(b) | 17,353 | 59,868 | |
| Aduro Biotech, Inc. (a)(b) | 132,877 | 1,614,456 | |
| Advaxis, Inc. (a)(b) | 152,732 | 1,040,105 | |
| Adverum Biotechnologies, Inc. (b) | 64,927 | 178,549 | |
| Aeglea BioTherapeutics, Inc. (b) | 23,707 | 97,436 | |
| Aevi Genomic Medicine, Inc. (b) | 125,878 | 159,865 | |
| Agenus, Inc. (a)(b) | 343,477 | 1,267,430 | |
| Agios Pharmaceuticals, Inc. (a)(b) | 190,140 | 12,028,256 | |
| Aimmune Therapeutics, Inc. (a)(b) | 100,406 | 2,158,729 | |
| Akebia Therapeutics, Inc. (b) | 172,813 | 2,892,890 | |
| Albireo Pharma, Inc. (b) | 20,676 | 511,524 | |
| Alder Biopharmaceuticals, Inc. (b) | 249,186 | 2,442,023 | |
| Aldeyra Therapeutics, Inc. (a)(b) | 48,557 | 201,512 | |
| Alkermes PLC (a)(b) | 689,906 | 35,033,427 | |
| Alnylam Pharmaceuticals, Inc. (a)(b) | 360,805 | 30,931,813 | |
| Alpine Immune Sciences, Inc. (b) | 17,943 | 157,001 | |
| AMAG Pharmaceuticals, Inc. (a)(b) | 152,392 | 2,544,946 | |
| Amicus Therapeutics, Inc. (a)(b) | 706,239 | 9,844,972 | |
| AmpliPhi Biosciences Corp. (a)(b) | 37,449 | 31,832 | |
| AnaptysBio, Inc. | 32,787 | 917,052 | |
| Anavex Life Sciences Corp. (a)(b) | 157,620 | 699,833 | |
| Anthera Pharmaceuticals, Inc. (a)(b) | 20,053 | 32,085 | |
| Applied Genetic Technologies Corp. (b) | 47,677 | 219,314 | |
| Aptevo Therapeutics, Inc. (b) | 62,747 | 83,454 | |
| AquaBounty Technologies, Inc. (a)(b) | 3,959 | 28,584 | |
| Aquinox Pharmaceuticals, Inc. (a)(b) | 82,558 | 1,206,172 | |
| ARCA Biopharma, Inc. (a)(b) | 7,333 | 8,066 | |
| Ardelyx, Inc. (b) | 75,570 | 389,186 | |
| Arena Pharmaceuticals, Inc. (b) | 166,506 | 3,859,609 | |
| Argos Therapeutics, Inc. (a)(b) | 95,222 | 18,978 | |
| ArQule, Inc. (b) | 223,720 | 243,855 | |
| Array BioPharma, Inc. (a)(b) | 764,318 | 7,398,598 | |
| Arrowhead Pharmaceuticals, Inc. (a)(b) | 358,619 | 1,004,133 | |
| Asterias Biotherapeutics, Inc. (a)(b) | 102,523 | 353,704 | |
| Atara Biotherapeutics, Inc. (a)(b) | 88,733 | 1,397,545 | |
| Athersys, Inc. (a)(b) | 484,446 | 847,781 | |
| aTyr Pharma, Inc. (a)(b) | 94,162 | 287,194 | |
| Audentes Therapeutics, Inc. (b) | 92,554 | 1,942,708 | |
| AVEO Pharmaceuticals, Inc. (a)(b) | 400,127 | 1,360,432 | |
| Aviragen Therapeutics, Inc. (a)(b) | 114,179 | 71,704 | |
| Bellicum Pharmaceuticals, Inc. (a)(b) | 101,319 | 1,097,285 | |
| Biocept, Inc. (a)(b) | 60,281 | 73,543 | |
| BioCryst Pharmaceuticals, Inc. (a)(b) | 339,447 | 1,731,180 | |
| Biohaven Pharmaceutical Holding Co. Ltd. (a) | 80,208 | 2,867,436 | |
| BioMarin Pharmaceutical, Inc. (b) | 769,205 | 69,374,599 | |
| Bioptix, Inc. (b) | 15,089 | 59,752 | |
| Biospecifics Technologies Corp. (b) | 20,059 | 945,782 | |
| Biostage, Inc. (a)(b) | 22,493 | 7,009 | |
| BioTime, Inc. (a)(b) | 571,875 | 1,675,594 | |
| Bioverativ, Inc. | 485,399 | 27,517,269 | |
| bluebird bio, Inc. (a)(b) | 199,884 | 24,955,517 | |
| Blueprint Medicines Corp. (a)(b) | 158,607 | 8,599,672 | |
| BrainStorm Cell Therpeutic, Inc. (a)(b) | 60,624 | 258,258 | |
| Calithera Biosciences, Inc. (b) | 115,170 | 1,888,788 | |
| Cancer Genetics, Inc. (a)(b) | 68,198 | 231,873 | |
| Capricor Therapeutics, Inc. (a)(b) | 40,820 | 41,636 | |
| Cara Therapeutics, Inc. (a)(b) | 115,679 | 1,657,680 | |
| CareDx, Inc. (a)(b) | 37,353 | 106,830 | |
| Cascadian Therapeutics, Inc. (a)(b) | 213,713 | 773,641 | |
| CASI Pharmaceuticals, Inc. (a)(b) | 37,512 | 36,023 | |
| Catabasis Pharmaceuticals, Inc. (a)(b) | 25,262 | 34,609 | |
| Catalyst Biosciences, Inc. (b) | 1,432 | 4,797 | |
| Catalyst Pharmaceutical Partners, Inc. (b) | 334,134 | 918,869 | |
| Cel-Sci Corp. (a)(b) | 34,407 | 62,621 | |
| Celldex Therapeutics, Inc. (a)(b) | 449,512 | 1,105,800 | |
| Cellectar Biosciences, Inc. (b) | 4,485 | 7,355 | |
| Cellular Biomedicine Group, Inc. (a)(b) | 29,329 | 288,891 | |
| Celsion Corp. (a)(b) | 4,287 | 5,745 | |
| ChemoCentryx, Inc. (b) | 96,267 | 668,093 | |
| Chiasma, Inc. (a)(b) | 30,058 | 66,128 | |
| Chimerix, Inc. (b) | 181,661 | 864,706 | |
| Cidara Therapeutics, Inc. (a)(b) | 38,754 | 267,403 | |
| Cleveland Biolabs, Inc. (a)(b) | 10,000 | 27,000 | |
| Clovis Oncology, Inc. (a)(b) | 216,220 | 16,447,855 | |
| Coherus BioSciences, Inc. (a)(b) | 149,050 | 2,153,773 | |
| Conatus Pharmaceuticals, Inc. (a)(b) | 122,869 | 705,268 | |
| Concert Pharmaceuticals, Inc. (b) | 59,495 | 905,514 | |
| ContraFect Corp. (a)(b) | 299,050 | 314,003 | |
| Corbus Pharmaceuticals Holdings, Inc. (a)(b) | 129,618 | 1,004,540 | |
| Corvus Pharmaceuticals, Inc. (a)(b) | 34,606 | 559,579 | |
| CTI BioPharma Corp. (a)(b) | 81,379 | 264,482 | |
| Curis, Inc. (b) | 510,614 | 1,041,653 | |
| Cyclacel Pharmaceuticals, Inc. (a) | 17,747 | 29,815 | |
| Cytokinetics, Inc. (a)(b) | 224,644 | 3,335,963 | |
| CytomX Therapeutics, Inc. (a)(b) | 99,639 | 1,721,762 | |
| Cytori Therapeutics, Inc. (a)(b) | 155,538 | 55,994 | |
| CytRx Corp. (a)(b) | 633,744 | 336,518 | |
| Dicerna Pharmaceuticals, Inc. (a)(b) | 54,393 | 189,832 | |
| Dimension Therapeutics, Inc. (b) | 78,948 | 268,423 | |
| Dyax Corp. rights 12/31/19 (b)(d) | 559,523 | 1,846,426 | |
| Dynavax Technologies Corp. (a)(b) | 240,272 | 4,312,882 | |
| Eagle Pharmaceuticals, Inc. (a)(b) | 35,982 | 1,963,178 | |
| Edge Therapeutics, Inc. (a)(b) | 82,791 | 873,445 | |
| Editas Medicine, Inc. (a)(b) | 100,034 | 2,111,718 | |
| Eiger Biopharmaceuticals, Inc. (a)(b) | 17,311 | 160,127 | |
| Eleven Biotherapeutics, Inc. (a)(b) | 33,461 | 36,138 | |
| Emergent BioSolutions, Inc. (a)(b) | 154,700 | 5,774,951 | |
| Enanta Pharmaceuticals, Inc. (a)(b) | 66,992 | 2,871,277 | |
| Epizyme, Inc. (a)(b) | 175,728 | 3,048,881 | |
| Esperion Therapeutics, Inc. (a)(b) | 87,171 | 4,307,991 | |
| Exact Sciences Corp. (a)(b) | 523,030 | 21,909,727 | |
| Exelixis, Inc. (b) | 1,037,416 | 30,334,044 | |
| Fate Therapeutics, Inc. (a)(b) | 72,909 | 275,596 | |
| Fibrocell Science, Inc. (a)(b) | 41,836 | 112,120 | |
| FibroGen, Inc. (b) | 289,340 | 13,946,188 | |
| Five Prime Therapeutics, Inc. (a)(b) | 136,056 | 4,615,020 | |
| Flexion Therapeutics, Inc. (a)(b) | 105,320 | 2,706,724 | |
| Fortress Biotech, Inc. (a)(b) | 160,408 | 761,938 | |
| Foundation Medicine, Inc. (a)(b) | 61,037 | 2,459,791 | |
| Galectin Therapeutics, Inc. (a)(b) | 122,625 | 210,915 | |
| Galena Biopharma, Inc. (a)(b) | 36,479 | 13,132 | |
| Genocea Biosciences, Inc. (a)(b) | 97,488 | 474,767 | |
| Genomic Health, Inc. (a)(b) | 80,972 | 2,566,812 | |
| GenVec, Inc. rights (d) | 14,247 | 0 | |
| Geron Corp. (a)(b) | 680,058 | 1,475,726 | |
| Global Blood Therapeutics, Inc. (b) | 145,920 | 4,435,968 | |
| GlycoMimetics, Inc. (a)(b) | 93,899 | 1,145,568 | |
| GTx, Inc. (a)(b) | 30,934 | 203,855 | |
| Halozyme Therapeutics, Inc. (a)(b) | 565,304 | 7,354,605 | |
| Heat Biologics, Inc. (a)(b) | 76,701 | 42,953 | |
| Hemispherx Biopharma, Inc. (a)(b) | 63,934 | 23,208 | |
| Heron Therapeutics, Inc. (a)(b) | 195,857 | 3,231,641 | |
| Histogenics Corp. (b) | 270 | 497 | |
| iBio, Inc. (a)(b) | 302,306 | 89,422 | |
| Idera Pharmaceuticals, Inc. (a)(b) | 556,964 | 1,102,789 | |
| Ignyta, Inc. (a)(b) | 184,424 | 2,120,876 | |
| Immucell Corp. (a)(b) | 6,741 | 39,165 | |
| Immune Design Corp. (a)(b) | 53,841 | 584,175 | |
| Immune Pharmaceuticals, Inc. (a)(b) | 15,214 | 17,648 | |
| ImmunoCellular Therapeutics Ltd. (a)(b) | 9,947 | 2,756 | |
| ImmunoGen, Inc. (a)(b) | 386,875 | 3,234,275 | |
| Immunomedics, Inc. (a)(b) | 441,967 | 5,586,463 | |
| Infinity Pharmaceuticals, Inc. (b) | 177,419 | 168,903 | |
| Inotek Pharmaceuticals Corp. (a)(b) | 72,423 | 73,871 | |
| Inovio Pharmaceuticals, Inc. (a)(b) | 369,930 | 2,197,384 | |
| Insmed, Inc. (b) | 273,340 | 3,394,883 | |
| Insys Therapeutics, Inc. (a)(b) | 118,023 | 1,078,730 | |
| Intellia Therapeutics, Inc. (a)(b) | 29,836 | 627,451 | |
| Intercept Pharmaceuticals, Inc. (a)(b) | 77,905 | 9,084,502 | |
| Intrexon Corp. (a)(b) | 268,982 | 5,307,015 | |
| Invitae Corp. (a)(b) | 143,536 | 1,409,524 | |
| Ionis Pharmaceuticals, Inc. (a)(b) | 553,332 | 29,669,662 | |
| Iovance Biotherapeutics, Inc. (b) | 301,070 | 1,731,153 | |
| Ironwood Pharmaceuticals, Inc. Class A (a)(b) | 584,864 | 9,328,581 | |
| IsoRay, Inc. (a)(b) | 212,731 | 112,747 | |
| Jounce Therapeutics, Inc. (a) | 34,622 | 588,228 | |
| Juno Therapeutics, Inc. (a)(b) | 337,015 | 13,908,609 | |
| Kadmon Holdings, Inc. (a)(b) | 20,092 | 52,641 | |
| Kalvista Pharmaceuticals, Inc. (a)(b) | 3,322 | 21,958 | |
| Karyopharm Therapeutics, Inc. (b) | 127,520 | 1,303,254 | |
| Keryx Biopharmaceuticals, Inc. (a)(b) | 467,581 | 3,371,259 | |
| Kindred Biosciences, Inc. (a)(b) | 105,425 | 801,230 | |
| Kite Pharma, Inc. (a)(b) | 223,812 | 39,836,298 | |
| Kura Oncology, Inc. (a)(b) | 82,876 | 596,707 | |
| La Jolla Pharmaceutical Co. (a)(b) | 71,395 | 2,438,139 | |
| Lexicon Pharmaceuticals, Inc. (a)(b) | 206,977 | 3,133,632 | |
| Ligand Pharmaceuticals, Inc.: | |||
| Class B (a)(b) | 82,450 | 10,625,332 | |
| General CVR (b) | 26,087 | 261 | |
| Glucagon CVR (b) | 26,087 | 2,478 | |
| rights (b) | 26,087 | 115 | |
| TR Beta CVR (b)(d) | 26,087 | 261 | |
| Loxo Oncology, Inc. (a)(b) | 81,790 | 6,821,286 | |
| Macrogenics, Inc. (a)(b) | 144,717 | 2,736,598 | |
| Madrigal Pharmaceuticals, Inc. (a)(b) | 12,780 | 218,282 | |
| MannKind Corp. (a)(b) | 248,623 | 514,650 | |
| Matinas BioPharma Holdings, Inc. (a) | 314,745 | 402,874 | |
| MediciNova, Inc. (a)(b) | 111,867 | 606,319 | |
| MEI Pharma, Inc. (b) | 122,276 | 322,809 | |
| Merrimack Pharmaceuticals, Inc. (a) | 499,691 | 679,580 | |
| MiMedx Group, Inc. (a)(b) | 470,139 | 7,649,162 | |
| Minerva Neurosciences, Inc. (a)(b) | 138,621 | 838,657 | |
| Mirati Therapeutics, Inc. (a)(b) | 68,149 | 368,005 | |
| Molecular Templates, Inc. (a)(b) | 23,057 | 132,808 | |
| Moleculin Biotech, Inc. (a)(b) | 58,888 | 148,398 | |
| Momenta Pharmaceuticals, Inc. (b) | 292,197 | 4,923,519 | |
| Myriad Genetics, Inc. (a)(b) | 304,682 | 9,289,754 | |
| NanoViricides, Inc. (a)(b) | 143,363 | 194,974 | |
| NantKwest, Inc. (a)(b) | 102,796 | 640,419 | |
| Natera, Inc. (a)(b) | 108,831 | 1,344,063 | |
| Navidea Biopharmaceuticals, Inc. (a)(b) | 571,658 | 224,376 | |
| Neothetics, Inc. (a)(b) | 19,486 | 6,705 | |
| Neuralstem, Inc. (a)(b) | 67,699 | 80,562 | |
| Neurocrine Biosciences, Inc. (a)(b) | 392,115 | 22,193,709 | |
| NewLink Genetics Corp. (a)(b) | 101,635 | 825,276 | |
| Novavax, Inc. (a)(b) | 1,386,707 | 1,456,042 | |
| Ohr Pharmaceutical, Inc. (a)(b) | 106,178 | 81,247 | |
| OncoCyte Corp. (a)(b) | 11,637 | 65,749 | |
| OncoGenex Pharmaceuticals, Inc. (a)(b) | 8,144 | 28,585 | |
| OncoGenex Pharmaceuticals, Inc. rights (d) | 89,591 | 1 | |
| OncoMed Pharmaceuticals, Inc. (a)(b) | 79,764 | 396,427 | |
| Onconova Therapeutics, Inc. (a)(b) | 3,480 | 5,638 | |
| OncoSec Medical, Inc. (a)(b) | 52,231 | 48,053 | |
| Opexa Therapeutics, Inc. (a)(b) | 35,198 | 30,182 | |
| OpGen, Inc. (a)(b) | 41,093 | 10,972 | |
| Ophthotech Corp. (b) | 123,408 | 382,565 | |
| Opko Health, Inc. (a)(b) | 1,702,739 | 10,897,530 | |
| Oragenics, Inc. (b) | 79,968 | 25,590 | |
| Organovo Holdings, Inc. (a)(b) | 401,186 | 834,467 | |
| Otonomy, Inc. (b) | 111,539 | 401,540 | |
| OvaScience, Inc. (a)(b) | 154,817 | 216,744 | |
| Ovid Therapeutics, Inc. (a) | 11,573 | 109,018 | |
| Palatin Technologies, Inc. (a)(b) | 634,919 | 273,015 | |
| PDL BioPharma, Inc. (a)(b) | 697,561 | 2,176,390 | |
| Peregrine Pharmaceuticals, Inc. (b) | 149,057 | 462,077 | |
| Pfenex, Inc. (b) | 65,771 | 237,433 | |
| PharmAthene, Inc. | 24,817 | 62,539 | |
| Portola Pharmaceuticals, Inc. (b) | 253,858 | 16,107,290 | |
| Progenics Pharmaceuticals, Inc. (a)(b) | 305,792 | 2,057,980 | |
| Protagonist Therapeutics, Inc. (a) | 32,503 | 530,774 | |
| Proteon Therapeutics, Inc. (a)(b) | 24,275 | 31,558 | |
| Proteostasis Therapeutics, Inc. (a)(b) | 51,559 | 111,883 | |
| Prothena Corp. PLC (a)(b) | 168,821 | 10,372,362 | |
| PTC Therapeutics, Inc. (a)(b) | 148,089 | 3,072,847 | |
| Puma Biotechnology, Inc. (a)(b) | 122,695 | 11,349,288 | |
| Radius Health, Inc. (a)(b) | 172,567 | 6,493,696 | |
| Recro Pharma, Inc. (a)(b) | 59,391 | 447,214 | |
| REGENXBIO, Inc. (a)(b) | 122,384 | 2,784,236 | |
| Regulus Therapeutics, Inc. (a)(b) | 368,835 | 368,835 | |
| Repligen Corp. (a)(b) | 161,329 | 7,045,237 | |
| Retrophin, Inc. (a)(b) | 156,492 | 3,818,405 | |
| Rexahn Pharmaceuticals, Inc. (a)(b) | 103,785 | 250,122 | |
| Rigel Pharmaceuticals, Inc. (b) | 535,297 | 1,365,007 | |
| RXi Pharmaceuticals Corp. (a)(b) | 26,638 | 15,184 | |
| Sage Therapeutics, Inc. (a)(b) | 137,807 | 11,334,626 | |
| Sangamo Therapeutics, Inc. (a)(b) | 357,866 | 4,777,511 | |
| Sarepta Therapeutics, Inc. (a)(b) | 254,120 | 10,238,495 | |
| Savara, Inc. (a)(b) | 12,370 | 64,943 | |
| Seattle Genetics, Inc. (a)(b) | 436,264 | 22,916,948 | |
| Selecta Biosciences, Inc. (a)(b) | 26,257 | 468,687 | |
| Seres Therapeutics, Inc. (a)(b) | 79,929 | 1,121,404 | |
| Soligenix, Inc. (a)(b) | 20,298 | 43,032 | |
| Sorrento Therapeutics, Inc. (a)(b) | 268,650 | 483,570 | |
| Spark Therapeutics, Inc. (a)(b) | 134,174 | 11,046,545 | |
| Spectrum Pharmaceuticals, Inc. (a)(b) | 318,369 | 3,107,281 | |
| Spring Bank Pharmaceuticals, Inc. (a)(b) | 40,920 | 595,795 | |
| Stemline Therapeutics, Inc. (a)(b) | 87,233 | 789,459 | |
| Sunesis Pharmaceuticals, Inc. (a)(b) | 46,639 | 101,673 | |
| Syndax Pharmaceuticals, Inc. (a)(b) | 65,978 | 765,345 | |
| Synergy Pharmaceuticals, Inc. (a)(b) | 1,043,707 | 3,110,247 | |
| Synthetic Biologics, Inc. (a)(b) | 314,451 | 238,983 | |
| Syros Pharmaceuticals, Inc. (a)(b) | 40,973 | 801,842 | |
| T2 Biosystems, Inc. (a)(b) | 68,463 | 286,860 | |
| Tenax Therapeutics, Inc. (a)(b) | 74,064 | 25,211 | |
| TESARO, Inc. (a)(b) | 154,098 | 19,900,216 | |
| TG Therapeutics, Inc. (a)(b) | 220,299 | 2,797,797 | |
| Tocagen, Inc. (a) | 42,397 | 589,742 | |
| TONIX Pharmaceuticals Holding (a)(b) | 6,944 | 26,179 | |
| TRACON Pharmaceuticals, Inc. (a)(b) | 15,504 | 38,760 | |
| Trevena, Inc. (a)(b) | 153,673 | 368,815 | |
| Trovagene, Inc. (a)(b) | 105,483 | 69,619 | |
| Ultragenyx Pharmaceutical, Inc. (a)(b) | 179,417 | 10,237,534 | |
| United Therapeutics Corp. (a)(b) | 201,618 | 26,371,634 | |
| Vanda Pharmaceuticals, Inc. (b) | 201,638 | 3,468,174 | |
| Veracyte, Inc. (b) | 68,214 | 558,673 | |
| Verastem, Inc. (b) | 127,456 | 497,078 | |
| Vericel Corp. (a)(b) | 180,932 | 778,008 | |
| Versartis, Inc. (a)(b) | 107,155 | 2,035,945 | |
| Vical, Inc. (a)(b) | 29,955 | 70,694 | |
| Viking Therapeutics, Inc. (a)(b) | 31,264 | 32,515 | |
| VistaGen Therapeutics, Inc. (a)(b) | 30,097 | 52,971 | |
| Vital Therapies, Inc. (a)(b) | 127,425 | 382,275 | |
| Voyager Therapeutics, Inc. (b) | 22,537 | 217,257 | |
| vTv Therapeutics, Inc. Class A (b) | 25,196 | 136,814 | |
| Xbiotech, Inc. (a)(b) | 79,667 | 407,895 | |
| Xencor, Inc. (a)(b) | 161,866 | 3,499,543 | |
| XOMA Corp. (a)(b) | 33,875 | 375,674 | |
| Zafgen, Inc. (b) | 77,644 | 280,295 | |
| ZIOPHARM Oncology, Inc. (a)(b) | 555,942 | 3,552,469 | |
| 910,488,107 | |||
| Health Care Equipment & Supplies - 2.6% | |||
| Abaxis, Inc. | 98,681 | 4,561,036 | |
| Abiomed, Inc. (b) | 181,743 | 27,406,844 | |
| Accuray, Inc. (a)(b) | 386,365 | 1,603,415 | |
| Aethlon Medical, Inc. (a)(b) | 20,809 | 28,508 | |
| Akers Biosciences, Inc. (a)(b) | 12,000 | 11,220 | |
| Alere, Inc. (b) | 387,359 | 19,158,776 | |
| Allied Healthcare Products, Inc. (b) | 2,477 | 5,747 | |
| Alliqua Biomedical, Inc. (a)(b) | 63,749 | 21,050 | |
| Alphatec Holdings, Inc. (a)(b) | 44,081 | 89,044 | |
| Amedica Corp. (a)(b) | 45,747 | 15,051 | |
| Analogic Corp. (a) | 56,318 | 4,029,553 | |
| Angiodynamics, Inc. (b) | 163,379 | 2,782,344 | |
| Anika Therapeutics, Inc. (a)(b) | 64,722 | 3,475,571 | |
| Antares Pharma, Inc. (a)(b) | 652,628 | 1,964,410 | |
| Apollo Endosurgery, Inc. (b) | 813 | 3,366 | |
| Atossa Genetics, Inc. (b) | 5,394 | 2,314 | |
| Atricure, Inc. (a)(b) | 137,373 | 3,081,276 | |
| Atrion Corp. | 6,263 | 3,896,525 | |
| Avinger, Inc. (a)(b) | 84,296 | 25,289 | |
| AxoGen, Inc. (b) | 116,552 | 2,051,315 | |
| Bellerophon Therapeutics, Inc. (a)(b) | 109,948 | 120,943 | |
| BioLase Technology, Inc. (a)(b) | 142,344 | 72,482 | |
| BioLife Solutions, Inc. (a)(b) | 69,384 | 328,880 | |
| Bovie Medical Corp. (b) | 92,879 | 221,052 | |
| Cantel Medical Corp. (a) | 161,364 | 13,110,825 | |
| Cardiovascular Systems, Inc. (b) | 142,913 | 4,197,355 | |
| CAS Medical Systems, Inc. (a)(b) | 6,117 | 5,383 | |
| Cerus Corp. (a)(b) | 442,280 | 1,039,358 | |
| Cesca Therapeutics, Inc. (b) | 3,165 | 10,761 | |
| Chembio Diagnostics, Inc. (a)(b) | 41,523 | 253,290 | |
| Chf Solutions, Inc. (b) | 1,359 | 924 | |
| Cogentix Medical, Inc. (b) | 158,919 | 365,514 | |
| ConforMis, Inc. (a)(b) | 157,069 | 581,155 | |
| CONMED Corp. | 112,423 | 5,576,181 | |
| Corindus Vascular Robotics, Inc. (a)(b) | 396,954 | 758,182 | |
| Cryolife, Inc. (b) | 121,962 | 2,536,810 | |
| CryoPort, Inc. (b) | 70,439 | 540,972 | |
| Cutera, Inc. (b) | 61,354 | 2,279,301 | |
| CytoSorbents Corp. (a)(b) | 88,558 | 456,074 | |
| Dare Bioscience, Inc. (a)(b) | 4,896 | 16,304 | |
| Delcath Systems, Inc. (a)(b) | 1,901,997 | 210,361 | |
| DexCom, Inc. (a)(b) | 386,297 | 28,821,619 | |
| Dextera Surgical, Inc. (a)(b) | 25,108 | 8,964 | |
| Dynatronics Corp. (b) | 3,425 | 8,391 | |
| Ekso Bionics Holdings, Inc. (a)(b) | 110,747 | 139,541 | |
| Electromed, Inc. (b) | 18,483 | 131,044 | |
| Endologix, Inc. (a)(b) | 367,188 | 1,553,205 | |
| Entellus Medical, Inc. (a)(b) | 52,720 | 933,144 | |
| EnteroMedics, Inc. (a)(b) | 13,716 | 25,923 | |
| Exactech, Inc. (b) | 45,189 | 1,380,524 | |
| Fonar Corp. (a)(b) | 28,662 | 848,395 | |
| Genmark Diagnostics, Inc. (b) | 243,937 | 2,375,946 | |
| Glaukos Corp. (a)(b) | 52,451 | 1,980,025 | |
| Globus Medical, Inc. (a)(b) | 332,565 | 10,053,440 | |
| Haemonetics Corp. (a)(b) | 231,066 | 9,940,459 | |
| Halyard Health, Inc. (a)(b) | 208,542 | 9,444,867 | |
| Heska Corp. (b) | 28,264 | 2,875,014 | |
| Hill-Rom Holdings, Inc. | 268,873 | 20,692,466 | |
| ICU Medical, Inc. (b) | 65,426 | 11,407,023 | |
| Inogen, Inc. (a)(b) | 70,478 | 6,751,792 | |
| InspireMD, Inc. (a)(b) | 394 | 130 | |
| Insulet Corp. (a)(b) | 260,638 | 15,132,642 | |
| Integer Holdings Corp. (b) | 124,964 | 5,742,096 | |
| Integra LifeSciences Holdings Corp. (a)(b) | 276,450 | 14,096,186 | |
| Invacare Corp. (a) | 140,919 | 1,902,407 | |
| InVivo Therapeutics Holdings Corp. (a)(b) | 122,248 | 140,585 | |
| Invuity, Inc. (a)(b) | 46,878 | 375,024 | |
| IRadimed Corp. (a)(b) | 17,654 | 178,305 | |
| iRhythm Technologies, Inc. (a) | 30,762 | 1,468,578 | |
| Iridex Corp. (a)(b) | 27,981 | 249,031 | |
| K2M Group Holdings, Inc. (b) | 156,379 | 3,656,141 | |
| Kewaunee Scientific Corp. | 5,250 | 135,188 | |
| Lantheus Holdings, Inc. (b) | 130,409 | 2,282,158 | |
| LeMaitre Vascular, Inc. | 55,211 | 2,009,680 | |
| LivaNova PLC (a)(b) | 192,615 | 12,053,847 | |
| Masimo Corp. (b) | 201,948 | 17,040,372 | |
| Meridian Bioscience, Inc. | 201,601 | 2,802,254 | |
| Merit Medical Systems, Inc. (a)(b) | 223,509 | 9,230,922 | |
| MGC Diagnostics Corp. | 3,151 | 24,483 | |
| Microbot Medical, Inc. (a)(b) | 30,945 | 31,873 | |
| Milestone Scientific, Inc. (b) | 45,410 | 59,033 | |
| Misonix, Inc. (a)(b) | 18,363 | 179,957 | |
| Natus Medical, Inc. (a)(b) | 144,748 | 4,863,533 | |
| Neogen Corp. (b) | 169,897 | 11,705,903 | |
| NeuroMetrix, Inc. (a)(b) | 842 | 1,718 | |
| Nevro Corp. (a)(b) | 102,337 | 8,819,403 | |
| NuVasive, Inc. (a)(b) | 227,718 | 14,227,821 | |
| Nuvectra Corp. (b) | 35,935 | 387,739 | |
| NxStage Medical, Inc. (b) | 265,053 | 7,421,484 | |
| OraSure Technologies, Inc. (b) | 251,081 | 5,124,563 | |
| Orthofix International NV (b) | 79,952 | 3,934,438 | |
| Penumbra, Inc. (a)(b) | 122,516 | 10,536,376 | |
| Presbia PLC (a)(b) | 14,898 | 44,545 | |
| Pulse Biosciences, Inc. (a)(b) | 23,721 | 475,132 | |
| Quidel Corp. (b) | 128,607 | 4,493,529 | |
| Retractable Technologies, Inc. (a)(b) | 36,514 | 23,223 | |
| Rockwell Medical Technologies, Inc. (a)(b) | 202,763 | 1,281,462 | |
| Roka Bioscience, Inc. (b) | 1,791 | 1,748 | |
| RTI Biologics, Inc. (b) | 250,898 | 1,129,041 | |
| Seaspine Holdings Corp. (b) | 41,314 | 466,848 | |
| Second Sight Medical Products, Inc. (a)(b) | 63,760 | 72,049 | |
| Sientra, Inc. (a)(b) | 58,832 | 674,215 | |
| Skyline Medical, Inc. (a)(b) | 27,737 | 38,832 | |
| Staar Surgical Co. (a)(b) | 117,470 | 1,403,767 | |
| Steris PLC | 371,678 | 32,395,454 | |
| STRATA Skin Sciences, Inc. (a)(b) | 2,348 | 4,391 | |
| SurModics, Inc. (b) | 57,901 | 1,505,426 | |
| Synergetics U.S.A., Inc. (b)(d) | 76,412 | 1 | |
| Tactile Systems Technology, Inc. (a)(b) | 20,528 | 674,961 | |
| Tandem Diabetes Care, Inc. (a)(b) | 144,184 | 121,115 | |
| TearLab Corp. (a)(b) | 24,963 | 33,700 | |
| Teleflex, Inc. | 202,441 | 42,866,882 | |
| TransEnterix, Inc. (a)(b) | 382,121 | 328,624 | |
| Utah Medical Products, Inc. | 15,694 | 1,132,322 | |
| Vermillion, Inc. (a)(b) | 65,547 | 83,245 | |
| ViewRay, Inc. (a)(b) | 133,734 | 703,441 | |
| Viveve Medical, Inc. (a)(b) | 46,102 | 261,398 | |
| VolitionRx Ltd. (a)(b) | 100,890 | 298,634 | |
| West Pharmaceutical Services, Inc. | 326,008 | 28,375,736 | |
| Wright Medical Group NV (a)(b) | 478,379 | 14,160,018 | |
| Zosano Pharma Corp. (a)(b) | 133,854 | 112,437 | |
| 505,242,589 | |||
| Health Care Providers & Services - 1.5% | |||
| AAC Holdings, Inc. (a)(b) | 40,868 | 379,664 | |
| Acadia Healthcare Co., Inc. (a)(b) | 344,046 | 16,149,519 | |
| Aceto Corp. | 135,992 | 1,442,875 | |
| Adcare Health Systems, Inc. (a)(b) | 40,556 | 38,528 | |
| Addus HomeCare Corp. (b) | 31,856 | 1,084,697 | |
| Almost Family, Inc. (b) | 53,272 | 2,594,346 | |
| Amedisys, Inc. (b) | 131,554 | 6,872,381 | |
| American Renal Associates Holdings, Inc. (a)(b) | 50,577 | 724,768 | |
| American Shared Hospital Services (b) | 115 | 334 | |
| AMN Healthcare Services, Inc. (a)(b) | 214,341 | 8,005,636 | |
| BioScrip, Inc. (a)(b) | 530,489 | 1,607,382 | |
| BioTelemetry, Inc. (a)(b) | 133,878 | 4,973,568 | |
| Brookdale Senior Living, Inc. (b) | 854,931 | 10,370,313 | |
| Caladrius Biosciences, Inc. (a)(b) | 17,378 | 69,686 | |
| Capital Senior Living Corp. (a)(b) | 114,940 | 1,428,704 | |
| Chemed Corp. (a) | 71,443 | 14,094,989 | |
| Civitas Solutions, Inc. (a)(b) | 72,322 | 1,381,350 | |
| Community Health Systems, Inc. (a)(b) | 505,186 | 3,859,621 | |
| Corvel Corp. (b) | 44,212 | 2,294,603 | |
| Cross Country Healthcare, Inc. (b) | 142,947 | 1,769,684 | |
| Digirad Corp. | 52,208 | 185,338 | |
| Diplomat Pharmacy, Inc. (a)(b) | 190,823 | 3,196,285 | |
| Diversicare Healthcare Services, Inc. | 13,755 | 130,810 | |
| Five Star Sr Living, Inc. (b) | 200,855 | 326,389 | |
| Genesis HealthCare, Inc. Class A (a)(b) | 122,459 | 127,357 | |
| HealthEquity, Inc. (b) | 197,508 | 8,447,417 | |
| HealthSouth Corp. | 435,709 | 19,933,687 | |
| InfuSystems Holdings, Inc. (b) | 46,642 | 88,620 | |
| Innovative Industrial Properties, Inc. (a) | 3,026 | 51,684 | |
| Interpace Diagnostics Group, Inc. (a)(b) | 26,246 | 34,382 | |
| Kindred Healthcare, Inc. | 383,129 | 3,103,345 | |
| Landauer, Inc. | 43,381 | 2,691,791 | |
| LHC Group, Inc. (b) | 65,956 | 4,303,629 | |
| LifePoint Hospitals, Inc. (a)(b) | 183,768 | 10,649,356 | |
| Magellan Health Services, Inc. (b) | 103,219 | 8,350,417 | |
| MEDNAX, Inc. (b) | 415,985 | 18,656,927 | |
| Molina Healthcare, Inc. (a)(b) | 186,222 | 11,918,208 | |
| National Healthcare Corp. | 53,157 | 3,313,807 | |
| National Research Corp. Class A | 29,921 | 966,448 | |
| Owens & Minor, Inc. | 279,804 | 7,817,724 | |
| PharMerica Corp. (b) | 140,004 | 4,116,118 | |
| Premier, Inc. (a)(b) | 231,650 | 7,760,275 | |
| Providence Service Corp. (b) | 55,715 | 2,887,708 | |
| Psychemedics Corp. | 24,573 | 519,473 | |
| Quorum Health Corp. (b) | 123,157 | 539,428 | |
| R1 RCM, Inc. (a)(b) | 331,964 | 1,095,481 | |
| RadNet, Inc. (b) | 138,775 | 1,422,444 | |
| Select Medical Holdings Corp. (a)(b) | 473,830 | 8,813,238 | |
| Sharps Compliance Corp. (a)(b) | 38,932 | 192,713 | |
| SunLink Health Systems, Inc. (b) | 19,190 | 28,785 | |
| Surgery Partners, Inc. (b) | 85,904 | 837,564 | |
| Teladoc, Inc. (a)(b) | 169,112 | 5,673,708 | |
| Tenet Healthcare Corp. (a)(b) | 349,778 | 6,005,688 | |
| The Ensign Group, Inc. (a) | 210,263 | 4,318,802 | |
| Tivity Health, Inc. (a)(b) | 145,588 | 5,707,050 | |
| Triple-S Management Corp. (a)(b) | 101,083 | 2,497,761 | |
| U.S. Physical Therapy, Inc. | 56,068 | 3,358,473 | |
| VCA, Inc. (b) | 350,488 | 32,581,364 | |
| Wellcare Health Plans, Inc. (b) | 198,112 | 34,606,204 | |
| 306,398,546 | |||
| Health Care Technology - 0.6% | |||
| Allscripts Healthcare Solutions, Inc. (a)(b) | 797,527 | 10,479,505 | |
| Arrhythmia Research Technology, Inc. (b) | 9,913 | 36,083 | |
| athenahealth, Inc. (a)(b) | 176,539 | 24,879,641 | |
| Castlight Health, Inc. Class B (a)(b) | 202,967 | 791,571 | |
| Computer Programs & Systems, Inc. (a) | 49,251 | 1,482,455 | |
| Connecture, Inc. (a)(b) | 29,490 | 19,758 | |
| Evolent Health, Inc. (a)(b) | 269,471 | 4,500,166 | |
| HealthStream, Inc. (a)(b) | 115,141 | 2,704,662 | |
| HMS Holdings Corp. (b) | 371,818 | 6,588,615 | |
| HTG Molecular Diagnostics (a)(b) | 19,859 | 32,966 | |
| iCAD, Inc. (b) | 51,129 | 202,471 | |
| Inovalon Holdings, Inc. Class A (a)(b) | 288,458 | 3,908,606 | |
| Medidata Solutions, Inc. (b) | 246,683 | 18,491,358 | |
| Omnicell, Inc. (b) | 163,472 | 8,386,114 | |
| Quality Systems, Inc. (b) | 196,746 | 3,098,750 | |
| Simulations Plus, Inc. | 44,648 | 647,396 | |
| Streamline Health Solutions, Inc. (b) | 74,551 | 97,662 | |
| Tabula Rasa HealthCare, Inc. | 21,610 | 491,195 | |
| Veeva Systems, Inc. Class A (a)(b) | 469,609 | 27,941,736 | |
| Vocera Communications, Inc. (b) | 115,619 | 3,219,989 | |
| 118,000,699 | |||
| Life Sciences Tools & Services - 0.8% | |||
| Accelerate Diagnostics, Inc. (a)(b) | 114,176 | 2,626,048 | |
| Albany Molecular Research, Inc. (a)(b) | 96,920 | 2,107,041 | |
| Bio-Rad Laboratories, Inc. Class A (a)(b) | 93,959 | 20,466,149 | |
| Bio-Techne Corp. | 166,067 | 20,555,773 | |
| Bioanalytical Systems, Inc. (b) | 4,687 | 7,171 | |
| Bruker Corp. | 464,594 | 13,515,039 | |
| Cambrex Corp. (b) | 141,044 | 7,348,392 | |
| Charles River Laboratories International, Inc. (b) | 211,597 | 23,021,754 | |
| ChromaDex, Inc. (a)(b) | 94,205 | 316,529 | |
| CombiMatrix Corp. (b) | 922 | 6,961 | |
| Enzo Biochem, Inc. (b) | 184,150 | 2,071,688 | |
| Fluidigm Corp. (a)(b) | 119,521 | 546,211 | |
| Harvard Bioscience, Inc. (b) | 111,418 | 345,396 | |
| INC Research Holdings, Inc. Class A (a)(b) | 242,252 | 14,220,192 | |
| Luminex Corp. (a) | 173,959 | 3,362,627 | |
| Medpace Holdings, Inc. (a) | 29,956 | 977,764 | |
| Nanostring Technologies, Inc. (b) | 75,121 | 1,160,619 | |
| NeoGenomics, Inc. (a)(b) | 214,850 | 2,172,134 | |
| Pacific Biosciences of California, Inc. (a)(b) | 415,712 | 2,057,774 | |
| PAREXEL International Corp. (b) | 221,017 | 19,425,184 | |
| PRA Health Sciences, Inc. (b) | 217,459 | 16,831,327 | |
| pSivida Corp. (a)(b) | 97,016 | 117,389 | |
| VWR Corp. (b) | 369,017 | 12,184,941 | |
| 165,444,103 | |||
| Pharmaceuticals - 1.4% | |||
| AcelRx Pharmaceuticals, Inc. (a)(b) | 126,457 | 417,308 | |
| Aclaris Therapeutics, Inc. (b) | 104,312 | 2,704,810 | |
| Adamis Pharmaceuticals Corp. (a)(b) | 97,382 | 530,732 | |
| Aerie Pharmaceuticals, Inc. (a)(b) | 157,930 | 9,057,286 | |
| Agile Therapeutics, Inc. (a)(b) | 73,763 | 253,745 | |
| Akorn, Inc. (b) | 378,868 | 12,464,757 | |
| Alimera Sciences, Inc. (b) | 102,415 | 142,357 | |
| Amphastar Pharmaceuticals, Inc. (a)(b) | 158,581 | 2,538,882 | |
| Ampio Pharmaceuticals, Inc. (a)(b) | 182,288 | 97,087 | |
| ANI Pharmaceuticals, Inc. (b) | 33,859 | 1,625,232 | |
| ANI Pharmaceuticals, Inc. rights (b)(d) | 58,183 | 1 | |
| Apricus Biosciences, Inc. (a)(b) | 18,299 | 29,827 | |
| Aradigm Corp. (a)(b) | 6,822 | 9,141 | |
| Aratana Therapeutics, Inc. (a)(b) | 155,922 | 890,315 | |
| Assembly Biosciences, Inc. (a)(b) | 65,478 | 1,775,109 | |
| AstraZeneca PLC rights (b)(d) | 21,542 | 0 | |
| Avexis, Inc. (a)(b) | 102,106 | 9,531,595 | |
| Axsome Therapeutics, Inc. (a)(b) | 61,057 | 311,391 | |
| Bio Path Holdings, Inc. (a)(b) | 346,086 | 95,174 | |
| Biodelivery Sciences International, Inc. (a)(b) | 266,001 | 824,603 | |
| BioPharmX Corp. (a)(b) | 259,103 | 79,286 | |
| Catalent, Inc. (b) | 548,701 | 22,655,864 | |
| Cempra, Inc. (a)(b) | 210,034 | 640,604 | |
| Clearside Biomedical, Inc. (a)(b) | 56,066 | 391,901 | |
| Collegium Pharmaceutical, Inc. (a)(b) | 84,457 | 847,948 | |
| ContraVir Pharmaceuticals, Inc. (a)(b) | 235,301 | 111,839 | |
| Corcept Therapeutics, Inc. (a)(b) | 367,098 | 6,119,524 | |
| Corium International, Inc. (a)(b) | 92,370 | 789,764 | |
| CorMedix, Inc. (a)(b) | 246,421 | 121,978 | |
| Cumberland Pharmaceuticals, Inc. (b) | 33,632 | 235,760 | |
| CymaBay Therapeutics, Inc. (b) | 169,517 | 1,057,786 | |
| DepoMed, Inc. (a)(b) | 279,603 | 1,699,986 | |
| Dermira, Inc. (a)(b) | 135,493 | 3,196,280 | |
| Durect Corp. (a)(b) | 600,826 | 955,313 | |
| Egalet Corp. (a)(b) | 55,293 | 66,905 | |
| Endo International PLC (a)(b) | 860,309 | 7,562,116 | |
| Endocyte, Inc. (a)(b) | 136,613 | 185,794 | |
| Evoke Pharma, Inc. (a)(b) | 15,864 | 39,977 | |
| Flex Pharma, Inc. (b) | 43,126 | 169,485 | |
| Gemphire Therapeutics, Inc. (a) | 23,191 | 223,561 | |
| Horizon Pharma PLC (a)(b) | 727,591 | 9,953,445 | |
| Impax Laboratories, Inc. (a)(b) | 325,117 | 7,038,783 | |
| Imprimis Pharmaceuticals, Inc. (a)(b) | 47,994 | 87,829 | |
| Innoviva, Inc. (a)(b) | 359,646 | 5,049,430 | |
| Intersect ENT, Inc. (a)(b) | 111,651 | 3,450,016 | |
| Intra-Cellular Therapies, Inc. (a)(b) | 150,680 | 2,780,046 | |
| Jaguar Health, Inc. (a)(b) | 27,742 | 10,359 | |
| Jazz Pharmaceuticals PLC (b) | 268,581 | 40,115,258 | |
| Juniper Pharmaceuticals, Inc. (b) | 42,963 | 199,778 | |
| KemPharm, Inc. (a)(b) | 54,249 | 165,459 | |
| Lannett Co., Inc. (a)(b) | 132,787 | 2,330,412 | |
| Lipocine, Inc. (a)(b) | 73,787 | 278,915 | |
| Mallinckrodt PLC (a)(b) | 450,015 | 18,486,616 | |
| Marinus Pharmaceuticals, Inc. (a)(b) | 87,400 | 267,444 | |
| MyoKardia, Inc. (b) | 87,793 | 3,805,827 | |
| Nektar Therapeutics (a)(b) | 702,424 | 14,771,977 | |
| Neos Therapeutics, Inc. (a)(b) | 97,688 | 815,695 | |
| NovaBay Pharmaceuticals, Inc. (a)(b) | 5,692 | 25,045 | |
| Novan, Inc. (a) | 36,199 | 182,805 | |
| Novus Therapeutics, Inc. (a)(b) | 3,220 | 12,751 | |
| Ocera Therapeutics, Inc. (a)(b) | 41,015 | 38,144 | |
| Ocular Therapeutix, Inc. (a)(b) | 99,153 | 620,698 | |
| Omeros Corp. (a)(b) | 194,237 | 3,976,031 | |
| Orexigen Therapeutics, Inc. (a)(b) | 43,174 | 98,005 | |
| Pacira Pharmaceuticals, Inc. (a)(b) | 185,742 | 7,076,770 | |
| Pain Therapeutics, Inc. (a)(b) | 20,714 | 66,492 | |
| Paratek Pharmaceuticals, Inc. (a)(b) | 89,723 | 2,530,189 | |
| Pernix Therapeutics Holdings, Inc. (a)(b) | 31,117 | 93,351 | |
| Phibro Animal Health Corp. Class A | 88,806 | 3,152,613 | |
| Plx Pharma PLC/New (a)(b) | 4,428 | 27,896 | |
| Prestige Brands Holdings, Inc. (a)(b) | 233,489 | 11,840,227 | |
| Pulmatrix, Inc. (a)(b) | 31,769 | 54,643 | |
| Reata Pharmaceuticals, Inc. (a)(b) | 43,792 | 1,324,708 | |
| Repros Therapeutics, Inc. (a)(b) | 95,900 | 28,367 | |
| Revance Therapeutics, Inc. (a)(b) | 97,298 | 2,388,666 | |
| Ritter Pharmaceuticals, Inc. (a)(b) | 29,614 | 16,889 | |
| SciClone Pharmaceuticals, Inc. (b) | 218,960 | 2,408,560 | |
| SCYNEXIS, Inc. (a)(b) | 102,549 | 196,894 | |
| Sonoma Pharmaceuticals, Inc. (a)(b) | 13,177 | 73,132 | |
| Sucampo Pharmaceuticals, Inc. Class A (a)(b) | 124,734 | 1,465,625 | |
| Supernus Pharmaceuticals, Inc. (a)(b) | 224,100 | 10,263,780 | |
| Teligent, Inc. (a)(b) | 188,677 | 1,303,758 | |
| Tetraphase Pharmaceuticals, Inc. (a)(b) | 225,292 | 1,572,538 | |
| The Medicines Company (a)(b) | 315,572 | 11,578,337 | |
| TherapeuticsMD, Inc. (a)(b) | 746,255 | 4,477,530 | |
| Theravance Biopharma, Inc. (a)(b) | 173,244 | 5,659,881 | |
| Titan Pharmaceuticals, Inc. (a)(b) | 68,182 | 102,273 | |
| VIVUS, Inc. (a)(b) | 380,623 | 338,983 | |
| WAVE Life Sciences (a)(b) | 61,241 | 1,439,164 | |
| Zogenix, Inc. (a)(b) | 109,963 | 1,303,062 | |
| Zynerba Pharmaceuticals, Inc. (a)(b) | 45,110 | 286,449 | |
| 276,082,568 | |||
| TOTAL HEALTH CARE | 2,281,656,612 | ||
| INDUSTRIALS - 13.2% | |||
| Aerospace & Defense - 1.7% | |||
| AAR Corp. | 143,570 | 5,177,134 | |
| Aerojet Rocketdyne Holdings, Inc. (a)(b) | 334,458 | 9,909,991 | |
| AeroVironment, Inc. (a)(b) | 92,122 | 4,515,820 | |
| Air Industries Group, Inc. (b) | 217 | 293 | |
| Arotech Corp. (a)(b) | 107,505 | 354,767 | |
| Astronics Corp. (a)(b) | 86,881 | 2,284,101 | |
| Astronics Corp. Class B (a) | 7,288 | 190,946 | |
| Astrotech Corp. (b) | 39,511 | 28,843 | |
| Axon Enterprise, Inc. (a)(b) | 237,339 | 5,152,630 | |
| BWX Technologies, Inc. | 434,849 | 23,794,937 | |
| CPI Aerostructures, Inc. (b) | 20,017 | 174,148 | |
| Cubic Corp. | 108,530 | 4,661,364 | |
| Curtiss-Wright Corp. | 200,716 | 19,433,323 | |
| DigitalGlobe, Inc. (a)(b) | 270,177 | 9,294,089 | |
| Ducommun, Inc. (b) | 49,143 | 1,351,433 | |
| Engility Holdings, Inc. (b) | 78,098 | 2,426,505 | |
| Esterline Technologies Corp. (b) | 133,161 | 11,371,949 | |
| HEICO Corp. (a) | 117,423 | 10,071,371 | |
| HEICO Corp. Class A | 200,680 | 14,579,402 | |
| Hexcel Corp. | 401,227 | 21,573,976 | |
| Huntington Ingalls Industries, Inc. | 203,232 | 43,483,519 | |
| Innovative Solutions & Support, Inc. (b) | 34,266 | 118,218 | |
| KEYW Holding Corp. (a)(b) | 187,901 | 1,343,492 | |
| KLX, Inc. (b) | 232,402 | 11,141,352 | |
| Kratos Defense & Security Solutions, Inc. (a)(b) | 316,334 | 4,232,549 | |
| Mercury Systems, Inc. (b) | 216,006 | 10,422,290 | |
| Micronet Enertec Technologies, Inc. (b) | 8,571 | 6,883 | |
| Moog, Inc. Class A (b) | 144,025 | 11,055,359 | |
| National Presto Industries, Inc. (a) | 22,481 | 2,239,108 | |
| Orbital ATK, Inc. | 258,902 | 28,888,285 | |
| SIFCO Industries, Inc. (b) | 8,947 | 49,209 | |
| Sparton Corp. (b) | 38,996 | 903,537 | |
| Spirit AeroSystems Holdings, Inc. Class A | 532,926 | 39,702,987 | |
| Teledyne Technologies, Inc. (b) | 156,637 | 23,504,948 | |
| Triumph Group, Inc. | 220,034 | 5,786,894 | |
| Vectrus, Inc. (b) | 47,874 | 1,368,239 | |
| Wesco Aircraft Holdings, Inc. (b) | 267,984 | 2,251,066 | |
| 332,844,957 | |||
| Air Freight& Logistics - 0.3% | |||
| Air T, Inc. (b) | 1,113 | 18,309 | |
| Air Transport Services Group, Inc. (b) | 236,478 | 5,429,535 | |
| Atlas Air Worldwide Holdings, Inc. (a)(b) | 110,896 | 7,407,853 | |
| Echo Global Logistics, Inc. (a)(b) | 127,579 | 1,939,201 | |
| Forward Air Corp. | 135,469 | 7,040,324 | |
| Hub Group, Inc. Class A (b) | 154,089 | 5,924,722 | |
| Radiant Logistics, Inc. (b) | 144,096 | 727,685 | |
| XPO Logistics, Inc. (a)(b) | 381,007 | 23,317,628 | |
| 51,805,257 | |||
| Airlines - 0.3% | |||
| Allegiant Travel Co. (a) | 57,825 | 6,823,350 | |
| Hawaiian Holdings, Inc. (b) | 235,963 | 10,111,015 | |
| JetBlue Airways Corp. (b) | 1,472,067 | 29,161,647 | |
| SkyWest, Inc. (a) | 229,350 | 7,958,445 | |
| Spirit Airlines, Inc. (b) | 308,675 | 10,510,384 | |
| 64,564,841 | |||
| Building Products - 1.0% | |||
| AAON, Inc. (a) | 174,071 | 5,674,715 | |
| Advanced Drain Systems, Inc. Del | 158,188 | 3,076,757 | |
| American Woodmark Corp. (b) | 63,037 | 5,219,464 | |
| Apogee Enterprises, Inc. (a) | 129,908 | 5,676,980 | |
| Armstrong World Industries, Inc. (a)(b) | 218,003 | 10,355,143 | |
| Builders FirstSource, Inc. (a)(b) | 438,206 | 7,133,994 | |
| Continental Building Products, Inc. (a)(b) | 175,679 | 4,277,784 | |
| CSW Industrials, Inc. (b) | 69,908 | 2,925,650 | |
| GCP Applied Technologies, Inc. (a)(b) | 323,986 | 9,152,605 | |
| Gibraltar Industries, Inc. (a)(b) | 140,820 | 4,118,985 | |
| GMS, Inc. (b) | 133,191 | 4,286,086 | |
| Griffon Corp. | 137,012 | 2,541,573 | |
| Insteel Industries, Inc. | 77,676 | 1,947,337 | |
| Jeld-Wen Holding, Inc. | 173,325 | 5,289,879 | |
| Lennox International, Inc. (a) | 168,062 | 27,852,915 | |
| Masonite International Corp. (a)(b) | 130,738 | 8,275,715 | |
| NCI Building Systems, Inc. (b) | 175,187 | 2,943,142 | |
| Owens Corning | 498,872 | 36,981,381 | |
| Patrick Industries, Inc. (b) | 70,801 | 5,239,274 | |
| PGT, Inc. (a)(b) | 222,722 | 2,939,930 | |
| Ply Gem Holdings, Inc. (b) | 97,641 | 1,518,318 | |
| Quanex Building Products Corp. | 151,050 | 2,960,580 | |
| Simpson Manufacturing Co. Ltd. (a) | 185,364 | 8,115,236 | |
| Tecogen, Inc. New (a)(b) | 6,158 | 18,474 | |
| Trex Co., Inc. (b) | 128,907 | 9,796,932 | |
| Universal Forest Products, Inc. | 94,515 | 8,242,653 | |
| USG Corp. (a)(b) | 398,293 | 11,948,790 | |
| 198,510,292 | |||
| Commercial Services & Supplies - 1.6% | |||
| ABM Industries, Inc. | 247,365 | 10,990,427 | |
| ACCO Brands Corp. (b) | 492,892 | 5,397,167 | |
| Acme United Corp. | 1,357 | 32,351 | |
| ADS Waste Holdings, Inc. | 179,339 | 4,275,442 | |
| Amrep Corp. (b) | 2,745 | 18,831 | |
| Aqua Metals, Inc. (a)(b) | 65,324 | 484,051 | |
| ARC Document Solutions, Inc. (b) | 152,363 | 537,841 | |
| Avalon Holdings Corp. Class A (b) | 128 | 246 | |
| Brady Corp. Class A | 217,590 | 7,256,627 | |
| Casella Waste Systems, Inc. Class A (b) | 167,872 | 2,821,928 | |
| CECO Environmental Corp. | 121,214 | 905,469 | |
| Cemtrex, Inc. (a) | 35,054 | 102,358 | |
| Cenveo, Inc. (a)(b) | 27,357 | 103,409 | |
| Clean Harbors, Inc. (a)(b) | 236,919 | 12,814,949 | |
| Command Security Corp. (b) | 4,127 | 11,968 | |
| CompX International, Inc. Class A | 729 | 10,971 | |
| Copart, Inc. (a)(b) | 905,964 | 29,615,963 | |
| Covanta Holding Corp. (a) | 578,029 | 8,294,716 | |
| Deluxe Corp. | 219,912 | 15,250,897 | |
| Ecology & Environment, Inc. Class A | 5,634 | 66,763 | |
| Ennis, Inc. | 117,199 | 2,238,501 | |
| Essendant, Inc. | 162,977 | 1,932,907 | |
| Fuel Tech, Inc. (a)(b) | 72,552 | 65,514 | |
| Healthcare Services Group, Inc. | 321,337 | 16,452,454 | |
| Heritage-Crystal Clean, Inc. (b) | 68,983 | 1,345,169 | |
| Herman Miller, Inc. | 274,491 | 9,236,622 | |
| HNI Corp. (a) | 197,609 | 7,242,370 | |
| Hudson Technologies, Inc. (a)(b) | 168,025 | 1,495,423 | |
| Industrial Services of America, Inc. (a)(b) | 12,843 | 25,044 | |
| InnerWorkings, Inc. (a)(b) | 175,021 | 1,832,470 | |
| Interface, Inc. (a) | 279,580 | 5,312,020 | |
| Intersections, Inc. (a)(b) | 42,827 | 150,323 | |
| KAR Auction Services, Inc. (a) | 618,392 | 27,883,295 | |
| Kimball International, Inc. Class B | 162,059 | 2,748,521 | |
| Knoll, Inc. | 222,691 | 4,019,573 | |
| LSC Communications, Inc. | 153,886 | 2,479,103 | |
| Matthews International Corp. Class A | 146,544 | 8,829,276 | |
| McGrath RentCorp. | 106,286 | 4,290,766 | |
| Mobile Mini, Inc. (a) | 195,778 | 5,922,285 | |
| Msa Safety, Inc. | 143,147 | 10,429,690 | |
| Multi-Color Corp. (a) | 59,263 | 4,729,187 | |
| NL Industries, Inc. (b) | 19,361 | 146,176 | |
| Odyssey Marine Exploration, Inc. (a)(b) | 21,390 | 79,357 | |
| Performant Financial Corp. (b) | 101,625 | 178,860 | |
| Perma-Fix Environmental Services, Inc. (b) | 24,334 | 86,386 | |
| Pitney Bowes, Inc. | 833,969 | 10,716,502 | |
| Quad/Graphics, Inc. | 135,690 | 2,586,251 | |
| Quest Resource Holding Corp. (a)(b) | 36,362 | 50,180 | |
| R.R. Donnelley & Sons Co. | 314,030 | 2,898,497 | |
| Rollins, Inc. (a) | 424,489 | 18,851,556 | |
| SP Plus Corp. (b) | 98,466 | 3,633,395 | |
| Steelcase, Inc. Class A | 394,969 | 5,213,591 | |
| Team, Inc. (a)(b) | 135,303 | 1,670,992 | |
| Tetra Tech, Inc. | 260,091 | 11,079,877 | |
| The Brink's Co. | 199,596 | 15,658,306 | |
| U.S. Ecology, Inc. | 96,736 | 4,972,230 | |
| UniFirst Corp. | 69,592 | 9,993,411 | |
| Versar, Inc. (b) | 11,390 | 8,998 | |
| Viad Corp. | 92,139 | 5,063,038 | |
| Virco Manufacturing Co. (b) | 17,110 | 88,972 | |
| VSE Corp. | 32,483 | 1,693,988 | |
| West Corp. | 211,662 | 4,946,541 | |
| 317,269,991 | |||
| Construction & Engineering - 0.7% | |||
| AECOM (a)(b) | 706,124 | 23,655,154 | |
| Aegion Corp. (a)(b) | 149,994 | 3,250,370 | |
| Ameresco, Inc. Class A (b) | 69,482 | 503,745 | |
| Argan, Inc. (a) | 59,650 | 3,778,828 | |
| Chicago Bridge & Iron Co. NV (a) | 437,751 | 5,401,847 | |
| Comfort Systems U.S.A., Inc. | 162,547 | 5,534,725 | |
| Dycom Industries, Inc. (a)(b) | 136,274 | 10,994,586 | |
| EMCOR Group, Inc. | 259,494 | 17,136,984 | |
| Goldfield Corp. | 101,619 | 452,205 | |
| Granite Construction, Inc. (a) | 173,385 | 9,576,054 | |
| Great Lakes Dredge & Dock Corp. (b) | 250,064 | 1,012,759 | |
| HC2 Holdings, Inc. (b) | 149,409 | 681,305 | |
| Ies Holdings, Inc. (a)(b) | 36,498 | 602,217 | |
| KBR, Inc. | 624,322 | 10,157,719 | |
| Keane Group, Inc. (a) | 127,298 | 1,648,509 | |
| Layne Christensen Co. (a)(b) | 82,090 | 881,647 | |
| MasTec, Inc. (a)(b) | 289,826 | 11,824,901 | |
| MYR Group, Inc. (b) | 77,211 | 1,992,816 | |
| Northwest Pipe Co. (a)(b) | 42,043 | 771,069 | |
| NV5 Holdings, Inc. (a)(b) | 35,335 | 1,704,914 | |
| Orion Group Holdings, Inc. (b) | 118,649 | 716,640 | |
| Primoris Services Corp. | 176,834 | 5,059,221 | |
| Sterling Construction Co., Inc. (b) | 109,184 | 1,286,188�� | |
| Tutor Perini Corp. (a)(b) | 176,871 | 4,625,177 | |
| Valmont Industries, Inc. | 102,456 | 14,707,559 | |
| 137,957,139 | |||
| Electrical Equipment - 0.6% | |||
| Allied Motion Technologies, Inc. | 28,596 | 723,193 | |
| American Electric Technologies, Inc. (b) | 11,601 | 17,982 | |
| American Superconductor Corp. (a)(b) | 66,860 | 259,417 | |
| AZZ, Inc. (a) | 113,590 | 5,554,551 | |
| Babcock & Wilcox Enterprises, Inc. (a)(b) | 206,668 | 467,070 | |
| Broadwind Energy, Inc. (b) | 61,516 | 210,385 | |
| Capstone Turbine Corp. (a)(b) | 61,006 | 39,105 | |
| Digital Power Corp. (a)(b) | 4,632 | 2,307 | |
| Encore Wire Corp. | 89,061 | 3,820,717 | |
| Energous Corp. (a)(b) | 80,549 | 764,410 | |
| Energy Focus, Inc. (a)(b) | 31,432 | 56,263 | |
| EnerSys | 196,436 | 12,591,548 | |
| Enphase Energy, Inc. (a)(b) | 219,384 | 201,833 | |
| EnSync, Inc. (a)(b) | 116,581 | 45,467 | |
| Espey Manufacturing & Electronics Corp. | 5,358 | 121,305 | |
| FuelCell Energy, Inc. (a)(b) | 207,717 | 319,884 | |
| Generac Holdings, Inc. (a)(b) | 277,773 | 11,216,474 | |
| General Cable Corp. | 226,028 | 3,831,175 | |
| Hubbell, Inc. Class B | 225,346 | 25,416,775 | |
| Ideal Power, Inc. (a)(b) | 18,012 | 43,769 | |
| LSI Industries, Inc. | 102,850 | 585,217 | |
| Ocean Power Technologies, Inc. (a)(b) | 5,215 | 6,362 | |
| Orion Energy Systems, Inc. (a)(b) | 83,634 | 77,069 | |
| Plug Power, Inc. (a)(b) | 1,337,613 | 2,862,492 | |
| Polar Power, Inc. (a) | 7,315 | 34,015 | |
| Powell Industries, Inc. | 39,054 | 1,111,867 | |
| Preformed Line Products Co. | 10,541 | 550,767 | |
| Real Goods Solar, Inc. (a)(b) | 43,365 | 34,042 | |
| Regal Beloit Corp. | 197,964 | 14,926,486 | |
| Revolution Lighting Technologies, Inc. (a)(b) | 38,380 | 284,396 | |
| Sensata Technologies Holding BV (a)(b) | 754,485 | 33,695,300 | |
| Sunrun, Inc. (a)(b) | 291,244 | 1,951,335 | |
| Sunworks, Inc. (a)(b) | 47,552 | 72,755 | |
| Thermon Group Holdings, Inc. (a)(b) | 144,076 | 2,380,136 | |
| TPI Composites, Inc. (b) | 67,536 | 1,373,682 | |
| Ultralife Corp. (b) | 43,594 | 283,361 | |
| Vicor Corp. (b) | 66,375 | 1,290,994 | |
| Vivint Solar, Inc. (a)(b) | 111,777 | 530,941 | |
| 127,754,847 | |||
| Industrial Conglomerates - 0.2% | |||
| Carlisle Companies, Inc. | 284,352 | 26,925,291 | |
| ITT, Inc. | 388,056 | 15,661,940 | |
| Raven Industries, Inc. | 161,156 | 4,512,368 | |
| 47,099,599 | |||
| Machinery - 3.7% | |||
| Actuant Corp. Class A (a) | 270,996 | 6,517,454 | |
| AGCO Corp. (a) | 291,318 | 19,940,717 | |
| Alamo Group, Inc. | 54,346 | 4,986,789 | |
| Albany International Corp. Class A (a) | 129,645 | 6,948,972 | |
| Allison Transmission Holdings, Inc. (a) | 667,252 | 23,173,662 | |
| Altra Industrial Motion Corp. | 139,829 | 6,439,125 | |
| American Railcar Industries, Inc. (a) | 34,464 | 1,240,704 | |
| ARC Group Worldwide, Inc. (b) | 25,827 | 63,276 | |
| Art's-Way Manufacturing Co., Inc. (b) | 9,831 | 20,645 | |
| Astec Industries, Inc. | 88,018 | 4,372,734 | |
| Barnes Group, Inc. | 219,896 | 13,747,898 | |
| Blue Bird Corp. (b) | 36,609 | 666,284 | |
| Briggs & Stratton Corp. | 195,366 | 4,090,964 | |
| Chart Industries, Inc. (b) | 134,764 | 4,546,937 | |
| Chicago Rivet & Machine Co. | 772 | 21,122 | |
| CIRCOR International, Inc. | 73,485 | 3,528,750 | |
| Colfax Corp. (b) | 436,120 | 17,392,466 | |
| Columbus McKinnon Corp. (NY Shares) | 93,121 | 3,075,787 | |
| Commercial Vehicle Group, Inc. (b) | 112,254 | 666,789 | |
| Crane Co. | 225,922 | 16,770,190 | |
| Dmc Global, Inc. | 55,020 | 712,509 | |
| Donaldson Co., Inc. (a) | 591,409 | 27,944,075 | |
| Douglas Dynamics, Inc. | 103,727 | 3,620,072 | |
| Eastern Co. (a) | 27,488 | 718,811 | |
| Energy Recovery, Inc. (a)(b) | 131,400 | 854,100 | |
| EnPro Industries, Inc. | 95,977 | 6,763,499 | |
| ESCO Technologies, Inc. (a) | 113,837 | 6,198,425 | |
| ExOne Co. (a)(b) | 41,005 | 331,730 | |
| Federal Signal Corp. | 258,672 | 4,834,580 | |
| Franklin Electric Co., Inc. | 171,998 | 6,630,523 | |
| FreightCar America, Inc. | 54,073 | 981,966 | |
| Gardner Denver Holdings, Inc. (a) | 190,573 | 4,476,560 | |
| Gencor Industries, Inc. (b) | 30,519 | 469,993 | |
| Global Brass & Copper Holdings, Inc. | 97,132 | 2,899,390 | |
| Gorman-Rupp Co. | 73,596 | 2,240,262 | |
| Graco, Inc. | 245,098 | 28,311,270 | |
| Graham Corp. | 37,894 | 759,017 | |
| Greenbrier Companies, Inc. (a) | 126,722 | 5,436,374 | |
| Hardinge, Inc. | 38,805 | 531,240 | |
| Harsco Corp. (b) | 358,982 | 6,138,592 | |
| Hillenbrand, Inc. | 279,706 | 9,999,490 | |
| Hurco Companies, Inc. | 24,930 | 876,290 | |
| Hyster-Yale Materials Handling Class A | 43,248 | 3,078,393 | |
| IDEX Corp. | 338,690 | 39,823,170 | |
| Jason Industries, Inc. (b) | 35,118 | 43,546 | |
| John Bean Technologies Corp. | 144,109 | 12,782,468 | |
| Kadant, Inc. | 49,681 | 4,314,795 | |
| Kennametal, Inc. (a) | 359,792 | 12,592,720 | |
| Key Technology, Inc. (b) | 12,346 | 184,449 | |
| L.B. Foster Co. Class A | 42,631 | 814,252 | |
| Lincoln Electric Holdings, Inc. | 270,985 | 23,532,337 | |
| Lindsay Corp. (a) | 47,752 | 4,133,891 | |
| LiqTech International, Inc. (b) | 90,569 | 35,322 | |
| Lydall, Inc. (b) | 75,237 | 3,536,139 | |
| Manitex International, Inc. (a)(b) | 52,326 | 480,353 | |
| Manitowoc Co., Inc. (a)(b) | 629,025 | 5,176,876 | |
| Meritor, Inc. (b) | 398,219 | 7,908,629 | |
| MFRI, Inc. (b) | 13,428 | 108,767 | |
| Middleby Corp. (a)(b) | 255,372 | 31,078,772 | |
| Milacron Holdings Corp. (b) | 193,671 | 3,089,052 | |
| Miller Industries, Inc. | 43,433 | 1,090,168 | |
| Mueller Industries, Inc. | 252,828 | 7,541,859 | |
| Mueller Water Products, Inc. Class A | 699,067 | 8,381,813 | |
| Navistar International Corp. New (a)(b) | 289,202 | 9,879,140 | |
| NN, Inc. | 117,774 | 3,003,237 | |
| Nordson Corp. | 236,872 | 25,890,110 | |
| Omega Flex, Inc. | 25,039 | 1,452,012 | |
| Oshkosh Corp. | 333,222 | 24,858,361 | |
| Park-Ohio Holdings Corp. | 37,253 | 1,484,532 | |
| ProPetro Holding Corp. (a) | 127,692 | 1,469,735 | |
| Proto Labs, Inc. (a)(b) | 107,285 | 7,703,063 | |
| RBC Bearings, Inc. (b) | 108,095 | 11,919,636 | |
| Rexnord Corp. (a)(b) | 464,832 | 11,100,188 | |
| Spartan Motors, Inc. | 147,713 | 1,358,960 | |
| SPX Corp. (b) | 185,849 | 4,478,961 | |
| SPX Flow, Inc. (b) | 185,763 | 6,217,488 | |
| Standex International Corp. | 55,773 | 5,323,533 | |
| Sun Hydraulics Corp. | 111,181 | 5,326,682 | |
| Supreme Industries, Inc. Class A | 55,775 | 1,167,929 | |
| Taylor Devices, Inc. (b) | 3,820 | 44,885 | |
| Tennant Co. | 79,161 | 4,824,863 | |
| Terex Corp. (a) | 394,514 | 15,208,515 | |
| The L.S. Starrett Co. Class A | 20,536 | 149,913 | |
| Timken Co. | 307,299 | 13,782,360 | |
| Titan International, Inc. | 216,636 | 1,858,737 | |
| Toro Co. | 472,830 | 29,164,154 | |
| TriMas Corp. (b) | 200,113 | 4,842,735 | |
| Trinity Industries, Inc. | 680,867 | 19,636,204 | |
| Twin Disc, Inc. (a)(b) | 35,431 | 615,082 | |
| Wabash National Corp. (a) | 259,988 | 5,464,948 | |
| WABCO Holdings, Inc. (b) | 223,311 | 32,071,926 | |
| Wabtec Corp. (a) | 381,016 | 26,888,299 | |
| Watts Water Technologies, Inc. Class A | 128,748 | 7,943,752 | |
| Woodward, Inc. | 251,943 | 17,688,918 | |
| WSI Industries, Inc. (a)(b) | 5,668 | 18,138 | |
| Xerium Technologies, Inc. (b) | 47,721 | 288,712 | |
| 732,793,512 | |||
| Marine - 0.1% | |||
| Genco Shipping & Trading Ltd. (a)(b) | 38,097 | 529,929 | |
| Kirby Corp. (a)(b) | 236,140 | 14,782,364 | |
| Matson, Inc. (a) | 198,804 | 5,129,143 | |
| Rand Logistics, Inc. (a)(b) | 41,510 | 11,602 | |
| 20,453,038 | |||
| Professional Services - 1.0% | |||
| Acacia Research Corp. (b) | 213,329 | 693,319 | |
| Advisory Board Co. (b) | 177,245 | 9,438,296 | |
| Barrett Business Services, Inc. | 30,306 | 1,563,183 | |
| BG Staffing, Inc. (a) | 29,747 | 481,009 | |
| CBIZ, Inc. (b) | 268,820 | 4,072,623 | |
| CDI Corp. (b) | 54,937 | 450,483 | |
| Cogint, Inc. (a)(b) | 168,940 | 827,806 | |
| CRA International, Inc. | 36,975 | 1,387,672 | |
| DLH Holdings Corp. (b) | 2,300 | 13,639 | |
| Dun & Bradstreet Corp. | 162,164 | 18,071,556 | |
| Exponent, Inc. | 117,241 | 7,984,112 | |
| Franklin Covey Co. (b) | 52,794 | 992,527 | |
| FTI Consulting, Inc. (a)(b) | 185,927 | 6,304,785 | |
| General Employment Enterprises, Inc. (a)(b) | 3,794 | 16,504 | |
| GP Strategies Corp. (b) | 68,198 | 1,950,463 | |
| Heidrick & Struggles International, Inc. | 82,403 | 1,503,855 | |
| Hill International, Inc. (b) | 149,735 | 711,241 | |
| Hudson Global, Inc. (b) | 74,637 | 109,716 | |
| Huron Consulting Group, Inc. (b) | 98,046 | 2,965,892 | |
| ICF International, Inc. (b) | 87,475 | 4,203,174 | |
| Insperity, Inc. | 83,293 | 6,688,428 | |
| Kelly Services, Inc. Class A (non-vtg.) | 143,305 | 3,099,687 | |
| Kforce, Inc. | 107,981 | 1,943,658 | |
| Korn/Ferry International | 251,900 | 8,393,308 | |
| Lightbridge Corp. (a)(b) | 12,874 | 13,775 | |
| Manpower, Inc. | 295,868 | 32,992,241 | |
| Marathon Patent Group, Inc. (a)(b) | 29,824 | 13,063 | |
| Mastech Digital, Inc. (b) | 3,140 | 28,574 | |
| MISTRAS Group, Inc. (b) | 76,579 | 1,448,109 | |
| Navigant Consulting, Inc. (b) | 207,969 | 3,188,165 | |
| On Assignment, Inc. (b) | 212,383 | 10,130,669 | |
| Pendrell Corp. (a)(b) | 74,270 | 503,551 | |
| RCM Technologies, Inc. (b) | 26,829 | 144,608 | |
| Resources Connection, Inc. | 147,742 | 1,883,711 | |
| RPX Corp. (b) | 214,024 | 2,795,153 | |
| Spherix, Inc. (a)(b) | 4,801 | 6,529 | |
| TransUnion Holding Co., Inc. (b) | 659,017 | 31,540,554 | |
| TriNet Group, Inc. (b) | 158,260 | 5,654,630 | |
| TrueBlue, Inc. (b) | 193,372 | 3,954,457 | |
| Volt Information Sciences, Inc. (a)(b) | 35,427 | 113,366 | |
| WageWorks, Inc. (a)(b) | 178,840 | 10,542,618 | |
| Willdan Group, Inc. (b) | 32,802 | 1,017,190 | |
| 189,837,899 | |||
| Road & Rail - 0.8% | |||
| AMERCO (a) | 24,227 | 9,041,759 | |
| ArcBest Corp. | 109,057 | 3,238,993 | |
| Avis Budget Group, Inc. (a)(b) | 375,306 | 13,597,336 | |
| Celadon Group, Inc. (a) | 115,770 | 578,850 | |
| Covenant Transport Group, Inc. Class A (b) | 52,825 | 1,268,328 | |
| Daseke, Inc. (a)(b) | 81,009 | 1,061,218 | |
| Genesee & Wyoming, Inc. Class A (a)(b) | 269,388 | 18,469,241 | |
| Heartland Express, Inc. (a) | 226,325 | 5,017,625 | |
| Knight Transportation, Inc. (a) | 294,681 | 11,507,293 | |
| Landstar System, Inc. | 182,950 | 17,078,383 | |
| Marten Transport Ltd. | 165,978 | 2,846,523 | |
| Old Dominion Freight Lines, Inc. | 305,942 | 30,563,606 | |
| P.A.M. Transportation Services, Inc. (b) | 12,026 | 237,634 | |
| Patriot Transportation Holding, Inc. (b) | 5,823 | 112,442 | |
| Roadrunner Transportation Systems, Inc. (b) | 119,733 | 894,406 | |
| Ryder System, Inc. | 237,682 | 18,444,123 | |
| Saia, Inc. (b) | 114,875 | 6,496,181 | |
| Schneider National, Inc. Class B (a) | 145,054 | 3,227,452 | |
| Swift Transporation Co. (a)(b) | 367,475 | 10,307,674 | |
| U.S.A. Truck, Inc. (b) | 31,657 | 352,976 | |
| Universal Logistics Holdings, Inc. | 36,649 | 608,373 | |
| Werner Enterprises, Inc. (a) | 192,509 | 6,372,048 | |
| YRC Worldwide, Inc. (b) | 143,374 | 1,919,778 | |
| 163,242,242 | |||
| Trading Companies & Distributors - 1.1% | |||
| AeroCentury Corp. (b) | 740 | 9,324 | |
| Air Lease Corp. Class A | 427,683 | 17,381,037 | |
| Aircastle Ltd. | 248,136 | 5,563,209 | |
| Applied Industrial Technologies, Inc. | 174,899 | 9,969,243 | |
| Beacon Roofing Supply, Inc. (a)(b) | 268,945 | 12,667,310 | |
| BlueLinx Corp. (b) | 7,336 | 71,599 | |
| BMC Stock Holdings, Inc. (b) | 269,547 | 5,471,804 | |
| CAI International, Inc. (b) | 69,862 | 2,165,023 | |
| DXP Enterprises, Inc. (b) | 67,444 | 1,827,058 | |
| EnviroStar, Inc. (a) | 8,419 | 278,248 | |
| GATX Corp. (a) | 173,209 | 10,493,001 | |
| General Finance Corp. (b) | 1,148 | 5,396 | |
| H&E Equipment Services, Inc. | 137,617 | 3,239,504 | |
| HD Supply Holdings, Inc. (b) | 888,452 | 29,585,452 | |
| Herc Holdings, Inc. (a)(b) | 111,403 | 4,703,435 | |
| Houston Wire & Cable Co. | 69,133 | 397,515 | |
| Huttig Building Products, Inc. (a)(b) | 74,305 | 423,539 | |
| Kaman Corp. (a) | 123,042 | 6,033,980 | |
| Lawson Products, Inc. (b) | 23,255 | 554,632 | |
| MRC Global, Inc. (a)(b) | 424,109 | 6,688,199 | |
| MSC Industrial Direct Co., Inc. Class A | 196,943 | 13,565,434 | |
| Neff Corp. (b) | 39,362 | 982,082 | |
| Nexeo Solutions, Inc. (b) | 267,934 | 1,921,087 | |
| Now, Inc. (a)(b) | 493,682 | 5,756,332 | |
| Rush Enterprises, Inc. Class A (b) | 159,993 | 6,558,113 | |
| SiteOne Landscape Supply, Inc. (a)(b) | 175,170 | 8,800,541 | |
| Textainer Group Holdings Ltd. (a) | 128,344 | 2,278,106 | |
| Titan Machinery, Inc. (a)(b) | 71,633 | 924,066 | |
| Transcat, Inc. (b) | 4,785 | 63,641 | |
| Triton International Ltd. | 145,243 | 5,362,372 | |
| Univar, Inc. (b) | 449,956 | 12,693,259 | |
| Veritiv Corp. (b) | 49,470 | 1,385,160 | |
| Watsco, Inc. (a) | 132,311 | 19,497,349 | |
| WESCO International, Inc. (a)(b) | 183,218 | 9,243,348 | |
| Willis Lease Finance Corp. (b) | 19,324 | 459,911 | |
| 207,019,309 | |||
| Transportation Infrastructure - 0.1% | |||
| Macquarie Infrastructure Co. LLC (a) | 336,449 | 25,058,722 | |
| SEACOR Marine Holdings, Inc. (a) | 70,798 | 906,922 | |
| 25,965,644 | |||
| TOTAL INDUSTRIALS | 2,617,118,567 | ||
| INFORMATION TECHNOLOGY - 18.0% | |||
| Communications Equipment - 1.6% | |||
| ADTRAN, Inc. | 213,624 | 4,721,090 | |
| Aerohive Networks, Inc. (a)(b) | 133,582 | 460,858 | |
| Applied Optoelectronics, Inc. (a)(b) | 76,484 | 4,521,734 | |
| Arista Networks, Inc. (a)(b) | 186,797 | 32,904,292 | |
| Arris International PLC (b) | 838,057 | 23,348,268 | |
| Aviat Networks, Inc. (b) | 18,281 | 282,990 | |
| Black Box Corp. | 75,745 | 227,235 | |
| Brocade Communications Systems, Inc. | 1,773,125 | 21,951,288 | |
| CalAmp Corp. (a)(b) | 157,687 | 2,923,517 | |
| Calix Networks, Inc. (b) | 185,025 | 906,623 | |
| Carvana Co. Class A (a) | 74,689 | 1,333,199 | |
| Ciena Corp. (a)(b) | 619,880 | 13,395,607 | |
| Clearfield, Inc. (a)(b) | 45,932 | 560,370 | |
| ClearOne, Inc. | 17,545 | 131,588 | |
| CommScope Holding Co., Inc. (a)(b) | 851,551 | 28,152,276 | |
| Communications Systems, Inc. | 9,294 | 33,551 | |
| Comtech Telecommunications Corp. | 104,409 | 2,043,284 | |
| Dasan Zhone Solutions, Inc. (b) | 16,898 | 110,851 | |
| Digi International, Inc. (b) | 109,744 | 1,009,645 | |
| EchoStar Holding Corp. Class A (b) | 217,069 | 13,089,261 | |
| EMCORE Corp. (b) | 119,065 | 1,083,492 | |
| Extreme Networks, Inc. (b) | 483,497 | 5,526,371 | |
| Finisar Corp. (b) | 493,602 | 11,920,488 | |
| Harmonic, Inc. (a)(b) | 354,615 | 1,152,499 | |
| Infinera Corp. (a)(b) | 641,831 | 5,429,890 | |
| InfoSonics Corp. (a)(b) | 41,938 | 16,230 | |
| InterDigital, Inc. | 156,562 | 11,170,699 | |
| KVH Industries, Inc. (b) | 54,401 | 641,932 | |
| Lantronix, Inc. (b) | 2,994 | 6,317 | |
| Lumentum Holdings, Inc. (a)(b) | 243,372 | 13,835,698 | |
| NETGEAR, Inc. (a)(b) | 146,517 | 7,032,816 | |
| NetScout Systems, Inc. (a)(b) | 418,975 | 13,721,431 | |
| Network-1 Security Solutions, Inc. | 45,735 | 173,793 | |
| Oclaro, Inc. (a)(b) | 574,765 | 4,833,774 | |
| Optical Cable Corp. (b) | 11,466 | 28,092 | |
| Palo Alto Networks, Inc. (b) | 406,134 | 53,889,920 | |
| Parkervision, Inc. (a)(b) | 61,776 | 118,610 | |
| PC-Tel, Inc. | 66,388 | 430,194 | |
| Plantronics, Inc. | 152,688 | 6,509,089 | |
| Relm Wireless Corp. | 69,394 | 270,637 | |
| Resonant, Inc. (a)(b) | 9,244 | 42,060 | |
| ShoreTel, Inc. (b) | 323,573 | 2,410,619 | |
| Sonus Networks, Inc. (a)(b) | 234,277 | 1,618,854 | |
| Technical Communications Corp. (a)(b) | 2,835 | 14,884 | |
| Tessco Technologies, Inc. | 22,372 | 293,073 | |
| Ubiquiti Networks, Inc. (a)(b) | 110,347 | 6,575,578 | |
| ViaSat, Inc. (a)(b) | 237,802 | 15,126,585 | |
| Viavi Solutions, Inc. (a)(b) | 994,806 | 9,987,852 | |
| Westell Technologies, Inc. Class A (b) | 37,506 | 107,642 | |
| xG Technology, Inc. (a)(b) | 3,477 | 6,363 | |
| 326,083,009 | |||
| Electronic Equipment & Components - 3.5% | |||
| ADDvantage Technologies Group, Inc. (a)(b) | 11,928 | 17,296 | |
| Akoustis Technologies, Inc. (a)(b) | 45,754 | 307,467 | |
| Anixter International, Inc. (b) | 125,022 | 9,226,624 | |
| Applied DNA Sciences, Inc. (a)(b) | 85,045 | 176,043 | |
| Arrow Electronics, Inc. (b) | 390,763 | 31,038,305 | |
| Avnet, Inc. | 556,888 | 21,479,170 | |
| AVX Corp. | 278,802 | 4,865,095 | |
| Badger Meter, Inc. | 128,072 | 5,878,505 | |
| Bel Fuse, Inc. Class B (non-vtg.) | 44,160 | 1,126,080 | |
| Belden, Inc. | 185,976 | 14,333,170 | |
| Benchmark Electronics, Inc. (b) | 225,726 | 7,336,095 | |
| Cardtronics PLC (b) | 198,745 | 5,163,395 | |
| CDW Corp. | 692,321 | 43,906,998 | |
| ClearSign Combustion Corp. (a)(b) | 63,125 | 192,531 | |
| Cognex Corp. | 383,092 | 41,745,535 | |
| Coherent, Inc. (a)(b) | 108,567 | 25,330,852 | |
| Control4 Corp. (a)(b) | 80,229 | 1,986,470 | |
| CTS Corp. | 140,891 | 3,170,048 | |
| CUI Global, Inc. (a)(b) | 87,433 | 338,366 | |
| Daktronics, Inc. (a) | 173,183 | 1,667,752 | |
| Data I/O Corp. (b) | 25,864 | 213,378 | |
| Dell Technologies, Inc. | 594,459 | 44,542,813 | |
| Digital Ally, Inc. (a)(b) | 15,000 | 42,750 | |
| Dolby Laboratories, Inc. Class A | 261,397 | 13,190,093 | |
| Dynasil Corp. of America (b) | 9,408 | 11,760 | |
| Echelon Corp. (b) | 10,844 | 50,208 | |
| Electro Scientific Industries, Inc. (b) | 156,262 | 1,925,148 | |
| eMagin Corp. (a)(b) | 60,537 | 130,155 | |
| ePlus, Inc. (b) | 59,953 | 5,018,066 | |
| Fabrinet (a)(b) | 169,751 | 6,593,129 | |
| FARO Technologies, Inc. (a)(b) | 72,512 | 2,498,038 | |
| Fitbit, Inc. (a)(b) | 653,267 | 3,939,200 | |
| Frequency Electronics, Inc. (b) | 18,354 | 146,465 | |
| Giga-Tronics, Inc. (b) | 16,884 | 10,173 | |
| I. D. Systems Inc. (b) | 43,008 | 272,671 | |
| Identiv, Inc. (a)(b) | 40,037 | 196,582 | |
| IEC Electronics Corp. (b) | 18,101 | 74,938 | |
| II-VI, Inc. (b) | 244,569 | 8,767,799 | |
| Image Sensing Systems, Inc. (b) | 9,763 | 30,265 | |
| Insight Enterprises, Inc. (b) | 156,429 | 6,269,674 | |
| Intellicheck, Inc. (a)(b) | 10,716 | 27,862 | |
| IntriCon Corp. (a)(b) | 8,644 | 72,610 | |
| IPG Photonics Corp. (a)(b) | 166,701 | 29,304,369 | |
| Iteris, Inc. (a)(b) | 124,948 | 802,166 | |
| Itron, Inc. (b) | 150,507 | 10,926,808 | |
| Jabil, Inc. | 811,458 | 25,439,208 | |
| KEMET Corp. (b) | 192,335 | 4,598,730 | |
| KEY Tronic Corp. (b) | 23,864 | 169,673 | |
| Keysight Technologies, Inc. (b) | 820,324 | 33,518,439 | |
| Kimball Electronics, Inc. (b) | 122,862 | 2,340,521 | |
| Knowles Corp. (a)(b) | 397,367 | 5,829,374 | |
| LGL Group, Inc. (b) | 3,009 | 15,617 | |
| LightPath Technologies, Inc. Class A (a)(b) | 76,597 | 199,918 | |
| Littelfuse, Inc. | 100,418 | 18,693,815 | |
| LRAD Corp. (b) | 77,211 | 132,031 | |
| Luna Innovations, Inc. (b) | 137,097 | 207,016 | |
| Maxwell Technologies, Inc. (b) | 125,294 | 697,888 | |
| Mesa Laboratories, Inc. | 15,120 | 2,064,938 | |
| Methode Electronics, Inc. Class A | 168,150 | 6,877,335 | |
| MicroVision, Inc. (a)(b) | 312,134 | 739,758 | |
| MTS Systems Corp. (a) | 73,708 | 3,567,467 | |
| Napco Security Technolgies, Inc. (b) | 36,465 | 286,250 | |
| National Instruments Corp. | 473,206 | 19,112,790 | |
| Neonode, Inc. (a)(b) | 121,979 | 153,694 | |
| NetList, Inc. (a)(b) | 140,493 | 98,345 | |
| Novanta, Inc. (b) | 137,094 | 5,360,375 | |
| OSI Systems, Inc. (b) | 81,512 | 6,770,387 | |
| Par Technology Corp. (b) | 27,309 | 293,572 | |
| Park Electrochemical Corp. | 84,819 | 1,540,313 | |
| PC Connection, Inc. | 76,692 | 1,956,413 | |
| PC Mall, Inc. (a)(b) | 33,187 | 436,409 | |
| Perceptron, Inc. (b) | 33,349 | 257,121 | |
| Plexus Corp. (b) | 155,046 | 8,074,796 | |
| RadiSys Corp. (b) | 140,804 | 221,062 | |
| Research Frontiers, Inc. (a)(b) | 71,977 | 84,933 | |
| RF Industries Ltd. | 13,982 | 25,168 | |
| Richardson Electronics Ltd. | 36,856 | 206,394 | |
| Rogers Corp. (b) | 80,748 | 9,572,675 | |
| Sanmina Corp. (b) | 333,975 | 12,507,364 | |
| ScanSource, Inc. (b) | 112,049 | 4,397,923 | |
| Sigmatron International, Inc. (b) | 11,463 | 96,518 | |
| Superconductor Technologies, Inc. (a)(b) | 28,777 | 28,489 | |
| SYNNEX Corp. | 128,283 | 15,343,930 | |
| Systemax, Inc. | 60,715 | 1,483,875 | |
| Tech Data Corp. (b) | 151,995 | 16,763,529 | |
| Trimble, Inc. (b) | 1,117,122 | 43,210,279 | |
| TTM Technologies, Inc. (a)(b) | 390,367 | 5,558,826 | |
| Uni-Pixel, Inc. (a)(b) | 176,104 | 19,389 | |
| Universal Display Corp. | 197,571 | 25,111,274 | |
| VeriFone Systems, Inc. (a)(b) | 501,200 | 9,908,724 | |
| Vishay Intertechnology, Inc. (a) | 622,274 | 11,014,250 | |
| Vishay Precision Group, Inc. (b) | 49,281 | 1,076,790 | |
| Wayside Technology Group, Inc. | 13,442 | 205,663 | |
| Wireless Telecom Group, Inc. (b) | 35,461 | 52,128 | |
| Zebra Technologies Corp. Class A (b) | 234,031 | 24,126,256 | |
| 684,790,549 | |||
| Internet Software & Services - 2.2% | |||
| 2U, Inc. (a)(b) | 189,911 | 9,514,541 | |
| Actua Corp. (b) | 161,479 | 2,066,931 | |
| Alarm.com Holdings, Inc. (a)(b) | 59,694 | 2,681,454 | |
| Amber Road, Inc. (b) | 59,273 | 477,740 | |
| Angie's List, Inc. (a)(b) | 154,180 | 1,874,829 | |
| AppFolio, Inc. (b) | 54,022 | 2,317,544 | |
| Apptio, Inc. Class A | 37,569 | 668,728 | |
| Autobytel, Inc. (b) | 47,015 | 341,329 | |
| Bankrate, Inc. (b) | 208,141 | 2,882,753 | |
| Bazaarvoice, Inc. (a)(b) | 361,054 | 1,715,007 | |
| Benefitfocus, Inc. (a)(b) | 64,424 | 1,987,480 | |
| BlackLine, Inc. (a) | 62,407 | 1,926,504 | |
| Blucora, Inc. (b) | 181,083 | 4,128,692 | |
| Box, Inc. Class A (a)(b) | 312,152 | 6,124,422 | |
| Bridgeline Digital, Inc. (a)(b) | 970 | 2,561 | |
| Brightcove, Inc. (b) | 145,383 | 1,024,950 | |
| BroadVision, Inc. (b) | 7,417 | 29,297 | |
| Carbonite, Inc. (a)(b) | 75,203 | 1,504,060 | |
| Care.com, Inc. (a)(b) | 70,954 | 1,062,181 | |
| ChannelAdvisor Corp. (b) | 104,787 | 1,215,529 | |
| Cloudera, Inc. (a) | 77,898 | 1,511,221 | |
| CommerceHub, Inc.: | |||
| Series A (a)(b) | 53,243 | 1,180,397 | |
| Series C (b) | 113,561 | 2,410,900 | |
| Cornerstone OnDemand, Inc. (a)(b) | 231,027 | 8,081,324 | |
| CoStar Group, Inc. (b) | 144,255 | 41,346,368 | |
| Coupa Software, Inc. (a) | 137,304 | 4,182,280 | |
| Determine, Inc. (a)(b) | 73,216 | 147,164 | |
| DHI Group, Inc. (b) | 207,864 | 405,335 | |
| eGain Communications Corp. (a)(b) | 49,320 | 83,844 | |
| Endurance International Group Holdings, Inc. (a)(b) | 301,288 | 2,319,918 | |
| Envestnet, Inc. (a)(b) | 200,566 | 8,915,159 | |
| Five9, Inc. (b) | 173,999 | 3,740,979 | |
| GlowPoint, Inc. (b) | 321,954 | 86,928 | |
| GoDaddy, Inc. (a)(b) | 200,065 | 8,966,913 | |
| Gogo, Inc. (a)(b) | 249,270 | 3,492,273 | |
| GrubHub, Inc. (a)(b) | 381,252 | 21,765,677 | |
| GTT Communications, Inc. (a)(b) | 117,419 | 3,728,053 | |
| Hortonworks, Inc. (b) | 191,509 | 3,253,738 | |
| IAC/InterActiveCorp (b) | 320,784 | 36,412,192 | |
| Instructure, Inc. (b) | 28,818 | 853,013 | |
| Internap Network Services Corp. (a)(b) | 217,848 | 973,781 | |
| Inuvo, Inc. (b) | 97,208 | 99,152 | |
| iPass, Inc. (b) | 412,177 | 230,819 | |
| Issuer Direct Corp. | 35,897 | 450,507 | |
| j2 Global, Inc. (a) | 210,591 | 15,853,290 | |
| Leaf Group Ltd. (b) | 42,441 | 301,331 | |
| Limelight Networks, Inc. (b) | 279,123 | 1,002,052 | |
| Liquidity Services, Inc. (b) | 96,138 | 547,987 | |
| LivePerson, Inc. (b) | 236,704 | 3,171,834 | |
| LogMeIn, Inc. | 232,572 | 26,606,237 | |
| Marchex, Inc. Class B (b) | 112,959 | 349,043 | |
| Marin Software, Inc. (b) | 77,141 | 88,712 | |
| Match Group, Inc. (a)(b) | 222,150 | 4,831,763 | |
| MaxPoint Interactive, Inc. (b) | 8,863 | 121,512 | |
| MeetMe, Inc. (a)(b) | 309,415 | 1,212,907 | |
| MINDBODY, Inc. (a)(b) | 137,891 | 3,261,122 | |
| MuleSoft, Inc. Class A (a) | 74,726 | 1,629,027 | |
| Net Element International, Inc. (a)(b) | 25,699 | 7,067 | |
| New Relic, Inc. (b) | 140,622 | 6,735,794 | |
| NIC, Inc. | 273,094 | 4,465,087 | |
| NumereX Corp. Class A (b) | 50,190 | 195,239 | |
| Nutanix, Inc. Class A (a) | 129,751 | 2,854,522 | |
| Okta, Inc. (a) | 65,157 | 1,758,587 | |
| Ominto, Inc. (a)(b) | 33,150 | 107,738 | |
| Onvia.com, Inc. (b) | 2,326 | 10,002 | |
| Pandora Media, Inc. (a)(b) | 1,083,008 | 9,151,418 | |
| Professional Diversity Network, Inc. (a)(b) | 5,792 | 26,585 | |
| Q2 Holdings, Inc. (b) | 120,373 | 4,887,144 | |
| QuinStreet, Inc. (b) | 158,196 | 846,349 | |
| Qumu Corp. (b) | 84,064 | 236,220 | |
| Quotient Technology, Inc. (a)(b) | 319,064 | 4,785,960 | |
| Reis, Inc. | 36,313 | 620,952 | |
| Remark Holdings, Inc. (a)(b) | 45,073 | 121,246 | |
| Rocket Fuel, Inc. (a)(b) | 143,044 | 370,484 | |
| SecureWorks Corp. (a)(b) | 52,243 | 534,446 | |
| Shutterstock, Inc. (a)(b) | 84,939 | 2,852,252 | |
| Spark Networks, Inc. (a)(b) | 80,921 | 101,151 | |
| SPS Commerce, Inc. (b) | 75,905 | 4,624,133 | |
| Stamps.com, Inc. (a)(b) | 69,417 | 13,276,001 | |
| Support.com, Inc. (b) | 55,905 | 131,936 | |
| Synacor, Inc. (a)(b) | 121,700 | 279,910 | |
| TechTarget, Inc. (b) | 66,813 | 664,121 | |
| The Trade Desk, Inc. (a) | 78,929 | 4,180,869 | |
| Travelzoo, Inc. (b) | 32,602 | 265,706 | |
| Tremor Video, Inc. (b) | 117,265 | 412,773 | |
| TrueCar, Inc. (a)(b) | 303,179 | 5,138,884 | |
| Twilio, Inc. Class A (a)(b) | 109,864 | 3,216,818 | |
| Twitter, Inc. (b) | 2,703,598 | 45,717,842 | |
| Veritone, Inc. (a) | 10,171 | 158,261 | |
| Web.com Group, Inc. (a)(b) | 229,327 | 5,801,973 | |
| WebMD Health Corp. (a)(b) | 164,590 | 10,935,360 | |
| XO Group, Inc. (b) | 113,629 | 2,115,772 | |
| Yelp, Inc. (a)(b) | 274,801 | 11,706,523 | |
| Yext, Inc. (a) | 66,767 | 868,639 | |
| YuMe, Inc. | 148,498 | 726,155 | |
| Zillow Group, Inc.: | |||
| Class A (b) | 235,990 | 9,420,721 | |
| Class C (a)(b) | 444,694 | 17,618,776 | |
| 435,090,700 | |||
| IT Services - 3.1% | |||
| Acxiom Corp. (a)(b) | 343,364 | 7,996,948 | |
| ALJ Regional Holdings, Inc. (a)(b) | 9,858 | 30,067 | |
| Amdocs Ltd. | 637,672 | 41,314,769 | |
| Black Knight Financial Services, Inc. Class A (a)(b) | 128,420 | 5,470,692 | |
| Blackhawk Network Holdings, Inc. (b) | 254,306 | 11,392,909 | |
| Booz Allen Hamilton Holding Corp. Class A | 655,949 | 22,374,420 | |
| Broadridge Financial Solutions, Inc. | 517,888 | 40,462,589 | |
| CACI International, Inc. Class A (a)(b) | 107,395 | 13,939,871 | |
| Cartesian, Inc. (b) | 2,929 | 1,451 | |
| Cass Information Systems, Inc. | 39,706 | 2,430,801 | |
| Computer Task Group, Inc. | 44,089 | 233,672 | |
| Conduent, Inc. | 785,465 | 12,968,027 | |
| Convergys Corp. (a) | 415,336 | 9,760,396 | |
| CoreLogic, Inc. (b) | 383,089 | 17,993,690 | |
| CSG Systems International, Inc. | 151,676 | 5,871,378 | |
| CSP, Inc. | 3,555 | 35,941 | |
| DST Systems, Inc. | 274,036 | 14,066,268 | |
| Edgewater Technology, Inc. (b) | 28,583 | 182,931 | |
| EPAM Systems, Inc. (b) | 205,054 | 16,677,042 | |
| Euronet Worldwide, Inc. (b) | 233,405 | 22,936,709 | |
| Everi Holdings, Inc. (b) | 288,895 | 2,227,380 | |
| EVERTEC, Inc. | 265,835 | 4,891,364 | |
| ExlService Holdings, Inc. (b) | 155,709 | 8,763,303 | |
| First Data Corp. Class A (b) | 869,387 | 16,005,415 | |
| FleetCor Technologies, Inc. (b) | 406,644 | 58,463,208 | |
| Forrester Research, Inc. | 46,079 | 1,877,719 | |
| Genpact Ltd. | 581,636 | 16,547,544 | |
| Hackett Group, Inc. | 109,633 | 1,497,587 | |
| Information Services Group, Inc. (b) | 108,930 | 408,488 | |
| Innodata, Inc. (b) | 58,124 | 90,092 | |
| Jack Henry & Associates, Inc. | 335,576 | 34,587,818 | |
| Leidos Holdings, Inc. | 635,298 | 37,050,579 | |
| ManTech International Corp. Class A | 116,151 | 4,671,593 | |
| Mattersight Corp. (a)(b) | 47,315 | 111,190 | |
| Maximus, Inc. | 289,307 | 17,584,079 | |
| ModusLink Global Solutions, Inc. (a)(b) | 128,863 | 206,181 | |
| MoneyGram International, Inc. (b) | 122,493 | 1,930,490 | |
| Perficient, Inc. (b) | 156,395 | 2,862,029 | |
| PFSweb, Inc. (b) | 60,946 | 480,254 | |
| Planet Payment, Inc. (b) | 177,497 | 702,888 | |
| Presidio, Inc. (a) | 103,875 | 1,444,901 | |
| PRG-Schultz International, Inc. (b) | 115,194 | 777,560 | |
| Sabre Corp. (a) | 914,345 | 16,860,522 | |
| Science Applications International Corp. | 196,197 | 14,495,034 | |
| ServiceSource International, Inc. (a)(b) | 263,840 | 928,717 | |
| Square, Inc. (a)(b) | 133,178 | 3,477,278 | |
| StarTek, Inc. (b) | 46,338 | 551,422 | |
| Sykes Enterprises, Inc. (b) | 182,449 | 4,864,090 | |
| Syntel, Inc. (a) | 129,694 | 2,342,274 | |
| Teletech Holdings, Inc. | 72,337 | 2,871,779 | |
| Teradata Corp. (a)(b) | 583,210 | 18,616,063 | |
| Travelport Worldwide Ltd. | 565,401 | 8,560,171 | |
| Unisys Corp. (a)(b) | 234,063 | 1,813,988 | |
| Vantiv, Inc. (a)(b) | 708,654 | 50,094,751 | |
| Virtusa Corp. (a)(b) | 123,714 | 4,493,292 | |
| WEX, Inc. (a)(b) | 171,294 | 18,695,027 | |
| WidePoint Corp. (a)(b) | 269,166 | 145,350 | |
| WPCS International, Inc. (b) | 40,159 | 48,191 | |
| 608,180,182 | |||
| Semiconductors & Semiconductor Equipment - 2.7% | |||
| Acacia Communications, Inc. (a)(b) | 61,999 | 3,027,411 | |
| Adesto Technologies Corp. (b) | 48,935 | 318,078 | |
| Advanced Energy Industries, Inc. (b) | 177,606 | 13,061,145 | |
| AEHR Test Systems (b) | 79,166 | 265,998 | |
| Alpha & Omega Semiconductor Ltd. (b) | 85,665 | 1,360,360 | |
| Amkor Technology, Inc. (b) | 574,885 | 5,047,490 | |
| Amtech Systems, Inc. (b) | 43,995 | 486,145 | |
| Axcelis Technologies, Inc. (b) | 130,729 | 2,732,236 | |
| AXT, Inc. (a)(b) | 166,392 | 1,297,858 | |
| Brooks Automation, Inc. | 309,179 | 8,060,297 | |
| Cabot Microelectronics Corp. | 110,101 | 7,885,434 | |
| Cavium, Inc. (a)(b) | 303,321 | 19,203,253 | |
| Ceva, Inc. (b) | 96,147 | 3,898,761 | |
| Cirrus Logic, Inc. (b) | 285,658 | 16,562,451 | |
| Cohu, Inc. | 116,622 | 2,187,829 | |
| Cree, Inc. (a)(b) | 430,758 | 10,480,342 | |
| CVD Equipment Corp. (a)(b) | 12,898 | 141,878 | |
| CyberOptics Corp. (a)(b) | 32,417 | 491,118 | |
| Cypress Semiconductor Corp. (a) | 1,440,585 | 19,721,609 | |
| Diodes, Inc. (b) | 175,145 | 4,928,580 | |
| DSP Group, Inc. (b) | 100,061 | 1,190,726 | |
| Entegris, Inc. (b) | 635,201 | 16,165,865 | |
| Experi Corp. | 219,637 | 5,985,108 | |
| First Solar, Inc. (a)(b) | 344,517 | 16,178,518 | |
| FormFactor, Inc. (b) | 312,733 | 4,722,268 | |
| GSI Technology, Inc. (a)(b) | 65,735 | 436,480 | |
| Ichor Holdings Ltd. | 77,562 | 1,774,619 | |
| Impinj, Inc. (a)(b) | 37,691 | 1,441,304 | |
| Inphi Corp. (a)(b) | 168,862 | 6,465,726 | |
| Integrated Device Technology, Inc. (a)(b) | 583,008 | 14,406,128 | |
| Intermolecular, Inc. (b) | 45,789 | 39,379 | |
| Intest Corp. (b) | 34,005 | 256,738 | |
| IXYS Corp. (b) | 117,193 | 2,695,439 | |
| Kopin Corp. (a)(b) | 265,387 | 1,066,856 | |
| Kulicke & Soffa Industries, Inc. (b) | 322,075 | 6,129,087 | |
| Lattice Semiconductor Corp. (b) | 557,001 | 3,147,056 | |
| M/A-COM Technology Solutions Holdings, Inc. (a)(b) | 153,866 | 7,007,058 | |
| Marvell Technology Group Ltd. | 1,931,431 | 34,591,929 | |
| Maxim Integrated Products, Inc. | 1,246,137 | 58,144,752 | |
| MaxLinear, Inc. Class A (b) | 227,130 | 4,906,008 | |
| Microsemi Corp. (b) | 512,536 | 25,821,564 | |
| MKS Instruments, Inc. | 239,191 | 19,697,379 | |
| Monolithic Power Systems, Inc. | 171,099 | 17,335,751 | |
| MoSys, Inc. (a)(b) | 16,576 | 16,079 | |
| Nanometrics, Inc. (b) | 114,026 | 2,940,731 | |
| NeoPhotonics Corp. (a)(b) | 134,183 | 784,971 | |
| NVE Corp. | 22,496 | 1,706,097 | |
| ON Semiconductor Corp. (b) | 1,844,767 | 31,508,620 | |
| PDF Solutions, Inc. (a)(b) | 125,323 | 1,903,656 | |
| Photronics, Inc. (b) | 325,040 | 2,567,816 | |
| Pixelworks, Inc. (a)(b) | 116,018 | 556,886 | |
| Power Integrations, Inc. | 133,482 | 9,724,164 | |
| QuickLogic Corp. (a)(b) | 369,431 | 495,038 | |
| Rambus, Inc. (a)(b) | 500,137 | 6,486,777 | |
| Rubicon Technology, Inc. (a)(b) | 8,619 | 70,590 | |
| Rudolph Technologies, Inc. (b) | 151,615 | 3,365,853 | |
| Semtech Corp. (b) | 301,972 | 11,354,147 | |
| Sigma Designs, Inc. (b) | 171,877 | 1,074,231 | |
| Silicon Laboratories, Inc. (b) | 185,999 | 14,117,324 | |
| SolarEdge Technologies, Inc. (a)(b) | 130,247 | 3,484,107 | |
| SunPower Corp. (a)(b) | 245,850 | 2,173,314 | |
| Synaptics, Inc. (a)(b) | 154,843 | 6,436,824 | |
| Teradyne, Inc. | 876,306 | 31,205,257 | |
| Ultra Clean Holdings, Inc. (b) | 144,924 | 3,343,397 | |
| Veeco Instruments, Inc. (b) | 215,377 | 4,070,625 | |
| Versum Materials, Inc. | 484,683 | 17,899,343 | |
| Xcerra Corp. (b) | 237,359 | 2,330,865 | |
| 530,380,723 | |||
| Software - 4.6% | |||
| 8x8, Inc. (b) | 423,901 | 5,998,199 | |
| A10 Networks, Inc. (b) | 208,779 | 1,367,502 | |
| ACI Worldwide, Inc. (a)(b) | 520,908 | 11,855,866 | |
| Agilysys, Inc. (b) | 51,105 | 525,870 | |
| American Software, Inc. Class A | 107,380 | 1,182,254 | |
| Aspen Technology, Inc. (b) | 328,414 | 20,772,186 | |
| Asure Software, Inc. (a)(b) | 45,600 | 528,048 | |
| Aware, Inc. (b) | 24,496 | 121,255 | |
| Barracuda Networks, Inc. (b) | 130,250 | 3,153,353 | |
| Blackbaud, Inc. | 210,879 | 17,800,296 | |
| Bottomline Technologies, Inc. (b) | 168,545 | 5,108,599 | |
| BroadSoft, Inc. (a)(b) | 135,708 | 6,724,331 | |
| BSQUARE Corp. (b) | 35,898 | 179,490 | |
| Cadence Design Systems, Inc. (b) | 1,227,809 | 48,240,616 | |
| Callidus Software, Inc. (b) | 289,709 | 7,460,007 | |
| CDK Global, Inc. | 633,979 | 40,891,646 | |
| CommVault Systems, Inc. (b) | 186,736 | 11,400,233 | |
| Datawatch Corp. (b) | 55,025 | 566,758 | |
| Digimarc Corp. (a)(b) | 49,238 | 1,521,454 | |
| Digital Turbine, Inc. (a)(b) | 162,229 | 188,186 | |
| Document Security Systems, Inc. (b) | 20,445 | 13,494 | |
| Ebix, Inc. | 94,982 | 5,480,461 | |
| Ellie Mae, Inc. (a)(b) | 151,578 | 12,577,942 | |
| Everbridge, Inc. (a) | 72,030 | 1,668,935 | |
| Evolving Systems, Inc. (b) | 27,515 | 130,696 | |
| Exa Corp. (b) | 47,934 | 687,853 | |
| Fair Isaac Corp. | 137,022 | 19,287,217 | |
| FalconStor Software, Inc. (a)(b) | 102,011 | 36,724 | |
| Finjan Holdings, Inc. (b) | 51,830 | 128,538 | |
| FireEye, Inc. (a)(b) | 707,444 | 10,448,948 | |
| Form Holdings Corp. (a)(b) | 94,034 | 114,721 | |
| Fortinet, Inc. (b) | 658,935 | 25,171,317 | |
| Gigamon, Inc. (b) | 141,252 | 6,066,773 | |
| Globalscape, Inc. | 29,423 | 107,100 | |
| Glu Mobile, Inc. (a)(b) | 469,639 | 1,709,486 | |
| GSE Systems, Inc. (b) | 33,148 | 92,814 | |
| Guidance Software, Inc. (b) | 114,811 | 812,862 | |
| Guidewire Software, Inc. (a)(b) | 329,936 | 24,979,455 | |
| HubSpot, Inc. (a)(b) | 142,387 | 10,444,086 | |
| Imperva, Inc. (b) | 129,369 | 5,776,326 | |
| Inseego Corp. (a) | 164,641 | 232,144 | |
| Majesco (b) | 52,545 | 259,047 | |
| MAM Software Group, Inc. (b) | 1,188 | 8,138 | |
| Manhattan Associates, Inc. (a)(b) | 309,249 | 13,003,920 | |
| MicroStrategy, Inc. Class A (b) | 41,918 | 5,407,422 | |
| Mitek Systems, Inc. (b) | 143,423 | 1,455,743 | |
| MobileIron, Inc. (a)(b) | 198,938 | 755,964 | |
| Model N, Inc. (b) | 101,356 | 1,373,374 | |
| Monotype Imaging Holdings, Inc. | 186,670 | 3,406,728 | |
| NetSol Technologies, Inc. (b) | 37,185 | 167,333 | |
| Nuance Communications, Inc. (b) | 1,132,716 | 18,202,746 | |
| NXT-ID, Inc. (a)(b) | 29,305 | 60,954 | |
| Parametric Technology Corp. (b) | 510,757 | 28,602,392 | |
| Park City Group, Inc. (a)(b) | 65,748 | 828,425 | |
| Paycom Software, Inc. (a)(b) | 176,592 | 13,175,529 | |
| Paylocity Holding Corp. (a)(b) | 108,535 | 5,333,410 | |
| Pegasystems, Inc. | 160,353 | 9,228,315 | |
| Polarityte, Inc. (a)(b) | 24,635 | 716,632 | |
| Progress Software Corp. | 222,520 | 7,472,222 | |
| Proofpoint, Inc. (a)(b) | 191,697 | 17,590,117 | |
| PROS Holdings, Inc. (a)(b) | 119,895 | 3,158,034 | |
| QAD, Inc.: | |||
| Class A | 27,311 | 920,381 | |
| Class B | 24,367 | 657,422 | |
| Qualys, Inc. (b) | 139,869 | 6,643,778 | |
| Rapid7, Inc. (b) | 73,979 | 1,247,286 | |
| RealNetworks, Inc. (b) | 91,284 | 364,223 | |
| RealPage, Inc. (a)(b) | 247,426 | 10,664,061 | |
| RingCentral, Inc. (b) | 284,098 | 12,031,550 | |
| Rosetta Stone, Inc. (b) | 76,625 | 704,950 | |
| SeaChange International, Inc. (b) | 126,310 | 329,669 | |
| ServiceNow, Inc. (b) | 751,028 | 87,261,943 | |
| Silver Spring Networks, Inc. (a)(b) | 187,413 | 2,372,649 | |
| SITO Mobile Ltd. (a)(b) | 75,644 | 323,756 | |
| Smith Micro Software, Inc. (a)(b) | 33,232 | 36,223 | |
| Sonic Foundry, Inc. (a)(b) | 57,013 | 194,414 | |
| Splunk, Inc. (a)(b) | 613,720 | 41,174,475 | |
| SS&C Technologies Holdings, Inc. | 760,818 | 29,451,265 | |
| Synchronoss Technologies, Inc.(b) | 187,568 | 3,149,267 | |
| Tableau Software, Inc. (a)(b) | 267,425 | 19,382,964 | |
| Take-Two Interactive Software, Inc. (a)(b) | 459,661 | 44,950,249 | |
| TeleNav, Inc. (b) | 140,738 | 914,797 | |
| The Rubicon Project, Inc. (b) | 165,320 | 621,603 | |
| TiVo Corp. | 536,011 | 9,809,001 | |
| Tyler Technologies, Inc. (a)(b) | 149,804 | 25,886,131 | |
| Ultimate Software Group, Inc. (a)(b) | 130,984 | 26,314,686 | |
| Upland Software, Inc. (b) | 49,341 | 1,134,843 | |
| Varonis Systems, Inc. (b) | 73,015 | 2,832,982 | |
| Vasco Data Security International, Inc. (b) | 142,853 | 1,792,805 | |
| Verint Systems, Inc. (b) | 279,739 | 11,105,638 | |
| VirnetX Holding Corp. (a)(b) | 208,849 | 835,396 | |
| VMware, Inc. Class A (a)(b) | 303,761 | 32,836,564 | |
| Workday, Inc. Class A (a)(b) | 578,157 | 63,418,041 | |
| Workiva, Inc. (b) | 93,631 | 1,891,346 | |
| Zedge, Inc. (b) | 23,011 | 41,420 | |
| Zendesk, Inc. (a)(b) | 352,425 | 9,656,445 | |
| Zix Corp. (b) | 279,934 | 1,486,450 | |
| Zynga, Inc. (b) | 3,445,768 | 12,921,630 | |
| 907,120,789 | |||
| Technology Hardware, Storage & Peripherals - 0.3% | |||
| 3D Systems Corp. (a)(b) | 483,680 | 6,075,021 | |
| Astro-Med, Inc. | 83,410 | 1,134,376 | |
| Avid Technology, Inc. (a)(b) | 153,041 | 674,911 | |
| Concurrent Computer Corp. | 30,661 | 193,778 | |
| CPI Card Group (a) | 72,158 | 69,293 | |
| Cray, Inc. (b) | 180,540 | 3,403,179 | |
| Diebold Nixdorf, Inc. (a) | 341,292 | 6,979,421 | |
| Eastman Kodak Co. (a)(b) | 162,328 | 1,258,042 | |
| Electronics for Imaging, Inc. (a)(b) | 209,195 | 7,438,974 | |
| Everspin Technologies, Inc. (a) | 23,347 | 380,556 | |
| Immersion Corp. (a)(b) | 128,551 | 940,993 | |
| Intevac, Inc. (b) | 82,658 | 752,188 | |
| ITUS Corp. (a)(b) | 34,351 | 23,050 | |
| NCR Corp. (a)(b) | 536,008 | 19,580,372 | |
| Pure Storage, Inc. Class A (a)(b) | 415,583 | 6,188,031 | |
| Qualstar Corp. (a)(b) | 11,989 | 84,043 | |
| Quantum Corp. (a)(b) | 142,708 | 786,321 | |
| Super Micro Computer, Inc. (a)(b) | 168,100 | 4,475,663 | |
| Transact Technologies, Inc. | 28,331 | 276,227 | |
| U.S.A. Technologies, Inc. (a)(b) | 214,765 | 1,170,469 | |
| Xplore Technologies Corp. (a)(b) | 14,878 | 47,163 | |
| 61,932,071 | |||
| TOTAL INFORMATION TECHNOLOGY | 3,553,578,023 | ||
| MATERIALS - 5.3% | |||
| Chemicals - 2.6% | |||
| A. Schulman, Inc. | 132,201 | 4,018,910 | |
| Advanced Emissions Solutions, Inc. (a) | 87,173 | 904,856 | |
| AdvanSix, Inc. | 131,973 | 4,213,898 | |
| AgroFresh Solutions, Inc. (a)(b) | 117,138 | 834,023 | |
| American Vanguard Corp. | 114,501 | 2,318,645 | |
| Ashland Global Holdings, Inc. | 273,622 | 16,978,245 | |
| Axalta Coating Systems (a)(b) | 963,156 | 28,432,365 | |
| Balchem Corp. | 143,958 | 10,791,092 | |
| BioAmber, Inc. (a)(b) | 93,053 | 40,664 | |
| Cabot Corp. | 283,446 | 14,931,935 | |
| Calgon Carbon Corp. | 227,771 | 2,778,806 | |
| Celanese Corp. Class A | 614,289 | 59,598,319 | |
| Chase Corp. | 32,113 | 3,002,566 | |
| Codexis, Inc. (b) | 156,032 | 865,978 | |
| Core Molding Technologies, Inc. (a) | 30,292 | 623,106 | |
| Ferro Corp. (b) | 370,398 | 7,137,569 | |
| Flotek Industries, Inc. (a)(b) | 235,242 | 1,218,554 | |
| FutureFuel Corp. | 99,234 | 1,337,674 | |
| H.B. Fuller Co. | 231,320 | 11,609,951 | |
| Hawkins, Inc. | 43,846 | 1,563,110 | |
| Huntsman Corp. | 880,465 | 23,393,955 | |
| Ingevity Corp. (b) | 185,743 | 11,696,237 | |
| Innophos Holdings, Inc. | 85,582 | 3,907,674 | |
| Innospec, Inc. | 107,399 | 5,960,645 | |
| Intrepid Potash, Inc. (a)(b) | 459,412 | 1,704,419 | |
| KMG Chemicals, Inc. | 32,018 | 1,537,504 | |
| Koppers Holdings, Inc. (b) | 93,218 | 3,654,146 | |
| Kraton Performance Polymers, Inc. (b) | 136,037 | 4,466,095 | |
| Kronos Worldwide, Inc. | 100,083 | 2,094,737 | |
| LSB Industries, Inc. (a)(b) | 92,483 | 564,146 | |
| MagneGas Corp. (b) | 12,080 | 6,282 | |
| Marrone Bio Innovations, Inc. (a)(b) | 53,732 | 63,941 | |
| Minerals Technologies, Inc. | 157,600 | 10,086,400 | |
| NewMarket Corp. | 41,406 | 17,328,825 | |
| Northern Technologies International Corp. (b) | 5,288 | 93,069 | |
| Olin Corp. | 734,298 | 23,666,425 | |
| OMNOVA Solutions, Inc. (b) | 176,347 | 1,534,219 | |
| Platform Specialty Products Corp. (a)(b) | 977,138 | 11,412,972 | |
| PolyOne Corp. | 364,913 | 13,187,956 | |
| Quaker Chemical Corp. | 58,562 | 8,153,002 | |
| Rayonier Advanced Materials, Inc. (a) | 193,665 | 2,657,084 | |
| RPM International, Inc. (a) | 591,653 | 28,973,247 | |
| Senomyx, Inc. (a)(b) | 176,669 | 106,902 | |
| Sensient Technologies Corp. | 200,422 | 14,460,447 | |
| Stepan Co. | 85,046 | 6,579,159 | |
| The Chemours Co. LLC | 816,567 | 40,068,943 | |
| The Scotts Miracle-Gro Co. Class A | 195,569 | 18,694,441 | |
| TOR Minerals International, Inc. (b) | 3,831 | 27,966 | |
| Trecora Resources (a)(b) | 74,645 | 906,937 | |
| Tredegar Corp. | 113,023 | 1,842,275 | |
| Trinseo SA | 193,228 | 12,926,953 | |
| Tronox Ltd. Class A (a) | 292,413 | 6,050,025 | |
| Valhi, Inc. | 74,540 | 162,497 | |
| Valvoline, Inc. | 911,442 | 19,404,600 | |
| W.R. Grace & Co. | 302,649 | 21,633,351 | |
| Westlake Chemical Corp. | 166,218 | 12,783,826 | |
| Yield10 Bioscience, Inc. (a)(b) | 2,061 | 5,544 | |
| 504,997,112 | |||
| Construction Materials - 0.2% | |||
| Eagle Materials, Inc. | 216,042 | 21,010,085 | |
| Forterra, Inc. (a) | 88,632 | 294,258 | |
| Foundation Building Materials, Inc. (a) | 60,974 | 796,320 | |
| Summit Materials, Inc. (a) | 476,064 | 14,062,931 | |
| Tecnoglass, Inc. (a) | 22,937 | 154,825 | |
| U.S. Concrete, Inc. (a)(b) | 66,707 | 5,339,895 | |
| United States Lime & Minerals, Inc. | 8,034 | 642,318 | |
| 42,300,632 | |||
| Containers & Packaging - 0.9% | |||
| Aptargroup, Inc. | 273,548 | 22,871,348 | |
| Bemis Co., Inc. | 405,093 | 17,261,013 | |
| Berry Global Group, Inc. (b) | 567,991 | 31,943,814 | |
| Crown Holdings, Inc. (b) | 590,501 | 34,857,274 | |
| Graphic Packaging Holding Co. | 1,378,331 | 17,987,220 | |
| Greif, Inc.: | |||
| Class A | 148,281 | 8,963,586 | |
| Class B | 6,493 | 410,033 | |
| Myers Industries, Inc. | 100,702 | 1,893,198 | |
| Owens-Illinois, Inc. (b) | 713,511 | 17,580,911 | |
| Silgan Holdings, Inc. | 342,970 | 10,319,967 | |
| Sonoco Products Co. | 440,287 | 21,248,251 | |
| UFP Technologies, Inc. (b) | 22,606 | 601,320 | |
| 185,937,935 | |||
| Metals & Mining - 1.3% | |||
| AK Steel Holding Corp. (a)(b) | 1,383,470 | 7,747,432 | |
| Alcoa Corp. | 652,326 | 28,624,065 | |
| Allegheny Technologies, Inc. (a) | 489,192 | 10,189,869 | |
| Ampco-Pittsburgh Corp. | 39,547 | 609,024 | |
| Atkore International Group, Inc. (b) | 96,317 | 1,604,641 | |
| Carpenter Technology Corp. | 204,311 | 8,280,725 | |
| Century Aluminum Co. (a)(b) | 216,529 | 4,226,646 | |
| Cliffs Natural Resources, Inc. (a)(b) | 1,203,173 | 10,058,526 | |
| Coeur d'Alene Mines Corp. (b) | 825,703 | 7,224,901 | |
| Commercial Metals Co. (a) | 501,945 | 9,481,741 | |
| Compass Minerals International, Inc. (a) | 150,364 | 10,044,315 | |
| Comstock Mining, Inc. (a)(b) | 223,980 | 41,638 | |
| Friedman Industries | 19,700 | 111,699 | |
| General Moly, Inc. (b) | 202,841 | 88,540 | |
| Gold Resource Corp. | 259,015 | 1,033,470 | |
| Golden Minerals Co. (a)(b) | 165,129 | 89,665 | |
| Handy & Harman Ltd. (b) | 25,445 | 832,052 | |
| Haynes International, Inc. | 55,379 | 1,691,828 | |
| Hecla Mining Co. | 1,823,688 | 9,629,073 | |
| Kaiser Aluminum Corp. (a) | 78,085 | 7,521,147 | |
| Materion Corp. | 94,585 | 3,613,147 | |
| McEwen Mining, Inc. (a) | 1,050,768 | 2,700,474 | |
| Olympic Steel, Inc. | 41,963 | 765,825 | |
| Paramount Gold Nevada Corp. (b) | 22,744 | 34,798 | |
| Pershing Gold Corp. (a)(b) | 69,048 | 209,215 | |
| Real Industries, Inc. (a)(b) | 102,876 | 174,889 | |
| Reliance Steel & Aluminum Co. | 319,915 | 23,168,244 | |
| Royal Gold, Inc. | 289,569 | 27,010,996 | |
| Ryerson Holding Corp. (b) | 62,218 | 535,075 | |
| Schnitzer Steel Industries, Inc. Class A | 119,830 | 3,223,427 | |
| Solitario Exploration & Royalty Corp. (b) | 57,827 | 40,479 | |
| Steel Dynamics, Inc. | 1,069,983 | 36,860,914 | |
| SunCoke Energy, Inc. (a)(b) | 276,143 | 2,573,653 | |
| Synalloy Corp. (b) | 24,589 | 279,085 | |
| TimkenSteel Corp. (a)(b) | 164,765 | 2,443,465 | |
| U.S. Antimony Corp. (a)(b) | 114,807 | 36,738 | |
| U.S. Gold Corp. (b) | 328 | 794 | |
| United States Steel Corp. (a) | 767,690 | 20,428,231 | |
| Universal Stainless & Alloy Products, Inc. (b) | 23,505 | 426,146 | |
| Worthington Industries, Inc. | 199,405 | 9,962,274 | |
| 253,618,866 | |||
| Paper & Forest Products - 0.3% | |||
| Boise Cascade Co. (b) | 171,188 | 5,135,640 | |
| Clearwater Paper Corp. (b) | 75,015 | 3,488,198 | |
| Deltic Timber Corp. | 49,917 | 3,895,523 | |
| Domtar Corp. (a) | 277,198 | 11,209,887 | |
| Kapstone Paper & Packaging Corp. | 391,172 | 8,750,518 | |
| Louisiana-Pacific Corp. (b) | 633,416 | 16,139,440 | |
| Mercer International, Inc. (SBI) | 191,792 | 2,119,302 | |
| Neenah Paper, Inc. (a) | 76,486 | 5,908,544 | |
| P.H. Glatfelter Co. | 196,344 | 3,400,678 | |
| Rentech, Inc. (a)(b) | 91,963 | 24,462 | |
| Resolute Forest Products (a)(b) | 383,964 | 1,900,622 | |
| Schweitzer-Mauduit International, Inc. | 146,944 | 5,573,586 | |
| Verso Corp. (a) | 157,433 | 837,544 | |
| 68,383,944 | |||
| TOTAL MATERIALS | 1,055,238,489 | ||
| REAL ESTATE - 9.0% | |||
| Equity Real Estate Investment Trusts (REITs) - 8.5% | |||
| Acadia Realty Trust (SBI) | 391,126 | 11,221,405 | |
| Agree Realty Corp. | 125,445 | 6,287,303 | |
| Alexanders, Inc. | 15,826 | 6,626,188 | |
| Altisource Residential Corp. Class B | 242,358 | 2,934,955 | |
| American Assets Trust, Inc. | 183,522 | 7,454,664 | |
| American Campus Communities, Inc. | 594,453 | 28,290,018 | |
| American Homes 4 Rent Class A | 1,034,024 | 22,913,972 | |
| Apple Hospitality (REIT), Inc. | 712,626 | 12,955,541 | |
| Armada Hoffler Properties, Inc. | 191,551 | 2,561,037 | |
| Ashford Hospitality Prime, Inc. | 140,879 | 1,355,256 | |
| Ashford Hospitality Trust, Inc. | 366,389 | 2,275,276 | |
| Bluerock Residential Growth (REIT), Inc. | 99,613 | 1,009,080 | |
| Brandywine Realty Trust (SBI) | 758,602 | 13,032,782 | |
| Brixmor Property Group, Inc. | 1,178,031 | 22,052,740 | |
| BRT Realty Trust (b) | 19,147 | 148,964 | |
| Camden Property Trust (SBI) | 384,233 | 34,381,169 | |
| CareTrust (REIT), Inc. | 315,696 | 6,089,776 | |
| CatchMark Timber Trust, Inc. | 177,492 | 2,046,483 | |
| CBL & Associates Properties, Inc. (a) | 749,524 | 5,996,192 | |
| Cedar Realty Trust, Inc. | 355,338 | 1,790,904 | |
| Chatham Lodging Trust | 168,993 | 3,427,178 | |
| Chesapeake Lodging Trust | 260,111 | 6,656,240 | |
| City Office REIT, Inc. | 101,821 | 1,302,291 | |
| Clipper Realty, Inc. (a) | 27,161 | 303,117 | |
| Colony NorthStar, Inc. (a) | 2,427,296 | 31,821,851 | |
| Columbia Property Trust, Inc. | 545,795 | 11,461,695 | |
| Communications Sales & Leasing, Inc. (a) | 704,481 | 13,568,304 | |
| Community Healthcare Trust, Inc. | 76,659 | 2,036,063 | |
| Condor Hospitality Trust, Inc. | 253 | 2,646 | |
| CorEnergy Infrastructure Trust, Inc. (a) | 54,615 | 1,782,087 | |
| CoreSite Realty Corp. | 150,575 | 17,882,287 | |
| Corporate Office Properties Trust (SBI) | 439,692 | 14,668,125 | |
| Corrections Corp. of America | 531,278 | 14,238,250 | |
| Cousins Properties, Inc. | 1,822,997 | 17,045,022 | |
| CubeSmart | 796,149 | 19,625,073 | |
| CyrusOne, Inc. | 345,852 | 21,799,052 | |
| DCT Industrial Trust, Inc. | 404,747 | 23,616,987 | |
| DDR Corp. | 1,391,721 | 13,471,859 | |
| DiamondRock Hospitality Co. | 896,182 | 9,849,040 | |
| Douglas Emmett, Inc. | 681,777 | 26,562,032 | |
| DuPont Fabros Technology, Inc. | 342,762 | 22,060,162 | |
| Easterly Government Properties, Inc. (a) | 124,324 | 2,493,939 | |
| EastGroup Properties, Inc. | 149,558 | 13,289,724 | |
| Education Realty Trust, Inc. (a) | 331,935 | 12,825,968 | |
| Empire State Realty Trust, Inc. | 572,025 | 11,640,709 | |
| EPR Properties | 280,442 | 19,535,590 | |
| Equity Commonwealth (a)(b) | 548,023 | 16,955,832 | |
| Equity Lifestyle Properties, Inc. | 356,301 | 31,764,234 | |
| Farmland Partners, Inc. (a) | 138,179 | 1,224,266 | |
| FelCor Lodging Trust, Inc. | 563,668 | 4,114,776 | |
| First Industrial Realty Trust, Inc. | 507,383 | 15,718,725 | |
| First Potomac Realty Trust | 260,221 | 2,896,260 | |
| Forest City Realty Trust, Inc. Class A | 967,865 | 23,190,045 | |
| Four Corners Property Trust, Inc. | 285,265 | 7,248,584 | |
| Franklin Street Properties Corp. | 501,603 | 5,000,982 | |
| Gaming & Leisure Properties | 852,335 | 33,403,009 | |
| Getty Realty Corp. | 140,686 | 3,877,306 | |
| Gladstone Commercial Corp. | 120,539 | 2,579,535 | |
| Gladstone Land Corp. (a) | 66,704 | 928,520 | |
| Global Net Lease, Inc. | 250,338 | 5,422,321 | |
| Global Self Storage, Inc. | 70,475 | 339,690 | |
| Government Properties Income Trust | 420,461 | 7,799,552 | |
| Gramercy Property Trust (a) | 670,405 | 20,420,536 | |
| Healthcare Realty Trust, Inc. | 545,003 | 18,137,700 | |
| Healthcare Trust of America, Inc. | 840,949 | 26,128,285 | |
| Hersha Hospitality Trust (a) | 184,853 | 3,427,175 | |
| Highwoods Properties, Inc. (SBI) | 447,760 | 23,386,505 | |
| Hospitality Properties Trust (SBI) | 740,484 | 20,259,642 | |
| Hudson Pacific Properties, Inc. | 701,418 | 23,146,794 | |
| Independence Realty Trust, Inc. | 249,560 | 2,567,972 | |
| InfraReit, Inc. | 163,697 | 3,681,546 | |
| Investors Real Estate Trust | 543,680 | 3,414,310 | |
| Invitation Homes, Inc. | 336,816 | 7,793,922 | |
| iStar Financial, Inc. (a)(b) | 324,915 | 3,772,263 | |
| JBG SMITH Properties | 381,771 | 12,495,365 | |
| Jernigan Capital, Inc. (a) | 56,379 | 1,096,008 | |
| Kilroy Realty Corp. | 434,125 | 30,054,474 | |
| Kite Realty Group Trust | 368,788 | 7,420,015 | |
| Lamar Advertising Co. Class A (a) | 369,898 | 24,620,411 | |
| LaSalle Hotel Properties (SBI) | 502,397 | 14,258,027 | |
| Lexington Corporate Properties Trust | 992,662 | 9,787,647 | |
| Liberty Property Trust (SBI) | 646,272 | 27,531,187 | |
| Life Storage, Inc. (a) | 203,317 | 14,962,098 | |
| LTC Properties, Inc. | 177,746 | 8,643,788 | |
| Mack-Cali Realty Corp. | 396,996 | 9,087,238 | |
| MedEquities Realty Trust, Inc. | 126,218 | 1,447,720 | |
| Medical Properties Trust, Inc. | 1,644,179 | 21,637,396 | |
| Monmouth Real Estate Investment Corp. Class A | 324,781 | 5,277,691 | |
| Monogram Residential Trust, Inc. | 731,984 | 8,783,808 | |
| National Health Investors, Inc. | 182,751 | 14,652,975 | |
| National Retail Properties, Inc. | 671,278 | 28,079,559 | |
| National Storage Affiliates Trust | 193,790 | 4,325,393 | |
| New Senior Investment Group, Inc. | 367,840 | 3,395,163 | |
| NexPoint Residential Trust, Inc. | 89,410 | 2,083,253 | |
| NorthStar Realty Europe Corp. | 240,392 | 2,988,073 | |
| Omega Healthcare Investors, Inc. (a) | 864,330 | 27,546,197 | |
| One Liberty Properties, Inc. | 69,690 | 1,673,257 | |
| Outfront Media, Inc. | 624,123 | 13,730,706 | |
| Paramount Group, Inc. | 808,735 | 12,761,838 | |
| Parkway, Inc. | 194,212 | 4,459,108 | |
| Pebblebrook Hotel Trust (a) | 308,222 | 10,353,177 | |
| Pennsylvania Real Estate Investment Trust (SBI) | 334,752 | 3,357,563 | |
| Physicians Realty Trust | 777,865 | 14,569,411 | |
| Piedmont Office Realty Trust, Inc. Class A | 659,484 | 13,354,551 | |
| Potlatch Corp. | 180,721 | 8,638,464 | |
| Power (REIT) (b) | 1,227 | 7,816 | |
| Preferred Apartment Communities, Inc. Class A | 147,693 | 2,686,536 | |
| PS Business Parks, Inc. | 87,887 | 11,874,413 | |
| QTS Realty Trust, Inc. Class A | 207,725 | 11,254,541 | |
| Quality Care Properties, Inc. | 407,304 | 5,588,211 | |
| RAIT Financial Trust | 372,193 | 307,878 | |
| Ramco-Gershenson Properties Trust (SBI) | 344,393 | 4,528,768 | |
| Rayonier, Inc. | 578,969 | 16,795,891 | |
| Retail Opportunity Investments Corp. | 501,177 | 9,943,352 | |
| Retail Properties America, Inc. | 1,050,675 | 14,005,498 | |
| Rexford Industrial Realty, Inc. | 313,382 | 9,417,129 | |
| RLJ Lodging Trust | 543,263 | 10,963,047 | |
| Ryman Hospitality Properties, Inc. | 226,971 | 13,486,617 | |
| Sabra Health Care REIT, Inc. (a) | 709,009 | 15,491,847 | |
| Saul Centers, Inc. | 55,021 | 3,334,273 | |
| Select Income REIT | 294,883 | 6,844,234 | |
| Senior Housing Properties Trust (SBI) | 1,056,031 | 20,824,931 | |
| Seritage Growth Properties (a) | 109,515 | 5,263,291 | |
| Sotherly Hotels, Inc. | 42,144 | 255,393 | |
| Spirit Realty Capital, Inc. | 2,148,486 | 18,691,828 | |
| Stag Industrial, Inc. | 386,136 | 10,807,947 | |
| Starwood Waypoint Homes (a) | 544,578 | 20,274,639 | |
| Store Capital Corp. (a) | 741,559 | 18,820,767 | |
| Summit Hotel Properties, Inc. | 470,212 | 6,977,946 | |
| Sun Communities, Inc. | 312,268 | 28,200,923 | |
| Sunstone Hotel Investors, Inc. | 985,377 | 15,568,957 | |
| Tanger Factory Outlet Centers, Inc. (a) | 419,841 | 9,824,279 | |
| Taubman Centers, Inc. | 268,239 | 14,012,805 | |
| Terreno Realty Corp. | 217,476 | 7,883,505 | |
| The GEO Group, Inc. (a) | 554,059 | 15,314,191 | |
| TIER REIT, Inc. | 211,369 | 3,891,303 | |
| UMH Properties, Inc. | 127,493 | 2,016,939 | |
| Universal Health Realty Income Trust (SBI) | 72,078 | 5,457,025 | |
| Urban Edge Properties | 461,372 | 11,603,506 | |
| Urstadt Biddle Properties, Inc. Class A | 138,313 | 2,860,313 | |
| VEREIT, Inc. | 4,330,126 | 36,546,263 | |
| Washington REIT (SBI) | 340,901 | 11,202,007 | |
| Weingarten Realty Investors (SBI) | 535,524 | 17,158,189 | |
| Wheeler REIT, Inc. (a) | 34,375 | 360,250 | |
| Whitestone REIT Class B | 165,726 | 2,078,204 | |
| WP Carey, Inc. | 467,339 | 32,176,290 | |
| WP Glimcher, Inc. | 812,804 | 6,786,913 | |
| Xenia Hotels & Resorts, Inc. | 466,605 | 9,313,436 | |
| 1,676,762,935 | |||
| Real Estate Management & Development - 0.5% | |||
| Alexander & Baldwin, Inc. | 202,930 | 8,807,162 | |
| Altisource Portfolio Solutions SA (a)(b) | 53,097 | 1,209,550 | |
| American Realty Investments, Inc. (b) | 2,022 | 16,803 | |
| Consolidated-Tomoka Land Co. (a) | 23,055 | 1,277,247 | |
| Forestar Group, Inc. (b) | 159,585 | 2,744,862 | |
| FRP Holdings, Inc. (b) | 24,947 | 1,095,173 | |
| Griffin Industrial Realty, Inc. | 7,963 | 273,529 | |
| HFF, Inc. (a) | 155,341 | 5,923,152 | |
| Howard Hughes Corp. (b) | 161,261 | 18,923,978 | |
| InterGroup Corp. (b) | 845 | 20,280 | |
| J.W. Mays, Inc. (b) | 15 | 548 | |
| Jones Lang LaSalle, Inc. | 199,466 | 24,316,900 | |
| Kennedy-Wilson Holdings, Inc. (a) | 406,490 | 7,845,257 | |
| Marcus & Millichap, Inc. (b) | 70,870 | 1,866,007 | |
| Maui Land & Pineapple, Inc. (a)(b) | 30,432 | 392,573 | |
| RE/MAX Holdings, Inc. | 76,810 | 4,704,613 | |
| Realogy Holdings Corp. | 613,126 | 20,784,971 | |
| Stratus Properties, Inc. | 12,801 | 378,910 | |
| Tejon Ranch Co. (a)(b) | 61,546 | 1,229,689 | |
| The St. Joe Co. (a)(b) | 324,094 | 6,109,172 | |
| Transcontinental Realty Investors, Inc. (a)(b) | 1,510 | 32,133 | |
| Trinity Place Holdings, Inc. (a)(b) | 36,952 | 255,338 | |
| 108,207,847 | |||
| TOTAL REAL ESTATE | 1,784,970,782 | ||
| TELECOMMUNICATION SERVICES - 1.1% | |||
| Diversified Telecommunication Services - 0.4% | |||
| Alaska Communication Systems Group, Inc. (b) | 196,814 | 432,991 | |
| Atlantic Tele-Network, Inc. | 51,425 | 3,114,812 | |
| Cincinnati Bell, Inc. (a)(b) | 197,493 | 4,157,228 | |
| Cogent Communications Group, Inc. (a) | 183,493 | 8,550,774 | |
| Consolidated Communications Holdings, Inc. (a) | 296,400 | 5,468,580 | |
| Frontier Communications Corp. (a) | 345,068 | 4,648,066 | |
| Fusion Telecommunications International (a)(b) | 48,146 | 153,586 | |
| General Communications, Inc. Class A (b) | 119,829 | 5,168,225 | |
| Globalstar, Inc. (a)(b) | 1,469,589 | 2,821,611 | |
| Hawaiian Telcom Holdco, Inc. (b) | 49,966 | 1,519,966 | |
| IDT Corp. Class B | 79,718 | 1,172,652 | |
| Intelsat SA (a)(b) | 174,158 | 672,250 | |
| Iridium Communications, Inc. (a)(b) | 364,703 | 4,048,203 | |
| Lumos Networks Corp. (b) | 98,569 | 1,772,271 | |
| Ooma, Inc. (a)(b) | 86,590 | 848,582 | |
| ORBCOMM, Inc. (a)(b) | 294,948 | 3,262,125 | |
| Pareteum Corp. (a)(b) | 31,920 | 29,366 | |
| PDVWireless, Inc. (a)(b) | 45,934 | 1,343,570 | |
| Straight Path Communications, Inc. Class B (b) | 37,097 | 6,622,185 | |
| Vonage Holdings Corp. (b) | 850,314 | 7,057,606 | |
| Windstream Holdings, Inc. (a) | 861,501 | 1,783,307 | |
| Zayo Group Holdings, Inc. (a)(b) | 444,051 | 15,173,223 | |
| 79,821,179 | |||
| Wireless Telecommunication Services - 0.7% | |||
| Airgain, Inc. (a) | 21,048 | 231,107 | |
| Boingo Wireless, Inc. (b) | 178,557 | 3,676,489 | |
| NII Holdings, Inc. (a)(b) | 406,747 | 270,080 | |
| Shenandoah Telecommunications Co. (a) | 205,715 | 7,416,026 | |
| Spok Holdings, Inc. | 91,059 | 1,525,238 | |
| Sprint Corp. (a)(b) | 2,819,911 | 23,264,266 | |
| T-Mobile U.S., Inc. (b) | 1,275,415 | 82,532,105 | |
| Telephone & Data Systems, Inc. | 410,485 | 12,031,315 | |
| U.S. Cellular Corp. (b) | 67,085 | 2,594,848 | |
| 133,541,474 | |||
| TOTAL TELECOMMUNICATION SERVICES | 213,362,653 | ||
| UTILITIES - 3.4% | |||
| Electric Utilities - 1.2% | |||
| Allete, Inc. | 224,711 | 17,376,902 | |
| El Paso Electric Co. | 183,416 | 10,188,759 | |
| Genie Energy Ltd. Class B (a) | 65,626 | 403,600 | |
| Great Plains Energy, Inc. | 919,114 | 28,207,609 | |
| Hawaiian Electric Industries, Inc. | 484,372 | 16,187,712 | |
| IDACORP, Inc. | 225,165 | 20,035,182 | |
| MGE Energy, Inc. | 155,669 | 9,900,548 | |
| OGE Energy Corp. | 867,451 | 30,985,350 | |
| Otter Tail Corp. | 173,461 | 7,250,670 | |
| PNM Resources, Inc. | 356,255 | 15,105,212 | |
| Portland General Electric Co. | 390,160 | 18,536,502 | |
| Spark Energy, Inc. Class A, (a) | 99,321 | 1,574,238 | |
| Vistra Energy Corp. (a) | 1,296,991 | 22,956,741 | |
| Westar Energy, Inc. | 625,499 | 32,094,354 | |
| 230,803,379 | |||
| Gas Utilities - 1.1% | |||
| Atmos Energy Corp. | 449,719 | 39,593,261 | |
| Chesapeake Utilities Corp. | 69,170 | 5,495,557 | |
| Delta Natural Gas Co., Inc. | 18,073 | 553,757 | |
| National Fuel Gas Co. (a) | 376,505 | 21,829,760 | |
| New Jersey Resources Corp. (a) | 377,291 | 16,468,752 | |
| Northwest Natural Gas Co. | 149,735 | 9,927,431 | |
| ONE Gas, Inc. | 231,055 | 17,384,578 | |
| RGC Resources, Inc. | 50,846 | 1,400,807 | |
| South Jersey Industries, Inc. | 346,161 | 12,420,257 | |
| Southwest Gas Holdings, Inc. | 219,396 | 17,446,370 | |
| Spire, Inc. | 217,359 | 16,627,964 | |
| UGI Corp. | 761,594 | 37,630,360 | |
| WGL Holdings, Inc. | 217,749 | 18,347,531 | |
| 215,126,385 | |||
| Independent Power and Renewable Electricity Producers - 0.3% | |||
| Calpine Corp. (b) | 1,598,019 | 23,490,879 | |
| Dynegy, Inc. (a)(b) | 572,559 | 5,393,506 | |
| NRG Yield, Inc.: | |||
| Class A | 127,027 | 2,310,621 | |
| Class C | 303,396 | 5,612,826 | |
| Ormat Technologies, Inc. | 163,348 | 9,382,709 | |
| Pattern Energy Group, Inc. (a) | 304,672 | 7,653,361 | |
| TerraForm Global, Inc. (b) | 196,426 | 991,951 | |
| Terraform Power, Inc. (a)(b) | 328,140 | 4,580,834 | |
| U.S. Geothermal, Inc. (a)(b) | 61,820 | 240,480 | |
| 59,657,167 | |||
| Multi-Utilities - 0.5% | |||
| Avangrid, Inc. | 258,239 | 12,607,228 | |
| Avista Corp. | 284,493 | 14,622,940 | |
| Black Hills Corp. (a) | 235,448 | 16,570,830 | |
| MDU Resources Group, Inc. | 862,482 | 23,321,513 | |
| NorthWestern Energy Corp. | 206,683 | 12,467,119 | |
| Unitil Corp. | 68,493 | 3,415,061 | |
| Vectren Corp. | 363,984 | 23,880,990 | |
| 106,885,681 | |||
| Water Utilities - 0.3% | |||
| American States Water Co. | 170,520 | 8,406,636 | |
| Aqua America, Inc. | 779,968 | 26,050,931 | |
| AquaVenture Holdings Ltd. (a) | 49,986 | 757,788 | |
| Artesian Resources Corp. Class A | 30,130 | 1,117,522 | |
| Cadiz, Inc. (a)(b) | 100,305 | 1,223,721 | |
| California Water Service Group | 217,369 | 8,140,469 | |
| Connecticut Water Service, Inc. | 54,452 | 2,953,476 | |
| Middlesex Water Co. | 74,490 | 2,829,130 | |
| Pure Cycle Corp. (a)(b) | 69,664 | 505,064 | |
| Select Energy Services, Inc. Class A | 64,020 | 902,682 | |
| SJW Corp. | 70,626 | 3,919,743 | |
| York Water Co. | 57,282 | 1,884,578 | |
| 58,691,740 | |||
| TOTAL UTILITIES | 671,164,352 | ||
| TOTAL COMMON STOCKS | |||
| (Cost $14,931,968,895) | 19,681,366,684 | ||
| Principal Amount | Value | ||
| U.S. Treasury Obligations - 0.0% | |||
| U.S. Treasury Bills, yield at date of purchase 1.18% 6/21/18 (e) | |||
| (Cost $5,942,865) | 6,000,000 | 5,943,170 | |
| Shares | Value | ||
| Money Market Funds - 22.7% | |||
| Fidelity Cash Central Fund, 1.11% (f) | 85,720,969 | $85,738,113 | |
| Fidelity Securities Lending Cash Central Fund 1.11% (f)(g) | 4,395,375,201 | 4,395,814,739 | |
| TOTAL MONEY MARKET FUNDS | |||
| (Cost $4,481,552,852) | 4,481,552,852 | ||
| TOTAL INVESTMENT IN SECURITIES - 122.1% | |||
| (Cost $19,419,464,612) | 24,168,862,706 | ||
| NET OTHER ASSETS (LIABILITIES) - (22.1)% | (4,375,636,751) | ||
| NET ASSETS - 100% | $19,793,225,955 |
| Futures Contracts | |||||
| Number of contracts | Expiration Date | Notional amount | Value | Unrealized Appreciation/(Depreciation) | |
| Purchased | |||||
| Equity Index Contracts | |||||
| CME E-mini S&P MidCap 400 Index Contracts (United States) | 268 | Sept. 2017 | $46,374,720 | $690,012 | $690,012 |
| ICE Russell 2000 Mini Contracts (United States) | 993 | Sept. 2017 | 69,728,460 | 1,507,683 | 1,507,683 |
| TOTAL FUTURES CONTRACTS | $2,197,695 |
The notional amount of futures purchased as a percentage of Net Assets is 0.6%
Legend
(a) Security or a portion of the security is on loan at period end.
(b) Non-income producing
(c) Security exempt from registration under Rule 144A of the Securities Act of 1933. These securities may be resold in transactions exempt from registration, normally to qualified institutional buyers. At the end of the period, the value of these securities amounted to $3 or 0.0% of net assets.
(d) Level 3 instrument
(e) Security or a portion of the security was pledged to cover margin requirements for futures contracts. At period end, the value of securities pledged amounted to $4,785,243.
(f) Affiliated fund that is generally available only to investment companies and other accounts managed by Fidelity Investments. The rate quoted is the annualized seven-day yield of the fund at period end. A complete unaudited listing of the fund's holdings as of its most recent quarter end is available upon request. In addition, each Fidelity Central Fund's financial statements are available on the SEC's website or upon request.
(g) Investment made with cash collateral received from securities on loan.
Affiliated Central Funds
Information regarding fiscal year to date income earned by the Fund from investments in Fidelity Central Funds is as follows:
| Fund | Income earned |
| Fidelity Cash Central Fund | $308,998 |
| Fidelity Securities Lending Cash Central Fund | 14,405,015 |
| Total | $14,714,013 |
Investment Valuation
The following is a summary of the inputs used, as of August 31, 2017, involving the Fund's assets and liabilities carried at fair value. The inputs or methodology used for valuing securities may not be an indication of the risk associated with investing in those securities. For more information on valuation inputs, and their aggregation into the levels used below, please refer to the Investment Valuation section in the accompanying Notes to Financial Statements.
| Valuation Inputs at Reporting Date: | ||||
| Description | Total | Level 1 | Level 2 | Level 3 |
| Investments in Securities: | ||||
| Equities: | ||||
| Consumer Discretionary | $2,837,294,528 | $2,837,294,067 | $461 | $-- |
| Consumer Staples | 610,633,883 | 610,633,883 | -- | -- |
| Energy | 728,087,865 | 728,087,860 | 3 | 2 |
| Financials | 3,328,260,930 | 3,328,260,929 | -- | 1 |
| Health Care | 2,281,656,612 | 2,279,809,922 | -- | 1,846,690 |
| Industrials | 2,617,118,567 | 2,617,118,567 | -- | -- |
| Information Technology | 3,553,578,023 | 3,553,578,023 | -- | -- |
| Materials | 1,055,238,489 | 1,055,238,489 | -- | -- |
| Real Estate | 1,784,970,782 | 1,784,970,782 | -- | -- |
| Telecommunication Services | 213,362,653 | 213,362,653 | -- | -- |
| Utilities | 671,164,352 | 671,164,352 | -- | -- |
| U.S. Government and Government Agency Obligations | 5,943,170 | -- | 5,943,170 | -- |
| Money Market Funds | 4,481,552,852 | 4,481,552,852 | -- | -- |
| Total Investments in Securities: | $24,168,862,706 | $24,161,072,379 | $5,943,634 | $1,846,693 |
| Derivative Instruments: | ||||
| Assets | ||||
| Futures Contracts | $2,197,695 | $2,197,695 | $-- | $-- |
| Total Assets | $2,197,695 | $2,197,695 | $-- | $-- |
| Total Derivative Instruments: | $2,197,695 | $2,197,695 | $-- | $-- |
Value of Derivative Instruments
The following table is a summary of the Fund's value of derivative instruments by primary risk exposure as of August 31, 2017. For additional information on derivative instruments, please refer to the Derivative Instruments section in the accompanying Notes to Financial Statements.
| Primary Risk Exposure / Derivative Type | Value | |
| Asset | Liability | |
| Equity Risk | ||
| Futures Contracts(a) | $2,197,695 | $0 |
| Total Equity Risk | 2,197,695 | 0 |
| Total Value of Derivatives | $2,197,695 | $0 |
(a) Reflects gross cumulative appreciation (depreciation) on futures contracts as presented in the Schedule of Investments. In the Statement of Assets and Liabilities, the period end daily variation margin is included in receivable or payable for daily variation margin on futures contracts, and the net cumulative appreciation (depreciation) is included in net unrealized appreciation (depreciation).
See accompanying notes which are an integral part of the financial statements.
Fidelity® Extended Market Index Fund
Financial Statements
Statement of Assets and Liabilities
| August 31, 2017 (Unaudited) | ||
| Assets | ||
| Investment in securities, at value (including securities loaned of $4,327,809,512) — See accompanying schedule: Unaffiliated issuers (cost $14,937,911,760) | $19,687,309,854 | |
| Fidelity Central Funds (cost $4,481,552,852) | 4,481,552,852 | |
| Total Investment in Securities (cost $19,419,464,612) | $24,168,862,706 | |
| Cash | 798,565 | |
| Receivable for investments sold | 81,969,436 | |
| Receivable for fund shares sold | 18,105,613 | |
| Dividends receivable | 15,723,686 | |
| Distributions receivable from Fidelity Central Funds | 2,581,609 | |
| Receivable for daily variation margin on futures contracts | 1,022,175 | |
| Total assets | 24,289,063,790 | |
| Liabilities | ||
| Payable for investments purchased | $86,775,789 | |
| Payable for fund shares redeemed | 11,843,363 | |
| Accrued management fee | 730,820 | |
| Other affiliated payables | 370,811 | |
| Collateral on securities loaned | 4,396,117,052 | |
| Total liabilities | 4,495,837,835 | |
| Net Assets | $19,793,225,955 | |
| Net Assets consist of: | ||
| Paid in capital | $14,337,235,083 | |
| Undistributed net investment income | 137,569,824 | |
| Accumulated undistributed net realized gain (loss) on investments and foreign currency transactions | 566,824,323 | |
| Net unrealized appreciation (depreciation) on investments and assets and liabilities in foreign currencies | 4,751,596,725 | |
| Net Assets | $19,793,225,955 | |
| Investor Class: | ||
| Net Asset Value, offering price and redemption price per share ($771,664,796 ÷ 13,007,867 shares) | $59.32 | |
| Premium Class: | ||
| Net Asset Value, offering price and redemption price per share ($16,377,117,514 ÷ 276,037,841 shares) | $59.33 | |
| Institutional Premium Class: | ||
| Net Asset Value, offering price and redemption price per share ($2,644,443,645 ÷ 44,582,027 shares) | $59.32 |
See accompanying notes which are an integral part of the financial statements.
Statement of Operations
| Six months ended August 31, 2017 (Unaudited) | ||
| Investment Income | ||
| Dividends | $129,802,141 | |
| Interest | 20,272 | |
| Income from Fidelity Central Funds (including $14,405,015 from security lending) | 14,714,013 | |
| Total income | 144,536,426 | |
| Expenses | ||
| Management fee | $4,375,209 | |
| Transfer agent fees | 2,245,723 | |
| Independent trustees' fees and expenses | 39,494 | |
| Legal | 16 | |
| Interest | 4,279 | |
| Miscellaneous | 31,272 | |
| Total expenses before reductions | 6,695,993 | |
| Expense reductions | (17,441) | 6,678,552 |
| Net investment income (loss) | 137,857,874 | |
| Realized and Unrealized Gain (Loss) | ||
| Net realized gain (loss) on: | ||
| Investment securities: | ||
| Unaffiliated issuers | 624,000,663 | |
| Fidelity Central Funds | (198,547) | |
| Foreign currency transactions | 449 | |
| Futures contracts | (10,029) | |
| Total net realized gain (loss) | 623,792,536 | |
| Change in net unrealized appreciation (depreciation) on: | ||
| Investment securities: | ||
| Unaffiliated issuers | (121,591,260) | |
| Fidelity Central Funds | (115,568) | |
| Assets and liabilities in foreign currencies | 936 | |
| Futures contracts | (264,817) | |
| Total change in net unrealized appreciation (depreciation) | (121,970,709) | |
| Net gain (loss) | 501,821,827 | |
| Net increase (decrease) in net assets resulting from operations | $639,679,701 |
See accompanying notes which are an integral part of the financial statements.
Statement of Changes in Net Assets
| Six months ended August 31, 2017 (Unaudited) | Year ended February 28, 2017 | |
| Increase (Decrease) in Net Assets | ||
| Operations | ||
| Net investment income (loss) | $137,857,874 | $249,578,137 |
| Net realized gain (loss) | 623,792,536 | 737,078,558 |
| Change in net unrealized appreciation (depreciation) | (121,970,709) | 3,647,100,185 |
| Net increase (decrease) in net assets resulting from operations | 639,679,701 | 4,633,756,880 |
| Distributions to shareholders from net investment income | (35,010,454) | (236,121,884) |
| Distributions to shareholders from net realized gain | (193,561,721) | (605,807,215) |
| Total distributions | (228,572,175) | (841,929,099) |
| Share transactions - net increase (decrease) | 124,966,400 | 1,125,097,806 |
| Redemption fees | – | 367,317 |
| Total increase (decrease) in net assets | 536,073,926 | 4,917,292,904 |
| Net Assets | ||
| Beginning of period | 19,257,152,029 | 14,339,859,125 |
| End of period | $19,793,225,955 | $19,257,152,029 |
| Other Information | ||
| Undistributed net investment income end of period | $137,569,824 | $34,722,404 |
See accompanying notes which are an integral part of the financial statements.
Financial Highlights — Fidelity Extended Market Index Fund Investor Class
| Six months ended (Unaudited) August 31, | Years ended February 28, | |||||
| 2017 | 2017 | 2016A | 2015 | 2014 | 2013 | |
| Selected Per–Share Data | ||||||
| Net asset value, beginning of period | $58.10 | $46.00 | $57.40 | $55.29 | $43.12 | $39.66 |
| Income from Investment Operations | ||||||
| Net investment income (loss)B | .40 | .77 | .75 | .74 | .67 | .73 |
| Net realized and unrealized gain (loss) | 1.50 | 14.00 | (8.99) | 3.62 | 13.09 | 4.61 |
| Total from investment operations | 1.90 | 14.77 | (8.24) | 4.36 | 13.76 | 5.34 |
| Distributions from net investment income | (.10) | (.74) | (.71) | (.70) | (.54) | (.70) |
| Distributions from net realized gain | (.58) | (1.93) | (2.45) | (1.55) | (1.06) | (1.17) |
| Total distributions | (.68) | (2.67) | (3.16) | (2.25) | (1.60) | (1.88)C |
| Redemption fees added to paid in capitalB | – | –D | –D | –D | .01 | –D |
| Net asset value, end of period | $59.32 | $58.10 | $46.00 | $57.40 | $55.29 | $43.12 |
| Total ReturnE,F | 3.33% | 32.50% | (14.86)% | 8.23% | 32.38% | 14.00% |
| Ratios to Average Net AssetsG,H | ||||||
| Expenses before reductions | .10%I | .10% | .10% | .10% | .10% | .10% |
| Expenses net of fee waivers, if any | .10%I | .10% | .10% | .10% | .10% | .10% |
| Expenses net of all reductions | .10%I | .10% | .10% | .10% | .10% | .10% |
| Net investment income (loss) | 1.39%I | 1.47% | 1.39% | 1.36% | 1.35% | 1.85% |
| Supplemental Data | ||||||
| Net assets, end of period (000 omitted) | $771,665 | $815,223 | $1,392,793 | $1,992,558 | $1,803,152 | $971,857 |
| Portfolio turnover rateJ | 14%I | 12% | 12%K | 7% | 14% | 10% |
A For the year ended February 29.
B Calculated based on average shares outstanding during the period.
C Total distributions of $1.88 per share is comprised of distributions from net investment income of $.703 and distributions from net realized gain of $1.172 per share.
D Amount represents less than $.005 per share.
E Total returns for periods of less than one year are not annualized.
F Total returns would have been lower if certain expenses had not been reduced during the applicable periods shown.
G Fees and expenses of any underlying Fidelity Central Funds are not included in the Fund's expense ratio. The Fund indirectly bears its proportionate share of the expenses of any underlying Fidelity Central Funds.
H Expense ratios reflect operating expenses of the class. Expenses before reductions do not reflect amounts reimbursed by the investment adviser or reductions from expense offset arrangements and do not represent the amount paid by the class during periods when reimbursements or reductions occur. Expenses net of fee waivers reflect expenses after reimbursement by the investment adviser but prior to reductions from expense offset arrangements. Expenses net of all reductions represent the net expenses paid by the class.
I Annualized
J Amount does not include the portfolio activity of any underlying Fidelity Central Funds.
K Portfolio turnover rate excludes securities received or delivered in-kind.
See accompanying notes which are an integral part of the financial statements.
Financial Highlights — Fidelity Extended Market Index Fund Premium Class
| Six months ended (Unaudited) August 31, | Years ended February 28, | |||||
| 2017 | 2017 | 2016A | 2015 | 2014 | 2013 | |
| Selected Per–Share Data | ||||||
| Net asset value, beginning of period | $58.11 | $46.00 | $57.40 | $55.30 | $43.12 | $39.66 |
| Income from Investment Operations | ||||||
| Net investment income (loss)B | .41 | .80 | .77 | .76 | .68 | .75 |
| Net realized and unrealized gain (loss) | 1.50 | 13.99 | (8.99) | 3.61 | 13.11 | 4.60 |
| Total from investment operations | 1.91 | 14.79 | (8.22) | 4.37 | 13.79 | 5.35 |
| Distributions from net investment income | (.10) | (.75) | (.73) | (.72) | (.56) | (.72) |
| Distributions from net realized gain | (.58) | (1.93) | (2.45) | (1.55) | (1.06) | (1.17) |
| Total distributions | (.69)C | (2.68) | (3.18) | (2.27) | (1.62) | (1.89) |
| Redemption fees added to paid in capitalB | – | –D | –D | –D | .01 | –D |
| Net asset value, end of period | $59.33 | $58.11 | $46.00 | $57.40 | $55.30 | $43.12 |
| Total ReturnE,F | 3.34% | 32.56% | (14.83)% | 8.24% | 32.44% | 14.04% |
| Ratios to Average Net AssetsG,H | ||||||
| Expenses before reductions | .07%I | .07% | .07% | .07% | .07% | .07% |
| Expenses net of fee waivers, if any | .07%I | .07% | .07% | .07% | .07% | .07% |
| Expenses net of all reductions | .07%I | .07% | .07% | .07% | .07% | .07% |
| Net investment income (loss) | 1.42%I | 1.49% | 1.42% | 1.39% | 1.38% | 1.88% |
| Supplemental Data | ||||||
| Net assets, end of period (000 omitted) | $16,377,118 | $16,222,551 | $11,837,818 | $13,356,931 | $12,280,754 | $7,173,852 |
| Portfolio turnover rateJ | 14%I | 12% | 12%K | 7% | 14% | 10% |
A For the year ended February 29.
B Calculated based on average shares outstanding during the period.
C Total distributions of $.69 per share is comprised of distributions from net investment income of $.104 and distributions from net realized gain of $.581 per share.
D Amount represents less than $.005 per share.
E Total returns for periods of less than one year are not annualized.
F Total returns would have been lower if certain expenses had not been reduced during the applicable periods shown.
G Fees and expenses of any underlying Fidelity Central Funds are not included in the Fund's expense ratio. The Fund indirectly bears its proportionate share of the expenses of any underlying Fidelity Central Funds.
H Expense ratios reflect operating expenses of the class. Expenses before reductions do not reflect amounts reimbursed by the investment adviser or reductions from expense offset arrangements and do not represent the amount paid by the class during periods when reimbursements or reductions occur. Expenses net of fee waivers reflect expenses after reimbursement by the investment adviser but prior to reductions from expense offset arrangements. Expenses net of all reductions represent the net expenses paid by the class.
I Annualized
J Amount does not include the portfolio activity of any underlying Fidelity Central Funds.
K Portfolio turnover rate excludes securities received or delivered in-kind.
See accompanying notes which are an integral part of the financial statements.
Financial Highlights — Fidelity Extended Market Index Fund Institutional Premium Class
| Six months ended (Unaudited) August 31, | Years ended February 28, | |||||
| 2017 | 2017 | 2016A | 2015 | 2014 | 2013 | |
| Selected Per–Share Data | ||||||
| Net asset value, beginning of period | $58.09 | $45.99 | $57.39 | $55.28 | $43.11 | $39.66 |
| Income from Investment Operations | ||||||
| Net investment income (loss)B | .42 | .81 | .76 | .76 | .72 | .75 |
| Net realized and unrealized gain (loss) | 1.50 | 13.98 | (8.98) | 3.63 | 13.06 | 4.60 |
| Total from investment operations | 1.92 | 14.79 | (8.22) | 4.39 | 13.78 | 5.35 |
| Distributions from net investment income | (.11) | (.76) | (.73) | (.72) | (.56) | (.72) |
| Distributions from net realized gain | (.58) | (1.93) | (2.45) | (1.55) | (1.06) | (1.17) |
| Total distributions | (.69) | (2.69) | (3.18) | (2.28)C | (1.62) | (1.90)D |
| Redemption fees added to paid in capitalB | – | –E | –E | –E | .01 | –E |
| Net asset value, end of period | $59.32 | $58.09 | $45.99 | $57.39 | $55.28 | $43.11 |
| Total ReturnF,G | 3.36% | 32.58% | (14.83)% | 8.27% | 32.44% | 14.04% |
| Ratios to Average Net AssetsH,I | ||||||
| Expenses before reductions | .05%J | .05% | .07% | .07% | .07% | .07% |
| Expenses net of fee waivers, if any | .05%J | .05% | .06% | .06% | .06% | .06% |
| Expenses net of all reductions | .05%J | .05% | .06% | .06% | .06% | .06% |
| Net investment income (loss) | 1.44%J | 1.52% | 1.43% | 1.40% | 1.39% | 1.89% |
| Supplemental Data | ||||||
| Net assets, end of period (000 omitted) | $2,644,444 | $2,219,377 | $1,109,249 | $754,325 | $95,747 | $226 |
| Portfolio turnover rateK | 14%J | 12% | 12%L | 7% | 14% | 10% |
A For the year ended February 29.
B Calculated based on average shares outstanding during the period.
C Total distributions of $2.28 per share is comprised of distributions from net investment income of $.722 and distributions from net realized gain of $1.553 per share.
D Total distributions of $1.90 per share is comprised of distributions from net investment income of $.723 and distributions from net realized gain of $1.172 per share.
E Amount represents less than $.005 per share.
F Total returns for periods of less than one year are not annualized.
G Total returns would have been lower if certain expenses had not been reduced during the applicable periods shown.
H Fees and expenses of any underlying Fidelity Central Funds are not included in the Fund's expense ratio. The Fund indirectly bears its proportionate share of the expenses of any underlying Fidelity Central Funds.
I Expense ratios reflect operating expenses of the class. Expenses before reductions do not reflect amounts reimbursed by the investment adviser or reductions from expense offset arrangements and do not represent the amount paid by the class during periods when reimbursements or reductions occur. Expenses net of fee waivers reflect expenses after reimbursement by the investment adviser but prior to reductions from expense offset arrangements. Expenses net of all reductions represent the net expenses paid by the class.
J Annualized
K Amount does not include the portfolio activity of any underlying Fidelity Central Funds.
L Portfolio turnover rate excludes securities received or delivered in-kind.
See accompanying notes which are an integral part of the financial statements.
Fidelity® International Index Fund
Investment Summary (Unaudited)
Top Ten Stocks as of August 31, 2017
| % of fund's net assets | % of fund's net assets 6 months ago | |
| Nestle SA (Reg. S) (Switzerland, Food Products) | 1.8 | 1.8 |
| HSBC Holdings PLC (United Kingdom) (United Kingdom, Banks) | 1.3 | 1.2 |
| Novartis AG (Switzerland, Pharmaceuticals) | 1.3 | 1.4 |
| Roche Holding AG (participation certificate) (Switzerland, Pharmaceuticals) | 1.2 | 1.3 |
| Toyota Motor Corp. (Japan, Automobiles) | 1.0 | 1.2 |
| British American Tobacco PLC (United Kingdom) (United Kingdom, Tobacco) | 1.0 | 0.9 |
| Royal Dutch Shell PLC Class A (United Kingdom) (United Kingdom, Oil, Gas & Consumable Fuels) | 0.8 | 0.9 |
| Total SA (France, Oil, Gas & Consumable Fuels) | 0.8 | 0.9 |
| Sanofi SA (France, Pharmaceuticals) | 0.8 | 0.8 |
| BP PLC (United Kingdom, Oil, Gas & Consumable Fuels) | 0.8 | 0.8 |
| 10.8 |
Top Market Sectors as of August 31, 2017
| % of fund's net assets | % of fund's net assets 6 months ago | |
| Financials | 20.6 | 20.5 |
| Industrials | 13.8 | 14.2 |
| Consumer Discretionary | 11.9 | 11.9 |
| Consumer Staples | 11.2 | 10.7 |
| Health Care | 9.8 | 10.6 |
| Materials | 7.7 | 7.9 |
| Information Technology | 6.1 | 5.2 |
| Energy | 4.6 | 4.9 |
| Telecommunication Services | 3.9 | 4.1 |
| Real Estate | 3.9 | 4.1 |
Geographic Diversification (% of fund's net assets)
| As of August 31, 2017 | ||
| Japan | 22.7% | |
| United Kingdom | 15.9% | |
| France | 9.7% | |
| Germany | 9.2% | |
| Switzerland | 8.1% | |
| Australia | 6.8% | |
| Netherlands | 4.3% | |
| Spain | 3.4% | |
| Sweden | 2.8% | |
| Other* | 17.1% | |

* Includes Short-Term investments and Net Other Assets (Liabilities).
Percentages are based on country or territory of incorporation and include the effect of futures contracts, options and swaps, as applicable. Foreign currency contracts and other assets and liabilities are included within United States of America, as applicable.
| As of February 28, 2017 | ||
| Japan | 23.7% | |
| United Kingdom | 16.3% | |
| Germany | 9.1% | |
| France | 9.0% | |
| Switzerland | 8.6% | |
| Australia | 7.4% | |
| Netherlands | 4.0% | |
| Spain | 3.0% | |
| Sweden | 2.8% | |
| Other* | 16.1% | |

* Includes Short-Term investments and Net Other Assets (Liabilities).
Percentages are based on country or territory of incorporation and include the effect of futures contracts, options and swaps, as applicable. Foreign currency contracts and other assets and liabilities are included within United States of America, as applicable.
Fidelity® International Index Fund
Investments August 31, 2017 (Unaudited)
Showing Percentage of Net Assets
| Common Stocks - 96.7% | |||
| Shares | Value | ||
| Australia - 6.8% | |||
| AGL Energy Ltd. | 920,637 | $17,557,331 | |
| Alumina Ltd. | 3,363,689 | 5,668,805 | |
| Amcor Ltd. | 1,590,436 | 20,368,148 | |
| AMP Ltd. | 4,057,901 | 16,451,725 | |
| APA Group unit | 1,519,960 | 10,705,469 | |
| Aristocrat Leisure Ltd. | 739,136 | 12,438,987 | |
| ASX Ltd. | 264,789 | 11,509,813 | |
| Aurizon Holdings Ltd. | 2,805,492 | 11,061,920 | |
| Australia & New Zealand Banking Group Ltd. | 4,023,628 | 94,038,343 | |
| Bank of Queensland Ltd. | 532,820 | 5,332,687 | |
| Bendigo & Adelaide Bank Ltd. | 647,979 | 6,155,575 | |
| BHP Billiton Ltd. | 4,400,808 | 95,801,918 | |
| BlueScope Steel Ltd. | 782,814 | 6,764,379 | |
| Boral Ltd. | 1,608,384 | 8,528,161 | |
| Brambles Ltd. | 2,177,259 | 16,113,860 | |
| Caltex Australia Ltd. | 355,143 | 9,426,696 | |
| Challenger Ltd. | 779,909 | 7,774,658 | |
| Cimic Group Ltd. | 133,601 | 4,465,967 | |
| Coca-Cola Amatil Ltd. | 787,550 | 5,039,806 | |
| Cochlear Ltd. | 78,514 | 9,749,801 | |
| Commonwealth Bank of Australia | 2,361,652 | 142,306,561 | |
| Computershare Ltd. | 634,239 | 7,083,846 | |
| Crown Ltd. | 549,809 | 5,070,020 | |
| CSL Ltd. | 624,242 | 63,776,916 | |
| DEXUS Property Group unit | 1,394,004 | 10,627,288 | |
| Dominos Pizza Enterprises Ltd. (a) | 83,801 | 2,874,550 | |
| Flight Centre Travel Group Ltd. (a) | 75,350 | 2,896,140 | |
| Fortescue Metals Group Ltd. | 2,128,690 | 10,170,135 | |
| Goodman Group unit | 2,451,540 | 16,155,981 | |
| Harvey Norman Holdings Ltd. (a) | 745,850 | 2,419,087 | |
| Healthscope Ltd. | 2,383,050 | 3,296,266 | |
| Incitec Pivot Ltd. | 2,315,980 | 6,130,824 | |
| Insurance Australia Group Ltd. | 3,240,460 | 16,512,184 | |
| Lendlease Group unit | 754,035 | 9,938,386 | |
| Macquarie Group Ltd. | 443,097 | 30,574,429 | |
| Medibank Private Ltd. | 3,767,888 | 9,105,659 | |
| Mirvac Group unit | 5,069,616 | 9,349,812 | |
| National Australia Bank Ltd. | 3,666,536 | 88,024,326 | |
| Newcrest Mining Ltd. | 1,050,002 | 19,072,874 | |
| Orica Ltd. | 514,007 | 8,307,039 | |
| Origin Energy Ltd. (b) | 2,408,159 | 14,644,900 | |
| Qantas Airways Ltd. | 709,284 | 3,225,195 | |
| QBE Insurance Group Ltd. | 1,877,903 | 15,585,239 | |
| Ramsay Health Care Ltd. | 192,926 | 10,476,467 | |
| realestate.com.au Ltd. | 72,331 | 3,812,219 | |
| Rio Tinto Ltd. | 580,955 | 31,330,559 | |
| Santos Ltd. (b) | 2,567,471 | 7,674,202 | |
| Scentre Management Ltd. A/S Trustee South Carolina unit | 7,294,932 | 22,384,550 | |
| SEEK Ltd. | 452,505 | 6,025,291 | |
| Sonic Healthcare Ltd. | 540,120 | 9,403,168 | |
| South32 Ltd. | 7,291,880 | 16,926,306 | |
| SP AusNet | 2,411,989 | 3,336,295 | |
| Stockland Corp. Ltd. unit | 3,300,498 | 11,623,128 | |
| Suncorp Group Ltd. | 1,767,489 | 18,308,002 | |
| Sydney Airport unit | 1,504,637 | 8,851,223 | |
| Tabcorp Holdings Ltd. | 1,125,519 | 3,677,346 | |
| Tatts Group Ltd. | 1,934,665 | 6,321,024 | |
| Telstra Corp. Ltd. | 5,721,256 | 16,691,573 | |
| The GPT Group unit | 2,462,308 | 9,787,059 | |
| TPG Telecom Ltd. (a) | 497,555 | 2,171,467 | |
| Transurban Group unit | 2,812,863 | 27,190,799 | |
| Treasury Wine Estates Ltd. | 1,011,589 | 11,644,276 | |
| Vicinity Centers unit | 4,600,704 | 9,582,204 | |
| Wesfarmers Ltd. | 1,547,469 | 52,429,440 | |
| Westfield Corp. unit | 2,704,659 | 15,975,010 | |
| Westpac Banking Corp. | 4,599,902 | 114,480,295 | |
| Woodside Petroleum Ltd. | 1,039,603 | 23,826,046 | |
| Woolworths Ltd. | 1,761,446 | 36,406,799 | |
| TOTAL AUSTRALIA | 1,352,436,454 | ||
| Austria - 0.2% | |||
| Andritz AG | 99,736 | 5,427,181 | |
| Erste Group Bank AG | 411,341 | 17,381,223 | |
| OMV AG | 202,168 | 11,621,998 | |
| Raiffeisen International Bank-Holding AG (b) | 203,883 | 6,689,157 | |
| Voestalpine AG | 154,581 | 8,021,473 | |
| TOTAL AUSTRIA | 49,141,032 | ||
| Bailiwick of Jersey - 1.2% | |||
| Experian PLC | 1,291,591 | 25,971,118 | |
| Glencore Xstrata PLC | 16,760,360 | 77,913,793 | |
| Randgold Resources Ltd. | 129,110 | 13,243,867 | |
| Shire PLC | 1,239,436 | 61,645,885 | |
| Wolseley PLC | 346,398 | 20,618,091 | |
| WPP PLC | 1,754,371 | 31,994,645 | |
| TOTAL BAILIWICK OF JERSEY | 231,387,399 | ||
| Belgium - 1.2% | |||
| Ageas | 266,883 | 12,393,901 | |
| Anheuser-Busch InBev SA NV | 1,043,907 | 123,630,955 | |
| Colruyt NV | 87,893 | 4,883,709 | |
| Groupe Bruxelles Lambert SA | 109,589 | 11,155,654 | |
| KBC Groep NV | 343,242 | 28,206,517 | |
| Proximus | 206,915 | 7,294,825 | |
| Solvay SA Class A | 101,330 | 14,698,558 | |
| Telenet Group Holding NV (b) | 71,725 | 4,855,846 | |
| UCB SA | 173,608 | 11,964,221 | |
| Umicore SA | 130,068 | 9,716,176 | |
| TOTAL BELGIUM | 228,800,362 | ||
| Bermuda - 0.4% | |||
| Cheung Kong Infrastructure Holdings Ltd. | 901,450 | 8,166,988 | |
| Hongkong Land Holdings Ltd. | 1,613,100 | 11,953,071 | |
| Jardine Matheson Holdings Ltd. | 293,200 | 19,266,172 | |
| Jardine Strategic Holdings Ltd. | 303,800 | 13,321,630 | |
| Kerry Properties Ltd. | 891,181 | 3,530,219 | |
| Li & Fung Ltd. | 8,097,246 | 3,652,465 | |
| NWS Holdings Ltd. | 2,090,104 | 4,016,888 | |
| Shangri-La Asia Ltd. | 1,725,380 | 2,888,219 | |
| Yue Yuen Industrial (Holdings) Ltd. | 999,500 | 4,329,687 | |
| TOTAL BERMUDA | 71,125,339 | ||
| British Virgin Islands - 0.0% | |||
| First Pacific Co. Ltd. | 2,886,665 | 2,320,177 | |
| Cayman Islands - 0.6% | |||
| ASM Pacific Technology Ltd. | 365,429 | 4,520,145 | |
| Cheung Kong Property Holdings Ltd. | 3,638,425 | 31,940,683 | |
| CK Hutchison Holdings Ltd. | 3,696,925 | 48,374,293 | |
| Melco Crown Entertainment Ltd. sponsored ADR | 335,781 | 7,370,393 | |
| MGM China Holdings Ltd. | 1,267,200 | 2,539,015 | |
| Sands China Ltd. | 3,310,800 | 14,828,424 | |
| WH Group Ltd. | 10,985,000 | 11,482,260 | |
| Wynn Macau Ltd. | 2,145,200 | 4,709,393 | |
| TOTAL CAYMAN ISLANDS | 125,764,606 | ||
| Denmark - 1.8% | |||
| A.P. Moller - Maersk A/S: | |||
| Series A | 5,150 | 10,081,795 | |
| Series B | 8,969 | 18,491,155 | |
| Carlsberg A/S Series B | 146,830 | 16,851,483 | |
| Christian Hansen Holding A/S | 135,142 | 11,627,142 | |
| Coloplast A/S Series B | 162,658 | 13,330,288 | |
| Danske Bank A/S | 1,010,766 | 39,282,894 | |
| DONG Energy A/S | 200,360 | 10,429,554 | |
| DSV de Sammensluttede Vognmaend A/S | 260,519 | 18,473,419 | |
| Genmab A/S (b) | 78,542 | 18,330,050 | |
| H Lundbeck A/S | 94,965 | 6,048,416 | |
| ISS Holdings A/S | 228,827 | 8,904,230 | |
| Novo Nordisk A/S Series B | 2,481,675 | 118,251,367 | |
| Novozymes A/S Series B | 316,304 | 16,090,248 | |
| Pandora A/S | 152,278 | 16,184,877 | |
| TDC A/S | 1,110,609 | 6,616,704 | |
| Tryg A/S | 154,486 | 3,570,759 | |
| Vestas Wind Systems A/S | 303,438 | 27,636,713 | |
| William Demant Holding A/S (b) | 164,772 | 4,359,738 | |
| TOTAL DENMARK | 364,560,832 | ||
| Finland - 1.0% | |||
| Elisa Corp. (A Shares) | 193,962 | 8,474,106 | |
| Fortum Corp. | 607,099 | 10,898,633 | |
| Kone Oyj (B Shares) | 462,541 | 25,097,804 | |
| Metso Corp. | 155,057 | 5,138,919 | |
| Neste Oyj | 174,855 | 7,710,103 | |
| Nokia Corp. | 7,996,887 | 49,603,043 | |
| Nokian Tyres PLC | 157,566 | 6,660,769 | |
| Orion Oyj (B Shares) | 140,873 | 6,671,196 | |
| Sampo Oyj (A Shares) | 612,307 | 32,320,351 | |
| Stora Enso Oyj (R Shares) | 753,429 | 9,901,992 | |
| UPM-Kymmene Corp. | 731,892 | 19,046,199 | |
| Wartsila Corp. (a) | 202,977 | 14,002,689 | |
| TOTAL FINLAND | 195,525,804 | ||
| France - 9.5% | |||
| Accor SA | 253,486 | 11,738,558 | |
| Aeroports de Paris | 40,593 | 7,241,342 | |
| Air Liquide SA | 243,898 | 29,775,226 | |
| Alstom SA | 209,933 | 7,466,203 | |
| Arkema SA | 92,747 | 10,078,286 | |
| Atos Origin SA | 129,168 | 19,928,339 | |
| AXA SA | 2,656,865 | 77,034,637 | |
| BIC SA | 39,151 | 4,705,008 | |
| BNP Paribas SA | 1,537,777 | 116,996,626 | |
| Bollore Group | 1,191,050 | 5,532,589 | |
| Bouygues SA | 292,469 | 13,263,526 | |
| Bureau Veritas SA | 362,872 | 8,628,820 | |
| Capgemini SA | 219,848 | 24,373,802 | |
| Carrefour SA | 795,894 | 16,050,176 | |
| Casino Guichard Perrachon SA | 75,070 | 4,268,619 | |
| CNP Assurances | 233,438 | 5,418,977 | |
| Compagnie de St. Gobain | 684,743 | 37,558,142 | |
| Credit Agricole SA | 1,559,436 | 27,523,515 | |
| Danone SA | 808,280 | 63,680,311 | |
| Dassault Aviation SA | 3,371 | 5,149,892 | |
| Dassault Systemes SA | 176,093 | 17,346,875 | |
| Edenred SA | 304,511 | 8,236,116 | |
| EDF SA | 569,201 | 6,030,687 | |
| EDF SA (b) | 200,740 | 2,126,841 | |
| Eiffage SA | 100,316 | 10,365,759 | |
| ENGIE | 2,334,343 | 38,960,439 | |
| Essilor International SA | 284,059 | 35,861,660 | |
| Eurazeo SA | 59,642 | 4,933,847 | |
| Eutelsat Communications | 239,381 | 6,957,570 | |
| Fonciere des Regions | 44,937 | 4,443,851 | |
| Gecina SA | 64,114 | 9,990,879 | |
| Groupe Eurotunnel SA | 636,765 | 7,591,740 | |
| Hermes International SCA | 43,386 | 22,947,590 | |
| ICADE | 49,334 | 4,384,756 | |
| Iliad SA | 36,177 | 9,343,366 | |
| Imerys SA | 48,916 | 4,303,349 | |
| Ingenico SA | 80,416 | 7,983,984 | |
| Ipsen SA | 51,329 | 6,895,655 | |
| JCDecaux SA | 102,845 | 3,367,488 | |
| Kering SA | 103,804 | 38,962,716 | |
| Klepierre SA | 301,591 | 12,153,132 | |
| L'Oreal SA (b) | 201,944 | 42,635,691 | |
| L'Oreal SA | 143,136 | 30,238,989 | |
| Lagardere S.C.A. (Reg.) | 162,556 | 5,222,964 | |
| Legrand SA | 365,677 | 25,631,652 | |
| LVMH Moet Hennessy - Louis Vuitton SA | 382,040 | 100,350,330 | |
| Michelin CGDE Series B | 234,012 | 31,897,363 | |
| Natixis SA | 1,286,734 | 9,662,547 | |
| Orange SA (b) | 2,733,088 | 46,404,116 | |
| Pernod Ricard SA | 290,940 | 39,760,925 | |
| Peugeot Citroen SA | 665,374 | 14,047,796 | |
| Publicis Groupe SA | 282,150 | 19,040,594 | |
| Remy Cointreau SA | 30,252 | 3,454,774 | |
| Renault SA | 243,179 | 21,523,763 | |
| Rexel SA | 413,493 | 6,177,646 | |
| Safran SA | 428,571 | 41,626,594 | |
| Sanofi SA | 1,593,085 | 155,326,333 | |
| Schneider Electric SA | 771,028 | 62,176,431 | |
| SCOR SE | 235,349 | 9,862,027 | |
| SEB SA | 30,826 | 5,599,933 | |
| Societe Generale Series A | 1,051,234 | 58,808,045 | |
| Sodexo SA | 41,362 | 4,826,938 | |
| Sodexo SA (b) | 6,851 | 799,510 | |
| Sodexo SA | 77,845 | 9,084,497 | |
| Suez Environnement SA | 500,064 | 9,486,124 | |
| Thales SA | 145,047 | 16,058,422 | |
| Total SA | 3,194,328 | 165,745,208 | |
| Unibail-Rodamco | 136,049 | 34,586,458 | |
| Valeo SA | 327,289 | 21,888,918 | |
| Veolia Environnement SA | 655,650 | 15,384,020 | |
| VINCI SA | 687,097 | 63,268,790 | |
| Vivendi SA | 1,410,006 | 32,353,890 | |
| Wendel SA | 38,565 | 6,112,877 | |
| Zodiac Aerospace | 279,198 | 8,078,283 | |
| TOTAL FRANCE | 1,876,723,342 | ||
| Germany - 8.7% | |||
| adidas AG | 258,010 | 57,912,756 | |
| Allianz SE | 626,145 | 134,199,352 | |
| Axel Springer Verlag AG | 66,525 | 4,118,124 | |
| BASF AG | 1,258,918 | 121,947,505 | |
| Bayer AG | 1,133,123 | 145,009,575 | |
| Bayerische Motoren Werke AG (BMW) | 450,889 | 41,867,343 | |
| Beiersdorf AG | 138,230 | 14,757,373 | |
| Brenntag AG | 212,194 | 11,244,772 | |
| Commerzbank AG (b) | 1,458,038 | 18,120,931 | |
| Continental AG | 150,584 | 33,979,249 | |
| Covestro AG | 152,032 | 11,946,919 | |
| Daimler AG (Germany) | 1,319,198 | 96,157,996 | |
| Deutsche Bank AG | 2,834,762 | 45,456,433 | |
| Deutsche Borse AG | 264,399 | 28,261,743 | |
| Deutsche Lufthansa AG | 317,735 | 7,969,678 | |
| Deutsche Post AG | 1,360,789 | 56,447,202 | |
| Deutsche Telekom AG | 4,486,799 | 81,143,502 | |
| Deutsche Wohnen AG (Bearer) | 485,197 | 20,608,867 | |
| E.ON AG | 3,014,649 | 34,118,203 | |
| Evonik Industries AG | 222,831 | 7,223,279 | |
| Fraport AG Frankfurt Airport Services Worldwide | 57,324 | 5,656,526 | |
| Fresenius Medical Care AG & Co. KGaA | 294,228 | 27,601,437 | |
| Fresenius SE & Co. KGaA | 568,428 | 48,105,545 | |
| GEA Group AG | 249,575 | 10,992,943 | |
| Hannover Reuck SE | 81,879 | 9,922,737 | |
| HeidelbergCement Finance AG | 204,132 | 19,598,671 | |
| Henkel AG & Co. KGaA | 142,773 | 17,285,351 | |
| Hochtief AG | 26,181 | 4,614,300 | |
| Hugo Boss AG | 88,183 | 7,464,947 | |
| Infineon Technologies AG | 1,554,075 | 35,889,710 | |
| Innogy SE | 189,647 | 8,358,959 | |
| K&S AG (a) | 261,329 | 6,228,204 | |
| KION Group AG | 95,000 | 8,665,167 | |
| Lanxess AG | 125,115 | 9,331,288 | |
| Linde AG | 254,540 | 48,873,058 | |
| MAN SE | 49,165 | 5,519,820 | |
| Merck KGaA | 176,943 | 19,433,812 | |
| Metro Wholesale & Food Specialist AG | 241,610 | 4,722,796 | |
| Muenchener Rueckversicherungs AG | 220,497 | 45,515,879 | |
| OSRAM Licht AG | 117,323 | 9,634,241 | |
| ProSiebenSat.1 Media AG | 319,930 | 10,731,749 | |
| RWE AG | 710,003 | 17,711,649 | |
| SAP SE | 1,347,022 | 141,372,352 | |
| Schaeffler AG | 223,006 | 3,143,254 | |
| Siemens AG | 1,048,104 | 137,206,281 | |
| Symrise AG | 168,134 | 12,289,524 | |
| Telefonica Deutschland Holding AG | 1,015,462 | 5,495,463 | |
| Thyssenkrupp AG | 503,346 | 15,094,056 | |
| TUI AG | 375,389 | 6,349,235 | |
| TUI AG | 277,478 | 4,675,732 | |
| United Internet AG | 168,446 | 9,996,248 | |
| Volkswagen AG | 45,299 | 7,003,088 | |
| Vonovia SE | 643,005 | 27,177,846 | |
| Zalando SE (b) | 152,097 | 7,203,626 | |
| TOTAL GERMANY | 1,731,356,296 | ||
| Hong Kong - 2.4% | |||
| AIA Group Ltd. | 16,517,000 | 126,741,316 | |
| Bank of East Asia Ltd. | 1,655,112 | 7,582,119 | |
| BOC Hong Kong (Holdings) Ltd. | 5,067,566 | 25,804,876 | |
| CLP Holdings Ltd. | 2,246,157 | 23,722,311 | |
| Galaxy Entertainment Group Ltd. | 3,216,000 | 20,177,695 | |
| Hang Lung Group Ltd. | 1,202,000 | 4,531,067 | |
| Hang Lung Properties Ltd. | 2,943,423 | 7,161,329 | |
| Hang Seng Bank Ltd. | 1,047,401 | 24,091,260 | |
| Henderson Land Development Co. Ltd. | 1,703,407 | 10,556,846 | |
| HK Electric Investments & HK Electric Investments Ltd. unit | 3,632,000 | 3,332,302 | |
| Hong Kong & China Gas Co. Ltd. | 11,475,384 | 21,726,725 | |
| Hong Kong Exchanges and Clearing Ltd. | 1,592,664 | 43,470,981 | |
| Hysan Development Co. Ltd. | 847,677 | 3,921,146 | |
| i-CABLE Communications Ltd. (b) | 1,306,203 | 48,404 | |
| Link (REIT) | 3,028,308 | 24,998,076 | |
| MTR Corp. Ltd. | 2,015,706 | 11,783,989 | |
| New World Development Co. Ltd. | 7,908,651 | 10,813,349 | |
| PCCW Ltd. | 5,694,863 | 3,172,808 | |
| Power Assets Holdings Ltd. | 1,899,676 | 16,749,531 | |
| Sino Land Ltd. | 4,235,610 | 7,328,391 | |
| SJM Holdings Ltd. | 2,650,000 | 2,312,813 | |
| Sun Hung Kai Properties Ltd. | 1,979,676 | 33,037,816 | |
| Swire Pacific Ltd. (A Shares) | 719,384 | 7,321,846 | |
| Swire Properties Ltd. | 1,596,400 | 5,528,216 | |
| Techtronic Industries Co. Ltd. | 1,880,000 | 9,729,419 | |
| Wharf Holdings Ltd. | 1,658,585 | 15,800,085 | |
| Wheelock and Co. Ltd. | 1,108,000 | 8,289,736 | |
| TOTAL HONG KONG | 479,734,452 | ||
| Ireland - 0.5% | |||
| Bank Ireland Group PLC (b) | 1,249,039 | 10,408,429 | |
| CRH PLC | 1,137,469 | 39,727,174 | |
| DCC PLC (United Kingdom) | 120,817 | 11,006,295 | |
| James Hardie Industries PLC CDI | 603,763 | 8,490,517 | |
| Kerry Group PLC Class A | 216,328 | 20,146,389 | |
| Paddy Power Betfair PLC (Ireland) | 108,563 | 9,536,533 | |
| Ryanair Holdings PLC (b) | 250,317 | 5,345,110 | |
| TOTAL IRELAND | 104,660,447 | ||
| Isle of Man - 0.0% | |||
| Genting Singapore PLC | 8,232,259 | 7,194,385 | |
| Israel - 0.5% | |||
| Azrieli Group | 57,870 | 3,337,536 | |
| Bank Hapoalim BM (Reg.) | 1,455,750 | 9,801,129 | |
| Bank Leumi le-Israel BM | 1,973,969 | 10,343,509 | |
| Bezeq The Israel Telecommunication Corp. Ltd. | 2,794,956 | 4,117,569 | |
| Check Point Software Technologies Ltd. (a)(b) | 179,988 | 20,135,258 | |
| Elbit Systems Ltd. (Israel)�� | 32,257 | 4,441,638 | |
| Frutarom Industries Ltd. | 52,736 | 4,049,371 | |
| Israel Chemicals Ltd. | 707,051 | 3,049,947 | |
| Mizrahi Tefahot Bank Ltd. | 190,167 | 3,389,472 | |
| NICE Systems Ltd. | 73,481 | 5,691,497 | |
| NICE Systems Ltd. sponsored ADR (a) | 8,696 | 680,201 | |
| Taro Pharmaceutical Industries Ltd. (a)(b) | 18,773 | 1,968,161 | |
| Teva Pharmaceutical Industries Ltd. sponsored ADR | 1,250,141 | 19,827,236 | |
| TOTAL ISRAEL | 90,832,524 | ||
| Italy - 2.0% | |||
| Assicurazioni Generali SpA | 1,706,203 | 30,548,486 | |
| Atlantia SpA | 620,596 | 19,947,290 | |
| Enel SpA | 11,129,028 | 67,423,830 | |
| Eni SpA | 3,481,372 | 54,678,632 | |
| Intesa Sanpaolo SpA | 17,306,138 | 58,590,090 | |
| Intesa Sanpaolo SpA (Risparmio Shares) | 1,351,357 | 4,269,551 | |
| Leonardo SpA | 552,467 | 9,345,694 | |
| Luxottica Group SpA | 231,944 | 13,350,292 | |
| Mediobanca SpA | 773,131 | 7,933,622 | |
| Poste Italiane SpA | 704,621 | 5,120,972 | |
| Prysmian SpA | 279,855 | 8,801,912 | |
| Recordati SpA | 142,226 | 6,091,880 | |
| Saipem SpA (b) | 814,279 | 3,022,460 | |
| Snam Rete Gas SpA | 3,209,312 | 15,625,949 | |
| Telecom Italia SpA (b) | 15,591,179 | 14,961,152 | |
| Terna SpA | 1,996,120 | 11,786,354 | |
| UniCredit SpA (b) | 2,741,790 | 55,781,143 | |
| Unipolsai SpA | 1,502,092 | 3,410,031 | |
| TOTAL ITALY | 390,689,340 | ||
| Japan - 22.7% | |||
| ABC-MART, Inc. | 43,500 | 2,235,639 | |
| ACOM Co. Ltd. (b) | 553,400 | 2,265,248 | |
| AEON Co. Ltd. | 859,600 | 12,682,687 | |
| AEON Financial Service Co. Ltd. | 151,900 | 3,220,802 | |
| AEON MALL Co. Ltd. | 150,940 | 2,713,034 | |
| Air Water, Inc. | 205,700 | 3,794,602 | |
| Aisin Seiki Co. Ltd. | 251,600 | 12,656,097 | |
| Ajinomoto Co., Inc. | 742,466 | 14,665,620 | |
| Alfresa Holdings Corp. | 256,100 | 4,819,856 | |
| All Nippon Airways Ltd. | 1,562,000 | 5,794,184 | |
| Alps Electric Co. Ltd. | 271,500 | 7,458,316 | |
| Amada Holdings Co. Ltd. | 463,400 | 5,087,768 | |
| Aozora Bank Ltd. | 1,611,000 | 6,096,111 | |
| Asahi Glass Co. Ltd. | 277,235 | 10,818,558 | |
| Asahi Group Holdings | 529,603 | 23,070,621 | |
| Asahi Kasei Corp. | 1,726,727 | 20,685,855 | |
| Asics Corp. | 220,100 | 3,317,467 | |
| Astellas Pharma, Inc. | 2,948,500 | 37,243,597 | |
| Bandai Namco Holdings, Inc. | 271,550 | 9,102,304 | |
| Bank of Kyoto Ltd. | 419,000 | 3,876,136 | |
| Benesse Holdings, Inc. | 99,100 | 3,813,099 | |
| Bridgestone Corp. | 889,779 | 38,194,088 | |
| Brother Industries Ltd. | 322,500 | 7,644,836 | |
| Calbee, Inc. | 109,400 | 3,741,702 | |
| Canon, Inc. | 1,460,944 | 51,208,634 | |
| Casio Computer Co. Ltd. | 288,400 | 4,076,714 | |
| Central Japan Railway Co. | 197,600 | 33,486,042 | |
| Chiba Bank Ltd. | 953,674 | 6,384,719 | |
| Chubu Electric Power Co., Inc. | 874,764 | 11,434,355 | |
| Chugai Pharmaceutical Co. Ltd. | 307,125 | 12,487,822 | |
| Chugoku Electric Power Co., Inc. | 379,900 | 4,381,800 | |
| Coca-Cola West Co. Ltd. | 169,300 | 5,805,803 | |
| Concordia Financial Group Ltd. | 1,689,484 | 8,082,045 | |
| Credit Saison Co. Ltd. | 216,452 | 3,927,973 | |
| CYBERDYNE, Inc. (a)(b) | 146,600 | 1,928,263 | |
| Dai Nippon Printing Co. Ltd. | 723,242 | 8,539,302 | |
| Dai-ichi Mutual Life Insurance Co. | 1,475,600 | 23,757,784 | |
| Daicel Chemical Industries Ltd. | 384,800 | 4,903,850 | |
| Daiichi Sankyo Kabushiki Kaisha | 791,470 | 18,711,334 | |
| Daikin Industries Ltd. | 341,194 | 34,124,055 | |
| Dainippon Sumitomo Pharma Co. Ltd. | 217,600 | 2,957,151 | |
| Daito Trust Construction Co. Ltd. | 95,963 | 17,008,587 | |
| Daiwa House Industry Co. Ltd. | 773,584 | 27,070,338 | |
| Daiwa House REIT Investment Corp. | 1,936 | 4,733,677 | |
| Daiwa Securities Group, Inc. | 2,271,985 | 12,437,173 | |
| DeNA Co. Ltd. | 142,800 | 3,055,129 | |
| DENSO Corp. | 652,138 | 31,653,326 | |
| Dentsu, Inc. | 296,500 | 12,406,422 | |
| Disco Corp. | 39,300 | 7,046,009 | |
| Don Quijote Holdings Co. Ltd. | 162,800 | 6,182,653 | |
| East Japan Railway Co. | 453,500 | 41,602,288 | |
| Eisai Co. Ltd. | 364,278 | 18,867,503 | |
| Electric Power Development Co. Ltd. | 198,580 | 5,437,084 | |
| FamilyMart Co. Ltd. | 112,000 | 6,071,952 | |
| Fanuc Corp. | 265,472 | 51,576,563 | |
| Fast Retailing Co. Ltd. | 72,500 | 20,753,855 | |
| Fuji Electric Co. Ltd. | 762,153 | 4,201,253 | |
| Fujifilm Holdings Corp. | 574,205 | 22,574,376 | |
| Fujitsu Ltd. | 2,691,075 | 19,952,656 | |
| Fukuoka Financial Group, Inc. | 1,060,300 | 4,658,434 | |
| Hakuhodo DY Holdings, Inc. | 320,800 | 4,368,378 | |
| Hamamatsu Photonics K.K. | 195,700 | 6,061,386 | |
| Hankyu Hanshin Holdings, Inc. | 331,800 | 12,646,036 | |
| Hikari Tsushin, Inc. | 29,500 | 3,660,163 | |
| Hino Motors Ltd. | 353,600 | 4,062,371 | |
| Hirose Electric Co. Ltd. | 43,712 | 6,051,727 | |
| Hiroshima Bank Ltd. | 669,000 | 2,689,753 | |
| Hisamitsu Pharmaceutical Co., Inc. | 84,800 | 4,080,520 | |
| Hitachi Chemical Co. Ltd. | 142,300 | 3,852,138 | |
| Hitachi Construction Machinery Co. Ltd. | 147,100 | 4,154,687 | |
| Hitachi High-Technologies Corp. | 95,100 | 3,395,347 | |
| Hitachi Ltd. | 6,620,271 | 45,586,439 | |
| Hitachi Metals Ltd. | 290,300 | 3,879,117 | |
| Honda Motor Co. Ltd. | 2,356,160 | 65,996,106 | |
| Hoshizaki Corp. | 74,100 | 6,450,512 | |
| Hoya Corp. | 533,516 | 30,549,718 | |
| Hulic Co. Ltd. | 405,800 | 4,019,795 | |
| Idemitsu Kosan Co. Ltd. | 184,700 | 4,512,705 | |
| IHI Corp. (b) | 2,122,185 | 7,026,655 | |
| Iida Group Holdings Co. Ltd. | 203,100 | 3,452,894 | |
| INPEX Corp. | 1,302,800 | 12,455,022 | |
| Isetan Mitsukoshi Holdings Ltd. | 462,287 | 4,760,166 | |
| Isuzu Motors Ltd. | 782,900 | 10,240,690 | |
| Itochu Corp. | 2,048,286 | 33,462,698 | |
| J. Front Retailing Co. Ltd. | 330,200 | 4,610,515 | |
| Japan Airlines Co. Ltd. | 159,400 | 5,477,902 | |
| Japan Airport Terminal Co. Ltd. | 64,100 | 2,326,457 | |
| Japan Exchange Group, Inc. | 710,200 | 12,099,919 | |
| Japan Post Bank Co. Ltd. | 551,800 | 7,027,061 | |
| Japan Post Holdings Co. Ltd. | 612,800 | 7,614,361 | |
| Japan Prime Realty Investment Corp. | 1,125 | 4,042,161 | |
| Japan Real Estate Investment Corp. | 1,721 | 8,923,182 | |
| Japan Retail Fund Investment Corp. | 3,491 | 6,424,062 | |
| Japan Tobacco, Inc. | 1,507,400 | 51,610,985 | |
| JFE Holdings, Inc. | 713,875 | 14,104,121 | |
| JGC Corp. | 285,017 | 4,581,116 | |
| JSR Corp. | 264,716 | 5,157,790 | |
| JTEKT Corp. | 305,100 | 4,082,431 | |
| JX Holdings, Inc. | 4,217,900 | 20,426,706 | |
| Kajima Corp. | 1,226,317 | 11,255,322 | |
| Kakaku.com, Inc. | 197,000 | 2,453,204 | |
| Kamigumi Co. Ltd. | 320,663 | 3,549,796 | |
| Kaneka Corp. | 377,559 | 2,939,833 | |
| Kansai Electric Power Co., Inc. | 966,236 | 13,535,302 | |
| Kansai Paint Co. Ltd. | 287,900 | 7,303,890 | |
| Kao Corp. | 677,650 | 42,298,033 | |
| Kawasaki Heavy Industries Ltd. | 2,054,945 | 6,318,019 | |
| KDDI Corp. | 2,512,600 | 67,785,794 | |
| Keihan Electric Railway Co., Ltd. | 670,000 | 4,040,660 | |
| Keihin Electric Express Railway Co. Ltd. | 643,061 | 6,832,176 | |
| Keio Corp. | 789,410 | 6,570,338 | |
| Keisei Electric Railway Co. | 189,600 | 5,165,343 | |
| Keyence Corp. | 133,224 | 69,390,151 | |
| Kikkoman Corp. | 201,149 | 6,303,346 | |
| Kintetsu Group Holdings Co. Ltd. | 2,472,100 | 9,332,074 | |
| Kirin Holdings Co. Ltd. | 1,188,856 | 26,997,580 | |
| Kobe Steel Ltd. (b) | 422,200 | 5,084,757 | |
| Koito Manufacturing Co. Ltd. | 154,300 | 9,614,363 | |
| Komatsu Ltd. | 1,264,345 | 34,122,079 | |
| Konami Holdings Corp. | 127,500 | 6,645,518 | |
| Konica Minolta, Inc. | 652,600 | 5,212,014 | |
| Kose Corp. | 41,600 | 5,221,995 | |
| Kubota Corp. | 1,444,464 | 25,017,142 | |
| Kuraray Co. Ltd. | 484,986 | 9,211,359 | |
| Kurita Water Industries Ltd. | 139,100 | 4,004,653 | |
| Kyocera Corp. | 439,204 | 26,367,821 | |
| Kyowa Hakko Kirin Co., Ltd. | 353,289 | 6,205,495 | |
| Kyushu Electric Power Co., Inc. (a) | 580,370 | 6,820,740 | |
| Kyushu Financial Group, Inc. | 471,000 | 2,870,514 | |
| Kyushu Railway Co. | 218,300 | 6,830,873 | |
| Lawson, Inc. | 82,716 | 5,560,297 | |
| LINE Corp. (a)(b) | 59,100 | 2,089,007 | |
| Lion Corp. | 315,900 | 6,281,506 | |
| LIXIL Group Corp. | 363,659 | 9,540,115 | |
| M3, Inc. | 288,300 | 7,492,365 | |
| Mabuchi Motor Co. Ltd. | 67,342 | 3,179,197 | |
| Makita Corp. | 304,800 | 12,240,797 | |
| Marubeni Corp. | 2,256,944 | 14,687,022 | |
| Marui Group Co. Ltd. | 275,049 | 3,850,461 | |
| Maruichi Steel Tube Ltd. | 77,000 | 2,279,847 | |
| Mazda Motor Corp. | 781,500 | 11,478,986 | |
| McDonald's Holdings Co. (Japan) Ltd. | 90,500 | 4,021,399 | |
| Mebuki Financial Group, Inc. | 1,369,010 | 4,856,633 | |
| Medipal Holdings Corp. | 233,600 | 4,120,166 | |
| Meiji Holdings Co. Ltd. | 167,058 | 13,311,758 | |
| Minebea Mitsumi, Inc. | 526,600 | 8,655,717 | |
| Miraca Holdings, Inc. | 76,700 | 3,484,937 | |
| Misumi Group, Inc. | 375,700 | 9,640,694 | |
| Mitsubishi Chemical Holdings Corp. | 1,958,175 | 18,221,795 | |
| Mitsubishi Corp. | 2,068,602 | 47,860,001 | |
| Mitsubishi Electric Corp. | 2,645,806 | 39,157,014 | |
| Mitsubishi Estate Co. Ltd. | 1,711,623 | 29,488,461 | |
| Mitsubishi Gas Chemical Co., Inc. | 247,433 | 6,142,217 | |
| Mitsubishi Heavy Industries Ltd. | 4,385,256 | 16,789,505 | |
| Mitsubishi Materials Corp. | 151,993 | 5,454,245 | |
| Mitsubishi Motors Corp. of Japan | 917,300 | 6,775,345 | |
| Mitsubishi Tanabe Pharma Corp. | 306,700 | 7,532,542 | |
| Mitsubishi UFJ Financial Group, Inc. | 16,497,730 | 100,529,794 | |
| Mitsubishi UFJ Lease & Finance Co. Ltd. | 600,600 | 3,037,555 | |
| Mitsui & Co. Ltd. | 2,335,823 | 34,941,201 | |
| Mitsui Chemicals, Inc. | 1,259,683 | 7,539,650 | |
| Mitsui Fudosan Co. Ltd. | 1,219,977 | 26,389,278 | |
| Mitsui OSK Lines Ltd. | 1,569,285 | 5,038,956 | |
| mixi, Inc. | 62,200 | 3,315,523 | |
| Mizuho Financial Group, Inc. | 33,017,600 | 56,657,465 | |
| MS&AD Insurance Group Holdings, Inc. | 660,684 | 21,809,453 | |
| Murata Manufacturing Co. Ltd. | 262,154 | 40,157,123 | |
| Nabtesco Corp. | 154,300 | 5,396,675 | |
| Nagoya Railroad Co. Ltd. | 1,262,000 | 5,647,919 | |
| NEC Corp. | 3,557,547 | 9,416,893 | |
| New Hampshire Foods Ltd. | 235,740 | 6,926,276 | |
| Nexon Co. Ltd. | 268,400 | 6,696,877 | |
| NGK Insulators Ltd. | 358,409 | 6,693,170 | |
| NGK Spark Plug Co. Ltd. | 235,000 | 4,478,328 | |
| Nidec Corp. | 326,584 | 37,014,933 | |
| Nikon Corp. | 463,938 | 7,651,063 | |
| Nintendo Co. Ltd. | 155,296 | 51,795,831 | |
| Nippon Building Fund, Inc. | 1,860 | 9,897,667 | |
| Nippon Electric Glass Co. Ltd. | 115,900 | 4,406,804 | |
| Nippon Express Co. Ltd. | 1,134,546 | 7,832,996 | |
| Nippon Paint Holdings Co. Ltd. | 222,600 | 7,593,123 | |
| Nippon Prologis REIT, Inc. | 2,354 | 5,113,342 | |
| Nippon Steel & Sumitomo Metal Corp. | 1,057,463 | 25,245,023 | |
| Nippon Telegraph & Telephone Corp. | 947,700 | 47,180,662 | |
| Nippon Yusen KK (b) | 2,205,578 | 4,373,639 | |
| Nissan Chemical Industries Co. Ltd. | 168,700 | 5,654,791 | |
| Nissan Motor Co. Ltd. | 3,175,348 | 31,612,611 | |
| Nisshin Seifun Group, Inc. | 268,823 | 4,672,950 | |
| Nissin Food Holdings Co. Ltd. | 79,123 | 4,879,737 | |
| Nitori Holdings Co. Ltd. | 109,600 | 16,928,258 | |
| Nitto Denko Corp. | 225,894 | 19,927,412 | |
| NKSJ Holdings, Inc. | 482,503 | 18,148,450 | |
| NOK Corp. | 129,600 | 2,916,545 | |
| Nomura Holdings, Inc. | 4,967,247 | 27,637,513 | |
| Nomura Real Estate Holdings, Inc. | 171,500 | 3,542,789 | |
| Nomura Real Estate Master Fund, Inc. | 5,237 | 6,921,691 | |
| Nomura Research Institute Ltd. | 181,055 | 7,048,851 | |
| NSK Ltd. | 579,876 | 6,883,506 | |
| NTT Data Corp. | 861,800 | 9,312,943 | |
| NTT DOCOMO, Inc. | 1,897,800 | 44,025,742 | |
| Obayashi Corp. | 885,204 | 10,443,531 | |
| OBIC Co. Ltd. | 88,900 | 5,571,665 | |
| Odakyu Electric Railway Co. Ltd. | 403,700 | 7,821,722 | |
| Oji Holdings Corp. | 1,177,352 | 6,179,398 | |
| Olympus Corp. | 398,129 | 13,743,572 | |
| OMRON Corp. | 264,260 | 13,268,888 | |
| Ono Pharmaceutical Co. Ltd. | 561,400 | 11,444,011 | |
| Oracle Corp. Japan | 53,100 | 3,926,893 | |
| Oriental Land Co. Ltd. | 298,224 | 22,404,439 | |
| ORIX Corp. | 1,811,780 | 28,997,379 | |
| Osaka Gas Co. Ltd. | 2,549,525 | 9,974,537 | |
| Otsuka Corp. | 71,400 | 4,728,176 | |
| Otsuka Holdings Co. Ltd. | 534,200 | 21,521,552 | |
| Panasonic Corp. | 3,022,973 | 40,296,869 | |
| Park24 Co. Ltd. | 147,900 | 3,555,735 | |
| Pola Orbis Holdings, Inc. | 126,000 | 4,051,576 | |
| Rakuten, Inc. | 1,274,800 | 15,138,504 | |
| Recruit Holdings Co. Ltd. | 1,509,900 | 30,092,245 | |
| Renesas Electronics Corp. (b) | 670,000 | 6,758,812 | |
| Resona Holdings, Inc. | 3,018,800 | 15,064,481 | |
| Ricoh Co. Ltd. | 965,470 | 9,669,191 | |
| Rinnai Corp. | 46,800 | 4,065,493 | |
| ROHM Co. Ltd. | 129,144 | 10,055,693 | |
| Ryohin Keikaku Co. Ltd. | 32,600 | 9,044,435 | |
| Sankyo Co. Ltd. (Gunma) | 61,200 | 1,998,526 | |
| Santen Pharmaceutical Co. Ltd. | 498,600 | 7,737,405 | |
| SBI Holdings, Inc. Japan | 279,960 | 3,891,198 | |
| Secom Co. Ltd. | 287,067 | 21,312,965 | |
| Sega Sammy Holdings, Inc. | 245,500 | 3,528,358 | |
| Seibu Holdings, Inc. | 257,400 | 4,427,556 | |
| Seiko Epson Corp. | 383,600 | 9,843,413 | |
| Sekisui Chemical Co. Ltd. | 555,493 | 10,358,490 | |
| Sekisui House Ltd. | 823,367 | 14,260,161 | |
| Seven & i Holdings Co. Ltd. | 1,028,400 | 40,804,956 | |
| Seven Bank Ltd. | 820,900 | 3,113,797 | |
| Sharp Corp. (a)(b) | 2,042,000 | 6,127,598 | |
| Shimadzu Corp. | 343,300 | 6,311,087 | |
| Shimamura Co. Ltd. | 30,500 | 3,723,200 | |
| SHIMANO, Inc. | 101,400 | 13,706,317 | |
| SHIMIZU Corp. | 753,616 | 7,787,400 | |
| Shin-Etsu Chemical Co. Ltd. | 532,662 | 47,115,162 | |
| Shinsei Bank Ltd. | 2,350,000 | 3,762,223 | |
| Shionogi & Co. Ltd. | 405,091 | 21,353,548 | |
| Shiseido Co. Ltd. | 520,150 | 21,570,599 | |
| Shizuoka Bank Ltd. | 705,274 | 6,165,173 | |
| Showa Shell Sekiyu K.K. | 252,600 | 2,768,754 | |
| SMC Corp. | 78,371 | 26,882,889 | |
| SoftBank Corp. | 1,130,930 | 92,070,385 | |
| Sohgo Security Services Co., Ltd. | 98,700 | 4,313,945 | |
| Sony Corp. | 1,730,485 | 68,472,413 | |
| Sony Financial Holdings, Inc. | 237,700 | 3,766,529 | |
| Stanley Electric Co. Ltd. | 198,425 | 6,587,995 | |
| Start Today Co. Ltd. | 264,400 | 8,225,297 | |
| Subaru Corp. | 842,300 | 29,543,901 | |
| Sumitomo Chemical Co. Ltd. | 2,156,334 | 12,926,039 | |
| Sumitomo Corp. | 1,625,142 | 23,009,356 | |
| Sumitomo Electric Industries Ltd. | 1,028,406 | 16,108,747 | |
| Sumitomo Heavy Industries Ltd. | 797,822 | 5,950,917 | |
| Sumitomo Metal Mining Co. Ltd. | 673,065 | 11,601,930 | |
| Sumitomo Mitsui Financial Group, Inc. | 1,839,500 | 68,490,627 | |
| Sumitomo Mitsui Trust Holdings, Inc. | 453,172 | 15,689,022 | |
| Sumitomo Realty & Development Co. Ltd. | 487,000 | 14,738,245 | |
| Sumitomo Rubber Industries Ltd. | 250,500 | 4,153,923 | |
| Sundrug Co. Ltd. | 99,700 | 4,130,927 | |
| Suntory Beverage & Food Ltd. | 189,700 | 8,765,871 | |
| Suzuken Co. Ltd. | 102,016 | 3,716,506 | |
| Suzuki Motor Corp. | 470,900 | 23,670,291 | |
| Sysmex Corp. | 214,800 | 13,247,319 | |
| T&D Holdings, Inc. | 762,400 | 10,461,458 | |
| Taiheiyo Cement Corp. | 1,648,000 | 6,356,047 | |
| Taisei Corp. | 1,413,594 | 14,182,873 | |
| Taisho Pharmaceutical Holdings Co. Ltd. | 48,057 | 3,750,662 | |
| Taiyo Nippon Sanso Corp. | 188,800 | 2,203,397 | |
| Takashimaya Co. Ltd. | 417,000 | 3,827,289 | |
| Takeda Pharmaceutical Co. Ltd. | 974,142 | 53,848,737 | |
| TDK Corp. | 177,825 | 11,921,319 | |
| Teijin Ltd. | 256,168 | 5,200,955 | |
| Terumo Corp. | 448,024 | 17,320,253 | |
| The Chugoku Bank Ltd. | 222,100 | 2,994,062 | |
| The Hachijuni Bank Ltd. | 554,700 | 3,380,625 | |
| The Suruga Bank Ltd. | 237,300 | 5,076,905 | |
| THK Co. Ltd. | 165,700 | 5,531,623 | |
| Tobu Railway Co. Ltd. | 1,322,297 | 7,313,017 | |
| Toho Co. Ltd. | 154,654 | 5,746,683 | |
| Toho Gas Co. Ltd. | 503,000 | 3,317,187 | |
| Tohoku Electric Power Co., Inc. | 617,390 | 8,446,396 | |
| Tokio Marine Holdings, Inc. | 932,800 | 37,249,211 | |
| Tokyo Electric Power Co., Inc. (b) | 1,974,518 | 7,992,546 | |
| Tokyo Electron Ltd. | 214,918 | 30,223,607 | |
| Tokyo Gas Co. Ltd. | 2,756,395 | 14,622,546 | |
| Tokyo Tatemono Co. Ltd. | 280,000 | 3,448,583 | |
| Tokyu Corp. | 723,977 | 10,536,801 | |
| Tokyu Fudosan Holdings Corp. | 697,900 | 4,164,483 | |
| Toppan Printing Co. Ltd. | 714,013 | 7,150,847 | |
| Toray Industries, Inc. | 2,007,783 | 19,121,743 | |
| Toshiba Corp. (a)(b) | 5,532,880 | 15,400,567 | |
| Tosoh Corp. | 796,000 | 9,340,428 | |
| Toto Ltd. | 193,792 | 7,377,264 | |
| Toyo Seikan Group Holdings Ltd. | 226,300 | 3,732,041 | |
| Toyo Suisan Kaisha Ltd. | 120,700 | 4,463,051 | |
| Toyoda Gosei Co. Ltd. | 85,700 | 1,997,991 | |
| Toyota Industries Corp. | 222,186 | 11,843,453 | |
| Toyota Motor Corp. | 3,575,963 | 201,341,666 | |
| Toyota Tsusho Corp. | 289,500 | 8,913,972 | |
| Trend Micro, Inc. | 163,300 | 7,560,804 | |
| Tsuruha Holdings, Inc. | 50,000 | 5,953,518 | |
| Unicharm Corp. | 551,340 | 12,974,181 | |
| United Urban Investment Corp. | 4,160 | 6,277,746 | |
| USS Co. Ltd. | 298,700 | 5,871,567 | |
| West Japan Railway Co. | 225,500 | 16,391,236 | |
| Yahoo! Japan Corp. | 1,951,300 | 8,945,788 | |
| Yakult Honsha Co. Ltd. | 120,366 | 8,343,011 | |
| Yamada Denki Co. Ltd. | 861,950 | 4,665,123 | |
| Yamaguchi Financial Group, Inc. | 270,000 | 3,055,260 | |
| Yamaha Corp. | 228,343 | 7,955,189 | |
| Yamaha Motor Co. Ltd. | 381,300 | 10,786,765 | |
| Yamato Holdings Co. Ltd. | 477,932 | 10,190,318 | |
| Yamazaki Baking Co. Ltd. | 179,300 | 3,398,928 | |
| Yaskawa Electric Corp. | 345,100 | 10,453,295 | |
| Yokogawa Electric Corp. | 313,000 | 4,877,146 | |
| Yokohama Rubber Co. Ltd. | 163,100 | 3,019,134 | |
| TOTAL JAPAN | 4,492,861,218 | ||
| Luxembourg - 0.3% | |||
| ArcelorMittal SA (Netherlands) (b) | 910,025 | 24,310,133 | |
| Eurofins Scientific SA | 14,889 | 8,509,585 | |
| Millicom International Cellular SA (depository receipt) | 90,720 | 5,659,617 | |
| RTL Group SA (a) | 53,188 | 4,036,500 | |
| SES SA (France) (depositary receipt) | 497,191 | 11,367,075 | |
| Tenaris SA | 646,756 | 8,618,206 | |
| TOTAL LUXEMBOURG | 62,501,116 | ||
| Malta - 0.0% | |||
| BGP Holdings PLC (b)(c) | 5,796,476 | 69 | |
| Mauritius - 0.0% | |||
| Golden Agri-Resources Ltd. | 9,451,280 | 2,753,240 | |
| Multi-National - 0.0% | |||
| HKT Trust/HKT Ltd. unit | 5,210,760 | 6,725,065 | |
| Netherlands - 4.3% | |||
| ABN AMRO Group NV GDR | 513,708 | 14,395,738 | |
| AEGON NV | 2,416,857 | 13,819,278 | |
| AerCap Holdings NV (b) | 207,621 | 10,443,336 | |
| Airbus Group NV | 794,305 | 66,895,578 | |
| Akzo Nobel NV | 345,472 | 31,564,524 | |
| Altice NV: | |||
| Class A (b) | 517,676 | 11,937,099 | |
| Class B (b) | 142,213 | 3,288,603 | |
| ASML Holding NV (Netherlands) | 511,462 | 79,851,938 | |
| CNH Industrial NV | 1,396,858 | 15,847,338 | |
| EXOR NV | 146,946 | 9,428,828 | |
| Ferrari NV | 167,999 | 19,219,463 | |
| Fiat Chrysler Automobiles NV (b) | 1,463,197 | 22,034,565 | |
| Gemalto NV | 111,041 | 6,000,709 | |
| Heineken Holding NV | 137,331 | 13,559,503 | |
| Heineken NV (Bearer) | 315,272 | 33,076,560 | |
| ING Groep NV (Certificaten Van Aandelen) | 5,312,556 | 94,302,085 | |
| Koninklijke Ahold Delhaize NV | 1,753,174 | 31,514,696 | |
| Koninklijke Boskalis Westminster NV | 123,239 | 4,027,186 | |
| Koninklijke DSM NV | 250,352 | 18,993,550 | |
| Koninklijke KPN NV | 4,671,578 | 16,522,489 | |
| Koninklijke Philips Electronics NV | 1,279,385 | 48,519,323 | |
| NN Group NV | 431,491 | 17,123,138 | |
| NXP Semiconductors NV (b) | 455,232 | 51,423,007 | |
| QIAGEN NV (Germany) | 299,129 | 9,598,625 | |
| Randstad Holding NV | 162,280 | 9,486,410 | |
| RELX NV | 1,321,096 | 27,743,190 | |
| STMicroelectronics NV (France) | 874,158 | 15,203,606 | |
| Unilever NV (Certificaten Van Aandelen) (Bearer) | 2,232,032 | 132,882,324 | |
| Vopak NV | 95,626 | 4,047,509 | |
| Wolters Kluwer NV | 412,735 | 18,029,735 | |
| TOTAL NETHERLANDS | 850,779,933 | ||
| New Zealand - 0.2% | |||
| Auckland International Airport Ltd. | 1,305,777 | 6,365,950 | |
| Contact Energy Ltd. | 978,765 | 3,921,363 | |
| Fletcher Building Ltd. | 960,900 | 5,629,798 | |
| Mercury Nz Ltd. | 950,422 | 2,347,466 | |
| Meridian Energy Ltd. | 1,746,786 | 3,699,867 | |
| Ryman Healthcare Group Ltd. | 549,196 | 3,580,450 | |
| Spark New Zealand Ltd. | 2,507,844 | 7,049,474 | |
| TOTAL NEW ZEALAND | 32,594,368 | ||
| Norway - 0.7% | |||
| DNB ASA | 1,339,478 | 26,157,802 | |
| Gjensidige Forsikring ASA | 275,248 | 4,818,113 | |
| Marine Harvest ASA (a) | 525,678 | 10,441,802 | |
| Norsk Hydro ASA | 1,848,240 | 13,341,339 | |
| Orkla ASA | 1,113,299 | 11,430,116 | |
| Schibsted ASA: | |||
| (A Shares) | 107,373 | 2,608,912 | |
| (B Shares) | 118,297 | 2,714,231 | |
| Statoil ASA | 1,557,667 | 29,477,107 | |
| Telenor ASA | 1,029,298 | 20,843,485 | |
| Yara International ASA | 243,146 | 9,944,667 | |
| TOTAL NORWAY | 131,777,574 | ||
| Papua New Guinea - 0.1% | |||
| Oil Search Ltd. ADR | 1,881,499 | 10,036,131 | |
| Portugal - 0.2% | |||
| Banco Espirito Santo SA (Reg.) (b)(c) | 2,598,658 | 31 | |
| Energias de Portugal SA | 3,246,760 | 12,464,965 | |
| Galp Energia SGPS SA Class B | 688,582 | 11,402,339 | |
| Jeronimo Martins SGPS SA | 343,396 | 6,851,417 | |
| TOTAL PORTUGAL | 30,718,752 | ||
| Singapore - 1.2% | |||
| Ascendas Real Estate Investment Trust | 3,351,783 | 6,575,274 | |
| CapitaCommercial Trust (REIT) | 2,816,200 | 3,613,841 | |
| CapitaLand Ltd. | 3,468,137 | 9,668,172 | |
| CapitaMall Trust | 3,345,300 | 5,353,664 | |
| City Developments Ltd. | 553,200 | 4,777,442 | |
| ComfortDelgro Corp. Ltd. | 2,954,884 | 4,990,364 | |
| DBS Group Holdings Ltd. | 2,442,508 | 37,143,342 | |
| Global Logistic Properties Ltd. | 3,841,200 | 9,178,427 | |
| Hutchison Port Holdings Trust | 7,131,900 | 3,245,015 | |
| Jardine Cycle & Carriage Ltd. | 144,530 | 4,256,118 | |
| Keppel Corp. Ltd. | 1,975,100 | 9,191,254 | |
| Oversea-Chinese Banking Corp. Ltd. | 4,302,686 | 35,444,524 | |
| Sembcorp Industries Ltd. | 1,341,130 | 2,947,430 | |
| Singapore Airlines Ltd. | 725,025 | 5,512,746 | |
| Singapore Airport Terminal Service Ltd. | 895,900 | 3,191,266 | |
| Singapore Exchange Ltd. | 1,090,900 | 6,033,961 | |
| Singapore Press Holdings Ltd. | 2,184,621 | 4,446,738 | |
| Singapore Technologies Engineering Ltd. | 2,129,561 | 5,732,437 | |
| Singapore Telecommunications Ltd. | 11,173,927 | 30,490,453 | |
| StarHub Ltd. | 805,200 | 1,549,889 | |
| Suntec (REIT) | 3,255,400 | 4,549,565 | |
| United Overseas Bank Ltd. | 1,801,960 | 31,934,141 | |
| UOL Group Ltd. | 645,150 | 3,891,978 | |
| Wilmar International Ltd. | 2,518,000 | 6,165,242 | |
| Yangzijiang Shipbuilding Holdings Ltd. | 3,163,900 | 3,488,352 | |
| TOTAL SINGAPORE | 243,371,635 | ||
| Spain - 3.4% | |||
| Abertis Infraestructuras SA | 949,207 | 19,209,719 | |
| ACS Actividades de Construccion y Servicios SA | 330,179 | 12,498,482 | |
| Aena SA | 92,290 | 18,023,621 | |
| Amadeus IT Holding SA Class A | 600,791 | 37,241,070 | |
| Banco Bilbao Vizcaya Argentaria SA | 9,161,709 | 81,070,176 | |
| Banco de Sabadell SA | 7,298,513 | 16,047,687 | |
| Banco Santander SA (Spain) | 21,976,418 | 143,230,812 | |
| Bankia SA | 1,516,578 | 7,382,323 | |
| Bankinter SA | 918,960 | 8,762,747 | |
| CaixaBank SA | 4,914,889 | 25,429,133 | |
| Distribuidora Internacional de Alimentacion SA | 847,015 | 5,360,277 | |
| Enagas SA | 308,207 | 9,082,734 | |
| Endesa SA | 435,585 | 10,508,257 | |
| Ferrovial SA | 663,463 | 15,121,095 | |
| Gamesa Corporacion Tecnologica SA | 327,034 | 4,883,990 | |
| Gas Natural SDG SA | 479,764 | 11,662,578 | |
| Grifols SA | 406,713 | 11,499,073 | |
| Iberdrola SA | 8,129,543 | 66,399,485 | |
| Inditex SA | 1,491,935 | 56,750,708 | |
| International Consolidated Airlines Group SA | 100,852 | 798,034 | |
| International Consolidated Airlines Group SA CDI | 761,807 | 6,023,841 | |
| MAPFRE SA (Reg.) | 1,469,287 | 5,200,112 | |
| Red Electrica Corporacion SA | 592,318 | 13,302,182 | |
| Repsol YPF SA | 1,686,454 | 28,970,233 | |
| Telefonica SA | 6,211,014 | 67,008,730 | |
| TOTAL SPAIN | 681,467,099 | ||
| Sweden - 2.8% | |||
| Alfa Laval AB | 401,420 | 9,093,616 | |
| ASSA ABLOY AB (B Shares) | 1,373,544 | 29,690,592 | |
| Atlas Copco AB: | |||
| (A Shares) | 919,003 | 36,016,428 | |
| (B Shares) | 535,831 | 19,124,900 | |
| Boliden AB | 375,407 | 13,134,461 | |
| Electrolux AB (B Shares) | 327,612 | 11,911,664 | |
| Essity AB Class B | 833,959 | 23,153,429 | |
| Getinge AB: | |||
| rights 9/14/17 (a) | 273,620 | 101,242 | |
| (B Shares) (a) | 273,620 | 5,082,756 | |
| H&M Hennes & Mauritz AB (B Shares) | 1,300,350 | 32,951,411 | |
| Hexagon AB (B Shares) | 354,088 | 17,375,189 | |
| Husqvarna AB (B Shares) | 567,756 | 5,727,042 | |
| ICA Gruppen AB (a) | 107,857 | 4,300,299 | |
| Industrivarden AB (C Shares) | 224,468 | 5,316,663 | |
| Investor AB (B Shares) | 624,872 | 29,223,476 | |
| Kinnevik AB (B Shares) | 320,380 | 9,640,733 | |
| Lundbergfoeretagen AB | 51,972 | 4,025,896 | |
| Lundin Petroleum AB | 260,362 | 5,586,851 | |
| Nordea Bank AB | 4,162,214 | 55,997,316 | |
| Sandvik AB | 1,545,952 | 25,546,172 | |
| Securitas AB (B Shares) | 427,416 | 7,025,206 | |
| Skandinaviska Enskilda Banken AB (A Shares) | 2,081,708 | 27,089,778 | |
| Skanska AB (B Shares) | 466,191 | 10,531,578 | |
| SKF AB (B Shares) | 524,049 | 10,473,395 | |
| Svenska Handelsbanken AB (A Shares) | 2,092,414 | 31,284,496 | |
| Swedbank AB (A Shares) | 1,240,970 | 33,566,956 | |
| Swedish Match Co. AB | 258,424 | 9,213,922 | |
| Tele2 AB (B Shares) | 496,605 | 5,781,199 | |
| Telefonaktiebolaget LM Ericsson (B Shares) | 4,205,117 | 24,661,021 | |
| TeliaSonera AB | 3,563,758 | 16,998,575 | |
| Volvo AB (B Shares) | 2,129,257 | 36,364,116 | |
| TOTAL SWEDEN | 555,990,378 | ||
| Switzerland - 8.1% | |||
| ABB Ltd. (Reg.) | 2,731,306 | 63,198,065 | |
| Adecco SA (Reg.) | 222,937 | 16,157,382 | |
| Baloise Holdings AG | 67,885 | 10,809,781 | |
| Barry Callebaut AG | 3,010 | 4,331,613 | |
| Coca-Cola HBC AG | 247,855 | 8,474,054 | |
| Compagnie Financiere Richemont SA Series A | 715,238 | 63,938,013 | |
| Credit Suisse Group AG | 3,214,908 | 47,203,979 | |
| Dufry AG (b) | 49,483 | 7,626,662 | |
| Ems-Chemie Holding AG | 11,185 | 7,645,620 | |
| Galenica AG | 66,814 | 6,751,422 | |
| Geberit AG (Reg.) | 50,821 | 23,217,770 | |
| Givaudan SA | 12,655 | 25,865,582 | |
| Julius Baer Group Ltd. | 306,304 | 17,128,034 | |
| Kuehne & Nagel International AG | 73,767 | 13,361,831 | |
| Lafargeholcim Ltd. (Reg.) | 623,728 | 36,651,622 | |
| Lindt & Spruengli AG | 140 | 9,739,194 | |
| Lindt & Spruengli AG (participation certificate) | 1,384 | 7,937,849 | |
| Lonza Group AG | 102,017 | 25,830,051 | |
| Nestle SA (Reg. S) | 4,264,644 | 361,539,227 | |
| Novartis AG | 3,059,961 | 257,976,609 | |
| Pargesa Holding SA | 53,001 | 4,294,466 | |
| Partners Group Holding AG | 23,759 | 15,410,708 | |
| Roche Holding AG (participation certificate) | 962,731 | 244,601,823 | |
| Schindler Holding AG: | |||
| (participation certificate) | 55,695 | 11,929,457 | |
| (Reg.) | 27,604 | 5,800,309 | |
| SGS SA (Reg.) | 7,517 | 16,778,881 | |
| Sika AG | 2,947 | 20,897,440 | |
| Sonova Holding AG Class B | 71,746 | 12,127,876 | |
| Straumann Holding AG | 13,023 | 8,345,204 | |
| Swatch Group AG (Bearer) | 42,171 | 16,834,099 | |
| Swatch Group AG (Bearer) (Reg.) | 77,182 | 5,984,130 | |
| Swiss Life Holding AG | 43,806 | 15,677,793 | |
| Swiss Prime Site AG | 97,612 | 8,835,415 | |
| Swiss Re Ltd. | 443,655 | 40,180,861 | |
| Swisscom AG (a) | 35,589 | 17,947,589 | |
| UBS Group AG | 5,012,827 | 82,593,114 | |
| Zurich Insurance Group AG | 206,324 | 61,728,302 | |
| TOTAL SWITZERLAND | 1,605,351,827 | ||
| United Kingdom - 15.9% | |||
| 3i Group PLC | 1,331,233 | 16,689,142 | |
| Admiral Group PLC | 280,860 | 7,013,007 | |
| Anglo American PLC (United Kingdom) | 1,835,862 | 33,294,693 | |
| Antofagasta PLC | 538,926 | 7,212,762 | |
| Ashtead Group PLC | 683,777 | 14,704,114 | |
| Associated British Foods PLC | 488,639 | 20,990,359 | |
| AstraZeneca PLC (United Kingdom) | 1,733,662 | 101,640,826 | |
| Auto Trader Group PLC | 1,338,204 | 6,115,345 | |
| Aviva PLC | 5,560,245 | 37,567,503 | |
| Babcock International Group PLC | 345,930 | 3,634,492 | |
| BAE Systems PLC | 4,352,335 | 34,202,613 | |
| Barclays PLC | 23,240,207 | 57,475,192 | |
| Barratt Developments PLC | 1,372,399 | 11,082,684 | |
| Berkeley Group Holdings PLC | 178,767 | 8,647,831 | |
| BHP Billiton PLC | 2,892,233 | 55,061,391 | |
| BP PLC | 26,803,521 | 154,827,207 | |
| British American Tobacco PLC (United Kingdom) | 3,151,877 | 196,630,266 | |
| British Land Co. PLC | 1,333,014 | 10,540,550 | |
| BT Group PLC | 11,597,766 | 43,808,423 | |
| Bunzl PLC | 460,311 | 13,749,770 | |
| Burberry Group PLC | 602,439 | 13,998,879 | |
| Capita Group PLC | 910,249 | 7,633,124 | |
| Carnival PLC | 257,837 | 17,940,066 | |
| Carphone Warehouse Group PLC | 1,344,792 | 3,015,340 | |
| Centrica PLC | 7,699,993 | 19,903,765 | |
| Cobham PLC | 3,283,717 | 5,829,997 | |
| Coca-Cola European Partners PLC | 297,166 | 12,724,793 | |
| Compass Group PLC | 2,162,877 | 46,203,404 | |
| ConvaTec Group PLC | 1,598,477 | 5,930,196 | |
| Croda International PLC | 178,585 | 8,872,264 | |
| Diageo PLC | 3,449,663 | 115,384,337 | |
| Direct Line Insurance Group PLC | 1,887,313 | 9,276,281 | |
| easyJet PLC | 214,726 | 3,320,840 | |
| Fresnillo PLC | 302,211 | 6,315,151 | |
| G4S PLC (United Kingdom) | 2,112,706 | 7,745,050 | |
| GKN PLC | 2,336,649 | 9,629,819 | |
| GlaxoSmithKline PLC | 6,727,364 | 133,469,313 | |
| Hammerson PLC | 1,075,362 | 7,800,989 | |
| Hargreaves Lansdown PLC | 356,336 | 6,450,893 | |
| Hikma Pharmaceuticals PLC (a) | 197,430 | 3,196,315 | |
| HSBC Holdings PLC (United Kingdom) | 27,218,799 | 263,879,231 | |
| IMI PLC | 372,013 | 5,459,918 | |
| Imperial Tobacco Group PLC | 1,313,840 | 54,374,142 | |
| Inmarsat PLC | 619,876 | 5,867,431 | |
| InterContinental Hotel Group PLC | 245,489 | 12,240,557 | |
| Intertek Group PLC | 221,765 | 14,653,657 | |
| Intu Properties PLC (a) | 1,251,605 | 4,026,705 | |
| Investec PLC | 895,569 | 6,832,556 | |
| ITV PLC | 4,940,695 | 10,132,657 | |
| J Sainsbury PLC | 2,226,920 | 6,784,409 | |
| Johnson Matthey PLC | 265,762 | 9,498,675 | |
| Kingfisher PLC | 3,075,724 | 11,884,679 | |
| Land Securities Group PLC | 1,081,309 | 14,122,231 | |
| Legal & General Group PLC | 8,138,756 | 27,384,034 | |
| Lloyds Banking Group PLC | 97,898,517 | 80,697,265 | |
| London Stock Exchange Group PLC | 432,179 | 22,074,601 | |
| Marks & Spencer Group PLC | 2,215,196 | 9,154,846 | |
| Mediclinic International PLC (a) | 506,873 | 5,010,819 | |
| Meggitt PLC | 1,060,068 | 7,100,609 | |
| Merlin Entertainments PLC | 967,278 | 5,769,881 | |
| Mondi PLC | 504,404 | 13,781,933 | |
| National Grid PLC | 4,706,391 | 59,318,626 | |
| Next PLC | 199,775 | 10,666,407 | |
| Old Mutual PLC | 6,744,461 | 18,096,620 | |
| Pearson PLC | 1,127,007 | 8,836,694 | |
| Persimmon PLC | 422,902 | 14,540,863 | |
| Provident Financial PLC (a) | 201,971 | 2,306,120 | |
| Prudential PLC | 3,534,929 | 82,979,936 | |
| Reckitt Benckiser Group PLC | 911,025 | 86,391,172 | |
| RELX PLC | 1,480,162 | 32,365,697 | |
| Rio Tinto PLC | 1,694,958 | 82,326,858 | |
| Rolls-Royce Holdings PLC | 2,267,508 | 26,780,725 | |
| Royal Bank of Scotland Group PLC (b) | 4,856,193 | 15,825,794 | |
| Royal Dutch Shell PLC: | |||
| Class A | 33,419 | 922,359 | |
| Class A (United Kingdom) | 6,029,841 | 166,175,512 | |
| Class B (United Kingdom) | 5,139,029 | 143,433,353 | |
| Royal Mail PLC | 1,233,494 | 6,287,613 | |
| RSA Insurance Group PLC | 1,391,827 | 11,995,477 | |
| Sage Group PLC | 1,483,362 | 13,283,088 | |
| Schroders PLC | 177,889 | 7,747,352 | |
| Scottish & Southern Energy PLC | 1,384,665 | 25,514,772 | |
| Segro PLC | 1,365,695 | 9,500,973 | |
| Severn Trent PLC | 323,013 | 9,477,343 | |
| SKY PLC | 1,412,024 | 17,455,491 | |
| Smith & Nephew PLC | 1,196,487 | 21,644,774 | |
| Smiths Group PLC | 541,804 | 10,824,374 | |
| St. James's Place Capital PLC | 720,584 | 10,743,506 | |
| Standard Chartered PLC (United Kingdom) (b) | 4,499,987 | 44,805,785 | |
| Standard Life PLC | 3,666,069 | 20,365,591 | |
| Tate & Lyle PLC | 633,924 | 5,602,835 | |
| Taylor Wimpey PLC | 4,462,559 | 11,569,923 | |
| Tesco PLC (b) | 11,189,184 | 26,144,358 | |
| The Weir Group PLC | 296,984 | 6,893,339 | |
| Travis Perkins PLC | 342,797 | 6,671,226 | |
| Unilever PLC | 1,758,693 | 102,610,316 | |
| United Utilities Group PLC | 928,118 | 10,921,359 | |
| Vodafone Group PLC | 36,383,908 | 104,120,144 | |
| Vodafone Group PLC sponsored ADR | 9,027 | 262,054 | |
| Whitbread PLC | 251,033 | 12,198,873 | |
| WM Morrison Supermarkets PLC | 3,012,798 | 9,583,789 | |
| Worldpay Group PLC | 2,742,687 | 14,789,191 | |
| TOTAL UNITED KINGDOM | 3,142,240,104 | ||
| TOTAL COMMON STOCKS | |||
| (Cost $17,354,533,133) | 19,151,421,300 | ||
| Nonconvertible Preferred Stocks - 0.7% | |||
| France - 0.2% | |||
| Air Liquide SA (b) | 288,912 | 35,270,564 | |
| Germany - 0.5% | |||
| Bayerische Motoren Werke AG (BMW) (non-vtg.) | 77,238 | 6,407,855 | |
| Fuchs Petrolub AG | 95,159 | 5,290,271 | |
| Henkel AG & Co. KGaA | 243,732 | 32,656,468 | |
| Porsche Automobil Holding SE (Germany) | 210,242 | 11,915,954 | |
| Volkswagen AG | 253,395 | 37,812,339 | |
| TOTAL GERMANY | 94,082,887 | ||
| Italy - 0.0% | |||
| Telecom Italia SpA (Risparmio Shares) | 8,267,099 | 6,421,623 | |
| TOTAL NONCONVERTIBLE PREFERRED STOCKS | |||
| (Cost $116,386,534) | 135,775,074 | ||
| Principal Amount | Value | ||
| Government Obligations - 0.1% | |||
| United States of America - 0.1% | |||
| U.S. Treasury Bills, yield at date of purchase 1.01% to 1.11% 10/12/17 to 12/14/17 (Cost $21,955,834)(d) | 22,000,000 | 21,959,430 | |
| Shares | Value | ||
| Money Market Funds - 2.5% | |||
| Fidelity Cash Central Fund, 1.11% (e) | 387,213,577 | 387,291,020 | |
| Fidelity Securities Lending Cash Central Fund 1.11% (e)(f) | 96,661,286 | 96,670,952 | |
| TOTAL MONEY MARKET FUNDS | |||
| (Cost $483,969,408) | 483,961,972 | ||
| TOTAL INVESTMENT IN SECURITIES - 100.0% | |||
| (Cost $17,976,844,909) | 19,793,117,776 | ||
| NET OTHER ASSETS (LIABILITIES) - 0.0% | 8,667,238 | ||
| NET ASSETS - 100% | $19,801,785,014 |
| Futures Contracts | |||||
| Number of contracts | Expiration Date | Notional amount | Value | Unrealized Appreciation/(Depreciation) | |
| Purchased | |||||
| Equity Index Contracts | |||||
| ICE E-mini MSCI EAFE Index Contracts (United States) | 5,479 | Sept. 2017 | $530,038,460 | $1,952,662 | $1,952,662 |
The notional amount of futures purchased as a percentage of Net Assets is 2.7%
| Forward Foreign Currency Contracts | ||||||
| Currency Purchased | Currency Sold | Counterparty | Settlement Date | Unrealized Appreciation/(Depreciation) | ||
| JPY | 2,405,000,000 | USD | 22,061,548 | Goldman Sachs Bank USA | 9/8/17 | $(181,871) |
| USD | 7,748,375 | JPY | 875,000,000 | Goldman Sachs Bank USA | 9/8/17 | (212,006) |
| USD | 10,183,490 | JPY | 1,140,000,000 | Goldman Sachs Bank USA | 9/8/17 | (187,750) |
| USD | 3,480,608 | JPY | 390,000,000 | Goldman Sachs Bank USA | 9/8/17 | (67,448) |
| EUR | 27,100,000 | USD | 30,519,180 | Goldman Sachs Bank USA | 9/15/17 | 1,759,495 |
| GBP | 15,100,000 | USD | 19,306,483�� | Goldman Sachs Bank USA | 9/15/17 | 226,198 |
| SEK | 29,000,000 | USD | 3,351,939 | Goldman Sachs Bank USA | 9/15/17 | 299,897 |
| USD | 13,743,960 | EUR | 12,000,000 | Goldman Sachs Bank USA | 9/15/17 | (549,180) |
| USD | 6,297,858 | EUR | 5,500,000 | Goldman Sachs Bank USA | 9/15/17 | (253,165) |
| USD | 10,925,251 | EUR | 9,600,000 | Goldman Sachs Bank USA | 9/15/17 | (509,261) |
| USD | 3,638,869 | GBP | 2,800,000 | Goldman Sachs Bank USA | 9/15/17 | 16,915 |
| USD | 9,123,093 | GBP | 7,000,000 | Goldman Sachs Bank USA | 9/15/17 | 68,208 |
| USD | 6,872,499 | GBP | 5,300,000 | Goldman Sachs Bank USA | 9/15/17 | 16,658 |
| USD | 671,168 | SEK | 5,700,000 | Goldman Sachs Bank USA | 9/15/17 | (46,606) |
| USD | 1,546,946 | SEK | 13,000,000 | Goldman Sachs Bank USA | 9/15/17 | (90,084) |
| USD | 1,217,267 | SEK | 10,300,000 | Goldman Sachs Bank USA | 9/15/17 | (79,764) |
| AUD | 10,500,000 | USD | 7,905,240 | Goldman Sachs Bank USA | 9/22/17 | 440,039 |
| USD | 3,608,919 | AUD | 4,700,000 | Goldman Sachs Bank USA | 9/22/17 | (126,587) |
| USD | 2,808,822 | AUD | 3,700,000 | Goldman Sachs Bank USA | 9/22/17 | (131,896) |
| USD | 1,606,420 | AUD | 2,100,000 | Goldman Sachs Bank USA | 9/22/17 | (62,636) |
| TOTAL FORWARD FOREIGN CURRENCY CONTRACTS | $329,156 | |||||
| Unrealized Appreciation | 2,827,410 | |||||
| Unrealized Depreciation | (2,498,254) | |||||
Currency Abbreviations
AUD – Australian dollar
EUR – European Monetary Unit
GBP – British pound
JPY – Japanese yen
SEK – Swedish krona
Categorizations in the Schedule of Investments are based on country or territory of incorporation.
Legend
(a) Security or a portion of the security is on loan at period end.
(b) Non-income producing
(c) Level 3 instrument
(d) Security or a portion of the security was pledged to cover margin requirements for futures contracts. At period end, the value of securities pledged amounted to $19,075,093.
(e) Affiliated fund that is generally available only to investment companies and other accounts managed by Fidelity Investments. The rate quoted is the annualized seven-day yield of the fund at period end. A complete unaudited listing of the fund's holdings as of its most recent quarter end is available upon request. In addition, each Fidelity Central Fund's financial statements are available on the SEC's website or upon request.
(f) Investment made with cash collateral received from securities on loan.
Affiliated Central Funds
Information regarding fiscal year to date income earned by the Fund from investments in Fidelity Central Funds is as follows:
| Fund | Income earned |
| Fidelity Cash Central Fund | $1,267,844 |
| Fidelity Securities Lending Cash Central Fund | 2,013,556 |
| Total | $3,281,400 |
Investment Valuation
The following is a summary of the inputs used, as of August 31, 2017, involving the Fund's assets and liabilities carried at fair value. The inputs or methodology used for valuing securities may not be an indication of the risk associated with investing in those securities. For more information on valuation inputs, and their aggregation into the levels used below, please refer to the Investment Valuation section in the accompanying Notes to Financial Statements.
| Valuation Inputs at Reporting Date: | ||||
| Description | Total | Level 1 | Level 2 | Level 3 |
| Investments in Securities: | ||||
| Equities: | ||||
| Consumer Discretionary | $2,311,105,991 | $1,514,727,946 | $796,378,045 | $-- |
| Consumer Staples | 2,226,531,596 | 946,594,385 | 1,279,937,211 | -- |
| Energy | 926,718,922 | 202,841,338 | 723,877,584 | -- |
| Financials | 4,139,732,244 | 2,459,172,940 | 1,680,559,204 | 100 |
| Health Care | 1,996,486,866 | 823,754,614 | 1,172,732,252 | -- |
| Industrials | 2,793,387,029 | 2,150,681,998 | 642,705,031 | -- |
| Information Technology | 1,179,008,656 | 727,333,514 | 451,675,142 | -- |
| Materials | 1,528,990,823 | 1,162,392,033 | 366,598,790 | -- |
| Real Estate | 706,170,966 | 706,170,966 | -- | -- |
| Telecommunication Services | 814,005,474 | 188,974,335 | 625,031,139 | -- |
| Utilities | 665,057,807 | 541,789,049 | 123,268,758 | -- |
| Government Obligations | 21,959,430 | -- | 21,959,430 | -- |
| Money Market Funds | 483,961,972 | 483,961,972 | -- | -- |
| Total Investments in Securities: | $19,793,117,776 | $11,908,395,090 | $7,884,722,586 | $100 |
| Derivative Instruments: | ||||
| Assets | ||||
| Forward Foreign Currency Contracts | $2,827,410 | $-- | $2,827,410 | $-- |
| Futures Contracts | 1,952,662 | 1,952,662 | -- | -- |
| Total Assets | $4,780,072 | $1,952,662 | $2,827,410 | $-- |
| Liabilities | ||||
| Forward Foreign Currency Contracts | $(2,498,254) | $-- | $(2,498,254) | $-- |
| Total Liabilities | $(2,498,254) | $-- | $(2,498,254) | $-- |
| Total Derivative Instruments: | $2,281,818 | $1,952,662 | $329,156 | $-- |
The following is a summary of transfers between Level 1 and Level 2 for the period ended August 31, 2017. Transfers are assumed to have occurred at the beginning of the period, and are primarily attributable to the valuation techniques used for foreign equity securities, as discussed in the accompanying Notes to Financial Statements:
| Transfers | Total |
| Level 1 to Level 2 | $154,807,200 |
| Level 2 to Level 1 | $689,311,865 |
Value of Derivative Instruments
The following table is a summary of the Fund's value of derivative instruments by primary risk exposure as of August 31, 2017. For additional information on derivative instruments, please refer to the Derivative Instruments section in the accompanying Notes to Financial Statements.
| Primary Risk Exposure / Derivative Type | Value | |
| Asset | Liability | |
| Equity Risk | ||
| Futures Contracts(a) | $1,952,662 | $0 |
| Total Equity Risk | 1,952,662 | 0 |
| Foreign Exchange Risk | ||
| Forward Foreign Currency Contracts(b) | 2,827,410 | (2,498,254) |
| Total Foreign Exchange Risk | 2,827,410 | (2,498,254) |
| Total Value of Derivatives | $4,780,072 | $(2,498,254) |
(a) Reflects gross cumulative appreciation (depreciation) on futures contracts as presented in the Schedule of Investments. In the Statement of Assets and Liabilities, the period end daily variation margin is included in receivable or payable for daily variation margin on futures contracts, and the net cumulative appreciation (depreciation) is included in net unrealized appreciation (depreciation).
(b) Gross value is presented in the Statement of Assets and Liabilities in the unrealized appreciation/depreciation on foreign currency contracts line-items.
See accompanying notes which are an integral part of the financial statements.
Fidelity® International Index Fund
Financial Statements
Statement of Assets and Liabilities
| August 31, 2017 (Unaudited) | ||
| Assets | ||
| Investment in securities, at value (including securities loaned of $93,318,818) — See accompanying schedule: Unaffiliated issuers (cost $17,492,875,501) | $19,309,155,804 | |
| Fidelity Central Funds (cost $483,969,408) | 483,961,972 | |
| Total Investment in Securities (cost $17,976,844,909) | $19,793,117,776 | |
| Foreign currency held at value (cost $5,550,723) | 5,552,828 | |
| Receivable for investments sold | 1,889,797 | |
| Unrealized appreciation on forward foreign currency contracts | 2,827,410 | |
| Receivable for fund shares sold | 26,791,331 | |
| Dividends receivable | 100,896,653 | |
| Distributions receivable from Fidelity Central Funds | 365,291 | |
| Receivable for daily variation margin on futures contracts | 3,948,089 | |
| Other receivables | 2,384 | |
| Total assets | 19,935,391,559 | |
| Liabilities | ||
| Payable for investments purchased | $15,413,265 | |
| Unrealized depreciation on forward foreign currency contracts | 2,498,254 | |
| Payable for fund shares redeemed | 18,084,431 | |
| Accrued management fee | 735,909 | |
| Other affiliated payables | 210,479 | |
| Collateral on securities loaned | 96,664,207 | |
| Total liabilities | 133,606,545 | |
| Net Assets | $19,801,785,014 | |
| Net Assets consist of: | ||
| Paid in capital | $18,237,149,160 | |
| Undistributed net investment income | 355,854,854 | |
| Accumulated undistributed net realized gain (loss) on investments and foreign currency transactions | (610,726,975) | |
| Net unrealized appreciation (depreciation) on investments and assets and liabilities in foreign currencies | 1,819,507,975 | |
| Net Assets | $19,801,785,014 | |
| Investor Class: | ||
| Net Asset Value, offering price and redemption price per share ($706,620,193 ÷ 16,994,967 shares) | $41.58 | |
| Premium Class: | ||
| Net Asset Value, offering price and redemption price per share ($10,532,514,686 ÷ 253,227,958 shares) | $41.59 | |
| Institutional Class: | ||
| Net Asset Value, offering price and redemption price per share ($2,889,789,962 ÷ 69,467,115 shares) | $41.60 | |
| Institutional Premium Class: | ||
| Net Asset Value, offering price and redemption price per share ($5,672,860,173 ÷ 136,372,986 shares) | $41.60 |
See accompanying notes which are an integral part of the financial statements.
Statement of Operations
| Six months ended August 31, 2017 (Unaudited) | ||
| Investment Income | ||
| Dividends | $399,029,973 | |
| Interest | 52,425 | |
| Income from Fidelity Central Funds (including $2,013,556 from security lending) | 3,281,400 | |
| Income before foreign taxes withheld | 402,363,798 | |
| Less foreign taxes withheld | (38,999,084) | |
| Total income | 363,364,714 | |
| Expenses | ||
| Management fee | $4,489,126 | |
| Transfer agent fees | 1,934,997 | |
| Independent trustees' fees and expenses | 36,086 | |
| Miscellaneous | 27,760 | |
| Total expenses before reductions | 6,487,969 | |
| Expense reductions | (483) | 6,487,486 |
| Net investment income (loss) | 356,877,228 | |
| Realized and Unrealized Gain (Loss) | ||
| Net realized gain (loss) on: | ||
| Investment securities: | ||
| Unaffiliated issuers | 35,549,521 | |
| Fidelity Central Funds | (3,077) | |
| Forward foreign currency contracts | 2,516,171 | |
| Foreign currency transactions | 1,028,978 | |
| Futures contracts | 33,776,789 | |
| Total net realized gain (loss) | 72,868,382 | |
| Change in net unrealized appreciation (depreciation) on: | ||
| Investment securities: | ||
| Unaffiliated issuers | 1,720,461,922 | |
| Fidelity Central Funds | (7,415) | |
| Forward foreign currency contracts | 707 | |
| Assets and liabilities in foreign currencies | 3,961,628 | |
| Futures contracts | 138,094 | |
| Total change in net unrealized appreciation (depreciation) | 1,724,554,936 | |
| Net gain (loss) | 1,797,423,318 | |
| Net increase (decrease) in net assets resulting from operations | $2,154,300,546 |
See accompanying notes which are an integral part of the financial statements.
Statement of Changes in Net Assets
| Six months ended August 31, 2017 (Unaudited) | Year ended February 28, 2017 | |
| Increase (Decrease) in Net Assets | ||
| Operations | ||
| Net investment income (loss) | $356,877,228 | $460,796,868 |
| Net realized gain (loss) | 72,868,382 | 27,754,673 |
| Change in net unrealized appreciation (depreciation) | 1,724,554,936 | 1,696,026,072 |
| Net increase (decrease) in net assets resulting from operations | 2,154,300,546 | 2,184,577,613 |
| Distributions to shareholders from net investment income | (12,191,602) | (439,896,097) |
| Distributions to shareholders from net realized gain | – | (13,514,538) |
| Total distributions | (12,191,602) | (453,410,635) |
| Share transactions - net increase (decrease) | 1,340,664,799 | 983,873,064 |
| Redemption fees | – | 491,955 |
| Total increase (decrease) in net assets | 3,482,773,743 | 2,715,531,997 |
| Net Assets | ||
| Beginning of period | 16,319,011,271 | 13,603,479,274 |
| End of period | $19,801,785,014 | $16,319,011,271 |
| Other Information | ||
| Undistributed net investment income end of period | $355,854,854 | $11,169,228 |
See accompanying notes which are an integral part of the financial statements.
Financial Highlights — Fidelity International Index Fund Investor Class
| Six months ended (Unaudited) August 31, | Years ended February 28, | |||||
| 2017 | 2017 | 2016A | 2015 | 2014 | 2013 | |
| Selected Per–Share Data | ||||||
| Net asset value, beginning of period | $36.88 | $32.81 | $39.75 | $41.19 | $35.31 | $33.06 |
| Income from Investment Operations | ||||||
| Net investment income (loss)B | .75 | 1.06 | 1.11 | 1.13 | 1.35C | 1.03 |
| Net realized and unrealized gain (loss) | 3.97 | 4.05 | (7.10) | (1.31) | 5.53 | 2.23 |
| Total from investment operations | 4.72 | 5.11 | (5.99) | (.18) | 6.88 | 3.26 |
| Distributions from net investment income | (.02) | (1.01) | (.95) | (1.26) | (.96) | (.97) |
| Distributions from net realized gain | – | (.03) | – | – | (.04) | (.04) |
| Total distributions | (.02) | (1.04) | (.95) | (1.26) | (1.00) | (1.01) |
| Redemption fees added to paid in capitalB | – | –D | –D | –D | –D | –D |
| Net asset value, end of period | $41.58 | $36.88 | $32.81 | $39.75 | $41.19 | $35.31 |
| Total ReturnE,F | 12.79% | 15.72% | (15.24)% | (.29)% | 19.66% | 10.01% |
| Ratios to Average Net AssetsG,H | ||||||
| Expenses before reductions | .19%I | .19% | .20% | .20% | .20% | .20% |
| Expenses net of fee waivers, if any | .19%I | .19% | .20% | .20% | .20% | .20% |
| Expenses net of all reductions | .19%I | .19% | .20% | .20% | .20% | .20% |
| Net investment income (loss) | 3.79%I | 2.97% | 2.92% | 2.83% | 3.52%C | 3.16% |
| Supplemental Data | ||||||
| Net assets, end of period (000 omitted) | $706,620 | $740,317 | $2,652,101 | $2,972,698 | $2,640,165 | $2,282,743 |
| Portfolio turnover rateJ | 2%I,K | 2% | 1%K | 1% | 2% | 1% |
A For the year ended February 29.
B Calculated based on average shares outstanding during the period.
C Net Investment income per share reflects a large, non-recurring dividend which amounted to $.27 per share. Excluding this non-recurring dividend, the ratio of net investment income (loss) to average net assets would have been 2.82%.
D Amount represents less than $.005 per share.
E Total returns for periods of less than one year are not annualized.
F Total returns would have been lower if certain expenses had not been reduced during the applicable periods shown.
G Fees and expenses of any underlying Fidelity Central Funds are not included in the Fund's expense ratio. The Fund indirectly bears its proportionate share of the expenses of any underlying Fidelity Central Funds.
H Expense ratios reflect operating expenses of the class. Expenses before reductions do not reflect amounts reimbursed by the investment adviser or reductions from expense offset arrangements and do not represent the amount paid by the class during periods when reimbursements or reductions occur. Expenses net of fee waivers reflect expenses after reimbursement by the investment adviser but prior to reductions from expense offset arrangements. Expenses net of all reductions represent the net expenses paid by the class.
I Annualized
J Amount does not include the portfolio activity of any underlying Fidelity Central Funds.
K Portfolio turnover rate excludes securities received or delivered in-kind.
See accompanying notes which are an integral part of the financial statements.
Financial Highlights — Fidelity International Index Fund Premium Class
| Six months ended (Unaudited) August 31, | Years ended February 28, | |||||
| 2017 | 2017 | 2016A | 2015 | 2014 | 2013 | |
| Selected Per–Share Data | ||||||
| Net asset value, beginning of period | $36.88 | $32.82 | $39.76 | $41.20 | $35.31 | $33.07 |
| Income from Investment Operations | ||||||
| Net investment income (loss)B | .78 | 1.10 | 1.14 | 1.17 | 1.38C | 1.06 |
| Net realized and unrealized gain (loss) | 3.96 | 4.03 | (7.10) | (1.32) | 5.54 | 2.22 |
| Total from investment operations | 4.74 | 5.13 | (5.96) | (.15) | 6.92 | 3.28 |
| Distributions from net investment income | (.03) | (1.04) | (.98) | (1.29) | (.99) | (1.00) |
| Distributions from net realized gain | – | (.03) | – | – | (.04) | (.04) |
| Total distributions | (.03) | (1.07) | (.98) | (1.29) | (1.03) | (1.04) |
| Redemption fees added to paid in capitalB | – | –D | –D | –D | –D | –D |
| Net asset value, end of period | $41.59 | $36.88 | $32.82 | $39.76 | $41.20 | $35.31 |
| Total ReturnE,F | 12.85% | 15.80% | (15.17)% | (.21)% | 19.79% | 10.07% |
| Ratios to Average Net AssetsG,H | ||||||
| Expenses before reductions | .08%I | .11% | .17% | .17% | .17% | .17% |
| Expenses net of fee waivers, if any | .08%I | .09% | .12% | .12% | .12% | .12% |
| Expenses net of all reductions | .08%I | .09% | .12% | .12% | .12% | .12% |
| Net investment income (loss) | 3.90%I | 3.07% | 3.00% | 2.91% | 3.60%C | 3.24% |
| Supplemental Data | ||||||
| Net assets, end of period (000 omitted) | $10,532,514 | $8,719,903 | $7,677,907 | $8,304,964 | $7,201,814 | $5,322,884 |
| Portfolio turnover rateJ | 2%I,K | 2% | 1%K | 1% | 2% | 1% |
A For the year ended February 29.
B Calculated based on average shares outstanding during the period.
C Net Investment income per share reflects a large, non-recurring dividend which amounted to $.27 per share. Excluding this non-recurring dividend, the ratio of net investment income (loss) to average net assets would have been 2.90%.
D Amount represents less than $.005 per share.
E Total returns for periods of less than one year are not annualized.
F Total returns would have been lower if certain expenses had not been reduced during the applicable periods shown.
G Fees and expenses of any underlying Fidelity Central Funds are not included in the Fund's expense ratio. The Fund indirectly bears its proportionate share of the expenses of any underlying Fidelity Central Funds.
H Expense ratios reflect operating expenses of the class. Expenses before reductions do not reflect amounts reimbursed by the investment adviser or reductions from expense offset arrangements and do not represent the amount paid by the class during periods when reimbursements or reductions occur. Expenses net of fee waivers reflect expenses after reimbursement by the investment adviser but prior to reductions from expense offset arrangements. Expenses net of all reductions represent the net expenses paid by the class.
I Annualized
J Amount does not include the portfolio activity of any underlying Fidelity Central Funds.
K Portfolio turnover rate excludes securities received or delivered in-kind.
See accompanying notes which are an integral part of the financial statements.
Financial Highlights — Fidelity International Index Fund Institutional Class
| Six months ended (Unaudited) August 31, | Years ended February 28, | |||||
| 2017 | 2017 | 2016A | 2015 | 2014 | 2013 | |
| Selected Per–Share Data | ||||||
| Net asset value, beginning of period | $36.89 | $32.82 | $39.76 | $41.20 | $35.31 | $33.07 |
| Income from Investment Operations | ||||||
| Net investment income (loss)B | .78 | 1.11 | 1.16 | 1.18 | 1.40C | 1.07 |
| Net realized and unrealized gain (loss) | 3.96 | 4.04 | (7.10) | (1.31) | 5.54 | 2.22 |
| Total from investment operations | 4.74 | 5.15 | (5.94) | (.13) | 6.94 | 3.29 |
| Distributions from net investment income | (.03) | (1.05) | (1.00) | (1.31) | (1.01) | (1.01) |
| Distributions from net realized gain | – | (.03) | – | – | (.04) | (.04) |
| Total distributions | (.03) | (1.08) | (1.00) | (1.31) | (1.05) | (1.05) |
| Redemption fees added to paid in capitalB | – | –D | –D | –D | –D | –D |
| Net asset value, end of period | $41.60 | $36.89 | $32.82 | $39.76 | $41.20 | $35.31 |
| Total ReturnE,F | 12.85% | 15.87% | (15.13)% | (.16)% | 19.85% | 10.12% |
| Ratios to Average Net AssetsG,H | ||||||
| Expenses before reductions | .06%I | .07% | .10% | .10% | .10% | .10% |
| Expenses net of fee waivers, if any | .06%I | .06% | .07% | .07% | .07% | .07% |
| Expenses net of all reductions | .06%I | .06% | .07% | .07% | .07% | .07% |
| Net investment income (loss) | 3.91%I | 3.10% | 3.05% | 2.96% | 3.65%C | 3.29% |
| Supplemental Data | ||||||
| Net assets, end of period (000 omitted) | $2,889,790 | $2,097,193 | $1,539,389 | $1,994,854 | $1,595,562 | $1,269,545 |
| Portfolio turnover rateJ | 2%I,K | 2% | 1%K | 1% | 2% | 1% |
A For the year ended February 29.
B Calculated based on average shares outstanding during the period.
C Net Investment income per share reflects a large, non-recurring dividend which amounted to $.27 per share. Excluding this non-recurring dividend, the ratio of net investment income (loss) to average net assets would have been 2.95%.
D Amount represents less than $.005 per share.
E Total returns for periods of less than one year are not annualized.
F Total returns would have been lower if certain expenses had not been reduced during the applicable periods shown.
G Fees and expenses of any underlying Fidelity Central Funds are not included in the Fund's expense ratio. The Fund indirectly bears its proportionate share of the expenses of any underlying Fidelity Central Funds.
H Expense ratios reflect operating expenses of the class. Expenses before reductions do not reflect amounts reimbursed by the investment adviser or reductions from expense offset arrangements and do not represent the amount paid by the class during periods when reimbursements or reductions occur. Expenses net of fee waivers reflect expenses after reimbursement by the investment adviser but prior to reductions from expense offset arrangements. Expenses net of all reductions represent the net expenses paid by the class.
I Annualized
J Amount does not include the portfolio activity of any underlying Fidelity Central Funds.
K Portfolio turnover rate excludes securities received or delivered in-kind.
See accompanying notes which are an integral part of the financial statements.
Financial Highlights — Fidelity International Index Fund Institutional Premium Class
| Six months ended (Unaudited) August 31, | Years ended February 28, | |||||
| 2017 | 2017 | 2016A | 2015 | 2014 | 2013 | |
| Selected Per–Share Data | ||||||
| Net asset value, beginning of period | $36.88 | $32.82 | $39.76 | $41.20 | $35.31 | $33.07 |
| Income from Investment Operations | ||||||
| Net investment income (loss)B | .78 | 1.11 | 1.16 | 1.19 | 1.41C | 1.08 |
| Net realized and unrealized gain (loss) | 3.97 | 4.04 | (7.10) | (1.32) | 5.53 | 2.22 |
| Total from investment operations | 4.75 | 5.15 | (5.94) | (.13) | 6.94 | 3.30 |
| Distributions from net investment income | (.03) | (1.06) | (1.00) | (1.31) | (1.01) | (1.02) |
| Distributions from net realized gain | – | (.03) | – | – | (.04) | (.04) |
| Total distributions | (.03) | (1.09) | (1.00) | (1.31) | (1.05) | (1.06) |
| Redemption fees added to paid in capitalB | – | –D | –D | –D | –D | –D |
| Net asset value, end of period | $41.60 | $36.88 | $32.82 | $39.76 | $41.20 | $35.31 |
| Total ReturnE,F | 12.89% | 15.85% | (15.12)% | (.15)% | 19.86% | 10.13% |
| Ratios to Average Net AssetsG,H | ||||||
| Expenses before reductions | .05%I | .06% | .08% | .08% | .08% | .08% |
| Expenses net of fee waivers, if any | .05%I | .05% | .06% | .06% | .06% | .06% |
| Expenses net of all reductions | .05%I | .05% | .06% | .06% | .06% | .06% |
| Net investment income (loss) | 3.92%I | 3.11% | 3.06% | 2.97% | 3.66%C | 3.30% |
| Supplemental Data | ||||||
| Net assets, end of period (000 omitted) | $5,672,860 | $4,761,598 | $1,734,082 | $1,797,254 | $1,651,834 | $1,155,733 |
| Portfolio turnover rateJ | 2%I,K | 2% | 1%K | 1% | 2% | 1% |
A For the year ended February 29.
B Calculated based on average shares outstanding during the period.
C Net Investment income per share reflects a large, non-recurring dividend which amounted to $.27 per share. Excluding this non-recurring dividend, the ratio of net investment income (loss) to average net assets would have been 2.96%.
D Amount represents less than $.005 per share.
E Total returns for periods of less than one year are not annualized.
F Total returns would have been lower if certain expenses had not been reduced during the applicable periods shown.
G Fees and expenses of any underlying Fidelity Central Funds are not included in the Fund's expense ratio. The Fund indirectly bears its proportionate share of the expenses of any underlying Fidelity Central Funds.
H Expense ratios reflect operating expenses of the class. Expenses before reductions do not reflect amounts reimbursed by the investment adviser or reductions from expense offset arrangements and do not represent the amount paid by the class during periods when reimbursements or reductions occur. Expenses net of fee waivers reflect expenses after reimbursement by the investment adviser but prior to reductions from expense offset arrangements. Expenses net of all reductions represent the net expenses paid by the class.
I Annualized
J Amount does not include the portfolio activity of any underlying Fidelity Central Funds.
K Portfolio turnover rate excludes securities received or delivered in-kind.
See accompanying notes which are an integral part of the financial statements.
Notes to Financial Statements (Unaudited)
For the period ended August 31, 2017
1. Organization.
Fidelity Total Market Index Fund, Fidelity Extended Market Index Fund and Fidelity International Index Fund (the Funds) are funds of Fidelity Concord Street Trust (the Trust). Each Fund is authorized to issue an unlimited number of shares. The Trust is registered under the Investment Company Act of 1940, as amended (the 1940 Act), as an open-end management investment company organized as a Massachusetts business trust. Fidelity Total Market Index Fund offers Investor Class, Premium Class, Institutional Class, Institutional Premium Class and Class F shares. Fidelity Extended Market Index Fund offers Investor Class, Premium Class and Institutional Premium Class shares. Fidelity International Index Fund offers Investor Class, Premium Class, Institutional Class and Institutional Premium Class shares, each of which has equal rights as to assets and voting privileges. Each class has exclusive voting rights with respect to matters that affect that class. Each Fund offers conversion privileges between share classes within each Fund to eligible shareholders. Class F shares of the Fund are only available for purchase by mutual funds for which Fidelity Management & Research Company (FMR) or an affiliate serves as investment manager.
2. Investments in Fidelity Central Funds.
The Funds invest in Fidelity Central Funds, which are open-end investment companies generally available only to other investment companies and accounts managed by the investment adviser and its affiliates. The Funds' Schedules of Investments list each of the Fidelity Central Funds held as of period end, if any, as an investment of each Fund, but do not include the underlying holdings of each Fidelity Central Fund. As an Investing Fund, each Fund indirectly bears its proportionate share of the expenses of the underlying Fidelity Central Funds.
The Money Market Central Funds seek preservation of capital and current income and are managed by Fidelity Investments Money Management, Inc. (FIMM), an affiliate of the investment adviser. Annualized expenses of the Money Market Central Funds as of their most recent shareholder report date are less than .005%.
A complete unaudited list of holdings for each Fidelity Central Fund is available upon request or at the Securities and Exchange Commission (the SEC) website at www.sec.gov. In addition, the financial statements of the Fidelity Central Funds are available on the SEC website or upon request.
3. Significant Accounting Policies.
Each Fund is an investment company and applies the accounting and reporting guidance of the Financial Accounting Standards Board (FASB) Accounting Standards Codification Topic 946 Financial Services – Investments Companies. The financial statements have been prepared in conformity with accounting principles generally accepted in the United States of America (GAAP), which require management to make certain estimates and assumptions at the date of the financial statements. Actual results could differ from those estimates. Subsequent events, if any, through the date that the financial statements were issued have been evaluated in the preparation of the financial statements. The following summarizes the significant accounting policies of the Funds:
Investment Valuation. Investments are valued as of 4:00 p.m. Eastern time on the last calendar day of the period. The Board of Trustees (the Board) has delegated the day to day responsibility for the valuation of each Fund's investments to the Fair Value Committee (the Committee) established by each Fund's investment adviser. In accordance with valuation policies and procedures approved by the Board, each Fund attempts to obtain prices from one or more third party pricing vendors or brokers to value its investments. When current market prices, quotations or currency exchange rates are not readily available or reliable, investments will be fair valued in good faith by the Committee, in accordance with procedures adopted by the Board. Factors used in determining fair value vary by investment type and may include market or investment specific events, changes in interest rates and credit quality. The frequency with which these procedures are used cannot be predicted and they may be utilized to a significant extent. The Committee oversees each Fund's valuation policies and procedures and reports to the Board on the Committee's activities and fair value determinations. The Board monitors the appropriateness of the procedures used in valuing each Fund's investments and ratifies the fair value determinations of the Committee.
Each Fund categorizes the inputs to valuation techniques used to value its investments into a disclosure hierarchy consisting of three levels as shown below:
- Level 1 – quoted prices in active markets for identical investments
- Level 2 – other significant observable inputs (including quoted prices for similar investments, interest rates, prepayment speeds, etc.)
- Level 3 – unobservable inputs (including the Fund's own assumptions based on the best information available)
Valuation techniques used to value each Fund's investments by major category are as follows:
Equity securities, including restricted securities, for which market quotations are readily available, are valued at the last reported sale price or official closing price as reported by a third party pricing vendor on the primary market or exchange on which they are traded and are categorized as Level 1 in the hierarchy. In the event there were no sales during the day or closing prices are not available, securities are valued at the last quoted bid price or may be valued using the last available price and are generally categorized as Level 2 in the hierarchy. For foreign equity securities, when market or security specific events arise, comparisons to the valuation of American Depositary Receipts (ADRs), futures contracts, Exchange-Traded Funds (ETFs) and certain indexes as well as quoted prices for similar securities may be used and would be categorized as Level 2 in the hierarchy. Utilizing these techniques may result in transfers between Level 1 and Level 2. For equity securities, including restricted securities, where observable inputs are limited, assumptions about market activity and risk are used and these securities may be categorized as Level 3 in the hierarchy.
Debt securities, including restricted securities, are valued based on evaluated prices received from third party pricing vendors or from brokers who make markets in such securities. U.S. government and government agency obligations are valued by pricing vendors who utilize matrix pricing which considers yield or price of bonds of comparable quality, coupon, maturity and type or by broker-supplied prices. When independent prices are unavailable or unreliable, debt securities may be valued utilizing pricing methodologies which consider similar factors that would be used by third party pricing vendors. Debt securities are generally categorized as Level 2 in the hierarchy but may be Level 3 depending on the circumstances.
The U.S. dollar value of foreign currency contracts is determined using currency exchange rates supplied by a pricing service and are categorized as Level 2 in the hierarchy. Futures contracts are valued at the settlement price established each day by the board of trade or exchange on which they are traded and are categorized as Level 1 in the hierarchy. Investments in open-end mutual funds, including the Fidelity Central Funds, are valued at their closing net asset value (NAV) each business day and are categorized as Level 1 in the hierarchy.
Changes in valuation techniques may result in transfers in or out of an assigned level within the disclosure hierarchy. The aggregate value of investments by input level as of August 31, 2017, including information on transfers between Levels 1 and 2, is included at the end of each applicable Fund's Schedule of Investments.
Foreign Currency. Foreign-denominated assets, including investment securities, and liabilities are translated into U.S. dollars at the exchange rates at period end. Purchases and sales of investment securities, income and dividends received and expenses denominated in foreign currencies are translated into U.S. dollars at the exchange rate in effect on the transaction date.
The effects of exchange rate fluctuations on investments are included with the net realized and unrealized gain (loss) on investment securities. Other foreign currency transactions resulting in realized and unrealized gain (loss) are disclosed separately.
Realized gains and losses on foreign currency transactions arise from the disposition of foreign currency, realized changes in the value of foreign currency between the trade and settlement dates on security transactions, and the difference between the amounts of dividends, interest and foreign withholding taxes recorded on transaction date and the U.S. dollar equivalent of the amounts actually received or paid. Unrealized gains and losses on assets and liabilities in foreign currencies arise from changes in the value of foreign currency, and from assets and liabilities denominated in foreign currencies, other than investments, which are held at period end.
Investment Transactions and Income. For financial reporting purposes, the Funds' investment holdings and NAV include trades executed through the end of the last business day of the period. The NAV per share for processing shareholder transactions is calculated as of the close of business of the New York Stock Exchange (NYSE), normally 4:00 p.m. Eastern time and includes trades executed through the end of the prior business day. Gains and losses on securities sold are determined on the basis of identified cost and may include proceeds received from litigation. Dividend income is recorded on the ex-dividend date, except for certain dividends from foreign securities where the ex-dividend date may have passed, which are recorded as soon as the Funds are informed of the ex-dividend date. Non-cash dividends included in dividend income, if any, are recorded at the fair market value of the securities received. Income and capital gain distributions from Fidelity Central Funds, if any, are recorded on the ex-dividend date. Certain distributions received by the Funds represent a return of capital or capital gain. The Funds determine the components of these distributions subsequent to the ex-dividend date, based upon receipt of tax filings or other correspondence relating to the underlying investment. These distributions are recorded as a reduction of cost of investments and/or as a realized gain. Interest income is accrued as earned and includes coupon interest and amortization of premium and accretion of discount on debt securities as applicable. Investment income is recorded net of foreign taxes withheld where recovery of such taxes is uncertain.
Class Allocations and Expenses. Investment income, realized and unrealized capital gains and losses, common expenses of each Fund, and certain fund-level expense reductions, if any, are allocated daily on a pro-rata basis to each class based on the relative net assets of each class to the total net assets of each Fund. Each class differs with respect to transfer agent fees incurred. Certain expense reductions may also differ by class. For the reporting period, the allocated portion of income and expenses to each class as a percent of its average net assets may vary due to the timing of recording these transactions in relation to fluctuating net assets of the classes. Expenses directly attributable to a fund are charged to that fund. Expenses attributable to more than one fund are allocated among the respective funds on the basis of relative net assets or other appropriate methods. Expense estimates are accrued in the period to which they relate and adjustments are made when actual amounts are known.
Deferred Trustee Compensation. Under a Deferred Compensation Plan (the Plan) for Fidelity Total Market Index Fund, independent Trustees may elect to defer receipt of a portion of their annual compensation. Deferred amounts are invested in a cross-section of Fidelity funds, are marked-to-market and remain in the Fund until distributed in accordance with the Plan. The investment of deferred amounts and the offsetting payable to the Trustees are included in the accompanying Statement of Assets and Liabilities.
Income Tax Information and Distributions to Shareholders. Each year, each Fund intends to qualify as a regulated investment company under Subchapter M of the Internal Revenue Code, including distributing substantially all of its taxable income and realized gains. As a result, no provision for U.S. Federal income taxes is required. Each Fund files a U.S. federal tax return, in addition to state and local tax returns as required. Each Fund's federal income tax returns are subject to examination by the Internal Revenue Service (IRS) for a period of three fiscal years after they are filed. State and local tax returns may be subject to examination for an additional fiscal year depending on the jurisdiction. Foreign taxes are provided for based on each Fund's understanding of the tax rules and rates that exist in the foreign markets in which it invests.
Distributions are declared and recorded on the ex-dividend date. Income dividends and capital gain distributions are declared separately for each class. Income and capital gain distributions are determined in accordance with income tax regulations, which may differ from GAAP.
Capital accounts within the financial statements are adjusted for permanent book-tax differences. These adjustments have no impact on net assets or the results of operations. Capital accounts are not adjusted for temporary book-tax differences which will reverse in a subsequent period.
Book-tax differences are primarily due to futures contracts, foreign currency transactions, passive foreign investment companies (PFIC), market discount, partnerships, deferred trustees compensation, capital loss carryforwards, expiring capital loss carryforwards and losses deferred due to wash sales and excise tax regulations.
As of period end, the cost and unrealized appreciation (depreciation) in securities, and derivatives if applicable, for federal income tax purposes were as follows for each Fund:
| Tax cost | Gross unrealized appreciation | Gross unrealized depreciation | Net unrealized appreciation (depreciation) | |
| Fidelity Total Market Index | $30,572,677,290 | $17,225,625,626 | $(2,019,235,140) | $15,206,390,486 |
| Fidelity Extended Market Index | 19,468,743,662 | 6,818,076,995 | (2,115,760,256) | 4,702,316,739 |
| Fidelity International Index | 18,066,906,537 | 4,284,425,878 | (2,555,932,821) | 1,728,493,057 |
Capital loss carryforwards are only available to offset future capital gains of the Funds to the extent provided by regulations and may be limited. Under the Regulated Investment Company Modernization Act of 2010 (the Act), the Funds are permitted to carry forward capital losses incurred in taxable years beginning after December 22, 2010 for an unlimited period and such capital losses are required to be used prior to any losses that expire. The capital loss carryforward information presented below, including any applicable limitation, is estimated as of prior fiscal period end and is subject to adjustment.
| Fiscal year of expiration | |||
| 2018 | 2019 | Total with expiration | |
| Fidelity International Index | $(148,608,684) | $(49,793,394) | $(198,402,078) |
| No expiration | ||||
| Short-term | Long-term | Total no expiration | Total capital loss carryforward | |
| Fidelity International Index | $(14,053,316) | $(377,210,986) | $(391,264,302) | $(589,666,380) |
Restricted Securities. The Funds may invest in securities that are subject to legal or contractual restrictions on resale. These securities generally may be resold in transactions exempt from registration or to the public if the securities are registered. Disposal of these securities may involve time-consuming negotiations and expense, and prompt sale at an acceptable price may be difficult. Information regarding restricted securities is included at the end of each applicable Fund's Schedule of Investments.
4. Derivative Instruments.
Risk Exposures and the Use of Derivative Instruments. The Funds' investment objective allows the Funds to enter into various types of derivative contracts, including futures contracts and forward foreign currency contracts. Derivatives are investments whose value is primarily derived from underlying assets, indices or reference rates and may be transacted on an exchange or over-the-counter (OTC). Derivatives may involve a future commitment to buy or sell a specified asset based on specified terms, to exchange future cash flows at periodic intervals based on a notional principal amount, or for one party to make one or more payments upon the occurrence of specified events in exchange for periodic payments from the other party.
The Funds used derivatives to increase returns and to manage exposure to certain risks as defined below. The success of any strategy involving derivatives depends on analysis of numerous economic factors, and if the strategies for investment do not work as intended, the Funds may not achieve their objectives.
The Funds' use of derivatives increased or decreased their exposure to the following risks:
| Equity Risk | Equity risk relates to the fluctuations in the value of financial instruments as a result of changes in market prices (other than those arising from interest rate risk or foreign exchange risk), whether caused by factors specific to an individual investment, its issuer, or all factors affecting all instruments traded in a market or market segment. |
| Foreign Exchange Risk | Foreign exchange rate risk relates to fluctuations in the value of an asset or liability due to changes in currency exchange rates. |
The Funds are also exposed to additional risks from investing in derivatives, such as liquidity risk and counterparty credit risk. Liquidity risk is the risk that the Funds will be unable to close out the derivative in the open market in a timely manner. Counterparty credit risk is the risk that the counterparty will not be able to fulfill its obligation to the Funds. Counterparty credit risk related to exchange-traded futures contracts may be mitigated by the protection provided by the exchange on which they trade.
Investing in derivatives may involve greater risks than investing in the underlying assets directly and, to varying degrees, may involve risk of loss in excess of any initial investment and collateral received and amounts recognized in the Statement of Assets and Liabilities. In addition, there may be the risk that the change in value of the derivative contract does not correspond to the change in value of the underlying instrument.
Net Realized Gain (Loss) and Change in Net Unrealized Appreciation (Depreciation) on Derivatives. The table below, which reflects the impacts of derivatives on the financial performance of the Funds, summarizes the net realized gain (loss) and change in net unrealized appreciation (depreciation) for derivatives during the period as presented in the Statement of Operations.
| Primary Risk Exposure / Derivative Type | Net Realized Gain (Loss) | Change in Net Unrealized Appreciation (Depreciation) |
| Fidelity Total Market Index | ||
| Equity Risk | ||
| Futures Contracts | $16,055,775 | $(6,800,984) |
| Total Equity Risk | 16,055,775 | (6,800,984) |
| Totals | $16,055,775 | $(6,800,984) |
| Fidelity Extended Market Index | ||
| Equity Risk | ||
| Futures Contracts | $(10,029) | $(264,817) |
| Total Equity Risk | (10,029) | (264,817) |
| Totals | $(10,029) | $(264,817) |
| Fidelity International Index | ||
| Equity Risk | ||
| Futures Contracts | $33,776,789 | $138,094 |
| Total Equity Risk | 33,776,789 | 138,094 |
| Foreign Exchange Risk | ||
| Forward Foreign Currency Contracts | 2,516,171 | 707 |
| Total Foreign Exchange Risk | 2,516,171 | 707 |
| Totals | $36,292,960 | $138,801 |
A summary of the value of derivatives by primary risk exposure as of period end, if any, is included at the end of the Schedule of Investments.
Forward Foreign Currency Contracts. Forward foreign currency contracts represent obligations to purchase or sell foreign currency on a specified future date at a price fixed at the time the contracts are entered into. The Funds used forward foreign currency contracts to facilitate transactions in foreign-denominated securities and to manage exposure to certain foreign currencies.
Forward foreign currency contracts are valued daily and fluctuations in exchange rates on open contracts are recorded as unrealized appreciation or (depreciation) and reflected in the Statement of Assets and Liabilities. When the contract is closed, the Funds realize a gain or loss equal to the difference between the closing value and the value at the time it was opened. The net realized gain (loss) and change in net unrealized appreciation (depreciation) on forward foreign currency contracts during the period is presented in the Statement of Operations.
Any open forward foreign currency contracts at period end are presented in the Schedule of Investments under the caption "Forward Foreign Currency Contracts." The contract amount and unrealized appreciation (depreciation) reflects each contract's exposure to the underlying currency at period end.
Futures Contracts. A futures contract is an agreement between two parties to buy or sell a specified underlying instrument for a fixed price at a specified future date. The Funds used futures contracts to manage their exposure to the stock market.
Upon entering into a futures contract, a fund is required to deposit either cash or securities (initial margin) with a clearing broker in an amount equal to a certain percentage of the face value of the contract. Futures contracts are marked-to-market daily and subsequent daily payments (variation margin) are made or received by a fund depending on the daily fluctuations in the value of the futures contracts and are recorded as unrealized appreciation or (depreciation). This receivable and/or payable, if any, is included in daily variation margin on futures contracts in the Statement of Assets and Liabilities. Realized gain or (loss) is recorded upon the expiration or closing of a futures contract.
Any open futures contracts at period end are presented in the Schedule of Investments under the caption "Futures Contracts". The underlying face amount at value reflects each contract's exposure to the underlying instrument or index at period end and is representative of volume of activity during the period. Securities deposited to meet initial margin requirements are identified in the Schedule of Investments.
5. Purchases and Sales of Investments.
Purchases and sales of securities, other than short-term securities and in-kind transactions, are noted in the table below.
| Purchases ($) | Sales ($) | |
| Fidelity Total Market Index | 3,043,267,353 | 544,461,282 |
| Fidelity Extended Market Index | 1,767,451,758 | 1,341,393,274 |
| Fidelity International Index | 1,571,813,407 | 191,603,421 |
Exchanges In-Kind. During the period, investments and cash received in-kind through subscriptions totaled $172,362,566 in exchange for 4,418,420 shares of Fidelity International Index. The amount of in-kind exchanges is included in share transactions in the accompanying Statement of Changes in Net Assets as well as the Notes to Financial Statements. The Fund recognized no gain or loss for federal income tax purposes.
6. Fees and Other Transactions with Affiliates.
Management Fee and Expense Contract. Fidelity Management & Research Company (the investment adviser) and its affiliates provide the Funds with investment management related services for which the Funds pay a monthly management fee. The management fee is based on an annual rate of .015% and .045% of Fidelity Total Market Index Fund and Fidelity Extended Market Index Fund's average net assets, respectively. Effective August 1, 2017, the Board approved an amendment to the management contract to reduce the management fee from an annual rate of .05% to .045% of Fidelity International Index Fund's average net assets. Under the management contract, the investment adviser pays all other fund-level expenses, except the compensation of the independent Trustees and certain other expenses such as interest expense, including commitment fees. For the reporting period, the total annual management fee rate was .049% of Fidelity International Index Fund's average net assets.
Effective August 1, 2017, the Board also approved an amendment to the expense contract. Under the expense contract, the investment adviser pays class-level expenses as necessary so that the total expenses do not exceed certain amounts of each class' average net assets on an annual basis with certain exceptions, as noted in the following table:
| Investor Class | Premium Class | Institutional Class | Institutional Premium Class | Class F | |
| Fidelity Total Market Index Fund | .09% | .035% | .030% | .015% | .015% |
| Fidelity Extended Market Index Fund | .10% | .07% | n/a | .045% | n/a |
| Fidelity International Index Fund | .16% | .06% | .05% | .045% | n/a |
Prior to August 1, 2017, the investment advisor paid class-level expenses as necessary so that the total expenses did not exceed certain amounts as noted in the following table:
| Investor Class | Premium Class | Institutional Class | Institutional Premium Class | Class F | |
| Fidelity Total Market Index Fund | .09% | .045% | .035% | .015% | .015% |
| Fidelity Extended Market Index Fund | .10% | .07% | n/a | .045% | n/a |
| Fidelity International Index Fund | .19% | .08% | .06% | .05% | n/a |
Sub-Adviser. Geode Capital Management, LLC (Geode), serves as sub-adviser for the Funds. Geode provides discretionary investment advisory services to the Funds and is paid by the investment adviser for providing these services.
Transfer Agent Fees. Fidelity Investments Institutional Operations Company, Inc. (FIIOC), an affiliate of the investment adviser, is the transfer, dividend disbursing and shareholder servicing agent for each class of the Funds. FIIOC receives transfer agent fees at annual rates based on class-level average net assets noted in the table below. FIIOC receives no fees for providing transfer agency services to Class F. FIIOC pays for typesetting, printing and mailing of shareholder reports, except proxy statements. Effective August 1, 2017, under the amended expense contract, each class pays all or a portion of the transfer agent fees at an annual rate based on class-level average net assets as noted in the following table:
| Received by FIIOC | Paid by Class Effective August 1, 2017 | Paid by Class Prior to August 1, 2017 | |
| Fidelity Total Market Index | |||
| Investor Class | .075% | .075% | .075% |
| Premium Class | .045% | .02% | .030% |
| Institutional Class | .035% | .015% | .02% |
| Institutional Premium Class | .015% | –% | –% |
| Fidelity Extended Market Index | |||
| Investor Class | .075% | .055% | .055% |
| Premium Class | .045% | .025% | .025% |
| Institutional Premium Class | .015% | –% | –% |
| Fidelity International Index | |||
| Investor Class | .21% | .115% | .14% |
| Premium Class | .11% | .015% | .03% |
| Institutional Class | .035% | .005% | .01% |
| Institutional Premium Class | .015% | –% | –% |
For the period, the total transfer agent fees paid by each applicable class were as follows:
| Amount | % of Class-Level Average Net Assets(a) | |
| Fidelity Total Market Index | ||
| Investor Class | $280,667 | .075 |
| Premium Class | 3,418,251 | .028 |
| Institutional Class | 237,148 | .019 |
| Institutional Premium Class | – | – |
| $3,936,066 | ||
| Fidelity Extended Market Index | ||
| Investor Class | $217,100 | .055 |
| Premium Class | 2,028,623 | .025 |
| Institutional Premium Class | – | – |
| $2,245,723 | ||
| Fidelity International Index | ||
| Investor Class | $494,547 | .136 |
| Premium Class | 1,326,456 | .027 |
| Institutional Class | 113,994 | .009 |
| Institutional Premium Class | – | – |
| $1,934,997 |
(a) Annualized
Interfund Lending Program. Pursuant to an Exemptive Order issued by the SEC, the Funds, along with other registered investment companies having management contracts with Fidelity Management & Research Company (FMR) or other affiliated entities of FMR, may participate in an interfund lending program. This program provides an alternative credit facility allowing the funds to borrow from, or lend money to, other participating affiliated funds. At period end, there were no interfund loans outstanding. Each applicable fund's activity in this program during the period for which loans were outstanding was as follows:
| Borrower or Lender | Average Loan Balance | Weighted Average Interest Rate | Interest Expense | |
| Fidelity Extended Market Index | Borrower | $12,117,500 | 1.27% | $4,279 |
Interfund Trades. The Funds may purchase from or sell securities to other Fidelity Funds under procedures adopted by the Board. The procedures have been designed to ensure these interfund trades are executed in accordance with Rule 17a-7 of the 1940 Act. Interfund trades are included within the respective purchases and sales amounts shown in the Purchases and Sales of Investments note.
7. Committed Line of Credit.
Certain Funds participate with other funds managed by the investment adviser or an affiliate in a $4.25 billion credit facility (the "line of credit") to be utilized for temporary or emergency purposes to fund shareholder redemptions or for other short-term liquidity purposes. The participating funds have agreed to pay commitment fees on their pro-rata portion of the line of credit, which are reflected in Miscellaneous expenses on the Statement of Operations, and are as follows:
| Fidelity Total Market Index | $65,808 |
| Fidelity Extended Market Index | 31,272 |
| Fidelity International Index | 27,760 |
During the period, the Funds did not borrow on this line of credit.
8. Security Lending.
Certain Funds lend portfolio securities through a lending agent from time to time in order to earn additional income. On the settlement date of the loan, each applicable Fund receives collateral (in the form of U.S. Treasury obligations, letters of credit and/or cash) against the loaned securities and maintains collateral in an amount not less than 100% of the market value of the loaned securities during the period of the loan. The market value of the loaned securities is determined at the close of business of the Funds and any additional required collateral is delivered to the Funds on the next business day. The Funds or borrower may terminate the loan at any time, and if the borrower defaults on its obligation to return the securities loaned because of insolvency or other reasons, the Funds may apply collateral received from the borrower against the obligation. The Funds may experience delays and costs in recovering the securities loaned. Any cash collateral received is invested in the Fidelity Securities Lending Cash Central Fund. The value of loaned securities and cash collateral at period end are disclosed on each applicable Fund's Statement of Assets and Liabilities. Security lending income represents the income earned on investing cash collateral, less rebates paid to borrowers and any lending agent fees associated with the loan, plus any premium payments received for lending certain types of securities. Security lending income is presented on each applicable Fund's Statement of Operations as a component of income from Fidelity Central Funds.
9. Expense Reductions.
Through arrangements with each applicable Fund's custodian, credits realized as a result of certain uninvested cash balances were used to reduce each applicable Fund's expenses as noted in the table below.
| Management fee reduction | |
| Fidelity Total Market Index | $7,598 |
| Fidelity Extended Market Index | 17,441 |
| Fidelity International Index | 483 |
10. Distributions to Shareholders.
Distributions to shareholders of each class were as follows:
| Six months ended August 31, 2017 | Year ended February 28, 2017 | |
| Fidelity Total Market Index | ||
| From net investment income | ||
| Investor Class | $1,974,932 | $16,896,705 |
| Premium Class | 65,259,273 | 378,185,569 |
| Institutional Class | 6,652,259 | 34,361,091 |
| Institutional Premium Class | 13,828,214 | 64,762,437 |
| Class F | 27,062,569 | 155,686,891 |
| Total | $114,777,247 | $649,892,693 |
| From net realized gain | ||
| Investor Class | $1,134,765 | $7,085,516 |
| Premium Class | 35,813,221 | 129,533,088 |
| Institutional Class | 3,614,600 | 11,106,621 |
| Institutional Premium Class | 7,368,243 | 19,355,949 |
| Class F | 14,420,059 | 51,563,948 |
| Total | $62,350,888 | $218,645,122 |
| Fidelity Extended Market Index | ||
| From net investment income | ||
| Investor Class | $1,423,640 | $11,793,290 |
| Premium Class | 29,394,831 | 197,507,483 |
| Institutional Premium Class | 4,191,983 | 26,821,111 |
| Total | $35,010,454 | $236,121,884 |
| From net realized gain | ||
| Investor Class | $8,271,347 | $32,816,744 |
| Premium Class | 162,915,168 | 506,502,591 |
| Institutional Premium Class | 22,375,206 | 66,487,880 |
| Total | $193,561,721 | $605,807,215 |
| Fidelity International Index | ||
| From net investment income | ||
| Investor Class | $291,977 | $24,076,149 |
| Premium Class | 6,344,090 | 233,531,573 |
| Institutional Class | 1,694,491 | 59,351,711 |
| Institutional Premium Class | 3,861,044 | 122,936,664 |
| Total | $12,191,602 | $439,896,097 |
| From net realized gain | ||
| Investor Class | $– | $671,052 |
| Premium Class | – | 7,150,508 |
| Institutional Class | – | 1,834,835 |
| Institutional Premium Class | – | 3,858,143 |
| Total | $– | $13,514,538 |
11. Share Transactions.
Share transactions for each class were as follows and may contain automatic conversions between classes or exchanges between affiliated funds:
| Shares | Shares | Dollars | Dollars | |
| Six months ended August 31, 2017 | Year ended February 28, 2017 | Six months ended August 31, 2017 | Year ended February 28, 2017 | |
| Fidelity Total Market Index | ||||
| Investor Class | ||||
| Shares sold | 3,340,976 | 8,795,818 | $231,898,223 | $548,532,660 |
| Reinvestment of distributions | 43,739 | 367,701 | 2,949,341 | 23,024,663 |
| Shares redeemed | (3,677,538) | (33,293,575) | (255,132,205) | (2,016,144,611) |
| Net increase (decrease) | (292,823) | (24,130,056) | $(20,284,641) | $(1,444,587,288) |
| Premium Class | ||||
| Shares sold | 29,280,232 | 72,938,672 | $2,028,991,757 | $4,593,828,256 |
| Reinvestment of distributions | 1,351,656 | 7,020,226 | 91,142,202 | 448,347,863 |
| Shares redeemed | (22,348,489) | (79,548,075) | (1,553,816,587) | (4,899,234,191) |
| Net increase (decrease) | 8,283,399 | 410,823 | $566,317,372 | $142,941,928 |
| Institutional Class | ||||
| Shares sold | 6,594,589 | 18,325,311 | $456,399,631 | $1,130,684,794 |
| Reinvestment of distributions | 135,029 | 632,945 | 9,103,650 | 40,590,795 |
| Shares redeemed | (4,468,517) | (6,254,614) | (309,213,464) | (386,019,299) |
| Net increase (decrease) | 2,261,101 | 12,703,642 | $156,289,817 | $785,256,290 |
| Institutional Premium Class | ||||
| Shares sold | 7,741,984 | 61,769,845 | $536,690,592 | $3,765,300,121 |
| Reinvestment of distributions | 314,441 | 1,300,415 | 21,196,456 | 84,118,042 |
| Shares redeemed | (5,600,465) | (8,839,371) | (389,953,233) | (559,041,660) |
| Net increase (decrease) | 2,455,960 | 54,230,889 | $167,933,815 | $3,290,376,503 |
| Class F | ||||
| Shares sold | 18,684,085 | 31,179,343 | $1,297,441,901 | $1,951,312,863 |
| Reinvestment of distributions | 615,195 | 3,238,153 | 41,482,628 | 207,250,839 |
| Shares redeemed | (2,657,086) | (22,327,967) | (185,814,320) | (1,432,285,287) |
| Net increase (decrease) | 16,642,194 | 12,089,529 | $1,153,110,209 | $726,278,415 |
| Fidelity Extended Market Index | ||||
| Investor Class | ||||
| Shares sold | 2,364,975 | 6,711,795 | $137,346,591 | $357,617,521 |
| Reinvestment of distributions | 166,868 | 807,669 | 9,451,425 | 43,536,543 |
| Shares redeemed | (3,554,306) | (23,767,851) | (206,020,009) | (1,235,806,632) |
| Net increase (decrease) | (1,022,463) | (16,248,387) | $(59,221,993) | $(834,652,568) |
| Premium Class | ||||
| Shares sold | 32,375,481 | 66,990,107 | $1,882,853,168 | $3,630,840,281 |
| Reinvestment of distributions | 3,255,275 | 12,308,792 | 184,378,834 | 673,965,867 |
| Shares redeemed | (38,774,296) | (57,455,289) | (2,253,935,691) | (3,070,052,457) |
| Net increase (decrease) | (3,143,540) | 21,843,610 | $(186,703,689) | $1,234,753,691 |
| Institutional Premium Class | ||||
| Shares sold | 11,510,913 | 18,428,166 | $667,157,368 | $957,133,137 |
| Reinvestment of distributions | 469,219 | 1,695,786 | 26,567,167 | 93,308,991 |
| Shares redeemed | (5,602,622) | (6,038,878) | (322,832,453) | (325,445,445) |
| Net increase (decrease) | 6,377,510 | 14,085,074 | $370,892,082 | $724,996,683 |
| Fidelity International Index | ||||
| Investor Class | ||||
| Shares sold | 5,832,986 | 15,676,836 | $232,726,625 | $556,901,003 |
| Reinvestment of distributions | 7,294 | 670,347 | 276,872 | 23,634,187 |
| Shares redeemed | (8,920,872) | (77,100,723) | (353,310,602) | (2,682,763,685) |
| Net increase (decrease) | (3,080,592) | (60,753,540) | $(120,307,105) | $(2,102,228,495) |
| Premium Class | ||||
| Shares sold | 41,063,321 | 67,826,776 | $1,638,488,081 | $2,420,149,137 |
| Reinvestment of distributions | 152,855 | 6,241,945 | 5,800,830 | 219,796,690 |
| Shares redeemed | (24,422,496) | (71,605,542) | (970,405,932) | (2,541,773,239) |
| Net increase (decrease) | 16,793,680 | 2,463,179 | $673,882,979 | $98,172,588 |
| Institutional Class | ||||
| Shares sold | 20,486,749 | 31,906,258 | $816,362,438 | $1,129,449,528 |
| Reinvestment of distributions | 44,637 | 1,737,812 | 1,694,412 | 61,183,600 |
| Shares redeemed | (7,921,466) | (23,692,151) | (316,309,753) | (837,030,962) |
| Net increase (decrease) | 12,609,920 | 9,951,919 | $501,747,097 | $353,602,166 |
| Institutional Premium Class | ||||
| Shares sold | 19,329,635(a) | 94,972,931 | $765,866,789(a) | $3,303,416,370 |
| Reinvestment of distributions | 101,740 | 3,602,030 | 3,861,023 | 126,794,046 |
| Shares redeemed | (12,157,309) | (22,317,015) | (484,385,984) | (795,883,611) |
| Net increase (decrease) | 7,274,066 | 76,257,946 | $285,341,828 | $2,634,326,805 |
(a) Amount includes in-kind exchanges (see the Exchanges In-Kind note for additional details).
12. Other.
The Funds' organizational documents provide former and current trustees and officers with a limited indemnification against liabilities arising in connection with the performance of their duties to the Funds. In the normal course of business, the Funds may also enter into contracts that provide general indemnifications. The Funds' maximum exposure under these arrangements is unknown as this would be dependent on future claims that may be made against the Funds. The risk of material loss from such claims is considered remote.
At the end of the period, mutual funds managed by the investment advisor or its affiliates were the owners of record, in the aggregate, of approximately 24% of the total outstanding shares of the Fidelity Total Market Index Fund.
Shareholder Expense Example
As a shareholder of a Fund, you incur two types of costs: (1) transaction costs and (2) ongoing costs, including management fees and other Fund expenses. This Example is intended to help you understand your ongoing costs (in dollars) of investing in the Funds and to compare these costs with the ongoing costs of investing in other mutual funds.
The Example is based on an investment of $1,000 invested at the beginning of the period and held for the entire period (March 1, 2017 to August 31, 2017).
Actual Expenses
The first line of the accompanying table for each class of the Fund provides information about actual account values and actual expenses. You may use the information in this line, together with the amount you invested, to estimate the expenses that you paid over the period. Simply divide your account value by $1,000.00 (for example, an $8,600 account value divided by $1,000.00 = 8.6), then multiply the result by the number in the first line for a class of the Fund under the heading entitled "Expenses Paid During Period" to estimate the expenses you paid on your account during this period. A small balance maintenance fee of $12.00 that is charged once a year may apply for certain accounts with a value of less than $2,000. This fee is not included in the table below. If it was, the estimate of expenses you paid during the period would be higher, and your ending account value lower, by this amount. In addition, the Fund, as a shareholder in the underlying Fidelity Central Funds, will indirectly bear its pro-rata share of the fees and expenses incurred by the underlying Fidelity Central Funds. These fees and expenses are not included in the Fund's annualized expense ratio used to calculate the expense estimate in the table below.
Hypothetical Example for Comparison Purposes
The second line of the accompanying table for each class of the Fund provides information about hypothetical account values and hypothetical expenses based on a Class' actual expense ratio and an assumed rate of return of 5% per year before expenses, which is not the Class' actual return. The hypothetical account values and expenses may not be used to estimate the actual ending account balance or expenses you paid for the period. You may use this information to compare the ongoing costs of investing in the Fund and other funds. To do so, compare this 5% hypothetical example with the 5% hypothetical examples that appear in the shareholder reports of the other funds. A small balance maintenance fee of $12.00 that is charged once a year may apply for certain accounts with a value of less than $2,000. This fee is not included in the table below. If it was, the estimate of expenses you paid during the period would be higher, and your ending account value lower, by this amount. In addition, the Fund, as a shareholder in the underlying Fidelity Central Funds, will indirectly bear its pro-rata share of the fees and expenses incurred by the underlying Fidelity Central Funds. These fees and expenses are not included in the Fund's annualized expense ratio used to calculate the expense estimate in the table below.
Please note that the expenses shown in the table are meant to highlight your ongoing costs only and do not reflect any transaction costs. Therefore, the second line of the table is useful in comparing ongoing costs only, and will not help you determine the relative total costs of owning different funds.
| Annualized Expense Ratio-A | Beginning Account Value March 1, 2017 | Ending Account Value August 31, 2017 | Expenses Paid During Period-B March 1, 2017 to August 31, 2017 | |
| Fidelity Total Market Index | ||||
| Investor Class | .09% | |||
| Actual | $1,000.00 | $1,051.90 | $.47 | |
| Hypothetical-C | $1,000.00 | $1,024.75 | $.46 | |
| Premium Class | .04% | |||
| Actual | $1,000.00 | $1,052.40 | $.21 | |
| Hypothetical-C | $1,000.00 | $1,025.00 | $.20 | |
| Institutional Class | .03% | |||
| Actual | $1,000.00 | $1,052.40 | $.16 | |
| Hypothetical-C | $1,000.00 | $1,025.05 | $.15 | |
| Institutional Premium Class | .02% | |||
| Actual | $1,000.00 | $1,052.50 | $.10 | |
| Hypothetical-C | $1,000.00 | $1,025.10 | $.10 | |
| Class F | .02% | |||
| Actual | $1,000.00 | $1,052.40 | $.10 | |
| Hypothetical-C | $1,000.00 | $1,025.10 | $.10 | |
| Fidelity Extended Market Index | ||||
| Investor Class | .10% | |||
| Actual | $1,000.00 | $1,033.30 | $.51 | |
| Hypothetical-C | $1,000.00 | $1,024.70 | $.51 | |
| Premium Class | .07% | |||
| Actual | $1,000.00 | $1,033.40 | $.36 | |
| Hypothetical-C | $1,000.00 | $1,024.85 | $.36 | |
| Institutional Premium Class | .05% | |||
| Actual | $1,000.00 | $1,033.60 | $.26 | |
| Hypothetical-C | $1,000.00 | $1,024.95 | $.26 | |
| Fidelity International Index | ||||
| Investor Class | .19%-D | |||
| Actual | $1,000.00 | $1,127.90 | $1.02-D | |
| Hypothetical-C | $1,000.00 | $1,024.25 | $.97-D | |
| Premium Class | .08% | |||
| Actual | $1,000.00 | $1,128.50 | $.43 | |
| Hypothetical-C | $1,000.00 | $1,024.80 | $.41 | |
| Institutional Class | .06% | |||
| Actual | $1,000.00 | $1,128.50 | $.32 | |
| Hypothetical-C | $1,000.00 | $1,024.90 | $.31 | |
| Institutional Premium Class | .05% | |||
| Actual | $1,000.00 | $1,128.90 | $.27 | |
| Hypothetical-C | $1,000.00 | $1,024.95 | $.26 |
A Annualized expense ratio reflects expenses net of applicable fee waivers.
B Expenses are equal to each Class' annualized expense ratio, multiplied by the average account value over the period, multiplied by 184/ 365 (to reflect the one-half year period).
C 5% return per year before expenses
D If fees and changes to the class level expense contract and/ or expense cap, effective August 1, 2017, had been in effect during the entire period, the restated annualized expense ratio would have been .16% and the expenses paid in the actual and hypothetical examples above would have been $.86 and $.82, respectively.
Board Approval of Investment Advisory Contracts and Management Fees
Fidelity Extended Market Index Fund
Fidelity International Index Fund
Fidelity Total Market Index Fund
Each year, the Board of Trustees, including the Independent Trustees (together, the Board), votes on the renewal of the management contract with Fidelity Management & Research Company (FMR) and the sub-advisory agreements (together, the Advisory Contracts) for each fund, including each fund's sub-advisory agreement with Geode Capital Management, LLC (Geode). FMR and the sub-advisers are referred to herein as the Investment Advisers. The Board, assisted by the advice of fund counsel and Independent Trustees' counsel, requests and considers a broad range of information relevant to the renewal of the Advisory Contracts throughout the year.
The Board meets regularly and, at each of its meetings, covers an extensive agenda of topics and materials and considers factors that are relevant to its annual consideration of the renewal of each fund's Advisory Contracts, including the services and support provided to each fund and its shareholders. The Board has established various standing committees (Committees), each composed of and chaired by Independent Trustees with varying backgrounds, to which the Board has assigned specific subject matter responsibilities in order to enhance effective decision-making by the Board. The Board, acting directly and through its Committees, requests and receives information concerning the annual consideration of the renewal of each fund's Advisory Contracts. The Board also meets as needed to review matters specifically related to the Board's annual consideration of the renewal of the Advisory Contracts. Members of the Board may also meet with trustees of other Fidelity funds through ad hoc joint committees to discuss certain matters relevant to all of the Fidelity funds.
At its July 2017 meeting, the Board unanimously determined to renew each fund's Advisory Contracts. In reaching its determination, the Board considered all factors it believed relevant, including (i) the nature, extent, and quality of the services to be provided to each fund and its shareholders (including the investment performance of each fund); (ii) the competitiveness of each fund's management fee and total expense ratio relative to peer funds; (iii) the total costs of the services to be provided by and the profits to be realized by Fidelity from its relationships with each fund; and (iv) the extent to which, if any, economies of scale exist and would be realized as each fund grows, and whether any economies of scale are appropriately shared with fund shareholders.
In considering whether to renew the Advisory Contracts for each fund, the Board reached a determination, with the assistance of fund counsel and Independent Trustees' counsel and through the exercise of its business judgment, that the renewal of the Advisory Contracts was in the best interests of each fund and its shareholders and that the compensation payable under the Advisory Contracts was fair and reasonable. The Board's decision to renew the Advisory Contracts was not based on any single factor, but rather was based on a comprehensive consideration of all the information provided to the Board at its meetings throughout the year. The Board, in reaching its determination to renew the Advisory Contracts, was aware that shareholders of each fund have a broad range of investment choices available to them, including a wide choice among funds offered by Fidelity's competitors, and that each fund's shareholders, who have the opportunity to review and weigh the disclosure provided by the fund in its prospectus and other public disclosures, have chosen to invest in that fund, which is part of the Fidelity family of funds.
Nature, Extent, and Quality of Services Provided. The Board considered staffing as it relates to the funds, including the backgrounds of investment personnel of Fidelity and Geode, and also considered the funds' investment objectives, strategies, and related investment philosophies. The Independent Trustees also had discussions with senior management of Fidelity's investment operations and investment groups and with representatives of Geode. The Board considered the structure of the investment personnel compensation programs and whether the structures provide appropriate incentives to act in the best interests of each fund. Additionally, the Board considered the portfolio managers' investments, if any, in the funds that they manage.Resources Dedicated to Investment Management and Support Services. The Board and the Fund Oversight and Research Committees reviewed the general qualifications and capabilities of Fidelity's and Geode's investment staffs, including their size, education, experience, and resources, as well as Fidelity's approach to recruiting, training, managing, and compensating investment personnel. The Board noted that Fidelity has continued to increase the resources devoted to non-U.S. offices, including expansion of Fidelity's global investment organization. Additionally, in its deliberations, the Board considered Fidelity's and Geode's trading, risk management, compliance, and technology and operations capabilities and resources, which are integral parts of the investment management process.Shareholder and Administrative Services. The Board considered (i) the nature, extent, quality, and cost of advisory, administrative, and shareholder services performed by the Investment Advisers and their affiliates under the Advisory Contracts and under separate agreements covering transfer agency, pricing and bookkeeping, and securities lending services for each fund; (ii) the nature and extent of the supervision of third party service providers, principally custodians, subcustodians, and pricing vendors; and (iii) the resources devoted to, and the record of compliance with, each fund's compliance policies and procedures. The Board also reviewed the allocation of fund brokerage, including allocations to brokers affiliated with the Investment Advisers.The Board noted that the growth of fund assets over time across the complex allows Fidelity to reinvest in the development of services designed to enhance the value or convenience of the Fidelity funds as investment vehicles. These services include 24-hour access to account information and market information through telephone representatives and over the Internet, investor education materials and asset allocation tools, and the expanded availability of Fidelity Investor Centers.In 2014, the Board formed an ad hoc Committee on Transfer Agency Fees to review the variety of transfer agency fee structures throughout the industry and Fidelity's competitive positioning with respect to industry participants.Investment in a Large Fund Family. The Board considered the benefits to shareholders of investing in a Fidelity fund, including the benefits of investing in a fund that is part of a large family of funds offering a variety of investment disciplines and providing a large variety of mutual fund investor services. The Board noted that Fidelity had taken, or had made recommendations that resulted in the Fidelity funds taking, a number of actions over the previous year that benefited particular funds, including: (i) continuing to dedicate additional resources to Fidelity's investment research process, and to the support of the senior management team that oversees asset management; (ii) continuing efforts to enhance Fidelity's global research capabilities; (iii) launching new funds and making other enhancements to meet client needs; (iv) launching new share classes of existing funds; (v) eliminating purchase minimums and broadening eligibility requirements for certain lower-priced share classes; (vi) reducing management fees and total expenses for certain growth equity funds and index funds; (vii) lowering expense caps for certain existing funds and classes to reduce expenses borne by shareholders; (viii) eliminating short-term redemption fees for certain funds; (ix) introducing a new pricing structure for certain funds of funds that is expected to reduce overall expenses paid by shareholders; (x) rationalizing product lines and gaining increased efficiencies through proposals for fund mergers and share class consolidations; (xi) continuing to develop, acquire and implement systems and technology to improve services to the funds and shareholders, strengthen information security, and increase efficiency; and (xii) implementing enhancements to further strengthen Fidelity's product line to increase investors' probability of success in achieving their investment goals, including retirement income goals.Investment Performance. The Board considered whether each fund has operated in accordance with its investment objective, as well as its record of compliance with its investment restrictions and its performance history.The Board took into account discussions with representatives of the Investment Advisers about fund investment performance that occur at Board meetings throughout the year. In this regard the Board noted that as part of regularly scheduled fund reviews and other reports to the Board on fund performance, the Board considers annualized return information for each fund for different time periods, measured against the securities market index the fund seeks to track. The Board also periodically considers each fund's tracking error versus its benchmark index. In its evaluation of fund investment performance, the Board gave particular attention to information indicating changes in performance of certain Fidelity funds for specific time periods and discussed with the Investment Advisers the reasons for any overperformance or underperformance.In addition to reviewing absolute and relative fund performance, the Independent Trustees periodically consider the appropriateness of fund performance metrics in evaluating the results achieved. In general, the Independent Trustees believe that an index fund's performance should be evaluated based on net performance (after fees and expenses) of both the highest performing and lowest performing fund share classes, where applicable, compared to a fund's benchmark index, over appropriate time periods taking into account relevant factors including the following: general market conditions; the characteristics of the fund's benchmark index; the extent to which statistical sampling is employed; any securities lending revenues; and fund cash flows and other factors.The Independent Trustees recognize that shareholders evaluate performance on a net basis over their own holding periods, for which one-, three-, and five-year periods are often used as a proxy. For this reason, the performance information reviewed by the Board also included net cumulative calendar year total return information for each fund and its benchmark index for the most recent one-, three-, and five-year periods, as shown below. Peer groups are not shown below because each fund does not generally utilize a peer group for performance comparison purposes. For Fidelity International Index Fund, returns of the benchmark index are "net MA," i.e., adjusted for tax withholding rates applicable to U.S.-based funds organized as Massachusetts business trusts.Fidelity Extended Market Index Fund

Fidelity International Index Fund
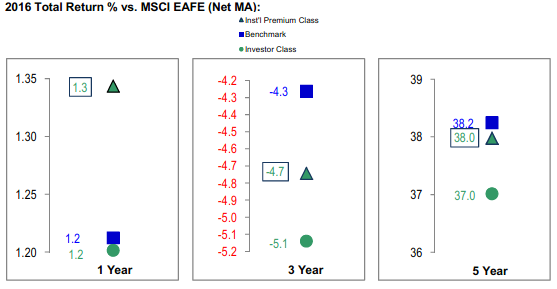
Fidelity Total Market Index Fund
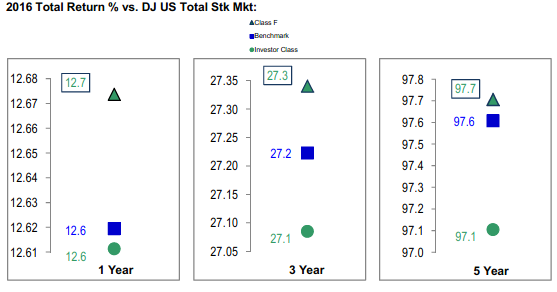
Fidelity Extended Market Index Fund

Fidelity International Index Fund
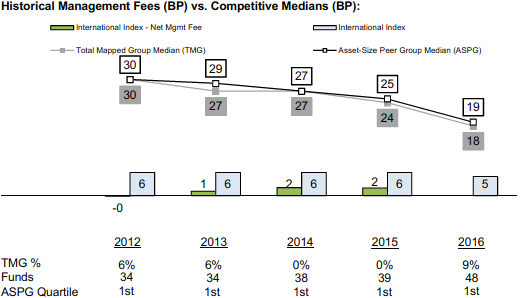
Fidelity Total Market Index Fund

![]()
SIF-SANN-1017
1.707985.119
Fidelity® Total Market Index Fund Semi-Annual Report August 31, 2017 |
|
Contents
Board Approval of Investment Advisory Contracts and Management Fees |
To view a fund's proxy voting guidelines and proxy voting record for the 12-month period ended June 30, visit http://www.fidelity.com/proxyvotingresults or visit the Securities and Exchange Commission's (SEC) web site at http://www.sec.gov.
You may also call 1-800-835-5092 to request a free copy of the proxy voting guidelines.
Standard & Poor's, S&P and S&P 500 are registered service marks of The McGraw-Hill Companies, Inc. and have been licensed for use by Fidelity Distributors Corporation.
Other third-party marks appearing herein are the property of their respective owners.
All other marks appearing herein are registered or unregistered trademarks or service marks of FMR LLC or an affiliated company. © 2017 FMR LLC. All rights reserved.
This report and the financial statements contained herein are submitted for the general information of the shareholders of the Fund. This report is not authorized for distribution to prospective investors in the Fund unless preceded or accompanied by an effective prospectus.
A fund files its complete schedule of portfolio holdings with the SEC for the first and third quarters of each fiscal year on Form N-Q. Forms N-Q are available on the SEC’s web site at http://www.sec.gov. A fund's Forms N-Q may be reviewed and copied at the SEC’s Public Reference Room in Washington, DC. Information regarding the operation of the SEC's Public Reference Room may be obtained by calling 1-800-SEC-0330.
For a complete list of a fund's portfolio holdings, view the most recent holdings listing, semiannual report, or annual report on Fidelity's web site at http://www.fidelity.com, http://www.institutional.fidelity.com, or http://www.401k.com, as applicable.
NOT FDIC INSURED •MAY LOSE VALUE •NO BANK GUARANTEE
Neither the Fund nor Fidelity Distributors Corporation is a bank.
Investment Summary (Unaudited)
Top Ten Stocks as of August 31, 2017
| % of fund's net assets | % of fund's net assets 6 months ago | |
| Apple, Inc. | 3.3 | 2.9 |
| Microsoft Corp. | 2.3 | 2.0 |
| Facebook, Inc. Class A | 1.6 | 1.3 |
| Amazon.com, Inc. | 1.5 | 1.3 |
| Johnson & Johnson | 1.4 | 1.4 |
| Berkshire Hathaway, Inc. Class B | 1.4 | 1.3 |
| Exxon Mobil Corp. | 1.3 | 1.4 |
| JPMorgan Chase & Co. | 1.3 | 1.3 |
| Alphabet, Inc. Class A | 1.1 | 1.0 |
| Alphabet, Inc. Class C | 1.1 | 1.0 |
| 16.3 |
Top Market Sectors as of August 31, 2017
| % of fund's net assets | % of fund's net assets 6 months ago | |
| Information Technology | 22.5 | 20.6 |
| Financials | 14.6 | 15.3 |
| Health Care | 14.1 | 13.3 |
| Consumer Discretionary | 12.4 | 12.4 |
| Industrials | 10.6 | 10.7 |
| Consumer Staples | 7.5 | 8.3 |
| Energy | 5.3 | 6.2 |
| Real Estate | 4.1 | 4.0 |
| Materials | 3.3 | 3.3 |
| Utilities | 3.3 | 3.2 |
Investments August 31, 2017 (Unaudited)
Showing Percentage of Net Assets
| Common Stocks - 99.6% | |||
| Shares | Value | ||
| CONSUMER DISCRETIONARY - 12.4% | |||
| Auto Components - 0.4% | |||
| Adient PLC | 159,281 | $11,257,981 | |
| American Axle & Manufacturing Holdings, Inc. (a) | 148,067 | 2,163,259 | |
| Autoliv, Inc. (b) | 151,190 | 16,422,258 | |
| BorgWarner, Inc. | 350,359 | 16,260,161 | |
| Clean Diesel Technologies, Inc. (a)(b) | 8,475 | 18,052 | |
| Cooper Tire & Rubber Co. | 91,978 | 3,090,461 | |
| Cooper-Standard Holding, Inc. (a) | 32,523 | 3,271,163 | |
| Dana Holding Corp. | 235,295 | 5,663,551 | |
| Delphi Automotive PLC | 456,707 | 44,026,555 | |
| Dorman Products, Inc. (a) | 55,243 | 3,669,240 | |
| Fox Factory Holding Corp. (a) | 56,459 | 2,258,360 | |
| Gentex Corp. | 483,427 | 8,832,211 | |
| Gentherm, Inc. (a) | 58,309 | 1,816,325 | |
| Hertz Global Holdings, Inc. (a)(b) | 124,860 | 2,714,456 | |
| Horizon Global Corp. (a)(b) | 41,718 | 717,550 | |
| LCI Industries | 43,682 | 4,315,782 | |
| Lear Corp. | 119,894 | 17,928,949 | |
| Modine Manufacturing Co. (a) | 88,001 | 1,421,216 | |
| Motorcar Parts of America, Inc. (a) | 32,435 | 852,067 | |
| Shiloh Industries, Inc. (a) | 23,634 | 207,034 | |
| Standard Motor Products, Inc. | 32,576 | 1,436,602 | |
| Stoneridge, Inc. (a) | 43,907 | 727,100 | |
| Strattec Security Corp. | 4,334 | 136,088 | |
| Superior Industries International, Inc. | 39,790 | 582,924 | |
| Sypris Solutions, Inc. (a) | 16,848 | 27,631 | |
| Tenneco, Inc. | 96,642 | 5,237,996 | |
| The Goodyear Tire & Rubber Co. | 424,185 | 12,852,806 | |
| Tower International, Inc. | 31,785 | 713,573 | |
| UQM Technologies, Inc. (a) | 38,648 | 34,783 | |
| Visteon Corp. (a) | 57,388 | 6,624,871 | |
| VOXX International Corp. (a)(b) | 39,260 | 318,006 | |
| Workhorse Group, Inc. (a)(b) | 43,808 | 147,633 | |
| 175,746,644 | |||
| Automobiles - 0.6% | |||
| Ford Motor Co. | 6,679,951 | 73,679,860 | |
| General Motors Co. | 2,352,167 | 85,948,182 | |
| Harley-Davidson, Inc. (b) | 295,888 | 13,909,695 | |
| REV Group, Inc. (b) | 22,528 | 567,480 | |
| Tesla, Inc. (a)(b) | 217,184 | 77,295,786 | |
| Thor Industries, Inc. | 80,273 | 8,720,859 | |
| Winnebago Industries, Inc. (b) | 45,507 | 1,645,078 | |
| 261,766,940 | |||
| Distributors - 0.1% | |||
| Core-Mark Holding Co., Inc. | 75,278 | 2,037,023 | |
| Educational Development Corp. (b) | 2,866 | 30,236 | |
| Genuine Parts Co. | 248,224 | 20,560,394 | |
| LKQ Corp. (a) | 538,255 | 18,650,536 | |
| Pool Corp. | 71,179 | 7,095,835 | |
| Weyco Group, Inc. | 5,169 | 142,406 | |
| 48,516,430 | |||
| Diversified Consumer Services - 0.2% | |||
| American Public Education, Inc. (a) | 24,607 | 453,999 | |
| Ascent Capital Group, Inc. (a) | 16,905 | 167,867 | |
| Bridgepoint Education, Inc. (a) | 27,580 | 243,531 | |
| Bright Horizons Family Solutions, Inc. (a) | 83,097 | 6,641,943 | |
| Cambium Learning Group, Inc. (a) | 12,514 | 73,332 | |
| Capella Education Co. | 20,930 | 1,409,636 | |
| Career Education Corp. (a) | 109,234 | 1,049,739 | |
| Carriage Services, Inc. | 24,048 | 588,936 | |
| Chegg, Inc. (a)(b) | 135,548 | 1,923,426 | |
| Collectors Universe, Inc. | 6,416 | 154,176 | |
| DeVry, Inc. | 101,372 | 3,466,922 | |
| Graham Holdings Co. | 8,772 | 5,150,918 | |
| Grand Canyon Education, Inc. (a) | 82,727 | 6,787,750 | |
| H&R Block, Inc. | 348,246 | 9,312,098 | |
| Houghton Mifflin Harcourt Co. (a) | 170,821 | 1,742,374 | |
| K12, Inc. (a) | 59,099 | 1,059,054 | |
| Laureate Education, Inc. Class A | 104,594 | 1,531,256 | |
| Liberty Tax, Inc. | 8,571 | 115,280 | |
| Lincoln Educational Services Corp. (a) | 15,671 | 43,879 | |
| National American University Holdings, Inc. | 5,378 | 11,616 | |
| Regis Corp. (a) | 52,945 | 703,110 | |
| Service Corp. International | 317,953 | 11,236,459 | |
| ServiceMaster Global Holdings, Inc. (a) | 236,280 | 11,133,514 | |
| Sotheby's Class A (Ltd. vtg.) (a)(b) | 77,436 | 3,474,553 | |
| Strayer Education, Inc. | 17,939 | 1,435,299 | |
| Universal Technical Institute, Inc. (a) | 29,419 | 104,143 | |
| Weight Watchers International, Inc. (a) | 50,480 | 2,362,969 | |
| 72,377,779 | |||
| Hotels, Restaurants & Leisure - 2.1% | |||
| ARAMARK Holdings Corp. | 423,578 | 17,235,389 | |
| Belmond Ltd. Class A (a) | 147,743 | 1,883,723 | |
| Biglari Holdings, Inc. (a) | 2,475 | 736,956 | |
| BJ's Restaurants, Inc. (a) | 35,904 | 1,080,710 | |
| Bloomin' Brands, Inc. | 181,456 | 3,086,567 | |
| Bob Evans Farms, Inc. | 36,126 | 2,484,746 | |
| Bojangles', Inc. (a)(b) | 24,608 | 328,517 | |
| Boyd Gaming Corp. | 147,259 | 3,893,528 | |
| Bravo Brio Restaurant Group, Inc. (a) | 12,451 | 34,240 | |
| Brinker International, Inc. | 77,201 | 2,410,215 | |
| Buffalo Wild Wings, Inc. (a) | 29,848 | 3,066,882 | |
| Caesars Entertainment Corp. (a)(b) | 91,365 | 1,059,834 | |
| Carnival Corp. | 714,595 | 49,650,061 | |
| Carrols Restaurant Group, Inc. (a) | 61,598 | 671,418 | |
| Century Casinos, Inc. (a) | 28,742 | 196,883 | |
| Chipotle Mexican Grill, Inc. (a)(b) | 49,526 | 15,685,379 | |
| Choice Hotels International, Inc. | 66,238 | 4,110,068 | |
| Churchill Downs, Inc. | 21,995 | 4,297,823 | |
| Chuy's Holdings, Inc. (a)(b) | 26,361 | 495,587 | |
| ClubCorp Holdings, Inc. | 105,707 | 1,797,019 | |
| Cracker Barrel Old Country Store, Inc. (b) | 40,400 | 6,005,864 | |
| Darden Restaurants, Inc. | 211,433 | 17,356,535 | |
| Dave & Buster's Entertainment, Inc. (a) | 61,208 | 3,578,220 | |
| Del Frisco's Restaurant Group, Inc. (a) | 37,615 | 526,610 | |
| Del Taco Restaurants, Inc. (a)(b) | 75,328 | 1,060,618 | |
| Denny's Corp. (a) | 117,334 | 1,403,315 | |
| DineEquity, Inc. | 27,200 | 1,081,200 | |
| Domino's Pizza, Inc. | 81,781 | 14,905,405 | |
| Dover Downs Gaming & Entertainment, Inc. (a) | 1,508 | 1,493 | |
| Dover Motorsports, Inc. | 9,993 | 20,985 | |
| Drive Shack, Inc. | 86,128 | 232,546 | |
| Dunkin' Brands Group, Inc. | 155,091 | 7,996,492 | |
| El Pollo Loco Holdings, Inc. (a)(b) | 42,298 | 480,082 | |
| Eldorado Resorts, Inc. (a)(b) | 69,377 | 1,595,671 | |
| Empire Resorts, Inc. (a)(b) | 4,022 | 93,914 | |
| Extended Stay America, Inc. unit | 338,299 | 6,627,277 | |
| Famous Dave's of America, Inc. (a)(b) | 7,623 | 33,160 | |
| Fiesta Restaurant Group, Inc. (a)(b) | 50,677 | 881,780 | |
| Fogo de Chao, Inc. (a) | 21,909 | 277,149 | |
| Golden Entertainment, Inc. (a) | 12,680 | 288,090 | |
| Good Times Restaurants, Inc. (a) | 7,939 | 22,229 | |
| Habit Restaurants, Inc. Class A (a)(b) | 36,946 | 480,298 | |
| Hilton Grand Vacations, Inc. | 107,778 | 3,906,953 | |
| Hilton, Inc. | 350,021 | 22,516,851 | |
| Hyatt Hotels Corp. Class A (a) | 85,165 | 5,068,169 | |
| ILG, Inc. | 190,126 | 5,019,326 | |
| International Speedway Corp. Class A | 44,736 | 1,594,838 | |
| J. Alexanders Holdings, Inc. (a) | 20,559 | 203,534 | |
| Jack in the Box, Inc. | 50,437 | 4,721,912 | |
| Jamba, Inc. (a)(b) | 19,136 | 188,298 | |
| Kona Grill, Inc. (a)(b) | 8,466 | 25,398 | |
| La Quinta Holdings, Inc. (a) | 128,968 | 2,037,694 | |
| Las Vegas Sands Corp. | 629,877 | 39,184,648 | |
| Lindblad Expeditions Holdings (a) | 22,275 | 247,698 | |
| Luby's, Inc. (a) | 14,614 | 38,727 | |
| Marcus Corp. | 30,096 | 749,390 | |
| Marriott International, Inc. Class A | 529,166 | 54,811,014 | |
| Marriott Vacations Worldwide Corp. (b) | 42,588 | 4,955,540 | |
| McDonald's Corp. | 1,396,519 | 223,401,144 | |
| MGM Mirage, Inc. | 840,509 | 27,703,177 | |
| Monarch Casino & Resort, Inc. (a) | 16,794 | 597,363 | |
| Nathan's Famous, Inc. (a) | 3,561 | 208,497 | |
| Noodles & Co. (a)(b) | 28,579 | 110,029 | |
| Norwegian Cruise Line Holdings Ltd. (a) | 304,314 | 18,094,510 | |
| Papa John's International, Inc. (b) | 42,981 | 3,214,549 | |
| Papa Murphy's Holdings, Inc. (a)(b) | 22,690 | 115,946 | |
| Park Hotels & Resorts, Inc. | 268,171 | 7,157,484 | |
| Penn National Gaming, Inc. (a) | 158,816 | 3,524,127 | |
| Pinnacle Entertainment, Inc. (a) | 94,638 | 1,845,441 | |
| Planet Fitness, Inc. | 118,106 | 2,996,349 | |
| Playa Hotels & Resorts NV | 140,860 | 1,460,718 | |
| Potbelly Corp. (a) | 30,614 | 367,368 | |
| Rave Restaurant Group, Inc. (a)(b) | 9,079 | 13,165 | |
| Rave Restaurant Group, Inc. rights (b) | 9,079 | 152 | |
| RCI Hospitality Holdings, Inc. | 15,482 | 360,731 | |
| Red Lion Hotels Corp. (a) | 6,989 | 48,923 | |
| Red Robin Gourmet Burgers, Inc. (a)(b) | 21,139 | 1,204,923 | |
| Red Rock Resorts, Inc. | 72,993 | 1,649,642 | |
| Royal Caribbean Cruises Ltd. | 285,089 | 35,482,177 | |
| Ruby Tuesday, Inc. (a) | 88,086 | 189,385 | |
| Ruth's Hospitality Group, Inc. | 42,076 | 822,586 | |
| Scientific Games Corp. Class A (a)(b) | 89,331 | 3,144,451 | |
| SeaWorld Entertainment, Inc. (b) | 103,555 | 1,344,144 | |
| Shake Shack, Inc. Class A (a)(b) | 35,538 | 1,098,835 | |
| Six Flags Entertainment Corp. | 140,263 | 7,654,152 | |
| Sonic Corp. (b) | 74,649 | 1,747,533 | |
| Speedway Motorsports, Inc. | 23,497 | 488,973 | |
| Starbucks Corp. | 2,484,039 | 136,274,380 | |
| Texas Roadhouse, Inc. Class A | 113,067 | 5,365,029 | |
| The Cheesecake Factory, Inc. (b) | 75,769 | 3,139,110 | |
| Town Sports International Holdings, Inc. (a) | 13,107 | 77,331 | |
| U.S. Foods Holding Corp. (a) | 221,001 | 6,066,477 | |
| Vail Resorts, Inc. | 67,071 | 15,288,834 | |
| Wendy's Co. | 328,867 | 4,906,696 | |
| Wingstop, Inc. | 55,195 | 1,788,870 | |
| Wyndham Worldwide Corp. | 177,047 | 17,648,045 | |
| Wynn Resorts Ltd. (b) | 138,056 | 19,188,403 | |
| Yum! Brands, Inc. | 570,420 | 43,819,664 | |
| Zoe's Kitchen, Inc. (a)(b) | 27,188 | 349,910 | |
| 924,383,691 | |||
| Household Durables - 0.6% | |||
| AV Homes, Inc. (a)(b) | 12,051 | 186,188 | |
| Bassett Furniture Industries, Inc. | 15,479 | 554,922 | |
| Beazer Homes U.S.A., Inc. (a) | 65,476 | 976,247 | |
| CalAtlantic Group, Inc. | 137,770 | 4,787,508 | |
| Cavco Industries, Inc. (a) | 13,938 | 1,875,358 | |
| Century Communities, Inc. (a) | 33,155 | 747,645 | |
| Comstock Holding Companies, Inc. (a) | 1,496 | 2,902 | |
| CSS Industries, Inc. | 16,118 | 431,640 | |
| D.R. Horton, Inc. | 588,321 | 21,267,804 | |
| Dixie Group, Inc. (a) | 11,105 | 45,531 | |
| Emerson Radio Corp. (a) | 23,724 | 26,096 | |
| Ethan Allen Interiors, Inc. (b) | 53,577 | 1,567,127 | |
| Flexsteel Industries, Inc. | 9,186 | 417,963 | |
| Garmin Ltd. (b) | 197,296 | 10,160,744 | |
| GoPro, Inc. Class A (a)(b) | 162,726 | 1,498,706 | |
| Green Brick Partners, Inc. (a) | 37,398 | 353,411 | |
| Helen of Troy Ltd. (a) | 44,560 | 4,023,768 | |
| Hooker Furniture Corp. | 17,507 | 704,657 | |
| Hovnanian Enterprises, Inc. Class A (a) | 177,163 | 322,437 | |
| Installed Building Products, Inc. (a) | 34,760 | 2,005,652 | |
| iRobot Corp. (a)(b) | 46,436 | 4,430,923 | |
| KB Home (b) | 179,193 | 3,834,730 | |
| Koss Corp. (a) | 2,669 | 3,817 | |
| La-Z-Boy, Inc. | 79,546 | 1,897,172 | |
| Leggett & Platt, Inc. | 221,974 | 10,204,145 | |
| Lennar Corp. Class A | 361,788 | 18,726,147 | |
| LGI Homes, Inc. (a)(b) | 30,018 | 1,276,966 | |
| Libbey, Inc. | 30,735 | 251,105 | |
| Lifetime Brands, Inc. | 14,046 | 244,400 | |
| M.D.C. Holdings, Inc. | 74,685 | 2,333,906 | |
| M/I Homes, Inc. (b) | 40,257 | 990,322 | |
| Meritage Homes Corp. (a) | 64,418 | 2,621,813 | |
| Mohawk Industries, Inc. (a) | 107,436 | 27,194,200 | |
| NACCO Industries, Inc. Class A | 7,854 | 569,415 | |
| New Home Co. LLC (a) | 17,775 | 183,438 | |
| Newell Brands, Inc. | 823,827 | 39,774,368 | |
| Nova LifeStyle, Inc. (a)(b) | 26,136 | 31,886 | |
| NVR, Inc. (a) | 5,916 | 16,096,549 | |
| PICO Holdings, Inc. (a) | 33,668 | 547,105 | |
| PulteGroup, Inc. | 477,718 | 12,334,679 | |
| Skyline Corp. (a) | 21,741 | 259,370 | |
| Stanley Furniture Co., Inc. | 5,699 | 6,383 | |
| Taylor Morrison Home Corp. (a) | 166,089 | 3,358,320 | |
| Tempur Sealy International, Inc. (a)(b) | 77,783 | 4,814,768 | |
| Toll Brothers, Inc. | 253,725 | 9,885,126 | |
| TopBuild Corp. (a) | 72,015 | 4,274,090 | |
| TRI Pointe Homes, Inc. (a)(b) | 267,734 | 3,410,931 | |
| Tupperware Brands Corp. | 86,145 | 4,985,211 | |
| Turtle Beach Corp. (a)(b) | 6,672 | 4,670 | |
| Universal Electronics, Inc. (a) | 25,010 | 1,464,336 | |
| Vuzix Corp. (a)(b) | 22,003 | 127,617 | |
| Whirlpool Corp. | 126,716 | 21,747,000 | |
| William Lyon Homes, Inc. (a)(b) | 35,265 | 846,007 | |
| Zagg, Inc. (a) | 38,365 | 483,399 | |
| 251,170,620 | |||
| Internet & Direct Marketing Retail - 2.4% | |||
| 1-800-FLOWERS.com, Inc. Class A (a) | 52,658 | 473,922 | |
| Amazon.com, Inc. (a) | 679,412 | 666,231,407 | |
| Duluth Holdings, Inc. (a)(b) | 12,299 | 240,937 | |
| Etsy, Inc. (a)(b) | 161,975 | 2,651,531 | |
| EVINE Live, Inc. (a) | 71,405 | 71,048 | |
| Expedia, Inc. | 205,735 | 30,522,845 | |
| FTD Companies, Inc. (a) | 25,393 | 340,012 | |
| Gaia, Inc. Class A (a) | 12,609 | 140,590 | |
| Groupon, Inc. (a)(b) | 645,768 | 2,867,210 | |
| HSN, Inc. | 58,131 | 2,133,408 | |
| Lands' End, Inc. (a)(b) | 26,352 | 320,177 | |
| Liberty Expedia Holdings, Inc. | 99,495 | 5,441,382 | |
| Liberty Interactive Corp. QVC Group: | |||
| (Venture Group) Series A (a) | 144,556 | 8,898,867 | |
| Series A (a) | 751,358 | 16,620,039 | |
| Liberty TripAdvisor Holdings, Inc. (a) | 119,998 | 1,601,973 | |
| Netflix, Inc. (a) | 737,411 | 128,833,076 | |
| NutriSystem, Inc. | 50,522 | 2,743,345 | |
| Overstock.com, Inc. (a)(b) | 24,847 | 545,392 | |
| PetMed Express, Inc. (b) | 32,292 | 1,171,231 | |
| Priceline Group, Inc. (a) | 83,939 | 155,461,743 | |
| Shutterfly, Inc. (a) | 54,203 | 2,470,573 | |
| TripAdvisor, Inc. (a)(b) | 187,324 | 8,004,355 | |
| U.S. Auto Parts Network, Inc. (a) | 5,048 | 14,740 | |
| Wayfair LLC Class A (a)(b) | 53,340 | 3,787,673 | |
| 1,041,587,476 | |||
| Leisure Products - 0.1% | |||
| American Outdoor Brands Corp. (a)(b) | 96,497 | 1,574,831 | |
| Brunswick Corp. | 157,212 | 8,250,486 | |
| Callaway Golf Co. | 178,654 | 2,490,437 | |
| Clarus Corp. (a) | 32,583 | 236,227 | |
| Escalade, Inc. | 7,022 | 84,615 | |
| Hasbro, Inc. | 191,773 | 18,841,697 | |
| JAKKS Pacific, Inc. (a)(b) | 19,661 | 67,830 | |
| Johnson Outdoors, Inc. Class A | 8,158 | 520,480 | |
| Malibu Boats, Inc. Class A (a) | 36,393 | 981,519 | |
| Marine Products Corp. | 11,741 | 182,925 | |
| Mattel, Inc. (b) | 607,515 | 9,853,893 | |
| MCBC Holdings, Inc. (a) | 21,350 | 365,939 | |
| Nautilus, Inc. (a) | 46,907 | 766,929 | |
| Polaris Industries, Inc. (b) | 100,575 | 9,376,607 | |
| Sturm, Ruger & Co., Inc. (b) | 33,314 | 1,525,781 | |
| Summer Infant, Inc. (a) | 32,605 | 66,514 | |
| Vista Outdoor, Inc. (a)(b) | 94,769 | 1,942,765 | |
| 57,129,475 | |||
| Media - 3.0% | |||
| A.H. Belo Corp. Class A | 22,177 | 110,885 | |
| AMC Entertainment Holdings, Inc. Class A (b) | 98,115 | 1,314,741 | |
| AMC Networks, Inc. Class A (a) | 101,098 | 6,144,736 | |
| Ballantyne of Omaha, Inc. (a) | 17,964 | 113,173 | |
| Cable One, Inc. | 8,311 | 6,305,888 | |
| CBS Corp. Class B | 648,125 | 41,518,888 | |
| Central European Media Enterprises Ltd. Class A (a)(b) | 116,862 | 484,977 | |
| Charter Communications, Inc. Class A (a) | 368,979 | 147,052,891 | |
| Cinedigm Corp. (a)(b) | 5,614 | 8,477 | |
| Cinemark Holdings, Inc. | 176,432 | 5,873,421 | |
| Clear Channel Outdoor Holding, Inc. Class A (a) | 57,659 | 221,987 | |
| Comcast Corp. Class A | 8,100,248 | 328,951,071 | |
| Cumulus Media, Inc. Class A (a)(b) | 17,877 | 6,972 | |
| Daily Journal Corp. (a) | 644 | 135,176 | |
| Discovery Communications, Inc.: | |||
| Class A (a)(b) | 247,368 | 5,494,043 | |
| Class C (non-vtg.) (a) | 376,024 | 7,900,264 | |
| DISH Network Corp. Class A (a) | 387,018 | 22,172,261 | |
| E.W. Scripps Co. Class A (a)(b) | 104,171 | 1,862,577 | |
| Emmis Communications Corp. Class A (a) | 1,993 | 5,281 | |
| Entercom Communications Corp. Class A (b) | 42,593 | 438,708 | |
| Entravision Communication Corp. Class A | 112,796 | 626,018 | |
| Gannett Co., Inc. | 225,017 | 1,910,394 | |
| Global Eagle Entertainment, Inc. (a)(b) | 84,431 | 260,892 | |
| Gray Television, Inc. (a) | 109,585 | 1,567,066 | |
| Harte-Hanks, Inc. (a) | 45,482 | 40,856 | |
| Hemisphere Media Group, Inc. (a)(b) | 10,964 | 141,984 | |
| Insignia Systems, Inc. | 5,038 | 5,290 | |
| Interpublic Group of Companies, Inc. | 672,240 | 13,538,914 | |
| John Wiley & Sons, Inc. Class A | 79,959 | 4,313,788 | |
| Lee Enterprises, Inc. (a)(b) | 58,988 | 123,875 | |
| Liberty Broadband Corp.: | |||
| Class A (a) | 36,926 | 3,745,404 | |
| Class C (a) | 130,665 | 13,266,417 | |
| Liberty Global PLC: | |||
| Class A (a) | 432,377 | 14,700,818 | |
| Class C (a) | 1,083,957 | 35,803,100 | |
| LiLAC Class A (a)(b) | 77,452 | 2,014,527 | |
| LiLAC Class C (a) | 214,602 | 5,534,586 | |
| Liberty Media Corp.: | |||
| Liberty Braves Class A (a) | 14,273 | 348,404 | |
| Liberty Braves Class C (a) | 68,302 | 1,671,350 | |
| Liberty Formula One Group Series C (a)(b) | 232,999 | 9,156,861 | |
| Liberty Media Class A (a)(b) | 28,511 | 1,081,422 | |
| Liberty SiriusXM Series A(a) | 131,422 | 5,874,563 | |
| Liberty SiriusXM Series C (a) | 317,236 | 14,151,898 | |
| Lions Gate Entertainment Corp.: | |||
| Class A (b) | 84,440 | 2,510,401 | |
| Class B (b) | 201,823 | 5,665,172 | |
| Live Nation Entertainment, Inc. (a) | 224,734 | 8,980,371 | |
| Loral Space & Communications Ltd. (a) | 20,272 | 920,349 | |
| Meredith Corp. | 62,660 | 3,405,571 | |
| MSG Network, Inc. Class A (a) | 103,460 | 2,219,217 | |
| National CineMedia, Inc. | 108,730 | 588,229 | |
| New Media Investment Group, Inc. | 89,861 | 1,239,183 | |
| News Corp.: | |||
| Class A | 717,388 | 9,591,478 | |
| Class B | 130,013 | 1,781,178 | |
| Nexstar Broadcasting Group, Inc. Class A (b) | 74,709 | 4,497,482 | |
| Omnicom Group, Inc. (b) | 395,017 | 28,591,330 | |
| Reading International, Inc. Class A (a) | 17,900 | 282,104 | |
| Regal Entertainment Group Class A | 191,111 | 2,822,709 | |
| RLJ Entertainment, Inc. (a) | 5,726 | 17,980 | |
| Saga Communications, Inc. Class A | 3,882 | 158,580 | |
| Salem Communications Corp. Class A | 10,842 | 65,594 | |
| Scholastic Corp. | 44,904 | 1,770,565 | |
| Scripps Networks Interactive, Inc. Class A | 162,026 | 13,877,527 | |
| Sinclair Broadcast Group, Inc. Class A | 119,056 | 3,601,444 | |
| Sirius XM Holdings, Inc. (b) | 2,845,102 | 16,359,337 | |
| Tegna, Inc. | 350,960 | 4,429,115 | |
| The Madison Square Garden Co. (a) | 25,883 | 5,500,396 | |
| The McClatchy Co. Class A (a) | 6,072 | 44,204 | |
| The New York Times Co. Class A | 207,571 | 3,871,199 | |
| The Walt Disney Co. | 2,487,987 | 251,784,284 | |
| Time Warner, Inc. | 1,326,649 | 134,124,214 | |
| Time, Inc. | 173,717 | 2,284,379 | |
| Townsquare Media, Inc. (a) | 1,285 | 12,824 | |
| Tribune Media Co. Class A | 123,479 | 4,947,804 | |
| tronc, Inc. (a) | 51,781 | 751,342 | |
| Twenty-First Century Fox, Inc.: | |||
| Class A | 1,810,082 | 49,940,162 | |
| Class B | 830,892 | 22,517,173 | |
| Urban One, Inc. Class D (non-vtg.) (a) | 32,336 | 56,588 | |
| Viacom, Inc. Class B (non-vtg.) | 632,315 | 18,084,209 | |
| World Wrestling Entertainment, Inc. Class A | 69,670 | 1,518,806 | |
| 1,314,807,344 | |||
| Multiline Retail - 0.3% | |||
| Big Lots, Inc. (b) | 72,215 | 3,437,434 | |
| Dillard's, Inc. Class A (b) | 40,152 | 2,441,242 | |
| Dollar General Corp. | 429,076 | 31,133,755 | |
| Dollar Tree, Inc. (a) | 405,144 | 32,265,668 | |
| Fred's, Inc. Class A (b) | 52,965 | 313,553 | |
| JC Penney Corp., Inc. (a)(b) | 535,524 | 2,072,478 | |
| Kohl's Corp. | 300,366 | 11,948,559 | |
| Macy's, Inc. | 517,789 | 10,754,478 | |
| Nordstrom, Inc. (b) | 185,779 | 8,289,459 | |
| Ollie's Bargain Outlet Holdings, Inc. (a)(b) | 79,892 | 3,343,480 | |
| Sears Holdings Corp. (a)(b) | 98,150 | 805,812 | |
| Target Corp. | 944,954 | 51,528,342 | |
| The Bon-Ton Stores, Inc. (a)(b) | 19,775 | 13,052 | |
| Tuesday Morning Corp. (a)(b) | 61,992 | 139,482 | |
| 158,486,794 | |||
| Specialty Retail - 2.0% | |||
| Aaron's, Inc. Class A | 106,680 | 4,722,724 | |
| Abercrombie & Fitch Co. Class A | 133,398 | 1,699,491 | |
| Advance Auto Parts, Inc. | 124,902 | 12,227,906 | |
| America's Car Mart, Inc. (a)(b) | 10,422 | 400,205 | |
| American Eagle Outfitters, Inc. | 303,607 | 3,628,104 | |
| Armstrong Flooring, Inc. (a) | 37,094 | 553,442 | |
| Asbury Automotive Group, Inc. (a) | 40,476 | 2,179,633 | |
| Ascena Retail Group, Inc. (a)(b) | 266,405 | 543,466 | |
| AutoNation, Inc. (a)(b) | 112,063 | 5,084,298 | |
| AutoZone, Inc. (a) | 48,090 | 25,412,680 | |
| Barnes & Noble Education, Inc. (a) | 60,796 | 314,923 | |
| Barnes & Noble, Inc. | 82,041 | 635,818 | |
| bebe stores, Inc. (a)(b) | 6,695 | 36,956 | |
| Bed Bath & Beyond, Inc. | 241,299 | 6,657,439 | |
| Best Buy Co., Inc. | 452,794 | 24,568,602 | |
| Big 5 Sporting Goods Corp. | 23,104 | 176,746 | |
| Boot Barn Holdings, Inc. (a)(b) | 24,133 | 195,477 | |
| Build-A-Bear Workshop, Inc. (a) | 15,205 | 139,886 | |
| Burlington Stores, Inc. (a) | 117,818 | 10,265,482 | |
| Cabela's, Inc. Class A (a) | 89,589 | 4,810,929 | |
| Caleres, Inc. | 81,369 | 2,195,336 | |
| CarMax, Inc. (a)(b) | 313,461 | 21,048,906 | |
| Cars.com, Inc. (b) | 116,986 | 3,025,258 | |
| Chico's FAS, Inc. | 231,778 | 1,780,055 | |
| Christopher & Banks Corp. (a) | 57,707 | 74,442 | |
| Citi Trends, Inc. | 19,731 | 357,723 | |
| Conn's, Inc. (a)(b) | 39,904 | 692,334 | |
| Destination Maternity Corp. (a) | 22,235 | 26,682 | |
| Destination XL Group, Inc. (a)(b) | 51,406 | 95,101 | |
| Dick's Sporting Goods, Inc. | 145,373 | 3,832,032 | |
| DSW, Inc. Class A (b) | 144,844 | 2,683,959 | |
| Express, Inc. (a) | 127,643 | 813,086 | |
| Finish Line, Inc. Class A (b) | 63,867 | 532,012 | |
| Five Below, Inc. (a)(b) | 100,983 | 4,803,761 | |
| Floor & Decor Holdings, Inc. Class A | 44,505 | 1,599,510 | |
| Foot Locker, Inc. | 223,548 | 7,875,596 | |
| Francesca's Holdings Corp. (a) | 57,702 | 418,917 | |
| GameStop Corp. Class A | 164,497 | 3,043,195 | |
| Gap, Inc. (b) | 381,256 | 9,005,267 | |
| Genesco, Inc. (a) | 32,141 | 679,782 | |
| GNC Holdings, Inc. Class A (b) | 120,441 | 999,660 | |
| Group 1 Automotive, Inc. | 30,918 | 1,855,698 | |
| Guess?, Inc. | 102,345 | 1,594,535 | |
| Haverty Furniture Companies, Inc. | 30,217 | 708,589 | |
| Hibbett Sports, Inc. (a)(b) | 34,547 | 424,928 | |
| Home Depot, Inc. | 2,049,223 | 307,117,051 | |
| Kirkland's, Inc. (a) | 21,240 | 244,897 | |
| L Brands, Inc. (b) | 421,006 | 15,248,837 | |
| Lithia Motors, Inc. Class A (sub. vtg.) (b) | 38,999 | 4,211,892 | |
| Lowe's Companies, Inc. | 1,466,570 | 108,364,857 | |
| Lumber Liquidators Holdings, Inc. (a)(b) | 49,362 | 1,852,556 | |
| MarineMax, Inc. (a) | 36,815 | 594,562 | |
| Michaels Companies, Inc. (a)(b) | 197,854 | 4,441,822 | |
| Monro, Inc. (b) | 59,370 | 2,831,949 | |
| Murphy U.S.A., Inc. (a)(b) | 58,955 | 3,800,239 | |
| New York & Co., Inc. (a) | 34,393 | 66,378 | |
| O'Reilly Automotive, Inc. (a) | 154,690 | 30,339,350 | |
| Office Depot, Inc. | 882,988 | 3,788,019 | |
| Party City Holdco, Inc. (a)(b) | 50,325 | 702,034 | |
| Penske Automotive Group, Inc. | 71,056 | 3,009,932 | |
| Perfumania Holdings, Inc. (a) | 876 | 1,594 | |
| Pier 1 Imports, Inc. | 163,568 | 685,350 | |
| Rent-A-Center, Inc. (b) | 93,716 | 1,133,964 | |
| RH (a)(b) | 55,177 | 2,581,732 | |
| Ross Stores, Inc. | 676,887 | 39,564,045 | |
| Sally Beauty Holdings, Inc. (a)(b) | 228,422 | 4,246,365 | |
| Sears Hometown & Outlet Stores, Inc. (a)(b) | 10,000 | 17,500 | |
| Select Comfort Corp. (a)(b) | 68,724 | 2,029,420 | |
| Shoe Carnival, Inc. | 21,330 | 428,733 | |
| Signet Jewelers Ltd. (b) | 116,151 | 7,325,644 | |
| Sonic Automotive, Inc. Class A (sub. vtg.) | 40,396 | 731,168 | |
| Sportsman's Warehouse Holdings, Inc. (a)(b) | 48,606 | 201,715 | |
| Stage Stores, Inc. (b) | 38,699 | 70,432 | |
| Staples, Inc. | 1,145,552 | 11,701,814 | |
| Stein Mart, Inc. (b) | 40,412 | 50,515 | |
| Tailored Brands, Inc. (b) | 76,887 | 908,804 | |
| The Buckle, Inc. (b) | 40,527 | 573,457 | |
| The Cato Corp. Class A (sub. vtg.) | 36,544 | 480,919 | |
| The Children's Place Retail Stores, Inc. | 29,482 | 3,129,514 | |
| The Container Store Group, Inc. (a)(b) | 22,029 | 89,438 | |
| Tiffany & Co., Inc. | 181,968 | 16,631,875 | |
| Tile Shop Holdings, Inc. | 56,926 | 856,736 | |
| Tilly's, Inc. | 14,113 | 155,384 | |
| TJX Companies, Inc. | 1,102,027 | 79,676,552 | |
| Tractor Supply Co. (b) | 226,801 | 13,496,928 | |
| Trans World Entertainment Corp. (a) | 2,977 | 4,614 | |
| Ulta Beauty, Inc. | 99,561 | 22,003,977 | |
| Urban Outfitters, Inc. (a)(b) | 143,484 | 2,932,813 | |
| Vitamin Shoppe, Inc. (a)(b) | 45,231 | 241,986 | |
| West Marine, Inc. | 26,644 | 345,573 | |
| Williams-Sonoma, Inc. (b) | 139,872 | 6,434,112 | |
| Winmark Corp. | 3,184 | 419,810 | |
| Zumiez, Inc. (a)(b) | 31,066 | 386,772 | |
| 880,574,201 | |||
| Textiles, Apparel & Luxury Goods - 0.6% | |||
| Carter's, Inc. | 82,628 | 7,164,674 | |
| Cherokee, Inc. (a) | 20,319 | 93,467 | |
| Coach, Inc. | 480,314 | 20,029,094 | |
| Columbia Sportswear Co. | 46,822 | 2,682,432 | |
| Crocs, Inc. (a) | 126,644 | 1,130,931 | |
| Culp, Inc. | 12,256 | 355,424 | |
| Deckers Outdoor Corp. (a) | 55,355 | 3,537,185 | |
| Delta Apparel, Inc. (a) | 4,312 | 84,601 | |
| Differential Brands Group, Inc. (a) | 1,083 | 1,787 | |
| Emerald Expositions Events, Inc. (b) | 58,843 | 1,279,247 | |
| Fossil Group, Inc. (a)(b) | 73,701 | 610,981 | |
| G-III Apparel Group Ltd. (a)(b) | 69,854 | 1,920,985 | |
| Hanesbrands, Inc. (b) | 627,279 | 15,217,789 | |
| Iconix Brand Group, Inc. (a)(b) | 101,691 | 568,453 | |
| J.Jill, Inc. | 24,557 | 238,448 | |
| Lakeland Industries, Inc. (a) | 6,813 | 96,063 | |
| lululemon athletica, Inc. (a) | 180,400 | 10,382,020 | |
| Michael Kors Holdings Ltd. (a) | 277,238 | 11,704,988 | |
| Movado Group, Inc. | 39,217 | 1,088,272 | |
| NIKE, Inc. Class B | 2,276,900 | 120,243,089 | |
| Oxford Industries, Inc. | 25,955 | 1,500,459 | |
| Perry Ellis International, Inc. (a) | 15,961 | 348,429 | |
| PVH Corp. | 132,712 | 16,707,114 | |
| Ralph Lauren Corp. | 91,187 | 8,014,425 | |
| Rocky Brands, Inc. | 8,326 | 107,405 | |
| Sequential Brands Group, Inc. (a)(b) | 82,806 | 252,558 | |
| Skechers U.S.A., Inc. Class A (sub. vtg.) (a) | 228,771 | 6,046,418 | |
| Steven Madden Ltd. (a) | 86,611 | 3,672,306 | |
| Superior Uniform Group, Inc. | 11,974 | 263,667 | |
| Under Armour, Inc.: | |||
| Class A (sub. vtg.) (a)(b) | 312,447 | 5,046,019 | |
| Class C (non-vtg.) (a)(b) | 313,320 | 4,731,132 | |
| Unifi, Inc. (a) | 22,047 | 685,221 | |
| Vera Bradley, Inc. (a) | 29,957 | 270,811 | |
| VF Corp. | 554,884 | 34,885,557 | |
| Vince Holding Corp. (a)(b) | 26,763 | 12,204 | |
| Wolverine World Wide, Inc. | 170,818 | 4,492,513 | |
| 285,466,168 | |||
| TOTAL CONSUMER DISCRETIONARY | 5,472,013,562 | ||
| CONSUMER STAPLES - 7.5% | |||
| Beverages - 1.7% | |||
| Boston Beer Co., Inc. Class A (a)(b) | 14,791 | 2,203,859 | |
| Brown-Forman Corp.: | |||
| Class A | 46,010 | 2,559,076 | |
| Class B (non-vtg.) | 362,686 | 19,236,865 | |
| Castle Brands, Inc. (a)(b) | 173,742 | 246,714 | |
| Coca-Cola Bottling Co. Consolidated | 7,832 | 1,672,837 | |
| Constellation Brands, Inc. Class A (sub. vtg.) | 292,803 | 58,589,880 | |
| Craft Brew Alliance, Inc. (a)(b) | 14,306 | 248,924 | |
| Dr. Pepper Snapple Group, Inc. | 315,830 | 28,756,322 | |
| MGP Ingredients, Inc. (b) | 19,078 | 1,072,756 | |
| Molson Coors Brewing Co. Class B | 313,413 | 28,128,817 | |
| Monster Beverage Corp. (a) | 699,904 | 39,068,641 | |
| National Beverage Corp. (b) | 22,740 | 2,642,615 | |
| New Age Beverages Corp. | 33,316 | 140,927 | |
| PepsiCo, Inc. | 2,449,315 | 283,459,225 | |
| Primo Water Corp. (a)(b) | 33,980 | 372,081 | |
| REED'S, Inc. (a)(b) | 1,830 | 4,209 | |
| The Coca-Cola Co. | 6,586,084 | 299,996,126 | |
| 768,399,874 | |||
| Food & Staples Retailing - 1.6% | |||
| Andersons, Inc. | 47,014 | 1,497,396 | |
| Casey's General Stores, Inc. (b) | 65,556 | 6,910,914 | |
| Chefs' Warehouse Holdings (a)(b) | 34,201 | 589,967 | |
| Costco Wholesale Corp. | 750,932 | 117,701,082 | |
| CVS Health Corp. | 1,751,876 | 135,490,090 | |
| Ingles Markets, Inc. Class A | 21,439 | 470,586 | |
| Kroger Co. | 1,557,377 | 34,059,835 | |
| Natural Grocers by Vitamin Cottage, Inc. (a)(b) | 12,082 | 67,901 | |
| Performance Food Group Co. (a) | 157,320 | 4,373,496 | |
| PriceSmart, Inc. | 38,992 | 3,168,100 | |
| Rite Aid Corp. (a)(b) | 1,799,849 | 4,355,635 | |
| Smart & Final Stores, Inc. (a)(b) | 46,551 | 328,185 | |
| SpartanNash Co. | 61,272 | 1,509,742 | |
| Sprouts Farmers Market LLC (a) | 217,629 | 4,339,522 | |
| SUPERVALU, Inc. (a) | 107,946 | 2,157,841 | |
| Sysco Corp. | 846,395 | 44,579,625 | |
| United Natural Foods, Inc. (a)(b) | 87,309 | 3,033,988 | |
| Village Super Market, Inc. Class A | 8,594 | 198,779 | |
| Wal-Mart Stores, Inc. | 2,527,879 | 197,351,514 | |
| Walgreens Boots Alliance, Inc. | 1,462,141 | 119,164,492 | |
| Weis Markets, Inc. | 29,625 | 1,309,721 | |
| Welbilt, Inc. (a)(b) | 274,877 | 5,470,052 | |
| 688,128,463 | |||
| Food Products - 1.3% | |||
| Alico, Inc. | 4,002 | 128,064 | |
| Amplify Snack Brands, Inc. (a)(b) | 47,704 | 343,946 | |
| Archer Daniels Midland Co. | 974,171 | 40,252,746 | |
| B&G Foods, Inc. Class A (b) | 116,520 | 3,553,860 | |
| Blue Buffalo Pet Products, Inc. (a)(b) | 164,852 | 4,246,588 | |
| Bunge Ltd. | 243,028 | 18,137,180 | |
| Cal-Maine Foods, Inc. (a)(b) | 58,088 | 2,117,308 | |
| Calavo Growers, Inc. (b) | 26,199 | 1,759,263 | |
| Campbell Soup Co. | 330,429 | 15,265,820 | |
| Coffee Holding Co., Inc. (a) | 3,401 | 12,958 | |
| ConAgra Foods, Inc. | 702,119 | 22,790,783 | |
| Darling International, Inc. (a) | 281,119 | 4,891,471 | |
| Dean Foods Co. | 156,497 | 1,721,467 | |
| Farmer Brothers Co. (a) | 27,261 | 887,346 | |
| Flowers Foods, Inc. | 308,740 | 5,362,814 | |
| Fresh Del Monte Produce, Inc. | 55,694 | 2,617,061 | |
| Freshpet, Inc. (a)(b) | 33,847 | 536,475 | |
| General Mills, Inc. (b) | 975,500 | 51,955,130 | |
| Hormel Foods Corp. (b) | 467,102 | 14,358,715 | |
| Hostess Brands, Inc. Class A (a)(b) | 143,616 | 1,915,837 | |
| Ingredion, Inc. | 123,585 | 15,302,295 | |
| Inventure Foods, Inc. (a)(b) | 20,016 | 68,655 | |
| J&J Snack Foods Corp. | 25,667 | 3,272,286 | |
| John B. Sanfilippo & Son, Inc. (b) | 17,222 | 1,068,797 | |
| Kellogg Co. | 425,266 | 27,837,912 | |
| Lamb Weston Holdings, Inc. | 239,740 | 10,903,375 | |
| Lancaster Colony Corp. | 32,520 | 3,787,604 | |
| Landec Corp. (a) | 35,757 | 464,841 | |
| Lifeway Foods, Inc. (a) | 1,962 | 17,069 | |
| Limoneira Co. | 13,723 | 307,395 | |
| McCormick & Co., Inc. (non-vtg.) | 192,200 | 18,283,986 | |
| Mondelez International, Inc. | 2,599,304 | 105,687,701 | |
| Omega Protein Corp. | 32,056 | 506,485 | |
| Pilgrim's Pride Corp. (a)(b) | 94,260 | 2,775,957 | |
| Pinnacle Foods, Inc. | 202,857 | 12,031,449 | |
| Post Holdings, Inc. (a) | 113,903 | 9,696,562 | |
| Sanderson Farms, Inc. (b) | 34,070 | 5,026,006 | |
| Seaboard Corp. | 460 | 1,976,008 | |
| Seneca Foods Corp. Class A (a) | 9,032 | 269,154 | |
| Snyders-Lance, Inc. | 142,680 | 5,067,994 | |
| The Hain Celestial Group, Inc. (a) | 175,026 | 7,039,546 | |
| The Hershey Co. | 243,763 | 25,575,614 | |
| The J.M. Smucker Co. | 195,769 | 20,508,760 | |
| The Kraft Heinz Co. | 1,023,514 | 82,648,756 | |
| Tootsie Roll Industries, Inc. (b) | 47,006 | 1,755,674 | |
| TreeHouse Foods, Inc. (a)(b) | 96,338 | 6,453,683 | |
| Tyson Foods, Inc. Class A | 497,168 | 31,470,734 | |
| 592,659,130 | |||
| Household Products - 1.5% | |||
| Central Garden & Pet Co. Class A (non-vtg.) (a) | 79,976 | 2,726,382 | |
| Church & Dwight Co., Inc. | 437,941 | 21,971,500 | |
| Clorox Co. | 220,454 | 30,539,493 | |
| Colgate-Palmolive Co. | 1,512,806 | 108,377,422 | |
| Energizer Holdings, Inc. | 99,799 | 4,406,126 | |
| HRG Group, Inc. (a) | 243,938 | 3,851,781 | |
| Kimberly-Clark Corp. | 606,754 | 74,806,701 | |
| Oil-Dri Corp. of America | 2,105 | 85,674 | |
| Orchids Paper Products Co. (b) | 12,438 | 126,868 | |
| Procter & Gamble Co. | 4,376,206 | 403,792,528 | |
| Spectrum Brands Holdings, Inc. (b) | 41,932 | 4,610,843 | |
| WD-40 Co. | 25,080 | 2,732,466 | |
| 658,027,784 | |||
| Personal Products - 0.2% | |||
| Avon Products, Inc. (a) | 750,697 | 1,869,236 | |
| Coty, Inc. Class A | 800,297 | 13,268,924 | |
| Cyanotech Corp. (a) | 2,300 | 10,810 | |
| Edgewell Personal Care Co. (a) | 95,191 | 7,228,805 | |
| elf Beauty, Inc. (b) | 35,801 | 740,723 | |
| Estee Lauder Companies, Inc. Class A | 380,597 | 40,720,073 | |
| Herbalife Ltd. (a)(b) | 121,381 | 8,376,503 | |
| Inter Parfums, Inc. | 29,691 | 1,171,310 | |
| LifeVantage Corp. (a) | 19,206 | 79,897 | |
| Mannatech, Inc. | 599 | 9,015 | |
| MediFast, Inc. | 40,989 | 2,320,797 | |
| Natural Health Trends Corp. | 11,452 | 231,101 | |
| Nature's Sunshine Products, Inc. | 6,985 | 73,692 | |
| Nu Skin Enterprises, Inc. Class A | 84,187 | 5,121,095 | |
| Revlon, Inc. (a)(b) | 25,388 | 429,057 | |
| The Female Health Co. (a) | 11,731 | 18,887 | |
| USANA Health Sciences, Inc. (a) | 20,348 | 1,204,602 | |
| 82,874,527 | |||
| Tobacco - 1.2% | |||
| 22nd Century Group, Inc. (a)(b) | 98,310 | 216,282 | |
| Alliance One International, Inc. (a) | 8,945 | 93,028 | |
| Altria Group, Inc. | 3,307,146 | 209,673,056 | |
| Philip Morris International, Inc. | 2,662,623 | 311,340,507 | |
| Universal Corp. | 43,930 | 2,512,796 | |
| Vector Group Ltd. (b) | 180,167 | 3,891,607 | |
| 527,727,276 | |||
| TOTAL CONSUMER STAPLES | 3,317,817,054 | ||
| ENERGY - 5.3% | |||
| Energy Equipment & Services - 0.8% | |||
| Archrock, Inc. | 117,660 | 1,200,132 | |
| Aspen Aerogels, Inc. (a) | 9,858 | 40,319 | |
| Atwood Oceanics, Inc. (a)(b) | 121,695 | 799,536 | |
| Baker Hughes, a GE Co. Class A | 724,941 | 24,575,500 | |
| Basic Energy Services, Inc. (a) | 42,877 | 610,568 | |
| Bristow Group, Inc. (b) | 47,191 | 388,854 | |
| C&J Energy Services, Inc. | 129,736 | 3,277,131 | |
| Carbo Ceramics, Inc. (a)(b) | 36,697 | 240,732 | |
| Core Laboratories NV (b) | 76,525 | 6,747,975 | |
| Dawson Geophysical Co. (a) | 19,081 | 79,759 | |
| Diamond Offshore Drilling, Inc. (a)(b) | 99,661 | 1,132,149 | |
| Dril-Quip, Inc. (a)(b) | 70,873 | 2,661,281 | |
| ENGlobal Corp. (a) | 5,637 | 7,272 | |
| Ensco PLC Class A (b) | 494,916 | 2,103,393 | |
| Era Group, Inc. (a) | 30,759 | 270,987 | |
| Exterran Corp. (a) | 59,232 | 1,643,096 | |
| Fairmount Santrol Holidings, Inc. (a)(b) | 254,086 | 777,503 | |
| Forum Energy Technologies, Inc. (a)(b) | 122,886 | 1,425,478 | |
| Frank's International NV (b) | 90,617 | 569,075 | |
| Geospace Technologies Corp. (a)(b) | 25,924 | 391,193 | |
| Gulf Island Fabrication, Inc. | 17,861 | 200,043 | |
| Halliburton Co. | 1,482,857 | 57,786,937 | |
| Helix Energy Solutions Group, Inc. (a) | 241,675 | 1,515,302 | |
| Helmerich & Payne, Inc. (b) | 179,550 | 7,602,147 | |
| Hornbeck Offshore Services, Inc. (a)(b) | 41,835 | 115,883 | |
| Independence Contract Drilling, Inc. (a) | 45,769 | 147,376 | |
| ION Geophysical Corp. (a)(b) | 10,360 | 76,146 | |
| Mammoth Energy Services, Inc. (b) | 11,194 | 154,253 | |
| Matrix Service Co. (a) | 47,813 | 566,584 | |
| McDermott International, Inc. (a) | 460,303 | 2,826,260 | |
| Mitcham Industries, Inc. (a) | 23,287 | 87,326 | |
| Nabors Industries Ltd. | 457,542 | 2,996,900 | |
| National Oilwell Varco, Inc. | 640,133 | 19,632,879 | |
| Natural Gas Services Group, Inc. (a) | 21,602 | 509,807 | |
| NCS Multistage Holdings, Inc. | 41,493 | 819,902 | |
| Newpark Resources, Inc. (a) | 153,002 | 1,231,666 | |
| Noble Corp. (b) | 421,660 | 1,374,612 | |
| Oceaneering International, Inc. | 170,909 | 3,853,998 | |
| Oil States International, Inc. (a) | 89,813 | 1,953,433 | |
| Parker Drilling Co. (a) | 180,331 | 198,364 | |
| Patterson-UTI Energy, Inc. | 274,325 | 4,380,970 | |
| PHI, Inc. (non-vtg.) (a) | 18,377 | 201,963 | |
| Pioneer Energy Services Corp. (a) | 120,721 | 205,226 | |
| Profire Energy, Inc. (a) | 14,213 | 21,462 | |
| RigNet, Inc. (a) | 15,376 | 246,016 | |
| Rowan Companies PLC (a)(b) | 205,609 | 2,004,688 | |
| RPC, Inc. (b) | 95,956 | 1,862,506 | |
| Schlumberger Ltd. | 2,382,237 | 151,295,872 | |
| SEACOR Holdings, Inc. (a)(b) | 30,397 | 1,166,333 | |
| Smart Sand, Inc. | 41,295 | 246,531 | |
| Solaris Oilfield Infrastructure, Inc. Class A | 17,397 | 246,342 | |
| Superior Energy Services, Inc. (a)(b) | 268,168 | 2,209,704 | |
| Synthesis Energy Systems, Inc. (a)(b) | 138,081 | 56,254 | |
| TechnipFMC PLC | 812,785 | 20,994,237 | |
| Tesco Corp. (a) | 127,576 | 561,334 | |
| TETRA Technologies, Inc. (a) | 186,418 | 384,021 | |
| Transocean Ltd. (United States) (a)(b) | 642,424 | 5,242,180 | |
| U.S. Silica Holdings, Inc. | 125,689 | 3,419,998 | |
| Unit Corp. (a) | 95,665 | 1,522,987 | |
| Weatherford International PLC (b) | 1,680,088 | 6,434,737 | |
| Willbros Group, Inc. (a) | 69,552 | 153,014 | |
| 355,448,126 | |||
| Oil, Gas & Consumable Fuels - 4.5% | |||
| Abraxas Petroleum Corp. (a) | 241,078 | 409,833 | |
| Adams Resources & Energy, Inc. | 2,090 | 72,460 | |
| Aemetis, Inc. (a) | 10,055 | 8,678 | |
| Amyris, Inc. (a)(b) | 3,925 | 9,695 | |
| Anadarko Petroleum Corp. | 953,300 | 39,018,569 | |
| Andeavor | 257,277 | 25,766,292 | |
| Antero Resources Corp. (a)(b) | 254,152 | 5,004,253 | |
| Apache Corp. (b) | 667,324 | 25,918,864 | |
| Approach Resources, Inc. (a)(b) | 60,041 | 166,914 | |
| Arch Coal, Inc. | 42,349 | 3,382,415 | |
| Ardmore Shipping Corp. (b) | 44,385 | 359,519 | |
| Barnwell Industries, Inc. (a) | 2,847 | 5,125 | |
| Bill Barrett Corp. (a)(b) | 120,934 | 361,593 | |
| Bonanza Creek Energy, Inc. | 3,794 | 98,606 | |
| Bonanza Creek Energy, Inc. (c) | 47,310 | 0 | |
| Cabot Oil & Gas Corp. | 796,005 | 20,337,928 | |
| California Resources Corp. (a)(b) | 64,079 | 499,816 | |
| Callon Petroleum Co. (a)(b) | 334,854 | 3,469,087 | |
| Camber Energy, Inc. (a)(b) | 376 | 73 | |
| Carrizo Oil & Gas, Inc. (a)(b) | 129,850 | 1,745,184 | |
| Centennial Resource Development, Inc. Class A (b) | 257,479 | 4,451,812 | |
| Cheniere Energy, Inc. (a) | 408,060 | 17,460,887 | |
| Chesapeake Energy Corp. (a)(b) | 1,267,641 | 4,614,213 | |
| Chevron Corp. | 3,246,859 | 349,426,966 | |
| Cimarex Energy Co. | 163,321 | 16,281,470 | |
| Clean Energy Fuels Corp. (a)(b) | 207,470 | 493,779 | |
| Cloud Peak Energy, Inc. (a) | 152,269 | 478,125 | |
| Cobalt International Energy, Inc. (a)(b) | 37,473 | 70,449 | |
| Comstock Resources, Inc. (a)(b) | 24,083 | 154,613 | |
| Concho Resources, Inc. (a) | 252,785 | 28,051,551 | |
| ConocoPhillips Co. | 2,125,019 | 92,778,330 | |
| CONSOL Energy, Inc. | 300,644 | 4,374,370 | |
| Contango Oil & Gas Co. (a) | 51,306 | 235,495 | |
| Continental Resources, Inc. (a)(b) | 146,908 | 4,983,119 | |
| CVR Energy, Inc. (b) | 23,933 | 512,645 | |
| Delek U.S. Holdings, Inc. | 119,223 | 2,947,193 | |
| Denbury Resources, Inc. (a)(b) | 635,481 | 673,610 | |
| Devon Energy Corp. | 895,520 | 28,119,328 | |
| Diamondback Energy, Inc. (a) | 166,969 | 15,159,116 | |
| Earthstone Energy, Inc. (a)(b) | 10,660 | 102,229 | |
| Eclipse Resources Corp. (a) | 169,538 | 395,024 | |
| Energen Corp. (a) | 161,072 | 8,259,772 | |
| Energy XXI Gulf Coast, Inc. (b) | 77,532 | 810,209 | |
| EOG Resources, Inc. | 987,307 | 83,911,222 | |
| EP Energy Corp. (a)(b) | 91,298 | 268,416 | |
| EQT Corp. (b) | 294,556 | 18,362,621 | |
| Evolution Petroleum Corp. | 53,534 | 372,061 | |
| EXCO Resources, Inc. (a)(b) | 21,120 | 37,805 | |
| Extraction Oil & Gas, Inc. (b) | 65,143 | 855,979 | |
| Exxon Mobil Corp. | 7,260,245 | 554,174,501 | |
| Gastar Exploration, Inc. (a)(b) | 285,601 | 168,562 | |
| Gener8 Maritime, Inc. (a)(b) | 186,799 | 840,596 | |
| Gevo, Inc. (a)(b) | 7,805 | 5,073 | |
| Green Plains, Inc. (b) | 65,482 | 1,214,691 | |
| Gulfport Energy Corp. (a) | 275,383 | 3,450,549 | |
| Halcon Resources Corp. (a)(b) | 43,182 | 267,297 | |
| Hallador Energy Co. | 29,822 | 172,968 | |
| Hess Corp. | 463,865 | 18,044,349 | |
| HollyFrontier Corp. | 300,302 | 9,402,456 | |
| Houston American Energy Corp. (a)(b) | 36,485 | 17,878 | |
| International Seaways, Inc. | 72,136 | 1,330,188 | |
| Isramco, Inc. (a) | 123 | 13,850 | |
| Jagged Peak Energy, Inc. (b) | 69,960 | 896,188 | |
| Jones Energy, Inc. (b) | 91,542 | 90,627 | |
| Kinder Morgan, Inc. | 3,278,366 | 63,370,815 | |
| Kosmos Energy Ltd. (a)(b) | 380,364 | 2,677,763 | |
| Laredo Petroleum, Inc. (a)(b) | 240,236 | 2,983,731 | |
| Lilis Energy, Inc. (a)(b) | 19,185 | 70,217 | |
| Lonestar Resources U.S., Inc. (a) | 18,853 | 61,461 | |
| Marathon Oil Corp. | 1,454,381 | 16,172,717 | |
| Marathon Petroleum Corp. | 886,982 | 46,522,206 | |
| Matador Resources Co. (a)(b) | 153,132 | 3,610,853 | |
| Murphy Oil Corp. (b) | 270,006 | 6,118,336 | |
| Newfield Exploration Co. (a) | 346,789 | 9,061,597 | |
| Noble Energy, Inc. | 783,196 | 18,616,569 | |
| Northern Oil & Gas, Inc. (a)(b) | 93,777 | 79,710 | |
| Oasis Petroleum, Inc. (a)(b) | 395,968 | 2,890,566 | |
| Occidental Petroleum Corp. | 1,319,327 | 78,763,822 | |
| ONEOK, Inc. | 645,368 | 34,953,131 | |
| Overseas Shipholding Group, Inc. (a) | 80,103 | 181,033 | |
| Pacific Ethanol, Inc. (a) | 51,285 | 256,425 | |
| Panhandle Royalty Co. Class A | 32,305 | 681,636 | |
| Par Pacific Holdings, Inc. (a)(b) | 53,028 | 944,429 | |
| Parsley Energy, Inc. Class A (a) | 385,750 | 9,663,038 | |
| PBF Energy, Inc. Class A (b) | 185,150 | 4,384,352 | |
| PDC Energy, Inc. (a) | 95,525 | 3,756,998 | |
| Peabody Energy Corp. | 204,690 | 5,936,010 | |
| Penn Virginia Corp. (b) | 9,594 | 369,369 | |
| Petroquest Energy, Inc. (a) | 17,737 | 31,749 | |
| Phillips 66 Co. | 754,225 | 63,211,597 | |
| Pioneer Natural Resources Co. | 290,835 | 37,706,758 | |
| QEP Resources, Inc. (a) | 417,391 | 3,151,302 | |
| Range Resources Corp. (b) | 313,387 | 5,440,398 | |
| Renewable Energy Group, Inc. (a)(b) | 62,544 | 756,782 | |
| Resolute Energy Corp. (a)(b) | 30,507 | 901,482 | |
| Rex American Resources Corp. (a) | 9,008 | 780,273 | |
| Rex Energy Corp. (a)(b) | 6,338 | 14,514 | |
| Rice Energy, Inc. (a) | 273,274 | 7,476,777 | |
| Ring Energy, Inc. (a) | 84,537 | 1,007,681 | |
| RSP Permian, Inc. (a) | 181,533 | 5,696,506 | |
| Sanchez Energy Corp. (a)(b) | 110,256 | 482,921 | |
| SandRidge Energy, Inc. (a) | 37,708 | 649,332 | |
| SemGroup Corp. Class A (b) | 87,119 | 2,238,958 | |
| SilverBow Resources, Inc. (a)(b) | 9,186 | 198,785 | |
| SM Energy Co. | 163,665 | 2,186,564 | |
| Southwestern Energy Co. (a) | 872,953 | 4,757,594 | |
| Src Energy, Inc. (a)(b) | 344,278 | 2,716,353 | |
| Stone Energy Corp. (b) | 44,486 | 1,076,561 | |
| Syntroleum Corp. (a)(b)(c) | 15,037 | 0 | |
| Targa Resources Corp. | 367,453 | 16,377,380 | |
| Teekay Corp. (b) | 95,089 | 876,721 | |
| Tellurian, Inc. (a)(b) | 82,724 | 764,370 | |
| Tengasco, Inc. (a) | 1,261 | 832 | |
| The Williams Companies, Inc. | 1,418,085 | 42,159,667 | |
| Torchlight Energy Resources, Inc. (a)(b) | 48,218 | 65,576 | |
| TransAtlantic Petroleum Ltd. (a) | 18,382 | 13,787 | |
| U.S. Energy Corp. (a) | 2,263 | 1,720 | |
| Uranium Energy Corp. (a)(b) | 246,510 | 325,393 | |
| VAALCO Energy, Inc. (a) | 68,248 | 49,650 | |
| Valero Energy Corp. | 765,807 | 52,151,457 | |
| Vertex Energy, Inc. (a)(b) | 17,824 | 14,259 | |
| W&T Offshore, Inc. (a)(b) | 37,319 | 71,279 | |
| Warrior Metropolitan Coal, Inc. | 102,882 | 2,807,650 | |
| Westmoreland Coal Co. (a) | 31,012 | 72,258 | |
| Westwater Resources, Inc. (a)(b) | 2,190 | 2,978 | |
| Whiting Petroleum Corp. (a)(b) | 451,901 | 2,019,997 | |
| WildHorse Resource Development Corp. (b) | 44,975 | 490,677 | |
| World Fuel Services Corp. | 116,948 | 4,039,384 | |
| WPX Energy, Inc. (a) | 680,691 | 6,800,103 | |
| Zion Oil & Gas, Inc. (a)(b) | 91,553 | 305,787 | |
| 1,983,387,682 | |||
| TOTAL ENERGY | 2,338,835,808 | ||
| FINANCIALS - 14.6% | |||
| Banks - 6.3% | |||
| 1st Source Corp. | 33,223 | 1,550,517 | |
| Access National Corp. | 21,459 | 551,067 | |
| ACNB Corp. | 3,789 | 99,082 | |
| Allegiance Bancshares, Inc. (a) | 20,938 | 712,939 | |
| American National Bankshares, Inc. | 2,748 | 100,302 | |
| Ameris Bancorp | 68,985 | 3,038,789 | |
| Ames National Corp. | 2,652 | 71,869 | |
| Arrow Financial Corp. | 16,949 | 547,453 | |
| Associated Banc-Corp. | 269,062 | 5,892,458 | |
| Atlantic Capital Bancshares, Inc. (a) | 27,339 | 490,735 | |
| Banc of California, Inc. (b) | 80,001 | 1,484,019 | |
| BancFirst Corp. | 35,422 | 1,785,269 | |
| Bancorp, Inc., Delaware (a) | 84,963 | 666,960 | |
| BancorpSouth, Inc. | 133,469 | 3,877,274 | |
| Bank of America Corp. | 17,019,398 | 406,593,418 | |
| Bank of Commerce Holdings (b) | 29,023 | 306,193 | |
| Bank of Hawaii Corp. | 74,301 | 5,805,137 | |
| Bank of Marin Bancorp | 8,356 | 546,900 | |
| Bank of the Ozarks, Inc. | 201,654 | 8,663,056 | |
| BankUnited, Inc. | 186,241 | 6,198,100 | |
| Banner Corp. | 51,093 | 2,816,246 | |
| Bar Harbor Bankshares | 27,763 | 729,056 | |
| BB&T Corp. | 1,389,355 | 64,035,372 | |
| BCB Bancorp, Inc. | 11,980 | 170,116 | |
| Berkshire Hills Bancorp, Inc. | 64,958 | 2,195,580 | |
| Blue Hills Bancorp, Inc. | 49,471 | 925,108 | |
| BOK Financial Corp. (b) | 49,801 | 4,007,984 | |
| Boston Private Financial Holdings, Inc. | 148,661 | 2,185,317 | |
| Bridge Bancorp, Inc. | 53,457 | 1,651,821 | |
| Brookline Bancorp, Inc., Delaware | 125,282 | 1,797,797 | |
| Bryn Mawr Bank Corp. | 27,092 | 1,109,417 | |
| C & F Financial Corp. | 1,992 | 93,325 | |
| Camden National Corp. | 25,093 | 978,627 | |
| Capital Bank Financial Corp. Series A | 55,839 | 2,099,546 | |
| Capital City Bank Group, Inc. | 7,146 | 147,851 | |
| Carolina Financial Corp. | 15,721 | 534,986 | |
| Cathay General Bancorp | 122,996 | 4,338,069 | |
| Centerstate Banks of Florida, Inc. | 102,610 | 2,510,867 | |
| Central Pacific Financial Corp. | 46,756 | 1,355,924 | |
| Central Valley Community Bancorp | 4,570 | 89,892 | |
| Century Bancorp, Inc. Class A (non-vtg.) | 686 | 45,825 | |
| Chemical Financial Corp. | 128,787 | 5,848,218 | |
| CIT Group, Inc. | 249,047 | 11,169,758 | |
| Citigroup, Inc. | 4,717,068 | 320,902,136 | |
| Citizens & Northern Corp. | 8,777 | 196,956 | |
| Citizens Financial Group, Inc. | 870,236 | 28,830,919 | |
| City Holding Co. | 25,184 | 1,594,903 | |
| Civista Bancshares, Inc. (b) | 10,636 | 214,954 | |
| CNB Financial Corp., Pennsylvania | 22,243 | 537,391 | |
| CoBiz, Inc. | 52,226 | 890,453 | |
| Columbia Banking Systems, Inc. | 99,994 | 3,716,777 | |
| Comerica, Inc. | 292,599 | 19,969,882 | |
| Commerce Bancshares, Inc. | 166,131 | 9,135,544 | |
| Commerce Union Bancshares, Inc. | 8,584 | 205,930 | |
| Community Bank System, Inc. | 95,374 | 4,907,946 | |
| Community Bankers Trust Corp. (a) | 24,176 | 203,078 | |
| Community Financial Corp. | 3,879 | 135,765 | |
| Community Trust Bancorp, Inc. | 30,823 | 1,311,519 | |
| ConnectOne Bancorp, Inc. | 44,434 | 1,013,095 | |
| CU Bancorp (a) | 27,578 | 983,156 | |
| Cullen/Frost Bankers, Inc. | 95,722 | 8,059,792 | |
| Customers Bancorp, Inc. (a) | 47,427 | 1,336,493 | |
| CVB Financial Corp. | 169,790 | 3,514,653 | |
| Eagle Bancorp, Inc. (a) | 51,420 | 3,198,324 | |
| East West Bancorp, Inc. | 249,361 | 13,807,119 | |
| Enterprise Bancorp, Inc. | 15,551 | 497,476 | |
| Enterprise Financial Services Corp. | 35,692 | 1,363,434 | |
| Equity Bancshares, Inc. (a) | 6,273 | 214,223 | |
| Evans Bancorp, Inc. (b) | 6,302 | 260,273 | |
| Farmers Capital Bank Corp. | 12,316 | 461,234 | |
| Farmers National Banc Corp. | 66,489 | 910,899 | |
| FCB Financial Holdings, Inc. Class A (a) | 80,361 | 3,503,740 | |
| Fidelity Southern Corp. | 33,831 | 739,546 | |
| Fifth Third Bancorp | 1,290,331 | 33,716,349 | |
| Financial Institutions, Inc. | 20,978 | 570,602 | |
| First Bancorp, North Carolina | 37,328 | 1,154,928 | |
| First Bancorp, Puerto Rico (a) | 301,460 | 1,712,293 | |
| First Bancshares, Inc. | 3,982 | 112,292 | |
| First Busey Corp. | 69,369 | 2,001,296 | |
| First Business Finance Services, Inc. | 3,936 | 83,876 | |
| First Citizen Bancshares, Inc. | 15,636 | 5,324,214 | |
| First Commonwealth Financial Corp. | 162,059 | 2,043,564 | |
| First Community Bancshares, Inc. | 14,260 | 367,052 | |
| First Connecticut Bancorp, Inc. | 13,599 | 336,575 | |
| First Financial Bancorp, Ohio | 103,444 | 2,477,484 | |
| First Financial Bankshares, Inc. (b) | 118,200 | 4,733,910 | |
| First Financial Corp., Indiana | 17,277 | 749,822 | |
| First Financial Northwest, Inc. | 2,197 | 35,152 | |
| First Foundation, Inc. (a) | 39,781 | 674,288 | |
| First Hawaiian, Inc. | 99,118 | 2,685,107 | |
| First Horizon National Corp. | 415,890 | 7,157,467 | |
| First Internet Bancorp | 6,364 | 202,375 | |
| First Interstate Bancsystem, Inc. | 47,490 | 1,671,648 | |
| First Merchants Corp. | 71,357 | 2,802,189 | |
| First Mid-Illinois Bancshares, Inc. | 15,730 | 545,516 | |
| First Midwest Bancorp, Inc., Delaware | 157,154 | 3,312,806 | |
| First Northwest Bancorp (a) | 5,375 | 85,248 | |
| First of Long Island Corp. | 37,824 | 1,011,792 | |
| First Republic Bank | 272,217 | 26,418,660 | |
| First South Bancorp, Inc., Virginia | 13,282 | 231,372 | |
| First United Corp. (a) | 3,395 | 53,471 | |
| Flushing Financial Corp. | 47,044 | 1,286,183 | |
| FNB Corp., Pennsylvania | 535,314 | 6,793,135 | |
| Franklin Financial Network, Inc. (a) | 20,997 | 686,602 | |
| Fulton Financial Corp. | 320,846 | 5,598,763 | |
| German American Bancorp, Inc. | 33,825 | 1,100,666 | |
| Glacier Bancorp, Inc. | 124,637 | 4,139,195 | |
| Great Southern Bancorp, Inc. | 16,765 | 834,897 | |
| Great Western Bancorp, Inc. | 100,598 | 3,613,480 | |
| Green Bancorp, Inc. (a) | 40,300 | 808,015 | |
| Guaranty Bancorp | 32,104 | 828,283 | |
| Hancock Holding Co. | 152,688 | 6,710,638 | |
| Hanmi Financial Corp. | 52,514 | 1,402,124 | |
| HarborOne Bancorp, Inc. (a) | 44,762 | 769,459 | |
| Heartland Financial U.S.A., Inc. | 40,533 | 1,844,252 | |
| Heritage Commerce Corp. | 59,915 | 802,861 | |
| Heritage Financial Corp., Washington | 51,567 | 1,348,477 | |
| Hilltop Holdings, Inc. | 136,474 | 3,230,340 | |
| Home Bancshares, Inc. | 211,108 | 4,920,927 | |
| HomeTrust Bancshares, Inc. (a) | 28,372 | 658,230 | |
| Hope Bancorp, Inc. | 216,598 | 3,495,892 | |
| Horizon Bancorp Industries | 29,396 | 769,293 | |
| Howard Bancorp, Inc. (a)(b) | 9,598 | 189,561 | |
| Huntington Bancshares, Inc. | 1,891,662 | 23,816,025 | |
| IBERIABANK Corp. | 90,251 | 6,913,227 | |
| Independent Bank Corp. | 29,867 | 609,287 | |
| Independent Bank Corp., Massachusetts (b) | 46,109 | 3,195,354 | |
| Independent Bank Group, Inc. | 22,475 | 1,250,734 | |
| International Bancshares Corp. | 106,256 | 3,819,903 | |
| Investar Holding Corp. | 8,384 | 184,448 | |
| Investors Bancorp, Inc. | 516,646 | 6,762,896 | |
| JPMorgan Chase & Co. | 6,088,307 | 553,366,223 | |
| KeyCorp | 1,887,018 | 32,475,580 | |
| Lakeland Bancorp, Inc. | 71,024 | 1,313,944 | |
| Lakeland Financial Corp. | 43,110 | 1,873,561 | |
| LegacyTexas Financial Group, Inc. | 83,607 | 3,009,016 | |
| Live Oak Bancshares, Inc. (b) | 47,360 | 1,058,496 | |
| M&T Bank Corp. | 267,858 | 39,605,484 | |
| Macatawa Bank Corp. | 22,839 | 218,569 | |
| MainSource Financial Group, Inc. | 34,621 | 1,133,145 | |
| MB Financial, Inc. | 124,722 | 4,960,194 | |
| MBT Financial Corp. | 19,637 | 199,316 | |
| Mercantile Bank Corp. | 25,655 | 779,655 | |
| Midland States Bancorp, Inc. | 9,812 | 299,658 | |
| Midsouth Bancorp, Inc. | 23,289 | 275,975 | |
| MidWestOne Financial Group, Inc. | 12,572 | 413,367 | |
| MutualFirst Financial, Inc. | 20,181 | 710,371 | |
| National Bank Holdings Corp. | 47,060 | 1,514,391 | |
| National Bankshares, Inc. (b) | 5,803 | 228,638 | |
| National Commerce Corp. (a) | 16,217 | 644,626 | |
| NBT Bancorp, Inc. | 92,219 | 3,027,550 | |
| Nicolet Bankshares, Inc. (a) | 8,651 | 472,777 | |
| Northeast Bancorp | 4,761 | 102,838 | |
| Northrim Bancorp, Inc. | 6,518 | 194,562 | |
| Norwood Financial Corp. (b) | 5,067 | 223,151 | |
| OFG Bancorp | 71,939 | 625,869 | |
| Ohio Valley Banc Corp. | 3,608 | 118,703 | |
| Old Line Bancshares, Inc. | 8,031 | 220,853 | |
| Old National Bancorp, Indiana | 272,863 | 4,461,310 | |
| Old Point Financial Corp. | 1,881 | 57,822 | |
| Old Second Bancorp, Inc. | 36,720 | 420,444 | |
| Opus Bank | 31,202 | 698,925 | |
| Orrstown Financial Services, Inc. | 5,669 | 138,607 | |
| Pacific Continental Corp. | 35,872 | 851,960 | |
| Pacific Mercantile Bancorp (a) | 10,321 | 87,729 | |
| Pacific Premier Bancorp, Inc. (a) | 51,645 | 1,828,233 | |
| PacWest Bancorp | 207,277 | 9,358,557 | |
| Park National Corp. | 25,668 | 2,479,272 | |
| Park Sterling Corp. | 83,541 | 949,861 | |
| PCSB Financial Corp. (b) | 61,717 | 1,044,252 | |
| Peapack-Gladstone Financial Corp. | 23,917 | 728,751 | |
| Penns Woods Bancorp, Inc. | 3,854 | 165,375 | |
| People's Utah Bancorp | 31,031 | 848,698 | |
| Peoples Bancorp of North Carolina | 3,856 | 117,145 | |
| Peoples Bancorp, Inc. | 27,844 | 864,835 | |
| Peoples Financial Corp., Mississippi (a) | 2,667 | 36,005 | |
| Peoples Financial Services Corp. | 12,111 | 503,212 | |
| Peoples United Financial, Inc. | 574,176 | 9,588,739 | |
| Pinnacle Financial Partners, Inc. | 128,020 | 7,962,844 | |
| PNC Financial Services Group, Inc. | 831,194 | 104,240,040 | |
| Popular, Inc. | 183,067 | 7,306,204 | |
| Preferred Bank, Los Angeles | 21,681 | 1,166,438 | |
| Premier Financial Bancorp, Inc. | 4,507 | 85,182 | |
| Prosperity Bancshares, Inc. | 109,880 | 6,565,330 | |
| QCR Holdings, Inc. | 31,102 | 1,359,157 | |
| Regions Financial Corp. | 2,020,677 | 28,511,752 | |
| Renasant Corp. | 83,390 | 3,321,424 | |
| Republic Bancorp, Inc., Kentucky Class A | 18,205 | 647,734 | |
| Republic First Bancorp, Inc. (a)(b) | 116,122 | 981,231 | |
| Royal Bancshares of Pennsylvania, Inc. Class A (a) | 5,400 | 22,086 | |
| S&T Bancorp, Inc. | 72,150 | 2,593,071 | |
| Sandy Spring Bancorp, Inc. | 42,176 | 1,626,728 | |
| Seacoast Banking Corp., Florida (a) | 63,108 | 1,443,280 | |
| ServisFirst Bancshares, Inc. | 88,788 | 3,028,559 | |
| Shore Bancshares, Inc. | 6,745 | 111,225 | |
| Sierra Bancorp | 11,641 | 294,634 | |
| Signature Bank (a) | 92,531 | 11,875,429 | |
| Simmons First National Corp. Class A | 56,478 | 2,948,152 | |
| SmartFinancial, Inc. (a) | 7,194 | 166,109 | |
| South State Corp. | 41,590 | 3,420,778 | |
| Southern First Bancshares, Inc. (a) | 4,963 | 175,442 | |
| Southern National Bancorp of Virginia, Inc. | 38,866 | 651,006 | |
| Southside Bancshares, Inc. | 47,031 | 1,536,503 | |
| Southwest Bancorp, Inc., Oklahoma | 34,097 | 860,949 | |
| State Bank Financial Corp. | 60,571 | 1,627,543 | |
| Sterling Bancorp | 235,339 | 5,283,361 | |
| Stock Yards Bancorp, Inc. | 30,796 | 1,071,701 | |
| Stonegate Bank | 27,534 | 1,327,414 | |
| Summit Financial Group, Inc. (b) | 7,690 | 168,334 | |
| Sun Bancorp, Inc. | 15,520 | 362,392 | |
| Sunshine Bancorp, Inc. (a)(b) | 3,140 | 67,824 | |
| SunTrust Banks, Inc. | 838,051 | 46,176,610 | |
| SVB Financial Group (a) | 90,200 | 15,274,468 | |
| Synovus Financial Corp. | 230,632 | 9,714,220 | |
| TCF Financial Corp. | 303,183 | 4,708,432 | |
| Texas Capital Bancshares, Inc. (a) | 86,508 | 6,423,219 | |
| The First Bancorp, Inc. | 17,759 | 462,267 | |
| Tompkins Financial Corp. | 22,580 | 1,714,274 | |
| TowneBank | 102,762 | 3,154,793 | |
| Trico Bancshares | 37,499 | 1,334,214 | |
| TriState Capital Holdings, Inc. (a) | 37,306 | 779,695 | |
| Triumph Bancorp, Inc. (a) | 26,498 | 747,244 | |
| Trustmark Corp. | 125,196 | 3,708,306 | |
| Two River Bancorp (b) | 3,500 | 63,770 | |
| U.S. Bancorp | 2,722,911 | 139,549,189 | |
| UMB Financial Corp. | 85,559 | 5,742,720 | |
| Umpqua Holdings Corp. | 368,620 | 6,450,850 | |
| Union Bankshares Corp. | 76,873 | 2,408,431 | |
| Union Bankshares, Inc. (b) | 1,824 | 78,706 | |
| United Bankshares, Inc., West Virginia (b) | 191,327 | 6,419,021 | |
| United Community Bank, Inc. | 111,127 | 2,901,526 | |
| United Security Bancshares, California | 5,985 | 55,361 | |
| Unity Bancorp, Inc. | 5,913 | 102,591 | |
| Univest Corp. of Pennsylvania | 42,518 | 1,239,400 | |
| Valley National Bancorp | 592,760 | 6,632,984 | |
| Veritex Holdings, Inc. (a) | 20,567 | 543,174 | |
| Washington Trust Bancorp, Inc. | 24,464 | 1,253,780 | |
| WashingtonFirst Bankshares, Inc. | 14,852 | 503,037 | |
| Webster Financial Corp. | 163,732 | 7,643,010 | |
| Wells Fargo & Co. | 7,714,368 | 393,972,774 | |
| WesBanco, Inc. | 73,993 | 2,810,254 | |
| West Bancorp., Inc. | 59,222 | 1,299,923 | |
| Westamerica Bancorp. | 50,684 | 2,612,760 | |
| Western Alliance Bancorp. (a) | 158,029 | 7,621,739 | |
| Wintrust Financial Corp. | 92,607 | 6,742,716 | |
| Xenith Bankshares, Inc. (a) | 13,287 | 380,673 | |
| Zions Bancorporation | 354,085 | 15,459,351 | |
| 2,786,881,926 | |||
| Capital Markets - 2.8% | |||
| Affiliated Managers Group, Inc. | 94,956 | 16,777,776 | |
| Ameriprise Financial, Inc. | 258,160 | 35,757,742 | |
| Arlington Asset Investment Corp. (b) | 39,851 | 514,875 | |
| Artisan Partners Asset Management, Inc. | 74,438 | 2,285,247 | |
| Ashford, Inc. (a) | 1,254 | 77,309 | |
| Associated Capital Group, Inc. | 6,083 | 208,951 | |
| B. Riley Financial, Inc. | 24,014 | 393,830 | |
| Bank of New York Mellon Corp. | 1,776,247 | 92,862,193 | |
| BGC Partners, Inc. Class A | 395,046 | 5,131,648 | |
| BlackRock, Inc. Class A | 207,191 | 86,815,101 | |
| Brighthouse Financial, Inc. | 167,673 | 9,569,098 | |
| CBOE Holdings, Inc. | 156,195 | 15,758,514 | |
| Charles Schwab Corp. | 2,081,741 | 83,061,466 | |
| CME Group, Inc. | 583,090 | 73,352,722 | |
| Cohen & Steers, Inc. | 39,455 | 1,492,977 | |
| Cowen Group, Inc. Class A (a)(b) | 42,436 | 689,585 | |
| Diamond Hill Investment Group, Inc. | 4,801 | 942,580 | |
| E*TRADE Financial Corp. (a) | 466,118 | 19,115,499 | |
| Eaton Vance Corp. (non-vtg.) | 189,531 | 9,017,885 | |
| Evercore, Inc. Class A | 86,895 | 6,556,228 | |
| FactSet Research Systems, Inc. | 68,243 | 10,726,435 | |
| Federated Investors, Inc. Class B (non-vtg.) (b) | 166,109 | 4,536,437 | |
| Financial Engines, Inc. (b) | 110,645 | 3,656,817 | |
| Franklin Resources, Inc. | 580,185 | 25,081,398 | |
| Gain Capital Holdings, Inc. | 33,946 | 213,860 | |
| GAMCO Investors, Inc. Class A | 6,083 | 179,266 | |
| Global Brokerage, Inc. Class A (a)(b) | 5,137 | 6,421 | |
| Goldman Sachs Group, Inc. | 625,751 | 140,005,529 | |
| Great Elm Capital Group, Inc. (a) | 8,360 | 27,588 | |
| Greenhill & Co., Inc. (b) | 46,751 | 703,603 | |
| Hamilton Lane, Inc. Class A | 48,843 | 1,144,880 | |
| Houlihan Lokey | 40,223 | 1,450,039 | |
| Institutional Financial Markets, Inc. | 6,881 | 7,844 | |
| Interactive Brokers Group, Inc. | 119,445 | 5,008,329 | |
| IntercontinentalExchange, Inc. | 1,016,421 | 65,731,946 | |
| INTL FCStone, Inc. (a) | 23,975 | 850,873 | |
| Invesco Ltd. | 685,472 | 22,469,772 | |
| Investment Technology Group, Inc. | 55,680 | 1,118,611 | |
| Janus Henderson Group PLC | 310,163 | 10,719,233 | |
| Ladenburg Thalmann Financial Services, Inc. | 146,974 | 377,723 | |
| Lazard Ltd. Class A | 222,637 | 9,548,901 | |
| Legg Mason, Inc. | 154,159 | 5,887,332 | |
| LPL Financial | 136,938 | 6,414,176 | |
| Manning & Napier, Inc. Class A | 21,800 | 77,390 | |
| MarketAxess Holdings, Inc. | 63,986 | 12,346,099 | |
| Moelis & Co. Class A | 54,806 | 2,159,356 | |
| Moody's Corp. | 288,845 | 38,713,895 | |
| Morgan Stanley | 2,432,356 | 110,672,198 | |
| Morningstar, Inc. | 35,957 | 2,973,644 | |
| MSCI, Inc. | 154,816 | 17,743,462 | |
| Northern Trust Corp. | 367,395 | 32,514,458 | |
| Oppenheimer Holdings, Inc. Class A (non-vtg.) | 13,547 | 220,139 | |
| Piper Jaffray Companies | 20,940 | 1,161,123 | |
| PJT Partners, Inc. | 43,421 | 1,678,656 | |
| Pzena Investment Management, Inc. | 4,972 | 49,223 | |
| Raymond James Financial, Inc. | 214,854 | 16,827,365 | |
| S&P Global, Inc. | 441,125 | 68,078,821 | |
| Safeguard Scientifics, Inc. (a)(b) | 26,745 | 326,289 | |
| SEI Investments Co. | 229,425 | 13,412,186 | |
| Silvercrest Asset Management Group Class A | 6,008 | 73,598 | |
| State Street Corp. | 603,058 | 55,776,834 | |
| Stifel Financial Corp. | 118,002 | 5,634,596 | |
| T. Rowe Price Group, Inc. | 411,469 | 34,711,525 | |
| TD Ameritrade Holding Corp. | 412,225 | 17,857,587 | |
| The NASDAQ OMX Group, Inc. | 201,312 | 15,174,899 | |
| TheStreet.com, Inc. (a) | 3,696 | 3,142 | |
| U.S. Global Investments, Inc. Class A | 7,637 | 10,157 | |
| Vector Capital Corp. rights (a)(c) | 4,280 | 0 | |
| Virtu Financial, Inc. Class A (b) | 77,143 | 1,384,717 | |
| Virtus Investment Partners, Inc. (b) | 10,135 | 1,074,310 | |
| Waddell & Reed Financial, Inc. Class A (b) | 156,809 | 2,918,215 | |
| Westwood Holdings Group, Inc. | 10,927 | 667,968 | |
| WisdomTree Investments, Inc. (b) | 190,333 | 1,745,354 | |
| 1,232,235,445 | |||
| Consumer Finance - 0.7% | |||
| Ally Financial, Inc. | 799,706 | 18,073,356 | |
| American Express Co. | 1,284,959 | 110,634,970 | |
| Asta Funding, Inc. (a) | 4,468 | 35,967 | |
| Atlanticus Holdings Corp. (a) | 35,598 | 87,215 | |
| Capital One Financial Corp. | 824,624 | 65,648,317 | |
| Consumer Portfolio Services, Inc. (a) | 11,930 | 46,885 | |
| Credit Acceptance Corp. (a)(b) | 19,841 | 5,402,704 | |
| Discover Financial Services | 653,137 | 38,502,426 | |
| Elevate Credit, Inc. | 13,402 | 84,835 | |
| Encore Capital Group, Inc. (a)(b) | 44,570 | 1,798,400 | |
| Enova International, Inc. (a) | 32,960 | 392,224 | |
| EZCORP, Inc. (non-vtg.) Class A (a)(b) | 86,606 | 783,784 | |
| First Cash Financial Services, Inc. | 90,535 | 5,314,405 | |
| Green Dot Corp. Class A (a) | 74,413 | 3,585,218 | |
| Imperial Holdings, Inc. warrants 4/11/19 (a) | 1,880 | 0 | |
| LendingClub Corp. (a)(b) | 543,864 | 3,366,518 | |
| Navient Corp. | 480,094 | 6,337,241 | |
| Nelnet, Inc. Class A | 36,382 | 1,725,598 | |
| Nicholas Financial, Inc. (a) | 5,705 | 49,120 | |
| OneMain Holdings, Inc. (a) | 91,372 | 2,500,852 | |
| PRA Group, Inc. (a)(b) | 79,585 | 2,300,007 | |
| Regional Management Corp. (a) | 12,187 | 267,505 | |
| Santander Consumer U.S.A. Holdings, Inc. (a) | 199,933 | 2,855,043 | |
| SLM Corp. (a) | 719,307 | 7,315,352 | |
| Synchrony Financial | 1,327,462 | 40,872,555 | |
| World Acceptance Corp. (a)(b) | 10,919 | 816,960 | |
| 318,797,457 | |||
| Diversified Financial Services - 1.4% | |||
| Acushnet Holdings Corp. | 49,208 | 808,980 | |
| Alteryx, Inc. (b) | 16,777 | 395,769 | |
| At Home Group, Inc. | 11,583 | 283,784 | |
| Berkshire Hathaway, Inc. Class B (a) | 3,252,453 | 589,214,385 | |
| Camping World Holdings, Inc. (b) | 32,678 | 1,200,917 | |
| Cotiviti Holdings, Inc. (a) | 64,469 | 2,303,477 | |
| Donnelley Financial Solutions, Inc. | 58,021 | 1,242,230 | |
| FB Financial Corp. (b) | 19,661 | 683,220 | |
| Leucadia National Corp. | 564,714 | 13,372,428 | |
| Marlin Business Services Corp. | 13,319 | 347,626 | |
| NewStar Financial, Inc. | 27,065 | 290,137 | |
| On Deck Capital, Inc. (a)(b) | 61,562 | 297,344 | |
| Quantenna Communications, Inc. (b) | 16,406 | 304,823 | |
| Ra Pharmaceuticals, Inc. | 9,916 | 148,839 | |
| Sachem Capital Corp. | 200 | 930 | |
| Senseonics Holdings, Inc. (a)(b) | 40,982 | 125,815 | |
| Tiptree, Inc. | 33,155 | 212,192 | |
| Varex Imaging Corp. (b) | 60,332 | 1,841,936 | |
| Voya Financial, Inc. | 328,653 | 12,564,404 | |
| 625,639,236 | |||
| Insurance - 2.9% | |||
| AFLAC, Inc. | 676,740 | 55,864,887 | |
| Alleghany Corp. (a) | 26,648 | 14,996,695 | |
| Allstate Corp. | 619,177 | 56,035,519 | |
| AMBAC Financial Group, Inc. (a) | 77,952 | 1,417,947 | |
| American Equity Investment Life Holding Co. | 151,614 | 4,208,805 | |
| American Financial Group, Inc. | 124,528 | 12,678,196 | |
| American International Group, Inc. | 1,500,016 | 90,720,968 | |
| American National Insurance Co. | 20,619 | 2,385,824 | |
| Amerisafe, Inc. | 34,393 | 1,850,343 | |
| AmTrust Financial Services, Inc. (b) | 184,814 | 2,291,694 | |
| Aon PLC | 448,420 | 62,402,127 | |
| Arch Capital Group Ltd. (a) | 219,343 | 21,350,848 | |
| Argo Group International Holdings, Ltd. | 52,927 | 3,186,205 | |
| Arthur J. Gallagher & Co. | 303,378 | 17,565,586 | |
| Aspen Insurance Holdings Ltd. | 111,432 | 5,036,726 | |
| Assurant, Inc. | 94,584 | 8,956,159 | |
| Assured Guaranty Ltd. | 219,846 | 9,352,249 | |
| Athene Holding Ltd. | 86,087 | 4,606,515 | |
| Atlas Financial Holdings, Inc. (a) | 9,356 | 157,649 | |
| Axis Capital Holdings Ltd. | 153,356 | 9,238,165 | |
| Baldwin & Lyons, Inc. Class B | 11,829 | 259,055 | |
| Brown & Brown, Inc. | 204,333 | 9,186,812 | |
| Chubb Ltd. | 798,902 | 112,980,721 | |
| Cincinnati Financial Corp. | 261,500 | 20,093,660 | |
| Citizens, Inc. Class A (a)(b) | 62,312 | 469,209 | |
| CNA Financial Corp. | 65,156 | 3,196,553 | |
| CNO Financial Group, Inc. | 290,469 | 6,491,982 | |
| Crawford & Co. Class B | 31,537 | 312,847 | |
| Donegal Group, Inc. Class A | 8,008 | 122,763 | |
| eHealth, Inc. (a) | 26,343 | 639,608 | |
| EMC Insurance Group | 8,724 | 243,225 | |
| Employers Holdings, Inc. | 50,084 | 2,111,041 | |
| Enstar Group Ltd. (a) | 18,704 | 3,882,015 | |
| Erie Indemnity Co. Class A | 39,674 | 4,792,222 | |
| Everest Re Group Ltd. | 70,880 | 17,895,782 | |
| FBL Financial Group, Inc. Class A | 16,450 | 1,118,600 | |
| Federated National Holding Co. | 19,431 | 301,958 | |
| Fidelity & Guaranty Life (b) | 29,774 | 930,438 | |
| First Acceptance Corp. (a) | 4,055 | 4,542 | |
| First American Financial Corp. | 189,648 | 9,304,131 | |
| FNF Group | 485,332 | 23,412,416 | |
| FNFV Group (a) | 119,032 | 2,005,689 | |
| Genworth Financial, Inc. Class A (a) | 831,470 | 2,851,942 | |
| Global Indemnity Ltd. | 13,709 | 554,118 | |
| Greenlight Capital Re, Ltd. (a) | 42,022 | 934,990 | |
| Hallmark Financial Services, Inc. (a) | 10,337 | 105,954 | |
| Hanover Insurance Group, Inc. | 70,993 | 6,970,093 | |
| Hartford Financial Services Group, Inc. | 624,209 | 33,750,981 | |
| HCI Group, Inc. | 13,167 | 513,381 | |
| Health Insurance Innovations, Inc. (a) | 14,064 | 473,254 | |
| Heritage Insurance Holdings, Inc. | 60,181 | 684,860 | |
| Horace Mann Educators Corp. | 65,267 | 2,294,135 | |
| Independence Holding Co. | 16,014 | 347,504 | |
| Infinity Property & Casualty Corp. | 17,608 | 1,557,428 | |
| Investors Title Co. | 1,086 | 190,995 | |
| James River Group Holdings Ltd. | 33,994 | 1,355,681 | |
| Kemper Corp. | 85,524 | 4,096,600 | |
| Kingstone Companies, Inc. | 9,045 | 136,127 | |
| Kinsale Capital Group, Inc. | 33,893 | 1,282,850 | |
| Lincoln National Corp. | 381,053 | 25,858,257 | |
| Loews Corp. | 473,959 | 22,077,010 | |
| Maiden Holdings Ltd. | 125,108 | 907,033 | |
| Markel Corp. (a) | 24,343 | 25,608,593 | |
| Marsh & McLennan Companies, Inc. | 882,937 | 68,939,721 | |
| MBIA, Inc. (a)(b) | 228,577 | 2,299,485 | |
| Mercury General Corp. | 66,212 | 3,805,204 | |
| MetLife, Inc. | 1,844,404 | 86,373,439 | |
| National General Holdings Corp. | 106,900 | 1,835,473 | |
| National Western Life Group, Inc. | 3,602 | 1,204,545 | |
| Navigators Group, Inc. | 37,597 | 2,097,913 | |
| NI Holdings, Inc. | 11,972 | 197,658 | |
| Old Republic International Corp. | 417,839 | 7,976,547 | |
| OneBeacon Insurance Group Ltd. | 45,014 | 820,155 | |
| Patriot National, Inc. (b) | 7,857 | 11,786 | |
| Primerica, Inc. | 75,461 | 5,776,540 | |
| Principal Financial Group, Inc. | 451,193 | 28,208,586 | |
| ProAssurance Corp. | 95,168 | 5,067,696 | |
| Progressive Corp. | 987,900 | 45,917,592 | |
| Prudential Financial, Inc. | 741,461 | 75,688,339 | |
| Reinsurance Group of America, Inc. | 107,870 | 14,503,122 | |
| RenaissanceRe Holdings Ltd. | 73,938 | 10,289,212 | |
| RLI Corp. | 67,585 | 3,617,149 | |
| Safety Insurance Group, Inc. | 21,926 | 1,565,516 | |
| Selective Insurance Group, Inc. | 101,970 | 5,139,288 | |
| State Auto Financial Corp. | 23,497 | 581,316 | |
| State National Companies, Inc. | 40,781 | 847,021 | |
| Stewart Information Services Corp. | 39,769 | 1,434,866 | |
| The Travelers Companies, Inc. | 475,109 | 57,573,709 | |
| Third Point Reinsurance Ltd. (a) | 92,317 | 1,297,054 | |
| Torchmark Corp. | 180,107 | 13,862,836 | |
| Trupanion, Inc. (a)(b) | 25,585 | 559,800 | |
| United Fire Group, Inc. | 36,055 | 1,516,473 | |
| United Insurance Holdings Corp. | 29,576 | 465,526 | |
| Universal Insurance Holdings, Inc. (b) | 52,834 | 1,133,289 | |
| Unum Group | 384,330 | 18,517,019 | |
| Validus Holdings Ltd. | 133,201 | 6,680,030 | |
| W.R. Berkley Corp. | 176,033 | 11,730,839 | |
| White Mountains Insurance Group Ltd. | 8,265 | 7,199,394 | |
| Willis Group Holdings PLC | 216,037 | 32,075,013 | |
| WMI Holdings Corp. (a) | 391,046 | 488,808 | |
| XL Group Ltd. | 452,595 | 18,538,291 | |
| 1,282,446,412 | |||
| Mortgage Real Estate Investment Trusts - 0.3% | |||
| AG Mortgage Investment Trust, Inc. | 28,740 | 553,820 | |
| AGNC Investment Corp. | 599,467 | 12,912,519 | |
| American Capital Mortgage Investment Corp. | 77,847 | 1,494,662 | |
| Annaly Capital Management, Inc. | 1,841,289 | 23,016,113 | |
| Anworth Mortgage Asset Corp. | 251,516 | 1,524,187 | |
| Apollo Commercial Real Estate Finance, Inc. | 157,668 | 2,852,214 | |
| Arbor Realty Trust, Inc. | 80,640 | 661,248 | |
| Ares Commercial Real Estate Corp. | 39,618 | 522,561 | |
| Armour Residential REIT, Inc. (b) | 61,211 | 1,616,583 | |
| Blackstone Mortgage Trust, Inc. (b) | 164,134 | 5,145,601 | |
| Capstead Mortgage Corp. | 155,839 | 1,506,963 | |
| Cherry Hill Mortgage Investment Corp. | 12,023 | 222,185 | |
| Chimera Investment Corp. | 306,209 | 5,839,406 | |
| CIM Commercial Trust Corp. (b) | 6,057 | 94,792 | |
| CYS Investments, Inc. | 246,028 | 2,162,586 | |
| Dynex Capital, Inc. | 68,104 | 486,944 | |
| Ellington Residential Mortgage REIT | 15,540 | 227,350 | |
| Five Oaks Investment Corp. (b) | 6,106 | 25,401 | |
| Great Ajax Corp. | 14,698 | 208,418 | |
| Hannon Armstrong Sustainable Infrastructure Capital, Inc. | 84,233 | 1,954,206 | |
| Invesco Mortgage Capital, Inc. | 180,605 | 3,066,673 | |
| KKR Real Estate Finance Trust, Inc. | 46,076 | 956,999 | |
| Ladder Capital Corp. Class A | 130,256 | 1,787,112 | |
| MFA Financial, Inc. | 654,424 | 5,745,843 | |
| New Residential Investment Corp. | 514,969 | 8,486,689 | |
| New York Mortgage Trust, Inc. (b) | 176,500 | 1,104,890 | |
| Orchid Island Capital, Inc. | 73,768 | 713,337 | |
| Owens Realty Mortgage, Inc. | 54,252 | 941,272 | |
| PennyMac Mortgage Investment Trust | 106,166 | 1,835,610 | |
| Redwood Trust, Inc. | 130,122 | 2,170,435 | |
| Resource Capital Corp. | 40,594 | 420,148 | |
| Starwood Property Trust, Inc. | 462,583 | 10,273,968 | |
| Two Harbors Investment Corp. | 567,052 | 5,800,942 | |
| Western Asset Mortgage Capital Corp. (b) | 72,828 | 765,422 | |
| ZAIS Financial Corp. | 6,000 | 91,500 | |
| 107,188,599 | |||
| Real Estate Management & Development - 0.0% | |||
| The RMR Group, Inc. | 10,073 | 520,270 | |
| Thrifts & Mortgage Finance - 0.2% | |||
| ASB Bancorp, Inc. (a) | 1,992 | 88,345 | |
| Astoria Financial Corp. | 151,919 | 2,976,093 | |
| Bank Mutual Corp. | 56,001 | 512,409 | |
| BankFinancial Corp. | 19,300 | 309,572 | |
| Bear State Financial, Inc. | 13,571 | 139,510 | |
| Beneficial Bancorp, Inc. | 178,014 | 2,661,309 | |
| BofI Holding, Inc. (a)(b) | 104,951 | 2,782,251 | |
| BSB Bancorp, Inc. (a) | 6,958 | 198,303 | |
| Capitol Federal Financial, Inc. | 255,033 | 3,499,053 | |
| Charter Financial Corp. | 26,857 | 436,695 | |
| Clifton Bancorp, Inc. | 32,703 | 515,072 | |
| Dime Community Bancshares, Inc. | 51,879 | 983,107 | |
| Entegra Financial Corp. (a)(b) | 3,030 | 70,296 | |
| ESSA Bancorp, Inc. | 4,298 | 64,900 | |
| Essent Group Ltd. (a) | 146,912 | 5,741,321 | |
| Farmer Mac Class C (non-vtg.) | 17,857 | 1,216,419 | |
| First Defiance Financial Corp. | 13,178 | 645,195 | |
| Flagstar Bancorp, Inc. (a) | 37,206 | 1,221,101 | |
| Hingham Institution for Savings | 2,103 | 386,973 | |
| Home Bancorp, Inc. | 3,114 | 125,743 | |
| HomeStreet, Inc. (a) | 54,010 | 1,363,753 | |
| Impac Mortgage Holdings, Inc. (a)(b) | 22,924 | 304,201 | |
| Kearny Financial Corp. | 157,909 | 2,234,412 | |
| Lendingtree, Inc. (a)(b) | 12,573 | 2,903,734 | |
| Malvern Bancorp, Inc. (a) | 6,089 | 144,918 | |
| Meridian Bancorp, Inc. Maryland | 112,706 | 1,983,626 | |
| Meta Financial Group, Inc. | 16,728 | 1,175,978 | |
| MGIC Investment Corp. (a) | 616,542 | 7,059,406 | |
| Nationstar Mortgage Holdings, Inc. (a)(b) | 63,329 | 1,090,525 | |
| New York Community Bancorp, Inc. | 878,574 | 10,586,817 | |
| NMI Holdings, Inc. (a) | 95,441 | 1,035,535 | |
| Northfield Bancorp, Inc. | 77,835 | 1,253,922 | |
| Northwest Bancshares, Inc. | 177,568 | 2,739,874 | |
| OceanFirst Financial Corp. | 60,020 | 1,498,099 | |
| Ocwen Financial Corp. (a)(b) | 179,422 | 525,706 | |
| Oritani Financial Corp. | 122,108 | 1,959,833 | |
| PennyMac Financial Services, Inc. (a) | 35,269 | 599,573 | |
| PHH Corp. (a) | 94,843 | 1,346,771 | |
| Poage Bankshares, Inc. | 2,365 | 43,161 | |
| Provident Financial Holdings, Inc. | 3,066 | 58,070 | |
| Provident Financial Services, Inc. | 124,224 | 3,086,966 | |
| Radian Group, Inc. | 389,840 | 6,822,200 | |
| Riverview Bancorp, Inc. | 6,875 | 55,206 | |
| Security National Financial Corp. Class A | 11,754 | 69,349 | |
| SI Financial Group, Inc. | 3,746 | 54,692 | |
| Southern Missouri Bancorp, Inc. | 5,377 | 174,537 | |
| Territorial Bancorp, Inc. | 13,244 | 400,366 | |
| TFS Financial Corp. | 159,329 | 2,450,480 | |
| Timberland Bancorp, Inc. | 5,034 | 139,492 | |
| Trustco Bank Corp., New York | 140,018 | 1,106,142 | |
| United Community Financial Corp. | 43,226 | 392,924 | |
| United Financial Bancorp, Inc. New | 84,987 | 1,471,975 | |
| Walker & Dunlop, Inc. (a) | 49,313 | 2,376,393 | |
| Walter Investment Management Corp. (a)(b) | 49,597 | 21,416 | |
| Washington Federal, Inc. | 157,606 | 4,925,188 | |
| Waterstone Financial, Inc. | 41,772 | 737,276 | |
| Westbury Bancorp, Inc. (a) | 4,860 | 97,929 | |
| Westfield Financial, Inc. | 33,310 | 331,435 | |
| WSFS Financial Corp. | 46,100 | 2,060,670 | |
| 91,256,217 | |||
| TOTAL FINANCIALS | 6,444,965,562 | ||
| HEALTH CARE - 14.1% | |||
| Biotechnology - 3.4% | |||
| AbbVie, Inc. | 2,726,854 | 205,332,106 | |
| Abeona Therapeutics, Inc. (a)(b) | 62,198 | 817,904 | |
| ACADIA Pharmaceuticals, Inc. (a)(b) | 164,038 | 5,841,393 | |
| Acceleron Pharma, Inc. (a)(b) | 65,396 | 2,534,749 | |
| Achaogen, Inc. (a)(b) | 54,118 | 1,014,171 | |
| Achillion Pharmaceuticals, Inc. (a) | 199,588 | 1,019,895 | |
| Acorda Therapeutics, Inc. (a)(b) | 83,616 | 1,739,213 | |
| Actinium Pharmaceuticals, Inc. (a)(b) | 38,656 | 23,580 | |
| Adamas Pharmaceuticals, Inc. (a)(b) | 24,337 | 509,617 | |
| Aduro Biotech, Inc. (a)(b) | 43,288 | 525,949 | |
| Advaxis, Inc. (a)(b) | 48,573 | 330,782 | |
| Adverum Biotechnologies, Inc. (a) | 12,370 | 34,018 | |
| Aevi Genomic Medicine, Inc. (a) | 41,669 | 52,920 | |
| Agenus, Inc. (a)(b) | 138,167 | 509,836 | |
| Agios Pharmaceuticals, Inc. (a)(b) | 72,800 | 4,605,328 | |
| Aimmune Therapeutics, Inc. (a)(b) | 39,537 | 850,046 | |
| Akebia Therapeutics, Inc. (a) | 89,194 | 1,493,108 | |
| Albireo Pharma, Inc. (a) | 5,786 | 143,146 | |
| Alder Biopharmaceuticals, Inc. (a) | 88,675 | 869,015 | |
| Alexion Pharmaceuticals, Inc. (a) | 385,294 | 54,869,719 | |
| Alkermes PLC (a)(b) | 263,559 | 13,383,526 | |
| Alnylam Pharmaceuticals, Inc. (a)(b) | 138,114 | 11,840,513 | |
| Alpine Immune Sciences, Inc. (a) | 12,084 | 105,735 | |
| AMAG Pharmaceuticals, Inc. (a)(b) | 54,744 | 914,225 | |
| Amgen, Inc. | 1,262,784 | 224,485,112 | |
| Amicus Therapeutics, Inc. (a)(b) | 274,496 | 3,826,474 | |
| AnaptysBio, Inc. | 8,529 | 238,556 | |
| Anavex Life Sciences Corp. (a)(b) | 58,538 | 259,909 | |
| Anthera Pharmaceuticals, Inc. (a)(b) | 7,268 | 11,629 | |
| Applied Genetic Technologies Corp. (a) | 14,097 | 64,846 | |
| Aptevo Therapeutics, Inc. (a) | 19,070 | 25,363 | |
| AquaBounty Technologies, Inc. (a)(b) | 1,372 | 9,906 | |
| Aquinox Pharmaceuticals, Inc. (a)(b) | 27,880 | 407,327 | |
| Ardelyx, Inc. (a) | 32,056 | 165,088 | |
| Arena Pharmaceuticals, Inc. (a) | 64,716 | 1,500,117 | |
| Argos Therapeutics, Inc. (a)(b) | 19,777 | 3,942 | |
| ArQule, Inc. (a) | 65,290 | 71,166 | |
| Array BioPharma, Inc. (a)(b) | 301,593 | 2,919,420 | |
| Arrowhead Pharmaceuticals, Inc. (a)(b) | 223,439 | 625,629 | |
| Asterias Biotherapeutics, Inc. (a)(b) | 24,436 | 84,304 | |
| Atara Biotherapeutics, Inc. (a)(b) | 38,054 | 599,351 | |
| Athersys, Inc. (a)(b) | 185,212 | 324,121 | |
| aTyr Pharma, Inc. (a) | 6,529 | 19,913 | |
| Audentes Therapeutics, Inc. (a) | 34,208 | 718,026 | |
| AVEO Pharmaceuticals, Inc. (a)(b) | 164,980 | 560,932 | |
| Aviragen Therapeutics, Inc. (a) | 46,093 | 28,946 | |
| Bellicum Pharmaceuticals, Inc. (a)(b) | 35,938 | 389,209 | |
| Biocept, Inc. (a)(b) | 7,092 | 8,652 | |
| BioCryst Pharmaceuticals, Inc. (a)(b) | 125,510 | 640,101 | |
| Biogen, Inc. (a) | 364,324 | 115,330,405 | |
| Biohaven Pharmaceutical Holding Co. Ltd. (b) | 57,394 | 2,051,836 | |
| BioMarin Pharmaceutical, Inc. (a) | 315,079 | 28,416,975 | |
| Biospecifics Technologies Corp. (a) | 7,257 | 342,168 | |
| Biostage, Inc. (a)(b) | 3,080 | 960 | |
| BioTime, Inc. (a)(b) | 346,441 | 1,015,072 | |
| Bioverativ, Inc. | 185,633 | 10,523,535 | |
| bluebird bio, Inc. (a)(b) | 75,907 | 9,476,989 | |
| Blueprint Medicines Corp. (a) | 59,036 | 3,200,932 | |
| BrainStorm Cell Therpeutic, Inc. (a)(b) | 15,396 | 65,587 | |
| Calithera Biosciences, Inc. (a) | 45,690 | 749,316 | |
| Cancer Genetics, Inc. (a)(b) | 9,725 | 33,065 | |
| Cara Therapeutics, Inc. (a)(b) | 41,713 | 597,747 | |
| Cascadian Therapeutics, Inc. (a)(b) | 49,541 | 179,338 | |
| CASI Pharmaceuticals, Inc. (a) | 289 | 278 | |
| Catalyst Biosciences, Inc. (a) | 180 | 603 | |
| Catalyst Pharmaceutical Partners, Inc. (a) | 93,518 | 257,175 | |
| Cel-Sci Corp. (a)(b) | 3,253 | 5,920 | |
| Celgene Corp. (a) | 1,338,817 | 186,001,846 | |
| Celldex Therapeutics, Inc. (a)(b) | 215,095 | 529,134 | |
| Cellular Biomedicine Group, Inc. (a)(b) | 8,068 | 79,470 | |
| Celsion Corp. (a) | 762 | 1,021 | |
| ChemoCentryx, Inc. (a) | 36,062 | 250,270 | |
| Chiasma, Inc. (a)(b) | 8,745 | 19,239 | |
| Chimerix, Inc. (a) | 63,824 | 303,802 | |
| Cidara Therapeutics, Inc. (a) | 2,782 | 19,196 | |
| Cleveland Biolabs, Inc. (a)(b) | 1,776 | 4,795 | |
| Clovis Oncology, Inc. (a)(b) | 83,622 | 6,361,126 | |
| Coherus BioSciences, Inc. (a)(b) | 71,178 | 1,028,522 | |
| Conatus Pharmaceuticals, Inc. (a)(b) | 36,543 | 209,757 | |
| Concert Pharmaceuticals, Inc. (a) | 25,754 | 391,976 | |
| Corbus Pharmaceuticals Holdings, Inc. (a)(b) | 46,114 | 357,384 | |
| Corvus Pharmaceuticals, Inc. (a)(b) | 10,405 | 168,249 | |
| CTI BioPharma Corp. (a)(b) | 19,153 | 62,247 | |
| Curis, Inc. (a) | 179,000 | 365,160 | |
| Cyclacel Pharmaceuticals, Inc. | 960 | 1,613 | |
| Cytokinetics, Inc. (a)(b) | 76,663 | 1,138,446 | |
| CytomX Therapeutics, Inc. (a) | 55,930 | 966,470 | |
| Cytori Therapeutics, Inc. (a)(b) | 10,777 | 3,880 | |
| CytRx Corp. (a)(b) | 243,861 | 129,490 | |
| Dicerna Pharmaceuticals, Inc. (a)(b) | 22,350 | 78,002 | |
| Dimension Therapeutics, Inc. (a) | 31,436 | 106,882 | |
| Dyax Corp. rights 12/31/19 (a)(c) | 200,675 | 662,228 | |
| Dynavax Technologies Corp. (a)(b) | 88,051 | 1,580,515 | |
| Eagle Pharmaceuticals, Inc. (a)(b) | 14,894 | 812,617 | |
| Edge Therapeutics, Inc. (a)(b) | 50,398 | 531,699 | |
| Editas Medicine, Inc. (a)(b) | 42,479 | 896,732 | |
| Eiger Biopharmaceuticals, Inc. (a) | 1,065 | 9,851 | |
| Eleven Biotherapeutics, Inc. (a)(b) | 6,105 | 6,593 | |
| Emergent BioSolutions, Inc. (a)(b) | 56,205 | 2,098,133 | |
| Enanta Pharmaceuticals, Inc. (a)(b) | 25,666 | 1,100,045 | |
| Epizyme, Inc. (a)(b) | 64,306 | 1,115,709 | |
| Esperion Therapeutics, Inc. (a)(b) | 35,029 | 1,731,133 | |
| Exact Sciences Corp. (a)(b) | 200,706 | 8,407,574 | |
| Exelixis, Inc. (a) | 390,440 | 11,416,466 | |
| Fate Therapeutics, Inc. (a)(b) | 23,219 | 87,768 | |
| Fibrocell Science, Inc. (a) | 12,960 | 34,733 | |
| FibroGen, Inc. (a) | 112,539 | 5,424,380 | |
| Five Prime Therapeutics, Inc. (a) | 46,353 | 1,572,294 | |
| Flexion Therapeutics, Inc. (a)(b) | 39,546 | 1,016,332 | |
| Fortress Biotech, Inc. (a)(b) | 43,908 | 208,563 | |
| Foundation Medicine, Inc. (a)(b) | 24,382 | 982,595 | |
| Galectin Therapeutics, Inc. (a)(b) | 56,076 | 96,451 | |
| Galena Biopharma, Inc. (a)(b) | 12,770 | 4,597 | |
| Genocea Biosciences, Inc. (a)(b) | 32,032 | 155,996 | |
| Genomic Health, Inc. (a) | 30,953 | 981,210 | |
| GenVec, Inc. rights (c) | 814 | 0 | |
| Geron Corp. (a)(b) | 277,780 | 602,783 | |
| Gilead Sciences, Inc. | 2,245,188 | 187,944,687 | |
| Global Blood Therapeutics, Inc. (a)(b) | 55,511 | 1,687,534 | |
| GlycoMimetics, Inc. (a)(b) | 35,771 | 436,406 | |
| GTx, Inc. (a)(b) | 1,962 | 12,930 | |
| Halozyme Therapeutics, Inc. (a)(b) | 222,904 | 2,899,981 | |
| Heat Biologics, Inc. (a) | 3,136 | 1,756 | |
| Hemispherx Biopharma, Inc. (a) | 10,898 | 3,956 | |
| Heron Therapeutics, Inc. (a)(b) | 88,956 | 1,467,774 | |
| iBio, Inc. (a) | 40,361 | 11,939 | |
| Idera Pharmaceuticals, Inc. (a)(b) | 159,215 | 315,246 | |
| Ignyta, Inc. (a)(b) | 75,502 | 868,273 | |
| Immune Design Corp. (a)(b) | 22,465 | 243,745 | |
| Immune Pharmaceuticals, Inc. (a)(b) | 7,141 | 8,284 | |
| ImmunoCellular Therapeutics Ltd. (a) | 1,048 | 290 | |
| ImmunoGen, Inc. (a)(b) | 155,417 | 1,299,286 | |
| Immunomedics, Inc. (a)(b) | 167,994 | 2,123,444 | |
| Incyte Corp. (a) | 290,297 | 39,889,711 | |
| Infinity Pharmaceuticals, Inc. (a) | 64,535 | 61,437 | |
| Inotek Pharmaceuticals Corp. (a)(b) | 20,127 | 20,530 | |
| Inovio Pharmaceuticals, Inc. (a)(b) | 153,711 | 913,043 | |
| Insmed, Inc. (a) | 93,412 | 1,160,177 | |
| Insys Therapeutics, Inc. (a)(b) | 45,156 | 412,726 | |
| Intellia Therapeutics, Inc. (a)(b) | 14,395 | 302,727 | |
| Intercept Pharmaceuticals, Inc. (a)(b) | 29,766 | 3,471,013 | |
| Intrexon Corp. (a)(b) | 110,181 | 2,173,871 | |
| Invitae Corp. (a) | 60,878 | 597,822 | |
| Ionis Pharmaceuticals, Inc. (a)(b) | 209,776 | 11,248,189 | |
| Iovance Biotherapeutics, Inc. (a) | 86,775 | 498,956 | |
| Ironwood Pharmaceuticals, Inc. Class A (a)(b) | 221,795 | 3,537,630 | |
| IsoRay, Inc. (a) | 57,047 | 30,235 | |
| Jounce Therapeutics, Inc. | 10,322 | 175,371 | |
| Juno Therapeutics, Inc. (a)(b) | 132,147 | 5,453,707 | |
| Kalvista Pharmaceuticals, Inc. (a) | 508 | 3,358 | |
| Karyopharm Therapeutics, Inc. (a) | 46,345 | 473,646 | |
| Keryx Biopharmaceuticals, Inc. (a)(b) | 176,242 | 1,270,705 | |
| Kindred Biosciences, Inc. (a) | 41,075 | 312,170 | |
| Kite Pharma, Inc. (a)(b) | 85,521 | 15,221,883 | |
| Kura Oncology, Inc. (a) | 20,397 | 146,858 | |
| La Jolla Pharmaceutical Co. (a)(b) | 28,865 | 985,740 | |
| Lexicon Pharmaceuticals, Inc. (a)(b) | 68,906 | 1,043,237 | |
| Ligand Pharmaceuticals, Inc. Class B (a)(b) | 36,373 | 4,687,389 | |
| Loxo Oncology, Inc. (a)(b) | 32,076 | 2,675,138 | |
| Macrogenics, Inc. (a)(b) | 52,348 | 989,901 | |
| Madrigal Pharmaceuticals, Inc. (a)(b) | 6,525 | 111,447 | |
| MannKind Corp. (a)(b) | 80,635 | 166,914 | |
| Matinas BioPharma Holdings, Inc. (b) | 91,988 | 117,745 | |
| MediciNova, Inc. (a) | 31,401 | 170,193 | |
| MEI Pharma, Inc. (a) | 62,189 | 164,179 | |
| Merrimack Pharmaceuticals, Inc. (b) | 222,876 | 303,111 | |
| MiMedx Group, Inc. (a)(b) | 170,113 | 2,767,739 | |
| Minerva Neurosciences, Inc. (a)(b) | 51,124 | 309,300 | |
| Mirati Therapeutics, Inc. (a)(b) | 22,963 | 124,000 | |
| Molecular Templates, Inc. (a)(b) | 11,026 | 63,510 | |
| Momenta Pharmaceuticals, Inc. (a) | 120,689 | 2,033,610 | |
| Myriad Genetics, Inc. (a)(b) | 115,012 | 3,506,716 | |
| NanoViricides, Inc. (a)(b) | 32,620 | 44,363 | |
| NantKwest, Inc. (a)(b) | 76,001 | 473,486 | |
| Natera, Inc. (a)(b) | 66,582 | 822,288 | |
| Navidea Biopharmaceuticals, Inc. (a)(b) | 148,549 | 58,305 | |
| Neothetics, Inc. (a)(b) | 10,095 | 3,474 | |
| Neuralstem, Inc. (a)(b) | 8,195 | 9,752 | |
| Neurocrine Biosciences, Inc. (a)(b) | 154,025 | 8,717,815 | |
| NewLink Genetics Corp. (a)(b) | 41,496 | 336,948 | |
| Novavax, Inc. (a)(b) | 436,535 | 458,362 | |
| Ohr Pharmaceutical, Inc. (a)(b) | 32,314 | 24,727 | |
| OncoCyte Corp. (a)(b) | 3,324 | 18,781 | |
| OncoGenex Pharmaceuticals, Inc. (a)(b) | 960 | 3,370 | |
| OncoGenex Pharmaceuticals, Inc. rights (c) | 10,565 | 0 | |
| OncoMed Pharmaceuticals, Inc. (a) | 27,577 | 137,058 | |
| Onconova Therapeutics, Inc. (a) | 624 | 1,011 | |
| Opexa Therapeutics, Inc. (a)(b) | 715 | 613 | |
| Ophthotech Corp. (a) | 50,366 | 156,135 | |
| Opko Health, Inc. (a)(b) | 617,855 | 3,954,272 | |
| Oragenics, Inc. (a) | 9,973 | 3,191 | |
| Organovo Holdings, Inc. (a)(b) | 337,362 | 701,713 | |
| Otonomy, Inc. (a) | 38,289 | 137,840 | |
| OvaScience, Inc. (a)(b) | 60,110 | 84,154 | |
| Palatin Technologies, Inc. (a) | 204,858 | 88,089 | |
| PDL BioPharma, Inc. (a)(b) | 309,517 | 965,693 | |
| Peregrine Pharmaceuticals, Inc. (a) | 55,462 | 171,932 | |
| Pfenex, Inc. (a) | 21,045 | 75,972 | |
| PharmAthene, Inc. | 5,138 | 12,948 | |
| Portola Pharmaceuticals, Inc. (a) | 95,806 | 6,078,891 | |
| Progenics Pharmaceuticals, Inc. (a)(b) | 118,604 | 798,205 | |
| Protagonist Therapeutics, Inc. (b) | 52,263 | 853,455 | |
| Proteon Therapeutics, Inc. (a)(b) | 5,515 | 7,170 | |
| Proteostasis Therapeutics, Inc. (a)(b) | 15,177 | 32,934 | |
| Prothena Corp. PLC (a)(b) | 67,107 | 4,123,054 | |
| PTC Therapeutics, Inc. (a)(b) | 53,763 | 1,115,582 | |
| Puma Biotechnology, Inc. (a)(b) | 47,911 | 4,431,768 | |
| Radius Health, Inc. (a)(b) | 63,620 | 2,394,021 | |
| Recro Pharma, Inc. (a)(b) | 20,797 | 156,601 | |
| Regeneron Pharmaceuticals, Inc. (a) | 129,960 | 64,577,124 | |
| REGENXBIO, Inc. (a) | 45,270 | 1,029,893 | |
| Regulus Therapeutics, Inc. (a)(b) | 85,834 | 85,834 | |
| Repligen Corp. (a)(b) | 69,352 | 3,028,602 | |
| Retrophin, Inc. (a)(b) | 55,340 | 1,350,296 | |
| Rexahn Pharmaceuticals, Inc. (a)(b) | 42,298 | 101,938 | |
| Rigel Pharmaceuticals, Inc. (a) | 204,250 | 520,838 | |
| Sage Therapeutics, Inc. (a)(b) | 54,004 | 4,441,829 | |
| Sangamo Therapeutics, Inc. (a)(b) | 153,345 | 2,047,156 | |
| Sarepta Therapeutics, Inc. (a)(b) | 98,863 | 3,983,190 | |
| Savara, Inc. (a)(b) | 2,094 | 10,994 | |
| Seattle Genetics, Inc. (a)(b) | 163,698 | 8,599,056 | |
| Selecta Biosciences, Inc. (a) | 4,963 | 88,590 | |
| Seres Therapeutics, Inc. (a)(b) | 32,924 | 461,924 | |
| Sorrento Therapeutics, Inc. (a)(b) | 134,335 | 241,803 | |
| Spark Therapeutics, Inc. (a)(b) | 52,137 | 4,292,439 | |
| Spectrum Pharmaceuticals, Inc. (a)(b) | 121,770 | 1,188,475 | |
| Spring Bank Pharmaceuticals, Inc. (a) | 9,145 | 133,151 | |
| Stemline Therapeutics, Inc. (a)(b) | 29,702 | 268,803 | |
| Sunesis Pharmaceuticals, Inc. (a)(b) | 5,440 | 11,859 | |
| Syndax Pharmaceuticals, Inc. (a)(b) | 33,111 | 384,088 | |
| Synergy Pharmaceuticals, Inc. (a)(b) | 387,288 | 1,154,118 | |
| Synthetic Biologics, Inc. (a)(b) | 84,770 | 64,425 | |
| Syros Pharmaceuticals, Inc. (a)(b) | 16,253 | 318,071 | |
| T2 Biosystems, Inc. (a) | 14,700 | 61,593 | |
| Tenax Therapeutics, Inc. (a)(b) | 1,373 | 467 | |
| TESARO, Inc. (a)(b) | 58,508 | 7,555,723 | |
| TG Therapeutics, Inc. (a)(b) | 86,621 | 1,100,087 | |
| Tocagen, Inc. (b) | 8,584 | 119,403 | |
| TONIX Pharmaceuticals Holding (a)(b) | 1,717 | 6,473 | |
| TRACON Pharmaceuticals, Inc. (a)(b) | 4,111 | 10,278 | |
| Trevena, Inc. (a)(b) | 130,021 | 312,050 | |
| Trovagene, Inc. (a)(b) | 33,847 | 22,339 | |
| Ultragenyx Pharmaceutical, Inc. (a)(b) | 65,524 | 3,738,799 | |
| United Therapeutics Corp. (a)(b) | 76,764 | 10,040,731 | |
| Vanda Pharmaceuticals, Inc. (a) | 83,623 | 1,438,316 | |
| Veracyte, Inc. (a) | 15,721 | 128,755 | |
| Verastem, Inc. (a) | 47,048 | 183,487 | |
| Vericel Corp. (a)(b) | 28,746 | 123,608 | |
| Versartis, Inc. (a) | 37,706 | 716,414 | |
| Vertex Pharmaceuticals, Inc. (a) | 425,706 | 68,342,841 | |
| Vical, Inc. (a) | 6,566 | 15,496 | |
| Vital Therapies, Inc. (a) | 26,714 | 80,142 | |
| Voyager Therapeutics, Inc. (a) | 6,634 | 63,952 | |
| Xbiotech, Inc. (a)(b) | 36,998 | 189,430 | |
| Xencor, Inc. (a)(b) | 60,989 | 1,318,582 | |
| XOMA Corp. (a)(b) | 4,980 | 55,228 | |
| Zafgen, Inc. (a) | 24,672 | 89,066 | |
| ZIOPHARM Oncology, Inc. (a)(b) | 222,939 | 1,424,580 | |
| 1,499,608,882 | |||
| Health Care Equipment & Supplies - 2.8% | |||
| Abaxis, Inc. | 36,438 | 1,684,164 | |
| Abbott Laboratories | 2,965,736 | 151,074,592 | |
| Abiomed, Inc. (a) | 70,588 | 10,644,670 | |
| Accuray, Inc. (a)(b) | 142,393 | 590,931 | |
| Alere, Inc. (a) | 147,553 | 7,297,971 | |
| Align Technology, Inc. (a) | 129,953 | 22,967,893 | |
| Alliqua Biomedical, Inc. (a)(b) | 4,397 | 1,452 | |
| Alphatec Holdings, Inc. (a)(b) | 3,066 | 6,193 | |
| Amedica Corp. (a)(b) | 69,010 | 22,704 | |
| Analogic Corp. | 19,536 | 1,397,801 | |
| Angiodynamics, Inc. (a) | 51,608 | 878,884 | |
| Anika Therapeutics, Inc. (a)(b) | 26,869 | 1,442,865 | |
| Antares Pharma, Inc. (a)(b) | 242,616 | 730,274 | |
| Apollo Endosurgery, Inc. (a) | 102 | 422 | |
| Atricure, Inc. (a)(b) | 47,294 | 1,060,804 | |
| Atrion Corp. | 2,291 | 1,425,346 | |
| Avinger, Inc. (a)(b) | 31,221 | 9,366 | |
| AxoGen, Inc. (a) | 41,462 | 729,731 | |
| Baxter International, Inc. | 832,536 | 51,650,533 | |
| Becton, Dickinson & Co. | 388,521 | 77,486,628 | |
| Bellerophon Therapeutics, Inc. (a)(b) | 16,556 | 18,212 | |
| BioLase Technology, Inc. (a)(b) | 31,172 | 15,873 | |
| Boston Scientific Corp. (a) | 2,353,090 | 64,827,630 | |
| Bovie Medical Corp. (a) | 10,849 | 25,821 | |
| C.R. Bard, Inc. | 123,487 | 39,615,864 | |
| Cantel Medical Corp. | 62,489 | 5,077,231 | |
| Cardiovascular Systems, Inc. (a) | 58,185 | 1,708,893 | |
| Cerus Corp. (a)(b) | 223,482 | 525,183 | |
| Cesca Therapeutics, Inc. (a) | 793 | 2,696 | |
| Cogentix Medical, Inc. (a) | 1,160 | 2,668 | |
| ConforMis, Inc. (a)(b) | 87,736 | 324,623 | |
| CONMED Corp. | 42,831 | 2,124,418 | |
| Corindus Vascular Robotics, Inc. (a)(b) | 178,714 | 341,344 | |
| Cryolife, Inc. (a) | 44,979 | 935,563 | |
| CryoPort, Inc. (a) | 21,868 | 167,946 | |
| Cutera, Inc. (a) | 22,484 | 835,281 | |
| CytoSorbents Corp. (a)(b) | 24,969 | 128,590 | |
| Danaher Corp. | 1,044,709 | 87,149,625 | |
| Dare Bioscience, Inc. (a)(b) | 2,822 | 9,397 | |
| Delcath Systems, Inc. (a)(b) | 724,984 | 80,183 | |
| Dentsply Sirona, Inc. | 392,936 | 22,228,390 | |
| DexCom, Inc. (a)(b) | 148,457 | 11,076,377 | |
| Dextera Surgical, Inc. (a)(b) | 2,377 | 849 | |
| Edwards Lifesciences Corp. (a) | 358,419 | 40,737,904 | |
| Ekso Bionics Holdings, Inc. (a)(b) | 18,398 | 23,181 | |
| Endologix, Inc. (a)(b) | 127,100 | 537,633 | |
| Entellus Medical, Inc. (a)(b) | 19,089 | 337,875 | |
| EnteroMedics, Inc. (a)(b) | 13,109 | 24,776 | |
| Exactech, Inc. (a) | 12,870 | 393,179 | |
| Fonar Corp. (a) | 7,275 | 215,340 | |
| Genmark Diagnostics, Inc. (a) | 85,964 | 837,289 | |
| Glaukos Corp. (a)(b) | 17,206 | 649,527 | |
| Globus Medical, Inc. (a) | 121,778 | 3,681,349 | |
| Haemonetics Corp. (a) | 91,218 | 3,924,198 | |
| Halyard Health, Inc. (a)(b) | 83,663 | 3,789,097 | |
| Heska Corp. (a) | 12,153 | 1,236,203 | |
| Hill-Rom Holdings, Inc. | 104,665 | 8,055,018 | |
| Hologic, Inc. (a) | 475,499 | 18,354,261 | |
| ICU Medical, Inc. (a) | 25,020 | 4,362,237 | |
| IDEXX Laboratories, Inc. (a) | 149,372 | 23,216,890 | |
| Inogen, Inc. (a) | 30,117 | 2,885,209 | |
| Insulet Corp. (a) | 96,745 | 5,617,015 | |
| Integer Holdings Corp. (a) | 45,898 | 2,109,013 | |
| Integra LifeSciences Holdings Corp. (a) | 106,721 | 5,441,704 | |
| Intuitive Surgical, Inc. (a) | 63,201 | 63,496,149 | |
| Invacare Corp. (b) | 57,619 | 777,857 | |
| InVivo Therapeutics Holdings Corp. (a)(b) | 46,249 | 53,186 | |
| Invuity, Inc. (a) | 16,779 | 134,232 | |
| IRadimed Corp. (a)(b) | 3,077 | 31,078 | |
| iRhythm Technologies, Inc. (b) | 20,421 | 974,899 | |
| Iridex Corp. (a) | 4,871 | 43,352 | |
| K2M Group Holdings, Inc. (a) | 62,592 | 1,463,401 | |
| Kewaunee Scientific Corp. | 1,376 | 35,432 | |
| Lantheus Holdings, Inc. (a) | 45,045 | 788,288 | |
| LeMaitre Vascular, Inc. | 20,554 | 748,166 | |
| LivaNova PLC (a)(b) | 75,176 | 4,704,514 | |
| Masimo Corp. (a) | 77,531 | 6,542,066 | |
| Medtronic PLC | 2,345,978 | 189,132,746 | |
| Meridian Bioscience, Inc. | 73,595 | 1,022,971 | |
| Merit Medical Systems, Inc. (a) | 93,532 | 3,862,872 | |
| Microbot Medical, Inc. (a)(b) | 7,285 | 7,504 | |
| Misonix, Inc. (a) | 7,938 | 77,792 | |
| Natus Medical, Inc. (a) | 56,909 | 1,912,142 | |
| Neogen Corp. (a) | 67,196 | 4,629,804 | |
| Nevro Corp. (a)(b) | 40,235 | 3,467,452 | |
| NuVasive, Inc. (a)(b) | 83,449 | 5,213,894 | |
| Nuvectra Corp. (a) | 13,499 | 145,654 | |
| NxStage Medical, Inc. (a) | 98,730 | 2,764,440 | |
| OraSure Technologies, Inc. (a) | 97,410 | 1,988,138 | |
| Orthofix International NV (a) | 32,172 | 1,583,184 | |
| Penumbra, Inc. (a)(b) | 54,930 | 4,723,980 | |
| Pulse Biosciences, Inc. (a)(b) | 10,423 | 208,773 | |
| Quidel Corp. (a) | 49,569 | 1,731,941 | |
| ResMed, Inc. (b) | 241,759 | 18,755,663 | |
| Retractable Technologies, Inc. (a) | 5,248 | 3,338 | |
| Rockwell Medical Technologies, Inc. (a)(b) | 83,284 | 526,355 | |
| Roka Bioscience, Inc. (a) | 10,160 | 9,917 | |
| RTI Biologics, Inc. (a) | 100,701 | 453,155 | |
| Seaspine Holdings Corp. (a) | 11,601 | 131,091 | |
| Second Sight Medical Products, Inc. (a)(b) | 20,882 | 23,597 | |
| Sientra, Inc. (a)(b) | 27,954 | 320,353 | |
| Skyline Medical, Inc. (a)(b) | 19,298 | 27,017 | |
| Staar Surgical Co. (a)(b) | 39,188 | 468,297 | |
| Steris PLC | 151,004 | 13,161,509 | |
| STRATA Skin Sciences, Inc. (a) | 803 | 1,502 | |
| Stryker Corp. | 531,872 | 75,190,745 | |
| SurModics, Inc. (a) | 19,525 | 507,650 | |
| Synergetics U.S.A., Inc. (a)(c) | 19,727 | 0 | |
| Tactile Systems Technology, Inc. (a)(b) | 22,275 | 732,402 | |
| Tandem Diabetes Care, Inc. (a)(b) | 25,765 | 21,643 | |
| TearLab Corp. (a)(b) | 1,739 | 2,348 | |
| Teleflex, Inc. | 77,066 | 16,318,726 | |
| The Cooper Companies, Inc. | 83,062 | 20,834,441 | |
| TransEnterix, Inc. (a)(b) | 90,218 | 77,587 | |
| Utah Medical Products, Inc. | 13,511 | 974,819 | |
| Varian Medical Systems, Inc. (a)(b) | 159,232 | 16,918,400 | |
| Vermillion, Inc. (a)(b) | 12,449 | 15,810 | |
| ViewRay, Inc. (a)(b) | 55,513 | 291,998 | |
| Viveve Medical, Inc. (a)(b) | 22,359 | 126,776 | |
| West Pharmaceutical Services, Inc. | 126,597 | 11,019,003 | |
| Wright Medical Group NV (a)(b) | 185,020 | 5,476,592 | |
| Zimmer Biomet Holdings, Inc. | 342,629 | 39,152,216 | |
| Zosano Pharma Corp. (a)(b) | 34,865 | 29,287 | |
| 1,218,592,923 | |||
| Health Care Providers & Services - 2.6% | |||
| AAC Holdings, Inc. (a)(b) | 12,779 | 118,717 | |
| Acadia Healthcare Co., Inc. (a)(b) | 128,691 | 6,040,756 | |
| Aceto Corp. | 47,837 | 507,551 | |
| Addus HomeCare Corp. (a) | 10,897 | 371,043 | |
| Aetna, Inc. | 564,977 | 89,096,873 | |
| Almost Family, Inc. (a) | 19,278 | 938,839 | |
| Amedisys, Inc. (a) | 47,206 | 2,466,041 | |
| American Renal Associates Holdings, Inc. (a)(b) | 16,913 | 242,363 | |
| AmerisourceBergen Corp. | 281,803 | 22,614,691 | |
| AMN Healthcare Services, Inc. (a)(b) | 87,493 | 3,267,864 | |
| Anthem, Inc. | 452,049 | 88,619,686 | |
| BioScrip, Inc. (a)(b) | 230,699 | 699,018 | |
| BioTelemetry, Inc. (a) | 51,243 | 1,903,677 | |
| Brookdale Senior Living, Inc. (a) | 326,054 | 3,955,035 | |
| Caladrius Biosciences, Inc. (a)(b) | 9,530 | 38,215 | |
| Capital Senior Living Corp. (a)(b) | 37,012 | 460,059 | |
| Cardinal Health, Inc. | 540,009 | 36,429,007 | |
| Centene Corp. (a) | 297,424 | 26,426,122 | |
| Chemed Corp. | 28,374 | 5,597,906 | |
| Cigna Corp. | 437,196 | 79,595,904 | |
| Civitas Solutions, Inc. (a) | 27,734 | 529,719 | |
| Community Health Systems, Inc. (a)(b) | 198,155 | 1,513,904 | |
| Corvel Corp. (a) | 17,696 | 918,422 | |
| Cross Country Healthcare, Inc. (a) | 55,702 | 689,591 | |
| DaVita HealthCare Partners, Inc. (a) | 263,576 | 15,435,011 | |
| Diplomat Pharmacy, Inc. (a)(b) | 79,924 | 1,338,727 | |
| Envision Healthcare Corp. | 199,964 | 10,480,113 | |
| Express Scripts Holding Co. (a) | 1,013,621 | 63,675,671 | |
| Five Star Sr Living, Inc. (a) | 70,113 | 113,934 | |
| Genesis HealthCare, Inc. Class A (a)(b) | 27,157 | 28,243 | |
| HCA Holdings, Inc. (a) | 489,951 | 38,539,546 | |
| HealthEquity, Inc. (a) | 76,252 | 3,261,298 | |
| HealthSouth Corp. | 168,846 | 7,724,705 | |
| Henry Schein, Inc. (a) | 146,456 | 25,436,478 | |
| Humana, Inc. | 247,696 | 63,811,444 | |
| Interpace Diagnostics Group, Inc. (a) | 136 | 178 | |
| Kindred Healthcare, Inc. | 151,684 | 1,228,640 | |
| Laboratory Corp. of America Holdings (a) | 175,793 | 27,576,648 | |
| Landauer, Inc. | 14,935 | 926,717 | |
| LHC Group, Inc. (a) | 27,965 | 1,824,716 | |
| LifePoint Hospitals, Inc. (a) | 65,814 | 3,813,921 | |
| Magellan Health Services, Inc. (a) | 40,373 | 3,266,176 | |
| McKesson Corp. | 363,256 | 54,237,753 | |
| MEDNAX, Inc. (a) | 163,523 | 7,334,007 | |
| Molina Healthcare, Inc. (a)(b) | 72,754 | 4,656,256 | |
| National Healthcare Corp. | 18,256 | 1,138,079 | |
| National Research Corp. Class A | 11,334 | 366,088 | |
| Owens & Minor, Inc. | 118,083 | 3,299,239 | |
| Patterson Companies, Inc. (b) | 134,760 | 5,188,260 | |
| PharMerica Corp. (a) | 50,899 | 1,496,431 | |
| Premier, Inc. (a) | 101,239 | 3,391,507 | |
| Providence Service Corp. (a) | 20,443 | 1,059,561 | |
| Psychemedics Corp. | 2,724 | 57,585 | |
| Quest Diagnostics, Inc. | 231,764 | 25,111,629 | |
| Quorum Health Corp. (a) | 41,687 | 182,589 | |
| R1 RCM, Inc. (a) | 178,635 | 589,496 | |
| RadNet, Inc. (a) | 43,227 | 443,077 | |
| Select Medical Holdings Corp. (a)(b) | 195,741 | 3,640,783 | |
| Sharps Compliance Corp. (a) | 12,687 | 62,801 | |
| Surgery Partners, Inc. (a) | 43,549 | 424,603 | |
| Teladoc, Inc. (a)(b) | 60,964 | 2,045,342 | |
| Tenet Healthcare Corp. (a)(b) | 137,153 | 2,354,917 | |
| The Ensign Group, Inc. | 78,310 | 1,608,487 | |
| Tivity Health, Inc.(a)(b) | 52,424 | 2,055,021 | |
| Triple-S Management Corp. (a)(b) | 37,106 | 916,889 | |
| U.S. Physical Therapy, Inc. | 18,467 | 1,106,173 | |
| UnitedHealth Group, Inc. | 1,650,119 | 328,208,669 | |
| Universal Health Services, Inc. Class B | 153,265 | 16,572,544 | |
| VCA, Inc. (a) | 141,830 | 13,184,517 | |
| Wellcare Health Plans, Inc. (a) | 75,649 | 13,214,367 | |
| 1,135,469,839 | |||
| Health Care Technology - 0.2% | |||
| Allscripts Healthcare Solutions, Inc. (a) | 329,763 | 4,333,086 | |
| athenahealth, Inc. (a)(b) | 66,612 | 9,387,629 | |
| Castlight Health, Inc. Class B (a)(b) | 69,240 | 270,036 | |
| Cerner Corp. (a) | 507,173 | 34,376,186 | |
| Computer Programs & Systems, Inc. (b) | 21,937 | 660,304 | |
| Connecture, Inc. (a) | 7,971 | 5,341 | |
| Evolent Health, Inc. (a)(b) | 108,849 | 1,817,778 | |
| HealthStream, Inc. (a)(b) | 41,650 | 978,359 | |
| HMS Holdings Corp. (a) | 140,319 | 2,486,453 | |
| iCAD, Inc. (a) | 14,864 | 58,861 | |
| Inovalon Holdings, Inc. Class A (a)(b) | 119,481 | 1,618,968 | |
| Medidata Solutions, Inc. (a) | 94,000 | 7,046,240 | |
| Omnicell, Inc. (a) | 60,052 | 3,080,668 | |
| Quality Systems, Inc. (a) | 73,135 | 1,151,876 | |
| Simulations Plus, Inc. | 6,008 | 87,116 | |
| Tabula Rasa HealthCare, Inc. | 5,543 | 125,992 | |
| Veeva Systems, Inc. Class A (a) | 198,680 | 11,821,460 | |
| Vocera Communications, Inc. (a) | 48,079 | 1,339,000 | |
| 80,645,353 | |||
| Life Sciences Tools & Services - 0.8% | |||
| Accelerate Diagnostics, Inc. (a)(b) | 47,182 | 1,085,186 | |
| Agilent Technologies, Inc. | 553,206 | 35,803,492 | |
| Albany Molecular Research, Inc. (a) | 40,643 | 883,579 | |
| Bio-Rad Laboratories, Inc. Class A (a) | 35,877 | 7,814,728 | |
| Bio-Techne Corp. | 69,291 | 8,576,840 | |
| Bruker Corp. | 188,235 | 5,475,756 | |
| Cambrex Corp. (a) | 66,661 | 3,473,038 | |
| Charles River Laboratories International, Inc. (a) | 77,816 | 8,466,381 | |
| ChromaDex, Inc. (a)(b) | 56,591 | 190,146 | |
| Enzo Biochem, Inc. (a) | 66,443 | 747,484 | |
| Fluidigm Corp. (a)(b) | 38,600 | 176,402 | |
| Harvard Bioscience, Inc. (a) | 18,919 | 58,649 | |
| Illumina, Inc. (a) | 250,734 | 51,265,074 | |
| INC Research Holdings, Inc. Class A (a)(b) | 91,734 | 5,384,786 | |
| Luminex Corp. | 66,508 | 1,285,600 | |
| Medpace Holdings, Inc. (b) | 21,051 | 687,105 | |
| Mettler-Toledo International, Inc. (a) | 43,558 | 26,356,510 | |
| Nanostring Technologies, Inc. (a) | 24,217 | 374,153 | |
| NeoGenomics, Inc. (a)(b) | 77,966 | 788,236 | |
| Pacific Biosciences of California, Inc. (a)(b) | 161,679 | 800,311 | |
| PAREXEL International Corp. (a) | 86,781 | 7,627,182 | |
| PerkinElmer, Inc. | 184,639 | 12,368,967 | |
| PRA Health Sciences, Inc. (a) | 84,500 | 6,540,300 | |
| pSivida Corp. (a)(b) | 25,265 | 30,571 | |
| Quintiles Transnational Holdings, Inc. (a) | 232,389 | 22,316,316 | |
| Thermo Fisher Scientific, Inc. | 667,814 | 124,974,712 | |
| VWR Corp. (a) | 150,777 | 4,978,657 | |
| Waters Corp. (a) | 136,882 | 25,115,109 | |
| 363,645,270 | |||
| Pharmaceuticals - 4.3% | |||
| AcelRx Pharmaceuticals, Inc. (a)(b) | 65,025 | 214,583 | |
| Aclaris Therapeutics, Inc. (a) | 40,572 | 1,052,032 | |
| Adamis Pharmaceuticals Corp. (a)(b) | 36,542 | 199,154 | |
| Aerie Pharmaceuticals, Inc. (a)(b) | 59,316 | 3,401,773 | |
| Agile Therapeutics, Inc. (a)(b) | 87,068 | 299,514 | |
| Akorn, Inc. (a) | 148,175 | 4,874,958 | |
| Alimera Sciences, Inc. (a) | 22,049 | 30,648 | |
| Allergan PLC | 574,331 | 131,797,478 | |
| Amphastar Pharmaceuticals, Inc. (a) | 63,932 | 1,023,551 | |
| Ampio Pharmaceuticals, Inc. (a)(b) | 59,082 | 31,467 | |
| ANI Pharmaceuticals, Inc. (a) | 10,919 | 524,112 | |
| ANI Pharmaceuticals, Inc. rights (a)(c) | 21,445 | 0 | |
| Apricus Biosciences, Inc. (a)(b) | 5,725 | 9,332 | |
| Aratana Therapeutics, Inc. (a)(b) | 38,612 | 220,475 | |
| Assembly Biosciences, Inc. (a) | 23,295 | 631,527 | |
| AstraZeneca PLC rights (a)(c) | 7,692 | 0 | |
| Avexis, Inc. (a)(b) | 38,150 | 3,561,303 | |
| Axsome Therapeutics, Inc. (a) | 21,511 | 109,706 | |
| Bio Path Holdings, Inc. (a)(b) | 166,645 | 45,827 | |
| Biodelivery Sciences International, Inc. (a)(b) | 170,623 | 528,931 | |
| BioPharmX Corp. (a)(b) | 64,864 | 19,848 | |
| Bristol-Myers Squibb Co. | 2,825,699 | 170,898,276 | |
| Catalent, Inc. (a) | 212,086 | 8,757,031 | |
| Cempra, Inc. (a)(b) | 81,591 | 248,853 | |
| Clearside Biomedical, Inc. (a)(b) | 19,198 | 134,194 | |
| Collegium Pharmaceutical, Inc. (a)(b) | 32,296 | 324,252 | |
| ContraVir Pharmaceuticals, Inc. (a)(b) | 80,626 | 38,322 | |
| Corcept Therapeutics, Inc. (a)(b) | 156,567 | 2,609,972 | |
| Corium International, Inc. (a)(b) | 42,043 | 359,468 | |
| CorMedix, Inc. (a)(b) | 48,587 | 24,051 | |
| Cumberland Pharmaceuticals, Inc. (a) | 7,158 | 50,178 | |
| CymaBay Therapeutics, Inc. (a) | 67,284 | 419,852 | |
| DepoMed, Inc. (a)(b) | 97,171 | 590,800 | |
| Dermira, Inc. (a)(b) | 70,654 | 1,666,728 | |
| Durect Corp. (a) | 198,076 | 314,941 | |
| Egalet Corp. (a) | 12,340 | 14,931 | |
| Eli Lilly & Co. | 1,666,890 | 135,501,488 | |
| Endo International PLC (a)(b) | 329,369 | 2,895,154 | |
| Endocyte, Inc. (a)(b) | 47,373 | 64,427 | |
| Flex Pharma, Inc. (a) | 10,224 | 40,180 | |
| Gemphire Therapeutics, Inc. (b) | 6,333 | 61,050 | |
| Horizon Pharma PLC (a)(b) | 272,914 | 3,733,464 | |
| Impax Laboratories, Inc. (a)(b) | 130,689 | 2,829,417 | |
| Imprimis Pharmaceuticals, Inc. (a)(b) | 10,757 | 19,685 | |
| Innoviva, Inc. (a)(b) | 134,795 | 1,892,522 | |
| Intersect ENT, Inc. (a) | 61,422 | 1,897,940 | |
| Intra-Cellular Therapies, Inc. (a)(b) | 67,457 | 1,244,582 | |
| Jazz Pharmaceuticals PLC (a) | 102,757 | 15,347,786 | |
| Johnson & Johnson | 4,615,739 | 610,985,371 | |
| Juniper Pharmaceuticals, Inc. (a) | 11,831 | 55,014 | |
| KemPharm, Inc. (a)(b) | 5,081 | 15,497 | |
| Lannett Co., Inc. (a)(b) | 44,883 | 787,697 | |
| Lipocine, Inc. (a)(b) | 20,645 | 78,038 | |
| Mallinckrodt PLC (a) | 172,938 | 7,104,293 | |
| Marinus Pharmaceuticals, Inc. (a) | 9,220 | 28,213 | |
| Merck & Co., Inc. | 4,685,121 | 299,191,827 | |
| Mylan N.V. (a) | 791,862 | 24,927,816 | |
| MyoKardia, Inc. (a) | 35,984 | 1,559,906 | |
| Nektar Therapeutics (a) | 273,203 | 5,745,459 | |
| Neos Therapeutics, Inc. (a)(b) | 19,225 | 160,529 | |
| Novan, Inc. (b) | 7,147 | 36,092 | |
| Novus Therapeutics, Inc. (a)(b) | 606 | 2,400 | |
| Ocera Therapeutics, Inc. (a)(b) | 10,720 | 9,970 | |
| Ocular Therapeutix, Inc. (a)(b) | 28,848 | 180,588 | |
| Omeros Corp. (a)(b) | 69,139 | 1,415,275 | |
| Orexigen Therapeutics, Inc. (a)(b) | 16,675 | 37,852 | |
| Pacira Pharmaceuticals, Inc. (a) | 70,346 | 2,680,183 | |
| Pain Therapeutics, Inc. (a) | 4,934 | 15,838 | |
| Paratek Pharmaceuticals, Inc. (a)(b) | 35,978 | 1,014,580 | |
| Pernix Therapeutics Holdings, Inc. (a)(b) | 4,109 | 12,327 | |
| Perrigo Co. PLC | 246,025 | 19,426,134 | |
| Pfizer, Inc. | 10,232,789 | 347,096,203 | |
| Phibro Animal Health Corp. Class A | 37,189 | 1,320,210 | |
| Plx Pharma PLC/New (a) | 290 | 1,827 | |
| Prestige Brands Holdings, Inc. (a) | 93,229 | 4,727,643 | |
| Reata Pharmaceuticals, Inc. (a) | 15,332 | 463,793 | |
| Repros Therapeutics, Inc. (a) | 24,715 | 7,311 | |
| Revance Therapeutics, Inc. (a)(b) | 37,609 | 923,301 | |
| SciClone Pharmaceuticals, Inc. (a) | 95,019 | 1,045,209 | |
| SCYNEXIS, Inc. (a)(b) | 16,272 | 31,242 | |
| Sucampo Pharmaceuticals, Inc. Class A (a)(b) | 39,776 | 467,368 | |
| Supernus Pharmaceuticals, Inc. (a)(b) | 84,621 | 3,875,642 | |
| Teligent, Inc. (a)(b) | 140,525 | 971,028 | |
| Tetraphase Pharmaceuticals, Inc. (a) | 74,420 | 519,452 | |
| The Medicines Company (a)(b) | 125,813 | 4,616,079 | |
| TherapeuticsMD, Inc. (a)(b) | 280,301 | 1,681,806 | |
| Theravance Biopharma, Inc. (a)(b) | 67,445 | 2,203,428 | |
| Titan Pharmaceuticals, Inc. (a)(b) | 11,285 | 16,928 | |
| VIVUS, Inc. (a)(b) | 157,068 | 139,885 | |
| WAVE Life Sciences (a)(b) | 28,404 | 667,494 | |
| Zoetis, Inc. Class A | 844,331 | 52,939,554 | |
| Zogenix, Inc. (a)(b) | 41,404 | 490,637 | |
| Zynerba Pharmaceuticals, Inc. (a)(b) | 23,422 | 148,730 | |
| 1,900,381,432 | |||
| TOTAL HEALTH CARE | 6,198,343,699 | ||
| INDUSTRIALS - 10.6% | |||
| Aerospace & Defense - 2.4% | |||
| AAR Corp. | 51,954 | 1,873,461 | |
| Aerojet Rocketdyne Holdings, Inc. (a) | 129,248 | 3,829,618 | |
| AeroVironment, Inc. (a)(b) | 33,858 | 1,659,719 | |
| Arconic, Inc. | 746,482 | 19,012,897 | |
| Arotech Corp. (a)(b) | 32,173 | 106,171 | |
| Astronics Corp. (a) | 34,623 | 910,239 | |
| Astronics Corp. Class B | 3,221 | 84,390 | |
| Astrotech Corp. (a) | 8,707 | 6,356 | |
| Axon Enterprise, Inc. (a)(b) | 93,306 | 2,025,673 | |
| BWX Technologies, Inc. | 171,125 | 9,363,960 | |
| CPI Aerostructures, Inc. (a) | 3,805 | 33,104 | |
| Cubic Corp. | 40,394 | 1,734,922 | |
| Curtiss-Wright Corp. | 91,404 | 8,849,735 | |
| DigitalGlobe, Inc. (a) | 105,249 | 3,620,566 | |
| Ducommun, Inc. (a) | 15,643 | 430,183 | |
| Engility Holdings, Inc. (a) | 28,046 | 871,389 | |
| Esterline Technologies Corp. (a) | 49,383 | 4,217,308 | |
| General Dynamics Corp. | 484,645 | 97,583,271 | |
| HEICO Corp. (b) | 55,920 | 4,796,258 | |
| HEICO Corp. Class A | 63,535 | 4,615,818 | |
| Hexcel Corp. | 159,521 | 8,577,444 | |
| Huntington Ingalls Industries, Inc. | 78,560 | 16,808,698 | |
| Innovative Solutions & Support, Inc. (a) | 21,878 | 75,479 | |
| KEYW Holding Corp. (a)(b) | 74,131 | 530,037 | |
| KLX, Inc. (a) | 87,459 | 4,192,784 | |
| Kratos Defense & Security Solutions, Inc. (a)(b) | 149,910 | 2,005,796 | |
| L3 Technologies, Inc. | 133,944 | 24,308,157 | |
| Lockheed Martin Corp. | 426,404 | 130,219,518 | |
| Mercury Systems, Inc. (a) | 82,892 | 3,999,539 | |
| Micronet Enertec Technologies, Inc. (a) | 3,018 | 2,423 | |
| Moog, Inc. Class A (a) | 52,323 | 4,016,313 | |
| National Presto Industries, Inc. (b) | 7,356 | 732,658 | |
| Northrop Grumman Corp. | 301,621 | 82,104,252 | |
| Orbital ATK, Inc. | 102,816 | 11,472,209 | |
| Raytheon Co. | 497,629 | 90,573,454 | |
| Rockwell Collins, Inc. | 276,208 | 36,197,058 | |
| SIFCO Industries, Inc. (a) | 891 | 4,901 | |
| Sparton Corp. (a) | 13,384 | 310,107 | |
| Spirit AeroSystems Holdings, Inc. Class A | 205,388 | 15,301,406 | |
| Teledyne Technologies, Inc. (a) | 61,440 | 9,219,686 | |
| Textron, Inc. | 452,435 | 22,210,034 | |
| The Boeing Co. | 960,373 | 230,162,993 | |
| TransDigm Group, Inc. | 84,738 | 22,087,807 | |
| Triumph Group, Inc. | 96,901 | 2,548,496 | |
| United Technologies Corp. | 1,276,596 | 152,834,073 | |
| Vectrus, Inc. (a) | 17,822 | 509,353 | |
| Wesco Aircraft Holdings, Inc. (a) | 94,440 | 793,296 | |
| 1,037,423,009 | |||
| Air Freight & Logistics - 0.6% | |||
| Air Transport Services Group, Inc. (a) | 108,399 | 2,488,841 | |
| Atlas Air Worldwide Holdings, Inc. (a) | 45,740 | 3,055,432 | |
| C.H. Robinson Worldwide, Inc. | 243,163 | 17,174,603 | |
| Echo Global Logistics, Inc. (a)(b) | 48,848 | 742,490 | |
| Expeditors International of Washington, Inc. | 312,542 | 17,533,606 | |
| FedEx Corp. | 419,000 | 89,825,220 | |
| Forward Air Corp. | 54,775 | 2,846,657 | |
| Hub Group, Inc. Class A (a) | 55,422 | 2,130,976 | |
| Radiant Logistics, Inc. (a) | 54,959 | 277,543 | |
| United Parcel Service, Inc. Class B | 1,179,920 | 134,935,651 | |
| XPO Logistics, Inc. (a)(b) | 147,648 | 9,036,058 | |
| 280,047,077 | |||
| Airlines - 0.5% | |||
| Alaska Air Group, Inc. | 212,539 | 15,868,162 | |
| Allegiant Travel Co. (b) | 23,703 | 2,796,954 | |
| American Airlines Group, Inc. | 840,913 | 37,622,448 | |
| Delta Air Lines, Inc. | 1,254,555 | 59,202,450 | |
| Hawaiian Holdings, Inc. (a) | 89,875 | 3,851,144 | |
| JetBlue Airways Corp. (a) | 563,310 | 11,159,171 | |
| SkyWest, Inc. | 97,566 | 3,385,540 | |
| Southwest Airlines Co. | 1,032,776 | 53,848,941 | |
| Spirit Airlines, Inc. (a) | 120,068 | 4,088,315 | |
| United Continental Holdings, Inc. (a) | 481,496 | 29,833,492 | |
| 221,656,617 | |||
| Building Products - 0.5% | |||
| A.O. Smith Corp. | 253,397 | 14,111,679 | |
| AAON, Inc. | 75,766 | 2,469,972 | |
| Advanced Drain Systems, Inc. Del | 62,250 | 1,210,763 | |
| Allegion PLC | 162,633 | 12,800,843 | |
| American Woodmark Corp. (a) | 24,566 | 2,034,065 | |
| Apogee Enterprises, Inc. | 47,950 | 2,095,415 | |
| Armstrong World Industries, Inc. (a) | 81,275 | 3,860,563 | |
| Builders FirstSource, Inc. (a) | 179,848 | 2,927,925 | |
| Continental Building Products, Inc. (a) | 69,835 | 1,700,482 | |
| CSW Industrials, Inc. (a) | 25,190 | 1,054,202 | |
| Fortune Brands Home & Security, Inc. | 256,876 | 16,062,456 | |
| GCP Applied Technologies, Inc. (a) | 121,060 | 3,419,945 | |
| Gibraltar Industries, Inc. (a) | 56,316 | 1,647,243 | |
| GMS, Inc. (a) | 46,973 | 1,511,591 | |
| Griffon Corp. | 59,127 | 1,096,806 | |
| Insteel Industries, Inc. | 29,073 | 728,860 | |
| Jeld-Wen Holding, Inc. | 63,204 | 1,928,986 | |
| Johnson Controls International PLC | 1,604,213 | 63,510,793 | |
| Lennox International, Inc. (b) | 64,752 | 10,731,349 | |
| Masco Corp. | 540,799 | 19,885,179 | |
| Masonite International Corp. (a) | 51,336 | 3,249,569 | |
| NCI Building Systems, Inc. (a) | 58,589 | 984,295 | |
| Owens Corning | 191,219 | 14,175,064 | |
| Patrick Industries, Inc. (a) | 27,897 | 2,064,378 | |
| PGT, Inc. (a) | 80,695 | 1,065,174 | |
| Ply Gem Holdings, Inc. (a) | 36,381 | 565,725 | |
| Quanex Building Products Corp. | 55,487 | 1,087,545 | |
| Simpson Manufacturing Co. Ltd. | 63,559 | 2,782,613 | |
| Tecogen, Inc. New (a) | 2,274 | 6,822 | |
| Trex Co., Inc. (a) | 51,288 | 3,897,888 | |
| Universal Forest Products, Inc. | 36,181 | 3,155,345 | |
| USG Corp. (a)(b) | 145,958 | 4,378,740 | |
| 202,202,275 | |||
| Commercial Services & Supplies - 0.5% | |||
| ABM Industries, Inc. | 102,806 | 4,567,671 | |
| ACCO Brands Corp. (a) | 198,147 | 2,169,710 | |
| ADS Waste Holdings, Inc. | 88,843 | 2,118,017 | |
| Aqua Metals, Inc. (a)(b) | 20,623 | 152,816 | |
| ARC Document Solutions, Inc. (a) | 46,203 | 163,097 | |
| Brady Corp. Class A | 89,558 | 2,986,759 | |
| Casella Waste Systems, Inc. Class A (a) | 64,851 | 1,090,145 | |
| CECO Environmental Corp. | 40,679 | 303,872 | |
| Cenveo, Inc. (a)(b) | 13,016 | 49,200 | |
| Cintas Corp. | 149,849 | 20,231,113 | |
| Clean Harbors, Inc. (a) | 97,820 | 5,291,084 | |
| Copart, Inc. (a) | 345,568 | 11,296,618 | |
| Covanta Holding Corp. (b) | 226,728 | 3,253,547 | |
| Deluxe Corp. | 77,034 | 5,342,308 | |
| Ennis, Inc. | 34,279 | 654,729 | |
| Essendant, Inc. | 58,461 | 693,347 | |
| Fuel Tech, Inc. (a) | 51,934 | 46,896 | |
| Healthcare Services Group, Inc. | 122,906 | 6,292,787 | |
| Heritage-Crystal Clean, Inc. (a) | 21,763 | 424,379 | |
| Herman Miller, Inc. | 110,582 | 3,721,084 | |
| HNI Corp. | 80,621 | 2,954,760 | |
| Hudson Technologies, Inc. (a)(b) | 56,393 | 501,898 | |
| Industrial Services of America, Inc. (a)(b) | 1,620 | 3,159 | |
| InnerWorkings, Inc. (a) | 57,411 | 601,093 | |
| Interface, Inc. | 108,800 | 2,067,200 | |
| Intersections, Inc. (a)(b) | 12,865 | 45,156 | |
| KAR Auction Services, Inc. | 230,024 | 10,371,782 | |
| Kimball International, Inc. Class B | 52,574 | 891,655 | |
| Knoll, Inc. | 81,039 | 1,462,754 | |
| LSC Communications, Inc. | 57,687 | 929,338 | |
| Matthews International Corp. Class A | 55,558 | 3,347,370 | |
| McGrath RentCorp. | 37,522 | 1,514,763 | |
| Mobile Mini, Inc. | 73,292 | 2,217,083 | |
| Msa Safety, Inc. | 56,016 | 4,081,326 | |
| Multi-Color Corp. | 21,263 | 1,696,787 | |
| NL Industries, Inc. (a) | 6,707 | 50,638 | |
| Odyssey Marine Exploration, Inc. (a)(b) | 5,346 | 19,834 | |
| Performant Financial Corp. (a) | 31,038 | 54,627 | |
| Perma-Fix Environmental Services, Inc. (a) | 6,937 | 24,626 | |
| Pitney Bowes, Inc. | 320,489 | 4,118,284 | |
| Quad/Graphics, Inc. | 51,478 | 981,171 | |
| Quest Resource Holding Corp. (a)(b) | 2,977 | 4,108 | |
| R.R. Donnelley & Sons Co. | 111,816 | 1,032,062 | |
| Republic Services, Inc. | 404,127 | 26,365,245 | |
| Rollins, Inc. (b) | 163,488 | 7,260,502 | |
| SP Plus Corp. (a) | 38,199 | 1,409,543 | |
| Steelcase, Inc. Class A | 153,375 | 2,024,550 | |
| Stericycle, Inc. (a) | 146,361 | 10,521,892 | |
| Team, Inc. (a)(b) | 59,115 | 730,070 | |
| Tetra Tech, Inc. | 99,334 | 4,231,628 | |
| The Brink's Co. | 75,766 | 5,943,843 | |
| U.S. Ecology, Inc. | 34,516 | 1,774,122 | |
| UniFirst Corp. | 28,960 | 4,158,656 | |
| Viad Corp. | 33,828 | 1,858,849 | |
| Virco Manufacturing Co. (a) | 2,682 | 13,946 | |
| VSE Corp. | 10,794 | 562,907 | |
| Waste Management, Inc. | 702,694 | 54,184,734 | |
| West Corp. | 87,503 | 2,044,945 | |
| 232,906,085 | |||
| Construction & Engineering - 0.2% | |||
| AECOM (a) | 274,003 | 9,179,101 | |
| Aegion Corp. (a) | 54,146 | 1,173,344 | |
| Ameresco, Inc. Class A (a) | 38,199 | 276,943 | |
| Argan, Inc. | 22,803 | 1,444,570 | |
| Chicago Bridge & Iron Co. NV (b) | 165,022 | 2,036,371 | |
| Comfort Systems U.S.A., Inc. | 69,706 | 2,373,489 | |
| Dycom Industries, Inc. (a)(b) | 52,510 | 4,236,507 | |
| EMCOR Group, Inc. | 106,586 | 7,038,939 | |
| Fluor Corp. | 233,020 | 8,987,581 | |
| Goldfield Corp. | 41,171 | 183,211 | |
| Granite Construction, Inc. (b) | 70,943 | 3,918,182 | |
| Great Lakes Dredge & Dock Corp. (a) | 77,922 | 315,584 | |
| HC2 Holdings, Inc. (a) | 49,076 | 223,787 | |
| Ies Holdings, Inc. (a) | 16,326 | 269,379 | |
| Jacobs Engineering Group, Inc. | 212,899 | 11,600,867 | |
| KBR, Inc. | 238,105 | 3,873,968 | |
| Keane Group, Inc. (b) | 49,477 | 640,727 | |
| Layne Christensen Co. (a)(b) | 24,456 | 262,657 | |
| MasTec, Inc. (a) | 112,881 | 4,605,545 | |
| MYR Group, Inc. (a) | 33,116 | 854,724 | |
| Northwest Pipe Co. (a)(b) | 12,188 | 223,528 | |
| NV5 Holdings, Inc. (a) | 11,806 | 569,640 | |
| Orion Group Holdings, Inc. (a) | 33,745 | 203,820 | |
| Primoris Services Corp. | 70,710 | 2,023,013 | |
| Quanta Services, Inc. (a) | 267,735 | 9,619,719 | |
| Sterling Construction Co., Inc. (a) | 41,743 | 491,733 | |
| Tutor Perini Corp. (a) | 72,569 | 1,897,679 | |
| Valmont Industries, Inc. | 38,333 | 5,502,702 | |
| 84,027,310 | |||
| Electrical Equipment - 0.6% | |||
| Acuity Brands, Inc. (b) | 75,177 | 13,290,542 | |
| Allied Motion Technologies, Inc. | 10,236 | 258,868 | |
| American Superconductor Corp. (a)(b) | 20,903 | 81,104 | |
| AMETEK, Inc. | 394,980 | 24,982,485 | |
| AZZ, Inc. | 45,717 | 2,235,561 | |
| Babcock & Wilcox Enterprises, Inc. (a) | 92,914 | 209,986 | |
| Broadwind Energy, Inc. (a) | 15,938 | 54,508 | |
| Capstone Turbine Corp. (a)(b) | 40,707 | 26,093 | |
| Eaton Corp. PLC | 763,510 | 54,789,478 | |
| Emerson Electric Co. | 1,105,773 | 65,284,838 | |
| Encore Wire Corp. | 34,550 | 1,482,195 | |
| Energous Corp. (a)(b) | 25,329 | 240,372 | |
| Energy Focus, Inc. (a)(b) | 8,003 | 14,325 | |
| EnerSys | 77,507 | 4,968,199 | |
| Enphase Energy, Inc. (a)(b) | 30,890 | 28,419 | |
| EnSync, Inc. (a)(b) | 32,445 | 12,654 | |
| Espey Manufacturing & Electronics Corp. | 2,015 | 45,620 | |
| Fortive Corp. | 514,592 | 33,433,042 | |
| FuelCell Energy, Inc. (a)(b) | 48,863 | 75,249 | |
| Generac Holdings, Inc. (a)(b) | 118,381 | 4,780,225 | |
| General Cable Corp. | 78,815 | 1,335,914 | |
| Hubbell, Inc. Class B | 92,812 | 10,468,265 | |
| Ideal Power, Inc. (a)(b) | 38,104 | 92,593 | |
| LSI Industries, Inc. | 35,290 | 200,800 | |
| Ocean Power Technologies, Inc. (a)(b) | 1,104 | 1,347 | |
| Orion Energy Systems, Inc. (a) | 20,733 | 19,105 | |
| Plug Power, Inc. (a)(b) | 485,070 | 1,038,050 | |
| Powell Industries, Inc. | 13,455 | 383,064 | |
| Preformed Line Products Co. | 1,961 | 102,462 | |
| Real Goods Solar, Inc. (a) | 1 | 1 | |
| Regal Beloit Corp. | 80,384 | 6,060,954 | |
| Revolution Lighting Technologies, Inc. (a)(b) | 7,326 | 54,286 | |
| Rockwell Automation, Inc. | 219,516 | 36,013,795 | |
| Sensata Technologies Holding BV (a)(b) | 292,485 | 13,062,380 | |
| Sunrun, Inc. (a)(b) | 104,524 | 700,311 | |
| Sunworks, Inc. (a)(b) | 12,722 | 19,465 | |
| Thermon Group Holdings, Inc. (a)(b) | 52,027 | 859,486 | |
| TPI Composites, Inc. (a) | 37,115 | 754,919 | |
| Ultralife Corp. (a) | 13,410 | 87,165 | |
| Vicor Corp. (a) | 18,023 | 350,547 | |
| Vivint Solar, Inc. (a)(b) | 34,907 | 165,808 | |
| 278,064,480 | |||
| Industrial Conglomerates - 1.9% | |||
| 3M Co. | 1,023,713 | 209,165,040 | |
| Carlisle Companies, Inc. | 111,464 | 10,554,526 | |
| General Electric Co. | 14,915,787 | 366,182,571 | |
| Honeywell International, Inc. | 1,302,893 | 180,151,015 | |
| ITT, Inc. | 140,185 | 5,657,867 | |
| Raven Industries, Inc. | 60,171 | 1,684,788 | |
| Roper Technologies, Inc. | 172,938 | 39,889,879 | |
| 813,285,686 | |||
| Machinery - 1.8% | |||
| Actuant Corp. Class A (b) | 105,914 | 2,547,232 | |
| AGCO Corp. | 111,076 | 7,603,152 | |
| Alamo Group, Inc. | 17,898 | 1,642,320 | |
| Albany International Corp. Class A | 47,080 | 2,523,488 | |
| Allison Transmission Holdings, Inc. | 274,756 | 9,542,276 | |
| Altra Industrial Motion Corp. | 46,822 | 2,156,153 | |
| American Railcar Industries, Inc. | 11,797 | 424,692 | |
| ARC Group Worldwide, Inc. (a) | 1,450 | 3,553 | |
| Astec Industries, Inc. | 38,170 | 1,896,286 | |
| Barnes Group, Inc. | 79,881 | 4,994,160 | |
| Blue Bird Corp. (a) | 4,122 | 75,020 | |
| Briggs & Stratton Corp. | 75,012 | 1,570,751 | |
| Caterpillar, Inc. | 1,011,242 | 118,810,823 | |
| Chart Industries, Inc. (a) | 59,494 | 2,007,328 | |
| CIRCOR International, Inc. | 26,680 | 1,281,174 | |
| Colfax Corp. (a) | 167,182 | 6,667,218 | |
| Columbus McKinnon Corp. (NY Shares) | 35,569 | 1,174,844 | |
| Commercial Vehicle Group, Inc. (a) | 77,079 | 457,849 | |
| Crane Co. | 92,238 | 6,846,827 | |
| Cummins, Inc. | 263,695 | 42,027,709 | |
| Deere & Co. | 504,280 | 58,461,180 | |
| Dmc Global, Inc. | 17,783 | 230,290 | |
| Donaldson Co., Inc. | 227,086 | 10,729,814 | |
| Douglas Dynamics, Inc. | 38,692 | 1,350,351 | |
| Dover Corp. | 262,682 | 22,296,448 | |
| Eastern Co. | 5,588 | 146,126 | |
| Energy Recovery, Inc. (a)(b) | 61,650 | 400,725 | |
| EnPro Industries, Inc. | 33,499 | 2,360,675 | |
| ESCO Technologies, Inc. | 41,567 | 2,263,323 | |
| ExOne Co. (a)(b) | 13,829 | 111,877 | |
| Federal Signal Corp. | 91,334 | 1,707,032 | |
| Flowserve Corp. | 226,246 | 8,886,943 | |
| Franklin Electric Co., Inc. | 62,330 | 2,402,822 | |
| FreightCar America, Inc. | 19,411 | 352,504 | |
| Gardner Denver Holdings, Inc. (b) | 127,416 | 2,993,002 | |
| Gencor Industries, Inc. (a) | 2,773 | 42,704 | |
| Global Brass & Copper Holdings, Inc. | 34,001 | 1,014,930 | |
| Gorman-Rupp Co. | 28,251 | 859,960 | |
| Graco, Inc. | 95,451 | 11,025,545 | |
| Graham Corp. | 12,124 | 242,844 | |
| Greenbrier Companies, Inc. (b) | 47,653 | 2,044,314 | |
| Hardinge, Inc. | 14,874 | 203,625 | |
| Harsco Corp. (a) | 144,208 | 2,465,957 | |
| Hillenbrand, Inc. | 107,808 | 3,854,136 | |
| Hurco Companies, Inc. | 6,325 | 222,324 | |
| Hyster-Yale Materials Handling Class A | 17,565 | 1,250,277 | |
| IDEX Corp. | 131,232 | 15,430,259 | |
| Illinois Tool Works, Inc. | 529,610 | 72,826,671 | |
| Ingersoll-Rand PLC | 433,238 | 36,994,193 | |
| Jason Industries, Inc. (a) | 13,118 | 16,266 | |
| John Bean Technologies Corp. | 55,934 | 4,961,346 | |
| Kadant, Inc. | 18,429 | 1,600,559 | |
| Kennametal, Inc. | 136,498 | 4,777,430 | |
| L.B. Foster Co. Class A | 13,680 | 261,288 | |
| Lincoln Electric Holdings, Inc. | 100,440 | 8,722,210 | |
| Lindsay Corp. (b) | 16,477 | 1,426,414 | |
| Lydall, Inc. (a) | 28,864 | 1,356,608 | |
| Manitex International, Inc. (a) | 11,053 | 101,467 | |
| Manitowoc Co., Inc. (a)(b) | 250,611 | 2,062,529 | |
| Meritor, Inc. (a) | 154,933 | 3,076,969 | |
| Middleby Corp. (a) | 99,566 | 12,117,182 | |
| Milacron Holdings Corp. (a) | 88,730 | 1,415,244 | |
| Miller Industries, Inc. | 16,197 | 406,545 | |
| Mueller Industries, Inc. | 98,286 | 2,931,871 | |
| Mueller Water Products, Inc. Class A | 293,253 | 3,516,103 | |
| Navistar International Corp. New (a)(b) | 114,244 | 3,902,575 | |
| NN, Inc. | 43,595 | 1,111,673 | |
| Nordson Corp. | 91,551 | 10,006,524 | |
| Omega Flex, Inc. | 5,880 | 340,981 | |
| Oshkosh Corp. | 126,887 | 9,465,770 | |
| PACCAR, Inc. | 598,876 | 39,723,445 | |
| Park-Ohio Holdings Corp. | 13,382 | 533,273 | |
| Parker Hannifin Corp. | 224,266 | 36,082,157 | |
| Pentair PLC | 293,393 | 18,205,036 | |
| ProPetro Holding Corp. (b) | 100,689 | 1,158,930 | |
| Proto Labs, Inc. (a)(b) | 43,461 | 3,120,500 | |
| RBC Bearings, Inc. (a) | 41,703 | 4,598,590 | |
| Rexnord Corp. (a) | 169,317 | 4,043,290 | |
| Snap-On, Inc. (b) | 97,697 | 14,417,146 | |
| Spartan Motors, Inc. | 44,931 | 413,365 | |
| SPX Corp. (a) | 68,191 | 1,643,403 | |
| SPX Flow, Inc. (a) | 72,709 | 2,433,570 | |
| Standex International Corp. | 20,721 | 1,977,819 | |
| Stanley Black & Decker, Inc. | 263,099 | 37,886,256 | |
| Sun Hydraulics Corp. | 42,205 | 2,022,042 | |
| Supreme Industries, Inc. Class A | 19,310 | 404,351 | |
| Tennant Co. | 30,833 | 1,879,271 | |
| Terex Corp. | 170,082 | 6,556,661 | |
| The L.S. Starrett Co. Class A | 4,836 | 35,303 | |
| Timken Co. | 116,166 | 5,210,045 | |
| Titan International, Inc. | 99,148 | 850,690 | |
| Toro Co. | 182,747 | 11,271,835 | |
| TriMas Corp. (a) | 72,524 | 1,755,081 | |
| Trinity Industries, Inc. | 263,641 | 7,603,406 | |
| Twin Disc, Inc. (a)(b) | 8,286 | 143,845 | |
| Wabash National Corp. (b) | 105,115 | 2,209,517 | |
| WABCO Holdings, Inc. (a) | 85,901 | 12,337,102 | |
| Wabtec Corp. | 148,338 | 10,468,213 | |
| Watts Water Technologies, Inc. Class A | 51,551 | 3,180,697 | |
| Woodward, Inc. | 92,622 | 6,502,991 | |
| Xerium Technologies, Inc. (a) | 10,544 | 63,791 | |
| Xylem, Inc. | 308,987 | 19,178,823 | |
| 808,911,704 | |||
| Marine - 0.0% | |||
| Genco Shipping & Trading Ltd. (a)(b) | 10,301 | 143,287 | |
| Kirby Corp. (a)(b) | 89,632 | 5,610,963 | |
| Matson, Inc. | 69,658 | 1,797,176 | |
| 7,551,426 | |||
| Professional Services - 0.4% | |||
| Acacia Research Corp. (a) | 73,187 | 237,858 | |
| Advisory Board Co. (a) | 68,427 | 3,643,738 | |
| Barrett Business Services, Inc. | 8,858 | 456,896 | |
| BG Staffing, Inc. (b) | 5,516 | 89,194 | |
| CBIZ, Inc. (a) | 94,868 | 1,437,250 | |
| CDI Corp. (a) | 12,621 | 103,492 | |
| Cogint, Inc. (a)(b) | 74,077 | 362,977 | |
| CRA International, Inc. | 15,589 | 585,055 | |
| Dun & Bradstreet Corp. | 69,069 | 7,697,049 | |
| Equifax, Inc. | 205,395 | 29,262,626 | |
| Exponent, Inc. | 49,089 | 3,342,961 | |
| Franklin Covey Co. (a) | 19,900 | 374,120 | |
| FTI Consulting, Inc. (a) | 78,630 | 2,666,343 | |
| GP Strategies Corp. (a) | 22,618 | 646,875 | |
| Heidrick & Struggles International, Inc. | 29,141 | 531,823 | |
| Hill International, Inc. (a) | 55,142 | 261,925 | |
| Hudson Global, Inc. (a) | 13,947 | 20,502 | |
| Huron Consulting Group, Inc. (a) | 39,007 | 1,179,962 | |
| ICF International, Inc. (a) | 34,131 | 1,639,995 | |
| IHS Markit Ltd. (a) | 539,528 | 25,271,492 | |
| Insperity, Inc. | 32,267 | 2,591,040 | |
| Kelly Services, Inc. Class A (non-vtg.) | 51,237 | 1,108,256 | |
| Kforce, Inc. | 36,597 | 658,746 | |
| Korn/Ferry International | 104,534 | 3,483,073 | |
| Manpower, Inc. | 113,986 | 12,710,579 | |
| Marathon Patent Group, Inc. (a)(b) | 8,838 | 3,871 | |
| Mastech Digital, Inc. (a) | 373 | 3,394 | |
| MISTRAS Group, Inc. (a) | 29,557 | 558,923 | |
| Navigant Consulting, Inc. (a) | 75,747 | 1,161,202 | |
| Nielsen Holdings PLC | 596,445 | 23,171,888 | |
| On Assignment, Inc. (a) | 80,032 | 3,817,526 | |
| Pendrell Corp. (a) | 15,028 | 101,890 | |
| RCM Technologies, Inc. (a) | 9,908 | 53,404 | |
| Resources Connection, Inc. | 51,824 | 660,756 | |
| Robert Half International, Inc. | 211,379 | 9,575,469 | |
| RPX Corp. (a) | 97,220 | 1,269,693 | |
| TransUnion Holding Co., Inc. (a) | 255,382 | 12,222,583 | |
| TriNet Group, Inc. (a) | 66,298 | 2,368,828 | |
| TrueBlue, Inc. (a) | 75,110 | 1,536,000 | |
| Verisk Analytics, Inc. (a) | 260,972 | 21,151,781 | |
| Volt Information Sciences, Inc. (a) | 6,248 | 19,994 | |
| WageWorks, Inc. (a) | 80,292 | 4,733,213 | |
| Willdan Group, Inc. (a) | 10,974 | 340,304 | |
| 183,114,546 | |||
| Road & Rail - 0.9% | |||
| AMERCO | 10,691 | 3,989,988 | |
| ArcBest Corp. | 43,696 | 1,297,771 | |
| Avis Budget Group, Inc. (a)(b) | 143,156 | 5,186,542 | |
| Celadon Group, Inc. (b) | 62,978 | 314,890 | |
| Covenant Transport Group, Inc. Class A (a) | 19,818 | 475,830 | |
| CSX Corp. | 1,571,799 | 78,904,310 | |
| Daseke, Inc. (a)(b) | 34,697 | 454,531 | |
| Genesee & Wyoming, Inc. Class A (a) | 108,225 | 7,419,906 | |
| Heartland Express, Inc. (b) | 91,092 | 2,019,510 | |
| J.B. Hunt Transport Services, Inc. | 147,712 | 14,607,240 | |
| Kansas City Southern | 182,352 | 18,860,667 | |
| Knight Transportation, Inc. (b) | 113,018 | 4,413,353 | |
| Landstar System, Inc. | 76,087 | 7,102,721 | |
| Marten Transport Ltd. | 73,518 | 1,260,834 | |
| Norfolk Southern Corp. | 494,111 | 59,550,258 | |
| Old Dominion Freight Lines, Inc. | 117,920 | 11,780,208 | |
| P.A.M. Transportation Services, Inc. (a) | 3,193 | 63,094 | |
| Patriot Transportation Holding, Inc. (a) | 1,280 | 24,717 | |
| Roadrunner Transportation Systems, Inc. (a) | 43,638 | 325,976 | |
| Ryder System, Inc. | 90,251 | 7,003,478 | |
| Saia, Inc. (a) | 39,382 | 2,227,052 | |
| Schneider National, Inc. Class B (b) | 73,442 | 1,634,085 | |
| Swift Transporation Co. (a)(b) | 138,111 | 3,874,014 | |
| U.S.A. Truck, Inc. (a) | 7,889 | 87,962 | |
| Union Pacific Corp. | 1,382,528 | 145,580,198 | |
| Universal Logistics Holdings, Inc. | 12,296 | 204,114 | |
| Werner Enterprises, Inc. (b) | 69,717 | 2,307,633 | |
| YRC Worldwide, Inc. (a) | 47,961 | 642,198 | |
| 381,613,080 | |||
| Trading Companies & Distributors - 0.3% | |||
| AeroCentury Corp. (a) | 688 | 8,669 | |
| Air Lease Corp. Class A | 168,551 | 6,849,913 | |
| Aircastle Ltd. | 96,241 | 2,157,723 | |
| Applied Industrial Technologies, Inc. | 64,348 | 3,667,836 | |
| Beacon Roofing Supply, Inc. (a) | 111,136 | 5,234,506 | |
| BlueLinx Corp. (a) | 2,338 | 22,819 | |
| BMC Stock Holdings, Inc. (a) | 96,728 | 1,963,578 | |
| CAI International, Inc. (a) | 29,270 | 907,077 | |
| DXP Enterprises, Inc. (a) | 22,844 | 618,844 | |
| Fastenal Co. (b) | 510,029 | 21,762,937 | |
| GATX Corp. (b) | 67,450 | 4,086,121 | |
| H&E Equipment Services, Inc. | 49,244 | 1,159,204 | |
| HD Supply Holdings, Inc. (a) | 339,883 | 11,318,104 | |
| Herc Holdings, Inc. (a)(b) | 42,814 | 1,807,607 | |
| Houston Wire & Cable Co. | 15,647 | 89,970 | |
| Huttig Building Products, Inc. (a) | 22,831 | 130,137 | |
| Kaman Corp. | 42,373 | 2,077,972 | |
| Lawson Products, Inc. (a) | 6,300 | 150,255 | |
| MRC Global, Inc. (a) | 173,407 | 2,734,628 | |
| MSC Industrial Direct Co., Inc. Class A | 88,439 | 6,091,678 | |
| Neff Corp. (a) | 8,761 | 218,587 | |
| Nexeo Solutions, Inc. (a) | 103,751 | 743,895 | |
| Now, Inc. (a) | 176,983 | 2,063,622 | |
| Rush Enterprises, Inc. Class A (a) | 64,888 | 2,659,759 | |
| SiteOne Landscape Supply, Inc. (a)(b) | 67,882 | 3,410,392 | |
| Textainer Group Holdings Ltd. (b) | 42,716 | 758,209 | |
| Titan Machinery, Inc. (a) | 24,582 | 317,108 | |
| Triton International Ltd. | 53,680 | 1,981,866 | |
| United Rentals, Inc. (a) | 143,088 | 16,892,969 | |
| Univar, Inc. (a) | 178,396 | 5,032,551 | |
| Veritiv Corp. (a) | 19,444 | 544,432 | |
| W.W. Grainger, Inc. (b) | 90,821 | 14,764,770 | |
| Watsco, Inc. | 53,435 | 7,874,182 | |
| WESCO International, Inc. (a) | 73,100 | 3,687,895 | |
| Willis Lease Finance Corp. (a) | 2,668 | 63,498 | |
| 133,853,313 | |||
| Transportation Infrastructure - 0.0% | |||
| Macquarie Infrastructure Co. LLC | 130,429 | 9,714,352 | |
| SEACOR Marine Holdings, Inc. (b) | 30,560 | 391,474 | |
| 10,105,826 | |||
| TOTAL INDUSTRIALS | 4,674,762,434 | ||
| INFORMATION TECHNOLOGY - 22.5% | |||
| Communications Equipment - 1.1% | |||
| ADTRAN, Inc. | 74,924 | 1,655,820 | |
| Aerohive Networks, Inc. (a) | 130,171 | 449,090 | |
| Applied Optoelectronics, Inc. (a)(b) | 29,272 | 1,730,561 | |
| Arista Networks, Inc. (a)(b) | 74,208 | 13,071,739 | |
| Arris International PLC (a) | 323,592 | 9,015,273 | |
| Aviat Networks, Inc. (a) | 5,550 | 85,914 | |
| Black Box Corp. | 16,753 | 50,259 | |
| Blonder Tongue Laboratories, Inc. (a) | 3,352 | 1,445 | |
| Brocade Communications Systems, Inc. | 716,208 | 8,866,655 | |
| CalAmp Corp. (a) | 63,415 | 1,175,714 | |
| Calix Networks, Inc. (a) | 55,272 | 270,833 | |
| Carvana Co. Class A (b) | 26,177 | 467,259 | |
| Ciena Corp. (a)(b) | 238,403 | 5,151,889 | |
| Cisco Systems, Inc. | 8,562,233 | 275,789,525 | |
| Clearfield, Inc. (a)(b) | 16,017 | 195,407 | |
| CommScope Holding Co., Inc. (a) | 326,580 | 10,796,735 | |
| Communications Systems, Inc. | 4,311 | 15,563 | |
| Comtech Telecommunications Corp. | 38,555 | 754,521 | |
| Dasan Zhone Solutions, Inc. (a) | 1,172 | 7,688 | |
| Digi International, Inc. (a) | 37,099 | 341,311 | |
| EchoStar Holding Corp. Class A (a) | 85,828 | 5,175,428 | |
| EMCORE Corp. (a) | 50,451 | 459,104 | |
| Extreme Networks, Inc. (a) | 245,320 | 2,804,008 | |
| F5 Networks, Inc. (a) | 110,573 | 13,200,205 | |
| Finisar Corp. (a) | 193,129 | 4,664,065 | |
| Harmonic, Inc. (a)(b) | 134,269 | 436,374 | |
| Harris Corp. | 209,532 | 25,751,483 | |
| Infinera Corp. (a)(b) | 259,331 | 2,193,940 | |
| InterDigital, Inc. | 59,150 | 4,220,353 | |
| Juniper Networks, Inc. | 647,360 | 17,951,293 | |
| KVH Industries, Inc. (a) | 23,641 | 278,964 | |
| Lantronix, Inc. (a) | 71 | 150 | |
| Lumentum Holdings, Inc. (a)(b) | 94,599 | 5,377,953 | |
| Motorola Solutions, Inc. | 275,488 | 24,276,003 | |
| NETGEAR, Inc. (a) | 57,212 | 2,746,176 | |
| NetScout Systems, Inc. (a) | 150,999 | 4,945,217 | |
| Network-1 Security Solutions, Inc. | 21,477 | 81,613 | |
| Oclaro, Inc. (a)(b) | 207,242 | 1,742,905 | |
| Optical Cable Corp. (a) | 564 | 1,382 | |
| Palo Alto Networks, Inc. (a) | 156,219 | 20,728,699 | |
| Parkervision, Inc. (a)(b) | 10,028 | 19,254 | |
| PC-Tel, Inc. | 11,999 | 77,754 | |
| Plantronics, Inc. | 53,885 | 2,297,118 | |
| Relm Wireless Corp. | 9,436 | 36,800 | |
| Resonant, Inc. (a)(b) | 2,385 | 10,852 | |
| ShoreTel, Inc. (a) | 114,759 | 854,955 | |
| Sonus Networks, Inc. (a) | 82,074 | 567,131 | |
| Tessco Technologies, Inc. | 7,287 | 95,460 | |
| Ubiquiti Networks, Inc. (a)(b) | 44,626 | 2,659,263 | |
| ViaSat, Inc. (a)(b) | 93,287 | 5,933,986 | |
| Viavi Solutions, Inc. (a) | 389,051 | 3,906,072 | |
| Westell Technologies, Inc. Class A (a) | 18,994 | 54,513 | |
| 483,441,674 | |||
| Electronic Equipment & Components - 1.0% | |||
| Amphenol Corp. Class A | 523,273 | 42,353,717 | |
| Anixter International, Inc. (a) | 51,288 | 3,785,054 | |
| Applied DNA Sciences, Inc. (a)(b) | 18,968 | 39,264 | |
| Arrow Electronics, Inc. (a) | 174,121 | 13,830,431 | |
| Avnet, Inc. | 219,819 | 8,478,419 | |
| AVX Corp. | 141,087 | 2,461,968 | |
| Badger Meter, Inc. | 74,053 | 3,399,033 | |
| Bel Fuse, Inc. Class B (non-vtg.) | 12,097 | 308,474 | |
| Belden, Inc. | 76,472 | 5,893,697 | |
| Benchmark Electronics, Inc. (a) | 73,834 | 2,399,605 | |
| Cardtronics PLC (a) | 76,739 | 1,993,679 | |
| CDW Corp. | 262,789 | 16,666,078 | |
| ClearSign Combustion Corp. (a)(b) | 7,019 | 21,408 | |
| Cognex Corp. | 154,691 | 16,856,678 | |
| Coherent, Inc. (a) | 41,706 | 9,730,844 | |
| Control4 Corp. (a) | 35,202 | 871,602 | |
| Corning, Inc. | 1,571,612 | 45,199,561 | |
| CTS Corp. | 48,442 | 1,089,945 | |
| CUI Global, Inc. (a)(b) | 26,608 | 102,973 | |
| Daktronics, Inc. | 49,334 | 475,086 | |
| Dell Technologies, Inc. | 232,199 | 17,398,671 | |
| Dolby Laboratories, Inc. Class A | 101,632 | 5,128,351 | |
| Echelon Corp. (a) | 3,219 | 14,904 | |
| Electro Scientific Industries, Inc. (a) | 113,580 | 1,399,306 | |
| eMagin Corp. (a) | 5,084 | 10,931 | |
| ePlus, Inc. (a) | 21,340 | 1,786,158 | |
| Fabrinet (a) | 63,037 | 2,448,357 | |
| FARO Technologies, Inc. (a) | 24,409 | 840,890 | |
| Fitbit, Inc. (a)(b) | 275,332 | 1,660,252 | |
| FLIR Systems, Inc. | 235,820 | 8,961,160 | |
| Frequency Electronics, Inc. (a) | 2,550 | 20,349 | |
| Giga-Tronics, Inc. (a) | 2,579 | 1,554 | |
| I. D. Systems Inc. (a) | 6,071 | 38,490 | |
| Identiv, Inc. (a) | 10,618 | 52,134 | |
| IEC Electronics Corp. (a) | 86 | 356 | |
| II-VI, Inc. (a) | 95,705 | 3,431,024 | |
| Insight Enterprises, Inc. (a) | 62,606 | 2,509,248 | |
| Intellicheck, Inc. (a)(b) | 545 | 1,417 | |
| IPG Photonics Corp. (a) | 63,918 | 11,236,145 | |
| Iteris, Inc. (a)(b) | 32,677 | 209,786 | |
| Itron, Inc. (a) | 55,882 | 4,057,033 | |
| Jabil, Inc. | 305,429 | 9,575,199 | |
| KEMET Corp. (a) | 73,106 | 1,747,964 | |
| KEY Tronic Corp. (a) | 6,483 | 46,094 | |
| Keysight Technologies, Inc. (a) | 331,556 | 13,547,378 | |
| Kimball Electronics, Inc. (a) | 30,376 | 578,663 | |
| Knowles Corp. (a)(b) | 178,238 | 2,614,751 | |
| LightPath Technologies, Inc. Class A (a) | 376 | 981 | |
| Littelfuse, Inc. | 39,308 | 7,317,577 | |
| LRAD Corp. (a) | 56,581 | 96,754 | |
| Luna Innovations, Inc. (a) | 1,444 | 2,180 | |
| Maxwell Technologies, Inc. (a) | 38,769 | 215,943 | |
| Mesa Laboratories, Inc. | 4,836 | 660,453 | |
| Methode Electronics, Inc. Class A | 56,055 | 2,292,650 | |
| MicroVision, Inc. (a)(b) | 117,860 | 279,328 | |
| MTS Systems Corp. (b) | 29,288 | 1,417,539 | |
| National Instruments Corp. | 178,144 | 7,195,236 | |
| Neonode, Inc. (a)(b) | 33,197 | 41,828 | |
| NetList, Inc. (a)(b) | 104,599 | 73,219 | |
| Novanta, Inc. (a) | 69,461 | 2,715,925 | |
| OSI Systems, Inc. (a) | 28,365 | 2,355,997 | |
| Park Electrochemical Corp. | 28,127 | 510,786 | |
| PC Connection, Inc. | 26,383 | 673,030 | |
| PC Mall, Inc. (a)(b) | 8,716 | 114,615 | |
| Perceptron, Inc. (a) | 13,154 | 101,417 | |
| Plexus Corp. (a) | 72,969 | 3,800,226 | |
| RadiSys Corp. (a) | 34,231 | 53,743 | |
| Research Frontiers, Inc. (a)(b) | 16,855 | 19,889 | |
| RF Industries Ltd. | 5,778 | 10,400 | |
| Richardson Electronics Ltd. | 23,707 | 132,759 | |
| Rogers Corp. (a) | 31,193 | 3,697,930 | |
| Sanmina Corp. (a) | 138,110 | 5,172,220 | |
| ScanSource, Inc. (a) | 36,663 | 1,439,023 | |
| SYNNEX Corp. | 50,673 | 6,060,998 | |
| Systemax, Inc. | 23,392 | 571,700 | |
| TE Connectivity Ltd. | 603,729 | 48,056,828 | |
| Tech Data Corp. (a) | 55,538 | 6,125,286 | |
| Trimble, Inc. (a) | 431,914 | 16,706,434 | |
| TTM Technologies, Inc. (a)(b) | 135,794 | 1,933,707 | |
| Uni-Pixel, Inc. (a)(b) | 49,445 | 5,444 | |
| Universal Display Corp. | 75,720 | 9,624,012 | |
| VeriFone Systems, Inc. (a) | 198,885 | 3,931,956 | |
| Vishay Intertechnology, Inc. | 233,503 | 4,133,003 | |
| Vishay Precision Group, Inc. (a) | 9,596 | 209,673 | |
| Wayside Technology Group, Inc. | 1,232 | 18,850 | |
| Wireless Telecom Group, Inc. (a) | 11,200 | 16,464 | |
| Zebra Technologies Corp. Class A (a) | 89,788 | 9,256,245 | |
| 412,316,329 | |||
| Internet Software & Services - 4.4% | |||
| 2U, Inc. (a)(b) | 68,060 | 3,409,806 | |
| Actua Corp. (a)(b) | 58,635 | 750,528 | |
| Akamai Technologies, Inc. (a) | 294,471 | 13,884,308 | |
| Alarm.com Holdings, Inc. (a)(b) | 24,291 | 1,091,152 | |
| Alphabet, Inc.: | |||
| Class A (a) | 508,559 | 485,795,899 | |
| Class C (a) | 512,009 | 480,945,414 | |
| Amber Road, Inc. (a) | 55,819 | 449,901 | |
| Angie's List, Inc. (a)(b) | 57,858 | 703,553 | |
| AppFolio, Inc. (a) | 18,857 | 808,965 | |
| Apptio, Inc. Class A | 10,079 | 179,406 | |
| Autobytel, Inc. (a) | 9,434 | 68,491 | |
| Bankrate, Inc. (a) | 83,183 | 1,152,085 | |
| Bazaarvoice, Inc. (a) | 201,642 | 957,800 | |
| Benefitfocus, Inc. (a) | 24,805 | 765,234 | |
| BlackLine, Inc. (b) | 26,716 | 824,723 | |
| Blucora, Inc. (a) | 67,133 | 1,530,632 | |
| Box, Inc. Class A (a) | 112,627 | 2,209,742 | |
| Brightcove, Inc. (a) | 59,246 | 417,684 | |
| BroadVision, Inc. (a) | 490 | 1,936 | |
| Carbonite, Inc. (a)(b) | 40,379 | 807,580 | |
| Care.com, Inc. (a) | 25,585 | 383,007 | |
| ChannelAdvisor Corp. (a) | 32,537 | 377,429 | |
| Cloudera, Inc. (b) | 72,946 | 1,415,152 | |
| CommerceHub, Inc.: | |||
| Series A (a) | 21,320 | 472,664 | |
| Series C (a) | 54,178 | 1,150,199 | |
| Cornerstone OnDemand, Inc. (a) | 79,186 | 2,769,926 | |
| CoStar Group, Inc. (a) | 54,807 | 15,708,782 | |
| Coupa Software, Inc. | 54,059 | 1,646,637 | |
| Determine, Inc. (a) | 552 | 1,110 | |
| DHI Group, Inc. (a) | 141,360 | 275,652 | |
| eBay, Inc. (a) | 1,720,569 | 62,164,158 | |
| eGain Communications Corp. (a) | 8,558 | 14,549 | |
| Endurance International Group Holdings, Inc. (a) | 119,063 | 916,785 | |
| Envestnet, Inc. (a) | 69,312 | 3,080,918 | |
| Facebook, Inc. Class A (a) | 4,046,445 | 695,867,147 | |
| Five9, Inc. (a) | 81,974 | 1,762,441 | |
| GlowPoint, Inc. (a) | 18,770 | 5,068 | |
| GoDaddy, Inc. (a)(b) | 96,243 | 4,313,611 | |
| Gogo, Inc. (a)(b) | 109,584 | 1,535,272 | |
| GrubHub, Inc. (a)(b) | 145,837 | 8,325,834 | |
| GTT Communications, Inc. (a) | 50,744 | 1,611,122 | |
| Hortonworks, Inc. (a) | 69,183 | 1,175,419 | |
| IAC/InterActiveCorp (a) | 125,109 | 14,201,123 | |
| Instructure, Inc. (a) | 8,268 | 244,733 | |
| Internap Network Services Corp. (a)(b) | 99,683 | 445,583 | |
| Inuvo, Inc. (a) | 9,640 | 9,833 | |
| iPass, Inc. (a) | 33,662 | 18,851 | |
| j2 Global, Inc. (b) | 83,229 | 6,265,479 | |
| Leaf Group Ltd. (a) | 19,244 | 136,632 | |
| Limelight Networks, Inc. (a) | 85,727 | 307,760 | |
| Liquidity Services, Inc. (a) | 37,923 | 216,161 | |
| LivePerson, Inc. (a) | 99,233 | 1,329,722 | |
| LogMeIn, Inc. | 88,256 | 10,096,486 | |
| Marchex, Inc. Class B (a) | 28,685 | 88,637 | |
| Marin Software, Inc. (a) | 9,976 | 11,472 | |
| Match Group, Inc. (a)(b) | 78,674 | 1,711,160 | |
| MaxPoint Interactive, Inc. (a) | 1,466 | 20,099 | |
| MeetMe, Inc. (a)(b) | 113,904 | 446,504 | |
| MINDBODY, Inc. (a)(b) | 51,352 | 1,214,475 | |
| MuleSoft, Inc. Class A (b) | 52,013 | 1,133,883 | |
| New Relic, Inc. (a) | 60,180 | 2,882,622 | |
| NIC, Inc. | 110,917 | 1,813,493 | |
| NumereX Corp. Class A (a) | 13,747 | 53,476 | |
| Nutanix, Inc. Class A (b) | 87,220 | 1,918,840 | |
| Okta, Inc. (b) | 46,160 | 1,245,858 | |
| Ominto, Inc. (a)(b) | 11,014 | 35,796 | |
| Pandora Media, Inc. (a)(b) | 408,712 | 3,453,616 | |
| Q2 Holdings, Inc. (a) | 48,710 | 1,977,626 | |
| QuinStreet, Inc. (a) | 38,666 | 206,863 | |
| Qumu Corp. (a) | 6,017 | 16,908 | |
| Quotient Technology, Inc. (a)(b) | 132,658 | 1,989,870 | |
| Reis, Inc. | 8,134 | 139,091 | |
| Rocket Fuel, Inc. (a)(b) | 59,472 | 154,032 | |
| SecureWorks Corp. (a)(b) | 18,872 | 193,061 | |
| Shutterstock, Inc. (a)(b) | 29,764 | 999,475 | |
| Spark Networks, Inc. (a)(b) | 16,620 | 20,775 | |
| SPS Commerce, Inc. (a) | 30,117 | 1,834,728 | |
| Stamps.com, Inc. (a)(b) | 27,053 | 5,173,886 | |
| Support.com, Inc. (a) | 39,218 | 92,554 | |
| Synacor, Inc. (a)(b) | 20,037 | 46,085 | |
| TechTarget, Inc. (a) | 23,593 | 234,514 | |
| The Trade Desk, Inc. (b) | 37,435 | 1,982,932 | |
| Travelzoo, Inc. (a) | 5,383 | 43,871 | |
| Tremor Video, Inc. (a) | 17,986 | 63,311 | |
| TrueCar, Inc. (a)(b) | 124,192 | 2,105,054 | |
| Twilio, Inc. Class A (a)(b) | 42,402 | 1,241,531 | |
| Twitter, Inc. (a) | 1,064,350 | 17,998,159 | |
| VeriSign, Inc. (a)(b) | 147,930 | 15,347,738 | |
| Web.com Group, Inc. (a)(b) | 88,964 | 2,250,789 | |
| WebMD Health Corp. (a)(b) | 69,214 | 4,598,578 | |
| XO Group, Inc. (a) | 81,695 | 1,521,161 | |
| Yelp, Inc. (a)(b) | 104,237 | 4,440,496 | |
| Yext, Inc. (b) | 22,445 | 292,009 | |
| YuMe, Inc. | 101,833 | 497,963 | |
| Zillow Group, Inc.: | |||
| Class A (a) | 72,361 | 2,888,651 | |
| Class C (a)(b) | 192,635 | 7,632,199 | |
| 1,927,013,925 | |||
| IT Services - 3.8% | |||
| Accenture PLC Class A | 1,060,760 | 138,704,978 | |
| Acxiom Corp. (a) | 136,727 | 3,184,372 | |
| Alliance Data Systems Corp. | 94,701 | 21,355,076 | |
| Amdocs Ltd. | 273,648 | 17,729,654 | |
| Automatic Data Processing, Inc. | 763,935 | 81,336,159 | |
| Black Knight Financial Services, Inc. Class A (a)(b) | 45,984 | 1,958,918 | |
| Blackhawk Network Holdings, Inc. (a) | 93,800 | 4,202,240 | |
| Booz Allen Hamilton Holding Corp. Class A | 251,437 | 8,576,516 | |
| Broadridge Financial Solutions, Inc. | 205,695 | 16,070,950 | |
| CACI International, Inc. Class A (a) | 43,520 | 5,648,896 | |
| Cartesian, Inc. (a) | 206 | 102 | |
| Cass Information Systems, Inc. | 15,060 | 921,973 | |
| Cognizant Technology Solutions Corp. Class A | 1,007,698 | 71,314,787 | |
| Computer Task Group, Inc. | 11,646 | 61,724 | |
| Conduent, Inc. | 300,582 | 4,962,609 | |
| Convergys Corp. | 164,874 | 3,874,539 | |
| CoreLogic, Inc. (a) | 146,089 | 6,861,800 | |
| CSG Systems International, Inc. | 60,961 | 2,359,800 | |
| CSP, Inc. | 3,696 | 37,367 | |
| CSRA, Inc. | 246,056 | 7,753,225 | |
| DST Systems, Inc. | 112,242 | 5,761,382 | |
| DXC Technology Co. | 482,546 | 41,016,410 | |
| Edgewater Technology, Inc. (a) | 2,875 | 18,400 | |
| EPAM Systems, Inc. (a) | 77,553 | 6,307,385 | |
| Euronet Worldwide, Inc. (a) | 88,098 | 8,657,390 | |
| Everi Holdings, Inc. (a) | 99,354 | 766,019 | |
| EVERTEC, Inc. | 105,730 | 1,945,432 | |
| ExlService Holdings, Inc. (a) | 59,903 | 3,371,341 | |
| Fidelity National Information Services, Inc. | 560,193 | 52,053,134 | |
| First Data Corp. Class A (a) | 335,780 | 6,181,710 | |
| Fiserv, Inc. (a) | 363,868 | 45,014,110 | |
| FleetCor Technologies, Inc. (a) | 157,293 | 22,614,015 | |
| Forrester Research, Inc. | 17,100 | 696,825 | |
| Gartner, Inc. (a) | 154,792 | 18,666,367 | |
| Genpact Ltd. | 232,461 | 6,613,515 | |
| Global Payments, Inc. | 258,559 | 24,689,799 | |
| Hackett Group, Inc. | 39,872 | 544,652 | |
| IBM Corp. | 1,465,294 | 209,581,001 | |
| Information Services Group, Inc. (a) | 18,000 | 67,500 | |
| Innodata, Inc. (a) | 14,010 | 21,716 | |
| Jack Henry & Associates, Inc. | 139,152 | 14,342,397 | |
| Leidos Holdings, Inc. | 242,832 | 14,161,962 | |
| ManTech International Corp. Class A | 47,385 | 1,905,825 | |
| MasterCard, Inc. Class A | 1,606,433 | 214,137,519 | |
| Mattersight Corp. (a)(b) | 9,437 | 22,177 | |
| Maximus, Inc. | 109,431 | 6,651,216 | |
| ModusLink Global Solutions, Inc. (a)(b) | 31,030 | 49,648 | |
| MoneyGram International, Inc. (a) | 66,937 | 1,054,927 | |
| Paychex, Inc. | 545,609 | 31,116,081 | |
| PayPal Holdings, Inc. (a) | 1,912,306 | 117,951,034 | |
| Perficient, Inc. (a) | 51,600 | 944,280 | |
| PFSweb, Inc. (a) | 22,457 | 176,961 | |
| Planet Payment, Inc. (a) | 40,113 | 158,847 | |
| Presidio, Inc. (b) | 95,619 | 1,330,060 | |
| PRG-Schultz International, Inc. (a) | 36,569 | 246,841 | |
| Sabre Corp. (b) | 349,079 | 6,437,017 | |
| Science Applications International Corp. | 74,228 | 5,483,965 | |
| ServiceSource International, Inc. (a) | 93,929 | 330,630 | |
| Square, Inc. (a) | 45,912 | 1,198,762 | |
| StarTek, Inc. (a) | 15,709 | 186,937 | |
| Sykes Enterprises, Inc. (a) | 68,849 | 1,835,514 | |
| Syntel, Inc. (b) | 56,060 | 1,012,444 | |
| Teletech Holdings, Inc. | 29,721 | 1,179,924 | |
| Teradata Corp. (a)(b) | 220,606 | 7,041,744 | |
| The Western Union Co. | 833,977 | 15,778,845 | |
| Total System Services, Inc. | 282,084 | 19,497,646 | |
| Travelport Worldwide Ltd. | 241,707 | 3,659,444 | |
| Unisys Corp. (a)(b) | 68,286 | 529,217 | |
| Vantiv, Inc. (a) | 274,434 | 19,399,739 | |
| Virtusa Corp. (a) | 48,896 | 1,775,903 | |
| Visa, Inc. Class A | 3,160,024 | 327,125,684 | |
| WEX, Inc. (a) | 68,406 | 7,465,831 | |
| WidePoint Corp. (a) | 71,654 | 38,693 | |
| 1,675,731,502 | |||
| Semiconductors & Semiconductor Equipment - 3.4% | |||
| Acacia Communications, Inc. (a)(b) | 24,135 | 1,178,512 | |
| Advanced Energy Industries, Inc. (a) | 70,933 | 5,216,413 | |
| Advanced Micro Devices, Inc. (a)(b) | 1,322,156 | 17,188,028 | |
| AEHR Test Systems (a) | 18,931 | 63,608 | |
| Alpha & Omega Semiconductor Ltd. (a) | 32,383 | 514,242 | |
| Amkor Technology, Inc. (a) | 223,902 | 1,965,860 | |
| Amtech Systems, Inc. (a) | 13,719 | 151,595 | |
| Analog Devices, Inc. | 632,839 | 52,949,639 | |
| Applied Materials, Inc. | 1,825,017 | 82,344,767 | |
| Axcelis Technologies, Inc. (a) | 45,794 | 957,095 | |
| AXT, Inc. (a)(b) | 68,422 | 533,692 | |
| Broadcom Ltd. | 687,438 | 173,282,497 | |
| Brooks Automation, Inc. | 126,012 | 3,285,133 | |
| Cabot Microelectronics Corp. | 44,714 | 3,202,417 | |
| Cavium, Inc. (a) | 113,279 | 7,171,693 | |
| Ceva, Inc. (a) | 37,331 | 1,513,772 | |
| Cirrus Logic, Inc. (a) | 109,205 | 6,331,706 | |
| Cohu, Inc. | 83,996 | 1,575,765 | |
| Cree, Inc. (a)(b) | 179,530 | 4,367,965 | |
| CVD Equipment Corp. (a)(b) | 24,298 | 267,278 | |
| CyberOptics Corp. (a)(b) | 9,251 | 140,153 | |
| Cypress Semiconductor Corp. (b) | 556,739 | 7,621,757 | |
| Diodes, Inc. (a) | 66,747 | 1,878,261 | |
| DSP Group, Inc. (a) | 64,723 | 770,204 | |
| Entegris, Inc. (a) | 244,281 | 6,216,951 | |
| Experi Corp. | 89,409 | 2,436,395 | |
| First Solar, Inc. (a)(b) | 134,619 | 6,321,708 | |
| FormFactor, Inc. (a) | 123,711 | 1,868,036 | |
| GSI Technology, Inc. (a) | 18,344 | 121,804 | |
| Ichor Holdings Ltd. | 29,846 | 682,876 | |
| Impinj, Inc. (a)(b) | 14,583 | 557,654 | |
| Inphi Corp. (a)(b) | 64,122 | 2,455,231 | |
| Integrated Device Technology, Inc. (a) | 224,546 | 5,548,532 | |
| Intel Corp. | 8,073,812 | 283,148,587 | |
| Intermolecular, Inc. (a) | 6,975 | 5,999 | |
| Intest Corp. (a) | 2,175 | 16,421 | |
| IXYS Corp. (a) | 67,452 | 1,551,396 | |
| KLA-Tencor Corp. | 267,440 | 25,056,454 | |
| Kopin Corp. (a)(b) | 88,411 | 355,412 | |
| Kulicke & Soffa Industries, Inc. (a) | 125,107 | 2,380,786 | |
| Lam Research Corp. | 272,876 | 45,291,958 | |
| Lattice Semiconductor Corp. (a) | 220,983 | 1,248,554 | |
| M/A-COM Technology Solutions Holdings, Inc. (a)(b) | 62,646 | 2,852,899 | |
| Marvell Technology Group Ltd. | 752,545 | 13,478,081 | |
| Maxim Integrated Products, Inc. | 484,561 | 22,609,616 | |
| MaxLinear, Inc. Class A (a) | 86,669 | 1,872,050 | |
| Microchip Technology, Inc. (b) | 388,920 | 33,758,256 | |
| Micron Technology, Inc. (a) | 1,773,384 | 56,695,086 | |
| Microsemi Corp. (a) | 202,154 | 10,184,519 | |
| MKS Instruments, Inc. | 93,742 | 7,719,654 | |
| Monolithic Power Systems, Inc. | 69,641 | 7,056,026 | |
| MoSys, Inc. (a)(b) | 6,042 | 5,861 | |
| Nanometrics, Inc. (a) | 38,377 | 989,743 | |
| NeoPhotonics Corp. (a)(b) | 44,702 | 261,507 | |
| NVE Corp. | 7,985 | 605,582 | |
| NVIDIA Corp. | 1,018,180 | 172,520,419 | |
| ON Semiconductor Corp. (a) | 717,972 | 12,262,962 | |
| PDF Solutions, Inc. (a)(b) | 47,788 | 725,900 | |
| Photronics, Inc. (a) | 101,617 | 802,774 | |
| Pixelworks, Inc. (a)(b) | 22,798 | 109,430 | |
| Power Integrations, Inc. | 52,203 | 3,802,989 | |
| Qorvo, Inc. (a)(b) | 214,691 | 15,719,675 | |
| Qualcomm, Inc. | 2,530,781 | 132,283,923 | |
| QuickLogic Corp. (a)(b) | 142,208 | 190,559 | |
| Rambus, Inc. (a) | 201,505 | 2,613,520 | |
| Rubicon Technology, Inc. (a)(b) | 2,504 | 20,508 | |
| Rudolph Technologies, Inc. (a) | 69,669 | 1,546,652 | |
| Semtech Corp. (a) | 111,258 | 4,183,301 | |
| Sevcon, Inc. (a) | 2,938 | 64,577 | |
| Sigma Designs, Inc. (a) | 51,095 | 319,344 | |
| Silicon Laboratories, Inc. (a) | 73,360 | 5,568,024 | |
| Skyworks Solutions, Inc. | 316,117 | 33,306,087 | |
| SolarEdge Technologies, Inc. (a) | 54,440 | 1,456,270 | |
| SunPower Corp. (a)(b) | 97,783 | 864,402 | |
| Synaptics, Inc. (a)(b) | 56,125 | 2,333,116 | |
| Teradyne, Inc. | 339,570 | 12,092,088 | |
| Texas Instruments, Inc. | 1,696,527 | 140,506,366 | |
| Ultra Clean Holdings, Inc. (a) | 60,588 | 1,397,765 | |
| Veeco Instruments, Inc. (a) | 86,705 | 1,638,725 | |
| Versum Materials, Inc. | 188,451 | 6,959,495 | |
| Xcerra Corp. (a) | 98,441 | 966,691 | |
| Xilinx, Inc. | 430,246 | 28,422,051 | |
| 1,500,503,299 | |||
| Software - 5.0% | |||
| 8x8, Inc. (a) | 162,409 | 2,298,087 | |
| A10 Networks, Inc. (a) | 73,118 | 478,923 | |
| ACI Worldwide, Inc. (a) | 200,153 | 4,555,482 | |
| Activision Blizzard, Inc. | 1,183,120 | 77,565,347 | |
| Adobe Systems, Inc. (a) | 841,242 | 130,527,109 | |
| Agilysys, Inc. (a) | 38,149 | 392,553 | |
| American Software, Inc. Class A | 55,166 | 607,378 | |
| ANSYS, Inc. (a) | 144,955 | 18,673,103 | |
| Aspen Technology, Inc. (a) | 131,521 | 8,318,703 | |
| Asure Software, Inc. (a)(b) | 8,721 | 100,989 | |
| Autodesk, Inc. (a) | 329,727 | 37,740,552 | |
| Barracuda Networks, Inc. (a) | 58,271 | 1,410,741 | |
| Blackbaud, Inc. | 80,900 | 6,828,769 | |
| Bottomline Technologies, Inc. (a) | 62,280 | 1,887,707 | |
| BroadSoft, Inc. (a)(b) | 53,585 | 2,655,137 | |
| BSQUARE Corp. (a) | 11,182 | 55,910 | |
| CA Technologies, Inc. | 535,355 | 17,763,079 | |
| Cadence Design Systems, Inc. (a) | 470,063 | 18,468,775 | |
| Callidus Software, Inc. (a) | 115,529 | 2,974,872 | |
| CDK Global, Inc. | 250,362 | 16,148,349 | |
| Citrix Systems, Inc. (a) | 260,051 | 20,338,589 | |
| CommVault Systems, Inc. (a) | 75,089 | 4,584,183 | |
| Datawatch Corp. (a) | 9,730 | 100,219 | |
| Digimarc Corp. (a)(b) | 18,523 | 572,361 | |
| Digital Turbine, Inc. (a)(b) | 41,910 | 48,616 | |
| Document Security Systems, Inc. (a) | 4,956 | 3,271 | |
| Ebix, Inc. | 35,461 | 2,046,100 | |
| Electronic Arts, Inc. (a) | 528,943 | 64,266,575 | |
| Ellie Mae, Inc. (a) | 59,098 | 4,903,952 | |
| Everbridge, Inc. | 29,747 | 689,238 | |
| Evolving Systems, Inc. (a) | 4,973 | 23,622 | |
| Exa Corp. (a) | 15,758 | 226,127 | |
| Fair Isaac Corp. | 53,660 | 7,553,182 | |
| FalconStor Software, Inc. (a)(b) | 37,427 | 13,474 | |
| FireEye, Inc. (a)(b) | 276,277 | 4,080,611 | |
| Form Holdings Corp. (a)(b) | 9,862 | 12,032 | |
| Fortinet, Inc. (a) | 253,763 | 9,693,747 | |
| Gigamon, Inc. (a) | 53,853 | 2,312,986 | |
| Glu Mobile, Inc. (a)(b) | 173,754 | 632,465 | |
| GSE Systems, Inc. (a) | 388 | 1,086 | |
| Guidance Software, Inc. (a) | 26,710 | 189,107 | |
| Guidewire Software, Inc. (a) | 129,374 | 9,794,906 | |
| HubSpot, Inc. (a)(b) | 54,014 | 3,961,927 | |
| Imperva, Inc. (a) | 51,764 | 2,311,263 | |
| Inseego Corp. (b) | 35,452 | 49,987 | |
| Intuit, Inc. | 414,561 | 58,639,653 | |
| Manhattan Associates, Inc. (a) | 127,067 | 5,343,167 | |
| Microsoft Corp. | 13,229,954 | 989,203,661 | |
| MicroStrategy, Inc. Class A (a) | 16,727 | 2,157,783 | |
| Mitek Systems, Inc. (a) | 45,058 | 457,339 | |
| MobileIron, Inc. (a) | 70,668 | 268,538 | |
| Model N, Inc. (a) | 64,636 | 875,818 | |
| Monotype Imaging Holdings, Inc. | 66,977 | 1,222,330 | |
| NetSol Technologies, Inc. (a) | 10,165 | 45,743 | |
| Nuance Communications, Inc. (a) | 427,719 | 6,873,444 | |
| Oracle Corp. | 5,148,287 | 259,113,285 | |
| Parametric Technology Corp. (a) | 196,550 | 11,006,800 | |
| Park City Group, Inc. (a)(b) | 18,083 | 227,846 | |
| Paycom Software, Inc. (a)(b) | 65,084 | 4,855,917 | |
| Paylocity Holding Corp. (a) | 39,896 | 1,960,489 | |
| Pegasystems, Inc. | 63,152 | 3,634,398 | |
| Polarityte, Inc. (a)(b) | 5,861 | 170,496 | |
| Progress Software Corp. | 78,882 | 2,648,858 | |
| Proofpoint, Inc. (a)(b) | 71,790 | 6,587,450 | |
| PROS Holdings, Inc. (a) | 40,708 | 1,072,249 | |
| QAD, Inc.: | |||
| Class A | 10,065 | 339,191 | |
| Class B | 4,298 | 115,960 | |
| Qualys, Inc. (a) | 50,519 | 2,399,653 | |
| Rapid7, Inc. (a) | 27,175 | 458,171 | |
| RealNetworks, Inc. (a) | 28,670 | 114,393 | |
| RealPage, Inc. (a) | 95,369 | 4,110,404 | |
| Red Hat, Inc. (a) | 303,397 | 32,615,178 | |
| RingCentral, Inc. (a) | 109,308 | 4,629,194 | |
| Rosetta Stone, Inc. (a) | 22,826 | 209,999 | |
| Salesforce.com, Inc. (a) | 1,141,898 | 109,039,840 | |
| SeaChange International, Inc. (a) | 36,866 | 96,220 | |
| ServiceNow, Inc. (a) | 298,950 | 34,735,001 | |
| Silver Spring Networks, Inc. (a)(b) | 66,256 | 838,801 | |
| SITO Mobile Ltd. (a)(b) | 17,979 | 76,950 | |
| Smith Micro Software, Inc. (a) | 10,363 | 11,296 | |
| Sonic Foundry, Inc. (a) | 155 | 529 | |
| Splunk, Inc. (a)(b) | 236,248 | 15,849,878 | |
| SS&C Technologies Holdings, Inc. | 293,141 | 11,347,488 | |
| Symantec Corp. | 1,047,401 | 31,401,082 | |
| Synchronoss Technologies, Inc. (a) | 70,331 | 1,180,857 | |
| Synopsys, Inc. (a) | 254,413 | 20,459,893 | |
| Tableau Software, Inc. (a)(b) | 103,158 | 7,476,892 | |
| Take-Two Interactive Software, Inc. (a) | 184,465 | 18,038,832 | |
| TeleNav, Inc. (a) | 46,856 | 304,564 | |
| The Rubicon Project, Inc. (a) | 59,339 | 223,115 | |
| TiVo Corp. | 211,366 | 3,867,998 | |
| Tyler Technologies, Inc. (a) | 58,649 | 10,134,547 | |
| Ultimate Software Group, Inc. (a)(b) | 52,907 | 10,629,016 | |
| Upland Software, Inc. (a) | 13,813 | 317,699 | |
| Varonis Systems, Inc. (a) | 31,174 | 1,209,551 | |
| Vasco Data Security International, Inc. (a) | 48,861 | 613,206 | |
| Verint Systems, Inc. (a) | 104,276 | 4,139,757 | |
| VirnetX Holding Corp. (a)(b) | 93,723 | 374,892 | |
| VMware, Inc. Class A (a)(b) | 121,491 | 13,133,177 | |
| Workday, Inc. Class A (a)(b) | 222,931 | 24,453,301 | |
| Workiva, Inc. (a) | 31,679 | 639,916 | |
| Zedge, Inc. (a) | 14,921 | 26,858 | |
| Zendesk, Inc. (a) | 130,945 | 3,587,893 | |
| Zix Corp. (a) | 69,803 | 370,654 | |
| Zynga, Inc. (a) | 1,392,357 | 5,221,339 | |
| 2,219,019,640 | |||
| Technology Hardware, Storage & Peripherals - 3.8% | |||
| 3D Systems Corp. (a)(b) | 180,858 | 2,271,576 | |
| Apple, Inc. | 8,935,155 | 1,465,365,349 | |
| Astro-Med, Inc. | 4,606 | 62,642 | |
| Avid Technology, Inc. (a)(b) | 38,570 | 170,094 | |
| Concurrent Computer Corp. | 6,675 | 42,186 | |
| CPI Card Group (b) | 22,281 | 21,396 | |
| Cray, Inc. (a) | 76,017 | 1,432,920 | |
| Diebold Nixdorf, Inc. | 123,985 | 2,535,493 | |
| Eastman Kodak Co. (a)(b) | 64,018 | 496,140 | |
| Electronics for Imaging, Inc. (a)(b) | 82,143 | 2,921,005 | |
| Everspin Technologies, Inc. (b) | 9,978 | 162,641 | |
| Hewlett Packard Enterprise Co. | 2,841,574 | 51,318,826 | |
| HP, Inc. | 2,885,248 | 55,050,532 | |
| Immersion Corp. (a)(b) | 59,681 | 436,865 | |
| Intevac, Inc. (a) | 29,097 | 264,783 | |
| NCR Corp. (a) | 216,399 | 7,905,055 | |
| NetApp, Inc. | 460,042 | 17,785,224 | |
| Pure Storage, Inc. Class A (a)(b) | 153,259 | 2,282,027 | |
| Quantum Corp. (a)(b) | 41,835 | 230,511 | |
| Seagate Technology LLC (b) | 503,012 | 15,859,968 | |
| Super Micro Computer, Inc. (a)(b) | 65,674 | 1,748,570 | |
| Transact Technologies, Inc. | 3,411 | 33,257 | |
| U.S.A. Technologies, Inc. (a)(b) | 68,908 | 375,549 | |
| Western Digital Corp. | 496,255 | 43,804,429 | |
| Xerox Corp. | 371,484 | 11,987,789 | |
| Xplore Technologies Corp. (a) | 2,067 | 6,552 | |
| 1,684,571,379 | |||
| TOTAL INFORMATION TECHNOLOGY | 9,902,597,748 | ||
| MATERIALS - 3.3% | |||
| Chemicals - 2.2% | |||
| A. Schulman, Inc. | 45,099 | 1,371,010 | |
| Advanced Emissions Solutions, Inc. (b) | 57,241 | 594,162 | |
| AdvanSix, Inc. | 52,136 | 1,664,702 | |
| AgroFresh Solutions, Inc. (a)(b) | 38,931 | 277,189 | |
| Air Products & Chemicals, Inc. | 375,812 | 54,631,790 | |
| Albemarle Corp. U.S. | 190,401 | 22,136,020 | |
| American Vanguard Corp. | 44,829 | 907,787 | |
| Ashland Global Holdings, Inc. | 107,479 | 6,669,072 | |
| Axalta Coating Systems (a) | 374,838 | 11,065,218 | |
| Balchem Corp. | 53,639 | 4,020,779 | |
| BioAmber, Inc. (a)(b) | 17,794 | 7,776 | |
| Cabot Corp. | 106,306 | 5,600,200 | |
| Calgon Carbon Corp. | 83,129 | 1,014,174 | |
| Celanese Corp. Class A | 237,507 | 23,042,929 | |
| CF Industries Holdings, Inc. | 394,832 | 11,446,180 | |
| Chase Corp. | 19,479 | 1,821,287 | |
| Codexis, Inc. (a) | 42,409 | 235,370 | |
| Core Molding Technologies, Inc. | 10,858 | 223,349 | |
| Eastman Chemical Co. | 259,233 | 22,345,885 | |
| Ecolab, Inc. | 447,379 | 59,635,621 | |
| Ferro Corp. (a) | 133,620 | 2,574,857 | |
| Flotek Industries, Inc. (a)(b) | 98,612 | 510,810 | |
| FMC Corp. | 228,847 | 19,731,188 | |
| FutureFuel Corp. | 37,844 | 510,137 | |
| H.B. Fuller Co. | 88,055 | 4,419,480 | |
| Hawkins, Inc. | 13,930 | 496,605 | |
| Huntsman Corp. | 335,090 | 8,903,341 | |
| Ingevity Corp. (a) | 71,031 | 4,472,822 | |
| Innophos Holdings, Inc. | 32,175 | 1,469,111 | |
| Innospec, Inc. | 41,822 | 2,321,121 | |
| International Flavors & Fragrances, Inc. | 134,797 | 18,446,969 | |
| Intrepid Potash, Inc. (a)(b) | 199,844 | 741,421 | |
| KMG Chemicals, Inc. | 10,303 | 494,750 | |
| Koppers Holdings, Inc. (a) | 34,144 | 1,338,445 | |
| Kraton Performance Polymers, Inc. (a) | 55,754 | 1,830,404 | |
| Kronos Worldwide, Inc. | 34,238 | 716,601 | |
| LSB Industries, Inc. (a)(b) | 28,693 | 175,027 | |
| LyondellBasell Industries NV Class A | 566,829 | 51,349,039 | |
| Marrone Bio Innovations, Inc. (a)(b) | 15,737 | 18,727 | |
| Minerals Technologies, Inc. | 58,663 | 3,754,432 | |
| Monsanto Co. | 754,490 | 88,426,228 | |
| NewMarket Corp. | 16,721 | 6,997,906 | |
| Olin Corp. | 276,573 | 8,913,948 | |
| OMNOVA Solutions, Inc. (a) | 52,644 | 458,003 | |
| Platform Specialty Products Corp. (a)(b) | 374,823 | 4,377,933 | |
| PolyOne Corp. | 144,671 | 5,228,410 | |
| PPG Industries, Inc. | 437,630 | 45,653,562 | |
| Praxair, Inc. | 486,123 | 63,944,619 | |
| Quaker Chemical Corp. | 22,939 | 3,193,568 | |
| Rayonier Advanced Materials, Inc. | 82,695 | 1,134,575 | |
| RPM International, Inc. | 226,844 | 11,108,551 | |
| Senomyx, Inc. (a) | 66,138 | 40,020 | |
| Sensient Technologies Corp. | 86,306 | 6,226,978 | |
| Sherwin-Williams Co. | 137,857 | 46,770,744 | |
| Stepan Co. | 34,404 | 2,661,493 | |
| The Chemours Co. LLC | 310,949 | 15,258,267 | |
| The Dow Chemical Co. | 3,839,123 | 255,877,548 | |
| The Mosaic Co. | 596,228 | 11,912,635 | |
| The Scotts Miracle-Gro Co. Class A | 77,671 | 7,424,571 | |
| Trecora Resources (a) | 28,770 | 349,556 | |
| Tredegar Corp. | 71,882 | 1,171,677 | |
| Trinseo SA | 75,141 | 5,026,933 | |
| Tronox Ltd. Class A | 110,795 | 2,292,349 | |
| Valhi, Inc. | 35,553 | 77,506 | |
| Valvoline, Inc. | 351,998 | 7,494,037 | |
| W.R. Grace & Co. | 111,862 | 7,995,896 | |
| Westlake Chemical Corp. | 64,435 | 4,955,696 | |
| Yield10 Bioscience, Inc. (a)(b) | 693 | 1,864 | |
| 967,960,860 | |||
| Construction Materials - 0.1% | |||
| Eagle Materials, Inc. | 85,683 | 8,332,672 | |
| Forterra, Inc. (b) | 32,917 | 109,284 | |
| Foundation Building Materials, Inc. | 21,184 | 276,663 | |
| Martin Marietta Materials, Inc. | 109,383 | 23,188,102 | |
| Summit Materials, Inc. | 172,319 | 5,090,303 | |
| U.S. Concrete, Inc. (a)(b) | 26,762 | 2,142,298 | |
| United States Lime & Minerals, Inc. | 2,200 | 175,890 | |
| Vulcan Materials Co. | 223,084 | 27,051,166 | |
| 66,366,378 | |||
| Containers & Packaging - 0.5% | |||
| Aptargroup, Inc. | 119,670 | 10,005,609 | |
| Avery Dennison Corp. | 149,434 | 14,085,649 | |
| Ball Corp. | 589,483 | 23,573,425 | |
| Bemis Co., Inc. | 156,089 | 6,650,952 | |
| Berry Global Group, Inc. (a) | 220,167 | 12,382,192 | |
| Crown Holdings, Inc. (a) | 233,058 | 13,757,414 | |
| Graphic Packaging Holding Co. | 529,162 | 6,905,564 | |
| Greif, Inc. Class A | 63,236 | 3,822,616 | |
| International Paper Co. | 704,583 | 37,955,886 | |
| Myers Industries, Inc. | 29,894 | 562,007 | |
| Owens-Illinois, Inc. (a) | 264,706 | 6,522,356 | |
| Packaging Corp. of America | 160,703 | 18,064,624 | |
| Sealed Air Corp. | 328,644 | 14,585,221 | |
| Silgan Holdings, Inc. | 135,972 | 4,091,397 | |
| Sonoco Products Co. | 183,166 | 8,839,591 | |
| UFP Technologies, Inc. (a) | 14,187 | 377,374 | |
| WestRock Co. | 427,751 | 24,343,309 | |
| 206,525,186 | |||
| Metals & Mining - 0.4% | |||
| AK Steel Holding Corp. (a)(b) | 525,512 | 2,942,867 | |
| Alcoa Corp. | 248,002 | 10,882,328 | |
| Allegheny Technologies, Inc. (b) | 174,474 | 3,634,293 | |
| Ampco-Pittsburgh Corp. | 10,414 | 160,376 | |
| Atkore International Group, Inc. (a) | 35,003 | 583,150 | |
| Carpenter Technology Corp. | 80,027 | 3,243,494 | |
| Century Aluminum Co. (a)(b) | 86,859 | 1,695,488 | |
| Cliffs Natural Resources, Inc. (a)(b) | 454,481 | 3,799,461 | |
| Coeur d'Alene Mines Corp. (a) | 297,840 | 2,606,100 | |
| Commercial Metals Co. | 192,032 | 3,627,484 | |
| Compass Minerals International, Inc. | 56,608 | 3,781,414 | |
| Comstock Mining, Inc. (a) | 56,723 | 10,545 | |
| Freeport-McMoRan, Inc. (a) | 2,260,613 | 33,411,860 | |
| Friedman Industries | 2,001 | 11,346 | |
| General Moly, Inc. (a) | 60,513 | 26,414 | |
| Gold Resource Corp. | 109,163 | 435,560 | |
| Golden Minerals Co. (a)(b) | 71,014 | 38,561 | |
| Handy & Harman Ltd. (a) | 5,646 | 184,624 | |
| Haynes International, Inc. | 18,364 | 561,020 | |
| Hecla Mining Co. | 683,190 | 3,607,243 | |
| Kaiser Aluminum Corp. | 27,980 | 2,695,034 | |
| Materion Corp. | 30,858 | 1,178,776 | |
| McEwen Mining, Inc. (b) | 403,016 | 1,035,751 | |
| Newmont Mining Corp. | 915,669 | 35,106,749 | |
| Nucor Corp. | 538,845 | 29,695,748 | |
| Olympic Steel, Inc. | 12,703 | 231,830 | |
| Paramount Gold Nevada Corp. (a) | 7,958 | 12,176 | |
| Pershing Gold Corp. (a)(b) | 31,696 | 96,039 | |
| Real Industries, Inc. (a)(b) | 30,069 | 51,117 | |
| Reliance Steel & Aluminum Co. | 131,422 | 9,517,581 | |
| Royal Gold, Inc. | 110,834 | 10,338,596 | |
| Ryerson Holding Corp. (a) | 30,039 | 258,335 | |
| Schnitzer Steel Industries, Inc. Class A | 47,241 | 1,270,783 | |
| Solitario Exploration & Royalty Corp. (a) | 18,115 | 12,681 | |
| Steel Dynamics, Inc. | 413,913 | 14,259,303 | |
| SunCoke Energy, Inc. (a) | 99,267 | 925,168 | |
| Synalloy Corp. (a) | 8,615 | 97,780 | |
| TimkenSteel Corp. (a)(b) | 69,807 | 1,035,238 | |
| U.S. Antimony Corp. (a) | 24,962 | 7,988 | |
| U.S. Gold Corp. (a) | 46 | 111 | |
| United States Steel Corp. (b) | 307,753 | 8,189,307 | |
| Universal Stainless & Alloy Products, Inc. (a) | 6,659 | 120,728 | |
| Worthington Industries, Inc. | 71,924 | 3,593,323 | |
| 194,973,770 | |||
| Paper & Forest Products - 0.1% | |||
| Boise Cascade Co. (a) | 63,767 | 1,913,010 | |
| Clearwater Paper Corp. (a) | 29,564 | 1,374,726 | |
| Deltic Timber Corp. | 17,765 | 1,386,381 | |
| Domtar Corp. | 128,751 | 5,206,690 | |
| Kapstone Paper & Packaging Corp. | 150,928 | 3,376,259 | |
| Louisiana-Pacific Corp. (a) | 261,592 | 6,665,364 | |
| Mercer International, Inc. (SBI) | 60,804 | 671,884 | |
| Neenah Paper, Inc. | 27,129 | 2,095,715 | |
| P.H. Glatfelter Co. | 69,408 | 1,202,147 | |
| Rentech, Inc. (a) | 27,522 | 7,321 | |
| Resolute Forest Products (a) | 146,819 | 726,754 | |
| Schweitzer-Mauduit International, Inc. | 48,432 | 1,837,026 | |
| Verso Corp. (b) | 59,171 | 314,790 | |
| 26,778,067 | |||
| TOTAL MATERIALS | 1,462,604,261 | ||
| REAL ESTATE - 4.1% | |||
| Equity Real Estate Investment Trusts (REITs) - 4.0% | |||
| Acadia Realty Trust (SBI) | 161,267 | 4,626,750 | |
| Agree Realty Corp. | 50,269 | 2,519,482 | |
| Alexanders, Inc. | 6,076 | 2,543,960 | |
| Alexandria Real Estate Equities, Inc. | 159,183 | 19,310,490 | |
| Altisource Residential Corp. Class B | 86,977 | 1,053,291 | |
| American Assets Trust, Inc. | 89,595 | 3,639,349 | |
| American Campus Communities, Inc. | 225,191 | 10,716,840 | |
| American Homes 4 Rent Class A | 382,812 | 8,483,114 | |
| American Tower Corp. | 728,593 | 107,868,194 | |
| Apartment Investment & Management Co. Class A | 262,560 | 11,901,845 | |
| Apple Hospitality (REIT), Inc. | 276,107 | 5,019,625 | |
| Armada Hoffler Properties, Inc. | 73,011 | 976,157 | |
| Ashford Hospitality Prime, Inc. | 47,533 | 457,267 | |
| Ashford Hospitality Trust, Inc. | 123,613 | 767,637 | |
| AvalonBay Communities, Inc. | 234,204 | 43,967,117 | |
| Bluerock Residential Growth (REIT), Inc. | 90,320 | 914,942 | |
| Boston Properties, Inc. | 262,495 | 31,656,897 | |
| Brandywine Realty Trust (SBI) | 276,702 | 4,753,740 | |
| Brixmor Property Group, Inc. | 452,816 | 8,476,716 | |
| BRT Realty Trust (a) | 189,164 | 1,471,696 | |
| Camden Property Trust (SBI) | 145,586 | 13,027,035 | |
| CareTrust (REIT), Inc. | 113,682 | 2,192,926 | |
| CatchMark Timber Trust, Inc. | 100,692 | 1,160,979 | |
| CBL & Associates Properties, Inc. (b) | 283,674 | 2,269,392 | |
| Cedar Realty Trust, Inc. | 134,023 | 675,476 | |
| Chatham Lodging Trust | 57,137 | 1,158,738 | |
| Chesapeake Lodging Trust | 98,722 | 2,526,296 | |
| City Office REIT, Inc. | 67,579 | 864,335 | |
| Clipper Realty, Inc. (b) | 6,962 | 77,696 | |
| Colony NorthStar, Inc. (b) | 925,392 | 12,131,889 | |
| Columbia Property Trust, Inc. | 198,850 | 4,175,850 | |
| Communications Sales & Leasing, Inc. | 267,108 | 5,144,500 | |
| Community Healthcare Trust, Inc. | 41,798 | 1,110,155 | |
| Condor Hospitality Trust, Inc. | 108 | 1,130 | |
| CorEnergy Infrastructure Trust, Inc. (b) | 14,135 | 461,225 | |
| CoreSite Realty Corp. | 56,759 | 6,740,699 | |
| Corporate Office Properties Trust (SBI) | 181,324 | 6,048,969 | |
| Corrections Corp. of America | 203,536 | 5,454,765 | |
| Cousins Properties, Inc. | 673,063 | 6,293,139 | |
| Crown Castle International Corp. | 687,025 | 74,500,991 | |
| CubeSmart | 296,680 | 7,313,162 | |
| CyrusOne, Inc. | 130,176 | 8,204,993 | |
| DCT Industrial Trust, Inc. | 161,523 | 9,424,867 | |
| DDR Corp. | 536,213 | 5,190,542 | |
| DiamondRock Hospitality Co. | 332,744 | 3,656,857 | |
| Digital Realty Trust, Inc. | 272,874 | 32,291,909 | |
| Douglas Emmett, Inc. | 264,925 | 10,321,478 | |
| Duke Realty Corp. | 603,073 | 17,923,330 | |
| DuPont Fabros Technology, Inc. | 130,007 | 8,367,251 | |
| Easterly Government Properties, Inc. (b) | 30,760 | 617,046 | |
| EastGroup Properties, Inc. | 54,382 | 4,832,385 | |
| Education Realty Trust, Inc. | 129,203 | 4,992,404 | |
| Empire State Realty Trust, Inc. | 218,080 | 4,437,928 | |
| EPR Properties | 106,196 | 7,397,613 | |
| Equinix, Inc. | 132,832 | 62,219,837 | |
| Equity Commonwealth (a) | 213,360 | 6,601,358 | |
| Equity Lifestyle Properties, Inc. | 141,492 | 12,614,012 | |
| Equity Residential (SBI) | 620,908 | 41,693,972 | |
| Essex Property Trust, Inc. | 111,421 | 29,634,643 | |
| Extra Space Storage, Inc. (b) | 213,703 | 16,589,764 | |
| Farmland Partners, Inc. (b) | 105,443 | 934,225 | |
| Federal Realty Investment Trust (SBI) | 126,706 | 16,082,793 | |
| FelCor Lodging Trust, Inc. | 200,216 | 1,461,577 | |
| First Industrial Realty Trust, Inc. | 184,151 | 5,704,998 | |
| First Potomac Realty Trust | 85,240 | 948,721 | |
| Forest City Realty Trust, Inc. Class A | 359,272 | 8,608,157 | |
| Four Corners Property Trust, Inc. | 103,212 | 2,622,617 | |
| Franklin Street Properties Corp. | 176,797 | 1,762,666 | |
| Gaming & Leisure Properties | 346,079 | 13,562,836 | |
| General Growth Properties, Inc. | 1,017,602 | 21,115,242 | |
| Getty Realty Corp. | 48,238 | 1,329,439 | |
| Gladstone Commercial Corp. | 76,606 | 1,639,368 | |
| Gladstone Land Corp. | 8,000 | 111,360 | |
| Global Net Lease, Inc. | 83,478 | 1,808,133 | |
| Government Properties Income Trust | 163,137 | 3,026,191 | |
| Gramercy Property Trust | 249,250 | 7,592,155 | |
| HCP, Inc. | 798,555 | 23,804,925 | |
| Healthcare Realty Trust, Inc. | 211,777 | 7,047,939 | |
| Healthcare Trust of America, Inc. | 317,837 | 9,875,196 | |
| Hersha Hospitality Trust | 71,283 | 1,321,587 | |
| Highwoods Properties, Inc. (SBI) | 169,915 | 8,874,660 | |
| Hospitality Properties Trust (SBI) | 292,755 | 8,009,777 | |
| Host Hotels & Resorts, Inc. | 1,241,687 | 22,499,368 | |
| Hudson Pacific Properties, Inc. | 249,715 | 8,240,595 | |
| Independence Realty Trust, Inc. | 102,753 | 1,057,328 | |
| InfraReit, Inc. | 82,809 | 1,862,374 | |
| Investors Real Estate Trust | 202,786 | 1,273,496 | |
| Invitation Homes, Inc. (b) | 138,858 | 3,213,174 | |
| Iron Mountain, Inc. | 427,140 | 16,837,859 | |
| iStar Financial, Inc. (a)(b) | 102,599 | 1,191,174 | |
| JBG SMITH Properties | 143,795 | 4,706,410 | |
| Jernigan Capital, Inc. (b) | 21,201 | 412,147 | |
| Kilroy Realty Corp. | 169,012 | 11,700,701 | |
| Kimco Realty Corp. | 718,168 | 14,090,456 | |
| Kite Realty Group Trust | 145,444 | 2,926,333 | |
| Lamar Advertising Co. Class A (b) | 144,792 | 9,637,356 | |
| LaSalle Hotel Properties (SBI) | 187,702 | 5,326,983 | |
| Lexington Corporate Properties Trust | 345,008 | 3,401,779 | |
| Liberty Property Trust (SBI) | 243,797 | 10,385,752 | |
| Life Storage, Inc. | 80,608 | 5,931,943 | |
| LTC Properties, Inc. | 62,032 | 3,016,616 | |
| Mack-Cali Realty Corp. | 154,097 | 3,527,280 | |
| MedEquities Realty Trust, Inc. | 56,982 | 653,584 | |
| Medical Properties Trust, Inc. | 636,344 | 8,374,287 | |
| Mid-America Apartment Communities, Inc. | 193,973 | 20,650,366 | |
| Monmouth Real Estate Investment Corp. Class A | 107,747 | 1,750,889 | |
| Monogram Residential Trust, Inc. | 273,079 | 3,276,948 | |
| National Health Investors, Inc. | 85,662 | 6,868,379 | |
| National Retail Properties, Inc. (b) | 250,989 | 10,498,870 | |
| National Storage Affiliates Trust | 66,569 | 1,485,820 | |
| New Senior Investment Group, Inc. | 149,321 | 1,378,233 | |
| NexPoint Residential Trust, Inc. | 32,020 | 746,066 | |
| NorthStar Realty Europe Corp. | 77,758 | 966,532 | |
| Omega Healthcare Investors, Inc. (b) | 333,230 | 10,620,040 | |
| One Liberty Properties, Inc. | 42,541 | 1,021,409 | |
| Outfront Media, Inc. | 245,927 | 5,410,394 | |
| Paramount Group, Inc. | 304,533 | 4,805,531 | |
| Parkway, Inc. | 79,308 | 1,820,912 | |
| Pebblebrook Hotel Trust (b) | 119,218 | 4,004,533 | |
| Pennsylvania Real Estate Investment Trust (SBI) | 105,464 | 1,057,804 | |
| Physicians Realty Trust | 319,999 | 5,993,581 | |
| Piedmont Office Realty Trust, Inc. Class A | 250,343 | 5,069,446 | |
| Potlatch Corp. | 63,794 | 3,049,353 | |
| Power (REIT) (a) | 718 | 4,574 | |
| Preferred Apartment Communities, Inc. Class A | 51,100 | 929,509 | |
| Prologis, Inc. | 903,235 | 57,228,970 | |
| PS Business Parks, Inc. | 31,822 | 4,299,470 | |
| Public Storage | 254,518 | 52,262,726 | |
| QTS Realty Trust, Inc. Class A | 76,420 | 4,140,436 | |
| Quality Care Properties, Inc. | 156,460 | 2,146,631 | |
| RAIT Financial Trust | 116,629 | 96,476 | |
| Ramco-Gershenson Properties Trust (SBI) | 128,503 | 1,689,814 | |
| Rayonier, Inc. | 230,983 | 6,700,817 | |
| Realty Income Corp. | 483,151 | 27,810,172 | |
| Regency Centers Corp. | 251,354 | 16,167,089 | |
| Retail Opportunity Investments Corp. | 189,056 | 3,750,871 | |
| Retail Properties America, Inc. | 409,657 | 5,460,728 | |
| Rexford Industrial Realty, Inc. | 121,774 | 3,659,309 | |
| RLJ Lodging Trust | 206,953 | 4,176,312 | |
| Ryman Hospitality Properties, Inc. | 91,162 | 5,416,846 | |
| Sabra Health Care REIT, Inc. (b) | 277,620 | 6,065,997 | |
| Saul Centers, Inc. | 23,905 | 1,448,643 | |
| SBA Communications Corp. Class A (a) | 208,263 | 31,978,784 | |
| Select Income REIT | 130,864 | 3,037,353 | |
| Senior Housing Properties Trust (SBI) | 396,382 | 7,816,653 | |
| Seritage Growth Properties (b) | 43,689 | 2,099,693 | |
| Simon Property Group, Inc. | 532,951 | 83,593,364 | |
| SL Green Realty Corp. | 183,660 | 17,701,151 | |
| Sotherly Hotels, Inc. | 2,721 | 16,489 | |
| Spirit Realty Capital, Inc. | 831,107 | 7,230,631 | |
| Stag Industrial, Inc. | 147,627 | 4,132,080 | |
| Starwood Waypoint Homes | 210,697 | 7,844,249 | |
| Store Capital Corp. | 322,243 | 8,178,527 | |
| Summit Hotel Properties, Inc. | 229,907 | 3,411,820 | |
| Sun Communities, Inc. | 118,372 | 10,690,175 | |
| Sunstone Hotel Investors, Inc. | 363,918 | 5,749,904 | |
| Tanger Factory Outlet Centers, Inc. (b) | 158,086 | 3,699,212 | |
| Taubman Centers, Inc. | 102,172 | 5,337,465 | |
| Terreno Realty Corp. | 83,145 | 3,014,006 | |
| The GEO Group, Inc. | 214,441 | 5,927,149 | |
| The Macerich Co. | 198,583 | 10,479,225 | |
| TIER REIT, Inc. | 108,647 | 2,000,191 | |
| UDR, Inc. | 456,019 | 17,702,658 | |
| UMH Properties, Inc. | 79,886 | 1,263,797 | |
| Universal Health Realty Income Trust (SBI) | 38,916 | 2,946,330 | |
| Urban Edge Properties | 187,255 | 4,709,463 | |
| Urstadt Biddle Properties, Inc. Class A | 92,798 | 1,919,063 | |
| Ventas, Inc. | 605,415 | 41,434,603 | |
| VEREIT, Inc. | 1,684,858 | 14,220,202 | |
| Vornado Realty Trust | 287,590 | 21,422,579 | |
| Washington REIT (SBI) | 128,414 | 4,219,684 | |
| Weingarten Realty Investors (SBI) | 198,541 | 6,361,254 | |
| Welltower, Inc. | 629,721 | 46,108,172 | |
| Weyerhaeuser Co. | 1,290,302 | 42,076,748 | |
| Wheeler REIT, Inc. (b) | 6,770 | 70,950 | |
| Whitestone REIT Class B | 105,336 | 1,320,913 | |
| WP Carey, Inc. | 185,070 | 12,742,070 | |
| WP Glimcher, Inc. | 352,285 | 2,941,580 | |
| Xenia Hotels & Resorts, Inc. | 170,955 | 3,412,262 | |
| 1,741,719,147 | |||
| Real Estate Management & Development - 0.1% | |||
| Alexander & Baldwin, Inc. | 76,237 | 3,308,686 | |
| Altisource Portfolio Solutions SA (a)(b) | 18,423 | 419,676 | |
| CBRE Group, Inc. (a) | 502,108 | 18,116,057 | |
| Consolidated-Tomoka Land Co. (b) | 6,987 | 387,080 | |
| Forestar Group, Inc. (a) | 61,936 | 1,065,299 | |
| FRP Holdings, Inc. (a) | 3,842 | 168,664 | |
| HFF, Inc. | 59,609 | 2,272,891 | |
| Howard Hughes Corp. (a) | 64,397 | 7,556,988 | |
| Jones Lang LaSalle, Inc. | 79,229 | 9,658,807 | |
| Kennedy-Wilson Holdings, Inc. (b) | 159,048 | 3,069,626 | |
| Marcus & Millichap, Inc. (a) | 19,559 | 514,988 | |
| Maui Land & Pineapple, Inc. (a) | 31,310 | 403,899 | |
| RE/MAX Holdings, Inc. | 27,266 | 1,670,043 | |
| Realogy Holdings Corp. | 241,978 | 8,203,054 | |
| Stratus Properties, Inc. | 12,801 | 378,910 | |
| Tejon Ranch Co. (a) | 21,096 | 421,498 | |
| The St. Joe Co. (a)(b) | 125,813 | 2,371,575 | |
| Transcontinental Realty Investors, Inc. (a)(b) | 20,697 | 440,432 | |
| Trinity Place Holdings, Inc. (a)(b) | 7,019 | 48,501 | |
| 60,476,674 | |||
| TOTAL REAL ESTATE | 1,802,195,821 | ||
| TELECOMMUNICATION SERVICES - 1.9% | |||
| Diversified Telecommunication Services - 1.8% | |||
| Alaska Communication Systems Group, Inc. (a) | 135,810 | 298,782 | |
| AT&T, Inc. | 10,533,465 | 394,583,599 | |
| Atlantic Tele-Network, Inc. | 20,159 | 1,221,031 | |
| CenturyLink, Inc. (b) | 939,434 | 18,525,638 | |
| Cincinnati Bell, Inc. (a) | 75,163 | 1,582,181 | |
| Cogent Communications Group, Inc. | 79,491 | 3,704,281 | |
| Consolidated Communications Holdings, Inc. (b) | 126,066 | 2,325,918 | |
| Frontier Communications Corp. (b) | 131,607 | 1,772,746 | |
| General Communications, Inc. Class A (a) | 45,133 | 1,946,586 | |
| Globalstar, Inc. (a)(b) | 552,886 | 1,061,541 | |
| Hawaiian Telcom Holdco, Inc. (a) | 18,678 | 568,185 | |
| IDT Corp. Class B | 44,765 | 658,493 | |
| Intelsat SA (a)(b) | 61,651 | 237,973 | |
| Iridium Communications, Inc. (a)(b) | 166,538 | 1,848,572 | |
| Level 3 Communications, Inc. (a) | 495,033 | 26,944,646 | |
| Lumos Networks Corp. (a) | 41,227 | 741,261 | |
| Ooma, Inc. (a) | 37,459 | 367,098 | |
| ORBCOMM, Inc. (a) | 100,896 | 1,115,910 | |
| Pareteum Corp. (a)(b) | 2,527 | 2,325 | |
| PDVWireless, Inc. (a) | 18,833 | 550,865 | |
| Straight Path Communications, Inc. Class B (a) | 14,258 | 2,545,196 | |
| Verizon Communications, Inc. | 6,992,211 | 335,416,362 | |
| Vonage Holdings Corp. (a) | 343,700 | 2,852,710 | |
| Windstream Holdings, Inc. (b) | 322,467 | 667,507 | |
| Zayo Group Holdings, Inc. (a) | 163,519 | 5,587,444 | |
| 807,126,850 | |||
| Wireless Telecommunication Services - 0.1% | |||
| Airgain, Inc. (b) | 9,732 | 106,857 | |
| Boingo Wireless, Inc. (a) | 75,566 | 1,555,904 | |
| NII Holdings, Inc. (a)(b) | 134,717 | 89,452 | |
| Shenandoah Telecommunications Co. | 75,836 | 2,733,888 | |
| Spok Holdings, Inc. | 43,148 | 722,729 | |
| Sprint Corp. (a)(b) | 1,082,920 | 8,934,090 | |
| T-Mobile U.S., Inc. (a) | 493,731 | 31,949,333 | |
| Telephone & Data Systems, Inc. | 160,373 | 4,700,533 | |
| U.S. Cellular Corp. (a) | 27,310 | 1,056,351 | |
| 51,849,137 | |||
| TOTAL TELECOMMUNICATION SERVICES | 858,975,987 | ||
| UTILITIES - 3.3% | |||
| Electric Utilities - 1.9% | |||
| Allete, Inc. | 89,687 | 6,935,496 | |
| Alliant Energy Corp. | 389,728 | 16,656,975 | |
| American Electric Power Co., Inc. | 834,358 | 61,433,780 | |
| Duke Energy Corp. | 1,199,150 | 104,685,795 | |
| Edison International | 554,634 | 44,470,554 | |
| El Paso Electric Co. | 80,794 | 4,488,107 | |
| Entergy Corp. | 309,998 | 24,542,542 | |
| Eversource Energy | 543,825 | 34,260,975 | |
| Exelon Corp. | 1,590,124 | 60,217,996 | |
| FirstEnergy Corp. | 753,599 | 24,552,255 | |
| Genie Energy Ltd. Class B | 24,074 | 148,055 | |
| Great Plains Energy, Inc. | 385,148 | 11,820,192 | |
| Hawaiian Electric Industries, Inc. | 219,652 | 7,340,770 | |
| IDACORP, Inc. | 95,061 | 8,458,528 | |
| MGE Energy, Inc. | 60,635 | 3,856,386 | |
| NextEra Energy, Inc. | 798,761 | 120,221,518 | |
| OGE Energy Corp. | 341,406 | 12,195,022 | |
| Otter Tail Corp. | 81,371 | 3,401,308 | |
| PG&E Corp. | 871,977 | 61,369,741 | |
| Pinnacle West Capital Corp. | 178,279 | 16,039,762 | |
| PNM Resources, Inc. | 139,589 | 5,918,574 | |
| Portland General Electric Co. | 147,815 | 7,022,691 | |
| PPL Corp. | 1,161,753 | 45,587,188 | |
| Southern Co. | 1,702,371 | 82,156,424 | |
| Spark Energy, Inc. Class A, (b) | 24,582 | 389,625 | |
| Vistra Energy Corp. | 545,395 | 9,653,492 | |
| Westar Energy, Inc. | 246,415 | 12,643,554 | |
| Xcel Energy, Inc. | 847,854 | 41,968,773 | |
| 832,436,078 | |||
| Gas Utilities - 0.2% | |||
| Atmos Energy Corp. | 177,568 | 15,633,087 | |
| Chesapeake Utilities Corp. | 27,662 | 2,197,746 | |
| Delta Natural Gas Co., Inc. | 3,078 | 94,310 | |
| National Fuel Gas Co. | 143,599 | 8,325,870 | |
| New Jersey Resources Corp. | 144,194 | 6,294,068 | |
| Northwest Natural Gas Co. | 56,327 | 3,734,480 | |
| ONE Gas, Inc. | 93,649 | 7,046,151 | |
| RGC Resources, Inc. | 6,537 | 180,094 | |
| South Jersey Industries, Inc. | 141,912 | 5,091,803 | |
| Southwest Gas Holdings, Inc. | 78,682 | 6,256,793 | |
| Spire, Inc. | 80,546 | 6,161,769 | |
| UGI Corp. | 292,531 | 14,453,957 | |
| WGL Holdings, Inc. | 90,512 | 7,626,541 | |
| 83,096,669 | |||
| Independent Power and Renewable Electricity Producers - 0.1% | |||
| Calpine Corp. (a) | 640,548 | 9,416,056 | |
| Dynegy, Inc. (a)(b) | 219,293 | 2,065,740 | |
| NRG Energy, Inc. | 543,641 | 13,542,097 | |
| NRG Yield, Inc.: | |||
| Class A | 44,523 | 809,873 | |
| Class C | 119,926 | 2,218,631 | |
| Ormat Technologies, Inc. | 63,023 | 3,620,041 | |
| Pattern Energy Group, Inc. (b) | 114,646 | 2,879,908 | |
| TerraForm Global, Inc. (a) | 98,063 | 495,218 | |
| Terraform Power, Inc. (a)(b) | 129,794 | 1,811,924 | |
| The AES Corp. | 1,082,881 | 11,955,006 | |
| U.S. Geothermal, Inc. (a) | 27,201 | 105,812 | |
| 48,920,306 | |||
| Multi-Utilities - 1.0% | |||
| Ameren Corp. | 427,084 | 25,620,769 | |
| Avangrid, Inc. | 122,071 | 5,959,506 | |
| Avista Corp. | 128,677 | 6,613,998 | |
| Black Hills Corp. (b) | 88,586 | 6,234,683 | |
| CenterPoint Energy, Inc. | 722,368 | 21,396,540 | |
| CMS Energy Corp. | 453,550 | 22,015,317 | |
| Consolidated Edison, Inc. | 513,131 | 43,241,549 | |
| Dominion Resources, Inc. | 1,074,271 | 84,620,327 | |
| DTE Energy Co. | 298,717 | 33,551,893 | |
| MDU Resources Group, Inc. | 335,493 | 9,071,731 | |
| NiSource, Inc. | 533,707 | 14,340,707 | |
| NorthWestern Energy Corp. | 78,122 | 4,712,319 | |
| Public Service Enterprise Group, Inc. | 861,594 | 40,357,063 | |
| SCANA Corp. | 249,382 | 15,057,685 | |
| Sempra Energy | 426,502 | 50,297,381 | |
| Unitil Corp. | 55,250 | 2,754,765 | |
| Vectren Corp. | 147,188 | 9,657,005 | |
| WEC Energy Group, Inc. | 529,641 | 34,543,186 | |
| 430,046,424 | |||
| Water Utilities - 0.1% | |||
| American States Water Co. | 59,968 | 2,956,422 | |
| American Water Works Co., Inc. | 287,864 | 23,288,198 | |
| Aqua America, Inc. | 319,867 | 10,683,558 | |
| AquaVenture Holdings Ltd. (b) | 15,365 | 232,933 | |
| Artesian Resources Corp. Class A | 60,277 | 2,235,674 | |
| Cadiz, Inc. (a)(b) | 33,186 | 404,869 | |
| California Water Service Group | 83,616 | 3,131,419 | |
| Connecticut Water Service, Inc. | 31,367 | 1,701,346 | |
| Middlesex Water Co. | 39,650 | 1,505,907 | |
| Pure Cycle Corp. (a) | 17,116 | 124,091 | |
| Select Energy Services, Inc. Class A | 15,108 | 213,023 | |
| SJW Corp. | 29,404 | 1,631,922 | |
| York Water Co. | 40,150 | 1,320,935 | |
| 49,430,297 | |||
| TOTAL UTILITIES | 1,443,929,774 | ||
| TOTAL COMMON STOCKS | |||
| (Cost $28,561,652,721) | 43,917,041,710 | ||
| Principal Amount | Value | ||
| U.S. Treasury Obligations - 0.0% | |||
| U.S. Treasury Bills, yield at date of purchase 0.87% to 1.18% 10/12/17 to 6/21/18 (d) | |||
| (Cost $14,942,485) | 15,000,000 | 14,939,958 | |
| Shares | Value | ||
| Money Market Funds - 4.2% | |||
| Fidelity Cash Central Fund, 1.11% (e) | 97,784,424 | $97,803,981 | |
| Fidelity Securities Lending Cash Central Fund 1.11% (e)(f) | 1,746,259,739 | 1,746,434,365 | |
| TOTAL MONEY MARKET FUNDS | |||
| (Cost $1,844,088,941) | 1,844,238,346 | ||
| TOTAL INVESTMENT IN SECURITIES - 103.8% | |||
| (Cost $30,420,684,147) | 45,776,220,014 | ||
| NET OTHER ASSETS (LIABILITIES) - (3.8)% | (1,675,770,670) | ||
| NET ASSETS - 100% | $44,100,449,344 |
| Futures Contracts | |||||
| Number of contracts | Expiration Date | Notional amount | Value | Unrealized Appreciation/(Depreciation) | |
| Purchased | |||||
| Equity Index Contracts | |||||
| CME E-mini S&P 500 Index Contracts (United States) | 1,259 | Sept. 2017 | $155,492,795 | $2,585,847 | $2,585,847 |
| CME E-mini S&P MidCap 400 Index Contracts (United States) | 65 | Sept. 2017 | 11,247,600 | 43,037 | 43,037 |
| ICE Russell 2000 Mini Contracts (United States) | 324 | Sept. 2017 | 22,751,280 | 218,878 | 218,878 |
| TOTAL FUTURES CONTRACTS | $2,847,762 |
The notional amount of futures purchased as a percentage of Net Assets is 0.4%
Legend
(a) Non-income producing
(b) Security or a portion of the security is on loan at period end.
(c) Level 3 instrument
(d) Security or a portion of the security was pledged to cover margin requirements for futures contracts. At period end, the value of securities pledged amounted to $6,588,331.
(e) Affiliated fund that is generally available only to investment companies and other accounts managed by Fidelity Investments. The rate quoted is the annualized seven-day yield of the fund at period end. A complete unaudited listing of the fund's holdings as of its most recent quarter end is available upon request. In addition, each Fidelity Central Fund's financial statements are available on the SEC's website or upon request.
(f) Investment made with cash collateral received from securities on loan.
Affiliated Central Funds
Information regarding fiscal year to date income earned by the Fund from investments in Fidelity Central Funds is as follows:
| Fund | Income earned |
| Fidelity Cash Central Fund | $826,367 |
| Fidelity Securities Lending Cash Central Fund | 5,377,449 |
| Total | $6,203,816 |
Investment Valuation
The following is a summary of the inputs used, as of August 31, 2017, involving the Fund's assets and liabilities carried at fair value. The inputs or methodology used for valuing securities may not be an indication of the risk associated with investing in those securities. For more information on valuation inputs, and their aggregation into the levels used below, please refer to the Investment Valuation section in the accompanying Notes to Financial Statements.
| Valuation Inputs at Reporting Date: | ||||
| Description | Total | Level 1 | Level 2 | Level 3 |
| Investments in Securities: | ||||
| Equities: | ||||
| Consumer Discretionary | $5,472,013,562 | $5,472,013,410 | $152 | $-- |
| Consumer Staples | 3,317,817,054 | 3,317,817,054 | -- | -- |
| Energy | 2,338,835,808 | 2,338,835,808 | -- | -- |
| Financials | 6,444,965,562 | 6,444,965,562 | -- | -- |
| Health Care | 6,198,343,699 | 6,197,681,471 | -- | 662,228 |
| Industrials | 4,674,762,434 | 4,674,762,434 | -- | -- |
| Information Technology | 9,902,597,748 | 9,902,597,748 | -- | -- |
| Materials | 1,462,604,261 | 1,462,604,261 | -- | -- |
| Real Estate | 1,802,195,821 | 1,802,195,821 | -- | -- |
| Telecommunication Services | 858,975,987 | 858,975,987 | -- | -- |
| Utilities | 1,443,929,774 | 1,443,929,774 | -- | -- |
| U.S. Government and Government Agency Obligations | 14,939,958 | -- | 14,939,958 | -- |
| Money Market Funds | 1,844,238,346 | 1,844,238,346 | -- | -- |
| Total Investments in Securities: | $45,776,220,014 | $45,760,617,676 | $14,940,110 | $662,228 |
| Derivative Instruments: | ||||
| Assets | ||||
| Futures Contracts | $2,847,762 | $2,847,762 | $-- | $-- |
| Total Assets | $2,847,762 | $2,847,762 | $-- | $-- |
| Total Derivative Instruments: | $2,847,762 | $2,847,762 | $-- | $-- |
Value of Derivative Instruments
The following table is a summary of the Fund's value of derivative instruments by primary risk exposure as of August 31, 2017. For additional information on derivative instruments, please refer to the Derivative Instruments section in the accompanying Notes to Financial Statements.
| Primary Risk Exposure / Derivative Type | Value | |
| Asset | Liability | |
| Equity Risk | ||
| Futures Contracts(a) | $2,847,762 | $0 |
| Total Equity Risk | 2,847,762 | 0 |
| Total Value of Derivatives | $2,847,762 | $0 |
(a) Reflects gross cumulative appreciation (depreciation) on futures contracts as presented in the Schedule of Investments. In the Statement of Assets and Liabilities, the period end daily variation margin is included in receivable or payable for daily variation margin on futures contracts, and the net cumulative appreciation (depreciation) is included in net unrealized appreciation (depreciation).
See accompanying notes which are an integral part of the financial statements.
Financial Statements
Statement of Assets and Liabilities
| August 31, 2017 (Unaudited) | ||
| Assets | ||
| Investment in securities, at value (including securities loaned of $1,719,278,042) — See accompanying schedule: Unaffiliated issuers (cost $28,576,595,206) | $43,931,981,668 | |
| Fidelity Central Funds (cost $1,844,088,941) | 1,844,238,346 | |
| Total Investment in Securities (cost $30,420,684,147) | $45,776,220,014 | |
| Receivable for investments sold | 124,426,439 | |
| Receivable for fund shares sold | 31,442,111 | |
| Dividends receivable | 86,493,059 | |
| Distributions receivable from Fidelity Central Funds | 1,090,571 | |
| Receivable for daily variation margin on futures contracts | 1,147,585 | |
| Other receivables | 676,982 | |
| Total assets | 46,021,496,761 | |
| Liabilities | ||
| Payable to custodian bank | $14,627 | |
| Payable for investments purchased | 147,632,521 | |
| Payable for fund shares redeemed | 25,476,811 | |
| Accrued management fee | 545,915 | |
| Other affiliated payables | 493,026 | |
| Other payables and accrued expenses | 671,569 | |
| Collateral on securities loaned | 1,746,212,948 | |
| Total liabilities | 1,921,047,417 | |
| Net Assets | $44,100,449,344 | |
| Net Assets consist of: | ||
| Paid in capital | $28,256,968,018 | |
| Undistributed net investment income | 417,925,088 | |
| Accumulated undistributed net realized gain (loss) on investments and foreign currency transactions | 67,172,247 | |
| Net unrealized appreciation (depreciation) on investments and assets and liabilities in foreign currencies | 15,358,383,991 | |
| Net Assets | $44,100,449,344 | |
| Investor Class: | ||
| Net Asset Value, offering price and redemption price per share ($751,125,831 ÷ 10,513,531 shares) | $71.44 | |
| Premium Class: | ||
| Net Asset Value, offering price and redemption price per share ($24,990,875,649 ÷ 349,738,361 shares) | $71.46 | |
| Institutional Class: | ||
| Net Asset Value, offering price and redemption price per share ($2,618,871,459 ÷ 36,654,262 shares) | $71.45 | |
| Institutional Premium Class: | ||
| Net Asset Value, offering price and redemption price per share ($5,083,793,066 ÷ 71,156,396 shares) | $71.45 | |
| Class F: | ||
| Net Asset Value, offering price and redemption price per share ($10,655,783,339 ÷ 149,103,358 shares) | $71.47 |
See accompanying notes which are an integral part of the financial statements.
Statement of Operations
| Six months ended August 31, 2017 (Unaudited) | ||
| Investment Income | ||
| Dividends | $419,790,336 | |
| Interest | 56,514 | |
| Income from Fidelity Central Funds (including $5,377,449 from security lending) | 6,203,816 | |
| Total income | 426,050,666 | |
| Expenses | ||
| Management fee | $3,165,702 | |
| Transfer agent fees | 3,936,066 | |
| Independent trustees' fees and expenses | 84,553 | |
| Legal | 9,817 | |
| Miscellaneous | 65,808 | |
| Total expenses before reductions | 7,261,946 | |
| Expense reductions | (7,598) | 7,254,348 |
| Net investment income (loss) | 418,796,318 | |
| Realized and Unrealized Gain (Loss) | ||
| Net realized gain (loss) on: | ||
| Investment securities: | ||
| Unaffiliated issuers | 208,983,651 | |
| Fidelity Central Funds | 11,823 | |
| Foreign currency transactions | 156 | |
| Futures contracts | 16,055,775 | |
| Total net realized gain (loss) | 225,051,405 | |
| Change in net unrealized appreciation (depreciation) on: | ||
| Investment securities: | ||
| Unaffiliated issuers | 1,526,646,005 | |
| Fidelity Central Funds | (149,405) | |
| Assets and liabilities in foreign currencies | 362 | |
| Futures contracts | (6,800,984) | |
| Total change in net unrealized appreciation (depreciation) | 1,519,695,978 | |
| Net gain (loss) | 1,744,747,383 | |
| Net increase (decrease) in net assets resulting from operations | $2,163,543,701 |
See accompanying notes which are an integral part of the financial statements.
Statement of Changes in Net Assets
| Six months ended August 31, 2017 (Unaudited) | Year ended February 28, 2017 | |
| Increase (Decrease) in Net Assets | ||
| Operations | ||
| Net investment income (loss) | $418,796,318 | $693,855,123 |
| Net realized gain (loss) | 225,051,405 | 214,952,729 |
| Change in net unrealized appreciation (depreciation) | 1,519,695,978 | 7,091,127,790 |
| Net increase (decrease) in net assets resulting from operations | 2,163,543,701 | 7,999,935,642 |
| Distributions to shareholders from net investment income | (114,777,247) | (649,892,693) |
| Distributions to shareholders from net realized gain | (62,350,888) | (218,645,122) |
| Total distributions | (177,128,135) | (868,537,815) |
| Share transactions - net increase (decrease) | 2,023,366,572 | 3,500,265,848 |
| Redemption fees | – | 257,287 |
| Total increase (decrease) in net assets | 4,009,782,138 | 10,631,920,962 |
| Net Assets | ||
| Beginning of period | 40,090,667,206 | 29,458,746,244 |
| End of period | $44,100,449,344 | $40,090,667,206 |
| Other Information | ||
| Undistributed net investment income end of period | $417,925,088 | $113,906,017 |
See accompanying notes which are an integral part of the financial statements.
Financial Highlights — Fidelity Total Market Index Fund Investor Class
| Six months ended (Unaudited) August 31, | Years ended February 28, | |||||
| 2017 | 2017 | 2016A | 2015 | 2014 | 2013 | |
| Selected Per–Share Data | ||||||
| Net asset value, beginning of period | $68.20 | $55.32 | $61.58 | $54.91 | $44.05 | $39.55 |
| Income from Investment Operations | ||||||
| Net investment income (loss)B | .67 | 1.20 | 1.13 | 1.10 | .92 | .87 |
| Net realized and unrealized gain (loss) | 2.86 | 13.20 | (5.97) | 6.51 | 10.74 | 4.40 |
| Total from investment operations | 3.53 | 14.40 | (4.84) | 7.61 | 11.66 | 5.27 |
| Distributions from net investment income | (.18) | (1.13) | (1.11) | (.94) | (.80) | (.77) |
| Distributions from net realized gain | (.10) | (.39) | (.31) | – | – | – |
| Total distributions | (.29)C | (1.52) | (1.42) | (.94) | (.80) | (.77) |
| Redemption fees added to paid in capitalB | – | –D | –D | –D | –D | –D |
| Net asset value, end of period | $71.44 | $68.20 | $55.32 | $61.58 | $54.91 | $44.05 |
| Total ReturnE,F | 5.19% | 26.22% | (7.96)% | 13.94% | 26.62% | 13.50% |
| Ratios to Average Net AssetsG,H | ||||||
| Expenses before reductions | .09%I | .09% | .10% | .10% | .10% | .10% |
| Expenses net of fee waivers, if any | .09%I | .09% | .10% | .10% | .10% | .10% |
| Expenses net of all reductions | .09%I | .09% | .10% | .10% | .10% | .10% |
| Net investment income (loss) | 1.93%I | 1.96% | 1.90% | 1.91% | 1.85% | 2.15% |
| Supplemental Data | ||||||
| Net assets, end of period (000 omitted) | $751,126 | $736,989 | $1,932,568 | $1,943,259 | $1,694,212 | $1,305,435 |
| Portfolio turnover rateJ | 3%I | 4% | 3% | 2% | 2% | 3% |
A For the year ended February 29.
B Calculated based on average shares outstanding during the period.
C Total distributions of $.29 per share is comprised of distributions from net investment income of $.181 and distributions from net realized gain of $.104 per share.
D Amount represents less than $.005 per share.
E Total returns for periods of less than one year are not annualized.
F Total returns would have been lower if certain expenses had not been reduced during the applicable periods shown.
G Fees and expenses of any underlying Fidelity Central Funds are not included in the Fund's expense ratio. The Fund indirectly bears its proportionate share of the expenses of any underlying Fidelity Central Funds.
H Expense ratios reflect operating expenses of the class. Expenses before reductions do not reflect amounts reimbursed by the investment adviser or reductions from expense offset arrangements and do not represent the amount paid by the class during periods when reimbursements or reductions occur. Expenses net of fee waivers reflect expenses after reimbursement by the investment adviser but prior to reductions from expense offset arrangements. Expenses net of all reductions represent the net expenses paid by the class.
I Annualized
J Amount does not include the portfolio activity of any underlying Fidelity Central Funds.
See accompanying notes which are an integral part of the financial statements.
Financial Highlights — Fidelity Total Market Index Fund Premium Class
| Six months ended (Unaudited) August 31, | Years ended February 28, | |||||
| 2017 | 2017 | 2016A | 2015 | 2014 | 2013 | |
| Selected Per–Share Data | ||||||
| Net asset value, beginning of period | $68.20 | $55.32 | $61.59 | $54.91 | $44.06 | $39.56 |
| Income from Investment Operations | ||||||
| Net investment income (loss)B | .69 | 1.25 | 1.16 | 1.13 | .94 | .89 |
| Net realized and unrealized gain (loss) | 2.86 | 13.18 | (5.98) | 6.52 | 10.73 | 4.39 |
| Total from investment operations | 3.55 | 14.43 | (4.82) | 7.65 | 11.67 | 5.28 |
| Distributions from net investment income | (.19) | (1.16) | (1.14) | (.97) | (.82) | (.78) |
| Distributions from net realized gain | (.10) | (.39) | (.31) | – | – | – |
| Total distributions | (.29) | (1.55) | (1.45) | (.97) | (.82) | (.78) |
| Redemption fees added to paid in capitalB | – | –C | –C | –C | –C | –C |
| Net asset value, end of period | $71.46 | $68.20 | $55.32 | $61.59 | $54.91 | $44.06 |
| Total ReturnD,E | 5.24% | 26.28% | (7.92)% | 14.02% | 26.65% | 13.53% |
| Ratios to Average Net AssetsF,G | ||||||
| Expenses before reductions | .04%H | .05% | .07% | .07% | .07% | .07% |
| Expenses net of fee waivers, if any | .04%H | .05% | .05% | .05% | .06% | .07% |
| Expenses net of all reductions | .04%H | .05% | .05% | .05% | .06% | .07% |
| Net investment income (loss) | 1.97%H | 2.00% | 1.95% | 1.96% | 1.89% | 2.18% |
| Supplemental Data | ||||||
| Net assets, end of period (000 omitted) | $24,990,876 | $23,288,507 | $18,866,595 | $18,860,117 | $14,943,835 | $10,262,592 |
| Portfolio turnover rateI | 3%H | 4% | 3% | 2% | 2% | 3% |
A For the year ended February 29.
B Calculated based on average shares outstanding during the period.
C Amount represents less than $.005 per share.
D Total returns for periods of less than one year are not annualized.
E Total returns would have been lower if certain expenses had not been reduced during the applicable periods shown.
F Fees and expenses of any underlying Fidelity Central Funds are not included in the Fund's expense ratio. The Fund indirectly bears its proportionate share of the expenses of any underlying Fidelity Central Funds.
G Expense ratios reflect operating expenses of the class. Expenses before reductions do not reflect amounts reimbursed by the investment adviser or reductions from expense offset arrangements and do not represent the amount paid by the class during periods when reimbursements or reductions occur. Expenses net of fee waivers reflect expenses after reimbursement by the investment adviser but prior to reductions from expense offset arrangements. Expenses net of all reductions represent the net expenses paid by the class.
H Annualized
I Amount does not include the portfolio activity of any underlying Fidelity Central Funds.
See accompanying notes which are an integral part of the financial statements.
Financial Highlights — Fidelity Total Market Index Fund Institutional Class
| Six months ended (Unaudited) August 31, | Years ended February 28, | |||||
| 2017 | 2017 | 2016A | 2015 | 2014 | 2013 | |
| Selected Per–Share Data | ||||||
| Net asset value, beginning of period | $68.19 | $55.31 | $61.58 | $54.91 | $44.05 | $39.55 |
| Income from Investment Operations | ||||||
| Net investment income (loss)B | .69 | 1.26 | 1.17 | 1.13 | .94 | .89 |
| Net realized and unrealized gain (loss) | 2.87 | 13.18 | (5.98) | 6.52 | 10.75 | 4.40 |
| Total from investment operations | 3.56 | 14.44 | (4.81) | 7.65 | 11.69 | 5.29 |
| Distributions from net investment income | (.19) | (1.16) | (1.15) | (.98) | (.83) | (.79) |
| Distributions from net realized gain | (.10) | (.39) | (.31) | – | – | – |
| Total distributions | (.30)C | (1.56)D | (1.46) | (.98) | (.83) | (.79) |
| Redemption fees added to paid in capitalB | – | –E | –E | –E | –E | –E |
| Net asset value, end of period | $71.45 | $68.19 | $55.31 | $61.58 | $54.91 | $44.05 |
| Total ReturnF,G | 5.24% | 26.30% | (7.92)% | 14.01% | 26.69% | 13.55% |
| Ratios to Average Net AssetsH,I | ||||||
| Expenses before reductions | .03%J | .05% | .07% | .07% | .07% | .07% |
| Expenses net of fee waivers, if any | .03%J | .04% | .04% | .04% | .05% | .06% |
| Expenses net of all reductions | .03%J | .04% | .04% | .04% | .05% | .06% |
| Net investment income (loss) | 1.98%J | 2.01% | 1.96% | 1.97% | 1.90% | 2.19% |
| Supplemental Data | ||||||
| Net assets, end of period (000 omitted) | $2,618,871 | $2,345,441 | $1,199,719 | $1,307,281 | $1,254,047 | $876,155 |
| Portfolio turnover rateK | 3%J | 4% | 3% | 2% | 2% | 3% |
A For the year ended February 29.
B Calculated based on average shares outstanding during the period.
C Total distributions of $.30 per share is comprised of distributions from net investment income of $.191 and distributions from net realized gain of $.104 per share.
D Total distributions of $1.56 per share is comprised of distributions from net investment income of $1.162 and distributions from net realized gain of $.393 per share.
E Amount represents less than $.005 per share.
F Total returns for periods of less than one year are not annualized.
G Total returns would have been lower if certain expenses had not been reduced during the applicable periods shown.
H Fees and expenses of any underlying Fidelity Central Funds are not included in the Fund's expense ratio. The Fund indirectly bears its proportionate share of the expenses of any underlying Fidelity Central Funds.
I Expense ratios reflect operating expenses of the class. Expenses before reductions do not reflect amounts reimbursed by the investment adviser or reductions from expense offset arrangements and do not represent the amount paid by the class during periods when reimbursements or reductions occur. Expenses net of fee waivers reflect expenses after reimbursement by the investment adviser but prior to reductions from expense offset arrangements. Expenses net of all reductions represent the net expenses paid by the class.
J Annualized
K Amount does not include the portfolio activity of any underlying Fidelity Central Funds.
See accompanying notes which are an integral part of the financial statements.
Financial Highlights — Fidelity Total Market Index Fund Institutional Premium Class
| Six months ended (Unaudited) August 31, | Years ended February 28, | |||||
| 2017 | 2017 | 2016A | 2015 | 2014 | 2013 | |
| Selected Per–Share Data | ||||||
| Net asset value, beginning of period | $68.19 | $55.31 | $61.58 | $54.90 | $44.05 | $39.55 |
| Income from Investment Operations | ||||||
| Net investment income (loss)B | .70 | 1.28 | 1.17 | 1.14 | .95 | .90 |
| Net realized and unrealized gain (loss) | 2.86 | 13.17 | (5.98) | 6.52 | 10.73 | 4.39 |
| Total from investment operations | 3.56 | 14.45 | (4.81) | 7.66 | 11.68 | 5.29 |
| Distributions from net investment income | (.20) | (1.17) | (1.15) | (.98) | (.83) | (.79) |
| Distributions from net realized gain | (.10) | (.39) | (.31) | – | – | – |
| Total distributions | (.30) | (1.57)C | (1.46) | (.98) | (.83) | (.79) |
| Redemption fees added to paid in capitalB | – | –D | –D | –D | –D | –D |
| Net asset value, end of period | $71.45 | $68.19 | $55.31 | $61.58 | $54.90 | $44.05 |
| Total ReturnE,F | 5.25% | 26.32% | (7.91)% | 14.04% | 26.67% | 13.57% |
| Ratios to Average Net AssetsG,H | ||||||
| Expenses before reductions | .02%I | .02% | .05% | .04% | .06% | .06% |
| Expenses net of fee waivers, if any | .02%I | .02% | .04% | .04% | .05% | .05% |
| Expenses net of all reductions | .02%I | .02% | .04% | .04% | .05% | .05% |
| Net investment income (loss) | 2.00%I | 2.02% | 1.97% | 1.97% | 1.90% | 2.20% |
| Supplemental Data | ||||||
| Net assets, end of period (000 omitted) | $5,083,793 | $4,684,669 | $800,304 | $1,022,585 | $740,877 | $546,329 |
| Portfolio turnover rateJ | 3%I | 4% | 3% | 2% | 2% | 3% |
A For the year ended February 29.
B Calculated based on average shares outstanding during the period.
C Total distributions of $1.57. per share is comprised of distributions from net investment income of $1.173 and distributions from net realized gain of $.393 per share.
D Amount represents less than $.005 per share.
E Total returns for periods of less than one year are not annualized.
F Total returns would have been lower if certain expenses had not been reduced during the applicable periods shown.
G Fees and expenses of any underlying Fidelity Central Funds are not included in the Fund's expense ratio. The Fund indirectly bears its proportionate share of the expenses of any underlying Fidelity Central Funds.
H Expense ratios reflect operating expenses of the class. Expenses before reductions do not reflect amounts reimbursed by the investment adviser or reductions from expense offset arrangements and do not represent the amount paid by the class during periods when reimbursements or reductions occur. Expenses net of fee waivers reflect expenses after reimbursement by the investment adviser but prior to reductions from expense offset arrangements. Expenses net of all reductions represent the net expenses paid by the class.
I Annualized
J Amount does not include the portfolio activity of any underlying Fidelity Central Funds.
See accompanying notes which are an integral part of the financial statements.
Financial Highlights — Fidelity Total Market Index Fund Class F
| Six months ended (Unaudited) August 31, | Years ended February 28, | |||||
| 2017 | 2017 | 2016A | 2015 | 2014 | 2013 | |
| Selected Per–Share Data | ||||||
| Net asset value, beginning of period | $68.21 | $55.32 | $61.59 | $54.92 | $44.06 | $39.56 |
| Income from Investment Operations | ||||||
| Net investment income (loss)B | .70 | 1.26 | 1.17 | 1.14 | .95 | .90 |
| Net realized and unrealized gain (loss) | 2.86 | 13.20 | (5.98) | 6.51 | 10.74 | 4.39 |
| Total from investment operations | 3.56 | 14.46 | (4.81) | 7.65 | 11.69 | 5.29 |
| Distributions from net investment income | (.20) | (1.17) | (1.15) | (.98) | (.83) | (.79) |
| Distributions from net realized gain | (.10) | (.39) | (.31) | – | – | – |
| Total distributions | (.30) | (1.57)C | (1.46) | (.98) | (.83) | (.79) |
| Redemption fees added to paid in capitalB | – | –D | –D | –D | –D | –D |
| Net asset value, end of period | $71.47 | $68.21 | $55.32 | $61.59 | $54.92 | $44.06 |
| Total ReturnE,F | 5.24% | 26.33% | (7.91)% | 14.01% | 26.69% | 13.55% |
| Ratios to Average Net AssetsG,H | ||||||
| Expenses before reductions | .02%I | .02% | .04% | .04% | .05% | .05% |
| Expenses net of fee waivers, if any | .02%I | .02% | .04% | .04% | .05% | .05% |
| Expenses net of all reductions | .02%I | .02% | .04% | .04% | .05% | .05% |
| Net investment income (loss) | 2.00%I | 2.02% | 1.97% | 1.97% | 1.90% | 2.20% |
| Supplemental Data | ||||||
| Net assets, end of period (000 omitted) | $10,655,783 | $9,035,061 | $6,659,560 | $6,368,808 | $5,088,489 | $2,833,198 |
| Portfolio turnover rateJ | 3%I | 4% | 3% | 2% | 2% | 3% |
A For the year ended February 29.
B Calculated based on average shares outstanding during the period.
C Total distributions of $1.57 per share is comprised of distributions from net investment income of $1.173 and distributions from net realized gain of $.393 per share.
D Amount represents less than $.005 per share.
E Total returns for periods of less than one year are not annualized.
F Total returns would have been lower if certain expenses had not been reduced during the applicable periods shown.
G Fees and expenses of any underlying Fidelity Central Funds are not included in the Fund's expense ratio. The Fund indirectly bears its proportionate share of the expenses of any underlying Fidelity Central Funds.
H Expense ratios reflect operating expenses of the class. Expenses before reductions do not reflect amounts reimbursed by the investment adviser or reductions from expense offset arrangements and do not represent the amount paid by the class during periods when reimbursements or reductions occur. Expenses net of fee waivers reflect expenses after reimbursement by the investment adviser but prior to reductions from expense offset arrangements. Expenses net of all reductions represent the net expenses paid by the class.
I Annualized
J Amount does not include the portfolio activity of any underlying Fidelity Central Funds.
See accompanying notes which are an integral part of the financial statements.
Notes to Financial Statements (Unaudited)
For the period ended August 31, 2017
1. Organization.
Fidelity Total Market Index Fund (the Fund) is a fund of Fidelity Concord Street Trust (the Trust) and is authorized to issue an unlimited number of shares. The Trust is registered under the Investment Company Act of 1940, as amended (the 1940 Act), as an open-end management investment company organized as a Massachusetts business trust. The Fund offers Investor Class, Premium Class, Institutional Class, Institutional Premium Class and Class F shares, each of which has equal rights as to assets and voting privileges. Each class has exclusive voting rights with respect to matters that affect that class. The Fund offers conversion privileges between share classes to eligible shareholders. Class F shares of the Fund are only available for purchase by mutual funds for which Fidelity Management & Research Company (FMR) or an affiliate serves as investment manager.
2. Investments in Fidelity Central Funds.
The Fund invests in Fidelity Central Funds, which are open-end investment companies generally available only to other investment companies and accounts managed by the investment adviser and its affiliates. The Fund's Schedule of Investments lists each of the Fidelity Central Funds held as of period end, if any, as an investment of the Fund, but does not include the underlying holdings of each Fidelity Central Fund. As an Investing Fund, the Fund indirectly bears its proportionate share of the expenses of the underlying Fidelity Central Funds.
The Money Market Central Funds seek preservation of capital and current income and are managed by Fidelity Investments Money Management, Inc. (FIMM), an affiliate of the investment adviser. Annualized expenses of the Money Market Central Funds as of their most recent shareholder report date are less than .005%.
A complete unaudited list of holdings for each Fidelity Central Fund is available upon request or at the Securities and Exchange Commission (the SEC) website at www.sec.gov. In addition, the financial statements of the Fidelity Central Funds are available on the SEC website or upon request.
3. Significant Accounting Policies.
The Fund is an investment company and applies the accounting and reporting guidance of the Financial Accounting Standards Board (FASB) Accounting Standards Codification Topic 946 Financial Services – Investments Companies. The financial statements have been prepared in conformity with accounting principles generally accepted in the United States of America (GAAP), which require management to make certain estimates and assumptions at the date of the financial statements. Actual results could differ from those estimates. Subsequent events, if any, through the date that the financial statements were issued have been evaluated in the preparation of the financial statements. The following summarizes the significant accounting policies of the Fund:
Investment Valuation. Investments are valued as of 4:00 p.m. Eastern time on the last calendar day of the period. The Board of Trustees (the Board) has delegated the day to day responsibility for the valuation of the Fund's investments to the Fair Value Committee (the Committee) established by the Fund's investment adviser. In accordance with valuation policies and procedures approved by the Board, the Fund attempts to obtain prices from one or more third party pricing vendors or brokers to value its investments. When current market prices, quotations or currency exchange rates are not readily available or reliable, investments will be fair valued in good faith by the Committee, in accordance with procedures adopted by the Board. Factors used in determining fair value vary by investment type and may include market or investment specific events, changes in interest rates and credit quality. The frequency with which these procedures are used cannot be predicted and they may be utilized to a significant extent. The Committee oversees the Fund's valuation policies and procedures and reports to the Board on the Committee's activities and fair value determinations. The Board monitors the appropriateness of the procedures used in valuing the Fund's investments and ratifies the fair value determinations of the Committee.
The Fund categorizes the inputs to valuation techniques used to value its investments into a disclosure hierarchy consisting of three levels as shown below:
- Level 1 – quoted prices in active markets for identical investments
- Level 2 – other significant observable inputs (including quoted prices for similar investments, interest rates, prepayment speeds, etc.)
- Level 3 – unobservable inputs (including the Fund's own assumptions based on the best information available)
Valuation techniques used to value the Fund's investments by major category are as follows:
Equity securities, including restricted securities, for which market quotations are readily available, are valued at the last reported sale price or official closing price as reported by a third party pricing vendor on the primary market or exchange on which they are traded and are categorized as Level 1 in the hierarchy. In the event there were no sales during the day or closing prices are not available, securities are valued at the last quoted bid price or may be valued using the last available price and are generally categorized as Level 2 in the hierarchy. For foreign equity securities, when market or security specific events arise, comparisons to the valuation of American Depositary Receipts (ADRs), futures contracts, Exchange-Traded Funds (ETFs) and certain indexes as well as quoted prices for similar securities may be used and would be categorized as Level 2 in the hierarchy. Utilizing these techniques may result in transfers between Level 1 and Level 2. For equity securities, including restricted securities, where observable inputs are limited, assumptions about market activity and risk are used and these securities may be categorized as Level 3 in the hierarchy.
Debt securities, including restricted securities, are valued based on evaluated prices received from third party pricing vendors or from brokers who make markets in such securities. U.S. government and government agency obligations are valued by pricing vendors who utilize matrix pricing which considers yield or price of bonds of comparable quality, coupon, maturity and type or by broker-supplied prices. When independent prices are unavailable or unreliable, debt securities may be valued utilizing pricing methodologies which consider similar factors that would be used by third party pricing vendors. Debt securities are generally categorized as Level 2 in the hierarchy but may be Level 3 depending on the circumstances.
Futures contracts are valued at the settlement price established each day by the board of trade or exchange on which they are traded and are categorized as Level 1 in the hierarchy. Investments in open-end mutual funds, including the Fidelity Central Funds, are valued at their closing net asset value (NAV) each business day and are categorized as Level 1 in the hierarchy.
Changes in valuation techniques may result in transfers in or out of an assigned level within the disclosure hierarchy. The aggregate value of investments by input level as of August 31, 2017 is included at the end of the Fund's Schedule of Investments.
Foreign Currency. Foreign-denominated assets, including investment securities, and liabilities are translated into U.S. dollars at the exchange rates at period end. Purchases and sales of investment securities, income and dividends received and expenses denominated in foreign currencies are translated into U.S. dollars at the exchange rate in effect on the transaction date.
The effects of exchange rate fluctuations on investments are included with the net realized and unrealized gain (loss) on investment securities. Other foreign currency transactions resulting in realized and unrealized gain (loss) are disclosed separately.
Realized gains and losses on foreign currency transactions arise from the disposition of foreign currency, realized changes in the value of foreign currency between the trade and settlement dates on security transactions, and the difference between the amounts of dividends, interest and foreign withholding taxes recorded on transaction date and the U.S. dollar equivalent of the amounts actually received or paid. Unrealized gains and losses on assets and liabilities in foreign currencies arise from changes in the value of foreign currency, and from assets and liabilities denominated in foreign currencies, other than investments, which are held at period end.
Investment Transactions and Income. For financial reporting purposes, the Fund's investment holdings and NAV include trades executed through the end of the last business day of the period. The NAV per share for processing shareholder transactions is calculated as of the close of business of the New York Stock Exchange (NYSE), normally 4:00 p.m. Eastern time and includes trades executed through the end of the prior business day. Gains and losses on securities sold are determined on the basis of identified cost and may include proceeds received from litigation. Dividend income is recorded on the ex-dividend date, except for certain dividends from foreign securities where the ex-dividend date may have passed, which are recorded as soon as the Fund is informed of the ex-dividend date. Non-cash dividends included in dividend income, if any, are recorded at the fair market value of the securities received. Income and capital gain distributions from Fidelity Central Funds, if any, are recorded on the ex-dividend date. Interest income is accrued as earned and includes coupon interest and amortization of premium and accretion of discount on debt securities as applicable. Investment income is recorded net of foreign taxes withheld where recovery of such taxes is uncertain.
Class Allocations and Expenses. Investment income, realized and unrealized capital gains and losses, common expenses of the Fund, and certain fund-level expense reductions, if any, are allocated daily on a pro-rata basis to each class based on the relative net assets of each class to the total net assets of the Fund. Each class differs with respect to transfer agent fees incurred. Certain expense reductions may also differ by class. For the reporting period, the allocated portion of income and expenses to each class as a percent of its average net assets may vary due to the timing of recording these transactions in relation to fluctuating net assets of the classes. Expenses directly attributable to a fund are charged to that fund. Expenses attributable to more than one fund are allocated among the respective funds on the basis of relative net assets or other appropriate methods. Expense estimates are accrued in the period to which they relate and adjustments are made when actual amounts are known.
Deferred Trustee Compensation. Under a Deferred Compensation Plan (the Plan), independent Trustees may elect to defer receipt of a portion of their annual compensation. Deferred amounts are invested in a cross-section of Fidelity funds, are marked-to-market and remain in the Fund until distributed in accordance with the Plan. The investment of deferred amounts and the offsetting payable to the Trustees are included in the accompanying Statement of Assets and Liabilities.
Income Tax Information and Distributions to Shareholders. Each year, the Fund intends to qualify as a regulated investment company under Subchapter M of the Internal Revenue Code, including distributing substantially all of its taxable income and realized gains. As a result, no provision for U.S. Federal income taxes is required. The Fund files a U.S. federal tax return, in addition to state and local tax returns as required. The Fund's federal income tax returns are subject to examination by the Internal Revenue Service (IRS) for a period of three fiscal years after they are filed. State and local tax returns may be subject to examination for an additional fiscal year depending on the jurisdiction. Foreign taxes are provided for based on the Fund's understanding of the tax rules and rates that exist in the foreign markets in which it invests.
Distributions are declared and recorded on the ex-dividend date. Income dividends and capital gain distributions are declared separately for each class. Income and capital gain distributions are determined in accordance with income tax regulations, which may differ from GAAP.
Capital accounts within the financial statements are adjusted for permanent book-tax differences. These adjustments have no impact on net assets or the results of operations. Capital accounts are not adjusted for temporary book-tax differences which will reverse in a subsequent period.
Book-tax differences are primarily due to futures contracts, foreign currency transactions, passive foreign investment companies (PFIC), market discount, partnerships, deferred trustees compensation and losses deferred due to wash sales.
As of period end, the cost and unrealized appreciation (depreciation) in securities, and derivatives if applicable, for federal income tax purposes were as follows:
| Gross unrealized appreciation | $17,225,625,626 |
| Gross unrealized depreciation | (2,019,235,140) |
| Net unrealized appreciation (depreciation) | $15,206,390,486 |
| Tax cost | $30,572,677,290 |
4. Derivative Instruments.
Risk Exposures and the Use of Derivative Instruments. The Fund's investment objective allows the Fund to enter into various types of derivative contracts, including futures contracts. Derivatives are investments whose value is primarily derived from underlying assets, indices or reference rates and may be transacted on an exchange or over-the-counter (OTC). Derivatives may involve a future commitment to buy or sell a specified asset based on specified terms, to exchange future cash flows at periodic intervals based on a notional principal amount, or for one party to make one or more payments upon the occurrence of specified events in exchange for periodic payments from the other party.
The Fund used derivatives to increase returns and to manage exposure to certain risks as defined below. The success of any strategy involving derivatives depends on analysis of numerous economic factors, and if the strategies for investment do not work as intended, the Fund may not achieve its objectives.
The Fund's use of derivatives increased or decreased its exposure to the following risk:
| Equity Risk | Equity risk relates to the fluctuations in the value of financial instruments as a result of changes in market prices (other than those arising from interest rate risk or foreign exchange risk), whether caused by factors specific to an individual investment, its issuer, or all factors affecting all instruments traded in a market or market segment. |
The Fund is also exposed to additional risks from investing in derivatives, such as liquidity risk and counterparty credit risk. Liquidity risk is the risk that the Fund will be unable to close out the derivative in the open market in a timely manner. Counterparty credit risk is the risk that the counterparty will not be able to fulfill its obligation to the Fund. Counterparty credit risk related to exchange-traded futures contracts may be mitigated by the protection provided by the exchange on which they trade.
Investing in derivatives may involve greater risks than investing in the underlying assets directly and, to varying degrees, may involve risk of loss in excess of any initial investment and collateral received and amounts recognized in the Statement of Assets and Liabilities. In addition, there may be the risk that the change in value of the derivative contract does not correspond to the change in value of the underlying instrument.
A summary of the value of derivatives by primary risk exposure as of period end is included at the end of the Schedule of Investments.
Futures Contracts. A futures contract is an agreement between two parties to buy or sell a specified underlying instrument for a fixed price at a specified future date. The Fund used futures contracts to manage its exposure to the stock market.
Upon entering into a futures contract, a fund is required to deposit either cash or securities (initial margin) with a clearing broker in an amount equal to a certain percentage of the face value of the contract. Futures contracts are marked-to-market daily and subsequent daily payments (variation margin) are made or received by a fund depending on the daily fluctuations in the value of the futures contracts and are recorded as unrealized appreciation or (depreciation). This receivable and/or payable, if any, is included in daily variation margin on futures contracts in the Statement of Assets and Liabilities. Realized gain or (loss) is recorded upon the expiration or closing of a futures contract.
Any open futures contracts at period end are presented in the Schedule of Investments under the caption "Futures Contracts". The underlying face amount at value reflects each contract's exposure to the underlying instrument or index at period end and is representative of volume of activity during the period. Securities deposited to meet initial margin requirements are identified in the Schedule of Investments.
During the period the Fund recognized net realized gain (loss) of $16,055,775 and a change in net unrealized appreciation (depreciation) of $(6,800,984) related to its investment in futures contracts. These amounts are included in the Statement of Operations.
5. Purchases and Sales of Investments.
Purchases and sales of securities, other than short-term securities, aggregated $3,043,267,353 and $544,461,282, respectively.
6. Fees and Other Transactions with Affiliates.
Management Fee and Expense Contract. Fidelity Management & Research Company (the investment adviser) and its affiliates provide the Fund with investment management related services for which the Fund pays a monthly management fee. The management fee is based on an annual rate of .015% of the Fund's average net assets. Under the management contract, the investment adviser pays all other fund-level expenses, except the compensation of the independent Trustees and certain other expenses such as interest expense, including commitment fees.
Effective August 1, 2017, the Board approved an amendment to the expense contract. Under the expense contract, the investment adviser pays class-level expenses as necessary so that the total expenses do not exceed certain amounts of each class' average net assets on an annual basis with certain exceptions, as noted in the following table:
| Investor Class | .09% |
| Premium Class | .035% |
| Institutional Class | .03% |
| Institutional Premium Class | .015% |
| Class F | .015% |
Prior to August 1, 2017, the investment adviser paid class-level expenses as necessary so that the total expenses did not exceed certain amounts as noted in the following table:
| Investor Class | .09% |
| Premium Class | .045% |
| Institutional Class | .035% |
| Institutional Premium Class | .015% |
| Class F | .015% |
Sub-Adviser. Geode Capital Management, LLC (Geode), serves as sub-adviser for the Funds. Geode provides discretionary investment advisory services to the Funds and is paid by the investment adviser for providing these services.
Transfer Agent Fees. Fidelity Investments Institutional Operations Company, Inc. (FIIOC), an affiliate of the investment adviser, is the transfer, dividend disbursing and shareholder servicing agent for each class. FIIOC receives transfer agent fees at an annual rate of .075%, .045%, .035% and .015% of class-level average net assets for Investor Class, Premium Class, Institutional Class and Institutional Premium Class, respectively. FIIOC receives no fees for providing transfer agency services to Class F. FIIOC pays for typesetting, printing and mailing of shareholder reports, except proxy statements.
Effective August 1, 2017, under the amended expense contract, Investor Class, Premium Class, and Institutional Class pay all or a portion of the transfer agent fees at an annual rate of .075%, .02%, and .015% of class-level average net assets, respectively, and Institutional Premium Class does not pay transfer agent fees. FIIOC receives no fees for providing transfer agency services to Class F. Prior to August 1, 2017, Investor Class, Premium Class, and Institutional Class paid all or a portion of the transfer agent fees at an annual rate of .075%, .03%, and .02% of class-level average net assets, respectively, and Institutional Premium Class did not pay transfer agent fees. FIIOC received no fees for providing transfer agency services to Class F.
For the period, the total transfer agent fees paid by each applicable class were as follows:
| Amount | % of Class-Level Average Net Assets(a) | |
| Investor Class | $280,667 | .075 |
| Premium Class | 3,418,251 | .028 |
| Institutional Class | 237,148 | .019 |
| Institutional Premium Class | – | |
| $3,936,066 |
(a) Annualized
Interfund Trades. The Fund may purchase from or sell securities to other Fidelity Funds under procedures adopted by the Board. The procedures have been designed to ensure these interfund trades are executed in accordance with Rule 17a-7 of the 1940 Act. Interfund trades are included within the respective purchases and sales amounts shown in the Purchases and Sales of Investments note.
7. Committed Line of Credit.
The Fund participates with other funds managed by the investment adviser or an affiliate in a $4.25 billion credit facility (the "line of credit") to be utilized for temporary or emergency purposes to fund shareholder redemptions or for other short-term liquidity purposes. The Fund has agreed to pay commitment fees on its pro-rata portion of the line of credit, which amounted to $65,808 and is reflected in Miscellaneous expenses on the Statement of Operations. During the period, the Fund did not borrow on this line of credit.
8. Security Lending.
The Fund lends portfolio securities through a lending agent from time to time in order to earn additional income. On the settlement date of the loan, the Fund receives collateral (in the form of U.S. Treasury obligations, letters of credit and/or cash) against the loaned securities and maintains collateral in an amount not less than 100% of the market value of the loaned securities during the period of the loan. The market value of the loaned securities is determined at the close of business of the Fund and any additional required collateral is delivered to the Fund on the next business day. The Fund or borrower may terminate the loan at any time, and if the borrower defaults on its obligation to return the securities loaned because of insolvency or other reasons, the Fund may apply collateral received from the borrower against the obligation. The Fund may experience delays and costs in recovering the securities loaned. Any cash collateral received is invested in the Fidelity Securities Lending Cash Central Fund. The value of loaned securities and cash collateral at period end are disclosed on the Fund's Statement of Assets and Liabilities. Security lending income represents the income earned on investing cash collateral, less rebates paid to borrowers and any lending agent fees associated with the loan, plus any premium payments received for lending certain types of securities. Security lending income is presented in the Statement of Operations as a component of income from Fidelity Central Funds.
9. Expense Reductions.
Through arrangements with the Fund's custodian, credits realized as a result of certain uninvested cash balances were used to reduce the Fund's expenses. During the period, these credits reduced the Fund's expenses by $7,598.
10. Distributions to Shareholders.
Distributions to shareholders of each class were as follows:
| Six months ended August 31, 2017 | Year ended February 28, 2017 | |
| From net investment income | ||
| Investor Class | $1,974,932 | $16,896,705 |
| Premium Class | 65,259,273 | 378,185,569 |
| Institutional Class | 6,652,259 | 34,361,091 |
| Institutional Premium Class | 13,828,214 | 64,762,437 |
| Class F | 27,062,569 | 155,686,891 |
| Total | $114,777,247 | $649,892,693 |
| From net realized gain | ||
| Investor Class | $1,134,765 | $7,085,516 |
| Premium Class | 35,813,221 | 129,533,088 |
| Institutional Class | 3,614,600 | 11,106,621 |
| Institutional Premium Class | 7,368,243 | 19,355,949 |
| Class F | 14,420,059 | 51,563,948 |
| Total | $62,350,888 | $218,645,122 |
11. Share Transactions.
Share transactions for each class were as follows and may contain automatic conversions between classes or exchanges between affiliated funds:
| Shares | Shares | Dollars | Dollars | |
| Six months ended August 31, 2017 | Year ended February 28, 2017 | Six months ended August 31, 2017 | Year ended February 28, 2017 | |
| Investor Class | ||||
| Shares sold | 3,340,976 | 8,795,818 | $231,898,223 | $548,532,660 |
| Reinvestment of distributions | 43,739 | 367,701 | 2,949,341 | 23,024,663 |
| Shares redeemed | (3,677,538) | (33,293,575) | (255,132,205) | (2,016,144,611) |
| Net increase (decrease) | (292,823) | (24,130,056) | $(20,284,641) | $(1,444,587,288) |
| Premium Class | ||||
| Shares sold | 29,280,232 | 72,938,672 | $2,028,991,757 | $4,593,828,256 |
| Reinvestment of distributions | 1,351,656 | 7,020,226 | 91,142,202 | 448,347,863 |
| Shares redeemed | (22,348,489) | (79,548,075) | (1,553,816,587) | (4,899,234,191) |
| Net increase (decrease) | 8,283,399 | 410,823 | $566,317,372 | $142,941,928 |
| Institutional Class | ||||
| Shares sold | 6,594,589 | 18,325,311 | $456,399,631 | $1,130,684,794 |
| Reinvestment of distributions | 135,029 | 632,945 | 9,103,650 | 40,590,795 |
| Shares redeemed | (4,468,517) | (6,254,614) | (309,213,464) | (386,019,299) |
| Net increase (decrease) | 2,261,101 | 12,703,642 | $156,289,817 | $785,256,290 |
| Institutional Premium Class | ||||
| Shares sold | 7,741,984 | 61,769,845 | $536,690,592 | $3,765,300,121 |
| Reinvestment of distributions | 314,441 | 1,300,415 | 21,196,456 | 84,118,042 |
| Shares redeemed | (5,600,465) | (8,839,371) | (389,953,233) | (559,041,660) |
| Net increase (decrease) | 2,455,960 | 54,230,889 | $167,933,815 | $3,290,376,503 |
| Class F | ||||
| Shares sold | 18,684,085 | 31,179,343 | $1,297,441,901 | $1,951,312,863 |
| Reinvestment of distributions | 615,195 | 3,238,153 | 41,482,628 | 207,250,839 |
| Shares redeemed | (2,657,086) | (22,327,967) | (185,814,320) | (1,432,285,287) |
| Net increase (decrease) | 16,642,194 | 12,089,529 | $1,153,110,209 | $726,278,415 |
12. Other.
The Fund's organizational documents provide former and current trustees and officers with a limited indemnification against liabilities arising in connection with the performance of their duties to the Fund. In the normal course of business, the Fund may also enter into contracts that provide general indemnifications. The Fund's maximum exposure under these arrangements is unknown as this would be dependent on future claims that may be made against the Fund. The risk of material loss from such claims is considered remote.
At the end of the period, mutual funds managed by the investment advisor or its affiliates were the owners of record, in the aggregate, of approximately 24% of the total outstanding shares of the Fund.
Shareholder Expense Example
As a shareholder of the Fund, you incur two types of costs: (1) transaction costs and (2) ongoing costs, including management fees and other Fund expenses. This Example is intended to help you understand your ongoing costs (in dollars) of investing in the Fund and to compare these costs with the ongoing costs of investing in other mutual funds.
The Example is based on an investment of $1,000 invested at the beginning of the period and held for the entire period (March 1, 2017 to August 31, 2017).
Actual Expenses
The first line of the accompanying table for each class of the Fund provides information about actual account values and actual expenses. You may use the information in this line, together with the amount you invested, to estimate the expenses that you paid over the period. Simply divide your account value by $1,000.00 (for example, an $8,600 account value divided by $1,000.00 = 8.6), then multiply the result by the number in the first line for a class of the Fund under the heading entitled "Expenses Paid During Period" to estimate the expenses you paid on your account during this period. A small balance maintenance fee of $12.00 that is charged once a year may apply for certain accounts with a value of less than $2,000. This fee is not included in the table below. If it was, the estimate of expenses you paid during the period would be higher, and your ending account value lower, by this amount. In addition, the Fund, as a shareholder in the underlying Fidelity Central Funds, will indirectly bear its pro-rata share of the fees and expenses incurred by the underlying Fidelity Central Funds. These fees and expenses are not included in the Fund's annualized expense ratio used to calculate the expense estimate in the table below.
Hypothetical Example for Comparison Purposes
The second line of the accompanying table for each class of the Fund provides information about hypothetical account values and hypothetical expenses based on a Class' actual expense ratio and an assumed rate of return of 5% per year before expenses, which is not the Class' actual return. The hypothetical account values and expenses may not be used to estimate the actual ending account balance or expenses you paid for the period. You may use this information to compare the ongoing costs of investing in the Fund and other funds. To do so, compare this 5% hypothetical example with the 5% hypothetical examples that appear in the shareholder reports of the other funds. A small balance maintenance fee of $12.00 that is charged once a year may apply for certain accounts with a value of less than $2,000. This fee is not included in the table below. If it was, the estimate of expenses you paid during the period would be higher, and your ending account value lower, by this amount. In addition, the Fund, as a shareholder in the underlying Fidelity Central Funds, will indirectly bear its pro-rata share of the fees and expenses incurred by the underlying Fidelity Central Funds. These fees and expenses are not included in the Fund's annualized expense ratio used to calculate the expense estimate in the table below.
Please note that the expenses shown in the table are meant to highlight your ongoing costs only and do not reflect any transaction costs. Therefore, the second line of the table is useful in comparing ongoing costs only, and will not help you determine the relative total costs of owning different funds.
| Annualized Expense Ratio-A | Beginning Account Value March 1, 2017 | Ending Account Value August 31, 2017 | Expenses Paid During Period-B March 1, 2017 to August 31, 2017 | |
| Investor Class | .09% | |||
| Actual | $1,000.00 | $1,051.90 | $.47 | |
| Hypothetical-C | $1,000.00 | $1,024.75 | $.46 | |
| Premium Class | .04% | |||
| Actual | $1,000.00 | $1,052.40 | $.21 | |
| Hypothetical-C | $1,000.00 | $1,025.00 | $.20 | |
| Institutional Class | .03% | |||
| Actual | $1,000.00 | $1,052.40 | $.16 | |
| Hypothetical-C | $1,000.00 | $1,025.05 | $.15 | |
| Institutional Premium Class | .02% | |||
| Actual | $1,000.00 | $1,052.50 | $.10 | |
| Hypothetical-C | $1,000.00 | $1,025.10 | $.10 | |
| Class F | .02% | |||
| Actual | $1,000.00 | $1,052.40 | $.10 | |
| Hypothetical-C | $1,000.00 | $1,025.10 | $.10 |
A Annualized expense ratio reflects expenses net of applicable fee waivers.
B Expenses are equal to each Class' annualized expense ratio, multiplied by the average account value over the period, multiplied by 184/365 (to reflect the one-half year period).
C 5% return per year before expenses
Board Approval of Investment Advisory Contracts and Management Fees
Fidelity Total Market Index Fund
Each year, the Board of Trustees, including the Independent Trustees (together, the Board), votes on the renewal of the management contract with Fidelity Management & Research Company (FMR) and the sub-advisory agreements (together, the Advisory Contracts) for the fund, including the fund's sub-advisory agreement with Geode Capital Management, LLC (Geode). FMR and the sub-advisers are referred to herein as the Investment Advisers. The Board, assisted by the advice of fund counsel and Independent Trustees' counsel, requests and considers a broad range of information relevant to the renewal of the Advisory Contracts throughout the year.
The Board meets regularly and, at each of its meetings, covers an extensive agenda of topics and materials and considers factors that are relevant to its annual consideration of the renewal of the fund's Advisory Contracts, including the services and support provided to the fund and its shareholders. The Board has established various standing committees (Committees), each composed of and chaired by Independent Trustees with varying backgrounds, to which the Board has assigned specific subject matter responsibilities in order to enhance effective decision-making by the Board. The Board, acting directly and through its Committees, requests and receives information concerning the annual consideration of the renewal of the fund's Advisory Contracts. The Board also meets as needed to review matters specifically related to the Board's annual consideration of the renewal of the Advisory Contracts. Members of the Board may also meet with trustees of other Fidelity funds through ad hoc joint committees to discuss certain matters relevant to all of the Fidelity funds.
At its July 2017 meeting, the Board unanimously determined to renew the fund's Advisory Contracts. In reaching its determination, the Board considered all factors it believed relevant, including (i) the nature, extent, and quality of the services to be provided to the fund and its shareholders (including the investment performance of the fund); (ii) the competitiveness of the fund's management fee and total expense ratio relative to peer funds; (iii) the total costs of the services to be provided by and the profits to be realized by Fidelity from its relationships with the fund; and (iv) the extent to which, if any, economies of scale exist and would be realized as the fund grows, and whether any economies of scale are appropriately shared with fund shareholders.
In considering whether to renew the Advisory Contracts for the fund, the Board reached a determination, with the assistance of fund counsel and Independent Trustees' counsel and through the exercise of its business judgment, that the renewal of the Advisory Contracts was in the best interests of the fund and its shareholders and that the compensation payable under the Advisory Contracts was fair and reasonable. The Board's decision to renew the Advisory Contracts was not based on any single factor, but rather was based on a comprehensive consideration of all the information provided to the Board at its meetings throughout the year. The Board, in reaching its determination to renew the Advisory Contracts, was aware that shareholders of the fund have a broad range of investment choices available to them, including a wide choice among funds offered by Fidelity's competitors, and that the fund's shareholders, who have the opportunity to review and weigh the disclosure provided by the fund in its prospectus and other public disclosures, have chosen to invest in this fund, which is part of the Fidelity family of funds.
Nature, Extent, and Quality of Services Provided. The Board considered staffing as it relates to the fund, including the backgrounds of investment personnel of Fidelity and Geode, and also considered the fund's investment objective, strategies, and related investment philosophy. The Independent Trustees also had discussions with senior management of Fidelity's investment operations and investment groups and with representatives of Geode. The Board considered the structure of the investment personnel compensation programs and whether the structures provide appropriate incentives to act in the best interests of each fund. Additionally, the Board considered the portfolio managers' investments, if any, in the funds that they manage.Resources Dedicated to Investment Management and Support Services. The Board and the Fund Oversight and Research Committees reviewed the general qualifications and capabilities of Fidelity's and Geode's investment staffs, including their size, education, experience, and resources, as well as Fidelity's approach to recruiting, training, managing, and compensating investment personnel. The Board noted that Fidelity has continued to increase the resources devoted to non-U.S. offices, including expansion of Fidelity's global investment organization. Additionally, in its deliberations, the Board considered Fidelity's and Geode's trading, risk management, compliance, and technology and operations capabilities and resources, which are integral parts of the investment management process.Shareholder and Administrative Services. The Board considered (i) the nature, extent, quality, and cost of advisory, administrative, and shareholder services performed by the Investment Advisers, and their affiliates under the Advisory Contracts and under separate agreements covering transfer agency, pricing and bookkeeping, and securities lending services for the fund; (ii) the nature and extent of the supervision of third party service providers, principally custodians, subcustodians, and pricing vendors; and (iii) the resources devoted to, and the record of compliance with, the fund's compliance policies and procedures. The Board also reviewed the allocation of fund brokerage, including allocations to brokers affiliated with the Investment Advisers.The Board noted that the growth of fund assets over time across the complex allows Fidelity to reinvest in the development of services designed to enhance the value or convenience of the Fidelity funds as investment vehicles. These services include 24-hour access to account information and market information through telephone representatives and over the Internet, investor education materials and asset allocation tools, and the expanded availability of Fidelity Investor Centers.In 2014, the Board formed an ad hoc Committee on Transfer Agency Fees to review the variety of transfer agency fee structures throughout the industry and Fidelity's competitive positioning with respect to industry participants.Investment in a Large Fund Family. The Board considered the benefits to shareholders of investing in a Fidelity fund, including the benefits of investing in a fund that is part of a large family of funds offering a variety of investment disciplines and providing a large variety of mutual fund investor services. The Board noted that Fidelity had taken, or had made recommendations that resulted in the Fidelity funds taking, a number of actions over the previous year that benefited particular funds, including: (i) continuing to dedicate additional resources to Fidelity's investment research process, and to the support of the senior management team that oversees asset management; (ii) continuing efforts to enhance Fidelity's global research capabilities; (iii) launching new funds and making other enhancements to meet client needs; (iv) launching new share classes of existing funds; (v) eliminating purchase minimums and broadening eligibility requirements for certain lower-priced share classes; (vi) reducing management fees and total expenses for certain growth equity funds and index funds; (vii) lowering expense caps for certain existing funds and classes to reduce expenses borne by shareholders; (viii) eliminating short-term redemption fees for certain funds; (ix) introducing a new pricing structure for certain funds of funds that is expected to reduce overall expenses paid by shareholders; (x) rationalizing product lines and gaining increased efficiencies through proposals for fund mergers and share class consolidations; (xi) continuing to develop, acquire and implement systems and technology to improve services to the funds and shareholders, strengthen information security, and increase efficiency; and (xii) implementing enhancements to further strengthen Fidelity's product line to increase investors' probability of success in achieving their investment goals, including retirement income goals.Investment Performance. The Board considered whether the fund has operated in accordance with its investment objective, as well as its record of compliance with its investment restrictions and its performance history.The Board took into account discussions with representatives of the Investment Advisers about fund investment performance that occur at Board meetings throughout the year. In this regard the Board noted that as part of regularly scheduled fund reviews and other reports to the Board on fund performance, the Board considers annualized return information for the fund for different time periods, measured against the securities market index the fund seeks to track. The Board also periodically considers the fund's tracking error versus its benchmark index. In its evaluation of fund investment performance, the Board gave particular attention to information indicating changes in performance of certain Fidelity funds for specific time periods and discussed with the Investment Advisers the reasons for any overperformance or underperformance.In addition to reviewing absolute and relative fund performance, the Independent Trustees periodically consider the appropriateness of fund performance metrics in evaluating the results achieved. In general, the Independent Trustees believe that an index fund's performance should be evaluated based on net performance (after fees and expenses) of both the highest performing and lowest performing fund share classes, where applicable, compared to a fund's benchmark index, over appropriate time periods taking into account relevant factors including the following: general market conditions; the characteristics of the fund's benchmark index; the extent to which statistical sampling is employed; any securities lending revenues; and fund cash flows and other factors.The Independent Trustees recognize that shareholders evaluate performance on a net basis over their own holding periods, for which one-, three-, and five-year periods are often used as a proxy. For this reason, the performance information reviewed by the Board also included net cumulative calendar year total return information for the fund and its benchmark index for the most recent one-, three-, and five-year periods, as shown below. A peer group is not shown below because the fund does not generally utilize a peer group for performance comparison purposes.Fidelity Total Market Index Fund

Fidelity Total Market Index Fund
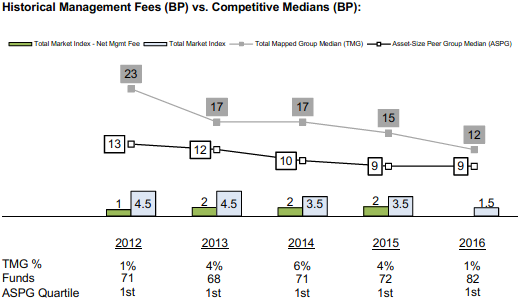
![]()
Corporate Headquarters
245 Summer St.
Boston, MA 02210
www.fidelity.com
STI-F-SANN-1017
1.899051.107
Fidelity® Total Market Index Fund Fidelity® Extended Market Index Fund Fidelity® International Index Fund Semi-Annual Report August 31, 2017 |
|
Contents
Fidelity® Total Market Index Fund | |
Fidelity® Extended Market Index Fund | |
Fidelity® International Index Fund | |
Board Approval of Investment Advisory Contracts and Management Fees |
To view a fund's proxy voting guidelines and proxy voting record for the 12-month period ended June 30, visit http://www.fidelity.com/proxyvotingresults or visit the Securities and Exchange Commission's (SEC) web site at http://www.sec.gov.
You may also call 1-800-544-8544 to request a free copy of the proxy voting guidelines.
The funds or securities referred to herein are not sponsored, endorsed, or promoted by MSCI, and MSCI bears no liability with respect to any such funds or securities or any index on which such funds or securities are based. The prospectus contains a more detailed description of the limited relationship MSCI has with Fidelity and any related funds.
Standard & Poor's, S&P and S&P 500 are registered service marks of The McGraw-Hill Companies, Inc. and have been licensed for use by Fidelity Distributors Corporation.
Other third-party marks appearing herein are the property of their respective owners.
All other marks appearing herein are registered or unregistered trademarks or service marks of FMR LLC or an affiliated company. © 2017 FMR LLC. All rights reserved.
This report and the financial statements contained herein are submitted for the general information of the shareholders of the Funds. This report is not authorized for distribution to prospective investors in the Funds unless preceded or accompanied by an effective prospectus.
A fund files its complete schedule of portfolio holdings with the SEC for the first and third quarters of each fiscal year on Form N-Q. Forms N-Q are available on the SEC’s web site at http://www.sec.gov. A fund's Forms N-Q may be reviewed and copied at the SEC’s Public Reference Room in Washington, DC. Information regarding the operation of the SEC's Public Reference Room may be obtained by calling 1-800-SEC-0330.
For a complete list of a fund's portfolio holdings, view the most recent holdings listing, semiannual report, or annual report on Fidelity's web site at http://www.fidelity.com, http://www.institutional.fidelity.com, or http://www.401k.com, as applicable.
NOT FDIC INSURED •MAY LOSE VALUE •NO BANK GUARANTEE
Neither the Funds nor Fidelity Distributors Corporation is a bank.
Fidelity® Total Market Index Fund
Investment Summary (Unaudited)
Top Ten Stocks as of August 31, 2017
| % of fund's net assets | % of fund's net assets 6 months ago | |
| Apple, Inc. | 3.3 | 2.9 |
| Microsoft Corp. | 2.3 | 2.0 |
| Facebook, Inc. Class A | 1.6 | 1.3 |
| Amazon.com, Inc. | 1.5 | 1.3 |
| Johnson & Johnson | 1.4 | 1.4 |
| Berkshire Hathaway, Inc. Class B | 1.4 | 1.3 |
| Exxon Mobil Corp. | 1.3 | 1.4 |
| JPMorgan Chase & Co. | 1.3 | 1.3 |
| Alphabet, Inc. Class A | 1.1 | 1.0 |
| Alphabet, Inc. Class C | 1.1 | 1.0 |
| 16.3 |
Top Market Sectors as of August 31, 2017
| % of fund's net assets | % of fund's net assets 6 months ago | |
| Information Technology | 22.5 | 20.6 |
| Financials | 14.6 | 15.3 |
| Health Care | 14.1 | 13.3 |
| Consumer Discretionary | 12.4 | 12.4 |
| Industrials | 10.6 | 10.7 |
| Consumer Staples | 7.5 | 8.3 |
| Energy | 5.3 | 6.2 |
| Real Estate | 4.1 | 4.0 |
| Materials | 3.3 | 3.3 |
| Utilities | 3.3 | 3.2 |
Fidelity® Total Market Index Fund
Investments August 31, 2017 (Unaudited)
Showing Percentage of Net Assets
| Common Stocks - 99.6% | |||
| Shares | Value | ||
| CONSUMER DISCRETIONARY - 12.4% | |||
| Auto Components - 0.4% | |||
| Adient PLC | 159,281 | $11,257,981 | |
| American Axle & Manufacturing Holdings, Inc. (a) | 148,067 | 2,163,259 | |
| Autoliv, Inc. (b) | 151,190 | 16,422,258 | |
| BorgWarner, Inc. | 350,359 | 16,260,161 | |
| Clean Diesel Technologies, Inc. (a)(b) | 8,475 | 18,052 | |
| Cooper Tire & Rubber Co. | 91,978 | 3,090,461 | |
| Cooper-Standard Holding, Inc. (a) | 32,523 | 3,271,163 | |
| Dana Holding Corp. | 235,295 | 5,663,551 | |
| Delphi Automotive PLC | 456,707 | 44,026,555 | |
| Dorman Products, Inc. (a) | 55,243 | 3,669,240 | |
| Fox Factory Holding Corp. (a) | 56,459 | 2,258,360 | |
| Gentex Corp. | 483,427 | 8,832,211 | |
| Gentherm, Inc. (a) | 58,309 | 1,816,325 | |
| Hertz Global Holdings, Inc. (a)(b) | 124,860 | 2,714,456 | |
| Horizon Global Corp. (a)(b) | 41,718 | 717,550 | |
| LCI Industries | 43,682 | 4,315,782 | |
| Lear Corp. | 119,894 | 17,928,949 | |
| Modine Manufacturing Co. (a) | 88,001 | 1,421,216 | |
| Motorcar Parts of America, Inc. (a) | 32,435 | 852,067 | |
| Shiloh Industries, Inc. (a) | 23,634 | 207,034 | |
| Standard Motor Products, Inc. | 32,576 | 1,436,602 | |
| Stoneridge, Inc. (a) | 43,907 | 727,100 | |
| Strattec Security Corp. | 4,334 | 136,088 | |
| Superior Industries International, Inc. | 39,790 | 582,924 | |
| Sypris Solutions, Inc. (a) | 16,848 | 27,631 | |
| Tenneco, Inc. | 96,642 | 5,237,996 | |
| The Goodyear Tire & Rubber Co. | 424,185 | 12,852,806 | |
| Tower International, Inc. | 31,785 | 713,573 | |
| UQM Technologies, Inc. (a) | 38,648 | 34,783 | |
| Visteon Corp. (a) | 57,388 | 6,624,871 | |
| VOXX International Corp. (a)(b) | 39,260 | 318,006 | |
| Workhorse Group, Inc. (a)(b) | 43,808 | 147,633 | |
| 175,746,644 | |||
| Automobiles - 0.6% | |||
| Ford Motor Co. | 6,679,951 | 73,679,860 | |
| General Motors Co. | 2,352,167 | 85,948,182 | |
| Harley-Davidson, Inc. (b) | 295,888 | 13,909,695 | |
| REV Group, Inc. (b) | 22,528 | 567,480 | |
| Tesla, Inc. (a)(b) | 217,184 | 77,295,786 | |
| Thor Industries, Inc. | 80,273 | 8,720,859 | |
| Winnebago Industries, Inc. (b) | 45,507 | 1,645,078 | |
| 261,766,940 | |||
| Distributors - 0.1% | |||
| Core-Mark Holding Co., Inc. | 75,278 | 2,037,023 | |
| Educational Development Corp. (b) | 2,866 | 30,236 | |
| Genuine Parts Co. | 248,224 | 20,560,394 | |
| LKQ Corp. (a) | 538,255 | 18,650,536 | |
| Pool Corp. | 71,179 | 7,095,835 | |
| Weyco Group, Inc. | 5,169 | 142,406 | |
| 48,516,430 | |||
| Diversified Consumer Services - 0.2% | |||
| American Public Education, Inc. (a) | 24,607 | 453,999 | |
| Ascent Capital Group, Inc. (a) | 16,905 | 167,867 | |
| Bridgepoint Education, Inc. (a) | 27,580 | 243,531 | |
| Bright Horizons Family Solutions, Inc. (a) | 83,097 | 6,641,943 | |
| Cambium Learning Group, Inc. (a) | 12,514 | 73,332 | |
| Capella Education Co. | 20,930 | 1,409,636 | |
| Career Education Corp. (a) | 109,234 | 1,049,739 | |
| Carriage Services, Inc. | 24,048 | 588,936 | |
| Chegg, Inc. (a)(b) | 135,548 | 1,923,426 | |
| Collectors Universe, Inc. | 6,416 | 154,176 | |
| DeVry, Inc. | 101,372 | 3,466,922 | |
| Graham Holdings Co. | 8,772 | 5,150,918 | |
| Grand Canyon Education, Inc. (a) | 82,727 | 6,787,750 | |
| H&R Block, Inc. | 348,246 | 9,312,098 | |
| Houghton Mifflin Harcourt Co. (a) | 170,821 | 1,742,374 | |
| K12, Inc. (a) | 59,099 | 1,059,054 | |
| Laureate Education, Inc. Class A | 104,594 | 1,531,256 | |
| Liberty Tax, Inc. | 8,571 | 115,280 | |
| Lincoln Educational Services Corp. (a) | 15,671 | 43,879 | |
| National American University Holdings, Inc. | 5,378 | 11,616 | |
| Regis Corp. (a) | 52,945 | 703,110 | |
| Service Corp. International | 317,953 | 11,236,459 | |
| ServiceMaster Global Holdings, Inc. (a) | 236,280 | 11,133,514 | |
| Sotheby's Class A (Ltd. vtg.) (a)(b) | 77,436 | 3,474,553 | |
| Strayer Education, Inc. | 17,939 | 1,435,299 | |
| Universal Technical Institute, Inc. (a) | 29,419 | 104,143 | |
| Weight Watchers International, Inc. (a) | 50,480 | 2,362,969 | |
| 72,377,779 | |||
| Hotels, Restaurants & Leisure - 2.1% | |||
| ARAMARK Holdings Corp. | 423,578 | 17,235,389 | |
| Belmond Ltd. Class A (a) | 147,743 | 1,883,723 | |
| Biglari Holdings, Inc. (a) | 2,475 | 736,956 | |
| BJ's Restaurants, Inc. (a) | 35,904 | 1,080,710 | |
| Bloomin' Brands, Inc. | 181,456 | 3,086,567 | |
| Bob Evans Farms, Inc. | 36,126 | 2,484,746 | |
| Bojangles', Inc. (a)(b) | 24,608 | 328,517 | |
| Boyd Gaming Corp. | 147,259 | 3,893,528 | |
| Bravo Brio Restaurant Group, Inc. (a) | 12,451 | 34,240 | |
| Brinker International, Inc. | 77,201 | 2,410,215 | |
| Buffalo Wild Wings, Inc. (a) | 29,848 | 3,066,882 | |
| Caesars Entertainment Corp. (a)(b) | 91,365 | 1,059,834 | |
| Carnival Corp. | 714,595 | 49,650,061 | |
| Carrols Restaurant Group, Inc. (a) | 61,598 | 671,418 | |
| Century Casinos, Inc. (a) | 28,742 | 196,883 | |
| Chipotle Mexican Grill, Inc. (a)(b) | 49,526 | 15,685,379 | |
| Choice Hotels International, Inc. | 66,238 | 4,110,068 | |
| Churchill Downs, Inc. | 21,995 | 4,297,823 | |
| Chuy's Holdings, Inc. (a)(b) | 26,361 | 495,587 | |
| ClubCorp Holdings, Inc. | 105,707 | 1,797,019 | |
| Cracker Barrel Old Country Store, Inc. (b) | 40,400 | 6,005,864 | |
| Darden Restaurants, Inc. | 211,433 | 17,356,535 | |
| Dave & Buster's Entertainment, Inc. (a) | 61,208 | 3,578,220 | |
| Del Frisco's Restaurant Group, Inc. (a) | 37,615 | 526,610 | |
| Del Taco Restaurants, Inc. (a)(b) | 75,328 | 1,060,618 | |
| Denny's Corp. (a) | 117,334 | 1,403,315 | |
| DineEquity, Inc. | 27,200 | 1,081,200 | |
| Domino's Pizza, Inc. | 81,781 | 14,905,405 | |
| Dover Downs Gaming & Entertainment, Inc. (a) | 1,508 | 1,493 | |
| Dover Motorsports, Inc. | 9,993 | 20,985 | |
| Drive Shack, Inc. | 86,128 | 232,546 | |
| Dunkin' Brands Group, Inc. | 155,091 | 7,996,492 | |
| El Pollo Loco Holdings, Inc. (a)(b) | 42,298 | 480,082 | |
| Eldorado Resorts, Inc. (a)(b) | 69,377 | 1,595,671 | |
| Empire Resorts, Inc. (a)(b) | 4,022 | 93,914 | |
| Extended Stay America, Inc. unit | 338,299 | 6,627,277 | |
| Famous Dave's of America, Inc. (a)(b) | 7,623 | 33,160 | |
| Fiesta Restaurant Group, Inc. (a)(b) | 50,677 | 881,780 | |
| Fogo de Chao, Inc. (a) | 21,909 | 277,149 | |
| Golden Entertainment, Inc. (a) | 12,680 | 288,090 | |
| Good Times Restaurants, Inc. (a) | 7,939 | 22,229 | |
| Habit Restaurants, Inc. Class A (a)(b) | 36,946 | 480,298 | |
| Hilton Grand Vacations, Inc. | 107,778 | 3,906,953 | |
| Hilton, Inc. | 350,021 | 22,516,851 | |
| Hyatt Hotels Corp. Class A (a) | 85,165 | 5,068,169 | |
| ILG, Inc. | 190,126 | 5,019,326 | |
| International Speedway Corp. Class A | 44,736 | 1,594,838 | |
| J. Alexanders Holdings, Inc. (a) | 20,559 | 203,534 | |
| Jack in the Box, Inc. | 50,437 | 4,721,912 | |
| Jamba, Inc. (a)(b) | 19,136 | 188,298 | |
| Kona Grill, Inc. (a)(b) | 8,466 | 25,398 | |
| La Quinta Holdings, Inc. (a) | 128,968 | 2,037,694 | |
| Las Vegas Sands Corp. | 629,877 | 39,184,648 | |
| Lindblad Expeditions Holdings (a) | 22,275 | 247,698 | |
| Luby's, Inc. (a) | 14,614 | 38,727 | |
| Marcus Corp. | 30,096 | 749,390 | |
| Marriott International, Inc. Class A | 529,166 | 54,811,014 | |
| Marriott Vacations Worldwide Corp. (b) | 42,588 | 4,955,540 | |
| McDonald's Corp. | 1,396,519 | 223,401,144 | |
| MGM Mirage, Inc. | 840,509 | 27,703,177 | |
| Monarch Casino & Resort, Inc. (a) | 16,794 | 597,363 | |
| Nathan's Famous, Inc. (a) | 3,561 | 208,497 | |
| Noodles & Co. (a)(b) | 28,579 | 110,029 | |
| Norwegian Cruise Line Holdings Ltd. (a) | 304,314 | 18,094,510 | |
| Papa John's International, Inc. (b) | 42,981 | 3,214,549 | |
| Papa Murphy's Holdings, Inc. (a)(b) | 22,690 | 115,946 | |
| Park Hotels & Resorts, Inc. | 268,171 | 7,157,484 | |
| Penn National Gaming, Inc. (a) | 158,816 | 3,524,127 | |
| Pinnacle Entertainment, Inc. (a) | 94,638 | 1,845,441 | |
| Planet Fitness, Inc. | 118,106 | 2,996,349 | |
| Playa Hotels & Resorts NV | 140,860 | 1,460,718 | |
| Potbelly Corp. (a) | 30,614 | 367,368 | |
| Rave Restaurant Group, Inc. (a)(b) | 9,079 | 13,165 | |
| Rave Restaurant Group, Inc. rights (b) | 9,079 | 152 | |
| RCI Hospitality Holdings, Inc. | 15,482 | 360,731 | |
| Red Lion Hotels Corp. (a) | 6,989 | 48,923 | |
| Red Robin Gourmet Burgers, Inc. (a)(b) | 21,139 | 1,204,923 | |
| Red Rock Resorts, Inc. | 72,993 | 1,649,642 | |
| Royal Caribbean Cruises Ltd. | 285,089 | 35,482,177 | |
| Ruby Tuesday, Inc. (a) | 88,086 | 189,385 | |
| Ruth's Hospitality Group, Inc. | 42,076 | 822,586 | |
| Scientific Games Corp. Class A (a)(b) | 89,331 | 3,144,451 | |
| SeaWorld Entertainment, Inc. (b) | 103,555 | 1,344,144 | |
| Shake Shack, Inc. Class A (a)(b) | 35,538 | 1,098,835 | |
| Six Flags Entertainment Corp. | 140,263 | 7,654,152 | |
| Sonic Corp. (b) | 74,649 | 1,747,533 | |
| Speedway Motorsports, Inc. | 23,497 | 488,973 | |
| Starbucks Corp. | 2,484,039 | 136,274,380 | |
| Texas Roadhouse, Inc. Class A | 113,067 | 5,365,029 | |
| The Cheesecake Factory, Inc. (b) | 75,769 | 3,139,110 | |
| Town Sports International Holdings, Inc. (a) | 13,107 | 77,331 | |
| U.S. Foods Holding Corp. (a) | 221,001 | 6,066,477 | |
| Vail Resorts, Inc. | 67,071 | 15,288,834 | |
| Wendy's Co. | 328,867 | 4,906,696 | |
| Wingstop, Inc. | 55,195 | 1,788,870 | |
| Wyndham Worldwide Corp. | 177,047 | 17,648,045 | |
| Wynn Resorts Ltd. (b) | 138,056 | 19,188,403 | |
| Yum! Brands, Inc. | 570,420 | 43,819,664 | |
| Zoe's Kitchen, Inc. (a)(b) | 27,188 | 349,910 | |
| 924,383,691 | |||
| Household Durables - 0.6% | |||
| AV Homes, Inc. (a)(b) | 12,051 | 186,188 | |
| Bassett Furniture Industries, Inc. | 15,479 | 554,922 | |
| Beazer Homes U.S.A., Inc. (a) | 65,476 | 976,247 | |
| CalAtlantic Group, Inc. | 137,770 | 4,787,508 | |
| Cavco Industries, Inc. (a) | 13,938 | 1,875,358 | |
| Century Communities, Inc. (a) | 33,155 | 747,645 | |
| Comstock Holding Companies, Inc. (a) | 1,496 | 2,902 | |
| CSS Industries, Inc. | 16,118 | 431,640 | |
| D.R. Horton, Inc. | 588,321 | 21,267,804 | |
| Dixie Group, Inc. (a) | 11,105 | 45,531 | |
| Emerson Radio Corp. (a) | 23,724 | 26,096 | |
| Ethan Allen Interiors, Inc. (b) | 53,577 | 1,567,127 | |
| Flexsteel Industries, Inc. | 9,186 | 417,963 | |
| Garmin Ltd. (b) | 197,296 | 10,160,744 | |
| GoPro, Inc. Class A (a)(b) | 162,726 | 1,498,706 | |
| Green Brick Partners, Inc. (a) | 37,398 | 353,411 | |
| Helen of Troy Ltd. (a) | 44,560 | 4,023,768 | |
| Hooker Furniture Corp. | 17,507 | 704,657 | |
| Hovnanian Enterprises, Inc. Class A (a) | 177,163 | 322,437 | |
| Installed Building Products, Inc. (a) | 34,760 | 2,005,652 | |
| iRobot Corp. (a)(b) | 46,436 | 4,430,923 | |
| KB Home (b) | 179,193 | 3,834,730 | |
| Koss Corp. (a) | 2,669 | 3,817 | |
| La-Z-Boy, Inc. | 79,546 | 1,897,172 | |
| Leggett & Platt, Inc. | 221,974 | 10,204,145 | |
| Lennar Corp. Class A | 361,788 | 18,726,147 | |
| LGI Homes, Inc. (a)(b) | 30,018 | 1,276,966 | |
| Libbey, Inc. | 30,735 | 251,105 | |
| Lifetime Brands, Inc. | 14,046 | 244,400 | |
| M.D.C. Holdings, Inc. | 74,685 | 2,333,906 | |
| M/I Homes, Inc. (b) | 40,257 | 990,322 | |
| Meritage Homes Corp. (a) | 64,418 | 2,621,813 | |
| Mohawk Industries, Inc. (a) | 107,436 | 27,194,200 | |
| NACCO Industries, Inc. Class A | 7,854 | 569,415 | |
| New Home Co. LLC (a) | 17,775 | 183,438 | |
| Newell Brands, Inc. | 823,827 | 39,774,368 | |
| Nova LifeStyle, Inc. (a)(b) | 26,136 | 31,886 | |
| NVR, Inc. (a) | 5,916 | 16,096,549 | |
| PICO Holdings, Inc. (a) | 33,668 | 547,105 | |
| PulteGroup, Inc. | 477,718 | 12,334,679 | |
| Skyline Corp. (a) | 21,741 | 259,370 | |
| Stanley Furniture Co., Inc. | 5,699 | 6,383 | |
| Taylor Morrison Home Corp. (a) | 166,089 | 3,358,320 | |
| Tempur Sealy International, Inc. (a)(b) | 77,783 | 4,814,768 | |
| Toll Brothers, Inc. | 253,725 | 9,885,126 | |
| TopBuild Corp. (a) | 72,015 | 4,274,090 | |
| TRI Pointe Homes, Inc. (a)(b) | 267,734 | 3,410,931 | |
| Tupperware Brands Corp. | 86,145 | 4,985,211 | |
| Turtle Beach Corp. (a)(b) | 6,672 | 4,670 | |
| Universal Electronics, Inc. (a) | 25,010 | 1,464,336 | |
| Vuzix Corp. (a)(b) | 22,003 | 127,617 | |
| Whirlpool Corp. | 126,716 | 21,747,000 | |
| William Lyon Homes, Inc. (a)(b) | 35,265 | 846,007 | |
| Zagg, Inc. (a) | 38,365 | 483,399 | |
| 251,170,620 | |||
| Internet & Direct Marketing Retail - 2.4% | |||
| 1-800-FLOWERS.com, Inc. Class A (a) | 52,658 | 473,922 | |
| Amazon.com, Inc. (a) | 679,412 | 666,231,407 | |
| Duluth Holdings, Inc. (a)(b) | 12,299 | 240,937 | |
| Etsy, Inc. (a)(b) | 161,975 | 2,651,531 | |
| EVINE Live, Inc. (a) | 71,405 | 71,048 | |
| Expedia, Inc. | 205,735 | 30,522,845 | |
| FTD Companies, Inc. (a) | 25,393 | 340,012 | |
| Gaia, Inc. Class A (a) | 12,609 | 140,590 | |
| Groupon, Inc. (a)(b) | 645,768 | 2,867,210 | |
| HSN, Inc. | 58,131 | 2,133,408 | |
| Lands' End, Inc. (a)(b) | 26,352 | 320,177 | |
| Liberty Expedia Holdings, Inc. | 99,495 | 5,441,382 | |
| Liberty Interactive Corp. QVC Group: | |||
| (Venture Group) Series A (a) | 144,556 | 8,898,867 | |
| Series A (a) | 751,358 | 16,620,039 | |
| Liberty TripAdvisor Holdings, Inc. (a) | 119,998 | 1,601,973 | |
| Netflix, Inc. (a) | 737,411 | 128,833,076 | |
| NutriSystem, Inc. | 50,522 | 2,743,345 | |
| Overstock.com, Inc. (a)(b) | 24,847 | 545,392 | |
| PetMed Express, Inc. (b) | 32,292 | 1,171,231 | |
| Priceline Group, Inc. (a) | 83,939 | 155,461,743 | |
| Shutterfly, Inc. (a) | 54,203 | 2,470,573 | |
| TripAdvisor, Inc. (a)(b) | 187,324 | 8,004,355 | |
| U.S. Auto Parts Network, Inc. (a) | 5,048 | 14,740 | |
| Wayfair LLC Class A (a)(b) | 53,340 | 3,787,673 | |
| 1,041,587,476 | |||
| Leisure Products - 0.1% | |||
| American Outdoor Brands Corp. (a)(b) | 96,497 | 1,574,831 | |
| Brunswick Corp. | 157,212 | 8,250,486 | |
| Callaway Golf Co. | 178,654 | 2,490,437 | |
| Clarus Corp. (a) | 32,583 | 236,227 | |
| Escalade, Inc. | 7,022 | 84,615 | |
| Hasbro, Inc. | 191,773 | 18,841,697 | |
| JAKKS Pacific, Inc. (a)(b) | 19,661 | 67,830 | |
| Johnson Outdoors, Inc. Class A | 8,158 | 520,480 | |
| Malibu Boats, Inc. Class A (a) | 36,393 | 981,519 | |
| Marine Products Corp. | 11,741 | 182,925 | |
| Mattel, Inc. (b) | 607,515 | 9,853,893 | |
| MCBC Holdings, Inc. (a) | 21,350 | 365,939 | |
| Nautilus, Inc. (a) | 46,907 | 766,929 | |
| Polaris Industries, Inc. (b) | 100,575 | 9,376,607 | |
| Sturm, Ruger & Co., Inc. (b) | 33,314 | 1,525,781 | |
| Summer Infant, Inc. (a) | 32,605 | 66,514 | |
| Vista Outdoor, Inc. (a)(b) | 94,769 | 1,942,765 | |
| 57,129,475 | |||
| Media - 3.0% | |||
| A.H. Belo Corp. Class A | 22,177 | 110,885 | |
| AMC Entertainment Holdings, Inc. Class A (b) | 98,115 | 1,314,741 | |
| AMC Networks, Inc. Class A (a) | 101,098 | 6,144,736 | |
| Ballantyne of Omaha, Inc. (a) | 17,964 | 113,173 | |
| Cable One, Inc. | 8,311 | 6,305,888 | |
| CBS Corp. Class B | 648,125 | 41,518,888 | |
| Central European Media Enterprises Ltd. Class A (a)(b) | 116,862 | 484,977 | |
| Charter Communications, Inc. Class A (a) | 368,979 | 147,052,891 | |
| Cinedigm Corp. (a)(b) | 5,614 | 8,477 | |
| Cinemark Holdings, Inc. | 176,432 | 5,873,421 | |
| Clear Channel Outdoor Holding, Inc. Class A (a) | 57,659 | 221,987 | |
| Comcast Corp. Class A | 8,100,248 | 328,951,071 | |
| Cumulus Media, Inc. Class A (a)(b) | 17,877 | 6,972 | |
| Daily Journal Corp. (a) | 644 | 135,176 | |
| Discovery Communications, Inc.: | |||
| Class A (a)(b) | 247,368 | 5,494,043 | |
| Class C (non-vtg.) (a) | 376,024 | 7,900,264 | |
| DISH Network Corp. Class A (a) | 387,018 | 22,172,261 | |
| E.W. Scripps Co. Class A (a)(b) | 104,171 | 1,862,577 | |
| Emmis Communications Corp. Class A (a) | 1,993 | 5,281 | |
| Entercom Communications Corp. Class A (b) | 42,593 | 438,708 | |
| Entravision Communication Corp. Class A | 112,796 | 626,018 | |
| Gannett Co., Inc. | 225,017 | 1,910,394 | |
| Global Eagle Entertainment, Inc. (a)(b) | 84,431 | 260,892 | |
| Gray Television, Inc. (a) | 109,585 | 1,567,066 | |
| Harte-Hanks, Inc. (a) | 45,482 | 40,856 | |
| Hemisphere Media Group, Inc. (a)(b) | 10,964 | 141,984 | |
| Insignia Systems, Inc. | 5,038 | 5,290 | |
| Interpublic Group of Companies, Inc. | 672,240 | 13,538,914 | |
| John Wiley & Sons, Inc. Class A | 79,959 | 4,313,788 | |
| Lee Enterprises, Inc. (a)(b) | 58,988 | 123,875 | |
| Liberty Broadband Corp.: | |||
| Class A (a) | 36,926 | 3,745,404 | |
| Class C (a) | 130,665 | 13,266,417 | |
| Liberty Global PLC: | |||
| Class A (a) | 432,377 | 14,700,818 | |
| Class C (a) | 1,083,957 | 35,803,100 | |
| LiLAC Class A (a)(b) | 77,452 | 2,014,527 | |
| LiLAC Class C (a) | 214,602 | 5,534,586 | |
| Liberty Media Corp.: | |||
| Liberty Braves Class A (a) | 14,273 | 348,404 | |
| Liberty Braves Class C (a) | 68,302 | 1,671,350 | |
| Liberty Formula One Group Series C (a)(b) | 232,999 | 9,156,861 | |
| Liberty Media Class A (a)(b) | 28,511 | 1,081,422 | |
| Liberty SiriusXM Series A(a) | 131,422 | 5,874,563 | |
| Liberty SiriusXM Series C (a) | 317,236 | 14,151,898 | |
| Lions Gate Entertainment Corp.: | |||
| Class A (b) | 84,440 | 2,510,401 | |
| Class B (b) | 201,823 | 5,665,172 | |
| Live Nation Entertainment, Inc. (a) | 224,734 | 8,980,371 | |
| Loral Space & Communications Ltd. (a) | 20,272 | 920,349 | |
| Meredith Corp. | 62,660 | 3,405,571 | |
| MSG Network, Inc. Class A (a) | 103,460 | 2,219,217 | |
| National CineMedia, Inc. | 108,730 | 588,229 | |
| New Media Investment Group, Inc. | 89,861 | 1,239,183 | |
| News Corp.: | |||
| Class A | 717,388 | 9,591,478 | |
| Class B | 130,013 | 1,781,178 | |
| Nexstar Broadcasting Group, Inc. Class A (b) | 74,709 | 4,497,482 | |
| Omnicom Group, Inc. (b) | 395,017 | 28,591,330 | |
| Reading International, Inc. Class A (a) | 17,900 | 282,104 | |
| Regal Entertainment Group Class A | 191,111 | 2,822,709 | |
| RLJ Entertainment, Inc. (a) | 5,726 | 17,980 | |
| Saga Communications, Inc. Class A | 3,882 | 158,580 | |
| Salem Communications Corp. Class A | 10,842 | 65,594 | |
| Scholastic Corp. | 44,904 | 1,770,565 | |
| Scripps Networks Interactive, Inc. Class A | 162,026 | 13,877,527 | |
| Sinclair Broadcast Group, Inc. Class A | 119,056 | 3,601,444 | |
| Sirius XM Holdings, Inc. (b) | 2,845,102 | 16,359,337 | |
| Tegna, Inc. | 350,960 | 4,429,115 | |
| The Madison Square Garden Co. (a) | 25,883 | 5,500,396 | |
| The McClatchy Co. Class A (a) | 6,072 | 44,204 | |
| The New York Times Co. Class A | 207,571 | 3,871,199 | |
| The Walt Disney Co. | 2,487,987 | 251,784,284 | |
| Time Warner, Inc. | 1,326,649 | 134,124,214 | |
| Time, Inc. | 173,717 | 2,284,379 | |
| Townsquare Media, Inc. (a) | 1,285 | 12,824 | |
| Tribune Media Co. Class A | 123,479 | 4,947,804 | |
| tronc, Inc. (a) | 51,781 | 751,342 | |
| Twenty-First Century Fox, Inc.: | |||
| Class A | 1,810,082 | 49,940,162 | |
| Class B | 830,892 | 22,517,173 | |
| Urban One, Inc. Class D (non-vtg.) (a) | 32,336 | 56,588 | |
| Viacom, Inc. Class B (non-vtg.) | 632,315 | 18,084,209 | |
| World Wrestling Entertainment, Inc. Class A | 69,670 | 1,518,806 | |
| 1,314,807,344 | |||
| Multiline Retail - 0.3% | |||
| Big Lots, Inc. (b) | 72,215 | 3,437,434 | |
| Dillard's, Inc. Class A (b) | 40,152 | 2,441,242 | |
| Dollar General Corp. | 429,076 | 31,133,755 | |
| Dollar Tree, Inc. (a) | 405,144 | 32,265,668 | |
| Fred's, Inc. Class A (b) | 52,965 | 313,553 | |
| JC Penney Corp., Inc. (a)(b) | 535,524 | 2,072,478 | |
| Kohl's Corp. | 300,366 | 11,948,559 | |
| Macy's, Inc. | 517,789 | 10,754,478 | |
| Nordstrom, Inc. (b) | 185,779 | 8,289,459 | |
| Ollie's Bargain Outlet Holdings, Inc. (a)(b) | 79,892 | 3,343,480 | |
| Sears Holdings Corp. (a)(b) | 98,150 | 805,812 | |
| Target Corp. | 944,954 | 51,528,342 | |
| The Bon-Ton Stores, Inc. (a)(b) | 19,775 | 13,052 | |
| Tuesday Morning Corp. (a)(b) | 61,992 | 139,482 | |
| 158,486,794 | |||
| Specialty Retail - 2.0% | |||
| Aaron's, Inc. Class A | 106,680 | 4,722,724 | |
| Abercrombie & Fitch Co. Class A | 133,398 | 1,699,491 | |
| Advance Auto Parts, Inc. | 124,902 | 12,227,906 | |
| America's Car Mart, Inc. (a)(b) | 10,422 | 400,205 | |
| American Eagle Outfitters, Inc. | 303,607 | 3,628,104 | |
| Armstrong Flooring, Inc. (a) | 37,094 | 553,442 | |
| Asbury Automotive Group, Inc. (a) | 40,476 | 2,179,633 | |
| Ascena Retail Group, Inc. (a)(b) | 266,405 | 543,466 | |
| AutoNation, Inc. (a)(b) | 112,063 | 5,084,298 | |
| AutoZone, Inc. (a) | 48,090 | 25,412,680 | |
| Barnes & Noble Education, Inc. (a) | 60,796 | 314,923 | |
| Barnes & Noble, Inc. | 82,041 | 635,818 | |
| bebe stores, Inc. (a)(b) | 6,695 | 36,956 | |
| Bed Bath & Beyond, Inc. | 241,299 | 6,657,439 | |
| Best Buy Co., Inc. | 452,794 | 24,568,602 | |
| Big 5 Sporting Goods Corp. | 23,104 | 176,746 | |
| Boot Barn Holdings, Inc. (a)(b) | 24,133 | 195,477 | |
| Build-A-Bear Workshop, Inc. (a) | 15,205 | 139,886 | |
| Burlington Stores, Inc. (a) | 117,818 | 10,265,482 | |
| Cabela's, Inc. Class A (a) | 89,589 | 4,810,929 | |
| Caleres, Inc. | 81,369 | 2,195,336 | |
| CarMax, Inc. (a)(b) | 313,461 | 21,048,906 | |
| Cars.com, Inc. (b) | 116,986 | 3,025,258 | |
| Chico's FAS, Inc. | 231,778 | 1,780,055 | |
| Christopher & Banks Corp. (a) | 57,707 | 74,442 | |
| Citi Trends, Inc. | 19,731 | 357,723 | |
| Conn's, Inc. (a)(b) | 39,904 | 692,334 | |
| Destination Maternity Corp. (a) | 22,235 | 26,682 | |
| Destination XL Group, Inc. (a)(b) | 51,406 | 95,101 | |
| Dick's Sporting Goods, Inc. | 145,373 | 3,832,032 | |
| DSW, Inc. Class A (b) | 144,844 | 2,683,959 | |
| Express, Inc. (a) | 127,643 | 813,086 | |
| Finish Line, Inc. Class A (b) | 63,867 | 532,012 | |
| Five Below, Inc. (a)(b) | 100,983 | 4,803,761 | |
| Floor & Decor Holdings, Inc. Class A | 44,505 | 1,599,510 | |
| Foot Locker, Inc. | 223,548 | 7,875,596 | |
| Francesca's Holdings Corp. (a) | 57,702 | 418,917 | |
| GameStop Corp. Class A | 164,497 | 3,043,195 | |
| Gap, Inc. (b) | 381,256 | 9,005,267 | |
| Genesco, Inc. (a) | 32,141 | 679,782 | |
| GNC Holdings, Inc. Class A (b) | 120,441 | 999,660 | |
| Group 1 Automotive, Inc. | 30,918 | 1,855,698 | |
| Guess?, Inc. | 102,345 | 1,594,535 | |
| Haverty Furniture Companies, Inc. | 30,217 | 708,589 | |
| Hibbett Sports, Inc. (a)(b) | 34,547 | 424,928 | |
| Home Depot, Inc. | 2,049,223 | 307,117,051 | |
| Kirkland's, Inc. (a) | 21,240 | 244,897 | |
| L Brands, Inc. (b) | 421,006 | 15,248,837 | |
| Lithia Motors, Inc. Class A (sub. vtg.) (b) | 38,999 | 4,211,892 | |
| Lowe's Companies, Inc. | 1,466,570 | 108,364,857 | |
| Lumber Liquidators Holdings, Inc. (a)(b) | 49,362 | 1,852,556 | |
| MarineMax, Inc. (a) | 36,815 | 594,562 | |
| Michaels Companies, Inc. (a)(b) | 197,854 | 4,441,822 | |
| Monro, Inc. (b) | 59,370 | 2,831,949 | |
| Murphy U.S.A., Inc. (a)(b) | 58,955 | 3,800,239 | |
| New York & Co., Inc. (a) | 34,393 | 66,378 | |
| O'Reilly Automotive, Inc. (a) | 154,690 | 30,339,350 | |
| Office Depot, Inc. | 882,988 | 3,788,019 | |
| Party City Holdco, Inc. (a)(b) | 50,325 | 702,034 | |
| Penske Automotive Group, Inc. | 71,056 | 3,009,932 | |
| Perfumania Holdings, Inc. (a) | 876 | 1,594 | |
| Pier 1 Imports, Inc. | 163,568 | 685,350 | |
| Rent-A-Center, Inc. (b) | 93,716 | 1,133,964 | |
| RH (a)(b) | 55,177 | 2,581,732 | |
| Ross Stores, Inc. | 676,887 | 39,564,045 | |
| Sally Beauty Holdings, Inc. (a)(b) | 228,422 | 4,246,365 | |
| Sears Hometown & Outlet Stores, Inc. (a)(b) | 10,000 | 17,500 | |
| Select Comfort Corp. (a)(b) | 68,724 | 2,029,420 | |
| Shoe Carnival, Inc. | 21,330 | 428,733 | |
| Signet Jewelers Ltd. (b) | 116,151 | 7,325,644 | |
| Sonic Automotive, Inc. Class A (sub. vtg.) | 40,396 | 731,168 | |
| Sportsman's Warehouse Holdings, Inc. (a)(b) | 48,606 | 201,715 | |
| Stage Stores, Inc. (b) | 38,699 | 70,432 | |
| Staples, Inc. | 1,145,552 | 11,701,814 | |
| Stein Mart, Inc. (b) | 40,412 | 50,515 | |
| Tailored Brands, Inc. (b) | 76,887 | 908,804 | |
| The Buckle, Inc. (b) | 40,527 | 573,457 | |
| The Cato Corp. Class A (sub. vtg.) | 36,544 | 480,919 | |
| The Children's Place Retail Stores, Inc. | 29,482 | 3,129,514 | |
| The Container Store Group, Inc. (a)(b) | 22,029 | 89,438 | |
| Tiffany & Co., Inc. | 181,968 | 16,631,875 | |
| Tile Shop Holdings, Inc. | 56,926 | 856,736 | |
| Tilly's, Inc. | 14,113 | 155,384 | |
| TJX Companies, Inc. | 1,102,027 | 79,676,552 | |
| Tractor Supply Co. (b) | 226,801 | 13,496,928 | |
| Trans World Entertainment Corp. (a) | 2,977 | 4,614 | |
| Ulta Beauty, Inc. | 99,561 | 22,003,977 | |
| Urban Outfitters, Inc. (a)(b) | 143,484 | 2,932,813 | |
| Vitamin Shoppe, Inc. (a)(b) | 45,231 | 241,986 | |
| West Marine, Inc. | 26,644 | 345,573 | |
| Williams-Sonoma, Inc. (b) | 139,872 | 6,434,112 | |
| Winmark Corp. | 3,184 | 419,810 | |
| Zumiez, Inc. (a)(b) | 31,066 | 386,772 | |
| 880,574,201 | |||
| Textiles, Apparel & Luxury Goods - 0.6% | |||
| Carter's, Inc. | 82,628 | 7,164,674 | |
| Cherokee, Inc. (a) | 20,319 | 93,467 | |
| Coach, Inc. | 480,314 | 20,029,094 | |
| Columbia Sportswear Co. | 46,822 | 2,682,432 | |
| Crocs, Inc. (a) | 126,644 | 1,130,931 | |
| Culp, Inc. | 12,256 | 355,424 | |
| Deckers Outdoor Corp. (a) | 55,355 | 3,537,185 | |
| Delta Apparel, Inc. (a) | 4,312 | 84,601 | |
| Differential Brands Group, Inc. (a) | 1,083 | 1,787 | |
| Emerald Expositions Events, Inc. (b) | 58,843 | 1,279,247 | |
| Fossil Group, Inc. (a)(b) | 73,701 | 610,981 | |
| G-III Apparel Group Ltd. (a)(b) | 69,854 | 1,920,985 | |
| Hanesbrands, Inc. (b) | 627,279 | 15,217,789 | |
| Iconix Brand Group, Inc. (a)(b) | 101,691 | 568,453 | |
| J.Jill, Inc. | 24,557 | 238,448 | |
| Lakeland Industries, Inc. (a) | 6,813 | 96,063 | |
| lululemon athletica, Inc. (a) | 180,400 | 10,382,020 | |
| Michael Kors Holdings Ltd. (a) | 277,238 | 11,704,988 | |
| Movado Group, Inc. | 39,217 | 1,088,272 | |
| NIKE, Inc. Class B | 2,276,900 | 120,243,089 | |
| Oxford Industries, Inc. | 25,955 | 1,500,459 | |
| Perry Ellis International, Inc. (a) | 15,961 | 348,429 | |
| PVH Corp. | 132,712 | 16,707,114 | |
| Ralph Lauren Corp. | 91,187 | 8,014,425 | |
| Rocky Brands, Inc. | 8,326 | 107,405 | |
| Sequential Brands Group, Inc. (a)(b) | 82,806 | 252,558 | |
| Skechers U.S.A., Inc. Class A (sub. vtg.) (a) | 228,771 | 6,046,418 | |
| Steven Madden Ltd. (a) | 86,611 | 3,672,306 | |
| Superior Uniform Group, Inc. | 11,974 | 263,667 | |
| Under Armour, Inc.: | |||
| Class A (sub. vtg.) (a)(b) | 312,447 | 5,046,019 | |
| Class C (non-vtg.) (a)(b) | 313,320 | 4,731,132 | |
| Unifi, Inc. (a) | 22,047 | 685,221 | |
| Vera Bradley, Inc. (a) | 29,957 | 270,811 | |
| VF Corp. | 554,884 | 34,885,557 | |
| Vince Holding Corp. (a)(b) | 26,763 | 12,204 | |
| Wolverine World Wide, Inc. | 170,818 | 4,492,513 | |
| 285,466,168 | |||
| TOTAL CONSUMER DISCRETIONARY | 5,472,013,562 | ||
| CONSUMER STAPLES - 7.5% | |||
| Beverages - 1.7% | |||
| Boston Beer Co., Inc. Class A (a)(b) | 14,791 | 2,203,859 | |
| Brown-Forman Corp.: | |||
| Class A | 46,010 | 2,559,076 | |
| Class B (non-vtg.) | 362,686 | 19,236,865 | |
| Castle Brands, Inc. (a)(b) | 173,742 | 246,714 | |
| Coca-Cola Bottling Co. Consolidated | 7,832 | 1,672,837 | |
| Constellation Brands, Inc. Class A (sub. vtg.) | 292,803 | 58,589,880 | |
| Craft Brew Alliance, Inc. (a)(b) | 14,306 | 248,924 | |
| Dr. Pepper Snapple Group, Inc. | 315,830 | 28,756,322 | |
| MGP Ingredients, Inc. (b) | 19,078 | 1,072,756 | |
| Molson Coors Brewing Co. Class B | 313,413 | 28,128,817 | |
| Monster Beverage Corp. (a) | 699,904 | 39,068,641 | |
| National Beverage Corp. (b) | 22,740 | 2,642,615 | |
| New Age Beverages Corp. | 33,316 | 140,927 | |
| PepsiCo, Inc. | 2,449,315 | 283,459,225 | |
| Primo Water Corp. (a)(b) | 33,980 | 372,081 | |
| REED'S, Inc. (a)(b) | 1,830 | 4,209 | |
| The Coca-Cola Co. | 6,586,084 | 299,996,126 | |
| 768,399,874 | |||
| Food & Staples Retailing - 1.6% | |||
| Andersons, Inc. | 47,014 | 1,497,396 | |
| Casey's General Stores, Inc. (b) | 65,556 | 6,910,914 | |
| Chefs' Warehouse Holdings (a)(b) | 34,201 | 589,967 | |
| Costco Wholesale Corp. | 750,932 | 117,701,082 | |
| CVS Health Corp. | 1,751,876 | 135,490,090 | |
| Ingles Markets, Inc. Class A | 21,439 | 470,586 | |
| Kroger Co. | 1,557,377 | 34,059,835 | |
| Natural Grocers by Vitamin Cottage, Inc. (a)(b) | 12,082 | 67,901 | |
| Performance Food Group Co. (a) | 157,320 | 4,373,496 | |
| PriceSmart, Inc. | 38,992 | 3,168,100 | |
| Rite Aid Corp. (a)(b) | 1,799,849 | 4,355,635 | |
| Smart & Final Stores, Inc. (a)(b) | 46,551 | 328,185 | |
| SpartanNash Co. | 61,272 | 1,509,742 | |
| Sprouts Farmers Market LLC (a) | 217,629 | 4,339,522 | |
| SUPERVALU, Inc. (a) | 107,946 | 2,157,841 | |
| Sysco Corp. | 846,395 | 44,579,625 | |
| United Natural Foods, Inc. (a)(b) | 87,309 | 3,033,988 | |
| Village Super Market, Inc. Class A | 8,594 | 198,779 | |
| Wal-Mart Stores, Inc. | 2,527,879 | 197,351,514 | |
| Walgreens Boots Alliance, Inc. | 1,462,141 | 119,164,492 | |
| Weis Markets, Inc. | 29,625 | 1,309,721 | |
| Welbilt, Inc. (a)(b) | 274,877 | 5,470,052 | |
| 688,128,463 | |||
| Food Products - 1.3% | |||
| Alico, Inc. | 4,002 | 128,064 | |
| Amplify Snack Brands, Inc. (a)(b) | 47,704 | 343,946 | |
| Archer Daniels Midland Co. | 974,171 | 40,252,746 | |
| B&G Foods, Inc. Class A (b) | 116,520 | 3,553,860 | |
| Blue Buffalo Pet Products, Inc. (a)(b) | 164,852 | 4,246,588 | |
| Bunge Ltd. | 243,028 | 18,137,180 | |
| Cal-Maine Foods, Inc. (a)(b) | 58,088 | 2,117,308 | |
| Calavo Growers, Inc. (b) | 26,199 | 1,759,263 | |
| Campbell Soup Co. | 330,429 | 15,265,820 | |
| Coffee Holding Co., Inc. (a) | 3,401 | 12,958 | |
| ConAgra Foods, Inc. | 702,119 | 22,790,783 | |
| Darling International, Inc. (a) | 281,119 | 4,891,471 | |
| Dean Foods Co. | 156,497 | 1,721,467 | |
| Farmer Brothers Co. (a) | 27,261 | 887,346 | |
| Flowers Foods, Inc. | 308,740 | 5,362,814 | |
| Fresh Del Monte Produce, Inc. | 55,694 | 2,617,061 | |
| Freshpet, Inc. (a)(b) | 33,847 | 536,475 | |
| General Mills, Inc. (b) | 975,500 | 51,955,130 | |
| Hormel Foods Corp. (b) | 467,102 | 14,358,715 | |
| Hostess Brands, Inc. Class A (a)(b) | 143,616 | 1,915,837 | |
| Ingredion, Inc. | 123,585 | 15,302,295 | |
| Inventure Foods, Inc. (a)(b) | 20,016 | 68,655 | |
| J&J Snack Foods Corp. | 25,667 | 3,272,286 | |
| John B. Sanfilippo & Son, Inc. (b) | 17,222 | 1,068,797 | |
| Kellogg Co. | 425,266 | 27,837,912 | |
| Lamb Weston Holdings, Inc. | 239,740 | 10,903,375 | |
| Lancaster Colony Corp. | 32,520 | 3,787,604 | |
| Landec Corp. (a) | 35,757 | 464,841 | |
| Lifeway Foods, Inc. (a) | 1,962 | 17,069 | |
| Limoneira Co. | 13,723 | 307,395 | |
| McCormick & Co., Inc. (non-vtg.) | 192,200 | 18,283,986 | |
| Mondelez International, Inc. | 2,599,304 | 105,687,701 | |
| Omega Protein Corp. | 32,056 | 506,485 | |
| Pilgrim's Pride Corp. (a)(b) | 94,260 | 2,775,957 | |
| Pinnacle Foods, Inc. | 202,857 | 12,031,449 | |
| Post Holdings, Inc. (a) | 113,903 | 9,696,562 | |
| Sanderson Farms, Inc. (b) | 34,070 | 5,026,006 | |
| Seaboard Corp. | 460 | 1,976,008 | |
| Seneca Foods Corp. Class A (a) | 9,032 | 269,154 | |
| Snyders-Lance, Inc. | 142,680 | 5,067,994 | |
| The Hain Celestial Group, Inc. (a) | 175,026 | 7,039,546 | |
| The Hershey Co. | 243,763 | 25,575,614 | |
| The J.M. Smucker Co. | 195,769 | 20,508,760 | |
| The Kraft Heinz Co. | 1,023,514 | 82,648,756 | |
| Tootsie Roll Industries, Inc. (b) | 47,006 | 1,755,674 | |
| TreeHouse Foods, Inc. (a)(b) | 96,338 | 6,453,683 | |
| Tyson Foods, Inc. Class A | 497,168 | 31,470,734 | |
| 592,659,130 | |||
| Household Products - 1.5% | |||
| Central Garden & Pet Co. Class A (non-vtg.) (a) | 79,976 | 2,726,382 | |
| Church & Dwight Co., Inc. | 437,941 | 21,971,500 | |
| Clorox Co. | 220,454 | 30,539,493 | |
| Colgate-Palmolive Co. | 1,512,806 | 108,377,422 | |
| Energizer Holdings, Inc. | 99,799 | 4,406,126 | |
| HRG Group, Inc. (a) | 243,938 | 3,851,781 | |
| Kimberly-Clark Corp. | 606,754 | 74,806,701 | |
| Oil-Dri Corp. of America | 2,105 | 85,674 | |
| Orchids Paper Products Co. (b) | 12,438 | 126,868 | |
| Procter & Gamble Co. | 4,376,206 | 403,792,528 | |
| Spectrum Brands Holdings, Inc. (b) | 41,932 | 4,610,843 | |
| WD-40 Co. | 25,080 | 2,732,466 | |
| 658,027,784 | |||
| Personal Products - 0.2% | |||
| Avon Products, Inc. (a) | 750,697 | 1,869,236 | |
| Coty, Inc. Class A | 800,297 | 13,268,924 | |
| Cyanotech Corp. (a) | 2,300 | 10,810 | |
| Edgewell Personal Care Co. (a) | 95,191 | 7,228,805 | |
| elf Beauty, Inc. (b) | 35,801 | 740,723 | |
| Estee Lauder Companies, Inc. Class A | 380,597 | 40,720,073 | |
| Herbalife Ltd. (a)(b) | 121,381 | 8,376,503 | |
| Inter Parfums, Inc. | 29,691 | 1,171,310 | |
| LifeVantage Corp. (a) | 19,206 | 79,897 | |
| Mannatech, Inc. | 599 | 9,015 | |
| MediFast, Inc. | 40,989 | 2,320,797 | |
| Natural Health Trends Corp. | 11,452 | 231,101 | |
| Nature's Sunshine Products, Inc. | 6,985 | 73,692 | |
| Nu Skin Enterprises, Inc. Class A | 84,187 | 5,121,095 | |
| Revlon, Inc. (a)(b) | 25,388 | 429,057 | |
| The Female Health Co. (a) | 11,731 | 18,887 | |
| USANA Health Sciences, Inc. (a) | 20,348 | 1,204,602 | |
| 82,874,527 | |||
| Tobacco - 1.2% | |||
| 22nd Century Group, Inc. (a)(b) | 98,310 | 216,282 | |
| Alliance One International, Inc. (a) | 8,945 | 93,028 | |
| Altria Group, Inc. | 3,307,146 | 209,673,056 | |
| Philip Morris International, Inc. | 2,662,623 | 311,340,507 | |
| Universal Corp. | 43,930 | 2,512,796 | |
| Vector Group Ltd. (b) | 180,167 | 3,891,607 | |
| 527,727,276 | |||
| TOTAL CONSUMER STAPLES | 3,317,817,054 | ||
| ENERGY - 5.3% | |||
| Energy Equipment & Services - 0.8% | |||
| Archrock, Inc. | 117,660 | 1,200,132 | |
| Aspen Aerogels, Inc. (a) | 9,858 | 40,319 | |
| Atwood Oceanics, Inc. (a)(b) | 121,695 | 799,536 | |
| Baker Hughes, a GE Co. Class A | 724,941 | 24,575,500 | |
| Basic Energy Services, Inc. (a) | 42,877 | 610,568 | |
| Bristow Group, Inc. (b) | 47,191 | 388,854 | |
| C&J Energy Services, Inc. | 129,736 | 3,277,131 | |
| Carbo Ceramics, Inc. (a)(b) | 36,697 | 240,732 | |
| Core Laboratories NV (b) | 76,525 | 6,747,975 | |
| Dawson Geophysical Co. (a) | 19,081 | 79,759 | |
| Diamond Offshore Drilling, Inc. (a)(b) | 99,661 | 1,132,149 | |
| Dril-Quip, Inc. (a)(b) | 70,873 | 2,661,281 | |
| ENGlobal Corp. (a) | 5,637 | 7,272 | |
| Ensco PLC Class A (b) | 494,916 | 2,103,393 | |
| Era Group, Inc. (a) | 30,759 | 270,987 | |
| Exterran Corp. (a) | 59,232 | 1,643,096 | |
| Fairmount Santrol Holidings, Inc. (a)(b) | 254,086 | 777,503 | |
| Forum Energy Technologies, Inc. (a)(b) | 122,886 | 1,425,478 | |
| Frank's International NV (b) | 90,617 | 569,075 | |
| Geospace Technologies Corp. (a)(b) | 25,924�� | 391,193 | |
| Gulf Island Fabrication, Inc. | 17,861 | 200,043 | |
| Halliburton Co. | 1,482,857 | 57,786,937 | |
| Helix Energy Solutions Group, Inc. (a) | 241,675 | 1,515,302 | |
| Helmerich & Payne, Inc. (b) | 179,550 | 7,602,147 | |
| Hornbeck Offshore Services, Inc. (a)(b) | 41,835 | 115,883 | |
| Independence Contract Drilling, Inc. (a) | 45,769 | 147,376 | |
| ION Geophysical Corp. (a)(b) | 10,360 | 76,146 | |
| Mammoth Energy Services, Inc. (b) | 11,194 | 154,253 | |
| Matrix Service Co. (a) | 47,813 | 566,584 | |
| McDermott International, Inc. (a) | 460,303 | 2,826,260 | |
| Mitcham Industries, Inc. (a) | 23,287 | 87,326 | |
| Nabors Industries Ltd. | 457,542 | 2,996,900 | |
| National Oilwell Varco, Inc. | 640,133 | 19,632,879 | |
| Natural Gas Services Group, Inc. (a) | 21,602 | 509,807 | |
| NCS Multistage Holdings, Inc. | 41,493 | 819,902 | |
| Newpark Resources, Inc. (a) | 153,002 | 1,231,666 | |
| Noble Corp. (b) | 421,660 | 1,374,612 | |
| Oceaneering International, Inc. | 170,909 | 3,853,998 | |
| Oil States International, Inc. (a) | 89,813 | 1,953,433 | |
| Parker Drilling Co. (a) | 180,331 | 198,364 | |
| Patterson-UTI Energy, Inc. | 274,325 | 4,380,970 | |
| PHI, Inc. (non-vtg.) (a) | 18,377 | 201,963 | |
| Pioneer Energy Services Corp. (a) | 120,721 | 205,226 | |
| Profire Energy, Inc. (a) | 14,213 | 21,462 | |
| RigNet, Inc. (a) | 15,376 | 246,016 | |
| Rowan Companies PLC (a)(b) | 205,609 | 2,004,688 | |
| RPC, Inc. (b) | 95,956 | 1,862,506 | |
| Schlumberger Ltd. | 2,382,237 | 151,295,872 | |
| SEACOR Holdings, Inc. (a)(b) | 30,397 | 1,166,333 | |
| Smart Sand, Inc. | 41,295 | 246,531 | |
| Solaris Oilfield Infrastructure, Inc. Class A | 17,397 | 246,342 | |
| Superior Energy Services, Inc. (a)(b) | 268,168 | 2,209,704 | |
| Synthesis Energy Systems, Inc. (a)(b) | 138,081 | 56,254 | |
| TechnipFMC PLC | 812,785 | 20,994,237 | |
| Tesco Corp. (a) | 127,576 | 561,334 | |
| TETRA Technologies, Inc. (a) | 186,418 | 384,021 | |
| Transocean Ltd. (United States) (a)(b) | 642,424 | 5,242,180 | |
| U.S. Silica Holdings, Inc. | 125,689 | 3,419,998 | |
| Unit Corp. (a) | 95,665 | 1,522,987 | |
| Weatherford International PLC (b) | 1,680,088 | 6,434,737 | |
| Willbros Group, Inc. (a) | 69,552 | 153,014 | |
| 355,448,126 | |||
| Oil, Gas & Consumable Fuels - 4.5% | |||
| Abraxas Petroleum Corp. (a) | 241,078 | 409,833 | |
| Adams Resources & Energy, Inc. | 2,090 | 72,460 | |
| Aemetis, Inc. (a) | 10,055 | 8,678 | |
| Amyris, Inc. (a)(b) | 3,925 | 9,695 | |
| Anadarko Petroleum Corp. | 953,300 | 39,018,569 | |
| Andeavor | 257,277 | 25,766,292 | |
| Antero Resources Corp. (a)(b) | 254,152 | 5,004,253 | |
| Apache Corp. (b) | 667,324 | 25,918,864 | |
| Approach Resources, Inc. (a)(b) | 60,041 | 166,914 | |
| Arch Coal, Inc. | 42,349 | 3,382,415 | |
| Ardmore Shipping Corp. (b) | 44,385 | 359,519 | |
| Barnwell Industries, Inc. (a) | 2,847 | 5,125 | |
| Bill Barrett Corp. (a)(b) | 120,934 | 361,593 | |
| Bonanza Creek Energy, Inc. | 3,794 | 98,606 | |
| Bonanza Creek Energy, Inc. (c) | 47,310 | 0 | |
| Cabot Oil & Gas Corp. | 796,005 | 20,337,928 | |
| California Resources Corp. (a)(b) | 64,079 | 499,816 | |
| Callon Petroleum Co. (a)(b) | 334,854 | 3,469,087 | |
| Camber Energy, Inc. (a)(b) | 376 | 73 | |
| Carrizo Oil & Gas, Inc. (a)(b) | 129,850 | 1,745,184 | |
| Centennial Resource Development, Inc. Class A (b) | 257,479 | 4,451,812 | |
| Cheniere Energy, Inc. (a) | 408,060 | 17,460,887 | |
| Chesapeake Energy Corp. (a)(b) | 1,267,641 | 4,614,213 | |
| Chevron Corp. | 3,246,859 | 349,426,966 | |
| Cimarex Energy Co. | 163,321 | 16,281,470 | |
| Clean Energy Fuels Corp. (a)(b) | 207,470 | 493,779 | |
| Cloud Peak Energy, Inc. (a) | 152,269 | 478,125 | |
| Cobalt International Energy, Inc. (a)(b) | 37,473 | 70,449 | |
| Comstock Resources, Inc. (a)(b) | 24,083 | 154,613 | |
| Concho Resources, Inc. (a) | 252,785 | 28,051,551 | |
| ConocoPhillips Co. | 2,125,019 | 92,778,330 | |
| CONSOL Energy, Inc. | 300,644 | 4,374,370 | |
| Contango Oil & Gas Co. (a) | 51,306 | 235,495 | |
| Continental Resources, Inc. (a)(b) | 146,908 | 4,983,119 | |
| CVR Energy, Inc. (b) | 23,933 | 512,645 | |
| Delek U.S. Holdings, Inc. | 119,223 | 2,947,193 | |
| Denbury Resources, Inc. (a)(b) | 635,481 | 673,610 | |
| Devon Energy Corp. | 895,520 | 28,119,328 | |
| Diamondback Energy, Inc. (a) | 166,969 | 15,159,116 | |
| Earthstone Energy, Inc. (a)(b) | 10,660 | 102,229 | |
| Eclipse Resources Corp. (a) | 169,538 | 395,024 | |
| Energen Corp. (a) | 161,072 | 8,259,772 | |
| Energy XXI Gulf Coast, Inc. (b) | 77,532 | 810,209 | |
| EOG Resources, Inc. | 987,307 | 83,911,222 | |
| EP Energy Corp. (a)(b) | 91,298 | 268,416 | |
| EQT Corp. (b) | 294,556 | 18,362,621 | |
| Evolution Petroleum Corp. | 53,534 | 372,061 | |
| EXCO Resources, Inc. (a)(b) | 21,120 | 37,805 | |
| Extraction Oil & Gas, Inc. (b) | 65,143 | 855,979 | |
| Exxon Mobil Corp. | 7,260,245 | 554,174,501 | |
| Gastar Exploration, Inc. (a)(b) | 285,601 | 168,562 | |
| Gener8 Maritime, Inc. (a)(b) | 186,799 | 840,596 | |
| Gevo, Inc. (a)(b) | 7,805 | 5,073 | |
| Green Plains, Inc. (b) | 65,482 | 1,214,691 | |
| Gulfport Energy Corp. (a) | 275,383 | 3,450,549 | |
| Halcon Resources Corp. (a)(b) | 43,182 | 267,297 | |
| Hallador Energy Co. | 29,822 | 172,968 | |
| Hess Corp. | 463,865 | 18,044,349 | |
| HollyFrontier Corp. | 300,302 | 9,402,456 | |
| Houston American Energy Corp. (a)(b) | 36,485 | 17,878 | |
| International Seaways, Inc. | 72,136 | 1,330,188 | |
| Isramco, Inc. (a) | 123 | 13,850 | |
| Jagged Peak Energy, Inc. (b) | 69,960 | 896,188 | |
| Jones Energy, Inc. (b) | 91,542 | 90,627 | |
| Kinder Morgan, Inc. | 3,278,366 | 63,370,815 | |
| Kosmos Energy Ltd. (a)(b) | 380,364 | 2,677,763 | |
| Laredo Petroleum, Inc. (a)(b) | 240,236 | 2,983,731 | |
| Lilis Energy, Inc. (a)(b) | 19,185 | 70,217 | |
| Lonestar Resources U.S., Inc. (a) | 18,853 | 61,461 | |
| Marathon Oil Corp. | 1,454,381 | 16,172,717 | |
| Marathon Petroleum Corp. | 886,982 | 46,522,206 | |
| Matador Resources Co. (a)(b) | 153,132 | 3,610,853 | |
| Murphy Oil Corp. (b) | 270,006 | 6,118,336 | |
| Newfield Exploration Co. (a) | 346,789 | 9,061,597�� | |
| Noble Energy, Inc. | 783,196 | 18,616,569 | |
| Northern Oil & Gas, Inc. (a)(b) | 93,777 | 79,710 | |
| Oasis Petroleum, Inc. (a)(b) | 395,968 | 2,890,566 | |
| Occidental Petroleum Corp. | 1,319,327 | 78,763,822 | |
| ONEOK, Inc. | 645,368 | 34,953,131 | |
| Overseas Shipholding Group, Inc. (a) | 80,103 | 181,033 | |
| Pacific Ethanol, Inc. (a) | 51,285 | 256,425 | |
| Panhandle Royalty Co. Class A | 32,305 | 681,636 | |
| Par Pacific Holdings, Inc. (a)(b) | 53,028 | 944,429 | |
| Parsley Energy, Inc. Class A (a) | 385,750 | 9,663,038 | |
| PBF Energy, Inc. Class A (b) | 185,150 | 4,384,352 | |
| PDC Energy, Inc. (a) | 95,525 | 3,756,998 | |
| Peabody Energy Corp. | 204,690 | 5,936,010 | |
| Penn Virginia Corp. (b) | 9,594 | 369,369 | |
| Petroquest Energy, Inc. (a) | 17,737 | 31,749 | |
| Phillips 66 Co. | 754,225 | 63,211,597 | |
| Pioneer Natural Resources Co. | 290,835 | 37,706,758 | |
| QEP Resources, Inc. (a) | 417,391 | 3,151,302 | |
| Range Resources Corp. (b) | 313,387 | 5,440,398 | |
| Renewable Energy Group, Inc. (a)(b) | 62,544 | 756,782 | |
| Resolute Energy Corp. (a)(b) | 30,507 | 901,482 | |
| Rex American Resources Corp. (a) | 9,008 | 780,273 | |
| Rex Energy Corp. (a)(b) | 6,338 | 14,514 | |
| Rice Energy, Inc. (a) | 273,274 | 7,476,777 | |
| Ring Energy, Inc. (a) | 84,537 | 1,007,681 | |
| RSP Permian, Inc. (a) | 181,533 | 5,696,506 | |
| Sanchez Energy Corp. (a)(b) | 110,256 | 482,921 | |
| SandRidge Energy, Inc. (a) | 37,708 | 649,332 | |
| SemGroup Corp. Class A (b) | 87,119 | 2,238,958 | |
| SilverBow Resources, Inc. (a)(b) | 9,186 | 198,785 | |
| SM Energy Co. | 163,665 | 2,186,564 | |
| Southwestern Energy Co. (a) | 872,953 | 4,757,594 | |
| Src Energy, Inc. (a)(b) | 344,278 | 2,716,353 | |
| Stone Energy Corp. (b) | 44,486 | 1,076,561 | |
| Syntroleum Corp. (a)(b)(c) | 15,037 | 0 | |
| Targa Resources Corp. | 367,453 | 16,377,380 | |
| Teekay Corp. (b) | 95,089 | 876,721 | |
| Tellurian, Inc. (a)(b) | 82,724 | 764,370 | |
| Tengasco, Inc. (a) | 1,261 | 832 | |
| The Williams Companies, Inc. | 1,418,085 | 42,159,667 | |
| Torchlight Energy Resources, Inc. (a)(b) | 48,218 | 65,576 | |
| TransAtlantic Petroleum Ltd. (a) | 18,382 | 13,787 | |
| U.S. Energy Corp. (a) | 2,263 | 1,720 | |
| Uranium Energy Corp. (a)(b) | 246,510 | 325,393 | |
| VAALCO Energy, Inc. (a) | 68,248 | 49,650 | |
| Valero Energy Corp. | 765,807 | 52,151,457 | |
| Vertex Energy, Inc. (a)(b) | 17,824 | 14,259 | |
| W&T Offshore, Inc. (a)(b) | 37,319 | 71,279 | |
| Warrior Metropolitan Coal, Inc. | 102,882 | 2,807,650 | |
| Westmoreland Coal Co. (a) | 31,012 | 72,258 | |
| Westwater Resources, Inc. (a)(b) | 2,190 | 2,978 | |
| Whiting Petroleum Corp. (a)(b) | 451,901 | 2,019,997 | |
| WildHorse Resource Development Corp. (b) | 44,975 | 490,677 | |
| World Fuel Services Corp. | 116,948 | 4,039,384 | |
| WPX Energy, Inc. (a) | 680,691 | 6,800,103 | |
| Zion Oil & Gas, Inc. (a)(b) | 91,553 | 305,787 | |
| 1,983,387,682 | |||
| TOTAL ENERGY | 2,338,835,808 | ||
| FINANCIALS - 14.6% | |||
| Banks - 6.3% | |||
| 1st Source Corp. | 33,223 | 1,550,517 | |
| Access National Corp. | 21,459 | 551,067 | |
| ACNB Corp. | 3,789 | 99,082 | |
| Allegiance Bancshares, Inc. (a) | 20,938 | 712,939 | |
| American National Bankshares, Inc. | 2,748 | 100,302 | |
| Ameris Bancorp | 68,985 | 3,038,789 | |
| Ames National Corp. | 2,652 | 71,869 | |
| Arrow Financial Corp. | 16,949 | 547,453 | |
| Associated Banc-Corp. | 269,062 | 5,892,458 | |
| Atlantic Capital Bancshares, Inc. (a) | 27,339 | 490,735 | |
| Banc of California, Inc. (b) | 80,001 | 1,484,019 | |
| BancFirst Corp. | 35,422 | 1,785,269 | |
| Bancorp, Inc., Delaware (a) | 84,963 | 666,960 | |
| BancorpSouth, Inc. | 133,469 | 3,877,274 | |
| Bank of America Corp. | 17,019,398 | 406,593,418 | |
| Bank of Commerce Holdings (b) | 29,023 | 306,193 | |
| Bank of Hawaii Corp. | 74,301 | 5,805,137 | |
| Bank of Marin Bancorp | 8,356 | 546,900 | |
| Bank of the Ozarks, Inc. | 201,654 | 8,663,056 | |
| BankUnited, Inc. | 186,241 | 6,198,100 | |
| Banner Corp. | 51,093 | 2,816,246 | |
| Bar Harbor Bankshares | 27,763 | 729,056 | |
| BB&T Corp. | 1,389,355 | 64,035,372 | |
| BCB Bancorp, Inc. | 11,980 | 170,116 | |
| Berkshire Hills Bancorp, Inc. | 64,958 | 2,195,580 | |
| Blue Hills Bancorp, Inc. | 49,471 | 925,108 | |
| BOK Financial Corp. (b) | 49,801 | 4,007,984 | |
| Boston Private Financial Holdings, Inc. | 148,661 | 2,185,317 | |
| Bridge Bancorp, Inc. | 53,457 | 1,651,821 | |
| Brookline Bancorp, Inc., Delaware | 125,282 | 1,797,797 | |
| Bryn Mawr Bank Corp. | 27,092 | 1,109,417 | |
| C & F Financial Corp. | 1,992 | 93,325 | |
| Camden National Corp. | 25,093 | 978,627 | |
| Capital Bank Financial Corp. Series A | 55,839 | 2,099,546 | |
| Capital City Bank Group, Inc. | 7,146 | 147,851 | |
| Carolina Financial Corp. | 15,721 | 534,986 | |
| Cathay General Bancorp | 122,996 | 4,338,069 | |
| Centerstate Banks of Florida, Inc. | 102,610 | 2,510,867 | |
| Central Pacific Financial Corp. | 46,756 | 1,355,924 | |
| Central Valley Community Bancorp | 4,570 | 89,892 | |
| Century Bancorp, Inc. Class A (non-vtg.) | 686 | 45,825 | |
| Chemical Financial Corp. | 128,787 | 5,848,218 | |
| CIT Group, Inc. | 249,047 | 11,169,758 | |
| Citigroup, Inc. | 4,717,068 | 320,902,136 | |
| Citizens & Northern Corp. | 8,777 | 196,956 | |
| Citizens Financial Group, Inc. | 870,236 | 28,830,919 | |
| City Holding Co. | 25,184 | 1,594,903 | |
| Civista Bancshares, Inc. (b) | 10,636 | 214,954 | |
| CNB Financial Corp., Pennsylvania | 22,243 | 537,391 | |
| CoBiz, Inc. | 52,226 | 890,453 | |
| Columbia Banking Systems, Inc. | 99,994 | 3,716,777 | |
| Comerica, Inc. | 292,599 | 19,969,882 | |
| Commerce Bancshares, Inc. | 166,131 | 9,135,544 | |
| Commerce Union Bancshares, Inc. | 8,584 | 205,930 | |
| Community Bank System, Inc. | 95,374 | 4,907,946 | |
| Community Bankers Trust Corp. (a) | 24,176 | 203,078 | |
| Community Financial Corp. | 3,879 | 135,765 | |
| Community Trust Bancorp, Inc. | 30,823 | 1,311,519 | |
| ConnectOne Bancorp, Inc. | 44,434 | 1,013,095 | |
| CU Bancorp (a) | 27,578 | 983,156 | |
| Cullen/Frost Bankers, Inc. | 95,722 | 8,059,792 | |
| Customers Bancorp, Inc. (a) | 47,427 | 1,336,493 | |
| CVB Financial Corp. | 169,790 | 3,514,653 | |
| Eagle Bancorp, Inc. (a) | 51,420 | 3,198,324 | |
| East West Bancorp, Inc. | 249,361 | 13,807,119 | |
| Enterprise Bancorp, Inc. | 15,551 | 497,476 | |
| Enterprise Financial Services Corp. | 35,692 | 1,363,434 | |
| Equity Bancshares, Inc. (a) | 6,273 | 214,223 | |
| Evans Bancorp, Inc. (b) | 6,302 | 260,273 | |
| Farmers Capital Bank Corp. | 12,316 | 461,234 | |
| Farmers National Banc Corp. | 66,489 | 910,899 | |
| FCB Financial Holdings, Inc. Class A (a) | 80,361 | 3,503,740 | |
| Fidelity Southern Corp. | 33,831 | 739,546 | |
| Fifth Third Bancorp | 1,290,331 | 33,716,349 | |
| Financial Institutions, Inc. | 20,978 | 570,602 | |
| First Bancorp, North Carolina | 37,328 | 1,154,928 | |
| First Bancorp, Puerto Rico (a) | 301,460 | 1,712,293 | |
| First Bancshares, Inc. | 3,982 | 112,292 | |
| First Busey Corp. | 69,369 | 2,001,296 | |
| First Business Finance Services, Inc. | 3,936 | 83,876 | |
| First Citizen Bancshares, Inc. | 15,636 | 5,324,214 | |
| First Commonwealth Financial Corp. | 162,059 | 2,043,564 | |
| First Community Bancshares, Inc. | 14,260 | 367,052 | |
| First Connecticut Bancorp, Inc. | 13,599 | 336,575 | |
| First Financial Bancorp, Ohio | 103,444 | 2,477,484 | |
| First Financial Bankshares, Inc. (b) | 118,200 | 4,733,910 | |
| First Financial Corp., Indiana | 17,277 | 749,822 | |
| First Financial Northwest, Inc. | 2,197 | 35,152 | |
| First Foundation, Inc. (a) | 39,781 | 674,288 | |
| First Hawaiian, Inc. | 99,118 | 2,685,107 | |
| First Horizon National Corp. | 415,890 | 7,157,467 | |
| First Internet Bancorp | 6,364 | 202,375 | |
| First Interstate Bancsystem, Inc. | 47,490 | 1,671,648 | |
| First Merchants Corp. | 71,357 | 2,802,189 | |
| First Mid-Illinois Bancshares, Inc. | 15,730 | 545,516 | |
| First Midwest Bancorp, Inc., Delaware | 157,154 | 3,312,806 | |
| First Northwest Bancorp (a) | 5,375 | 85,248 | |
| First of Long Island Corp. | 37,824 | 1,011,792 | |
| First Republic Bank | 272,217 | 26,418,660 | |
| First South Bancorp, Inc., Virginia | 13,282 | 231,372 | |
| First United Corp. (a) | 3,395 | 53,471 | |
| Flushing Financial Corp. | 47,044 | 1,286,183 | |
| FNB Corp., Pennsylvania | 535,314 | 6,793,135 | |
| Franklin Financial Network, Inc. (a) | 20,997 | 686,602 | |
| Fulton Financial Corp. | 320,846 | 5,598,763 | |
| German American Bancorp, Inc. | 33,825 | 1,100,666 | |
| Glacier Bancorp, Inc. | 124,637 | 4,139,195 | |
| Great Southern Bancorp, Inc. | 16,765 | 834,897 | |
| Great Western Bancorp, Inc. | 100,598 | 3,613,480 | |
| Green Bancorp, Inc. (a) | 40,300 | 808,015 | |
| Guaranty Bancorp | 32,104 | 828,283 | |
| Hancock Holding Co. | 152,688 | 6,710,638 | |
| Hanmi Financial Corp. | 52,514 | 1,402,124 | |
| HarborOne Bancorp, Inc. (a) | 44,762 | 769,459 | |
| Heartland Financial U.S.A., Inc. | 40,533 | 1,844,252 | |
| Heritage Commerce Corp. | 59,915 | 802,861 | |
| Heritage Financial Corp., Washington | 51,567 | 1,348,477 | |
| Hilltop Holdings, Inc. | 136,474 | 3,230,340 | |
| Home Bancshares, Inc. | 211,108 | 4,920,927 | |
| HomeTrust Bancshares, Inc. (a) | 28,372 | 658,230 | |
| Hope Bancorp, Inc. | 216,598 | 3,495,892 | |
| Horizon Bancorp Industries | 29,396 | 769,293 | |
| Howard Bancorp, Inc. (a)(b) | 9,598 | 189,561 | |
| Huntington Bancshares, Inc. | 1,891,662 | 23,816,025 | |
| IBERIABANK Corp. | 90,251 | 6,913,227 | |
| Independent Bank Corp. | 29,867 | 609,287 | |
| Independent Bank Corp., Massachusetts (b) | 46,109 | 3,195,354 | |
| Independent Bank Group, Inc. | 22,475 | 1,250,734 | |
| International Bancshares Corp. | 106,256 | 3,819,903 | |
| Investar Holding Corp. | 8,384 | 184,448 | |
| Investors Bancorp, Inc. | 516,646 | 6,762,896 | |
| JPMorgan Chase & Co. | 6,088,307 | 553,366,223 | |
| KeyCorp | 1,887,018 | 32,475,580 | |
| Lakeland Bancorp, Inc. | 71,024 | 1,313,944 | |
| Lakeland Financial Corp. | 43,110 | 1,873,561 | |
| LegacyTexas Financial Group, Inc. | 83,607 | 3,009,016 | |
| Live Oak Bancshares, Inc. (b) | 47,360 | 1,058,496 | |
| M&T Bank Corp. | 267,858 | 39,605,484 | |
| Macatawa Bank Corp. | 22,839 | 218,569 | |
| MainSource Financial Group, Inc. | 34,621 | 1,133,145 | |
| MB Financial, Inc. | 124,722 | 4,960,194 | |
| MBT Financial Corp. | 19,637 | 199,316 | |
| Mercantile Bank Corp. | 25,655 | 779,655 | |
| Midland States Bancorp, Inc. | 9,812 | 299,658 | |
| Midsouth Bancorp, Inc. | 23,289 | 275,975 | |
| MidWestOne Financial Group, Inc. | 12,572 | 413,367 | |
| MutualFirst Financial, Inc. | 20,181 | 710,371 | |
| National Bank Holdings Corp. | 47,060 | 1,514,391 | |
| National Bankshares, Inc. (b) | 5,803 | 228,638 | |
| National Commerce Corp. (a) | 16,217 | 644,626 | |
| NBT Bancorp, Inc. | 92,219 | 3,027,550 | |
| Nicolet Bankshares, Inc. (a) | 8,651 | 472,777 | |
| Northeast Bancorp | 4,761 | 102,838 | |
| Northrim Bancorp, Inc. | 6,518 | 194,562 | |
| Norwood Financial Corp. (b) | 5,067 | 223,151 | |
| OFG Bancorp | 71,939 | 625,869 | |
| Ohio Valley Banc Corp. | 3,608 | 118,703 | |
| Old Line Bancshares, Inc. | 8,031 | 220,853 | |
| Old National Bancorp, Indiana | 272,863 | 4,461,310 | |
| Old Point Financial Corp. | 1,881 | 57,822 | |
| Old Second Bancorp, Inc. | 36,720 | 420,444 | |
| Opus Bank | 31,202 | 698,925 | |
| Orrstown Financial Services, Inc. | 5,669 | 138,607 | |
| Pacific Continental Corp. | 35,872 | 851,960 | |
| Pacific Mercantile Bancorp (a) | 10,321 | 87,729 | |
| Pacific Premier Bancorp, Inc. (a) | 51,645 | 1,828,233 | |
| PacWest Bancorp | 207,277 | 9,358,557 | |
| Park National Corp. | 25,668 | 2,479,272 | |
| Park Sterling Corp. | 83,541 | 949,861 | |
| PCSB Financial Corp. (b) | 61,717 | 1,044,252 | |
| Peapack-Gladstone Financial Corp. | 23,917 | 728,751 | |
| Penns Woods Bancorp, Inc. | 3,854 | 165,375 | |
| People's Utah Bancorp | 31,031 | 848,698 | |
| Peoples Bancorp of North Carolina | 3,856 | 117,145 | |
| Peoples Bancorp, Inc. | 27,844 | 864,835 | |
| Peoples Financial Corp., Mississippi (a) | 2,667 | 36,005 | |
| Peoples Financial Services Corp. | 12,111 | 503,212 | |
| Peoples United Financial, Inc. | 574,176 | 9,588,739 | |
| Pinnacle Financial Partners, Inc. | 128,020 | 7,962,844 | |
| PNC Financial Services Group, Inc. | 831,194 | 104,240,040 | |
| Popular, Inc. | 183,067 | 7,306,204 | |
| Preferred Bank, Los Angeles | 21,681 | 1,166,438 | |
| Premier Financial Bancorp, Inc. | 4,507 | 85,182 | |
| Prosperity Bancshares, Inc. | 109,880 | 6,565,330 | |
| QCR Holdings, Inc. | 31,102 | 1,359,157 | |
| Regions Financial Corp. | 2,020,677 | 28,511,752 | |
| Renasant Corp. | 83,390 | 3,321,424 | |
| Republic Bancorp, Inc., Kentucky Class A | 18,205 | 647,734 | |
| Republic First Bancorp, Inc. (a)(b) | 116,122 | 981,231 | |
| Royal Bancshares of Pennsylvania, Inc. Class A (a) | 5,400 | 22,086 | |
| S&T Bancorp, Inc. | 72,150 | 2,593,071 | |
| Sandy Spring Bancorp, Inc. | 42,176 | 1,626,728 | |
| Seacoast Banking Corp., Florida (a) | 63,108 | 1,443,280 | |
| ServisFirst Bancshares, Inc. | 88,788 | 3,028,559 | |
| Shore Bancshares, Inc. | 6,745 | 111,225 | |
| Sierra Bancorp | 11,641 | 294,634 | |
| Signature Bank (a) | 92,531 | 11,875,429 | |
| Simmons First National Corp. Class A | 56,478 | 2,948,152 | |
| SmartFinancial, Inc. (a) | 7,194 | 166,109 | |
| South State Corp. | 41,590 | 3,420,778 | |
| Southern First Bancshares, Inc. (a) | 4,963 | 175,442 | |
| Southern National Bancorp of Virginia, Inc. | 38,866 | 651,006 | |
| Southside Bancshares, Inc. | 47,031 | 1,536,503 | |
| Southwest Bancorp, Inc., Oklahoma | 34,097 | 860,949 | |
| State Bank Financial Corp. | 60,571 | 1,627,543 | |
| Sterling Bancorp | 235,339 | 5,283,361 | |
| Stock Yards Bancorp, Inc. | 30,796 | 1,071,701 | |
| Stonegate Bank | 27,534 | 1,327,414 | |
| Summit Financial Group, Inc. (b) | 7,690 | 168,334 | |
| Sun Bancorp, Inc. | 15,520 | 362,392 | |
| Sunshine Bancorp, Inc. (a)(b) | 3,140 | 67,824 | |
| SunTrust Banks, Inc. | 838,051 | 46,176,610 | |
| SVB Financial Group (a) | 90,200 | 15,274,468 | |
| Synovus Financial Corp. | 230,632 | 9,714,220 | |
| TCF Financial Corp. | 303,183 | 4,708,432 | |
| Texas Capital Bancshares, Inc. (a) | 86,508 | 6,423,219 | |
| The First Bancorp, Inc. | 17,759 | 462,267 | |
| Tompkins Financial Corp. | 22,580 | 1,714,274 | |
| TowneBank | 102,762 | 3,154,793 | |
| Trico Bancshares | 37,499 | 1,334,214 | |
| TriState Capital Holdings, Inc. (a) | 37,306 | 779,695 | |
| Triumph Bancorp, Inc. (a) | 26,498 | 747,244 | |
| Trustmark Corp. | 125,196 | 3,708,306 | |
| Two River Bancorp (b) | 3,500 | 63,770 | |
| U.S. Bancorp | 2,722,911 | 139,549,189 | |
| UMB Financial Corp. | 85,559 | 5,742,720 | |
| Umpqua Holdings Corp. | 368,620 | 6,450,850 | |
| Union Bankshares Corp. | 76,873 | 2,408,431 | |
| Union Bankshares, Inc. (b) | 1,824 | 78,706 | |
| United Bankshares, Inc., West Virginia (b) | 191,327 | 6,419,021 | |
| United Community Bank, Inc. | 111,127 | 2,901,526 | |
| United Security Bancshares, California | 5,985 | 55,361 | |
| Unity Bancorp, Inc. | 5,913 | 102,591 | |
| Univest Corp. of Pennsylvania | 42,518 | 1,239,400 | |
| Valley National Bancorp | 592,760 | 6,632,984 | |
| Veritex Holdings, Inc. (a) | 20,567 | 543,174 | |
| Washington Trust Bancorp, Inc. | 24,464 | 1,253,780 | |
| WashingtonFirst Bankshares, Inc. | 14,852 | 503,037 | |
| Webster Financial Corp. | 163,732 | 7,643,010 | |
| Wells Fargo & Co. | 7,714,368 | 393,972,774 | |
| WesBanco, Inc. | 73,993 | 2,810,254 | |
| West Bancorp., Inc. | 59,222 | 1,299,923 | |
| Westamerica Bancorp. | 50,684 | 2,612,760 | |
| Western Alliance Bancorp. (a) | 158,029 | 7,621,739 | |
| Wintrust Financial Corp. | 92,607 | 6,742,716 | |
| Xenith Bankshares, Inc. (a) | 13,287 | 380,673 | |
| Zions Bancorporation | 354,085 | 15,459,351 | |
| 2,786,881,926 | |||
| Capital Markets - 2.8% | |||
| Affiliated Managers Group, Inc. | 94,956 | 16,777,776 | |
| Ameriprise Financial, Inc. | 258,160 | 35,757,742 | |
| Arlington Asset Investment Corp. (b) | 39,851 | 514,875 | |
| Artisan Partners Asset Management, Inc. | 74,438 | 2,285,247 | |
| Ashford, Inc. (a) | 1,254 | 77,309 | |
| Associated Capital Group, Inc. | 6,083 | 208,951 | |
| B. Riley Financial, Inc. | 24,014 | 393,830 | |
| Bank of New York Mellon Corp. | 1,776,247 | 92,862,193 | |
| BGC Partners, Inc. Class A | 395,046 | 5,131,648 | |
| BlackRock, Inc. Class A | 207,191 | 86,815,101 | |
| Brighthouse Financial, Inc. | 167,673 | 9,569,098 | |
| CBOE Holdings, Inc. | 156,195 | 15,758,514 | |
| Charles Schwab Corp. | 2,081,741 | 83,061,466 | |
| CME Group, Inc. | 583,090 | 73,352,722 | |
| Cohen & Steers, Inc. | 39,455 | 1,492,977 | |
| Cowen Group, Inc. Class A (a)(b) | 42,436 | 689,585 | |
| Diamond Hill Investment Group, Inc. | 4,801 | 942,580 | |
| E*TRADE Financial Corp. (a) | 466,118 | 19,115,499 | |
| Eaton Vance Corp. (non-vtg.) | 189,531 | 9,017,885 | |
| Evercore, Inc. Class A | 86,895 | 6,556,228 | |
| FactSet Research Systems, Inc. | 68,243 | 10,726,435 | |
| Federated Investors, Inc. Class B (non-vtg.) (b) | 166,109 | 4,536,437 | |
| Financial Engines, Inc. (b) | 110,645 | 3,656,817 | |
| Franklin Resources, Inc. | 580,185 | 25,081,398 | |
| Gain Capital Holdings, Inc. | 33,946 | 213,860 | |
| GAMCO Investors, Inc. Class A | 6,083 | 179,266 | |
| Global Brokerage, Inc. Class A (a)(b) | 5,137 | 6,421 | |
| Goldman Sachs Group, Inc. | 625,751 | 140,005,529 | |
| Great Elm Capital Group, Inc. (a) | 8,360 | 27,588 | |
| Greenhill & Co., Inc. (b) | 46,751 | 703,603 | |
| Hamilton Lane, Inc. Class A | 48,843 | 1,144,880 | |
| Houlihan Lokey | 40,223 | 1,450,039 | |
| Institutional Financial Markets, Inc. | 6,881 | 7,844 | |
| Interactive Brokers Group, Inc. | 119,445 | 5,008,329 | |
| IntercontinentalExchange, Inc. | 1,016,421 | 65,731,946 | |
| INTL FCStone, Inc. (a) | 23,975 | 850,873 | |
| Invesco Ltd. | 685,472 | 22,469,772 | |
| Investment Technology Group, Inc. | 55,680 | 1,118,611 | |
| Janus Henderson Group PLC | 310,163 | 10,719,233 | |
| Ladenburg Thalmann Financial Services, Inc. | 146,974 | 377,723 | |
| Lazard Ltd. Class A | 222,637 | 9,548,901 | |
| Legg Mason, Inc. | 154,159 | 5,887,332 | |
| LPL Financial | 136,938 | 6,414,176 | |
| Manning & Napier, Inc. Class A | 21,800 | 77,390 | |
| MarketAxess Holdings, Inc. | 63,986 | 12,346,099 | |
| Moelis & Co. Class A | 54,806 | 2,159,356 | |
| Moody's Corp. | 288,845 | 38,713,895 | |
| Morgan Stanley | 2,432,356 | 110,672,198 | |
| Morningstar, Inc. | 35,957 | 2,973,644 | |
| MSCI, Inc. | 154,816 | 17,743,462 | |
| Northern Trust Corp. | 367,395 | 32,514,458 | |
| Oppenheimer Holdings, Inc. Class A (non-vtg.) | 13,547 | 220,139 | |
| Piper Jaffray Companies | 20,940 | 1,161,123 | |
| PJT Partners, Inc. | 43,421 | 1,678,656 | |
| Pzena Investment Management, Inc. | 4,972 | 49,223 | |
| Raymond James Financial, Inc. | 214,854 | 16,827,365 | |
| S&P Global, Inc. | 441,125 | 68,078,821 | |
| Safeguard Scientifics, Inc. (a)(b) | 26,745 | 326,289 | |
| SEI Investments Co. | 229,425 | 13,412,186 | |
| Silvercrest Asset Management Group Class A | 6,008 | 73,598 | |
| State Street Corp. | 603,058 | 55,776,834 | |
| Stifel Financial Corp. | 118,002 | 5,634,596 | |
| T. Rowe Price Group, Inc. | 411,469 | 34,711,525 | |
| TD Ameritrade Holding Corp. | 412,225 | 17,857,587 | |
| The NASDAQ OMX Group, Inc. | 201,312 | 15,174,899 | |
| TheStreet.com, Inc. (a) | 3,696 | 3,142 | |
| U.S. Global Investments, Inc. Class A | 7,637 | 10,157 | |
| Vector Capital Corp. rights (a)(c) | 4,280 | 0 | |
| Virtu Financial, Inc. Class A (b) | 77,143 | 1,384,717 | |
| Virtus Investment Partners, Inc. (b) | 10,135 | 1,074,310 | |
| Waddell & Reed Financial, Inc. Class A (b) | 156,809 | 2,918,215 | |
| Westwood Holdings Group, Inc. | 10,927 | 667,968 | |
| WisdomTree Investments, Inc. (b) | 190,333 | 1,745,354 | |
| 1,232,235,445 | |||
| Consumer Finance - 0.7% | |||
| Ally Financial, Inc. | 799,706 | 18,073,356 | |
| American Express Co. | 1,284,959 | 110,634,970 | |
| Asta Funding, Inc. (a) | 4,468 | 35,967 | |
| Atlanticus Holdings Corp. (a) | 35,598 | 87,215 | |
| Capital One Financial Corp. | 824,624 | 65,648,317 | |
| Consumer Portfolio Services, Inc. (a) | 11,930 | 46,885 | |
| Credit Acceptance Corp. (a)(b) | 19,841 | 5,402,704 | |
| Discover Financial Services | 653,137 | 38,502,426 | |
| Elevate Credit, Inc. | 13,402 | 84,835 | |
| Encore Capital Group, Inc. (a)(b) | 44,570 | 1,798,400 | |
| Enova International, Inc. (a) | 32,960 | 392,224 | |
| EZCORP, Inc. (non-vtg.) Class A (a)(b) | 86,606 | 783,784 | |
| First Cash Financial Services, Inc. | 90,535 | 5,314,405 | |
| Green Dot Corp. Class A (a) | 74,413 | 3,585,218 | |
| Imperial Holdings, Inc. warrants 4/11/19 (a) | 1,880 | 0 | |
| LendingClub Corp. (a)(b) | 543,864 | 3,366,518 | |
| Navient Corp. | 480,094 | 6,337,241 | |
| Nelnet, Inc. Class A | 36,382 | 1,725,598 | |
| Nicholas Financial, Inc. (a) | 5,705 | 49,120 | |
| OneMain Holdings, Inc. (a) | 91,372 | 2,500,852 | |
| PRA Group, Inc. (a)(b) | 79,585 | 2,300,007 | |
| Regional Management Corp. (a) | 12,187 | 267,505 | |
| Santander Consumer U.S.A. Holdings, Inc. (a) | 199,933 | 2,855,043 | |
| SLM Corp. (a) | 719,307 | 7,315,352 | |
| Synchrony Financial | 1,327,462 | 40,872,555 | |
| World Acceptance Corp. (a)(b) | 10,919 | 816,960 | |
| 318,797,457 | |||
| Diversified Financial Services - 1.4% | |||
| Acushnet Holdings Corp. | 49,208 | 808,980 | |
| Alteryx, Inc. (b) | 16,777 | 395,769 | |
| At Home Group, Inc. | 11,583 | 283,784 | |
| Berkshire Hathaway, Inc. Class B (a) | 3,252,453 | 589,214,385 | |
| Camping World Holdings, Inc. (b) | 32,678 | 1,200,917 | |
| Cotiviti Holdings, Inc. (a) | 64,469 | 2,303,477 | |
| Donnelley Financial Solutions, Inc. | 58,021 | 1,242,230 | |
| FB Financial Corp. (b) | 19,661 | 683,220 | |
| Leucadia National Corp. | 564,714 | 13,372,428 | |
| Marlin Business Services Corp. | 13,319 | 347,626 | |
| NewStar Financial, Inc. | 27,065 | 290,137 | |
| On Deck Capital, Inc. (a)(b) | 61,562 | 297,344 | |
| Quantenna Communications, Inc. (b) | 16,406 | 304,823 | |
| Ra Pharmaceuticals, Inc. | 9,916 | 148,839 | |
| Sachem Capital Corp. | 200 | 930 | |
| Senseonics Holdings, Inc. (a)(b) | 40,982 | 125,815 | |
| Tiptree, Inc. | 33,155 | 212,192 | |
| Varex Imaging Corp. (b) | 60,332 | 1,841,936 | |
| Voya Financial, Inc. | 328,653 | 12,564,404 | |
| 625,639,236 | |||
| Insurance - 2.9% | |||
| AFLAC, Inc. | 676,740 | 55,864,887 | |
| Alleghany Corp. (a) | 26,648 | 14,996,695 | |
| Allstate Corp. | 619,177 | 56,035,519 | |
| AMBAC Financial Group, Inc. (a) | 77,952 | 1,417,947 | |
| American Equity Investment Life Holding Co. | 151,614 | 4,208,805 | |
| American Financial Group, Inc. | 124,528 | 12,678,196 | |
| American International Group, Inc. | 1,500,016 | 90,720,968 | |
| American National Insurance Co. | 20,619 | 2,385,824 | |
| Amerisafe, Inc. | 34,393 | 1,850,343 | |
| AmTrust Financial Services, Inc. (b) | 184,814 | 2,291,694 | |
| Aon PLC | 448,420 | 62,402,127 | |
| Arch Capital Group Ltd. (a) | 219,343 | 21,350,848 | |
| Argo Group International Holdings, Ltd. | 52,927 | 3,186,205 | |
| Arthur J. Gallagher & Co. | 303,378 | 17,565,586 | |
| Aspen Insurance Holdings Ltd. | 111,432 | 5,036,726 | |
| Assurant, Inc. | 94,584 | 8,956,159 | |
| Assured Guaranty Ltd. | 219,846 | 9,352,249 | |
| Athene Holding Ltd. | 86,087 | 4,606,515 | |
| Atlas Financial Holdings, Inc. (a) | 9,356 | 157,649 | |
| Axis Capital Holdings Ltd. | 153,356 | 9,238,165 | |
| Baldwin & Lyons, Inc. Class B | 11,829 | 259,055 | |
| Brown & Brown, Inc. | 204,333 | 9,186,812 | |
| Chubb Ltd. | 798,902 | 112,980,721 | |
| Cincinnati Financial Corp. | 261,500 | 20,093,660 | |
| Citizens, Inc. Class A (a)(b) | 62,312 | 469,209 | |
| CNA Financial Corp. | 65,156 | 3,196,553 | |
| CNO Financial Group, Inc. | 290,469 | 6,491,982 | |
| Crawford & Co. Class B | 31,537 | 312,847 | |
| Donegal Group, Inc. Class A | 8,008 | 122,763 | |
| eHealth, Inc. (a) | 26,343 | 639,608 | |
| EMC Insurance Group | 8,724 | 243,225 | |
| Employers Holdings, Inc. | 50,084 | 2,111,041 | |
| Enstar Group Ltd. (a) | 18,704 | 3,882,015 | |
| Erie Indemnity Co. Class A | 39,674 | 4,792,222 | |
| Everest Re Group Ltd. | 70,880 | 17,895,782 | |
| FBL Financial Group, Inc. Class A | 16,450 | 1,118,600 | |
| Federated National Holding Co. | 19,431 | 301,958 | |
| Fidelity & Guaranty Life (b) | 29,774 | 930,438 | |
| First Acceptance Corp. (a) | 4,055 | 4,542 | |
| First American Financial Corp. | 189,648 | 9,304,131 | |
| FNF Group | 485,332 | 23,412,416 | |
| FNFV Group (a) | 119,032 | 2,005,689 | |
| Genworth Financial, Inc. Class A (a) | 831,470 | 2,851,942 | |
| Global Indemnity Ltd. | 13,709 | 554,118 | |
| Greenlight Capital Re, Ltd. (a) | 42,022 | 934,990 | |
| Hallmark Financial Services, Inc. (a) | 10,337 | 105,954 | |
| Hanover Insurance Group, Inc. | 70,993 | 6,970,093 | |
| Hartford Financial Services Group, Inc. | 624,209 | 33,750,981 | |
| HCI Group, Inc. | 13,167 | 513,381 | |
| Health Insurance Innovations, Inc. (a) | 14,064 | 473,254 | |
| Heritage Insurance Holdings, Inc. | 60,181 | 684,860 | |
| Horace Mann Educators Corp. | 65,267 | 2,294,135 | |
| Independence Holding Co. | 16,014 | 347,504 | |
| Infinity Property & Casualty Corp. | 17,608 | 1,557,428 | |
| Investors Title Co. | 1,086 | 190,995 | |
| James River Group Holdings Ltd. | 33,994 | 1,355,681 | |
| Kemper Corp. | 85,524 | 4,096,600 | |
| Kingstone Companies, Inc. | 9,045 | 136,127 | |
| Kinsale Capital Group, Inc. | 33,893 | 1,282,850 | |
| Lincoln National Corp. | 381,053 | 25,858,257 | |
| Loews Corp. | 473,959 | 22,077,010 | |
| Maiden Holdings Ltd. | 125,108 | 907,033 | |
| Markel Corp. (a) | 24,343 | 25,608,593 | |
| Marsh & McLennan Companies, Inc. | 882,937 | 68,939,721 | |
| MBIA, Inc. (a)(b) | 228,577 | 2,299,485 | |
| Mercury General Corp. | 66,212 | 3,805,204 | |
| MetLife, Inc. | 1,844,404 | 86,373,439 | |
| National General Holdings Corp. | 106,900 | 1,835,473 | |
| National Western Life Group, Inc. | 3,602 | 1,204,545 | |
| Navigators Group, Inc. | 37,597 | 2,097,913 | |
| NI Holdings, Inc. | 11,972 | 197,658 | |
| Old Republic International Corp. | 417,839 | 7,976,547 | |
| OneBeacon Insurance Group Ltd. | 45,014 | 820,155 | |
| Patriot National, Inc. (b) | 7,857 | 11,786 | |
| Primerica, Inc. | 75,461 | 5,776,540 | |
| Principal Financial Group, Inc. | 451,193 | 28,208,586 | |
| ProAssurance Corp. | 95,168 | 5,067,696 | |
| Progressive Corp. | 987,900 | 45,917,592 | |
| Prudential Financial, Inc. | 741,461 | 75,688,339 | |
| Reinsurance Group of America, Inc. | 107,870 | 14,503,122 | |
| RenaissanceRe Holdings Ltd. | 73,938 | 10,289,212 | |
| RLI Corp. | 67,585 | 3,617,149 | |
| Safety Insurance Group, Inc. | 21,926 | 1,565,516 | |
| Selective Insurance Group, Inc. | 101,970 | 5,139,288 | |
| State Auto Financial Corp. | 23,497 | 581,316 | |
| State National Companies, Inc. | 40,781 | 847,021 | |
| Stewart Information Services Corp. | 39,769 | 1,434,866 | |
| The Travelers Companies, Inc. | 475,109 | 57,573,709 | |
| Third Point Reinsurance Ltd. (a) | 92,317 | 1,297,054 | |
| Torchmark Corp. | 180,107 | 13,862,836 | |
| Trupanion, Inc. (a)(b) | 25,585 | 559,800 | |
| United Fire Group, Inc. | 36,055 | 1,516,473 | |
| United Insurance Holdings Corp. | 29,576 | 465,526 | |
| Universal Insurance Holdings, Inc. (b) | 52,834 | 1,133,289 | |
| Unum Group | 384,330 | 18,517,019 | |
| Validus Holdings Ltd. | 133,201 | 6,680,030 | |
| W.R. Berkley Corp. | 176,033 | 11,730,839 | |
| White Mountains Insurance Group Ltd. | 8,265 | 7,199,394 | |
| Willis Group Holdings PLC | 216,037 | 32,075,013 | |
| WMI Holdings Corp. (a) | 391,046 | 488,808 | |
| XL Group Ltd. | 452,595 | 18,538,291 | |
| 1,282,446,412 | |||
| Mortgage Real Estate Investment Trusts - 0.3% | |||
| AG Mortgage Investment Trust, Inc. | 28,740 | 553,820 | |
| AGNC Investment Corp. | 599,467 | 12,912,519 | |
| American Capital Mortgage Investment Corp. | 77,847 | 1,494,662 | |
| Annaly Capital Management, Inc. | 1,841,289 | 23,016,113 | |
| Anworth Mortgage Asset Corp. | 251,516 | 1,524,187 | |
| Apollo Commercial Real Estate Finance, Inc. | 157,668 | 2,852,214 | |
| Arbor Realty Trust, Inc. | 80,640 | 661,248 | |
| Ares Commercial Real Estate Corp. | 39,618 | 522,561 | |
| Armour Residential REIT, Inc. (b) | 61,211 | 1,616,583 | |
| Blackstone Mortgage Trust, Inc. (b) | 164,134 | 5,145,601 | |
| Capstead Mortgage Corp. | 155,839 | 1,506,963 | |
| Cherry Hill Mortgage Investment Corp. | 12,023 | 222,185 | |
| Chimera Investment Corp. | 306,209 | 5,839,406 | |
| CIM Commercial Trust Corp. (b) | 6,057 | 94,792 | |
| CYS Investments, Inc. | 246,028 | 2,162,586 | |
| Dynex Capital, Inc. | 68,104 | 486,944 | |
| Ellington Residential Mortgage REIT | 15,540 | 227,350 | |
| Five Oaks Investment Corp. (b) | 6,106 | 25,401 | |
| Great Ajax Corp. | 14,698 | 208,418 | |
| Hannon Armstrong Sustainable Infrastructure Capital, Inc. | 84,233 | 1,954,206 | |
| Invesco Mortgage Capital, Inc. | 180,605 | 3,066,673 | |
| KKR Real Estate Finance Trust, Inc. | 46,076 | 956,999 | |
| Ladder Capital Corp. Class A | 130,256 | 1,787,112 | |
| MFA Financial, Inc. | 654,424 | 5,745,843 | |
| New Residential Investment Corp. | 514,969 | 8,486,689 | |
| New York Mortgage Trust, Inc. (b) | 176,500 | 1,104,890 | |
| Orchid Island Capital, Inc. | 73,768 | 713,337 | |
| Owens Realty Mortgage, Inc. | 54,252 | 941,272 | |
| PennyMac Mortgage Investment Trust | 106,166 | 1,835,610 | |
| Redwood Trust, Inc. | 130,122 | 2,170,435 | |
| Resource Capital Corp. | 40,594 | 420,148 | |
| Starwood Property Trust, Inc. | 462,583 | 10,273,968 | |
| Two Harbors Investment Corp. | 567,052 | 5,800,942 | |
| Western Asset Mortgage Capital Corp. (b) | 72,828 | 765,422 | |
| ZAIS Financial Corp. | 6,000 | 91,500 | |
| 107,188,599 | |||
| Real Estate Management & Development - 0.0% | |||
| The RMR Group, Inc. | 10,073 | 520,270 | |
| Thrifts & Mortgage Finance - 0.2% | |||
| ASB Bancorp, Inc. (a) | 1,992 | 88,345 | |
| Astoria Financial Corp. | 151,919 | 2,976,093 | |
| Bank Mutual Corp. | 56,001 | 512,409 | |
| BankFinancial Corp. | 19,300 | 309,572 | |
| Bear State Financial, Inc. | 13,571 | 139,510 | |
| Beneficial Bancorp, Inc. | 178,014 | 2,661,309 | |
| BofI Holding, Inc. (a)(b) | 104,951 | 2,782,251 | |
| BSB Bancorp, Inc. (a) | 6,958 | 198,303 | |
| Capitol Federal Financial, Inc. | 255,033 | 3,499,053 | |
| Charter Financial Corp. | 26,857 | 436,695 | |
| Clifton Bancorp, Inc. | 32,703 | 515,072 | |
| Dime Community Bancshares, Inc. | 51,879 | 983,107 | |
| Entegra Financial Corp. (a)(b) | 3,030 | 70,296 | |
| ESSA Bancorp, Inc. | 4,298 | 64,900 | |
| Essent Group Ltd. (a) | 146,912 | 5,741,321 | |
| Farmer Mac Class C (non-vtg.) | 17,857 | 1,216,419 | |
| First Defiance Financial Corp. | 13,178 | 645,195 | |
| Flagstar Bancorp, Inc. (a) | 37,206 | 1,221,101 | |
| Hingham Institution for Savings | 2,103 | 386,973 | |
| Home Bancorp, Inc. | 3,114 | 125,743 | |
| HomeStreet, Inc. (a) | 54,010 | 1,363,753 | |
| Impac Mortgage Holdings, Inc. (a)(b) | 22,924 | 304,201 | |
| Kearny Financial Corp. | 157,909 | 2,234,412 | |
| Lendingtree, Inc. (a)(b) | 12,573 | 2,903,734 | |
| Malvern Bancorp, Inc. (a) | 6,089 | 144,918 | |
| Meridian Bancorp, Inc. Maryland | 112,706 | 1,983,626 | |
| Meta Financial Group, Inc. | 16,728 | 1,175,978 | |
| MGIC Investment Corp. (a) | 616,542 | 7,059,406 | |
| Nationstar Mortgage Holdings, Inc. (a)(b) | 63,329 | 1,090,525 | |
| New York Community Bancorp, Inc. | 878,574 | 10,586,817 | |
| NMI Holdings, Inc. (a) | 95,441 | 1,035,535 | |
| Northfield Bancorp, Inc. | 77,835 | 1,253,922 | |
| Northwest Bancshares, Inc. | 177,568 | 2,739,874 | |
| OceanFirst Financial Corp. | 60,020 | 1,498,099 | |
| Ocwen Financial Corp. (a)(b) | 179,422 | 525,706 | |
| Oritani Financial Corp. | 122,108 | 1,959,833 | |
| PennyMac Financial Services, Inc. (a) | 35,269 | 599,573 | |
| PHH Corp. (a) | 94,843 | 1,346,771 | |
| Poage Bankshares, Inc. | 2,365 | 43,161 | |
| Provident Financial Holdings, Inc. | 3,066 | 58,070 | |
| Provident Financial Services, Inc. | 124,224 | 3,086,966 | |
| Radian Group, Inc. | 389,840 | 6,822,200 | |
| Riverview Bancorp, Inc. | 6,875 | 55,206 | |
| Security National Financial Corp. Class A | 11,754 | 69,349 | |
| SI Financial Group, Inc. | 3,746 | 54,692 | |
| Southern Missouri Bancorp, Inc. | 5,377 | 174,537 | |
| Territorial Bancorp, Inc. | 13,244 | 400,366 | |
| TFS Financial Corp. | 159,329 | 2,450,480 | |
| Timberland Bancorp, Inc. | 5,034 | 139,492 | |
| Trustco Bank Corp., New York | 140,018 | 1,106,142 | |
| United Community Financial Corp. | 43,226 | 392,924 | |
| United Financial Bancorp, Inc. New | 84,987 | 1,471,975 | |
| Walker & Dunlop, Inc. (a) | 49,313 | 2,376,393 | |
| Walter Investment Management Corp. (a)(b) | 49,597 | 21,416 | |
| Washington Federal, Inc. | 157,606 | 4,925,188 | |
| Waterstone Financial, Inc. | 41,772 | 737,276 | |
| Westbury Bancorp, Inc. (a) | 4,860 | 97,929 | |
| Westfield Financial, Inc. | 33,310 | 331,435 | |
| WSFS Financial Corp. | 46,100 | 2,060,670 | |
| 91,256,217 | |||
| TOTAL FINANCIALS | 6,444,965,562 | ||
| HEALTH CARE - 14.1% | |||
| Biotechnology - 3.4% | |||
| AbbVie, Inc. | 2,726,854 | 205,332,106 | |
| Abeona Therapeutics, Inc. (a)(b) | 62,198 | 817,904 | |
| ACADIA Pharmaceuticals, Inc. (a)(b) | 164,038 | 5,841,393 | |
| Acceleron Pharma, Inc. (a)(b) | 65,396 | 2,534,749 | |
| Achaogen, Inc. (a)(b) | 54,118 | 1,014,171 | |
| Achillion Pharmaceuticals, Inc. (a) | 199,588 | 1,019,895 | |
| Acorda Therapeutics, Inc. (a)(b) | 83,616 | 1,739,213 | |
| Actinium Pharmaceuticals, Inc. (a)(b) | 38,656 | 23,580 | |
| Adamas Pharmaceuticals, Inc. (a)(b) | 24,337 | 509,617 | |
| Aduro Biotech, Inc. (a)(b) | 43,288 | 525,949 | |
| Advaxis, Inc. (a)(b) | 48,573 | 330,782 | |
| Adverum Biotechnologies, Inc. (a) | 12,370 | 34,018 | |
| Aevi Genomic Medicine, Inc. (a) | 41,669 | 52,920 | |
| Agenus, Inc. (a)(b) | 138,167 | 509,836 | |
| Agios Pharmaceuticals, Inc. (a)(b) | 72,800 | 4,605,328 | |
| Aimmune Therapeutics, Inc. (a)(b) | 39,537 | 850,046 | |
| Akebia Therapeutics, Inc. (a) | 89,194 | 1,493,108 | |
| Albireo Pharma, Inc. (a) | 5,786 | 143,146 | |
| Alder Biopharmaceuticals, Inc. (a) | 88,675 | 869,015 | |
| Alexion Pharmaceuticals, Inc. (a) | 385,294 | 54,869,719 | |
| Alkermes PLC (a)(b) | 263,559 | 13,383,526 | |
| Alnylam Pharmaceuticals, Inc. (a)(b) | 138,114 | 11,840,513 | |
| Alpine Immune Sciences, Inc. (a) | 12,084 | 105,735 | |
| AMAG Pharmaceuticals, Inc. (a)(b) | 54,744 | 914,225 | |
| Amgen, Inc. | 1,262,784 | 224,485,112 | |
| Amicus Therapeutics, Inc. (a)(b) | 274,496 | 3,826,474 | |
| AnaptysBio, Inc. | 8,529 | 238,556 | |
| Anavex Life Sciences Corp. (a)(b) | 58,538 | 259,909 | |
| Anthera Pharmaceuticals, Inc. (a)(b) | 7,268 | 11,629 | |
| Applied Genetic Technologies Corp. (a) | 14,097 | 64,846 | |
| Aptevo Therapeutics, Inc. (a) | 19,070 | 25,363 | |
| AquaBounty Technologies, Inc. (a)(b) | 1,372 | 9,906 | |
| Aquinox Pharmaceuticals, Inc. (a)(b) | 27,880 | 407,327 | |
| Ardelyx, Inc. (a) | 32,056 | 165,088 | |
| Arena Pharmaceuticals, Inc. (a) | 64,716 | 1,500,117 | |
| Argos Therapeutics, Inc. (a)(b) | 19,777 | 3,942 | |
| ArQule, Inc. (a) | 65,290 | 71,166 | |
| Array BioPharma, Inc. (a)(b) | 301,593 | 2,919,420 | |
| Arrowhead Pharmaceuticals, Inc. (a)(b) | 223,439 | 625,629 | |
| Asterias Biotherapeutics, Inc. (a)(b) | 24,436 | 84,304 | |
| Atara Biotherapeutics, Inc. (a)(b) | 38,054 | 599,351 | |
| Athersys, Inc. (a)(b) | 185,212 | 324,121 | |
| aTyr Pharma, Inc. (a) | 6,529 | 19,913 | |
| Audentes Therapeutics, Inc. (a) | 34,208 | 718,026 | |
| AVEO Pharmaceuticals, Inc. (a)(b) | 164,980 | 560,932 | |
| Aviragen Therapeutics, Inc. (a) | 46,093 | 28,946 | |
| Bellicum Pharmaceuticals, Inc. (a)(b) | 35,938 | 389,209 | |
| Biocept, Inc. (a)(b) | 7,092 | 8,652 | |
| BioCryst Pharmaceuticals, Inc. (a)(b) | 125,510 | 640,101 | |
| Biogen, Inc. (a) | 364,324 | 115,330,405 | |
| Biohaven Pharmaceutical Holding Co. Ltd. (b) | 57,394 | 2,051,836 | |
| BioMarin Pharmaceutical, Inc. (a) | 315,079 | 28,416,975 | |
| Biospecifics Technologies Corp. (a) | 7,257 | 342,168 | |
| Biostage, Inc. (a)(b) | 3,080 | 960 | |
| BioTime, Inc. (a)(b) | 346,441 | 1,015,072 | |
| Bioverativ, Inc. | 185,633 | 10,523,535 | |
| bluebird bio, Inc. (a)(b) | 75,907 | 9,476,989 | |
| Blueprint Medicines Corp. (a) | 59,036 | 3,200,932 | |
| BrainStorm Cell Therpeutic, Inc. (a)(b) | 15,396 | 65,587 | |
| Calithera Biosciences, Inc. (a) | 45,690 | 749,316 | |
| Cancer Genetics, Inc. (a)(b) | 9,725 | 33,065 | |
| Cara Therapeutics, Inc. (a)(b) | 41,713 | 597,747 | |
| Cascadian Therapeutics, Inc. (a)(b) | 49,541 | 179,338 | |
| CASI Pharmaceuticals, Inc. (a) | 289 | 278 | |
| Catalyst Biosciences, Inc. (a) | 180 | 603 | |
| Catalyst Pharmaceutical Partners, Inc. (a) | 93,518 | 257,175 | |
| Cel-Sci Corp. (a)(b) | 3,253 | 5,920 | |
| Celgene Corp. (a) | 1,338,817 | 186,001,846 | |
| Celldex Therapeutics, Inc. (a)(b) | 215,095 | 529,134 | |
| Cellular Biomedicine Group, Inc. (a)(b) | 8,068 | 79,470 | |
| Celsion Corp. (a) | 762 | 1,021 | |
| ChemoCentryx, Inc. (a) | 36,062 | 250,270 | |
| Chiasma, Inc. (a)(b) | 8,745 | 19,239 | |
| Chimerix, Inc. (a) | 63,824 | 303,802 | |
| Cidara Therapeutics, Inc. (a) | 2,782 | 19,196 | |
| Cleveland Biolabs, Inc. (a)(b) | 1,776 | 4,795 | |
| Clovis Oncology, Inc. (a)(b) | 83,622 | 6,361,126 | |
| Coherus BioSciences, Inc. (a)(b) | 71,178 | 1,028,522 | |
| Conatus Pharmaceuticals, Inc. (a)(b) | 36,543 | 209,757 | |
| Concert Pharmaceuticals, Inc. (a) | 25,754 | 391,976 | |
| Corbus Pharmaceuticals Holdings, Inc. (a)(b) | 46,114 | 357,384 | |
| Corvus Pharmaceuticals, Inc. (a)(b) | 10,405 | 168,249 | |
| CTI BioPharma Corp. (a)(b) | 19,153 | 62,247 | |
| Curis, Inc. (a) | 179,000 | 365,160 | |
| Cyclacel Pharmaceuticals, Inc. | 960 | 1,613 | |
| Cytokinetics, Inc. (a)(b) | 76,663 | 1,138,446 | |
| CytomX Therapeutics, Inc. (a) | 55,930 | 966,470 | |
| Cytori Therapeutics, Inc. (a)(b) | 10,777 | 3,880 | |
| CytRx Corp. (a)(b) | 243,861 | 129,490 | |
| Dicerna Pharmaceuticals, Inc. (a)(b) | 22,350 | 78,002 | |
| Dimension Therapeutics, Inc. (a) | 31,436 | 106,882 | |
| Dyax Corp. rights 12/31/19 (a)(c) | 200,675 | 662,228 | |
| Dynavax Technologies Corp. (a)(b) | 88,051 | 1,580,515 | |
| Eagle Pharmaceuticals, Inc. (a)(b) | 14,894 | 812,617 | |
| Edge Therapeutics, Inc. (a)(b) | 50,398 | 531,699 | |
| Editas Medicine, Inc. (a)(b) | 42,479 | 896,732 | |
| Eiger Biopharmaceuticals, Inc. (a) | 1,065 | 9,851 | |
| Eleven Biotherapeutics, Inc. (a)(b) | 6,105 | 6,593 | |
| Emergent BioSolutions, Inc. (a)(b) | 56,205 | 2,098,133 | |
| Enanta Pharmaceuticals, Inc. (a)(b) | 25,666 | 1,100,045 | |
| Epizyme, Inc. (a)(b) | 64,306 | 1,115,709 | |
| Esperion Therapeutics, Inc. (a)(b) | 35,029 | 1,731,133 | |
| Exact Sciences Corp. (a)(b) | 200,706 | 8,407,574 | |
| Exelixis, Inc. (a) | 390,440 | 11,416,466 | |
| Fate Therapeutics, Inc. (a)(b) | 23,219 | 87,768 | |
| Fibrocell Science, Inc. (a) | 12,960 | 34,733 | |
| FibroGen, Inc. (a) | 112,539 | 5,424,380 | |
| Five Prime Therapeutics, Inc. (a) | 46,353 | 1,572,294 | |
| Flexion Therapeutics, Inc. (a)(b) | 39,546 | 1,016,332 | |
| Fortress Biotech, Inc. (a)(b) | 43,908 | 208,563 | |
| Foundation Medicine, Inc. (a)(b) | 24,382 | 982,595 | |
| Galectin Therapeutics, Inc. (a)(b) | 56,076 | 96,451 | |
| Galena Biopharma, Inc. (a)(b) | 12,770 | 4,597 | |
| Genocea Biosciences, Inc. (a)(b) | 32,032 | 155,996 | |
| Genomic Health, Inc. (a) | 30,953 | 981,210 | |
| GenVec, Inc. rights (c) | 814 | 0 | |
| Geron Corp. (a)(b) | 277,780 | 602,783 | |
| Gilead Sciences, Inc. | 2,245,188 | 187,944,687 | |
| Global Blood Therapeutics, Inc. (a)(b) | 55,511 | 1,687,534 | |
| GlycoMimetics, Inc. (a)(b) | 35,771 | 436,406 | |
| GTx, Inc. (a)(b) | 1,962 | 12,930 | |
| Halozyme Therapeutics, Inc. (a)(b) | 222,904 | 2,899,981 | |
| Heat Biologics, Inc. (a) | 3,136 | 1,756 | |
| Hemispherx Biopharma, Inc. (a) | 10,898 | 3,956 | |
| Heron Therapeutics, Inc. (a)(b) | 88,956 | 1,467,774 | |
| iBio, Inc. (a) | 40,361 | 11,939 | |
| Idera Pharmaceuticals, Inc. (a)(b) | 159,215 | 315,246 | |
| Ignyta, Inc. (a)(b) | 75,502 | 868,273 | |
| Immune Design Corp. (a)(b) | 22,465 | 243,745 | |
| Immune Pharmaceuticals, Inc. (a)(b) | 7,141 | 8,284 | |
| ImmunoCellular Therapeutics Ltd. (a) | 1,048 | 290 | |
| ImmunoGen, Inc. (a)(b) | 155,417 | 1,299,286 | |
| Immunomedics, Inc. (a)(b) | 167,994 | 2,123,444 | |
| Incyte Corp. (a) | 290,297 | 39,889,711 | |
| Infinity Pharmaceuticals, Inc. (a) | 64,535 | 61,437 | |
| Inotek Pharmaceuticals Corp. (a)(b) | 20,127 | 20,530 | |
| Inovio Pharmaceuticals, Inc. (a)(b) | 153,711 | 913,043 | |
| Insmed, Inc. (a) | 93,412 | 1,160,177 | |
| Insys Therapeutics, Inc. (a)(b) | 45,156 | 412,726 | |
| Intellia Therapeutics, Inc. (a)(b) | 14,395 | 302,727 | |
| Intercept Pharmaceuticals, Inc. (a)(b) | 29,766 | 3,471,013 | |
| Intrexon Corp. (a)(b) | 110,181 | 2,173,871 | |
| Invitae Corp. (a) | 60,878 | 597,822 | |
| Ionis Pharmaceuticals, Inc. (a)(b) | 209,776 | 11,248,189 | |
| Iovance Biotherapeutics, Inc. (a) | 86,775 | 498,956 | |
| Ironwood Pharmaceuticals, Inc. Class A (a)(b) | 221,795 | 3,537,630 | |
| IsoRay, Inc. (a) | 57,047 | 30,235 | |
| Jounce Therapeutics, Inc. | 10,322 | 175,371 | |
| Juno Therapeutics, Inc. (a)(b) | 132,147 | 5,453,707 | |
| Kalvista Pharmaceuticals, Inc. (a) | 508 | 3,358 | |
| Karyopharm Therapeutics, Inc. (a) | 46,345 | 473,646 | |
| Keryx Biopharmaceuticals, Inc. (a)(b) | 176,242 | 1,270,705 | |
| Kindred Biosciences, Inc. (a) | 41,075 | 312,170 | |
| Kite Pharma, Inc. (a)(b) | 85,521 | 15,221,883 | |
| Kura Oncology, Inc. (a) | 20,397 | 146,858 | |
| La Jolla Pharmaceutical Co. (a)(b) | 28,865 | 985,740 | |
| Lexicon Pharmaceuticals, Inc. (a)(b) | 68,906 | 1,043,237 | |
| Ligand Pharmaceuticals, Inc. Class B (a)(b) | 36,373 | 4,687,389 | |
| Loxo Oncology, Inc. (a)(b) | 32,076 | 2,675,138 | |
| Macrogenics, Inc. (a)(b) | 52,348 | 989,901 | |
| Madrigal Pharmaceuticals, Inc. (a)(b) | 6,525 | 111,447 | |
| MannKind Corp. (a)(b) | 80,635 | 166,914 | |
| Matinas BioPharma Holdings, Inc. (b) | 91,988 | 117,745 | |
| MediciNova, Inc. (a) | 31,401 | 170,193 | |
| MEI Pharma, Inc. (a) | 62,189 | 164,179 | |
| Merrimack Pharmaceuticals, Inc. (b) | 222,876 | 303,111 | |
| MiMedx Group, Inc. (a)(b) | 170,113 | 2,767,739 | |
| Minerva Neurosciences, Inc. (a)(b) | 51,124 | 309,300 | |
| Mirati Therapeutics, Inc. (a)(b) | 22,963 | 124,000 | |
| Molecular Templates, Inc. (a)(b) | 11,026 | 63,510 | |
| Momenta Pharmaceuticals, Inc. (a) | 120,689 | 2,033,610 | |
| Myriad Genetics, Inc. (a)(b) | 115,012 | 3,506,716 | |
| NanoViricides, Inc. (a)(b) | 32,620 | 44,363 | |
| NantKwest, Inc. (a)(b) | 76,001 | 473,486 | |
| Natera, Inc. (a)(b) | 66,582 | 822,288 | |
| Navidea Biopharmaceuticals, Inc. (a)(b) | 148,549 | 58,305 | |
| Neothetics, Inc. (a)(b) | 10,095 | 3,474 | |
| Neuralstem, Inc. (a)(b) | 8,195 | 9,752 | |
| Neurocrine Biosciences, Inc. (a)(b) | 154,025 | 8,717,815 | |
| NewLink Genetics Corp. (a)(b) | 41,496 | 336,948 | |
| Novavax, Inc. (a)(b) | 436,535 | 458,362 | |
| Ohr Pharmaceutical, Inc. (a)(b) | 32,314 | 24,727 | |
| OncoCyte Corp. (a)(b) | 3,324 | 18,781 | |
| OncoGenex Pharmaceuticals, Inc. (a)(b) | 960 | 3,370 | |
| OncoGenex Pharmaceuticals, Inc. rights (c) | 10,565 | 0 | |
| OncoMed Pharmaceuticals, Inc. (a) | 27,577 | 137,058 | |
| Onconova Therapeutics, Inc. (a) | 624 | 1,011 | |
| Opexa Therapeutics, Inc. (a)(b) | 715 | 613 | |
| Ophthotech Corp. (a) | 50,366 | 156,135 | |
| Opko Health, Inc. (a)(b) | 617,855 | 3,954,272 | |
| Oragenics, Inc. (a) | 9,973 | 3,191 | |
| Organovo Holdings, Inc. (a)(b) | 337,362 | 701,713 | |
| Otonomy, Inc. (a) | 38,289 | 137,840 | |
| OvaScience, Inc. (a)(b) | 60,110 | 84,154 | |
| Palatin Technologies, Inc. (a) | 204,858 | 88,089 | |
| PDL BioPharma, Inc. (a)(b) | 309,517 | 965,693 | |
| Peregrine Pharmaceuticals, Inc. (a) | 55,462 | 171,932 | |
| Pfenex, Inc. (a) | 21,045 | 75,972 | |
| PharmAthene, Inc. | 5,138 | 12,948 | |
| Portola Pharmaceuticals, Inc. (a) | 95,806 | 6,078,891 | |
| Progenics Pharmaceuticals, Inc. (a)(b) | 118,604 | 798,205 | |
| Protagonist Therapeutics, Inc. (b) | 52,263 | 853,455 | |
| Proteon Therapeutics, Inc. (a)(b) | 5,515 | 7,170 | |
| Proteostasis Therapeutics, Inc. (a)(b) | 15,177 | 32,934 | |
| Prothena Corp. PLC (a)(b) | 67,107 | 4,123,054 | |
| PTC Therapeutics, Inc. (a)(b) | 53,763 | 1,115,582 | |
| Puma Biotechnology, Inc. (a)(b) | 47,911 | 4,431,768 | |
| Radius Health, Inc. (a)(b) | 63,620 | 2,394,021 | |
| Recro Pharma, Inc. (a)(b) | 20,797 | 156,601 | |
| Regeneron Pharmaceuticals, Inc. (a) | 129,960 | 64,577,124 | |
| REGENXBIO, Inc. (a) | 45,270 | 1,029,893 | |
| Regulus Therapeutics, Inc. (a)(b) | 85,834 | 85,834 | |
| Repligen Corp. (a)(b) | 69,352 | 3,028,602 | |
| Retrophin, Inc. (a)(b) | 55,340 | 1,350,296 | |
| Rexahn Pharmaceuticals, Inc. (a)(b) | 42,298 | 101,938 | |
| Rigel Pharmaceuticals, Inc. (a) | 204,250 | 520,838 | |
| Sage Therapeutics, Inc. (a)(b) | 54,004 | 4,441,829 | |
| Sangamo Therapeutics, Inc. (a)(b) | 153,345 | 2,047,156 | |
| Sarepta Therapeutics, Inc. (a)(b) | 98,863 | 3,983,190 | |
| Savara, Inc. (a)(b) | 2,094 | 10,994 | |
| Seattle Genetics, Inc. (a)(b) | 163,698 | 8,599,056 | |
| Selecta Biosciences, Inc. (a) | 4,963 | 88,590 | |
| Seres Therapeutics, Inc. (a)(b) | 32,924 | 461,924 | |
| Sorrento Therapeutics, Inc. (a)(b) | 134,335 | 241,803 | |
| Spark Therapeutics, Inc. (a)(b) | 52,137 | 4,292,439 | |
| Spectrum Pharmaceuticals, Inc. (a)(b) | 121,770 | 1,188,475 | |
| Spring Bank Pharmaceuticals, Inc. (a) | 9,145 | 133,151 | |
| Stemline Therapeutics, Inc. (a)(b) | 29,702 | 268,803 | |
| Sunesis Pharmaceuticals, Inc. (a)(b) | 5,440 | 11,859 | |
| Syndax Pharmaceuticals, Inc. (a)(b) | 33,111 | 384,088 | |
| Synergy Pharmaceuticals, Inc. (a)(b) | 387,288 | 1,154,118 | |
| Synthetic Biologics, Inc. (a)(b) | 84,770 | 64,425 | |
| Syros Pharmaceuticals, Inc. (a)(b) | 16,253 | 318,071 | |
| T2 Biosystems, Inc. (a) | 14,700 | 61,593 | |
| Tenax Therapeutics, Inc. (a)(b) | 1,373 | 467 | |
| TESARO, Inc. (a)(b) | 58,508 | 7,555,723 | |
| TG Therapeutics, Inc. (a)(b) | 86,621 | 1,100,087 | |
| Tocagen, Inc. (b) | 8,584 | 119,403 | |
| TONIX Pharmaceuticals Holding (a)(b) | 1,717 | 6,473 | |
| TRACON Pharmaceuticals, Inc. (a)(b) | 4,111 | 10,278 | |
| Trevena, Inc. (a)(b) | 130,021 | 312,050 | |
| Trovagene, Inc. (a)(b) | 33,847 | 22,339 | |
| Ultragenyx Pharmaceutical, Inc. (a)(b) | 65,524 | 3,738,799 | |
| United Therapeutics Corp. (a)(b) | 76,764 | 10,040,731 | |
| Vanda Pharmaceuticals, Inc. (a) | 83,623 | 1,438,316 | |
| Veracyte, Inc. (a) | 15,721 | 128,755 | |
| Verastem, Inc. (a) | 47,048 | 183,487 | |
| Vericel Corp. (a)(b) | 28,746 | 123,608 | |
| Versartis, Inc. (a) | 37,706 | 716,414 | |
| Vertex Pharmaceuticals, Inc. (a) | 425,706 | 68,342,841 | |
| Vical, Inc. (a) | 6,566 | 15,496 | |
| Vital Therapies, Inc. (a) | 26,714 | 80,142 | |
| Voyager Therapeutics, Inc. (a) | 6,634 | 63,952 | |
| Xbiotech, Inc. (a)(b) | 36,998 | 189,430 | |
| Xencor, Inc. (a)(b) | 60,989 | 1,318,582 | |
| XOMA Corp. (a)(b) | 4,980 | 55,228 | |
| Zafgen, Inc. (a) | 24,672 | 89,066 | |
| ZIOPHARM Oncology, Inc. (a)(b) | 222,939 | 1,424,580 | |
| 1,499,608,882 | |||
| Health Care Equipment & Supplies - 2.8% | |||
| Abaxis, Inc. | 36,438 | 1,684,164 | |
| Abbott Laboratories | 2,965,736 | 151,074,592 | |
| Abiomed, Inc. (a) | 70,588 | 10,644,670 | |
| Accuray, Inc. (a)(b) | 142,393 | 590,931 | |
| Alere, Inc. (a) | 147,553 | 7,297,971 | |
| Align Technology, Inc. (a) | 129,953 | 22,967,893 | |
| Alliqua Biomedical, Inc. (a)(b) | 4,397 | 1,452 | |
| Alphatec Holdings, Inc. (a)(b) | 3,066 | 6,193 | |
| Amedica Corp. (a)(b) | 69,010 | 22,704 | |
| Analogic Corp. | 19,536 | 1,397,801 | |
| Angiodynamics, Inc. (a) | 51,608 | 878,884 | |
| Anika Therapeutics, Inc. (a)(b) | 26,869 | 1,442,865 | |
| Antares Pharma, Inc. (a)(b) | 242,616 | 730,274 | |
| Apollo Endosurgery, Inc. (a) | 102 | 422 | |
| Atricure, Inc. (a)(b) | 47,294 | 1,060,804 | |
| Atrion Corp. | 2,291 | 1,425,346 | |
| Avinger, Inc. (a)(b) | 31,221 | 9,366 | |
| AxoGen, Inc. (a) | 41,462 | 729,731 | |
| Baxter International, Inc. | 832,536 | 51,650,533 | |
| Becton, Dickinson & Co. | 388,521 | 77,486,628 | |
| Bellerophon Therapeutics, Inc. (a)(b) | 16,556 | 18,212 | |
| BioLase Technology, Inc. (a)(b) | 31,172 | 15,873 | |
| Boston Scientific Corp. (a) | 2,353,090 | 64,827,630 | |
| Bovie Medical Corp. (a) | 10,849 | 25,821 | |
| C.R. Bard, Inc. | 123,487 | 39,615,864 | |
| Cantel Medical Corp. | 62,489 | 5,077,231 | |
| Cardiovascular Systems, Inc. (a) | 58,185 | 1,708,893 | |
| Cerus Corp. (a)(b) | 223,482 | 525,183 | |
| Cesca Therapeutics, Inc. (a) | 793 | 2,696 | |
| Cogentix Medical, Inc. (a) | 1,160 | 2,668 | |
| ConforMis, Inc. (a)(b) | 87,736 | 324,623 | |
| CONMED Corp. | 42,831 | 2,124,418 | |
| Corindus Vascular Robotics, Inc. (a)(b) | 178,714 | 341,344 | |
| Cryolife, Inc. (a) | 44,979 | 935,563 | |
| CryoPort, Inc. (a) | 21,868 | 167,946 | |
| Cutera, Inc. (a) | 22,484 | 835,281 | |
| CytoSorbents Corp. (a)(b) | 24,969 | 128,590 | |
| Danaher Corp. | 1,044,709 | 87,149,625 | |
| Dare Bioscience, Inc. (a)(b) | 2,822 | 9,397 | |
| Delcath Systems, Inc. (a)(b) | 724,984 | 80,183 | |
| Dentsply Sirona, Inc. | 392,936 | 22,228,390 | |
| DexCom, Inc. (a)(b) | 148,457 | 11,076,377 | |
| Dextera Surgical, Inc. (a)(b) | 2,377 | 849 | |
| Edwards Lifesciences Corp. (a) | 358,419 | 40,737,904 | |
| Ekso Bionics Holdings, Inc. (a)(b) | 18,398 | 23,181 | |
| Endologix, Inc. (a)(b) | 127,100 | 537,633 | |
| Entellus Medical, Inc. (a)(b) | 19,089 | 337,875 | |
| EnteroMedics, Inc. (a)(b) | 13,109 | 24,776 | |
| Exactech, Inc. (a) | 12,870 | 393,179 | |
| Fonar Corp. (a) | 7,275 | 215,340 | |
| Genmark Diagnostics, Inc. (a) | 85,964 | 837,289 | |
| Glaukos Corp. (a)(b) | 17,206 | 649,527 | |
| Globus Medical, Inc. (a) | 121,778 | 3,681,349 | |
| Haemonetics Corp. (a) | 91,218 | 3,924,198 | |
| Halyard Health, Inc. (a)(b) | 83,663 | 3,789,097 | |
| Heska Corp. (a) | 12,153 | 1,236,203 | |
| Hill-Rom Holdings, Inc. | 104,665 | 8,055,018 | |
| Hologic, Inc. (a) | 475,499 | 18,354,261 | |
| ICU Medical, Inc. (a) | 25,020 | 4,362,237 | |
| IDEXX Laboratories, Inc. (a) | 149,372 | 23,216,890 | |
| Inogen, Inc. (a) | 30,117 | 2,885,209 | |
| Insulet Corp. (a) | 96,745 | 5,617,015 | |
| Integer Holdings Corp. (a) | 45,898 | 2,109,013 | |
| Integra LifeSciences Holdings Corp. (a) | 106,721 | 5,441,704 | |
| Intuitive Surgical, Inc. (a) | 63,201 | 63,496,149 | |
| Invacare Corp. (b) | 57,619 | 777,857 | |
| InVivo Therapeutics Holdings Corp. (a)(b) | 46,249 | 53,186 | |
| Invuity, Inc. (a) | 16,779 | 134,232 | |
| IRadimed Corp. (a)(b) | 3,077 | 31,078 | |
| iRhythm Technologies, Inc. (b) | 20,421 | 974,899 | |
| Iridex Corp. (a) | 4,871 | 43,352 | |
| K2M Group Holdings, Inc. (a) | 62,592 | 1,463,401 | |
| Kewaunee Scientific Corp. | 1,376 | 35,432 | |
| Lantheus Holdings, Inc. (a) | 45,045 | 788,288 | |
| LeMaitre Vascular, Inc. | 20,554 | 748,166 | |
| LivaNova PLC (a)(b) | 75,176 | 4,704,514 | |
| Masimo Corp. (a) | 77,531 | 6,542,066 | |
| Medtronic PLC | 2,345,978 | 189,132,746 | |
| Meridian Bioscience, Inc. | 73,595 | 1,022,971 | |
| Merit Medical Systems, Inc. (a) | 93,532 | 3,862,872 | |
| Microbot Medical, Inc. (a)(b) | 7,285 | 7,504 | |
| Misonix, Inc. (a) | 7,938 | 77,792 | |
| Natus Medical, Inc. (a) | 56,909 | 1,912,142 | |
| Neogen Corp. (a) | 67,196 | 4,629,804 | |
| Nevro Corp. (a)(b) | 40,235 | 3,467,452 | |
| NuVasive, Inc. (a)(b) | 83,449 | 5,213,894 | |
| Nuvectra Corp. (a) | 13,499 | 145,654 | |
| NxStage Medical, Inc. (a) | 98,730 | 2,764,440 | |
| OraSure Technologies, Inc. (a) | 97,410 | 1,988,138 | |
| Orthofix International NV (a) | 32,172 | 1,583,184 | |
| Penumbra, Inc. (a)(b) | 54,930 | 4,723,980 | |
| Pulse Biosciences, Inc. (a)(b) | 10,423 | 208,773 | |
| Quidel Corp. (a) | 49,569 | 1,731,941 | |
| ResMed, Inc. (b) | 241,759 | 18,755,663 | |
| Retractable Technologies, Inc. (a) | 5,248 | 3,338 | |
| Rockwell Medical Technologies, Inc. (a)(b) | 83,284 | 526,355 | |
| Roka Bioscience, Inc. (a) | 10,160 | 9,917 | |
| RTI Biologics, Inc. (a) | 100,701 | 453,155 | |
| Seaspine Holdings Corp. (a) | 11,601 | 131,091 | |
| Second Sight Medical Products, Inc. (a)(b) | 20,882 | 23,597 | |
| Sientra, Inc. (a)(b) | 27,954 | 320,353 | |
| Skyline Medical, Inc. (a)(b) | 19,298 | 27,017 | |
| Staar Surgical Co. (a)(b) | 39,188 | 468,297 | |
| Steris PLC | 151,004 | 13,161,509 | |
| STRATA Skin Sciences, Inc. (a) | 803 | 1,502 | |
| Stryker Corp. | 531,872 | 75,190,745 | |
| SurModics, Inc. (a) | 19,525 | 507,650 | |
| Synergetics U.S.A., Inc. (a)(c) | 19,727 | 0 | |
| Tactile Systems Technology, Inc. (a)(b) | 22,275 | 732,402 | |
| Tandem Diabetes Care, Inc. (a)(b) | 25,765 | 21,643 | |
| TearLab Corp. (a)(b) | 1,739 | 2,348 | |
| Teleflex, Inc. | 77,066 | 16,318,726 | |
| The Cooper Companies, Inc. | 83,062 | 20,834,441 | |
| TransEnterix, Inc. (a)(b) | 90,218 | 77,587 | |
| Utah Medical Products, Inc. | 13,511 | 974,819 | |
| Varian Medical Systems, Inc. (a)(b) | 159,232 | 16,918,400 | |
| Vermillion, Inc. (a)(b) | 12,449 | 15,810 | |
| ViewRay, Inc. (a)(b) | 55,513 | 291,998 | |
| Viveve Medical, Inc. (a)(b) | 22,359 | 126,776 | |
| West Pharmaceutical Services, Inc. | 126,597 | 11,019,003 | |
| Wright Medical Group NV (a)(b) | 185,020 | 5,476,592 | |
| Zimmer Biomet Holdings, Inc. | 342,629 | 39,152,216 | |
| Zosano Pharma Corp. (a)(b) | 34,865 | 29,287 | |
| 1,218,592,923 | |||
| Health Care Providers & Services - 2.6% | |||
| AAC Holdings, Inc. (a)(b) | 12,779 | 118,717 | |
| Acadia Healthcare Co., Inc. (a)(b) | 128,691 | 6,040,756 | |
| Aceto Corp. | 47,837 | 507,551 | |
| Addus HomeCare Corp. (a) | 10,897 | 371,043 | |
| Aetna, Inc. | 564,977 | 89,096,873 | |
| Almost Family, Inc. (a) | 19,278 | 938,839 | |
| Amedisys, Inc. (a) | 47,206 | 2,466,041 | |
| American Renal Associates Holdings, Inc. (a)(b) | 16,913 | 242,363 | |
| AmerisourceBergen Corp. | 281,803 | 22,614,691 | |
| AMN Healthcare Services, Inc. (a)(b) | 87,493 | 3,267,864 | |
| Anthem, Inc. | 452,049 | 88,619,686 | |
| BioScrip, Inc. (a)(b) | 230,699 | 699,018 | |
| BioTelemetry, Inc. (a) | 51,243 | 1,903,677 | |
| Brookdale Senior Living, Inc. (a) | 326,054 | 3,955,035 | |
| Caladrius Biosciences, Inc. (a)(b) | 9,530 | 38,215 | |
| Capital Senior Living Corp. (a)(b) | 37,012 | 460,059 | |
| Cardinal Health, Inc. | 540,009 | 36,429,007 | |
| Centene Corp. (a) | 297,424 | 26,426,122 | |
| Chemed Corp. | 28,374 | 5,597,906 | |
| Cigna Corp. | 437,196 | 79,595,904 | |
| Civitas Solutions, Inc. (a) | 27,734 | 529,719 | |
| Community Health Systems, Inc. (a)(b) | 198,155 | 1,513,904 | |
| Corvel Corp. (a) | 17,696 | 918,422 | |
| Cross Country Healthcare, Inc. (a) | 55,702 | 689,591 | |
| DaVita HealthCare Partners, Inc. (a) | 263,576 | 15,435,011 | |
| Diplomat Pharmacy, Inc. (a)(b) | 79,924 | 1,338,727 | |
| Envision Healthcare Corp. | 199,964 | 10,480,113 | |
| Express Scripts Holding Co. (a) | 1,013,621 | 63,675,671 | |
| Five Star Sr Living, Inc. (a) | 70,113 | 113,934 | |
| Genesis HealthCare, Inc. Class A (a)(b) | 27,157 | 28,243 | |
| HCA Holdings, Inc. (a) | 489,951 | 38,539,546 | |
| HealthEquity, Inc. (a) | 76,252 | 3,261,298 | |
| HealthSouth Corp. | 168,846 | 7,724,705 | |
| Henry Schein, Inc. (a) | 146,456 | 25,436,478 | |
| Humana, Inc. | 247,696 | 63,811,444 | |
| Interpace Diagnostics Group, Inc. (a) | 136 | 178 | |
| Kindred Healthcare, Inc. | 151,684 | 1,228,640 | |
| Laboratory Corp. of America Holdings (a) | 175,793 | 27,576,648 | |
| Landauer, Inc. | 14,935 | 926,717 | |
| LHC Group, Inc. (a) | 27,965 | 1,824,716 | |
| LifePoint Hospitals, Inc. (a) | 65,814 | 3,813,921 | |
| Magellan Health Services, Inc. (a) | 40,373 | 3,266,176 | |
| McKesson Corp. | 363,256 | 54,237,753 | |
| MEDNAX, Inc. (a) | 163,523 | 7,334,007 | |
| Molina Healthcare, Inc. (a)(b) | 72,754 | 4,656,256 | |
| National Healthcare Corp. | 18,256 | 1,138,079 | |
| National Research Corp. Class A | 11,334 | 366,088 | |
| Owens & Minor, Inc. | 118,083 | 3,299,239 | |
| Patterson Companies, Inc. (b) | 134,760 | 5,188,260 | |
| PharMerica Corp. (a) | 50,899 | 1,496,431 | |
| Premier, Inc. (a) | 101,239 | 3,391,507 | |
| Providence Service Corp. (a) | 20,443 | 1,059,561 | |
| Psychemedics Corp. | 2,724 | 57,585 | |
| Quest Diagnostics, Inc. | 231,764 | 25,111,629 | |
| Quorum Health Corp. (a) | 41,687 | 182,589 | |
| R1 RCM, Inc. (a) | 178,635 | 589,496 | |
| RadNet, Inc. (a) | 43,227 | 443,077 | |
| Select Medical Holdings Corp. (a)(b) | 195,741 | 3,640,783 | |
| Sharps Compliance Corp. (a) | 12,687 | 62,801 | |
| Surgery Partners, Inc. (a) | 43,549 | 424,603 | |
| Teladoc, Inc. (a)(b) | 60,964 | 2,045,342 | |
| Tenet Healthcare Corp. (a)(b) | 137,153 | 2,354,917 | |
| The Ensign Group, Inc. | 78,310 | 1,608,487 | |
| Tivity Health, Inc.(a)(b) | 52,424 | 2,055,021 | |
| Triple-S Management Corp. (a)(b) | 37,106 | 916,889 | |
| U.S. Physical Therapy, Inc. | 18,467 | 1,106,173 | |
| UnitedHealth Group, Inc. | 1,650,119 | 328,208,669 | |
| Universal Health Services, Inc. Class B | 153,265 | 16,572,544 | |
| VCA, Inc. (a) | 141,830 | 13,184,517 | |
| Wellcare Health Plans, Inc. (a) | 75,649 | 13,214,367 | |
| 1,135,469,839 | |||
| Health Care Technology - 0.2% | |||
| Allscripts Healthcare Solutions, Inc. (a) | 329,763 | 4,333,086 | |
| athenahealth, Inc. (a)(b) | 66,612 | 9,387,629 | |
| Castlight Health, Inc. Class B (a)(b) | 69,240 | 270,036 | |
| Cerner Corp. (a) | 507,173 | 34,376,186 | |
| Computer Programs & Systems, Inc. (b) | 21,937 | 660,304 | |
| Connecture, Inc. (a) | 7,971 | 5,341 | |
| Evolent Health, Inc. (a)(b) | 108,849 | 1,817,778 | |
| HealthStream, Inc. (a)(b) | 41,650 | 978,359 | |
| HMS Holdings Corp. (a) | 140,319 | 2,486,453 | |
| iCAD, Inc. (a) | 14,864 | 58,861 | |
| Inovalon Holdings, Inc. Class A (a)(b) | 119,481 | 1,618,968 | |
| Medidata Solutions, Inc. (a) | 94,000 | 7,046,240 | |
| Omnicell, Inc. (a) | 60,052 | 3,080,668 | |
| Quality Systems, Inc. (a) | 73,135 | 1,151,876 | |
| Simulations Plus, Inc. | 6,008 | 87,116 | |
| Tabula Rasa HealthCare, Inc. | 5,543 | 125,992 | |
| Veeva Systems, Inc. Class A (a) | 198,680 | 11,821,460 | |
| Vocera Communications, Inc. (a) | 48,079 | 1,339,000 | |
| 80,645,353 | |||
| Life Sciences Tools & Services - 0.8% | |||
| Accelerate Diagnostics, Inc. (a)(b) | 47,182 | 1,085,186 | |
| Agilent Technologies, Inc. | 553,206 | 35,803,492 | |
| Albany Molecular Research, Inc. (a) | 40,643 | 883,579 | |
| Bio-Rad Laboratories, Inc. Class A (a) | 35,877 | 7,814,728 | |
| Bio-Techne Corp. | 69,291 | 8,576,840 | |
| Bruker Corp. | 188,235 | 5,475,756 | |
| Cambrex Corp. (a) | 66,661 | 3,473,038 | |
| Charles River Laboratories International, Inc. (a) | 77,816 | 8,466,381 | |
| ChromaDex, Inc. (a)(b) | 56,591 | 190,146 | |
| Enzo Biochem, Inc. (a) | 66,443 | 747,484 | |
| Fluidigm Corp. (a)(b) | 38,600 | 176,402 | |
| Harvard Bioscience, Inc. (a) | 18,919 | 58,649 | |
| Illumina, Inc. (a) | 250,734 | 51,265,074 | |
| INC Research Holdings, Inc. Class A (a)(b) | 91,734 | 5,384,786 | |
| Luminex Corp. | 66,508 | 1,285,600 | |
| Medpace Holdings, Inc. (b) | 21,051 | 687,105 | |
| Mettler-Toledo International, Inc. (a) | 43,558 | 26,356,510 | |
| Nanostring Technologies, Inc. (a) | 24,217 | 374,153 | |
| NeoGenomics, Inc. (a)(b) | 77,966 | 788,236 | |
| Pacific Biosciences of California, Inc. (a)(b) | 161,679 | 800,311 | |
| PAREXEL International Corp. (a) | 86,781 | 7,627,182 | |
| PerkinElmer, Inc. | 184,639 | 12,368,967 | |
| PRA Health Sciences, Inc. (a) | 84,500 | 6,540,300 | |
| pSivida Corp. (a)(b) | 25,265 | 30,571 | |
| Quintiles Transnational Holdings, Inc. (a) | 232,389 | 22,316,316 | |
| Thermo Fisher Scientific, Inc. | 667,814 | 124,974,712 | |
| VWR Corp. (a) | 150,777 | 4,978,657 | |
| Waters Corp. (a) | 136,882 | 25,115,109 | |
| 363,645,270 | |||
| Pharmaceuticals - 4.3% | |||
| AcelRx Pharmaceuticals, Inc. (a)(b) | 65,025 | 214,583 | |
| Aclaris Therapeutics, Inc. (a) | 40,572 | 1,052,032 | |
| Adamis Pharmaceuticals Corp. (a)(b) | 36,542 | 199,154 | |
| Aerie Pharmaceuticals, Inc. (a)(b) | 59,316 | 3,401,773 | |
| Agile Therapeutics, Inc. (a)(b) | 87,068 | 299,514 | |
| Akorn, Inc. (a) | 148,175 | 4,874,958 | |
| Alimera Sciences, Inc. (a) | 22,049 | 30,648 | |
| Allergan PLC | 574,331 | 131,797,478 | |
| Amphastar Pharmaceuticals, Inc. (a) | 63,932 | 1,023,551 | |
| Ampio Pharmaceuticals, Inc. (a)(b) | 59,082 | 31,467 | |
| ANI Pharmaceuticals, Inc. (a) | 10,919 | 524,112 | |
| ANI Pharmaceuticals, Inc. rights (a)(c) | 21,445 | 0 | |
| Apricus Biosciences, Inc. (a)(b) | 5,725 | 9,332 | |
| Aratana Therapeutics, Inc. (a)(b) | 38,612 | 220,475 | |
| Assembly Biosciences, Inc. (a) | 23,295 | 631,527 | |
| AstraZeneca PLC rights (a)(c) | 7,692 | 0 | |
| Avexis, Inc. (a)(b) | 38,150 | 3,561,303 | |
| Axsome Therapeutics, Inc. (a) | 21,511 | 109,706 | |
| Bio Path Holdings, Inc. (a)(b) | 166,645 | 45,827 | |
| Biodelivery Sciences International, Inc. (a)(b) | 170,623 | 528,931 | |
| BioPharmX Corp. (a)(b) | 64,864 | 19,848 | |
| Bristol-Myers Squibb Co. | 2,825,699 | 170,898,276 | |
| Catalent, Inc. (a) | 212,086 | 8,757,031 | |
| Cempra, Inc. (a)(b) | 81,591 | 248,853 | |
| Clearside Biomedical, Inc. (a)(b) | 19,198 | 134,194 | |
| Collegium Pharmaceutical, Inc. (a)(b) | 32,296 | 324,252 | |
| ContraVir Pharmaceuticals, Inc. (a)(b) | 80,626 | 38,322 | |
| Corcept Therapeutics, Inc. (a)(b) | 156,567 | 2,609,972 | |
| Corium International, Inc. (a)(b) | 42,043 | 359,468 | |
| CorMedix, Inc. (a)(b) | 48,587 | 24,051 | |
| Cumberland Pharmaceuticals, Inc. (a) | 7,158 | 50,178 | |
| CymaBay Therapeutics, Inc. (a) | 67,284 | 419,852 | |
| DepoMed, Inc. (a)(b) | 97,171 | 590,800 | |
| Dermira, Inc. (a)(b) | 70,654 | 1,666,728 | |
| Durect Corp. (a) | 198,076 | 314,941 | |
| Egalet Corp. (a) | 12,340 | 14,931 | |
| Eli Lilly & Co. | 1,666,890 | 135,501,488 | |
| Endo International PLC (a)(b) | 329,369 | 2,895,154 | |
| Endocyte, Inc. (a)(b) | 47,373 | 64,427 | |
| Flex Pharma, Inc. (a) | 10,224 | 40,180 | |
| Gemphire Therapeutics, Inc. (b) | 6,333 | 61,050 | |
| Horizon Pharma PLC (a)(b) | 272,914 | 3,733,464 | |
| Impax Laboratories, Inc. (a)(b) | 130,689 | 2,829,417 | |
| Imprimis Pharmaceuticals, Inc. (a)(b) | 10,757 | 19,685 | |
| Innoviva, Inc. (a)(b) | 134,795 | 1,892,522 | |
| Intersect ENT, Inc. (a) | 61,422 | 1,897,940 | |
| Intra-Cellular Therapies, Inc. (a)(b) | 67,457 | 1,244,582 | |
| Jazz Pharmaceuticals PLC (a) | 102,757 | 15,347,786 | |
| Johnson & Johnson | 4,615,739 | 610,985,371 | |
| Juniper Pharmaceuticals, Inc. (a) | 11,831 | 55,014 | |
| KemPharm, Inc. (a)(b) | 5,081 | 15,497 | |
| Lannett Co., Inc. (a)(b) | 44,883 | 787,697 | |
| Lipocine, Inc. (a)(b) | 20,645 | 78,038 | |
| Mallinckrodt PLC (a) | 172,938 | 7,104,293 | |
| Marinus Pharmaceuticals, Inc. (a) | 9,220 | 28,213 | |
| Merck & Co., Inc. | 4,685,121 | 299,191,827 | |
| Mylan N.V. (a) | 791,862 | 24,927,816 | |
| MyoKardia, Inc. (a) | 35,984 | 1,559,906 | |
| Nektar Therapeutics (a) | 273,203 | 5,745,459 | |
| Neos Therapeutics, Inc. (a)(b) | 19,225 | 160,529 | |
| Novan, Inc. (b) | 7,147 | 36,092 | |
| Novus Therapeutics, Inc. (a)(b) | 606 | 2,400 | |
| Ocera Therapeutics, Inc. (a)(b) | 10,720 | 9,970 | |
| Ocular Therapeutix, Inc. (a)(b) | 28,848 | 180,588 | |
| Omeros Corp. (a)(b) | 69,139 | 1,415,275 | |
| Orexigen Therapeutics, Inc. (a)(b) | 16,675 | 37,852 | |
| Pacira Pharmaceuticals, Inc. (a) | 70,346 | 2,680,183 | |
| Pain Therapeutics, Inc. (a) | 4,934 | 15,838 | |
| Paratek Pharmaceuticals, Inc. (a)(b) | 35,978 | 1,014,580 | |
| Pernix Therapeutics Holdings, Inc. (a)(b) | 4,109 | 12,327 | |
| Perrigo Co. PLC | 246,025 | 19,426,134 | |
| Pfizer, Inc. | 10,232,789 | 347,096,203 | |
| Phibro Animal Health Corp. Class A | 37,189 | 1,320,210 | |
| Plx Pharma PLC/New (a) | 290 | 1,827 | |
| Prestige Brands Holdings, Inc. (a) | 93,229 | 4,727,643 | |
| Reata Pharmaceuticals, Inc. (a) | 15,332 | 463,793 | |
| Repros Therapeutics, Inc. (a) | 24,715 | 7,311 | |
| Revance Therapeutics, Inc. (a)(b) | 37,609 | 923,301 | |
| SciClone Pharmaceuticals, Inc. (a) | 95,019 | 1,045,209 | |
| SCYNEXIS, Inc. (a)(b) | 16,272 | 31,242 | |
| Sucampo Pharmaceuticals, Inc. Class A (a)(b) | 39,776 | 467,368 | |
| Supernus Pharmaceuticals, Inc. (a)(b) | 84,621 | 3,875,642 | |
| Teligent, Inc. (a)(b) | 140,525 | 971,028 | |
| Tetraphase Pharmaceuticals, Inc. (a) | 74,420 | 519,452 | |
| The Medicines Company (a)(b) | 125,813 | 4,616,079 | |
| TherapeuticsMD, Inc. (a)(b) | 280,301 | 1,681,806 | |
| Theravance Biopharma, Inc. (a)(b) | 67,445 | 2,203,428 | |
| Titan Pharmaceuticals, Inc. (a)(b) | 11,285 | 16,928 | |
| VIVUS, Inc. (a)(b) | 157,068 | 139,885 | |
| WAVE Life Sciences (a)(b) | 28,404 | 667,494 | |
| Zoetis, Inc. Class A | 844,331 | 52,939,554 | |
| Zogenix, Inc. (a)(b) | 41,404 | 490,637 | |
| Zynerba Pharmaceuticals, Inc. (a)(b) | 23,422 | 148,730 | |
| 1,900,381,432 | |||
| TOTAL HEALTH CARE | 6,198,343,699 | ||
| INDUSTRIALS - 10.6% | |||
| Aerospace & Defense - 2.4% | |||
| AAR Corp. | 51,954 | 1,873,461 | |
| Aerojet Rocketdyne Holdings, Inc. (a) | 129,248 | 3,829,618 | |
| AeroVironment, Inc. (a)(b) | 33,858 | 1,659,719 | |
| Arconic, Inc. | 746,482 | 19,012,897 | |
| Arotech Corp. (a)(b) | 32,173 | 106,171 | |
| Astronics Corp. (a) | 34,623 | 910,239 | |
| Astronics Corp. Class B | 3,221 | 84,390 | |
| Astrotech Corp. (a) | 8,707 | 6,356 | |
| Axon Enterprise, Inc. (a)(b) | 93,306 | 2,025,673 | |
| BWX Technologies, Inc. | 171,125 | 9,363,960 | |
| CPI Aerostructures, Inc. (a) | 3,805 | 33,104 | |
| Cubic Corp. | 40,394 | 1,734,922 | |
| Curtiss-Wright Corp. | 91,404 | 8,849,735 | |
| DigitalGlobe, Inc. (a) | 105,249 | 3,620,566 | |
| Ducommun, Inc. (a) | 15,643 | 430,183 | |
| Engility Holdings, Inc. (a) | 28,046 | 871,389 | |
| Esterline Technologies Corp. (a) | 49,383 | 4,217,308 | |
| General Dynamics Corp. | 484,645 | 97,583,271 | |
| HEICO Corp. (b) | 55,920 | 4,796,258 | |
| HEICO Corp. Class A | 63,535 | 4,615,818 | |
| Hexcel Corp. | 159,521 | 8,577,444 | |
| Huntington Ingalls Industries, Inc. | 78,560 | 16,808,698 | |
| Innovative Solutions & Support, Inc. (a) | 21,878 | 75,479 | |
| KEYW Holding Corp. (a)(b) | 74,131 | 530,037 | |
| KLX, Inc. (a) | 87,459 | 4,192,784 | |
| Kratos Defense & Security Solutions, Inc. (a)(b) | 149,910 | 2,005,796 | |
| L3 Technologies, Inc. | 133,944 | 24,308,157 | |
| Lockheed Martin Corp. | 426,404 | 130,219,518 | |
| Mercury Systems, Inc. (a) | 82,892 | 3,999,539 | |
| Micronet Enertec Technologies, Inc. (a) | 3,018 | 2,423 | |
| Moog, Inc. Class A (a) | 52,323 | 4,016,313 | |
| National Presto Industries, Inc. (b) | 7,356 | 732,658 | |
| Northrop Grumman Corp. | 301,621 | 82,104,252 | |
| Orbital ATK, Inc. | 102,816 | 11,472,209 | |
| Raytheon Co. | 497,629 | 90,573,454 | |
| Rockwell Collins, Inc. | 276,208 | 36,197,058 | |
| SIFCO Industries, Inc. (a) | 891 | 4,901 | |
| Sparton Corp. (a) | 13,384 | 310,107 | |
| Spirit AeroSystems Holdings, Inc. Class A | 205,388 | 15,301,406 | |
| Teledyne Technologies, Inc. (a) | 61,440 | 9,219,686 | |
| Textron, Inc. | 452,435 | 22,210,034 | |
| The Boeing Co. | 960,373 | 230,162,993 | |
| TransDigm Group, Inc. | 84,738 | 22,087,807 | |
| Triumph Group, Inc. | 96,901 | 2,548,496 | |
| United Technologies Corp. | 1,276,596 | 152,834,073 | |
| Vectrus, Inc. (a) | 17,822 | 509,353 | |
| Wesco Aircraft Holdings, Inc. (a) | 94,440 | 793,296 | |
| 1,037,423,009 | |||
| Air Freight & Logistics - 0.6% | |||
| Air Transport Services Group, Inc. (a) | 108,399 | 2,488,841 | |
| Atlas Air Worldwide Holdings, Inc. (a) | 45,740 | 3,055,432 | |
| C.H. Robinson Worldwide, Inc. | 243,163 | 17,174,603 | |
| Echo Global Logistics, Inc. (a)(b) | 48,848 | 742,490 | |
| Expeditors International of Washington, Inc. | 312,542 | 17,533,606 | |
| FedEx Corp. | 419,000 | 89,825,220 | |
| Forward Air Corp. | 54,775 | 2,846,657 | |
| Hub Group, Inc. Class A (a) | 55,422 | 2,130,976 | |
| Radiant Logistics, Inc. (a) | 54,959 | 277,543 | |
| United Parcel Service, Inc. Class B | 1,179,920 | 134,935,651 | |
| XPO Logistics, Inc. (a)(b) | 147,648 | 9,036,058 | |
| 280,047,077 | |||
| Airlines - 0.5% | |||
| Alaska Air Group, Inc. | 212,539 | 15,868,162 | |
| Allegiant Travel Co. (b) | 23,703 | 2,796,954 | |
| American Airlines Group, Inc. | 840,913 | 37,622,448 | |
| Delta Air Lines, Inc. | 1,254,555 | 59,202,450 | |
| Hawaiian Holdings, Inc. (a) | 89,875 | 3,851,144 | |
| JetBlue Airways Corp. (a) | 563,310 | 11,159,171 | |
| SkyWest, Inc. | 97,566 | 3,385,540 | |
| Southwest Airlines Co. | 1,032,776 | 53,848,941 | |
| Spirit Airlines, Inc. (a) | 120,068 | 4,088,315 | |
| United Continental Holdings, Inc. (a) | 481,496 | 29,833,492 | |
| 221,656,617 | |||
| Building Products - 0.5% | |||
| A.O. Smith Corp. | 253,397 | 14,111,679 | |
| AAON, Inc. | 75,766 | 2,469,972 | |
| Advanced Drain Systems, Inc. Del | 62,250 | 1,210,763 | |
| Allegion PLC | 162,633 | 12,800,843 | |
| American Woodmark Corp. (a) | 24,566 | 2,034,065 | |
| Apogee Enterprises, Inc. | 47,950 | 2,095,415 | |
| Armstrong World Industries, Inc. (a) | 81,275 | 3,860,563 | |
| Builders FirstSource, Inc. (a) | 179,848 | 2,927,925 | |
| Continental Building Products, Inc. (a) | 69,835 | 1,700,482 | |
| CSW Industrials, Inc. (a) | 25,190 | 1,054,202 | |
| Fortune Brands Home & Security, Inc. | 256,876 | 16,062,456 | |
| GCP Applied Technologies, Inc. (a) | 121,060 | 3,419,945 | |
| Gibraltar Industries, Inc. (a) | 56,316 | 1,647,243 | |
| GMS, Inc. (a) | 46,973 | 1,511,591 | |
| Griffon Corp. | 59,127 | 1,096,806 | |
| Insteel Industries, Inc. | 29,073 | 728,860 | |
| Jeld-Wen Holding, Inc. | 63,204 | 1,928,986 | |
| Johnson Controls International PLC | 1,604,213 | 63,510,793 | |
| Lennox International, Inc. (b) | 64,752 | 10,731,349 | |
| Masco Corp. | 540,799 | 19,885,179 | |
| Masonite International Corp. (a) | 51,336 | 3,249,569 | |
| NCI Building Systems, Inc. (a) | 58,589 | 984,295 | |
| Owens Corning | 191,219 | 14,175,064 | |
| Patrick Industries, Inc. (a) | 27,897 | 2,064,378 | |
| PGT, Inc. (a) | 80,695 | 1,065,174 | |
| Ply Gem Holdings, Inc. (a) | 36,381 | 565,725 | |
| Quanex Building Products Corp. | 55,487 | 1,087,545 | |
| Simpson Manufacturing Co. Ltd. | 63,559 | 2,782,613 | |
| Tecogen, Inc. New (a) | 2,274 | 6,822 | |
| Trex Co., Inc. (a) | 51,288 | 3,897,888 | |
| Universal Forest Products, Inc. | 36,181 | 3,155,345 | |
| USG Corp. (a)(b) | 145,958 | 4,378,740 | |
| 202,202,275 | |||
| Commercial Services & Supplies - 0.5% | |||
| ABM Industries, Inc. | 102,806 | 4,567,671 | |
| ACCO Brands Corp. (a) | 198,147 | 2,169,710 | |
| ADS Waste Holdings, Inc. | 88,843 | 2,118,017 | |
| Aqua Metals, Inc. (a)(b) | 20,623 | 152,816 | |
| ARC Document Solutions, Inc. (a) | 46,203 | 163,097 | |
| Brady Corp. Class A | 89,558 | 2,986,759 | |
| Casella Waste Systems, Inc. Class A (a) | 64,851 | 1,090,145 | |
| CECO Environmental Corp. | 40,679 | 303,872 | |
| Cenveo, Inc. (a)(b) | 13,016 | 49,200 | |
| Cintas Corp. | 149,849 | 20,231,113 | |
| Clean Harbors, Inc. (a) | 97,820 | 5,291,084 | |
| Copart, Inc. (a) | 345,568 | 11,296,618 | |
| Covanta Holding Corp. (b) | 226,728 | 3,253,547 | |
| Deluxe Corp. | 77,034 | 5,342,308 | |
| Ennis, Inc. | 34,279 | 654,729 | |
| Essendant, Inc. | 58,461 | 693,347 | |
| Fuel Tech, Inc. (a) | 51,934 | 46,896 | |
| Healthcare Services Group, Inc. | 122,906 | 6,292,787 | |
| Heritage-Crystal Clean, Inc. (a) | 21,763 | 424,379 | |
| Herman Miller, Inc. | 110,582 | 3,721,084 | |
| HNI Corp. | 80,621 | 2,954,760 | |
| Hudson Technologies, Inc. (a)(b) | 56,393 | 501,898 | |
| Industrial Services of America, Inc. (a)(b) | 1,620 | 3,159 | |
| InnerWorkings, Inc. (a) | 57,411 | 601,093 | |
| Interface, Inc. | 108,800 | 2,067,200 | |
| Intersections, Inc. (a)(b) | 12,865 | 45,156 | |
| KAR Auction Services, Inc. | 230,024 | 10,371,782 | |
| Kimball International, Inc. Class B | 52,574 | 891,655 | |
| Knoll, Inc. | 81,039 | 1,462,754 | |
| LSC Communications, Inc. | 57,687 | 929,338 | |
| Matthews International Corp. Class A | 55,558 | 3,347,370 | |
| McGrath RentCorp. | 37,522 | 1,514,763 | |
| Mobile Mini, Inc. | 73,292 | 2,217,083 | |
| Msa Safety, Inc. | 56,016 | 4,081,326 | |
| Multi-Color Corp. | 21,263 | 1,696,787 | |
| NL Industries, Inc. (a) | 6,707 | 50,638 | |
| Odyssey Marine Exploration, Inc. (a)(b) | 5,346 | 19,834 | |
| Performant Financial Corp. (a) | 31,038 | 54,627 | |
| Perma-Fix Environmental Services, Inc. (a) | 6,937 | 24,626 | |
| Pitney Bowes, Inc. | 320,489 | 4,118,284 | |
| Quad/Graphics, Inc. | 51,478 | 981,171 | |
| Quest Resource Holding Corp. (a)(b) | 2,977 | 4,108 | |
| R.R. Donnelley & Sons Co. | 111,816 | 1,032,062 | |
| Republic Services, Inc. | 404,127 | 26,365,245 | |
| Rollins, Inc. (b) | 163,488 | 7,260,502 | |
| SP Plus Corp. (a) | 38,199 | 1,409,543 | |
| Steelcase, Inc. Class A | 153,375 | 2,024,550 | |
| Stericycle, Inc. (a) | 146,361 | 10,521,892 | |
| Team, Inc. (a)(b) | 59,115 | 730,070 | |
| Tetra Tech, Inc. | 99,334 | 4,231,628 | |
| The Brink's Co. | 75,766 | 5,943,843 | |
| U.S. Ecology, Inc. | 34,516 | 1,774,122 | |
| UniFirst Corp. | 28,960 | 4,158,656 | |
| Viad Corp. | 33,828 | 1,858,849 | |
| Virco Manufacturing Co. (a) | 2,682 | 13,946 | |
| VSE Corp. | 10,794 | 562,907 | |
| Waste Management, Inc. | 702,694 | 54,184,734 | |
| West Corp. | 87,503 | 2,044,945 | |
| 232,906,085 | |||
| Construction & Engineering - 0.2% | |||
| AECOM (a) | 274,003 | 9,179,101 | |
| Aegion Corp. (a) | 54,146 | 1,173,344 | |
| Ameresco, Inc. Class A (a) | 38,199 | 276,943 | |
| Argan, Inc. | 22,803 | 1,444,570 | |
| Chicago Bridge & Iron Co. NV (b) | 165,022 | 2,036,371 | |
| Comfort Systems U.S.A., Inc. | 69,706 | 2,373,489 | |
| Dycom Industries, Inc. (a)(b) | 52,510 | 4,236,507 | |
| EMCOR Group, Inc. | 106,586 | 7,038,939 | |
| Fluor Corp. | 233,020 | 8,987,581 | |
| Goldfield Corp. | 41,171 | 183,211 | |
| Granite Construction, Inc. (b) | 70,943 | 3,918,182 | |
| Great Lakes Dredge & Dock Corp. (a) | 77,922 | 315,584 | |
| HC2 Holdings, Inc. (a) | 49,076 | 223,787 | |
| Ies Holdings, Inc. (a) | 16,326 | 269,379 | |
| Jacobs Engineering Group, Inc. | 212,899 | 11,600,867 | |
| KBR, Inc. | 238,105 | 3,873,968 | |
| Keane Group, Inc. (b) | 49,477 | 640,727 | |
| Layne Christensen Co. (a)(b) | 24,456 | 262,657 | |
| MasTec, Inc. (a) | 112,881 | 4,605,545 | |
| MYR Group, Inc. (a) | 33,116 | 854,724 | |
| Northwest Pipe Co. (a)(b) | 12,188 | 223,528 | |
| NV5 Holdings, Inc. (a) | 11,806 | 569,640 | |
| Orion Group Holdings, Inc. (a) | 33,745 | 203,820 | |
| Primoris Services Corp. | 70,710 | 2,023,013 | |
| Quanta Services, Inc. (a) | 267,735 | 9,619,719 | |
| Sterling Construction Co., Inc. (a) | 41,743 | 491,733 | |
| Tutor Perini Corp. (a) | 72,569 | 1,897,679 | |
| Valmont Industries, Inc. | 38,333 | 5,502,702 | |
| 84,027,310 | |||
| Electrical Equipment - 0.6% | |||
| Acuity Brands, Inc. (b) | 75,177 | 13,290,542 | |
| Allied Motion Technologies, Inc. | 10,236 | 258,868 | |
| American Superconductor Corp. (a)(b) | 20,903 | 81,104 | |
| AMETEK, Inc. | 394,980 | 24,982,485 | |
| AZZ, Inc. | 45,717 | 2,235,561 | |
| Babcock & Wilcox Enterprises, Inc. (a) | 92,914 | 209,986 | |
| Broadwind Energy, Inc. (a) | 15,938 | 54,508 | |
| Capstone Turbine Corp. (a)(b) | 40,707 | 26,093 | |
| Eaton Corp. PLC | 763,510 | 54,789,478 | |
| Emerson Electric Co. | 1,105,773 | 65,284,838 | |
| Encore Wire Corp. | 34,550 | 1,482,195 | |
| Energous Corp. (a)(b) | 25,329 | 240,372 | |
| Energy Focus, Inc. (a)(b) | 8,003 | 14,325 | |
| EnerSys | 77,507 | 4,968,199 | |
| Enphase Energy, Inc. (a)(b) | 30,890 | 28,419 | |
| EnSync, Inc. (a)(b) | 32,445 | 12,654 | |
| Espey Manufacturing & Electronics Corp. | 2,015 | 45,620 | |
| Fortive Corp. | 514,592 | 33,433,042 | |
| FuelCell Energy, Inc. (a)(b) | 48,863 | 75,249 | |
| Generac Holdings, Inc. (a)(b) | 118,381 | 4,780,225 | |
| General Cable Corp. | 78,815 | 1,335,914 | |
| Hubbell, Inc. Class B | 92,812 | 10,468,265 | |
| Ideal Power, Inc. (a)(b) | 38,104 | 92,593 | |
| LSI Industries, Inc. | 35,290 | 200,800 | |
| Ocean Power Technologies, Inc. (a)(b) | 1,104 | 1,347 | |
| Orion Energy Systems, Inc. (a) | 20,733 | 19,105 | |
| Plug Power, Inc. (a)(b) | 485,070 | 1,038,050 | |
| Powell Industries, Inc. | 13,455 | 383,064 | |
| Preformed Line Products Co. | 1,961 | 102,462 | |
| Real Goods Solar, Inc. (a) | 1 | 1 | |
| Regal Beloit Corp. | 80,384 | 6,060,954 | |
| Revolution Lighting Technologies, Inc. (a)(b) | 7,326 | 54,286 | |
| Rockwell Automation, Inc. | 219,516 | 36,013,795 | |
| Sensata Technologies Holding BV (a)(b) | 292,485 | 13,062,380 | |
| Sunrun, Inc. (a)(b) | 104,524 | 700,311 | |
| Sunworks, Inc. (a)(b) | 12,722 | 19,465 | |
| Thermon Group Holdings, Inc. (a)(b) | 52,027 | 859,486 | |
| TPI Composites, Inc. (a) | 37,115 | 754,919 | |
| Ultralife Corp. (a) | 13,410 | 87,165 | |
| Vicor Corp. (a) | 18,023 | 350,547 | |
| Vivint Solar, Inc. (a)(b) | 34,907 | 165,808 | |
| 278,064,480 | |||
| Industrial Conglomerates - 1.9% | |||
| 3M Co. | 1,023,713 | 209,165,040 | |
| Carlisle Companies, Inc. | 111,464 | 10,554,526 | |
| General Electric Co. | 14,915,787 | 366,182,571 | |
| Honeywell International, Inc. | 1,302,893 | 180,151,015 | |
| ITT, Inc. | 140,185 | 5,657,867 | |
| Raven Industries, Inc. | 60,171 | 1,684,788 | |
| Roper Technologies, Inc. | 172,938 | 39,889,879 | |
| 813,285,686 | |||
| Machinery - 1.8% | |||
| Actuant Corp. Class A (b) | 105,914 | 2,547,232 | |
| AGCO Corp. | 111,076 | 7,603,152 | |
| Alamo Group, Inc. | 17,898 | 1,642,320 | |
| Albany International Corp. Class A | 47,080 | 2,523,488 | |
| Allison Transmission Holdings, Inc. | 274,756 | 9,542,276 | |
| Altra Industrial Motion Corp. | 46,822 | 2,156,153 | |
| American Railcar Industries, Inc. | 11,797 | 424,692 | |
| ARC Group Worldwide, Inc. (a) | 1,450 | 3,553 | |
| Astec Industries, Inc. | 38,170 | 1,896,286 | |
| Barnes Group, Inc. | 79,881 | 4,994,160 | |
| Blue Bird Corp. (a) | 4,122 | 75,020 | |
| Briggs & Stratton Corp. | 75,012 | 1,570,751 | |
| Caterpillar, Inc. | 1,011,242 | 118,810,823 | |
| Chart Industries, Inc. (a) | 59,494 | 2,007,328 | |
| CIRCOR International, Inc. | 26,680 | 1,281,174 | |
| Colfax Corp. (a) | 167,182 | 6,667,218 | |
| Columbus McKinnon Corp. (NY Shares) | 35,569 | 1,174,844 | |
| Commercial Vehicle Group, Inc. (a) | 77,079 | 457,849 | |
| Crane Co. | 92,238 | 6,846,827 | |
| Cummins, Inc. | 263,695 | 42,027,709 | |
| Deere & Co. | 504,280 | 58,461,180 | |
| Dmc Global, Inc. | 17,783 | 230,290 | |
| Donaldson Co., Inc. | 227,086 | 10,729,814 | |
| Douglas Dynamics, Inc. | 38,692 | 1,350,351 | |
| Dover Corp. | 262,682 | 22,296,448 | |
| Eastern Co. | 5,588 | 146,126 | |
| Energy Recovery, Inc. (a)(b) | 61,650 | 400,725 | |
| EnPro Industries, Inc. | 33,499 | 2,360,675 | |
| ESCO Technologies, Inc. | 41,567 | 2,263,323 | |
| ExOne Co. (a)(b) | 13,829 | 111,877 | |
| Federal Signal Corp. | 91,334 | 1,707,032 | |
| Flowserve Corp. | 226,246 | 8,886,943 | |
| Franklin Electric Co., Inc. | 62,330 | 2,402,822 | |
| FreightCar America, Inc. | 19,411 | 352,504 | |
| Gardner Denver Holdings, Inc. (b) | 127,416 | 2,993,002 | |
| Gencor Industries, Inc. (a) | 2,773 | 42,704 | |
| Global Brass & Copper Holdings, Inc. | 34,001 | 1,014,930 | |
| Gorman-Rupp Co. | 28,251 | 859,960 | |
| Graco, Inc. | 95,451 | 11,025,545 | |
| Graham Corp. | 12,124 | 242,844 | |
| Greenbrier Companies, Inc. (b) | 47,653 | 2,044,314 | |
| Hardinge, Inc. | 14,874 | 203,625 | |
| Harsco Corp. (a) | 144,208 | 2,465,957 | |
| Hillenbrand, Inc. | 107,808 | 3,854,136 | |
| Hurco Companies, Inc. | 6,325 | 222,324 | |
| Hyster-Yale Materials Handling Class A | 17,565 | 1,250,277 | |
| IDEX Corp. | 131,232 | 15,430,259 | |
| Illinois Tool Works, Inc. | 529,610 | 72,826,671 | |
| Ingersoll-Rand PLC | 433,238 | 36,994,193 | |
| Jason Industries, Inc. (a) | 13,118 | 16,266 | |
| John Bean Technologies Corp. | 55,934 | 4,961,346 | |
| Kadant, Inc. | 18,429 | 1,600,559 | |
| Kennametal, Inc. | 136,498 | 4,777,430 | |
| L.B. Foster Co. Class A | 13,680 | 261,288 | |
| Lincoln Electric Holdings, Inc. | 100,440 | 8,722,210 | |
| Lindsay Corp. (b) | 16,477 | 1,426,414 | |
| Lydall, Inc. (a) | 28,864 | 1,356,608 | |
| Manitex International, Inc. (a) | 11,053 | 101,467 | |
| Manitowoc Co., Inc. (a)(b) | 250,611 | 2,062,529 | |
| Meritor, Inc. (a) | 154,933 | 3,076,969 | |
| Middleby Corp. (a) | 99,566 | 12,117,182 | |
| Milacron Holdings Corp. (a) | 88,730 | 1,415,244 | |
| Miller Industries, Inc. | 16,197 | 406,545 | |
| Mueller Industries, Inc. | 98,286 | 2,931,871 | |
| Mueller Water Products, Inc. Class A | 293,253 | 3,516,103 | |
| Navistar International Corp. New (a)(b) | 114,244 | 3,902,575 | |
| NN, Inc. | 43,595 | 1,111,673 | |
| Nordson Corp. | 91,551 | 10,006,524 | |
| Omega Flex, Inc. | 5,880 | 340,981 | |
| Oshkosh Corp. | 126,887 | 9,465,770 | |
| PACCAR, Inc. | 598,876 | 39,723,445 | |
| Park-Ohio Holdings Corp. | 13,382 | 533,273 | |
| Parker Hannifin Corp. | 224,266 | 36,082,157 | |
| Pentair PLC | 293,393 | 18,205,036 | |
| ProPetro Holding Corp. (b) | 100,689 | 1,158,930 | |
| Proto Labs, Inc. (a)(b) | 43,461 | 3,120,500 | |
| RBC Bearings, Inc. (a) | 41,703 | 4,598,590 | |
| Rexnord Corp. (a) | 169,317 | 4,043,290 | |
| Snap-On, Inc. (b) | 97,697 | 14,417,146 | |
| Spartan Motors, Inc. | 44,931 | 413,365 | |
| SPX Corp. (a) | 68,191 | 1,643,403 | |
| SPX Flow, Inc. (a) | 72,709 | 2,433,570 | |
| Standex International Corp. | 20,721 | 1,977,819 | |
| Stanley Black & Decker, Inc. | 263,099 | 37,886,256 | |
| Sun Hydraulics Corp. | 42,205 | 2,022,042 | |
| Supreme Industries, Inc. Class A | 19,310 | 404,351 | |
| Tennant Co. | 30,833 | 1,879,271 | |
| Terex Corp. | 170,082 | 6,556,661 | |
| The L.S. Starrett Co. Class A | 4,836 | 35,303 | |
| Timken Co. | 116,166 | 5,210,045 | |
| Titan International, Inc. | 99,148 | 850,690 | |
| Toro Co. | 182,747 | 11,271,835 | |
| TriMas Corp. (a) | 72,524 | 1,755,081 | |
| Trinity Industries, Inc. | 263,641 | 7,603,406 | |
| Twin Disc, Inc. (a)(b) | 8,286 | 143,845 | |
| Wabash National Corp. (b) | 105,115 | 2,209,517 | |
| WABCO Holdings, Inc. (a) | 85,901 | 12,337,102 | |
| Wabtec Corp. | 148,338 | 10,468,213 | |
| Watts Water Technologies, Inc. Class A | 51,551 | 3,180,697 | |
| Woodward, Inc. | 92,622 | 6,502,991 | |
| Xerium Technologies, Inc. (a) | 10,544 | 63,791 | |
| Xylem, Inc. | 308,987 | 19,178,823 | |
| 808,911,704 | |||
| Marine - 0.0% | |||
| Genco Shipping & Trading Ltd. (a)(b) | 10,301 | 143,287 | |
| Kirby Corp. (a)(b) | 89,632 | 5,610,963 | |
| Matson, Inc. | 69,658 | 1,797,176 | |
| 7,551,426 | |||
| Professional Services - 0.4% | |||
| Acacia Research Corp. (a) | 73,187 | 237,858 | |
| Advisory Board Co. (a) | 68,427 | 3,643,738 | |
| Barrett Business Services, Inc. | 8,858 | 456,896 | |
| BG Staffing, Inc. (b) | 5,516 | 89,194 | |
| CBIZ, Inc. (a) | 94,868 | 1,437,250 | |
| CDI Corp. (a) | 12,621 | 103,492 | |
| Cogint, Inc. (a)(b) | 74,077 | 362,977 | |
| CRA International, Inc. | 15,589 | 585,055 | |
| Dun & Bradstreet Corp. | 69,069 | 7,697,049 | |
| Equifax, Inc. | 205,395 | 29,262,626 | |
| Exponent, Inc. | 49,089 | 3,342,961 | |
| Franklin Covey Co. (a) | 19,900 | 374,120 | |
| FTI Consulting, Inc. (a) | 78,630 | 2,666,343 | |
| GP Strategies Corp. (a) | 22,618 | 646,875 | |
| Heidrick & Struggles International, Inc. | 29,141 | 531,823 | |
| Hill International, Inc. (a) | 55,142 | 261,925 | |
| Hudson Global, Inc. (a) | 13,947 | 20,502 | |
| Huron Consulting Group, Inc. (a) | 39,007 | 1,179,962 | |
| ICF International, Inc. (a) | 34,131 | 1,639,995 | |
| IHS Markit Ltd. (a) | 539,528 | 25,271,492 | |
| Insperity, Inc. | 32,267 | 2,591,040 | |
| Kelly Services, Inc. Class A (non-vtg.) | 51,237 | 1,108,256 | |
| Kforce, Inc. | 36,597 | 658,746 | |
| Korn/Ferry International | 104,534 | 3,483,073 | |
| Manpower, Inc. | 113,986 | 12,710,579 | |
| Marathon Patent Group, Inc. (a)(b) | 8,838 | 3,871 | |
| Mastech Digital, Inc. (a) | 373 | 3,394 | |
| MISTRAS Group, Inc. (a) | 29,557 | 558,923 | |
| Navigant Consulting, Inc. (a) | 75,747 | 1,161,202 | |
| Nielsen Holdings PLC | 596,445 | 23,171,888 | |
| On Assignment, Inc. (a) | 80,032 | 3,817,526 | |
| Pendrell Corp. (a) | 15,028 | 101,890 | |
| RCM Technologies, Inc. (a) | 9,908 | 53,404 | |
| Resources Connection, Inc. | 51,824 | 660,756 | |
| Robert Half International, Inc. | 211,379 | 9,575,469 | |
| RPX Corp. (a) | 97,220 | 1,269,693 | |
| TransUnion Holding Co., Inc. (a) | 255,382 | 12,222,583 | |
| TriNet Group, Inc. (a) | 66,298 | 2,368,828 | |
| TrueBlue, Inc. (a) | 75,110 | 1,536,000 | |
| Verisk Analytics, Inc. (a) | 260,972 | 21,151,781 | |
| Volt Information Sciences, Inc. (a) | 6,248 | 19,994 | |
| WageWorks, Inc. (a) | 80,292 | 4,733,213 | |
| Willdan Group, Inc. (a) | 10,974 | 340,304 | |
| 183,114,546 | |||
| Road & Rail - 0.9% | |||
| AMERCO | 10,691 | 3,989,988 | |
| ArcBest Corp. | 43,696 | 1,297,771 | |
| Avis Budget Group, Inc. (a)(b) | 143,156 | 5,186,542 | |
| Celadon Group, Inc. (b) | 62,978 | 314,890 | |
| Covenant Transport Group, Inc. Class A (a) | 19,818 | 475,830 | |
| CSX Corp. | 1,571,799 | 78,904,310 | |
| Daseke, Inc. (a)(b) | 34,697 | 454,531 | |
| Genesee & Wyoming, Inc. Class A (a) | 108,225 | 7,419,906 | |
| Heartland Express, Inc. (b) | 91,092 | 2,019,510 | |
| J.B. Hunt Transport Services, Inc. | 147,712 | 14,607,240 | |
| Kansas City Southern | 182,352 | 18,860,667 | |
| Knight Transportation, Inc. (b) | 113,018 | 4,413,353 | |
| Landstar System, Inc. | 76,087 | 7,102,721 | |
| Marten Transport Ltd. | 73,518 | 1,260,834 | |
| Norfolk Southern Corp. | 494,111 | 59,550,258 | |
| Old Dominion Freight Lines, Inc. | 117,920 | 11,780,208 | |
| P.A.M. Transportation Services, Inc. (a) | 3,193 | 63,094 | |
| Patriot Transportation Holding, Inc. (a) | 1,280 | 24,717 | |
| Roadrunner Transportation Systems, Inc. (a) | 43,638 | 325,976 | |
| Ryder System, Inc. | 90,251 | 7,003,478 | |
| Saia, Inc. (a) | 39,382 | 2,227,052 | |
| Schneider National, Inc. Class B (b) | 73,442 | 1,634,085 | |
| Swift Transporation Co. (a)(b) | 138,111 | 3,874,014 | |
| U.S.A. Truck, Inc. (a) | 7,889 | 87,962 | |
| Union Pacific Corp. | 1,382,528 | 145,580,198 | |
| Universal Logistics Holdings, Inc. | 12,296 | 204,114 | |
| Werner Enterprises, Inc. (b) | 69,717 | 2,307,633 | |
| YRC Worldwide, Inc. (a) | 47,961 | 642,198 | |
| 381,613,080 | |||
| Trading Companies & Distributors - 0.3% | |||
| AeroCentury Corp. (a) | 688 | 8,669 | |
| Air Lease Corp. Class A | 168,551 | 6,849,913 | |
| Aircastle Ltd. | 96,241 | 2,157,723 | |
| Applied Industrial Technologies, Inc. | 64,348 | 3,667,836 | |
| Beacon Roofing Supply, Inc. (a) | 111,136 | 5,234,506 | |
| BlueLinx Corp. (a) | 2,338 | 22,819 | |
| BMC Stock Holdings, Inc. (a) | 96,728 | 1,963,578 | |
| CAI International, Inc. (a) | 29,270 | 907,077 | |
| DXP Enterprises, Inc. (a) | 22,844 | 618,844 | |
| Fastenal Co. (b) | 510,029 | 21,762,937 | |
| GATX Corp. (b) | 67,450 | 4,086,121 | |
| H&E Equipment Services, Inc. | 49,244 | 1,159,204 | |
| HD Supply Holdings, Inc. (a) | 339,883 | 11,318,104 | |
| Herc Holdings, Inc. (a)(b) | 42,814 | 1,807,607 | |
| Houston Wire & Cable Co. | 15,647 | 89,970 | |
| Huttig Building Products, Inc. (a) | 22,831 | 130,137 | |
| Kaman Corp. | 42,373 | 2,077,972 | |
| Lawson Products, Inc. (a) | 6,300 | 150,255 | |
| MRC Global, Inc. (a) | 173,407 | 2,734,628 | |
| MSC Industrial Direct Co., Inc. Class A | 88,439 | 6,091,678 | |
| Neff Corp. (a) | 8,761 | 218,587 | |
| Nexeo Solutions, Inc. (a) | 103,751 | 743,895 | |
| Now, Inc. (a) | 176,983 | 2,063,622 | |
| Rush Enterprises, Inc. Class A (a) | 64,888 | 2,659,759 | |
| SiteOne Landscape Supply, Inc. (a)(b) | 67,882 | 3,410,392 | |
| Textainer Group Holdings Ltd. (b) | 42,716 | 758,209 | |
| Titan Machinery, Inc. (a) | 24,582 | 317,108 | |
| Triton International Ltd. | 53,680 | 1,981,866 | |
| United Rentals, Inc. (a) | 143,088 | 16,892,969 | |
| Univar, Inc. (a) | 178,396 | 5,032,551 | |
| Veritiv Corp. (a) | 19,444 | 544,432 | |
| W.W. Grainger, Inc. (b) | 90,821 | 14,764,770 | |
| Watsco, Inc. | 53,435 | 7,874,182 | |
| WESCO International, Inc. (a) | 73,100 | 3,687,895 | |
| Willis Lease Finance Corp. (a) | 2,668 | 63,498 | |
| 133,853,313 | |||
| Transportation Infrastructure - 0.0% | |||
| Macquarie Infrastructure Co. LLC | 130,429 | 9,714,352 | |
| SEACOR Marine Holdings, Inc. (b) | 30,560 | 391,474 | |
| 10,105,826 | |||
| TOTAL INDUSTRIALS | 4,674,762,434 | ||
| INFORMATION TECHNOLOGY - 22.5% | |||
| Communications Equipment - 1.1% | |||
| ADTRAN, Inc. | 74,924 | 1,655,820 | |
| Aerohive Networks, Inc. (a) | 130,171 | 449,090 | |
| Applied Optoelectronics, Inc. (a)(b) | 29,272 | 1,730,561 | |
| Arista Networks, Inc. (a)(b) | 74,208 | 13,071,739 | |
| Arris International PLC (a) | 323,592 | 9,015,273 | |
| Aviat Networks, Inc. (a) | 5,550 | 85,914 | |
| Black Box Corp. | 16,753 | 50,259 | |
| Blonder Tongue Laboratories, Inc. (a) | 3,352 | 1,445 | |
| Brocade Communications Systems, Inc. | 716,208 | 8,866,655 | |
| CalAmp Corp. (a) | 63,415 | 1,175,714 | |
| Calix Networks, Inc. (a) | 55,272 | 270,833 | |
| Carvana Co. Class A (b) | 26,177 | 467,259 | |
| Ciena Corp. (a)(b) | 238,403 | 5,151,889 | |
| Cisco Systems, Inc. | 8,562,233 | 275,789,525 | |
| Clearfield, Inc. (a)(b) | 16,017 | 195,407 | |
| CommScope Holding Co., Inc. (a) | 326,580 | 10,796,735 | |
| Communications Systems, Inc. | 4,311 | 15,563 | |
| Comtech Telecommunications Corp. | 38,555 | 754,521 | |
| Dasan Zhone Solutions, Inc. (a) | 1,172 | 7,688 | |
| Digi International, Inc. (a) | 37,099 | 341,311 | |
| EchoStar Holding Corp. Class A (a) | 85,828 | 5,175,428 | |
| EMCORE Corp. (a) | 50,451 | 459,104 | |
| Extreme Networks, Inc. (a) | 245,320 | 2,804,008 | |
| F5 Networks, Inc. (a) | 110,573 | 13,200,205 | |
| Finisar Corp. (a) | 193,129 | 4,664,065 | |
| Harmonic, Inc. (a)(b) | 134,269 | 436,374 | |
| Harris Corp. | 209,532 | 25,751,483 | |
| Infinera Corp. (a)(b) | 259,331 | 2,193,940 | |
| InterDigital, Inc. | 59,150 | 4,220,353 | |
| Juniper Networks, Inc. | 647,360 | 17,951,293 | |
| KVH Industries, Inc. (a) | 23,641 | 278,964 | |
| Lantronix, Inc. (a) | 71 | 150 | |
| Lumentum Holdings, Inc. (a)(b) | 94,599 | 5,377,953 | |
| Motorola Solutions, Inc. | 275,488 | 24,276,003 | |
| NETGEAR, Inc. (a) | 57,212 | 2,746,176 | |
| NetScout Systems, Inc. (a) | 150,999 | 4,945,217 | |
| Network-1 Security Solutions, Inc. | 21,477 | 81,613 | |
| Oclaro, Inc. (a)(b) | 207,242 | 1,742,905 | |
| Optical Cable Corp. (a) | 564 | 1,382 | |
| Palo Alto Networks, Inc. (a) | 156,219 | 20,728,699 | |
| Parkervision, Inc. (a)(b) | 10,028 | 19,254 | |
| PC-Tel, Inc. | 11,999 | 77,754 | |
| Plantronics, Inc. | 53,885 | 2,297,118 | |
| Relm Wireless Corp. | 9,436 | 36,800 | |
| Resonant, Inc. (a)(b) | 2,385 | 10,852 | |
| ShoreTel, Inc. (a) | 114,759 | 854,955 | |
| Sonus Networks, Inc. (a) | 82,074 | 567,131 | |
| Tessco Technologies, Inc. | 7,287 | 95,460 | |
| Ubiquiti Networks, Inc. (a)(b) | 44,626 | 2,659,263 | |
| ViaSat, Inc. (a)(b) | 93,287 | 5,933,986 | |
| Viavi Solutions, Inc. (a) | 389,051 | 3,906,072 | |
| Westell Technologies, Inc. Class A (a) | 18,994 | 54,513 | |
| 483,441,674 | |||
| Electronic Equipment & Components - 1.0% | |||
| Amphenol Corp. Class A | 523,273 | 42,353,717 | |
| Anixter International, Inc. (a) | 51,288 | 3,785,054 | |
| Applied DNA Sciences, Inc. (a)(b) | 18,968 | 39,264 | |
| Arrow Electronics, Inc. (a) | 174,121 | 13,830,431 | |
| Avnet, Inc. | 219,819 | 8,478,419 | |
| AVX Corp. | 141,087 | 2,461,968 | |
| Badger Meter, Inc. | 74,053 | 3,399,033 | |
| Bel Fuse, Inc. Class B (non-vtg.) | 12,097 | 308,474 | |
| Belden, Inc. | 76,472 | 5,893,697 | |
| Benchmark Electronics, Inc. (a) | 73,834 | 2,399,605 | |
| Cardtronics PLC (a) | 76,739 | 1,993,679 | |
| CDW Corp. | 262,789 | 16,666,078 | |
| ClearSign Combustion Corp. (a)(b) | 7,019 | 21,408 | |
| Cognex Corp. | 154,691 | 16,856,678 | |
| Coherent, Inc. (a) | 41,706 | 9,730,844 | |
| Control4 Corp. (a) | 35,202 | 871,602 | |
| Corning, Inc. | 1,571,612 | 45,199,561 | |
| CTS Corp. | 48,442 | 1,089,945 | |
| CUI Global, Inc. (a)(b) | 26,608 | 102,973 | |
| Daktronics, Inc. | 49,334 | 475,086 | |
| Dell Technologies, Inc. | 232,199 | 17,398,671 | |
| Dolby Laboratories, Inc. Class A | 101,632 | 5,128,351 | |
| Echelon Corp. (a) | 3,219 | 14,904 | |
| Electro Scientific Industries, Inc. (a) | 113,580 | 1,399,306 | |
| eMagin Corp. (a) | 5,084 | 10,931 | |
| ePlus, Inc. (a) | 21,340 | 1,786,158 | |
| Fabrinet (a) | 63,037 | 2,448,357 | |
| FARO Technologies, Inc. (a) | 24,409 | 840,890 | |
| Fitbit, Inc. (a)(b) | 275,332 | 1,660,252 | |
| FLIR Systems, Inc. | 235,820 | 8,961,160 | |
| Frequency Electronics, Inc. (a) | 2,550 | 20,349 | |
| Giga-Tronics, Inc. (a) | 2,579 | 1,554 | |
| I. D. Systems Inc. (a) | 6,071 | 38,490 | |
| Identiv, Inc. (a) | 10,618 | 52,134 | |
| IEC Electronics Corp. (a) | 86 | 356 | |
| II-VI, Inc. (a) | 95,705 | 3,431,024 | |
| Insight Enterprises, Inc. (a) | 62,606 | 2,509,248 | |
| Intellicheck, Inc. (a)(b) | 545 | 1,417 | |
| IPG Photonics Corp. (a) | 63,918 | 11,236,145 | |
| Iteris, Inc. (a)(b) | 32,677 | 209,786 | |
| Itron, Inc. (a) | 55,882 | 4,057,033 | |
| Jabil, Inc. | 305,429 | 9,575,199 | |
| KEMET Corp. (a) | 73,106 | 1,747,964 | |
| KEY Tronic Corp. (a) | 6,483 | 46,094 | |
| Keysight Technologies, Inc. (a) | 331,556 | 13,547,378 | |
| Kimball Electronics, Inc. (a) | 30,376 | 578,663 | |
| Knowles Corp. (a)(b) | 178,238 | 2,614,751 | |
| LightPath Technologies, Inc. Class A (a) | 376 | 981 | |
| Littelfuse, Inc. | 39,308 | 7,317,577 | |
| LRAD Corp. (a) | 56,581 | 96,754 | |
| Luna Innovations, Inc. (a) | 1,444 | 2,180 | |
| Maxwell Technologies, Inc. (a) | 38,769 | 215,943 | |
| Mesa Laboratories, Inc. | 4,836 | 660,453 | |
| Methode Electronics, Inc. Class A | 56,055 | 2,292,650 | |
| MicroVision, Inc. (a)(b) | 117,860 | 279,328 | |
| MTS Systems Corp. (b) | 29,288 | 1,417,539 | |
| National Instruments Corp. | 178,144 | 7,195,236 | |
| Neonode, Inc. (a)(b) | 33,197 | 41,828 | |
| NetList, Inc. (a)(b) | 104,599 | 73,219 | |
| Novanta, Inc. (a) | 69,461 | 2,715,925 | |
| OSI Systems, Inc. (a) | 28,365 | 2,355,997 | |
| Park Electrochemical Corp. | 28,127 | 510,786 | |
| PC Connection, Inc. | 26,383 | 673,030 | |
| PC Mall, Inc. (a)(b) | 8,716 | 114,615 | |
| Perceptron, Inc. (a) | 13,154 | 101,417 | |
| Plexus Corp. (a) | 72,969 | 3,800,226 | |
| RadiSys Corp. (a) | 34,231 | 53,743 | |
| Research Frontiers, Inc. (a)(b) | 16,855 | 19,889 | |
| RF Industries Ltd. | 5,778 | 10,400 | |
| Richardson Electronics Ltd. | 23,707 | 132,759 | |
| Rogers Corp. (a) | 31,193 | 3,697,930 | |
| Sanmina Corp. (a) | 138,110 | 5,172,220 | |
| ScanSource, Inc. (a) | 36,663 | 1,439,023 | |
| SYNNEX Corp. | 50,673 | 6,060,998 | |
| Systemax, Inc. | 23,392 | 571,700 | |
| TE Connectivity Ltd. | 603,729 | 48,056,828 | |
| Tech Data Corp. (a) | 55,538 | 6,125,286 | |
| Trimble, Inc. (a) | 431,914 | 16,706,434 | |
| TTM Technologies, Inc. (a)(b) | 135,794 | 1,933,707 | |
| Uni-Pixel, Inc. (a)(b) | 49,445 | 5,444 | |
| Universal Display Corp. | 75,720 | 9,624,012 | |
| VeriFone Systems, Inc. (a) | 198,885 | 3,931,956 | |
| Vishay Intertechnology, Inc. | 233,503 | 4,133,003 | |
| Vishay Precision Group, Inc. (a) | 9,596 | 209,673 | |
| Wayside Technology Group, Inc. | 1,232 | 18,850 | |
| Wireless Telecom Group, Inc. (a) | 11,200 | 16,464 | |
| Zebra Technologies Corp. Class A (a) | 89,788 | 9,256,245 | |
| 412,316,329 | |||
| Internet Software & Services - 4.4% | |||
| 2U, Inc. (a)(b) | 68,060 | 3,409,806 | |
| Actua Corp. (a)(b) | 58,635 | 750,528 | |
| Akamai Technologies, Inc. (a) | 294,471 | 13,884,308 | |
| Alarm.com Holdings, Inc. (a)(b) | 24,291 | 1,091,152 | |
| Alphabet, Inc.: | |||
| Class A (a) | 508,559 | 485,795,899 | |
| Class C (a) | 512,009 | 480,945,414 | |
| Amber Road, Inc. (a) | 55,819 | 449,901 | |
| Angie's List, Inc. (a)(b) | 57,858 | 703,553 | |
| AppFolio, Inc. (a) | 18,857 | 808,965 | |
| Apptio, Inc. Class A | 10,079 | 179,406 | |
| Autobytel, Inc. (a) | 9,434 | 68,491 | |
| Bankrate, Inc. (a) | 83,183 | 1,152,085 | |
| Bazaarvoice, Inc. (a) | 201,642 | 957,800 | |
| Benefitfocus, Inc. (a) | 24,805 | 765,234 | |
| BlackLine, Inc. (b) | 26,716 | 824,723 | |
| Blucora, Inc. (a) | 67,133 | 1,530,632 | |
| Box, Inc. Class A (a) | 112,627 | 2,209,742 | |
| Brightcove, Inc. (a) | 59,246 | 417,684 | |
| BroadVision, Inc. (a) | 490 | 1,936 | |
| Carbonite, Inc. (a)(b) | 40,379 | 807,580 | |
| Care.com, Inc. (a) | 25,585 | 383,007 | |
| ChannelAdvisor Corp. (a) | 32,537 | 377,429 | |
| Cloudera, Inc. (b) | 72,946 | 1,415,152 | |
| CommerceHub, Inc.: | |||
| Series A (a) | 21,320 | 472,664 | |
| Series C (a) | 54,178 | 1,150,199 | |
| Cornerstone OnDemand, Inc. (a) | 79,186 | 2,769,926 | |
| CoStar Group, Inc. (a) | 54,807 | 15,708,782 | |
| Coupa Software, Inc. | 54,059 | 1,646,637 | |
| Determine, Inc. (a) | 552 | 1,110 | |
| DHI Group, Inc. (a) | 141,360 | 275,652 | |
| eBay, Inc. (a) | 1,720,569 | 62,164,158 | |
| eGain Communications Corp. (a) | 8,558 | 14,549 | |
| Endurance International Group Holdings, Inc. (a) | 119,063 | 916,785 | |
| Envestnet, Inc. (a) | 69,312 | 3,080,918 | |
| Facebook, Inc. Class A (a) | 4,046,445 | 695,867,147 | |
| Five9, Inc. (a) | 81,974 | 1,762,441 | |
| GlowPoint, Inc. (a) | 18,770 | 5,068 | |
| GoDaddy, Inc. (a)(b) | 96,243 | 4,313,611 | |
| Gogo, Inc. (a)(b) | 109,584 | 1,535,272 | |
| GrubHub, Inc. (a)(b) | 145,837 | 8,325,834 | |
| GTT Communications, Inc. (a) | 50,744 | 1,611,122 | |
| Hortonworks, Inc. (a) | 69,183 | 1,175,419 | |
| IAC/InterActiveCorp (a) | 125,109 | 14,201,123 | |
| Instructure, Inc. (a) | 8,268 | 244,733 | |
| Internap Network Services Corp. (a)(b) | 99,683 | 445,583 | |
| Inuvo, Inc. (a) | 9,640 | 9,833 | |
| iPass, Inc. (a) | 33,662 | 18,851 | |
| j2 Global, Inc. (b) | 83,229 | 6,265,479 | |
| Leaf Group Ltd. (a) | 19,244 | 136,632 | |
| Limelight Networks, Inc. (a) | 85,727 | 307,760 | |
| Liquidity Services, Inc. (a) | 37,923 | 216,161 | |
| LivePerson, Inc. (a) | 99,233 | 1,329,722 | |
| LogMeIn, Inc. | 88,256 | 10,096,486 | |
| Marchex, Inc. Class B (a) | 28,685 | 88,637 | |
| Marin Software, Inc. (a) | 9,976 | 11,472 | |
| Match Group, Inc. (a)(b) | 78,674 | 1,711,160 | |
| MaxPoint Interactive, Inc. (a) | 1,466 | 20,099 | |
| MeetMe, Inc. (a)(b) | 113,904 | 446,504 | |
| MINDBODY, Inc. (a)(b) | 51,352 | 1,214,475 | |
| MuleSoft, Inc. Class A (b) | 52,013 | 1,133,883 | |
| New Relic, Inc. (a) | 60,180 | 2,882,622 | |
| NIC, Inc. | 110,917 | 1,813,493 | |
| NumereX Corp. Class A (a) | 13,747 | 53,476 | |
| Nutanix, Inc. Class A (b) | 87,220 | 1,918,840 | |
| Okta, Inc. (b) | 46,160 | 1,245,858 | |
| Ominto, Inc. (a)(b) | 11,014 | 35,796 | |
| Pandora Media, Inc. (a)(b) | 408,712 | 3,453,616 | |
| Q2 Holdings, Inc. (a) | 48,710 | 1,977,626 | |
| QuinStreet, Inc. (a) | 38,666 | 206,863 | |
| Qumu Corp. (a) | 6,017 | 16,908 | |
| Quotient Technology, Inc. (a)(b) | 132,658 | 1,989,870 | |
| Reis, Inc. | 8,134 | 139,091 | |
| Rocket Fuel, Inc. (a)(b) | 59,472 | 154,032 | |
| SecureWorks Corp. (a)(b) | 18,872 | 193,061 | |
| Shutterstock, Inc. (a)(b) | 29,764 | 999,475 | |
| Spark Networks, Inc. (a)(b) | 16,620 | 20,775 | |
| SPS Commerce, Inc. (a) | 30,117 | 1,834,728 | |
| Stamps.com, Inc. (a)(b) | 27,053 | 5,173,886 | |
| Support.com, Inc. (a) | 39,218 | 92,554 | |
| Synacor, Inc. (a)(b) | 20,037 | 46,085 | |
| TechTarget, Inc. (a) | 23,593 | 234,514 | |
| The Trade Desk, Inc. (b) | 37,435 | 1,982,932 | |
| Travelzoo, Inc. (a) | 5,383 | 43,871 | |
| Tremor Video, Inc. (a) | 17,986 | 63,311 | |
| TrueCar, Inc. (a)(b) | 124,192 | 2,105,054 | |
| Twilio, Inc. Class A (a)(b) | 42,402 | 1,241,531 | |
| Twitter, Inc. (a) | 1,064,350 | 17,998,159 | |
| VeriSign, Inc. (a)(b) | 147,930 | 15,347,738 | |
| Web.com Group, Inc. (a)(b) | 88,964 | 2,250,789 | |
| WebMD Health Corp. (a)(b) | 69,214 | 4,598,578 | |
| XO Group, Inc. (a) | 81,695 | 1,521,161 | |
| Yelp, Inc. (a)(b) | 104,237 | 4,440,496 | |
| Yext, Inc. (b) | 22,445 | 292,009 | |
| YuMe, Inc. | 101,833 | 497,963 | |
| Zillow Group, Inc.: | |||
| Class A (a) | 72,361 | 2,888,651 | |
| Class C (a)(b) | 192,635 | 7,632,199 | |
| 1,927,013,925 | |||
| IT Services - 3.8% | |||
| Accenture PLC Class A | 1,060,760 | 138,704,978 | |
| Acxiom Corp. (a) | 136,727 | 3,184,372 | |
| Alliance Data Systems Corp. | 94,701 | 21,355,076 | |
| Amdocs Ltd. | 273,648 | 17,729,654 | |
| Automatic Data Processing, Inc. | 763,935 | 81,336,159 | |
| Black Knight Financial Services, Inc. Class A (a)(b) | 45,984 | 1,958,918 | |
| Blackhawk Network Holdings, Inc. (a) | 93,800 | 4,202,240 | |
| Booz Allen Hamilton Holding Corp. Class A | 251,437 | 8,576,516 | |
| Broadridge Financial Solutions, Inc. | 205,695 | 16,070,950 | |
| CACI International, Inc. Class A (a) | 43,520 | 5,648,896 | |
| Cartesian, Inc. (a) | 206 | 102 | |
| Cass Information Systems, Inc. | 15,060 | 921,973 | |
| Cognizant Technology Solutions Corp. Class A | 1,007,698 | 71,314,787 | |
| Computer Task Group, Inc. | 11,646 | 61,724 | |
| Conduent, Inc. | 300,582 | 4,962,609 | |
| Convergys Corp. | 164,874 | 3,874,539 | |
| CoreLogic, Inc. (a) | 146,089 | 6,861,800 | |
| CSG Systems International, Inc. | 60,961 | 2,359,800 | |
| CSP, Inc. | 3,696 | 37,367 | |
| CSRA, Inc. | 246,056 | 7,753,225 | |
| DST Systems, Inc. | 112,242 | 5,761,382 | |
| DXC Technology Co. | 482,546 | 41,016,410 | |
| Edgewater Technology, Inc. (a) | 2,875 | 18,400 | |
| EPAM Systems, Inc. (a) | 77,553 | 6,307,385 | |
| Euronet Worldwide, Inc. (a) | 88,098 | 8,657,390 | |
| Everi Holdings, Inc. (a) | 99,354 | 766,019 | |
| EVERTEC, Inc. | 105,730 | 1,945,432 | |
| ExlService Holdings, Inc. (a) | 59,903 | 3,371,341 | |
| Fidelity National Information Services, Inc. | 560,193 | 52,053,134 | |
| First Data Corp. Class A (a) | 335,780 | 6,181,710 | |
| Fiserv, Inc. (a) | 363,868 | 45,014,110 | |
| FleetCor Technologies, Inc. (a) | 157,293 | 22,614,015 | |
| Forrester Research, Inc. | 17,100 | 696,825 | |
| Gartner, Inc. (a) | 154,792 | 18,666,367 | |
| Genpact Ltd. | 232,461 | 6,613,515 | |
| Global Payments, Inc. | 258,559 | 24,689,799 | |
| Hackett Group, Inc. | 39,872 | 544,652 | |
| IBM Corp. | 1,465,294 | 209,581,001 | |
| Information Services Group, Inc. (a) | 18,000 | 67,500 | |
| Innodata, Inc. (a) | 14,010 | 21,716 | |
| Jack Henry & Associates, Inc. | 139,152 | 14,342,397 | |
| Leidos Holdings, Inc. | 242,832 | 14,161,962 | |
| ManTech International Corp. Class A | 47,385 | 1,905,825 | |
| MasterCard, Inc. Class A | 1,606,433 | 214,137,519 | |
| Mattersight Corp. (a)(b) | 9,437 | 22,177 | |
| Maximus, Inc. | 109,431 | 6,651,216 | |
| ModusLink Global Solutions, Inc. (a)(b) | 31,030 | 49,648 | |
| MoneyGram International, Inc. (a) | 66,937 | 1,054,927 | |
| Paychex, Inc. | 545,609 | 31,116,081 | |
| PayPal Holdings, Inc. (a) | 1,912,306 | 117,951,034 | |
| Perficient, Inc. (a) | 51,600 | 944,280 | |
| PFSweb, Inc. (a) | 22,457 | 176,961 | |
| Planet Payment, Inc. (a) | 40,113 | 158,847 | |
| Presidio, Inc. (b) | 95,619 | 1,330,060 | |
| PRG-Schultz International, Inc. (a) | 36,569 | 246,841 | |
| Sabre Corp. (b) | 349,079 | 6,437,017 | |
| Science Applications International Corp. | 74,228 | 5,483,965 | |
| ServiceSource International, Inc. (a) | 93,929 | 330,630 | |
| Square, Inc. (a) | 45,912 | 1,198,762 | |
| StarTek, Inc. (a) | 15,709 | 186,937 | |
| Sykes Enterprises, Inc. (a) | 68,849 | 1,835,514 | |
| Syntel, Inc. (b) | 56,060 | 1,012,444 | |
| Teletech Holdings, Inc. | 29,721 | 1,179,924 | |
| Teradata Corp. (a)(b) | 220,606 | 7,041,744 | |
| The Western Union Co. | 833,977 | 15,778,845 | |
| Total System Services, Inc. | 282,084 | 19,497,646 | |
| Travelport Worldwide Ltd. | 241,707 | 3,659,444 | |
| Unisys Corp. (a)(b) | 68,286 | 529,217 | |
| Vantiv, Inc. (a) | 274,434 | 19,399,739 | |
| Virtusa Corp. (a) | 48,896 | 1,775,903 | |
| Visa, Inc. Class A | 3,160,024 | 327,125,684 | |
| WEX, Inc. (a) | 68,406 | 7,465,831 | |
| WidePoint Corp. (a) | 71,654 | 38,693 | |
| 1,675,731,502 | |||
| Semiconductors & Semiconductor Equipment - 3.4% | |||
| Acacia Communications, Inc. (a)(b) | 24,135 | 1,178,512 | |
| Advanced Energy Industries, Inc. (a) | 70,933 | 5,216,413 | |
| Advanced Micro Devices, Inc. (a)(b) | 1,322,156 | 17,188,028 | |
| AEHR Test Systems (a) | 18,931 | 63,608 | |
| Alpha & Omega Semiconductor Ltd. (a) | 32,383 | 514,242 | |
| Amkor Technology, Inc. (a) | 223,902 | 1,965,860 | |
| Amtech Systems, Inc. (a) | 13,719 | 151,595 | |
| Analog Devices, Inc. | 632,839 | 52,949,639 | |
| Applied Materials, Inc. | 1,825,017 | 82,344,767 | |
| Axcelis Technologies, Inc. (a) | 45,794 | 957,095 | |
| AXT, Inc. (a)(b) | 68,422 | 533,692 | |
| Broadcom Ltd. | 687,438 | 173,282,497 | |
| Brooks Automation, Inc. | 126,012 | 3,285,133 | |
| Cabot Microelectronics Corp. | 44,714 | 3,202,417 | |
| Cavium, Inc. (a) | 113,279 | 7,171,693 | |
| Ceva, Inc. (a) | 37,331 | 1,513,772 | |
| Cirrus Logic, Inc. (a) | 109,205 | 6,331,706 | |
| Cohu, Inc. | 83,996 | 1,575,765 | |
| Cree, Inc. (a)(b) | 179,530 | 4,367,965 | |
| CVD Equipment Corp. (a)(b) | 24,298 | 267,278 | |
| CyberOptics Corp. (a)(b) | 9,251 | 140,153 | |
| Cypress Semiconductor Corp. (b) | 556,739 | 7,621,757 | |
| Diodes, Inc. (a) | 66,747 | 1,878,261 | |
| DSP Group, Inc. (a) | 64,723 | 770,204 | |
| Entegris, Inc. (a) | 244,281 | 6,216,951 | |
| Experi Corp. | 89,409 | 2,436,395 | |
| First Solar, Inc. (a)(b) | 134,619 | 6,321,708 | |
| FormFactor, Inc. (a) | 123,711 | 1,868,036 | |
| GSI Technology, Inc. (a) | 18,344 | 121,804 | |
| Ichor Holdings Ltd. | 29,846 | 682,876 | |
| Impinj, Inc. (a)(b) | 14,583 | 557,654 | |
| Inphi Corp. (a)(b) | 64,122 | 2,455,231 | |
| Integrated Device Technology, Inc. (a) | 224,546 | 5,548,532 | |
| Intel Corp. | 8,073,812 | 283,148,587 | |
| Intermolecular, Inc. (a) | 6,975 | 5,999 | |
| Intest Corp. (a) | 2,175 | 16,421 | |
| IXYS Corp. (a) | 67,452 | 1,551,396 | |
| KLA-Tencor Corp. | 267,440 | 25,056,454 | |
| Kopin Corp. (a)(b) | 88,411 | 355,412 | |
| Kulicke & Soffa Industries, Inc. (a) | 125,107 | 2,380,786 | |
| Lam Research Corp. | 272,876 | 45,291,958 | |
| Lattice Semiconductor Corp. (a) | 220,983 | 1,248,554 | |
| M/A-COM Technology Solutions Holdings, Inc. (a)(b) | 62,646 | 2,852,899 | |
| Marvell Technology Group Ltd. | 752,545 | 13,478,081 | |
| Maxim Integrated Products, Inc. | 484,561 | 22,609,616 | |
| MaxLinear, Inc. Class A (a) | 86,669 | 1,872,050 | |
| Microchip Technology, Inc. (b) | 388,920 | 33,758,256 | |
| Micron Technology, Inc. (a) | 1,773,384 | 56,695,086 | |
| Microsemi Corp. (a) | 202,154 | 10,184,519 | |
| MKS Instruments, Inc. | 93,742 | 7,719,654 | |
| Monolithic Power Systems, Inc. | 69,641 | 7,056,026 | |
| MoSys, Inc. (a)(b) | 6,042 | 5,861 | |
| Nanometrics, Inc. (a) | 38,377 | 989,743 | |
| NeoPhotonics Corp. (a)(b) | 44,702 | 261,507 | |
| NVE Corp. | 7,985 | 605,582 | |
| NVIDIA Corp. | 1,018,180 | 172,520,419 | |
| ON Semiconductor Corp. (a) | 717,972 | 12,262,962 | |
| PDF Solutions, Inc. (a)(b) | 47,788 | 725,900 | |
| Photronics, Inc. (a) | 101,617 | 802,774 | |
| Pixelworks, Inc. (a)(b) | 22,798 | 109,430 | |
| Power Integrations, Inc. | 52,203 | 3,802,989 | |
| Qorvo, Inc. (a)(b) | 214,691 | 15,719,675 | |
| Qualcomm, Inc. | 2,530,781 | 132,283,923 | |
| QuickLogic Corp. (a)(b) | 142,208 | 190,559 | |
| Rambus, Inc. (a) | 201,505 | 2,613,520 | |
| Rubicon Technology, Inc. (a)(b) | 2,504 | 20,508 | |
| Rudolph Technologies, Inc. (a) | 69,669 | 1,546,652 | |
| Semtech Corp. (a) | 111,258 | 4,183,301 | |
| Sevcon, Inc. (a) | 2,938 | 64,577 | |
| Sigma Designs, Inc. (a) | 51,095 | 319,344 | |
| Silicon Laboratories, Inc. (a) | 73,360 | 5,568,024 | |
| Skyworks Solutions, Inc. | 316,117 | 33,306,087 | |
| SolarEdge Technologies, Inc. (a) | 54,440 | 1,456,270 | |
| SunPower Corp. (a)(b) | 97,783 | 864,402 | |
| Synaptics, Inc. (a)(b) | 56,125 | 2,333,116 | |
| Teradyne, Inc. | 339,570 | 12,092,088 | |
| Texas Instruments, Inc. | 1,696,527 | 140,506,366 | |
| Ultra Clean Holdings, Inc. (a) | 60,588 | 1,397,765 | |
| Veeco Instruments, Inc. (a) | 86,705 | 1,638,725 | |
| Versum Materials, Inc. | 188,451 | 6,959,495 | |
| Xcerra Corp. (a) | 98,441 | 966,691 | |
| Xilinx, Inc. | 430,246 | 28,422,051 | |
| 1,500,503,299 | |||
| Software - 5.0% | |||
| 8x8, Inc. (a) | 162,409 | 2,298,087 | |
| A10 Networks, Inc. (a) | 73,118 | 478,923 | |
| ACI Worldwide, Inc. (a) | 200,153 | 4,555,482 | |
| Activision Blizzard, Inc. | 1,183,120 | 77,565,347 | |
| Adobe Systems, Inc. (a) | 841,242 | 130,527,109 | |
| Agilysys, Inc. (a) | 38,149 | 392,553 | |
| American Software, Inc. Class A | 55,166 | 607,378 | |
| ANSYS, Inc. (a) | 144,955 | 18,673,103 | |
| Aspen Technology, Inc. (a) | 131,521 | 8,318,703 | |
| Asure Software, Inc. (a)(b) | 8,721 | 100,989 | |
| Autodesk, Inc. (a) | 329,727 | 37,740,552 | |
| Barracuda Networks, Inc. (a) | 58,271 | 1,410,741 | |
| Blackbaud, Inc. | 80,900 | 6,828,769 | |
| Bottomline Technologies, Inc. (a) | 62,280 | 1,887,707 | |
| BroadSoft, Inc. (a)(b) | 53,585 | 2,655,137 | |
| BSQUARE Corp. (a) | 11,182 | 55,910 | |
| CA Technologies, Inc. | 535,355 | 17,763,079 | |
| Cadence Design Systems, Inc. (a) | 470,063 | 18,468,775 | |
| Callidus Software, Inc. (a) | 115,529 | 2,974,872 | |
| CDK Global, Inc. | 250,362 | 16,148,349 | |
| Citrix Systems, Inc. (a) | 260,051 | 20,338,589 | |
| CommVault Systems, Inc. (a) | 75,089 | 4,584,183 | |
| Datawatch Corp. (a) | 9,730 | 100,219 | |
| Digimarc Corp. (a)(b) | 18,523 | 572,361 | |
| Digital Turbine, Inc. (a)(b) | 41,910 | 48,616 | |
| Document Security Systems, Inc. (a) | 4,956 | 3,271 | |
| Ebix, Inc. | 35,461 | 2,046,100 | |
| Electronic Arts, Inc. (a) | 528,943 | 64,266,575 | |
| Ellie Mae, Inc. (a) | 59,098 | 4,903,952 | |
| Everbridge, Inc. | 29,747 | 689,238 | |
| Evolving Systems, Inc. (a) | 4,973 | 23,622 | |
| Exa Corp. (a) | 15,758 | 226,127 | |
| Fair Isaac Corp. | 53,660 | 7,553,182 | |
| FalconStor Software, Inc. (a)(b) | 37,427 | 13,474 | |
| FireEye, Inc. (a)(b) | 276,277 | 4,080,611 | |
| Form Holdings Corp. (a)(b) | 9,862 | 12,032 | |
| Fortinet, Inc. (a) | 253,763 | 9,693,747 | |
| Gigamon, Inc. (a) | 53,853 | 2,312,986 | |
| Glu Mobile, Inc. (a)(b) | 173,754 | 632,465 | |
| GSE Systems, Inc. (a) | 388 | 1,086 | |
| Guidance Software, Inc. (a) | 26,710 | 189,107 | |
| Guidewire Software, Inc. (a) | 129,374 | 9,794,906 | |
| HubSpot, Inc. (a)(b) | 54,014 | 3,961,927 | |
| Imperva, Inc. (a) | 51,764 | 2,311,263 | |
| Inseego Corp. (b) | 35,452 | 49,987 | |
| Intuit, Inc. | 414,561 | 58,639,653 | |
| Manhattan Associates, Inc. (a) | 127,067 | 5,343,167 | |
| Microsoft Corp. | 13,229,954 | 989,203,661 | |
| MicroStrategy, Inc. Class A (a) | 16,727 | 2,157,783 | |
| Mitek Systems, Inc. (a) | 45,058 | 457,339 | |
| MobileIron, Inc. (a) | 70,668 | 268,538 | |
| Model N, Inc. (a) | 64,636 | 875,818 | |
| Monotype Imaging Holdings, Inc. | 66,977 | 1,222,330 | |
| NetSol Technologies, Inc. (a) | 10,165 | 45,743 | |
| Nuance Communications, Inc. (a) | 427,719 | 6,873,444 | |
| Oracle Corp. | 5,148,287 | 259,113,285 | |
| Parametric Technology Corp. (a) | 196,550 | 11,006,800 | |
| Park City Group, Inc. (a)(b) | 18,083 | 227,846 | |
| Paycom Software, Inc. (a)(b) | 65,084 | 4,855,917 | |
| Paylocity Holding Corp. (a) | 39,896 | 1,960,489 | |
| Pegasystems, Inc. | 63,152 | 3,634,398 | |
| Polarityte, Inc. (a)(b) | 5,861 | 170,496 | |
| Progress Software Corp. | 78,882 | 2,648,858 | |
| Proofpoint, Inc. (a)(b) | 71,790 | 6,587,450 | |
| PROS Holdings, Inc. (a) | 40,708 | 1,072,249 | |
| QAD, Inc.: | |||
| Class A | 10,065 | 339,191 | |
| Class B | 4,298 | 115,960 | |
| Qualys, Inc. (a) | 50,519 | 2,399,653 | |
| Rapid7, Inc. (a) | 27,175 | 458,171 | |
| RealNetworks, Inc. (a) | 28,670 | 114,393 | |
| RealPage, Inc. (a) | 95,369 | 4,110,404 | |
| Red Hat, Inc. (a) | 303,397 | 32,615,178 | |
| RingCentral, Inc. (a) | 109,308 | 4,629,194 | |
| Rosetta Stone, Inc. (a) | 22,826 | 209,999 | |
| Salesforce.com, Inc. (a) | 1,141,898 | 109,039,840 | |
| SeaChange International, Inc. (a) | 36,866 | 96,220 | |
| ServiceNow, Inc. (a) | 298,950 | 34,735,001 | |
| Silver Spring Networks, Inc. (a)(b) | 66,256 | 838,801 | |
| SITO Mobile Ltd. (a)(b) | 17,979 | 76,950 | |
| Smith Micro Software, Inc. (a) | 10,363 | 11,296 | |
| Sonic Foundry, Inc. (a) | 155 | 529 | |
| Splunk, Inc. (a)(b) | 236,248 | 15,849,878 | |
| SS&C Technologies Holdings, Inc. | 293,141 | 11,347,488 | |
| Symantec Corp. | 1,047,401 | 31,401,082 | |
| Synchronoss Technologies, Inc. (a) | 70,331 | 1,180,857 | |
| Synopsys, Inc. (a) | 254,413 | 20,459,893 | |
| Tableau Software, Inc. (a)(b) | 103,158 | 7,476,892 | |
| Take-Two Interactive Software, Inc. (a) | 184,465 | 18,038,832 | |
| TeleNav, Inc. (a) | 46,856 | 304,564 | |
| The Rubicon Project, Inc. (a) | 59,339 | 223,115 | |
| TiVo Corp. | 211,366 | 3,867,998 | |
| Tyler Technologies, Inc. (a) | 58,649 | 10,134,547 | |
| Ultimate Software Group, Inc. (a)(b) | 52,907 | 10,629,016 | |
| Upland Software, Inc. (a) | 13,813 | 317,699 | |
| Varonis Systems, Inc. (a) | 31,174 | 1,209,551 | |
| Vasco Data Security International, Inc. (a) | 48,861 | 613,206 | |
| Verint Systems, Inc. (a) | 104,276 | 4,139,757 | |
| VirnetX Holding Corp. (a)(b) | 93,723 | 374,892 | |
| VMware, Inc. Class A (a)(b) | 121,491 | 13,133,177 | |
| Workday, Inc. Class A (a)(b) | 222,931 | 24,453,301 | |
| Workiva, Inc. (a) | 31,679 | 639,916 | |
| Zedge, Inc. (a) | 14,921 | 26,858 | |
| Zendesk, Inc. (a) | 130,945 | 3,587,893 | |
| Zix Corp. (a) | 69,803 | 370,654 | |
| Zynga, Inc. (a) | 1,392,357 | 5,221,339 | |
| 2,219,019,640 | |||
| Technology Hardware, Storage & Peripherals - 3.8% | |||
| 3D Systems Corp. (a)(b) | 180,858 | 2,271,576 | |
| Apple, Inc. | 8,935,155 | 1,465,365,349 | |
| Astro-Med, Inc. | 4,606 | 62,642 | |
| Avid Technology, Inc. (a)(b) | 38,570 | 170,094 | |
| Concurrent Computer Corp. | 6,675 | 42,186 | |
| CPI Card Group (b) | 22,281 | 21,396 | |
| Cray, Inc. (a) | 76,017 | 1,432,920 | |
| Diebold Nixdorf, Inc. | 123,985 | 2,535,493 | |
| Eastman Kodak Co. (a)(b) | 64,018 | 496,140 | |
| Electronics for Imaging, Inc. (a)(b) | 82,143 | 2,921,005 | |
| Everspin Technologies, Inc. (b) | 9,978 | 162,641 | |
| Hewlett Packard Enterprise Co. | 2,841,574 | 51,318,826 | |
| HP, Inc. | 2,885,248 | 55,050,532 | |
| Immersion Corp. (a)(b) | 59,681 | 436,865 | |
| Intevac, Inc. (a) | 29,097 | 264,783 | |
| NCR Corp. (a) | 216,399 | 7,905,055 | |
| NetApp, Inc. | 460,042 | 17,785,224 | |
| Pure Storage, Inc. Class A (a)(b) | 153,259 | 2,282,027 | |
| Quantum Corp. (a)(b) | 41,835 | 230,511 | |
| Seagate Technology LLC (b) | 503,012 | 15,859,968 | |
| Super Micro Computer, Inc. (a)(b) | 65,674 | 1,748,570 | |
| Transact Technologies, Inc. | 3,411 | 33,257 | |
| U.S.A. Technologies, Inc. (a)(b) | 68,908 | 375,549 | |
| Western Digital Corp. | 496,255 | 43,804,429 | |
| Xerox Corp. | 371,484 | 11,987,789 | |
| Xplore Technologies Corp. (a) | 2,067 | 6,552 | |
| 1,684,571,379 | |||
| TOTAL INFORMATION TECHNOLOGY | 9,902,597,748 | ||
| MATERIALS - 3.3% | |||
| Chemicals - 2.2% | |||
| A. Schulman, Inc. | 45,099 | 1,371,010 | |
| Advanced Emissions Solutions, Inc. (b) | 57,241 | 594,162 | |
| AdvanSix, Inc. | 52,136 | 1,664,702 | |
| AgroFresh Solutions, Inc. (a)(b) | 38,931 | 277,189 | |
| Air Products & Chemicals, Inc. | 375,812 | 54,631,790 | |
| Albemarle Corp. U.S. | 190,401 | 22,136,020 | |
| American Vanguard Corp. | 44,829 | 907,787 | |
| Ashland Global Holdings, Inc. | 107,479 | 6,669,072 | |
| Axalta Coating Systems (a) | 374,838 | 11,065,218 | |
| Balchem Corp. | 53,639 | 4,020,779 | |
| BioAmber, Inc. (a)(b) | 17,794 | 7,776 | |
| Cabot Corp. | 106,306 | 5,600,200 | |
| Calgon Carbon Corp. | 83,129 | 1,014,174 | |
| Celanese Corp. Class A | 237,507 | 23,042,929 | |
| CF Industries Holdings, Inc. | 394,832 | 11,446,180 | |
| Chase Corp. | 19,479 | 1,821,287 | |
| Codexis, Inc. (a) | 42,409 | 235,370 | |
| Core Molding Technologies, Inc. | 10,858 | 223,349 | |
| Eastman Chemical Co. | 259,233 | 22,345,885 | |
| Ecolab, Inc. | 447,379 | 59,635,621 | |
| Ferro Corp. (a) | 133,620 | 2,574,857 | |
| Flotek Industries, Inc. (a)(b) | 98,612 | 510,810 | |
| FMC Corp. | 228,847 | 19,731,188 | |
| FutureFuel Corp. | 37,844 | 510,137 | |
| H.B. Fuller Co. | 88,055 | 4,419,480 | |
| Hawkins, Inc. | 13,930 | 496,605 | |
| Huntsman Corp. | 335,090 | 8,903,341 | |
| Ingevity Corp. (a) | 71,031 | 4,472,822 | |
| Innophos Holdings, Inc. | 32,175 | 1,469,111 | |
| Innospec, Inc. | 41,822 | 2,321,121 | |
| International Flavors & Fragrances, Inc. | 134,797 | 18,446,969 | |
| Intrepid Potash, Inc. (a)(b) | 199,844 | 741,421 | |
| KMG Chemicals, Inc. | 10,303 | 494,750 | |
| Koppers Holdings, Inc. (a) | 34,144 | 1,338,445 | |
| Kraton Performance Polymers, Inc. (a) | 55,754 | 1,830,404 | |
| Kronos Worldwide, Inc. | 34,238 | 716,601 | |
| LSB Industries, Inc. (a)(b) | 28,693 | 175,027 | |
| LyondellBasell Industries NV Class A | 566,829 | 51,349,039 | |
| Marrone Bio Innovations, Inc. (a)(b) | 15,737 | 18,727 | |
| Minerals Technologies, Inc. | 58,663 | 3,754,432 | |
| Monsanto Co. | 754,490 | 88,426,228 | |
| NewMarket Corp. | 16,721 | 6,997,906 | |
| Olin Corp. | 276,573 | 8,913,948 | |
| OMNOVA Solutions, Inc. (a) | 52,644 | 458,003 | |
| Platform Specialty Products Corp. (a)(b) | 374,823 | 4,377,933 | |
| PolyOne Corp. | 144,671 | 5,228,410 | |
| PPG Industries, Inc. | 437,630 | 45,653,562 | |
| Praxair, Inc. | 486,123 | 63,944,619 | |
| Quaker Chemical Corp. | 22,939 | 3,193,568 | |
| Rayonier Advanced Materials, Inc. | 82,695 | 1,134,575 | |
| RPM International, Inc. | 226,844 | 11,108,551 | |
| Senomyx, Inc. (a) | 66,138 | 40,020 | |
| Sensient Technologies Corp. | 86,306 | 6,226,978 | |
| Sherwin-Williams Co. | 137,857 | 46,770,744 | |
| Stepan Co. | 34,404 | 2,661,493 | |
| The Chemours Co. LLC | 310,949 | 15,258,267 | |
| The Dow Chemical Co. | 3,839,123 | 255,877,548 | |
| The Mosaic Co. | 596,228 | 11,912,635 | |
| The Scotts Miracle-Gro Co. Class A | 77,671 | 7,424,571 | |
| Trecora Resources (a) | 28,770 | 349,556 | |
| Tredegar Corp. | 71,882 | 1,171,677 | |
| Trinseo SA | 75,141 | 5,026,933 | |
| Tronox Ltd. Class A | 110,795 | 2,292,349 | |
| Valhi, Inc. | 35,553 | 77,506 | |
| Valvoline, Inc. | 351,998 | 7,494,037 | |
| W.R. Grace & Co. | 111,862 | 7,995,896 | |
| Westlake Chemical Corp. | 64,435 | 4,955,696 | |
| Yield10 Bioscience, Inc. (a)(b) | 693 | 1,864 | |
| 967,960,860 | |||
| Construction Materials - 0.1% | |||
| Eagle Materials, Inc. | 85,683 | 8,332,672 | |
| Forterra, Inc. (b) | 32,917 | 109,284 | |
| Foundation Building Materials, Inc. | 21,184 | 276,663 | |
| Martin Marietta Materials, Inc. | 109,383 | 23,188,102 | |
| Summit Materials, Inc. | 172,319 | 5,090,303 | |
| U.S. Concrete, Inc. (a)(b) | 26,762 | 2,142,298 | |
| United States Lime & Minerals, Inc. | 2,200 | 175,890 | |
| Vulcan Materials Co. | 223,084 | 27,051,166 | |
| 66,366,378 | |||
| Containers & Packaging - 0.5% | |||
| Aptargroup, Inc. | 119,670 | 10,005,609 | |
| Avery Dennison Corp. | 149,434 | 14,085,649 | |
| Ball Corp. | 589,483 | 23,573,425 | |
| Bemis Co., Inc. | 156,089 | 6,650,952 | |
| Berry Global Group, Inc. (a) | 220,167 | 12,382,192 | |
| Crown Holdings, Inc. (a) | 233,058 | 13,757,414 | |
| Graphic Packaging Holding Co. | 529,162 | 6,905,564 | |
| Greif, Inc. Class A | 63,236 | 3,822,616 | |
| International Paper Co. | 704,583 | 37,955,886 | |
| Myers Industries, Inc. | 29,894 | 562,007 | |
| Owens-Illinois, Inc. (a) | 264,706 | 6,522,356 | |
| Packaging Corp. of America | 160,703 | 18,064,624 | |
| Sealed Air Corp. | 328,644 | 14,585,221 | |
| Silgan Holdings, Inc. | 135,972 | 4,091,397 | |
| Sonoco Products Co. | 183,166 | 8,839,591 | |
| UFP Technologies, Inc. (a) | 14,187 | 377,374 | |
| WestRock Co. | 427,751 | 24,343,309 | |
| 206,525,186 | |||
| Metals & Mining - 0.4% | |||
| AK Steel Holding Corp. (a)(b) | 525,512 | 2,942,867 | |
| Alcoa Corp. | 248,002 | 10,882,328 | |
| Allegheny Technologies, Inc. (b) | 174,474 | 3,634,293 | |
| Ampco-Pittsburgh Corp. | 10,414 | 160,376 | |
| Atkore International Group, Inc. (a) | 35,003 | 583,150 | |
| Carpenter Technology Corp. | 80,027 | 3,243,494 | |
| Century Aluminum Co. (a)(b) | 86,859 | 1,695,488 | |
| Cliffs Natural Resources, Inc. (a)(b) | 454,481 | 3,799,461 | |
| Coeur d'Alene Mines Corp. (a) | 297,840 | 2,606,100 | |
| Commercial Metals Co. | 192,032 | 3,627,484 | |
| Compass Minerals International, Inc. | 56,608 | 3,781,414 | |
| Comstock Mining, Inc. (a) | 56,723 | 10,545 | |
| Freeport-McMoRan, Inc. (a) | 2,260,613 | 33,411,860 | |
| Friedman Industries | 2,001 | 11,346 | |
| General Moly, Inc. (a) | 60,513 | 26,414 | |
| Gold Resource Corp. | 109,163 | 435,560 | |
| Golden Minerals Co. (a)(b) | 71,014 | 38,561 | |
| Handy & Harman Ltd. (a) | 5,646 | 184,624 | |
| Haynes International, Inc. | 18,364 | 561,020 | |
| Hecla Mining Co. | 683,190 | 3,607,243 | |
| Kaiser Aluminum Corp. | 27,980 | 2,695,034 | |
| Materion Corp. | 30,858 | 1,178,776 | |
| McEwen Mining, Inc. (b) | 403,016 | 1,035,751 | |
| Newmont Mining Corp. | 915,669 | 35,106,749 | |
| Nucor Corp. | 538,845 | 29,695,748 | |
| Olympic Steel, Inc. | 12,703 | 231,830 | |
| Paramount Gold Nevada Corp. (a) | 7,958 | 12,176 | |
| Pershing Gold Corp. (a)(b) | 31,696 | 96,039 | |
| Real Industries, Inc. (a)(b) | 30,069 | 51,117 | |
| Reliance Steel & Aluminum Co. | 131,422 | 9,517,581 | |
| Royal Gold, Inc. | 110,834 | 10,338,596 | |
| Ryerson Holding Corp. (a) | 30,039 | 258,335 | |
| Schnitzer Steel Industries, Inc. Class A | 47,241 | 1,270,783 | |
| Solitario Exploration & Royalty Corp. (a) | 18,115 | 12,681 | |
| Steel Dynamics, Inc. | 413,913 | 14,259,303 | |
| SunCoke Energy, Inc. (a) | 99,267 | 925,168 | |
| Synalloy Corp. (a) | 8,615 | 97,780 | |
| TimkenSteel Corp. (a)(b) | 69,807 | 1,035,238 | |
| U.S. Antimony Corp. (a) | 24,962 | 7,988 | |
| U.S. Gold Corp. (a) | 46 | 111 | |
| United States Steel Corp. (b) | 307,753 | 8,189,307 | |
| Universal Stainless & Alloy Products, Inc. (a) | 6,659 | 120,728 | |
| Worthington Industries, Inc. | 71,924 | 3,593,323 | |
| 194,973,770 | |||
| Paper & Forest Products - 0.1% | |||
| Boise Cascade Co. (a) | 63,767 | 1,913,010 | |
| Clearwater Paper Corp. (a) | 29,564 | 1,374,726 | |
| Deltic Timber Corp. | 17,765 | 1,386,381 | |
| Domtar Corp. | 128,751 | 5,206,690 | |
| Kapstone Paper & Packaging Corp. | 150,928 | 3,376,259 | |
| Louisiana-Pacific Corp. (a) | 261,592 | 6,665,364 | |
| Mercer International, Inc. (SBI) | 60,804 | 671,884 | |
| Neenah Paper, Inc. | 27,129 | 2,095,715 | |
| P.H. Glatfelter Co. | 69,408 | 1,202,147 | |
| Rentech, Inc. (a) | 27,522 | 7,321 | |
| Resolute Forest Products (a) | 146,819 | 726,754 | |
| Schweitzer-Mauduit International, Inc. | 48,432 | 1,837,026 | |
| Verso Corp. (b) | 59,171 | 314,790 | |
| 26,778,067 | |||
| TOTAL MATERIALS | 1,462,604,261 | ||
| REAL ESTATE - 4.1% | |||
| Equity Real Estate Investment Trusts (REITs) - 4.0% | |||
| Acadia Realty Trust (SBI) | 161,267 | 4,626,750 | |
| Agree Realty Corp. | 50,269 | 2,519,482 | |
| Alexanders, Inc. | 6,076 | 2,543,960 | |
| Alexandria Real Estate Equities, Inc. | 159,183 | 19,310,490 | |
| Altisource Residential Corp. Class B | 86,977 | 1,053,291 | |
| American Assets Trust, Inc. | 89,595 | 3,639,349 | |
| American Campus Communities, Inc. | 225,191 | 10,716,840 | |
| American Homes 4 Rent Class A | 382,812 | 8,483,114 | |
| American Tower Corp. | 728,593 | 107,868,194 | |
| Apartment Investment & Management Co. Class A | 262,560 | 11,901,845 | |
| Apple Hospitality (REIT), Inc. | 276,107 | 5,019,625 | |
| Armada Hoffler Properties, Inc. | 73,011 | 976,157 | |
| Ashford Hospitality Prime, Inc. | 47,533 | 457,267 | |
| Ashford Hospitality Trust, Inc. | 123,613 | 767,637 | |
| AvalonBay Communities, Inc. | 234,204 | 43,967,117 | |
| Bluerock Residential Growth (REIT), Inc. | 90,320 | 914,942 | |
| Boston Properties, Inc. | 262,495 | 31,656,897 | |
| Brandywine Realty Trust (SBI) | 276,702 | 4,753,740 | |
| Brixmor Property Group, Inc. | 452,816 | 8,476,716 | |
| BRT Realty Trust (a) | 189,164 | 1,471,696 | |
| Camden Property Trust (SBI) | 145,586 | 13,027,035 | |
| CareTrust (REIT), Inc. | 113,682 | 2,192,926 | |
| CatchMark Timber Trust, Inc. | 100,692 | 1,160,979 | |
| CBL & Associates Properties, Inc. (b) | 283,674 | 2,269,392 | |
| Cedar Realty Trust, Inc. | 134,023 | 675,476 | |
| Chatham Lodging Trust | 57,137 | 1,158,738 | |
| Chesapeake Lodging Trust | 98,722 | 2,526,296 | |
| City Office REIT, Inc. | 67,579 | 864,335 | |
| Clipper Realty, Inc. (b) | 6,962 | 77,696 | |
| Colony NorthStar, Inc. (b) | 925,392 | 12,131,889 | |
| Columbia Property Trust, Inc. | 198,850 | 4,175,850 | |
| Communications Sales & Leasing, Inc. | 267,108 | 5,144,500 | |
| Community Healthcare Trust, Inc. | 41,798 | 1,110,155 | |
| Condor Hospitality Trust, Inc. | 108 | 1,130 | |
| CorEnergy Infrastructure Trust, Inc. (b) | 14,135 | 461,225 | |
| CoreSite Realty Corp. | 56,759 | 6,740,699 | |
| Corporate Office Properties Trust (SBI) | 181,324 | 6,048,969 | |
| Corrections Corp. of America | 203,536 | 5,454,765 | |
| Cousins Properties, Inc. | 673,063 | 6,293,139 | |
| Crown Castle International Corp. | 687,025 | 74,500,991 | |
| CubeSmart | 296,680 | 7,313,162 | |
| CyrusOne, Inc. | 130,176 | 8,204,993 | |
| DCT Industrial Trust, Inc. | 161,523 | 9,424,867 | |
| DDR Corp. | 536,213 | 5,190,542 | |
| DiamondRock Hospitality Co. | 332,744 | 3,656,857 | |
| Digital Realty Trust, Inc. | 272,874 | 32,291,909 | |
| Douglas Emmett, Inc. | 264,925 | 10,321,478 | |
| Duke Realty Corp. | 603,073 | 17,923,330 | |
| DuPont Fabros Technology, Inc. | 130,007 | 8,367,251 | |
| Easterly Government Properties, Inc. (b) | 30,760 | 617,046 | |
| EastGroup Properties, Inc. | 54,382 | 4,832,385 | |
| Education Realty Trust, Inc. | 129,203 | 4,992,404 | |
| Empire State Realty Trust, Inc. | 218,080 | 4,437,928 | |
| EPR Properties | 106,196 | 7,397,613 | |
| Equinix, Inc. | 132,832 | 62,219,837 | |
| Equity Commonwealth (a) | 213,360 | 6,601,358 | |
| Equity Lifestyle Properties, Inc. | 141,492 | 12,614,012 | |
| Equity Residential (SBI) | 620,908 | 41,693,972 | |
| Essex Property Trust, Inc. | 111,421 | 29,634,643 | |
| Extra Space Storage, Inc. (b) | 213,703 | 16,589,764 | |
| Farmland Partners, Inc. (b) | 105,443 | 934,225 | |
| Federal Realty Investment Trust (SBI) | 126,706 | 16,082,793 | |
| FelCor Lodging Trust, Inc. | 200,216 | 1,461,577 | |
| First Industrial Realty Trust, Inc. | 184,151 | 5,704,998 | |
| First Potomac Realty Trust | 85,240 | 948,721 | |
| Forest City Realty Trust, Inc. Class A | 359,272 | 8,608,157 | |
| Four Corners Property Trust, Inc. | 103,212 | 2,622,617 | |
| Franklin Street Properties Corp. | 176,797 | 1,762,666 | |
| Gaming & Leisure Properties | 346,079 | 13,562,836 | |
| General Growth Properties, Inc. | 1,017,602 | 21,115,242 | |
| Getty Realty Corp. | 48,238 | 1,329,439 | |
| Gladstone Commercial Corp. | 76,606 | 1,639,368 | |
| Gladstone Land Corp. | 8,000 | 111,360 | |
| Global Net Lease, Inc. | 83,478 | 1,808,133 | |
| Government Properties Income Trust | 163,137 | 3,026,191 | |
| Gramercy Property Trust | 249,250 | 7,592,155 | |
| HCP, Inc. | 798,555 | 23,804,925 | |
| Healthcare Realty Trust, Inc. | 211,777 | 7,047,939 | |
| Healthcare Trust of America, Inc. | 317,837 | 9,875,196 | |
| Hersha Hospitality Trust | 71,283 | 1,321,587 | |
| Highwoods Properties, Inc. (SBI) | 169,915 | 8,874,660 | |
| Hospitality Properties Trust (SBI) | 292,755 | 8,009,777 | |
| Host Hotels & Resorts, Inc. | 1,241,687 | 22,499,368 | |
| Hudson Pacific Properties, Inc. | 249,715 | 8,240,595 | |
| Independence Realty Trust, Inc. | 102,753 | 1,057,328 | |
| InfraReit, Inc. | 82,809 | 1,862,374 | |
| Investors Real Estate Trust | 202,786 | 1,273,496 | |
| Invitation Homes, Inc. (b) | 138,858 | 3,213,174 | |
| Iron Mountain, Inc. | 427,140 | 16,837,859 | |
| iStar Financial, Inc. (a)(b) | 102,599 | 1,191,174 | |
| JBG SMITH Properties | 143,795 | 4,706,410 | |
| Jernigan Capital, Inc. (b) | 21,201 | 412,147 | |
| Kilroy Realty Corp. | 169,012 | 11,700,701 | |
| Kimco Realty Corp. | 718,168 | 14,090,456 | |
| Kite Realty Group Trust | 145,444 | 2,926,333 | |
| Lamar Advertising Co. Class A (b) | 144,792 | 9,637,356 | |
| LaSalle Hotel Properties (SBI) | 187,702 | 5,326,983 | |
| Lexington Corporate Properties Trust | 345,008 | 3,401,779 | |
| Liberty Property Trust (SBI) | 243,797 | 10,385,752 | |
| Life Storage, Inc. | 80,608 | 5,931,943 | |
| LTC Properties, Inc. | 62,032 | 3,016,616 | |
| Mack-Cali Realty Corp. | 154,097 | 3,527,280 | |
| MedEquities Realty Trust, Inc. | 56,982 | 653,584 | |
| Medical Properties Trust, Inc. | 636,344 | 8,374,287 | |
| Mid-America Apartment Communities, Inc. | 193,973 | 20,650,366 | |
| Monmouth Real Estate Investment Corp. Class A | 107,747 | 1,750,889 | |
| Monogram Residential Trust, Inc. | 273,079 | 3,276,948 | |
| National Health Investors, Inc. | 85,662 | 6,868,379 | |
| National Retail Properties, Inc. (b) | 250,989 | 10,498,870 | |
| National Storage Affiliates Trust | 66,569 | 1,485,820 | |
| New Senior Investment Group, Inc. | 149,321 | 1,378,233 | |
| NexPoint Residential Trust, Inc. | 32,020 | 746,066 | |
| NorthStar Realty Europe Corp. | 77,758 | 966,532 | |
| Omega Healthcare Investors, Inc. (b) | 333,230 | 10,620,040 | |
| One Liberty Properties, Inc. | 42,541 | 1,021,409 | |
| Outfront Media, Inc. | 245,927 | 5,410,394 | |
| Paramount Group, Inc. | 304,533 | 4,805,531 | |
| Parkway, Inc. | 79,308 | 1,820,912 | |
| Pebblebrook Hotel Trust (b) | 119,218 | 4,004,533 | |
| Pennsylvania Real Estate Investment Trust (SBI) | 105,464 | 1,057,804 | |
| Physicians Realty Trust | 319,999 | 5,993,581 | |
| Piedmont Office Realty Trust, Inc. Class A | 250,343 | 5,069,446 | |
| Potlatch Corp. | 63,794 | 3,049,353 | |
| Power (REIT) (a) | 718 | 4,574 | |
| Preferred Apartment Communities, Inc. Class A | 51,100 | 929,509 | |
| Prologis, Inc. | 903,235 | 57,228,970 | |
| PS Business Parks, Inc. | 31,822 | 4,299,470 | |
| Public Storage | 254,518 | 52,262,726 | |
| QTS Realty Trust, Inc. Class A | 76,420 | 4,140,436 | |
| Quality Care Properties, Inc. | 156,460 | 2,146,631 | |
| RAIT Financial Trust | 116,629 | 96,476 | |
| Ramco-Gershenson Properties Trust (SBI) | 128,503 | 1,689,814 | |
| Rayonier, Inc. | 230,983 | 6,700,817 | |
| Realty Income Corp. | 483,151 | 27,810,172 | |
| Regency Centers Corp. | 251,354 | 16,167,089 | |
| Retail Opportunity Investments Corp. | 189,056 | 3,750,871 | |
| Retail Properties America, Inc. | 409,657 | 5,460,728 | |
| Rexford Industrial Realty, Inc. | 121,774 | 3,659,309 | |
| RLJ Lodging Trust | 206,953 | 4,176,312 | |
| Ryman Hospitality Properties, Inc. | 91,162 | 5,416,846 | |
| Sabra Health Care REIT, Inc. (b) | 277,620 | 6,065,997 | |
| Saul Centers, Inc. | 23,905 | 1,448,643 | |
| SBA Communications Corp. Class A (a) | 208,263 | 31,978,784 | |
| Select Income REIT | 130,864 | 3,037,353 | |
| Senior Housing Properties Trust (SBI) | 396,382 | 7,816,653 | |
| Seritage Growth Properties (b) | 43,689 | 2,099,693 | |
| Simon Property Group, Inc. | 532,951 | 83,593,364 | |
| SL Green Realty Corp. | 183,660 | 17,701,151 | |
| Sotherly Hotels, Inc. | 2,721 | 16,489 | |
| Spirit Realty Capital, Inc. | 831,107 | 7,230,631 | |
| Stag Industrial, Inc. | 147,627 | 4,132,080 | |
| Starwood Waypoint Homes | 210,697 | 7,844,249 | |
| Store Capital Corp. | 322,243 | 8,178,527 | |
| Summit Hotel Properties, Inc. | 229,907 | 3,411,820 | |
| Sun Communities, Inc. | 118,372 | 10,690,175 | |
| Sunstone Hotel Investors, Inc. | 363,918 | 5,749,904 | |
| Tanger Factory Outlet Centers, Inc. (b) | 158,086 | 3,699,212 | |
| Taubman Centers, Inc. | 102,172 | 5,337,465 | |
| Terreno Realty Corp. | 83,145 | 3,014,006 | |
| The GEO Group, Inc. | 214,441 | 5,927,149 | |
| The Macerich Co. | 198,583 | 10,479,225 | |
| TIER REIT, Inc. | 108,647 | 2,000,191 | |
| UDR, Inc. | 456,019 | 17,702,658 | |
| UMH Properties, Inc. | 79,886 | 1,263,797 | |
| Universal Health Realty Income Trust (SBI) | 38,916 | 2,946,330 | |
| Urban Edge Properties | 187,255 | 4,709,463 | |
| Urstadt Biddle Properties, Inc. Class A | 92,798 | 1,919,063 | |
| Ventas, Inc. | 605,415 | 41,434,603 | |
| VEREIT, Inc. | 1,684,858 | 14,220,202 | |
| Vornado Realty Trust | 287,590 | 21,422,579 | |
| Washington REIT (SBI) | 128,414 | 4,219,684 | |
| Weingarten Realty Investors (SBI) | 198,541 | 6,361,254 | |
| Welltower, Inc. | 629,721 | 46,108,172 | |
| Weyerhaeuser Co. | 1,290,302 | 42,076,748 | |
| Wheeler REIT, Inc. (b) | 6,770 | 70,950 | |
| Whitestone REIT Class B | 105,336 | 1,320,913 | |
| WP Carey, Inc. | 185,070 | 12,742,070 | |
| WP Glimcher, Inc. | 352,285 | 2,941,580 | |
| Xenia Hotels & Resorts, Inc. | 170,955 | 3,412,262 | |
| 1,741,719,147 | |||
| Real Estate Management & Development - 0.1% | |||
| Alexander & Baldwin, Inc. | 76,237 | 3,308,686 | |
| Altisource Portfolio Solutions SA (a)(b) | 18,423 | 419,676 | |
| CBRE Group, Inc. (a) | 502,108 | 18,116,057 | |
| Consolidated-Tomoka Land Co. (b) | 6,987 | 387,080 | |
| Forestar Group, Inc. (a) | 61,936 | 1,065,299 | |
| FRP Holdings, Inc. (a) | 3,842 | 168,664 | |
| HFF, Inc. | 59,609 | 2,272,891 | |
| Howard Hughes Corp. (a) | 64,397 | 7,556,988 | |
| Jones Lang LaSalle, Inc. | 79,229 | 9,658,807 | |
| Kennedy-Wilson Holdings, Inc. (b) | 159,048 | 3,069,626 | |
| Marcus & Millichap, Inc. (a) | 19,559 | 514,988 | |
| Maui Land & Pineapple, Inc. (a) | 31,310 | 403,899 | |
| RE/MAX Holdings, Inc. | 27,266 | 1,670,043 | |
| Realogy Holdings Corp. | 241,978 | 8,203,054 | |
| Stratus Properties, Inc. | 12,801 | 378,910 | |
| Tejon Ranch Co. (a) | 21,096 | 421,498 | |
| The St. Joe Co. (a)(b) | 125,813 | 2,371,575 | |
| Transcontinental Realty Investors, Inc. (a)(b) | 20,697 | 440,432 | |
| Trinity Place Holdings, Inc. (a)(b) | 7,019 | 48,501 | |
| 60,476,674 | |||
| TOTAL REAL ESTATE | 1,802,195,821 | ||
| TELECOMMUNICATION SERVICES - 1.9% | |||
| Diversified Telecommunication Services - 1.8% | |||
| Alaska Communication Systems Group, Inc. (a) | 135,810 | 298,782 | |
| AT&T, Inc. | 10,533,465 | 394,583,599 | |
| Atlantic Tele-Network, Inc. | 20,159 | 1,221,031 | |
| CenturyLink, Inc. (b) | 939,434 | 18,525,638 | |
| Cincinnati Bell, Inc. (a) | 75,163 | 1,582,181 | |
| Cogent Communications Group, Inc. | 79,491 | 3,704,281 | |
| Consolidated Communications Holdings, Inc. (b) | 126,066 | 2,325,918 | |
| Frontier Communications Corp. (b) | 131,607 | 1,772,746 | |
| General Communications, Inc. Class A (a) | 45,133 | 1,946,586 | |
| Globalstar, Inc. (a)(b) | 552,886 | 1,061,541 | |
| Hawaiian Telcom Holdco, Inc. (a) | 18,678 | 568,185 | |
| IDT Corp. Class B | 44,765 | 658,493 | |
| Intelsat SA (a)(b) | 61,651 | 237,973 | |
| Iridium Communications, Inc. (a)(b) | 166,538 | 1,848,572 | |
| Level 3 Communications, Inc. (a) | 495,033 | 26,944,646 | |
| Lumos Networks Corp. (a) | 41,227 | 741,261 | |
| Ooma, Inc. (a) | 37,459 | 367,098 | |
| ORBCOMM, Inc. (a) | 100,896 | 1,115,910 | |
| Pareteum Corp. (a)(b) | 2,527 | 2,325 | |
| PDVWireless, Inc. (a) | 18,833 | 550,865 | |
| Straight Path Communications, Inc. Class B (a) | 14,258 | 2,545,196 | |
| Verizon Communications, Inc. | 6,992,211 | 335,416,362 | |
| Vonage Holdings Corp. (a) | 343,700 | 2,852,710 | |
| Windstream Holdings, Inc. (b) | 322,467 | 667,507 | |
| Zayo Group Holdings, Inc. (a) | 163,519 | 5,587,444 | |
| 807,126,850 | |||
| Wireless Telecommunication Services - 0.1% | |||
| Airgain, Inc. (b) | 9,732 | 106,857 | |
| Boingo Wireless, Inc. (a) | 75,566 | 1,555,904 | |
| NII Holdings, Inc. (a)(b) | 134,717 | 89,452 | |
| Shenandoah Telecommunications Co. | 75,836 | 2,733,888 | |
| Spok Holdings, Inc. | 43,148 | 722,729 | |
| Sprint Corp. (a)(b) | 1,082,920 | 8,934,090 | |
| T-Mobile U.S., Inc. (a) | 493,731 | 31,949,333 | |
| Telephone & Data Systems, Inc. | 160,373 | 4,700,533 | |
| U.S. Cellular Corp. (a) | 27,310 | 1,056,351 | |
| 51,849,137 | |||
| TOTAL TELECOMMUNICATION SERVICES | 858,975,987 | ||
| UTILITIES - 3.3% | |||
| Electric Utilities - 1.9% | |||
| Allete, Inc. | 89,687 | 6,935,496 | |
| Alliant Energy Corp. | 389,728 | 16,656,975 | |
| American Electric Power Co., Inc. | 834,358 | 61,433,780 | |
| Duke Energy Corp. | 1,199,150 | 104,685,795 | |
| Edison International | 554,634 | 44,470,554 | |
| El Paso Electric Co. | 80,794 | 4,488,107 | |
| Entergy Corp. | 309,998 | 24,542,542 | |
| Eversource Energy | 543,825 | 34,260,975 | |
| Exelon Corp. | 1,590,124 | 60,217,996 | |
| FirstEnergy Corp. | 753,599 | 24,552,255 | |
| Genie Energy Ltd. Class B | 24,074 | 148,055 | |
| Great Plains Energy, Inc. | 385,148 | 11,820,192 | |
| Hawaiian Electric Industries, Inc. | 219,652 | 7,340,770 | |
| IDACORP, Inc. | 95,061 | 8,458,528 | |
| MGE Energy, Inc. | 60,635 | 3,856,386 | |
| NextEra Energy, Inc. | 798,761 | 120,221,518 | |
| OGE Energy Corp. | 341,406 | 12,195,022 | |
| Otter Tail Corp. | 81,371 | 3,401,308 | |
| PG&E Corp. | 871,977 | 61,369,741 | |
| Pinnacle West Capital Corp. | 178,279 | 16,039,762 | |
| PNM Resources, Inc. | 139,589 | 5,918,574 | |
| Portland General Electric Co. | 147,815 | 7,022,691 | |
| PPL Corp. | 1,161,753 | 45,587,188 | |
| Southern Co. | 1,702,371 | 82,156,424 | |
| Spark Energy, Inc. Class A, (b) | 24,582 | 389,625 | |
| Vistra Energy Corp. | 545,395 | 9,653,492 | |
| Westar Energy, Inc. | 246,415 | 12,643,554 | |
| Xcel Energy, Inc. | 847,854 | 41,968,773 | |
| 832,436,078 | |||
| Gas Utilities - 0.2% | |||
| Atmos Energy Corp. | 177,568 | 15,633,087 | |
| Chesapeake Utilities Corp. | 27,662 | 2,197,746 | |
| Delta Natural Gas Co., Inc. | 3,078 | 94,310 | |
| National Fuel Gas Co. | 143,599 | 8,325,870 | |
| New Jersey Resources Corp. | 144,194 | 6,294,068 | |
| Northwest Natural Gas Co. | 56,327 | 3,734,480 | |
| ONE Gas, Inc. | 93,649 | 7,046,151 | |
| RGC Resources, Inc. | 6,537 | 180,094 | |
| South Jersey Industries, Inc. | 141,912 | 5,091,803 | |
| Southwest Gas Holdings, Inc. | 78,682 | 6,256,793 | |
| Spire, Inc. | 80,546 | 6,161,769 | |
| UGI Corp. | 292,531 | 14,453,957 | |
| WGL Holdings, Inc. | 90,512 | 7,626,541 | |
| 83,096,669 | |||
| Independent Power and Renewable Electricity Producers - 0.1% | |||
| Calpine Corp. (a) | 640,548 | 9,416,056 | |
| Dynegy, Inc. (a)(b) | 219,293 | 2,065,740 | |
| NRG Energy, Inc. | 543,641 | 13,542,097 | |
| NRG Yield, Inc.: | |||
| Class A | 44,523 | 809,873 | |
| Class C | 119,926 | 2,218,631 | |
| Ormat Technologies, Inc. | 63,023 | 3,620,041 | |
| Pattern Energy Group, Inc. (b) | 114,646 | 2,879,908 | |
| TerraForm Global, Inc. (a) | 98,063 | 495,218 | |
| Terraform Power, Inc. (a)(b) | 129,794 | 1,811,924 | |
| The AES Corp. | 1,082,881 | 11,955,006 | |
| U.S. Geothermal, Inc. (a) | 27,201 | 105,812 | |
| 48,920,306 | |||
| Multi-Utilities - 1.0% | |||
| Ameren Corp. | 427,084 | 25,620,769 | |
| Avangrid, Inc. | 122,071 | 5,959,506 | |
| Avista Corp. | 128,677 | 6,613,998 | |
| Black Hills Corp. (b) | 88,586 | 6,234,683 | |
| CenterPoint Energy, Inc. | 722,368 | 21,396,540 | |
| CMS Energy Corp. | 453,550 | 22,015,317 | |
| Consolidated Edison, Inc. | 513,131 | 43,241,549 | |
| Dominion Resources, Inc. | 1,074,271 | 84,620,327 | |
| DTE Energy Co. | 298,717 | 33,551,893 | |
| MDU Resources Group, Inc. | 335,493 | 9,071,731 | |
| NiSource, Inc. | 533,707 | 14,340,707 | |
| NorthWestern Energy Corp. | 78,122 | 4,712,319 | |
| Public Service Enterprise Group, Inc. | 861,594 | 40,357,063 | |
| SCANA Corp. | 249,382 | 15,057,685 | |
| Sempra Energy | 426,502 | 50,297,381 | |
| Unitil Corp. | 55,250 | 2,754,765 | |
| Vectren Corp. | 147,188 | 9,657,005 | |
| WEC Energy Group, Inc. | 529,641 | 34,543,186 | |
| 430,046,424 | |||
| Water Utilities - 0.1% | |||
| American States Water Co. | 59,968 | 2,956,422 | |
| American Water Works Co., Inc. | 287,864 | 23,288,198 | |
| Aqua America, Inc. | 319,867 | 10,683,558 | |
| AquaVenture Holdings Ltd. (b) | 15,365 | 232,933 | |
| Artesian Resources Corp. Class A | 60,277 | 2,235,674 | |
| Cadiz, Inc. (a)(b) | 33,186 | 404,869 | |
| California Water Service Group | 83,616 | 3,131,419 | |
| Connecticut Water Service, Inc. | 31,367 | 1,701,346 | |
| Middlesex Water Co. | 39,650 | 1,505,907 | |
| Pure Cycle Corp. (a) | 17,116 | 124,091 | |
| Select Energy Services, Inc. Class A | 15,108 | 213,023 | |
| SJW Corp. | 29,404 | 1,631,922 | |
| York Water Co. | 40,150 | 1,320,935 | |
| 49,430,297 | |||
| TOTAL UTILITIES | 1,443,929,774 | ||
| TOTAL COMMON STOCKS | |||
| (Cost $28,561,652,721) | 43,917,041,710 | ||
| Principal Amount | Value | ||
| U.S. Treasury Obligations - 0.0% | |||
| U.S. Treasury Bills, yield at date of purchase 0.87% to 1.18% 10/12/17 to 6/21/18 (d) | |||
| (Cost $14,942,485) | 15,000,000 | 14,939,958 | |
| Shares | Value | ||
| Money Market Funds - 4.2% | |||
| Fidelity Cash Central Fund, 1.11% (e) | 97,784,424 | $97,803,981 | |
| Fidelity Securities Lending Cash Central Fund 1.11% (e)(f) | 1,746,259,739 | 1,746,434,365 | |
| TOTAL MONEY MARKET FUNDS | |||
| (Cost $1,844,088,941) | 1,844,238,346 | ||
| TOTAL INVESTMENT IN SECURITIES - 103.8% | |||
| (Cost $30,420,684,147) | 45,776,220,014 | ||
| NET OTHER ASSETS (LIABILITIES) - (3.8)% | (1,675,770,670) | ||
| NET ASSETS - 100% | $44,100,449,344 |
| Futures Contracts | |||||
| Number of contracts | Expiration Date | Notional amount | Value | Unrealized Appreciation/(Depreciation) | |
| Purchased | |||||
| Equity Index Contracts | |||||
| CME E-mini S&P 500 Index Contracts (United States) | 1,259 | Sept. 2017 | $155,492,795 | $2,585,847 | $2,585,847 |
| CME E-mini S&P MidCap 400 Index Contracts (United States) | 65 | Sept. 2017 | 11,247,600 | 43,037 | 43,037 |
| ICE Russell 2000 Mini Contracts (United States) | 324 | Sept. 2017 | 22,751,280 | 218,878 | 218,878 |
| TOTAL FUTURES CONTRACTS | $2,847,762 |
The notional amount of futures purchased as a percentage of Net Assets is 0.4%
Legend
(a) Non-income producing
(b) Security or a portion of the security is on loan at period end.
(c) Level 3 instrument
(d) Security or a portion of the security was pledged to cover margin requirements for futures contracts. At period end, the value of securities pledged amounted to $6,588,331.
(e) Affiliated fund that is generally available only to investment companies and other accounts managed by Fidelity Investments. The rate quoted is the annualized seven-day yield of the fund at period end. A complete unaudited listing of the fund's holdings as of its most recent quarter end is available upon request. In addition, each Fidelity Central Fund's financial statements are available on the SEC's website or upon request.
(f) Investment made with cash collateral received from securities on loan.
Affiliated Central Funds
Information regarding fiscal year to date income earned by the Fund from investments in Fidelity Central Funds is as follows:
| Fund | Income earned |
| Fidelity Cash Central Fund | $826,367 |
| Fidelity Securities Lending Cash Central Fund | 5,377,449 |
| Total | $6,203,816 |
Investment Valuation
The following is a summary of the inputs used, as of August 31, 2017, involving the Fund's assets and liabilities carried at fair value. The inputs or methodology used for valuing securities may not be an indication of the risk associated with investing in those securities. For more information on valuation inputs, and their aggregation into the levels used below, please refer to the Investment Valuation section in the accompanying Notes to Financial Statements.
| Valuation Inputs at Reporting Date: | ||||
| Description | Total | Level 1 | Level 2 | Level 3 |
| Investments in Securities: | ||||
| Equities: | ||||
| Consumer Discretionary | $5,472,013,562 | $5,472,013,410 | $152 | $-- |
| Consumer Staples | 3,317,817,054 | 3,317,817,054 | -- | -- |
| Energy | 2,338,835,808 | 2,338,835,808 | -- | -- |
| Financials | 6,444,965,562 | 6,444,965,562 | -- | -- |
| Health Care | 6,198,343,699 | 6,197,681,471 | -- | 662,228 |
| Industrials | 4,674,762,434 | 4,674,762,434 | -- | -- |
| Information Technology | 9,902,597,748 | 9,902,597,748 | -- | -- |
| Materials | 1,462,604,261 | 1,462,604,261 | -- | -- |
| Real Estate | 1,802,195,821 | 1,802,195,821 | -- | -- |
| Telecommunication Services | 858,975,987 | 858,975,987 | -- | -- |
| Utilities | 1,443,929,774 | 1,443,929,774 | -- | -- |
| U.S. Government and Government Agency Obligations | 14,939,958 | -- | 14,939,958 | -- |
| Money Market Funds | 1,844,238,346 | 1,844,238,346 | -- | -- |
| Total Investments in Securities: | $45,776,220,014 | $45,760,617,676 | $14,940,110 | $662,228 |
| Derivative Instruments: | ||||
| Assets | ||||
| Futures Contracts | $2,847,762 | $2,847,762 | $-- | $-- |
| Total Assets | $2,847,762 | $2,847,762 | $-- | $-- |
| Total Derivative Instruments: | $2,847,762 | $2,847,762 | $-- | $-- |
Value of Derivative Instruments
The following table is a summary of the Fund's value of derivative instruments by primary risk exposure as of August 31, 2017. For additional information on derivative instruments, please refer to the Derivative Instruments section in the accompanying Notes to Financial Statements.
| Primary Risk Exposure / Derivative Type | Value | |
| Asset | Liability | |
| Equity Risk | ||
| Futures Contracts(a) | $2,847,762 | $0 |
| Total Equity Risk | 2,847,762 | 0 |
| Total Value of Derivatives | $2,847,762 | $0 |
(a) Reflects gross cumulative appreciation (depreciation) on futures contracts as presented in the Schedule of Investments. In the Statement of Assets and Liabilities, the period end daily variation margin is included in receivable or payable for daily variation margin on futures contracts, and the net cumulative appreciation (depreciation) is included in net unrealized appreciation (depreciation).
See accompanying notes which are an integral part of the financial statements.
Fidelity® Total Market Index Fund
Financial Statements
Statement of Assets and Liabilities
| August 31, 2017 (Unaudited) | ||
| Assets | ||
| Investment in securities, at value (including securities loaned of $1,719,278,042) — See accompanying schedule: Unaffiliated issuers (cost $28,576,595,206) | $43,931,981,668 | |
| Fidelity Central Funds (cost $1,844,088,941) | 1,844,238,346 | |
| Total Investment in Securities (cost $30,420,684,147) | $45,776,220,014 | |
| Receivable for investments sold | 124,426,439 | |
| Receivable for fund shares sold | 31,442,111 | |
| Dividends receivable | 86,493,059 | |
| Distributions receivable from Fidelity Central Funds | 1,090,571 | |
| Receivable for daily variation margin on futures contracts | 1,147,585 | |
| Other receivables | 676,982 | |
| Total assets | 46,021,496,761 | |
| Liabilities | ||
| Payable to custodian bank | $14,627 | |
| Payable for investments purchased | 147,632,521 | |
| Payable for fund shares redeemed | 25,476,811 | |
| Accrued management fee | 545,915 | |
| Other affiliated payables | 493,026 | |
| Other payables and accrued expenses | 671,569 | |
| Collateral on securities loaned | 1,746,212,948 | |
| Total liabilities | 1,921,047,417 | |
| Net Assets | $44,100,449,344 | |
| Net Assets consist of: | ||
| Paid in capital | $28,256,968,018 | |
| Undistributed net investment income | 417,925,088 | |
| Accumulated undistributed net realized gain (loss) on investments and foreign currency transactions | 67,172,247 | |
| Net unrealized appreciation (depreciation) on investments and assets and liabilities in foreign currencies | 15,358,383,991 | |
| Net Assets | $44,100,449,344 | |
| Investor Class: | ||
| Net Asset Value, offering price and redemption price per share ($751,125,831 ÷ 10,513,531 shares) | $71.44 | |
| Premium Class: | ||
| Net Asset Value, offering price and redemption price per share ($24,990,875,649 ÷ 349,738,361 shares) | $71.46 | |
| Institutional Class: | ||
| Net Asset Value, offering price and redemption price per share ($2,618,871,459 ÷ 36,654,262 shares) | $71.45 | |
| Institutional Premium Class: | ||
| Net Asset Value, offering price and redemption price per share ($5,083,793,066 ÷ 71,156,396 shares) | $71.45 | |
| Class F: | ||
| Net Asset Value, offering price and redemption price per share ($10,655,783,339 ÷ 149,103,358 shares) | $71.47 |
See accompanying notes which are an integral part of the financial statements.
Statement of Operations
| Six months ended August 31, 2017 (Unaudited) | ||
| Investment Income | ||
| Dividends | $419,790,336 | |
| Interest | 56,514 | |
| Income from Fidelity Central Funds (including $5,377,449 from security lending) | 6,203,816 | |
| Total income | 426,050,666 | |
| Expenses | ||
| Management fee | $3,165,702 | |
| Transfer agent fees | 3,936,066 | |
| Independent trustees' fees and expenses | 84,553 | |
| Legal | 9,817 | |
| Miscellaneous | 65,808 | |
| Total expenses before reductions | 7,261,946 | |
| Expense reductions | (7,598) | 7,254,348 |
| Net investment income (loss) | 418,796,318 | |
| Realized and Unrealized Gain (Loss) | ||
| Net realized gain (loss) on: | ||
| Investment securities: | ||
| Unaffiliated issuers | 208,983,651 | |
| Fidelity Central Funds | 11,823 | |
| Foreign currency transactions | 156 | |
| Futures contracts | 16,055,775 | |
| Total net realized gain (loss) | 225,051,405 | |
| Change in net unrealized appreciation (depreciation) on: | ||
| Investment securities: | ||
| Unaffiliated issuers | 1,526,646,005 | |
| Fidelity Central Funds | (149,405) | |
| Assets and liabilities in foreign currencies | 362 | |
| Futures contracts | (6,800,984) | |
| Total change in net unrealized appreciation (depreciation) | 1,519,695,978 | |
| Net gain (loss) | 1,744,747,383 | |
| Net increase (decrease) in net assets resulting from operations | $2,163,543,701 |
See accompanying notes which are an integral part of the financial statements.
Statement of Changes in Net Assets
| Six months ended August 31, 2017 (Unaudited) | Year ended February 28, 2017 | |
| Increase (Decrease) in Net Assets | ||
| Operations | ||
| Net investment income (loss) | $418,796,318 | $693,855,123 |
| Net realized gain (loss) | 225,051,405 | 214,952,729 |
| Change in net unrealized appreciation (depreciation) | 1,519,695,978 | 7,091,127,790 |
| Net increase (decrease) in net assets resulting from operations | 2,163,543,701 | 7,999,935,642 |
| Distributions to shareholders from net investment income | (114,777,247) | (649,892,693) |
| Distributions to shareholders from net realized gain | (62,350,888) | (218,645,122) |
| Total distributions | (177,128,135) | (868,537,815) |
| Share transactions - net increase (decrease) | 2,023,366,572 | 3,500,265,848 |
| Redemption fees | – | 257,287 |
| Total increase (decrease) in net assets | 4,009,782,138 | 10,631,920,962 |
| Net Assets | ||
| Beginning of period | 40,090,667,206 | 29,458,746,244 |
| End of period | $44,100,449,344 | $40,090,667,206 |
| Other Information | ||
| Undistributed net investment income end of period | $417,925,088 | $113,906,017 |
See accompanying notes which are an integral part of the financial statements.
Financial Highlights — Fidelity Total Market Index Fund Investor Class
| Six months ended (Unaudited) August 31, | Years ended February 28, | |||||
| 2017 | 2017 | 2016A | 2015 | 2014 | 2013 | |
| Selected Per–Share Data | ||||||
| Net asset value, beginning of period | $68.20 | $55.32 | $61.58 | $54.91 | $44.05 | $39.55 |
| Income from Investment Operations | ||||||
| Net investment income (loss)B | .67 | 1.20 | 1.13 | 1.10 | .92 | .87 |
| Net realized and unrealized gain (loss) | 2.86 | 13.20 | (5.97) | 6.51 | 10.74 | 4.40 |
| Total from investment operations | 3.53 | 14.40 | (4.84) | 7.61 | 11.66 | 5.27 |
| Distributions from net investment income | (.18) | (1.13) | (1.11) | (.94) | (.80) | (.77) |
| Distributions from net realized gain | (.10) | (.39) | (.31) | – | – | – |
| Total distributions | (.29)C | (1.52) | (1.42) | (.94) | (.80) | (.77) |
| Redemption fees added to paid in capitalB | – | –D | –D | –D | –D | –D |
| Net asset value, end of period | $71.44 | $68.20 | $55.32 | $61.58 | $54.91 | $44.05 |
| Total ReturnE,F | 5.19% | 26.22% | (7.96)% | 13.94% | 26.62% | 13.50% |
| Ratios to Average Net AssetsG,H | ||||||
| Expenses before reductions | .09%I | .09% | .10% | .10% | .10% | .10% |
| Expenses net of fee waivers, if any | .09%I | .09% | .10% | .10% | .10% | .10% |
| Expenses net of all reductions | .09%I | .09% | .10% | .10% | .10% | .10% |
| Net investment income (loss) | 1.93%I | 1.96% | 1.90% | 1.91% | 1.85% | 2.15% |
| Supplemental Data | ||||||
| Net assets, end of period (000 omitted) | $751,126 | $736,989 | $1,932,568 | $1,943,259 | $1,694,212 | $1,305,435 |
| Portfolio turnover rateJ | 3%I | 4% | 3% | 2% | 2% | 3% |
A For the year ended February 29.
B Calculated based on average shares outstanding during the period.
C Total distributions of $.29 per share is comprised of distributions from net investment income of $.181 and distributions from net realized gain of $.104 per share.
D Amount represents less than $.005 per share.
E Total returns for periods of less than one year are not annualized.
F Total returns would have been lower if certain expenses had not been reduced during the applicable periods shown.
G Fees and expenses of any underlying Fidelity Central Funds are not included in the Fund's expense ratio. The Fund indirectly bears its proportionate share of the expenses of any underlying Fidelity Central Funds.
H Expense ratios reflect operating expenses of the class. Expenses before reductions do not reflect amounts reimbursed by the investment adviser or reductions from expense offset arrangements and do not represent the amount paid by the class during periods when reimbursements or reductions occur. Expenses net of fee waivers reflect expenses after reimbursement by the investment adviser but prior to reductions from expense offset arrangements. Expenses net of all reductions represent the net expenses paid by the class.
I Annualized
J Amount does not include the portfolio activity of any underlying Fidelity Central Funds.
See accompanying notes which are an integral part of the financial statements.
Financial Highlights — Fidelity Total Market Index Fund Premium Class
| Six months ended (Unaudited) August 31, | Years ended February 28, | |||||
| 2017 | 2017 | 2016A | 2015 | 2014 | 2013 | |
| Selected Per–Share Data | ||||||
| Net asset value, beginning of period | $68.20 | $55.32 | $61.59 | $54.91 | $44.06 | $39.56 |
| Income from Investment Operations | ||||||
| Net investment income (loss)B | .69 | 1.25 | 1.16 | 1.13 | .94 | .89 |
| Net realized and unrealized gain (loss) | 2.86 | 13.18 | (5.98) | 6.52 | 10.73 | 4.39 |
| Total from investment operations | 3.55 | 14.43 | (4.82) | 7.65 | 11.67 | 5.28 |
| Distributions from net investment income | (.19) | (1.16) | (1.14) | (.97) | (.82) | (.78) |
| Distributions from net realized gain | (.10) | (.39) | (.31) | – | – | – |
| Total distributions | (.29) | (1.55) | (1.45) | (.97) | (.82) | (.78) |
| Redemption fees added to paid in capitalB | – | –C | –C | –C | –C | –C |
| Net asset value, end of period | $71.46 | $68.20 | $55.32 | $61.59 | $54.91 | $44.06 |
| Total ReturnD,E | 5.24% | 26.28% | (7.92)% | 14.02% | 26.65% | 13.53% |
| Ratios to Average Net AssetsF,G | ||||||
| Expenses before reductions | .04%H | .05% | .07% | .07% | .07% | .07% |
| Expenses net of fee waivers, if any | .04%H | .05% | .05% | .05% | .06% | .07% |
| Expenses net of all reductions | .04%H | .05% | .05% | .05% | .06% | .07% |
| Net investment income (loss) | 1.97%H | 2.00% | 1.95% | 1.96% | 1.89% | 2.18% |
| Supplemental Data | ||||||
| Net assets, end of period (000 omitted) | $24,990,876 | $23,288,507 | $18,866,595 | $18,860,117 | $14,943,835 | $10,262,592 |
| Portfolio turnover rateI | 3%H | 4% | 3% | 2% | 2% | 3% |
A For the year ended February 29.
B Calculated based on average shares outstanding during the period.
C Amount represents less than $.005 per share.
D Total returns for periods of less than one year are not annualized.
E Total returns would have been lower if certain expenses had not been reduced during the applicable periods shown.
F Fees and expenses of any underlying Fidelity Central Funds are not included in the Fund's expense ratio. The Fund indirectly bears its proportionate share of the expenses of any underlying Fidelity Central Funds.
G Expense ratios reflect operating expenses of the class. Expenses before reductions do not reflect amounts reimbursed by the investment adviser or reductions from expense offset arrangements and do not represent the amount paid by the class during periods when reimbursements or reductions occur. Expenses net of fee waivers reflect expenses after reimbursement by the investment adviser but prior to reductions from expense offset arrangements. Expenses net of all reductions represent the net expenses paid by the class.
H Annualized
I Amount does not include the portfolio activity of any underlying Fidelity Central Funds.
See accompanying notes which are an integral part of the financial statements.
Financial Highlights — Fidelity Total Market Index Fund Institutional Class
| Six months ended (Unaudited) August 31, | Years ended February 28, | |||||
| 2017 | 2017 | 2016A | 2015 | 2014 | 2013 | |
| Selected Per–Share Data | ||||||
| Net asset value, beginning of period | $68.19 | $55.31 | $61.58 | $54.91 | $44.05 | $39.55 |
| Income from Investment Operations | ||||||
| Net investment income (loss)B | .69 | 1.26 | 1.17 | 1.13 | .94 | .89 |
| Net realized and unrealized gain (loss) | 2.87 | 13.18 | (5.98) | 6.52 | 10.75 | 4.40 |
| Total from investment operations | 3.56 | 14.44 | (4.81) | 7.65 | 11.69 | 5.29 |
| Distributions from net investment income | (.19) | (1.16) | (1.15) | (.98) | (.83) | (.79) |
| Distributions from net realized gain | (.10) | (.39) | (.31) | – | – | – |
| Total distributions | (.30)C | (1.56)D | (1.46) | (.98) | (.83) | (.79) |
| Redemption fees added to paid in capitalB | – | –E | –E | –E | –E | –E |
| Net asset value, end of period | $71.45 | $68.19 | $55.31 | $61.58 | $54.91 | $44.05 |
| Total ReturnF,G | 5.24% | 26.30% | (7.92)% | 14.01% | 26.69% | 13.55% |
| Ratios to Average Net AssetsH,I | ||||||
| Expenses before reductions | .03%J | .05% | .07% | .07% | .07% | .07% |
| Expenses net of fee waivers, if any | .03%J | .04% | .04% | .04% | .05% | .06% |
| Expenses net of all reductions | .03%J | .04% | .04% | .04% | .05% | .06% |
| Net investment income (loss) | 1.98%J | 2.01% | 1.96% | 1.97% | 1.90% | 2.19% |
| Supplemental Data | ||||||
| Net assets, end of period (000 omitted) | $2,618,871 | $2,345,441 | $1,199,719 | $1,307,281 | $1,254,047 | $876,155 |
| Portfolio turnover rateK | 3%J | 4% | 3% | 2% | 2% | 3% |
A For the year ended February 29.
B Calculated based on average shares outstanding during the period.
C Total distributions of $.30 per share is comprised of distributions from net investment income of $.191 and distributions from net realized gain of $.104 per share.
D Total distributions of $1.56 per share is comprised of distributions from net investment income of $1.162 and distributions from net realized gain of $.393 per share.
E Amount represents less than $.005 per share.
F Total returns for periods of less than one year are not annualized.
G Total returns would have been lower if certain expenses had not been reduced during the applicable periods shown.
H Fees and expenses of any underlying Fidelity Central Funds are not included in the Fund's expense ratio. The Fund indirectly bears its proportionate share of the expenses of any underlying Fidelity Central Funds.
I Expense ratios reflect operating expenses of the class. Expenses before reductions do not reflect amounts reimbursed by the investment adviser or reductions from expense offset arrangements and do not represent the amount paid by the class during periods when reimbursements or reductions occur. Expenses net of fee waivers reflect expenses after reimbursement by the investment adviser but prior to reductions from expense offset arrangements. Expenses net of all reductions represent the net expenses paid by the class.
J Annualized
K Amount does not include the portfolio activity of any underlying Fidelity Central Funds.
See accompanying notes which are an integral part of the financial statements.
Financial Highlights — Fidelity Total Market Index Fund Institutional Premium Class
| Six months ended (Unaudited) August 31, | Years ended February 28, | |||||
| 2017 | 2017 | 2016A | 2015 | 2014 | 2013 | |
| Selected Per–Share Data | ||||||
| Net asset value, beginning of period | $68.19 | $55.31 | $61.58 | $54.90 | $44.05 | $39.55 |
| Income from Investment Operations | ||||||
| Net investment income (loss)B | .70 | 1.28 | 1.17 | 1.14 | .95 | .90 |
| Net realized and unrealized gain (loss) | 2.86 | 13.17 | (5.98) | 6.52 | 10.73 | 4.39 |
| Total from investment operations | 3.56 | 14.45 | (4.81) | 7.66 | 11.68 | 5.29 |
| Distributions from net investment income | (.20) | (1.17) | (1.15) | (.98) | (.83) | (.79) |
| Distributions from net realized gain | (.10) | (.39) | (.31) | – | – | – |
| Total distributions | (.30) | (1.57)C | (1.46) | (.98) | (.83) | (.79) |
| Redemption fees added to paid in capitalB | – | –D | –D | –D | –D | –D |
| Net asset value, end of period | $71.45 | $68.19 | $55.31 | $61.58 | $54.90 | $44.05 |
| Total ReturnE,F | 5.25% | 26.32% | (7.91)% | 14.04% | 26.67% | 13.57% |
| Ratios to Average Net AssetsG,H | ||||||
| Expenses before reductions | .02%I | .02% | .05% | .04% | .06% | .06% |
| Expenses net of fee waivers, if any | .02%I | .02% | .04% | .04% | .05% | .05% |
| Expenses net of all reductions | .02%I | .02% | .04% | .04% | .05% | .05% |
| Net investment income (loss) | 2.00%I | 2.02% | 1.97% | 1.97% | 1.90% | 2.20% |
| Supplemental Data | ||||||
| Net assets, end of period (000 omitted) | $5,083,793 | $4,684,669 | $800,304 | $1,022,585 | $740,877 | $546,329 |
| Portfolio turnover rateJ | 3%I | 4% | 3% | 2% | 2% | 3% |
A For the year ended February 29.
B Calculated based on average shares outstanding during the period.
C Total distributions of $1.57. per share is comprised of distributions from net investment income of $1.173 and distributions from net realized gain of $.393 per share.
D Amount represents less than $.005 per share.
E Total returns for periods of less than one year are not annualized.
F Total returns would have been lower if certain expenses had not been reduced during the applicable periods shown.
G Fees and expenses of any underlying Fidelity Central Funds are not included in the Fund's expense ratio. The Fund indirectly bears its proportionate share of the expenses of any underlying Fidelity Central Funds.
H Expense ratios reflect operating expenses of the class. Expenses before reductions do not reflect amounts reimbursed by the investment adviser or reductions from expense offset arrangements and do not represent the amount paid by the class during periods when reimbursements or reductions occur. Expenses net of fee waivers reflect expenses after reimbursement by the investment adviser but prior to reductions from expense offset arrangements. Expenses net of all reductions represent the net expenses paid by the class.
I Annualized
J Amount does not include the portfolio activity of any underlying Fidelity Central Funds.
See accompanying notes which are an integral part of the financial statements.
Financial Highlights — Fidelity Total Market Index Fund Class F
| Six months ended (Unaudited) August 31, | Years ended February 28, | |||||
| 2017 | 2017 | 2016A | 2015 | 2014 | 2013 | |
| Selected Per–Share Data | ||||||
| Net asset value, beginning of period | $68.21 | $55.32 | $61.59 | $54.92 | $44.06 | $39.56 |
| Income from Investment Operations | ||||||
| Net investment income (loss)B | .70 | 1.26 | 1.17 | 1.14 | .95 | .90 |
| Net realized and unrealized gain (loss) | 2.86 | 13.20 | (5.98) | 6.51 | 10.74 | 4.39 |
| Total from investment operations | 3.56 | 14.46 | (4.81) | 7.65 | 11.69 | 5.29 |
| Distributions from net investment income | (.20) | (1.17) | (1.15) | (.98) | (.83) | (.79) |
| Distributions from net realized gain | (.10) | (.39) | (.31) | – | – | – |
| Total distributions | (.30) | (1.57)C | (1.46) | (.98) | (.83) | (.79) |
| Redemption fees added to paid in capitalB | – | –D | –D | –D | –D | –D |
| Net asset value, end of period | $71.47 | $68.21 | $55.32 | $61.59 | $54.92 | $44.06 |
| Total ReturnE,F | 5.24% | 26.33% | (7.91)% | 14.01% | 26.69% | 13.55% |
| Ratios to Average Net AssetsG,H | ||||||
| Expenses before reductions | .02%I | .02% | .04% | .04% | .05% | .05% |
| Expenses net of fee waivers, if any | .02%I | .02% | .04% | .04% | .05% | .05% |
| Expenses net of all reductions | .02%I | .02% | .04% | .04% | .05% | .05% |
| Net investment income (loss) | 2.00%I | 2.02% | 1.97% | 1.97% | 1.90% | 2.20% |
| Supplemental Data | ||||||
| Net assets, end of period (000 omitted) | $10,655,783 | $9,035,061 | $6,659,560 | $6,368,808 | $5,088,489 | $2,833,198 |
| Portfolio turnover rateJ | 3%I | 4% | 3% | 2% | 2% | 3% |
A For the year ended February 29.
B Calculated based on average shares outstanding during the period.
C Total distributions of $1.57 per share is comprised of distributions from net investment income of $1.173 and distributions from net realized gain of $.393 per share.
D Amount represents less than $.005 per share.
E Total returns for periods of less than one year are not annualized.
F Total returns would have been lower if certain expenses had not been reduced during the applicable periods shown.
G Fees and expenses of any underlying Fidelity Central Funds are not included in the Fund's expense ratio. The Fund indirectly bears its proportionate share of the expenses of any underlying Fidelity Central Funds.
H Expense ratios reflect operating expenses of the class. Expenses before reductions do not reflect amounts reimbursed by the investment adviser or reductions from expense offset arrangements and do not represent the amount paid by the class during periods when reimbursements or reductions occur. Expenses net of fee waivers reflect expenses after reimbursement by the investment adviser but prior to reductions from expense offset arrangements. Expenses net of all reductions represent the net expenses paid by the class.
I Annualized
J Amount does not include the portfolio activity of any underlying Fidelity Central Funds.
See accompanying notes which are an integral part of the financial statements.
Fidelity® Extended Market Index Fund
Investment Summary (Unaudited)
Top Ten Stocks as of August 31, 2017
| % of fund's net assets | % of fund's net assets 6 months ago | |
| Tesla, Inc. | 1.0 | 0.7 |
| Las Vegas Sands Corp. | 0.5 | 0.4 |
| Liberty Global PLC Class C | 0.5 | 0.5 |
| ServiceNow, Inc. | 0.4 | 0.3 |
| T-Mobile U.S., Inc. | 0.4 | 0.4 |
| BioMarin Pharmaceutical, Inc. | 0.4 | 0.4 |
| First Republic Bank | 0.3 | 0.3 |
| Markel Corp. | 0.3 | 0.3 |
| Workday, Inc. Class A | 0.3 | 0.2 |
| Celanese Corp. Class A | 0.3 | 0.3 |
| 4.4 |
Top Market Sectors as of August 31, 2017
| % of fund's net assets | % of fund's net assets 6 months ago | |
| Information Technology | 18.0 | 17.1 |
| Financials | 16.8 | 17.6 |
| Consumer Discretionary | 14.3 | 14.0 |
| Industrials | 13.2 | 13.2 |
| Health Care | 11.5 | 10.3 |
| Real Estate | 9.0 | 9.3 |
| Materials | 5.3 | 5.6 |
| Energy | 3.7 | 4.2 |
| Utilities | 3.4 | 3.0 |
| Consumer Staples | 3.1 | 3.4 |
Fidelity® Extended Market Index Fund
Investments August 31, 2017 (Unaudited)
Showing Percentage of Net Assets
| Common Stocks - 99.4% | |||
| Shares | Value | ||
| CONSUMER DISCRETIONARY - 14.3% | |||
| Auto Components - 1.3% | |||
| Adient PLC (a) | 415,327 | $29,355,312 | |
| American Axle & Manufacturing Holdings, Inc. (a)(b) | 361,716 | 5,284,671 | |
| Autoliv, Inc. (a) | 390,972 | 42,467,379 | |
| Clean Diesel Technologies, Inc. (a)(b) | 23,558 | 50,179 | |
| Cooper Tire & Rubber Co. | 229,720 | 7,718,592 | |
| Cooper-Standard Holding, Inc. (b) | 81,211 | 8,168,202 | |
| Dana Holding Corp. | 630,727 | 15,181,599 | |
| Dorman Products, Inc. (a)(b) | 133,826 | 8,888,723 | |
| Fox Factory Holding Corp. (b) | 151,917 | 6,076,680 | |
| Gentex Corp. (a) | 1,292,449 | 23,613,043 | |
| Gentherm, Inc. (a)(b) | 162,500 | 5,061,875 | |
| Hertz Global Holdings, Inc. (a)(b) | 315,419 | 6,857,209 | |
| Horizon Global Corp. (a)(b) | 106,337 | 1,828,996 | |
| LCI Industries (a) | 109,508 | 10,819,390 | |
| Lear Corp. | 302,955 | 45,303,891 | |
| Modine Manufacturing Co. (b) | 218,308 | 3,525,674 | |
| Motorcar Parts of America, Inc. (a)(b) | 89,786 | 2,358,678 | |
| Shiloh Industries, Inc. (b) | 47,028 | 411,965 | |
| Standard Motor Products, Inc. | 91,465 | 4,033,607 | |
| Stoneridge, Inc. (b) | 118,638 | 1,964,645 | |
| Strattec Security Corp. | 16,381 | 514,363 | |
| Superior Industries International, Inc. | 103,889 | 1,521,974 | |
| Sypris Solutions, Inc. (b) | 33,998 | 55,757 | |
| Tenneco, Inc. | 242,021 | 13,117,538 | |
| Tower International, Inc. | 98,181 | 2,204,163 | |
| Unique Fabricating, Inc. | 9,604 | 70,589 | |
| UQM Technologies, Inc. (a)(b) | 137,888 | 124,099 | |
| Visteon Corp. (a)(b) | 143,483 | 16,563,678 | |
| VOXX International Corp. (a)(b) | 83,482 | 676,204 | |
| Workhorse Group, Inc. (a)(b) | 97,973 | 330,169 | |
| 264,148,844 | |||
| Automobiles - 1.1% | |||
| REV Group, Inc. (a) | 54,597 | 1,375,298 | |
| Tesla, Inc. (a)(b) | 560,262 | 199,397,154 | |
| Thor Industries, Inc. (a) | 211,698 | 22,998,871 | |
| Winnebago Industries, Inc. (a) | 117,184 | 4,236,202 | |
| 228,007,525 | |||
| Distributors - 0.1% | |||
| Core-Mark Holding Co., Inc. | 203,246 | 5,499,837 | |
| Educational Development Corp. (a) | 16,502 | 174,096 | |
| Pool Corp. | 184,742 | 18,416,930 | |
| Weyco Group, Inc. | 21,447 | 590,865 | |
| 24,681,728 | |||
| Diversified Consumer Services - 0.8% | |||
| American Public Education, Inc. (b) | 68,815 | 1,269,637 | |
| Ascent Capital Group, Inc. (b) | 47,464 | 471,318 | |
| Bridgepoint Education, Inc. (b) | 97,961 | 864,996 | |
| Bright Horizons Family Solutions, Inc. (b) | 221,472 | 17,702,257 | |
| Cambium Learning Group, Inc. (b) | 48,546 | 284,480 | |
| Capella Education Co. | 52,862 | 3,560,256 | |
| Career Education Corp. (b) | 286,747 | 2,755,639 | |
| Carriage Services, Inc. | 65,607 | 1,606,715 | |
| Chegg, Inc. (a)(b) | 349,784 | 4,963,435 | |
| Collectors Universe, Inc. | 21,093 | 506,865 | |
| DeVry, Inc. (a) | 251,371 | 8,596,888 | |
| Graham Holdings Co. | 20,435 | 11,999,432 | |
| Grand Canyon Education, Inc. (b) | 214,591 | 17,607,192 | |
| Houghton Mifflin Harcourt Co. (b) | 463,566 | 4,728,373 | |
| K12, Inc. (b) | 154,850 | 2,774,912 | |
| Laureate Education, Inc. Class A | 166,957 | 2,444,250 | |
| Liberty Tax, Inc. | 35,449 | 476,789 | |
| Lincoln Educational Services Corp. (b) | 84,172 | 235,682 | |
| National American University Holdings, Inc. | 23,237 | 50,192 | |
| Regis Corp. (a)(b) | 160,027 | 2,125,159 | |
| Service Corp. International | 828,622 | 29,283,501 | |
| ServiceMaster Global Holdings, Inc. (b) | 594,775 | 28,025,798 | |
| Sotheby's Class A (Ltd. vtg.) (a)(b) | 205,416 | 9,217,016 | |
| Strayer Education, Inc. | 46,164 | 3,693,582 | |
| Universal Technical Institute, Inc. (b) | 87,539 | 309,888 | |
| Weight Watchers International, Inc. (a)(b) | 122,175 | 5,719,012 | |
| 161,273,264 | |||
| Hotels, Restaurants & Leisure - 3.4% | |||
| ARAMARK Holdings Corp. (a) | 1,074,112 | 43,705,617 | |
| Ark Restaurants Corp. | 8,457 | 194,511 | |
| Belmond Ltd. Class A (a)(b) | 384,579 | 4,903,382 | |
| Biglari Holdings, Inc. (b) | 4,573 | 1,361,656 | |
| BJ's Restaurants, Inc. (a)(b) | 88,226 | 2,655,603 | |
| Bloomin' Brands, Inc. (a) | 459,073 | 7,808,832 | |
| Bob Evans Farms, Inc. | 88,961 | 6,118,738 | |
| Bojangles', Inc. (a)(b) | 82,760 | 1,104,846 | |
| Boyd Gaming Corp. | 373,563 | 9,877,006 | |
| Bravo Brio Restaurant Group, Inc. (b) | 63,389 | 174,320 | |
| Brinker International, Inc. | 218,671 | 6,826,909 | |
| Buffalo Wild Wings, Inc. (a)(b) | 71,413 | 7,337,686 | |
| Caesars Entertainment Corp. (a)(b) | 251,223 | 2,914,187 | |
| Carrols Restaurant Group, Inc. (b) | 153,011 | 1,667,820 | |
| Century Casinos, Inc. (b) | 84,324 | 577,619 | |
| Chanticleer Holdings, Inc. (a)(b) | 9,214 | 20,824 | |
| Choice Hotels International, Inc. | 163,521 | 10,146,478 | |
| Churchill Downs, Inc. | 56,961 | 11,130,179 | |
| Chuy's Holdings, Inc. (a)(b) | 82,228 | 1,545,886 | |
| ClubCorp Holdings, Inc. | 285,558 | 4,854,486 | |
| Cracker Barrel Old Country Store, Inc. (a) | 105,563 | 15,692,996 | |
| Dave & Buster's Entertainment, Inc. (b) | 170,599 | 9,973,218 | |
| Del Frisco's Restaurant Group, Inc. (b) | 105,058 | 1,470,812 | |
| Del Taco Restaurants, Inc. (a)(b) | 140,561 | 1,979,099 | |
| Denny's Corp. (b) | 339,423 | 4,059,499 | |
| DineEquity, Inc. (a) | 75,057 | 2,983,516 | |
| Diversified Restaurant Holdings, Inc. (b) | 54,865 | 108,084 | |
| Domino's Pizza, Inc. | 210,545 | 38,373,932 | |
| Dover Downs Gaming & Entertainment, Inc. (b) | 28,631 | 28,345 | |
| Dover Motorsports, Inc. | 22,686 | 47,641 | |
| Drive Shack, Inc. (a) | 278,628 | 752,296 | |
| Dunkin' Brands Group, Inc. | 404,552 | 20,858,701 | |
| El Pollo Loco Holdings, Inc. (a)(b) | 97,361 | 1,105,047 | |
| Eldorado Resorts, Inc. (a)(b) | 179,218 | 4,122,014 | |
| Empire Resorts, Inc. (a)(b) | 9,364 | 218,649 | |
| Extended Stay America, Inc. unit | 892,623 | 17,486,485 | |
| Famous Dave's of America, Inc. (a)(b) | 21,114 | 91,846 | |
| Fiesta Restaurant Group, Inc. (a)(b) | 118,712 | 2,065,589 | |
| Flanigans Enterprises, Inc. | 1,120 | 28,728 | |
| Fogo de Chao, Inc. (b) | 44,064 | 557,410 | |
| Full House Resorts, Inc. (b) | 24,413 | 61,277 | |
| Gaming Partners International Corp. | 1,584 | 16,711 | |
| Golden Entertainment, Inc. (b) | 38,650 | 878,128 | |
| Good Times Restaurants, Inc. (b) | 41,006 | 114,817 | |
| Habit Restaurants, Inc. Class A (a)(b) | 85,475 | 1,111,175 | |
| Hilton Grand Vacations, Inc. | 291,660 | 10,572,675 | |
| Hyatt Hotels Corp. Class A (b) | 209,713 | 12,480,021 | |
| ILG, Inc. | 469,206 | 12,387,038 | |
| International Speedway Corp. Class A | 111,755 | 3,984,066 | |
| J. Alexanders Holdings, Inc. (b) | 59,031 | 584,407 | |
| Jack in the Box, Inc. | 134,174 | 12,561,370 | |
| Jamba, Inc. (a)(b) | 61,744 | 607,561 | |
| Kona Grill, Inc. (a)(b) | 43,155 | 129,465 | |
| La Quinta Holdings, Inc. (b) | 357,487 | 5,648,295 | |
| Las Vegas Sands Corp. | 1,611,777 | 100,268,647 | |
| Lindblad Expeditions Holdings (b) | 93,954 | 1,044,768 | |
| Luby's, Inc. (b) | 54,955 | 145,631 | |
| Marcus Corp. | 82,737 | 2,060,151 | |
| Marriott Vacations Worldwide Corp. (a) | 108,946 | 12,676,957 | |
| Monarch Casino & Resort, Inc. (b) | 52,952 | 1,883,503 | |
| Nathan's Famous, Inc. (b) | 14,327 | 838,846 | |
| Noodles & Co. (a)(b) | 86,399 | 332,636 | |
| Norwegian Cruise Line Holdings Ltd. (b) | 782,398 | 46,521,385 | |
| Papa John's International, Inc. (a) | 117,281 | 8,771,446 | |
| Papa Murphy's Holdings, Inc. (a)(b) | 43,281 | 221,166 | |
| Park Hotels & Resorts, Inc. | 622,485 | 16,614,125 | |
| Peak Resorts, Inc. | 18,903 | 91,680 | |
| Penn National Gaming, Inc. (a)(b) | 372,134 | 8,257,653 | |
| Pinnacle Entertainment, Inc. (a)(b) | 259,117 | 5,052,782 | |
| Planet Fitness, Inc. (a) | 321,777 | 8,163,482 | |
| Playa Hotels & Resorts NV | 214,907 | 2,228,586 | |
| Potbelly Corp. (b) | 111,393 | 1,336,716 | |
| Rave Restaurant Group, Inc. (a)(b) | 27,514 | 39,895 | |
| Rave Restaurant Group, Inc. rights | 27,514 | 461 | |
| RCI Hospitality Holdings, Inc. | 40,834 | 951,432 | |
| Red Lion Hotels Corp. (b) | 96,281 | 673,967 | |
| Red Robin Gourmet Burgers, Inc. (a)(b) | 59,222 | 3,375,654 | |
| Red Rock Resorts, Inc. (a) | 181,693 | 4,106,262 | |
| Ruby Tuesday, Inc. (a)(b) | 276,837 | 595,200 | |
| Ruth's Hospitality Group, Inc. | 146,679 | 2,867,574 | |
| Scientific Games Corp. Class A (a)(b) | 229,308 | 8,071,642 | |
| SeaWorld Entertainment, Inc. (a) | 290,191 | 3,766,679 | |
| Shake Shack, Inc. Class A (a)(b) | 79,162 | 2,447,689 | |
| Six Flags Entertainment Corp. | 356,741 | 19,467,356 | |
| Sonic Corp. (a) | 197,876 | 4,632,277 | |
| Speedway Motorsports, Inc. | 53,351 | 1,110,234 | |
| Texas Roadhouse, Inc. Class A (a) | 288,713 | 13,699,432 | |
| The Cheesecake Factory, Inc. (a) | 203,008 | 8,410,621 | |
| The ONE Group Hospitality, Inc. (b) | 65 | 103 | |
| Town Sports International Holdings, Inc. (b) | 75,993 | 448,359 | |
| U.S. Foods Holding Corp. (a)(b) | 590,944 | 16,221,413 | |
| Vail Resorts, Inc. | 176,916 | 40,328,002 | |
| Wendy's Co. | 845,883 | 12,620,574 | |
| Wingstop, Inc. | 134,080 | 4,345,533 | |
| Zoe's Kitchen, Inc. (a)(b) | 85,967 | 1,106,395 | |
| 673,864,412 | |||
| Household Durables - 1.2% | |||
| AV Homes, Inc. (a)(b) | 49,463 | 764,203 | |
| Bassett Furniture Industries, Inc. | 45,391 | 1,627,267 | |
| Beazer Homes U.S.A., Inc. (b) | 147,094 | 2,193,172 | |
| CalAtlantic Group, Inc. | 335,797 | 11,668,946 | |
| Cavco Industries, Inc. (b) | 38,060 | 5,120,973 | |
| Century Communities, Inc. (b) | 96,185 | 2,168,972 | |
| Comstock Holding Companies, Inc. (b) | 5,354 | 10,387 | |
| CSS Industries, Inc. | 33,658 | 901,361 | |
| Dixie Group, Inc. (b) | 53,047 | 217,493 | |
| Emerson Radio Corp. (b) | 24,397 | 26,837 | |
| Ethan Allen Interiors, Inc. (a) | 110,848 | 3,242,304 | |
| Flexsteel Industries, Inc. | 28,089 | 1,278,050 | |
| GoPro, Inc. Class A (a)(b) | 436,274 | 4,018,084 | |
| Green Brick Partners, Inc. (b) | 103,995 | 982,753 | |
| Helen of Troy Ltd. (b) | 120,394 | 10,871,578 | |
| Hooker Furniture Corp. | 52,315 | 2,105,679 | |
| Hovnanian Enterprises, Inc. Class A (a)(b) | 504,242 | 917,720 | |
| Installed Building Products, Inc. (a)(b) | 87,541 | 5,051,116 | |
| iRobot Corp. (a)(b) | 121,600 | 11,603,072 | |
| KB Home (a) | 365,917 | 7,830,624 | |
| Koss Corp. (b) | 1,389 | 1,986 | |
| La-Z-Boy, Inc. | 214,088 | 5,105,999 | |
| LGI Homes, Inc. (a)(b) | 75,233 | 3,200,412 | |
| Libbey, Inc. | 91,140 | 744,614 | |
| Lifetime Brands, Inc. | 49,962 | 869,339 | |
| Live Ventures, Inc. (a)(b) | 13,691 | 142,934 | |
| M.D.C. Holdings, Inc. (a) | 186,008 | 5,812,750 | |
| M/I Homes, Inc. (a) | 105,916 | 2,605,534 | |
| Meritage Homes Corp. (a)(b) | 173,856 | 7,075,939 | |
| NACCO Industries, Inc. Class A | 20,539 | 1,489,078 | |
| New Home Co. LLC (b) | 57,074 | 589,004 | |
| Nova LifeStyle, Inc. (a)(b) | 96,346 | 117,542 | |
| NVR, Inc. (b) | 15,400 | 41,901,090 | |
| PICO Holdings, Inc. (b) | 106,751 | 1,734,704 | |
| Skyline Corp. (b) | 30,617 | 365,261 | |
| Stanley Furniture Co., Inc. | 37,789 | 42,324 | |
| Taylor Morrison Home Corp. (a)(b) | 316,611 | 6,401,874 | |
| Tempur Sealy International, Inc. (a)(b) | 208,981 | 12,935,924 | |
| Toll Brothers, Inc. | 648,053 | 25,248,145 | |
| TopBuild Corp. (b) | 162,219 | 9,627,698 | |
| TRI Pointe Homes, Inc. (a)(b) | 738,525 | 9,408,809 | |
| Tupperware Brands Corp. | 222,339 | 12,866,758 | |
| Turtle Beach Corp. (a)(b) | 43,489 | 30,442 | |
| Universal Electronics, Inc. (b) | 65,853 | 3,855,693 | |
| Vuzix Corp. (a)(b) | 70,636 | 409,689 | |
| William Lyon Homes, Inc. (a)(b) | 111,071 | 2,664,593 | |
| Zagg, Inc. (b) | 120,643 | 1,520,102 | |
| 229,368,828 | |||
| Internet & Direct Marketing Retail - 0.7% | |||
| 1-800-FLOWERS.com, Inc. Class A (b) | 131,286 | 1,181,574 | |
| CafePress, Inc. (b) | 18,875 | 40,015 | |
| Duluth Holdings, Inc. (a)(b) | 36,141 | 708,002 | |
| Etsy, Inc. (a)(b) | 428,850 | 7,020,275 | |
| EVINE Live, Inc. (b) | 206,333 | 205,301 | |
| FTD Companies, Inc. (b) | 73,961 | 990,338 | |
| Gaia, Inc. Class A (b) | 64,695 | 721,349 | |
| Groupon, Inc. (a)(b) | 1,706,591 | 7,577,264 | |
| HSN, Inc. | 139,421 | 5,116,751 | |
| JRJR Networks (b) | 44,389 | 26,190 | |
| Lands' End, Inc. (a)(b) | 66,814 | 811,790 | |
| Liberty Expedia Holdings, Inc. | 237,560 | 12,992,156 | |
| Liberty Interactive Corp. QVC Group: | |||
| (Venture Group) Series A (a)(b) | 357,061 | 21,980,675 | |
| Series A (a)(b) | 1,764,149 | 39,022,976 | |
| Liberty TripAdvisor Holdings, Inc. (b) | 317,071 | 4,232,898 | |
| NutriSystem, Inc. | 134,203 | 7,287,223 | |
| Overstock.com, Inc. (a)(b) | 74,996 | 1,646,162 | |
| PetMed Express, Inc. (a) | 87,890 | 3,187,770 | |
| Shutterfly, Inc. (a)(b) | 152,525 | 6,952,090 | |
| U.S. Auto Parts Network, Inc. (b) | 62,757 | 183,250 | |
| Wayfair LLC Class A (a)(b) | 139,452 | 9,902,487 | |
| 131,786,536 | |||
| Leisure Products - 0.4% | |||
| American Outdoor Brands Corp. (a)(b) | 252,912 | 4,127,524 | |
| Brunswick Corp. | 396,224 | 20,793,836 | |
| Callaway Golf Co. | 417,114 | 5,814,569 | |
| Clarus Corp. (b) | 93,828 | 680,253 | |
| Escalade, Inc. | 33,614 | 405,049 | |
| JAKKS Pacific, Inc. (a)(b) | 79,564 | 274,496 | |
| Johnson Outdoors, Inc. Class A | 25,505 | 1,627,219 | |
| Malibu Boats, Inc. Class A (a)(b) | 91,166 | 2,458,747 | |
| Marine Products Corp. | 25,214 | 392,834 | |
| MCBC Holdings, Inc. (b) | 72,487 | 1,242,427 | |
| Nautilus, Inc. (b) | 142,013 | 2,321,913 | |
| Polaris Industries, Inc. (a) | 257,551 | 24,011,480 | |
| Sturm, Ruger & Co., Inc. (a) | 80,609 | 3,691,892 | |
| Summer Infant, Inc. (b) | 37,416 | 76,329 | |
| Vista Outdoor, Inc. (a)(b) | 251,298 | 5,151,609 | |
| 73,070,177 | |||
| Media - 2.8% | |||
| A.H. Belo Corp. Class A | 70,842 | 354,210 | |
| AMC Entertainment Holdings, Inc. Class A (a) | 233,263 | 3,125,724 | |
| AMC Networks, Inc. Class A (a)(b) | 229,829 | 13,969,007 | |
| Ballantyne of Omaha, Inc. (b) | 47,765 | 300,920 | |
| Beasley Broadcast Group, Inc. Class A | 8,569 | 85,262 | |
| Cable One, Inc. | 20,878 | 15,840,974 | |
| Central European Media Enterprises Ltd. Class A (a)(b) | 338,460 | 1,404,609 | |
| Cinedigm Corp. (a)(b) | 23,731 | 35,834 | |
| Cinemark Holdings, Inc. | 473,543 | 15,764,246 | |
| Clear Channel Outdoor Holding, Inc. Class A (a)(b) | 153,163 | 589,678 | |
| Cumulus Media, Inc. Class A (a)(b) | 76,888 | 29,986 | |
| Daily Journal Corp. (a)(b) | 4,313 | 905,299 | |
| E.W. Scripps Co. Class A (a)(b) | 249,395 | 4,459,183 | |
| Emmis Communications Corp. Class A (b) | 24,761 | 65,617 | |
| Entercom Communications Corp. Class A (a) | 120,536 | 1,241,521 | |
| Entravision Communication Corp. Class A | 286,902 | 1,592,306 | |
| Gannett Co., Inc. | 490,323 | 4,162,842 | |
| Global Eagle Entertainment, Inc. (a)(b) | 223,324 | 690,071 | |
| Gray Television, Inc. (a)(b) | 300,702 | 4,300,039 | |
| Harte-Hanks, Inc. (b) | 205,404 | 184,514 | |
| Hemisphere Media Group, Inc. (a)(b) | 52,967 | 685,923 | |
| Insignia Systems, Inc. | 22,896 | 24,041 | |
| John Wiley & Sons, Inc. Class A | 203,117 | 10,958,162 | |
| Lee Enterprises, Inc. (a)(b) | 197,525 | 414,803 | |
| Liberty Broadband Corp.: | |||
| Class A (b) | 106,720 | 10,824,610 | |
| Class C (b) | 305,673 | 31,034,980 | |
| Liberty Global PLC: | |||
| Class A (b) | 1,034,512 | 35,173,408 | |
| Class C (b) | 2,851,073 | 94,170,941 | |
| LiLAC Class A (a)(b) | 230,476 | 5,994,691 | |
| LiLAC Class C (a)(b) | 537,090 | 13,851,551 | |
| Liberty Media Corp.: | |||
| Liberty Braves Class A (b) | 47,693 | 1,164,186 | |
| Liberty Braves Class C (b) | 135,237 | 3,309,249 | |
| Liberty Formula One Group Series C (a)(b) | 562,233 | 22,095,757 | |
| Liberty Media Class A (a)(b) | 112,685 | 4,274,142 | |
| Liberty SiriusXM Series A (b) | 450,124 | 20,120,543 | |
| Liberty SiriusXM Series C (b) | 715,187 | 31,904,492 | |
| Lions Gate Entertainment Corp.: | |||
| Class A (a) | 200,958 | 5,974,481 | |
| Class B (a) | 506,700 | 14,223,069 | |
| Live Nation Entertainment, Inc. (a)(b) | 590,348 | 23,590,306 | |
| Loral Space & Communications Ltd. (a)(b) | 56,686 | 2,573,544 | |
| Meredith Corp. | 165,628 | 9,001,882 | |
| MSG Network, Inc. Class A (a)(b) | 287,087 | 6,158,016 | |
| National CineMedia, Inc. | 289,834 | 1,568,002 | |
| New Media Investment Group, Inc. | 243,842 | 3,362,581 | |
| Nexstar Broadcasting Group, Inc. Class A (a) | 196,033 | 11,801,187 | |
| NTN Communications, Inc. (a)(b) | 21,179 | 154,607 | |
| Reading International, Inc. Class A (b) | 68,862 | 1,085,265 | |
| Regal Entertainment Group Class A | 483,323 | 7,138,681 | |
| RLJ Entertainment, Inc. (b) | 85,916 | 269,776 | |
| Saga Communications, Inc. Class A | 17,390 | 710,382 | |
| Salem Communications Corp. Class A | 38,916 | 235,442 | |
| Scholastic Corp. | 121,686 | 4,798,079 | |
| Sinclair Broadcast Group, Inc. Class A | 327,708 | 9,913,167 | |
| Sirius XM Holdings, Inc. (a) | 7,363,922 | 42,342,552 | |
| SPAR Group, Inc. (b) | 211,168 | 221,726 | |
| Tegna, Inc. | 954,663 | 12,047,847 | |
| The Madison Square Garden Co. (b) | 62,580 | 13,298,876 | |
| The McClatchy Co. Class A (a)(b) | 20,839 | 151,708 | |
| The New York Times Co. Class A (a) | 535,564 | 9,988,269 | |
| Time, Inc. | 431,065 | 5,668,505 | |
| Townsquare Media, Inc. (b) | 40,471 | 403,901 | |
| Tribune Media Co. Class A | 321,979 | 12,901,699 | |
| tronc, Inc. (b) | 102,477 | 1,486,941 | |
| Urban One, Inc. Class D (non-vtg.) (b) | 114,506 | 200,386 | |
| World Wrestling Entertainment, Inc. Class A | 178,244 | 3,885,719 | |
| 560,259,917 | |||
| Multiline Retail - 0.2% | |||
| Big Lots, Inc. (a) | 204,194 | 9,719,634 | |
| Dillard's, Inc. Class A (a) | 99,840 | 6,070,272 | |
| Fred's, Inc. Class A (a) | 148,273 | 877,776 | |
| JC Penney Corp., Inc. (a)(b) | 1,335,725 | 5,169,256 | |
| Ollie's Bargain Outlet Holdings, Inc. (a)(b) | 207,746 | 8,694,170 | |
| Sears Holdings Corp. (a)(b) | 214,478 | 1,760,864 | |
| The Bon-Ton Stores, Inc. (a)(b) | 46,249 | 30,524 | |
| Tuesday Morning Corp. (a)(b) | 195,077 | 438,923 | |
| 32,761,419 | |||
| Specialty Retail - 1.7% | |||
| Aaron's, Inc. Class A | 281,323 | 12,454,169 | |
| Abercrombie & Fitch Co. Class A | 288,053 | 3,669,795 | |
| America's Car Mart, Inc. (a)(b) | 32,877 | 1,262,477 | |
| American Eagle Outfitters, Inc. (a) | 719,120 | 8,593,484 | |
| Appliance Recycling Centers of America, Inc. (b) | 2,967 | 4,065 | |
| Armstrong Flooring, Inc. (b) | 109,555 | 1,634,561 | |
| Asbury Automotive Group, Inc. (a)(b) | 87,283 | 4,700,190 | |
| Ascena Retail Group, Inc. (a)(b) | 736,486 | 1,502,431 | |
| AutoNation, Inc. (a)(b) | 285,000 | 12,930,450 | |
| Barnes & Noble Education, Inc. (a)(b) | 156,009 | 808,127 | |
| Barnes & Noble, Inc. (a) | 244,408 | 1,894,162 | |
| bebe stores, Inc. (a)(b) | 12,304 | 67,918 | |
| Bed Bath & Beyond, Inc. | 621,375 | 17,143,736 | |
| Big 5 Sporting Goods Corp. | 77,948 | 596,302 | |
| Boot Barn Holdings, Inc. (a)(b) | 56,501 | 457,658 | |
| Build-A-Bear Workshop, Inc. (b) | 62,129 | 571,587 | |
| Burlington Stores, Inc. (a)(b) | 304,704 | 26,548,860 | |
| Cabela's, Inc. Class A (b) | 226,029 | 12,137,757 | |
| Caleres, Inc. | 202,318 | 5,458,540 | |
| Cars.com, Inc. (a) | 310,000 | 8,016,600 | |
| Chico's FAS, Inc. | 580,288 | 4,456,612 | |
| Christopher & Banks Corp. (a)(b) | 142,357 | 183,641 | |
| Citi Trends, Inc. | 69,557 | 1,261,068 | |
| Conn's, Inc. (a)(b) | 103,172 | 1,790,034 | |
| Destination Maternity Corp. (b) | 47,814 | 57,377 | |
| Destination XL Group, Inc. (a)(b) | 165,015 | 305,278 | |
| DGSE Companies, Inc. (a)(b) | 6,929 | 9,216 | |
| Dick's Sporting Goods, Inc. | 382,225 | 10,075,451 | |
| DSW, Inc. Class A (a) | 313,027 | 5,800,390 | |
| Express, Inc. (a)(b) | 375,573 | 2,392,400 | |
| Finish Line, Inc. Class A (a) | 173,876 | 1,448,387 | |
| Five Below, Inc. (a)(b) | 243,633 | 11,589,622 | |
| Floor & Decor Holdings, Inc. Class A | 89,209 | 3,206,171 | |
| Francesca's Holdings Corp. (b) | 164,101 | 1,191,373 | |
| GameStop Corp. Class A (a) | 436,723 | 8,079,376 | |
| Genesco, Inc. (a)(b) | 88,725 | 1,876,534 | |
| GNC Holdings, Inc. Class A (a) | 311,587 | 2,586,172 | |
| Group 1 Automotive, Inc. | 93,406 | 5,606,228 | |
| Guess?, Inc. | 272,830 | 4,250,691 | |
| Haverty Furniture Companies, Inc. | 84,810 | 1,988,795 | |
| Hibbett Sports, Inc. (a)(b) | 113,850 | 1,400,355 | |
| Kirkland's, Inc. (b) | 64,776 | 746,867 | |
| Lithia Motors, Inc. Class A (sub. vtg.) (a) | 104,049 | 11,237,292 | |
| Lumber Liquidators Holdings, Inc. (a)(b) | 125,749 | 4,719,360 | |
| MarineMax, Inc. (a)(b) | 110,011 | 1,776,678 | |
| Michaels Companies, Inc. (a)(b) | 481,990 | 10,820,676 | |
| Monro, Inc. (a) | 145,692 | 6,949,508 | |
| Murphy U.S.A., Inc. (a)(b) | 156,605 | 10,094,758 | |
| New York & Co., Inc. (a)(b) | 123,907 | 239,141 | |
| Office Depot, Inc. | 2,251,861 | 9,660,484 | |
| Party City Holdco, Inc. (a)(b) | 108,856 | 1,518,541 | |
| Penske Automotive Group, Inc. (a) | 166,277 | 7,043,494 | |
| Perfumania Holdings, Inc. (a)(b) | 10,679 | 19,436 | |
| Pier 1 Imports, Inc. (a) | 336,151 | 1,408,473 | |
| Rent-A-Center, Inc. (a) | 229,748 | 2,779,951 | |
| RH (a)(b) | 87,612 | 4,099,365 | |
| Sally Beauty Holdings, Inc. (a)(b) | 635,949 | 11,822,292 | |
| Sears Hometown & Outlet Stores, Inc. (a)(b) | 48,309 | 84,541 | |
| Select Comfort Corp. (a)(b) | 185,514 | 5,478,228 | |
| Shoe Carnival, Inc. | 61,077 | 1,227,648 | |
| Sonic Automotive, Inc. Class A (sub. vtg.) | 124,006 | 2,244,509 | |
| Sportsman's Warehouse Holdings, Inc. (a)(b) | 125,349 | 520,198 | |
| Stage Stores, Inc. (a) | 128,267 | 233,446 | |
| Stein Mart, Inc. (a) | 120,516 | 150,645 | |
| Tailored Brands, Inc. (a) | 222,120 | 2,625,458 | |
| Tandy Leather Factory, Inc. (b) | 3,074 | 25,361 | |
| The Buckle, Inc. (a) | 134,493 | 1,903,076 | |
| The Cato Corp. Class A (sub. vtg.) | 111,693 | 1,469,880 | |
| The Children's Place Retail Stores, Inc. | 77,364 | 8,212,189 | |
| The Container Store Group, Inc. (a)(b) | 75,281 | 305,641 | |
| Tile Shop Holdings, Inc. (a) | 146,904 | 2,210,905 | |
| Tilly's, Inc. | 54,153 | 596,225 | |
| Trans World Entertainment Corp. (b) | 29,120 | 45,136 | |
| Urban Outfitters, Inc. (a)(b) | 390,214 | 7,975,974 | |
| Vitamin Shoppe, Inc. (a)(b) | 110,328 | 590,255 | |
| West Marine, Inc. | 82,712 | 1,072,775 | |
| Williams-Sonoma, Inc. (a) | 354,940 | 16,327,240 | |
| Winmark Corp. | 8,782 | 1,157,907 | |
| Zumiez, Inc. (a)(b) | 83,973 | 1,045,464 | |
| 330,447,057 | |||
| Textiles, Apparel & Luxury Goods - 0.6% | |||
| Carter's, Inc. | 214,862 | 18,630,684 | |
| Charles & Colvard Ltd. (b) | 45,090 | 40,130 | |
| Cherokee, Inc. (b) | 51,314 | 236,044 | |
| Columbia Sportswear Co. | 123,057 | 7,049,936 | |
| Crocs, Inc. (b) | 338,182 | 3,019,965 | |
| Crown Crafts, Inc. | 2,227 | 14,810 | |
| Culp, Inc. | 41,594 | 1,206,226 | |
| Deckers Outdoor Corp. (a)(b) | 145,090 | 9,271,251 | |
| Delta Apparel, Inc. (b) | 25,490 | 500,114 | |
| Differential Brands Group, Inc. (b) | 22,419 | 36,991 | |
| Emerald Expositions Events, Inc. (a) | 82,412 | 1,791,637 | |
| Forward Industries, Inc. (NY Shares) (a)(b) | 18,823 | 20,894 | |
| Fossil Group, Inc. (a)(b) | 171,326 | 1,420,293 | |
| G-III Apparel Group Ltd. (a)(b) | 199,717 | 5,492,218 | |
| Iconix Brand Group, Inc. (a)(b) | 274,433 | 1,534,080 | |
| J.Jill, Inc. (a) | 85,367 | 828,914 | |
| Lakeland Industries, Inc. (b) | 24,535 | 345,944 | |
| lululemon athletica, Inc. (a)(b) | 472,460 | 27,190,073 | |
| Movado Group, Inc. (a) | 67,327 | 1,868,324 | |
| Naked Brand Group, Inc. (a)(b) | 34,817 | 48,396 | |
| Oxford Industries, Inc. | 65,064 | 3,761,350 | |
| Perry Ellis International, Inc. (b) | 55,257 | 1,206,260 | |
| Rocky Brands, Inc. | 27,150 | 350,235 | |
| Sequential Brands Group, Inc. (a)(b) | 184,989 | 564,216 | |
| Skechers U.S.A., Inc. Class A (sub. vtg.) (b) | 597,488 | 15,791,608 | |
| Steven Madden Ltd. (b) | 243,792 | 10,336,781 | |
| Superior Uniform Group, Inc. | 30,551 | 672,733 | |
| Unifi, Inc. (b) | 63,053 | 1,959,687 | |
| Vera Bradley, Inc. (b) | 96,199 | 869,639 | |
| Vince Holding Corp. (a)(b) | 105,062 | 47,908 | |
| Wolverine World Wide, Inc. (a) | 437,927 | 11,517,480 | |
| 127,624,821 | |||
| TOTAL CONSUMER DISCRETIONARY | 2,837,294,528 | ||
| CONSUMER STAPLES - 3.1% | |||
| Beverages - 0.1% | |||
| Boston Beer Co., Inc. Class A (a)(b) | 41,723 | 6,216,727 | |
| Castle Brands, Inc. (a)(b) | 356,392 | 506,077 | |
| Coca-Cola Bottling Co. Consolidated | 20,918 | 4,467,876 | |
| Craft Brew Alliance, Inc. (a)(b) | 39,325 | 684,255 | |
| Crystal Rock Holdings, Inc. (b) | 4,384 | 3,346 | |
| MGP Ingredients, Inc. (a) | 57,126 | 3,212,195 | |
| National Beverage Corp. (a) | 51,760 | 6,015,030 | |
| New Age Beverages Corp. (a) | 91,718 | 387,967 | |
| Primo Water Corp. (a)(b) | 117,562 | 1,287,304 | |
| REED'S, Inc. (a)(b) | 71,901 | 165,372 | |
| 22,946,149 | |||
| Food & Staples Retailing - 0.5% | |||
| Andersons, Inc. | 121,250 | 3,861,813 | |
| Casey's General Stores, Inc. (a) | 177,673 | 18,730,288 | |
| Chefs' Warehouse Holdings (a)(b) | 84,128 | 1,451,208 | |
| Ingles Markets, Inc. Class A | 63,051 | 1,383,969 | |
| Natural Grocers by Vitamin Cottage, Inc. (a)(b) | 42,822 | 240,660 | |
| Performance Food Group Co. (a)(b) | 374,106 | 10,400,147 | |
| PriceSmart, Inc. (a) | 101,308 | 8,231,275 | |
| Rite Aid Corp. (a)(b) | 4,669,312 | 11,299,735 | |
| Smart & Final Stores, Inc. (a)(b) | 132,210 | 932,081 | |
| SpartanNash Co. | 166,314 | 4,097,977 | |
| Sprouts Farmers Market LLC (a)(b) | 572,540 | 11,416,448 | |
| SUPERVALU, Inc. (b) | 168,596 | 3,370,234 | |
| United Natural Foods, Inc. (a)(b) | 221,930 | 7,712,068 | |
| Village Super Market, Inc. Class A | 36,569 | 845,841 | |
| Weis Markets, Inc. | 76,401 | 3,377,688 | |
| Welbilt, Inc. (a)(b) | 619,869 | 12,335,393 | |
| 99,686,825 | |||
| Food Products - 1.8% | |||
| Alico, Inc. | 12,666 | 405,312 | |
| Amplify Snack Brands, Inc. (a)(b) | 150,310 | 1,083,735 | |
| Arcadia Biosciences, Inc. (a)(b) | 26,228 | 10,753 | |
| B&G Foods, Inc. Class A (a) | 298,213 | 9,095,497 | |
| Blue Buffalo Pet Products, Inc. (a)(b) | 411,859 | 10,609,488 | |
| Bunge Ltd. | 618,883 | 46,187,238 | |
| Cal-Maine Foods, Inc. (a)(b) | 130,643 | 4,761,937 | |
| Calavo Growers, Inc. (a) | 68,245 | 4,582,652 | |
| Coffee Holding Co., Inc. (a)(b) | 18,940 | 72,161 | |
| Darling International, Inc. (b) | 719,937 | 12,526,904 | |
| Dean Foods Co. | 392,749 | 4,320,239 | |
| Farmer Brothers Co. (b) | 40,539 | 1,319,544 | |
| Flowers Foods, Inc. | 840,298 | 14,595,976 | |
| Fresh Del Monte Produce, Inc. | 143,001 | 6,719,617 | |
| Freshpet, Inc. (a)(b) | 92,564 | 1,467,139 | |
| Hostess Brands, Inc. Class A (a)(b) | 387,414 | 5,168,103 | |
| Ingredion, Inc. | 313,871 | 38,863,507 | |
| Inventure Foods, Inc. (a)(b) | 76,402 | 262,059 | |
| J&J Snack Foods Corp. | 69,066 | 8,805,224 | |
| John B. Sanfilippo & Son, Inc. (a) | 39,021 | 2,421,643 | |
| Lamb Weston Holdings, Inc. | 610,493 | 27,765,222 | |
| Lancaster Colony Corp. | 85,473 | 9,955,040 | |
| Landec Corp. (b) | 116,866 | 1,519,258 | |
| Lifeway Foods, Inc. (b) | 27,446 | 238,780 | |
| Limoneira Co. | 47,312 | 1,059,789 | |
| Omega Protein Corp. | 96,626 | 1,526,691 | |
| Pilgrim's Pride Corp. (a)(b) | 254,353 | 7,490,696 | |
| Pinnacle Foods, Inc. | 519,350 | 30,802,649 | |
| Post Holdings, Inc. (a)(b) | 289,377 | 24,634,664 | |
| RiceBran Technologies (b) | 15,640 | 16,578 | |
| Rocky Mountain Chocolate Factory, Inc. | 3,001 | 35,142 | |
| S&W Seed Co. (a)(b) | 38,997 | 128,690 | |
| Sanderson Farms, Inc. (a) | 87,851 | 12,959,780 | |
| Seaboard Corp. | 1,198 | 5,146,213 | |
| Seneca Foods Corp. Class A (b) | 30,121 | 897,606 | |
| Snyders-Lance, Inc. (a) | 382,787 | 13,596,594 | |
| The Hain Celestial Group, Inc. (b) | 455,320 | 18,312,970 | |
| Tootsie Roll Industries, Inc. (a) | 89,305 | 3,335,542 | |
| TreeHouse Foods, Inc. (a)(b) | 250,906 | 16,808,193 | |
| 349,508,825 | |||
| Household Products - 0.2% | |||
| Central Garden & Pet Co. Class A (non-vtg.) (b) | 203,188 | 6,926,679 | |
| Energizer Holdings, Inc. (a) | 275,587 | 12,167,166 | |
| HRG Group, Inc. (a)(b) | 611,179 | 9,650,516 | |
| Ocean Bio-Chem, Inc. | 26,292 | 114,107 | |
| Oil-Dri Corp. of America | 22,679 | 923,035 | |
| Orchids Paper Products Co. (a) | 40,696 | 415,099 | |
| Spectrum Brands Holdings, Inc. (a) | 105,465 | 11,596,931 | |
| WD-40 Co. (a) | 63,004 | 6,864,286 | |
| 48,657,819 | |||
| Personal Products - 0.4% | |||
| Avon Products, Inc. (b) | 1,906,557 | 4,747,327 | |
| CCA Industries, Inc. (b) | 3,083 | 10,945 | |
| Cyanotech Corp. (b) | 3,808 | 17,898 | |
| Edgewell Personal Care Co. (a)(b) | 255,772 | 19,423,326 | |
| elf Beauty, Inc. (a) | 86,380 | 1,787,202 | |
| Herbalife Ltd. (a)(b) | 307,483 | 21,219,402 | |
| Inter Parfums, Inc. | 80,161 | 3,162,351 | |
| LifeVantage Corp. (a)(b) | 58,439 | 243,106 | |
| Mannatech, Inc. | 4,519 | 68,011 | |
| MediFast, Inc. | 51,562 | 2,919,440 | |
| MYOS Corp. (a)(b) | 849 | 1,061 | |
| Natural Alternatives International, Inc. (b) | 20,104 | 221,144 | |
| Natural Health Trends Corp. | 30,893 | 623,421 | |
| Nature's Sunshine Products, Inc. | 31,943 | 336,999 | |
| Nu Skin Enterprises, Inc. Class A | 218,397 | 13,285,090 | |
| Reliv International, Inc. (b) | 1,527 | 11,758 | |
| Revlon, Inc. (a)(b) | 56,452 | 954,039 | |
| The Female Health Co. (b) | 72,631 | 116,936 | |
| United-Guardian, Inc. | 6,016 | 102,272 | |
| USANA Health Sciences, Inc. (a)(b) | 50,330 | 2,979,536 | |
| 72,231,264 | |||
| Tobacco - 0.1% | |||
| 22nd Century Group, Inc. (a)(b) | 345,348 | 759,766 | |
| Alliance One International, Inc. (b) | 33,481 | 348,202 | |
| Turning Point Brands, Inc. (b) | 29,381 | 505,353 | |
| Universal Corp. | 111,115 | 6,355,778 | |
| Vector Group Ltd. (a) | 446,014 | 9,633,902 | |
| 17,603,001 | |||
| TOTAL CONSUMER STAPLES | 610,633,883 | ||
| ENERGY - 3.7% | |||
| Energy Equipment & Services - 1.0% | |||
| Archrock, Inc. | 301,614 | 3,076,463 | |
| Aspen Aerogels, Inc. (b) | 85,012 | 347,699 | |
| Atwood Oceanics, Inc. (a)(b) | 321,131 | 2,109,831 | |
| Basic Energy Services, Inc. (b) | 100,658 | 1,433,370 | |
| Bristow Group, Inc. (a) | 142,536 | 1,174,497 | |
| C&J Energy Services, Inc. (a) | 281,497 | 7,110,614 | |
| Carbo Ceramics, Inc. (a)(b) | 90,902 | 596,317 | |
| Core Laboratories NV (a) | 194,145 | 17,119,706 | |
| Dawson Geophysical Co. (b) | 84,323 | 352,470 | |
| Diamond Offshore Drilling, Inc. (a)(b) | 274,267 | 3,115,673 | |
| Dril-Quip, Inc. (a)(b) | 165,265 | 6,205,701 | |
| EcoStim Energy Solutions, Inc. (a)(b) | 45,860 | 60,077 | |
| ENGlobal Corp. (b) | 49,530 | 63,894 | |
| Ensco PLC Class A (a) | 1,312,309 | 5,577,313 | |
| Enservco Corp. (a)(b) | 77,749 | 37,024 | |
| Era Group, Inc. (b) | 75,717 | 667,067 | |
| Exterran Corp. (b) | 137,290 | 3,808,425 | |
| Fairmount Santrol Holidings, Inc. (a)(b) | 640,322 | 1,959,385 | |
| Forum Energy Technologies, Inc. (a)(b) | 311,762 | 3,616,439 | |
| Frank's International NV (a) | 226,789 | 1,424,235 | |
| Geospace Technologies Corp. (a)(b) | 53,804 | 811,902 | |
| Gulf Island Fabrication, Inc. | 51,115 | 572,488 | |
| Helix Energy Solutions Group, Inc. (b) | 603,189 | 3,781,995 | |
| Hornbeck Offshore Services, Inc. (a)(b) | 148,293 | 410,772 | |
| Independence Contract Drilling, Inc. (b) | 127,230 | 409,681 | |
| ION Geophysical Corp. (a)(b) | 31,686 | 232,892 | |
| Mammoth Energy Services, Inc. (a) | 59,263 | 816,644 | |
| Matrix Service Co. (b) | 116,892 | 1,385,170 | |
| McDermott International, Inc. (a)(b) | 1,235,190 | 7,584,067 | |
| Mitcham Industries, Inc. (b) | 40,926 | 153,473 | |
| Nabors Industries Ltd. | 1,284,767 | 8,415,224 | |
| Natural Gas Services Group, Inc. (b) | 52,753 | 1,244,971 | |
| NCS Multistage Holdings, Inc. | 47,450 | 937,612 | |
| Newpark Resources, Inc. (a)(b) | 403,139 | 3,245,269 | |
| Noble Corp. (a) | 1,084,172 | 3,534,401 | |
| Oceaneering International, Inc. (a) | 426,515 | 9,617,913 | |
| Oil States International, Inc. (a)(b) | 226,051 | 4,916,609 | |
| Parker Drilling Co. (a)(b) | 571,982 | 629,180 | |
| Patterson-UTI Energy, Inc. | 742,721 | 11,861,254 | |
| PHI, Inc. (non-vtg.) (b) | 46,438 | 510,354 | |
| Pioneer Energy Services Corp. (b) | 318,662 | 541,725 | |
| Profire Energy, Inc. (b) | 83,066 | 125,430 | |
| RigNet, Inc. (b) | 52,479 | 839,664 | |
| Rowan Companies PLC (a)(b) | 586,816 | 5,721,456 | |
| RPC, Inc. (a) | 264,838 | 5,140,506 | |
| SAExploration Holdings, Inc.: | |||
| warrants 7/27/21 (c) | 42 | 1 | |
| warrants 7/27/21 (c) | 42 | 2 | |
| SEACOR Holdings, Inc. (a)(b) | 70,418 | 2,701,939 | |
| Smart Sand, Inc. (a) | 101,936 | 608,558 | |
| Solaris Oilfield Infrastructure, Inc. Class A | 70,674 | 1,000,744 | |
| Superior Energy Services, Inc. (a)(b) | 660,904 | 5,445,849 | |
| Synthesis Energy Systems, Inc. (a)(b) | 247,060 | 100,652 | |
| Tesco Corp. (b) | 196,597 | 865,027 | |
| TETRA Technologies, Inc. (b) | 540,634 | 1,113,706 | |
| Transocean Ltd. (United States) (a)(b) | 1,742,456 | 14,218,441 | |
| U.S. Silica Holdings, Inc. | 322,967 | 8,787,932 | |
| Unit Corp. (a)(b) | 236,049 | 3,757,900 | |
| Weatherford International PLC (a) | 4,387,855 | 16,805,485 | |
| Willbros Group, Inc. (b) | 173,199 | 381,038 | |
| 189,084,126 | |||
| Oil, Gas & Consumable Fuels - 2.7% | |||
| Abraxas Petroleum Corp. (b) | 679,559 | 1,155,250 | |
| Adams Resources & Energy, Inc. | 9,909 | 343,545 | |
| Aemetis, Inc. (a)(b) | 44,295 | 38,231 | |
| Amyris, Inc. (a)(b) | 25,665 | 63,393 | |
| Antero Resources Corp. (a)(b) | 643,512 | 12,670,751 | |
| Approach Resources, Inc. (a)(b) | 211,859 | 588,968 | |
| Arch Coal, Inc. | 108,752 | 8,686,022 | |
| Ardmore Shipping Corp. (a) | 128,732 | 1,042,729 | |
| Barnwell Industries, Inc. (b) | 11,298 | 20,336 | |
| Bill Barrett Corp. (a)(b) | 346,422 | 1,035,802 | |
| Bonanza Creek Energy, Inc. | 9,121 | 237,055 | |
| Bonanza Creek Energy, Inc. (d) | 166,099 | 2 | |
| California Resources Corp. (a)(b) | 172,583 | 1,346,147 | |
| Callon Petroleum Co. (a)(b) | 902,491 | 9,349,807 | |
| Carrizo Oil & Gas, Inc. (a)(b) | 334,669 | 4,497,951 | |
| Centennial Resource Development, Inc. Class A (a) | 544,343 | 9,411,690 | |
| Centrus Energy Corp. Class A (a)(b) | 22,164 | 83,780 | |
| Cheniere Energy, Inc. (a)(b) | 1,052,608 | 45,041,096 | |
| Clean Energy Fuels Corp. (a)(b) | 457,470 | 1,088,779 | |
| Cloud Peak Energy, Inc. (a)(b) | 350,207 | 1,099,650 | |
| Cobalt International Energy, Inc. (a)(b) | 109,951 | 206,708 | |
| Comstock Resources, Inc. (a)(b) | 59,844 | 384,198 | |
| CONSOL Energy, Inc. | 790,515 | 11,501,993 | |
| Contango Oil & Gas Co. (a)(b) | 88,353 | 405,540 | |
| Continental Resources, Inc. (a)(b) | 391,200 | 13,269,504 | |
| CVR Energy, Inc. (a) | 67,664 | 1,449,363 | |
| Delek U.S. Holdings, Inc. | 324,339 | 8,017,660 | |
| Denbury Resources, Inc. (a)(b) | 1,713,341 | 1,816,141 | |
| Diamondback Energy, Inc. (b) | 430,889 | 39,120,412 | |
| Earthstone Energy, Inc. (a)(b) | 37,892 | 363,384 | |
| Eclipse Resources Corp. (b) | 384,060 | 894,860 | |
| Energen Corp. (b) | 425,353 | 21,812,102 | |
| Energy XXI Gulf Coast, Inc. (a) | 141,118 | 1,474,683 | |
| EP Energy Corp. (a)(b) | 194,327 | 571,321 | |
| Evolution Petroleum Corp. | 131,930 | 916,914 | |
| EXCO Resources, Inc. (a)(b) | 48,051 | 86,011 | |
| Extraction Oil & Gas, Inc. (a) | 178,876 | 2,350,431 | |
| FieldPoint Petroleum Corp. (b) | 9,981 | 3,314 | |
| Gastar Exploration, Inc. (a)(b) | 765,403 | 451,741 | |
| Gener8 Maritime, Inc. (a)(b) | 367,090 | 1,651,905 | |
| Gevo, Inc. (a)(b) | 25,651 | 16,673 | |
| Green Plains, Inc. (a) | 167,214 | 3,101,820 | |
| Gulfport Energy Corp. (b) | 697,873 | 8,744,349 | |
| Halcon Resources Corp. (a)(b) | 129,266 | 800,157 | |
| Hallador Energy Co. (a) | 78,379 | 454,598 | |
| HollyFrontier Corp. (a) | 781,490 | 24,468,452 | |
| Houston American Energy Corp. (a)(b) | 98,796 | 48,410 | |
| International Seaways, Inc. | 134,191 | 2,474,482 | |
| Isramco, Inc. (a)(b) | 3,497 | 393,762 | |
| Jagged Peak Energy, Inc. (a) | 152,260 | 1,950,451 | |
| Jones Energy, Inc. (a) | 301,130 | 298,119 | |
| Kosmos Energy Ltd. (a)(b) | 1,024,087 | 7,209,572 | |
| Laredo Petroleum, Inc. (a)(b) | 622,734 | 7,734,356 | |
| Lilis Energy, Inc. (a)(b) | 116,379 | 425,947 | |
| Lonestar Resources U.S., Inc. (b) | 83,150 | 271,069 | |
| Matador Resources Co. (a)(b) | 416,404 | 9,818,806 | |
| Mexco Energy Corp. (b) | 2,119 | 9,345 | |
| Murphy Oil Corp. (a) | 717,888 | 16,267,342 | |
| Northern Oil & Gas, Inc. (a)(b) | 216,184 | 183,756 | |
| Oasis Petroleum, Inc. (a)(b) | 1,064,131 | 7,768,156 | |
| Overseas Shipholding Group, Inc. (b) | 203,430 | 459,752 | |
| Pacific Ethanol, Inc. (b) | 157,778 | 788,890 | |
| Panhandle Royalty Co. Class A | 65,031 | 1,372,154 | |
| Par Pacific Holdings, Inc. (a)(b) | 146,529 | 2,609,681 | |
| Parsley Energy, Inc. Class A (b) | 1,000,939 | 25,073,522 | |
| PBF Energy, Inc. Class A (a) | 489,298 | 11,586,577 | |
| PDC Energy, Inc. (a)(b) | 251,056 | 9,874,032 | |
| Peabody Energy Corp. (a) | 433,861 | 12,581,969 | |
| Pedevco Corp. (a)(b) | 6,185 | 4,094 | |
| Penn Virginia Corp. (a) | 30,000 | 1,155,000 | |
| Petroquest Energy, Inc. (b) | 55,392 | 99,152 | |
| PrimeEnergy Corp. (b) | 4,530 | 199,320 | |
| QEP Resources, Inc. (a)(b) | 1,089,505 | 8,225,763 | |
| Ramaco Resources, Inc. (a) | 23,661 | 183,846 | |
| Renewable Energy Group, Inc. (a)(b) | 153,384 | 1,855,946 | |
| Resolute Energy Corp. (a)(b) | 84,842 | 2,507,081 | |
| Rex American Resources Corp. (b) | 26,148 | 2,264,940 | |
| Rex Energy Corp. (a)(b) | 38,463 | 88,080 | |
| Rice Energy, Inc. (b) | 715,932 | 19,587,900 | |
| Ring Energy, Inc. (b) | 208,423 | 2,484,402 | |
| RSP Permian, Inc. (a)(b) | 478,288 | 15,008,677 | |
| Sanchez Energy Corp. (a)(b) | 307,135 | 1,345,251 | |
| SandRidge Energy, Inc. (a)(b) | 95,557 | 1,645,492 | |
| SemGroup Corp. Class A (a) | 235,573 | 6,054,226 | |
| SilverBow Resources, Inc. (a)(b) | 23,761 | 514,188 | |
| SM Energy Co. (a) | 443,376 | 5,923,503 | |
| Southwestern Energy Co. (b) | 2,298,895 | 12,528,978 | |
| Src Energy, Inc. (b) | 892,580 | 7,042,456 | |
| Stone Energy Corp. (a) | 92,375 | 2,235,475 | |
| Syntroleum Corp. (a)(b)(d) | 21,880 | 0 | |
| Targa Resources Corp. | 954,087 | 42,523,658 | |
| Teekay Corp. (a) | 243,861 | 2,248,398 | |
| Tellurian, Inc. (a)(b) | 201,608 | 1,862,858 | |
| Tengasco, Inc. (a)(b) | 73,015 | 48,190 | |
| Torchlight Energy Resources, Inc. (a)(b) | 200,782 | 273,064 | |
| TransAtlantic Petroleum Ltd. (b) | 79,564 | 59,673 | |
| U.S. Energy Corp. (a)(b) | 16,587 | 12,608 | |
| Uranium Energy Corp. (a)(b) | 640,353 | 845,266 | |
| VAALCO Energy, Inc. (b) | 208,727 | 151,849 | |
| Vertex Energy, Inc. (a)(b) | 54,529 | 43,623 | |
| W&T Offshore, Inc. (a)(b) | 172,461 | 329,401 | |
| Warrior Metropolitan Coal, Inc. (a) | 83,389 | 2,275,686 | |
| Westmoreland Coal Co. (a)(b) | 73,444 | 171,125 | |
| Westwater Resources, Inc. (a)(b) | 151,823 | 206,479 | |
| Whiting Petroleum Corp. (a)(b) | 1,205,956 | 5,390,623 | |
| WildHorse Resource Development Corp. (a) | 130,932 | 1,428,468 | |
| World Fuel Services Corp. | 302,651 | 10,453,566 | |
| WPX Energy, Inc. (b) | 1,772,698 | 17,709,253 | |
| Yuma Energy, Inc. (a)(b) | 5,304 | 6,153 | |
| Zion Oil & Gas, Inc. (a)(b) | 201,994 | 674,660 | |
| 539,003,739 | |||
| TOTAL ENERGY | 728,087,865 | ||
| FINANCIALS - 16.8% | |||
| Banks - 6.9% | |||
| 1st Constitution Bancorp | 42,103 | 724,172 | |
| 1st Source Corp. | 82,536 | 3,851,955 | |
| Access National Corp. (a) | 63,466 | 1,629,807 | |
| ACNB Corp. | 17,139 | 448,185 | |
| Allegiance Bancshares, Inc. (a)(b) | 49,520 | 1,686,156 | |
| American National Bankshares, Inc. | 28,161 | 1,027,877 | |
| American River Bankshares | 8,231 | 108,732 | |
| Ameris Bancorp | 168,643 | 7,428,724 | |
| AmeriServ Financial, Inc. | 14,728 | 57,439 | |
| Ames National Corp. (a) | 27,281 | 739,315 | |
| Anchor Bancorp (b) | 8,039 | 201,377 | |
| Arrow Financial Corp. | 50,020 | 1,615,646 | |
| Associated Banc-Corp. | 677,617 | 14,839,812 | |
| Atlantic Capital Bancshares, Inc. (b) | 74,953 | 1,345,406 | |
| Auburn National Bancorp., Inc. | 3,534 | 126,341 | |
| Banc of California, Inc. (a) | 218,168 | 4,047,016 | |
| BancFirst Corp. | 75,734 | 3,816,994 | |
| Bancorp, Inc., Delaware (b) | 253,910 | 1,993,194 | |
| BancorpSouth, Inc. | 364,939 | 10,601,478 | |
| Bank of Commerce Holdings (a) | 98,321 | 1,037,287 | |
| Bank of Hawaii Corp. | 190,452 | 14,880,015 | |
| Bank of Marin Bancorp | 24,262 | 1,587,948 | |
| Bank of South Carolina Corp. | 10,268 | 185,337 | |
| Bank of the Ozarks, Inc. (a) | 538,139 | 23,118,451 | |
| BankUnited, Inc. | 489,886 | 16,303,406 | |
| Bankwell Financial Group, Inc. | 40,974 | 1,389,019 | |
| Banner Corp. | 127,685 | 7,037,997 | |
| Bar Harbor Bankshares | 62,421 | 1,639,175 | |
| BCB Bancorp, Inc. (a) | 55,365 | 786,183 | |
| Berkshire Hills Bancorp, Inc. | 161,342 | 5,453,360 | |
| Blue Hills Bancorp, Inc. (a) | 123,079 | 2,301,577 | |
| BOK Financial Corp. (a) | 95,691 | 7,701,212 | |
| Boston Private Financial Holdings, Inc. | 373,066 | 5,484,070 | |
| Bridge Bancorp, Inc. | 80,834 | 2,497,771 | |
| Brookline Bancorp, Inc., Delaware | 346,551 | 4,973,007 | |
| Bryn Mawr Bank Corp. (a) | 81,577 | 3,340,578 | |
| C & F Financial Corp. | 11,407 | 534,418 | |
| California First National Bancorp | 1,545 | 24,952 | |
| Camden National Corp. | 73,144 | 2,852,616 | |
| Capital Bank Financial Corp. Series A | 119,506 | 4,493,426 | |
| Capital City Bank Group, Inc. | 48,944 | 1,012,651 | |
| Capstar Financial Holdings, Inc. (a) | 10,727 | 186,006 | |
| Carolina Financial Corp. | 55,435 | 1,886,453 | |
| Cathay General Bancorp | 324,330 | 11,439,119 | |
| CB Financial Services, Inc. | 34,610 | 939,662 | |
| Centerstate Banks of Florida, Inc. | 276,150 | 6,757,391 | |
| Central Pacific Financial Corp. | 137,108 | 3,976,132 | |
| Central Valley Community Bancorp | 34,644 | 681,447 | |
| Century Bancorp, Inc. Class A (non-vtg.) | 8,372 | 559,250 | |
| Chemical Financial Corp. | 313,725 | 14,246,252 | |
| Chemung Financial Corp. (a) | 14,797 | 597,651 | |
| CIT Group, Inc. (a) | 592,137 | 26,557,344 | |
| Citizens & Northern Corp. | 49,346 | 1,107,324 | |
| Citizens Holding Co. | 12,650 | 295,378 | |
| City Holding Co. | 75,888 | 4,805,987 | |
| Civista Bancshares, Inc. (a) | 34,892 | 705,167 | |
| CNB Financial Corp., Pennsylvania | 61,173 | 1,477,940 | |
| CoBiz, Inc. | 222,257 | 3,789,482 | |
| Codorus Valley Bancorp, Inc. | 33,275 | 833,539 | |
| Colony Bankcorp, Inc. | 4,518 | 60,089 | |
| Columbia Banking Systems, Inc. (a) | 254,513 | 9,460,248 | |
| Commerce Bancshares, Inc. | 385,313 | 21,188,362 | |
| Commerce Union Bancshares, Inc. (a) | 23,562 | 565,252 | |
| Community Bank System, Inc. (a) | 217,028 | 11,168,261 | |
| Community Bankers Trust Corp. (a)(b) | 171,891 | 1,443,884 | |
| Community Financial Corp. (a) | 16,726 | 585,410 | |
| Community Trust Bancorp, Inc. | 84,178 | 3,581,774 | |
| ConnectOne Bancorp, Inc. | 128,046 | 2,919,449 | |
| County Bancorp, Inc. | 25,129 | 753,367 | |
| CU Bancorp (b) | 78,920 | 2,813,498 | |
| Cullen/Frost Bankers, Inc. | 251,960 | 21,215,032 | |
| Customers Bancorp, Inc. (b) | 124,000 | 3,494,320 | |
| CVB Financial Corp. (a) | 441,582 | 9,140,747 | |
| DNB Financial Corp. | 4,951 | 161,155 | |
| Eagle Bancorp, Inc. (b) | 134,184 | 8,346,245 | |
| East West Bancorp, Inc. | 632,265 | 35,008,513 | |
| Enterprise Bancorp, Inc. | 37,217 | 1,190,572 | |
| Enterprise Financial Services Corp. | 105,839 | 4,043,050 | |
| Equity Bancshares, Inc. (b) | 21,834 | 745,631 | |
| Evans Bancorp, Inc. (a) | 17,239 | 711,971 | |
| Farmers Capital Bank Corp. | 34,947 | 1,308,765 | |
| Farmers National Banc Corp. | 109,961 | 1,506,466 | |
| FCB Financial Holdings, Inc. Class A (a)(b) | 190,229 | 8,293,984 | |
| Fidelity Southern Corp. | 97,915 | 2,140,422 | |
| Financial Institutions, Inc. | 63,631 | 1,730,763 | |
| First Bancorp, North Carolina | 107,671 | 3,331,341 | |
| First Bancorp, Puerto Rico (b) | 809,686 | 4,599,016 | |
| First Bancshares, Inc. (a) | 28,134 | 793,379 | |
| First Bank Hamilton New Jersey | 51,342 | 616,104 | |
| First Busey Corp. | 190,257 | 5,488,914 | |
| First Business Finance Services, Inc. | 37,553 | 800,254 | |
| First Citizen Bancshares, Inc. | 39,444 | 13,431,076 | |
| First Commonwealth Financial Corp. | 394,538 | 4,975,124 | |
| First Community Bancshares, Inc. | 65,716 | 1,691,530 | |
| First Community Corp. | 50,202 | 1,059,262 | |
| First Connecticut Bancorp, Inc. | 63,853 | 1,580,362 | |
| First Financial Bancorp, Ohio | 288,325 | 6,905,384 | |
| First Financial Bankshares, Inc. (a) | 290,331 | 11,627,757 | |
| First Financial Corp., Indiana | 56,581 | 2,455,615 | |
| First Financial Northwest, Inc. | 38,725 | 619,600 | |
| First Foundation, Inc. (b) | 120,044 | 2,034,746 | |
| First Hawaiian, Inc. | 221,378 | 5,997,130 | |
| First Horizon National Corp. | 1,034,454 | 17,802,953 | |
| First Internet Bancorp | 24,292 | 772,486 | |
| First Interstate Bancsystem, Inc. | 125,482 | 4,416,966 | |
| First Merchants Corp. | 189,960 | 7,459,729 | |
| First Mid-Illinois Bancshares, Inc. | 30,682 | 1,064,052 | |
| First Midwest Bancorp, Inc., Delaware | 356,411 | 7,513,144 | |
| First Northwest Bancorp (b) | 29,480 | 467,553 | |
| First of Long Island Corp. | 95,119 | 2,544,433 | |
| First Republic Bank | 673,295 | 65,343,280 | |
| First South Bancorp, Inc., Virginia | 39,689 | 691,382 | |
| First United Corp. (b) | 16,427 | 258,725 | |
| Flushing Financial Corp. | 128,655 | 3,517,428 | |
| FNB Corp., Pennsylvania | 1,411,846 | 17,916,326 | |
| Franklin Financial Network, Inc. (b) | 55,816 | 1,825,183 | |
| Fulton Financial Corp. | 763,857 | 13,329,305 | |
| German American Bancorp, Inc. | 91,374 | 2,973,310 | |
| Glacier Bancorp, Inc. (a) | 342,242 | 11,365,857 | |
| Glen Burnie Bancorp | 18,661 | 196,127 | |
| Great Southern Bancorp, Inc. | 44,239 | 2,203,102 | |
| Great Western Bancorp, Inc. | 265,155 | 9,524,368 | |
| Green Bancorp, Inc. (b) | 96,487 | 1,934,564 | |
| Guaranty Bancorp | 81,387 | 2,099,785 | |
| Guaranty Bancshares, Inc. Texas | 6,893 | 208,444 | |
| Hancock Holding Co. | 379,714 | 16,688,430 | |
| Hanmi Financial Corp. | 139,169 | 3,715,812 | |
| HarborOne Bancorp, Inc. (b) | 139,543 | 2,398,744 | |
| Hawthorn Bancshares, Inc. | 48,188 | 970,988 | |
| Heartland Financial U.S.A., Inc. | 111,545 | 5,075,298 | |
| Heritage Commerce Corp. | 144,223 | 1,932,588 | |
| Heritage Financial Corp., Washington | 134,310 | 3,512,207 | |
| Hilltop Holdings, Inc. | 360,056 | 8,522,526 | |
| Home Bancshares, Inc. (a) | 553,439 | 12,900,663 | |
| HomeTrust Bancshares, Inc. (b) | 82,069 | 1,904,001 | |
| Hope Bancorp, Inc. | 575,341 | 9,286,004 | |
| Horizon Bancorp Industries | 89,615 | 2,345,225 | |
| Howard Bancorp, Inc. (a)(b) | 32,517 | 642,211 | |
| IBERIABANK Corp. | 220,149 | 16,863,413 | |
| Independent Bank Corp. | 96,933 | 1,977,433 | |
| Independent Bank Corp., Massachusetts (a) | 121,955 | 8,451,482 | |
| Independent Bank Group, Inc. | 55,312 | 3,078,113 | |
| International Bancshares Corp. | 260,048 | 9,348,726 | |
| Investar Holding Corp. | 29,136 | 640,992 | |
| Investors Bancorp, Inc. | 1,364,718 | 17,864,159 | |
| Lakeland Bancorp, Inc. | 184,477 | 3,412,825 | |
| Lakeland Financial Corp. | 114,291 | 4,967,087 | |
| Landmark Bancorp, Inc. | 38 | 1,112 | |
| LCNB Corp. | 38,996 | 719,476 | |
| LegacyTexas Financial Group, Inc. | 185,316 | 6,669,523 | |
| Live Oak Bancshares, Inc. (a) | 117,643 | 2,629,321 | |
| Macatawa Bank Corp. | 91,347 | 874,191 | |
| MainSource Financial Group, Inc. | 119,416 | 3,908,486 | |
| MB Financial, Inc. | 313,695 | 12,475,650 | |
| MBT Financial Corp. | 69,241 | 702,796 | |
| Mercantile Bank Corp. | 67,865 | 2,062,417 | |
| Mid Penn Bancorp, Inc. | 28,255 | 836,348 | |
| Middlefield Banc Corp. (a) | 24,755 | 1,112,737 | |
| Midland States Bancorp, Inc. | 36,485 | 1,114,252 | |
| Midsouth Bancorp, Inc. | 59,250 | 702,113 | |
| MidWestOne Financial Group, Inc. | 36,136 | 1,188,152 | |
| MutualFirst Financial, Inc. | 16,479 | 580,061 | |
| National Bank Holdings Corp. | 120,099 | 3,864,786 | |
| National Bankshares, Inc. (a) | 27,586 | 1,086,888 | |
| National Commerce Corp. (b) | 43,733 | 1,738,387 | |
| NBT Bancorp, Inc. | 212,914 | 6,989,967 | |
| Nicolet Bankshares, Inc. (b) | 27,108 | 1,481,452 | |
| Northeast Bancorp | 47,101 | 1,017,382 | |
| Northrim Bancorp, Inc. | 32,754 | 977,707 | |
| Norwood Financial Corp. (a) | 17,432 | 767,705 | |
| OFG Bancorp (a) | 196,849 | 1,712,586 | |
| Ohio Valley Banc Corp. (a) | 14,494 | 476,853 | |
| Old Line Bancshares, Inc. | 23,282 | 640,255 | |
| Old National Bancorp, Indiana | 617,544 | 10,096,844 | |
| Old Point Financial Corp. | 8,603 | 264,456 | |
| Old Second Bancorp, Inc. | 127,732 | 1,462,531 | |
| Opus Bank | 75,669 | 1,694,986 | |
| Orrstown Financial Services, Inc. | 28,866 | 705,774 | |
| Pacific Continental Corp. | 89,523 | 2,126,171 | |
| Pacific Mercantile Bancorp (b) | 76,145 | 647,233 | |
| Pacific Premier Bancorp, Inc. (b) | 150,823 | 5,339,134 | |
| PacWest Bancorp | 532,317 | 24,034,113 | |
| Park National Corp. | 59,483 | 5,745,463 | |
| Park Sterling Corp. | 235,316 | 2,675,543 | |
| Parke Bancorp, Inc. (a) | 9,617 | 187,051 | |
| Patriot National Bancorp, Inc. | 1,402 | 23,413 | |
| PCSB Financial Corp. (a) | 71,701 | 1,213,181 | |
| Peapack-Gladstone Financial Corp. | 67,127 | 2,045,360 | |
| Penns Woods Bancorp, Inc. | 18,934 | 812,458 | |
| People's Utah Bancorp | 68,752 | 1,880,367 | |
| Peoples Bancorp of North Carolina (a) | 28,481 | 865,253 | |
| Peoples Bancorp, Inc. | 86,252 | 2,678,987 | |
| Peoples Financial Corp., Mississippi (b) | 7,232 | 97,632 | |
| Peoples Financial Services Corp. | 28,276 | 1,174,868 | |
| Pinnacle Financial Partners, Inc. | 321,651 | 20,006,692 | |
| Popular, Inc. | 447,330 | 17,852,940 | |
| Porter Bancorp, Inc. (b) | 747 | 8,299 | |
| Preferred Bank, Los Angeles | 57,012 | 3,067,246 | |
| Premier Financial Bancorp, Inc. | 21,201 | 400,699 | |
| Prosperity Bancshares, Inc. | 302,610 | 18,080,948 | |
| QCR Holdings, Inc. | 57,990 | 2,534,163 | |
| Renasant Corp. (a) | 194,858 | 7,761,194 | |
| Republic Bancorp, Inc., Kentucky Class A | 38,600 | 1,373,388 | |
| Republic First Bancorp, Inc. (a)(b) | 238,609 | 2,016,246 | |
| Royal Bancshares of Pennsylvania, Inc. Class A (b) | 13,408 | 54,839 | |
| S&T Bancorp, Inc. | 157,543 | 5,662,095 | |
| Sandy Spring Bancorp, Inc. | 113,430 | 4,374,995 | |
| SB Financial Group, Inc. | 532 | 8,783 | |
| Seacoast Banking Corp., Florida (b) | 179,262 | 4,099,722 | |
| Select Bancorp, Inc. New (b) | 98 | 1,144 | |
| ServisFirst Bancshares, Inc. (a) | 200,763 | 6,848,026 | |
| Shore Bancshares, Inc. | 42,320 | 697,857 | |
| Sierra Bancorp | 45,562 | 1,153,174 | |
| Signature Bank (b) | 237,314 | 30,456,879 | |
| Simmons First National Corp. Class A (a) | 133,602 | 6,974,024 | |
| SmartFinancial, Inc. (a)(b) | 29,546 | 682,217 | |
| South State Corp. | 109,889 | 9,038,370 | |
| Southern First Bancshares, Inc. (b) | 41,478 | 1,466,247 | |
| Southern National Bancorp of Virginia, Inc. | 84,680 | 1,418,390 | |
| Southside Bancshares, Inc. | 125,401 | 4,096,851 | |
| Southwest Bancorp, Inc., Oklahoma | 82,567 | 2,084,817 | |
| State Bank Financial Corp. | 163,053 | 4,381,234 | |
| Sterling Bancorp (a) | 608,039 | 13,650,476 | |
| Stock Yards Bancorp, Inc. | 114,773 | 3,994,100 | |
| Stonegate Bank | 66,942 | 3,227,274 | |
| Summit Financial Group, Inc. (a) | 28,736 | 629,031 | |
| Sun Bancorp, Inc. | 52,032 | 1,214,947 | |
| Sunshine Bancorp, Inc. (a)(b) | 22,894 | 494,510 | |
| Sussex Bancorp (a) | 1,371 | 32,630 | |
| SVB Financial Group (b) | 230,334 | 39,004,760 | |
| Synovus Financial Corp. | 529,490 | 22,302,119 | |
| TCF Financial Corp. | 787,248 | 12,225,961 | |
| Texas Capital Bancshares, Inc. (a)(b) | 215,943 | 16,033,768 | |
| The First Bancorp, Inc. | 40,384 | 1,051,196 | |
| Tompkins Financial Corp. (a) | 56,854 | 4,316,356 | |
| TowneBank (a) | 258,979 | 7,950,655 | |
| Trico Bancshares | 98,612 | 3,508,615 | |
| TriState Capital Holdings, Inc. (b) | 98,771 | 2,064,314 | |
| Triumph Bancorp, Inc. (b) | 78,615 | 2,216,943 | |
| Trustmark Corp. | 296,262 | 8,775,280 | |
| Two River Bancorp (a) | 43,275 | 788,471 | |
| UMB Financial Corp. (a) | 200,120 | 13,432,054 | |
| Umpqua Holdings Corp. | 987,453 | 17,280,428 | |
| Union Bankshares Corp. (a) | 202,037 | 6,329,819 | |
| Union Bankshares, Inc. (a) | 26,240 | 1,132,256 | |
| United Bancorp, Inc. | 41,665 | 495,814 | |
| United Bankshares, Inc., West Virginia (a) | 460,054 | 15,434,812 | |
| United Community Bank, Inc. | 313,340 | 8,181,307 | |
| United Security Bancshares, Inc. | 8,545 | 96,559 | |
| United Security Bancshares, California | 21,338 | 197,377 | |
| Unity Bancorp, Inc. | 57,145 | 991,466 | |
| Univest Corp. of Pennsylvania | 120,426 | 3,510,418 | |
| Valley National Bancorp | 1,183,756 | 13,246,230 | |
| Veritex Holdings, Inc. (a)(b) | 71,960 | 1,900,464 | |
| Village Bank & Trust Financial Corp. (b) | 8,883 | 271,376 | |
| Washington Trust Bancorp, Inc. | 63,697 | 3,264,471 | |
| WashingtonFirst Bankshares, Inc. | 40,114 | 1,358,661 | |
| Webster Financial Corp. | 407,516 | 19,022,847 | |
| WesBanco, Inc. | 179,643 | 6,822,841 | |
| West Bancorp., Inc. | 62,916 | 1,381,006 | |
| Westamerica Bancorp. (a) | 117,356 | 6,049,702 | |
| Western Alliance Bancorp. (b) | 415,273 | 20,028,617 | |
| Wintrust Financial Corp. | 242,225 | 17,636,402 | |
| Xenith Bankshares, Inc. (b) | 35,243 | 1,009,712 | |
| 1,360,535,804 | |||
| Capital Markets - 2.2% | |||
| Arlington Asset Investment Corp. (a) | 114,310 | 1,476,885 | |
| Artisan Partners Asset Management, Inc. | 207,245 | 6,362,422 | |
| Ashford, Inc. (b) | 4,486 | 276,562 | |
| Associated Capital Group, Inc. | 20,662 | 709,740 | |
| B. Riley Financial, Inc. | 77,782 | 1,275,625 | |
| BGC Partners, Inc. Class A | 969,436 | 12,592,974 | |
| Cohen & Steers, Inc. | 93,396 | 3,534,105 | |
| Cowen Group, Inc. Class A (a)(b) | 119,709 | 1,945,271 | |
| Diamond Hill Investment Group, Inc. (a) | 13,288 | 2,608,833 | |
| Eaton Vance Corp. (non-vtg.) | 501,551 | 23,863,797 | |
| Evercore, Inc. Class A | 182,141 | 13,742,538 | |
| FactSet Research Systems, Inc. | 172,980 | 27,188,996 | |
| Federated Investors, Inc. Class B (non-vtg.) (a) | 401,131 | 10,954,888 | |
| Fifth Street Asset Management, Inc. Class A (a) | 29,106 | 119,335 | |
| Financial Engines, Inc. (a) | 276,738 | 9,146,191 | |
| Gain Capital Holdings, Inc. | 115,932 | 730,372 | |
| GAMCO Investors, Inc. Class A | 17,907 | 527,719 | |
| Global Brokerage, Inc. Class A (a)(b) | 23,887 | 29,859 | |
| Great Elm Capital Group, Inc. (b) | 27,036 | 89,219 | |
| Greenhill & Co., Inc. (a) | 121,210 | 1,824,211 | |
| Hamilton Lane, Inc. Class A (a) | 59,581 | 1,396,579 | |
| Hennessy Advisors, Inc. | 9,352 | 138,223 | |
| Houlihan Lokey | 112,015 | 4,038,141 | |
| Institutional Financial Markets, Inc. | 16,813 | 19,167 | |
| Interactive Brokers Group, Inc. | 314,893 | 13,203,463 | |
| INTL FCStone, Inc. (b) | 64,346 | 2,283,640 | |
| Investment Technology Group, Inc. | 132,967 | 2,671,307 | |
| Janus Henderson Group PLC (a) | 801,528 | 27,700,808 | |
| Ladenburg Thalmann Financial Services, Inc. | 402,412 | 1,034,199 | |
| Lazard Ltd. Class A | 570,797 | 24,481,483 | |
| Legg Mason, Inc. | 376,000 | 14,359,440 | |
| LPL Financial | 352,936 | 16,531,522 | |
| Manning & Napier, Inc. Class A | 54,262 | 192,630 | |
| MarketAxess Holdings, Inc. | 165,985 | 32,026,806 | |
| Medley Management, Inc. (a) | 32,708 | 202,790 | |
| Moelis & Co. Class A | 139,192 | 5,484,165 | |
| Morningstar, Inc. | 86,170 | 7,126,259 | |
| MSCI, Inc. | 400,887 | 45,945,659 | |
| National Holdings Corp. (b) | 3,483 | 9,091 | |
| National Holdings Corp. warrants 1/18/22 | 3,483 | 1,898 | |
| Oppenheimer Holdings, Inc. Class A (non-vtg.) | 40,209 | 653,396 | |
| Paragon Commercial Corp. (b) | 5,375 | 278,694 | |
| Piper Jaffray Companies | 64,129 | 3,555,953 | |
| PJT Partners, Inc. | 73,261 | 2,832,270 | |
| Pzena Investment Management, Inc. | 58,015 | 574,349 | |
| Safeguard Scientifics, Inc. (a)(b) | 85,673 | 1,045,211 | |
| SEI Investments Co. | 587,931 | 34,370,446 | |
| Silvercrest Asset Management Group Class A | 17,895 | 219,214 | |
| Stifel Financial Corp. | 307,295 | 14,673,336 | |
| TD Ameritrade Holding Corp. | 1,071,588 | 46,421,192 | |
| TheStreet.com, Inc. (b) | 85,257 | 72,468 | |
| U.S. Global Investments, Inc. Class A | 36,632 | 48,721 | |
| Value Line, Inc. | 13,155 | 210,085 | |
| Vector Capital Corp. rights (b)(d) | 49,572 | 1 | |
| Virtu Financial, Inc. Class A (a) | 190,073 | 3,411,810 | |
| Virtus Investment Partners, Inc. (a) | 29,444 | 3,121,064 | |
| Waddell & Reed Financial, Inc. Class A (a) | 368,027 | 6,848,982 | |
| Westwood Holdings Group, Inc. | 31,636 | 1,933,909 | |
| WisdomTree Investments, Inc. (a) | 492,911 | 4,519,994 | |
| Zais Group Holdings, Inc. (a)(b) | 22,211 | 41,090 | |
| 442,678,997 | |||
| Consumer Finance - 0.8% | |||
| Ally Financial, Inc. | 2,040,124 | 46,106,802 | |
| Asta Funding, Inc. (a)(b) | 38,423 | 309,305 | |
| Atlanticus Holdings Corp. (b) | 33,601 | 82,322 | |
| Consumer Portfolio Services, Inc. (b) | 87,449 | 343,675 | |
| Credit Acceptance Corp. (a)(b) | 53,276 | 14,507,055 | |
| Elevate Credit, Inc. (a) | 77,759 | 492,214 | |
| Encore Capital Group, Inc. (a)(b) | 104,445 | 4,214,356 | |
| Enova International, Inc. (a)(b) | 106,637 | 1,268,980 | |
| EZCORP, Inc. (non-vtg.) Class A (a)(b) | 207,953 | 1,881,975 | |
| First Cash Financial Services, Inc. | 214,308 | 12,579,880 | |
| Green Dot Corp. Class A (b) | 196,552 | 9,469,875 | |
| Imperial Holdings, Inc. warrants 4/11/19 (b) | 3,852 | 0 | |
| LendingClub Corp. (a)(b) | 1,483,428 | 9,182,419 | |
| Nelnet, Inc. Class A | 84,547 | 4,010,064 | |
| Nicholas Financial, Inc. (b) | 73,640 | 634,040 | |
| OneMain Holdings, Inc. (a)(b) | 231,191 | 6,327,698 | |
| PRA Group, Inc. (a)(b) | 202,706 | 5,858,203 | |
| Regional Management Corp. (b) | 42,651 | 936,189 | |
| Santander Consumer U.S.A. Holdings, Inc. (b) | 489,438 | 6,989,175 | |
| SLM Corp. (b) | 1,930,689 | 19,635,107 | |
| World Acceptance Corp. (a)(b) | 25,904 | 1,938,137 | |
| 146,767,471 | |||
| Diversified Financial Services - 0.3% | |||
| A-Mark Precious Metals, Inc. | 15,543 | 266,407 | |
| Acushnet Holdings Corp. (a) | 96,112 | 1,580,081 | |
| Alteryx, Inc. (a) | 45,290 | 1,068,391 | |
| At Home Group, Inc. (a) | 46,573 | 1,141,039 | |
| Camping World Holdings, Inc. (a) | 90,236 | 3,316,173 | |
| Catskill Litigation Trust (b)(d) | 1,036 | 0 | |
| Cotiviti Holdings, Inc. (a)(b) | 165,909 | 5,927,929 | |
| Donnelley Financial Solutions, Inc. | 142,998 | 3,061,587 | |
| FB Financial Corp. (a) | 55,658 | 1,934,116 | |
| Marlin Business Services Corp. | 36,382 | 949,570 | |
| NCP Litigation Trust (b)(d) | 200 | 0 | |
| NewStar Financial, Inc. | 83,480 | 894,906 | |
| On Deck Capital, Inc. (a)(b) | 192,982 | 932,103 | |
| Quantenna Communications, Inc. (a) | 32,196 | 598,202 | |
| Ra Pharmaceuticals, Inc. | 33,809 | 507,473 | |
| Senseonics Holdings, Inc. (a)(b) | 144,591 | 443,894 | |
| Tiptree, Inc. | 128,445 | 822,048 | |
| Varex Imaging Corp. (a) | 162,547 | 4,962,560 | |
| Voya Financial, Inc. | 818,279 | 31,282,806 | |
| 59,689,285 | |||
| Insurance - 4.0% | |||
| 1347 Property Insurance Holdings, Inc. (a)(b) | 6,993 | 52,448 | |
| Alleghany Corp. (b) | 68,441 | 38,516,542 | |
| AMBAC Financial Group, Inc. (b) | 200,573 | 3,648,423 | |
| American Equity Investment Life Holding Co. (a) | 387,822 | 10,765,939 | |
| American Financial Group, Inc. | 320,127 | 32,592,130 | |
| American National Insurance Co. | 40,063 | 4,635,690 | |
| Amerisafe, Inc. | 82,809 | 4,455,124 | |
| AmTrust Financial Services, Inc. (a) | 469,157 | 5,817,547 | |
| Arch Capital Group Ltd. (b) | 566,925 | 55,184,480 | |
| Argo Group International Holdings, Ltd. | 134,581 | 8,101,776 | |
| Aspen Insurance Holdings Ltd. | 263,854 | 11,926,201 | |
| Assured Guaranty Ltd. | 533,794 | 22,707,597 | |
| Athene Holding Ltd. | 225,513 | 12,067,201 | |
| Atlas Financial Holdings, Inc. (b) | 42,675 | 719,074 | |
| Axis Capital Holdings Ltd. | 374,665 | 22,569,820 | |
| Baldwin & Lyons, Inc. Class B | 42,752 | 936,269 | |
| Blue Capital Reinsurance Holdings Ltd. | 23,939 | 450,053 | |
| Brown & Brown, Inc. | 506,538 | 22,773,948 | |
| Citizens, Inc. Class A (a)(b) | 184,834 | 1,391,800 | |
| CNA Financial Corp. | 123,338 | 6,050,962 | |
| CNO Financial Group, Inc. | 755,655 | 16,888,889 | |
| Conifer Holdings, Inc. (b) | 13,396 | 86,404 | |
| Crawford & Co. Class B | 86,860 | 861,651 | |
| Donegal Group, Inc. Class A | 119,498 | 1,831,904 | |
| eHealth, Inc. (b) | 78,217 | 1,899,109 | |
| EMC Insurance Group | 32,192 | 897,513 | |
| Employers Holdings, Inc. | 143,996 | 6,069,431 | |
| Enstar Group Ltd. (a)(b) | 48,866 | 10,142,138 | |
| Erie Indemnity Co. Class A | 88,842 | 10,731,225 | |
| FBL Financial Group, Inc. Class A | 43,350 | 2,947,800 | |
| Federated National Holding Co. | 50,478 | 784,428 | |
| Fidelity & Guaranty Life (a) | 51,288 | 1,602,750 | |
| First Acceptance Corp. (b) | 24,679 | 27,640 | |
| First American Financial Corp. | 484,867 | 23,787,575 | |
| FNF Group | 1,200,506 | 57,912,409 | |
| FNFV Group (b) | 291,196 | 4,906,653 | |
| Genworth Financial, Inc. Class A (b) | 2,224,677 | 7,630,642 | |
| Global Indemnity Ltd. | 37,631 | 1,521,045 | |
| Greenlight Capital Re, Ltd. (b) | 129,165 | 2,873,921 | |
| Hallmark Financial Services, Inc. (b) | 49,582 | 508,216 | |
| Hanover Insurance Group, Inc. | 189,091 | 18,564,954 | |
| HCI Group, Inc. | 36,061 | 1,406,018 | |
| Health Insurance Innovations, Inc. (a)(b) | 27,165 | 914,102 | |
| Heritage Insurance Holdings, Inc. | 108,895 | 1,239,225 | |
| Horace Mann Educators Corp. | 178,779 | 6,284,082 | |
| Independence Holding Co. | 94,596 | 2,052,733 | |
| Infinity Property & Casualty Corp. | 47,591 | 4,209,424 | |
| Investors Title Co. | 5,515 | 969,923 | |
| James River Group Holdings Ltd. | 95,401 | 3,804,592 | |
| Kemper Corp. | 217,544 | 10,420,358 | |
| Kingstone Companies, Inc. | 39,207 | 590,065 | |
| Kinsale Capital Group, Inc. | 81,546 | 3,086,516 | |
| Maiden Holdings Ltd. (a) | 316,619 | 2,295,488 | |
| Markel Corp. (b) | 61,648 | 64,853,080 | |
| MBIA, Inc. (a)(b) | 566,957 | 5,703,587 | |
| Mercury General Corp. | 167,105 | 9,603,524 | |
| National General Holdings Corp. | 271,086 | 4,654,547 | |
| National Western Life Group, Inc. | 9,867 | 3,299,623 | |
| Navigators Group, Inc. | 101,022 | 5,637,028 | |
| NI Holdings, Inc. (a) | 45,692 | 754,375 | |
| Old Republic International Corp. | 1,099,149 | 20,982,754 | |
| OneBeacon Insurance Group Ltd. | 104,662 | 1,906,942 | |
| Patriot National, Inc. (a) | 41,971 | 62,957 | |
| Primerica, Inc. | 203,248 | 15,558,634 | |
| ProAssurance Corp. | 239,584 | 12,757,848 | |
| Reinsurance Group of America, Inc. | 281,871 | 37,897,556 | |
| RenaissanceRe Holdings Ltd. | 176,360 | 24,542,258 | |
| RLI Corp. | 167,632 | 8,971,665 | |
| Safety Insurance Group, Inc. | 66,718 | 4,763,665 | |
| Selective Insurance Group, Inc. | 258,572 | 13,032,029 | |
| State Auto Financial Corp. | 68,353 | 1,691,053 | |
| State National Companies, Inc. | 135,068 | 2,805,362 | |
| Stewart Information Services Corp. (a) | 103,105 | 3,720,028 | |
| Third Point Reinsurance Ltd. (a)(b) | 255,705 | 3,592,655 | |
| Trupanion, Inc. (a)(b) | 68,165 | 1,491,450 | |
| United Fire Group, Inc. | 93,258 | 3,922,431 | |
| United Insurance Holdings Corp. | 78,431 | 1,234,504 | |
| Universal Insurance Holdings, Inc. (a) | 143,216 | 3,071,983 | |
| Validus Holdings Ltd. | 347,186 | 17,411,378 | |
| W.R. Berkley Corp. | 427,107 | 28,462,410 | |
| White Mountains Insurance Group Ltd. | 20,241 | 17,631,328 | |
| WMI Holdings Corp. (b) | 870,756 | 1,088,445 | |
| 796,216,946 | |||
| Mortgage Real Estate Investment Trusts - 1.4% | |||
| AG Mortgage Investment Trust, Inc. | 128,388 | 2,474,037 | |
| AGNC Investment Corp. | 1,549,591 | 33,378,190 | |
| American Capital Mortgage Investment Corp. | 216,830 | 4,163,136 | |
| Annaly Capital Management, Inc. | 4,727,742 | 59,096,775 | |
| Anworth Mortgage Asset Corp. | 522,696 | 3,167,538 | |
| Apollo Commercial Real Estate Finance, Inc. | 408,851 | 7,396,115 | |
| Arbor Realty Trust, Inc. | 227,213 | 1,863,147 | |
| Ares Commercial Real Estate Corp. | 140,575 | 1,854,184 | |
| Armour Residential REIT, Inc. (a) | 182,039 | 4,807,650 | |
| Blackstone Mortgage Trust, Inc. (a) | 411,032 | 12,885,853 | |
| Capstead Mortgage Corp. | 453,763 | 4,387,888 | |
| Cherry Hill Mortgage Investment Corp. | 46,903 | 866,767 | |
| Chimera Investment Corp. | 797,417 | 15,206,742 | |
| CIM Commercial Trust Corp. | 63,757 | 997,797 | |
| CYS Investments, Inc. | 708,349 | 6,226,388 | |
| Dynex Capital, Inc. | 259,773 | 1,857,377 | |
| Ellington Residential Mortgage REIT | 40,648 | 594,680 | |
| Five Oaks Investment Corp. (a) | 77,659 | 323,061 | |
| Great Ajax Corp. | 64,550 | 915,319 | |
| Hannon Armstrong Sustainable Infrastructure Capital, Inc. (a) | 215,560 | 5,000,992 | |
| Invesco Mortgage Capital, Inc. | 486,582 | 8,262,162 | |
| KKR Real Estate Finance Trust, Inc. (a) | 54,773 | 1,137,635 | |
| Ladder Capital Corp. Class A | 379,158 | 5,202,048 | |
| MFA Financial, Inc. | 1,728,465 | 15,175,923 | |
| New Residential Investment Corp. | 1,361,840 | 22,443,123 | |
| New York Mortgage Trust, Inc. (a) | 504,041 | 3,155,297 | |
| Orchid Island Capital, Inc. (a) | 181,831 | 1,758,306 | |
| Owens Realty Mortgage, Inc. | 37,687 | 653,869 | |
| PennyMac Mortgage Investment Trust | 295,936 | 5,116,733 | |
| Redwood Trust, Inc. | 353,007 | 5,888,157 | |
| Resource Capital Corp. | 146,355 | 1,514,774 | |
| Starwood Property Trust, Inc. | 1,138,958 | 25,296,257 | |
| Two Harbors Investment Corp. | 1,517,727 | 15,526,347 | |
| Western Asset Mortgage Capital Corp. (a) | 191,198 | 2,009,491 | |
| ZAIS Financial Corp. (a) | 43,166 | 658,282 | |
| 281,262,040 | |||
| Real Estate Management & Development - 0.0% | |||
| The RMR Group, Inc. | 33,925 | 1,752,226 | |
| Thrifts & Mortgage Finance - 1.2% | |||
| ASB Bancorp, Inc. (a)(b) | 33,389 | 1,480,802 | |
| Astoria Financial Corp. | 425,857 | 8,342,539 | |
| Atlantic Coast Financial Corp. (b) | 8,654 | 72,261 | |
| Bank Mutual Corp. | 187,600 | 1,716,540 | |
| BankFinancial Corp. | 75,843 | 1,216,522 | |
| Bear State Financial, Inc. | 45,612 | 468,891 | |
| Beneficial Bancorp, Inc. | 357,084 | 5,338,406 | |
| BofI Holding, Inc. (a)(b) | 254,547 | 6,748,041 | |
| BSB Bancorp, Inc. (b) | 29,828 | 850,098 | |
| Capitol Federal Financial, Inc. | 583,580 | 8,006,718 | |
| Charter Financial Corp. | 65,398 | 1,063,371 | |
| Citizens Community Bancorp, Inc. | 15,634 | 212,622 | |
| Clifton Bancorp, Inc. (a) | 102,761 | 1,618,486 | |
| Dime Community Bancshares, Inc. | 152,632 | 2,892,376 | |
| Elmira Savings Bank | 185 | 3,765 | |
| Entegra Financial Corp. (a)(b) | 77,977 | 1,809,066 | |
| ESSA Bancorp, Inc. | 32,482 | 490,478 | |
| Essent Group Ltd. (b) | 364,284 | 14,236,219 | |
| Farmer Mac Class C (non-vtg.) | 44,156 | 3,007,907 | |
| First Capital, Inc. | 12,982 | 416,722 | |
| First Defiance Financial Corp. | 41,293 | 2,021,705 | |
| Flagstar Bancorp, Inc. (b) | 95,859 | 3,146,092 | |
| Greene County Bancorp, Inc. (a) | 2,032 | 47,447 | |
| Hamilton Bancorp, Inc. (b) | 69 | 980 | |
| Hingham Institution for Savings | 8,459 | 1,556,541 | |
| HMN Financial, Inc. (b) | 3,871 | 68,710 | |
| Home Bancorp, Inc. | 16,971 | 685,289 | |
| Home Federal Bancorp, Inc. | 31 | 806 | |
| HomeStreet, Inc. (a)(b) | 121,978 | 3,079,945 | |
| HopFed Bancorp, Inc. | 18,100 | 253,400 | |
| Impac Mortgage Holdings, Inc. (a)(b) | 65,855 | 873,896 | |
| Kearny Financial Corp. | 415,174 | 5,874,712 | |
| Lendingtree, Inc. (a)(b) | 32,192 | 7,434,742 | |
| Malvern Bancorp, Inc. (b) | 64,070 | 1,524,866 | |
| Meridian Bancorp, Inc. Maryland | 235,823 | 4,150,485 | |
| Meta Financial Group, Inc. | 40,463 | 2,844,549 | |
| MGIC Investment Corp. (b) | 1,644,961 | 18,834,803 | |
| Nationstar Mortgage Holdings, Inc. (a)(b) | 148,405 | 2,555,534 | |
| New York Community Bancorp, Inc. (a) | 2,154,746 | 25,964,689 | |
| NMI Holdings, Inc. (b) | 243,001 | 2,636,561 | |
| Northfield Bancorp, Inc. | 220,790 | 3,556,927 | |
| Northwest Bancshares, Inc. (a) | 450,358 | 6,949,024 | |
| OceanFirst Financial Corp. (a) | 135,646 | 3,385,724 | |
| Ocwen Financial Corp. (a)(b) | 453,944 | 1,330,056 | |
| Oritani Financial Corp. | 189,634 | 3,043,626 | |
| PB Bancorp, Inc. | 7,070 | 72,468 | |
| PennyMac Financial Services, Inc. (b) | 84,716 | 1,440,172 | |
| PHH Corp. (b) | 240,647 | 3,417,187 | |
| Poage Bankshares, Inc. | 6,654 | 121,436 | |
| Provident Bancorp, Inc. (b) | 84,161 | 1,716,884 | |
| Provident Financial Holdings, Inc. | 21,795 | 412,797 | |
| Provident Financial Services, Inc. | 266,158 | 6,614,026 | |
| Prudential Bancorp, Inc. (a) | 82,322 | 1,518,841 | |
| Radian Group, Inc. (a) | 961,592 | 16,827,860 | |
| Riverview Bancorp, Inc. | 146,681 | 1,177,848 | |
| Security National Financial Corp. Class A | 38,708 | 228,377 | |
| SI Financial Group, Inc. | 23,177 | 338,384 | |
| Southern Missouri Bancorp, Inc. | 20,482 | 664,846 | |
| Territorial Bancorp, Inc. | 30,643 | 926,338 | |
| TFS Financial Corp. | 269,004 | 4,137,282 | |
| Timberland Bancorp, Inc. (a) | 27,057 | 749,749 | |
| Trustco Bank Corp., New York | 425,565 | 3,361,964 | |
| United Community Bancorp, Inc. | 1,461 | 27,540 | |
| United Community Financial Corp. | 251,020 | 2,281,772 | |
| United Financial Bancorp, Inc. New | 220,063 | 3,811,491 | |
| Walker & Dunlop, Inc. (b) | 129,353 | 6,233,521 | |
| Walter Investment Management Corp. (a)(b) | 163,591 | 70,639 | |
| Washington Federal, Inc. | 382,695 | 11,959,219 | |
| Waterstone Financial, Inc. | 133,580 | 2,357,687 | |
| Westbury Bancorp, Inc. (b) | 15,948 | 321,352 | |
| Westfield Financial, Inc. | 126,385 | 1,257,531 | |
| WSFS Financial Corp. | 122,998 | 5,498,011 | |
| 239,358,161 | |||
| TOTAL FINANCIALS | 3,328,260,930 | ||
| HEALTH CARE - 11.5% | |||
| Biotechnology - 4.6% | |||
| Abeona Therapeutics, Inc. (a)(b) | 112,297 | 1,476,706 | |
| ACADIA Pharmaceuticals, Inc. (a)(b) | 437,926 | 15,594,545 | |
| Acceleron Pharma, Inc. (a)(b) | 140,916 | 5,461,904 | |
| Achaogen, Inc. (a)(b) | 136,730 | 2,562,320 | |
| Achillion Pharmaceuticals, Inc. (a)(b) | 536,785 | 2,742,971 | |
| Acorda Therapeutics, Inc. (a)(b) | 203,958 | 4,242,326 | |
| Actinium Pharmaceuticals, Inc. (a)(b) | 152,593 | 93,082 | |
| Adamas Pharmaceuticals, Inc. (a)(b) | 61,583 | 1,289,548 | |
| ADMA Biologics, Inc. (a)(b) | 17,353 | 59,868 | |
| Aduro Biotech, Inc. (a)(b) | 132,877 | 1,614,456 | |
| Advaxis, Inc. (a)(b) | 152,732 | 1,040,105 | |
| Adverum Biotechnologies, Inc. (b) | 64,927 | 178,549 | |
| Aeglea BioTherapeutics, Inc. (b) | 23,707 | 97,436 | |
| Aevi Genomic Medicine, Inc. (b) | 125,878 | 159,865 | |
| Agenus, Inc. (a)(b) | 343,477 | 1,267,430 | |
| Agios Pharmaceuticals, Inc. (a)(b) | 190,140 | 12,028,256 | |
| Aimmune Therapeutics, Inc. (a)(b) | 100,406 | 2,158,729 | |
| Akebia Therapeutics, Inc. (b) | 172,813 | 2,892,890 | |
| Albireo Pharma, Inc. (b) | 20,676 | 511,524 | |
| Alder Biopharmaceuticals, Inc. (b) | 249,186 | 2,442,023 | |
| Aldeyra Therapeutics, Inc. (a)(b) | 48,557 | 201,512 | |
| Alkermes PLC (a)(b) | 689,906 | 35,033,427 | |
| Alnylam Pharmaceuticals, Inc. (a)(b) | 360,805 | 30,931,813 | |
| Alpine Immune Sciences, Inc. (b) | 17,943 | 157,001 | |
| AMAG Pharmaceuticals, Inc. (a)(b) | 152,392 | 2,544,946 | |
| Amicus Therapeutics, Inc. (a)(b) | 706,239 | 9,844,972 | |
| AmpliPhi Biosciences Corp. (a)(b) | 37,449 | 31,832 | |
| AnaptysBio, Inc. | 32,787 | 917,052 | |
| Anavex Life Sciences Corp. (a)(b) | 157,620 | 699,833 | |
| Anthera Pharmaceuticals, Inc. (a)(b) | 20,053 | 32,085 | |
| Applied Genetic Technologies Corp. (b) | 47,677 | 219,314 | |
| Aptevo Therapeutics, Inc. (b) | 62,747 | 83,454 | |
| AquaBounty Technologies, Inc. (a)(b) | 3,959 | 28,584 | |
| Aquinox Pharmaceuticals, Inc. (a)(b) | 82,558 | 1,206,172 | |
| ARCA Biopharma, Inc. (a)(b) | 7,333 | 8,066 | |
| Ardelyx, Inc. (b) | 75,570 | 389,186 | |
| Arena Pharmaceuticals, Inc. (b) | 166,506 | 3,859,609 | |
| Argos Therapeutics, Inc. (a)(b) | 95,222 | 18,978 | |
| ArQule, Inc. (b) | 223,720 | 243,855 | |
| Array BioPharma, Inc. (a)(b) | 764,318 | 7,398,598 | |
| Arrowhead Pharmaceuticals, Inc. (a)(b) | 358,619 | 1,004,133 | |
| Asterias Biotherapeutics, Inc. (a)(b) | 102,523 | 353,704 | |
| Atara Biotherapeutics, Inc. (a)(b) | 88,733 | 1,397,545 | |
| Athersys, Inc. (a)(b) | 484,446 | 847,781 | |
| aTyr Pharma, Inc. (a)(b) | 94,162 | 287,194 | |
| Audentes Therapeutics, Inc. (b) | 92,554 | 1,942,708 | |
| AVEO Pharmaceuticals, Inc. (a)(b) | 400,127 | 1,360,432 | |
| Aviragen Therapeutics, Inc. (a)(b) | 114,179 | 71,704 | |
| Bellicum Pharmaceuticals, Inc. (a)(b) | 101,319 | 1,097,285 | |
| Biocept, Inc. (a)(b) | 60,281 | 73,543 | |
| BioCryst Pharmaceuticals, Inc. (a)(b) | 339,447 | 1,731,180 | |
| Biohaven Pharmaceutical Holding Co. Ltd. (a) | 80,208 | 2,867,436 | |
| BioMarin Pharmaceutical, Inc. (b) | 769,205 | 69,374,599 | |
| Bioptix, Inc. (b) | 15,089 | 59,752 | |
| Biospecifics Technologies Corp. (b) | 20,059 | 945,782 | |
| Biostage, Inc. (a)(b) | 22,493 | 7,009 | |
| BioTime, Inc. (a)(b) | 571,875 | 1,675,594 | |
| Bioverativ, Inc. | 485,399 | 27,517,269 | |
| bluebird bio, Inc. (a)(b) | 199,884 | 24,955,517 | |
| Blueprint Medicines Corp. (a)(b) | 158,607 | 8,599,672 | |
| BrainStorm Cell Therpeutic, Inc. (a)(b) | 60,624 | 258,258 | |
| Calithera Biosciences, Inc. (b) | 115,170 | 1,888,788 | |
| Cancer Genetics, Inc. (a)(b) | 68,198 | 231,873 | |
| Capricor Therapeutics, Inc. (a)(b) | 40,820 | 41,636 | |
| Cara Therapeutics, Inc. (a)(b) | 115,679 | 1,657,680 | |
| CareDx, Inc. (a)(b) | 37,353 | 106,830 | |
| Cascadian Therapeutics, Inc. (a)(b) | 213,713 | 773,641 | |
| CASI Pharmaceuticals, Inc. (a)(b) | 37,512 | 36,023 | |
| Catabasis Pharmaceuticals, Inc. (a)(b) | 25,262 | 34,609 | |
| Catalyst Biosciences, Inc. (b) | 1,432 | 4,797 | |
| Catalyst Pharmaceutical Partners, Inc. (b) | 334,134 | 918,869 | |
| Cel-Sci Corp. (a)(b) | 34,407 | 62,621 | |
| Celldex Therapeutics, Inc. (a)(b) | 449,512 | 1,105,800 | |
| Cellectar Biosciences, Inc. (b) | 4,485 | 7,355 | |
| Cellular Biomedicine Group, Inc. (a)(b) | 29,329 | 288,891 | |
| Celsion Corp. (a)(b) | 4,287 | 5,745 | |
| ChemoCentryx, Inc. (b) | 96,267 | 668,093 | |
| Chiasma, Inc. (a)(b) | 30,058 | 66,128 | |
| Chimerix, Inc. (b) | 181,661 | 864,706 | |
| Cidara Therapeutics, Inc. (a)(b) | 38,754 | 267,403 | |
| Cleveland Biolabs, Inc. (a)(b) | 10,000 | 27,000 | |
| Clovis Oncology, Inc. (a)(b) | 216,220 | 16,447,855 | |
| Coherus BioSciences, Inc. (a)(b) | 149,050 | 2,153,773 | |
| Conatus Pharmaceuticals, Inc. (a)(b) | 122,869 | 705,268 | |
| Concert Pharmaceuticals, Inc. (b) | 59,495 | 905,514 | |
| ContraFect Corp. (a)(b) | 299,050 | 314,003 | |
| Corbus Pharmaceuticals Holdings, Inc. (a)(b) | 129,618 | 1,004,540 | |
| Corvus Pharmaceuticals, Inc. (a)(b) | 34,606 | 559,579 | |
| CTI BioPharma Corp. (a)(b) | 81,379 | 264,482 | |
| Curis, Inc. (b) | 510,614 | 1,041,653 | |
| Cyclacel Pharmaceuticals, Inc. (a) | 17,747 | 29,815 | |
| Cytokinetics, Inc. (a)(b) | 224,644 | 3,335,963 | |
| CytomX Therapeutics, Inc. (a)(b) | 99,639 | 1,721,762 | |
| Cytori Therapeutics, Inc. (a)(b) | 155,538 | 55,994 | |
| CytRx Corp. (a)(b) | 633,744 | 336,518 | |
| Dicerna Pharmaceuticals, Inc. (a)(b) | 54,393 | 189,832 | |
| Dimension Therapeutics, Inc. (b) | 78,948 | 268,423 | |
| Dyax Corp. rights 12/31/19 (b)(d) | 559,523 | 1,846,426 | |
| Dynavax Technologies Corp. (a)(b) | 240,272 | 4,312,882 | |
| Eagle Pharmaceuticals, Inc. (a)(b) | 35,982 | 1,963,178 | |
| Edge Therapeutics, Inc. (a)(b) | 82,791 | 873,445 | |
| Editas Medicine, Inc. (a)(b) | 100,034 | 2,111,718 | |
| Eiger Biopharmaceuticals, Inc. (a)(b) | 17,311 | 160,127 | |
| Eleven Biotherapeutics, Inc. (a)(b) | 33,461 | 36,138 | |
| Emergent BioSolutions, Inc. (a)(b) | 154,700 | 5,774,951 | |
| Enanta Pharmaceuticals, Inc. (a)(b) | 66,992 | 2,871,277 | |
| Epizyme, Inc. (a)(b) | 175,728 | 3,048,881 | |
| Esperion Therapeutics, Inc. (a)(b) | 87,171 | 4,307,991 | |
| Exact Sciences Corp. (a)(b) | 523,030 | 21,909,727 | |
| Exelixis, Inc. (b) | 1,037,416 | 30,334,044 | |
| Fate Therapeutics, Inc. (a)(b) | 72,909 | 275,596 | |
| Fibrocell Science, Inc. (a)(b) | 41,836 | 112,120 | |
| FibroGen, Inc. (b) | 289,340 | 13,946,188 | |
| Five Prime Therapeutics, Inc. (a)(b) | 136,056 | 4,615,020 | |
| Flexion Therapeutics, Inc. (a)(b) | 105,320 | 2,706,724 | |
| Fortress Biotech, Inc. (a)(b) | 160,408 | 761,938 | |
| Foundation Medicine, Inc. (a)(b) | 61,037 | 2,459,791 | |
| Galectin Therapeutics, Inc. (a)(b) | 122,625 | 210,915 | |
| Galena Biopharma, Inc. (a)(b) | 36,479 | 13,132 | |
| Genocea Biosciences, Inc. (a)(b) | 97,488 | 474,767 | |
| Genomic Health, Inc. (a)(b) | 80,972 | 2,566,812 | |
| GenVec, Inc. rights (d) | 14,247 | 0 | |
| Geron Corp. (a)(b) | 680,058 | 1,475,726 | |
| Global Blood Therapeutics, Inc. (b) | 145,920 | 4,435,968 | |
| GlycoMimetics, Inc. (a)(b) | 93,899 | 1,145,568 | |
| GTx, Inc. (a)(b) | 30,934 | 203,855 | |
| Halozyme Therapeutics, Inc. (a)(b) | 565,304 | 7,354,605 | |
| Heat Biologics, Inc. (a)(b) | 76,701 | 42,953 | |
| Hemispherx Biopharma, Inc. (a)(b) | 63,934 | 23,208 | |
| Heron Therapeutics, Inc. (a)(b) | 195,857 | 3,231,641 | |
| Histogenics Corp. (b) | 270 | 497 | |
| iBio, Inc. (a)(b) | 302,306 | 89,422 | |
| Idera Pharmaceuticals, Inc. (a)(b) | 556,964 | 1,102,789 | |
| Ignyta, Inc. (a)(b) | 184,424 | 2,120,876 | |
| Immucell Corp. (a)(b) | 6,741 | 39,165 | |
| Immune Design Corp. (a)(b) | 53,841 | 584,175 | |
| Immune Pharmaceuticals, Inc. (a)(b) | 15,214 | 17,648 | |
| ImmunoCellular Therapeutics Ltd. (a)(b) | 9,947 | 2,756 | |
| ImmunoGen, Inc. (a)(b) | 386,875 | 3,234,275 | |
| Immunomedics, Inc. (a)(b) | 441,967 | 5,586,463 | |
| Infinity Pharmaceuticals, Inc. (b) | 177,419 | 168,903 | |
| Inotek Pharmaceuticals Corp. (a)(b) | 72,423 | 73,871 | |
| Inovio Pharmaceuticals, Inc. (a)(b) | 369,930 | 2,197,384 | |
| Insmed, Inc. (b) | 273,340 | 3,394,883 | |
| Insys Therapeutics, Inc. (a)(b) | 118,023 | 1,078,730 | |
| Intellia Therapeutics, Inc. (a)(b) | 29,836 | 627,451 | |
| Intercept Pharmaceuticals, Inc. (a)(b) | 77,905 | 9,084,502 | |
| Intrexon Corp. (a)(b) | 268,982 | 5,307,015 | |
| Invitae Corp. (a)(b) | 143,536 | 1,409,524 | |
| Ionis Pharmaceuticals, Inc. (a)(b) | 553,332 | 29,669,662 | |
| Iovance Biotherapeutics, Inc. (b) | 301,070 | 1,731,153 | |
| Ironwood Pharmaceuticals, Inc. Class A (a)(b) | 584,864 | 9,328,581 | |
| IsoRay, Inc. (a)(b) | 212,731 | 112,747 | |
| Jounce Therapeutics, Inc. (a) | 34,622 | 588,228 | |
| Juno Therapeutics, Inc. (a)(b) | 337,015 | 13,908,609 | |
| Kadmon Holdings, Inc. (a)(b) | 20,092 | 52,641 | |
| Kalvista Pharmaceuticals, Inc. (a)(b) | 3,322 | 21,958 | |
| Karyopharm Therapeutics, Inc. (b) | 127,520 | 1,303,254 | |
| Keryx Biopharmaceuticals, Inc. (a)(b) | 467,581 | 3,371,259 | |
| Kindred Biosciences, Inc. (a)(b) | 105,425 | 801,230 | |
| Kite Pharma, Inc. (a)(b) | 223,812 | 39,836,298 | |
| Kura Oncology, Inc. (a)(b) | 82,876 | 596,707 | |
| La Jolla Pharmaceutical Co. (a)(b) | 71,395 | 2,438,139 | |
| Lexicon Pharmaceuticals, Inc. (a)(b) | 206,977 | 3,133,632 | |
| Ligand Pharmaceuticals, Inc.: | |||
| Class B (a)(b) | 82,450 | 10,625,332 | |
| General CVR (b) | 26,087 | 261 | |
| Glucagon CVR (b) | 26,087 | 2,478 | |
| rights (b) | 26,087 | 115 | |
| TR Beta CVR (b)(d) | 26,087 | 261 | |
| Loxo Oncology, Inc. (a)(b) | 81,790 | 6,821,286 | |
| Macrogenics, Inc. (a)(b) | 144,717 | 2,736,598 | |
| Madrigal Pharmaceuticals, Inc. (a)(b) | 12,780 | 218,282 | |
| MannKind Corp. (a)(b) | 248,623 | 514,650 | |
| Matinas BioPharma Holdings, Inc. (a) | 314,745 | 402,874 | |
| MediciNova, Inc. (a)(b) | 111,867 | 606,319 | |
| MEI Pharma, Inc. (b) | 122,276 | 322,809 | |
| Merrimack Pharmaceuticals, Inc. (a) | 499,691 | 679,580 | |
| MiMedx Group, Inc. (a)(b) | 470,139 | 7,649,162 | |
| Minerva Neurosciences, Inc. (a)(b) | 138,621 | 838,657 | |
| Mirati Therapeutics, Inc. (a)(b) | 68,149 | 368,005 | |
| Molecular Templates, Inc. (a)(b) | 23,057 | 132,808 | |
| Moleculin Biotech, Inc. (a)(b) | 58,888 | 148,398 | |
| Momenta Pharmaceuticals, Inc. (b) | 292,197 | 4,923,519 | |
| Myriad Genetics, Inc. (a)(b) | 304,682 | 9,289,754 | |
| NanoViricides, Inc. (a)(b) | 143,363 | 194,974 | |
| NantKwest, Inc. (a)(b) | 102,796 | 640,419 | |
| Natera, Inc. (a)(b) | 108,831 | 1,344,063 | |
| Navidea Biopharmaceuticals, Inc. (a)(b) | 571,658 | 224,376 | |
| Neothetics, Inc. (a)(b) | 19,486 | 6,705 | |
| Neuralstem, Inc. (a)(b) | 67,699 | 80,562 | |
| Neurocrine Biosciences, Inc. (a)(b) | 392,115 | 22,193,709 | |
| NewLink Genetics Corp. (a)(b) | 101,635 | 825,276 | |
| Novavax, Inc. (a)(b) | 1,386,707 | 1,456,042 | |
| Ohr Pharmaceutical, Inc. (a)(b) | 106,178 | 81,247 | |
| OncoCyte Corp. (a)(b) | 11,637 | 65,749 | |
| OncoGenex Pharmaceuticals, Inc. (a)(b) | 8,144 | 28,585 | |
| OncoGenex Pharmaceuticals, Inc. rights (d) | 89,591 | 1 | |
| OncoMed Pharmaceuticals, Inc. (a)(b) | 79,764 | 396,427 | |
| Onconova Therapeutics, Inc. (a)(b) | 3,480 | 5,638 | |
| OncoSec Medical, Inc. (a)(b) | 52,231 | 48,053 | |
| Opexa Therapeutics, Inc. (a)(b) | 35,198 | 30,182 | |
| OpGen, Inc. (a)(b) | 41,093 | 10,972 | |
| Ophthotech Corp. (b) | 123,408 | 382,565 | |
| Opko Health, Inc. (a)(b) | 1,702,739 | 10,897,530 | |
| Oragenics, Inc. (b) | 79,968 | 25,590 | |
| Organovo Holdings, Inc. (a)(b) | 401,186 | 834,467 | |
| Otonomy, Inc. (b) | 111,539 | 401,540 | |
| OvaScience, Inc. (a)(b) | 154,817 | 216,744 | |
| Ovid Therapeutics, Inc. (a) | 11,573 | 109,018 | |
| Palatin Technologies, Inc. (a)(b) | 634,919 | 273,015 | |
| PDL BioPharma, Inc. (a)(b) | 697,561 | 2,176,390 | |
| Peregrine Pharmaceuticals, Inc. (b) | 149,057 | 462,077 | |
| Pfenex, Inc. (b) | 65,771 | 237,433 | |
| PharmAthene, Inc. | 24,817 | 62,539 | |
| Portola Pharmaceuticals, Inc. (b) | 253,858 | 16,107,290 | |
| Progenics Pharmaceuticals, Inc. (a)(b) | 305,792 | 2,057,980 | |
| Protagonist Therapeutics, Inc. (a) | 32,503 | 530,774 | |
| Proteon Therapeutics, Inc. (a)(b) | 24,275 | 31,558 | |
| Proteostasis Therapeutics, Inc. (a)(b) | 51,559 | 111,883 | |
| Prothena Corp. PLC (a)(b) | 168,821 | 10,372,362 | |
| PTC Therapeutics, Inc. (a)(b) | 148,089 | 3,072,847 | |
| Puma Biotechnology, Inc. (a)(b) | 122,695 | 11,349,288 | |
| Radius Health, Inc. (a)(b) | 172,567 | 6,493,696 | |
| Recro Pharma, Inc. (a)(b) | 59,391 | 447,214 | |
| REGENXBIO, Inc. (a)(b) | 122,384 | 2,784,236 | |
| Regulus Therapeutics, Inc. (a)(b) | 368,835 | 368,835 | |
| Repligen Corp. (a)(b) | 161,329 | 7,045,237 | |
| Retrophin, Inc. (a)(b) | 156,492 | 3,818,405 | |
| Rexahn Pharmaceuticals, Inc. (a)(b) | 103,785 | 250,122 | |
| Rigel Pharmaceuticals, Inc. (b) | 535,297 | 1,365,007 | |
| RXi Pharmaceuticals Corp. (a)(b) | 26,638 | 15,184 | |
| Sage Therapeutics, Inc. (a)(b) | 137,807 | 11,334,626 | |
| Sangamo Therapeutics, Inc. (a)(b) | 357,866 | 4,777,511 | |
| Sarepta Therapeutics, Inc. (a)(b) | 254,120 | 10,238,495 | |
| Savara, Inc. (a)(b) | 12,370 | 64,943 | |
| Seattle Genetics, Inc. (a)(b) | 436,264 | 22,916,948 | |
| Selecta Biosciences, Inc. (a)(b) | 26,257 | 468,687 | |
| Seres Therapeutics, Inc. (a)(b) | 79,929 | 1,121,404 | |
| Soligenix, Inc. (a)(b) | 20,298 | 43,032 | |
| Sorrento Therapeutics, Inc. (a)(b) | 268,650 | 483,570 | |
| Spark Therapeutics, Inc. (a)(b) | 134,174 | 11,046,545 | |
| Spectrum Pharmaceuticals, Inc. (a)(b) | 318,369 | 3,107,281 | |
| Spring Bank Pharmaceuticals, Inc. (a)(b) | 40,920 | 595,795 | |
| Stemline Therapeutics, Inc. (a)(b) | 87,233 | 789,459 | |
| Sunesis Pharmaceuticals, Inc. (a)(b) | 46,639 | 101,673 | |
| Syndax Pharmaceuticals, Inc. (a)(b) | 65,978 | 765,345 | |
| Synergy Pharmaceuticals, Inc. (a)(b) | 1,043,707 | 3,110,247 | |
| Synthetic Biologics, Inc. (a)(b) | 314,451 | 238,983 | |
| Syros Pharmaceuticals, Inc. (a)(b) | 40,973 | 801,842 | |
| T2 Biosystems, Inc. (a)(b) | 68,463 | 286,860 | |
| Tenax Therapeutics, Inc. (a)(b) | 74,064 | 25,211 | |
| TESARO, Inc. (a)(b) | 154,098 | 19,900,216 | |
| TG Therapeutics, Inc. (a)(b) | 220,299 | 2,797,797 | |
| Tocagen, Inc. (a) | 42,397 | 589,742 | |
| TONIX Pharmaceuticals Holding (a)(b) | 6,944 | 26,179 | |
| TRACON Pharmaceuticals, Inc. (a)(b) | 15,504 | 38,760 | |
| Trevena, Inc. (a)(b) | 153,673 | 368,815 | |
| Trovagene, Inc. (a)(b) | 105,483 | 69,619 | |
| Ultragenyx Pharmaceutical, Inc. (a)(b) | 179,417 | 10,237,534 | |
| United Therapeutics Corp. (a)(b) | 201,618 | 26,371,634 | |
| Vanda Pharmaceuticals, Inc. (b) | 201,638 | 3,468,174 | |
| Veracyte, Inc. (b) | 68,214 | 558,673 | |
| Verastem, Inc. (b) | 127,456 | 497,078 | |
| Vericel Corp. (a)(b) | 180,932 | 778,008 | |
| Versartis, Inc. (a)(b) | 107,155 | 2,035,945 | |
| Vical, Inc. (a)(b) | 29,955 | 70,694 | |
| Viking Therapeutics, Inc. (a)(b) | 31,264 | 32,515 | |
| VistaGen Therapeutics, Inc. (a)(b) | 30,097 | 52,971 | |
| Vital Therapies, Inc. (a)(b) | 127,425 | 382,275 | |
| Voyager Therapeutics, Inc. (b) | 22,537 | 217,257 | |
| vTv Therapeutics, Inc. Class A (b) | 25,196 | 136,814 | |
| Xbiotech, Inc. (a)(b) | 79,667 | 407,895 | |
| Xencor, Inc. (a)(b) | 161,866 | 3,499,543 | |
| XOMA Corp. (a)(b) | 33,875 | 375,674 | |
| Zafgen, Inc. (b) | 77,644 | 280,295 | |
| ZIOPHARM Oncology, Inc. (a)(b) | 555,942 | 3,552,469 | |
| 910,488,107 | |||
| Health Care Equipment & Supplies - 2.6% | |||
| Abaxis, Inc. | 98,681 | 4,561,036 | |
| Abiomed, Inc. (b) | 181,743 | 27,406,844 | |
| Accuray, Inc. (a)(b) | 386,365 | 1,603,415 | |
| Aethlon Medical, Inc. (a)(b) | 20,809 | 28,508 | |
| Akers Biosciences, Inc. (a)(b) | 12,000 | 11,220 | |
| Alere, Inc. (b) | 387,359 | 19,158,776 | |
| Allied Healthcare Products, Inc. (b) | 2,477 | 5,747 | |
| Alliqua Biomedical, Inc. (a)(b) | 63,749 | 21,050 | |
| Alphatec Holdings, Inc. (a)(b) | 44,081 | 89,044 | |
| Amedica Corp. (a)(b) | 45,747 | 15,051 | |
| Analogic Corp. (a) | 56,318 | 4,029,553 | |
| Angiodynamics, Inc. (b) | 163,379 | 2,782,344 | |
| Anika Therapeutics, Inc. (a)(b) | 64,722 | 3,475,571 | |
| Antares Pharma, Inc. (a)(b) | 652,628 | 1,964,410 | |
| Apollo Endosurgery, Inc. (b) | 813 | 3,366 | |
| Atossa Genetics, Inc. (b) | 5,394 | 2,314 | |
| Atricure, Inc. (a)(b) | 137,373 | 3,081,276 | |
| Atrion Corp. | 6,263 | 3,896,525 | |
| Avinger, Inc. (a)(b) | 84,296 | 25,289 | |
| AxoGen, Inc. (b) | 116,552 | 2,051,315 | |
| Bellerophon Therapeutics, Inc. (a)(b) | 109,948 | 120,943 | |
| BioLase Technology, Inc. (a)(b) | 142,344 | 72,482 | |
| BioLife Solutions, Inc. (a)(b) | 69,384 | 328,880 | |
| Bovie Medical Corp. (b) | 92,879 | 221,052 | |
| Cantel Medical Corp. (a) | 161,364 | 13,110,825 | |
| Cardiovascular Systems, Inc. (b) | 142,913 | 4,197,355 | |
| CAS Medical Systems, Inc. (a)(b) | 6,117 | 5,383 | |
| Cerus Corp. (a)(b) | 442,280 | 1,039,358 | |
| Cesca Therapeutics, Inc. (b) | 3,165 | 10,761 | |
| Chembio Diagnostics, Inc. (a)(b) | 41,523 | 253,290 | |
| Chf Solutions, Inc. (b) | 1,359 | 924 | |
| Cogentix Medical, Inc. (b) | 158,919 | 365,514 | |
| ConforMis, Inc. (a)(b) | 157,069 | 581,155 | |
| CONMED Corp. | 112,423 | 5,576,181 | |
| Corindus Vascular Robotics, Inc. (a)(b) | 396,954 | 758,182 | |
| Cryolife, Inc. (b) | 121,962 | 2,536,810 | |
| CryoPort, Inc. (b) | 70,439 | 540,972 | |
| Cutera, Inc. (b) | 61,354 | 2,279,301 | |
| CytoSorbents Corp. (a)(b) | 88,558 | 456,074 | |
| Dare Bioscience, Inc. (a)(b) | 4,896 | 16,304 | |
| Delcath Systems, Inc. (a)(b) | 1,901,997 | 210,361 | |
| DexCom, Inc. (a)(b) | 386,297 | 28,821,619 | |
| Dextera Surgical, Inc. (a)(b) | 25,108 | 8,964 | |
| Dynatronics Corp. (b) | 3,425 | 8,391 | |
| Ekso Bionics Holdings, Inc. (a)(b) | 110,747 | 139,541 | |
| Electromed, Inc. (b) | 18,483 | 131,044 | |
| Endologix, Inc. (a)(b) | 367,188 | 1,553,205 | |
| Entellus Medical, Inc. (a)(b) | 52,720 | 933,144 | |
| EnteroMedics, Inc. (a)(b) | 13,716 | 25,923 | |
| Exactech, Inc. (b) | 45,189 | 1,380,524 | |
| Fonar Corp. (a)(b) | 28,662 | 848,395 | |
| Genmark Diagnostics, Inc. (b) | 243,937 | 2,375,946 | |
| Glaukos Corp. (a)(b) | 52,451 | 1,980,025 | |
| Globus Medical, Inc. (a)(b) | 332,565 | 10,053,440 | |
| Haemonetics Corp. (a)(b) | 231,066 | 9,940,459 | |
| Halyard Health, Inc. (a)(b) | 208,542 | 9,444,867 | |
| Heska Corp. (b) | 28,264 | 2,875,014 | |
| Hill-Rom Holdings, Inc. | 268,873 | 20,692,466 | |
| ICU Medical, Inc. (b) | 65,426 | 11,407,023 | |
| Inogen, Inc. (a)(b) | 70,478 | 6,751,792 | |
| InspireMD, Inc. (a)(b) | 394 | 130 | |
| Insulet Corp. (a)(b) | 260,638 | 15,132,642 | |
| Integer Holdings Corp. (b) | 124,964 | 5,742,096 | |
| Integra LifeSciences Holdings Corp. (a)(b) | 276,450 | 14,096,186 | |
| Invacare Corp. (a) | 140,919 | 1,902,407 | |
| InVivo Therapeutics Holdings Corp. (a)(b) | 122,248 | 140,585 | |
| Invuity, Inc. (a)(b) | 46,878 | 375,024 | |
| IRadimed Corp. (a)(b) | 17,654 | 178,305 | |
| iRhythm Technologies, Inc. (a) | 30,762 | 1,468,578 | |
| Iridex Corp. (a)(b) | 27,981 | 249,031 | |
| K2M Group Holdings, Inc. (b) | 156,379 | 3,656,141 | |
| Kewaunee Scientific Corp. | 5,250 | 135,188 | |
| Lantheus Holdings, Inc. (b) | 130,409 | 2,282,158 | |
| LeMaitre Vascular, Inc. | 55,211 | 2,009,680 | |
| LivaNova PLC (a)(b) | 192,615 | 12,053,847 | |
| Masimo Corp. (b) | 201,948 | 17,040,372 | |
| Meridian Bioscience, Inc. | 201,601 | 2,802,254 | |
| Merit Medical Systems, Inc. (a)(b) | 223,509 | 9,230,922 | |
| MGC Diagnostics Corp. | 3,151 | 24,483 | |
| Microbot Medical, Inc. (a)(b) | 30,945 | 31,873 | |
| Milestone Scientific, Inc. (b) | 45,410 | 59,033 | |
| Misonix, Inc. (a)(b) | 18,363 | 179,957 | |
| Natus Medical, Inc. (a)(b) | 144,748 | 4,863,533 | |
| Neogen Corp. (b) | 169,897 | 11,705,903 | |
| NeuroMetrix, Inc. (a)(b) | 842 | 1,718 | |
| Nevro Corp. (a)(b) | 102,337 | 8,819,403 | |
| NuVasive, Inc. (a)(b) | 227,718 | 14,227,821 | |
| Nuvectra Corp. (b) | 35,935 | 387,739 | |
| NxStage Medical, Inc. (b) | 265,053 | 7,421,484 | |
| OraSure Technologies, Inc. (b) | 251,081 | 5,124,563 | |
| Orthofix International NV (b) | 79,952 | 3,934,438 | |
| Penumbra, Inc. (a)(b) | 122,516 | 10,536,376 | |
| Presbia PLC (a)(b) | 14,898 | 44,545 | |
| Pulse Biosciences, Inc. (a)(b) | 23,721 | 475,132 | |
| Quidel Corp. (b) | 128,607 | 4,493,529 | |
| Retractable Technologies, Inc. (a)(b) | 36,514 | 23,223 | |
| Rockwell Medical Technologies, Inc. (a)(b) | 202,763 | 1,281,462 | |
| Roka Bioscience, Inc. (b) | 1,791 | 1,748 | |
| RTI Biologics, Inc. (b) | 250,898 | 1,129,041 | |
| Seaspine Holdings Corp. (b) | 41,314 | 466,848 | |
| Second Sight Medical Products, Inc. (a)(b) | 63,760 | 72,049 | |
| Sientra, Inc. (a)(b) | 58,832 | 674,215 | |
| Skyline Medical, Inc. (a)(b) | 27,737 | 38,832 | |
| Staar Surgical Co. (a)(b) | 117,470 | 1,403,767 | |
| Steris PLC | 371,678 | 32,395,454 | |
| STRATA Skin Sciences, Inc. (a)(b) | 2,348 | 4,391 | |
| SurModics, Inc. (b) | 57,901 | 1,505,426 | |
| Synergetics U.S.A., Inc. (b)(d) | 76,412 | 1 | |
| Tactile Systems Technology, Inc. (a)(b) | 20,528 | 674,961 | |
| Tandem Diabetes Care, Inc. (a)(b) | 144,184 | 121,115 | |
| TearLab Corp. (a)(b) | 24,963 | 33,700 | |
| Teleflex, Inc. | 202,441 | 42,866,882 | |
| TransEnterix, Inc. (a)(b) | 382,121 | 328,624 | |
| Utah Medical Products, Inc. | 15,694 | 1,132,322 | |
| Vermillion, Inc. (a)(b) | 65,547 | 83,245 | |
| ViewRay, Inc. (a)(b) | 133,734 | 703,441 | |
| Viveve Medical, Inc. (a)(b) | 46,102 | 261,398 | |
| VolitionRx Ltd. (a)(b) | 100,890 | 298,634 | |
| West Pharmaceutical Services, Inc. | 326,008 | 28,375,736 | |
| Wright Medical Group NV (a)(b) | 478,379 | 14,160,018 | |
| Zosano Pharma Corp. (a)(b) | 133,854 | 112,437 | |
| 505,242,589 | |||
| Health Care Providers & Services - 1.5% | |||
| AAC Holdings, Inc. (a)(b) | 40,868 | 379,664 | |
| Acadia Healthcare Co., Inc. (a)(b) | 344,046 | 16,149,519 | |
| Aceto Corp. | 135,992 | 1,442,875 | |
| Adcare Health Systems, Inc. (a)(b) | 40,556 | 38,528 | |
| Addus HomeCare Corp. (b) | 31,856 | 1,084,697 | |
| Almost Family, Inc. (b) | 53,272 | 2,594,346 | |
| Amedisys, Inc. (b) | 131,554 | 6,872,381 | |
| American Renal Associates Holdings, Inc. (a)(b) | 50,577 | 724,768 | |
| American Shared Hospital Services (b) | 115 | 334 | |
| AMN Healthcare Services, Inc. (a)(b) | 214,341 | 8,005,636 | |
| BioScrip, Inc. (a)(b) | 530,489 | 1,607,382 | |
| BioTelemetry, Inc. (a)(b) | 133,878 | 4,973,568 | |
| Brookdale Senior Living, Inc. (b) | 854,931 | 10,370,313 | |
| Caladrius Biosciences, Inc. (a)(b) | 17,378 | 69,686 | |
| Capital Senior Living Corp. (a)(b) | 114,940 | 1,428,704 | |
| Chemed Corp. (a) | 71,443 | 14,094,989 | |
| Civitas Solutions, Inc. (a)(b) | 72,322 | 1,381,350 | |
| Community Health Systems, Inc. (a)(b) | 505,186 | 3,859,621 | |
| Corvel Corp. (b) | 44,212 | 2,294,603 | |
| Cross Country Healthcare, Inc. (b) | 142,947 | 1,769,684 | |
| Digirad Corp. | 52,208 | 185,338 | |
| Diplomat Pharmacy, Inc. (a)(b) | 190,823 | 3,196,285 | |
| Diversicare Healthcare Services, Inc. | 13,755 | 130,810 | |
| Five Star Sr Living, Inc. (b) | 200,855 | 326,389 | |
| Genesis HealthCare, Inc. Class A (a)(b) | 122,459 | 127,357 | |
| HealthEquity, Inc. (b) | 197,508 | 8,447,417 | |
| HealthSouth Corp. | 435,709 | 19,933,687 | |
| InfuSystems Holdings, Inc. (b) | 46,642 | 88,620 | |
| Innovative Industrial Properties, Inc. (a) | 3,026 | 51,684 | |
| Interpace Diagnostics Group, Inc. (a)(b) | 26,246 | 34,382 | |
| Kindred Healthcare, Inc. | 383,129 | 3,103,345 | |
| Landauer, Inc. | 43,381 | 2,691,791 | |
| LHC Group, Inc. (b) | 65,956 | 4,303,629 | |
| LifePoint Hospitals, Inc. (a)(b) | 183,768 | 10,649,356 | |
| Magellan Health Services, Inc. (b) | 103,219 | 8,350,417 | |
| MEDNAX, Inc. (b) | 415,985 | 18,656,927 | |
| Molina Healthcare, Inc. (a)(b) | 186,222 | 11,918,208 | |
| National Healthcare Corp. | 53,157 | 3,313,807 | |
| National Research Corp. Class A | 29,921 | 966,448 | |
| Owens & Minor, Inc. | 279,804 | 7,817,724 | |
| PharMerica Corp. (b) | 140,004 | 4,116,118 | |
| Premier, Inc. (a)(b) | 231,650 | 7,760,275 | |
| Providence Service Corp. (b) | 55,715 | 2,887,708 | |
| Psychemedics Corp. | 24,573 | 519,473 | |
| Quorum Health Corp. (b) | 123,157 | 539,428 | |
| R1 RCM, Inc. (a)(b) | 331,964 | 1,095,481 | |
| RadNet, Inc. (b) | 138,775 | 1,422,444 | |
| Select Medical Holdings Corp. (a)(b) | 473,830 | 8,813,238 | |
| Sharps Compliance Corp. (a)(b) | 38,932 | 192,713 | |
| SunLink Health Systems, Inc. (b) | 19,190 | 28,785 | |
| Surgery Partners, Inc. (b) | 85,904 | 837,564 | |
| Teladoc, Inc. (a)(b) | 169,112 | 5,673,708 | |
| Tenet Healthcare Corp. (a)(b) | 349,778 | 6,005,688 | |
| The Ensign Group, Inc. (a) | 210,263 | 4,318,802 | |
| Tivity Health, Inc. (a)(b) | 145,588 | 5,707,050 | |
| Triple-S Management Corp. (a)(b) | 101,083 | 2,497,761 | |
| U.S. Physical Therapy, Inc. | 56,068 | 3,358,473 | |
| VCA, Inc. (b) | 350,488 | 32,581,364 | |
| Wellcare Health Plans, Inc. (b) | 198,112 | 34,606,204 | |
| 306,398,546 | |||
| Health Care Technology - 0.6% | |||
| Allscripts Healthcare Solutions, Inc. (a)(b) | 797,527 | 10,479,505 | |
| Arrhythmia Research Technology, Inc. (b) | 9,913 | 36,083 | |
| athenahealth, Inc. (a)(b) | 176,539 | 24,879,641 | |
| Castlight Health, Inc. Class B (a)(b) | 202,967 | 791,571 | |
| Computer Programs & Systems, Inc. (a) | 49,251 | 1,482,455 | |
| Connecture, Inc. (a)(b) | 29,490 | 19,758 | |
| Evolent Health, Inc. (a)(b) | 269,471 | 4,500,166 | |
| HealthStream, Inc. (a)(b) | 115,141 | 2,704,662 | |
| HMS Holdings Corp. (b) | 371,818 | 6,588,615 | |
| HTG Molecular Diagnostics (a)(b) | 19,859 | 32,966 | |
| iCAD, Inc. (b) | 51,129 | 202,471 | |
| Inovalon Holdings, Inc. Class A (a)(b) | 288,458 | 3,908,606 | |
| Medidata Solutions, Inc. (b) | 246,683 | 18,491,358 | |
| Omnicell, Inc. (b) | 163,472 | 8,386,114 | |
| Quality Systems, Inc. (b) | 196,746 | 3,098,750 | |
| Simulations Plus, Inc. | 44,648 | 647,396 | |
| Streamline Health Solutions, Inc. (b) | 74,551 | 97,662 | |
| Tabula Rasa HealthCare, Inc. | 21,610 | 491,195 | |
| Veeva Systems, Inc. Class A (a)(b) | 469,609 | 27,941,736 | |
| Vocera Communications, Inc. (b) | 115,619 | 3,219,989 | |
| 118,000,699 | |||
| Life Sciences Tools & Services - 0.8% | |||
| Accelerate Diagnostics, Inc. (a)(b) | 114,176 | 2,626,048 | |
| Albany Molecular Research, Inc. (a)(b) | 96,920 | 2,107,041 | |
| Bio-Rad Laboratories, Inc. Class A (a)(b) | 93,959 | 20,466,149 | |
| Bio-Techne Corp. | 166,067 | 20,555,773 | |
| Bioanalytical Systems, Inc. (b) | 4,687 | 7,171 | |
| Bruker Corp. | 464,594 | 13,515,039 | |
| Cambrex Corp. (b) | 141,044 | 7,348,392 | |
| Charles River Laboratories International, Inc. (b) | 211,597 | 23,021,754 | |
| ChromaDex, Inc. (a)(b) | 94,205 | 316,529 | |
| CombiMatrix Corp. (b) | 922 | 6,961 | |
| Enzo Biochem, Inc. (b) | 184,150 | 2,071,688 | |
| Fluidigm Corp. (a)(b) | 119,521 | 546,211 | |
| Harvard Bioscience, Inc. (b) | 111,418 | 345,396 | |
| INC Research Holdings, Inc. Class A (a)(b) | 242,252 | 14,220,192 | |
| Luminex Corp. (a) | 173,959 | 3,362,627 | |
| Medpace Holdings, Inc. (a) | 29,956 | 977,764 | |
| Nanostring Technologies, Inc. (b) | 75,121 | 1,160,619 | |
| NeoGenomics, Inc. (a)(b) | 214,850 | 2,172,134 | |
| Pacific Biosciences of California, Inc. (a)(b) | 415,712 | 2,057,774 | |
| PAREXEL International Corp. (b) | 221,017 | 19,425,184 | |
| PRA Health Sciences, Inc. (b) | 217,459 | 16,831,327 | |
| pSivida Corp. (a)(b) | 97,016 | 117,389 | |
| VWR Corp. (b) | 369,017 | 12,184,941 | |
| 165,444,103 | |||
| Pharmaceuticals - 1.4% | |||
| AcelRx Pharmaceuticals, Inc. (a)(b) | 126,457 | 417,308 | |
| Aclaris Therapeutics, Inc. (b) | 104,312 | 2,704,810 | |
| Adamis Pharmaceuticals Corp. (a)(b) | 97,382 | 530,732 | |
| Aerie Pharmaceuticals, Inc. (a)(b) | 157,930 | 9,057,286 | |
| Agile Therapeutics, Inc. (a)(b) | 73,763 | 253,745 | |
| Akorn, Inc. (b) | 378,868 | 12,464,757 | |
| Alimera Sciences, Inc. (b) | 102,415 | 142,357 | |
| Amphastar Pharmaceuticals, Inc. (a)(b) | 158,581 | 2,538,882 | |
| Ampio Pharmaceuticals, Inc. (a)(b) | 182,288 | 97,087 | |
| ANI Pharmaceuticals, Inc. (b) | 33,859 | 1,625,232 | |
| ANI Pharmaceuticals, Inc. rights (b)(d) | 58,183 | 1 | |
| Apricus Biosciences, Inc. (a)(b) | 18,299 | 29,827 | |
| Aradigm Corp. (a)(b) | 6,822 | 9,141 | |
| Aratana Therapeutics, Inc. (a)(b) | 155,922 | 890,315 | |
| Assembly Biosciences, Inc. (a)(b) | 65,478 | 1,775,109 | |
| AstraZeneca PLC rights (b)(d) | 21,542 | 0 | |
| Avexis, Inc. (a)(b) | 102,106 | 9,531,595 | |
| Axsome Therapeutics, Inc. (a)(b) | 61,057 | 311,391 | |
| Bio Path Holdings, Inc. (a)(b) | 346,086 | 95,174 | |
| Biodelivery Sciences International, Inc. (a)(b) | 266,001 | 824,603 | |
| BioPharmX Corp. (a)(b) | 259,103 | 79,286 | |
| Catalent, Inc. (b) | 548,701 | 22,655,864 | |
| Cempra, Inc. (a)(b) | 210,034 | 640,604 | |
| Clearside Biomedical, Inc. (a)(b) | 56,066 | 391,901 | |
| Collegium Pharmaceutical, Inc. (a)(b) | 84,457 | 847,948 | |
| ContraVir Pharmaceuticals, Inc. (a)(b) | 235,301 | 111,839 | |
| Corcept Therapeutics, Inc. (a)(b) | 367,098 | 6,119,524 | |
| Corium International, Inc. (a)(b) | 92,370 | 789,764 | |
| CorMedix, Inc. (a)(b) | 246,421 | 121,978 | |
| Cumberland Pharmaceuticals, Inc. (b) | 33,632 | 235,760 | |
| CymaBay Therapeutics, Inc. (b) | 169,517 | 1,057,786 | |
| DepoMed, Inc. (a)(b) | 279,603 | 1,699,986 | |
| Dermira, Inc. (a)(b) | 135,493 | 3,196,280 | |
| Durect Corp. (a)(b) | 600,826 | 955,313 | |
| Egalet Corp. (a)(b) | 55,293 | 66,905 | |
| Endo International PLC (a)(b) | 860,309 | 7,562,116 | |
| Endocyte, Inc. (a)(b) | 136,613 | 185,794 | |
| Evoke Pharma, Inc. (a)(b) | 15,864 | 39,977 | |
| Flex Pharma, Inc. (b) | 43,126 | 169,485 | |
| Gemphire Therapeutics, Inc. (a) | 23,191 | 223,561 | |
| Horizon Pharma PLC (a)(b) | 727,591 | 9,953,445 | |
| Impax Laboratories, Inc. (a)(b) | 325,117 | 7,038,783 | |
| Imprimis Pharmaceuticals, Inc. (a)(b) | 47,994 | 87,829 | |
| Innoviva, Inc. (a)(b) | 359,646 | 5,049,430 | |
| Intersect ENT, Inc. (a)(b) | 111,651 | 3,450,016 | |
| Intra-Cellular Therapies, Inc. (a)(b) | 150,680 | 2,780,046 | |
| Jaguar Health, Inc. (a)(b) | 27,742 | 10,359 | |
| Jazz Pharmaceuticals PLC (b) | 268,581 | 40,115,258 | |
| Juniper Pharmaceuticals, Inc. (b) | 42,963 | 199,778 | |
| KemPharm, Inc. (a)(b) | 54,249 | 165,459 | |
| Lannett Co., Inc. (a)(b) | 132,787 | 2,330,412 | |
| Lipocine, Inc. (a)(b) | 73,787 | 278,915 | |
| Mallinckrodt PLC (a)(b) | 450,015 | 18,486,616 | |
| Marinus Pharmaceuticals, Inc. (a)(b) | 87,400 | 267,444 | |
| MyoKardia, Inc. (b) | 87,793 | 3,805,827 | |
| Nektar Therapeutics (a)(b) | 702,424 | 14,771,977 | |
| Neos Therapeutics, Inc. (a)(b) | 97,688 | 815,695 | |
| NovaBay Pharmaceuticals, Inc. (a)(b) | 5,692 | 25,045 | |
| Novan, Inc. (a) | 36,199 | 182,805 | |
| Novus Therapeutics, Inc. (a)(b) | 3,220 | 12,751 | |
| Ocera Therapeutics, Inc. (a)(b) | 41,015 | 38,144 | |
| Ocular Therapeutix, Inc. (a)(b) | 99,153 | 620,698 | |
| Omeros Corp. (a)(b) | 194,237 | 3,976,031 | |
| Orexigen Therapeutics, Inc. (a)(b) | 43,174 | 98,005 | |
| Pacira Pharmaceuticals, Inc. (a)(b) | 185,742 | 7,076,770 | |
| Pain Therapeutics, Inc. (a)(b) | 20,714 | 66,492 | |
| Paratek Pharmaceuticals, Inc. (a)(b) | 89,723 | 2,530,189 | |
| Pernix Therapeutics Holdings, Inc. (a)(b) | 31,117 | 93,351 | |
| Phibro Animal Health Corp. Class A | 88,806 | 3,152,613 | |
| Plx Pharma PLC/New (a)(b) | 4,428 | 27,896 | |
| Prestige Brands Holdings, Inc. (a)(b) | 233,489 | 11,840,227 | |
| Pulmatrix, Inc. (a)(b) | 31,769 | 54,643 | |
| Reata Pharmaceuticals, Inc. (a)(b) | 43,792 | 1,324,708 | |
| Repros Therapeutics, Inc. (a)(b) | 95,900 | 28,367 | |
| Revance Therapeutics, Inc. (a)(b) | 97,298 | 2,388,666 | |
| Ritter Pharmaceuticals, Inc. (a)(b) | 29,614 | 16,889 | |
| SciClone Pharmaceuticals, Inc. (b) | 218,960 | 2,408,560 | |
| SCYNEXIS, Inc. (a)(b) | 102,549 | 196,894 | |
| Sonoma Pharmaceuticals, Inc. (a)(b) | 13,177 | 73,132 | |
| Sucampo Pharmaceuticals, Inc. Class A (a)(b) | 124,734 | 1,465,625 | |
| Supernus Pharmaceuticals, Inc. (a)(b) | 224,100 | 10,263,780 | |
| Teligent, Inc. (a)(b) | 188,677 | 1,303,758 | |
| Tetraphase Pharmaceuticals, Inc. (a)(b) | 225,292 | 1,572,538 | |
| The Medicines Company (a)(b) | 315,572 | 11,578,337 | |
| TherapeuticsMD, Inc. (a)(b) | 746,255 | 4,477,530 | |
| Theravance Biopharma, Inc. (a)(b) | 173,244 | 5,659,881 | |
| Titan Pharmaceuticals, Inc. (a)(b) | 68,182 | 102,273 | |
| VIVUS, Inc. (a)(b) | 380,623 | 338,983 | |
| WAVE Life Sciences (a)(b) | 61,241 | 1,439,164 | |
| Zogenix, Inc. (a)(b) | 109,963 | 1,303,062 | |
| Zynerba Pharmaceuticals, Inc. (a)(b) | 45,110 | 286,449 | |
| 276,082,568 | |||
| TOTAL HEALTH CARE | 2,281,656,612 | ||
| INDUSTRIALS - 13.2% | |||
| Aerospace & Defense - 1.7% | |||
| AAR Corp. | 143,570 | 5,177,134 | |
| Aerojet Rocketdyne Holdings, Inc. (a)(b) | 334,458 | 9,909,991 | |
| AeroVironment, Inc. (a)(b) | 92,122 | 4,515,820 | |
| Air Industries Group, Inc. (b) | 217 | 293 | |
| Arotech Corp. (a)(b) | 107,505 | 354,767 | |
| Astronics Corp. (a)(b) | 86,881 | 2,284,101 | |
| Astronics Corp. Class B (a) | 7,288 | 190,946 | |
| Astrotech Corp. (b) | 39,511 | 28,843 | |
| Axon Enterprise, Inc. (a)(b) | 237,339 | 5,152,630 | |
| BWX Technologies, Inc. | 434,849 | 23,794,937 | |
| CPI Aerostructures, Inc. (b) | 20,017 | 174,148 | |
| Cubic Corp. | 108,530 | 4,661,364 | |
| Curtiss-Wright Corp. | 200,716 | 19,433,323 | |
| DigitalGlobe, Inc. (a)(b) | 270,177 | 9,294,089 | |
| Ducommun, Inc. (b) | 49,143 | 1,351,433 | |
| Engility Holdings, Inc. (b) | 78,098 | 2,426,505 | |
| Esterline Technologies Corp. (b) | 133,161 | 11,371,949 | |
| HEICO Corp. (a) | 117,423 | 10,071,371 | |
| HEICO Corp. Class A | 200,680 | 14,579,402 | |
| Hexcel Corp. | 401,227 | 21,573,976 | |
| Huntington Ingalls Industries, Inc. | 203,232 | 43,483,519 | |
| Innovative Solutions & Support, Inc. (b) | 34,266 | 118,218 | |
| KEYW Holding Corp. (a)(b) | 187,901 | 1,343,492 | |
| KLX, Inc. (b) | 232,402 | 11,141,352 | |
| Kratos Defense & Security Solutions, Inc. (a)(b) | 316,334 | 4,232,549 | |
| Mercury Systems, Inc. (b) | 216,006 | 10,422,290 | |
| Micronet Enertec Technologies, Inc. (b) | 8,571 | 6,883 | |
| Moog, Inc. Class A (b) | 144,025 | 11,055,359 | |
| National Presto Industries, Inc. (a) | 22,481 | 2,239,108 | |
| Orbital ATK, Inc. | 258,902 | 28,888,285 | |
| SIFCO Industries, Inc. (b) | 8,947 | 49,209 | |
| Sparton Corp. (b) | 38,996 | 903,537 | |
| Spirit AeroSystems Holdings, Inc. Class A | 532,926 | 39,702,987 | |
| Teledyne Technologies, Inc. (b) | 156,637 | 23,504,948 | |
| Triumph Group, Inc. | 220,034 | 5,786,894 | |
| Vectrus, Inc. (b) | 47,874 | 1,368,239 | |
| Wesco Aircraft Holdings, Inc. (b) | 267,984 | 2,251,066 | |
| 332,844,957 | |||
| Air Freight& Logistics - 0.3% | |||
| Air T, Inc. (b) | 1,113 | 18,309 | |
| Air Transport Services Group, Inc. (b) | 236,478 | 5,429,535 | |
| Atlas Air Worldwide Holdings, Inc. (a)(b) | 110,896 | 7,407,853 | |
| Echo Global Logistics, Inc. (a)(b) | 127,579 | 1,939,201 | |
| Forward Air Corp. | 135,469 | 7,040,324 | |
| Hub Group, Inc. Class A (b) | 154,089 | 5,924,722 | |
| Radiant Logistics, Inc. (b) | 144,096 | 727,685 | |
| XPO Logistics, Inc. (a)(b) | 381,007 | 23,317,628 | |
| 51,805,257 | |||
| Airlines - 0.3% | |||
| Allegiant Travel Co. (a) | 57,825 | 6,823,350 | |
| Hawaiian Holdings, Inc. (b) | 235,963 | 10,111,015 | |
| JetBlue Airways Corp. (b) | 1,472,067 | 29,161,647 | |
| SkyWest, Inc. (a) | 229,350 | 7,958,445 | |
| Spirit Airlines, Inc. (b) | 308,675 | 10,510,384 | |
| 64,564,841 | |||
| Building Products - 1.0% | |||
| AAON, Inc. (a) | 174,071 | 5,674,715 | |
| Advanced Drain Systems, Inc. Del | 158,188 | 3,076,757 | |
| American Woodmark Corp. (b) | 63,037 | 5,219,464 | |
| Apogee Enterprises, Inc. (a) | 129,908 | 5,676,980 | |
| Armstrong World Industries, Inc. (a)(b) | 218,003 | 10,355,143 | |
| Builders FirstSource, Inc. (a)(b) | 438,206 | 7,133,994 | |
| Continental Building Products, Inc. (a)(b) | 175,679 | 4,277,784 | |
| CSW Industrials, Inc. (b) | 69,908 | 2,925,650 | |
| GCP Applied Technologies, Inc. (a)(b) | 323,986 | 9,152,605 | |
| Gibraltar Industries, Inc. (a)(b) | 140,820 | 4,118,985 | |
| GMS, Inc. (b) | 133,191 | 4,286,086 | |
| Griffon Corp. | 137,012 | 2,541,573 | |
| Insteel Industries, Inc. | 77,676 | 1,947,337 | |
| Jeld-Wen Holding, Inc. | 173,325 | 5,289,879 | |
| Lennox International, Inc. (a) | 168,062 | 27,852,915 | |
| Masonite International Corp. (a)(b) | 130,738 | 8,275,715 | |
| NCI Building Systems, Inc. (b) | 175,187 | 2,943,142 | |
| Owens Corning | 498,872 | 36,981,381 | |
| Patrick Industries, Inc. (b) | 70,801 | 5,239,274 | |
| PGT, Inc. (a)(b) | 222,722 | 2,939,930 | |
| Ply Gem Holdings, Inc. (b) | 97,641 | 1,518,318 | |
| Quanex Building Products Corp. | 151,050 | 2,960,580 | |
| Simpson Manufacturing Co. Ltd. (a) | 185,364 | 8,115,236 | |
| Tecogen, Inc. New (a)(b) | 6,158 | 18,474 | |
| Trex Co., Inc. (b) | 128,907 | 9,796,932 | |
| Universal Forest Products, Inc. | 94,515 | 8,242,653 | |
| USG Corp. (a)(b) | 398,293 | 11,948,790 | |
| 198,510,292 | |||
| Commercial Services & Supplies - 1.6% | |||
| ABM Industries, Inc. | 247,365 | 10,990,427 | |
| ACCO Brands Corp. (b) | 492,892 | 5,397,167 | |
| Acme United Corp. | 1,357 | 32,351 | |
| ADS Waste Holdings, Inc. | 179,339 | 4,275,442 | |
| Amrep Corp. (b) | 2,745 | 18,831 | |
| Aqua Metals, Inc. (a)(b) | 65,324 | 484,051 | |
| ARC Document Solutions, Inc. (b) | 152,363 | 537,841 | |
| Avalon Holdings Corp. Class A (b) | 128 | 246 | |
| Brady Corp. Class A | 217,590 | 7,256,627 | |
| Casella Waste Systems, Inc. Class A (b) | 167,872 | 2,821,928 | |
| CECO Environmental Corp. | 121,214 | 905,469 | |
| Cemtrex, Inc. (a) | 35,054 | 102,358 | |
| Cenveo, Inc. (a)(b) | 27,357 | 103,409 | |
| Clean Harbors, Inc. (a)(b) | 236,919 | 12,814,949 | |
| Command Security Corp. (b) | 4,127 | 11,968 | |
| CompX International, Inc. Class A | 729 | 10,971 | |
| Copart, Inc. (a)(b) | 905,964 | 29,615,963 | |
| Covanta Holding Corp. (a) | 578,029 | 8,294,716 | |
| Deluxe Corp. | 219,912 | 15,250,897 | |
| Ecology & Environment, Inc. Class A | 5,634 | 66,763 | |
| Ennis, Inc. | 117,199 | 2,238,501 | |
| Essendant, Inc. | 162,977 | 1,932,907 | |
| Fuel Tech, Inc. (a)(b) | 72,552 | 65,514 | |
| Healthcare Services Group, Inc. | 321,337 | 16,452,454 | |
| Heritage-Crystal Clean, Inc. (b) | 68,983 | 1,345,169 | |
| Herman Miller, Inc. | 274,491 | 9,236,622 | |
| HNI Corp. (a) | 197,609 | 7,242,370 | |
| Hudson Technologies, Inc. (a)(b) | 168,025 | 1,495,423 | |
| Industrial Services of America, Inc. (a)(b) | 12,843 | 25,044 | |
| InnerWorkings, Inc. (a)(b) | 175,021 | 1,832,470 | |
| Interface, Inc. (a) | 279,580 | 5,312,020 | |
| Intersections, Inc. (a)(b) | 42,827 | 150,323 | |
| KAR Auction Services, Inc. (a) | 618,392 | 27,883,295 | |
| Kimball International, Inc. Class B | 162,059 | 2,748,521 | |
| Knoll, Inc. | 222,691 | 4,019,573 | |
| LSC Communications, Inc. | 153,886 | 2,479,103 | |
| Matthews International Corp. Class A | 146,544 | 8,829,276 | |
| McGrath RentCorp. | 106,286 | 4,290,766 | |
| Mobile Mini, Inc. (a) | 195,778 | 5,922,285 | |
| Msa Safety, Inc. | 143,147 | 10,429,690 | |
| Multi-Color Corp. (a) | 59,263 | 4,729,187 | |
| NL Industries, Inc. (b) | 19,361 | 146,176 | |
| Odyssey Marine Exploration, Inc. (a)(b) | 21,390 | 79,357 | |
| Performant Financial Corp. (b) | 101,625 | 178,860 | |
| Perma-Fix Environmental Services, Inc. (b) | 24,334 | 86,386 | |
| Pitney Bowes, Inc. | 833,969 | 10,716,502 | |
| Quad/Graphics, Inc. | 135,690 | 2,586,251 | |
| Quest Resource Holding Corp. (a)(b) | 36,362 | 50,180 | |
| R.R. Donnelley & Sons Co. | 314,030 | 2,898,497 | |
| Rollins, Inc. (a) | 424,489 | 18,851,556 | |
| SP Plus Corp. (b) | 98,466 | 3,633,395 | |
| Steelcase, Inc. Class A | 394,969 | 5,213,591 | |
| Team, Inc. (a)(b) | 135,303 | 1,670,992 | |
| Tetra Tech, Inc. | 260,091 | 11,079,877 | |
| The Brink's Co. | 199,596 | 15,658,306 | |
| U.S. Ecology, Inc. | 96,736 | 4,972,230 | |
| UniFirst Corp. | 69,592 | 9,993,411 | |
| Versar, Inc. (b) | 11,390 | 8,998 | |
| Viad Corp. | 92,139 | 5,063,038 | |
| Virco Manufacturing Co. (b) | 17,110 | 88,972 | |
| VSE Corp. | 32,483 | 1,693,988 | |
| West Corp. | 211,662 | 4,946,541 | |
| 317,269,991 | |||
| Construction & Engineering - 0.7% | |||
| AECOM (a)(b) | 706,124 | 23,655,154 | |
| Aegion Corp. (a)(b) | 149,994 | 3,250,370 | |
| Ameresco, Inc. Class A (b) | 69,482 | 503,745 | |
| Argan, Inc. (a) | 59,650 | 3,778,828 | |
| Chicago Bridge & Iron Co. NV (a) | 437,751 | 5,401,847 | |
| Comfort Systems U.S.A., Inc. | 162,547 | 5,534,725 | |
| Dycom Industries, Inc. (a)(b) | 136,274 | 10,994,586 | |
| EMCOR Group, Inc. | 259,494 | 17,136,984 | |
| Goldfield Corp. | 101,619 | 452,205 | |
| Granite Construction, Inc. (a) | 173,385 | 9,576,054 | |
| Great Lakes Dredge & Dock Corp. (b) | 250,064 | 1,012,759 | |
| HC2 Holdings, Inc. (b) | 149,409 | 681,305 | |
| Ies Holdings, Inc. (a)(b) | 36,498 | 602,217 | |
| KBR, Inc. | 624,322 | 10,157,719 | |
| Keane Group, Inc. (a) | 127,298 | 1,648,509 | |
| Layne Christensen Co. (a)(b) | 82,090 | 881,647 | |
| MasTec, Inc. (a)(b) | 289,826 | 11,824,901 | |
| MYR Group, Inc. (b) | 77,211 | 1,992,816 | |
| Northwest Pipe Co. (a)(b) | 42,043 | 771,069 | |
| NV5 Holdings, Inc. (a)(b) | 35,335 | 1,704,914 | |
| Orion Group Holdings, Inc. (b) | 118,649 | 716,640 | |
| Primoris Services Corp. | 176,834 | 5,059,221 | |
| Sterling Construction Co., Inc. (b) | 109,184 | 1,286,188 | |
| Tutor Perini Corp. (a)(b) | 176,871 | 4,625,177 | |
| Valmont Industries, Inc. | 102,456 | 14,707,559 | |
| 137,957,139 | |||
| Electrical Equipment - 0.6% | |||
| Allied Motion Technologies, Inc. | 28,596 | 723,193 | |
| American Electric Technologies, Inc. (b) | 11,601 | 17,982 | |
| American Superconductor Corp. (a)(b) | 66,860 | 259,417 | |
| AZZ, Inc. (a) | 113,590 | 5,554,551 | |
| Babcock & Wilcox Enterprises, Inc. (a)(b) | 206,668 | 467,070 | |
| Broadwind Energy, Inc. (b) | 61,516 | 210,385 | |
| Capstone Turbine Corp. (a)(b) | 61,006 | 39,105 | |
| Digital Power Corp. (a)(b) | 4,632 | 2,307 | |
| Encore Wire Corp. | 89,061 | 3,820,717 | |
| Energous Corp. (a)(b) | 80,549 | 764,410 | |
| Energy Focus, Inc. (a)(b) | 31,432 | 56,263 | |
| EnerSys | 196,436 | 12,591,548 | |
| Enphase Energy, Inc. (a)(b) | 219,384 | 201,833 | |
| EnSync, Inc. (a)(b) | 116,581 | 45,467 | |
| Espey Manufacturing & Electronics Corp. | 5,358 | 121,305 | |
| FuelCell Energy, Inc. (a)(b) | 207,717 | 319,884 | |
| Generac Holdings, Inc. (a)(b) | 277,773 | 11,216,474 | |
| General Cable Corp. | 226,028 | 3,831,175 | |
| Hubbell, Inc. Class B | 225,346 | 25,416,775 | |
| Ideal Power, Inc. (a)(b) | 18,012 | 43,769 | |
| LSI Industries, Inc. | 102,850 | 585,217 | |
| Ocean Power Technologies, Inc. (a)(b) | 5,215 | 6,362 | |
| Orion Energy Systems, Inc. (a)(b) | 83,634 | 77,069 | |
| Plug Power, Inc. (a)(b) | 1,337,613 | 2,862,492 | |
| Polar Power, Inc. (a) | 7,315 | 34,015 | |
| Powell Industries, Inc. | 39,054 | 1,111,867 | |
| Preformed Line Products Co. | 10,541 | 550,767 | |
| Real Goods Solar, Inc. (a)(b) | 43,365 | 34,042 | |
| Regal Beloit Corp. | 197,964 | 14,926,486 | |
| Revolution Lighting Technologies, Inc. (a)(b) | 38,380 | 284,396 | |
| Sensata Technologies Holding BV (a)(b) | 754,485 | 33,695,300 | |
| Sunrun, Inc. (a)(b) | 291,244 | 1,951,335 | |
| Sunworks, Inc. (a)(b) | 47,552 | 72,755 | |
| Thermon Group Holdings, Inc. (a)(b) | 144,076 | 2,380,136 | |
| TPI Composites, Inc. (b) | 67,536 | 1,373,682 | |
| Ultralife Corp. (b) | 43,594 | 283,361 | |
| Vicor Corp. (b) | 66,375 | 1,290,994 | |
| Vivint Solar, Inc. (a)(b) | 111,777 | 530,941 | |
| 127,754,847 | |||
| Industrial Conglomerates - 0.2% | |||
| Carlisle Companies, Inc. | 284,352 | 26,925,291 | |
| ITT, Inc. | 388,056 | 15,661,940 | |
| Raven Industries, Inc. | 161,156 | 4,512,368 | |
| 47,099,599 | |||
| Machinery - 3.7% | |||
| Actuant Corp. Class A (a) | 270,996 | 6,517,454 | |
| AGCO Corp. (a) | 291,318 | 19,940,717 | |
| Alamo Group, Inc. | 54,346 | 4,986,789 | |
| Albany International Corp. Class A (a) | 129,645 | 6,948,972 | |
| Allison Transmission Holdings, Inc. (a) | 667,252 | 23,173,662 | |
| Altra Industrial Motion Corp. | 139,829 | 6,439,125 | |
| American Railcar Industries, Inc. (a) | 34,464 | 1,240,704 | |
| ARC Group Worldwide, Inc. (b) | 25,827 | 63,276 | |
| Art's-Way Manufacturing Co., Inc. (b) | 9,831 | 20,645 | |
| Astec Industries, Inc. | 88,018 | 4,372,734 | |
| Barnes Group, Inc. | 219,896 | 13,747,898 | |
| Blue Bird Corp. (b) | 36,609 | 666,284 | |
| Briggs & Stratton Corp. | 195,366 | 4,090,964 | |
| Chart Industries, Inc. (b) | 134,764 | 4,546,937 | |
| Chicago Rivet & Machine Co. | 772 | 21,122 | |
| CIRCOR International, Inc. | 73,485 | 3,528,750 | |
| Colfax Corp. (b) | 436,120 | 17,392,466 | |
| Columbus McKinnon Corp. (NY Shares) | 93,121 | 3,075,787 | |
| Commercial Vehicle Group, Inc. (b) | 112,254 | 666,789 | |
| Crane Co. | 225,922 | 16,770,190 | |
| Dmc Global, Inc. | 55,020 | 712,509 | |
| Donaldson Co., Inc. (a) | 591,409 | 27,944,075 | |
| Douglas Dynamics, Inc. | 103,727 | 3,620,072 | |
| Eastern Co. (a) | 27,488 | 718,811 | |
| Energy Recovery, Inc. (a)(b) | 131,400 | 854,100 | |
| EnPro Industries, Inc. | 95,977 | 6,763,499 | |
| ESCO Technologies, Inc. (a) | 113,837 | 6,198,425 | |
| ExOne Co. (a)(b) | 41,005 | 331,730 | |
| Federal Signal Corp. | 258,672 | 4,834,580 | |
| Franklin Electric Co., Inc. | 171,998 | 6,630,523 | |
| FreightCar America, Inc. | 54,073 | 981,966 | |
| Gardner Denver Holdings, Inc. (a) | 190,573 | 4,476,560 | |
| Gencor Industries, Inc. (b) | 30,519 | 469,993 | |
| Global Brass & Copper Holdings, Inc. | 97,132 | 2,899,390 | |
| Gorman-Rupp Co. | 73,596 | 2,240,262 | |
| Graco, Inc. | 245,098 | 28,311,270 | |
| Graham Corp. | 37,894 | 759,017 | |
| Greenbrier Companies, Inc. (a) | 126,722 | 5,436,374 | |
| Hardinge, Inc. | 38,805 | 531,240 | |
| Harsco Corp. (b) | 358,982 | 6,138,592 | |
| Hillenbrand, Inc. | 279,706 | 9,999,490 | |
| Hurco Companies, Inc. | 24,930 | 876,290 | |
| Hyster-Yale Materials Handling Class A | 43,248 | 3,078,393 | |
| IDEX Corp. | 338,690 | 39,823,170 | |
| Jason Industries, Inc. (b) | 35,118 | 43,546 | |
| John Bean Technologies Corp. | 144,109 | 12,782,468 | |
| Kadant, Inc. | 49,681 | 4,314,795 | |
| Kennametal, Inc. (a) | 359,792 | 12,592,720 | |
| Key Technology, Inc. (b) | 12,346 | 184,449 | |
| L.B. Foster Co. Class A | 42,631 | 814,252 | |
| Lincoln Electric Holdings, Inc. | 270,985 | 23,532,337 | |
| Lindsay Corp. (a) | 47,752 | 4,133,891 | |
| LiqTech International, Inc. (b) | 90,569 | 35,322 | |
| Lydall, Inc. (b) | 75,237 | 3,536,139 | |
| Manitex International, Inc. (a)(b) | 52,326 | 480,353 | |
| Manitowoc Co., Inc. (a)(b) | 629,025 | 5,176,876 | |
| Meritor, Inc. (b) | 398,219 | 7,908,629 | |
| MFRI, Inc. (b) | 13,428 | 108,767 | |
| Middleby Corp. (a)(b) | 255,372 | 31,078,772 | |
| Milacron Holdings Corp. (b) | 193,671 | 3,089,052 | |
| Miller Industries, Inc. | 43,433 | 1,090,168 | |
| Mueller Industries, Inc. | 252,828 | 7,541,859 | |
| Mueller Water Products, Inc. Class A | 699,067 | 8,381,813 | |
| Navistar International Corp. New (a)(b) | 289,202 | 9,879,140 | |
| NN, Inc. | 117,774 | 3,003,237 | |
| Nordson Corp. | 236,872 | 25,890,110 | |
| Omega Flex, Inc. | 25,039 | 1,452,012 | |
| Oshkosh Corp. | 333,222 | 24,858,361 | |
| Park-Ohio Holdings Corp. | 37,253 | 1,484,532 | |
| ProPetro Holding Corp. (a) | 127,692 | 1,469,735 | |
| Proto Labs, Inc. (a)(b) | 107,285 | 7,703,063 | |
| RBC Bearings, Inc. (b) | 108,095 | 11,919,636 | |
| Rexnord Corp. (a)(b) | 464,832 | 11,100,188 | |
| Spartan Motors, Inc. | 147,713 | 1,358,960 | |
| SPX Corp. (b) | 185,849 | 4,478,961 | |
| SPX Flow, Inc. (b) | 185,763 | 6,217,488 | |
| Standex International Corp. | 55,773 | 5,323,533 | |
| Sun Hydraulics Corp. | 111,181 | 5,326,682 | |
| Supreme Industries, Inc. Class A | 55,775 | 1,167,929 | |
| Taylor Devices, Inc. (b) | 3,820 | 44,885 | |
| Tennant Co. | 79,161 | 4,824,863 | |
| Terex Corp. (a) | 394,514 | 15,208,515 | |
| The L.S. Starrett Co. Class A | 20,536 | 149,913 | |
| Timken Co. | 307,299 | 13,782,360 | |
| Titan International, Inc. | 216,636 | 1,858,737 | |
| Toro Co. | 472,830 | 29,164,154 | |
| TriMas Corp. (b) | 200,113 | 4,842,735 | |
| Trinity Industries, Inc. | 680,867 | 19,636,204 | |
| Twin Disc, Inc. (a)(b) | 35,431 | 615,082 | |
| Wabash National Corp. (a) | 259,988 | 5,464,948 | |
| WABCO Holdings, Inc. (b) | 223,311 | 32,071,926 | |
| Wabtec Corp. (a) | 381,016 | 26,888,299 | |
| Watts Water Technologies, Inc. Class A | 128,748 | 7,943,752 | |
| Woodward, Inc. | 251,943 | 17,688,918 | |
| WSI Industries, Inc. (a)(b) | 5,668 | 18,138 | |
| Xerium Technologies, Inc. (b) | 47,721 | 288,712 | |
| 732,793,512 | |||
| Marine - 0.1% | |||
| Genco Shipping & Trading Ltd. (a)(b) | 38,097 | 529,929 | |
| Kirby Corp. (a)(b) | 236,140 | 14,782,364 | |
| Matson, Inc. (a) | 198,804 | 5,129,143 | |
| Rand Logistics, Inc. (a)(b) | 41,510 | 11,602 | |
| 20,453,038 | |||
| Professional Services - 1.0% | |||
| Acacia Research Corp. (b) | 213,329 | 693,319 | |
| Advisory Board Co. (b) | 177,245 | 9,438,296 | |
| Barrett Business Services, Inc. | 30,306 | 1,563,183 | |
| BG Staffing, Inc. (a) | 29,747 | 481,009 | |
| CBIZ, Inc. (b) | 268,820 | 4,072,623 | |
| CDI Corp. (b) | 54,937 | 450,483 | |
| Cogint, Inc. (a)(b) | 168,940 | 827,806 | |
| CRA International, Inc. | 36,975 | 1,387,672 | |
| DLH Holdings Corp. (b) | 2,300 | 13,639 | |
| Dun & Bradstreet Corp. | 162,164 | 18,071,556 | |
| Exponent, Inc. | 117,241 | 7,984,112 | |
| Franklin Covey Co. (b) | 52,794 | 992,527 | |
| FTI Consulting, Inc. (a)(b) | 185,927 | 6,304,785 | |
| General Employment Enterprises, Inc. (a)(b) | 3,794 | 16,504 | |
| GP Strategies Corp. (b) | 68,198 | 1,950,463 | |
| Heidrick & Struggles International, Inc. | 82,403 | 1,503,855 | |
| Hill International, Inc. (b) | 149,735 | 711,241 | |
| Hudson Global, Inc. (b) | 74,637 | 109,716 | |
| Huron Consulting Group, Inc. (b) | 98,046 | 2,965,892 | |
| ICF International, Inc. (b) | 87,475 | 4,203,174 | |
| Insperity, Inc. | 83,293 | 6,688,428 | |
| Kelly Services, Inc. Class A (non-vtg.) | 143,305 | 3,099,687 | |
| Kforce, Inc. | 107,981 | 1,943,658 | |
| Korn/Ferry International | 251,900 | 8,393,308 | |
| Lightbridge Corp. (a)(b) | 12,874 | 13,775 | |
| Manpower, Inc. | 295,868 | 32,992,241 | |
| Marathon Patent Group, Inc. (a)(b) | 29,824 | 13,063 | |
| Mastech Digital, Inc. (b) | 3,140 | 28,574 | |
| MISTRAS Group, Inc. (b) | 76,579 | 1,448,109 | |
| Navigant Consulting, Inc. (b) | 207,969 | 3,188,165 | |
| On Assignment, Inc. (b) | 212,383 | 10,130,669 | |
| Pendrell Corp. (a)(b) | 74,270 | 503,551 | |
| RCM Technologies, Inc. (b) | 26,829 | 144,608 | |
| Resources Connection, Inc. | 147,742 | 1,883,711 | |
| RPX Corp. (b) | 214,024 | 2,795,153 | |
| Spherix, Inc. (a)(b) | 4,801 | 6,529 | |
| TransUnion Holding Co., Inc. (b) | 659,017 | 31,540,554 | |
| TriNet Group, Inc. (b) | 158,260 | 5,654,630 | |
| TrueBlue, Inc. (b) | 193,372 | 3,954,457 | |
| Volt Information Sciences, Inc. (a)(b) | 35,427 | 113,366 | |
| WageWorks, Inc. (a)(b) | 178,840 | 10,542,618 | |
| Willdan Group, Inc. (b) | 32,802 | 1,017,190 | |
| 189,837,899 | |||
| Road & Rail - 0.8% | |||
| AMERCO (a) | 24,227 | 9,041,759 | |
| ArcBest Corp. | 109,057 | 3,238,993 | |
| Avis Budget Group, Inc. (a)(b) | 375,306 | 13,597,336 | |
| Celadon Group, Inc. (a) | 115,770 | 578,850 | |
| Covenant Transport Group, Inc. Class A (b) | 52,825 | 1,268,328 | |
| Daseke, Inc. (a)(b) | 81,009 | 1,061,218 | |
| Genesee & Wyoming, Inc. Class A (a)(b) | 269,388 | 18,469,241 | |
| Heartland Express, Inc. (a) | 226,325 | 5,017,625 | |
| Knight Transportation, Inc. (a) | 294,681 | 11,507,293 | |
| Landstar System, Inc. | 182,950 | 17,078,383 | |
| Marten Transport Ltd. | 165,978 | 2,846,523 | |
| Old Dominion Freight Lines, Inc. | 305,942 | 30,563,606 | |
| P.A.M. Transportation Services, Inc. (b) | 12,026 | 237,634 | |
| Patriot Transportation Holding, Inc. (b) | 5,823 | 112,442 | |
| Roadrunner Transportation Systems, Inc. (b) | 119,733 | 894,406 | |
| Ryder System, Inc. | 237,682 | 18,444,123 | |
| Saia, Inc. (b) | 114,875 | 6,496,181 | |
| Schneider National, Inc. Class B (a) | 145,054 | 3,227,452 | |
| Swift Transporation Co. (a)(b) | 367,475 | 10,307,674 | |
| U.S.A. Truck, Inc. (b) | 31,657 | 352,976 | |
| Universal Logistics Holdings, Inc. | 36,649 | 608,373 | |
| Werner Enterprises, Inc. (a) | 192,509 | 6,372,048 | |
| YRC Worldwide, Inc. (b) | 143,374 | 1,919,778 | |
| 163,242,242 | |||
| Trading Companies & Distributors - 1.1% | |||
| AeroCentury Corp. (b) | 740 | 9,324 | |
| Air Lease Corp. Class A | 427,683 | 17,381,037 | |
| Aircastle Ltd. | 248,136 | 5,563,209 | |
| Applied Industrial Technologies, Inc. | 174,899 | 9,969,243 | |
| Beacon Roofing Supply, Inc. (a)(b) | 268,945 | 12,667,310 | |
| BlueLinx Corp. (b) | 7,336 | 71,599 | |
| BMC Stock Holdings, Inc. (b) | 269,547 | 5,471,804 | |
| CAI International, Inc. (b) | 69,862 | 2,165,023 | |
| DXP Enterprises, Inc. (b) | 67,444 | 1,827,058 | |
| EnviroStar, Inc. (a) | 8,419 | 278,248 | |
| GATX Corp. (a) | 173,209 | 10,493,001 | |
| General Finance Corp. (b) | 1,148 | 5,396 | |
| H&E Equipment Services, Inc. | 137,617 | 3,239,504 | |
| HD Supply Holdings, Inc. (b) | 888,452 | 29,585,452 | |
| Herc Holdings, Inc. (a)(b) | 111,403 | 4,703,435 | |
| Houston Wire & Cable Co. | 69,133 | 397,515 | |
| Huttig Building Products, Inc. (a)(b) | 74,305 | 423,539 | |
| Kaman Corp. (a) | 123,042 | 6,033,980 | |
| Lawson Products, Inc. (b) | 23,255 | 554,632 | |
| MRC Global, Inc. (a)(b) | 424,109 | 6,688,199 | |
| MSC Industrial Direct Co., Inc. Class A | 196,943 | 13,565,434 | |
| Neff Corp. (b) | 39,362 | 982,082 | |
| Nexeo Solutions, Inc. (b) | 267,934 | 1,921,087 | |
| Now, Inc. (a)(b) | 493,682 | 5,756,332 | |
| Rush Enterprises, Inc. Class A (b) | 159,993 | 6,558,113 | |
| SiteOne Landscape Supply, Inc. (a)(b) | 175,170 | 8,800,541 | |
| Textainer Group Holdings Ltd. (a) | 128,344 | 2,278,106 | |
| Titan Machinery, Inc. (a)(b) | 71,633 | 924,066 | |
| Transcat, Inc. (b) | 4,785 | 63,641 | |
| Triton International Ltd. | 145,243 | 5,362,372 | |
| Univar, Inc. (b) | 449,956 | 12,693,259 | |
| Veritiv Corp. (b) | 49,470 | 1,385,160 | |
| Watsco, Inc. (a) | 132,311 | 19,497,349 | |
| WESCO International, Inc. (a)(b) | 183,218 | 9,243,348 | |
| Willis Lease Finance Corp. (b) | 19,324 | 459,911 | |
| 207,019,309 | |||
| Transportation Infrastructure - 0.1% | |||
| Macquarie Infrastructure Co. LLC (a) | 336,449 | 25,058,722 | |
| SEACOR Marine Holdings, Inc. (a) | 70,798 | 906,922 | |
| 25,965,644 | |||
| TOTAL INDUSTRIALS | 2,617,118,567 | ||
| INFORMATION TECHNOLOGY - 18.0% | |||
| Communications Equipment - 1.6% | |||
| ADTRAN, Inc. | 213,624 | 4,721,090 | |
| Aerohive Networks, Inc. (a)(b) | 133,582 | 460,858 | |
| Applied Optoelectronics, Inc. (a)(b) | 76,484 | 4,521,734 | |
| Arista Networks, Inc. (a)(b) | 186,797 | 32,904,292 | |
| Arris International PLC (b) | 838,057 | 23,348,268 | |
| Aviat Networks, Inc. (b) | 18,281 | 282,990 | |
| Black Box Corp. | 75,745 | 227,235 | |
| Brocade Communications Systems, Inc. | 1,773,125 | 21,951,288 | |
| CalAmp Corp. (a)(b) | 157,687 | 2,923,517 | |
| Calix Networks, Inc. (b) | 185,025 | 906,623 | |
| Carvana Co. Class A (a) | 74,689 | 1,333,199 | |
| Ciena Corp. (a)(b) | 619,880 | 13,395,607 | |
| Clearfield, Inc. (a)(b) | 45,932 | 560,370 | |
| ClearOne, Inc. | 17,545 | 131,588 | |
| CommScope Holding Co., Inc. (a)(b) | 851,551 | 28,152,276 | |
| Communications Systems, Inc. | 9,294 | 33,551 | |
| Comtech Telecommunications Corp. | 104,409 | 2,043,284 | |
| Dasan Zhone Solutions, Inc. (b) | 16,898 | 110,851 | |
| Digi International, Inc. (b) | 109,744 | 1,009,645 | |
| EchoStar Holding Corp. Class A (b) | 217,069 | 13,089,261 | |
| EMCORE Corp. (b) | 119,065 | 1,083,492 | |
| Extreme Networks, Inc. (b) | 483,497 | 5,526,371 | |
| Finisar Corp. (b) | 493,602 | 11,920,488 | |
| Harmonic, Inc. (a)(b) | 354,615 | 1,152,499 | |
| Infinera Corp. (a)(b) | 641,831 | 5,429,890 | |
| InfoSonics Corp. (a)(b) | 41,938 | 16,230 | |
| InterDigital, Inc. | 156,562 | 11,170,699 | |
| KVH Industries, Inc. (b) | 54,401 | 641,932 | |
| Lantronix, Inc. (b) | 2,994 | 6,317 | |
| Lumentum Holdings, Inc. (a)(b) | 243,372 | 13,835,698 | |
| NETGEAR, Inc. (a)(b) | 146,517 | 7,032,816 | |
| NetScout Systems, Inc. (a)(b) | 418,975 | 13,721,431 | |
| Network-1 Security Solutions, Inc. | 45,735 | 173,793 | |
| Oclaro, Inc. (a)(b) | 574,765 | 4,833,774 | |
| Optical Cable Corp. (b) | 11,466 | 28,092 | |
| Palo Alto Networks, Inc. (b) | 406,134 | 53,889,920 | |
| Parkervision, Inc. (a)(b) | 61,776 | 118,610 | |
| PC-Tel, Inc. | 66,388 | 430,194 | |
| Plantronics, Inc. | 152,688 | 6,509,089 | |
| Relm Wireless Corp. | 69,394 | 270,637 | |
| Resonant, Inc. (a)(b) | 9,244 | 42,060 | |
| ShoreTel, Inc. (b) | 323,573 | 2,410,619 | |
| Sonus Networks, Inc. (a)(b) | 234,277 | 1,618,854 | |
| Technical Communications Corp. (a)(b) | 2,835 | 14,884 | |
| Tessco Technologies, Inc. | 22,372 | 293,073 | |
| Ubiquiti Networks, Inc. (a)(b) | 110,347 | 6,575,578 | |
| ViaSat, Inc. (a)(b) | 237,802 | 15,126,585 | |
| Viavi Solutions, Inc. (a)(b) | 994,806 | 9,987,852 | |
| Westell Technologies, Inc. Class A (b) | 37,506 | 107,642 | |
| xG Technology, Inc. (a)(b) | 3,477 | 6,363 | |
| 326,083,009 | |||
| Electronic Equipment & Components - 3.5% | |||
| ADDvantage Technologies Group, Inc. (a)(b) | 11,928 | 17,296 | |
| Akoustis Technologies, Inc. (a)(b) | 45,754 | 307,467 | |
| Anixter International, Inc. (b) | 125,022 | 9,226,624 | |
| Applied DNA Sciences, Inc. (a)(b) | 85,045 | 176,043 | |
| Arrow Electronics, Inc. (b) | 390,763 | 31,038,305 | |
| Avnet, Inc. | 556,888 | 21,479,170 | |
| AVX Corp. | 278,802 | 4,865,095 | |
| Badger Meter, Inc. | 128,072 | 5,878,505 | |
| Bel Fuse, Inc. Class B (non-vtg.) | 44,160 | 1,126,080 | |
| Belden, Inc. | 185,976 | 14,333,170 | |
| Benchmark Electronics, Inc. (b) | 225,726 | 7,336,095 | |
| Cardtronics PLC (b) | 198,745 | 5,163,395 | |
| CDW Corp. | 692,321 | 43,906,998 | |
| ClearSign Combustion Corp. (a)(b) | 63,125 | 192,531 | |
| Cognex Corp. | 383,092 | 41,745,535 | |
| Coherent, Inc. (a)(b) | 108,567 | 25,330,852 | |
| Control4 Corp. (a)(b) | 80,229 | 1,986,470 | |
| CTS Corp. | 140,891 | 3,170,048 | |
| CUI Global, Inc. (a)(b) | 87,433 | 338,366 | |
| Daktronics, Inc. (a) | 173,183 | 1,667,752 | |
| Data I/O Corp. (b) | 25,864 | 213,378 | |
| Dell Technologies, Inc. | 594,459 | 44,542,813 | |
| Digital Ally, Inc. (a)(b) | 15,000 | 42,750 | |
| Dolby Laboratories, Inc. Class A | 261,397 | 13,190,093 | |
| Dynasil Corp. of America (b) | 9,408 | 11,760 | |
| Echelon Corp. (b) | 10,844 | 50,208 | |
| Electro Scientific Industries, Inc. (b) | 156,262 | 1,925,148 | |
| eMagin Corp. (a)(b) | 60,537 | 130,155 | |
| ePlus, Inc. (b) | 59,953 | 5,018,066 | |
| Fabrinet (a)(b) | 169,751 | 6,593,129 | |
| FARO Technologies, Inc. (a)(b) | 72,512 | 2,498,038 | |
| Fitbit, Inc. (a)(b) | 653,267 | 3,939,200 | |
| Frequency Electronics, Inc. (b) | 18,354 | 146,465 | |
| Giga-Tronics, Inc. (b) | 16,884 | 10,173 | |
| I. D. Systems Inc. (b) | 43,008 | 272,671 | |
| Identiv, Inc. (a)(b) | 40,037 | 196,582 | |
| IEC Electronics Corp. (b) | 18,101 | 74,938 | |
| II-VI, Inc. (b) | 244,569 | 8,767,799 | |
| Image Sensing Systems, Inc. (b) | 9,763 | 30,265 | |
| Insight Enterprises, Inc. (b) | 156,429 | 6,269,674 | |
| Intellicheck, Inc. (a)(b) | 10,716 | 27,862 | |
| IntriCon Corp. (a)(b) | 8,644 | 72,610 | |
| IPG Photonics Corp. (a)(b) | 166,701 | 29,304,369 | |
| Iteris, Inc. (a)(b) | 124,948 | 802,166 | |
| Itron, Inc. (b) | 150,507 | 10,926,808 | |
| Jabil, Inc. | 811,458 | 25,439,208 | |
| KEMET Corp. (b) | 192,335 | 4,598,730 | |
| KEY Tronic Corp. (b) | 23,864 | 169,673 | |
| Keysight Technologies, Inc. (b) | 820,324 | 33,518,439 | |
| Kimball Electronics, Inc. (b) | 122,862 | 2,340,521 | |
| Knowles Corp. (a)(b) | 397,367 | 5,829,374 | |
| LGL Group, Inc. (b) | 3,009 | 15,617 | |
| LightPath Technologies, Inc. Class A (a)(b) | 76,597 | 199,918 | |
| Littelfuse, Inc. | 100,418 | 18,693,815 | |
| LRAD Corp. (b) | 77,211 | 132,031 | |
| Luna Innovations, Inc. (b) | 137,097 | 207,016 | |
| Maxwell Technologies, Inc. (b) | 125,294 | 697,888 | |
| Mesa Laboratories, Inc. | 15,120 | 2,064,938 | |
| Methode Electronics, Inc. Class A | 168,150 | 6,877,335 | |
| MicroVision, Inc. (a)(b) | 312,134 | 739,758 | |
| MTS Systems Corp. (a) | 73,708 | 3,567,467 | |
| Napco Security Technolgies, Inc. (b) | 36,465 | 286,250 | |
| National Instruments Corp. | 473,206 | 19,112,790 | |
| Neonode, Inc. (a)(b) | 121,979 | 153,694 | |
| NetList, Inc. (a)(b) | 140,493 | 98,345 | |
| Novanta, Inc. (b) | 137,094 | 5,360,375 | |
| OSI Systems, Inc. (b) | 81,512 | 6,770,387 | |
| Par Technology Corp. (b) | 27,309 | 293,572 | |
| Park Electrochemical Corp. | 84,819 | 1,540,313 | |
| PC Connection, Inc. | 76,692 | 1,956,413 | |
| PC Mall, Inc. (a)(b) | 33,187 | 436,409 | |
| Perceptron, Inc. (b) | 33,349 | 257,121 | |
| Plexus Corp. (b) | 155,046 | 8,074,796 | |
| RadiSys Corp. (b) | 140,804 | 221,062 | |
| Research Frontiers, Inc. (a)(b) | 71,977 | 84,933 | |
| RF Industries Ltd. | 13,982 | 25,168 | |
| Richardson Electronics Ltd. | 36,856 | 206,394 | |
| Rogers Corp. (b) | 80,748 | 9,572,675 | |
| Sanmina Corp. (b) | 333,975 | 12,507,364 | |
| ScanSource, Inc. (b) | 112,049 | 4,397,923 | |
| Sigmatron International, Inc. (b) | 11,463 | 96,518 | |
| Superconductor Technologies, Inc. (a)(b) | 28,777 | 28,489 | |
| SYNNEX Corp. | 128,283 | 15,343,930 | |
| Systemax, Inc. | 60,715 | 1,483,875 | |
| Tech Data Corp. (b) | 151,995 | 16,763,529 | |
| Trimble, Inc. (b) | 1,117,122 | 43,210,279 | |
| TTM Technologies, Inc. (a)(b) | 390,367 | 5,558,826 | |
| Uni-Pixel, Inc. (a)(b) | 176,104 | 19,389 | |
| Universal Display Corp. | 197,571 | 25,111,274 | |
| VeriFone Systems, Inc. (a)(b) | 501,200 | 9,908,724 | |
| Vishay Intertechnology, Inc. (a) | 622,274 | 11,014,250 | |
| Vishay Precision Group, Inc. (b) | 49,281 | 1,076,790 | |
| Wayside Technology Group, Inc. | 13,442 | 205,663 | |
| Wireless Telecom Group, Inc. (b) | 35,461 | 52,128 | |
| Zebra Technologies Corp. Class A (b) | 234,031 | 24,126,256 | |
| 684,790,549 | |||
| Internet Software & Services - 2.2% | |||
| 2U, Inc. (a)(b) | 189,911 | 9,514,541 | |
| Actua Corp. (b) | 161,479 | 2,066,931 | |
| Alarm.com Holdings, Inc. (a)(b) | 59,694 | 2,681,454 | |
| Amber Road, Inc. (b) | 59,273 | 477,740 | |
| Angie's List, Inc. (a)(b) | 154,180 | 1,874,829 | |
| AppFolio, Inc. (b) | 54,022 | 2,317,544 | |
| Apptio, Inc. Class A | 37,569 | 668,728 | |
| Autobytel, Inc. (b) | 47,015 | 341,329 | |
| Bankrate, Inc. (b) | 208,141 | 2,882,753 | |
| Bazaarvoice, Inc. (a)(b) | 361,054 | 1,715,007 | |
| Benefitfocus, Inc. (a)(b) | 64,424 | 1,987,480 | |
| BlackLine, Inc. (a) | 62,407 | 1,926,504 | |
| Blucora, Inc. (b) | 181,083 | 4,128,692 | |
| Box, Inc. Class A (a)(b) | 312,152 | 6,124,422 | |
| Bridgeline Digital, Inc. (a)(b) | 970 | 2,561 | |
| Brightcove, Inc. (b) | 145,383 | 1,024,950 | |
| BroadVision, Inc. (b) | 7,417 | 29,297 | |
| Carbonite, Inc. (a)(b) | 75,203 | 1,504,060 | |
| Care.com, Inc. (a)(b) | 70,954 | 1,062,181 | |
| ChannelAdvisor Corp. (b) | 104,787 | 1,215,529 | |
| Cloudera, Inc. (a) | 77,898 | 1,511,221 | |
| CommerceHub, Inc.: | |||
| Series A (a)(b) | 53,243 | 1,180,397 | |
| Series C (b) | 113,561 | 2,410,900 | |
| Cornerstone OnDemand, Inc. (a)(b) | 231,027 | 8,081,324 | |
| CoStar Group, Inc. (b) | 144,255 | 41,346,368 | |
| Coupa Software, Inc. (a) | 137,304 | 4,182,280 | |
| Determine, Inc. (a)(b) | 73,216 | 147,164 | |
| DHI Group, Inc. (b) | 207,864 | 405,335 | |
| eGain Communications Corp. (a)(b) | 49,320 | 83,844 | |
| Endurance International Group Holdings, Inc. (a)(b) | 301,288 | 2,319,918 | |
| Envestnet, Inc. (a)(b) | 200,566 | 8,915,159 | |
| Five9, Inc. (b) | 173,999 | 3,740,979 | |
| GlowPoint, Inc. (b) | 321,954 | 86,928 | |
| GoDaddy, Inc. (a)(b) | 200,065 | 8,966,913 | |
| Gogo, Inc. (a)(b) | 249,270 | 3,492,273 | |
| GrubHub, Inc. (a)(b) | 381,252 | 21,765,677 | |
| GTT Communications, Inc. (a)(b) | 117,419 | 3,728,053 | |
| Hortonworks, Inc. (b) | 191,509 | 3,253,738 | |
| IAC/InterActiveCorp (b) | 320,784 | 36,412,192 | |
| Instructure, Inc. (b) | 28,818 | 853,013 | |
| Internap Network Services Corp. (a)(b) | 217,848 | 973,781 | |
| Inuvo, Inc. (b) | 97,208 | 99,152 | |
| iPass, Inc. (b) | 412,177 | 230,819 | |
| Issuer Direct Corp. | 35,897 | 450,507 | |
| j2 Global, Inc. (a) | 210,591 | 15,853,290 | |
| Leaf Group Ltd. (b) | 42,441 | 301,331 | |
| Limelight Networks, Inc. (b) | 279,123 | 1,002,052 | |
| Liquidity Services, Inc. (b) | 96,138 | 547,987 | |
| LivePerson, Inc. (b) | 236,704 | 3,171,834 | |
| LogMeIn, Inc. | 232,572 | 26,606,237 | |
| Marchex, Inc. Class B (b) | 112,959 | 349,043 | |
| Marin Software, Inc. (b) | 77,141 | 88,712 | |
| Match Group, Inc. (a)(b) | 222,150 | 4,831,763 | |
| MaxPoint Interactive, Inc. (b) | 8,863 | 121,512 | |
| MeetMe, Inc. (a)(b) | 309,415 | 1,212,907 | |
| MINDBODY, Inc. (a)(b) | 137,891 | 3,261,122 | |
| MuleSoft, Inc. Class A (a) | 74,726 | 1,629,027 | |
| Net Element International, Inc. (a)(b) | 25,699 | 7,067 | |
| New Relic, Inc. (b) | 140,622 | 6,735,794 | |
| NIC, Inc. | 273,094 | 4,465,087 | |
| NumereX Corp. Class A (b) | 50,190 | 195,239 | |
| Nutanix, Inc. Class A (a) | 129,751 | 2,854,522 | |
| Okta, Inc. (a) | 65,157 | 1,758,587 | |
| Ominto, Inc. (a)(b) | 33,150 | 107,738 | |
| Onvia.com, Inc. (b) | 2,326 | 10,002 | |
| Pandora Media, Inc. (a)(b) | 1,083,008 | 9,151,418 | |
| Professional Diversity Network, Inc. (a)(b) | 5,792 | 26,585 | |
| Q2 Holdings, Inc. (b) | 120,373 | 4,887,144 | |
| QuinStreet, Inc. (b) | 158,196 | 846,349 | |
| Qumu Corp. (b) | 84,064 | 236,220 | |
| Quotient Technology, Inc. (a)(b) | 319,064 | 4,785,960 | |
| Reis, Inc. | 36,313 | 620,952 | |
| Remark Holdings, Inc. (a)(b) | 45,073 | 121,246 | |
| Rocket Fuel, Inc. (a)(b) | 143,044 | 370,484 | |
| SecureWorks Corp. (a)(b) | 52,243 | 534,446 | |
| Shutterstock, Inc. (a)(b) | 84,939 | 2,852,252 | |
| Spark Networks, Inc. (a)(b) | 80,921 | 101,151 | |
| SPS Commerce, Inc. (b) | 75,905 | 4,624,133 | |
| Stamps.com, Inc. (a)(b) | 69,417 | 13,276,001 | |
| Support.com, Inc. (b) | 55,905 | 131,936 | |
| Synacor, Inc. (a)(b) | 121,700 | 279,910 | |
| TechTarget, Inc. (b) | 66,813 | 664,121 | |
| The Trade Desk, Inc. (a) | 78,929 | 4,180,869 | |
| Travelzoo, Inc. (b) | 32,602 | 265,706 | |
| Tremor Video, Inc. (b) | 117,265 | 412,773 | |
| TrueCar, Inc. (a)(b) | 303,179 | 5,138,884 | |
| Twilio, Inc. Class A (a)(b) | 109,864 | 3,216,818 | |
| Twitter, Inc. (b) | 2,703,598 | 45,717,842 | |
| Veritone, Inc. (a) | 10,171 | 158,261 | |
| Web.com Group, Inc. (a)(b) | 229,327 | 5,801,973 | |
| WebMD Health Corp. (a)(b) | 164,590 | 10,935,360 | |
| XO Group, Inc. (b) | 113,629 | 2,115,772 | |
| Yelp, Inc. (a)(b) | 274,801 | 11,706,523 | |
| Yext, Inc. (a) | 66,767 | 868,639 | |
| YuMe, Inc. | 148,498 | 726,155 | |
| Zillow Group, Inc.: | |||
| Class A (b) | 235,990 | 9,420,721 | |
| Class C (a)(b) | 444,694 | 17,618,776 | |
| 435,090,700 | |||
| IT Services - 3.1% | |||
| Acxiom Corp. (a)(b) | 343,364 | 7,996,948 | |
| ALJ Regional Holdings, Inc. (a)(b) | 9,858 | 30,067 | |
| Amdocs Ltd. | 637,672 | 41,314,769 | |
| Black Knight Financial Services, Inc. Class A (a)(b) | 128,420 | 5,470,692 | |
| Blackhawk Network Holdings, Inc. (b) | 254,306 | 11,392,909 | |
| Booz Allen Hamilton Holding Corp. Class A | 655,949 | 22,374,420 | |
| Broadridge Financial Solutions, Inc. | 517,888 | 40,462,589 | |
| CACI International, Inc. Class A (a)(b) | 107,395 | 13,939,871 | |
| Cartesian, Inc. (b) | 2,929 | 1,451 | |
| Cass Information Systems, Inc. | 39,706 | 2,430,801 | |
| Computer Task Group, Inc. | 44,089 | 233,672 | |
| Conduent, Inc. | 785,465 | 12,968,027 | |
| Convergys Corp. (a) | 415,336 | 9,760,396 | |
| CoreLogic, Inc. (b) | 383,089 | 17,993,690 | |
| CSG Systems International, Inc. | 151,676 | 5,871,378 | |
| CSP, Inc. | 3,555 | 35,941 | |
| DST Systems, Inc. | 274,036 | 14,066,268 | |
| Edgewater Technology, Inc. (b) | 28,583 | 182,931 | |
| EPAM Systems, Inc. (b) | 205,054 | 16,677,042 | |
| Euronet Worldwide, Inc. (b) | 233,405 | 22,936,709 | |
| Everi Holdings, Inc. (b) | 288,895 | 2,227,380 | |
| EVERTEC, Inc. | 265,835 | 4,891,364 | |
| ExlService Holdings, Inc. (b) | 155,709 | 8,763,303 | |
| First Data Corp. Class A (b) | 869,387 | 16,005,415 | |
| FleetCor Technologies, Inc. (b) | 406,644 | 58,463,208 | |
| Forrester Research, Inc. | 46,079 | 1,877,719 | |
| Genpact Ltd. | 581,636 | 16,547,544 | |
| Hackett Group, Inc. | 109,633 | 1,497,587 | |
| Information Services Group, Inc. (b) | 108,930 | 408,488 | |
| Innodata, Inc. (b) | 58,124 | 90,092 | |
| Jack Henry & Associates, Inc. | 335,576 | 34,587,818 | |
| Leidos Holdings, Inc. | 635,298 | 37,050,579 | |
| ManTech International Corp. Class A | 116,151 | 4,671,593 | |
| Mattersight Corp. (a)(b) | 47,315 | 111,190 | |
| Maximus, Inc. | 289,307 | 17,584,079 | |
| ModusLink Global Solutions, Inc. (a)(b) | 128,863 | 206,181 | |
| MoneyGram International, Inc. (b) | 122,493 | 1,930,490 | |
| Perficient, Inc. (b) | 156,395 | 2,862,029 | |
| PFSweb, Inc. (b) | 60,946 | 480,254 | |
| Planet Payment, Inc. (b) | 177,497 | 702,888 | |
| Presidio, Inc. (a) | 103,875 | 1,444,901 | |
| PRG-Schultz International, Inc. (b) | 115,194 | 777,560 | |
| Sabre Corp. (a) | 914,345 | 16,860,522 | |
| Science Applications International Corp. | 196,197 | 14,495,034 | |
| ServiceSource International, Inc. (a)(b) | 263,840 | 928,717 | |
| Square, Inc. (a)(b) | 133,178 | 3,477,278 | |
| StarTek, Inc. (b) | 46,338 | 551,422 | |
| Sykes Enterprises, Inc. (b) | 182,449 | 4,864,090 | |
| Syntel, Inc. (a) | 129,694 | 2,342,274 | |
| Teletech Holdings, Inc. | 72,337 | 2,871,779 | |
| Teradata Corp. (a)(b) | 583,210 | 18,616,063 | |
| Travelport Worldwide Ltd. | 565,401 | 8,560,171 | |
| Unisys Corp. (a)(b) | 234,063 | 1,813,988 | |
| Vantiv, Inc. (a)(b) | 708,654 | 50,094,751 | |
| Virtusa Corp. (a)(b) | 123,714 | 4,493,292 | |
| WEX, Inc. (a)(b) | 171,294 | 18,695,027 | |
| WidePoint Corp. (a)(b) | 269,166 | 145,350 | |
| WPCS International, Inc. (b) | 40,159 | 48,191 | |
| 608,180,182 | |||
| Semiconductors & Semiconductor Equipment - 2.7% | |||
| Acacia Communications, Inc. (a)(b) | 61,999 | 3,027,411 | |
| Adesto Technologies Corp. (b) | 48,935 | 318,078 | |
| Advanced Energy Industries, Inc. (b) | 177,606 | 13,061,145 | |
| AEHR Test Systems (b) | 79,166 | 265,998 | |
| Alpha & Omega Semiconductor Ltd. (b) | 85,665 | 1,360,360 | |
| Amkor Technology, Inc. (b) | 574,885 | 5,047,490 | |
| Amtech Systems, Inc. (b) | 43,995 | 486,145 | |
| Axcelis Technologies, Inc. (b) | 130,729 | 2,732,236 | |
| AXT, Inc. (a)(b) | 166,392 | 1,297,858 | |
| Brooks Automation, Inc. | 309,179 | 8,060,297 | |
| Cabot Microelectronics Corp. | 110,101 | 7,885,434 | |
| Cavium, Inc. (a)(b) | 303,321 | 19,203,253 | |
| Ceva, Inc. (b) | 96,147 | 3,898,761 | |
| Cirrus Logic, Inc. (b) | 285,658 | 16,562,451 | |
| Cohu, Inc. | 116,622 | 2,187,829 | |
| Cree, Inc. (a)(b) | 430,758 | 10,480,342 | |
| CVD Equipment Corp. (a)(b) | 12,898 | 141,878 | |
| CyberOptics Corp. (a)(b) | 32,417 | 491,118 | |
| Cypress Semiconductor Corp. (a) | 1,440,585 | 19,721,609 | |
| Diodes, Inc. (b) | 175,145 | 4,928,580 | |
| DSP Group, Inc. (b) | 100,061 | 1,190,726 | |
| Entegris, Inc. (b) | 635,201 | 16,165,865 | |
| Experi Corp. | 219,637 | 5,985,108 | |
| First Solar, Inc. (a)(b) | 344,517 | 16,178,518 | |
| FormFactor, Inc. (b) | 312,733 | 4,722,268 | |
| GSI Technology, Inc. (a)(b) | 65,735 | 436,480 | |
| Ichor Holdings Ltd. | 77,562 | 1,774,619 | |
| Impinj, Inc. (a)(b) | 37,691 | 1,441,304 | |
| Inphi Corp. (a)(b) | 168,862 | 6,465,726 | |
| Integrated Device Technology, Inc. (a)(b) | 583,008 | 14,406,128 | |
| Intermolecular, Inc. (b) | 45,789 | 39,379 | |
| Intest Corp. (b) | 34,005 | 256,738 | |
| IXYS Corp. (b) | 117,193 | 2,695,439 | |
| Kopin Corp. (a)(b) | 265,387 | 1,066,856 | |
| Kulicke & Soffa Industries, Inc. (b) | 322,075 | 6,129,087 | |
| Lattice Semiconductor Corp. (b) | 557,001 | 3,147,056 | |
| M/A-COM Technology Solutions Holdings, Inc. (a)(b) | 153,866 | 7,007,058 | |
| Marvell Technology Group Ltd. | 1,931,431 | 34,591,929 | |
| Maxim Integrated Products, Inc. | 1,246,137 | 58,144,752 | |
| MaxLinear, Inc. Class A (b) | 227,130 | 4,906,008 | |
| Microsemi Corp. (b) | 512,536 | 25,821,564 | |
| MKS Instruments, Inc. | 239,191 | 19,697,379 | |
| Monolithic Power Systems, Inc. | 171,099 | 17,335,751 | |
| MoSys, Inc. (a)(b) | 16,576 | 16,079 | |
| Nanometrics, Inc. (b) | 114,026 | 2,940,731 | |
| NeoPhotonics Corp. (a)(b) | 134,183 | 784,971 | |
| NVE Corp. | 22,496 | 1,706,097 | |
| ON Semiconductor Corp. (b) | 1,844,767 | 31,508,620 | |
| PDF Solutions, Inc. (a)(b) | 125,323 | 1,903,656 | |
| Photronics, Inc. (b) | 325,040 | 2,567,816 | |
| Pixelworks, Inc. (a)(b) | 116,018 | 556,886 | |
| Power Integrations, Inc. | 133,482 | 9,724,164 | |
| QuickLogic Corp. (a)(b) | 369,431 | 495,038 | |
| Rambus, Inc. (a)(b) | 500,137 | 6,486,777 | |
| Rubicon Technology, Inc. (a)(b) | 8,619 | 70,590 | |
| Rudolph Technologies, Inc. (b) | 151,615 | 3,365,853 | |
| Semtech Corp. (b) | 301,972 | 11,354,147 | |
| Sigma Designs, Inc. (b) | 171,877 | 1,074,231 | |
| Silicon Laboratories, Inc. (b) | 185,999 | 14,117,324 | |
| SolarEdge Technologies, Inc. (a)(b) | 130,247 | 3,484,107 | |
| SunPower Corp. (a)(b) | 245,850 | 2,173,314 | |
| Synaptics, Inc. (a)(b) | 154,843 | 6,436,824 | |
| Teradyne, Inc. | 876,306 | 31,205,257 | |
| Ultra Clean Holdings, Inc. (b) | 144,924 | 3,343,397 | |
| Veeco Instruments, Inc. (b) | 215,377 | 4,070,625 | |
| Versum Materials, Inc. | 484,683 | 17,899,343 | |
| Xcerra Corp. (b) | 237,359 | 2,330,865 | |
| 530,380,723 | |||
| Software - 4.6% | |||
| 8x8, Inc. (b) | 423,901 | 5,998,199 | |
| A10 Networks, Inc. (b) | 208,779 | 1,367,502 | |
| ACI Worldwide, Inc. (a)(b) | 520,908 | 11,855,866 | |
| Agilysys, Inc. (b) | 51,105 | 525,870 | |
| American Software, Inc. Class A | 107,380 | 1,182,254 | |
| Aspen Technology, Inc. (b) | 328,414 | 20,772,186 | |
| Asure Software, Inc. (a)(b) | 45,600 | 528,048 | |
| Aware, Inc. (b) | 24,496 | 121,255 | |
| Barracuda Networks, Inc. (b) | 130,250 | 3,153,353 | |
| Blackbaud, Inc. | 210,879 | 17,800,296 | |
| Bottomline Technologies, Inc. (b) | 168,545 | 5,108,599 | |
| BroadSoft, Inc. (a)(b) | 135,708 | 6,724,331 | |
| BSQUARE Corp. (b) | 35,898 | 179,490 | |
| Cadence Design Systems, Inc. (b) | 1,227,809 | 48,240,616 | |
| Callidus Software, Inc. (b) | 289,709 | 7,460,007 | |
| CDK Global, Inc. | 633,979 | 40,891,646 | |
| CommVault Systems, Inc. (b) | 186,736 | 11,400,233 | |
| Datawatch Corp. (b) | 55,025 | 566,758 | |
| Digimarc Corp. (a)(b) | 49,238 | 1,521,454 | |
| Digital Turbine, Inc. (a)(b) | 162,229 | 188,186 | |
| Document Security Systems, Inc. (b) | 20,445 | 13,494 | |
| Ebix, Inc. | 94,982 | 5,480,461 | |
| Ellie Mae, Inc. (a)(b) | 151,578 | 12,577,942 | |
| Everbridge, Inc. (a) | 72,030 | 1,668,935 | |
| Evolving Systems, Inc. (b) | 27,515 | 130,696 | |
| Exa Corp. (b) | 47,934 | 687,853 | |
| Fair Isaac Corp. | 137,022 | 19,287,217 | |
| FalconStor Software, Inc. (a)(b) | 102,011 | 36,724 | |
| Finjan Holdings, Inc. (b) | 51,830 | 128,538 | |
| FireEye, Inc. (a)(b) | 707,444 | 10,448,948 | |
| Form Holdings Corp. (a)(b) | 94,034 | 114,721 | |
| Fortinet, Inc. (b) | 658,935 | 25,171,317 | |
| Gigamon, Inc. (b) | 141,252 | 6,066,773 | |
| Globalscape, Inc. | 29,423 | 107,100 | |
| Glu Mobile, Inc. (a)(b) | 469,639 | 1,709,486 | |
| GSE Systems, Inc. (b) | 33,148 | 92,814 | |
| Guidance Software, Inc. (b) | 114,811 | 812,862 | |
| Guidewire Software, Inc. (a)(b) | 329,936 | 24,979,455 | |
| HubSpot, Inc. (a)(b) | 142,387 | 10,444,086 | |
| Imperva, Inc. (b) | 129,369 | 5,776,326 | |
| Inseego Corp. (a) | 164,641 | 232,144 | |
| Majesco (b) | 52,545 | 259,047 | |
| MAM Software Group, Inc. (b) | 1,188 | 8,138 | |
| Manhattan Associates, Inc. (a)(b) | 309,249 | 13,003,920 | |
| MicroStrategy, Inc. Class A (b) | 41,918 | 5,407,422 | |
| Mitek Systems, Inc. (b) | 143,423 | 1,455,743 | |
| MobileIron, Inc. (a)(b) | 198,938 | 755,964 | |
| Model N, Inc. (b) | 101,356 | 1,373,374 | |
| Monotype Imaging Holdings, Inc. | 186,670 | 3,406,728 | |
| NetSol Technologies, Inc. (b) | 37,185 | 167,333 | |
| Nuance Communications, Inc. (b) | 1,132,716 | 18,202,746 | |
| NXT-ID, Inc. (a)(b) | 29,305 | 60,954 | |
| Parametric Technology Corp. (b) | 510,757 | 28,602,392 | |
| Park City Group, Inc. (a)(b) | 65,748 | 828,425 | |
| Paycom Software, Inc. (a)(b) | 176,592 | 13,175,529 | |
| Paylocity Holding Corp. (a)(b) | 108,535 | 5,333,410 | |
| Pegasystems, Inc. | 160,353 | 9,228,315 | |
| Polarityte, Inc. (a)(b) | 24,635 | 716,632 | |
| Progress Software Corp. | 222,520 | 7,472,222 | |
| Proofpoint, Inc. (a)(b) | 191,697 | 17,590,117 | |
| PROS Holdings, Inc. (a)(b) | 119,895 | 3,158,034 | |
| QAD, Inc.: | |||
| Class A | 27,311 | 920,381 | |
| Class B | 24,367 | 657,422 | |
| Qualys, Inc. (b) | 139,869 | 6,643,778 | |
| Rapid7, Inc. (b) | 73,979 | 1,247,286 | |
| RealNetworks, Inc. (b) | 91,284 | 364,223 | |
| RealPage, Inc. (a)(b) | 247,426 | 10,664,061 | |
| RingCentral, Inc. (b) | 284,098 | 12,031,550 | |
| Rosetta Stone, Inc. (b) | 76,625 | 704,950 | |
| SeaChange International, Inc. (b) | 126,310 | 329,669 | |
| ServiceNow, Inc. (b) | 751,028 | 87,261,943 | |
| Silver Spring Networks, Inc. (a)(b) | 187,413 | 2,372,649 | |
| SITO Mobile Ltd. (a)(b) | 75,644 | 323,756 | |
| Smith Micro Software, Inc. (a)(b) | 33,232 | 36,223 | |
| Sonic Foundry, Inc. (a)(b) | 57,013 | 194,414 | |
| Splunk, Inc. (a)(b) | 613,720 | 41,174,475 | |
| SS&C Technologies Holdings, Inc. | 760,818 | 29,451,265 | |
| Synchronoss Technologies, Inc.(b) | 187,568 | 3,149,267 | |
| Tableau Software, Inc. (a)(b) | 267,425 | 19,382,964 | |
| Take-Two Interactive Software, Inc. (a)(b) | 459,661 | 44,950,249 | |
| TeleNav, Inc. (b) | 140,738 | 914,797 | |
| The Rubicon Project, Inc. (b) | 165,320 | 621,603 | |
| TiVo Corp. | 536,011 | 9,809,001 | |
| Tyler Technologies, Inc. (a)(b) | 149,804 | 25,886,131 | |
| Ultimate Software Group, Inc. (a)(b) | 130,984 | 26,314,686 | |
| Upland Software, Inc. (b) | 49,341 | 1,134,843 | |
| Varonis Systems, Inc. (b) | 73,015 | 2,832,982 | |
| Vasco Data Security International, Inc. (b) | 142,853 | 1,792,805 | |
| Verint Systems, Inc. (b) | 279,739 | 11,105,638 | |
| VirnetX Holding Corp. (a)(b) | 208,849 | 835,396 | |
| VMware, Inc. Class A (a)(b) | 303,761 | 32,836,564 | |
| Workday, Inc. Class A (a)(b) | 578,157 | 63,418,041 | |
| Workiva, Inc. (b) | 93,631 | 1,891,346 | |
| Zedge, Inc. (b) | 23,011 | 41,420 | |
| Zendesk, Inc. (a)(b) | 352,425 | 9,656,445 | |
| Zix Corp. (b) | 279,934 | 1,486,450 | |
| Zynga, Inc. (b) | 3,445,768 | 12,921,630 | |
| 907,120,789 | |||
| Technology Hardware, Storage & Peripherals - 0.3% | |||
| 3D Systems Corp. (a)(b) | 483,680 | 6,075,021 | |
| Astro-Med, Inc. | 83,410 | 1,134,376 | |
| Avid Technology, Inc. (a)(b) | 153,041 | 674,911 | |
| Concurrent Computer Corp. | 30,661 | 193,778 | |
| CPI Card Group (a) | 72,158 | 69,293 | |
| Cray, Inc. (b) | 180,540 | 3,403,179 | |
| Diebold Nixdorf, Inc. (a) | 341,292 | 6,979,421 | |
| Eastman Kodak Co. (a)(b) | 162,328 | 1,258,042 | |
| Electronics for Imaging, Inc. (a)(b) | 209,195 | 7,438,974 | |
| Everspin Technologies, Inc. (a) | 23,347 | 380,556 | |
| Immersion Corp. (a)(b) | 128,551 | 940,993 | |
| Intevac, Inc. (b) | 82,658 | 752,188 | |
| ITUS Corp. (a)(b) | 34,351 | 23,050 | |
| NCR Corp. (a)(b) | 536,008 | 19,580,372 | |
| Pure Storage, Inc. Class A (a)(b) | 415,583 | 6,188,031 | |
| Qualstar Corp. (a)(b) | 11,989 | 84,043 | |
| Quantum Corp. (a)(b) | 142,708 | 786,321 | |
| Super Micro Computer, Inc. (a)(b) | 168,100 | 4,475,663 | |
| Transact Technologies, Inc. | 28,331 | 276,227 | |
| U.S.A. Technologies, Inc. (a)(b) | 214,765 | 1,170,469 | |
| Xplore Technologies Corp. (a)(b) | 14,878 | 47,163 | |
| 61,932,071 | |||
| TOTAL INFORMATION TECHNOLOGY | 3,553,578,023 | ||
| MATERIALS - 5.3% | |||
| Chemicals - 2.6% | |||
| A. Schulman, Inc. | 132,201 | 4,018,910 | |
| Advanced Emissions Solutions, Inc. (a) | 87,173 | 904,856 | |
| AdvanSix, Inc. | 131,973 | 4,213,898 | |
| AgroFresh Solutions, Inc. (a)(b) | 117,138 | 834,023 | |
| American Vanguard Corp. | 114,501 | 2,318,645 | |
| Ashland Global Holdings, Inc. | 273,622 | 16,978,245 | |
| Axalta Coating Systems (a)(b) | 963,156 | 28,432,365 | |
| Balchem Corp. | 143,958 | 10,791,092 | |
| BioAmber, Inc. (a)(b) | 93,053 | 40,664 | |
| Cabot Corp. | 283,446 | 14,931,935 | |
| Calgon Carbon Corp. | 227,771 | 2,778,806 | |
| Celanese Corp. Class A | 614,289 | 59,598,319 | |
| Chase Corp. | 32,113 | 3,002,566 | |
| Codexis, Inc. (b) | 156,032 | 865,978 | |
| Core Molding Technologies, Inc. (a) | 30,292 | 623,106 | |
| Ferro Corp. (b) | 370,398 | 7,137,569 | |
| Flotek Industries, Inc. (a)(b) | 235,242 | 1,218,554 | |
| FutureFuel Corp. | 99,234 | 1,337,674 | |
| H.B. Fuller Co. | 231,320 | 11,609,951 | |
| Hawkins, Inc. | 43,846 | 1,563,110 | |
| Huntsman Corp. | 880,465 | 23,393,955 | |
| Ingevity Corp. (b) | 185,743 | 11,696,237 | |
| Innophos Holdings, Inc. | 85,582 | 3,907,674 | |
| Innospec, Inc. | 107,399 | 5,960,645 | |
| Intrepid Potash, Inc. (a)(b) | 459,412 | 1,704,419 | |
| KMG Chemicals, Inc. | 32,018 | 1,537,504 | |
| Koppers Holdings, Inc. (b) | 93,218 | 3,654,146 | |
| Kraton Performance Polymers, Inc. (b) | 136,037 | 4,466,095 | |
| Kronos Worldwide, Inc. | 100,083 | 2,094,737 | |
| LSB Industries, Inc. (a)(b) | 92,483 | 564,146 | |
| MagneGas Corp. (b) | 12,080 | 6,282 | |
| Marrone Bio Innovations, Inc. (a)(b) | 53,732 | 63,941 | |
| Minerals Technologies, Inc. | 157,600 | 10,086,400 | |
| NewMarket Corp. | 41,406 | 17,328,825 | |
| Northern Technologies International Corp. (b) | 5,288 | 93,069 | |
| Olin Corp. | 734,298 | 23,666,425 | |
| OMNOVA Solutions, Inc. (b) | 176,347 | 1,534,219 | |
| Platform Specialty Products Corp. (a)(b) | 977,138 | 11,412,972 | |
| PolyOne Corp. | 364,913 | 13,187,956 | |
| Quaker Chemical Corp. | 58,562 | 8,153,002 | |
| Rayonier Advanced Materials, Inc. (a) | 193,665 | 2,657,084 | |
| RPM International, Inc. (a) | 591,653 | 28,973,247 | |
| Senomyx, Inc. (a)(b) | 176,669 | 106,902 | |
| Sensient Technologies Corp. | 200,422 | 14,460,447 | |
| Stepan Co. | 85,046 | 6,579,159 | |
| The Chemours Co. LLC | 816,567 | 40,068,943 | |
| The Scotts Miracle-Gro Co. Class A | 195,569 | 18,694,441 | |
| TOR Minerals International, Inc. (b) | 3,831 | 27,966 | |
| Trecora Resources (a)(b) | 74,645 | 906,937 | |
| Tredegar Corp. | 113,023 | 1,842,275 | |
| Trinseo SA | 193,228 | 12,926,953 | |
| Tronox Ltd. Class A (a) | 292,413 | 6,050,025 | |
| Valhi, Inc. | 74,540 | 162,497 | |
| Valvoline, Inc. | 911,442 | 19,404,600 | |
| W.R. Grace & Co. | 302,649 | 21,633,351 | |
| Westlake Chemical Corp. | 166,218 | 12,783,826 | |
| Yield10 Bioscience, Inc. (a)(b) | 2,061 | 5,544 | |
| 504,997,112 | |||
| Construction Materials - 0.2% | |||
| Eagle Materials, Inc. | 216,042 | 21,010,085 | |
| Forterra, Inc. (a) | 88,632 | 294,258 | |
| Foundation Building Materials, Inc. (a) | 60,974 | 796,320 | |
| Summit Materials, Inc. (a) | 476,064 | 14,062,931 | |
| Tecnoglass, Inc. (a) | 22,937 | 154,825 | |
| U.S. Concrete, Inc. (a)(b) | 66,707 | 5,339,895 | |
| United States Lime & Minerals, Inc. | 8,034 | 642,318 | |
| 42,300,632 | |||
| Containers & Packaging - 0.9% | |||
| Aptargroup, Inc. | 273,548 | 22,871,348 | |
| Bemis Co., Inc. | 405,093 | 17,261,013 | |
| Berry Global Group, Inc. (b) | 567,991 | 31,943,814 | |
| Crown Holdings, Inc. (b) | 590,501 | 34,857,274 | |
| Graphic Packaging Holding Co. | 1,378,331 | 17,987,220 | |
| Greif, Inc.: | |||
| Class A | 148,281 | 8,963,586 | |
| Class B | 6,493 | 410,033 | |
| Myers Industries, Inc. | 100,702 | 1,893,198 | |
| Owens-Illinois, Inc. (b) | 713,511 | 17,580,911 | |
| Silgan Holdings, Inc. | 342,970 | 10,319,967 | |
| Sonoco Products Co. | 440,287 | 21,248,251 | |
| UFP Technologies, Inc. (b) | 22,606 | 601,320 | |
| 185,937,935 | |||
| Metals & Mining - 1.3% | |||
| AK Steel Holding Corp. (a)(b) | 1,383,470 | 7,747,432 | |
| Alcoa Corp. | 652,326 | 28,624,065 | |
| Allegheny Technologies, Inc. (a) | 489,192 | 10,189,869 | |
| Ampco-Pittsburgh Corp. | 39,547 | 609,024 | |
| Atkore International Group, Inc. (b) | 96,317 | 1,604,641 | |
| Carpenter Technology Corp. | 204,311 | 8,280,725 | |
| Century Aluminum Co. (a)(b) | 216,529 | 4,226,646 | |
| Cliffs Natural Resources, Inc. (a)(b) | 1,203,173 | 10,058,526 | |
| Coeur d'Alene Mines Corp. (b) | 825,703 | 7,224,901 | |
| Commercial Metals Co. (a) | 501,945 | 9,481,741 | |
| Compass Minerals International, Inc. (a) | 150,364 | 10,044,315 | |
| Comstock Mining, Inc. (a)(b) | 223,980 | 41,638 | |
| Friedman Industries | 19,700 | 111,699 | |
| General Moly, Inc. (b) | 202,841 | 88,540 | |
| Gold Resource Corp. | 259,015 | 1,033,470 | |
| Golden Minerals Co. (a)(b) | 165,129 | 89,665 | |
| Handy & Harman Ltd. (b) | 25,445 | 832,052 | |
| Haynes International, Inc. | 55,379 | 1,691,828 | |
| Hecla Mining Co. | 1,823,688 | 9,629,073 | |
| Kaiser Aluminum Corp. (a) | 78,085 | 7,521,147 | |
| Materion Corp. | 94,585 | 3,613,147 | |
| McEwen Mining, Inc. (a) | 1,050,768 | 2,700,474 | |
| Olympic Steel, Inc. | 41,963 | 765,825 | |
| Paramount Gold Nevada Corp. (b) | 22,744 | 34,798 | |
| Pershing Gold Corp. (a)(b) | 69,048 | 209,215 | |
| Real Industries, Inc. (a)(b) | 102,876 | 174,889 | |
| Reliance Steel & Aluminum Co. | 319,915 | 23,168,244 | |
| Royal Gold, Inc. | 289,569 | 27,010,996 | |
| Ryerson Holding Corp. (b) | 62,218 | 535,075 | |
| Schnitzer Steel Industries, Inc. Class A | 119,830 | 3,223,427 | |
| Solitario Exploration & Royalty Corp. (b) | 57,827 | 40,479 | |
| Steel Dynamics, Inc. | 1,069,983 | 36,860,914 | |
| SunCoke Energy, Inc. (a)(b) | 276,143 | 2,573,653 | |
| Synalloy Corp. (b) | 24,589 | 279,085 | |
| TimkenSteel Corp. (a)(b) | 164,765 | 2,443,465 | |
| U.S. Antimony Corp. (a)(b) | 114,807 | 36,738 | |
| U.S. Gold Corp. (b) | 328 | 794 | |
| United States Steel Corp. (a) | 767,690 | 20,428,231 | |
| Universal Stainless & Alloy Products, Inc. (b) | 23,505 | 426,146 | |
| Worthington Industries, Inc. | 199,405 | 9,962,274 | |
| 253,618,866 | |||
| Paper & Forest Products - 0.3% | |||
| Boise Cascade Co. (b) | 171,188 | 5,135,640 | |
| Clearwater Paper Corp. (b) | 75,015 | 3,488,198 | |
| Deltic Timber Corp. | 49,917 | 3,895,523 | |
| Domtar Corp. (a) | 277,198 | 11,209,887 | |
| Kapstone Paper & Packaging Corp. | 391,172 | 8,750,518 | |
| Louisiana-Pacific Corp. (b) | 633,416 | 16,139,440 | |
| Mercer International, Inc. (SBI) | 191,792 | 2,119,302 | |
| Neenah Paper, Inc. (a) | 76,486 | 5,908,544 | |
| P.H. Glatfelter Co. | 196,344 | 3,400,678 | |
| Rentech, Inc. (a)(b) | 91,963 | 24,462 | |
| Resolute Forest Products (a)(b) | 383,964 | 1,900,622 | |
| Schweitzer-Mauduit International, Inc. | 146,944 | 5,573,586 | |
| Verso Corp. (a) | 157,433 | 837,544 | |
| 68,383,944 | |||
| TOTAL MATERIALS | 1,055,238,489 | ||
| REAL ESTATE - 9.0% | |||
| Equity Real Estate Investment Trusts (REITs) - 8.5% | |||
| Acadia Realty Trust (SBI) | 391,126 | 11,221,405 | |
| Agree Realty Corp. | 125,445 | 6,287,303 | |
| Alexanders, Inc. | 15,826 | 6,626,188 | |
| Altisource Residential Corp. Class B | 242,358 | 2,934,955 | |
| American Assets Trust, Inc. | 183,522 | 7,454,664 | |
| American Campus Communities, Inc. | 594,453 | 28,290,018 | |
| American Homes 4 Rent Class A | 1,034,024 | 22,913,972 | |
| Apple Hospitality (REIT), Inc. | 712,626 | 12,955,541 | |
| Armada Hoffler Properties, Inc. | 191,551 | 2,561,037 | |
| Ashford Hospitality Prime, Inc. | 140,879 | 1,355,256 | |
| Ashford Hospitality Trust, Inc. | 366,389 | 2,275,276 | |
| Bluerock Residential Growth (REIT), Inc. | 99,613 | 1,009,080 | |
| Brandywine Realty Trust (SBI) | 758,602 | 13,032,782 | |
| Brixmor Property Group, Inc. | 1,178,031 | 22,052,740 | |
| BRT Realty Trust (b) | 19,147 | 148,964 | |
| Camden Property Trust (SBI) | 384,233 | 34,381,169 | |
| CareTrust (REIT), Inc. | 315,696 | 6,089,776 | |
| CatchMark Timber Trust, Inc. | 177,492 | 2,046,483 | |
| CBL & Associates Properties, Inc. (a) | 749,524 | 5,996,192 | |
| Cedar Realty Trust, Inc. | 355,338 | 1,790,904 | |
| Chatham Lodging Trust | 168,993 | 3,427,178 | |
| Chesapeake Lodging Trust | 260,111 | 6,656,240 | |
| City Office REIT, Inc. | 101,821 | 1,302,291 | |
| Clipper Realty, Inc. (a) | 27,161 | 303,117 | |
| Colony NorthStar, Inc. (a) | 2,427,296 | 31,821,851 | |
| Columbia Property Trust, Inc. | 545,795 | 11,461,695 | |
| Communications Sales & Leasing, Inc. (a) | 704,481 | 13,568,304 | |
| Community Healthcare Trust, Inc. | 76,659 | 2,036,063 | |
| Condor Hospitality Trust, Inc.�� | 253 | 2,646 | |
| CorEnergy Infrastructure Trust, Inc. (a) | 54,615 | 1,782,087 | |
| CoreSite Realty Corp. | 150,575 | 17,882,287 | |
| Corporate Office Properties Trust (SBI) | 439,692 | 14,668,125 | |
| Corrections Corp. of America | 531,278 | 14,238,250 | |
| Cousins Properties, Inc. | 1,822,997 | 17,045,022 | |
| CubeSmart | 796,149 | 19,625,073 | |
| CyrusOne, Inc. | 345,852 | 21,799,052 | |
| DCT Industrial Trust, Inc. | 404,747 | 23,616,987 | |
| DDR Corp. | 1,391,721 | 13,471,859 | |
| DiamondRock Hospitality Co. | 896,182 | 9,849,040 | |
| Douglas Emmett, Inc. | 681,777 | 26,562,032 | |
| DuPont Fabros Technology, Inc. | 342,762 | 22,060,162 | |
| Easterly Government Properties, Inc. (a) | 124,324 | 2,493,939 | |
| EastGroup Properties, Inc. | 149,558 | 13,289,724 | |
| Education Realty Trust, Inc. (a) | 331,935 | 12,825,968 | |
| Empire State Realty Trust, Inc. | 572,025 | 11,640,709 | |
| EPR Properties | 280,442 | 19,535,590 | |
| Equity Commonwealth (a)(b) | 548,023 | 16,955,832 | |
| Equity Lifestyle Properties, Inc. | 356,301 | 31,764,234 | |
| Farmland Partners, Inc. (a) | 138,179 | 1,224,266 | |
| FelCor Lodging Trust, Inc. | 563,668 | 4,114,776 | |
| First Industrial Realty Trust, Inc. | 507,383 | 15,718,725 | |
| First Potomac Realty Trust | 260,221 | 2,896,260 | |
| Forest City Realty Trust, Inc. Class A | 967,865 | 23,190,045 | |
| Four Corners Property Trust, Inc. | 285,265 | 7,248,584 | |
| Franklin Street Properties Corp. | 501,603 | 5,000,982 | |
| Gaming & Leisure Properties | 852,335 | 33,403,009 | |
| Getty Realty Corp. | 140,686 | 3,877,306 | |
| Gladstone Commercial Corp. | 120,539 | 2,579,535 | |
| Gladstone Land Corp. (a) | 66,704 | 928,520 | |
| Global Net Lease, Inc. | 250,338 | 5,422,321 | |
| Global Self Storage, Inc. | 70,475 | 339,690 | |
| Government Properties Income Trust | 420,461 | 7,799,552 | |
| Gramercy Property Trust (a) | 670,405 | 20,420,536 | |
| Healthcare Realty Trust, Inc. | 545,003 | 18,137,700 | |
| Healthcare Trust of America, Inc. | 840,949 | 26,128,285 | |
| Hersha Hospitality Trust (a) | 184,853 | 3,427,175 | |
| Highwoods Properties, Inc. (SBI) | 447,760 | 23,386,505 | |
| Hospitality Properties Trust (SBI) | 740,484 | 20,259,642 | |
| Hudson Pacific Properties, Inc. | 701,418 | 23,146,794 | |
| Independence Realty Trust, Inc. | 249,560 | 2,567,972 | |
| InfraReit, Inc. | 163,697 | 3,681,546 | |
| Investors Real Estate Trust | 543,680 | 3,414,310 | |
| Invitation Homes, Inc. | 336,816 | 7,793,922 | |
| iStar Financial, Inc. (a)(b) | 324,915 | 3,772,263 | |
| JBG SMITH Properties | 381,771 | 12,495,365 | |
| Jernigan Capital, Inc. (a) | 56,379 | 1,096,008 | |
| Kilroy Realty Corp. | 434,125 | 30,054,474 | |
| Kite Realty Group Trust | 368,788 | 7,420,015 | |
| Lamar Advertising Co. Class A (a) | 369,898 | 24,620,411 | |
| LaSalle Hotel Properties (SBI) | 502,397 | 14,258,027 | |
| Lexington Corporate Properties Trust | 992,662 | 9,787,647 | |
| Liberty Property Trust (SBI) | 646,272 | 27,531,187 | |
| Life Storage, Inc. (a) | 203,317 | 14,962,098 | |
| LTC Properties, Inc. | 177,746 | 8,643,788 | |
| Mack-Cali Realty Corp. | 396,996 | 9,087,238 | |
| MedEquities Realty Trust, Inc. | 126,218 | 1,447,720 | |
| Medical Properties Trust, Inc. | 1,644,179 | 21,637,396 | |
| Monmouth Real Estate Investment Corp. Class A | 324,781 | 5,277,691 | |
| Monogram Residential Trust, Inc. | 731,984 | 8,783,808 | |
| National Health Investors, Inc. | 182,751 | 14,652,975 | |
| National Retail Properties, Inc. | 671,278 | 28,079,559 | |
| National Storage Affiliates Trust | 193,790 | 4,325,393 | |
| New Senior Investment Group, Inc. | 367,840 | 3,395,163 | |
| NexPoint Residential Trust, Inc. | 89,410 | 2,083,253 | |
| NorthStar Realty Europe Corp. | 240,392 | 2,988,073 | |
| Omega Healthcare Investors, Inc. (a) | 864,330 | 27,546,197 | |
| One Liberty Properties, Inc. | 69,690 | 1,673,257 | |
| Outfront Media, Inc. | 624,123 | 13,730,706 | |
| Paramount Group, Inc. | 808,735 | 12,761,838 | |
| Parkway, Inc. | 194,212 | 4,459,108 | |
| Pebblebrook Hotel Trust (a) | 308,222 | 10,353,177 | |
| Pennsylvania Real Estate Investment Trust (SBI) | 334,752 | 3,357,563 | |
| Physicians Realty Trust | 777,865 | 14,569,411 | |
| Piedmont Office Realty Trust, Inc. Class A | 659,484 | 13,354,551 | |
| Potlatch Corp. | 180,721 | 8,638,464 | |
| Power (REIT) (b) | 1,227 | 7,816 | |
| Preferred Apartment Communities, Inc. Class A | 147,693 | 2,686,536 | |
| PS Business Parks, Inc. | 87,887 | 11,874,413 | |
| QTS Realty Trust, Inc. Class A | 207,725 | 11,254,541 | |
| Quality Care Properties, Inc. | 407,304 | 5,588,211 | |
| RAIT Financial Trust | 372,193 | 307,878 | |
| Ramco-Gershenson Properties Trust (SBI) | 344,393 | 4,528,768 | |
| Rayonier, Inc. | 578,969 | 16,795,891 | |
| Retail Opportunity Investments Corp. | 501,177 | 9,943,352 | |
| Retail Properties America, Inc. | 1,050,675 | 14,005,498 | |
| Rexford Industrial Realty, Inc. | 313,382 | 9,417,129 | |
| RLJ Lodging Trust | 543,263 | 10,963,047 | |
| Ryman Hospitality Properties, Inc. | 226,971 | 13,486,617 | |
| Sabra Health Care REIT, Inc. (a) | 709,009 | 15,491,847 | |
| Saul Centers, Inc. | 55,021 | 3,334,273 | |
| Select Income REIT | 294,883 | 6,844,234 | |
| Senior Housing Properties Trust (SBI) | 1,056,031 | 20,824,931 | |
| Seritage Growth Properties (a) | 109,515 | 5,263,291 | |
| Sotherly Hotels, Inc. | 42,144 | 255,393 | |
| Spirit Realty Capital, Inc. | 2,148,486 | 18,691,828 | |
| Stag Industrial, Inc. | 386,136 | 10,807,947 | |
| Starwood Waypoint Homes (a) | 544,578 | 20,274,639 | |
| Store Capital Corp. (a) | 741,559 | 18,820,767 | |
| Summit Hotel Properties, Inc. | 470,212 | 6,977,946 | |
| Sun Communities, Inc. | 312,268 | 28,200,923 | |
| Sunstone Hotel Investors, Inc. | 985,377 | 15,568,957 | |
| Tanger Factory Outlet Centers, Inc. (a) | 419,841 | 9,824,279 | |
| Taubman Centers, Inc. | 268,239 | 14,012,805 | |
| Terreno Realty Corp. | 217,476 | 7,883,505 | |
| The GEO Group, Inc. (a) | 554,059 | 15,314,191 | |
| TIER REIT, Inc. | 211,369 | 3,891,303 | |
| UMH Properties, Inc. | 127,493 | 2,016,939 | |
| Universal Health Realty Income Trust (SBI) | 72,078 | 5,457,025 | |
| Urban Edge Properties | 461,372 | 11,603,506 | |
| Urstadt Biddle Properties, Inc. Class A | 138,313 | 2,860,313 | |
| VEREIT, Inc. | 4,330,126 | 36,546,263 | |
| Washington REIT (SBI) | 340,901 | 11,202,007 | |
| Weingarten Realty Investors (SBI) | 535,524 | 17,158,189 | |
| Wheeler REIT, Inc. (a) | 34,375 | 360,250 | |
| Whitestone REIT Class B | 165,726 | 2,078,204 | |
| WP Carey, Inc. | 467,339 | 32,176,290 | |
| WP Glimcher, Inc. | 812,804 | 6,786,913 | |
| Xenia Hotels & Resorts, Inc. | 466,605 | 9,313,436 | |
| 1,676,762,935 | |||
| Real Estate Management & Development - 0.5% | |||
| Alexander & Baldwin, Inc. | 202,930 | 8,807,162 | |
| Altisource Portfolio Solutions SA (a)(b) | 53,097 | 1,209,550 | |
| American Realty Investments, Inc. (b) | 2,022 | 16,803 | |
| Consolidated-Tomoka Land Co. (a) | 23,055 | 1,277,247 | |
| Forestar Group, Inc. (b) | 159,585 | 2,744,862 | |
| FRP Holdings, Inc. (b) | 24,947 | 1,095,173 | |
| Griffin Industrial Realty, Inc. | 7,963 | 273,529 | |
| HFF, Inc. (a) | 155,341 | 5,923,152 | |
| Howard Hughes Corp. (b) | 161,261 | 18,923,978 | |
| InterGroup Corp. (b) | 845 | 20,280 | |
| J.W. Mays, Inc. (b) | 15 | 548 | |
| Jones Lang LaSalle, Inc. | 199,466 | 24,316,900 | |
| Kennedy-Wilson Holdings, Inc. (a) | 406,490 | 7,845,257 | |
| Marcus & Millichap, Inc. (b) | 70,870 | 1,866,007 | |
| Maui Land & Pineapple, Inc. (a)(b) | 30,432 | 392,573 | |
| RE/MAX Holdings, Inc. | 76,810 | 4,704,613 | |
| Realogy Holdings Corp. | 613,126 | 20,784,971 | |
| Stratus Properties, Inc. | 12,801 | 378,910 | |
| Tejon Ranch Co. (a)(b) | 61,546 | 1,229,689 | |
| The St. Joe Co. (a)(b) | 324,094 | 6,109,172 | |
| Transcontinental Realty Investors, Inc. (a)(b) | 1,510 | 32,133 | |
| Trinity Place Holdings, Inc. (a)(b) | 36,952 | 255,338 | |
| 108,207,847 | |||
| TOTAL REAL ESTATE | 1,784,970,782 | ||
| TELECOMMUNICATION SERVICES - 1.1% | |||
| Diversified Telecommunication Services - 0.4% | |||
| Alaska Communication Systems Group, Inc. (b) | 196,814 | 432,991 | |
| Atlantic Tele-Network, Inc. | 51,425 | 3,114,812 | |
| Cincinnati Bell, Inc. (a)(b) | 197,493 | 4,157,228 | |
| Cogent Communications Group, Inc. (a) | 183,493 | 8,550,774 | |
| Consolidated Communications Holdings, Inc. (a) | 296,400 | 5,468,580 | |
| Frontier Communications Corp. (a) | 345,068 | 4,648,066 | |
| Fusion Telecommunications International (a)(b) | 48,146 | 153,586 | |
| General Communications, Inc. Class A (b) | 119,829 | 5,168,225 | |
| Globalstar, Inc. (a)(b) | 1,469,589 | 2,821,611 | |
| Hawaiian Telcom Holdco, Inc. (b) | 49,966 | 1,519,966 | |
| IDT Corp. Class B | 79,718 | 1,172,652 | |
| Intelsat SA (a)(b) | 174,158 | 672,250 | |
| Iridium Communications, Inc. (a)(b) | 364,703 | 4,048,203 | |
| Lumos Networks Corp. (b) | 98,569 | 1,772,271 | |
| Ooma, Inc. (a)(b) | 86,590 | 848,582 | |
| ORBCOMM, Inc. (a)(b) | 294,948 | 3,262,125 | |
| Pareteum Corp. (a)(b) | 31,920 | 29,366 | |
| PDVWireless, Inc. (a)(b) | 45,934 | 1,343,570 | |
| Straight Path Communications, Inc. Class B (b) | 37,097 | 6,622,185 | |
| Vonage Holdings Corp. (b) | 850,314 | 7,057,606 | |
| Windstream Holdings, Inc. (a) | 861,501 | 1,783,307 | |
| Zayo Group Holdings, Inc. (a)(b) | 444,051 | 15,173,223 | |
| 79,821,179 | |||
| Wireless Telecommunication Services - 0.7% | |||
| Airgain, Inc. (a) | 21,048 | 231,107 | |
| Boingo Wireless, Inc. (b) | 178,557 | 3,676,489 | |
| NII Holdings, Inc. (a)(b) | 406,747 | 270,080 | |
| Shenandoah Telecommunications Co. (a) | 205,715 | 7,416,026 | |
| Spok Holdings, Inc. | 91,059 | 1,525,238 | |
| Sprint Corp. (a)(b) | 2,819,911 | 23,264,266 | |
| T-Mobile U.S., Inc. (b) | 1,275,415 | 82,532,105 | |
| Telephone & Data Systems, Inc. | 410,485 | 12,031,315 | |
| U.S. Cellular Corp. (b) | 67,085 | 2,594,848 | |
| 133,541,474 | |||
| TOTAL TELECOMMUNICATION SERVICES | 213,362,653 | ||
| UTILITIES - 3.4% | |||
| Electric Utilities - 1.2% | |||
| Allete, Inc. | 224,711 | 17,376,902 | |
| El Paso Electric Co. | 183,416 | 10,188,759 | |
| Genie Energy Ltd. Class B (a) | 65,626 | 403,600 | |
| Great Plains Energy, Inc. | 919,114 | 28,207,609 | |
| Hawaiian Electric Industries, Inc. | 484,372 | 16,187,712 | |
| IDACORP, Inc. | 225,165 | 20,035,182 | |
| MGE Energy, Inc. | 155,669 | 9,900,548 | |
| OGE Energy Corp. | 867,451 | 30,985,350 | |
| Otter Tail Corp. | 173,461 | 7,250,670 | |
| PNM Resources, Inc. | 356,255 | 15,105,212 | |
| Portland General Electric Co. | 390,160 | 18,536,502 | |
| Spark Energy, Inc. Class A, (a) | 99,321 | 1,574,238 | |
| Vistra Energy Corp. (a) | 1,296,991 | 22,956,741 | |
| Westar Energy, Inc. | 625,499 | 32,094,354 | |
| 230,803,379 | |||
| Gas Utilities - 1.1% | |||
| Atmos Energy Corp. | 449,719 | 39,593,261 | |
| Chesapeake Utilities Corp. | 69,170 | 5,495,557 | |
| Delta Natural Gas Co., Inc. | 18,073 | 553,757 | |
| National Fuel Gas Co. (a) | 376,505 | 21,829,760 | |
| New Jersey Resources Corp. (a) | 377,291 | 16,468,752 | |
| Northwest Natural Gas Co. | 149,735 | 9,927,431 | |
| ONE Gas, Inc. | 231,055 | 17,384,578 | |
| RGC Resources, Inc. | 50,846 | 1,400,807 | |
| South Jersey Industries, Inc. | 346,161 | 12,420,257 | |
| Southwest Gas Holdings, Inc. | 219,396 | 17,446,370 | |
| Spire, Inc. | 217,359 | 16,627,964 | |
| UGI Corp. | 761,594 | 37,630,360 | |
| WGL Holdings, Inc. | 217,749 | 18,347,531 | |
| 215,126,385 | |||
| Independent Power and Renewable Electricity Producers - 0.3% | |||
| Calpine Corp. (b) | 1,598,019 | 23,490,879 | |
| Dynegy, Inc. (a)(b) | 572,559 | 5,393,506 | |
| NRG Yield, Inc.: | |||
| Class A | 127,027 | 2,310,621 | |
| Class C | 303,396 | 5,612,826 | |
| Ormat Technologies, Inc. | 163,348 | 9,382,709 | |
| Pattern Energy Group, Inc. (a) | 304,672 | 7,653,361 | |
| TerraForm Global, Inc. (b) | 196,426 | 991,951 | |
| Terraform Power, Inc. (a)(b) | 328,140 | 4,580,834 | |
| U.S. Geothermal, Inc. (a)(b) | 61,820 | 240,480 | |
| 59,657,167 | |||
| Multi-Utilities - 0.5% | |||
| Avangrid, Inc. | 258,239 | 12,607,228 | |
| Avista Corp. | 284,493 | 14,622,940 | |
| Black Hills Corp. (a) | 235,448 | 16,570,830 | |
| MDU Resources Group, Inc. | 862,482 | 23,321,513 | |
| NorthWestern Energy Corp. | 206,683 | 12,467,119 | |
| Unitil Corp. | 68,493 | 3,415,061 | |
| Vectren Corp. | 363,984 | 23,880,990 | |
| 106,885,681 | |||
| Water Utilities - 0.3% | |||
| American States Water Co. | 170,520 | 8,406,636 | |
| Aqua America, Inc. | 779,968 | 26,050,931 | |
| AquaVenture Holdings Ltd. (a) | 49,986 | 757,788 | |
| Artesian Resources Corp. Class A | 30,130 | 1,117,522 | |
| Cadiz, Inc. (a)(b) | 100,305 | 1,223,721 | |
| California Water Service Group | 217,369 | 8,140,469 | |
| Connecticut Water Service, Inc. | 54,452 | 2,953,476 | |
| Middlesex Water Co. | 74,490 | 2,829,130 | |
| Pure Cycle Corp. (a)(b) | 69,664 | 505,064 | |
| Select Energy Services, Inc. Class A | 64,020 | 902,682 | |
| SJW Corp. | 70,626 | 3,919,743 | |
| York Water Co. | 57,282 | 1,884,578 | |
| 58,691,740 | |||
| TOTAL UTILITIES | 671,164,352 | ||
| TOTAL COMMON STOCKS | |||
| (Cost $14,931,968,895) | 19,681,366,684 | ||
| Principal Amount | Value | ||
| U.S. Treasury Obligations - 0.0% | |||
| U.S. Treasury Bills, yield at date of purchase 1.18% 6/21/18 (e) | |||
| (Cost $5,942,865) | 6,000,000 | 5,943,170 | |
| Shares | Value | ||
| Money Market Funds - 22.7% | |||
| Fidelity Cash Central Fund, 1.11% (f) | 85,720,969 | $85,738,113 | |
| Fidelity Securities Lending Cash Central Fund 1.11% (f)(g) | 4,395,375,201 | 4,395,814,739 | |
| TOTAL MONEY MARKET FUNDS | |||
| (Cost $4,481,552,852) | 4,481,552,852 | ||
| TOTAL INVESTMENT IN SECURITIES - 122.1% | |||
| (Cost $19,419,464,612) | 24,168,862,706 | ||
| NET OTHER ASSETS (LIABILITIES) - (22.1)% | (4,375,636,751) | ||
| NET ASSETS - 100% | $19,793,225,955 |
| Futures Contracts | |||||
| Number of contracts | Expiration Date | Notional amount | Value | Unrealized Appreciation/(Depreciation) | |
| Purchased | |||||
| Equity Index Contracts | |||||
| CME E-mini S&P MidCap 400 Index Contracts (United States) | 268 | Sept. 2017 | $46,374,720 | $690,012 | $690,012 |
| ICE Russell 2000 Mini Contracts (United States) | 993 | Sept. 2017 | 69,728,460 | 1,507,683 | 1,507,683 |
| TOTAL FUTURES CONTRACTS | $2,197,695 |
The notional amount of futures purchased as a percentage of Net Assets is 0.6%
Legend
(a) Security or a portion of the security is on loan at period end.
(b) Non-income producing
(c) Security exempt from registration under Rule 144A of the Securities Act of 1933. These securities may be resold in transactions exempt from registration, normally to qualified institutional buyers. At the end of the period, the value of these securities amounted to $3 or 0.0% of net assets.
(d) Level 3 instrument
(e) Security or a portion of the security was pledged to cover margin requirements for futures contracts. At period end, the value of securities pledged amounted to $4,785,243.
(f) Affiliated fund that is generally available only to investment companies and other accounts managed by Fidelity Investments. The rate quoted is the annualized seven-day yield of the fund at period end. A complete unaudited listing of the fund's holdings as of its most recent quarter end is available upon request. In addition, each Fidelity Central Fund's financial statements are available on the SEC's website or upon request.
(g) Investment made with cash collateral received from securities on loan.
Affiliated Central Funds
Information regarding fiscal year to date income earned by the Fund from investments in Fidelity Central Funds is as follows:
| Fund | Income earned |
| Fidelity Cash Central Fund | $308,998 |
| Fidelity Securities Lending Cash Central Fund | 14,405,015 |
| Total | $14,714,013 |
Investment Valuation
The following is a summary of the inputs used, as of August 31, 2017, involving the Fund's assets and liabilities carried at fair value. The inputs or methodology used for valuing securities may not be an indication of the risk associated with investing in those securities. For more information on valuation inputs, and their aggregation into the levels used below, please refer to the Investment Valuation section in the accompanying Notes to Financial Statements.
| Valuation Inputs at Reporting Date: | ||||
| Description | Total | Level 1 | Level 2 | Level 3 |
| Investments in Securities: | ||||
| Equities: | ||||
| Consumer Discretionary | $2,837,294,528 | $2,837,294,067 | $461 | $-- |
| Consumer Staples | 610,633,883 | 610,633,883 | -- | -- |
| Energy | 728,087,865 | 728,087,860 | 3 | 2 |
| Financials | 3,328,260,930 | 3,328,260,929 | -- | 1 |
| Health Care | 2,281,656,612 | 2,279,809,922 | -- | 1,846,690 |
| Industrials | 2,617,118,567 | 2,617,118,567 | -- | -- |
| Information Technology | 3,553,578,023 | 3,553,578,023 | -- | -- |
| Materials | 1,055,238,489 | 1,055,238,489 | -- | -- |
| Real Estate | 1,784,970,782 | 1,784,970,782 | -- | -- |
| Telecommunication Services | 213,362,653 | 213,362,653 | -- | -- |
| Utilities | 671,164,352 | 671,164,352 | -- | -- |
| U.S. Government and Government Agency Obligations | 5,943,170 | -- | 5,943,170 | -- |
| Money Market Funds | 4,481,552,852 | 4,481,552,852 | -- | -- |
| Total Investments in Securities: | $24,168,862,706 | $24,161,072,379 | $5,943,634 | $1,846,693 |
| Derivative Instruments: | ||||
| Assets | ||||
| Futures Contracts | $2,197,695 | $2,197,695 | $-- | $-- |
| Total Assets | $2,197,695 | $2,197,695 | $-- | $-- |
| Total Derivative Instruments: | $2,197,695 | $2,197,695 | $-- | $-- |
Value of Derivative Instruments
The following table is a summary of the Fund's value of derivative instruments by primary risk exposure as of August 31, 2017. For additional information on derivative instruments, please refer to the Derivative Instruments section in the accompanying Notes to Financial Statements.
| Primary Risk Exposure / Derivative Type | Value | |
| Asset | Liability | |
| Equity Risk | ||
| Futures Contracts(a) | $2,197,695 | $0 |
| Total Equity Risk | 2,197,695 | 0 |
| Total Value of Derivatives | $2,197,695 | $0 |
(a) Reflects gross cumulative appreciation (depreciation) on futures contracts as presented in the Schedule of Investments. In the Statement of Assets and Liabilities, the period end daily variation margin is included in receivable or payable for daily variation margin on futures contracts, and the net cumulative appreciation (depreciation) is included in net unrealized appreciation (depreciation).
See accompanying notes which are an integral part of the financial statements.
Fidelity® Extended Market Index Fund
Financial Statements
Statement of Assets and Liabilities
| August 31, 2017 (Unaudited) | ||
| Assets | ||
| Investment in securities, at value (including securities loaned of $4,327,809,512) — See accompanying schedule: Unaffiliated issuers (cost $14,937,911,760) | $19,687,309,854 | |
| Fidelity Central Funds (cost $4,481,552,852) | 4,481,552,852 | |
| Total Investment in Securities (cost $19,419,464,612) | $24,168,862,706 | |
| Cash | 798,565 | |
| Receivable for investments sold | 81,969,436 | |
| Receivable for fund shares sold | 18,105,613 | |
| Dividends receivable | 15,723,686 | |
| Distributions receivable from Fidelity Central Funds | 2,581,609 | |
| Receivable for daily variation margin on futures contracts | 1,022,175 | |
| Total assets | 24,289,063,790 | |
| Liabilities | ||
| Payable for investments purchased | $86,775,789 | |
| Payable for fund shares redeemed | 11,843,363 | |
| Accrued management fee | 730,820 | |
| Other affiliated payables | 370,811 | |
| Collateral on securities loaned | 4,396,117,052 | |
| Total liabilities | 4,495,837,835 | |
| Net Assets | $19,793,225,955 | |
| Net Assets consist of: | ||
| Paid in capital | $14,337,235,083 | |
| Undistributed net investment income | 137,569,824 | |
| Accumulated undistributed net realized gain (loss) on investments and foreign currency transactions | 566,824,323 | |
| Net unrealized appreciation (depreciation) on investments and assets and liabilities in foreign currencies | 4,751,596,725 | |
| Net Assets | $19,793,225,955 | |
| Investor Class: | ||
| Net Asset Value, offering price and redemption price per share ($771,664,796 ÷ 13,007,867 shares) | $59.32 | |
| Premium Class: | ||
| Net Asset Value, offering price and redemption price per share ($16,377,117,514 ÷ 276,037,841 shares) | $59.33 | |
| Institutional Premium Class: | ||
| Net Asset Value, offering price and redemption price per share ($2,644,443,645 ÷ 44,582,027 shares) | $59.32 |
See accompanying notes which are an integral part of the financial statements.
Statement of Operations
| Six months ended August 31, 2017 (Unaudited) | ||
| Investment Income | ||
| Dividends | $129,802,141 | |
| Interest | 20,272 | |
| Income from Fidelity Central Funds (including $14,405,015 from security lending) | 14,714,013 | |
| Total income | 144,536,426 | |
| Expenses | ||
| Management fee | $4,375,209 | |
| Transfer agent fees | 2,245,723 | |
| Independent trustees' fees and expenses | 39,494 | |
| Legal | 16 | |
| Interest | 4,279 | |
| Miscellaneous | 31,272 | |
| Total expenses before reductions | 6,695,993 | |
| Expense reductions | (17,441) | 6,678,552 |
| Net investment income (loss) | 137,857,874 | |
| Realized and Unrealized Gain (Loss) | ||
| Net realized gain (loss) on: | ||
| Investment securities: | ||
| Unaffiliated issuers | 624,000,663 | |
| Fidelity Central Funds | (198,547) | |
| Foreign currency transactions | 449 | |
| Futures contracts | (10,029) | |
| Total net realized gain (loss) | 623,792,536 | |
| Change in net unrealized appreciation (depreciation) on: | ||
| Investment securities: | ||
| Unaffiliated issuers | (121,591,260) | |
| Fidelity Central Funds | (115,568) | |
| Assets and liabilities in foreign currencies | 936 | |
| Futures contracts | (264,817) | |
| Total change in net unrealized appreciation (depreciation) | (121,970,709) | |
| Net gain (loss) | 501,821,827 | |
| Net increase (decrease) in net assets resulting from operations | $639,679,701 |
See accompanying notes which are an integral part of the financial statements.
Statement of Changes in Net Assets
| Six months ended August 31, 2017 (Unaudited) | Year ended February 28, 2017 | |
| Increase (Decrease) in Net Assets | ||
| Operations | ||
| Net investment income (loss) | $137,857,874 | $249,578,137 |
| Net realized gain (loss) | 623,792,536 | 737,078,558 |
| Change in net unrealized appreciation (depreciation) | (121,970,709) | 3,647,100,185 |
| Net increase (decrease) in net assets resulting from operations | 639,679,701 | 4,633,756,880 |
| Distributions to shareholders from net investment income | (35,010,454) | (236,121,884) |
| Distributions to shareholders from net realized gain | (193,561,721) | (605,807,215) |
| Total distributions | (228,572,175) | (841,929,099) |
| Share transactions - net increase (decrease) | 124,966,400 | 1,125,097,806 |
| Redemption fees | – | 367,317 |
| Total increase (decrease) in net assets | 536,073,926 | 4,917,292,904 |
| Net Assets | ||
| Beginning of period | 19,257,152,029 | 14,339,859,125 |
| End of period | $19,793,225,955 | $19,257,152,029 |
| Other Information | ||
| Undistributed net investment income end of period | $137,569,824 | $34,722,404 |
See accompanying notes which are an integral part of the financial statements.
Financial Highlights — Fidelity Extended Market Index Fund Investor Class
| Six months ended (Unaudited) August 31, | Years ended February 28, | |||||
| 2017 | 2017 | 2016A | 2015 | 2014 | 2013 | |
| Selected Per–Share Data | ||||||
| Net asset value, beginning of period | $58.10 | $46.00 | $57.40 | $55.29 | $43.12 | $39.66 |
| Income from Investment Operations | ||||||
| Net investment income (loss)B | .40 | .77 | .75 | .74 | .67 | .73 |
| Net realized and unrealized gain (loss) | 1.50 | 14.00 | (8.99) | 3.62 | 13.09 | 4.61 |
| Total from investment operations | 1.90 | 14.77 | (8.24) | 4.36 | 13.76 | 5.34 |
| Distributions from net investment income | (.10) | (.74) | (.71) | (.70) | (.54) | (.70) |
| Distributions from net realized gain | (.58) | (1.93) | (2.45) | (1.55) | (1.06) | (1.17) |
| Total distributions | (.68) | (2.67) | (3.16) | (2.25) | (1.60) | (1.88)C |
| Redemption fees added to paid in capitalB | – | –D | –D | –D | .01 | –D |
| Net asset value, end of period | $59.32 | $58.10 | $46.00 | $57.40 | $55.29 | $43.12 |
| Total ReturnE,F | 3.33% | 32.50% | (14.86)% | 8.23% | 32.38% | 14.00% |
| Ratios to Average Net AssetsG,H | ||||||
| Expenses before reductions | .10%I | .10% | .10% | .10% | .10% | .10% |
| Expenses net of fee waivers, if any | .10%I | .10% | .10% | .10% | .10% | .10% |
| Expenses net of all reductions | .10%I | .10% | .10% | .10% | .10% | .10% |
| Net investment income (loss) | 1.39%I | 1.47% | 1.39% | 1.36% | 1.35% | 1.85% |
| Supplemental Data | ||||||
| Net assets, end of period (000 omitted) | $771,665 | $815,223 | $1,392,793 | $1,992,558 | $1,803,152 | $971,857 |
| Portfolio turnover rateJ | 14%I | 12% | 12%K | 7% | 14% | 10% |
A For the year ended February 29.
B Calculated based on average shares outstanding during the period.
C Total distributions of $1.88 per share is comprised of distributions from net investment income of $.703 and distributions from net realized gain of $1.172 per share.
D Amount represents less than $.005 per share.
E Total returns for periods of less than one year are not annualized.
F Total returns would have been lower if certain expenses had not been reduced during the applicable periods shown.
G Fees and expenses of any underlying Fidelity Central Funds are not included in the Fund's expense ratio. The Fund indirectly bears its proportionate share of the expenses of any underlying Fidelity Central Funds.
H Expense ratios reflect operating expenses of the class. Expenses before reductions do not reflect amounts reimbursed by the investment adviser or reductions from expense offset arrangements and do not represent the amount paid by the class during periods when reimbursements or reductions occur. Expenses net of fee waivers reflect expenses after reimbursement by the investment adviser but prior to reductions from expense offset arrangements. Expenses net of all reductions represent the net expenses paid by the class.
I Annualized
J Amount does not include the portfolio activity of any underlying Fidelity Central Funds.
K Portfolio turnover rate excludes securities received or delivered in-kind.
See accompanying notes which are an integral part of the financial statements.
Financial Highlights — Fidelity Extended Market Index Fund Premium Class
| Six months ended (Unaudited) August 31, | Years ended February 28, | |||||
| 2017 | 2017 | 2016A | 2015 | 2014 | 2013 | |
| Selected Per–Share Data | ||||||
| Net asset value, beginning of period | $58.11 | $46.00 | $57.40 | $55.30 | $43.12 | $39.66 |
| Income from Investment Operations | ||||||
| Net investment income (loss)B | .41 | .80 | .77 | .76 | .68 | .75 |
| Net realized and unrealized gain (loss) | 1.50 | 13.99 | (8.99) | 3.61 | 13.11 | 4.60 |
| Total from investment operations | 1.91 | 14.79 | (8.22) | 4.37 | 13.79 | 5.35 |
| Distributions from net investment income | (.10) | (.75) | (.73) | (.72) | (.56) | (.72) |
| Distributions from net realized gain | (.58) | (1.93) | (2.45) | (1.55) | (1.06) | (1.17) |
| Total distributions | (.69)C | (2.68) | (3.18) | (2.27) | (1.62) | (1.89) |
| Redemption fees added to paid in capitalB | – | –D | –D | –D | .01 | –D |
| Net asset value, end of period | $59.33 | $58.11 | $46.00 | $57.40 | $55.30 | $43.12 |
| Total ReturnE,F | 3.34% | 32.56% | (14.83)% | 8.24% | 32.44% | 14.04% |
| Ratios to Average Net AssetsG,H | ||||||
| Expenses before reductions | .07%I | .07% | .07% | .07% | .07% | .07% |
| Expenses net of fee waivers, if any | .07%I | .07% | .07% | .07% | .07% | .07% |
| Expenses net of all reductions | .07%I | .07% | .07% | .07% | .07% | .07% |
| Net investment income (loss) | 1.42%I | 1.49% | 1.42% | 1.39% | 1.38% | 1.88% |
| Supplemental Data | ||||||
| Net assets, end of period (000 omitted) | $16,377,118 | $16,222,551 | $11,837,818 | $13,356,931 | $12,280,754 | $7,173,852 |
| Portfolio turnover rateJ | 14%I | 12% | 12%K | 7% | 14% | 10% |
A For the year ended February 29.
B Calculated based on average shares outstanding during the period.
C Total distributions of $.69 per share is comprised of distributions from net investment income of $.104 and distributions from net realized gain of $.581 per share.
D Amount represents less than $.005 per share.
E Total returns for periods of less than one year are not annualized.
F Total returns would have been lower if certain expenses had not been reduced during the applicable periods shown.
G Fees and expenses of any underlying Fidelity Central Funds are not included in the Fund's expense ratio. The Fund indirectly bears its proportionate share of the expenses of any underlying Fidelity Central Funds.
H Expense ratios reflect operating expenses of the class. Expenses before reductions do not reflect amounts reimbursed by the investment adviser or reductions from expense offset arrangements and do not represent the amount paid by the class during periods when reimbursements or reductions occur. Expenses net of fee waivers reflect expenses after reimbursement by the investment adviser but prior to reductions from expense offset arrangements. Expenses net of all reductions represent the net expenses paid by the class.
I Annualized
J Amount does not include the portfolio activity of any underlying Fidelity Central Funds.
K Portfolio turnover rate excludes securities received or delivered in-kind.
See accompanying notes which are an integral part of the financial statements.
Financial Highlights — Fidelity Extended Market Index Fund Institutional Premium Class
| Six months ended (Unaudited) August 31, | Years ended February 28, | |||||
| 2017 | 2017 | 2016A | 2015 | 2014 | 2013 | |
| Selected Per–Share Data | ||||||
| Net asset value, beginning of period | $58.09 | $45.99 | $57.39 | $55.28 | $43.11 | $39.66 |
| Income from Investment Operations | ||||||
| Net investment income (loss)B | .42 | .81 | .76 | .76 | .72 | .75 |
| Net realized and unrealized gain (loss) | 1.50 | 13.98 | (8.98) | 3.63 | 13.06 | 4.60 |
| Total from investment operations | 1.92 | 14.79 | (8.22) | 4.39 | 13.78 | 5.35 |
| Distributions from net investment income | (.11) | (.76) | (.73) | (.72) | (.56) | (.72) |
| Distributions from net realized gain | (.58) | (1.93) | (2.45) | (1.55) | (1.06) | (1.17) |
| Total distributions | (.69) | (2.69) | (3.18) | (2.28)C | (1.62) | (1.90)D |
| Redemption fees added to paid in capitalB | – | –E | –E | –E | .01 | –E |
| Net asset value, end of period | $59.32 | $58.09 | $45.99 | $57.39 | $55.28 | $43.11 |
| Total ReturnF,G | 3.36% | 32.58% | (14.83)% | 8.27% | 32.44% | 14.04% |
| Ratios to Average Net AssetsH,I | ||||||
| Expenses before reductions | .05%J | .05% | .07% | .07% | .07% | .07% |
| Expenses net of fee waivers, if any | .05%J | .05% | .06% | .06% | .06% | .06% |
| Expenses net of all reductions | .05%J | .05% | .06% | .06% | .06% | .06% |
| Net investment income (loss) | 1.44%J | 1.52% | 1.43% | 1.40% | 1.39% | 1.89% |
| Supplemental Data | ||||||
| Net assets, end of period (000 omitted) | $2,644,444 | $2,219,377 | $1,109,249 | $754,325 | $95,747 | $226 |
| Portfolio turnover rateK | 14%J | 12% | 12%L | 7% | 14% | 10% |
A For the year ended February 29.
B Calculated based on average shares outstanding during the period.
C Total distributions of $2.28 per share is comprised of distributions from net investment income of $.722 and distributions from net realized gain of $1.553 per share.
D Total distributions of $1.90 per share is comprised of distributions from net investment income of $.723 and distributions from net realized gain of $1.172 per share.
E Amount represents less than $.005 per share.
F Total returns for periods of less than one year are not annualized.
G Total returns would have been lower if certain expenses had not been reduced during the applicable periods shown.
H Fees and expenses of any underlying Fidelity Central Funds are not included in the Fund's expense ratio. The Fund indirectly bears its proportionate share of the expenses of any underlying Fidelity Central Funds.
I Expense ratios reflect operating expenses of the class. Expenses before reductions do not reflect amounts reimbursed by the investment adviser or reductions from expense offset arrangements and do not represent the amount paid by the class during periods when reimbursements or reductions occur. Expenses net of fee waivers reflect expenses after reimbursement by the investment adviser but prior to reductions from expense offset arrangements. Expenses net of all reductions represent the net expenses paid by the class.
J Annualized
K Amount does not include the portfolio activity of any underlying Fidelity Central Funds.
L Portfolio turnover rate excludes securities received or delivered in-kind.
See accompanying notes which are an integral part of the financial statements.
Fidelity® International Index Fund
Investment Summary (Unaudited)
Top Ten Stocks as of August 31, 2017
| % of fund's net assets | % of fund's net assets 6 months ago | |
| Nestle SA (Reg. S) (Switzerland, Food Products) | 1.8 | 1.8 |
| HSBC Holdings PLC (United Kingdom) (United Kingdom, Banks) | 1.3 | 1.2 |
| Novartis AG (Switzerland, Pharmaceuticals) | 1.3 | 1.4 |
| Roche Holding AG (participation certificate) (Switzerland, Pharmaceuticals) | 1.2 | 1.3 |
| Toyota Motor Corp. (Japan, Automobiles) | 1.0 | 1.2 |
| British American Tobacco PLC (United Kingdom) (United Kingdom, Tobacco) | 1.0 | 0.9 |
| Royal Dutch Shell PLC Class A (United Kingdom) (United Kingdom, Oil, Gas & Consumable Fuels) | 0.8 | 0.9 |
| Total SA (France, Oil, Gas & Consumable Fuels) | 0.8 | 0.9 |
| Sanofi SA (France, Pharmaceuticals) | 0.8 | 0.8 |
| BP PLC (United Kingdom, Oil, Gas & Consumable Fuels) | 0.8 | 0.8 |
| 10.8 |
Top Market Sectors as of August 31, 2017
| % of fund's net assets | % of fund's net assets 6 months ago | |
| Financials | 20.6 | 20.5 |
| Industrials | 13.8 | 14.2 |
| Consumer Discretionary | 11.9 | 11.9 |
| Consumer Staples | 11.2 | 10.7 |
| Health Care | 9.8 | 10.6 |
| Materials | 7.7 | 7.9 |
| Information Technology | 6.1 | 5.2 |
| Energy | 4.6 | 4.9 |
| Telecommunication Services | 3.9 | 4.1 |
| Real Estate | 3.9 | 4.1 |
Geographic Diversification (% of fund's net assets)
| As of August 31, 2017 | ||
| Japan | 22.7% | |
| United Kingdom | 15.9% | |
| France | 9.7% | |
| Germany | 9.2% | |
| Switzerland | 8.1% | |
| Australia | 6.8% | |
| Netherlands | 4.3% | |
| Spain | 3.4% | |
| Sweden | 2.8% | |
| Other* | 17.1% | |

* Includes Short-Term investments and Net Other Assets (Liabilities).
Percentages are based on country or territory of incorporation and include the effect of futures contracts, options and swaps, as applicable. Foreign currency contracts and other assets and liabilities are included within United States of America, as applicable.
| As of February 28, 2017 | ||
| Japan | 23.7% | |
| United Kingdom | 16.3% | |
| Germany | 9.1% | |
| France | 9.0% | |
| Switzerland | 8.6% | |
| Australia | 7.4% | |
| Netherlands | 4.0% | |
| Spain | 3.0% | |
| Sweden | 2.8% | |
| Other* | 16.1% | |
* Includes Short-Term investments and Net Other Assets (Liabilities).
Percentages are based on country or territory of incorporation and include the effect of futures contracts, options and swaps, as applicable. Foreign currency contracts and other assets and liabilities are included within United States of America, as applicable.
Fidelity® International Index Fund
Investments August 31, 2017 (Unaudited)
Showing Percentage of Net Assets
| Common Stocks - 96.7% | |||
| Shares | Value | ||
| Australia - 6.8% | |||
| AGL Energy Ltd. | 920,637 | $17,557,331 | |
| Alumina Ltd. | 3,363,689 | 5,668,805 | |
| Amcor Ltd. | 1,590,436 | 20,368,148 | |
| AMP Ltd. | 4,057,901 | 16,451,725 | |
| APA Group unit | 1,519,960 | 10,705,469 | |
| Aristocrat Leisure Ltd. | 739,136 | 12,438,987 | |
| ASX Ltd. | 264,789 | 11,509,813 | |
| Aurizon Holdings Ltd. | 2,805,492 | 11,061,920 | |
| Australia & New Zealand Banking Group Ltd. | 4,023,628 | 94,038,343 | |
| Bank of Queensland Ltd. | 532,820 | 5,332,687 | |
| Bendigo & Adelaide Bank Ltd. | 647,979 | 6,155,575 | |
| BHP Billiton Ltd. | 4,400,808 | 95,801,918 | |
| BlueScope Steel Ltd. | 782,814 | 6,764,379 | |
| Boral Ltd. | 1,608,384 | 8,528,161 | |
| Brambles Ltd. | 2,177,259 | 16,113,860 | |
| Caltex Australia Ltd. | 355,143 | 9,426,696 | |
| Challenger Ltd. | 779,909 | 7,774,658 | |
| Cimic Group Ltd. | 133,601 | 4,465,967 | |
| Coca-Cola Amatil Ltd. | 787,550 | 5,039,806 | |
| Cochlear Ltd. | 78,514 | 9,749,801 | |
| Commonwealth Bank of Australia | 2,361,652 | 142,306,561 | |
| Computershare Ltd. | 634,239 | 7,083,846 | |
| Crown Ltd. | 549,809 | 5,070,020 | |
| CSL Ltd. | 624,242 | 63,776,916 | |
| DEXUS Property Group unit | 1,394,004 | 10,627,288 | |
| Dominos Pizza Enterprises Ltd. (a) | 83,801 | 2,874,550 | |
| Flight Centre Travel Group Ltd. (a) | 75,350 | 2,896,140 | |
| Fortescue Metals Group Ltd. | 2,128,690 | 10,170,135 | |
| Goodman Group unit | 2,451,540 | 16,155,981 | |
| Harvey Norman Holdings Ltd. (a) | 745,850 | 2,419,087 | |
| Healthscope Ltd. | 2,383,050 | 3,296,266 | |
| Incitec Pivot Ltd. | 2,315,980 | 6,130,824 | |
| Insurance Australia Group Ltd. | 3,240,460 | 16,512,184 | |
| Lendlease Group unit | 754,035 | 9,938,386 | |
| Macquarie Group Ltd. | 443,097 | 30,574,429 | |
| Medibank Private Ltd. | 3,767,888 | 9,105,659 | |
| Mirvac Group unit | 5,069,616 | 9,349,812 | |
| National Australia Bank Ltd. | 3,666,536 | 88,024,326 | |
| Newcrest Mining Ltd. | 1,050,002 | 19,072,874 | |
| Orica Ltd. | 514,007 | 8,307,039 | |
| Origin Energy Ltd. (b) | 2,408,159 | 14,644,900 | |
| Qantas Airways Ltd. | 709,284 | 3,225,195 | |
| QBE Insurance Group Ltd. | 1,877,903 | 15,585,239 | |
| Ramsay Health Care Ltd. | 192,926 | 10,476,467 | |
| realestate.com.au Ltd. | 72,331 | 3,812,219 | |
| Rio Tinto Ltd. | 580,955 | 31,330,559 | |
| Santos Ltd. (b) | 2,567,471 | 7,674,202 | |
| Scentre Management Ltd. A/S Trustee South Carolina unit | 7,294,932 | 22,384,550 | |
| SEEK Ltd. | 452,505 | 6,025,291 | |
| Sonic Healthcare Ltd. | 540,120 | 9,403,168 | |
| South32 Ltd. | 7,291,880 | 16,926,306 | |
| SP AusNet | 2,411,989 | 3,336,295 | |
| Stockland Corp. Ltd. unit | 3,300,498 | 11,623,128 | |
| Suncorp Group Ltd. | 1,767,489 | 18,308,002 | |
| Sydney Airport unit | 1,504,637 | 8,851,223 | |
| Tabcorp Holdings Ltd. | 1,125,519 | 3,677,346 | |
| Tatts Group Ltd. | 1,934,665 | 6,321,024 | |
| Telstra Corp. Ltd. | 5,721,256 | 16,691,573 | |
| The GPT Group unit | 2,462,308 | 9,787,059 | |
| TPG Telecom Ltd. (a) | 497,555 | 2,171,467 | |
| Transurban Group unit | 2,812,863 | 27,190,799 | |
| Treasury Wine Estates Ltd. | 1,011,589 | 11,644,276 | |
| Vicinity Centers unit | 4,600,704 | 9,582,204 | |
| Wesfarmers Ltd. | 1,547,469 | 52,429,440 | |
| Westfield Corp. unit | 2,704,659 | 15,975,010 | |
| Westpac Banking Corp. | 4,599,902 | 114,480,295 | |
| Woodside Petroleum Ltd. | 1,039,603 | 23,826,046 | |
| Woolworths Ltd. | 1,761,446 | 36,406,799 | |
| TOTAL AUSTRALIA | 1,352,436,454 | ||
| Austria - 0.2% | |||
| Andritz AG | 99,736 | 5,427,181 | |
| Erste Group Bank AG | 411,341 | 17,381,223 | |
| OMV AG | 202,168 | 11,621,998 | |
| Raiffeisen International Bank-Holding AG (b) | 203,883 | 6,689,157 | |
| Voestalpine AG | 154,581 | 8,021,473 | |
| TOTAL AUSTRIA | 49,141,032 | ||
| Bailiwick of Jersey - 1.2% | |||
| Experian PLC | 1,291,591 | 25,971,118 | |
| Glencore Xstrata PLC | 16,760,360 | 77,913,793 | |
| Randgold Resources Ltd. | 129,110 | 13,243,867 | |
| Shire PLC | 1,239,436 | 61,645,885 | |
| Wolseley PLC | 346,398 | 20,618,091 | |
| WPP PLC | 1,754,371 | 31,994,645 | |
| TOTAL BAILIWICK OF JERSEY | 231,387,399 | ||
| Belgium - 1.2% | |||
| Ageas | 266,883 | 12,393,901 | |
| Anheuser-Busch InBev SA NV | 1,043,907 | 123,630,955 | |
| Colruyt NV | 87,893 | 4,883,709 | |
| Groupe Bruxelles Lambert SA | 109,589 | 11,155,654 | |
| KBC Groep NV | 343,242 | 28,206,517 | |
| Proximus | 206,915 | 7,294,825 | |
| Solvay SA Class A | 101,330 | 14,698,558 | |
| Telenet Group Holding NV (b) | 71,725 | 4,855,846 | |
| UCB SA | 173,608 | 11,964,221 | |
| Umicore SA | 130,068 | 9,716,176 | |
| TOTAL BELGIUM | 228,800,362 | ||
| Bermuda - 0.4% | |||
| Cheung Kong Infrastructure Holdings Ltd. | 901,450 | 8,166,988 | |
| Hongkong Land Holdings Ltd. | 1,613,100 | 11,953,071 | |
| Jardine Matheson Holdings Ltd. | 293,200 | 19,266,172 | |
| Jardine Strategic Holdings Ltd. | 303,800 | 13,321,630 | |
| Kerry Properties Ltd. | 891,181 | 3,530,219 | |
| Li & Fung Ltd. | 8,097,246 | 3,652,465 | |
| NWS Holdings Ltd. | 2,090,104 | 4,016,888 | |
| Shangri-La Asia Ltd. | 1,725,380 | 2,888,219 | |
| Yue Yuen Industrial (Holdings) Ltd. | 999,500 | 4,329,687 | |
| TOTAL BERMUDA | 71,125,339 | ||
| British Virgin Islands - 0.0% | |||
| First Pacific Co. Ltd. | 2,886,665 | 2,320,177 | |
| Cayman Islands - 0.6% | |||
| ASM Pacific Technology Ltd. | 365,429 | 4,520,145 | |
| Cheung Kong Property Holdings Ltd. | 3,638,425 | 31,940,683 | |
| CK Hutchison Holdings Ltd. | 3,696,925 | 48,374,293 | |
| Melco Crown Entertainment Ltd. sponsored ADR | 335,781 | 7,370,393 | |
| MGM China Holdings Ltd. | 1,267,200 | 2,539,015 | |
| Sands China Ltd. | 3,310,800 | 14,828,424 | |
| WH Group Ltd. | 10,985,000 | 11,482,260 | |
| Wynn Macau Ltd. | 2,145,200 | 4,709,393 | |
| TOTAL CAYMAN ISLANDS | 125,764,606 | ||
| Denmark - 1.8% | |||
| A.P. Moller - Maersk A/S: | |||
| Series A | 5,150 | 10,081,795 | |
| Series B | 8,969 | 18,491,155 | |
| Carlsberg A/S Series B | 146,830 | 16,851,483 | |
| Christian Hansen Holding A/S | 135,142 | 11,627,142 | |
| Coloplast A/S Series B | 162,658 | 13,330,288 | |
| Danske Bank A/S | 1,010,766 | 39,282,894 | |
| DONG Energy A/S | 200,360 | 10,429,554 | |
| DSV de Sammensluttede Vognmaend A/S | 260,519 | 18,473,419 | |
| Genmab A/S (b) | 78,542 | 18,330,050 | |
| H Lundbeck A/S | 94,965 | 6,048,416 | |
| ISS Holdings A/S | 228,827 | 8,904,230 | |
| Novo Nordisk A/S Series B | 2,481,675 | 118,251,367 | |
| Novozymes A/S Series B | 316,304 | 16,090,248 | |
| Pandora A/S | 152,278 | 16,184,877 | |
| TDC A/S | 1,110,609 | 6,616,704 | |
| Tryg A/S | 154,486 | 3,570,759 | |
| Vestas Wind Systems A/S | 303,438 | 27,636,713 | |
| William Demant Holding A/S (b) | 164,772 | 4,359,738 | |
| TOTAL DENMARK | 364,560,832 | ||
| Finland - 1.0% | |||
| Elisa Corp. (A Shares) | 193,962 | 8,474,106 | |
| Fortum Corp. | 607,099 | 10,898,633 | |
| Kone Oyj (B Shares) | 462,541 | 25,097,804 | |
| Metso Corp. | 155,057 | 5,138,919 | |
| Neste Oyj | 174,855 | 7,710,103 | |
| Nokia Corp. | 7,996,887 | 49,603,043 | |
| Nokian Tyres PLC | 157,566 | 6,660,769 | |
| Orion Oyj (B Shares) | 140,873 | 6,671,196 | |
| Sampo Oyj (A Shares) | 612,307 | 32,320,351 | |
| Stora Enso Oyj (R Shares) | 753,429 | 9,901,992 | |
| UPM-Kymmene Corp. | 731,892 | 19,046,199 | |
| Wartsila Corp. (a) | 202,977 | 14,002,689 | |
| TOTAL FINLAND | 195,525,804 | ||
| France - 9.5% | |||
| Accor SA | 253,486 | 11,738,558 | |
| Aeroports de Paris | 40,593 | 7,241,342 | |
| Air Liquide SA | 243,898 | 29,775,226 | |
| Alstom SA | 209,933 | 7,466,203 | |
| Arkema SA | 92,747 | 10,078,286 | |
| Atos Origin SA | 129,168 | 19,928,339 | |
| AXA SA | 2,656,865 | 77,034,637 | |
| BIC SA | 39,151 | 4,705,008 | |
| BNP Paribas SA | 1,537,777 | 116,996,626 | |
| Bollore Group | 1,191,050 | 5,532,589 | |
| Bouygues SA | 292,469 | 13,263,526 | |
| Bureau Veritas SA | 362,872 | 8,628,820 | |
| Capgemini SA | 219,848 | 24,373,802 | |
| Carrefour SA | 795,894 | 16,050,176 | |
| Casino Guichard Perrachon SA | 75,070 | 4,268,619 | |
| CNP Assurances | 233,438 | 5,418,977 | |
| Compagnie de St. Gobain | 684,743 | 37,558,142 | |
| Credit Agricole SA | 1,559,436 | 27,523,515 | |
| Danone SA | 808,280 | 63,680,311 | |
| Dassault Aviation SA | 3,371 | 5,149,892 | |
| Dassault Systemes SA | 176,093 | 17,346,875 | |
| Edenred SA | 304,511 | 8,236,116 | |
| EDF SA | 569,201 | 6,030,687 | |
| EDF SA (b) | 200,740 | 2,126,841 | |
| Eiffage SA | 100,316 | 10,365,759 | |
| ENGIE | 2,334,343 | 38,960,439 | |
| Essilor International SA | 284,059 | 35,861,660 | |
| Eurazeo SA | 59,642 | 4,933,847 | |
| Eutelsat Communications | 239,381 | 6,957,570 | |
| Fonciere des Regions | 44,937 | 4,443,851 | |
| Gecina SA | 64,114 | 9,990,879 | |
| Groupe Eurotunnel SA | 636,765 | 7,591,740 | |
| Hermes International SCA | 43,386 | 22,947,590 | |
| ICADE | 49,334 | 4,384,756 | |
| Iliad SA | 36,177 | 9,343,366 | |
| Imerys SA | 48,916 | 4,303,349 | |
| Ingenico SA | 80,416 | 7,983,984 | |
| Ipsen SA | 51,329 | 6,895,655 | |
| JCDecaux SA | 102,845 | 3,367,488 | |
| Kering SA | 103,804 | 38,962,716 | |
| Klepierre SA | 301,591 | 12,153,132 | |
| L'Oreal SA (b) | 201,944 | 42,635,691 | |
| L'Oreal SA | 143,136 | 30,238,989 | |
| Lagardere S.C.A. (Reg.) | 162,556 | 5,222,964 | |
| Legrand SA | 365,677 | 25,631,652 | |
| LVMH Moet Hennessy - Louis Vuitton SA | 382,040 | 100,350,330 | |
| Michelin CGDE Series B | 234,012 | 31,897,363 | |
| Natixis SA | 1,286,734 | 9,662,547 | |
| Orange SA (b) | 2,733,088 | 46,404,116 | |
| Pernod Ricard SA | 290,940 | 39,760,925 | |
| Peugeot Citroen SA | 665,374 | 14,047,796 | |
| Publicis Groupe SA | 282,150 | 19,040,594 | |
| Remy Cointreau SA | 30,252 | 3,454,774 | |
| Renault SA | 243,179 | 21,523,763 | |
| Rexel SA | 413,493 | 6,177,646 | |
| Safran SA | 428,571 | 41,626,594 | |
| Sanofi SA | 1,593,085 | 155,326,333 | |
| Schneider Electric SA | 771,028 | 62,176,431 | |
| SCOR SE | 235,349 | 9,862,027 | |
| SEB SA | 30,826 | 5,599,933 | |
| Societe Generale Series A | 1,051,234 | 58,808,045 | |
| Sodexo SA | 41,362 | 4,826,938 | |
| Sodexo SA (b) | 6,851 | 799,510 | |
| Sodexo SA | 77,845 | 9,084,497 | |
| Suez Environnement SA | 500,064 | 9,486,124 | |
| Thales SA | 145,047 | 16,058,422 | |
| Total SA | 3,194,328 | 165,745,208 | |
| Unibail-Rodamco | 136,049 | 34,586,458 | |
| Valeo SA | 327,289 | 21,888,918 | |
| Veolia Environnement SA | 655,650 | 15,384,020 | |
| VINCI SA | 687,097 | 63,268,790 | |
| Vivendi SA | 1,410,006 | 32,353,890 | |
| Wendel SA | 38,565 | 6,112,877 | |
| Zodiac Aerospace | 279,198 | 8,078,283 | |
| TOTAL FRANCE | 1,876,723,342 | ||
| Germany - 8.7% | |||
| adidas AG | 258,010 | 57,912,756 | |
| Allianz SE | 626,145 | 134,199,352 | |
| Axel Springer Verlag AG | 66,525 | 4,118,124 | |
| BASF AG | 1,258,918 | 121,947,505 | |
| Bayer AG | 1,133,123 | 145,009,575 | |
| Bayerische Motoren Werke AG (BMW) | 450,889 | 41,867,343 | |
| Beiersdorf AG | 138,230 | 14,757,373 | |
| Brenntag AG | 212,194 | 11,244,772 | |
| Commerzbank AG (b) | 1,458,038 | 18,120,931 | |
| Continental AG | 150,584 | 33,979,249 | |
| Covestro AG | 152,032 | 11,946,919 | |
| Daimler AG (Germany) | 1,319,198 | 96,157,996 | |
| Deutsche Bank AG | 2,834,762 | 45,456,433 | |
| Deutsche Borse AG | 264,399 | 28,261,743 | |
| Deutsche Lufthansa AG | 317,735 | 7,969,678 | |
| Deutsche Post AG | 1,360,789 | 56,447,202 | |
| Deutsche Telekom AG | 4,486,799 | 81,143,502 | |
| Deutsche Wohnen AG (Bearer) | 485,197 | 20,608,867 | |
| E.ON AG | 3,014,649 | 34,118,203 | |
| Evonik Industries AG | 222,831 | 7,223,279 | |
| Fraport AG Frankfurt Airport Services Worldwide | 57,324 | 5,656,526 | |
| Fresenius Medical Care AG & Co. KGaA | 294,228 | 27,601,437 | |
| Fresenius SE & Co. KGaA | 568,428 | 48,105,545 | |
| GEA Group AG | 249,575 | 10,992,943 | |
| Hannover Reuck SE | 81,879 | 9,922,737 | |
| HeidelbergCement Finance AG | 204,132 | 19,598,671 | |
| Henkel AG & Co. KGaA | 142,773 | 17,285,351 | |
| Hochtief AG | 26,181 | 4,614,300 | |
| Hugo Boss AG | 88,183 | 7,464,947 | |
| Infineon Technologies AG | 1,554,075 | 35,889,710 | |
| Innogy SE | 189,647 | 8,358,959 | |
| K&S AG (a) | 261,329 | 6,228,204 | |
| KION Group AG | 95,000 | 8,665,167 | |
| Lanxess AG | 125,115 | 9,331,288 | |
| Linde AG | 254,540 | 48,873,058 | |
| MAN SE | 49,165 | 5,519,820 | |
| Merck KGaA | 176,943 | 19,433,812 | |
| Metro Wholesale & Food Specialist AG | 241,610 | 4,722,796 | |
| Muenchener Rueckversicherungs AG | 220,497 | 45,515,879 | |
| OSRAM Licht AG | 117,323 | 9,634,241 | |
| ProSiebenSat.1 Media AG | 319,930 | 10,731,749 | |
| RWE AG | 710,003 | 17,711,649 | |
| SAP SE | 1,347,022 | 141,372,352 | |
| Schaeffler AG | 223,006 | 3,143,254 | |
| Siemens AG | 1,048,104 | 137,206,281 | |
| Symrise AG | 168,134 | 12,289,524 | |
| Telefonica Deutschland Holding AG | 1,015,462 | 5,495,463 | |
| Thyssenkrupp AG | 503,346 | 15,094,056 | |
| TUI AG | 375,389 | 6,349,235 | |
| TUI AG | 277,478 | 4,675,732 | |
| United Internet AG | 168,446 | 9,996,248 | |
| Volkswagen AG | 45,299 | 7,003,088 | |
| Vonovia SE | 643,005 | 27,177,846 | |
| Zalando SE (b) | 152,097 | 7,203,626 | |
| TOTAL GERMANY | 1,731,356,296 | ||
| Hong Kong - 2.4% | |||
| AIA Group Ltd. | 16,517,000 | 126,741,316 | |
| Bank of East Asia Ltd. | 1,655,112 | 7,582,119 | |
| BOC Hong Kong (Holdings) Ltd. | 5,067,566 | 25,804,876 | |
| CLP Holdings Ltd. | 2,246,157 | 23,722,311 | |
| Galaxy Entertainment Group Ltd. | 3,216,000 | 20,177,695 | |
| Hang Lung Group Ltd. | 1,202,000 | 4,531,067 | |
| Hang Lung Properties Ltd. | 2,943,423 | 7,161,329 | |
| Hang Seng Bank Ltd. | 1,047,401 | 24,091,260 | |
| Henderson Land Development Co. Ltd. | 1,703,407 | 10,556,846 | |
| HK Electric Investments & HK Electric Investments Ltd. unit | 3,632,000 | 3,332,302 | |
| Hong Kong & China Gas Co. Ltd. | 11,475,384 | 21,726,725 | |
| Hong Kong Exchanges and Clearing Ltd. | 1,592,664 | 43,470,981 | |
| Hysan Development Co. Ltd. | 847,677 | 3,921,146 | |
| i-CABLE Communications Ltd. (b) | 1,306,203 | 48,404 | |
| Link (REIT) | 3,028,308 | 24,998,076 | |
| MTR Corp. Ltd. | 2,015,706 | 11,783,989 | |
| New World Development Co. Ltd. | 7,908,651 | 10,813,349 | |
| PCCW Ltd. | 5,694,863 | 3,172,808 | |
| Power Assets Holdings Ltd. | 1,899,676 | 16,749,531 | |
| Sino Land Ltd. | 4,235,610 | 7,328,391 | |
| SJM Holdings Ltd. | 2,650,000 | 2,312,813 | |
| Sun Hung Kai Properties Ltd. | 1,979,676 | 33,037,816 | |
| Swire Pacific Ltd. (A Shares) | 719,384 | 7,321,846 | |
| Swire Properties Ltd. | 1,596,400 | 5,528,216 | |
| Techtronic Industries Co. Ltd. | 1,880,000 | 9,729,419 | |
| Wharf Holdings Ltd. | 1,658,585 | 15,800,085 | |
| Wheelock and Co. Ltd. | 1,108,000 | 8,289,736 | |
| TOTAL HONG KONG | 479,734,452 | ||
| Ireland - 0.5% | |||
| Bank Ireland Group PLC (b) | 1,249,039 | 10,408,429 | |
| CRH PLC | 1,137,469 | 39,727,174 | |
| DCC PLC (United Kingdom) | 120,817 | 11,006,295 | |
| James Hardie Industries PLC CDI | 603,763 | 8,490,517 | |
| Kerry Group PLC Class A | 216,328 | 20,146,389 | |
| Paddy Power Betfair PLC (Ireland) | 108,563 | 9,536,533 | |
| Ryanair Holdings PLC (b) | 250,317 | 5,345,110 | |
| TOTAL IRELAND | 104,660,447 | ||
| Isle of Man - 0.0% | |||
| Genting Singapore PLC | 8,232,259 | 7,194,385 | |
| Israel - 0.5% | |||
| Azrieli Group | 57,870 | 3,337,536 | |
| Bank Hapoalim BM (Reg.) | 1,455,750 | 9,801,129 | |
| Bank Leumi le-Israel BM | 1,973,969 | 10,343,509 | |
| Bezeq The Israel Telecommunication Corp. Ltd. | 2,794,956 | 4,117,569 | |
| Check Point Software Technologies Ltd. (a)(b) | 179,988 | 20,135,258 | |
| Elbit Systems Ltd. (Israel) | 32,257 | 4,441,638 | |
| Frutarom Industries Ltd. | 52,736 | 4,049,371 | |
| Israel Chemicals Ltd. | 707,051 | 3,049,947 | |
| Mizrahi Tefahot Bank Ltd. | 190,167 | 3,389,472 | |
| NICE Systems Ltd. | 73,481 | 5,691,497 | |
| NICE Systems Ltd. sponsored ADR (a) | 8,696 | 680,201 | |
| Taro Pharmaceutical Industries Ltd. (a)(b) | 18,773 | 1,968,161 | |
| Teva Pharmaceutical Industries Ltd. sponsored ADR | 1,250,141 | 19,827,236 | |
| TOTAL ISRAEL | 90,832,524 | ||
| Italy - 2.0% | |||
| Assicurazioni Generali SpA | 1,706,203 | 30,548,486 | |
| Atlantia SpA | 620,596 | 19,947,290 | |
| Enel SpA | 11,129,028 | 67,423,830 | |
| Eni SpA | 3,481,372 | 54,678,632 | |
| Intesa Sanpaolo SpA | 17,306,138 | 58,590,090 | |
| Intesa Sanpaolo SpA (Risparmio Shares) | 1,351,357 | 4,269,551 | |
| Leonardo SpA | 552,467 | 9,345,694 | |
| Luxottica Group SpA | 231,944 | 13,350,292 | |
| Mediobanca SpA | 773,131 | 7,933,622 | |
| Poste Italiane SpA | 704,621 | 5,120,972 | |
| Prysmian SpA | 279,855 | 8,801,912 | |
| Recordati SpA | 142,226 | 6,091,880 | |
| Saipem SpA (b) | 814,279 | 3,022,460 | |
| Snam Rete Gas SpA | 3,209,312 | 15,625,949 | |
| Telecom Italia SpA (b) | 15,591,179 | 14,961,152 | |
| Terna SpA | 1,996,120 | 11,786,354 | |
| UniCredit SpA (b) | 2,741,790 | 55,781,143 | |
| Unipolsai SpA | 1,502,092 | 3,410,031 | |
| TOTAL ITALY | 390,689,340 | ||
| Japan - 22.7% | |||
| ABC-MART, Inc. | 43,500 | 2,235,639 | |
| ACOM Co. Ltd. (b) | 553,400 | 2,265,248 | |
| AEON Co. Ltd. | 859,600 | 12,682,687 | |
| AEON Financial Service Co. Ltd. | 151,900 | 3,220,802 | |
| AEON MALL Co. Ltd. | 150,940 | 2,713,034 | |
| Air Water, Inc. | 205,700 | 3,794,602 | |
| Aisin Seiki Co. Ltd. | 251,600 | 12,656,097 | |
| Ajinomoto Co., Inc. | 742,466 | 14,665,620 | |
| Alfresa Holdings Corp. | 256,100 | 4,819,856 | |
| All Nippon Airways Ltd. | 1,562,000 | 5,794,184 | |
| Alps Electric Co. Ltd. | 271,500 | 7,458,316 | |
| Amada Holdings Co. Ltd. | 463,400 | 5,087,768 | |
| Aozora Bank Ltd. | 1,611,000 | 6,096,111 | |
| Asahi Glass Co. Ltd. | 277,235 | 10,818,558 | |
| Asahi Group Holdings | 529,603 | 23,070,621 | |
| Asahi Kasei Corp. | 1,726,727 | 20,685,855 | |
| Asics Corp. | 220,100 | 3,317,467 | |
| Astellas Pharma, Inc. | 2,948,500 | 37,243,597 | |
| Bandai Namco Holdings, Inc. | 271,550 | 9,102,304 | |
| Bank of Kyoto Ltd. | 419,000 | 3,876,136 | |
| Benesse Holdings, Inc. | 99,100 | 3,813,099 | |
| Bridgestone Corp. | 889,779 | 38,194,088 | |
| Brother Industries Ltd. | 322,500 | 7,644,836 | |
| Calbee, Inc. | 109,400 | 3,741,702 | |
| Canon, Inc. | 1,460,944 | 51,208,634 | |
| Casio Computer Co. Ltd. | 288,400 | 4,076,714 | |
| Central Japan Railway Co. | 197,600 | 33,486,042 | |
| Chiba Bank Ltd. | 953,674 | 6,384,719 | |
| Chubu Electric Power Co., Inc. | 874,764 | 11,434,355 | |
| Chugai Pharmaceutical Co. Ltd. | 307,125 | 12,487,822 | |
| Chugoku Electric Power Co., Inc. | 379,900 | 4,381,800 | |
| Coca-Cola West Co. Ltd. | 169,300 | 5,805,803 | |
| Concordia Financial Group Ltd. | 1,689,484 | 8,082,045 | |
| Credit Saison Co. Ltd. | 216,452 | 3,927,973 | |
| CYBERDYNE, Inc. (a)(b) | 146,600 | 1,928,263 | |
| Dai Nippon Printing Co. Ltd. | 723,242 | 8,539,302 | |
| Dai-ichi Mutual Life Insurance Co. | 1,475,600 | 23,757,784 | |
| Daicel Chemical Industries Ltd. | 384,800 | 4,903,850 | |
| Daiichi Sankyo Kabushiki Kaisha | 791,470 | 18,711,334 | |
| Daikin Industries Ltd. | 341,194 | 34,124,055 | |
| Dainippon Sumitomo Pharma Co. Ltd. | 217,600 | 2,957,151 | |
| Daito Trust Construction Co. Ltd. | 95,963 | 17,008,587 | |
| Daiwa House Industry Co. Ltd. | 773,584 | 27,070,338 | |
| Daiwa House REIT Investment Corp. | 1,936 | 4,733,677 | |
| Daiwa Securities Group, Inc. | 2,271,985 | 12,437,173 | |
| DeNA Co. Ltd. | 142,800 | 3,055,129 | |
| DENSO Corp. | 652,138 | 31,653,326 | |
| Dentsu, Inc. | 296,500 | 12,406,422 | |
| Disco Corp. | 39,300 | 7,046,009 | |
| Don Quijote Holdings Co. Ltd. | 162,800 | 6,182,653 | |
| East Japan Railway Co. | 453,500 | 41,602,288 | |
| Eisai Co. Ltd. | 364,278 | 18,867,503 | |
| Electric Power Development Co. Ltd. | 198,580 | 5,437,084 | |
| FamilyMart Co. Ltd. | 112,000 | 6,071,952 | |
| Fanuc Corp. | 265,472 | 51,576,563 | |
| Fast Retailing Co. Ltd. | 72,500 | 20,753,855 | |
| Fuji Electric Co. Ltd. | 762,153 | 4,201,253 | |
| Fujifilm Holdings Corp. | 574,205 | 22,574,376 | |
| Fujitsu Ltd. | 2,691,075 | 19,952,656 | |
| Fukuoka Financial Group, Inc. | 1,060,300 | 4,658,434 | |
| Hakuhodo DY Holdings, Inc. | 320,800 | 4,368,378 | |
| Hamamatsu Photonics K.K. | 195,700 | 6,061,386 | |
| Hankyu Hanshin Holdings, Inc. | 331,800 | 12,646,036 | |
| Hikari Tsushin, Inc. | 29,500 | 3,660,163 | |
| Hino Motors Ltd. | 353,600 | 4,062,371 | |
| Hirose Electric Co. Ltd. | 43,712 | 6,051,727 | |
| Hiroshima Bank Ltd. | 669,000 | 2,689,753 | |
| Hisamitsu Pharmaceutical Co., Inc. | 84,800 | 4,080,520 | |
| Hitachi Chemical Co. Ltd. | 142,300 | 3,852,138 | |
| Hitachi Construction Machinery Co. Ltd. | 147,100 | 4,154,687 | |
| Hitachi High-Technologies Corp. | 95,100 | 3,395,347 | |
| Hitachi Ltd. | 6,620,271 | 45,586,439 | |
| Hitachi Metals Ltd. | 290,300 | 3,879,117 | |
| Honda Motor Co. Ltd. | 2,356,160 | 65,996,106 | |
| Hoshizaki Corp. | 74,100 | 6,450,512 | |
| Hoya Corp. | 533,516 | 30,549,718 | |
| Hulic Co. Ltd. | 405,800 | 4,019,795 | |
| Idemitsu Kosan Co. Ltd. | 184,700 | 4,512,705 | |
| IHI Corp. (b) | 2,122,185 | 7,026,655 | |
| Iida Group Holdings Co. Ltd. | 203,100 | 3,452,894 | |
| INPEX Corp. | 1,302,800 | 12,455,022 | |
| Isetan Mitsukoshi Holdings Ltd. | 462,287 | 4,760,166 | |
| Isuzu Motors Ltd. | 782,900 | 10,240,690 | |
| Itochu Corp. | 2,048,286 | 33,462,698 | |
| J. Front Retailing Co. Ltd. | 330,200 | 4,610,515 | |
| Japan Airlines Co. Ltd. | 159,400 | 5,477,902 | |
| Japan Airport Terminal Co. Ltd. | 64,100 | 2,326,457 | |
| Japan Exchange Group, Inc. | 710,200 | 12,099,919 | |
| Japan Post Bank Co. Ltd. | 551,800 | 7,027,061 | |
| Japan Post Holdings Co. Ltd. | 612,800 | 7,614,361 | |
| Japan Prime Realty Investment Corp. | 1,125 | 4,042,161 | |
| Japan Real Estate Investment Corp. | 1,721 | 8,923,182 | |
| Japan Retail Fund Investment Corp. | 3,491 | 6,424,062 | |
| Japan Tobacco, Inc. | 1,507,400 | 51,610,985 | |
| JFE Holdings, Inc. | 713,875 | 14,104,121 | |
| JGC Corp. | 285,017 | 4,581,116 | |
| JSR Corp. | 264,716 | 5,157,790 | |
| JTEKT Corp. | 305,100 | 4,082,431 | |
| JX Holdings, Inc. | 4,217,900 | 20,426,706 | |
| Kajima Corp. | 1,226,317 | 11,255,322 | |
| Kakaku.com, Inc. | 197,000 | 2,453,204 | |
| Kamigumi Co. Ltd. | 320,663 | 3,549,796 | |
| Kaneka Corp. | 377,559 | 2,939,833 | |
| Kansai Electric Power Co., Inc. | 966,236 | 13,535,302 | |
| Kansai Paint Co. Ltd. | 287,900 | 7,303,890 | |
| Kao Corp. | 677,650 | 42,298,033 | |
| Kawasaki Heavy Industries Ltd. | 2,054,945 | 6,318,019 | |
| KDDI Corp. | 2,512,600 | 67,785,794 | |
| Keihan Electric Railway Co., Ltd. | 670,000 | 4,040,660 | |
| Keihin Electric Express Railway Co. Ltd. | 643,061 | 6,832,176 | |
| Keio Corp. | 789,410 | 6,570,338 | |
| Keisei Electric Railway Co. | 189,600 | 5,165,343 | |
| Keyence Corp. | 133,224 | 69,390,151 | |
| Kikkoman Corp. | 201,149 | 6,303,346 | |
| Kintetsu Group Holdings Co. Ltd. | 2,472,100 | 9,332,074 | |
| Kirin Holdings Co. Ltd. | 1,188,856 | 26,997,580 | |
| Kobe Steel Ltd. (b) | 422,200 | 5,084,757 | |
| Koito Manufacturing Co. Ltd. | 154,300 | 9,614,363 | |
| Komatsu Ltd. | 1,264,345 | 34,122,079 | |
| Konami Holdings Corp. | 127,500 | 6,645,518 | |
| Konica Minolta, Inc. | 652,600 | 5,212,014 | |
| Kose Corp. | 41,600 | 5,221,995 | |
| Kubota Corp. | 1,444,464 | 25,017,142 | |
| Kuraray Co. Ltd. | 484,986 | 9,211,359 | |
| Kurita Water Industries Ltd. | 139,100 | 4,004,653 | |
| Kyocera Corp. | 439,204 | 26,367,821 | |
| Kyowa Hakko Kirin Co., Ltd. | 353,289 | 6,205,495 | |
| Kyushu Electric Power Co., Inc. (a) | 580,370 | 6,820,740 | |
| Kyushu Financial Group, Inc. | 471,000 | 2,870,514 | |
| Kyushu Railway Co. | 218,300 | 6,830,873 | |
| Lawson, Inc. | 82,716 | 5,560,297 | |
| LINE Corp. (a)(b) | 59,100 | 2,089,007 | |
| Lion Corp. | 315,900 | 6,281,506 | |
| LIXIL Group Corp. | 363,659 | 9,540,115 | |
| M3, Inc. | 288,300 | 7,492,365 | |
| Mabuchi Motor Co. Ltd. | 67,342 | 3,179,197 | |
| Makita Corp. | 304,800 | 12,240,797 | |
| Marubeni Corp. | 2,256,944 | 14,687,022 | |
| Marui Group Co. Ltd. | 275,049 | 3,850,461 | |
| Maruichi Steel Tube Ltd. | 77,000 | 2,279,847 | |
| Mazda Motor Corp. | 781,500 | 11,478,986 | |
| McDonald's Holdings Co. (Japan) Ltd. | 90,500 | 4,021,399 | |
| Mebuki Financial Group, Inc. | 1,369,010 | 4,856,633 | |
| Medipal Holdings Corp. | 233,600 | 4,120,166 | |
| Meiji Holdings Co. Ltd. | 167,058 | 13,311,758 | |
| Minebea Mitsumi, Inc. | 526,600 | 8,655,717 | |
| Miraca Holdings, Inc. | 76,700 | 3,484,937 | |
| Misumi Group, Inc. | 375,700 | 9,640,694 | |
| Mitsubishi Chemical Holdings Corp. | 1,958,175 | 18,221,795 | |
| Mitsubishi Corp. | 2,068,602 | 47,860,001 | |
| Mitsubishi Electric Corp. | 2,645,806 | 39,157,014 | |
| Mitsubishi Estate Co. Ltd. | 1,711,623 | 29,488,461 | |
| Mitsubishi Gas Chemical Co., Inc. | 247,433 | 6,142,217 | |
| Mitsubishi Heavy Industries Ltd. | 4,385,256 | 16,789,505 | |
| Mitsubishi Materials Corp. | 151,993 | 5,454,245 | |
| Mitsubishi Motors Corp. of Japan | 917,300 | 6,775,345 | |
| Mitsubishi Tanabe Pharma Corp. | 306,700 | 7,532,542 | |
| Mitsubishi UFJ Financial Group, Inc. | 16,497,730 | 100,529,794 | |
| Mitsubishi UFJ Lease & Finance Co. Ltd. | 600,600 | 3,037,555 | |
| Mitsui & Co. Ltd. | 2,335,823 | 34,941,201 | |
| Mitsui Chemicals, Inc. | 1,259,683 | 7,539,650 | |
| Mitsui Fudosan Co. Ltd. | 1,219,977 | 26,389,278 | |
| Mitsui OSK Lines Ltd. | 1,569,285 | 5,038,956 | |
| mixi, Inc. | 62,200 | 3,315,523 | |
| Mizuho Financial Group, Inc. | 33,017,600 | 56,657,465 | |
| MS&AD Insurance Group Holdings, Inc. | 660,684 | 21,809,453 | |
| Murata Manufacturing Co. Ltd. | 262,154 | 40,157,123 | |
| Nabtesco Corp. | 154,300 | 5,396,675 | |
| Nagoya Railroad Co. Ltd. | 1,262,000 | 5,647,919 | |
| NEC Corp. | 3,557,547 | 9,416,893 | |
| New Hampshire Foods Ltd. | 235,740 | 6,926,276 | |
| Nexon Co. Ltd. | 268,400 | 6,696,877 | |
| NGK Insulators Ltd. | 358,409 | 6,693,170 | |
| NGK Spark Plug Co. Ltd. | 235,000 | 4,478,328 | |
| Nidec Corp. | 326,584 | 37,014,933 | |
| Nikon Corp. | 463,938 | 7,651,063 | |
| Nintendo Co. Ltd. | 155,296 | 51,795,831 | |
| Nippon Building Fund, Inc. | 1,860 | 9,897,667 | |
| Nippon Electric Glass Co. Ltd. | 115,900 | 4,406,804 | |
| Nippon Express Co. Ltd. | 1,134,546 | 7,832,996 | |
| Nippon Paint Holdings Co. Ltd. | 222,600 | 7,593,123 | |
| Nippon Prologis REIT, Inc. | 2,354 | 5,113,342 | |
| Nippon Steel & Sumitomo Metal Corp. | 1,057,463 | 25,245,023 | |
| Nippon Telegraph & Telephone Corp. | 947,700 | 47,180,662 | |
| Nippon Yusen KK (b) | 2,205,578 | 4,373,639 | |
| Nissan Chemical Industries Co. Ltd. | 168,700 | 5,654,791 | |
| Nissan Motor Co. Ltd. | 3,175,348 | 31,612,611 | |
| Nisshin Seifun Group, Inc. | 268,823 | 4,672,950 | |
| Nissin Food Holdings Co. Ltd. | 79,123 | 4,879,737 | |
| Nitori Holdings Co. Ltd. | 109,600 | 16,928,258 | |
| Nitto Denko Corp. | 225,894 | 19,927,412 | |
| NKSJ Holdings, Inc. | 482,503 | 18,148,450 | |
| NOK Corp. | 129,600 | 2,916,545 | |
| Nomura Holdings, Inc. | 4,967,247 | 27,637,513 | |
| Nomura Real Estate Holdings, Inc. | 171,500 | 3,542,789 | |
| Nomura Real Estate Master Fund, Inc. | 5,237 | 6,921,691 | |
| Nomura Research Institute Ltd. | 181,055 | 7,048,851 | |
| NSK Ltd. | 579,876 | 6,883,506 | |
| NTT Data Corp. | 861,800 | 9,312,943 | |
| NTT DOCOMO, Inc. | 1,897,800 | 44,025,742 | |
| Obayashi Corp. | 885,204 | 10,443,531 | |
| OBIC Co. Ltd. | 88,900 | 5,571,665 | |
| Odakyu Electric Railway Co. Ltd. | 403,700 | 7,821,722 | |
| Oji Holdings Corp. | 1,177,352 | 6,179,398 | |
| Olympus Corp. | 398,129 | 13,743,572 | |
| OMRON Corp. | 264,260 | 13,268,888 | |
| Ono Pharmaceutical Co. Ltd. | 561,400 | 11,444,011 | |
| Oracle Corp. Japan | 53,100 | 3,926,893 | |
| Oriental Land Co. Ltd. | 298,224 | 22,404,439 | |
| ORIX Corp. | 1,811,780 | 28,997,379 | |
| Osaka Gas Co. Ltd. | 2,549,525 | 9,974,537 | |
| Otsuka Corp. | 71,400 | 4,728,176 | |
| Otsuka Holdings Co. Ltd. | 534,200 | 21,521,552 | |
| Panasonic Corp. | 3,022,973 | 40,296,869 | |
| Park24 Co. Ltd. | 147,900 | 3,555,735 | |
| Pola Orbis Holdings, Inc. | 126,000 | 4,051,576 | |
| Rakuten, Inc. | 1,274,800 | 15,138,504 | |
| Recruit Holdings Co. Ltd. | 1,509,900 | 30,092,245 | |
| Renesas Electronics Corp. (b) | 670,000 | 6,758,812 | |
| Resona Holdings, Inc. | 3,018,800 | 15,064,481 | |
| Ricoh Co. Ltd. | 965,470 | 9,669,191 | |
| Rinnai Corp. | 46,800 | 4,065,493 | |
| ROHM Co. Ltd. | 129,144 | 10,055,693 | |
| Ryohin Keikaku Co. Ltd. | 32,600 | 9,044,435 | |
| Sankyo Co. Ltd. (Gunma) | 61,200 | 1,998,526 | |
| Santen Pharmaceutical Co. Ltd. | 498,600 | 7,737,405 | |
| SBI Holdings, Inc. Japan | 279,960 | 3,891,198 | |
| Secom Co. Ltd. | 287,067 | 21,312,965 | |
| Sega Sammy Holdings, Inc. | 245,500 | 3,528,358 | |
| Seibu Holdings, Inc. | 257,400 | 4,427,556 | |
| Seiko Epson Corp. | 383,600 | 9,843,413 | |
| Sekisui Chemical Co. Ltd. | 555,493 | 10,358,490 | |
| Sekisui House Ltd. | 823,367 | 14,260,161 | |
| Seven & i Holdings Co. Ltd. | 1,028,400 | 40,804,956 | |
| Seven Bank Ltd. | 820,900 | 3,113,797 | |
| Sharp Corp. (a)(b) | 2,042,000 | 6,127,598 | |
| Shimadzu Corp. | 343,300 | 6,311,087 | |
| Shimamura Co. Ltd. | 30,500 | 3,723,200 | |
| SHIMANO, Inc. | 101,400 | 13,706,317 | |
| SHIMIZU Corp. | 753,616 | 7,787,400 | |
| Shin-Etsu Chemical Co. Ltd. | 532,662 | 47,115,162 | |
| Shinsei Bank Ltd. | 2,350,000 | 3,762,223 | |
| Shionogi & Co. Ltd. | 405,091 | 21,353,548 | |
| Shiseido Co. Ltd. | 520,150 | 21,570,599 | |
| Shizuoka Bank Ltd. | 705,274 | 6,165,173 | |
| Showa Shell Sekiyu K.K. | 252,600 | 2,768,754 | |
| SMC Corp. | 78,371 | 26,882,889 | |
| SoftBank Corp. | 1,130,930 | 92,070,385 | |
| Sohgo Security Services Co., Ltd. | 98,700 | 4,313,945 | |
| Sony Corp. | 1,730,485 | 68,472,413 | |
| Sony Financial Holdings, Inc. | 237,700 | 3,766,529 | |
| Stanley Electric Co. Ltd. | 198,425 | 6,587,995 | |
| Start Today Co. Ltd. | 264,400 | 8,225,297 | |
| Subaru Corp. | 842,300 | 29,543,901 | |
| Sumitomo Chemical Co. Ltd. | 2,156,334 | 12,926,039 | |
| Sumitomo Corp. | 1,625,142 | 23,009,356 | |
| Sumitomo Electric Industries Ltd. | 1,028,406 | 16,108,747 | |
| Sumitomo Heavy Industries Ltd. | 797,822 | 5,950,917 | |
| Sumitomo Metal Mining Co. Ltd. | 673,065 | 11,601,930 | |
| Sumitomo Mitsui Financial Group, Inc. | 1,839,500 | 68,490,627 | |
| Sumitomo Mitsui Trust Holdings, Inc. | 453,172 | 15,689,022 | |
| Sumitomo Realty & Development Co. Ltd. | 487,000 | 14,738,245 | |
| Sumitomo Rubber Industries Ltd. | 250,500 | 4,153,923 | |
| Sundrug Co. Ltd. | 99,700 | 4,130,927 | |
| Suntory Beverage & Food Ltd. | 189,700 | 8,765,871 | |
| Suzuken Co. Ltd. | 102,016 | 3,716,506 | |
| Suzuki Motor Corp. | 470,900 | 23,670,291 | |
| Sysmex Corp. | 214,800 | 13,247,319 | |
| T&D Holdings, Inc. | 762,400 | 10,461,458 | |
| Taiheiyo Cement Corp. | 1,648,000 | 6,356,047 | |
| Taisei Corp. | 1,413,594 | 14,182,873 | |
| Taisho Pharmaceutical Holdings Co. Ltd. | 48,057 | 3,750,662 | |
| Taiyo Nippon Sanso Corp. | 188,800 | 2,203,397 | |
| Takashimaya Co. Ltd. | 417,000 | 3,827,289 | |
| Takeda Pharmaceutical Co. Ltd. | 974,142 | 53,848,737 | |
| TDK Corp. | 177,825 | 11,921,319 | |
| Teijin Ltd. | 256,168 | 5,200,955 | |
| Terumo Corp. | 448,024 | 17,320,253 | |
| The Chugoku Bank Ltd. | 222,100 | 2,994,062 | |
| The Hachijuni Bank Ltd. | 554,700 | 3,380,625 | |
| The Suruga Bank Ltd. | 237,300 | 5,076,905 | |
| THK Co. Ltd. | 165,700 | 5,531,623 | |
| Tobu Railway Co. Ltd. | 1,322,297 | 7,313,017 | |
| Toho Co. Ltd. | 154,654 | 5,746,683 | |
| Toho Gas Co. Ltd. | 503,000 | 3,317,187 | |
| Tohoku Electric Power Co., Inc. | 617,390 | 8,446,396 | |
| Tokio Marine Holdings, Inc. | 932,800 | 37,249,211 | |
| Tokyo Electric Power Co., Inc. (b) | 1,974,518 | 7,992,546 | |
| Tokyo Electron Ltd. | 214,918 | 30,223,607 | |
| Tokyo Gas Co. Ltd. | 2,756,395 | 14,622,546 | |
| Tokyo Tatemono Co. Ltd. | 280,000 | 3,448,583 | |
| Tokyu Corp. | 723,977 | 10,536,801 | |
| Tokyu Fudosan Holdings Corp. | 697,900 | 4,164,483 | |
| Toppan Printing Co. Ltd. | 714,013 | 7,150,847 | |
| Toray Industries, Inc. | 2,007,783 | 19,121,743 | |
| Toshiba Corp. (a)(b) | 5,532,880 | 15,400,567 | |
| Tosoh Corp. | 796,000 | 9,340,428 | |
| Toto Ltd. | 193,792 | 7,377,264 | |
| Toyo Seikan Group Holdings Ltd. | 226,300 | 3,732,041 | |
| Toyo Suisan Kaisha Ltd. | 120,700 | 4,463,051 | |
| Toyoda Gosei Co. Ltd. | 85,700 | 1,997,991 | |
| Toyota Industries Corp. | 222,186 | 11,843,453 | |
| Toyota Motor Corp. | 3,575,963 | 201,341,666 | |
| Toyota Tsusho Corp. | 289,500 | 8,913,972 | |
| Trend Micro, Inc. | 163,300 | 7,560,804 | |
| Tsuruha Holdings, Inc. | 50,000 | 5,953,518 | |
| Unicharm Corp. | 551,340 | 12,974,181 | |
| United Urban Investment Corp. | 4,160 | 6,277,746 | |
| USS Co. Ltd. | 298,700 | 5,871,567 | |
| West Japan Railway Co. | 225,500 | 16,391,236 | |
| Yahoo! Japan Corp. | 1,951,300 | 8,945,788 | |
| Yakult Honsha Co. Ltd. | 120,366 | 8,343,011 | |
| Yamada Denki Co. Ltd. | 861,950 | 4,665,123 | |
| Yamaguchi Financial Group, Inc. | 270,000 | 3,055,260 | |
| Yamaha Corp. | 228,343 | 7,955,189 | |
| Yamaha Motor Co. Ltd. | 381,300 | 10,786,765 | |
| Yamato Holdings Co. Ltd. | 477,932 | 10,190,318 | |
| Yamazaki Baking Co. Ltd. | 179,300 | 3,398,928 | |
| Yaskawa Electric Corp. | 345,100 | 10,453,295 | |
| Yokogawa Electric Corp. | 313,000 | 4,877,146 | |
| Yokohama Rubber Co. Ltd. | 163,100 | 3,019,134 | |
| TOTAL JAPAN | 4,492,861,218 | ||
| Luxembourg - 0.3% | |||
| ArcelorMittal SA (Netherlands) (b) | 910,025 | 24,310,133 | |
| Eurofins Scientific SA | 14,889 | 8,509,585 | |
| Millicom International Cellular SA (depository receipt) | 90,720 | 5,659,617 | |
| RTL Group SA (a) | 53,188 | 4,036,500 | |
| SES SA (France) (depositary receipt) | 497,191 | 11,367,075 | |
| Tenaris SA | 646,756 | 8,618,206 | |
| TOTAL LUXEMBOURG | 62,501,116 | ||
| Malta - 0.0% | |||
| BGP Holdings PLC (b)(c) | 5,796,476 | 69 | |
| Mauritius - 0.0% | |||
| Golden Agri-Resources Ltd. | 9,451,280 | 2,753,240 | |
| Multi-National - 0.0% | |||
| HKT Trust/HKT Ltd. unit | 5,210,760 | 6,725,065 | |
| Netherlands - 4.3% | |||
| ABN AMRO Group NV GDR | 513,708 | 14,395,738 | |
| AEGON NV | 2,416,857 | 13,819,278 | |
| AerCap Holdings NV (b) | 207,621 | 10,443,336 | |
| Airbus Group NV | 794,305 | 66,895,578 | |
| Akzo Nobel NV | 345,472 | 31,564,524 | |
| Altice NV: | |||
| Class A (b) | 517,676 | 11,937,099 | |
| Class B (b) | 142,213 | 3,288,603 | |
| ASML Holding NV (Netherlands) | 511,462 | 79,851,938 | |
| CNH Industrial NV | 1,396,858 | 15,847,338 | |
| EXOR NV | 146,946 | 9,428,828 | |
| Ferrari NV | 167,999 | 19,219,463 | |
| Fiat Chrysler Automobiles NV (b) | 1,463,197 | 22,034,565 | |
| Gemalto NV | 111,041 | 6,000,709 | |
| Heineken Holding NV | 137,331 | 13,559,503 | |
| Heineken NV (Bearer) | 315,272 | 33,076,560 | |
| ING Groep NV (Certificaten Van Aandelen) | 5,312,556 | 94,302,085 | |
| Koninklijke Ahold Delhaize NV | 1,753,174 | 31,514,696 | |
| Koninklijke Boskalis Westminster NV | 123,239 | 4,027,186 | |
| Koninklijke DSM NV | 250,352 | 18,993,550 | |
| Koninklijke KPN NV | 4,671,578 | 16,522,489 | |
| Koninklijke Philips Electronics NV | 1,279,385 | 48,519,323 | |
| NN Group NV | 431,491 | 17,123,138 | |
| NXP Semiconductors NV (b) | 455,232 | 51,423,007 | |
| QIAGEN NV (Germany) | 299,129 | 9,598,625 | |
| Randstad Holding NV | 162,280 | 9,486,410 | |
| RELX NV | 1,321,096 | 27,743,190 | |
| STMicroelectronics NV (France) | 874,158 | 15,203,606 | |
| Unilever NV (Certificaten Van Aandelen) (Bearer) | 2,232,032 | 132,882,324 | |
| Vopak NV | 95,626 | 4,047,509 | |
| Wolters Kluwer NV | 412,735 | 18,029,735 | |
| TOTAL NETHERLANDS | 850,779,933 | ||
| New Zealand - 0.2% | |||
| Auckland International Airport Ltd. | 1,305,777 | 6,365,950 | |
| Contact Energy Ltd. | 978,765 | 3,921,363 | |
| Fletcher Building Ltd. | 960,900 | 5,629,798 | |
| Mercury Nz Ltd. | 950,422 | 2,347,466 | |
| Meridian Energy Ltd. | 1,746,786 | 3,699,867 | |
| Ryman Healthcare Group Ltd. | 549,196 | 3,580,450 | |
| Spark New Zealand Ltd. | 2,507,844 | 7,049,474 | |
| TOTAL NEW ZEALAND | 32,594,368 | ||
| Norway - 0.7% | |||
| DNB ASA | 1,339,478 | 26,157,802 | |
| Gjensidige Forsikring ASA | 275,248 | 4,818,113 | |
| Marine Harvest ASA (a) | 525,678 | 10,441,802 | |
| Norsk Hydro ASA | 1,848,240 | 13,341,339 | |
| Orkla ASA | 1,113,299 | 11,430,116 | |
| Schibsted ASA: | |||
| (A Shares) | 107,373 | 2,608,912 | |
| (B Shares) | 118,297 | 2,714,231 | |
| Statoil ASA | 1,557,667 | 29,477,107 | |
| Telenor ASA | 1,029,298 | 20,843,485 | |
| Yara International ASA | 243,146 | 9,944,667 | |
| TOTAL NORWAY | 131,777,574 | ||
| Papua New Guinea - 0.1% | |||
| Oil Search Ltd. ADR | 1,881,499 | 10,036,131 | |
| Portugal - 0.2% | |||
| Banco Espirito Santo SA (Reg.) (b)(c) | 2,598,658 | 31 | |
| Energias de Portugal SA | 3,246,760 | 12,464,965 | |
| Galp Energia SGPS SA Class B | 688,582 | 11,402,339 | |
| Jeronimo Martins SGPS SA | 343,396 | 6,851,417 | |
| TOTAL PORTUGAL | 30,718,752 | ||
| Singapore - 1.2% | |||
| Ascendas Real Estate Investment Trust | 3,351,783 | 6,575,274 | |
| CapitaCommercial Trust (REIT) | 2,816,200 | 3,613,841 | |
| CapitaLand Ltd. | 3,468,137 | 9,668,172 | |
| CapitaMall Trust | 3,345,300 | 5,353,664 | |
| City Developments Ltd. | 553,200 | 4,777,442 | |
| ComfortDelgro Corp. Ltd. | 2,954,884 | 4,990,364 | |
| DBS Group Holdings Ltd. | 2,442,508 | 37,143,342 | |
| Global Logistic Properties Ltd. | 3,841,200 | 9,178,427 | |
| Hutchison Port Holdings Trust | 7,131,900 | 3,245,015 | |
| Jardine Cycle & Carriage Ltd. | 144,530 | 4,256,118 | |
| Keppel Corp. Ltd. | 1,975,100 | 9,191,254 | |
| Oversea-Chinese Banking Corp. Ltd. | 4,302,686 | 35,444,524 | |
| Sembcorp Industries Ltd. | 1,341,130 | 2,947,430 | |
| Singapore Airlines Ltd. | 725,025 | 5,512,746 | |
| Singapore Airport Terminal Service Ltd. | 895,900 | 3,191,266 | |
| Singapore Exchange Ltd. | 1,090,900 | 6,033,961 | |
| Singapore Press Holdings Ltd. | 2,184,621 | 4,446,738 | |
| Singapore Technologies Engineering Ltd. | 2,129,561 | 5,732,437 | |
| Singapore Telecommunications Ltd. | 11,173,927 | 30,490,453 | |
| StarHub Ltd. | 805,200 | 1,549,889 | |
| Suntec (REIT) | 3,255,400 | 4,549,565 | |
| United Overseas Bank Ltd. | 1,801,960 | 31,934,141 | |
| UOL Group Ltd. | 645,150 | 3,891,978 | |
| Wilmar International Ltd. | 2,518,000 | 6,165,242 | |
| Yangzijiang Shipbuilding Holdings Ltd. | 3,163,900 | 3,488,352 | |
| TOTAL SINGAPORE | 243,371,635 | ||
| Spain - 3.4% | |||
| Abertis Infraestructuras SA | 949,207 | 19,209,719 | |
| ACS Actividades de Construccion y Servicios SA | 330,179 | 12,498,482 | |
| Aena SA | 92,290 | 18,023,621 | |
| Amadeus IT Holding SA Class A | 600,791 | 37,241,070 | |
| Banco Bilbao Vizcaya Argentaria SA | 9,161,709 | 81,070,176 | |
| Banco de Sabadell SA | 7,298,513 | 16,047,687 | |
| Banco Santander SA (Spain) | 21,976,418 | 143,230,812 | |
| Bankia SA | 1,516,578 | 7,382,323 | |
| Bankinter SA | 918,960 | 8,762,747 | |
| CaixaBank SA | 4,914,889 | 25,429,133 | |
| Distribuidora Internacional de Alimentacion SA | 847,015 | 5,360,277 | |
| Enagas SA | 308,207 | 9,082,734 | |
| Endesa SA | 435,585 | 10,508,257 | |
| Ferrovial SA | 663,463 | 15,121,095 | |
| Gamesa Corporacion Tecnologica SA | 327,034 | 4,883,990 | |
| Gas Natural SDG SA | 479,764 | 11,662,578 | |
| Grifols SA | 406,713 | 11,499,073 | |
| Iberdrola SA | 8,129,543 | 66,399,485 | |
| Inditex SA | 1,491,935 | 56,750,708 | |
| International Consolidated Airlines Group SA | 100,852 | 798,034 | |
| International Consolidated Airlines Group SA CDI | 761,807 | 6,023,841 | |
| MAPFRE SA (Reg.) | 1,469,287 | 5,200,112 | |
| Red Electrica Corporacion SA | 592,318 | 13,302,182 | |
| Repsol YPF SA | 1,686,454 | 28,970,233 | |
| Telefonica SA | 6,211,014 | 67,008,730 | |
| TOTAL SPAIN | 681,467,099 | ||
| Sweden - 2.8% | |||
| Alfa Laval AB | 401,420 | 9,093,616 | |
| ASSA ABLOY AB (B Shares) | 1,373,544 | 29,690,592 | |
| Atlas Copco AB: | |||
| (A Shares) | 919,003 | 36,016,428 | |
| (B Shares) | 535,831 | 19,124,900 | |
| Boliden AB | 375,407 | 13,134,461 | |
| Electrolux AB (B Shares) | 327,612 | 11,911,664 | |
| Essity AB Class B | 833,959 | 23,153,429 | |
| Getinge AB: | |||
| rights 9/14/17 (a) | 273,620 | 101,242 | |
| (B Shares) (a) | 273,620 | 5,082,756 | |
| H&M Hennes & Mauritz AB (B Shares) | 1,300,350 | 32,951,411 | |
| Hexagon AB (B Shares) | 354,088 | 17,375,189 | |
| Husqvarna AB (B Shares) | 567,756 | 5,727,042 | |
| ICA Gruppen AB (a) | 107,857 | 4,300,299 | |
| Industrivarden AB (C Shares) | 224,468 | 5,316,663 | |
| Investor AB (B Shares) | 624,872 | 29,223,476 | |
| Kinnevik AB (B Shares) | 320,380 | 9,640,733 | |
| Lundbergfoeretagen AB | 51,972 | 4,025,896 | |
| Lundin Petroleum AB | 260,362 | 5,586,851 | |
| Nordea Bank AB | 4,162,214 | 55,997,316 | |
| Sandvik AB | 1,545,952 | 25,546,172 | |
| Securitas AB (B Shares) | 427,416 | 7,025,206 | |
| Skandinaviska Enskilda Banken AB (A Shares) | 2,081,708 | 27,089,778 | |
| Skanska AB (B Shares) | 466,191 | 10,531,578 | |
| SKF AB (B Shares) | 524,049 | 10,473,395 | |
| Svenska Handelsbanken AB (A Shares) | 2,092,414 | 31,284,496 | |
| Swedbank AB (A Shares) | 1,240,970 | 33,566,956 | |
| Swedish Match Co. AB | 258,424 | 9,213,922 | |
| Tele2 AB (B Shares) | 496,605 | 5,781,199 | |
| Telefonaktiebolaget LM Ericsson (B Shares) | 4,205,117 | 24,661,021 | |
| TeliaSonera AB | 3,563,758 | 16,998,575 | |
| Volvo AB (B Shares) | 2,129,257 | 36,364,116 | |
| TOTAL SWEDEN | 555,990,378 | ||
| Switzerland - 8.1% | |||
| ABB Ltd. (Reg.) | 2,731,306 | 63,198,065 | |
| Adecco SA (Reg.) | 222,937 | 16,157,382 | |
| Baloise Holdings AG | 67,885 | 10,809,781 | |
| Barry Callebaut AG | 3,010 | 4,331,613 | |
| Coca-Cola HBC AG | 247,855 | 8,474,054 | |
| Compagnie Financiere Richemont SA Series A | 715,238 | 63,938,013 | |
| Credit Suisse Group AG | 3,214,908 | 47,203,979 | |
| Dufry AG (b) | 49,483 | 7,626,662 | |
| Ems-Chemie Holding AG | 11,185 | 7,645,620 | |
| Galenica AG | 66,814 | 6,751,422 | |
| Geberit AG (Reg.) | 50,821 | 23,217,770 | |
| Givaudan SA | 12,655 | 25,865,582 | |
| Julius Baer Group Ltd. | 306,304 | 17,128,034 | |
| Kuehne & Nagel International AG | 73,767 | 13,361,831 | |
| Lafargeholcim Ltd. (Reg.) | 623,728 | 36,651,622 | |
| Lindt & Spruengli AG | 140 | 9,739,194 | |
| Lindt & Spruengli AG (participation certificate) | 1,384 | 7,937,849 | |
| Lonza Group AG | 102,017 | 25,830,051 | |
| Nestle SA (Reg. S) | 4,264,644 | 361,539,227 | |
| Novartis AG | 3,059,961 | 257,976,609 | |
| Pargesa Holding SA | 53,001 | 4,294,466 | |
| Partners Group Holding AG | 23,759 | 15,410,708 | |
| Roche Holding AG (participation certificate) | 962,731 | 244,601,823 | |
| Schindler Holding AG: | |||
| (participation certificate) | 55,695 | 11,929,457 | |
| (Reg.) | 27,604 | 5,800,309 | |
| SGS SA (Reg.) | 7,517 | 16,778,881 | |
| Sika AG | 2,947 | 20,897,440 | |
| Sonova Holding AG Class B | 71,746 | 12,127,876 | |
| Straumann Holding AG | 13,023 | 8,345,204 | |
| Swatch Group AG (Bearer) | 42,171 | 16,834,099 | |
| Swatch Group AG (Bearer) (Reg.) | 77,182 | 5,984,130 | |
| Swiss Life Holding AG | 43,806 | 15,677,793 | |
| Swiss Prime Site AG | 97,612 | 8,835,415 | |
| Swiss Re Ltd. | 443,655 | 40,180,861 | |
| Swisscom AG (a) | 35,589 | 17,947,589 | |
| UBS Group AG | 5,012,827 | 82,593,114 | |
| Zurich Insurance Group AG | 206,324 | 61,728,302 | |
| TOTAL SWITZERLAND | 1,605,351,827 | ||
| United Kingdom - 15.9% | |||
| 3i Group PLC | 1,331,233 | 16,689,142 | |
| Admiral Group PLC | 280,860 | 7,013,007 | |
| Anglo American PLC (United Kingdom) | 1,835,862 | 33,294,693 | |
| Antofagasta PLC | 538,926 | 7,212,762 | |
| Ashtead Group PLC | 683,777 | 14,704,114 | |
| Associated British Foods PLC | 488,639 | 20,990,359 | |
| AstraZeneca PLC (United Kingdom) | 1,733,662 | 101,640,826 | |
| Auto Trader Group PLC | 1,338,204 | 6,115,345 | |
| Aviva PLC | 5,560,245 | 37,567,503 | |
| Babcock International Group PLC | 345,930 | 3,634,492 | |
| BAE Systems PLC | 4,352,335 | 34,202,613 | |
| Barclays PLC | 23,240,207 | 57,475,192 | |
| Barratt Developments PLC | 1,372,399 | 11,082,684 | |
| Berkeley Group Holdings PLC | 178,767 | 8,647,831 | |
| BHP Billiton PLC | 2,892,233 | 55,061,391 | |
| BP PLC | 26,803,521 | 154,827,207 | |
| British American Tobacco PLC (United Kingdom) | 3,151,877 | 196,630,266 | |
| British Land Co. PLC | 1,333,014 | 10,540,550 | |
| BT Group PLC | 11,597,766 | 43,808,423 | |
| Bunzl PLC | 460,311 | 13,749,770 | |
| Burberry Group PLC | 602,439 | 13,998,879 | |
| Capita Group PLC | 910,249 | 7,633,124 | |
| Carnival PLC | 257,837 | 17,940,066 | |
| Carphone Warehouse Group PLC | 1,344,792 | 3,015,340 | |
| Centrica PLC | 7,699,993 | 19,903,765 | |
| Cobham PLC | 3,283,717 | 5,829,997 | |
| Coca-Cola European Partners PLC | 297,166 | 12,724,793 | |
| Compass Group PLC | 2,162,877 | 46,203,404 | |
| ConvaTec Group PLC | 1,598,477 | 5,930,196 | |
| Croda International PLC | 178,585 | 8,872,264 | |
| Diageo PLC | 3,449,663 | 115,384,337 | |
| Direct Line Insurance Group PLC | 1,887,313 | 9,276,281 | |
| easyJet PLC | 214,726 | 3,320,840 | |
| Fresnillo PLC | 302,211 | 6,315,151 | |
| G4S PLC (United Kingdom) | 2,112,706 | 7,745,050 | |
| GKN PLC | 2,336,649 | 9,629,819 | |
| GlaxoSmithKline PLC | 6,727,364 | 133,469,313 | |
| Hammerson PLC | 1,075,362 | 7,800,989 | |
| Hargreaves Lansdown PLC | 356,336 | 6,450,893 | |
| Hikma Pharmaceuticals PLC (a) | 197,430 | 3,196,315 | |
| HSBC Holdings PLC (United Kingdom) | 27,218,799 | 263,879,231 | |
| IMI PLC | 372,013 | 5,459,918 | |
| Imperial Tobacco Group PLC | 1,313,840 | 54,374,142 | |
| Inmarsat PLC | 619,876 | 5,867,431 | |
| InterContinental Hotel Group PLC | 245,489 | 12,240,557 | |
| Intertek Group PLC | 221,765 | 14,653,657 | |
| Intu Properties PLC (a) | 1,251,605 | 4,026,705 | |
| Investec PLC | 895,569 | 6,832,556 | |
| ITV PLC | 4,940,695 | 10,132,657 | |
| J Sainsbury PLC | 2,226,920 | 6,784,409 | |
| Johnson Matthey PLC | 265,762 | 9,498,675 | |
| Kingfisher PLC | 3,075,724 | 11,884,679 | |
| Land Securities Group PLC | 1,081,309 | 14,122,231 | |
| Legal & General Group PLC | 8,138,756 | 27,384,034 | |
| Lloyds Banking Group PLC | 97,898,517 | 80,697,265 | |
| London Stock Exchange Group PLC | 432,179 | 22,074,601 | |
| Marks & Spencer Group PLC | 2,215,196 | 9,154,846 | |
| Mediclinic International PLC (a) | 506,873 | 5,010,819 | |
| Meggitt PLC | 1,060,068 | 7,100,609 | |
| Merlin Entertainments PLC | 967,278 | 5,769,881 | |
| Mondi PLC | 504,404 | 13,781,933 | |
| National Grid PLC | 4,706,391 | 59,318,626 | |
| Next PLC | 199,775 | 10,666,407 | |
| Old Mutual PLC | 6,744,461 | 18,096,620 | |
| Pearson PLC | 1,127,007 | 8,836,694 | |
| Persimmon PLC | 422,902 | 14,540,863 | |
| Provident Financial PLC (a) | 201,971 | 2,306,120 | |
| Prudential PLC | 3,534,929 | 82,979,936 | |
| Reckitt Benckiser Group PLC | 911,025 | 86,391,172 | |
| RELX PLC | 1,480,162 | 32,365,697 | |
| Rio Tinto PLC | 1,694,958 | 82,326,858 | |
| Rolls-Royce Holdings PLC | 2,267,508 | 26,780,725 | |
| Royal Bank of Scotland Group PLC (b) | 4,856,193 | 15,825,794 | |
| Royal Dutch Shell PLC: | |||
| Class A | 33,419 | 922,359 | |
| Class A (United Kingdom) | 6,029,841 | 166,175,512 | |
| Class B (United Kingdom) | 5,139,029 | 143,433,353 | |
| Royal Mail PLC | 1,233,494 | 6,287,613 | |
| RSA Insurance Group PLC | 1,391,827 | 11,995,477 | |
| Sage Group PLC | 1,483,362 | 13,283,088 | |
| Schroders PLC | 177,889 | 7,747,352 | |
| Scottish & Southern Energy PLC | 1,384,665 | 25,514,772 | |
| Segro PLC | 1,365,695 | 9,500,973 | |
| Severn Trent PLC | 323,013 | 9,477,343 | |
| SKY PLC | 1,412,024 | 17,455,491 | |
| Smith & Nephew PLC | 1,196,487 | 21,644,774 | |
| Smiths Group PLC | 541,804 | 10,824,374 | |
| St. James's Place Capital PLC | 720,584 | 10,743,506 | |
| Standard Chartered PLC (United Kingdom) (b) | 4,499,987 | 44,805,785 | |
| Standard Life PLC | 3,666,069 | 20,365,591 | |
| Tate & Lyle PLC | 633,924 | 5,602,835 | |
| Taylor Wimpey PLC | 4,462,559 | 11,569,923 | |
| Tesco PLC (b) | 11,189,184 | 26,144,358 | |
| The Weir Group PLC | 296,984 | 6,893,339 | |
| Travis Perkins PLC | 342,797 | 6,671,226 | |
| Unilever PLC | 1,758,693 | 102,610,316 | |
| United Utilities Group PLC | 928,118 | 10,921,359 | |
| Vodafone Group PLC | 36,383,908 | 104,120,144 | |
| Vodafone Group PLC sponsored ADR | 9,027 | 262,054 | |
| Whitbread PLC | 251,033 | 12,198,873 | |
| WM Morrison Supermarkets PLC | 3,012,798 | 9,583,789 | |
| Worldpay Group PLC | 2,742,687 | 14,789,191 | |
| TOTAL UNITED KINGDOM | 3,142,240,104 | ||
| TOTAL COMMON STOCKS | |||
| (Cost $17,354,533,133) | 19,151,421,300 | ||
| Nonconvertible Preferred Stocks - 0.7% | |||
| France - 0.2% | |||
| Air Liquide SA (b) | 288,912 | 35,270,564 | |
| Germany - 0.5% | |||
| Bayerische Motoren Werke AG (BMW) (non-vtg.) | 77,238 | 6,407,855 | |
| Fuchs Petrolub AG | 95,159 | 5,290,271 | |
| Henkel AG & Co. KGaA | 243,732 | 32,656,468 | |
| Porsche Automobil Holding SE (Germany) | 210,242 | 11,915,954 | |
| Volkswagen AG | 253,395 | 37,812,339 | |
| TOTAL GERMANY | 94,082,887 | ||
| Italy - 0.0% | |||
| Telecom Italia SpA (Risparmio Shares) | 8,267,099 | 6,421,623 | |
| TOTAL NONCONVERTIBLE PREFERRED STOCKS | |||
| (Cost $116,386,534) | 135,775,074 | ||
| Principal Amount | Value | ||
| Government Obligations - 0.1% | |||
| United States of America - 0.1% | |||
| U.S. Treasury Bills, yield at date of purchase 1.01% to 1.11% 10/12/17 to 12/14/17 (Cost $21,955,834)(d) | 22,000,000 | 21,959,430 | |
| Shares | Value | ||
| Money Market Funds - 2.5% | |||
| Fidelity Cash Central Fund, 1.11% (e) | 387,213,577 | 387,291,020 | |
| Fidelity Securities Lending Cash Central Fund 1.11% (e)(f) | 96,661,286 | 96,670,952 | |
| TOTAL MONEY MARKET FUNDS | |||
| (Cost $483,969,408) | 483,961,972 | ||
| TOTAL INVESTMENT IN SECURITIES - 100.0% | |||
| (Cost $17,976,844,909) | 19,793,117,776 | ||
| NET OTHER ASSETS (LIABILITIES) - 0.0% | 8,667,238 | ||
| NET ASSETS - 100% | $19,801,785,014 |
| Futures Contracts | |||||
| Number of contracts | Expiration Date | Notional amount | Value | Unrealized Appreciation/(Depreciation) | |
| Purchased | |||||
| Equity Index Contracts | |||||
| ICE E-mini MSCI EAFE Index Contracts (United States) | 5,479 | Sept. 2017 | $530,038,460 | $1,952,662 | $1,952,662 |
The notional amount of futures purchased as a percentage of Net Assets is 2.7%
| Forward Foreign Currency Contracts | ||||||
| Currency Purchased | Currency Sold | Counterparty | Settlement Date | Unrealized Appreciation/(Depreciation) | ||
| JPY | 2,405,000,000 | USD | 22,061,548 | Goldman Sachs Bank USA | 9/8/17 | $(181,871) |
| USD | 7,748,375 | JPY | 875,000,000 | Goldman Sachs Bank USA | 9/8/17 | (212,006) |
| USD | 10,183,490 | JPY | 1,140,000,000 | Goldman Sachs Bank USA | 9/8/17 | (187,750) |
| USD | 3,480,608 | JPY | 390,000,000 | Goldman Sachs Bank USA | 9/8/17 | (67,448) |
| EUR | 27,100,000 | USD | 30,519,180 | Goldman Sachs Bank USA | 9/15/17 | 1,759,495 |
| GBP | 15,100,000 | USD | 19,306,483 | Goldman Sachs Bank USA | 9/15/17 | 226,198 |
| SEK | 29,000,000 | USD | 3,351,939 | Goldman Sachs Bank USA | 9/15/17 | 299,897 |
| USD | 13,743,960 | EUR | 12,000,000 | Goldman Sachs Bank USA | 9/15/17 | (549,180) |
| USD | 6,297,858 | EUR | 5,500,000 | Goldman Sachs Bank USA | 9/15/17 | (253,165) |
| USD | 10,925,251 | EUR | 9,600,000 | Goldman Sachs Bank USA | 9/15/17 | (509,261) |
| USD | 3,638,869 | GBP | 2,800,000 | Goldman Sachs Bank USA | 9/15/17 | 16,915 |
| USD | 9,123,093 | GBP | 7,000,000 | Goldman Sachs Bank USA | 9/15/17 | 68,208 |
| USD | 6,872,499 | GBP | 5,300,000 | Goldman Sachs Bank USA | 9/15/17 | 16,658 |
| USD | 671,168 | SEK | 5,700,000 | Goldman Sachs Bank USA | 9/15/17 | (46,606) |
| USD | 1,546,946 | SEK | 13,000,000 | Goldman Sachs Bank USA | 9/15/17 | (90,084) |
| USD | 1,217,267 | SEK | 10,300,000 | Goldman Sachs Bank USA | 9/15/17 | (79,764) |
| AUD | 10,500,000 | USD | 7,905,240 | Goldman Sachs Bank USA | 9/22/17 | 440,039 |
| USD | 3,608,919 | AUD | 4,700,000 | Goldman Sachs Bank USA | 9/22/17 | (126,587) |
| USD | 2,808,822 | AUD | 3,700,000 | Goldman Sachs Bank USA | 9/22/17 | (131,896) |
| USD | 1,606,420 | AUD | 2,100,000 | Goldman Sachs Bank USA | 9/22/17 | (62,636) |
| TOTAL FORWARD FOREIGN CURRENCY CONTRACTS | $329,156 | |||||
| Unrealized Appreciation | 2,827,410 | |||||
| Unrealized Depreciation | (2,498,254) | |||||
Currency Abbreviations
AUD – Australian dollar
EUR – European Monetary Unit
GBP – British pound
JPY – Japanese yen
SEK – Swedish krona
Categorizations in the Schedule of Investments are based on country or territory of incorporation.
Legend
(a) Security or a portion of the security is on loan at period end.
(b) Non-income producing
(c) Level 3 instrument
(d) Security or a portion of the security was pledged to cover margin requirements for futures contracts. At period end, the value of securities pledged amounted to $19,075,093.
(e) Affiliated fund that is generally available only to investment companies and other accounts managed by Fidelity Investments. The rate quoted is the annualized seven-day yield of the fund at period end. A complete unaudited listing of the fund's holdings as of its most recent quarter end is available upon request. In addition, each Fidelity Central Fund's financial statements are available on the SEC's website or upon request.
(f) Investment made with cash collateral received from securities on loan.
Affiliated Central Funds
Information regarding fiscal year to date income earned by the Fund from investments in Fidelity Central Funds is as follows:
| Fund | Income earned |
| Fidelity Cash Central Fund | $1,267,844 |
| Fidelity Securities Lending Cash Central Fund | 2,013,556 |
| Total | $3,281,400 |
Investment Valuation
The following is a summary of the inputs used, as of August 31, 2017, involving the Fund's assets and liabilities carried at fair value. The inputs or methodology used for valuing securities may not be an indication of the risk associated with investing in those securities. For more information on valuation inputs, and their aggregation into the levels used below, please refer to the Investment Valuation section in the accompanying Notes to Financial Statements.
| Valuation Inputs at Reporting Date: | ||||
| Description | Total | Level 1 | Level 2 | Level 3 |
| Investments in Securities: | ||||
| Equities: | ||||
| Consumer Discretionary | $2,311,105,991 | $1,514,727,946 | $796,378,045 | $-- |
| Consumer Staples | 2,226,531,596 | 946,594,385 | 1,279,937,211 | -- |
| Energy | 926,718,922 | 202,841,338 | 723,877,584 | -- |
| Financials | 4,139,732,244 | 2,459,172,940 | 1,680,559,204 | 100 |
| Health Care | 1,996,486,866 | 823,754,614 | 1,172,732,252 | -- |
| Industrials | 2,793,387,029 | 2,150,681,998 | 642,705,031 | -- |
| Information Technology | 1,179,008,656 | 727,333,514 | 451,675,142 | -- |
| Materials | 1,528,990,823 | 1,162,392,033 | 366,598,790 | -- |
| Real Estate | 706,170,966 | 706,170,966 | -- | -- |
| Telecommunication Services | 814,005,474 | 188,974,335 | 625,031,139 | -- |
| Utilities | 665,057,807 | 541,789,049 | 123,268,758 | -- |
| Government Obligations | 21,959,430 | -- | 21,959,430 | -- |
| Money Market Funds | 483,961,972 | 483,961,972 | -- | -- |
| Total Investments in Securities: | $19,793,117,776 | $11,908,395,090 | $7,884,722,586 | $100 |
| Derivative Instruments: | ||||
| Assets | ||||
| Forward Foreign Currency Contracts | $2,827,410 | $-- | $2,827,410 | $-- |
| Futures Contracts | 1,952,662 | 1,952,662 | -- | -- |
| Total Assets | $4,780,072 | $1,952,662 | $2,827,410 | $-- |
| Liabilities | ||||
| Forward Foreign Currency Contracts | $(2,498,254) | $-- | $(2,498,254) | $-- |
| Total Liabilities | $(2,498,254) | $-- | $(2,498,254) | $-- |
| Total Derivative Instruments: | $2,281,818 | $1,952,662 | $329,156 | $-- |
The following is a summary of transfers between Level 1 and Level 2 for the period ended August 31, 2017. Transfers are assumed to have occurred at the beginning of the period, and are primarily attributable to the valuation techniques used for foreign equity securities, as discussed in the accompanying Notes to Financial Statements:
| Transfers | Total |
| Level 1 to Level 2 | $154,807,200 |
| Level 2 to Level 1 | $689,311,865 |
Value of Derivative Instruments
The following table is a summary of the Fund's value of derivative instruments by primary risk exposure as of August 31, 2017. For additional information on derivative instruments, please refer to the Derivative Instruments section in the accompanying Notes to Financial Statements.
| Primary Risk Exposure / Derivative Type | Value | |
| Asset | Liability | |
| Equity Risk | ||
| Futures Contracts(a) | $1,952,662 | $0 |
| Total Equity Risk | 1,952,662 | 0 |
| Foreign Exchange Risk | ||
| Forward Foreign Currency Contracts(b) | 2,827,410 | (2,498,254) |
| Total Foreign Exchange Risk | 2,827,410 | (2,498,254) |
| Total Value of Derivatives | $4,780,072 | $(2,498,254) |
(a) Reflects gross cumulative appreciation (depreciation) on futures contracts as presented in the Schedule of Investments. In the Statement of Assets and Liabilities, the period end daily variation margin is included in receivable or payable for daily variation margin on futures contracts, and the net cumulative appreciation (depreciation) is included in net unrealized appreciation (depreciation).
(b) Gross value is presented in the Statement of Assets and Liabilities in the unrealized appreciation/depreciation on foreign currency contracts line-items.
See accompanying notes which are an integral part of the financial statements.
Fidelity® International Index Fund
Financial Statements
Statement of Assets and Liabilities
| August 31, 2017 (Unaudited) | ||
| Assets | ||
| Investment in securities, at value (including securities loaned of $93,318,818) — See accompanying schedule: Unaffiliated issuers (cost $17,492,875,501) | $19,309,155,804 | |
| Fidelity Central Funds (cost $483,969,408) | 483,961,972 | |
| Total Investment in Securities (cost $17,976,844,909) | $19,793,117,776 | |
| Foreign currency held at value (cost $5,550,723) | 5,552,828 | |
| Receivable for investments sold | 1,889,797 | |
| Unrealized appreciation on forward foreign currency contracts | 2,827,410 | |
| Receivable for fund shares sold | 26,791,331 | |
| Dividends receivable | 100,896,653 | |
| Distributions receivable from Fidelity Central Funds | 365,291 | |
| Receivable for daily variation margin on futures contracts | 3,948,089 | |
| Other receivables | 2,384 | |
| Total assets | 19,935,391,559 | |
| Liabilities | ||
| Payable for investments purchased | $15,413,265 | |
| Unrealized depreciation on forward foreign currency contracts | 2,498,254 | |
| Payable for fund shares redeemed | 18,084,431 | |
| Accrued management fee | 735,909 | |
| Other affiliated payables | 210,479 | |
| Collateral on securities loaned | 96,664,207 | |
| Total liabilities | 133,606,545 | |
| Net Assets | $19,801,785,014 | |
| Net Assets consist of: | ||
| Paid in capital | $18,237,149,160 | |
| Undistributed net investment income | 355,854,854 | |
| Accumulated undistributed net realized gain (loss) on investments and foreign currency transactions | (610,726,975) | |
| Net unrealized appreciation (depreciation) on investments and assets and liabilities in foreign currencies | 1,819,507,975 | |
| Net Assets | $19,801,785,014 | |
| Investor Class: | ||
| Net Asset Value, offering price and redemption price per share ($706,620,193 ÷ 16,994,967 shares) | $41.58 | |
| Premium Class: | ||
| Net Asset Value, offering price and redemption price per share ($10,532,514,686 ÷ 253,227,958 shares) | $41.59 | |
| Institutional Class: | ||
| Net Asset Value, offering price and redemption price per share ($2,889,789,962 ÷ 69,467,115 shares) | $41.60 | |
| Institutional Premium Class: | ||
| Net Asset Value, offering price and redemption price per share ($5,672,860,173 ÷ 136,372,986 shares) | $41.60 |
See accompanying notes which are an integral part of the financial statements.
Statement of Operations
| Six months ended August 31, 2017 (Unaudited) | ||
| Investment Income | ||
| Dividends | $399,029,973 | |
| Interest | 52,425 | |
| Income from Fidelity Central Funds (including $2,013,556 from security lending) | 3,281,400 | |
| Income before foreign taxes withheld | 402,363,798 | |
| Less foreign taxes withheld | (38,999,084) | |
| Total income | 363,364,714 | |
| Expenses | ||
| Management fee | $4,489,126 | |
| Transfer agent fees | 1,934,997 | |
| Independent trustees' fees and expenses | 36,086 | |
| Miscellaneous | 27,760 | |
| Total expenses before reductions | 6,487,969 | |
| Expense reductions | (483) | 6,487,486 |
| Net investment income (loss) | 356,877,228 | |
| Realized and Unrealized Gain (Loss) | ||
| Net realized gain (loss) on: | ||
| Investment securities: | ||
| Unaffiliated issuers | 35,549,521 | |
| Fidelity Central Funds | (3,077) | |
| Forward foreign currency contracts | 2,516,171 | |
| Foreign currency transactions | 1,028,978 | |
| Futures contracts | 33,776,789 | |
| Total net realized gain (loss) | 72,868,382 | |
| Change in net unrealized appreciation (depreciation) on: | ||
| Investment securities: | ||
| Unaffiliated issuers | 1,720,461,922 | |
| Fidelity Central Funds | (7,415) | |
| Forward foreign currency contracts | 707 | |
| Assets and liabilities in foreign currencies | 3,961,628 | |
| Futures contracts | 138,094 | |
| Total change in net unrealized appreciation (depreciation) | 1,724,554,936 | |
| Net gain (loss) | 1,797,423,318 | |
| Net increase (decrease) in net assets resulting from operations | $2,154,300,546 |
See accompanying notes which are an integral part of the financial statements.
Statement of Changes in Net Assets
| Six months ended August 31, 2017 (Unaudited) | Year ended February 28, 2017 | |
| Increase (Decrease) in Net Assets | ||
| Operations | ||
| Net investment income (loss) | $356,877,228 | $460,796,868 |
| Net realized gain (loss) | 72,868,382 | 27,754,673 |
| Change in net unrealized appreciation (depreciation) | 1,724,554,936 | 1,696,026,072 |
| Net increase (decrease) in net assets resulting from operations | 2,154,300,546 | 2,184,577,613 |
| Distributions to shareholders from net investment income | (12,191,602) | (439,896,097) |
| Distributions to shareholders from net realized gain | – | (13,514,538) |
| Total distributions | (12,191,602) | (453,410,635) |
| Share transactions - net increase (decrease) | 1,340,664,799 | 983,873,064 |
| Redemption fees | – | 491,955 |
| Total increase (decrease) in net assets | 3,482,773,743 | 2,715,531,997 |
| Net Assets | ||
| Beginning of period | 16,319,011,271 | 13,603,479,274 |
| End of period | $19,801,785,014 | $16,319,011,271 |
| Other Information | ||
| Undistributed net investment income end of period | $355,854,854 | $11,169,228 |
See accompanying notes which are an integral part of the financial statements.
Financial Highlights — Fidelity International Index Fund Investor Class
| Six months ended (Unaudited) August 31, | Years ended February 28, | |||||
| 2017 | 2017 | 2016A | 2015 | 2014 | 2013 | |
| Selected Per–Share Data | ||||||
| Net asset value, beginning of period | $36.88 | $32.81 | $39.75 | $41.19 | $35.31 | $33.06 |
| Income from Investment Operations | ||||||
| Net investment income (loss)B | .75 | 1.06 | 1.11 | 1.13 | 1.35C | 1.03 |
| Net realized and unrealized gain (loss) | 3.97 | 4.05 | (7.10) | (1.31) | 5.53 | 2.23 |
| Total from investment operations | 4.72 | 5.11 | (5.99) | (.18) | 6.88 | 3.26 |
| Distributions from net investment income | (.02) | (1.01) | (.95) | (1.26) | (.96) | (.97) |
| Distributions from net realized gain | – | (.03) | – | – | (.04) | (.04) |
| Total distributions | (.02) | (1.04) | (.95) | (1.26) | (1.00) | (1.01) |
| Redemption fees added to paid in capitalB | – | –D | –D | –D | –D | –D |
| Net asset value, end of period | $41.58 | $36.88 | $32.81 | $39.75 | $41.19 | $35.31 |
| Total ReturnE,F | 12.79% | 15.72% | (15.24)% | (.29)% | 19.66% | 10.01% |
| Ratios to Average Net AssetsG,H | ||||||
| Expenses before reductions | .19%I | .19% | .20% | .20% | .20% | .20% |
| Expenses net of fee waivers, if any | .19%I | .19% | .20% | .20% | .20% | .20% |
| Expenses net of all reductions | .19%I | .19% | .20% | .20% | .20% | .20% |
| Net investment income (loss) | 3.79%I | 2.97% | 2.92% | 2.83% | 3.52%C | 3.16% |
| Supplemental Data | ||||||
| Net assets, end of period (000 omitted) | $706,620 | $740,317 | $2,652,101 | $2,972,698 | $2,640,165 | $2,282,743 |
| Portfolio turnover rateJ | 2%I,K | 2% | 1%K | 1% | 2% | 1% |
A For the year ended February 29.
B Calculated based on average shares outstanding during the period.
C Net Investment income per share reflects a large, non-recurring dividend which amounted to $.27 per share. Excluding this non-recurring dividend, the ratio of net investment income (loss) to average net assets would have been 2.82%.
D Amount represents less than $.005 per share.
E Total returns for periods of less than one year are not annualized.
F Total returns would have been lower if certain expenses had not been reduced during the applicable periods shown.
G Fees and expenses of any underlying Fidelity Central Funds are not included in the Fund's expense ratio. The Fund indirectly bears its proportionate share of the expenses of any underlying Fidelity Central Funds.
H Expense ratios reflect operating expenses of the class. Expenses before reductions do not reflect amounts reimbursed by the investment adviser or reductions from expense offset arrangements and do not represent the amount paid by the class during periods when reimbursements or reductions occur. Expenses net of fee waivers reflect expenses after reimbursement by the investment adviser but prior to reductions from expense offset arrangements. Expenses net of all reductions represent the net expenses paid by the class.
I Annualized
J Amount does not include the portfolio activity of any underlying Fidelity Central Funds.
K Portfolio turnover rate excludes securities received or delivered in-kind.
See accompanying notes which are an integral part of the financial statements.
Financial Highlights — Fidelity International Index Fund Premium Class
| Six months ended (Unaudited) August 31, | Years ended February 28, | |||||
| 2017 | 2017 | 2016A | 2015 | 2014 | 2013 | |
| Selected Per–Share Data | ||||||
| Net asset value, beginning of period | $36.88 | $32.82 | $39.76 | $41.20 | $35.31 | $33.07 |
| Income from Investment Operations | ||||||
| Net investment income (loss)B | .78 | 1.10 | 1.14 | 1.17 | 1.38C | 1.06 |
| Net realized and unrealized gain (loss) | 3.96 | 4.03 | (7.10) | (1.32) | 5.54 | 2.22 |
| Total from investment operations | 4.74 | 5.13 | (5.96) | (.15) | 6.92 | 3.28 |
| Distributions from net investment income | (.03) | (1.04) | (.98) | (1.29) | (.99) | (1.00) |
| Distributions from net realized gain | – | (.03) | – | – | (.04) | (.04) |
| Total distributions | (.03) | (1.07) | (.98) | (1.29) | (1.03) | (1.04) |
| Redemption fees added to paid in capitalB | – | –D | –D | –D | –D | –D |
| Net asset value, end of period | $41.59 | $36.88 | $32.82 | $39.76 | $41.20 | $35.31 |
| Total ReturnE,F | 12.85% | 15.80% | (15.17)% | (.21)% | 19.79% | 10.07% |
| Ratios to Average Net AssetsG,H | ||||||
| Expenses before reductions | .08%I | .11% | .17% | .17% | .17% | .17% |
| Expenses net of fee waivers, if any | .08%I | .09% | .12% | .12% | .12% | .12% |
| Expenses net of all reductions | .08%I | .09% | .12% | .12% | .12% | .12% |
| Net investment income (loss) | 3.90%I | 3.07% | 3.00% | 2.91% | 3.60%C | 3.24% |
| Supplemental Data | ||||||
| Net assets, end of period (000 omitted) | $10,532,514 | $8,719,903 | $7,677,907 | $8,304,964 | $7,201,814 | $5,322,884 |
| Portfolio turnover rateJ | 2%I,K | 2% | 1%K | 1% | 2% | 1% |
A For the year ended February 29.
B Calculated based on average shares outstanding during the period.
C Net Investment income per share reflects a large, non-recurring dividend which amounted to $.27 per share. Excluding this non-recurring dividend, the ratio of net investment income (loss) to average net assets would have been 2.90%.
D Amount represents less than $.005 per share.
E Total returns for periods of less than one year are not annualized.
F Total returns would have been lower if certain expenses had not been reduced during the applicable periods shown.
G Fees and expenses of any underlying Fidelity Central Funds are not included in the Fund's expense ratio. The Fund indirectly bears its proportionate share of the expenses of any underlying Fidelity Central Funds.
H Expense ratios reflect operating expenses of the class. Expenses before reductions do not reflect amounts reimbursed by the investment adviser or reductions from expense offset arrangements and do not represent the amount paid by the class during periods when reimbursements or reductions occur. Expenses net of fee waivers reflect expenses after reimbursement by the investment adviser but prior to reductions from expense offset arrangements. Expenses net of all reductions represent the net expenses paid by the class.
I Annualized
J Amount does not include the portfolio activity of any underlying Fidelity Central Funds.
K Portfolio turnover rate excludes securities received or delivered in-kind.
See accompanying notes which are an integral part of the financial statements.
Financial Highlights — Fidelity International Index Fund Institutional Class
| Six months ended (Unaudited) August 31, | Years ended February 28, | |||||
| 2017 | 2017 | 2016A | 2015 | 2014 | 2013 | |
| Selected Per–Share Data | ||||||
| Net asset value, beginning of period | $36.89 | $32.82 | $39.76 | $41.20 | $35.31 | $33.07 |
| Income from Investment Operations | ||||||
| Net investment income (loss)B | .78 | 1.11 | 1.16 | 1.18 | 1.40C | 1.07 |
| Net realized and unrealized gain (loss) | 3.96 | 4.04 | (7.10) | (1.31) | 5.54 | 2.22 |
| Total from investment operations | 4.74 | 5.15 | (5.94) | (.13) | 6.94 | 3.29 |
| Distributions from net investment income | (.03) | (1.05) | (1.00) | (1.31) | (1.01) | (1.01) |
| Distributions from net realized gain | – | (.03) | – | – | (.04) | (.04) |
| Total distributions | (.03) | (1.08) | (1.00) | (1.31) | (1.05) | (1.05) |
| Redemption fees added to paid in capitalB | – | –D | –D | –D | –D | –D |
| Net asset value, end of period | $41.60 | $36.89 | $32.82 | $39.76 | $41.20 | $35.31 |
| Total ReturnE,F | 12.85% | 15.87% | (15.13)% | (.16)% | 19.85% | 10.12% |
| Ratios to Average Net AssetsG,H | ||||||
| Expenses before reductions | .06%I | .07% | .10% | .10% | .10% | .10% |
| Expenses net of fee waivers, if any | .06%I | .06% | .07% | .07% | .07% | .07% |
| Expenses net of all reductions | .06%I | .06% | .07% | .07% | .07% | .07% |
| Net investment income (loss) | 3.91%I | 3.10% | 3.05% | 2.96% | 3.65%C | 3.29% |
| Supplemental Data | ||||||
| Net assets, end of period (000 omitted) | $2,889,790 | $2,097,193 | $1,539,389 | $1,994,854 | $1,595,562 | $1,269,545 |
| Portfolio turnover rateJ | 2%I,K | 2% | 1%K | 1% | 2% | 1% |
A For the year ended February 29.
B Calculated based on average shares outstanding during the period.
C Net Investment income per share reflects a large, non-recurring dividend which amounted to $.27 per share. Excluding this non-recurring dividend, the ratio of net investment income (loss) to average net assets would have been 2.95%.
D Amount represents less than $.005 per share.
E Total returns for periods of less than one year are not annualized.
F Total returns would have been lower if certain expenses had not been reduced during the applicable periods shown.
G Fees and expenses of any underlying Fidelity Central Funds are not included in the Fund's expense ratio. The Fund indirectly bears its proportionate share of the expenses of any underlying Fidelity Central Funds.
H Expense ratios reflect operating expenses of the class. Expenses before reductions do not reflect amounts reimbursed by the investment adviser or reductions from expense offset arrangements and do not represent the amount paid by the class during periods when reimbursements or reductions occur. Expenses net of fee waivers reflect expenses after reimbursement by the investment adviser but prior to reductions from expense offset arrangements. Expenses net of all reductions represent the net expenses paid by the class.
I Annualized
J Amount does not include the portfolio activity of any underlying Fidelity Central Funds.
K Portfolio turnover rate excludes securities received or delivered in-kind.
See accompanying notes which are an integral part of the financial statements.
Financial Highlights — Fidelity International Index Fund Institutional Premium Class
| Six months ended (Unaudited) August 31, | Years ended February 28, | |||||
| 2017 | 2017 | 2016A | 2015 | 2014 | 2013 | |
| Selected Per–Share Data | ||||||
| Net asset value, beginning of period | $36.88 | $32.82 | $39.76 | $41.20 | $35.31 | $33.07 |
| Income from Investment Operations | ||||||
| Net investment income (loss)B | .78 | 1.11 | 1.16 | 1.19 | 1.41C | 1.08 |
| Net realized and unrealized gain (loss) | 3.97 | 4.04 | (7.10) | (1.32) | 5.53 | 2.22 |
| Total from investment operations | 4.75 | 5.15 | (5.94) | (.13) | 6.94 | 3.30 |
| Distributions from net investment income | (.03) | (1.06) | (1.00) | (1.31) | (1.01) | (1.02) |
| Distributions from net realized gain | – | (.03) | – | – | (.04) | (.04) |
| Total distributions | (.03) | (1.09) | (1.00) | (1.31) | (1.05) | (1.06) |
| Redemption fees added to paid in capitalB | – | –D | –D | –D | –D | –D |
| Net asset value, end of period | $41.60 | $36.88 | $32.82 | $39.76 | $41.20 | $35.31 |
| Total ReturnE,F | 12.89% | 15.85% | (15.12)% | (.15)% | 19.86% | 10.13% |
| Ratios to Average Net AssetsG,H | ||||||
| Expenses before reductions | .05%I | .06% | .08% | .08% | .08% | .08% |
| Expenses net of fee waivers, if any | .05%I | .05% | .06% | .06% | .06% | .06% |
| Expenses net of all reductions | .05%I | .05% | .06% | .06% | .06% | .06% |
| Net investment income (loss) | 3.92%I | 3.11% | 3.06% | 2.97% | 3.66%C | 3.30% |
| Supplemental Data | ||||||
| Net assets, end of period (000 omitted) | $5,672,860 | $4,761,598 | $1,734,082 | $1,797,254 | $1,651,834 | $1,155,733 |
| Portfolio turnover rateJ | 2%I,K | 2% | 1%K | 1% | 2% | 1% |
A For the year ended February 29.
B Calculated based on average shares outstanding during the period.
C Net Investment income per share reflects a large, non-recurring dividend which amounted to $.27 per share. Excluding this non-recurring dividend, the ratio of net investment income (loss) to average net assets would have been 2.96%.
D Amount represents less than $.005 per share.
E Total returns for periods of less than one year are not annualized.
F Total returns would have been lower if certain expenses had not been reduced during the applicable periods shown.
G Fees and expenses of any underlying Fidelity Central Funds are not included in the Fund's expense ratio. The Fund indirectly bears its proportionate share of the expenses of any underlying Fidelity Central Funds.
H Expense ratios reflect operating expenses of the class. Expenses before reductions do not reflect amounts reimbursed by the investment adviser or reductions from expense offset arrangements and do not represent the amount paid by the class during periods when reimbursements or reductions occur. Expenses net of fee waivers reflect expenses after reimbursement by the investment adviser but prior to reductions from expense offset arrangements. Expenses net of all reductions represent the net expenses paid by the class.
I Annualized
J Amount does not include the portfolio activity of any underlying Fidelity Central Funds.
K Portfolio turnover rate excludes securities received or delivered in-kind.
See accompanying notes which are an integral part of the financial statements.
Notes to Financial Statements (Unaudited)
For the period ended August 31, 2017
1. Organization.
Fidelity Total Market Index Fund, Fidelity Extended Market Index Fund and Fidelity International Index Fund (the Funds) are funds of Fidelity Concord Street Trust (the Trust). Each Fund is authorized to issue an unlimited number of shares. The Trust is registered under the Investment Company Act of 1940, as amended (the 1940 Act), as an open-end management investment company organized as a Massachusetts business trust. Fidelity Total Market Index Fund offers Investor Class, Premium Class, Institutional Class, Institutional Premium Class and Class F shares. Fidelity Extended Market Index Fund offers Investor Class, Premium Class and Institutional Premium Class shares. Fidelity International Index Fund offers Investor Class, Premium Class, Institutional Class and Institutional Premium Class shares, each of which has equal rights as to assets and voting privileges. Each class has exclusive voting rights with respect to matters that affect that class. Each Fund offers conversion privileges between share classes within each Fund to eligible shareholders. Class F shares of the Fund are only available for purchase by mutual funds for which Fidelity Management & Research Company (FMR) or an affiliate serves as investment manager.
2. Investments in Fidelity Central Funds.
The Funds invest in Fidelity Central Funds, which are open-end investment companies generally available only to other investment companies and accounts managed by the investment adviser and its affiliates. The Funds' Schedules of Investments list each of the Fidelity Central Funds held as of period end, if any, as an investment of each Fund, but do not include the underlying holdings of each Fidelity Central Fund. As an Investing Fund, each Fund indirectly bears its proportionate share of the expenses of the underlying Fidelity Central Funds.
The Money Market Central Funds seek preservation of capital and current income and are managed by Fidelity Investments Money Management, Inc. (FIMM), an affiliate of the investment adviser. Annualized expenses of the Money Market Central Funds as of their most recent shareholder report date are less than .005%.
A complete unaudited list of holdings for each Fidelity Central Fund is available upon request or at the Securities and Exchange Commission (the SEC) website at www.sec.gov. In addition, the financial statements of the Fidelity Central Funds are available on the SEC website or upon request.
3. Significant Accounting Policies.
Each Fund is an investment company and applies the accounting and reporting guidance of the Financial Accounting Standards Board (FASB) Accounting Standards Codification Topic 946 Financial Services – Investments Companies. The financial statements have been prepared in conformity with accounting principles generally accepted in the United States of America (GAAP), which require management to make certain estimates and assumptions at the date of the financial statements. Actual results could differ from those estimates. Subsequent events, if any, through the date that the financial statements were issued have been evaluated in the preparation of the financial statements. The following summarizes the significant accounting policies of the Funds:
Investment Valuation. Investments are valued as of 4:00 p.m. Eastern time on the last calendar day of the period. The Board of Trustees (the Board) has delegated the day to day responsibility for the valuation of each Fund's investments to the Fair Value Committee (the Committee) established by each Fund's investment adviser. In accordance with valuation policies and procedures approved by the Board, each Fund attempts to obtain prices from one or more third party pricing vendors or brokers to value its investments. When current market prices, quotations or currency exchange rates are not readily available or reliable, investments will be fair valued in good faith by the Committee, in accordance with procedures adopted by the Board. Factors used in determining fair value vary by investment type and may include market or investment specific events, changes in interest rates and credit quality. The frequency with which these procedures are used cannot be predicted and they may be utilized to a significant extent. The Committee oversees each Fund's valuation policies and procedures and reports to the Board on the Committee's activities and fair value determinations. The Board monitors the appropriateness of the procedures used in valuing each Fund's investments and ratifies the fair value determinations of the Committee.
Each Fund categorizes the inputs to valuation techniques used to value its investments into a disclosure hierarchy consisting of three levels as shown below:
- Level 1 – quoted prices in active markets for identical investments
- Level 2 – other significant observable inputs (including quoted prices for similar investments, interest rates, prepayment speeds, etc.)
- Level 3 – unobservable inputs (including the Fund's own assumptions based on the best information available)
Valuation techniques used to value each Fund's investments by major category are as follows:
Equity securities, including restricted securities, for which market quotations are readily available, are valued at the last reported sale price or official closing price as reported by a third party pricing vendor on the primary market or exchange on which they are traded and are categorized as Level 1 in the hierarchy. In the event there were no sales during the day or closing prices are not available, securities are valued at the last quoted bid price or may be valued using the last available price and are generally categorized as Level 2 in the hierarchy. For foreign equity securities, when market or security specific events arise, comparisons to the valuation of American Depositary Receipts (ADRs), futures contracts, Exchange-Traded Funds (ETFs) and certain indexes as well as quoted prices for similar securities may be used and would be categorized as Level 2 in the hierarchy. Utilizing these techniques may result in transfers between Level 1 and Level 2. For equity securities, including restricted securities, where observable inputs are limited, assumptions about market activity and risk are used and these securities may be categorized as Level 3 in the hierarchy.
Debt securities, including restricted securities, are valued based on evaluated prices received from third party pricing vendors or from brokers who make markets in such securities. U.S. government and government agency obligations are valued by pricing vendors who utilize matrix pricing which considers yield or price of bonds of comparable quality, coupon, maturity and type or by broker-supplied prices. When independent prices are unavailable or unreliable, debt securities may be valued utilizing pricing methodologies which consider similar factors that would be used by third party pricing vendors. Debt securities are generally categorized as Level 2 in the hierarchy but may be Level 3 depending on the circumstances.
The U.S. dollar value of foreign currency contracts is determined using currency exchange rates supplied by a pricing service and are categorized as Level 2 in the hierarchy. Futures contracts are valued at the settlement price established each day by the board of trade or exchange on which they are traded and are categorized as Level 1 in the hierarchy. Investments in open-end mutual funds, including the Fidelity Central Funds, are valued at their closing net asset value (NAV) each business day and are categorized as Level 1 in the hierarchy.
Changes in valuation techniques may result in transfers in or out of an assigned level within the disclosure hierarchy. The aggregate value of investments by input level as of August 31, 2017, including information on transfers between Levels 1 and 2, is included at the end of each applicable Fund's Schedule of Investments.
Foreign Currency. Foreign-denominated assets, including investment securities, and liabilities are translated into U.S. dollars at the exchange rates at period end. Purchases and sales of investment securities, income and dividends received and expenses denominated in foreign currencies are translated into U.S. dollars at the exchange rate in effect on the transaction date.
The effects of exchange rate fluctuations on investments are included with the net realized and unrealized gain (loss) on investment securities. Other foreign currency transactions resulting in realized and unrealized gain (loss) are disclosed separately.
Realized gains and losses on foreign currency transactions arise from the disposition of foreign currency, realized changes in the value of foreign currency between the trade and settlement dates on security transactions, and the difference between the amounts of dividends, interest and foreign withholding taxes recorded on transaction date and the U.S. dollar equivalent of the amounts actually received or paid. Unrealized gains and losses on assets and liabilities in foreign currencies arise from changes in the value of foreign currency, and from assets and liabilities denominated in foreign currencies, other than investments, which are held at period end.
Investment Transactions and Income. For financial reporting purposes, the Funds' investment holdings and NAV include trades executed through the end of the last business day of the period. The NAV per share for processing shareholder transactions is calculated as of the close of business of the New York Stock Exchange (NYSE), normally 4:00 p.m. Eastern time and includes trades executed through the end of the prior business day. Gains and losses on securities sold are determined on the basis of identified cost and may include proceeds received from litigation. Dividend income is recorded on the ex-dividend date, except for certain dividends from foreign securities where the ex-dividend date may have passed, which are recorded as soon as the Funds are informed of the ex-dividend date. Non-cash dividends included in dividend income, if any, are recorded at the fair market value of the securities received. Income and capital gain distributions from Fidelity Central Funds, if any, are recorded on the ex-dividend date. Certain distributions received by the Funds represent a return of capital or capital gain. The Funds determine the components of these distributions subsequent to the ex-dividend date, based upon receipt of tax filings or other correspondence relating to the underlying investment. These distributions are recorded as a reduction of cost of investments and/or as a realized gain. Interest income is accrued as earned and includes coupon interest and amortization of premium and accretion of discount on debt securities as applicable. Investment income is recorded net of foreign taxes withheld where recovery of such taxes is uncertain.
Class Allocations and Expenses. Investment income, realized and unrealized capital gains and losses, common expenses of each Fund, and certain fund-level expense reductions, if any, are allocated daily on a pro-rata basis to each class based on the relative net assets of each class to the total net assets of each Fund. Each class differs with respect to transfer agent fees incurred. Certain expense reductions may also differ by class. For the reporting period, the allocated portion of income and expenses to each class as a percent of its average net assets may vary due to the timing of recording these transactions in relation to fluctuating net assets of the classes. Expenses directly attributable to a fund are charged to that fund. Expenses attributable to more than one fund are allocated among the respective funds on the basis of relative net assets or other appropriate methods. Expense estimates are accrued in the period to which they relate and adjustments are made when actual amounts are known.
Deferred Trustee Compensation. Under a Deferred Compensation Plan (the Plan) for Fidelity Total Market Index Fund, independent Trustees may elect to defer receipt of a portion of their annual compensation. Deferred amounts are invested in a cross-section of Fidelity funds, are marked-to-market and remain in the Fund until distributed in accordance with the Plan. The investment of deferred amounts and the offsetting payable to the Trustees are included in the accompanying Statement of Assets and Liabilities.
Income Tax Information and Distributions to Shareholders. Each year, each Fund intends to qualify as a regulated investment company under Subchapter M of the Internal Revenue Code, including distributing substantially all of its taxable income and realized gains. As a result, no provision for U.S. Federal income taxes is required. Each Fund files a U.S. federal tax return, in addition to state and local tax returns as required. Each Fund's federal income tax returns are subject to examination by the Internal Revenue Service (IRS) for a period of three fiscal years after they are filed. State and local tax returns may be subject to examination for an additional fiscal year depending on the jurisdiction. Foreign taxes are provided for based on each Fund's understanding of the tax rules and rates that exist in the foreign markets in which it invests.
Distributions are declared and recorded on the ex-dividend date. Income dividends and capital gain distributions are declared separately for each class. Income and capital gain distributions are determined in accordance with income tax regulations, which may differ from GAAP.
Capital accounts within the financial statements are adjusted for permanent book-tax differences. These adjustments have no impact on net assets or the results of operations. Capital accounts are not adjusted for temporary book-tax differences which will reverse in a subsequent period.
Book-tax differences are primarily due to futures contracts, foreign currency transactions, passive foreign investment companies (PFIC), market discount, partnerships, deferred trustees compensation, capital loss carryforwards, expiring capital loss carryforwards and losses deferred due to wash sales and excise tax regulations.
As of period end, the cost and unrealized appreciation (depreciation) in securities, and derivatives if applicable, for federal income tax purposes were as follows for each Fund:
| Tax cost | Gross unrealized appreciation | Gross unrealized depreciation | Net unrealized appreciation (depreciation) | |
| Fidelity Total Market Index | $30,572,677,290 | $17,225,625,626 | $(2,019,235,140) | $15,206,390,486 |
| Fidelity Extended Market Index | 19,468,743,662 | 6,818,076,995 | (2,115,760,256) | 4,702,316,739 |
| Fidelity International Index | 18,066,906,537 | 4,284,425,878 | (2,555,932,821) | 1,728,493,057 |
Capital loss carryforwards are only available to offset future capital gains of the Funds to the extent provided by regulations and may be limited. Under the Regulated Investment Company Modernization Act of 2010 (the Act), the Funds are permitted to carry forward capital losses incurred in taxable years beginning after December 22, 2010 for an unlimited period and such capital losses are required to be used prior to any losses that expire. The capital loss carryforward information presented below, including any applicable limitation, is estimated as of prior fiscal period end and is subject to adjustment.
| Fiscal year of expiration | |||
| 2018 | 2019 | Total with expiration | |
| Fidelity International Index | $(148,608,684) | $(49,793,394) | $(198,402,078) |
| No expiration | ||||
| Short-term | Long-term | Total no expiration | Total capital loss carryforward | |
| Fidelity International Index | $(14,053,316) | $(377,210,986) | $(391,264,302) | $(589,666,380) |
Restricted Securities. The Funds may invest in securities that are subject to legal or contractual restrictions on resale. These securities generally may be resold in transactions exempt from registration or to the public if the securities are registered. Disposal of these securities may involve time-consuming negotiations and expense, and prompt sale at an acceptable price may be difficult. Information regarding restricted securities is included at the end of each applicable Fund's Schedule of Investments.
4. Derivative Instruments.
Risk Exposures and the Use of Derivative Instruments. The Funds' investment objective allows the Funds to enter into various types of derivative contracts, including futures contracts and forward foreign currency contracts. Derivatives are investments whose value is primarily derived from underlying assets, indices or reference rates and may be transacted on an exchange or over-the-counter (OTC). Derivatives may involve a future commitment to buy or sell a specified asset based on specified terms, to exchange future cash flows at periodic intervals based on a notional principal amount, or for one party to make one or more payments upon the occurrence of specified events in exchange for periodic payments from the other party.
The Funds used derivatives to increase returns and to manage exposure to certain risks as defined below. The success of any strategy involving derivatives depends on analysis of numerous economic factors, and if the strategies for investment do not work as intended, the Funds may not achieve their objectives.
The Funds' use of derivatives increased or decreased their exposure to the following risks:
| Equity Risk | Equity risk relates to the fluctuations in the value of financial instruments as a result of changes in market prices (other than those arising from interest rate risk or foreign exchange risk), whether caused by factors specific to an individual investment, its issuer, or all factors affecting all instruments traded in a market or market segment. |
| Foreign Exchange Risk | Foreign exchange rate risk relates to fluctuations in the value of an asset or liability due to changes in currency exchange rates. |
The Funds are also exposed to additional risks from investing in derivatives, such as liquidity risk and counterparty credit risk. Liquidity risk is the risk that the Funds will be unable to close out the derivative in the open market in a timely manner. Counterparty credit risk is the risk that the counterparty will not be able to fulfill its obligation to the Funds. Counterparty credit risk related to exchange-traded futures contracts may be mitigated by the protection provided by the exchange on which they trade.
Investing in derivatives may involve greater risks than investing in the underlying assets directly and, to varying degrees, may involve risk of loss in excess of any initial investment and collateral received and amounts recognized in the Statement of Assets and Liabilities. In addition, there may be the risk that the change in value of the derivative contract does not correspond to the change in value of the underlying instrument.
Net Realized Gain (Loss) and Change in Net Unrealized Appreciation (Depreciation) on Derivatives. The table below, which reflects the impacts of derivatives on the financial performance of the Funds, summarizes the net realized gain (loss) and change in net unrealized appreciation (depreciation) for derivatives during the period as presented in the Statement of Operations.
| Primary Risk Exposure / Derivative Type | Net Realized Gain (Loss) | Change in Net Unrealized Appreciation (Depreciation) |
| Fidelity Total Market Index | ||
| Equity Risk | ||
| Futures Contracts | $16,055,775 | $(6,800,984) |
| Total Equity Risk | 16,055,775 | (6,800,984) |
| Totals | $16,055,775 | $(6,800,984) |
| Fidelity Extended Market Index | ||
| Equity Risk | ||
| Futures Contracts | $(10,029) | $(264,817) |
| Total Equity Risk | (10,029) | (264,817) |
| Totals | $(10,029) | $(264,817) |
| Fidelity International Index | ||
| Equity Risk | ||
| Futures Contracts | $33,776,789 | $138,094 |
| Total Equity Risk | 33,776,789 | 138,094 |
| Foreign Exchange Risk | ||
| Forward Foreign Currency Contracts | 2,516,171 | 707 |
| Total Foreign Exchange Risk | 2,516,171 | 707 |
| Totals | $36,292,960 | $138,801 |
A summary of the value of derivatives by primary risk exposure as of period end, if any, is included at the end of the Schedule of Investments.
Forward Foreign Currency Contracts. Forward foreign currency contracts represent obligations to purchase or sell foreign currency on a specified future date at a price fixed at the time the contracts are entered into. The Funds used forward foreign currency contracts to facilitate transactions in foreign-denominated securities and to manage exposure to certain foreign currencies.
Forward foreign currency contracts are valued daily and fluctuations in exchange rates on open contracts are recorded as unrealized appreciation or (depreciation) and reflected in the Statement of Assets and Liabilities. When the contract is closed, the Funds realize a gain or loss equal to the difference between the closing value and the value at the time it was opened. The net realized gain (loss) and change in net unrealized appreciation (depreciation) on forward foreign currency contracts during the period is presented in the Statement of Operations.
Any open forward foreign currency contracts at period end are presented in the Schedule of Investments under the caption "Forward Foreign Currency Contracts." The contract amount and unrealized appreciation (depreciation) reflects each contract's exposure to the underlying currency at period end.
Futures Contracts. A futures contract is an agreement between two parties to buy or sell a specified underlying instrument for a fixed price at a specified future date. The Funds used futures contracts to manage their exposure to the stock market.
Upon entering into a futures contract, a fund is required to deposit either cash or securities (initial margin) with a clearing broker in an amount equal to a certain percentage of the face value of the contract. Futures contracts are marked-to-market daily and subsequent daily payments (variation margin) are made or received by a fund depending on the daily fluctuations in the value of the futures contracts and are recorded as unrealized appreciation or (depreciation). This receivable and/or payable, if any, is included in daily variation margin on futures contracts in the Statement of Assets and Liabilities. Realized gain or (loss) is recorded upon the expiration or closing of a futures contract.
Any open futures contracts at period end are presented in the Schedule of Investments under the caption "Futures Contracts". The underlying face amount at value reflects each contract's exposure to the underlying instrument or index at period end and is representative of volume of activity during the period. Securities deposited to meet initial margin requirements are identified in the Schedule of Investments.
5. Purchases and Sales of Investments.
Purchases and sales of securities, other than short-term securities and in-kind transactions, are noted in the table below.
| Purchases ($) | Sales ($) | |
| Fidelity Total Market Index | 3,043,267,353 | 544,461,282 |
| Fidelity Extended Market Index | 1,767,451,758 | 1,341,393,274 |
| Fidelity International Index | 1,571,813,407 | 191,603,421 |
Exchanges In-Kind. During the period, investments and cash received in-kind through subscriptions totaled $172,362,566 in exchange for 4,418,420 shares of Fidelity International Index. The amount of in-kind exchanges is included in share transactions in the accompanying Statement of Changes in Net Assets as well as the Notes to Financial Statements. The Fund recognized no gain or loss for federal income tax purposes.
6. Fees and Other Transactions with Affiliates.
Management Fee and Expense Contract. Fidelity Management & Research Company (the investment adviser) and its affiliates provide the Funds with investment management related services for which the Funds pay a monthly management fee. The management fee is based on an annual rate of .015% and .045% of Fidelity Total Market Index Fund and Fidelity Extended Market Index Fund's average net assets, respectively. Effective August 1, 2017, the Board approved an amendment to the management contract to reduce the management fee from an annual rate of .05% to .045% of Fidelity International Index Fund's average net assets. Under the management contract, the investment adviser pays all other fund-level expenses, except the compensation of the independent Trustees and certain other expenses such as interest expense, including commitment fees. For the reporting period, the total annual management fee rate was .049% of Fidelity International Index Fund's average net assets.
Effective August 1, 2017, the Board also approved an amendment to the expense contract. Under the expense contract, the investment adviser pays class-level expenses as necessary so that the total expenses do not exceed certain amounts of each class' average net assets on an annual basis with certain exceptions, as noted in the following table:
| Investor Class | Premium Class | Institutional Class | Institutional Premium Class | Class F | |
| Fidelity Total Market Index Fund | .09% | .035% | .030% | .015% | .015% |
| Fidelity Extended Market Index Fund | .10% | .07% | n/a | .045% | n/a |
| Fidelity International Index Fund | .16% | .06% | .05% | .045% | n/a |
Prior to August 1, 2017, the investment advisor paid class-level expenses as necessary so that the total expenses did not exceed certain amounts as noted in the following table:
| Investor Class | Premium Class | Institutional Class | Institutional Premium Class | Class F | |
| Fidelity Total Market Index Fund | .09% | .045% | .035% | .015% | .015% |
| Fidelity Extended Market Index Fund | .10% | .07% | n/a | .045% | n/a |
| Fidelity International Index Fund | .19% | .08% | .06% | .05% | n/a |
Sub-Adviser. Geode Capital Management, LLC (Geode), serves as sub-adviser for the Funds. Geode provides discretionary investment advisory services to the Funds and is paid by the investment adviser for providing these services.
Transfer Agent Fees. Fidelity Investments Institutional Operations Company, Inc. (FIIOC), an affiliate of the investment adviser, is the transfer, dividend disbursing and shareholder servicing agent for each class of the Funds. FIIOC receives transfer agent fees at annual rates based on class-level average net assets noted in the table below. FIIOC receives no fees for providing transfer agency services to Class F. FIIOC pays for typesetting, printing and mailing of shareholder reports, except proxy statements. Effective August 1, 2017, under the amended expense contract, each class pays all or a portion of the transfer agent fees at an annual rate based on class-level average net assets as noted in the following table:
| Received by FIIOC | Paid by Class Effective August 1, 2017 | Paid by Class Prior to August 1, 2017 | |
| Fidelity Total Market Index | |||
| Investor Class | .075% | .075% | .075% |
| Premium Class | .045% | .02% | .030% |
| Institutional Class | .035% | .015% | .02% |
| Institutional Premium Class | .015% | –% | –% |
| Fidelity Extended Market Index | |||
| Investor Class | .075% | .055% | .055% |
| Premium Class | .045% | .025% | .025% |
| Institutional Premium Class | .015% | –% | –% |
| Fidelity International Index | |||
| Investor Class | .21% | .115% | .14% |
| Premium Class | .11% | .015% | .03% |
| Institutional Class | .035% | .005% | .01% |
| Institutional Premium Class | .015% | –% | –% |
For the period, the total transfer agent fees paid by each applicable class were as follows:
| Amount | % of Class-Level Average Net Assets(a) | |
| Fidelity Total Market Index | ||
| Investor Class | $280,667 | .075 |
| Premium Class | 3,418,251 | .028 |
| Institutional Class | 237,148 | .019 |
| Institutional Premium Class | – | – |
| $3,936,066 | ||
| Fidelity Extended Market Index | ||
| Investor Class | $217,100 | .055 |
| Premium Class | 2,028,623 | .025 |
| Institutional Premium Class | – | – |
| $2,245,723 | ||
| Fidelity International Index | ||
| Investor Class | $494,547 | .136 |
| Premium Class | 1,326,456 | .027 |
| Institutional Class | 113,994 | .009 |
| Institutional Premium Class | – | – |
| $1,934,997 |
(a) Annualized
Interfund Lending Program. Pursuant to an Exemptive Order issued by the SEC, the Funds, along with other registered investment companies having management contracts with Fidelity Management & Research Company (FMR) or other affiliated entities of FMR, may participate in an interfund lending program. This program provides an alternative credit facility allowing the funds to borrow from, or lend money to, other participating affiliated funds. At period end, there were no interfund loans outstanding. Each applicable fund's activity in this program during the period for which loans were outstanding was as follows:
| Borrower or Lender | Average Loan Balance | Weighted Average Interest Rate | Interest Expense | |
| Fidelity Extended Market Index | Borrower | $12,117,500 | 1.27% | $4,279 |
Interfund Trades. The Funds may purchase from or sell securities to other Fidelity Funds under procedures adopted by the Board. The procedures have been designed to ensure these interfund trades are executed in accordance with Rule 17a-7 of the 1940 Act. Interfund trades are included within the respective purchases and sales amounts shown in the Purchases and Sales of Investments note.
7. Committed Line of Credit.
Certain Funds participate with other funds managed by the investment adviser or an affiliate in a $4.25 billion credit facility (the "line of credit") to be utilized for temporary or emergency purposes to fund shareholder redemptions or for other short-term liquidity purposes. The participating funds have agreed to pay commitment fees on their pro-rata portion of the line of credit, which are reflected in Miscellaneous expenses on the Statement of Operations, and are as follows:
| Fidelity Total Market Index | $65,808 |
| Fidelity Extended Market Index | 31,272 |
| Fidelity International Index | 27,760 |
During the period, the Funds did not borrow on this line of credit.
8. Security Lending.
Certain Funds lend portfolio securities through a lending agent from time to time in order to earn additional income. On the settlement date of the loan, each applicable Fund receives collateral (in the form of U.S. Treasury obligations, letters of credit and/or cash) against the loaned securities and maintains collateral in an amount not less than 100% of the market value of the loaned securities during the period of the loan. The market value of the loaned securities is determined at the close of business of the Funds and any additional required collateral is delivered to the Funds on the next business day. The Funds or borrower may terminate the loan at any time, and if the borrower defaults on its obligation to return the securities loaned because of insolvency or other reasons, the Funds may apply collateral received from the borrower against the obligation. The Funds may experience delays and costs in recovering the securities loaned. Any cash collateral received is invested in the Fidelity Securities Lending Cash Central Fund. The value of loaned securities and cash collateral at period end are disclosed on each applicable Fund's Statement of Assets and Liabilities. Security lending income represents the income earned on investing cash collateral, less rebates paid to borrowers and any lending agent fees associated with the loan, plus any premium payments received for lending certain types of securities. Security lending income is presented on each applicable Fund's Statement of Operations as a component of income from Fidelity Central Funds.
9. Expense Reductions.
Through arrangements with each applicable Fund's custodian, credits realized as a result of certain uninvested cash balances were used to reduce each applicable Fund's expenses as noted in the table below.
| Management fee reduction | |
| Fidelity Total Market Index | $7,598 |
| Fidelity Extended Market Index | 17,441 |
| Fidelity International Index | 483 |
10. Distributions to Shareholders.
Distributions to shareholders of each class were as follows:
| Six months ended August 31, 2017 | Year ended February 28, 2017 | |
| Fidelity Total Market Index | ||
| From net investment income | ||
| Investor Class | $1,974,932 | $16,896,705 |
| Premium Class | 65,259,273 | 378,185,569 |
| Institutional Class | 6,652,259 | 34,361,091 |
| Institutional Premium Class | 13,828,214 | 64,762,437 |
| Class F | 27,062,569 | 155,686,891 |
| Total | $114,777,247 | $649,892,693 |
| From net realized gain | ||
| Investor Class | $1,134,765 | $7,085,516 |
| Premium Class | 35,813,221 | 129,533,088 |
| Institutional Class | 3,614,600 | 11,106,621 |
| Institutional Premium Class | 7,368,243 | 19,355,949 |
| Class F | 14,420,059 | 51,563,948 |
| Total | $62,350,888 | $218,645,122 |
| Fidelity Extended Market Index | ||
| From net investment income | ||
| Investor Class | $1,423,640 | $11,793,290 |
| Premium Class | 29,394,831 | 197,507,483 |
| Institutional Premium Class | 4,191,983 | 26,821,111 |
| Total | $35,010,454 | $236,121,884 |
| From net realized gain | ||
| Investor Class | $8,271,347 | $32,816,744 |
| Premium Class | 162,915,168 | 506,502,591 |
| Institutional Premium Class | 22,375,206 | 66,487,880 |
| Total | $193,561,721 | $605,807,215 |
| Fidelity International Index | ||
| From net investment income | ||
| Investor Class | $291,977 | $24,076,149 |
| Premium Class | 6,344,090 | 233,531,573 |
| Institutional Class | 1,694,491 | 59,351,711 |
| Institutional Premium Class | 3,861,044 | 122,936,664 |
| Total | $12,191,602 | $439,896,097 |
| From net realized gain | ||
| Investor Class | $– | $671,052 |
| Premium Class | – | 7,150,508 |
| Institutional Class | – | 1,834,835 |
| Institutional Premium Class | – | 3,858,143 |
| Total | $– | $13,514,538 |
11. Share Transactions.
Share transactions for each class were as follows and may contain automatic conversions between classes or exchanges between affiliated funds:
| Shares | Shares | Dollars | Dollars | |
| Six months ended August 31, 2017 | Year ended February 28, 2017 | Six months ended August 31, 2017 | Year ended February 28, 2017 | |
| Fidelity Total Market Index | ||||
| Investor Class | ||||
| Shares sold | 3,340,976 | 8,795,818 | $231,898,223 | $548,532,660 |
| Reinvestment of distributions | 43,739 | 367,701 | 2,949,341 | 23,024,663 |
| Shares redeemed | (3,677,538) | (33,293,575) | (255,132,205) | (2,016,144,611) |
| Net increase (decrease) | (292,823) | (24,130,056) | $(20,284,641) | $(1,444,587,288) |
| Premium Class | ||||
| Shares sold | 29,280,232 | 72,938,672 | $2,028,991,757 | $4,593,828,256 |
| Reinvestment of distributions | 1,351,656 | 7,020,226 | 91,142,202 | 448,347,863 |
| Shares redeemed | (22,348,489) | (79,548,075) | (1,553,816,587) | (4,899,234,191) |
| Net increase (decrease) | 8,283,399 | 410,823 | $566,317,372 | $142,941,928 |
| Institutional Class | ||||
| Shares sold | 6,594,589 | 18,325,311 | $456,399,631 | $1,130,684,794 |
| Reinvestment of distributions | 135,029 | 632,945 | 9,103,650 | 40,590,795 |
| Shares redeemed | (4,468,517) | (6,254,614) | (309,213,464) | (386,019,299) |
| Net increase (decrease) | 2,261,101 | 12,703,642 | $156,289,817 | $785,256,290 |
| Institutional Premium Class | ||||
| Shares sold | 7,741,984 | 61,769,845 | $536,690,592 | $3,765,300,121 |
| Reinvestment of distributions | 314,441 | 1,300,415 | 21,196,456 | 84,118,042 |
| Shares redeemed | (5,600,465) | (8,839,371) | (389,953,233) | (559,041,660) |
| Net increase (decrease) | 2,455,960 | 54,230,889 | $167,933,815 | $3,290,376,503 |
| Class F | ||||
| Shares sold | 18,684,085 | 31,179,343 | $1,297,441,901 | $1,951,312,863 |
| Reinvestment of distributions | 615,195 | 3,238,153 | 41,482,628 | 207,250,839 |
| Shares redeemed | (2,657,086) | (22,327,967) | (185,814,320) | (1,432,285,287) |
| Net increase (decrease) | 16,642,194 | 12,089,529 | $1,153,110,209 | $726,278,415 |
| Fidelity Extended Market Index | ||||
| Investor Class | ||||
| Shares sold | 2,364,975 | 6,711,795 | $137,346,591 | $357,617,521 |
| Reinvestment of distributions | 166,868 | 807,669 | 9,451,425 | 43,536,543 |
| Shares redeemed | (3,554,306) | (23,767,851) | (206,020,009) | (1,235,806,632) |
| Net increase (decrease) | (1,022,463) | (16,248,387) | $(59,221,993) | $(834,652,568) |
| Premium Class | ||||
| Shares sold | 32,375,481 | 66,990,107 | $1,882,853,168 | $3,630,840,281 |
| Reinvestment of distributions | 3,255,275 | 12,308,792 | 184,378,834 | 673,965,867 |
| Shares redeemed | (38,774,296) | (57,455,289) | (2,253,935,691) | (3,070,052,457) |
| Net increase (decrease) | (3,143,540) | 21,843,610 | $(186,703,689) | $1,234,753,691 |
| Institutional Premium Class | ||||
| Shares sold | 11,510,913 | 18,428,166 | $667,157,368 | $957,133,137 |
| Reinvestment of distributions | 469,219 | 1,695,786 | 26,567,167 | 93,308,991 |
| Shares redeemed | (5,602,622) | (6,038,878) | (322,832,453) | (325,445,445) |
| Net increase (decrease) | 6,377,510 | 14,085,074 | $370,892,082 | $724,996,683 |
| Fidelity International Index | ||||
| Investor Class | ||||
| Shares sold | 5,832,986 | 15,676,836 | $232,726,625 | $556,901,003 |
| Reinvestment of distributions | 7,294 | 670,347 | 276,872 | 23,634,187 |
| Shares redeemed | (8,920,872) | (77,100,723) | (353,310,602) | (2,682,763,685) |
| Net increase (decrease) | (3,080,592) | (60,753,540) | $(120,307,105) | $(2,102,228,495) |
| Premium Class | ||||
| Shares sold | 41,063,321 | 67,826,776 | $1,638,488,081 | $2,420,149,137 |
| Reinvestment of distributions | 152,855 | 6,241,945 | 5,800,830 | 219,796,690 |
| Shares redeemed | (24,422,496) | (71,605,542) | (970,405,932) | (2,541,773,239) |
| Net increase (decrease) | 16,793,680 | 2,463,179 | $673,882,979 | $98,172,588 |
| Institutional Class | ||||
| Shares sold | 20,486,749 | 31,906,258 | $816,362,438 | $1,129,449,528 |
| Reinvestment of distributions | 44,637 | 1,737,812 | 1,694,412 | 61,183,600 |
| Shares redeemed | (7,921,466) | (23,692,151) | (316,309,753) | (837,030,962) |
| Net increase (decrease) | 12,609,920 | 9,951,919 | $501,747,097 | $353,602,166 |
| Institutional Premium Class | ||||
| Shares sold | 19,329,635(a) | 94,972,931 | $765,866,789(a) | $3,303,416,370 |
| Reinvestment of distributions | 101,740 | 3,602,030 | 3,861,023 | 126,794,046 |
| Shares redeemed | (12,157,309) | (22,317,015) | (484,385,984) | (795,883,611) |
| Net increase (decrease) | 7,274,066 | 76,257,946 | $285,341,828 | $2,634,326,805 |
(a) Amount includes in-kind exchanges (see the Exchanges In-Kind note for additional details).
12. Other.
The Funds' organizational documents provide former and current trustees and officers with a limited indemnification against liabilities arising in connection with the performance of their duties to the Funds. In the normal course of business, the Funds may also enter into contracts that provide general indemnifications. The Funds' maximum exposure under these arrangements is unknown as this would be dependent on future claims that may be made against the Funds. The risk of material loss from such claims is considered remote.
At the end of the period, mutual funds managed by the investment advisor or its affiliates were the owners of record, in the aggregate, of approximately 24% of the total outstanding shares of the Fidelity Total Market Index Fund.
Shareholder Expense Example
As a shareholder of a Fund, you incur two types of costs: (1) transaction costs and (2) ongoing costs, including management fees and other Fund expenses. This Example is intended to help you understand your ongoing costs (in dollars) of investing in the Funds and to compare these costs with the ongoing costs of investing in other mutual funds.
The Example is based on an investment of $1,000 invested at the beginning of the period and held for the entire period (March 1, 2017 to August 31, 2017).
Actual Expenses
The first line of the accompanying table for each class of the Fund provides information about actual account values and actual expenses. You may use the information in this line, together with the amount you invested, to estimate the expenses that you paid over the period. Simply divide your account value by $1,000.00 (for example, an $8,600 account value divided by $1,000.00 = 8.6), then multiply the result by the number in the first line for a class of the Fund under the heading entitled "Expenses Paid During Period" to estimate the expenses you paid on your account during this period. A small balance maintenance fee of $12.00 that is charged once a year may apply for certain accounts with a value of less than $2,000. This fee is not included in the table below. If it was, the estimate of expenses you paid during the period would be higher, and your ending account value lower, by this amount. In addition, the Fund, as a shareholder in the underlying Fidelity Central Funds, will indirectly bear its pro-rata share of the fees and expenses incurred by the underlying Fidelity Central Funds. These fees and expenses are not included in the Fund's annualized expense ratio used to calculate the expense estimate in the table below.
Hypothetical Example for Comparison Purposes
The second line of the accompanying table for each class of the Fund provides information about hypothetical account values and hypothetical expenses based on a Class' actual expense ratio and an assumed rate of return of 5% per year before expenses, which is not the Class' actual return. The hypothetical account values and expenses may not be used to estimate the actual ending account balance or expenses you paid for the period. You may use this information to compare the ongoing costs of investing in the Fund and other funds. To do so, compare this 5% hypothetical example with the 5% hypothetical examples that appear in the shareholder reports of the other funds. A small balance maintenance fee of $12.00 that is charged once a year may apply for certain accounts with a value of less than $2,000. This fee is not included in the table below. If it was, the estimate of expenses you paid during the period would be higher, and your ending account value lower, by this amount. In addition, the Fund, as a shareholder in the underlying Fidelity Central Funds, will indirectly bear its pro-rata share of the fees and expenses incurred by the underlying Fidelity Central Funds. These fees and expenses are not included in the Fund's annualized expense ratio used to calculate the expense estimate in the table below.
Please note that the expenses shown in the table are meant to highlight your ongoing costs only and do not reflect any transaction costs. Therefore, the second line of the table is useful in comparing ongoing costs only, and will not help you determine the relative total costs of owning different funds.
| Annualized Expense Ratio-A | Beginning Account Value March 1, 2017 | Ending Account Value August 31, 2017 | Expenses Paid During Period-B March 1, 2017 to August 31, 2017 | |
| Fidelity Total Market Index | ||||
| Investor Class | .09% | |||
| Actual | $1,000.00 | $1,051.90 | $.47 | |
| Hypothetical-C | $1,000.00 | $1,024.75 | $.46 | |
| Premium Class | .04% | |||
| Actual | $1,000.00 | $1,052.40 | $.21 | |
| Hypothetical-C | $1,000.00 | $1,025.00 | $.20 | |
| Institutional Class | .03% | |||
| Actual | $1,000.00 | $1,052.40 | $.16 | |
| Hypothetical-C | $1,000.00 | $1,025.05 | $.15 | |
| Institutional Premium Class | .02% | |||
| Actual | $1,000.00 | $1,052.50 | $.10 | |
| Hypothetical-C | $1,000.00 | $1,025.10 | $.10 | |
| Class F | .02% | |||
| Actual | $1,000.00 | $1,052.40 | $.10 | |
| Hypothetical-C | $1,000.00 | $1,025.10 | $.10 | |
| Fidelity Extended Market Index | ||||
| Investor Class | .10% | |||
| Actual | $1,000.00 | $1,033.30 | $.51 | |
| Hypothetical-C | $1,000.00 | $1,024.70 | $.51 | |
| Premium Class | .07% | |||
| Actual | $1,000.00 | $1,033.40 | $.36 | |
| Hypothetical-C | $1,000.00 | $1,024.85 | $.36 | |
| Institutional Premium Class | .05% | |||
| Actual | $1,000.00 | $1,033.60 | $.26 | |
| Hypothetical-C | $1,000.00 | $1,024.95 | $.26 | |
| Fidelity International Index | ||||
| Investor Class | .19%-D | |||
| Actual | $1,000.00 | $1,127.90 | $1.02-D | |
| Hypothetical-C | $1,000.00 | $1,024.25 | $.97-D | |
| Premium Class | .08% | |||
| Actual | $1,000.00 | $1,128.50 | $.43 | |
| Hypothetical-C | $1,000.00 | $1,024.80 | $.41 | |
| Institutional Class | .06% | |||
| Actual | $1,000.00 | $1,128.50 | $.32 | |
| Hypothetical-C | $1,000.00 | $1,024.90 | $.31 | |
| Institutional Premium Class | .05% | |||
| Actual | $1,000.00 | $1,128.90 | $.27 | |
| Hypothetical-C | $1,000.00 | $1,024.95 | $.26 |
A Annualized expense ratio reflects expenses net of applicable fee waivers.
B Expenses are equal to each Class' annualized expense ratio, multiplied by the average account value over the period, multiplied by 184/ 365 (to reflect the one-half year period).
C 5% return per year before expenses
D If fees and changes to the class level expense contract and/ or expense cap, effective August 1, 2017, had been in effect during the entire period, the restated annualized expense ratio would have been .16% and the expenses paid in the actual and hypothetical examples above would have been $.86 and $.82, respectively.
Board Approval of Investment Advisory Contracts and Management Fees
Fidelity Extended Market Index Fund
Fidelity International Index Fund
Fidelity Total Market Index Fund
Each year, the Board of Trustees, including the Independent Trustees (together, the Board), votes on the renewal of the management contract with Fidelity Management & Research Company (FMR) and the sub-advisory agreements (together, the Advisory Contracts) for each fund, including each fund's sub-advisory agreement with Geode Capital Management, LLC (Geode). FMR and the sub-advisers are referred to herein as the Investment Advisers. The Board, assisted by the advice of fund counsel and Independent Trustees' counsel, requests and considers a broad range of information relevant to the renewal of the Advisory Contracts throughout the year.
The Board meets regularly and, at each of its meetings, covers an extensive agenda of topics and materials and considers factors that are relevant to its annual consideration of the renewal of each fund's Advisory Contracts, including the services and support provided to each fund and its shareholders. The Board has established various standing committees (Committees), each composed of and chaired by Independent Trustees with varying backgrounds, to which the Board has assigned specific subject matter responsibilities in order to enhance effective decision-making by the Board. The Board, acting directly and through its Committees, requests and receives information concerning the annual consideration of the renewal of each fund's Advisory Contracts. The Board also meets as needed to review matters specifically related to the Board's annual consideration of the renewal of the Advisory Contracts. Members of the Board may also meet with trustees of other Fidelity funds through ad hoc joint committees to discuss certain matters relevant to all of the Fidelity funds.
At its July 2017 meeting, the Board unanimously determined to renew each fund's Advisory Contracts. In reaching its determination, the Board considered all factors it believed relevant, including (i) the nature, extent, and quality of the services to be provided to each fund and its shareholders (including the investment performance of each fund); (ii) the competitiveness of each fund's management fee and total expense ratio relative to peer funds; (iii) the total costs of the services to be provided by and the profits to be realized by Fidelity from its relationships with each fund; and (iv) the extent to which, if any, economies of scale exist and would be realized as each fund grows, and whether any economies of scale are appropriately shared with fund shareholders.
In considering whether to renew the Advisory Contracts for each fund, the Board reached a determination, with the assistance of fund counsel and Independent Trustees' counsel and through the exercise of its business judgment, that the renewal of the Advisory Contracts was in the best interests of each fund and its shareholders and that the compensation payable under the Advisory Contracts was fair and reasonable. The Board's decision to renew the Advisory Contracts was not based on any single factor, but rather was based on a comprehensive consideration of all the information provided to the Board at its meetings throughout the year. The Board, in reaching its determination to renew the Advisory Contracts, was aware that shareholders of each fund have a broad range of investment choices available to them, including a wide choice among funds offered by Fidelity's competitors, and that each fund's shareholders, who have the opportunity to review and weigh the disclosure provided by the fund in its prospectus and other public disclosures, have chosen to invest in that fund, which is part of the Fidelity family of funds.
Nature, Extent, and Quality of Services Provided. The Board considered staffing as it relates to the funds, including the backgrounds of investment personnel of Fidelity and Geode, and also considered the funds' investment objectives, strategies, and related investment philosophies. The Independent Trustees also had discussions with senior management of Fidelity's investment operations and investment groups and with representatives of Geode. The Board considered the structure of the investment personnel compensation programs and whether the structures provide appropriate incentives to act in the best interests of each fund. Additionally, the Board considered the portfolio managers' investments, if any, in the funds that they manage.Resources Dedicated to Investment Management and Support Services. The Board and the Fund Oversight and Research Committees reviewed the general qualifications and capabilities of Fidelity's and Geode's investment staffs, including their size, education, experience, and resources, as well as Fidelity's approach to recruiting, training, managing, and compensating investment personnel. The Board noted that Fidelity has continued to increase the resources devoted to non-U.S. offices, including expansion of Fidelity's global investment organization. Additionally, in its deliberations, the Board considered Fidelity's and Geode's trading, risk management, compliance, and technology and operations capabilities and resources, which are integral parts of the investment management process.Shareholder and Administrative Services. The Board considered (i) the nature, extent, quality, and cost of advisory, administrative, and shareholder services performed by the Investment Advisers and their affiliates under the Advisory Contracts and under separate agreements covering transfer agency, pricing and bookkeeping, and securities lending services for each fund; (ii) the nature and extent of the supervision of third party service providers, principally custodians, subcustodians, and pricing vendors; and (iii) the resources devoted to, and the record of compliance with, each fund's compliance policies and procedures. The Board also reviewed the allocation of fund brokerage, including allocations to brokers affiliated with the Investment Advisers.The Board noted that the growth of fund assets over time across the complex allows Fidelity to reinvest in the development of services designed to enhance the value or convenience of the Fidelity funds as investment vehicles. These services include 24-hour access to account information and market information through telephone representatives and over the Internet, investor education materials and asset allocation tools, and the expanded availability of Fidelity Investor Centers.In 2014, the Board formed an ad hoc Committee on Transfer Agency Fees to review the variety of transfer agency fee structures throughout the industry and Fidelity's competitive positioning with respect to industry participants.Investment in a Large Fund Family. The Board considered the benefits to shareholders of investing in a Fidelity fund, including the benefits of investing in a fund that is part of a large family of funds offering a variety of investment disciplines and providing a large variety of mutual fund investor services. The Board noted that Fidelity had taken, or had made recommendations that resulted in the Fidelity funds taking, a number of actions over the previous year that benefited particular funds, including: (i) continuing to dedicate additional resources to Fidelity's investment research process, and to the support of the senior management team that oversees asset management; (ii) continuing efforts to enhance Fidelity's global research capabilities; (iii) launching new funds and making other enhancements to meet client needs; (iv) launching new share classes of existing funds; (v) eliminating purchase minimums and broadening eligibility requirements for certain lower-priced share classes; (vi) reducing management fees and total expenses for certain growth equity funds and index funds; (vii) lowering expense caps for certain existing funds and classes to reduce expenses borne by shareholders; (viii) eliminating short-term redemption fees for certain funds; (ix) introducing a new pricing structure for certain funds of funds that is expected to reduce overall expenses paid by shareholders; (x) rationalizing product lines and gaining increased efficiencies through proposals for fund mergers and share class consolidations; (xi) continuing to develop, acquire and implement systems and technology to improve services to the funds and shareholders, strengthen information security, and increase efficiency; and (xii) implementing enhancements to further strengthen Fidelity's product line to increase investors' probability of success in achieving their investment goals, including retirement income goals.Investment Performance. The Board considered whether each fund has operated in accordance with its investment objective, as well as its record of compliance with its investment restrictions and its performance history.The Board took into account discussions with representatives of the Investment Advisers about fund investment performance that occur at Board meetings throughout the year. In this regard the Board noted that as part of regularly scheduled fund reviews and other reports to the Board on fund performance, the Board considers annualized return information for each fund for different time periods, measured against the securities market index the fund seeks to track. The Board also periodically considers each fund's tracking error versus its benchmark index. In its evaluation of fund investment performance, the Board gave particular attention to information indicating changes in performance of certain Fidelity funds for specific time periods and discussed with the Investment Advisers the reasons for any overperformance or underperformance.In addition to reviewing absolute and relative fund performance, the Independent Trustees periodically consider the appropriateness of fund performance metrics in evaluating the results achieved. In general, the Independent Trustees believe that an index fund's performance should be evaluated based on net performance (after fees and expenses) of both the highest performing and lowest performing fund share classes, where applicable, compared to a fund's benchmark index, over appropriate time periods taking into account relevant factors including the following: general market conditions; the characteristics of the fund's benchmark index; the extent to which statistical sampling is employed; any securities lending revenues; and fund cash flows and other factors.The Independent Trustees recognize that shareholders evaluate performance on a net basis over their own holding periods, for which one-, three-, and five-year periods are often used as a proxy. For this reason, the performance information reviewed by the Board also included net cumulative calendar year total return information for each fund and its benchmark index for the most recent one-, three-, and five-year periods, as shown below. Peer groups are not shown below because each fund does not generally utilize a peer group for performance comparison purposes. For Fidelity International Index Fund, returns of the benchmark index are "net MA," i.e., adjusted for tax withholding rates applicable to U.S.-based funds organized as Massachusetts business trusts.Fidelity Extended Market Index Fund
Fidelity International Index Fund
Fidelity Total Market Index Fund
Fidelity Extended Market Index Fund
Fidelity International Index Fund
Fidelity Total Market Index Fund
![]()
SIF-I-SANN-1017
1.929382.105
Fidelity® 500 Index Fund Semi-Annual Report August 31, 2017 |
|
Contents
Board Approval of Investment Advisory Contracts and Management Fees |
To view a fund's proxy voting guidelines and proxy voting record for the 12-month period ended June 30, visit http://www.fidelity.com/proxyvotingresults or visit the Securities and Exchange Commission's (SEC) web site at http://www.sec.gov.
You may also call 1-800-835-5092 to request a free copy of the proxy voting guidelines.
Standard & Poor's, S&P and S&P 500 are registered service marks of The McGraw-Hill Companies, Inc. and have been licensed for use by Fidelity Distributors Corporation.
Other third-party marks appearing herein are the property of their respective owners.
All other marks appearing herein are registered or unregistered trademarks or service marks of FMR LLC or an affiliated company. © 2017 FMR LLC. All rights reserved.
This report and the financial statements contained herein are submitted for the general information of the shareholders of the Fund. This report is not authorized for distribution to prospective investors in the Fund unless preceded or accompanied by an effective prospectus.
A fund files its complete schedule of portfolio holdings with the SEC for the first and third quarters of each fiscal year on Form N-Q. Forms N-Q are available on the SEC’s web site at http://www.sec.gov. A fund's Forms N-Q may be reviewed and copied at the SEC’s Public Reference Room in Washington, DC. Information regarding the operation of the SEC's Public Reference Room may be obtained by calling 1-800-SEC-0330.
For a complete list of a fund's portfolio holdings, view the most recent holdings listing, semiannual report, or annual report on Fidelity's web site at http://www.fidelity.com, http://www.institutional.fidelity.com, or http://www.401k.com, as applicable.
NOT FDIC INSURED •MAY LOSE VALUE •NO BANK GUARANTEE
Neither the Fund nor Fidelity Distributors Corporation is a bank.
Investment Summary (Unaudited)
Top Ten Stocks as of August 31, 2017
| % of fund's net assets | % of fund's net assets 6 months ago | |
| Apple, Inc. | 4.0 | 3.6 |
| Microsoft Corp. | 2.7 | 2.4 |
| Facebook, Inc. Class A | 1.9 | 1.5 |
| Amazon.com, Inc. | 1.8 | 1.6 |
| Johnson & Johnson | 1.7 | 1.6 |
| Berkshire Hathaway, Inc. Class B | 1.6 | 1.6 |
| Exxon Mobil Corp. | 1.5 | 1.6 |
| JPMorgan Chase & Co. | 1.5 | 1.6 |
| Alphabet, Inc. Class A | 1.3 | 1.2 |
| Alphabet, Inc. Class C | 1.3 | 1.2 |
| 19.3 |
Top Market Sectors as of August 31, 2017
| % of fund's net assets | % of fund's net assets 6 months ago | |
| Information Technology | 23.4 | 21.4 |
| Health Care | 14.6 | 14.0 |
| Financials | 14.2 | 14.7 |
| Consumer Discretionary | 12.0 | 12.0 |
| Industrials | 10.1 | 10.1 |
| Consumer Staples | 8.5 | 9.4 |
| Energy | 5.7 | 6.6 |
| Utilities | 3.2 | 3.2 |
| Real Estate | 3.1 | 2.8 |
| Materials | 2.9 | 2.8 |
Investments August 31, 2017 (Unaudited)
Showing Percentage of Net Assets
| Common Stocks - 99.8% | |||
| Shares | Value (000s) | ||
| CONSUMER DISCRETIONARY - 12.0% | |||
| Auto Components - 0.2% | |||
| BorgWarner, Inc. | 1,157,865 | $53,737 | |
| Delphi Automotive PLC | 1,554,898 | 149,892 | |
| The Goodyear Tire & Rubber Co. | 1,461,468 | 44,282 | |
| 247,911 | |||
| Automobiles - 0.5% | |||
| Ford Motor Co. | 22,701,084 | 250,393 | |
| General Motors Co. | 7,970,651 | 291,248 | |
| Harley-Davidson, Inc. (a) | 1,015,959 | 47,760 | |
| 589,401 | |||
| Distributors - 0.1% | |||
| Genuine Parts Co. | 855,507 | 70,862 | |
| LKQ Corp. (b) | 1,789,354 | 62,001 | |
| 132,863 | |||
| Diversified Consumer Services - 0.0% | |||
| H&R Block, Inc. | 1,202,443 | 32,153 | |
| Hotels, Restaurants & Leisure - 1.8% | |||
| Carnival Corp. | 2,429,413 | 168,796 | |
| Chipotle Mexican Grill, Inc. (a)(b) | 166,366 | 52,690 | |
| Darden Restaurants, Inc. | 721,691 | 59,244 | |
| Hilton, Inc. | 1,189,299 | 76,508 | |
| Marriott International, Inc. Class A | 1,803,317 | 186,788 | |
| McDonald's Corp. | 4,730,846 | 756,793 | |
| MGM Mirage, Inc. | 2,802,166 | 92,359 | |
| Royal Caribbean Cruises Ltd. | 973,707 | 121,188 | |
| Starbucks Corp. | 8,405,092 | 461,103 | |
| Wyndham Worldwide Corp. | 605,694 | 60,376 | |
| Wynn Resorts Ltd. | 463,432 | 64,412 | |
| Yum! Brands, Inc. | 1,920,144 | 147,505 | |
| 2,247,762 | |||
| Household Durables - 0.4% | |||
| D.R. Horton, Inc. | 1,983,738 | 71,712 | |
| Garmin Ltd. (a) | 665,901 | 34,294 | |
| Leggett & Platt, Inc. | 767,939 | 35,302 | |
| Lennar Corp. Class A | 1,179,360 | 61,044 | |
| Mohawk Industries, Inc. (b) | 366,664 | 92,810 | |
| Newell Brands, Inc. | 2,804,019 | 135,378 | |
| PulteGroup, Inc. | 1,648,129 | 42,555 | |
| Whirlpool Corp. | 429,338 | 73,683 | |
| 546,778 | |||
| Internet & Direct Marketing Retail - 2.7% | |||
| Amazon.com, Inc. (b) | 2,302,646 | 2,257,975 | |
| Expedia, Inc. | 705,615 | 104,685 | |
| Netflix, Inc. (b) | 2,501,642 | 437,062 | |
| Priceline Group, Inc. (b) | 285,394 | 528,573 | |
| TripAdvisor, Inc. (a)(b) | 640,980 | 27,389 | |
| 3,355,684 | |||
| Leisure Products - 0.1% | |||
| Hasbro, Inc. | 652,990 | 64,156 | |
| Mattel, Inc. (a) | 1,988,271 | 32,250 | |
| 96,406 | |||
| Media - 3.0% | |||
| CBS Corp. Class B | 2,138,031 | 136,962 | |
| Charter Communications, Inc. Class A (b) | 1,251,882 | 498,925 | |
| Comcast Corp. Class A | 27,469,716 | 1,115,545 | |
| Discovery Communications, Inc.: | |||
| Class A (a)(b) | 892,521 | 19,823 | |
| Class C (non-vtg.) (b) | 1,223,719 | 25,710 | |
| DISH Network Corp. Class A (b) | 1,320,309 | 75,641 | |
| Interpublic Group of Companies, Inc. | 2,293,306 | 46,187 | |
| News Corp.: | |||
| Class A | 2,218,263 | 29,658 | |
| Class B | 695,218 | 9,524 | |
| Omnicom Group, Inc. (a) | 1,350,897 | 97,778 | |
| Scripps Networks Interactive, Inc. Class A | 556,660 | 47,678 | |
| The Walt Disney Co. | 8,443,679 | 854,500 | |
| Time Warner, Inc. | 4,501,394 | 455,091 | |
| Twenty-First Century Fox, Inc.: | |||
| Class A | 6,107,985 | 168,519 | |
| Class B | 2,827,223 | 76,618 | |
| Viacom, Inc. Class B (non-vtg.) | 2,044,827 | 58,482 | |
| 3,716,641 | |||
| Multiline Retail - 0.4% | |||
| Dollar General Corp. | 1,464,329 | 106,252 | |
| Dollar Tree, Inc. (b) | 1,373,795 | 109,409 | |
| Kohl's Corp. | 989,509 | 39,363 | |
| Macy's, Inc. | 1,767,426 | 36,709 | |
| Nordstrom, Inc. (a) | 645,748 | 28,813 | |
| Target Corp. | 3,202,235 | 174,618 | |
| 495,164 | |||
| Specialty Retail - 2.1% | |||
| Advance Auto Parts, Inc. | 428,613 | 41,961 | |
| AutoZone, Inc. (b) | 163,418 | 86,357 | |
| Best Buy Co., Inc. | 1,539,958 | 83,558 | |
| CarMax, Inc. (a)(b) | 1,075,000 | 72,186 | |
| Foot Locker, Inc. | 761,705 | 26,835 | |
| Gap, Inc. (a) | 1,277,634 | 30,178 | |
| Home Depot, Inc. | 6,939,265 | 1,039,988 | |
| L Brands, Inc. (a) | 1,398,516 | 50,654 | |
| Lowe's Companies, Inc. | 4,980,375 | 368,000 | |
| O'Reilly Automotive, Inc. (b) | 528,213 | 103,598 | |
| Ross Stores, Inc. | 2,275,254 | 132,989 | |
| Signet Jewelers Ltd. (a) | 397,009 | 25,039 | |
| Staples, Inc. | 3,791,119 | 38,726 | |
| Tiffany & Co., Inc. | 622,202 | 56,869 | |
| TJX Companies, Inc. | 3,733,716 | 269,948 | |
| Tractor Supply Co. | 746,214 | 44,407 | |
| Ulta Beauty, Inc. | 338,450 | 74,801 | |
| 2,546,094 | |||
| Textiles, Apparel & Luxury Goods - 0.7% | |||
| Coach, Inc. | 1,631,735 | 68,043 | |
| Hanesbrands, Inc. (a) | 2,113,619 | 51,276 | |
| Michael Kors Holdings Ltd. (b) | 904,524 | 38,189 | |
| NIKE, Inc. Class B | 7,691,898 | 406,209 | |
| PVH Corp. | 452,758 | 56,998 | |
| Ralph Lauren Corp. | 319,894 | 28,115 | |
| Under Armour, Inc.: | |||
| Class A (sub. vtg.) (a)(b) | 1,071,871 | 17,311 | |
| Class C (non-vtg.) (a)(b) | 1,069,958 | 16,156 | |
| VF Corp. | 1,859,473 | 116,905 | |
| 799,202 | |||
| TOTAL CONSUMER DISCRETIONARY | 14,806,059 | ||
| CONSUMER STAPLES - 8.5% | |||
| Beverages - 2.1% | |||
| Brown-Forman Corp. Class B (non-vtg.) | 1,026,697 | 54,456 | |
| Constellation Brands, Inc. Class A (sub. vtg.) | 995,116 | 199,123 | |
| Dr. Pepper Snapple Group, Inc. | 1,066,903 | 97,142 | |
| Molson Coors Brewing Co. Class B | 1,071,803 | 96,194 | |
| Monster Beverage Corp. (b) | 2,339,951 | 130,616 | |
| PepsiCo, Inc. | 8,291,335 | 959,556 | |
| The Coca-Cola Co. | 22,318,987 | 1,016,630 | |
| 2,553,717 | |||
| Food & Staples Retailing - 1.8% | |||
| Costco Wholesale Corp. | 2,545,690 | 399,011 | |
| CVS Health Corp. | 5,913,311 | 457,335 | |
| Kroger Co. | 5,296,949 | 115,844 | |
| Sysco Corp. | 2,857,895 | 150,525 | |
| Wal-Mart Stores, Inc. | 8,573,440 | 669,328 | |
| Walgreens Boots Alliance, Inc. | 4,956,522 | 403,957 | |
| 2,196,000 | |||
| Food Products - 1.3% | |||
| Archer Daniels Midland Co. | 3,312,271 | 136,863 | |
| Campbell Soup Co. | 1,113,010 | 51,421 | |
| ConAgra Foods, Inc. | 2,346,222 | 76,158 | |
| General Mills, Inc. | 3,344,015 | 178,102 | |
| Hormel Foods Corp. (a) | 1,565,663 | 48,128 | |
| Kellogg Co. | 1,463,825 | 95,822 | |
| McCormick & Co., Inc. (non-vtg.) | 657,194 | 62,519 | |
| Mondelez International, Inc. | 8,806,616 | 358,077 | |
| The Hershey Co. | 812,554 | 85,253 | |
| The J.M. Smucker Co. | 675,762 | 70,793 | |
| The Kraft Heinz Co. | 3,463,031 | 279,640 | |
| Tyson Foods, Inc. Class A | 1,672,730 | 105,884 | |
| 1,548,660 | |||
| Household Products - 1.8% | |||
| Church & Dwight Co., Inc. | 1,446,731 | 72,582 | |
| Clorox Co. | 747,572 | 103,561 | |
| Colgate-Palmolive Co. | 5,126,827 | 367,286 | |
| Kimberly-Clark Corp. | 2,060,080 | 253,987 | |
| Procter & Gamble Co. | 14,844,956 | 1,369,744 | |
| 2,167,160 | |||
| Personal Products - 0.1% | |||
| Coty, Inc. Class A (a) | 2,733,857 | 45,327 | |
| Estee Lauder Companies, Inc. Class A | 1,299,397 | 139,022 | |
| 184,349 | |||
| Tobacco - 1.4% | |||
| Altria Group, Inc. | 11,211,693 | 710,821 | |
| Philip Morris International, Inc. | 9,014,784 | 1,054,099 | |
| 1,764,920 | |||
| TOTAL CONSUMER STAPLES | 10,414,806 | ||
| ENERGY - 5.7% | |||
| Energy Equipment & Services - 0.8% | |||
| Baker Hughes, a GE Co. Class A | 2,469,597 | 83,719 | |
| Halliburton Co. | 5,037,297 | 196,303 | |
| Helmerich & Payne, Inc. (a) | 630,147 | 26,680 | |
| National Oilwell Varco, Inc. | 2,205,848 | 67,653 | |
| Schlumberger Ltd. | 8,064,831 | 512,197 | |
| TechnipFMC PLC | 2,708,203 | 69,953 | |
| 956,505 | |||
| Oil, Gas & Consumable Fuels - 4.9% | |||
| Anadarko Petroleum Corp. | 3,252,331 | 133,118 | |
| Andeavor | 877,183 | 87,850 | |
| Apache Corp. (a) | 2,207,751 | 85,749 | |
| Cabot Oil & Gas Corp. | 2,701,998 | 69,036 | |
| Chesapeake Energy Corp. (a)(b) | 4,427,322 | 16,115 | |
| Chevron Corp. | 10,996,427 | 1,183,435 | |
| Cimarex Energy Co. | 552,034 | 55,032 | |
| Concho Resources, Inc. (b) | 859,971 | 95,431 | |
| ConocoPhillips Co. | 7,180,424 | 313,497 | |
| Devon Energy Corp. | 3,051,279 | 95,810 | |
| EOG Resources, Inc. | 3,350,591 | 284,767 | |
| EQT Corp. (a) | 1,005,964 | 62,712 | |
| Exxon Mobil Corp. | 24,594,026 | 1,877,262 | |
| Hess Corp. | 1,568,466 | 61,013 | |
| Kinder Morgan, Inc. | 11,143,524 | 215,404 | |
| Marathon Oil Corp. | 4,933,541 | 54,861 | |
| Marathon Petroleum Corp. | 3,010,864 | 157,920 | |
| Newfield Exploration Co. (b) | 1,156,172 | 30,211 | |
| Noble Energy, Inc. | 2,642,009 | 62,801 | |
| Occidental Petroleum Corp. | 4,437,803 | 264,937 | |
| ONEOK, Inc. | 2,205,012 | 119,423 | |
| Phillips 66 Co. | 2,546,215 | 213,398 | |
| Pioneer Natural Resources Co. | 987,263 | 127,999 | |
| Range Resources Corp. (a) | 1,092,171 | 18,960 | |
| The Williams Companies, Inc. | 4,795,882 | 142,582 | |
| Valero Energy Corp. | 2,595,827 | 176,776 | |
| 6,006,099 | |||
| TOTAL ENERGY | 6,962,604 | ||
| FINANCIALS - 14.2% | |||
| Banks - 6.2% | |||
| Bank of America Corp. | 57,763,016 | 1,379,958 | |
| BB&T Corp. | 4,709,370 | 217,055 | |
| Citigroup, Inc. | 15,980,517 | 1,087,155 | |
| Citizens Financial Group, Inc. | 2,940,105 | 97,406 | |
| Comerica, Inc. | 1,026,976 | 70,091 | |
| Fifth Third Bancorp | 4,354,727 | 113,789 | |
| Huntington Bancshares, Inc. | 6,309,884 | 79,441 | |
| JPMorgan Chase & Co. | 20,621,258 | 1,874,266 | |
| KeyCorp | 6,362,047 | 109,491 | |
| M&T Bank Corp. | 893,061 | 132,048 | |
| Peoples United Financial, Inc. | 1,998,660 | 33,378 | |
| PNC Financial Services Group, Inc. | 2,808,668 | 352,235 | |
| Regions Financial Corp. | 6,977,039 | 98,446 | |
| SunTrust Banks, Inc. | 2,806,201 | 154,622 | |
| U.S. Bancorp | 9,194,849 | 471,236 | |
| Wells Fargo & Co. | 26,104,982 | 1,333,181 | |
| Zions Bancorporation | 1,176,103 | 51,349 | |
| 7,655,147 | |||
| Capital Markets - 2.9% | |||
| Affiliated Managers Group, Inc. | 328,530 | 58,048 | |
| Ameriprise Financial, Inc. | 884,877 | 122,564 | |
| Bank of New York Mellon Corp. | 6,035,675 | 315,545 | |
| BlackRock, Inc. Class A | 703,715 | 294,864 | |
| Brighthouse Financial, Inc. | 570,105 | 32,536 | |
| CBOE Holdings, Inc. | 533,264 | 53,801 | |
| Charles Schwab Corp. | 7,062,523 | 281,795 | |
| CME Group, Inc. | 1,972,204 | 248,103 | |
| E*TRADE Financial Corp. (b) | 1,594,292 | 65,382 | |
| Franklin Resources, Inc. | 1,987,385 | 85,915 | |
| Goldman Sachs Group, Inc. | 2,124,791 | 475,401 | |
| IntercontinentalExchange, Inc. | 3,436,487 | 222,238 | |
| Invesco Ltd. | 2,361,488 | 77,410 | |
| Moody's Corp. | 966,002 | 129,473 | |
| Morgan Stanley | 8,267,138 | 376,155 | |
| Northern Trust Corp. | 1,252,614 | 110,856 | |
| Raymond James Financial, Inc. | 743,977 | 58,268 | |
| S&P Global, Inc. | 1,496,328 | 230,928 | |
| State Street Corp. | 2,052,731 | 189,857 | |
| T. Rowe Price Group, Inc. | 1,400,373 | 118,135 | |
| The NASDAQ OMX Group, Inc. | 661,523 | 49,866 | |
| 3,597,140 | |||
| Consumer Finance - 0.7% | |||
| American Express Co. | 4,357,660 | 375,195 | |
| Capital One Financial Corp. | 2,803,259 | 223,167 | |
| Discover Financial Services | 2,206,712 | 130,086 | |
| Navient Corp. | 1,653,860 | 21,831 | |
| Synchrony Financial | 4,470,687 | 137,652 | |
| 887,931 | |||
| Diversified Financial Services - 1.7% | |||
| Berkshire Hathaway, Inc. Class B (b) | 11,025,045 | 1,997,297 | |
| Leucadia National Corp. | 1,879,617 | 44,509 | |
| 2,041,806 | |||
| Insurance - 2.7% | |||
| AFLAC, Inc. | 2,303,387 | 190,145 | |
| Allstate Corp. | 2,115,743 | 191,475 | |
| American International Group, Inc. | 5,104,716 | 308,733 | |
| Aon PLC | 1,521,112 | 211,678 | |
| Arthur J. Gallagher & Co. | 1,041,718 | 60,315 | |
| Assurant, Inc. | 318,002 | 30,112 | |
| Chubb Ltd. | 2,710,136 | 383,267 | |
| Cincinnati Financial Corp. | 869,856 | 66,840 | |
| Everest Re Group Ltd. | 238,374 | 60,185 | |
| Hartford Financial Services Group, Inc. | 2,132,244 | 115,290 | |
| Lincoln National Corp. | 1,301,759 | 88,337 | |
| Loews Corp. | 1,602,520 | 74,645 | |
| Marsh & McLennan Companies, Inc. | 2,991,112 | 233,546 | |
| MetLife, Inc. | 6,271,158 | 293,678 | |
| Principal Financial Group, Inc. | 1,555,779 | 97,267 | |
| Progressive Corp. | 3,371,672 | 156,715 | |
| Prudential Financial, Inc. | 2,490,011 | 254,180 | |
| The Travelers Companies, Inc. | 1,621,792 | 196,529 | |
| Torchmark Corp. | 631,460 | 48,603 | |
| Unum Group | 1,324,604 | 63,819 | |
| Willis Group Holdings PLC (a) | 737,603 | 109,512 | |
| XL Group Ltd. | 1,517,467 | 62,155 | |
| 3,297,026 | |||
| TOTAL FINANCIALS | 17,479,050 | ||
| HEALTH CARE - 14.6% | |||
| Biotechnology - 3.2% | |||
| AbbVie, Inc. | 9,237,655 | 695,595 | |
| Alexion Pharmaceuticals, Inc. (b) | 1,303,378 | 185,614 | |
| Amgen, Inc. | 4,271,268 | 759,303 | |
| Biogen, Inc. (b) | 1,239,874 | 392,495 | |
| Celgene Corp. (b) | 4,532,075 | 629,641 | |
| Gilead Sciences, Inc. | 7,584,537 | 634,902 | |
| Incyte Corp. (b) | 986,499 | 135,555 | |
| Regeneron Pharmaceuticals, Inc. (b) | 442,262 | 219,760 | |
| Vertex Pharmaceuticals, Inc. (b) | 1,445,651 | 232,085 | |
| 3,884,950 | |||
| Health Care Equipment & Supplies - 2.8% | |||
| Abbott Laboratories | 10,071,901 | 513,063 | |
| Align Technology, Inc. (b) | 438,283 | 77,462 | |
| Baxter International, Inc. | 2,831,074 | 175,640 | |
| Becton, Dickinson & Co. | 1,319,607 | 263,182 | |
| Boston Scientific Corp. (b) | 7,948,311 | 218,976 | |
| C.R. Bard, Inc. | 420,324 | 134,844 | |
| Danaher Corp. | 3,545,366 | 295,754 | |
| Dentsply Sirona, Inc. | 1,330,501 | 75,266 | |
| Edwards Lifesciences Corp. (b) | 1,217,743 | 138,409 | |
| Hologic, Inc. (b) | 1,625,246 | 62,734 | |
| IDEXX Laboratories, Inc. (b) | 511,485 | 79,500 | |
| Intuitive Surgical, Inc. (b) | 213,833 | 214,832 | |
| Medtronic PLC | 7,945,310 | 640,551 | |
| ResMed, Inc. (a) | 823,149 | 63,860 | |
| Stryker Corp. | 1,800,614 | 254,553 | |
| The Cooper Companies, Inc. | 283,577 | 71,130 | |
| Varian Medical Systems, Inc. (a)(b) | 533,536 | 56,688 | |
| Zimmer Biomet Holdings, Inc. | 1,167,948 | 133,461 | |
| 3,469,905 | |||
| Health Care Providers & Services - 2.8% | |||
| Aetna, Inc. | 1,925,260 | 303,614 | |
| AmerisourceBergen Corp. | 963,214 | 77,298 | |
| Anthem, Inc. | 1,538,037 | 301,517 | |
| Cardinal Health, Inc. | 1,833,455 | 123,685 | |
| Centene Corp. (b) | 999,939 | 88,845 | |
| Cigna Corp. | 1,485,968 | 270,535 | |
| DaVita HealthCare Partners, Inc. (b) | 903,601 | 52,915 | |
| Envision Healthcare Corp. | 681,764 | 35,731 | |
| Express Scripts Holding Co. (b) | 3,444,962 | 216,413 | |
| HCA Holdings, Inc. (b) | 1,661,086 | 130,661 | |
| Henry Schein, Inc. (b) | 460,443 | 79,970 | |
| Humana, Inc. | 837,636 | 215,792 | |
| Laboratory Corp. of America Holdings (b) | 593,772 | 93,145 | |
| McKesson Corp. | 1,224,122 | 182,774 | |
| Patterson Companies, Inc. (a) | 473,581 | 18,233 | |
| Quest Diagnostics, Inc. | 794,168 | 86,048 | |
| UnitedHealth Group, Inc. | 5,593,307 | 1,112,509 | |
| Universal Health Services, Inc. Class B | 518,950 | 56,114 | |
| 3,445,799 | |||
| Health Care Technology - 0.1% | |||
| Cerner Corp. (b) | 1,706,420 | 115,661 | |
| Life Sciences Tools & Services - 0.8% | |||
| Agilent Technologies, Inc. | 1,870,706 | 121,072 | |
| Illumina, Inc. (b) | 847,416 | 173,263 | |
| Mettler-Toledo International, Inc. (b) | 149,877 | 90,689 | |
| PerkinElmer, Inc. | 638,691 | 42,786 | |
| Quintiles Transnational Holdings, Inc. (b) | 796,484 | 76,486 | |
| Thermo Fisher Scientific, Inc. | 2,270,727 | 424,944 | |
| Waters Corp. (b) | 464,558 | 85,237 | |
| 1,014,477 | |||
| Pharmaceuticals - 4.9% | |||
| Allergan PLC | 1,949,446 | 447,359 | |
| Bristol-Myers Squibb Co. | 9,562,070 | 578,314 | |
| Eli Lilly & Co. | 5,635,795 | 458,134 | |
| Johnson & Johnson | 15,635,601 | 2,069,685 | |
| Merck & Co., Inc. | 15,875,501 | 1,013,809 | |
| Mylan N.V. (b) | 2,675,424 | 84,222 | |
| Perrigo Co. PLC | 832,174 | 65,708 | |
| Pfizer, Inc. | 34,638,682 | 1,174,944 | |
| Zoetis, Inc. Class A | 2,848,694 | 178,613 | |
| 6,070,788 | |||
| TOTAL HEALTH CARE | 18,001,580 | ||
| INDUSTRIALS - 10.1% | |||
| Aerospace & Defense - 2.5% | |||
| Arconic, Inc. | 2,558,332 | 65,161 | |
| General Dynamics Corp. | 1,645,983 | 331,419 | |
| L3 Technologies, Inc. | 452,015 | 82,032 | |
| Lockheed Martin Corp. | 1,444,792 | 441,225 | |
| Northrop Grumman Corp. | 1,013,260 | 275,820 | |
| Raytheon Co. | 1,689,463 | 307,499 | |
| Rockwell Collins, Inc. | 942,507 | 123,516 | |
| Textron, Inc. | 1,553,726 | 76,272 | |
| The Boeing Co. | 3,258,085 | 780,833 | |
| TransDigm Group, Inc. (a) | 283,841 | 73,986 | |
| United Technologies Corp. | 4,324,969 | 517,785 | |
| 3,075,548 | |||
| Air Freight & Logistics - 0.7% | |||
| C.H. Robinson Worldwide, Inc. | 817,745 | 57,757 | |
| Expeditors International of Washington, Inc. | 1,045,717 | 58,665 | |
| FedEx Corp. | 1,427,751 | 306,081 | |
| United Parcel Service, Inc. Class B | 3,997,773 | 457,185 | |
| 879,688 | |||
| Airlines - 0.5% | |||
| Alaska Air Group, Inc. | 717,425 | 53,563 | |
| American Airlines Group, Inc. | 2,859,095 | 127,916 | |
| Delta Air Lines, Inc. | 4,272,150 | 201,603 | |
| Southwest Airlines Co. | 3,509,597 | 182,990 | |
| United Continental Holdings, Inc. (b) | 1,635,554 | 101,339 | |
| 667,411 | |||
| Building Products - 0.4% | |||
| A.O. Smith Corp. | 854,817 | 47,605 | |
| Allegion PLC | 552,974 | 43,525 | |
| Fortune Brands Home & Security, Inc. | 892,945 | 55,836 | |
| Johnson Controls International PLC | 5,444,991 | 215,567 | |
| Masco Corp. | 1,857,037 | 68,283 | |
| 430,816 | |||
| Commercial Services & Supplies - 0.3% | |||
| Cintas Corp. | 501,281 | 67,678 | |
| Republic Services, Inc. | 1,334,366 | 87,054 | |
| Stericycle, Inc. (b) | 494,914 | 35,579 | |
| Waste Management, Inc. | 2,359,155 | 181,914 | |
| 372,225 | |||
| Construction & Engineering - 0.1% | |||
| Fluor Corp. | 811,326 | 31,293 | |
| Jacobs Engineering Group, Inc. | 698,973 | 38,087 | |
| Quanta Services, Inc. (b) | 859,675 | 30,888 | |
| 100,268 | |||
| Electrical Equipment - 0.6% | |||
| Acuity Brands, Inc. (a) | 255,966 | 45,252 | |
| AMETEK, Inc. | 1,335,598 | 84,477 | |
| Eaton Corp. PLC | 2,596,228 | 186,305 | |
| Emerson Electric Co. | 3,740,704 | 220,851 | |
| Fortive Corp. | 1,750,135 | 113,706 | |
| Rockwell Automation, Inc. | 747,787 | 122,682 | |
| 773,273 | |||
| Industrial Conglomerates - 2.2% | |||
| 3M Co. | 3,468,585 | 708,701 | |
| General Electric Co. | 50,547,290 | 1,240,936 | |
| Honeywell International, Inc. | 4,424,778 | 611,814 | |
| Roper Technologies, Inc. | 592,216 | 136,601 | |
| 2,698,052 | |||
| Machinery - 1.5% | |||
| Caterpillar, Inc. | 3,419,597 | 401,768 | |
| Cummins, Inc. | 896,967 | 142,959 | |
| Deere & Co. | 1,708,026 | 198,011 | |
| Dover Corp. | 903,543 | 76,693 | |
| Flowserve Corp. | 758,136 | 29,780 | |
| Illinois Tool Works, Inc. | 1,804,566 | 248,146 | |
| Ingersoll-Rand PLC | 1,486,008 | 126,890 | |
| PACCAR, Inc. | 2,038,907 | 135,241 | |
| Parker Hannifin Corp. | 773,023 | 124,372 | |
| Pentair PLC | 973,167 | 60,385 | |
| Snap-On, Inc. | 336,349 | 49,635 | |
| Stanley Black & Decker, Inc. | 887,889 | 127,856 | |
| Xylem, Inc. | 1,043,111 | 64,746 | |
| 1,786,482 | |||
| Professional Services - 0.3% | |||
| Equifax, Inc. | 697,737 | 99,407 | |
| IHS Markit Ltd. (b) | 1,842,042 | 86,281 | |
| Nielsen Holdings PLC | 1,949,428 | 75,735 | |
| Robert Half International, Inc. | 738,175 | 33,439 | |
| Verisk Analytics, Inc. (b) | 892,493 | 72,337 | |
| 367,199 | |||
| Road & Rail - 0.9% | |||
| CSX Corp. | 5,355,479 | 268,845 | |
| J.B. Hunt Transport Services, Inc. | 497,925 | 49,240 | |
| Kansas City Southern | 615,735 | 63,685 | |
| Norfolk Southern Corp. | 1,681,964 | 202,710 | |
| Union Pacific Corp. | 4,686,554 | 493,494 | |
| 1,077,974 | |||
| Trading Companies & Distributors - 0.1% | |||
| Fastenal Co. (a) | 1,678,952 | 71,641 | |
| United Rentals, Inc. (b) | 490,532 | 57,912 | |
| W.W. Grainger, Inc. (a) | 311,881 | 50,702 | |
| 180,255 | |||
| TOTAL INDUSTRIALS | 12,409,191 | ||
| INFORMATION TECHNOLOGY - 23.4% | |||
| Communications Equipment - 1.0% | |||
| Cisco Systems, Inc. | 29,021,416 | 934,780 | |
| F5 Networks, Inc. (b) | 375,550 | 44,833 | |
| Harris Corp. | 707,604 | 86,965 | |
| Juniper Networks, Inc. | 2,217,769 | 61,499 | |
| Motorola Solutions, Inc. | 948,810 | 83,609 | |
| 1,211,686 | |||
| Electronic Equipment & Components - 0.4% | |||
| Amphenol Corp. Class A | 1,773,863 | 143,576 | |
| Corning, Inc. | 5,341,229 | 153,614 | |
| FLIR Systems, Inc. | 792,021 | 30,097 | |
| TE Connectivity Ltd. | 2,060,655 | 164,028 | |
| 491,315 | |||
| Internet Software & Services - 4.8% | |||
| Akamai Technologies, Inc. (b) | 1,003,393 | 47,310 | |
| Alphabet, Inc.: | |||
| Class A (b) | 1,727,504 | 1,650,181 | |
| Class C (b) | 1,731,931 | 1,626,855 | |
| eBay, Inc. (b) | 5,842,379 | 211,085 | |
| Facebook, Inc. Class A (b) | 13,719,651 | 2,359,368 | |
| VeriSign, Inc. (a)(b) | 512,421 | 53,164 | |
| 5,947,963 | |||
| IT Services - 3.9% | |||
| Accenture PLC Class A | 3,599,098 | 470,618 | |
| Alliance Data Systems Corp. | 323,156 | 72,872 | |
| Automatic Data Processing, Inc. | 2,596,866 | 276,488 | |
| Cognizant Technology Solutions Corp. Class A | 3,418,668 | 241,939 | |
| CSRA, Inc. | 843,310 | 26,573 | |
| DXC Technology Co. | 1,643,546 | 139,701 | |
| Fidelity National Information Services, Inc. | 1,918,771 | 178,292 | |
| Fiserv, Inc. (b) | 1,232,689 | 152,496 | |
| Gartner, Inc. (b) | 524,887 | 63,296 | |
| Global Payments, Inc. | 885,051 | 84,514 | |
| IBM Corp. | 4,962,273 | 709,754 | |
| MasterCard, Inc. Class A | 5,444,304 | 725,726 | |
| Paychex, Inc. | 1,855,788 | 105,836 | |
| PayPal Holdings, Inc. (b) | 6,484,301 | 399,952 | |
| The Western Union Co. | 2,735,262 | 51,751 | |
| Total System Services, Inc. | 961,341 | 66,448 | |
| Visa, Inc. Class A | 10,716,042 | 1,109,325 | |
| 4,875,581 | |||
| Semiconductors & Semiconductor Equipment - 3.6% | |||
| Advanced Micro Devices, Inc. (a)(b) | 4,497,767 | 58,471 | |
| Analog Devices, Inc. | 2,130,213 | 178,235 | |
| Applied Materials, Inc. | 6,237,401 | 281,432 | |
| Broadcom Ltd. | 2,329,594 | 587,221 | |
| Intel Corp. | 27,332,074 | 958,536 | |
| KLA-Tencor Corp. | 909,887 | 85,247 | |
| Lam Research Corp. | 936,290 | 155,405 | |
| Microchip Technology, Inc. (a) | 1,331,477 | 115,572 | |
| Micron Technology, Inc. (b) | 6,035,975 | 192,970 | |
| NVIDIA Corp. | 3,453,511 | 585,163 | |
| Qorvo, Inc. (b) | 737,699 | 54,014 | |
| Qualcomm, Inc. | 8,575,370 | 448,235 | |
| Skyworks Solutions, Inc. | 1,071,024 | 112,843 | |
| Texas Instruments, Inc. | 5,782,884 | 478,938 | |
| Xilinx, Inc. | 1,439,737 | 95,109 | |
| 4,387,391 | |||
| Software - 5.1% | |||
| Activision Blizzard, Inc. | 4,024,467 | 263,844 | |
| Adobe Systems, Inc. (b) | 2,871,336 | 445,516 | |
| ANSYS, Inc. (b) | 496,243 | 63,926 | |
| Autodesk, Inc. (b) | 1,125,699 | 128,848 | |
| CA Technologies, Inc. | 1,818,809 | 60,348 | |
| Citrix Systems, Inc. (b) | 877,296 | 68,613 | |
| Electronic Arts, Inc. (b) | 1,799,471 | 218,636 | |
| Intuit, Inc. | 1,412,783 | 199,838 | |
| Microsoft Corp. | 44,811,571 | 3,350,561 | |
| Oracle Corp. | 17,434,249 | 877,466 | |
| Red Hat, Inc. (b) | 1,031,857 | 110,925 | |
| Salesforce.com, Inc. (b) | 3,881,037 | 370,600 | |
| Symantec Corp. | 3,530,359 | 105,840 | |
| Synopsys, Inc. (b) | 872,438 | 70,161 | |
| 6,335,122 | |||
| Technology Hardware, Storage & Peripherals - 4.6% | |||
| Apple, Inc. | 30,262,277 | 4,963,022 | |
| Hewlett Packard Enterprise Co. | 9,662,965 | 174,513 | |
| HP, Inc. | 9,770,448 | 186,420 | |
| NetApp, Inc. | 1,572,659 | 60,799 | |
| Seagate Technology LLC (a) | 1,723,853 | 54,353 | |
| Western Digital Corp. | 1,690,433 | 149,215 | |
| Xerox Corp. | 1,239,100 | 39,986 | |
| 5,628,308 | |||
| TOTAL INFORMATION TECHNOLOGY | 28,877,366 | ||
| MATERIALS - 2.9% | |||
| Chemicals - 2.1% | |||
| Air Products & Chemicals, Inc. | 1,263,718 | 183,707 | |
| Albemarle Corp. U.S. | 642,829 | 74,735 | |
| CF Industries Holdings, Inc. | 1,353,138 | 39,227 | |
| Eastman Chemical Co. | 846,412 | 72,961 | |
| Ecolab, Inc. | 1,515,137 | 201,968 | |
| FMC Corp. | 777,777 | 67,060 | |
| International Flavors & Fragrances, Inc. | 458,365 | 62,727 | |
| LyondellBasell Industries NV Class A | 1,917,135 | 173,673 | |
| Monsanto Co. | 2,546,938 | 298,501 | |
| PPG Industries, Inc. | 1,487,024 | 155,126 | |
| Praxair, Inc. | 1,659,200 | 218,251 | |
| Sherwin-Williams Co. | 470,266 | 159,547 | |
| The Dow Chemical Co. | 13,000,923 | 866,512 | |
| The Mosaic Co. | 2,037,380 | 40,707 | |
| 2,614,702 | |||
| Construction Materials - 0.1% | |||
| Martin Marietta Materials, Inc. | 363,524 | 77,063 | |
| Vulcan Materials Co. | 767,063 | 93,014 | |
| 170,077 | |||
| Containers & Packaging - 0.4% | |||
| Avery Dennison Corp. | 514,010 | 48,451 | |
| Ball Corp. | 2,032,150 | 81,266 | |
| International Paper Co. | 2,396,539 | 129,102 | |
| Packaging Corp. of America | 546,787 | 61,464 | |
| Sealed Air Corp. | 1,136,542 | 50,440 | |
| WestRock Co. | 1,457,434 | 82,943 | |
| 453,666 | |||
| Metals & Mining - 0.3% | |||
| Freeport-McMoRan, Inc. (b) | 7,725,812 | 114,188 | |
| Newmont Mining Corp. | 3,095,002 | 118,662 | |
| Nucor Corp. | 1,851,848 | 102,055 | |
| 334,905 | |||
| TOTAL MATERIALS | 3,573,350 | ||
| REAL ESTATE - 3.1% | |||
| Equity Real Estate Investment Trusts (REITs) - 3.0% | |||
| Alexandria Real Estate Equities, Inc. | 528,608 | 64,125 | |
| American Tower Corp. | 2,466,846 | 365,217 | |
| Apartment Investment & Management Co. Class A | 911,390 | 41,313 | |
| AvalonBay Communities, Inc. | 799,740 | 150,135 | |
| Boston Properties, Inc. | 893,020 | 107,698 | |
| Crown Castle International Corp. | 2,336,831 | 253,406 | |
| Digital Realty Trust, Inc. | 927,369 | 109,745 | |
| Duke Realty Corp. | 2,063,940 | 61,340 | |
| Equinix, Inc. | 452,218 | 211,823 | |
| Equity Residential (SBI) | 2,131,049 | 143,100 | |
| Essex Property Trust, Inc. | 380,751 | 101,268 | |
| Extra Space Storage, Inc. | 730,821 | 56,734 | |
| Federal Realty Investment Trust (SBI) | 419,279 | 53,219 | |
| General Growth Properties, Inc. | 3,381,090 | 70,158 | |
| HCP, Inc. | 2,719,695 | 81,074 | |
| Host Hotels & Resorts, Inc. | 4,293,643 | 77,801 | |
| Iron Mountain, Inc. | 1,425,684 | 56,200 | |
| Kimco Realty Corp. | 2,470,595 | 48,473 | |
| Mid-America Apartment Communities, Inc. | 659,220 | 70,181 | |
| Prologis, Inc. | 3,078,065 | 195,026 | |
| Public Storage | 867,775 | 178,189 | |
| Realty Income Corp. | 1,584,895 | 91,227 | |
| Regency Centers Corp. | 848,966 | 54,605 | |
| SBA Communications Corp. Class A (b) | 704,058 | 108,108 | |
| Simon Property Group, Inc. | 1,812,043 | 284,219 | |
| SL Green Realty Corp. | 591,055 | 56,966 | |
| The Macerich Co. | 691,250 | 36,477 | |
| UDR, Inc. | 1,552,002 | 60,249 | |
| Ventas, Inc. | 2,059,767 | 140,970 | |
| Vornado Realty Trust | 999,810 | 74,476 | |
| Welltower, Inc. | 2,125,314 | 155,615 | |
| Weyerhaeuser Co. | 4,360,682 | 142,202 | |
| 3,701,339 | |||
| Real Estate Management & Development - 0.1% | |||
| CBRE Group, Inc. (b) | 1,745,380 | 62,973 | |
| TOTAL REAL ESTATE | 3,764,312 | ||
| TELECOMMUNICATION SERVICES - 2.1% | |||
| Diversified Telecommunication Services - 2.1% | |||
| AT&T, Inc. | 35,684,348 | 1,336,736 | |
| CenturyLink, Inc. (a) | 3,185,426 | 62,817 | |
| Level 3 Communications, Inc. (b) | 1,699,032 | 92,478 | |
| Verizon Communications, Inc. | 23,677,557 | 1,135,812 | |
| 2,627,843 | |||
| UTILITIES - 3.2% | |||
| Electric Utilities - 2.0% | |||
| Alliant Energy Corp. | 1,322,335 | 56,517 | |
| American Electric Power Co., Inc. | 2,854,005 | 210,140 | |
| Duke Energy Corp. | 4,062,281 | 354,637 | |
| Edison International | 1,891,079 | 151,627 | |
| Entergy Corp. | 1,041,660 | 82,468 | |
| Eversource Energy | 1,839,276 | 115,874 | |
| Exelon Corp. | 5,375,271 | 203,562 | |
| FirstEnergy Corp. | 2,575,565 | 83,912 | |
| NextEra Energy, Inc. | 2,717,321 | 408,984 | |
| PG&E Corp. | 2,963,693 | 208,585 | |
| Pinnacle West Capital Corp. | 647,519 | 58,257 | |
| PPL Corp. | 3,965,298 | 155,598 | |
| Southern Co. | 5,772,872 | 278,599 | |
| Xcel Energy, Inc. | 2,947,168 | 145,885 | |
| 2,514,645 | |||
| Independent Power and Renewable Electricity Producers - 0.1% | |||
| NRG Energy, Inc. | 1,834,610 | 45,700 | |
| The AES Corp. | 3,831,621 | 42,301 | |
| 88,001 | |||
| Multi-Utilities - 1.1% | |||
| Ameren Corp. | 1,408,307 | 84,484 | |
| CenterPoint Energy, Inc. | 2,501,416 | 74,092 | |
| CMS Energy Corp. | 1,627,811 | 79,014 | |
| Consolidated Edison, Inc. | 1,772,493 | 149,368 | |
| Dominion Resources, Inc. | 3,650,773 | 287,571 | |
| DTE Energy Co. | 1,041,202 | 116,948 | |
| NiSource, Inc. | 1,877,352 | 50,444 | |
| Public Service Enterprise Group, Inc. | 2,936,233 | 137,533 | |
| SCANA Corp. | 829,522 | 50,087 | |
| Sempra Energy | 1,455,878 | 171,692 | |
| WEC Energy Group, Inc. | 1,831,690 | 119,463 | |
| 1,320,696 | |||
| Water Utilities - 0.0% | |||
| American Water Works Co., Inc. | 1,034,260 | 83,672 | |
| TOTAL UTILITIES | 4,007,014 | ||
| TOTAL COMMON STOCKS | |||
| (Cost $68,507,718) | 122,923,175 | ||
| Principal Amount (000s) | Value (000s) | ||
| U.S. Treasury Obligations - 0.0% | |||
| U.S. Treasury Bills, yield at date of purchase 0.87% 10/12/17 (c) | |||
| (Cost $29,970) | 30,000 | 29,962 | |
| Shares | Value (000s) | ||
| Money Market Funds - 0.9% | |||
| Fidelity Cash Central Fund, 1.11% (d) | 524 | $1 | |
| Fidelity Securities Lending Cash Central Fund 1.11% (d)(e) | 1,063,669,111 | 1,063,775 | |
| TOTAL MONEY MARKET FUNDS | |||
| (Cost $1,063,677) | 1,063,776 | ||
| TOTAL INVESTMENT IN SECURITIES - 100.7% | |||
| (Cost $69,601,365) | 124,016,913 | ||
| NET OTHER ASSETS (LIABILITIES) - (0.7)% | (867,739) | ||
| NET ASSETS - 100% | $123,149,174 |
| Futures Contracts | |||||
| Number of contracts | Expiration Date | Notional amount (000s) | Value (000s) | Unrealized Appreciation/(Depreciation) (000s) | |
| Purchased | |||||
| Equity Index Contracts | |||||
| CME E-mini S&P 500 Index Contracts (United States) | 1,963 | Sept. 2017 | $242,440 | $4,236 | $4,236 |
The notional amount of futures purchased as a percentage of Net Assets is 0.2%
Legend
(a) Security or a portion of the security is on loan at period end.
(b) Non-income producing
(c) Security or a portion of the security was pledged to cover margin requirements for futures contracts. At period end, the value of securities pledged amounted to $9,186,000.
(d) Affiliated fund that is generally available only to investment companies and other accounts managed by Fidelity Investments. The rate quoted is the annualized seven-day yield of the fund at period end. A complete unaudited listing of the fund's holdings as of its most recent quarter end is available upon request. In addition, each Fidelity Central Fund's financial statements are available on the SEC's website or upon request.
(e) Investment made with cash collateral received from securities on loan.
Affiliated Central Funds
Information regarding fiscal year to date income earned by the Fund from investments in Fidelity Central Funds is as follows:
| Fund | Income earned |
| (Amounts in thousands) | |
| Fidelity Cash Central Fund | $1,096 |
| Fidelity Securities Lending Cash Central Fund | 1,121 |
| Total | $2,217 |
Investment Valuation
The following is a summary of the inputs used, as of August 31, 2017, involving the Fund's assets and liabilities carried at fair value. The inputs or methodology used for valuing securities may not be an indication of the risk associated with investing in those securities. For more information on valuation inputs, and their aggregation into the levels used below, please refer to the Investment Valuation section in the accompanying Notes to Financial Statements.
| Valuation Inputs at Reporting Date: | ||||
| Description | Total | Level 1 | Level 2 | Level 3 |
| (Amounts in thousands) | ||||
| Investments in Securities: | ||||
| Equities: | ||||
| Consumer Discretionary | $14,806,059 | $14,806,059 | $-- | $-- |
| Consumer Staples | 10,414,806 | 10,414,806 | -- | -- |
| Energy | 6,962,604 | 6,962,604 | -- | -- |
| Financials | 17,479,050 | 17,479,050 | -- | -- |
| Health Care | 18,001,580 | 18,001,580 | -- | -- |
| Industrials | 12,409,191 | 12,409,191 | -- | -- |
| Information Technology | 28,877,366 | 28,877,366 | -- | -- |
| Materials | 3,573,350 | 3,573,350 | -- | -- |
| Real Estate | 3,764,312 | 3,764,312 | -- | -- |
| Telecommunication Services | 2,627,843 | 2,627,843 | -- | -- |
| Utilities | 4,007,014 | 4,007,014 | -- | -- |
| U.S. Government and Government Agency Obligations | 29,962 | -- | 29,962 | -- |
| Money Market Funds | 1,063,776 | 1,063,776 | -- | -- |
| Total Investments in Securities: | $124,016,913 | $123,986,951 | $29,962 | $-- |
| Derivative Instruments: | ||||
| Assets | ||||
| Futures Contracts | $4,236 | $4,236 | $-- | $-- |
| Total Assets | $4,236 | $4,236 | $-- | $-- |
| Total Derivative Instruments: | $4,236 | $4,236 | $-- | $-- |
Value of Derivative Instruments
The following table is a summary of the Fund's value of derivative instruments by primary risk exposure as of August 31, 2017. For additional information on derivative instruments, please refer to the Derivative Instruments section in the accompanying Notes to Financial Statements.
| Primary Risk Exposure / Derivative Type | Value | |
| Asset | Liability | |
| (Amounts in thousands) | ||
| Equity Risk | ||
| Futures Contracts(a) | $4,236 | $0 |
| Total Equity Risk | 4,236 | 0 |
| Total Value of Derivatives | $4,236 | $0 |
(a) Reflects gross cumulative appreciation (depreciation) on futures contracts as presented in the Schedule of Investments. Only the period end receivable or payable for daily variation margin and net unrealized appreciation (depreciation) are presented in the Statement of Assets and Liabilities.
See accompanying notes which are an integral part of the financial statements.
Financial Statements
Statement of Assets and Liabilities
| Amounts in thousands (except per-share amounts) | August 31, 2017 (Unaudited) | |
| Assets | ||
| Investment in securities, at value (including securities loaned of $1,046,845) — See accompanying schedule: Unaffiliated issuers (cost $68,537,688) | $122,953,137 | |
| Fidelity Central Funds (cost $1,063,677) | 1,063,776 | |
| Total Investment in Securities (cost $69,601,365) | $124,016,913 | |
| Cash | 1 | |
| Receivable for investments sold | 699,669 | |
| Receivable for fund shares sold | 90,080 | |
| Dividends receivable | 273,008 | |
| Distributions receivable from Fidelity Central Funds | 397 | |
| Receivable for daily variation margin on futures contracts | 1,506 | |
| Other receivables | 2,821 | |
| Total assets | 125,084,395 | |
| Liabilities | ||
| Payable for investments purchased | $540,755 | |
| Payable for fund shares redeemed | 292,370 | |
| Accrued management fee | 1,531 | |
| Notes payable to affiliates | 32,294 | |
| Other affiliated payables | 1,811 | |
| Other payables and accrued expenses | 2,824 | |
| Collateral on securities loaned | 1,063,636 | |
| Total liabilities | 1,935,221 | |
| Net Assets | $123,149,174 | |
| Net Assets consist of: | ||
| Paid in capital | $67,576,541 | |
| Undistributed net investment income | 517,302 | |
| Accumulated undistributed net realized gain (loss) on investments | 635,547 | |
| Net unrealized appreciation (depreciation) on investments | 54,419,784 | |
| Net Assets | $123,149,174 | |
| Investor Class: | ||
| Net Asset Value, offering price and redemption price per share ($3,791,720 ÷ 43,727 shares) | $86.71 | |
| Premium Class: | ||
| Net Asset Value, offering price and redemption price per share ($69,085,329 ÷ 796,560 shares) | $86.73 | |
| Institutional Class: | ||
| Net Asset Value, offering price and redemption price per share ($33,810,221 ÷ 389,818 shares) | $86.73 | |
| Institutional Premium Class: | ||
| Net Asset Value, offering price and redemption price per share ($16,461,904 ÷ 189,800 shares) | $86.73 |
See accompanying notes which are an integral part of the financial statements.
Statement of Operations
| Amounts in thousands | Six months ended August 31, 2017 (Unaudited) | |
| Investment Income | ||
| Dividends | $1,271,841 | |
| Interest | 120 | |
| Income from Fidelity Central Funds | 2,217 | |
| Total income | 1,274,178 | |
| Expenses | ||
| Management fee | $8,975 | |
| Transfer agent fees | 14,111 | |
| Independent trustees' fees and expenses | 240 | |
| Appreciation in deferred trustee compensation account | 1 | |
| Legal | 85 | |
| Interest | 2 | |
| Miscellaneous | 188 | |
| Total expenses before reductions | 23,602 | |
| Expense reductions | (10) | 23,592 |
| Net investment income (loss) | 1,250,586 | |
| Realized and Unrealized Gain (Loss) | ||
| Net realized gain (loss) on: | ||
| Investment securities: | ||
| Unaffiliated issuers | 1,201,987 | |
| Fidelity Central Funds | 28 | |
| Futures contracts | 36,923 | |
| Total net realized gain (loss) | 1,238,938 | |
| Change in net unrealized appreciation (depreciation) on: | ||
| Investment securities: | ||
| Unaffiliated issuers | 4,083,595 | |
| Fidelity Central Funds | 99 | |
| Futures contracts | (21,797) | |
| Total change in net unrealized appreciation (depreciation) | 4,061,897 | |
| Net gain (loss) | 5,300,835 | |
| Net increase (decrease) in net assets resulting from operations | $6,551,421 |
See accompanying notes which are an integral part of the financial statements.
Statement of Changes in Net Assets
| Amounts in thousands | Six months ended August 31, 2017 (Unaudited) | Year ended February 28, 2017 |
| Increase (Decrease) in Net Assets | ||
| Operations | ||
| Net investment income (loss) | $1,250,586 | $2,117,384 |
| Net realized gain (loss) | 1,238,938 | 648,777 |
| Change in net unrealized appreciation (depreciation) | 4,061,897 | 19,684,467 |
| Net increase (decrease) in net assets resulting from operations | 6,551,421 | 22,450,628 |
| Distributions to shareholders from net investment income | (1,093,137) | (2,077,274) |
| Distributions to shareholders from net realized gain | (186,054) | (545,764) |
| Total distributions | (1,279,191) | (2,623,038) |
| Share transactions - net increase (decrease) | 1,091,736 | 9,525,609 |
| Total increase (decrease) in net assets | 6,363,966 | 29,353,199 |
| Net Assets | ||
| Beginning of period | 116,785,208 | 87,432,009 |
| End of period | $123,149,174 | $116,785,208 |
| Other Information | ||
| Undistributed net investment income end of period | $517,302 | $359,853 |
See accompanying notes which are an integral part of the financial statements.
Financial Highlights — Fidelity 500 Index Fund Investor Class
| Six months ended (Unaudited) August 31, | Years ended February 28, | |||||
| 2017 | 2017 | 2016A | 2015 | 2014 | 2013 | |
| Selected Per–Share Data | ||||||
| Net asset value, beginning of period | $82.98 | $68.13 | $74.71 | $66.10 | $53.81 | $48.49 |
| Income from Investment Operations | ||||||
| Net investment income (loss)B | .86 | 1.54 | 1.45 | 1.44 | 1.19 | 1.10 |
| Net realized and unrealized gain (loss) | 3.75 | 15.23 | (6.05) | 8.64 | 12.26 | 5.28 |
| Total from investment operations | 4.61 | 16.77 | (4.60) | 10.08 | 13.45 | 6.38 |
| Distributions from net investment income | (.75) | (1.52) | (1.52) | (1.31) | (1.16) | (1.06) |
| Distributions from net realized gain | (.13) | (.40) | (.46) | (.16) | – | – |
| Total distributions | (.88) | (1.92) | (1.98) | (1.47) | (1.16) | (1.06) |
| Net asset value, end of period | $86.71 | $82.98 | $68.13 | $74.71 | $66.10 | $53.81 |
| Total ReturnC,D | 5.60% | 24.88% | (6.26)% | 15.40% | 25.27% | 13.36% |
| Ratios to Average Net AssetsE,F | ||||||
| Expenses before reductions | .09%G | .09% | .10% | .10% | .10% | .10% |
| Expenses net of fee waivers, if any | .09%G | .09% | .10% | .10% | .10% | .10% |
| Expenses net of all reductions | .09%G | .09% | .10% | .10% | .10% | .10% |
| Net investment income (loss) | 2.04%G | 2.04% | 2.02% | 2.06% | 1.98% | 2.21% |
| Supplemental Data | ||||||
| Net assets, end of period (in millions) | $3,792 | $3,823 | $7,635 | $7,315 | $5,751 | $4,705 |
| Portfolio turnover rateH | 6%G,I | 5% | 5% | 4% | 4% | 4% |
A For the year ended February 29.
B Calculated based on average shares outstanding during the period.
C Total returns for periods of less than one year are not annualized.
D Total returns would have been lower if certain expenses had not been reduced during the applicable periods shown.
E Fees and expenses of any underlying Fidelity Central Funds are not included in the Fund's expense ratio. The Fund indirectly bears its proportionate share of the expenses of any underlying Fidelity Central Funds.
F Expense ratios reflect operating expenses of the class. Expenses before reductions do not reflect amounts reimbursed by the investment adviser or reductions from brokerage service arrangements or reductions from other expense offset arrangements and do not represent the amount paid by the class during periods when reimbursements or reductions occur. Expenses net of fee waivers reflect expenses after reimbursement by the investment adviser but prior to reductions from brokerage service arrangements or other expense offset arrangements. Expenses net of all reductions represent the net expenses paid by the class.
G Annualized
H Amount does not include the portfolio activity of any underlying Fidelity Central Funds.
I Portfolio turnover rate excludes securities received or delivered in-kind.
See accompanying notes which are an integral part of the financial statements.
Financial Highlights — Fidelity 500 Index Fund Premium Class
| Six months ended (Unaudited) August 31, | Years ended February 28, | |||||
| 2017 | 2017 | 2016A | 2015 | 2014 | 2013 | |
| Selected Per–Share Data | ||||||
| Net asset value, beginning of period | $82.99 | $68.15 | $74.72 | $66.11 | $53.82 | $48.50 |
| Income from Investment Operations | ||||||
| Net investment income (loss)B | .88 | 1.58 | 1.48 | 1.48 | 1.22 | 1.13 |
| Net realized and unrealized gain (loss) | 3.76 | 15.21 | (6.04) | 8.63 | 12.26 | 5.27 |
| Total from investment operations | 4.64 | 16.79 | (4.56) | 10.11 | 13.48 | 6.40 |
| Distributions from net investment income | (.77) | (1.55) | (1.55) | (1.34) | (1.19) | (1.08) |
| Distributions from net realized gain | (.13) | (.40) | (.46) | (.16) | – | – |
| Total distributions | (.90) | (1.95) | (2.01) | (1.50) | (1.19) | (1.08) |
| Net asset value, end of period | $86.73 | $82.99 | $68.15 | $74.72 | $66.11 | $53.82 |
| Total ReturnC,D | 5.64% | 24.91% | (6.21)% | 15.45% | 25.32% | 13.39% |
| Ratios to Average Net AssetsE,F | ||||||
| Expenses before reductions | .04%G | .05% | .07% | .07% | .07% | .07% |
| Expenses net of fee waivers, if any | .04%G | .05% | .05% | .05% | .05% | .06% |
| Expenses net of all reductions | .04%G | .05% | .05% | .05% | .05% | .06% |
| Net investment income (loss) | 2.09%G | 2.08% | 2.06% | 2.11% | 2.02% | 2.25% |
| Supplemental Data | ||||||
| Net assets, end of period (in millions) | $69,085 | $66,051 | $49,215 | $49,784 | $38,736 | $28,996 |
| Portfolio turnover rateH | 6%G,I | 5% | 5% | 4% | 4% | 4% |
A For the year ended February 29.
B Calculated based on average shares outstanding during the period.
C Total returns for periods of less than one year are not annualized.
D Total returns would have been lower if certain expenses had not been reduced during the applicable periods shown.
E Fees and expenses of any underlying Fidelity Central Funds are not included in the Fund's expense ratio. The Fund indirectly bears its proportionate share of the expenses of any underlying Fidelity Central Funds.
F Expense ratios reflect operating expenses of the class. Expenses before reductions do not reflect amounts reimbursed by the investment adviser or reductions from brokerage service arrangements or reductions from other expense offset arrangements and do not represent the amount paid by the class during periods when reimbursements or reductions occur. Expenses net of fee waivers reflect expenses after reimbursement by the investment adviser but prior to reductions from brokerage service arrangements or other expense offset arrangements. Expenses net of all reductions represent the net expenses paid by the class.
G Annualized
H Amount does not include the portfolio activity of any underlying Fidelity Central Funds.
I Portfolio turnover rate excludes securities received or delivered in-kind.
See accompanying notes which are an integral part of the financial statements.
Financial Highlights — Fidelity 500 Index Fund Institutional Class
| Six months ended (Unaudited) August 31, | Years ended February 28, | |||||
| 2017 | 2017 | 2016A | 2015 | 2014 | 2013 | |
| Selected Per–Share Data | ||||||
| Net asset value, beginning of period | $83.00 | $68.15 | $74.73 | $66.11 | $53.82 | $48.50 |
| Income from Investment Operations | ||||||
| Net investment income (loss)B | .89 | 1.59 | 1.49 | 1.48 | 1.22 | 1.13 |
| Net realized and unrealized gain (loss) | 3.74 | 15.22 | (6.05) | 8.64 | 12.26 | 5.28 |
| Total from investment operations | 4.63 | 16.81 | (4.56) | 10.12 | 13.48 | 6.41 |
| Distributions from net investment income | (.77) | (1.56) | (1.56) | (1.35) | (1.19) | (1.09) |
| Distributions from net realized gain | (.13) | (.40) | (.46) | (.16) | – | – |
| Total distributions | (.90) | (1.96) | (2.02) | (1.50)C | (1.19) | (1.09) |
| Net asset value, end of period | $86.73 | $83.00 | $68.15 | $74.73 | $66.11 | $53.82 |
| Total ReturnD,E | 5.63% | 24.94% | (6.21)% | 15.47% | 25.33% | 13.42% |
| Ratios to Average Net AssetsF,G | ||||||
| Expenses before reductions | .03%H | .04% | .05% | .05% | .05% | .05% |
| Expenses net of fee waivers, if any | .03%H | .04% | .04% | .04% | .04% | .04% |
| Expenses net of all reductions | .03%H | .04% | .04% | .04% | .04% | .04% |
| Net investment income (loss) | 2.09%H | 2.09% | 2.07% | 2.12% | 2.03% | 2.27% |
| Supplemental Data | ||||||
| Net assets, end of period (in millions) | $33,810 | $32,087 | $23,860 | $25,621 | $22,636 | $17,703 |
| Portfolio turnover rateI | 6%H,J | 5% | 5% | 4% | 4% | 4% |
A For the year ended February 29.
B Calculated based on average shares outstanding during the period.
C Total distributions of $1.50 per share is comprised of distributions from net investment income of $1.347 and distributions from net realized gain of $.157 per share.
D Total returns for periods of less than one year are not annualized.
E Total returns would have been lower if certain expenses had not been reduced during the applicable periods shown.
F Fees and expenses of any underlying Fidelity Central Funds are not included in the Fund's expense ratio. The Fund indirectly bears its proportionate share of the expenses of any underlying Fidelity Central Funds.
G Expense ratios reflect operating expenses of the class. Expenses before reductions do not reflect amounts reimbursed by the investment adviser or reductions from brokerage service arrangements or reductions from other expense offset arrangements and do not represent the amount paid by the class during periods when reimbursements or reductions occur. Expenses net of fee waivers reflect expenses after reimbursement by the investment adviser but prior to reductions from brokerage service arrangements or other expense offset arrangements. Expenses net of all reductions represent the net expenses paid by the class.
H Annualized
I Amount does not include the portfolio activity of any underlying Fidelity Central Funds.
J Portfolio turnover rate excludes securities received or delivered in-kind.
See accompanying notes which are an integral part of the financial statements.
Financial Highlights — Fidelity 500 Index Fund Institutional Premium Class
| Six months ended (Unaudited) August 31, | Years ended February 28, | |||||
| 2017 | 2017 | 2016A | 2015 | 2014 | 2013 | |
| Selected Per–Share Data | ||||||
| Net asset value, beginning of period | $83.00 | $68.15 | $74.73 | $66.11 | $53.83 | $48.50 |
| Income from Investment Operations | ||||||
| Net investment income (loss)B | .89 | 1.61 | 1.50 | 1.50 | 1.24 | 1.14 |
| Net realized and unrealized gain (loss) | 3.75 | 15.21 | (6.05) | 8.64 | 12.24 | 5.29 |
| Total from investment operations | 4.64 | 16.82 | (4.55) | 10.14 | 13.48 | 6.43 |
| Distributions from net investment income | (.78) | (1.58) | (1.57) | (1.36) | (1.20) | (1.10) |
| Distributions from net realized gain | (.13) | (.40) | (.46) | (.16) | – | – |
| Total distributions | (.91) | (1.97)C | (2.03) | (1.52) | (1.20) | (1.10) |
| Net asset value, end of period | $86.73 | $83.00 | $68.15 | $74.73 | $66.11 | $53.83 |
| Total ReturnD,E | 5.64% | 24.97% | (6.19)% | 15.50% | 25.34% | 13.46% |
| Ratios to Average Net AssetsF,G | ||||||
| Expenses before reductions | .02%H | .02% | .03% | .03% | .03% | .03% |
| Expenses net of fee waivers, if any | .02%H | .02% | .02% | .02% | .02% | .02% |
| Expenses net of all reductions | .02%H | .02% | .02% | .02% | .02% | .02% |
| Net investment income (loss) | 2.11%H | 2.11% | 2.09% | 2.14% | 2.05% | 2.29% |
| Supplemental Data | ||||||
| Net assets, end of period (in millions) | $16,462 | $14,824 | $6,722 | $6,217 | $3,506 | $1,912 |
| Portfolio turnover rateI | 6%H,J | 5% | 5% | 4% | 4% | 4% |
A For the year ended February 29.
B Calculated based on average shares outstanding during the period.
C Total distributions of $1.97 per share is comprised of distributions from net investment income of $1.576 and distributions from net realized gain of $.398 per share.
D Total returns for periods of less than one year are not annualized.
E Total returns would have been lower if certain expenses had not been reduced during the applicable periods shown.
F Fees and expenses of any underlying Fidelity Central Funds are not included in the Fund's expense ratio. The Fund indirectly bears its proportionate share of the expenses of any underlying Fidelity Central Funds.
G Expense ratios reflect operating expenses of the class. Expenses before reductions do not reflect amounts reimbursed by the investment adviser or reductions from brokerage service arrangements or reductions from other expense offset arrangements and do not represent the amount paid by the class during periods when reimbursements or reductions occur. Expenses net of fee waivers reflect expenses after reimbursement by the investment adviser but prior to reductions from brokerage service arrangements or other expense offset arrangements. Expenses net of all reductions represent the net expenses paid by the class.
H Annualized
I Amount does not include the portfolio activity of any underlying Fidelity Central Funds.
J Portfolio turnover rate excludes securities received or delivered in-kind.
See accompanying notes which are an integral part of the financial statements.
Notes to Financial Statements (Unaudited)
For the period ended August 31, 2017
(Amounts in thousands except percentages)
1. Organization.
Fidelity 500 Index Fund (the Fund) is a fund of Fidelity Concord Street Trust (the Trust) and is authorized to issue an unlimited number of shares. The Trust is registered under the Investment Company Act of 1940, as amended (the 1940 Act), as an open-end management investment company organized as a Massachusetts business trust. The Fund offers Investor Class, Premium Class, Institutional Class and Institutional Premium Class shares, each of which has equal rights as to assets and voting privileges. Each class has exclusive voting rights with respect to matters that affect that class. The Fund offers conversion privileges between share classes to eligible shareholders.
2. Investments in Fidelity Central Funds.
The Fund invests in Fidelity Central Funds, which are open-end investment companies generally available only to other investment companies and accounts managed by the investment adviser and its affiliates. The Fund's Schedule of Investments lists each of the Fidelity Central Funds held as of period end, if any, as an investment of the Fund, but does not include the underlying holdings of each Fidelity Central Fund. As an Investing Fund, the Fund indirectly bears its proportionate share of the expenses of the underlying Fidelity Central Funds.
The Money Market Central Funds seek preservation of capital and current income and are managed by Fidelity Investments Money Management, Inc. (FIMM), an affiliate of the investment adviser. Annualized expenses of the Money Market Central Funds as of their most recent shareholder report date are less than .005%.
A complete unaudited list of holdings for each Fidelity Central Fund is available upon request or at the Securities and Exchange Commission (the SEC) website at www.sec.gov. In addition, the financial statements of the Fidelity Central Funds are available on the SEC website or upon request.
3. Significant Accounting Policies.
The Fund is an investment company and applies the accounting and reporting guidance of the Financial Accounting Standards Board (FASB) Accounting Standards Codification Topic 946 Financial Services – Investments Companies. The financial statements have been prepared in conformity with accounting principles generally accepted in the United States of America (GAAP), which require management to make certain estimates and assumptions at the date of the financial statements. Actual results could differ from those estimates. Subsequent events, if any, through the date that the financial statements were issued have been evaluated in the preparation of the financial statements. The following summarizes the significant accounting policies of the Fund:
Investment Valuation. Investments are valued as of 4:00 p.m. Eastern time on the last calendar day of the period. The Board of Trustees (the Board) has delegated the day to day responsibility for the valuation of the Fund's investments to the Fair Value Committee (the Committee) established by the Fund's investment adviser. In accordance with valuation policies and procedures approved by the Board, the Fund attempts to obtain prices from one or more third party pricing vendors or brokers to value its investments. When current market prices, quotations or currency exchange rates are not readily available or reliable, investments will be fair valued in good faith by the Committee, in accordance with procedures adopted by the Board. Factors used in determining fair value vary by investment type and may include market or investment specific events, changes in interest rates and credit quality. The frequency with which these procedures are used cannot be predicted and they may be utilized to a significant extent. The Committee oversees the Fund's valuation policies and procedures and reports to the Board on the Committee's activities and fair value determinations. The Board monitors the appropriateness of the procedures used in valuing the Fund's investments and ratifies the fair value determinations of the Committee.
The Fund categorizes the inputs to valuation techniques used to value its investments into a disclosure hierarchy consisting of three levels as shown below:
- Level 1 – quoted prices in active markets for identical investments
- Level 2 – other significant observable inputs (including quoted prices for similar investments, interest rates, prepayment speeds, etc.)
- Level 3 – unobservable inputs (including the Fund's own assumptions based on the best information available)
Valuation techniques used to value the Fund's investments by major category are as follows:
Equity securities, including restricted securities, for which market quotations are readily available, are valued at the last reported sale price or official closing price as reported by a third party pricing vendor on the primary market or exchange on which they are traded and are categorized as Level 1 in the hierarchy. In the event there were no sales during the day or closing prices are not available, securities are valued at the last quoted bid price or may be valued using the last available price and are generally categorized as Level 2 in the hierarchy. For foreign equity securities, when market or security specific events arise, comparisons to the valuation of American Depositary Receipts (ADRs), futures contracts, Exchange-Traded Funds (ETFs) and certain indexes as well as quoted prices for similar securities may be used and would be categorized as Level 2 in the hierarchy. Utilizing these techniques may result in transfers between Level 1 and Level 2. For equity securities, including restricted securities, where observable inputs are limited, assumptions about market activity and risk are used and these securities may be categorized as Level 3 in the hierarchy.
Debt securities, including restricted securities, are valued based on evaluated prices received from third party pricing vendors or from brokers who make markets in such securities. U.S. government and government agency obligations, are valued by pricing vendors who utilize matrix pricing which considers yield or price of bonds of comparable quality, coupon, maturity and type or by broker-supplied prices. When independent prices are unavailable or unreliable, debt securities may be valued utilizing pricing methodologies which consider similar factors that would be used by third party pricing vendors. Debt securities are generally categorized as Level 2 in the hierarchy but may be Level 3 depending on the circumstances.
Futures contracts are valued at the settlement price established each day by the board of trade or exchange on which they are traded and are categorized as Level 1 in the hierarchy. Investments in open-end mutual funds, including the Fidelity Central Funds, are valued at their closing net asset value (NAV) each business day and are categorized as Level 1 in the hierarchy.
Changes in valuation techniques may result in transfers in or out of an assigned level within the disclosure hierarchy. The aggregate value of investments by input level as of August 31, 2017, is included at the end of the Fund's Schedule of Investments.
Investment Transactions and Income. For financial reporting purposes, the Fund's investment holdings and NAV include trades executed through the end of the last business day of the period. The NAV per share for processing shareholder transactions is calculated as of the close of business of the New York Stock Exchange (NYSE), normally 4:00 p.m. Eastern time and includes trades executed through the end of the prior business day. Gains and losses on securities sold are determined on the basis of identified cost and may include proceeds received from litigation. Dividend income is recorded on the ex-dividend date, except for certain dividends from foreign securities where the ex-dividend date may have passed, which are recorded as soon as the Fund is informed of the ex-dividend date. Non-cash dividends included in dividend income, if any, are recorded at the fair market value of the securities received. Income and capital gain distributions from Fidelity Central Funds, if any, are recorded on the ex-dividend date. Certain distributions received by the Fund represent a return of capital or capital gain. The Fund determines the components of these distributions subsequent to the ex-dividend date, based upon receipt of tax filings or other correspondence relating to the underlying investment. These distributions are recorded as a reduction of cost of investments and/or as a realized gain. Interest income is accrued as earned and includes coupon interest and amortization of premium and accretion of discount on debt securities as applicable.
Class Allocations and Expenses. Investment income, realized and unrealized capital gains and losses, common expenses of the Fund, and certain fund-level expense reductions, if any, are allocated daily on a pro-rata basis to each class based on the relative net assets of each class to the total net assets of the Fund. Each class differs with respect to transfer agent fees incurred. Certain expense reductions may also differ by class. For the reporting period, the allocated portion of income and expenses to each class as a percent of its average net assets may vary due to the timing of recording these transactions in relation to fluctuating net assets of the classes. Expenses directly attributable to a fund are charged to that fund. Expenses attributable to more than one fund are allocated among the respective funds on the basis of relative net assets or other appropriate methods. Expense estimates are accrued in the period to which they relate and adjustments are made when actual amounts are known.
Deferred Trustee Compensation. Under a Deferred Compensation Plan (the Plan), independent Trustees may elect to defer receipt of a portion of their annual compensation. Deferred amounts are invested in a cross-section of Fidelity funds, are marked-to-market and remain in the Fund until distributed in accordance with the Plan. The investment of deferred amounts and the offsetting payable to the Trustees are included in the accompanying Statement of Assets and Liabilities.
Income Tax Information and Distributions to Shareholders. Each year, the Fund intends to qualify as a regulated investment company under Subchapter M of the Internal Revenue Code, including distributing substantially all of its taxable income and realized gains. As a result, no provision for U.S. Federal income taxes is required. The Fund files a U.S. federal tax return, in addition to state and local tax returns as required. The Fund's federal income tax returns are subject to examination by the Internal Revenue Service (IRS) for a period of three fiscal years after they are filed. State and local tax returns may be subject to examination for an additional fiscal year depending on the jurisdiction.
Distributions are declared and recorded on the ex-dividend date. Income dividends and capital gain distributions are declared separately for each class. Income and capital gain distributions are determined in accordance with income tax regulations, which may differ from GAAP.
Capital accounts within the financial statements are adjusted for permanent book-tax differences. These adjustments have no impact on net assets or the results of operations. Capital accounts are not adjusted for temporary book-tax differences which will reverse in a subsequent period.
Book-tax differences are primarily due to futures contracts, market discount, deferred trustees compensation and losses deferred due to wash sales.
As of period end, the cost and unrealized appreciation (depreciation) in securities, and derivatives if applicable, for federal income tax purposes were as follows:
| Gross unrealized appreciation | $57,319,004 |
| Gross unrealized depreciation | (3,386,872) |
| Net unrealized appreciation (depreciation) | $53,932,132 |
| Tax cost | $70,089,017 |
4. Derivative Instruments.
Risk Exposures and the Use of Derivative Instruments. The Fund's investment objective allows the Fund to enter into various types of derivative contracts, including futures contracts. Derivatives are investments whose value is primarily derived from underlying assets, indices or reference rates and may be transacted on an exchange or over-the-counter (OTC). Derivatives may involve a future commitment to buy or sell a specified asset based on specified terms, to exchange future cash flows at periodic intervals based on a notional principal amount, or for one party to make one or more payments upon the occurrence of specified events in exchange for periodic payments from the other party.
The Fund used derivatives to increase returns and to manage exposure to certain risks as defined below. The success of any strategy involving derivatives depends on analysis of numerous economic factors, and if the strategies for investment do not work as intended, the Fund may not achieve its objectives.
The Fund's use of derivatives increased or decreased its exposure to the following risk:
| Equity Risk | Equity risk relates to the fluctuations in the value of financial instruments as a result of changes in market prices (other than those arising from interest rate risk or foreign exchange risk), whether caused by factors specific to an individual investment, its issuer, or all factors affecting all instruments traded in a market or market segment. |
The Fund is also exposed to additional risks from investing in derivatives, such as liquidity risk and counterparty credit risk. Liquidity risk is the risk that the Fund will be unable to close out the derivative in the open market in a timely manner. Counterparty credit risk is the risk that the counterparty will not be able to fulfill its obligation to the Fund. Counterparty credit risk related to exchange-traded futures contracts may be mitigated by the protection provided by the exchange on which they trade.
Investing in derivatives may involve greater risks than investing in the underlying assets directly and, to varying degrees, may involve risk of loss in excess of any initial investment and collateral received and amounts recognized in the Statement of Assets and Liabilities. In addition, there may be the risk that the change in value of the derivative contract does not correspond to the change in value of the underlying instrument.
Futures Contracts. A futures contract is an agreement between two parties to buy or sell a specified underlying instrument for a fixed price at a specified future date. The Fund used futures contracts to manage its exposure to the stock market.
Upon entering into a futures contract, a fund is required to deposit either cash or securities (initial margin) with a clearing broker in an amount equal to a certain percentage of the face value of the contract. Futures contracts are marked-to-market daily and subsequent daily payments (variation margin) are made or received by a fund depending on the daily fluctuations in the value of the futures contracts and are recorded as unrealized appreciation or (depreciation). This receivable and/or payable, if any, is included in daily variation margin on futures contracts in the Statement of Assets and Liabilities. Realized gain or (loss) is recorded upon the expiration or closing of a futures contract.
Any open futures contracts at period end are presented in the Schedule of Investments under the caption "Futures Contracts". The underlying face amount at value reflects each contract's exposure to the underlying instrument or index at period end and is representative of volume of activity during the period. Securities deposited to meet initial margin requirements are identified in the Schedule of Investments.
During the period the Fund recognized net realized gain (loss) of $36,923 and a change in net unrealized appreciation (depreciation) of ($21,797) related to its investment in futures contracts. These amounts are included in the Statement of Operations.
5. Purchases and Sales of Investments.
Purchases and sales of securities, other than short-term securities and in-kind transactions, aggregated $6,917,059 and $3,752,156, respectively.
Redemptions In-Kind. During the period, 18,388,043 shares of the Fund held by unaffiliated entities were redeemed in-kind for investments and cash with a value of $1,534,318,182. The net realized gain of $1,107,402,193 on investments delivered through in-kind redemptions is included in the accompanying Statement of Operations. The amount of the in-kind redemptions is included in share transactions in the accompanying Statement of Changes in Net Assets as well as the Notes to Financial Statements. The Fund recognized no gain or loss for federal income tax purposes.
6. Fees and Other Transactions with Affiliates.
Management Fee and Expense Contract. Fidelity Management & Research Company (the investment adviser) and its affiliates provide the Fund with investment management related services for which the Fund pays a monthly management fee. The management fee is based on an annual rate of .015% of the Fund's average net assets. Under the management contract, the investment adviser pays all other fund-level expenses, except the compensation of the independent Trustees and certain other expenses such as interest expense, including commitment fees.
Effective August 1, 2017, the Board approved an amendment to the expense contract. Under the expense contract, the investment adviser pays class-level expenses as necessary so that the total expenses do not exceed certain amounts of each class' average net assets on an annual basis with certain exceptions, as noted in the following table:
| Investor Class | .09% |
| Premium Class | .035% |
| Institutional Class | .030% |
| Institutional Premium Class | .015% |
Prior to August 1, 2017, the investment adviser paid class-level expenses as necessary so that the total expenses did not exceed .09%, .045%, .035% and .015% for Investor Class, Premium Class, Institutional Class and Institutional Premium Class, respectively.
Sub-Adviser. Geode Capital Management, LLC (Geode), serves as sub-adviser for the Fund. Geode provides discretionary investment advisory services to the Fund and is paid by the investment adviser for providing these services.
Transfer Agent Fees. Fidelity Investments Institutional Operations Company, Inc. (FIIOC), an affiliate of the investment adviser, is the transfer, dividend disbursing and shareholder servicing agent for each class. FIIOC receives transfer agent fees at an annual rate of .075%, .045%, .035% and .015% of class-level average net assets for Investor Class, Premium Class, Institutional Class and Institutional Premium Class, respectively. FIIOC pays for typesetting, printing and mailing of shareholder reports, except proxy statements.
Effective August 1, 2017, under the amended expense contract, Investor Class, Premium Class and Institutional Class pay all or a portion of the transfer agent fees at an annual rate of .075%, .02% and .015%, of class-level average net assets, respectively, and Institutional Premium Class does not pay transfer agent fees. Prior to August 1, 2017, Investor Class, Premium Class and Institutional Class paid all or a portion of the transfer agent fees at an annual rate of .075%, .03% and .02% of class-level average net assets, respectively, and Institutional Premium Class did not pay transfer agent fees.
For the period, the total transfer agent fees paid by each applicable class were as follows:
| Amount | % of Class-Level Average Net Assets(a) | |
| Investor Class | $1,437 | .075 |
| Premium Class | 9,541 | .028 |
| Institutional Class | 3,133 | .019 |
| $14,111 |
(a) Annualized
Interfund Lending Program. Pursuant to an Exemptive Order issued by the SEC, the Fund, along with other registered investment companies having management contracts with FMR or other affiliated entities of FMR, may participate in an interfund lending program. This program provides an alternative credit facility allowing the funds to borrow from, or lend money to, other participating affiliated funds. Any open loans, including accrued interest, at period end are presented under the caption "Notes payable to affiliates" in the Fund's Statement of Assets and Liabilities. The Fund's activity in this program during the period for which loans were outstanding was as follows:
| Borrower or Lender | Average Loan Balance | Weighted Average Interest Rate | Interest Expense |
| Borrower | $25,201 | 1.35% | $2 |
Interfund Trades. The Fund may purchase from or sell securities to other Fidelity Funds under procedures adopted by the Board. The procedures have been designed to ensure these interfund trades are executed in accordance with Rule 17a-7 of the 1940 Act. Interfund trades are included within the respective purchases and sales amounts shown in the Purchases and Sales of Investments note.
7. Committed Line of Credit.
The Fund participates with other funds managed by the investment adviser or an affiliate in a $4.25 billion credit facility (the "line of credit") to be utilized for temporary or emergency purposes to fund shareholder redemptions or for other short-term liquidity purposes. The Fund has agreed to pay commitment fees on its pro-rata portion of the line of credit, which amounted to $188 and is reflected in Miscellaneous expenses on the Statement of Operations. During the period, the Fund did not borrow on this line of credit.
8. Security Lending.
The Fund lends portfolio securities through a lending agent from time to time in order to earn additional income. On the settlement date of the loan, the Fund receives collateral (in the form of U.S. Treasury obligations, letters of credit and/or cash) against the loaned securities and maintains collateral in an amount not less than 100% of the market value of the loaned securities during the period of the loan. The market value of the loaned securities is determined at the close of business of the Fund and any additional required collateral is delivered to the Fund on the next business day. The Fund or borrower may terminate the loan at any time, and if the borrower defaults on its obligation to return the securities loaned because of insolvency or other reasons, the Fund may apply collateral received from the borrower against the obligation. The Fund may experience delays and costs in recovering the securities loaned. Any cash collateral received is invested in the Fidelity Securities Lending Cash Central Fund. The value of loaned securities and cash collateral at period end are disclosed on the Fund's Statement of Assets and Liabilities. Security lending income represents the income earned on investing cash collateral, less rebates paid to borrowers and any lending agent fees associated with the loan, plus any premium payments received for lending certain types of securities. Security lending income is presented in the Statement of Operations as a component of income from Fidelity Central Funds. Total security lending income during the period amounted to $1,121.
9. Expense Reductions.
Through arrangements with the Fund's custodian, credits realized as a result of certain uninvested cash balances were used to reduce the Fund's expenses. During the period, these credits reduced the Fund's miscellaneous expenses by $10.
10. Distributions to Shareholders.
Distributions to shareholders of each class were as follows:
| Six months ended August 31, 2017 | Year ended February 28, 2017 | |
| From net investment income | ||
| Investor Class | $34,014 | $103,371 |
| Premium Class | 612,916 | 1,163,534 |
| Institutional Class | 298,100 | 571,931 |
| Institutional Premium Class | 148,107 | 238,438 |
| Total | $1,093,137 | $2,077,274 |
| From net realized gain | ||
| Investor Class | $6,052 | $21,275 |
| Premium Class | 104,764 | 305,450 |
| Institutional Class | 50,048 | 149,467 |
| Institutional Premium Class | 25,190 | 69,572 |
| Total | $186,054 | $545,764 |
11. Share Transactions.
Share transactions for each class were as follows and may contain automatic conversions between classes or exchanges between affiliated funds:
| Shares | Shares | Dollars | Dollars | |
| Six months ended August 31, 2017 | Year ended February 28, 2017 | Six months ended August 31, 2017 | Year ended February 28, 2017 | |
| Investor Class | ||||
| Shares sold | 14,800 | 52,360 | $1,247,327 | $3,969,866 |
| Reinvestment of distributions | 444 | 1,552 | 37,043 | 117,535 |
| Shares redeemed | (17,587) | (119,903) | (1,482,193) | (8,989,547) |
| Net increase (decrease) | (2,343) | (65,991) | $(197,823) | $(4,902,146) |
| Premium Class | ||||
| Shares sold | 84,560 | 207,763 | $7,124,710 | $15,845,150 |
| Reinvestment of distributions | 7,983 | 17,738 | 666,591 | 1,356,321 |
| Shares redeemed | (91,838)(a) | (151,849) | (7,735,337)(a) | (11,521,839) |
| Net increase (decrease) | 705 | 73,652 | $55,964 | $5,679,632 |
| Institutional Class | ||||
| Shares sold | 64,785 | 137,895 | $5,464,486 | $10,500,882 |
| Reinvestment of distributions | 4,102 | 9,370 | 342,601 | 716,383 |
| Shares redeemed | (65,670)(a) | (110,790) | (5,518,597)(a) | (8,442,330) |
| Net increase (decrease) | 3,217 | 36,475 | $288,490 | $2,774,935 |
| Institutional Premium Class | ||||
| Shares sold | 35,881 | 104,472 | $3,007,139 | $7,851,293 |
| Reinvestment of distributions | 2,074 | 3,986 | 173,132 | 306,104 |
| Shares redeemed | (26,761) | (28,482) | (2,235,166) | (2,184,209) |
| Net increase (decrease) | 11,194 | 79,976 | $945,105 | $5,973,188 |
(a) Amount includes in-kind redemptions (see the Redemptions In-Kind note for additional details).
12. Other.
The Fund's organizational documents provide former and current trustees and officers with a limited indemnification against liabilities arising in connection with the performance of their duties to the Fund. In the normal course of business, the Fund may also enter into contracts that provide general indemnifications. The Fund's maximum exposure under these arrangements is unknown as this would be dependent on future claims that may be made against the Fund. The risk of material loss from such claims is considered remote.
Shareholder Expense Example
As a shareholder of the Fund, you incur two types of costs: (1) transaction costs, and (2) ongoing costs, including management fees and other Fund expenses. This Example is intended to help you understand your ongoing costs (in dollars) of investing in the Fund and to compare these costs with the ongoing costs of investing in other mutual funds.
The Example is based on an investment of $1,000 invested at the beginning of the period and held for the entire period (March 1, 2017 to August 31, 2017).
Actual Expenses
The first line of the accompanying table for each class of the Fund provides information about actual account values and actual expenses. You may use the information in this line, together with the amount you invested, to estimate the expenses that you paid over the period. Simply divide your account value by $1,000.00 (for example, an $8,600 account value divided by $1,000.00 = 8.6), then multiply the result by the number in the first line for a class of the Fund under the heading entitled "Expenses Paid During Period" to estimate the expenses you paid on your account during this period. A small balance maintenance fee of $12.00 that is charged once a year may apply for certain accounts with a value of less than $2,000. This fee is not included in the table below. If it was, the estimate of expenses you paid during the period would be higher, and your ending account value lower, by this amount. In addition, the Fund, as a shareholder in the underlying Fidelity Central Funds, will indirectly bear its pro-rata share of the fees and expenses incurred by the underlying Fidelity Central Funds. These fees and expenses are not included in the Fund's annualized expense ratio used to calculate the expense estimate in the table below.
Hypothetical Example for Comparison Purposes
The second line of the accompanying table for each class of the Fund provides information about hypothetical account values and hypothetical expenses based on a Class' actual expense ratio and an assumed rate of return of 5% per year before expenses, which is not the Class' actual return. The hypothetical account values and expenses may not be used to estimate the actual ending account balance or expenses you paid for the period. You may use this information to compare the ongoing costs of investing in the Fund and other funds. To do so, compare this 5% hypothetical example with the 5% hypothetical examples that appear in the shareholder reports of the other funds. A small balance maintenance fee of $12.00 that is charged once a year may apply for certain accounts with a value of less than $2,000. This fee is not included in the table below. If it was, the estimate of expenses you paid during the period would be higher, and your ending account value lower, by this amount. In addition, the Fund, as a shareholder in the underlying Fidelity Central Funds, will indirectly bear its pro-rata share of the fees and expenses incurred by the underlying Fidelity Central Funds. These fees and expenses are not included in the Fund's annualized expense ratio used to calculate the expense estimate in the table below.
Please note that the expenses shown in the table are meant to highlight your ongoing costs only and do not reflect any transaction costs. Therefore, the second line of the table is useful in comparing ongoing costs only, and will not help you determine the relative total costs of owning different funds.
| Annualized Expense Ratio-A | Beginning Account Value March 1, 2017 | Ending Account Value August 31, 2017 | Expenses Paid During Period-B March 1, 2017 to August 31, 2017 | |
| Investor Class | .09% | |||
| Actual | $1,000.00 | $1,056.00 | $.47 | |
| Hypothetical-C | $1,000.00 | $1,024.75 | $.46 | |
| Premium Class | .04% | |||
| Actual | $1,000.00 | $1,056.40 | $.21 | |
| Hypothetical-C | $1,000.00 | $1,025.00 | $.20 | |
| Institutional Class | .03% | |||
| Actual | $1,000.00 | $1,056.30 | $.16 | |
| Hypothetical-C | $1,000.00 | $1,025.05 | $.15 | |
| Institutional Premium Class | .02% | |||
| Actual | $1,000.00 | $1,056.40 | $.10 | |
| Hypothetical-C | $1,000.00 | $1,025.10 | $.10 |
A Annualized expense ratio reflects expenses net of applicable fee waivers.
B Expenses are equal to each Class' annualized expense ratio, multiplied by the average account value over the period, multiplied by 184/365 (to reflect the one-half year period).
C 5% return per year before expenses
Board Approval of Investment Advisory Contracts and Management Fees
Fidelity 500 Index Fund
Each year, the Board of Trustees, including the Independent Trustees (together, the Board), votes on the renewal of the management contract with Fidelity Management & Research Company (FMR) and the sub-advisory agreements (together, the Advisory Contracts) for the fund, including the fund's sub-advisory agreement with Geode Capital Management, LLC (Geode). FMR and the sub-advisers are referred to herein as the Investment Advisers. The Board, assisted by the advice of fund counsel and Independent Trustees' counsel, requests and considers a broad range of information relevant to the renewal of the Advisory Contracts throughout the year.
The Board meets regularly and, at each of its meetings, covers an extensive agenda of topics and materials and considers factors that are relevant to its annual consideration of the renewal of the fund's Advisory Contracts, including the services and support provided to the fund and its shareholders. The Board has established various standing committees (Committees), each composed of and chaired by Independent Trustees with varying backgrounds, to which the Board has assigned specific subject matter responsibilities in order to enhance effective decision-making by the Board. The Board, acting directly and through its Committees, requests and receives information concerning the annual consideration of the renewal of the fund's Advisory Contracts. The Board also meets as needed to review matters specifically related to the Board's annual consideration of the renewal of the Advisory Contracts. Members of the Board may also meet with trustees of other Fidelity funds through ad hoc joint committees to discuss certain matters relevant to all of the Fidelity funds.
At its July 2017 meeting, the Board unanimously determined to renew the fund's Advisory Contracts. In reaching its determination, the Board considered all factors it believed relevant, including (i) the nature, extent, and quality of the services to be provided to the fund and its shareholders (including the investment performance of the fund); (ii) the competitiveness of the fund's management fee and total expense ratio relative to peer funds; (iii) the total costs of the services to be provided by and the profits to be realized by Fidelity from its relationships with the fund; and (iv) the extent to which, if any, economies of scale exist and would be realized as the fund grows, and whether any economies of scale are appropriately shared with fund shareholders.
In considering whether to renew the Advisory Contracts for the fund, the Board reached a determination, with the assistance of fund counsel and Independent Trustees' counsel and through the exercise of its business judgment, that the renewal of the Advisory Contracts was in the best interests of the fund and its shareholders and that the compensation payable under the Advisory Contracts was fair and reasonable. The Board's decision to renew the Advisory Contracts was not based on any single factor, but rather was based on a comprehensive consideration of all the information provided to the Board at its meetings throughout the year. The Board, in reaching its determination to renew the Advisory Contracts, was aware that shareholders of the fund have a broad range of investment choices available to them, including a wide choice among funds offered by Fidelity's competitors, and that the fund's shareholders, who have the opportunity to review and weigh the disclosure provided by the fund in its prospectus and other public disclosures, have chosen to invest in this fund, which is part of the Fidelity family of funds.
Nature, Extent, and Quality of Services Provided. The Board considered staffing as it relates to the fund, including the backgrounds of investment personnel of Fidelity and Geode, and also considered the fund's investment objective, strategies, and related investment philosophy. The Independent Trustees also had discussions with senior management of Fidelity's investment operations and investment groups and with representatives of Geode. The Board considered the structure of the investment personnel compensation programs and whether the structures provide appropriate incentives to act in the best interests of the fund. Additionally, the Board considered the portfolio managers' investments, if any, in the funds that they manage.Resources Dedicated to Investment Management and Support Services. The Board and the Fund Oversight and Research Committees reviewed the general qualifications and capabilities of Fidelity's and Geode's investment staffs, including their size, education, experience, and resources, as well as Fidelity's approach to recruiting, training, managing, and compensating investment personnel. The Board noted that Fidelity has continued to increase the resources devoted to non-U.S. offices, including expansion of Fidelity's global investment organization. Additionally, in its deliberations, the Board considered Fidelity's and Geode's trading, risk management, compliance, and technology and operations capabilities and resources, which are integral parts of the investment management process.Shareholder and Administrative Services. The Board considered (i) the nature, extent, quality, and cost of advisory, administrative, and shareholder services performed by the Investment Advisers and their affiliates under the Advisory Contracts and under separate agreements covering transfer agency, pricing and bookkeeping, and securities lending services for the fund; (ii) the nature and extent of the supervision of third party service providers, principally custodians, subcustodians, and pricing vendors; and (iii) the resources devoted to, and the record of compliance with, the fund's compliance policies and procedures. The Board also reviewed the allocation of fund brokerage, including allocations to brokers affiliated with the Investment Advisers.The Board noted that the growth of fund assets over time across the complex allows Fidelity to reinvest in the development of services designed to enhance the value or convenience of the Fidelity funds as investment vehicles. These services include 24-hour access to account information and market information through telephone representatives and over the Internet, investor education materials and asset allocation tools, and the expanded availability of Fidelity Investor Centers.In 2014, the Board formed an ad hoc Committee on Transfer Agency Fees to review the variety of transfer agency fee structures throughout the industry and Fidelity's competitive positioning with respect to industry participants.Investment in a Large Fund Family. The Board considered the benefits to shareholders of investing in a Fidelity fund, including the benefits of investing in a fund that is part of a large family of funds offering a variety of investment disciplines and providing a large variety of mutual fund investor services. The Board noted that Fidelity had taken, or had made recommendations that resulted in the Fidelity funds taking, a number of actions over the previous year that benefited particular funds, including: (i) continuing to dedicate additional resources to Fidelity's investment research process, and to the support of the senior management team that oversees asset management; (ii) continuing efforts to enhance Fidelity's global research capabilities; (iii) launching new funds and making other enhancements to meet client needs; (iv) launching new share classes of existing funds; (v) eliminating purchase minimums and broadening eligibility requirements for certain lower-priced share classes; (vi) reducing management fees and total expenses for certain growth equity funds and index funds; (vii) lowering expense caps for certain existing funds and classes to reduce expenses borne by shareholders; (viii) eliminating short-term redemption fees for certain funds; (ix) introducing a new pricing structure for certain funds of funds that is expected to reduce overall expenses paid by shareholders; (x) rationalizing product lines and gaining increased efficiencies through proposals for fund mergers and share class consolidations; (xi) continuing to develop, acquire and implement systems and technology to improve services to the funds and shareholders, strengthen information security, and increase efficiency; and (xii) implementing enhancements to further strengthen Fidelity's product line to increase investors' probability of success in achieving their investment goals, including retirement income goals.Investment Performance. The Board considered whether the fund has operated in accordance with its investment objective, as well as its record of compliance with its investment restrictions and its performance history.The Board took into account discussions with representatives of the Investment Advisers about fund investment performance that occur at Board meetings throughout the year. In this regard the Board noted that as part of regularly scheduled fund reviews and other reports to the Board on fund performance, the Board considers annualized return information for the fund for different time periods, measured against the securities market index the fund seeks to track and a peer group of funds with similar objectives ("peer group"), if any. The Board also periodically considers the fund's tracking error versus its benchmark index. In its evaluation of fund investment performance, the Board gave particular attention to information indicating changes in performance of certain Fidelity funds for specific time periods and discussed with the Investment Advisers the reasons for any overperformance or underperformance.In addition to reviewing absolute and relative fund performance, the Independent Trustees periodically consider the appropriateness of fund performance metrics in evaluating the results achieved. In general, the Independent Trustees believe that an index fund's performance should be evaluated based on net performance (after fees and expenses) of both the highest performing and lowest performing fund share classes, where applicable, compared to a fund's benchmark index, over appropriate time periods taking into account relevant factors including the following: general market conditions; the characteristics of the fund's benchmark index; the extent to which statistical sampling is employed; any securities lending revenues; and fund cash flows and other factors.The Independent Trustees recognize that shareholders evaluate performance on a net basis over their own holding periods, for which one-, three-, and five-year periods are often used as a proxy. For this reason, the performance information reviewed by the Board also included net cumulative calendar year total return information for the fund and an appropriate benchmark index and peer group for the most recent one-, three-, and five-year periods, as shown below. Returns are shown compared to the 25th percentile (top of box, 75% beaten) and 75th percentile (bottom of box, 25% beaten) of the peer universe.Fidelity 500 Index Fund
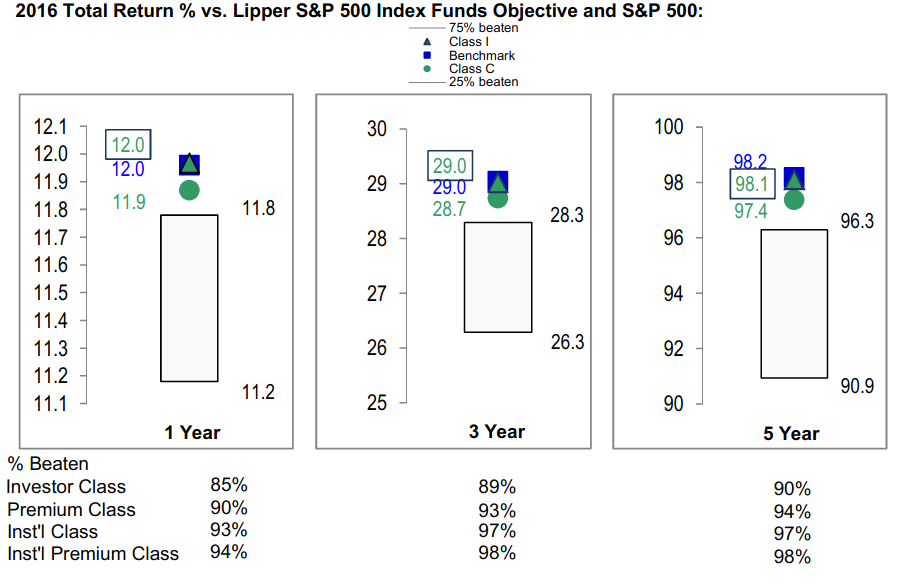
Fidelity 500 Index Fund

![]()
U5I-U5A-SANN-1017
1.925892.106
Fidelity® 500 Index Fund Semi-Annual Report August 31, 2017 |
|
Contents
Board Approval of Investment Advisory Contracts and Management Fees |
To view a fund's proxy voting guidelines and proxy voting record for the 12-month period ended June 30, visit http://www.fidelity.com/proxyvotingresults or visit the Securities and Exchange Commission's (SEC) web site at http://www.sec.gov.
You may also call 1-800-544-8544 to request a free copy of the proxy voting guidelines.
Standard & Poor's, S&P and S&P 500 are registered service marks of The McGraw-Hill Companies, Inc. and have been licensed for use by Fidelity Distributors Corporation.
Other third-party marks appearing herein are the property of their respective owners.
All other marks appearing herein are registered or unregistered trademarks or service marks of FMR LLC or an affiliated company. © 2017 FMR LLC. All rights reserved.
This report and the financial statements contained herein are submitted for the general information of the shareholders of the Fund. This report is not authorized for distribution to prospective investors in the Fund unless preceded or accompanied by an effective prospectus.
A fund files its complete schedule of portfolio holdings with the SEC for the first and third quarters of each fiscal year on Form N-Q. Forms N-Q are available on the SEC’s web site at http://www.sec.gov. A fund's Forms N-Q may be reviewed and copied at the SEC’s Public Reference Room in Washington, DC. Information regarding the operation of the SEC's Public Reference Room may be obtained by calling 1-800-SEC-0330.
For a complete list of a fund's portfolio holdings, view the most recent holdings listing, semiannual report, or annual report on Fidelity's web site at http://www.fidelity.com, http://www.institutional.fidelity.com, or http://www.401k.com, as applicable.
NOT FDIC INSURED •MAY LOSE VALUE •NO BANK GUARANTEE
Neither the Fund nor Fidelity Distributors Corporation is a bank.
Investment Summary (Unaudited)
Top Ten Stocks as of August 31, 2017
| % of fund's net assets | % of fund's net assets 6 months ago | |
| Apple, Inc. | 4.0 | 3.6 |
| Microsoft Corp. | 2.7 | 2.4 |
| Facebook, Inc. Class A | 1.9 | 1.5 |
| Amazon.com, Inc. | 1.8 | 1.6 |
| Johnson & Johnson | 1.7 | 1.6 |
| Berkshire Hathaway, Inc. Class B | 1.6 | 1.6 |
| Exxon Mobil Corp. | 1.5 | 1.6 |
| JPMorgan Chase & Co. | 1.5 | 1.6 |
| Alphabet, Inc. Class A | 1.3 | 1.2 |
| Alphabet, Inc. Class C | 1.3 | 1.2 |
| 19.3 |
Top Market Sectors as of August 31, 2017
| % of fund's net assets | % of fund's net assets 6 months ago | |
| Information Technology | 23.4 | 21.4 |
| Health Care | 14.6 | 14.0 |
| Financials | 14.2 | 14.7 |
| Consumer Discretionary | 12.0 | 12.0 |
| Industrials | 10.1 | 10.1 |
| Consumer Staples | 8.5 | 9.4 |
| Energy | 5.7 | 6.6 |
| Utilities | 3.2 | 3.2 |
| Real Estate | 3.1 | 2.8 |
| Materials | 2.9 | 2.8 |
Investments August 31, 2017 (Unaudited)
Showing Percentage of Net Assets
| Common Stocks - 99.8% | |||
| Shares | Value (000s) | ||
| CONSUMER DISCRETIONARY - 12.0% | |||
| Auto Components - 0.2% | |||
| BorgWarner, Inc. | 1,157,865 | $53,737 | |
| Delphi Automotive PLC | 1,554,898 | 149,892 | |
| The Goodyear Tire & Rubber Co. | 1,461,468 | 44,282 | |
| 247,911 | |||
| Automobiles - 0.5% | |||
| Ford Motor Co. | 22,701,084 | 250,393 | |
| General Motors Co. | 7,970,651 | 291,248 | |
| Harley-Davidson, Inc. (a) | 1,015,959 | 47,760 | |
| 589,401 | |||
| Distributors - 0.1% | |||
| Genuine Parts Co. | 855,507 | 70,862 | |
| LKQ Corp. (b) | 1,789,354 | 62,001 | |
| 132,863 | |||
| Diversified Consumer Services - 0.0% | |||
| H&R Block, Inc. | 1,202,443 | 32,153 | |
| Hotels, Restaurants & Leisure - 1.8% | |||
| Carnival Corp. | 2,429,413 | 168,796 | |
| Chipotle Mexican Grill, Inc. (a)(b) | 166,366 | 52,690 | |
| Darden Restaurants, Inc. | 721,691 | 59,244 | |
| Hilton, Inc. | 1,189,299 | 76,508 | |
| Marriott International, Inc. Class A | 1,803,317 | 186,788 | |
| McDonald's Corp. | 4,730,846 | 756,793 | |
| MGM Mirage, Inc. | 2,802,166 | 92,359 | |
| Royal Caribbean Cruises Ltd. | 973,707 | 121,188 | |
| Starbucks Corp. | 8,405,092 | 461,103 | |
| Wyndham Worldwide Corp. | 605,694 | 60,376 | |
| Wynn Resorts Ltd. | 463,432 | 64,412 | |
| Yum! Brands, Inc. | 1,920,144 | 147,505 | |
| 2,247,762 | |||
| Household Durables - 0.4% | |||
| D.R. Horton, Inc. | 1,983,738 | 71,712 | |
| Garmin Ltd. (a) | 665,901 | 34,294 | |
| Leggett & Platt, Inc. | 767,939 | 35,302 | |
| Lennar Corp. Class A | 1,179,360 | 61,044 | |
| Mohawk Industries, Inc. (b) | 366,664 | 92,810 | |
| Newell Brands, Inc. | 2,804,019 | 135,378 | |
| PulteGroup, Inc. | 1,648,129 | 42,555 | |
| Whirlpool Corp. | 429,338 | 73,683 | |
| 546,778 | |||
| Internet & Direct Marketing Retail - 2.7% | |||
| Amazon.com, Inc. (b) | 2,302,646 | 2,257,975 | |
| Expedia, Inc. | 705,615 | 104,685 | |
| Netflix, Inc. (b) | 2,501,642 | 437,062 | |
| Priceline Group, Inc. (b) | 285,394 | 528,573 | |
| TripAdvisor, Inc. (a)(b) | 640,980 | 27,389 | |
| 3,355,684 | |||
| Leisure Products - 0.1% | |||
| Hasbro, Inc. | 652,990 | 64,156 | |
| Mattel, Inc. (a) | 1,988,271 | 32,250 | |
| 96,406 | |||
| Media - 3.0% | |||
| CBS Corp. Class B | 2,138,031 | 136,962 | |
| Charter Communications, Inc. Class A (b) | 1,251,882 | 498,925 | |
| Comcast Corp. Class A | 27,469,716 | 1,115,545 | |
| Discovery Communications, Inc.: | |||
| Class A (a)(b) | 892,521 | 19,823 | |
| Class C (non-vtg.) (b) | 1,223,719 | 25,710 | |
| DISH Network Corp. Class A (b) | 1,320,309 | 75,641 | |
| Interpublic Group of Companies, Inc. | 2,293,306 | 46,187 | |
| News Corp.: | |||
| Class A | 2,218,263 | 29,658 | |
| Class B | 695,218 | 9,524 | |
| Omnicom Group, Inc. (a) | 1,350,897 | 97,778 | |
| Scripps Networks Interactive, Inc. Class A | 556,660 | 47,678 | |
| The Walt Disney Co. | 8,443,679 | 854,500 | |
| Time Warner, Inc. | 4,501,394 | 455,091 | |
| Twenty-First Century Fox, Inc.: | |||
| Class A | 6,107,985 | 168,519 | |
| Class B | 2,827,223 | 76,618 | |
| Viacom, Inc. Class B (non-vtg.) | 2,044,827 | 58,482 | |
| 3,716,641 | |||
| Multiline Retail - 0.4% | |||
| Dollar General Corp. | 1,464,329 | 106,252 | |
| Dollar Tree, Inc. (b) | 1,373,795 | 109,409 | |
| Kohl's Corp. | 989,509 | 39,363 | |
| Macy's, Inc. | 1,767,426 | 36,709 | |
| Nordstrom, Inc. (a) | 645,748 | 28,813 | |
| Target Corp. | 3,202,235 | 174,618 | |
| 495,164 | |||
| Specialty Retail - 2.1% | |||
| Advance Auto Parts, Inc. | 428,613 | 41,961 | |
| AutoZone, Inc. (b) | 163,418 | 86,357 | |
| Best Buy Co., Inc. | 1,539,958 | 83,558 | |
| CarMax, Inc. (a)(b) | 1,075,000 | 72,186 | |
| Foot Locker, Inc. | 761,705 | 26,835 | |
| Gap, Inc. (a) | 1,277,634 | 30,178 | |
| Home Depot, Inc. | 6,939,265 | 1,039,988 | |
| L Brands, Inc. (a) | 1,398,516 | 50,654 | |
| Lowe's Companies, Inc. | 4,980,375 | 368,000 | |
| O'Reilly Automotive, Inc. (b) | 528,213 | 103,598 | |
| Ross Stores, Inc. | 2,275,254 | 132,989 | |
| Signet Jewelers Ltd. (a) | 397,009 | 25,039 | |
| Staples, Inc. | 3,791,119 | 38,726 | |
| Tiffany & Co., Inc. | 622,202 | 56,869 | |
| TJX Companies, Inc. | 3,733,716 | 269,948 | |
| Tractor Supply Co. | 746,214 | 44,407 | |
| Ulta Beauty, Inc. | 338,450 | 74,801 | |
| 2,546,094 | |||
| Textiles, Apparel & Luxury Goods - 0.7% | |||
| Coach, Inc. | 1,631,735 | 68,043 | |
| Hanesbrands, Inc. (a) | 2,113,619 | 51,276 | |
| Michael Kors Holdings Ltd. (b) | 904,524 | 38,189 | |
| NIKE, Inc. Class B | 7,691,898 | 406,209 | |
| PVH Corp. | 452,758 | 56,998 | |
| Ralph Lauren Corp. | 319,894 | 28,115 | |
| Under Armour, Inc.: | |||
| Class A (sub. vtg.) (a)(b) | 1,071,871 | 17,311 | |
| Class C (non-vtg.) (a)(b) | 1,069,958 | 16,156 | |
| VF Corp. | 1,859,473 | 116,905 | |
| 799,202 | |||
| TOTAL CONSUMER DISCRETIONARY | 14,806,059 | ||
| CONSUMER STAPLES - 8.5% | |||
| Beverages - 2.1% | |||
| Brown-Forman Corp. Class B (non-vtg.) | 1,026,697 | 54,456 | |
| Constellation Brands, Inc. Class A (sub. vtg.) | 995,116 | 199,123 | |
| Dr. Pepper Snapple Group, Inc. | 1,066,903 | 97,142 | |
| Molson Coors Brewing Co. Class B | 1,071,803 | 96,194 | |
| Monster Beverage Corp. (b) | 2,339,951 | 130,616 | |
| PepsiCo, Inc. | 8,291,335 | 959,556 | |
| The Coca-Cola Co. | 22,318,987 | 1,016,630 | |
| 2,553,717 | |||
| Food & Staples Retailing - 1.8% | |||
| Costco Wholesale Corp. | 2,545,690 | 399,011 | |
| CVS Health Corp. | 5,913,311 | 457,335 | |
| Kroger Co. | 5,296,949 | 115,844 | |
| Sysco Corp. | 2,857,895 | 150,525 | |
| Wal-Mart Stores, Inc. | 8,573,440 | 669,328 | |
| Walgreens Boots Alliance, Inc. | 4,956,522 | 403,957 | |
| 2,196,000 | |||
| Food Products - 1.3% | |||
| Archer Daniels Midland Co. | 3,312,271 | 136,863 | |
| Campbell Soup Co. | 1,113,010 | 51,421 | |
| ConAgra Foods, Inc. | 2,346,222 | 76,158 | |
| General Mills, Inc. | 3,344,015 | 178,102 | |
| Hormel Foods Corp. (a) | 1,565,663 | 48,128 | |
| Kellogg Co. | 1,463,825 | 95,822 | |
| McCormick & Co., Inc. (non-vtg.) | 657,194 | 62,519 | |
| Mondelez International, Inc. | 8,806,616 | 358,077 | |
| The Hershey Co. | 812,554 | 85,253 | |
| The J.M. Smucker Co. | 675,762 | 70,793 | |
| The Kraft Heinz Co. | 3,463,031 | 279,640 | |
| Tyson Foods, Inc. Class A | 1,672,730 | 105,884 | |
| 1,548,660 | |||
| Household Products - 1.8% | |||
| Church & Dwight Co., Inc. | 1,446,731 | 72,582 | |
| Clorox Co. | 747,572 | 103,561 | |
| Colgate-Palmolive Co. | 5,126,827 | 367,286 | |
| Kimberly-Clark Corp. | 2,060,080 | 253,987 | |
| Procter & Gamble Co. | 14,844,956 | 1,369,744 | |
| 2,167,160 | |||
| Personal Products - 0.1% | |||
| Coty, Inc. Class A (a) | 2,733,857 | 45,327 | |
| Estee Lauder Companies, Inc. Class A | 1,299,397 | 139,022 | |
| 184,349 | |||
| Tobacco - 1.4% | |||
| Altria Group, Inc. | 11,211,693 | 710,821 | |
| Philip Morris International, Inc. | 9,014,784 | 1,054,099 | |
| 1,764,920 | |||
| TOTAL CONSUMER STAPLES | 10,414,806 | ||
| ENERGY - 5.7% | |||
| Energy Equipment & Services - 0.8% | |||
| Baker Hughes, a GE Co. Class A | 2,469,597 | 83,719 | |
| Halliburton Co. | 5,037,297 | 196,303 | |
| Helmerich & Payne, Inc. (a) | 630,147 | 26,680 | |
| National Oilwell Varco, Inc. | 2,205,848 | 67,653 | |
| Schlumberger Ltd. | 8,064,831 | 512,197 | |
| TechnipFMC PLC | 2,708,203 | 69,953 | |
| 956,505 | |||
| Oil, Gas & Consumable Fuels - 4.9% | |||
| Anadarko Petroleum Corp. | 3,252,331 | 133,118 | |
| Andeavor | 877,183 | 87,850 | |
| Apache Corp. (a) | 2,207,751 | 85,749 | |
| Cabot Oil & Gas Corp. | 2,701,998 | 69,036 | |
| Chesapeake Energy Corp. (a)(b) | 4,427,322 | 16,115 | |
| Chevron Corp. | 10,996,427 | 1,183,435 | |
| Cimarex Energy Co. | 552,034 | 55,032 | |
| Concho Resources, Inc. (b) | 859,971 | 95,431 | |
| ConocoPhillips Co. | 7,180,424 | 313,497 | |
| Devon Energy Corp. | 3,051,279 | 95,810 | |
| EOG Resources, Inc. | 3,350,591 | 284,767 | |
| EQT Corp. (a) | 1,005,964 | 62,712 | |
| Exxon Mobil Corp. | 24,594,026 | 1,877,262 | |
| Hess Corp. | 1,568,466 | 61,013 | |
| Kinder Morgan, Inc. | 11,143,524 | 215,404 | |
| Marathon Oil Corp. | 4,933,541 | 54,861 | |
| Marathon Petroleum Corp. | 3,010,864 | 157,920 | |
| Newfield Exploration Co. (b) | 1,156,172 | 30,211 | |
| Noble Energy, Inc. | 2,642,009 | 62,801 | |
| Occidental Petroleum Corp. | 4,437,803 | 264,937 | |
| ONEOK, Inc. | 2,205,012 | 119,423 | |
| Phillips 66 Co. | 2,546,215 | 213,398 | |
| Pioneer Natural Resources Co. | 987,263 | 127,999 | |
| Range Resources Corp. (a) | 1,092,171 | 18,960 | |
| The Williams Companies, Inc. | 4,795,882 | 142,582 | |
| Valero Energy Corp. | 2,595,827 | 176,776 | |
| 6,006,099 | |||
| TOTAL ENERGY | 6,962,604 | ||
| FINANCIALS - 14.2% | |||
| Banks - 6.2% | |||
| Bank of America Corp. | 57,763,016 | 1,379,958 | |
| BB&T Corp. | 4,709,370 | 217,055 | |
| Citigroup, Inc. | 15,980,517 | 1,087,155 | |
| Citizens Financial Group, Inc. | 2,940,105 | 97,406 | |
| Comerica, Inc. | 1,026,976 | 70,091 | |
| Fifth Third Bancorp | 4,354,727 | 113,789 | |
| Huntington Bancshares, Inc. | 6,309,884 | 79,441 | |
| JPMorgan Chase & Co. | 20,621,258 | 1,874,266 | |
| KeyCorp | 6,362,047 | 109,491 | |
| M&T Bank Corp. | 893,061 | 132,048 | |
| Peoples United Financial, Inc. | 1,998,660 | 33,378 | |
| PNC Financial Services Group, Inc. | 2,808,668 | 352,235 | |
| Regions Financial Corp. | 6,977,039 | 98,446 | |
| SunTrust Banks, Inc. | 2,806,201 | 154,622 | |
| U.S. Bancorp | 9,194,849 | 471,236 | |
| Wells Fargo & Co. | 26,104,982 | 1,333,181 | |
| Zions Bancorporation | 1,176,103 | 51,349 | |
| 7,655,147 | |||
| Capital Markets - 2.9% | |||
| Affiliated Managers Group, Inc. | 328,530 | 58,048 | |
| Ameriprise Financial, Inc. | 884,877 | 122,564 | |
| Bank of New York Mellon Corp. | 6,035,675 | 315,545 | |
| BlackRock, Inc. Class A | 703,715 | 294,864 | |
| Brighthouse Financial, Inc. | 570,105 | 32,536 | |
| CBOE Holdings, Inc. | 533,264 | 53,801 | |
| Charles Schwab Corp. | 7,062,523 | 281,795 | |
| CME Group, Inc. | 1,972,204 | 248,103 | |
| E*TRADE Financial Corp. (b) | 1,594,292 | 65,382 | |
| Franklin Resources, Inc. | 1,987,385 | 85,915 | |
| Goldman Sachs Group, Inc. | 2,124,791 | 475,401 | |
| IntercontinentalExchange, Inc. | 3,436,487 | 222,238 | |
| Invesco Ltd. | 2,361,488 | 77,410 | |
| Moody's Corp. | 966,002 | 129,473 | |
| Morgan Stanley | 8,267,138 | 376,155 | |
| Northern Trust Corp. | 1,252,614 | 110,856 | |
| Raymond James Financial, Inc. | 743,977 | 58,268 | |
| S&P Global, Inc. | 1,496,328 | 230,928 | |
| State Street Corp. | 2,052,731 | 189,857 | |
| T. Rowe Price Group, Inc. | 1,400,373 | 118,135 | |
| The NASDAQ OMX Group, Inc. | 661,523 | 49,866 | |
| 3,597,140 | |||
| Consumer Finance - 0.7% | |||
| American Express Co. | 4,357,660 | 375,195 | |
| Capital One Financial Corp. | 2,803,259 | 223,167 | |
| Discover Financial Services | 2,206,712 | 130,086 | |
| Navient Corp. | 1,653,860 | 21,831 | |
| Synchrony Financial | 4,470,687 | 137,652 | |
| 887,931 | |||
| Diversified Financial Services - 1.7% | |||
| Berkshire Hathaway, Inc. Class B (b) | 11,025,045 | 1,997,297 | |
| Leucadia National Corp. | 1,879,617 | 44,509 | |
| 2,041,806 | |||
| Insurance - 2.7% | |||
| AFLAC, Inc. | 2,303,387 | 190,145 | |
| Allstate Corp. | 2,115,743 | 191,475 | |
| American International Group, Inc. | 5,104,716 | 308,733 | |
| Aon PLC | 1,521,112 | 211,678 | |
| Arthur J. Gallagher & Co. | 1,041,718 | 60,315 | |
| Assurant, Inc. | 318,002 | 30,112 | |
| Chubb Ltd. | 2,710,136 | 383,267 | |
| Cincinnati Financial Corp. | 869,856 | 66,840 | |
| Everest Re Group Ltd. | 238,374 | 60,185 | |
| Hartford Financial Services Group, Inc. | 2,132,244 | 115,290 | |
| Lincoln National Corp. | 1,301,759 | 88,337 | |
| Loews Corp. | 1,602,520 | 74,645 | |
| Marsh & McLennan Companies, Inc. | 2,991,112 | 233,546 | |
| MetLife, Inc. | 6,271,158 | 293,678 | |
| Principal Financial Group, Inc. | 1,555,779 | 97,267 | |
| Progressive Corp. | 3,371,672 | 156,715 | |
| Prudential Financial, Inc. | 2,490,011 | 254,180 | |
| The Travelers Companies, Inc. | 1,621,792 | 196,529 | |
| Torchmark Corp. | 631,460 | 48,603 | |
| Unum Group | 1,324,604 | 63,819 | |
| Willis Group Holdings PLC (a) | 737,603 | 109,512 | |
| XL Group Ltd. | 1,517,467 | 62,155 | |
| 3,297,026 | |||
| TOTAL FINANCIALS | 17,479,050 | ||
| HEALTH CARE - 14.6% | |||
| Biotechnology - 3.2% | |||
| AbbVie, Inc. | 9,237,655 | 695,595 | |
| Alexion Pharmaceuticals, Inc. (b) | 1,303,378 | 185,614 | |
| Amgen, Inc. | 4,271,268 | 759,303 | |
| Biogen, Inc. (b) | 1,239,874 | 392,495 | |
| Celgene Corp. (b) | 4,532,075 | 629,641 | |
| Gilead Sciences, Inc. | 7,584,537 | 634,902 | |
| Incyte Corp. (b) | 986,499 | 135,555 | |
| Regeneron Pharmaceuticals, Inc. (b) | 442,262 | 219,760 | |
| Vertex Pharmaceuticals, Inc. (b) | 1,445,651 | 232,085 | |
| 3,884,950 | |||
| Health Care Equipment & Supplies - 2.8% | |||
| Abbott Laboratories | 10,071,901 | 513,063 | |
| Align Technology, Inc. (b) | 438,283 | 77,462 | |
| Baxter International, Inc. | 2,831,074 | 175,640 | |
| Becton, Dickinson & Co. | 1,319,607 | 263,182 | |
| Boston Scientific Corp. (b) | 7,948,311 | 218,976 | |
| C.R. Bard, Inc. | 420,324 | 134,844 | |
| Danaher Corp. | 3,545,366 | 295,754 | |
| Dentsply Sirona, Inc. | 1,330,501 | 75,266 | |
| Edwards Lifesciences Corp. (b) | 1,217,743 | 138,409 | |
| Hologic, Inc. (b) | 1,625,246 | 62,734 | |
| IDEXX Laboratories, Inc. (b) | 511,485 | 79,500 | |
| Intuitive Surgical, Inc. (b) | 213,833 | 214,832 | |
| Medtronic PLC | 7,945,310 | 640,551 | |
| ResMed, Inc. (a) | 823,149 | 63,860 | |
| Stryker Corp. | 1,800,614 | 254,553 | |
| The Cooper Companies, Inc. | 283,577 | 71,130 | |
| Varian Medical Systems, Inc. (a)(b) | 533,536 | 56,688 | |
| Zimmer Biomet Holdings, Inc. | 1,167,948 | 133,461 | |
| 3,469,905 | |||
| Health Care Providers & Services - 2.8% | |||
| Aetna, Inc. | 1,925,260 | 303,614 | |
| AmerisourceBergen Corp. | 963,214 | 77,298 | |
| Anthem, Inc. | 1,538,037 | 301,517 | |
| Cardinal Health, Inc. | 1,833,455 | 123,685 | |
| Centene Corp. (b) | 999,939 | 88,845 | |
| Cigna Corp. | 1,485,968 | 270,535 | |
| DaVita HealthCare Partners, Inc. (b) | 903,601 | 52,915 | |
| Envision Healthcare Corp. | 681,764 | 35,731 | |
| Express Scripts Holding Co. (b) | 3,444,962 | 216,413 | |
| HCA Holdings, Inc. (b) | 1,661,086 | 130,661 | |
| Henry Schein, Inc. (b) | 460,443 | 79,970 | |
| Humana, Inc. | 837,636 | 215,792 | |
| Laboratory Corp. of America Holdings (b) | 593,772 | 93,145 | |
| McKesson Corp. | 1,224,122 | 182,774 | |
| Patterson Companies, Inc. (a) | 473,581 | 18,233 | |
| Quest Diagnostics, Inc. | 794,168 | 86,048 | |
| UnitedHealth Group, Inc. | 5,593,307 | 1,112,509 | |
| Universal Health Services, Inc. Class B | 518,950 | 56,114 | |
| 3,445,799 | |||
| Health Care Technology - 0.1% | |||
| Cerner Corp. (b) | 1,706,420 | 115,661 | |
| Life Sciences Tools & Services - 0.8% | |||
| Agilent Technologies, Inc. | 1,870,706 | 121,072 | |
| Illumina, Inc. (b) | 847,416 | 173,263 | |
| Mettler-Toledo International, Inc. (b) | 149,877 | 90,689 | |
| PerkinElmer, Inc. | 638,691 | 42,786 | |
| Quintiles Transnational Holdings, Inc. (b) | 796,484 | 76,486 | |
| Thermo Fisher Scientific, Inc. | 2,270,727 | 424,944 | |
| Waters Corp. (b) | 464,558 | 85,237 | |
| 1,014,477 | |||
| Pharmaceuticals - 4.9% | |||
| Allergan PLC | 1,949,446 | 447,359 | |
| Bristol-Myers Squibb Co. | 9,562,070 | 578,314 | |
| Eli Lilly & Co. | 5,635,795 | 458,134 | |
| Johnson & Johnson | 15,635,601 | 2,069,685 | |
| Merck & Co., Inc. | 15,875,501 | 1,013,809 | |
| Mylan N.V. (b) | 2,675,424 | 84,222 | |
| Perrigo Co. PLC | 832,174 | 65,708 | |
| Pfizer, Inc. | 34,638,682 | 1,174,944 | |
| Zoetis, Inc. Class A | 2,848,694 | 178,613 | |
| 6,070,788 | |||
| TOTAL HEALTH CARE | 18,001,580 | ||
| INDUSTRIALS - 10.1% | |||
| Aerospace & Defense - 2.5% | |||
| Arconic, Inc. | 2,558,332 | 65,161 | |
| General Dynamics Corp. | 1,645,983 | 331,419 | |
| L3 Technologies, Inc. | 452,015 | 82,032 | |
| Lockheed Martin Corp. | 1,444,792 | 441,225 | |
| Northrop Grumman Corp. | 1,013,260 | 275,820 | |
| Raytheon Co. | 1,689,463 | 307,499 | |
| Rockwell Collins, Inc. | 942,507 | 123,516 | |
| Textron, Inc. | 1,553,726 | 76,272 | |
| The Boeing Co. | 3,258,085 | 780,833 | |
| TransDigm Group, Inc. (a) | 283,841 | 73,986 | |
| United Technologies Corp. | 4,324,969 | 517,785 | |
| 3,075,548 | |||
| Air Freight & Logistics - 0.7% | |||
| C.H. Robinson Worldwide, Inc. | 817,745 | 57,757 | |
| Expeditors International of Washington, Inc. | 1,045,717 | 58,665 | |
| FedEx Corp. | 1,427,751 | 306,081 | |
| United Parcel Service, Inc. Class B | 3,997,773 | 457,185 | |
| 879,688 | |||
| Airlines - 0.5% | |||
| Alaska Air Group, Inc. | 717,425 | 53,563 | |
| American Airlines Group, Inc. | 2,859,095 | 127,916 | |
| Delta Air Lines, Inc. | 4,272,150 | 201,603 | |
| Southwest Airlines Co. | 3,509,597 | 182,990 | |
| United Continental Holdings, Inc. (b) | 1,635,554 | 101,339 | |
| 667,411 | |||
| Building Products - 0.4% | |||
| A.O. Smith Corp. | 854,817 | 47,605 | |
| Allegion PLC | 552,974 | 43,525 | |
| Fortune Brands Home & Security, Inc. | 892,945 | 55,836 | |
| Johnson Controls International PLC | 5,444,991 | 215,567 | |
| Masco Corp. | 1,857,037 | 68,283 | |
| 430,816 | |||
| Commercial Services & Supplies - 0.3% | |||
| Cintas Corp. | 501,281 | 67,678 | |
| Republic Services, Inc. | 1,334,366 | 87,054 | |
| Stericycle, Inc. (b) | 494,914 | 35,579 | |
| Waste Management, Inc. | 2,359,155 | 181,914 | |
| 372,225 | |||
| Construction & Engineering - 0.1% | |||
| Fluor Corp. | 811,326 | 31,293 | |
| Jacobs Engineering Group, Inc. | 698,973 | 38,087 | |
| Quanta Services, Inc. (b) | 859,675 | 30,888 | |
| 100,268 | |||
| Electrical Equipment - 0.6% | |||
| Acuity Brands, Inc. (a) | 255,966 | 45,252 | |
| AMETEK, Inc. | 1,335,598 | 84,477 | |
| Eaton Corp. PLC | 2,596,228 | 186,305 | |
| Emerson Electric Co. | 3,740,704 | 220,851 | |
| Fortive Corp. | 1,750,135 | 113,706 | |
| Rockwell Automation, Inc. | 747,787 | 122,682 | |
| 773,273 | |||
| Industrial Conglomerates - 2.2% | |||
| 3M Co. | 3,468,585 | 708,701 | |
| General Electric Co. | 50,547,290 | 1,240,936 | |
| Honeywell International, Inc. | 4,424,778 | 611,814 | |
| Roper Technologies, Inc. | 592,216 | 136,601 | |
| 2,698,052 | |||
| Machinery - 1.5% | |||
| Caterpillar, Inc. | 3,419,597 | 401,768 | |
| Cummins, Inc. | 896,967 | 142,959 | |
| Deere & Co. | 1,708,026 | 198,011 | |
| Dover Corp. | 903,543 | 76,693 | |
| Flowserve Corp. | 758,136 | 29,780 | |
| Illinois Tool Works, Inc. | 1,804,566 | 248,146 | |
| Ingersoll-Rand PLC | 1,486,008 | 126,890 | |
| PACCAR, Inc. | 2,038,907 | 135,241 | |
| Parker Hannifin Corp. | 773,023 | 124,372 | |
| Pentair PLC | 973,167 | 60,385 | |
| Snap-On, Inc. | 336,349 | 49,635 | |
| Stanley Black & Decker, Inc. | 887,889 | 127,856 | |
| Xylem, Inc. | 1,043,111 | 64,746 | |
| 1,786,482 | |||
| Professional Services - 0.3% | |||
| Equifax, Inc. | 697,737 | 99,407 | |
| IHS Markit Ltd. (b) | 1,842,042 | 86,281 | |
| Nielsen Holdings PLC | 1,949,428 | 75,735 | |
| Robert Half International, Inc. | 738,175 | 33,439 | |
| Verisk Analytics, Inc. (b) | 892,493 | 72,337 | |
| 367,199 | |||
| Road & Rail - 0.9% | |||
| CSX Corp. | 5,355,479 | 268,845 | |
| J.B. Hunt Transport Services, Inc. | 497,925 | 49,240 | |
| Kansas City Southern | 615,735 | 63,685 | |
| Norfolk Southern Corp. | 1,681,964 | 202,710 | |
| Union Pacific Corp. | 4,686,554 | 493,494 | |
| 1,077,974 | |||
| Trading Companies & Distributors - 0.1% | |||
| Fastenal Co. (a) | 1,678,952 | 71,641 | |
| United Rentals, Inc. (b) | 490,532 | 57,912 | |
| W.W. Grainger, Inc. (a) | 311,881 | 50,702 | |
| 180,255 | |||
| TOTAL INDUSTRIALS | 12,409,191 | ||
| INFORMATION TECHNOLOGY - 23.4% | |||
| Communications Equipment - 1.0% | |||
| Cisco Systems, Inc. | 29,021,416 | 934,780 | |
| F5 Networks, Inc. (b) | 375,550 | 44,833 | |
| Harris Corp. | 707,604 | 86,965 | |
| Juniper Networks, Inc. | 2,217,769 | 61,499 | |
| Motorola Solutions, Inc. | 948,810 | 83,609 | |
| 1,211,686 | |||
| Electronic Equipment & Components - 0.4% | |||
| Amphenol Corp. Class A | 1,773,863 | 143,576 | |
| Corning, Inc. | 5,341,229 | 153,614 | |
| FLIR Systems, Inc. | 792,021 | 30,097 | |
| TE Connectivity Ltd. | 2,060,655 | 164,028 | |
| 491,315 | |||
| Internet Software & Services - 4.8% | |||
| Akamai Technologies, Inc. (b) | 1,003,393 | 47,310 | |
| Alphabet, Inc.: | |||
| Class A (b) | 1,727,504 | 1,650,181 | |
| Class C (b) | 1,731,931 | 1,626,855 | |
| eBay, Inc. (b) | 5,842,379 | 211,085 | |
| Facebook, Inc. Class A (b) | 13,719,651 | 2,359,368 | |
| VeriSign, Inc. (a)(b) | 512,421 | 53,164 | |
| 5,947,963 | |||
| IT Services - 3.9% | |||
| Accenture PLC Class A | 3,599,098 | 470,618 | |
| Alliance Data Systems Corp. | 323,156 | 72,872 | |
| Automatic Data Processing, Inc. | 2,596,866 | 276,488 | |
| Cognizant Technology Solutions Corp. Class A | 3,418,668 | 241,939 | |
| CSRA, Inc. | 843,310 | 26,573 | |
| DXC Technology Co. | 1,643,546 | 139,701 | |
| Fidelity National Information Services, Inc. | 1,918,771 | 178,292 | |
| Fiserv, Inc. (b) | 1,232,689 | 152,496 | |
| Gartner, Inc. (b) | 524,887 | 63,296 | |
| Global Payments, Inc. | 885,051 | 84,514 | |
| IBM Corp. | 4,962,273 | 709,754 | |
| MasterCard, Inc. Class A | 5,444,304 | 725,726 | |
| Paychex, Inc. | 1,855,788 | 105,836 | |
| PayPal Holdings, Inc. (b) | 6,484,301 | 399,952 | |
| The Western Union Co. | 2,735,262 | 51,751 | |
| Total System Services, Inc. | 961,341 | 66,448 | |
| Visa, Inc. Class A | 10,716,042 | 1,109,325 | |
| 4,875,581 | |||
| Semiconductors & Semiconductor Equipment - 3.6% | |||
| Advanced Micro Devices, Inc. (a)(b) | 4,497,767 | 58,471 | |
| Analog Devices, Inc. | 2,130,213 | 178,235 | |
| Applied Materials, Inc. | 6,237,401 | 281,432 | |
| Broadcom Ltd. | 2,329,594 | 587,221 | |
| Intel Corp. | 27,332,074 | 958,536 | |
| KLA-Tencor Corp. | 909,887 | 85,247 | |
| Lam Research Corp. | 936,290 | 155,405 | |
| Microchip Technology, Inc. (a) | 1,331,477 | 115,572 | |
| Micron Technology, Inc. (b) | 6,035,975 | 192,970 | |
| NVIDIA Corp. | 3,453,511 | 585,163 | |
| Qorvo, Inc. (b) | 737,699 | 54,014 | |
| Qualcomm, Inc. | 8,575,370 | 448,235 | |
| Skyworks Solutions, Inc. | 1,071,024 | 112,843 | |
| Texas Instruments, Inc. | 5,782,884 | 478,938 | |
| Xilinx, Inc. | 1,439,737 | 95,109 | |
| 4,387,391 | |||
| Software - 5.1% | |||
| Activision Blizzard, Inc. | 4,024,467 | 263,844 | |
| Adobe Systems, Inc. (b) | 2,871,336 | 445,516 | |
| ANSYS, Inc. (b) | 496,243 | 63,926 | |
| Autodesk, Inc. (b) | 1,125,699 | 128,848 | |
| CA Technologies, Inc. | 1,818,809 | 60,348 | |
| Citrix Systems, Inc. (b) | 877,296 | 68,613 | |
| Electronic Arts, Inc. (b) | 1,799,471 | 218,636 | |
| Intuit, Inc. | 1,412,783 | 199,838 | |
| Microsoft Corp. | 44,811,571 | 3,350,561 | |
| Oracle Corp. | 17,434,249 | 877,466 | |
| Red Hat, Inc. (b) | 1,031,857 | 110,925 | |
| Salesforce.com, Inc. (b) | 3,881,037 | 370,600 | |
| Symantec Corp. | 3,530,359 | 105,840 | |
| Synopsys, Inc. (b) | 872,438 | 70,161 | |
| 6,335,122 | |||
| Technology Hardware, Storage & Peripherals - 4.6% | |||
| Apple, Inc. | 30,262,277 | 4,963,022 | |
| Hewlett Packard Enterprise Co. | 9,662,965 | 174,513 | |
| HP, Inc. | 9,770,448 | 186,420 | |
| NetApp, Inc. | 1,572,659 | 60,799 | |
| Seagate Technology LLC (a) | 1,723,853 | 54,353 | |
| Western Digital Corp. | 1,690,433 | 149,215 | |
| Xerox Corp. | 1,239,100 | 39,986 | |
| 5,628,308 | |||
| TOTAL INFORMATION TECHNOLOGY | 28,877,366 | ||
| MATERIALS - 2.9% | |||
| Chemicals - 2.1% | |||
| Air Products & Chemicals, Inc. | 1,263,718 | 183,707 | |
| Albemarle Corp. U.S. | 642,829 | 74,735 | |
| CF Industries Holdings, Inc. | 1,353,138 | 39,227 | |
| Eastman Chemical Co. | 846,412 | 72,961 | |
| Ecolab, Inc. | 1,515,137 | 201,968 | |
| FMC Corp. | 777,777 | 67,060 | |
| International Flavors & Fragrances, Inc. | 458,365 | 62,727 | |
| LyondellBasell Industries NV Class A | 1,917,135 | 173,673 | |
| Monsanto Co. | 2,546,938 | 298,501 | |
| PPG Industries, Inc. | 1,487,024 | 155,126 | |
| Praxair, Inc. | 1,659,200 | 218,251 | |
| Sherwin-Williams Co. | 470,266 | 159,547 | |
| The Dow Chemical Co. | 13,000,923 | 866,512 | |
| The Mosaic Co. | 2,037,380 | 40,707 | |
| 2,614,702 | |||
| Construction Materials - 0.1% | |||
| Martin Marietta Materials, Inc. | 363,524 | 77,063 | |
| Vulcan Materials Co. | 767,063 | 93,014 | |
| 170,077 | |||
| Containers & Packaging - 0.4% | |||
| Avery Dennison Corp. | 514,010 | 48,451 | |
| Ball Corp. | 2,032,150 | 81,266 | |
| International Paper Co. | 2,396,539 | 129,102 | |
| Packaging Corp. of America | 546,787 | 61,464 | |
| Sealed Air Corp. | 1,136,542 | 50,440 | |
| WestRock Co. | 1,457,434 | 82,943 | |
| 453,666 | |||
| Metals & Mining - 0.3% | |||
| Freeport-McMoRan, Inc. (b) | 7,725,812 | 114,188 | |
| Newmont Mining Corp. | 3,095,002 | 118,662 | |
| Nucor Corp. | 1,851,848 | 102,055 | |
| 334,905 | |||
| TOTAL MATERIALS | 3,573,350 | ||
| REAL ESTATE - 3.1% | |||
| Equity Real Estate Investment Trusts (REITs) - 3.0% | |||
| Alexandria Real Estate Equities, Inc. | 528,608 | 64,125 | |
| American Tower Corp. | 2,466,846 | 365,217 | |
| Apartment Investment & Management Co. Class A | 911,390 | 41,313 | |
| AvalonBay Communities, Inc. | 799,740 | 150,135 | |
| Boston Properties, Inc. | 893,020 | 107,698 | |
| Crown Castle International Corp. | 2,336,831 | 253,406 | |
| Digital Realty Trust, Inc. | 927,369 | 109,745 | |
| Duke Realty Corp. | 2,063,940 | 61,340 | |
| Equinix, Inc. | 452,218 | 211,823 | |
| Equity Residential (SBI) | 2,131,049 | 143,100 | |
| Essex Property Trust, Inc. | 380,751 | 101,268 | |
| Extra Space Storage, Inc. | 730,821 | 56,734 | |
| Federal Realty Investment Trust (SBI) | 419,279 | 53,219 | |
| General Growth Properties, Inc. | 3,381,090 | 70,158 | |
| HCP, Inc. | 2,719,695 | 81,074 | |
| Host Hotels & Resorts, Inc. | 4,293,643 | 77,801 | |
| Iron Mountain, Inc. | 1,425,684 | 56,200 | |
| Kimco Realty Corp. | 2,470,595 | 48,473 | |
| Mid-America Apartment Communities, Inc. | 659,220 | 70,181 | |
| Prologis, Inc. | 3,078,065 | 195,026 | |
| Public Storage | 867,775 | 178,189 | |
| Realty Income Corp. | 1,584,895 | 91,227 | |
| Regency Centers Corp. | 848,966 | 54,605 | |
| SBA Communications Corp. Class A (b) | 704,058 | 108,108 | |
| Simon Property Group, Inc. | 1,812,043 | 284,219 | |
| SL Green Realty Corp. | 591,055 | 56,966 | |
| The Macerich Co. | 691,250 | 36,477 | |
| UDR, Inc. | 1,552,002 | 60,249 | |
| Ventas, Inc. | 2,059,767 | 140,970 | |
| Vornado Realty Trust | 999,810 | 74,476 | |
| Welltower, Inc. | 2,125,314 | 155,615 | |
| Weyerhaeuser Co. | 4,360,682 | 142,202 | |
| 3,701,339 | |||
| Real Estate Management & Development - 0.1% | |||
| CBRE Group, Inc. (b) | 1,745,380 | 62,973 | |
| TOTAL REAL ESTATE | 3,764,312 | ||
| TELECOMMUNICATION SERVICES - 2.1% | |||
| Diversified Telecommunication Services - 2.1% | |||
| AT&T, Inc. | 35,684,348 | 1,336,736 | |
| CenturyLink, Inc. (a) | 3,185,426 | 62,817 | |
| Level 3 Communications, Inc. (b) | 1,699,032 | 92,478 | |
| Verizon Communications, Inc. | 23,677,557 | 1,135,812 | |
| 2,627,843 | |||
| UTILITIES - 3.2% | |||
| Electric Utilities - 2.0% | |||
| Alliant Energy Corp. | 1,322,335 | 56,517 | |
| American Electric Power Co., Inc. | 2,854,005 | 210,140 | |
| Duke Energy Corp. | 4,062,281 | 354,637 | |
| Edison International | 1,891,079 | 151,627 | |
| Entergy Corp. | 1,041,660 | 82,468 | |
| Eversource Energy | 1,839,276 | 115,874 | |
| Exelon Corp. | 5,375,271 | 203,562 | |
| FirstEnergy Corp. | 2,575,565 | 83,912 | |
| NextEra Energy, Inc. | 2,717,321 | 408,984 | |
| PG&E Corp. | 2,963,693 | 208,585 | |
| Pinnacle West Capital Corp. | 647,519 | 58,257 | |
| PPL Corp. | 3,965,298 | 155,598 | |
| Southern Co. | 5,772,872 | 278,599 | |
| Xcel Energy, Inc. | 2,947,168 | 145,885 | |
| 2,514,645 | |||
| Independent Power and Renewable Electricity Producers - 0.1% | |||
| NRG Energy, Inc. | 1,834,610 | 45,700 | |
| The AES Corp. | 3,831,621 | 42,301 | |
| 88,001 | |||
| Multi-Utilities - 1.1% | |||
| Ameren Corp. | 1,408,307 | 84,484 | |
| CenterPoint Energy, Inc. | 2,501,416 | 74,092 | |
| CMS Energy Corp. | 1,627,811 | 79,014 | |
| Consolidated Edison, Inc. | 1,772,493 | 149,368 | |
| Dominion Resources, Inc. | 3,650,773 | 287,571 | |
| DTE Energy Co. | 1,041,202 | 116,948 | |
| NiSource, Inc. | 1,877,352 | 50,444 | |
| Public Service Enterprise Group, Inc. | 2,936,233 | 137,533 | |
| SCANA Corp. | 829,522 | 50,087 | |
| Sempra Energy | 1,455,878 | 171,692 | |
| WEC Energy Group, Inc. | 1,831,690 | 119,463 | |
| 1,320,696 | |||
| Water Utilities - 0.0% | |||
| American Water Works Co., Inc. | 1,034,260 | 83,672 | |
| TOTAL UTILITIES | 4,007,014 | ||
| TOTAL COMMON STOCKS | |||
| (Cost $68,507,718) | 122,923,175 | ||
| Principal Amount (000s) | Value (000s) | ||
| U.S. Treasury Obligations - 0.0% | |||
| U.S. Treasury Bills, yield at date of purchase 0.87% 10/12/17 (c) | |||
| (Cost $29,970) | 30,000 | 29,962 | |
| Shares | Value (000s) | ||
| Money Market Funds - 0.9% | |||
| Fidelity Cash Central Fund, 1.11% (d) | 524 | $1 | |
| Fidelity Securities Lending Cash Central Fund 1.11% (d)(e) | 1,063,669,111 | 1,063,775 | |
| TOTAL MONEY MARKET FUNDS | |||
| (Cost $1,063,677) | 1,063,776 | ||
| TOTAL INVESTMENT IN SECURITIES - 100.7% | |||
| (Cost $69,601,365) | 124,016,913 | ||
| NET OTHER ASSETS (LIABILITIES) - (0.7)% | (867,739) | ||
| NET ASSETS - 100% | $123,149,174 |
| Futures Contracts | |||||
| Number of contracts | Expiration Date | Notional amount (000s) | Value (000s) | Unrealized Appreciation/(Depreciation) (000s) | |
| Purchased | |||||
| Equity Index Contracts | |||||
| CME E-mini S&P 500 Index Contracts (United States) | 1,963 | Sept. 2017 | $242,440 | $4,236 | $4,236 |
The notional amount of futures purchased as a percentage of Net Assets is 0.2%
Legend
(a) Security or a portion of the security is on loan at period end.
(b) Non-income producing
(c) Security or a portion of the security was pledged to cover margin requirements for futures contracts. At period end, the value of securities pledged amounted to $9,186,000.
(d) Affiliated fund that is generally available only to investment companies and other accounts managed by Fidelity Investments. The rate quoted is the annualized seven-day yield of the fund at period end. A complete unaudited listing of the fund's holdings as of its most recent quarter end is available upon request. In addition, each Fidelity Central Fund's financial statements are available on the SEC's website or upon request.
(e) Investment made with cash collateral received from securities on loan.
Affiliated Central Funds
Information regarding fiscal year to date income earned by the Fund from investments in Fidelity Central Funds is as follows:
| Fund | Income earned |
| (Amounts in thousands) | |
| Fidelity Cash Central Fund | $1,096 |
| Fidelity Securities Lending Cash Central Fund | 1,121 |
| Total | $2,217 |
Investment Valuation
The following is a summary of the inputs used, as of August 31, 2017, involving the Fund's assets and liabilities carried at fair value. The inputs or methodology used for valuing securities may not be an indication of the risk associated with investing in those securities. For more information on valuation inputs, and their aggregation into the levels used below, please refer to the Investment Valuation section in the accompanying Notes to Financial Statements.
| Valuation Inputs at Reporting Date: | ||||
| Description | Total | Level 1 | Level 2 | Level 3 |
| (Amounts in thousands) | ||||
| Investments in Securities: | ||||
| Equities: | ||||
| Consumer Discretionary | $14,806,059 | $14,806,059 | $-- | $-- |
| Consumer Staples | 10,414,806 | 10,414,806 | -- | -- |
| Energy | 6,962,604 | 6,962,604 | -- | -- |
| Financials | 17,479,050 | 17,479,050 | -- | -- |
| Health Care | 18,001,580 | 18,001,580 | -- | -- |
| Industrials | 12,409,191 | 12,409,191 | -- | -- |
| Information Technology | 28,877,366 | 28,877,366 | -- | -- |
| Materials | 3,573,350 | 3,573,350 | -- | -- |
| Real Estate | 3,764,312 | 3,764,312 | -- | -- |
| Telecommunication Services | 2,627,843 | 2,627,843 | -- | -- |
| Utilities | 4,007,014 | 4,007,014 | -- | -- |
| U.S. Government and Government Agency Obligations | 29,962 | -- | 29,962 | -- |
| Money Market Funds | 1,063,776 | 1,063,776 | -- | -- |
| Total Investments in Securities: | $124,016,913 | $123,986,951 | $29,962 | $-- |
| Derivative Instruments: | ||||
| Assets | ||||
| Futures Contracts | $4,236 | $4,236 | $-- | $-- |
| Total Assets | $4,236 | $4,236 | $-- | $-- |
| Total Derivative Instruments: | $4,236 | $4,236 | $-- | $-- |
Value of Derivative Instruments
The following table is a summary of the Fund's value of derivative instruments by primary risk exposure as of August 31, 2017. For additional information on derivative instruments, please refer to the Derivative Instruments section in the accompanying Notes to Financial Statements.
| Primary Risk Exposure / Derivative Type | Value | |
| Asset | Liability | |
| (Amounts in thousands) | ||
| Equity Risk | ||
| Futures Contracts(a) | $4,236 | $0 |
| Total Equity Risk | 4,236 | 0 |
| Total Value of Derivatives | $4,236 | $0 |
(a) Reflects gross cumulative appreciation (depreciation) on futures contracts as presented in the Schedule of Investments. Only the period end receivable or payable for daily variation margin and net unrealized appreciation (depreciation) are presented in the Statement of Assets and Liabilities.
See accompanying notes which are an integral part of the financial statements.
Financial Statements
Statement of Assets and Liabilities
| Amounts in thousands (except per-share amounts) | August 31, 2017 (Unaudited) | |
| Assets | ||
| Investment in securities, at value (including securities loaned of $1,046,845) — See accompanying schedule: Unaffiliated issuers (cost $68,537,688) | $122,953,137 | |
| Fidelity Central Funds (cost $1,063,677) | 1,063,776 | |
| Total Investment in Securities (cost $69,601,365) | $124,016,913 | |
| Cash | 1 | |
| Receivable for investments sold | 699,669 | |
| Receivable for fund shares sold | 90,080 | |
| Dividends receivable | 273,008 | |
| Distributions receivable from Fidelity Central Funds | 397 | |
| Receivable for daily variation margin on futures contracts | 1,506 | |
| Other receivables | 2,821 | |
| Total assets | 125,084,395 | |
| Liabilities | ||
| Payable for investments purchased | $540,755 | |
| Payable for fund shares redeemed | 292,370 | |
| Accrued management fee | 1,531 | |
| Notes payable to affiliates | 32,294 | |
| Other affiliated payables | 1,811 | |
| Other payables and accrued expenses | 2,824 | |
| Collateral on securities loaned | 1,063,636 | |
| Total liabilities | 1,935,221 | |
| Net Assets | $123,149,174 | |
| Net Assets consist of: | ||
| Paid in capital | $67,576,541 | |
| Undistributed net investment income | 517,302 | |
| Accumulated undistributed net realized gain (loss) on investments | 635,547 | |
| Net unrealized appreciation (depreciation) on investments | 54,419,784 | |
| Net Assets | $123,149,174 | |
| Investor Class: | ||
| Net Asset Value, offering price and redemption price per share ($3,791,720 ÷ 43,727 shares) | $86.71 | |
| Premium Class: | ||
| Net Asset Value, offering price and redemption price per share ($69,085,329 ÷ 796,560 shares) | $86.73 | |
| Institutional Class: | ||
| Net Asset Value, offering price and redemption price per share ($33,810,221 ÷ 389,818 shares) | $86.73 | |
| Institutional Premium Class: | ||
| Net Asset Value, offering price and redemption price per share ($16,461,904 ÷ 189,800 shares) | $86.73 |
See accompanying notes which are an integral part of the financial statements.
Statement of Operations
| Amounts in thousands | Six months ended August 31, 2017 (Unaudited) | |
| Investment Income | ||
| Dividends | $1,271,841 | |
| Interest | 120 | |
| Income from Fidelity Central Funds | 2,217 | |
| Total income | 1,274,178 | |
| Expenses | ||
| Management fee | $8,975 | |
| Transfer agent fees | 14,111 | |
| Independent trustees' fees and expenses | 240 | |
| Appreciation in deferred trustee compensation account | 1 | |
| Legal | 85 | |
| Interest | 2 | |
| Miscellaneous | 188 | |
| Total expenses before reductions | 23,602 | |
| Expense reductions | (10) | 23,592 |
| Net investment income (loss) | 1,250,586 | |
| Realized and Unrealized Gain (Loss) | ||
| Net realized gain (loss) on: | ||
| Investment securities: | ||
| Unaffiliated issuers | 1,201,987 | |
| Fidelity Central Funds | 28 | |
| Futures contracts | 36,923 | |
| Total net realized gain (loss) | 1,238,938 | |
| Change in net unrealized appreciation (depreciation) on: | ||
| Investment securities: | ||
| Unaffiliated issuers | 4,083,595 | |
| Fidelity Central Funds | 99 | |
| Futures contracts | (21,797) | |
| Total change in net unrealized appreciation (depreciation) | 4,061,897 | |
| Net gain (loss) | 5,300,835 | |
| Net increase (decrease) in net assets resulting from operations | $6,551,421 |
See accompanying notes which are an integral part of the financial statements.
Statement of Changes in Net Assets
| Amounts in thousands | Six months ended August 31, 2017 (Unaudited) | Year ended February 28, 2017 |
| Increase (Decrease) in Net Assets | ||
| Operations | ||
| Net investment income (loss) | $1,250,586 | $2,117,384 |
| Net realized gain (loss) | 1,238,938 | 648,777 |
| Change in net unrealized appreciation (depreciation) | 4,061,897 | 19,684,467 |
| Net increase (decrease) in net assets resulting from operations | 6,551,421 | 22,450,628 |
| Distributions to shareholders from net investment income | (1,093,137) | (2,077,274) |
| Distributions to shareholders from net realized gain | (186,054) | (545,764) |
| Total distributions | (1,279,191) | (2,623,038) |
| Share transactions - net increase (decrease) | 1,091,736 | 9,525,609 |
| Total increase (decrease) in net assets | 6,363,966 | 29,353,199 |
| Net Assets | ||
| Beginning of period | 116,785,208 | 87,432,009 |
| End of period | $123,149,174 | $116,785,208 |
| Other Information | ||
| Undistributed net investment income end of period | $517,302 | $359,853 |
See accompanying notes which are an integral part of the financial statements.
Financial Highlights — Fidelity 500 Index Fund Investor Class
| Six months ended (Unaudited) August 31, | Years ended February 28, | |||||
| 2017 | 2017 | 2016A | 2015 | 2014 | 2013 | |
| Selected Per–Share Data | ||||||
| Net asset value, beginning of period | $82.98 | $68.13 | $74.71 | $66.10 | $53.81 | $48.49 |
| Income from Investment Operations | ||||||
| Net investment income (loss)B | .86 | 1.54 | 1.45 | 1.44 | 1.19 | 1.10 |
| Net realized and unrealized gain (loss) | 3.75 | 15.23 | (6.05) | 8.64 | 12.26 | 5.28 |
| Total from investment operations | 4.61 | 16.77 | (4.60) | 10.08 | 13.45 | 6.38 |
| Distributions from net investment income | (.75) | (1.52) | (1.52) | (1.31) | (1.16) | (1.06) |
| Distributions from net realized gain | (.13) | (.40) | (.46) | (.16) | – | – |
| Total distributions | (.88) | (1.92) | (1.98) | (1.47) | (1.16) | (1.06) |
| Net asset value, end of period | $86.71 | $82.98 | $68.13 | $74.71 | $66.10 | $53.81 |
| Total ReturnC,D | 5.60% | 24.88% | (6.26)% | 15.40% | 25.27% | 13.36% |
| Ratios to Average Net AssetsE,F | ||||||
| Expenses before reductions | .09%G | .09% | .10% | .10% | .10% | .10% |
| Expenses net of fee waivers, if any | .09%G | .09% | .10% | .10% | .10% | .10% |
| Expenses net of all reductions | .09%G | .09% | .10% | .10% | .10% | .10% |
| Net investment income (loss) | 2.04%G | 2.04% | 2.02% | 2.06% | 1.98% | 2.21% |
| Supplemental Data | ||||||
| Net assets, end of period (in millions) | $3,792 | $3,823 | $7,635 | $7,315 | $5,751 | $4,705 |
| Portfolio turnover rateH | 6%G,I | 5% | 5% | 4% | 4% | 4% |
A For the year ended February 29.
B Calculated based on average shares outstanding during the period.
C Total returns for periods of less than one year are not annualized.
D Total returns would have been lower if certain expenses had not been reduced during the applicable periods shown.
E Fees and expenses of any underlying Fidelity Central Funds are not included in the Fund's expense ratio. The Fund indirectly bears its proportionate share of the expenses of any underlying Fidelity Central Funds.
F Expense ratios reflect operating expenses of the class. Expenses before reductions do not reflect amounts reimbursed by the investment adviser or reductions from brokerage service arrangements or reductions from other expense offset arrangements and do not represent the amount paid by the class during periods when reimbursements or reductions occur. Expenses net of fee waivers reflect expenses after reimbursement by the investment adviser but prior to reductions from brokerage service arrangements or other expense offset arrangements. Expenses net of all reductions represent the net expenses paid by the class.
G Annualized
H Amount does not include the portfolio activity of any underlying Fidelity Central Funds.
I Portfolio turnover rate excludes securities received or delivered in-kind.
See accompanying notes which are an integral part of the financial statements.
Financial Highlights — Fidelity 500 Index Fund Premium Class
| Six months ended (Unaudited) August 31, | Years ended February 28, | |||||
| 2017 | 2017 | 2016A | 2015 | 2014 | 2013 | |
| Selected Per–Share Data | ||||||
| Net asset value, beginning of period | $82.99 | $68.15 | $74.72 | $66.11 | $53.82 | $48.50 |
| Income from Investment Operations | ||||||
| Net investment income (loss)B | .88 | 1.58 | 1.48 | 1.48 | 1.22 | 1.13 |
| Net realized and unrealized gain (loss) | 3.76 | 15.21 | (6.04) | 8.63 | 12.26 | 5.27 |
| Total from investment operations | 4.64 | 16.79 | (4.56) | 10.11 | 13.48 | 6.40 |
| Distributions from net investment income | (.77) | (1.55) | (1.55) | (1.34) | (1.19) | (1.08) |
| Distributions from net realized gain | (.13) | (.40) | (.46) | (.16) | – | – |
| Total distributions | (.90) | (1.95) | (2.01) | (1.50) | (1.19) | (1.08) |
| Net asset value, end of period | $86.73 | $82.99 | $68.15 | $74.72 | $66.11 | $53.82 |
| Total ReturnC,D | 5.64% | 24.91% | (6.21)% | 15.45% | 25.32% | 13.39% |
| Ratios to Average Net AssetsE,F | ||||||
| Expenses before reductions | .04%G | .05% | .07% | .07% | .07% | .07% |
| Expenses net of fee waivers, if any | .04%G | .05% | .05% | .05% | .05% | .06% |
| Expenses net of all reductions | .04%G | .05% | .05% | .05% | .05% | .06% |
| Net investment income (loss) | 2.09%G | 2.08% | 2.06% | 2.11% | 2.02% | 2.25% |
| Supplemental Data | ||||||
| Net assets, end of period (in millions) | $69,085 | $66,051 | $49,215 | $49,784 | $38,736 | $28,996 |
| Portfolio turnover rateH | 6%G,I | 5% | 5% | 4% | 4% | 4% |
A For the year ended February 29.
B Calculated based on average shares outstanding during the period.
C Total returns for periods of less than one year are not annualized.
D Total returns would have been lower if certain expenses had not been reduced during the applicable periods shown.
E Fees and expenses of any underlying Fidelity Central Funds are not included in the Fund's expense ratio. The Fund indirectly bears its proportionate share of the expenses of any underlying Fidelity Central Funds.
F Expense ratios reflect operating expenses of the class. Expenses before reductions do not reflect amounts reimbursed by the investment adviser or reductions from brokerage service arrangements or reductions from other expense offset arrangements and do not represent the amount paid by the class during periods when reimbursements or reductions occur. Expenses net of fee waivers reflect expenses after reimbursement by the investment adviser but prior to reductions from brokerage service arrangements or other expense offset arrangements. Expenses net of all reductions represent the net expenses paid by the class.
G Annualized
H Amount does not include the portfolio activity of any underlying Fidelity Central Funds.
I Portfolio turnover rate excludes securities received or delivered in-kind.
See accompanying notes which are an integral part of the financial statements.
Financial Highlights — Fidelity 500 Index Fund Institutional Class
| Six months ended (Unaudited) August 31, | Years ended February 28, | |||||
| 2017 | 2017 | 2016A | 2015 | 2014 | 2013 | |
| Selected Per–Share Data | ||||||
| Net asset value, beginning of period | $83.00 | $68.15 | $74.73 | $66.11 | $53.82 | $48.50 |
| Income from Investment Operations | ||||||
| Net investment income (loss)B | .89 | 1.59 | 1.49 | 1.48 | 1.22 | 1.13 |
| Net realized and unrealized gain (loss) | 3.74 | 15.22 | (6.05) | 8.64 | 12.26 | 5.28 |
| Total from investment operations | 4.63 | 16.81 | (4.56) | 10.12 | 13.48 | 6.41 |
| Distributions from net investment income | (.77) | (1.56) | (1.56) | (1.35) | (1.19) | (1.09) |
| Distributions from net realized gain | (.13) | (.40) | (.46) | (.16) | – | – |
| Total distributions | (.90) | (1.96) | (2.02) | (1.50)C | (1.19) | (1.09) |
| Net asset value, end of period | $86.73 | $83.00 | $68.15 | $74.73 | $66.11 | $53.82 |
| Total ReturnD,E | 5.63% | 24.94% | (6.21)% | 15.47% | 25.33% | 13.42% |
| Ratios to Average Net AssetsF,G | ||||||
| Expenses before reductions | .03%H | .04% | .05% | .05% | .05% | .05% |
| Expenses net of fee waivers, if any | .03%H | .04% | .04% | .04% | .04% | .04% |
| Expenses net of all reductions | .03%H | .04% | .04% | .04% | .04% | .04% |
| Net investment income (loss) | 2.09%H | 2.09% | 2.07% | 2.12% | 2.03% | 2.27% |
| Supplemental Data | ||||||
| Net assets, end of period (in millions) | $33,810 | $32,087 | $23,860 | $25,621 | $22,636 | $17,703 |
| Portfolio turnover rateI | 6%H,J | 5% | 5% | 4% | 4% | 4% |
A For the year ended February 29.
B Calculated based on average shares outstanding during the period.
C Total distributions of $1.50 per share is comprised of distributions from net investment income of $1.347 and distributions from net realized gain of $.157 per share.
D Total returns for periods of less than one year are not annualized.
E Total returns would have been lower if certain expenses had not been reduced during the applicable periods shown.
F Fees and expenses of any underlying Fidelity Central Funds are not included in the Fund's expense ratio. The Fund indirectly bears its proportionate share of the expenses of any underlying Fidelity Central Funds.
G Expense ratios reflect operating expenses of the class. Expenses before reductions do not reflect amounts reimbursed by the investment adviser or reductions from brokerage service arrangements or reductions from other expense offset arrangements and do not represent the amount paid by the class during periods when reimbursements or reductions occur. Expenses net of fee waivers reflect expenses after reimbursement by the investment adviser but prior to reductions from brokerage service arrangements or other expense offset arrangements. Expenses net of all reductions represent the net expenses paid by the class.
H Annualized
I Amount does not include the portfolio activity of any underlying Fidelity Central Funds.
J Portfolio turnover rate excludes securities received or delivered in-kind.
See accompanying notes which are an integral part of the financial statements.
Financial Highlights — Fidelity 500 Index Fund Institutional Premium Class
| Six months ended (Unaudited) August 31, | Years ended February 28, | |||||
| 2017 | 2017 | 2016A | 2015 | 2014 | 2013 | |
| Selected Per–Share Data | ||||||
| Net asset value, beginning of period | $83.00 | $68.15 | $74.73 | $66.11 | $53.83 | $48.50 |
| Income from Investment Operations | ||||||
| Net investment income (loss)B | .89 | 1.61 | 1.50 | 1.50 | 1.24 | 1.14 |
| Net realized and unrealized gain (loss) | 3.75 | 15.21 | (6.05) | 8.64 | 12.24 | 5.29 |
| Total from investment operations | 4.64 | 16.82 | (4.55) | 10.14 | 13.48 | 6.43 |
| Distributions from net investment income | (.78) | (1.58) | (1.57) | (1.36) | (1.20) | (1.10) |
| Distributions from net realized gain | (.13) | (.40) | (.46) | (.16) | – | – |
| Total distributions | (.91) | (1.97)C | (2.03) | (1.52) | (1.20) | (1.10) |
| Net asset value, end of period | $86.73 | $83.00 | $68.15 | $74.73 | $66.11 | $53.83 |
| Total ReturnD,E | 5.64% | 24.97% | (6.19)% | 15.50% | 25.34% | 13.46% |
| Ratios to Average Net AssetsF,G | ||||||
| Expenses before reductions | .02%H | .02% | .03% | .03% | .03% | .03% |
| Expenses net of fee waivers, if any | .02%H | .02% | .02% | .02% | .02% | .02% |
| Expenses net of all reductions | .02%H | .02% | .02% | .02% | .02% | .02% |
| Net investment income (loss) | 2.11%H | 2.11% | 2.09% | 2.14% | 2.05% | 2.29% |
| Supplemental Data | ||||||
| Net assets, end of period (in millions) | $16,462 | $14,824 | $6,722 | $6,217 | $3,506 | $1,912 |
| Portfolio turnover rateI | 6%H,J | 5% | 5% | 4% | 4% | 4% |
A For the year ended February 29.
B Calculated based on average shares outstanding during the period.
C Total distributions of $1.97 per share is comprised of distributions from net investment income of $1.576 and distributions from net realized gain of $.398 per share.
D Total returns for periods of less than one year are not annualized.
E Total returns would have been lower if certain expenses had not been reduced during the applicable periods shown.
F Fees and expenses of any underlying Fidelity Central Funds are not included in the Fund's expense ratio. The Fund indirectly bears its proportionate share of the expenses of any underlying Fidelity Central Funds.
G Expense ratios reflect operating expenses of the class. Expenses before reductions do not reflect amounts reimbursed by the investment adviser or reductions from brokerage service arrangements or reductions from other expense offset arrangements and do not represent the amount paid by the class during periods when reimbursements or reductions occur. Expenses net of fee waivers reflect expenses after reimbursement by the investment adviser but prior to reductions from brokerage service arrangements or other expense offset arrangements. Expenses net of all reductions represent the net expenses paid by the class.
H Annualized
I Amount does not include the portfolio activity of any underlying Fidelity Central Funds.
J Portfolio turnover rate excludes securities received or delivered in-kind.
See accompanying notes which are an integral part of the financial statements.
Notes to Financial Statements (Unaudited)
For the period ended August 31, 2017
(Amounts in thousands except percentages)
1. Organization.
Fidelity 500 Index Fund (the Fund) is a fund of Fidelity Concord Street Trust (the Trust) and is authorized to issue an unlimited number of shares. The Trust is registered under the Investment Company Act of 1940, as amended (the 1940 Act), as an open-end management investment company organized as a Massachusetts business trust. The Fund offers Investor Class, Premium Class, Institutional Class and Institutional Premium Class shares, each of which has equal rights as to assets and voting privileges. Each class has exclusive voting rights with respect to matters that affect that class. The Fund offers conversion privileges between share classes to eligible shareholders.
2. Investments in Fidelity Central Funds.
The Fund invests in Fidelity Central Funds, which are open-end investment companies generally available only to other investment companies and accounts managed by the investment adviser and its affiliates. The Fund's Schedule of Investments lists each of the Fidelity Central Funds held as of period end, if any, as an investment of the Fund, but does not include the underlying holdings of each Fidelity Central Fund. As an Investing Fund, the Fund indirectly bears its proportionate share of the expenses of the underlying Fidelity Central Funds.
The Money Market Central Funds seek preservation of capital and current income and are managed by Fidelity Investments Money Management, Inc. (FIMM), an affiliate of the investment adviser. Annualized expenses of the Money Market Central Funds as of their most recent shareholder report date are less than .005%.
A complete unaudited list of holdings for each Fidelity Central Fund is available upon request or at the Securities and Exchange Commission (the SEC) website at www.sec.gov. In addition, the financial statements of the Fidelity Central Funds are available on the SEC website or upon request.
3. Significant Accounting Policies.
The Fund is an investment company and applies the accounting and reporting guidance of the Financial Accounting Standards Board (FASB) Accounting Standards Codification Topic 946 Financial Services – Investments Companies. The financial statements have been prepared in conformity with accounting principles generally accepted in the United States of America (GAAP), which require management to make certain estimates and assumptions at the date of the financial statements. Actual results could differ from those estimates. Subsequent events, if any, through the date that the financial statements were issued have been evaluated in the preparation of the financial statements. The following summarizes the significant accounting policies of the Fund:
Investment Valuation. Investments are valued as of 4:00 p.m. Eastern time on the last calendar day of the period. The Board of Trustees (the Board) has delegated the day to day responsibility for the valuation of the Fund's investments to the Fair Value Committee (the Committee) established by the Fund's investment adviser. In accordance with valuation policies and procedures approved by the Board, the Fund attempts to obtain prices from one or more third party pricing vendors or brokers to value its investments. When current market prices, quotations or currency exchange rates are not readily available or reliable, investments will be fair valued in good faith by the Committee, in accordance with procedures adopted by the Board. Factors used in determining fair value vary by investment type and may include market or investment specific events, changes in interest rates and credit quality. The frequency with which these procedures are used cannot be predicted and they may be utilized to a significant extent. The Committee oversees the Fund's valuation policies and procedures and reports to the Board on the Committee's activities and fair value determinations. The Board monitors the appropriateness of the procedures used in valuing the Fund's investments and ratifies the fair value determinations of the Committee.
The Fund categorizes the inputs to valuation techniques used to value its investments into a disclosure hierarchy consisting of three levels as shown below:
- Level 1 – quoted prices in active markets for identical investments
- Level 2 – other significant observable inputs (including quoted prices for similar investments, interest rates, prepayment speeds, etc.)
- Level 3 – unobservable inputs (including the Fund's own assumptions based on the best information available)
Valuation techniques used to value the Fund's investments by major category are as follows:
Equity securities, including restricted securities, for which market quotations are readily available, are valued at the last reported sale price or official closing price as reported by a third party pricing vendor on the primary market or exchange on which they are traded and are categorized as Level 1 in the hierarchy. In the event there were no sales during the day or closing prices are not available, securities are valued at the last quoted bid price or may be valued using the last available price and are generally categorized as Level 2 in the hierarchy. For foreign equity securities, when market or security specific events arise, comparisons to the valuation of American Depositary Receipts (ADRs), futures contracts, Exchange-Traded Funds (ETFs) and certain indexes as well as quoted prices for similar securities may be used and would be categorized as Level 2 in the hierarchy. Utilizing these techniques may result in transfers between Level 1 and Level 2. For equity securities, including restricted securities, where observable inputs are limited, assumptions about market activity and risk are used and these securities may be categorized as Level 3 in the hierarchy.
Debt securities, including restricted securities, are valued based on evaluated prices received from third party pricing vendors or from brokers who make markets in such securities. U.S. government and government agency obligations, are valued by pricing vendors who utilize matrix pricing which considers yield or price of bonds of comparable quality, coupon, maturity and type or by broker-supplied prices. When independent prices are unavailable or unreliable, debt securities may be valued utilizing pricing methodologies which consider similar factors that would be used by third party pricing vendors. Debt securities are generally categorized as Level 2 in the hierarchy but may be Level 3 depending on the circumstances.
Futures contracts are valued at the settlement price established each day by the board of trade or exchange on which they are traded and are categorized as Level 1 in the hierarchy. Investments in open-end mutual funds, including the Fidelity Central Funds, are valued at their closing net asset value (NAV) each business day and are categorized as Level 1 in the hierarchy.
Changes in valuation techniques may result in transfers in or out of an assigned level within the disclosure hierarchy. The aggregate value of investments by input level as of August 31, 2017, is included at the end of the Fund's Schedule of Investments.
Investment Transactions and Income. For financial reporting purposes, the Fund's investment holdings and NAV include trades executed through the end of the last business day of the period. The NAV per share for processing shareholder transactions is calculated as of the close of business of the New York Stock Exchange (NYSE), normally 4:00 p.m. Eastern time and includes trades executed through the end of the prior business day. Gains and losses on securities sold are determined on the basis of identified cost and may include proceeds received from litigation. Dividend income is recorded on the ex-dividend date, except for certain dividends from foreign securities where the ex-dividend date may have passed, which are recorded as soon as the Fund is informed of the ex-dividend date. Non-cash dividends included in dividend income, if any, are recorded at the fair market value of the securities received. Income and capital gain distributions from Fidelity Central Funds, if any, are recorded on the ex-dividend date. Certain distributions received by the Fund represent a return of capital or capital gain. The Fund determines the components of these distributions subsequent to the ex-dividend date, based upon receipt of tax filings or other correspondence relating to the underlying investment. These distributions are recorded as a reduction of cost of investments and/or as a realized gain. Interest income is accrued as earned and includes coupon interest and amortization of premium and accretion of discount on debt securities as applicable.
Class Allocations and Expenses. Investment income, realized and unrealized capital gains and losses, common expenses of the Fund, and certain fund-level expense reductions, if any, are allocated daily on a pro-rata basis to each class based on the relative net assets of each class to the total net assets of the Fund. Each class differs with respect to transfer agent fees incurred. Certain expense reductions may also differ by class. For the reporting period, the allocated portion of income and expenses to each class as a percent of its average net assets may vary due to the timing of recording these transactions in relation to fluctuating net assets of the classes. Expenses directly attributable to a fund are charged to that fund. Expenses attributable to more than one fund are allocated among the respective funds on the basis of relative net assets or other appropriate methods. Expense estimates are accrued in the period to which they relate and adjustments are made when actual amounts are known.
Deferred Trustee Compensation. Under a Deferred Compensation Plan (the Plan), independent Trustees may elect to defer receipt of a portion of their annual compensation. Deferred amounts are invested in a cross-section of Fidelity funds, are marked-to-market and remain in the Fund until distributed in accordance with the Plan. The investment of deferred amounts and the offsetting payable to the Trustees are included in the accompanying Statement of Assets and Liabilities.
Income Tax Information and Distributions to Shareholders. Each year, the Fund intends to qualify as a regulated investment company under Subchapter M of the Internal Revenue Code, including distributing substantially all of its taxable income and realized gains. As a result, no provision for U.S. Federal income taxes is required. The Fund files a U.S. federal tax return, in addition to state and local tax returns as required. The Fund's federal income tax returns are subject to examination by the Internal Revenue Service (IRS) for a period of three fiscal years after they are filed. State and local tax returns may be subject to examination for an additional fiscal year depending on the jurisdiction.
Distributions are declared and recorded on the ex-dividend date. Income dividends and capital gain distributions are declared separately for each class. Income and capital gain distributions are determined in accordance with income tax regulations, which may differ from GAAP.
Capital accounts within the financial statements are adjusted for permanent book-tax differences. These adjustments have no impact on net assets or the results of operations. Capital accounts are not adjusted for temporary book-tax differences which will reverse in a subsequent period.
Book-tax differences are primarily due to futures contracts, market discount, deferred trustees compensation and losses deferred due to wash sales.
As of period end, the cost and unrealized appreciation (depreciation) in securities, and derivatives if applicable, for federal income tax purposes were as follows:
| Gross unrealized appreciation | $57,319,004 |
| Gross unrealized depreciation | (3,386,872) |
| Net unrealized appreciation (depreciation) | $53,932,132 |
| Tax cost | $70,089,017 |
4. Derivative Instruments.
Risk Exposures and the Use of Derivative Instruments. The Fund's investment objective allows the Fund to enter into various types of derivative contracts, including futures contracts. Derivatives are investments whose value is primarily derived from underlying assets, indices or reference rates and may be transacted on an exchange or over-the-counter (OTC). Derivatives may involve a future commitment to buy or sell a specified asset based on specified terms, to exchange future cash flows at periodic intervals based on a notional principal amount, or for one party to make one or more payments upon the occurrence of specified events in exchange for periodic payments from the other party.
The Fund used derivatives to increase returns and to manage exposure to certain risks as defined below. The success of any strategy involving derivatives depends on analysis of numerous economic factors, and if the strategies for investment do not work as intended, the Fund may not achieve its objectives.
The Fund's use of derivatives increased or decreased its exposure to the following risk:
| Equity Risk | Equity risk relates to the fluctuations in the value of financial instruments as a result of changes in market prices (other than those arising from interest rate risk or foreign exchange risk), whether caused by factors specific to an individual investment, its issuer, or all factors affecting all instruments traded in a market or market segment. |
The Fund is also exposed to additional risks from investing in derivatives, such as liquidity risk and counterparty credit risk. Liquidity risk is the risk that the Fund will be unable to close out the derivative in the open market in a timely manner. Counterparty credit risk is the risk that the counterparty will not be able to fulfill its obligation to the Fund. Counterparty credit risk related to exchange-traded futures contracts may be mitigated by the protection provided by the exchange on which they trade.
Investing in derivatives may involve greater risks than investing in the underlying assets directly and, to varying degrees, may involve risk of loss in excess of any initial investment and collateral received and amounts recognized in the Statement of Assets and Liabilities. In addition, there may be the risk that the change in value of the derivative contract does not correspond to the change in value of the underlying instrument.
Futures Contracts. A futures contract is an agreement between two parties to buy or sell a specified underlying instrument for a fixed price at a specified future date. The Fund used futures contracts to manage its exposure to the stock market.
Upon entering into a futures contract, a fund is required to deposit either cash or securities (initial margin) with a clearing broker in an amount equal to a certain percentage of the face value of the contract. Futures contracts are marked-to-market daily and subsequent daily payments (variation margin) are made or received by a fund depending on the daily fluctuations in the value of the futures contracts and are recorded as unrealized appreciation or (depreciation). This receivable and/or payable, if any, is included in daily variation margin on futures contracts in the Statement of Assets and Liabilities. Realized gain or (loss) is recorded upon the expiration or closing of a futures contract.
Any open futures contracts at period end are presented in the Schedule of Investments under the caption "Futures Contracts". The underlying face amount at value reflects each contract's exposure to the underlying instrument or index at period end and is representative of volume of activity during the period. Securities deposited to meet initial margin requirements are identified in the Schedule of Investments.
During the period the Fund recognized net realized gain (loss) of $36,923 and a change in net unrealized appreciation (depreciation) of ($21,797) related to its investment in futures contracts. These amounts are included in the Statement of Operations.
5. Purchases and Sales of Investments.
Purchases and sales of securities, other than short-term securities and in-kind transactions, aggregated $6,917,059 and $3,752,156, respectively.
Redemptions In-Kind. During the period, 18,388,043 shares of the Fund held by unaffiliated entities were redeemed in-kind for investments and cash with a value of $1,534,318,182. The net realized gain of $1,107,402,193 on investments delivered through in-kind redemptions is included in the accompanying Statement of Operations. The amount of the in-kind redemptions is included in share transactions in the accompanying Statement of Changes in Net Assets as well as the Notes to Financial Statements. The Fund recognized no gain or loss for federal income tax purposes.
6. Fees and Other Transactions with Affiliates.
Management Fee and Expense Contract. Fidelity Management & Research Company (the investment adviser) and its affiliates provide the Fund with investment management related services for which the Fund pays a monthly management fee. The management fee is based on an annual rate of .015% of the Fund's average net assets. Under the management contract, the investment adviser pays all other fund-level expenses, except the compensation of the independent Trustees and certain other expenses such as interest expense, including commitment fees.
Effective August 1, 2017, the Board approved an amendment to the expense contract. Under the expense contract, the investment adviser pays class-level expenses as necessary so that the total expenses do not exceed certain amounts of each class' average net assets on an annual basis with certain exceptions, as noted in the following table:
| Investor Class | .09% |
| Premium Class | .035% |
| Institutional Class | .030% |
| Institutional Premium Class | .015% |
Prior to August 1, 2017, the investment adviser paid class-level expenses as necessary so that the total expenses did not exceed .09%, .045%, .035% and .015% for Investor Class, Premium Class, Institutional Class and Institutional Premium Class, respectively.
Sub-Adviser. Geode Capital Management, LLC (Geode), serves as sub-adviser for the Fund. Geode provides discretionary investment advisory services to the Fund and is paid by the investment adviser for providing these services.
Transfer Agent Fees. Fidelity Investments Institutional Operations Company, Inc. (FIIOC), an affiliate of the investment adviser, is the transfer, dividend disbursing and shareholder servicing agent for each class. FIIOC receives transfer agent fees at an annual rate of .075%, .045%, .035% and .015% of class-level average net assets for Investor Class, Premium Class, Institutional Class and Institutional Premium Class, respectively. FIIOC pays for typesetting, printing and mailing of shareholder reports, except proxy statements.
Effective August 1, 2017, under the amended expense contract, Investor Class, Premium Class and Institutional Class pay all or a portion of the transfer agent fees at an annual rate of .075%, .02% and .015%, of class-level average net assets, respectively, and Institutional Premium Class does not pay transfer agent fees. Prior to August 1, 2017, Investor Class, Premium Class and Institutional Class paid all or a portion of the transfer agent fees at an annual rate of .075%, .03% and .02% of class-level average net assets, respectively, and Institutional Premium Class did not pay transfer agent fees.
For the period, the total transfer agent fees paid by each applicable class were as follows:
| Amount | % of Class-Level Average Net Assets(a) | |
| Investor Class | $1,437 | .075 |
| Premium Class | 9,541 | .028 |
| Institutional Class | 3,133 | .019 |
| $14,111 |
(a) Annualized
Interfund Lending Program. Pursuant to an Exemptive Order issued by the SEC, the Fund, along with other registered investment companies having management contracts with FMR or other affiliated entities of FMR, may participate in an interfund lending program. This program provides an alternative credit facility allowing the funds to borrow from, or lend money to, other participating affiliated funds. Any open loans, including accrued interest, at period end are presented under the caption "Notes payable to affiliates" in the Fund's Statement of Assets and Liabilities. The Fund's activity in this program during the period for which loans were outstanding was as follows:
| Borrower or Lender | Average Loan Balance | Weighted Average Interest Rate | Interest Expense |
| Borrower | $25,201 | 1.35% | $2 |
Interfund Trades. The Fund may purchase from or sell securities to other Fidelity Funds under procedures adopted by the Board. The procedures have been designed to ensure these interfund trades are executed in accordance with Rule 17a-7 of the 1940 Act. Interfund trades are included within the respective purchases and sales amounts shown in the Purchases and Sales of Investments note.
7. Committed Line of Credit.
The Fund participates with other funds managed by the investment adviser or an affiliate in a $4.25 billion credit facility (the "line of credit") to be utilized for temporary or emergency purposes to fund shareholder redemptions or for other short-term liquidity purposes. The Fund has agreed to pay commitment fees on its pro-rata portion of the line of credit, which amounted to $188 and is reflected in Miscellaneous expenses on the Statement of Operations. During the period, the Fund did not borrow on this line of credit.
8. Security Lending.
The Fund lends portfolio securities through a lending agent from time to time in order to earn additional income. On the settlement date of the loan, the Fund receives collateral (in the form of U.S. Treasury obligations, letters of credit and/or cash) against the loaned securities and maintains collateral in an amount not less than 100% of the market value of the loaned securities during the period of the loan. The market value of the loaned securities is determined at the close of business of the Fund and any additional required collateral is delivered to the Fund on the next business day. The Fund or borrower may terminate the loan at any time, and if the borrower defaults on its obligation to return the securities loaned because of insolvency or other reasons, the Fund may apply collateral received from the borrower against the obligation. The Fund may experience delays and costs in recovering the securities loaned. Any cash collateral received is invested in the Fidelity Securities Lending Cash Central Fund. The value of loaned securities and cash collateral at period end are disclosed on the Fund's Statement of Assets and Liabilities. Security lending income represents the income earned on investing cash collateral, less rebates paid to borrowers and any lending agent fees associated with the loan, plus any premium payments received for lending certain types of securities. Security lending income is presented in the Statement of Operations as a component of income from Fidelity Central Funds. Total security lending income during the period amounted to $1,121.
9. Expense Reductions.
Through arrangements with the Fund's custodian, credits realized as a result of certain uninvested cash balances were used to reduce the Fund's expenses. During the period, these credits reduced the Fund's miscellaneous expenses by $10.
10. Distributions to Shareholders.
Distributions to shareholders of each class were as follows:
| Six months ended August 31, 2017 | Year ended February 28, 2017 | |
| From net investment income | ||
| Investor Class | $34,014 | $103,371 |
| Premium Class | 612,916 | 1,163,534 |
| Institutional Class | 298,100 | 571,931 |
| Institutional Premium Class | 148,107 | 238,438 |
| Total | $1,093,137 | $2,077,274 |
| From net realized gain | ||
| Investor Class | $6,052 | $21,275 |
| Premium Class | 104,764 | 305,450 |
| Institutional Class | 50,048 | 149,467 |
| Institutional Premium Class | 25,190 | 69,572 |
| Total | $186,054 | $545,764 |
11. Share Transactions.
Share transactions for each class were as follows and may contain automatic conversions between classes or exchanges between affiliated funds:
| Shares | Shares | Dollars | Dollars | |
| Six months ended August 31, 2017 | Year ended February 28, 2017 | Six months ended August 31, 2017 | Year ended February 28, 2017 | |
| Investor Class | ||||
| Shares sold | 14,800 | 52,360 | $1,247,327 | $3,969,866 |
| Reinvestment of distributions | 444 | 1,552 | 37,043 | 117,535 |
| Shares redeemed | (17,587) | (119,903) | (1,482,193) | (8,989,547) |
| Net increase (decrease) | (2,343) | (65,991) | $(197,823) | $(4,902,146) |
| Premium Class | ||||
| Shares sold | 84,560 | 207,763 | $7,124,710 | $15,845,150 |
| Reinvestment of distributions | 7,983 | 17,738 | 666,591 | 1,356,321 |
| Shares redeemed | (91,838)(a) | (151,849) | (7,735,337)(a) | (11,521,839) |
| Net increase (decrease) | 705 | 73,652 | $55,964 | $5,679,632 |
| Institutional Class | ||||
| Shares sold | 64,785 | 137,895 | $5,464,486 | $10,500,882 |
| Reinvestment of distributions | 4,102 | 9,370 | 342,601 | 716,383 |
| Shares redeemed | (65,670)(a) | (110,790) | (5,518,597)(a) | (8,442,330) |
| Net increase (decrease) | 3,217 | 36,475 | $288,490 | $2,774,935 |
| Institutional Premium Class | ||||
| Shares sold | 35,881 | 104,472 | $3,007,139 | $7,851,293 |
| Reinvestment of distributions | 2,074 | 3,986 | 173,132 | 306,104 |
| Shares redeemed | (26,761) | (28,482) | (2,235,166) | (2,184,209) |
| Net increase (decrease) | 11,194 | 79,976 | $945,105 | $5,973,188 |
(a) Amount includes in-kind redemptions (see the Redemptions In-Kind note for additional details).
12. Other.
The Fund's organizational documents provide former and current trustees and officers with a limited indemnification against liabilities arising in connection with the performance of their duties to the Fund. In the normal course of business, the Fund may also enter into contracts that provide general indemnifications. The Fund's maximum exposure under these arrangements is unknown as this would be dependent on future claims that may be made against the Fund. The risk of material loss from such claims is considered remote.
Shareholder Expense Example
As a shareholder of the Fund, you incur two types of costs: (1) transaction costs, and (2) ongoing costs, including management fees and other Fund expenses. This Example is intended to help you understand your ongoing costs (in dollars) of investing in the Fund and to compare these costs with the ongoing costs of investing in other mutual funds.
The Example is based on an investment of $1,000 invested at the beginning of the period and held for the entire period (March 1, 2017 to August 31, 2017).
Actual Expenses
The first line of the accompanying table for each class of the Fund provides information about actual account values and actual expenses. You may use the information in this line, together with the amount you invested, to estimate the expenses that you paid over the period. Simply divide your account value by $1,000.00 (for example, an $8,600 account value divided by $1,000.00 = 8.6), then multiply the result by the number in the first line for a class of the Fund under the heading entitled "Expenses Paid During Period" to estimate the expenses you paid on your account during this period. A small balance maintenance fee of $12.00 that is charged once a year may apply for certain accounts with a value of less than $2,000. This fee is not included in the table below. If it was, the estimate of expenses you paid during the period would be higher, and your ending account value lower, by this amount. In addition, the Fund, as a shareholder in the underlying Fidelity Central Funds, will indirectly bear its pro-rata share of the fees and expenses incurred by the underlying Fidelity Central Funds. These fees and expenses are not included in the Fund's annualized expense ratio used to calculate the expense estimate in the table below.
Hypothetical Example for Comparison Purposes
The second line of the accompanying table for each class of the Fund provides information about hypothetical account values and hypothetical expenses based on a Class' actual expense ratio and an assumed rate of return of 5% per year before expenses, which is not the Class' actual return. The hypothetical account values and expenses may not be used to estimate the actual ending account balance or expenses you paid for the period. You may use this information to compare the ongoing costs of investing in the Fund and other funds. To do so, compare this 5% hypothetical example with the 5% hypothetical examples that appear in the shareholder reports of the other funds. A small balance maintenance fee of $12.00 that is charged once a year may apply for certain accounts with a value of less than $2,000. This fee is not included in the table below. If it was, the estimate of expenses you paid during the period would be higher, and your ending account value lower, by this amount. In addition, the Fund, as a shareholder in the underlying Fidelity Central Funds, will indirectly bear its pro-rata share of the fees and expenses incurred by the underlying Fidelity Central Funds. These fees and expenses are not included in the Fund's annualized expense ratio used to calculate the expense estimate in the table below.
Please note that the expenses shown in the table are meant to highlight your ongoing costs only and do not reflect any transaction costs. Therefore, the second line of the table is useful in comparing ongoing costs only, and will not help you determine the relative total costs of owning different funds.
| Annualized Expense Ratio-A | Beginning Account Value March 1, 2017 | Ending Account Value August 31, 2017 | Expenses Paid During Period-B March 1, 2017 to August 31, 2017 | |
| Investor Class | .09% | |||
| Actual | $1,000.00 | $1,056.00 | $.47 | |
| Hypothetical-C | $1,000.00 | $1,024.75 | $.46 | |
| Premium Class | .04% | |||
| Actual | $1,000.00 | $1,056.40 | $.21 | |
| Hypothetical-C | $1,000.00 | $1,025.00 | $.20 | |
| Institutional Class | .03% | |||
| Actual | $1,000.00 | $1,056.30 | $.16 | |
| Hypothetical-C | $1,000.00 | $1,025.05 | $.15 | |
| Institutional Premium Class | .02% | |||
| Actual | $1,000.00 | $1,056.40 | $.10 | |
| Hypothetical-C | $1,000.00 | $1,025.10 | $.10 |
A Annualized expense ratio reflects expenses net of applicable fee waivers.
B Expenses are equal to each Class' annualized expense ratio, multiplied by the average account value over the period, multiplied by 184/365 (to reflect the one-half year period).
C 5% return per year before expenses
Board Approval of Investment Advisory Contracts and Management Fees
Fidelity 500 Index Fund
Each year, the Board of Trustees, including the Independent Trustees (together, the Board), votes on the renewal of the management contract with Fidelity Management & Research Company (FMR) and the sub-advisory agreements (together, the Advisory Contracts) for the fund, including the fund's sub-advisory agreement with Geode Capital Management, LLC (Geode). FMR and the sub-advisers are referred to herein as the Investment Advisers. The Board, assisted by the advice of fund counsel and Independent Trustees' counsel, requests and considers a broad range of information relevant to the renewal of the Advisory Contracts throughout the year.
The Board meets regularly and, at each of its meetings, covers an extensive agenda of topics and materials and considers factors that are relevant to its annual consideration of the renewal of the fund's Advisory Contracts, including the services and support provided to the fund and its shareholders. The Board has established various standing committees (Committees), each composed of and chaired by Independent Trustees with varying backgrounds, to which the Board has assigned specific subject matter responsibilities in order to enhance effective decision-making by the Board. The Board, acting directly and through its Committees, requests and receives information concerning the annual consideration of the renewal of the fund's Advisory Contracts. The Board also meets as needed to review matters specifically related to the Board's annual consideration of the renewal of the Advisory Contracts. Members of the Board may also meet with trustees of other Fidelity funds through ad hoc joint committees to discuss certain matters relevant to all of the Fidelity funds.
At its July 2017 meeting, the Board unanimously determined to renew the fund's Advisory Contracts. In reaching its determination, the Board considered all factors it believed relevant, including (i) the nature, extent, and quality of the services to be provided to the fund and its shareholders (including the investment performance of the fund); (ii) the competitiveness of the fund's management fee and total expense ratio relative to peer funds; (iii) the total costs of the services to be provided by and the profits to be realized by Fidelity from its relationships with the fund; and (iv) the extent to which, if any, economies of scale exist and would be realized as the fund grows, and whether any economies of scale are appropriately shared with fund shareholders.
In considering whether to renew the Advisory Contracts for the fund, the Board reached a determination, with the assistance of fund counsel and Independent Trustees' counsel and through the exercise of its business judgment, that the renewal of the Advisory Contracts was in the best interests of the fund and its shareholders and that the compensation payable under the Advisory Contracts was fair and reasonable. The Board's decision to renew the Advisory Contracts was not based on any single factor, but rather was based on a comprehensive consideration of all the information provided to the Board at its meetings throughout the year. The Board, in reaching its determination to renew the Advisory Contracts, was aware that shareholders of the fund have a broad range of investment choices available to them, including a wide choice among funds offered by Fidelity's competitors, and that the fund's shareholders, who have the opportunity to review and weigh the disclosure provided by the fund in its prospectus and other public disclosures, have chosen to invest in this fund, which is part of the Fidelity family of funds.
Nature, Extent, and Quality of Services Provided. The Board considered staffing as it relates to the fund, including the backgrounds of investment personnel of Fidelity and Geode, and also considered the fund's investment objective, strategies, and related investment philosophy. The Independent Trustees also had discussions with senior management of Fidelity's investment operations and investment groups and with representatives of Geode. The Board considered the structure of the investment personnel compensation programs and whether the structures provide appropriate incentives to act in the best interests of the fund. Additionally, the Board considered the portfolio managers' investments, if any, in the funds that they manage.Resources Dedicated to Investment Management and Support Services. The Board and the Fund Oversight and Research Committees reviewed the general qualifications and capabilities of Fidelity's and Geode's investment staffs, including their size, education, experience, and resources, as well as Fidelity's approach to recruiting, training, managing, and compensating investment personnel. The Board noted that Fidelity has continued to increase the resources devoted to non-U.S. offices, including expansion of Fidelity's global investment organization. Additionally, in its deliberations, the Board considered Fidelity's and Geode's trading, risk management, compliance, and technology and operations capabilities and resources, which are integral parts of the investment management process.Shareholder and Administrative Services. The Board considered (i) the nature, extent, quality, and cost of advisory, administrative, and shareholder services performed by the Investment Advisers and their affiliates under the Advisory Contracts and under separate agreements covering transfer agency, pricing and bookkeeping, and securities lending services for the fund; (ii) the nature and extent of the supervision of third party service providers, principally custodians, subcustodians, and pricing vendors; and (iii) the resources devoted to, and the record of compliance with, the fund's compliance policies and procedures. The Board also reviewed the allocation of fund brokerage, including allocations to brokers affiliated with the Investment Advisers.The Board noted that the growth of fund assets over time across the complex allows Fidelity to reinvest in the development of services designed to enhance the value or convenience of the Fidelity funds as investment vehicles. These services include 24-hour access to account information and market information through telephone representatives and over the Internet, investor education materials and asset allocation tools, and the expanded availability of Fidelity Investor Centers.In 2014, the Board formed an ad hoc Committee on Transfer Agency Fees to review the variety of transfer agency fee structures throughout the industry and Fidelity's competitive positioning with respect to industry participants.Investment in a Large Fund Family. The Board considered the benefits to shareholders of investing in a Fidelity fund, including the benefits of investing in a fund that is part of a large family of funds offering a variety of investment disciplines and providing a large variety of mutual fund investor services. The Board noted that Fidelity had taken, or had made recommendations that resulted in the Fidelity funds taking, a number of actions over the previous year that benefited particular funds, including: (i) continuing to dedicate additional resources to Fidelity's investment research process, and to the support of the senior management team that oversees asset management; (ii) continuing efforts to enhance Fidelity's global research capabilities; (iii) launching new funds and making other enhancements to meet client needs; (iv) launching new share classes of existing funds; (v) eliminating purchase minimums and broadening eligibility requirements for certain lower-priced share classes; (vi) reducing management fees and total expenses for certain growth equity funds and index funds; (vii) lowering expense caps for certain existing funds and classes to reduce expenses borne by shareholders; (viii) eliminating short-term redemption fees for certain funds; (ix) introducing a new pricing structure for certain funds of funds that is expected to reduce overall expenses paid by shareholders; (x) rationalizing product lines and gaining increased efficiencies through proposals for fund mergers and share class consolidations; (xi) continuing to develop, acquire and implement systems and technology to improve services to the funds and shareholders, strengthen information security, and increase efficiency; and (xii) implementing enhancements to further strengthen Fidelity's product line to increase investors' probability of success in achieving their investment goals, including retirement income goals.Investment Performance. The Board considered whether the fund has operated in accordance with its investment objective, as well as its record of compliance with its investment restrictions and its performance history.The Board took into account discussions with representatives of the Investment Advisers about fund investment performance that occur at Board meetings throughout the year. In this regard the Board noted that as part of regularly scheduled fund reviews and other reports to the Board on fund performance, the Board considers annualized return information for the fund for different time periods, measured against the securities market index the fund seeks to track and a peer group of funds with similar objectives ("peer group"), if any. The Board also periodically considers the fund's tracking error versus its benchmark index. In its evaluation of fund investment performance, the Board gave particular attention to information indicating changes in performance of certain Fidelity funds for specific time periods and discussed with the Investment Advisers the reasons for any overperformance or underperformance.In addition to reviewing absolute and relative fund performance, the Independent Trustees periodically consider the appropriateness of fund performance metrics in evaluating the results achieved. In general, the Independent Trustees believe that an index fund's performance should be evaluated based on net performance (after fees and expenses) of both the highest performing and lowest performing fund share classes, where applicable, compared to a fund's benchmark index, over appropriate time periods taking into account relevant factors including the following: general market conditions; the characteristics of the fund's benchmark index; the extent to which statistical sampling is employed; any securities lending revenues; and fund cash flows and other factors.The Independent Trustees recognize that shareholders evaluate performance on a net basis over their own holding periods, for which one-, three-, and five-year periods are often used as a proxy. For this reason, the performance information reviewed by the Board also included net cumulative calendar year total return information for the fund and an appropriate benchmark index and peer group for the most recent one-, three-, and five-year periods, as shown below. Returns are shown compared to the 25th percentile (top of box, 75% beaten) and 75th percentile (bottom of box, 25% beaten) of the peer universe.Fidelity 500 Index Fund
Fidelity 500 Index Fund
![]()
UEI-SANN-1017
1.536672.120
Item 2.
Code of Ethics
Not applicable.
Item 3.
Audit Committee Financial Expert
Not applicable.
Item 4.
Principal Accountant Fees and Services
Not applicable.
Item 5.
Audit Committee of Listed Registrants
Not applicable.
Item 6.
Investments
(a)
Not applicable.
(b)
Not applicable
Item 7.
Disclosure of Proxy Voting Policies and Procedures for Closed-End Management Investment Companies
Not applicable.
Item 8.
Portfolio Managers of Closed-End Management Investment Companies
Not applicable.
Item 9.
Purchase of Equity Securities by Closed-End Management Investment Company and Affiliated Purchasers
Not applicable.
Item 10.
Submission of Matters to a Vote of Security Holders
There were no material changes to the procedures by which shareholders may recommend nominees to the Fidelity Concord Street Trust’s Board of Trustees.
Item 11.
Controls and Procedures
(a)(i) The President and Treasurer and the Chief Financial Officer have concluded that the Fidelity Concord Street Trust’s (the “Trust”) disclosure controls and procedures (as defined in Rule 30a-3(c) under the Investment Company Act) provide reasonable
assurances that material information relating to the Trust is made known to them by the appropriate persons, based on their evaluation of these controls and procedures as of a date within 90 days of the filing date of this report.
(a)(ii) There was no change in the Trust’s internal control over financial reporting (as defined in Rule 30a-3(d) under the Investment Company Act) that occurred during the second fiscal quarter of the period covered by this report that has materially affected, or is reasonably likely to materially affect, the Trust’s internal control over financial reporting.
Item 12.
Exhibits
(a) | (1) | Not applicable. |
(a) | (2) | Certification pursuant to Rule 30a-2(a) under the Investment Company Act of 1940 (17 CFR 270.30a-2(a)) is filed and attached hereto as Exhibit 99.CERT. |
(a) | (3) | Not applicable. |
(b) | Certification pursuant to Rule 30a-2(b) under the Investment Company Act of 1940 (17 CFR 270.30a-2(b)) is furnished and attached hereto as Exhibit 99.906CERT. |
SIGNATURES
Pursuant to the requirements of the Securities Exchange Act of 1934 and the Investment Company Act of 1940, the registrant has duly caused this report to be signed on its behalf by the undersigned, thereunto duly authorized.
Fidelity Concord Street Trust
By: | /s/Stacie M. Smith |
Stacie M. Smith | |
President and Treasurer | |
Date: | October 25, 2017 |
Pursuant to the requirements of the Securities Exchange Act of 1934 and the Investment Company Act of 1940, this report has been signed below by the following persons on behalf of the registrant and in the capacities and on the dates indicated.
By: | /s/Stacie M. Smith |
Stacie M. Smith | |
President and Treasurer | |
Date: | October 25, 2017 |
By: | /s/Howard J. Galligan III |
Howard J. Galligan III | |
Chief Financial Officer | |
Date: | October 25, 2017 |